Janus Capital Funds Plc Annual Report and Statutory Financial ... - AIA
342
Janus Capital Funds Plc 31 December 2015 Annual Report and Statutory Financial Statements Janus Capital Funds plc is an investment company with variable capital incorporated with limited liability in Ireland under registration number 296610 and established as an umbrella fund with segregated liability between sub-funds (a) This fund commenced operations on 1 May 2015. The information from this Fund is from the date of commencement of the operations to 31 December 2015. (b) This fund commenced operations on 5 April 2016. The above footnotes are consistently applied throughout the document. EQUITY & ALLOCATION FUNDS Janus Asia Frontier Markets Fund Janus Asia Growth Drivers Fund Janus Asia Fund Janus Balanced Fund Janus Emerging Markets Fund Janus Europe Fund Janus Global Adaptive Multi-Asset Fund (b) Janus Global Life Sciences Fund Janus Global Research Fund Janus Global Technology Fund Janus Japan Emerging Opportunities Fund Janus Japan Fund Janus Opportunistic Alpha Fund Janus US Fund Janus US Research Fund Janus US Twenty Fund Janus US Venture Fund Perkins Global Value Fund Perkins US Strategic Value Fund INTECH SUB-ADVISED FUNDS INTECH All-World Minimum Variance Core Fund (a) INTECH European Core Fund INTECH Global All Country Low Volatility Fund INTECH Global Dividend Fund INTECH US Core Fund ALTERNATIVE INVESTMENT FUNDS (For the avoidance of doubt, the Alternative Investment Funds (other than the Janus Global Real Estate Fund) are Equity Investing Funds) Janus Global Diversified Alternatives Fund Janus Global Real Estate Fund FIXED INCOME FUNDS Janus Flexible Income Fund Janus Global Flexible Income Fund Janus Global High Yield Fund Janus Global Investment Grade Bond Fund Janus Global Unconstrained Bond Fund Janus High Yield Fund Janus US Short-Term Bond Fund
-
Upload
khangminh22 -
Category
Documents
-
view
1 -
download
0
Transcript of Janus Capital Funds Plc Annual Report and Statutory Financial ... - AIA
Janus Capital Funds Plc31 December 2015
Annual Report and Statutory Financial Statements
Janus Capital Funds plc is an investment company with variable capital incorporated with limited liability in Ireland under registration number 296610 and established as an umbrella fund with segregated liability between sub-funds
(a) This fund commenced operations on 1 May 2015. The information from this Fund is from the date of commencement of the operations to 31 December 2015.(b) This fund commenced operations on 5 April 2016.
The above footnotes are consistently applied throughout the document.
EQUITY & ALLOCATION FUNDSJanus Asia Frontier Markets FundJanus Asia Growth Drivers FundJanus Asia FundJanus Balanced FundJanus Emerging Markets FundJanus Europe FundJanus Global Adaptive Multi-Asset Fund(b)
Janus Global Life Sciences FundJanus Global Research FundJanus Global Technology FundJanus Japan Emerging Opportunities FundJanus Japan FundJanus Opportunistic Alpha FundJanus US FundJanus US Research FundJanus US Twenty FundJanus US Venture FundPerkins Global Value FundPerkins US Strategic Value Fund
INTECH SUB-ADVISED FUNDSINTECH All-World MinimumVariance Core Fund(a)
INTECH European Core FundINTECH Global All Country Low Volatility FundINTECH Global Dividend FundINTECH US Core Fund
ALTERNATIVE INVESTMENT FUNDS(For the avoidance of doubt, the Alternative Investment Funds (other than the Janus Global Real Estate Fund) are Equity Investing Funds)Janus Global Diversifi ed Alternatives FundJanus Global Real Estate Fund
FIXED INCOME FUNDSJanus Flexible Income FundJanus Global Flexible Income FundJanus Global High Yield FundJanus Global Investment Grade Bond Fund Janus Global Unconstrained Bond FundJanus High Yield FundJanus US Short-Term Bond Fund

Erratum
Janus Capital Funds Plc 31 December 2015 Annual Report
The Janus Capital Funds Plc Annual Report for the year ended 31 December 2015
mailed out to shareholders incorrectly reflected the office address on page 338 for
Janus Capital Asia Limited (“JCAL”).
The Correct address for JCAL is set out below:
Janus Capital Asia Limited Suites 1911-15 One International Finance Centre 1 Harbour View Central, Hong Kong Any communication sent to the incorrect office address will be redirected to the
new office.
29 April 2016

Table of Contents
Background of the Company (unaudited) . . . . . . . . . . . . . . . . . . . . . . . . 1
Report of the Directors . . . . . . . . . . . . . . . . . . . . . . . . . . . . . . . . . . . . . 1 7
Fund Overviews (unaudited) . . . . . . . . . . . . . . . . . . . . . . . . . . . . . . . . 21
Fund Performance (unaudited) . . . . . . . . . . . . . . . . . . . . . . . . . . . . . . . 66
Financial Statements:
Portfolio Investments. . . . . . . . . . . . . . . . . . . . . . . . . . . . . . . . . . . 75
Statement of Financial Position . . . . . . . . . . . . . . . . . . . . . . . . . . 2 12
Statement of Comprehensive Income . . . . . . . . . . . . . . . . . . . . . 2 20
Statement of Changes in Net Assets Attributable to Redeemable Participating Shareholders . . . . . . . . . . . . . . . . 22 8
Notes to the Financial Statements . . . . . . . . . . . . . . . . . . . . . . . . 2 32
Explanation of Portfolio Investments and Primary Statements (unaudited) . . . . . . . . . . . . . . . . . . . . . . . . . 30 8
Statements of Changes in Composition of Portfolio (unaudited) . . . . . 30 9
Fund Expense Limits and Total Expense Ratios (unaudited) . . . . . . . . 32 8
Report of the Depositary to the Shareholders . . . . . . . . . . . . . . . . . . . 33 4
Independent Auditors’ Report . . . . . . . . . . . . . . . . . . . . . . . . . . . . . . . 33 5
Directors and Other Information (unaudited) . . . . . . . . . . . . . . . . . . . 33 7

J a n u s C a p i t a l F u n d s P l c / 3 1 D e c e m b e r 2 0 1 5 1
Janus Capital Funds plc (the “Company”) was incorporated in Ireland as a public limited company on 19 November 1998 under the Companies Act 2014 (the “Companies Act”). Unless otherwise provided for in this report, all capitalised terms shall have the same meaning herein as in the prospectus of the Company dated 1 April 2016 (the “Prospectus”). Capitalised terms not defined in this report shall have the same meaning as defined in the Prospectus.
The Company is an open ended investment company with variable capital established as an umbrella fund with segregated liability between sub-funds and is currently authorised by the Central Bank of Ireland (the “Central Bank”), as an undertaking for collective investment in transferable securities under the European Communities (Undertakings for Collective Investment in Transferable Securities) Regulations 2011 as amended (the “UCITS Regulations”).
The Company is organised in the form of an umbrella fund and has fifty two constituent sub-funds (individually a “Fund”, collectively the “Funds”) as follows:
EQUITY & ALLOCATION FUNDS
Janus Asia Frontier Markets FundJanus Asia Growth Drivers FundJanus Asia FundJanus Balanced FundJanus Emerging Markets FundJanus Europe Allocation Fund1
Janus Europe FundJanus Global Adaptive Capital Appreciation Fund1 (formerly known as the Janus Global Adaptive Equity Allocation Fund)Janus Global Adaptive Multi-Asset Fund (b)
Janus Global Growth Fund1
Janus Global Life Sciences FundJanus Global Opportunistic Alpha Fund1
Janus Global Research FundJanus Global Research (ex-Japan) Fund1
Janus Global Technology FundJanus Japan Emerging Opportunities FundJanus Japan FundJanus Opportunistic Alpha FundJanus US FundJanus US Research FundJanus US Twenty FundJanus US Venture FundPerkins Global Value FundPerkins US Strategic Value Fund
INTECH SUB-ADVISED FUNDS
INTECH All-World Minimum Variance Core Fund(a)
INTECH Emerging Markets Core Fund1
INTECH Emerging Markets Managed Volatility Fund1
INTECH European Core FundINTECH Global All Country Core Fund1
INTECH Global All Country Low Volatility FundINTECH Global All Country Managed Volatility Fund1
INTECH Global Core Fund2
INTECH Global Dividend FundINTECH Global Dividend Low Volatility Fund1
INTECH US Core Fund
ALTERNATIVE INVESTMENT FUNDS
(for the avoidance of doubt, the Alternative Investments Funds (other than the Janus Global Real Estate Fund) are Equity Investing Funds)Janus Extended Alpha Fund1
Janus Global Diversified Alternatives Fund Janus Global Real Estate Fund Janus Global Research 130/30 Fund1
FIXED INCOME FUNDS
Janus Absolute Return Income Fund1
Janus Emerging Market Debt Fund1
Janus Europe Flexible Income Fund1
Janus Flexible Income FundJanus Global Flexible Income FundJanus Global High Yield FundJanus Global Investment Grade Bond FundJanus Global Opportunity Income Fund1
Janus Multi-Sector Income Fund1
Janus Global Strategic Income Fund1
Janus Global Unconstrained Bond FundJanus High Yield FundJanus US Short-Term Bond Fund
Eighteen of the Funds have not yet launched, as indicated previously. Each Fund may issue Shares in multiple Classes denominated in US Dollars ($), Euro (€), Pound Sterling (£), Hong Kong Dollars (HK$), Australian Dollars (AUD$), Swiss Francs (CHF), Canadian Dollars (CAD$), Chinese Renminbi (RMB (CNH)), Swedish Kronor (SEK), New Zealand Dollars (NZD$), Norwegian Krone (NOK), Singapore Dollars (SGD$) or Japanese Yen (JPY). Certain Classes of Shares of the Funds have been admitted to the Official List and to trading on the Main Securities Market of the Irish Stock Exchange. Please refer to Citibank Europe plc (the “Administrator”) for a complete listing of the Classes of Shares of the Funds listed on the Irish Stock Exchange. The Administrator determines the net asset value per Share of each Class of each Fund once on each Business Day. Valuation Point for all Funds is at the close of the regular trading session of the New York Stock Exchange (normally 4:00 P.M., New York time, Monday through Friday).
The most recent Prospectus of the Company is dated 1 April 2016. Any reference to “Primarily” in the description of the investment objectives and policies of the Funds shall mean that at all times at least two thirds of the relevant Fund’s total asset value (excluding cash and cash equivalents) will be invested in investments in the manner described.
The following summarises the investment objective and policies of the lauched Funds. Please see the Prospectus for a complete description of the investment objectives and policies of the Funds.
1 Not yet launched.2 All Shares in this Fund were mandatorily redeemed on 30 November 2010.
Background of the Company (unaudited)

Background of the Company (unaudited)
2 J a n u s C a p i t a l F u n d s P l c / 3 1 D e c e m b e r 2 0 1 5
JANUS ASIA FRONTIER MARKETS FUND
This Fund’s investment objective is to seek to achieve long-term growth of capital. It pursues its objective by investing principally in common stocks of companies of any size, from larger, well-established companies to smaller, emerging growth companies, which are domiciled in, or are conducting the predominant portion of their economic activities in Developing Markets in Asia. It is expected that the Fund will be broadly diversified among a variety of industry sectors. The Fund may employ investment techniques and instruments, such as trading in futures, options and swaps and other derivative instruments for efficient portfolio management (i.e. reduction of risk, reduction of costs, generation of additional capital or income for the Fund) or, subject to a limit of up to 10% of the net asset value, for investment purposes as described in the “Types and Description of Financial Derivative Instruments” section of the Prospectus and subject to the conditions and within the limits from time to time laid down by the Central Bank to gain or hedge exposure to the investments contemplated in these investment policies. Due to its exposure to Developing Markets, an investment in the Fund should not constitute a substantial proportion of an investment portfolio and may not be appropriate for all investors.
JANUS ASIA GROWTH DRIVERS FUND
This Fund’s investment objective is to seek to achieve long-term growth of capital. It pursues its objective by investing principally in common stocks of companies of any size, from larger, well-established companies to smaller, emerging growth companies, which are domiciled in, or which are conducting the predominant portion of their economic activities in either Developed or Developing Markets in Asia, with a special emphasis on sectors considered by the Sub-Investment Adviser to be leading the growth of Asia, excluding Japan. The Fund may employ investment techniques and instruments, such as trading in futures, options and swaps and other derivative instruments for efficient portfolio management (i.e. reduction of risk, reduction of costs, generation of additional capital or income for the Fund) or, subject to a limit of up to 10% of the net asset value, for investment purposes as described in the “Types and Description of Financial Derivative Instruments” section of the Prospectus and subject to the conditions and within the limits from time to time laid down by the Central Bank to gain or hedge exposure to the investments contemplated in these investment policies. Due to its exposure to Developing Markets, an investment in the Fund should not constitute a substantial proportion of an investment portfolio and may not be appropriate for all investors.
JANUS ASIA FUND
This Fund’s investment objective is to seek to achieve long-term growth of capital. It pursues its objective by investing principally in common stocks of companies of any size, from larger, well established companies to smaller, emerging growth companies, which are domiciled in Asia, excluding Japan, or are conducting the predominant portion of their economic activities in one or more countries in Asia. The Fund may employ investment techniques and instruments, such as trading in futures, options
and swaps and other derivative instruments for efficient portfolio management (i.e. reduction of risk, reduction of costs, generation of additional capital or income for the Fund) or for investment purposes, subject to the conditions and within the limits from time to time laid down by the Central Bank). Due to its exposure to Developing Markets, an investment in the Fund should not constitute a substantial proportion of an investment portfolio and may not be appropriate for all investors.
JANUS BALANCED FUND
This Fund’s investment objective is long-term capital growth, consistent with preservation of capital and balanced by current income. It pursues its objective by investing 35% – 65% of its net asset value in equity securities of US Companies, such as common stocks, and 35% – 65% of its net asset value in Debt Securities of US Issuers. This Fund may invest up to 35% of its net asset value in Debt Securities rated below investment grade. The Fund may employ investment techniques and instruments for investment purposes, such as trading in futures, options and swaps and other financial derivative instruments, subject to a limit of up to 10% of its net asset value and subject to the conditions and within the limits from time to time laid down by the Central Bank. No more than 10% of the net asset value of the Fund may be invested in securities traded on any one Developing Market and the aggregate amount of the Fund which may be invested in securities traded on the Developing Markets is 20% of the net asset value of the Fund. Due to its exposure to below investment grade securities, an investment in the Fund should not constitute a substantial proportion of an investment portfolio and may not be appropriate for all investors.
JANUS EMERGING MARKETS FUND
This Fund’s investment objective is long-term growth of capital. Under normal circumstances, the Fund seeks to achieve its objective by investing principally in equity securities issued by companies incorporated or having their principal business activities in one or more Developing Markets (including China) or companies which derive a significant proportion of their revenues or profits from one or more Developing Markets or have a significant portion of their assets in one or more Developing Markets. Due to its exposure to Developing Markets, an investment in the Fund should not constitute a substantial proportion of an investment portfolio and may not be appropriate for all investors. The Fund may invest, without limit, in equity securities or employ investment techniques and instruments which have exposure to the Chinese market. The Fund may invest directly in China “B” Shares. The Fund may have exposure to China “A” shares indirectly via investments in (i) other collective investment schemes that invest primarily in China “A” shares; (ii) other financial instruments, such as structured notes, participation notes, equity linked notes; and (iii) financial derivative instruments, such as trading in futures, options and swaps where the underlying assets consist of securities issued by companies quoted on Regulated Markets in China and/or in unlisted securities of Chinese companies to the extent permitted by the UCITS Regulations, and/or the performance of which is linked to the performance of securities

J a n u s C a p i t a l F u n d s P l c / 3 1 D e c e m b e r 2 0 1 5 3
issued by companies quoted on Regulated Markets in China and/or in unlisted securities of Chinese companies to the extent permitted by the UCITS Regulations. The Fund will limit its’ exposure to China “A” shares and China “B” shares in the aggregate to no more than 25% of its net asset value. Only participation notes and structured notes which are unleveraged, securitised and capable of free sale and transfer to other investors and which are purchased through recognised regulated dealers are deemed to be transferable securities which are traded on Regulated Markets. The Fund may employ investment techniques and instruments, such as trading in futures, options and swaps and other derivative instruments for efficient portfolio management (i.e. reduction of risk, reduction of costs, generation of additional capital or income for the Fund) or for investment purposes as described in the “Types and Description of Financial Derivative Instruments” section of the Prospectus, subject to the conditions and within the limits from time to time laid down by the Central Bank to gain or hedge exposure to the investments contemplated in these investment policies.
JANUS GLOBAL ADAPTIVE MULTI-ASSET FUND
This Fund’s investment objective is to seek to achieve total return through growth of capital and income. It pursues its objective by allocating its assets across a portfolio of equity, fixed-income and commodities asset classes located anywhere in the world (including Developing Markets). The Fund will have the flexibility to shift these allocations and may invest up to 100% of its assets in any of these asset classes depending on market conditions. The Fund uses a variety of investments to gain exposure to different asset classes by investing principally in common stock, Debt Securities, Government Securities and exchange-traded funds. The Fund’s exposure to commodities may include investment in exchange traded commodities, exchange traded notes , commodity index future contracts, options and swaps which provide exposure to the Commodity Indices provided such instruments are in accordance with the requirement of the Central Bank. The exchange traded notes in which the Fund may invest may contain embedded derivatives and/or leverage. These securities will be from issuers located anywhere in the world. It is expected that the Fund will be broadly diversified among a variety of industry sectors. The Fund may also employ investment techniques and instruments, such as trading in futures, options, swaps and forward currency exchange contracts for efficient portfolio management (i.e. reduction of risk, reduction of costs, generation of additional capital or income for the Fund) or for investment purposes as described in the “Types and Description of Financial Derivative Instruments” section herein, subject to the conditions and within the limits from time to time laid down by the Central Bank) to gain or hedge exposure to the investments contemplated in these investment policies. The Investment Adviser uses various selection criteria which will be afforded greater or lesser focus depending upon current economic conditions. Due to its exposure to Developing Markets and below investment grade securities, an investment in the Fund should not constitute a substantial proportion of an investment portfolio and may not be appropriate for all investors.
JANUS EUROPE FUND
This Fund’s investment objective is long-term growth of capital. It pursues its objective by investing principally in common stocks of companies of any size from larger, well-established companies to smaller, emerging growth companies that are domiciled in or are conducting the predominant portion of their economic activities in Western, Central or Eastern Europe (EU and non-EU members) and Turkey. It is expected that the Fund will be broadly diversified among a variety of industry sectors. The Fund may employ investment techniques and instruments, such as trading in futures, options and swaps and other financial derivative instruments for efficient portfolio management (i.e. reduction of risk, reduction of costs, generation of additional capital or income for the Fund) or, subject to a limit of up to 10% of its net asset value, for investment purposes, subject to the conditions and within the limits from time to time laid down by the Central Bank. Subject to the above, no more than 10% of the net asset value of the Fund may be invested in securities traded on any one Developing Market and the aggregate amount of the Fund which may be invested in securities traded on the Developing Markets is 20% of the net asset value of the Fund.
JANUS GLOBAL LIFE SCIENCES FUND
This Fund’s investment objective is long-term growth of capital. It pursues its objective by investing Primarily in equity securities of companies located anywhere in the world and selected for their growth potential. The Fund will invest Primarily in securities of companies that the relevant Sub-Investment Adviser believes have a life sciences orientation. Generally speaking, the “life sciences” relate to maintaining or improving quality of life. Thus, companies with a “life sciences orientation” include companies engaged in research, development, production or distribution of products or services related to health and personal care, medicine or pharmaceuticals. Such companies may also include companies that the relevant Sub-Investment Adviser believes have growth potential mainly as a result of particular products, technology, patents or other market advantages in the life sciences. The Fund will invest at least 25% of its total assets, in the aggregate, in the following industry groups: healthcare; pharmaceuticals; agriculture; cosmetics/personal care; and biotechnology. The Fund may employ investment techniques and instruments for investment purposes, such as trading in futures, options and swaps and other financial derivative instruments, subject to a limit of up to 10% of its net asset value and subject to the conditions and within the limits from time to time laid down by the Central Bank. No more than 10% of the net asset value of the Fund may be invested in securities traded on any one Developing Market and the aggregate amount of the Fund which may be invested in securities traded on the Developing Markets is 20% of the net asset value of the Fund.
JANUS GLOBAL RESEARCH FUND
This Fund’s investment objective is long-term growth of capital. It pursues its objective by investing Primarily in common stocks selected for their growth potential. The Fund may invest in

Background of the Company (unaudited)
4 J a n u s C a p i t a l F u n d s P l c / 3 1 D e c e m b e r 2 0 1 5
companies of any size and located anywhere in the world, from larger, well-established companies to smaller, emerging growth companies. It is expected that the Fund will be broadly diversified among a variety of industry sectors. The investment selection process currently employed by the Sub-Investment Adviser for the Fund is to select investments which are high conviction investment ideas in all market capitalisations, styles and geographies. The Sub-Investment Adviser oversees the investment process, sets the criteria for asset allocation amongst the sectors (which criteria may change from time to time) and conducts fundamental analysis with a focus on “bottom-up” research, quantitative modelling, and valuation analysis. Using this research process, the stocks will be rated based upon attractiveness, comparing the appreciation potential of each of these high conviction ideas to construct a sector portfolio that is intended to maximise the best risk/reward opportunities. Securities may be sold when, among other things, there is no longer high conviction in the return potential of the investment or if the risk characteristics have caused a re-evaluation of the opportunity. Securities may also be sold from the portfolio to rebalance sector weightings. The Sub-Investment Adviser may at any time employ an alternative selection process consistent with the Fund’s investment objective and policies. The Fund may employ investment techniques and instruments for investment purposes, such as trading in futures, options and swaps and other financial derivative instruments, subject to a limit of up to 10% of its net asset value and subject to the conditions and within the limits from time to time laid down by the Central Bank. No more than 10% of the net asset value of the Fund may be invested in securities traded on any one Developing Market and the aggregate amount of the Fund which may be invested in securities traded on the Developing Markets is 20% of the net asset value of the Fund.
JANUS GLOBAL TECHNOLOGY FUND
This Fund’s investment objective is long-term growth of capital. It pursues its objective by investing Primarily in equity securities of companies located anywhere in the world and selected for their growth potential. The Fund will invest Primarily in securities of companies that the relevant Sub-Investment Adviser believes will benefit significantly from advances or improvements in technology. These are generally: (i) companies that the relevant Sub-Investment Adviser believes have or will develop products, processes or services that will provide significant technological advancements or improvements; or (ii) companies that the relevant Sub-Investment Adviser believes rely extensively on technology in connection with their operations or services such as but not limited to companies offering medical products and services, alternative energy equipment and services, or sophisticated industrial products. The Fund may employ investment techniques and instruments for investment purposes, such as trading in futures, options and swaps and other financial derivative instruments, subject to a limit of up to 10% of its net asset value and subject to the conditions and within the limits from time to time laid down by the Central Bank. No more than 10% of the net asset value of the Fund may be invested in securities traded on any one Developing Market
and the aggregate amount of the Fund which may be invested in securities traded on the Developing Markets is 20% of the net asset value of the Fund.
JANUS JAPAN EMERGING OPPORTUNITIES FUND
This Fund’s investment objective is to seek to achieve long-term growth of capital. It pursues its objective by investing principally in common stocks of small and mid-sized companies which are domiciled in Japan, or are conducting the predominant portion of their economic activities in Japan. Companies whose market capitalisations grow and thereby fall outside of these ranges after the Fund’s initial purchase will still be considered small and mid-sized. It is expected that the Fund will be broadly diversified among a variety of industry sectors. The Fund may employ investment techniques and instruments, such as trading in futures, options and swaps and other derivative instruments for efficient portfolio management (i.e. reduction of risk, reduction of costs, generation of additional capital or income for the Fund) or, subject to a limit of up to 10% of the net asset value, for investment purposes as described in the “Types and Description of Financial Derivative Instruments” section of the Prospectus and subject to the conditions and within the limits from time to time laid down by the Central Bank to gain or hedge exposure to the investments contemplated in these investment policies.
JANUS JAPAN FUND
This Fund’s investment objective is to seek to achieve long-term growth of capital. It pursues its objective by investing principally in common stocks of companies of any size, from larger, well-established companies to smaller, emerging growth companies, which are domiciled in Japan, or are conducting the predominant portion of their economic activities in Japan. It is expected that the Fund will be broadly diversified among a variety of industry sectors. The Fund may employ investment techniques and instruments, such as trading in futures, options and swaps and other derivative instruments for efficient portfolio management (i.e. reduction of risk, reduction of costs, generation of additional capital or income for the Fund) or, subject to a limit of up to 10% of the net asset value, for investment purposes as described in the “Types and Description of Financial Derivative Instruments” section of the Prospectus and subject to the conditions and within the limits from time to time laid down by the Central Bank to gain or hedge exposure to the investments contemplated in these investment policies.
JANUS OPPORTUNISTIC ALPHA FUND This Fund’s investment objective is long-term growth of capital. It pursues its objective by investing Primarily in common stocks of US Issuers of any size, which may include larger well-established issuers and/or smaller emerging growth issuers. Opportunistic alpha is achieved by the Fund investing opportunistically across variety of market capitalisations predominantly in the US in its attempt to generate alpha (i.e. obtain excess returns) for Shareholders. Investing opportunistically means investing in stocks which the Sub-Investment Adviser believes are undervalued or show potential for future growth / returns at times when such opportunities arise. The Fund may employ

J a n u s C a p i t a l F u n d s P l c / 3 1 D e c e m b e r 2 0 1 5 5
investment techniques and instruments, for investment purposes such as trading in futures, options and swaps and other financial derivative instruments, subject to a limit of up to 10% of its net asset value and subject to the conditions and within the limits from time to time laid down by the Central Bank. No more than 10% of the net asset value of the Fund may be invested in securities traded on any one Developing Market and the aggregate amount of the Fund which may be invested in securities traded on the Developing Markets is 20% of the net asset value of the Fund.
JANUS US FUND
This Fund’s investment objective is long-term growth of capital. Under normal circumstances, the Fund seeks to achieve its objective by investing principally in common stocks of US Companies and US Issuers selected for their growth potential. Although the Fund may invest in companies of any size, it generally invests in larger, more established companies. The Fund may employ investment techniques and instruments, such as trading in futures, options and swaps and other derivative instruments for efficient portfolio management (i.e. reduction of risk, reduction of costs, generation of additional capital or income for the Fund) or for investment purposes as described in the “Types and Description of Financial Derivative Instruments” section of the Prospectus, subject to the conditions and within the limits from time to time laid down by the Central Bank to gain or hedge exposure to the investments contemplated in these investment policies. No more than 10% of the net asset value of the Fund may be invested in securities traded on any one Developing Market and the aggregate amount of the Fund which may be invested in securities traded on the Developing Markets is 20% of the net asset value of the Fund.
JANUS US RESEARCH FUND
This Fund’s investment objective is long-term growth of capital. It pursues its objective by investing Primarily in equity securities of US Companies selected for their growth potential. Eligible equity securities include US and non-US common stocks, preferred stocks, securities convertible into common stocks or preferred stocks, such as convertible preferred stocks, and other securities with equity characteristics. The Fund may invest in companies of any size. The Fund may employ investment techniques and instruments for investment purposes, such as trading in futures, options and swaps and other financial derivative instruments, subject to a limit of up to 10% of its net asset value and subject to the conditions and within the limits from time to time laid down by the Central Bank. Subject to the above, no more than 10% of the net asset value of the Fund may be invested in securities traded on any one Developing Market and the aggregate amount of the Fund which may be invested in securities traded on the Developing Markets is 20% of the net asset value of the Fund. The investment selection process currently employed by the Sub-Investment Adviser for the Fund is to select investments which are high conviction investment ideas in all market capitalisations, styles and geographies. The Sub-Investment Adviser oversees the investment process, sets the criteria for asset allocation amongst
the sectors (which criteria may change from time to time) and conducts fundamental analysis with a focus on “bottom-up” research, quantitative modelling, and valuation analysis. Using this research process, the stocks will be rated based upon attractiveness, comparing the appreciation potential of each of these high conviction ideas to construct a sector portfolio that is intended to maximise the best risk/ reward opportunities. Securities may be sold when, among other things, there is no longer high conviction in the return potential of the investment or if the risk characteristics have caused a re-evaluation of the opportunity. Securities may also be sold from the portfolio to rebalance sector weightings. The Sub-Investment Adviser may at any time employ an alternative selection process consistent with the Fund’s investment objective and policies.
JANUS US TWENTY FUND
This Fund’s investment objective is long-term growth of capital. It seeks to achieve its objective by investing Primarily in a core portfolio of 20-30 common stocks of US Issuers selected for their growth potential. The Fund may employ investment techniques and instruments for investment purposes, such as trading in futures, options and swaps and other financial derivative instruments, subject to a limit of up to 10% of its net asset value and subject to the conditions and within the limits from time to time laid down by the Central Bank. No more than 10% of the net asset value of the Fund may be invested in securities traded on any one Developing Market and the aggregate amount of the Fund which may be invested in securities traded on the Developing Markets is 20% of the net asset value of the Fund.
JANUS US VENTURE FUND
This Fund’s investment objective is capital appreciation. It pursues its objective by investing at least half of its equity assets in equity securities of small sized US Companies. Small sized US Companies are those whose market capitalisations, at the time of initial purchase, falls within the range of companies in the Russell 2000® Growth Index. Companies whose capitalisations grow and thereby fall outside of these ranges after the Fund’s initial purchase will still be considered small-sized. The Fund may also invest in larger companies with strong growth potential or larger, well-known companies with potential for capital appreciation. The Fund may employ investment techniques and instruments for investment purposes, such as trading in futures, options and swaps and other financial derivative instruments, subject to a limit of up to 10% of its net asset value and subject to the conditions and within the limits from time to time laid down by the Central Bank. No more than 10% of the net asset value of the Fund may be invested in securities traded on any one Developing Market and the aggregate amount of the Fund which may be invested in securities traded on the Developing Markets is 20% of the net asset value of the Fund.
PERKINS GLOBAL VALUE FUND
This Fund’s investment objective is long-term growth of capital. Under normal circumstances, the Fund seeks to achieve its objective by investing principally in common stocks of companies of any size located anywhere in the

Background of the Company (unaudited)
6 J a n u s C a p i t a l F u n d s P l c / 3 1 D e c e m b e r 2 0 1 5
world whose stock prices the Sub-Investment Adviser believes to be undervalued. The Sub-Investment Adviser focuses on companies that have fallen out of favour with the market or that appear to be undervalued. The “value” approach emphasises investments in companies the relevant Sub-Investment Adviser believes are undervalued relative to their intrinsic worth. The Fund may employ investment techniques and instruments, such as trading in futures, options and swaps and other derivative instruments for efficient portfolio management (i.e. reduction of risk, reduction of costs, generation of additional capital or income for the Fund) or for investment purposes as described in the “Types and Description of Financial Derivative Instruments” section of the Prospectus, subject to the conditions and within the limits from time to time laid down by the Central Bank to gain or hedge exposure to the investments contemplated in these investment policies. Due to its exposure to Developing Markets, an investment in the Fund should not constitute a substantial proportion of an investment portfolio and may not be appropriate for all investors.
PERKINS US STRATEGIC VALUE FUND
This Fund’s investment objective is long-term growth of capital. It pursues its objective by investing Primarily in common stocks of US Companies with the potential for long-term growth of capital using a “value” approach. The “value” approach emphasises investments in companies the relevant Sub-Investment Adviser believes are undervalued relative to their intrinsic worth. The relevant Sub-Investment Adviser measures value as a function of price/earnings (P/E) ratios and price/free cash flow. A P/E ratio is the relationship between the price of a stock and its earnings per share. This figure is determined by dividing a stock’s market price by the company’s earnings per share amount. Price/free cash flow is the relationship between the price of a stock and the company’s available cash from operations minus capital expenditures. The relevant Sub-Investment Adviser will typically seek attractively valued companies that are improving their free cash flow and improving their returns on invested capital. These companies may also include special situations companies that are experiencing management changes and/or are temporarily out of favour. The Fund may employ investment techniques and instruments for investment purposes, such as trading in futures, options and swaps and other financial derivative instruments, subject to a limit of up to 10% of its net asset value and subject to the conditions and within the limits from time to time laid down by the Central Bank. Subject to the above, no more than 10% of the net asset value of the Fund may be invested in securities traded on any one Developing Market and the aggregate amount of the Fund which may be invested in securities traded on the Developing Markets is 20% of the net asset value of the Fund.
INTECH ALL-WORLD MINIMUM VARIANCE CORE FUND(a)
This Fund’s investment objective is long-term growth of capital. It pursues its objective by investing at least 80% of its net asset value in equities and equity related securities or companies located anywhere in the world whose market capitalisation is at least equal to the market capitalisation of one of the companies listed in the FTSE All-World Minimum Variance
Index. The Fund intends to hedge the various underlying currency exposures in the FTSE All-World Minimum Variance Index (other than any Pound Sterling exposure) to the Pound Sterling to the extent that hedging such currency exposure is consistent with the investment objective of the Fund. The currency hedging shall be based on the weighting of the FTSE All-World Minimum Variance Index in those underlying currencies. As a result, the Fund’s exposure to a currency may be greater or less than the weighted exposure to that currency in the FTSE All-World Minimum Variance Index. Due to its exposure to Developing Markets, an investment in the Fund should not constitute a substantial proportion of an investment portfolio and may not be appropriate for all investors. The Fund may also seek to adhere to environmental, social and governance guidelines to the extent determined by the Sub-Investment Adviser in its sole discretion.
INTECH EUROPEAN CORE FUND
This Fund’s investment objective is long-term growth of capital. It pursues its objective by investing at least 80% of its net asset value in equities and equity related securities of European companies whose market capitalisation is at least equal to the market capitalisation of one of the companies listed in the MSCI Europe Index at the time of purchase.
INTECH GLOBAL ALL COUNTRY LOW VOLATILITY FUND
This Fund’s investment objective is to seek to achieve long-term growth of capital. It pursues its objective by investing at least 80% of its net asset value in equities and equity related securities of companies located anywhere in the world whose market capitalisation is at least equal to the market capitalisation of one of the companies listed in the MSCI All Country World Index at time of purchase. Over full market cycles it is expected that the Fund may provide returns in line with the MSCI All Country World Index while providing less volatility, as measured by standard deviation, than the MSCI All Country World Index. The Fund attempts to achieve this lower volatility within its mathematical portfolio management process by seeking to minimise the standard deviation of portfolio absolute returns. Due to its exposure to Developing Markets, an investment in the Fund should not constitute a substantial proportion of an investment portfolio and may not be appropriate for all investors.
INTECH GLOBAL DIVIDEND FUND
This Fund’s investment objective is long-term growth of capital and equity dividend income. It pursues its objective by investing at least 80% in equities and equity related securities of companies located anywhere in the world whose market capitalisation is at least equal to the market capitalisation of one of the companies listed in the MSCI World High Dividend Yield Index at the time of purchase. The Fund pursues its goal by constructing a portfolio of securities with higher relative stock volatility than the MSCI World High Dividend Yield Index.
INTECH US CORE FUND
This Fund’s investment objective is long-term growth of capital. It pursues its objective by investing at least 80% of

J a n u s C a p i t a l F u n d s P l c / 3 1 D e c e m b e r 2 0 1 5 7
its net asset value in equities and equity related securities of US Companies whose market capitalisation is at least equal to the market capitalisation of one of the companies listed in the S&P 500®Index at the time of purchase.
JANUS GLOBAL DIVERSIFIED ALTERNATIVES FUND
This Fund’s investment objective is to seek to achieve long-term capital appreciation with low correlation to global stocks and bonds. Under normal circumstances, the Fund seeks to achieve its investment objective by investing in a number of asset classes including equities, fixed income, commodities, interest rates, and currencies, with the investment selection driven by risk/reward factors within those asset classes. The risk/reward factors in each underlying asset class that will drive the portfolio’s returns might also be referred to as Market Risk Premia. Understanding these sources of return has historically been a key focus of academic research. The process of identifying investments for the Fund includes unique insights from years of market experience combined with academic research and quantitative models. The relevant Sub-Investment Adviser may, in its sole discretion, actively allocate between the various asset classes on the basis of its assessment of the relevant Market Risk Premia of those asset classes. To capture these diverse sources of potential return the Fund may invest in the common stocks of companies of any size and located anywhere in the world, from larger, well established companies to smaller, emerging growth companies. Additionally, the Fund may invest in income producing securities of issuers located anywhere in the world. This may include securities of any maturity and of any credit quality, and may include exposure to Government Securities and Debt Securities. The Fund’s exposure to commodities may include investment in exchange traded commodities, exchange traded notes, commodity index futures contracts, options, swaps and other financial derivative instruments which provide exposure to the Commodity Indices provided such instruments are in accordance with the requirement of the Central Bank. The Fund may also invest in other financial derivative instruments which provide exposure to the currency carry risk premia. Currency carry investing seeks to generate returns by investing in higher yielding currencies versus lower yielding currencies. In a carry trade, low interest rate currencies may be sold, and high interest rate currencies may be purchased. The Fund may also invest in other financial derivative instruments which provide exposure to various market interest rates. The Fund may invest in financial derivative instruments for efficient portfolio management (i.e. reduction of risk, reduction of costs, generation of additional capital or income for the Fund) or for investment purposes as described in the “Types and Description of Financial Derivative Instruments” section of the Prospectus, subject to the conditions and within the limits from time to time laid down by the Central Bank to gain or hedge exposure to the investments contemplated in these investment policies. The Fund will make significant use of financial derivative instruments. The market risk of the Fund will be measured using the VaR methodology. The absolute VaR of the Fund will not exceed 14.1% of the Fund’s Net Asset Value. It is expected that under normal market conditions, the Fund’s leverage, as calculated using the
sum of the notionals of the derivatives held by the Fund (the “Notionals Approach”), will be less than 600% of the Fund’s Net Asset Value, and is expected to typically range from 200 to 700% of the Fund’s Net Asset Value. Under exceptional circumstances, it is expected that the Fund may be leveraged up to 1000% (using the Notionals Approach) of the Fund’s Net Asset Value. Exceptional circumstances may include periods characterised by (i) lack of liquidity, particularly in securities listed, traded or dealt on a Regulated Market, causing the Sub-Investment Adviser to seek exposure in derivatives markets; (ii) volatility where the Sub-Investment Adviser seek to hedge or be opportunistic while respecting the investment policies and restrictions applicable to the Fund; or (iii) imperfect correlations and unanticipated market conditions. If the Fund uses a high amount of leverage, especially the higher amount permitted in exceptional circumstances, it may have greater losses that would have occurred absent the high leverage. The leverage figure is calculated using the Notional Approach as is required by the UCITS Regulations. The notional value of the investments varies significantly from their market value which is why the leverage limits are high. These leverage limits do not take into account any netting and hedging arrangements that the Fund may have in place at any time even though these netting and hedging arrangements are used for risk reduction purposes. The Fund seeks to achieve its investment objective by investing in the securities listed above, traded or dealt in Regulated Markets (including Developing Markets) or by investing indirectly in such securities through the use of financial derivative instruments. Due to its exposure to Developing Markets and below investment grade securities, an investment in the Fund should not constitute a substantial proportion of an investment portfolio and may not be appropriate for all investors.
JANUS GLOBAL REAL ESTATE FUND
This Fund’s investment objective is total return through a combination of capital appreciation and current income. It pursues its objective by investing Primarily in securities of US and non-US companies engaged in or related to the property industry, or which own significant property assets. This may include investments in companies involved in the real estate business or property development, domiciled either inside or outside of the US, including REITs and issuers whose businesses, assets, products or services are related to the real estate sector. This may also include small capitalisation stocks. Small capitalisation stocks are defined as those whose market capitalisation, at the time of initial purchase, is less than the 12-month average of the maximum market capitalisation for the companies included in the Russell 2000® Index. This average is updated monthly. REITs are pooled investment vehicles that invest in income producing real property or real property related loans or interests. REITs are generally classified as equity REITs, mortgage REITs or a combination of equity and mortgage REITs. Equity REITs invest their assets directly in real property and derive income primarily from the collection of rents. Equity REITs can also realise capital gains by selling properties that have appreciated in value. Mortgage REITs invest their assets in real property mortgages and derive income from the collection

Background of the Company (unaudited)
8 J a n u s C a p i t a l F u n d s P l c / 3 1 D e c e m b e r 2 0 1 5
of interest payments. In selecting the investments for the Fund, the relevant Sub-Investment Adviser seeks to identify securities that have good management, strong balance sheets, above average investment growth in “funds from operations” and that trade at a discount to their assets’ underlying value. “Funds from operations” generally means a REIT’s net income excluding gains or losses from debt restructuring and sales of property plus depreciation of real property. The percentage of Fund assets invested in common stocks and other property companies will vary and, depending on market conditions as determined by the Sub-Investment Adviser, the Fund may invest in short-term investment grade interest bearing securities, such as Government Securities or Debt Securities and/or Index/ Structured Securities. The Fund may also invest in other types of securities including preferred stock, Government Securities, Debt Securities, warrants and securities convertible into common stock when the Sub-Investment Adviser perceives an opportunity for additional return from such securities. The Fund may also invest up to 10% of its net asset value in mortgage and asset backed securities and collateralised mortgage obligations issued or guaranteed by any OECD government, its agencies or instrumentalities or by private issuers and which may be rated below investment grade by the primary rating agencies. The Fund may employ investment techniques and instruments for investment purposes, such as trading in futures, options and swaps and other financial derivative instruments, subject to a limit of up to 10% of its net asset value and subject to the conditions and within the limits from time to time laid down by the Central Bank. Subject to the above, no more than 10% of the net asset value of the Fund may be invested in securities traded on any one Developing Market and the aggregate amount of the Fund which may be invested in securities traded on Developing Markets shall not exceed 20% of the net asset value of the Fund. The Fund may invest directly or indirectly (i.e. through depositary receipts including American Depositary Receipts, European Depositary Receipts and Global Depositary Receipts) in the relevant markets.
JANUS FLEXIBLE INCOME FUND
This Fund’s investment objective is to obtain maximum total return, consistent with preservation of capital. Total return is expected to result from a combination of current income and capital appreciation, although income will normally be the dominant component of total return. Investments in income producing securities of US Issuers will normally make up 80%, but at all times not less than two thirds of the Fund’s net asset value. The Fund may invest in preferred stock, and all types of Government Securities and Debt Securities, including specifically Debt Securities that are convertible or exchangeable into equity securities and Debt Securities that carry with them the right to acquire equity securities as evidenced by warrants attached to or acquired with the securities. The Fund has no pre-established maturity or quality standards, and its average maturity and quality may vary substantially. The Fund may invest without limit in Debt Securities or preferred stock rated below investment grade or unrated Debt Securities of similar quality as determined by the relevant Sub-Investment Adviser and may have substantial holdings in such securities. The
Fund may employ investment techniques and instruments for investment purposes, such as trading in futures, options and swaps and other financial derivative instruments, subject to a limit of up to 10% of its net asset value and subject to the conditions and within the limits from time to time laid down by the Central Bank. Subject to the above, no more than 10% of the net asset value of the Fund may be invested in securities traded on any one Developing Market and the aggregate amount of the Fund which may be invested in securities traded on the Developing Markets is 20% of the net asset value of the Fund.
JANUS GLOBAL FLEXIBLE INCOME FUND
This Fund’s investment objective is to seek total return, consistent with preservation of capital. Total return is expected to result from a combination of current income and capital appreciation, although income will normally be the dominant component of total return. Investments in income producing securities of issuers located anywhere in the world, including issuers located in Developing Markets, will normally make up at least 80% of the net asset value of the Fund. The Fund may invest in preferred stock, and all types of Government Securities and Debt Securities, including specifically Debt Securities that are convertible or exchangeable into equity securities and Debt Securities that carry with them the right to acquire equity securities as evidenced by warrants attached to or acquired with the securities. (The convertible securities in which the Fund may invest will not contain embedded derivatives.) The Fund has no pre-established maturity or quality standards, and its average maturity and quality may vary substantially. The Fund may invest without limit in Debt Securities or preferred stock rated below investment grade or unrated Debt Securities of similar quality as determined by the relevant Sub-Investment Adviser and may have substantial holdings in such securities. The Fund may employ investment techniques and instruments, such as trading in futures, options and swaps and other financial derivative instruments for efficient portfolio management (i.e. reduction of risk, reduction of costs, generation of additional capital or income for the Fund) or for investment purposes as described in the “Types and Description of Financial Derivative Instruments” section of the Prospectus, subject to the conditions and within the limits from time to time laid down by the Central Bank. Due to its exposure to below investment grade securities and Developing Markets, an investment in the Fund should not constitute a substantial proportion of an investment portfolio and may not be appropriate for all investors.
JANUS GLOBAL HIGH YIELD FUND
This Fund’s primary investment objective is to obtain high current income. Capital appreciation is a secondary objective when consistent with the primary objective. Capital appreciation may result, for example, from an improvement in the credit standing of an issuer whose securities are held by the Fund or from a general lowering of interest rates, or both. Under normal circumstances, the Fund pursues its investment objectives by investing principally in Debt Securities or preferred stock of issuers located anywhere in the world which are either rated below investment grade or if unrated are of a similar quality to below investment grade as determined by the relevant

J a n u s C a p i t a l F u n d s P l c / 3 1 D e c e m b e r 2 0 1 5 9
Sub-Investment Adviser. The Fund may employ investment techniques and instruments, such as trading in futures, options and swaps and other derivative instruments for efficient portfolio management (i.e. reduction of risk, reduction of costs, generation of additional capital or income for the Fund) or for investment purposes as described in the “Types and Description of Financial Derivative Instruments” section of the Prospectus, subject to the conditions and within the limits from time to time laid down by the Central Bank to gain or hedge exposure to the investments contemplated in these investment policies. The Investment Adviser uses various selection criteria which will be afforded greater or lesser focus depending upon current economic conditions. Due to its exposure to below investment grade securities and Developing Markets, an investment in the Fund should not constitute a substantial proportion of an investment portfolio and may not be appropriate for all investors.
JANUS GLOBAL INVESTMENT GRADE BOND FUND
This Fund’s investment objective is to maximise total return. Under normal circumstances, the Fund pursues its investment objective by investing principally in fixed or floating rate Investment Grade bonds of issuers located anywhere in the world. The Fund may employ investment techniques and instruments, such as trading in futures, options and swaps and other derivative instruments for efficient portfolio management (i.e. reduction of risk, reduction of costs, generation of additional capital or income for the Fund) or for investment purposes as described in the “Types and Description of Financial Derivative Instruments” section of the Prospectus, subject to the conditions and within the limits from time to time laid down by the Central Bank to gain or hedge exposure to the investments contemplated in these investment policies. No more than 10% of the net asset value of the Fund may be invested in securities traded on any one Developing Market and the aggregate amount of the Fund which may be invested in securities traded on the Developing Markets is 20% of the net asset value of the Fund.
JANUS GLOBAL UNCONSTRAINED BOND FUND
This Fund’s investment objective is to seek to maximise total return consistent with the preservation of capital. The Fund seeks to provide long term positive returns through various market environments (i.e. the typical cyclical expansion/ contraction/recession periods of the Business Cycle and the ensuing increasing and decreasing of interest rate levels due to market forces or central bank intervention). The Fund is ‘unconstrained’ in that it is not tied to a specific benchmark, and therefore has significant latitude to pursue opportunities across the fixed income spectrum, including moving between sectors, across credit risk and may have long, short or negative duration. Under normal circumstances, the Fund seeks to achieve its objective by investing principally in Debt Securities located anywhere in the world (including Developing Markets) with a range of maturities from short- to long-term. It expects that its average portfolio duration will vary normally from -4 years to +6 years. The Fund may make significant use of financial derivative instruments, such as futures, options, forward commitments and swap agreements to try to enhance returns
or to reduce the risk of loss of certain of its holdings or to manage duration. The Fund may invest in securities of both investment grade and non-investment grade credit quality and may invest in securities that have not been rated by a ratings agency. As noted above, the Fund may make significant use of financial derivative instruments and may employ investment techniques and instruments, such as trading in futures, options and swaps and other derivative instruments for efficient portfolio management (i.e. reduction of risk, reduction of costs, generation of additional capital or income for the Fund) or for investment purposes as described in the “Types and Description of Financial Derivative Instruments” section of the Prospectus, subject to the conditions and within the limits from time to time laid down by the Central Bank) to gain or hedge exposure to the investments contemplated in these investment policies. The Fund will make significant use of financial derivative instruments. The market risk of the Fund will be measured using the VaR methodology. The absolute VaR of the Fund will not exceed 14.1% of the Fund’s Net Asset Value. It is expected that under normal market conditions, the Fund’s leverage, as calculated using the sum of the notionals of the derivatives held by the Fund (the “Notionals Approach”), will typically range from 0 to 800% of the Fund’s net asset value. Under exceptional circumstances, it is expected that the Fund may be leveraged up to 1,000% (using the Notionals Approach) of the Fund’s Net Asset Value. Exceptional circumstances may include periods characterised by (i) lack of liquidity, particularly in securities listed, traded or dealt on a Regulated Market, causing the Sub-Investment Adviser to seek exposure in derivatives markets; (ii) volatility; or (iii) imperfect correlations and unanticipated market conditions. If the Fund uses a high amount of leverage, especially the higher amount permitted in exceptional circumstances, it may have greater losses than would have occurred absent the high leverage. The leverage figure is calculated using the Notional Approach as is required by the UCITS Regulations. The notional value of the investments varies significantly from their market value which is why the leverage limits are high. These leverage limits do not take into account any netting and hedging arrangements that the Fund may have in place at any time even though these netting and hedging arrangements are used for risk reduction purposes. The Investment Adviser uses various selection criteria which will be afforded greater or lesser focus depending upon current economic conditions. Due to its exposure to below investment grade securities and Developing Markets, an investment in the Fund should not constitute a substantial proportion of an investment portfolio and may not be appropriate for all investors.
JANUS HIGH YIELD FUND
This Fund’s primary investment objective is to obtain high current income. Capital appreciation is a secondary objective when consistent with the primary objective. Capital appreciation may result, for example, from an improvement in the credit standing of an issuer whose securities are held by the Fund or from a general lowering of interest rates, or both. This Fund pursues its objectives by investing Primarily in Debt Securities or preferred stock rated below investment grade or unrated
Background of the Company (unaudited)
1 0 J a n u s C a p i t a l F u n d s P l c / 3 1 D e c e m b e r 2 0 1 5
Debt Securities of similar quality of US Issuers as determined by the relevant Sub-Investment Adviser provided that at least 51% of its net asset value are invested in Debt Securities. The overall quality of the securities in this portfolio may vary greatly. See the “Income Investing” section of the Prospectus for more information on the rating of the issuers or guarantees of the debt securities. The Fund may employ investment techniques and instruments for investment purposes, such as trading in futures, options and swaps and other financial derivative instruments, subject to a limit of up to 10% of its net asset value and subject to the conditions and within the limits from time to time laid down by the Central Bank. Subject to the above, no more than 10% of the net asset value of the Fund may be invested in securities traded on any one Developing Market and the aggregate amount of the Fund which may be invested in securities traded on the Developing Markets is 20% of the net asset value of the Fund. Due to its exposure to below investment grade securities, an investment in the Fund should not constitute a substantial proportion of an investment portfolio and may not be appropriate for all investors.
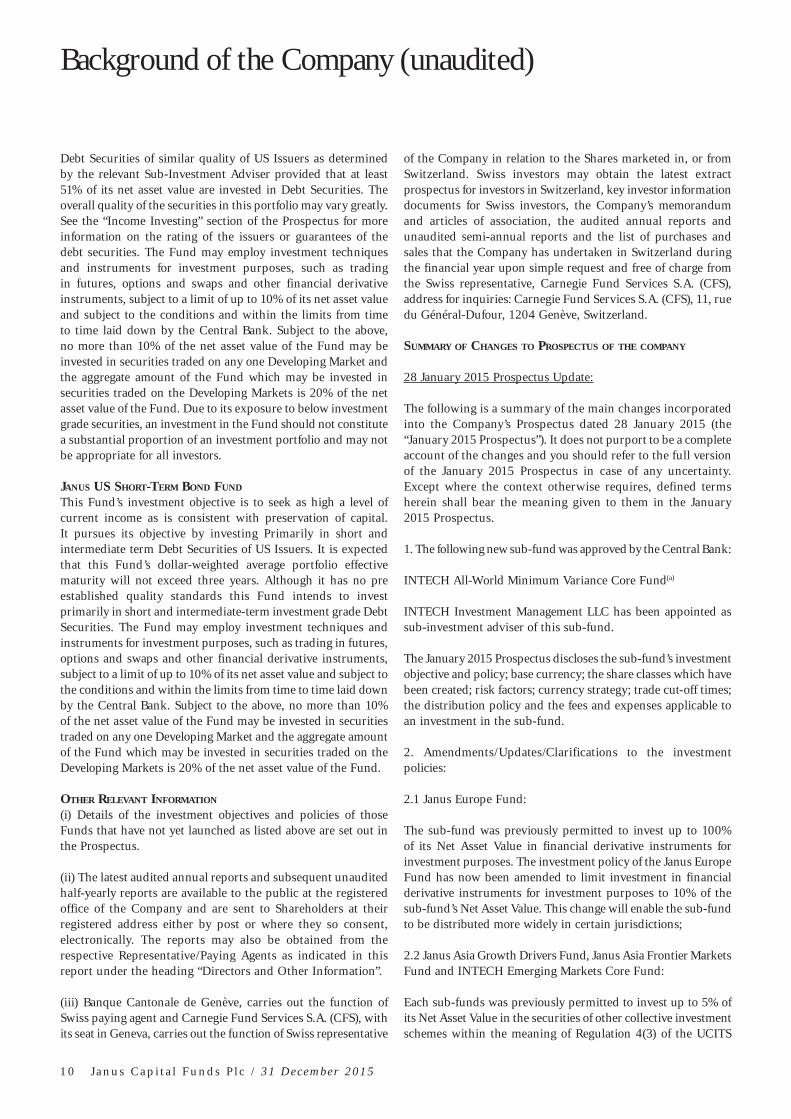
JANUS US SHORT-TERM BOND FUND
This Fund’s investment objective is to seek as high a level of current income as is consistent with preservation of capital. It pursues its objective by investing Primarily in short and intermediate term Debt Securities of US Issuers. It is expected that this Fund’s dollar-weighted average portfolio effective maturity will not exceed three years. Although it has no pre established quality standards this Fund intends to invest primarily in short and intermediate-term investment grade Debt Securities. The Fund may employ investment techniques and instruments for investment purposes, such as trading in futures, options and swaps and other financial derivative instruments, subject to a limit of up to 10% of its net asset value and subject to the conditions and within the limits from time to time laid down by the Central Bank. Subject to the above, no more than 10% of the net asset value of the Fund may be invested in securities traded on any one Developing Market and the aggregate amount of the Fund which may be invested in securities traded on the Developing Markets is 20% of the net asset value of the Fund.
OTHER RELEVANT INFORMATION
(i) Details of the investment objectives and policies of those Funds that have not yet launched as listed above are set out in the Prospectus.
(ii) The latest audited annual reports and subsequent unaudited half-yearly reports are available to the public at the registered office of the Company and are sent to Shareholders at their registered address either by post or where they so consent, electronically. The reports may also be obtained from the respective Representative/Paying Agents as indicated in this report under the heading “Directors and Other Information”.
(iii) Banque Cantonale de Genève, carries out the function of Swiss paying agent and Carnegie Fund Services S.A. (CFS), with its seat in Geneva, carries out the function of Swiss representative
of the Company in relation to the Shares marketed in, or from Switzerland. Swiss investors may obtain the latest extract prospectus for investors in Switzerland, key investor information documents for Swiss investors, the Company’s memorandum and articles of association, the audited annual reports and unaudited semi-annual reports and the list of purchases and sales that the Company has undertaken in Switzerland during the financial year upon simple request and free of charge from the Swiss representative, Carnegie Fund Services S.A. (CFS), address for inquiries: Carnegie Fund Services S.A. (CFS), 11, rue du Général-Dufour, 1204 Genève, Switzerland.
SUMMARY OF CHANGES TO PROSPECTUS OF THE COMPANY
28 January 2015 Prospectus Update:
The following is a summary of the main changes incorporated into the Company’s Prospectus dated 28 January 2015 (the “January 2015 Prospectus”). It does not purport to be a complete account of the changes and you should refer to the full version of the January 2015 Prospectus in case of any uncertainty. Except where the context otherwise requires, defined terms herein shall bear the meaning given to them in the January 2015 Prospectus.
1. The following new sub-fund was approved by the Central Bank:
INTECH All-World Minimum Variance Core Fund(a)
INTECH Investment Management LLC has been appointed as sub-investment adviser of this sub-fund.
The January 2015 Prospectus discloses the sub-fund’s investment objective and policy; base currency; the share classes which have been created; risk factors; currency strategy; trade cut-off times; the distribution policy and the fees and expenses applicable to an investment in the sub-fund.
2. Amendments/Updates/Clarifications to the investment policies:
2.1 Janus Europe Fund:
The sub-fund was previously permitted to invest up to 100% of its Net Asset Value in financial derivative instruments for investment purposes. The investment policy of the Janus Europe Fund has now been amended to limit investment in financial derivative instruments for investment purposes to 10% of the sub-fund’s Net Asset Value. This change will enable the sub-fund to be distributed more widely in certain jurisdictions;
2.2 Janus Asia Growth Drivers Fund, Janus Asia Frontier Markets Fund and INTECH Emerging Markets Core Fund:
Each sub-funds was previously permitted to invest up to 5% of its Net Asset Value in the securities of other collective investment schemes within the meaning of Regulation 4(3) of the UCITS

J a n u s C a p i t a l F u n d s P l c / 3 1 D e c e m b e r 2 0 1 5 1 1
Regulation. This limit has now been increased to permit each sub-fund to invest up to 10% of its Net Asset Value in the securities of other collective investment schemes within the meaning of Regulation 4(3) of the UCITS Regulations;
2.3 Janus Global Unconstrained Bond Fund:
Under the previous investment policy, the sub-fund’s leverage, as calculated using the Notionals Approach, was stated to be less than 200% of the sub-fund’s Net Asset Value, with the expected typically range to be from 150 to 250% of the sub-fund’s Net Asset Value. Under exceptional circumstances, it was expected that the Fund may be leveraged up to 300% (using the Notionals Approach) of the sub-fund’s Net Asset Value.
These parameters were amended in the January 2015 Prospectus to reflect that the sub-fund’s leverage, as calculated using the Notionals Approach will typically range from 0 to 800% of the sub-fund’s Net Asset Value. Under exceptional circumstances, it is expected that the sub-fund may be leveraged up to 1,000% (using the Notionals Approach) of the sub-fund’s Net Asset Value. The amendment was due to the increased volume and more complex usage of derivative strategies in the portfolio of the sub-fund.
Exceptional circumstances may include periods characterised by (i) lack of liquidity, particularly in securities listed, traded or dealt on a Regulated Market, causing the Sub-Investment Adviser to seek exposure in derivatives markets; (ii) volatility; or (iii) imperfect correlations and unanticipated market conditions. If the sub-fund uses a high amount of leverage, especially the higher amount permitted in exceptional circumstances, it may have greater losses than would have occurred absent the high leverage. The leverage figure is calculated using the Notional Approach as is required by the UCITS Regulations. The notional value of the investments varies significantly from their market value which is why the leverage limits are high. These leverage limits do not take into account any netting and hedging arrangements that the sub-fund may have in place at any time even though these netting and hedging arrangements are used for risk reduction purposes.
2.4 Janus Opportunistic Alpha Fund:
Additional disclosure was included in the investment policies of the Janus Opportunistic Alpha Fund to provide shareholders with further information on the investment strategy;
2.5 Janus Asia Frontier Markets Fund, Janus Asia Growth Drivers Fund, Janus Europe Allocation Fund, Janus Japan Emerging Opportunities Fund, Janus Japan Fund and Janus Europe Flexible Income Fund:
The investment policies for the Janus Asia Frontier Markets Fund, Janus Asia Growth Drivers Fund, Janus Europe Allocation Fund, Janus Japan Emerging Opportunities Fund, Janus Japan Fund and Janus Europe Flexible Income Fund have been amended to make it clear, consistent with the other disclosure
in the January 2015 Prospectus, that the relevant sub-fund may employ financial derivative instruments, subject to a limit of 10% of its Net Asset Value, for investment purposes.
3. Investment Restrictions:
Disclosure was included in the section entitled “Investment Restrictions” to clarify that the relevant sub-investment adviser may be required to comply with certain further restrictions as may be required by the regulatory authorities in any country in which the Shares of a sub-fund are offered.
4. Fair Value Pricing:
The section entitled “Fair Value Pricing” was amended to reflect that the Janus Europe Fund does not regularly use systematic fair valuation.
5. Permit certain share classes of the certain sub-funds to charge fees and expenses to capital/pay dividends out of capital:
All of the inc share classes (the “Fees & Expenses Share Classes” and “Dividends out of Capital Share Classes”) of the Janus Asia Frontier Markets Fund, Janus Asia Growth Drivers Fund, Janus Japan Emerging Opportunities Fund and Janus Japan Fund are now permitted, at the discretion of the Company/Directors, to charge fees to capital and distribute dividends out of capital.
Charging all or part of the fees and expenses to capital for the Fees & Expenses Share Classes of the sub-funds will result in income being increased for distribution for these Shares; however, the capital that the Fees & Expenses Share Classes will have to be available for investment in the future, and capital growth, may be reduced notwithstanding the performance of the sub-fund. Shareholders should note that there is an increased risk that on the redemption of these Fees & Expenses Share Classes, Shareholders may not receive back the full amount invested. Shareholders should be aware that charging fees and expenses to capital may result in the erosion of a Shareholders‘ capital investment, or capital gains attributable to that original investment, which will likely diminish the value of future returns. The increased dividend payout as a result of charging fees and expenses to capital effectively amounts to a return or withdrawal of a Shareholder‘s original capital investment or of capital gains attributable to that original investment.
Shareholders should note that to the extent expenses are charged to capital, some or all of the distributions made by the Fees & Expenses Share Classes should be considered to be a form of capital reimbursement.
Distributing the capital of the relevant Dividends Out of Capital Share Class will lower the value of those Shares by the amount of the distribution. As distributions may be made out of the capital of the relevant Dividends Out of Capital Share Class, there is a greater risk that capital will be eroded and “income”

Background of the Company (unaudited)
1 2 J a n u s C a p i t a l F u n d s P l c / 3 1 D e c e m b e r 2 0 1 5
will be achieved by foregoing the potential for future capital growth of the investment of Shareholders in the relevant Dividends Out of Capital Share Class and the value of future returns may also be diminished. This cycle may continue until all capital is depleted.
The payment of dividends out of capital amounts to a return or withdrawal of part of a Shareholder‘s original investment or from any capital gains attributable to that original investment and such distribution will result in a corresponding immediate decrease of the Net Asset Value per share for the relevant Dividends Out of Capital Share Class.
Distributions out of capital may have different tax implications from distributions of income and capital gains and if you propose to invest in one or more of the relevant Dividends Out of Capital Share Classes of a sub-fund you are recommended to seek advice in this regard.
6. Change in name of old depositary (see summary below on 4 January 2016 Prospectus, for details on change in depositary):
Effective 31 October 2014 “Citibank International plc” changed its name to “Citibank International Limited”. As a result, the branch name of Citibank also changed and was known as “Citibank International Limited, Ireland branch”. References to the Depositary throughout the January 2015 Prospectus were updated to reflect this change.
7. Change in dividend frequency for the Janus Asia Frontier Markets Fund, Janus Asia Growth Drivers Fund, Janus Japan Emerging Opportunities Fund and Janus Japan Fund:
The Janus Asia Frontier Markets Fund, Janus Asia Growth Drivers Fund, Janus Japan Emerging Opportunities Fund and Janus Japan Fund previously intended to declare and distribute dividends annually or semi-annually on or about 15 April and/ or 15 October, or on such other date or more frequently at the discretion of the Director. Going forward the intention is to declare dividends monthly, with distribution normally on the fifteenth day of each month unless the fifteenth day is not a Business Day in which case the distribution will be made on the last Business Day before the fifteenth day of the month.
8. Creation of new share classes:
The January 2015 Prospectus was updated throughout to reflect the creation of new shares classes in certain of the existing sub-funds, as more particularly described in Appendix 5 of the January 2015 Prospectus.
9. Short term trading fee:
The ability to charge a short term trading fee on redemptions of Class A, Class B, Class E, Class I, Class S, Class U and Class V Shares was removed.
10. Change of name of existing share classes:
The names of all existing “RMB(CNH)” share classes were changed to “CNH” in light of the update issued by the International Standardisation Organisation (the “ISO”). A query was addressed to the Irish Stock Exchange (the “ISE”) in respect of the update issued by the ISO and the ISE explained that being a member of the Association of National Numbering Agencies (“ANNA”), the ISE was obliged to log on each ISIN/SEDOL to ANNA’s database. ANNA confirmed that the reference to “RMB” needed to be removed and the following codes were to be abided by internationally: CNH – Chinese Offshore Renminbi; CNY – Yuan Renminbi. For example the “Class ARMB(CNH)acc (Hedged)” share class changed its name to the “Class ACNHacc (Hedged)” share class. The initial offer prices, minimum initial subscription amount and minimum subsequent subscription amount have also been updated to refer to “CNH”. References to “RMB” in the body of the January 2015 Prospectus have been updated to refer to “Renminbi”.
11. Taxation:
This section of the January 2015 Prospectus was updated in light of amendments to the Irish tax legislation.
10 July 2015 Prospectus Update:
The following is a summary of the main changes incorporated into the Company’s Prospectus dated 10 July 2015 (the “July 2015 Prospectus”). It does not purport to be a complete account of the changes and you should refer to the full version of the July 2015 Prospectus in case of any uncertainty. Except where the context otherwise requires, defined terms herein shall bear the meaning given to them in the July 2015 Prospectus.
1. The following new sub-fund was approved by the Central Bank:
Janus Emerging Market Debt Fund
Janus Capital Management LLC has been appointed as sub-investment adviser of this sub-fund.
The July 2015 Prospectus discloses the sub-fund’s investment objective and policy; base currency; the share classes which have been created; risk factors; currency strategy; trade cut-off times; the distribution policy and the fees and expenses applicable to an investment in the sub-fund.
2. Change of sub-fund name:
The name of the “Janus Global Multi-Sector Income Fund” changed to the “Janus Multi-Sector Income Fund” so as to more accurately reflect the investment policies of the sub-fund.

J a n u s C a p i t a l F u n d s P l c / 3 1 D e c e m b e r 2 0 1 5 1 3
3. Amendment to the investment policies of the Janus Global Diversified Alternatives Fund:
This sub-fund will make significant use of financial derivative instruments. The prospectus previously provided that it is expected that under normal market conditions, the Fund’s leverage, as calculated using the sum of the notionals of the derivatives held by the Fund (the “Notionals Approach”), will be less than 600% of the Fund’s Net Asset Value, and is expected to typically range from 400 to 700% of the Fund’s Net Asset Value. The typical range has been changed to 200 to 700% of the Fund’s Net Asset Value.
4. Change to permit the payment of dividends out of capital for the Class Vinc Shares of all sub-funds of the Company and the Class ACNHinc (Hedged), Class A$inc, Class AAUD$inc (Hedged), Class AHK$inc and Class E€inc (Hedged) Shares of the Janus Flexible Income Fund and Janus High Yield Fund:
Previously, dividends in relation to Class Vinc Shares of all sub-funds of the Company and the Class ACNHinc (Hedged), Class A$inc, Class AAUD$inc (Hedged), Class AHK$inc and Class E€inc (Hedged) Shares of the Janus Flexible Income Fund and Janus High Yield Fund were paid out of all or some portion of net investment income and all or some portion of any net capital gains realised (i.e. net capital gains less realised and unrealised losses) attributed to the relevant Shares. However, under the Articles of Association, the Directors may also declare dividends on the shares or on any class of shares from the capital of the relevant class provided appropriate disclosure is made in the July 2015 Prospectus in accordance with the requirements of the Central Bank.
The July 2015 Prospectus was updated to permit, at the discretion of the Directors, the Class Vinc Shares of all sub-funds of the Company and the Class ACNHinc (Hedged), Class A$inc, Class AAUD$inc (Hedged), Class AHK$inc and Class E€inc (Hedged) Shares of the Janus Flexible Income Fund and Janus High Yield Fund (the “Dividends Out of Capital Share Classes”), declare and distribute up to 100% of dividends out of capital.
Please note comments above under January 2015 Prospectus in relation to distributing dividends out of capital.
5. Management and Administration:
This section was updated in relation to assets under management for the Investment Adviser and Sub-Investment Advisers.
4 January 2016 Prospectus Update:
The following is a summary of the main changes incorporated in the update to the Company’s prospectus noted by the Central Bank on 4 January 2016 (the “ January 2016 Prospectus”). It does not purport to be a complete account of the changes and you should refer to the full version of the January 2016 Prospectus in case of any uncertainty. Except where the context otherwise
requires, defined terms herein shall bear the meaning given to them in the January 2016 Prospectus.
1. The following new sub-funds were approved by the Central Bank:
Janus Global Adaptive Equity Allocation Fund (now known as the Janus Global Adaptive Capital Appreciation Fund), Janus Global Adaptive Multi-Asset Fund, Janus Absolute Return Income Fund, and Janus Global Opportunity Income Fund
Janus Capital Management LLC has been appointed as sub-investment adviser of each sub-fund.
The January 2016 Prospectus discloses each sub-funds’ investment objective and policy; base currency; the share classes which have been created; risk factors; currency strategy; trade cut-off times; the distribution policy and the fees and expenses applicable to an investment in the sub-fund.
2. Change of depositary:
With effect from 00.01 am on 31 December, 2015 Citi Depositary Services Ireland Limited (the “New Depositary”) was appointed as a depositary to the Company, pursuant to a deed of novation, dated 30 December 2015, between the Company, Citibank International Limited, Ireland Branch (the “Old Depositary”) and the New Depositary. The January 2016 Prospectus was updated throughout to reflect this change.
3. Change in company secretary and registered office:
Citibank Europe plc, the Administrator of the Company, formally took the decision that they will no longer act as the secretary and registered office of the Company with effect from 23.59 pm on 31 December 2015. Bradwell Limited has been appointed as company secretary and the registered office changed to Arthur Cox Building, Earlsfort Centre, Earlsfort Terrace, Dublin 2 Ireland following this change. The January 2016 Prospectus was updated throughout to reflect this change.
4. Investment in other collective investment schemes:
Under its investment policies, the Janus Europe Allocation Fund may invest up to 100% of its net asset value in the securities of other Eligible Collective Investment Schemes. The January 2016 Prospectus was updated to include details of the maximum level of management fees (exclusive of any performance fee) that may be charged by a collective investment scheme in which the Janus Europe Allocation Fund invests, namely 2% per annum of the net asset value of that scheme.
5. Central Bank UCITS Regulations:
On 5 October 2015, the Central Bank published the Central Bank (Supervision and Enforcement) Act 2013 (Section 48(1)) (Undertakings for Collective Investment in Transferable

Background of the Company (unaudited)
1 4 J a n u s C a p i t a l F u n d s P l c / 3 1 D e c e m b e r 2 0 1 5
Securities) Regulations 2015 (the “ Central Bank UCITS Regulations 2015”) which came into effect on 1 November 2015. The January 2016 Prospectus was updated throughout to reflect the provisions of the Central Bank UCITS Regulations 2015.
6. Change to permit the payment of dividends out of capital for the Class A$inc, Class AAUD$inc (Hedged) and Class E€inc (Hedged) Shares of the Janus Global Real Estate Fund :
Previously, dividends in relation to Class A$inc, Class AAUD$inc (Hedged) and Class E€inc (Hedged) Shares of the Janus Global Real Estate Fund were paid out of all or some portion of net investment income and all or some portion of any net capital gains realised (i.e. net capital gains less realised and unrealised losses) attributed to the relevant Shares. However, under the Articles of Association, the Directors may also declare dividends on the shares or on any class of shares from the capital of the relevant class provided appropriate disclosure is made in the prospectus in accordance with the requirements of the Central Bank.
The January 2016 Prospectus was updated to permit, at the discretion of the Directors, the Class A$inc, Class AAUD$inc (Hedged) and Class E€inc (Hedged) Shares of the Janus Global Real Estate Fund (the “Dividends Out of Capital Share Classes”), declare and distribute up to 100% of dividends out of capital.
Please note comments above under January 2015 Prospectus in relation to distributing dividends out of capital.
7. Taxation:
The January 2016 Prospectus was updated throughout in light of amendments to the Irish tax legislation, EU Savings Directive and the implementation of the OECD Common Reporting Standard since the July 2015 Prospectus.
8. Portfolio holdings disclosure policy:
Updates were made to the portfolio holdings disclosure policy including to reflect that portfolio holdings shall generally be available quarterly, with a 30 or 60-day lag, depending on the sub-fund, upon request from Janus Capital International Limited (“JCIL”). Any portfolio holdings information which may be requested by Shareholders shall be provided at JCIL’s discretion and subject to the entry into a confidentiality agreement.
9. Definitions:
The definition of “Companies Acts” was updated to reflect the coming into effect of the Companies Act 2014 and a new definition of “Eligible Collective Investment Scheme” was inserted.
1 April 2016 Prospectus Update:
The following is a summary of the main changes incorporated into the Company’s Prospectus dated 1 April 2016 (the “April
2016 Prospectus”). It does not purport to be a complete account of the changes and you should refer to the full version of the April 2016 Prospectus in case of any uncertainty. Except where the context otherwise requires, defined terms herein shall bear the meaning given to them in the April 2016 Prospectus.
1. Change of sub-fund name:
The name of the “Janus Global Adaptive Equity Allocation Fund” changed to the “Janus Global Adaptive Capital Appreciation Fund” so as to more accurately reflect the investment strategy of the sub-fund.
2. UCITS V:
Following the coming into effect of the UCITS V Directive (“UCITS V”) with effect from 18 March 2016 the following changes were made:
2.1 Custodian/Depositary
All reference to “Custodian” were replaced with “Depositary” to reflect the term used the UCITS V. Disclosure relating to the Depositary, Citi Depositary Services Ireland Limited, was update to include a description of the depositary’s duties, conflicts of interest that may arise, any safekeeping functions delegated by the depositary, the list of delegates and sub-delegates and any conflicts of interest that may arise from such a delegation. Up-to-date information regarding the duties of the Depositary, any conflicts of interest that may arise and the Depositary’s delegation arrangements will be made available to investors from the Depositary on request. Details of the Depositary’s liability were also update in light of the requirements under UCITS V.
2.2 Remuneration Policy
The Company has adopted a remuneration policy as required by the UCITS Regulations (the “Remuneration Policy”). Information in relation to the Remuneration Policy included in the April 2016 Prospectus.
3. Central Bank UCITS Regulations:
General updates were included throughout the April 2016 Prospectus to reflect the provisions of the Central Bank UCITS Regulations 2015.
4. Management and Administration:
This section was updated in relation to assets under management for the Sub-Investment Advisers.
5. Personal Data/Taxation:
The April 2016 Prospectus was updated throughout in light of amendments to the Irish tax legislation, EU Savings Directive

J a n u s C a p i t a l F u n d s P l c / 3 1 D e c e m b e r 2 0 1 5 1 5
and the implementation of the OECD Common Reporting Standard since the prospectus was last updated. In light of this, enhanced disclosure was included in relation to the use of personal data.
6. Decrease in certain fee provision:
Fees applicable to the certain share classes of certain sub- funds as detailed below were reduced:
6.1 Janus US Research Fund
(a) Class A Shares:
(i) the maximum investment management fee was reduced from 1.5% to 1% of the sub-fund’s average daily net assets attributable to such shares; and
(ii) the total fees (including all fees of the administrator, the custodian and any Company representatives in any jurisdiction) and out-of-pocket expenses allocated to the sub-fund in any fiscal year (the “Total Fees and Expenses Limit”) was reduced from 3% to 2.5% of the average daily net assets attributable to the Class A Shares of such sub-fund.
6.2 Janus US Short-Term Bond Fund
(a) Class A Shares:
(i) the maximum investment management fee was reduced from 0.65% to 0.5% of the sub-fund’s average daily net assets attributable to such Shares;
(ii) the ongoing shareholder servicing fee was reduced from 0.5% to 0.2% of the sub-fund’s average daily net asset value attributable to each such Class; and
(iii) the Total Fees and Expenses Limit was reduced from 1.9% to 1.45% of the average daily net assets attributable to the Class A Shares of such sub-fund.
(b) Class I Shares:
(i) the maximum investment management fee was reduced from 0.65% to 0.5% of the sub-fund’s average daily net assets attributable to such Shares; and
(ii) the Total Fees and Expenses Limit was reduced from 0.9% to 0.75% of the average daily net assets attributable to the Class I Shares of such sub-fund.
(c) Class U Shares:
(i) the maximum investment management fee was reduced from 0.6% to 0.5% of the sub-fund’s average daily net assets attributable to such Shares; and
(ii) the Total Fees and Expenses Limit was reduced from 1.35% to 1.25% of the average daily net assets attributable to the Class U Shares of such sub-fund.
6.3 Perkins US Strategic Value Fund
(a) Class A Shares
(i) the maximum investment management fee was reduced from 1.5% to 1% of the sub-fund’s average daily net assets attributable to such Shares; and
(ii) the Total Fees and Expenses Limit was reduced from 3% to 2.5% of the average daily net assets attributable to the Class A Shares of such sub-fund.
(b) Class I Shares
(i) the maximum investment management fee was reduced from 1.5% to 0.95% of the sub-fund’s average daily net assets attributable to such Shares; and
(ii) the Total Fees and Expenses Limit was reduced from 1.75% to 1.2% of the average daily net assets attributable to the Class I Shares of such sub-fund.
6.4 Janus Global Adaptive Capital Appreciation Fund (formerly known as the Janus Global Adaptive Equity Allocation Fund)
(a) Class A Shares:
(i) the maximum investment management fee was reduced from 1.25% to 0.9% of the sub-fund’s average daily net assets attributable to such Shares;
(ii) the ongoing shareholder servicing fee was reduced from 0.75% to 0.65% of the sub-fund’s average daily net asset value attributable to each such Class; and
(iii) the Total Fees and Expenses Limit was reduced from 2.75% to 2.25% of the average daily net assets attributable to the Class A Shares of such sub-fund.
(b) Class E Shares
(i) the Total Fees and Expenses Limit was reduced from 3.25% to 2.9% of the average daily net assets attributable to the Class E Shares of such sub-fund.
(c) Class I Shares
(i) the maximum investment management fee was reduced from 0.9% to 0.8% of the sub-fund’s average daily net assets attributable to such Shares; and
(ii) the Total Fees and Expenses Limit was reduced from 1.1% to 1.05% of the average daily net assets attributable to the Class I Shares of such sub-fund.

Background of the Company (unaudited)
1 6 J a n u s C a p i t a l F u n d s P l c / 3 1 D e c e m b e r 2 0 1 5
6.5 Janus Global Adaptive Multi-Asset Fund
(a) Class A Shares:
(i) the maximum investment management fee was reduced from 1.25% to 0.9% of the sub-fund’s average daily net assets attributable to such Shares;
(ii) the ongoing shareholder servicing fee was reduced from 0.75% to 0.65% of the sub-fund’s average daily net asset value attributable to each such Class; and
(iii) the Total Fees and Expenses Limit was reduced from 2.75% to 2.25% of the average daily net assets attributable to the Class A Shares of such sub-fund.
(b) Class E Shares
(i) the Total Fees and Expenses Limit was reduced from 3.25% to 2.9% of the average daily net assets attributable to the Class E Shares of such sub-fund.
(c) Class I Shares
(i) the maximum investment management fee was reduced from 0.9% to 0.8% of the sub-fund’s average daily net assets attributable to such Shares; and
(ii) the Total Fees and Expenses Limit was reduced from 1.1% to 1.05% of the average daily net assets attributable to the Class I Shares of such sub-fund.
6.6 Janus Absolute Return Income Fund
(a) Class A Shares:
(i) the maximum investment management fee was reduced from 1% to 0.65% of the sub-fund’s average daily net assets attributable to such Shares;
(ii) the ongoing shareholder servicing fee was reduced from 0.75% to 0.35% of the sub-fund’s average daily net asset value attributable to each such Class; and
(iii) the Total Fees and Expenses Limit was reduced from 2.5% to 1.75% of the average daily net assets attributable to the Class A Shares of such sub-fund.
(b) Class B, E and V Shares:
(i) the maximum investment management fee was reduced from 1% to 0.65% of the sub-fund’s average daily net assets attributable to such Shares;
(c) Class E Shares
(i) the Total Fees and Expenses Limit was reduced from 2.75% to 2.4% of the average daily net assets attributable to the Class E Shares of such sub-fund.
(d) Class I Shares
(i) the maximum investment management fee was reduced from 0.8% to 0.65% of the sub-fund’s average daily net assets attributable to such Shares; and
(ii) the Total Fees and Expenses Limit was reduced from 1.05% to 0.9% of the average daily net assets attributable to the Class I Shares of such sub-fund.
(e) Class U Shares:
(i) the maximum investment management fee was reduced from 0.65% to 0.6% of the sub-fund’s average daily net assets attributable to such Shares.
6.7 Janus Global Opportunity Income Fund
(a) Class A Shares:
(i) the maximum investment management fee was reduced from 1% to 0.65% of the sub-fund’s average daily net assets attributable to such Shares;
(ii) the ongoing shareholder servicing fee was reduced from 0.75% to 0.35% of the sub-fund’s average daily net asset value attributable to each such Class; and
(iii) the Total Fees and Expenses Limit was reduced from 2.5% to 1.75% of the average daily net assets attributable to the Class A Shares of such sub-fund.
(b) Class B, E and V Shares:
(i) the maximum investment management fee was reduced from 1% to 0.65% of the sub-fund’s average daily net assets attributable to such Shares.
(c) Class E Shares
(i) the Total Fees and Expenses Limit was reduced from 2.75% to 2.4% of the average daily net assets attributable to the Class E Shares of such sub-fund.
(d) Class I Shares
(i) the maximum investment management fee was reduced from 0.8% to 0.65% of the sub-fund’s average daily net assets attributable to such Shares; and
(ii) the Total Fees and Expenses Limit was reduced from 1.05% to 0.9% of the average daily net assets attributable to the Class I Shares of such sub-fund.
J a n u s C a p i t a l F u n d s P l c / 3 1 D e c e m b e r 2 0 1 5 1 7
Report of the Directors
The Directors submit their report together with the audited financial statements for the financial year ended 31 December 2015.
CONNECTED PARTIES
In accordance with the requirements of UCITS Regulations, the Board confirm that there are arrangements (evidenced by written procedures) in place, to ensure: (i) that any transaction carried out with the Company by JCIL, the Depositary and/or associated or group companies of these (“connected parties”) were carried out as if negotiated at arm’s length and that such transactions were in the best interests of the shareholders; and (ii) that these arrangements were applied to all transactions with connected parties during the period. The Board is satisfied that transactions with connected parties entered into during the period were carried out as if negotiated at arm’s length and were in the best interests of the shareholders.
Please refer to the “Related Parties” Note 3 on page 2 40 for details of transactions to the Directors’ respective entities during the financial year.
DIRECTORS’ RESPONSIBILITIES
The Directors are responsible for preparing the annual report and the financial statements in accordance with FRS 102 Financial Reporting Standard applicable in the UK and Republic of Ireland issued by the Financial Reporting Council (FRC) and promulgated by the Institute of Chartered Accountants in Ireland (“FRS 102”) and the European Communities (Undertakings for Collective Investment in Transferable Securities) Regulations, 2011, as amended.
Irish company law requires the Directors to prepare financial statements for each financial year which give a true and fair view of the assets, liabilities and financial position of the Company as at the end of the financial year, and profit or loss, for the financial year. In preparing those financial statements, the Directors are required to:
• select suitable accounting policies and then apply them consistently;
• make judgments and estimates that are reasonable and prudent; and
• state whether the financial statements have been prepared in accordance with applicable accounting standards and identify the standards in question, subject to any material departures from those standards being disclosed and explained in the notes to the financial statements; and
• prepare the financial statements on the going concern basis unless it is inappropriate to presume that the Company will continue in business.
The Directors confirm that they have complied with the above requirements in preparing the financial statements.
The Directors are responsible for keeping adequate accounting records that are sufficient to correctly record and explain the
transactions of the company; enable, at any time, the assets, liabilities, financial position and profit or loss of the company to be determined with reasonable accuracy; and enable them to ensure that the financial statements comply with the Companies Act 2014 and the European Communities (Undertaking for Collective Investment in Transferable Securities) Regulations, 2011 (the “UCITS Regulations”). They are also responsible for safeguarding the assets of the Company and hence for taking reasonable steps for the prevention and detection of fraud and other irregularities.
Under the UCITS Regulations, the Directors are required to entrust the assets of the Company to a trustee for safe-keeping. In carrying out this duty, the Company has delegated custody of the Company’s assets to Citibank International Limited, Ireland branch.
The Directors are responsible for the maintenance and integrity of the corporate and financial information of the Company included on the website of Janus Capital International Limited (www.janusinternational.com). Legislation in the Republic of Ireland governing the preparation and dissemination of financial statements may differ from legislation in other jurisdictions.
CORPORATE GOVERNANCE STATEMENT
The Company has adopted the ‘Corporate Governance Code for Irish Domiciled Collective Investment Schemes’ issued by the Irish Funds Industry Association (the “IF Code”) which can be obtained from the IFIA’s website at http://www.irishfunds.ie. The Company is also subject to corporate governance practices imposed by:
• The Irish Companies Act 2014 which are available for inspection at the registered office of the Company; and may also be obtained at http://www.irishstatutebook.ie/home.html
• The Articles of Association of the Company which are available for inspection at the registered office of the Company and at the Companies Registration Office in Ireland; and
• The Central Bank of Ireland (“Central Bank”) in their UCITS Regulations which can be obtained from the Central Bank’s website at: http://www.centralbank.ie/regulation/industry-sectors/funds/ucits/Pages/default.aspx and are available for inspection at the registered office of the Company; and
• The Irish Stock Exchange (“ISE”) through the ISE Code of Listing Requirements and Procedures which can be obtained from the ISE’s website at: http://www.ise.ie.
The Company is subject to the Companies Acts, the UCITS Regulations and the Listing Rules of the ISE, as applicable to investment funds. The Company does not apply additional corporate governance requirements beyond those required by the above. Each of the service providers engaged by the Company is subject to its own corporate governance requirements.
FINANCIAL REPORTING PROCESS – DESCRIPTION OF MAIN FEATURES
The Board of Directors (“the “Board”) is ultimately responsible for overseeing the establishment and maintenance of adequate internal control and risk management systems of the Company

Report of the Directors
1 8 J a n u s C a p i t a l F u n d s P l c / 3 1 D e c e m b e r 2 0 1 5
in relation to the financial reporting process. As the Company has no employees and all directors serve in a non executive capacity all functions including the preparation of the financial statements have been outsourced. The Company has appointed Citibank Europe plc (the “Administrator”) as its Administrator consistent with the regulatory framework applicable to investment fund companies such as the Company. The Administrator has functional responsibility for the preparation of the Company’s interim and annual financial statements and the maintenance of its accounting records. On appointing the Administrator the Board noted that it was regulated by the Central Bank and in the Board’s opinion, had significant experience as an administrator. The Board also noted the independence of the Administrator from the Company’s investment adviser. Subject to the supervision of the Board, the appointment of the Administrator is intended to manage rather than eliminate the risk of failure to achieve the Company’s financial reporting objectives and can only provide reasonable and not absolute assurance against material misstatement or loss.
The Board evaluates and discusses significant accounting and reporting issues as the need arises. The Board reviews the financial statements prior to their approval, though it should be noted that such review does not include verification of information in the financial statements to source documents. The annual financial statements are subject to independent audit by PricewaterhouseCoopers and the Board receives and considers a report from PricewaterhouseCoopers as to the audit process. This report includes observations as to the extent to which (i) the annual financial statements provide a true and fair view (ii) adjustments were made to the accounting records maintained by the Administrator in order to provide financial statements giving a true and fair view and (iii) potential control weaknesses identified by PricewaterhouseCoopers during the audit process.
RISK ASSESSMENT
The Board is responsible for assessing the risk of irregularities whether caused by fraud or error in financial reporting and for ensuring that processes are in place for the timely identification of internal and external matters with a potential effect on financial reporting. The Board is advised by the Administrator as to changes in accounting rules and provides recommendations as to how these changes are best reflected in the Company’s financial statements. The Board’s appointment of an administrator independent of the investment adviser to the Company and which is regulated by Central Bank is intended to mitigate though not eliminate the risk of fraud or irregularities which may impact the financial statements of the Company.
MONITORING
The Board receives regular presentations and reviews reports from the Depositary, Investment Adviser and Administrator. The Board also has an annual process to ensure that appropriate measures are taken to consider and address any control weaknesses identified and measures recommended by the independent auditors.
CAPITAL STRUCTURE
No person has a significant direct or indirect holding of securities in the Company. No person has any special rights of control over the Company’s share capital. There are no restrictions on voting rights.
For the appointment and replacement of Directors, the Company is governed by its Articles of Association. The Articles of Association themselves may be amended by special resolution of the shareholders.
COMPOSITION AND OPERATION OF THE BOARD OF DIRECTORS
None of the Directors have entered into an employment or service contract with the Company. All related party transactions during the year are detailed in Note 3 to the financial statements. The Articles of Association do not provide for retirement of Directors by rotation. However, the Directors may be removed by the shareholders by ordinary resolution in accordance with the procedures established under the Companies Act. The Board meets at least quarterly. There are no subcommittees of the Board.
The Board is responsible for managing the business affairs of the Company in accordance with the Articles of Association. Subject to its supervision and direction the Board has delegated the day to day administration of the Company to the Administrator and the investment management and distribution functions to Janus Capital International Limited as the Investment Adviser. The Company has appointed Citibank International Limited, Ireland branch as the Depositary to the Company with responsibility for the safekeeping of the assets of the Company. Consequently none of the Directors is an executive director.
SHAREHOLDER MEETINGS
The annual general meeting (the “AGM”) of the Company will usually be held in Dublin as determined by the Directors, normally during the month of June, in any event it shall be held within six months of the Company’s financial year-end as determined by the Directors. Notice convening the AGM in each year at which the audited financial statements of the Company will be presented (together with the Directors’ and Independent Auditors’ Reports of the Company) will be sent to Shareholders at their registered addresses with 21 clear days notice before the date fixed for the meeting. Other general meetings may be convened from time to time by the Directors in such manner as provided by Irish law and the Articles of Association.
Each of the Shares entitles the holder to attend and vote at meetings of the Company and of the sub-funds represented by those Shares. Matters may be determined by a meeting of Shareholders on a show of hands unless a poll is requested by at least five Shareholders present or by Shareholders present holding 10% or more of the Shares in issue having the right to vote at the meeting or unless the chairman of the meeting requests a poll. Each Shareholder has one vote on a show of hands. Each Share gives the holder one vote in relation to

J a n u s C a p i t a l F u n d s P l c / 3 1 D e c e m b e r 2 0 1 5 1 9
any matters relating to the Company which are submitted to Shareholders for a vote by poll.
No Class confers on the holder thereof any preferential or preemptive rights or any rights to participate in the profits and dividends of any other Class or any voting rights in relation to matters relating solely to any other Class.
The quorum for any general meeting shall be two shareholders present in person or by proxy save that where it is proposed to vary the rights attached to a particular class of Shares, unless otherwise provided, the quorum at such general meeting shall be two or more shareholders of that class present in person or by proxy together holding at least one-third of the Shares of that class.
Each of the Shares other than subscriber shares entitles the Shareholder to participate equally on a pro-rata basis in the dividends and net assets of the Company in respect of which the Shares have been issued, save in the case of dividends declared prior to becoming a Shareholder.
ACCOUNTING RECORDS
We confirm that we have secured compliance with the Company’s obligation to maintain adequate accounting records by the employment of a competent third party who uses appropriate systems and procedures and that the Company has kept adequate accounting records in accordance with Sections 281 to 285 of the Companies Act 2014 throughout the financial year. The accouting records are kept at Citibank Europe plc, 1 North Wall Quay, Dublin 1, Ireland.
PRINCIPAL ACTIVITIES
The Company is an investment company with variable capital incorporated under the laws of Ireland as a public limited company pursuant to the Companies Act 2014, and the UCITS Regulations. The Company is an umbrella fund with segregated liability between Funds.
REVIEW OF THE BUSINESS AND FUTURE DEVELOPMENTS
The business of the Company is reviewed in detail in the Investment Adviser’s Market and Fund Overviews on pages 21 to 65. The performance of the various Classes on offer is detailed in the Fund Performance section on pages 66 to 74. Details of changes to the Company’s portfolio managers, Prospectus and changes to various Funds and Share Classes are detailed in the Other Relevant Information section to the Background of the Company on pages 1 to 16. The Company intends to continue promoting and generating interest in its business in the future.
RISK MANAGEMENT OBJECTIVES AND POLICIES
Details of the risks applicable to an investment in the Company are listed in Note 13, Financial Instruments and Financial Derivative Instruments, including market price risk, foreign currency risk, interest rate risk, liquidity risk and credit risk. In order to manage such risks, the Company shall comply with the
investment restrictions and diversification limits provided for in the Prospectus and the UCITS Regulations.
RESULTS AND DIVIDENDS
The results for the year and particulars relating to distributions’ are stated in the Statement of Comprehensive Income on pages 2 20 to 22 7 of the financial statements. Particulars relating to the issue and redemption of Shares are set out in note 15. Capital Share Transactions on pages 28 9 to 29 3 of the financial statements.
EVENTS DURING THE FINANCIAL YEAR
Effective from 31 December 2015, the Depositary Citibank International Limited, Ireland Branch changed its name to Citi Depositary Services Ireland Limited. The change is reflected in the Prospectus issued on 1 April 2016.
On 1 November 2015, the Central Bank (Supervision and Enforcement) Act 2013 (Section 48(1)) (Undertaking for Collective Investment in Transferable Securities) Regulations 2015 came into effect.
Effective from 30 November 2015 share classes were closed:Janus Balanced Fund I€inc SharesJanus Balanced Fund I$inc SharesJanus Europe Fund ASEKacc SharesJanus Global Research Fund B$acc SharesJanus Global Research Fund I$dis SharesJanus Global Research Fund A$dis SharesJanus US Research Fund A$dis SharesJanus US Research Fund I$dis SharesJanus US Twenty Fund A$dis SharesJanus US Venture Fund U€acc Hedged SharesJanus US Venture Fund I$dis SharesPerkins Global Value Fund B$acc SharesPerkins US Strategic Value Fund I€acc SharesINTECH US Core Fund A$dis SharesINTECH US Core Fund I$dis SharesJanus Flexible Income Fund AHKDacc SharesJanus Flexible Income Fund AAUD$acc SharesJanus Global High Yield Fund AAUD$incJanus Global High Yield Fund IAUD$incJanus Global High Yield Fund I€acc Hedged SharesJanus Global High Yield Fund B€inc SharesJanus Global High Yield Fund B$inc SharesJanus Global High Yield Fund B$acc SharesJanus Global Investment Grade Bond Fund B$acc SharesJanus Global Investment Grade Bond Fund B$inc SharesJanus Global Investment Grade Bond Fund B$inc SharesJanus High Yield Fund IAUDinc SharesJanus High Yield Fund AAUD$acc SharesJanus US Short-Term Bond Fund ICHFinc SharesJanus US Short-Term Bond Fund I£acc Shares


Fund Overviews (unaudited)
J a n u s C a p i t a l F u n d s P l c / 3 1 D e c e m b e r 2 0 1 5 2 1
Fund Overviews (unaudited)
Janus Asia Frontier Markets Fund
DIAM Asset Management, portfolio manager
For the period ended 31 December 2015, Janus Asia Frontier Markets Fund, as refl ected by the Fund’s Class I$acc Shares, returned (14.81)% as compared to its benchmark, the MSCI All Country Asia Ex-Japan Index, which returned (9.17)%.
Investment Enviro nment
Asian markets experienced a weak 2015 stemming from negative impact driven by sharp currencies movements and persistent weakness from China. CNY depreciated against USD by 4.6% during the year with China’s intentions to liberalise its currency. The sharp abrupt movement in the currency surprised the markets, spurring weakness around Asia as a weaker CNY drains export market share from other Asian markets. Despite repeated stimulus from economic policies, the Chinese economy continued to soften prompting further weakness in Asian markets.
Geopolitical events, weak Chinese demand and the strengthening of the USD prompted further decline in prices of oil and other commodities. The weak oil and commodities prices dragged inflation down globally which resulted in a negative hit to top and bottom line for most businesses. The widely expected Fed rate hike in December 2015 and policy normalisation also contributed to the negative sentiment and volatility in the market.
Apart from China, Thailand and Singapore were one of the worst performing markets in Asia. Expectations of domestic demand revival in Thailand after the coup did not materialize causing the market to correct to its new lower level of growth. Singapore’s market got dragged down by NPL concerns from its banks due to exposures to oil, commodities and China. Malaysia continues to be dogged by weak domestic demand, political instability as well as concerns over the state of its fiscal health. Indonesia experienced a challenging year after initial election euphoria gave way as infrastructure spending and government execution lagged expectations coupled with weak domestic and external demand resulted in lower economic growth and disappointing corporate earnings. Philippines remained relatively sheltered from the market upheaval as growth was supported by resilient domestic demand even as export growth faltered. Vietnam registered strong market performance buoyed by plans to open up corporates for foreign ownership and robust economic growth.
Performance Discussion
Our holdings in Financials were the largest detractor from absolute performance followed by our holdings in utilities and energy. In terms of countries, our holdings and overweight position in Indonesia detracted the most from absolute performance, while our holding in South Korea was the largest contributor.
Metro Pacific Investment is a Philippine infrastructure conglomerate with business interests in water, power, toll roads, hospitals and rail. The company is expected to benefit from the fast growing Philippine economy and demand for infrastructure development. Metro Pacific currently owns several privately owned hospitals and will continue to expand its hospitals and bed count given the under penetration of quality healthcare services in the Philippines. It is also the largest toll road operator owning over 60% of the total toll roads in the Philippines with opportunities to expand its road network. Metro’s water and power businesses are held under subsidiaries Maynilad Water and Beacon Electric and these are regulated businesses with a tariff structure that allows for opex and capex recovery and adjustments for forex and inflation. Given the strong balance sheet and cash flow generation capabilities of its businesses, Metro would be able to capitalise on further infrastructure developments in the Philippines.
PT Perusahaan Gas Negara is a state owned utility company that is involved in gas distribution and transmission business in Indonesia. The company enjoys a dominant position via ownership of close to 4,000km in gas pipelines which facilitates the distribution and transmission of gas supplies to end users. PGAS has also recently ventured into upstream oil and gas in order to secure additional supplies of gas. While energy prices have been on the decline, PGAS remains an excellent proxy to rising gas consumption in Indonesia in the long term.
Outlook and Positioning
We are relatively positive on the Asian equity outlook in 2016. Earnings growth and cheap valuation will be the biggest reason behind our view. Our market preferences centre on improving earnings growth and reform: we are positive on India and Indonesia, and look for opportunities in Korea, Taiwan and Philippines. We remain cautious on commodity-dependent market such as Malaysia given the growing headwinds from slower growth and higher rates from the U.S.
India was not spared from the weak global macro environment. Exporters and commodities companies continued to suffer while lower inflation also dragged overall growth in the economy. While certain sectors continued to see sector specified issues such as rising NPL from aged projects and moderating rural wage growth, there were pockets of strength in the economy that displayed strong recovery in demand. Four-wheeled vehicle grew around 10% yoy in the 4Q 2015 and we might see the same trend in 2016. Furthermore, new projects investments have stopped deteriorating and is picking up especially in roads and railways. The 7th pay commission recommended a 23.55% hike in total pay and pension bill for 4.8m central government employees and 5.4m pensioners. This represents a significant stimulus and should drive consumer spend going forward.
Fundamentals have not changed too much in China but after the massive injections of liquidity, people start to look

Fund Overviews (unaudited)
2 2 J a n u s C a p i t a l F u n d s P l c / 3 1 D e c e m b e r 2 0 1 5
at fundamentals again and we believe we will see diverging performance among quality stocks and junk ones in this year. We are more positive on stocks with better governance quality as well as infrastructure related stocks in sight of possible stimulus by Beijing.
The Philippines remains the most promising economy in ASEAN as recent economic data suggest that growth prospects are fairly promising, as remittances, consumption and infrastructure development demonstrate resilience. We are cautious on export and agriculture sector but maintain the view that buoyant private consumption and resurgent government spending should be enough to drive growth in 2016.
In Malaysia, the recent developments in the domestic and external sector and the 1MBD scandal continue to suggest that the export dependent economy will not turn around anytime soon. Ringgit has been under pressure and the retirement of Bank Negara Malaysia, Tan Sri Dato’ Sri Dr. Zeti in April 2016 may exacerbate further decline as there are concerns that her successor may have different views about capital controls. A successor who lacks the credentials to maintain the independence and integrity of the central bank may hurt foreigner investor confidence.
Top Contributors & Detractors
Contributors
COSMAX INC. Original development and design manufacturing (ODM) company in cosmetics industry. The company provides cosmetics products to both local Korean and foreign brands, such as L’Oreal and Johnson & Johnson. As cosmetics products cycle is shorter due to hard competition, original brand companies tend to use ODM companies more. The company launched its business in China in 2004, and they have plans to increase their manufacturing capacity for rising order from Chinese local brands.
SM Prime is one of the largest integrated property developers in Southeast Asia by market capitalization. In addition, they are also the largest listed real estate developer on the Philippine stock exchange by market capitalization, total assets and net income. The company’s main sources of revenues include rental income from mall and food courts, cinema ticket sales and amusement income from bowling and ice-skating.
Tencent Holdings is an Internet media company that owns leading social network platforms QQ and Weixin. It also develops online and client based games which together form the bulk of Tencent’s revenues through monthly subscriptions and in-application item purchases. The company has in the past released a number of hit game titles which reflects its strength in game development. Tencent also derives revenues from online advertising and transaction based commissions. The company is poised to benefit from greater internet and smartphone penetration in China, while it is looking to further gain market share in mobile gaming which is experiencing rapid
growth by focusing new content there. There is also room for non-gaming revenues to grow through greater monetization of existing platforms such as QQ, Weixin and Kakao.
China Overseas Land & Investment Limited. China Overseas Land & Investment (COLI) has business interests in real estate development and investment and is a subsidiary of China State Construction. COLI has historically shown a promising track record in property development in China’s Tier 1 and 2 cities. The company has been conservative in its land banking acquisitions as it looks to defend its margins in a slowing property market while it has been able to lock in earnings growth for 2016 due to its strong contracted sales figure. COLI also enjoys a strong balance sheet and access to low cost financing which gives it flexibility to engage in further land banking or M&A where appropriate.
China State Construction International Holdings Limited. China’s largest construction company and building contractor, having undertaken a number of landmarks projects and is a proxy to greater infrastructure spending in China. The company is also the largest contractor for affordable housing in China and is expected to benefit from initiatives from the Chinese government to increase the supply of affordable housing. Contracts for the construction of affordable housing typically command higher margins due to the nature of the contract which calls for the contractor to fund the construction initially and receive payment only after construction is complete.
Detractors
DBS Group Holdings Ltd. Singapore based DBS Group Holdings is ASEAN’s largest banking group by assets with over 280 branches across 17 countries in Asia. The banks’ dominance in Singapore was cemented via its acquisition of POSB bank in Singapore which gave the bank a sizable presence in mortgages and low cost CASA deposits. The bank today maintains the highest CASA ratio amongst the 3 big banks in Singapore and is best poised to benefit from an environment of potential interest rate hikes. Given the muted outlook for loan growth in general for the near term, the bank has also focused on growing its non-interest income through wealth management and transaction services.
Guotai Junan International is a leading securities brokerage firm in Hong Kong offering brokerage, margin finance, asset management and trading services to its mainly Chinese clientele. Guotai Junan’s online brokerage platform also allows Chinese investors to invest in overseas markets, while the low cost nature of the online platform allows it to keep its cost to income ratio down. The company also enjoys support by its parent Guotai Junan PRC which is one of China’s top investment banks with a customer base of more than 3 million.
PT Kalbe Farma Tbk is one of Indonesia’s largest pharmaceutical companies with business interests in Prescription & OTC drugs, Consumer health products, Nutritionals and distribution and

J a n u s C a p i t a l F u n d s P l c / 3 1 D e c e m b e r 2 0 1 5 2 3
logistics services. The company enjoys leading market share in Indonesia’s pharmaceutical and OTC sector through its strong sales force of over 2,500 medical representatives and extensive distribution network which allows it to enjoy broad coverage of the Indonesia market. The company also produces a number of leading consumer health and nutritional products which enjoys strong branding in Indonesia such as Extra Joss, Milna, Diabetasol and Prenagen. Given the lack of well-established pharmaceutical companies in Indonesia, Kalbe Farma remains a strong proxy to growth in Indonesia’s healthcare demand.
PT Perusahaan Gas Negara is a state owned utility company that is involved in gas distribution and transmission business in Indonesia. The company enjoys a dominant position via ownership of close to 4,000km in gas pipelines which facilitates the distribution and transmission of gas supplies to end users. Company has also recently ventured into upstream oil and gas in order to secure additional supplies of gas. While energy prices have been on the decline, PT Perusahaan Gas Negara remains an excellent proxy to rising gas consumption in Indonesia in the long term.
Premium Leisure Corp. The company currently jointly runs an integrated gaming resort called City of Dreams Manila (CODM) with reputable casino operator Melco Crown. Opened in Feb 2015, the resort holds over 350 gaming tables and 1,680 slot machines and is the latest entrant into the Philippine gaming space. Non-gaming amenities include high end hotels, F&B outlets and over 20,000 sqm of retail space. The resort is set to benefit from the underpenetrated gaming landscape in the region catering especially to less affluent consumers which will be attracted by the lower minimum bet requirements in the Philippines. PLC is attractive as a proxy to Philippine gaming due to its unique structure whereby it does not need to bear any capex for future expansions and it is free from interest and working capital requirements.
Thank you for your investment in Janus Asia Frontier Markets Fund.
(February 2016)
Janus Asia Growth Drivers Fund
DIAM Asset Management, portfolio manager
For the period ended 31 December 2015 , Janus Asia Growth Drivers Fund, as refl ected by the Fund’s Class I$acc Shares, re-turned (12.65)% as compared to its benchmark, the MSCI All Country Asia Ex-Japan Index, which returned (9.17)%.
Investment Environment
Asia markets experienced a weak 2015 stemming from negative impact driven by sharp currencies movements and persistent weakness from China. CNY depreciated against USD by 4.6% during the year with China’s intentions to liberalise its currency.
The sharp abrupt movement in the currency surprised the markets, spurring weakness around Asia as a weaker CNY drains export market share from other Asian markets. Despite repeated stimulus from economic policies, the Chinese economy continued to soften prompting further weakness in Asian markets.
Geopolitical events, weak Chinese demand and the strengthening of the USD prompted further decline in prices of oil and other commodities. The weak oil and commodities prices dragged inflation down globally which resulted in a negative hit to top and bottom line for most businesses. The widely expected Fed rate hike in December 2015 and policy normalisation also contributed to the negative sentiment and volatility in the market.
Apart from China, Thailand and Singapore were one of the worse performing markets in Asia. Expectations of domestic demand revival in Thailand after the coup did not materialize causing the market to correct to its new lower level of growth. Singapore’s market got dragged down by NPL concerns from its banks due to exposures to oil, commodities and China. Malaysia continues to be dogged by weak domestic demand, political instability as well as concerns over the state of its fiscal health. Indonesia experienced a challenging year after initial election euphoria gave way as infrastructure spending and government execution lagged expectations coupled with weak domestic and external demand resulted in lower economic growth and disappointing corporate earnings. Philippines remained relatively sheltered from the market upheaval as growth was supported by resilient domestic demand even as export growth faltered.
Performance Discussion
Our holdings in Financials were the largest detractor from absolute performance followed by our holdings in consumer discretionary and utilities. In terms of countries, our holdings and overweight position in China and Indonesia detracted the most from absolute performance, while our holding in South Korea was the largest contributor.
We like two technology companies in Taiwan. First is Taiwan Semiconductor Manufacturing. TSMC is the world’s largest semiconductor foundry with leading revenue market share. The company is expected to be a key beneficiary of increased smartphone and tablet production as these devices gain traction with consumers, given its strong capabilities and experience in manufacturing various products for a wide variety of customers. Its technology advantage in advanced nodes would also give it pricing power and it should make further market share gains from smaller foundry players who lack similar scale and competitiveness. Second is Largan Precision, is a Taiwanese manufacturer and one of the world’s largest suppliers for lens for various electronics ranging from cameras, smartphones and other camera welding devices. The company is one of the main suppliers for the Apple range of products and its technological prowess in lens allows it to enjoy a strong competitive advantage

Fund Overviews (unaudited)
2 4 J a n u s C a p i t a l F u n d s P l c / 3 1 D e c e m b e r 2 0 1 5
against its rivals especially as lens cameras get more sophisticated. It is also one of the few companies with the scale and track record for consistent delivery to market. Largan should also benefit from its expansion to non-Apple clients as it looks to diversify its client base even as it looks to add capacity over the coming years.
LG Chem is Korean petrochemical company producing naphtha based petrochemical products like olefins, synthetic rubber, PVC, acrylonitrile butadiene styrene (ABS), and acrylate. The company also runs separate divisions in Information Electronics and Energy solutions. LG Chem is a beneficiary of lower feedstock costs for its petrochemical products given lower oil prices while product spreads are widening due to tightening supply from maintenance shutdowns in the region and better demand trends.
Outlook
We are relatively positive on the Asian equity outlook in 2016. Earnings growth and cheap valuation will be the biggest reason behind our views. Our market preferences centre on improving earnings growth and reform: we are positive on India and Indonesia, and look for opportunities in Korea, Taiwan and Philippines. We remain cautious on commodity-dependent market such as Malaysia given the growing headwinds from slower growth and higher rates from the U.S.
India was not spared from the weak global macro environment. Exporters and commodities companies continued to suffer while lower inflation also dragged overall growth in the economy. While certain sectors continued to see sector specified issues such as rising NPL from aged projects and moderating rural wage growth, there were pockets of strength in the economy that displayed strong recovery in demand. Four-wheeled vehicle grew around 10% yoy in the 4Q 2015 and we might see the same trend in 2016. Furthermore, new projects investments have stopped deteriorating and is picking up especially in roads and railways. The 7th pay commission recommended a 23.55% hike in total pay and pension bill for 4.8m central government employees and 5.4m pensioners. This represents a significant stimulus and should drive consumer spend going forward.
Fundamentals have not changed too much in China but after the massive injections of liquidity, people start to look at fundamentals again and we believe we will see diverging performance among quality stocks and junk ones in this year. We are more positive on stocks with better governance quality as well as infrastructure related stocks in sight of possible stimulus by Beijing.
The Philippines remains the most promising economy in ASEAN as recent economic data suggest that growth prospects are fairly promising, as remittances, consumption and infrastructure development demonstrate resilience. We are cautious on export and agriculture sector but maintain the view that buoyant private consumption and resurgent government spending should be enough to drive growth in 2016.
In Malaysia, the recent developments in the domestic and external sector and the 1MBD scandal continue to suggest that the export dependent economy will not turn around anytime soon. Ringgit has been under pressure and the retirement of Bank Negara Malaysia, Tan Sri Dato’ Sri Dr. Zeti in April 2016 may exacerbate further decline as there are concerns that her successor may have different views about capital controls. A successor who lacks the credentials to maintain the independence and integrity of the central bank may hurt foreigner investor confidence.
Top Contributors & Detractors
Contributors
Amorepacific Corp.: No.1 cosmetics company in Korea with 34% market share. The company designs, manufactures, and distributes cosmetics products through various channels backed by strong brand power such as Sulwhasoo, Laneige, Marmonde, and so on. The strongest growth driver is high margin duty-free channel because Chinese tourist traffic to Korea is rising recently. This structural change will contribute not only revenue growth but also margin improvement.
Tencent Holdings is an Internet media company that owns leading social network platforms QQ and Weixin. It also develops online and client based games which together form the bulk of Tencent’s revenues through monthly subscriptions and in-application item purchases. The company has in the past released a number of hit game titles which reflects its strength in game development. Tencent also derives revenues from online advertising and transaction based commissions. The company is poised to benefit from greater internet and smartphone penetration in China, while it is looking to further gain market share in mobile gaming which is experiencing rapid growth by focusing new content there. There is also room for non-gaming revenues to grow through greater monetization of existing platforms such as QQ, Weixin and Kakao.
LG Chem Ltd.: is Korean petrochemical company producing naphtha based petrochemical products like olefins, synthetic rubber, PVC, acrylonitrile butadiene styrene (ABS), and acrylate. The company also runs separate divisions in Information Electronics and Energy solutions. LG Chem is a beneficiary of lower feedstock costs for its petrochemical products given lower oil prices while product spreads are widening due to tightening supply from maintenance shutdowns in the region and better demand trends.
COSMAX INC.: Original development and design manufacturing (ODM) company in cosmetics industry. The company provides cosmetics products to both local Korean and foreign brands, such as L’Oreal and Johnson & Johnson. As cosmetics products cycle is shorter due to hard competition, original brand companies tend to use ODM companies more. The company launched its business in China in 2004, and they

J a n u s C a p i t a l F u n d s P l c / 3 1 D e c e m b e r 2 0 1 5 2 5
have plans to increase their manufacturing capacity for rising order from Chinese local brands.
Kossan Rubber Industries Bhd.: Kossan Rubber is a Malaysian OEM disposable gloves manufacturer producing gloves for various purposes such as medical examination, surgical, cleanroom and sterilized. Kossan enjoys a diversified customer base with over 300 active customers and no customer accounts for more than 5% of the company’s revenues while demand is robust driven by increasing healthcare demand and the transition from usage of latex to nitrile gloves. The company currently operates with over 22bn annual capacity and is targeting further earnings growth through additional capacity upgrades, while it also enjoys favorable tailwinds from lower raw material prices and a weak Ringgit.
Detractors
Haitong Securities is one of China’s largest and oldest brokers by asset size. It provides brokerage, trading, underwriting and other services. Haitong has been able to gain market share in its respective market segments as it has concentrated its business outlets in areas where commission rates and penetration of brokerage are low. Haitong has also been innovative in its product offerings and since 2013 it has expanded to offer financing to its customers. This has enabled the company to enjoy greater earnings growth.
ICICI Bank. largest private bank in India in terms of assets. The bank has one of the most established retail franchises domestically and thus is well poised to capture pickup in consumer lending. It offers an extensive range of banking products and financial services for corporate and retail customers through multiple platforms such as investment banking, life, non-life insurance, venture capital and asset management.
PT Express Transindo Utama Tbk.: The company owns the second largest fleet of taxis operating taxi services in major cities in Indonesia and is a proxy to the increasing demand for transportation services in Indonesia given the lack of reliable public transport, traffic congestion and increasing urbanization. Express has been growing its fleet at a CAGR of 28% over the last 5 years with about 11,000 vehicles currently, and it will look to add between 1,000 and 2,000 vehicles going forward annually. The company enjoys predictable cash flow given its fixed fee scheme with its drivers with growth dependent on its expansion plans.
TPK Holding Co., Ltd.: TPK Holdings is a Taiwanese manufacturer of glass based touch panels used for small and mid-sized panel displays with over 20% revenue market share in the industry. TPK supplies such panels to top tier handset and tablet makers such as Apple, Amazon, Google, Sony and Blackberry and was the panel supplier for the very first Apple iPhone. Apple in 2014 accounted for over 30% of TPK revenues and TPK will continually benefit from panel demand from
Apple products and upgrades, such as larger panel size or new technology upgrades like ForceTouch or finger print sensors.
Premium Leisure Corp.: The company currently jointly runs an integrated gaming resort called City of Dreams Manila (CODM) with reputable casino operator Melco Crown. Opened in Feb 2015, the resort holds over 350 gaming tables and 1,680 slot machines and is the latest entrant into the Philippine gaming space. Non-gaming amenities include high end hotels, F&B outlets and over 20,000 sqm of retail space. The resort is set to benefit from the underpenetrated gaming landscape in the region catering especially to less affluent consumers which will be attracted by the lower minimum bet requirements in the Philippines. PLC is attractive as a proxy to Philippine gaming due to its unique structure whereby it does not need to bear any capex for future expansions and it is free from interest and working capital requirements.
Thank you for your investment in Janus Asia Growth Drivers Fund.
(February 2016)
Janus Asia Fund
Hiroshi Yoh, portfolio manager
Performance Summary
Janus Asia Equity Fund‘s Class I$acc Shares returned (5.86)% for the 12-month period ended December 31, 2015, while its benchmark, the MSCI All Country Asia ex-Japan Index, returned (9.17)%.
Investment Environment
Asia’s stock exchanges sold off aggressively during the latter half of 2015. Early in the year, Chinese stocks rose rapidly as the government took steps to catalyze slower-than-expected growth. For much of the post-crisis era, China has borrowed heavily to invest in assets; after a binge on infrastructure, much of the loose money has flowed into real estate and the stock market. Early in the year, investors interpreted steps taken by authorities to spur growth as a signal that the government would work hard to support both economic growth and asset prices. After reaching what was largely considered an overextended rally, shares, first in China, then across the region, fell in dramatic fashion.
In addition to slowing growth, also weighing on Asian equity performance were significant declines in currency values in U.S. dollar terms. As the market grew more expectant over the course of the year that the Federal Reserve (Fed) would raise interest rates in the U.S., the potential risk-adjusted return of holding assets denominated in emerging market currencies became less attractive. This dynamic was especially pronounced in countries and companies with high levels of U.S. dollar-denominated debt.

Fund Overviews (unaudited)
2 6 J a n u s C a p i t a l F u n d s P l c / 3 1 D e c e m b e r 2 0 1 5
Even the prospect of lower raw materials and energy prices for the region’s commodities importers was insufficient in enabling investors to see a near-term recovery in growth rates.
While growth in China continues to lag – especially by the benchmark set over the past two decades – it is not about to enter a recession, regardless of what signals the stock market sends, and some quality mainland names are trading at attractive valuation compared with global peers.
All country constituents within the benchmark generated negative returns in 2015, led by Thailand, Malaysia and Indonesia. Hong Kong, India and the Philippines fell the least. On a sector basis, energy and consumer discretionary stocks lost the most while health care was the lone sector to generate positive returns.
Performance Discussion
Within the Portfolio, relative outperformance was generated by our selection of Chinese stocks and underweights to Thailand and Malaysia. Holdings within South Korea and Taiwan weighed most on relative results. Stock selection within consumer discretionary and health care generated the most relative returns on a sector basis. The Portfolio’s industrial and materials holdings detracted from performance.
On an individual basis, a top gainer for the period was India’s PC Jeweller. The company is expanding at a pace much higher than that of the broader industry; this encompasses store openings and gold sales. The company has also introduced lower priced products and created online shopping platforms to tap into either underserved or new market segments. At the same time, PC Jeweller is selling well-known overseas luxury brands to meet demands from higher-end market segments. All of these steps have contributed to boosting top-line growth.
Another leading contributor was China’s Tencent Holding. Among other products, the company provides a word-chat SMS service that also enables sending pictures. Driving recent stock gains has been the company’s expansion efforts from China toward Singapore, Taiwan and Hong Kong. It has experienced impressive user growth, reaching 600 million. Seventy percent of revenue is from smartphone games. This channel has become especially lucrative as Tencent gets 70% of game revenue and the game supplier receives only 30%. Profitability has improved and earnings continue to grow – even from a relatively high base – due to effective monetization.
Home appliance manufacturer and distributor Qingdao Haier had a strong year. The company is reaping the benefits of its strategy of focusing on China’s rural population, which still accounts for roughly half the country. Demand for home appliances has been especially high in this segment. The market is also recognizing Qingdao Haier’s efforts in expanding operating margins by generating a greater portion of its sales online.
Korean giant Samsung detracted from performance. The company’s stock declined during the first half of the year on disappointing Galaxy smartphone sales. The leadership transition between the chairman and his son weighed on shares, as uncertainty created by the succession has yet to be fully ironed out. Sentiment toward the company improved during the last half of the year as management took steps to reverse its culture of heavy investment in capital expenditure and research and development, instead shifting toward more shareholder-friendly initiatives.
Staying in Korea, Daewoo Shipbuilding detracted from results. Lower freight rates for oil and gas tankers have weighed on the company’s stock during this recent period of weak energy prices. While there is a lull in the shipbuilding cycle, the company has a full order book for the next few years. Given its low valuation, especially on a price-to-book basis, we consider this an attractive value stock.
Gaming and hotel company Louis XIII Holding weighed on performance. While conspicuous consumption has diminished in the wake of the anti-corruption crackdown by China’s central government, the companies operating in Macau that concentrate on the VIP segment are the ones that appear most vulnerable, in our view. Louis XIII, however, focuses on the premium mass market segment, which should be more insulated from the government’s actions. That said, the company may benefit from the recent loosening of monetary policy by the People’s Bank of China, aimed at reinvigorating the economy.
Outlook
While we do see certain opportunities in Asian stocks, we expect 2016 to be no less volatile than the recently completed year. We are therefore approaching markets with an abundance of caution. Much of the negative performance in 2015 can be attributed to the significant decline in the region’s currencies. Portfolios denominated in U.S. dollars, consequently, took a beating. Portfolio returns and company earnings in local terms were not as dire. While we do expect some future currency depreciation, it is our view that most of the declines are in the rearview mirror.
Consensus calls for economic growth in China to decelerate further, a view with which we concur. Yet the evolution of the economy over the past few decades has resulted in a dynamism in which pockets will flourish as they would in other large, diversified – or diversifying – economies. Here is where fundamental stock picking is a competitive advantage. Much of our focus remains on durable themes tied to a growing and more sophisticated consumer class. Despite last year’s softness in auto sales, we continue to favor the sector. We also like Internet-related stocks. Health care and insurance continue to develop products and services that heretofore were unavailable to a growing middle class.

J a n u s C a p i t a l F u n d s P l c / 3 1 D e c e m b e r 2 0 1 5 2 7
Our outlook for the region’s industrials and materials companies is less sanguine. We expect these sectors to continue to face headwinds, especially for those companies tied closely to China’s manufacturing supply chain. Consequently, we are underweight these sectors, preferring instead consumer discretionary and financials, in which we are overweight.
On a country basis, we favor India as the Modi government makes methodical headway in administrative reforms and market liberalization. Within China, the summer’s aggressive sell-off in stocks has resulted in many high-quality companies presently trading at cheap valuations. Volatility presents opportunities to scoop these up, but we also recognize the need to maintain our sell discipline in such environments.
Thank you for your investment in Janus Asia Fund.
(February 2016)
Janus Balanced Fund
Marc Pinto, Gibson Smith, Jeremiah Buckley, Darrell Watters and Mayur Saigal, portfolio managers
Performance Summary
For the year ending December 31, 2015, the Janus Balanced Fund’s Class I$acc Shares returned 0.34% after expenses. This is compared to 1.25% for its primary benchmark, the Balanced Index, which is an internally calculated and blended benchmark of the S&P 500 Index (55%) and the Barclays U.S. Aggregate Bond Index (45%). The S&P 500 Index returned 1.38% during the same time period, while the Barclays U.S. Aggregate Bond Index returned 0.55%.
Investment Environment
The multi-year equities rally encountered turbulence during 2015. Cooling growth, weak commodities prices, a surging U.S. dollar and a shift in monetary policy were some of the factors investors had to consider.
Mid-year, a dramatic sell-off in Chinese stocks – after an equally dramatic rally – spread to developed markets, including the U.S., with several indices declining by more than 10%. Global volatility was in the minds of Federal Reserve (Fed) officials when they chose to delay raising interest rates at their September meeting. Later, improving U.S. employment data led to a consensus that rates would indeed rise by the end of the year. Monetary policy did provide one surprise when the ECB failed to meet expectations in expanding its quantitative easing (QE) program. Later in the year, markets were roiled by energy prices coming under renewed pressure, bringing back the prospect that global growth may fall short of projections.
These same factors influenced fixed income markets. The expectations of a rate increase sent the yield on the 2-year
Treasury above 1%. The yield on the 10-year, however, dipped as inflation data remained muted. Investment-grade corporate spreads widened in the spring and stayed range-bound for much of the remainder of the year. High-yield credits, on the other hand, widened considerably between June and December.
Performance Discussion
We began the period with a 39.8% weighting to equities and 59.8% to fixed income while ending the period with a 60.7% weighting to equities and 37% allocated to fixed income. The Fund, which seeks to provide more consistent returns over time by allocating across the spectrum of fixed income and equity securities, underperformed the Balanced Index during the period.
Within the equity sleeve, the Fund’s holdings in consumer discretionary and information technology detracted most from relative results. A combination of overweight positioning and security selection within health care also detracted. Security selection in materials aided relative returns, as did the Fund’s underweight to the hard-hit energy sector.
Equity detractors were led by railroad operator Union Pacific which was acutely affected by negative sentiment toward the industry. The sour mood was driven, in part, by a slowdown in U.S. industrial production on account of a strong U.S. dollar weighing on exports, and the continued weak pricing environment across a range of commodities.
Enterprise Products Partners saw shares decline on broad pressure within the energy space. This was despite the company issuing earnings in line with consensus estimates. The company announced that its CEO would be stepping down. We exited the position during the reporting period.
The stock of Valeant Pharmaceuticals sold off after politicians criticized the company for high drug prices for some of its products treating cardiac conditions. A short seller also questioned the company’s relationship with a specialty pharmacy that distributed some of its drugs. We have exited our position.
Microsoft was the top stock contributor. The stock has benefited from a re-valuation as investors begin to give the company credit for the growth of its cloud business, which is second only to Amazon, and the potential for Microsoft Office 365. We continue to believe Microsoft’s cloud business and some of its other services are underappreciated by the market.
Nike was another top contributor. The company continues to benefit from growth of its athletic apparel and footwear across the globe. Going forward we believe innovation for both its products and manufacturing processes are long-term tailwinds for Nike. We also believe that investments to create a better omnichannel sales experience position Nike well as more sales migrate online.

Fund Overviews (unaudited)
2 8 J a n u s C a p i t a l F u n d s P l c / 3 1 D e c e m b e r 2 0 1 5
Alphabet Inc. (formerly Google) was also a top contributor within the equity sleeve. Alphabet benefited from improvements in its mobile search revenue, as well as strong results for YouTube. The firm’s stock buyback announcement and the third quarter initiation of the company’s restructuring provided additional support to its shares. We have also been encouraged by Alphabet’s new CFO’s focus on reining in unnecessary spending.
Conditions in fixed income markets, in our view, continued to merit defensive positioning. Among the factors that concern us most are company actions indicative of the later stages of a credit cycle and alarmingly low market liquidity. While we aim at maximizing risk-adjusted returns, we believed that it was in our clients’ best interest to focus on capital preservation during the year, resulting in the Fund underperforming its benchmark.
Detracting most from relative performance was yield curve positioning within Treasurys. The front-end of the Treasury yield curve steepened during the period as the market anticipated an eventual interest rate hike by the Fed. While lowering Fund duration to a level below the benchmark during the year, we raised it to in line with the benchmark by the end of the period.
Also detracting from relative performance was our yield curve positioning within mortgage-backed securities (MBS). Rate volatility early in the period impacted MBS performance as mixed economic data and lack of clarity on the timing of the Fed’s initial rate hike made it difficult for investors to gauge prepayment risks on these securities. Toward the end of the period, we slightly increased our positioning in MBS.
Our out-of-benchmark allocation to high-yield corporate credit, concentrated in the highest tier of the high-yield segment, contributed to relative returns. Performance was largely generated by spread carry, a measure of excess income generated by the Fund’s holdings. Our out-of-benchmark allocations to bank loans and preferred equity also contributed to relative performance.
The credit sector that weighed most on relative performance was independent energy. After having stabilized during the first half of 2015, global energy prices resumed their downward slide through the end of the period. Also detracting was the Fund’s positioning within pharmaceuticals. During the latter part of the period, government officials called into question the pricing policies of several companies within the sector. Spread carry and security selection within banking contributed to performance. The prospect of rising rates caused many to project that banks would soon be able to generating higher operating margins.
Outlook
While valuations in some large-cap growth companies are higher after the fourth quarter and the Fed is finally raising interest
rates, we believe the backdrop for U.S. equities is still positive. While much attention has been paid to the rate hike, we believe it is important to put interest rates into perspective. Rates are still very low from a historical perspective and most economic data, especially U.S. employment levels, indicate that a gradual rate hike is warranted.
Looking across sectors, we continue to see some opportunities to add positions to our Fund. While the outlook for oil prices remains subdued and we still do not believe it is time to step in and buy energy stocks broadly, we see potential opportunities with select industrial companies that may have been overly punished for their exposure to the energy sector. We also see opportunity within the consumer discretionary sector, where companies are benefiting from improved U.S. consumer spending power at a broad level, and at the company level, select companies are also benefiting from value-creating innovation. As we head into the new year, we are looking at select apparel, lodging and luxury companies that had a tough year in 2015, but may be poised for a rebound.
With regard to fixed income, we believe that many of the clouds that hung over markets in 2015 remain with us. As such, we consider it prudent to maintain a defensive stance within our Funds. Yes, the Fed removed lingering uncertainty about whether it would raise interest rates, but the timing of future hikes is a matter of debate. It is our view that neither the economic growth nor the four 0.25% increases that the Fed projects such growth merits in 2016 will come to fruition.
While the change in nonfarm payrolls rebounded after subpar late-summer readings, and the unemployment rate, at 5%, is roughly what the Fed considers optimal, the other part of its dual mandate – inflation – remains frustratingly low. We expect the downward pressure exerted on year-over-year headline data will soon roll off, but more-resilient core data remains well below the central bank’s target of 2%.
Company developments, we believe, validate our view that we are in the later stages of the credit cycle. Shareholder-friendly activities continue and balance sheet strength has become more fleeting across a range of sectors, most notably energy. A chief concern is that much of the financial engineering that has occurred is aimed at compensating for lower revenue growth. With economic acceleration remaining elusive and rates still low, we expect management teams to continue to purchase growth, with these acquisitions often financed by debt issuance. We see less room for margin expansion, and with extended balance sheets, suboptimal results may be met with harsh market reaction. The quarter’s widening of high-yield credit spreads provides a vivid example of the simmering tension permeating markets.
Given this environment, we have minimized our exposure to the riskiest tiers of high-yield credit as we suspect the market may experience an uptick in defaults. Instead, we have focused

J a n u s C a p i t a l F u n d s P l c / 3 1 D e c e m b e r 2 0 1 5 2 9
our credit allocation on high-yield issuers with higher ratings. This segment of the market is a component of what we consider “crossover” credits and represents attractive risk-adjusted returns as disciplined balance sheet management and a commitment to generating stable cash flow may potentially lead to ratings upgrades.
Identifying such opportunities, in our view, requires bottom-up, active management. In the energy sector, for example, our research is focused on identifying management teams that can weather the volatile supply/demand environment the industry is currently experiencing. While we believe it is too early to increase our exposure to the sector, we are working to identify companies with the most attractive assets and innovative technologies that will enable them to meet their obligations regardless of the price environment. We aim to avoid companies that are a proxy for crude prices.
By utilizing our Treasury allocation, we ended the quarter with the Fund’s duration slightly above that of the benchmark. We believe that our increased exposure to longer dated Treasurys may counteract the volatility we expect risk assets to experience over the coming quarters. At the same time, our exposure to shorter dated Treasurys stands to be a source of liquidity, which may enable us to capitalize on attractive buying opportunities.
Despite the Fed’s move away from its zero-interest-rate policy, fixed income markets are no less fraught with risks. The potential price dislocations associated with illiquid markets becomes more of a threat as stretched balance sheets and low growth may lead to earnings misses and investor redemptions. We believe that security avoidance will be a central driver of performance as the asymmetric risk of holding risky credits far outweighs the potential upside. Perhaps at no other time since the economy emerged from the financial crisis have our core tenets of capital preservation and risk-adjusted returns been so essential in managing the fixed income segments of our portfolio.
Thank you for your investment in Janus Balanced Fund.
(February 2016)
Janus Emerging Markets Fund
Hiroshi Yoh and Wahid Chammas, portfolio managers
Performance Summary
For the financial year ended December 31, 2015, Janus Emerging Market Fund returned on the Class I$acc Shares (11.62)%, outperformed its benchmark, the MSCI Emerging Markets Index.
Investment Environment
Emerging market stock exchanges sold off aggressively during 2015. Early in the year, Chinese stocks rose rapidly as the
government took steps to catalyze slower-than-expected growth. For much of the post-crisis era, China has borrowed heavily to invest in assets; after a binge on infrastructure, much of the loose money has flowed into real estate and the stock market. Early in the year, investors interpreted steps taken by authorities to spur growth as a signal that the government would work hard to support both economic growth and asset prices. After reaching what was largely considered an overextended rally, shares, first in China, then across Asia, fell in dramatic fashion. Meanwhile, Latin American stocks were weighed down by subdued forecasts for their raw materials exports on account of projections for slowing global growth.
In addition to slowing growth, also weighing on emerging market performance were significant declines in currency values in U.S. dollar terms. As the market grew more expectant over the course of the year that the Federal Reserve (Fed) would raise interest rates in the U.S., the potential risk-adjusted return of holding assets denominated in emerging market currencies became less attractive. This dynamic was especially pronounced in countries and companies with high levels of U.S. dollar-denominated debt. Even the prospect of lower raw materials and energy prices for the emerging market commodities importers was insufficient in enabling investors to see a near-term recovery in growth rates. This pain was acutely felt in commodities producers such as those in Latin America. Oil producer Russia, on the other hand, was the lone benchmark constituent to register gains for the year, in part on a bounce-back from a difficult 2014.
While growth in China continues to lag – especially by the benchmark set over the past two decades – it is not about to enter a recession, regardless of what signals the stock market sends, and some quality mainland names are trading at attractive valuation compared with global peers.
Leading decliners, geographically, were not only countries in commodities-centric Latin America such as Colombia, Brazil and Peru, but also commodities importer Turkey. South Africa was among the poorer performers as were Thailand and Malaysia. All sectors within the benchmark declined, led by heavy losses in materials, utilities and telecommunications.
Performance Discussion
The Fund’s selection of Chinese and Mexican stocks contributed most to outperformance. An underweight to South Africa also aided relative results. Holdings in South Korea and Taiwan led relative detractors. On a sector basis, stock selection in consumer discretionary and financials contributed most to relative returns, while holdings within energy and industrials detracted.
On an individual basis, a top gainer for the period was India’s PC Jeweller. The company is expanding at a pace much higher than that of the broader industry; this encompasses store openings and gold sales. The company has also introduced lower priced products and created online shopping platforms to tap into

Fund Overviews (unaudited)
3 0 J a n u s C a p i t a l F u n d s P l c / 3 1 D e c e m b e r 2 0 1 5
either underserved or new market segments. At the same time, PC Jeweller is selling well-known overseas luxury brands to meet demands from higher-end market segments. All of these steps have contributed to boosting top-line growth.
Another leading contributor was China’s Tencent Holding. Among other products, the company provides a word-chat SMS service that also enables sending pictures. Driving recent stock gains has been the company’s expansion efforts from China toward Singapore, Taiwan and Hong Kong. It has experienced impressive user growth, reaching 600 million. Seventy percent of revenue is from smartphone games. This channel has become especially lucrative as Tencent gets 70% of game revenue and the game supplier receives only 30%. Profitability has improved and earnings continue to grow – even from a relatively high base – due to effective monetization.
Home appliance manufacturer and distributor Qingdao Haier had a strong year. The company is reaping the benefits of its strategy of focusing on China’s rural population, which still accounts for roughly half the country. Demand for home appliances has been especially high in this segment. The market is also recognizing Qingdao Haier’s efforts in expanding operating margins by generating a greater portion of its sales online.
Although Brazilian bank Itau performed in line with its domestic market, it underperformed the broader emerging market index given the weakness of Brazil during the period. The country’s macro backdrop continues to be a headwind for Itau. GDP is expected to contract in 2016 once again. Taxation on banks is expected to increase and nonperforming loans are projected to peak late this year. That means investors should not expect a reversal in loan-loss provisioning in the coming quarters. All of this adds up to another year of flat earnings. Management is focused on long-term initiatives, such as expanding into the Andean countries (Chile and Colombia), which should serve the business well over the time. The company also continues to emphasize prudence in its home market.
Another leading detractor for the period was Turkey’s Ulusoy Elektrik. The switch maker was adversely impacted by the macroeconomic environment within its country of domicile. Market disappointments with recent political developments, such as pressure exerted on the central bank by government officials, outweighed what should have been the positive benefits on cheap oil. Issues in Turkey’s near-abroad, such as Syria’s civil war and Iran’s nuclear negotiations, also added to bearishness. These factors overshadowed the favorable profile of Ulusoy; the company has no debt, a strong net cash position, generates a robust 20% return on invested capital, and has a sizable payout ratio. In a vote of confidence, management has been buying back stock.
Daewoo Shipbuilding detracted from results. Lower freight rates for oil and gas tankers have weighed on the company’s stock during this recent period of weak energy prices. While there is a lull in the shipbuilding cycle, the company has a full order book
for the next few years. Given its low valuation, especially on a price-to-book basis, we consider this an attractive value stock.
Outlook
While we do see certain opportunities in emerging market stocks, we expect 2016 to be no less volatile than the recently completed year. We are therefore approaching markets with an abundance of caution. Much of the negative performance in 2015 can be attributed to the significant decline in emerging market currencies. Portfolios denominated in U.S. dollars, consequently, took a beating. Portfolio returns and company earnings in local terms were not as dire. While we do expect some future currency depreciation, it is our view that most of the declines are in the rearview mirror.
Consensus calls for economic growth in China to decelerate further, a view with which we concur. Yet the evolution of the economy over the past few decades has resulted in a dynamism in which pockets will flourish as they would in other large, diversified – or diversifying – economies. Here is where fundamental stock picking is a competitive advantage. Much of our focus remains on durable themes tied to a growing and more sophisticated consumer class. Despite last year’s softness in auto sales, we continue to favor the sector. We also like Internet-related stocks. Health care and insurance continue to develop products and services that heretofore were unavailable to a growing middle class.
Our outlook for industrials and materials companies is less sanguine. We expect these sectors to continue to face headwinds, especially for those companies tied closely to China’s manufacturing supply chain. Consequently, we are underweight these sectors, preferring instead consumer discretionary and financials, in which we are overweight.
Related to this dynamic is our cautious view toward Latin America. The region’s exporters have ridden the wave of Asia’s appetite for their materials and agricultural products. Sluggish growth not only there, but also potentially in cooling developed markets, provides additional headwinds for commodities producers. Political risk within Brazil remains a wild card as the potential remains for impeachment proceedings against the president. Such steps may only prolong the addressing the need for market-oriented reforms.
On a country basis, we favor India as the Modi government makes methodical headway in administrative reforms and market liberalization. Within China, the summer’s aggressive sell-off in stocks has resulted in many high-quality companies presently trading at cheap valuations. Volatility presents opportunities to scoop these up, but we also recognize the need to maintain our sell discipline in such environments.
Thank you for your investment in Janus Emerging Markets Fund.
(February 2016)

J a n u s C a p i t a l F u n d s P l c / 3 1 D e c e m b e r 2 0 1 5 3 1
Janus Europe Fund
Wahid Chammas, portfolio manager
Performance Summary
The Janus Europe Fund returned on the Class I€acc Shares 6.40% during 2015. Its benchmark, the MSCI Europe Index, returned 8.22%.
Investment Environment
The volatility that marked the end of 2014 carried over into early 2015. Investors feared that crude oil’s precipitous slide could be a consequence of slowing global growth, rather than solely of elevated North American production. Conditions in Europe contributed to market angst as prices within the eurozone entered deflationary territory. Sentiment toward the region was also hindered by the victory of Syriza, an anti-austerity party, in Greece’s parliamentary election.
Mid-winter, European stocks regained favour upon the European Central Bank’s (ECB) announcement that it would christen its own version of quantitative easing (QE) by purchasing 60 billion euros in bonds monthly for a total exceeding 1 trillion euros. Turbulence again hit the region’s exchanges during the summer, first on a renewed session of brinksmanship between Greece and is European creditors, then on account of the global stock sell-off, which had spread from China to developed markets by August.
European stocks spent much of the fourth quarter recovering from the late-summer tumult. One catalyst was the expectation that the European Central Bank (ECB) would broaden its QE program, which could spur both inflation and aggregate demand.
Equities, however took a step back in December as the ECB’s announcement of extending its monthly asset-purchases by six months. The ensuing sell-off wiped out much of the gains European equities registered in the wake of the August market tumult. The move also reversed recent losses in the value of the euro, a development that could further complicate the ECB’s battle against disinflation.
Performance Discussion
Underperformance was largely driven by the Fund’s industrial and communications holdings. Two of the fund’s top detractors, ArcelorMittal and Glencore, were adversely impacted by lower global growth expectations, especially in previously fast-growing emerging markets. Such cooling is expected to dent the demand for materials provided by these companies, but we remain attracted to the stock specific catalysts that should enable each company to create value and come out of this viscous cycle stronger. Glencore, one of the world’s largest miners and commodities trading firms, saw its shares plummet as investors worried about its debt load accumulated over recent quarters and its ability to service it in a weakening revenue environment.
We believe these fears to be excessive, and indeed the stock has since recouped a large amount of the aforementioned losses. Its September announcement of a debt reduction planned aimed at ameliorating the leverage issues is, in our view, a good start. Management has successfully written a path toward slashing its debt by a third, augmented by a balance sheet restructuring and the sale of certain assets. We believe they will exceed expectations when monetizing their agriculture business. Our expectation is that these steps should be sufficient to achieve its debt-reduction goals and enable the company to withstand the pressures of a weak commodities cycle.
Similarly, steel producer ArcelorMittal saw shares decline in the wake of hard-landing fears in China. We still favor the stock as management makes strides in improving its balance sheet and keeping its products cost competitive. We also believe that anti-dumping initiatives aimed at Chinese steel exports to the U.S. and European Union will benefit domestic producers like ArcelorMittal, and augment their pricing power for many years to come. In our view, the stock remains mispriced.
German automaker Volkswagen saw its shares plummet in September after it admitted to manipulating emissions sensors in order meet U.S. environmental standards. A substantial portion of its market capitalization was wiped out and the events resulted in the ousting of the company’s CEO. While we expect fines to be in the offing, recall-associated write-downs to occur and a tarnished brand to weigh on sales near-term, we believe the damage to its stock is overblown. The company has a strong position in its home market of Europe as well as in China’s massive car market. While we are not adding to the position, we continue to hold the stock on account of this positioning.
Contributing to relative performance was our stock selection in health care and financials. Individually, German specialty real estate group Aroundtown Property Holdings contributed to results. It has been well-documented that German real estate has been hot for several years. Only recently, however, has the commercial segment begun to fire on all cylinders. Aroundtown’s diverse portfolio, which includes sizeable hotel, office and retail allocations, is well positioned to benefit from this growth. The relative strength of Germany’s economy should provide sufficient secular demand for the company’s developments as will their concentration in some of the most densely populated municipalities of the country.
Staying within real estate, Magnolia Bostad of Sweden performed extremely well late in the period. The Swedish real estate market has been very strong and Magnolia was finally recognized as the developer with the fastest growing pipeline of projects. During the quarter the company’s stock reached our price target and we exited the position.
Another top individual contributor was BG Group Plc. The integrated natural gas company was a strong performer following
Fund Overviews (unaudited)
3 2 J a n u s C a p i t a l F u n d s P l c / 3 1 D e c e m b e r 2 0 1 5
the much-publicised takeover approach from Royal Dutch Shell which valued the company at a hefty premium to the market cap at that time. BG’s strength in the global liquefied natural gas (LNG) business has made the company a very attractive target, in our view. We exited the position after the strong performance of the stock.
Outlook
We took the ECB’s decision in stride. While we diligently monitor macro factors that may influence the broader economic climate, we consider such developments secondary to our core responsibility of fundamental, bottom-up stock picking. The optimism we maintain is based on what we see as a fertile environment for European stocks. Several companies effectively used the crisis years to streamline their structures and raise their level of operational leverage. Now that the economy is on the path to recovery, margins are primed to expand. This is especially true in some of the economically-sensitive sectors we tend to favor. The consumer is gaining strength by the month and a euro that remains well below its average over recent years should provide a tailwind for export-oriented sectors such as automobile companies and manufacturers of capital goods. We continue to monitor slowing growth projections for the global economy, especially emerging markets, but believe that much of the opportunity for European companies is domestic. By positioning our portfolio toward companies with solid management teams focusing on free-cash-flow generation and return on invested capital, we believe that we can continue to generate positive returns for our clients regardless of the adjustments to the region’s monetary policy.
As the market once again turned south during the month’s final trading sessions, it is our view that investors are seeing fear where we don’t see it. We do not believe China is bound for financial collapse, but that the country’s deep capital reserves will enable it to weather this current contraction. Yet given the strong trading relationship between Europe and the world’s second largest economy, we are closely monitoring China’s economic growth trajectory and policy responses by authorities.
Our response to irrational markets is to hold to our time-tested discipline. In the meantime, we see buying opportunities among undervalued companies with sound fundamentals across a range of industries. As markets return to normal, our portfolio will be well positioned to benefit.
As of February 1, 2016, management of the JCF Europe Fund transitioned to George Maris. We do not anticipate a change in investment philosophy of the Janus Europe strategy. The strategy will remain a bottom-up, all-cap European equity strategy leveraging off Janus’ experienced, deep, fundamental research platform. However as the portfolio transitions over to George Maris’ management, he will bring his own style of investing to the JCF Europe Fund. Consequently, changes
may occur over time to the investment process and underlying holdings.
Thank you for your investment in Janus Europe Fund.
(February 2016)
Janus Global Life Sciences Fund
Andy Acker, portfolio manager
Fund Snapshot
We take a global approach to identify high quality or improving businesses in the life sciences sector trading at a discount to our estimate of intrinsic value. We believe the rapidly growing global health care sector offers fertile opportunities for differentiated research. We believe what sets us apart is the quality of our team, the depth of our research and our commitment to delivering superior long-term results for our clients.
Performance Summary
For the financial year ended December 31, 2015, the Janus Global Life Sciences Fund returned 6.55% on Class I$acc Shares, modestly underperforming its benchmark, the MSCI World Health Care Index, which returned 6.60%. Both were ahead of the MSCI World Index, which returned (0.87)%.
Investment Environment
Global health care stocks ended the year with gains and outperformed broader global equity indices. While the MSCI World Health Care Index was up more than 6% for the calendar year, the back half of the year was more challenging for the sector as concerns over rhetoric about drug prices created volatility. Stocks of specialty pharmaceutical companies were hit especially hard as business practices and aggressive price increases for some of the largest specialty pharmaceutical companies grabbed headlines.
Performance Discussion
Our portfolio modestly underperformed its benchmark during the period, and our stock selection in the pharmaceutical industry was the largest detractor from relative performance. Our overweight in specialty pharmaceutical companies hurt as the entire group sold off due to concerns about drug pricing, marketing practices, and financial leverage. We continue to hold several of these stocks, and feel they were overly punished during the period (with many now trading at single digit P/E multiples). Even in an environment without aggressive price increases, we feel the market is overlooking the remaining growth potential.
Horizon Pharmaceuticals, one of our leading detractors, serves as an example. We felt it was dragged down by the broad specialty pharmaceutical sell off. At recent levels, we believe the stock

J a n u s C a p i t a l F u n d s P l c / 3 1 D e c e m b e r 2 0 1 5 3 3
trades with a double-digit free cash flow yield, which overlooks the company’s more diversified revenue base of treatments for orphan diseases, which typically have lower reimbursement hurdles. We also like the management team, which has demonstrated a history of making value-accretive acquisitions.
Several holdings in biotechnology also weighed on performance. OvaScience was our largest detractor, as the company suffered from a slower-than-expected uptake for its initial product, Augment, which aims to improve the viability of eggs for women seeking to get pregnant through in vitro fertilization. While we were disappointed by the initial uptake (hurt by the need for more clinical data), we still like the potential for the product, which we believe could address an important unmet medical need. We also like the potential for the company’s pipeline, most notably for OvaPrime, which could address the large subset of women incapable of producing an egg.
Puma Biotechnology, one of our top contributors last year, was another top detractor this year. The stock fell on data it released in June about its new post-surgery breast cancer treatment that didn’t meet high expectations. We believe the stock still offers value, though our outlook has diminished somewhat. Investors were also disappointed that an expected acquisition hadn’t materialized yet, although we still think this is a possibility in the future.
While the aforementioned stocks detracted from performance, we were pleased by the results of many other companies in our portfolio. Stock selection in the biotechnology subsector was the largest driver of relative performance, aided by several announced acquisitions.
Pharmacyclics was our top contributor, and benefited from the continued strong roll-out of blood-cancer drug Imbruvica. We believed that Imbruvica was the best new treatment for leukemia, offering a well-tolerated oral therapy with better efficacy than prior standard of care chemotherapy regimens. Our estimates were far ahead of consensus expectations, and were confirmed when the company announced 2015 sales guidance of $1 billion, well ahead of analyst estimates. Pharmacyclics’ stock performance was further bolstered when AbbVie moved to acquire the company for over $20 billion, representing a greater than 100% return over a 6 month period.
Dyax was another top contributing biotech company. The stock was up after an announcement it would be acquired by Shire Pharmaceuticals. We were not surprised to see Dyax pursued as an acquisition candidate, as we believed the company had a potential best-in-class drug for hereditary angioedema (HAE). HAE is a potentially life-threatening disease in which patients live in fear of sudden attacks that can cause swelling anywhere in the body (including in the throat). We believed Shire, as the current leader in HAE treatments, was a logical partner to acquire Dyax.
Anacor was another top contributor and provides an example of how our research team’s statistical analysis of a treatment’s viability can aid in stock selection. Our analysis indicated that the company’s atopic dermatitis (eczema) treatment for children had a high probability of success in clinical trials. Despite the pullback in the biotech sector, Anacor was a strong performer when the company’s phase 3 trials reported a positive outcome.
Outlook
After several years of strong performance, the sector hit some turbulence in the second half of 2015, with renewed political pressure and concerns about drug pricing. We believe the attention paid to drug pricing may cause management teams to move more cautiously in this area, which could slow growth on the margin. While we believe that much of this is political noise rather than actionable policy, we recognize that the election is still almost a year away and such rhetoric may remain an overhang for some time.
The pullback of specialty pharmaceutical and biotechnology stocks put a dent in the recent rally of these subsectors, but we believe it hasn’t materially impacted the fundamentals for many of these companies. We have seen some indiscriminate selling, especially among small biotechnology companies, but we continue to believe the market is overreacting to concerns about price pressure for many of our holdings. In some cases, we are using volatile markets to adjust our positions based on the relative risk/reward, but with the broad sell-off we don’t anticipate major changes.
Going forward, we continue to see many positive fundamental drivers for the sector, including an acceleration of innovation and a new wave of therapies addressing unmet medical needs. In 2015 alone, there were 45 new drugs approved, the most in 19 years. Although we anticipate higher volatility going forward, with the recent pullback in prices, we believe we are finding some attractive opportunities. We remain optimistic about the long term outlook for the sector.
Thank you for your investment in Janus Global Life Sciences Fund.
(February 2016)
Janus Global Research Fund
Research Team led by Carmel Wellso, portfolio manager
Performance Summary
For the financial year ended December 31, 2015, Janus Global Research Fund’s Class I$acc Shares underperformed its primary benchmark, the MSCI World Index, returning (2.88)% for the Class I$acc Shares and (0.87)% for the Index.

Fund Overviews (unaudited)
3 4 J a n u s C a p i t a l F u n d s P l c / 3 1 D e c e m b e r 2 0 1 5
Investment Environment
The multi-year equities rally encountered significant turbulence during 2015. Cooling growth, weak commodities prices, a surging U.S. dollar and a shift in monetary policy were some of the factors investors had to consider when valuing stock portfolios. Volatility began early with the slide in crude prices being considered a potential harbinger for sagging demand rather than solely a consequence of overproduction. A series of uninspiring U.S. economic data also weighed on sentiment, as did disinflation in Europe and the victory of an anti-austerity party in Greek elections. Markets received a boost when the European Central Bank (ECB) announced its version of quantitative easing (QE). The move not only propelled European stocks higher, it sent short-term yields on the region’s government debt into negative territory and caused a surge in the dollar. The latter development put downward pressure on emerging market currencies and raised the prospect that U.S. corporate earnings could suffer.
Mid-year, efforts in China to catalyze slowing growth caused mainland shares to go on a tear, far outpacing emerging market peers. But nearly as quickly, gains violently reversed. Not only did Chinese indices enter into bear-market territory, but other regional benchmarks, and those of commodities producers, experienced corrections. Eventually the souring mood spread to developed markets with several declining by more than 10%.
Global volatility was in the minds of Federal Reserve (Fed) officials when they chose to delay raising interest rates at their September meeting. Later, improving U.S. employment data led to a consensus that rates would indeed rise by the end of the year. Monetary policy did provide one surprise when the ECB failed to meet expectations in expanding its QE program. Markets were also roiled late year by energy prices coming under renewed pressure, bringing back the prospect that global growth may fall short of projections.
Performance Discussion
The Fund’s industrial and consumer holdings weighed the most on relative performance. Railroad names, in general, were pressured during the period. Weekly carload volumes during the latter part of the year decelerated significantly, causing analysts to cut revenue forecasts. Two factors behind the decline were a slowdown in U.S. industrial production on account of a strong U.S. dollar weighing on exports, and the continued weak pricing environment across a range of commodities, including energy, agriculture and base metals. Railroad operator Canadian Pacific (CP) was among those affected. Although CP announced third-quarter results that slightly beat consensus estimates on both revenue and earnings, volumes of crude and metals were down by over 15%. Earnings were driven instead by strong automobile volumes and additional cost savings. Still, the hint by management about a potential decrease in shipping prices for energy products fell flat with investors. The other story was
CP’s takeover offer for U.S. railroad operator Norfolk Southern, which turned contentious. CP management presented a range of potential structures contingent upon regulatory approval, and stated it was willing to take the issue all the way to Norfolk Southern shareholders.
Also detracting from performance was Anadarko Petroleum. Energy prices continued to slide on concerns of slowing global growth prospects, especially in previously strong-performing emerging markets. The continued rise in U.S. crude oil inventories also weighed on the sector. In the fourth quarter, Anadarko’s overtures regarding a potential merger were spurned by Apache Oil.
MarkWest Energy Partners was another detractor. The master limited partnership (MLP) gathers and processes natural gas and also transports and stores natural gas liquids (NGLs). We appreciate that its assets are focused on the prolific Marcellus (mostly in West Virginia and Pennsylvania) and Utica (northeastern U.S. and adjacent parts of Canada) shale development areas and feel that it has a superior capital structure. Weakness in North American energy markets weighed on the sector during the year. Ultimately the company was merged with MPLX, in which we maintain a position.
Contributing most to relative performance on a sector basis was our selection of financial and technology stocks. The class-C stock of Alphabet Inc. (formerly Google) was one of the Fund’s top contributors to performance. Alphabet’s share price benefited from better than expected third-quarter earnings results, as well as from the company’s restructuring, which was initiated in the third quarter. The restructuring, which involved the creation of the Alphabet holding company that now owns Google and several other businesses, has resulted in greater accounting transparency, making it easier to value each of the company’s entities. Alphabet’s earnings growth was driven by improvements in its mobile search revenue, as well as its YouTube and programmatic businesses. The firm recently announced a significant stock buyback program, providing additional support to its shares.
Pharmacyclics was the leading individual contributor. This commercial-stage biotechnology company is focused on discovering and developing innovative small-molecule drugs for the treatment of cancer and immune-mediated diseases. The company’s stock surged in January on a consensus-beating report as well as upbeat guidance for its lead blood-cancer drug, Imbruvica. It was then announced that AbbVie would acquire the company for $21 billion, validating our view of Imbruvica’s vast commercial potential for the treatment of leukemia, lymphoma and other potential cancers.
Late in the year, shares in Keyence recovered nearly all of the losses experienced during a late summer swoon. We have long been attracted to Keyence’s unique business model of direct sales for its sensors and automation products as it tends to deliver impressive returns on invested capital (ROIC). Much of the late-

J a n u s C a p i t a l F u n d s P l c / 3 1 D e c e m b e r 2 0 1 5 3 5
year gains can be attributed to investors recognizing that – due to multiple compression – valuations dipped to what in our view are quite attractive levels. Further adding to the stock’s allure was the strong cash position on the company’s balance sheet, which could potentially be returned to shareholders.
Outlook
What was good is now bad, what worried us is now all right, and signals of strength are warning lights. What is the year coming to? And where will 2016 take us?
Investors can be forgiven for not knowing which way is up as we pull out of 2015. The low oil price that was a boon to the U.S. consumer is now so low that markets are spooked. The Fed is raising rates, but, once anticipated as a sign of economic strength, some now see liftoff as negative for the equity markets.
It is not whether the glass is half full or half empty. It is that there are two glasses. There’s an abundance of conflicting economic data but nowhere is the contrast as stark as in the varying directions of the consumer and industrial sectors. Man versus machine. Earlier this year, in America, falling oil was seen as a boon to the consumer. We are seeing signs that the consumer is using the savings from the pump to increase spending. Retail sales are holding up and consumer activity is fairly strong.
Unfortunately, the U.S. industrial sector is suffering. China, the dollar and especially lower oil field investment are hurting the sector, even for companies without large direct energy exposures. Competitors with oil exposure, it seems, are turning to other market segments to generate cash and gain share. If the U.S. industrial sector is not in recession, it is close. Economic measures and our own company discussions lead us to draw the conclusion that this is indeed the case. Industrial and material stocks were the most likely to disappoint in fourth quarter results.
The question for U.S. markets, however, is whether the slowdown will transfer to the consumer and ultimately to the equity markets. The consumer is standing on a platform that could prove to be fragile if an economic turndown saps confidence. The Fed could help with a slow pace of rate increases but its power is limited from here.
In the consumer versus industrial war, the largest battlefield is in China. So far, we see that the consumer is holding up despite weakness on the manufacturing side. The Chinese government is trying to help, with measures promoting consumer purchases. The recent pickup in auto sales shows some success.
The weak industrial sector is just one concern, however. The junk bond market also is worrying investors. Spreads are blowing out, liquidity is scarce, and the market is under pressure. If an investor recalls 2007, the concern is understandable. Fixed income market turmoil was the canary in the coal mine in the financial crisis. There are differences, however, including that the weakness in high
yield today comes from energy and not from financials. Corporate and household balance sheets are far healthier than in 2007.
Adjusting for the outperformance of a narrow group of stocks and for the different energy weights in the S&P 500 and the high-yield index, the two indices have fallen about the same amount this quarter. In other words, equities to some extent are already reflecting the high-yield market.
Investors, still looking for canaries however, can consider commodities. Often commodities signal a bear market for equities but commodities have been weak for three years and equities are holding up. For the last five years, China represented more than 50% of the demand for many commodities and producers expanded to accommodate what was seen as always expanding appetite. Commodities are suffering now but the signal may be more about prior over-optimism in the sector than about equity markets.
The push-me, pull-you markets of the fourth quarter reflect the risks and opportunities investors are weighing and the return of volatility after a period of doldrums.
In the end, we think the opportunities matter more. With U.S. markets, as measured by the S&P 500 Index, at a forward price-earnings ratio of 16 – and shares cheaper in Europe in most cases – we don’t think markets are stretched. China and Japan too offer stock-picking chances. While the market may offer modest earnings growth (more if you take out industrials and energy), the range of outcomes should be wide, making the stock markets around the world fertile ground for fundamental analysis. Earnings growth and strong balance sheets will likely be rewarded.
Man versus machine makes for good movies but we do not think the theme will hold the attention of markets much into 2016. We expect to see encouraging signs from the consumer and moderating pain in the industrial sector, especially if our base case holds true that China is resilient and that oil eventually moves higher.
If that is where 2016 takes us, the canaries will be fine.
Thank you for your investment in Janus Global Research Fund.
(February 2016)
Janus Global Technology Fund
Brad Slingerlend and Brinton Johns, portfolio managers
Performance Overview
For the financial year ended December 31, 2015, Janus Global Technology Fund’s Class I$acc Shares returned 2.54% , outperforming its primary benchmark, the MSCI World Information Technology Index, and its secondary benchmark, the S&P 500 Index.

Fund Overviews (unaudited)
3 6 J a n u s C a p i t a l F u n d s P l c / 3 1 D e c e m b e r 2 0 1 5
Investment Environment
Technology stocks outperformed broader global equity markets and the MSCI All Country World Information Technology Index notched modest gains during the year. The home entertainment software, Internet software and services and application software subsectors had the highest returns, while the semiconductor equipment, communications equipment and tech hardware, storage and peripherals subsectors had the biggest losses during the year.
Portfolio Manager Comments
Our portfolio outperformed both its primary and secondary benchmarks during the period. Our stock selection in the Internet Retail and Semiconductor subsectors were the largest contributors to relative performance. Our holdings in the systems software and Internet software and services categories detracted the most from relative results.
On an absolute basis, Alphabet, the holding company of Google and several other businesses owned or tied to Google, was our largest contributor. Strong earnings results have helped drive stock for Alphabet during the year. The market has also been encouraged by the new CFO’s focus on expense discipline, and the announcement to restructure Google under Alphabet Inc. and separately report the revenue and profitability of its core search, YouTube, apps and display businesses from its newer noncore ventures. The increased disclosure is positive and will help investors be better able to accurately value the businesses held in the portfolio.
Facebook was another top contributor. Stronger than expected earnings growth has driven the stock, demonstrating that the company is quickly becoming a dominant mobile advertising platform. We remain confident in the company’s ability to maintain a high rate of growth in the months ahead.
Netflix was another top contributor. The stock rose after beating estimates on member growth and margins earlier in the year. Subscription expansion has remained positive in the U.S., if slowing, and international subscriber growth has been offsetting slower growth in the more mature U.S. market. We continue to like the potential for Netflix. The company has now reached a size where creating original content can be more cost-efficient than simply purchasing distribution rights. Coupled with its extensive data about subscribers’ viewing habits, it has built a powerful ability to deliver profitable, targeted entertainment.
While pleased with the performance of most companies in our portfolio, we still held some companies that produced disappointing results. Oracle Corp. was our largest detractor. The company has continued to lose share in its application market, and its transition to the company’s cloud products has
gone slower than expected. Those issues have weighed on the stock this year, and are reasons we trimmed the position during the period.
Belden was our also a large detractor. Belden’s stock fell in the third quarter, following management’s announcement of weaker than expected earnings due in part to a decline in demand from its industrial customers, and also due to weaker demand for high-end video equipment the company sells to the broadcasting industry. We view the softness as temporary. We like connector and component suppliers such as Belden. These are attractive end markets that are growing content in a number of industrial products. We continue to be strong supporters of the firm’s management team, which has proven to be a strong capital allocator.
Barracuda Networks was another detractor. Barracuda Networks was another detractor. The provider of network tools and software for small and medium sized businesses reported disappointing results stemming from a restructuring of their go to market strategy and sales channel. After assessing weakening trends in their business we exited the position.
Outlook
Looking ahead, we remain optimistic about several secular themes unfolding in the technology sector. Perhaps the most exciting of these is the shift by enterprises from hardware, servers and on-premises data centers to the cloud. Security concerns about on-premises data centers and the quick adoption of Microsoft Office 365, which is critical to so many business functions, is hastening cloud adoption of many IT functions.
At the same time, many large legacy tech companies tethered to desktop computing or enterprise hardware face rapidly slowing growth prospects as these businesses are displaced by the cloud and software as a service models. These companies, which make up large weightings in our benchmark indices, trade at high valuations due to the perceived safety of large cash reserves on their balance sheets or high dividend payments. We believe risk for these companies is underpriced as profit pools begin to erode for these companies.
We have actively positioned our portfolio to be overweight many of the cloud and software-as-a-service companies we think are poised to take share of enterprise IT spending over the next decade, and are significantly underweight many legacy tech companies that serve shrinking end markets. We believe this positioning will prove beneficial as IT spending continues to transform in 2016.
Thank you for your investment in Janus Global Technology Fund.
(February 2016)

J a n u s C a p i t a l F u n d s P l c / 3 1 D e c e m b e r 2 0 1 5 3 7
Janus Japan Emerging Opportunities Fund
DIAM Asset Management, portfolio manager
For the period ended 31 December 2015, Janus Japan Emerging Opportunities Fund, as reflected by the Fund’s Class I$acc Hedged Shares, returned 16.95% as compared to its benchmark, the TOPIX Index, which returned 11.69%.
Investment Environment
The TOPIX Total Return index climbed 12.06% on the year, supported by robust corporate earnings and the low interest rate environment. Volatility of the index increased after it recorded its year high in August due to the external environment turmoil such as the slowdown of China’s economy, financial market rout in China, plunging commodities prices especially crude oil price and the Greek fiscal situation. Concerns around the timing of a US interest rate hike and its impact on financial markets lingered throughout the year and influenced investor sentiment.
Performance Discussion
Defensive sectors such as Insurance and Pharmaceuticals made large positive contributions while sectors driven by the commodity markets such as Iron & Steel and Metal Products made negative contributions.
Amongst the Services sector, Nihon M&A Center and Cookpad stock prices rallied on the back of strong earnings.
Amongst the Machinery sector, DMG Mori and Kato Works stocks declined on slower order momentum due to the weak demand from automobile and construction machines industries in China. Amongst the Iron & Steel sector, Hitachi Metals declined amid slower metal demand for automobiles.
Amid the deteriorating external environment, we kept our high exposures to stocks with strong earnings momentum in sectors such as Service and Information & Communication, while we made switches among export sectors such as Electric Appliances and Machinery based on earnings outlook.
Outlook
Oil price declines and associated credit market turmoil may cause volatility in near-term stock markets. We expect neither a near-term recovery nor a crash of China and other emerging economies. We expect the stock market to trade range-bound as long as pessimism does not spread across markets further.
Risks to our scenario are China’s economic slowdown, emergence of geopolitical risks, such as those in the Middle East, Ukraine and Spratly islands and the appreciation of the Japanese yen.
We will continue to closely monitor external environment such as politics, financial policies, currency and commodity markets, economic indicators, interest rates and emerging market developments as well as earnings outlook of Japanese companies this year and next year in evaluating earnings and valuation of each stock selection.
Considering the uncertain economic outlook, we will keep our overweight position in the Services and Precision Equipment sectors, the latter around medical equipment. We will keep our neutral position in external demand sectors such as Electric Appliances and Transportation Equipment with selective investments to companies with advanced technologies. We will trim our underweight position in relatively defensive sectors such as Construction, Electricity and Transportation through additions to blue chips in the sectors.
We will actively change sector allocations in case of heightened risk-averse movements as a result of turmoil in currency and oil markets after the US interest rate hike starts.
We will increase stable growth stocks in Services and Healthcare sectors whilst limiting the number of stocks in Electronics and Machinery to neutralize cyclical growth exposure.
We will continue active research on high growth internet-related stocks listed on emerging stock markets.
Top Contributors & Detractors
Contributors
Nihon M&A Center Inc.: The stock rose favoring strong earnings momentum and growing number of M&As. The company has a strong network in regional banks and accountants amid growing demand of succession planning among aging managements of small and medium size entities.
Shionogi&Co., Ltd.: The stock performed well on the back of strong sales of anti-HIV drug and research and development of candidate drugs in infection and pain areas.
GMO Payment Gateway Inc.: Growing fee revenue on the back of increases in credit settlements and a new partnership with domestic mega financial institution prompted further business expansion.
Cookpad Inc.: News report that the company will supply gourmet service contents to NTT Docomo spurred a stock price rally.
Asahi Intecc Co., Ltd.: The stock rose as technological advantage of the company became well recognized by the market and global sales of its medical tools such as guide-wires for heart surgery were growing fast.
Fund Overviews (unaudited)
3 8 J a n u s C a p i t a l F u n d s P l c / 3 1 D e c e m b e r 2 0 1 5
Detractors
Sanken Electric: Sluggish semiconductor demand for air-conditioners and electric appliances due to the slow down in emerging economies.
OMRON Corporation: While the control equipment business, its mainstream business, benefitted from active labor saving investments, the slump in peripheral business such as backlights for smartphones, dragged down overall earnings to below market expectation.
DMG MORI: Concerns emerged on slowing demand for tool machinery from the automobile industry.
Hitachi Metal, Ltd.: Slower demand for automobile metal plates and slowing capital expenditure by domestic mobile carriers spurred concern on earnings.
Unicharm Corporation: Indonesia market, where the company has dominant market share, saw new entrants and slow sales as well as decelerating sales in China prompted stock price decline.
Thank you for your investm ent in Janus Japan Emerging Opportunities Fund.
(February 2016)
Janus Japan Fund
DIAM Asset Management, portfolio manager
For the period ended 31 December 2015, Janus Japan Fund, as reflected by the Fund’s Class I$acc Hedged Shares, returned 12.55% as compared to its benchmark, the TOPIX Index, which returned 11.69%.
Investment Environment
The stock market surged in the first half of the year favouring ECB monetary easing, bottoming out oil prices, ceasefire between Russia and Ukraine, extension of financial aid to Greece and observations of large Japanese pension funds buying Japanese stocks. After the summer, the stock market plunged to levels seen at the beginning of the year on deepening concern over emerging economies, especially China, and uncertainties over a US interest hike before rebounding towards the financial year end as the concerns receded. The TOPIX rose nearly 10% for the year.
Performance Discussion
The portfolio adopted and invested in “Abenomics”, “Internet of Things” and “Domestic Demand Recovery” as investment themes. Throughout the year, the portfolio kept its large overweight positions in Precision, Pharmaceutical and Service sectors as key beneficiaries of growth strategies of Abenomics.
The portfolio, however, reduced exposure to Electric Appliances, which we consider a long term growth sector, due to mounting uncertainties overseas and higher exchange rate risk. The portfolio increased exposure to the Retail sector on the private consumption recovery but postponed its decision on capital expenditure stocks over the slow recovery of relevant indicators.
The portfolio outperformed the benchmark TOPIX by +320bp with +70bp attributed to sector allocation and +250bp to Stock Selection. Small-mid cap growth stocks among Precision Instrument, Information & Communication and Pharmaceutical sectors the portfolio invested in as part of the Abenomics growth strategy made positive contributions. Detractors were Machinery stocks the portfolio invested in on expectations of a capital expenditure recovery and Land Transportation which the portfolio was underweight on due to its limited growth potential.
Outlook
This year is an election year for both the US and Japan. We believe the Japanese government would like to avoid volatile market conditions and an economic slowdown, at least, during the first half of the year and will implement policy measures when such risks arise. On the other hand, uncertainties over China’s stock market, volatile movements of oil prices and the US stock market after the interest rate hike will likely weigh on Japanese stocks as well. As such, we believe the upside of the Japanese stock market will be capped for the time being. We expect the market to be driven by individual stocks this year and believe there are plenty of investment opportunities in growth stocks, in particular, areas such as self-driving cars, robotics, artificial intelligence technology and bio-ventures. Later this year, we expect Japanese stocks to enter another uptrend on the back of relatively good fundamentals of Japan and progress of the Abenomics growth strategies.
Top Contributors & Detractors
Contributors
1. FFRI
FFRI is a cyber-security software company and offers virus detection engine with heuristic search technology that detects and protect from viruses with new patterns. We like this cutting edge technology and invest in the company. The stock rallied after a massive personal data leak from the Japan Pension Service. We like the company’s high growth potential as cyber-security becomes more and more important and continue to hold the stock in the portfolio.
2. Sosei Group
Sosei Group is a biopharmaceutical venture with major therapeutic drug in chronic obstructive pulmonary diseases. The company acquired UK biopharmaceutical company

J a n u s C a p i t a l F u n d s P l c / 3 1 D e c e m b e r 2 0 1 5 3 9
Heptares to grow as a source of profit growth in the future. In June, the share price shot up after the company indicated its next quarter profit would grow substantially. In the second half, the stock climbed as investors favoured the new drug development pipeline from Heptares.
3. GMO Payment Gateway
GMO Payment Gateway is a leading online settlement service provider for rapidly expanding e-commerce. We invest in the company for its long term high growth potential. The stock price surged favoring sell-side recommendations and on expectations for business expansion through an alliance with a mega bank. We like the favorable earnings outlook and growth potential of the company and will keep our investment position.
4. Asahi Intecc
Asahi Intecc manufactures medical and industrial-use stainless wire rope and is the domestic market leader in circulatory organ-related Percutaneous Transluminal Coronary Angioplasty (PTCA) guide-wires. The company is highly esteemed for its product development capability and technology. PTCA guide-wires sales are growing very fast overseas through Abbott Laboratories, its exclusive distributor in US and European markets. The company is setting up PTCA guide-wire direct sales channels in other parts of the world. New product launch and sales of catheter will be another earnings growth driver. Strong quarterly earnings release has raised long term growth expectation and share price this year.
5. Kaken Pharmaceutical
We took a position in this stock in anticipation of rapid growth from sale of Clenafin, a new drug for onychomycosis treatment. The company announced faster than anticipated sales of the drug and growing earnings at its quarterly earnings release, prompting expectation for upward earnings revision for the full year and stock price rally. We sold off the stock judging the stock price has been fully discounted due to its high growth potential from the new drug.
Detractors
1. Sun Corp
Sun Corp is rapidly expanding sales of mobile data transfer products to mobile carriers and mobile phone shops overseas especially in North America and expanding scope of business rapidly by offering mobile forensics solution for criminal intelligence. The stock declined after the company reduced earnings guidance due to the delay in new business start-up and the initial start-up cost. We like the company’s new business and appreciate its growth potential. We continue to invest in the stock.
2. FINDEX
FINDEX develops medical systems and is rapidly growing earnings with over a 60% market share among national university hospitals. The stock price declined amid short term sluggish earnings this year. We expect the company to grow its business through the expansion of its reach to hospitals affiliated with national university hospitals and non-hospital business entities. We continue to invest in this stock.
3. Leopalace21
Leopalace21 constructs and subleases apartments for singles. It benefitted from the recent recovery in the property market and improved earnings rapidly. We invest in the company expecting it to benefit from the Bank of Japan’s easy monetary policy to end deflation and increase of foreign national residents to drive its growth. The stock declined during the quarter on profit taking and slowdown in construction order intakes. We believe in the growth potential of the stock and will keep our position in the stock.
4. Toshiba
Toshiba is the second largest general electric appliances manufacturer with its main business in social infrastructure and semiconductors expanding different businesses such as healthcare and storages leveraging on its technological advantages. We liked the company’s rapidly growing and highly profitable NAND flash business and its positioning as the leading social infrastructure company that will play an important role in future government energy policies. However, the stock price plunged after inappropriate accounting practices over the last few years became public and destroyed investor confidence on past reported earnings. We sold-off all shares in the company as it was uncertain the extent of inappropriate accounting practices and the stock was placed under supervisory post that could result in delisting.
5. Kobe Steel
Kobe Steel is a steel maker with a diversified business portfolio such as aluminum and construction machinery. We think the company has growing business opportunities in its aluminum welding technology to reduce vehicle weight and power generation capabilities that will contribute to earnings once electric power market liberalization begins. However, the stock declined as the company announced modest earnings guidance that was below expectation and the steel market deteriorated. We continue to invest in the stock as we believe the growth potential in aluminum welding business that will reduce vehicle weight and electric power generation business amid electric power liberalization.
Thank you for your investment in Janus Japan Fund.
(February 2016)

Fund Overviews (unaudited)
4 0 J a n u s C a p i t a l F u n d s P l c / 3 1 D e c e m b e r 2 0 1 5
Janus Opportunistic Alpha Fund
Daniel Kozlowski and Andy Summers, portfolio managers
For the financial year ended December 31, 2015, the Janus Opportunistic Alpha Fund underperformed its benchmark, the S&P 500 Index, returning (7.87)% on Class I$acc Shares v ersus 1.38% for the Index. Our holdings in the industrial and consumer discretionary sectors were the largest detractors from relative performance. Our underweight to the energy sector and stock selection in the financial sector contributed to relative results.
Investment Environment
The S&P 500 Index ended the year with modest gains. A low interest rate environment and signs of a strengthening U.S. economy helped lift stocks in the first half of the year. Stocks sold off toward the end of the second quarter due to concerns that Greece might exit the eurozone. Concerns about slowing global growth, particularly in emerging markets, and a weakening energy sector weighed on stocks in the second half of the year. Large cap stocks outperformed small caps during 2015. At the sector level, the consumer staples and consumer discretionary sectors enjoyed the highest returns within the Russell 1000 Growth Index. The energy sector suffered steep losses.
Investment Process
We approach U.S. equities with a contrarian investment philosophy. We typically seek companies in our Fund that are undergoing a structural change in their business or industry that has gone unrecognized by the market, but that we believe should positively reshape the company’s destiny, and stock performance, over time. These stocks are generally out of favor with investors, but if we correctly identify the changing dynamics at work within these companies or industries, the stocks in our portfolio have the potential to move from being out of favor to in favor as the company executes its turnaround. Our long-term performance ultimately should be driven by our ability to correctly identify companies that are early in the process of undergoing dramatic changes.
The past year has not been an ideal backdrop for our performance as the market has tended to favor companies with higher, near-term growth prospects. Given our contrarian investment mandate, we tend to have a value-bias in our portfolio, and low valuations have provided little support for stocks that have any short-term headwinds or negative sentiment around them. That said, as contrarian investors, we are structured to withstand a negative consensus argument against the companies we hold, and we continue to have a high degree of conviction in the majority of those companies that were large detractors.
Knowles Corporation was one of those detractors we still have strong conviction in. The company is a global supplier of
micro-acoustics used in smartphones, hearing aids and other applications. We bought the position after the company was spun out of Dover, which we felt would give management more control over its own destiny. The company’s share price has suffered from declining smartphone sales during the period, including sales of the Apple iPhone 6s, for which Knowles is a significant supplier. In addition, Knowles’ acquisition of Audience Inc. earlier this year has not produced expected results. We continue to hold our shares due to the stock’s attractive valuation, its position as a major supplier to Apple, and its dominance in the hearing aid market, which is poised to grow strongly in 2016 and beyond.
Lands’ End was another detractor. Stock for the clothing company was down sharply in the second quarter of the year, after the company reported disappointing first quarter earnings. There was also a negative halo surrounding the company due to its association with Sears, the company Lands’ End was spun out from. In reality, we believe the companies couldn’t be more different. Sears and other large retailers have been hurt by the migration toward mobile and online shopping. Lands’ End is actually incredibly well positioned for this change, as the company has very few lease obligations and derives the vast majority of its sales online. Another reason we hold the stock is that we believe a new CEO, who understands merchandising and branding quite well, will help improve the company’s image.
Mallinckrodt Pharmaceuticals was also a large detractor. The stock was down in the third quarter after the company lowered revenue forecasts for a key product, Acthar. We remain positive on the company. A spin-off from Covidien has given the management team flexibility to dictate the strategy and incentive structure at the company. Since that time, Mallinckrodt has trimmed costs and made strategic acquisitions that have improved the firm’s product profile. We believe the company will remain a strong consolidator within the specialty pharmaceutical industry, or could be a potential acquisition target. We also don’t expect the drug competing with Acthar to be able to come to market in the near term.
While the aforementioned companies weighed on performance, we were pleased with the results of other companies in the portfolio. Eagle Pharmaceuticals was our top contributor. The specialty pharmaceutical company focuses on improving formulations of existing hospital administered drugs. These improved formulations make the intake of the drug easier or faster for the patient. Many of the drugs under development by Eagle address rare orphan diseases, and command significant pricing power. The stock has risen in response to several potential catalysts on the horizon for the company in the coming months. We believe the value of the company’s product pipeline remains underappreciated, particularly the potential of a licensing agreement with Teva Pharmaceuticals for a new formulation to treat chronic lymphocytic leukemia (CLL) and non-Hodgkin lymphoma (NHL).

J a n u s C a p i t a l F u n d s P l c / 3 1 D e c e m b e r 2 0 1 5 4 1
Xenoport was another contributor. We believe a new CEO at the company will rightsize its cost structure and put more focus on its commercial asset, Horizant, a drug used to treat Restless Leg Syndrome and pain associated with Shingles.
Herbalife was also a large contributor to the Fund’s performance. The company sells its weight management and nutritional supplements through a network of independent resellers. The stock has drawn considerable interest from short sellers, who have tried to illegitimize the business, pointing to the failure rate of many of these independent resellers and claiming the company is making more money by recruiting new distributors than it does from product sales. Our thesis has been that the failure rate of these independent sellers is not that different from most small businesses, and that the company sells a viable product with a legitimate path to earnings growth. The stock has risen as the company has put up better results and the short case for the company has unwound.
Outlook
While disappointed with our recent performance, little has changed in terms of our conviction in the companies we hold. Our strategy has always been to invest in companies where we see change taking place that will lead to a meaningful impact on profitability a year or two in the future. We seek to be early in identifying those underlying changes, which means many of our holdings trade at lower valuations. In recent months, those low valuations have provided little support for some of our stocks as the market waits to see results that prove a positive change is underway. For many of our holdings, we have seen companies announce large share buybacks or management teams report insider buying, which points to their own confidence in the underlying improvements about to take shape for their companies. We look forward to seeing how these changes play out in 2016.
Thank you for your investment in Janus Opportunistic Alpha Fund.
(February 2016)
Janus US Fund
Barney Wilson, portfolio manager
Investment Philosophy
We believe that buying high-quality growth franchises with sustainable, projected above-average earnings growth for the next five-plus years and a market leadership position driven by a clearly articulated strategy should allow us to outperform the benchmark and peers over the long term. We perform in-depth, fundamental research to build a diversified, moderately positioned portfolio aiming to deliver peer and index-beating returns while managing for risk and volatility.
Performance Overview
The Janus U.S. Fund‘s Class I$acc Shares underperformed its benchmark, the Russell 1000 Growth Index, for the 12 months ended December 31, 2015, returning 4.36% versus 5.67% for the Index. Our holdings in the industrial and energy sectors detracted from relative performance. Stock selection in the technology and health care sectors contributed to relative results.
Investment Environment
Large cap growth equities ended the year with gains. A low interest rate environment and signs of a strengthening U.S. economy helped lift stocks in the first half of the year. Stocks sold off toward the end of the second quarter due to concerns that Greece might exit the eurozone. Concerns about slowing global growth, particularly in emerging markets, and a weakening energy sector weighed on stocks in the second half of the year. Large cap stocks outperformed small caps during 2015. At the sector level, the consumer staples and consumer discretionary sectors enjoyed the highest returns within the Russell 1000 Growth Index. The energy sector suffered steep losses.
Performance Discussion
The Portfolio underperformed its primary benchmark, the Russell 1000 Growth Index, returning on Class I$acc 4.36%. As part of our investment process, we seek companies with clearly definable and sustainable long-term growth drivers. These companies often have a high barrier to entry, a notable competitive edge in an attractive, growing industry, or a strong management team with a clear vision for the future of their company. We believe that over a long time horizon, a collection of companies with these competitive advantages should lead to compounded growth in excess of the market.
Our stock selection in the industrial sector detracted from relative results. Two companies, Canadian Pacific and Colfax, were among the Fund’s largest detractors. Softer rail volumes due to a weaker commodity market have impacted all rail companies, and Canadian Pacific was not immune to the slowdown. However, we continue to have a high level of conviction in the long-term potential of the company. We believe Canadian Pacific’s railroad network across Canada and the U.S. is a valuable asset that would be nearly impossible for other transportation and logistics companies to replicate. Going forward, we believe Canadian Pacific can continue to grow revenues and railroad volumes as it improves execution around its railroad network. The company has made substantial investments to improve its service and reliability to customers, which should drive more shippers to use Canadian Pacific instead of other options.
Colfax, a diversified manufacturing and engineering company, was negatively impacted by weak demand from emerging

Fund Overviews (unaudited)
4 2 J a n u s C a p i t a l F u n d s P l c / 3 1 D e c e m b e r 2 0 1 5
markets and also for end markets tied to the company’s welding business. We sold the position due to concerns those headwinds will last longer than expected.
We also had some holdings outside the industrial sector that were large detractors from performance. Chipotle Mexican Grill was our largest detractor. News about food-related illnesses at its stores created headwinds for the company toward the end of the year. However, we continue to like the stock and believe that, in time, the company will be able to re-establish its reputation for food integrity. Over the long term, we believe Chipotle is well positioned to benefit from rising demand for healthier fast food. We also like the potential for two of Chipotle’s new food concepts, ShopHouse Southeast Asian Kitchen and Pizzeria Locale.
Strong stock selection in the technology sector was a large contributor to relative performance. We have exposure to some of the companies we believe will be large beneficiaries of a migration in advertising spending from traditional to digital media. Some of these companies, Alphabet Inc. and Facebook, were among our top contributors to performance. Strong earnings results have helped drive stock for Alphabet, the holding company of Google and several other businesses owned or tied to Google, during the year. The market has also been encouraged by the new CFO’s focus on expense discipline, and the announcement to restructure Google under Alphabet Inc. and separately report the revenue and profitability of its core search, YouTube, apps and display businesses from its newer noncore ventures. The increased disclosure is positive and will help investors be better able to accurately value the businesses held in the portfolio.
Stronger than expected earnings growth has also helped drive Facebook’s stock during the year, demonstrating that the company is quickly becoming a dominant mobile advertising platform. We remain confident in the company’s ability to maintain a high rate of growth in the months ahead.
Strong stock selection in the health care sector was also a meaningful driver of relative outperformance. We own a number of biotech companies with breakthrough therapies addressing highly unmet medical needs, and these companies were among our top contributors to the Fund’s performance. Pharmacyclics was our top contributor within the sector. The stock was up significantly this quarter after it was announced that AbbVie had won a bidding war to acquire the company. The high interest Pharmacyclics received from other companies validated our view that its blood cancer treatments offer significant growth potential.
Outlook
Heading into 2016, we like the potential for U.S. large-cap stocks relative to other equities. We see a number of secular growth trends that are likely to push forward next year independent
of the global economy, and U.S. large cap companies are at the forefront of many of these changes. Cloud computing is quickly commanding a greater share of enterprise IT spending. Heavier use of smart phones in multiple facets of consumers’ lives are creating opportunities for digital platforms and for select consumer discretionary companies that can create better touch points with their customers. Within the health care sector, many innovative therapies are coming to market that address highly unmet medical needs or represent significant improvements over existing treatment options. We look forward to seeing how these and other trends play out in the coming year.
Top Contributors & Detractors
Contributors
Alphabet Inc: The company provides advertisers with superior cross-device marketing offerings, in our view, and we see continued opportunity for Google to monetize its Android mobile platform. We also see opportunity for Google to increase monetization of its YouTube video platform in the coming quarters now that it is easier for advertisers to buy ads and target specific audience segments on YouTube.
Amazon: The online retailer offers a wide range of products, including books, music, videotapes, computers, electronics, home and garden, and numerous other products. Amazon offers personalized shopping services, Web-based credit card payment and direct shipping to customers. We believe the company’s competitive advantages of a low overhead cost structure, allowing an aggressive pricing structure, and faster shipping will continue to cause consumers to shift an increasing amount of their general merchandise spending toward it. Given that over 90% of retail sales are still sold offline, Amazon has significant opportunities ahead, particularly as they expand into new business lines and geographies.
Pharmacyclics: We liked the commercial-stage biotechnology company, which was acquired during the period, for its cancer drug, Imbruvica, a well-tolerated and effective maintenance treatment for chronic lymphocytic leukemia (CLL), a relatively high prevalence form of leukemia, and mantle cell lymphoma (MCL), a rare and aggressive type of blood cancer.
Facebook: The social networking website facilitates the sharing of information, photographs, website links and videos among family, friends and co-workers. Recent data, including fast-growing sales, have given us greater confidence in the sustainability of Facebook’s core product and thus the advertising market that should accrete to it. We believe the company will be among the few mobile platform operators that disproportionately benefit from meaningful new developments in advertising/marketing models, which we expect will develop over the next several years. In particular, we think we are in the early phase of advertising dollars shifting to mobile, where Facebook is gaining

J a n u s C a p i t a l F u n d s P l c / 3 1 D e c e m b e r 2 0 1 5 4 3
traction with app developers, direct response advertisers, brand advertisers and small- to medium-size businesses.
Home Depot: We believe the home retailer is poised for growth over the next three to five years as the economy and housing market rebounds. We also like that Home Depot has continued to improve its product offering in core categories and adjacent categories. When combined with improving service and merchandise, we believe Home Depot will be able to gain market share from other home retailers. We also like that Home Depot has continued to invest to improve its omni-channel shopping experience for consumers, enabling them to offer more products to customers in a more convenient way.
Detractors
Canadian Pacific Railway: Canadian Pacific Railway operates a rail system connecting the major business centers in Canada. We like that the company operates in an industry that has significant barriers to entry. We believe a new management team is improving the railroad company’s culture, operational performance and capital allocation decisions.
Union Pacific: We like the railroad operator for its strong competitive moat and significant barriers to entry that may lead to sustainable and consistent pricing power. Steady volume growth and ongoing operating improvements are also additive. Collectively, we think these factors should enable the company to produce visible, significant earnings growth over the coming years.
Colfax Corp: The diversified manufacturing and engineering company provides gas- and fluid-handling and fabrication technology products and services to industrial customers worldwide. Colfax manufactures a range of fluid handling products, including pumps, fluid handling systems and specialty valves. We trimmed the position due to concerns about some of its end markets.
Chipotle Mexican Grill: We think Chipotle is still early in its store unit growth. While food-related illnesses have been a near-term headwind, we think that over the long term, Chipotle is poised to benefit from the trend of consumers seeking healthier, more natural foods, as its commitment to simple, sustainably grown and produced food is a differentiator compared to other fast-food, family dining and fast-casual establishments.
Mallinckrodt: The pharmaceutical company was spun off from Covidien. We believe the management team at Mallinckrodt will continue to reduce costs and improve the management of its existing assets. We also like the potential for some of the company’s treatments including Ofirmev, an acetaminophen injection the company obtained as part of an acquisition, and also Xartemis, an extended-release, abuse-deterrent pain treatment.
Thank you for your investment in Janus US Fund.
(February 2016)
Janus US Research Fund
Research Team led by Carmel Wellso, portfolio manager
Performance Summary
For t he financial year ended December 31, 2015, Janus U.S. Research Fund outperformed its benchmark, the Russell 1000 Index, returning 0.47% on Class I$acc Shares.
Investment Environment
The multi-year U.S. equities rally encountered significant turbulence during 2015. Cooling global growth, weak commodities prices, a surging U.S. dollar and a shift in monetary policy were some of the factors investors had to consider when valuing stock portfolios. Volatility began early with the slide in crude prices being considered a potential harbinger for sagging demand rather than solely a consequence of overproduction. A series of uninspiring U.S. economic data also weighed on sentiment. Expansionary monetary policy in Europe put upward pressure on the U.S. dollar and raised the prospect that U.S. corporate earnings could suffer.
Mid-year, the souring mood in Chinese and broader emerging market exchanges spread to developed markets, including the U.S., with several declining by more than 10%. Global volatility was in the minds of Federal Reserve (Fed) officials when they chose to delay raising interest rates at their September meeting. Later, improving U.S. employment data led to a consensus that rates would indeed rise by the end of the year. Markets were then roiled late year by energy prices coming under renewed pressure, bringing back the prospect that global growth may fall short of projections.
Performance Discussion
Stock selection within information technology and communications contributed most to relative results. On an individual stock basis, the class-C stock of Alphabet Inc. (formerly Google) was one of the Fund’s top contributors to performance. Alphabet’s share price benefited from better than expected third-quarter earnings results, as well as from the company’s restructuring, which was initiated in the third quarter. The restructuring, which involved the creation of the Alphabet holding company that now owns Google and several other businesses, has resulted in greater accounting transparency, making it easier to value each of the company’s entities. Alphabet’s earnings growth was driven by improvements in its mobile search revenue, as well as its YouTube and programmatic businesses. The firm recently announced a significant stock buyback program, providing additional support to its shares.

Fund Overviews (unaudited)
4 4 J a n u s C a p i t a l F u n d s P l c / 3 1 D e c e m b e r 2 0 1 5
Another marquee Internet name, Amazon, was also a strong contributor. The company released a consensus-beating earnings report late in the year, driven by acceleration in year-over-year revenue growth. Sales gains are reaching the bottom line despite the healthy pace of investment and hiring. Its electronics and general merchandise segment posted strong gains, as did its cloud-computing division, Amazon Web Services (AWS). The latter segment continues to record impressive increases in operating margins. AWS, in our view, remains well positioned to benefit from the increasing shift to cloud computing. We believe Amazon’s low overhead cost structure allows the company to pursue an aggressive pricing strategy which, together with faster shipping, is driving market share gains in general merchandise.
Pharmacyclics was another leading contributor. This commercial-stage biotechnology company was focused on discovering and developing innovative small-molecule drugs for the treatment of cancer and immune-mediated diseases. The company’s stock surged in January on a consensus-beating report as well as upbeat guidance for its lead blood-cancer drug, Imbruvica. It was then announced that AbbVie would acquire the company for $21 billion, validating our view of Imbruvica’s vast commercial potential for the treatment of leukemia, lymphoma and other potential cancers.
Detracting most from relative performance were the Fund’s industrials and energy holdings. Within industrials, railroad names were pressured during the period. Weekly carload volumes decelerated significantly late in the year, causing analysts to cut revenue forecasts. Two factors behind the decline were a slowdown in U.S. industrial production on account of a strong U.S. dollar weighing on exports, and the continued weak pricing environment across a range of commodities, including energy, agriculture and base metals. Union Pacific, a railroad operator, was acutely affected by negative sentiment toward the industry. In October, the company released a consensus-beating earnings report. The report showed that pricing remained solid. The company had reduced capital expenditure continued buying back shares. It did state, however, that overall rail volumes were down. Automobiles were a rare source of strength. Energy volumes, on the other hand, were specifically hard hit.
Also detracting from performance was Anadarko Petroleum. Energy prices continued to slide on concerns of slowing global growth prospects, especially in previously strong-performing emerging markets. The continued rise in U.S. crude oil inventories also weighed on the sector. In the fourth quarter, Anadarko’s overtures regarding a potential merger were spurned by Apache Oil.
MarkWest Energy Partners was another detractor. The master limited partnership (MLP) gathers and processes natural gas and also transports and stores natural gas liquids (NGLs). We appreciate that its assets are focused on the prolific
Marcellus (mostly in West Virginia and Pennsylvania) and Utica (northeastern U.S. and adjacent parts of Canada) shale development areas and feel that it has a superior capital structure. Weakness in North American energy markets weighed on the sector during the year. Ultimately the company was merged with MPLX, in which we maintain a position.
Outlook
What was good is now bad, what worried us is now all right, and signals of strength are warning lights. What is the year coming to? And where will 2016 take us?
Investors can be forgiven for not knowing which way is up as we pull out of 2015. The low oil price that was a boon to the U.S. consumer is now so low that markets are spooked. The Fed is raising rates, but, once anticipated as a sign of economic strength, some now see liftoff as negative for the equity markets.
It is not whether the glass is half full or half empty. It is that there are two glasses. There’s an abundance of conflicting economic data but nowhere is the contrast as stark as in the varying directions of the consumer and industrial sectors. Man versus machine. Earlier this year, in America, falling oil was seen as a boon to the consumer. We are seeing signs that the consumer is using the savings from the pump to increase spending. Retail sales are holding up and consumer activity is fairly strong.
Unfortunately, the U.S. industrial sector is suffering. China, the dollar and especially lower oil field investment are hurting the sector, even for companies without large direct energy exposures. Competitors with oil exposure, it seems, are turning to other market segments to generate cash and gain share. If the U.S. industrial sector is not in recession, it is close. Economic measures and our own company discussions lead us to draw the conclusion that this is indeed the case. Industrial and material stocks were the most likely to disappoint in fourth quarter results.
The question for U.S. markets, however, is whether the slowdown will transfer to the consumer and ultimately to the equity markets. The consumer is standing on a platform that could prove to be fragile if an economic turndown saps confidence. The Fed could help with a slow pace of rate increases but its power is limited from here.
In the consumer versus industrial war, the largest battlefield is in China. So far, we see that the consumer is holding up despite weakness on the manufacturing side. The Chinese government is trying to help, with measures promoting consumer purchases. The recent pickup in auto sales shows some success.
The weak industrial sector is just one concern, however. The junk bond market also is worrying investors. Spreads are blowing out, liquidity is scarce, and the market is under pressure. If an investor recalls 2007, the concern is understandable. Fixed
J a n u s C a p i t a l F u n d s P l c / 3 1 D e c e m b e r 2 0 1 5 4 5
income market turmoil was the canary in the coal mine in the financial crisis. There are differences, however, including that the weakness in high yield today comes from energy and not from financials. Corporate and household balance sheets are far healthier than in 2007.
Adjusting for the outperformance of a narrow group of stocks and for the different energy weights in the S&P 500 and the high-yield index, the two indices have fallen about the same amount this quarter. In other words, equities to some extent are already reflecting the high-yield market.
Investors, still looking for canaries however, can consider commodities. Often commodities signal a bear market for equities but commodities have been weak for three years and equities are holding up. For the last five years, China represented more than 50% of the demand for many commodities and producers expanded to accommodate what was seen as always expanding appetite. Commodities are suffering now but the signal may be more about prior over-optimism in the sector than about equity markets.
The push-me, pull-you markets of the fourth quarter reflect the risks and opportunities investors are weighing and the return of volatility after a period of doldrums.
In the end, we think the opportunities matter more. With U.S. markets, as measured by the S&P 500 Index, at a forward price-earnings ratio of 16 – and shares cheaper in Europe in most cases – we don’t think markets are stretched. China and Japan too offer stock-picking chances. While the market may offer modest earnings growth (more if you take out industrials and energy), the range of outcomes should be wide, making the stock markets around the world fertile ground for fundamental analysis. Earnings growth and strong balance sheets will likely be rewarded.
Man versus machine makes for good movies but we do not think the theme will hold the attention of markets much into 2016. We expect to see encouraging signs from the consumer and moderating pain in the industrial sector, especially if our base case holds true that China is resilient and that oil eventually moves higher.
If that is where 2016 takes us, the canaries will be fine.
Thank you for your investment in Janus US Research Fund.
(February 2016)
Janus US Twenty Fund
Marc Pinto, portfolio manager
For the financial year ended December 31, 2015, the Janus U.S. Twenty Fund outperformed its benchmark, the Russell 1000 Growth Index, returning 6.68% on its Class I$acc Shares .
Investment Environment
Large cap growth equities ended the year with gains. A low interest rate environment and signs of a strengthening U.S. economy helped lift stocks in the first half of the year. Stocks sold off toward the end of the second quarter due to concerns that Greece might exit the eurozone. Concerns about slowing global growth, particularly in emerging markets, and a weakening energy sector weighed on stocks in the second half of the year. Large cap stocks outperformed small caps during 2015. At the sector level, the consumer staples and consumer discretionary sectors enjoyed the highest returns within the Russell 1000 Growth Index. The energy sector suffered steep losses.
Performance Discussion
Our Fund is a concentrated, opportunistic portfolio drawing from our analysts’ highest-conviction ideas among U.S. large-cap stocks. We hold companies that we believe are dominant global franchises with long-duration growth. This quarter, we were encouraged to see a number of these companies put up positive results, further validating our conviction.
Amazon was our top contributor to performance during the year. Improved operating leverage for its core retail business and impressive growth for Amazon Web Services helped drive the stock. We continue to like the company. We believe Amazon’s competitive advantages of a low overhead cost structure, allowing an aggressive pricing structure, and faster shipping will cause consumers to shift an increasing amount of their general merchandise spending toward it. Given that over 90% of retail sales are still sold offline, we believe Amazon has significant opportunities ahead, particularly as they expand into new business lines and geographies.
Pharmacyclics was another top contributor. The stock was up significantly this quarter after it was announced that AbbVie had won a bidding war to acquire the company. The high interest Pharmacyclics received from other companies validated our view that its blood cancer treatments offer significant growth potential.
Alphabet Inc., the holding company of Google and several other businesses owned or tied to Google, was another top contributor. Strong earnings results have helped drive the stock this year. The market has also been encouraged by the new CFO’s focus on expense discipline, and the announcement to restructure Google under Alphabet Inc. and separately report the revenue and profitability of its core search, YouTube, apps and display businesses from its newer noncore ventures. The increased disclosure is positive and will help investors be better able to accurately value the businesses held in the portfolio.
While pleased with the performance of most companies in our portfolio, we did own a few stocks that had disappointing results during the year. Yahoo Inc. was our largest detractor. The company

Fund Overviews (unaudited)
4 6 J a n u s C a p i t a l F u n d s P l c / 3 1 D e c e m b e r 2 0 1 5
owns a large stake in Chinese Internet company Alibaba, and weak results for Alibaba’s business, and its corresponding falling stock price, have been a headwind for Yahoo. Questions about whether Yahoo will be able to eventually spin off Alibaba in a tax efficient manner have also been a headwind for the stock. We continue to believe the company will be able to monetize this asset in a tax-efficient manner. Perhaps more important, we think the fall in Yahoo’s stock is overdone, and that the sum of the various parts of Yahoo’s business are worth much more than the stock price currently reflects.
Chemours Company was another detractor. Chemours is an American chemical company that was spun out from DuPont. We like the company’s position as a producer of titanium dioxide. However we believe the company’s capital structure after its spinoff is sub-optimal, and we are reviewing the stock.
Chipotle Mexican Grill was another detractor. Chipotle Mexican Grill was our largest detractor from performance. Food-related illnesses related to some of its stores has negatively impacted the stock. We continue to like the company, however. We believe Chipotle’s higher throughput rates, which have led to higher unit economics at each store, still separate it from most competitors in the fast-food or fast-casual industry. While we acknowledge that the latest news about food-related illnesses may continue to be a headwind for the company in the near term, we also believe that, in time, the company will be able to re-establish its reputation for food integrity, which has been a differentiator for Chipotle.
Outlook
While valuations are higher after the fourth quarter and the Federal Reserve is finally raising interest rates, we believe the backdrop for U.S. equities is still positive. While much attention has been paid to the rate hike, we believe it is important to put interest rates into perspective. Rates are still very low from a historical perspective and most economic data, especially U.S. employment levels, indicate that a gradual rate hike is warranted.
Looking across sectors, we continue to see some opportunities to add positions to our portfolio. While the outlook for oil prices remains subdued and we still do not believe it is time to step in and buy energy stocks broadly, we do see potential opportunities with select industrial companies that may have been overly punished for their exposure to the energy sector. We also see opportunity within the consumer discretionary sector, where companies are benefiting from improved U.S. consumer spending power at a broad level, and at the company level, select companies are also benefiting from value-creating innovation. As we head into the new year, we are looking at select apparel, lodging and luxury companies that had a tough year in 2015, but may be poised for a rebound.
Thank you for your investment in Janus US Twenty Fund.
(February 2016)
Janus US Venture Fund
Jonathan Coleman and Maneesh Modi( Maneesh Modi departed February 2015), portfolio managers
The Janus US Venture Fund‘s Class I$acc Shares underperformed its benchmark, the Russell 2000 Growth Index, for the financial year ended December 31, 2015, returning (1.89)% , versus (1.38)% for the Index.
Investment Environment
Small cap growth stocks ended the year with modest losses. A low interest rate environment and signs of a strengthening economy helped lift stocks in the first half of the year. Concerns about slow global economic growth, particularly in emerging markets, and a weakening energy sector led stocks down in the second half of the year. The energy, telecom and materials sectors suffered the steepest losses during the calendar year. The health care and information technology sectors were the top performers within the index.
Performance Discussion
The Portfolio underperformed its benchmark during the year. We have taken a high-quality approach to investing in small-caps, and that approach paid off during year. Many of the companies in our Fund have predictable, recurring revenue streams. Our companies also typically generate a high return on invested capital and have demonstrated a proven ability to expand profit margins. We also put a great emphasis on identifying companies with sustainable competitive advantages that should help them gain market share and grow in a variety of market environments. We believe a focus on such companies creates a smoother path to investing in small caps and a better opportunity to generate higher compounded returns over full market cycles.
Our stock selection in the industrial sector detracted from relative performance. Weak energy and commodity markets were a headwind for some of our companies. Rexnord was our largest detractor from performance. Rexnord produces parts involved in process and motion control for manufacturers, mines and aerospace clients. During the quarter, the company experienced declining demand from mining customers who use Rexnord machinery to move ore. These losses were partially offset by Rexnord’s commercial plumbing business, which has benefited from a rebound in commercial construction. We believe Rexnord is positioned for steady growth in both businesses in the months ahead, and is likely to benefit from management’s efforts to cut costs and expand operating margins. We also expect Rexnord to generate value through strategic acquisitions as it improves the operations of the companies it acquires.
Kennametal was another large detractor within the industrial sector. The company makes cutting tools used in end markets

J a n u s C a p i t a l F u n d s P l c / 3 1 D e c e m b e r 2 0 1 5 4 7
serving the energy sector. While those end markets have been weak, we believe the new management team at Kennametal will take some appropriate steps to restructure the company.
Outside the industrial sector, Wolverine World Wide was a large detractor, falling most recently due to softer sales of its Sperry and Merrell shoe brands. While soft sales of some of its shoe brands have disappointed lately, we continue to like the stock. Wolverine has a long history of improving the management of the brands it acquires as well as increasing sales through its global distribution network.
Synageva BioPharma Corporation was our top contributor to absolute performance during the year. The stock was up after the company was acquired by Alexion Pharmaceuticals. We believe Synageva has a strong platform for producing human proteins that are used in enzyme replacement therapy to treat orphan genetic diseases, and given the attractive series of drugs under development, we were not surprised to see Alexion pay a hefty price for the company in a heated acquisition market.
Another health care company, Dyax Corp., was also a top contributor. The stock was up after an announcement it would be acquired by Shire Plc. We were not surprised to see Dyax pursued as an acquisition candidate. In our view, the company has a potential best-in-class drug for hereditary angioedema (HAE) therapy, which could become the new standard of treatment based on strong efficacy from early-stage trials. Shire is the current leader in HAE treatments, and a logical partner to acquire Dyax.
Blackbaud was also a top contributor. The stock rose during the year as the market received more confirmation about the growth potential of the company. Blackbaud provides technology solutions designed to improve fundraising for the nonprofit industry. Fundraising is clearly a critical function for that industry, and Blackbaud’s solutions have proved an effective proposition for improving those fundraising efforts. However, many nonprofits have been slow to integrate technology into the fundraising process, which creates a potentially large addressable market for Blackbaud going forward.
Outlook
Heading into 2016, we expect a modest aggregate return environment for small-cap equities. However, there are a number of factors that make us excited about the potential for active management to add value going forward. With valuations of small-cap equities near normalized levels, earnings growth will be needed to driver further stock price appreciation. A slow-growth economy will make broad earnings growth less robust, but should be favorable for our investment process, in our view. We tend to focus on companies that have demonstrated a steady path toward earnings growth through strong pricing power or market share gains. These companies should be more
appreciated by the market when broad earnings growth is harder for many businesses to achieve.
Another important point to consider about small-cap valuations is the disparity between valuations for a set of momentum-driven stocks, which are yet to generate earnings, and the rest of the market. As it stands today, the percentage of loss-making companies in the index is at its highest level in any non-recessionary period over the last 20 years. Many of these stocks are tied to popular high-growth themes such as cloud computing and biotechnology. If one strips the loss-making companies out of our benchmark index, the valuation premium of other small-cap companies relative to large caps is actually much more reasonable.
While we do not deny the exciting innovation and growth potential tied to these industries – and hold a few companies that our health care and technology teams have identified with exciting new drugs on the horizon or a disruptive business model attacking a specific industry - not every company tied to cloud computing and biotechnology will be successful. As part of our investment process, we have sought to avoid many of the companies with negative earnings in the index, and we believe this strategy will prove successful over the long term as it will prove difficult for many of these companies to generate the future earnings currently implied in their valuations. We see more opportunity in companies we believe have more steady business models and can continue to generate earnings growth in 2016. Many of these businesses are heading into the new year with relatively attractive valuations that offer an interesting entry point for investing. We look forward to seeing how these companies perform in the coming months.
Thank you for your investment in Janus US Venture Fund.
(February 2016)
Perkins Global Value Fund
Gregory Kolb, Tadd Chessen and Christian Kirtley (departed Q3 2015), portfolio managers
Summary
For the year, Perkins Global Value Fund returned on Class I$acc Shares (2.96)% underperforming its primary benchmark, the MSCI World Index and its secondary benchmark, the MSCI All Country World Index. Interestingly, growth stocks (as measured by the MSCI World Growth Index) outperformed value stocks (as measured by the MSCI World Value Index) by over 800 basis points in 2015, which was clearly a headwind for any value-oriented strategy.
The year 2015 appeared to mark the revival of risk aversion. The collapse in the Chinese A-share market during the summer of 2015, the unexpected devaluation of the Chinese renminbi,

Fund Overviews (unaudited)
4 8 J a n u s C a p i t a l F u n d s P l c / 3 1 D e c e m b e r 2 0 1 5
and the continued plunge in most commodity prices sent shock waves rippling across the globe and across asset classes, particularly in the third quarter of 2015, the market’s worst quarter since the third quarter of 2011. While the MSCI World Index recovered somewhat in the fourth quarter, volatility has remained high.
Stock selection in information technology and our underweight positions in financials and materials aided relative performance in the period. By country, stock selection in Sweden, Norway, and Japan contributed to performance, as did our underweight exposure to Australia and Spain. Stock selection in telecommunication services, consumer discretionary and health care detracted. Holdings in Mexico, the UK and the U.S. contributed negatively. Currency hedges (investments to reduce the risk of adverse price movements in an asset) were positive, as the euro weakened considerably against the U.S. dollar (the yen only modestly weakened vs. the U.S. dollar).
Top Contributors & Detractors
Contributors
Google (now Alphabet Inc Holding Company) is the dominant internet search provider and has used its large search share to capture an estimated 52% share of total digital advertising revenue and 14% of the overall ad market. Alphabet was strong contributor in 2015 after the company reported better than expected results. Overall revenue growth was strong with accelerating growth of 15% year over year. Equally important, the company also posted a better than expected operating margin. As has been the case for the past few quarters, the CFO continued to do a good job identifying and cutting costs at Alphabet. We expect more discipline on the cost front going forward and believe there are more costs that could be reduced in the future. Longer term, we believe that Alphabet is still well positioned to post double-digit growth based on its dominant share in search, emerging strength in video, and better expense management. As a result, we continue to own a sizable position in the company.
Microsoft was a strong contributor during the year. Microsoft reported better than expected revenue and, cloud-based revenue, a particular area of focus for the company, accelerated during the year. We view the recent results positively in light of the challenges the company faces in the consumer and PC end markets. While Microsoft continues to invest in growth areas such as cloud based applications, Microsoft also did a good job controlling costs as gross and operating margins were better than expected. Going forward, we continue to like the large amount of highly profitable, recurring revenue at Microsoft, and believe the company will continue to manage costs while achieving modest top line growth.
Orkla is primarily a branded consumer goods company focused on food, home and personal care, and ingredients in the Scandinavian region. The company is a conglomerate and continues to own a
disparate set of assets in industrials, real estate, and renewables). Throughout 2015, Orkla continued to deliver organic growth (approximately 2%), which is actually quite robust for its mature geographic markets. Management continues to eliminate redundancies and excess costs, driving margin improvement as well. Strong cash generation is redeployed into sensible mergers and acquisitions (M&A) to expand its geographic footprint and add scale. We believe substantial further opportunity exists as Orkla diligently exits non-core investments and redeploys that capital into bolt-on M&A and eventually a growing dividend. The core branded consumer business also presents substantial further cost take-out opportunities as management rationalizes the businesses it has acquired.
Detractors
America Movil is one of the world’s largest integrated telecommunications companies with 368 million access lines in 25 countries, principally in Latin America. The shares underperformed in the period due reporting results that missed expectations and continued poor macro conditions in one of its major markets, Brazil. The 33% decline in the Brazilian real and the 14% decline in the Mexican peso in 2015 also weighed on the share price. During the final quarter of the year, America Movil shares went “ex” the spin-off to shareholders of its Mexican cell tower assets into a newly listed company, Telesites, representing a distribution to shareholders of approximately 5% of market capitalization. We believe that America Movil’s unrivaled scale, diversification of operations, strong free cash flow and solid balance sheet are significant competitive advantages that limit the potential downside and should enable the company to weather the present headwinds.
Oracle is a technology company that provides enterprise class software solutions for a variety of applications and end markets. Shares of Oracle underperformed in 2015 because revenue, margins, and earnings were below expectations. The company is in the process of transitioning some revenue to cloud-based sales and the investment required to build out the cloud offering is temporarily affecting revenue and operating margins negatively. We believe most of the investments for Oracle’s cloud solutions are complete and that revenue and margin growth will accelerate going forward. Additionally, we believe Oracle has sticky customers and recurring revenue resulting from the maintenance, support and services lines of business. We believe the reward-to-risk ratio is attractive at the current level and we continue to own a sizable position in the company.
UTi Worldwide is a U.S.-based global supply chain management business providing freight forwarding and contract logistics. We first purchased shares as the company was coming to the end of a costly and painful IT integration project that we believed would enable operating cost savings and a large uptick in margins, if executed properly. Unfortunately, the company delivered disappointing and deteriorating results throughout the year as the

J a n u s C a p i t a l F u n d s P l c / 3 1 D e c e m b e r 2 0 1 5 4 9
execution on the turnaround alienated customers who switched to more reliable competitors and as a general macroeconomic slowdown provided further topline headwinds. We exited the position after an additional profit warning early in the third quarter of 2015 demonstrated that customers were increasingly losing confidence in management’s ability to execute its turnaround.
Outlook
Despite a roller-coaster year of heightened volatility and a modest recovery in the fourth quarter, global equity markets (as represented by the MSCI World Index) ended the year nearly unchanged. As we write this, markets are yet again under pressure from a continued slide in the oil price and general anxiety over the implications for global growth. The volatility experienced in the second half of 2015 seems likely to remain in place for the broader global markets heading into 2016. Our core focus on what we believe to be high-quality companies with less downside price risk becomes paramount in this type of environment.
The broad U.S. market, as represented by the S&P 500® Index, was also up only slightly for the year as a small group of companies provided the bulk of the gains. Conversely, a large number of index constituents were down on the year. The reasons for this broad weakness are many, of course, and can be hard to specify with precision. However, a few big picture observations are worth noting: 1) After many years of strong growth, corporate profits have stalled with S&P 500 Index earnings in 2015 roughly flat as compared to 2014; 2) A remarkable period of falling and generally low interest rates may be ending (or changing), at least at the front end of the yield curve following the Federal Reserve’s (Fed) first hike in interest rates; 3) At roughly 18x 2015 estimated earnings per share, the S&P 500 Index is stretched from a valuation standpoint; and 4) Credit markets, particularly in high yield, have become choppy and have led to higher financing costs for a host of companies and industries. After many years of gains, the stock market is becoming riskier for market participants.
At Perkins we have long been cautious about the sustainability of the Chinese economic growth engine, which had been driven largely by massive government-sponsored infrastructure spending creating a virtuous cycle for companies, economies and currencies of nations that supply basic materials and resources for this investment program. If this aggregate demand were to slow (it appears to be) as China attempts to transition towards a consumer-led economy, then it seems logical that many of the tailwinds would soon become headwinds for the former beneficiaries of the infrastructure boom. In a market with valuation multiples that have already expanded significantly, in our opinion, due to unprecedented quantitative easing by various global central banks, we face an investment environment with significant valuation risk. As Warren Buffett said, “Price is what you pay, and value is what you get”. At Perkins, we have an intense focus on price-to-value relationships with
an aim to compound capital over time by minimizing our absolute downside risk. Given the current environment, we are maintaining our defensive posture, and we are optimistic about our ability to take advantage of the heightened volatility by deploying capital into our best ideas.
While many investors remain complacent with their portfolios, and in so doing take on risk which may come to hurt later, we suggest a different approach. We know in theory that the combination of missed earnings expectations and high starting valuations can result in substantial losses, and more recently we’ve seen countless examples of this dynamic unfolding in the market. As a result, we favor companies which we believe have durable competitive advantages selling into growing and/or stable end markets and which have managements actively pursuing “self-help” strategies such as cost containment. These companies are likely to have higher earnings on a two- to three-year timeframe, and thus be worth more. Paying reasonable, but not exorbitant, valuations for these stocks is an attractive opportunity in an otherwise challenging market environment.
We established a number of new positions during the year including Alphabet, Hyundai Motor, Ally Financial, Fifth Third Bancorp, Cobham, Honda Motor, and Meggitt. We also received four new securities via spin-out/restructuring: BWX Technologies, Cheung Kong Property Holdings, CK Hutchison Holdings, and Telesites. We also exited a number of holdings including: Pfeiffer Vacuum, NTT DoCoMo, Pola Orbis, Suez Environnement, BB&T Corp, Republic Services, Capitol Federal Financial, and UTi Worldwide. We continue to hold significant stakes in U.S. blue chips and European multinationals, stocks which typically exhibit stable cash flows that are relatively less economically sensitive than the broad market. We continue to be very selective with our emerging market positions. Cash remains high due to a lack of what we believe to be bargain securities. We continue to hedge 60% of our yen exposure and 50% of our euro exposure.
As we look forward to a new year, we want to thank you, our shareholders, for the confidence you have placed in us.
Thank you for your investment in Perkins Global Value Fund.
(February 2016)
Perkins US Strategic Value Fund
Thomas Perkins and Alec Perkins, portfolio managers
Executive Summary
The Fund outperformed its benchmark led by positive stock selection in technology coupled with our underweight in energy and overweight the health care sectors.
During the year, we reduced health care on strength, and added to financials on weakness.

Fund Overviews (unaudited)
5 0 J a n u s C a p i t a l F u n d s P l c / 3 1 D e c e m b e r 2 0 1 5
Our focus on what we believe to be high-quality companies with less downside risk has served us well in this more volatile environment.
Performance Review
The Fund’s Class I$acc Shares outperformed the Russell 3000 Value Index for the 12 month period and underperformed its secondary benchmark, the S&P 500 Index, returning (3.62)% . The broader market was down for the first time since 2008 and the S&P 500 had a modest gain. On the heels of the worst quarter for equities in four years, volatility remained elevated with a wide disparity in sector returns.
The Fund’s outperformance for the year was led by stock selection in technology as our top contributor Microsoft experienced an acceleration in cloud based revenue growth and Google (now Alphabet) which had better than expected results. Our stock selection in consumer staples was also additive to returns, while stock selection in the industrial sector hurt performance as pressure on crude depressed coal shipments in the year. Energy related stocks were again the worst performers in the index as OPEC maintained its current strategy with no cut to production target. Our underweight to energy as a result heavily contributed to performance, as well as our overweight to health care which posted among the strongest returns within the benchmark.
The most significant changes were a decrease in the health care sector as it was relatively strong and risk to reward trade-offs became less attractive, and an increase in financials where valuations were attractive. We made lesser reductions in the cyclical industrial and technology sector and increased more stable consumer stocks.
For detailed performance information, please visit www.janusinternational.com
Top Contributors & Detractors
Contributors
Microsoft
Microsoft provides software that is essential for daily business operations. Shares of Microsoft performed well after the company reported good yearly results. Microsoft reported better than expected revenue, and cloud based revenue accelerated in the year, which continues to be an area of focus for the company. We view the recent results positively in light of the challenges the company faces in the consumer and PC end markets. While Microsoft continues to invest in growth areas such as cloud based applications, Microsoft also did a good job controlling costs as gross and operating margins were better than expected. Going forward, we continue to like the large amount of highly profitable, recurring revenue at Microsoft, and believe the
company will continue to manage costs while achieving modest top line growth.
Casey’s General Stores
Casey’s operates gas stations and convenience stores throughout small towns in the Midwest, and is slowly expanding into the Southeast. The steep decline in crude oil, and ultimately gasoline prices, were a significant reason for the stocks strong performance this year. Gasoline margins at Casey’s typically benefit when wholesale gasoline prices decline as retail prices at the pump are stickier on the way down. Casey’s has done a solid job in executing its growth strategy – evidenced by strength in same-store sales of grocery items and prepared foods during the year. Over the past two years, other publicly traded convenience store chains have been acquired by master limited partnerships (MLPs), adopted MLP structures, or have been acquired by parent companies that own MLPs, any of which would unlock further value at Casey’s should management elect to go that route. While we did trim some of our holdings on price strength, Casey’s remains one of our largest holdings in the Fund.
Alphabet, Inc
Google (now Alphabet Inc Holding Company) is the dominant internet search provider and has used its large search share to capture an estimated 52% share of total digital advertising revenue and 14% of the overall ad market. Alphabet Inc was a strong contributor after the company reported better than expected results. Overall revenue growth was strong with accelerating growth of roughly 15% year over year. Equally important, the company also posted a better than expected operating margin. The recent expense management is the result of the CFO that joined in 2015 as she has done a good job identifying and cutting costs at Alphabet. We expect more discipline on the cost front and believe there are more costs that could be reduced in future periods. Longer term, we believe that Alphabet is still well positioned to post double digit growth based on its dominant share in search, emerging strength in video, and better expense management. As a result, we continue to own a sizable position in the company.
Detractors
Anadarko Petroleum
Anadarko Petroleum Corporation is a global independent oil and gas exploration and production company that owns reserves in some of the most prolific oil and gas basins around the globe. The shares traded down to year to date lows in the fourth quarter of 2015 as crude oil prices touched new year to date lows such that WTI and Brent crude oil prices bottomed at $34.73 a barrel and $36.11 a barrel respectively. Anadarko Petroleum’s shares also traded lower in the back half of the year after it was announced that they made a failed bid to acquire Apache Corporation. While we are not happy with the poor share performance, we are

J a n u s C a p i t a l F u n d s P l c / 3 1 D e c e m b e r 2 0 1 5 5 1
encouraged that Anadarko Petroleum’s shares outperformed its peer group as represented by the Philadelphia Stock Exchange Oil Exploration & Production Index (EPX). The macro environment remains challenging for oil and gas producers but we continue to hold Anadarko shares as the company’s tier 1 asset base, strong execution track record and solid balance sheet will help it endure the industry wide downturn driven by low commodity prices.
Oracle
Oracle is a technology company that provides enterprise class software solutions for a variety of applications and end markets. Shares of Oracle underperformed in 2015 because revenue, margins, and earnings were below expectations. Oracle is in the process of transitioning some revenue to cloud based sales. As a result, Oracle’s cloud based investments are negatively affecting revenue and operating margin as the company spends to build out its cloud offerings. We believe most of the investments have taken place for Oracle’s cloud solutions and believe that revenue and margin growth will accelerate going forward. Additionally, we believe Oracle has sticky customers and recurring revenue resulting from the maintenance, support and services lines of business. At 12x estimated 2017 earnings, we believe the reward-to-risk ratio is attractive at the current level and we continue to own a sizable position in the company
Union Pacific
Union Pacific is one of the largest railroads in the U.S. with a network covering 32,000 route miles stretching from Pacific Ocean on the west to Chicago and New Orleans on the east. While the freight that it hauls is diversified, weakness in their mining, industrial, and agriculture customers weighed on performance all year long. Specifically, while the company was not as exposed to the crude by rail phenomena as others, the pressure on crude prices drove many utility customers to switch from coal to natural gas power generation which depressed coal train shipments during the year, one of their higher profit car types. While we don’t think the impact of power generation changes will abate soon, the stock has significantly re-priced valuation wise leaving the stock at one of the lowest relative valuation levels versus the market in quite some time.
Outlook
The Russell 3000 Value Index posted its worst calendar year performance since 2008 while the largest end of the market, as represented by the S&P 500® Index, managed to close slightly up on the year. The reasons for this broad weakness are many. A few big picture observations are worth noting: 1) At roughly 18x 2015 estimated earnings per share, the S&P 500 Index is stretched from a valuation standpoint; 2) After many years of strong growth, corporate profits have stalled with S&P 500 Index earnings in 2015 roughly flat as compared to 2014; 3) A remarkable period of falling and generally low interest rates may be ending (or changing), at least at the front end of the yield curve
following the Federal Reserve’s (Fed) first hike in interest rates since 2006; and 4) Credit markets, particularly in high yield, have become choppy and have led to higher financing costs for a host of companies and industries. After many years of gains, the stock market has become riskier for market participants.
While many investors remain complacent with their portfolios, and in so doing take on risk which may come to hurt later, we suggest a different approach. The investment team at Perkins is especially focused on the relationship between earnings and valuation. We know in theory that the combination of missed earnings expectations and high starting valuations can result in substantial losses, and more recently we’ve seen countless examples of this dynamic unfolding in the market. As a result, we favor companies which we believe have durable competitive advantages selling into growing and/or stable end markets and which have managements actively pursuing “self-help” strategies such as cost containment. These companies are likely to have higher earnings on a two-to-three year timeframe, and thus may be worth more. Paying reasonable, but not exorbitant, valuations for these stocks is an attractive opportunity in an otherwise challenging market environment. The volatility experienced in the fourth quarter would seem to remain for the broader market heading into 2016 given continued concerns about economic growth – both globally and domestically, the fallout from the commodity price collapse, the possibility of miscommunication on the part of the Fed, reduced market liquidity, and increasing geopolitical risk. Our core focus on what we believe to be high quality companies with less downside price risk becomes paramount in this type of environment. Additionally we look forward to volatility providing the opportunities to purchase high quality franchises at unusually attractive valuations
Thank you for your investment in Perkins US Strategic Value Fund.
(February 2016)
INTECH All-World Minimum Variance Core Fund(a)
INTECH Investment Management LLC, portfolio manager
May 1, 2015 to December 31, 2015 (Since Inception of the Fund)
Performance Overview
From the Fund’s date of inception through December 31, 2015, INTECH All World Minimum Variance Core outperformed the FTSE All World Minimum Variance Index, the Fund’s benchmark.
Investment Strategy
INTECH’s mathematical investing process seeks to build a more efficient portfolio than its benchmark, with returns in excess of the index while maintaining benchmark-like risk. The process

Fund Overviews (unaudited)
5 2 J a n u s C a p i t a l F u n d s P l c / 3 1 D e c e m b e r 2 0 1 5
does not attempt to predict the direction of the market, nor does it have a view of any particular company in the portfolio. Instead, it employs a proprietary optimization process to build portfolios with the potential to outperform the index by capturing stocks’ natural volatility.
Within specific risk controls, INTECH’s disciplined mathematical process establishes target proportional weightings for stocks in the portfolio as a result of an optimization routine. Once the weights are determined and the portfolio is constructed, it is rebalanced and re-optimized on a periodic basis. By limiting the distance any one stock position can deviate from its benchmark weight, INTECH’s process attempts to control the relative risk of the portfolio. We believe that instituting an investment process aimed at providing consistent, positive excess returns at benchmark-like risk, will allow us to meet our investors’ objectives while minimizing the risk of significant underperformance relative to the benchmark.
The Fund intends to hedge the various underlying currency exposures in the FTSE All-World Minimum Variance Index (other than any Pound Sterling exposure) to the Pound Sterling to the extent that hedging such currency exposure is consistent with the investment objective of the Fund.
Outlook
Going forward, we will continue building portfolios in a disciplined and deliberate manner, with risk management remaining the hallmark of our investment process. While we may experience short periods of underperformance, we expect to exceed the benchmark over a three- to five-year time horizon. As INTECH’s ongoing research efforts yield modest improvements, we will continue implementing changes that we believe are likely to improve the long-term results for our clients.
Thank you for your investment in INTECH All World Minimum Variance Core Fund(a).
(February 2016)
INTECH European Core Fund
INTECH Investment Management LLC, portfolio manager
Performance Overview
For the twelve-month period ended December 31, 2015, INTECH European Core Fund outperformed the MSCI Europe Index, the Fund’s benchmark, returning on Class A€acc Shares 13.00%.
Investment Strategy
INTECH’s mathematical investing process seeks to build a more efficient portfolio than its benchmark, with returns in excess of the index while maintaining benchmark-like risk. The process does not attempt to predict the direction of the market, nor does
it have a view of any particular company in the portfolio. Instead, it employs a proprietary optimization process to build portfolios with the potential to outperform the index by capturing stocks’ natural volatility.
Within specific risk controls, INTECH’s disciplined mathematical process establishes target proportional weightings for stocks in the portfolio as a result of an optimization routine. Once the weights are determined and the portfolio is constructed, it is rebalanced and re-optimized on a periodic basis. By limiting the distance any one stock position can deviate from its benchmark weight, INTECH’s process attempts to control the relative risk of the portfolio. We believe that instituting an investment process aimed at providing consistent, positive excess returns at benchmark-like risk, will allow us to meet our investors’ objectives while minimizing the risk of significant underperformance relative to the benchmark.
Outlook
Going forward, we will continue building portfolios in a disciplined and deliberate manner, with risk management remaining the hallmark of our investment process. While we may experience short periods of underperformance, we expect to exceed the benchmark over a three- to five-year time horizon. As INTECH’s ongoing research efforts yield modest improvements, we will continue implementing changes that we believe are likely to improve the long-term results for our clients.
Thank you for your investment in INTECH European Core Fund.
(February 2016)
INTECH Global All Country Low Volatility Fund
INTECH Investments Management LLC, portfolio manager
Performance Overview
For the twelve-month period ended December 31, 2015, INTECH Global All Country Low Volatility Fund (GBP) outperformed the MSCI All Country World Index (GBP), the Fund’s benchmark.
Investment Strategy
INTECH’s mathematical investment process is designed to determine potentially more efficient equity weightings of the securities in the benchmark index, utilizing a specific mathematical optimization and disciplined rebalancing routine. Rather than trying to predict the future direction of stock prices, the process seeks to use the volatility and correlation characteristics of stocks to construct portfolios.
The investment process begins with the stocks in the MSCI All Country World Index (GBP). INTECH’s investment

J a n u s C a p i t a l F u n d s P l c / 3 1 D e c e m b e r 2 0 1 5 5 3
process aims to capture stocks’ natural volatility through a rebalancing mechanism based on estimates of relative volatility and correlation in an attempt to generate market like return while minimizing the volatility of the portfolio over the long term. Once the target proportions are determined and the portfolio is constructed, it is then rebalanced to those target proportions and re-optimized on a periodic basis. INTECH Global All Country Low Volatility Fund aims to generate market-like returns over time with significantly lower return fluctuations. While some downside protection and a more consistent experience are expected over the long term, the tracking-error relative to the MSCI All Country World Index (GBP) is expected to be high.
Outlook
Going forward, we will continue building portfolios in a disciplined and deliberate manner, with risk management remaining the hallmark of our investment process. As INTECH’s ongoing research efforts yield modest improvements, we will continue implementing changes that we believe are likely to improve the long-term results for our clients.
Thank you for your investment in INTECH Global All Country Low Volatility Fund (GBP).
(February 2016)
INTECH Global Dividend Fund
INTECH Investment Management LLC, portfolio manager
Performance Overview
For the twelve-month period ended December 31, 2015, INTECH Global Dividend Fund underperformed the MSCI World Index, the Fund’s primary benchmark, and its secondary benchmark, the MSCI World High Dividend Yield Index, returning (4.38)% on Class I$acc Shares.
Investment Strategy
INTECH’s mathematical investing process seeks to build a more efficient portfolio than its benchmark, with returns in excess of the index while maintaining benchmark-like risk. The process does not attempt to predict the direction of the market, nor does it have a view of any particular company in the portfolio. Instead, it employs a proprietary optimization process to build portfolios with the potential to outperform the index by capturing stocks’ natural volatility.
Within specific risk controls, INTECH’s disciplined mathematical process establishes target proportional weightings for stocks in the portfolio as a result of an optimization routine. Once the weights are determined and the portfolio is constructed, it is rebalanced and re-optimized on a periodic basis. By
limiting the distance any one stock position can deviate from its benchmark weight, INTECH’s process attempts to control the relative risk of the portfolio. We believe that instituting an investment process aimed at providing consistent, positive excess returns at benchmark-like risk, will allow us to meet our investors’ objectives while minimizing the risk of significant underperformance relative to the benchmark.
Outlook
Going forward, we will continue building portfolios in a disciplined and deliberate manner, with risk management remaining the hallmark of our investment process. While we may experience short periods of underperformance, we expect to exceed the benchmark over a three- to five-year time horizon. As INTECH’s ongoing research efforts yield modest improvements, we will continue implementing changes that we believe are likely to improve the long-term results for our clients.
Thank you for your investment in INTECH Global Dividend Fund.
(February 2016)
INTECH US Core Fund
INTECH Investments Management LLC, portfolio manager
Performance Overview
For the twelve-month period ended December 31, 2015, INTECH U.S. Core Fund returned 1.84% for its Class I$acc Shares outperforming the S&P 500 Index, the Fund’s benchmark.
Investment Strategy
INTECH’s mathematical investing process seeks to build a more efficient portfolio than its benchmark, with returns in excess of the index while maintaining benchmark-like risk. The process does not attempt to predict the direction of the market, nor does it have a view of any particular company in the portfolio. Instead, it employs a proprietary optimization process to build portfolios with the potential to outperform the index by capturing stocks’ natural volatility.
Within specific risk controls, INTECH’s disciplined mathematical process establishes target proportional weightings for stocks in the portfolio as a result of an optimization routine. Once the weights are determined and the portfolio is constructed, it is rebalanced and re-optimized on a periodic basis. By limiting the distance any one stock position can deviate from its benchmark weight, INTECH’s process attempts to control the relative risk of the portfolio. We believe that instituting an investment process aimed at providing consistent, positive excess returns at benchmark-like risk, will allow us to meet our investors’ objectives while

Fund Overviews (unaudited)
5 4 J a n u s C a p i t a l F u n d s P l c / 3 1 D e c e m b e r 2 0 1 5
minimizing the risk of significant underperformance relative to the benchmark.
Outlook
Going forward, we will continue building portfolios in a disciplined and deliberate manner, with risk management remaining the hallmark of our investment process. While we may experience short periods of underperformance, we expect to exceed the benchmark over a three- to five-year time horizon. As INTECH’s ongoing research efforts yield modest improvements, we will continue implementing changes that we believe are likely to improve the long-term results for our clients.
Thank you for your investment in INTECH US Core Fund.
(February 2016)
Janus Global Diversifi ed Alternatives Fund
Andrew Weisman, John Fujiwara and Richard Lindsey, portfolio managers
Performance Summary
For the financial year ended December 31, 2015, the Janus Global Diversified Alternatives Fund underperformed its benchmark, returning (7.74)% on Class I$acc Shares.
Investment Environment
U.S. stocks gained over the first half of the year, driven by the expectation that weak economic and jobs data during the winter would prove transitory. A resumption of growth validated this viewpoint. In late summer, slowing growth expectations in China and the subsequent sell-off in the country’s stock markets weighed on markets. The policy responses of Chinese authorities, which included a devaluation of the country’s currency, the renminbi, further added to investor discomfort. Despite a rally at the beginning of the fourth quarter, stock investors later became concerned with renewed weakness in energy markets. Prices on global crude benchmarks dropped to multi-year lows on the back of surging inventory and OPEC’s decision to not curtail production. The European Central Bank’s (ECB) plan to extend its asset-buying program failed to meet expectations, sending the region’s stock indices into a tailspin.
Steady growth and the expectation that the Federal Reserve (Fed) would raise rates during the year pushed yields on the 10-year Treasury higher, nearly reaching 2.50% in June before retreating as global growth concerns weighed on sentiment. After foregoing a hike in September, investors grew confident that the Fed would move at its December meeting. The yield on the 2-year subsequently rose. Spreads on investment-grade corporates widened in 2015, due, in part, to record new issuance. High-yield spreads spiked late year as energy prices experienced a sharp decline.
Performance Discussion
The Fund underperformed its primary benchmark, the Barclays U.S. Aggregate Bond Index, and its secondary benchmark, LIBOR + 4%, during the year. Over time, the Fund seeks to provide positive absolute returns and offer true diversification with low correlation to stocks and bonds by investing in a portfolio of risk premia strategies.
Two of the Fund’s commodity strategies contributed to returns. Because these strategies were short energy – specifically crude oil – during the period, they benefited as energy prices fell throughout the period. The commodity value strategy, which looks to benefit from identifying relative inventory conditions between commodities and investing in those that are signalling low inventories and selling those that are signalling high inventories, was the leading contributor. The commodity curve strategy was also able to capitalize on the price weakness. This strategy seeks to generate returns by providing liquidity to the most “crowded” section of the commodity futures curve; it is typically short the most active front-month contract and long farther-dated tenors.
The credit strategy, which seeks to capture the potential systematic return associated with the default and duration risks of investing in bond markets, also contributed. Because this strategy uses interest rate swaps to create a synthetic replication of a credit portfolio, it generally benefited from falling interest rates and the outperformance of interest rate swaps over Treasurys during the year.
Three of the Fund’s equity strategies underperformed during the year. The equity value strategy, which aims to capture the potential returns associated with holding value equities while also being short growth stocks, was the leading detractor. Since the energy sector has become an increasingly significant component of value indices, the strategy’s performance was impacted as energy markets traded lower throughout the period and underperformed growth stocks. The equity emerging strategy, which looks to capture the potential return associated with holding equities in companies of lesser-developed economies, underperformed as the weakness in the commodities space weighed on emerging market economies.
The equity momentum strategy also underperformed. This strategy aims to capture directional momentum in equities through the quantitative analysis of equity index price movement. Diverging macroeconomic events during the year led to directionless and choppy equity markets, which weighed on the strategy’s performance.
Outlook
Although we do not believe in forecasting a market’s particular direction, we remain mindful of ongoing volatility in the financial markets.

J a n u s C a p i t a l F u n d s P l c / 3 1 D e c e m b e r 2 0 1 5 5 5
Elevated volatility near the end of the year, especially within the currency market, caused the Fund’s models to reduce the weighting to the currency momentum strategy. Amid continued volatility in the energy space, the models also reduced the allocations to the equity value strategy and the commodity curve strategy. The allocations of the equity size and equity emerging strategies were increased.
Thank you for investing in Janus Global Diversified Alternatives Fund.
(February 2016)
Janus Global Real Estate Fund
Patrick Brophy, portfolio manager
On a relative basis, the Janus Global Real Estate Fund underperformed its benchmark for the 12-month period ending 31 December 2015. The Fund’s Class I$inc Shares finished the year at (3.77) %. The benchmark, the FTSE/EPRA NAREIT Global Index, returned (0.41)%.
Investment Environment
While still volatile, the final quarter of the calendar year provided a much smoother ride than the previous three months. It also proved a good quarter for global real estate, with the sector posting just shy of a 5% gain to close out the year. That strong finish wasn’t quite enough to get the sector back to flat for calendar 2015, and it certainly wasn’t enough to make us more optimistic about the short-term prospects for equity markets. In fact, the continued uptick in volatility suggests to us that investors are increasingly apprehensive about the global economy and the durability of its underwhelming growth. We share their concerns.
For real estate specifically, a more cautious approach seems warranted for several reasons, not the least of which is that the sector has had one heck of a run since its trough in 2009. It has also benefited from an unprecedented period of low interest rates, making its lifeblood, capital, both plentiful and cheap. Clearly, central banks, at least in much of the developed world, wanted to reflate asset prices. And, in the case of commercial real estate, they’ve succeeded. We think it gets harder from here, even though rates are still very low, certain central banks from Japan to Europe continue to ease, and fundamentals remain strong. This is not to say that we’re bearish on real estate; we just think the easy money has been made.
As we scour global markets, we’re currently most enthused about the investment opportunities we’re finding in Europe and parts of Asia. We’re uncovering less that appeals in the U.S., and we remain wary of emerging markets. We’re not sure that the macro environment will get any less turbulent, but if it does we think the emphasis will shift back to stock picking, something we would certainly welcome.
Performance Discussion
Looking at our performance across major geographies (those that occupy a 2% index weighting or greater, our stock selection in the U.S. and Hong Kong were the largest detractors from relative performance. Our stock selection in Japan and Germany contributed to our relative results.
Our geographic allocation detracted from relative performance. Our overweight to Brazil and underweight to China detracted most from performance. Our underweight to Hong Kong and overweight to the UK contributed most to relative results.
In terms of returns by sector, the top contributors to the Fund’s performance were specialized REITs and real estate service companies. Notable detractors included hotel and resort REITs and diversified real estate companies. Relative to the index, our holdings in hotel and resort REITs and residential REITs were the largest detractors from relative performance. Our holdings in homebuilders and office REITs were the largest contributors to relative results.
On an absolute basis, Chatham Lodging was our largest detractor from performance. Chatham is a U.S. REIT that was launched in 2010 to invest in upscale extended-stay and branded select-service hotels. In its relatively brief existence, the company has assembled what we consider a solid portfolio of hotel properties, and its focus on select service, a sector most of the hotel REITs shy away from, provides an attractive growth opportunity, in our opinion. Coming off of a strong 2014, the stock has been disappointing this year, but we still see good value and solid growth, and we’re confident that we’ve invested with a management team that won’t be shy about taking chips off the table when they feel the upcycle is nearing its end.
Pebblebrook Hotel was another detractor. Listed in late 2009 as a blind pool, Pebblebrook has already grown into an approximately $4 billion hotel REIT. We have a high level of confidence in its management team, and we think they’ve done an exceptional job of acquiring and repositioning/upgrading hotels in multiple U.S. markets. If, as we continue to believe, the upcycle for the hotel industry has at least a year or two left to run, Pebblebrook should be well positioned to continue generating strong returns.
LGI Homes was our largest contributor to performance. LGI Homes is a Texas-based homebuilder with a different business model than most of the listed homebuilders. LGI focuses on marketing to current apartment renters within a 25-mile radius of its new developments. Its marketing model is similar to the one used in the timeshare industry; LGI builds units on speculation and then markets them move-in ready. The company only went public in November 2013, so we think the stock is still in the discovery phase for the bulk of the market. And we anticipate the market will like what it discovers, especially as it relates to both business model and valuation.

Fund Overviews (unaudited)
5 6 J a n u s C a p i t a l F u n d s P l c / 3 1 D e c e m b e r 2 0 1 5
Aroundtown Property was another top contributor to the Fund’s performance during the year. Aroundtown is a specialist real estate company that invests in value-add, income-generating properties, primarily in Germany. We believe it has a proven business model predicated on operational excellence, off-market acquisitions, and a focus on high-barrier-to-entry markets. We also like its conservative financial profile, and view it as a defensive investment opportunity that provides direct exposure to both an existing portfolio with strong cash flow and a compelling acquisition pipeline.
Outlook
In recent quarters we have seen performance differences – both positive and negative – that were significantly more pronounced. We mention this because we anticipate that, given how different the Fund tends to look from the index, results will likely continue to diverge, especially in today’s more volatile markets. As long-term investors are aware, we don’t set out to be different from the index, but we also don’t let the index supersede the results of our intensive research and bottom-up approach. Our best ideas get owned in size, whether or not they’re a significant component of, or even in, the index.
Over the years, this research-driven process has tended to lead to a small-cap bias and more of a deep value approach, which is consistent with how the Fund looks today. We mention this here, because if we do enter into a more defensive/negative market environment, as pondered in our Market/Economics discussion above, this positioning could result in more volatility (investors tend to gravitate to the more liquid large-caps when things get rocky). Obviously, this is something we think about a lot, and, as a result, we have made some tweaks to the portfolio. However, we don’t think a potential downturn warrants abandoning the disciplined and somewhat unique process that has made the Fund a long-term outperformer. Having endured the collapse of 2008/2009, we know that ultimately the market recognizes value and patience should in fact pay.
Thank you for your investment in Janus Global Real Estate Fund.
(February 2016)
Janus Flexible Income Fund
Gibson Smith, Darrell Watters, Mikael Keough and Mayur Saigal, portfolio managers
Performance Summary
During the year ended December 31, 2015, Janus Flexible Income Fund’s Class I$acc Shares returned 0.09% after expenses, compared with 0.55% for the Fund’s benchmark, the Barclays U.S. Aggregate Bond Index.
Investment Environment
U.S. fixed income markets endured a volatile 2015, with investor angst driven by the prospect of diverging monetary policy and varying growth trajectories among major economies. Early on, worries about slowing global growth drove demand for Treasurys, pushing yields to 1.64%. Another source of risk was Europe, as an anti-austerity party won elections in Greece. Investors’ attention stayed focused on Europe as the European Central Bank (ECB) announced its own version of quantitative easing (QE). By spring, improving U.S. data that confirmed the winter slowdown was ephemeral resulted in a rise in Treasury yields.
Markets also took cues from the Federal Reserve (Fed) as investors anticipated when the central bank would move off its zero-percent interest rate policy. Volatility emanating from China, as that country struggled with slowing growth, caused the Fed to delay raising rates at its September meeting. Improving jobs data increased expectations of a December increase, which ultimately occurred. This sent the yield on the 2-year Treasury above 1%. The yield on the 10-year, however, dipped as inflation data remained muted.
Investment-grade corporate spreads widened in the spring and stayed range-bound for much of the remainder of the year. High-yield credits, on the other hand, widened considerably between June and December. For the year, the Treasury yield curve steepened, with upward pressure felt most on the front end of the curve.
Performance Discussion
Conditions in fixed income markets during the period, in our view, continued to merit defensive positioning. Among the factors that concern us most are company actions indicative of the later stages of a credit cycle and alarmingly low market liquidity. While we aim at maximizing risk-adjusted returns, we believed that it was in our clients’ best interest to focus on capital preservation during the year, resulting in the Fund underperforming its benchmark.
Detracting from relative performance was our yield curve positioning within Treasurys. The front-end of the Treasury yield curve steepened during the period as the market anticipated an eventual interest rate hike by the Fed. While lowering Fund duration to a level below the benchmark during the year, we raised it to in line with the benchmark by the end of the period.
Also detracting from performance was yield curve positioning within mortgage-backed securities (MBS). Rate volatility early in the period impacted MBS performance as mixed economic data and lack of clarity on the timing of the Fed’s initial rate hike made it difficult for investors to gauge prepayment risks

J a n u s C a p i t a l F u n d s P l c / 3 1 D e c e m b e r 2 0 1 5 5 7
on these securities. Toward the end of the period, we slightly increased our positioning in MBS.
Our out-of-benchmark allocation to high-yield corporate credit, concentrated in the highest tier of the high-yield segment, contributed most to relative returns. Performance was largely generated by spread carry, a measure of excess income generated by the Fund’s holdings. Our out-of-benchmark allocation to preferred equity also contributed to relative performance.
The credit sectors that weighed most on relative performance were independent- and midstream-energy. After having stabilized during the first half of 2015, global energy prices resumed their downward slide through the end of the period. Spread carry and security selection within banking contributed to performance, as did our overweight positioning, along with spread carry, in brokerages, asset managers and exchanges.
Outlook
We believe that many of the clouds that hung over fixed income markets in 2015 remain with us. As such, we consider it prudent to maintain a defensive stance within our Funds. Yes, the Fed removed lingering uncertainty about whether it would raise interest rates, but the timing of future hikes is a matter of debate. It is our view that the Fed’s economic growth projections for 2016 are too optimistic. Therefore, we doubt that the four 0.25% increases the central bank anticipates for the year will come to fruition.
While the change in nonfarm payrolls rebounded after subpar late-summer readings, and the unemployment rate, at 5%, is roughly what the Fed considers optimal, the other part of its dual mandate – inflation – remains frustratingly low. It is difficult to identify future sources of inflationary pressure. Hourly wage growth is mired in the 2% to 2.5% range and there are only incipient signs that consumers are spending a portion of their “gasoline dividend,” while much of the windfall created by multi-year lows in energy prices is finding its way into savings. Weak global growth and a strengthening U.S. dollar could further keep upward price pressure at bay.
Company developments, we believe, validate our view that we are in the later stages of the credit cycle. Shareholder-friendly activities continue and balance sheet strength has become more fleeting across a range of sectors, most notably energy. A chief concern is that much of the financial engineering that has occurred is aimed at compensating for lower revenue growth. With economic acceleration remaining elusive and rates still low, we expect management teams to continue to purchase growth, with these acquisitions often financed by debt issuance. We see less room for margin expansion, and with extended balance sheets, suboptimal results may be met with harsh market reaction.
Given this environment, we have minimized our exposure to the riskiest tiers of high-yield credit as we suspect the
market may experience an uptick in defaults. Instead, we have increased our credit allocation by focusing on high-yield issuers with higher ratings.
By utilizing our Treasury allocation, we ended the period with the Fund’s duration in line with that of the benchmark. We believe that our increased exposure to longer dated Treasurys may counteract the volatility we expect risk assets to experience over the coming quarters. At the same time, our exposure to shorter dated Treasurys stands to be a source of liquidity, which may enable us to capitalize on attractive buying opportunities.
Despite the Fed’s move away from its zero-interest-rate policy, fixed income markets are no less fraught with risks. The potential price dislocations associated with illiquid markets becomes more of a threat as stretched balance sheets and low growth may lead to earnings misses and investor redemptions. We believe that security avoidance will be a central driver of performance as the asymmetric risk of holding risky credits far outweighs the potential upside. Perhaps at no other time since the economy emerged from the financial crisis have our core tenets of capital preservation and risk-adjusted returns been so essential to meeting the investment goals of our clients.
Thank you for your investment in Janus Flexible Income Fund.
(February 2016)
Janus Global Flexible Income Fund
Christopher Diaz, Ryan Myerberg, Gibson Smith and Darrell Watters (Gibson Smith and Darrell Watters departed in December 2015), portfolio managers
Performance Summary
Janus Global Flexible Income Fund‘s Class I$inc underperformed its benchmark, the Barclays Global Aggregate Bond Index, for the year ended December 31, 2015, returning (4.01)% versus (3.15)% for the Index.
Investment Environment
Trends that were prevalent in global bond and currency markets during the first quarter 2015 underwent a marked reversal during the second three months of the year. Some of the most dynamic moves were associated with Europe. In the wake of the European Central Bank’s (ECB) winter announcement of its own quantitative-easing (QE) program, yields on the 10-year bund nearly dip to 0%. German sovereign debt then sold off aggressively during the spring, with the 10-year yield rising to as high as 0.98%. Fueling the sell-off were concerns that the winter’s bond rally within the eurozone may have gotten ahead of itself. Following the bund’s lead, yield curves steepened across the eurozone, with peripheral nations experiencing the strongest moves. By June, growing concern over Greece’s
Fund Overviews (unaudited)
5 8 J a n u s C a p i t a l F u n d s P l c / 3 1 D e c e m b e r 2 0 1 5
ability to meet its debt obligations also weighed on peripheral sovereign debt, while at the same time reeling yields back in on safe-haven bunds.
Global fixed income markets continued to grapple with potential effects of diverging monetary policy and growth trajectories among major economies during the latter half of the year. Volatility emanating from China, as that country struggled with slowing growth was among the factors that caused the Federal Reserve (Fed) to delay raising rates at its September meeting. Improving jobs data increased expectations of a December increase, which ultimately occurred. This sent the yield on the 2-year Treasury above 1%. The yield on the 10-year, however, dipped as inflation data remained muted. Also in December, the ECB’s plan to extend its asset-purchase program by six months fell flat with investors, who had hoped for more. The move sent the yield on 2-year and 10-year German bunds sharply higher.
Investment-grade corporate spreads widened late summer but later retreated as the sell-off in risk assets subsided. High-yield credits, on the other hand, widened considerably. The front end of the Treasury yield curve steepened, while low growth and inflation expectations caused the long end to slightly flatten in the second half of the year. A strong dollar and weak commodities prices kept emerging market currencies under pressure.
Performance Discussion
The Fund’s Class I$inc Shares underperformed its primary benchmark, the Barclays Global Aggregate Bond Index during the period. On an asset class basis, our out-of-benchmark allocation to high-yield corporate credit was the leading contributor on a relative basis, primarily driven by spread carry – a measure of excess income generated by the Fund’s holdings. Our yield curve positioning in sovereign debt was also a relative contributor. Our yield curve positioning and allocation in out-of-benchmark Portuguese sovereign debt was the largest contributor in this category. Yield curve positioning in the sovereigns of New Zealand also contributed.
Within corporate credit, leading sector contributors included banking and building materials. Our leading credit sector detractors were independent- and integrated-energy, reflecting the decline in crude oil prices during the year.
The largest individual corporate credit detractor from relative performance was hard disk manufacturer Seagate Technology. We invested in Seagate in 2014 due to its leading position in an industry that had undergone consolidation. Recently, hard disk demand has softened due to weak personal computer growth in emerging markets and a strong U.S. dollar. Still, Seagate maintains a conservative balance sheet and management aims to reduce leverage further. The company continues to generate solid free cash flow, and, in our view, has a sufficient equity cushion to protect bondholders.
Chesapeake Energy, a major natural gas producer with some oil assets, also detracted from relative results. Although the company has achieved productivity gains to help combat the weak price environment, we exited the position during the period.
Our exposure to the British pound, Canadian dollar and Mexican peso detracted from relative results. Relative gains were attributable to our euro exposure. After the euro’s calamitous decline beginning in late 2014 and continuing on through the early stages of the ECB’s QE program, its fortunes reversed against the U.S. dollar for much of the year until another bout of weakness occurred late summer.
Outlook
The U.S. having entered a rising rate environment far from clarifies the outlook for global interest rate and monetary policy. The U.S. is one of the highest yielders among advanced economies, but the trajectory and cadence of future rate hikes is by no means settled. The Fed’s optimistic economic projections call for four rate hikes of 0.25% during 2016. We view that scenario as doubtful. The rails of future U.S. growth may be confined within the 1.5% to 3% range. In such an environment, we would suspect the interest rate that the Fed deems appropriate over the long term to be lower than its pre-crisis average.
Subpar growth trajectories are evidenced in low rates of inflation in both the U.S. and abroad. What had earlier been considered an issue of excess supply across commodities – especially with regard to North American crude production and OPEC’s refusal to rationalize output – now can partly be ascribed to flagging demand. Low inflation complicates many central banks’ accommodative goals as it acts as a de-facto tightening mechanism. Most vulnerable to this are emerging markets whose consumption basket is weighted toward energy and food. Disinflation within the U.S. would likely keep downward pressure on the long-end of the Treasurys curve.
ECB officials are dealing with the same issue as its asset-purchasing program has yet to spur inflation and subsequently catalyze aggregate demand. The euro’s sharp advance in December may further add to disinflationary pressure. Many continental economies, led by Ireland and Spain, have made substantive reforms. We expect the yields on the bonds of reforming countries to converge toward those of German Bunds. While the economic situation slowly improves, the region faces an array of geopolitical risks. The UK is expected hold a referendum on a so-called “Brexit” during 2016. At the very least, the country will seek to negotiate its relationship with the European Union.
Emerging markets remained challenged. But given their abysmal recent run, we expect many of the hurdles have been priced in. Before increasing exposure to these regions it is necessary to differentiate between the dispersed range of

J a n u s C a p i t a l F u n d s P l c / 3 1 D e c e m b e r 2 0 1 5 5 9
potential outcomes. Brazil, for example, is mired not only in a commodities-driven recession, but also a political quagmire, including the possibility of impeachment proceedings against the president.
A risk we continue to monitor in emerging markets is the pressure that weak currencies and low prices for basic materials may place on the government and corporate balance sheets. Emerging market debt has surged over the past several years, and while a greater share is denominated in local currency, a sizeable amount remains U.S. dollar-denominated, meaning the risk of default is on the table should revenues weaken further. There are bright spots. In our opinion, India continues to lead the way in reforms among the largest developing economies, and Mexico may represent an attractive risk/reward profile.
While we see opportunity in 2016, our positioning remains defensive. The Fund’s credit allocation is near the low end of its historical range. We are overweight the U.S. dollar and have portfolio duration below that of the benchmark. In light of widening of spreads among corporate credit in the fourth quarter and risks roiling across many regions, we are closely adhering to our long-standing core tenets of capital preservation and risk adjusted returns. Perhaps at no other time since the financial crisis have these principles been so essential to meeting the investment goals of our clients.
Thank you for your investment in Janus Global Flexible Income Fund.
(February 2016)
Janus Global High Yield Fund
Christopher Diaz, Ryan Myerberg and Annika Eiremo, portfolio managers
Performance Summary
During the financial year ended December 31, 2015, the Janus Global High Yield Fund’s Class I$acc Shares returned (2.26)% compared with a (2.72)% return for the Fund’s benchmark, the Barclays Global High-Yield Bond Index.
Investment Environment
U.S. fixed income markets endured a volatile 2015, with investor angst driven by the prospect of diverging monetary policy and varying growth trajectories among major economies. Concern about slowing global growth drove demand for Treasurys early in the year, pushing yields down to 1.64%. Another source of risk was Europe, as a radical, anti-austerity party won elections in Greece. Investors’ attention stayed focused on Europe as the European Central Bank (ECB) announced its own version of quantitative easing (QE). By spring, improving U.S. data that confirmed the winter slowdown was indeed ephemeral resulted in a rise in Treasury yields.
Markets also took cues from the Federal Reserve (Fed) as investors anticipated when the central bank would eventually move off its zero-percent interest rate policy. Volatility emanating from China – as that country struggled with slowing growth – caused the Fed to delay raising rates at its September meeting. Improving jobs data increased expectations of a December increase, which ultimately occurred. This sent the yield on the 2-year Treasury above 1%. The yield on the 10-year, however, dipped as inflation data remained muted.
Spreads on high-yield corporate credits widened considerably between June and December, leading to much higher yields. High-yield spreads were close to 7% by mid-December. Renewed weakness in the energy sector was partly responsible, along with deteriorating quality on corporate balance sheets.
Performance Discussion
The Fund’s Class I$acc Shares outperformed its benchmark, the Barclays Global High-Yield Bond Index, during the period. Many of the concerns that have caused us to maintain defensive positioning were on full display during the period. Shareholder-friendly activity in the form of buybacks and merger and acquisition (M&A) activity continued. Many of these initiatives have been funded by debt issuance. Specifically within high yield, the renewed declines in energy prices have compromised the balance sheets of sector names that feasted on low interested rates to fund expansion. As a consequence, during the period we increased our defensive stance. We have reduced our allocation toward economically sensitive sectors, namely transportation and elevated our cash position. We increased our allocation in technology and banking. The combination of stressed balance sheets and the risk of subdued revenue growth led us to reduce our exposure to the lower-rated tiers within high-yield credit, preferring, instead, higher rated issuers whose management teams have shown a commitment to capital discipline and generating cash flow across a range of market cycles.
On an asset class basis, our security selection in high-yield corporate credit was the primary relative contributor to performance, aided by spread carry – a measure of excess income generated by the Portfolio’s holdings – in the segment. Our out-of-index allocations to convertible securities, commercial mortgage-backed securities (CMBS) and common stock were also relative contributors. Given the stress experienced in high-yield markets toward the end of the period, our elevated cash positioning also contributed to relative performance. We do not aim for cash to be a source of returns, but rather it is a frictional component of investing activity.
The primary detractor from relative results was our lack of exposure to government-related debt.
On a credit sector basis, our underweight to metals and mining and oil field services contributed most to relative results. Security selection within aerospace/defense, gaming and wireless communications also aided performance.

Fund Overviews (unaudited)
6 0 J a n u s C a p i t a l F u n d s P l c / 3 1 D e c e m b e r 2 0 1 5
Our holdings in media entertainment and railroads weighed most on relative results, as did our security selection and overweight in pharmaceuticals.
Outlook
We believe that many of the clouds that hung over fixed income markets in 2015 remain with us. As such, we consider it prudent to maintain a defensive stance within our portfolios. It is our view that neither the economic growth nor the four 0.25% increases that the Fed projects such growth merits in 2016 will come to fruition. Recent weakness in the ISM Purchasing Managers Index – a key gauge of U.S. manufacturing – underpins our concerns.
While the change in nonfarm payrolls rebounded after subpar late-summer readings, and the unemployment rate, at 5%, is roughly what the Fed considers optimal, the other part of its dual mandate – inflation – remains frustratingly low. It is difficult to identify future sources of inflationary pressure. Hourly wage growth is mired in the 2% to 2.5% range and there are only incipient signs that consumers are spending a portion of their “gasoline dividend,” while much of the windfall created by multi-year lows in energy prices is finding its way into savings. Weak global growth and a strengthening U.S. dollar could further keep upward price pressure at bay.
Company developments, we believe, validate our view that we are in the later stages of the credit cycle. Shareholder-friendly activities continue and balance sheet strength has become more fleeting across a range of sectors, most notably energy. A chief concern is that much of the financial engineering that has occurred is aimed at compensating for lower revenue growth. With economic acceleration remaining elusive and rates still low, we expect management teams to continue to purchase growth, with these acquisitions often financed by debt issuance. We see less room for margin expansion, and with extended balance sheets, suboptimal results may be met with harsh market reaction.
Given this environment, we have minimized our exposure to the riskiest tiers of high-yield credit as we suspect the market may experience an uptick in defaults. Identifying opportunities in the current environment, in our view, requires bottom-up, active management. In the energy sector, for example, our research is focused on identifying management teams that can weather the volatile supply/demand environment the industry is currently experiencing. While we believe it is too early to increase our exposure to the sector, we are working to identify companies with the most attractive assets and innovative technologies that will enable them to meet their obligations regardless of the price environment. We aim to avoid companies that are a proxy for crude prices.
Despite the Fed’s move away from its zero-interest-rate policy, fixed income markets are no less fraught with risks. The potential price dislocations associated with illiquid markets
become more of a threat as stretched balance sheets and low growth may lead to earnings misses and investor redemptions. We believe that security avoidance will be a central driver of performance as the asymmetric risk of holding risky credits far outweighs the potential upside. Perhaps at no other time since the economy emerged from the financial crisis have our core tenets of capital preservation and risk-adjusted returns been so essential to meeting the investment goals of our clients.
Thank you for your investment in Janus Global High Yield Fund.
(February 2016)
Janus Global Investment Grade Bond Fund
Christopher Diaz, Ryan Myerberg and Annika Eiremo, portfolio managers
Performance Summary
During the financial year ended December 31, 2015, Janus Global Investment Grade Bond Fund’s Class I$acc Shares returned (4.91)% compared with a (3.56)% return for the Fund’s benchmark, the Barclays Global Aggregate Corporate Bond Index.
Investment Environment U.S. fixed income markets endured a volatile 2015, with investor angst driven by the prospect of diverging monetary policy and varying growth trajectories among major economies. Early on, worries about slowing global growth drove demand for Treasurys, pushing yields to 1.64%. Another source of risk was Europe, as an anti-austerity party won elections in Greece . Investors’ attention stayed focused on Europe as the European Central Bank (ECB) announced its own version of quantitative easing (QE). By spring, improving U.S. data that confirmed the winter slowdown was ephemeral resulted in a rise in Treasury yields.
Markets also took cues from the Federal Reserve (Fed) as investors anticipated when the central bank would move off its zero-percent interest rate policy. Volatility emanating from China, as that country struggled with slowing growth, was among the factors that caused the Fed to delay raising rates at its September meeting. Improving jobs data increased expectations of a December increase, which ultimately occurred. This sent the yield on the 2-year Treasury above 1%. The yield on the 10-year, however, dipped as inflation data remained muted.
Investment-grade corporate spreads widened in the spring and stayed range-bound for much of the remainder of the year. High-yield credits, on the other hand, widened considerably between June and December. For the year, the Treasury yield curve steepened, with upward pressure felt most on the front end of the curve.
Performance Discussion
The Fund’s Class I$acc Shares underperformed its benchmark, the Barclays Global Aggregate Corporate Bond Index, for the

J a n u s C a p i t a l F u n d s P l c / 3 1 D e c e m b e r 2 0 1 5 6 1
financial year ending December 31, 2015. Conditions in fixed income markets during the period, in our view, continued to merit defensive positioning. Among the factors that concern us most are company actions indicative of the later stages of a credit cycle and alarmingly low market liquidity. The Fund’s duration finished the year below that of the benchmark. We believe our yield curve and duration positioning is appropriate as we do not expect economic growth to meet market expectations. Additionally, we see little impetus for upward pressure on longer-dated bonds given tepid growth and inflation that remains well below the Fed’s target.
On an asset class basis, our out-of-benchmark allocation to high-yield corporate credit was the largest relative contributor to performance, with spread carry – a measure of excess income generated by the Portfolio’s holdings – a key component of the performance. These contributing factors were partially offset by security selection in the segment. Securities within the highest-quality segment of high-yield credits were the main source of positive performance. Our out-of-benchmark allocation to bank loans also contributed to relative results. Security selection and yield curve positioning within investment grade credit weighed on relative performance.
On a credit sector basis, our holdings in technology, integrated energy and pharmaceuticals were the largest detractors from relative performance. Hard disk manufacturer Seagate Technology was the largest individual relative detractor. We invested in Seagate in 2014 due to its leading position in an industry that had undergone consolidation. We also liked its conservative balance sheet and potential for a ratings upgrade, which ultimately occurred. Recently, hard disk demand has softened due to weak personal computer growth in emerging markets and a strong U.S. dollar. The company also released a disappointing earnings report. Still, Seagate maintains a conservative balance sheet and management aims to reduce leverage further. The company continues to generate solid free cash flow, and, in our view, has a sufficient equity cushion to protect bondholders.
During the year, energy prices, namely crude oil, experienced another leg down, with North American benchmark crude falling below $36 per barrel in intraday trading. As a result, Chesapeake Energy had a negative impact on performance. The major natural gas producer with some oil assets, has achieved productivity gains to help combat the weak price environment; however, we exited the position during the period.
Our underweight to metals and mining was the primary contributor to relative results. Security selection within banking, aided by spread carry, was also a positive contributor.
Outlook
We believe that many of the clouds that hung over fixed income markets in 2015 remain with us. As such, we consider it prudent to maintain a defensive stance within our portfolios. Yes, the
Federal Reserve (Fed) removed lingering uncertainty about whether it would raise interest rates, but the timing of future hikes is a matter of debate. Whereas the prospect of diverging central bank policy, in part, drove markets over the past few years, divergence has now become reality. The corresponding rate differentials and shifts in currencies will undoubtedly impact investment flows and returns going forward.
While the change in nonfarm payrolls rebounded after subpar late-summer readings, and the unemployment rate, at 5%, is roughly what the Fed considers optimal, the other part of its dual mandate – inflation – remains frustratingly low. It is difficult to identify future sources of inflationary pressure. Hourly wage growth is mired in the 2% to 2.5% range and there are only incipient signs that consumers are spending a portion of their “gasoline dividend,” while much of that windfall is finding its way into savings. Weak global growth and a strengthening U.S. dollar could further keep upward price pressure at bay.
Company developments, we believe, validate our view that we are in the later stages of the credit cycle. Shareholder-friendly activities continue and balance sheet strength has become more fleeting across a range of sectors, most notably energy. A chief concern is that much of the financial engineering that has occurred is aimed at compensating for lower revenue growth. With economic acceleration remaining elusive and rates still low, we expect management teams to continue to purchase growth, with these acquisitions often financed by debt issuance. We see less room for margin expansion, and with extended balance sheets, suboptimal results may be met with harsh market reaction.
Given this environment, we are focused on investment-grade credits and high-yield issuers with the highest ratings. This upper-tier of high-yield is a component of what we consider “crossover” credits and represents attractive risk-adjusted returns as disciplined balance sheet management and a commitment to generating stable cash flow may potentially lead to ratings upgrades.
Identifying such opportunities, in our view, requires bottom-up, active management. In the energy sector, for example, our research is focused on identifying management teams that can weather the volatile supply/demand environment the industry is currently experiencing. While we believe it is too early to increase our exposure to the sector, we are working to identify companies with the most attractive assets and innovative technologies that will enable them to meet their obligations regardless of the price environment. We aim to avoid companies that are a proxy for crude prices.
Despite the Fed’s move away from its zero-interest-rate policy, fixed income markets are no less fraught with risks. The potential price dislocations associated with illiquid markets become more of a threat as stretched balance sheets and low growth may lead to earnings misses and investor redemptions. We believe that security avoidance will be a central driver of performance as the asymmetric risk of holding risky credits far outweighs the

Fund Overviews (unaudited)
6 2 J a n u s C a p i t a l F u n d s P l c / 3 1 D e c e m b e r 2 0 1 5
potential upside. Perhaps at no other time since the economy emerged from the financial crisis have our core tenets of capital preservation and risk-adjusted returns been so essential to meeting the investment goals of our clients.
Thank you for your investment in Janus Global Investment Grade Bond Fund.
(February 2016)
Janus High Yield Fund
Gibson Smith, Darrell Watters and Seth Meyer, portfolio managers
During the year ended December 31, 2015, Janus High Yield Fund’s Class I$inc Shares returned (1.68)% after expenses, compared with (4.47)% for the Fund’s benchmark, the Barclays U.S. Corporate High Yield Bond Index.
Investment Environment
U.S. fixed income markets endured a volatile 2015, with investor angst driven by the prospect of diverging monetary policy and varying growth trajectories among major economies. Investor angst about slowing global growth drove demand for Treasurys early in the year, pushing yields to 1.64%. Another source of risk was Europe, as a radical, anti-austerity party won elections in Greece. Investors’ attention stayed focused on Europe as the European Central Bank (ECB) announced its own version of quantitative easing (QE). By spring, improving U.S. data that confirmed the winter slowdown was indeed ephemeral resulted in a rise in the yields of government bonds.
Markets also took cues from the Federal Reserve (Fed) as investors anticipated when the central bank would eventually move off its zero-percent interest rate policy. Volatility emanating from China, as that country struggled with slowing growth, caused the Fed to delay raising rates at its September meeting. Improving jobs data increased expectations of a December increase, which ultimately occurred. This sent the yield on the 2-year Treasury above 1%. The yield on the 10-year, however, dipped as inflation data remained muted.
Investment-grade corporate spreads widened in the spring and stayed range-bound for much of the remainder of the year. High-yield credits, on the other hand, widened considerably between June and December. For the year, the Treasury yield curve steepened, with expectations of rate hikes exerting most upward pressure on the front end of the curve.
Performance Discussion
The Fund’s Class I$ inc Shares outperformed its benchmark, the Barclays U.S. Corporate High-Yield Bond Index, during the period. Many of the concerns that have caused us to maintain defensive positioning were on full display during the period.
Shareholder-friendly activity in the form of buybacks and merger and acquisition (M&A) activity continued. Many of these initiatives have been funded by debt issuance. Specifically within high yield, the renewed declines in energy prices have compromised the balance sheets of sector names that feasted on low interested rates to fund expansion. As a consequence, during the period we increased our defensive stance. The combination of stressed balance sheets and the risk of subdued revenue growth led us to reduce our exposure to the lower-rated tiers within high-yield credit, preferring, instead, higher rated issuers whose management teams have shown a commitment to capital discipline and generating cash flow across a range of market cycles.
Security selection within high-yield corporate credits contributed most to outperformance. Given the stress experienced in high-yield markets toward the end of the period, our elevated cash positioning also contributed to relative performance. The Fund’s small out-of-benchmark allocation to common stock was a positive contributor as well.
On a credit sector basis, our underweight to metals and mining contributed most to relative results. This was followed by our slight underweight and security selection in independent energy. Security selection and an overweight in gaming, also aided performance.
Our allocation to the retail sector, media entertainment and finance companies weighed most on relative returns. The period’s leading individual detractor was sports apparel and active lifestyle company Quiksilver, which unexpectedly filed for bankruptcy in September. We maintain a position within the company as we believe it still has valuable assets – including its strong brand – that can provide value much greater than what is being priced into the market.
Outlook
We believe that many of the clouds that hung over fixed income markets in 2015 remain with us. As such, we consider it prudent to maintain a defensive stance within our portfolios. Yes, the Fed removed lingering uncertainty about whether it would raise interest rates, but the timing of future hikes is a matter of debate. It is our view that neither the economic growth nor the four 0.25% increases that the Fed projects such growth merits in 2016 will come to fruition.
While the change in nonfarm payrolls rebounded after subpar late-summer readings, and the unemployment rate, at 5%, is roughly what the Fed considers optimal, the other part of its dual mandate – inflation – remains frustratingly low. It is difficult to identify future sources of inflationary pressure. Hourly wage growth is mired in the 2% to 2.5% range and there are only incipient signs that consumers are spending a portion of their “gasoline dividend,” while much of the windfall created by multi-year lows in energy prices is finding its way into savings. Weak

J a n u s C a p i t a l F u n d s P l c / 3 1 D e c e m b e r 2 0 1 5 6 3
global growth and a strengthening U.S. dollar could further keep upward price pressure at bay.
Company developments, we believe, validate our view that we are in the later stages of the credit cycle. Shareholder-friendly activities continue and balance sheet strength has become more fleeting across a range of sectors, most notably energy. A chief concern is that much of the financial engineering that has occurred is aimed at compensating for lower revenue growth. With economic acceleration remaining elusive and rates still low, we expect management teams to continue to purchase growth, with these acquisitions often financed by debt issuance. We see less room for margin expansion, and with extended balance sheets, suboptimal results may be met with harsh market reaction.
Given this environment, we have minimized our exposure to the riskiest tiers of high-yield credit as we suspect the market may experience an uptick in defaults. Instead, we have increased our credit allocation by focusing on high-yield issuers with higher ratings.
Despite the Fed’s move away from its zero-interest-rate policy, fixed income markets are no less fraught with risks. The potential price dislocations associated with illiquid markets becomes more of a threat as stretched balance sheets and low growth may lead to earnings misses and investor redemptions. We believe that security avoidance will be a central driver of performance as the asymmetric risk of holding risky credits far outweighs the potential upside. Perhaps at no other time since the economy emerged from the financial crisis have our core tenets of capital preservation and risk-adjusted returns been so essential to meeting the investment goals of our clients.
Thank you for your investment in Janus High Yield Bond Fund.
(February 2016)
Janus Global Unconstrained Bond Fund
Bill Gross and Kumar Palghat, portfolio managers
Performance Summary
The Fund’s Class I$acc Shares returned (1.49)% underperforming its benchmark, the 3-month USD London Interbank Offered Rate (LIBOR) for the financial year.
Investment Environment
Global financial markets experienced an elevated level of volatility during the period. The dramatic reversal of the early-year rise in Chinese equities leached into other markets. While emerging markets were most affected, many developed market indices also experienced corrections. Concerns about market
volatility and the slowing global growth fueling it were factors in the Federal Reserve (Fed) opting not to raise interest rates at its September meeting.
Later, as consensus coalesced around Fed action in December, the yield on the 2-year Treasury increased, ultimately cresting 1% upon the announcement of a rate hike. The 10-year Treasury yield initially rose in anticipation of a hike, but then slipped back as lower growth and subdued inflation data removed additional upward pressure on rates. European monetary policy also swayed markets as the European Central Bank (ECB) disappointed investors with what they considered a modest extension of the bank’s asset-purchases program. The move sent the yield on 2-year and 10-year German bunds sharply higher. The region’s stocks also sold off and the euro rose against the U.S. dollar.
Investment-grade corporate spreads widened late summer but then retreated as the sell-off in risk assets subsided. High-yield credits, on the other hand, widened considerably. The front end of the Treasury yield curve steepened, while low growth and inflation expectations caused the long end to slightly flatten over the period. A strong dollar and weak commodities prices kept emerging market currencies under pressure.
Performance Discussion
For the period, the Fund underperformed its benchmark, the 3-month USD LIBOR. The strategy seeks to provide long-term positive returns through various market environments by managing portfolio duration, credit risk and volatility. The Fund seeks to limit potential downside and avoid areas of the market where we see disproportionate risk. The Fund is built upon a core of shorter duration cash-based fixed-income securities that provide a visible income stream. During the period, the Fund’s holdings in corporate credit contributed to performance.
Complementing the Fund’s core holdings are a series of strategies referred to as Structural Alpha, which are designed to generate excess returns by capitalizing on long-standing market tendencies. We constantly monitor markets to identify the asset classes and sectors where such tendencies may be present.
During the spring, we gained exposure to Germany bunds by employing such strategies. After having seen yields on the 10-year bund plummet to near 0% as the European Central Bank (ECB) rolled out its plan to purchase 60 billion euros of assets monthly, the market exhibited trepidation, wondering if the bund rally was overextended or if the ECB would need to complete its scheduled asset purchases in light of slowly improving eurozone data.
Our position on the bund involved selling volatility using options without taking a directional stance. As the bund rally reversed, the exposure of the trade shifted to a point where it

Fund Overviews (unaudited)
6 4 J a n u s C a p i t a l F u n d s P l c / 3 1 D e c e m b e r 2 0 1 5
was long the bund. Both the speed and the magnitude of the bund reversal surprised markets. As prices continued to fall, we employed other strategies to manage losses until expiry of the original contracts.
Given the shadow cast by impending central bank decisions during late summer, many investors sought protection on interest rate products. Consequently, the selling of U.S. and European interest rate volatility contributed to Fund performance. We structured these positions by selling put and call options on both bonds and bond futures. Toward the end of the period, as shifts in central bank policies put upward pressure on rates, we exercised what we viewed as prudent risk management by hedging some of the Fund’s interest rate risk. The cost incurred by implementing this hedge reduced the gains generated by other components of the Fund’s interest rate strategy.
The Fund also sold volatility on several currencies through the selling of put and call options. Currencies in which we had exposure during the period include the euro, the Mexican peso and the Japanese yen. The pronounced volatility in global financial markets seeped into currency markets in August. During that period, consensus grew that the Fed would likely not raise rates at its September meeting. This put downward pressure on the dollar, which weighed on Fund performance. Later in the period, after the ECB’s failure to excite investors with the extension of its quantitative easing program in December, the euro strengthened against the U.S. dollar, resulting in an additional loss for in the Fund’s currency positioning.
Thank you for your investment in Janus Global Unconstrained Bond Fund.
(February 2016)
Janus US Short-Term Bond Fund
Mayur Saigal, Gibson Smith and Darrell Watters, portfolio managers
Performance Summary
During the year ended December 31, 2015, Janus U.S. Short-Term Bond Fund’s Class I$acc Shares returned 0.10% after expenses, compared with 0.65% for the Fund’s benchmark, the Barclays 1-3 Year U.S. Government/Credit Index.
Investment Environment
U.S. fixed income markets endured a volatile 2015, with investor angst driven by the prospect of diverging monetary policy and varying growth trajectories among major economies. Early on, worries about slowing global growth drove demand for Treasurys, pushing yields to 1.64%. Another source of risk was Europe, as an anti-austerity party won elections in Greece.
Investors’ attention stayed focused on Europe as the European Central Bank (ECB) announced its own version of quantitative easing (QE). By spring, improving U.S. data that confirmed the winter slowdown was ephemeral resulted in a rise in Treasury yields.
Markets also took cues from the Federal Reserve (Fed) as investors anticipated when the central bank would move off its zero-percent interest rate policy. Volatility emanating from China, as that country struggled with slowing growth, caused the Fed to delay raising rates at its September meeting. Improving jobs data increased expectations of a December increase, which ultimately occurred. This sent the yield on the 2-year Treasury above 1%. The yield on the 10-year, however, dipped as inflation data remained muted.
Investment-grade corporate spreads widened in the spring and stayed range-bound for much of the remainder of the year. High-yield credits, on the other hand, widened considerably between June and December. For the year, the Treasury yield curve steepened, with upward pressure felt most on the front end of the curve.
Performance Discussion
Conditions in fixed income markets during the period, in our view, continued to merit defensive positioning. Among the factors that concern us most are company actions indicative of the later stages of a credit cycle and alarmingly low market liquidity. The Fund’s duration finished the period below that of the benchmark, and we decreased our corporate credit allocation, although we sought to take advantage of the spread widening in specific issues that continue to exhibit solid fundamentals. Our corporate credit weighting and security selection highlights our continued defensive stance, and we are concentrating our remaining holdings on higher-quality issuers.
On an asset class basis, the Fund’s yield curve positioning within Treasurys detracted from performance. The front end of the Treasury yield curve steepened during the period as the market anticipated an eventual interest rate hike by the Fed. Our cash holdings also detracted from performance. Cash is a residual component of our day-to-day investing and is not used as a source of returns. Contributing to performance was the Fund’s out-of-benchmark allocation to high-yield corporate credit. Spread carry, a measure of excess income generated by the Fund’s holdings, contributed to high-yield performance. This was offset, however, by security selection detracting for the period. Given our defensive stance, the Fund’s high-yield exposure is comprised almost entirely of the upper tier of this segment.
Our investment-grade corporate credit allocation was a significant asset class contributor as well, driven by spread carry.

J a n u s C a p i t a l F u n d s P l c / 3 1 D e c e m b e r 2 0 1 5 6 5
Other relative contributors included our out-of-index allocations to bank loans and asset-backed securities (ABS).
On a credit sector basis, our allocations to independent- and midstream-energy were the largest detractors from relative performance. During the period, energy prices, namely crude oil, experienced another leg down, with North American benchmark crude falling below $36 per barrel in intraday trading. The largest detracting issuer was Chesapeake Energy, a major natural gas producer with some oil assets. While they have achieved productivity gains to help combat the weak price environment, we exited the position during the period.
Relative credit sector contributors included technology and banks. On an issuer basis, banking and payment technology company Fidelity National Information Services was a key contributor. We like the company’s solid business model, which can remain stable in a tepid economic environment. We believe that management has the opportunity to better penetrate its customer base and can use free cash flow to pay down debt.
Outlook
We believe that many of the clouds that hung over fixed income markets in 2015 remain with us. As such, we consider it prudent to maintain a defensive stance within our portfolios. Yes, the Fed removed lingering uncertainty about whether it would raise interest rates, but the timing of future hikes is a matter of debate. It is our view that neither the economic growth nor the four 0.25% increases that the Fed projects such growth merits in 2016 will come to fruition.
While the change in nonfarm payrolls rebounded after subpar late-summer readings, and the unemployment rate, at 5%, is roughly what the Fed considers optimal, the other part of its dual mandate – inflation – remains frustratingly low. It is difficult to identify future sources of inflationary pressure. Hourly wage growth is mired in the 2% to 2.5% range and there are only incipient signs that consumers are spending a portion of their
“gasoline dividend,” while much of the windfall created by multi-year lows in energy prices is finding its way into savings. Weak global growth and a strengthening U.S. dollar could further keep upward price pressure at bay.
Company developments, we believe, validate our view that we are in the later stages of the credit cycle. Shareholder-friendly activities continue and balance sheet strength has become more fleeting across a range of sectors, most notably energy. A chief concern is that much of the financial engineering that has occurred is aimed at compensating for lower revenue growth. With economic acceleration remaining elusive and rates still low, we expect management teams to continue to purchase growth, with these acquisitions often financed by debt issuance. We see less room for margin expansion, and with extended balance sheets, suboptimal results may be met with harsh market reaction.
Given this environment, we have minimized our exposure to the riskiest tiers of high-yield credit as we suspect the market may experience an uptick in defaults. Instead, we have increased our credit allocation by focusing on high-yield issuers with higher ratings.
Despite the Fed’s move away from its zero-interest-rate policy, fixed income markets are no less fraught with risks. The potential price dislocations associated with illiquid markets become more of a threat as stretched balance sheets and low growth may lead to earnings misses and investor redemptions. We believe that security avoidance will be a central driver of performance as the asymmetric risk of holding risky credits far outweighs the potential upside. Perhaps at no other time since the economy emerged from the financial crisis have our core tenets of capital preservation and risk-adjusted returns been so essential to meeting the investment goals of our clients.
Thank you for your investment in Janus US Short-Term Bond Fund.
(February 2016)

Fund Performance (unaudited)
TOTAL RETURNS(1)
As at 31 December 2015
6 6 J a n u s C a p i t a l F u n d s P l c / 3 1 D e c e m b e r 2 0 1 5
Past performance does not guarantee future returns. The rates of return will vary and the principal value of an investment will fluctuate. Shares, if redeemed, may be worth more or less than their original cost. The performance data does not take account of the commissions and costs incurred on the issue and redemption of Shares. All returns are calculated in the base currency of the relevant Share Class.(1) Total returns assume the reinvestment of distributions, and in the case of the Class A Shares, exclude the effect of an initial 5% maximum possible sales charge.
InceptionDate
2015One Year
AnnualisedThree Year Annualised
Five Year Annualised
SinceInception
Annualised
Since Inception
Cumulative
Janus Asia Frontier Markets Fund A$acc share . . . . . . . . . . . . . . . . . . . . 26 September 2014 (15.89)% N/A N/A (14.95)% (18.50)% AAUD$acc Hedged Shares. . . . . . . . . . . . . 26 September 2014 (15.05)% N/A N/A (13.72)% (17.00)% ACAD$acc Hedged Shares . . . . . . . . . . . . . 26 September 2014 (16.00)% N/A N/A (15.04)% (18.60)% ARMB(CNH)acc Headged Shares . . . . . . . . . 26 September 2014 (13.10)% N/A N/A (12.16)% (15.10)% A€acc Hedged Shares . . . . . . . . . . . . . . . 26 September 2014 (15.93)% N/A N/A (15.12)% (18.70)% AHKD$acc Shares . . . . . . . . . . . . . . . . . 26 September 2014 (16.00)% N/A N/A (15.04)% (18.60)% E€acc Headged Shares . . . . . . . . . . . . . . . 26 September 2014 (16.25)% N/A N/A (15.45)% (19.10)% I$acc share. . . . . . . . . . . . . . . . . . . . . 26 September 2014 (14.81)% N/A N/A (13.88)% (17.20)% IRMB(CNH)acc Hedged Shares . . . . . . . . . . 26 September 2014 (11.94)% N/A N/A (11.01)% (13.70)% I€acc Hedged Shares. . . . . . . . . . . . . . . . 26 September 2014 (14.85)% N/A N/A (14.05)% (17.40)% U€acc Hedged Shares . . . . . . . . . . . . . . . 26 September 2014 (14.73)% N/A N/A (13.88)% (17.20)% U£acc Hedged Shares . . . . . . . . . . . . . . . 26 September 2014 (14.62)% N/A N/A (13.80)% (17.10)%
Janus Asia Growth Drivers Fund A$acc share . . . . . . . . . . . . . . . . . . . . 19 September 2014 (13.76)% N/A N/A (15.81)% (19.80)% AAUD$acc Hedged Shares. . . . . . . . . . . . . 19 September 2014 (12.77)% N/A N/A (14.34)% (18.00)% ACAD$acc Hedged Shares . . . . . . . . . . . . . 19 September 2014 (13.69)% N/A N/A (15.40)% (19.30)% ARMB(CNH)acc Headged Shares . . . . . . . . . 19 September 2014 (10.86)% N/A N/A (12.96)% (16.30)% A€acc Hedged Shares . . . . . . . . . . . . . . . 19 September 2014 (13.89)% N/A N/A (15.97)% (20.00)% AHKD$acc Shares . . . . . . . . . . . . . . . . . 19 September 2014 (13.76)% N/A N/A (15.81)% (19.80)% E€acc Headged Shares . . . . . . . . . . . . . . . 19 September 2014 (14.33)% N/A N/A (16.38)% (20.50)% I$acc share. . . . . . . . . . . . . . . . . . . . . 19 September 2014 (12.65)% N/A N/A (14.75)% (18.50)% IRMB(CNH)acc Hedged Shares . . . . . . . . . . 19 September 2014 (9.77)% N/A N/A (11.90)% (15.00)% I€acc Hedged Shares. . . . . . . . . . . . . . . . 19 September 2014 (12.86)% N/A N/A (14.91)% (18.70)% U€acc Hedged Shares . . . . . . . . . . . . . . . 19 September 2014 (12.65)% N/A N/A (14.75)% (18.50)% U£acc Hedged Shares . . . . . . . . . . . . . . . 19 September 2014 (12.45)% N/A N/A (14.67)% (18.40)%
Janus Asia Fund A$acc Shares. . . . . . . . . . . . . . . . . . . . 31 August 2011 (7.07)% (2.65)% N/A 1.44% 6.40% E€acc Hedged Shares . . . . . . . . . . . . . . . 30 March 2012 (7.38)% (4.58)% N/A 1.10% 4.20% I$acc Shares . . . . . . . . . . . . . . . . . . . . 31 August 2011 (5.86)% 1.26% N/A 2.73% 12.40% I€acc Hedged Shares. . . . . . . . . . . . . . . . 30 March 2012 (6.16)% 0.45% N/A 2.89% 11.30% U£acc Shares . . . . . . . . . . . . . . . . . . . 2 January 2013 (0.27)% N/A N/A 3.08% 9.50% Z$inc Shares . . . . . . . . . . . . . . . . . . . . 26 June 2013 (4.71)% N/A N/A 7.17% 19.02%
Janus Balanced Fund A$acc Shares. . . . . . . . . . . . . . . . . . . . 24 December 1998 (0.56)% 6.50% 6.07% 5.00% 129.30% A$inc Shares. . . . . . . . . . . . . . . . . . . . 1 October 2013 (0.58)% N/A N/A 3.59% 8.27% AAUD$acc Hedged Shares. . . . . . . . . . . . . 1 October 2013 1.78% N/A N/A 6.20% 14.50% AAUD$inc Hedged Shares . . . . . . . . . . . . . 1 October 2013 0.84% N/A N/A 5.65% 13.16% ACAD$inc Hedged Shares . . . . . . . . . . . . . 4 October 2013 (0.52)% N/A N/A 4.11% 9.45% ARMB(CNH)acc Headged Shares . . . . . . . . . 4 October 2013 2.78% N/A N/A 6.23% 14.50% A€acc Hedged Shares . . . . . . . . . . . . . . . 31 December 1999 (1.18)% 6.07% 5.49% 4.45% 100.82% A€inc Hedged Shares . . . . . . . . . . . . . . . 1 October 2013 (1.19)% N/A N/A 3.09% 7.08% AHKD$acc Shares . . . . . . . . . . . . . . . . . 31 August 2011 (0.66)% 6.49% N/A 7.28% 35.60% AHKD$inc Shares . . . . . . . . . . . . . . . . . 4 October 2013 (0.68)% N/A N/A 3.55% 8.14% B$acc Shares. . . . . . . . . . . . . . . . . . . . 24 December 1998 (1.52)% 5.44% 5.00% 3.97% 93.90% E€acc Hedged Shares . . . . . . . . . . . . . . . 31 August 2011 (1.59)% 5.58% N/A 6.30% 30.30% E€inc Hedged Shares . . . . . . . . . . . . . . . 4 October 2013 (1.68)% N/A N/A 2.61% 5.94% I$acc Shares . . . . . . . . . . . . . . . . . . . . 31 December 1999 0.34% 7.50% 7.08% 4.94% 116.19% I€acc Hedged Shares. . . . . . . . . . . . . . . . 31 January 2008 (0.13)% 7.16% 6.67% 5.67% 54.70% V$inc Shares. . . . . . . . . . . . . . . . . . . . 4 October 2013 (0.53)% N/A N/A 3.59% 8.21% VAUD$inc Hedged Shares . . . . . . . . . . . . . 4 October 2013 1.08% N/A N/A 5.90% 13.71%

J a n u s C a p i t a l F u n d s P l c / 3 1 D e c e m b e r 2 0 1 5 6 7
TOTAL RETURNS(1)
As at 31 December 2015
InceptionDate
2015One Year
AnnualisedThree Year Annualised
Five Year Annualised
SinceInception
Annualised
Since Inception
Cumulative
Janus Emerging Markets Fund A$acc Shares. . . . . . . . . . . . . . . . . . . . 30 September 2010 (12.41)% (6.22)% (7.01)% (5.04)% (23.80)% A€acc Hedged Shares . . . . . . . . . . . . . . . 30 September 2010 (12.92)% (6.62)% (7.67)% (5.87)% (27.20)% B$acc Shares. . . . . . . . . . . . . . . . . . . . 30 September 2010 (13.31)% (7.14)% (7.95)% (5.99)% (27.70)% E€acc Hedged Shares . . . . . . . . . . . . . . . 31 August 2011 (13.12)% (8.71)% N/A (7.24)% (27.80)% I$acc Shares . . . . . . . . . . . . . . . . . . . . 30 September 2010 (11.62)% (5.37)% (6.18)% (4.18)% (20.10)% I€acc Hedged Shares. . . . . . . . . . . . . . . . 30 September 2010 (12.06)% (5.15)% (6.42)% (4.62)% (22.00)% U£acc Shares . . . . . . . . . . . . . . . . . . . 2 January 2013 (6.34)% N/A N/A (2.89)% (8.40)% Z$inc Shares . . . . . . . . . . . . . . . . . . . . 29 June 2015 N/A N/A N/A N/A (12.96)%
Janus Europe Fund A$acc Hedged Shares . . . . . . . . . . . . . . . 18 September 2013 4.65% N/A N/A 2.50% 5.80% A€acc Shares. . . . . . . . . . . . . . . . . . . . 28 November 2008 5.28% 7.50% 6.04% 12.68% 133.20% E€acc Shares. . . . . . . . . . . . . . . . . . . . 31 August 2011 4.74% 6.99% N/A 10.24% 52.60% I€acc Shares . . . . . . . . . . . . . . . . . . . . 28 November 2008 6.40% 8.64% 7.34% 14.08% 154.50% ISEKacc Hedged Shares . . . . . . . . . . . . . . 16 January 2014 5.79% N/A N/A 2.08% 4.10% U$acc Hedged Shares . . . . . . . . . . . . . . . 31 October 2013 6.17% N/A N/A 3.04% 6.70% U€acc Shares . . . . . . . . . . . . . . . . . . . 31 October 2013 6.59% N/A N/A 3.75% 8.30% Z€acc Shares. . . . . . . . . . . . . . . . . . . . 1 October 2013 7.67% N/A N/A 5.75% 13.41% Z€inc Shares . . . . . . . . . . . . . . . . . . . . 26 June 2014 7.67% N/A N/A 0.98% 1.48%
Janus Global Life Sciences Fund A$acc Shares. . . . . . . . . . . . . . . . . . . . 31 March 2000 5.69% 28.84% 22.68% 6.94% 187.90% AAUD$acc Shares . . . . . . . . . . . . . . . . . 4 October 2013 6.88% N/A N/A 22.82% 58.50% ARMB(CNH)acc Hedged Shares . . . . . . . . . . 3 October 2014 9.32% N/A N/A 15.55% 19.70% A€acc Hedged Shares . . . . . . . . . . . . . . . 31 March 2000 5.45% 28.52% 22.04% 7.00% 190.20% AHKD$acc Shares . . . . . . . . . . . . . . . . . 27 February 2015 N/A N/A N/A N/A (4.00)% B$acc Shares. . . . . . . . . . . . . . . . . . . . 31 March 2000 4.70% 27.59% 21.47% 5.85% 144.90% E$acc Shares. . . . . . . . . . . . . . . . . . . . 1 October 2013 5.19% N/A N/A 19.79% 50.10% E€acc Hedged Shares . . . . . . . . . . . . . . . 1 October 2013 4.88% N/A N/A 19.15% 48.30% I$acc Shares . . . . . . . . . . . . . . . . . . . . 31 March 2000 6.55% 29.90% 23.75% 7.88% 230.30% I€acc Shares . . . . . . . . . . . . . . . . . . . . 20 October 2014 18.55% N/A N/A 34.42% 42.50% I€acc Hedged Shares. . . . . . . . . . . . . . . . 31 January 2008 6.47% 29.33% 23.37% 13.61% 174.70% U$acc Shares . . . . . . . . . . . . . . . . . . . 31 October 2013 7.24% N/A N/A 23.68% 58.50% U$inc Shares. . . . . . . . . . . . . . . . . . . . 20 October 2014 7.21% N/A N/A 17.99% 21.90% U€acc Shares . . . . . . . . . . . . . . . . . . . 20 October 2014 19.45% N/A N/A 35.37% 43.70% U€acc Shares Hedged 31 October 2013 7.08% N/A N/A 23.82% 58.90% U£acc Shares . . . . . . . . . . . . . . . . . . . 2 January 2013 13.43% N/A N/A 34.26% 141.60% U£inc Shares. . . . . . . . . . . . . . . . . . . . 20 October 2014 13.39% N/A N/A 27.53% 33.80% V$acc Shares. . . . . . . . . . . . . . . . . . . . 16 October 2015 N/A N/A N/A N/A 1.40% V€acc Hedged Shares . . . . . . . . . . . . . . . 16 October 2015 N/A N/A N/A N/A 1.30%
Janus Global Research Fund A$acc Shares. . . . . . . . . . . . . . . . . . . . 24 April 2006 (4.15)% 7.28% 5.04% 4.12% 47.80% A€acc Hedged Shares . . . . . . . . . . . . . . . 24 April 2006 (4.71)% 6.85% 4.31% 2.87% 31.50% E€acc Hedged Shares . . . . . . . . . . . . . . . 31 August 2011 (5.79)% 6.12% N/A 5.63% 26.80% I$acc Shares . . . . . . . . . . . . . . . . . . . . 24 April 2006 (2.88)% 8.65% 6.37% 5.32% 65.20% I€acc Hedged Shares. . . . . . . . . . . . . . . . 24 April 2006 (3.44)% 6.81% 4.71% 3.57% 40.50% U£acc Shares . . . . . . . . . . . . . . . . . . . 2 January 2013 2.88% N/A N/A 11.65% 39.10% Z$inc Shares . . . . . . . . . . . . . . . . . . . . 11 January 2013 (1.70)% N/A N/A 9.01% 29.22%

Fund Performance (unaudited)
Past performance does not guarantee future returns. The rates of return will vary and the principal value of an investment will fluctuate. Shares, if redeemed, may be worth more or less than their original cost. The performance data does not take account of the commissions and costs incurred on the issue and redemption of Shares. All returns are calculated in the base currency of the relevant Share Class.(1) Total returns assume the reinvestment of distributions, and in the case of the Class A Shares, exclude the effect of an initial 5% maximum possible sales charge.
6 8 J a n u s C a p i t a l F u n d s P l c / 3 1 D e c e m b e r 2 0 1 5
TOTAL RETURNS(1)
As at 31 December 2015
InceptionDate
2015One Year
AnnualisedThree Year Annualised
Five Year Annualised
SinceInception
Annualised
Since Inception
Cumulative
Janus Global Technology Fund A$acc . . . . . . . . . . . . . . . . . . . . . . . 31 March 2000 1.74% 12.96% 8.59% (2.22)% (29.80)% AAUD$acc Hedged Shares. . . . . . . . . . . . . 30 May 2014 3.91% N/A N/A 8.78% 14.30% ARMB(CNH)acc Hedged Shares . . . . . . . . . . 30 May 2014 5.31% N/A N/A 9.19% 15.00% A€acc Hedged Shares . . . . . . . . . . . . . . . 31 March 2000 1.28% 12.56% 7.92% (2.12)% (28.70)% AHKDacc Shares. . . . . . . . . . . . . . . . . . 30 May 2014 2.43% N/A N/A 5.82% 9.40% B$acc Shares. . . . . . . . . . . . . . . . . . . . 31 March 2000 0.67% 11.81% 7.53% (3.18)% (39.90)% I$acc Shares . . . . . . . . . . . . . . . . . . . . 31 March 2000 2.54% 13.98% 9.61% (1.35)% (19.30)% I€acc Hedged Shares. . . . . . . . . . . . . . . . 31 January 2008 2.42% 14.16% 9.46% 8.49% 90.60% U$acc Shares . . . . . . . . . . . . . . . . . . . 31 October 2013 3.34% N/A N/A 9.11% 20.80% U€acc Hedged Shares . . . . . . . . . . . . . . . 31 October 2013 (16.68)% N/A N/A (0.97)% (2.10)% V$acc Shares. . . . . . . . . . . . . . . . . . . . 16 October 2015 N/A N/A N/A N/A 0.90% V€acc Hedged Shares . . . . . . . . . . . . . . . 16 October 2015 N/A N/A N/A N/A 0.80%
Janus Japan Emerging Opportunities Fund A$acc Hedged Shares . . . . . . . . . . . . . . . 26 September 2014 15.50% N/A N/A 18.34% 23.70% AAUD$acc Hedged Shares. . . . . . . . . . . . . 26 September 2014 16.84% N/A N/A 20.31% 26.30% ACAD$acc Hedged Shares . . . . . . . . . . . . . 26 September 2014 15.49% N/A N/A 18.42% 23.80% ARMB(CNH)acc Hedged Shares . . . . . . . . . . 26 September 2014 19.15% N/A N/A 22.19% 28.80% A€acc Hedged Shares . . . . . . . . . . . . . . . 26 September 2014 15.59% N/A N/A 18.42% 23.80% AHKDacc Hedged Shares . . . . . . . . . . . . . 26 September 2014 15.47% N/A N/A 18.49% 23.90% E€acc Hedged Shares . . . . . . . . . . . . . . . 26 September 2014 15.15% N/A N/A 17.89% 23.10% I$acc Hedged Shares. . . . . . . . . . . . . . . . 26 September 2014 16.95% N/A N/A 19.78% 25.60% I€acc Shares . . . . . . . . . . . . . . . . . . . . 26 September 2014 17.13% N/A N/A 19.93% 25.80% IRMB(CNH)acc Hedged Shares . . . . . . . . . . 26 September 2014 20.66% N/A N/A 23.69% 30.80% IJPYacc Shares . . . . . . . . . . . . . . . . . . . 26 September 2014 17.55% N/A N/A 20.91% 27.10% U€acc Shares . . . . . . . . . . . . . . . . . . . 26 September 2014 17.30% N/A N/A 20.16% 26.10% U£acc Shares Hedged 26 September 2014 17.57% N/A N/A 20.46% 26.50%
Janus Japan Fund A$acc Hedged Shares . . . . . . . . . . . . . . . 26 September 2014 11.32% N/A N/A 11.01% 14.10% AAUD$acc Hedged Shares. . . . . . . . . . . . . 26 September 2014 12.77% N/A N/A 12.93% 16.60% ACAD$acc Hedged Shares . . . . . . . . . . . . . 26 September 2014 11.31% N/A N/A 11.09% 14.20% ARMB(CNH)acc Hedged Shares . . . . . . . . . . 26 September 2014 14.89% N/A N/A 14.61% 18.80% A€acc Hedged Shares . . . . . . . . . . . . . . . 26 September 2014 11.51% N/A N/A 11.16% 14.30% AHKDacc Hedged Shares . . . . . . . . . . . . . 26 September 2014 11.40% N/A N/A 11.16% 14.30% E€acc Hedged Shares . . . . . . . . . . . . . . . 26 September 2014 11.05% N/A N/A 10.62% 13.60% I$acc Hedged Shares. . . . . . . . . . . . . . . . 26 September 2014 12.55% N/A N/A 12.24% 15.70% IRMB(CNH)acc Hedged Shares . . . . . . . . . . 26 September 2014 16.20% N/A N/A 15.91% 20.50% I€acc Hedged Shares. . . . . . . . . . . . . . . . 26 September 2014 12.85% N/A N/A 12.39% 15.90% IJPYacc Shares . . . . . . . . . . . . . . . . . . . 26 September 2014 13.35% N/A N/A 13.45% 17.28% U€acc Hedged Shares . . . . . . . . . . . . . . . 26 September 2014 12.94% N/A N/A 12.55% 16.10% U£acc Hedged Shares . . . . . . . . . . . . . . . 26 September 2014 13.02% N/A N/A 12.70% 16.30%

J a n u s C a p i t a l F u n d s P l c / 3 1 D e c e m b e r 2 0 1 5 6 9
TOTAL RETURNS(1)
As at 31 December 2015
InceptionDate
2015One Year
AnnualisedThree Year Annualised
Five Year Annualised
SinceInception
Annualised
Since Inception
Cumulative
Janus Opportunistic Alpha Fund A$acc Share . . . . . . . . . . . . . . . . . . . . 24 December 1998 (8.93)% 10.92% 3.29% 3.28% 73.30% A$dis Share . . . . . . . . . . . . . . . . . . . . 31 January 2008 (8.89)% 10.96% 3.31% 3.79% 34.30% ARMB(CNH)acc Hedged Shares . . . . . . . . . . 3 October 2014 (5.91)% N/A N/A 0.24% 0.30% A€acc Hedged Shares . . . . . . . . . . . . . . . 31 December 1999 (9.18)% 10.56% 2.63% (0.60)% (9.13)% B$acc Share 24 December 1998 (9.85)% 9.82% 2.26% 2.27% 46.50% E€acc Hedged Shares . . . . . . . . . . . . . . . 31 August 2011 (9.93)% 9.74% N/A 4.79% 22.50% I$acc Share . . . . . . . . . . . . . . . . . . . . 31 December 1999 (7.87)% 12.21% 4.44% 0.19% 3.09% I$dis Share. . . . . . . . . . . . . . . . . . . . . 31 January 2008 (7.83)% 12.20% 4.46% 4.89% 45.90% I€acc Hedged Shares. . . . . . . . . . . . . . . . 31 January 2008 (8.86)% 12.37% 3.89% 3.84% 34.80% U$acc share . . . . . . . . . . . . . . . . . . . . 31 October 2013 (7.76)% N/A N/A 8.27% 18.80% U€acc Hedged Shares . . . . . . . . . . . . . . . 31 October 2013 (8.04)% N/A N/A 8.32% 18.90% U£acc Shares . . . . . . . . . . . . . . . . . . . 2 January 2013 (2.43)% N/A N/A 15.16% 52.60%
Janus US Fund A$acc Shares. . . . . . . . . . . . . . . . . . . . 30 September 2010 3.28% 13.15% 9.33% 10.61% 69.80% A€acc Hedged Shares . . . . . . . . . . . . . . . 30 September 2010 3.02% 12.80% 8.72% 9.83% 63.60% B$acc Shares. . . . . . . . . . . . . . . . . . . . 30 September 2010 2.29% 12.02% 8.25% 9.50% 61.10% I$acc Shares . . . . . . . . . . . . . . . . . . . . 30 September 2010 4.36% 14.34% 10.48% 11.77% 79.40% I€acc Hedged Shares. . . . . . . . . . . . . . . . 30 September 2010 3.98% 13.96% 9.81% 10.93% 72.40%
Janus US Research Fund A$acc Shares. . . . . . . . . . . . . . . . . . . . 11 January 2002 (0.91)% 12.70% 9.32% 5.69% 116.60% A€acc Hedged Shares . . . . . . . . . . . . . . . 11 January 2002 (1.33)% 12.34% 8.88% 4.83% 93.40% B$acc Shares. . . . . . . . . . . . . . . . . . . . 11 January 2002 (1.88)% 11.60% 8.25% 4.62% 87.90% I$acc Shares . . . . . . . . . . . . . . . . . . . . 11 January 2002 0.47% 14.40% 10.98% 6.93% 155.10% I€acc Hedged Shares. . . . . . . . . . . . . . . . 31 January 2008 0.13% 14.55% 10.79% 5.75% 55.70% Z$inc Shares . . . . . . . . . . . . . . . . . . . . 21 March 2013 1.73% N/A N/A 13.34% 41.67%
Janus US Twenty Fund A$acc Shares. . . . . . . . . . . . . . . . . . . . 24 December 1998 5.56% 16.36% 11.75% 4.96% 128.00% AAUD$acc Hedhed Shares. . . . . . . . . . . . . 4 October 2013 6.70% N/A N/A 13.26% 32.20% ARMB(CNH)acc Hedged Shares . . . . . . . . . . 3 October 2014 9.04% N/A N/A 12.52% 15.80% A€acc Hedged Shares . . . . . . . . . . . . . . . 31 December 1999 5.20% 16.00% 11.10% 1.98% 36.80% B$acc Shares. . . . . . . . . . . . . . . . . . . . 24 Decemeber 1998 4.51% 15.21% 10.65% 3.92% 92.40% E€acc Hedged Shares . . . . . . . . . . . . . . . 31 August 2011 4.78% 15.60% N/A 14.16% 77.50% I$acc Shares . . . . . . . . . . . . . . . . . . . . 31 December 1999 6.68% 17.58% 12.93% 2.64% 51.79% I$dis Shares . . . . . . . . . . . . . . . . . . . . 31 January 2008 6.64% 17.56% 12.93% 7.08% 71.90% I€acc Hedged Shares. . . . . . . . . . . . . . . . 31 Decemeber 1999 6.42% 16.98% 12.08% 3.09% 62.73% U$acc Shares . . . . . . . . . . . . . . . . . . . 31 October 2013 6.87% N/A N/A 11.86% 27.50% U€acc Hedged Shares . . . . . . . . . . . . . . . 31 October 2013 6.51% N/A N/A 11.90% 27.60% U£acc Shares . . . . . . . . . . . . . . . . . . . 2 January 2013 12.93% N/A N/A 20.48% 74.70% V$acc Shares. . . . . . . . . . . . . . . . . . . . 16 October 2015 N/A N/A N/A N/A 0.50% V€acc Hedged Shares . . . . . . . . . . . . . . . 16 October 2015 N/A N/A N/A N/A 0.40%

Fund Performance (unaudited)
Past performance does not guarantee future returns. The rates of return will vary and the principal value of an investment will fluctuate. Shares, if redeemed, may be worth more or less than their original cost. The performance data does not take account of the commissions and costs incurred on the issue and redemption of Shares. All returns are calculated in the base currency of the relevant Share Class.(1) Total returns assume the reinvestment of distributions, and in the case of the Class A Shares, exclude the effect of an initial 5% maximum possible sales charge.
7 0 J a n u s C a p i t a l F u n d s P l c / 3 1 D e c e m b e r 2 0 1 5
TOTAL RETURNS(1)
As at 31 December 2015
InceptionDate
2015One Year
AnnualisedThree Year Annualised
Five Year Annualised
SinceInception
Annualised
Since Inception
Cumulative
Janus US Venture Fund A$acc Shares. . . . . . . . . . . . . . . . . . . . 31 December 1999 (2.66)% 14.76% 12.22% 4.58% 104.80% A$dis Shares . . . . . . . . . . . . . . . . . . . . 31 January 2008 (2.67)% 14.82% 12.27% 7.86% 82.10% AAUD$acc Hedged Shares. . . . . . . . . . . . . 4 October 2013 (1.87)% N/A N/A 8.64% 20.40% A€acc Hedged Shares . . . . . . . . . . . . . . . 31 December 1999 (2.91)% 14.35% 11.51% 4.96% 117.10% B$acc Shares. . . . . . . . . . . . . . . . . . . . 31 December 1999 (3.58)% 13.60% 11.08% 3.56% 74.90% I$acc Shares . . . . . . . . . . . . . . . . . . . . 31 December 1999 (1.89)% 15.72% 13.23% 5.44% 133.40% I€acc Hedged Shares. . . . . . . . . . . . . . . . 31 January 2008 (2.18)% 13.40% 11.40% 7.35% 75.30% U$acc Shares . . . . . . . . . . . . . . . . . . . 31 October 2013 (1.16)% N/A N/A 8.44% 19.20% U£acc Shares . . . . . . . . . . . . . . . . . . . 2 January 2013 4.47% N/A N/A 19.53% 70.60% Z$acc Shares. . . . . . . . . . . . . . . . . . . . 3 April 2013 (0.20)% N/A N/A 16.27% 51.27% Z€acc Shares. . . . . . . . . . . . . . . . . . . . 6 May 2014 11.12% N/A N/A 28.97% 52.34%
Perkins Global Value Fund A$acc Shares. . . . . . . . . . . . . . . . . . . . 30 September 2010 (3.91)% 6.81% 6.13% 7.00% 42.70% A€acc Hedged Shares . . . . . . . . . . . . . . . 30 September 2010 (4.52)% 6.40% 5.50% 6.21% 37.20% E€acc Hedged Shares . . . . . . . . . . . . . . . 31 October 2013 (5.36)% N/A N/A 0.28% 0.60% I$acc Shares . . . . . . . . . . . . . . . . . . . . 30 September 2010 (2.96)% 7.95% 7.25% 8.12% 50.70% I€acc Hedged Shares. . . . . . . . . . . . . . . . 30 September 2010 (28.44)% 7.27% 6.52% 7.25% 44.40% U$acc Shares . . . . . . . . . . . . . . . . . . . 31 October 2013 (2.77)% N/A N/A 2.41% 5.30% U€acc Hedged Shares . . . . . . . . . . . . . . . 31 October 2013 (3.40)% N/A N/A 2.32% 5.10% Z$inc Shares . . . . . . . . . . . . . . . . . . . . 26 June 2013 (1.79)% N/A N/A 6.40% 16.88%
Perkins US Strategic Value Fund A$acc Shares. . . . . . . . . . . . . . . . . . . . 30 November 2000 (4.33)% 8.74% 5.77% 4.74% 101.10% A$dis Shares . . . . . . . . . . . . . . . . . . . . 31 January 2008 (4.36)% 8.73% 5.74% 4.22% 38.76% A€acc Hedged Shares . . . . . . . . . . . . . . . 30 November 2000 (4.77)% 8.34% 5.12% 3.88% 77.50% B$acc Shares. . . . . . . . . . . . . . . . . . . . 30 November 2000 (5.29)% 7.64% 4.72% 3.66% 72.00% E€acc Hedged Shares . . . . . . . . . . . . . . . 31 August 2011 (5.42)% 7.72% N/A 6.71% 32.50% I$acc Shares . . . . . . . . . . . . . . . . . . . . 30 November 2000 (3.62)% 9.54% 6.56% 5.57% 126.60% I$dis Shares . . . . . . . . . . . . . . . . . . . . 31 January 2008 (3.60)% 9.55% 6.58% 5.03% 47.46% I€acc Hedged Shares. . . . . . . . . . . . . . . . 31 January 2008 (4.16)% 9.09% 5.84% 4.19% 38.40% U$acc Shares . . . . . . . . . . . . . . . . . . . 31 October 2013 (2.99)% N/A N/A 4.58% 10.20% U€acc Hedged Shares . . . . . . . . . . . . . . . 31 October 2013 (4.04)% N/A N/A 4.23% 9.40% U£acc Shares . . . . . . . . . . . . . . . . . . . 2 January 2013 2.62% N/A N/A 13.18% 44.90%
INTECH All-Word Minimum Variance Core Fund(a)
Z£acc Shares. . . . . . . . . . . . . . . . . . . . 1 May 2015 N/A N/A N/A N/A (0.64)%
INTECH European Core Fund A€acc Shares. . . . . . . . . . . . . . . . . . . . 28 February 2014 13.00% N/A N/A 7.34% 13.90% Z€inc Shares . . . . . . . . . . . . . . . . . . . . 31 January 2014 15.04% N/A N/A 11.93% 24.08%
INTECH Global All Country Low Volatility Fund Z£acc Shares. . . . . . . . . . . . . . . . . . . . 3 November 2014 5.21% N/A N/A 7.74% 9.02%

J a n u s C a p i t a l F u n d s P l c / 3 1 D e c e m b e r 2 0 1 5 7 1
TOTAL RETURNS(1)
As at 31 December 2015
InceptionDate
2015One Year
AnnualisedThree Year Annualised
Five Year Annualised
SinceInception
Annualised
Since Inception
Cumulative
INTECH Global Dividend Fund A$acc Shares. . . . . . . . . . . . . . . . . . . . 28 March 2013 (4.88)% N/A N/A 1.18% 3.30% A$inc Shares. . . . . . . . . . . . . . . . . . . . 28 March 2013 (4.84)% N/A N/A 1.06% 2.94% A€acc Hedged Shares . . . . . . . . . . . . . . . 28 March 2013 (5.34)% N/A N/A 0.36% 1.00% A€inc Hedged Shares . . . . . . . . . . . . . . . 28 March 2013 (5.94)% N/A N/A 0.13% 0.36% E€acc Hedged Shares . . . . . . . . . . . . . . . 28 March 2013 (6.42)% N/A N/A (0.33)% (0.90)% E€inc Hedged Shares . . . . . . . . . . . . . . . 28 March 2013 (6.41)% N/A N/A (0.47)% (1.31)% I$acc Shares . . . . . . . . . . . . . . . . . . . . 28 March 2013 (4.38)% N/A N/A 1.75% 4.90% I$inc Shares . . . . . . . . . . . . . . . . . . . . 28 March 2013 (4.25)% N/A N/A 1.77% 4.96% I€acc Hedged Shares. . . . . . . . . . . . . . . . 28 March 2013 (5.23)% N/A N/A 1.15% 3.20% I€inc Hedged Shares . . . . . . . . . . . . . . . . 28 March 2013 (5.26)% N/A N/A 1.13% 3.16% U$acc Shares . . . . . . . . . . . . . . . . . . . 31 October 2013 (4.28)% N/A N/A (1.82)% (3.90)% U€acc Hedged Shares . . . . . . . . . . . . . . . 31 October 2013 (5.06)% N/A N/A (2.01)% (4.30)% U£inc Shares. . . . . . . . . . . . . . . . . . . . 28 March 2013 1.23% N/A N/A 2.93% 8.31% Z€acc Shares. . . . . . . . . . . . . . . . . . . . 28 February 2013 7.51% N/A N/A 10.10% 31.42%
INTECH US Core Fund A$acc Shares. . . . . . . . . . . . . . . . . . . . 25 April 2003 1.31% 14.45% 11.76% 8.43% 179.30% A€acc Hedged Shares . . . . . . . . . . . . . . . 25 April 2003 0.80% 14.00% 11.03% 7.53% 151.10% B$acc Shares. . . . . . . . . . . . . . . . . . . . 25 April 2003 0.29% 13.31% 10.63% 7.36% 146.30% I$acc Shares . . . . . . . . . . . . . . . . . . . . 25 April 2003 1.84% 15.08% 12.36% 9.00% 198.40% I€acc Hedged Shares. . . . . . . . . . . . . . . . 24 April 2006 1.46% 14.73% 11.91% 4.98% 60.10% U$acc Shares . . . . . . . . . . . . . . . . . . . 31 October 2013 2.01% N/A N/A 9.49% 21.70% U€acc Hedged Shares . . . . . . . . . . . . . . . 31 October 2013 1.75% N/A N/A 9.61% 22.00% U£acc Shares . . . . . . . . . . . . . . . . . . . 2 January 2013 7.91% N/A N/A 18.20% 65.00%
Janus Global Diversified Alternatives Fund A$acc Shares. . . . . . . . . . . . . . . . . . . . 6 January 2014 (8.41)% N/A N/A (3.23)% (6.30)% ACHFacc Hedged Shares . . . . . . . . . . . . . 31 January 2014 (9.94)% N/A N/A (3.07)% (5.80)% A€acc Hedged Shares . . . . . . . . . . . . . . . 6 January 2014 (8.72)% N/A N/A (3.49)% (6.80)% ASEKacc Hedged Shares . . . . . . . . . . . . . . 31 January 2014 (9.12)% N/A N/A (2.27)% (4.30)% E€acc Hedged Shares . . . . . . . . . . . . . . . 6 January 2014 (9.76)% N/A N/A (4.38)% (8.50)% I$acc Shares . . . . . . . . . . . . . . . . . . . . 31 December 2013 (7.74)% N/A N/A (2.33)% (4.60)% ICHFacc Hedged Shares . . . . . . . . . . . . . . 31 January 2014 (9.10)% N/A N/A (2.16)% (4.10)% I€acc Hedged Shares. . . . . . . . . . . . . . . . 6 January 2014 (8.16)% N/A N/A (2.81)% (5.50)% ISEKacc Hedged Shares . . . . . . . . . . . . . . 31 January 2014 (8.20)% N/A N/A (1.37)% (2.60)% U$acc Shares . . . . . . . . . . . . . . . . . . . 6 January 2014 (7.45)% N/A N/A (2.19)% (4.30)% U€acc Hedged Shares . . . . . . . . . . . . . . . 6 January 2014 (8.14)% N/A N/A (2.66)% (5.20)% U£acc Hedged Shares . . . . . . . . . . . . . . . 31 January 2014 (7.39)% N/A N/A (0.52)% (1.00)%
Janus Global Real Estate Fund A$acc Shares. . . . . . . . . . . . . . . . . . . . 29 September 2003 (4.72)% 4.26% 4.92% 3.77% 57.40% A$inc Shares. . . . . . . . . . . . . . . . . . . . 29 September 2003 (4.68)% 4.26% 4.92% 3.75% 57.08% AAUD$inc Hedged Shares . . . . . . . . . . . . . 4 October 2013 (3.45)% N/A N/A 6.60% 15.41% ARMB(CNH)acc Hedged Shares . . . . . . . . . . 3 October 2014 (1.52)% N/A N/A 3.20% 4.00% A€acc Hedged Shares . . . . . . . . . . . . . . . 29 September 2003 (5.45)% 3.68% 4.14% 2.49% 35.20% B$acc Shares. . . . . . . . . . . . . . . . . . . . 29 September 2003 (5.62)% 3.21% 3.89% 2.75% 39.40% B$inc Shares . . . . . . . . . . . . . . . . . . . . 29 September 2003 (5.63)% 3.21% 3.88% 2.74% 39.24% E€acc Hedged Shares . . . . . . . . . . . . . . . 28 March 2013 (5.89)% N/A N/A 1.36% 3.80% E€inc Hedged Shares . . . . . . . . . . . . . . . 28 March 2013 (5.86)% N/A N/A 1.48% 4.14% I$inc Shares . . . . . . . . . . . . . . . . . . . . 29 Septemebr 2003 (3.77)% 5.30% 5.99% 4.72% 75.89% I€acc Hedged Shares. . . . . . . . . . . . . . . . 31 January 2008 (6.60)% 11.88% 9.44% 4.49% 41.60% U£inc Shares. . . . . . . . . . . . . . . . . . . . 27 June 2014 1.97% N/A N/A 8.17% 12.61% U£inc Hedged Shares . . . . . . . . . . . . . . . 27 June 2014 (3.96)% N/A N/A (2.24)% (3.37)%

Fund Performance (unaudited)
Past performance does not guarantee future returns. The rates of return will vary and the principal value of an investment will fluctuate. Shares, if redeemed, may be worth more or less than their original cost. The performance data does not take account of the commissions and costs incurred on the issue and redemption of Shares. All returns are calculated in the base currency of the relevant Share Class.(1) Total returns assume the reinvestment of distributions, and in the case of the Class A Shares, exclude the effect of an initial 5% maximum possible sales charge.
7 2 J a n u s C a p i t a l F u n d s P l c / 3 1 D e c e m b e r 2 0 1 5
TOTAL RETURNS(1)
As at 31 December 2015
InceptionDate
2015One Year
AnnualisedThree Year Annualised
Five Year Annualised
SinceInception
Annualised
Since Inception
Cumulative
Janus Flexible Income Fund A$acc Shares. . . . . . . . . . . . . . . . . . . . 24 December 1998 (1.14)% 0.25% 2.45% 4.13% 99.20% A$inc Shares. . . . . . . . . . . . . . . . . . . . 24 December 1998 (1.09)% 0.23% 2.45% 4.21% 101.66% AAUD$inc Hedged Shares . . . . . . . . . . . . . 28 March 2013 0.98% N/A N/A 2.02% 5.69% ARMB(CNH)inc Hedged Shares . . . . . . . . . . 28 March 2013 2.35% N/A N/A 2.84% 8.04% A€acc Hedged Shares . . . . . . . . . . . . . . . 31 December 1999 (1.86)% (0.18)% 2.24% 4.94% 116.26% AHKDinc Shares . . . . . . . . . . . . . . . . . . 28 March 2013 (1.14)% N/A N/A 0.07% 0.21% B$acc Shares. . . . . . . . . . . . . . . . . . . . 24 December 1998 (2.07)% (0.73)% 1.44% 3.16% 69.90% B$inc Shares . . . . . . . . . . . . . . . . . . . . 24 December 1998 (2.11)% (0.75)% 1.42% 3.22% 71.63% B€inc Hedged Shares . . . . . . . . . . . . . . . 31 December 1999 (2.90)% (1.21)% 1.23% 4.03% 88.21% E€acc Hedged Shares . . . . . . . . . . . . . . . 31 August 2011 (2.14)% (0.44)% N/A 1.22% 5.40% E€inc Hedged Shares . . . . . . . . . . . . . . . 31 August 2011 (2.05)% (0.43)% N/A 1.24% 5.49% I$acc Shares . . . . . . . . . . . . . . . . . . . . 9 May 2012 0.09% 1.45% N/A 2.26% 8.50% I$inc Shares . . . . . . . . . . . . . . . . . . . . 31 December 1999 0.03% 1.47% 3.67% 5.28% 127.82% I€acc Hedged Shares. . . . . . . . . . . . . . . . 31 December 1999 (0.68)% 0.96% 3.42% 6.18% 161.08% U$acc Shares . . . . . . . . . . . . . . . . . . . 31 October 2013 0.00% N/A N/A 2.01% 4.40% U€acc Hedged Shares . . . . . . . . . . . . . . . 31 October 2013 (0.57)% N/A N/A 1.96% 4.30% U£acc Hedged Shares . . . . . . . . . . . . . . . 2 January 2013 0.09% N/A N/A 1.80% 5.50% U£inc Hedged Shares . . . . . . . . . . . . . . . 2 January 2013 (0.77)% N/A N/A 1.41% 4.28% V$inc Hedged Shares . . . . . . . . . . . . . . . 28 September 2012 (1.09)% 0.14% N/A 0.17% 0.54% VAUD$inc Hedged Shares . . . . . . . . . . . . . 28 March 2013 1.20% N/A N/A 2.59% 7.31% Z$acc Shares. . . . . . . . . . . . . . . . . . . . 19 March 2014 0.83% N/A N/A 2.43% 4.38%
Janus Global Flexible Income Fund A$acc Shares. . . . . . . . . . . . . . . . . . . . 28 September 2012 (5.08)% (1.49)% N/A (1.50)% (4.80)% A€acc Hedged Shares . . . . . . . . . . . . . . . 28 September 2012 (6.07)% (2.03)% N/A (2.24)% (7.10)% E€acc Hedged Shares . . . . . . . . . . . . . . . 31 October 2012 (6.46)% (2.33)% N/A (2.36)% (7.30)% E€inc Hedged Shares . . . . . . . . . . . . . . . 31 October 2012 (6.23)% (2.29)% N/A (2.32)% (7.17)% I$inc Shares . . . . . . . . . . . . . . . . . . . . 28 September 2012 (4.01)% (0.45)% N/A (0.46)% (1.49)% I€acc Hedged Shares. . . . . . . . . . . . . . . . 28 September 2012 (5.03)% (0.99)% N/A (1.18)% (3.80)% U$acc Shares . . . . . . . . . . . . . . . . . . . 31 October 2013 (3.99)% N/A N/A 0.46% 1.00% U€acc Hedged Shares . . . . . . . . . . . . . . . 31 October 2013 (4.93)% N/A N/A 0.14% 0.30% U£acc Hedged Shares . . . . . . . . . . . . . . . 2 January 2013 (4.14)% N/A N/A (0.17)% (0.50)% U£inc Hedged Shares . . . . . . . . . . . . . . . 2 January 2013 (4.09)% N/A N/A (0.16)% (0.47)%
Janus Global High Yield Fund A$acc Shares. . . . . . . . . . . . . . . . . . . . 29 October 2010 (3.16)% 0.85% 3.67% 3.50% 19.50% A$inc Shares. . . . . . . . . . . . . . . . . . . . 29 October 2010 (3.16)% 0.88% 3.67% 3.52% 19.60% A€acc Hedged Shares . . . . . . . . . . . . . . . 29 October 2010 (4.11)% 0.35% 3.12% 3.01% 16.60% A€inc Hedged Shares . . . . . . . . . . . . . . . 29 October 2010 (4.14)% 0.35% 3.15% 3.04% 16.76% E€acc Hedged Shares . . . . . . . . . . . . . . . 31 August 2011 (4.59)% 0.12% N/A 3.15% 14.40% E€inc Hedged Shares . . . . . . . . . . . . . . . 31 August 2011 (4.51)% (0.12)% N/A 3.06% 13.96% I$acc Shares . . . . . . . . . . . . . . . . . . . . 29 October 2010 (2.26)% 1.82% 4.65% 4.49% 25.50% I$inc Shares . . . . . . . . . . . . . . . . . . . . 29 October 2010 (2.36)% 1.79% 4.63% 4.47% 25.39% I€inc Hedged Shares . . . . . . . . . . . . . . . . 29 October 2010 (3.26)% 2.88% 5.16% 5.03% 28.90% U£acc Hedged Shares . . . . . . . . . . . . . . . 2 January 2013 (2.11)% N/A N/A 2.16% 6.60% U£inc Hedged Shares . . . . . . . . . . . . . . . 2 January 2013 (2.21)% N/A N/A 2.12% 6.49% Z$inc Shares . . . . . . . . . . . . . . . . . . . . 7 October 2013 (1.26)% N/A N/A 1.26% 2.84%
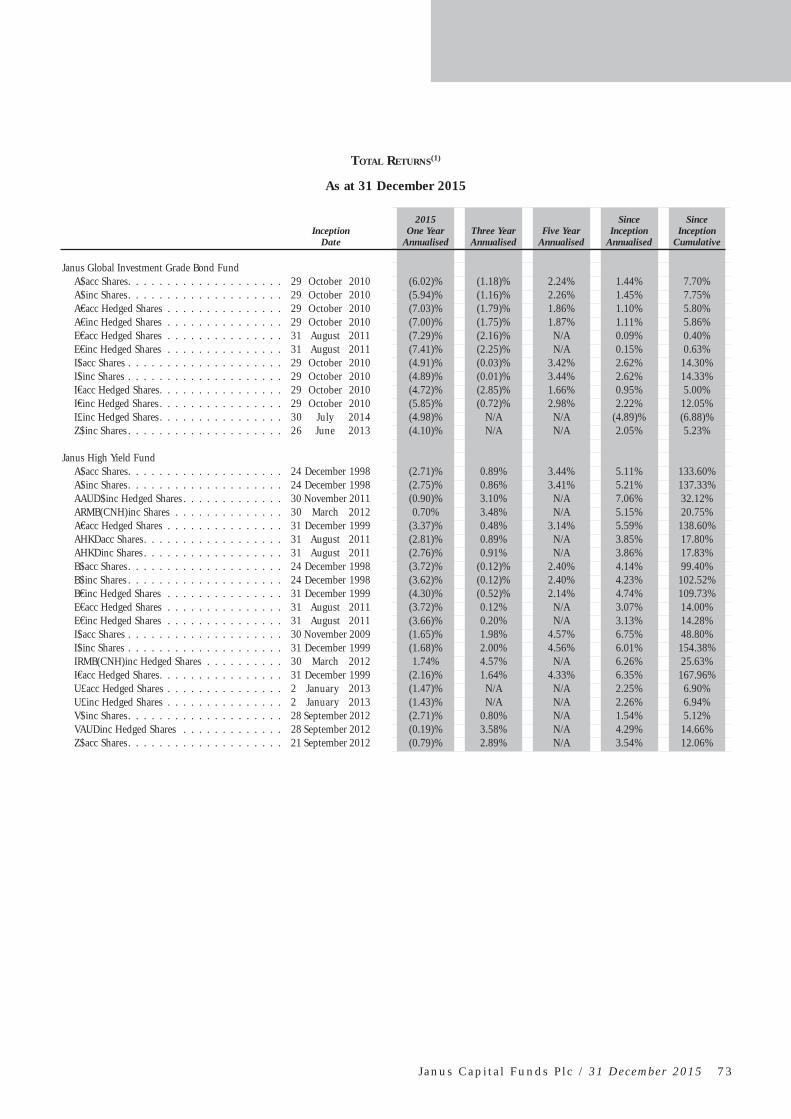
J a n u s C a p i t a l F u n d s P l c / 3 1 D e c e m b e r 2 0 1 5 7 3
TOTAL RETURNS(1)
As at 31 December 2015
InceptionDate
2015One Year
AnnualisedThree Year Annualised
Five Year Annualised
SinceInception
Annualised
Since Inception
Cumulative
Janus Global Investment Grade Bond Fund A$acc Shares. . . . . . . . . . . . . . . . . . . . 29 October 2010 (6.02)% (1.18)% 2.24% 1.44% 7.70% A$inc Shares. . . . . . . . . . . . . . . . . . . . 29 October 2010 (5.94)% (1.16)% 2.26% 1.45% 7.75% A€acc Hedged Shares . . . . . . . . . . . . . . . 29 October 2010 (7.03)% (1.79)% 1.86% 1.10% 5.80% A€inc Hedged Shares . . . . . . . . . . . . . . . 29 October 2010 (7.00)% (1.75)% 1.87% 1.11% 5.86% E€acc Hedged Shares . . . . . . . . . . . . . . . 31 August 2011 (7.29)% (2.16)% N/A 0.09% 0.40% E€inc Hedged Shares . . . . . . . . . . . . . . . 31 August 2011 (7.41)% (2.25)% N/A 0.15% 0.63% I$acc Shares . . . . . . . . . . . . . . . . . . . . 29 October 2010 (4.91)% (0.03)% 3.42% 2.62% 14.30% I$inc Shares . . . . . . . . . . . . . . . . . . . . 29 October 2010 (4.89)% (0.01)% 3.44% 2.62% 14.33% I€acc Hedged Shares. . . . . . . . . . . . . . . . 29 October 2010 (4.72)% (2.85)% 1.66% 0.95% 5.00% I€inc Hedged Shares . . . . . . . . . . . . . . . . 29 October 2010 (5.85)% (0.72)% 2.98% 2.22% 12.05% I£inc Hedged Shares. . . . . . . . . . . . . . . . 30 July 2014 (4.98)% N/A N/A (4.89)% (6.88)% Z$inc Shares . . . . . . . . . . . . . . . . . . . . 26 June 2013 (4.10)% N/A N/A 2.05% 5.23%
Janus High Yield Fund A$acc Shares. . . . . . . . . . . . . . . . . . . . 24 December 1998 (2.71)% 0.89% 3.44% 5.11% 133.60% A$inc Shares. . . . . . . . . . . . . . . . . . . . 24 December 1998 (2.75)% 0.86% 3.41% 5.21% 137.33% AAUD$inc Hedged Shares . . . . . . . . . . . . . 30 November 2011 (0.90)% 3.10% N/A 7.06% 32.12% ARMB(CNH)inc Shares . . . . . . . . . . . . . . 30 March 2012 0.70% 3.48% N/A 5.15% 20.75% A€acc Hedged Shares . . . . . . . . . . . . . . . 31 December 1999 (3.37)% 0.48% 3.14% 5.59% 138.60% AHKDacc Shares. . . . . . . . . . . . . . . . . . 31 August 2011 (2.81)% 0.89% N/A 3.85% 17.80% AHKDinc Shares . . . . . . . . . . . . . . . . . . 31 August 2011 (2.76)% 0.91% N/A 3.86% 17.83% B$acc Shares. . . . . . . . . . . . . . . . . . . . 24 December 1998 (3.72)% (0.12)% 2.40% 4.14% 99.40% B$inc Shares . . . . . . . . . . . . . . . . . . . . 24 December 1998 (3.62)% (0.12)% 2.40% 4.23% 102.52% B€inc Hedged Shares . . . . . . . . . . . . . . . 31 December 1999 (4.30)% (0.52)% 2.14% 4.74% 109.73% E€acc Hedged Shares . . . . . . . . . . . . . . . 31 August 2011 (3.72)% 0.12% N/A 3.07% 14.00% E€inc Hedged Shares . . . . . . . . . . . . . . . 31 August 2011 (3.66)% 0.20% N/A 3.13% 14.28% I$acc Shares . . . . . . . . . . . . . . . . . . . . 30 November 2009 (1.65)% 1.98% 4.57% 6.75% 48.80% I$inc Shares . . . . . . . . . . . . . . . . . . . . 31 December 1999 (1.68)% 2.00% 4.56% 6.01% 154.38% IRMB(CNH)inc Hedged Shares . . . . . . . . . . 30 March 2012 1.74% 4.57% N/A 6.26% 25.63% I€acc Hedged Shares. . . . . . . . . . . . . . . . 31 December 1999 (2.16)% 1.64% 4.33% 6.35% 167.96% U£acc Hedged Shares . . . . . . . . . . . . . . . 2 January 2013 (1.47)% N/A N/A 2.25% 6.90% U£inc Hedged Shares . . . . . . . . . . . . . . . 2 January 2013 (1.43)% N/A N/A 2.26% 6.94% V$inc Shares. . . . . . . . . . . . . . . . . . . . 28 September 2012 (2.71)% 0.80% N/A 1.54% 5.12% VAUDinc Hedged Shares . . . . . . . . . . . . . 28 September 2012 (0.19)% 3.58% N/A 4.29% 14.66% Z$acc Shares. . . . . . . . . . . . . . . . . . . . 21 September 2012 (0.79)% 2.89% N/A 3.54% 12.06%

Fund Performance (unaudited)
Past performance does not guarantee future returns. The rates of return will vary and the principal value of an investment will fluctuate. Shares, if redeemed, may be worth more or less than their original cost. The performance data does not take account of the commissions and costs incurred on the issue and redemption of Shares. All returns are calculated in the base currency of the relevant Share Class.(1) Total returns assume the reinvestment of distributions, and in the case of the Class A Shares, exclude the effect of an initial 5% maximum possible sales charge.
7 4 J a n u s C a p i t a l F u n d s P l c / 3 1 D e c e m b e r 2 0 1 5
TOTAL RETURNS(1)
As at 31 December 2015
InceptionDate
2015One Year
AnnualisedThree Year Annualised
Five Year Annualised
SinceInception
Annualised
Since Inception
Cumulative
Janus Global Unconstrained Bond Fund A$acc share . . . . . . . . . . . . . . . . . . . . 29 September 2014 (2.50)% N/A N/A (1.92)% (2.40)% A$inc share . . . . . . . . . . . . . . . . . . . . 29 October 2014 (2.46)% N/A N/A (2.25)% (2.69)% AAUD$inc Hedged Shares . . . . . . . . . . . . . 27 February 2015 N/A N/A N/A N/A (1.24)% ACAD$inc Hedged Shares . . . . . . . . . . . . . 27 February 2015 N/A N/A N/A N/A (2.64)% ACHFacc Hedged Shares . . . . . . . . . . . . . 20 October 2014 (3.79)% N/A N/A (3.02)% (3.60)% ACHFinc Hedged Shares . . . . . . . . . . . . . 20 October 2014 (3.77)% N/A N/A (3.03)% (3.62)% ARMB(CNH)inc Hedged Shares . . . . . . . . . . 27 February 2015 N/A N/A N/A N/A (0.39)% A€acc Hedged Shares . . . . . . . . . . . . . . . 20 October 2014 (3.00)% N/A N/A (2.60)% (3.10)% A€inc Hedged Shares . . . . . . . . . . . . . . . 20 October 2014 (3.04)% N/A N/A (2.33)% (2.78)% AHKD$inc Shares . . . . . . . . . . . . . . . . . 27 February 2015 N/A N/A N/A N/A (3.15)% ASGDinc Hedged Shares. . . . . . . . . . . . . . 20 October 2014 (1.42)% N/A N/A (1.30)% (1.56)% E€acc Hedged Shares . . . . . . . . . . . . . . . 20 October 2014 (2.20)% N/A N/A (1.76)% (2.10)% E€inc Hedged Shares . . . . . . . . . . . . . . . 20 October 2014 (2.96)% N/A N/A (2.45)% (2.93)% I$acc share. . . . . . . . . . . . . . . . . . . . . 29 September 2014 (1.49)% N/A N/A (0.88)% (1.10)% I€acc Hedged Shares. . . . . . . . . . . . . . . . 20 October 2014 (2.10)% N/A N/A (1.59)% (1.90)% U$acc . . . . . . . . . . . . . . . . . . . . . . . 20 October 2014 (1.30)% N/A N/A (1.09)% (1.30)% U$inc . . . . . . . . . . . . . . . . . . . . . . . 20 October 2014 (1.18)% N/A N/A (1.01)% (1.21)% U€acc Hedged Shares . . . . . . . . . . . . . . . 20 October 2014 (1.79)% N/A N/A (1.17)% (1.40)% U£acc Hedged Shares . . . . . . . . . . . . . . . 20 October 2014 (1.50)% N/A N/A (1.17)% (1.40)% U£inc Shares. . . . . . . . . . . . . . . . . . . . 20 October 2014 4.43% N/A N/A 6.87% 8.28% U£inc Hedged Shares . . . . . . . . . . . . . . . 20 October 2014 (1.09)% N/A N/A (0.85)% (1.02)%
Janus US Short-Term Bond Fund A$acc Shares. . . . . . . . . . . . . . . . . . . . 24 December 1998 (0.42)% 0.04% 0.72% 2.97% 64.50% A$inc Shares. . . . . . . . . . . . . . . . . . . . 24 December 1998 (0.37)% 0.05% 0.73% 2.95% 64.00% AAUD$inc Hedged Shares . . . . . . . . . . . . . 1 October 2013 1.62% N/A N/A 2.48% 5.67% ACHFinc Hedged Shares . . . . . . . . . . . . . 1 February 2012 (2.12)% (0.81)% N/A (0.17)% (0.65)% A€acc Hedged Shares . . . . . . . . . . . . . . . 31 Decemeber 1999 (1.03)% (0.33)% 0.48% 3.66% 77.86% B$acc Shares. . . . . . . . . . . . . . . . . . . . 24 December 1998 (1.23)% (0.71)% (0.03)% 2.19% 44.50% B$inc Shares . . . . . . . . . . . . . . . . . . . . 24 December 1998 (1.16)% (0.69)% 0.00% 2.22% 45.38% E€acc Hedged Shares . . . . . . . . . . . . . . . 31 August 2011 (1.28)% (0.66)% N/A 0.05% 0.20% E€inc Hedged Shares . . . . . . . . . . . . . . . 31 August 2011 (1.91)% (0.89)% N/A (0.26)% (1.13)% I$acc Shares . . . . . . . . . . . . . . . . . . . . 29 June 2012 0.10% 0.52% N/A 0.82% 2.90% I$inc Shares . . . . . . . . . . . . . . . . . . . . 31 December 1999 0.13% 0.57% 1.22% 3.51% 73.71% I€acc Hedged Shares. . . . . . . . . . . . . . . . 31 January 2008 (0.08)% 0.13% 1.10% 2.81% 24.50% I£inc Hedged Shares. . . . . . . . . . . . . . . . 28 September 2012 (44.61)% (17.35)% N/A (16.09)% (43.54)% U$acc Shares . . . . . . . . . . . . . . . . . . . 31 October 2013 0.10% N/A N/A 0.32% 0.70% U$inc Shares. . . . . . . . . . . . . . . . . . . . 31 October 2013 0.07% N/A N/A 0.35% 0.77% U£acc Hedged Shares . . . . . . . . . . . . . . . 2 January 2013 0.19% N/A N/A 0.93% 2.80% U£inc Hedged Shares . . . . . . . . . . . . . . . 2 January 2013 0.22% N/A N/A (0.05)% (0.16)% Z$acc Shares. . . . . . . . . . . . . . . . . . . . 31 October 2013 0.92% N/A N/A 1.16% 2.52%

Janus Asia Frontier Markets Fund
PORTFOLIO INVESTMENTS
The accompanying notes are an integral part of the fi nancial statements.
J a n u s C a p i t a l F u n d s P l c / 3 1 D e c e m b e r 2 0 1 5 7 5
Share or Principal Amount
Percentage of Net
Assets (%) Fair
Value (USD)
Financial Assets at fair value through profi t or loss Common Stock Agricultural Operations
16,600 Astra Agro Lestari Tbk PT . . . . . . . . . . . . . . . . 0.8 19,179
Appliances 10,000 Haier Electronics Group Co., Ltd.. . . . . . . . . . 0.8 19,897
390 LG Corp. . . . . . . . . . . . . . . . . . . . . . . . . . . . . 1.0 23,8791.8 43,776
Automotive – Cars and Light Trucks 12,000 BAIC Motor Corp., Ltd. (144A) . . . . . . . . . . . 0.5 12,06216,500 Great Wall Motor Co., Ltd. . . . . . . . . . . . . . . . 0.8 19,672
214 Hyundai Motor Co. . . . . . . . . . . . . . . . . . . . . 1.1 27,2672.4 59,001
Building – Heavy Construction 16,000 China Railway Construction Corp.,
Ltd. . . . . . . . . . . . . . . . . . . . . . . . . . . . . . . . 0.9 20,37741,650 DMCI Holdings, Inc. . . . . . . . . . . . . . . . . . . . 0.5 12,219
1.4 32,596
Building and Construction – Miscellaneous 18,000 China State Construction
International Holdings, Ltd. . . . . . . . . . . . . 1.3 31,123
Building Products – Cement and Aggregate 7,500 Anhui Conch Cement Co., Ltd. . . . . . . . . . . . 0.9 20,419
20,000 Indocement Tunggal Prakarsa Tbk PT . . . . . . . . . . . . . . . . . . . . . . . . . . . . 1.4 32,678
37,500 Semen Indonesia Persero Tbk PT . . . . . . . . . . 1.3 30,4993.6 83,596
Casino Hotels 4,000 Sands China, Ltd. . . . . . . . . . . . . . . . . . . . . . . 0.6 13,600
Cellular Telecommunications 3,000 China Mobile, Ltd. . . . . . . . . . . . . . . . . . . . . . 1.4 33,968
Circuit Boards 5,207 FLEXium Interconnect, Inc. . . . . . . . . . . . . . . 0.5 12,7314,000 Zhen Ding Technology Holding,
Ltd. . . . . . . . . . . . . . . . . . . . . . . . . . . . . . . . 0.4 9,4630.9 22,194
Coal 31,900 Tambang Batubara Bukit Asam
Persero Tbk PT . . . . . . . . . . . . . . . . . . . . . . 0.4 10,633
Commercial Banks – Non U.S. 44,500 Bank Central Asia Tbk PT. . . . . . . . . . . . . . . . 1.8 42,91360,700 Bank Mandiri Tbk . . . . . . . . . . . . . . . . . . . . . 1.7 40,31213,300 Bank of the Philippine Islands . . . . . . . . . . . . 1.0 23,708
216,000 Bank Pembangunan Daerah Jawa Barat Dan Banten Tbk PT . . . . . . . . . . . . . . 0.5 11,790
57,100 Bank Rakyat Indonesia Persero Tbk PT . . . . . . . . . . . . . . . . . . . . . . . . . . . . 2.0 47,375
20,320 BDO Unibank, Inc. . . . . . . . . . . . . . . . . . . . . . 1.9 45,35842,000 China Construction Bank Corp. . . . . . . . . . . . 1.2 29,04817,000 China Merchants Bank Co., Ltd. . . . . . . . . . . . 1.7 40,405
4,000 DBS Group Holdings, Ltd. . . . . . . . . . . . . . . . 2.0 47,40648,000 Industrial & Commercial Bank of
China, Ltd. . . . . . . . . . . . . . . . . . . . . . . . . . 1.2 29,2954,200 Kasikornbank PCL (NVDR) . . . . . . . . . . . . . . 0.7 17,573
17,379 Metropolitan Bank and Trust . . . . . . . . . . . . . 1.2 29,74216.9 404,925
Computers 16,000 Lenovo Group, Ltd. . . . . . . . . . . . . . . . . . . . . 0.7 16,392
Computers – Integrated Systems 20,000 PAX Global Technology, Ltd. . . . . . . . . . . . . . 0.9 21,729
Consumer Products – Miscellaneous 7,000 Samsonite International S.A.. . . . . . . . . . . . . . 0.9 20,774
Cosmetics and Toiletries 42 AMOREPACIFIC Corp. . . . . . . . . . . . . . . . . . 0.6 14,869
Share or Principal Amount
Percentage of Net
Assets (%) Fair
Value (USD)
Diversifi ed Financial Services 535 Shinhan Financial Group Co., Ltd. . . . . . . . . . 0.8 18,369
Diversifi ed Operations 40,000 Alliance Global Group, Inc. . . . . . . . . . . . . . . 0.6 13,691
610,000 Premium Leisure Corp. . . . . . . . . . . . . . . . . . 0.3 8,3000.9 21,991
E-Commerce/Products 280 Alibaba Group Holding, Ltd. (ADR) . . . . . . . . 1.0 23,313400 JD.com, Inc. . . . . . . . . . . . . . . . . . . . . . . . . . . 0.5 13,060700 Vipshop Holdings, Ltd. . . . . . . . . . . . . . . . . . 0.5 11,039
2.0 47,412
Electric – Generation 40,000 China Power International
Development, Ltd. . . . . . . . . . . . . . . . . . . . 0.9 22,658119,800 Energy Development Corp. . . . . . . . . . . . . . . 0.7 15,790
25,500 First Gen Corp. . . . . . . . . . . . . . . . . . . . . . . . 0.5 12,25230,000 Huadian Fuxin Energy Corp., Ltd. –
Class H . . . . . . . . . . . . . . . . . . . . . . . . . . . . 0.4 8,6322.5 59,332
Electronic Components – Semiconductors 22 Samsung Electronics Co., Ltd. . . . . . . . . . . . . 1.0 23,592
Entertainment Software 48,000 Xurpas, Inc. . . . . . . . . . . . . . . . . . . . . . . . . . . 0.6 15,531
Feminine Health Care Products 2,000 Hengan International Group
Co., Ltd. . . . . . . . . . . . . . . . . . . . . . . . . . . . 0.8 18,864
Finance – Investment Bankers/Brokers 9,600 Haitong Securities Co., Ltd. . . . . . . . . . . . . . . 0.7 17,243
12,000 Huatai Securities Co., Ltd. (144A) . . . . . . . . . 1.2 28,1811.9 45,424
Food – Miscellaneous/Diversifi ed 60,700 Indofood Sukses Makmur Tbk PT . . . . . . . . . 0.9 22,64110,000 JG Summit Holdings, Inc. . . . . . . . . . . . . . . . 0.7 15,58312,180 Universal Robina Corp. . . . . . . . . . . . . . . . . . 2.0 48,162
3.6 86,386
Gas – Distribution 9,000 China Gas Holdings, Ltd. . . . . . . . . . . . . . . . . 0.5 12,612
104,200 Perusahaan Gas Negara Persero Tbk PT . . . . . . . . . . . . . . . . . . . . . . . . . . . . 0.9 20,703
1.4 33,315
Internet Applications Software 3,000 Tencent Holdings, Ltd. . . . . . . . . . . . . . . . . . . 2.4 58,374
Investment Companies 2,000 CK Hutchison Holdings, Ltd. . . . . . . . . . . . . . 1.1 27,071
112,000 Gallant Venture, Ltd. . . . . . . . . . . . . . . . . . . . 0.7 17,465760 GT Capital Holdings, Inc. . . . . . . . . . . . . . . . . 0.9 21,327
2.7 65,863
Investment Management and Advisory Services 10,200 GF Securities Co., Ltd. . . . . . . . . . . . . . . . . . . 1.1 26,165
Life and Health Insurance 15,000 China Life Insurance Co., Ltd. . . . . . . . . . . . . 2.1 49,548
4,000 China Pacifi c Insurance Group Co., Ltd. . . . . . . . . . . . . . . . . . . . . . . . . . . . . . . . 0.7 16,594
2.8 66,142
Machinery – Construction and Mining 10,300 United Tractors Tbk PT . . . . . . . . . . . . . . . . . 0.5 12,331
Medical – Drugs 352,000 Kalbe Farma Tbk PT . . . . . . . . . . . . . . . . . . . . 1.4 33,176
Medical – Wholesale Drug Distributors 7,200 Sinopharm Group Co., Ltd. . . . . . . . . . . . . . . 1.2 28,800
Metal Processors and Fabrication 1,000 Catcher Technology Co., Ltd. . . . . . . . . . . . . . 0.4 8,460
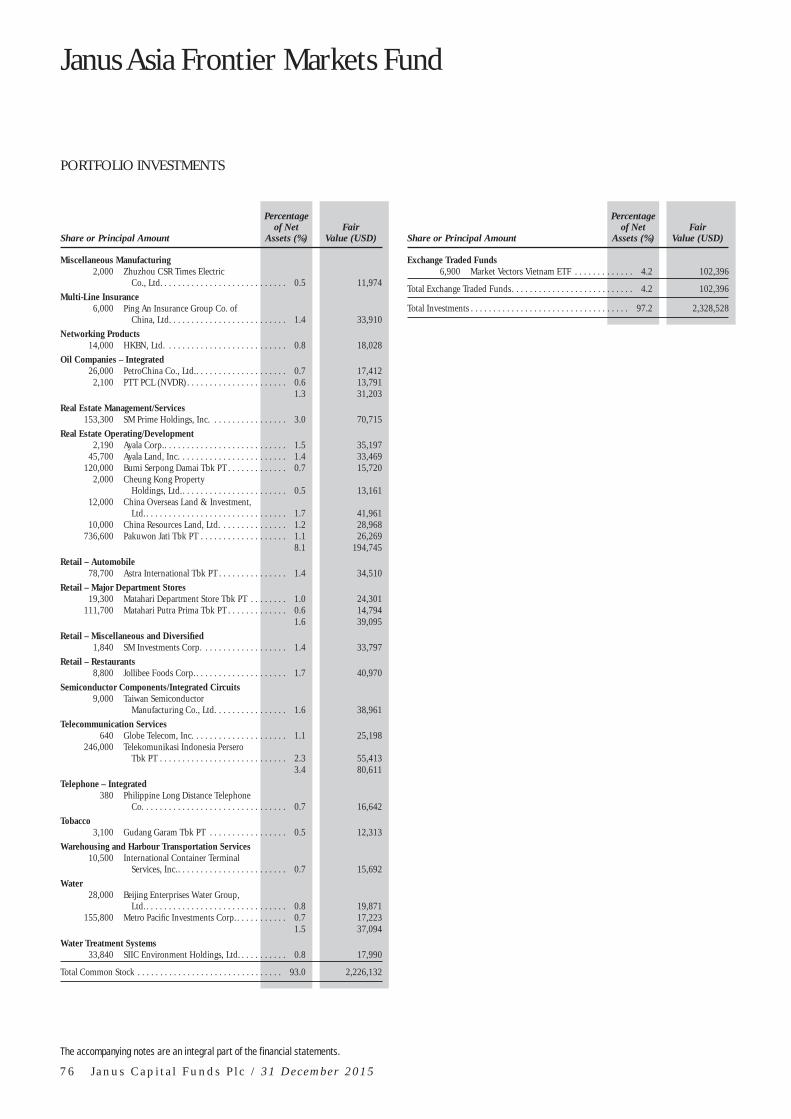
Janus Asia Frontier Markets Fund
PORTFOLIO INVESTMENTS
The accompanying notes are an integral part of the fi nancial statements.
7 6 J a n u s C a p i t a l F u n d s P l c / 3 1 D e c e m b e r 2 0 1 5
Share or Principal Amount
Percentage of Net
Assets (%) Fair
Value (USD)
Miscellaneous Manufacturing 2,000 Zhuzhou CSR Times Electric
Co., Ltd. . . . . . . . . . . . . . . . . . . . . . . . . . . . 0.5 11,974
Multi-Line Insurance 6,000 Ping An Insurance Group Co. of
China, Ltd. . . . . . . . . . . . . . . . . . . . . . . . . . 1.4 33,910
Networking Products 14,000 HKBN, Ltd. . . . . . . . . . . . . . . . . . . . . . . . . . . 0.8 18,028
Oil Companies – Integrated 26,000 PetroChina Co., Ltd. . . . . . . . . . . . . . . . . . . . . 0.7 17,412
2,100 PTT PCL (NVDR) . . . . . . . . . . . . . . . . . . . . . . 0.6 13,7911.3 31,203
Real Estate Management/Services 153,300 SM Prime Holdings, Inc. . . . . . . . . . . . . . . . . 3.0 70,715
Real Estate Operating/Development 2,190 Ayala Corp. . . . . . . . . . . . . . . . . . . . . . . . . . . . 1.5 35,197
45,700 Ayala Land, Inc. . . . . . . . . . . . . . . . . . . . . . . . 1.4 33,469120,000 Bumi Serpong Damai Tbk PT . . . . . . . . . . . . . 0.7 15,720
2,000 Cheung Kong Property Holdings, Ltd. . . . . . . . . . . . . . . . . . . . . . . . 0.5 13,161
12,000 China Overseas Land & Investment, Ltd. . . . . . . . . . . . . . . . . . . . . . . . . . . . . . . . 1. 7 41,961
10,000 China Resources Land, Ltd. . . . . . . . . . . . . . . 1.2 28,968736,600 Pakuwon Jati Tbk PT . . . . . . . . . . . . . . . . . . . 1.1 26,269
8. 1 194,745
Retail – Automobile 78,700 Astra International Tbk PT . . . . . . . . . . . . . . . 1.4 34,510
Retail – Major Department Stores 19,300 Matahari Department Store Tbk PT . . . . . . . . 1.0 24,301
111,700 Matahari Putra Prima Tbk PT . . . . . . . . . . . . . 0.6 14,794 1.6 39,095
Retail – Miscellaneous and Diversifi ed 1,840 SM Investments Corp. . . . . . . . . . . . . . . . . . . 1.4 33,797
Retail – Restaurants 8,800 Jollibee Foods Corp. . . . . . . . . . . . . . . . . . . . . 1.7 40,970
Semiconductor Components/Integrated Circuits 9,000 Taiwan Semiconductor
Manufacturing Co., Ltd. . . . . . . . . . . . . . . . 1.6 38,961
Telecommunication Services 640 Globe Telecom, Inc. . . . . . . . . . . . . . . . . . . . . 1.1 25,198
246,000 Telekomunikasi Indonesia Persero Tbk PT . . . . . . . . . . . . . . . . . . . . . . . . . . . . 2.3 55,413
3.4 80,611
Telephone – Integrated 380 Philippine Long Distance Telephone
Co. . . . . . . . . . . . . . . . . . . . . . . . . . . . . . . . 0.7 16,642
Tobacco 3,100 Gudang Garam Tbk PT . . . . . . . . . . . . . . . . . 0.5 12,313
Warehousing and Harbour Transportation Services 10,500 International Container Terminal
Services, Inc. . . . . . . . . . . . . . . . . . . . . . . . . 0.7 15,692
Water 28,000 Beijing Enterprises Water Group,
Ltd. . . . . . . . . . . . . . . . . . . . . . . . . . . . . . . . 0.8 19,871155,800 Metro Pacifi c Investments Corp. . . . . . . . . . . . 0.7 17,223
1.5 37,094
Water Treatment Systems 33,840 SIIC Environment Holdings, Ltd. . . . . . . . . . . 0.8 17,990
Total Common Stock . . . . . . . . . . . . . . . . . . . . . . . . . . . . . . . . 93. 0 2,226,132
Share or Principal Amount
Percentage of Net
Assets (%) Fair
Value (USD)
Exchange Traded Funds 6,900 Market Vectors Vietnam ETF . . . . . . . . . . . . . 4. 2 102,396
Total Exchange Traded Funds . . . . . . . . . . . . . . . . . . . . . . . . . . . 4. 2 102,396
Total Investments . . . . . . . . . . . . . . . . . . . . . . . . . . . . . . . . . . . 97. 2 2,328,528

PORTFOLIO INVESTMENTS
The accompanying notes are an integral part of the fi nancial statements.
J a n u s C a p i t a l F u n d s P l c / 3 1 D e c e m b e r 2 0 1 5 7 7
Financial Liabilities at fair value through profi t or loss
Forward Currency Contracts, Open as at 31 December 2015
Currency Purchased
Currency Sold
Current Market
Value (USD) Settle Date
Unrealised (Depreciation)
(USD)
CitibankCAD 2,794 USD 2,023 2,024 29-Jan-16 (1)CNH 13,517 USD 2,049 2,051 29-Jan-16 (2)CNH 13,291 USD 2,015 2,017 29-Jan-16 (2)CNH 3,047 USD 463 465 29-Jan-16 (2)CNH 2,979 USD 453 455 29-Jan-16 (2)CNH 7,778 USD 1,183 1,187 29-Jan-16 (4)CNH 7,923 USD 1,205 1,210 29-Jan-16 (5)CNH 8,251 USD 1,254 1,259 29-Jan-16 (5)CNH 8,445 USD 1,284 1,289 29-Jan-16 (5)CNH 629,544 USD 95,379 95,410 29-Jan-16 (31)CNH 639,227 USD 96,846 96,878 29-Jan-16 (32)EUR 974 USD 1,067 1,068 29-Jan-16 (1)EUR 1,086 USD 1,189 1,190 29-Jan-16 (1)EUR 997 USD 1,092 1,093 29-Jan-16 (1)EUR 1,001 USD 1,096 1,097 29-Jan-16 (1)EUR 856 USD 939 942 29-Jan-16 (3)EUR 875 USD 960 963 29-Jan-16 (3)EUR 956 USD 1,049 1,052 29-Jan-16 (3)EUR 872 USD 957 960 29-Jan-16 (3)GBP 405 USD 603 605 29-Jan-16 (2)GBP 794 USD 1,183 1,189 29-Jan-16 (6)GBP 690 USD 1,035 1,047 29-Jan-16 (12)GBP 1,578 USD 2,358 2,377 29-Jan-16 (19)GBP 61,392 USD 91,671 92,337 29-Jan-16 (666)USD 29 AUD 41 30 29-Jan-16 (1)USD 46 EUR 43 47 29-Jan-16 (1)USD 53 EUR 49 54 29-Jan-16 (1)USD 629 EUR 579 634 29-Jan-16 (5)USD 621 EUR 572 626 29-Jan-16 (5)USD 580 CAD 808 585 29-Jan-16 (5)USD 696 EUR 641 701 29-Jan-16 (5)USD 628 EUR 578 633 29-Jan-16 (5)USD 590 AUD 827 602 29-Jan-16 (12)
Total (852)
Total Financial Liabilities at fair value through profi t or loss (852)
Forward Currency Contracts, Open as at 31 December 2015
Currency Purchased
Currency Sold
Current Market
Value (USD) Settle Date
Unrealised Appreciation
(USD)
CitibankAUD 113,633 USD 81,649 80,490 29-Jan-16 1,163AUD 2,891 USD 2,081 2,056 29-Jan-16 25AUD 1,457 USD 1,052 1,043 29-Jan-16 9AUD 734 USD 530 525 29-Jan-16 5AUD 1,291 USD 938 935 29-Jan-16 3CAD 109,170 USD 78,935 78,870 29-Jan-16 65CAD 1,395 USD 1,001 993 29-Jan-16 8CAD 706 USD 508 505 29-Jan-16 3CAD 1,228 USD 887 885 29-Jan-16 2EUR 86,246 USD 93,724 93,066 29-Jan-16 658EUR 78,483 USD 85,288 84,689 29-Jan-16 599EUR 78,292 USD 85,080 84,482 29-Jan-16 598EUR 77,111 USD 83,796 83,207 29-Jan-16 589EUR 2,198 USD 2,390 2,374 29-Jan-16 16EUR 1,967 USD 2,139 2,125 29-Jan-16 14EUR 2,009 USD 2,184 2,170 29-Jan-16 14EUR 2,003 USD 2,178 2,164 29-Jan-16 14EUR 502 USD 550 550 29-Jan-16 —EUR 513 USD 561 561 29-Jan-16 —EUR 560 USD 613 613 29-Jan-16 —EUR 514 USD 563 563 29-Jan-16 —USD 673 GBP 452 670 29-Jan-16 3USD 718 CNH 4,732 717 29-Jan-16 1USD 725 CNH 4,782 724 29-Jan-16 1USD 44 EUR 40 44 29-Jan-16 —USD 10 CNH 65 10 29-Jan-16 —USD 13 CNH 86 13 29-Jan-16 —USD 27 CAD 38 27 29-Jan-16 —USD 27 GBP 18 27 29-Jan-16 —USD 44 EUR 41 44 29-Jan-16 —
Total 3,790
Total Financial Assets at fair value through profi t or loss 2,332,318

Janus Asia Growth Drivers Fund
PORTFOLIO INVESTMENTS
The accompanying notes are an integral part of the fi nancial statements.
7 8 J a n u s C a p i t a l F u n d s P l c / 3 1 D e c e m b e r 2 0 1 5
Share or Principal Amount
Percentage of Net
Assets (%) Fair
Value (USD)
Financial Assets at fair value through profi t or loss Common Stock Airlines
22,000 China Eastern Airlines Corp., Ltd. . . . . . . . . . . 0.5 12,519
Airport Development and Maintenance 3,100 Airports of Thailand PCL (NVDR) . . . . . . . . . . 1.3 29,819
Appliances 14,000 Haier Electronics Group Co., Ltd.. . . . . . . . . . . 1.2 28,398
Automotive – Cars and Light Trucks 13,500 BAIC Motor Corp., Ltd. (144A) . . . . . . . . . . . . 0.6 13,51816,500 Great Wall Motor Co., Ltd. . . . . . . . . . . . . . . . . 0.8 19,226
266 Hyundai Motor Co. . . . . . . . . . . . . . . . . . . . . . 1.5 33,809900 Tata Motors, Ltd. . . . . . . . . . . . . . . . . . . . . . . . 1.1 26,523
4.0 93,076
Automotive – Truck Parts and Equipment – Original 186 Hyundai Wia Corp. . . . . . . . . . . . . . . . . . . . . . 0.8 17,770
Building – Heavy Construction 26,000 China Railway Construction Corp.,
Ltd. . . . . . . . . . . . . . . . . . . . . . . . . . . . . . . . . 1. 5 32,241
Building and Construction – Miscellaneous 18,000 Gamuda Bhd . . . . . . . . . . . . . . . . . . . . . . . . . . 0.8 19,552
Building Products – Cement and Aggregate 23,200 Semen Indonesia Persero Tbk PT . . . . . . . . . . . 0.8 19,193
Casino Hotels 8,500 Genting Malaysia Bhd . . . . . . . . . . . . . . . . . . . . 0.4 8,678
Cellular Telecommunications 4,000 China Mobile, Ltd. . . . . . . . . . . . . . . . . . . . . . . 1.9 45,163
Circuit Boards 9,373 FLEXium Interconnect, Inc. . . . . . . . . . . . . . . . 1.0 22,4628,000 Zhen Ding Technology Holding,
Ltd. . . . . . . . . . . . . . . . . . . . . . . . . . . . . . . . . 0.8 18,465 1.8 40,927
Commercial Banks – Non U.S. 80,000 Bank of China, Ltd. . . . . . . . . . . . . . . . . . . . . . 1.5 35,71753,900 Bank Rakyat Indonesia Persero
Tbk PT . . . . . . . . . . . . . . . . . . . . . . . . . . . . 1.9 44,68948,000 China Construction Bank Corp. . . . . . . . . . . . . 1.4 32,889
9,000 China Merchants Bank Co., Ltd. . . . . . . . . . . . . 0.9 21,25219,500 China Minsheng Banking Corp.,
Ltd. . . . . . . . . . . . . . . . . . . . . . . . . . . . . . . . . 0.8 19,324900 DBS Group Holdings, Ltd. . . . . . . . . . . . . . . . . 0.5 10,598
4,200 ICICI Bank, Ltd. (ADR) . . . . . . . . . . . . . . . . . . 1.4 32,8864,500 Kasikornbank PCL (NVDR) . . . . . . . . . . . . . . . 0.8 18,8289,800 Malayan Banking Bhd . . . . . . . . . . . . . . . . . . . . 0.8 19,189
10.0 235,372
Computer Services 1,800 Infosys, Ltd. . . . . . . . . . . . . . . . . . . . . . . . . . . . 1.3 30,150
Computers 14,000 Lenovo Group, Ltd. . . . . . . . . . . . . . . . . . . . . . 0.6 14,217
Computers – Integrated Systems 17,000 PAX Global Technology, Ltd. . . . . . . . . . . . . . . 0.8 17,527
Consumer Products – Miscellaneous 7,000 Samsonite International S.A.. . . . . . . . . . . . . . . 0.9 21,046
Cosmetics and Toiletries 110 AMOREPACIFIC Corp. . . . . . . . . . . . . . . . . . . 1.7 38,893
45 Cosmax, Inc. . . . . . . . . . . . . . . . . . . . . . . . . . . 0.3 7,063 2.0 45,956
Diversifi ed Financial Services 15,000 Fubon Financial Holding Co., Ltd. . . . . . . . . . . 0.9 20,554
649 Shinhan Financial Group Co., Ltd. . . . . . . . . . . 0.9 21,895 1.8 42,449
Diversifi ed Manufacturing Operations 12,100 Cahya Mata Sarawak Bhd . . . . . . . . . . . . . . . . . 0.6 14,469
Share or Principal Amount
Percentage of Net
Assets (%) Fair
Value (USD)
Diversifi ed Operations 36,700 Alliance Global Group, Inc. . . . . . . . . . . . . . . . 0.5 12,561
550,000 Premium Leisure Corp. . . . . . . . . . . . . . . . . . . 0.3 7,4831,200 Siam Cement PCL (NVDR) . . . . . . . . . . . . . . . . 0.7 15,346
1.5 35,390
E-Commerce/Products 230 Alibaba Group Holding, Ltd. (ADR). . . . . . . . . . 0.8 18,692700 Vipshop Holdings, Ltd. . . . . . . . . . . . . . . . . . . 0.5 10,689
1.3 29,381
Electric – Generation 52,000 China Power International
Development, Ltd. . . . . . . . . . . . . . . . . . . . . 1.3 30,060178,500 Energy Development Corp. . . . . . . . . . . . . . . . 1.0 23,527
46,000 Huadian Fuxin Energy Corp., Ltd. – Class H . . . . . . . . . . . . . . . . . . . . . . . . . . . . . 0.6 13,177
2.9 66,764
Electric – Integrated 5,100 Tenaga Nasional Bhd . . . . . . . . . . . . . . . . . . . . 0.7 15,835
Electronic Components – Miscellaneous 4,000 TPK Holding Co., Ltd. . . . . . . . . . . . . . . . . . . . 0.4 10,049
Electronic Components – Semiconductors 10,000 Everlight Electronics Co., Ltd. . . . . . . . . . . . . . 0.6 14,540
714 Hynix Semiconductor, Inc. . . . . . . . . . . . . . . . . 0.8 18,72848 Samsung Electronics Co., Ltd. . . . . . . . . . . . . . 2. 3 51,591
3. 7 84,859
Electronic Connectors 12,000 Cheng Uei Precision Industry Co.,
Ltd. . . . . . . . . . . . . . . . . . . . . . . . . . . . . . . . . 0.7 16,626
Energy – Alternate Sources 17,000 Motech Industries, Inc. . . . . . . . . . . . . . . . . . . . 1.0 23,398
Entertainment Software 46,900 Xurpas, Inc. . . . . . . . . . . . . . . . . . . . . . . . . . . . 0.7 15,175
Feminine Health Care Products 1,500 Hengan International Group Co.,
Ltd. . . . . . . . . . . . . . . . . . . . . . . . . . . . . . . . . 0.6 14,168
Finance – Investment Bankers/Brokers 21,000 Guotai Junan International Holdings,
Ltd. . . . . . . . . . . . . . . . . . . . . . . . . . . . . . . . . 0.3 7,37116,000 Haitong Securities Co., Ltd. . . . . . . . . . . . . . . . 1.2 28,28512,000 Huatai Securities Co., Ltd. (144A) . . . . . . . . . . 1.2 27,996
2.7 63,652
Food – Miscellaneous/Diversifi ed 50,800 Indofood Sukses Makmur Tbk PT . . . . . . . . . . 0.8 19,078
5,960 Universal Robina Corp. . . . . . . . . . . . . . . . . . . 1.0 23,567 1.8 42,645
Gas – Distribution 8,000 China Gas Holdings, Ltd. . . . . . . . . . . . . . . . . . 0.5 11,541
Internet Applications Software 3,200 Tencent Holdings, Ltd. . . . . . . . . . . . . . . . . . . . 2.7 62,969
Investment Companies 1,868 CK Hutchison Holdings, Ltd. . . . . . . . . . . . . . . 1.1 25,213
Investment Management and Advisory Services 9,800 GF Securities Co., Ltd. . . . . . . . . . . . . . . . . . . . 1.1 24,608
Life and Health Insurance 15,000 Cathay Financial Holding Co., Ltd. . . . . . . . . . 0.9 21,14811,000 China Life Insurance Co., Ltd. . . . . . . . . . . . . . 1.5 35,556
2.4 56,704
Machinery – General Industrial 30,000 Shanghai Electric Group Co., Ltd. . . . . . . . . . . 0.7 15,910
Medical – Drugs 190,000 Kalbe Farma Tbk PT . . . . . . . . . . . . . . . . . . . . . 0.8 18,201
Medical – Wholesale Drug Distributors 7,200 Sinopharm Group Co., Ltd. . . . . . . . . . . . . . . . 1.2 28,894

PORTFOLIO INVESTMENTS
The accompanying notes are an integral part of the fi nancial statements.
J a n u s C a p i t a l F u n d s P l c / 3 1 D e c e m b e r 2 0 1 5 7 9
Share or Principal Amount
Percentage of Net
Assets (%) Fair
Value (USD)
Metal Processors and Fabrication 3,000 Catcher Technology Co., Ltd. . . . . . . . . . . . . . . 1.1 25,213
Miscellaneous Manufacturing 200 Largan Precision Co., Ltd. . . . . . . . . . . . . . . . . 0.6 13,824
2,000 Zhuzhou CSR Times Electric Co., Ltd. . . . . . . . . . . . . . . . . . . . . . . . . . . . . . . . . 0.5 11,626
1.1 25,450
Multi-Line Insurance 5,500 Ping An Insurance Group Co. of
China, Ltd. . . . . . . . . . . . . . . . . . . . . . . . . . . 1.3 30,517
Networking Products 13,500 HKBN, Ltd. . . . . . . . . . . . . . . . . . . . . . . . . . . . 0.8 17,420
Oil Companies – Exploration and Production 17,000 CNOOC, Ltd. . . . . . . . . . . . . . . . . . . . . . . . . . . 0.8 17,702
Oil Companies – Integrated 28,000 China Petroleum & Chemical Corp. . . . . . . . . . 0.7 16,909
2,800 PTT PCL (NVDR) . . . . . . . . . . . . . . . . . . . . . . . 0.8 18,994 1.5 35,903
Petrochemicals 100 LG Chem, Ltd. . . . . . . . . . . . . . . . . . . . . . . . . . 1.2 28,022
Poultry 52,400 GFPT PCL . . . . . . . . . . . . . . . . . . . . . . . . . . . . 0.6 14,422
Real Estate Management/Services 57,500 SM Prime Holdings, Inc. . . . . . . . . . . . . . . . . . 1.1 26,526
Real Estate Operating/Development 2,000 Ayala Corp. . . . . . . . . . . . . . . . . . . . . . . . . . . . . 1.4 32,144
117,200 Bumi Serpong Damai Tbk PT . . . . . . . . . . . . . . 0.7 15,3093,868 Cheung Kong Property Holdings,
Ltd. . . . . . . . . . . . . . . . . . . . . . . . . . . . . . . . . 1.1 25,1559,000 China Overseas Land & Investment,
Ltd. . . . . . . . . . . . . . . . . . . . . . . . . . . . . . . . . 1. 3 31,58810,000 China Resources Land, Ltd. . . . . . . . . . . . . . . . 1.3 29,162
500,000 Pakuwon Jati Tbk PT . . . . . . . . . . . . . . . . . . . . 0.8 17,997 6. 6 151,355
Retail – Automobile 56,900 Astra International Tbk PT . . . . . . . . . . . . . . . . 1.1 24,77537,380 Berjaya Auto Bhd . . . . . . . . . . . . . . . . . . . . . . . 0.8 18,646
1.9 43,421
Retail – Major Department Stores 22,000 Matahari Department Store Tbk PT . . . . . . . . . 1.2 28,099
107,600 Matahari Putra Prima Tbk PT . . . . . . . . . . . . . . 0.6 14,251 1.8 42,350
Retail – Miscellaneous and Diversifi ed 1,290 SM Investments Corp. . . . . . . . . . . . . . . . . . . . 1.0 23,694
Retail – Restaurants 6,560 Jollibee Foods Corp. . . . . . . . . . . . . . . . . . . . . . 1.3 30,542
15,900 Minor International PCL (NVDR) . . . . . . . . . . . 0.7 16,024 2.0 46,566
Semiconductor Components/Integrated Circuits 12,000 Chipbond Technology Corp. . . . . . . . . . . . . . . 0.7 17,375
2,500 Siliconware Precision Industries Co., Ltd. . . . . . . . . . . . . . . . . . . . . . . . . . . . . . . . . 0.8 19,375
4,000 Taiwan Semiconductor Manufacturing Co., Ltd. . . . . . . . . . . . . . . . . . . . . . . . . . . . . 0.8 17,417
1,700 Taiwan Semiconductor Manufacturing Co., Ltd. (ADR) . . . . . . . . . . . . . . . . . . . . . . . 1.7 38,675
4.0 92,842
Semiconductor Equipment 26,100 Inari Amertron Bhd . . . . . . . . . . . . . . . . . . . . . 1.2 27,864
Telecommunication Services 110,000 Telekomunikasi Indonesia Persero
Tbk PT . . . . . . . . . . . . . . . . . . . . . . . . . . . . . 1.1 24,786
Share or Principal Amount
Percentage of Net
Assets (%) Fair
Value (USD)
Telephone – Integrated 435 Philippine Long Distance Telephone
Co. . . . . . . . . . . . . . . . . . . . . . . . . . . . . . . . . 0.8 19,050
Transportation – Railroad 70,000 BTS Group Holdings PCL (NVDR) . . . . . . . . . . 0.8 17,709
Water Treatment Systems 153 Coway Co., Ltd. . . . . . . . . . . . . . . . . . . . . . . . . 0.5 10,976
20,160 SIIC Environment Holdings, Ltd. . . . . . . . . . . . 0.5 10,882 1.0 21,858
Web Portals/Internet Service Providers 47 NAVER Corp. . . . . . . . . . . . . . . . . . . . . . . . . . . 1.1 26,381
Total Common Stock . . . . . . . . . . . . . . . . . . . . . . . . . . . . . . . . . 94. 3 2,189,555
Exchange Traded Funds 2,900 iShares MSCI India ETF . . . . . . . . . . . . . . . . . . 3.4 79,866
Total Exchange Traded Funds . . . . . . . . . . . . . . . . . . . . . . . . . . . . 3.4 79,866
Total Investments . . . . . . . . . . . . . . . . . . . . . . . . . . . . . . . . . . . . 97. 7 2,269,421

Janus Asia Growth Drivers Fund
PORTFOLIO INVESTMENTS
The accompanying notes are an integral part of the fi nancial statements.
8 0 J a n u s C a p i t a l F u n d s P l c / 3 1 D e c e m b e r 2 0 1 5
Forward Currency Contracts, Open as at 31 December 2015
Currency Purchased
Currency Sold
Current Market
Value (USD) Settle Date
Unrealised Appreciation
(USD)
Citibank AUD 111,065 USD 79,804 78,817 29-Jan-16 987AUD 2,459 USD 1,770 1,752 29-Jan-16 18AUD 1,477 USD 1,067 1,060 29-Jan-16 7AUD 708 USD 512 508 29-Jan-16 4AUD 1,309 USD 951 950 29-Jan-16 1CAD 1,418 USD 1,017 1,010 29-Jan-16 7CAD 684 USD 491 488 29-Jan-16 3CAD 1,249 USD 902 901 29-Jan-16 1CNH 630,626 USD 95,543 95,499 29-Jan-16 44CNH 620,924 USD 94,073 94,030 29-Jan-16 43CNH 13,628 USD 2,066 2,066 25-Jan-16 —CNH 13,862 USD 2,101 2,101 29-Jan-16 —EUR 76,711 USD 83,362 83,312 29-Jan-16 50EUR 76,903 USD 83,570 83,520 29-Jan-16 50EUR 74,692 USD 81,168 81,119 29-Jan-16 49EUR 75,154 USD 81,670 81,621 29-Jan-16 49EUR 2,060 USD 2,239 2,239 29-Jan-16 —EUR 1,718 USD 1,868 1,868 29-Jan-16 —EUR 1,713 USD 1,862 1,862 29-Jan-16 —EUR 2,045 USD 2,223 2,223 29-Jan-16 —USD 585 GBP 393 579 29-Jan-16 6USD 518 GBP 349 514 29-Jan-16 4USD 479 EUR 437 475 29-Jan-16 4USD 478 EUR 435 474 29-Jan-16 4USD 484 EUR 441 480 29-Jan-16 4USD 485 EUR 442 481 29-Jan-16 4USD 172 GBP 116 170 29-Jan-16 2USD 389 GBP 262 387 29-Jan-16 2USD 370 EUR 339 368 25-Jan-16 2USD 379 EUR 347 377 29-Jan-16 2USD 383 EUR 350 381 29-Jan-16 2USD 369 EUR 337 367 29-Jan-16 2USD 335 EUR 307 333 29-Jan-16 2USD 338 EUR 309 336 29-Jan-16 2USD 334 EUR 306 332 29-Jan-16 2USD 361 GBP 243 359 29-Jan-16 2USD 338 EUR 309 336 29-Jan-16 2USD 324 AUD 445 323 29-Jan-16 1USD 232 CNH 1,530 231 29-Jan-16 1USD 246 CNH 1,617 245 29-Jan-16 1USD 324 AUD 443 323 29-Jan-16 1USD 163 CNH 1,076 163 29-Jan-16 —USD 162 CNH 1,071 162 29-Jan-16 —USD 634 CNH 4,178 634 29-Jan-16 —USD 627 CNH 4,136 627 29-Jan-16 —USD 370 CNH 2,443 370 29-Jan-16 —USD 373 CNH 2,460 373 29-Jan-16 —
Total 1,365
Total Financial Assets at fair value through profi t or loss 2,270,786
Financial Liabilities at fair value through profi t or loss
Forward Currency Contracts, Open as at 31 December 2015
Currency Purchased
Currency Sold
Current Market
Value (USD)Settle Date
Unrealised (Depreciation)
(USD)
Citibank CAD 2,926 USD 2,119 2,123 29-Jan-16 (4)CAD 106,467 USD 76,980 76,999 29-Jan-16 (19)CNH 2,902 USD 441 442 29-Jan-16 (1)CNH 2,971 USD 451 452 29-Jan-16 (1)CNH 8,660 USD 1,316 1,320 29-Jan-16 (4)CNH 8,462 USD 1,286 1,290 29-Jan-16 (4)CNH 7,965 USD 1,211 1,215 29-Jan-16 (4)CNH 8,114 USD 1,234 1,238 29-Jan-16 (4)EUR 498 USD 545 549 29-Jan-16 (4)EUR 496 USD 543 547 29-Jan-16 (4)EUR 482 USD 527 531 29-Jan-16 (4)EUR 486 USD 532 536 29-Jan-16 (4)EUR 980 USD 1,074 1,082 29-Jan-16 (8)EUR 1,017 USD 1,114 1,122 29-Jan-16 (8)EUR 1,013 USD 1,110 1,118 29-Jan-16 (8)EUR 990 USD 1,084 1,092 29-Jan-16 (8)EUR 890 USD 977 986 29-Jan-16 (9)EUR 871 USD 956 965 25-Jan-16 (9)EUR 887 USD 974 983 29-Jan-16 (9)EUR 864 USD 948 957 29-Jan-16 (9)GBP 395 USD 588 593 29-Jan-16 (5)GBP 814 USD 1,212 1,225 29-Jan-16 (13)GBP 708 USD 1,062 1,080 29-Jan-16 (18)GBP 1,359 USD 2,031 2,058 29-Jan-16 (27)GBP 60,683 USD 90,613 91,772 29-Jan-16 (1,154)USD 178 EUR 164 179 29-Jan-16 (1)USD 176 EUR 162 177 29-Jan-16 (1)USD 176 EUR 162 177 29-Jan-16 (1)USD 178 EUR 164 179 29-Jan-16 (1)USD 150 CAD 209 151 29-Jan-16 (1)USD 534 EUR 492 535 29-Jan-16 (1)USD 543 EUR 500 544 29-Jan-16 (1)USD 542 EUR 499 543 29-Jan-16 (1)USD 536 EUR 494 537 29-Jan-16 (1)USD 491 CNH 3,244 492 29-Jan-16 (1)USD 495 CNH 3,274 496 29-Jan-16 (1)USD 456 AUD 628 457 29-Jan-16 (1)USD 340 CAD 472 341 29-Jan-16 (1)USD 308 CAD 428 309 29-Jan-16 (1)USD 157 AUD 220 160 29-Jan-16 (3)USD 501 CAD 697 504 29-Jan-16 (3)USD 437 CAD 609 440 29-Jan-16 (3)USD 507 AUD 710 517 29-Jan-16 (10)
Total (1,375)
Total Financial Liabilities at fair value through profi t or loss (1,375)
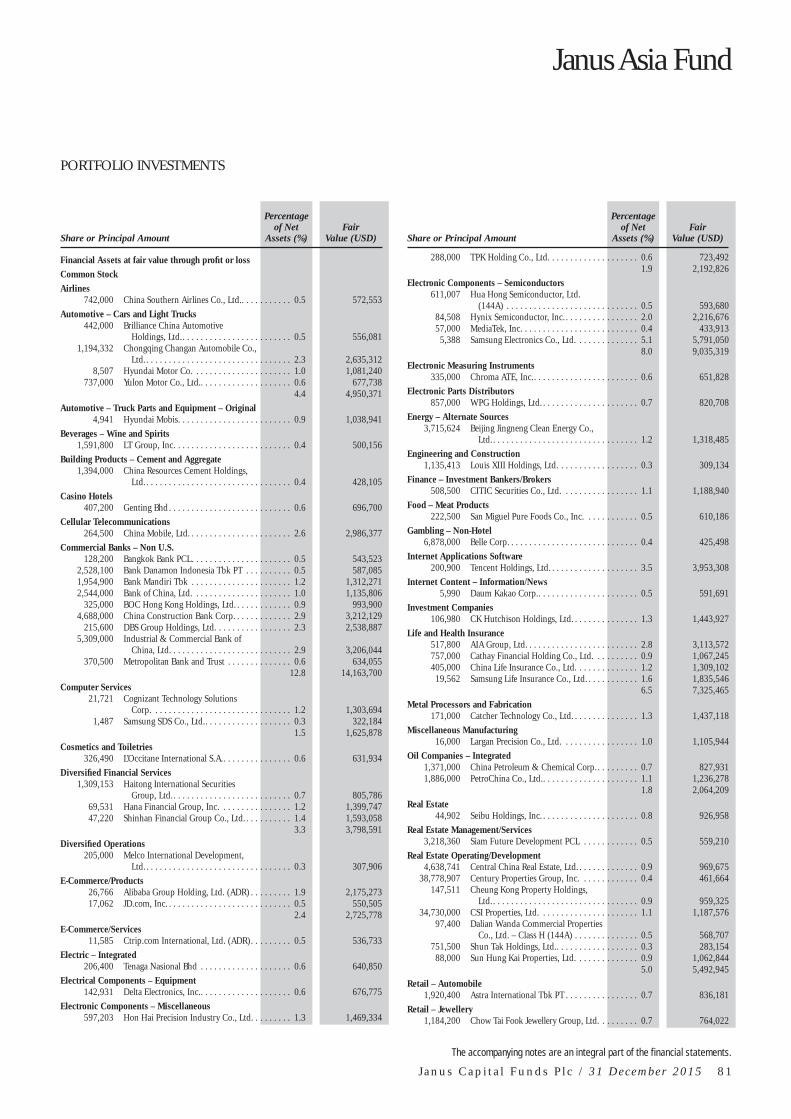
Janus Asia Fund
PORTFOLIO INVESTMENTS
The accompanying notes are an integral part of the fi nancial statements.
J a n u s C a p i t a l F u n d s P l c / 3 1 D e c e m b e r 2 0 1 5 8 1
Share or Principal Amount
Percentage of Net
Assets (%) Fair
Value (USD)
Financial Assets at fair value through profi t or loss Common Stock Airlines
742,000 China Southern Airlines Co., Ltd.. . . . . . . . . . . 0.5 572,553
Automotive – Cars and Light Trucks 442,000 Brilliance China Automotive
Holdings, Ltd. . . . . . . . . . . . . . . . . . . . . . . . . 0.5 556,0811,194,332 Chongqing Changan Automobile Co.,
Ltd. . . . . . . . . . . . . . . . . . . . . . . . . . . . . . . . . 2.3 2,635,3128,507 Hyundai Motor Co. . . . . . . . . . . . . . . . . . . . . . 1.0 1,081,240
737,000 Yulon Motor Co., Ltd.. . . . . . . . . . . . . . . . . . . . 0.6 677,738 4.4 4,950,371
Automotive – Truck Parts and Equipment – Original 4,941 Hyundai Mobis . . . . . . . . . . . . . . . . . . . . . . . . . 0.9 1,038,941
Beverages – Wine and Spirits 1,591,800 LT Group, Inc. . . . . . . . . . . . . . . . . . . . . . . . . . 0.4 500,156
Building Products – Cement and Aggregate 1,394,000 China Resources Cement Holdings,
Ltd. . . . . . . . . . . . . . . . . . . . . . . . . . . . . . . . . 0.4 428,105
Casino Hotels 407,200 Genting Bhd . . . . . . . . . . . . . . . . . . . . . . . . . . . 0.6 696,700
Cellular Telecommunications 264,500 China Mobile, Ltd. . . . . . . . . . . . . . . . . . . . . . . 2.6 2,986,377
Commercial Banks – Non U.S. 128,200 Bangkok Bank PCL . . . . . . . . . . . . . . . . . . . . . . 0.5 543,523
2,528,100 Bank Danamon Indonesia Tbk PT . . . . . . . . . . 0.5 587,0851,954,900 Bank Mandiri Tbk . . . . . . . . . . . . . . . . . . . . . . 1.2 1,312,2712,544,000 Bank of China, Ltd. . . . . . . . . . . . . . . . . . . . . . 1.0 1,135,806
325,000 BOC Hong Kong Holdings, Ltd. . . . . . . . . . . . . 0.9 993,9004,688,000 China Construction Bank Corp. . . . . . . . . . . . . 2.9 3,212,129
215,600 DBS Group Holdings, Ltd. . . . . . . . . . . . . . . . . 2.3 2,538,8875,309,000 Industrial & Commercial Bank of
China, Ltd. . . . . . . . . . . . . . . . . . . . . . . . . . . 2.9 3,206,044370,500 Metropolitan Bank and Trust . . . . . . . . . . . . . . 0.6 634,055
12.8 14,163,700
Computer Services 21,721 Cognizant Technology Solutions
Corp. . . . . . . . . . . . . . . . . . . . . . . . . . . . . . . 1.2 1,303,6941,487 Samsung SDS Co., Ltd. . . . . . . . . . . . . . . . . . . . 0.3 322,184
1.5 1,625,878
Cosmetics and Toiletries 326,490 L’Occitane International S.A. . . . . . . . . . . . . . . . 0.6 631,934
Diversifi ed Financial Services 1,309,153 Haitong International Securities
Group, Ltd. . . . . . . . . . . . . . . . . . . . . . . . . . . 0.7 805,78669,531 Hana Financial Group, Inc. . . . . . . . . . . . . . . . 1.2 1,399,74747,220 Shinhan Financial Group Co., Ltd. . . . . . . . . . . 1.4 1,593,058
3.3 3,798,591
Diversifi ed Operations 205,000 Melco International Development,
Ltd. . . . . . . . . . . . . . . . . . . . . . . . . . . . . . . . . 0.3 307,906
E-Commerce/Products 26,766 Alibaba Group Holding, Ltd. (ADR) . . . . . . . . . 1.9 2,175,27317,062 JD.com, Inc. . . . . . . . . . . . . . . . . . . . . . . . . . . . 0.5 550,505
2.4 2,725,778
E-Commerce/Services 11,585 Ctrip.com International, Ltd. (ADR) . . . . . . . . . 0.5 536,733
Electric – Integrated 206,400 Tenaga Nasional Bhd . . . . . . . . . . . . . . . . . . . . 0.6 640,850
Electrical Components – Equipment 142,931 Delta Electronics, Inc. . . . . . . . . . . . . . . . . . . . . 0.6 676,775
Electronic Components – Miscellaneous 597,203 Hon Hai Precision Industry Co., Ltd. . . . . . . . . 1.3 1,469,334
Share or Principal Amount
Percentage of Net
Assets (%) Fair
Value (USD)
288,000 TPK Holding Co., Ltd. . . . . . . . . . . . . . . . . . . . 0.6 723,492 1.9 2,192,826
Electronic Components – Semiconductors 611,007 Hua Hong Semiconductor, Ltd.
(144A) . . . . . . . . . . . . . . . . . . . . . . . . . . . . . 0.5 593,68084,508 Hynix Semiconductor, Inc. . . . . . . . . . . . . . . . . 2.0 2,216,67657,000 MediaTek, Inc. . . . . . . . . . . . . . . . . . . . . . . . . . 0.4 433,913
5,388 Samsung Electronics Co., Ltd. . . . . . . . . . . . . . 5.1 5,791,050 8.0 9,035,319
Electronic Measuring Instruments 335,000 Chroma ATE, Inc. . . . . . . . . . . . . . . . . . . . . . . . 0.6 651,828
Electronic Parts Distributors 857,000 WPG Holdings, Ltd. . . . . . . . . . . . . . . . . . . . . . 0.7 820,708
Energy – Alternate Sources 3,715,624 Beijing Jingneng Clean Energy Co.,
Ltd. . . . . . . . . . . . . . . . . . . . . . . . . . . . . . . . . 1.2 1,318,485
Engineering and Construction 1,135,413 Louis XIII Holdings, Ltd. . . . . . . . . . . . . . . . . . 0.3 309,134
Finance – Investment Bankers/Brokers 508,500 CITIC Securities Co., Ltd. . . . . . . . . . . . . . . . . 1.1 1,188,940
Food – Meat Products 222,500 San Miguel Pure Foods Co., Inc. . . . . . . . . . . . 0.5 610,186
Gambling – Non-Hotel 6,878,000 Belle Corp. . . . . . . . . . . . . . . . . . . . . . . . . . . . . 0.4 425,498
Internet Applications Software 200,900 Tencent Holdings, Ltd. . . . . . . . . . . . . . . . . . . . 3.5 3,953,308
Internet Content – Information/News 5,990 Daum Kakao Corp. . . . . . . . . . . . . . . . . . . . . . . 0.5 591,691
Investment Companies 106,980 CK Hutchison Holdings, Ltd. . . . . . . . . . . . . . . 1.3 1,443,927
Life and Health Insurance 517,800 AIA Group, Ltd. . . . . . . . . . . . . . . . . . . . . . . . . 2.8 3,113,572757,000 Cathay Financial Holding Co., Ltd. . . . . . . . . . 0.9 1,067,245405,000 China Life Insurance Co., Ltd. . . . . . . . . . . . . . 1.2 1,309,102
19,562 Samsung Life Insurance Co., Ltd. . . . . . . . . . . . 1.6 1,835,546 6.5 7,325,465
Metal Processors and Fabrication 171,000 Catcher Technology Co., Ltd. . . . . . . . . . . . . . . 1.3 1,437,118
Miscellaneous Manufacturing 16,000 Largan Precision Co., Ltd. . . . . . . . . . . . . . . . . 1.0 1,105,944
Oil Companies – Integrated 1,371,000 China Petroleum & Chemical Corp. . . . . . . . . . 0.7 827,9311,886,000 PetroChina Co., Ltd. . . . . . . . . . . . . . . . . . . . . . 1.1 1,236,278
1.8 2,064,209
Real Estate 44,902 Seibu Holdings, Inc. . . . . . . . . . . . . . . . . . . . . . 0.8 926,958
Real Estate Management/Services 3,218,360 Siam Future Development PCL . . . . . . . . . . . . 0.5 559,210
Real Estate Operating/Development 4,638,741 Central China Real Estate, Ltd. . . . . . . . . . . . . . 0.9 969,675
38,778,907 Century Properties Group, Inc. . . . . . . . . . . . . 0.4 461,664147,511 Cheung Kong Property Holdings,
Ltd. . . . . . . . . . . . . . . . . . . . . . . . . . . . . . . . . 0.9 959,32534,730,000 CSI Properties, Ltd. . . . . . . . . . . . . . . . . . . . . . 1.1 1,187,576
97,400 Dalian Wanda Commercial Properties Co., Ltd. – Class H (144A) . . . . . . . . . . . . . . 0.5 568,707
751,500 Shun Tak Holdings, Ltd. . . . . . . . . . . . . . . . . . . 0.3 283,15488,000 Sun Hung Kai Properties, Ltd. . . . . . . . . . . . . . 0.9 1,062,844
5.0 5,492,945
Retail – Automobile 1,920,400 Astra International Tbk PT . . . . . . . . . . . . . . . . 0.7 836,181
Retail – Jewellery 1,184,200 Chow Tai Fook Jewellery Group, Ltd. . . . . . . . . 0.7 764,022

Janus Asia Fund
PORTFOLIO INVESTMENTS
The accompanying notes are an integral part of the fi nancial statements.
8 2 J a n u s C a p i t a l F u n d s P l c / 3 1 D e c e m b e r 2 0 1 5
Share or Principal Amount
Percentage of Net
Assets (%) Fair
Value (USD)
Retail – Major Department Stores 553,000 Lifestyle International Holdings,
Ltd. . . . . . . . . . . . . . . . . . . . . . . . . . . . . . . . . 0.7 739,258
Semiconductor Components/Integrated Circuits 1,144,000 Taiwan Semiconductor
Manufacturing Co., Ltd. . . . . . . . . . . . . . . . . 4.4 4,981,376
Steel – Producers 6,370 POSCO . . . . . . . . . . . . . . . . . . . . . . . . . . . . . . 0.8 904,717
Telecommunication Services 222,300 Singapore Telecommunications,
Ltd. . . . . . . . . . . . . . . . . . . . . . . . . . . . . . . . 0.5 575,630
Telecommunications 1,432,984 China Telecom Corp., Ltd. . . . . . . . . . . . . . . . . 0.6 673,060
Telephone – Integrated 19,200 KT Corp. . . . . . . . . . . . . . . . . . . . . . . . . . . . . . 0.4 462,678
Transportation – Marine 1,264,831 First Steamship Co., Ltd. . . . . . . . . . . . . . . . . . 0.3 370,506
Web Portals/Internet Service Providers 5,393 Baidu, Inc. (ADR) . . . . . . . . . . . . . . . . . . . . . . . 0.9 1,019,4931,945 NAVER Corp. . . . . . . . . . . . . . . . . . . . . . . . . . . 1.0 1,091,704
1.9 2,111,197
Total Common Stock . . . . . . . . . . . . . . . . . . . . . . . . . . . . . . . . . 80.3 90,153,672
Preferred Stock Electronic Components – Semiconductors
1,655 Samsung Electronics Co., Ltd., 1.3200% . . . . . . . . . . . . . . . . . . . . . . . . . . . . 1.3 1,540,218
Total Preferred Stock . . . . . . . . . . . . . . . . . . . . . . . . . . . . . . . . . . 1.3 1,540,218
Contract Amount Schedule of Written Options – Calls
3,889,251 CNH/USD Currency Option, expires November 2016, exercise price USD 6.40 (covered) . . . . . . . . . . . . . . . 0.2 224,861
Total Schedule of Written Options – Calls . . . . . . . . . . . . . . . . . . 0.2 224,861
Total Investments . . . . . . . . . . . . . . . . . . . . . . . . . . . . . . . . . . . . 81.8 91,918,751
Fully Funded Equity Swaps at 31 December 2015
Counterparty Notional Amount
Return Paid
by the Fund
Return Received
by the Fund Termination
Date Fair Value
(USD)
Goldman Sachs & Co. 117,588
Fully Funded Swap
Hindustan Zinc, Ltd. 15-Sep-16 260,216
Goldman Sachs & Co. 103,068
Fully Funded Swap ITC, Ltd. 9-May-16 510,695
Goldman Sachs & Co. 85,413
Fully Funded Swap
Yunnan Baiyao Group Co., Ltd. 12-Dec-16 955,201
Goldman Sachs & Co. 96,409
Fully Funded Swap
Housing Development Finance Corp., Ltd. 29-Nov-16 1,841,653
Goldman Sachs & Co. 171,917
Fully Funded Swap
China Vanke Co., Ltd. 18-Jul-16 646,780
Goldman Sachs & Co. 1,202
Fully Funded Swap
Reliance Industries, Ltd. 12-Dec-16 18,434
Goldman Sachs & Co. 68,725
Fully Funded Swap
Finolex Cables, Ltd. 15-Jun-16 262,772
Goldman Sachs & Co. 84,342
Fully Funded Swap
LIC Housing Finance, Ltd. 29-Nov-16 650,258
Goldman Sachs & Co. 167,477
Fully Funded Swap Axis Bank, Ltd. 29-Nov-16 1,136,913
Goldman Sachs & Co. 71,007
Fully Funded Swap Voltas, Ltd. 25-Apr-16 348,079
Total 6,631,001

PORTFOLIO INVESTMENTS
The accompanying notes are an integral part of the fi nancial statements.
J a n u s C a p i t a l F u n d s P l c / 3 1 D e c e m b e r 2 0 1 5 8 3
Total Return Swaps at 31 December 2015
Counterparty Notional Amount
Return Paid
by the Fund
Return Received
by the Fund Termination
Date
Unrealised Appreciation
(USD)
Credit Suisse 42,802
1-month USD LIBOR plus 75 basis points
Reliance Industries, Ltd. 19-Jun-17 32,359
UBS 82,869
1-month USD LIBOR plus 70 basis points
Finolex Cables, Ltd. 12-Sep-16 2,649
UBS 240,000
1-month USD LIBOR plus 50 basis points
Midea Group Co., Ltd 3-Jun-16 96,257
UBS 191,520
1-month USD LIBOR plus 70 basis points
PC Jeweller, Ltd. 26-Sep-16 12,119
UBS 442,480
1-month USD LIBOR plus 50 basis points
Ping An Insurance Co. 29-Aug-16 38,301
UBS 566,076
1-month USD LIBOR plus 70 basis points
Power Grid Corp. of India, Ltd. 8-Aug-16 112,413
Total 294,098
Forward Currency Contracts, Open as at 31 December 2015
Currency Purchased
Currency Sold
Current Market
Value (USD) Settle Date
Unrealised Appreciation
(USD)
Citibank EUR 189,229 USD 205,636 205,513 29-Jan-16 122EUR 25,673 USD 27,898 27,881 29-Jan-16 17EUR 4,542 USD 4,938 4,937 29-Jan-16 1EUR 614 USD 667 667 29-Jan-16 —USD 1,076 EUR 981 1,066 29-Jan-16 10USD 1,478 EUR 1,352 1,470 29-Jan-16 8USD 860 EUR 788 856 29-Jan-16 4USD 147 EUR 134 146 29-Jan-16 1USD 208 EUR 190 207 29-Jan-16 1USD 118 EUR 108 117 29-Jan-16 1USD 150 EUR 138 150 29-Jan-16 —
Total 165
Total Financial Assets at fair value through profi t or loss 98,844,015
Financial Liabilities at fair value through profi t or loss
Total Return Swaps at 31 December 2015
Counterparty Notional Amount
Return Paid by the Fund
Return Received by
the Fund Termination
Date
Unrealised Depreciation
(USD)
UBS 816,500
1-month USD LIBOR plus 50 basis points
DAQIN Railway Co., Ltd. 10-Aug-16 (13,051)
UBS 111,700
1-month USD LIBOR plus 50 basis points
Yunnan Baiyao Group Co., Ltd. 3-Jun-16 (15,811)
UBS 31,107
1-month USD LIBOR plus 70 basis points
Mahindra and Mahindra, Ltd. 10-Oct-16 (890)
Total (29,752)
Forward Currency Contracts, Open as at 31 December 2015
Currency Purchased
Currency Sold
Current Market
Value (USD) Settle Date
Unrealised (Depreciation)
(USD)
Citibank USD 121 EUR 112 122 29-Jan-16 (1)USD 1,096 EUR 1,009 1,097 29-Jan-16 (1)EUR 166 USD 181 182 29-Jan-16 (1)EUR 278 USD 304 306 29-Jan-16 (2)EUR 235 USD 258 260 29-Jan-16 (2)USD 881 EUR 814 885 29-Jan-16 (4)EUR 1,230 USD 1,347 1,356 29-Jan-16 (9)EUR 2,074 USD 2,272 2,288 29-Jan-16 (16)EUR 1,738 USD 1,908 1,926 29-Jan-16 (18)
Total (54)
Total Financial Liabilities at fair value through profi t or loss (29,806)

Janus Balanced Fund
PORTFOLIO INVESTMENTS
The accompanying notes are an integral part of the fi nancial statements.
8 4 J a n u s C a p i t a l F u n d s P l c / 3 1 D e c e m b e r 2 0 1 5
Share or Principal Amount
Percentage of Net
Assets (%) Fair
Value (USD)
Financial Assets at fair value through profi t or loss Asset-Backed/Commercial Mortgage-Backed Securities
219,000 AmeriCredit Automobile Receivables Trust 2012-4, 3.8200%, due 10/2/20 (144A) . . . . . . . . . . . . . . . . . . . . — 221,728
326,000 AmeriCredit Automobile Receivables Trust 2015-2, 3.0000%, due 8/6/21 . . . . . . . . . . . . . . . . . . . — 321,951
172,000 AmeriCredit Automobile Receivables Trust, 3.3100%, due 8/10/19 . . . . . . . . . . . . . — 174,897
1,938,000 Applebee’s/IHOP Funding LLC, 4.2770%, due 5/9/44 (144A) . . . . . . . . . . . . 0.3 1,965,395
339,000 Aventura Mall Trust 2013-AVM, 3.7427%, due 5/12/32 (144A) . . . . . . . . . . . 0.1 333,581
629,000 BAMLL Commercial Mortgage Securities Trust 2015-200P, 3.5958%, due 14/4/33 (144A) . . . . . . . . . . . 0.1 550,959
220,000 Banc of America Commercial Mortgage Trust 2006-6, 5.4210%, due 10/10/45 . . . . . . . . . . . . . . . . . — 223,291
170,000 BHP Billiton PLC, 3.3805%, due 15/8/26 (144A) . . . . . . . . . . . . . . . . . . . . — 169,803
220,000 CGBAM Commercial Mortgage Trust 2014-HD, 3.3305%, due 15/2/31 (144A) . . . . . . . . . . . . . . . . . . . . — 219,134
907,936 CKE Restaurant Holdings, Inc., 4.4740%, due 20/3/43 (144A) . . . . . . . . . . . 0.1 903,980
1,168,236 COMM 2007-C9 Mortgage Trust, 5.6500%, due 10/12/49 . . . . . . . . . . . . . . . . 0.3 1,185,147
675,000 Core Industrial Trust 2015-TEXW, 3.8487%, due 10/2/34 (144A) . . . . . . . . . . . 0.1 633,675
316,608 DB Master Finance LLC 2015-1, 3.2620%, due 20/2/45 (144A) . . . . . . . . . . . . — 314,044
855,000 Domino’s Pizza Master Issuer LLC, 3.4840%, due 25/10/45 (144A) . . . . . . . . . . 0.1 838,969
408,926 Domino’s Pizza Master Issuer LLC, 5.2160%, due 25/1/42 (144A) . . . . . . . . . . . 0.1 421,041
138,000 Freddie Mac Structured Agency Credit Risk Debt Notes, 2.8216%, due 25/10/24 . . . . . . . . . . . . . . . . . . . . . . . . . — 138,447
163,000 Freddie Mac Structured Agency Credit Risk Debt Notes, 3.0716%, due 25/10/24 . . . . . . . . . . . . . . . . . — 165,285
236,633 FREMF 2010 K-SCT Mortgage Trust, 2.0000%, due 25/1/20 (144A) . . . . . . . . . . . . — 212,974
326,000 GAHR Commercial Mortgage Trust 2015-NRF, 3.3822%, due 15/12/19 (144A) . . . . . . . . . . . . . . . . . . . — 314,598
247,000 GS Mortgage Securities Corporation II, 3.4350%, due 10/12/27 (144A) . . . . . . . . . . . — 236,729
100,000 GS Mortgage Securities Corporation Trust 2013-NYC5, 3.6490%, due 10/1/30 (144A) . . . . . . . . . . . . . . . . . . . . — 99,563
417,000 Hilton U.S.A. Trust 2013-HLT, 4.4533%, due 5/11/30 (144A) . . . . . . . . . . . 0.1 418,015
229,000 JP Morgan Chase Commercial Mortgage Securities Trust 2014-FBLU, 2.9305%, due 15/12/28 (144A) . . . . . . . . . . . . . . . . . . . — 229,006
147,000 JP Morgan Chase Commercial Mortgage Securities Trust 2014-FBLU, 3.8305%, due 15/12/28 (144A) . . . . . . . . . . . . . . . . . . . — 146,986
400,000 JP Morgan Chase Commercial Mortgage Securities Trust 2015-COSMO, 2.1305%, due 15/1/32 (144A) . . . . . . . . . . . . . . . . . . . 0.1 398,391
Share or Principal Amount
Percentage of Net
Assets (%) Fair
Value (USD)
388,000 JP Morgan Chase Commercial Mortgage Securities Trust 2015-COSMO, 4.2805%, due 15/1/32 (144A) . . . . . . . . . . . . . . . . . . . 0.1 383,177
126,000 JP Morgan Chase Commercial Mortgage Securities Trust 2015-SGP, 3.0805%, due 15/7/36 (144A) . . . . . . . . . . . . — 126,459
383,000 JP Morgan Chase Commercial Mortgage Securities Trust 2015-SGP, 4.8305%, due 15/7/36 (144A) . . . . . . . . . . . 0.1 385,643
296,000 JP Morgan Chase Commercial Mortgage Securities Trust 2015-UES, 3.6210%, due 5/9/32 (144A) . . . . . . . . . . . . . . . . . . . . . — 278,140
156,000 LB-UBS Commercial Mortgage Trust 2007-C1, 5.4840%, due 15/2/40 . . . . . . . . . . — 157,726
221,503 LB-UBS Commercial Mortgage Trust, 5.4930%, due 15/2/40 . . . . . . . . . . . . . . . . . . — 226,960
604,000 Santander Drive Auto Receivables Trust 2013-4, 4.6700%, due 15/1/20 (144A) . . . . . . . . . . . . . . . . . . . 0.1 619,879
320,000 Santander Drive Auto Receivables Trust 2013-A, 4.7100%, due 15/1/21 (144A) . . . . . . . . . . . . . . . . . . . . — 327,399
342,000 Santander Drive Auto Receivables Trust 2015-1, 3.2400%, due 15/4/21 . . . . . . . . . . . . . . . . . . . . . . . . . 0.1 341,613
585,000 Santander Drive Auto Receivables Trust 2015-4, 3.5300%, due 16/8/21 . . . . . . . . . . . . . . . . . . . . . . . . . 0.1 580,264
200,000 Santander Drive Auto Receivables Trust, 2.5200%, due 17/9/18 . . . . . . . . . . . . . — 200,972
200,000 Starwood Retail Property Trust 2014-STAR, 2.8305%, due 15/11/27 (144A) . . . . . . . . . . . . . . . . . . . — 199,515
670,000 Starwood Retail Property Trust 2014-STAR, 3.5805%, due 15/11/27 (144A) . . . . . . . . . . . . . . . . . . 0.1 662,731
430,000 Starwood Retail Property Trust 2014-STAR, 4.4805%, due 15/11/27 (144A) . . . . . . . . . . . . . . . . . . 0.1 428,493
540,000 Structured Agency Credit Risk, 2.6216%, due 25/3/25 . . . . . . . . . . . . . . . . . 0.1 538,874
160,705 Wachovia Bank Commercial Mortgage Trust Series 2007-C30, 5.3830%, due 15/12/43 . . . . . . . . . . . . . . . . . — 166,161
1,126,138 Wachovia Bank Commercial Mortgage Trust Series 2007-C31, 5.6600%, due 15/4/47 . . . . . . . . . . . . . . . . . 0.3 1,126,792
331,436 Wachovia Bank Commercial Mortgage Trust Series 2007-C33, 5.9524%, due 15/2/51 . . . . . . . . . . . . . . . . . . — 338,302
317,000 Wells Fargo Commercial Mortgage Trust 2014-TISH, 2.5805%, due 15/2/27 (144A) . . . . . . . . . . . . — 308,667
250,000 Wells Fargo Commercial Mortgage Trust 2014-TISH, 3.0805%, due 15/1/27 (144A) . . . . . . . . . . . . — 243,699
75,000 Wells Fargo Commercial Mortgage Trust 2014-TISH, 3.5805%, due 15/2/27 (144A) . . . . . . . . . . . . — 72,775
969,570 Wendys Funding LLC, 3.3710%, due 15/6/45 (144A) . . . . . . . . . . . . . . . . . . . 0.1 948,784
Total Asset-Backed/Commercial Mortgage-Backed Securities . . . . . . . . . . . . . . . . . . . . . . . . . . . . . . . . . . . . . . . . . 2. 6 19,500,614

PORTFOLIO INVESTMENTS
The accompanying notes are an integral part of the fi nancial statements.
J a n u s C a p i t a l F u n d s P l c / 3 1 D e c e m b e r 2 0 1 5 8 5
Share or Principal Amount
Percentage of Net
Assets (%) Fair
Value (USD)
Common Stock Aerospace and Defence
91,662 Boeing Co. . . . . . . . . . . . . . . . . . . . . . . . . . . . . 1.8 13,253,409
Applications Software 375,703 Microsoft Corp. . . . . . . . . . . . . . . . . . . . . . . . . 3.0 20,844,002
Athletic Footwear 275,528 NIKE, Inc. – Class B . . . . . . . . . . . . . . . . . . . . . 2.4 17,220,500
Automotive – Cars and Light Trucks 243,851 General Motors Co. . . . . . . . . . . . . . . . . . . . . . 1.2 8,293,373
Beverages – Wine and Spirits 82,350 Diageo PLC . . . . . . . . . . . . . . . . . . . . . . . . . . . 0.3 2,253,492
Chemicals – Diversifi ed 151,886 E.I. du Pont de Nemours & Co. . . . . . . . . . . . . 1.4 10,115,608151,739 LyondellBasell Industries N.V. –
Class A . . . . . . . . . . . . . . . . . . . . . . . . . . . . . 1.8 13,186,119 3.2 23,301,727
Commercial Services – Finance 40,233 Automatic Data Processing, Inc. . . . . . . . . . . . . 0.5 3,408,540
217,153 Mastercard, Inc. – Class A . . . . . . . . . . . . . . . . 2.9 21,142,018 3.4 24,550,558
Computers 155,912 Apple, Inc. . . . . . . . . . . . . . . . . . . . . . . . . . . . . 2.3 16,411,297
Cruise Lines 105,681 Norwegian Cruise Line Holdings,
Ltd. . . . . . . . . . . . . . . . . . . . . . . . . . . . . . . . . 0.9 6,192,907
Diversifi ed Banking Institutions 101,447 JP Morgan Chase & Co. . . . . . . . . . . . . . . . . . . 0.9 6,698,545
Diversifi ed Manufacturing Operations 22,478 3M Co. . . . . . . . . . . . . . . . . . . . . . . . . . . . . . . . 0.5 3,386,086
168,428 General Electric Co. . . . . . . . . . . . . . . . . . . . . . 0.7 5,246,532 1.2 8,632,618
Diversifi ed Operations 57,384 Dover Corp. . . . . . . . . . . . . . . . . . . . . . . . . . . . 0.5 3,518,213
E-Commerce/Services 52,475 Ctrip.com International, Ltd. (ADR) . . . . . . . . . 0.3 2,431,167
8,239 priceline.com, Inc. . . . . . . . . . . . . . . . . . . . . . . 1.5 10,504,313 1.8 12,935,480
Electronic Forms 72,732 Adobe Systems, Inc. . . . . . . . . . . . . . . . . . . . . . 0.9 6,832,444
Finance – Consumer Loans 198,026 Synchrony Financial . . . . . . . . . . . . . . . . . . . . . 0.8 6,021,971
Finance – Credit Card 89,977 American Express Co. . . . . . . . . . . . . . . . . . . . 0.9 6,257,900
Finance – Investment Bankers/Brokers 166,665 TD Ameritrade Holding Corp. . . . . . . . . . . . . . 0.8 5,784,942
Finance – Other Services 86,378 CME Group, Inc. . . . . . . . . . . . . . . . . . . . . . . . 1.1 7,825,847
Food – Confectionery 65,796 Hershey Co. . . . . . . . . . . . . . . . . . . . . . . . . . . . 0.8 5,873,609
Instruments – Controls 92,775 Honeywell International, Inc. . . . . . . . . . . . . . . 1.3 9,608,707
Life and Health Insurance 287,630 Prudential PLC . . . . . . . . . . . . . . . . . . . . . . . . . 0.9 6,490,929
Medical – Biomedical and Genetic 129,089 Amgen, Inc. . . . . . . . . . . . . . . . . . . . . . . . . . . . 2.9 20,955,017
13,260 Regeneron Pharmaceuticals, Inc. . . . . . . . . . . . 1.0 7,198,456 3.9 28,153,473
Medical – Drugs 265,681 AbbVie, Inc. . . . . . . . . . . . . . . . . . . . . . . . . . . . 2. 1 15,738,942186,115 Bristol-Myers Squibb Co. . . . . . . . . . . . . . . . . . 1.8 12,802,851
Share or Principal Amount
Percentage of Net
Assets (%) Fair
Value (USD)
107,333 Eli Lilly & Co. . . . . . . . . . . . . . . . . . . . . . . . . . 1.3 9,043,879136,084 Merck & Co., Inc. . . . . . . . . . . . . . . . . . . . . . . 1.0 7,187,957
6. 2 44,773,629
Medical – Generic Drugs 58,004 Allergan PLC . . . . . . . . . . . . . . . . . . . . . . . . . . 2.5 18,126,250
Medical – HMO 66,822 Aetna, Inc. . . . . . . . . . . . . . . . . . . . . . . . . . . . . 1.0 7,224,795
Private Equity 419,424 Blackstone Group L.P. . . . . . . . . . . . . . . . . . . . . 1.7 12,263,958
Real Estate Management/Services 205,017 CBRE Group, Inc. – Class A . . . . . . . . . . . . . . . 1.0 7,089,488
REIT – Diversifi ed 79,631 Outfront Media, Inc.. . . . . . . . . . . . . . . . . . . . . 0.2 1,738,345
Resorts and Theme Parks 57,073 Six Flags Entertainment Corp. . . . . . . . . . . . . . 0.4 3,135,591
Retail – Building Products 111,854 Home Depot, Inc. . . . . . . . . . . . . . . . . . . . . . . . 2.1 14,792,692
Retail – Discount 166,797 Dollar Tree, Inc. . . . . . . . . . . . . . . . . . . . . . . . . 1.8 12,880,064
Retail – Restaurants 68,772 Starbucks Corp. . . . . . . . . . . . . . . . . . . . . . . . . 0.6 4,128,383
Super – Regional Banks 262,433 U.S. Bancorp . . . . . . . . . . . . . . . . . . . . . . . . . . 1.6 11,198,016
Telephone – Integrated 28,939 Verizon Communications, Inc. . . . . . . . . . . . . . 0.2 1,337,561
Tobacco 143,445 Altria Group, Inc. . . . . . . . . . . . . . . . . . . . . . . . 1.2 8,349,933
47,432 Philip Morris International, Inc. . . . . . . . . . . . . 0.6 4,169,747 1.8 12,519,680
Toys 137,597 Mattel, Inc. . . . . . . . . . . . . . . . . . . . . . . . . . . . . 0.5 3,738,510
Transportation – Railroad 110,973 Union Pacifi c Corp. . . . . . . . . . . . . . . . . . . . . . 1.2 8,678,089
Web Portals/Internet Service Providers 22,957 Alphabet, Inc. . . . . . . . . . . . . . . . . . . . . . . . . . . 2.4 17,421,608
162,803 Yahoo!, Inc. . . . . . . . . . . . . . . . . . . . . . . . . . . . 0.8 5,414,828 3.2 22,836,436
Total Common Stock . . . . . . . . . . . . . . . . . . . . . . . . . . . . . . . . . 60. 3 433,417,430
Corporate Bonds Aerospace and Defence – Equipment
499,000 Exelis, Inc., 4.2500%, due 1/10/16 . . . . . . . . . 0.1 508,045227,000 Exelis, Inc., 5.5500%, due 1/10/21 . . . . . . . . . . — 249,236246,000 Harris Corp., 3.8320%, due 27/4/25 . . . . . . . . . — 242,762372,000 Harris Corp., 5.0540%, due 27/4/45 . . . . . . . . 0.1 365,625
0.2 1,365,668
Airlines 427,000 Southwest Airlines Co., 5.1250%,
due 1/3/17 . . . . . . . . . . . . . . . . . . . . . . . . . . 0.1 443,905
Automotive – Cars and Light Trucks 970,000 Ford Motor Credit Co., LLC,
3.9840%, due 15/6/16 . . . . . . . . . . . . . . . . . 0.1 980,876456,000 General Motors Co., 3.5000%,
due 2/10/18 . . . . . . . . . . . . . . . . . . . . . . . . . 0.1 461,71856,000 General Motors Co., 4.0000%,
due 1/4/25 . . . . . . . . . . . . . . . . . . . . . . . . . . . — 53,2552,473,000 General Motors Co., 4.8750%,
due 2/10/23 . . . . . . . . . . . . . . . . . . . . . . . . . 0.4 2,541,401570,000 General Motors Financial Co., Inc.,
3.1000%, due 15/1/19 . . . . . . . . . . . . . . . . . 0.1 569,579 0.7 4,606,829

Janus Balanced Fund
PORTFOLIO INVESTMENTS
The accompanying notes are an integral part of the fi nancial statements.
8 6 J a n u s C a p i t a l F u n d s P l c / 3 1 D e c e m b e r 2 0 1 5
Share or Principal Amount
Percentage of Net
Assets (%) Fair
Value (USD)
Automotive – Truck Parts and Equipment – Original 215,000 Schaeffl er Finance B.V., 4.2500%,
due 15/5/21 (144A) . . . . . . . . . . . . . . . . . . . . — 214,463277,000 ZF North America Capital, Inc.,
4.0000%, due 29/4/20 (144A) . . . . . . . . . . . . — 280,324146,000 ZF North America Capital, Inc.,
4.5000%, due 29/4/22 (144A) . . . . . . . . . . . . — 143,263281,000 ZF North America Capital, Inc.,
4.7500%, due 29/4/25 (144A) . . . . . . . . . . . . — 268,706 — 906,756
Building – Heavy Construction 339,000 SBA Tower Trust, 2.9330%,
due 15/12/17 (144A) . . . . . . . . . . . . . . . . . . . — 343,359
Building – Residential and Commercial 482,000 D.R. Horton, Inc., 3.7500%,
due 1/3/19 . . . . . . . . . . . . . . . . . . . . . . . . . . 0.1 483,205217,000 D.R. Horton, Inc., 4.7500%,
due 15/5/17 . . . . . . . . . . . . . . . . . . . . . . . . . . — 224,324548,000 MDC Holdings, Inc., 5.5000%,
due 15/1/24 . . . . . . . . . . . . . . . . . . . . . . . . . 0.1 556,220191,000 Toll Brothers Finance Corp.,
4.0000%, due 31/12/18 . . . . . . . . . . . . . . . . . — 195,298100,000 Toll Brothers Finance Corp.,
4.3750%, due 15/4/23 . . . . . . . . . . . . . . . . . . — 97,500174,000 Toll Brothers Finance Corp.,
5.8750%, due 15/2/22 . . . . . . . . . . . . . . . . . . — 183,570 0.2 1,740,117
Building and Construction Products – Miscellaneous 255,000 Owens Corning, 4.2000%,
due 1/12/24 . . . . . . . . . . . . . . . . . . . . . . . . . . — 248,634
Building Products – Cement and Aggregate 566,000 Hanson, Ltd., 6.1250%,
due 15/8/16 . . . . . . . . . . . . . . . . . . . . . . . . . 0.1 582,273350,000 Martin Marietta Materials, Inc.,
4.2500%, due 2/7/24 . . . . . . . . . . . . . . . . . . . — 344,1111,094,000 Vulcan Materials Co., 4.5000%,
due 1/4/25 . . . . . . . . . . . . . . . . . . . . . . . . . . 0.2 1,088,530419,000 Vulcan Materials Co., 7.0000%,
due 15/6/18 . . . . . . . . . . . . . . . . . . . . . . . . . 0.1 467,185237,000 Vulcan Materials Co., 7.5000%,
due 15/6/21 . . . . . . . . . . . . . . . . . . . . . . . . . . — 277,290 0.4 2,759,389
Cable/Satellite TV 448,000 CCO Safari II LLC, 4.4640%,
due 23/7/22 (144A) . . . . . . . . . . . . . . . . . . . 0.1 446,9391,551,000 CCO Safari II LLC, 4.9080%,
due 23/7/25 (144A) . . . . . . . . . . . . . . . . . . . 0.2 1,551,833 0.3 1,998,772
Casino Hotels 264,000 Wynn Las Vegas LLC / Wynn Las
Vegas Capital Corp., 4.2500%, due 30/5/23 (144A) . . . . . . . . . . . . . . . . . . . . — 226,875
Chemicals – Diversifi ed 769,000 LyondellBasell Industries N.V.,
4.6250%, due 26/2/55 . . . . . . . . . . . . . . . . . 0.1 626,131
Chemicals – Specialty 882,000 Albemarle Corp., 4.1500%,
due 1/12/24 . . . . . . . . . . . . . . . . . . . . . . . . . 0.1 844,447683,000 Albemarle Corp., 5.4500%,
due 1/12/44 . . . . . . . . . . . . . . . . . . . . . . . . . 0.1 662,939340,000 Ashland, Inc., 3.8750%,
due 15/4/18 . . . . . . . . . . . . . . . . . . . . . . . . . . — 348,075436,000 Ashland, Inc., 6.8750%,
due 15/5/43 . . . . . . . . . . . . . . . . . . . . . . . . . 0.1 416,380 0.3 2,271,841
Share or Principal Amount
Percentage of Net
Assets (%) Fair
Value (USD)
Commercial Banks – Eastern U.S. 1,309,000 CIT Group, Inc., 4.2500%,
due 15/8/17 . . . . . . . . . . . . . . . . . . . . . . . . . 0.2 1,341,7251,055,000 CIT Group, Inc., 5.5000%,
due 15/2/19 (144A) . . . . . . . . . . . . . . . . . . . 0.2 1,105,113 0.4 2,446,838
Commercial Banks – Non U.S. 669,000 Intesa Sanpaolo SpA, 5.0170%,
due 26/6/24 (144A) . . . . . . . . . . . . . . . . . . . 0.1 659,3171,596,000 Santander U.K. PLC, 5.0000%,
due 7/11/23 (144A) . . . . . . . . . . . . . . . . . . . 0.2 1,664,071 0.3 2,323,388
Commercial Banks – Western U.S. 636,000 SVB Financial Group, 5.3750%,
due 15/9/20 . . . . . . . . . . . . . . . . . . . . . . . . . 0.1 697,263160,000 Zions Bancorporation, 5.8000%,
due 15/6/23 . . . . . . . . . . . . . . . . . . . . . . . . . . — 153,600 0.1 850,863
Commercial Services 665,000 UBM PLC, 5.7500%, due 3/11/20
(144A) . . . . . . . . . . . . . . . . . . . . . . . . . . . . . 0.1 711,459
Computer Aided Design 325,000 Autodesk, Inc., 3.6000%,
due 15/12/22 . . . . . . . . . . . . . . . . . . . . . . . . . — 316,178
Computers – Memory Devices 2,178,000 Seagate HDD Cayman, 4.7500%,
due 1/1/25 . . . . . . . . . . . . . . . . . . . . . . . . . . 0.3 1,816,794617,000 Seagate HDD Cayman, 4.8750%,
due 1/6/27 (144A) . . . . . . . . . . . . . . . . . . . . 0.1 474,425142,000 Seagate Technology PLC, 4.7500%,
due 1/6/23 . . . . . . . . . . . . . . . . . . . . . . . . . . . — 124,477752,000 Seagate Technology PLC, 5.7500%,
due 1/12/34 (144A) . . . . . . . . . . . . . . . . . . . 0.1 527,526 0.5 2,943,222
Consulting Services 1,260,000 Verisk Analytics, Inc., 4.0000%,
due 15/6/25 . . . . . . . . . . . . . . . . . . . . . . . . . 0.2 1,226,217390,000 Verisk Analytics, Inc., 4.1250%,
due 12/9/22 . . . . . . . . . . . . . . . . . . . . . . . . . 0.1 393,520403,000 Verisk Analytics, Inc., 4.8750%,
due 15/1/19 . . . . . . . . . . . . . . . . . . . . . . . . . 0.1 421,829681,000 Verisk Analytics, Inc., 5.5000%,
due 15/6/45 . . . . . . . . . . . . . . . . . . . . . . . . . 0.1 652,5021,498,000 Verisk Analytics, Inc., 5.8000%,
due 1/5/21 . . . . . . . . . . . . . . . . . . . . . . . . . . 0.2 1,661,871 0.7 4,355,939
Containers – Metal and Glass 353,000 Ball Corp., 4.3750%, due 15/12/20 . . . . . . . . . . — 359,178
Data Processing and Management 1,410,000 Fidelity National Information Services,
Inc., 3.6250%, due 15/10/20 . . . . . . . . . . . . 0.2 1,429,901704,000 Fidelity National Information Services,
Inc., 4.5000%, due 15/10/22 . . . . . . . . . . . . 0.1 717,6082,409,000 Fidelity National Information Services,
Inc., 5.0000%, due 15/10/25 . . . . . . . . . . . . 0.3 2,479,899146,000 Fidelity National Information Services,
Inc., 5.0000%, due 15/3/22 . . . . . . . . . . . . . . — 151,831 0.6 4,779,239
Diagnostic Equipment 425,000 Life Technologies Corp., 6.0000%,
due 1/3/20 . . . . . . . . . . . . . . . . . . . . . . . . . . 0.1 471,572
Dialysis Centres 808,000 Fresenius Medical Care U.S. Finance
II, Inc., 5.8750%, due 31/1/22 (144A) . . . . . . . . . . . . . . . . . . . . . . . . . . . . . 0.1 868,600

PORTFOLIO INVESTMENTS
The accompanying notes are an integral part of the fi nancial statements.
J a n u s C a p i t a l F u n d s P l c / 3 1 D e c e m b e r 2 0 1 5 8 7
Share or Principal Amount
Percentage of Net
Assets (%) Fair
Value (USD)
Diversifi ed Banking Institutions 210,000 Bank of America Corp., 5.7500%,
due 15/8/16 . . . . . . . . . . . . . . . . . . . . . . . . . . — 215,180583,000 Bank of America Corp., 8.0000%,
due 29/12/49 . . . . . . . . . . . . . . . . . . . . . . . . 0.1 593,9311,091,000 Citigroup, Inc., 4.4500%,
due 29/9/27 . . . . . . . . . . . . . . . . . . . . . . . . . 0.2 1,086,232596,000 Goldman Sachs Group, Inc.,
4.2500%, due 21/10/25 . . . . . . . . . . . . . . . . 0.1 592,619236,000 Goldman Sachs Group, Inc.,
5.6250%, due 15/1/17 . . . . . . . . . . . . . . . . . . — 245,189222,000 Morgan Stanley, 4.3500%,
due 8/9/26 . . . . . . . . . . . . . . . . . . . . . . . . . . . — 223,198245,000 Morgan Stanley, 4.8750%,
due 1/11/22 . . . . . . . . . . . . . . . . . . . . . . . . . . — 260,385644,000 Morgan Stanley, 5.5500%,
due 29/12/49 . . . . . . . . . . . . . . . . . . . . . . . . 0.1 644,8051,661,000 Royal Bank of Scotland Group PLC,
5.1250%, due 28/5/24 . . . . . . . . . . . . . . . . . 0.2 1,685,702716,000 Royal Bank of Scotland Group PLC,
6.0000%, due 19/12/23 . . . . . . . . . . . . . . . . 0.1 772,369907,000 Royal Bank of Scotland Group PLC,
6.1000%, due 10/6/23 . . . . . . . . . . . . . . . . . 0.1 975,982 0.9 7,295,592
Diversifi ed Financial Services 273,000 Carlyle Holdings Finance LLC,
3.8750%, due 1/2/23 (144A) . . . . . . . . . . . . . — 276,728311,000 General Electric Capital Corp.,
6.3750%, due 15/11/67 . . . . . . . . . . . . . . . . . — 325,555 — 602,283
Diversifi ed Manufacturing Operations 246,000 General Electric Co., 4.0000%,
due 29/12/49 . . . . . . . . . . . . . . . . . . . . . . . . . — 246,3081,065,000 General Electric Co., 4.1000%,
due 29/12/49 . . . . . . . . . . . . . . . . . . . . . . . . 0.1 1,064,989 0.1 1,311,297
Diversifi ed Operations 720,000 GE Capital Trust I, 6.3750%,
due 15/11/67 . . . . . . . . . . . . . . . . . . . . . . . . 0.1 750,150
Electric – Integrated 310,000 Ipalco Enterprises, Inc., 5.0000%,
due 1/5/18 . . . . . . . . . . . . . . . . . . . . . . . . . . . — 326,275415,000 PPL WEM Holdings PLC, 3.9000%,
due 1/5/16 (144A) . . . . . . . . . . . . . . . . . . . . 0.1 416,690573,000 PPL WEM Holdings PLC, 5.3750%,
due 1/5/21 (144A) . . . . . . . . . . . . . . . . . . . . 0.1 625,840 0.2 1,368,805
Electric Products – Miscellaneous 288,000 Molex Electronic Technologies LLC,
2.8780%, due 15/4/20 (144A) . . . . . . . . . . . . — 280,881
Electronic Design Automation 1,110,000 Cadence Design Systems, Inc.,
4.3750%, due 15/10/24 . . . . . . . . . . . . . . . . 0.2 1,104,010
Electronic Measuring Instruments 621,000 FLIR Systems, Inc., 3.7500%,
due 1/9/16 . . . . . . . . . . . . . . . . . . . . . . . . . . 0.1 630,0671,225,000 Trimble Navigation, Ltd., 4.7500%,
due 1/12/24 . . . . . . . . . . . . . . . . . . . . . . . . . 0.2 1,219,374 0.3 1,849,441
Fiduciary Banks 718,000 Citizens Financial Group, Inc.,
4.3000%, due 3/12/25 . . . . . . . . . . . . . . . . . 0.1 723,212
Finance – Auto Loans 679,000 Ally Financial, Inc., 4.1250%,
due 30/3/20 . . . . . . . . . . . . . . . . . . . . . . . . . 0.1 677,303
Share or Principal Amount
Percentage of Net
Assets (%) Fair
Value (USD)
198,000 Ally Financial, Inc., 5.7500%, due 20/11/25 . . . . . . . . . . . . . . . . . . . . . . . . . — 200,970
120,000 Ally Financial, Inc., 8.0000%, due 31/12/18 . . . . . . . . . . . . . . . . . . . . . . . . . — 131,700
0.1 1,009,973
Finance – Consumer Loans 733,000 Synchrony Financial, 3.0000%,
due 15/8/19 . . . . . . . . . . . . . . . . . . . . . . . . . 0.1 732,605
Finance – Credit Card 687,000 American Express Co., 6.8000%,
due 1/9/66 . . . . . . . . . . . . . . . . . . . . . . . . . . 0.1 693,870510,000 Discover Financial Services, 3.7500%,
due 4/3/25 . . . . . . . . . . . . . . . . . . . . . . . . . . 0.1 490,693239,000 Discover Financial Services, 3.9500%,
due 6/11/24 . . . . . . . . . . . . . . . . . . . . . . . . . . — 236,031 0.2 1,420,594
Finance – Investment Bankers/Brokers 434,000 Charles Schwab Corp., 3.0000%,
due 10/3/25 . . . . . . . . . . . . . . . . . . . . . . . . . 0.1 427,355559,000 Charles Schwab Corp., 7.0000%,
due 28/2/49 . . . . . . . . . . . . . . . . . . . . . . . . . 0.1 637,260945,000 E*TRADE Financial Corp., 4.6250%,
due 15/9/23 . . . . . . . . . . . . . . . . . . . . . . . . . 0.1 962,719702,000 E*TRADE Financial Corp., 5.3750%,
due 15/11/22 . . . . . . . . . . . . . . . . . . . . . . . . 0.1 737,100708,000 Lazard Group LLC, 4.2500%,
due 14/11/20 . . . . . . . . . . . . . . . . . . . . . . . . 0.1 734,13231,000 Lazard Group LLC, 6.8500%,
due 15/6/17 . . . . . . . . . . . . . . . . . . . . . . . . . . — 33,018834,000 Raymond James Financial, Inc.,
4.2500%, due 15/4/16 . . . . . . . . . . . . . . . . . 0.1 840,3981,610,000 Raymond James Financial, Inc.,
5.6250%, due 1/4/24 . . . . . . . . . . . . . . . . . . 0.2 1,784,838494,000 Stifel Financial Corp., 4.2500%,
due 18/7/24 . . . . . . . . . . . . . . . . . . . . . . . . . 0.1 491,683601,000 TD Ameritrade Holding Corp.,
2.9500%, due 1/4/22 . . . . . . . . . . . . . . . . . . 0.1 595,8201,234,000 TD Ameritrade Holding Corp.,
3.6250%, due 1/4/25 . . . . . . . . . . . . . . . . . . 0.2 1,250,195 1.2 8,494,518
Finance – Leasing Company 344,000 AerCap Ireland Capital Ltd., / AerCap
Global Aviation Trust, 4.6250%, due 1/7/22 . . . . . . . . . . . . . . . . . . . . . . . . . . . — 348,730
582,000 AerCap Ireland Capital, Ltd. / AerCap Global Aviation Trust, 4.6250%, due 30/10/20 . . . . . . . . . . . . . . . . . . . . . . . . 0.1 597,278
624,000 International Lease Finance Corp., 6.7500%, due 1/9/16 (144A) . . . . . . . . . . . . 0.1 641,940
237,000 International Lease Finance Corp., 8.7500%, due 15/3/17 . . . . . . . . . . . . . . . . . . — 252,998
1,252,000 LeasePlan Corp. N.V., 2.5000%, due 16/5/18 (144A) . . . . . . . . . . . . . . . . . . . 0.2 1,233,763
0.4 3,074,709
Finance – Other Services 579,000 Intercontinental Exchange, Inc.,
3.7500%, due 1/12/25 . . . . . . . . . . . . . . . . . 0.1 581,293
Food – Confectionery 1,026,000 Wm Wrigley Jr., Co., 2.4000%,
due 21/10/18 (144A) . . . . . . . . . . . . . . . . . . 0.1 1,029,409338,000 Wm Wrigley Jr., Co., 3.3750%,
due 21/10/20 (144A) . . . . . . . . . . . . . . . . . . . — 344,963 0.1 1,374,372
Food – Meat Products 96,000 Sun Merger Sub, Inc., 5.2500%,
due 1/8/18 (144A) . . . . . . . . . . . . . . . . . . . . . — 97,440

Janus Balanced Fund
PORTFOLIO INVESTMENTS
The accompanying notes are an integral part of the fi nancial statements.
8 8 J a n u s C a p i t a l F u n d s P l c / 3 1 D e c e m b e r 2 0 1 5
Share or Principal Amount
Percentage of Net
Assets (%) Fair
Value (USD)
455,000 Tyson Foods, Inc., 6.6000%, due 1/4/16 . . . . . . . . . . . . . . . . . . . . . . . . . . 0.1 461,048
0.1 558,488
Food – Miscellaneous/Diversifi ed 432,000 HJ Heinz Co., 2.8000%, due 2/7/20
(144A) . . . . . . . . . . . . . . . . . . . . . . . . . . . . . 0.1 431,334369,000 HJ Heinz Co., 3.5000%, due 15/7/22
(144A) . . . . . . . . . . . . . . . . . . . . . . . . . . . . . 0.1 372,070 0.2 803,404
Gas – Distribution 645,000 NGL Energy Partners L.P. / NGL
Energy Finance Corp., 5.1250%, due 15/7/19 . . . . . . . . . . . . . . . . . . . . . . . . . 0.1 512,775
Instruments – Scientifi c 328,000 Thermo Fisher Scientifi c, Inc.,
3.3000%, due 15/2/22 . . . . . . . . . . . . . . . . . . — 327,643
Investment Management and Advisory Services 1,174,000 Ameriprise Financial, Inc., 7.5180%,
due 1/6/66 . . . . . . . . . . . . . . . . . . . . . . . . . . 0.2 1,150,520747,000 Neuberger Berman Group LLC /
Neuberger Berman Finance Corp., 4.8750%, due 15/4/45 (144A) . . . . . . . . . . . 0.1 632,108
695,000 Neuberger Berman Group LLC / Neuberger Berman Finance Corp., 5.8750%, due 15/3/22 (144A) . . . . . . . . . . . 0.1 723,669
0.4 2,506,297
Life and Health Insurance 167,000 CNO Financial Group, Inc.,
4.5000%, due 30/5/20 . . . . . . . . . . . . . . . . . . — 170,758541,000 CNO Financial Group, Inc.,
5.2500%, due 30/5/25 . . . . . . . . . . . . . . . . . 0.1 552,4961,063,000 Primerica, Inc., 4.7500%,
due 15/7/22 . . . . . . . . . . . . . . . . . . . . . . . . . 0.2 1,124,650 0.3 1,847,904
Linen Supply and Related Items 286,000 Cintas Corp. No 2, 2.8500%,
due 1/6/16 . . . . . . . . . . . . . . . . . . . . . . . . . . . — 287,147301,000 Cintas Corp. No 2, 4.3000%,
due 1/6/21 . . . . . . . . . . . . . . . . . . . . . . . . . . . — 317,992 — 605,139
Machinery – Farm 387,000 CNH Capital LLC, 3.6250%,
due 15/4/18 . . . . . . . . . . . . . . . . . . . . . . . . . 0.1 382,937
Medical – Generic Drugs 912,000 Actavis Funding SCS, 3.0000%,
due 12/3/20 . . . . . . . . . . . . . . . . . . . . . . . . . 0.1 913,555754,000 Actavis Funding SCS, 3.8000%,
due 15/3/25 . . . . . . . . . . . . . . . . . . . . . . . . . 0.1 751,593498,000 Actavis Funding SCS, 4.5500%,
due 15/3/35 . . . . . . . . . . . . . . . . . . . . . . . . . 0.1 485,513 0.3 2,150,661
Medical – Hospitals 353,000 HCA, Inc., 3.7500%, due 15/3/19 . . . . . . . . . . . — 356,530
Medical Labs and Testing Services 691,000 Laboratory Corp. of America
Holdings, 3.2000%, due 1/2/22 . . . . . . . . . . 0.1 679,093
Medical Products 603,000 Becton Dickinson and Co., 1.8000%,
due 15/12/17 . . . . . . . . . . . . . . . . . . . . . . . . 0.1 602,409685,000 Zimmer Holdings, Inc., 2.7000%,
due 1/4/20 . . . . . . . . . . . . . . . . . . . . . . . . . . 0.1 677,063810,000 Zimmer Holdings, Inc., 3.1500%,
due 1/4/22 . . . . . . . . . . . . . . . . . . . . . . . . . . 0.1 797,412655,000 Zimmer Holdings, Inc., 3.5500%,
due 1/4/25 . . . . . . . . . . . . . . . . . . . . . . . . . . 0.1 637,718 0.4 2,714,602
Share or Principal Amount
Percentage of Net
Assets (%) Fair
Value (USD)
Metal – Aluminum 754,000 Alcoa, Inc., 5.1250%, due 1/10/24 . . . . . . . . . . 0.1 689,910
Multi-Line Insurance 434,000 ING U.S., Inc., 5.6500%,
due 15/5/53 . . . . . . . . . . . . . . . . . . . . . . . . . 0.1 429,660
Oil – Field Services 1,105,000 Oceaneering International, Inc.,
4.6500%, due 15/11/24 . . . . . . . . . . . . . . . . 0.1 928,874
Oil and Gas Drilling 951,000 Helmerich & Payne International
Drilling Co., 4.6500%, due 15/3/25 . . . . . . . . . . . . . . . . . . . . . . . . . 0.1 953,195
Oil Companies – Exploration and Production 1,340,000 Cimarex Energy Co., 4.3750%,
due 1/6/24 . . . . . . . . . . . . . . . . . . . . . . . . . . 0.2 1,190,8101,378,000 Cimarex Energy Co., 5.8750%,
due 1/5/22 . . . . . . . . . . . . . . . . . . . . . . . . . . 0.2 1,321,126533,000 Devon Energy Corp., 2.2500%,
due 15/12/18 . . . . . . . . . . . . . . . . . . . . . . . . 0.1 486,788 0.5 2,998,724
Oil Companies – Integrated 481,000 Chevron Corp., 1.3450%,
due 15/11/17 . . . . . . . . . . . . . . . . . . . . . . . . 0.1 479,6181,066,000 Shell International Finance B.V.,
2.2500%, due 10/11/20 . . . . . . . . . . . . . . . . 0.1 1,051,515 0.2 1,531,133
Oil Refi ning and Marketing 452,000 Motiva Enterprises LLC, 5.7500%,
due 15/1/20 (144A) . . . . . . . . . . . . . . . . . . . 0.1 487,024
Paper and Related Products 1,054,000 Georgia-Pacifi c LLC, 3.1630%,
due 15/11/21 (144A) . . . . . . . . . . . . . . . . . . 0.1 1,053,793534,000 Georgia-Pacifi c LLC, 3.6000%,
due 1/3/25 (144A) . . . . . . . . . . . . . . . . . . . . 0.1 528,668 0.2 1,582,461
Pipelines 441,000 DCP Midstream Operating L.P.,
4.9500%, due 1/4/22 . . . . . . . . . . . . . . . . . . 0.1 361,842149,000 DCP Midstream Operating L.P.,
5.6000%, due 1/4/44 . . . . . . . . . . . . . . . . . . . — 90,96631,000 El Paso Corp., 6.5000%,
due 15/9/20 . . . . . . . . . . . . . . . . . . . . . . . . . . — 30,895326,000 El Paso Pipeline Partners
Operating Co., LLC, 4.3000%, due 1/5/24 . . . . . . . . . . . . . . . . . . . . . . . . . . . — 280,772
298,000 El Paso Pipeline Partners Operating Co., LLC, 5.0000%, due 1/10/21 . . . . . . . . . . . . . . . . . . . . . . . . . . — 281,621
325,000 Energy Transfer Partners L.P., 4.1500%, due 1/10/20 . . . . . . . . . . . . . . . . . . — 300,125
488,000 EnLink Midstream Partners L.P., 4.4000%, due 1/4/24 . . . . . . . . . . . . . . . . . . 0.1 387,031
378,000 EnLink Midstream Partners L.P., 5.6000%, due 1/4/44 . . . . . . . . . . . . . . . . . . . — 264,032
368,000 Kinder Morgan, Inc., 7.7500%, due 15/1/32 . . . . . . . . . . . . . . . . . . . . . . . . . 0.1 350,757
196,000 Phillips 66 Partners L.P., 3.6050%, due 15/2/25 . . . . . . . . . . . . . . . . . . . . . . . . . . — 168,924
765,000 Spectra Energy Corp., 4.7500%, due 15/3/24 . . . . . . . . . . . . . . . . . . . . . . . . . 0.1 742,277
573,000 Targa Resources Partners L.P. / Targa Resources Partners Finance Corp., 4.1250%, due 15/11/19 . . . . . . . . . . . . . . . . 0.1 479,888
1,060,000 Western Gas Partners L.P., 5.3750%, due 1/6/21 . . . . . . . . . . . . . . . . . . . . . . . . . . 0. 2 1,074,110
0. 7 4,813,240

PORTFOLIO INVESTMENTS
The accompanying notes are an integral part of the fi nancial statements.
J a n u s C a p i t a l F u n d s P l c / 3 1 D e c e m b e r 2 0 1 5 8 9
Share or Principal Amount
Percentage of Net
Assets (%) Fair
Value (USD)
Property and Casualty Insurance 661,000 ACE INA Holdings, Inc., 3.3500%,
due 3/5/26 . . . . . . . . . . . . . . . . . . . . . . . . . . 0.1 659,831
Publishing – Periodicals 283,000 Nielsen Finance LLC / Nielsen Finance
Co., 4.5000%, due 1/10/20 . . . . . . . . . . . . . . . — 288,306
Real Estate Management/Services 707,000 Jones Lang LaSalle, Inc., 4.4000%,
due 15/11/22 . . . . . . . . . . . . . . . . . . . . . . . . 0.1 725,949901,000 Kennedy-Wilson, Inc., 5.8750%,
due 1/4/24 . . . . . . . . . . . . . . . . . . . . . . . . . . 0.1 871,718 0.2 1,597,667
Real Estate Operating/Development 407,000 Post Apartment Homes L.P., 4.7500%,
due 15/10/17 . . . . . . . . . . . . . . . . . . . . . . . . 0.1 423,438
REIT – Diversifi ed 595,000 American Tower Trust I, 1.5510%,
due 15/3/18 (144A) . . . . . . . . . . . . . . . . . . . 0.1 581,792
REIT – Health Care 220,000 Senior Housing Properties Trust,
6.7500%, due 15/12/21 . . . . . . . . . . . . . . . . . — 247,913199,000 Senior Housing Properties Trust,
6.7500%, due 15/4/20 . . . . . . . . . . . . . . . . . . — 220,433 — 468,346
REIT – Offi ce Property 517,000 Alexandria Real Estate Equities, Inc.,
2.7500%, due 15/1/20 . . . . . . . . . . . . . . . . . 0.1 508,739473,000 Alexandria Real Estate Equities, Inc.,
4.5000%, due 30/7/29 . . . . . . . . . . . . . . . . . 0.1 463,785870,000 Alexandria Real Estate Equities, Inc.,
4.6000%, due 1/4/22 . . . . . . . . . . . . . . . . . . 0.1 903,754472,000 Reckson Operating Partnership L.P.,
5.0000%, due 15/8/18 . . . . . . . . . . . . . . . . . 0.1 495,554222,000 Reckson Operating Partnership L.P.,
6.0000%, due 31/3/16 . . . . . . . . . . . . . . . . . . — 224,084932,000 Reckson Operating Partnership L.P.,
7.7500%, due 15/3/20 . . . . . . . . . . . . . . . . . 0.2 1,088,799 0.6 3,684,715
REIT – Shopping Centres 258,000 Retail Opportunity Investments
Partnership L.P., 4.0000%, due 15/12/24 . . . . . . . . . . . . . . . . . . . . . . . . . — 244,182
134,000 Retail Opportunity Investments Partnership L.P., 5.0000%, due 15/12/23 . . . . . . . . . . . . . . . . . . . . . . . . . — 137,034
— 381,216
Retail – Drug Store 1,097,000 CVS Health Corp., 2.8000%,
due 20/7/20 . . . . . . . . . . . . . . . . . . . . . . . . . 0.2 1,103,075615,000 CVS Health Corp., 3.5000%,
due 20/7/22 . . . . . . . . . . . . . . . . . . . . . . . . . 0.1 626,686913,000 CVS Health Corp., 3.8750%,
due 20/7/25 . . . . . . . . . . . . . . . . . . . . . . . . . 0.1 933,601395,000 CVS Health Corp., 4.7500%,
due 1/12/22 . . . . . . . . . . . . . . . . . . . . . . . . . 0.1 423,851510,000 CVS Health Corp., 5.0000%,
due 1/12/24 . . . . . . . . . . . . . . . . . . . . . . . . . 0.1 552,718 0.6 3,639,931
Retail – Restaurants 734,000 1011778 BC ULC / New Red
Finance, Inc., 4.6250%, due 15/1/22 (144A) . . . . . . . . . . . . . . . . . . . 0.1 737,670
884,000 Brinker International, Inc., 3.8750%, due 15/5/23 . . . . . . . . . . . . . . . . . . . . . . . . . 0.1 853,875
0.2 1,591,545
Share or Principal Amount
Percentage of Net
Assets (%) Fair
Value (USD)
Semiconductor Components/Integrated Circuits 1,687,000 TSMC Global, Ltd., 1.6250%,
due 3/4/18 (144A) . . . . . . . . . . . . . . . . . . . . 0.2 1,654,375
Special Purpose Entity 1,119,000 Goldman Sachs Capital I, 6.3450%,
due 15/2/34 . . . . . . . . . . . . . . . . . . . . . . . . . 0.2 1,312,810
Steel – Producers 534,000 Reliance Steel & Aluminum Co.,
4.5000%, due 15/4/23 . . . . . . . . . . . . . . . . . 0.1 497,834
Super – Regional Banks 212,000 Wells Fargo & Co., 5.8750%,
due 15/6/25 . . . . . . . . . . . . . . . . . . . . . . . . . . — 223,395
Transportation – Railroad 2,013,000 Florida East Coast Holdings Corp.,
9.7500%, due 1/5/20 (144A) . . . . . . . . . . . . 0.2 1,378,905
Trucking and Leasing 79,000 Penske Truck Leasing Co., L.P. /
PTL Finance Corp., 2.5000%, due 15/3/16 (144A) . . . . . . . . . . . . . . . . . . . . — 79,140
432,000 Penske Truck Leasing Co., L.P. / PTL Finance Corp., 2.5000%, due 15/6/19 (144A) . . . . . . . . . . . . . . . . . . . 0.1 425,292
659,000 Penske Truck Leasing Co., L.P. / PTL Finance Corp., 3.3750%, due 15/3/18 (144A) . . . . . . . . . . . . . . . . . . . 0.1 669,763
366,000 Penske Truck Leasing Co., L.P. / PTL Finance Corp., 4.2500%, due 17/1/23 (144A) . . . . . . . . . . . . . . . . . . . 0.1 368,822
66,000 Penske Truck Leasing Co., L.P. / PTL Finance Corp., 4.8750%, due 11/7/22 (144A) . . . . . . . . . . . . . . . . . . . . — 68,742
0.3 1,611,759
Total Corporate Bonds . . . . . . . . . . . . . . . . . . . . . . . . . . . . . . . . 16. 3 117,794,046
Government Obligations U.S. Treasury Notes/Bonds
1,110,000 1.2500%, due 31/10/18 . . . . . . . . . . . . . . . . . . 0.2 1,108,6567,200,000 1.3750%, due 30/9/18 . . . . . . . . . . . . . . . . . . . 1.0 7,224,0482,343,000 1.3750%, due 30/9/20 . . . . . . . . . . . . . . . . . . . 0.3 2,302,7753,452,000 1.5000%, due 31/10/19 . . . . . . . . . . . . . . . . . . 0.5 3,441,6163,632,000 1.6250%, due 31/12/19 . . . . . . . . . . . . . . . . . . 0.5 3,632,5672,597,000 1.6250%, due 31/7/19 . . . . . . . . . . . . . . . . . . . 0.4 2,606,435
799,000 1.7500%, due 15/5/23 . . . . . . . . . . . . . . . . . . . 0.1 778,5882,365,000 1.7500%, due 30/9/19 . . . . . . . . . . . . . . . . . . . 0.3 2,381,259
373,000 2.0000%, due 15/2/25 . . . . . . . . . . . . . . . . . . . 0.1 364,6803,230,000 2.0000%, due 15/8/25 . . . . . . . . . . . . . . . . . . . 0.4 3,149,7541,929,000 2.1250%, due 30/9/21 . . . . . . . . . . . . . . . . . . . 0.3 1,949,6092,689,000 2.1250%, due 31/12/21 . . . . . . . . . . . . . . . . . . 0.4 2,713,1075,421,000 2.2500%, due 15/11/25 . . . . . . . . . . . . . . . . . . 0. 7 5,409,459
417,000 2.5000%, due 15/2/45 . . . . . . . . . . . . . . . . . . . 0.1 374,2582,147,000 2.5000%, due 15/5/24 . . . . . . . . . . . . . . . . . . . 0.3 2,194,2172,945,000 2.5000%, due 15/8/23 . . . . . . . . . . . . . . . . . . . 0.4 3,022,0774,104,000 2.7500%, due 15/11/23 . . . . . . . . . . . . . . . . . . 0.6 4,283,9527,756,000 3.0000%, due 15/11/45 . . . . . . . . . . . . . . . . . . 1.1 7,734,024
628,000 3.0000%, due 15/5/45 . . . . . . . . . . . . . . . . . . . 0.1 625,290511,000 3.3750%, due 15/5/44 . . . . . . . . . . . . . . . . . . . 0.1 548,567587,000 3.6250%, due 15/2/44 . . . . . . . . . . . . . . . . . . . 0.1 660,489
2,168,000 3.7500%, due 15/11/43 . . . . . . . . . . . . . . . . . . 0.3 2,497,816
Total Government Obligations . . . . . . . . . . . . . . . . . . . . . . . . . . . 8. 3 59,003,243
Mortgage-Backed Securities Fannie Mae Pool
602,190 3.5000%, due 1/1/43 . . . . . . . . . . . . . . . . . . . . 0.1 622,4311,509,934 3.5000%, due 1/1/44 . . . . . . . . . . . . . . . . . . . . 0.3 1,570,913
37,122 3.5000%, due 1/10/29 . . . . . . . . . . . . . . . . . . . . — 38,948

Janus Balanced Fund
PORTFOLIO INVESTMENTS
The accompanying notes are an integral part of the fi nancial statements.
9 0 J a n u s C a p i t a l F u n d s P l c / 3 1 D e c e m b e r 2 0 1 5
Share or Principal Amount
Percentage of Net
Assets (%) Fair
Value (USD)
2,549,976 3.5000%, due 1/2/43 . . . . . . . . . . . . . . . . . . . . 0.4 2,635,5561,085,008 3.5000%, due 1/2/45 . . . . . . . . . . . . . . . . . . . . 0.2 1,121,447
550,063 3.5000%, due 1/4/44 . . . . . . . . . . . . . . . . . . . . 0.1 570,3001,593,210 3.5000%, due 1/5/44 . . . . . . . . . . . . . . . . . . . . 0.2 1,656,996
327,944 3.5000%, due 1/7/42 . . . . . . . . . . . . . . . . . . . . 0.1 339,772342,215 4.0000%, due 1/11/42 . . . . . . . . . . . . . . . . . . . 0.1 364,454272,752 4.0000%, due 1/12/42 . . . . . . . . . . . . . . . . . . . . — 291,687567,691 4.0000%, due 1/2/44 . . . . . . . . . . . . . . . . . . . . 0.1 604,710302,424 4.0000%, due 1/4/34 . . . . . . . . . . . . . . . . . . . . 0.1 326,024136,442 4.0000%, due 1/6/29 . . . . . . . . . . . . . . . . . . . . . — 145,952498,488 4.0000%, due 1/6/42 . . . . . . . . . . . . . . . . . . . . 0.1 530,938723,162 4.0000%, due 1/6/44 . . . . . . . . . . . . . . . . . . . . 0.1 770,227
99,378 4.0000%, due 1/7/42 . . . . . . . . . . . . . . . . . . . . . — 105,8401,058,036 4.0000%, due 1/7/43 . . . . . . . . . . . . . . . . . . . . 0.2 1,127,1291,399,000 4.0000%, due 1/7/44 . . . . . . . . . . . . . . . . . . . . 0.2 1,498,781
231,863 4.0000%, due 1/8/42 . . . . . . . . . . . . . . . . . . . . . — 246,959869,741 4.0000%, due 1/8/43 . . . . . . . . . . . . . . . . . . . . 0.1 926,636 335,978 4.0000%, due 1/8/44 . . . . . . . . . . . . . . . . . . . . . — 359,941 887,204 4.0000%, due 1/8/44 . . . . . . . . . . . . . . . . . . . . 0.1 950,485266,340 4.0000%, due 1/9/29 . . . . . . . . . . . . . . . . . . . . . — 284,896751,473 4.0000%, due 1/9/42 . . . . . . . . . . . . . . . . . . . . 0.1 800,506216,107 4.0000%, due 1/9/43 . . . . . . . . . . . . . . . . . . . . . — 230,242
2,026,248 4.0000%, due 1/9/45 . . . . . . . . . . . . . . . . . . . . 0.3 2,159,05780,271 4.5000%, due 1/1/42 . . . . . . . . . . . . . . . . . . . . . — 87,04385,080 4.5000%, due 1/10/40 . . . . . . . . . . . . . . . . . . . . — 92,188
1,091,091 4.5000%, due 1/10/44 . . . . . . . . . . . . . . . . . . . 0.2 1,202,6371,435,931 4.5000%, due 1/10/45 . . . . . . . . . . . . . . . . . . . 0.2 1,576,4321,439,367 4.5000%, due 1/2/43 . . . . . . . . . . . . . . . . . . . . 0.2 1,561,628
490,282 4.5000%, due 1/3/43 . . . . . . . . . . . . . . . . . . . . 0.1 538,238722,364 4.5000%, due 1/3/45 . . . . . . . . . . . . . . . . . . . . 0.1 794,836
2,060,566 4.5000%, due 1/5/44 . . . . . . . . . . . . . . . . . . . . 0.3 2,273,316571,500 4.5000%, due 1/5/45 . . . . . . . . . . . . . . . . . . . . 0.1 630,600112,814 4.5000%, due 1/6/42 . . . . . . . . . . . . . . . . . . . . . — 121,843333,599 4.5000%, due 1/6/45 . . . . . . . . . . . . . . . . . . . . 0.1 367,100291,217 4.5000%, due 1/8/41 . . . . . . . . . . . . . . . . . . . . . — 315,595907,338 4.5000%, due 1/8/44 . . . . . . . . . . . . . . . . . . . . 0.1 1,001,024
91,578 5.0000%, due 1/1/30 . . . . . . . . . . . . . . . . . . . . . — 100,773127,070 5.0000%, due 1/10/40 . . . . . . . . . . . . . . . . . . . . — 142,204628,616 5.0000%, due 1/2/41 . . . . . . . . . . . . . . . . . . . . 0.1 698,133151,342 5.0000%, due 1/4/41 . . . . . . . . . . . . . . . . . . . . . — 166,593381,834 5.0000%, due 1/5/41 . . . . . . . . . . . . . . . . . . . . 0.1 421,896326,394 5.0000%, due 1/7/41 . . . . . . . . . . . . . . . . . . . . 0.1 362,205830,088 5.0000%, due 1/7/44 . . . . . . . . . . . . . . . . . . . . 0.1 933,588216,713 5.0000%, due 1/9/29 . . . . . . . . . . . . . . . . . . . . . — 238,472
85,169 5.5000%, due 1/1/25 . . . . . . . . . . . . . . . . . . . . . — 91,79255,647 5.5000%, due 1/1/33 . . . . . . . . . . . . . . . . . . . . . — 62,580
379,284 5.5000%, due 1/12/39 . . . . . . . . . . . . . . . . . . . 0.1 423,180424,603 5.5000%, due 1/12/41 . . . . . . . . . . . . . . . . . . . 0.1 476,274168,451 5.5000%, due 1/2/41 . . . . . . . . . . . . . . . . . . . . . — 191,656
1,678,511 5.5000%, due 1/2/42 . . . . . . . . . . . . . . . . . . . . 0.3 1,871,868312,659 5.5000%, due 1/3/40 . . . . . . . . . . . . . . . . . . . . 0.1 355,725856,773 5.5000%, due 1/4/40 . . . . . . . . . . . . . . . . . . . . 0.1 956,368277,729 5.5000%, due 1/5/41 . . . . . . . . . . . . . . . . . . . . . — 309,586834,894 5.5000%, due 1/6/41 . . . . . . . . . . . . . . . . . . . . 0.2 938,410
46,983 5.5000%, due 1/7/41 . . . . . . . . . . . . . . . . . . . . . — 52,377249,957 6.0000%, due 1/10/35 . . . . . . . . . . . . . . . . . . . . — 284,060206,643 6.0000%, due 1/10/38 . . . . . . . . . . . . . . . . . . . . — 233,770281,816 6.0000%, due 1/12/35 . . . . . . . . . . . . . . . . . . . . — 320,847
47,262 6.0000%, due 1/2/37 . . . . . . . . . . . . . . . . . . . . . — 54,366201,622 6.0000%, due 1/9/37 . . . . . . . . . . . . . . . . . . . . . — 218,092
72,962 7.0000%, due 1/2/39 . . . . . . . . . . . . . . . . . . . . . — 84,288 5. 6 40,832,410
Freddie Mac Giant 285,816 4.0000%, due 1/8/44 . . . . . . . . . . . . . . . . . . . . . — 305,212
Freddie Mac Gold Pool 422,995 3.5000%, due 1/2/44 . . . . . . . . . . . . . . . . . . . . 0.1 437,166336,929 3.5000%, due 1/7/29 . . . . . . . . . . . . . . . . . . . . . — 352,814217,682 4.5000%, due 1/1/41 . . . . . . . . . . . . . . . . . . . . . — 236,703
Share or Principal Amount
Percentage of Net
Assets (%) Fair
Value (USD)
412,479 4.5000%, due 1/5/44 . . . . . . . . . . . . . . . . . . . . 0.1 453,857581,587 4.5000%, due 1/6/45 . . . . . . . . . . . . . . . . . . . . 0.1 640,584
1,345,029 4.5000%, due 1/9/44 . . . . . . . . . . . . . . . . . . . . 0.3 1,481,30648,339 5.0000%, due 1/1/19 . . . . . . . . . . . . . . . . . . . . . — 50,019
445,089 5.0000%, due 1/5/41 . . . . . . . . . . . . . . . . . . . . 0.1 495,99380,413 5.0000%, due 1/6/20 . . . . . . . . . . . . . . . . . . . . . — 85,236
167,073 5.5000%, due 1/10/36 . . . . . . . . . . . . . . . . . . . . — 187,314197,736 5.5000%, due 1/12/28 . . . . . . . . . . . . . . . . . . . . — 218,542257,100 5.5000%, due 1/5/41 . . . . . . . . . . . . . . . . . . . . . — 284,665
42,309 5.5000%, due 1/8/19 . . . . . . . . . . . . . . . . . . . . . — 43,827736,862 5.5000%, due 1/8/41 . . . . . . . . . . . . . . . . . . . . 0.1 840,628126,907 5.5000%, due 1/9/41 . . . . . . . . . . . . . . . . . . . . . — 140,449811,570 6.0000%, due 1/4/40 . . . . . . . . . . . . . . . . . . . . 0.2 924,658
1.0 6,873,761
Ginnie Mae I Pool 156,076 3.5000%, due 20/5/42 . . . . . . . . . . . . . . . . . . . . — 163,706228,128 4.0000%, due 15/4/45 . . . . . . . . . . . . . . . . . . . . — 245,754308,647 4.5000%, due 15/5/44 . . . . . . . . . . . . . . . . . . . 0.1 336,908307,275 4.5000%, due 15/7/41 . . . . . . . . . . . . . . . . . . . 0.1 332,843650,623 4.5000%, due 15/8/41 . . . . . . . . . . . . . . . . . . . 0.1 717,262450,532 4.5000%, due 20/10/41 . . . . . . . . . . . . . . . . . . 0.1 485,028327,023 4.9000%, due 15/10/34 . . . . . . . . . . . . . . . . . . 0.1 360,679
86,468 5.0000%, due 15/1/40 . . . . . . . . . . . . . . . . . . . . — 95,684158,853 5.0000%, due 15/10/39 . . . . . . . . . . . . . . . . . . . — 176,314258,912 5.0000%, due 15/11/39 . . . . . . . . . . . . . . . . . . 0.1 286,803482,187 5.0000%, due 15/11/43 . . . . . . . . . . . . . . . . . . 0.1 534,422287,489 5.0000%, due 15/2/41 . . . . . . . . . . . . . . . . . . . . — 318,384110,170 5.0000%, due 15/4/41 . . . . . . . . . . . . . . . . . . . . — 122,050123,945 5.0000%, due 15/5/40 . . . . . . . . . . . . . . . . . . . . — 138,255116,365 5.0000%, due 15/5/41 . . . . . . . . . . . . . . . . . . . . — 130,669651,247 5.0000%, due 15/6/44 . . . . . . . . . . . . . . . . . . . 0.1 730,217353,428 5.0000%, due 15/7/40 . . . . . . . . . . . . . . . . . . . 0.1 391,472
67,862 5.0000%, due 15/9/41 . . . . . . . . . . . . . . . . . . . . — 75,194259,874 5.5000%, due 15/10/39 . . . . . . . . . . . . . . . . . . 0.1 295,984172,521 5.5000%, due 15/3/36 . . . . . . . . . . . . . . . . . . . . — 195,267949,851 5.5000%, due 15/8/39 . . . . . . . . . . . . . . . . . . . 0.2 1,079,281
37,085 5.5000%, due 15/9/35 . . . . . . . . . . . . . . . . . . . . — 42,723168,901 5.5000%, due 20/1/42 . . . . . . . . . . . . . . . . . . . . — 187,895188,580 5.5000%, due 20/11/37 . . . . . . . . . . . . . . . . . . . — 208,914235,056 5.5000%, due 20/5/42 . . . . . . . . . . . . . . . . . . . . — 262,142321,392 5.5000%, due 20/7/42 . . . . . . . . . . . . . . . . . . . 0.1 354,443
65,003 6.0000%, due 20/1/39 . . . . . . . . . . . . . . . . . . . . — 72,72883,596 6.0000%, due 20/1/42 . . . . . . . . . . . . . . . . . . . . — 94,75325,782 6.0000%, due 20/10/41 . . . . . . . . . . . . . . . . . . . — 29,242
153,810 6.0000%, due 20/11/34 . . . . . . . . . . . . . . . . . . . — 172,18865,837 6.0000%, due 20/11/42 . . . . . . . . . . . . . . . . . . . — 74,21280,372 6.0000%, due 20/12/41 . . . . . . . . . . . . . . . . . . . — 90,84670,760 6.0000%, due 20/2/42 . . . . . . . . . . . . . . . . . . . . — 80,16891,021 6.0000%, due 20/2/43 . . . . . . . . . . . . . . . . . . . . — 102,97060,495 6.0000%, due 20/3/42 . . . . . . . . . . . . . . . . . . . . — 68,564
223,657 6.0000%, due 20/4/42 . . . . . . . . . . . . . . . . . . . . — 253,43697,075 6.0000%, due 20/5/42 . . . . . . . . . . . . . . . . . . . . — 108,62965,241 6.0000%, due 20/7/42 . . . . . . . . . . . . . . . . . . . . — 73,78273,682 6.0000%, due 20/8/42 . . . . . . . . . . . . . . . . . . . . — 83,502
162,782 6.0000%, due 20/9/42 . . . . . . . . . . . . . . . . . . . . — 184,499 1. 3 9,757,812
Ginnie Mae II Pool 1,241,869 4.0000%, due 20/12/45 . . . . . . . . . . . . . . . . . . 0.3 1,343,536
431,982 3.5000%, due 20/9/44 . . . . . . . . . . . . . . . . . . . 0.1 453,198270,720 5.0000%, due 20/12/44 . . . . . . . . . . . . . . . . . . . — 303,337
35,428 7.0000%, due 20/5/39 . . . . . . . . . . . . . . . . . . . . — 40,513 0.4 2,140,584
Ginnie Mae Pool 300,362 5.1000%, due 15/1/32 . . . . . . . . . . . . . . . . . . . 0.1 340,655
Multiple Pool 762,066 4.0000%, due 1/5/43 . . . . . . . . . . . . . . . . . . . . 0.2 811,604
Total Mortgage-Backed Securities . . . . . . . . . . . . . . . . . . . . . . . . . 8. 4 61,062,038

PORTFOLIO INVESTMENTS
The accompanying notes are an integral part of the fi nancial statements.
J a n u s C a p i t a l F u n d s P l c / 3 1 D e c e m b e r 2 0 1 5 9 1
Share or Principal Amount
Percentage of Net
Assets (%) Fair
Value (USD)
Preferred Stock Diversifi ed Banking Institutions
16,000 Citigroup Capital XIII, 6.6919% . . . . . . . . . . . . 0.1 415,84024,000 Morgan Stanley, 6.8750% . . . . . . . . . . . . . . . . . 0.1 666,00024,010 Morgan Stanley, 7.1250% . . . . . . . . . . . . . . . . . 0.1 686,686
0.3 1,768,526
Diversifi ed Financial Services 3,000 General Electric Capital Corp.,
4.7000% . . . . . . . . . . . . . . . . . . . . . . . . . . . . . — 76,410
Finance – Credit Card 29,675 Discover Financial Services, 6.5000% . . . . . . . 0. 2 785,497
Finance – Investment Bankers/Brokers 4,000 Morgan Stanley Capital Trust III,
6.2500% . . . . . . . . . . . . . . . . . . . . . . . . . . . . . — 101,9201,000 Morgan Stanley Capital Trust IV,
6.2500% . . . . . . . . . . . . . . . . . . . . . . . . . . . . . — 25,3702,000 Morgan Stanley Capital Trust VIII,
6.4500% . . . . . . . . . . . . . . . . . . . . . . . . . . . . . — 50,620 — 177,910
Super – Regional Banks 19,050 Wells Fargo & Co., 6.6250% . . . . . . . . . . . . . . 0.1 547,307
Total Preferred Stock . . . . . . . . . . . . . . . . . . . . . . . . . . . . . . . . . . 0. 6 3,355,650
Tranche Loans Electronic Components – Semiconductors
2,631,354 Avago Technologies (Cayman), Ltd., 3.0000%, due 6/5/21 . . . . . . . . . . . . . . . . . . 0.4 2,622,592
1,433,000 Avago Technologies (Cayman), Ltd., 3.5000%, due 11/11/22 . . . . . . . . . . . . . . . . 0.2 1,415,990
0.6 4,038,582
Media 337,140 Tribune Media Co., 3.0000%,
due 27/12/20 . . . . . . . . . . . . . . . . . . . . . . . . . — 331,557
Medical Information Systems 671,770 IMS Health, Inc., 2.2500%,
due 17/3/21 . . . . . . . . . . . . . . . . . . . . . . . . . 0.1 654,976
Retail – Offi ce Supplies 337,000 Staples, Inc., 2.7500%, due 23/4/21 . . . . . . . . . . — 332,646
Telecommunications 937,000 Charter Communications, 2.7500%,
due 21/1/23 . . . . . . . . . . . . . . . . . . . . . . . . . 0.2 935,051
Transport – Equipment and Leasing 732,743 Maxim Crane Works L.P., 9.2500%,
due 26/11/18 . . . . . . . . . . . . . . . . . . . . . . . . 0.1 718,088
Total Tranche Loans . . . . . . . . . . . . . . . . . . . . . . . . . . . . . . . . . . . 1.0 7,010,900
Total Investments . . . . . . . . . . . . . . . . . . . . . . . . . . . . . . . . . . . . 97 . 3 701,143,921
Forward Currency Contracts, Open as at 31 December 2015
Currency Purchased
Currency Sold
Current Market
Value (USD) Settle Date
Unrealised Appreciation
(USD)
Citibank AUD 12,949,274 USD 9,304,480 9,189,439 29-Jan-16 115,041AUD 270,000 USD 192,102 187,802 29-Jan-16 4,300AUD 350,790 USD 253,000 250,830 29-Jan-16 2,170AUD 164,843 USD 118,679 117,448 7-Jan-16 1,231AUD 118,175 USD 85,364 84,765 29-Jan-16 599AUD 59,745 USD 42,929 42,398 29-Jan-16 531AUD 53,675 USD 38,801 38,557 29-Jan-16 244AUD 69,325 USD 50,361 50,294 7-Jan-16 67AUD 29,188 USD 21,186 21,140 29-Jan-16 46AUD 3,612 USD 2,596 2,564 29-Jan-16 32AUD 565 USD 407 403 7-Jan-16 4AUD 519 USD 375 372 29-Jan-16 3AUD 32 USD 23 23 29-Jan-16 —AUD 18 USD 13 13 29-Jan-16 —AUD 305 USD 222 222 29-Jan-16 —AUD 331 USD 241 241 29-Jan-16 —AUD 20 USD 15 15 29-Jan-16 —AUD 46 USD 33 33 7-Jan-16 —CAD 281,139 USD 202,103 200,980 29-Jan-16 1,123CAD 170,228 USD 122,824 122,595 29-Jan-16 229CAD 164,619 USD 118,858 118,719 7-Jan-16 139CNH 5,765,632 USD 873,524 873,123 29-Jan-16 401CNH 53,233 USD 8,069 8,069 14-Jan-16 —EUR 61,012,768 USD 66,302,758 66,263,039 29-Jan-16 39,719EUR 26,216,225 USD 28,489,250 28,472,183 29-Jan-16 17,067EUR 6,371,384 USD 6,923,802 6,919,654 29-Jan-16 4,148EUR 3,144,867 USD 3,417,537 3,415,490 29-Jan-16 2,047EUR 2,113,306 USD 2,296,536 2,295,160 29-Jan-16 1,376EUR 38,666 USD 41,864 41,684 29-Jan-16 180EUR 582,675 USD 633,474 633,374 7-Jan-16 100EUR 251,079 USD 272,968 272,925 7-Jan-16 43EUR 60,759 USD 66,057 66,047 7-Jan-16 10EUR 41,752 USD 45,392 45,385 7-Jan-16 7EUR 27,684 USD 30,097 30,092 29-Jan-16 5EUR 349 USD 380 380 29-Jan-16 —USD 2,204,834 GBP 1,455,000 2,144,730 7-Jan-16 60,104USD 138,633 GBP 93,000 137,085 29-Jan-16 1,548USD 258,645 EUR 236,724 257,404 29-Jan-16 1,241USD 111,115 EUR 101,698 110,582 29-Jan-16 533USD 53,121 EUR 48,473 52,708 29-Jan-16 413USD 70,619 EUR 64,648 70,295 29-Jan-16 324USD 44,284 EUR 40,498 44,036 29-Jan-16 248USD 28,288 EUR 25,813 28,068 29-Jan-16 220USD 32,128 EUR 29,382 31,948 29-Jan-16 180USD 29,345 EUR 26,826 29,170 29-Jan-16 175USD 38,123 AUD 52,213 37,980 29-Jan-16 143USD 132,889 EUR 122,082 132,747 29-Jan-16 142USD 27,141 EUR 24,841 27,011 29-Jan-16 130USD 15,184 EUR 13,900 15,114 29-Jan-16 70USD 11,877 EUR 10,861 11,810 29-Jan-16 67USD 13,139 EUR 12,025 13,076 29-Jan-16 63USD 6,990 EUR 6,378 6,935 7-Jan-16 55USD 10,587 EUR 9,688 10,533 29-Jan-16 54USD 9,144 EUR 8,369 9,100 29-Jan-16 44USD 5,155 EUR 4,704 5,115 29-Jan-16 40USD 5,309 EUR 4,855 5,279 29-Jan-16 30USD 3,629 EUR 3,317 3,607 29-Jan-16 22USD 1,434 EUR 1,311 1,425 29-Jan-16 9USD 10,074 CNH 66,424 10,068 29-Jan-16 6USD 746 AUD 1,023 744 29-Jan-16 2USD 164 AUD 224 163 29-Jan-16 1USD 21 AUD 30 21 29-Jan-16 —USD 3 AUD 4 3 29-Jan-16 —USD 47 AUD 64 47 29-Jan-16 —USD 10 AUD 14 10 29-Jan-16 —

Janus Balanced Fund
PORTFOLIO INVESTMENTS
The accompanying notes are an integral part of the fi nancial statements.
9 2 J a n u s C a p i t a l F u n d s P l c / 3 1 D e c e m b e r 2 0 1 5
Forward Currency Contracts, Open as at 31 December 2015
Currency Purchased
Currency Sold
Current Market
Value (USD) Settle Date
Unrealised Appreciation
(USD)
Credit Suisse USD 2,159,880 GBP 1,431,000 2,109,309 29-Jan-16 50,570USD 2,124,176 GBP 1,431,000 2,109,456 29-Jan-16 14,720
Total 322,016
Total Financial Assets at fair value through profi t or loss 701,465,937
Financial Liabilities at fair value through profi t or loss
Forward Currency Contracts, Open as at 31 December 2015
Currency Purchased
Currency Sold
Current Market
Value (USD) Settle Date
Unrealised (Depreciation)
(USD)
Citibank AUD 30,364 USD 22,140 22,193 29-Jan-16 (53)AUD 75,363 USD 54,931 55,042 29-Jan-16 (111)CAD 500 USD 363 364 29-Jan-16 (1)CAD 435,599 USD 315,446 316,012 7-Jan-16 (566)CAD 32,625,125 USD 23,589,362 23,595,163 29-Jan-16 (5,801)CNH 15,855 USD 2,410 2,416 29-Jan-16 (6)CNH 26,342 USD 4,004 4,015 29-Jan-16 (11)CNH 40,372 USD 6,134 6,148 29-Jan-16 (14)CNH 35,167 USD 5,347 5,363 29-Jan-16 (16)EUR 197 USD 216 217 29-Jan-16 (1)EUR 5,512 USD 6,000 6,006 29-Jan-16 (6)EUR 3,125 USD 3,418 3,438 29-Jan-16 (20)EUR 3,678 USD 4,023 4,047 29-Jan-16 (24)EUR 4,108 USD 4,493 4,520 29-Jan-16 (27)EUR 50,192 USD 54,635 54,694 29-Jan-16 (59)EUR 17,752 USD 19,401 19,499 29-Jan-16 (98)EUR 21,464 USD 23,458 23,577 29-Jan-16 (119)EUR 18,258 USD 19,980 20,107 29-Jan-16 (127)EUR 17,986 USD 19,692 19,826 29-Jan-16 (134)EUR 29,687 USD 32,429 32,578 29-Jan-16 (149)EUR 26,767 USD 29,291 29,477 29-Jan-16 (186)EUR 26,361 USD 28,861 29,058 29-Jan-16 (197)EUR 54,458 USD 59,593 59,971 29-Jan-16 (378)EUR 44,531 USD 48,803 49,185 7-Jan-16 (382)EUR 53,910 USD 59,022 59,424 29-Jan-16 (402)EUR 91,574 USD 100,358 101,143 29-Jan-16 (785)EUR 234,406 USD 256,508 258,134 29-Jan-16 (1,626)EUR 226,939 USD 248,455 250,147 29-Jan-16 (1,692)EUR 527,083 USD 576,781 580,437 29-Jan-16 (3,656)EUR 518,200 USD 567,330 571,194 29-Jan-16 (3,864)USD 29 AUD 41 30 29-Jan-16 (1)USD 588 CNH 3,889 589 29-Jan-16 (1)USD 3,319 CNH 21,905 3,320 29-Jan-16 (1)USD 7,003 CNH 46,230 7,008 29-Jan-16 (5)USD 352 AUD 494 360 29-Jan-16 (8)USD 479 AUD 671 488 29-Jan-16 (9)USD 10,607 AUD 14,618 10,633 29-Jan-16 (26)USD 26,279 EUR 24,192 26,306 29-Jan-16 (27)USD 38,272 EUR 35,234 38,312 29-Jan-16 (40)USD 78,948 EUR 72,681 79,030 29-Jan-16 (82)USD 19,438 EUR 17,956 19,524 29-Jan-16 (86)USD 28,340 EUR 26,179 28,466 29-Jan-16 (126)USD 26,526 CAD 36,922 26,689 29-Jan-16 (163)USD 32,896 AUD 45,507 33,103 29-Jan-16 (207)USD 30,270 AUD 41,955 30,519 29-Jan-16 (249)USD 58,536 EUR 54,072 58,796 29-Jan-16 (260)USD 89,749 CAD 124,614 90,079 29-Jan-16 (330)USD 323,999 EUR 298,279 324,334 29-Jan-16 (335)USD 108,192 EUR 99,927 108,656 29-Jan-16 (464)USD 754,274 EUR 694,397 755,054 29-Jan-16 (780)USD 239,541 EUR 221,276 240,604 29-Jan-16 (1,063)USD 78,469 AUD 110,202 80,165 29-Jan-16 (1,696)USD 193,162 CAD 269,615 194,895 29-Jan-16 (1,733)USD 268,044 CAD 373,355 269,886 29-Jan-16 (1,842)USD 109,268 AUD 153,069 111,348 29-Jan-16 (2,080)USD 559,821 EUR 517,134 562,306 29-Jan-16 (2,485)
Credit Suisse GBP 1,431,000 USD 2,124,320 2,139,331 29-Jan-16 (15,011)
Total (49,621)
Total Financial Liabilities at fair value through profi t or loss (49,621)

Janus Emerging Markets Fund
PORTFOLIO INVESTMENTS
The accompanying notes are an integral part of the fi nancial statements.
J a n u s C a p i t a l F u n d s P l c / 3 1 D e c e m b e r 2 0 1 5 9 3
Share or Principal Amount
Percentage of Net
Assets (%) Fair
Value (USD)
Financial Assets at fair value through profi t or loss Common Stock Agricultural Operations
365,305 Amatheon Agri Holding N.V. . . . . . . . . . . . . . . 0.7 889,147
Airlines 714,000 China Southern Airlines Co., Ltd.. . . . . . . . . . . 0.5 550,948
Automotive – Cars and Light Trucks 432,000 Brilliance China Automotive . . . . . . .
Holdings, Ltd. . . . . . . . . . . . . . . . . . . . . . . . . 0.5 543,5001,107,000 Chongqing Changan Automobile Co.,
Ltd. . . . . . . . . . . . . . . . . . . . . . . . . . . . . . . . . 2.2 2,442,6138,539 Hyundai Motor Co. . . . . . . . . . . . . . . . . . . . . . 1.0 1,085,307
756,414 Yulon Motor Co., Ltd.. . . . . . . . . . . . . . . . . . . . 0.6 695,591 4.3 4,767,011
Automotive – Medical and Heavy Duty Trucks 29,983 Mahindra & Mahindra, Ltd. (144A) . . . . . . . . . 0.5 576,696
Automotive – Truck Parts and Equipment – Original 3,633 Hyundai Mobis . . . . . . . . . . . . . . . . . . . . . . . . . 0.6 763,909
34,258 Iochpe-Maxion S.A. . . . . . . . . . . . . . . . . . . . . . 0.1 106,542 0.7 870,451
Beverages – Non-Alcoholic 194,100 Arca Continental SAB de C.V. . . . . . . . . . . . . . . 1.1 1,179,494270,400 Fomento Economico Mexicano,
S.A.B. de C.V. . . . . . . . . . . . . . . . . . . . . . . . . 2.2 2,523,501 3.3 3,702,995
Beverages – Wine and Spirits 1,331,279 LT Group, Inc. . . . . . . . . . . . . . . . . . . . . . . . . . 0.4 418,299
Brewery 22,154 SABMiller PLC . . . . . . . . . . . . . . . . . . . . . . . . . 1.2 1,345,740
Building Products – Cement and Aggregate 1,332,000 China Resources Cement Holdings,
Ltd. . . . . . . . . . . . . . . . . . . . . . . . . . . . . . . . . 0.4 409,065
Casino Hotels 427,900 Genting Bhd . . . . . . . . . . . . . . . . . . . . . . . . . . . 0.7 732,117
Cellular Telecommunications 197,500 China Mobile, Ltd. . . . . . . . . . . . . . . . . . . . . . . 2.0 2,229,903
Commercial Banks – Non U.S. 165,824 Axis Bank, Ltd. (144A) . . . . . . . . . . . . . . . . . . . 1.0 1,125,787144,200 Banco do Brasil S.A. . . . . . . . . . . . . . . . . . . . . . 0.5 537,424
20,872,710 Banco Santander Chile . . . . . . . . . . . . . . . . . . . 0.8 937,587126,600 Bangkok Bank PCL . . . . . . . . . . . . . . . . . . . . . . 0.5 536,740
2,006,600 Bank Danamon Indonesia Tbk PT (144A) . . . . . . . . . . . . . . . . . . . . . . . . . . . . . 0.4 465,981
1,456,600 Bank Mandiri Tbk . . . . . . . . . . . . . . . . . . . . . . 0.9 977,7762,455,000 Bank of China, Ltd. . . . . . . . . . . . . . . . . . . . . . 1.0 1,096,0703,534,000 China Construction Bank Corp. . . . . . . . . . . . . 2.2 2,421,430
194,385 FirstRand, Ltd. . . . . . . . . . . . . . . . . . . . . . . . . . 0.5 533,073371,800 Grupo Financiero Banorte S.A.B.
de C.V. . . . . . . . . . . . . . . . . . . . . . . . . . . . . . 1.8 2,045,8913,685,000 Industrial & Commercial Bank of
China, Ltd. . . . . . . . . . . . . . . . . . . . . . . . . . . 2.0 2,225,329444,066 Itau Unibanco Holding S.A. (ADR)
(144A) . . . . . . . . . . . . . . . . . . . . . . . . . . . . . 2.6 2,890,870312,661 Metropolitan Bank and Trust . . . . . . . . . . . . . . 0.5 535,072244,848 Sberbank of Russia (ADR) . . . . . . . . . . . . . . . . 1.3 1,439,706
74,653 Turkiye Halk Bankasi A/S . . . . . . . . . . . . . . . . . 0.2 266,024 16.2 18,034,760
Computer Services 24,857 Cognizant Technology Solutions
Corp. (144A) . . . . . . . . . . . . . . . . . . . . . . . . 1.3 1,491,9171,852 Samsung SDS Co., Ltd. (144A) . . . . . . . . . . . . . 0.4 401,267
1.7 1,893,184
Cosmetics and Toiletries 152,705 L’Occitane International S.A. . . . . . . . . . . . . . . . 0.3 295,567
Share or Principal Amount
Percentage of Net
Assets (%) Fair
Value (USD)
Diversifi ed Financial Services 1,057,499 Haitong International Securities
Group, Ltd. . . . . . . . . . . . . . . . . . . . . . . . . . . 0.6 650,89236,302 Hana Financial Group, Inc. . . . . . . . . . . . . . . . 0.7 730,80545,468 Shinhan Financial Group Co., Ltd. . . . . . . . . . . 1.4 1,533,951
2.7 2,915,648
Diversifi ed Operations 207,000 Melco International Development,
Ltd. . . . . . . . . . . . . . . . . . . . . . . . . . . . . . . . . 0.3 310,910
E-Commerce/Products 26,818 Alibaba Group Holding, Ltd. (ADR)
(144A) . . . . . . . . . . . . . . . . . . . . . . . . . . . . . 1.9 2,179,49917,095 JD.com, Inc. . . . . . . . . . . . . . . . . . . . . . . . . . . . 0.5 551,570
1,273,205 MySale Group PLC . . . . . . . . . . . . . . . . . . . . . . 0.8 844,517 3.2 3,575,586
E-Commerce/Services 11,650 Ctrip.com International, Ltd. (ADR) . . . . . . . . . 0.5 539,74514,985 QIWI PLC (ADR) . . . . . . . . . . . . . . . . . . . . . . . 0.2 268,981
0.7 808,726
Electric – Integrated 198,800 Tenaga Nasional Bhd . . . . . . . . . . . . . . . . . . . . 0.5 617,253
Electric – Transmission 556,842 Power Grid Corp of India, Ltd. (144A) . . . . . . . 1.1 1,188,170
Electrical Components – Equipment 181,032 Delta Electronics, Inc. . . . . . . . . . . . . . . . . . . . . 0.8 857,182
Electronic Components – Miscellaneous 462,738 Hon Hai Precision Industry Co., Ltd. . . . . . . . . 1.0 1,138,502270,000 TPK Holding Co., Ltd. . . . . . . . . . . . . . . . . . . . 0.6 678,274
1.6 1,816,776
Electronic Components – Semiconductors 619,544 Hua Hong Semiconductor, Ltd. . . . . . . . . . . . . 0.5 601,974
84,673 Hynix Semiconductor, Inc. . . . . . . . . . . . . . . . . 2.0 2,221,00455,000 MediaTek, Inc. . . . . . . . . . . . . . . . . . . . . . . . . . 0.4 418,688
4,643 Samsung Electronics Co., Ltd. . . . . . . . . . . . . . 4.4 4,990,321 7.3 8,231,987
Electronic Measuring Instruments 274,000 Chroma ATE, Inc. . . . . . . . . . . . . . . . . . . . . . . . 0.5 533,137
Electronic Parts Distributors 789,000 WPG Holdings, Ltd. . . . . . . . . . . . . . . . . . . . . . 0.7 755,588
Energy – Alternate Sources 3,611,399 Beijing Jingneng Clean Energy Co.,
Ltd. (144A) . . . . . . . . . . . . . . . . . . . . . . . . . . 1.1 1,281,501
Engineering and Construction 1,145,794 Louis XIII Holdings, Ltd. . . . . . . . . . . . . . . . . . 0.3 311,961
Finance – Investment Bankers/Brokers 374,000 CITIC Securities Co., Ltd. . . . . . . . . . . . . . . . . 0.8 874,461
Finance – Mortgage Loan Banker 94,643 Housing Development Finance Corp.
(144A) . . . . . . . . . . . . . . . . . . . . . . . . . . . . . 1.6 1,808,07082,617 LIC Housing Finance, Ltd. (144A) . . . . . . . . . . 0.6 637,012
2.2 2,445,082
Finance – Other Services 213,300 BM&FBovespa S.A. – Bolsa de Valores
Mercadorias e Futuros (144A) . . . . . . . . . . . . 0.5 587,318
Food – Meat Products 134,680 San Miguel Pure Foods Co., Inc. . . . . . . . . . . . 0.3 369,348
Food – Miscellaneous/Diversifi ed 335,300 Marfrig Global Foods S.A. . . . . . . . . . . . . . . . . 0.5 538,346
Food – Retail 25,893 X5 Retail Group N.V. (GDR) (144A) . . . . . . . . . 0.4 490,672
Gambling – Non-Hotel 5,518,750 Belle Corp. . . . . . . . . . . . . . . . . . . . . . . . . . . . . 0.3 341,410

Janus Emerging Markets Fund
PORTFOLIO INVESTMENTS
The accompanying notes are an integral part of the fi nancial statements.
9 4 J a n u s C a p i t a l F u n d s P l c / 3 1 D e c e m b e r 2 0 1 5
Share or Principal Amount
Percentage of Net
Assets (%) Fair
Value (USD)
Internet Applications Software 148,600 Tencent Holdings, Ltd. . . . . . . . . . . . . . . . . . . . 2.6 2,924,149
Internet Content – Information/News 5,874 Daum Kakao Corp. . . . . . . . . . . . . . . . . . . . . . . 0.5 580,232
Internet Investment 1,822 Rocket Internet S.E. . . . . . . . . . . . . . . . . . . . . . . — 55,909
Life and Health Insurance 407,000 China Life Insurance Co., Ltd. . . . . . . . . . . . . . 1.2 1,315,567
15,845 Samsung Life Insurance Co., Ltd. (144A) . . . . . . . . . . . . . . . . . . . . . . . . . . . . . 1.3 1,486,771
2.5 2,802,338
Machinery – Electric Utilities 481,764 Ulusoy Elektrik Imalat Taahhut Ve
Ticaret A/S . . . . . . . . . . . . . . . . . . . . . . . . . . 1.3 1,454,034
Medical Labs and Testing Services 148,206 Integrated Diagnostics
Holdings PLC . . . . . . . . . . . . . . . . . . . . . . . . 0.7 732,879
Metal – Diversifi ed 134,329 Hindustan Zinc, Ltd. (144A) . . . . . . . . . . . . . . 0.3 297,287
Metal – Iron 104,931 Vale S.A. (ADR) (144A) . . . . . . . . . . . . . . . . . . 0.3 345,223
Metal Processors and Fabrication 169,000 Catcher Technology Co., Ltd. . . . . . . . . . . . . . . 1.3 1,420,310
Miscellaneous Manufacturing 17,000 Largan Precision Co., Ltd. . . . . . . . . . . . . . . . . 1.0 1,175,066
Multimedia 10,879 Naspers, Ltd. . . . . . . . . . . . . . . . . . . . . . . . . . . 1.3 1,492,761
Oil and Gas Drilling 157,408 Ocean Rig UDW, Inc. . . . . . . . . . . . . . . . . . . . . 0.2 256,575
Oil Companies – Exploration and Production 705,856 Ophir Energy PLC . . . . . . . . . . . . . . . . . . . . . . 0.9 1,024,305
Oil Companies – Integrated 868,600 China Petroleum & Chemical Corp. . . . . . . . . . 0.5 524,538
1,376,000 PetroChina Co., Ltd. . . . . . . . . . . . . . . . . . . . . . 0.8 901,972129,394 Petroleo Brasileiro S.A. (ADR)
(144A) . . . . . . . . . . . . . . . . . . . . . . . . . . . . . 0.5 556,394 1.8 1,982,904
Oil Refi ning and Marketing 41,764 Reliance Industries, Ltd. . . . . . . . . . . . . . . . . . . 0.6 640,564
Paper and Related Products 378,400 Suzano Papel e Celulose S.A. . . . . . . . . . . . . . . 1.6 1,788,195
Real Estate 45,154 Seibu Holdings, Inc. . . . . . . . . . . . . . . . . . . . . . 0.8 932,160
Real Estate Management/Services 3,478,500 Siam Future Development PCL . . . . . . . . . . . . 0.5 604,411
Real Estate Operating/Development 3,057,906 Central China Real Estate, Ltd. . . . . . . . . . . . . . 0.6 639,220
25,180,000 CSI Properties, Ltd. . . . . . . . . . . . . . . . . . . . . . 0.8 861,01997,900 Dalian Wanda Commercial Properties
Co., Ltd. – Class H . . . . . . . . . . . . . . . . . . . . 0.5 571,626359,478 Emaar Properties PJSC (144A) . . . . . . . . . . . . . 0.5 556,897758,250 Shun Tak Holdings, Ltd. . . . . . . . . . . . . . . . . . . 0.3 285,697
2.7 2,914,459
Retail – Automobile 1,654,300 Astra International Tbk PT . . . . . . . . . . . . . . . . 0.6 720,315
Retail – Jewellery 892,200 Chow Tai Fook Jewellery Group, Ltd. . . . . . . . . 0.5 575,630
83,198 CIE Financiere Richemont S.A.. . . . . . . . . . . . . 0.5 600,956146,839 PC Jeweller, Ltd. (144A) . . . . . . . . . . . . . . . . . . 0.8 866,263
1.8 2,042,849
Retail – Major Department Stores 196,553 SACI Falabella . . . . . . . . . . . . . . . . . . . . . . . . . 1.1 1,254,226
Share or Principal Amount
Percentage of Net
Assets (%) Fair
Value (USD)
Semiconductor Components/Integrated Circuits 897,000 Taiwan Semiconductor Manufacturing
Co., Ltd. . . . . . . . . . . . . . . . . . . . . . . . . . . . . 3.5 3,905,852
Specifi ed Purpose Acquisition 11,123 Atlas Mara Co-Nvest, Ltd. . . . . . . . . . . . . . . . . 0.1 58,396
Steel – Producers 3,976 POSCO . . . . . . . . . . . . . . . . . . . . . . . . . . . . . . 0.5 564,703
Telecommunication Services 215,800 Singapore Telecommunications, Ltd. . . . . . . . . 0.5 558,799
Telecommunications 1,435,503 China Telecom Corp., Ltd. . . . . . . . . . . . . . . . . 0.6 674,243
Telephone – Integrated 12,600 KT Corp. . . . . . . . . . . . . . . . . . . . . . . . . . . . . . 0.3 303,632
Tobacco 130,700 ITC, Ltd. . . . . . . . . . . . . . . . . . . . . . . . . . . . . . 0.5 647,665
Transportation – Marine 1,160,000 First Steamship Co., Ltd. . . . . . . . . . . . . . . . . . 0.3 339,798
Transportation – Railroad 57,320 Globaltrans Investment PLC (GDR)
(144A) . . . . . . . . . . . . . . . . . . . . . . . . . . . . . 0.2 260,806
Web Portals/Internet Service Providers 4,149 Baidu, Inc. (ADR) (144A) . . . . . . . . . . . . . . . . . 0.7 784,3271,609 NAVER Corp. . . . . . . . . . . . . . . . . . . . . . . . . . . 0.8 903,111
29,560 Yandex N.V. (144A) . . . . . . . . . . . . . . . . . . . . . 0.4 464,683 1.9 2,152,121
Wire and Cable Products 98,067 Finolex Cables, Ltd. . . . . . . . . . . . . . . . . . . . . . 0. 2 374,993
Total Common Stock . . . . . . . . . . . . . . . . . . . . . . . . . . . . . . . . . 91. 7 102,849,104
Contract Amount Schedule of Purchased Options – Calls
3,874,395 CNH/USD Currency Option, expires November 2016, exercise price USD 6.4 (covered) . . . . . . . . . . . . . . . . 0. 1 224,002
Total Schedule of Purchased Options – Calls . . . . . . . . . . . . . . . . 0. 1 224,002
Preferred Stock Electronic Components – Semiconductors
1,217 Samsung Electronics Co., Ltd. 1.3200% . . . . . . . . . . . . . . . . . . . . . . . . . . . . 1.0 1,132,595
Total Preferred Stock . . . . . . . . . . . . . . . . . . . . . . . . . . . . . . . . . . 1.0 1,132,595
Warrant Specifi ed Purpose Acquisitions
11,049 Atlas Mara Co-Nvest, Ltd. . . . . . . . . . . . . . . . . . — 1,381
Total Warrant . . . . . . . . . . . . . . . . . . . . . . . . . . . . . . . . . . . . . . . . . — 1,381
Total Investments . . . . . . . . . . . . . . . . . . . . . . . . . . . . . . . . . . . . 9 2. 9 104,207,082
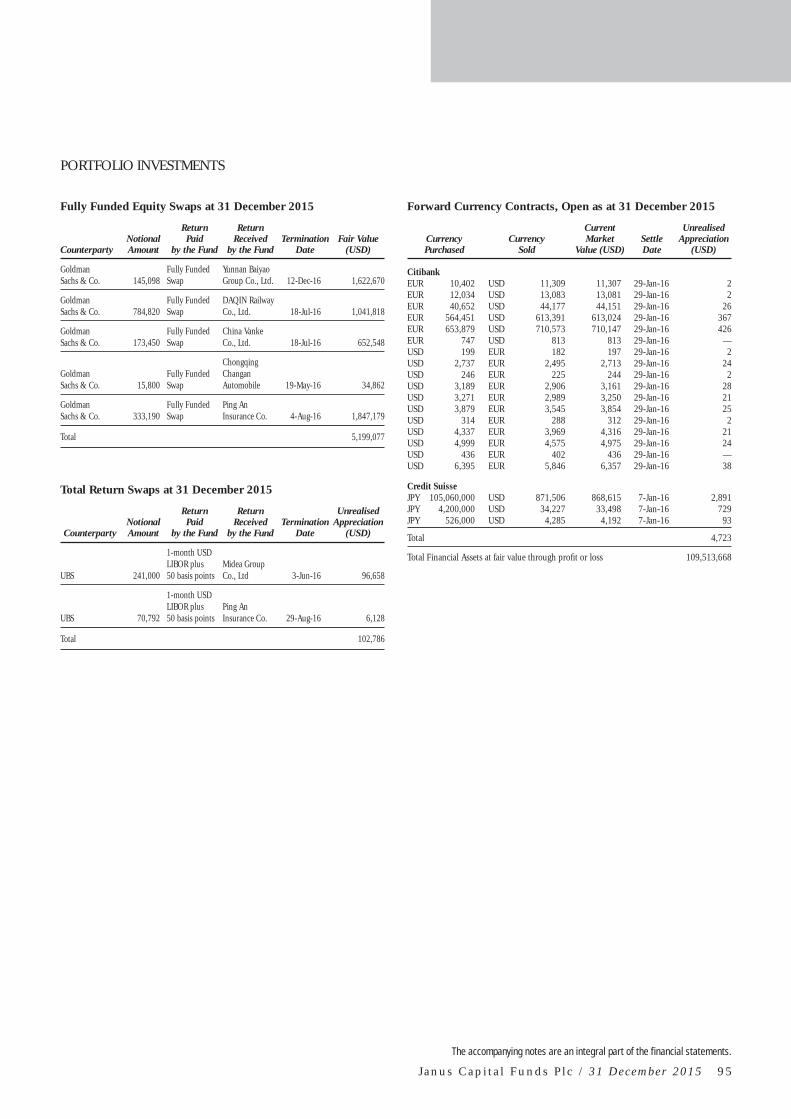
PORTFOLIO INVESTMENTS
The accompanying notes are an integral part of the fi nancial statements.
J a n u s C a p i t a l F u n d s P l c / 3 1 D e c e m b e r 2 0 1 5 9 5
Fully Funded Equity Swaps at 31 December 2015
Counterparty Notional Amount
Return Paid
by the Fund
Return Received
by the Fund Termination
Date Fair Value
(USD)
Goldman Sachs & Co. 145,098
Fully Funded Swap
Yunnan Baiyao Group Co., Ltd. 12-Dec-16 1,622,670
Goldman Sachs & Co. 784,820
Fully Funded Swap
DAQIN Railway Co., Ltd. 18-Jul-16 1,041,818
Goldman Sachs & Co. 173,450
Fully Funded Swap
China Vanke Co., Ltd. 18-Jul-16 652,548
Goldman Sachs & Co. 15,800
Fully Funded Swap
Chongqing Changan Automobile 19-May-16 34,862
Goldman Sachs & Co. 333,190
Fully Funded Swap
Ping An Insurance Co. 4-Aug-16 1,847,179
Total 5,199,077
Total Return Swaps at 31 December 2015
Counterparty Notional Amount
Return Paid
by the Fund
Return Received
by the Fund Termination
Date
Unrealised Appreciation
(USD)
UBS 241,000
1-month USD LIBOR plus 50 basis points
Midea Group Co., Ltd 3-Jun-16 96,658
UBS 70,792
1-month USD LIBOR plus 50 basis points
Ping An Insurance Co. 29-Aug-16 6,128
Total 102,786
Forward Currency Contracts, Open as at 31 December 2015
Currency Purchased
Currency Sold
Current Market
Value (USD) Settle Date
Unrealised Appreciation
(USD)
Citibank EUR 10,402 USD 11,309 11,307 29-Jan-16 2EUR 12,034 USD 13,083 13,081 29-Jan-16 2EUR 40,652 USD 44,177 44,151 29-Jan-16 26EUR 564,451 USD 613,391 613,024 29-Jan-16 367EUR 653,879 USD 710,573 710,147 29-Jan-16 426EUR 747 USD 813 813 29-Jan-16 —USD 199 EUR 182 197 29-Jan-16 2USD 2,737 EUR 2,495 2,713 29-Jan-16 24USD 246 EUR 225 244 29-Jan-16 2USD 3,189 EUR 2,906 3,161 29-Jan-16 28USD 3,271 EUR 2,989 3,250 29-Jan-16 21USD 3,879 EUR 3,545 3,854 29-Jan-16 25USD 314 EUR 288 312 29-Jan-16 2USD 4,337 EUR 3,969 4,316 29-Jan-16 21USD 4,999 EUR 4,575 4,975 29-Jan-16 24USD 436 EUR 402 436 29-Jan-16 —USD 6,395 EUR 5,846 6,357 29-Jan-16 38
Credit Suisse JPY 105,060,000 USD 871,506 868,615 7-Jan-16 2,891JPY 4,200,000 USD 34,227 33,498 7-Jan-16 729JPY 526,000 USD 4,285 4,192 7-Jan-16 93
Total 4,723
Total Financial Assets at fair value through profi t or loss 109,513,668

Janus Emerging Markets Fund
PORTFOLIO INVESTMENTS
The accompanying notes are an integral part of the fi nancial statements.
9 6 J a n u s C a p i t a l F u n d s P l c / 3 1 D e c e m b e r 2 0 1 5
Financial Liabilities at fair value through profi t or loss
Total Return Swaps as 31 December 2015
Counterparty Notional Amount
Return Paid
by the Fund
Return Received
by the Fund Termination
Date
Unrealised (Depreciation)
(USD)
Credit Suisse 84,199
1-month USD LIBOR plus 100 basis points
Saudi International Petrochemical Co. 8-Feb-16 (51,334)
UBS 5,791
1-month USD LIBOR plus 50 basis points
Yunnan Baiyao Group Co., Ltd. 3-Jun-16 (792)
Total (52,126)
Forward Currency Contracts, Open as at 31 December 2015
Currency Purchased
Currency Sold
Current Market
Value (USD) Settle Date
Unrealised (Depreciation)
(USD)
Citibank EUR 292 USD 319 321 29-Jan-16 (2)EUR 293 USD 321 323 29-Jan-16 (2)EUR 384 USD 422 426 29-Jan-16 (4)EUR 4,099 USD 4,488 4,519 29-Jan-16 (31)EUR 4,126 USD 4,519 4,551 29-Jan-16 (32)EUR 4,731 USD 5,181 5,218 29-Jan-16 (37)EUR 4,732 USD 5,180 5,215 29-Jan-16 (35)EUR 5,360 USD 5,883 5,938 29-Jan-16 (55)EUR 6,191 USD 6,795 6,858 29-Jan-16 (63)USD 187 EUR 172 188 29-Jan-16 (1)USD 2,562 EUR 2,367 2,573 29-Jan-16 (11)USD 2,986 EUR 2,758 2,999 29-Jan-16 (13)USD 6,029 EUR 5,550 6,035 29-Jan-16 (6)USD 7,001 EUR 6,445 7,008 29-Jan-16 (7)
Credit Suisse USD 17,441 JPY 2,100,000 17,478 7-Jan-16 (37)USD 263,534 JPY 32,000,000 266,330 7-Jan-16 (2,796)USD 616,838 JPY 75,686,000 629,919 7-Jan-16 (13,083)USD 871,867 JPY 105,060,000 874,866 4-Feb-16 (2,999)
Total (19,214)
Total Financial Liabilities at fair value through profi t or loss (71,340)
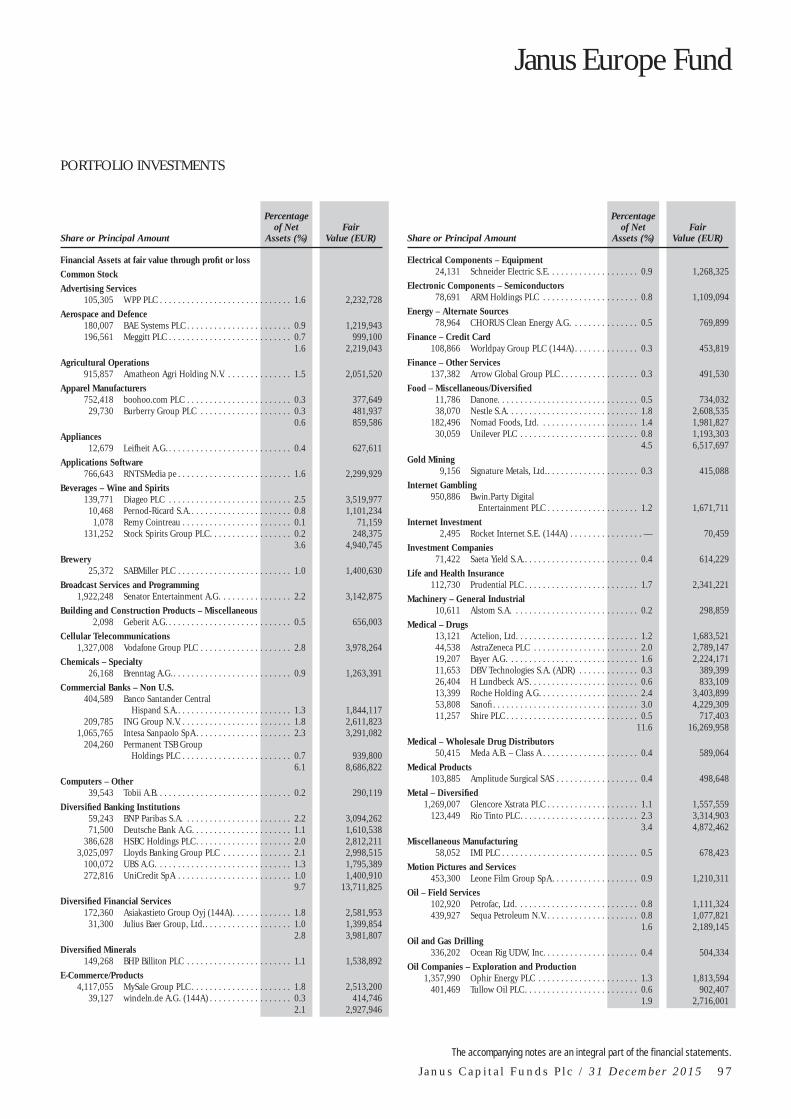
Janus Europe Fund
PORTFOLIO INVESTMENTS
The accompanying notes are an integral part of the fi nancial statements.
J a n u s C a p i t a l F u n d s P l c / 3 1 D e c e m b e r 2 0 1 5 9 7
Share or Principal Amount
Percentage of Net
Assets (%) Fair
Value (EUR)
Financial Assets at fair value through profi t or loss Common Stock Advertising Services
105,305 WPP PLC . . . . . . . . . . . . . . . . . . . . . . . . . . . . . 1.6 2,232,728
Aerospace and Defence 180,007 BAE Systems PLC . . . . . . . . . . . . . . . . . . . . . . . 0.9 1,219,943196,561 Meggitt PLC . . . . . . . . . . . . . . . . . . . . . . . . . . . 0.7 999,100
1.6 2,219,043
Agricultural Operations 915,857 Amatheon Agri Holding N.V. . . . . . . . . . . . . . . 1.5 2,051,520
Apparel Manufacturers 752,418 boohoo.com PLC . . . . . . . . . . . . . . . . . . . . . . . 0.3 377,649
29,730 Burberry Group PLC . . . . . . . . . . . . . . . . . . . . 0.3 481,9370.6 859,586
Appliances 12,679 Leifheit A.G. . . . . . . . . . . . . . . . . . . . . . . . . . . . 0.4 627,611
Applications Software 766,643 RNTSMedia pe . . . . . . . . . . . . . . . . . . . . . . . . . 1.6 2,299,929
Beverages – Wine and Spirits 139,771 Diageo PLC . . . . . . . . . . . . . . . . . . . . . . . . . . . 2.5 3,519,977
10,468 Pernod-Ricard S.A. . . . . . . . . . . . . . . . . . . . . . . 0.8 1,101,2341,078 Remy Cointreau . . . . . . . . . . . . . . . . . . . . . . . . 0.1 71,159
131,252 Stock Spirits Group PLC . . . . . . . . . . . . . . . . . . 0.2 248,3753.6 4,940,745
Brewery 25,372 SABMiller PLC . . . . . . . . . . . . . . . . . . . . . . . . . 1.0 1,400,630
Broadcast Services and Programming 1,922,248 Senator Entertainment A.G. . . . . . . . . . . . . . . . 2.2 3,142,875
Building and Construction Products – Miscellaneous 2,098 Geberit A.G. . . . . . . . . . . . . . . . . . . . . . . . . . . . 0.5 656,003
Cellular Telecommunications 1,327,008 Vodafone Group PLC . . . . . . . . . . . . . . . . . . . . 2.8 3,978,264
Chemicals – Specialty 26,168 Brenntag A.G. . . . . . . . . . . . . . . . . . . . . . . . . . . 0.9 1,263,391
Commercial Banks – Non U.S. 404,589 Banco Santander Central
Hispand S.A. . . . . . . . . . . . . . . . . . . . . . . . . . 1.3 1,844,117209,785 ING Group N.V. . . . . . . . . . . . . . . . . . . . . . . . . 1.8 2,611,823
1,065,765 Intesa Sanpaolo SpA . . . . . . . . . . . . . . . . . . . . . 2.3 3,291,082204,260 Permanent TSB Group
Holdings PLC . . . . . . . . . . . . . . . . . . . . . . . . 0.7 939,8006.1 8,686,822
Computers – Other 39,543 Tobii A.B. . . . . . . . . . . . . . . . . . . . . . . . . . . . . . 0.2 290,119
Diversifi ed Banking Institutions 59,243 BNP Paribas S.A. . . . . . . . . . . . . . . . . . . . . . . . 2.2 3,094,26271,500 Deutsche Bank A.G. . . . . . . . . . . . . . . . . . . . . . 1.1 1,610,538
386,628 HSBC Holdings PLC . . . . . . . . . . . . . . . . . . . . . 2.0 2,812,2113,025,097 Lloyds Banking Group PLC . . . . . . . . . . . . . . . 2.1 2,998,515
100,072 UBS A.G. . . . . . . . . . . . . . . . . . . . . . . . . . . . . . 1.3 1,795,389272,816 UniCredit SpA . . . . . . . . . . . . . . . . . . . . . . . . . 1.0 1,400,910
9.7 13,711,825
Diversifi ed Financial Services 172,360 Asiakastieto Group Oyj (144A) . . . . . . . . . . . . . 1.8 2,581,953
31,300 Julius Baer Group, Ltd. . . . . . . . . . . . . . . . . . . . 1.0 1,399,8542.8 3,981,807
Diversifi ed Minerals 149,268 BHP Billiton PLC . . . . . . . . . . . . . . . . . . . . . . . 1.1 1,538,892
E-Commerce/Products 4,117,055 MySale Group PLC . . . . . . . . . . . . . . . . . . . . . . 1.8 2,513,200
39,127 windeln.de A.G. (144A) . . . . . . . . . . . . . . . . . . 0.3 414,7462.1 2,927,946
Share or Principal Amount
Percentage of Net
Assets (%) Fair
Value (EUR)
Electrical Components – Equipment 24,131 Schneider Electric S.E. . . . . . . . . . . . . . . . . . . . 0.9 1,268,325
Electronic Components – Semiconductors 78,691 ARM Holdings PLC . . . . . . . . . . . . . . . . . . . . . 0.8 1,109,094
Energy – Alternate Sources 78,964 CHORUS Clean Energy A.G. . . . . . . . . . . . . . . 0.5 769,899
Finance – Credit Card 108,866 Worldpay Group PLC (144A) . . . . . . . . . . . . . . 0.3 453,819
Finance – Other Services 137,382 Arrow Global Group PLC . . . . . . . . . . . . . . . . . 0.3 491,530
Food – Miscellaneous/Diversifi ed 11,786 Danone. . . . . . . . . . . . . . . . . . . . . . . . . . . . . . . 0.5 734,03238,070 Nestle S.A. . . . . . . . . . . . . . . . . . . . . . . . . . . . . 1.8 2,608,535
182,496 Nomad Foods, Ltd. . . . . . . . . . . . . . . . . . . . . . 1.4 1,981,82730,059 Unilever PLC . . . . . . . . . . . . . . . . . . . . . . . . . . 0.8 1,193,303
4.5 6,517,697
Gold Mining 9,156 Signature Metals, Ltd. . . . . . . . . . . . . . . . . . . . . 0.3 415,088
Internet Gambling 950,886 Bwin.Party Digital
Entertainment PLC . . . . . . . . . . . . . . . . . . . . 1.2 1,671,711
Internet Investment 2,495 Rocket Internet S.E. (144A) . . . . . . . . . . . . . . . . — 70,459
Investment Companies 71,422 Saeta Yield S.A. . . . . . . . . . . . . . . . . . . . . . . . . . 0.4 614,229
Life and Health Insurance 112,730 Prudential PLC . . . . . . . . . . . . . . . . . . . . . . . . . 1.7 2,341,221
Machinery – General Industrial 10,611 Alstom S.A. . . . . . . . . . . . . . . . . . . . . . . . . . . . 0.2 298,859
Medical – Drugs 13,121 Actelion, Ltd. . . . . . . . . . . . . . . . . . . . . . . . . . . 1.2 1,683,52144,538 AstraZeneca PLC . . . . . . . . . . . . . . . . . . . . . . . 2.0 2,789,14719,207 Bayer A.G. . . . . . . . . . . . . . . . . . . . . . . . . . . . . 1.6 2,224,17111,653 DBV Technologies S.A. (ADR) . . . . . . . . . . . . . 0.3 389,39926,404 H Lundbeck A/S . . . . . . . . . . . . . . . . . . . . . . . . 0.6 833,10913,399 Roche Holding A.G. . . . . . . . . . . . . . . . . . . . . . 2.4 3,403,89953,808 Sanofi . . . . . . . . . . . . . . . . . . . . . . . . . . . . . . . . 3.0 4,229,30911,257 Shire PLC . . . . . . . . . . . . . . . . . . . . . . . . . . . . . 0.5 717,403
11.6 16,269,958
Medical – Wholesale Drug Distributors 50,415 Meda A.B. – Class A . . . . . . . . . . . . . . . . . . . . . 0.4 589,064
Medical Products 103,885 Amplitude Surgical SAS . . . . . . . . . . . . . . . . . . 0.4 498,648
Metal – Diversifi ed 1,269,007 Glencore Xstrata PLC . . . . . . . . . . . . . . . . . . . . 1.1 1,557,559
123,449 Rio Tinto PLC . . . . . . . . . . . . . . . . . . . . . . . . . . 2.3 3,314,9033.4 4,872,462
Miscellaneous Manufacturing 58,052 IMI PLC . . . . . . . . . . . . . . . . . . . . . . . . . . . . . . 0.5 678,423
Motion Pictures and Services 453,300 Leone Film Group SpA . . . . . . . . . . . . . . . . . . . 0.9 1,210,311
Oil – Field Services 102,920 Petrofac, Ltd. . . . . . . . . . . . . . . . . . . . . . . . . . . 0.8 1,111,324439,927 Sequa Petroleum N.V. . . . . . . . . . . . . . . . . . . . . 0.8 1,077,821
1.6 2,189,145
Oil and Gas Drilling 336,202 Ocean Rig UDW, Inc. . . . . . . . . . . . . . . . . . . . . 0.4 504,334
Oil Companies – Exploration and Production 1,357,990 Ophir Energy PLC . . . . . . . . . . . . . . . . . . . . . . 1.3 1,813,594
401,469 Tullow Oil PLC . . . . . . . . . . . . . . . . . . . . . . . . . 0.6 902,4071.9 2,716,001

Janus Europe Fund
PORTFOLIO INVESTMENTS
The accompanying notes are an integral part of the fi nancial statements.
9 8 J a n u s C a p i t a l F u n d s P l c / 3 1 D e c e m b e r 2 0 1 5
Share or Principal Amount
Percentage of Net
Assets (%) Fair
Value (EUR)
Oil Companies – Integrated 238,225 BP PLC . . . . . . . . . . . . . . . . . . . . . . . . . . . . . . . 0.8 1,143,980133,796 Royal Dutch Shell PLC – Class A . . . . . . . . . . . 2.0 2,769,654
43,844 Total S.A. . . . . . . . . . . . . . . . . . . . . . . . . . . . . . 1.3 1,809,2234.1 5,722,857
Pharmaceuticals 7,227 Mallinckrodt PLC . . . . . . . . . . . . . . . . . . . . . . . 0.4 496,366
Professional Sports 1,493 Manchester United PLC – Class A . . . . . . . . . . . — 24,471
Real Estate Management/Services 291,490 Atrium European Real Estate, Ltd. . . . . . . . . . . 0.7 1,040,619
12,697 Countrywide PLC . . . . . . . . . . . . . . . . . . . . . . . . — 68,7920.7 1,109,411
Real Estate Operating/Development 15,064 ADO Properties S.A. (144A) . . . . . . . . . . . . . . . 0.3 399,196
1,111,086 Aroundtown Property Holdings PLC . . . . . . . . . 3.3 4,711,006878,705 ISARIA Wohnbau A.G. . . . . . . . . . . . . . . . . . . . 2.3 3,259,996
5.9 8,370,198
Resorts and Theme Parks 106,969 Merlin Entertainments PLC (144A) . . . . . . . . . 0.5 660,958
Retail – Jewellery 21,285 CIE Financiere de Richemont S.A. . . . . . . . . . . 1.0 1,410,507
Semiconductor Equipment 9,500 ASML Holding N.V. . . . . . . . . . . . . . . . . . . . . . 0.5 776,104
Specifi ed Purpose Acquisition 410,767 Atlas Mara Co-Nvest, Ltd. . . . . . . . . . . . . . . . . 1.4 1,984,656
64,186 Pace Holdings Corp. . . . . . . . . . . . . . . . . . . . . . 0.4 596,6121.8 2,581,268
Steel – Producers 513,535 ArcelorMittal . . . . . . . . . . . . . . . . . . . . . . . . . . 1.4 2,001,246
Steel Pipe and Tube 70,768 Vallourec S.A. . . . . . . . . . . . . . . . . . . . . . . . . . . 0.4 608,605
Telephone – Integrated 87,620 Deutsche Telekom A.G. . . . . . . . . . . . . . . . . . . 1.0 1,462,378
Textile – Apparel 13,018 LVMH Moet Hennessy Louis
Vuitton S.A. . . . . . . . . . . . . . . . . . . . . . . . . . 1.3 1,886,308
Therapeutics 4,135 GW Pharmaceuticals PLC (ADR) . . . . . . . . . . . 0.2 264,250
Transportation – Marine 768 AP Moeller-Maersk A/S . . . . . . . . . . . . . . . . . . . 0.7 923,893
Transportation – Railroad 166,439 Globaltrans Investment PLC (GDR) . . . . . . . . . 0.5 696,942
Transportation Services 180,510 Nobina A.B. . . . . . . . . . . . . . . . . . . . . . . . . . . . 0.5 762,124
Water 52,507 Suez Environnement Co. . . . . . . . . . . . . . . . . . 0.6 906,271
Wireless Equipment 149,545 Telefonaktiebolaget L.M. Ericsson . . . . . . . . . . . 1.0 1,342,719
Total Common Stock . . . . . . . . . . . . . . . . . . . . . . . . . . . . . . . . . 95.0 134,366,889
Corporate Bonds Medical Products
4,000,000 Avatera Medical Investment GmbH, 5.0000%, due 7/8/18* . . . . . . . . . . . . . . . . . 2.6 3,680,000
Total Corporate Bonds . . . . . . . . . . . . . . . . . . . . . . . . . . . . . . . . . 2.6 3,680,000
Preferred Stock Automotive – Cars and Light Trucks
5,663 Volkswagen A.G., 2.5800% . . . . . . . . . . . . . . . 0.5 757,426
Total Preferred Stock . . . . . . . . . . . . . . . . . . . . . . . . . . . . . . . . . . 0.5 757,426
Share or Principal Amount
Percentage of Net
Assets (%) Fair
Value (EUR)
Warrant Specifi ed Purpose Acquisitions
1,124,165 Atlas Mara Co-Nvest, Ltd.(144A) . . . . . . . . . . . 0.1 129,321
Total Warrant . . . . . . . . . . . . . . . . . . . . . . . . . . . . . . . . . . . . . . . . 0.1 129,321
Total Investments . . . . . . . . . . . . . . . . . . . . . . . . . . . . . . . . . . . . 98.2 138,933,636
*Fair Valued by Janus Global Pricing Committee at 31 December 2015.

PORTFOLIO INVESTMENTS
The accompanying notes are an integral part of the fi nancial statements.
J a n u s C a p i t a l F u n d s P l c / 3 1 D e c e m b e r 2 0 1 5 9 9
Forward Currency Contracts, Open as at 31 December 2015
Currency Purchased
Currency Sold
Current Market
Value (USD) Settle Date
Unrealised Appreciation
(USD)
Citibank EUR 35,117 USD 38,016 37,861 29-Jan-16 155EUR 97,802 USD 106,236 106,135 29-Jan-16 101EUR 10 USD 11 11 29-Jan-16 —EUR 28 USD 30 30 29-Jan-16 —EUR 3 USD 3 3 29-Jan-16 —EUR 5 USD 6 6 29-Jan-16 —EUR 15 USD 17 17 29-Jan-16 —SEK 72,227,923 EUR 7,785,204 7,688,768 29-Jan-16 96,436SEK 828,417 EUR 89,361 88,324 29-Jan-16 1,037SEK 2,203,523 EUR 239,774 239,095 29-Jan-16 679USD 335,080 EUR 305,295 332,214 29-Jan-16 2,866USD 67,253 EUR 61,458 66,861 29-Jan-16 392USD 97 EUR 88 96 29-Jan-16 1USD 36 EUR 33 36 29-Jan-16 —USD 20 EUR 18 20 29-Jan-16 —
Total 101,667
Total Financial Assets at fair value through profi t or loss 139,097,406
Financial Liabilities at fair value through profi t or loss
Forward Currency Contracts, Open as at 31 December 2015
Currency Purchased
Currency Sold
Current Market
Value (USD) Settle Date
Unrealised (Depreciation)
(USD)
Citibank EUR 15,846 SEK 145,283 15,853 29-Jan-16 (7)EUR 42,404 SEK 389,101 42,459 29-Jan-16 (55)EUR 7,284 SEK 67,489 7,364 29-Jan-16 (80)EUR 11,619 USD 12,725 12,809 29-Jan-16 (84)EUR 18,940 USD 20,780 20,951 29-Jan-16 (171)EUR 54,163 USD 59,178 59,439 29-Jan-16 (261)EUR 29,800 SEK 276,091 30,128 29-Jan-16 (328)EUR 75,914 SEK 704,544 76,881 29-Jan-16 (967)SEK 398,418 EUR 43,585 43,694 29-Jan-16 (109)USD 3,121 EUR 2,872 3,123 29-Jan-16 (2)USD 122,811 EUR 112,963 122,829 29-Jan-16 (18)USD 150,000 EUR 138,541 150,592 29-Jan-16 (592)USD 10,702,574 EUR 9,848,665 10,708,470 29-Jan-16 (5,897)
Total (8,571)
Total Financial Liabilities at fair value through profi t or loss (8,571)
Total Return Swaps Outstanding at 31 December 2015
Counterparty Notional Amount
Return Paid by the Fund
Return Received by
the Fund Termination
Date
Unrealised Appreciation
(USD)
Goldman Sachs Group, Inc. 713,946
1-month USD LIBOR plus 70 basis points
Ulusoy Elektrik Imalat Taahhüt Tic. A.S. 4-Oct-16 62,103
Total 62,103

Janus Global Life Sciences Fund
PORTFOLIO INVESTMENTS
1 0 0 J a n u s C a p i t a l F u n d s P l c / 3 1 D e c e m b e r 2 0 1 5
*Fair Valued by Janus Global Pricing Committee at 31 December 2015.The accompanying notes are an integral part of the fi nancial statements.
Share or Principal Amount
Percentage of Net
Assets (%) Fair
Value (USD)
Financial Assets at fair value through profi t or loss Common Stock Biotechnology
575,384 ACERTA PHARMA B.V. PP* . . . . . . . . . . . . . . . 0.7 12,865,586
Dialysis Centres 252,392 DaVita, Inc. . . . . . . . . . . . . . . . . . . . . . . . . . . . 0.9 17,594,246
Diversifi ed Operations 728,812 Horizon Pharma PLC . . . . . . . . . . . . . . . . . . . . 0.8 15,793,356
Drug Delivery Systems 676,989 Flamel Technologies S.A. . . . . . . . . . . . . . . . . . 0.4 8,266,036520,013 Heron Therapeutics, Inc. . . . . . . . . . . . . . . . . . 0.7 13,884,347601,524 Nektar Therapeutics . . . . . . . . . . . . . . . . . . . . . 0.5 10,135,679
1.6 32,286,062
Heart Monitors 167,212 HeartWare International, Inc. . . . . . . . . . . . . . . 0.4 8,427,485
Instruments – Controls 30,985 Mettler-Toledo International, Inc. . . . . . . . . . . . 0.5 10,507,943
Instruments – Scientifi c 116,523 Thermo Fisher Scientifi c, Inc. . . . . . . . . . . . . . . 0.8 16,528,788
Medical 476,857 LDR Holding Corp. . . . . . . . . . . . . . . . . . . . . . 0.6 11,973,879
Medical – Biomedical and Genetic 1,605,395 Achillion Pharmaceuticals, Inc.. . . . . . . . . . . . . 0.9 17,322,212
731,507 Alder Biopharmaceuticals, Inc. . . . . . . . . . . . . . 1.2 24,161,676166,432 Alexion Pharmaceuticals, Inc. . . . . . . . . . . . . . . 1.6 31,746,904413,248 AMAG Pharmaceuticals, Inc. . . . . . . . . . . . . . . 0.6 12,475,957464,683 Amgen, Inc. . . . . . . . . . . . . . . . . . . . . . . . . . . . 3.8 75,433,640122,433 Biogen Idec, Inc.. . . . . . . . . . . . . . . . . . . . . . . . 1.9 37,507,350
57,296 Bluebird Bio, Inc. . . . . . . . . . . . . . . . . . . . . . . . 0.2 3,679,549448,599 Celgene Corp. . . . . . . . . . . . . . . . . . . . . . . . . . 2.7 53,724,216312,251 Dimension Therapeutics, Inc. . . . . . . . . . . . . . . 0.2 3,522,191416,995 Edge Therapeutics, Inc. . . . . . . . . . . . . . . . . . . 0.3 5,212,438347,901 Gilead Sciences, Inc. . . . . . . . . . . . . . . . . . . . . . 1.8 35,204,102
96,267 Incyte Corp., Ltd. . . . . . . . . . . . . . . . . . . . . . . . 0.5 10,440,156679,782 Insmed, Inc. . . . . . . . . . . . . . . . . . . . . . . . . . . . 0.6 12,338,043758,638 Intellia Therapeutics, Inc*. . . . . . . . . . . . . . . . . 0.2 3,982,850322,884 Medivation, Inc. . . . . . . . . . . . . . . . . . . . . . . . . 0. 9 15,608,213763,947 Novavax, Inc. . . . . . . . . . . . . . . . . . . . . . . . . . . 0.3 6,409,515657,120 OvaScience, Inc. . . . . . . . . . . . . . . . . . . . . . . . . 0.3 6,420,062145,874 PTC Therapeutics, Inc. . . . . . . . . . . . . . . . . . . . 0.2 4,726,318109,246 Puma Biotechnology, Inc. . . . . . . . . . . . . . . . . . 0.4 8,564,886
53,221 Regeneron Pharmaceuticals, Inc. . . . . . . . . . . . 1.5 28,892,084679,213 Regenxbio, Inc.*. . . . . . . . . . . . . . . . . . . . . . . . 0.5 10,711,189
9,228 Solid GT, LLC* . . . . . . . . . . . . . . . . . . . . . . . . . 0.1 2,906,820552,378 Trillium Therapeutics, Inc. . . . . . . . . . . . . . . . . 0.4 6,965,487173,007 Vertex Pharmaceuticals, Inc. . . . . . . . . . . . . . . . 1. 2 21,769,471
22. 3 439,725,329
Medical – Drugs 1,028,693 AbbVie, Inc. . . . . . . . . . . . . . . . . . . . . . . . . . . . 3.2 60,939,773
157,342 Actelion, Ltd. . . . . . . . . . . . . . . . . . . . . . . . . . . 1.1 21,936,433177,372 Alkermes PLC. . . . . . . . . . . . . . . . . . . . . . . . . . 0.7 14,079,789
1,190,716 Amicus Therapeutics, Inc. . . . . . . . . . . . . . . . . 0.6 11,549,945159,772 Anacor Pharmaceuticals, Inc. . . . . . . . . . . . . . . 0.9 18,049,443491,820 AstraZeneca PLC . . . . . . . . . . . . . . . . . . . . . . . 1.7 33,466,979356,668 Baxalta, Inc. . . . . . . . . . . . . . . . . . . . . . . . . . . . 0.7 13,920,752160,286 Bayer A.G. . . . . . . . . . . . . . . . . . . . . . . . . . . . . 1.0 20,168,512673,530 Bristol-Myers Squibb Co. . . . . . . . . . . . . . . . . . 2.4 46,332,129451,984 Chimerix, Inc. . . . . . . . . . . . . . . . . . . . . . . . . . 0.2 4,045,257
44,534 Clementia Pharmaceuticals, Inc.* . . . . . . . . . . . 0.3 5,499,949509,136 DBV Technologies S.A. (ADR) . . . . . . . . . . . . . 0.9 18,486,728178,775 Eagle Pharmaceuticals, Inc. . . . . . . . . . . . . . . . 0.8 15,851,979537,924 Eli Lilly & Co. . . . . . . . . . . . . . . . . . . . . . . . . . 2.3 45,325,476423,951 Endo International PLC . . . . . . . . . . . . . . . . . . 1.3 25,954,280404,198 FibroGen, Inc. . . . . . . . . . . . . . . . . . . . . . . . . . 0.6 12,315,913178,525 Global Blood Therapeutics, Inc. . . . . . . . . . . . . 0.3 5,771,713
Share or Principal Amount
Percentage of Net
Assets (%) Fair
Value (USD)
356,402 H Lundbeck A/S . . . . . . . . . . . . . . . . . . . . . . . . 0.6 12,219,183792,450 HLS Therapeutics Inc.* . . . . . . . . . . . . . . . . . . 0.4 7,924,500
6,524,251 Indivior PLC . . . . . . . . . . . . . . . . . . . . . . . . . . . 0.9 18,060,249528,283 Insys Therapeutics, Inc. . . . . . . . . . . . . . . . . . . 0.8 15,124,742
1,348,082 Ironwood Pharmaceuticals, Inc. . . . . . . . . . . . . 0.8 15,624,270147,191 Jazz Pharmaceuticals PLC . . . . . . . . . . . . . . . . . 1.1 20,689,167343,080 Johnson & Johnson . . . . . . . . . . . . . . . . . . . . . 1.8 35,241,178205,479 Novartis A.G. . . . . . . . . . . . . . . . . . . . . . . . . . . 0.9 17,812,427472,445 Novo Nordisk A/S – Class B . . . . . . . . . . . . . . . 1.4 27,516,820
1,323,709 Pfi zer, Inc. . . . . . . . . . . . . . . . . . . . . . . . . . . . . 2.3 42,729,327112,626 ProQR Therapeutics N.V. . . . . . . . . . . . . . . . . . . — 977,594490,047 Relypsa, Inc. . . . . . . . . . . . . . . . . . . . . . . . . . . . 0.7 13,887,932141,255 Roche Holding A.G. . . . . . . . . . . . . . . . . . . . . . 2.0 38,992,204547,845 Sanofi . . . . . . . . . . . . . . . . . . . . . . . . . . . . . . . . 2.4 46,789,666175,636 Shire PLC (ADR) . . . . . . . . . . . . . . . . . . . . . . . 1.8 36,005,380337,375 Valeant Pharmaceuticals
International, Inc. . . . . . . . . . . . . . . . . . . . . . 1.7 34,294,16938.6 757,583,858
Medical – Generic Drugs 171,431 Allergan PLC . . . . . . . . . . . . . . . . . . . . . . . . . . 2.7 53,572,188
53,456 Perrigo Co., PLC. . . . . . . . . . . . . . . . . . . . . . . . 0.4 7,735,083797,423 Teva Pharmaceutical Industries, Ltd.
(ADR) . . . . . . . . . . . . . . . . . . . . . . . . . . . . . . 2.7 52,342,8465.8 113,650,117
Medical – HMO 447,088 Aetna, Inc. . . . . . . . . . . . . . . . . . . . . . . . . . . . . 2.5 48,339,155166,201 Humana, Inc. . . . . . . . . . . . . . . . . . . . . . . . . . . 1.5 29,668,541
4.0 78,007,696
Medical – Hospitals 405,422 HCA Holdings, Inc. . . . . . . . . . . . . . . . . . . . . . 1.4 27,418,690298,765 Universal Health Services, Inc. . . . . . . . . . . . . . 1.8 35,699,430
3.2 63,118,120
Medical – Wholesale Drug Distributors 172,180 AmerisourceBergen Corp. . . . . . . . . . . . . . . . . . 0.9 17,856,788990,014 Meda A.B. – Class A . . . . . . . . . . . . . . . . . . . . . 0.6 12,569,386
1.5 30,426,174
Medical Information Systems 167,323 Athenahealth, Inc. . . . . . . . . . . . . . . . . . . . . . . 1.4 26,933,983
Medical Instruments 2,472,951 Boston Scientifi c Corp. . . . . . . . . . . . . . . . . . . . 2.3 45,601,216
335,265 Endologix, Inc. . . . . . . . . . . . . . . . . . . . . . . . . . 0.2 3,319,1242.5 48,920,340
Medical Products 62,339 Advanced Accelerator Applications
S.A. . . . . . . . . . . . . . . . . . . . . . . . . . . . . . . . . 0.1 1,949,341564,968 Baxter International, Inc. . . . . . . . . . . . . . . . . . 1.1 21,553,529
79,284 Henry Schein, Inc. . . . . . . . . . . . . . . . . . . . . . . 0.6 12,541,936265,667 Varian Medical Systems, Inc. . . . . . . . . . . . . . . 1.1 21,465,894191,449 Zimmer Holdings, Inc. . . . . . . . . . . . . . . . . . . . 1.0 19,640,753
3.9 77,151,453
Pharmaceuticals 683,088 Dyax Corp. . . . . . . . . . . . . . . . . . . . . . . . . . . . . 1.3 25,697,771298,628 Mallinckrodt PLC . . . . . . . . . . . . . . . . . . . . . . . 1. 2 22,286,608321,046 Neurocrine Biosciences, Inc. . . . . . . . . . . . . . . . 0.9 18,161,572
3. 4 66,145,951
Pharmacy Services 496,161 Diplomat Pharmacy, Inc. . . . . . . . . . . . . . . . . . 0.9 16,978,629414,616 Express Scripts Holding Co. . . . . . . . . . . . . . . . 1.8 36,241,585
2.7 53,220,214
Physical Practice Management 177,276 Mednax, Inc. . . . . . . . . . . . . . . . . . . . . . . . . . . 0. 7 12,703,598
Therapeutics 63,882 Agios Pharmaceuticals, Inc. . . . . . . . . . . . . . . . 0.2 4,147,219
774,243 Axovant Sciences, Ltd. . . . . . . . . . . . . . . . . . . . 0.8 13,959,601183,145 GW Pharmaceuticals PLC (ADR) . . . . . . . . . . . 0. 7 12,717,589

PORTFOLIO INVESTMENTS
The accompanying notes are an integral part of the fi nancial statements.
J a n u s C a p i t a l F u n d s P l c / 3 1 D e c e m b e r 2 0 1 5 1 0 1
Share or Principal Amount
Percentage of Net
Assets (%) Fair
Value (USD)
236,380 La Jolla Pharmaceutical Co. . . . . . . . . . . . . . . . 0.3 6,382,260129,820 Voyager Therapeutics, Inc. . . . . . . . . . . . . . . . . 0.1 2,843,058
2. 1 40,049,727
Total Common Stock . . . . . . . . . . . . . . . . . . . . . . . . . . . . . . . . . 9 8. 4 1,933,613,905
Corporate Bonds Medical – Biomedical and Genetic
9,919,000 PTC Therapeutics, Inc., 3.0000%, due 15/8/22 (144A) . . . . . . . . . . . . . . . . . . . 0.5 8,976,695
Total Corporate Bonds . . . . . . . . . . . . . . . . . . . . . . . . . . . . . . . . . 0.5 8,976,695
Total Investments . . . . . . . . . . . . . . . . . . . . . . . . . . . . . . . . . . . . 98. 9 1,942,590,600
Forward Currency Contracts, Open as at 31 December 2015
Currency Purchased
Currency Sold
Current Market
Value (USD) Settle Date
Unrealised Appreciation
(USD)
Bank of America USD 17,068,670 CHF 16,835,000 16,824,864 29-Jan-16 243,806USD 1,652,418 SEK 13,922,000 1,651,108 29-Jan-16 1,310
Citibank AUD 30,055,972 USD 21,596,208 21,329,191 29-Jan-16 267,017AUD 482,348 USD 347,267 343,665 29-Jan-16 3,602AUD 244,951 USD 176,952 175,723 29-Jan-16 1,229AUD 609,187 USD 442,544 441,955 29-Jan-16 589AUD 1,136 USD 819 812 29-Jan-16 7CNH 2,063,468 USD 312,627 312,483 29-Jan-16 144CNH 1,958 USD 296 295 29-Jan-16 1CNH 32,681 USD 4,954 4,954 29-Jan-16 —EUR 82,135,989 USD 89,257,426 89,203,955 29-Jan-16 53,471EUR 43,795,104 USD 47,592,270 47,563,759 29-Jan-16 28,511EUR 2,322,706 USD 2,524,092 2,522,580 29-Jan-16 1,512EUR 1,356,087 USD 1,473,664 1,472,781 29-Jan-16 883EUR 96,930 USD 104,948 104,498 29-Jan-16 450EUR 1,327,733 USD 1,443,488 1,443,260 29-Jan-16 228EUR 708,958 USD 770,767 770,645 29-Jan-16 122EUR 37,498 USD 40,767 40,761 7-Jan-16 6EUR 21,976 USD 23,892 23,888 29-Jan-16 4EUR 2,638 USD 2,866 2,864 29-Jan-16 2EUR 43 USD 46 46 7-Jan-16 —EUR 279 USD 304 304 29-Jan-16 —EUR 21 USD 23 23 29-Jan-16 —USD 8,628,480 CHF 8,517,000 8,514,516 29-Jan-16 113,964USD 1,369,263 CHF 1,360,000 1,359,595 29-Jan-16 9,668USD 373,336 EUR 341,307 371,124 29-Jan-16 2,212USD 373,194 EUR 341,565 371,403 7-Jan-16 1,791USD 268,100 EUR 245,429 266,870 29-Jan-16 1,230USD 125,326 EUR 114,360 124,350 29-Jan-16 976USD 195,026 EUR 178,497 194,090 29-Jan-16 936USD 63,902 EUR 58,471 63,579 29-Jan-16 323USD 74,425 AUD 101,931 74,146 29-Jan-16 279USD 13,454 EUR 12,300 13,374 29-Jan-16 80USD 68,679 EUR 63,094 68,605 29-Jan-16 74USD 10,843 EUR 9,924 10,791 29-Jan-16 52USD 4,401 EUR 4,016 4,367 29-Jan-16 34USD 12,023 AUD 16,489 11,994 29-Jan-16 29USD 5,734 EUR 5,248 5,706 29-Jan-16 28USD 1,823 EUR 1,666 1,812 29-Jan-16 11USD 15,776 AUD 21,682 15,772 29-Jan-16 4USD 3,309 CNH 21,818 3,307 29-Jan-16 2USD 12 EUR 11 12 29-Jan-16 —USD 25 EUR 23 25 29-Jan-16 —USD 30 EUR 28 30 29-Jan-16 —
Credit Suisse USD 7,666,869 CHF 7,581,000 7,583,836 29-Jan-16 83,033USD 2,002,259 SEK 16,840,000 1,998,508 29-Jan-16 3,751SEK 3,000,000 USD 352,859 350,005 29-Jan-16 2,854
JP Morgan Chase & Co. USD 237,230 SEK 2,000,000 237,194 29-Jan-16 36
Royal Bank of Canada USD 5,341,351 CHF 5,285,000 5,286,971 29-Jan-16 54,381USD 5,317,276 CHF 5,285,000 5,280,157 29-Jan-16 37,119USD 2,417,927 SEK 20,350,000 2,415,060 29-Jan-16 2,867USD 262,931 SEK 2,200,000 260,857 29-Jan-16 2,074
Total 920,702
Total Financial Assets at fair value through profi t or loss 1,943,511,302

Janus Global Life Sciences Fund
PORTFOLIO INVESTMENTS
The accompanying notes are an integral part of the fi nancial statements.
1 0 2 J a n u s C a p i t a l F u n d s P l c / 3 1 D e c e m b e r 2 0 1 5
Financial Liabilities at fair value through profi t or loss
Forward Currency Contracts, Open as at 31 December 2015
Currency Purchased
Currency Sold
Current Market
Value (USD) Settle Date
Unrealised (Depreciation)
(USD)
Citibank CNH 5,179 USD 787 789 29-Jan-16 (2)CNH 6,419 USD 976 979 29-Jan-16 (3)CNH 17,541 USD 2,666 2,674 29-Jan-16 (8)CNH 34,084 USD 5,182 5,198 29-Jan-16 (16)EUR 53 USD 58 59 29-Jan-16 (1)EUR 579 USD 633 637 29-Jan-16 (4)EUR 4,980 USD 5,443 5,471 29-Jan-16 (28)EUR 3,955 USD 4,335 4,370 29-Jan-16 (35)EUR 8,542 USD 9,344 9,400 29-Jan-16 (56)EUR 7,188 USD 7,878 7,940 29-Jan-16 (62)EUR 11,001 USD 12,049 12,136 29-Jan-16 (87)EUR 15,823 USD 17,307 17,410 29-Jan-16 (103)EUR 94,392 USD 102,748 102,858 29-Jan-16 (110)EUR 18,389 USD 20,140 20,285 29-Jan-16 (145)EUR 31,117 USD 34,008 34,180 29-Jan-16 (172)EUR 27,366 USD 30,036 30,315 29-Jan-16 (279)EUR 58,771 USD 64,199 64,494 29-Jan-16 (295)EUR 41,639 USD 45,633 45,990 29-Jan-16 (357)EUR 46,378 USD 50,902 51,375 29-Jan-16 (473)EUR 419,666 USD 458,896 461,467 29-Jan-16 (2,571)EUR 354,771 USD 388,552 391,343 29-Jan-16 (2,791)EUR 519,387 USD 567,939 571,121 29-Jan-16 (3,182)EUR 652,199 USD 714,301 719,431 29-Jan-16 (5,130)EUR 896,005 USD 983,419 992,564 29-Jan-16 (9,145)EUR 1,649,185 USD 1,810,079 1,826,911 29-Jan-16 (16,832)USD 1,541 CNH 10,173 1,542 29-Jan-16 (1)USD 2,576 CNH 17,008 2,578 29-Jan-16 (2)USD 15,334 EUR 14,117 15,350 29-Jan-16 (16)USD 26,283 EUR 24,196 26,310 29-Jan-16 (27)USD 11,233 EUR 10,375 11,281 29-Jan-16 (48)USD 12,708 EUR 11,739 12,764 29-Jan-16 (56)USD 22,239 EUR 20,540 22,334 29-Jan-16 (95)USD 21,904 EUR 20,234 22,001 29-Jan-16 (97)USD 39,192 AUD 54,217 39,439 29-Jan-16 (247)USD 26,232 AUD 36,595 26,620 29-Jan-16 (388)USD 497,815 EUR 458,296 498,330 29-Jan-16 (515)USD 926,865 EUR 853,286 927,823 29-Jan-16 (958)USD 238,246 EUR 220,046 239,267 29-Jan-16 (1,021)USD 411,856 EUR 380,451 413,684 29-Jan-16 (1,828)USD 293,009 AUD 405,338 294,853 29-Jan-16 (1,844)USD 771,237 EUR 712,430 774,661 29-Jan-16 (3,424)USD 182,320 AUD 256,050 186,261 29-Jan-16 (3,941)USD 220,775 AUD 309,273 224,977 29-Jan-16 (4,202)
Credit Suisse CHF 1,400,000 USD 1,425,854 1,452,994 29-Jan-16 (27,140)CHF 7,581,000 USD 7,659,897 7,745,761 29-Jan-16 (85,864)SEK 2,300,000 USD 272,831 272,949 29-Jan-16 (118)SEK 16,840,000 USD 2,000,832 2,004,928 29-Jan-16 (4,096)USD 2,527,518 SEK 22,140,000 2,625,140 29-Jan-16 (97,622)USD 8,789,993 CHF 8,981,000 8,972,677 29-Jan-16 (182,684)
Royal Bank of Canada SEK 20,350,000 USD 2,416,147 2,419,374 29-Jan-16 (3,227)USD 303,244 SEK 2,600,000 308,284 29-Jan-16 (5,040)USD 219,241 SEK 1,900,000 225,284 29-Jan-16 (6,043)USD 1,585,034 SEK 13,650,000 1,618,486 29-Jan-16 (33,452)CHF 5,285,000 USD 5,335,689 5,391,235 29-Jan-16 (55,546)
Total (561,429)
Total Financial Liabilities at fair value through profi t or loss (561,429)

Janus Global Research Fund
PORTFOLIO INVESTMENTS
The accompanying notes are an integral part of the fi nancial statements.
J a n u s C a p i t a l F u n d s P l c / 3 1 D e c e m b e r 2 0 1 5 1 0 3
Share or Principal Amount
Percentage of Net
Assets (%) Fair
Value (USD)
Financial Assets at fair value through profi t or loss Common Stock Aerospace and Defence
33,933 Meggitt PLC . . . . . . . . . . . . . . . . . . . . . . . . . . . 0.5 187,415
Aerospace and Defence – Equipment 2,978 United Technologies Corp. . . . . . . . . . . . . . . . . 0.7 286,096
Airlines 7,627 United Continental Holdings, Inc. . . . . . . . . . . 1.1 437,027
Apparel Manufacturers 8,950 Gildan Activewear, Inc. . . . . . . . . . . . . . . . . . . 0. 7 254,359
Applications Software 1,846 NetSuite, Inc. . . . . . . . . . . . . . . . . . . . . . . . . . . 0.4 156,209
829 ServiceNow, Inc. . . . . . . . . . . . . . . . . . . . . . . . . 0.2 71,7580.6 227,967
Athletic Footwear 4,824 NIKE, Inc. – Class B . . . . . . . . . . . . . . . . . . . . . 0.8 301,500
Audio and Video Products 6,000 Sony Corp. . . . . . . . . . . . . . . . . . . . . . . . . . . . . 0.4 149,875
Automotive – Truck Parts and Equipment – Original 22,400 NGK Spark Plug Co., Ltd. . . . . . . . . . . . . . . . . 1.5 599,234
Beverages – Non-Alcoholic 11,992 Coca-Cola Co. . . . . . . . . . . . . . . . . . . . . . . . . . 1.3 515,176
Beverages – Wine and Spirits 2,783 Pernod-Ricard S.A. . . . . . . . . . . . . . . . . . . . . . . 0.8 318,126
Brewery 8,052 SABMiller PLC . . . . . . . . . . . . . . . . . . . . . . . . . 1.2 482,995
Building and Construction Products – Miscellaneous 942 Geberit A.G. . . . . . . . . . . . . . . . . . . . . . . . . . . . 0.8 320,052
Building Products – Cement and Aggregate 14,285 Cemex S.A.B. de C.V. (ADR) . . . . . . . . . . . . . . . 0.2 79,567
1,817 Vulcan Materials Co.. . . . . . . . . . . . . . . . . . . . . 0.4 172,5600.6 252,127
Cable/Satellite TV 5,583 Comcast Corp. – Class A . . . . . . . . . . . . . . . . . 0. 9 315,0497,112 Liberty Global PLC – Class C . . . . . . . . . . . . . . 0.7 289,956
1. 6 605,005
Casino Hotels 27,000 Galaxy Entertainment Group, Ltd. . . . . . . . . . . 0.2 85,183
Cellular Telecommunications 7,773 T-Mobile U.S., Inc. . . . . . . . . . . . . . . . . . . . . . . 0.8 304,080
74,001 Vodafone Group PLC . . . . . . . . . . . . . . . . . . . . 0.6 241,0611.4 545,141
Chemicals – Diversifi ed 5,513 Johnson Matthey PLC . . . . . . . . . . . . . . . . . . . . 0.6 215,9122,048 PPG Industries, Inc. . . . . . . . . . . . . . . . . . . . . . 0.5 202,383
1.1 418,295
Chemicals – Specialty 10,789 Brenntag A.G. . . . . . . . . . . . . . . . . . . . . . . . . . . 1. 5 566,002
Commercial Banks – Non U.S. 29,594 ING Group N.V. . . . . . . . . . . . . . . . . . . . . . . . . 1.0 400,353
Commercial Services 765 CoStar Group, Inc. . . . . . . . . . . . . . . . . . . . . . . 0.4 158,118
Commercial Services – Finance 5,020 Mastercard, Inc. – Class A . . . . . . . . . . . . . . . . 1. 3 488,747
Computer Services 2,581 Cognizant Technology Solutions
Corp. . . . . . . . . . . . . . . . . . . . . . . . . . . . . . . 0.4 154,912
Computer Software 408 Constellation Software, Inc. . . . . . . . . . . . . . . . 0.4 170,124
Computers 3,695 Apple, Inc. . . . . . . . . . . . . . . . . . . . . . . . . . . . . 1.0 388,936
Share or Principal Amount
Percentage of Net
Assets (%) Fair
Value (USD)
Consulting Services 4,551 Verisk Analytics, Inc. – Class A . . . . . . . . . . . . . 0.9 349,881
Consumer Products – Miscellaneous 86,864 Samsonite International S.A.. . . . . . . . . . . . . . . 0.7 261,160
Containers – Metal and Glass 7,277 Crown Holdings, Inc. . . . . . . . . . . . . . . . . . . . . 0.9 368,944
Cosmetics and Toiletries 3,596 Colgate-Palmolive Co. . . . . . . . . . . . . . . . . . . . 0.6 239,5661,239 Estee Lauder Cos, Inc. – Class A . . . . . . . . . . . . 0.3 109,106
103,498 L’Occitane International S.A. . . . . . . . . . . . . . . . 0.5 200,3251.4 548,997
Cruise Lines 3,913 Norwegian Cruise Line Holdings, Ltd. . . . . . . . 0.6 229,302
Distribution/Wholesale 5,764 Fastenal Co. . . . . . . . . . . . . . . . . . . . . . . . . . . . 0.6 235,286
Diversifi ed Banking Institutions 5,117 BNP Paribas S.A. . . . . . . . . . . . . . . . . . . . . . . . 0.7 290,4065,990 Citigroup, Inc. . . . . . . . . . . . . . . . . . . . . . . . . . 0.8 309,983
14,646 HSBC Holdings PLC . . . . . . . . . . . . . . . . . . . . . 0.3 115,7565,093 JP Morgan Chase & Co. . . . . . . . . . . . . . . . . . . 0.9 336,291
369,598 Lloyds Banking Group PLC . . . . . . . . . . . . . . . 1.0 398,07666,600 Mitsubishi UFJ Financial Group, Inc. . . . . . . . . 1.1 419,56118,396 UBS A.G. . . . . . . . . . . . . . . . . . . . . . . . . . . . . . 0.9 358,624
5.7 2,228,697
Diversifi ed Operations 2,540 Dover Corp. . . . . . . . . . . . . . . . . . . . . . . . . . . . 0.4 155,727
E-Commerce/Products 2,579 Alibaba Group Holding, Ltd. (ADR) . . . . . . . . . 0.5 209,595
476 Amazon.com, Inc. . . . . . . . . . . . . . . . . . . . . . . 0.8 321,7241.3 531,319
E-Commerce/Services 2,424 Ctrip.com International, Ltd. (ADR) . . . . . . . . . 0.3 112,304
164 priceline.com, Inc. . . . . . . . . . . . . . . . . . . . . . . 0.5 209,0920.8 321,396
Electric – Transmission 5,424 Brookfi eld Infrastructure Partners
L.P. . . . . . . . . . . . . . . . . . . . . . . . . . . . . . . . . 0.5 205,624
Electrical Components – Equipment 6,479 Schneider Electric S.E. . . . . . . . . . . . . . . . . . . . 0.9 370,027
Electronic Components – Semiconductors 23,860 ARM Holdings PLC . . . . . . . . . . . . . . . . . . . . . 0.9 365,413
1,909 Avago Technologies, Ltd. . . . . . . . . . . . . . . . . . 0.7 277,091438 Samsung Electronics Co., Ltd. . . . . . . . . . . . . . 1.2 470,765
2.8 1,113,269
Electronic Connectors 4,954 Amphenol Corp. – Class A . . . . . . . . . . . . . . . . 0.7 258,747
Electronic Forms 3,022 Adobe Systems, Inc. . . . . . . . . . . . . . . . . . . . . . 0.7 283,887
Electronic Measuring Instruments 800 Keyence Corp. . . . . . . . . . . . . . . . . . . . . . . . . . 1.1 446,530
Enterprise Software/Services 1,094 Ultimate Software Group, Inc. . . . . . . . . . . . . . 0.5 213,888
Finance – Consumer Loans 13,060 Synchrony Financial . . . . . . . . . . . . . . . . . . . . . 1.0 397,155
Finance – Credit Card 3,819 American Express Co. . . . . . . . . . . . . . . . . . . . 0.7 265,6114,632 Visa, Inc. – Class A . . . . . . . . . . . . . . . . . . . . . . 0.9 359,212
45,978 Worldpay Group PLC (144A) . . . . . . . . . . . . . . 0.5 208,2622.1 833,085
Finance – Investment Bankers/Brokers 11,387 E*TRADE Financial Corp. . . . . . . . . . . . . . . . . 0.9 337,511

Janus Global Research Fund
PORTFOLIO INVESTMENTS
The accompanying notes are an integral part of the fi nancial statements.
1 0 4 J a n u s C a p i t a l F u n d s P l c / 3 1 D e c e m b e r 2 0 1 5
Share or Principal Amount
Percentage of Net
Assets (%) Fair
Value (USD)
Finance – Other Services 1,202 Intercontinental Exchange . . . . . . . . . . . . . . . . 0.8 308,025
Food – Confectionery 5,499 Hershey Co. . . . . . . . . . . . . . . . . . . . . . . . . . . . 1.3 490,896
Food – Retail 10,967 Kroger Co. . . . . . . . . . . . . . . . . . . . . . . . . . . . . 1.2 458,750
Gold Mining 4,069 Signature Metals, Ltd. . . . . . . . . . . . . . . . . . . . . 0.5 200,443
Independent Power Producer 21,956 NRG Energy, Inc. . . . . . . . . . . . . . . . . . . . . . . . 0.7 258,422
Industrial Gases 3,088 Air Products and Chemicals, Inc. . . . . . . . . . . . 1.0 401,780
Instruments – Controls 7,751 Sensata Technologies Holding N.V. . . . . . . . . . . 0.9 357,011
Insurance 23,976 MGIC Investment Corp. . . . . . . . . . . . . . . . . . . 0.5 211,708
Internet Content – Entertainment 4,179 Facebook, Inc. . . . . . . . . . . . . . . . . . . . . . . . . . 1.1 437,374
Investment Management and Advisory Services 882 BlackRock, Inc. . . . . . . . . . . . . . . . . . . . . . . . . 0.8 300,339
Life and Health Insurance 136,400 AIA Group, Ltd. . . . . . . . . . . . . . . . . . . . . . . . . 2.1 820,184
12,942 Prudential PLC . . . . . . . . . . . . . . . . . . . . . . . . . 0.7 292,0612.8 1,112,245
Medical – Biomedical and Genetic 7,017 Alder Biopharmaceuticals, Inc. . . . . . . . . . . . . . 0.6 231,7723,130 Amgen, Inc. . . . . . . . . . . . . . . . . . . . . . . . . . . . 1.3 508,0931,073 Biogen Idec, Inc.. . . . . . . . . . . . . . . . . . . . . . . . 0.8 328,7143,565 Celgene Corp. . . . . . . . . . . . . . . . . . . . . . . . . . 1.1 426,944
558 Regeneron Pharmaceuticals, Inc. . . . . . . . . . . . 0.8 302,9214.6 1,798,444
Medical – Drugs 6,672 AbbVie, Inc. . . . . . . . . . . . . . . . . . . . . . . . . . . . 1.0 395,2492,713 Actelion, Ltd. . . . . . . . . . . . . . . . . . . . . . . . . . . 1.0 378,2435,914 Endo International PLC . . . . . . . . . . . . . . . . . . 0.9 362,055
65,885 Indivior PLC . . . . . . . . . . . . . . . . . . . . . . . . . . . 0.5 182,38125,008 Ironwood Pharmaceuticals, Inc. . . . . . . . . . . . . 0.7 289,84313,148 Pfi zer, Inc. . . . . . . . . . . . . . . . . . . . . . . . . . . . . 1.1 424,417
2,192 Valeant Pharmaceuticals International, Inc. . . . . . . . . . . . . . . . . . . . . . 0.6 222,817
5.8 2,255,005
Medical – HMO 3,485 Aetna, Inc. . . . . . . . . . . . . . . . . . . . . . . . . . . . . 1.0 376,798
Medical – Hospitals 1,934 Universal Health Services, Inc. . . . . . . . . . . . . . 0.6 231,094
Medical Instruments 20,620 Boston Scientifi c Corp. . . . . . . . . . . . . . . . . . . . 1.0 380,233
Metal Processors and Fabrication 5,363 Rexnord Corp. . . . . . . . . . . . . . . . . . . . . . . . . . 0.2 97,178
Miscellaneous Manufacturing 12,665 IMI PLC . . . . . . . . . . . . . . . . . . . . . . . . . . . . . . 0.4 160,827
Multimedia 2,798 Walt Disney Co. . . . . . . . . . . . . . . . . . . . . . . . . 0.8 294,014
Oil – Field Services 7,838 Baker Hughes, Inc. . . . . . . . . . . . . . . . . . . . . . . 0.9 361,724
Oil Companies – Exploration and Production 6,703 Anadarko Petroleum Corp. . . . . . . . . . . . . . . . . 0.8 325,632
10,443 Canadian Natural Resources, Ltd. . . . . . . . . . . . 0.6 228,10812,265 MEG Energy Corp. . . . . . . . . . . . . . . . . . . . . . . 0.2 71,099
1.6 624,839
Share or Principal Amount
Percentage of Net
Assets (%) Fair
Value (USD)
Oil Companies – Integrated 3,791 Chevron Corp. . . . . . . . . . . . . . . . . . . . . . . . . . 0.9 341,0384,546 Phillips 66 . . . . . . . . . . . . . . . . . . . . . . . . . . . . 0.9 371,863
12,531 Total S.A. . . . . . . . . . . . . . . . . . . . . . . . . . . . . . 1.4 561,8723.2 1,274,773
Pharmaceuticals 4,095 Mallinckrodt PLC . . . . . . . . . . . . . . . . . . . . . . . 0.8 305,610
Pharmacy Services 4,725 Diplomat Pharmacy, Inc. . . . . . . . . . . . . . . . . . 0.4 161,690
Pipelines 19,083 Enterprise Products Partners L.P. . . . . . . . . . . . 1.3 488,143
2 Kinder Morgan, Inc. . . . . . . . . . . . . . . . . . . . . . . — 3011,195 MPLX L.P. . . . . . . . . . . . . . . . . . . . . . . . . . . . . . 1.1 440,299
2.4 928,472
Private Equity 14,266 Blackstone Group L.P. . . . . . . . . . . . . . . . . . . . . 1.1 417,138
Real Estate Management/Services 2,197 Jones Lang LaSalle, Inc. . . . . . . . . . . . . . . . . . . 0.9 351,212
Real Estate Operating/Development 8,437 Brookfi eld Asset Management, Inc. –
Class A . . . . . . . . . . . . . . . . . . . . . . . . . . . . . 0.7 266,019
Recreational Vehicles 2,078 Polaris Industries, Inc. . . . . . . . . . . . . . . . . . . . 0.5 178,604
REIT – Diversifi ed 2,653 American Tower Corp. . . . . . . . . . . . . . . . . . . . 0.7 257,208
REIT – Regional Malls 1,385 Simon Property Group, Inc. . . . . . . . . . . . . . . . 0.7 269,299
Resorts and Theme Parks 16,272 Merlin Entertainments PLC (144A) . . . . . . . . . 0.3 109,251
Retail – Building Products 4,686 Lowe’s Cos., Inc. . . . . . . . . . . . . . . . . . . . . . . . . 0.9 356,323
Retail – Discount 4,395 Dollar Tree, Inc. . . . . . . . . . . . . . . . . . . . . . . . . 0.9 339,382
Retail – Jewellery 132,999 Chow Tai Fook Jewellery Group,
Ltd. . . . . . . . . . . . . . . . . . . . . . . . . . . . . . . . . 0.2 85,8083,161 CIE Financiere de Richemont S.A. . . . . . . . . . . 0.6 227,612
0.8 313,420
Retail – Restaurants 200 Chipotle Mexican Grill, Inc. . . . . . . . . . . . . . . . 0.2 95,970
7,569 Starbucks Corp. . . . . . . . . . . . . . . . . . . . . . . . . 1.2 454,3671.4 550,337
Semiconductor Components/Integrated Circuits 13,255 Atmel Corp. . . . . . . . . . . . . . . . . . . . . . . . . . . . 0.3 114,126
2,958 NXP Semiconductors N.V. . . . . . . . . . . . . . . . . 0.6 249,21284,000 Taiwan Semiconductor
Manufacturing Co., Ltd. . . . . . . . . . . . . . . . . 1.0 365,7651.9 729,103
Super – Regional Banks 5,647 U.S. Bancorp . . . . . . . . . . . . . . . . . . . . . . . . . . 0.6 240,957
Telecommunication Equipment 5,133 CommScope Holding Co., Inc. . . . . . . . . . . . . . 0.3 132,893
Telecommunication Services 2,333 Amdocs, Ltd. . . . . . . . . . . . . . . . . . . . . . . . . . . 0.3 127,312
152,600 Tower Bersama Infrastructure Tbk PT . . . . . . . . . . . . . . . . . . . . . . . . . . . . . 0.2 65,061
0.5 192,373
Toys 6,788 Mattel, Inc. . . . . . . . . . . . . . . . . . . . . . . . . . . . . 0.5 184,430
400 Nintendo Co., Ltd. . . . . . . . . . . . . . . . . . . . . . . 0.1 55,7660.6 240,196

PORTFOLIO INVESTMENTS
The accompanying notes are an integral part of the fi nancial statements.
J a n u s C a p i t a l F u n d s P l c / 3 1 D e c e m b e r 2 0 1 5 1 0 5
Share or Principal Amount
Percentage of Net
Assets (%) Fair
Value (USD)
Transportation – Railroad 4,718 Canadian Pacifi c Railway, Ltd. . . . . . . . . . . . . . 1.5 602,683
Transportation Services 2,740 Panalpina Welt A.G. . . . . . . . . . . . . . . . . . . . . . 0.8 307,850
Web Portals/Internet Service Providers 1,276 Alphabet, Inc. . . . . . . . . . . . . . . . . . . . . . . . . . . 2.5 968,316
Wireless Equipment 2,488 Motorola Solutions, Inc. . . . . . . . . . . . . . . . . . . 0. 5 170,304
Total Common Stock . . . . . . . . . . . . . . . . . . . . . . . . . . . . . . . . . 9 9. 0 38,783,759
Total Investments . . . . . . . . . . . . . . . . . . . . . . . . . . . . . . . . . . . . 9 9. 0 38,783,759
Forward Currency Contracts, Open as at 31 December 2015
Currency Purchased
Currency Sold
Current Market
Value (USD) Settle Date
Unrealised Appreciation
(USD)
Citibank EUR 662,751 USD 720,214 719,783 29-Jan-16 431EUR 263,173 USD 285,990 285,819 29-Jan-16 171EUR 6,150 USD 6,683 6,679 29-Jan-16 4EUR 11,100 USD 12,068 12,066 29-Jan-16 2EUR 4,406 USD 4,790 4,789 29-Jan-16 1EUR 103 USD 112 112 29-Jan-16 —USD 2,379 EUR 2,177 2,368 29-Jan-16 11USD 1,014 EUR 924 1,005 29-Jan-16 9USD 959 EUR 878 954 29-Jan-16 5USD 404 EUR 368 400 29-Jan-16 4USD 97 EUR 89 97 7-Jan-16 —USD 84 EUR 77 84 14-Jan-16 —USD 9 EUR 8 9 29-Jan-16 —USD 20 EUR 19 20 29-Jan-16 —
Total 638
Total Financial Assets at fair value through profi t or loss 38,784,397
Financial Liabilities at fair value through profi t or loss
Forward Currency Contracts, Open as at 31 December 2015
Currency Purchased
Currency Sold
Current Market
Value (USD) Settle Date
Unrealised (Depreciation)
(USD)
Citibank EUR 88 USD 96 97 29-Jan-16 (1)EUR 90 USD 99 100 29-Jan-16 (1)EUR 3,703 USD 4,054 4,082 29-Jan-16 (28)EUR 6,841 USD 7,477 7,515 29-Jan-16 (38)EUR 3,827 USD 4,200 4,239 29-Jan-16 (39)EUR 9,363 USD 10,250 10,320 29-Jan-16 (70)EUR 9,647 USD 10,588 10,686 29-Jan-16 (99)USD 3,610 EUR 3,323 3,614 29-Jan-16 (4)USD 9,081 EUR 8,360 9,090 29-Jan-16 (9)USD 4,148 EUR 3,832 4,166 4-Feb-16 (18)USD 10,436 EUR 9,640 10,482 7-Jan-16 (46)
Total (353)
Total Financial Liabilities at fair value through profi t or loss (353)

Janus Global Technology Fund
PORTFOLIO INVESTMENTS
The accompanying notes are an integral part of the fi nancial statements.
1 0 6 J a n u s C a p i t a l F u n d s P l c / 3 1 D e c e m b e r 2 0 1 5
Share or Principal Amount
Percentage of Net
Assets (%) Fair
Value (USD)
Financial Assets at fair value through profi t or loss Common Stock Aerospace and Defence
1,753 Teledyne Technologies, Inc. . . . . . . . . . . . . . . . 0.3 155,491
Applications Software 18,735 Microsoft Corp. . . . . . . . . . . . . . . . . . . . . . . . . 1.8 1,039,41814,509 NetSuite, Inc. . . . . . . . . . . . . . . . . . . . . . . . . . . 2.1 1,227,752
3,841 Salesforce.com, Inc. . . . . . . . . . . . . . . . . . . . . . 0.5 301,13416,368 ServiceNow, Inc. . . . . . . . . . . . . . . . . . . . . . . . . 2.4 1,416,814
5,338 Tableau Software, Inc. – Class A . . . . . . . . . . . . 0.8 502,9467.6 4,488,064
Audio and Video Products 12,400 Sony Corp. . . . . . . . . . . . . . . . . . . . . . . . . . . . . 0.5 309,742
Automotive – Cars and Light Trucks 690 Tesla Motors, Inc. . . . . . . . . . . . . . . . . . . . . . . . 0.3 165,607
Cable/Satellite TV 4,789 Comcast Corp. – Class A . . . . . . . . . . . . . . . . . 0.5 270,243
Commercial Services 1,247 CoStar Group, Inc. . . . . . . . . . . . . . . . . . . . . . . 0.4 257,742
Commercial Services – Finance 4,160 Square, Inc. . . . . . . . . . . . . . . . . . . . . . . . . . . . 0.1 54,454
Computer Aided Design 6,634 ANSYS, Inc. . . . . . . . . . . . . . . . . . . . . . . . . . . . 1.0 613,645
Computer Services 5,755 Accenture PLC – Class A . . . . . . . . . . . . . . . . . 1.0 601,398
10,893 Cognizant Technology Solutions Corp. . . . . . . . . . . . . . . . . . . . . . . . . . . . . . . 1.1 653,798
3,691 Computer Sciences Corp. . . . . . . . . . . . . . . . . . 0.2 120,6222.3 1,375,818
Computer Software 5,713 Blackbaud, Inc. . . . . . . . . . . . . . . . . . . . . . . . . 0.6 376,2582,090 Constellation Software, Inc. . . . . . . . . . . . . . . . 1.5 871,4708,373 Envestnet, Inc. . . . . . . . . . . . . . . . . . . . . . . . . . 0.4 249,9345,419 SS&C Technologies Holdings, Inc. . . . . . . . . . . 0.6 369,955
3.1 1,867,617
Computers 37,583 Apple, Inc. . . . . . . . . . . . . . . . . . . . . . . . . . . . . 6.7 3,955,987
Computers – Memory Devices 4,658 EMC Corp. . . . . . . . . . . . . . . . . . . . . . . . . . . . . 0.2 119,6176,351 Seagate Technology PLC . . . . . . . . . . . . . . . . . . 0.4 232,828
0.6 352,445
Computers – Other 5,539 Stratasys, Ltd. . . . . . . . . . . . . . . . . . . . . . . . . . . 0.2 130,056
Consulting Services 3,966 CEB, Inc. . . . . . . . . . . . . . . . . . . . . . . . . . . . . . 0.4 243,4737,532 Gartner, Inc. . . . . . . . . . . . . . . . . . . . . . . . . . . . 1.2 683,1523,903 Verisk Analytics, Inc. – Class A . . . . . . . . . . . . . 0.5 300,063
2.1 1,226,688
E-Commerce/Products 15,096 Alibaba Group Holding,
Ltd. (ADR) . . . . . . . . . . . . . . . . . . . . . . . . . . 2.1 1,226,8521,003 Amazon.com, Inc. . . . . . . . . . . . . . . . . . . . . . . 1.1 677,9184,058 MercadoLibre, Inc. . . . . . . . . . . . . . . . . . . . . . . 0.8 463,992
4.0 2,368,762
E-Commerce/Services 20,244 ChannelAdvisor Corp. . . . . . . . . . . . . . . . . . . . 0.5 280,37913,523 Ctrip.com International,
Ltd. (ADR) . . . . . . . . . . . . . . . . . . . . . . . . . . 1.1 626,52111,971 Etsy, Inc. . . . . . . . . . . . . . . . . . . . . . . . . . . . . . . 0.2 98,880
840 Expedia, Inc. . . . . . . . . . . . . . . . . . . . . . . . . . . 0.2 104,4123,645 GrubHub, Inc. . . . . . . . . . . . . . . . . . . . . . . . . . 0.1 88,2097,431 MakeMyTrip, Ltd. . . . . . . . . . . . . . . . . . . . . . . . 0.2 127,5166,905 Netfl ix, Inc. . . . . . . . . . . . . . . . . . . . . . . . . . . . 1.3 789,794
333 priceline.com, Inc. . . . . . . . . . . . . . . . . . . . . . . 0.7 424,558
Share or Principal Amount
Percentage of Net
Assets (%) Fair
Value (USD)
41,321 Zillow Group, Inc. . . . . . . . . . . . . . . . . . . . . . . 1.7 1,005,4766.0 3,545,745
Electric Products – Equipment 18,526 Belden, Inc. . . . . . . . . . . . . . . . . . . . . . . . . . . . 1.5 883,320
Electronic Components – Miscellaneous 19,606 TE Connectivity, Ltd. (U.S. Shares) . . . . . . . . . . 2.1 1,266,744
Electronic Components – Semiconductors 153,433 ARM Holdings PLC . . . . . . . . . . . . . . . . . . . . . 4.0 2,349,805
5,301 Avago Technologies, Ltd. . . . . . . . . . . . . . . . . . 1.3 769,4407,736 Microchip Technology, Inc. . . . . . . . . . . . . . . . . 0.6 360,0336,258 NVIDIA Corp. . . . . . . . . . . . . . . . . . . . . . . . . . 0.3 206,264
47,075 ON Semiconductor Corp. . . . . . . . . . . . . . . . . . 0.8 461,3352,025 Samsung Electronics Co., Ltd. . . . . . . . . . . . . . 3.7 2,176,481
18,500 Sumco Corp. . . . . . . . . . . . . . . . . . . . . . . . . . . 0.2 142,23711,567 Texas Instruments, Inc.. . . . . . . . . . . . . . . . . . . 1.1 633,987
12.0 7,099,582
Electronic Connectors 38,810 Amphenol Corp. – Class A . . . . . . . . . . . . . . . . 3.4 2,027,046
Electronic Design Automation 58,484 Cadence Design Systems, Inc. . . . . . . . . . . . . . 2.1 1,217,052
Electronic Forms 12,980 Adobe Systems, Inc. . . . . . . . . . . . . . . . . . . . . . 2.1 1,219,341
Electronic Measuring Instruments 21,206 National Instruments Corp. . . . . . . . . . . . . . . . 1.0 608,400
Enterprise Software/Services 3,862 Atlassian Corp., PLC . . . . . . . . . . . . . . . . . . . . 0.2 116,169
11,538 Aveva Group PLC . . . . . . . . . . . . . . . . . . . . . . . 0.5 275,1738,131 Oracle Corp.. . . . . . . . . . . . . . . . . . . . . . . . . . . 0.5 297,025
16,791 PROS Holdings, Inc. . . . . . . . . . . . . . . . . . . . . . 0.7 386,8659,740 Qlik Technologies, Inc. . . . . . . . . . . . . . . . . . . . 0.5 308,3681,658 Tyler Technologies, Inc. . . . . . . . . . . . . . . . . . . 0.5 289,0233,418 Ultimate Software Group, Inc. . . . . . . . . . . . . . 1.1 668,2537,548 Workday, Inc. – Class A . . . . . . . . . . . . . . . . . . 1.0 601,425
5.0 2,942,301
Entertainment Software 3,840 Activision Blizzard, Inc. . . . . . . . . . . . . . . . . . . 0.3 148,646
Finance – Consumer Loans 6,723 LendingClub Corp. . . . . . . . . . . . . . . . . . . . . . 0.1 74,289
Finance – Credit Card 15,952 American Express Co. . . . . . . . . . . . . . . . . . . . 1.9 1,109,462
Human Resources 35,386 Care.com, Inc. . . . . . . . . . . . . . . . . . . . . . . . . . 0.4 253,364
Internet Applications Software 60,100 Tencent Holdings, Ltd. . . . . . . . . . . . . . . . . . . . 1.9 1,182,64712,615 Zendesk, Inc. . . . . . . . . . . . . . . . . . . . . . . . . . . 0.6 333,541
2.5 1,516,188
Internet Content – Entertainment 19,104 Facebook, Inc. . . . . . . . . . . . . . . . . . . . . . . . . . 3.4 1,999,42511,400 Nexon Co., Ltd. . . . . . . . . . . . . . . . . . . . . . . . . 0.3 187,723
6,605 Shutterstock, Inc. . . . . . . . . . . . . . . . . . . . . . . . 0.4 213,6066,647 Twitter, Inc. . . . . . . . . . . . . . . . . . . . . . . . . . . . 0.3 153,812
4.4 2,554,566
Internet Content – Information/News 1,119 LinkedIn Corp. . . . . . . . . . . . . . . . . . . . . . . . . . 0.4 251,8657,638 Mail.Ru Group, Ltd. . . . . . . . . . . . . . . . . . . . . . 0.3 172,237
0.7 424,102
Multimedia 11,150 Walt Disney Co. . . . . . . . . . . . . . . . . . . . . . . . . 2.0 1,171,642
REIT – Diversifi ed 19,520 American Tower Corp. . . . . . . . . . . . . . . . . . . . 3.2 1,892,464
Semiconductor Components/Integrated Circuits 13,609 Atmel Corp. . . . . . . . . . . . . . . . . . . . . . . . . . . . 0.2 117,17315,480 NXP Semiconductors N.V. . . . . . . . . . . . . . . . . 2.2 1,304,190

PORTFOLIO INVESTMENTS
The accompanying notes are an integral part of the fi nancial statements.
J a n u s C a p i t a l F u n d s P l c / 3 1 D e c e m b e r 2 0 1 5 1 0 7
Share or Principal Amount
Percentage of Net
Assets (%) Fair
Value (USD)
258,000 Taiwan Semiconductor Manufacturing Co., Ltd. . . . . . . . . . . . . . . . . 1.8 1,123,422
4.2 2,544,785
Semiconductor Equipment 2,599 ASML Holding N.V. . . . . . . . . . . . . . . . . . . . . . 0.4 233,127
Software 3,963 SPS Commerce, Inc. . . . . . . . . . . . . . . . . . . . . . 0.5 278,242
Telecommunication Equipment 15,217 CommScope Holding Co., Inc. . . . . . . . . . . . . . 0.7 393,968
7,803 NICE Systems, Ltd. (ADR) . . . . . . . . . . . . . . . . 0.8 447,2681.5 841,236
Telecommunication Services 10,157 Amdocs, Ltd. . . . . . . . . . . . . . . . . . . . . . . . . . . 0.9 554,267
Toys 2,650 Nintendo Co., Ltd. . . . . . . . . . . . . . . . . . . . . . . 0.6 369,452
Web Hosting and Design 1,917 Equinix, Inc. . . . . . . . . . . . . . . . . . . . . . . . . . . 1.0 579,701
Web Portals/Internet Service Providers 8,162 Alphabet, Inc. . . . . . . . . . . . . . . . . . . . . . . . . . 10. 2 6,193,980
Total Common Stock . . . . . . . . . . . . . . . . . . . . . . . . . . . . . . . . . 99. 7 59,141,405
Total Investments . . . . . . . . . . . . . . . . . . . . . . . . . . . . . . . . . . . . 99. 7 59,141,405
Forward Currency Contracts, Open as at 31 December 2015
Currency Purchased
CurrencySold
Current Market
Value (USD) SettleDate
Unrealised Appreciation
(USD)
Bank of America USD 287,917 GBP 190,000 280,068 29-JAN-16 7,849
CitibankAUD 2,234,727 USD 1,605,725 1,585,872 29-Jan-16 19,853AUD 38,930 USD 28,028 27,737 29-Jan-16 291AUD 12,784 USD 9,234 9,170 29-Jan-16 65AUD 12,192 USD 8,808 8,747 29-Jan-16 61AUD 17,028 USD 12,370 12,353 29-Jan-16 16CNH 28,819 USD 4,366 4,364 29-Jan-16 2CNH 168 USD 26 26 29-Jan-16 —CNH 116 USD 18 18 29-Jan-16 —CNH 248 USD 38 38 29-Jan-16 —CNH 342 USD 52 52 29-Jan-16 —CNH 496 USD 75 75 29-Jan-16 —EUR 4,451,950 USD 4,837,947 4,835,049 29-Jan-16 2,898EUR 3,168,653 USD 3,443,385 3,441,322 29-Jan-16 2,063EUR 78,163 USD 84,978 84,964 29-Jan-16 13EUR 55,719 USD 60,576 60,567 29-Jan-16 10EUR 2,671 USD 2,903 2,901 29-Jan-16 2EUR 2,165 USD 2,353 2,351 29-Jan-16 1EUR 229 USD 249 249 29-Jan-16 —EUR 14 USD 15 15 29-Jan-16 —EUR 14 USD 16 16 29-Jan-16 —EUR 13 USD 14 15 29-Jan-16 —EUR 15 USD 17 17 29-Jan-16 —EUR 20 USD 22 22 29-Jan-16 —EUR 15 USD 17 17 29-Jan-16 —EUR 21 USD 24 24 29-Jan-16 —EUR 26 USD 29 29 29-Jan-16 —EUR 47 USD 51 51 29-Jan-16 —EUR 48 USD 52 52 29-Jan-16 —JPY 3,100,000 USD 25,636 25,465 29-Jan-16 171USD 32,984 EUR 30,188 32,825 29-Jan-16 158USD 24,483 EUR 22,408 24,366 29-Jan-16 117USD 4,833 EUR 4,405 4,790 29-Jan-16 43USD 11,485 AUD 15,730 11,442 29-Jan-16 43USD 5,982 EUR 5,468 5,946 29-Jan-16 35USD 3,502 EUR 3,192 3,471 29-Jan-16 31USD 2,300 EUR 2,099 2,282 29-Jan-16 18USD 1,748 EUR 1,599 1,739 29-Jan-16 9USD 63 CNH 419 63 29-Jan-16 —USD 39 EUR 36 39 29-Jan-16 —USD 43 EUR 40 44 29-Jan-16 —USD 37 EUR 34 37 29-Jan-16 —USD 49 EUR 45 49 29-Jan-16 —USD 74 CNH 489 74 29-Jan-16 —USD 3 EUR 3 3 29-Jan-16 —USD 2 CNH 14 2 29-Jan-16 —USD 1 EUR 1 1 29-Jan-16 —USD 31 CNH 202 31 29-Jan-16 —USD 21 EUR 19 21 29-Jan-16 —USD 17 EUR 15 17 29-Jan-16 —
Credit SuisseJPY 3,600,000 USD 29,283 28,604 29-Jan-16 679JPY 5,600,000 USD 46,161 45,714 29-Jan-16 447JPY 2,100,000 USD 17,032 16,587 29-Jan-16 446JPY 2,500,000 USD 20,373 19,940 29-Jan-16 434JPY 2,500,000 USD 20,589 20,370 29-Jan-16 218JPY 2,000,000 USD 16,564 16,482 29-Jan-16 82JPY 537,000 USD 4,455 4,440 29-Jan-16 15USD 291,003 GBP 192,800 284,189 29-Jan-16 6,815USD 286,192 GBP 192,800 284,209 29-Jan-16 1,983

Janus Global Technology Fund
PORTFOLIO INVESTMENTS
The accompanying notes are an integral part of the fi nancial statements.
1 0 8 J a n u s C a p i t a l F u n d s P l c / 3 1 D e c e m b e r 2 0 1 5
Currency Purchased
CurrencySold
Current Market
Value (USD) SettleDate
Unrealised Appreciation
(USD)
JP Morgan Chase & Co. JPY 2,600,000 USD 21,471 21,299 29-Jan-16 171USD 71,093 GBP 47,000 69,280 29-Jan-16 1,813USD 7,546 GBP 5,100 7,518 29-Jan-16 28
Royal Bank of CanadaJPY 28,932,000 USD 239,980 239,164 29-Jan-16 816JPY 2,300,000 USD 18,719 18,296 29-Jan-16 423USD 43,083 GBP 28,275 41,678 29-Jan-16 1,406USD 41,932 GBP 28,275 41,681 29-Jan-16 252
Total 49,777
Total Financial Assets at fair value through profi t or loss 59,191,182
Financial Liabilities at fair value through profi t or loss
Forward Currency Contracts, Open as at 31 December 2015
Currency Purchased
Currency Sold
Current Market
Value (USD) Settle Date
Unrealised (Depreciation)
(USD)
Bank of AmericaUSD 96,343 JPY 11,751,000 97,813 29-Jan-16 (1,470)
CitibankAUD 23,128 USD 16,858 16,892 29-Jan-16 (34)EUR 17,091 USD 18,718 18,853 29-Jan-16 (134)EUR 18,252 USD 19,983 20,119 29-Jan-16 (136)EUR 22,645 USD 24,802 24,980 29-Jan-16 (178)EUR 24,435 USD 26,752 26,934 29-Jan-16 (182)EUR 31,672 USD 34,658 34,878 29-Jan-16 (220)EUR 23,398 USD 25,681 25,920 29-Jan-16 (239)EUR 41,970 USD 45,927 46,218 29-Jan-16 (291)EUR 31,334 USD 34,391 34,711 29-Jan-16 (320)USD 1,471 AUD 2,027 1,475 29-Jan-16 (4)USD 17,437 JPY 2,100,000 17,483 29-Jan-16 (45)USD 57,830 EUR 53,239 57,889 29-Jan-16 (60)USD 77,984 EUR 71,793 78,065 29-Jan-16 (81)USD 51,338 EUR 47,423 51,565 29-Jan-16 (228)USD 72,263 EUR 66,753 72,584 29-Jan-16 (321)USD 26,553 AUD 37,197 27,059 29-Jan-16 (505)USD 23,624 AUD 33,177 24,134 29-Jan-16 (511)USD 205,878 EUR 190,150 206,760 29-Jan-16 (882)USD 325,518 JPY 39,494,000 328,786 29-Jan-16 (3,270)
Credit SuisseGBP 192,800 USD 286,212 288,234 29-Jan-16 (2,022)USD 4,456 JPY 537,000 4,472 29-Jan-16 (15)USD 153,521 JPY 18,837,000 156,776 29-Jan-16 (3,256)
JP Morgan Chase & Co.USD 114,742 JPY 14,000,000 116,534 29-Jan-16 (1,793)
Royal Bank of CanadaGBP 28,275 USD 41,932 42,186 29-Jan-16 (254)USD 11,359 JPY 1,400,000 11,652 29-Jan-16 (293)USD 20,420 JPY 2,500,000 20,807 29-Jan-16 (387)USD 20,378 JPY 2,500,000 20,807 29-Jan-16 (429)USD 240,105 JPY 28,932,000 240,925 29-Jan-16 (820)USD 204,306 JPY 24,832,000 206,672 29-Jan-16 (2,366)
Total (20,746)
Total Financial Liabilities at fair value through profi t or loss (20,746)

Janus Japan Emerging Opportunities Fund
PORTFOLIO INVESTMENTS
The accompanying notes are an integral part of the fi nancial statements.
J a n u s C a p i t a l F u n d s P l c / 3 1 D e c e m b e r 2 0 1 5 1 0 9
Share or Principal Amount
Percentage of Net
Assets (%) Fair
Value (JPY)
Financial Assets at fair value through profi t or loss Common Stock Aerospace and Defence
4,000 Kawasaki Heavy Industries, Ltd. . . . . . . . . . . . . 0.5 1,808,000
Aerospace and Defence – Equipment 5,000 IHI Corp. . . . . . . . . . . . . . . . . . . . . . . . . . . . . . 0.4 1,685,000
Airlines 1,000 Japan Airlines Co., Ltd. . . . . . . . . . . . . . . . . . . 1.1 4,356,000
Apparel Manufacturers 800 Samantha Thavasa Japan, Ltd. . . . . . . . . . . . . . 0.2 612,800
Athletic Footwear 400 Asics Corp. . . . . . . . . . . . . . . . . . . . . . . . . . . . . 0.3 1,009,600
Automotive – Cars and Light Trucks 400 Suzuki Motor Corp. . . . . . . . . . . . . . . . . . . . . . 0.4 1,481,200
Automotive – Medical and Heavy Duty Trucks 3,300 Isuzu Motors, Ltd. . . . . . . . . . . . . . . . . . . . . . . 1.1 4,336,200
Automotive – Truck Parts and Equipment – Original 500 Aisin Seiki Co., Ltd. . . . . . . . . . . . . . . . . . . . . . 0.7 2,620,000400 Koito Manufacturing Co., Ltd. . . . . . . . . . . . . . 0.5 2,004,000
2,000 NGK Insulators, Ltd. . . . . . . . . . . . . . . . . . . . . 1.4 5,508,0001,000 Nippon Seiki Co., Ltd. . . . . . . . . . . . . . . . . . . . 0.7 2,776,000
600 Taiho Kogyo Co., Ltd. . . . . . . . . . . . . . . . . . . . 0.2 878,400600 TS Tech Co., Ltd. . . . . . . . . . . . . . . . . . . . . . . . 0.5 1,893,000
4.0 15,679,400
Beverages – Non-Alcoholic 700 Suntory Beverage & Food, Ltd. . . . . . . . . . . . . 0.9 3,724,000
Bicycle Manufacturing 400 Shimano, Inc. . . . . . . . . . . . . . . . . . . . . . . . . . . 1.9 7,464,000
Brewery 2,000 Asahi Group Holdings, Ltd. . . . . . . . . . . . . . . . 1.9 7,598,000
Building – Heavy Construction 600 SHO-BOND Holdings Co., Ltd. . . . . . . . . . . . . 0.7 2,652,000
Building and Construction – Miscellaneous 4,000 Taisei Corp. . . . . . . . . . . . . . . . . . . . . . . . . . . . 0.8 3,200,0004,000 Tekken Corp. . . . . . . . . . . . . . . . . . . . . . . . . . . 0.3 1,204,0001,000 Totetsu Kogyo Co., Ltd. . . . . . . . . . . . . . . . . . . 0.8 3,045,000
1.9 7,449,000
Cellular Telecommunications 1,500 MTI, Ltd. . . . . . . . . . . . . . . . . . . . . . . . . . . . . . 0.3 1,023,000
Chemicals – Diversifi ed 600 Aica Kogyo Co., Ltd. . . . . . . . . . . . . . . . . . . . . 0.4 1,434,600900 Nitto Denko Corp. . . . . . . . . . . . . . . . . . . . . . . 2.0 8,020,800
2.4 9,455,400
Chemicals – Specialty 2,000 Kumiai Chemical Industry Co., Ltd. . . . . . . . . . 0.7 2,632,000
Commercial Banks – Non U.S. 1,000 Suruga Bank, Ltd. . . . . . . . . . . . . . . . . . . . . . . . 0.6 2,513,000
Commercial Services 1,100 First Energy Service Co., Ltd. . . . . . . . . . . . . . . 0.1 574,2008,700 Nippon Parking Development Co.,
Ltd. . . . . . . . . . . . . . . . . . . . . . . . . . . . . . . . . 0.3 1,209,300800 Outsourcing, Inc. . . . . . . . . . . . . . . . . . . . . . . . 0.6 2,552,000300 Wellnet Corp. . . . . . . . . . . . . . . . . . . . . . . . . . . 0.2 931,500
1.2 5,267,000
Commercial Services – Finance 1,000 GMO Payment Gateway, Inc. . . . . . . . . . . . . . . 1.5 5,790,000
Computers – Integrated Systems 300 Otsuka Corp. . . . . . . . . . . . . . . . . . . . . . . . . . . 0.5 1,788,000
Computers – Memory Devices 600 TDK Corp. . . . . . . . . . . . . . . . . . . . . . . . . . . . . 1.2 4,692,000
Computers – Peripheral Equipment 600 Ferrotec Corp. . . . . . . . . . . . . . . . . . . . . . . . . . 0.2 861,600
Share or Principal Amount
Percentage of Net
Assets (%) Fair
Value (JPY)
Consulting Services 2,600 Nihon M&A Center, Inc. . . . . . . . . . . . . . . . . . 3.9 15,236,000
Cosmetics and Toiletries 400 Pigeon Corp. . . . . . . . . . . . . . . . . . . . . . . . . . . 0.3 1,186,000
1,800 Unicharm Corp. . . . . . . . . . . . . . . . . . . . . . . . . 1.1 4,458,6001.4 5,644,600
Diversifi ed Financial Services 500 Hitachi Capital Corp. . . . . . . . . . . . . . . . . . . . . 0.4 1,637,500
Diversifi ed Minerals 2,000 Dowa Holdings Co., Ltd. . . . . . . . . . . . . . . . . . 0.4 1,752,000
E-Commerce/Products 1,000 MonotaRO Co., Ltd. . . . . . . . . . . . . . . . . . . . . . 0.9 3,375,0003,200 Rakuten, Inc. . . . . . . . . . . . . . . . . . . . . . . . . . . 1.1 4,489,600
500 Syuppin Co., Ltd. . . . . . . . . . . . . . . . . . . . . . . . 0.2 625,0002.2 8,489,600
E-Commerce/Services 900 Enigmo, Inc. . . . . . . . . . . . . . . . . . . . . . . . . . . . 0.2 751,500
1,100 Gurunavi, Inc. . . . . . . . . . . . . . . . . . . . . . . . . . 0.7 2,775,300700 Ikyu Corp. . . . . . . . . . . . . . . . . . . . . . . . . . . . . 0.6 2,390,500
1.5 5,917,300
Electric – Generation 600 eRex Co., Ltd.. . . . . . . . . . . . . . . . . . . . . . . . . . 0.3 1,203,000
Electric Products – Miscellaneous 1,000 Casio Computer Co., Ltd. . . . . . . . . . . . . . . . . . 0.7 2,847,000
200 Mabuchi Motor Co., Ltd. . . . . . . . . . . . . . . . . . 0.3 1,328,0001,000 Nidec Corp. . . . . . . . . . . . . . . . . . . . . . . . . . . . 2.2 8,837,000
3.2 13,012,000
Electronic Components – Miscellaneous 300 Alps Electric Co., Ltd. . . . . . . . . . . . . . . . . . . . 0.3 994,500400 Hoya Corp.. . . . . . . . . . . . . . . . . . . . . . . . . . . . 0.5 1,992,400
1,100 Omron Corp. . . . . . . . . . . . . . . . . . . . . . . . . . . 1.1 4,471,5001.9 7,458,400
Electronic Connectors 1,000 Yamaichi Electronics Co., Ltd. . . . . . . . . . . . . . 0.2 948,000
E-Marketing and Information 800 Septeni Holdings Co., Ltd. . . . . . . . . . . . . . . . . 0.5 2,144,800
Engineering – Research and Development Services 1,000 JGC Corp. . . . . . . . . . . . . . . . . . . . . . . . . . . . . 0.5 1,863,000
Finance – Credit Card 500 AEON Financial Service Co., Ltd. . . . . . . . . . . . 0.3 1,363,000
Finance – Other Services 1,100 eGuarantee, Inc. . . . . . . . . . . . . . . . . . . . . . . . . 0.7 2,873,200
Food – Confectionery 700 Ezaki Glico Co., Ltd. . . . . . . . . . . . . . . . . . . . . 1.2 4,585,000
Food – Dairy Products 400 Yakult Honsha Co., Ltd. . . . . . . . . . . . . . . . . . . 0.6 2,384,000
Food – Miscellaneous/Diversifi ed 2,100 Fuji Oil Co., Ltd. . . . . . . . . . . . . . . . . . . . . . . . 1.0 4,141,200
Food – Retail 1,300 Daikokutenbussan Co., Ltd. . . . . . . . . . . . . . . . 1.5 5,941,000
Golf 3,100 Accordia Golf Co., Ltd. . . . . . . . . . . . . . . . . . . . 0.9 3,602,200
Hotels and Motels 300 Resorttrust, Inc. . . . . . . . . . . . . . . . . . . . . . . . . 0.2 961,500
Human Resources 500 Careerlink Co., Ltd. . . . . . . . . . . . . . . . . . . . . . 0.2 819,000
Instruments – Scientifi c 1,900 Hamamatsu Photonics KK . . . . . . . . . . . . . . . . 1.6 6,336,500
400 Horiba, Ltd. . . . . . . . . . . . . . . . . . . . . . . . . . . . 0.5 1,878,0002.1 8,214,500
Internet Content – Information/News 2,800 COOKPAD, Inc. . . . . . . . . . . . . . . . . . . . . . . . . 1.8 7,257,600

Janus Japan Emerging Opportunities Fund
PORTFOLIO INVESTMENTS
The accompanying notes are an integral part of the fi nancial statements.
1 1 0 J a n u s C a p i t a l F u n d s P l c / 3 1 D e c e m b e r 2 0 1 5
Share or Principal Amount
Percentage of Net
Assets (%) Fair
Value (JPY)
700 Kakaku.com, Inc. . . . . . . . . . . . . . . . . . . . . . . . 0.4 1,675,8001,200 M3, Inc. . . . . . . . . . . . . . . . . . . . . . . . . . . . . . . 0.8 3,026,400
3.0 11,959,800
Investment Management and Advisory Services 2,000 Kenedix, Inc. . . . . . . . . . . . . . . . . . . . . . . . . . . 0.2 876,000
Leisure and Recreational Products 500 Daiichikosho Co., Ltd. . . . . . . . . . . . . . . . . . . . 0.6 2,402,500400 Sun Corp. . . . . . . . . . . . . . . . . . . . . . . . . . . . . . 0.1 266,000
0.7 2,668,500
Life and Health Insurance 1,000 Anicom Holdings, Inc. . . . . . . . . . . . . . . . . . . . 0.8 3,255,000
Machine Tools and Related Products 500 DMG Mori Co., Ltd. . . . . . . . . . . . . . . . . . . . . . 0.2 712,500600 THK Co., Ltd. . . . . . . . . . . . . . . . . . . . . . . . . . 0.3 1,354,800
0.5 2,067,300
Machinery – Electrical 300 Disco Corp. . . . . . . . . . . . . . . . . . . . . . . . . . . . 0.9 3,450,000
Machinery – General Industrial 500 Eagle Industry Co., Ltd. . . . . . . . . . . . . . . . . . . 0.3 1,115,500800 Freund Corp. . . . . . . . . . . . . . . . . . . . . . . . . . . 0.3 1,133,600
1,100 Nabtesco Corp. . . . . . . . . . . . . . . . . . . . . . . . . 0.7 2,725,8001.3 4,974,900
Machinery – Material Handling 2,000 Tsubakimoto Chain Co. . . . . . . . . . . . . . . . . . . 0.5 1,876,000
Machinery – Print Trade 700 MIMAKI ENGINEERING Co., Ltd. . . . . . . . . . . 0.1 344,400
Medical – Biomedical and Genetic 1,300 Eiken Chemical Co., Ltd. . . . . . . . . . . . . . . . . . 0.7 2,915,900
Medical – Drugs 1,500 Chugai Pharmaceutical Co., Ltd. . . . . . . . . . . . 1.6 6,360,000
200 Ono Pharmaceutical Co., Ltd. . . . . . . . . . . . . . 1.1 4,338,0001,700 Rohto Pharmaceutical Co., Ltd. . . . . . . . . . . . . 1.0 4,117,4002,200 Santen Pharmaceutical Co., Ltd. . . . . . . . . . . . . 1.1 4,413,2001,800 Shionogi & Co., Ltd. . . . . . . . . . . . . . . . . . . . . 2.5 9,905,400
7.3 29,134,000
Medical – Generic Drugs 300 Sawai Pharmaceutical Co., Ltd. . . . . . . . . . . . . 0.6 2,493,000
Medical – Outpatient and Home Medical Care 1,400 St-Care Holding Corp. . . . . . . . . . . . . . . . . . . . 0.4 1,776,600
Medical Instruments 3,000 Japan Medical Dynamic Marketing,
Inc. . . . . . . . . . . . . . . . . . . . . . . . . . . . . . . . . 0.5 2,175,0001,200 Olympus Corp. . . . . . . . . . . . . . . . . . . . . . . . . 1.5 5,760,0001,000 Shimadzu Corp. . . . . . . . . . . . . . . . . . . . . . . . . 0.5 2,045,000
700 Sysmex Corp. . . . . . . . . . . . . . . . . . . . . . . . . . . 1.4 5,481,0001,000 Topcon Corp. . . . . . . . . . . . . . . . . . . . . . . . . . . 0.5 2,059,000
4.4 17,520,000
Medical Products 1,200 Asahi Intecc Co., Ltd. . . . . . . . . . . . . . . . . . . . . 1.7 6,708,0001,000 Kawasumi Laboratories, Inc.. . . . . . . . . . . . . . . 0.2 872,0001,300 Terumo Corp. . . . . . . . . . . . . . . . . . . . . . . . . . . 1.2 4,914,000
3.1 12,494,000
Metal Processors and Fabrication 1,700 NSK, Ltd. . . . . . . . . . . . . . . . . . . . . . . . . . . . . . 0.6 2,254,200
Metal Products – Distributors 2,000 MISUMI Group, Inc. . . . . . . . . . . . . . . . . . . . . 0.9 3,372,000
Miscellaneous Manufacturing 900 Amano Corp. . . . . . . . . . . . . . . . . . . . . . . . . . . 0.4 1,482,300500 Glory, Ltd. . . . . . . . . . . . . . . . . . . . . . . . . . . . . 0.5 1,867,500800 Nikkiso Co., Ltd. . . . . . . . . . . . . . . . . . . . . . . . 0.2 767,200
1.1 4,117,000
Share or Principal Amount
Percentage of Net
Assets (%) Fair
Value (JPY)
Offi ce Supplies and Forms 900 Kokuyo Co., Ltd. . . . . . . . . . . . . . . . . . . . . . . . 0.3 1,181,700
Real Estate Management/Services 600 CRE Japan, Inc. . . . . . . . . . . . . . . . . . . . . . . . . 0.3 1,376,400200 Daito Trust Construction Co., Ltd. . . . . . . . . . . 0.7 2,802,000200 Relo Holdings, Inc. . . . . . . . . . . . . . . . . . . . . . . 0.7 2,938,000
1.7 7,116,400
Real Estate Operating/Development 4,600 Hulic Co., Ltd. . . . . . . . . . . . . . . . . . . . . . . . . . 1.2 4,917,400
Recreational Centers 2,600 Tosho Co., Ltd. . . . . . . . . . . . . . . . . . . . . . . . . . 2.1 8,437,000
Resorts and Theme Parks 800 Oriental Land Co., Ltd. . . . . . . . . . . . . . . . . . . 1.5 5,869,600
Retail – Apparel and Shoe 300 Workman Co., Ltd.. . . . . . . . . . . . . . . . . . . . . . 0.6 2,281,500
Retail – Auto Parts 400 Fuji Corp. /Miyagi . . . . . . . . . . . . . . . . . . . . . . 0.2 864,800
Retail – Convenience Store 300 Lawson, Inc. . . . . . . . . . . . . . . . . . . . . . . . . . . . 0.7 2,955,000
Retail – Drug Store 300 Cosmos Pharmaceutical Corp. . . . . . . . . . . . . . 1.4 5,730,000
2,800 Medical System Network Co., Ltd. . . . . . . . . . . 0.5 1,828,400300 Welcia Holdings Co., Ltd. . . . . . . . . . . . . . . . . . 0.5 2,016,000
2.4 9,574,400
Retail – Home Furnishings 200 Nitori Holdings Co., Ltd. . . . . . . . . . . . . . . . . . 0.5 2,046,000
Retail – Major Department Stores 1,500 H2O Retailing Corp.. . . . . . . . . . . . . . . . . . . . . 0.9 3,562,500
Retail – Restaurants 1,700 Hiramatsu, Inc. . . . . . . . . . . . . . . . . . . . . . . . . 0.3 1,247,800
Rubber – Tires 1,000 Toyo Tire & Rubber Co., Ltd. . . . . . . . . . . . . . . 0.6 2,404,000
Rubber and Vinyl 2,000 Zeon Corp. . . . . . . . . . . . . . . . . . . . . . . . . . . . . 0.5 1,958,000
Rubber/Plastic Products 900 Asahi Rubber, Inc. . . . . . . . . . . . . . . . . . . . . . . 0.3 994,500
Schools – Day Care 14,200 JP-Holdings, Inc. . . . . . . . . . . . . . . . . . . . . . . . 1.2 4,913,200
Semiconductor Equipment 1,200 Shinkawa, Ltd. . . . . . . . . . . . . . . . . . . . . . . . . . 0.2 751,200
Steel – Specialty 4,000 Aichi Steel Corp. . . . . . . . . . . . . . . . . . . . . . . . 0.6 2,280,0003,000 Topy Industries., Ltd. . . . . . . . . . . . . . . . . . . . . 0.2 816,000
0.8 3,096,000
Transportation – Railroad 10,000 Tokyu Corp. . . . . . . . . . . . . . . . . . . . . . . . . . . . 2.5 9,600,000
Transportation – Truck 1,000 Hamakyorex Co., Ltd. . . . . . . . . . . . . . . . . . . . 0.6 2,265,0001,000 Yamato Holdings Co., Ltd. . . . . . . . . . . . . . . . . 0.6 2,576,000
1.2 4,841,000
Web Portals/Internet Service Providers 2,300 GMO internet, Inc. . . . . . . . . . . . . . . . . . . . . . . 0.9 3,684,600
700 Itokuro, Inc. . . . . . . . . . . . . . . . . . . . . . . . . . . . 0.4 1,620,5006,500 Yahoo Japan Corp. . . . . . . . . . . . . . . . . . . . . . . 0.8 3,211,000
2.1 8,516,100
Wire and Cable Products 2,000 Tokyo Rope Manufacturing Co., Ltd. . . . . . . . . 0.1 404,000
Total Common Stock . . . . . . . . . . . . . . . . . . . . . . . . . . . . . . . . . 98.0 389,148,700
Total Investments . . . . . . . . . . . . . . . . . . . . . . . . . . . . . . . . . . . . 98.0 389,148,700

PORTFOLIO INVESTMENTS
The accompanying notes are an integral part of the fi nancial statements.
J a n u s C a p i t a l F u n d s P l c / 3 1 D e c e m b e r 2 0 1 5 1 1 1
Forward Currency Contracts, Open as at 31 December 2015
Currency Purchased
Currency Sold
Current Market
Value (USD) Settle Date
Unrealised Appreciation
(JPY)
Citibank AUD 1,016 JPY 88,677 88,372 29-Jan-16 305.00CAD 968 JPY 83,919 83,905 29-Jan-16 14.00EUR 2,303 JPY 303,250 303,199 29-Jan-16 51.00EUR 2,294 JPY 302,079 302,028 29-Jan-16 51.00EUR 2,240 JPY 294,940 294,890 29-Jan-16 50.00EUR 2,218 JPY 292,160 292,111 29-Jan-16 49.00JPY 212,727 GBP 1,178 210,150 29-Jan-16 2,577.00JPY 283,375 CNH 15,421 281,533 29-Jan-16 1,842.00JPY 279,638 CNH 15,218 277,821 29-Jan-16 1,817.00JPY 235,564 USD 1,941 233,771 29-Jan-16 1,793.00JPY 233,060 USD 1,921 231,286 29-Jan-16 1,774.00JPY 231,289 HKD 14,786 229,783 29-Jan-16 1,506.00JPY 182,694 CAD 2,099 182,105 29-Jan-16 589.00JPY 191,883 EUR 1,453 191,397 29-Jan-16 486.00JPY 191,647 EUR 1,451 191,161 29-Jan-16 486.00JPY 190,214 EUR 1,440 189,732 29-Jan-16 482.00JPY 189,659 EUR 1,436 189,178 29-Jan-16 481.00JPY 197,842 GBP 1,108 197,635 29-Jan-16 207.00JPY 198,321 EUR 1,505 198,288 29-Jan-16 33.00JPY 198,654 EUR 1,508 198,621 29-Jan-16 33.00JPY 196,333 EUR 1,490 196,301 29-Jan-16 32.00JPY 195,703 EUR 1,486 195,671 29-Jan-16 32.00USD 2,934 JPY 353,197 353,032 29-Jan-16 165.00USD 2,864 JPY 344,713 344,551 29-Jan-16 162.00
Total 15,017
Total Financial Assets at fair value through profi t or loss 389,163,717
Financial Liabilities at fair value through profi t or loss
Forward Currency Contracts, Open as at 31 December 2015
Currency Purchased
Currency Sold
Current Market
Value (USD) Settle Date
Unrealised (Depreciation)
(JPY)
Citibank AUD 3,367 JPY 295,414 295,852 29-Jan-16 (438)AUD 5,059 JPY 444,747 446,201 29-Jan-16 (1,454)AUD 159,887 JPY 14,041,727 14,074,242 29-Jan-16 (32,515)CAD 3,174 JPY 275,987 276,608 29-Jan-16 (621)CAD 4,906 JPY 434,095 442,640 29-Jan-16 (8,545)CAD 153,470 JPY 13,564,123 13,815,633 29-Jan-16 (251,510)CNH 2,208 JPY 40,534 40,763 29-Jan-16 (229)CNH 2,273 JPY 41,736 41,972 29-Jan-16 (236)CNH 3,013 JPY 55,277 55,544 29-Jan-16 (267)CNH 3,091 JPY 56,715 56,989 29-Jan-16 (274)CNH 19,827 JPY 362,634 363,274 29-Jan-16 (640)CNH 20,295 JPY 371,177 371,832 29-Jan-16 (655)CNH 5,887 JPY 108,177 108,882 29-Jan-16 (705)CNH 6,072 JPY 111,576 112,303 29-Jan-16 (727)CNH 27,678 JPY 512,845 520,363 29-Jan-16 (7,518)CNH 28,135 JPY 521,306 528,948 29-Jan-16 (7,642)CNH 879,321 JPY 16,290,491 16,527,062 29-Jan-16 (236,571)CNH 892,868 JPY 16,541,450 16,781,665 29-Jan-16 (240,215)EUR 662 JPY 87,577 88,010 29-Jan-16 (433)EUR 670 JPY 88,706 89,145 29-Jan-16 (439)EUR 692 JPY 91,601 92,054 29-Jan-16 (453)EUR 696 JPY 92,072 92,527 29-Jan-16 (455)EUR 3,459 JPY 459,290 462,925 29-Jan-16 (3,635)EUR 3,516 JPY 466,837 470,532 29-Jan-16 (3,695)EUR 3,526 JPY 468,082 471,786 29-Jan-16 (3,704)EUR 3,437 JPY 456,495 460,244 29-Jan-16 (3,749)EUR 107,852 JPY 14,324,337 14,442,528 29-Jan-16 (118,191)EUR 108,498 JPY 14,410,195 14,529,095 29-Jan-16 (118,900)EUR 110,164 JPY 14,631,441 14,752,167 29-Jan-16 (120,726)EUR 110,439 JPY 14,667,948 14,788,975 29-Jan-16 (121,027)GBP 1,818 JPY 324,608 324,882 29-Jan-16 (274)GBP 558 JPY 100,477 101,372 29-Jan-16 (895)GBP 2,766 JPY 505,008 516,516 29-Jan-16 (11,508)GBP 86,527 JPY 15,793,627 16,147,109 29-Jan-16 (353,482)HKD 22,221 JPY 345,379 345,430 29-Jan-16 (51)HKD 6,688 JPY 104,400 104,860 29-Jan-16 (460)HKD 34,041 JPY 536,811 544,596 29-Jan-16 (7,785)HKD 1,068,351 JPY 16,854,514 17,105,906 29-Jan-16 (251,392)JPY 217,878 HKD 14,030 218,038 29-Jan-16 (160)JPY 215,795 USD 1,794 216,018 29-Jan-16 (223)JPY 217,490 USD 1,808 217,715 29-Jan-16 (225)JPY 171,387 CAD 1,983 171,981 29-Jan-16 (594)JPY 178,039 AUD 2,039 178,651 29-Jan-16 (612)JPY 250,276 CNH 13,766 251,330 29-Jan-16 (1,054)JPY 253,042 CNH 13,918 254,108 29-Jan-16 (1,066)JPY 185,272 AUD 2,139 187,393 29-Jan-16 (2,121)USD 865 JPY 104,557 104,951 29-Jan-16 (394)USD 893 JPY 107,996 108,402 29-Jan-16 (406)USD 4,382 JPY 535,113 542,558 29-Jan-16 (7,445)USD 4,456 JPY 544,184 551,755 29-Jan-16 (7,571)USD 137,504 JPY 16,813,074 17,067,274 29-Jan-16 (254,200)USD 139,687 JPY 17,079,891 17,338,126 29-Jan-16 (258,235)
Total (2,446,322)
Total Financial Liabilities at fair value through profi t or loss (2,446,322)

Janus Japan Fund
PORTFOLIO INVESTMENTS
The accompanying notes are an integral part of the fi nancial statements.
1 1 2 J a n u s C a p i t a l F u n d s P l c / 3 1 D e c e m b e r 2 0 1 5
Share or Principal Amount
Percentage of Net
Assets (%) Fair
Value (JPY)
Financial Assets at fair value through profi t or loss Common Stock Airlines
5,000 ANA Holdings, Inc. . . . . . . . . . . . . . . . . . . . . . 0.7 1,750,000200 Japan Airlines Co., Ltd. . . . . . . . . . . . . . . . . . . 0.4 871,200
1.1 2,621,200
Applications Software 200 FFRI, Inc. . . . . . . . . . . . . . . . . . . . . . . . . . . . . . 0.8 1,918,000
Audio and Video Products 3,000 Sony Corp. . . . . . . . . . . . . . . . . . . . . . . . . . . . . 3.7 9,005,999
Automotive – Cars and Light Trucks 1,400 Fuji Heavy Industries, Ltd. . . . . . . . . . . . . . . . . 2.9 7,037,800
700 Honda Motor Co., Ltd. . . . . . . . . . . . . . . . . . . . 1.1 2,737,0001,000 Nissan Motor Co., Ltd. . . . . . . . . . . . . . . . . . . . 0.5 1,279,500
800 Toyota Motor Corp. . . . . . . . . . . . . . . . . . . . . . 2.5 5,990,4007.0 17,044,700
Automotive – Truck Parts and Equipment – Original 300 Aisin Seiki Co., Ltd. . . . . . . . . . . . . . . . . . . . . . 0.6 1,572,000
Building and Construction – Miscellaneous 3,700 Hazama Ando Corp. . . . . . . . . . . . . . . . . . . . . . 1.0 2,423,5003,000 Taisei Corp. . . . . . . . . . . . . . . . . . . . . . . . . . . . 1.0 2,400,0004,000 Toa Corp. . . . . . . . . . . . . . . . . . . . . . . . . . . . . . 0.5 1,276,000
2.5 6,099,500
Building Products – Doors and Windows 2,000 Central Glass Co., Ltd. . . . . . . . . . . . . . . . . . . . 0.5 1,114,000
Chemicals 200 Daiichi Kigenso Kagaku-Kogyo Co.,
Ltd. . . . . . . . . . . . . . . . . . . . . . . . . . . . . . . . . 0.4 906,000
Chemicals – Diversifi ed 1,600 Mitsubishi Chemical Holdings Corp. . . . . . . . . 0.5 1,238,880
200 Nitto Denko Corp. . . . . . . . . . . . . . . . . . . . . . . 0.7 1,782,4003,000 Tosoh Corp. . . . . . . . . . . . . . . . . . . . . . . . . . . . 0.8 1,881,000
2.0 4,902,280
Chemicals – Specialty 1,000 Daicel Corp. . . . . . . . . . . . . . . . . . . . . . . . . . . . 0.7 1,814,0003,000 Toray Industries, Inc. . . . . . . . . . . . . . . . . . . . . 1.4 3,390,000
2.1 5,204,000
Commercial Banks – Non U.S. 16,800 Mizuho Financial Group, Inc. . . . . . . . . . . . . . . 1.7 4,090,800
1,000 Sumitomo Mitsui Financial Group, Inc. . . . . . . . . . . . . . . . . . . . . . . . . . . . . . . . . 1.9 4,606,000
5,000 Sumitomo Mitsui Trust Holdings, Inc. . . . . . . . . . . . . . . . . . . . . . . . . . . . . . . . . 0.9 2,305,000
4.5 11,001,800
Commercial Services 1,800 First Energy Service Co., Ltd. . . . . . . . . . . . . . . 0.4 939,600
300 TechnoPro Holdings, Inc. . . . . . . . . . . . . . . . . . 0.4 1,066,5000.8 2,006,100
Commercial Services – Finance 500 GMO Payment Gateway, Inc. . . . . . . . . . . . . . . 1.2 2,895,000
Computers – Integrated Systems 2,000 Fujitsu, Ltd. . . . . . . . . . . . . . . . . . . . . . . . . . . . 0.5 1,222,737
400 Otsuka Corp. . . . . . . . . . . . . . . . . . . . . . . . . . . 1.0 2,384,0001.5 3,606,737
Computers – Memory Devices 200 TDK Corp. . . . . . . . . . . . . . . . . . . . . . . . . . . . . 0.6 1,564,000
Cosmetics and Toiletries 200 Kao Corp. . . . . . . . . . . . . . . . . . . . . . . . . . . . . . 0.5 1,251,000
Distribution/Wholesale 900 Ai Holdings Corp. . . . . . . . . . . . . . . . . . . . . . . 1.1 2,772,000600 Doshisha Co., Ltd. . . . . . . . . . . . . . . . . . . . . . . 0.6 1,464,000600 Nippon Gas Co., Ltd. . . . . . . . . . . . . . . . . . . . . 0.7 1,789,200
2.4 6,025,200
Share or Principal Amount
Percentage of Net
Assets (%) Fair
Value (JPY)
Diversifi ed Banking Institutions 8,600 Mitsubishi UFJ Financial Group,
Inc. . . . . . . . . . . . . . . . . . . . . . . . . . . . . . . . . 2.7 6,511,060
E-Commerce/Products 1,300 Syuppin Co., Ltd. . . . . . . . . . . . . . . . . . . . . . . . 0.7 1,625,000
E-Commerce/Services 500 en-japan, Inc. . . . . . . . . . . . . . . . . . . . . . . . . . . 0.9 2,230,000
Electric – Generation 200 Electric Power Development Co.,
Ltd. . . . . . . . . . . . . . . . . . . . . . . . . . . . . . . . . 0.4 865,000
Electric – Integrated 1,300 Kyushu Electric Power Co., Inc. . . . . . . . . . . . . 0.7 1,725,100
Electronic Components – Miscellaneous 300 Alps Electric Co., Ltd. . . . . . . . . . . . . . . . . . . . 0.4 994,500100 Murata Manufacturing Co., Ltd. . . . . . . . . . . . . 0.7 1,757,000
10,000 NEC Corp. . . . . . . . . . . . . . . . . . . . . . . . . . . . . 1.6 3,850,000700 Star Micronics Co., Ltd. . . . . . . . . . . . . . . . . . . 0.5 1,110,900
3.2 7,712,400
Electronic Connectors 200 Iriso Electronics Co., Ltd. . . . . . . . . . . . . . . . . . 0.6 1,364,000
Entertainment Software 400 Konami Corp.. . . . . . . . . . . . . . . . . . . . . . . . . . 0.5 1,155,200
E-Services and Consulting 1,300 Digital Garage, Inc. . . . . . . . . . . . . . . . . . . . . . . 1.2 2,823,600
Finance – Investment Bankers/Brokers 2,300 GCA Savvian Corp. . . . . . . . . . . . . . . . . . . . . . 1.2 2,865,800
Finance – Leasing Company 800 ORIX Corp. . . . . . . . . . . . . . . . . . . . . . . . . . . . 0.6 1,372,400
Food – Miscellaneous/Diversifi ed 1,000 Ajinomoto Co., Inc. . . . . . . . . . . . . . . . . . . . . . 1.2 2,879,500
300 Ariake Japan Co., Ltd. . . . . . . . . . . . . . . . . . . . 0.8 2,013,000400 Kewpie Corp. . . . . . . . . . . . . . . . . . . . . . . . . . . 0.5 1,200,000200 MEIJI Holdings Co., Ltd. . . . . . . . . . . . . . . . . . 0.8 2,010,000
3.3 8,102,500
Food – Retail 200 San-A Co., Ltd. . . . . . . . . . . . . . . . . . . . . . . . . . 0.4 1,090,000400 Seven & I Holdings Co., Ltd. . . . . . . . . . . . . . . 0.9 2,220,000
1.3 3,310,000
Hotels and Motels 800 Resorttrust, Inc. . . . . . . . . . . . . . . . . . . . . . . . . 1.1 2,564,000
Human Resources 900 Temp Holdings Co., Ltd. . . . . . . . . . . . . . . . . . 0.7 1,696,500
Instruments – Scientifi c 400 Hamamatsu Photonics KK . . . . . . . . . . . . . . . . 0.5 1,334,000
Internet Content – Information/News 400 Mixi, Inc. . . . . . . . . . . . . . . . . . . . . . . . . . . . . . 0.7 1,820,000
1,500 Next Co., Ltd. . . . . . . . . . . . . . . . . . . . . . . . . . 0.9 2,239,5001.6 4,059,500
Leisure and Recreational Products 1,600 Sun Corp. . . . . . . . . . . . . . . . . . . . . . . . . . . . . . 0.4 1,064,000
Life and Health Insurance 600 Dai-ichi Life Insurance Co., Ltd. . . . . . . . . . . . . 0.5 1,221,000
Machine Tools and Related Products 600 DMG Mori Co., Ltd. . . . . . . . . . . . . . . . . . . . . . 0.4 855,000
Machinery – Diversifi ed 3,000 Daihen Corp. . . . . . . . . . . . . . . . . . . . . . . . . . . 0.7 1,722,000
Machinery – Electrical 2,000 Meidensha Corp. . . . . . . . . . . . . . . . . . . . . . . . 0.4 980,000
Machinery – Farm 1,000 Kubota Corp. . . . . . . . . . . . . . . . . . . . . . . . . . . 0.8 1,888,000
Machinery – General Industrial 1,600 Amada Co., Ltd. . . . . . . . . . . . . . . . . . . . . . . . . 0.8 1,862,400

PORTFOLIO INVESTMENTS
The accompanying notes are an integral part of the fi nancial statements.
J a n u s C a p i t a l F u n d s P l c / 3 1 D e c e m b e r 2 0 1 5 1 1 3
Share or Principal Amount
Percentage of Net
Assets (%) Fair
Value (JPY)
400 Harmonic Drive Systems, Inc. . . . . . . . . . . . . . 0.4 1,054,4002,000 Makino Milling Machine Co., Ltd. . . . . . . . . . . 0.8 1,836,000
2.0 4,752,800
Machinery – Material Handling 900 Aida Engineering, Ltd. . . . . . . . . . . . . . . . . . . . 0.5 1,129,500700 Daifuku Co., Ltd. . . . . . . . . . . . . . . . . . . . . . . . 0.6 1,452,500
1.1 2,582,000
Machinery – Pumps 1,100 Teikoku Electric Manufacturing Co.,
Ltd. . . . . . . . . . . . . . . . . . . . . . . . . . . . . . . . . 0.4 1,058,200
Medical – Biomedical and Genetic 700 JCR Pharmaceuticals Co., Ltd. . . . . . . . . . . . . . 0.8 1,851,500
1,200 PeptiDream, Inc. . . . . . . . . . . . . . . . . . . . . . . . 1.9 4,650,0001,800 Takara Bio, Inc. . . . . . . . . . . . . . . . . . . . . . . . . 0.9 2,181,600
3.6 8,683,100
Medical – Drugs 300 Chugai Pharmaceutical Co., Ltd. . . . . . . . . . . . 0.5 1,272,000800 HEALIOS KK . . . . . . . . . . . . . . . . . . . . . . . . . . 0.4 898,400700 KYORIN Holdings, Inc. . . . . . . . . . . . . . . . . . . 0.7 1,772,400
1,000 Kyowa Hakko Kirin Co., Ltd. . . . . . . . . . . . . . . 0.8 1,915,000100 Ono Pharmaceutical Co., Ltd. . . . . . . . . . . . . . 0.9 2,169,000700 SanBio Co., Ltd. . . . . . . . . . . . . . . . . . . . . . . . . 0.3 724,500500 Santen Pharmaceutical Co., Ltd. . . . . . . . . . . . . 0.4 1,003,000300 Shionogi & Co., Ltd. . . . . . . . . . . . . . . . . . . . . 0.7 1,650,900400 Sosei Group Corp. . . . . . . . . . . . . . . . . . . . . . . 1.6 3,980,000
6.3 15,385,200
Medical – Generic Drugs 800 NanoCarrier Co., Ltd. . . . . . . . . . . . . . . . . . . . . 0.3 836,800
Medical – Outpatient and Home Medical Care 1,200 Tsukui Corp. . . . . . . . . . . . . . . . . . . . . . . . . . . 0.7 1,597,200
Medical Information Systems 900 FINDEX, Inc. . . . . . . . . . . . . . . . . . . . . . . . . . . 0.3 813,600
Medical Instruments 600 Olympus Corp. . . . . . . . . . . . . . . . . . . . . . . . . 1.2 2,880,000
1,000 Shimadzu Corp. . . . . . . . . . . . . . . . . . . . . . . . . 0.8 2,045,000200 Sysmex Corp. . . . . . . . . . . . . . . . . . . . . . . . . . . 0.6 1,566,000
2.6 6,491,000
Medical Products 700 Asahi Intecc Co., Ltd. . . . . . . . . . . . . . . . . . . . . 1.6 3,913,000
2,500 CYBERDYNE, Inc. . . . . . . . . . . . . . . . . . . . . . . 2.1 5,115,000600 Terumo Corp. . . . . . . . . . . . . . . . . . . . . . . . . . . 0.9 2,268,000
4.6 11,296,000
Metal – Diversifi ed 700 OSAKA Titanium Technologies Co.,
Ltd. . . . . . . . . . . . . . . . . . . . . . . . . . . . . . . . . 0.7 1,752,800
Miscellaneous Manufacturing 300 Rion Co., Ltd. . . . . . . . . . . . . . . . . . . . . . . . . . . 0.3 612,600
2,500 Towa Corp. . . . . . . . . . . . . . . . . . . . . . . . . . . . . 0.8 1,957,5001.1 2,570,100
Motion Pictures and Services 200 Toei Animation Co., Ltd. . . . . . . . . . . . . . . . . . 0.5 1,186,000
Real Estate Operating/Development 300 Jowa Holdings Co., Ltd. . . . . . . . . . . . . . . . . . . 0.6 1,465,500
3,400 Leopalace21 Corp. . . . . . . . . . . . . . . . . . . . . . . 0.9 2,237,2001,000 Mitsui Fudosan Co., Ltd. . . . . . . . . . . . . . . . . . 1.3 3,056,000
2.8 6,758,700
Retail – Drug Store 400 Matsumotokiyoshi Holdings Co., Ltd. . . . . . . . 1.0 2,480,000300 Welcia Holdings Co., Ltd. . . . . . . . . . . . . . . . . . 0.8 2,016,000
1.8 4,496,000
Retail – Home Furnishings 300 Nitori Holdings Co., Ltd. . . . . . . . . . . . . . . . . . 1.3 3,069,000
Retail – Major Department Stores 1,200 H2O Retailing Corp.. . . . . . . . . . . . . . . . . . . . . 1.2 2,850,000
Share or Principal Amount
Percentage of Net
Assets (%) Fair
Value (JPY)
Retail – Miscellaneous and Diversifi ed 500 Izumi Co., Ltd. . . . . . . . . . . . . . . . . . . . . . . . . . 1.0 2,355,000
Retail – Restaurants 1,300 Toridoll Corp. . . . . . . . . . . . . . . . . . . . . . . . . . . 1.2 2,891,200
Security Services 200 Sohgo Security Services Co., Ltd. . . . . . . . . . . . 0.5 1,140,000
Steel – Producers 8,000 Kobe Steel, Ltd. . . . . . . . . . . . . . . . . . . . . . . . . 0.4 1,064,000
800 Nippon Steel & Sumitomo Metal Corp. . . . . . . . . . . . . . . . . . . . . . . . . . . . . . . 0.8 1,932,800
1.2 2,996,800
Telephone – Integrated 500 Nippon Telegraph & Telephone
Corp. . . . . . . . . . . . . . . . . . . . . . . . . . . . . . . 1.0 2,418,000
Transportation Services 1,100 Kintetsu World Express, Inc. . . . . . . . . . . . . . . 0.9 2,356,200
Travel Services 400 HIS Co., Ltd. . . . . . . . . . . . . . . . . . . . . . . . . . . 0.7 1,626,000
Web Portals/Internet Service Providers 1,500 GMO internet, Inc. . . . . . . . . . . . . . . . . . . . . . . 0.9 2,403,000
Total Common Stock . . . . . . . . . . . . . . . . . . . . . . . . . . . . . . . . . 95.3 232,148,276
Total Investments . . . . . . . . . . . . . . . . . . . . . . . . . . . . . . . . . . . . 95.3 232,148,276

Janus Japan Fund
PORTFOLIO INVESTMENTS
The accompanying notes are an integral part of the fi nancial statements.
1 1 4 J a n u s C a p i t a l F u n d s P l c / 3 1 D e c e m b e r 2 0 1 5
Forward Currency Contracts, Open as at 31 December 2015
Currency Purchased
Currency Sold
Current Market
Value (JPY) Settle Date
Unrealised Appreciation
(JPY)
Citibank AUD 651 JPY 56,854 56,659 29-Jan-16 195CAD 622 JPY 53,924 53,915 29-Jan-16 9EUR 1,424 JPY 187,499 187,467 29-Jan-16 32EUR 1,392 JPY 183,260 183,229 29-Jan-16 31EUR 1,378 JPY 181,516 181,485 29-Jan-16 31EUR 1,421 JPY 187,140 187,109 29-Jan-16 31JPY 188,119 GBP 1,041 185,841 29-Jan-16 2,278JPY 204,682 USD 1,687 203,125 29-Jan-16 1,557JPY 202,167 USD 1,666 200,628 29-Jan-16 1,539JPY 203,052 HKD 12,981 201,730 29-Jan-16 1,322JPY 198,164 CNH 10,784 196,876 29-Jan-16 1,288JPY 195,780 CNH 10,654 194,508 29-Jan-16 1,272JPY 161,588 CAD 1,857 161,066 29-Jan-16 522JPY 27,377 GBP 151 27,009 29-Jan-16 368JPY 122,017 EUR 924 121,709 29-Jan-16 308JPY 121,939 EUR 923 121,631 29-Jan-16 308JPY 121,112 EUR 917 120,805 29-Jan-16 307JPY 120,738 EUR 914 120,432 29-Jan-16 306JPY 32,106 USD 264 31,826 29-Jan-16 280JPY 31,982 USD 263 31,704 29-Jan-16 278JPY 30,194 HKD 1,931 30,011 29-Jan-16 183JPY 30,128 CNH 1,642 29,982 29-Jan-16 146JPY 30,224 CNH 1,647 30,078 29-Jan-16 146JPY 125,770 GBP 704 125,638 29-Jan-16 132JPY 23,862 CAD 274 23,797 29-Jan-16 65JPY 173,094 EUR 1,314 173,065 29-Jan-16 29JPY 175,156 EUR 1,330 175,127 29-Jan-16 29JPY 175,343 EUR 1,331 175,314 29-Jan-16 29JPY 172,157 EUR 1,307 172,129 29-Jan-16 28USD 1,817 JPY 218,668 218,565 29-Jan-16 103USD 1,778 JPY 214,044 213,943 29-Jan-16 101
Total 13,253
Total Financial Assets at fair value through profi t or loss 232,161,529
Financial Liabilities at fair value through profi t or loss
Forward Currency Contracts, Open as at 31 December 2015
Currency Purchased
Currency Sold
Current Market
Value (JPY) Settle Date
Unrealised (Depreciation)
(JPY)
Citibank AUD 2,090 JPY 183,430 183,702 29-Jan-16 (272)AUD 3,578 JPY 314,544 315,572 29-Jan-16 (1,028)AUD 98,787 JPY 8,675,773 8,695,862 29-Jan-16 (20,089)CAD 1,969 JPY 171,206 171,591 29-Jan-16 (385)CAD 3,465 JPY 306,586 312,617 29-Jan-16 (6,031)CAD 94,729 JPY 8,372,401 8,527,645 29-Jan-16 (155,244)CNH 1,418 JPY 26,028 26,175 29-Jan-16 (147)CNH 1,382 JPY 25,371 25,519 29-Jan-16 (148)CNH 12,298 JPY 224,930 225,327 29-Jan-16 (397)CNH 12,555 JPY 229,619 230,025 29-Jan-16 (406)CNH 3,770 JPY 69,289 69,741 29-Jan-16 (452)CNH 3,873 JPY 71,171 71,635 29-Jan-16 (464)CNH 19,586 JPY 362,908 368,228 29-Jan-16 (5,320)CNH 19,872 JPY 368,206 373,603 29-Jan-16 (5,397)CNH 543,068 JPY 10,060,998 10,207,104 29-Jan-16 (146,106)CNH 550,534 JPY 10,199,305 10,347,419 29-Jan-16 (148,114)EUR 425 JPY 56,282 56,560 29-Jan-16 (278)EUR 431 JPY 56,996 57,278 29-Jan-16 (282)EUR 443 JPY 58,596 58,885 29-Jan-16 (289)EUR 444 JPY 58,744 59,034 29-Jan-16 (290)EUR 2,431 JPY 322,807 325,362 29-Jan-16 (2,555)EUR 2,447 JPY 325,016 327,685 29-Jan-16 (2,669)EUR 2,482 JPY 329,674 332,382 29-Jan-16 (2,708)EUR 2,486 JPY 330,102 332,813 29-Jan-16 (2,711)EUR 66,650 JPY 8,852,162 8,925,202 29-Jan-16 (73,040)EUR 67,061 JPY 8,906,687 8,980,176 29-Jan-16 (73,489)EUR 67,967 JPY 9,027,008 9,101,490 29-Jan-16 (74,482)EUR 68,050 JPY 9,038,027 9,112,601 29-Jan-16 (74,574)GBP 1,122 JPY 200,471 200,641 29-Jan-16 (170)GBP 356 JPY 64,021 64,591 29-Jan-16 (570)GBP 1,947 JPY 355,608 363,711 29-Jan-16 (8,103)GBP 53,264 JPY 9,722,259 9,939,855 29-Jan-16 (217,596)HKD 13,796 JPY 214,427 214,459 29-Jan-16 (32)HKD 4,299 JPY 67,105 67,400 29-Jan-16 (295)HKD 24,060 JPY 379,416 384,919 29-Jan-16 (5,503)HKD 659,890 JPY 10,410,549 10,565,826 29-Jan-16 (155,277)JPY 25,710 EUR 196 25,786 29-Jan-16 (76)JPY 25,633 EUR 195 25,709 29-Jan-16 (76)JPY 25,702 EUR 196 25,778 29-Jan-16 (76)JPY 25,504 EUR 194 25,580 29-Jan-16 (76)JPY 138,676 HKD 8,930 138,778 29-Jan-16 (102)JPY 137,403 USD 1,142 137,545 29-Jan-16 (142)JPY 138,394 USD 1,150 138,537 29-Jan-16 (143)JPY 23,897 AUD 276 24,224 29-Jan-16 (327)JPY 109,050 CAD 1,262 109,428 29-Jan-16 (378)JPY 113,461 AUD 1,299 113,852 29-Jan-16 (391)JPY 158,862 CNH 8,738 159,531 29-Jan-16 (669)JPY 160,450 CNH 8,825 161,127 29-Jan-16 (677)JPY 165,669 AUD 1,912 167,566 29-Jan-16 (1,897)USD 556 JPY 67,256 67,509 29-Jan-16 (253)USD 572 JPY 69,165 69,426 29-Jan-16 (261)USD 3,098 JPY 378,336 383,600 29-Jan-16 (5,264)USD 3,144 JPY 383,957 389,299 29-Jan-16 (5,342)USD 84,942 JPY 10,386,144 10,543,173 29-Jan-16 (157,029)USD 86,133 JPY 10,531,731 10,690,962 29-Jan-16 (159,231)
Total (1,517,323)
Total Financial Liabilities at fair value through profi t or loss (1,517,323)

Janus Opportunistic Alpha Fund
PORTFOLIO INVESTMENTS
The accompanying notes are an integral part of the fi nancial statements.
J a n u s C a p i t a l F u n d s P l c / 3 1 D e c e m b e r 2 0 1 5 1 1 5
Share or Principal Amount
Percentage of Net
Assets (%) Fair
Value (USD)
Financial Assets at fair value through profi t or loss Common Stock Airlines
1,311 American Airlines Group, Inc. . . . . . . . . . . . . . 0.1 55,52164,349 United Continental Holdings, Inc. . . . . . . . . . . 7.2 3,687,198
7.3 3,742,719
Batteries and Battery Systems 37,908 Energizer Holdings, Inc. . . . . . . . . . . . . . . . . . . 2.5 1,291,146
Cable/Satellite TV 10,047 Comcast Corp. – Class A . . . . . . . . . . . . . . . . . 1.1 566,952
Chemicals – Specialty 21,949 Platform Specialty Products Corp. . . . . . . . . . . 0.5 281,606
Containers – Metal and Glass 7,739 Ball Corp. . . . . . . . . . . . . . . . . . . . . . . . . . . . . . 1.1 562,857
Containers – Paper and Plastic 57,937 Multi Packaging Solutions
International, Ltd. . . . . . . . . . . . . . . . . . . . . . 2.0 1,005,207
Cosmetics and Toiletries 13,370 Edgewell Personal Care Co. . . . . . . . . . . . . . . . 2.0 1,047,807
Diversifi ed Banking Institutions 12,148 JP Morgan Chase & Co. . . . . . . . . . . . . . . . . . . 1.6 802,132
Drug Delivery Systems 88,907 Flamel Technologies S.A. . . . . . . . . . . . . . . . . . 2.1 1,085,554
E-Commerce/Products 40,914 Lands’ End, Inc. . . . . . . . . . . . . . . . . . . . . . . . . 1.9 959,024
Finance – Consumer Loans 16,265 Synchrony Financial . . . . . . . . . . . . . . . . . . . . . 1.0 494,619
Finance – Investment Bankers/Brokers 56,535 E*TRADE Financial Corp. . . . . . . . . . . . . . . . . 3.3 1,675,697
Finance – Other Services 7,625 CME Group, Inc. . . . . . . . . . . . . . . . . . . . . . . . 1.3 690,825
Industrial Gases 24,852 Air Products and Chemicals, Inc. . . . . . . . . . . . 6.3 3,233,494
Machine Tools and Related Products 33,558 Kennametal, Inc. . . . . . . . . . . . . . . . . . . . . . . . 1.3 644,314
Machinery – General Industrial 24,446 Zebra Technologies Corp. . . . . . . . . . . . . . . . . . 3.3 1,702,664
Medical – Drugs 28,720 Akorn, Inc. . . . . . . . . . . . . . . . . . . . . . . . . . . . . 2.1 1,071,54325,858 Eagle Pharmaceuticals, Inc. . . . . . . . . . . . . . . . 4.5 2,292,82980,083 Endo International PLC . . . . . . . . . . . . . . . . . . 9.5 4,902,68131,043 HLS Therapeutics Inc.* . . . . . . . . . . . . . . . . . . 0.6 310,430
408,497 Indivior PLC . . . . . . . . . . . . . . . . . . . . . . . . . . . 2.2 1,130,790183,393 XenoPort, Inc. . . . . . . . . . . . . . . . . . . . . . . . . . 2.0 1,006,828
20.9 10,715,101
Oil Refi ning and Marketing 12,687 Murphy U.S.A., Inc. . . . . . . . . . . . . . . . . . . . . . 1.5 770,608
Paper and Related Products 39,177 Veritiv Corp. . . . . . . . . . . . . . . . . . . . . . . . . . . . 2.8 1,418,991
Pharmaceuticals 44,929 Mallinckrodt PLC . . . . . . . . . . . . . . . . . . . . . . . 6.5 3,353,051
Publishing – Newspapers 72,100 News Corp. . . . . . . . . . . . . . . . . . . . . . . . . . . . 1.9 963,256
Real Estate Operating/Development 97,346 St. Joe Co. . . . . . . . . . . . . . . . . . . . . . . . . . . . . 3.5 1,801,874
Retail – Auto Parts 6,841 Advance Auto Parts, Inc. . . . . . . . . . . . . . . . . . 2.0 1,029,639
Retail – Discount 10,351 Target Corp. . . . . . . . . . . . . . . . . . . . . . . . . . . . 1.5 751,586
Retail – Restaurants 115,645 Wendy’s Co. . . . . . . . . . . . . . . . . . . . . . . . . . . . 2.4 1,245,497
Share or Principal Amount
Percentage of Net
Assets (%) Fair
Value (USD)
Telecommunication Equipment 98,645 Knowles Corp. . . . . . . . . . . . . . . . . . . . . . . . . . 2.6 1,314,938
Toys 119,341 Mattel, Inc. . . . . . . . . . . . . . . . . . . . . . . . . . . . . 6.3 3,242,495
Wireless Equipment 29,958 Motorola Solutions, Inc. . . . . . . . . . . . . . . . . . . 3.9 2,050,625
Total Common Stock . . . . . . . . . . . . . . . . . . . . . . . . . . . . . . . . . 94.4 48,444,278
Total Investments . . . . . . . . . . . . . . . . . . . . . . . . . . . . . . . . . . . . 94.4 48,444,278
*Fair Valued by Janus Global Pricing Committee at 31 December 2015.

Janus Opportunistic Alpha Fund
PORTFOLIO INVESTMENTS
The accompanying notes are an integral part of the fi nancial statements.
1 1 6 J a n u s C a p i t a l F u n d s P l c / 3 1 D e c e m b e r 2 0 1 5
Forward Currency Contracts, Open as at 31 December 2015
Currency Purchased
Currency Sold
Current Market
Value (USD) Settle Date
Unrealised Appreciation
(USD)
Citibank CNH 18,780 USD 2,845 2,844 7-Jan-16 1CNH 162 USD 25 25 29-Jan-16 —CNH 189 USD 29 29 29-Jan-16 —CNH 255 USD 39 39 29-Jan-16 —CNH 182 USD 28 28 7-Jan-16 —EUR 7,404,905 USD 8,046,932 8,042,111 7-Jan-16 4,821EUR 57,909 USD 62,929 62,891 7-Jan-16 38EUR 37,254 USD 40,484 40,460 7-Jan-16 24EUR 74,070 USD 80,527 80,514 7-Jan-16 13EUR 19,513 USD 21,205 21,192 7-Jan-16 13EUR 195 USD 212 212 7-Jan-16 —EUR 374 USD 407 407 7-Jan-16 —EUR 581 USD 632 632 7-Jan-16 —USD 46,427 EUR 42,492 46,204 7-Jan-16 223USD 17,955 EUR 16,408 17,841 29-Jan-16 114USD 11,325 EUR 10,322 11,224 7-Jan-16 101USD 19,021 EUR 17,413 18,934 7-Jan-16 87USD 4,689 EUR 4,279 4,652 29-Jan-16 37USD 2,126 EUR 1,944 2,113 7-Jan-16 13USD 10,692 EUR 9,822 10,681 29-Jan-16 11USD 361 EUR 330 359 7-Jan-16 2USD 197 EUR 181 196 29-Jan-16 1USD 86 EUR 79 85 7-Jan-16 1USD 129 EUR 118 128 29-Jan-16 1USD 82 EUR 75 81 7-Jan-16 1USD 233 EUR 213 232 7-Jan-16 1USD 123 EUR 113 122 7-Jan-16 1USD 58 CNH 380 58 29-Jan-16 —USD 446 EUR 411 446 29-Jan-16 —USD 32 CNH 210 32 29-Jan-16 —USD 235 EUR 216 235 29-Jan-16 —USD 24 EUR 22 24 29-Jan-16 —USD 2 CNH 16 2 29-Jan-16 —USD 30 EUR 28 30 29-Jan-16 —USD 56 EUR 51 56 29-Jan-16 —USD 49 EUR 45 49 7-Jan-16 —USD 17 CNH 111 17 7-Jan-16 —
Total 5,504
Total Financial Assets at fair value through profi t or loss 48,449,782
Financial Liabilities at fair value through profi t or loss
Forward Currency Contracts, Open as at 31 December 2015
Currency Purchased
Currency Sold
Current Market
Value (USD) Settle Date
Unrealised (Depreciation)
(USD)
Citibank EUR 158 USD 173 174 29-Jan-16 (1)EUR 307 USD 336 338 29-Jan-16 (2)EUR 229 USD 250 252 29-Jan-16 (2)EUR 241 USD 264 266 29-Jan-16 (2)EUR 439 USD 480 483 29-Jan-16 (3)EUR 476 USD 522 526 29-Jan-16 (4)EUR 682 USD 747 752 7-Jan-16 (5)EUR 462 USD 507 512 29-Jan-16 (5)EUR 717 USD 787 794 29-Jan-16 (7)EUR 1,233 USD 1,351 1,362 29-Jan-16 (11)EUR 8,530 USD 9,331 9,386 7-Jan-16 (55)EUR 8,992 USD 9,836 9,895 7-Jan-16 (59)EUR 59,899 USD 65,602 66,073 7-Jan-16 (471)EUR 86,596 USD 94,807 95,453 7-Jan-16 (646)EUR 91,080 USD 99,966 100,896 7-Jan-16 (932)USD 693 EUR 638 694 29-Jan-16 (1)USD 438 EUR 404 440 7-Jan-16 (2)USD 834 EUR 770 838 7-Jan-16 (4)USD 1,296 EUR 1,197 1,302 7-Jan-16 (6)USD 88,740 EUR 81,696 88,832 29-Jan-16 (92)USD 165,643 EUR 153,013 166,378 7-Jan-16 (735)
Total (3,045)
Total Financial Liabilities at fair value through profi t or loss (3,045)

Janus US Fund
PORTFOLIO INVESTMENTS
The accompanying notes are an integral part of the fi nancial statements.
J a n u s C a p i t a l F u n d s P l c / 3 1 D e c e m b e r 2 0 1 5 1 1 7
Share or Principal Amount
Percentage of Net
Assets (%) Fair
Value (USD)
Financial Assets at fair value through profi t or loss Common Stock Aerospace and Defence
50 Northrop Grumman Corp. . . . . . . . . . . . . . . . . 0.5 9,441
Airlines 344 Southwest Airlines Co. . . . . . . . . . . . . . . . . . . . 0.8 14,813
Apparel Manufacturers 316 Gildan Activewear, Inc. . . . . . . . . . . . . . . . . . . 0.5 8,981
Applications Software 175 Microsoft Corp. . . . . . . . . . . . . . . . . . . . . . . . . 0.5 9,709229 NetSuite, Inc. . . . . . . . . . . . . . . . . . . . . . . . . . . 1.0 19,378212 Salesforce.com, Inc. . . . . . . . . . . . . . . . . . . . . . 0.9 16,621113 ServiceNow, Inc. . . . . . . . . . . . . . . . . . . . . . . . . 0.5 9,781
2.9 55,489
Athletic Footwear 78 NIKE, Inc. – Class B . . . . . . . . . . . . . . . . . . . . . 0.3 4,875
Automotive – Cars and Light Trucks 28 Tesla Motors, Inc. . . . . . . . . . . . . . . . . . . . . . . . 0.4 6,720
Automotive – Truck Parts and Equipment – Original 187 Delphi Automotive PLC . . . . . . . . . . . . . . . . . . 0.8 16,032
Cable/Satellite TV 511 Comcast Corp. – Class A . . . . . . . . . . . . . . . . . 1.5 28,836349 Liberty Global PLC – Class C . . . . . . . . . . . . . . 0.8 14,229
2.3 43,065
Cellular Telecommunications 308 T-Mobile U.S., Inc. . . . . . . . . . . . . . . . . . . . . . . 0.6 12,049
Chemicals – Diversifi ed 219 PPG Industries, Inc. . . . . . . . . . . . . . . . . . . . . . 1.1 21,642
Commercial Services 413 Aramark . . . . . . . . . . . . . . . . . . . . . . . . . . . . . . 0.7 13,319
84 CoStar Group, Inc. . . . . . . . . . . . . . . . . . . . . . . 0.9 17,36221 ServiceMaster Global Holdings, Inc. . . . . . . . . . . — 824
1.6 31,505
Commercial Services – Finance 236 Mastercard, Inc. – Class A . . . . . . . . . . . . . . . . 1.2 22,977
Computer Aided Design 130 ANSYS, Inc. . . . . . . . . . . . . . . . . . . . . . . . . . . . 0.6 12,025
Computers 566 Apple, Inc. . . . . . . . . . . . . . . . . . . . . . . . . . . . . 3.1 59,577
Consulting Services 291 Verisk Analytics, Inc. – Class A . . . . . . . . . . . . . 1.2 22,372
Consumer Products – Miscellaneous 243 Kimberly-Clark Corp. . . . . . . . . . . . . . . . . . . . . 1.6 30,934
Containers – Metal and Glass 152 Ball Corp. . . . . . . . . . . . . . . . . . . . . . . . . . . . . . 0.6 11,055
Cosmetics and Toiletries 144 Colgate-Palmolive Co. . . . . . . . . . . . . . . . . . . . 0.5 9,593161 Estee Lauder Cos, Inc. – Class A . . . . . . . . . . . . 0.7 14,178
1.2 23,771
Cruise Lines 476 Norwegian Cruise Line Holdings,
Ltd. . . . . . . . . . . . . . . . . . . . . . . . . . . . . . . . . 1.5 27,894
Diversifi ed Manufacturing Operations 592 General Electric Co. . . . . . . . . . . . . . . . . . . . . . 1.0 18,441
E-Commerce/Products 193 Alibaba Group Holding, Ltd. (ADR) . . . . . . . . . 0.8 15,685
65 Amazon.com, Inc. . . . . . . . . . . . . . . . . . . . . . . 2.3 43,9333.1 59,618
E-Commerce/Services 184 Ctrip.com International, Ltd. (ADR) . . . . . . . . . 0.5 8,525
9 priceline.com, Inc. . . . . . . . . . . . . . . . . . . . . . . 0.6 11,4751.1 20,000
Share or Principal Amount
Percentage of Net
Assets (%) Fair
Value (USD)
Electric – Transmission 405 Brookfi eld Infrastructure
Partners L.P. . . . . . . . . . . . . . . . . . . . . . . . . . 0.8 15,354
Electronic Components – Semiconductors 968 ARM Holdings PLC . . . . . . . . . . . . . . . . . . . . . 0.8 14,825197 Avago Technologies, Ltd. . . . . . . . . . . . . . . . . . 1.5 28,595
2.3 43,420
Electronic Connectors 391 Amphenol Corp. – Class A . . . . . . . . . . . . . . . . 1.1 20,422
Electronic Design Automation 1,182 Cadence Design Systems, Inc. . . . . . . . . . . . . . 1.3 24,597
Electronic Forms 226 Adobe Systems, Inc. . . . . . . . . . . . . . . . . . . . . . 1.1 21,230
Enterprise Software/Services 241 Oracle Corp.. . . . . . . . . . . . . . . . . . . . . . . . . . . 0.5 8,804
75 Ultimate Software Group, Inc. . . . . . . . . . . . . . 0.8 14,663107 Workday, Inc. – Class A . . . . . . . . . . . . . . . . . . 0.5 8,526
1.8 31,993
Finance – Consumer Loans 504 Synchrony Financial . . . . . . . . . . . . . . . . . . . . . 0.8 15,327
Finance – Credit Card 441 Visa, Inc. – Class A . . . . . . . . . . . . . . . . . . . . . . 1.8 34,200
Finance – Investment Bankers/Brokers 378 Charles Schwab Corp. . . . . . . . . . . . . . . . . . . . 0.7 12,448
Food – Confectionery 219 Hershey Co. . . . . . . . . . . . . . . . . . . . . . . . . . . . 1.0 19,550
Food – Retail 715 Kroger Co. . . . . . . . . . . . . . . . . . . . . . . . . . . . . 1.6 29,908
Industrial Gases 98 Air Products and Chemicals, Inc. . . . . . . . . . . . 0.7 12,751
Instruments – Controls 295 Honeywell International, Inc. . . . . . . . . . . . . . . 1.6 30,553305 Sensata Technologies Holding N.V. . . . . . . . . . . 0.7 14,048
2.3 44,601
Internet Content – Entertainment 527 Facebook, Inc. . . . . . . . . . . . . . . . . . . . . . . . . . 2.9 55,156
Medical – Biomedical and Genetic 301 Amgen, Inc. . . . . . . . . . . . . . . . . . . . . . . . . . . . 2.6 48,861157 Celgene Corp. . . . . . . . . . . . . . . . . . . . . . . . . . 1.0 18,802
18 Regeneron Pharmaceuticals, Inc. . . . . . . . . . . . 0.5 9,7724.1 77,435
Medical – Drugs 174 AbbVie, Inc. . . . . . . . . . . . . . . . . . . . . . . . . . . . 0.5 10,308614 Bristol-Myers Squibb Co. . . . . . . . . . . . . . . . . . 2.2 42,237245 Eli Lilly & Co. . . . . . . . . . . . . . . . . . . . . . . . . . 1.1 20,644313 Endo International PLC . . . . . . . . . . . . . . . . . . 1.0 19,162115 Jazz Pharmaceuticals PLC . . . . . . . . . . . . . . . . . 0.9 16,164
5.7 108,515
Medical – Generic Drugs 139 Allergan PLC . . . . . . . . . . . . . . . . . . . . . . . . . . 2.3 43,438
Medical – HMO 67 Aetna, Inc. . . . . . . . . . . . . . . . . . . . . . . . . . . . . 0.4 7,244
Medical Information Systems 145 Athenahealth, Inc. . . . . . . . . . . . . . . . . . . . . . . 1.2 23,341
Medical Instruments 1,514 Boston Scientifi c Corp. . . . . . . . . . . . . . . . . . . . 1.5 27,918
Medical Products 108 Telefl ex, Inc. . . . . . . . . . . . . . . . . . . . . . . . . . . . 0.8 14,197
Multi-Industry 202 Southwestern Energy Co. . . . . . . . . . . . . . . . . . 0.1 1,436
Multimedia 246 Walt Disney Co. . . . . . . . . . . . . . . . . . . . . . . . . 1.4 25,850
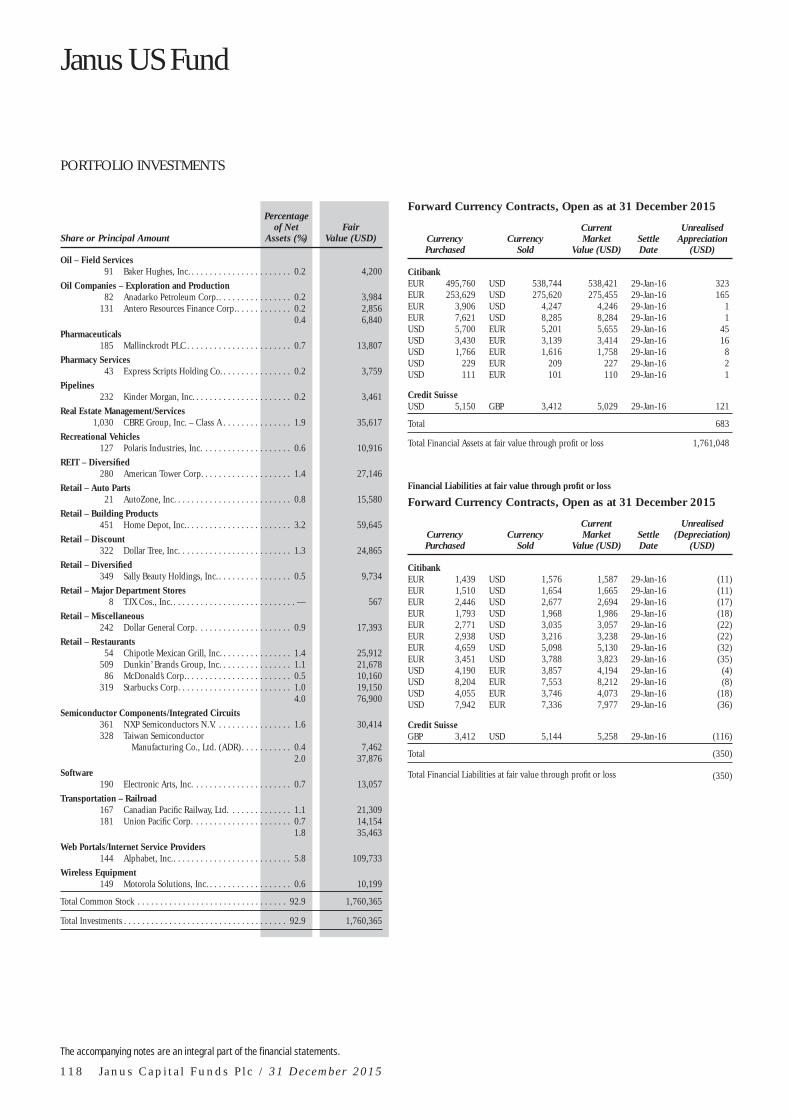
Janus US Fund
PORTFOLIO INVESTMENTS
The accompanying notes are an integral part of the fi nancial statements.
1 1 8 J a n u s C a p i t a l F u n d s P l c / 3 1 D e c e m b e r 2 0 1 5
Share or Principal Amount
Percentage of Net
Assets (%) Fair
Value (USD)
Oil – Field Services 91 Baker Hughes, Inc. . . . . . . . . . . . . . . . . . . . . . . 0.2 4,200
Oil Companies – Exploration and Production 82 Anadarko Petroleum Corp. . . . . . . . . . . . . . . . . 0.2 3,984
131 Antero Resources Finance Corp. . . . . . . . . . . . . 0.2 2,8560.4 6,840
Pharmaceuticals 185 Mallinckrodt PLC . . . . . . . . . . . . . . . . . . . . . . . 0.7 13,807
Pharmacy Services 43 Express Scripts Holding Co. . . . . . . . . . . . . . . . 0.2 3,759
Pipelines 232 Kinder Morgan, Inc. . . . . . . . . . . . . . . . . . . . . . 0.2 3,461
Real Estate Management/Services 1,030 CBRE Group, Inc. – Class A . . . . . . . . . . . . . . . 1.9 35,617
Recreational Vehicles 127 Polaris Industries, Inc. . . . . . . . . . . . . . . . . . . . 0.6 10,916
REIT – Diversifi ed 280 American Tower Corp. . . . . . . . . . . . . . . . . . . . 1.4 27,146
Retail – Auto Parts 21 AutoZone, Inc. . . . . . . . . . . . . . . . . . . . . . . . . . 0.8 15,580
Retail – Building Products 451 Home Depot, Inc. . . . . . . . . . . . . . . . . . . . . . . . 3.2 59,645
Retail – Discount 322 Dollar Tree, Inc. . . . . . . . . . . . . . . . . . . . . . . . . 1.3 24,865
Retail – Diversifi ed 349 Sally Beauty Holdings, Inc. . . . . . . . . . . . . . . . . 0.5 9,734
Retail – Major Department Stores 8 TJX Cos., Inc. . . . . . . . . . . . . . . . . . . . . . . . . . . . — 567
Retail – Miscellaneous 242 Dollar General Corp. . . . . . . . . . . . . . . . . . . . . 0.9 17,393
Retail – Restaurants 54 Chipotle Mexican Grill, Inc. . . . . . . . . . . . . . . . 1.4 25,912
509 Dunkin’ Brands Group, Inc. . . . . . . . . . . . . . . . 1.1 21,67886 McDonald’s Corp. . . . . . . . . . . . . . . . . . . . . . . . 0.5 10,160
319 Starbucks Corp. . . . . . . . . . . . . . . . . . . . . . . . . 1.0 19,1504.0 76,900
Semiconductor Components/Integrated Circuits 361 NXP Semiconductors N.V. . . . . . . . . . . . . . . . . 1.6 30,414328 Taiwan Semiconductor
Manufacturing Co., Ltd. (ADR) . . . . . . . . . . . 0.4 7,4622.0 37,876
Software 190 Electronic Arts, Inc. . . . . . . . . . . . . . . . . . . . . . 0.7 13,057
Transportation – Railroad 167 Canadian Pacifi c Railway, Ltd. . . . . . . . . . . . . . 1.1 21,309181 Union Pacifi c Corp. . . . . . . . . . . . . . . . . . . . . . 0.7 14,154
1.8 35,463
Web Portals/Internet Service Providers 144 Alphabet, Inc. . . . . . . . . . . . . . . . . . . . . . . . . . . 5.8 109,733
Wireless Equipment 149 Motorola Solutions, Inc. . . . . . . . . . . . . . . . . . . 0. 6 10,199
Total Common Stock . . . . . . . . . . . . . . . . . . . . . . . . . . . . . . . . . 92. 9 1,760,365
Total Investments . . . . . . . . . . . . . . . . . . . . . . . . . . . . . . . . . . . . 92. 9 1,760,365
Forward Currency Contracts, Open as at 31 December 2015
Currency Purchased
Currency Sold
Current Market
Value (USD) Settle Date
Unrealised Appreciation
(USD)
Citibank EUR 495,760 USD 538,744 538,421 29-Jan-16 323EUR 253,629 USD 275,620 275,455 29-Jan-16 165EUR 3,906 USD 4,247 4,246 29-Jan-16 1EUR 7,621 USD 8,285 8,284 29-Jan-16 1USD 5,700 EUR 5,201 5,655 29-Jan-16 45USD 3,430 EUR 3,139 3,414 29-Jan-16 16USD 1,766 EUR 1,616 1,758 29-Jan-16 8USD 229 EUR 209 227 29-Jan-16 2USD 111 EUR 101 110 29-Jan-16 1
Credit Suisse USD 5,150 GBP 3,412 5,029 29-Jan-16 121
Total 683
Total Financial Assets at fair value through profi t or loss 1,761,048
Financial Liabilities at fair value through profi t or loss Forward Currency Contracts, Open as at 31 December 2015
Currency Purchased
Currency Sold
Current Market
Value (USD) Settle Date
Unrealised (Depreciation)
(USD)
Citibank EUR 1,439 USD 1,576 1,587 29-Jan-16 (11)EUR 1,510 USD 1,654 1,665 29-Jan-16 (11)EUR 2,446 USD 2,677 2,694 29-Jan-16 (17)EUR 1,793 USD 1,968 1,986 29-Jan-16 (18)EUR 2,771 USD 3,035 3,057 29-Jan-16 (22)EUR 2,938 USD 3,216 3,238 29-Jan-16 (22)EUR 4,659 USD 5,098 5,130 29-Jan-16 (32)EUR 3,451 USD 3,788 3,823 29-Jan-16 (35)USD 4,190 EUR 3,857 4,194 29-Jan-16 (4)USD 8,204 EUR 7,553 8,212 29-Jan-16 (8)USD 4,055 EUR 3,746 4,073 29-Jan-16 (18)USD 7,942 EUR 7,336 7,977 29-Jan-16 (36)
Credit Suisse GBP 3,412 USD 5,144 5,258 29-Jan-16 (116)
Total (350)
Total Financial Liabilities at fair value through profi t or loss (350)

Janus US Research Fund
PORTFOLIO INVESTMENTS
The accompanying notes are an integral part of the fi nancial statements.
J a n u s C a p i t a l F u n d s P l c / 3 1 D e c e m b e r 2 0 1 5 1 1 9
Share or Principal Amount
Percentage of Net
Assets (%) Fair
Value (USD)
Financial Assets at fair value through profi t or loss Common Stock Advertising Services
10,422 Nielsen Holdings PLC . . . . . . . . . . . . . . . . . . . 0.3 485,665
Aerospace and Defence – Equipment 15,072 United Technologies Corp. . . . . . . . . . . . . . . . . 0.7 1,447,967
Airlines 39,950 United Continental Holdings, Inc. . . . . . . . . . . 1.2 2,289,135
Apparel Manufacturers 4,964 Carter’s, Inc. . . . . . . . . . . . . . . . . . . . . . . . . . . . 0.2 441,945
Applications Software 14,399 NetSuite, Inc. . . . . . . . . . . . . . . . . . . . . . . . . . . 0.6 1,218,44320,229 ServiceNow, Inc. . . . . . . . . . . . . . . . . . . . . . . . . 0.9 1,751,022
5,027 Tableau Software, Inc. – Class A . . . . . . . . . . . . 0.2 473,6441.7 3,443,109
Athletic Footwear 25,650 NIKE, Inc. – Class B . . . . . . . . . . . . . . . . . . . . . 0.8 1,603,125
Automotive – Truck Parts and Equipment – Original 21,065 Delphi Automotive PLC . . . . . . . . . . . . . . . . . . 0.9 1,805,902
Beverages – Non-Alcoholic 52,065 Coca-Cola Co. . . . . . . . . . . . . . . . . . . . . . . . . . 1.2 2,236,712
Beverages – Wine and Spirits 6,083 Brown-Forman Corp. – Class B . . . . . . . . . . . . 0.3 603,920
Building Products – Cement and Aggregate 14,828 Vulcan Materials Co.. . . . . . . . . . . . . . . . . . . . . 0.7 1,408,215
Cable/Satellite TV 37,921 Comcast Corp. – Class A . . . . . . . . . . . . . . . . . 1.1 2,139,882
3,605 Time Warner Cable, Inc.. . . . . . . . . . . . . . . . . . 0.3 669,0521.4 2,808,934
Cellular Telecommunications 29,957 T-Mobile U.S., Inc. . . . . . . . . . . . . . . . . . . . . . . 0.6 1,171,918
Chemicals – Diversifi ed 18,934 PPG Industries, Inc. . . . . . . . . . . . . . . . . . . . . . 1.0 1,871,058
Commercial Banks – Western U.S. 41,594 PacWest Bancorp. . . . . . . . . . . . . . . . . . . . . . . . 0.9 1,792,701
Commercial Services 21,353 Aramark . . . . . . . . . . . . . . . . . . . . . . . . . . . . . . 0.4 688,634
3,828 CoStar Group, Inc. . . . . . . . . . . . . . . . . . . . . . . 0.4 791,20920,054 ServiceMaster Global Holdings,
Inc. . . . . . . . . . . . . . . . . . . . . . . . . . . . . . . . . 0.4 786,9191.2 2,266,762
Commercial Services – Finance 26,100 Mastercard, Inc. – Class A . . . . . . . . . . . . . . . . 1.3 2,541,096
Computer Aided Design 9,579 ANSYS, Inc. . . . . . . . . . . . . . . . . . . . . . . . . . . . 0.5 886,058
Computer Services 16,943 Cognizant Technology Solutions
Corp. . . . . . . . . . . . . . . . . . . . . . . . . . . . . . . 0.5 1,016,919
Computers 39,647 Apple, Inc. . . . . . . . . . . . . . . . . . . . . . . . . . . . . 2.2 4,173,243
Consulting Services 28,983 Verisk Analytics, Inc. – Class A . . . . . . . . . . . . . 1.2 2,228,213
Containers – Metal and Glass 34,843 Crown Holdings, Inc. . . . . . . . . . . . . . . . . . . . . 0.9 1,766,540
Cosmetics and Toiletries 15,546 Colgate-Palmolive Co. . . . . . . . . . . . . . . . . . . . 0.5 1,035,675
6,041 Estee Lauder Cos, Inc. – Class A . . . . . . . . . . . . 0.3 531,9700.8 1,567,645
Cruise Lines 24,842 Norwegian Cruise Line
Holdings, Ltd. . . . . . . . . . . . . . . . . . . . . . . . . 0.8 1,455,741
Share or Principal Amount
Percentage of Net
Assets (%) Fair
Value (USD)
Data Processing and Management 21,206 Fidelity National Information
Services, Inc. . . . . . . . . . . . . . . . . . . . . . . . . . 0.7 1,285,084
Distribution/Wholesale 32,106 Fastenal Co. . . . . . . . . . . . . . . . . . . . . . . . . . . . 0.7 1,310,567
Diversifi ed Banking Institutions 39,364 Citigroup, Inc. . . . . . . . . . . . . . . . . . . . . . . . . . 1.1 2,037,08739,388 JP Morgan Chase & Co. . . . . . . . . . . . . . . . . . . 1.3 2,600,790
2.4 4,637,877
Diversifi ed Manufacturing Operations 15,898 AO Smith Corp. . . . . . . . . . . . . . . . . . . . . . . . . 0.6 1,217,946
Diversifi ed Operations 21,643 Dover Corp. . . . . . . . . . . . . . . . . . . . . . . . . . . . 0.7 1,326,932
E-Commerce/Products 4,519 Amazon.com, Inc. . . . . . . . . . . . . . . . . . . . . . . 1.6 3,054,347
E-Commerce/Services 1,065 priceline.com, Inc. . . . . . . . . . . . . . . . . . . . . . . 0.7 1,357,822
Electric – Transmission 49,097 Brookfi eld Infrastructure
Partners L.P. . . . . . . . . . . . . . . . . . . . . . . . . . 1.0 1,861,267
Electronic Components – Miscellaneous 27,618 TE Connectivity, Ltd.
(U.S. Shares) . . . . . . . . . . . . . . . . . . . . . . . . . 0.9 1,784,399
Electronic Components – Semiconductors 11,653 Avago Technologies, Ltd. . . . . . . . . . . . . . . . . . 0.9 1,691,43319,780 Texas Instruments, Inc.. . . . . . . . . . . . . . . . . . . 0.6 1,084,142
1.5 2,775,575
Electronic Connectors 42,953 Amphenol Corp. – Class A . . . . . . . . . . . . . . . . 1.2 2,243,435
Electronic Design Automation 53,031 Cadence Design Systems, Inc. . . . . . . . . . . . . . 0.6 1,103,575
Electronic Forms 23,327 Adobe Systems, Inc. . . . . . . . . . . . . . . . . . . . . . 1.1 2,191,338
Electronic Measuring Instruments 28,036 National Instruments Corp. . . . . . . . . . . . . . . . 0.4 804,353
Enterprise Software/Services 3,654 Tyler Technologies, Inc. . . . . . . . . . . . . . . . . . . 0.3 636,9656,171 Ultimate Software Group, Inc. . . . . . . . . . . . . . 0.6 1,206,4924,907 Workday, Inc. – Class A . . . . . . . . . . . . . . . . . . 0.2 390,990
1.1 2,234,447
Finance – Consumer Loans 76,092 Synchrony Financial . . . . . . . . . . . . . . . . . . . . . 1.2 2,313,958
Finance – Credit Card 23,361 American Express Co. . . . . . . . . . . . . . . . . . . . 0.8 1,624,75833,095 Visa, Inc. – Class A . . . . . . . . . . . . . . . . . . . . . . 1.3 2,566,517
2.1 4,191,275
Finance – Investment Bankers/Brokers 73,052 E*TRADE Financial Corp. . . . . . . . . . . . . . . . . 1.1 2,165,26140,008 LPL Financial Holdings, Inc. . . . . . . . . . . . . . . 0.9 1,706,341
2.0 3,871,602
Finance – Other Services 7,397 Intercontinental Exchange . . . . . . . . . . . . . . . . 1.0 1,895,555
Food – Confectionery 18,881 Hershey Co. . . . . . . . . . . . . . . . . . . . . . . . . . . . 0.9 1,685,507
Food – Retail 59,999 Kroger Co. . . . . . . . . . . . . . . . . . . . . . . . . . . . . 1.3 2,509,758
Food – Wholesale/Distribution 34,680 Sysco Corp. . . . . . . . . . . . . . . . . . . . . . . . . . . . 0.7 1,421,880
Hotels and Motels 35,136 Hilton Worldwide Holdings, Inc. . . . . . . . . . . . 0.4 751,910
Independent Power Producer 188,006 NRG Energy, Inc. . . . . . . . . . . . . . . . . . . . . . . . 1.1 2,212,831

Janus US Research Fund
PORTFOLIO INVESTMENTS
The accompanying notes are an integral part of the fi nancial statements.
1 2 0 J a n u s C a p i t a l F u n d s P l c / 3 1 D e c e m b e r 2 0 1 5
Share or Principal Amount
Percentage of Net
Assets (%) Fair
Value (USD)
Industrial Gases 17,681 Air Products and Chemicals, Inc. . . . . . . . . . . . 1.2 2,300,475
Instruments – Controls 22,170 Honeywell International, Inc. . . . . . . . . . . . . . . 1.2 2,296,14746,401 Sensata Technologies Holding N.V. . . . . . . . . . . 1.1 2,137,230
2.3 4,433,377
Insurance 191,474 MGIC Investment Corp. . . . . . . . . . . . . . . . . . . 0.9 1,690,715
Internet Content – Entertainment 31,261 Facebook, Inc. . . . . . . . . . . . . . . . . . . . . . . . . . 1.7 3,271,776
Internet Content – Information/News 2,319 LinkedIn Corp. . . . . . . . . . . . . . . . . . . . . . . . . . 0.3 521,961
Investment Management and Advisory Services 6,190 BlackRock, Inc. . . . . . . . . . . . . . . . . . . . . . . . . 1.1 2,107,819
Machinery – General Industrial 7,363 Roper Industries, Inc. . . . . . . . . . . . . . . . . . . . . 0.7 1,397,424
Medical – Biomedical and Genetic 29,610 Alder Biopharmaceuticals, Inc. . . . . . . . . . . . . . 0.5 978,01819,490 Amgen, Inc. . . . . . . . . . . . . . . . . . . . . . . . . . . . 1.6 3,163,812
6,839 Biogen Idec, Inc.. . . . . . . . . . . . . . . . . . . . . . . . 1.1 2,095,12822,332 Celgene Corp. . . . . . . . . . . . . . . . . . . . . . . . . . 1.4 2,674,480
3,641 Regeneron Pharmaceuticals, Inc. . . . . . . . . . . . 1.0 1,976,5905.6 10,888,028
Medical – Drugs 42,819 AbbVie, Inc. . . . . . . . . . . . . . . . . . . . . . . . . . . . 1.3 2,536,59840,567 Bristol-Myers Squibb Co. . . . . . . . . . . . . . . . . . 1.4 2,790,60419,942 Eli Lilly & Co. . . . . . . . . . . . . . . . . . . . . . . . . . 0.9 1,680,31331,466 Endo International PLC . . . . . . . . . . . . . . . . . . 1.0 1,926,34992,810 Ironwood Pharmaceuticals, Inc. . . . . . . . . . . . . 0.6 1,075,668
5.2 10,009,532
Medical – Hospitals 8,758 Universal Health Services, Inc. . . . . . . . . . . . . . 0.5 1,046,493
Medical Information Systems 9,681 Athenahealth, Inc. . . . . . . . . . . . . . . . . . . . . . . 0.8 1,558,351
Medical Instruments 100,934 Boston Scientifi c Corp. . . . . . . . . . . . . . . . . . . . 1.0 1,861,223
Metal Processors and Fabrication 57,348 Rexnord Corp. . . . . . . . . . . . . . . . . . . . . . . . . . 0.5 1,039,146
Multimedia 18,997 Walt Disney Co. . . . . . . . . . . . . . . . . . . . . . . . . 1.0 1,996,205
Oil – Field Services 48,489 Baker Hughes, Inc. . . . . . . . . . . . . . . . . . . . . . . 1.2 2,237,767
Oil Companies – Exploration and Production 46,048 Anadarko Petroleum Corp. . . . . . . . . . . . . . . . . 1.2 2,237,012
Oil Companies – Integrated 36,441 Chevron Corp. . . . . . . . . . . . . . . . . . . . . . . . . . 1.7 3,278,23223,939 Phillips 66 . . . . . . . . . . . . . . . . . . . . . . . . . . . . 1.0 1,958,210
2.7 5,236,442
Pharmaceuticals 20,107 Mallinckrodt PLC . . . . . . . . . . . . . . . . . . . . . . . 0.8 1,500,585
Pharmacy Services 25,730 Diplomat Pharmacy, Inc. . . . . . . . . . . . . . . . . . 0.5 880,48124,410 Express Scripts Holding Co. . . . . . . . . . . . . . . . 1.1 2,133,678
1.6 3,014,159
Pipelines 94,080 Enterprise Products Partners L.P. . . . . . . . . . . . 1.2 2,406,566
2 Kinder Morgan, Inc. . . . . . . . . . . . . . . . . . . . . . . — 3058,094 MPLX L.P. . . . . . . . . . . . . . . . . . . . . . . . . . . . . . 1.2 2,284,837
2.4 4,691,433
Private Equity 70,010 Blackstone Group L.P. . . . . . . . . . . . . . . . . . . . . 1.1 2,047,092
Real Estate Management/Services 12,997 Jones Lang LaSalle, Inc. . . . . . . . . . . . . . . . . . . 1.1 2,077,700
Share or Principal Amount
Percentage of Net
Assets (%) Fair
Value (USD)
Recreational Vehicles 17,066 Polaris Industries, Inc. . . . . . . . . . . . . . . . . . . . 0.8 1,466,823
REIT – Diversifi ed 19,566 American Tower Corp. . . . . . . . . . . . . . . . . . . . 1.0 1,896,92494,919 Lexington Realty Trust . . . . . . . . . . . . . . . . . . . 0.4 759,352
1.4 2,656,276
REIT – Regional Malls 9,447 Simon Property Group, Inc. . . . . . . . . . . . . . . . 1.0 1,836,875
Retail – Auto Parts 1,031 AutoZone, Inc. . . . . . . . . . . . . . . . . . . . . . . . . . 0.4 764,909
Retail – Building Products 36,450 Lowe’s Cos., Inc. . . . . . . . . . . . . . . . . . . . . . . . . 1.4 2,771,658
Retail – Discount 19,791 Dollar Tree, Inc. . . . . . . . . . . . . . . . . . . . . . . . . 0.8 1,528,261
Retail – Gardening Products 15,059 Tractor Supply Co. . . . . . . . . . . . . . . . . . . . . . . 0.7 1,287,545
Retail – Restaurants 644 Chipotle Mexican Grill, Inc. . . . . . . . . . . . . . . . 0.2 309,023
17,334 Dunkin’ Brands Group, Inc. . . . . . . . . . . . . . . . 0.4 738,25536,228 Starbucks Corp. . . . . . . . . . . . . . . . . . . . . . . . . 1.1 2,174,767
1.7 3,222,045
Semiconductor Components/Integrated Circuits 82,982 Atmel Corp. . . . . . . . . . . . . . . . . . . . . . . . . . . . 0.4 714,475
Super – Regional Banks 34,930 U.S. Bancorp . . . . . . . . . . . . . . . . . . . . . . . . . . 0.8 1,490,463
Telecommunication Equipment 32,059 CommScope Holding Co., Inc. . . . . . . . . . . . . . 0.4 830,008
Telecommunication Services 33,441 Amdocs, Ltd. . . . . . . . . . . . . . . . . . . . . . . . . . . 0.9 1,824,875
Tobacco 34,304 Altria Group, Inc. . . . . . . . . . . . . . . . . . . . . . . . 1.0 1,996,836
Toys 32,554 Mattel, Inc. . . . . . . . . . . . . . . . . . . . . . . . . . . . . 0.5 884,492
Transportation – Railroad 24,104 Union Pacifi c Corp. . . . . . . . . . . . . . . . . . . . . . 1.0 1,884,933
Web Portals/Internet Service Providers 8,729 Alphabet, Inc. . . . . . . . . . . . . . . . . . . . . . . . . . . 3.4 6,624,264
Wireless Equipment 21,005 Motorola Solutions, Inc. . . . . . . . . . . . . . . . . . . 0. 6 1,437,792
Total Common Stock . . . . . . . . . . . . . . . . . . . . . . . . . . . . . . . . . 99. 3 191,743,008
Total Investments . . . . . . . . . . . . . . . . . . . . . . . . . . . . . . . . . . . . 99. 3 191,743,008

PORTFOLIO INVESTMENTS
The accompanying notes are an integral part of the fi nancial statements.
J a n u s C a p i t a l F u n d s P l c / 3 1 D e c e m b e r 2 0 1 5 1 2 1
Forward Currency Contracts, Open as at 31 December 2015
Currency Purchased
Currency Sold
Current Market
Value (USD) Settle Date
Unrealised Appreciation
(USD)
Citibank EUR 891,743 USD 969,059 968,478 29-Jan-16 581EUR 4,445 USD 4,830 4,827 29-Jan-16 3EUR 13,265 USD 14,421 14,419 29-Jan-16 2EUR 66 USD 72 72 29-Jan-16 —EUR 97 USD 105 105 29-Jan-16 —EUR 36 USD 39 39 29-Jan-16 —EUR 42 USD 45 45 29-Jan-16 —EUR 29 USD 32 32 29-Jan-16 —USD 7,677 EUR 7,026 7,640 29-Jan-16 37USD 896 EUR 817 888 29-Jan-16 8USD 79 EUR 73 79 29-Jan-16 —USD 74 EUR 68 74 29-Jan-16 —USD 4 EUR 4 4 29-Jan-16 —USD 38 EUR 35 38 29-Jan-16 —
Total 631
Total Financial Assets at fair value through profi t or loss 191,743,639
Financial Liabilities at fair value through profi t or loss
Forward Currency Contracts, Open as at 31 December 2015
Currency Purchased
Currency Sold
Current Market
Value (USD) Settle Date
Unrealised (Depreciation)
(USD)
Citibank EUR 61 USD 67 68 29-Jan-16 (1)EUR 5,618 USD 6,148 6,187 29-Jan-16 (39)EUR 7,005 USD 7,672 7,727 29-Jan-16 (55)EUR 8,301 USD 9,088 9,150 29-Jan-16 (62)EUR 12,262 USD 13,459 13,584 29-Jan-16 (127)USD 14,937 EUR 13,751 14,952 29-Jan-16 (15)USD 15,846 EUR 14,638 15,916 29-Jan-16 (70)
Total (369)
Total Financial Liabilities at fair value through profi t or loss (369)

Janus US Twenty Fund
PORTFOLIO INVESTMENTS
The accompanying notes are an integral part of the fi nancial statements.
1 2 2 J a n u s C a p i t a l F u n d s P l c / 3 1 D e c e m b e r 2 0 1 5
Share or Principal Amount
Percentage of Net
Assets (%) Fair
Value (USD)
Financial Assets at fair value through profi t or loss Common Stock Applications Software
438,440 Microsoft Corp. . . . . . . . . . . . . . . . . . . . . . . . . 6.5 24,324,650108,189 NetSuite, Inc. . . . . . . . . . . . . . . . . . . . . . . . . . . 2.5 9,154,953156,701 Salesforce.com, Inc. . . . . . . . . . . . . . . . . . . . . . 3.3 12,285,358
12.3 45,764,961
Athletic Footwear 282,594 NIKE, Inc. – Class B . . . . . . . . . . . . . . . . . . . . . 4.7 17,662,125
Chemicals – Diversifi ed 166,103 LyondellBasell Industries N.V. –
Class A . . . . . . . . . . . . . . . . . . . . . . . . . . . . . 3.9 14,434,351
Chemicals – Specialty 424,270 Chemours Co. . . . . . . . . . . . . . . . . . . . . . . . . . 0.6 2,274,087
Commercial Banks – Western U.S. 222,805 PacWest Bancorp. . . . . . . . . . . . . . . . . . . . . . . . 2.6 9,602,896
Commercial Services – Finance 175,739 Mastercard, Inc. – Class A . . . . . . . . . . . . . . . . 4.6 17,109,949
Cruise Lines 110,345 Norwegian Cruise Line
Holdings, Ltd. . . . . . . . . . . . . . . . . . . . . . . . . 1.7 6,466,217
E-Commerce/Products 22,165 Amazon.com, Inc. . . . . . . . . . . . . . . . . . . . . . . 4.0 14,981,102
E-Commerce/Services 126,272 Ctrip.com International,
Ltd. (ADR) . . . . . . . . . . . . . . . . . . . . . . . . . . 1.6 5,850,18215,040 priceline.com, Inc. . . . . . . . . . . . . . . . . . . . . . . 5.2 19,175,248
6.8 25,025,430
Electronic Connectors 114,959 Amphenol Corp. – Class A . . . . . . . . . . . . . . . . 1.6 6,004,309
Finance – Investment Bankers/Brokers 280,424 E*TRADE Financial Corp. . . . . . . . . . . . . . . . . 2.2 8,311,767
Food – Retail 314,839 Kroger Co. . . . . . . . . . . . . . . . . . . . . . . . . . . . . 3.5 13,169,715
Internet Content – Entertainment 160,351 Facebook, Inc. . . . . . . . . . . . . . . . . . . . . . . . . . 4.5 16,782,336
Medical – Biomedical and Genetic 118,601 Celgene Corp. . . . . . . . . . . . . . . . . . . . . . . . . . 3.8 14,203,656145,100 Medivation, Inc. . . . . . . . . . . . . . . . . . . . . . . . . 1.9 7,014,134
25,074 Regeneron Pharmaceuticals, Inc. . . . . . . . . . . . 3.7 13,611,9229.4 34,829,712
Medical – Drugs 261,697 AbbVie, Inc. . . . . . . . . . . . . . . . . . . . . . . . . . . . 4.2 15,502,930
Medical – Generic Drugs 46,597 Allergan PLC . . . . . . . . . . . . . . . . . . . . . . . . . . 3.9 14,561,563
Oil Companies – Integrated 89,172 Phillips 66 . . . . . . . . . . . . . . . . . . . . . . . . . . . . 2.0 7,294,270
Private Equity 487,736 Blackstone Group L.P. . . . . . . . . . . . . . . . . . . . . 3.8 14,261,401
Real Estate Management/Services 138,293 CBRE Group, Inc. – Class A . . . . . . . . . . . . . . . 1.3 4,782,172
Retail – Auto Parts 32,444 Advance Auto Parts, Inc. . . . . . . . . . . . . . . . . . 1.3 4,883,146
Retail – Discount 132,541 Dollar Tree, Inc. . . . . . . . . . . . . . . . . . . . . . . . . 2.7 10,234,816
Retail – Restaurants 16,959 Chipotle Mexican Grill, Inc. . . . . . . . . . . . . . . . 2.2 8,137,776
251,410 Starbucks Corp. . . . . . . . . . . . . . . . . . . . . . . . . 4.0 15,092,1426.2 23,229,918
Share or Principal Amount
Percentage of Net
Assets (%) Fair
Value (USD)
Web Portals/Internet Service Providers 31,672 Alphabet, Inc. . . . . . . . . . . . . . . . . . . . . . . . . . . 6.5 24,035,247
294,951 Yahoo!, Inc. . . . . . . . . . . . . . . . . . . . . . . . . . . . 2.6 9,810,0709.1 33,845,317
Total Common Stock . . . . . . . . . . . . . . . . . . . . . . . . . . . . . . . . . 96.9 361,014,490
Total Investments . . . . . . . . . . . . . . . . . . . . . . . . . . . . . . . . . . . . 96.9 361,014,490

PORTFOLIO INVESTMENTS
The accompanying notes are an integral part of the fi nancial statements.
J a n u s C a p i t a l F u n d s P l c / 3 1 D e c e m b e r 2 0 1 5 1 2 3
Forward Currency Contracts, Open as at 31 December 2015
Currency Purchased
Currency Sold
Current Market
Value (USD) Settle Date
Unrealised Appreciation
(USD)
Citibank AUD 2,458,038 USD 1,766,182 1,744,345 7-Jan-16 21,837AUD 42,255 USD 30,422 30,106 7-Jan-16 316AUD 21,924 USD 15,837 15,726 29-Jan-16 111AUD 5,440 USD 3,901 3,845 7-Jan-16 56AUD 20,564 USD 14,939 14,919 7-Jan-16 20CNH 21,418 USD 3,245 3,244 7-Jan-16 1CNH 364 USD 55 55 7-Jan-16 —CNH 97 USD 15 15 7-Jan-16 —CNH 98 USD 15 15 29-Jan-16 —CNH 231 USD 35 35 29-Jan-16 —CNH 290 USD 44 44 29-Jan-16 —EUR 33,634,377 USD 36,550,578 36,528,682 7-Jan-16 21,894EUR 921,837 USD 1,001,763 1,001,163 7-Jan-16 600EUR 251,611 USD 273,426 273,262 7-Jan-16 164EUR 582,550 USD 633,338 633,238 7-Jan-16 100EUR 62,101 USD 67,485 67,445 7-Jan-16 40EUR 15,994 USD 17,389 17,386 29-Jan-16 3EUR 2,650 USD 2,880 2,878 7-Jan-16 2EUR 4,354 USD 4,734 4,733 7-Jan-16 1EUR 1,078 USD 1,172 1,172 7-Jan-16 —EUR 46 USD 50 50 29-Jan-16 —EUR 27 USD 30 30 29-Jan-16 —EUR 25 USD 28 28 29-Jan-16 —EUR 31 USD 33 33 29-Jan-16 —USD 272,011 EUR 248,957 270,706 29-Jan-16 1,305USD 110,398 EUR 100,622 109,413 29-Jan-16 985USD 19,273 EUR 17,586 19,122 7-Jan-16 151USD 13,589 EUR 12,440 13,527 7-Jan-16 62USD 11,249 AUD 15,406 11,207 29-Jan-16 42USD 7,395 EUR 6,768 7,360 29-Jan-16 35USD 2,987 EUR 2,722 2,960 29-Jan-16 27USD 2,110 EUR 1,931 2,100 7-Jan-16 10USD 856 EUR 780 848 29-Jan-16 8USD 201 EUR 183 199 29-Jan-16 2USD 498 EUR 456 496 29-Jan-16 2USD 45 CNH 296 45 7-Jan-16 —USD 41 EUR 38 41 7-Jan-16 —USD 44 EUR 41 44 7-Jan-16 —USD 51 CNH 333 51 7-Jan-16 —USD 9 EUR 8 9 29-Jan-16 —USD 8 CNH 52 8 29-Jan-16 —USD 24 CNH 156 24 7-Jan-16 —USD 21 EUR 20 21 29-Jan-16 —
Total 47,774
Total Financial Assets at fair value through profi t or loss 361,062,264
Financial Liabilities at fair value through profi t or loss
Forward Currency Contracts, Open as at 31 December 2015
Currency Purchased
Currency Sold
Current Market
Value (USD) Settle Date
Unrealised (Depreciation)
(USD)
Citibank AUD 25,332 USD 18,464 18,501 29-Jan-16 (37)EUR 310 USD 339 341 7-Jan-16 (2)EUR 647 USD 708 713 29-Jan-16 (5)EUR 729 USD 798 803 29-Jan-16 (5)EUR 594 USD 652 658 29-Jan-16 (6)EUR 2,572 USD 2,816 2,835 29-Jan-16 (19)EUR 3,001 USD 3,284 3,305 29-Jan-16 (21)EUR 2,392 USD 2,626 2,650 29-Jan-16 (24)EUR 2,738 USD 3,001 3,025 29-Jan-16 (24)EUR 5,119 USD 5,595 5,623 29-Jan-16 (28)EUR 9,983 USD 10,910 10,965 29-Jan-16 (55)EUR 9,589 USD 10,498 10,570 29-Jan-16 (72)EUR 10,800 USD 11,819 11,894 7-Jan-16 (75)EUR 8,811 USD 9,671 9,761 29-Jan-16 (90)EUR 29,532 USD 32,304 32,497 29-Jan-16 (193)EUR 169,833 USD 184,866 185,064 7-Jan-16 (198)EUR 65,446 USD 71,588 72,012 7-Jan-16 (424)EUR 346,490 USD 379,341 381,924 29-Jan-16 (2,583)EUR 389,116 USD 425,806 428,505 7-Jan-16 (2,699)EUR 320,881 USD 352,186 355,461 29-Jan-16 (3,275)USD 148 EUR 137 149 7-Jan-16 (1)USD 1,038 EUR 956 1,039 7-Jan-16 (1)USD 957 EUR 884 961 7-Jan-16 (4)USD 4,220 EUR 3,885 4,224 7-Jan-16 (4)USD 4,372 AUD 6,025 4,383 29-Jan-16 (11)USD 15,418 EUR 14,194 15,434 7-Jan-16 (16)USD 3,889 EUR 3,593 3,906 7-Jan-16 (17)USD 14,204 EUR 13,121 14,267 7-Jan-16 (63)USD 85,840 EUR 79,282 86,208 7-Jan-16 (368)USD 22,867 AUD 32,033 23,302 7-Jan-16 (435)USD 21,140 AUD 29,689 21,597 7-Jan-16 (457)USD 562,113 EUR 517,489 562,694 7-Jan-16 (581)USD 262,265 AUD 363,635 264,518 7-Jan-16 (2,253)USD 519,200 EUR 479,611 521,505 7-Jan-16 (2,305)
Total (16,351)
Total Financial Liabilities at fair value through profi t or loss (16,351)

Janus US Venture Fund
PORTFOLIO INVESTMENTS
The accompanying notes are an integral part of the fi nancial statements.
1 2 4 J a n u s C a p i t a l F u n d s P l c / 3 1 D e c e m b e r 2 0 1 5
Share or Principal Amount
Percentage of Net
Assets (%) Fair
Value (USD)
Financial Assets at fair value through profi t or loss Common Stock Aerospace and Defence – Equipment
70,561 HEICO Corp. – Class A . . . . . . . . . . . . . . . . . . 1.7 3,471,601
Agricultural Chemicals 54,872 Phibro Animal Health Corp. . . . . . . . . . . . . . . . 0.8 1,653,293
Apparel Manufacturers 33,675 Carter’s, Inc. . . . . . . . . . . . . . . . . . . . . . . . . . . . 1.4 2,998,085
Applications Software 93,557 RealPage, Inc. . . . . . . . . . . . . . . . . . . . . . . . . . . 1.0 2,100,355
Auto Repair Centres 17,439 Monro Muffl er Brake, Inc. . . . . . . . . . . . . . . . . 0.6 1,154,811
Batteries and Battery Systems 43,675 EnerSys . . . . . . . . . . . . . . . . . . . . . . . . . . . . . . 1.2 2,442,743
Beverages – Non-Alcoholic 35,410 Britvic PLC . . . . . . . . . . . . . . . . . . . . . . . . . . . . 0.2 379,71428,775 DavidsTea, Inc. . . . . . . . . . . . . . . . . . . . . . . . . . 0.2 356,522
0.4 736,236
Chemicals – Diversifi ed 9,155 Aceto Corp. . . . . . . . . . . . . . . . . . . . . . . . . . . . 0.1 247,002
Chemicals – Specialty 63,339 Sensient Technology Corp. . . . . . . . . . . . . . . . . 1.9 3,978,956
Commercial Services 7,921 CoStar Group, Inc. . . . . . . . . . . . . . . . . . . . . . . 0.8 1,637,191
95,467 ServiceMaster Global Holdings, Inc. . . . . . . . . . 1.8 3,746,12582,106 SP Plus Corp. . . . . . . . . . . . . . . . . . . . . . . . . . . 0.9 1,962,333
3.5 7,345,649
Commercial Services – Finance 54,032 Euronet Worldwide, Inc. . . . . . . . . . . . . . . . . . 1.9 3,913,53813,890 LendingTree, Inc. . . . . . . . . . . . . . . . . . . . . . . . 0.6 1,240,09926,887 WEX, Inc. . . . . . . . . . . . . . . . . . . . . . . . . . . . . 1.1 2,376,811
3.6 7,530,448
Computer Services 40,709 FleetMatics Group PLC. . . . . . . . . . . . . . . . . . . 1.0 2,067,61036,231 j2 Global, Inc. . . . . . . . . . . . . . . . . . . . . . . . . . 1.4 2,982,536
2.4 5,050,146
Computer Software 54,939 Blackbaud, Inc. . . . . . . . . . . . . . . . . . . . . . . . . 1.7 3,618,28362,732 Envestnet, Inc. . . . . . . . . . . . . . . . . . . . . . . . . . 0.9 1,872,55066,813 SS&C Technologies Holdings, Inc. . . . . . . . . . . 2.2 4,561,324
4.8 10,052,157
Computers – Other 28,531 Stratasys, Ltd. . . . . . . . . . . . . . . . . . . . . . . . . . . 0.3 669,908
Consulting Services 40,580 Advisory Board Co. . . . . . . . . . . . . . . . . . . . . . 1.0 2,013,17429,100 CEB, Inc. . . . . . . . . . . . . . . . . . . . . . . . . . . . . . 0.9 1,786,44936,412 MAXIMUS, Inc. . . . . . . . . . . . . . . . . . . . . . . . . 1.0 2,048,175
2.9 5,847,798
Consumer Products – Miscellaneous 42,118 Prestige Brands Holdings, Inc. . . . . . . . . . . . . . 1.0 2,168,23586,734 Tumi Holdings, Inc. . . . . . . . . . . . . . . . . . . . . . 0.7 1,442,386
1.7 3,610,621
Data Processing and Management 71,253 Broadridge Financial Solutions, Inc. . . . . . . . . . 1.8 3,828,424
Decision Support Software 35,186 MSCI, Inc. . . . . . . . . . . . . . . . . . . . . . . . . . . . . 1.2 2,537,966
Diagnostic Kits 60,517 Quidel Corp. . . . . . . . . . . . . . . . . . . . . . . . . . . 0.6 1,282,96095,319 Trinity Biotech PLC . . . . . . . . . . . . . . . . . . . . . 0.5 1,120,951
1.1 2,403,911
Disposable Medical Products 14,819 ICU Medical, Inc. . . . . . . . . . . . . . . . . . . . . . . . 0.8 1,671,287
Share or Principal Amount
Percentage of Net
Assets (%) Fair
Value (USD)
31,939 STERIS PLC . . . . . . . . . . . . . . . . . . . . . . . . . . . 1.2 2,406,2842.0 4,077,571
Diversifi ed Banking Institutions 37,972 Bank of America Corp. . . . . . . . . . . . . . . . . . . . 0.9 1,878,095
Diversifi ed Manufacturing Operations 30,457 AO Smith Corp. . . . . . . . . . . . . . . . . . . . . . . . . 1.1 2,333,31172,858 Raven Industries, Inc. . . . . . . . . . . . . . . . . . . . . 0.5 1,136,585
1.6 3,469,896
Drug Delivery Systems 103,886 Catalent, Inc. . . . . . . . . . . . . . . . . . . . . . . . . . . 1.2 2,600,267
92,956 Flamel Technologies S.A. . . . . . . . . . . . . . . . . . 0.5 1,134,9931.7 3,735,260
E-Commerce/Services 82,743 ChannelAdvisor Corp. . . . . . . . . . . . . . . . . . . . 0.5 1,145,99138,577 Zillow Group, Inc. . . . . . . . . . . . . . . . . . . . . . . 0.5 1,004,545
1.0 2,150,536
Electric Products – Equipment 48,149 Belden, Inc. . . . . . . . . . . . . . . . . . . . . . . . . . . . 1.1 2,295,744
Electronic Components – Miscellaneous 126,835 CTS Corp. . . . . . . . . . . . . . . . . . . . . . . . . . . . . 1.1 2,237,369
29,417 OSI Systems, Inc. . . . . . . . . . . . . . . . . . . . . . . . 1.2 2,608,11135,710 Sparton Corp. . . . . . . . . . . . . . . . . . . . . . . . . . . 0.3 713,843
2.6 5,559,323
Electronic Components – Semiconductors 253,473 ON Semiconductor Corp. . . . . . . . . . . . . . . . . . 1.2 2,484,035
Electronic Design Automation 178,288 Cadence Design Systems, Inc. . . . . . . . . . . . . . 1.8 3,710,173
Electronic Measuring Instruments 41,594 National Instruments Corp. . . . . . . . . . . . . . . . 0.6 1,193,332
Energy – Alternate Sources 43,145 SolarEdge Technologies, Inc. . . . . . . . . . . . . . . 0.6 1,215,395
Enterprise Software/Services 20,370 Guidewire Software, Inc. . . . . . . . . . . . . . . . . . 0.6 1,225,459
6,943 Tyler Technologies, Inc. . . . . . . . . . . . . . . . . . . 0.6 1,210,3041.2 2,435,763
Entertainment 32,956 Cedar Fair L.P. . . . . . . . . . . . . . . . . . . . . . . . . . 0.9 1,840,263
Finance – Credit Card 20,964 Blackhawk Network Holdings, Inc. . . . . . . . . . 0.4 926,818
Finance – Investment Bankers/Brokers 69,696 LPL Financial Holdings, Inc. . . . . . . . . . . . . . . 1.4 2,972,534
Footwear and Related Apparel 110,978 Wolverine World Wide, Inc. . . . . . . . . . . . . . . . 0.9 1,854,442
Health Care Cost Containment 27,244 ExamWorks Group, Inc. . . . . . . . . . . . . . . . . . . 0.3 724,69051,625 HealthEquity, Inc. . . . . . . . . . . . . . . . . . . . . . . . 0.6 1,294,239
0.9 2,018,929
Human Resources 33,707 Paylocity Holding Corp. . . . . . . . . . . . . . . . . . . 0.7 1,366,819
Industrial Audio and Video Products 31,390 Nordson Corp. . . . . . . . . . . . . . . . . . . . . . . . . . 1.0 2,013,669
Instruments – Scientifi c 26,690 FEI Co. . . . . . . . . . . . . . . . . . . . . . . . . . . . . . . . 1.0 2,129,595
Internet Applications Software 34,123 Textura Corp. . . . . . . . . . . . . . . . . . . . . . . . . . . 0.4 736,374
Investment Management and Advisory Services 37,386 Artisan Partners Asset Management,
Inc. . . . . . . . . . . . . . . . . . . . . . . . . . . . . . . . . 0.6 1,348,13930,880 Financial Engines, Inc. . . . . . . . . . . . . . . . . . . . 0.5 1,039,73077,504 WisdomTree Investments, Inc. . . . . . . . . . . . . . 0.6 1,215,263
1.7 3,603,132
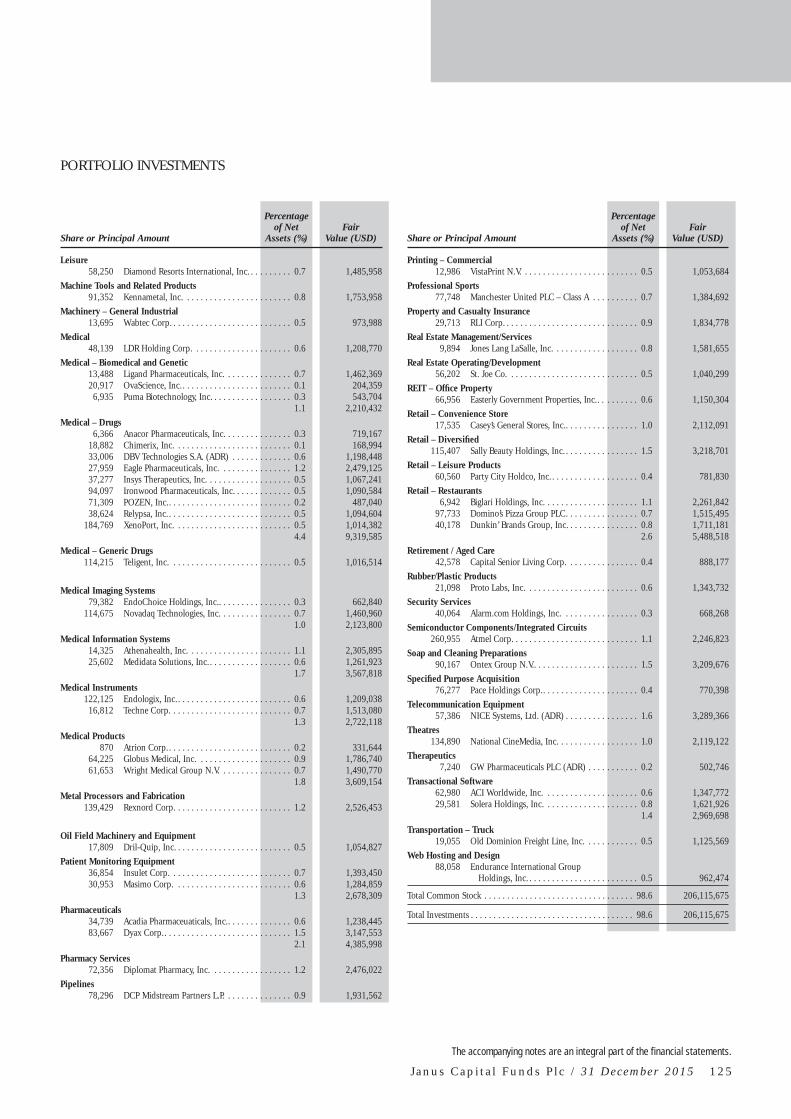
PORTFOLIO INVESTMENTS
The accompanying notes are an integral part of the fi nancial statements.
J a n u s C a p i t a l F u n d s P l c / 3 1 D e c e m b e r 2 0 1 5 1 2 5
Share or Principal Amount
Percentage of Net
Assets (%) Fair
Value (USD)
Leisure 58,250 Diamond Resorts International, Inc. . . . . . . . . . 0.7 1,485,958
Machine Tools and Related Products 91,352 Kennametal, Inc. . . . . . . . . . . . . . . . . . . . . . . . 0.8 1,753,958
Machinery – General Industrial 13,695 Wabtec Corp. . . . . . . . . . . . . . . . . . . . . . . . . . . 0.5 973,988
Medical 48,139 LDR Holding Corp. . . . . . . . . . . . . . . . . . . . . . 0.6 1,208,770
Medical – Biomedical and Genetic 13,488 Ligand Pharmaceuticals, Inc. . . . . . . . . . . . . . . 0.7 1,462,36920,917 OvaScience, Inc. . . . . . . . . . . . . . . . . . . . . . . . . 0.1 204,359
6,935 Puma Biotechnology, Inc. . . . . . . . . . . . . . . . . . 0.3 543,7041.1 2,210,432
Medical – Drugs 6,366 Anacor Pharmaceuticals, Inc. . . . . . . . . . . . . . . 0.3 719,167
18,882 Chimerix, Inc. . . . . . . . . . . . . . . . . . . . . . . . . . 0.1 168,99433,006 DBV Technologies S.A. (ADR) . . . . . . . . . . . . . 0.6 1,198,44827,959 Eagle Pharmaceuticals, Inc. . . . . . . . . . . . . . . . 1.2 2,479,12537,277 Insys Therapeutics, Inc. . . . . . . . . . . . . . . . . . . 0.5 1,067,24194,097 Ironwood Pharmaceuticals, Inc. . . . . . . . . . . . . 0.5 1,090,58471,309 POZEN, Inc. . . . . . . . . . . . . . . . . . . . . . . . . . . . 0.2 487,04038,624 Relypsa, Inc. . . . . . . . . . . . . . . . . . . . . . . . . . . . 0.5 1,094,604
184,769 XenoPort, Inc. . . . . . . . . . . . . . . . . . . . . . . . . . 0.5 1,014,3824.4 9,319,585
Medical – Generic Drugs 114,215 Teligent, Inc. . . . . . . . . . . . . . . . . . . . . . . . . . . 0.5 1,016,514
Medical Imaging Systems 79,382 EndoChoice Holdings, Inc.. . . . . . . . . . . . . . . . 0.3 662,840
114,675 Novadaq Technologies, Inc. . . . . . . . . . . . . . . . 0.7 1,460,9601.0 2,123,800
Medical Information Systems 14,325 Athenahealth, Inc. . . . . . . . . . . . . . . . . . . . . . . 1.1 2,305,89525,602 Medidata Solutions, Inc. . . . . . . . . . . . . . . . . . . 0.6 1,261,923
1.7 3,567,818
Medical Instruments 122,125 Endologix, Inc. . . . . . . . . . . . . . . . . . . . . . . . . . 0.6 1,209,038
16,812 Techne Corp. . . . . . . . . . . . . . . . . . . . . . . . . . . 0.7 1,513,0801.3 2,722,118
Medical Products 870 Atrion Corp. . . . . . . . . . . . . . . . . . . . . . . . . . . . 0.2 331,644
64,225 Globus Medical, Inc. . . . . . . . . . . . . . . . . . . . . 0.9 1,786,74061,653 Wright Medical Group N.V. . . . . . . . . . . . . . . . 0.7 1,490,770
1.8 3,609,154
Metal Processors and Fabrication 139,429 Rexnord Corp. . . . . . . . . . . . . . . . . . . . . . . . . . 1.2 2,526,453
Oil Field Machinery and Equipment 17,809 Dril-Quip, Inc. . . . . . . . . . . . . . . . . . . . . . . . . . 0.5 1,054,827
Patient Monitoring Equipment 36,854 Insulet Corp. . . . . . . . . . . . . . . . . . . . . . . . . . . 0.7 1,393,45030,953 Masimo Corp. . . . . . . . . . . . . . . . . . . . . . . . . . 0.6 1,284,859
1.3 2,678,309
Pharmaceuticals 34,739 Acadia Pharmaceuaticals, Inc. . . . . . . . . . . . . . . 0.6 1,238,44583,667 Dyax Corp. . . . . . . . . . . . . . . . . . . . . . . . . . . . . 1.5 3,147,553
2.1 4,385,998
Pharmacy Services 72,356 Diplomat Pharmacy, Inc. . . . . . . . . . . . . . . . . . 1.2 2,476,022
Pipelines 78,296 DCP Midstream Partners L.P. . . . . . . . . . . . . . . 0.9 1,931,562
Share or Principal Amount
Percentage of Net
Assets (%) Fair
Value (USD)
Printing – Commercial 12,986 VistaPrint N.V. . . . . . . . . . . . . . . . . . . . . . . . . . 0.5 1,053,684
Professional Sports 77,748 Manchester United PLC – Class A . . . . . . . . . . 0.7 1,384,692
Property and Casualty Insurance 29,713 RLI Corp. . . . . . . . . . . . . . . . . . . . . . . . . . . . . . 0.9 1,834,778
Real Estate Management/Services 9,894 Jones Lang LaSalle, Inc. . . . . . . . . . . . . . . . . . . 0.8 1,581,655
Real Estate Operating/Development 56,202 St. Joe Co. . . . . . . . . . . . . . . . . . . . . . . . . . . . . 0.5 1,040,299
REIT – Offi ce Property 66,956 Easterly Government Properties, Inc. . . . . . . . . . 0.6 1,150,304
Retail – Convenience Store 17,535 Casey’s General Stores, Inc.. . . . . . . . . . . . . . . . 1.0 2,112,091
Retail – Diversifi ed 115,407 Sally Beauty Holdings, Inc. . . . . . . . . . . . . . . . . 1.5 3,218,701
Retail – Leisure Products 60,560 Party City Holdco, Inc. . . . . . . . . . . . . . . . . . . . 0.4 781,830
Retail – Restaurants 6,942 Biglari Holdings, Inc. . . . . . . . . . . . . . . . . . . . . 1.1 2,261,842
97,733 Domino’s Pizza Group PLC . . . . . . . . . . . . . . . . 0.7 1,515,49540,178 Dunkin’ Brands Group, Inc. . . . . . . . . . . . . . . . 0.8 1,711,181
2.6 5,488,518
Retirement / Aged Care 42,578 Capital Senior Living Corp. . . . . . . . . . . . . . . . 0.4 888,177
Rubber/Plastic Products 21,098 Proto Labs, Inc. . . . . . . . . . . . . . . . . . . . . . . . . 0.6 1,343,732
Security Services 40,064 Alarm.com Holdings, Inc. . . . . . . . . . . . . . . . . 0.3 668,268
Semiconductor Components/Integrated Circuits 260,955 Atmel Corp. . . . . . . . . . . . . . . . . . . . . . . . . . . . 1.1 2,246,823
Soap and Cleaning Preparations 90,167 Ontex Group N.V.. . . . . . . . . . . . . . . . . . . . . . . 1.5 3,209,676
Specifi ed Purpose Acquisition 76,277 Pace Holdings Corp. . . . . . . . . . . . . . . . . . . . . . 0.4 770,398
Telecommunication Equipment 57,386 NICE Systems, Ltd. (ADR) . . . . . . . . . . . . . . . . 1.6 3,289,366
Theatres 134,890 National CineMedia, Inc. . . . . . . . . . . . . . . . . . 1.0 2,119,122
Therapeutics 7,240 GW Pharmaceuticals PLC (ADR) . . . . . . . . . . . 0.2 502,746
Transactional Software 62,980 ACI Worldwide, Inc. . . . . . . . . . . . . . . . . . . . . 0.6 1,347,77229,581 Solera Holdings, Inc. . . . . . . . . . . . . . . . . . . . . 0.8 1,621,926
1.4 2,969,698
Transportation – Truck 19,055 Old Dominion Freight Line, Inc. . . . . . . . . . . . 0.5 1,125,569
Web Hosting and Design 88,058 Endurance International Group
Holdings, Inc. . . . . . . . . . . . . . . . . . . . . . . . . 0.5 962,474
Total Common Stock . . . . . . . . . . . . . . . . . . . . . . . . . . . . . . . . . 98.6 206,115,675
Total Investments . . . . . . . . . . . . . . . . . . . . . . . . . . . . . . . . . . . . 98.6 206,115,675

Janus US Venture Fund
PORTFOLIO INVESTMENTS
The accompanying notes are an integral part of the fi nancial statements.
1 2 6 J a n u s C a p i t a l F u n d s P l c / 3 1 D e c e m b e r 2 0 1 5
Forward Currency Contracts, Open as at 31 December 2015
Currency Purchased
Currency Sold
Current Market
Value (USD) Settle Date
Unrealised Appreciation
(USD)
Bank of America USD 1,286,381 GBP 848,900 1,251,314 7-Jan-16 35,067USD 874,439 EUR 795,900 865,117 7-Jan-16 9,322USD 125,217 GBP 84,000 123,819 29-Jan-16 1,398USD 96,924 GBP 65,000 95,812 29-Jan-16 1,112
Citibank AUD 2,116,667 USD 1,520,895 1,502,091 7-Jan-16 18,804AUD 25,462 USD 18,331 18,141 7-Jan-16 190AUD 27,258 USD 19,690 19,552 29-Jan-16 138AUD 24,976 USD 18,144 18,120 29-Jan-16 24EUR 14,310,709 USD 15,551,490 15,542,174 7-Jan-16 9,316EUR 11,881,888 USD 12,912,084 12,904,349 7-Jan-16 7,735EUR 173,579 USD 188,712 188,682 7-Jan-16 30EUR 144,391 USD 156,980 156,955 7-Jan-16 25USD 1,231,499 EUR 1,124,400 1,222,390 7-Jan-16 9,109USD 90,802 EUR 82,854 90,092 29-Jan-16 710USD 54,622 EUR 49,993 54,360 7-Jan-16 262USD 40,345 EUR 36,882 40,104 7-Jan-16 241USD 44,230 EUR 40,482 44,018 7-Jan-16 212USD 39,125 EUR 35,817 38,945 7-Jan-16 180USD 7,779 EUR 7,112 7,733 7-Jan-16 46USD 6,534 EUR 5,975 6,497 29-Jan-16 37USD 4,528 AUD 6,202 4,511 7-Jan-16 17USD 14,992 EUR 13,773 14,976 29-Jan-16 16USD 1,714 EUR 1,562 1,699 7-Jan-16 15USD 1,150 EUR 1,048 1,140 7-Jan-16 10USD 1,120 EUR 1,025 1,114 29-Jan-16 6USD 332 EUR 303 329 29-Jan-16 3USD 631 EUR 578 628 29-Jan-16 3USD 182 EUR 166 181 7-Jan-16 1USD 461 EUR 423 461 29-Jan-16 —
Credit Suisse USD 1,113,900 GBP 738,000 1,087,819 29-Jan-16 26,081USD 810,482 GBP 546,000 804,866 7-Jan-16 5,616USD 324,174 EUR 296,700 322,667 7-Jan-16 1,507
Total 127,233
Total Financial Assets at fair value through profi t or loss 206,242,908
Financial Liabilities at fair value through profi t or loss
Forward Currency Contracts, Open as at 31 December 2015
Currency Purchased
Currency Sold
Current Market
Value (USD) Settle Date
Unrealised (Depreciation)
(USD)
Citibank EUR 16,057 USD 17,599 17,739 29-Jan-16 (140)EUR 152,310 USD 166,750 167,886 29-Jan-16 (1,136)EUR 180,694 USD 197,826 199,173 29-Jan-16 (1,347)EUR 137,775 USD 151,216 152,622 29-Jan-16 (1,406)EUR 163,234 USD 179,159 180,825 29-Jan-16 (1,666)USD 169,724 EUR 156,251 169,900 29-Jan-16 (176)USD 203,377 EUR 187,232 203,587 29-Jan-16 (210)USD 67,885 EUR 62,699 68,176 29-Jan-16 (291)USD 19,644 AUD 27,519 20,018 29-Jan-16 (374)USD 17,600 AUD 24,718 17,980 29-Jan-16 (380)USD 152,160 EUR 140,558 152,835 29-Jan-16 (675)USD 183,190 EUR 169,222 184,003 29-Jan-16 (813)
Credit Suisse EUR 118,000 USD 129,062 129,884 29-Jan-16 (822)GBP 33,000 USD 49,916 51,190 29-Jan-16 (1,274)EUR 154,000 USD 168,807 170,250 7-Jan-16 (1,443)EUR 296,700 USD 323,996 325,545 7-Jan-16 (1,549)GBP 46,000 USD 69,732 71,660 7-Jan-16 (1,928)GBP 113,000 USD 171,388 176,213 7-Jan-16 (4,825)GBP 546,000 USD 810,537 816,265 7-Jan-16 (5,728)USD 602,651 EUR 568,700 618,049 29-Jan-16 (15,398)
Total (41,581)
Total Financial Liabilities at fair value through profi t or loss (41,581)

Perkins Global Value Fund
PORTFOLIO INVESTMENTS
The accompanying notes are an integral part of the fi nancial statements.
J a n u s C a p i t a l F u n d s P l c / 3 1 D e c e m b e r 2 0 1 5 1 2 7
Share or Principal Amount
Percentage of Net
Assets (%) Fair
Value (USD)
Financial Assets at fair value through profi t or loss Common Stock Aerospace and Defence
320,301 Meggitt PLC . . . . . . . . . . . . . . . . . . . . . . . . . . . 1.1 1,769,047
Aerospace and Defence – Equipment 226,580 BBA Aviation PLC . . . . . . . . . . . . . . . . . . . . . . . 0.4 631,554520,632 Cobham PLC . . . . . . . . . . . . . . . . . . . . . . . . . . 1.3 2,173,310
1.7 2,804,864
Agricultural Chemicals 32,527 Mosaic Co. . . . . . . . . . . . . . . . . . . . . . . . . . . . . 0.5 897,42099,500 Nitto FC Co., Ltd. . . . . . . . . . . . . . . . . . . . . . . 0.5 751,756
1.0 1,649,176
Applications Software 69,433 Lectra . . . . . . . . . . . . . . . . . . . . . . . . . . . . . . . . 0.6 912,89580,036 Microsoft Corp. . . . . . . . . . . . . . . . . . . . . . . . . 2.7 4,440,397
3.3 5,353,292
Automotive – Cars and Light Trucks 66,600 Honda Motor Co., Ltd. . . . . . . . . . . . . . . . . . . . 1.3 2,166,79924,360 Hyundai Motor Co. . . . . . . . . . . . . . . . . . . . . . 1.9 3,096,156
3.2 5,262,955
Banks 122,333 Fifth Third Bancorp . . . . . . . . . . . . . . . . . . . . . 1.5 2,458,893
Beverages – Non-Alcoholic 131,209 Coca-Cola Co. . . . . . . . . . . . . . . . . . . . . . . . . . 3.4 5,636,739
47,906 PepsiCo, Inc. . . . . . . . . . . . . . . . . . . . . . . . . . . 2.9 4,786,7686.3 10,423,507
Beverages – Wine and Spirits 47,930 Diageo PLC . . . . . . . . . . . . . . . . . . . . . . . . . . . 0.8 1,311,595
599,225 Stock Spirits Group PLC . . . . . . . . . . . . . . . . . . 0.7 1,232,1441.5 2,543,739
Broadcast Services and Programming 71,500 Grupo Televisa S.A.B. (ADR) . . . . . . . . . . . . . . 1.2 1,945,515
Cellular Telecommunications 4,193,552 America Movil S.A.B. de C.V. . . . . . . . . . . . . . . 1.8 2,945,318
84,349 Rogers Communications, Inc. . . . . . . . . . . . . . . 1.8 2,909,383660,449 Vodafone Group PLC . . . . . . . . . . . . . . . . . . . . 1.3 2,151,439
4.9 8,006,140
Chemicals – Specialty 60,200 Nippon Fine Chemical Co., Ltd. . . . . . . . . . . . . 0.3 453,328
Commercial Banks 88,204 CIT Group, Inc. . . . . . . . . . . . . . . . . . . . . . . . . 2.1 3,501,699
Commercial Banks – Western U.S. 87,109 Zions Bancorporation . . . . . . . . . . . . . . . . . . . . 1.4 2,378,076
Commercial Services 155,484 UBM PLC . . . . . . . . . . . . . . . . . . . . . . . . . . . . . 0.7 1,206,651
Cosmetics and Toiletries 78,528 Procter & Gamble Co. . . . . . . . . . . . . . . . . . . . 3.8 6,235,90847,397 Unilever N.V. . . . . . . . . . . . . . . . . . . . . . . . . . . 1.3 2,065,471
5.1 8,301,379
Dental Supplies and Equipment 11,000 Nakanishi, Inc. . . . . . . . . . . . . . . . . . . . . . . . . . 0.3 430,646
Diversifi ed Financial Services 146,947 Ally Financial, Inc. . . . . . . . . . . . . . . . . . . . . . . 1.7 2,739,092
Electric – Integrated 86,743 Exelon Corp. . . . . . . . . . . . . . . . . . . . . . . . . . . 1.5 2,408,85364,464 GDF Suez . . . . . . . . . . . . . . . . . . . . . . . . . . . . . 0.7 1,143,510
113,726 PPL Corp. . . . . . . . . . . . . . . . . . . . . . . . . . . . . . 2.3 3,881,4684.5 7,433,831
Electric Products – Miscellaneous 18,200 Icom, Inc. . . . . . . . . . . . . . . . . . . . . . . . . . . . . . 0.2 381,476
Electronic Measuring Instruments 100,655 Cosel Co., Ltd. . . . . . . . . . . . . . . . . . . . . . . . . . 0.6 914,588
Share or Principal Amount
Percentage of Net
Assets (%) Fair
Value (USD)
Enterprise Software/Services 162,722 Oracle Corp.. . . . . . . . . . . . . . . . . . . . . . . . . . . 3.6 5,944,235
Fiduciary Banks 135,141 Citizens Financial Group, Inc. . . . . . . . . . . . . . 2.1 3,539,343
Food – Miscellaneous/Diversifi ed 54,336 Danone. . . . . . . . . . . . . . . . . . . . . . . . . . . . . . . 2.2 3,677,10433,997 Nestle S.A. . . . . . . . . . . . . . . . . . . . . . . . . . . . . 1.5 2,531,18796,356 Orkla ASA . . . . . . . . . . . . . . . . . . . . . . . . . . . . 0.5 763,346
4.2 6,971,637
Food – Retail 940,169 TESCO PLC . . . . . . . . . . . . . . . . . . . . . . . . . . . 1.3 2,071,785
Food – Wholesale/Distribution 55,150 Sysco Corp. . . . . . . . . . . . . . . . . . . . . . . . . . . . 1.4 2,261,150
Investment Companies 102,000 CK Hutchison Holdings, Ltd. . . . . . . . . . . . . . . 0.8 1,376,711
Machinery – General Industrial 34,869 BWX Technologies, Inc. . . . . . . . . . . . . . . . . . . 0.7 1,107,788
Medical – Drugs 126,113 GlaxoSmithKline PLC . . . . . . . . . . . . . . . . . . . . 1.5 2,552,277
56,492 Johnson & Johnson . . . . . . . . . . . . . . . . . . . . . 3.5 5,802,85843,949 Novartis A.G. . . . . . . . . . . . . . . . . . . . . . . . . . . 2.3 3,809,822
133,593 Pfi zer, Inc. . . . . . . . . . . . . . . . . . . . . . . . . . . . . 2.6 4,312,3826,037 Roche Holding A.G. . . . . . . . . . . . . . . . . . . . . . 1.0 1,666,461
12,530 Sanofi . . . . . . . . . . . . . . . . . . . . . . . . . . . . . . . . 0.6 1,070,14711.5 19,213,947
Medical Instruments 22,000 As One Corp. . . . . . . . . . . . . . . . . . . . . . . . . . . 0.5 849,392
3,440 Medikit Co., Ltd. . . . . . . . . . . . . . . . . . . . . . . . 0.1 104,76311,824 Medtronic PLC . . . . . . . . . . . . . . . . . . . . . . . . . 0.6 909,502
1.2 1,863,657
Medical Products 24,088 Stryker Corp. . . . . . . . . . . . . . . . . . . . . . . . . . . 1.4 2,238,739
Metal Products – Fasteners 44,946 Kitagawa Industries Co., Ltd. . . . . . . . . . . . . . . 0.3 442,242
Offi ce Automation and Equipment 22,400 Canon, Inc. . . . . . . . . . . . . . . . . . . . . . . . . . . . 0.4 684,972
Oil Companies – Exploration and Production 39,047 Canadian Natural Resources, Ltd. . . . . . . . . . . . 0.5 852,90925,363 Devon Energy Corp. . . . . . . . . . . . . . . . . . . . . . 0.5 811,616
1.0 1,664,525
Oil Companies – Integrated 94,146 BP PLC (ADR) . . . . . . . . . . . . . . . . . . . . . . . . . 1.8 2,943,004
105,085 Cenovus Energy, Inc. . . . . . . . . . . . . . . . . . . . . 0.8 1,329,22860,808 Royal Dutch Shell PLC – Class A . . . . . . . . . . . 0.8 1,367,769
3.4 5,640,001
Property and Casualty Insurance 47,250 NKSJ Holdings, Inc. . . . . . . . . . . . . . . . . . . . . . 1.0 1,576,965
Protection – Safety 23,900 Secom Joshinetsu Co., Ltd. . . . . . . . . . . . . . . . . 0.5 799,451
Real Estate Operating/Development 102,000 Cheung Kong Property Holdings,
Ltd. . . . . . . . . . . . . . . . . . . . . . . . . . . . . . . . . 0.4 663,348
REIT – Mortgage 48,263 American Capital Agency Corp. . . . . . . . . . . . . 0.5 836,88053,368 Hatteras Financial Corp. . . . . . . . . . . . . . . . . . . 0.4 701,789
231,874 Two Harbors Investment Corp. . . . . . . . . . . . . . 1.1 1,878,1792.0 3,416,848
Retail – Miscellaneous and Diversifi ed 69,129 Matas A/S . . . . . . . . . . . . . . . . . . . . . . . . . . . . . 0.8 1,339,083
Schools 82,900 Shingakukai Co., Ltd. . . . . . . . . . . . . . . . . . . . . 0.3 426,295

Perkins Global Value Fund
PORTFOLIO INVESTMENTS
The accompanying notes are an integral part of the fi nancial statements.
1 2 8 J a n u s C a p i t a l F u n d s P l c / 3 1 D e c e m b e r 2 0 1 5
Share or Principal Amount
Percentage of Net
Assets (%) Fair
Value (USD)
Security Services 337,839 G4S PLC. . . . . . . . . . . . . . . . . . . . . . . . . . . . . . 0.7 1,122,933
24,500 Secom Co., Ltd. . . . . . . . . . . . . . . . . . . . . . . . . 1.0 1,679,8131.7 2,802,746
Super – Regional Banks 99,312 Wells Fargo & Co. . . . . . . . . . . . . . . . . . . . . . . 3.3 5,398,600
Telecommunication Equipment 209,678 Telesites SAB . . . . . . . . . . . . . . . . . . . . . . . . . . 0.1 136,799
Telecommunication Services 55,753 Telenor ASA . . . . . . . . . . . . . . . . . . . . . . . . . . . 0.6 934,402
Tobacco 8,174 KT&G Corp. . . . . . . . . . . . . . . . . . . . . . . . . . . 0.4 728,635
104,008 Swedish Match A.B. . . . . . . . . . . . . . . . . . . . . . 2.2 3,701,3542.6 4,429,989
Warehousing and Harbour Transportation Services 49,247 Hamburger Hafen und Logistik A.G. . . . . . . . . 0.4 752,376
Web Portals/Internet Service Providers 6,579 Alphabet, Inc. . . . . . . . . . . . . . . . . . . . . . . . . . . 3.0 5,118,528
Total Common Stock . . . . . . . . . . . . . . . . . . . . . . . . . . . . . . . . . 92.6 152,774,056
Total Investments . . . . . . . . . . . . . . . . . . . . . . . . . . . . . . . . . . . . 92.6 152,774,056

PORTFOLIO INVESTMENTS
The accompanying notes are an integral part of the fi nancial statements.
J a n u s C a p i t a l F u n d s P l c / 3 1 D e c e m b e r 2 0 1 5 1 2 9
Forward Currency Contracts, Open as at 31 December 2015
Currency Purchased
Currency Sold
Current Market
Value (USD) Settle Date
Unrealised Appreciation
(USD)
Citibank EUR 1,450,548 USD 1,576,315 1,575,371 29-Jan-16 944EUR 115,380 USD 125,384 125,309 29-Jan-16 75EUR 27,550 USD 29,939 29,921 29-Jan-16 18EUR 21,032 USD 22,866 22,862 29-Jan-16 4EUR 2,320 USD 2,521 2,519 29-Jan-16 2EUR 34 USD 37 37 29-Jan-16 —EUR 400 USD 435 435 29-Jan-16 —EUR 1,671 USD 1,816 1,816 29-Jan-16 —EUR 23 USD 25 25 29-Jan-16 —EUR 30 USD 33 33 29-Jan-16 —USD 2,909 EUR 2,655 2,886 29-Jan-16 23USD 2,612 EUR 2,381 2,589 29-Jan-16 23USD 19,634 EUR 18,037 19,613 29-Jan-16 21USD 214 EUR 195 212 29-Jan-16 2USD 405 EUR 371 403 29-Jan-16 2USD 34 EUR 31 34 29-Jan-16 —USD 369 EUR 340 369 29-Jan-16 —USD 31 EUR 29 31 29-Jan-16 —USD 77 EUR 71 77 29-Jan-16 —USD 4 EUR 4 4 29-Jan-16 —USD 50 EUR 45 50 29-Jan-16 —USD 3 EUR 3 3 29-Jan-16 —USD 48 EUR 44 48 29-Jan-16 —
Credit Suisse JPY 345,650,000 USD 2,867,275 2,857,764 29-Jan-16 9,511USD 2,436,498 EUR 2,230,000 2,425,175 29-Jan-16 11,323
JP Morgan Chase & Co. USD 1,264,576 EUR 1,152,500 1,252,729 29-Jan-16 11,847
Royal Bank of Canada EUR 167,000 USD 178,568 175,644 29-Jan-16 2,924JPY 478,405,000 USD 3,968,190 3,954,697 29-Jan-16 13,493JPY 23,000,000 USD 189,902 188,379 29-Jan-16 1,523USD 1,055,542 EUR 966,000 1,050,546 29-Jan-16 4,996USD 907,962 EUR 833,000 905,289 29-Jan-16 2,673USD 326,324 EUR 300,000 326,034 29-Jan-16 290
Total 59,694
Total Financial Assets at fair value through profi t or loss 152,833,750
Financial Liabilities at fair value through profi t or loss
Forward Currency Contracts, Open as at 31 December 2015
Currency Purchased
Currency Sold
Current Market
Value (USD) Settle Date
Unrealised (Depreciation)
(USD)
Citibank EUR 271 USD 297 299 29-Jan-16 (2)EUR 360 USD 395 399 29-Jan-16 (4)EUR 1,114 USD 1,220 1,228 29-Jan-16 (8)EUR 1,500 USD 1,646 1,661 29-Jan-16 (15)EUR 13,897 USD 15,214 15,318 29-Jan-16 (104)EUR 18,544 USD 20,353 20,542 29-Jan-16 (189)USD 398 EUR 368 400 29-Jan-16 (2)USD 1,551 EUR 1,428 1,553 29-Jan-16 (2)USD 1,675 EUR 1,547 1,682 29-Jan-16 (7)USD 19,399 EUR 17,859 19,419 29-Jan-16 (20)USD 6,078 EUR 5,614 6,104 29-Jan-16 (26)USD 21,023 EUR 19,420 21,116 29-Jan-16 (93)
Credit Suisse EUR 61,000 USD 66,937 67,581 29-Jan-16 (644)EUR 2,230,000 USD 2,435,160 2,446,801 29-Jan-16 (11,641)USD 2,868,465 JPY 345,650,000 2,878,331 29-Jan-16 (9,866)USD 2,817,033 JPY 345,650,000 2,876,772 29-Jan-16 (59,739)USD 2,427,773 EUR 2,291,000 2,489,803 29-Jan-16 (62,030)
Royal Bank of Canada EUR 966,000 USD 1,054,872 1,059,915 29-Jan-16 (5,043)USD 3,970,258 JPY 478,405,000 3,983,821 29-Jan-16 (13,563)USD 2,669,055 JPY 324,405,000 2,699,960 29-Jan-16 (30,905)USD 1,440,573 JPY 177,000,000 1,473,133 29-Jan-16 (32,556)
Total (226,459)
Total Financial Liabilities at fair value through profi t or loss (226,459)

Perkins US Strategic Value Fund
PORTFOLIO INVESTMENTS
The accompanying notes are an integral part of the fi nancial statements.
1 3 0 J a n u s C a p i t a l F u n d s P l c / 3 1 D e c e m b e r 2 0 1 5
Share or Principal Amount
Percentage of Net
Assets (%) Fair
Value (USD)
Financial Assets at fair value through profi t or loss Common Stock Advertising Services
19,686 Omnicom Group, Inc. . . . . . . . . . . . . . . . . . . . 0.7 1,489,443
Aerospace and Defence – Equipment 30,509 United Technologies Corp. . . . . . . . . . . . . . . . . 1.4 2,931,000
Applications Software 34,465 Check Point Software Technologies,
Ltd. . . . . . . . . . . . . . . . . . . . . . . . . . . . . . . . . 1.4 2,804,762103,899 Microsoft Corp. . . . . . . . . . . . . . . . . . . . . . . . . 2.8 5,764,317
4.2 8,569,079Automotive – Truck Parts and Equipment –
Replacement 39,388 Standard Motor Products, Inc. . . . . . . . . . . . . . 0.7 1,498,713
Banks 167,158 Fifth Third Bancorp . . . . . . . . . . . . . . . . . . . . . 1.6 3,359,876
Beverages – Non-Alcoholic 38,874 PepsiCo, Inc. . . . . . . . . . . . . . . . . . . . . . . . . . . 1.9 3,884,290
Building and Construction Products – Miscellaneous 69,323 Simpson Manufacturing Co., Inc. . . . . . . . . . . . 1.2 2,367,380
Chemicals – Diversifi ed 32,072 FMC Corp. . . . . . . . . . . . . . . . . . . . . . . . . . . . . 0.6 1,254,977
Commercial Banks – Western U.S. 138,394 Umpqua Holdings Corp. . . . . . . . . . . . . . . . . . 1.1 2,200,465
81,976 Zions Bancorporation . . . . . . . . . . . . . . . . . . . . 1.1 2,237,9452.2 4,438,410
Computer Services 10,199 Accenture PLC – Class A . . . . . . . . . . . . . . . . . 0.5 1,065,796
Computers – Memory Devices 44,040 EMC Corp. . . . . . . . . . . . . . . . . . . . . . . . . . . . . 0.6 1,130,947
Cosmetics and Toiletries 65,895 Procter & Gamble Co. . . . . . . . . . . . . . . . . . . . 2.5 5,232,722
Diversifi ed Banking Institutions 44,510 Citigroup, Inc. . . . . . . . . . . . . . . . . . . . . . . . . . 1.1 2,303,39343,918 JP Morgan Chase & Co. . . . . . . . . . . . . . . . . . . 1.4 2,899,906
2.5 5,203,299
Diversifi ed Financial Services 69,889 Ally Financial, Inc. . . . . . . . . . . . . . . . . . . . . . . 0.6 1,302,731
Electric – Integrated 52,019 Alliant Energy Corp. . . . . . . . . . . . . . . . . . . . . . 1.6 3,248,58731,031 Edison International . . . . . . . . . . . . . . . . . . . . . 0.9 1,837,34693,055 Exelon Corp. . . . . . . . . . . . . . . . . . . . . . . . . . . 1.3 2,584,13780,181 PPL Corp. . . . . . . . . . . . . . . . . . . . . . . . . . . . . . 1.3 2,736,578
5.1 10,406,648
Electrical Components – Equipment 54,506 Generac Holdings, Inc. . . . . . . . . . . . . . . . . . . . 0.8 1,622,644
Electronic Components – Semiconductors 23,438 Microchip Technology, Inc. . . . . . . . . . . . . . . . . 0.5 1,090,805
Electronic Design Automation 80,390 Synopsys, Inc. . . . . . . . . . . . . . . . . . . . . . . . . . 1.8 3,666,588
Electronic Measuring Instruments 54,667 Agilent Technologies, Inc. . . . . . . . . . . . . . . . . . 1.1 2,285,627
Electronic Security Devices 57,782 Tyco International Plc . . . . . . . . . . . . . . . . . . . . 0.9 1,842,668
Enterprise Software/Services 162,464 Oracle Corp.. . . . . . . . . . . . . . . . . . . . . . . . . . . 2.9 5,934,810
Entertainment 51,994 Cedar Fair L.P. . . . . . . . . . . . . . . . . . . . . . . . . . 1.4 2,903,345
Fiduciary Banks 124,764 Citizens Financial Group, Inc. . . . . . . . . . . . . . 1.6 3,267,569
Finance – Credit Card 32,567 Discover Financial Services. . . . . . . . . . . . . . . . 0.9 1,746,243
Share or Principal Amount
Percentage of Net
Assets (%) Fair
Value (USD)
Finance – Investment Bankers/Brokers 33,725 Raymond James Financial, Inc. . . . . . . . . . . . . . 1.0 1,955,038
Footwear and Related Apparel 32,676 Wolverine World Wide, Inc. . . . . . . . . . . . . . . . 0.3 546,016
Gas – Distribution 43,096 Southwest Gas Corp. . . . . . . . . . . . . . . . . . . . . 1.2 2,377,175
Instruments – Controls 19,539 Honeywell International, Inc. . . . . . . . . . . . . . . 1.0 2,023,654
Insurance Brokers 25,058 Marsh & McLennan Cos., Inc. . . . . . . . . . . . . . 0.7 1,389,466
Internet Infrastructure Software 12,234 F5 Networks, Inc.. . . . . . . . . . . . . . . . . . . . . . . 0.6 1,186,209
Linen Supply and Related Items 14,371 UniFirst Corp. /MA . . . . . . . . . . . . . . . . . . . . . 0.7 1,497,458
Machine Tools and Related Products 22,948 Lincoln Electric Holdings, Inc. . . . . . . . . . . . . . 0.6 1,190,772
Machinery – General Industrial 53,219 BWX Technologies, Inc. . . . . . . . . . . . . . . . . . . 0.8 1,690,768
Medical – Drugs 20,217 AbbVie, Inc. . . . . . . . . . . . . . . . . . . . . . . . . . . . 0.6 1,197,65537,745 Baxalta, Inc. . . . . . . . . . . . . . . . . . . . . . . . . . . . 0.7 1,473,18769,462 Johnson & Johnson . . . . . . . . . . . . . . . . . . . . . 3.5 7,135,12970,041 Merck & Co., Inc. . . . . . . . . . . . . . . . . . . . . . . 1.8 3,699,56697,634 Pfi zer, Inc. . . . . . . . . . . . . . . . . . . . . . . . . . . . . 1.5 3,151,626
8.1 16,657,163
Medical – Generic Drugs 38,485 Teva Pharmaceutical Industries, Ltd.
(ADR) . . . . . . . . . . . . . . . . . . . . . . . . . . . . . . 1.2 2,526,155
Medical Labs and Testing Services 33,534 Laboratory Corp. of America
Holdings . . . . . . . . . . . . . . . . . . . . . . . . . . . . 2.0 4,146,144
Medical Products 17,324 Zimmer Holdings, Inc. . . . . . . . . . . . . . . . . . . . 0.9 1,777,269
Metal Processors and Fabrication 51,110 Timken Co. . . . . . . . . . . . . . . . . . . . . . . . . . . . 0.7 1,461,235
Multi-Line Insurance 29,748 Allstate Corp. . . . . . . . . . . . . . . . . . . . . . . . . . . 0.9 1,847,05363,632 American International Group, Inc. . . . . . . . . . 1.9 3,943,275
2.8 5,790,328
Multimedia 22,258 Walt Disney Co. . . . . . . . . . . . . . . . . . . . . . . . . 1.1 2,338,871
Non-Hazardous Waste Disposal 64,388 Waste Connections, Inc. . . . . . . . . . . . . . . . . . . 1.8 3,626,332
Oil – Field Services 30,294 Oceaneering International, Inc. . . . . . . . . . . . . 0.6 1,136,63130,806 Schlumberger, Ltd. . . . . . . . . . . . . . . . . . . . . . . 1.0 2,148,719
1.6 3,285,350
Oil Companies – Exploration and Production 43,444 Anadarko Petroleum Corp. . . . . . . . . . . . . . . . . 1.0 2,110,51029,893 Occidental Petroleum Corp. . . . . . . . . . . . . . . . 1.0 2,021,066
2.0 4,131,576
Oil Companies – Integrated 58,461 Royal Dutch Shell PLC (ADR). . . . . . . . . . . . . . 1.3 2,676,929
Pipelines 26,874 Magellan Midstream Partners L.P. . . . . . . . . . . . 0.9 1,825,28253,444 Western Gas Partners L.P. . . . . . . . . . . . . . . . . . 1.2 2,540,193
2.1 4,365,475
Quarrying 28,712 Compass Minerals International,
Inc. . . . . . . . . . . . . . . . . . . . . . . . . . . . . . . . . 1.1 2,161,152
Reinsurance 27,380 Berkshire Hathaway, Inc. – Class B . . . . . . . . . . 1.8 3,615,255

PORTFOLIO INVESTMENTS
The accompanying notes are an integral part of the fi nancial statements.
J a n u s C a p i t a l F u n d s P l c / 3 1 D e c e m b e r 2 0 1 5 1 3 1
Share or Principal Amount
Percentage of Net
Assets (%) Fair
Value (USD)
REIT – Apartments 11,103 AvalonBay Communities, Inc. . . . . . . . . . . . . . . 1.0 2,044,39528,620 Post Properties, Inc. . . . . . . . . . . . . . . . . . . . . . 0.8 1,693,159
1.8 3,737,554
REIT – Diversifi ed 71,670 Potlatch Corp. . . . . . . . . . . . . . . . . . . . . . . . . . 1.1 2,167,301
REIT – Health Care 58,616 Healthcare Trust of America, Inc. . . . . . . . . . . . 0.8 1,580,874
REIT – Hotels 26,440 LaSalle Hotel Properties . . . . . . . . . . . . . . . . . . 0.3 665,230
REIT – Offi ce Property 19,552 Alexandria Real Estate Equities, Inc. . . . . . . . . . 0.9 1,766,719
9,421 Boston Properties, Inc. . . . . . . . . . . . . . . . . . . . 0.6 1,201,5541.5 2,968,273
REIT – Storage 15,195 Extra Space Storage, Inc. . . . . . . . . . . . . . . . . . 0.7 1,340,351
REIT – Warehouse and Industrial 23,089 EastGroup Properties, Inc. . . . . . . . . . . . . . . . . 0.6 1,283,979
Retail – Convenience Store 52,297 Casey’s General Stores, Inc.. . . . . . . . . . . . . . . . 3.1 6,299,174
Retail – Discount 17,035 HSN, Inc. . . . . . . . . . . . . . . . . . . . . . . . . . . . . . 0.4 863,163
Semiconductor Components/Integrated Circuits 23,552 Analog Devices, Inc. . . . . . . . . . . . . . . . . . . . . . 0.6 1,302,897
Super – Regional Banks 27,028 PNC Financial Services Group, Inc. . . . . . . . . . 1.3 2,576,03948,768 U.S. Bancorp . . . . . . . . . . . . . . . . . . . . . . . . . . 1.0 2,080,931
116,262 Wells Fargo & Co. . . . . . . . . . . . . . . . . . . . . . . 3.1 6,320,0025.4 10,976,972
Television 47,468 CBS Corp. . . . . . . . . . . . . . . . . . . . . . . . . . . . . 1.1 2,237,167
Transportation – Marine 21,397 Kirby Corp. . . . . . . . . . . . . . . . . . . . . . . . . . . . 0.5 1,125,910
Transportation – Railroad 122,864 CSX Corp. . . . . . . . . . . . . . . . . . . . . . . . . . . . . 1.5 3,188,321
24,889 Union Pacifi c Corp. . . . . . . . . . . . . . . . . . . . . . 0.9 1,946,3202.4 5,134,641
Vitamins and Nutrition Products 8,828 Mead Johnson Nutrition Co. . . . . . . . . . . . . . . 0.3 696,971
Web Portals/Internet Service Providers 4,679 Alphabet, Inc. . . . . . . . . . . . . . . . . . . . . . . . . . . 1.8 3,640,309
Total Common Stock . . . . . . . . . . . . . . . . . . . . . . . . . . . . . . . . . 96.0 196,932,166
Total Investments . . . . . . . . . . . . . . . . . . . . . . . . . . . . . . . . . . . . 96.0 196,932,166
Forward Currency Contracts, Open as at 31 December 2015
Currency Purchased
Currency Sold
Current Market
Value (USD) Settle Date
Unrealised Appreciation
(USD)
Citibank EUR 21,092,550 USD 22,921,337 22,907,606 29-Jan-16 13,733EUR 2,779,269 USD 3,020,240 3,018,431 29-Jan-16 1,809EUR 88,001 USD 95,630 95,573 29-Jan-16 57EUR 280,681 USD 305,152 305,104 29-Jan-16 48EUR 39,707 USD 43,149 43,123 29-Jan-16 26EUR 37,045 USD 40,275 40,269 29-Jan-16 6EUR 482 USD 522 520 29-Jan-16 2EUR 530 USD 576 576 29-Jan-16 —EUR 1,170 USD 1,272 1,272 29-Jan-16 —USD 160,070 EUR 146,504 159,302 29-Jan-16 768USD 135,606 EUR 124,082 134,921 29-Jan-16 685USD 63,355 EUR 57,939 63,000 29-Jan-16 355USD 191,351 EUR 175,790 191,146 29-Jan-16 205USD 21,402 EUR 19,588 21,299 29-Jan-16 103USD 9,164 EUR 8,389 9,122 29-Jan-16 42USD 681 EUR 623 678 29-Jan-16 3USD 305 EUR 279 304 29-Jan-16 1
Total 17,843
Total Financial Assets at fair value through profi t or loss 196,950,009
Financial Liabilities at fair value through profi t or loss Forward Currency Contracts, Open as at 31 December 2015
Currency Purchased
Currency Sold
Current Market
Value (USD) Settle Date
Unrealised (Depreciation)
(USD)
Citibank EUR 200 USD 219 221 29-Jan-16 (2)EUR 276 USD 302 304 29-Jan-16 (2)EUR 423 USD 463 466 29-Jan-16 (3)EUR 582 USD 637 641 29-Jan-16 (4)EUR 491 USD 539 544 29-Jan-16 (5)EUR 1,358 USD 1,487 1,497 29-Jan-16 (10)EUR 1,085 USD 1,191 1,202 29-Jan-16 (11)EUR 1,920 USD 2,100 2,113 29-Jan-16 (13)EUR 2,471 USD 2,703 2,719 29-Jan-16 (16)EUR 13,774 USD 15,086 15,194 29-Jan-16 (108)EUR 18,988 USD 20,779 20,911 29-Jan-16 (132)EUR 29,536 USD 32,337 32,557 29-Jan-16 (220)EUR 34,365 USD 37,717 38,068 29-Jan-16 (351)EUR 138,700 USD 151,778 152,740 29-Jan-16 (962)EUR 323,157 USD 353,795 356,204 29-Jan-16 (2,409)EUR 257,435 USD 282,550 285,177 29-Jan-16 (2,627)USD 678 EUR 624 679 29-Jan-16 (1)USD 1,511 EUR 1,391 1,513 29-Jan-16 (2)USD 633 EUR 585 636 29-Jan-16 (3)USD 1,404 EUR 1,297 1,410 29-Jan-16 (6)USD 47,595 EUR 43,817 47,644 29-Jan-16 (49)USD 44,232 EUR 40,860 44,428 29-Jan-16 (196)USD 361,623 EUR 332,915 361,997 29-Jan-16 (374)USD 335,994 EUR 310,374 337,486 29-Jan-16 (1,492)
Total (8,998)
Total Financial Liabilities at fair value through profi t or loss (8,998)

INTECH All-World Minimum Variance Core Fund(a)
PORTFOLIO INVESTMENTS
The accompanying notes are an integral part of the fi nancial statements.
1 3 2 J a n u s C a p i t a l F u n d s P l c / 3 1 D e c e m b e r 2 0 1 5
Share or Principal Amount
Percentage of Net
Assets (%) Fair
Value (USD)
Financial Assets at fair value through profi t or loss Common Stock Advertising Services
131 JCDecaux S.A. . . . . . . . . . . . . . . . . . . . . . . . . . — 5,025
Aerospace and Defence 3,600 Boeing Co. . . . . . . . . . . . . . . . . . . . . . . . . . . . 0.1 520,524
13,400 General Dynamics Corp. . . . . . . . . . . . . . . . . 0.2 1,840,6241,971 Hanwha Techwin Co., Ltd. . . . . . . . . . . . . . . . . — 59,770
19,156 Korea Aerospace Industries, Ltd. . . . . . . . . . . 0.2 1,276,18911,800 Lockheed Martin Corp. . . . . . . . . . . . . . . . . . 0.3 2,562,37010,400 Northrop Grumman Corp. . . . . . . . . . . . . . . . 0.3 1,963,62420,400 Raytheon Co. . . . . . . . . . . . . . . . . . . . . . . . . . 0.3 2,540,412
900 Rockwell Collins, Inc.. . . . . . . . . . . . . . . . . . . . — 83,0701,620 Thales S.A. . . . . . . . . . . . . . . . . . . . . . . . . . . . . — 121,636
12,200 TransDigm Group, Inc. . . . . . . . . . . . . . . . . . . 0.4 2,787,090
1.8 13,755,309 Aerospace and Defence – Equipment
11,032 Elbit Systems, Ltd. . . . . . . . . . . . . . . . . . . . . . 0.1 972,1767,100 Harris Corp. . . . . . . . . . . . . . . . . . . . . . . . . . . 0.1 616,990
0.2 1,589,166 Agricultural Chemicals
5,500 CF Industries Holdings, Inc.. . . . . . . . . . . . . . . — 224,455230,930 Incitec Pivot, Ltd. . . . . . . . . . . . . . . . . . . . . . . 0.1 666,201
11,600 Monsanto Co. . . . . . . . . . . . . . . . . . . . . . . . . . 0.2 1,142,83252,890 PhosAgro OAO . . . . . . . . . . . . . . . . . . . . . . . . 0.1 679,637
. . . . . . 0.4 2,713,125 Agricultural Operations
58,100 Archer-Daniels-Midland Co. . . . . . . . . . . . . . . 0.3 2,131,108
Airlines 2,426,404 Air Arabia PJSC . . . . . . . . . . . . . . . . . . . . . . . 0.1 898,447
336,579 Air New Zealand, Ltd. . . . . . . . . . . . . . . . . . . 0.1 680,002199,000 ANA Holdings, Inc. . . . . . . . . . . . . . . . . . . . . 0.1 579,547368,000 Cathay Pacifi c Airways, Ltd. . . . . . . . . . . . . . . 0.1 637,252
1,779,000 China Airlines, Ltd. . . . . . . . . . . . . . . . . . . . . 0.1 650,0472,455 easyJet PLC. . . . . . . . . . . . . . . . . . . . . . . . . . . . — 62,965
1,103,000 Eva Airways Corp. . . . . . . . . . . . . . . . . . . . . . 0.1 624,70630,100 Japan Airlines Co., Ltd. . . . . . . . . . . . . . . . . . 0.1 1,090,993
247,808 Qantas Airways, Ltd. . . . . . . . . . . . . . . . . . . . 0.1 738,36018,200 Southwest Airlines Co. . . . . . . . . . . . . . . . . . . 0.1 783,692
0.9 6,746,011 Airport Development and Maintenance
653,886 Auckland International Airport, Ltd. . . . . . . . 0.4 2,570,606920,000 Beijing Capital International Airport
Co., Ltd. . . . . . . . . . . . . . . . . . . . . . . . . . . . 0.1 993,629120,300 Grupo Aeroportuario del Pacifi co
S.A.B. de C.V. . . . . . . . . . . . . . . . . . . . . . . . 0. 2 1,063,064384,762 Sydney Airport . . . . . . . . . . . . . . . . . . . . . . . . 0.3 1,779,899
1,400 TAV Havalimanlari Holding A/S . . . . . . . . . . . . — 8,734
1. 0 6,415,932 Apparel Manufacturers
64,000 Hanesbrands, Inc. . . . . . . . . . . . . . . . . . . . . . 0. 4 1,883,52014,100 Under Armour, Inc. – Class A . . . . . . . . . . . . . 0.2 1,136,60137,000 VF Corp. . . . . . . . . . . . . . . . . . . . . . . . . . . . . 0.3 2,303,25022,000 Wacoal Holdings Corp. . . . . . . . . . . . . . . . . . . — 265,435
0. 9 5,588,806 Applications Software
2,000 Check Point Software Technologies, Ltd. . . . . . . . . . . . . . . . . . . . . . . . . . . . . . . . . — 162,760
14,200 Intuit, Inc. . . . . . . . . . . . . . . . . . . . . . . . . . . . 0.2 1,370,30036,000 Microsoft Corp. . . . . . . . . . . . . . . . . . . . . . . . 0.3 1,997,280
Share or Principal Amount
Percentage of Net
Assets (%) Fair
Value (USD)
6,200 Red Hat, Inc. . . . . . . . . . . . . . . . . . . . . . . . . . 0.1 513,42287,887 Sage Group PLC . . . . . . . . . . . . . . . . . . . . . . . 0.1 781,807
100 Salesforce.com, Inc. . . . . . . . . . . . . . . . . . . . . . — 7,840
0.7 4,833,409 Athletic Footwear
142,000 Feng TAY Enterprise Co., Ltd. . . . . . . . . . . . . 0.1 726,41533,800 NIKE, Inc. – Class B . . . . . . . . . . . . . . . . . . . . 0.3 2,112,500
364,000 Pou Chen Corp. . . . . . . . . . . . . . . . . . . . . . . . 0.1 477,712715,000 Yue Yuen Industrial Holdings, Ltd. . . . . . . . . . 0.3 2,431,071
0.8 5,747,698 Automotive – Cars and Light Trucks
39,600 Nissan Motor Co., Ltd. . . . . . . . . . . . . . . . . . . 0.1 421,6028,000 Toyota Motor Corp. . . . . . . . . . . . . . . . . . . . . 0.1 498,452
0.2 920,054 Automotive – Truck Parts and Equipment – Original
68,000 Calsonic Kansei Corp. . . . . . . . . . . . . . . . . . . 0.1 609,3866,300 Delphi Automotive PLC . . . . . . . . . . . . . . . . . 0.1 540,099
27,600 NHK Spring Co., Ltd. . . . . . . . . . . . . . . . . . . . . — 280,63911,800 Nifco Japan, Inc.. . . . . . . . . . . . . . . . . . . . . . . 0.1 552,78729,300 Tokai Rika Co., Ltd. . . . . . . . . . . . . . . . . . . . . 0.1 733,84136,600 Toyoda Gosei Co., Ltd. . . . . . . . . . . . . . . . . . . 0.1 842,97523,600 Toyota Boshoku Corp. . . . . . . . . . . . . . . . . . . 0.1 481,897
9,900 TS Tech Co., Ltd. . . . . . . . . . . . . . . . . . . . . . . . — 259,898
0.6 4,301,522 Banks
1,490,000 Agricultural Bank of China, Ltd. . . . . . . . . . . . 0.1 609,476648,000 Aozora Bank, Ltd. . . . . . . . . . . . . . . . . . . . . . . 0.3 2,280,778
400 Comerica, Inc. . . . . . . . . . . . . . . . . . . . . . . . . . — 16,732188,000 Dah Sing Financial Holdings, Ltd. . . . . . . . . . 0.1 940,027104,635 First Gulf Bank PJSC . . . . . . . . . . . . . . . . . . . . — 360,378
27,000 Yamaguchi Financial Group, Inc. . . . . . . . . . . . — 323,515
0.5 4,530,906 Beverages – Non-Alcoholic
9,900 Coca-Cola West Co., Ltd. . . . . . . . . . . . . . . . . . — 202,39938,100 Dr. Pepper Snapple Group, Inc. . . . . . . . . . . . 0.5 3,550,90628,981 Embotelladora Andina S.A.. . . . . . . . . . . . . . . . — 86,315
188 Lotte Chilsung Beverage Co., Ltd.. . . . . . . . . . . — 355,8567,100 Monster Beverage Corp. . . . . . . . . . . . . . . . . . 0.1 1,057,616
32,500 PepsiCo, Inc. . . . . . . . . . . . . . . . . . . . . . . . . . 0.4 3,247,400
1.0 8,500,492 Beverages – Wine and Spirits
25,300 Brown-Forman Corp. – Class B . . . . . . . . . . . 0.3 2,511,78419,000 Constellation Brands, Inc. – Class A . . . . . . . . 0.4 2,706,360
675 Davide Campari-Milano SpA . . . . . . . . . . . . . . — 5,868149 Distell Group, Ltd. . . . . . . . . . . . . . . . . . . . . . . — 1,591
14,744 Treasury Wine Estates, Ltd. . . . . . . . . . . . . . . . — 89,150
0.7 5,314,753 Brewery
29,600 Asahi Group Holdings, Ltd. . . . . . . . . . . . . . . 0.1 935,68315,200 Molson Coors Brewing Co. . . . . . . . . . . . . . . . 0.2 1,427,584
0.3 2,363,267 Building – Heavy Construction
330,000 Cheung Kong Infrastructure Holdings, Ltd. . . . . . . . . . . . . . . . . . . . . . . . 0.5 3,057,379
1,000 Maeda Road Construction Co., Ltd. . . . . . . . . . — 16,96624,800 SBA Communications Corp. – Class A . . . . . . 0.3 2,605,736
0.8 5,680,081 Building – Residential and Commercial
43,400 Sekisui House, Ltd. . . . . . . . . . . . . . . . . . . . . 0.1 739,042

PORTFOLIO INVESTMENTS
The accompanying notes are an integral part of the fi nancial statements.
J a n u s C a p i t a l F u n d s P l c / 3 1 D e c e m b e r 2 0 1 5 1 3 3
Share or Principal Amount
Percentage of Net
Assets (%) Fair
Value (USD)
Building and Construction – Miscellaneous 8,491 Ferrovial S.A. . . . . . . . . . . . . . . . . . . . . . . . . . . — 192,415
24,000 Taisei Corp. . . . . . . . . . . . . . . . . . . . . . . . . . . . — 159,760
— 352,175 Building and Construction Products – Miscellaneous
200 Fortune Brands Home & Security, Inc. . . . . . . . — 11,100726 Geberit A.G. . . . . . . . . . . . . . . . . . . . . . . . . . . . — 246,665
10,200 TOTO, Ltd. . . . . . . . . . . . . . . . . . . . . . . . . . . 0.1 363,679
0.1 621,444 Building Products – Cement and Aggregate
159,787 Adelaide Brighton, Ltd. . . . . . . . . . . . . . . . . . 0.1 552,9232,300 Martin Marietta Materials, Inc. . . . . . . . . . . . . . — 314,1342,800 Vulcan Materials Co.. . . . . . . . . . . . . . . . . . . . . — 265,916
0.1 1,132,973 Building Products – Wood
5,500 Masco Corp. . . . . . . . . . . . . . . . . . . . . . . . . . . . — 155,650
Cable/Satellite TV 22,073 Altice N.V. – Class A . . . . . . . . . . . . . . . . . . . . . — 317,79536,788 British Sky Broadcasting Group PLC . . . . . . . . 0.1 602,98831,800 Cablevision Systems Corp. . . . . . . . . . . . . . . . 0.1 1,014,42060,600 Comcast Corp. – Class A . . . . . . . . . . . . . . . . 0. 4 3,419,65825,600 DISH Network Corp. . . . . . . . . . . . . . . . . . . . 0.2 1,463,80815,970 Kabel Deutschland Holding A.G. . . . . . . . . . . 0.3 1,980,845
3,400 Liberty Global PLC – Class A . . . . . . . . . . . . . . — 144,02439,300 Liberty Global PLC – Class C . . . . . . . . . . . . . 0.2 1,602,261
5,669 Numericable-SFR . . . . . . . . . . . . . . . . . . . . . . . — 206,35816,000 Time Warner Cable, Inc.. . . . . . . . . . . . . . . . . 0.4 2,969,440
1. 7 13,721,597 Casino Hotels
72,328 Kangwon Land, Inc. . . . . . . . . . . . . . . . . . . . . 0.3 2,369,174446,974 Star Entertainment Group, Ltd. . . . . . . . . . . . 0.2 1,654,152
0.5 4,023,326 Cellular Telecommunications
65,700 Advanced Info Service PCL . . . . . . . . . . . . . . . — 277,63264,000 China Mobile, Ltd. . . . . . . . . . . . . . . . . . . . . . 0.1 722,602
922,000 Far EasTone Telecommunications Co., Ltd. . . . . . . . . . . . . . . . . . . . . . . . . . . . . . . . 0.3 1,897,863
127,700 Sprint Corp. . . . . . . . . . . . . . . . . . . . . . . . . . . 0.1 462,274510,000 Taiwan Mobile Co., Ltd. . . . . . . . . . . . . . . . . . 0.2 1,552,950
17,600 T-Mobile U.S., Inc. . . . . . . . . . . . . . . . . . . . . . 0.1 688,512
0.8 5,601,833 Chemicals – Diversifi ed
229,000 Asahi Kasei Corp. . . . . . . . . . . . . . . . . . . . . . . 0.2 1,568,0155,500 Ashland, Inc. . . . . . . . . . . . . . . . . . . . . . . . . . 0.1 564,850
11,268 Croda International PLC . . . . . . . . . . . . . . . . . 0.1 505,247171,000 Denka Co., Ltd. . . . . . . . . . . . . . . . . . . . . . . . 0.1 768,347270,000 DIC Corp. . . . . . . . . . . . . . . . . . . . . . . . . . . . 0.1 741,388
1,706 Evonik Industries A.G. . . . . . . . . . . . . . . . . . . . — 56,75214,200 Hitachi Chemical Co., Ltd. . . . . . . . . . . . . . . . . — 228,75057,000 Kaneka Corp. . . . . . . . . . . . . . . . . . . . . . . . . . 0.1 599,97514,700 Lintec Corp. . . . . . . . . . . . . . . . . . . . . . . . . . . . — 313,008
105,700 Mitsubishi Chemical Holdings Corp. . . . . . . . 0.1 681,0084,300 Nippon Shokubai Co., Ltd. . . . . . . . . . . . . . . . — 303,0546,100 Nissan Chemical Industries, Ltd. . . . . . . . . . . . — 140,547
144,966 Nufarm Australia, Ltd. . . . . . . . . . . . . . . . . . . 0.1 882,88112,100 PPG Industries, Inc. . . . . . . . . . . . . . . . . . . . . 0.2 1,195,722
5,300 Samsung Fine Chemicals Co., Ltd. . . . . . . . . . . — 160,9488,200 Sherwin-Williams Co. . . . . . . . . . . . . . . . . . . 0.3 2,128,720
12,124 Symrise A.G. . . . . . . . . . . . . . . . . . . . . . . . . . 0.1 807,958107,000 Ube Industries, Ltd. . . . . . . . . . . . . . . . . . . . . . — 228,815
1.5 11,875,985
Share or Principal Amount
Percentage of Net
Assets (%) Fair
Value (USD)
Chemicals – Plastics 1,121 EMS-Chemie Holding A.G.. . . . . . . . . . . . . . . 0.1 493,719
Chemicals – Specialty 14,100 Ecolab, Inc. . . . . . . . . . . . . . . . . . . . . . . . . . . 0.2 1,612,758
847 Givaudan S.A. . . . . . . . . . . . . . . . . . . . . . . . . 0.2 1,542,07716,400 International Flavors & Fragrances,
Inc. . . . . . . . . . . . . . . . . . . . . . . . . . . . . . . . 0.3 1,962,0964,256 Lonza Group A.G. . . . . . . . . . . . . . . . . . . . . . 0.1 693,2536,240 Novozymes A/S . . . . . . . . . . . . . . . . . . . . . . . . — 300,457
64,000 Teijin, Ltd. . . . . . . . . . . . . . . . . . . . . . . . . . . . . — 221,002119,000 Toray Industries, Inc. . . . . . . . . . . . . . . . . . . . 0.1 1,118,905
0.9 7,450,548 Coal
276,920 Semirara Mining and Power Corp. . . . . . . . . . 0.1 803,581
Collectibles 2,900 Sanrio Co., Ltd. . . . . . . . . . . . . . . . . . . . . . . . . — 68,772
Commercial Banks – Non U.S. 207,400 Bank Central Asia Tbk PT. . . . . . . . . . . . . . . . . — 200,179
1,495,000 Bank of China, Ltd. . . . . . . . . . . . . . . . . . . . . 0.1 667,46598,000 Bank of Communications Co., Ltd.. . . . . . . . . . — 69,045
221,240 BDO Unibank, Inc. . . . . . . . . . . . . . . . . . . . . . 0.1 493,851313,500 BOC Hong Kong Holdings, Ltd. . . . . . . . . . . . 0.1 958,731
1,000 Canadian Imperial Bank of Commerce . . . . . . . — 65,913327,000 China Construction Bank Corp. . . . . . . . . . . . . — 224,054484,428 Commercial International Bank Egypt
SAE . . . . . . . . . . . . . . . . . . . . . . . . . . . . . . . 0.3 2,356,561234,000 Dah Sing Banking Group, Ltd. . . . . . . . . . . . . 0.1 414,268
67,000 Daishi Bank, Ltd. . . . . . . . . . . . . . . . . . . . . . . . — 298,81827,100 DBS Group Holdings, Ltd. . . . . . . . . . . . . . . . . — 319,12711,600 Hang Seng Bank, Ltd. . . . . . . . . . . . . . . . . . . . . — 220,78183,000 Hokkoku Bank, Ltd. . . . . . . . . . . . . . . . . . . . . . — 278,32434,000 Hyakugo Bank, Ltd. . . . . . . . . . . . . . . . . . . . . . — 167,199
406,000 Industrial & Commercial Bank of China, Ltd. . . . . . . . . . . . . . . . . . . . . . . . . . . — 245,179
1,029 Jyske Bank A/S . . . . . . . . . . . . . . . . . . . . . . . . . — 46,77470,500 Mizuho Financial Group, Inc. . . . . . . . . . . . . . . — 142,842
471,900 Public Bank Bhd . . . . . . . . . . . . . . . . . . . . . . . 0.3 2,037,198114,200 Seven Bank, Ltd.. . . . . . . . . . . . . . . . . . . . . . . 0.1 506,478
1.1 9,712,787 Commercial Services
27,300 Cintas Corp. . . . . . . . . . . . . . . . . . . . . . . . . . . 0.3 2,485,665
Commercial Services – Finance 16,000 Automatic Data Processing, Inc. . . . . . . . . . . . 0.2 1,355,52019,900 Equifax, Inc. . . . . . . . . . . . . . . . . . . . . . . . . . . 0.3 2,216,263
1,800 FleetCor Technologies, Inc. . . . . . . . . . . . . . . . — 257,27432,700 H&R Block, Inc. . . . . . . . . . . . . . . . . . . . . . . . 0.1 1,089,23713,300 McGraw Hill Financial, Inc. . . . . . . . . . . . . . . 0.2 1,311,11410,700 Moody’s Corp. . . . . . . . . . . . . . . . . . . . . . . . . 0.1 1,073,63822,400 SEI Investments Co. . . . . . . . . . . . . . . . . . . . . 0.2 1,173,760
7,900 Total System Services, Inc. . . . . . . . . . . . . . . . 0.1 393,42038,400 Western Union Co. . . . . . . . . . . . . . . . . . . . . . 0.1 687,744
1.3 9,557,970 Computer Aided Design
6,380 Dassault Systemes. . . . . . . . . . . . . . . . . . . . . . 0.1 511,411
Computer Services 1,700 Accenture PLC – Class A . . . . . . . . . . . . . . . . . — 177,650
15,441 Asseco Poland S.A. . . . . . . . . . . . . . . . . . . . . . . — 223,98935 Atos S.E. . . . . . . . . . . . . . . . . . . . . . . . . . . . . . . — 2,946
8,300 Cognizant Technology Solutions Corp. . . . . . . . . . . . . . . . . . . . . . . . . . . . . . 0.1 498,166

INTECH All-World Minimum Variance Core Fund(a)
PORTFOLIO INVESTMENTS
The accompanying notes are an integral part of the fi nancial statements.
1 3 4 J a n u s C a p i t a l F u n d s P l c / 3 1 D e c e m b e r 2 0 1 5
Share or Principal Amount
Percentage of Net
Assets (%) Fair
Value (USD)
24,131 DataTec, Ltd. . . . . . . . . . . . . . . . . . . . . . . . . . . — 80,4366,800 DST Systems, Inc.. . . . . . . . . . . . . . . . . . . . . . 0.1 775,608
89,300 Hewlett Packard Enterprise Co. . . . . . . . . . . . 0.2 1,357,36028,930 Nomura Research Institute, Ltd. . . . . . . . . . . . 0.2 1,124,173
1,800 SCSK Corp. . . . . . . . . . . . . . . . . . . . . . . . . . . . — 73,165
0.6 4,313,493 Computers
167,000 Advantech Co., Ltd. . . . . . . . . . . . . . . . . . . . . 0.2 1,075,50918,600 Apple, Inc. . . . . . . . . . . . . . . . . . . . . . . . . . . . 0.3 1,957,836
166,000 Asustek Computer, Inc. . . . . . . . . . . . . . . . . . 0.2 1,374,878480,365 Chicony Electronics Co., Ltd. . . . . . . . . . . . . . 0.1 1,056,078
78,900 HP, Inc. . . . . . . . . . . . . . . . . . . . . . . . . . . . . . . 0.1 934,176652,000 Lenovo Group, Ltd. . . . . . . . . . . . . . . . . . . . . 0.1 662,115253,000 Quanta Computer, Inc. . . . . . . . . . . . . . . . . . . 0.1 408,304
1.1 7,468,896 Computers – Integrated Systems
19,000 CGI Group, Inc. – Class A . . . . . . . . . . . . . . . 0.1 760,82315,400 NS Solutions Corp. . . . . . . . . . . . . . . . . . . . . . . — 354,95112,200 NTT Data Corp. . . . . . . . . . . . . . . . . . . . . . . . 0.1 596,90520,800 Obic Co., Ltd. . . . . . . . . . . . . . . . . . . . . . . . . 0. 2 1,114,59543,200 Otsuka Corp. . . . . . . . . . . . . . . . . . . . . . . . . . 0. 4 2,142,386
0. 8 4,969,660 Computers – Memory Devices
6,400 Seagate Technology PLC . . . . . . . . . . . . . . . . . 0.1 234,6246,100 Western Digital Corp. . . . . . . . . . . . . . . . . . . . 0.1 366,305
0.2 600,929 Consulting Services
1,900 Towers Watson & Co. – Class A . . . . . . . . . . . . — 244,074
Consumer Products – Miscellaneous 23,500 Clorox Co. . . . . . . . . . . . . . . . . . . . . . . . . . . . 0.4 2,980,50526,700 Kimberly-Clark Corp. . . . . . . . . . . . . . . . . . . . 0.5 3,398,910
0.9 6,379,415 Containers – Metal and Glass
30,200 Ball Corp. . . . . . . . . . . . . . . . . . . . . . . . . . . . . 0.3 2,196,446
Containers – Paper and Plastic 182,095 Amcor, Ltd. . . . . . . . . . . . . . . . . . . . . . . . . . . 0.2 1,782,899
15,100 FP Corp. . . . . . . . . . . . . . . . . . . . . . . . . . . . . . 0.1 550,9538,000 Lee & Man Paper Manufacturing,
Ltd. . . . . . . . . . . . . . . . . . . . . . . . . . . . . . . . . — 4,470
0.3 2,338,322 Cosmetics and Toiletries
2,719 AMOREPACIFIC Corp. . . . . . . . . . . . . . . . . . 0.1 961,3753,341 AMOREPACIFIC Group . . . . . . . . . . . . . . . . . 0.1 421,791
42,700 Kao Corp. . . . . . . . . . . . . . . . . . . . . . . . . . . . . 0.3 2,222,40311,500 Kose Corp. . . . . . . . . . . . . . . . . . . . . . . . . . . . 0.1 1,078,424
1,266 LG Household & Health Care, Ltd. . . . . . . . . 0.2 1,133,91926,000 Lion Corp. . . . . . . . . . . . . . . . . . . . . . . . . . . . . — 247,495
104,000 L’Occitane International S.A. . . . . . . . . . . . . . . . — 201,296258 L’Oreal S.A. . . . . . . . . . . . . . . . . . . . . . . . . . . . . — 43,537
31,700 Pigeon Corp. . . . . . . . . . . . . . . . . . . . . . . . . . 0.1 782,08119,600 Pola Orbis Holdings, Inc. . . . . . . . . . . . . . . . . 0.2 1,307,97125,200 Procter & Gamble Co. . . . . . . . . . . . . . . . . . . 0.3 2,001,13232,400 Shiseido Co., Ltd. . . . . . . . . . . . . . . . . . . . . . . 0.1 681,807
2,971 Svenska Cellulosa A.B. SCA . . . . . . . . . . . . . . . — 86,81771,800 Unicharm Corp. . . . . . . . . . . . . . . . . . . . . . . . 0.2 1,479,852
1.7 12,649,900 Cruise Lines
3,600 Carnival Corp. . . . . . . . . . . . . . . . . . . . . . . . . . — 196,12812,139 Carnival PLC . . . . . . . . . . . . . . . . . . . . . . . . . 0.1 691,73925,700 Norwegian Cruise Line Holdings,
Ltd. . . . . . . . . . . . . . . . . . . . . . . . . . . . . . . . 0.2 1,506,020
Share or Principal Amount
Percentage of Net
Assets (%) Fair
Value (USD)
600 Royal Caribbean Cruises, Ltd. . . . . . . . . . . . . . — 60,726
0.3 2,454,613 Data Processing and Management
23,900 Broadridge Financial Solutions, Inc. . . . . . . . . 0.2 1,284,14730,200 Fidelity National Information
Services, Inc. . . . . . . . . . . . . . . . . . . . . . . . . 0.2 1,830,120
0.4 3,114,267 Dental Supplies and Equipment
3,800 Patterson Cos, Inc. . . . . . . . . . . . . . . . . . . . . . . — 171,798
Dialysis Centres 43,300 DaVita, Inc. . . . . . . . . . . . . . . . . . . . . . . . . . . 0.4 3,018,443
2,231 Fresenius Medical Care A.G. & Co., KGaA . . . . . . . . . . . . . . . . . . . . . . . . . . . . . . — 188,433
16,789 Fresenius S.E. & Co. . . . . . . . . . . . . . . . . . . . 0.2 1,203,486
0.6 4,410,362 Disposable Medical Products
14,300 CR Bard, Inc. . . . . . . . . . . . . . . . . . . . . . . . . . 0.4 2,708,992
Distribution/Wholesale 9,100 Canon Marketing Japan, Inc. . . . . . . . . . . . . . . — 143,5659,200 Genuine Parts Co. . . . . . . . . . . . . . . . . . . . . . 0.1 790,188
22,762 Hanwha Corp. . . . . . . . . . . . . . . . . . . . . . . . . 0.1 765,0087,517 Wolseley PLC . . . . . . . . . . . . . . . . . . . . . . . . . 0.1 408,965
0.3 2,107,726 Diversifi ed Banking Institutions
800 Goldman Sachs Group, Inc. . . . . . . . . . . . . . . . — 144,184600 JP Morgan Chase & Co. . . . . . . . . . . . . . . . . . . — 39,618
2,900 Morgan Stanley. . . . . . . . . . . . . . . . . . . . . . . . . — 92,2498,646 UBS A.G. . . . . . . . . . . . . . . . . . . . . . . . . . . . . 0.1 168,551
0.1 444,602 Diversifi ed Financial Services
22,690 Capitec Bank Holdings, Ltd. . . . . . . . . . . . . . . 0.1 790,923805,000 China Development Financial
Holding Corp.. . . . . . . . . . . . . . . . . . . . . . . . — 201,7361,319,000 E.Sun Financial Holding Co., Ltd. . . . . . . . . . 0.1 769,132
545,000 Far East Horizon, Ltd. . . . . . . . . . . . . . . . . . . 0.1 507,041808,000 Fubon Financial Holding Co., Ltd. . . . . . . . . . 0.1 1,107,162
45,900 Hong Kong Exchanges and Clearing, Ltd. . . . . . . . . . . . . . . . . . . . . . . . . . . . . . . . 0.2 1,175,666
72,478 JSE, Ltd. . . . . . . . . . . . . . . . . . . . . . . . . . . . . . 0.1 600,4567,615 Provident Financial PLC . . . . . . . . . . . . . . . . . 0.1 377,929
35,000 Taishin Financial Holding Co., Ltd. . . . . . . . . . . . . . . . . . . . . . . . . . . . . . . . . — 12,150
32,400 Zenkoku Hosho Co., Ltd. . . . . . . . . . . . . . . . . 0.1 1,085,122
0.9 6,627,317 Diversifi ed Manufacturing Operations
8,100 3M Co. . . . . . . . . . . . . . . . . . . . . . . . . . . . . . . 0.2 1,220,184
Diversifi ed Operations 39,228 Bollore S.A. . . . . . . . . . . . . . . . . . . . . . . . . . . . — 183,160
6,186 CJ Corp. . . . . . . . . . . . . . . . . . . . . . . . . . . . . . 0.2 1,324,472360,000 Goldin Properties Holdings, Ltd. . . . . . . . . . . 0.1 415,289267,700 IJM Corp. Bhd . . . . . . . . . . . . . . . . . . . . . . . . . — 210,915153,000 NWS Holdings, Ltd. . . . . . . . . . . . . . . . . . . . . . — 229,013
98,500 Swire Pacifi c, Ltd. . . . . . . . . . . . . . . . . . . . . . . 0.1 1,108,316
0.4 3,471,165 Diversifi ed Operations – Commercial Services
33,329 Bunzl PLC . . . . . . . . . . . . . . . . . . . . . . . . . . . 0.1 926,043103,422 KAP Industrial Holdings, Ltd. . . . . . . . . . . . . . — 46,188
80,173 Rentokil Initial PLC . . . . . . . . . . . . . . . . . . . . . — 188,253
0.1 1,160,484 E-Commerce/Products
400 Amazon.com, Inc. . . . . . . . . . . . . . . . . . . . . . . — 270,356

PORTFOLIO INVESTMENTS
J a n u s C a p i t a l F u n d s P l c / 3 1 D e c e m b e r 2 0 1 5 1 3 5
*Fair Valued by Janus Global Pricing Committee at 31 December 2015.The accompanying notes are an integral part of the fi nancial statements.
Share or Principal Amount
Percentage of Net
Assets (%) Fair
Value (USD)
Electric – Distribution 803,117 AusNet Services . . . . . . . . . . . . . . . . . . . . . . . 0.1 868,830
Electric – Generation 2,551,200 Aboitiz Power Corp. . . . . . . . . . . . . . . . . . . . . 0.3 2,261,640
19,796 CEZ A/S . . . . . . . . . . . . . . . . . . . . . . . . . . . . . . — 353,987402,000 China Resources Power Holdings
Co., Ltd. . . . . . . . . . . . . . . . . . . . . . . . . . . . 0.1 782,2378,600 Electric Power Development
Co., Ltd. . . . . . . . . . . . . . . . . . . . . . . . . . . . . — 309,49461,800 Electricity Generating PCL . . . . . . . . . . . . . . . . — 260,292
4,416,600 Energy Development Corp. . . . . . . . . . . . . . . 0.1 582,1341,450,000 Huaneng Power International, Inc. . . . . . . . . . 0.2 1,251,714
247,400 Ratchaburi Electricity Generating Holding PCL . . . . . . . . . . . . . . . . . . . . . . . . . — 326,703
0.7 6,128,201 Electric – Integrated
856,137 AES Gener S.A. . . . . . . . . . . . . . . . . . . . . . . . . 0.1 380,38545,200 Alliant Energy Corp. . . . . . . . . . . . . . . . . . . . . 0.4 2,822,74034,800 American Electric Power Co., Inc. . . . . . . . . . 0.3 2,027,79653,000 Chubu Electric Power Co., Inc. . . . . . . . . . . . 0.1 733,17118,400 Chugoku Electric Power Co., Inc.. . . . . . . . . . . — 244,966
291,000 CLP Holdings, Ltd. . . . . . . . . . . . . . . . . . . . . . 0.3 2,472,63324,800 CMS Energy Corp. . . . . . . . . . . . . . . . . . . . . . 0.1 894,784
2,502,364 Colbun S.A. . . . . . . . . . . . . . . . . . . . . . . . . . . 0.1 598,26412,600 Dominion Resources, Inc. . . . . . . . . . . . . . . . . 0.1 852,26426,100 DTE Energy Co. . . . . . . . . . . . . . . . . . . . . . . . 0.3 2,092,95936,800 Edison International . . . . . . . . . . . . . . . . . . . . 0.3 2,178,92842,100 Entergy Corp. . . . . . . . . . . . . . . . . . . . . . . . . . 0.4 2,877,956
119,900 Exelon Corp. . . . . . . . . . . . . . . . . . . . . . . . . . 0.4 3,329,62318,200 Hokuriku Electric Power Co. . . . . . . . . . . . . . . — 271,83411,100 NextEra Energy, Inc. . . . . . . . . . . . . . . . . . . . . 0.2 1,153,17978,100 Pepco Holdings, Inc. . . . . . . . . . . . . . . . . . . . 0.3 2,031,38131,500 PG&E Corp. . . . . . . . . . . . . . . . . . . . . . . . . . . 0.2 1,675,485
255,000 Power Assets Holdings, Ltd. . . . . . . . . . . . . . . 0.3 2,346,06816,700 PPL Corp. . . . . . . . . . . . . . . . . . . . . . . . . . . . . 0.1 569,97144,900 Public Service Enterprise Group,
Inc. . . . . . . . . . . . . . . . . . . . . . . . . . . . . . . . 0.2 1,737,18172,500 Southern Co. . . . . . . . . . . . . . . . . . . . . . . . . . 0.5 3,392,27522,031 SSE PLC . . . . . . . . . . . . . . . . . . . . . . . . . . . . . 0.1 496,198
151,700 Tenaga Nasional Bhd . . . . . . . . . . . . . . . . . . . 0.1 471,01273,600 Xcel Energy, Inc. . . . . . . . . . . . . . . . . . . . . . . . 0.4 2,642,976
5.3 38,294,029 Electric – Transmission
2,269 Red Electrica Corp S.A. . . . . . . . . . . . . . . . . . . — 190,114
Electric Products – Miscellaneous 20,800 Casio Computer Co., Ltd. . . . . . . . . . . . . . . . . 0.1 492,741
1,135 Legrand S.A. . . . . . . . . . . . . . . . . . . . . . . . . . . . — 64,37810,600 Mabuchi Motor Co., Ltd. . . . . . . . . . . . . . . . . 0.1 585,655
8,100 Nidec Corp. . . . . . . . . . . . . . . . . . . . . . . . . . . 0.1 595,604
0.3 1,738,378 Electrical Components – Equipment
230,000 Delta Electronics, Inc. . . . . . . . . . . . . . . . . . . . 0.1 1,089,044
Electronic Components – Miscellaneous 9,000 AAC Technologies Holdings, Inc. . . . . . . . . . . . — 58,705
436,850 Hon Hai Precision Industry Co., Ltd. . . . . . . . . . . . . . . . . . . . . . . . . . . . 0.1 1,074,808
21,500 Hoya Corp.. . . . . . . . . . . . . . . . . . . . . . . . . . . 0.1 891,092718 Samsung Electro-Mechanics
Co., Ltd. . . . . . . . . . . . . . . . . . . . . . . . . . . . . — 38,524
0.2 2,063,129 Electronic Components – Semiconductors
32,600 Broadcom Corp. – Class A . . . . . . . . . . . . . . . 0.3 1,884,932
Share or Principal Amount
Percentage of Net
Assets (%) Fair
Value (USD)
2,996,000 Hanergy Thin Film Power Group, Ltd *. . . . . . . . . . . . . . . . . . . . . . . . . . — 83,048
37,100 Intel Corp. . . . . . . . . . . . . . . . . . . . . . . . . . . . 0.2 1,278,09512,700 NVIDIA Corp. . . . . . . . . . . . . . . . . . . . . . . . . 0.1 418,59219,300 Texas Instruments, Inc.. . . . . . . . . . . . . . . . . . 0.1 1,057,833
0.7 4,722,500 Electronic Connectors
25,600 Amphenol Corp. – Class A . . . . . . . . . . . . . . . 0.2 1,337,08820,000 Japan Aviation Electronics Industry,
Ltd. . . . . . . . . . . . . . . . . . . . . . . . . . . . . . . . . — 292,228
0.2 1,629,316 Electronic Design Automation
200 Synopsys, Inc. . . . . . . . . . . . . . . . . . . . . . . . . . — 9,122
Electronic Forms 8,000 Adobe Systems, Inc. . . . . . . . . . . . . . . . . . . . . 0.1 751,520
Electronics – Military 10,300 L-3 Communications Holdings,
Inc. . . . . . . . . . . . . . . . . . . . . . . . . . . . . . . . 0.2 1,230,953606 Safran S.A. . . . . . . . . . . . . . . . . . . . . . . . . . . . . — 41,728
0.2 1,272,681 Electronics – Miscellaneous
568,000 Delta Electronics Thailand PCL . . . . . . . . . . . 0.2 1,208,00984,300 Flextronics International, Ltd. . . . . . . . . . . . . 0.1 945,003
4,300 Jabil Circuit, Inc. . . . . . . . . . . . . . . . . . . . . . . . — 100,147184,000 Pegatron Corp. . . . . . . . . . . . . . . . . . . . . . . . . 0.1 403,402
0.4 2,656,561 E-Marketing and Information
22,300 CyberAgent, Inc. . . . . . . . . . . . . . . . . . . . . . . 0.1 933,341
Energy – Alternate Sources 64,000 China Longyuan Power Group Corp.,
Ltd. . . . . . . . . . . . . . . . . . . . . . . . . . . . . . . . . — 48,311
Engineering – Research and Development Services 3,000 Kandenko Co., Ltd. . . . . . . . . . . . . . . . . . . . . . — 20,320
18,416 KEPCO Plant Service & Engineering Co., Ltd. . . . . . . . . . . . . . . . . . . . . . . . . . . . 0.2 1,398,120
90,500 Kinden Corp. . . . . . . . . . . . . . . . . . . . . . . . . . 0.2 1,167,207
0.4 2,585,647 Engineering and Construction
58,000 Kajima Corp. . . . . . . . . . . . . . . . . . . . . . . . . . . — 349,40957,000 Obayashi Corp. . . . . . . . . . . . . . . . . . . . . . . . 0.1 530,72936,000 Shimizu Corp. . . . . . . . . . . . . . . . . . . . . . . . . . — 296,555
0.1 1,176,693 Enterprise Software/Services
11,200 Oracle Corp.. . . . . . . . . . . . . . . . . . . . . . . . . . 0.1 409,136
Entertainment 171,567 Aristocrat Leisure, Ltd. . . . . . . . . . . . . . . . . . . 0.2 1,276,113133,038 Tabcorp Holdings, Ltd. . . . . . . . . . . . . . . . . . . 0.1 456,485
0.3 1,732,598 Entertainment Software
9,800 Capcom Co., Ltd. . . . . . . . . . . . . . . . . . . . . . . . — 238,6801,400 COLOPL, Inc. . . . . . . . . . . . . . . . . . . . . . . . . . — 27,911
800 Konami Corp.. . . . . . . . . . . . . . . . . . . . . . . . . . — 19,22422,400 Square Enix Holdings Co., Ltd. . . . . . . . . . . . 0.1 547,046
0.1 832,861 Fiduciary Banks
27,800 Bank of New York Mellon Corp. . . . . . . . . . . . 0.2 1,145,9164,300 Northern Trust Corp. . . . . . . . . . . . . . . . . . . . . — 309,987
0.2 1,455,903

INTECH All-World Minimum Variance Core Fund(a)
PORTFOLIO INVESTMENTS
The accompanying notes are an integral part of the fi nancial statements.
1 3 6 J a n u s C a p i t a l F u n d s P l c / 3 1 D e c e m b e r 2 0 1 5
Share or Principal Amount
Percentage of Net
Assets (%) Fair
Value (USD)
Finance – Consumer Loans 166,200 Aiful Corp. . . . . . . . . . . . . . . . . . . . . . . . . . . . 0.1 551,787
53,900 SLM Corp. . . . . . . . . . . . . . . . . . . . . . . . . . . . . — 351,428
0.1 903,215 Finance – Credit Card
1,200 Alliance Data Systems Corp. . . . . . . . . . . . . . . . — 331,8848,200 Discover Financial Services. . . . . . . . . . . . . . . 0.1 439,684
17,100 Visa, Inc. – Class A . . . . . . . . . . . . . . . . . . . . . 0.2 1,326,105
0.3 2,097,673 Finance – Investment Bankers/Brokers
30,500 Charles Schwab Corp. . . . . . . . . . . . . . . . . . . 0.1 1,004,36510,357 Korea Investment Holdings Co., Ltd. . . . . . . . 0.1 437,76138,300 TD Ameritrade Holding Corp. . . . . . . . . . . . . 0.2 1,329,393
0.4 2,771,519 Finance – Mortgage Loan Banker
89,000 FNF Group . . . . . . . . . . . . . . . . . . . . . . . . . . . 0.4 3,085,630
Finance – Other Services 6,204 Alior Bank S.A. . . . . . . . . . . . . . . . . . . . . . . . . . — 105,365
26,400 CME Group, Inc. . . . . . . . . . . . . . . . . . . . . . . 0. 4 2,391,8402,199 Deutsche Boerse A.G. . . . . . . . . . . . . . . . . . . . . — 194,4761,000 Intercontinental Exchange . . . . . . . . . . . . . . . . — 256,260
0. 4 2,947,941 Fisheries
42,200 Toyo Suisan Kaisha, Ltd.. . . . . . . . . . . . . . . . . 0.2 1,485,322
Food – Canned 663,900 Thai Union Group PCL . . . . . . . . . . . . . . . . . . — 317,462
Food – Catering 69,236 Compass Group PLC . . . . . . . . . . . . . . . . . . . 0.2 1,199,133
Food – Confectionery 9,900 Ezaki Glico Co., Ltd. . . . . . . . . . . . . . . . . . . . 0.1 539,566
20,600 Hershey Co. . . . . . . . . . . . . . . . . . . . . . . . . . . 0.2 1,838,962355 Lindt & Spruengli A.G. (CHF 10) . . . . . . . . . 0.3 2,217,643
30 Lindt & Spruengli A.G. (CHF 100) . . . . . . . . 0.3 2,235,6941,467 Orion Corp. . . . . . . . . . . . . . . . . . . . . . . . . . . 0.2 1,459,109
1.1 8,290,974 Food – Dairy Products
1,623,000 China Huishan Dairy Holdings Co., Ltd. . . . . . . . . . . . . . . . . . . . . . . . . . . . . . . . 0.1 621,994
30,400 Saputo, Inc. . . . . . . . . . . . . . . . . . . . . . . . . . . 0.1 727,314
0.2 1,349,308 Food – Flour and Grain
4,300 Nisshin Seifun Group, Inc. . . . . . . . . . . . . . . . . — 71,094
Food – Meat Products 35,600 Hormel Foods Corp. . . . . . . . . . . . . . . . . . . . 0.4 2,815,24895,000 NH Foods, Ltd. . . . . . . . . . . . . . . . . . . . . . . . 0.3 1,879,76351,800 Tyson Foods, Inc. – Class A . . . . . . . . . . . . . . 0.4 2,762,494
1.1 7,457,505 Food – Miscellaneous/Diversifi ed
78,000 Ajinomoto Co., Inc. . . . . . . . . . . . . . . . . . . . . 0.3 1,868,87129,600 Calbee, Inc. . . . . . . . . . . . . . . . . . . . . . . . . . . 0.2 1,265,967
810 Chr Hansen Holding A/S . . . . . . . . . . . . . . . . . — 50,9291,794 CJ CheilJedang Corp. . . . . . . . . . . . . . . . . . . . 0.1 577,695
16,000 ConAgra Foods, Inc.. . . . . . . . . . . . . . . . . . . . 0.1 674,56044,906 Frutarom Industries, Ltd. . . . . . . . . . . . . . . . . 0.3 2,412,68455,100 General Mills, Inc. . . . . . . . . . . . . . . . . . . . . . 0.4 3,177,066
2,500 George Weston, Ltd. . . . . . . . . . . . . . . . . . . . . . — 193,2427,700 Industrias Bachoco S.A.B. de C.V. . . . . . . . . . . . — 31,309
1,374,750 JG Summit Holdings, Inc. . . . . . . . . . . . . . . . 0.3 2,142,25225,300 Kellogg Co.. . . . . . . . . . . . . . . . . . . . . . . . . . . 0.2 1,828,431
Share or Principal Amount
Percentage of Net
Assets (%) Fair
Value (USD)
24,694 Kerry Group PLC . . . . . . . . . . . . . . . . . . . . . . 0.3 2,047,58846,300 Kewpie Corp. . . . . . . . . . . . . . . . . . . . . . . . . . 0.2 1,155,76632,800 Loblaw Cos, Ltd. . . . . . . . . . . . . . . . . . . . . . . 0.2 1,549,07938,200 McCormick & Co., Inc. . . . . . . . . . . . . . . . . . 0.4 3,268,392
8,900 MEIJI Holdings Co., Ltd. . . . . . . . . . . . . . . . . 0.1 744,25818,324 Nestle S.A. . . . . . . . . . . . . . . . . . . . . . . . . . . . 0.2 1,364,281
148,000 Nichirei Corp. . . . . . . . . . . . . . . . . . . . . . . . . 0.1 1,105,87416,400 Nissin Foods Holdings Co., Ltd. . . . . . . . . . . . 0.1 877,450
89 NongShim Co., Ltd. . . . . . . . . . . . . . . . . . . . . . — 33,3669,249 Orkla ASA . . . . . . . . . . . . . . . . . . . . . . . . . . . . — 73,272
107,993 Pioneer Foods, Ltd. . . . . . . . . . . . . . . . . . . . . 0.1 1,111,36858,000 Yamazaki Baking Co., Ltd. . . . . . . . . . . . . . . . 0.2 1,319,936
3.8 28,873,636 Food – Retail
10,376 Koninklijke Ahold N.V.. . . . . . . . . . . . . . . . . . . — 219,57277,200 Kroger Co. . . . . . . . . . . . . . . . . . . . . . . . . . . . 0.4 3,229,27663,100 Metro, Inc. . . . . . . . . . . . . . . . . . . . . . . . . . . . 0.2 1,766,890
4,291 SPAR Group, Ltd. . . . . . . . . . . . . . . . . . . . . . . . — 51,1305,625 WM. Morrison Supermarkets PLC . . . . . . . . . . — 12,288
0.6 5,279,156 Food – Wholesale/Distribution
16,922 Dongsuh Cos, Inc. . . . . . . . . . . . . . . . . . . . . . 0.1 449,64426,534 Eurocash S.A. . . . . . . . . . . . . . . . . . . . . . . . . . . — 328,660
0.1 778,304 Forestry
81,200 Fibria Celulose S.A. . . . . . . . . . . . . . . . . . . . . 0.1 1,065,354
Gas – Distribution 26,500 Beijing Enterprises Holdings, Ltd. . . . . . . . . . . — 160,54310,062 Enagas S.A. . . . . . . . . . . . . . . . . . . . . . . . . . . . . — 284,26826,000 Hong Kong & China Gas Co., Ltd. . . . . . . . . . . — 50,99593,527 National Grid PLC . . . . . . . . . . . . . . . . . . . . . 0.2 1,292,42622,400 NiSource, Inc. . . . . . . . . . . . . . . . . . . . . . . . . 0.1 437,02425,300 Sempra Energy . . . . . . . . . . . . . . . . . . . . . . . . 0.3 2,378,453
0.6 4,603,709 Gold Mining
23,200 Agnico Eagle Mines, Ltd. . . . . . . . . . . . . . . . . 0.1 609,89020,146 AngloGold Ashanti, Ltd. . . . . . . . . . . . . . . . . . . — 138,55612,100 Franco-Nevada Corp. . . . . . . . . . . . . . . . . . . . 0.1 553,617
300,131 Gold Fields, Ltd. . . . . . . . . . . . . . . . . . . . . . . 0.1 819,76492,036 Newcrest Mining, Ltd. . . . . . . . . . . . . . . . . . . 0.1 869,615
2,926 Signature Metals, Ltd. . . . . . . . . . . . . . . . . . . . . — 144,138
0.4 3,135,580 Home Builders
12,000 DR Horton, Inc. . . . . . . . . . . . . . . . . . . . . . . . 0.1 384,3602,400 Lennar Corp. . . . . . . . . . . . . . . . . . . . . . . . . . . — 117,384
0.1 501,744 Home Decoration Products
47,600 Newell Rubbermaid, Inc. . . . . . . . . . . . . . . . . 0.3 2,098,208
Home Furnishings 5,706 Hanssem Co., Ltd. . . . . . . . . . . . . . . . . . . . . . 0.2 1,126,787
12,200 Hoshizaki Electric Co., Ltd. . . . . . . . . . . . . . . 0.1 767,44939,700 Leggett & Platt, Inc. . . . . . . . . . . . . . . . . . . . . 0.2 1,668,19448,183 Steinhoff International Holdings N.V. . . . . . . . . . — 244,841
400 Whirlpool Corp. . . . . . . . . . . . . . . . . . . . . . . . . — 58,748
0.5 3,866,019 Hotels and Motels
10,540 InterContinental Hotels Group PLC . . . . . . . . . 0.1 412,94613,800 Marriott International, Inc. –
Class A . . . . . . . . . . . . . . . . . . . . . . . . . . . . 0.1 925,15247,400 Resorttrust, Inc. . . . . . . . . . . . . . . . . . . . . . . . 0.2 1,264,079
0.4 2,602,177

PORTFOLIO INVESTMENTS
The accompanying notes are an integral part of the fi nancial statements.
J a n u s C a p i t a l F u n d s P l c / 3 1 D e c e m b e r 2 0 1 5 1 3 7
Share or Principal Amount
Percentage of Net
Assets (%) Fair
Value (USD)
Human Resources 26,728 Capita PLC . . . . . . . . . . . . . . . . . . . . . . . . . . . 0.1 475,917
9,800 Robert Half International, Inc. . . . . . . . . . . . . 0.1 461,97222,400 Temp Holdings Co., Ltd. . . . . . . . . . . . . . . . . . — 351,340
0.2 1,289,229 Import and Export
321,000 Sojitz Corp. . . . . . . . . . . . . . . . . . . . . . . . . . . 0.1 683,774
Instruments – Controls 9,100 Honeywell International, Inc. . . . . . . . . . . . . . 0.1 942,487
Instruments – Scientifi c 11,300 Thermo Fisher Scientifi c, Inc. . . . . . . . . . . . . . 0.2 1,602,905
Insurance 100 ACE, Ltd. . . . . . . . . . . . . . . . . . . . . . . . . . . . . . — 11,685
79,713 Direct Line Insurance Group PLC . . . . . . . . . . 0.1 478,800400 Markel Corp. . . . . . . . . . . . . . . . . . . . . . . . . . . — 353,340
12,851 QBE Insurance Group, Ltd. . . . . . . . . . . . . . . . — 117,86731,300 Renaissancere Holdings, Ltd. . . . . . . . . . . . . . 0.5 3,542,847
0.6 4,504,539 Insurance Brokers
10,400 Aon PLC . . . . . . . . . . . . . . . . . . . . . . . . . . . . . 0.1 958,98443,000 Marsh & McLennan Cos., Inc. . . . . . . . . . . . . 0.3 2,384,350
0.4 3,343,334 Internet Content – Entertainment
14,200 Facebook, Inc. . . . . . . . . . . . . . . . . . . . . . . . . 0.2 1,486,1722,702 NCSoft Corp. . . . . . . . . . . . . . . . . . . . . . . . . . 0.1 490,935
0.3 1,977,107 Internet Content – Information/News
11,700 Liberty Ventures . . . . . . . . . . . . . . . . . . . . . . . 0.1 527,7871,500 LinkedIn Corp. . . . . . . . . . . . . . . . . . . . . . . . . . — 337,620
62,400 M3, Inc. . . . . . . . . . . . . . . . . . . . . . . . . . . . . . 0.2 1,309,4752,625 United Internet A.G. . . . . . . . . . . . . . . . . . . . . . — 145,212
0.3 2,320,094 Internet Infrastructure Software
7,800 F5 Networks, Inc.. . . . . . . . . . . . . . . . . . . . . . 0.1 756,288
Internet Security 1,600 Trend Micro, Inc. . . . . . . . . . . . . . . . . . . . . . . . — 65,635
Investment Companies 33,895 GT Capital Holdings, Inc. . . . . . . . . . . . . . . . . 0.1 951,157
Investment Management and Advisory Services 5,707 Partners Group Holding A.G. . . . . . . . . . . . . . 0.3 2,058,978
Leisure and Recreational Products 13,800 Jarden Corp. . . . . . . . . . . . . . . . . . . . . . . . . . . 0.1 788,256
Life and Health Insurance 146,600 AIA Group, Ltd. . . . . . . . . . . . . . . . . . . . . . . . 0.1 881,517631,000 Cathay Financial Holding Co., Ltd. . . . . . . . . 0.1 889,606
8,800 Sony Financial Holdings, Inc. . . . . . . . . . . . . . . — 159,55413,400 Torchmark Corp. . . . . . . . . . . . . . . . . . . . . . . 0.1 765,944
0.3 2,696,621 Lighting Products& Systems
36,300 Ushio, Inc. . . . . . . . . . . . . . . . . . . . . . . . . . . . 0.1 506,835
Machine Tools and Related Products 6,500 OSG Corp. . . . . . . . . . . . . . . . . . . . . . . . . . . . . — 124,343
163,000 Techtronic Industries Co., Ltd. . . . . . . . . . . . . 0.1 664,639
0.1 788,982 Machinery – Electrical
15,300 Disco Corp. . . . . . . . . . . . . . . . . . . . . . . . . . . 0.2 1,464,054757 Schindler Holding A.G. . . . . . . . . . . . . . . . . . . — 127,425
0.2 1,591,479
Share or Principal Amount
Percentage of Net
Assets (%) Fair
Value (USD)
Machinery – General Industrial 7,600 Amada Co., Ltd. . . . . . . . . . . . . . . . . . . . . . . . . — 73,6107,900 Roper Industries, Inc. . . . . . . . . . . . . . . . . . . . 0.2 1,499,341
24,000 Sumitomo Heavy Industries, Ltd. . . . . . . . . . . . — 109,4368,037 Zardoya Otis S.A. . . . . . . . . . . . . . . . . . . . . . . . — 94,142
0.2 1,776,529 Media
11,700 Charter Communications, Inc. . . . . . . . . . . . . 0.3 2,142,2701,511 Lagardere SCA . . . . . . . . . . . . . . . . . . . . . . . . . — 45,167
0.3 2,187,437 Medical – Biomedical and Genetic
4,400 Amgen, Inc. . . . . . . . . . . . . . . . . . . . . . . . . . . 0.1 714,25215,067 CSL, Ltd. . . . . . . . . . . . . . . . . . . . . . . . . . . . . 0.2 1,155,915
8,900 Gilead Sciences, Inc. . . . . . . . . . . . . . . . . . . . . 0.1 900,5915,200 Illumina, Inc. . . . . . . . . . . . . . . . . . . . . . . . . . 0.1 998,1141,200 Regeneron Pharmaceuticals, Inc. . . . . . . . . . . 0.1 651,444
0.6 4,420,316 Medical – Drugs
22,600 Abbott Laboratories . . . . . . . . . . . . . . . . . . . . 0.1 1,014,96621,400 AbbVie, Inc. . . . . . . . . . . . . . . . . . . . . . . . . . . 0.2 1,267,736
3,428 Actelion, Ltd. . . . . . . . . . . . . . . . . . . . . . . . . . 0.1 477,92811,191 AstraZeneca PLC . . . . . . . . . . . . . . . . . . . . . . 0.1 761,516
7,300 Bristol-Myers Squibb Co. . . . . . . . . . . . . . . . . 0.1 502,16720,200 Chugai Pharmaceutical Co., Ltd. . . . . . . . . . . 0.1 712,66416,100 Daiichi Sankyo Co., Ltd. . . . . . . . . . . . . . . . . . . — 336,32111,200 Eisai Co., Ltd. . . . . . . . . . . . . . . . . . . . . . . . . . 0.1 751,41929,200 Eli Lilly & Co. . . . . . . . . . . . . . . . . . . . . . . . . 0.3 2,460,39215,300 Endo International PLC . . . . . . . . . . . . . . . . . 0.1 936,666
1,702 Hanmi Pharm Co., Ltd. . . . . . . . . . . . . . . . . . 0.1 1,056,94022,341 Hanmi Science Co., Ltd. . . . . . . . . . . . . . . . . . 0.3 2,458,394
3,549 Ipsen S.A. . . . . . . . . . . . . . . . . . . . . . . . . . . . . . — 235,23726,600 Johnson & Johnson . . . . . . . . . . . . . . . . . . . . 0.4 2,732,35231,000 Kyowa Hakko Kirin Co., Ltd. . . . . . . . . . . . . . 0.1 493,96724,400 Merck & Co., Inc. . . . . . . . . . . . . . . . . . . . . . 0.2 1,288,808
4,546 Merck KGaA . . . . . . . . . . . . . . . . . . . . . . . . . . 0.1 442,4478,300 Mitsubishi Tanabe Pharma Corp. . . . . . . . . . . . — 144,756
14,652 Novartis A.G. . . . . . . . . . . . . . . . . . . . . . . . . . 0.2 1,270,14316,819 Novo Nordisk A/S – Class B . . . . . . . . . . . . . . 0.1 979,596
6,100 Ono Pharmaceutical Co., Ltd. . . . . . . . . . . . . 0.1 1,100,92312,900 Otsuka Holdings Co., Ltd. . . . . . . . . . . . . . . . 0.1 463,38223,400 Pfi zer, Inc. . . . . . . . . . . . . . . . . . . . . . . . . . . . 0.1 755,352
890 Roche Holding A.G. . . . . . . . . . . . . . . . . . . . . . — 245,67762,700 Santen Pharmaceutical Co., Ltd. . . . . . . . . . . . 0.1 1,046,565
6,021 Yuhan Corp. . . . . . . . . . . . . . . . . . . . . . . . . . . 0.2 1,399,56911,700 Zoetis, Inc. . . . . . . . . . . . . . . . . . . . . . . . . . . . 0.1 560,664
3.4 25,896,547 Medical – Generic Drugs
5,400 Allergan PLC . . . . . . . . . . . . . . . . . . . . . . . . . 0.2 1,687,5001,200 Perrigo Co., PLC. . . . . . . . . . . . . . . . . . . . . . . . — 173,640
30,051 Teva Pharmaceutical Industries, Ltd. . . . . . . . 0.3 1,966,058
0.5 3,827,198 Medical – HMO
18,100 Aetna, Inc. . . . . . . . . . . . . . . . . . . . . . . . . . . . 0.3 1,956,97220,000 Anthem, Inc. . . . . . . . . . . . . . . . . . . . . . . . . . 0.4 2,788,80019,900 Cigna Corp. . . . . . . . . . . . . . . . . . . . . . . . . . . 0.4 2,911,96718,500 Humana, Inc. . . . . . . . . . . . . . . . . . . . . . . . . . 0.4 3,302,43519,400 UnitedHealth Group, Inc. . . . . . . . . . . . . . . . . 0.3 2,282,216
1.8 13,242,390 Medical – Hospitals
82,000 Bangkok Dusit Medical Services PCL . . . . . . . . — 50,837

INTECH All-World Minimum Variance Core Fund(a)
PORTFOLIO INVESTMENTS
The accompanying notes are an integral part of the fi nancial statements.
1 3 8 J a n u s C a p i t a l F u n d s P l c / 3 1 D e c e m b e r 2 0 1 5
Share or Principal Amount
Percentage of Net
Assets (%) Fair
Value (USD)
87,500 Bumrungrad Hospital PCL . . . . . . . . . . . . . . . 0.1 513,27641,100 HCA Holdings, Inc. . . . . . . . . . . . . . . . . . . . . 0.4 2,779,593
1,169,900 IHH Healthcare Bhd . . . . . . . . . . . . . . . . . . . . 0.2 1,794,39018,642 Ramsay Health Care, Ltd. . . . . . . . . . . . . . . . . 0.1 922,67318,000 Universal Health Services, Inc. . . . . . . . . . . . . 0.3 2,150,820
1.1 8,211,589 Medical – Wholesale Drug Distributors
28,700 AmerisourceBergen Corp. . . . . . . . . . . . . . . . . 0.4 2,976,47727,900 Cardinal Health, Inc. . . . . . . . . . . . . . . . . . . . 0.3 2,490,633
9 Galenica A.G. . . . . . . . . . . . . . . . . . . . . . . . . . . — 14,14811,900 McKesson Corp. . . . . . . . . . . . . . . . . . . . . . . . 0.3 2,347,03748,500 Medipal Holdings Corp. . . . . . . . . . . . . . . . . . 0.1 836,986
5,400 Suzuken Co., Ltd.. . . . . . . . . . . . . . . . . . . . . . . — 207,813
1.1 8,873,094 Medical Information Systems
4,900 Cerner Corp. . . . . . . . . . . . . . . . . . . . . . . . . . . — 294,833
Medical Instruments 64,400 Boston Scientifi c Corp. . . . . . . . . . . . . . . . . . . 0.2 1,187,53634,600 Edwards Lifesciences Corp. . . . . . . . . . . . . . . 0.4 2,732,70816,600 Medtronic PLC . . . . . . . . . . . . . . . . . . . . . . . . 0.2 1,276,87261,000 Shimadzu Corp. . . . . . . . . . . . . . . . . . . . . . . . 0.1 1,037,984
5,900 St. Jude Medical, Inc. . . . . . . . . . . . . . . . . . . . . — 364,443
0.9 6,599,543 Medical Labs and Testing Services
24,000 Laboratory Corp. of America Holdings . . . . . . . . . . . . . . . . . . . . . . . . . . . 0.4 2,967,360
8,600 Quest Diagnostics, Inc. . . . . . . . . . . . . . . . . . . 0.1 611,804
0.5 3,579,164 Medical Products
2,700 Asahi Intecc Co., Ltd. . . . . . . . . . . . . . . . . . . . . — 125,58716,900 Becton Dickinson and Co. . . . . . . . . . . . . . . . 0.3 2,604,121
116,000 China Medical System Holdings, Ltd. . . . . . . . . . . . . . . . . . . . . . . . . . . . . . . . — 170,937
8,775 Cochlear, Ltd. . . . . . . . . . . . . . . . . . . . . . . . . . 0.1 611,0045,800 Henry Schein, Inc. . . . . . . . . . . . . . . . . . . . . . 0.1 917,502
39,700 Nipro Corp. . . . . . . . . . . . . . . . . . . . . . . . . . . 0.1 438,68939,919 Smith & Nephew PLC . . . . . . . . . . . . . . . . . . 0.1 710,795
609 Sonova Holding A.G. . . . . . . . . . . . . . . . . . . . . — 77,4259,800 Stryker Corp. . . . . . . . . . . . . . . . . . . . . . . . . . 0.1 910,812
0.8 6,566,872 Metal Products – Distributors
2,333 Hyosung Corp. . . . . . . . . . . . . . . . . . . . . . . . . . — 233,83681,000 MISUMI Group, Inc. . . . . . . . . . . . . . . . . . . . 0.2 1,136,345
0.2 1,370,181 Mining
187,000 Mitsubishi Materials Corp. . . . . . . . . . . . . . . . 0.1 597,50417,774 Sibanye Gold, Ltd. . . . . . . . . . . . . . . . . . . . . . . — 26,287
2,647,000 United Co., RUSAL PLC . . . . . . . . . . . . . . . . . 0.1 809,4932,702,000 Zijin Mining Group Co., Ltd. . . . . . . . . . . . . . 0.1 707,770
0.3 2,141,054 Miscellaneous Manufacturing
3,000 Illinois Tool Works, Inc. . . . . . . . . . . . . . . . . . . — 278,0406,000 Largan Precision Co., Ltd. . . . . . . . . . . . . . . . 0.1 414,729
0.1 692,769 MRI/Medical Diagnostic Imaging
79,113 Sonic Healthcare, Ltd. . . . . . . . . . . . . . . . . . . 0.1 1,029,916
Multi-Line Insurance 3,385 Ageas . . . . . . . . . . . . . . . . . . . . . . . . . . . . . . . . — 157,424
46,300 Allstate Corp. . . . . . . . . . . . . . . . . . . . . . . . . . 0.4 2,874,76719,300 Assurant, Inc. . . . . . . . . . . . . . . . . . . . . . . . . . 0.2 1,554,422
Share or Principal Amount
Percentage of Net
Assets (%) Fair
Value (USD)
230 Helvetia Holding A.G. . . . . . . . . . . . . . . . . . . . — 130,01111,600 Voya Financial, Inc. . . . . . . . . . . . . . . . . . . . . 0.1 428,156
0.7 5,144,780 Multimedia
15,808 Informa PLC . . . . . . . . . . . . . . . . . . . . . . . . . . . — 142,8358,412 Pearson PLC . . . . . . . . . . . . . . . . . . . . . . . . . . . — 91,259
25,200 Time Warner, Inc.. . . . . . . . . . . . . . . . . . . . . . 0.2 1,629,68416,400 Walt Disney Co. . . . . . . . . . . . . . . . . . . . . . . . 0.2 1,723,312
0.4 3,587,090 Non – Ferrous Metals
33 Korea Zinc Co., Ltd. . . . . . . . . . . . . . . . . . . . . . — 13,202
Non-Hazardous Waste Disposal 9,900 Republic Services, Inc. . . . . . . . . . . . . . . . . . . 0.1 435,501
Offi ce Supplies and Forms 3,600 Avery Dennison Corp. . . . . . . . . . . . . . . . . . . . — 225,5767,819 Societe BIC S.A. . . . . . . . . . . . . . . . . . . . . . . . 0.2 1,288,437
0.2 1,514,013 Oil – Field Services
1,508 Technip S.A. . . . . . . . . . . . . . . . . . . . . . . . . . . . — 74,941
Oil Companies – Exploration and Production 1,800 Cimarex Energy Co. . . . . . . . . . . . . . . . . . . . . . — 160,884
796 GS Holdings Corp. . . . . . . . . . . . . . . . . . . . . . . — 34,426
— 195,310 Oil Companies – Integrated
9,790 MOL Hungarian Oil & Gas PLC . . . . . . . . . . . 0.1 482,2252,400 Phillips 66 . . . . . . . . . . . . . . . . . . . . . . . . . . . . — 196,320
0.1 678,545 Oil Refi ning and Marketing
2,877,000 Brightoil Petroleum Holdings, Ltd. . . . . . . . . . 0.1 965,21536,475 Caltex Australia, Ltd. . . . . . . . . . . . . . . . . . . . 0.1 1,001,766
7,842 DCC PLC . . . . . . . . . . . . . . . . . . . . . . . . . . . . 0.1 654,24630,549 Grupa Lotos S.A. . . . . . . . . . . . . . . . . . . . . . . . — 210,651
400 HollyFrontier Corp. . . . . . . . . . . . . . . . . . . . . . — 15,95619,500 Marathon Petroleum Corp. . . . . . . . . . . . . . . . 0.1 1,010,880
3,254 Neste Oil Oyj . . . . . . . . . . . . . . . . . . . . . . . . . . — 97,694231 Paz Oil Co., Ltd. . . . . . . . . . . . . . . . . . . . . . . . . — 36,336
4,353 SK Innovation Co., Ltd. . . . . . . . . . . . . . . . . . 0.1 482,71515,100 Tesoro Corp. . . . . . . . . . . . . . . . . . . . . . . . . . . 0.2 1,591,08711,400 Valero Energy Corp. . . . . . . . . . . . . . . . . . . . . 0.1 806,094
0.8 6,872,640 Optical Supplies
1,427 Essilor International S.A. . . . . . . . . . . . . . . . . . — 178,394
Paper and Related Products 2,800 Klabin S.A. . . . . . . . . . . . . . . . . . . . . . . . . . . . . — 16,6027,500 Nippon Paper Industries Co., Ltd. . . . . . . . . . . — 122,566
146,000 Oji Holdings Corp. . . . . . . . . . . . . . . . . . . . . . 0.1 594,059253,100 Suzano Papel e Celulose S.A. . . . . . . . . . . . . . 0.2 1,196,068
0.3 1,929,295 Pharmaceuticals
16,900 Alfresa Holdings Corp. . . . . . . . . . . . . . . . . . . . — 338,19719,790 Celltrion, Inc. . . . . . . . . . . . . . . . . . . . . . . . . . 0.2 1,426,467
1,062,000 CSPC Pharmaceutical Group, Ltd. . . . . . . . . . 0.1 1,085,3273,200 Kissei Pharmaceutical Co., Ltd. . . . . . . . . . . . . — 81,212
10,300 Mallinckrodt PLC . . . . . . . . . . . . . . . . . . . . . . 0.1 768,68927,000 Nippon Shinyaku Co., Ltd. . . . . . . . . . . . . . . 0.1 1,006,490
0.5 4,706,382 Pharmacy Services
6,500 Express Scripts Holding Co. . . . . . . . . . . . . . . 0.1 568,165
Photo Equipment and Supplies 17,000 FUJIFILM Holdings Corp. . . . . . . . . . . . . . . . 0.1 718,589

PORTFOLIO INVESTMENTS
The accompanying notes are an integral part of the fi nancial statements.
J a n u s C a p i t a l F u n d s P l c / 3 1 D e c e m b e r 2 0 1 5 1 3 9
Share or Principal Amount
Percentage of Net
Assets (%) Fair
Value (USD)
Pipelines 280,789 APA Group . . . . . . . . . . . . . . . . . . . . . . . . . . . 0.2 1,775,536
100 Enbridge, Inc.. . . . . . . . . . . . . . . . . . . . . . . . . . — 3,32526,000 Petronas Gas Bhd . . . . . . . . . . . . . . . . . . . . . . . — 137,57613,600 Williams Cos., Inc. . . . . . . . . . . . . . . . . . . . . . . — 349,520
0.2 2,265,957 Precious Metals
28,608 Polymetal International PLC . . . . . . . . . . . . . . . — 246,473
Printing – Commercial 25,000 Toppan Printing Co., Ltd. . . . . . . . . . . . . . . . . . — 232,776
Property and Casualty Insurance 3,185 Admiral Group PLC . . . . . . . . . . . . . . . . . . . . . — 77,885
28,085 Dongbu Insurance Co., Ltd. . . . . . . . . . . . . . . 0.2 1,684,1823,000 Fairfax Financial Holdings, Ltd. . . . . . . . . . . . 0.2 1,424,452
17,400 Intact Financial Corp. . . . . . . . . . . . . . . . . . . . 0.1 1,115,3106,668 Samsung Fire & Marine Insurance
Co., Ltd. . . . . . . . . . . . . . . . . . . . . . . . . . . . 0.2 1,749,0417,600 Travelers Cos., Inc. . . . . . . . . . . . . . . . . . . . . . 0.1 857,7368,600 WR Berkley Corp. . . . . . . . . . . . . . . . . . . . . . 0.1 470,850
0.9 7,379,456 Public Thoroughfares
50,000 Jiangsu Expressway Co., Ltd. . . . . . . . . . . . . . . — 67,486224,650 Transurban Group . . . . . . . . . . . . . . . . . . . . . 0.2 1,713,494
1,100,000 Zhejiang Expressway Co., Ltd. . . . . . . . . . . . . 0.2 1,322,877
0.4 3,103,857 Publishing – Books
58,791 Reed Elsevier N.V.. . . . . . . . . . . . . . . . . . . . . . 0.1 992,731
Publishing – Periodicals 56,170 Reed Elsevier PLC . . . . . . . . . . . . . . . . . . . . . 0.1 991,051
Real Estate 1,053,000 Evergrande Real Estate Group, Ltd. . . . . . . . . 0.1 926,667
136,200 Henderson Land Development Co., Ltd. . . . . . . . . . . . . . . . . . . . . . . . . . . . . . . . 0.1 834,798
170,500 Kerry Properties, Ltd. . . . . . . . . . . . . . . . . . . . 0.1 465,31344,600 Swire Properties, Ltd. . . . . . . . . . . . . . . . . . . . . — 128,912
309,777 Talaat Moustafa Group . . . . . . . . . . . . . . . . . . . — 255,972113,000 Wheelock & Co., Ltd. . . . . . . . . . . . . . . . . . . 0.1 476,072
0.4 3,087,734 Real Estate Management/Services
1,790,000 China Jinmao Holdings Group, Ltd. . . . . . . . . 0.1 612,0828,600 Daito Trust Construction Co., Ltd. . . . . . . . . . 0.1 1,002,546
18,179 Deutsche Wohnen A.G. . . . . . . . . . . . . . . . . . 0.1 505,98110,033 Four Corners Property Trust, Inc. . . . . . . . . . . . — 242,39736,115 Lend Lease Group . . . . . . . . . . . . . . . . . . . . . 0.1 375,177
0.4 2,738,183 Real Estate Operating/Development
26,441 Azrieli Group, Ltd. . . . . . . . . . . . . . . . . . . . . . 0.1 985,58888,000 China Overseas Land & Investment,
Ltd. . . . . . . . . . . . . . . . . . . . . . . . . . . . . . . . . — 308,861538,000 Longfor Properties Co., Ltd. . . . . . . . . . . . . . . 0.1 802,511
18,800 Nomura Real Estate Holdings, Inc. . . . . . . . . . . — 352,7546,328,000 Renhe Commercial Holdings
Co., Ltd. . . . . . . . . . . . . . . . . . . . . . . . . . . . . — 293,954114,000 Sun Hung Kai Properties, Ltd. . . . . . . . . . . . . 0.2 1,376,866
0.4 4,120,534 Reinsurance
6,300 Axis Capital Holdings, Ltd. . . . . . . . . . . . . . . . . — 354,18616,300 Berkshire Hathaway, Inc. – Class B . . . . . . . . . 0.3 2,152,25216,800 Everest Re Group, Ltd. . . . . . . . . . . . . . . . . . . 0.4 3,075,912
3,888 Hannover Rueckversicherung S.E. . . . . . . . . . 0.1 446,34023,600 PartnerRe, Ltd. . . . . . . . . . . . . . . . . . . . . . . . . 0.5 3,297,864
Share or Principal Amount
Percentage of Net
Assets (%) Fair
Value (USD)
5,557 SCOR S.E. . . . . . . . . . . . . . . . . . . . . . . . . . . . . — 208,380
1.3 9,534,934 REIT – Apartments
12,700 AvalonBay Communities, Inc. . . . . . . . . . . . . . 0.3 2,338,45139,200 Equity Residential. . . . . . . . . . . . . . . . . . . . . . 0.4 3,198,328
8,200 Essex Property Trust, Inc. . . . . . . . . . . . . . . . . 0.3 1,963,162
1.0 7,499,941 REIT – Diversifi ed
8,600 American Tower Corp. . . . . . . . . . . . . . . . . . . 0.1 833,77048,500 CapitaCommercial Trust . . . . . . . . . . . . . . . . . . — 46,197
1,057,000 Champion REIT . . . . . . . . . . . . . . . . . . . . . . . 0.1 529,1976,625 Derwent London PLC . . . . . . . . . . . . . . . . . . . . — 358,580
36,900 Digital Realty Trust, Inc. . . . . . . . . . . . . . . . . . 0.4 2,790,37815,400 Duke Realty Corp. . . . . . . . . . . . . . . . . . . . . . . — 323,70827,446 GPT Group . . . . . . . . . . . . . . . . . . . . . . . . . . . . — 95,573
5,541 Land Securities Group PLC . . . . . . . . . . . . . . . — 96,1319,000 Vornado Realty Trust . . . . . . . . . . . . . . . . . . . 0.1 899,640
0.7 5,973,174 REIT – Health Care
12,900 Welltower, Inc. . . . . . . . . . . . . . . . . . . . . . . . . 0.1 877,587
REIT – Offi ce Property 7,400 Boston Properties, Inc. . . . . . . . . . . . . . . . . . . 0.1 943,7961,000 SL Green Realty Corp. . . . . . . . . . . . . . . . . . . . — 112,980
0.1 1,056,776 REIT – Regional Malls
19,800 General Growth Properties, Inc. . . . . . . . . . . . 0.1 538,7583,900 Macerich Co. . . . . . . . . . . . . . . . . . . . . . . . . . . — 314,6911,974 Resilient REIT, Ltd. . . . . . . . . . . . . . . . . . . . . . . — 14,7573,500 Simon Property Group, Inc. . . . . . . . . . . . . . . 0.1 680,540
0.2 1,548,746 REIT – Shopping Centres
4,800 Federal Realty Investment Trust . . . . . . . . . . . 0.1 701,280342,500 Link REIT . . . . . . . . . . . . . . . . . . . . . . . . . . . . 0.3 2,050,640
11,200 Regency Centers Corp. . . . . . . . . . . . . . . . . . . 0.1 762,94493,097 Vicinity Centres . . . . . . . . . . . . . . . . . . . . . . . . — 189,899
181,201 Westfi eld Corp. . . . . . . . . . . . . . . . . . . . . . . . 0.2 1,255,367
0.7 4,960,130 REIT – Storage
4,700 Public Storage . . . . . . . . . . . . . . . . . . . . . . . . 0.2 1,164,190
Resorts and Theme Parks 23,000 Oriental Land Co., Ltd. . . . . . . . . . . . . . . . . . 0.2 1,404,152
Respiratory Products 387,338 Fisher & Paykel Healthcare Corp.,
Ltd. . . . . . . . . . . . . . . . . . . . . . . . . . . . . . . . 0.3 2,356,925
Retail – Apparel and Shoe 13,900 Aoyama Trading Co., Ltd. . . . . . . . . . . . . . . . . 0.1 541,866
4,134,000 China Dongxiang Group Co., Ltd. . . . . . . . . . 0.1 986,85425,700 L Brands, Inc. . . . . . . . . . . . . . . . . . . . . . . . . . 0.3 2,462,574
446,500 Li Ning Co., Ltd. . . . . . . . . . . . . . . . . . . . . . . . — 241,98112,717 Next PLC . . . . . . . . . . . . . . . . . . . . . . . . . . . . 0.2 1,366,50023,800 Ross Stores, Inc. . . . . . . . . . . . . . . . . . . . . . . . 0.2 1,280,67842,092 Truworths International, Ltd. . . . . . . . . . . . . . . — 248,326
0.9 7,128,779 Retail – Auto Parts
17,400 Advance Auto Parts, Inc. . . . . . . . . . . . . . . . . 0.4 2,618,8744,300 AutoZone, Inc. . . . . . . . . . . . . . . . . . . . . . . . . 0.4 3,190,213
10,800 O’Reilly Automotive, Inc. . . . . . . . . . . . . . . . . 0.4 2,736,936
1.2 8,546,023 Retail – Automobile
38,400 USS Co., Ltd. . . . . . . . . . . . . . . . . . . . . . . . . . 0.1 584,723

INTECH All-World Minimum Variance Core Fund(a)
PORTFOLIO INVESTMENTS
The accompanying notes are an integral part of the fi nancial statements.
1 4 0 J a n u s C a p i t a l F u n d s P l c / 3 1 D e c e m b e r 2 0 1 5
Share or Principal Amount
Percentage of Net
Assets (%) Fair
Value (USD)
Retail – Building Products 18,500 Home Depot, Inc. . . . . . . . . . . . . . . . . . . . . . . 0.3 2,446,62532,998 Kingfi sher PLC . . . . . . . . . . . . . . . . . . . . . . . . . — 160,26631,800 Lowe’s Cos., Inc. . . . . . . . . . . . . . . . . . . . . . . . 0.3 2,418,072
0.6 5,024,963 Retail – Computer Equpment
2,400 GameStop Corp. – Class A . . . . . . . . . . . . . . . . — 67,296
Retail – Consumer Electronics 42,400 Best Buy Co., Inc. . . . . . . . . . . . . . . . . . . . . . . 0.2 1,291,08062,700 Bic Camera, Inc. . . . . . . . . . . . . . . . . . . . . . . . 0.1 543,10877,503 Dixons Carphone PLC . . . . . . . . . . . . . . . . . . 0.1 571,19730,000 K’s Holdings Corp. . . . . . . . . . . . . . . . . . . . . . 0.1 1,030,953
178,500 Yamada Denki Co., Ltd. . . . . . . . . . . . . . . . . . 0.1 776,797
0.6 4,213,135 Retail – Convenience Store
48,900 CP ALL PCL . . . . . . . . . . . . . . . . . . . . . . . . . . . — 53,359274,000 President Chain Store Corp. . . . . . . . . . . . . . . 0.2 1,714,548
0.2 1,767,907 Retail – Discount
37,300 Aeon Co., Ltd. . . . . . . . . . . . . . . . . . . . . . . . . 0.1 579,76720,100 Costco Wholesale Corp. . . . . . . . . . . . . . . . . . 0.4 3,246,15023,100 Dollar Tree, Inc. . . . . . . . . . . . . . . . . . . . . . . . 0.2 1,783,782
4,000 Don Quijote Holdings Co., Ltd. . . . . . . . . . . . . — 142,28719,800 Target Corp. . . . . . . . . . . . . . . . . . . . . . . . . . . 0.2 1,437,678
0.9 7,189,664 Retail – Drug Store
2,500 Cosmos Pharmaceutical Corp. . . . . . . . . . . . . 0.1 397,32115,800 Matsumotokiyoshi Holdings Co.,
Ltd. . . . . . . . . . . . . . . . . . . . . . . . . . . . . . . . 0.1 815,1107,200 Sundrug Co., Ltd. . . . . . . . . . . . . . . . . . . . . . . 0.1 468,4977,000 Welcia Holdings Co., Ltd. . . . . . . . . . . . . . . . . 0.1 391,413
0.4 2,072,341 Retail – Gardening Products
6,400 Tractor Supply Co. . . . . . . . . . . . . . . . . . . . . . 0.1 547,200
Retail – Home Furnishings 22,200 Nitori Holdings Co., Ltd. . . . . . . . . . . . . . . . . 0.3 1,889,715
Retail – Hypermarkets 89,280 Pick n Pay Holdings, Ltd. . . . . . . . . . . . . . . . . . — 161,80051,959 Pick n Pay Stores, Ltd. . . . . . . . . . . . . . . . . . . . — 218,595
— 380,395 Retail – Jewellery
2,055 Pandora A/S . . . . . . . . . . . . . . . . . . . . . . . . . . . — 260,990
Retail – Major Department Stores 42,400 H2O Retailing Corp.. . . . . . . . . . . . . . . . . . . . 0.1 837,910
1,067 Hyundai Department Store Co., Ltd. . . . . . . . . . — 115,13756,870 Marks & Spencer Group PLC . . . . . . . . . . . . . 0.1 379,23121,800 TJX Cos., Inc. . . . . . . . . . . . . . . . . . . . . . . . . . 0.2 1,545,838
0.4 2,878,116 Retail – Miscellaneous
42,400 ABC-Mart, Inc. . . . . . . . . . . . . . . . . . . . . . . . . 0.3 2,346,14729,900 Alimentation Couche-Tard, Inc. . . . . . . . . . . . 0.2 1,316,377
506,000 ANTA Sports Products, Ltd. . . . . . . . . . . . . . . 0.2 1,390,72486,000 Cafe de Coral Holdings, Ltd. . . . . . . . . . . . . . . — 252,459
4,800 CarMax, Inc. . . . . . . . . . . . . . . . . . . . . . . . . . . — 259,05631,300 CVS Caremark Corp. . . . . . . . . . . . . . . . . . . . 0.5 3,060,20124,300 Darden Restaurants, Inc. . . . . . . . . . . . . . . . . 0.2 1,546,45220,700 Foot Locker, Inc. . . . . . . . . . . . . . . . . . . . . . . 0.2 1,347,363
250,053 Harvey Norman Holdings, Ltd. . . . . . . . . . . . 0.1 761,44427,800 lululemon athletica, Inc. . . . . . . . . . . . . . . . . . 0.2 1,458,666
5,497 Luxottica Group SpA . . . . . . . . . . . . . . . . . . . . — 360,772
Share or Principal Amount
Percentage of Net
Assets (%) Fair
Value (USD)
20,400 Restaurant Brands International, Inc. . . . . . . . . 0.1 763,0647,300 Ryohin Keikaku Co., Ltd. . . . . . . . . . . . . . . . . 0.2 1,496,6882,200 Signet Jewelers, Ltd. . . . . . . . . . . . . . . . . . . . . . — 272,118
21,301 Sports Direct International PLC . . . . . . . . . . . . — 181,16524,100 Tsuruha Holdings, Inc. . . . . . . . . . . . . . . . . . . 0.3 2,107,59620,800 Walgreens Boots Alliance, Inc. . . . . . . . . . . . . 0.2 1,771,224
2.7 20,691,516 Retail – Miscellaneous and Diversifi ed
21,300 Izumi Co., Ltd. . . . . . . . . . . . . . . . . . . . . . . . . 0.1 834,773
Retail – Offi ce Supplies 202,500 Staples, Inc. . . . . . . . . . . . . . . . . . . . . . . . . . . 0.3 1,917,675
Retail – Regional Department Stores 9,000 Golden Eagle Retail Group., Ltd. . . . . . . . . . . . — 10,870
23,200 J Front Retailing Co., Ltd. . . . . . . . . . . . . . . . . . — 340,91515,700 Kohl’s Corp. . . . . . . . . . . . . . . . . . . . . . . . . . . 0.1 747,79146,400 Macy’s, Inc. . . . . . . . . . . . . . . . . . . . . . . . . . . . 0.2 1,623,072
0.3 2,722,648 Retail – Restaurants
2,000 Chipotle Mexican Grill, Inc. . . . . . . . . . . . . . . 0.1 959,700173,210 Jollibee Foods Corp. . . . . . . . . . . . . . . . . . . . . 0.1 806,417
21,900 McDonald’s Corp. . . . . . . . . . . . . . . . . . . . . . . 0.3 2,587,26622,800 Starbucks Corp. . . . . . . . . . . . . . . . . . . . . . . . 0.2 1,368,684
1,200 Yum! Brands, Inc. . . . . . . . . . . . . . . . . . . . . . . . — 87,660
0.7 5,809,727 Rubber – Tires
931 Cie Generale des Etablissements Michelin . . . . . . . . . . . . . . . . . . . . . . . . . . . . — 88,922
Satellite Telecommunications 23,234 Eutelsat Communications S.A. . . . . . . . . . . . . 0.1 696,79164,377 Inmarsat PLC . . . . . . . . . . . . . . . . . . . . . . . . . 0.1 1,078,91969,751 SES S.A. . . . . . . . . . . . . . . . . . . . . . . . . . . . . . 0.3 1,938,366
0.5 3,714,076 Savings/Loans/Thrifts – Eastern U.S.
200 New York Community Bancorp, Inc. . . . . . . . . — 3,264
Security Services 10,300 ADT Corp. . . . . . . . . . . . . . . . . . . . . . . . . . . . . — 339,694
162,053 G4S PLC. . . . . . . . . . . . . . . . . . . . . . . . . . . . . 0.1 538,6439,900 Sohgo Security Services Co., Ltd. . . . . . . . . . . 0.1 469,546
107,000 Taiwan Secom Co., Ltd. . . . . . . . . . . . . . . . . . . — 317,670
0.2 1,665,553 Semiconductor Components/Integrated Circuits
4,500 Analog Devices, Inc. . . . . . . . . . . . . . . . . . . . . . — 248,9407,100 QUALCOMM, Inc. . . . . . . . . . . . . . . . . . . . . . 0.1 354,894
4,692,000 Semiconductor Manufacturing International Corp. . . . . . . . . . . . . . . . . . . . 0.1 478,295
75,000 Taiwan Semiconductor Manufacturing Co., Ltd. . . . . . . . . . . . . . . . . — 326,576
0. 2 1,408,705 Semiconductor Equipment
16,400 ASM Pacifi c Technology, Ltd. . . . . . . . . . . . . . . — 128,876
Semiconductors 1,298,000 Advanced Semiconductor
Engineering, Inc.. . . . . . . . . . . . . . . . . . . . . 0. 3 1,501,9164,700 Maxim Integrated Products. . . . . . . . . . . . . . . . — 178,600
83,000 Novatek Microelectronics Corp. . . . . . . . . . . . . — 326,028494,000 Siliconware Precision Industries
Co., Ltd. . . . . . . . . . . . . . . . . . . . . . . . . . . . 0.1 786,7124,700 Skyworks Solutions, Inc. . . . . . . . . . . . . . . . . . — 361,101
395,000 Transcend Information, Inc. . . . . . . . . . . . . . . 0. 2 1,030,778
0. 6 4,185,135

PORTFOLIO INVESTMENTS
The accompanying notes are an integral part of the fi nancial statements.
J a n u s C a p i t a l F u n d s P l c / 3 1 D e c e m b e r 2 0 1 5 1 4 1
Share or Principal Amount
Percentage of Net
Assets (%) Fair
Value (USD)
Shipbuilding 790,300 Yangzijiang Shipbuilding Holdings,
Ltd. . . . . . . . . . . . . . . . . . . . . . . . . . . . . . . . 0.1 613,371
Soap and Cleaning Preparations 6,100 Church & Dwight Co., Inc. . . . . . . . . . . . . . . 0.1 517,768
16,974 Reckitt Benckiser Group PLC . . . . . . . . . . . . . 0.2 1,571,486
0.3 2,089,254 Software
12,600 Akamai Technologies, Inc. . . . . . . . . . . . . . . . 0.1 663,13826,700 Electronic Arts, Inc. . . . . . . . . . . . . . . . . . . . . 0.2 1,834,82421,500 Fiserv, Inc. . . . . . . . . . . . . . . . . . . . . . . . . . . . 0.3 1,966,39014,400 Rackspace Hosting, Inc. . . . . . . . . . . . . . . . . . . — 364,608
0.6 4,828,960 Steel – Producers
536,000 Angang Steel Co., Ltd. . . . . . . . . . . . . . . . . . . . — 217,1732,000 Japan Steel Works Ltd. . . . . . . . . . . . . . . . . . . . — 7,106
46,128 Severstal PAO . . . . . . . . . . . . . . . . . . . . . . . . . 0.1 385,861
0.1 610,140 Sugar
13,114 Suedzucker A.G.. . . . . . . . . . . . . . . . . . . . . . . . — 261,339
Super – Regional Banks 3,000 Capital One Financial Corp. . . . . . . . . . . . . . . . — 216,540
12,500 KeyCorp . . . . . . . . . . . . . . . . . . . . . . . . . . . . . . — 164,8754,000 PNC Financial Services Group, Inc. . . . . . . . . 0.1 381,240
38,200 U.S. Bancorp . . . . . . . . . . . . . . . . . . . . . . . . . 0.2 1,629,99434,600 Wells Fargo & Co. . . . . . . . . . . . . . . . . . . . . . 0.3 1,880,856
0.6 4,273,505 Telecommunication Equipment
31,816 NICE Systems, Ltd. . . . . . . . . . . . . . . . . . . . . 0.2 1,836,16576,800 VTech Holdings, Ltd. . . . . . . . . . . . . . . . . . . . 0.1 796,266
0.3 2,632,431 Telecommunication Services
43,200 BCE, Inc. . . . . . . . . . . . . . . . . . . . . . . . . . . . . 0.2 1,669,2961,190,700 DiGi.Com Bhd . . . . . . . . . . . . . . . . . . . . . . . . 0.2 1,498,782
31,380 Globe Telecom, Inc. . . . . . . . . . . . . . . . . . . . . 0.2 1,235,4834,039,000 PCCW, Ltd. . . . . . . . . . . . . . . . . . . . . . . . . . . 0.3 2,371,353
876,847 Spark New Zealand, Ltd. . . . . . . . . . . . . . . . . 0.3 1,978,351508,100 StarHub, Ltd. . . . . . . . . . . . . . . . . . . . . . . . . . 0.2 1,326,445
48,673 TalkTalk Telecom Group PLC . . . . . . . . . . . . . . — 155,9712,773,200 Tower Bersama Infrastructure
Tbk PT . . . . . . . . . . . . . . . . . . . . . . . . . . . . 0.2 1,182,350
1.6 11,418,031 Telecommunications
1,154,000 China Telecom Corp., Ltd. . . . . . . . . . . . . . . . 0.1 542,0234,600 Level 3 Communications, Inc. . . . . . . . . . . . . . — 250,0566,600 Palo Alto Networks, Inc. . . . . . . . . . . . . . . . . . 0.2 1,162,524
1,512,600 Telekom Malaysia Bhd . . . . . . . . . . . . . . . . . . 0. 4 2,390,540
0. 7 4,345,143 Telephone – Integrated
44,313 AT&T, Inc. . . . . . . . . . . . . . . . . . . . . . . . . . . . 0.2 1,524,81035,722 Belgacom S.A.. . . . . . . . . . . . . . . . . . . . . . . . . 0.2 1,164,466
715,190 Bezeq The Israeli Telecommunication Corp., Ltd. . . . . . . . . . . . . . . . . . . . . . . . . . 0.2 1,575,622
1,374 Elisa Oyj . . . . . . . . . . . . . . . . . . . . . . . . . . . . . . — 51,941304,800 Frontier Communications Corp. . . . . . . . . . . . 0.2 1,423,416
44,200 KDDI Corp. . . . . . . . . . . . . . . . . . . . . . . . . . . 0.2 1,159,98371,132 Koninklijke KPN N.V. . . . . . . . . . . . . . . . . . . . . — 269,90432,900 Nippon Telegraph & Telephone
Corp. . . . . . . . . . . . . . . . . . . . . . . . . . . . . . 0.2 1,323,884
Share or Principal Amount
Percentage of Net
Assets (%) Fair
Value (USD)
3,592 Swisscom A.G. . . . . . . . . . . . . . . . . . . . . . . . . 0.2 1,804,43121,146 Telefonica Deutschland
Holding A.G. . . . . . . . . . . . . . . . . . . . . . . . . — 112,382240,905 Telstra Corp. . . . . . . . . . . . . . . . . . . . . . . . . . . 0.1 984,551
42,600 Verizon Communications, Inc. . . . . . . . . . . . . 0.3 1,968,972
1.8 13,364,362 Television
9,253 Societe Television Francaise 1 . . . . . . . . . . . . . . — 103,057
Textile – Apparel 67,000 Eclat Textile Co., Ltd. . . . . . . . . . . . . . . . . . . . 0.1 925,208
177,000 Shenzhou International Group Holdings, Ltd. . . . . . . . . . . . . . . . . . . . . . . . 0. 2 1,017,494
0. 3 1,942,702 Textile – Home Furnishings
3,500 Mohawk Industries, Inc. . . . . . . . . . . . . . . . . . 0.1 662,865
Textile – Products 276,000 Texwinca Holdings, Ltd. . . . . . . . . . . . . . . . . . . — 288,829
Tobacco 56,500 Altria Group, Inc. . . . . . . . . . . . . . . . . . . . . . . 0.4 3,288,86554,000 British American Tobacco Malaysia
Bhd . . . . . . . . . . . . . . . . . . . . . . . . . . . . . . . 0.1 705,9016,790 British American Tobacco PLC . . . . . . . . . . . . 0.1 377,419
23,500 Imperial Tobacco Group PLC . . . . . . . . . . . . . 0.2 1,242,3284,900 Japan Tobacco, Inc. . . . . . . . . . . . . . . . . . . . . . — 182,292
27,248 KT&G Corp. . . . . . . . . . . . . . . . . . . . . . . . . . 0.3 2,428,90372,570 Reynolds American, Inc. . . . . . . . . . . . . . . . . . 0.4 3,349,106
1.5 11,574,814 Tools – Hand Held
3,500 Makita Corp. . . . . . . . . . . . . . . . . . . . . . . . . . . — 204,735
Toys 48,600 Bandai Namco Holdings, Inc. . . . . . . . . . . . . . 0.1 1,036,86411,200 Hasbro, Inc. . . . . . . . . . . . . . . . . . . . . . . . . . . 0.1 754,432
0.2 1,791,296 Transportation
725,100 BTS Group Holdings PCL . . . . . . . . . . . . . . . . . — 183,44212,856 CJ Korea Express Co., Ltd. . . . . . . . . . . . . . . . 0.3 2,094,587
17 DSV A/S . . . . . . . . . . . . . . . . . . . . . . . . . . . . . . — 6739,900 FedEx Corp. . . . . . . . . . . . . . . . . . . . . . . . . . . 0.2 1,475,001
185,000 Kawasaki Kisen Kaisha, Ltd. . . . . . . . . . . . . . . 0.1 400,233287,000 Keihan Electric Railway Co., Ltd. . . . . . . . . . . 0.3 1,941,512209,000 MTR Corp., Ltd. . . . . . . . . . . . . . . . . . . . . . . . 0.1 1,035,591133,300 Singapore Post, Ltd. . . . . . . . . . . . . . . . . . . . . . — 154,245226,000 Sotetsu Holdings, Inc. . . . . . . . . . . . . . . . . . . 0.2 1,327,642
18,700 West Japan Railway Co. . . . . . . . . . . . . . . . . . 0.2 1,306,106
1.4 9,919,032 Transportation – Marine
993,000 China COSCO Holdings Co., Ltd. . . . . . . . . . 0.1 451,027280,000 China Shipping Development Co.,
Ltd. . . . . . . . . . . . . . . . . . . . . . . . . . . . . . . . . — 186,07013,438 Hanjin Shipping Co., Ltd. . . . . . . . . . . . . . . . . — 41,668
582,700 MISC Bhd . . . . . . . . . . . . . . . . . . . . . . . . . . . . 0.2 1,272,70216,000 Orient Overseas International, Ltd. . . . . . . . . . — 76,905
0.3 2,028,372 Transportation – Railroad
10,000 CSX Corp. . . . . . . . . . . . . . . . . . . . . . . . . . . . . — 259,5003,600 East Japan Railway Co. . . . . . . . . . . . . . . . . . . . — 342,985
381,000 Nagoya Railroad Co., Ltd.. . . . . . . . . . . . . . . . 0. 3 1,600,9732,000 Tokyu Corp. . . . . . . . . . . . . . . . . . . . . . . . . . . . — 15,9765,300 Union Pacifi c Corp. . . . . . . . . . . . . . . . . . . . . 0.1 414,460
0. 4 2,633,894

INTECH All-World Minimum Variance Core Fund(a)
PORTFOLIO INVESTMENTS
The accompanying notes are an integral part of the fi nancial statements.
1 4 2 J a n u s C a p i t a l F u n d s P l c / 3 1 D e c e m b e r 2 0 1 5
Share or Principal Amount
Percentage of Net
Assets (%) Fair
Value (USD)
Transportation – Services 107,000 Nippon Express Co., Ltd. . . . . . . . . . . . . . . . . 0. 2 509,269
2,518 Royal Mail PLC . . . . . . . . . . . . . . . . . . . . . . . . . — 16,479
0. 2 525,748 Transportation – Truck
4,100 Hitachi Transport System, Ltd. . . . . . . . . . . . . . — 72,39332,800 Seino Holdings Co., Ltd. . . . . . . . . . . . . . . . . 0.1 345,522
0.1 417,915 Transportation Services
6,900 CH Robinson Worldwide, Inc. . . . . . . . . . . . . 0.1 427,938999,000 ComfortDelGro Corp., Ltd. . . . . . . . . . . . . . . 0.3 2,149,827
0.4 2,577,765 Travel Services
800 HIS Co., Ltd. . . . . . . . . . . . . . . . . . . . . . . . . . . — 27,0594,656 TUI A.G. . . . . . . . . . . . . . . . . . . . . . . . . . . . . . — 83,110
— 110,169 Water
33,300 American Water Works Co., Inc. . . . . . . . . . . 0.4 1,989,676638,000 Beijing Enterprises Water Group, Ltd. . . . . . . 0.1 447,025
1,052,000 Guangdong Investment, Ltd. . . . . . . . . . . . . . 0.2 1,490,49047,273 Severn Trent PLC . . . . . . . . . . . . . . . . . . . . . . 0.2 1,516,942
104,702 United Utilities Group PLC . . . . . . . . . . . . . . 0.2 1,443,764
1.1 6,887,897 Water Treatment Systems
22,315 Coway Co., Ltd. . . . . . . . . . . . . . . . . . . . . . . . 0.3 1,600,855
Web Hosting and Design 3,857 Equinix, Inc. . . . . . . . . . . . . . . . . . . . . . . . . . 0. 3 1,166,357
Web Portals/Internet Service Providers 8,700 Yahoo Japan Corp. . . . . . . . . . . . . . . . . . . . . . . — 35,761
Wireless Equipment 3,700 Motorola Solutions, Inc. . . . . . . . . . . . . . . . . . 0.1 253,265
Total Common Stock . . . . . . . . . . . . . . . . . . . . . . . . . . . . . . . 101.0 755,749,988
Preferred Stock Cosmetics and Toiletries
1,652 AMOREPACIFIC Corp. . . . . . . . . . . . . . . . . . 0.1 324,113
Total Preferred Stock . . . . . . . . . . . . . . . . . . . . . . . . . . . 0.1 324,113
Total Investments . . . . . . . . . . . . . . . . . . . . . . . . . . . . . . . . . . 101. 1 756,074,101
Forward Currency Contracts, Open as at 31 December 2015
Currency Purchased
Currency Sold
Current Market
Value (USD)Settle Date
Unrealised Appreciation
(USD)
CitibankGBP 1,722,140 ZAR 39,077,000 1,704,003 19- Jan-16 18,137
HSBC USAGBP 1,719,147 ZAR 39,076,000 1,705,372 19- Jan-16 13,775
Total 31,912
Total Financial Assets at fair value through profi t or loss 756,106,013

PORTFOLIO INVESTMENTS
The accompanying notes are an integral part of the fi nancial statements.
J a n u s C a p i t a l F u n d s P l c / 3 1 D e c e m b e r 2 0 1 5 1 4 3
Financial Liabilities at fair value through profi t or loss
Forward Currency Contracts, Open as at 31 December 2015
Currency Purchased
Currency Sold
Current Market
Value (USD)Settle Date
Unrealised (Depreciation)
(USD)
CitibankGBP 5,315,946 CHF 7,856,000 5,332,808 19-Jan-16 (16,862)GBP 1,007,573 DKK 10,314,000 1,025,488 19-Jan-16 (17,915)GBP 795,563 PLN 4,709,000 825,026 19-Jan-16 (29,463)GBP 3,390,069 ILS 19,738,000 3,468,926 19-Jan-16 (78,857)GBP 4,234,624 CAD 8,762,000 4,326,090 19-Jan-16 (91,466)GBP 2,095,445 NZD 4,663,000 2,190,606 19-Jan-16 (95,161)GBP 5,399,392 SGD 11,429,000 5,499,764 19-Jan-16 (100,372)GBP 3,545,991 THB 192,031,000 3,655,000 19-Jan-16 (109,009)GBP 5,192,905 MYR 33,540,000 5,316,972 19-Jan-16 (124,067)GBP 6,817,117 TWD 335,975,000 6,957,946 19-Jan-16 (140,829)GBP 11,746,784 EUR 16,122,000 11,957,311 19-Jan-16 (210,527)GBP 5,352,767 INR 538,545,000 5,582,183 19-Jan-16 (229,416)GBP 6,403,810 AUD 13,367,000 6,692,860 19-Jan-16 (289,050)GBP 10,695,215 KRW 18,896,332,000 11,006,503 19-Jan-16 (311,288)GBP 18,631,353 HKD 216,765,000 19,143,393 19-Jan-16 (512,040)GBP 35,703,349 JPY 6,522,452,000 37,371,084 19-Jan-16 (1,667,735)GBP 216,983,595 USD 325,777,000 222,913,322 19-Jan-16 (5,929,727)
HSBC USAGBP 1,006,318 DKK 10,314,000 1,026,082 19-Jan-16 (19,764)GBP 795,469 PLN 4,708,000 824,815 19-Jan-16 (29,346)GBP 5,305,568 CHF 7,857,000 5,338,711 19-Jan-16 (33,143)GBP 3,389,161 ILS 19,738,000 3,469,356 19-Jan-16 (80,195)GBP 2,093,032 NZD 4,663,000 2,191,756 19-Jan-16 (98,724)GBP 4,228,465 CAD 8,762,000 4,329,009 19-Jan-16 (100,544)GBP 5,389,637 SGD 11,428,000 5,503,691 19-Jan-16 (114,054)GBP 3,539,111 THB 192,031,000 3,658,267 19-Jan-16 (119,156)GBP 5,187,780 MYR 33,539,000 5,319,206 19-Jan-16 (131,426)GBP 9,660,757 TWD 475,744,000 9,848,850 19-Jan-16 (188,093)GBP 11,733,366 EUR 16,122,000 11,963,663 19-Jan-16 (230,297)GBP 5,350,671 INR 538,545,000 5,583,186 19-Jan-16 (232,515)GBP 6,392,848 AUD 13,366,000 6,697,344 19-Jan-16 (304,496)GBP 10,695,472 KRW 18,896,332,000 11,006,380 19-Jan-16 (310,908)GBP 13,151,410 HKD 153,252,000 13,544,197 19-Jan-16 (392,787)GBP 42,137,913 JPY 7,706,940,000 44,181,035 19-Jan-16 (2,043,122)
Total (14,382,354)
Total Financial Liabilities at fair value through profi t or loss (14,382,354)

INTECH European Core Fund
PORTFOLIO INVESTMENTS
The accompanying notes are an integral part of the fi nancial statements.
1 4 4 J a n u s C a p i t a l F u n d s P l c / 3 1 D e c e m b e r 2 0 1 5
Share or Principal Amount
Percentage of Net
Assets (%) Fair
Value (EUR)
Financial Assets at fair value through profi t or loss Common Stock Advertising Services
7,871 JCDecaux S.A. . . . . . . . . . . . . . . . . . . . . . . . . . 0.3 277,8467,727 WPP PLC . . . . . . . . . . . . . . . . . . . . . . . . . . . . . 0.2 163,832
0.5 441,678
Aerospace and Defence 36,364 BAE Systems PLC . . . . . . . . . . . . . . . . . . . . . . . 0.3 246,44644,265 Finmeccanica SpA . . . . . . . . . . . . . . . . . . . . . . 0.6 571,019
3,272 Thales S.A. . . . . . . . . . . . . . . . . . . . . . . . . . . . . 0.2 226,0951.1 1,043,560
Aerospace and Defence – Equipment 1,183 Airbus Group S.E. . . . . . . . . . . . . . . . . . . . . . . 0.1 73,346
17,164 Cobham PLC . . . . . . . . . . . . . . . . . . . . . . . . . . 0.1 65,9390.2 139,285
Agricultural Chemicals 143 Yara International ASA . . . . . . . . . . . . . . . . . . . . — 5,695
Airlines 13,088 Deutsche Lufthansa A.G. . . . . . . . . . . . . . . . . . 0.2 190,62741,115 International Consolidated Airlines
Group S.A. . . . . . . . . . . . . . . . . . . . . . . . . . . 0.4 340,2270.6 530,854
Airport Development and Maintenance 927 Aeroports de Paris . . . . . . . . . . . . . . . . . . . . . . 0.1 99,374
1,685 Fraport AG Frankfurt Airport Services Worldwide . . . . . . . . . . . . . . . . . . . . . . . . . . 0.1 99,314
0.2 198,688
Apparel Manufacturers 2,242 Christian Dior S.E. . . . . . . . . . . . . . . . . . . . . . . 0.4 351,434
681 Hermes International . . . . . . . . . . . . . . . . . . . . 0.2 212,3020.6 563,736
Appliances 8,553 Electrolux A.B. . . . . . . . . . . . . . . . . . . . . . . . . . 0.2 191,474
Applications Software 9,720 Sage Group PLC . . . . . . . . . . . . . . . . . . . . . . . . 0.1 79,574
Athletic Footwear 2,053 adidas A.G. . . . . . . . . . . . . . . . . . . . . . . . . . . . . 0.2 184,585
Automotive – Cars and Light Trucks 73,581 Fiat Chrysler Automobiles N.V. . . . . . . . . . . . . 1.0 950,66747,239 Peugeot S.A. . . . . . . . . . . . . . . . . . . . . . . . . . . . 0.8 765,508
6,726 Renault S.A. . . . . . . . . . . . . . . . . . . . . . . . . . . . 0.6 623,0292.4 2,339,204
Automotive – Truck Parts and Equipment – Original 5,072 Valeo S.A. . . . . . . . . . . . . . . . . . . . . . . . . . . . . . 0.8 723,014
Banks 18,627 DNB ASA . . . . . . . . . . . . . . . . . . . . . . . . . . . . . 0.2 212,71622,918 Erste Group Bank A.G. . . . . . . . . . . . . . . . . . . . 0.7 662,55912,413 KBC Groep N.V. . . . . . . . . . . . . . . . . . . . . . . . . 0.7 715,858
4,263 UBI Banca – Rights . . . . . . . . . . . . . . . . . . . . . . . — —1.6 1,591,133
Beverages – Non-Alcoholic 21,476 Coca-Cola HBC A.G. . . . . . . . . . . . . . . . . . . . . 0.4 421,842
Brewery 1,582 Anheuser-Busch InBev N.V. . . . . . . . . . . . . . . . 0.2 180,9811,111 Carlsberg A/S . . . . . . . . . . . . . . . . . . . . . . . . . . 0.1 91,2116,125 Heineken Holding N.V. . . . . . . . . . . . . . . . . . . . 0.5 434,8756,793 Heineken N.V. . . . . . . . . . . . . . . . . . . . . . . . . . 0.6 535,085
1.4 1,242,152
Building – Heavy Construction 1,130 ACS Actividades de Construccion y
Servicios S.A. . . . . . . . . . . . . . . . . . . . . . . . . . — 30,527
Building – Residential and Commercial 103,075 Barratt Developments PLC . . . . . . . . . . . . . . . . 0.9 875,297
Share or Principal Amount
Percentage of Net
Assets (%) Fair
Value (EUR)
31,717 Persimmon PLC . . . . . . . . . . . . . . . . . . . . . . . . 0.9 872,1151.8 1,747,412
Building and Construction – Miscellaneous 41,699 Ferrovial S.A. . . . . . . . . . . . . . . . . . . . . . . . . . . 0.9 869,633
Building and Construction Products – Miscellaneous 4,228 CIE de St-Gobain . . . . . . . . . . . . . . . . . . . . . . . 0.2 168,4861,379 Geberit A.G. . . . . . . . . . . . . . . . . . . . . . . . . . . . 0.4 431,186
132 Sika A.G. . . . . . . . . . . . . . . . . . . . . . . . . . . . . . 0.5 439,1861.1 1,038,858
Building Products – Cement and Aggregate 12,527 CRH PLC . . . . . . . . . . . . . . . . . . . . . . . . . . . . . 0.3 334,471
1,180 HeidelbergCement A.G. . . . . . . . . . . . . . . . . . . 0.1 89,2320.4 423,703
Cable/Satellite TV 25,500 Altice N.V. – Class A . . . . . . . . . . . . . . . . . . . . . 0.4 337,875
700 Altice N.V. – Class B . . . . . . . . . . . . . . . . . . . . . . — 9,38048,256 British Sky Broadcasting Group PLC . . . . . . . . . 0.8 727,920
35 Kabel Deutschland Holding A.G. . . . . . . . . . . . . — 3,9951.2 1,079,170
Cellular Telecommunications 69 Millicom International Cellular S.A. . . . . . . . . . . — 3,662
Chemicals – Diversifi ed 14,350 Evonik Industries A.G. . . . . . . . . . . . . . . . . . . . 0.5 439,325
9,763 LANXESS A.G. . . . . . . . . . . . . . . . . . . . . . . . . . 0.4 416,6850.9 856,010
Chemicals – Plastics 332 EMS-Chemie Holding A.G.. . . . . . . . . . . . . . . . 0.1 134,568
Chemicals – Specialty 1,873 Brenntag A.G. . . . . . . . . . . . . . . . . . . . . . . . . . . 0.1 90,4285,747 FUCHS PETROLUB S.E.. . . . . . . . . . . . . . . . . . 0.3 249,995
326 Givaudan S.A. . . . . . . . . . . . . . . . . . . . . . . . . . 0.6 546,2245,626 Lonza Group A.G. . . . . . . . . . . . . . . . . . . . . . . 0.9 843,373
1.9 1,730,020
Commercial Banks – Non U.S. 38,735 Banco Popolare SC . . . . . . . . . . . . . . . . . . . . . . 0.5 496,195
710,356 Bank of Ireland . . . . . . . . . . . . . . . . . . . . . . . . . 0.2 240,10026,482 Bankinter S.A. . . . . . . . . . . . . . . . . . . . . . . . . . 0.2 173,298
3,878 Danske Bank A/S . . . . . . . . . . . . . . . . . . . . . . . 0.1 96,26641,258 ING Group N.V. . . . . . . . . . . . . . . . . . . . . . . . . 0.5 513,662
648,302 Intesa Sanpaolo SpA . . . . . . . . . . . . . . . . . . . . . 2.1 1,976,45943,958 Mediobanca SpA . . . . . . . . . . . . . . . . . . . . . . . 0.4 390,56782,443 Skandinaviska Enskilda Banken A.B. –
Class A . . . . . . . . . . . . . . . . . . . . . . . . . . . . . 0.8 804,0903,823 Swedbank A.B. . . . . . . . . . . . . . . . . . . . . . . . . . 0.1 78,035
55,969 Unione di Banche Italiane SpA . . . . . . . . . . . . . 0.4 347,0085.3 5,115,680
Computer Aided Design 8,695 Dassault Systemes. . . . . . . . . . . . . . . . . . . . . . . 0.7 641,430
Computer Data Security 3,850 Gemalto N.V. . . . . . . . . . . . . . . . . . . . . . . . . . . 0.2 212,790
Computer Services 1,367 Atos S.E. . . . . . . . . . . . . . . . . . . . . . . . . . . . . . . 0.1 105,8749,509 Cap Gemini S.A. . . . . . . . . . . . . . . . . . . . . . . . . 0.8 813,970
0.9 919,844
Consulting Services 2,090 Bureau Veritas S.A. . . . . . . . . . . . . . . . . . . . . . . . — 38,435
Containers – Metal and Glass 3,799 Rexam PLC . . . . . . . . . . . . . . . . . . . . . . . . . . . . . — 31,153
Cosmetics and Toiletries 788 Beiersdorf A.G. . . . . . . . . . . . . . . . . . . . . . . . . . 0.1 66,318
6,729 Svenska Cellulosa A.B. SCA . . . . . . . . . . . . . . . 0.2 180,9590.3 247,277
Cruise Lines 9,863 Carnival PLC . . . . . . . . . . . . . . . . . . . . . . . . . . 0.5 517,248

PORTFOLIO INVESTMENTS
The accompanying notes are an integral part of the fi nancial statements.
J a n u s C a p i t a l F u n d s P l c / 3 1 D e c e m b e r 2 0 1 5 1 4 5
Share or Principal Amount
Percentage of Net
Assets (%) Fair
Value (EUR)
Diagnostic Kits 10,344 QIAGEN N.V. . . . . . . . . . . . . . . . . . . . . . . . . . . 0.3 259,790
Dialysis Centres 6,261 Fresenius Medical Care A.G. & Co.,
KGaA . . . . . . . . . . . . . . . . . . . . . . . . . . . . . . 0.5 486,6686,595 Fresenius S.E. & Co. . . . . . . . . . . . . . . . . . . . . 0.5 435,072
1.0 921,740
Distribution/Wholesale 13,299 Wolseley PLC . . . . . . . . . . . . . . . . . . . . . . . . . . 0.7 665,872
Diversifi ed Banking Institutions 61,350 Credit Agricole S.A. . . . . . . . . . . . . . . . . . . . . . 0.7 667,48880,160 Natixis . . . . . . . . . . . . . . . . . . . . . . . . . . . . . . . 0.4 418,19521,756 UBS A.G. . . . . . . . . . . . . . . . . . . . . . . . . . . . . . 0.4 390,324
1,931 UniCredit SpA . . . . . . . . . . . . . . . . . . . . . . . . . . — 9,9161.5 1,485,923
Diversifi ed Financial Services 36,113 Investec PLC . . . . . . . . . . . . . . . . . . . . . . . . . . 0.2 234,84923,109 Julius Baer Group, Ltd. . . . . . . . . . . . . . . . . . . . 1.1 1,033,521
1.3 1,268,370
Diversifi ed Operations 91,940 Bollore S.A. . . . . . . . . . . . . . . . . . . . . . . . . . . . 0.4 395,06617,441 Industrivarden A.B. . . . . . . . . . . . . . . . . . . . . . 0.3 276,091
3,067 Wendel S.A. . . . . . . . . . . . . . . . . . . . . . . . . . . . 0.3 336,1431.0 1,007,300
Diversifi ed Operations – Commercial Services 8,068 Bunzl PLC . . . . . . . . . . . . . . . . . . . . . . . . . . . . 0.2 206,303
Electric – Distribution 211,236 Enel SpA . . . . . . . . . . . . . . . . . . . . . . . . . . . . . 0.9 822,131
Electric – Integrated 183,325 EDP – Energias de Portugal S.A. . . . . . . . . . . . . 0.6 608,822
14,081 Endesa S.A. . . . . . . . . . . . . . . . . . . . . . . . . . . . 0.3 260,85159,394 Iberdrola S.A. . . . . . . . . . . . . . . . . . . . . . . . . . . 0.4 389,03155,460 SSE PLC . . . . . . . . . . . . . . . . . . . . . . . . . . . . . . 1.2 1,149,558
2.5 2,408,262
Electric – Transmission 4,453 Red Electrica Corp S.A. . . . . . . . . . . . . . . . . . . 0.4 343,371
83,950 Terna Rete Elettrica Nazionale SpA . . . . . . . . . . 0.4 399,2660.8 742,637
Electric Products – Miscellaneous 298 Legrand S.A. . . . . . . . . . . . . . . . . . . . . . . . . . . . . — 15,556
Electrical Components – Equipment 5,870 OSRAM Licht A.G. . . . . . . . . . . . . . . . . . . . . . . 0.2 227,697
17,537 Prysmian SpA . . . . . . . . . . . . . . . . . . . . . . . . . . 0.4 355,3000.6 582,997
Electronic Components – Semiconductors 37,342 STMicroelectronics N.V. . . . . . . . . . . . . . . . . . . 0.2 230,811
Electronics – Military 896 Safran S.A. . . . . . . . . . . . . . . . . . . . . . . . . . . . . 0.1 56,780
Energy – Alternate Sources 13,169 Vestas Wind Systems A/S . . . . . . . . . . . . . . . . . 0.9 853,974
Finance – Investment Bankers/Brokers 34,682 ICAP PLC . . . . . . . . . . . . . . . . . . . . . . . . . . . . . 0.2 239,704
Finance – Other Services 9,166 Deutsche Boerse A.G. . . . . . . . . . . . . . . . . . . . . 0.8 746,021
15,031 London Stock Exchange Group PLC . . . . . . . . . 0.6 559,5001.4 1,305,521
Food – Catering 94,176 Compass Group PLC . . . . . . . . . . . . . . . . . . . . 1.6 1,501,087
Food – Confectionery 102 Lindt & Spruengli A.G. (CHF 10) . . . . . . . . . . 0.6 586,400
9 Lindt & Spruengli A.G. (CHF 100) . . . . . . . . . 0.6 617,2541.2 1,203,654
Share or Principal Amount
Percentage of Net
Assets (%) Fair
Value (EUR)
Food – Miscellaneous/Diversifi ed 127 Barry Callebaut A.G. . . . . . . . . . . . . . . . . . . . . . 0.1 128,049
18,513 Jeronimo Martins SGPS S.A. . . . . . . . . . . . . . . . 0.2 222,0636,593 Kerry Group PLC . . . . . . . . . . . . . . . . . . . . . . . 0.5 503,112
68,691 Orkla ASA . . . . . . . . . . . . . . . . . . . . . . . . . . . . 0.5 500,8106,712 Unilever PLC . . . . . . . . . . . . . . . . . . . . . . . . . . 0.3 266,458
1.6 1,620,492
Food – Retail 4,482 Colruyt S.A. . . . . . . . . . . . . . . . . . . . . . . . . . . . 0.2 212,6482,635 Distribuidora Internacional de
Alimentacion S.A. . . . . . . . . . . . . . . . . . . . . . . — 14,3452,293 ICA Gruppen A.B. . . . . . . . . . . . . . . . . . . . . . . 0.1 76,899
27,278 J. Sainsbury PLC . . . . . . . . . . . . . . . . . . . . . . . . 0.1 95,76516,798 WM. Morrison Supermarkets PLC . . . . . . . . . . . — 33,770
0.4 433,427
Gambling – Non-Hotel 31,201 William Hill PLC . . . . . . . . . . . . . . . . . . . . . . . 0.2 167,607
Gas – Distribution 1,753 Enagas S.A. . . . . . . . . . . . . . . . . . . . . . . . . . . . . . — 45,578
47,491 National Grid PLC . . . . . . . . . . . . . . . . . . . . . . 0.6 603,9630.6 649,541
Gas – Transportation 54,218 SNAM Rete Gas SpA. . . . . . . . . . . . . . . . . . . . . 0.3 261,873
Gold Mining 3,839 Signature Metals, Ltd. . . . . . . . . . . . . . . . . . . . . 0.2 174,041
Home Builders 349,526 Taylor Wimpey PLC . . . . . . . . . . . . . . . . . . . . . 1.0 962,980
Hotels and Motels 9,675 Accor S.A. . . . . . . . . . . . . . . . . . . . . . . . . . . . . 0.4 387,0487,057 InterContinental Hotels Group PLC . . . . . . . . . 0.3 254,450
19,320 Whitbread PLC . . . . . . . . . . . . . . . . . . . . . . . . 1.2 1,153,4171.9 1,794,915
Human Resources 11,650 Adecco S.A. . . . . . . . . . . . . . . . . . . . . . . . . . . . 0.8 737,75446,737 Capita PLC . . . . . . . . . . . . . . . . . . . . . . . . . . . . 0.8 765,87113,688 Randstad Holding N.V. . . . . . . . . . . . . . . . . . . . 0.8 787,471
2.4 2,291,096
Industrial Gases 1,083 Air Liquide S.A. . . . . . . . . . . . . . . . . . . . . . . . . 0.1 112,253
203 Linde A.G. . . . . . . . . . . . . . . . . . . . . . . . . . . . . . — 27,182. . . . . . . 0.1 139,435
Insurance 82,557 Direct Line Insurance Group PLC . . . . . . . . . . . 0.5 456,362
5,361 NN Group N.V.. . . . . . . . . . . . . . . . . . . . . . . . . 0.2 174,50131,552 Standard Life PLC. . . . . . . . . . . . . . . . . . . . . . . 0.2 166,796
1,480 Swiss Life Holding A.G. . . . . . . . . . . . . . . . . . . 0.4 369,0441.3 1,166,703
Internet Content – Information/News 3,370 United Internet A.G. . . . . . . . . . . . . . . . . . . . . . 0.2 171,567
Investment Companies 10,579 EXOR SpA . . . . . . . . . . . . . . . . . . . . . . . . . . . . 0.5 445,270
2,225 Investment A.B. Kinnevik . . . . . . . . . . . . . . . . . 0.1 63,59814,791 Investor A.B.. . . . . . . . . . . . . . . . . . . . . . . . . . . 0.5 504,429
1.1 1,013,297
Investment Management and Advisory Services 27,726 Hargreaves Lansdown PLC . . . . . . . . . . . . . . . . 0.6 566,42226,923 Old Mutual PLC . . . . . . . . . . . . . . . . . . . . . . . . 0.1 65,337
1,703 Partners Group Holding A.G. . . . . . . . . . . . . . . 0.6 565,44310,813 Schroders PLC . . . . . . . . . . . . . . . . . . . . . . . . . 0.5 436,523
1.8 1,633,725
Life and Health Insurance 9,819 Aviva PLC . . . . . . . . . . . . . . . . . . . . . . . . . . . . . 0.1 68,730

INTECH European Core Fund
PORTFOLIO INVESTMENTS
The accompanying notes are an integral part of the fi nancial statements.
1 4 6 J a n u s C a p i t a l F u n d s P l c / 3 1 D e c e m b e r 2 0 1 5
Share or Principal Amount
Percentage of Net
Assets (%) Fair
Value (EUR)
413,620 Legal & General Group PLC . . . . . . . . . . . . . . . 1.6 1,502,58817,553 Prudential PLC . . . . . . . . . . . . . . . . . . . . . . . . . 0.4 364,548
2.1 1,935,866
Machinery – Electrical 3,811 Schindler Holding A.G. . . . . . . . . . . . . . . . . . . 0.6 590,205
Machinery – Farm 44,970 CNH Industrial N.V. . . . . . . . . . . . . . . . . . . . . . 0.3 285,110
Machinery – General Industrial 1 MAN S.E. . . . . . . . . . . . . . . . . . . . . . . . . . . . . . . — 93
8,430 Zardoya Otis S.A. . . . . . . . . . . . . . . . . . . . . . . . 0.1 90,8750.1 90,968
Media 10,834 Lagardere SCA . . . . . . . . . . . . . . . . . . . . . . . . . 0.3 298,043
Medical – Drugs 10,524 Actelion, Ltd. . . . . . . . . . . . . . . . . . . . . . . . . . . 1.4 1,350,307
5,768 Merck KGaA . . . . . . . . . . . . . . . . . . . . . . . . . . . 0.5 516,6403,258 Novartis A.G. . . . . . . . . . . . . . . . . . . . . . . . . . . 0.3 259,9189,190 Orion Oyj . . . . . . . . . . . . . . . . . . . . . . . . . . . . . 0.3 293,8043,316 Roche Holding A.G. . . . . . . . . . . . . . . . . . . . . . 0.9 842,401
37,807 Shire PLC . . . . . . . . . . . . . . . . . . . . . . . . . . . . . 2.5 2,409,4145.9 5,672,484
Medical Products 376 Sonova Holding A.G. . . . . . . . . . . . . . . . . . . . . . — 43,993
Metal – Diversifi ed 15,756 Boliden A.B. . . . . . . . . . . . . . . . . . . . . . . . . . . . 0.3 245,636
Metal Processors and Fabrication 17,927 Assa Abloy A.B. . . . . . . . . . . . . . . . . . . . . . . . . 0.4 348,130
3,163 SKF A.B. – Class B . . . . . . . . . . . . . . . . . . . . . . . — 47,3440.4 395,474
Multi-Line Insurance 10,283 Ageas . . . . . . . . . . . . . . . . . . . . . . . . . . . . . . . . 0.5 440,112
1,969 AXA S.A. . . . . . . . . . . . . . . . . . . . . . . . . . . . . . 0.1 49,678308 Baloise Holding A.G. . . . . . . . . . . . . . . . . . . . . . — 36,122
22,961 Sampo . . . . . . . . . . . . . . . . . . . . . . . . . . . . . . . 1.1 1,079,1671,423 Zurich Insurance Group A.G. . . . . . . . . . . . . . . 0.4 337,959
2.1 1,943,038
Multimedia 22,504 Pearson PLC . . . . . . . . . . . . . . . . . . . . . . . . . . . 0.2 224,68012,398 Vivendi S.A. . . . . . . . . . . . . . . . . . . . . . . . . . . . 0.3 246,224
0.5 470,904
Offi ce Supplies and Forms 3,147 Societe BIC S.A. . . . . . . . . . . . . . . . . . . . . . . . . 0.5 477,243
Oil – Field Services 2,548 AMEC PLC . . . . . . . . . . . . . . . . . . . . . . . . . . . . . — 14,825
27,731 Petrofac, Ltd. . . . . . . . . . . . . . . . . . . . . . . . . . . 0.3 299,4381,214 Technip S.A. . . . . . . . . . . . . . . . . . . . . . . . . . . . 0.1 55,522
0.4 369,785
Oil and Gas Drilling 1,750 Transocean, Ltd. . . . . . . . . . . . . . . . . . . . . . . . . . — 20,105
Oil Companies – Exploration and Production 23,218 Lundin Petroleum A.B. . . . . . . . . . . . . . . . . . . . 0.3 310,548
Oil Companies – Integrated 24,814 Galp Energia SGPS S.A. . . . . . . . . . . . . . . . . . . 0.3 266,006
3,251 OMV A.G. . . . . . . . . . . . . . . . . . . . . . . . . . . . . 0.1 84,9490.4 350,955
Optical Supplies 3,610 Essilor International S.A. . . . . . . . . . . . . . . . . . 0.4 415,331
Paper and Related Products 34,508 Mondi PLC . . . . . . . . . . . . . . . . . . . . . . . . . . . . 0.6 624,45831,435 Stora Enso OYJ . . . . . . . . . . . . . . . . . . . . . . . . . 0.3 263,74020,019 UPM-Kymmene OYJ . . . . . . . . . . . . . . . . . . . . . 0.4 344,927
1.3 1,233,125
Private Equity 106,389 3i Group PLC . . . . . . . . . . . . . . . . . . . . . . . . . . 0.7 695,042
Share or Principal Amount
Percentage of Net
Assets (%) Fair
Value (EUR)
722 Eurazeo S.A. . . . . . . . . . . . . . . . . . . . . . . . . . . . . — 45,8470.7 740,889
Property and Casualty Insurance 8,199 Admiral Group PLC . . . . . . . . . . . . . . . . . . . . . 0.2 184,516
Public Thoroughfares 32,065 Atlantia SpA . . . . . . . . . . . . . . . . . . . . . . . . . . . 0.8 785,593
Publishing – Books 73,837 Reed Elsevier N.V.. . . . . . . . . . . . . . . . . . . . . . . 1.2 1,147,427
Publishing – Periodicals 78,680 Reed Elsevier PLC . . . . . . . . . . . . . . . . . . . . . . 1.3 1,277,575
Real Estate Management/Services 11,452 Deutsche Wohnen A.G. . . . . . . . . . . . . . . . . . . 0.3 293,343
Reinsurance 4,225 Hannover Rueckversicherung S.E. . . . . . . . . . . 0.5 446,371
16,802 SCOR S.E. . . . . . . . . . . . . . . . . . . . . . . . . . . . . 0.6 579,8379,171 Swiss Re A.G. . . . . . . . . . . . . . . . . . . . . . . . . . . 0.9 827,319
2.0 1,853,527
REIT – Diversifi ed 28,188 British Land Co. PLC . . . . . . . . . . . . . . . . . . . . 0.3 300,549
807 Intu Properties PLC . . . . . . . . . . . . . . . . . . . . . . — 3,4745,773 Klepierre . . . . . . . . . . . . . . . . . . . . . . . . . . . . . 0.2 236,6354,810 Land Securities Group PLC . . . . . . . . . . . . . . . 0.1 76,798
47,004 Segro PLC. . . . . . . . . . . . . . . . . . . . . . . . . . . . . 0.3 273,7940.9 891,250
REIT – Shopping Centres 14,472 Hammerson PLC . . . . . . . . . . . . . . . . . . . . . . . 0.1 117,790
Resorts and Theme Parks 26,761 Merlin Entertainments
PLC (144A) . . . . . . . . . . . . . . . . . . . . . . . . . . 0.2 165,355
Retail – Apparel and Shoe 418 Hugo Boss A.G. . . . . . . . . . . . . . . . . . . . . . . . . . — 32,019
7,205 Industria de Diseno Textil S.A. . . . . . . . . . . . . . 0.2 228,32615,430 Next PLC . . . . . . . . . . . . . . . . . . . . . . . . . . . . . 1.6 1,525,883
1.8 1,786,228
Retail – Building Products 11,882 Kingfi sher PLC . . . . . . . . . . . . . . . . . . . . . . . . . 0.1 53,11017,569 Travis Perkins PLC . . . . . . . . . . . . . . . . . . . . . . 0.5 470,221
0.6 523,331
Retail – Consumer Electronics 10,410 Dixons Carphone PLC . . . . . . . . . . . . . . . . . . . 0.1 70,607
Retail – Jewellery 11,486 Pandora A/S . . . . . . . . . . . . . . . . . . . . . . . . . . . 1.4 1,342,490
Retail – Major Department Stores 16,791 Marks & Spencer Group PLC . . . . . . . . . . . . . . 0.1 103,045
Retail – Miscellaneous 15,918 Luxottica Group SpA . . . . . . . . . . . . . . . . . . . . 1.0 961,44722,447 Sports Direct International PLC . . . . . . . . . . . . 0.2 175,696
110 Swatch Group A.G. . . . . . . . . . . . . . . . . . . . . . . — 6,8751.2 1,144,018
Rubber – Tires 673 Cie Generale des Etablissements
Michelin . . . . . . . . . . . . . . . . . . . . . . . . . . . . 0.1 59,1573,185 Continental A.G. . . . . . . . . . . . . . . . . . . . . . . . 0.7 715,1929,489 Nokian Renkaat OYJ . . . . . . . . . . . . . . . . . . . . . 0.3 314,086
1.1 1,088,435
Satellite Telecommunications 319 Eutelsat Communications S.A. . . . . . . . . . . . . . . — 8,804
30,736 Inmarsat PLC . . . . . . . . . . . . . . . . . . . . . . . . . . 0.5 474,06316,450 SES S.A. . . . . . . . . . . . . . . . . . . . . . . . . . . . . . . 0.4 420,709
0.9 903,576

PORTFOLIO INVESTMENTS
The accompanying notes are an integral part of the fi nancial statements.
J a n u s C a p i t a l F u n d s P l c / 3 1 D e c e m b e r 2 0 1 5 1 4 7
Share or Principal Amount
Percentage of Net
Assets (%) Fair
Value (EUR)
Security Services 12,320 Securitas A.B. – Class B . . . . . . . . . . . . . . . . . . 0.2 174,730
Semiconductors 37,687 Infi neon Technologies A.G. . . . . . . . . . . . . . . . 0.5 508,963
Silver Mining 14,103 Fresnillo PLC . . . . . . . . . . . . . . . . . . . . . . . . . . 0.1 135,448
Soap and Cleaning Preparations 7,453 Reckitt Benckiser Group PLC . . . . . . . . . . . . . . 0.7 635,020
Software 6,550 Amadeus IT Holding S.A. . . . . . . . . . . . . . . . . . 0.3 266,487
Steel – Producers 1,303 voestalpine A.G. . . . . . . . . . . . . . . . . . . . . . . . . . — 36,934
Telecommunication Services 6,893 Tele2 A.B. . . . . . . . . . . . . . . . . . . . . . . . . . . . . . 0.1 63,733
Telephone – Integrated 51,445 BT Group PLC . . . . . . . . . . . . . . . . . . . . . . . . . 0.3 329,18315,173 Elisa Oyj . . . . . . . . . . . . . . . . . . . . . . . . . . . . . . 0.5 527,86997,540 Koninklijke KPN N.V. . . . . . . . . . . . . . . . . . . . . 0.4 340,610
1,248 Swisscom A.G. . . . . . . . . . . . . . . . . . . . . . . . . . 0.6 576,964274,896 Telecom Italia SpA . . . . . . . . . . . . . . . . . . . . . . 0.3 323,003647,269 Telecom Italia SpA (RSP) . . . . . . . . . . . . . . . . . 0.6 615,553
41,033 Telefonica Deutschland Holding A.G. . . . . . . . . . . . . . . . . . . . . . . . . 0.2 200,692
2.9 2,913,874
Television 304,688 ITV PLC . . . . . . . . . . . . . . . . . . . . . . . . . . . . . . 1.2 1,143,235
15,465 ProSiebenSat.1 Media A.G. . . . . . . . . . . . . . . . . 0.8 723,2212.0 1,866,456
Tobacco 14,415 British American Tobacco PLC . . . . . . . . . . . . . 0.8 737,39316,547 Imperial Tobacco Group PLC . . . . . . . . . . . . . . 0.8 805,041
2,007 Swedish Match A.B. . . . . . . . . . . . . . . . . . . . . . 0.1 65,7311.7 1,608,165
Transportation 4,000 DSV A/S . . . . . . . . . . . . . . . . . . . . . . . . . . . . . . 0.2 145,672
Transportation – Railroad 51,146 Groupe Eurotunnel S.A. . . . . . . . . . . . . . . . . . . 0.6 586,133
Transportation – Services 47,496 Royal Mail PLC . . . . . . . . . . . . . . . . . . . . . . . . . 0.2 286,067
Transportation Services 132 Kuehne + Nagel International A.G. . . . . . . . . . . . — 16,718
Water 22,148 Severn Trent PLC . . . . . . . . . . . . . . . . . . . . . . . 0.7 654,06514,745 Suez Environnement Co. . . . . . . . . . . . . . . . . . 0.3 254,49943,217 United Utilities Group PLC . . . . . . . . . . . . . . . 0.6 548,43637,970 Veolia Environnement S.A. . . . . . . . . . . . . . . . . 0.9 830,214
2.5 2,287,214
Wireless Equipment 89,148 Nokia Oyj. . . . . . . . . . . . . . . . . . . . . . . . . . . . . 0.5 587,931
Total Common Stock . . . . . . . . . . . . . . . . . . . . . . . . . . . . . . . . . 99.3 95,280,358
Total Investments . . . . . . . . . . . . . . . . . . . . . . . . . . . . . . . . . . . . 99.3 95,280,358
Total Financial Assets at fair value through profi t or loss 95,280,358
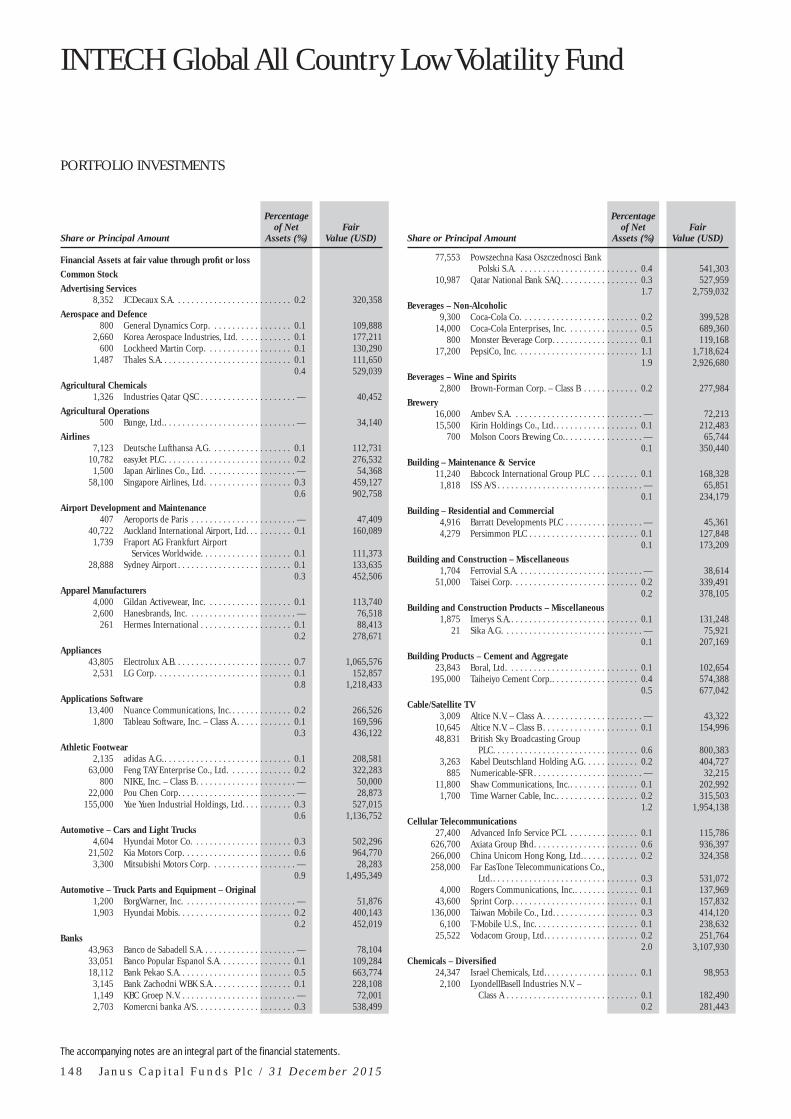
INTECH Global All Country Low Volatility Fund
PORTFOLIO INVESTMENTS
The accompanying notes are an integral part of the fi nancial statements.
1 4 8 J a n u s C a p i t a l F u n d s P l c / 3 1 D e c e m b e r 2 0 1 5
Share or Principal Amount
Percentage of Net
Assets (%) Fair
Value (USD)
Financial Assets at fair value through profi t or loss Common Stock Advertising Services
8,352 JCDecaux S.A. . . . . . . . . . . . . . . . . . . . . . . . . . 0.2 320,358
Aerospace and Defence 800 General Dynamics Corp. . . . . . . . . . . . . . . . . . 0.1 109,888
2,660 Korea Aerospace Industries, Ltd. . . . . . . . . . . . 0.1 177,211600 Lockheed Martin Corp. . . . . . . . . . . . . . . . . . . 0.1 130,290
1,487 Thales S.A. . . . . . . . . . . . . . . . . . . . . . . . . . . . . 0.1 111,6500.4 529,039
Agricultural Chemicals 1,326 Industries Qatar QSC . . . . . . . . . . . . . . . . . . . . . — 40,452
Agricultural Operations 500 Bunge, Ltd. . . . . . . . . . . . . . . . . . . . . . . . . . . . . . — 34,140
Airlines 7,123 Deutsche Lufthansa A.G. . . . . . . . . . . . . . . . . . 0.1 112,731
10,782 easyJet PLC. . . . . . . . . . . . . . . . . . . . . . . . . . . . 0.2 276,5321,500 Japan Airlines Co., Ltd. . . . . . . . . . . . . . . . . . . . — 54,368
58,100 Singapore Airlines, Ltd. . . . . . . . . . . . . . . . . . . 0.3 459,1270.6 902,758
Airport Development and Maintenance 407 Aeroports de Paris . . . . . . . . . . . . . . . . . . . . . . . — 47,409
40,722 Auckland International Airport, Ltd. . . . . . . . . . 0.1 160,0891,739 Fraport AG Frankfurt Airport
Services Worldwide . . . . . . . . . . . . . . . . . . . . 0.1 111,37328,888 Sydney Airport . . . . . . . . . . . . . . . . . . . . . . . . . 0.1 133,635
0.3 452,506
Apparel Manufacturers 4,000 Gildan Activewear, Inc. . . . . . . . . . . . . . . . . . . 0.1 113,7402,600 Hanesbrands, Inc. . . . . . . . . . . . . . . . . . . . . . . . — 76,518
261 Hermes International . . . . . . . . . . . . . . . . . . . . 0.1 88,4130.2 278,671
Appliances 43,805 Electrolux A.B. . . . . . . . . . . . . . . . . . . . . . . . . . 0.7 1,065,576
2,531 LG Corp. . . . . . . . . . . . . . . . . . . . . . . . . . . . . . 0.1 152,8570.8 1,218,433
Applications Software 13,400 Nuance Communications, Inc. . . . . . . . . . . . . . 0.2 266,526
1,800 Tableau Software, Inc. – Class A . . . . . . . . . . . . 0.1 169,5960.3 436,122
Athletic Footwear 2,135 adidas A.G. . . . . . . . . . . . . . . . . . . . . . . . . . . . . 0.1 208,581
63,000 Feng TAY Enterprise Co., Ltd. . . . . . . . . . . . . . 0.2 322,283800 NIKE, Inc. – Class B . . . . . . . . . . . . . . . . . . . . . . — 50,000
22,000 Pou Chen Corp. . . . . . . . . . . . . . . . . . . . . . . . . . — 28,873155,000 Yue Yuen Industrial Holdings, Ltd. . . . . . . . . . . 0.3 527,015
0.6 1,136,752
Automotive – Cars and Light Trucks 4,604 Hyundai Motor Co. . . . . . . . . . . . . . . . . . . . . . 0.3 502,296
21,502 Kia Motors Corp. . . . . . . . . . . . . . . . . . . . . . . . 0.6 964,7703,300 Mitsubishi Motors Corp. . . . . . . . . . . . . . . . . . . — 28,283
0.9 1,495,349
Automotive – Truck Parts and Equipment – Original 1,200 BorgWarner, Inc. . . . . . . . . . . . . . . . . . . . . . . . . — 51,8761,903 Hyundai Mobis . . . . . . . . . . . . . . . . . . . . . . . . . 0.2 400,143
0.2 452,019
Banks 43,963 Banco de Sabadell S.A. . . . . . . . . . . . . . . . . . . . . — 78,10433,051 Banco Popular Espanol S.A. . . . . . . . . . . . . . . . 0.1 109,28418,112 Bank Pekao S.A. . . . . . . . . . . . . . . . . . . . . . . . . 0.5 663,774
3,145 Bank Zachodni WBK S.A. . . . . . . . . . . . . . . . . . 0.1 228,1081,149 KBC Groep N.V. . . . . . . . . . . . . . . . . . . . . . . . . . — 72,0012,703 Komercni banka A/S . . . . . . . . . . . . . . . . . . . . . 0.3 538,499
Share or Principal Amount
Percentage of Net
Assets (%) Fair
Value (USD)
77,553 Powszechna Kasa Oszczednosci Bank Polski S.A. . . . . . . . . . . . . . . . . . . . . . . . . . . 0.4 541,303
10,987 Qatar National Bank SAQ . . . . . . . . . . . . . . . . . 0.3 527,9591.7 2,759,032
Beverages – Non-Alcoholic 9,300 Coca-Cola Co. . . . . . . . . . . . . . . . . . . . . . . . . . 0.2 399,528
14,000 Coca-Cola Enterprises, Inc. . . . . . . . . . . . . . . . 0.5 689,360800 Monster Beverage Corp. . . . . . . . . . . . . . . . . . . 0.1 119,168
17,200 PepsiCo, Inc. . . . . . . . . . . . . . . . . . . . . . . . . . . 1. 1 1,718,624 1. 9 2,926,680
Beverages – Wine and Spirits 2,800 Brown-Forman Corp. – Class B . . . . . . . . . . . . 0.2 277,984
Brewery 16,000 Ambev S.A. . . . . . . . . . . . . . . . . . . . . . . . . . . . . — 72,21315,500 Kirin Holdings Co., Ltd. . . . . . . . . . . . . . . . . . . 0.1 212,483
700 Molson Coors Brewing Co. . . . . . . . . . . . . . . . . . — 65,7440.1 350,440
Building – Maintenance & Service 11,240 Babcock International Group PLC . . . . . . . . . . 0.1 168,328
1,818 ISS A/S . . . . . . . . . . . . . . . . . . . . . . . . . . . . . . . . — 65,8510.1 234,179
Building – Residential and Commercial 4,916 Barratt Developments PLC . . . . . . . . . . . . . . . . . — 45,3614,279 Persimmon PLC . . . . . . . . . . . . . . . . . . . . . . . . 0.1 127,848
0.1 173,209
Building and Construction – Miscellaneous 1,704 Ferrovial S.A. . . . . . . . . . . . . . . . . . . . . . . . . . . . — 38,614
51,000 Taisei Corp. . . . . . . . . . . . . . . . . . . . . . . . . . . . 0.2 339,4910.2 378,105
Building and Construction Products – Miscellaneous 1,875 Imerys S.A. . . . . . . . . . . . . . . . . . . . . . . . . . . . . 0.1 131,248
21 Sika A.G. . . . . . . . . . . . . . . . . . . . . . . . . . . . . . . — 75,9210.1 207,169
Building Products – Cement and Aggregate 23,843 Boral, Ltd. . . . . . . . . . . . . . . . . . . . . . . . . . . . . 0.1 102,654
195,000 Taiheiyo Cement Corp. . . . . . . . . . . . . . . . . . . . 0.4 574,3880.5 677,042
Cable/Satellite TV 3,009 Altice N.V. – Class A . . . . . . . . . . . . . . . . . . . . . . — 43,322
10,645 Altice N.V. – Class B . . . . . . . . . . . . . . . . . . . . . 0.1 154,99648,831 British Sky Broadcasting Group
PLC. . . . . . . . . . . . . . . . . . . . . . . . . . . . . . . . 0.6 800,3833,263 Kabel Deutschland Holding A.G. . . . . . . . . . . . 0.2 404,727
885 Numericable-SFR . . . . . . . . . . . . . . . . . . . . . . . . — 32,21511,800 Shaw Communications, Inc. . . . . . . . . . . . . . . . 0.1 202,992
1,700 Time Warner Cable, Inc.. . . . . . . . . . . . . . . . . . 0.2 315,5031.2 1,954,138
Cellular Telecommunications 27,400 Advanced Info Service PCL . . . . . . . . . . . . . . . 0.1 115,786
626,700 Axiata Group Bhd . . . . . . . . . . . . . . . . . . . . . . . 0.6 936,397266,000 China Unicom Hong Kong, Ltd. . . . . . . . . . . . . 0.2 324,358258,000 Far EasTone Telecommunications Co.,
Ltd. . . . . . . . . . . . . . . . . . . . . . . . . . . . . . . . . 0.3 531,0724,000 Rogers Communications, Inc. . . . . . . . . . . . . . . 0.1 137,969
43,600 Sprint Corp. . . . . . . . . . . . . . . . . . . . . . . . . . . . 0.1 157,832136,000 Taiwan Mobile Co., Ltd. . . . . . . . . . . . . . . . . . . 0.3 414,120
6,100 T-Mobile U.S., Inc. . . . . . . . . . . . . . . . . . . . . . . 0.1 238,63225,522 Vodacom Group, Ltd. . . . . . . . . . . . . . . . . . . . . 0.2 251,764
2.0 3,107,930
Chemicals – Diversifi ed 24,347 Israel Chemicals, Ltd. . . . . . . . . . . . . . . . . . . . . 0.1 98,953
2,100 LyondellBasell Industries N.V. – Class A . . . . . . . . . . . . . . . . . . . . . . . . . . . . . 0.1 182,490
0.2 281,443

PORTFOLIO INVESTMENTS
The accompanying notes are an integral part of the fi nancial statements.
J a n u s C a p i t a l F u n d s P l c / 3 1 D e c e m b e r 2 0 1 5 1 4 9
Share or Principal Amount
Percentage of Net
Assets (%) Fair
Value (USD)
Chemicals – Plastics 568 EMS-Chemie Holding A.G.. . . . . . . . . . . . . . . . 0.2 250,163
Chemicals – Specialty 20,000 Toray Industries, Inc. . . . . . . . . . . . . . . . . . . . . 0.1 188,051
Coffee 3,800 Keurig Green Mountain, Inc. . . . . . . . . . . . . . . 0.2 341,924
Commercial Banks – Non U.S. 445,905 Banco de Chile . . . . . . . . . . . . . . . . . . . . . . . . . . — 45,478194,352 Bank Hapoalim BM . . . . . . . . . . . . . . . . . . . . . 0.7 1,004,234264,227 Bank Leumi Le-Israel BM . . . . . . . . . . . . . . . . . 0.6 916,982565,642 Bank of Ireland . . . . . . . . . . . . . . . . . . . . . . . . . 0.1 207,744
21,148 Bankinter S.A. . . . . . . . . . . . . . . . . . . . . . . . . . 0.1 150,377162,274 CaixaBank S.A. . . . . . . . . . . . . . . . . . . . . . . . . . 0.3 566,715
5,226 Danske Bank A/S . . . . . . . . . . . . . . . . . . . . . . . 0.1 140,96324,000 DBS Group Holdings, Ltd. . . . . . . . . . . . . . . . . 0.2 282,62210,065 Intesa Sanpaolo SpA . . . . . . . . . . . . . . . . . . . . . . — 30,99418,393 OTP Bank PLC . . . . . . . . . . . . . . . . . . . . . . . . . 0.2 381,33250,500 Public Bank Bhd . . . . . . . . . . . . . . . . . . . . . . . . 0.1 218,009
3,719 Qatar Islamic Bank SAQ . . . . . . . . . . . . . . . . . . 0.1 108,96211,088 Skandinaviska Enskilda
Banken A.B. – Class A . . . . . . . . . . . . . . . . . . 0.1 117,5106,607 Swedbank A.B. . . . . . . . . . . . . . . . . . . . . . . . . . 0.1 146,542
19,900 United Overseas Bank, Ltd. . . . . . . . . . . . . . . . 0.2 275,3402.9 4,593,804
Commercial Banks – Western U.S. 7,200 First Republic Bank . . . . . . . . . . . . . . . . . . . . . 0.3 475,632
Commercial Services 2,501 Aggreko PLC . . . . . . . . . . . . . . . . . . . . . . . . . . . — 33,6945,100 Aramark . . . . . . . . . . . . . . . . . . . . . . . . . . . . . . 0.1 164,475
900 CDK Global, Inc. . . . . . . . . . . . . . . . . . . . . . . . . — 42,7232,827 Intertek Group PLC . . . . . . . . . . . . . . . . . . . . . 0.1 115,718
25 SGS S.A. . . . . . . . . . . . . . . . . . . . . . . . . . . . . . . . — 47,7130.2 404,323
Commercial Services – Finance 5,700 Cielo S.A. . . . . . . . . . . . . . . . . . . . . . . . . . . . . . . — 48,410
Computer Aided Design 4,516 Dassault Systemes. . . . . . . . . . . . . . . . . . . . . . . 0.2 361,996
Computer Data Security 5,544 Gemalto N.V. . . . . . . . . . . . . . . . . . . . . . . . . . . 0.2 332,953
Computer Services 1,211 Atos S.E. . . . . . . . . . . . . . . . . . . . . . . . . . . . . . . 0.1 101,914
800 International Business Machines Corp. . . . . . . . . . . . . . . . . . . . . . . . . . . . . . . 0.1 110,096
4,900 Nomura Research Institute, Ltd. . . . . . . . . . . . . 0.1 190,4060.3 402,416
Computer Software 400 Constellation Software, Inc. . . . . . . . . . . . . . . . 0.1 166,788
Computers 9,000 Netapp, Inc. . . . . . . . . . . . . . . . . . . . . . . . . . . . 0.1 238,770
Computers – Integrated Systems 21,000 Fujitsu, Ltd. . . . . . . . . . . . . . . . . . . . . . . . . . . . 0.1 106,048
974 Ingenico Group S.A. . . . . . . . . . . . . . . . . . . . . . 0.1 123,298600 Otsuka Corp. . . . . . . . . . . . . . . . . . . . . . . . . . . . — 29,755
2,000 Teradata Corp. . . . . . . . . . . . . . . . . . . . . . . . . . . — 52,8400.2 311,941
Consulting Services 14,612 Bureau Veritas S.A. . . . . . . . . . . . . . . . . . . . . . . 0.2 291,985
2,800 Towers Watson & Co. – Class A . . . . . . . . . . . . 0.2 359,6882,800 Verisk Analytics, Inc. – Class A . . . . . . . . . . . . . 0.1 215,264
0.5 866,937
Consumer Products – Miscellaneous 5,800 Clorox Co. . . . . . . . . . . . . . . . . . . . . . . . . . . . . 0.5 735,6144,411 Husqvarna A.B. . . . . . . . . . . . . . . . . . . . . . . . . . — 29,283
12,300 Kimberly-Clark Corp. . . . . . . . . . . . . . . . . . . . . 1.0 1,565,790
Share or Principal Amount
Percentage of Net
Assets (%) Fair
Value (USD)
18,600 Kimberly-Clark de Mexico SAB de C.V. . . . . . . . . . . . . . . . . . . . . . . . . . . . . . . — 43,412
1.5 2,374,099
Containers – Metal and Glass 122,246 Rexam PLC . . . . . . . . . . . . . . . . . . . . . . . . . . . . 0.7 1,089,252
Containers – Paper and Plastic 3,400 Sealed Air Corp. . . . . . . . . . . . . . . . . . . . . . . . . 0.1 151,640
Cosmetics and Toiletries 12,600 Colgate-Palmolive Co. . . . . . . . . . . . . . . . . . . . 0.5 839,412
2,300 Estee Lauder Cos, Inc. – Class A . . . . . . . . . . . . 0.1 202,53817,400 Procter & Gamble Co. . . . . . . . . . . . . . . . . . . . 0.8 1,381,734
1.4 2,423,684
Cruise Lines 400 Royal Caribbean Cruises, Ltd. . . . . . . . . . . . . . . — 40,484
Data Processing and Management 800 Fidelity National Information
Services, Inc. . . . . . . . . . . . . . . . . . . . . . . . . . . — 48,480
Dental Supplies and Equipment 4,100 Patterson Cos, Inc. . . . . . . . . . . . . . . . . . . . . . . 0.1 185,361
Dialysis Centres 2,400 DaVita, Inc. . . . . . . . . . . . . . . . . . . . . . . . . . . . 0.1 167,3042,872 Fresenius Medical Care A.G. & Co.,
KGaA . . . . . . . . . . . . . . . . . . . . . . . . . . . . . . 0.1 242,5730.2 409,877
Disposable Medical Products 600 CR Bard, Inc. . . . . . . . . . . . . . . . . . . . . . . . . . . 0.1 113,664
Distribution/Wholesale 7,400 Fastenal Co. . . . . . . . . . . . . . . . . . . . . . . . . . . . 0.2 302,0682,000 WW Grainger, Inc. . . . . . . . . . . . . . . . . . . . . . . 0.2 405,180
0.4 707,248
Diversifi ed Banking Institutions 503,028 Lloyds Banking Group PLC . . . . . . . . . . . . . . . 0.3 541,787
85,393 Royal Bank of Scotland Group PLC . . . . . . . . . 0.2 380,1250.5 921,912
Diversifi ed Financial Services 23,200 Ally Financial, Inc. . . . . . . . . . . . . . . . . . . . . . . 0.3 432,448
4,541 Shinhan Financial Group Co., Ltd. . . . . . . . . . . 0.1 153,1990.4 585,647
Diversifi ed Minerals 18,000 Sumitomo Metal Mining Co., Ltd. . . . . . . . . . . 0.1 221,593
Diversifi ed Operations 819 CJ Corp. . . . . . . . . . . . . . . . . . . . . . . . . . . . . . . 0.1 175,354
E-Commerce/Services 15,200 Zillow Group, Inc. . . . . . . . . . . . . . . . . . . . . . . 0.2 356,896
Electric – Generation 25,730 CEZ A/S . . . . . . . . . . . . . . . . . . . . . . . . . . . . . . 0.3 460,09763,354 Enel Green Power SpA . . . . . . . . . . . . . . . . . . . 0.1 129,627
165,500 HK Electric Investments & HK Electric Investments, Ltd. (144A) . . . . . . . . . 0.1 138,810
0.5 728,534
Electric – Integrated 18,509 AGL Energy, Ltd. . . . . . . . . . . . . . . . . . . . . . . . 0.1 243,787
1,000 Alliant Energy Corp. . . . . . . . . . . . . . . . . . . . . . . — 62,4504,100 Ameren Corp. . . . . . . . . . . . . . . . . . . . . . . . . . . 0.1 177,2434,800 American Electric Power Co., Inc. . . . . . . . . . . 0.2 279,6962,300 Chubu Electric Power Co., Inc. . . . . . . . . . . . . . — 31,8177,700 CMS Energy Corp. . . . . . . . . . . . . . . . . . . . . . . 0.2 277,816
32,100 Consolidated Edison, Inc.. . . . . . . . . . . . . . . . . 1.3 2,063,0676,500 Dominion Resources, Inc. . . . . . . . . . . . . . . . . . 0.3 439,6602,700 DTE Energy Co. . . . . . . . . . . . . . . . . . . . . . . . . 0.1 216,513
21,400 Duke Energy Corp. . . . . . . . . . . . . . . . . . . . . . . 0.9 1,527,7464,600 Edison International . . . . . . . . . . . . . . . . . . . . . 0.2 272,366
20,431 Endesa S.A. . . . . . . . . . . . . . . . . . . . . . . . . . . . 0.3 411,261
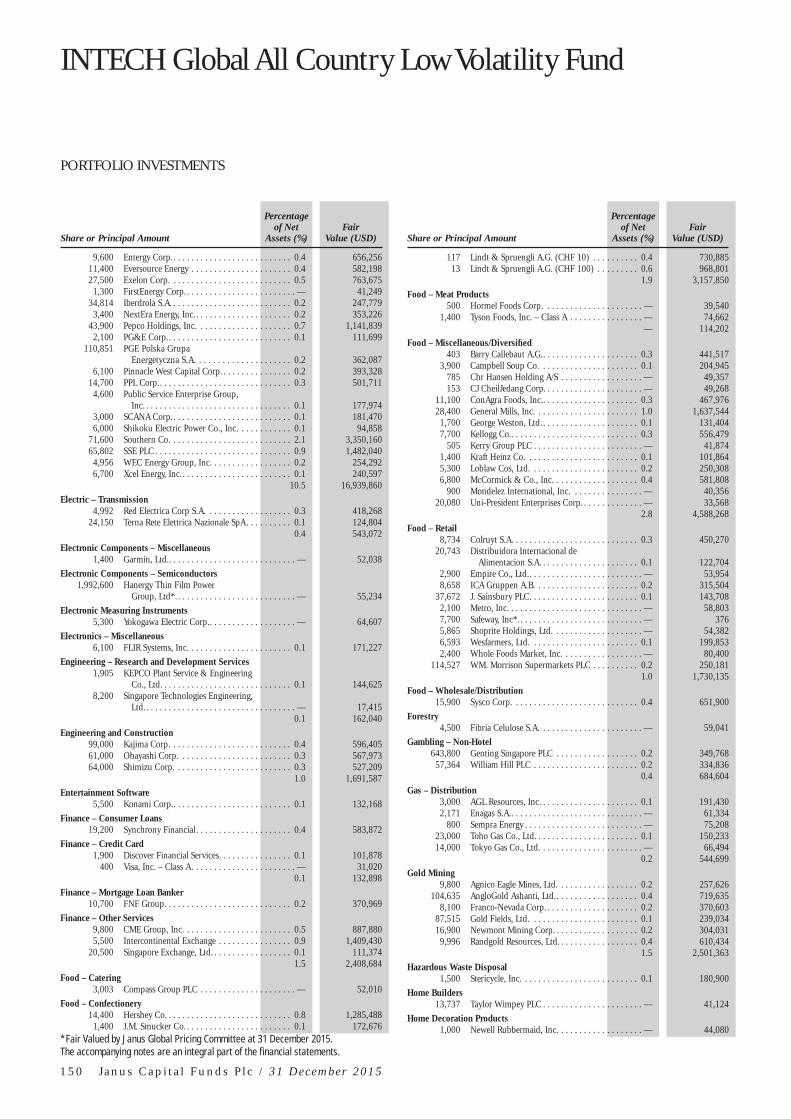
INTECH Global All Country Low Volatility Fund
PORTFOLIO INVESTMENTS
1 5 0 J a n u s C a p i t a l F u n d s P l c / 3 1 D e c e m b e r 2 0 1 5
*Fair Valued by Janus Global Pricing Committee at 31 December 2015.The accompanying notes are an integral part of the fi nancial statements.
Share or Principal Amount
Percentage of Net
Assets (%) Fair
Value (USD)
9,600 Entergy Corp. . . . . . . . . . . . . . . . . . . . . . . . . . . 0.4 656,25611,400 Eversource Energy . . . . . . . . . . . . . . . . . . . . . . 0.4 582,19827,500 Exelon Corp. . . . . . . . . . . . . . . . . . . . . . . . . . . 0.5 763,675
1,300 FirstEnergy Corp. . . . . . . . . . . . . . . . . . . . . . . . . — 41,24934,814 Iberdrola S.A. . . . . . . . . . . . . . . . . . . . . . . . . . . 0.2 247,779
3,400 NextEra Energy, Inc. . . . . . . . . . . . . . . . . . . . . . 0.2 353,22643,900 Pepco Holdings, Inc. . . . . . . . . . . . . . . . . . . . . 0.7 1,141,839
2,100 PG&E Corp. . . . . . . . . . . . . . . . . . . . . . . . . . . . 0.1 111,699110,851 PGE Polska Grupa
Energetyczna S.A. . . . . . . . . . . . . . . . . . . . . 0.2 362,0876,100 Pinnacle West Capital Corp. . . . . . . . . . . . . . . . 0.2 393,328
14,700 PPL Corp. . . . . . . . . . . . . . . . . . . . . . . . . . . . . . 0.3 501,7114,600 Public Service Enterprise Group,
Inc. . . . . . . . . . . . . . . . . . . . . . . . . . . . . . . . . 0.1 177,9743,000 SCANA Corp. . . . . . . . . . . . . . . . . . . . . . . . . . . 0.1 181,4706,000 Shikoku Electric Power Co., Inc. . . . . . . . . . . . 0.1 94,858
71,600 Southern Co. . . . . . . . . . . . . . . . . . . . . . . . . . . 2.1 3,350,16065,802 SSE PLC . . . . . . . . . . . . . . . . . . . . . . . . . . . . . . 0.9 1,482,040
4,956 WEC Energy Group, Inc. . . . . . . . . . . . . . . . . . 0.2 254,2926,700 Xcel Energy, Inc. . . . . . . . . . . . . . . . . . . . . . . . . 0.1 240,597
10.5 16,939,860
Electric – Transmission 4,992 Red Electrica Corp S.A. . . . . . . . . . . . . . . . . . . 0.3 418,268
24,150 Terna Rete Elettrica Nazionale SpA . . . . . . . . . . 0.1 124,8040.4 543,072
Electronic Components – Miscellaneous 1,400 Garmin, Ltd.. . . . . . . . . . . . . . . . . . . . . . . . . . . . — 52,038
Electronic Components – Semiconductors 1,992,600 Hanergy Thin Film Power
Group, Ltd *. . . . . . . . . . . . . . . . . . . . . . . . . . . — 55,234
Electronic Measuring Instruments 5,300 Yokogawa Electric Corp. . . . . . . . . . . . . . . . . . . . — 64,607
Electronics – Miscellaneous 6,100 FLIR Systems, Inc. . . . . . . . . . . . . . . . . . . . . . . 0.1 171,227
Engineering – Research and Development Services 1,905 KEPCO Plant Service & Engineering
Co., Ltd. . . . . . . . . . . . . . . . . . . . . . . . . . . . . 0.1 144,6258,200 Singapore Technologies Engineering,
Ltd. . . . . . . . . . . . . . . . . . . . . . . . . . . . . . . . . . — 17,4150.1 162,040
Engineering and Construction 99,000 Kajima Corp. . . . . . . . . . . . . . . . . . . . . . . . . . . 0.4 596,40561,000 Obayashi Corp. . . . . . . . . . . . . . . . . . . . . . . . . 0.3 567,97364,000 Shimizu Corp. . . . . . . . . . . . . . . . . . . . . . . . . . 0.3 527,209
1.0 1,691,587
Entertainment Software 5,500 Konami Corp.. . . . . . . . . . . . . . . . . . . . . . . . . . 0.1 132,168
Finance – Consumer Loans 19,200 Synchrony Financial . . . . . . . . . . . . . . . . . . . . . 0.4 583,872
Finance – Credit Card 1,900 Discover Financial Services. . . . . . . . . . . . . . . . 0.1 101,878
400 Visa, Inc. – Class A . . . . . . . . . . . . . . . . . . . . . . . — 31,0200.1 132,898
Finance – Mortgage Loan Banker 10,700 FNF Group . . . . . . . . . . . . . . . . . . . . . . . . . . . . 0.2 370,969
Finance – Other Services 9,800 CME Group, Inc. . . . . . . . . . . . . . . . . . . . . . . . 0.5 887,8805,500 Intercontinental Exchange . . . . . . . . . . . . . . . . 0.9 1,409,430
20,500 Singapore Exchange, Ltd. . . . . . . . . . . . . . . . . . 0.1 111,3741.5 2,408,684
Food – Catering 3,003 Compass Group PLC . . . . . . . . . . . . . . . . . . . . . — 52,010
Food – Confectionery 14,400 Hershey Co. . . . . . . . . . . . . . . . . . . . . . . . . . . . 0.8 1,285,488
1,400 J.M. Smucker Co. . . . . . . . . . . . . . . . . . . . . . . . 0.1 172,676
Share or Principal Amount
Percentage of Net
Assets (%) Fair
Value (USD)
117 Lindt & Spruengli A.G. (CHF 10) . . . . . . . . . . 0.4 730,88513 Lindt & Spruengli A.G. (CHF 100) . . . . . . . . . 0.6 968,801
1.9 3,157,850
Food – Meat Products 500 Hormel Foods Corp. . . . . . . . . . . . . . . . . . . . . . — 39,540
1,400 Tyson Foods, Inc. – Class A . . . . . . . . . . . . . . . . — 74,662— 114,202
Food – Miscellaneous/Diversifi ed 403 Barry Callebaut A.G. . . . . . . . . . . . . . . . . . . . . . 0.3 441,517
3,900 Campbell Soup Co. . . . . . . . . . . . . . . . . . . . . . 0.1 204,945785 Chr Hansen Holding A/S . . . . . . . . . . . . . . . . . . — 49,357153 CJ CheilJedang Corp. . . . . . . . . . . . . . . . . . . . . . — 49,268
11,100 ConAgra Foods, Inc.. . . . . . . . . . . . . . . . . . . . . 0.3 467,97628,400 General Mills, Inc. . . . . . . . . . . . . . . . . . . . . . . 1.0 1,637,544
1,700 George Weston, Ltd. . . . . . . . . . . . . . . . . . . . . . 0.1 131,4047,700 Kellogg Co.. . . . . . . . . . . . . . . . . . . . . . . . . . . . 0.3 556,479
505 Kerry Group PLC . . . . . . . . . . . . . . . . . . . . . . . . — 41,8741,400 Kraft Heinz Co. . . . . . . . . . . . . . . . . . . . . . . . . 0.1 101,8645,300 Loblaw Cos, Ltd. . . . . . . . . . . . . . . . . . . . . . . . 0.2 250,3086,800 McCormick & Co., Inc. . . . . . . . . . . . . . . . . . . 0.4 581,808
900 Mondelez International, Inc. . . . . . . . . . . . . . . . — 40,35620,080 Uni-President Enterprises Corp. . . . . . . . . . . . . . — 33,568
2.8 4,588,268
Food – Retail 8,734 Colruyt S.A. . . . . . . . . . . . . . . . . . . . . . . . . . . . 0.3 450,270
20,743 Distribuidora Internacional de Alimentacion S.A. . . . . . . . . . . . . . . . . . . . . . 0.1 122,704
2,900 Empire Co., Ltd. . . . . . . . . . . . . . . . . . . . . . . . . . — 53,9548,658 ICA Gruppen A.B. . . . . . . . . . . . . . . . . . . . . . . 0.2 315,504
37,672 J. Sainsbury PLC . . . . . . . . . . . . . . . . . . . . . . . . 0.1 143,7082,100 Metro, Inc. . . . . . . . . . . . . . . . . . . . . . . . . . . . . . — 58,8037,700 Safeway, Inc *. . . . . . . . . . . . . . . . . . . . . . . . . . . . — 3765,865 Shoprite Holdings, Ltd. . . . . . . . . . . . . . . . . . . . — 54,3826,593 Wesfarmers, Ltd. . . . . . . . . . . . . . . . . . . . . . . . 0.1 199,8532,400 Whole Foods Market, Inc. . . . . . . . . . . . . . . . . . — 80,400
114,527 WM. Morrison Supermarkets PLC . . . . . . . . . . 0.2 250,1811.0 1,730,135
Food – Wholesale/Distribution 15,900 Sysco Corp. . . . . . . . . . . . . . . . . . . . . . . . . . . . 0.4 651,900
Forestry 4,500 Fibria Celulose S.A. . . . . . . . . . . . . . . . . . . . . . . — 59,041
Gambling – Non-Hotel 643,800 Genting Singapore PLC . . . . . . . . . . . . . . . . . . 0.2 349,768
57,364 William Hill PLC . . . . . . . . . . . . . . . . . . . . . . . 0.2 334,8360.4 684,604
Gas – Distribution 3,000 AGL Resources, Inc. . . . . . . . . . . . . . . . . . . . . . 0.1 191,4302,171 Enagas S.A. . . . . . . . . . . . . . . . . . . . . . . . . . . . . . — 61,334
800 Sempra Energy . . . . . . . . . . . . . . . . . . . . . . . . . . — 75,20823,000 Toho Gas Co., Ltd. . . . . . . . . . . . . . . . . . . . . . . 0.1 150,23314,000 Tokyo Gas Co., Ltd. . . . . . . . . . . . . . . . . . . . . . . — 66,494
0.2 544,699
Gold Mining 9,800 Agnico Eagle Mines, Ltd. . . . . . . . . . . . . . . . . . 0.2 257,626
104,635 AngloGold Ashanti, Ltd. . . . . . . . . . . . . . . . . . . 0.4 719,6358,100 Franco-Nevada Corp. . . . . . . . . . . . . . . . . . . . . 0.2 370,603
87,515 Gold Fields, Ltd. . . . . . . . . . . . . . . . . . . . . . . . 0.1 239,03416,900 Newmont Mining Corp. . . . . . . . . . . . . . . . . . . 0.2 304,031
9,996 Randgold Resources, Ltd. . . . . . . . . . . . . . . . . . 0.4 610,4341.5 2,501,363
Hazardous Waste Disposal 1,500 Stericycle, Inc. . . . . . . . . . . . . . . . . . . . . . . . . . 0.1 180,900
Home Builders 13,737 Taylor Wimpey PLC . . . . . . . . . . . . . . . . . . . . . . — 41,124
Home Decoration Products 1,000 Newell Rubbermaid, Inc. . . . . . . . . . . . . . . . . . . — 44,080

PORTFOLIO INVESTMENTS
The accompanying notes are an integral part of the fi nancial statements.
J a n u s C a p i t a l F u n d s P l c / 3 1 D e c e m b e r 2 0 1 5 1 5 1
Share or Principal Amount
Percentage of Net
Assets (%) Fair
Value (USD)
Home Furnishings 283 Hanssem Co., Ltd. . . . . . . . . . . . . . . . . . . . . . . . — 55,885700 Hoshizaki Electric Co., Ltd. . . . . . . . . . . . . . . . . — 44,034
1,200 Leggett & Platt, Inc. . . . . . . . . . . . . . . . . . . . . . . — 50,4241,000 Whirlpool Corp. . . . . . . . . . . . . . . . . . . . . . . . . 0.1 146,870
0.1 297,213
Hotels and Motels 1,194 Whitbread PLC . . . . . . . . . . . . . . . . . . . . . . . . . — 77,456
Human Resources 846 Adecco S.A. . . . . . . . . . . . . . . . . . . . . . . . . . . . . — 58,214
15,484 Capita PLC . . . . . . . . . . . . . . . . . . . . . . . . . . . . 0.2 275,7072,800 Recruit Holdings Co., Ltd. . . . . . . . . . . . . . . . . 0.1 82,942
0.3 416,863
Import and Export 20,700 ITOCHU Corp. . . . . . . . . . . . . . . . . . . . . . . . . 0.2 248,372
3,000 Mitsubishi Corp. . . . . . . . . . . . . . . . . . . . . . . . . — 50,62416,500 Mitsui & Co., Ltd. . . . . . . . . . . . . . . . . . . . . . . 0.1 198,45911,400 Sumitomo Corp. . . . . . . . . . . . . . . . . . . . . . . . . 0.1 117,671
0.4 615,126
Industrial Gases 1,800 Praxair, Inc. . . . . . . . . . . . . . . . . . . . . . . . . . . . 0.1 184,320
Insurance 54,831 Direct Line Insurance Group PLC . . . . . . . . . . . 0.2 329,345
6,361 NN Group N.V.. . . . . . . . . . . . . . . . . . . . . . . . . 0.1 224,98120,540 Powszechny Zaklad
Ubezpieczen S.A. . . . . . . . . . . . . . . . . . . . . . 0.1 178,45815,261 QBE Insurance Group, Ltd. . . . . . . . . . . . . . . . 0.1 139,971
7,600 Renaissancere Holdings, Ltd. . . . . . . . . . . . . . . 0.5 860,244866 Swiss Life Holding A.G. . . . . . . . . . . . . . . . . . . 0.1 234,641
12,897 Tryg A/S . . . . . . . . . . . . . . . . . . . . . . . . . . . . . . 0.2 258,0901.3 2,225,730
Insurance Brokers 4,900 Willis Group Holdings PLC . . . . . . . . . . . . . . . 0.1 237,993
Internet Content – Entertainment 1,272 NCSoft Corp. . . . . . . . . . . . . . . . . . . . . . . . . . . 0.1 231,114
Internet Content – Information/News 700 LinkedIn Corp. . . . . . . . . . . . . . . . . . . . . . . . . . 0.1 157,556
Internet Infrastructure Software 2,000 F5 Networks, Inc.. . . . . . . . . . . . . . . . . . . . . . . 0.1 193,920
Internet Security 4,900 Symantec Corp. . . . . . . . . . . . . . . . . . . . . . . . . 0.1 102,9004,300 Trend Micro, Inc. . . . . . . . . . . . . . . . . . . . . . . . 0.1 176,394
0.2 279,294
Investment Companies 37,651 Melrose Industries PLC. . . . . . . . . . . . . . . . . . . 0.1 161,442
586 Pargesa Holding S.A. . . . . . . . . . . . . . . . . . . . . . — 37,1630.1 198,605
Life and Health Insurance 16,605 Challenger Australia, Ltd. . . . . . . . . . . . . . . . . . 0.1 105,484
Lighting Products& Systems 400 Acuity Brands, Inc. . . . . . . . . . . . . . . . . . . . . . . 0.1 93,520
Machine Tools and Related Products 98,500 Techtronic Industries Co., Ltd. . . . . . . . . . . . . . 0.2 401,637
Machinery – Construction and Mining 1,200 Caterpillar, Inc. . . . . . . . . . . . . . . . . . . . . . . . . 0.1 81,552
Machinery – Electrical 2,009 Schindler Holding A.G. . . . . . . . . . . . . . . . . . . 0.2 338,452
Machinery – Farm 2,700 AGCO Corp. . . . . . . . . . . . . . . . . . . . . . . . . . . 0.1 122,5539,700 Deere & Co. . . . . . . . . . . . . . . . . . . . . . . . . . . . 0.5 739,819
0.6 862,372
Machinery – General Industrial 13,791 Alstom S.A. . . . . . . . . . . . . . . . . . . . . . . . . . . . 0.3 422,061
6,407 MAN S.E. . . . . . . . . . . . . . . . . . . . . . . . . . . . . . 0.4 645,363
Share or Principal Amount
Percentage of Net
Assets (%) Fair
Value (USD)
20,000 Mitsubishi Heavy Industries, Ltd. . . . . . . . . . . . 0.1 88,75019,400 WEG S.A. . . . . . . . . . . . . . . . . . . . . . . . . . . . . . . — 73,333
0.8 1,229,507
Machinery – Pumps 2,800 Xylem, Inc. . . . . . . . . . . . . . . . . . . . . . . . . . . . . 0.1 102,200
Media 1,200 Lagardere SCA . . . . . . . . . . . . . . . . . . . . . . . . . . — 35,8711,527 RTL Group S.A. . . . . . . . . . . . . . . . . . . . . . . . . 0.1 127,844
0.1 163,715
Medical – Biomedical and Genetic 600 BioMarin Pharmaceutical, Inc. . . . . . . . . . . . . . . — 62,856
1,600 Illumina, Inc. . . . . . . . . . . . . . . . . . . . . . . . . . . 0.2 307,1121,100 United Therapeutics Corp. . . . . . . . . . . . . . . . . 0.1 172,271
0.3 542,239
Medical – Drugs 3,803 Actelion, Ltd. . . . . . . . . . . . . . . . . . . . . . . . . . . 0.3 530,2102,600 Astellas Pharma, Inc. . . . . . . . . . . . . . . . . . . . . . — 37,460
800 Bristol-Myers Squibb Co. . . . . . . . . . . . . . . . . . . — 55,0321,300 Eli Lilly & Co. . . . . . . . . . . . . . . . . . . . . . . . . . 0.1 109,538
204 Hanmi Pharm Co., Ltd. . . . . . . . . . . . . . . . . . . 0.1 126,68410,000 Johnson & Johnson . . . . . . . . . . . . . . . . . . . . . 0.6 1,027,200
3,000 Kyowa Hakko Kirin Co., Ltd. . . . . . . . . . . . . . . . — 47,8032,368 Orion Oyj . . . . . . . . . . . . . . . . . . . . . . . . . . . . . 0.1 82,2612,100 Quintiles Transnational Holdings,
Inc. . . . . . . . . . . . . . . . . . . . . . . . . . . . . . . . . 0.1 144,1866,605 Richter Gedeon Nyrt . . . . . . . . . . . . . . . . . . . . 0.1 125,481
182 Roche Holding A.G. . . . . . . . . . . . . . . . . . . . . . . — 50,2403,300 Takeda Pharmaceutical Co., Ltd. . . . . . . . . . . . 0.1 166,5381,331 UCB S.A. . . . . . . . . . . . . . . . . . . . . . . . . . . . . . 0.1 120,373
1.6 2,623,006
Medical – Generic Drugs 1,169 Teva Pharmaceutical Industries, Ltd. . . . . . . . . . — 76,481
Medical – HMO 1,300 Aetna, Inc. . . . . . . . . . . . . . . . . . . . . . . . . . . . . 0.1 140,5561,100 Anthem, Inc. . . . . . . . . . . . . . . . . . . . . . . . . . . 0.1 153,384
800 Cigna Corp. . . . . . . . . . . . . . . . . . . . . . . . . . . . 0.1 117,064800 Humana, Inc. . . . . . . . . . . . . . . . . . . . . . . . . . . 0.1 142,808
0.4 553,812
Medical – Hospitals 72,500 Bumrungrad Hospital PCL . . . . . . . . . . . . . . . . 0.3 425,286
4,200 HCA Holdings, Inc. . . . . . . . . . . . . . . . . . . . . . 0.2 284,0461,400 Universal Health Services, Inc. . . . . . . . . . . . . . 0.1 167,286
0.6 876,618
Medical – Wholesale Drug Distributors 1,600 AmerisourceBergen Corp. . . . . . . . . . . . . . . . . . 0.1 165,9362,300 Cardinal Health, Inc. . . . . . . . . . . . . . . . . . . . . 0.1 205,321
85 Galenica A.G. . . . . . . . . . . . . . . . . . . . . . . . . . . 0.1 133,6160.3 504,873
Medical Instruments 5,400 Edwards Lifesciences Corp. . . . . . . . . . . . . . . . 0.3 426,492
400 Intuitive Surgical, Inc. . . . . . . . . . . . . . . . . . . . 0.1 218,4641,600 St. Jude Medical, Inc. . . . . . . . . . . . . . . . . . . . . 0.1 98,832
0.5 743,788
Medical Labs and Testing Services 800 Laboratory Corp. of America
Holdings . . . . . . . . . . . . . . . . . . . . . . . . . . . . 0.1 98,912
Medical Products 2,700 Baxter International, Inc. . . . . . . . . . . . . . . . . . 0.1 103,0051,000 Becton Dickinson and Co. . . . . . . . . . . . . . . . . 0.1 154,0901,156 Cochlear, Ltd. . . . . . . . . . . . . . . . . . . . . . . . . . . . — 80,492
700 Cooper Cos, Inc. . . . . . . . . . . . . . . . . . . . . . . . 0.1 93,940800 Stryker Corp. . . . . . . . . . . . . . . . . . . . . . . . . . . . — 74,352
2,100 Terumo Corp. . . . . . . . . . . . . . . . . . . . . . . . . . . . — 66,0512,092 William Demant Holding A/S . . . . . . . . . . . . . . 0.1 200,1812,500 Zimmer Holdings, Inc. . . . . . . . . . . . . . . . . . . . 0.2 256,475
0.6 1,028,586

INTECH Global All Country Low Volatility Fund
PORTFOLIO INVESTMENTS
The accompanying notes are an integral part of the fi nancial statements.
1 5 2 J a n u s C a p i t a l F u n d s P l c / 3 1 D e c e m b e r 2 0 1 5
Share or Principal Amount
Percentage of Net
Assets (%) Fair
Value (USD)
Metal – Copper 3,464 Antofagasta PLC . . . . . . . . . . . . . . . . . . . . . . . . . — 23,962
Metal Processors and Fabrication 4,400 NSK, Ltd. . . . . . . . . . . . . . . . . . . . . . . . . . . . . . . — 48,5474,400 Precision Castparts Corp. . . . . . . . . . . . . . . . . . 0.6 1,020,844
0.6 1,069,391
Mining Services 28,505 Orica, Ltd. . . . . . . . . . . . . . . . . . . . . . . . . . . . . 0.2 321,871
Miscellaneous Manufacturing 3,363 Sulzer A.G. . . . . . . . . . . . . . . . . . . . . . . . . . . . . 0.2 316,887
Motorcycle and Motor Scooter Manufacturing 700 Harley-Davidson, Inc.. . . . . . . . . . . . . . . . . . . . . — 31,773
MRI/Medical Diagnostic Imaging 28,540 Sonic Healthcare, Ltd. . . . . . . . . . . . . . . . . . . . 0.2 371,542
Multi-Line Insurance 8,563 Ageas . . . . . . . . . . . . . . . . . . . . . . . . . . . . . . . . 0.2 398,235
500 Assurant, Inc. . . . . . . . . . . . . . . . . . . . . . . . . . . . — 40,270697 Baloise Holding A.G. . . . . . . . . . . . . . . . . . . . . 0.1 88,822
0.3 527,327
Non – Ferrous Metals 809 Korea Zinc Co., Ltd. . . . . . . . . . . . . . . . . . . . . . 0.2 323,654
Non-Hazardous Waste Disposal 7,900 Republic Services, Inc. . . . . . . . . . . . . . . . . . . . 0.2 347,5211,700 Waste Management, Inc.. . . . . . . . . . . . . . . . . . 0.1 90,729
0.3 438,250
Offi ce Automation and Equipment 11,900 Ricoh Co., Ltd. . . . . . . . . . . . . . . . . . . . . . . . . . 0.1 123,872
Oil – Field Services 100 Core Laboratories N.V. . . . . . . . . . . . . . . . . . . . . — 10,874
Oil Companies – Exploration and Production 7,100 EQT Corp. . . . . . . . . . . . . . . . . . . . . . . . . . . . . 0.2 370,123
10,001 GS Holdings Corp. . . . . . . . . . . . . . . . . . . . . . . 0.3 432,5243,368 Lundin Petroleum A.B. . . . . . . . . . . . . . . . . . . . . — 48,949
10,400 Range Resources Corp. . . . . . . . . . . . . . . . . . . . 0.2 255,9440.7 1,107,540
Oil Companies – Integrated 2,826 MOL Hungarian Oil & Gas PLC . . . . . . . . . . . . 0.1 139,200
404,081 Polskie Gornictwo Naftowe i Gazownictwo S.A. . . . . . . . . . . . . . . . . . . . . . 0.3 530,437
0.4 669,637
Oil Refi ning and Marketing 91,600 JX Holdings, Inc. . . . . . . . . . . . . . . . . . . . . . . . 0.2 387,497
2,856 Neste Oil Oyj . . . . . . . . . . . . . . . . . . . . . . . . . . 0.1 85,74550,663 Polski Koncern Naftowy
ORLEN S.A. . . . . . . . . . . . . . . . . . . . . . . . . . 0.5 877,89637,000 TonenGeneral Sekiyu KK . . . . . . . . . . . . . . . . . 0.2 314,645
1.0 1,665,783
Paper and Related Products 45,000 Klabin S.A. . . . . . . . . . . . . . . . . . . . . . . . . . . . . 0.2 266,81557,000 Oji Holdings Corp. . . . . . . . . . . . . . . . . . . . . . . 0.1 231,927
0.3 498,742
Pharmaceuticals 1,800 Alfresa Holdings Corp. . . . . . . . . . . . . . . . . . . . . — 36,021
Pharmacy Services 2,300 Express Scripts Holding Co. . . . . . . . . . . . . . . . 0.1 201,043
Physical Practice Management 4,100 Envision Healthcare Holdings, Inc.. . . . . . . . . . 0.1 106,477
Private Equity 3,100 Onex Corp. . . . . . . . . . . . . . . . . . . . . . . . . . . . 0.1 190,056
Property and Casualty Insurance 22,343 Admiral Group PLC . . . . . . . . . . . . . . . . . . . . . 0.3 546,368
8,500 Arch Capital Group, Ltd. . . . . . . . . . . . . . . . . . 0.4 592,8753,100 Chubb Corp. . . . . . . . . . . . . . . . . . . . . . . . . . . 0.3 411,184
Share or Principal Amount
Percentage of Net
Assets (%) Fair
Value (USD)
1,100 Fairfax Financial Holdings, Ltd. . . . . . . . . . . . . 0.3 522,29915,700 Intact Financial Corp. . . . . . . . . . . . . . . . . . . . . 0.6 1,006,34312,365 RSA Insurance Group PLC . . . . . . . . . . . . . . . . . — 77,734
1,218 Samsung Fire & Marine Insurance Co., Ltd. . . . . . . . . . . . . . . . . . . . . . . . . . . . . 0.2 319,486
4,400 WR Berkley Corp. . . . . . . . . . . . . . . . . . . . . . . 0.1 240,9002.2 3,717,189
Public Thoroughfares 10,519 Transurban Group . . . . . . . . . . . . . . . . . . . . . . . — 80,233
Publishing – Newspapers 198,000 Singapore Press Holdings, Ltd. . . . . . . . . . . . . . 0.3 550,427
Publishing – Periodicals 3,070 Axel Springer S.E.. . . . . . . . . . . . . . . . . . . . . . . 0.1 171,263
Real Estate 16,000 Swire Properties, Ltd. . . . . . . . . . . . . . . . . . . . . . — 46,247
Real Estate Management/Services 8,620 New Europe Property Investments
PLC. . . . . . . . . . . . . . . . . . . . . . . . . . . . . . . . 0.1 99,2042,300 Realogy Holdings Corp. . . . . . . . . . . . . . . . . . . 0.1 84,341
10,840 Swiss Prime Site A.G. . . . . . . . . . . . . . . . . . . . . 0.5 849,8350.7 1,033,380
Real Estate Operating/Development 2,800 Nomura Real Estate Holdings, Inc. . . . . . . . . . . . — 52,538
Reinsurance 15,300 Axis Capital Holdings, Ltd. . . . . . . . . . . . . . . . . 0.5 860,166
3,600 Everest Re Group, Ltd. . . . . . . . . . . . . . . . . . . . 0.4 659,124336 Muenchener Rueckversicherungs
A.G. . . . . . . . . . . . . . . . . . . . . . . . . . . . . . . . . — 67,3797,100 PartnerRe, Ltd. . . . . . . . . . . . . . . . . . . . . . . . . . 0.6 992,154
641 Swiss Re A.G. . . . . . . . . . . . . . . . . . . . . . . . . . . . — 62,8321.5 2,641,655
REIT – Apartments 3,100 AvalonBay Communities, Inc. . . . . . . . . . . . . . . 0.4 570,8031,400 Camden Property Trust . . . . . . . . . . . . . . . . . . 0.1 107,464
800 Equity Residential. . . . . . . . . . . . . . . . . . . . . . . . — 65,272400 Essex Property Trust, Inc. . . . . . . . . . . . . . . . . . 0.1 95,764
5,700 UDR, Inc. . . . . . . . . . . . . . . . . . . . . . . . . . . . . . 0.1 214,1490.7 1,053,452
REIT – Diversifi ed 178,100 Ascendas Real Estate Investment
Trust . . . . . . . . . . . . . . . . . . . . . . . . . . . . . . . 0.2 286,5086,678 Ascendas Real Estate Investment
Trust – Rights . . . . . . . . . . . . . . . . . . . . . . . . . — 2923,200 Digital Realty Trust, Inc. . . . . . . . . . . . . . . . . . . 0.1 241,984
152 Nomura Real Estate Master Fund, Inc. . . . . . . . . . . . . . . . . . . . . . . . . . . . . . . . . 0.1 188,957
11,100 Plum Creek Timber Co., Inc. . . . . . . . . . . . . . . 0.3 529,69239,577 Stockland . . . . . . . . . . . . . . . . . . . . . . . . . . . . . 0.1 118,211
400 United Urban Investment Corp. . . . . . . . . . . . . 0.3 545,8481.1 1,911,492
REIT – Health Care 14,500 HCP, Inc. . . . . . . . . . . . . . . . . . . . . . . . . . . . . . 0.3 554,48010,400 Ventas, Inc. . . . . . . . . . . . . . . . . . . . . . . . . . . . . 0.4 586,87210,500 Welltower, Inc. . . . . . . . . . . . . . . . . . . . . . . . . . 0.4 714,315
1.1 1,855,667
REIT – Mortgage 25,800 American Capital Agency Corp. . . . . . . . . . . . . 0.3 447,372
157,900 Annaly Capital Management, Inc. . . . . . . . . . . . 0.9 1,481,1021.2 1,928,474
REIT – Offi ce Property 149 Japan Prime Realty Investment Corp. . . . . . . . . 0.3 512,040194 Japan Real Estate Investment Corp. . . . . . . . . . 0.6 947,562
40 Nippon Building Fund, Inc. . . . . . . . . . . . . . . . 0.1 192,0451.0 1,651,647

PORTFOLIO INVESTMENTS
J a n u s C a p i t a l F u n d s P l c / 3 1 D e c e m b e r 2 0 1 5 1 5 3
*Fair Valued by Janus Global Pricing Committee at 31 December 2015.The accompanying notes are an integral part of the fi nancial statements.
Share or Principal Amount
Percentage of Net
Assets (%) Fair
Value (USD)
REIT – Regional Malls 4,800 Macerich Co. . . . . . . . . . . . . . . . . . . . . . . . . . . 0.2 387,312
900 Simon Property Group, Inc. . . . . . . . . . . . . . . . 0.1 174,9960.3 562,308
REIT – Shopping Centres 3,700 Brixmor Property Group, Inc. . . . . . . . . . . . . . . 0.1 95,534
113,900 CapitaMall Trust . . . . . . . . . . . . . . . . . . . . . . . . 0.1 155,1031,700 Federal Realty Investment Trust . . . . . . . . . . . . 0.2 248,370
519 Japan Retail Fund Investment Corp. . . . . . . . . . 0.6 1,002,76128,000 Link REIT . . . . . . . . . . . . . . . . . . . . . . . . . . . . . 0.1 167,644
2,200 RioCan Real Estate Investment Trust . . . . . . . . . . — 37,671169,473 Vicinity Centres . . . . . . . . . . . . . . . . . . . . . . . . 0.2 345,691
1.3 2,052,774
REIT – Storage 900 Extra Space Storage, Inc. . . . . . . . . . . . . . . . . . . — 79,389
1,000 Public Storage . . . . . . . . . . . . . . . . . . . . . . . . . 0.2 247,7000.2 327,089
REIT – Warehouse and Industrial 146 Nippon Prologis REIT, Inc. . . . . . . . . . . . . . . . . 0.2 265,443
REITS – Single Tenant 19,500 Realty Income Corp. . . . . . . . . . . . . . . . . . . . . . 0.6 1,006,785
Rental – Auto/Equipment 1,275 Ashtead Group PLC . . . . . . . . . . . . . . . . . . . . . . — 21,030
Retail – Apparel and Shoe 200 Fast Retailing Co., Ltd. . . . . . . . . . . . . . . . . . . . . — 70,960
3,700 Gap, Inc. . . . . . . . . . . . . . . . . . . . . . . . . . . . . . 0.1 91,3902,400 L Brands, Inc. . . . . . . . . . . . . . . . . . . . . . . . . . . 0.1 229,968
85,000 Lojas Renner S.A. . . . . . . . . . . . . . . . . . . . . . . . 0.2 367,5108,427 Next PLC . . . . . . . . . . . . . . . . . . . . . . . . . . . . . 0.6 905,520
80,094 Truworths International, Ltd. . . . . . . . . . . . . . . 0.3 472,5221.3 2,137,870
Retail – Auto Parts 3,000 Advance Auto Parts, Inc. . . . . . . . . . . . . . . . . . 0.3 451,5301,800 AutoZone, Inc. . . . . . . . . . . . . . . . . . . . . . . . . . 0.8 1,335,438
100 O’Reilly Automotive, Inc. . . . . . . . . . . . . . . . . . . — 25,3421.1 1,812,310
Retail – Building Products 5,274 Kingfi sher PLC . . . . . . . . . . . . . . . . . . . . . . . . . . — 25,615
14,260 Travis Perkins PLC . . . . . . . . . . . . . . . . . . . . . . 0.3 414,7100.3 440,325
Retail – Consumer Electronics 34,436 Dixons Carphone PLC . . . . . . . . . . . . . . . . . . . 0.2 253,793
Retail – Convenience Store 3,000 FamilyMart Co., Ltd. . . . . . . . . . . . . . . . . . . . . 0.1 140,7898,800 Lawson, Inc. . . . . . . . . . . . . . . . . . . . . . . . . . . . 0.4 721,2517,700 Safeway Casa* . . . . . . . . . . . . . . . . . . . . . . . . . . — 7,815
0.5 869,855
Retail – Discount 5,679 Dollar Tree, Inc. . . . . . . . . . . . . . . . . . . . . . . . . 0.3 438,5323,400 Dollarama, Inc. . . . . . . . . . . . . . . . . . . . . . . . . . 0.1 196,4551,500 Don Quijote Holdings Co., Ltd. . . . . . . . . . . . . . — 53,3573,300 Target Corp. . . . . . . . . . . . . . . . . . . . . . . . . . . . 0.1 239,613
23,200 Wal-Mart Stores, Inc. . . . . . . . . . . . . . . . . . . . . 0.9 1,422,1601.4 2,350,117
Retail – Home Furnishings 700 Nitori Holdings Co., Ltd. . . . . . . . . . . . . . . . . . . — 59,586
Retail – Jewellery 50,600 Citizen Holdings Co., Ltd. . . . . . . . . . . . . . . . . 0.2 367,985
1,095 Pandora A/S . . . . . . . . . . . . . . . . . . . . . . . . . . . 0.1 139,0680.3 507,053
Retail – Major Department Stores 3,200 Nordstrom, Inc. . . . . . . . . . . . . . . . . . . . . . . . . 0.1 159,3925,900 TJX Cos., Inc. . . . . . . . . . . . . . . . . . . . . . . . . . . 0.3 418,369
0.4 577,761
Share or Principal Amount
Percentage of Net
Assets (%) Fair
Value (USD)
Retail – Miscellaneous 1,000 Alimentation Couche-Tard, Inc. . . . . . . . . . . . . . — 44,0262,300 Bed Bath & Beyond, Inc. . . . . . . . . . . . . . . . . . 0.1 110,975
900 Canadian Tire Corp., Ltd. . . . . . . . . . . . . . . . . . . — 76,8663,000 CVS Caremark Corp. . . . . . . . . . . . . . . . . . . . . 0.2 293,3105,900 Darden Restaurants, Inc. . . . . . . . . . . . . . . . . . 0.2 375,476
19,000 Dollar General Corp. . . . . . . . . . . . . . . . . . . . . 0.8 1,365,5303,700 Foot Locker, Inc. . . . . . . . . . . . . . . . . . . . . . . . 0.1 240,8331,900 PVH Corp. . . . . . . . . . . . . . . . . . . . . . . . . . . . . 0.1 139,935
10,200 Raia Drogasil S.A. . . . . . . . . . . . . . . . . . . . . . . . 0.1 91,5044,100 Signet Jewelers, Ltd. . . . . . . . . . . . . . . . . . . . . . 0.3 507,129
60,772 Sports Direct International PLC . . . . . . . . . . . . 0.3 516,8652.2 3,762,449
Retail – Miscellaneous and Diversifi ed 164,000 China Resources Enterprise, Ltd. . . . . . . . . . . . 0.2 351,288
24,454 Foschini Group, Ltd. . . . . . . . . . . . . . . . . . . . . 0.1 192,7490.3 544,037
Retail – Offi ce Supplies 74,600 Staples, Inc. . . . . . . . . . . . . . . . . . . . . . . . . . . . 0.4 706,462
Retail – Perfume and Cosmetics 3,500 Ulta Salon Cosmetics & Fragrance,
Inc. . . . . . . . . . . . . . . . . . . . . . . . . . . . . . . . . 0.4 647,500
Retail – Restaurants 400 Chipotle Mexican Grill, Inc. . . . . . . . . . . . . . . . 0.1 191,940
18,800 McDonald’s Corp. . . . . . . . . . . . . . . . . . . . . . . . 1. 5 2,221,0321. 6 2,412,972
Retirement / Aged Care 41,210 Ryman Healthcare, Ltd. . . . . . . . . . . . . . . . . . . 0.1 239,490
Rubber – Tires 1,194 Cie Generale des Etablissements
Michelin . . . . . . . . . . . . . . . . . . . . . . . . . . . . 0.1 114,042
Satellite Telecommunications 3,844 Eutelsat Communications S.A. . . . . . . . . . . . . . 0.1 115,2822,559 Inmarsat PLC . . . . . . . . . . . . . . . . . . . . . . . . . . . — 42,887
0.1 158,169
Savings/Loans/Thrifts – Eastern U.S. 40,800 New York Community Bancorp,
Inc. . . . . . . . . . . . . . . . . . . . . . . . . . . . . . . . . 0.5 665,85634,400 People’s United Financial, Inc. . . . . . . . . . . . . . 0.3 555,560
0.8 1,221,416
Security Services 220,201 G4S PLC. . . . . . . . . . . . . . . . . . . . . . . . . . . . . . 0.5 731,920
Semiconductors 82,000 Siliconware Precision Industries Co.,
Ltd. . . . . . . . . . . . . . . . . . . . . . . . . . . . . . . . . 0.1 130,588
Silver Mining 24,971 Fresnillo PLC . . . . . . . . . . . . . . . . . . . . . . . . . . 0.2 260,595
Soap and Cleaning Preparations 3,300 Church & Dwight Co., Inc. . . . . . . . . . . . . . . . 0.2 280,104
Software Tools 3,000 VMware, Inc. – Class A . . . . . . . . . . . . . . . . . . 0.1 169,710
Steel – Producers 28,647 Severstal PAO . . . . . . . . . . . . . . . . . . . . . . . . . . 0.1 239,632
Telecommunication Equipment 4,530 NICE Systems, Ltd. . . . . . . . . . . . . . . . . . . . . . 0.2 261,435
Telecommunication Services 510,000 Chunghwa Telecom Co., Ltd. . . . . . . . . . . . . . . 0.9 1,538,973284,600 DiGi.Com Bhd . . . . . . . . . . . . . . . . . . . . . . . . . 0.2 358,237365,000 HKT Trust & HKT, Ltd. – Rights . . . . . . . . . . . 0.3 466,272102,200 Singapore Telecommunications, Ltd. . . . . . . . . . 0.2 264,640213,765 Spark New Zealand, Ltd. . . . . . . . . . . . . . . . . . 0.3 482,299
6,719 Telenet Group Holding N.V. . . . . . . . . . . . . . . . 0.2 363,3642.1 3,473,785

INTECH Global All Country Low Volatility Fund
PORTFOLIO INVESTMENTS
The accompanying notes are an integral part of the fi nancial statements.
1 5 4 J a n u s C a p i t a l F u n d s P l c / 3 1 D e c e m b e r 2 0 1 5
Share or Principal Amount
Percentage of Net
Assets (%) Fair
Value (USD)
Telecommunications 500 Palo Alto Networks, Inc. . . . . . . . . . . . . . . . . . . 0.1 88,070
5,556 TPG Telecom, Ltd. . . . . . . . . . . . . . . . . . . . . . . . — 40,03047,546 Turkcell Iletisim Hizmetleri A/S . . . . . . . . . . . . 0.1 161,438
0.2 289,538
Telephone – Integrated 45,314 AT&T, Inc. . . . . . . . . . . . . . . . . . . . . . . . . . . . . 1.1 1,559,255
4,173 Belgacom S.A.. . . . . . . . . . . . . . . . . . . . . . . . . . 0.1 136,03112,608 Bezeq The Israeli Telecommunication
Corp., Ltd. . . . . . . . . . . . . . . . . . . . . . . . . . . . — 27,77636,470 BT Group PLC . . . . . . . . . . . . . . . . . . . . . . . . . 0.2 253,571
2,337 Elisa Oyj . . . . . . . . . . . . . . . . . . . . . . . . . . . . . . 0.1 88,34511,800 KDDI Corp. . . . . . . . . . . . . . . . . . . . . . . . . . . . 0.2 309,67916,377 Koninklijke KPN N.V. . . . . . . . . . . . . . . . . . . . . . — 62,141
1,000 Nippon Telegraph & Telephone Corp. . . . . . . . . . . . . . . . . . . . . . . . . . . . . . . . — 40,240
2,945 Philippine Long Distance Telephone Co. . . . . . . . . . . . . . . . . . . . . . . . . . . . . . . . . 0.1 128,972
755 Swisscom A.G. . . . . . . . . . . . . . . . . . . . . . . . . . 0.2 379,27224,150 TELE DANMARK A/S . . . . . . . . . . . . . . . . . . . . 0.1 120,961
288,511 Telecom Italia SpA . . . . . . . . . . . . . . . . . . . . . . 0.2 368,358165,577 Telecom Italia SpA (RSP) . . . . . . . . . . . . . . . . . 0.1 171,100
6,737 Telefonica Deutschland Holding A.G. . . . . . . . . . . . . . . . . . . . . . . . . . — 35,804
6,361 Telefonica S.A. . . . . . . . . . . . . . . . . . . . . . . . . . . — 70,74315,301 Telstra Corp. . . . . . . . . . . . . . . . . . . . . . . . . . . . . — 62,533
7,200 Verizon Communications, Inc. . . . . . . . . . . . . . 0.2 332,7842.6 4,147,565
Television 15,822 ITV PLC . . . . . . . . . . . . . . . . . . . . . . . . . . . . . . . — 64,508
Textile – Apparel 22,000 Eclat Textile Co., Ltd. . . . . . . . . . . . . . . . . . . . . 0.2 303,800
173 LPP S.A. . . . . . . . . . . . . . . . . . . . . . . . . . . . . . . 0.2 245,4350.4 549,235
Tobacco 13,200 Altria Group, Inc. . . . . . . . . . . . . . . . . . . . . . . . 0.6 768,372
3,446 KT&G Corp. . . . . . . . . . . . . . . . . . . . . . . . . . . 0.2 307,1786,400 Philip Morris International, Inc. . . . . . . . . . . . . 0.3 562,624
22,068 Reynolds American, Inc. . . . . . . . . . . . . . . . . . . 0.7 1,018,4383,215 Swedish Match A.B. . . . . . . . . . . . . . . . . . . . . . 0.1 114,413
1.9 2,771,025
Tools – Hand Held 900 Snap-on, Inc. . . . . . . . . . . . . . . . . . . . . . . . . . . 0.1 154,287
4,400 Stanley Black & Decker, Inc. . . . . . . . . . . . . . . 0.3 469,6120.4 623,899
Toys 11,300 Hasbro, Inc. . . . . . . . . . . . . . . . . . . . . . . . . . . . 0.5 761,16824,900 Mattel, Inc. . . . . . . . . . . . . . . . . . . . . . . . . . . . . 0.5 676,533
1.0 1,437,701
Transport – Equipment and Leasing 200 AMERCO . . . . . . . . . . . . . . . . . . . . . . . . . . . . . . — 77,900
Transportation 4,500 Expeditors International of
Washington, Inc. . . . . . . . . . . . . . . . . . . . . . . 0.1 202,95078,000 Mitsui OSK Lines, Ltd. . . . . . . . . . . . . . . . . . . . 0.1 199,25158,695 TNT Express N.V. . . . . . . . . . . . . . . . . . . . . . . . 0.3 496,831
3,900 United Parcel Service, Inc. – Class B . . . . . . . . . . . . . . . . . . . . . . . . . . . . . 0.2 375,297
0.7 1,274,329
Transportation – Railroad 14,564 Groupe Eurotunnel S.A. . . . . . . . . . . . . . . . . . . 0.1 181,357
Transportation – Services 25,170 Asciano, Ltd. . . . . . . . . . . . . . . . . . . . . . . . . . . 0.1 160,26023,408 Royal Mail PLC . . . . . . . . . . . . . . . . . . . . . . . . . 0.1 153,195
0.2 313,455
Share or Principal Amount
Percentage of Net
Assets (%) Fair
Value (USD)
Transportation Services 282,200 ComfortDelGro Corp., Ltd. . . . . . . . . . . . . . . . 0.4 607,289
1,747 Kuehne + Nagel International A.G. . . . . . . . . . . 0.1 240,4240.5 847,713
Travel Services 12,102 TUI A.G. . . . . . . . . . . . . . . . . . . . . . . . . . . . . . 0. 2 216,022
Warehousing and Harbour Transportation Services 64,000 COSCO Pacifi c, Ltd. . . . . . . . . . . . . . . . . . . . . . . — 70,526
Water 4,300 American Water Works Co., Inc. . . . . . . . . . . . 0.2 256,9253,344 Severn Trent PLC . . . . . . . . . . . . . . . . . . . . . . . 0.1 107,306
0.3 364,231
Web Portals/Internet Service Providers 837 Iliad S.A. . . . . . . . . . . . . . . . . . . . . . . . . . . . . . 0.1 200,087
84 NAVER Corp. . . . . . . . . . . . . . . . . . . . . . . . . . . . — 47,1480.1 247,235
Wireless Equipment 1,800 Crown Castle International Corp. . . . . . . . . . . . 0.1 155,6101,200 Motorola Solutions, Inc. . . . . . . . . . . . . . . . . . . 0.1 82,140
0.2 237,750
X-Ray Equipment 3,100 Hologic, Inc.. . . . . . . . . . . . . . . . . . . . . . . . . . . 0. 2 119,939
Total Common Stock . . . . . . . . . . . . . . . . . . . . . . . . . . . . . . . . . 98. 4 160,502,858
Preferred Stock Automotive – Cars and Light Trucks
2,325 Hyundai Motor Co., 3.0700% . . . . . . . . . . . . . 0.1 208,243
Total Preferred Stock . . . . . . . . . . . . . . . . . . . . . . . . . . . . . . . . . . 0.1 208,243
Total Investments . . . . . . . . . . . . . . . . . . . . . . . . . . . . . . . . . . . . 98. 5 160,711,101
Total Financial Assets at fair value through profi t or loss 160,711,101

INTECH Global Dividend Fund
PORTFOLIO INVESTMENTS
The accompanying notes are an integral part of the fi nancial statements.
J a n u s C a p i t a l F u n d s P l c / 3 1 D e c e m b e r 2 0 1 5 1 5 5
Share or Principal Amount
Percentage of Net
Assets (%) Fair
Value (USD)
Financial Assets at fair value through profi t or loss Common Stock Aerospace and Defence
555 BAE Systems PLC . . . . . . . . . . . . . . . . . . . . . . . 0.2 4,087100 Lockheed Martin Corp. . . . . . . . . . . . . . . . . . . 1.1 21,715487 Meggitt PLC . . . . . . . . . . . . . . . . . . . . . . . . . . . 0.1 2,690410 Rolls-Royce Holdings PLC . . . . . . . . . . . . . . . . 0.2 3,475
1.6 31,967
Aerospace and Defence – Equipment 624 Cobham PLC . . . . . . . . . . . . . . . . . . . . . . . . . . 0.1 2,605
Agricultural Chemicals 1,591 Incitec Pivot, Ltd. . . . . . . . . . . . . . . . . . . . . . . . 0.2 4,590
100 Mosaic Co. . . . . . . . . . . . . . . . . . . . . . . . . . . . . 0.1 2,759100 Potash Corp. of Saskatchewan, Inc. . . . . . . . . . 0.1 1,713
15 Syngenta A.G.. . . . . . . . . . . . . . . . . . . . . . . . . . 0.3 5,87794 Yara International ASA . . . . . . . . . . . . . . . . . . . 0.2 4,068
0.9 19,007
Airport Development and Maintenance 1,780 Auckland International Airport, Ltd. . . . . . . . . . 0.4 6,998
Appliances 215 Electrolux A.B. . . . . . . . . . . . . . . . . . . . . . . . . . 0.3 5,230
Athletic Footwear 1,500 Yue Yuen Industrial Holdings, Ltd. . . . . . . . . . . 0.3 5,100
Automotive – Cars and Light Trucks 200 Daihatsu Motor Co., Ltd. . . . . . . . . . . . . . . . . . 0.1 2,731
26 Daimler A.G. . . . . . . . . . . . . . . . . . . . . . . . . . . 0.1 2,192200 General Motors Co. . . . . . . . . . . . . . . . . . . . . . 0.4 6,802
0.6 11,725
Beverages – Non-Alcoholic 300 Coca-Cola Co. . . . . . . . . . . . . . . . . . . . . . . . . . 0.7 12,888
Building – Heavy Construction 1,000 Cheung Kong Infrastructure Holdings,
Ltd. . . . . . . . . . . . . . . . . . . . . . . . . . . . . . . . . 0.5 9,265176 Skanska A.B. . . . . . . . . . . . . . . . . . . . . . . . . . . 0.2 3,438
50 Vinci S.A. . . . . . . . . . . . . . . . . . . . . . . . . . . . . . 0.2 3,2130.9 15,916
Building – Residential and Commercial 437 Persimmon PLC . . . . . . . . . . . . . . . . . . . . . . . . 0.7 13,057
1,000 Sekisui House, Ltd. . . . . . . . . . . . . . . . . . . . . . 0.9 17,0291.6 30,086
Building and Construction – Miscellaneous 396 Bouygues S.A.. . . . . . . . . . . . . . . . . . . . . . . . . . 0.8 15,725
70 Koninklijke Boskalis Westminister N.V. . . . . . . . . . . . . . . . . . . . . . . . . . . . . . . . . 0.2 2,862
1.0 18,587
Building and Construction Products – Miscellaneous 84 CIE de St-Gobain . . . . . . . . . . . . . . . . . . . . . . . 0.2 3,637
594 Fletcher Building, Ltd. . . . . . . . . . . . . . . . . . . . 0.2 2,9850.4 6,622
Building Products – Cement and Aggregate 363 James Hardie Industries PLC . . . . . . . . . . . . . . 0.2 4,620
Cable/Satellite TV 1,073 British Sky Broadcasting Group PLC . . . . . . . . . 0.9 17,587
200 Shaw Communications, Inc. . . . . . . . . . . . . . . . 0.2 3,4411.1 21,028
Casino Hotels 100 Las Vegas Sands Corp. . . . . . . . . . . . . . . . . . . . 0.2 4,384
2,000 Sands China, Ltd. . . . . . . . . . . . . . . . . . . . . . . . 0.4 6,8520.6 11,236
Cellular Telecommunications 400 NTT DOCOMO, Inc. . . . . . . . . . . . . . . . . . . . . 0.4 8,268100 Rogers Communications, Inc. . . . . . . . . . . . . . . 0.2 3,449
1,349 Vodafone Group PLC . . . . . . . . . . . . . . . . . . . . 0.2 4,3940.8 16,111
Share or Principal Amount
Percentage of Net
Assets (%) Fair
Value (USD)
Chemicals – Diversifi ed 30 BASF S.E. . . . . . . . . . . . . . . . . . . . . . . . . . . . . . 0.1 2,305
100 Dow Chemical Co. . . . . . . . . . . . . . . . . . . . . . . 0.3 5,148178 Koninklijke DSM N.V. . . . . . . . . . . . . . . . . . . . 0.5 8,951200 LyondellBasell Industries N.V. –
Class A . . . . . . . . . . . . . . . . . . . . . . . . . . . . . 0.9 17,3801.8 33,784
Chemicals – Specialty 3 Givaudan S.A. . . . . . . . . . . . . . . . . . . . . . . . . . 0.3 5,462
Commercial Banks – Non U.S. 1,200 Bank of East Asia, Ltd. . . . . . . . . . . . . . . . . . . . 0.2 4,467
100 Bank of Nova Scotia . . . . . . . . . . . . . . . . . . . . . 0.2 4,046536 Bendigo and Adelaide Bank, Ltd. . . . . . . . . . . . 0.2 4,666
6,500 BOC Hong Kong Holdings, Ltd. . . . . . . . . . . . . 1. 1 19,878100 Canadian Imperial Bank of
Commerce . . . . . . . . . . . . . . . . . . . . . . . . . . 0.3 6,591900 DBS Group Holdings, Ltd. . . . . . . . . . . . . . . . . 0.6 10,598700 Hang Seng Bank, Ltd. . . . . . . . . . . . . . . . . . . . . 0.7 13,323
1,000 Oversea-Chinese Banking Corp, Ltd. . . . . . . . . . . . . . . . . . . . . . . . . . . . . . . . . 0.3 6,209
300 United Overseas Bank, Ltd. . . . . . . . . . . . . . . . 0.2 4,1513. 8 73,929
Commercial Services 133 Edenred . . . . . . . . . . . . . . . . . . . . . . . . . . . . . . 0.1 2,522
1 SGS S.A. . . . . . . . . . . . . . . . . . . . . . . . . . . . . . . 0.1 1,9090.2 4,431
Commercial Services – Finance 200 Western Union Co. . . . . . . . . . . . . . . . . . . . . . . 0.2 3,582
Computer Services 100 International Business
Machines Corp.. . . . . . . . . . . . . . . . . . . . . . . 0.7 13,762
Computers – Memory Devices 200 Seagate Technology PLC . . . . . . . . . . . . . . . . . . 0.4 7,332
Consumer Products – Miscellaneous 100 Clorox Co. . . . . . . . . . . . . . . . . . . . . . . . . . . . . 0.7 12,683108 Husqvarna A.B. . . . . . . . . . . . . . . . . . . . . . . . . . — 717100 Kimberly-Clark Corp. . . . . . . . . . . . . . . . . . . . . 0.7 12,730
1.4 26,130
Containers – Metal and Glass 578 Rexam PLC . . . . . . . . . . . . . . . . . . . . . . . . . . . . 0.3 5,150
Containers – Paper and Plastic 410 Amcor, Ltd. . . . . . . . . . . . . . . . . . . . . . . . . . . . 0.2 4,014
Cosmetics and Toiletries 200 Procter & Gamble Co. . . . . . . . . . . . . . . . . . . . 0.8 15,882
90 Unilever N.V. . . . . . . . . . . . . . . . . . . . . . . . . . . 0.2 3,9221.0 19,804
Data Processing and Management 200 Paychex, Inc. . . . . . . . . . . . . . . . . . . . . . . . . . . 0.6 10,578
Distribution/Wholesale 228 Rexel S.A. . . . . . . . . . . . . . . . . . . . . . . . . . . . . . 0.2 3,042
Diversifi ed Financial Services 850 Investec PLC . . . . . . . . . . . . . . . . . . . . . . . . . . 0.3 6,006
Diversifi ed Manufacturing Operations 100 Eaton Corp., PLC . . . . . . . . . . . . . . . . . . . . . . . 0.3 5,204
22 Siemens A.G. . . . . . . . . . . . . . . . . . . . . . . . . . . 0.1 2,149203 Smiths Group PLC . . . . . . . . . . . . . . . . . . . . . . 0.1 2,811
78 Wartsila Oyj Abp . . . . . . . . . . . . . . . . . . . . . . . 0.2 3,5720.7 13,736
Diversifi ed Minerals 260 BHP Billiton PLC . . . . . . . . . . . . . . . . . . . . . . . 0.2 3,113
Diversifi ed Operations 247 Industrivarden A.B. . . . . . . . . . . . . . . . . . . . . . 0.2 4,249
1,000 Keppel Corp., Ltd. . . . . . . . . . . . . . . . . . . . . . . 0.2 4,5932,000 NWS Holdings, Ltd. . . . . . . . . . . . . . . . . . . . . . 0.2 2,994

INTECH Global Dividend Fund
PORTFOLIO INVESTMENTS
The accompanying notes are an integral part of the fi nancial statements.
1 5 6 J a n u s C a p i t a l F u n d s P l c / 3 1 D e c e m b e r 2 0 1 5
Share or Principal Amount
Percentage of Net
Assets (%) Fair
Value (USD)
1,000 Swire Pacifi c, Ltd. . . . . . . . . . . . . . . . . . . . . . . . 0.6 11,2521,000 Wharf Holdings, Ltd. . . . . . . . . . . . . . . . . . . . . 0.3 5,549
1.5 28,637
Diversifi ed Operations – Commercial Services 346 Brambles, Ltd. . . . . . . . . . . . . . . . . . . . . . . . . . 0.2 2,916
Electric – Integrated 100 Alliant Energy Corp. . . . . . . . . . . . . . . . . . . . . . 0.3 6,245100 Ameren Corp. . . . . . . . . . . . . . . . . . . . . . . . . . . 0.2 4,323100 American Electric Power Co., Inc. . . . . . . . . . . 0.3 5,827500 CLP Holdings, Ltd. . . . . . . . . . . . . . . . . . . . . . . 0.2 4,249200 CMS Energy Corp. . . . . . . . . . . . . . . . . . . . . . . 0.4 7,216200 Consolidated Edison, Inc.. . . . . . . . . . . . . . . . . 0.7 12,854
1,385 Contact Energy, Ltd. . . . . . . . . . . . . . . . . . . . . . 0.2 4,488100 DTE Energy Co. . . . . . . . . . . . . . . . . . . . . . . . . 0.4 8,019100 Duke Energy Corp. . . . . . . . . . . . . . . . . . . . . . . 0.4 7,139
2,054 EDP – Energias de Portugal S.A. . . . . . . . . . . . . 0.4 7,412164 Endesa S.A. . . . . . . . . . . . . . . . . . . . . . . . . . . . 0.2 3,301100 Entergy Corp. . . . . . . . . . . . . . . . . . . . . . . . . . . 0.4 6,836200 Eversource Energy . . . . . . . . . . . . . . . . . . . . . . 0.5 10,214100 Fortis, Inc. . . . . . . . . . . . . . . . . . . . . . . . . . . . . 0.1 2,704577 Fortum Oyj . . . . . . . . . . . . . . . . . . . . . . . . . . . 0.5 8,727100 NextEra Energy, Inc. . . . . . . . . . . . . . . . . . . . . . 0.5 10,389100 OGE Energy Corp. . . . . . . . . . . . . . . . . . . . . . . 0.1 2,629200 Pepco Holdings, Inc. . . . . . . . . . . . . . . . . . . . . 0.3 5,202200 PG&E Corp. . . . . . . . . . . . . . . . . . . . . . . . . . . . 0.6 10,638100 Pinnacle West Capital Corp. . . . . . . . . . . . . . . . 0.3 6,448500 Power Assets Holdings, Ltd. . . . . . . . . . . . . . . . 0.2 4,600200 PPL Corp. . . . . . . . . . . . . . . . . . . . . . . . . . . . . . 0.4 6,826100 Public Service Enterprise Group,
Inc. . . . . . . . . . . . . . . . . . . . . . . . . . . . . . . . . 0.2 3,869200 SCANA Corp. . . . . . . . . . . . . . . . . . . . . . . . . . . 0.6 12,098100 Southern Co. . . . . . . . . . . . . . . . . . . . . . . . . . . 0.2 4,679221 SSE PLC . . . . . . . . . . . . . . . . . . . . . . . . . . . . . . 0.3 4,978212 WEC Energy Group, Inc. . . . . . . . . . . . . . . . . . 0.6 10,878200 Xcel Energy, Inc. . . . . . . . . . . . . . . . . . . . . . . . . 0.4 7,182
9.9 189,970
Electric – Transmission 67 Red Electrica Corp S.A. . . . . . . . . . . . . . . . . . . 0.3 5,614
1,886 Terna Rete Elettrica Nazionale SpA . . . . . . . . . . 0.5 9,7470.8 15,361
Electric Products – Miscellaneous 100 Emerson Electric Co. . . . . . . . . . . . . . . . . . . . . 0.3 4,783
Electrical Components – Equipment 74 Schneider Electric S.E. . . . . . . . . . . . . . . . . . . . 0.2 4,226
Electronic Components – Miscellaneous 200 Garmin, Ltd.. . . . . . . . . . . . . . . . . . . . . . . . . . . 0.4 7,434
Electronic Components – Semiconductors 600 Intel Corp. . . . . . . . . . . . . . . . . . . . . . . . . . . . . 1.1 20,670100 Microchip Technology, Inc. . . . . . . . . . . . . . . . . 0.2 4,654
1.3 25,324
Electronics – Miscellaneous 86 Koninklijke Philips N.V. . . . . . . . . . . . . . . . . . . 0.1 2,202
Engineering – Research and Development Services 282 ABB, Ltd. . . . . . . . . . . . . . . . . . . . . . . . . . . . . . 0.3 5,058
1,000 Sembcorp Industries, Ltd. . . . . . . . . . . . . . . . . 0.1 2,1522,000 Singapore Technologies Engineering,
Ltd. . . . . . . . . . . . . . . . . . . . . . . . . . . . . . . . . 0.2 4,2480.6 11,458
Enterprise Software/Services 200 CA, Inc. . . . . . . . . . . . . . . . . . . . . . . . . . . . . . . 0.3 5,712
Finance – Investment Bankers/Brokers 1,250 ICAP PLC . . . . . . . . . . . . . . . . . . . . . . . . . . . . . 0.5 9,388
Finance – Other Services 149 ASX, Ltd. . . . . . . . . . . . . . . . . . . . . . . . . . . . . . 0.2 4,609180 Deutsche Boerse A.G. . . . . . . . . . . . . . . . . . . . . 0.8 15,919
Share or Principal Amount
Percentage of Net
Assets (%) Fair
Value (USD)
1,000 Singapore Exchange, Ltd. . . . . . . . . . . . . . . . . . 0.3 5,4331.3 25,961
Food – Miscellaneous/Diversifi ed 100 Campbell Soup Co. . . . . . . . . . . . . . . . . . . . . . 0.3 5,255100 General Mills, Inc. . . . . . . . . . . . . . . . . . . . . . . 0.3 5,766200 Kellogg Co.. . . . . . . . . . . . . . . . . . . . . . . . . . . . 0.8 14,454
43 Nestle S.A. . . . . . . . . . . . . . . . . . . . . . . . . . . . . 0.2 3,201783 Orkla ASA . . . . . . . . . . . . . . . . . . . . . . . . . . . . 0.3 6,203351 Tate & Lyle PLC . . . . . . . . . . . . . . . . . . . . . . . . 0.2 3,099101 Unilever PLC . . . . . . . . . . . . . . . . . . . . . . . . . . 0.2 4,357
2.3 42,335
Food – Retail 63 Casino Guichard Perrachon S.A. . . . . . . . . . . . . 0.2 2,90455 ICA Gruppen A.B. . . . . . . . . . . . . . . . . . . . . . . 0.1 2,004
114 Wesfarmers, Ltd. . . . . . . . . . . . . . . . . . . . . . . . 0.2 3,456151 Woolworths, Ltd. . . . . . . . . . . . . . . . . . . . . . . . 0.1 2,695
0.6 11,059
Food – Wholesale/Distribution 100 Sysco Corp. . . . . . . . . . . . . . . . . . . . . . . . . . . . 0.2 4,100
Gambling – Non-Hotel 776 William Hill PLC . . . . . . . . . . . . . . . . . . . . . . . 0.2 4,530
Gas – Distribution 100 Canadian Utilities, Ltd. . . . . . . . . . . . . . . . . . . . 0.1 2,309100 CenterPoint Energy, Inc. . . . . . . . . . . . . . . . . . . 0.1 1,836
1,037 Centrica PLC . . . . . . . . . . . . . . . . . . . . . . . . . . 0.2 3,334417 Enagas S.A. . . . . . . . . . . . . . . . . . . . . . . . . . . . . 0.6 11,781371 Gas Natural SDG S.A. . . . . . . . . . . . . . . . . . . . . 0.4 7,585200 Keyera Corp. . . . . . . . . . . . . . . . . . . . . . . . . . . 0.3 5,820376 National Grid PLC . . . . . . . . . . . . . . . . . . . . . . 0.3 5,196100 Sempra Energy . . . . . . . . . . . . . . . . . . . . . . . . . 0.5 9,401
2.5 47,262
Gas – Transportation 1,148 SNAM Rete Gas SpA. . . . . . . . . . . . . . . . . . . . . 0.3 6,025
Home Furnishings 200 Leggett & Platt, Inc. . . . . . . . . . . . . . . . . . . . . . 0.4 8,404
Human Resources 159 Adecco S.A. . . . . . . . . . . . . . . . . . . . . . . . . . . . 0.6 10,941
Import and Export 1,800 ITOCHU Corp. . . . . . . . . . . . . . . . . . . . . . . . . 1.1 21,5981,000 Marubeni Corp. . . . . . . . . . . . . . . . . . . . . . . . . 0.3 5,201
400 Mitsui & Co., Ltd. . . . . . . . . . . . . . . . . . . . . . . 0.3 4,8111.7 31,610
Insurance 2,755 Direct Line Insurance Group PLC . . . . . . . . . . . 0.9 16,548
270 Tryg A/S . . . . . . . . . . . . . . . . . . . . . . . . . . . . . . 0.3 5,4031.2 21,951
Investment Companies 607 Melrose Industries PLC. . . . . . . . . . . . . . . . . . . 0.1 2,603
Investment Management and Advisory Services 717 Aberdeen Asset Management PLC . . . . . . . . . . 0.2 3,059100 CI Financial Corp. . . . . . . . . . . . . . . . . . . . . . . 0.1 2,212100 IGM Financial, Inc. . . . . . . . . . . . . . . . . . . . . . 0.1 2,554100 InvesCo., Ltd. . . . . . . . . . . . . . . . . . . . . . . . . . . 0.2 3,348
3,992 Old Mutual PLC . . . . . . . . . . . . . . . . . . . . . . . . 0.6 10,527411 Platinum Asset Management, Ltd. . . . . . . . . . . 0.1 2,419
1.3 24,119
Life and Health Insurance 200 Great-West Lifeco, Inc. . . . . . . . . . . . . . . . . . . . 0.3 4,992
5,259 Legal & General Group PLC . . . . . . . . . . . . . . . 1.1 20,759100 Power Corp. of Canada . . . . . . . . . . . . . . . . . . 0.1 2,092100 Power Financial Corp. . . . . . . . . . . . . . . . . . . . 0.1 2,299
1.6 30,142
Lottery Services 1,868 Tatts Group, Ltd. . . . . . . . . . . . . . . . . . . . . . . . 0.3 5,974

PORTFOLIO INVESTMENTS
The accompanying notes are an integral part of the fi nancial statements.
J a n u s C a p i t a l F u n d s P l c / 3 1 D e c e m b e r 2 0 1 5 1 5 7
Share or Principal Amount
Percentage of Net
Assets (%) Fair
Value (USD)
Machine Tools and Related Products 200 Finning International, Inc. . . . . . . . . . . . . . . . . 0.1 2,700335 Sandvik A.B. . . . . . . . . . . . . . . . . . . . . . . . . . . . 0.2 2,941
0.3 5,641
Machinery – Construction and Mining 29 Atlas Copco A.B. . . . . . . . . . . . . . . . . . . . . . . . . — 671
Machinery – General Industrial 74 Kone OYJ . . . . . . . . . . . . . . . . . . . . . . . . . . . . . 0.2 3,150
254 Metso Oyj . . . . . . . . . . . . . . . . . . . . . . . . . . . . . 0.3 5,7130.5 8,863
Medical – Drugs 400 AbbVie, Inc. . . . . . . . . . . . . . . . . . . . . . . . . . . . 1.3 23,696191 AstraZeneca PLC . . . . . . . . . . . . . . . . . . . . . . . 0.7 12,997222 GlaxoSmithKline PLC . . . . . . . . . . . . . . . . . . . . 0.2 4,493100 Merck & Co., Inc. . . . . . . . . . . . . . . . . . . . . . . 0.3 5,282
39 Novartis A.G. . . . . . . . . . . . . . . . . . . . . . . . . . . 0.2 3,381169 Orion Oyj . . . . . . . . . . . . . . . . . . . . . . . . . . . . . 0.3 5,871200 Pfi zer, Inc. . . . . . . . . . . . . . . . . . . . . . . . . . . . . 0.3 6,456
13 Roche Holding A.G. . . . . . . . . . . . . . . . . . . . . . 0.2 3,58941 Sanofi . . . . . . . . . . . . . . . . . . . . . . . . . . . . . . . . 0.2 3,502
3.7 69,267
Metal – Diversifi ed 86 Rio Tinto PLC . . . . . . . . . . . . . . . . . . . . . . . . . . 0.1 2,509
124 Rio Tinto, Ltd. . . . . . . . . . . . . . . . . . . . . . . . . . 0.2 4,0390.3 6,548
Metal Processors and Fabrication 104 SKF A.B. – Class B . . . . . . . . . . . . . . . . . . . . . . 0.1 1,691
Mining Services 250 Orica, Ltd. . . . . . . . . . . . . . . . . . . . . . . . . . . . . 0.1 2,823
Miscellaneous Manufacturing 128 IMI PLC . . . . . . . . . . . . . . . . . . . . . . . . . . . . . . 0.1 1,625
17 Sulzer A.G. . . . . . . . . . . . . . . . . . . . . . . . . . . . . 0.1 1,6020.2 3,227
MRI/Medical Diagnostic Imaging 221 Sonic Healthcare, Ltd. . . . . . . . . . . . . . . . . . . . 0.2 2,877
Multi-Line Insurance 26 Allianz S.E. . . . . . . . . . . . . . . . . . . . . . . . . . . . . 0.2 4,621
537 AXA S.A. . . . . . . . . . . . . . . . . . . . . . . . . . . . . . 0.8 14,722200 Cincinnati Financial Corp. . . . . . . . . . . . . . . . . 0.6 11,834421 CNP Assurances . . . . . . . . . . . . . . . . . . . . . . . . 0.3 5,691
1,043 Mapfre S.A. . . . . . . . . . . . . . . . . . . . . . . . . . . . 0.1 2,62092 Sampo . . . . . . . . . . . . . . . . . . . . . . . . . . . . . . . 0.2 4,698
3,031 UnipolSai SpA . . . . . . . . . . . . . . . . . . . . . . . . . 0.4 7,77322 Zurich Insurance Group A.G. . . . . . . . . . . . . . . 0.3 5,677
2.9 57,636
Multimedia 497 Pearson PLC . . . . . . . . . . . . . . . . . . . . . . . . . . . 0.3 5,392
Networking Products 100 Cisco Systems, Inc. . . . . . . . . . . . . . . . . . . . . . . 0.1 2,716
Non-Hazardous Waste Disposal 100 Waste Management, Inc.. . . . . . . . . . . . . . . . . . 0.3 5,337
Offi ce Automation and Equipment 100 Canon, Inc. . . . . . . . . . . . . . . . . . . . . . . . . . . . 0.2 3,058
Oil – Field Services 361 AMEC PLC . . . . . . . . . . . . . . . . . . . . . . . . . . . . 0.1 2,282204 Petrofac, Ltd. . . . . . . . . . . . . . . . . . . . . . . . . . . 0.1 2,394
35 Technip S.A. . . . . . . . . . . . . . . . . . . . . . . . . . . . 0.1 1,7390.3 6,415
Oil and Gas Drilling 100 Helmerich & Payne, Inc. . . . . . . . . . . . . . . . . . 0.3 5,355436 Transocean, Ltd. . . . . . . . . . . . . . . . . . . . . . . . . 0.3 5,443
0.6 10,798
Share or Principal Amount
Percentage of Net
Assets (%) Fair
Value (USD)
Oil Companies – Exploration and Production 200 ConocoPhillips . . . . . . . . . . . . . . . . . . . . . . . . . 0.5 9,338100 Occidental Petroleum Corp. . . . . . . . . . . . . . . . 0.4 6,761200 Peyto Exploration & Development
Corp. . . . . . . . . . . . . . . . . . . . . . . . . . . . . . . 0.2 3,595100 PrairieSky Royalty, Ltd. . . . . . . . . . . . . . . . . . . . 0.1 1,584447 Woodside Petroleum, Ltd. . . . . . . . . . . . . . . . . 0.5 9,352
1.7 30,630
Oil Companies – Integrated 300 Exxon Mobil Corp. . . . . . . . . . . . . . . . . . . . . . . 1.2 23,385340 Galp Energia SGPS S.A. . . . . . . . . . . . . . . . . . . 0.2 3,960100 Murphy Oil Corp. . . . . . . . . . . . . . . . . . . . . . . 0.1 2,245110 OMV A.G. . . . . . . . . . . . . . . . . . . . . . . . . . . . . 0.2 3,123164 Royal Dutch Shell PLC – Class A . . . . . . . . . . . 0.2 3,689139 Royal Dutch Shell PLC – Class B . . . . . . . . . . . 0.2 3,161432 Statoil ASA . . . . . . . . . . . . . . . . . . . . . . . . . . . . 0.3 6,039100 Suncor Energy, Inc.. . . . . . . . . . . . . . . . . . . . . . 0.1 2,582
90 Total S.A. . . . . . . . . . . . . . . . . . . . . . . . . . . . . . 0.2 4,0352.7 52,219
Oil Field Machinery and Equipment 100 National Oilwell Varco, Inc. . . . . . . . . . . . . . . . 0.2 3,349
Paper and Related Products 100 International Paper Co. . . . . . . . . . . . . . . . . . . 0.2 3,770329 UPM-Kymmene OYJ . . . . . . . . . . . . . . . . . . . . . 0.3 6,160
0.5 9,930
Pipelines 200 Spectra Energy Corp. . . . . . . . . . . . . . . . . . . . . 0.3 4,788300 TransCanada Corp. . . . . . . . . . . . . . . . . . . . . . . 0.5 9,799
0.8 14,587
Property and Casualty Insurance 325 Admiral Group PLC . . . . . . . . . . . . . . . . . . . . . 0.4 7,947652 Gjensidige Forsikring ASA . . . . . . . . . . . . . . . . 0.6 10,470
2,386 Insurance Australia, Ltd.. . . . . . . . . . . . . . . . . . 0.5 9,6641.5 28,081
Public Thoroughfares 257 Abertis Infraestructuras S.A. . . . . . . . . . . . . . . . 0.2 4,024
Publishing – Books 226 Reed Elsevier N.V.. . . . . . . . . . . . . . . . . . . . . . . 0.2 3,816
Publishing – Newspapers 1,500 Singapore Press Holdings, Ltd. . . . . . . . . . . . . . 0.2 4,170
Publishing – Periodicals 105 Axel Springer S.E.. . . . . . . . . . . . . . . . . . . . . . . 0.3 5,858
Real Estate Management/Services 391 Lend Lease Group . . . . . . . . . . . . . . . . . . . . . . 0.2 4,062
38 Swiss Prime Site A.G. . . . . . . . . . . . . . . . . . . . . 0.2 2,9790.4 7,041
Real Estate Operating/Development 1,000 Hang Lung Properties, Ltd. . . . . . . . . . . . . . . . . 0.1 2,2761,000 Hysan Development Co., Ltd.. . . . . . . . . . . . . . 0.2 4,0976,000 New World Development Co., Ltd. . . . . . . . . . 0.3 5,9304,000 Sino Land Co., Ltd. . . . . . . . . . . . . . . . . . . . . . 0.3 5,8631,000 Sun Hung Kai Properties, Ltd. . . . . . . . . . . . . . 0.6 12,078
. . . . . . . 1.5 30,244
Reinsurance 53 Hannover Rueckversicherung S.E. . . . . . . . . . . 0.3 6,08421 Muenchener Rueckversicherungs A.G. . . . . . . . 0.2 4,211
171 SCOR S.E. . . . . . . . . . . . . . . . . . . . . . . . . . . . . 0.3 6,41255 Swiss Re A.G. . . . . . . . . . . . . . . . . . . . . . . . . . . 0.3 5,391
. . . . . . . 1.1 22,098
Retail – Apparel and Shoe 300 Coach, Inc. . . . . . . . . . . . . . . . . . . . . . . . . . . . . 0.5 9,819100 Gap, Inc. . . . . . . . . . . . . . . . . . . . . . . . . . . . . . 0.1 2,470100 Hennes & Mauritz A.B. . . . . . . . . . . . . . . . . . . 0.2 3,581
31 Hugo Boss A.G. . . . . . . . . . . . . . . . . . . . . . . . . 0.1 2,5800.9 18,450

INTECH Global Dividend Fund
PORTFOLIO INVESTMENTS
The accompanying notes are an integral part of the fi nancial statements.
1 5 8 J a n u s C a p i t a l F u n d s P l c / 3 1 D e c e m b e r 2 0 1 5
Share or Principal Amount
Percentage of Net
Assets (%) Fair
Value (USD)
Retail – Building Products 872 Kingfi sher PLC . . . . . . . . . . . . . . . . . . . . . . . . . 0.2 4,235
Retail – Computer Equpment 100 GameStop Corp. – Class A . . . . . . . . . . . . . . . . 0.1 2,804
Retail – Convenience Store 100 Lawson, Inc. . . . . . . . . . . . . . . . . . . . . . . . . . . . 0.4 8,196
Retail – Major Department Stores 1,360 Marks & Spencer Group PLC . . . . . . . . . . . . . . 0.5 9,069
Retail – Miscellaneous 2,200 Harvey Norman Holdings, Ltd. . . . . . . . . . . . . 0.4 6,699
Retail – Offi ce Supplies 700 Staples, Inc. . . . . . . . . . . . . . . . . . . . . . . . . . . . 0.3 6,629
Retail – Regional Department Stores 100 Macy’s, Inc. . . . . . . . . . . . . . . . . . . . . . . . . . . . . 0.2 3,498
Rubber – Tires 66 Cie Generale des Etablissements
Michelin . . . . . . . . . . . . . . . . . . . . . . . . . . . . 0.3 6,304164 Nokian Renkaat OYJ . . . . . . . . . . . . . . . . . . . . . 0.3 5,899
0.6 12,203
Satellite Telecommunications 113 Eutelsat Communications S.A. . . . . . . . . . . . . . 0.2 3,389737 Inmarsat PLC . . . . . . . . . . . . . . . . . . . . . . . . . . 0.7 12,352118 SES S.A. . . . . . . . . . . . . . . . . . . . . . . . . . . . . . . 0.2 3,279
1.1 19,020
Security Services 1,088 G4S PLC. . . . . . . . . . . . . . . . . . . . . . . . . . . . . . 0.2 3,616
Semiconductor Components/Integrated Circuits 200 QUALCOMM, Inc. . . . . . . . . . . . . . . . . . . . . . . 0.5 9,997
Semiconductor Equipment 100 KLA-Tencor Corp. . . . . . . . . . . . . . . . . . . . . . . 0.4 6,935
Semiconductors 200 Maxim Integrated Products. . . . . . . . . . . . . . . . 0.4 7,600
Shipbuilding 1,000 Sembcorp Marine, Ltd. . . . . . . . . . . . . . . . . . . . 0.1 1,2356,000 Yangzijiang Shipbuilding Holdings,
Ltd. . . . . . . . . . . . . . . . . . . . . . . . . . . . . . . . . 0.2 4,6570.3 5,892
Steel – Producers 74 voestalpine A.G. . . . . . . . . . . . . . . . . . . . . . . . . 0.1 2,279
Steel Pipe and Tube 291 Tenaris S.A. . . . . . . . . . . . . . . . . . . . . . . . . . . . 0.2 3,459
Telecommunication Services 143 BCE, Inc. . . . . . . . . . . . . . . . . . . . . . . . . . . . . . 0.3 5,526
4,000 HKT Trust & HKT, Ltd. – Rights . . . . . . . . . . . 0.3 5,11012,000 PCCW, Ltd. . . . . . . . . . . . . . . . . . . . . . . . . . . . 0.4 7,045
2,000 Singapore Telecommunications, Ltd. . . . . . . . . 0.3 5,1792,000 StarHub, Ltd. . . . . . . . . . . . . . . . . . . . . . . . . . . 0.3 5,221
240 Telenor ASA . . . . . . . . . . . . . . . . . . . . . . . . . . . 0.2 4,0221.8 32,103
Telephone – Integrated 100 AT&T, Inc. . . . . . . . . . . . . . . . . . . . . . . . . . . . . 0.2 3,441427 Elisa Oyj . . . . . . . . . . . . . . . . . . . . . . . . . . . . . . 0.9 16,142
7 Swisscom A.G. . . . . . . . . . . . . . . . . . . . . . . . . . 0.2 3,516451 TELE DANMARK A/S . . . . . . . . . . . . . . . . . . . . 0.1 2,259
1,001 TeliaSonera A.B. . . . . . . . . . . . . . . . . . . . . . . . . 0.3 5,0061,171 Telstra Corp. . . . . . . . . . . . . . . . . . . . . . . . . . . . 0.3 4,786
2.0 35,150
Television 3,638 ITV PLC . . . . . . . . . . . . . . . . . . . . . . . . . . . . . . 0.8 14,832
260 ProSiebenSat.1 Media A.G. . . . . . . . . . . . . . . . . 0.7 13,2121.5 28,044
Share or Principal Amount
Percentage of Net
Assets (%) Fair
Value (USD)
Tobacco 600 Altria Group, Inc. . . . . . . . . . . . . . . . . . . . . . . . 1.8 34,926214 British American Tobacco PLC . . . . . . . . . . . . . 0.6 11,895523 Imperial Tobacco Group PLC . . . . . . . . . . . . . . 1.5 27,648100 Philip Morris International, Inc. . . . . . . . . . . . . 0.5 8,791
1,006 Reynolds American, Inc. . . . . . . . . . . . . . . . . . . 2.5 46,429114 Swedish Match A.B. . . . . . . . . . . . . . . . . . . . . . 0.2 4,057
7.1 133,746
Toys 100 Mattel, Inc. . . . . . . . . . . . . . . . . . . . . . . . . . . . . 0.1 2,717
Transportation – Railroad 1,454 Aurizon Holdings, Ltd. . . . . . . . . . . . . . . . . . . . 0. 3 4,639
Transportation Services 2,000 ComfortDelGro Corp., Ltd. . . . . . . . . . . . . . . . 0.2 4,304
37 Kuehne + Nagel International A.G. . . . . . . . . . . 0.3 5,0920.5 9,396
Travel Services 118 Flight Centre Travel Group, Ltd. . . . . . . . . . . . . 0. 3 3,429
Wireless Equipment 209 Telefonaktiebolaget L.M. Ericsson . . . . . . . . . . . 0. 2 2,039
Total Common Stock . . . . . . . . . . . . . . . . . . . . . . . . . . . . . . . . . 96. 4 1,828,859
Total Investments . . . . . . . . . . . . . . . . . . . . . . . . . . . . . . . . . . . . 96. 4 1,828,859

PORTFOLIO INVESTMENTS
The accompanying notes are an integral part of the fi nancial statements.
J a n u s C a p i t a l F u n d s P l c / 3 1 D e c e m b e r 2 0 1 5 1 5 9
Forward Currency Contracts, Open as at 31 December 2015
Currency Purchased
Currency Sold
Current Market
Value (USD) Settle Date
Unrealised Appreciation
(USD)
Citibank EUR 84,076 USD 91,366 91,311 29-Jan-16 56EUR 63,347 USD 68,840 68,799 29-Jan-16 41EUR 25,007 USD 27,175 27,159 29-Jan-16 16EUR 2,380 USD 2,586 2,584 29-Jan-16 2EUR 2,379 USD 2,585 2,583 29-Jan-16 2EUR 2,286 USD 2,484 2,483 29-Jan-16 1EUR 2,083 USD 2,264 2,263 29-Jan-16 1EUR 382 USD 415 415 29-Jan-16 —EUR 1,284 USD 1,396 1,396 29-Jan-16 —EUR 965 USD 1,050 1,050 29-Jan-16 —EUR 35 USD 38 38 29-Jan-16 —EUR 36 USD 40 40 29-Jan-16 —EUR 36 USD 40 40 29-Jan-16 —EUR 32 USD 35 35 29-Jan-16 —EUR 8 USD 8 8 29-Jan-16 —EUR 27 USD 29 29 29-Jan-16 —EUR 23 USD 25 25 29-Jan-16 —EUR 27 USD 29 29 29-Jan-16 —EUR 25 USD 28 28 29-Jan-16 —EUR 33 USD 36 36 29-Jan-16 —EUR 37 USD 41 41 29-Jan-16 —EUR 36 USD 39 39 29-Jan-16 —EUR 13 USD 14 14 29-Jan-16 —EUR 14 USD 15 15 29-Jan-16 —EUR 15 USD 16 16 29-Jan-16 —EUR 15 USD 16 16 29-Jan-16 —USD 371 EUR 340 369 29-Jan-16 2USD 70 EUR 64 69 29-Jan-16 1USD 281 EUR 258 280 29-Jan-16 1USD 30 EUR 27 30 29-Jan-16 —USD 29 EUR 26 29 29-Jan-16 —USD 30 EUR 27 30 29-Jan-16 —USD 26 EUR 24 26 29-Jan-16 —USD 21 EUR 19 21 29-Jan-16 —USD 24 EUR 22 24 29-Jan-16 —USD 163 EUR 150 163 29-Jan-16 —USD 23 EUR 21 23 29-Jan-16 —USD 13 EUR 12 13 29-Jan-16 —USD 2 EUR 2 2 29-Jan-16 —USD 2 EUR 2 2 29-Jan-16 —USD 55 EUR 50 55 29-Jan-16 —USD 2 EUR 2 2 29-Jan-16 —USD 71 EUR 65 71 29-Jan-16 —USD 10 EUR 9 10 29-Jan-16 —USD 10 EUR 10 10 29-Jan-16 —USD 9 EUR 8 9 29-Jan-16 —USD 10 EUR 10 10 29-Jan-16 —
Total 123
Total Financial Assets at fair value through profi t or loss 1,828,982
Financial Liabilities at fair value through profi t or loss
Forward Currency Contracts, Open as at 31 December 2015
Currency Purchased
Currency Sold
Current Market
Value (USD) Settle Date
Unrealised (Depreciation)
(USD)
Citibank USD 312 EUR 289 313 29-Jan-16 (1)USD 633 EUR 583 634 29-Jan-16 (1)USD 838 EUR 771 839 29-Jan-16 (1)EUR 178 USD 195 196 29-Jan-16 (1)EUR 98 USD 107 108 29-Jan-16 (1)EUR 251 USD 276 279 29-Jan-16 (3)EUR 378 USD 413 416 29-Jan-16 (3)USD 793 EUR 733 797 29-Jan-16 (4)EUR 513 USD 561 565 29-Jan-16 (4)USD 1,050 EUR 970 1,055 29-Jan-16 (5)EUR 696 USD 762 767 29-Jan-16 (5)EUR 933 USD 1,021 1,028 29-Jan-16 (7)EUR 992 USD 1,088 1,098 29-Jan-16 (10)EUR 1,319 USD 1,447 1,460 29-Jan-16 (13)USD 9,754 EUR 9,009 9,796 29-Jan-16 (42)
Total (101)
Total Financial Liabilities at fair value through profi t or loss (101)

INTECH US Core Fund
PORTFOLIO INVESTMENTS
The accompanying notes are an integral part of the fi nancial statements.
1 6 0 J a n u s C a p i t a l F u n d s P l c / 3 1 D e c e m b e r 2 0 1 5
Share or Principal Amount
Percentage of Net
Assets (%) Fair
Value (USD)
Financial Assets at fair value through profi t or loss Common Stock Advertising Services
3,700 Nielsen Holdings PLC . . . . . . . . . . . . . . . . . . . 0.1 172,420
Aerospace and Defence 4,700 General Dynamics Corp. . . . . . . . . . . . . . . . . . 0.4 645,592
18,700 Lockheed Martin Corp. . . . . . . . . . . . . . . . . . . 2.4 4,060,7055,600 Northrop Grumman Corp. . . . . . . . . . . . . . . . . 0.6 1,057,3363,100 Raytheon Co. . . . . . . . . . . . . . . . . . . . . . . . . . . 0.2 386,0431,200 Rockwell Collins, Inc.. . . . . . . . . . . . . . . . . . . . 0.1 110,760
3.7 6,260,436
Apparel Manufacturers 45,700 Hanesbrands, Inc. . . . . . . . . . . . . . . . . . . . . . . 0.8 1,344,95121,300 Under Armour, Inc. – Class A . . . . . . . . . . . . . . 1.0 1,716,99331,100 VF Corp. . . . . . . . . . . . . . . . . . . . . . . . . . . . . . 1.2 1,935,975
3.0 4,997,919
Applications Software 800 Citrix Systems, Inc. . . . . . . . . . . . . . . . . . . . . . . — 60,520
9,300 Intuit, Inc. . . . . . . . . . . . . . . . . . . . . . . . . . . . . 0.5 897,4507,000 Red Hat, Inc. . . . . . . . . . . . . . . . . . . . . . . . . . . 0.3 579,670
0.8 1,537,640
Athletic Footwear 15,000 NIKE, Inc. – Class B . . . . . . . . . . . . . . . . . . . . . 0.6 937,500
Automotive – Truck Parts and Equipment – Original 19,500 Delphi Automotive PLC . . . . . . . . . . . . . . . . . . 1.0 1,671,735
Banks 17,700 Comerica, Inc. . . . . . . . . . . . . . . . . . . . . . . . . . 0.4 740,39139,800 Fifth Third Bancorp . . . . . . . . . . . . . . . . . . . . . 0.5 799,98035,300 Huntington Bancshares, Inc. . . . . . . . . . . . . . . . 0.2 390,418
1.1 1,930,789
Beverages – Non-Alcoholic 4,900 Coca-Cola Enterprises, Inc. . . . . . . . . . . . . . . . 0.1 241,276
22,200 Dr. Pepper Snapple Group, Inc. . . . . . . . . . . . . 1.2 2,069,0402,500 Monster Beverage Corp. . . . . . . . . . . . . . . . . . . 0.2 372,400
1.5 2,682,716
Beverages – Wine and Spirits 3,500 Brown-Forman Corp. – Class B . . . . . . . . . . . . 0.2 347,4808,600 Constellation Brands, Inc. – Class A . . . . . . . . . 0.7 1,224,984
0.9 1,572,464
Building Products – Cement and Aggregate 6,200 Martin Marietta Materials, Inc. . . . . . . . . . . . . . 0.5 846,796
18,000 Vulcan Materials Co.. . . . . . . . . . . . . . . . . . . . . 1.0 1,709,4601.5 2,556,256
Building Products – Wood 17,800 Masco Corp. . . . . . . . . . . . . . . . . . . . . . . . . . . . 0.3 503,740
Cable/Satellite TV 23,100 Cablevision Systems Corp. . . . . . . . . . . . . . . . . 0.4 736,890
8,400 Comcast Corp. – Class A . . . . . . . . . . . . . . . . . 0.3 474,0124,600 Time Warner Cable, Inc.. . . . . . . . . . . . . . . . . . 0.5 853,714
1.2 2,064,616
Chemicals – Diversifi ed 10,900 Eastman Chemical Co. . . . . . . . . . . . . . . . . . . . 0.4 735,85924,000 LyondellBasell Industries N.V. –
Class A . . . . . . . . . . . . . . . . . . . . . . . . . . . . . 1.3 2,085,6001.7 2,821,459
Chemicals – Specialty 6,200 Ecolab, Inc. . . . . . . . . . . . . . . . . . . . . . . . . . . . 0.4 709,156
Commer Banks – Southern U.S. 27,600 Regions Financial Corp. . . . . . . . . . . . . . . . . . . 0.2 264,960
Commercial Banks 5,100 BB&T Corp. . . . . . . . . . . . . . . . . . . . . . . . . . . . 0.1 192,831
Commercial Banks – Eastern U.S. 2,400 M&T Bank Corp. . . . . . . . . . . . . . . . . . . . . . . . 0.2 290,832
Share or Principal Amount
Percentage of Net
Assets (%) Fair
Value (USD)
Commercial Banks – Western U.S. 20,800 Zions Bancorporation . . . . . . . . . . . . . . . . . . . . 0.3 567,840
Commercial Services 10,700 Cintas Corp. . . . . . . . . . . . . . . . . . . . . . . . . . . . 0.6 974,23513,300 Quanta Services, Inc. . . . . . . . . . . . . . . . . . . . . 0.2 269,325
0.8 1,243,560
Commercial Services – Finance 1,200 Automatic Data Processing, Inc. . . . . . . . . . . . . 0.1 101,6648,800 Equifax, Inc. . . . . . . . . . . . . . . . . . . . . . . . . . . . 0.6 980,056
10,700 H&R Block, Inc. . . . . . . . . . . . . . . . . . . . . . . . . 0.2 356,4171,300 Mastercard, Inc. – Class A . . . . . . . . . . . . . . . . 0.1 126,5682,000 McGraw Hill Financial, Inc. . . . . . . . . . . . . . . . 0.1 197,1607,400 Moody’s Corp. . . . . . . . . . . . . . . . . . . . . . . . . . 0.4 742,5169,900 Total System Services, Inc. . . . . . . . . . . . . . . . . 0.3 493,020
1.8 2,997,401
Computer Services 1,300 Accenture PLC – Class A . . . . . . . . . . . . . . . . . 0.1 135,850
Computers 800 Apple, Inc. . . . . . . . . . . . . . . . . . . . . . . . . . . . . 0.1 84,208
Consulting Services 5,400 Verisk Analytics, Inc. – Class A . . . . . . . . . . . . . 0.2 415,152
Consumer Products – Miscellaneous 2,200 Clorox Co. . . . . . . . . . . . . . . . . . . . . . . . . . . . . 0.2 279,026
Containers – Paper and Plastic 17,000 Sealed Air Corp. . . . . . . . . . . . . . . . . . . . . . . . . 0.5 758,200
Cosmetics and Toiletries 3,100 Estee Lauder Cos, Inc. – Class A . . . . . . . . . . . . 0.2 272,986
Cruise Lines 7,500 Carnival Corp. . . . . . . . . . . . . . . . . . . . . . . . . . 0.2 408,6005,000 Royal Caribbean Cruises, Ltd. . . . . . . . . . . . . . 0.3 506,050
0.5 914,650
Data Processing and Management 8,300 Fidelity National Information
Services, Inc. . . . . . . . . . . . . . . . . . . . . . . . . . 0.3 502,980
Dental Supplies and Equipment 1,100 DENTSPLY International, Inc. . . . . . . . . . . . . . . — 66,935
Disposable Medical Products 4,000 CR Bard, Inc. . . . . . . . . . . . . . . . . . . . . . . . . . . 0.5 757,760
Distribution/Wholesale 700 WW Grainger, Inc. . . . . . . . . . . . . . . . . . . . . . . 0.1 141,813
Diversifi ed Banking Institutions 9,800 Goldman Sachs Group, Inc. . . . . . . . . . . . . . . . 1.1 1,766,254
44,000 Morgan Stanley. . . . . . . . . . . . . . . . . . . . . . . . . 0.8 1,399,6401.9 3,165,894
Diversifi ed Operations 24,500 Leucadia National Corp. . . . . . . . . . . . . . . . . . . 0.3 426,055
E-Commerce/Products 14,100 eBay, Inc. . . . . . . . . . . . . . . . . . . . . . . . . . . . . . 0.2 387,468
E-Commerce/Services 2,300 Expedia, Inc. . . . . . . . . . . . . . . . . . . . . . . . . . . 0.2 285,890
21,900 Netfl ix, Inc. . . . . . . . . . . . . . . . . . . . . . . . . . . . 1.5 2,504,9221.7 2,790,812
Electric – Integrated 5,000 Ameren Corp. . . . . . . . . . . . . . . . . . . . . . . . . . . 0.1 216,1504,200 American Electric Power Co., Inc. . . . . . . . . . . 0.1 244,7348,800 CMS Energy Corp. . . . . . . . . . . . . . . . . . . . . . . 0.2 317,504
12,100 Consolidated Edison, Inc.. . . . . . . . . . . . . . . . . 0.5 777,6672,900 DTE Energy Co. . . . . . . . . . . . . . . . . . . . . . . . . 0.1 232,5513,200 Edison International . . . . . . . . . . . . . . . . . . . . . 0.1 189,4726,400 Eversource Energy . . . . . . . . . . . . . . . . . . . . . . 0.2 326,8481,400 Pepco Holdings, Inc. . . . . . . . . . . . . . . . . . . . . . — 36,4144,700 PG&E Corp. . . . . . . . . . . . . . . . . . . . . . . . . . . . 0.2 249,993

PORTFOLIO INVESTMENTS
The accompanying notes are an integral part of the fi nancial statements.
J a n u s C a p i t a l F u n d s P l c / 3 1 D e c e m b e r 2 0 1 5 1 6 1
Share or Principal Amount
Percentage of Net
Assets (%) Fair
Value (USD)
4,800 Pinnacle West Capital Corp. . . . . . . . . . . . . . . . 0.2 309,50411,100 PPL Corp. . . . . . . . . . . . . . . . . . . . . . . . . . . . . . 0.2 378,843
7,000 Public Service Enterprise Group, Inc. . . . . . . . . 0.2 270,8304,700 SCANA Corp. . . . . . . . . . . . . . . . . . . . . . . . . . . 0.2 284,3034,300 Southern Co. . . . . . . . . . . . . . . . . . . . . . . . . . . 0.1 201,197
16,600 TECO Energy, Inc. . . . . . . . . . . . . . . . . . . . . . . 0.3 442,39010,400 WEC Energy Group, Inc. . . . . . . . . . . . . . . . . . 0.3 533,62412,100 Xcel Energy, Inc. . . . . . . . . . . . . . . . . . . . . . . . . 0.3 434,511
3.3 5,446,535
Electric Products – Miscellaneous 4,600 AMETEK, Inc. . . . . . . . . . . . . . . . . . . . . . . . . . 0.1 246,514
Electronic Components – Semiconductors 16,100 Avago Technologies, Ltd. . . . . . . . . . . . . . . . . . 1.4 2,336,91528,800 Broadcom Corp. – Class A . . . . . . . . . . . . . . . . 1.0 1,665,216
7,100 NVIDIA Corp. . . . . . . . . . . . . . . . . . . . . . . . . . 0.1 234,0161,000 Xilinx, Inc. . . . . . . . . . . . . . . . . . . . . . . . . . . . . . — 46,970
2.5 4,283,117
Electronic Forms 5,000 Adobe Systems, Inc. . . . . . . . . . . . . . . . . . . . . . 0.3 469,700
Electronic Security Devices 6,600 Allegion PLC . . . . . . . . . . . . . . . . . . . . . . . . . . 0.3 435,072
Enterprise Software/Services 13,800 CA, Inc. . . . . . . . . . . . . . . . . . . . . . . . . . . . . . . 0.2 394,128
Entertainment Software 26,800 Activision Blizzard, Inc. . . . . . . . . . . . . . . . . . . 0.6 1,037,428
Fiduciary Banks 800 Bank of New York Mellon Corp. . . . . . . . . . . . . . — 32,976
13,500 Northern Trust Corp. . . . . . . . . . . . . . . . . . . . . 0.6 973,2158,100 State Street Corp. . . . . . . . . . . . . . . . . . . . . . . . 0.3 537,516
0.9 1,543,707
Finance – Credit Card 25,800 Discover Financial Services. . . . . . . . . . . . . . . . 0.8 1,383,396
Finance – Other Services 30,800 CME Group, Inc. . . . . . . . . . . . . . . . . . . . . . . . 1.7 2,790,48011,200 NASDAQ OMX Group, Inc. . . . . . . . . . . . . . . . 0.4 651,504
2.1 3,441,984
Food – Confectionery 2,500 Hershey Co. . . . . . . . . . . . . . . . . . . . . . . . . . . . 0.1 223,175
300 J.M. Smucker Co. . . . . . . . . . . . . . . . . . . . . . . . . — 37,0020.1 260,177
Food – Meat Products 4,600 Hormel Foods Corp. . . . . . . . . . . . . . . . . . . . . 0.2 363,768
16,000 Tyson Foods, Inc. – Class A . . . . . . . . . . . . . . . 0.5 853,2800.7 1,217,048
Food – Miscellaneous/Diversifi ed 17,700 Campbell Soup Co. . . . . . . . . . . . . . . . . . . . . . 0.6 930,13535,200 ConAgra Foods, Inc.. . . . . . . . . . . . . . . . . . . . . 0.9 1,484,032
7,700 General Mills, Inc. . . . . . . . . . . . . . . . . . . . . . . 0.3 443,9826,800 Kellogg Co.. . . . . . . . . . . . . . . . . . . . . . . . . . . . 0.3 491,4369,200 McCormick & Co., Inc. . . . . . . . . . . . . . . . . . . 0.5 787,1524,300 Mondelez International, Inc. . . . . . . . . . . . . . . 0.1 192,812
2.7 4,329,549
Food – Retail 60,000 Kroger Co. . . . . . . . . . . . . . . . . . . . . . . . . . . . . 1.5 2,509,800
Food – Wholesale/Distribution 1,700 Sysco Corp. . . . . . . . . . . . . . . . . . . . . . . . . . . . . — 69,700
Gas – Distribution 29,000 NiSource, Inc. . . . . . . . . . . . . . . . . . . . . . . . . . 0.3 565,790
Hazardous Waste Disposal 3,400 Stericycle, Inc. . . . . . . . . . . . . . . . . . . . . . . . . . 0.2 410,040
Home Builders 20,700 DR Horton, Inc. . . . . . . . . . . . . . . . . . . . . . . . . 0.4 663,021
2,600 Lennar Corp. . . . . . . . . . . . . . . . . . . . . . . . . . . 0.1 127,1660.5 790,187
Share or Principal Amount
Percentage of Net
Assets (%) Fair
Value (USD)
Home Decoration Products 32,300 Newell Rubbermaid, Inc. . . . . . . . . . . . . . . . . . 0.9 1,423,784
Home Furnishings 13,300 Leggett & Platt, Inc. . . . . . . . . . . . . . . . . . . . . . 0.3 558,866
Hotels and Motels 6,600 Marriott International, Inc. –
Class A . . . . . . . . . . . . . . . . . . . . . . . . . . . . . 0.3 442,464
Insurance 20,600 Hartford Financial Services Group,
Inc. . . . . . . . . . . . . . . . . . . . . . . . . . . . . . . . . 0.5 895,276
Insurance Brokers 2,900 Aon PLC . . . . . . . . . . . . . . . . . . . . . . . . . . . . . . 0.2 267,409
15,500 Marsh & McLennan Cos., Inc. . . . . . . . . . . . . . 0.5 859,4750.7 1,126,884
Internet Content – Entertainment 24,500 Facebook, Inc. . . . . . . . . . . . . . . . . . . . . . . . . . 1.5 2,564,170
Internet Infrastructure Software 3,800 F5 Networks, Inc.. . . . . . . . . . . . . . . . . . . . . . . 0.2 368,448
Internet Security 8,300 VeriSign, Inc. . . . . . . . . . . . . . . . . . . . . . . . . . . 0.4 725,088
Life and Health Insurance 200 Prudential Financial, Inc. . . . . . . . . . . . . . . . . . . — 16,282
10,700 Torchmark Corp. . . . . . . . . . . . . . . . . . . . . . . . 0.4 611,61217,200 Unum Group . . . . . . . . . . . . . . . . . . . . . . . . . . 0.3 572,588
0.7 1,200,482
Machinery – General Industrial 100 Roper Industries, Inc. . . . . . . . . . . . . . . . . . . . . . — 18,979
Medical – Biomedical and Genetic 9,100 Gilead Sciences, Inc. . . . . . . . . . . . . . . . . . . . . . 0.6 920,8293,800 Regeneron Pharmaceuticals, Inc. . . . . . . . . . . . 1.2 2,062,906
1.8 2,983,735
Medical – Drugs 15,100 Eli Lilly & Co. . . . . . . . . . . . . . . . . . . . . . . . . . 0.8 1,272,32654,600 Zoetis, Inc. . . . . . . . . . . . . . . . . . . . . . . . . . . . . 1.6 2,616,432
2.4 3,888,758
Medical – Generic Drugs 6,416 Allergan PLC . . . . . . . . . . . . . . . . . . . . . . . . . . 1.2 2,005,000
Medical – HMO 22,583 Aetna, Inc. . . . . . . . . . . . . . . . . . . . . . . . . . . . . 1.5 2,441,67435,600 Anthem, Inc. . . . . . . . . . . . . . . . . . . . . . . . . . . 3. 0 4,964,06517,000 Cigna Corp. . . . . . . . . . . . . . . . . . . . . . . . . . . . 1.5 2,487,610
9,300 UnitedHealth Group, Inc. . . . . . . . . . . . . . . . . . 0.7 1,094,0526. 7 10,987,401
Medical – Hospitals 8,200 HCA Holdings, Inc. . . . . . . . . . . . . . . . . . . . . . 0.3 554,566
15,000 Universal Health Services, Inc. . . . . . . . . . . . . . 1.1 1,792,3501.4 2,346,916
Medical – Wholesale Drug Distributors 26,600 AmerisourceBergen Corp. . . . . . . . . . . . . . . . . . 1.7 2,758,68625,300 Cardinal Health, Inc. . . . . . . . . . . . . . . . . . . . . 1.4 2,258,531
800 McKesson Corp. . . . . . . . . . . . . . . . . . . . . . . . . 0.1 157,7843.2 5,175,001
Medical Information Systems 3,900 Cerner Corp. . . . . . . . . . . . . . . . . . . . . . . . . . . 0.1 234,663
Medical Instruments 81,500 Boston Scientifi c Corp. . . . . . . . . . . . . . . . . . . . 0.9 1,502,860
4,000 Edwards Lifesciences Corp. . . . . . . . . . . . . . . . 0.2 315,9201.1 1,818,780
Medical Products 2,300 Stryker Corp. . . . . . . . . . . . . . . . . . . . . . . . . . . 0.1 213,762
Multi-Line Insurance 4,100 Allstate Corp. . . . . . . . . . . . . . . . . . . . . . . . . . . 0.2 254,5695,000 American International Group, Inc. . . . . . . . . . 0.2 309,850

INTECH US Core Fund
PORTFOLIO INVESTMENTS
The accompanying notes are an integral part of the fi nancial statements.
1 6 2 J a n u s C a p i t a l F u n d s P l c / 3 1 D e c e m b e r 2 0 1 5
Share or Principal Amount
Percentage of Net
Assets (%) Fair
Value (USD)
8,500 Assurant, Inc. . . . . . . . . . . . . . . . . . . . . . . . . . . 0.4 684,5901,800 Cincinnati Financial Corp. . . . . . . . . . . . . . . . . 0.1 106,5064,000 MetLife, Inc. . . . . . . . . . . . . . . . . . . . . . . . . . . . 0.1 192,840
15,100 XL Group PLC . . . . . . . . . . . . . . . . . . . . . . . . . 0.4 591,6181.4 2,139,973
Multimedia 17,000 Walt Disney Co. . . . . . . . . . . . . . . . . . . . . . . . . 1.1 1,786,360
Non-Hazardous Waste Disposal 10,500 Republic Services, Inc. . . . . . . . . . . . . . . . . . . . 0.3 461,895
Offi ce Supplies and Forms 9,200 Avery Dennison Corp. . . . . . . . . . . . . . . . . . . . 0.3 576,472
Oil and Gas Drilling 2,900 Transocean, Ltd. . . . . . . . . . . . . . . . . . . . . . . . . . — 35,902
Oil Companies – Exploration and Production 4,700 Cimarex Energy Co. . . . . . . . . . . . . . . . . . . . . . 0.3 420,086
16,900 Newfi eld Exploration Co. . . . . . . . . . . . . . . . . . 0.3 550,2640.6 970,350
Oil Companies – Integrated 6,100 Phillips 66 . . . . . . . . . . . . . . . . . . . . . . . . . . . . 0.3 498,980
Oil Field Machinery and Equipment 9,500 Cameron International Corp. . . . . . . . . . . . . . . 0.4 600,400
Oil Refi ning and Marketing 900 Marathon Petroleum Corp. . . . . . . . . . . . . . . . . . — 46,656
7,300 Tesoro Corp. . . . . . . . . . . . . . . . . . . . . . . . . . . . 0.5 769,20122,000 Valero Energy Corp. . . . . . . . . . . . . . . . . . . . . . 0.9 1,555,620
1.4 2,371,477
Property and Casualty Insurance 27,600 Progressive Corp. . . . . . . . . . . . . . . . . . . . . . . . 0.5 877,680
REIT – Apartments 1,700 Apartment Investment &
Management, Co. – Class A . . . . . . . . . . . . . . — 68,0512,200 AvalonBay Communities, Inc. . . . . . . . . . . . . . . 0.2 405,0862,700 Equity Residential. . . . . . . . . . . . . . . . . . . . . . . 0.1 220,2932,800 Essex Property Trust, Inc. . . . . . . . . . . . . . . . . . 0.4 670,348
0.7 1,363,778
REIT – Shopping Centres 2,700 Kimco Realty Corp. . . . . . . . . . . . . . . . . . . . . . . — 71,442
REIT – Storage 1,200 Public Storage . . . . . . . . . . . . . . . . . . . . . . . . . 0.2 297,240
Retail – Apparel and Shoe 26,400 L Brands, Inc. . . . . . . . . . . . . . . . . . . . . . . . . . . 1.5 2,529,64828,200 Ross Stores, Inc. . . . . . . . . . . . . . . . . . . . . . . . . 0.9 1,517,442
2.4 4,047,090
Retail – Auto Parts 3,800 Advance Auto Parts, Inc. . . . . . . . . . . . . . . . . . 0.3 571,938
800 AutoZone, Inc. . . . . . . . . . . . . . . . . . . . . . . . . . 0.4 593,5286,300 O’Reilly Automotive, Inc. . . . . . . . . . . . . . . . . . 1.0 1,596,546
1.7 2,762,012
Retail – Building Products 29,600 Home Depot, Inc. . . . . . . . . . . . . . . . . . . . . . . . 2.3 3,914,60021,300 Lowe’s Cos., Inc. . . . . . . . . . . . . . . . . . . . . . . . . 1.0 1,619,652
3.3 5,534,252
Retail – Computer Equpment 10,400 GameStop Corp. – Class A . . . . . . . . . . . . . . . . 0.2 291,616
Retail – Discount 7,800 Dollar Tree, Inc. . . . . . . . . . . . . . . . . . . . . . . . . 0.4 602,316
28,200 Target Corp. . . . . . . . . . . . . . . . . . . . . . . . . . . . 1.2 2,047,6021.6 2,649,918
Retail – Gardening Products 9,100 Tractor Supply Co. . . . . . . . . . . . . . . . . . . . . . . 0.5 778,050
Retail – Miscellaneous 1,900 CarMax, Inc. . . . . . . . . . . . . . . . . . . . . . . . . . . 0.1 102,543
Share or Principal Amount
Percentage of Net
Assets (%) Fair
Value (USD)
32,800 CVS Caremark Corp. . . . . . . . . . . . . . . . . . . . . 1.9 3,206,85613,800 Darden Restaurants, Inc. . . . . . . . . . . . . . . . . . 0.5 878,232
9,800 Dollar General Corp. . . . . . . . . . . . . . . . . . . . . 0.4 704,326300 PVH Corp. . . . . . . . . . . . . . . . . . . . . . . . . . . . . . — 22,095
2,900 Walgreens Boots Alliance, Inc. . . . . . . . . . . . . . 0.1 246,9503.0 5,161,002
Retail – Restaurants 400 Chipotle Mexican Grill, Inc. . . . . . . . . . . . . . . . 0.1 191,940
25,800 Starbucks Corp. . . . . . . . . . . . . . . . . . . . . . . . . 0.9 1,548,7741.0 1,740,714
Rubber – Tires 27,500 Goodyear Tire & Rubber Co. . . . . . . . . . . . . . . 0.5 898,425
Savings/Loans/Thrifts – Eastern U.S. 30,600 People’s United Financial, Inc. . . . . . . . . . . . . . 0.3 494,190
Semiconductors 10,400 Skyworks Solutions, Inc. . . . . . . . . . . . . . . . . . 0.5 799,032
Software 4,100 Akamai Technologies, Inc. . . . . . . . . . . . . . . . . 0.1 215,783
36,900 Electronic Arts, Inc. . . . . . . . . . . . . . . . . . . . . . 1.6 2,535,76814,900 Fiserv, Inc. . . . . . . . . . . . . . . . . . . . . . . . . . . . . 0.8 1,362,754
2.5 4,114,305
Super – Regional Banks 8,400 Capital One Financial Corp. . . . . . . . . . . . . . . . 0.4 606,312
31,200 KeyCorp . . . . . . . . . . . . . . . . . . . . . . . . . . . . . . 0.2 411,52812,972 Wells Fargo & Co. . . . . . . . . . . . . . . . . . . . . . . 0.4 705,158
1.0 1,722,998
Telecommunication Equipment 10,700 Juniper Networks, Inc. . . . . . . . . . . . . . . . . . . . 0.2 295,320
Textile – Home Furnishings 4,100 Mohawk Industries, Inc. . . . . . . . . . . . . . . . . . . 0.5 776,499
Tobacco 35,800 Altria Group, Inc. . . . . . . . . . . . . . . . . . . . . . . . 1.3 2,083,91825,924 Reynolds American, Inc. . . . . . . . . . . . . . . . . . . 0.7 1,196,393
2.0 3,280,311
Tools – Hand Held 4,200 Snap-on, Inc. . . . . . . . . . . . . . . . . . . . . . . . . . . 0.5 720,0065,400 Stanley Black & Decker, Inc. . . . . . . . . . . . . . . 0.3 576,342
0.8 1,296,348
Toys 14,500 Hasbro, Inc. . . . . . . . . . . . . . . . . . . . . . . . . . . . 0.6 976,720
Transportation 1,900 Expeditors International of
Washington, Inc. . . . . . . . . . . . . . . . . . . . . . . 0.1 85,690
Transportation Services 1,600 CH Robinson Worldwide, Inc. . . . . . . . . . . . . . 0.1 99,232
Web Hosting and Design 1,027 Equinix, Inc. . . . . . . . . . . . . . . . . . . . . . . . . . . 0. 3 310,565
Wireless Equipment 7,900 Motorola Solutions, Inc. . . . . . . . . . . . . . . . . . . 0. 4 540,755
Total Common Stock . . . . . . . . . . . . . . . . . . . . . . . . . . . . . . . . . 99. 3 165,595,381
Total Investments . . . . . . . . . . . . . . . . . . . . . . . . . . . . . . . . . . . . 99. 3 165,595,381

PORTFOLIO INVESTMENTS
The accompanying notes are an integral part of the fi nancial statements.
J a n u s C a p i t a l F u n d s P l c / 3 1 D e c e m b e r 2 0 1 5 1 6 3
Forward Currency Contracts, Open as at 31 December 2015
Currency Purchased
Currency Sold
Current Market
Value (USD) Settle Date
Unrealised Appreciation
(USD)
Citibank EUR 32,172,658 USD 34,962,124 34,941,180 29-Jan-16 20,944EUR 7,585,826 USD 8,243,540 8,238,602 29-Jan-16 4,938EUR 457,998 USD 497,927 497,848 29-Jan-16 79EUR 107,873 USD 117,277 117,258 29-Jan-16 19EUR 2,696 USD 2,930 2,928 29-Jan-16 2EUR 38 USD 42 42 29-Jan-16 —EUR 19 USD 21 21 29-Jan-16 —EUR 19 USD 21 21 29-Jan-16 —EUR 23 USD 25 25 29-Jan-16 —EUR 23 USD 25 25 29-Jan-16 —USD 231,224 EUR 211,627 230,115 29-Jan-16 1,109USD 45,682 EUR 41,637 45,274 29-Jan-16 408USD 53,491 EUR 48,957 53,234 29-Jan-16 257USD 21,456 EUR 19,641 21,358 29-Jan-16 98USD 10,658 EUR 9,714 10,563 29-Jan-16 95USD 21,462 EUR 19,717 21,439 29-Jan-16 23USD 2,784 EUR 2,546 2,768 29-Jan-16 16USD 38 EUR 35 38 29-Jan-16 —USD 43 EUR 40 43 29-Jan-16 —USD 55 EUR 50 55 29-Jan-16 —USD 4 EUR 3 4 29-Jan-16 —USD 19 EUR 18 19 29-Jan-16 —
Total 27,988
Total Financial Assets at fair value through profi t or loss 165,623,369
Financial Liabilities at fair value through profi t or loss Forward Currency Contracts, Open as at 31 December 2015
Currency Purchased
Currency Sold
Current Market
Value (USD) Settle Date
Unrealised (Depreciation)
(USD)
Citibank EUR 19,106 USD 20,797 20,819 29-Jan-16 (22)EUR 9,406 USD 10,289 10,350 29-Jan-16 (61)EUR 22,886 USD 25,011 25,137 29-Jan-16 (126)EUR 21,398 USD 23,406 23,545 29-Jan-16 (139)EUR 27,800 USD 30,399 30,569 29-Jan-16 (170)EUR 21,978 USD 24,087 24,275 29-Jan-16 (188)EUR 41,565 USD 45,404 45,612 29-Jan-16 (208)EUR 40,593 USD 44,363 44,587 29-Jan-16 (224)EUR 49,674 USD 54,338 54,662 29-Jan-16 (324)EUR 51,154 USD 55,956 56,290 29-Jan-16 (334)EUR 39,622 USD 43,429 43,775 29-Jan-16 (346)EUR 52,765 USD 57,768 58,161 29-Jan-16 (393)EUR 51,491 USD 56,394 56,799 29-Jan-16 (405)EUR 63,353 USD 69,327 69,766 29-Jan-16 (439)EUR 75,745 USD 82,852 83,343 29-Jan-16 (491)EUR 62,788 USD 68,914 69,555 29-Jan-16 (641)EUR 229,757 USD 251,540 253,253 29-Jan-16 (1,713)EUR 224,878 USD 246,291 248,060 29-Jan-16 (1,769)EUR 276,970 USD 303,085 305,006 29-Jan-16 (1,921)EUR 273,556 USD 300,244 303,036 29-Jan-16 (2,795)USD 119,611 EUR 110,116 119,735 29-Jan-16 (124)USD 106,065 EUR 97,978 106,536 29-Jan-16 (471)USD 516,668 EUR 475,652 517,202 29-Jan-16 (534)USD 133,384 EUR 123,195 133,956 29-Jan-16 (572)USD 159,805 EUR 147,597 160,490 29-Jan-16 (685)USD 450,967 EUR 416,580 452,969 29-Jan-16 (2,002)
Total (17,097)
Total Financial Liabilities at fair value through profi t or loss (17,097)

Janus Global Diversified Alternatives Fund
PORTFOLIO INVESTMENTS
The accompanying notes are an integral part of the fi nancial statements.
1 6 4 J a n u s C a p i t a l F u n d s P l c / 3 1 D e c e m b e r 2 0 1 5
Share or Principal Amount
Percentage of Net
Assets (%) Fair
Value (USD)
Financial Assets at fair value through profi t or loss Futures
2 U.S. Treasury Note 10 Year Bond Future 21/3/16 . . . . . . . . . . . . . . . . . . . . . . . . — 1,022
Total Futures . . . . . . . . . . . . . . . . . . . . . . . . . . . . . . . . . . . . . . . . . — 1,022
Government Obligations U.S. Treasury Notes/Bonds
500,000 0.0000%, due 10/3/16 . . . . . . . . . . . . . . . . . . 22.1 499,898500,000 0.0000%, due 25/2/16 . . . . . . . . . . . . . . . . . . 22.1 499,950200,000 0.0000%, due 4/3/16 . . . . . . . . . . . . . . . . . . . . 8.8 199,903
Total Government Obligations . . . . . . . . . . . . . . . . . . . . . . . . . . 53.0 1,199,751
Total Investments . . . . . . . . . . . . . . . . . . . . . . . . . . . . . . . . . . . . 53.0 1,200,773
Forward Currency Contracts, Open as at 31 December 2015
Currency Purchased
Currency Sold
Current Market
Value (USD) Settle Date
Unrealised Appreciation
(USD)
Citibank EUR 247,183 USD 268,614 268,453 29-Jan-16 161EUR 199,185 USD 216,455 216,325 29-Jan-16 130EUR 115,528 USD 125,544 125,469 29-Jan-16 75EUR 111,589 USD 121,264 121,191 29-Jan-16 73EUR 1,931 USD 2,090 2,081 29-Jan-16 9EUR 1,571 USD 1,700 1,692 29-Jan-16 8EUR 913 USD 988 984 29-Jan-16 4EUR 865 USD 936 932 29-Jan-16 4SEK 1,021,864 USD 119,663 118,078 29-Jan-16 1,585SEK 1,004,925 USD 117,679 116,120 29-Jan-16 1,559SEK 8,258 USD 967 954 29-Jan-16 13SEK 8,473 USD 992 979 29-Jan-16 13USD 2,788 EUR 2,548 2,770 29-Jan-16 18USD 2,197 EUR 2,008 2,183 29-Jan-16 14USD 1,460 CHF 1,446 1,447 29-Jan-16 13USD 1,457 CHF 1,443 1,444 29-Jan-16 13USD 1,323 SEK 11,073 1,314 29-Jan-16 9USD 1,402 GBP 945 1,393 29-Jan-16 9USD 1,321 SEK 11,060 1,312 29-Jan-16 9USD 1,273 EUR 1,163 1,265 29-Jan-16 8USD 1,279 EUR 1,168 1,271 29-Jan-16 8USD 252 CHF 249 249 29-Jan-16 3USD 258 CHF 255 255 29-Jan-16 3USD 372 EUR 339 369 29-Jan-16 3USD 481 EUR 439 478 29-Jan-16 3USD 563 EUR 515 560 29-Jan-16 3USD 213 EUR 195 211 29-Jan-16 2USD 231 GBP 155 229 29-Jan-16 2USD 225 EUR 205 223 29-Jan-16 2USD 104 GBP 70 103 29-Jan-16 1USD 85 CHF 84 85 29-Jan-16 —USD 96 EUR 89 96 29-Jan-16 —USD 93 EUR 86 93 29-Jan-16 —USD 83 CHF 82 83 29-Jan-16 —USD 162 EUR 149 162 29-Jan-16 —USD 208 EUR 191 208 29-Jan-16 —
Total 3,757
Total Financial Assets at fair value through profi t or loss 1,258,052
Total Return Swaps at 31 December 2015
Counterparty Notional Amount
Return Paid by the Fund
Return Received
by the Fund Termination
Date
Unrealised Appreciation
(USD)
BNP Paribas 1,461
1-month USD LIBOR plus 30 basis points
BNP Paribas Commodity Swap Future 31-Dec-50 12,024
BNP Paribas 1,057
1-month USD LIBOR plus 30 basis points
BNP Paribas Commodity Swap Future 31-Dec-50 3,281
BNP Paribas 4,947
1-month USD LIBOR plus 30 basis points
BNP Paribas Commodity Swap Future 31-Dec-50 8,276
Goldman Sachs Group, Inc. (457)
1-month USD LIBOR plus 10 basis points
MSCI The World Index Large Cap Future 31-Dec-50 9,852
Goldman Sachs Group, Inc. (46)
1-month USD LIBOR plus 25 basis points
MSCI Daily Trust Gross World Future 31-Dec-50 5,113
Goldman Sachs Group, Inc. (84)
1-month USD LIBOR plus 20 basis points
S&P 500 Pure Growth Trust Future 31-Dec-50 14,976
Total 53,522

PORTFOLIO INVESTMENTS
The accompanying notes are an integral part of the fi nancial statements.
J a n u s C a p i t a l F u n d s P l c / 3 1 D e c e m b e r 2 0 1 5 1 6 5
Total Return Swaps at 31 December 2015
Counterparty Notional Amount
Return Paid by the Fund
Return Received
by the Fund Termination
Date
Unrealised (Depreciation)
(USD)
Barclays Capital, Inc. 3,238
1-month USD LIBOR plus 20 basis points
Barclys U.S. Interest Rate Swap Future 31-Dec-50 (5,167)
Goldman Sachs Group, Inc. 1,600
1-month USD LIBOR plus 50 basis points
MSCI Daily Trust Gross Small Cap Future 31-Dec-50 (14,836)
Goldman Sachs Group, Inc. 859
1-month USD LIBOR plus 48 basis points
MSCI Daily Trust Net Emerging Markets Future 31-Dec-50 (6,688)
Goldman Sachs Group, Inc. 89
1-month USD LIBOR plus 40 basis points
S&P 500 Pure Value Trust Future 31-Dec-50 (35,181)
Total (61,872)
Financial Liabilities at fair value through profi t or loss
Percentage of Net
Assets (%) Fair Value
(USD)
Futures
6 Dollar Index Currency Future 14/3/16 . . . . . . . . . . . . . . . . (0.3) (7,304)
2 S&P 500 Emini Index Future 18/3/16 . . . . . . . . . . . . . . . . (0.2) (3,735)
Total Futures (0.5) (11,039)
Forward Currency Contracts, Open as at 31 December 2015
Currency Purchased
Currency Sold
Current Market
Value (USD) Settle Date
Unrealised (Depreciation)
(USD)
Citibank CHF 1,075 USD 1,082 1,089 29-Jan-16 (7)CHF 1,104 USD 1,111 1,118 29-Jan-16 (7)CHF 136,992 USD 137,711 138,424 29-Jan-16 (713)CHF 139,317 USD 140,048 140,773 29-Jan-16 (725)GBP 791 USD 1,180 1,195 29-Jan-16 (15)GBP 96,455 USD 144,027 145,873 29-Jan-16 (1,846)USD 88 SEK 754 89 29-Jan-16 (1)USD 90 SEK 767 91 29-Jan-16 (1)USD 180 SEK 1,526 181 29-Jan-16 (1)USD 186 SEK 1,575 187 29-Jan-16 (1)
Total (3,317)
Total Financial Liabilities at fair value through profi t or loss (76,228)

Janus Global Real Estate Fund
PORTFOLIO INVESTMENTS
The accompanying notes are an integral part of the fi nancial statements.
1 6 6 J a n u s C a p i t a l F u n d s P l c / 3 1 D e c e m b e r 2 0 1 5
Share or Principal Amount
Percentage of Net
Assets (%) Fair
Value (USD)
Financial Assets at fair value through profi t or loss Common Stock Advertising Sales
10,972 Lamar Advertising Co. . . . . . . . . . . . . . . . . . . . 0.5 658,101
Building – Residential and Commercial 32,100 Iida Group Holdings Co., Ltd. . . . . . . . . . . . . . 0.5 603,644
200,278 New Home Co., Inc. . . . . . . . . . . . . . . . . . . . . . 2.0 2,595,6032.5 3,199,247
Casino Hotels 73,331 Crown, Ltd. . . . . . . . . . . . . . . . . . . . . . . . . . . . 0.5 667,77028,369 Las Vegas Sands Corp. . . . . . . . . . . . . . . . . . . . 0.9 1,243,697
1.4 1,911,467
Computer Software 50,995 InterXion Holding N.V. . . . . . . . . . . . . . . . . . . . 1.2 1,537,499
Consulting Services 47,507 Savills PLC . . . . . . . . . . . . . . . . . . . . . . . . . . . . 0.5 620,424
Diversifi ed Operations 267,620 Wharf Holdings, Ltd. . . . . . . . . . . . . . . . . . . . . 1.1 1,484,902
Electric – Transmission 39,362 Brookfi eld Infrastructure
Partners L.P. . . . . . . . . . . . . . . . . . . . . . . . . . 1.1 1,492,213
Finance – Other Services 142,093 Tricon Capital Group, Inc. . . . . . . . . . . . . . . . . 0.7 930,511
Investment Management and Advisory Services 56,285 NorthStar Asset Management
Group, Inc. . . . . . . . . . . . . . . . . . . . . . . . . . . 0.5 683,300
Metal – Copper 164,113 Copper Mountain Mining Corp. . . . . . . . . . . . . . — 52,787
Private Equity 191,924 Gramercy Property Trust . . . . . . . . . . . . . . . . . 1.1 1,481,653
Real Estate – Operationg / Development 163,414 Scentre Group . . . . . . . . . . . . . . . . . . . . . . . . . 0.4 498,807
Real Estate Management/Services 409,473 Arealink Co., Ltd. . . . . . . . . . . . . . . . . . . . . . . . 0.4 490,632474,340 Atrium European Real Estate, Ltd. . . . . . . . . . . 1.4 1,840,042
25,363 CBRE Group, Inc. – Class A . . . . . . . . . . . . . . . 0.7 877,053224,840 Corp Inmobiliaria Vesta S.A.B.
de C.V. . . . . . . . . . . . . . . . . . . . . . . . . . . . . . 0.3 346,369167,217 Countrywide PLC . . . . . . . . . . . . . . . . . . . . . . . 0.7 984,433
84,279 First Capital Realty, Inc. . . . . . . . . . . . . . . . . . . 0.8 1,117,83185,237 Hispania Activos Inmobiliarios SAU . . . . . . . . . 0.9 1,213,303
213,343 Kennedy Wilson Europe Real Estate PLC. . . . . . . . . . . . . . . . . . . . . . . . . . . . . . . . 2.9 3,805,058
216,599 Kennedy-Wilson Holdings, Inc. . . . . . . . . . . . . 4.0 5,215,69873,000 Mitsubishi Estate Co., Ltd. . . . . . . . . . . . . . . . . 1.2 1,532,830
13.3 17,423,249
Real Estate Operating/Development 61,088 ADO Properties S.A. (144A) . . . . . . . . . . . . . . . 1.3 1,759,023
938,175 Aroundtown Property Holdings PLC . . . . . . . . 3.3 4,322,34541,624 Brookfi eld Asset Management, Inc. –
Class A . . . . . . . . . . . . . . . . . . . . . . . . . . . . . 1.0 1,312,4051,174,900 CapitaLand, Ltd.. . . . . . . . . . . . . . . . . . . . . . . . 2.1 2,777,052
34,050,000 CSI Properties, Ltd. . . . . . . . . . . . . . . . . . . . . . 0.9 1,164,324263,200 Cyrela Commercial Properties S.A.
Empreendimentos e Participacoes . . . . . . . . . 0.4 532,390176,884 Dalian Wanda Commercial Properties
Co., Ltd. – Class H (144A) . . . . . . . . . . . . . . 0.8 1,032,80438,100 First Juken Co., Ltd. . . . . . . . . . . . . . . . . . . . . . 0.3 431,787
502,115 Global Logistic Properties, Ltd. . . . . . . . . . . . . . 0.6 761,693929,000 Hang Lung Properties, Ltd. . . . . . . . . . . . . . . . . 1.6 2,114,585
91,000 Hysan Development Co., Ltd.. . . . . . . . . . . . . . 0.3 372,817153,700 Iguatemi Empresa de Shopping
Centers S.A. . . . . . . . . . . . . . . . . . . . . . . . . . 0.6 734,886501,632 Kingdom Construction Corp. . . . . . . . . . . . . . . 0.2 251,269
Share or Principal Amount
Percentage of Net
Assets (%) Fair
Value (USD)
18,409 LEG Immobilien A.G. . . . . . . . . . . . . . . . . . . . . 1.1 1,510,24322,000 Mitsui Fudosan Co., Ltd. . . . . . . . . . . . . . . . . . 0.4 559,42716,792 PDG Realty S.A. Empreendimentos e
Participacoes . . . . . . . . . . . . . . . . . . . . . . . . . . — 6,921155,172 Phoenix Mills, Ltd. . . . . . . . . . . . . . . . . . . . . . . 0.6 787,463269,600 Prestige Estates Projects, Ltd. . . . . . . . . . . . . . . 0.6 788,618290,800 Primecity Investment PLC . . . . . . . . . . . . . . . . 0.9 1,165,978
2,294,000 Shun Tak Holdings, Ltd. . . . . . . . . . . . . . . . . . . 0.7 864,345161,939 St. Joe Co. . . . . . . . . . . . . . . . . . . . . . . . . . . . . 2.3 2,997,491
8,833 Sun Hung Kai Properties, Ltd. . . . . . . . . . . . . . 0.1 106,68373,651 TLG Immobilien A.G. . . . . . . . . . . . . . . . . . . . . 1.1 1,386,906
21.2 27,741,455
Recreational Centers 57,660 Clubcorp Holdings, Inc. . . . . . . . . . . . . . . . . . . 0.8 1,053,448
REIT – Apartments 41,611 American Homes 4 Rent . . . . . . . . . . . . . . . . . . 0.5 693,239
6,872 AvalonBay Communities, Inc. . . . . . . . . . . . . . . 1.0 1,265,34120,345 Camden Property Trust . . . . . . . . . . . . . . . . . . 1.2 1,561,682
2,541 Invincible Investment Corp. . . . . . . . . . . . . . . . 1.1 1,488,487336 Kenedix Residential Investment
Corp. . . . . . . . . . . . . . . . . . . . . . . . . . . . . . . 0.6 833,15033,485 Post Properties, Inc. . . . . . . . . . . . . . . . . . . . . . 1.5 1,980,97327,673 Starwood Waypoint Residential
Trust . . . . . . . . . . . . . . . . . . . . . . . . . . . . . . . 0.5 626,5176.4 8,449,389
REIT – Diversifi ed 15,919 American Assets Trust, Inc.. . . . . . . . . . . . . . . . 0.5 610,49440,563 American Tower Corp. . . . . . . . . . . . . . . . . . . . 3.0 3,932,583
192,613 Armada Hoffl er Properties, Inc. . . . . . . . . . . . . 1.5 2,018,584358,716 Astro Japan Property Group . . . . . . . . . . . . . . . 1.0 1,322,303166,445 Charter Hall Group . . . . . . . . . . . . . . . . . . . . . 0.4 550,499774,685 Cromwell Property Group . . . . . . . . . . . . . . . . 0.5 592,576
66,732 Land Securities Group PLC . . . . . . . . . . . . . . . 0.9 1,157,732258,777 Lexington Realty Trust . . . . . . . . . . . . . . . . . . . 1.6 2,070,216
1,093,774 Mirvac Group . . . . . . . . . . . . . . . . . . . . . . . . . . 1.2 1,577,692924 Mori Hills REIT Investment Corp. . . . . . . . . . . 0.9 1,191,712
1,385,006 National Storage REIT . . . . . . . . . . . . . . . . . . . 1.2 1,553,82423,360 NorthStar Realty Europe Corp. . . . . . . . . . . . . . 0.2 275,882
142,624 NorthStar Realty Finance Corp. . . . . . . . . . . . . 1.8 2,428,887176,935 Pure Industrial Real Estate Trust . . . . . . . . . . . . 0.4 558,876
2,911 Unibail-Rodamco S.E. . . . . . . . . . . . . . . . . . . . 0.6 741,42915.7 20,583,289
REIT – Health Care 9,621 Care Capital Properties, Inc. . . . . . . . . . . . . . . . 0.2 294,114
29,912 Ventas, Inc. . . . . . . . . . . . . . . . . . . . . . . . . . . . . 1.3 1,687,9341.5 1,982,048
REIT – Hotels 1,092,800 Ascott Residence Trust . . . . . . . . . . . . . . . . . . . 0.7 913,687
180,903 Chatham Lodging Trust . . . . . . . . . . . . . . . . . . 2.8 3,704,893773,544 Concentradora Fibra Hotelera
Mexicana S.A. de C.V. . . . . . . . . . . . . . . . . . . 0.5 703,14041,085 Pebblebrook Hotel Trust . . . . . . . . . . . . . . . . . . 0.9 1,151,202
4.9 6,472,922
REIT – Mortgage 50,259 Colony Financial, Inc. . . . . . . . . . . . . . . . . . . . 0.7 979,04588,572 Starwood Property Trust, Inc. . . . . . . . . . . . . . . 1.4 1,821,040
2.1 2,800,085
REIT – Offi ce Property 7,324 Alexandria Real Estate Equities, Inc. . . . . . . . . . 0.5 661,797
13,459 Boston Properties, Inc. . . . . . . . . . . . . . . . . . . . 1.3 1,716,561464,673 Concentradora Fibra Dabhos S.A.
de C.V. . . . . . . . . . . . . . . . . . . . . . . . . . . . . . 0.7 960,20176,064 Great Portland Estates PLC . . . . . . . . . . . . . . . . 0.7 928,340
828 Hulic REIT, Inc. . . . . . . . . . . . . . . . . . . . . . . . . 0.9 1,160,90835,667 Mack-Cali Realty Corp. . . . . . . . . . . . . . . . . . . 0.6 832,82437,751 Parkway Properties, Inc. . . . . . . . . . . . . . . . . . . 0.4 590,048
5.1 6,850,679

PORTFOLIO INVESTMENTS
The accompanying notes are an integral part of the fi nancial statements.
J a n u s C a p i t a l F u n d s P l c / 3 1 D e c e m b e r 2 0 1 5 1 6 7
Share or Principal Amount
Percentage of Net
Assets (%) Fair
Value (USD)
REIT – Regional Malls 22,599 Simon Property Group, Inc. . . . . . . . . . . . . . . . 3.3 4,394,150
REIT – Shopping Centres 46,389 DDR Corp. . . . . . . . . . . . . . . . . . . . . . . . . . . . . 0.6 781,191
1,090 Kenedix Retail REIT Corp. . . . . . . . . . . . . . . . . 1.8 2,314,59428,471 Kite Realty Group Trust . . . . . . . . . . . . . . . . . . 0.6 738,25324,586 OneREIT . . . . . . . . . . . . . . . . . . . . . . . . . . . . . . — 58,99953,544 Ramco-Gershenson Properties Trust . . . . . . . . . 0.7 889,36660,360 WP GLIMCHER, Inc. . . . . . . . . . . . . . . . . . . . . 0.5 640,420
4.2 5,422,823
REIT – Warehouse and Industrial 1,757,000 AIMS AMP Capital Industrial REIT . . . . . . . . . . 1.3 1,704,562
281 Nippon Prologis REIT, Inc. . . . . . . . . . . . . . . . . 0.4 510,888589,688 Prologis Property Mexico S.A.
de C.V. . . . . . . . . . . . . . . . . . . . . . . . . . . . . . 0.7 893,36218,730 Prologis, Inc. . . . . . . . . . . . . . . . . . . . . . . . . . . 0.6 803,89216,362 QTS Realty Trust, Inc. . . . . . . . . . . . . . . . . . . . 0.6 738,09057,112 Terreno Realty Corp. . . . . . . . . . . . . . . . . . . . . 1.0 1,291,873
4.6 5,942,667
Retirement / Aged Care 53,345 Capital Senior Living Corp. . . . . . . . . . . . . . . . 0.8 1,112,777
Transportation – Marine 52,612 Hoegh LNG Partners L.P. . . . . . . . . . . . . . . . . . 0.7 979,635
Web Hosting and Design 5,175 Equinix, Inc. . . . . . . . . . . . . . . . . . . . . . . . . . . 1.2 1,564,920
Total Common Stock . . . . . . . . . . . . . . . . . . . . . . . . . . . . . . . . . 96.8 127,324,447
Corporate Bonds Real Estate Operating/Development
347,000 Consolidated-Tomoka Land Co., 4.5000%, due 15/3/20 (144A) . . . . . . . . . . . 0.3 346,132
Total Corporate Bonds . . . . . . . . . . . . . . . . . . . . . . . . . . . . . . . . . 0.3 346,132
Total Investments . . . . . . . . . . . . . . . . . . . . . . . . . . . . . . . . . . . . 97.1 127,670,579
Forward Currency Contracts, Open as at 31 December 2015
Currency Purchased
Currency Sold
Current Market
Value (USD) Settle Date
Unrealised Appreciation
(USD)
Citibank AUD 6,956 USD 4,998 4,936 29-Jan-16 62AUD 146 USD 105 104 29-Jan-16 1AUD 70 USD 51 51 29-Jan-16 —AUD 73 USD 53 53 29-Jan-16 —AUD 52 USD 38 38 29-Jan-16 —CNH 18,768 USD 2,844 2,843 29-Jan-16 1CNH 305 USD 46 46 29-Jan-16 —CNH 56 USD 9 9 29-Jan-16 —CNH 106 USD 16 16 29-Jan-16 —CNH 216 USD 33 33 29-Jan-16 —CNH 6 USD 1 1 29-Jan-16 —CNH 171 USD 26 26 29-Jan-16 —EUR 4,803,479 USD 5,219,955 5,216,828 29-Jan-16 3,127EUR 98,034 USD 106,534 106,470 29-Jan-16 64EUR 32,613 USD 35,440 35,419 29-Jan-16 21EUR 101,465 USD 110,311 110,294 29-Jan-16 17EUR 7,770 USD 8,444 8,439 29-Jan-16 5EUR 2,068 USD 2,248 2,248 29-Jan-16 —EUR 688 USD 748 748 29-Jan-16 —EUR 165 USD 179 179 29-Jan-16 —EUR 56 USD 62 62 29-Jan-16 —USD 53,998 EUR 49,382 53,696 29-Jan-16 302USD 28,474 EUR 26,061 28,337 29-Jan-16 137USD 7,410 GBP 4,965 7,319 29-Jan-16 91USD 4,644 GBP 3,117 4,595 29-Jan-16 49USD 5,659 EUR 5,164 5,615 29-Jan-16 44USD 5,990 EUR 5,476 5,954 29-Jan-16 36USD 5,470 GBP 3,689 5,439 29-Jan-16 31USD 1,279 EUR 1,166 1,268 29-Jan-16 11USD 589 EUR 539 586 29-Jan-16 3USD 214 GBP 144 213 29-Jan-16 1USD 196 EUR 179 195 29-Jan-16 1USD 64 EUR 59 64 29-Jan-16 —USD 20 CNH 134 20 29-Jan-16 —USD 39 EUR 36 39 29-Jan-16 —USD 166 EUR 153 166 29-Jan-16 —USD 14 CNH 90 14 29-Jan-16 —USD 23 AUD 32 23 29-Jan-16 —USD 2 EUR 2 2 29-Jan-16 —USD 28 EUR 25 28 29-Jan-16 —USD 9 EUR 8 9 29-Jan-16 —USD 15 CNH 101 15 29-Jan-16 —USD 28 AUD 38 28 29-Jan-16 —USD 46 EUR 42 46 29-Jan-16 —
Total 4,004
Total Financial Assets at fair value through profi t or loss 127,674,583

Janus Global Real Estate Fund
PORTFOLIO INVESTMENTS
The accompanying notes are an integral part of the fi nancial statements.
1 6 8 J a n u s C a p i t a l F u n d s P l c / 3 1 D e c e m b e r 2 0 1 5
Financial Liabilities at fair value through profi t or loss Forward Currency Contracts, Open as at 31 December 2015
Currency Purchased
Currency Sold
Current Market
Value (USD) Settle Date
Unrealised (Depreciation)
(USD)
Citibank EUR 78 USD 85 86 29-Jan-16 (1)EUR 80 USD 88 89 29-Jan-16 (1)EUR 322 USD 353 355 29-Jan-16 (2)EUR 229 USD 251 253 29-Jan-16 (2)EUR 335 USD 368 371 29-Jan-16 (3)EUR 690 USD 755 760 14-Jan-16 (5)EUR 968 USD 1,060 1,067 29-Jan-16 (7)EUR 1,008 USD 1,106 1,116 29-Jan-16 (10)EUR 4,660 USD 5,093 5,119 29-Jan-16 (26)EUR 33,786 USD 36,971 37,205 29-Jan-16 (234)EUR 47,340 USD 51,828 52,181 29-Jan-16 (353)EUR 48,898 USD 53,669 54,168 29-Jan-16 (499)GBP 5,036 USD 7,471 7,519 29-Jan-16 (48)GBP 6,921 USD 10,298 10,393 29-Jan-16 (95)GBP 7,041 USD 10,563 10,746 29-Jan-16 (183)GBP 14,398 USD 21,512 21,800 29-Jan-16 (288)GBP 676,537 USD 1,010,213 1,023,138 29-Jan-16 (12,924)USD 37 AUD 52 38 29-Jan-16 (1)USD 269 EUR 249 270 29-Jan-16 (1)USD 500 EUR 461 501 29-Jan-16 (1)USD 809 EUR 748 813 29-Jan-16 (4)USD 24,450 EUR 22,509 24,475 29-Jan-16 (25)USD 39,580 EUR 36,562 39,756 29-Jan-16 (176)
Total (14,889)
Total Financial Liabilities at fair value through profi t or loss (14,889)

Janus Flexible Income Fund
PORTFOLIO INVESTMENTS
The accompanying notes are an integral part of the fi nancial statements.
J a n u s C a p i t a l F u n d s P l c / 3 1 D e c e m b e r 2 0 1 5 1 6 9
Share or Principal Amount
Percentage of Net
Assets (%) Fair
Value (USD)
Financial Assets at fair value through profi t or loss Asset-Backed/Commercial Mortgage-Backed
Securities 595,000 AmeriCredit Automobile Receivables
Trust 2012-4, 3.8200%, due 10/2/20 . . . . . . . . . . . . . . . . . . . . . . . . . 0.1 602,412
1,062,000 AmeriCredit Automobile Receivables Trust 2015-2, 3.0000%, due 8/6/21 . . . . . . . 0.1 1,048,811
577,000 AmeriCredit Automobile Receivables Trust, 3.3100%, due 8/10/19 . . . . . . . . . . . . 0.1 586,717
3,788,000 Applebee’s/IHOP Funding LLC, 4.2770%, due 5/9/44 . . . . . . . . . . . . . . . . . . 0.4 3,841,546
1,139,000 Aventura Mall Trust 2013-AVM, 3.7427%, due 5/12/32 . . . . . . . . . . . . . . . . . 0.1 1,120,792
1,367,000 BAMLL Commercial Mortgage Securities Trust 2015-200P, 3.5958%, due 14/4/33 . . . . . . . . . . . . . . . . . 0.1 1,197,395
819,166 Banc of America Commercial Mortgage Trust 2006-6, 5.4210%, due 10/10/45 . . . . . . . . . . . . . . . . . . . . . . . . 0.1 831,420
913,000 BHP Billiton PLC, 3.3805%, due 15/8/26 . . . . . . . . . . . . . . . . . . . . . . . . . 0.1 911,943
478,000 CGBAM Commercial Mortgage Trust 2014-HD, 3.3305%, due 15/2/31 . . . . . . . . . 0.1 476,118
2,287,578 CKE Restaurant Holdings, Inc., 4.4740%, due 20/3/43 . . . . . . . . . . . . . . . . . 0.2 2,277,609
1,019,000 COMM 2007-C9 Mortgage Trust, 5.6500%, due 10/12/49 . . . . . . . . . . . . . . . . 0.1 1,033,751
571,000 Commercial Mortgage Trust 2007-GG11, 5.8670%, due 10/12/49 . . . . . . . . . . . 0.1 593,880
1,499,000 Core Industrial Trust 2015-TEXW, 3.8487%, due 10/2/34 . . . . . . . . . . . . . . . . . 0.2 1,407,228
1,052,050 DB Master Finance LLC 2015-1, 3.2620%, due 20/2/45 . . . . . . . . . . . . . . . . . 0.1 1,043,532
2,817,000 Domino’s Pizza Master Issuer LLC, 3.4840%, due 25/10/45 . . . . . . . . . . . . . . . . 0.3 2,764,181
1,070,910 Domino’s Pizza Master Issuer LLC, 5.2160%, due 25/1/42 . . . . . . . . . . . . . . . . . 0.1 1,102,638
1,916,135 Fannie Mae Pool, 3.5000%, due 1/1/43 . . . . . . . . . . . . . . . . . . . . . . . . . . 0.2 1,980,541
4,700,304 Fannie Mae Pool, 3.5000%, due 1/10/29 . . . . . . . . . . . . . . . . . . . . . . . . . 0.5 4,931,519
8,397,109 Fannie Mae Pool, 3.5000%, due 1/2/43 . . . . . . . . . . . . . . . . . . . . . . . . . . 0.9 8,678,924
3,532,969 Fannie Mae Pool, 3.5000%, due 1/2/45 . . . . . . . . . . . . . . . . . . . . . . . . . . 0.4 3,651,622
2,090,522 Fannie Mae Pool, 3.5000%, due 1/3/43 . . . . . . . . . . . . . . . . . . . . . . . . . . 0.2 2,160,952
1,737,291 Fannie Mae Pool, 3.5000%, due 1/5/33 . . . . . . . . . . . . . . . . . . . . . . . . . . 0.2 1,820,766
1,051,452 Fannie Mae Pool, 4.0000%, due 1/4/34 . . . . . . . . . . . . . . . . . . . . . . . . . . 0.1 1,133,501
367,056 Fannie Mae Pool, 4.0000%, due 1/6/29 . . . . . . . . . . . . . . . . . . . . . . . . . . . — 392,642
960,132 Fannie Mae Pool, 4.0000%, due 1/7/42 . . . . . . . . . . . . . . . . . . . . . . . . . . 0.1 1,022,568
1,018,730 Fannie Mae Pool, 4.0000%, due 1/9/29 . . . . . . . . . . . . . . . . . . . . . . . . . . 0.1 1,089,703
7,510,367 Fannie Mae Pool, 4.0000%, due 1/9/45 . . . . . . . . . . . . . . . . . . . . . . . . . . 0.9 8,002,630
3,711,498 Fannie Mae Pool, 4.5000%, due 1/10/44 . . . . . . . . . . . . . . . . . . . . . . . . . 0.5 4,091,015
1,420,693 Fannie Mae Pool, 4.5000%, due 1/3/43 . . . . . . . . . . . . . . . . . . . . . . . . . . 0.2 1,559,657
2,411,722 Fannie Mae Pool, 4.5000%, due 1/3/45 . . . . . . . . . . . . . . . . . . . . . . . . . . 0.3 2,653,680
3,131,646 Fannie Mae Pool, 4.5000%, due 1/8/44 . . . . . . . . . . . . . . . . . . . . . . . . . . 0.4 3,455,000
Share or Principal Amount
Percentage of Net
Assets (%) Fair
Value (USD)
503,302 Fannie Mae Pool, 5.0000%, due 1/10/41 . . . . . . . . . . . . . . . . . . . . . . . . . 0.1 554,793
1,782,707 Fannie Mae Pool, 5.0000%, due 1/7/44 . . . . . . . . . . . . . . . . . . . . . . . . . . 0.2 2,004,985
6,284,018 Fannie Mae Pool, 5.5000%, due 1/2/42 . . . . . . . . . . . . . . . . . . . . . . . . . . 0.8 7,007,908
1,440,779 Fannie Mae Pool, 5.5000%, due 1/6/41 . . . . . . . . . . . . . . . . . . . . . . . . . . 0.2 1,632,173
407,405 Freddie Mac Giant, 4.0000%, due 1/8/44 . . . . . . . . . . . . . . . . . . . . . . . . . . . — 435,054
1,503,691 Freddie Mac Gold Pool, 3.5000%, due 1/2/44 . . . . . . . . . . . . . . . . . . . . . . . . . . 0.2 1,554,070
890,791 Freddie Mac Gold Pool, 3.5000%, due 1/7/29 . . . . . . . . . . . . . . . . . . . . . . . . . . 0.1 932,788
747,564 Freddie Mac Gold Pool, 3.5000%, due 1/9/29 . . . . . . . . . . . . . . . . . . . . . . . . . . 0.1 782,896
2,220,504 Freddie Mac Gold Pool, 4.5000%, due 1/6/45 . . . . . . . . . . . . . . . . . . . . . . . . . . 0.3 2,445,755
4,696,729 Freddie Mac Gold Pool, 4.5000%, due 1/9/44 . . . . . . . . . . . . . . . . . . . . . . . . . . 0.6 5,172,598
1,370,112 Freddie Mac Gold Pool, 5.5000%, due 1/4/40 . . . . . . . . . . . . . . . . . . . . . . . . . . 0.2 1,532,710
438,000 Freddie Mac Structured Agency Credit Risk Debt Notes, 2.8216%, due 25/10/24 . . . . . . . . . . . . . . . . . . . . . . . . . — 439,420
396,000 Freddie Mac Structured Agency Credit Risk Debt Notes, 3.0716%, due 25/10/24 . . . . . . . . . . . . . . . . . . . . . . . . . — 401,551
4,282,973 FREMF 2010 K-SCT Mortgage Trust, 2.0000%, due 25/1/20 . . . . . . . . . . . . . . . . . 0.4 3,854,750
705,000 GAHR Commercial Mortgage Trust 2015-NRF, 3.3822%, due 15/12/19 . . . . . . . 0.1 680,342
482,302 Ginnie Mae I pool, 4.0000%, due 15/8/24 . . . . . . . . . . . . . . . . . . . . . . . . . 0.1 512,773
1,029,623 Ginnie Mae I pool, 4.5000%, due 15/5/41 . . . . . . . . . . . . . . . . . . . . . . . . . 0.1 1,122,694
974,109 Ginnie Mae I pool, 4.5000%, due 15/5/44 . . . . . . . . . . . . . . . . . . . . . . . . . 0.1 1,063,301
2,369,767 Ginnie Mae I pool, 5.0000%, due 15/9/39 . . . . . . . . . . . . . . . . . . . . . . . . . 0.3 2,657,510
4,763,203 Ginnie Mae II pool, 5.0000%, due 20/12/44 . . . . . . . . . . . . . . . . . . . . . . . . 0.6 5,337,085
1,309,912 Ginnie Mae II pool, 5.0000%, due 20/6/41 . . . . . . . . . . . . . . . . . . . . . . . . . 0.1 1,435,234
1,914,178 Ginnie Mae II pool, 5.5000%, due 20/3/35 . . . . . . . . . . . . . . . . . . . . . . . . . 0.2 2,136,656
496,742 Ginnie Mae II pool, 5.5000%, due 20/3/36 . . . . . . . . . . . . . . . . . . . . . . . . . 0.1 553,961
1,621,000 GS Mortgage Securities Corporation II, 3.4350%, due 10/12/27 . . . . . . . . . . . . . . . . 0.2 1,553,596
740,000 GS Mortgage Securities Corporation Trust 2013-NYC5, 3.6490%, due 10/1/30 . . . . . . . . . . . . . . . . . . . . . . . . . 0.1 736,767
486,000 Hilton U.S.A. Trust 2013-HLT, 4.4533%, due 5/11/30 . . . . . . . . . . . . . . . . . 0.1 487,183
1,095,000 JP Morgan Chase Commercial Mortgage Securities Trust 2013-JWRZ MZ, 4.8447%, due 16/2/25 . . . . . . . . 0.1 1,111,052
485,000 JP Morgan Chase Commercial Mortgage Securities Trust 2014-FBLU, 2.9305%, due 15/12/28 . . . . . . . . . . . 0.1 485,012
416,000 JP Morgan Chase Commercial Mortgage Securities Trust 2014-FBLU, 3.8305%, due 15/12/28 . . . . . . . . . . . . — 415,959
816,000 JP Morgan Chase Commercial Mortgage Securities Trust 2015-COSMO, 2.1305%, due 15/1/32 . . . . . . . . . . . . . . . . . . . . . . . . . 0.1 812,718

Janus Flexible Income Fund
PORTFOLIO INVESTMENTS
The accompanying notes are an integral part of the fi nancial statements.
1 7 0 J a n u s C a p i t a l F u n d s P l c / 3 1 D e c e m b e r 2 0 1 5
Share or Principal Amount
Percentage of Net
Assets (%) Fair
Value (USD)
885,000 JP Morgan Chase Commercial Mortgage Securities Trust 2015-COSMO, 4.2805%, due 15/1/32 . . . . . . . . . . . . . . . . . . . . . . . . . 0.1 873,999
437,000 JP Morgan Chase Commercial Mortgage Securities Trust 2015-SGP, 3.0805%, due 15/7/36 . . . . . . . . . . . . . . . . . . — 438,594
1,256,000 JP Morgan Chase Commercial Mortgage Securities Trust 2015-SGP, 4.8305%, due 15/7/36 . . . . . . . . . . . . . . . . . 0.1 1,264,667
972,000 JP Morgan Chase Commercial Mortgage Securities Trust 2015-UES, 3.6210%, due 5/9/32 . . . . . . . . . . . . . . 0.1 913,352
529,000 LB-UBS Commercial Mortgage Trust 2007-C1, 5.4840%, due 15/2/40 . . . . . . . . . 0.1 534,852
554,000 LB-UBS Commercial Mortgage Trust, 5.4930%, due 15/2/40 . . . . . . . . . . . . . . . . . 0.1 567,648
2,122,165 Multiple Pool, 4.0000%, due 1/5/43 . . . . . . . . . 0.2 2,260,1181,715,000 Santander Drive Auto Receivables
Trust 2013-4, 4.6700%, due 15/1/20 . . . . . . . . . . . . . . . . . . . . . . . . . 0.2 1,760,086
1,149,000 Santander Drive Auto Receivables Trust 2013-A, 4.7100%, due 15/1/21 . . . . . . . . . . . . . . . . . . . . . . . . . 0.1 1,175,568
1,089,000 Santander Drive Auto Receivables Trust 2015-1, 3.2400%, due 15/4/21 . . . . . . . . . . . . . . . . . . . . . . . . . 0.1 1,087,767
1,802,000 Santander Drive Auto Receivables Trust 2015-4, 3.5300%, due 16/8/21 . . . . . . . . . . . . . . . . . . . . . . . . . 0.2 1,787,412
718,000 Santander Drive Auto Receivables Trust, 2.5200%, due 17/9/18 . . . . . . . . . . . . 0.1 721,491
448,000 Starwood Retail Property Trust 2014-STAR, 2.8305%, due 15/11/27 . . . . . . . . . . . . — 446,915
1,709,000 Starwood Retail Property Trust 2014-STAR, 3.5805%, due 15/11/27 . . . . . . . . . . . 0.2 1,690,459
838,000 Starwood Retail Property Trust 2014-STAR, 4.4805%, due 15/11/27 . . . . . . . . . . . 0.1 835,064
1,745,000 Structured Agency Credit Risk, 2.6216%, due 25/3/25 . . . . . . . . . . . . . . . . . 0.2 1,741,362
2,504,000 Wachovia Bank Commercial Mortgage Trust Series 2007-C31, 5.6600%, due 15/4/47 . . . . . . . . . . . . . . . . . . . . . . . . . 0.3 2,505,454
788,000 Wachovia Bank Commercial Mortgage Trust Series 2007-C33, 5.9524%, due 15/2/51 . . . . . . . . . . . . . . . . . . . . . . . . . 0.1 804,325
691,000 Wells Fargo Commercial Mortgage Trust 2014-TISH, 2.5805%, due 15/2/27 . . . . . . . . . . . . . . . . . . . . . . . . . 0.1 672,835
498,000 Wells Fargo Commercial Mortgage Trust 2014-TISH, 3.0805%, due 15/1/27 . . . . . . . . . . . . . . . . . . . . . . . . . 0.1 485,449
204,000 Wells Fargo Commercial Mortgage Trust 2014-TISH, 3.5805%, due 15/2/27 . . . . . . . . . . . . . . . . . . . . . . . . . . — 197,948
3,121,178 Wendys Funding LLC, 3.3710%, due 15/6/45 . . . . . . . . . . . . . . . . . . . . . . . . . 0. 2 3,054,263
Total Asset-Backed/Commercial Mortgage-Backed Securities . . . . . . . . . . . . . . . . . . . . . . . . . . . . . . . . . . . . . . . . 15. 6 143,137,615
Corporate Bonds Aerospace and Defence – Equipment
1,354,000 Exelis, Inc., 4.2500%, due 1/10/16 . . . . . . . . . 0.1 1,378,543585,000 Exelis, Inc., 5.5500%, due 1/10/21 . . . . . . . . . 0.1 642,304754,000 Harris Corp., 3.8320%, due 27/4/25 . . . . . . . . 0.1 744,077
1,172,000 Harris Corp., 5.0540%, due 27/4/45 . . . . . . . . 0.1 1,151,9150.4 3,916,839
Share or Principal Amount
Percentage of Net
Assets (%) Fair
Value (USD)
Airlines 1,111,000 Southwest Airlines Co., 5.1250%,
due 1/3/17 . . . . . . . . . . . . . . . . . . . . . . . . . . 0.1 1,154,984
Automotive – Cars and Light Trucks 3,190,000 Ford Motor Credit Co., LLC,
3.9840%, due 15/6/16 . . . . . . . . . . . . . . . . . 0.4 3,225,766737,000 General Motors Co., 3.5000%,
due 2/10/18 . . . . . . . . . . . . . . . . . . . . . . . . . 0.1 746,242184,000 General Motors Co., 4.0000%,
due 1/4/25 . . . . . . . . . . . . . . . . . . . . . . . . . . . — 174,9795,200,000 General Motors Co., 4.8750%,
due 2/10/23 . . . . . . . . . . . . . . . . . . . . . . . . . 0.6 5,343,8271,881,000 General Motors Financial Co., Inc.,
3.1000%, due 15/1/19 . . . . . . . . . . . . . . . . . 0.2 1,879,6121.3 11,370,426
Automotive – Truck Parts and Equipment – Original 600,000 Schaeffl er Finance B.V., 4.2500%,
due 15/5/21 . . . . . . . . . . . . . . . . . . . . . . . . . 0.1 598,500891,000 ZF North America Capital, Inc.,
4.0000%, due 29/4/20 . . . . . . . . . . . . . . . . . 0.1 901,692632,000 ZF North America Capital, Inc.,
4.5000%, due 29/4/22 . . . . . . . . . . . . . . . . . 0.1 620,150895,000 ZF North America Capital, Inc.,
4.7500%, due 29/4/25 . . . . . . . . . . . . . . . . . 0.1 855,8440.4 2,976,186
Building – Heavy Construction 1,220,000 SBA Tower Trust, 2.9330%,
due 15/12/17 . . . . . . . . . . . . . . . . . . . . . . . . 0.1 1,235,686
Building – Residential and Commercial 1,256,000 D.R. Horton, Inc., 3.7500%,
due 1/3/19 . . . . . . . . . . . . . . . . . . . . . . . . . . 0.1 1,259,140714,000 D.R. Horton, Inc., 4.7500%,
due 15/5/17 . . . . . . . . . . . . . . . . . . . . . . . . . 0.1 738,0981,430,000 MDC Holdings, Inc., 5.5000%,
due 15/1/24 . . . . . . . . . . . . . . . . . . . . . . . . . 0.2 1,451,450614,000 Toll Brothers Finance Corp., 4.0000%,
due 31/12/18 . . . . . . . . . . . . . . . . . . . . . . . . 0.1 627,815342,000 Toll Brothers Finance Corp., 4.3750%,
due 15/4/23 . . . . . . . . . . . . . . . . . . . . . . . . . . — 333,450500,000 Toll Brothers Finance Corp., 5.8750%,
due 15/2/22 . . . . . . . . . . . . . . . . . . . . . . . . . 0.1 527,5000.6 4,937,453
Building and Construction Products – Miscellaneous 803,000 Owens Corning, 4.2000%,
due 1/12/24 . . . . . . . . . . . . . . . . . . . . . . . . . 0.1 782,953
Building Products – Cement and Aggregate 1,263,000 Hanson, Ltd., 6.1250%, due 15/8/16 . . . . . . . . 0.1 1,299,311
970,000 Martin Marietta Materials, Inc., 4.2500%, due 2/7/24 . . . . . . . . . . . . . . . . . . 0.1 953,678
3,401,000 Vulcan Materials Co., 4.5000%, due 1/4/25 . . . . . . . . . . . . . . . . . . . . . . . . . . 0.4 3,383,995
1,344,000 Vulcan Materials Co., 7.0000%, due 15/6/18 . . . . . . . . . . . . . . . . . . . . . . . . . 0.2 1,498,560
725,000 Vulcan Materials Co., 7.5000%, due 15/6/21 . . . . . . . . . . . . . . . . . . . . . . . . . 0.1 848,250
0.9 7,983,794
Cable/Satellite TV 1,465,000 CCO Safari II LLC, 4.4640%,
due 23/7/22 . . . . . . . . . . . . . . . . . . . . . . . . . 0.2 1,461,5295,087,000 CCO Safari II LLC, 4.9080%,
due 23/7/25 . . . . . . . . . . . . . . . . . . . . . . . . . 0.6 5,089,7320.8 6,551,261
Casino Hotels 925,000 Wynn Las Vegas LLC / Wynn Las
Vegas Capital Corp., 4.2500%, due 30/5/23 . . . . . . . . . . . . . . . . . . . . . . . . . 0.1 794,922

PORTFOLIO INVESTMENTS
The accompanying notes are an integral part of the fi nancial statements.
J a n u s C a p i t a l F u n d s P l c / 3 1 D e c e m b e r 2 0 1 5 1 7 1
Share or Principal Amount
Percentage of Net
Assets (%) Fair
Value (USD)
Chemicals – Specialty 2,830,000 Albemarle Corp., 4.1500%,
due 1/12/24 . . . . . . . . . . . . . . . . . . . . . . . . . 0.3 2,709,5072,108,000 Albemarle Corp., 5.4500%,
due 1/12/44 . . . . . . . . . . . . . . . . . . . . . . . . . 0.2 2,046,0841,160,000 Ashland, Inc., 3.8750%,
due 15/4/18 . . . . . . . . . . . . . . . . . . . . . . . . . 0.1 1,187,5501,525,000 Ashland, Inc., 6.8750%,
due 15/5/43 . . . . . . . . . . . . . . . . . . . . . . . . . 0.2 1,456,3750.8 7,399,516
Commercial Banks – Eastern U.S. 4,878,000 CIT Group, Inc., 4.2500%,
due 15/8/17 . . . . . . . . . . . . . . . . . . . . . . . . . 0.5 4,999,9503,364,000 CIT Group, Inc., 5.5000%,
due 15/2/19 . . . . . . . . . . . . . . . . . . . . . . . . . 0.4 3,523,7900.9 8,523,740
Commercial Banks – Non U.S. 3,151,000 Intesa Sanpaolo SpA, 5.0170%,
due 26/6/24 . . . . . . . . . . . . . . . . . . . . . . . . . 0.3 3,105,3925,045,000 Santander U.K. PLC, 5.0000%,
due 7/11/23 . . . . . . . . . . . . . . . . . . . . . . . . . 0.6 5,260,1740.9 8,365,566
Commercial Banks – Western U.S. 1,710,000 SVB Financial Group, 5.3750%,
due 15/9/20 . . . . . . . . . . . . . . . . . . . . . . . . . 0.2 1,874,717540,000 Zions Bancorporation, 5.8000%,
due 15/6/23 . . . . . . . . . . . . . . . . . . . . . . . . . 0.1 518,4000.3 2,393,117
Commercial Services 1,853,000 UBM PLC, 5.7500%, due 3/11/20 . . . . . . . . . . 0.2 1,982,456
Computer Aided Design 1,243,000 Autodesk, Inc., 3.6000%,
due 15/12/22 . . . . . . . . . . . . . . . . . . . . . . . . 0.1 1,209,260
Computers – Memory Devices 6,260,000 Seagate HDD Cayman, 4.7500%,
due 1/1/25 . . . . . . . . . . . . . . . . . . . . . . . . . . 0.6 5,221,8232,049,000 Seagate HDD Cayman, 4.8750%,
due 1/6/27 . . . . . . . . . . . . . . . . . . . . . . . . . . 0.2 1,575,523388,000 Seagate Technology PLC, 4.7500%,
due 1/6/23 . . . . . . . . . . . . . . . . . . . . . . . . . . . — 340,1222,422,000 Seagate Technology PLC, 5.7500%,
due 1/12/34 . . . . . . . . . . . . . . . . . . . . . . . . . 0.2 1,699,0261.0 8,836,494
Consulting Services 3,944,000 Verisk Analytics, Inc., 4.0000%,
due 15/6/25 . . . . . . . . . . . . . . . . . . . . . . . . . 0.4 3,838,2531,343,000 Verisk Analytics, Inc., 4.1250%,
due 12/9/22 . . . . . . . . . . . . . . . . . . . . . . . . . 0.1 1,355,1221,078,000 Verisk Analytics, Inc., 4.8750%,
due 15/1/19 . . . . . . . . . . . . . . . . . . . . . . . . . 0.1 1,128,3672,150,000 Verisk Analytics, Inc., 5.5000%,
due 15/6/45 . . . . . . . . . . . . . . . . . . . . . . . . . 0.2 2,060,0294,453,000 Verisk Analytics, Inc., 5.8000%,
due 1/5/21 . . . . . . . . . . . . . . . . . . . . . . . . . . 0.5 4,940,1271.3 13,321,898
Containers – Metal and Glass 1,142,000 Ball Corp., 4.3750%, due 15/12/20 . . . . . . . . . 0.1 1,161,985
Data Processing and Management 4,618,000 Fidelity National Information Services,
Inc., 3.6250%, due 15/10/20 . . . . . . . . . . . . 0.5 4,683,1782,302,000 Fidelity National Information Services,
Inc., 4.5000%, due 15/10/22 . . . . . . . . . . . . 0.3 2,346,4957,879,000 Fidelity National Information Services,
Inc., 5.0000%, due 15/10/25 . . . . . . . . . . . . 0.9 8,110,887369,000 Fidelity National Information Services,
Inc., 5.0000%, due 15/3/22 . . . . . . . . . . . . . . — 383,7371.7 15,524,297
Share or Principal Amount
Percentage of Net
Assets (%) Fair
Value (USD)
Diagnostic Equipment 1,513,000 Life Technologies Corp.,
6.0000%, due 1/3/20 . . . . . . . . . . . . . . . . . . 0.2 1,678,796
Dialysis Centres 2,437,000 Fresenius Medical Care U.S. Finance
II, Inc., 5.8750%, due 31/1/22 . . . . . . . . . . . 0.3 2,619,775
Diversifi ed Banking Institutions 685,000 Bank of America Corp.,
5.7500%, due 15/8/16 . . . . . . . . . . . . . . . . . 0.1 701,8963,167,000 Bank of America Corp.,
8.0000%, due 29/12/49 . . . . . . . . . . . . . . . . 0.4 3,226,3813,581,000 Citigroup, Inc., 4.4500%,
due 29/9/27 . . . . . . . . . . . . . . . . . . . . . . . . . 0.4 3,565,3511,956,000 Goldman Sachs Group, Inc.,
4.2500%, due 21/10/25 . . . . . . . . . . . . . . . . 0.2 1,944,904790,000 Goldman Sachs Group, Inc.,
5.6250%, due 15/1/17 . . . . . . . . . . . . . . . . . 0.1 820,760733,000 Morgan Stanley, 4.3500%,
due 8/9/26 . . . . . . . . . . . . . . . . . . . . . . . . . . 0.1 736,957805,000 Morgan Stanley, 4.8750%,
due 1/11/22 . . . . . . . . . . . . . . . . . . . . . . . . . 0.1 855,5501,998,000 Morgan Stanley, 5.5500%,
due 29/12/49 . . . . . . . . . . . . . . . . . . . . . . . . 0.2 2,000,4984,634,000 Royal Bank of Scotland Group PLC,
5.1250%, due 28/5/24 . . . . . . . . . . . . . . . . . 0.5 4,702,9172,457,000 Royal Bank of Scotland Group PLC,
6.0000%, due 19/12/23 . . . . . . . . . . . . . . . . 0.3 2,650,4352,981,000 Royal Bank of Scotland Group PLC,
6.1000%, due 10/6/23 . . . . . . . . . . . . . . . . . 0.3 3,207,7202.7 24,413,369
Diversifi ed Financial Services 1,081,000 Carlyle Holdings Finance LLC,
3.8750%, due 1/2/23 . . . . . . . . . . . . . . . . . . 0.1 1,095,7621,501,000 General Electric Capital Corp.,
6.3750%, due 15/11/67 . . . . . . . . . . . . . . . . 0.2 1,571,2470.3 2,667,009
Diversifi ed Manufacturing Operations 987,000 General Electric Co., 4.0000%,
due 29/12/49 . . . . . . . . . . . . . . . . . . . . . . . . 0.1 988,2343,789,000 General Electric Co., 4.1000%,
due 29/12/49 . . . . . . . . . . . . . . . . . . . . . . . . 0.4 3,788,9620.5 4,777,196
Diversifi ed Operations 2,319,000 GE Capital Trust I, 6.3750%,
due 15/11/67 . . . . . . . . . . . . . . . . . . . . . . . . 0.3 2,416,108
Electric – Integrated 853,000 Ipalco Enterprises, Inc., 5.0000%,
due 1/5/18 . . . . . . . . . . . . . . . . . . . . . . . . . . 0.1 897,7831,142,000 PPL WEM Holdings PLC, 3.9000%,
due 1/5/16 . . . . . . . . . . . . . . . . . . . . . . . . . . 0.1 1,146,6511,681,000 PPL WEM Holdings PLC, 5.3750%,
due 1/5/21 . . . . . . . . . . . . . . . . . . . . . . . . . . 0.2 1,836,0150.4 3,880,449
Electric Products – Miscellaneous 952,000 Molex Electronic Technologies LLC,
2.8780%, due 15/4/20 . . . . . . . . . . . . . . . . . 0.1 928,467
Electronic Design Automation 3,487,000 Cadence Design Systems, Inc.,
4.3750%, due 15/10/24 . . . . . . . . . . . . . . . . 0.4 3,468,184
Electronic Measuring Instruments 1,827,000 FLIR Systems, Inc., 3.7500%,
due 1/9/16 . . . . . . . . . . . . . . . . . . . . . . . . . . 0.2 1,853,6764,083,000 Trimble Navigation, Ltd., 4.7500%,
due 1/12/24 . . . . . . . . . . . . . . . . . . . . . . . . . 0.4 4,064,2470.6 5,917,923

Janus Flexible Income Fund
PORTFOLIO INVESTMENTS
The accompanying notes are an integral part of the fi nancial statements.
1 7 2 J a n u s C a p i t a l F u n d s P l c / 3 1 D e c e m b e r 2 0 1 5
Share or Principal Amount
Percentage of Net
Assets (%) Fair
Value (USD)
Fiduciary Banks 2,336,000 Citizens Financial Group, Inc.,
4.3000%, due 3/12/25 . . . . . . . . . . . . . . . . . 0.3 2,352,957
Finance – Auto Loans 2,094,000 Ally Financial, Inc., 4.1250%,
due 30/3/20 . . . . . . . . . . . . . . . . . . . . . . . . . 0.2 2,088,765654,000 Ally Financial, Inc., 5.7500%,
due 20/11/25 . . . . . . . . . . . . . . . . . . . . . . . . 0.1 663,810373,000 Ally Financial, Inc., 8.0000%,
due 31/12/18 . . . . . . . . . . . . . . . . . . . . . . . . . — 409,3680.3 3,161,943
Finance – Consumer Loans 2,137,000 Synchrony Financial, 3.0000%,
due 15/8/19 . . . . . . . . . . . . . . . . . . . . . . . . . 0.2 2,135,848
Finance – Credit Card 1,492,000 American Express Co., 6.8000%,
due 1/9/66 . . . . . . . . . . . . . . . . . . . . . . . . . . 0.2 1,506,9201,599,000 Discover Financial Services,
3.7500%, due 4/3/25 . . . . . . . . . . . . . . . . . . 0.2 1,538,467743,000 Discover Financial Services,
3.9500%, due 6/11/24 . . . . . . . . . . . . . . . . . 0.1 733,7710.5 3,779,158
Finance – Investment Bankers/Brokers 1,193,000 Charles Schwab Corp., 3.0000%,
due 10/3/25 . . . . . . . . . . . . . . . . . . . . . . . . . 0.1 1,174,7331,608,000 Charles Schwab Corp., 7.0000%,
due 28/2/49 . . . . . . . . . . . . . . . . . . . . . . . . . 0.2 1,833,1202,899,000 E*TRADE Financial Corp.,
4.6250%, due 15/9/23 . . . . . . . . . . . . . . . . . 0.3 2,953,3562,178,000 E*TRADE Financial Corp.,
5.3750%, due 15/11/22 . . . . . . . . . . . . . . . . 0.2 2,286,9002,057,000 Lazard Group LLC, 4.2500%,
due 14/11/20 . . . . . . . . . . . . . . . . . . . . . . . . 0.2 2,132,92248,000 Lazard Group LLC, 6.8500%,
due 15/6/17 . . . . . . . . . . . . . . . . . . . . . . . . . . — 51,1244,830,000 Raymond James Financial, Inc.,
5.6250%, due 1/4/24 . . . . . . . . . . . . . . . . . . 0.6 5,354,5141,475,000 Stifel Financial Corp., 4.2500%,
due 18/7/24 . . . . . . . . . . . . . . . . . . . . . . . . . 0.2 1,468,0811,838,000 TD Ameritrade Holding Corp.,
2.9500%, due 1/4/22 . . . . . . . . . . . . . . . . . . 0.2 1,822,1583,895,000 TD Ameritrade Holding Corp.,
3.6250%, due 1/4/25 . . . . . . . . . . . . . . . . . . 0.4 3,946,1182.4 23,023,026
Finance – Leasing Company 1,097,000 AerCap Ireland Capital Ltd., / AerCap
Global Aviation Trust, 4.6250%, due 1/7/22 . . . . . . . . . . . . . . . . . . . . . . . . . . 0.1 1,112,084
1,990,000 AerCap Ireland Capital, Ltd. / AerCap Global Aviation Trust, 4.6250%, due 30/10/20 . . . . . . . . . . . . . . . . . . . . . . . . 0.2 2,042,238
1,861,000 International Lease Finance Corp., 6.7500%, due 1/9/16 . . . . . . . . . . . . . . . . . . 0.2 1,914,504
773,000 International Lease Finance Corp., 8.7500%, due 15/3/17 . . . . . . . . . . . . . . . . . 0.1 825,178
4,503,000 LeasePlan Corp. N.V., 2.5000%, due 16/5/18 . . . . . . . . . . . . . . . . . . . . . . . . . 0.5 4,437,409
1.1 10,331,413
Finance – Other Services 1,888,000 Intercontinental Exchange, Inc.,
3.7500%, due 1/12/25 . . . . . . . . . . . . . . . . . 0.2 1,895,478
Food – Confectionery 2,552,000 Wm Wrigley Jr., Co., 2.4000%,
due 21/10/18 . . . . . . . . . . . . . . . . . . . . . . . . 0.3 2,560,4801,472,000 Wm Wrigley Jr., Co., 3.3750%,
due 21/10/20 . . . . . . . . . . . . . . . . . . . . . . . . 0.2 1,502,3260.5 4,062,806
Share or Principal Amount
Percentage of Net
Assets (%) Fair
Value (USD)
Food – Meat Products 314,000 Sun Merger Sub, Inc., 5.2500%,
due 1/8/18 . . . . . . . . . . . . . . . . . . . . . . . . . . . — 318,710918,000 Tyson Foods, Inc., 6.6000%,
due 1/4/16 . . . . . . . . . . . . . . . . . . . . . . . . . . 0.1 930,2020.1 1,248,912
Food – Miscellaneous/Diversifi ed 1,384,000 HJ Heinz Co., 2.8000%,
due 2/7/20 . . . . . . . . . . . . . . . . . . . . . . . . . . 0.2 1,381,8671,186,000 HJ Heinz Co., 3.5000%,
due 15/7/22 . . . . . . . . . . . . . . . . . . . . . . . . . 0.1 1,195,8690.3 2,577,736
Gas – Distribution 1,834,000 NGL Energy Partners L.P. / NGL
Energy Finance Corp., 5.1250%, due 15/7/19 . . . . . . . . . . . . . . . . . . . . . . . . . 0.2 1,458,030
226,000 Southern Star Central Gas Pipeline, Inc., 6.0000%, due 1/6/16 . . . . . . . . . . . . . . . — 228,241
0.2 1,686,271
Instruments – Scientifi c 1,023,000 Thermo Fisher Scientifi c, Inc.,
3.3000%, due 15/2/22 . . . . . . . . . . . . . . . . . 0.1 1,021,888
Investment Management and Advisory Services 3,253,000 Ameriprise Financial, Inc.,
7.5180%, due 1/6/66 . . . . . . . . . . . . . . . . . . 0.3 3,187,9402,435,000 Neuberger Berman Group LLC /
Neuberger Berman Finance Corp., 4.8750%, due 15/4/45 . . . . . . . . . . . . . . . . . 0.2 2,060,485
2,141,000 Neuberger Berman Group LLC / Neuberger Berman Finance Corp., 5.8750%, due 15/3/22 . . . . . . . . . . . . . . . . . 0.2 2,229,316
0.7 7,477,741
Life and Health Insurance 530,000 CNO Financial Group, Inc.,
4.5000%, due 30/5/20 . . . . . . . . . . . . . . . . . 0.1 541,9251,722,000 CNO Financial Group, Inc.,
5.2500%, due 30/5/25 . . . . . . . . . . . . . . . . . 0.2 1,758,5933,702,000 Primerica, Inc., 4.7500%,
due 15/7/22 . . . . . . . . . . . . . . . . . . . . . . . . . 0.4 3,916,7010.7 6,217,219
Linen Supply and Related Items 632,000 Cintas Corp. No 2, 2.8500%,
due 1/6/16 . . . . . . . . . . . . . . . . . . . . . . . . . . 0.1 634,536707,000 Cintas Corp. No 2, 4.3000%,
due 1/6/21 . . . . . . . . . . . . . . . . . . . . . . . . . . 0.1 746,9110.2 1,381,447
Machinery – Farm 1,246,000 CNH Capital LLC, 3.6250%,
due 15/4/18 . . . . . . . . . . . . . . . . . . . . . . . . . 0.1 1,232,917
Medical – Biomedical and Genetic 486,000 Life Technologies Corp., 5.0000%,
due 15/1/21 . . . . . . . . . . . . . . . . . . . . . . . . . 0.1 517,610
Medical – Generic Drugs 2,784,000 Actavis Funding SCS, 3.0000%,
due 12/3/20 . . . . . . . . . . . . . . . . . . . . . . . . . 0.3 2,788,7472,244,000 Actavis Funding SCS, 3.8000%,
due 15/3/25 . . . . . . . . . . . . . . . . . . . . . . . . . 0.2 2,236,8372,185,000 Actavis Funding SCS, 4.5500%,
due 15/3/35 . . . . . . . . . . . . . . . . . . . . . . . . . 0.2 2,130,2110.7 7,155,795
Medical – Hospitals 902,000 HCA, Inc., 3.7500%, due 15/3/19 . . . . . . . . . . 0.1 911,020
Medical Labs and Testing Services 2,239,000 Laboratory Corp. of America
Holdings, 3.2000%, due 1/2/22 . . . . . . . . . . 0.2 2,200,418

PORTFOLIO INVESTMENTS
The accompanying notes are an integral part of the fi nancial statements.
J a n u s C a p i t a l F u n d s P l c / 3 1 D e c e m b e r 2 0 1 5 1 7 3
Share or Principal Amount
Percentage of Net
Assets (%) Fair
Value (USD)
Medical Products 1,839,000 Becton Dickinson and Co., 1.8000%,
due 15/12/17 . . . . . . . . . . . . . . . . . . . . . . . . 0.2 1,837,1982,087,000 Zimmer Holdings, Inc., 2.7000%,
due 1/4/20 . . . . . . . . . . . . . . . . . . . . . . . . . . 0.2 2,062,8182,370,000 Zimmer Holdings, Inc., 3.1500%,
due 1/4/22 . . . . . . . . . . . . . . . . . . . . . . . . . . 0.3 2,333,1681,483,000 Zimmer Holdings, Inc., 3.5500%,
due 1/4/25 . . . . . . . . . . . . . . . . . . . . . . . . . . 0.2 1,443,8710.9 7,677,055
Metal – Aluminum 2,555,000 Alcoa, Inc., 5.1250%, due 1/10/24 . . . . . . . . . . 0.3 2,337,825
Multi-Line Insurance 1,414,000 ING U.S., Inc., 5.6500%,
due 15/5/53 . . . . . . . . . . . . . . . . . . . . . . . . . 0.2 1,399,860
Oil – Field Services 3,542,000 Oceaneering International, Inc.,
4.6500%, due 15/11/24 . . . . . . . . . . . . . . . . 0.3 2,977,441
Oil and Gas Drilling 2,918,000 Helmerich & Payne International
Drilling Co., 4.6500%, due 15/3/25 . . . . . . . . . . . . . . . . . . . . . . . . . 0.3 2,924,735
Oil Companies – Exploration and Production 4,398,000 Cimarex Energy Co., 4.3750%,
due 1/6/24 . . . . . . . . . . . . . . . . . . . . . . . . . . 0.4 3,908,3444,595,000 Cimarex Energy Co., 5.8750%,
due 1/5/22 . . . . . . . . . . . . . . . . . . . . . . . . . . 0.5 4,405,3511,407,000 Devon Energy Corp., 2.2500%,
due 15/12/18 . . . . . . . . . . . . . . . . . . . . . . . . 0.1 1,285,0101.0 9,598,705
Oil Companies – Integrated 1,490,000 Chevron Corp., 1.3450%,
due 15/11/17 . . . . . . . . . . . . . . . . . . . . . . . . 0.2 1,485,7183,461,000 Shell International Finance B.V.,
2.2500%, due 10/11/20 . . . . . . . . . . . . . . . . 0.4 3,413,9720.6 4,899,690
Oil Field Services 1,125,000 Korea National Oil Corp., 4.0000%,
due 27/10/16 . . . . . . . . . . . . . . . . . . . . . . . . 0.1 1,148,192
Oil Refi ning and Marketing 825,000 Motiva Enterprises LLC, 5.7500%,
due 15/1/20 . . . . . . . . . . . . . . . . . . . . . . . . . 0.1 888,926
Paper and Related Products 3,291,000 Georgia-Pacifi c LLC, 3.1630%,
due 15/11/21 . . . . . . . . . . . . . . . . . . . . . . . . 0.4 3,290,3551,733,000 Georgia-Pacifi c LLC, 3.6000%,
due 1/3/25 . . . . . . . . . . . . . . . . . . . . . . . . . . 0.2 1,715,6960.6 5,006,051
Pipelines 1,403,000 DCP Midstream Operating L.P.,
4.9500%, due 1/4/22 . . . . . . . . . . . . . . . . . . 0.1 1,151,166429,000 DCP Midstream Operating L.P.,
5.6000%, due 1/4/44 . . . . . . . . . . . . . . . . . . . — 261,908101,000 El Paso Corp., 6.5000%,
due 15/9/20 . . . . . . . . . . . . . . . . . . . . . . . . . . — 100,657861,000 El Paso Pipeline Partners Operating
Co., LLC, 4.3000%, due 1/5/24 . . . . . . . . . . 0.1 741,547871,000 El Paso Pipeline Partners Operating
Co., LLC, 5.0000%, due 1/10/21 . . . . . . . . . 0.1 823,127933,000 Energy Transfer Partners L.P.,
4.1500%, due 1/10/20 . . . . . . . . . . . . . . . . . 0.1 861,5911,238,000 EnLink Midstream Partners L.P.,
4.4000%, due 1/4/24 . . . . . . . . . . . . . . . . . . 0.1 981,853995,000 EnLink Midstream Partners L.P.,
5.6000%, due 1/4/44 . . . . . . . . . . . . . . . . . . 0.1 695,006
Share or Principal Amount
Percentage of Net
Assets (%) Fair
Value (USD)
1,029,000 Kinder Morgan, Inc., 7.7500%, due 15/1/32 . . . . . . . . . . . . . . . . . . . . . . . . . 0.1 980,785
599,000 Phillips 66 Partners L.P., 3.6050%, due 15/2/25 . . . . . . . . . . . . . . . . . . . . . . . . . 0.1 516,252
2,275,000 Spectra Energy Corp., 4.7500%, due 15/3/24 . . . . . . . . . . . . . . . . . . . . . . . . . 0.2 2,207,426
1,775,000 Targa Resources Partners L.P. / Targa Resources Partners Finance Corp., 4.1250%, due 15/11/19 . . . . . . . . . . . . . . . . 0.2 1,486,563
3,575,000 Western Gas Partners L.P., 5.3750%, due 1/6/21 . . . . . . . . . . . . . . . . . . . . . . . . . . 0.4 3,622,587
1.6 14,430,468
Property and Casualty Insurance 2,375,000 ACE INA Holdings, Inc., 3.3500%,
due 3/5/26 . . . . . . . . . . . . . . . . . . . . . . . . . . 0.3 2,370,801
Publishing – Periodicals 735,000 Nielsen Finance LLC / Nielsen
Finance Co., 4.5000%, due 1/10/20 . . . . . . . . . . . . . . . . . . . . . . . . . 0.1 748,781
Real Estate Management/Services 2,620,000 Jones Lang LaSalle, Inc., 4.4000%,
due 15/11/22 . . . . . . . . . . . . . . . . . . . . . . . . 0.3 2,690,2212,611,000 Kennedy-Wilson, Inc., 5.8750%,
due 1/4/24 . . . . . . . . . . . . . . . . . . . . . . . . . . 0.3 2,526,1430.6 5,216,364
Real Estate Operating/Development 1,176,000 Post Apartment Homes L.P.,
4.7500%, due 15/10/17 . . . . . . . . . . . . . . . . 0.1 1,223,497
REIT – Diversifi ed 2,205,000 American Tower Trust I, 1.5510%,
due 15/3/18 . . . . . . . . . . . . . . . . . . . . . . . . . 0.2 2,156,0522,726,000 Goodman Funding Pty, Ltd.,
6.3750%, due 15/4/21 . . . . . . . . . . . . . . . . . 0.3 3,101,8640.5 5,257,916
REIT – Health Care 637,000 Senior Housing Properties Trust,
6.7500%, due 15/12/21 . . . . . . . . . . . . . . . . 0.1 717,821545,000 Senior Housing Properties Trust,
6.7500%, due 15/4/20 . . . . . . . . . . . . . . . . . 0.1 603,6990.2 1,321,520
REIT – Offi ce Property 525,000 Alexandria Real Estate Equities, Inc.,
2.7500%, due 15/1/20 . . . . . . . . . . . . . . . . . 0.1 516,6121,203,000 Alexandria Real Estate Equities, Inc.,
4.5000%, due 30/7/29 . . . . . . . . . . . . . . . . . 0.1 1,179,5622,639,000 Alexandria Real Estate Equities, Inc.,
4.6000%, due 1/4/22 . . . . . . . . . . . . . . . . . . 0.3 2,741,3881,177,000 Reckson Operating Partnership L.P.,
5.0000%, due 15/8/18 . . . . . . . . . . . . . . . . . 0.1 1,235,736369,000 Reckson Operating Partnership L.P.,
6.0000%, due 31/3/16 . . . . . . . . . . . . . . . . . . — 372,4642,093,000 Reckson Operating Partnership L.P.,
7.7500%, due 15/3/20 . . . . . . . . . . . . . . . . . 0.3 2,445,1240.9 8,490,886
REIT – Shopping Centres 794,000 Retail Opportunity Investments
Partnership L.P., 4.0000%, due 15/12/24 . . . . . . . . . . . . . . . . . . . . . . . . 0.1 751,475
375,000 Retail Opportunity Investments Partnership L.P., 5.0000%, due 15/12/23 . . . . . . . . . . . . . . . . . . . . . . . . . — 383,490
0.1 1,134,965
Retail – Drug Store 3,545,000 CVS Health Corp., 2.8000%,
due 20/7/20 . . . . . . . . . . . . . . . . . . . . . . . . . 0.4 3,564,6321,989,000 CVS Health Corp., 3.5000%,
due 20/7/22 . . . . . . . . . . . . . . . . . . . . . . . . . 0.2 2,026,795
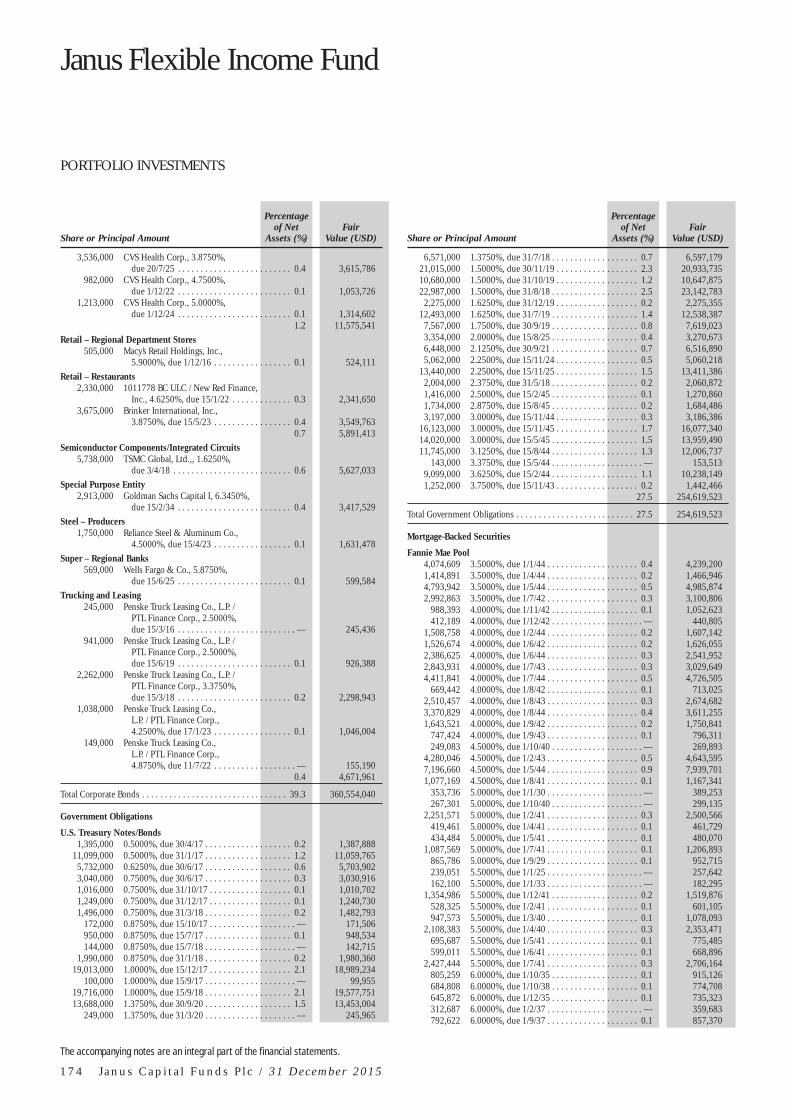
Janus Flexible Income Fund
PORTFOLIO INVESTMENTS
The accompanying notes are an integral part of the fi nancial statements.
1 7 4 J a n u s C a p i t a l F u n d s P l c / 3 1 D e c e m b e r 2 0 1 5
Share or Principal Amount
Percentage of Net
Assets (%) Fair
Value (USD)
3,536,000 CVS Health Corp., 3.8750%, due 20/7/25 . . . . . . . . . . . . . . . . . . . . . . . . . 0.4 3,615,786
982,000 CVS Health Corp., 4.7500%, due 1/12/22 . . . . . . . . . . . . . . . . . . . . . . . . . 0.1 1,053,726
1,213,000 CVS Health Corp., 5.0000%, due 1/12/24 . . . . . . . . . . . . . . . . . . . . . . . . . 0.1 1,314,602
1.2 11,575,541
Retail – Regional Department Stores 505,000 Macy’s Retail Holdings, Inc.,
5.9000%, due 1/12/16 . . . . . . . . . . . . . . . . . 0.1 524,111
Retail – Restaurants 2,330,000 1011778 BC ULC / New Red Finance,
Inc., 4.6250%, due 15/1/22 . . . . . . . . . . . . . 0.3 2,341,6503,675,000 Brinker International, Inc.,
3.8750%, due 15/5/23 . . . . . . . . . . . . . . . . . 0.4 3,549,7630.7 5,891,413
Semiconductor Components/Integrated Circuits 5,738,000 TSMC Global, Ltd.,, 1.6250%,
due 3/4/18 . . . . . . . . . . . . . . . . . . . . . . . . . . 0.6 5,627,033
Special Purpose Entity 2,913,000 Goldman Sachs Capital I, 6.3450%,
due 15/2/34 . . . . . . . . . . . . . . . . . . . . . . . . . 0.4 3,417,529
Steel – Producers 1,750,000 Reliance Steel & Aluminum Co.,
4.5000%, due 15/4/23 . . . . . . . . . . . . . . . . . 0. 1 1,631,478
Super – Regional Banks 569,000 Wells Fargo & Co., 5.8750%,
due 15/6/25 . . . . . . . . . . . . . . . . . . . . . . . . . 0.1 599,584
Trucking and Leasing 245,000 Penske Truck Leasing Co., L.P. /
PTL Finance Corp., 2.5000%, due 15/3/16 . . . . . . . . . . . . . . . . . . . . . . . . . . — 245,436
941,000 Penske Truck Leasing Co., L.P. / PTL Finance Corp., 2.5000%, due 15/6/19 . . . . . . . . . . . . . . . . . . . . . . . . . 0.1 926,388
2,262,000 Penske Truck Leasing Co., L.P. / PTL Finance Corp., 3.3750%, due 15/3/18 . . . . . . . . . . . . . . . . . . . . . . . . . 0.2 2,298,943
1,038,000 Penske Truck Leasing Co., L.P. / PTL Finance Corp., 4.2500%, due 17/1/23 . . . . . . . . . . . . . . . . . 0.1 1,046,004
149,000 Penske Truck Leasing Co., L.P. / PTL Finance Corp., 4.8750%, due 11/7/22 . . . . . . . . . . . . . . . . . . — 155,190
0.4 4,671,961
Total Corporate Bonds . . . . . . . . . . . . . . . . . . . . . . . . . . . . . . . . 39. 3 360,554,040
Government Obligations U.S. Treasury Notes/Bonds
1,395,000 0.5000%, due 30/4/17 . . . . . . . . . . . . . . . . . . . 0.2 1,387,88811,099,000 0.5000%, due 31/1/17 . . . . . . . . . . . . . . . . . . . 1.2 11,059,765
5,732,000 0.6250%, due 30/6/17 . . . . . . . . . . . . . . . . . . . 0.6 5,703,9023,040,000 0.7500%, due 30/6/17 . . . . . . . . . . . . . . . . . . . 0.3 3,030,9161,016,000 0.7500%, due 31/10/17 . . . . . . . . . . . . . . . . . . 0.1 1,010,7021,249,000 0.7500%, due 31/12/17 . . . . . . . . . . . . . . . . . . 0.1 1,240,7301,496,000 0.7500%, due 31/3/18 . . . . . . . . . . . . . . . . . . . 0.2 1,482,793
172,000 0.8750%, due 15/10/17 . . . . . . . . . . . . . . . . . . . — 171,506950,000 0.8750%, due 15/7/17 . . . . . . . . . . . . . . . . . . . 0.1 948,534144,000 0.8750%, due 15/7/18 . . . . . . . . . . . . . . . . . . . . — 142,715
1,990,000 0.8750%, due 31/1/18 . . . . . . . . . . . . . . . . . . . 0.2 1,980,36019,013,000 1.0000%, due 15/12/17 . . . . . . . . . . . . . . . . . . 2.1 18,989,234
100,000 1.0000%, due 15/9/17 . . . . . . . . . . . . . . . . . . . . — 99,95519,716,000 1.0000%, due 15/9/18 . . . . . . . . . . . . . . . . . . . 2.1 19,577,75113,688,000 1.3750%, due 30/9/20 . . . . . . . . . . . . . . . . . . . 1.5 13,453,004
249,000 1.3750%, due 31/3/20 . . . . . . . . . . . . . . . . . . . . — 245,965
Share or Principal Amount
Percentage of Net
Assets (%) Fair
Value (USD)
6,571,000 1.3750%, due 31/7/18 . . . . . . . . . . . . . . . . . . . 0.7 6,597,17921,015,000 1.5000%, due 30/11/19 . . . . . . . . . . . . . . . . . . 2.3 20,933,73510,680,000 1.5000%, due 31/10/19 . . . . . . . . . . . . . . . . . . 1.2 10,647,87522,987,000 1.5000%, due 31/8/18 . . . . . . . . . . . . . . . . . . . 2.5 23,142,783
2,275,000 1.6250%, due 31/12/19 . . . . . . . . . . . . . . . . . . 0.2 2,275,35512,493,000 1.6250%, due 31/7/19 . . . . . . . . . . . . . . . . . . . 1.4 12,538,387
7,567,000 1.7500%, due 30/9/19 . . . . . . . . . . . . . . . . . . . 0.8 7,619,0233,354,000 2.0000%, due 15/8/25 . . . . . . . . . . . . . . . . . . . 0.4 3,270,6736,448,000 2.1250%, due 30/9/21 . . . . . . . . . . . . . . . . . . . 0.7 6,516,8905,062,000 2.2500%, due 15/11/24 . . . . . . . . . . . . . . . . . . 0.5 5,060,218
13,440,000 2.2500%, due 15/11/25 . . . . . . . . . . . . . . . . . . 1.5 13,411,3862,004,000 2.3750%, due 31/5/18 . . . . . . . . . . . . . . . . . . . 0.2 2,060,8721,416,000 2.5000%, due 15/2/45 . . . . . . . . . . . . . . . . . . . 0.1 1,270,8601,734,000 2.8750%, due 15/8/45 . . . . . . . . . . . . . . . . . . . 0.2 1,684,4863,197,000 3.0000%, due 15/11/44 . . . . . . . . . . . . . . . . . . 0.3 3,186,386
16,123,000 3.0000%, due 15/11/45 . . . . . . . . . . . . . . . . . . 1.7 16,077,34014,020,000 3.0000%, due 15/5/45 . . . . . . . . . . . . . . . . . . . 1.5 13,959,49011,745,000 3.1250%, due 15/8/44 . . . . . . . . . . . . . . . . . . . 1.3 12,006,737
143,000 3.3750%, due 15/5/44 . . . . . . . . . . . . . . . . . . . . — 153,5139,099,000 3.6250%, due 15/2/44 . . . . . . . . . . . . . . . . . . . 1.1 10,238,1491,252,000 3.7500%, due 15/11/43 . . . . . . . . . . . . . . . . . . 0.2 1,442,466
27.5 254,619,523
Total Government Obligations . . . . . . . . . . . . . . . . . . . . . . . . . . 27.5 254,619,523
Mortgage-Backed Securities Fannie Mae Pool
4,074,609 3.5000%, due 1/1/44 . . . . . . . . . . . . . . . . . . . . 0.4 4,239,2001,414,891 3.5000%, due 1/4/44 . . . . . . . . . . . . . . . . . . . . 0.2 1,466,9464,793,942 3.5000%, due 1/5/44 . . . . . . . . . . . . . . . . . . . . 0.5 4,985,8742,992,863 3.5000%, due 1/7/42 . . . . . . . . . . . . . . . . . . . . 0.3 3,100,806
988,393 4.0000%, due 1/11/42 . . . . . . . . . . . . . . . . . . . 0.1 1,052,623412,189 4.0000%, due 1/12/42 . . . . . . . . . . . . . . . . . . . . — 440,805
1,508,758 4.0000%, due 1/2/44 . . . . . . . . . . . . . . . . . . . . 0.2 1,607,1421,526,674 4.0000%, due 1/6/42 . . . . . . . . . . . . . . . . . . . . 0.2 1,626,0552,386,625 4.0000%, due 1/6/44 . . . . . . . . . . . . . . . . . . . . 0.3 2,541,9522,843,931 4.0000%, due 1/7/43 . . . . . . . . . . . . . . . . . . . . 0.3 3,029,6494,411,841 4.0000%, due 1/7/44 . . . . . . . . . . . . . . . . . . . . 0.5 4,726,505
669,442 4.0000%, due 1/8/42 . . . . . . . . . . . . . . . . . . . . 0.1 713,0252,510,457 4.0000%, due 1/8/43 . . . . . . . . . . . . . . . . . . . . 0.3 2,674,6823,370,829 4.0000%, due 1/8/44 . . . . . . . . . . . . . . . . . . . . 0.4 3,611,2551,643,521 4.0000%, due 1/9/42 . . . . . . . . . . . . . . . . . . . . 0.2 1,750,841
747,424 4.0000%, due 1/9/43 . . . . . . . . . . . . . . . . . . . . 0.1 796,311249,083 4.5000%, due 1/10/40 . . . . . . . . . . . . . . . . . . . . — 269,893
4,280,046 4.5000%, due 1/2/43 . . . . . . . . . . . . . . . . . . . . 0.5 4,643,5957,196,660 4.5000%, due 1/5/44 . . . . . . . . . . . . . . . . . . . . 0.9 7,939,7011,077,169 4.5000%, due 1/8/41 . . . . . . . . . . . . . . . . . . . . 0.1 1,167,341
353,736 5.0000%, due 1/1/30 . . . . . . . . . . . . . . . . . . . . . — 389,253267,301 5.0000%, due 1/10/40 . . . . . . . . . . . . . . . . . . . . — 299,135
2,251,571 5.0000%, due 1/2/41 . . . . . . . . . . . . . . . . . . . . 0.3 2,500,566419,461 5.0000%, due 1/4/41 . . . . . . . . . . . . . . . . . . . . 0.1 461,729434,484 5.0000%, due 1/5/41 . . . . . . . . . . . . . . . . . . . . 0.1 480,070
1,087,569 5.0000%, due 1/7/41 . . . . . . . . . . . . . . . . . . . . 0.1 1,206,893865,786 5.0000%, due 1/9/29 . . . . . . . . . . . . . . . . . . . . 0.1 952,715239,051 5.5000%, due 1/1/25 . . . . . . . . . . . . . . . . . . . . . — 257,642162,100 5.5000%, due 1/1/33 . . . . . . . . . . . . . . . . . . . . . — 182,295
1,354,986 5.5000%, due 1/12/41 . . . . . . . . . . . . . . . . . . . 0.2 1,519,876528,325 5.5000%, due 1/2/41 . . . . . . . . . . . . . . . . . . . . 0.1 601,105947,573 5.5000%, due 1/3/40 . . . . . . . . . . . . . . . . . . . . 0.1 1,078,093
2,108,383 5.5000%, due 1/4/40 . . . . . . . . . . . . . . . . . . . . 0.3 2,353,471695,687 5.5000%, due 1/5/41 . . . . . . . . . . . . . . . . . . . . 0.1 775,485599,011 5.5000%, due 1/6/41 . . . . . . . . . . . . . . . . . . . . 0.1 668,896
2,427,444 5.5000%, due 1/7/41 . . . . . . . . . . . . . . . . . . . . 0.3 2,706,164805,259 6.0000%, due 1/10/35 . . . . . . . . . . . . . . . . . . . 0.1 915,126684,808 6.0000%, due 1/10/38 . . . . . . . . . . . . . . . . . . . 0.1 774,708645,872 6.0000%, due 1/12/35 . . . . . . . . . . . . . . . . . . . 0.1 735,323312,687 6.0000%, due 1/2/37 . . . . . . . . . . . . . . . . . . . . . — 359,683792,622 6.0000%, due 1/9/37 . . . . . . . . . . . . . . . . . . . . 0.1 857,370

PORTFOLIO INVESTMENTS
The accompanying notes are an integral part of the fi nancial statements.
J a n u s C a p i t a l F u n d s P l c / 3 1 D e c e m b e r 2 0 1 5 1 7 5
Share or Principal Amount
Percentage of Net
Assets (%) Fair
Value (USD)
275,765 7.0000%, due 1/2/39 . . . . . . . . . . . . . . . . . . . . . — 318,5737.9 72,778,372
Freddie Mac Gold Pool 614,221 4.5000%, due 1/1/41 . . . . . . . . . . . . . . . . . . . . 0.1 667,890138,126 5.0000%, due 1/1/19 . . . . . . . . . . . . . . . . . . . . . — 142,929995,380 5.0000%, due 1/5/41 . . . . . . . . . . . . . . . . . . . . 0.1 1,109,220299,503 5.0000%, due 1/6/20 . . . . . . . . . . . . . . . . . . . . . — 317,464589,527 5.5000%, due 1/10/36 . . . . . . . . . . . . . . . . . . . 0.1 660,946546,051 5.5000%, due 1/12/28 . . . . . . . . . . . . . . . . . . . 0.1 603,508833,756 5.5000%, due 1/5/41 . . . . . . . . . . . . . . . . . . . . 0.1 923,146120,986 5.5000%, due 1/8/19 . . . . . . . . . . . . . . . . . . . . . — 125,327
3,212,151 6.0000%, due 1/4/40 . . . . . . . . . . . . . . . . . . . . 0.4 3,659,7470.9 8,210,177
Ginnie Mae 1,046,082 5.1000%, due 15/1/32 . . . . . . . . . . . . . . . . . . . 0.1 1,186,415
Ginnie Mae I pool 1,016,902 4.5000%, due 15/7/41 . . . . . . . . . . . . . . . . . . . 0.1 1,101,4121,972,469 4.5000%, due 15/8/41 . . . . . . . . . . . . . . . . . . . 0.2 2,174,496
863,293 4.5000%, due 15/9/40 . . . . . . . . . . . . . . . . . . . 0.1 942,6071,201,229 4.9000%, due 15/10/34 . . . . . . . . . . . . . . . . . . 0.1 1,324,852
258,416 5.0000%, due 15/1/40 . . . . . . . . . . . . . . . . . . . . — 285,960456,084 5.0000%, due 15/10/39 . . . . . . . . . . . . . . . . . . 0.1 506,215826,288 5.0000%, due 15/11/39 . . . . . . . . . . . . . . . . . . 0.1 915,299
1,818,098 5.0000%, due 15/11/43 . . . . . . . . . . . . . . . . . . 0.2 2,015,049846,078 5.0000%, due 15/2/41 . . . . . . . . . . . . . . . . . . . 0.1 937,003289,028 5.0000%, due 15/4/41 . . . . . . . . . . . . . . . . . . . . — 320,196
1,430,999 5.0000%, due 15/5/40 . . . . . . . . . . . . . . . . . . . 0.1 1,591,707336,222 5.0000%, due 15/5/41 . . . . . . . . . . . . . . . . . . . . — 377,552
4,221,619 5.0000%, due 15/6/44 . . . . . . . . . . . . . . . . . . . 0.6 4,731,5361,120,706 5.0000%, due 15/7/40 . . . . . . . . . . . . . . . . . . . 0.1 1,241,331
461,581 5.0000%, due 15/9/41 . . . . . . . . . . . . . . . . . . . 0.1 511,456467,609 5.5000%, due 15/3/36 . . . . . . . . . . . . . . . . . . . 0.1 529,260
2,268,930 5.5000%, due 15/6/39 . . . . . . . . . . . . . . . . . . . 0.3 2,601,3312,135,891 5.5000%, due 15/8/39 . . . . . . . . . . . . . . . . . . . 0.3 2,425,438
311,977 5.5000%, due 15/9/35 . . . . . . . . . . . . . . . . . . . . — 359,4072.6 24,892,107
Ginnie Mae II pool 584,473 3.5000%, due 20/5/42 . . . . . . . . . . . . . . . . . . . 0.1 613,047637,898 5.5000%, due 20/1/42 . . . . . . . . . . . . . . . . . . . 0.1 709,633547,001 5.5000%, due 20/11/37 . . . . . . . . . . . . . . . . . . 0.1 605,981749,450 5.5000%, due 20/5/42 . . . . . . . . . . . . . . . . . . . 0.1 835,809
1,177,006 5.5000%, due 20/7/42 . . . . . . . . . . . . . . . . . . . 0.1 1,298,047199,181 6.0000%, due 20/1/39 . . . . . . . . . . . . . . . . . . . . — 222,852243,214 6.0000%, due 20/1/42 . . . . . . . . . . . . . . . . . . . . — 275,673
85,702 6.0000%, due 20/10/41 . . . . . . . . . . . . . . . . . . . — 97,204440,806 6.0000%, due 20/11/34 . . . . . . . . . . . . . . . . . . 0.1 493,478264,751 6.0000%, due 20/11/42 . . . . . . . . . . . . . . . . . . . — 298,431392,094 6.0000%, due 20/12/41 . . . . . . . . . . . . . . . . . . 0.1 443,194375,221 6.0000%, due 20/2/42 . . . . . . . . . . . . . . . . . . . . — 425,109322,592 6.0000%, due 20/2/43 . . . . . . . . . . . . . . . . . . . . — 364,942228,117 6.0000%, due 20/3/42 . . . . . . . . . . . . . . . . . . . . — 258,543925,820 6.0000%, due 20/4/42 . . . . . . . . . . . . . . . . . . . 0.1 1,049,091627,462 6.0000%, due 20/5/42 . . . . . . . . . . . . . . . . . . . 0.1 702,144263,476 6.0000%, due 20/7/42 . . . . . . . . . . . . . . . . . . . . — 297,971273,861 6.0000%, due 20/8/42 . . . . . . . . . . . . . . . . . . . . — 310,361320,703 6.0000%, due 20/9/42 . . . . . . . . . . . . . . . . . . . . — 363,487
96,725 7.0000%, due 20/5/39 . . . . . . . . . . . . . . . . . . . . — 110,6080.8 9,775,605
Total Mortgage-Backed Securities . . . . . . . . . . . . . . . . . . . . . . . . 12. 4 116,842,676
Preferred Stock Diversifi ed Banking Institutions
45,000 Citigroup Capital XIII, 6.6919% . . . . . . . . . . . . 0.1 1,169,55075,975 Morgan Stanley, 6.8750% . . . . . . . . . . . . . . . . . 0.2 2,108,30673,000 Morgan Stanley, 7.1250% . . . . . . . . . . . . . . . . . 0.2 2,087,800
0.5 5,365,656
Share or Principal Amount
Percentage of Net
Assets (%) Fair
Value (USD)
Diversifi ed Financial Services 9,000 General Electric Capital Corp.,,
4.7000% . . . . . . . . . . . . . . . . . . . . . . . . . . . . . — 229,230
Finance – Credit Card 100,000 Discover Financial Services,
6.5000% . . . . . . . . . . . . . . . . . . . . . . . . . . . . 0.3 2,647,000
Finance – Investment Bankers/Brokers 13,000 Morgan Stanley Capital Trust III,
6.2500% . . . . . . . . . . . . . . . . . . . . . . . . . . . . . — 331,2402,000 Morgan Stanley Capital Trust IV,
6.2500% . . . . . . . . . . . . . . . . . . . . . . . . . . . . . — 50,7401,000 Morgan Stanley Capital Trust V,
5.7500% . . . . . . . . . . . . . . . . . . . . . . . . . . . . . — 25,1805,000 Morgan Stanley Capital Trust VIII,
6.4500% . . . . . . . . . . . . . . . . . . . . . . . . . . . . . — 126,550— 533,710
Super – Regional Banks 71,000 Wells Fargo & Co., 6.6250% . . . . . . . . . . . . . . 0. 3 2,039,835
Total Preferred Stock . . . . . . . . . . . . . . . . . . . . . . . . . . . . . . . . . . 1. 1 10,815,431
Tranche Loans Electronic Components – Semiconductors
8,006,528 Avago Technologies Cayman, Ltd., 3.0000%, due 6/5/21 . . . . . . . . . . . . . . . . . . 1. 0 7,979,858
Finance – Other Services 4,771,000 Avago Technologies (Cayman), Ltd.,
3.5000%, due 11/11/22 . . . . . . . . . . . . . . . . 0.5 4,714,368
Media 1,876,912 Tribune Media Co., 3.0000%,
due 27/12/20 . . . . . . . . . . . . . . . . . . . . . . . . 0.2 1,845,830
Medical Information Systems 2,461,515 IMS Health, Inc., 2.2500%,
due 17/3/21 . . . . . . . . . . . . . . . . . . . . . . . . . 0.3 2,399,977
Retail – Offi ce Supplies 796,000 Staples, Inc., 2.7500%, due 23/4/21 . . . . . . . . . 0.1 785,716
Telecommunications 2,111,000 Charter Communications, 2.7500%,
due 21/1/23 . . . . . . . . . . . . . . . . . . . . . . . . . 0.2 2,106,609
Total Tranche Loans . . . . . . . . . . . . . . . . . . . . . . . . . . . . . . . . . . . 2. 3 19,832,358
Total Investments . . . . . . . . . . . . . . . . . . . . . . . . . . . . . . . . . . . . 98. 3 905,801,643
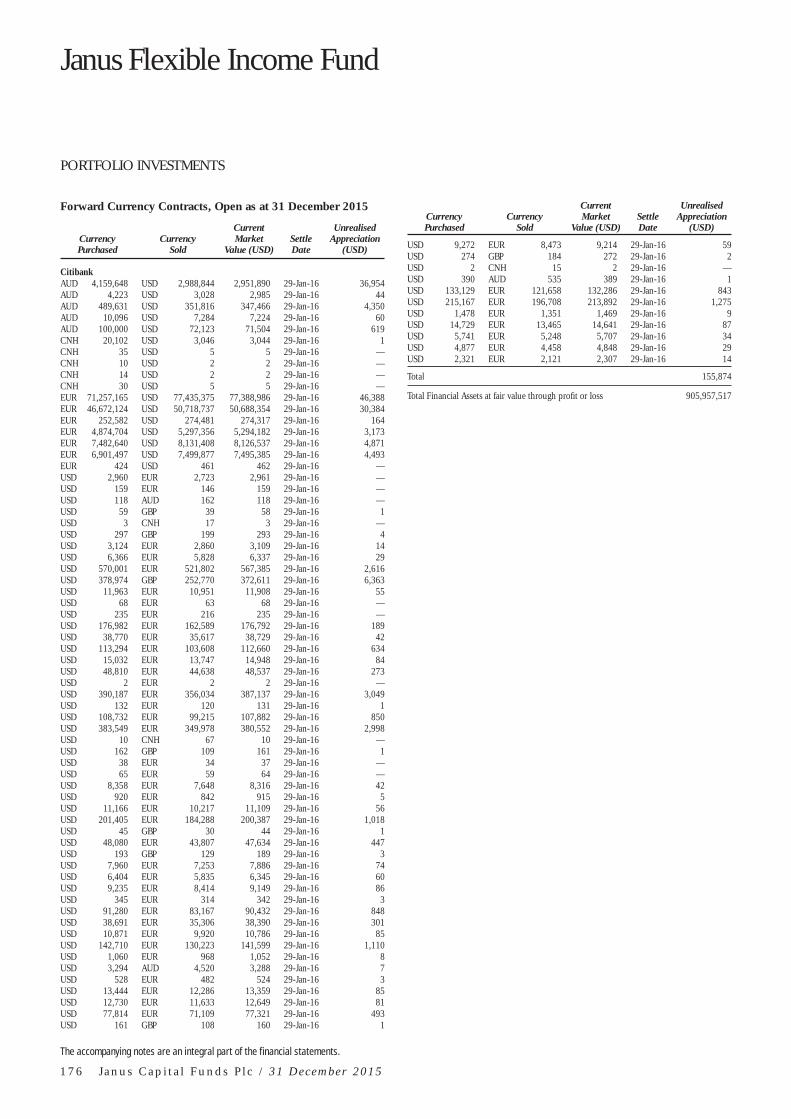
Janus Flexible Income Fund
PORTFOLIO INVESTMENTS
The accompanying notes are an integral part of the fi nancial statements.
1 7 6 J a n u s C a p i t a l F u n d s P l c / 3 1 D e c e m b e r 2 0 1 5
Forward Currency Contracts, Open as at 31 December 2015
Currency Purchased
Currency Sold
Current Market
Value (USD) Settle Date
Unrealised Appreciation
(USD)
Citibank AUD 4,159,648 USD 2,988,844 2,951,890 29-Jan-16 36,954AUD 4,223 USD 3,028 2,985 29-Jan-16 44AUD 489,631 USD 351,816 347,466 29-Jan-16 4,350AUD 10,096 USD 7,284 7,224 29-Jan-16 60AUD 100,000 USD 72,123 71,504 29-Jan-16 619CNH 20,102 USD 3,046 3,044 29-Jan-16 1CNH 35 USD 5 5 29-Jan-16 —CNH 10 USD 2 2 29-Jan-16 —CNH 14 USD 2 2 29-Jan-16 —CNH 30 USD 5 5 29-Jan-16 —EUR 71,257,165 USD 77,435,375 77,388,986 29-Jan-16 46,388EUR 46,672,124 USD 50,718,737 50,688,354 29-Jan-16 30,384EUR 252,582 USD 274,481 274,317 29-Jan-16 164EUR 4,874,704 USD 5,297,356 5,294,182 29-Jan-16 3,173EUR 7,482,640 USD 8,131,408 8,126,537 29-Jan-16 4,871EUR 6,901,497 USD 7,499,877 7,495,385 29-Jan-16 4,493EUR 424 USD 461 462 29-Jan-16 —USD 2,960 EUR 2,723 2,961 29-Jan-16 —USD 159 EUR 146 159 29-Jan-16 —USD 118 AUD 162 118 29-Jan-16 —USD 59 GBP 39 58 29-Jan-16 1USD 3 CNH 17 3 29-Jan-16 —USD 297 GBP 199 293 29-Jan-16 4USD 3,124 EUR 2,860 3,109 29-Jan-16 14USD 6,366 EUR 5,828 6,337 29-Jan-16 29USD 570,001 EUR 521,802 567,385 29-Jan-16 2,616USD 378,974 GBP 252,770 372,611 29-Jan-16 6,363USD 11,963 EUR 10,951 11,908 29-Jan-16 55USD 68 EUR 63 68 29-Jan-16 —USD 235 EUR 216 235 29-Jan-16 —USD 176,982 EUR 162,589 176,792 29-Jan-16 189USD 38,770 EUR 35,617 38,729 29-Jan-16 42USD 113,294 EUR 103,608 112,660 29-Jan-16 634USD 15,032 EUR 13,747 14,948 29-Jan-16 84USD 48,810 EUR 44,638 48,537 29-Jan-16 273USD 2 EUR 2 2 29-Jan-16 —USD 390,187 EUR 356,034 387,137 29-Jan-16 3,049USD 132 EUR 120 131 29-Jan-16 1USD 108,732 EUR 99,215 107,882 29-Jan-16 850USD 383,549 EUR 349,978 380,552 29-Jan-16 2,998USD 10 CNH 67 10 29-Jan-16 —USD 162 GBP 109 161 29-Jan-16 1USD 38 EUR 34 37 29-Jan-16 —USD 65 EUR 59 64 29-Jan-16 —USD 8,358 EUR 7,648 8,316 29-Jan-16 42USD 920 EUR 842 915 29-Jan-16 5USD 11,166 EUR 10,217 11,109 29-Jan-16 56USD 201,405 EUR 184,288 200,387 29-Jan-16 1,018USD 45 GBP 30 44 29-Jan-16 1USD 48,080 EUR 43,807 47,634 29-Jan-16 447USD 193 GBP 129 189 29-Jan-16 3USD 7,960 EUR 7,253 7,886 29-Jan-16 74USD 6,404 EUR 5,835 6,345 29-Jan-16 60USD 9,235 EUR 8,414 9,149 29-Jan-16 86USD 345 EUR 314 342 29-Jan-16 3USD 91,280 EUR 83,167 90,432 29-Jan-16 848USD 38,691 EUR 35,306 38,390 29-Jan-16 301USD 10,871 EUR 9,920 10,786 29-Jan-16 85USD 142,710 EUR 130,223 141,599 29-Jan-16 1,110USD 1,060 EUR 968 1,052 29-Jan-16 8USD 3,294 AUD 4,520 3,288 29-Jan-16 7USD 528 EUR 482 524 29-Jan-16 3USD 13,444 EUR 12,286 13,359 29-Jan-16 85USD 12,730 EUR 11,633 12,649 29-Jan-16 81USD 77,814 EUR 71,109 77,321 29-Jan-16 493USD 161 GBP 108 160 29-Jan-16 1
Currency Purchased
Currency Sold
Current Market
Value (USD) Settle Date
Unrealised Appreciation
(USD)
USD 9,272 EUR 8,473 9,214 29-Jan-16 59USD 274 GBP 184 272 29-Jan-16 2USD 2 CNH 15 2 29-Jan-16 —USD 390 AUD 535 389 29-Jan-16 1USD 133,129 EUR 121,658 132,286 29-Jan-16 843USD 215,167 EUR 196,708 213,892 29-Jan-16 1,275USD 1,478 EUR 1,351 1,469 29-Jan-16 9USD 14,729 EUR 13,465 14,641 29-Jan-16 87USD 5,741 EUR 5,248 5,707 29-Jan-16 34USD 4,877 EUR 4,458 4,848 29-Jan-16 29USD 2,321 EUR 2,121 2,307 29-Jan-16 14
Total 155,874
Total Financial Assets at fair value through profi t or loss 905,957,517

PORTFOLIO INVESTMENTS
The accompanying notes are an integral part of the fi nancial statements.
J a n u s C a p i t a l F u n d s P l c / 3 1 D e c e m b e r 2 0 1 5 1 7 7
Financial Liabilities at fair value through profi t or loss
Forward Currency Contracts, Open as at 31 December 2015
Currency Purchased
Currency Sold
Current Market
Value (USD) Settle Date
Unrealised (Depreciation)
(USD)
Citibank AUD 14,596 USD 10,643 10,668 29-Jan-16 (25)EUR 812 USD 888 893 29-Jan-16 (5)EUR 7,980 USD 8,747 8,817 29-Jan-16 (70)EUR 400 USD 437 439 29-Jan-16 (2)EUR 15,582 USD 17,044 17,146 29-Jan-16 (102)GBP 384,735 USD 574,490 581,840 29-Jan-16 (7,350)GBP 76,937 USD 114,883 116,353 29-Jan-16 (1,470)USD 1,772 AUD 2,461 1,790 29-Jan-16 (18)USD 4,183 EUR 3,847 4,183 29-Jan-16 (1)USD 26,327 EUR 24,216 26,331 29-Jan-16 (4)USD 209 AUD 290 211 29-Jan-16 (2)USD 42,816 EUR 39,383 42,823 29-Jan-16 (7)USD 4,230 EUR 3,891 4,231 29-Jan-16 (1)USD 16,013 EUR 14,790 16,082 29-Jan-16 (69)USD 10,793 EUR 9,968 10,839 29-Jan-16 (46)USD 1,603 EUR 1,480 1,610 29-Jan-16 (7)USD 85,055 EUR 78,557 85,420 29-Jan-16 (365)USD 343,998 EUR 317,719 345,473 29-Jan-16 (1,474)USD 873 AUD 1,202 874 29-Jan-16 (1)
Total (11,019)
Total Financial Liabilities at fair value through profi t or loss (11,019)

Janus Global Flexible Income Fund
PORTFOLIO INVESTMENTS
The accompanying notes are an integral part of the fi nancial statements.
1 7 8 J a n u s C a p i t a l F u n d s P l c / 3 1 D e c e m b e r 2 0 1 5
Share or Principal Amount
Percentage of Net
Assets (%) Fair
Value (USD)
Financial Assets at fair value through profi t or loss Asset-Backed/Commercial Mortgage-Backed
Securities 25,000 AmeriCredit Automobile
Receivables Trust 2015-2, 3.0000%, due 8/6/21 . . . . . . . . . . . . . . . . . . 0.1 24,690
8,000 AmeriCredit Automobile Receivables Trust, 3.3100%, due 8/10/19 . . . . . . . . . . . . . — 8,135
33,646 Broadgate Financing PLC, 1.5504%, due 5/1/22 . . . . . . . . . . . . . . . . . . 0.2 48,602
107,662 DECO 12-UK 4 PLC, 0.8494%, due 27/1/20 . . . . . . . . . . . . . . . . . . . . . . . . . 0.7 149,402
100,000 DECO 2012-MHILL, Ltd., 2.8481%, due 28/7/16 . . . . . . . . . . . . . . . . . 0.7 146,295
170,000 DECO 2012-MHILL, Ltd., 2.8481%, due 28/7/21 . . . . . . . . . . . . . . . . . 1.2 249,910
68,000 Domino’s Pizza Master Issuer LLC, 3.4840%, due 25/10/45 (144A) . . . . . . . . . . 0.3 66,725
28,059 FREMF 2010 K-SCT Mortgage Trust, 2.0000%, due 25/1/20 (144A) . . . . . . . . . . . 0.1 25,254
100,000 Hilton U.S.A. Trust 2013-HLT, 4.4533%, due 5/11/30 (144A) . . . . . . . . . . . 0.5 100,243
227,000 JP Morgan Chase Commercial Mortgage Securities Trust 2015-COSMO, 3.6305%, due 15/1/32 (144A) . . . . . . . . . . . . . . . . . . . 1.1 226,214
25,000 JP Morgan Chase Commercial Mortgage Securities Trust 2015-UES, 3.6210%, due 5/9/32 (144A) . . . . . . . . . . . . . . . . . . . . 0.1 23,492
100,000 Leek Finance Number Eighteen PLC, 0.8570%, due 21/9/38 . . . . . . . . . . . . . . . . . 0.5 107,075
148,571 London & Regional Debt Securitisation No 2 PLC, 5.8794%, due 15/10/18 . . . . . . . . . . . . . . . . 1.0 220,865
214,886 Magellan Mortgages No3 PLC, 0.1790%, due 15/5/58 . . . . . . . . . . . . . . . . . 1.0 200,573
252,072 Nemus II Arden PLC, 0.8031%, due 15/2/20 . . . . . . . . . . . . . . . . . . . . . . . . . 1.8 361,986
101,000 Residential Mortgage Securities 28 PLC, 2.2358%, due 15/6/46 . . . . . . . . . . . . . 0.7 145,041
26,000 Santander Drive Auto Receivables Trust 2015-1, 3.2400%, due 15/4/21 . . . . . . . . . . . . . . . . . . . . . . . . . 0.1 25,971
11,000 Santander Drive Auto Receivables Trust, 2.5200%, due 17/9/18 . . . . . . . . . . . . 0.1 11,053
1,000,000 Scandinavian Consumer Loans No. 4, Ltd., 3.9500%, due 15/1/37 . . . . . . . . . . . . . 0.5 113,496
148,444 Shenton Aircraft Investment I, Ltd., 4.7500%, due 15/10/42 (144A) . . . . . . . . . . 0.7 147,145
114,000 Starwood Retail Property Trust 2014-STAR, 2.8305%, due 15/11/27 (144A) . . . . . . . . . . . . . . . . . . 0.5 113,724
167,400 Starwood Retail Property Trust 2014-STAR, 3.5805%, due 15/11/27 (144A) . . . . . . . . . . . . . . . . . . 0.8 165,584
103,000 Trinity Square 2015-1 PLC, 2.0360%, due 15/7/51 . . . . . . . . . . . . . . . . . 0.7 146,056
68,000 Ulysses European Loan Conduit No 27 PLC, 0.8094%, due 25/7/17 . . . . . . . . . . 0.5 95,220
91,770 Wendys Funding LLC, 3.3710%, due 15/6/45 (144A) . . . . . . . . . . . . . . . . . . . 0.4 89,803
Total Asset-Backed/Commercial Mortgage-Backed Securities . . . . . . . . . . . . . . . . . . . . . . . . . . . . . . . . . . . . . . . . 14.3 3,012,554
Share or Principal Amount
Percentage of Net
Assets (%) Fair
Value (USD)
Corporate Bonds Aerospace and Defence – Equipment
56,000 Exelis, Inc., 5.5500%, due 1/10/21 . . . . . . . . . 0.3 61,48520,000 Harris Corp., 3.8320%, due 27/4/25 . . . . . . . . 0.1 19,73730,000 Harris Corp., 5.0540%, due 27/4/45 . . . . . . . . 0.1 29,486
0.5 110,708
Automotive – Cars and Light Trucks 4,000 General Motors Co., 4.0000%,
due 1/4/25 . . . . . . . . . . . . . . . . . . . . . . . . . . . — 3,80450,000 General Motors Co., 4.8750%,
due 2/10/23 . . . . . . . . . . . . . . . . . . . . . . . . . 0.2 51,38346,000 General Motors Financial Co., Inc.,
3.1000%, due 15/1/19 . . . . . . . . . . . . . . . . . 0.2 45,96652,000 Volkswagen International Finance
N.V., 3.5000%, due 29/12/99 . . . . . . . . . . . . 0.2 47,41644,000 Volkswagen International Finance
N.V., 3.7500%, due 24/3/49 . . . . . . . . . . . . . 0.2 44,59013,000 Volkswagen International Finance
N.V., 4.6250%, due 24/3/49 . . . . . . . . . . . . . 0.1 13,7320.9 206,891
Automotive – Truck Parts and Equipment – Original 100,000 Schaeffl er Finance B.V., 3.2500%,
due 15/5/19 . . . . . . . . . . . . . . . . . . . . . . . . . 0.5 110,290
Building – Residential and Commercial 31,000 D.R. Horton, Inc., 3.7500%,
due 1/3/19 . . . . . . . . . . . . . . . . . . . . . . . . . . 0.1 31,078
Building Products – Cement and Aggregate 51,000 Martin Marietta Materials, Inc.,
1.7031%, due 30/6/17 . . . . . . . . . . . . . . . . . 0.2 50,664
Cable/Satellite TV 36,000 CCO Safari II LLC, 4.4640%,
due 23/7/22 (144A) . . . . . . . . . . . . . . . . . . . 0.2 35,915124,000 CCO Safari II LLC, 4.9080%,
due 23/7/25 (144A) . . . . . . . . . . . . . . . . . . . 0.6 124,0670.8 159,982
Cellular Telecommunications 52,000 Rogers Communications, Inc.,
5.3800%, due 4/11/19 . . . . . . . . . . . . . . . . . 0.2 41,944
Chemicals – Specialty 168,000 Albemarle Corp., 1.8750%,
due 8/12/21 . . . . . . . . . . . . . . . . . . . . . . . . . 0.8 176,33924,000 Albemarle Corp., 4.1500%,
due 1/12/24 . . . . . . . . . . . . . . . . . . . . . . . . . 0.1 22,97839,000 Ashland, Inc., 6.8750%,
due 15/5/43 . . . . . . . . . . . . . . . . . . . . . . . . . 0.2 37,2451.1 236,562
Commercial Banks – Non U.S. 103,000 Allied Irish Banks PLC, 4.1250%,
due 26/11/25 . . . . . . . . . . . . . . . . . . . . . . . . 0.5 112,759230,000 Bank of Ireland, 4.2500%,
due 11/6/24 . . . . . . . . . . . . . . . . . . . . . . . . . 1.2 259,446100,000 Bankia S.A., 4.0000%, due 22/5/24 . . . . . . . . . 0.5 108,185223,000 Intesa Sanpaolo SpA, 5.0170%,
due 26/6/24 (144A) . . . . . . . . . . . . . . . . . . . 1.0 219,7723.2 700,162
Commercial Banks – Western U.S. 10,000 Zions Bancorporation, 5.8000%,
due 15/6/23 . . . . . . . . . . . . . . . . . . . . . . . . . . — 9,600
Computers – Memory Devices 94,000 Seagate HDD Cayman, 4.7500%,
due 1/1/25 . . . . . . . . . . . . . . . . . . . . . . . . . . 0.4 78,41149,000 Seagate HDD Cayman, 4.8750%,
due 1/6/27 (144A) . . . . . . . . . . . . . . . . . . . . 0.2 37,677

PORTFOLIO INVESTMENTS
The accompanying notes are an integral part of the fi nancial statements.
J a n u s C a p i t a l F u n d s P l c / 3 1 D e c e m b e r 2 0 1 5 1 7 9
Share or Principal Amount
Percentage of Net
Assets (%) Fair
Value (USD)
11,000 Seagate Technology PLC, 4.7500%, due 1/6/23 . . . . . . . . . . . . . . . . . . . . . . . . . . . — 9,643
49,000 Seagate Technology PLC, 5.7500%, due 1/12/34 (144A) . . . . . . . . . . . . . . . . . . . 0.2 34,373
0.8 160,104
Consulting Services 100,000 Verisk Analytics, Inc., 4.0000%,
due 15/6/25 . . . . . . . . . . . . . . . . . . . . . . . . . 0.5 97,31975,000 Verisk Analytics, Inc., 4.1250%,
due 12/9/22 . . . . . . . . . . . . . . . . . . . . . . . . . 0.4 75,67731,000 Verisk Analytics, Inc., 4.8750%,
due 15/1/19 . . . . . . . . . . . . . . . . . . . . . . . . . 0.2 32,44854,000 Verisk Analytics, Inc., 5.5000%,
due 15/6/45 . . . . . . . . . . . . . . . . . . . . . . . . . 0.2 51,74044,000 Verisk Analytics, Inc., 5.8000%,
due 1/5/21 . . . . . . . . . . . . . . . . . . . . . . . . . . 0.2 48,8131.5 305,997
Containers – Metal and Glass 100,000 Ball Corp., 3.5000%, due 15/12/20 . . . . . . . . . 0.5 111,950100,000 Ball Corp., 4.3750%, due 15/12/23 . . . . . . . . . 0.5 112,110
1.0 224,060
Data Processing and Management 113,000 Fidelity National Information Services,
Inc., 3.6250%, due 15/10/20 . . . . . . . . . . . . 0.5 114,59556,000 Fidelity National Information Services,
Inc., 4.5000%, due 15/10/22 . . . . . . . . . . . . 0.3 57,082193,000 Fidelity National Information Services,
Inc., 5.0000%, due 15/10/25 . . . . . . . . . . . . 0.9 198,6801.7 370,357
Dialysis Centres 50,000 Fresenius Medical Care U.S.
Finance II, Inc., 5.8750%, due 31/1/22 (144A) . . . . . . . . . . . . . . . . . . . 0.3 53,750
Diversifi ed Banking Institutions 66,000 Bank of America Corp., 8.0000%,
due 29/12/49 . . . . . . . . . . . . . . . . . . . . . . . . 0.3 67,23886,000 Citigroup, Inc., 4.4500%, due 29/9/27 . . . . . . . 0.4 85,62448,000 Goldman Sachs Group, Inc., 4.2500%,
due 21/10/25 . . . . . . . . . . . . . . . . . . . . . . . . 0.2 47,72849,000 Morgan Stanley, 4.1000%,
due 22/5/23 . . . . . . . . . . . . . . . . . . . . . . . . . 0.2 49,57818,000 Morgan Stanley, 4.3500%, due 8/9/26 . . . . . . . 0.1 18,09719,000 Morgan Stanley, 4.8750%,
due 1/11/22 . . . . . . . . . . . . . . . . . . . . . . . . . 0.1 20,193248,000 Morgan Stanley, 5.0000%,
due 30/9/21 . . . . . . . . . . . . . . . . . . . . . . . . . 0.9 189,365100,000 Royal Bank of Scotland Group PLC,
1.6250%, due 25/6/19 . . . . . . . . . . . . . . . . . 0.5 110,721191,000 Royal Bank of Scotland Group PLC,
6.0000%, due 19/12/23 . . . . . . . . . . . . . . . . 1.0 206,037100,000 UBS A.G., 4.7500%, due 12/2/26 . . . . . . . . . . . 0.6 116,225
4.3 910,806
Diversifi ed Financial Services 21,000 General Electric Capital Corp.,
6.3750%, due 15/11/67 . . . . . . . . . . . . . . . . 0.1 21,983104,000 Permanent TSB PLC, 2.3750%,
due 22/5/18 . . . . . . . . . . . . . . . . . . . . . . . . . 0.5 114,8330.6 136,816
Diversifi ed Manufacturing Operations 123,000 General Electric Co., 4.0000%,
due 29/12/49 . . . . . . . . . . . . . . . . . . . . . . . . 0.6 123,154
Diversifi ed Operations 16,000 GE Capital Trust I, 6.3750%,
due 15/11/67 . . . . . . . . . . . . . . . . . . . . . . . . 0.1 16,670
Share or Principal Amount
Percentage of Net
Assets (%) Fair
Value (USD)
E-Commerce/Services 116,000 Expedia, Inc., 2.5000%, due 3/6/22 . . . . . . . . . 0.6 124,507
Electric – Integrated 29,000 PPL WEM Holdings PLC, 3.9000%,
due 1/5/16 (144A) . . . . . . . . . . . . . . . . . . . . 0.1 29,118
Electric Products – Miscellaneous 23,000 Molex Electronic Technologies LLC,
2.8780%, due 15/4/20 (144A) . . . . . . . . . . . 0.1 22,431
Electronic Design Automation 221,000 Cadence Design Systems, Inc.,
4.3750%, due 15/10/24 . . . . . . . . . . . . . . . . 1.0 219,807
Electronic Measuring Instruments 142,000 Trimble Navigation, Ltd., 4.7500%,
due 1/12/24 . . . . . . . . . . . . . . . . . . . . . . . . . 0.7 141,348
Fiduciary Banks 53,000 Citizens Financial Group, Inc.,
4.3000%, due 3/12/25 . . . . . . . . . . . . . . . . . 0.3 53,385
Finance – Auto Loans 16,000 Ally Financial, Inc., 5.7500%,
due 20/11/25 . . . . . . . . . . . . . . . . . . . . . . . . 0.1 16,240100,000 FCE Bank PLC, 1.8750%, due 18/4/19 . . . . . . . 0.5 112,172
0.6 128,412
Finance – Investment Bankers/Brokers 76,000 E*TRADE Financial Corp., 4.6250%,
due 15/9/23 . . . . . . . . . . . . . . . . . . . . . . . . . 0.5 77,42522,000 E*TRADE Financial Corp., 5.3750%,
due 15/11/22 . . . . . . . . . . . . . . . . . . . . . . . . 0.1 23,10048,000 Lazard Group LLC, 4.2500%,
due 14/11/20 . . . . . . . . . . . . . . . . . . . . . . . . 0.2 49,772130,000 Raymond James Financial, Inc.,
5.6250%, due 1/4/24 . . . . . . . . . . . . . . . . . . 0.7 144,11748,000 TD Ameritrade Holding Corp.,
2.9500%, due 1/4/22 . . . . . . . . . . . . . . . . . . 0.2 47,58654,000 TD Ameritrade Holding Corp.,
3.6250%, due 1/4/25 . . . . . . . . . . . . . . . . . . 0.3 54,7092.0 396,709
Finance – Other Services 45,000 Intercontinental Exchange, Inc.,
3.7500%, due 1/12/25 . . . . . . . . . . . . . . . . . 0.2 45,178
Food – Miscellaneous/Diversifi ed 34,000 HJ Heinz Co., 2.8000%, due 2/7/20
(144A) . . . . . . . . . . . . . . . . . . . . . . . . . . . . . 0.2 33,94829,000 HJ Heinz Co., 3.5000%, due 15/7/22
(144A) . . . . . . . . . . . . . . . . . . . . . . . . . . . . . 0.1 29,2410.3 63,189
Investment Management and Advisory Services 59,000 Neuberger Berman Group LLC /
Neuberger Berman Finance Corp., 4.8750%, due 15/4/45 (144A) . . . . . . . . . . . 0.2 49,926
36,000 Neuberger Berman Group LLC / Neuberger Berman Finance Corp., 5.8750%, due 15/3/22 (144A) . . . . . . . . . . . 0.2 37,485
0.4 87,411
Life and Health Insurance 13,000 CNO Financial Group, Inc., 4.5000%,
due 30/5/20 . . . . . . . . . . . . . . . . . . . . . . . . . 0.1 13,29338,000 CNO Financial Group, Inc., 5.2500%,
due 30/5/25 . . . . . . . . . . . . . . . . . . . . . . . . . 0.2 38,80868,000 Primerica, Inc., 4.7500%, due 15/7/22 . . . . . . . 0.3 71,944
0.6 124,045
Machinery – Farm 48,000 CNH Capital LLC, 3.6250%,
due 15/4/18 . . . . . . . . . . . . . . . . . . . . . . . . . 0.2 47,496

Janus Global Flexible Income Fund
PORTFOLIO INVESTMENTS
The accompanying notes are an integral part of the fi nancial statements.
1 8 0 J a n u s C a p i t a l F u n d s P l c / 3 1 D e c e m b e r 2 0 1 5
Share or Principal Amount
Percentage of Net
Assets (%) Fair
Value (USD)
Medical – Drugs 100,000 Bayer A.G., 2.3750%, due 2/4/75 . . . . . . . . . . . 0.5 102,223
Medical – Generic Drugs 72,000 Actavis Funding SCS, 3.0000%,
due 12/3/20 . . . . . . . . . . . . . . . . . . . . . . . . . 0.3 72,12361,000 Actavis Funding SCS, 3.8000%,
due 15/3/25 . . . . . . . . . . . . . . . . . . . . . . . . . 0.3 60,80540,000 Actavis Funding SCS, 4.5500%,
due 15/3/35 . . . . . . . . . . . . . . . . . . . . . . . . . 0.2 38,9970.8 171,925
Medical Labs and Testing Services 56,000 Laboratory Corp. of America
Holdings, 3.2000%, due 1/2/22 . . . . . . . . . . 0.3 55,035
Medical Products 23,000 FMC Finance VIII S.A., 5.2500%,
due 31/7/19 . . . . . . . . . . . . . . . . . . . . . . . . . 0.1 28,55054,000 Zimmer Holdings, Inc., 2.7000%,
due 1/4/20 . . . . . . . . . . . . . . . . . . . . . . . . . . 0.3 53,37464,000 Zimmer Holdings, Inc., 3.1500%,
due 1/4/22 . . . . . . . . . . . . . . . . . . . . . . . . . . 0.3 63,00574,000 Zimmer Holdings, Inc., 3.5500%,
due 1/4/25 . . . . . . . . . . . . . . . . . . . . . . . . . . 0.3 72,0481.0 216,977
Metal – Aluminum 63,000 Alcoa, Inc., 5.1250%, due 1/10/24 . . . . . . . . . . 0.3 57,645
Money Center Banks 229,000 ABN AMRO Bank N.V., 4.7500%,
due 28/7/25 (144A) . . . . . . . . . . . . . . . . . . . 1.1 228,691
Oil and Gas Drilling 131,000 Helmerich & Payne International
Drilling Co., 4.6500%, due 15/3/25 . . . . . . . . . . . . . . . . . . . . . . . . . 0.6 131,302
Oil Companies – Exploration and Production 53,000 Cimarex Energy Co., 4.3750%,
due 1/6/24 . . . . . . . . . . . . . . . . . . . . . . . . . . 0.2 47,09918,000 Cimarex Energy Co., 5.8750%,
due 1/5/22 . . . . . . . . . . . . . . . . . . . . . . . . . . 0.1 17,2570.3 64,356
Oil Companies – Integrated 82,000 Shell International Finance B.V.,
2.2500%, due 10/11/20 . . . . . . . . . . . . . . . . 0.4 80,886200,000 TOTAL S.A., 2.2500%,
due 29/12/49 . . . . . . . . . . . . . . . . . . . . . . . . 1.0 201,293100,000 TOTAL S.A., 2.6250%,
due 29/12/49 . . . . . . . . . . . . . . . . . . . . . . . . 0.5 96,2761.9 378,455
Pipelines 13,000 DCP Midstream Operating L.P.,
5.6000%, due 1/4/44 . . . . . . . . . . . . . . . . . . . — 7,93718,000 EnLink Midstream Partners L.P.,
5.6000%, due 1/4/44 . . . . . . . . . . . . . . . . . . 0.1 12,5730.1 20,510
Property and Casualty Insurance 51,000 ACE INA Holdings, Inc., 3.3500%,
due 3/5/26 . . . . . . . . . . . . . . . . . . . . . . . . . . 0.2 50,910
Property Trust 125,000 Prologis International Funding II S.A.,
1.8760%, due 17/4/25 . . . . . . . . . . . . . . . . . 0.6 126,464
Radio 217,000 Sirius XM Radio, Inc., 5.2500%,
due 15/8/22 (144A) . . . . . . . . . . . . . . . . . . . 1.1 229,749
Real Estate 145,000 Kennedy Wilson Europe Real Estate
PLC, 3.9500%, due 30/6/22 . . . . . . . . . . . . . 1.0 209,032
Share or Principal Amount
Percentage of Net
Assets (%) Fair
Value (USD)
Retail – Drug Store 87,000 CVS Health Corp., 2.8000%,
due 20/7/20 . . . . . . . . . . . . . . . . . . . . . . . . . 0.4 87,48249,000 CVS Health Corp., 3.5000%,
due 20/7/22 . . . . . . . . . . . . . . . . . . . . . . . . . 0.2 49,93172,000 CVS Health Corp., 3.8750%,
due 20/7/25 . . . . . . . . . . . . . . . . . . . . . . . . . 0.3 73,6250.9 211,038
Retail – Restaurants 59,000 1011778 BC ULC / New Red
Finance, Inc., 4.6250%, due 15/1/22 (144A) . . . . . . . . . . . . . . . . . . . 0.3 59,295
Semiconductor Components/Integrated Circuits 200,000 TSMC Global, Ltd., 1.6250%,
due 3/4/18 (144A) . . . . . . . . . . . . . . . . . . . . 1. 0 196,132
Super – Regional Banks 10,000 Wells Fargo & Co., 5.8750%,
due 15/6/25 . . . . . . . . . . . . . . . . . . . . . . . . . 0. 2 10,538
Total Corporate Bonds . . . . . . . . . . . . . . . . . . . . . . . . . . . . . . . . 37. 7 7,962,908
Government Obligations Bundesobligation
37,000 0.5000%, due 15/2/25 . . . . . . . . . . . . . . . . . . . 0.2 39,936
German Governmant Bond 192,000 1.0000%, due 15/8/24 . . . . . . . . . . . . . . . . . . . 1.0 217,987
42,000 2.5000%, due 4/7/44 . . . . . . . . . . . . . . . . . . . . 0.3 56,907
1.3 274,894
Irish Government Bond 119,000 2.0000%, due 18/2/45 . . . . . . . . . . . . . . . . . . . 0.6 124,205216,000 2.4000%, due 15/5/30 . . . . . . . . . . . . . . . . . . . 1.2 256,476
52,000 3.4000%, due 18/3/24 . . . . . . . . . . . . . . . . . . . 0.3 67,298308,000 3.9000%, due 20/3/23 . . . . . . . . . . . . . . . . . . . 1.9 409,710
4.0 857,689
Italian Government Bond 265,000 1.5000%, due 1/6/25 . . . . . . . . . . . . . . . . . . . . 1.4 288,286324,000 2.1500%, due 15/12/21 . . . . . . . . . . . . . . . . . . 1.8 377,685
91,000 4.5000%, due 1/3/24 . . . . . . . . . . . . . . . . . . . . 0.6 122,883140,000 4.5000%, due 1/5/23 . . . . . . . . . . . . . . . . . . . . 0.9 187,710
97,000 4.7500%, due 1/9/44 (144A) . . . . . . . . . . . . . . 0.7 149,1165.4 1,125,680
Mexican Government Bond 40,800 4.7500%, due 14/6/18 . . . . . . . . . . . . . . . . . . . 1.1 238,25231,900 7.7500%, due 13/11/42 . . . . . . . . . . . . . . . . . . 1.0 202,808
2.1 441,060
New Zealand Government Bond 184,000 3.0000%, due 15/4/20 . . . . . . . . . . . . . . . . . . . 0.6 126,350330,000 4.5000%, due 15/4/27 . . . . . . . . . . . . . . . . . . . 1.2 244,838442,000 5.0000%, due 15/3/19 . . . . . . . . . . . . . . . . . . . 1.5 322,604
1,043,000 5.5000%, due 15/4/23 . . . . . . . . . . . . . . . . . . . 3.9 818,7027.2 1,512,494
Portugal Obrigacoes do Tesouro OT 98,000 2.2000%, due 17/10/22 (144A) . . . . . . . . . . . . 0.5 108,86196,000 2.8750%, due 15/10/25 (144A) . . . . . . . . . . . . 0.5 107,529
1.0 216,390
Spain Government Bond 49,000 1.6000%, due 30/4/25 (144A) . . . . . . . . . . . . . 0.3 52,964
167,000 4.4000%, due 31/10/23 (144A) . . . . . . . . . . . . 1.1 221,73797,000 4.8500%, due 31/10/20 (144A) . . . . . . . . . . . . 0.6 125,95239,000 5.1500%, due 31/10/44 (144A) . . . . . . . . . . . . 0.3 60,20390,000 5.5000%, due 30/4/21 (144A) . . . . . . . . . . . . . 0.6 121,653
2.9 582,509
Sweden Government Bond 1,780,000 1.5000%, due 13/11/23 . . . . . . . . . . . . . . . . . . 1.1 221,7513,615,000 2.5000%, due 12/5/25 . . . . . . . . . . . . . . . . . . . 2.3 486,073
3.4 707,824

PORTFOLIO INVESTMENTS
The accompanying notes are an integral part of the fi nancial statements.
J a n u s C a p i t a l F u n d s P l c / 3 1 D e c e m b e r 2 0 1 5 1 8 1
Share or Principal Amount
Percentage of Net
Assets (%) Fair
Value (USD)
U.S. Treasury Notes/Bonds 165,000 0.6250%, due 15/7/16 . . . . . . . . . . . . . . . . . . . 0.8 165,032224,000 1.0000%, due 15/9/18 . . . . . . . . . . . . . . . . . . . 1.1 222,429
1,187,000 1.0000%, due 30/9/16 . . . . . . . . . . . . . . . . . . . 5.6 1,189,58256,000 1.3750%, due 30/9/20 . . . . . . . . . . . . . . . . . . . 0.3 55,039
189,000 2.5000%, due 15/2/45 . . . . . . . . . . . . . . . . . . . 0.8 169,6289,000 2.8750%, due 15/8/45 . . . . . . . . . . . . . . . . . . . . — 8,7436,000 3.0000%, due 15/11/44 . . . . . . . . . . . . . . . . . . . — 5,980
264,000 3.0000%, due 15/11/45 . . . . . . . . . . . . . . . . . . 1.2 263,252181,000 3.0000%, due 15/5/45 . . . . . . . . . . . . . . . . . . . 0.9 180,219
28,000 3.1250%, due 15/8/44 . . . . . . . . . . . . . . . . . . . 0.1 28,62493,000 3.5000%, due 15/2/39 . . . . . . . . . . . . . . . . . . . 0.5 102,903
11.3 2,391,431
United Kingdom Treasury 76,000 2.0000%, due 7/9/25 . . . . . . . . . . . . . . . . . . . . 0.5 112,654
236,000 2.2500%, due 7/9/23 . . . . . . . . . . . . . . . . . . . . 1.7 360,162172,000 3.2500%, due 22/1/44 . . . . . . . . . . . . . . . . . . . 1.3 282,281
64,000 3.5000%, due 22/1/45 . . . . . . . . . . . . . . . . . . . 0.5 110,1504.0 865,247
Total Government Obligations . . . . . . . . . . . . . . . . . . . . . . . . . . 42.8 9,015,154
Preferred Stock Diversifi ed Banking Institutions
1,050 Morgan Stanley, 6.8750% . . . . . . . . . . . . . . . . . 0.2 29,138
Diversifi ed Financial Services 218 General Electric Capital Corp.,
4.7000% . . . . . . . . . . . . . . . . . . . . . . . . . . . . . — 5,552
Finance – Investment Bankers/Brokers 300 Morgan Stanley Capital Trust III,
6.2500% . . . . . . . . . . . . . . . . . . . . . . . . . . . . . — 7,64443 Morgan Stanley Capital Trust IV,
6.2500% . . . . . . . . . . . . . . . . . . . . . . . . . . . . . — 1,09120 Morgan Stanley Capital Trust V,
5.7500% . . . . . . . . . . . . . . . . . . . . . . . . . . . . . — 50417 Morgan Stanley Capital Trust VIII,
6.4500% . . . . . . . . . . . . . . . . . . . . . . . . . . . . . — 430
— 9,669
Super – Regional Banks 1,175 Wells Fargo & Co., 6.6250% . . . . . . . . . . . . . . 0.2 33,757
Total Preferred Stock . . . . . . . . . . . . . . . . . . . . . . . . . . . . . . . . . . 0.4 78,116
Tranche Loans Distribution/Wholesale
71,208 American Builders & Contractors Supply Co., Inc., 2.7500%, due 16/4/20 . . . . . . . . . . . . . . . . . . . . . . . . . 0.3 70,518
Electronic Components – Semiconductors 200,034 Avago Technologies (Cayman), Ltd.,
3.0000%, due 6/5/21 . . . . . . . . . . . . . . . . . . 1.0 199,368109,000 Avago Technologies (Cayman), Ltd.,
3.5000%, due 11/11/22 . . . . . . . . . . . . . . . . 0.5 107,7061.5 307,074
Medical Information Systems 25,610 IMS Health, Inc., 2.2500%,
due 17/3/21 . . . . . . . . . . . . . . . . . . . . . . . . . 0.1 24,970
Retail – Offi ce Supplies 18,000 Staples, Inc., 2.7500%, due 23/4/21 . . . . . . . . . 0.1 17,767
Telecommunications 48,000 Charter Communications,
2.7500%, due 21/1/23 . . . . . . . . . . . . . . . . . 0.2 47,900
Total Tranche Loans . . . . . . . . . . . . . . . . . . . . . . . . . . . . . . . . . . . 2.2 468,229
Total Investments . . . . . . . . . . . . . . . . . . . . . . . . . . . . . . . . . . . . 97. 4 20,536,961
Forward Currency Contracts, Open as at 31 December 2015
Currency Purchased
Currency Sold
Current Market
Value (USD) Settle Date
Unrealised Appreciation
(USD)
Citibank EUR 7,144,795 USD 7,764,270 7,759,619 29-Jan-16 4,651EUR 2,823,569 USD 3,068,381 3,066,543 29-Jan-16 1,838EUR 1,105,244 USD 1,201,072 1,200,352 29-Jan-16 720EUR 442,201 USD 480,541 480,253 29-Jan-16 288EUR 12,919 USD 14,039 14,031 29-Jan-16 8EUR 118 USD 128 128 29-Jan-16 —USD 72,286 EUR 66,106 71,881 29-Jan-16 405USD 14,909 EUR 13,634 14,826 29-Jan-16 83USD 9,638 EUR 8,814 9,584 29-Jan-16 54USD 33,498 EUR 30,774 33,462 29-Jan-16 36USD 5,754 EUR 5,260 5,720 29-Jan-16 34USD 2,846 EUR 2,605 2,833 29-Jan-16 13USD 1,182 EUR 1,082 1,176 29-Jan-16 6USD 431 EUR 395 429 29-Jan-16 2USD 10 EUR 10 10 29-Jan-16 —USD 2 GBP 1 2 29-Jan-16 —USD 373 EUR 343 373 29-Jan-16 —USD 2 GBP 1 2 29-Jan-16 —USD 12 EUR 11 12 29-Jan-16 —USD 2 GBP 1 2 29-Jan-16 —USD 70 EUR 64 70 29-Jan-16 —USD 2,361 EUR 2,172 2,361 29-Jan-16 —USD 935 EUR 860 935 29-Jan-16 —
JP Morgan Chase & Co. CAD 164,000 USD 117,767 116,991 29-Jan-16 776INR 29,537,000 USD 442,502 438,966 29-Jan-16 3,536JPY 295,231,000 USD 2,412,891 2,368,625 29-Jan-16 44,266MXN 504,000 USD 28,975 28,708 29-Jan-16 267MXN 416,000 USD 23,955 23,775 29-Jan-16 180NZD 169,000 USD 115,041 114,589 29-Jan-16 452SEK 7,124,000 USD 838,167 831,634 29-Jan-16 6,533SEK 208,000 USD 24,527 24,391 29-Jan-16 136USD 177,526 GBP 117,000 172,459 29-Jan-16 5,067USD 117,371 NOK 1,015,000 114,705 29-Jan-16 2,666USD 139,537 GBP 93,000 137,083 29-Jan-16 2,454USD 63,380 GBP 42,000 61,909 29-Jan-16 1,471USD 25,582 MXN 423,000 24,541 29-Jan-16 1,041USD 23,745 MXN 393,000 22,801 29-Jan-16 944USD 40,801 EUR 37,000 40,211 29-Jan-16 590USD 22,592 GBP 15,000 22,110 29-Jan-16 482USD 35,032 EUR 32,000 34,777 29-Jan-16 255USD 26,294 EUR 24,000 26,083 29-Jan-16 211
Total 79,465
Total Financial Assets at fair value through profi t or loss 20,616,426

Janus Global Flexible Income Fund
PORTFOLIO INVESTMENTS
The accompanying notes are an integral part of the fi nancial statements.
1 8 2 J a n u s C a p i t a l F u n d s P l c / 3 1 D e c e m b e r 2 0 1 5
Financial Liabilities at fair value through profi t or loss
Forward Currency Contracts, Open as at 31 December 2015
Currency Purchased
Currency Sold
Current Market
Value (USD) Settle Date
Unrealised (Depreciation)
(USD)
Citibank EUR 15,532 USD 17,022 17,155 29-Jan-16 (133)EUR 20,612 USD 22,546 22,680 29-Jan-16 (134)GBP 1,837 USD 2,743 2,778 29-Jan-16 (35)GBP 1,837 USD 2,743 2,778 29-Jan-16 (35)USD 5,751 EUR 5,290 5,752 29-Jan-16 (1)USD 428 EUR 395 430 29-Jan-16 (2)USD 1,070 EUR 989 1,075 29-Jan-16 (5)USD 2,712 EUR 2,506 2,725 29-Jan-16 (13)USD 6,637 EUR 6,132 6,668 29-Jan-16 (31)USD 19,703 EUR 18,197 19,787 29-Jan-16 (84)
JP Morgan Chase & Co. CAD 373,000 USD 279,515 289,418 29-Jan-16 (9,903)EUR 24,000 USD 26,285 26,488 29-Jan-16 (203)EUR 25,000 USD 27,556 27,943 29-Jan-16 (387)GBP 28,000 USD 41,753 42,234 29-Jan-16 (481)GBP 14,000 USD 21,219 21,802 29-Jan-16 (583)GBP 279,400 USD 421,333 430,827 29-Jan-16 (9,494)MXN 312,000 USD 18,188 18,274 29-Jan-16 (86)MXN 6,753,000 USD 393,665 395,534 29-Jan-16 (1,869)USD 22,486 INR 1,498,000 22,622 29-Jan-16 (136)USD 35,837 JPY 4,343,000 36,146 29-Jan-16 (309)USD 26,612 EUR 25,000 27,169 29-Jan-16 (557)USD 65,881 JPY 8,054,000 67,032 29-Jan-16 (1,151)USD 71,449 EUR 67,000 72,814 29-Jan-16 (1,365)USD 191,021 AUD 265,000 192,984 29-Jan-16 (1,963)USD 529,206 EUR 498,000 541,215 29-Jan-16 (12,009)USD 918,504 SEK 7,985,000 946,783 29-Jan-16 (28,279)USD 2,219,818 EUR 2,082,000 2,262,669 29-Jan-16 (42,851)USD 1,566,306 NZD 2,406,000 1,644,272 29-Jan-16 (77,966)
Total (190,065)
Total Financial Liabilities at fair value through profi t or loss (190,065)

Janus Global High Yield Fund
PORTFOLIO INVESTMENTS
The accompanying notes are an integral part of the fi nancial statements.
J a n u s C a p i t a l F u n d s P l c / 3 1 D e c e m b e r 2 0 1 5 1 8 3
Share or Principal Amount
Percentage of Net
Assets (%) Fair
Value (USD)
Financial Assets at fair value through profi t or loss Asset-Backed/Commercial Mortgage-Backed Securities
152,000 COMM 2015-3BP Mortgage Trust, 3.2384%, due 10/2/35 (144A) . . . . . . . . . . . 0.3 135,627
440,527 DECO 12-UK 4 PLC, 1.0094%, due 27/1/20 . . . . . . . . . . . . . . . . . . . . . . . . . 1.2 600,389
226,000 Fannie Mae Connecticut Avenue Securities, 4.4216%, due 25/5/25 . . . . . . . . . 0.4 215,010
176,799 Fannie Mae Connecticut Avenue Securities, 5.3216%, due 25/11/24 . . . . . . . . 0.4 180,337
330,000 GAHR Commercial Mortgage Trust 2015-NRF, 3.3822%, due 15/12/19 (144A) . . . . . . . . . . . . . . . . . . . . . . . . . . . . . 0.6 307,908
119,000 JP Morgan Chase Commercial Mortgage Securities Trust 2015-COSMO, 4.2805%, due 15/1/32 (144A) . . . . . . . . . . . . . . . . . . . 0.2 117,521
62,000 JP Morgan Chase Commercial Mortgage Securities Trust 2015-UES, 3.6210%, due 5/9/32 (144A) . . . . . . . . 0.1 56,725
499,571 London & Regional Debt Securitisation No 2 PLC, 5.8794%, due 15/10/18 . . . . . . . . . . . . . . . . . . . . . . . . 1.5 742,660
100,587 Wachovia Bank Commercial Mortgage Trust Series 2007-C31, 5.6600%, due 15/4/47 . . . . . . . . . . . . . . . . . . . . . . . . . 0.2 100,645
Total Asset-Backed/Commercial Mortgage-Backed Securities . . . . . . . . . . . . . . . . . . . . . . . . . . . . . . . . . . . . . . . . . 4.9 2,456,822
Common Stock Finance – Investment Bankers/Brokers
5,978 E*TRADE Financial Corp. . . . . . . . . . . . . . . . . 0.4 177,188
Total Common Stock . . . . . . . . . . . . . . . . . . . . . . . . . . . . . . . . . . 0.4 177,188
Corporate Bonds Aerospace and Defence
930,000 ADS Tactical, Inc., 11.0000%, due 1/4/18 (144A) . . . . . . . . . . . . . . . . . . . . 1.9 946,275
466,000 TA MFG, Ltd., 3.6250%, due 15/4/23 . . . . . . . 1.0 493,1062.9 1,439,381
Apparel Manufacturers 342,000 Boardriders S.A., 8.8750%,
due 15/12/17 . . . . . . . . . . . . . . . . . . . . . . . . 0.7 335,385140,000 QS Wholesale, Inc., 7.8750%,
due 1/8/18 (144A) . . . . . . . . . . . . . . . . . . . . 0.1 29,40058,000 Quiksilver, Inc., 10.0000%,
due 1/8/20 . . . . . . . . . . . . . . . . . . . . . . . . . . . — 3,0450.8 367,830
Automotive – Truck Parts and Equipment – Original 381,000 MPG Holdco I, Inc., 7.3750%,
due 15/10/22 . . . . . . . . . . . . . . . . . . . . . . . . 0.8 386,715280,000 Schaeffl er Holding, 6.8750%,
due 15/8/18 . . . . . . . . . . . . . . . . . . . . . . . . . 0.6 315,581200,000 ZF North America Capital, Inc.,
2.7500%, due 27/4/23 . . . . . . . . . . . . . . . . . 0.4 208,4751.8 910,771
Building – Residential and Commercial 455,000 Century Communities, Inc., 6.8750%,
due 15/5/22 . . . . . . . . . . . . . . . . . . . . . . . . . 0.8 419,738342,000 KB Home, 7.6250%, due 15/5/23 . . . . . . . . . . . 0.7 339,435
96,000 Meritage Homes Corp., 7.0000%, due 1/4/22 . . . . . . . . . . . . . . . . . . . . . . . . . . 0.2 101,040
214,000 Meritage Homes Corp., 7.1500%, due 15/4/20 . . . . . . . . . . . . . . . . . . . . . . . . . 0.5 226,305
Share or Principal Amount
Percentage of Net
Assets (%) Fair
Value (USD)
203,000 WCI Communities, Inc., 6.8750%, due 15/8/21 . . . . . . . . . . . . . . . . . . . . . . . . . 0.4 214,291
2.6 1,300,809
Building and Construction Products – Miscellaneous 126,000 Builders FirstSource, Inc., 10.7500%,
due 15/8/23 (144A) . . . . . . . . . . . . . . . . . . . 0.3 125,685
Cable/Satellite TV 588,000 CCO Holdings LLC / CCO Holdings
Capital Corp., 5.2500%, due 15/3/21 . . . . . . . . . . . . . . . . . . . . . . . . . 1.2 612,255
180,000 CCO Holdings LLC / CCO Holdings Capital Corp., 5.3750%, due 1/5/25 (144A) . . . . . . . . . . . . . . . . . . . . . . . . . . . . . 0.4 179,550
185,000 Unitymedia Hessen GmbH & Co., K.G. / Unitymedia NRW GmbH, 4.0000%, due 15/1/25 . . . . . . . . . . . . . . . . . 0.4 194,237
2.0 986,042
Casino Hotels 174,000 Caesars Entertainment Resort
Properties LLC / Caesars Entertainment Resort Properties, 11.0000%, due 1/10/21 . . . . . . . . . . . . . . . . 0.3 158,340
311,000 Caesars Entertainment Resort Properties LLC / Caesars Entertainment Resort Properties, 8.0000%, due 1/10/20 . . . . . . . . . . . . . . . . . 0.6 297,005
245,000 MGM Resorts International, 6.6250%, due 15/12/21 . . . . . . . . . . . . . . . . . . . . . . . . 0.5 252,044
123,000 MGM Resorts International, 6.7500%, due 1/10/20 . . . . . . . . . . . . . . . . . . . . . . . . . 0.3 126,998
43,000 MGM Resorts International, 7.7500%, due 15/3/22 . . . . . . . . . . . . . . . . . . . . . . . . . 0.1 45,849
1.8 880,236
Casino Services 654,000 Boyd Acquisition Sub LLC/Boyd
Acquisition Finance Corp., 8.3750%, due 15/2/18 (144A) . . . . . . . . . . . 1.3 667,080
184,000 CCM Merger, Inc., 9.1250%, due 1/5/19 (144A) . . . . . . . . . . . . . . . . . . . . 0.4 192,970
1.7 860,050
Cellular Telecommunications 548,000 T-Mobile U.S., Inc., 6.0000%,
due 1/3/23 . . . . . . . . . . . . . . . . . . . . . . . . . . 1.1 556,220
Commercial Banks – Non U.S. 244,000 Allied Irish Banks PLC, 4.1250%,
due 26/11/25 . . . . . . . . . . . . . . . . . . . . . . . . 0.5 267,119200,000 Allied Irish Banks PLC, 7.3750%,
due 29/12/49 . . . . . . . . . . . . . . . . . . . . . . . . 0.4 220,716200,000 Banco Bilbao Vizcaya Argentaria S.A.,
9.0000%, due 8/5/19 . . . . . . . . . . . . . . . . . . 0.4 214,814443,000 Bank of Ireland, 4.2500%,
due 11/6/24 . . . . . . . . . . . . . . . . . . . . . . . . . 1.0 499,716500,000 Bankia S.A., 4.0000%, due 22/5/24 . . . . . . . . . 1.1 540,923
3.4 1,743,288
Commercial Services – Finance 390,000 Cardtronics, Inc., 5.1250%,
due 1/8/22 . . . . . . . . . . . . . . . . . . . . . . . . . . 0.8 378,300
Computer Services 402,000 HIS, Inc., 5.0000%, due 1/11/22 . . . . . . . . . . . 0.8 408,533
Consumer Products – Miscellaneous 194,000 GHD Bondco PLC, 7.0000%,
due 15/4/20 . . . . . . . . . . . . . . . . . . . . . . . . . 0.5 260,935100,000 GHD Bondco PLC, 7.0000%,
due 15/4/20 (144A) . . . . . . . . . . . . . . . . . . . 0.3 134,503352,000 Jarden Corp., 5.0000%, due 15/11/23
(144A) . . . . . . . . . . . . . . . . . . . . . . . . . . . . . 0.7 361,6801.5 757,118

Janus Global High Yield Fund
PORTFOLIO INVESTMENTS
The accompanying notes are an integral part of the fi nancial statements.
1 8 4 J a n u s C a p i t a l F u n d s P l c / 3 1 D e c e m b e r 2 0 1 5
Share or Principal Amount
Percentage of Net
Assets (%) Fair
Value (USD)
Containers – Metal and Glass 232,000 Ball Corp., 3.5000%, due 15/12/20 . . . . . . . . . 0.5 259,723232,000 Ball Corp., 4.3750%, due 15/12/23 . . . . . . . . . 0.5 260,095150,000 Horizon Holdings III SASU, 5.1250%,
due 1/8/22 . . . . . . . . . . . . . . . . . . . . . . . . . . 0.3 168,7111.3 688,529
Containers – Paper and Plastic 261,000 Kloeckner Pentaplast of America, Inc.,
7.1250%, due 1/11/20 . . . . . . . . . . . . . . . . . 0.6 290,820133,000 Sealed Air Corp., 4.5000%,
due 15/9/23 . . . . . . . . . . . . . . . . . . . . . . . . . 0.3 149,9420.9 440,762
Data Processing and Management 399,000 First Data Corp., 7.0000%,
due 1/12/23 (144A) . . . . . . . . . . . . . . . . . . . 0.8 399,998
Dialysis Centres 88,000 Fresenius Medical Care U.S. Finance
II, Inc., 5.6250%, due 31/7/19 (144A) . . . . . . . . . . . . . . . . . . . . . . . . . . . . . 0.2 95,150
85,000 Fresenius Medical Care U.S. Finance II, Inc., 5.8750%, due 31/1/22 (144A) . . . . . . . . . . . . . . . . . . . . . . . . . . . . . 0.2 91,375
0.4 186,525
Disposable Medical Products 226,000 ConvaTec Healthcare E S.A., 8.2500%,
due 15/1/19 (144A) . . . . . . . . . . . . . . . . . . . 0.4 211,028
Diversifi ed Banking Institutions 291,000 Lloyds Banking Group PLC, 7.0000%,
due . . . . . . . . . . . . . . . . . . . . . . . . . . . . . . . . 0.9 436,977200,000 Royal Bank of Scotland Group PLC,
7.5000%, due 10/8/20 . . . . . . . . . . . . . . . . . 0.4 208,7501.3 645,727
Diversifi ed Financial Services 100,000 Baggot Securities, 10.2400%,
due 31/12/49 . . . . . . . . . . . . . . . . . . . . . . . . 0.2 108,934
Diversifi ed Operations 200,000 Horizon Pharma Financing, Inc.,
6.6250%, due 1/5/23 (144A) . . . . . . . . . . . . 0.4 179,000
Educational Software 666,000 Blackboard, Inc., 7.7500%,
due 15/11/19 (144A) . . . . . . . . . . . . . . . . . . 1.2 579,420
Electronic Components – Semiconductors 238,000 Qorvo, Inc., 6.7500%, due 1/12/23
(144A) . . . . . . . . . . . . . . . . . . . . . . . . . . . . . 0.5 243,355401,000 Qorvo, Inc., 7.0000%, due 1/12/25
(144A) . . . . . . . . . . . . . . . . . . . . . . . . . . . . . 0.8 414,0331.3 657,388
Environmental Control 235,000 Paprec Holding, 5.2500%, due 1/4/22 . . . . . . . 0.5 255,236244,000 Paprec Holding, 7.3750%, due 1/4/23 . . . . . . . 0.5 261,153
1.0 516,389
E-Services and Consulting 405,000 TES Finance PLC, 6.7500%,
due 15/7/20 . . . . . . . . . . . . . . . . . . . . . . . . . 1.1 573,091
Finance – Auto Loans 396,000 Ally Financial, Inc., 3.2500%,
due 5/11/18 . . . . . . . . . . . . . . . . . . . . . . . . . 0.8 389,565360,000 Ally Financial, Inc., 4.6250%,
due 30/3/25 . . . . . . . . . . . . . . . . . . . . . . . . . 0.7 356,4001.5 745,965
Food – Catering 78,000 Aramark Services, Inc., 5.1250%,
due 15/1/24 (144A) . . . . . . . . . . . . . . . . . . . 0.2 79,658
Food – Confectionery 450,000 R&R Ice Cream PLC, 4.7500%,
due 15/5/20 . . . . . . . . . . . . . . . . . . . . . . . . . 1.0 505,355
Share or Principal Amount
Percentage of Net
Assets (%) Fair
Value (USD)
Food – Dairy Products 594,000 FAGE Dairy Industry S.A. / FAGE
U.S.A. Dairy Industry, Inc., 9.8750%, due 1/2/20 (144A) . . . . . . . . . . . . 1.2 618,874
Food – Meat Products 286,000 JBS U.S.A. LLC / JBS U.S.A. Finance,
Inc., 7.2500%, due 1/6/21 (144A) . . . . . . . . 0.6 285,286295,000 JBS U.S.A. LLC / JBS U.S.A. Finance,
Inc., 8.2500%, due 1/2/20 (144A) . . . . . . . . 0.6 296,4751.2 581,761
Food – Retail 337,000 SUPERVALU, Inc., 6.7500%,
due 1/6/21 . . . . . . . . . . . . . . . . . . . . . . . . . . 0.6 306,670196,000 SUPERVALU, Inc., 7.7500%,
due 15/11/22 . . . . . . . . . . . . . . . . . . . . . . . . 0.4 178,8501.0 485,520
Gambling – Non-Hotel 210,000 Ameristar Casinos, Inc., 7.5000%,
due 15/4/21 . . . . . . . . . . . . . . . . . . . . . . . . . 0.4 219,975248,000 Greektown Holdings LLC/Greektown
Mothership Corp., 8.8750%, due 15/3/19 (144A) . . . . . . . . . . . . . . . . . . . 0.5 251,720
444,000 Mohegan Tribal Gaming Authority, 9.7500%, due 1/9/21 . . . . . . . . . . . . . . . . . . 0.9 445,110
190,000 Mohegan Tribal Gaming Authority, 9.7500%, due 1/9/21 (144A) . . . . . . . . . . . . 0.4 190,475
2.2 1,107,280
Hotels and Motels 370,000 NH Hotels S.A., 6.8750%,
due 15/11/19 . . . . . . . . . . . . . . . . . . . . . . . . 0.9 443,794420,000 Playa Resorts Holdings, 8.0000%,
due 15/8/20 (144A) . . . . . . . . . . . . . . . . . . . 0.9 428,4001.8 872,194
Internet Connectivity Services 537,000 United Group B.V., 7.8750%,
due 15/11/20 . . . . . . . . . . . . . . . . . . . . . . . . 1.2 617,172
Medical – Drugs 279,000 Capsugel S.A., 7.0000%, due 15/5/19
(144A) . . . . . . . . . . . . . . . . . . . . . . . . . . . . . 0.5 272,548275,000 Endo Finance LLC / Endo Ltd / Endo
Finco, Inc., 6.0000%, due 1/2/25 (144A) . . . . . . . . . . . . . . . . . . . . . . . . . . . . . 0.5 272,250
148,000 Valeant Pharmaceuticals International, Inc., 5.8750%, due 15/5/23 (144A) . . . . . . . 0.3 132,830
148,000 Valeant Pharmaceuticals International, Inc., 6.1250%, due 15/4/25 (144A) . . . . . . . 0.3 132,460
1.6 810,088
Medical – HMO 327,000 Centene Corp., 4.7500%, due 15/5/22 . . . . . . . 0.6 318,008
Medical – Hospitals 280,000 Tenet Healthcare Corp., 8.0000%,
due 1/8/20 . . . . . . . . . . . . . . . . . . . . . . . . . . 0.6 282,100
Medical Information Systems 482,000 IMS Health, Inc., 4.1250%,
due 1/4/23 . . . . . . . . . . . . . . . . . . . . . . . . . . 1.0 511,276
Medical Products 164,000 Mallinckrodt International Finance
S.A. / Mallinckrodt CB LLC, 5.6250%, due 15/10/23 (144A) . . . . . . . . . . 0.3 156,620
Oil Companies – Exploration and Production 651,000 Endeavor Energy Resources L.P.
/ EER Finance, Inc., 7.0000%, due 15/8/21 (144A) . . . . . . . . . . . . . . . . . . . 1.2 582,645
221,000 Endeavor Energy Resources L.P. / EER Finance, Inc., 8.1250%, due 15/9/23 (144A) . . . . . . . . . . . . . . . . . . . 0.4 200,005

PORTFOLIO INVESTMENTS
The accompanying notes are an integral part of the fi nancial statements.
J a n u s C a p i t a l F u n d s P l c / 3 1 D e c e m b e r 2 0 1 5 1 8 5
Share or Principal Amount
Percentage of Net
Assets (%) Fair
Value (USD)
184,000 Newfi eld Exploration Co., 5.3750%, due 1/1/26 . . . . . . . . . . . . . . . . . . . . . . . . . . 0.3 153,180
129,000 Oasis Petroleum, Inc., 6.5000%, due 1/11/21 . . . . . . . . . . . . . . . . . . . . . . . . . 0.2 86,108
113,000 Oasis Petroleum, Inc., 6.8750%, due 15/3/22 . . . . . . . . . . . . . . . . . . . . . . . . . 0.1 72,885
193,000 Rice Energy, Inc., 6.2500%, due 1/5/22 . . . . . . . . . . . . . . . . . . . . . . . . . . 0.3 139,925
2.5 1,234,748
Oil Refi ning and Marketing 143,000 Seven Generations Energy, Ltd.,
6.7500%, due 1/5/23 (144A) . . . . . . . . . . . . 0.2 120,835
Paper and Related Products 189,000 Resolute Forest Products, Inc.,
5.8750%, due 15/5/23 . . . . . . . . . . . . . . . . . 0.3 138,443
Pharmaceuticals 200,000 Endo Finance LLC / Endo Ltd / Endo
Finco, Inc., 6.0000%, due 15/7/23 (144A) . . . . . . . . . . . . . . . . . . . . . . . . . . . . . 0.4 200,000
Pipelines 87,000 Crestwood Midstream Partners L.P.
/ Crestwood Midstream Finance Corp., 6.0000%, due 15/12/20 . . . . . . . . . . . 0.1 64,380
360,000 Crestwood Midstream Partners L.P. / Crestwood Midstream Finance Corp., 6.1250%, due 1/3/22 . . . . . . . . . . . . . 0.5 252,000
0.6 316,380
Poultry 567,000 Simmons Foods, Inc., 7.8750%,
due 1/10/21 (144A) . . . . . . . . . . . . . . . . . . . 1.0 514,553
Publishing – Newspapers 200,000 Johnston Press Bond PLC, 8.6250%,
due 1/6/19 . . . . . . . . . . . . . . . . . . . . . . . . . . 0.5 244,684
Radio 666,000 Entercom Radio LLC, 10.5000%,
due 1/12/19 . . . . . . . . . . . . . . . . . . . . . . . . . 1.4 692,640408,000 Townsquare Media, Inc., 6.5000%,
due 1/4/23 (144A) . . . . . . . . . . . . . . . . . . . . 0.7 374,8502.1 1,067,490
Real Estate Management/Services 770,000 Kennedy-Wilson, Inc., 5.8750%,
due 1/4/24 . . . . . . . . . . . . . . . . . . . . . . . . . . 1.5 744,975
Real Estate Operating/Development 55,000 Forest City Enterprises, Inc., 3.6250%,
due 15/8/20 . . . . . . . . . . . . . . . . . . . . . . . . . 0.1 58,506437,000 Forestar U.S.A. Real Estate Group,
Inc., 8.5000%, due 1/6/22 (144A) . . . . . . . . 0.9 428,260187,000 Greystar Real Estate Partners LLC,
8.2500%, due 1/12/22 (144A) . . . . . . . . . . . 0.4 194,94824,000 Howard Hughes Corp., 6.8750%,
due 1/10/21 (144A) . . . . . . . . . . . . . . . . . . . . — 24,600566,000 Hunt Cos, Inc., 9.6250%, due 1/3/21
(144A) . . . . . . . . . . . . . . . . . . . . . . . . . . . . . 1.0 515,0602.4 1,221,374
Resorts and Theme Parks 100,000 CPUK Finance, Ltd., 7.0000%,
due 28/8/20 . . . . . . . . . . . . . . . . . . . . . . . . . 0.3 151,461
Retail – Apparel and Shoe 319,000 New Look Secured Issuer PLC,
6.5000%, due 1/7/22 . . . . . . . . . . . . . . . . . . 0.9 467,926107,000 New Look Senior Issuer PLC,
8.0000%, due 1/7/23 . . . . . . . . . . . . . . . . . . 0.3 153,5781.2 621,504
Retail – Discount 170,000 Family Tree Escrow LLC, 5.7500%,
due 1/3/23 (144A) . . . . . . . . . . . . . . . . . . . . 0.4 176,800
Share or Principal Amount
Percentage of Net
Assets (%) Fair
Value (USD)
Retail – Propane Distribution 344,000 Ferrellgas Partners L.P. / Ferrellgas
Partners Finance Corp., 8.6250%, due 15/6/20 . . . . . . . . . . . . . . . . . . . . . . . . . 0.6 325,080
Retail – Regional Department Stores 301,000 JC Penney Corp., Inc., 5.7500%,
due 15/2/18 . . . . . . . . . . . . . . . . . . . . . . . . . 0.6 277,673213,000 JC Penney Corp., Inc., 8.1250%,
due 1/10/19 . . . . . . . . . . . . . . . . . . . . . . . . . 0.4 193,8301.0 471,503
Retail – Restaurants 37,000 Landry’s Holdings II, Inc., 10.2500%,
due 1/1/18 (144A) . . . . . . . . . . . . . . . . . . . . 0.1 37,0001,090,000 Landry’s, Inc., 9.3750%, due 1/5/20
(144A) . . . . . . . . . . . . . . . . . . . . . . . . . . . . . 2.3 1,152,673685,000 Wok Acquisition Corp., 10.2500%,
due 30/6/20 (144A) . . . . . . . . . . . . . . . . . . . 1.1 565,1253.5 1,754,798
Special Purpose Entity 510,000 ROC Finance LLC, 12.1250%,
due 1/9/18 (144A) . . . . . . . . . . . . . . . . . . . . 1.1 535,500
Specifi ed Purpose Acquisition 249,000 Argos Merger Sub, Inc., 7.1250%,
due 15/3/23 (144A) . . . . . . . . . . . . . . . . . . . 0.5 247,506
Steel – Producers 365,000 Steel Dynamics, Inc., 6.1250%,
due 15/8/19 . . . . . . . . . . . . . . . . . . . . . . . . . 0.7 369,563
Telecommunication Equipment 982,000 CommScope Holding Co., Inc.,
6.6250%, due 1/6/20 (144A) . . . . . . . . . . . . 2.0 996,730
Telecommunication Services 382,000 Altice Financing S.A., 5.2500%,
due 15/2/23 . . . . . . . . . . . . . . . . . . . . . . . . . 0.8 415,143338,000 Altice Finco S.A., 7.6250%,
due 15/2/25 (144A) . . . . . . . . . . . . . . . . . . . 0.6 313,495236,000 Altice U.S. Finance I Corp., 5.3750%,
due 15/7/23 (144A) . . . . . . . . . . . . . . . . . . . 0.5 237,180505,000 Play Topco S.A., 7.7500%,
due 28/2/20 . . . . . . . . . . . . . . . . . . . . . . . . . 1.1 562,451367,000 Wind Acquisition Finance S.A.,
7.3750%, due 23/4/21 (144A) . . . . . . . . . . . 0.7 347,7333.7 1,876,002
Telephone – Integrated 600,000 Frontier Communications Corp.,
10.5000%, due 15/9/22 (144A) . . . . . . . . . . 1.2 599,25099,000 Frontier Communications Corp.,
11.0000%, due 15/9/25 (144A) . . . . . . . . . . 0.2 98,258300,000 Telefonica Europe B.V., 5.8750%,
due 31/12/49 . . . . . . . . . . . . . . . . . . . . . . . . 0.7 327,6912.1 1,025,199
Transportation – Marine 165,000 Eletson Holdings, 9.6250%,
due 15/1/22 (144A) . . . . . . . . . . . . . . . . . . . 0.3 147,67537,000 Navios Maritime Holdings Inc. /
Navios Maritime Finance II U.S., Inc., 7.3750%, due 15/1/22 (144A) . . . . . . . . — 18,639
220,000 Navios Maritime Holdings Inc. / Navios Maritime Finance II U.S., Inc., 8.1250%, due 15/2/19 . . . . . . . . . . . . . 0.2 95,700
0.5 262,014
Transportation – Railroad 434,000 Florida East Coast Holdings Corp.,
6.7500%, due 1/5/19 (144A) . . . . . . . . . . . . 0.8 398,195570,000 Florida East Coast Holdings Corp.,
9.7500%, due 1/5/20 (144A) . . . . . . . . . . . . 0.8 390,4501.6 788,645
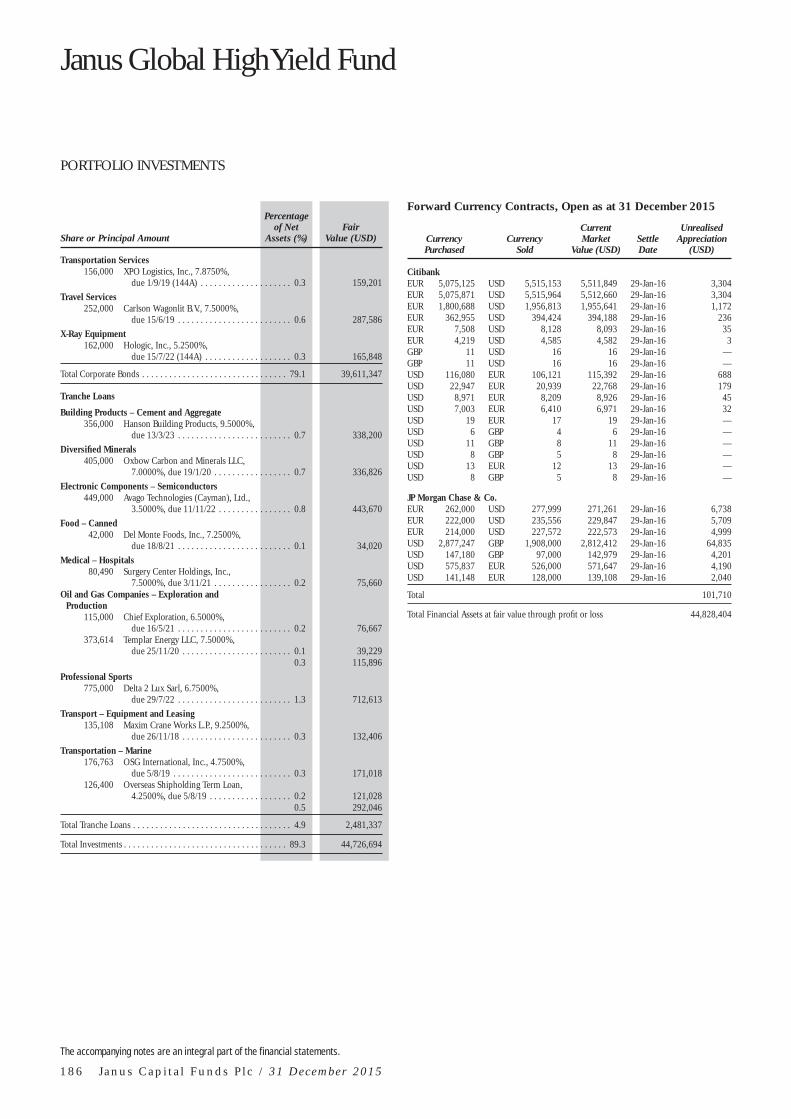
Janus Global High Yield Fund
PORTFOLIO INVESTMENTS
The accompanying notes are an integral part of the fi nancial statements.
1 8 6 J a n u s C a p i t a l F u n d s P l c / 3 1 D e c e m b e r 2 0 1 5
Share or Principal Amount
Percentage of Net
Assets (%) Fair
Value (USD)
Transportation Services 156,000 XPO Logistics, Inc., 7.8750%,
due 1/9/19 (144A) . . . . . . . . . . . . . . . . . . . . 0.3 159,201
Travel Services 252,000 Carlson Wagonlit B.V., 7.5000%,
due 15/6/19 . . . . . . . . . . . . . . . . . . . . . . . . . 0.6 287,586
X-Ray Equipment 162,000 Hologic, Inc., 5.2500%,
due 15/7/22 (144A) . . . . . . . . . . . . . . . . . . . 0.3 165,848
Total Corporate Bonds . . . . . . . . . . . . . . . . . . . . . . . . . . . . . . . . 79.1 39,611,347
Tranche Loans Building Products – Cement and Aggregate
356,000 Hanson Building Products, 9.5000%, due 13/3/23 . . . . . . . . . . . . . . . . . . . . . . . . . 0.7 338,200
Diversifi ed Minerals 405,000 Oxbow Carbon and Minerals LLC,
7.0000%, due 19/1/20 . . . . . . . . . . . . . . . . . 0.7 336,826
Electronic Components – Semiconductors 449,000 Avago Technologies (Cayman), Ltd.,
3.5000%, due 11/11/22 . . . . . . . . . . . . . . . . 0.8 443,670
Food – Canned 42,000 Del Monte Foods, Inc., 7.2500%,
due 18/8/21 . . . . . . . . . . . . . . . . . . . . . . . . . 0.1 34,020
Medical – Hospitals 80,490 Surgery Center Holdings, Inc.,
7.5000%, due 3/11/21 . . . . . . . . . . . . . . . . . 0.2 75,660Oil and Gas Companies – Exploration and
Production 115,000 Chief Exploration, 6.5000%,
due 16/5/21 . . . . . . . . . . . . . . . . . . . . . . . . . 0.2 76,667373,614 Templar Energy LLC, 7.5000%,
due 25/11/20 . . . . . . . . . . . . . . . . . . . . . . . . 0.1 39,2290.3 115,896
Professional Sports 775,000 Delta 2 Lux Sarl, 6.7500%,
due 29/7/22 . . . . . . . . . . . . . . . . . . . . . . . . . 1.3 712,613
Transport – Equipment and Leasing 135,108 Maxim Crane Works L.P., 9.2500%,
due 26/11/18 . . . . . . . . . . . . . . . . . . . . . . . . 0.3 132,406
Transportation – Marine 176,763 OSG International, Inc., 4.7500%,
due 5/8/19 . . . . . . . . . . . . . . . . . . . . . . . . . . 0.3 171,018126,400 Overseas Shipholding Term Loan,
4.2500%, due 5/8/19 . . . . . . . . . . . . . . . . . . 0.2 121,0280.5 292,046
Total Tranche Loans . . . . . . . . . . . . . . . . . . . . . . . . . . . . . . . . . . . 4.9 2,481,337
Total Investments . . . . . . . . . . . . . . . . . . . . . . . . . . . . . . . . . . . . 89.3 44,726,694
Forward Currency Contracts, Open as at 31 December 2015
Currency Purchased
Currency Sold
Current Market
Value (USD) Settle Date
Unrealised Appreciation
(USD)
Citibank EUR 5,075,125 USD 5,515,153 5,511,849 29-Jan-16 3,304EUR 5,075,871 USD 5,515,964 5,512,660 29-Jan-16 3,304EUR 1,800,688 USD 1,956,813 1,955,641 29-Jan-16 1,172EUR 362,955 USD 394,424 394,188 29-Jan-16 236EUR 7,508 USD 8,128 8,093 29-Jan-16 35EUR 4,219 USD 4,585 4,582 29-Jan-16 3GBP 11 USD 16 16 29-Jan-16 —GBP 11 USD 16 16 29-Jan-16 —USD 116,080 EUR 106,121 115,392 29-Jan-16 688USD 22,947 EUR 20,939 22,768 29-Jan-16 179USD 8,971 EUR 8,209 8,926 29-Jan-16 45USD 7,003 EUR 6,410 6,971 29-Jan-16 32USD 19 EUR 17 19 29-Jan-16 —USD 6 GBP 4 6 29-Jan-16 —USD 11 GBP 8 11 29-Jan-16 —USD 8 GBP 5 8 29-Jan-16 —USD 13 EUR 12 13 29-Jan-16 —USD 8 GBP 5 8 29-Jan-16 —
JP Morgan Chase & Co. EUR 262,000 USD 277,999 271,261 29-Jan-16 6,738EUR 222,000 USD 235,556 229,847 29-Jan-16 5,709EUR 214,000 USD 227,572 222,573 29-Jan-16 4,999USD 2,877,247 GBP 1,908,000 2,812,412 29-Jan-16 64,835USD 147,180 GBP 97,000 142,979 29-Jan-16 4,201USD 575,837 EUR 526,000 571,647 29-Jan-16 4,190USD 141,148 EUR 128,000 139,108 29-Jan-16 2,040
Total 101,710
Total Financial Assets at fair value through profi t or loss 44,828,404

PORTFOLIO INVESTMENTS
The accompanying notes are an integral part of the fi nancial statements.
J a n u s C a p i t a l F u n d s P l c / 3 1 D e c e m b e r 2 0 1 5 1 8 7
Financial Liabilities at fair value through profi t or loss
Forward Currency Contracts, Open as at 31 December 2015
Currency Purchased
Currency Sold
Current Market
Value (USD) Settle Date
Unrealised (Depreciation)
(USD)
Citibank EUR 429 USD 467 468 29-Jan-16 (1)EUR 16,459 USD 17,988 18,079 29-Jan-16 (91)EUR 240,491 USD 261,779 262,059 29-Jan-16 (280)EUR 59,988 USD 65,617 66,006 29-Jan-16 (389)EUR 124,050 USD 135,646 136,406 29-Jan-16 (760)GBP 1,973 USD 2,946 2,984 29-Jan-16 (38)GBP 1,970 USD 2,941 2,979 29-Jan-16 (38)USD 1,123 EUR 1,034 1,124 29-Jan-16 (1)USD 991 EUR 916 995 29-Jan-16 (4)USD 5,490 EUR 5,054 5,496 29-Jan-16 (6)USD 15,628 EUR 14,388 15,644 29-Jan-16 (16)USD 15,651 EUR 14,409 15,667 29-Jan-16 (16)USD 4,835 EUR 4,466 4,856 29-Jan-16 (21)USD 17,286 EUR 15,965 17,360 29-Jan-16 (74)USD 21,353 EUR 19,722 21,445 29-Jan-16 (92)USD 22,622 EUR 20,897 22,722 29-Jan-16 (100)USD 22,717 EUR 20,985 22,818 29-Jan-16 (101)
JP Morgan Chase & Co. EUR 243,000 USD 264,467 264,846 29-Jan-16 (379)EUR 122,000 USD 133,617 134,647 29-Jan-16 (1,030)EUR 116,000 USD 127,330 128,594 29-Jan-16 (1,264)GBP 550,000 USD 827,342 843,978 29-Jan-16 (16,636)USD 69,191 EUR 65,000 70,640 29-Jan-16 (1,449)USD 136,254 EUR 128,000 139,107 29-Jan-16 (2,853)USD 167,425 EUR 157,000 170,624 29-Jan-16 (3,199)USD 141,771 EUR 134,000 145,628 29-Jan-16 (3,857)USD 213,595 EUR 201,000 218,442 29-Jan-16 (4,847)USD 297,468 EUR 279,000 303,210 29-Jan-16 (5,742)
Total (43,284)
Total Financial Liabilities at fair value through profi t or loss (43,284)

Janus Global Investment Grade Bond Fund
PORTFOLIO INVESTMENTS
The accompanying notes are an integral part of the fi nancial statements.
1 8 8 J a n u s C a p i t a l F u n d s P l c / 3 1 D e c e m b e r 2 0 1 5
Share or Principal Amount
Percentage of Net
Assets (%) Fair
Value (USD)
Financial Assets at fair value through profi t or loss Asset-Backed/Commercial Mortgage-Backed
Securities
187,708 Broadgate Financing PLC, 1.5504%, due 5/1/22 . . . . . . . . . . . . . . . . . . . . . . . . . . 0.6 271,148
77,415 DB Master Finance LLC 2015-1, 3.2620%, due 20/2/45 (144A) . . . . . . . . . . . 0.2 76,788
200,000 Leek Finance Number Eighteen PLC, 0.8570%, due 21/9/38 . . . . . . . . . . . . . . . . . 0.5 214,149
593,086 Magellan Mortgages No3 PLC, 0.1790%, due 15/5/58 . . . . . . . . . . . . . . . . . 1.3 553,583
624,178 Nemus II Arden PLC, 0.8031%, due 15/2/20 . . . . . . . . . . . . . . . . . . . . . . . . . 2.0 896,347
267,198 Shenton Aircraft Investment I, Ltd., 4.7500%, due 15/10/42 (144A) . . . . . . . . . . 0.6 264,860
218,000 Trinity Square 2015-1 PLC, 2.0360%, due 15/7/51 . . . . . . . . . . . . . . . . . . . . . . . . . 0.7 309,129
Total Asset-Backed/Commercial Mortgage-Backed Securities . . . . . . . . . . . . . . . . . . . . . . . . . . . . . . . . . . . . . . . . . 5.9 2,586,004
Corporate Bonds Aerospace and Defence – Equipment
155,000 Exelis, Inc., 5.5500%, due 1/10/21 . . . . . . . . . 0.4 170,18343,000 Harris Corp., 3.8320%, due 27/4/25 . . . . . . . . 0.1 42,43480,000 Harris Corp., 5.0540%, due 27/4/45 . . . . . . . . 0.2 78,629
0.7 291,246
Airport Development and Maintenance 215,000 DAA Finance PLC, 6.5872%,
due 9/7/18 . . . . . . . . . . . . . . . . . . . . . . . . . . 0.6 269,497202,000 Heathrow Funding, Ltd., 4.6250%,
due 31/10/46 . . . . . . . . . . . . . . . . . . . . . . . . 0.7 325,9191.3 595,416
Automotive – Cars and Light Trucks 154,000 Ford Motor Credit Co., LLC,
3.9840%, due 15/6/16 . . . . . . . . . . . . . . . . . 0.4 155,7279,000 General Motors Co., 4.0000%,
due 1/4/25 . . . . . . . . . . . . . . . . . . . . . . . . . . . — 8,559245,000 General Motors Co., 4.8750%,
due 2/10/23 . . . . . . . . . . . . . . . . . . . . . . . . . 0.6 251,77698,000 General Motors Financial Co., Inc.,
3.1000%, due 15/1/19 . . . . . . . . . . . . . . . . . 0.2 97,928240,000 Renault S.A., 3.1250%, due 5/3/21 . . . . . . . . . 0.6 282,376
81,000 Volkswagen International Finance N.V., 3.5000%, due 29/12/99 . . . . . . . . . . . . 0.2 73,860
80,000 Volkswagen International Finance N.V., 3.7500%, due 24/3/49 . . . . . . . . . . . . . 0.2 81,073
75,000 Volkswagen International Finance N.V., 4.6250%, due 24/3/49 . . . . . . . . . . . . . 0.2 79,220
2.4 1,030,519
Automotive – Truck Parts and Equipment – Original 113,000 Schaeffl er Finance B.V., 3.2500%,
due 15/5/19 . . . . . . . . . . . . . . . . . . . . . . . . . 0.3 124,628176,000 Schaeffl er Finance B.V., 3.2500%,
due 15/5/25 . . . . . . . . . . . . . . . . . . . . . . . . . 0.4 186,461113,000 Schaeffl er Finance B.V., 3.5000%,
due 15/5/22 . . . . . . . . . . . . . . . . . . . . . . . . . 0.3 125,858200,000 ZF North America Capital, Inc.,
2.7500%, due 27/4/23 . . . . . . . . . . . . . . . . . 0.5 208,4751.5 645,422
Building – Residential and Commercial 124,000 MDC Holdings, Inc., 6.0000%,
due 15/1/43 . . . . . . . . . . . . . . . . . . . . . . . . . 0.2 98,580
Building Products – Cement and Aggregate 194,000 Martin Marietta Materials, Inc.,
1.7031%, due 30/6/17 . . . . . . . . . . . . . . . . . 0.4 192,721
Share or Principal Amount
Percentage of Net
Assets (%) Fair
Value (USD)
Cable/Satellite TV 75,000 CCO Safari II LLC, 4.4640%,
due 23/7/22 (144A) . . . . . . . . . . . . . . . . . . . 0.2 74,822265,000 CCO Safari II LLC, 4.9080%,
due 23/7/25 (144A) . . . . . . . . . . . . . . . . . . . 0.6 265,142410,000 Unitymedia Hessen GmbH & Co.,
K.G. / Unitymedia NRW GmbH, 5.5000%, due 15/1/23 (144A) . . . . . . . . . . . 0.9 410,513
1.7 750,477
Cellular Telecommunications 315,000 Rogers Communications, Inc.,
5.3800%, due 4/11/19 . . . . . . . . . . . . . . . . . 0.6 254,083
Chemicals – Diversifi ed 137,000 LyondellBasell Industries N.V.,
4.6250%, due 26/2/55 . . . . . . . . . . . . . . . . . 0.3 111,547
Chemicals – Specialty 65,000 Albemarle Corp., 4.1500%,
due 1/12/24 . . . . . . . . . . . . . . . . . . . . . . . . . 0.1 62,233288,000 Albemarle Corp., 5.4500%,
due 1/12/44 . . . . . . . . . . . . . . . . . . . . . . . . . 0.6 279,541312,000 Ashland, Inc., 6.8750%, due 15/5/43 . . . . . . . . 0.7 297,960276,000 Ecolab, Inc., 2.6250%, due 8/7/25 . . . . . . . . . . 0.7 315,561199,000 Ecolab, Inc., 5.5000%, due 8/12/41 . . . . . . . . . 0.5 217,287
2.6 1,172,582
Commercial Banks – Non U.S. 306,000 Abbey National Treasury Services PLC,
0.8750%, due 13/1/20 . . . . . . . . . . . . . . . . . 0.8 333,309278,000 Abbey National Treasury Services PLC,
1.1250%, due 14/1/22 . . . . . . . . . . . . . . . . . 0.7 298,902315,000 Allied Irish Banks PLC, 4.1250%,
due 26/11/25 . . . . . . . . . . . . . . . . . . . . . . . . 0.8 344,846432,000 Bank of Ireland, 4.2500%,
due 11/6/24 . . . . . . . . . . . . . . . . . . . . . . . . . 1.1 487,308300,000 Bankia S.A., 4.0000%, due 22/5/24 . . . . . . . . . 0.7 324,554507,000 Intesa Sanpaolo SpA, 5.0170%,
due 26/6/24 (144A) . . . . . . . . . . . . . . . . . . . 1.1 499,662200,000 National Bank of Abu Dhabi PJSC,
2.2500%, due 11/2/20 . . . . . . . . . . . . . . . . . 0.4 197,188243,000 Santander U.K. PLC, 5.0000%,
due 7/11/23 (144A) . . . . . . . . . . . . . . . . . . . 0.6 253,3646.2 2,739,133
Commercial Banks – Western U.S. 47,000 Zions Bancorporation, 5.8000%,
due 15/6/23 . . . . . . . . . . . . . . . . . . . . . . . . . 0.1 45,120
Computers – Memory Devices 349,000 Seagate HDD Cayman, 4.7500%,
due 1/1/25 . . . . . . . . . . . . . . . . . . . . . . . . . . 0.7 291,121105,000 Seagate HDD Cayman, 4.8750%,
due 1/6/27 (144A) . . . . . . . . . . . . . . . . . . . . 0.2 80,73730,000 Seagate Technology PLC, 4.7500%,
due 1/6/23 . . . . . . . . . . . . . . . . . . . . . . . . . . 0.1 26,298239,000 Seagate Technology PLC, 5.7500%,
due 1/12/34 (144A) . . . . . . . . . . . . . . . . . . . 0.4 167,6581.4 565,814
Consulting Services 215,000 Verisk Analytics, Inc., 4.0000%,
due 15/6/25 . . . . . . . . . . . . . . . . . . . . . . . . . 0.5 209,235100,000 Verisk Analytics, Inc., 4.8750%,
due 15/1/19 . . . . . . . . . . . . . . . . . . . . . . . . . 0.2 104,672146,000 Verisk Analytics, Inc., 5.5000%,
due 15/6/45 . . . . . . . . . . . . . . . . . . . . . . . . . 0.3 139,890118,000 Verisk Analytics, Inc., 5.8000%,
due 1/5/21 . . . . . . . . . . . . . . . . . . . . . . . . . . 0.3 130,9081.3 584,705
Containers – Metal and Glass 206,000 Ball Corp., 3.5000%, due 15/12/20 . . . . . . . . . 0.5 230,616206,000 Ball Corp., 4.3750%, due 15/12/23 . . . . . . . . . 0.5 230,947
1.0 461,563

PORTFOLIO INVESTMENTS
The accompanying notes are an integral part of the fi nancial statements.
J a n u s C a p i t a l F u n d s P l c / 3 1 D e c e m b e r 2 0 1 5 1 8 9
Share or Principal Amount
Percentage of Net
Assets (%) Fair
Value (USD)
Data Processing and Management 240,000 Fidelity National Information Services,
Inc., 3.6250%, due 15/10/20 . . . . . . . . . . . . 0.6 243,387120,000 Fidelity National Information Services,
Inc., 4.5000%, due 15/10/22 . . . . . . . . . . . . 0.3 122,319411,000 Fidelity National Information Services,
Inc., 5.0000%, due 15/10/25 . . . . . . . . . . . . 1.0 423,09628,000 Fidelity National Information Services,
Inc., 5.0000%, due 15/3/22 . . . . . . . . . . . . . 0.1 29,1182.0 817,920
Dialysis Centres 123,000 Fresenius Medical Care U.S. Finance
II, Inc., 5.8750%, due 31/1/22 (144A) . . . . . . . . . . . . . . . . . . . . . . . . . . . . . 0.3 132,225
Diversifi ed Banking Institutions 230,000 Bank of America Corp., 5.5000%,
due 22/11/21 . . . . . . . . . . . . . . . . . . . . . . . . 0.9 376,670340,000 Bank of America Corp., 8.0000%,
due 29/12/49 . . . . . . . . . . . . . . . . . . . . . . . . 0.8 346,375396,000 Citigroup, Inc., 1.3750%,
due 27/10/21 . . . . . . . . . . . . . . . . . . . . . . . . 1.0 432,537180,000 Citigroup, Inc., 4.4500%,
due 29/9/27 . . . . . . . . . . . . . . . . . . . . . . . . . 0.4 179,213101,000 Goldman Sachs Group, Inc., 4.2500%,
due 21/10/25 . . . . . . . . . . . . . . . . . . . . . . . . 0.2 100,427292,000 Morgan Stanley, 1.7500%,
due 30/1/25 . . . . . . . . . . . . . . . . . . . . . . . . . 0.7 312,366112,000 Morgan Stanley, 2.1250%,
due 25/4/18 . . . . . . . . . . . . . . . . . . . . . . . . . 0.3 112,21236,000 Morgan Stanley, 4.3500%,
due 8/9/26 . . . . . . . . . . . . . . . . . . . . . . . . . . 0.1 36,19440,000 Morgan Stanley, 4.8750%,
due 1/11/22 . . . . . . . . . . . . . . . . . . . . . . . . . 0.1 42,512583,000 Morgan Stanley, 5.0000%,
due 30/9/21 . . . . . . . . . . . . . . . . . . . . . . . . . 1.0 445,161113,000 Morgan Stanley, 5.5500%,
due 29/12/49 . . . . . . . . . . . . . . . . . . . . . . . . 0.3 113,141540,000 Royal Bank of Scotland Group PLC,
1.6250%, due 25/6/19 . . . . . . . . . . . . . . . . . 1.4 597,891634,000 Royal Bank of Scotland Group PLC,
6.0000%, due 19/12/23 . . . . . . . . . . . . . . . . 1. 5 683,914421,000 UBS A.G., 4.7500%, due 12/2/26 . . . . . . . . . . . 1.1 489,309
9. 8 4,267,922
Diversifi ed Financial Services 132,000 Carlyle Holdings Finance LLC,
3.8750%, due 1/2/23 (144A) . . . . . . . . . . . . 0.3 133,803381,000 GE Capital International Funding Co.,
4.4180%, due 15/11/35 . . . . . . . . . . . . . . . . 0.9 389,576119,000 General Electric Capital Corp.,
5.8750%, due 14/1/38 . . . . . . . . . . . . . . . . . 0.3 145,894221,000 General Electric Capital Corp.,
6.3750%, due 15/11/67 . . . . . . . . . . . . . . . . 0.5 231,343280,000 Permanent TSB PLC, 2.3750%,
due 22/5/18 . . . . . . . . . . . . . . . . . . . . . . . . . 0.7 309,1672.7 1,209,783
Diversifi ed Manufacturing Operations 246,000 General Electric Co., 4.0000%,
due 29/12/49 . . . . . . . . . . . . . . . . . . . . . . . . 0.6 246,308236,000 General Electric Co., 4.1000%,
due 29/12/49 . . . . . . . . . . . . . . . . . . . . . . . . 0.5 235,9981.1 482,306
Diversifi ed Operations 4,000 GE Capital Trust I, 6.3750%,
due 15/11/67 . . . . . . . . . . . . . . . . . . . . . . . . . — 4,168
E-Commerce/Services 312,000 Expedia, Inc., 2.5000%, due 3/6/22 . . . . . . . . . 0.8 334,881
Share or Principal Amount
Percentage of Net
Assets (%) Fair
Value (USD)
Electric – Integrated 178,000 Enel Finance International N.V.,
5.6250%, due 14/8/24 . . . . . . . . . . . . . . . . . 0.7 308,007242,000 PPL WEM Holdings PLC, 3.9000%,
due 1/5/16 (144A) . . . . . . . . . . . . . . . . . . . . 0.6 242,9861.3 550,993
Electric Products – Miscellaneous 50,000 Molex Electronic Technologies LLC,
2.8780%, due 15/4/20 (144A) . . . . . . . . . . . 0.1 48,764
Electronic Design Automation 480,000 Cadence Design Systems, Inc.,
4.3750%, due 15/10/24 . . . . . . . . . . . . . . . . 1.1 477,410
Electronic Measuring Instruments 106,000 FLIR Systems, Inc., 3.7500%,
due 1/9/16 . . . . . . . . . . . . . . . . . . . . . . . . . . 0.2 107,548330,000 Trimble Navigation, Ltd., 4.7500%,
due 1/12/24 . . . . . . . . . . . . . . . . . . . . . . . . . 0.7 328,4840.9 436,032
Fiduciary Banks 111,000 Citizens Financial Group, Inc.,
4.3000%, due 3/12/25 . . . . . . . . . . . . . . . . . 0.3 111,806
Finance – Auto Loans 31,000 Ally Financial, Inc., 5.7500%,
due 20/11/25 . . . . . . . . . . . . . . . . . . . . . . . . 0.1 31,46528,000 Ally Financial, Inc., 8.0000%,
due 31/12/18 . . . . . . . . . . . . . . . . . . . . . . . . 0.1 30,730211,000 FCE Bank PLC, 1.8750%,
due 18/4/19 . . . . . . . . . . . . . . . . . . . . . . . . . 0.5 236,682235,000 FCE Bank PLC, 1.8750%,
due 24/6/21 . . . . . . . . . . . . . . . . . . . . . . . . . 0.6 259,925310,000 FGA Capital Ireland PLC, 2.0000%,
due 23/10/19 . . . . . . . . . . . . . . . . . . . . . . . . 0.8 343,153200,000 FGA Capital Ireland PLC, 2.8750%,
due 26/1/18 . . . . . . . . . . . . . . . . . . . . . . . . . 0.5 225,3172.6 1,127,272
Finance – Credit Card 323,000 American Express Co., 6.8000%,
due 1/9/66 . . . . . . . . . . . . . . . . . . . . . . . . . . 0.7 326,23091,000 Discover Financial Services, 3.7500%,
due 4/3/25 . . . . . . . . . . . . . . . . . . . . . . . . . . 0.2 87,5550.9 413,785
Finance – Investment Bankers/Brokers 77,000 Charles Schwab Corp., 3.0000%,
due 10/3/25 . . . . . . . . . . . . . . . . . . . . . . . . . 0.2 75,821149,000 Charles Schwab Corp., 7.0000%,
due 28/2/49 . . . . . . . . . . . . . . . . . . . . . . . . . 0.4 169,860169,000 E*TRADE Financial Corp., 4.6250%,
due 15/9/23 . . . . . . . . . . . . . . . . . . . . . . . . . 0.4 172,16955,000 E*TRADE Financial Corp., 5.3750%,
due 15/11/22 . . . . . . . . . . . . . . . . . . . . . . . . 0.1 57,750146,000 Lazard Group LLC, 4.2500%,
due 14/11/20 . . . . . . . . . . . . . . . . . . . . . . . . 0.3 151,3898,000 Lazard Group LLC, 6.8500%,
due 15/6/17 . . . . . . . . . . . . . . . . . . . . . . . . . . — 8,521502,000 Raymond James Financial, Inc.,
5.6250%, due 1/4/24 . . . . . . . . . . . . . . . . . . 1.3 556,515107,000 TD Ameritrade Holding Corp.,
2.9500%, due 1/4/22 . . . . . . . . . . . . . . . . . . 0.2 106,078259,000 TD Ameritrade Holding Corp.,
3.6250%, due 1/4/25 . . . . . . . . . . . . . . . . . . 0.6 262,3993.5 1,560,502
Finance – Leasing Company 150,000 AerCap Ireland Capital, Ltd. / AerCap
Global Aviation Trust, 4.6250%, due 30/10/20 . . . . . . . . . . . . . . . . . . . . . . . . 0.3 153,938
99,000 International Lease Finance Corp., 6.7500%, due 1/9/16 (144A) . . . . . . . . . . . . 0.2 101,846

Janus Global Investment Grade Bond Fund
PORTFOLIO INVESTMENTS
The accompanying notes are an integral part of the fi nancial statements.
1 9 0 J a n u s C a p i t a l F u n d s P l c / 3 1 D e c e m b e r 2 0 1 5
Share or Principal Amount
Percentage of Net
Assets (%) Fair
Value (USD)
235,000 LeasePlan Corp. N.V., 2.5000%, due 16/5/18 (144A) . . . . . . . . . . . . . . . . . . . 0.5 231,577
1.0 487,361
Finance – Other Services 90,000 Intercontinental Exchange, Inc.,
3.7500%, due 1/12/25 . . . . . . . . . . . . . . . . . 0.2 90,356
Food – Catering 216,000 Compass Group PLC, 3.8500%,
due 26/6/26 . . . . . . . . . . . . . . . . . . . . . . . . . 0.8 342,236
Food – Miscellaneous/Diversifi ed 73,000 HJ Heinz Co., 2.8000%, due 2/7/20
(144A) . . . . . . . . . . . . . . . . . . . . . . . . . . . . . 0.2 72,88878,000 HJ Heinz Co., 3.5000%, due 15/7/22
(144A) . . . . . . . . . . . . . . . . . . . . . . . . . . . . . 0.2 78,6490.4 151,537
Investment Companies 200,000 JAB Holdings B.V., 1.5000%,
due 24/11/21 . . . . . . . . . . . . . . . . . . . . . . . . 0.5 212,269
Investment Management and Advisory Services 226,000 Ameriprise Financial, Inc., 7.5180%,
due 1/6/66 . . . . . . . . . . . . . . . . . . . . . . . . . . 0.5 221,480160,000 Neuberger Berman Group LLC /
Neuberger Berman Finance Corp., 4.8750%, due 15/4/45 (144A) . . . . . . . . . . . 0.3 135,391
219,000 Neuberger Berman Group LLC / Neuberger Berman Finance Corp., 5.8750%, due 15/3/22 (144A) . . . . . . . . . . . 0.5 228,034
1.3 584,905
Life and Health Insurance 29,000 CNO Financial Group, Inc., 4.5000%,
due 30/5/20 . . . . . . . . . . . . . . . . . . . . . . . . . 0.1 29,653103,000 CNO Financial Group, Inc., 5.2500%,
due 30/5/25 . . . . . . . . . . . . . . . . . . . . . . . . . 0.2 105,189380,000 Primerica, Inc., 4.7500%, due 15/7/22 . . . . . . . 0.9 402,038
1.2 536,880
Medical – Biomedical and Genetic 173,000 Gilead Sciences, Inc., 4.5000%,
due 1/2/45 . . . . . . . . . . . . . . . . . . . . . . . . . . 0.4 169,629
Medical – Drugs 260,000 AbbVie, Inc., 4.4000%, due 6/11/42 . . . . . . . . 0.6 243,747243,000 Almirall S.A., 4.6250%, due 1/4/21 . . . . . . . . . 0.6 275,479860,000 Bayer A.G., 2.3750%, due 2/4/75 . . . . . . . . . . . 2.0 879,120200,000 Merck KGaA, 2.6250%, due 12/12/74 . . . . . . . 0.5 214,125235,000 Merck KGaA, 3.3750%, due 12/12/74 . . . . . . . 0.6 252,553300,000 UCB S.A., 1.8750%, due 2/4/22 . . . . . . . . . . . . 0.7 326,275293,000 UCB S.A., 4.1250%, due 4/1/21 . . . . . . . . . . . . 0.8 356,026
5.8 2,547,325
Medical – Generic Drugs 162,000 Actavis Funding SCS, 3.0000%,
due 12/3/20 . . . . . . . . . . . . . . . . . . . . . . . . . 0.4 162,276136,000 Actavis Funding SCS, 3.8000%,
due 15/3/25 . . . . . . . . . . . . . . . . . . . . . . . . . 0.3 135,5660.7 297,842
Medical Instruments 246,000 Medtronic, Inc., 3.5000%,
due 15/3/25 . . . . . . . . . . . . . . . . . . . . . . . . . 0.6 248,301
Medical Labs and Testing Services 65,000 Laboratory Corp. of America
Holdings, 3.2000%, due 1/2/22 . . . . . . . . . . 0.1 63,880247,000 Laboratory Corp. of America
Holdings, 4.7000%, due 1/2/45 . . . . . . . . . . 0.5 226,5290.6 290,409
Medical Products 96,000 Mallinckrodt International Finance
S.A. / Mallinckrodt CB LLC, 5.7500%, due 1/8/22 (144A) . . . . . . . . . . . . 0.2 92,640
Share or Principal Amount
Percentage of Net
Assets (%) Fair
Value (USD)
163,000 Zimmer Holdings, Inc., 3.5500%, due 1/4/25 . . . . . . . . . . . . . . . . . . . . . . . . . . 0.4 158,699
0.6 251,339
Metal – Aluminum 133,000 Alcoa, Inc., 5.1250%, due 1/10/24 . . . . . . . . . . 0.3 121,695
Money Center Banks 498,000 ABN AMRO Bank N.V., 4.7500%,
due 28/7/25 (144A) . . . . . . . . . . . . . . . . . . . 1.1 497,328
Oil and Gas Drilling 287,000 Helmerich & Payne International
Drilling Co., 4.6500%, due 15/3/25 . . . . . . . 0.7 287,662
Oil Companies – Exploration and Production 257,000 Cimarex Energy Co., 4.3750%,
due 1/6/24 . . . . . . . . . . . . . . . . . . . . . . . . . . 0.5 228,38751,000 Cimarex Energy Co., 5.8750%,
due 1/5/22 . . . . . . . . . . . . . . . . . . . . . . . . . . 0.1 48,8950.6 277,282
Oil Companies – Integrated 170,000 Shell International Finance B.V.,
2.2500%, due 10/11/20 . . . . . . . . . . . . . . . . 0.4 167,690557,000 TOTAL S.A., 2.2500%, due 29/12/49 . . . . . . . . 1.3 560,600560,000 TOTAL S.A., 2.6250%, due 29/12/49 . . . . . . . . 1.2 539,148
2.9 1,267,438
Oil Field Services 292,000 Korea National Oil Corp., 4.0000%,
due 27/10/16 (144A) . . . . . . . . . . . . . . . . . . 0.7 298,020
Pipelines 31,000 DCP Midstream Operating L.P.,
5.6000%, due 1/4/44 . . . . . . . . . . . . . . . . . . . — 18,92666,000 Energy Transfer Partners L.P.,
4.1500%, due 1/10/20 . . . . . . . . . . . . . . . . . 0.1 60,949378,000 Energy Transfer Partners L.P.,
5.1500%, due 1/2/43 . . . . . . . . . . . . . . . . . . 0.6 271,05758,000 EnLink Midstream Partners L.P.,
5.6000%, due 1/4/44 . . . . . . . . . . . . . . . . . . 0.1 40,513235,000 Phillips 66 Partners L.P., 4.6800%,
due 15/2/45 . . . . . . . . . . . . . . . . . . . . . . . . . 0.4 174,3181.2 565,763
Property and Casualty Insurance 108,000 ACE INA Holdings, Inc., 3.3500%,
due 3/5/26 . . . . . . . . . . . . . . . . . . . . . . . . . . 0.2 107,809
Property Trust 152,000 Prologis International Funding II S.A.,
1.8760%, due 17/4/25 . . . . . . . . . . . . . . . . . 0.3 153,781297,000 Prologis International Funding II S.A.,
2.8750%, due 4/4/22 . . . . . . . . . . . . . . . . . . 0.8 339,7991.1 493,580
Radio 499,000 Sirius XM Radio, Inc., 5.2500%,
due 15/8/22 (144A) . . . . . . . . . . . . . . . . . . . 1.2 528,316
Real Estate 163,000 Kennedy Wilson Europe Real Estate
PLC, 3.9500%, due 30/6/22 . . . . . . . . . . . . . 0.5 234,980
Real Estate Management/Services 503,000 Deutsche Annington Finance, B.V.,
3.2000%, due 2/10/17 (144A) . . . . . . . . . . . 1.2 508,069402,000 Jones Lang LaSalle, Inc., 4.4000%,
due 15/11/22 . . . . . . . . . . . . . . . . . . . . . . . . 0.9 412,7742.1 920,843
REIT – Diversifi ed 536,000 GELF Bond Issuer I S.A., 1.7500%,
due 22/11/21 . . . . . . . . . . . . . . . . . . . . . . . . 1.3 575,512457,000 Goodman Funding Pty, Ltd., 6.3750%,
due 15/4/21 (144A) . . . . . . . . . . . . . . . . . . . 1.2 520,0122.5 1,095,524

PORTFOLIO INVESTMENTS
The accompanying notes are an integral part of the fi nancial statements.
J a n u s C a p i t a l F u n d s P l c / 3 1 D e c e m b e r 2 0 1 5 1 9 1
Share or Principal Amount
Percentage of Net
Assets (%) Fair
Value (USD)
REIT – Offi ce Property 223,000 Alexandria Real Estate Equities, Inc.,
4.6000%, due 1/4/22 . . . . . . . . . . . . . . . . . . 0.5 231,652
Retail – Discount 67,000 Wal-Mart Stores, Inc., 4.8750%,
due 19/1/39 . . . . . . . . . . . . . . . . . . . . . . . . . 0.3 116,585
Retail – Drug Store 187,000 CVS Health Corp., 2.8000%,
due 20/7/20 . . . . . . . . . . . . . . . . . . . . . . . . . 0.4 188,036105,000 CVS Health Corp., 3.5000%,
due 20/7/22 . . . . . . . . . . . . . . . . . . . . . . . . . 0.2 106,995155,000 CVS Health Corp., 3.8750%,
due 20/7/25 . . . . . . . . . . . . . . . . . . . . . . . . . 0.4 158,4971.0 453,528
Retail – Major Department Stores 162,000 John Lewis PLC, 4.2500%,
due 18/12/34 . . . . . . . . . . . . . . . . . . . . . . . . 0.5 234,611
Retail – Restaurants 126,000 1011778 BC ULC / New Red Finance,
Inc., 4.6250%, due 15/1/22 (144A) . . . . . . . 0.3 126,630
Semiconductor Components/Integrated Circuits 316,000 TSMC Global, Ltd., 1.6250%,
due 3/4/18 (144A) . . . . . . . . . . . . . . . . . . . . 0.7 309,889
Special Purpose Entity 74,000 Goldman Sachs Capital I, 6.3450%,
due 15/2/34 . . . . . . . . . . . . . . . . . . . . . . . . . 0.2 86,817
Steel – Producers 175,000 Reliance Steel & Aluminum Co.,
4.5000%, due 15/4/23 . . . . . . . . . . . . . . . . . 0.4 163,148
Super – Regional Banks 208,000 Wells Fargo & Co., 1.1250%,
due 29/10/21 . . . . . . . . . . . . . . . . . . . . . . . . 0.5 227,22142,000 Wells Fargo & Co., 5.8750%,
due 15/6/25 . . . . . . . . . . . . . . . . . . . . . . . . . 0.1 44,2580.6 271,479
Telephone – Integrated 200,000 Telefonica Emisiones SAU, 5.4450%,
due 8/10/29 . . . . . . . . . . . . . . . . . . . . . . . . . 0.8 332,280300,000 Telefonica Europe B.V., 5.8750%,
due 31/12/49 . . . . . . . . . . . . . . . . . . . . . . . . 0.7 327,6911.5 659,971
Textile – Home Furnishings 117,000 Mohawk Industries, Inc., 2.0000%,
due 14/1/22 . . . . . . . . . . . . . . . . . . . . . . . . . 0.3 128,835
Total Corporate Bonds . . . . . . . . . . . . . . . . . . . . . . . . . . . . . . . . 84. 6 37,204,471
Preferred Stock Diversifi ed Banking Institutions
1,375 Citigroup Capital XIII, 6.6919% . . . . . . . . . . . . 0.1 35,7364,550 Morgan Stanley, 6.8750% . . . . . . . . . . . . . . . . . 0.3 126,263
0.4 161,999
Diversifi ed Financial Services 590 General Electric Capital Corp.,
4.7000% . . . . . . . . . . . . . . . . . . . . . . . . . . . . . — 15,027
Finance – Investment Bankers/Brokers 825 Morgan Stanley Capital Trust III,
6.2500% . . . . . . . . . . . . . . . . . . . . . . . . . . . . . — 21,021112 Morgan Stanley Capital Trust IV,
6.2500% . . . . . . . . . . . . . . . . . . . . . . . . . . . . . — 2,84151 Morgan Stanley Capital Trust V,
5.7500% . . . . . . . . . . . . . . . . . . . . . . . . . . . . . — 1,28444 Morgan Stanley Capital Trust VIII,
6.4500% . . . . . . . . . . . . . . . . . . . . . . . . . . . . . — 1,114. . . . . . . . — 26,260
Share or Principal Amount
Percentage of Net
Assets (%) Fair
Value (USD)
Super – Regional Banks 4,925 Wells Fargo & Co., 6.6250% . . . . . . . . . . . . . . 0.3 141,496
Total Preferred Stock . . . . . . . . . . . . . . . . . . . . . . . . . . . . . . . . . . 0.7 344,782
Tranche Loans Casino Hotels
947,595 Las Vegas Sands LLC, 2.5000%, due 19/12/20 . . . . . . . . . . . . . . . . . . . . . . . . 2.1 936,935
Electronic Components – Semiconductors 1,026,786 Avago Technologies (Cayman), Ltd.,
3.0000%, due 6/5/21 . . . . . . . . . . . . . . . . . . 2.3 1,023,368225,000 Avago Technologies (Cayman), Ltd.,
3.5000%, due 11/11/22 . . . . . . . . . . . . . . . . 0.5 222,3292.8 1,245,697
Investment Companies 317,401 RPI Finance Trust, 2.7500%,
due 9/11/20 . . . . . . . . . . . . . . . . . . . . . . . . . 0.7 315,716
Medical Information Systems 129,035 IMS Health, Inc., 2.2500%,
due 17/3/21 . . . . . . . . . . . . . . . . . . . . . . . . . 0.3 125,809
Telecommunications 105,000 Charter Communications, 2.7500%,
due 21/1/23 . . . . . . . . . . . . . . . . . . . . . . . . . 0.2 104,782
Total Tranche Loans . . . . . . . . . . . . . . . . . . . . . . . . . . . . . . . . . . . 6.1 2,728,939
Total Investments . . . . . . . . . . . . . . . . . . . . . . . . . . . . . . . . . . . . 97.4 42,864,196

Janus Global Investment Grade Bond Fund
PORTFOLIO INVESTMENTS
The accompanying notes are an integral part of the fi nancial statements.
1 9 2 J a n u s C a p i t a l F u n d s P l c / 3 1 D e c e m b e r 2 0 1 5
Forward Currency Contracts, Open as at 31 December 2015
Currency Purchased
Currency Sold
Current Market
Value (USD) Settle Date
Unrealised Appreciation
(USD)
Citibank EUR 1,394,498 USD 1,515,406 1,514,498 29-Jan-16 908EUR 862,789 USD 937,595 937,033 29-Jan-16 562EUR 598,188 USD 650,052 649,663 29-Jan-16 389EUR 177,700 USD 193,108 192,992 29-Jan-16 116EUR 5,874 USD 6,383 6,379 29-Jan-16 4EUR 3,568 USD 3,878 3,876 29-Jan-16 2EUR 31 USD 33 33 29-Jan-16 —USD 24,814 EUR 22,705 24,689 29-Jan-16 125USD 14,856 EUR 13,586 14,773 29-Jan-16 83USD 578 GBP 387 571 29-Jan-16 7USD 326 GBP 218 322 29-Jan-16 4USD 17 EUR 16 17 29-Jan-16 —USD 417 EUR 384 417 29-Jan-16 —USD 673 EUR 619 673 29-Jan-16 —USD 3 EUR 2 3 29-Jan-16 —USD 2 EUR 1 2 29-Jan-16 —USD 88 EUR 81 88 29-Jan-16 —USD 294 EUR 271 294 29-Jan-16 —USD 4 EUR 4 4 29-Jan-16 —USD 6 EUR 6 6 29-Jan-16 —
JP Morgan Chase & Co. CAD 406,000 USD 291,545 289,625 29-Jan-16 1,920CHF 331,000 USD 326,252 321,809 29-Jan-16 4,443JPY 115,553,000 USD 944,402 927,076 29-Jan-16 17,326USD 589,624 GBP 391,000 576,338 29-Jan-16 13,286USD 386,916 GBP 255,000 375,873 29-Jan-16 11,043USD 478,404 EUR 437,000 474,923 29-Jan-16 3,481USD 118,478 EUR 109,000 118,459 29-Jan-16 19
Total 53,718
Total Financial Assets at fair value through profi t or loss 42,917,914
Financial Liabilities at fair value through profi t or loss
Forward Currency Contracts, Open as at 31 December 2015
Currency Purchased
Currency Sold
Current Market
Value (USD) Settle Date
Unrealised (Depreciation)
(USD)
Citibank EUR 3,741 USD 4,087 4,106 29-Jan-16 (19)EUR 7,983 USD 8,724 8,768 29-Jan-16 (44)GBP 521,158 USD 778,199 788,156 29-Jan-16 (9,957)USD 199 EUR 184 200 29-Jan-16 (1)USD 670 EUR 619 673 29-Jan-16 (3)USD 960 EUR 886 964 29-Jan-16 (4)USD 1,549 EUR 1,431 1,556 29-Jan-16 (7)USD 18,401 EUR 16,995 18,480 29-Jan-16 (79)USD 29,249 EUR 27,015 29,374 29-Jan-16 (125)
JP Morgan Chase & Co. CAD 866,000 USD 648,954 671,946 29-Jan-16 (22,992)EUR 257,000 USD 279,704 280,105 29-Jan-16 (401)EUR 166,000 USD 180,973 181,541 29-Jan-16 (568)EUR 169,000 USD 184,581 185,496 29-Jan-16 (915)USD 201,834 AUD 280,000 203,908 29-Jan-16 (2,074)USD 131,996 EUR 124,000 134,760 29-Jan-16 (2,764)USD 122,206 EUR 115,000 124,979 29-Jan-16 (2,773)USD 4,218,934 EUR 3,957,000 4,300,375 29-Jan-16 (81,441)
Total (124,167)
Total Financial Liabilities at fair value through profi t or loss (124,167)

Janus High Yield Fund
PORTFOLIO INVESTMENTS
The accompanying notes are an integral part of the fi nancial statements.
J a n u s C a p i t a l F u n d s P l c / 3 1 D e c e m b e r 2 0 1 5 1 9 3
Share or Principal Amount
Percentage of Net
Assets (%) Fair
Value (USD)
Financial Assets at fair value through profi t or loss Asset-Backed/Commercial Mortgage-Backed
Securities 1,549,000 COMM 2015-3BP Mortgage Trust,
3.2384%, due 10/2/35 (144A) . . . . . . . . . . . 0.2 1,382,1472,555,000 Fannie Mae Connecticut
Avenue Securities, 4.4216%, due 25/5/25 . . . . . . . . . . . . . . . . . . . . . . . . . 0.4 2,430,760
1,241,000 Fannie Mae Connecticut Avenue Securities, 5.3216%, due 25/11/24 . . . . . . . . . . . . . . . . . . . . . . . . 0.2 1,265,833
3,362,000 GAHR Commercial Mortgage Trust 2015-NRF, 3.3822%, due 15/12/19 (144A) . . . . . . . . . . . . . . . . . . 0.5 3,136,927
1,309,000 JP Morgan Chase Commercial Mortgage Securities Trust 2015-COSMO, 4.2805%, due 15/1/32 (144A) . . . . . . . . . . . . . . . . . . . 0.2 1,292,729
773,000 JP Morgan Chase Commercial Mortgage Securities Trust 2015-UES, 3.6210%, due 5/9/32 (144A) . . . . . . . . . . . . . . . . . . . . 0.1 707,234
1,304,000 Wachovia Bank Commercial Mortgage Trust Series 2007-C31, 5.6600%, due 15/4/47 . . . . . . . . . . . . . . . . . 0.2 1,304,757
Total Asset-Backed/Commercial Mortgage-Backed Securities . . . . . . . . . . . . . . . . . . . . . . . . . . . . . . . . . . . . . . . . . 1.8 11,520,387
Common Stock Finance – Investment Bankers/Brokers
73,534 E*TRADE Financial Corp. . . . . . . . . . . . . . . . . 0.3 2,179,547
Total Common Stock . . . . . . . . . . . . . . . . . . . . . . . . . . . . . . . . . . 0.3 2,179,547
Corporate Bonds Aerospace and Defence
12,348,000 ADS Tactical, Inc., 11.0000%, due 1/4/18 (144A) . . . . . . . . . . . . . . . . . . . . 2.0 12,564,090
Apparel Manufacturers 3,037,000 Levi Strauss & Co., 5.0000%,
due 1/5/25 . . . . . . . . . . . . . . . . . . . . . . . . . . 0.5 3,037,0004,236,000 QS Wholesale, Inc., 7.8750%,
due 1/8/18 (144A) . . . . . . . . . . . . . . . . . . . . 0.1 889,5605,071,000 Quiksilver, Inc., 10.0000%,
due 1/8/20 . . . . . . . . . . . . . . . . . . . . . . . . . . . — 266,2280.6 4,192,788
Automotive – Cars and Light Trucks 3,559,000 Fiat Chrysler Automobiles N.V.,
4.5000%, due 15/4/20 . . . . . . . . . . . . . . . . . 0.6 3,621,283
Automotive – Truck Parts and Equipment – Original 3,618,000 MPG Holdco I, Inc., 7.3750%,
due 15/10/22 . . . . . . . . . . . . . . . . . . . . . . . . 0.6 3,672,2703,681,000 Schaeffl er Holding, 6.2500%,
due 15/11/19 (144A) . . . . . . . . . . . . . . . . . . 0.6 3,860,4491,558,000 Schaeffl er Holding, 6.7500%,
due 15/11/22 (144A) . . . . . . . . . . . . . . . . . . 0.3 1,682,6401.5 9,215,359
Building – Residential and Commercial 6,531,000 Century Communities, Inc.,
6.8750%, due 15/5/22 . . . . . . . . . . . . . . . . . 1.0 6,024,8481,394,000 D.R. Horton, Inc., 4.0000%,
due 15/2/20 . . . . . . . . . . . . . . . . . . . . . . . . . 0.2 1,408,9163,581,000 KB Home, 7.6250%, due 15/5/23 . . . . . . . . . . . 0.6 3,554,1432,989,000 Meritage Homes Corp., 7.0000%,
due 1/4/22 . . . . . . . . . . . . . . . . . . . . . . . . . . 0.5 3,145,9232,795,000 Meritage Homes Corp., 7.1500%,
due 15/4/20 . . . . . . . . . . . . . . . . . . . . . . . . . 0.5 2,955,713
Share or Principal Amount
Percentage of Net
Assets (%) Fair
Value (USD)
1,936,000 WCI Communities, Inc., 6.8750%, due 15/8/21 . . . . . . . . . . . . . . . . . . . . . . . . . 0.3 2,043,680
3.1 19,133,223
Building and Construction Products – Miscellaneous 1,646,000 Builders FirstSource, Inc.,
10.7500%, due 15/8/23 (144A) . . . . . . . . . . 0.3 1,641,885744,000 NCI Building Systems, Inc.,
8.2500%, due 15/1/23 (144A) . . . . . . . . . . . 0.1 784,9200.4 2,426,805
Cable/Satellite TV 5,121,000 Block Communications, Inc.,
7.2500%, due 1/2/20 (144A) . . . . . . . . . . . . 0.8 5,121,0007,753,000 CCO Holdings LLC / CCO
Holdings Capital Corp., 5.2500%, due 15/3/21 . . . . . . . . . . . . . . . . . 1.3 8,072,811
2,037,000 CCO Holdings LLC / CCO Holdings Capital Corp., 5.3750%, due 1/5/25 (144A) . . . . . . . . . . . . 0.3 2,031,908
1,770,000 CCO Holdings LLC / CCO Holdings Capital Corp., 5.8750%, due 1/5/27 (144A) . . . . . . . . . . . . 0.3 1,765,575
2,339,000 Harron Communications L.P. / Harron Finance Corp., 9.1250%, due 1/4/20 (144A) . . . . . . . . . . . . . . . . . . . . 0.4 2,482,264
3.1 19,473,558
Casino Hotels 1,826,000 Caesars Entertainment Resort
Properties LLC / Caesars Entertainment Resort Properties, 11.0000%, due 1/10/21 . . . . . . . . . . . . . . . . 0.3 1,661,660
2,972,000 Caesars Entertainment Resort Properties LLC / Caesars Entertainment Resort Properties, 8.0000%, due 1/10/20 . . . . . . . . . . . . . . . . . 0.5 2,838,260
1,913,000 MGM Resorts International, 6.6250%, due 15/12/21 . . . . . . . . . . . . . . . . 0.3 1,967,999
5,060,000 MGM Resorts International, 6.7500%, due 1/10/20 . . . . . . . . . . . . . . . . . 0.8 5,224,450
3,009,000 MGM Resorts International, 7.7500%, due 15/3/22 . . . . . . . . . . . . . . . . . 0.5 3,208,347
2,433,000 Station Casinos LLC, 7.5000%, due 1/3/21 . . . . . . . . . . . . . . . . . . . . . . . . . . 0.4 2,493,825
2.8 17,394,541
Casino Services 8,809,000 Boyd Acquisition Sub LLC/Boyd
Acquisition Finance Corp., 8.3750%, due 15/2/18 (144A) . . . . . . . . . . . 1.4 8,985,180
1,953,000 CCM Merger, Inc., 9.1250%, due 1/5/19 (144A) . . . . . . . . . . . . . . . . . . . . 0.3 2,048,209
1.7 11,033,389
Cellular Telecommunications 8,621,000 T-Mobile U.S., Inc., 6.0000%,
due 1/3/23 . . . . . . . . . . . . . . . . . . . . . . . . . . 1.4 8,750,3154,007,000 T-Mobile U.S., Inc., 6.2500%,
due 1/4/21 . . . . . . . . . . . . . . . . . . . . . . . . . . 0.7 4,137,2282.1 12,887,543
Commercial Banks – Eastern U.S. 2,948,000 CIT Group, Inc., 5.5000%,
due 15/2/19 (144A) . . . . . . . . . . . . . . . . . . . 0.5 3,088,030
Commercial Services – Finance 6,636,000 Cardtronics, Inc., 5.1250%,
due 1/8/22 . . . . . . . . . . . . . . . . . . . . . . . . . . 1.0 6,436,920
Computer Services 4,561,000 HIS, Inc., 5.0000%, due 1/11/22 . . . . . . . . . . . 0.7 4,635,116

Janus High Yield Fund
PORTFOLIO INVESTMENTS
The accompanying notes are an integral part of the fi nancial statements.
1 9 4 J a n u s C a p i t a l F u n d s P l c / 3 1 D e c e m b e r 2 0 1 5
Share or Principal Amount
Percentage of Net
Assets (%) Fair
Value (USD)
Consumer Products – Miscellaneous 4,462,000 Jarden Corp., 5.0000%,
due 15/11/23 (144A) . . . . . . . . . . . . . . . . . . 0.7 4,584,705
Containers – Metal and Glass 3,355,000 Ball Corp., 5.2500%, due 1/7/25 . . . . . . . . . . . 0.6 3,443,069
Data Processing and Management 1,816,000 First Data Corp., 5.0000%,
due 15/1/24 (144A) . . . . . . . . . . . . . . . . . . . 0.3 1,811,4607,557,000 First Data Corp., 7.0000%,
due 1/12/23 (144A) . . . . . . . . . . . . . . . . . . . 1.2 7,575,8931.5 9,387,353
Dialysis Centres 1,363,000 Fresenius Medical Care U.S.
Finance II, Inc., 5.6250%, due 31/7/19 (144A) . . . . . . . . . . . . . . . . . . . 0.2 1,473,744
2,765,000 Fresenius Medical Care U.S. Finance II, Inc., 5.8750%, due 31/1/22 (144A) . . . . . . . . . . . . . . . . . . . 0.5 2,972,375
0.7 4,446,119
Disposable Medical Products 3,983,000 ConvaTec Healthcare E S.A.,
8.2500%, due 15/1/19 (144A) . . . . . . . . . . . 0.6 3,719,126
Distribution/Wholesale 3,025,000 American Builders & Contractors
Supply Co., Inc., 5.6250%, due 15/4/21 (144A) . . . . . . . . . . . . . . . . . . . 0.5 3,077,938
3,010,000 Park-Ohio Industries, Inc., 8.1250%, due 1/4/21 . . . . . . . . . . . . . . . . . . 0.5 3,122,875
1.0 6,200,813
Diversifi ed Banking Institutions 3,937,000 Royal Bank of Scotland Group PLC,
5.1250%, due 28/5/24 . . . . . . . . . . . . . . . . . 0.6 3,995,5511,760,000 Royal Bank of Scotland Group PLC,
7.5000%, due 10/8/20 . . . . . . . . . . . . . . . . . 0.3 1,837,0000.9 5,832,551
Diversifi ed Operations 1,202,000 Horizon Pharma Financing, Inc.,
6.6250%, due 1/5/23 (144A) . . . . . . . . . . . . 0.2 1,075,790
Educational Software 9,834,000 Blackboard, Inc., 7.7500%,
due 15/11/19 (144A) . . . . . . . . . . . . . . . . . . 1.4 8,555,580
Electronic Components – Semiconductors 3,092,000 Qorvo, Inc., 6.7500%,
due 1/12/23 (144A) . . . . . . . . . . . . . . . . . . . 0.5 3,161,5705,209,000 Qorvo, Inc., 7.0000%,
due 1/12/25 (144A) . . . . . . . . . . . . . . . . . . . 0.9 5,378,2931.4 8,539,863
Finance – Auto Loans 5,107,000 Ally Financial, Inc., 3.2500%,
due 5/11/18 . . . . . . . . . . . . . . . . . . . . . . . . . 0.8 5,024,0114,652,000 Ally Financial, Inc., 4.6250%,
due 30/3/25 . . . . . . . . . . . . . . . . . . . . . . . . . 0.7 4,605,4801.5 9,629,491
Finance – Commercial 1,633,000 Jefferies Finance LLC / JFIN
Co-Issuer Corp., 7.3750%, due 1/4/20 (144A) . . . . . . . . . . . . . . . . . . . . 0.2 1,457,453
Food – Catering 1,025,000 Aramark Services, Inc., 5.1250%,
due 15/1/24 (144A) . . . . . . . . . . . . . . . . . . . 0.2 1,046,781
Food – Dairy Products 8,170,000 FAGE Dairy Industry S.A. / FAGE
U.S.A. Dairy Industry, Inc., 9.8750%, due 1/2/20 (144A) . . . . . . . . . . . . 1.4 8,512,119
Share or Principal Amount
Percentage of Net
Assets (%) Fair
Value (USD)
Food – Meat Products 6,658,000 JBS U.S.A. LLC / JBS U.S.A.
Finance, Inc., 7.2500%, due 1/6/21 (144A) . . . . . . . . . . . . . . . . . . . . 1.0 6,641,355
4,002,000 JBS U.S.A. LLC / JBS U.S.A. Finance, Inc., 8.2500%, due 1/2/20 (144A) . . . . . . . . . . . . . . . . . . . . 0.6 4,022,010
120,000 Smithfi eld Foods, Inc., 6.6250%, due 15/8/22 . . . . . . . . . . . . . . . . . . . . . . . . . . — 124,950
16,000 Sun Merger Sub, Inc., 5.8750%, due 1/8/21 (144A) . . . . . . . . . . . . . . . . . . . . . — 16,520
1.6 10,804,835
Food – Retail 1,115,000 Albertsons Holdings LLC/Saturn
Acquisition Merger Sub, Inc., 7.7500%, due 15/10/22 (144A) . . . . . . . . . . 0.2 1,188,166
8,661,000 SUPERVALU, Inc., 6.7500%, due 1/6/21 . . . . . . . . . . . . . . . . . . . . . . . . . . 1.3 7,881,510
1,847,000 SUPERVALU, Inc., 7.7500%, due 15/11/22 . . . . . . . . . . . . . . . . . . . . . . . . 0.3 1,685,388
1.8 10,755,064
Gambling – Non-Hotel 5,558,000 Ameristar Casinos, Inc., 7.5000%,
due 15/4/21 . . . . . . . . . . . . . . . . . . . . . . . . . 0.9 5,822,0054,296,000 Greektown Holdings LLC/Greektown
Mothership Corp., 8.8750%, due 15/3/19 (144A) . . . . . . . . . . . . . . . . . . . 0.7 4,360,440
5,318,000 Mohegan Tribal Gaming Authority, 9.7500%, due 1/9/21 . . . . . . . . . . . . . . . . . . 0.9 5,331,295
2,362,000 Mohegan Tribal Gaming Authority, 9.7500%, due 1/9/21 (144A) . . . . . . . . . . . . 0.4 2,367,905
2.9 17,881,645
Gas – Distribution 953,000 Altice U.S. Finance S.A., 7.7500%,
due 15/7/25 (144A) . . . . . . . . . . . . . . . . . . . 0.1 874,378
Hotels and Motels 4,825,000 Playa Resorts Holdings, 8.0000%,
due 15/8/20 (144A) . . . . . . . . . . . . . . . . . . . 0.8 4,921,500
Medical – Drugs 3,115,000 Capsugel S.A., 7.0000%,
due 15/5/19 (144A) . . . . . . . . . . . . . . . . . . . 0.5 3,042,9662,622,000 Endo Finance LLC / Endo Ltd / Endo
Finco, Inc., 6.0000%, due 1/2/25 (144A) . . . . . . . . . . . . . . . . . . . . 0.4 2,595,780
1,910,000 Valeant Pharmaceuticals International, Inc., 5.8750%, due 15/5/23 (144A) . . . . . . . . . . . . . . . . . . . 0.3 1,714,225
1,910,000 Valeant Pharmaceuticals International, Inc., 6.1250%, due 15/4/25 (144A) . . . . . . . . . . . . . . . . . . . 0.3 1,709,450
1.5 9,062,421
Medical – HMO 3,587,000 Centene Corp., 4.7500%,
due 15/5/22 . . . . . . . . . . . . . . . . . . . . . . . . . 0.6 3,488,358
Medical – Hospitals 7,011,000 CHS/Community Health Systems,
Inc., 8.0000%, due 15/11/19 . . . . . . . . . . . . 1.1 7,098,6382,177,000 Tenet Healthcare Corp., 6.0000%,
due 1/10/20 . . . . . . . . . . . . . . . . . . . . . . . . . 0.4 2,302,1782,207,000 Tenet Healthcare Corp., 8.0000%,
due 1/8/20 . . . . . . . . . . . . . . . . . . . . . . . . . . 0.4 2,223,5531.9 11,624,369
Medical Products 2,131,000 Mallinckrodt International Finance
S.A. / Mallinckrodt CB LLC, 5.5000%, due 15/4/25 (144A) . . . . . . . . . . . 0.3 1,971,175

PORTFOLIO INVESTMENTS
The accompanying notes are an integral part of the fi nancial statements.
J a n u s C a p i t a l F u n d s P l c / 3 1 D e c e m b e r 2 0 1 5 1 9 5
Share or Principal Amount
Percentage of Net
Assets (%) Fair
Value (USD)
2,022,000 Mallinckrodt International Finance S.A. / Mallinckrodt CB LLC, 5.6250%, due 15/10/23 (144A) . . . . . . . . . . 0.3 1,931,010
0.6 3,902,185
Oil – Field Services 4,849,000 Hiland Partners L.P. / Hiland
Partners Finance Corp., 5.5000%, due 15/5/22 (144A) . . . . . . . . . . . 0.7 4,664,132
5,683,000 Hiland Partners L.P. / Hiland Partners Finance Corp., 7.2500%, due 1/10/20 (144A) . . . . . . . . . . . 0.9 5,746,934
1.6 10,411,066
Oil Companies – Exploration and Production 716,000 Carrizo Oil & Gas, Inc., 6.2500%,
due 15/4/23 . . . . . . . . . . . . . . . . . . . . . . . . . 0.1 583,5407,253,000 Endeavor Energy Resources
L.P. / EER Finance, Inc., 7.0000%, due 15/8/21 (144A) . . . . . . . . . . . 1.0 6,491,435
2,466,000 Endeavor Energy Resources L.P. / EER Finance, Inc., 8.1250%, due 15/9/23 (144A) . . . . . . . . . . . 0.4 2,231,730
1,977,000 Newfi eld Exploration Co., 5.3750%, due 1/1/26 . . . . . . . . . . . . . . . . . . 0.3 1,645,853
1,180,000 Oasis Petroleum, Inc., 6.5000%, due 1/11/21 . . . . . . . . . . . . . . . . . 0.1 787,650
2,491,000 Oasis Petroleum, Inc., 6.8750%, due 15/3/22 . . . . . . . . . . . . . . . . . 0.3 1,606,695
2,354,000 QEP Resources, Inc., 5.2500%, due 1/5/23 . . . . . . . . . . . . . . . . . . 0.3 1,683,110
2,424,000 QEP Resources, Inc., 5.3750%, due 1/10/22 . . . . . . . . . . . . . . . . . 0.3 1,757,400
2,141,000 Rice Energy, Inc., 6.2500%, due 1/5/22 . . . . . . . . . . . . . . . . . . . . . . . . . . 0.2 1,552,225
1,118,000 Sanchez Energy Corp., 6.1250%, due 15/1/23 . . . . . . . . . . . . . . . . . 0.1 609,310
3.1 18,948,948
Oil Refi ning and Marketing 1,754,000 PBF Holding Co., LLC / PBF Finance
Corp., 8.2500%, due 15/2/20 . . . . . . . . . . . . 0.3 1,824,1601,651,000 Seven Generations Energy, Ltd.,
6.7500%, due 1/5/23 (144A) . . . . . . . . . . . . 0.2 1,395,0950.5 3,219,255
Paper and Related Products 2,250,000 Resolute Forest Products, Inc.,
5.8750%, due 15/5/23 . . . . . . . . . . . . . . . . . 0.3 1,648,125
Pharmaceuticals 1,725,000 Endo Finance LLC / Endo Ltd / Endo
Finco, Inc., 6.0000%, due 15/7/23 (144A) . . . . . . . . . . . . . . . . . . . . . . . . . . . . . 0.3 1,725,000
Pipelines 1,826,000 Crestwood Midstream Partners L.P.
/ Crestwood Midstream Finance Corp., 6.0000%, due 15/12/20 . . . . . . . . . . . 0.2 1,351,240
5,578,000 Crestwood Midstream Partners L.P. / Crestwood Midstream Finance Corp., 6.1250%, due 1/3/22 . . . . . . . . . . . . . 0.6 3,904,600
3,176,000 Holly Energy Partners L.P. / Holly Energy Finance Corp., 6.5000%, due 1/3/20 . . . . . . . . . . . . . . . . . . . . . . . . . . 0.5 3,160,120
7,024,000 MPLX L.P., 4.5000%, due 15/7/23 . . . . . . . . . . 1.0 6,319,4931,231,000 Targa Resources Partners L.P. / Targa
Resources Partners Finance Corp., 6.6250%, due 1/10/20 (144A) . . . . . . . . . . . 0.2 1,117,133
2.5 15,852,586
Share or Principal Amount
Percentage of Net
Assets (%) Fair
Value (USD)
Poultry 6,764,000 Simmons Foods, Inc., 7.8750%,
due 1/10/21 (144A) . . . . . . . . . . . . . . . . . . . 1.0 6,138,330
Radio 6,314,000 Entercom Radio LLC, 10.5000%,
due 1/12/19 . . . . . . . . . . . . . . . . . . . . . . . . . 1.1 6,566,5604,435,000 Townsquare Media, Inc., 6.5000%,
due 1/4/23 (144A) . . . . . . . . . . . . . . . . . . . . 0.7 4,074,6561.8 10,641,216
Real Estate Management/Services 8,415,000 Kennedy-Wilson, Inc., 5.8750%,
due 1/4/24 . . . . . . . . . . . . . . . . . . . . . . . . . . 1.3 8,141,513
Real Estate Operating/Development 1,281,000 Forest City Enterprises, Inc.,
3.6250%, due 15/8/20 . . . . . . . . . . . . . . . . . 0.2 1,362,6644,699,000 Forestar U.S.A. Real Estate Group, Inc.,
8.5000%, due 1/6/22 (144A) . . . . . . . . . . . . . 0.7 4,605,0201,763,000 Greystar Real Estate Partners LLC,
8.2500%, due 1/12/22 (144A) . . . . . . . . . . . 0.3 1,837,9287,593,000 Howard Hughes Corp., 6.8750%,
due 1/10/21 (144A) . . . . . . . . . . . . . . . . . . . 1.2 7,782,8256,619,000 Hunt Cos, Inc., 9.6250%,
due 1/3/21 (144A) . . . . . . . . . . . . . . . . . . . . 1.0 6,023,2903.4 21,611,727
Retail – Discount 3,787,000 Family Tree Escrow LLC, 5.7500%,
due 1/3/23 (144A) . . . . . . . . . . . . . . . . . . . . 0.6 3,938,480
Retail – Drug Store 1,233,000 Rite Aid Corp., 6.1250%,
due 1/4/23 (144A) . . . . . . . . . . . . . . . . . . . . 0.2 1,280,779
Retail – Propane Distribution 2,013,000 Ferrellgas Partners L.P. / Ferrellgas
Partners Finance Corp., 8.6250%, due 15/6/20 . . . . . . . . . . . . . . . . . . . . . . . . . 0.3 1,902,285
Retail – Regional Department Stores 4,125,000 JC Penney Corp., Inc., 5.7500%,
due 15/2/18 . . . . . . . . . . . . . . . . . . . . . . . . . 0.6 3,805,3132,390,000 JC Penney Corp., Inc., 8.1250%,
due 1/10/19 . . . . . . . . . . . . . . . . . . . . . . . . . 0.3 2,174,9000.9 5,980,213
Retail – Restaurants 749,000 Landry’s Holdings II, Inc.,
10.2500%, due 1/1/18 (144A) . . . . . . . . . . . 0.1 749,00011,888,000 Landry’s, Inc., 9.3750%,
due 1/5/20 (144A) . . . . . . . . . . . . . . . . . . . . 2.0 12,571,5428,875,000 Wok Acquisition Corp., 10.2500%,
due 30/6/20 (144A) . . . . . . . . . . . . . . . . . . . 1.2 7,321,8753.3 20,642,417
Semiconductor Equipment 3,170,000 Sensata Technologies B.V., 5.6250%,
due 1/11/24 (144A) . . . . . . . . . . . . . . . . . . . 0.5 3,253,213
Special Purpose Entity 7,174,000 ROC Finance LLC, 12.1250%,
due 1/9/18 (144A) . . . . . . . . . . . . . . . . . . . . 1.2 7,532,700
Specifi ed Purpose Acquisition 2,624,000 Argos Merger Sub, Inc., 7.1250%,
due 15/3/23 (144A) . . . . . . . . . . . . . . . . . . . 0.4 2,608,256
Steel – Producers 1,779,000 ArcelorMittal, 5.1250%,
due 1/6/20 . . . . . . . . . . . . . . . . . . . . . . . . . . 0.2 1,485,465
Telecommunication Equipment 8,996,000 CommScope Holding Co., Inc.,
6.6250%, due 1/6/20 (144A) . . . . . . . . . . . . 1.5 9,130,940

Janus High Yield Fund
PORTFOLIO INVESTMENTS
The accompanying notes are an integral part of the fi nancial statements.
1 9 6 J a n u s C a p i t a l F u n d s P l c / 3 1 D e c e m b e r 2 0 1 5
Share or Principal Amount
Percentage of Net
Assets (%) Fair
Value (USD)
4,854,000 CommScope Technologies Finance LLC, 6.0000%, due 15/6/25 (144A) . . . . . . . . . . . . . . . . . . . 0.7 4,684,110
2.2 13,815,050
Telecommunication Services 6,040,000 Altice Financing S.A., 6.6250%,
due 15/2/23 (144A) . . . . . . . . . . . . . . . . . . . 1.0 5,979,6002,053,000 Altice Finco S.A., 7.6250%,
due 15/2/25 (144A) . . . . . . . . . . . . . . . . . . . 0.3 1,904,1582,664,000 Altice U.S. Finance I Corp.,
5.3750%, due 15/7/23 (144A) . . . . . . . . . . . 0.4 2,677,3203,756,000 UPCB Finance IV, Ltd., 5.3750%,
due 15/1/25 (144A) . . . . . . . . . . . . . . . . . . . 0.6 3,558,8102.3 14,119,888
Telephone – Integrated 7,418,000 Frontier Communications Corp.,
10.5000%, due 15/9/22 (144A) . . . . . . . . . . 1.2 7,408,7284,215,000 Frontier Communications Corp.,
11.0000%, due 15/9/25 (144A) . . . . . . . . . . 0.7 4,183,3883,603,000 Level 3 Financing, Inc., 5.1250%,
due 1/5/23 (144A) . . . . . . . . . . . . . . . . . . . . 0.6 3,589,4893,403,000 Level 3 Financing, Inc., 5.3750%,
due 15/1/24 (144A) . . . . . . . . . . . . . . . . . . . 0.5 3,428,5234,257,000 Level 3 Financing, Inc., 5.3750%,
due 15/8/22 . . . . . . . . . . . . . . . . . . . . . . . . . 0.7 4,336,8193.7 22,946,947
Theatres 2,991,000 National CineMedia LLC, 7.8750%,
due 15/7/21 . . . . . . . . . . . . . . . . . . . . . . . . . 0.5 3,125,595
Transportation – Marine 1,816,000 Eletson Holdings, 9.6250%,
due 15/1/22 (144A) . . . . . . . . . . . . . . . . . . . 0.3 1,625,320393,000 Navios Maritime Holdings
Inc. / Navios Maritime Finance II U.S., Inc., 7.3750%, due 15/1/22 (144A) . . . . . . . . . . . . . . . . . . . . — 197,974
2,376,000 Navios Maritime Holdings Inc. / Navios Maritime Finance II U.S., Inc., 8.1250%, due 15/2/19 . . . . . . . . . . . . . 0.2 1,033,560
0.5 2,856,854
Transportation – Railroad 7,140,000 Florida East Coast Holdings Corp.,
6.7500%, due 1/5/19 (144A) . . . . . . . . . . . . 1.0 6,550,9506,345,000 Florida East Coast Holdings Corp.,
9.7500%, due 1/5/20 (144A) . . . . . . . . . . . . 0.7 4,346,3252,543,000 Watco Cos LLC / Watco Finance
Corp., 6.3750%, due 1/4/23 (144A) . . . . . . . . . . . . . . . . . . . . . . . . . . . . . 0.4 2,517,570
2.1 13,414,845
Transportation Services 1,760,000 CEVA Group PLC, 4.0000%,
due 1/5/18 (144A) . . . . . . . . . . . . . . . . . . . . 0.2 1,487,2007,146,000 XPO Logistics, Inc., 7.8750%,
due 1/9/19 (144A) . . . . . . . . . . . . . . . . . . . . 1.2 7,292,6361.4 8,779,836
X-Ray Equipment 1,774,000 Hologic, Inc., 5.2500%, due 15/7/22
(144A) . . . . . . . . . . . . . . . . . . . . . . . . . . . . . 0.3 1,816,133
Total Corporate Bonds . . . . . . . . . . . . . . . . . . . . . . . . . . . . . . . . 80.6 503,684,935
Preferred Stock Building – Residential and Commercial
10,603 William Lyon Homes, 6.5000% . . . . . . . . . . . . 0.2 939,002
Total Preferred Stock . . . . . . . . . . . . . . . . . . . . . . . . . . . . . . . . . . 0.2 939,002
Share or Principal Amount
Percentage of Net
Assets (%) Fair
Value (USD)
Tranche Loans Building Products – Cement and Aggregate
4,190,000 Hanson Building Products, 9.5000%, due 13/3/23 . . . . . . . . . . . . . . . . . 0.6 3,980,500
Casino Hotels 2,218,000 Cosmopolitan of Las Vegas,
8.7500%, due 19/12/16 . . . . . . . . . . . . . . . . 0.4 2,206,910
Diversifi ed Minerals 5,310,000 Oxbow Carbon and Minerals LLC,
7.0000%, due 19/1/20 . . . . . . . . . . . . . . . . . 0.7 4,416,168
Electronic Components – Semiconductors 10,465,000 Avago Technologies (Cayman), Ltd.,
3.5000%, due 11/11/22 . . . . . . . . . . . . . . . . 1.7 10,340,780
Food – Canned 574,000 Del Monte Foods, Inc., 7.2500%,
due 18/8/21 . . . . . . . . . . . . . . . . . . . . . . . . . 0.1 464,940
Medical – Hospitals 812,444 Surgery Center Holdings, Inc.,
7.5000%, due 3/11/21 . . . . . . . . . . . . . . . . . 0.1 763,697Oil and Gas Companies – Exploration and
Production 1,456,000 Chief Exploration, 6.5000%,
due 16/5/21 . . . . . . . . . . . . . . . . . . . . . . . . . 0.2 970,6724,375,295 Templar Energy LLC, 7.5000%,
due 25/11/20 . . . . . . . . . . . . . . . . . . . . . . . . 0.1 459,4060.3 1,430,078
Professional Sports 8,480,000 Delta 2 Lux Sarl, 6.7500%,
due 29/7/22 . . . . . . . . . . . . . . . . . . . . . . . . . 1.2 7,797,360
Real Estate Services 2,645,000 Dtz Term Loan, 8.2500%,
due 4/11/22 . . . . . . . . . . . . . . . . . . . . . . . . . 0.4 2,600,908
Transport – Equipment and Leasing 2,215,423 Maxim Crane Works L.P.,
9.2500%, due 26/11/18 . . . . . . . . . . . . . . . . 0.3 2,171,115
Transportation – Marine 1,871,313 OSG International, Inc., 4.7500%,
due 5/8/19 . . . . . . . . . . . . . . . . . . . . . . . . . . 0.3 1,810,4951,337,075 Overseas Shipholding Term Loan,
4.2500%, due 5/8/19 . . . . . . . . . . . . . . . . . . 0.2 1,280,2490.5 3,090,744
Total Tranche Loans . . . . . . . . . . . . . . . . . . . . . . . . . . . . . . . . . . . 6.3 39,263,200
Total Investments . . . . . . . . . . . . . . . . . . . . . . . . . . . . . . . . . . . . 89.2 557,587,071

PORTFOLIO INVESTMENTS
The accompanying notes are an integral part of the fi nancial statements.
J a n u s C a p i t a l F u n d s P l c / 3 1 D e c e m b e r 2 0 1 5 1 9 7
Forward Currency Contracts, Open as at 31 December 2015
Currency Purchased
Currency Sold
Current Market
Value (USD) Settle Date
Unrealised Appreciation
(USD)
Citibank AUD 4,207,205 USD 3,023,016 2,985,639 7-Jan-16 37,377AUD 3,124,360 USD 2,244,956 2,217,199 29-Jan-16 27,757AUD 7,300 USD 5,267 5,224 7-Jan-16 43AUD 1,996 USD 1,440 1,428 7-Jan-16 12AUD 232 USD 166 164 29-Jan-16 2CNH 1,056,697 USD 160,095 160,021 29-Jan-16 74CNH 23,719 USD 3,594 3,592 29-Jan-16 2CNH 1,405 USD 213 213 7-Jan-16 —CNH 32 USD 5 5 4-Feb-16 —CNH 703 USD 107 107 7-Jan-16 —CNH 18 USD 3 3 7-Jan-16 —CNH 82 USD 12 12 29-Jan-16 —CNH 1,121 USD 169 169 29-Jan-16 —CNH 26 USD 4 4 29-Jan-16 —CNH 92 USD 14 14 29-Jan-16 —CNH 33 USD 5 5 29-Jan-16 —CNH 1,462 USD 222 222 29-Jan-16 —EUR 40,948,189 USD 44,498,520 44,471,863 29-Jan-16 26,657EUR 22,602,321 USD 24,562,010 24,547,296 29-Jan-16 14,714EUR 6,818,169 USD 7,409,325 7,404,886 29-Jan-16 4,439EUR 3,108,005 USD 3,377,479 3,375,456 4-Feb-16 2,023EUR 296,024 USD 321,690 321,497 7-Jan-16 193EUR 236,641 USD 257,271 257,230 29-Jan-16 41EUR 129,283 USD 140,554 140,532 29-Jan-16 22EUR 1,689 USD 1,836 1,836 29-Jan-16 —GBP 11 USD 17 17 29-Jan-16 —GBP 12 USD 18 18 29-Jan-16 —GBP 12 USD 18 18 29-Jan-16 —USD 105,824 EUR 96,875 105,338 29-Jan-16 486USD 23,384 EUR 21,377 23,245 29-Jan-16 139USD 29,843 EUR 27,319 29,706 7-Jan-16 137USD 19,158 EUR 17,515 19,044 29-Jan-16 114USD 13,231 EUR 12,073 13,128 7-Jan-16 103USD 20,196 EUR 18,488 20,103 29-Jan-16 93USD 10,694 EUR 9,758 10,610 7-Jan-16 84USD 9,758 EUR 8,904 9,682 29-Jan-16 76USD 62,321 EUR 57,253 62,254 29-Jan-16 67USD 59,356 EUR 54,529 59,292 29-Jan-16 64USD 9,343 EUR 8,542 9,288 29-Jan-16 55USD 8,086 EUR 7,398 8,045 29-Jan-16 41USD 2,902 EUR 2,648 2,879 7-Jan-16 23USD 2,154 EUR 1,966 2,137 7-Jan-16 17USD 13,209 EUR 12,135 13,195 29-Jan-16 14USD 1,716 EUR 1,566 1,703 7-Jan-16 13USD 2,193 EUR 2,004 2,180 29-Jan-16 13USD 278 CNH 1,835 278 29-Jan-16 —USD 6 CNH 40 6 29-Jan-16 —USD 6 GBP 4 6 29-Jan-16 —USD 18 CNH 120 18 29-Jan-16 —USD 14 GBP 10 14 29-Jan-16 —USD 816 CNH 5,379 816 7-Jan-16 —USD 15 GBP 10 15 7-Jan-16 —USD 156 CNH 1,027 156 7-Jan-16 —USD 3 CNH 22 3 7-Jan-16 —
Total 114,895
Total Financial Assets at fair value through profi t or loss 557,701,966
Financial Liabilities at fair value through profi t or loss
Forward Currency Contracts, Open as at 31 December 2015
Currency Purchased
Currency Sold
Current Market
Value (USD) Settle Date
Unrealised (Depreciation)
(USD)
Citibank AUD 800 USD 583 584 29-Jan-16 (1)AUD 464 USD 338 339 29-Jan-16 (1)AUD 19,791 USD 14,425 14,454 29-Jan-16 (29)AUD 27,301 USD 19,899 19,939 29-Jan-16 (40)AUD 25,255 USD 18,415 18,459 29-Jan-16 (44)CNH 3,919 USD 595 596 29-Jan-16 (1)CNH 3,623 USD 551 553 29-Jan-16 (2)EUR 139 USD 152 153 7-Jan-16 (1)EUR 1,372 USD 1,501 1,511 29-Jan-16 (10)EUR 2,175 USD 2,379 2,393 29-Jan-16 (14)EUR 2,461 USD 2,692 2,708 7-Jan-16 (16)EUR 3,024 USD 3,305 3,322 29-Jan-16 (17)EUR 19,123 USD 20,889 20,985 29-Jan-16 (96)EUR 16,366 USD 17,909 18,023 29-Jan-16 (114)EUR 29,693 USD 32,469 32,651 7-Jan-16 (182)EUR 34,484 USD 37,735 37,974 29-Jan-16 (239)EUR 313,209 USD 340,935 341,300 29-Jan-16 (365)EUR 120,242 USD 131,580 132,414 29-Jan-16 (834)EUR 207,884 USD 227,485 228,927 29-Jan-16 (1,442)GBP 1,962 USD 2,929 2,966 29-Jan-16 (37)USD 1,460 EUR 1,344 1,462 29-Jan-16 (2)USD 652 EUR 602 655 29-Jan-16 (3)USD 1,868 EUR 1,725 1,876 7-Jan-16 (8)USD 694 AUD 974 709 7-Jan-16 (15)USD 16,764 EUR 15,433 16,781 29-Jan-16 (17)USD 932 AUD 1,309 952 29-Jan-16 (20)USD 33,803 EUR 31,120 33,838 29-Jan-16 (35)USD 8,842 EUR 8,167 8,880 7-Jan-16 (38)USD 10,202 EUR 9,423 10,246 29-Jan-16 (44)USD 7,284 AUD 10,096 7,344 7-Jan-16 (60)USD 8,818 AUD 12,226 8,894 29-Jan-16 (76)USD 14,951 AUD 20,683 15,045 29-Jan-16 (94)USD 121,537 EUR 111,889 121,663 29-Jan-16 (126)USD 10,625 AUD 14,884 10,827 29-Jan-16 (202)USD 195,623 EUR 180,094 195,825 29-Jan-16 (202)USD 52,766 EUR 48,743 53,000 29-Jan-16 (234)USD 17,190 AUD 23,971 17,438 7-Jan-16 (248)USD 14,541 AUD 20,370 14,818 29-Jan-16 (277)USD 94,535 EUR 87,327 94,955 29-Jan-16 (420)USD 108,961 EUR 100,637 109,428 29-Jan-16 (467)USD 23,642 AUD 33,228 24,172 29-Jan-16 (530)USD 5,464,880 EUR 5,047,409 5,488,304 29-Jan-16 (23,462)
Total (30,065)
Total Financial Liabilities at fair value through profi t or loss (30,065)

Janus Global Unconstrained Bond Fund
PORTFOLIO INVESTMENTS
1 9 8 J a n u s C a p i t a l F u n d s P l c / 3 1 D e c e m b e r 2 0 1 5
* 7,200 shares with a value of $229,716 is held as non-cash collateral with Goldman Sachs.The accompanying notes are an integral part of the fi nancial statements.
Share or Principal Amount
Percentage of Net
Assets (%) Fair
Value (USD)
Financial Assets at fair value through profi t or loss Asset-Backed/Commercial Mortgage-Backed
Securities 2,073,492 Alternative Loan Trust 2003-4CB,
5.7500%, due 25/4/33 . . . . . . . . . . . . . . . . . 2.0 2,100,093391,739 Alternative Loan Trust 2006-14CB,
6.0000%, due 25/6/36 . . . . . . . . . . . . . . . . . 0.3 341,260666,725 Alternative Loan Trust 2006-45T1,
6.0000%, due 25/2/37 . . . . . . . . . . . . . . . . . 0.5 581,186245,756 Alternative Loan Trust 2006-4CB,
5.5000%, due 25/4/36 . . . . . . . . . . . . . . . . . 0.2 236,194871,745 Alternative Loan Trust 2006-5T2,
6.0000%, due 25/4/36 . . . . . . . . . . . . . . . . . 0.7 752,101496,662 Banc of America Alternative
Loan Trust 2003-5, 5.5000%, due 25/7/33 . . . . . . . . . . . . . . . . . . . . . . . . . 0.5 506,094
183,141 Banc of America Funding 2006-7 Trust, 6.0000%, due 25/9/36 . . . . . . . . . . . . 0.2 178,470
18,237 Banc of America Mortgage Trust 2004-5, 4.7500%, due 25/6/19 . . . . . . . . . . . . . . . . . . . . . . . . . . — 18,489
4,820,157 Bear Stearns Asset Backed Securities I Trust 2005-AC4, 6.0000%, due 25/7/35 . . . . . . . . . . . . . . . . . . . . . . . . . 4.2 4,502,705
364,079 CHL Mortgage Pass-Through Trust 2006-13, 6.2500%, due 25/9/36 . . . . . . . . . . 0.3 332,217
50,000 General Obligation Unlimited, 6.1380%, due 1/12/39 . . . . . . . . . . . . . . . . . . — 41,388
1,773,184 GSR Mortgage Loan Trust 2006-5F, 6.0000%, due 25/6/36 . . . . . . . . . . . . . . . . . 1.6 1,710,015
315,808 JP Morgan Mortgage Trust 2005-S3, 5.5000%, due 25/1/36 . . . . . . . . . . . . . . . . . 0.3 297,871
324,175 JP Morgan Mortgage Trust 2005-S3, 5.7500%, due 25/1/36 . . . . . . . . . . . . . . . . . 0.3 285,150
943,814 MASTR Alternative Loan Trust 2004-6, 6.0000%, due 25/7/34 . . . . . . . . . . . . . . . . . . . . . . . . . 0.9 963,155
184,644 Morgan Stanley Mortgage Loan Trust 2006-11, 6.0000%, due 25/8/36 . . . . . . . . . . 0.2 170,593
87,360 Morgan Stanley Mortgage Loan Trust 2006-2, 5.2500%, due 25/2/21 . . . . . . . . . . . 0.1 84,806
390,638 RASC Series 2004-KS4 Trust, 4.2600%, due 25/11/31 . . . . . . . . . . . . . . . . 0.4 389,417
3,489,263 Structured Asset Securities Corp Trust 2005-14, 0.7216%, due 25/7/35 . . . . . . . . . . 2.8 2,972,407
1,038,036 Wells Fargo Mortgage Backed Securities 2007-8 Trust, 6.0000%, due 25/7/37 . . . . . . . . . . . . . . . . . . . . . . . . . 0.7 766,630
249,305 Wells Fargo Mortgage Loan 2010-RR2 Trust, 5.5000%, due 27/4/35 (144A) . . . . . . . . . . . . . . . . . . . 0.2 248,324
Total Asset-Backed/Commercial Mortgage-Backed Securities . . . . . . . . . . . . . . . . . . . . . . . . . . . . . . . . . . . . . . . . 16.4 17,478,565
Common Stock Cable/Satellite TV
17,056 Cablevision Systems Corp. . . . . . . . . . . . . . . . . 0.5 544,086
Coffee 3,260 Keurig Green Mountain, Inc. . . . . . . . . . . . . . . 0.3 293,335
Electric – Integrated 796 TECO Energy, Inc. . . . . . . . . . . . . . . . . . . . . . . . — 21,213
Gas – Distribution 15,154 AGL Resources, Inc. . . . . . . . . . . . . . . . . . . . . . 0.9 966,977*
Industrial Gases 6,167 Airgas Inc. . . . . . . . . . . . . . . . . . . . . . . . . . . . . 0.8 853,019
Share or Principal Amount
Percentage of Net
Assets (%) Fair
Value (USD)
Investment Companies 2,365 BlackRock Credit Allocation Income
Trust . . . . . . . . . . . . . . . . . . . . . . . . . . . . . . . . — 29,1842,082 Duff & Phelps Global Utility Income
Fund, Inc. . . . . . . . . . . . . . . . . . . . . . . . . . . . . — 30,6687,449 Eaton Vance Limited Duration Income
Fund . . . . . . . . . . . . . . . . . . . . . . . . . . . . . . . 0.1 95,0498,968 First Trust Intermediate Duration
Preferred & Income Fund . . . . . . . . . . . . . . . 0.2 190,7493,101 Nuveen Preferred Income
Opportunities Fund . . . . . . . . . . . . . . . . . . . . — 28,4054,312 PIMCO Dynamic Credit Income
Fund . . . . . . . . . . . . . . . . . . . . . . . . . . . . . . . 0.1 77,7455,117 Reaves Utility Income Fund . . . . . . . . . . . . . . . 0.1 132,888
0.5 584,688
Life and Health Insurance 5,789 Fidelity & Guaranty Life . . . . . . . . . . . . . . . . . . 0.1 146,867
228 Phoenix Cos, Inc. . . . . . . . . . . . . . . . . . . . . . . . . — 8,44515 Symetra Financial Corp. . . . . . . . . . . . . . . . . . . . — 477
0.1 155,789
Metal Processors and Fabrication 376 Precision Castparts Corp. . . . . . . . . . . . . . . . . . 0.1 87,236
REIT – Mortgage 10,449 American Capital Agency Corp. . . . . . . . . . . . . 0.2 181,18622,522 Annaly Capital Management, Inc. . . . . . . . . . . . 0.2 211,25668,643 Capstead Mortgage Corp. . . . . . . . . . . . . . . . . . 0.6 599,940
1.0 992,382
Total Common Stock . . . . . . . . . . . . . . . . . . . . . . . . . . . . . . . . . . 4.2 4,498,725
Corporate Bonds Automotive – Cars and Light Trucks
200,000 Ford Motor Credit Co., LLC, 1.7000%, due 9/5/16 . . . . . . . . . . . . . . . . . . 0.2 200,213
444,000 Ford Motor Credit Co., LLC, 2.5510%, due 5/10/18 . . . . . . . . . . . . . . . . . 0.4 441,138
298,000 Ford Motor Credit Co., LLC, 3.9840%, due 15/6/16 . . . . . . . . . . . . . . . . . 0.3 301,341
1,363,000 Ford Motor Credit Co., LLC, 4.2070%, due 15/4/16 . . . . . . . . . . . . . . . . . 1.3 1,374,009
181,000 Ford Motor Credit Co., LLC, 6.6250%, due 15/8/17 . . . . . . . . . . . . . . . . . 0.2 192,998
200,000 Kia Motors Corp., 3.6250%, due 14/6/16 (144A) . . . . . . . . . . . . . . . . . . . 0.2 201,660
338,000 Volkswagen International Finance N.V., 0.8041%, due 18/11/16 (144A) . . . . . . . . . . . . . . . . . . . . . . . . . . . . . 0.3 333,077
2.9 3,044,436
Beverages – Wine and Spirits 1,075,000 Constellation Brands, Inc., 7.2500%,
due 1/9/16 . . . . . . . . . . . . . . . . . . . . . . . . . . 1.0 1,113,9691,002,000 Constellation Brands, Inc., 7.2500%,
due 15/5/17 . . . . . . . . . . . . . . . . . . . . . . . . . 1.0 1,069,6352.0 2,183,604
Building – Residential and Commercial 733,000 D.R. Horton, Inc., 4.7500%,
due 15/5/17 . . . . . . . . . . . . . . . . . . . . . . . . . 0.7 757,739398,000 Lennar Corp., 4.5000%, due 15/11/19 . . . . . . . 0.4 406,706733,000 Lennar Corp., 4.7500%, due 15/12/17 . . . . . . . 0.7 756,823
1.8 1,921,268
Building Products – Cement and Aggregate 717,000 Hanson, Ltd., 6.1250%, due 15/8/16 . . . . . . . . 0.7 737,614
Building Products – Wood 375,000 Masco Corp., 6.1250%, due 3/10/16 . . . . . . . . 0.4 387,180
Cable/Satellite TV 39,000 Dish DBS Corp., 7.1250%, due 1/2/16 . . . . . . . . — 39,146

PORTFOLIO INVESTMENTS
The accompanying notes are an integral part of the fi nancial statements.
J a n u s C a p i t a l F u n d s P l c / 3 1 D e c e m b e r 2 0 1 5 1 9 9
Share or Principal Amount
Percentage of Net
Assets (%) Fair
Value (USD)
Casino Hotels 1,000,000 MGM Resorts International,
10.0000%, due 1/11/16 . . . . . . . . . . . . . . . . 1.0 1,059,580487,000 MGM Resorts International,
6.8750%, due 1/4/16 . . . . . . . . . . . . . . . . . . 0.5 492,4791.5 1,552,059
Commercial Banks – Central U.S. 550,000 First Midwest Bancorp., Inc.,
5.8500%, due 1/4/16 . . . . . . . . . . . . . . . . . . 0.5 554,435
Commercial Banks – Eastern U.S. 59,000 CIT Group, Inc., 4.2500%,
due 15/8/17 . . . . . . . . . . . . . . . . . . . . . . . . . 0.1 60,475576,000 Santander Holdings U.S.A., Inc.,
4.6250%, due 19/4/16 . . . . . . . . . . . . . . . . . 0.5 581,0950.6 641,570
Commercial Banks – Non U.S. 603,000 First Citizens St Lucia, Ltd.,
4.9030%, due 9/2/16 (144A) . . . . . . . . . . . . 0.6 603,163
Computers 534,000 Dell, Inc., 3.1000%, due 1/4/16 . . . . . . . . . . . . 0.5 536,003
Data Processing and Management 1,785,000 Fidelity National Information Services,
Inc., 2.8500%, due 15/10/18 . . . . . . . . . . . . 1.7 1,792,492
Dialysis Centres 717,000 Fresenius Medical Care U.S. Finance,
Inc., 6.8750%, due 15/7/17 . . . . . . . . . . . . . 0.7 768,983
Diversifi ed Banking Institutions 100,000 Bank of America Corp., 6.0500%,
due 16/5/16 . . . . . . . . . . . . . . . . . . . . . . . . . 0.1 101,658
Electric – Integrated 200,000 PPL WEM Holdings PLC, 3.9000%,
due 1/5/16 (144A) . . . . . . . . . . . . . . . . . . . . 0.2 200,815880,000 Southern Power Co., 1.8500%,
due 1/12/17 . . . . . . . . . . . . . . . . . . . . . . . . . 0.8 880,0291.0 1,080,844
Finance – Auto Loans 1,059,000 Ally Financial, Inc., 3.2500%,
due 29/9/17 . . . . . . . . . . . . . . . . . . . . . . . . . 1.0 1,060,3243,880,000 Ally Financial, Inc., 3.6000%,
due 21/5/18 . . . . . . . . . . . . . . . . . . . . . . . . . 3.6 3,889,7002,400,000 Ally Financial, Inc., 6.2500%,
due 1/12/17 . . . . . . . . . . . . . . . . . . . . . . . . . 2.4 2,523,000700,000 Ally Financial, Inc., 8.0000%,
due 31/12/18 . . . . . . . . . . . . . . . . . . . . . . . . 0.7 768,2501,053,000 General Motors Financial Co., Inc.,
2.7500%, due 15/5/16 . . . . . . . . . . . . . . . . . 1.0 1,056,1738.7 9,297,447
Finance – Investment Bankers/Brokers 562,000 Citigroup Global Markets Holdings,
Inc., 0.0000%, due 7/9/16 . . . . . . . . . . . . . . 0.5 557,252296,000 Nomura Holdings, Inc., 4.1250%,
due 19/1/16 . . . . . . . . . . . . . . . . . . . . . . . . . 0.3 296,3190.8 853,571
Finance – Leasing Company 314,000 Air Lease Corp., 4.5000%,
due 15/1/16 . . . . . . . . . . . . . . . . . . . . . . . . . 0.3 314,204717,000 Aircastle, Ltd., 6.7500%,
due 15/4/17 . . . . . . . . . . . . . . . . . . . . . . . . . 0.7 749,717875,000 ICBCIL Finance Co., Ltd., 2.6000%,
due 13/11/18 (144A) . . . . . . . . . . . . . . . . . . 0.8 871,034483,000 International Lease Finance Corp.,
5.7500%, due 15/5/16 . . . . . . . . . . . . . . . . . 0.5 490,245891,000 LeasePlan Corp., N.V., 2.8750%,
due 22/1/19 (144A) . . . . . . . . . . . . . . . . . . . 0.8 880,1643.1 3,305,364
Share or Principal Amount
Percentage of Net
Assets (%) Fair
Value (USD)
Food – Miscellaneous/Diversifi ed 240,000 ConAgra Foods, Inc., 1.3000%,
due 25/1/16 . . . . . . . . . . . . . . . . . . . . . . . . . 0.2 240,038
Gas – Distribution 2,825,000 CenterPoint Energy Resources Corp.,
6.1500%, due 1/5/16 . . . . . . . . . . . . . . . . . . 2.7 2,867,406167,000 Sempra Energy, 6.5000%,
due 1/6/16 . . . . . . . . . . . . . . . . . . . . . . . . . . 0.2 170,0502.9 3,037,456
Machinery – Farm 717,000 CNH Industrial America LLC,
7.2500%, due 15/1/16 . . . . . . . . . . . . . . . . . 0.7 718,076
Machinery – Pumps 570,000 SPX FLOW, Inc., 6.8750%,
due 1/9/17 . . . . . . . . . . . . . . . . . . . . . . . . . . 0.6 608,475
Media 136,000 Historic TW, Inc., 8.0500%,
due 15/1/16 . . . . . . . . . . . . . . . . . . . . . . . . . 0.1 136,225
Medical Products 357,000 Becton Dickinson and Co.,
0.9620%, due 15/6/16 . . . . . . . . . . . . . . . . . 0.3 356,873
Metal – Aluminum 261,000 Alcoa, Inc., 5.5500%, due 1/2/17 . . . . . . . . . . . 0.3 268,504
Oil and Gas Drilling 660,000 Nabors Industries, Inc., 2.3500%,
due 15/9/16 . . . . . . . . . . . . . . . . . . . . . . . . . 0.6 656,833447,000 Noble Holding International, Ltd.,
4.0000%, due 16/3/18 . . . . . . . . . . . . . . . . . 0.4 404,9731.0 1,061,806
Oil Companies – Exploration and Production 576,000 Anadarko Petroleum Corp.,
5.9500%, due 15/9/16 . . . . . . . . . . . . . . . . . 0.6 591,974622,000 Gazprom OAO Via Gaz Capital S.A.,
4.9500%, due 23/5/16 (144A) . . . . . . . . . . . 0.6 627,3891.2 1,219,363
Oil Companies – Integrated 1,310,000 Petrobras Global Finance B.V.,
2.0000%, due 20/5/16 . . . . . . . . . . . . . . . . . 1.2 1,293,625285,000 Petrobras Global Finance B.V.,
3.2500%, due 17/3/17 . . . . . . . . . . . . . . . . . 0.2 264,3381,838,000 Petrobras Global Finance B.V.,
3.8750%, due 27/1/16 . . . . . . . . . . . . . . . . . 1.7 1,832,946385,000 Petrobras International Finance Co.,
S.A., 3.5000%, due 6/2/17 . . . . . . . . . . . . . . 0.3 360,938650,000 Petrobras International Finance Co.,
S.A., 6.1250%, due 6/10/16 . . . . . . . . . . . . . 0.6 645,1254.0 4,396,972
Oil Refi ning and Marketing 321,000 Marathon Petroleum Corp.,
2.7000%, due 14/12/18 . . . . . . . . . . . . . . . . 0.3 317,641495,000 Marathon Petroleum Corp.,
3.5000%, due 1/3/16 . . . . . . . . . . . . . . . . . . 0.5 496,4140.8 814,055
Pipelines 85,000 DCP Midstream Operating L.P.,
2.5000%, due 1/12/17 . . . . . . . . . . . . . . . . . 0.1 76,6292,132,000 Kinder Morgan Finance Co., LLC,
5.7000%, due 5/1/16 . . . . . . . . . . . . . . . . . . 2.0 2,132,00050,000 Plains All American Pipeline L.P. /
PAA Finance Corp., 6.1250%, due 15/1/17 . . . . . . . . . . . . . . . . . . . . . . . . . . — 51,385
224,000 Spectra Energy Partners L.P., 2.9500%, due 15/6/16 . . . . . . . . . . . . . . . . . 0.2 224,835
576,000 Tennessee Gas Pipeline Co., LLC, 8.0000%, due 1/2/16 . . . . . . . . . . . . . . . . . . 0.5 578,115
2.8 3,062,964

Janus Global Unconstrained Bond Fund
PORTFOLIO INVESTMENTS
The accompanying notes are an integral part of the fi nancial statements.
2 0 0 J a n u s C a p i t a l F u n d s P l c / 3 1 D e c e m b e r 2 0 1 5
Share or Principal Amount
Percentage of Net
Assets (%) Fair
Value (USD)
Real Estate Management/Services 130,000 Realogy Group LLC / Sunshine Group
Florida, Ltd., 3.3750%, due 1/5/16 (144A) . . . . . . . . . . . . . . . . . . . . . . . . . . . . . 0.1 130,564
REIT – Health Care 257,000 HCP, Inc., 3.7500%, due 1/2/16 . . . . . . . . . . . . 0.2 257,366
REIT – Mortgage 86,000 iStar Financial, Inc., 3.8750%,
due 1/7/16 . . . . . . . . . . . . . . . . . . . . . . . . . . 0.1 85,893
Rental – Auto/Equipment 83,000 ERAC USA Finance LLC, 1.4000%,
due 15/4/16 (144A) . . . . . . . . . . . . . . . . . . . 0.1 82,966
Retail – Consumer Electronics 1,864,000 Best Buy Co., Inc., 3.7500%,
due 15/3/16 . . . . . . . . . . . . . . . . . . . . . . . . . 1.8 1,873,040
Retail – Regional Department Stores 146,000 Dillard’s, Inc., 6.6250%,
due 15/1/18 . . . . . . . . . . . . . . . . . . . . . . . . . 0.1 157,686
Retail – Restaurants 444,000 Yum! Brands, Inc., 6.2500%,
due 15/4/16 . . . . . . . . . . . . . . . . . . . . . . . . . 0.4 449,872
Security Services 267,000 ADT Corp., 2.2500%,
due 15/7/17 . . . . . . . . . . . . . . . . . . . . . . . . . 0.2 266,333
Special Purpose Banks 803,000 Eksportfi nans ASA, 2.3750%,
due 25/5/16 . . . . . . . . . . . . . . . . . . . . . . . . . 0.8 804,064
Special Purpose Entity 400,000 Toll Road Investors Partnership II L.P.,
0.0000%, due 15/2/43 (144A) . . . . . . . . . . . 0.1 57,356
Steel – Producers 60,000 United States Steel Corp., 6.0500%,
due 1/6/17 . . . . . . . . . . . . . . . . . . . . . . . . . . . — 48,900
Super – Regional Banks 2,000,000 SunTrust Banks, Inc., 2.3500%,
due 1/11/18 . . . . . . . . . . . . . . . . . . . . . . . . . 1.9 2,011,782
Telecommunication Equipment 111,000 Juniper Networks, Inc., 3.1000%,
due 15/3/16 . . . . . . . . . . . . . . . . . . . . . . . . . 0.1 111,360
Telecommunication Services 210,000 PCCW-HKT Capital No 4, Ltd.,
4.2500%, due 24/2/16 . . . . . . . . . . . . . . . . . 0.2 210,827109,000 Qwest Corp., 6.5000%, due 1/6/17 . . . . . . . . . 0.1 114,338
0.3 325,165
Telecommunications 31,000 Embarq Corp., 7.0820%,
due 1/6/16 . . . . . . . . . . . . . . . . . . . . . . . . . . . — 31,561
Telephone – Integrated 130,000 AT&T, Inc., 0.7411%, due 12/2/16 . . . . . . . . . . 0.1 129,946777,000 CenturyLink, Inc., 5.1500%,
due 15/6/17 . . . . . . . . . . . . . . . . . . . . . . . . . 0.8 801,281394,000 Verizon Communications, Inc.,
2.5000%, due 15/9/16 . . . . . . . . . . . . . . . . . 0.4 397,143951,000 Verizon Florida LLC, 6.8600%,
due 1/2/28 . . . . . . . . . . . . . . . . . . . . . . . . . . 0.8 901,8292.1 2,230,199
Tobacco 425,000 Reynolds American, Inc., 3.5000%,
due 4/8/16 . . . . . . . . . . . . . . . . . . . . . . . . . . 0.4 429,600
Transport – Equipment and Leasing 506,000 Aviation Capital Group Corp.,
3.8750%, due 27/9/16 (144A) . . . . . . . . . . . 0.5 510,428576,000 GATX Corp., 3.5000%, due 15/7/16 . . . . . . . . . 0.5 582,284
1.0 1,092,712
Share or Principal Amount
Percentage of Net
Assets (%) Fair
Value (USD)
Transportation – Services 428,000 Transnet SOC, Ltd., 4.5000%,
due 10/2/16 (144A) . . . . . . . . . . . . . . . . . . . 0.4 428,917
Trucking and Leasing 948,000 Penske Truck Leasing Co., L.P. /
PTL Finance Corp., 2.5000%, due 15/3/16 (144A) . . . . . . . . . . . . . . . . . . . 0.9 949,686
Total Corporate Bonds . . . . . . . . . . . . . . . . . . . . . . . . . . . . . . . . 53.5 57,146,666
Exchange Traded Funds 129,193 BlackRock Build America
Bond Trust . . . . . . . . . . . . . . . . . . . . . . . . . . 2.5 2,710,469
Total Exchange Traded Funds . . . . . . . . . . . . . . . . . . . . . . . . . . . . 2.5 2,710,469
Government Obligations Brazilian Government Bond
771,000 3.3750%, due 26/9/16 (144A) . . . . . . . . . . . . . 0.7 765,218
Special Purpose Banks 550,000 Chicago Board of Education,
6.0380%, due 1/12/29 . . . . . . . . . . . . . . . . . 0.4 462,330100,000 City of Chicago IL, 6.2070%,
due 1/1/36 . . . . . . . . . . . . . . . . . . . . . . . . . . 0.1 92,725100,000 City of Chicago IL, 6.2570%,
due 1/1/40 . . . . . . . . . . . . . . . . . . . . . . . . . . 0.1 91,004124,000 Eksportfi nans ASA, 5.5000%,
due 25/5/16 . . . . . . . . . . . . . . . . . . . . . . . . . 0.1 125,6360.7 771,695
Total Government Obligations . . . . . . . . . . . . . . . . . . . . . . . . . . . 1.4 1,536,913
Total Investments . . . . . . . . . . . . . . . . . . . . . . . . . . . . . . . . . . . . 78.0 83,371,338

PORTFOLIO INVESTMENTS
The accompanying notes are an integral part of the fi nancial statements.
J a n u s C a p i t a l F u n d s P l c / 3 1 D e c e m b e r 2 0 1 5 2 0 1
Credit Default Swaps
Counterparty Reference Asset Notional
Amount (USD) Termination
Date
Unrealised Appreciation
(USD)
Barclays Capital, Inc. Berkshire Hathaway, Inc. 192,000 20-Dec-19 3,396
Barclays Capital, Inc. Berkshire Hathaway, Inc. 1,390,000 20-Mar-20 23,711
Barclays Capital, Inc. Berkshire Hathaway, Inc. 527,000 20-Dec-19 9,321
Barclays Capital, Inc. Republic of Colombia CDS 1,936,000 20-Mar-16 665
BNP ParibasUnited Mexican States CDS 3,438,000 20-Jun-16 7,662
Citigroup Global Markets, Ltd. Markit MCDX CDS 722,000 20-Dec-19 4,771
Citigroup Global Markets, Ltd. Berkshire Hathaway, Inc. 635,000 20-Mar-20 10,832
Citigroup Global Markets, Ltd.
United Mexican States CDS 956,000 20-Mar-16 1,101
Citigroup Global Markets, Ltd.
United Mexican States CDS 1,911,000 20-Mar-16 2,200
Citigroup Global Markets, Ltd. JP Morgan Chase & Co. 1,343,000 20-Mar-16 2,284
Citigroup Global Markets, Ltd.
Bank of America Corporation 1,343,000 20-Mar-16 2,345
Citigroup Global Markets, Ltd. Markit MCDX CDS 1,557,000 20-Jun-20 5,678
Credit Suisse United Mexican States CDS 2,246,000 20-Jun-16 5,006
Credit Suisse Republic of Colombia CDS 2,266,000 20-Jun-16 1,155
Credit Suisse First Boston Berkshire Hathaway, Inc. 1,717,000 20-Jun-20 28,210
Goldman Sachs Group, Inc. Berkshire Hathaway, Inc. 1,343,000 20-Mar-20 22,910
Goldman Sachs Group, Inc. Berkshire Hathaway, Inc. 1,343,000 20-Mar-20 22,910
Goldman Sachs Group, Inc. Berkshire Hathaway, Inc. 1,392,000 20-Mar-20 23,746
Goldman Sachs Group, Inc.
Italian Government Bonds CDS 2,797,000 20-Mar-17 20,873
Goldman Sachs Group, Inc.
Spanish Government Bonds CDS 2,797,000 20-Mar-17 20,510
Goldman Sachs Group, Inc.
United Mexican States CDS 3,142,000 20-Jun-16 7,002
JP Morgan Chase & Co.
United Mexican States CDS 1,935,000 20-Mar-16 2,228
JP Morgan Chase & Co.
United Mexican States CDS 3,187,000 20-Jun-16 7,103
Morgan Stanley Berkshire Hathaway, Inc. 1,343,000 20-Mar-20 22,910
Total 258,529
Interest Rate Swaps Outstanding at 31 December 2015
Counterparty Notional Amount
Return Paid by the Fund
Return Received
by the Fund Termination
Date
Unrealised Appreciation
(USD)
Goldman Sachs Group, Inc. 148,496,000
Mexico Interbank TIIE 28 day Fixed 7.5% 25-Sep-25 2,857
Morgan Stanley 57,111,000
Mexico Interbank TIIE 28 day Fixed 7.9% 28-May-25 53,450
Total 56,307
Forward Currency Contracts, Open as at 31 December 2015
Currency Purchased
Currency Sold
Current Market
Value (USD) Settle Date
Unrealised Appreciation
(USD)
Citibank AUD 3,758 USD 2,700 2,667 29-Jan-16 33AUD 20 USD 14 14 19-Jan-16 —CAD 18 USD 13 13 19-Jan-16 —CNH 18,621 USD 2,821 2,820 29-Jan-16 1CNH 10 USD 2 2 19-Jan-16 —CNH 47 USD 7 7 19-Jan-16 —CNH 2 USD 0 0 19-Jan-16 —CNH 10 USD 2 2 19-Jan-16 —CNH 17 USD 3 3 19-Jan-16 —CNH 60 USD 9 9 29-Jan-16 —CNH 11 USD 2 2 29-Jan-16 —CNH 29 USD 4 4 29-Jan-16 —EUR 9,345,567 USD 10,155,855 10,149,771 29-Jan-16 6,084EUR 4,908,084 USD 5,333,629 5,330,434 29-Jan-16 3,195EUR 3,951,624 USD 4,294,241 4,291,668 19-Jan-16 2,573EUR 2,186,222 USD 2,375,774 2,374,351 29-Jan-16 1,423EUR 776,500 USD 843,824 843,318 29-Jan-16 506EUR 28,410 USD 30,873 30,854 19-Jan-16 19EUR 12 USD 13 13 19-Jan-16 —GBP 32 USD 48 48 19-Jan-16 —SGD 67 USD 48 48 19-Jan-16 —USD 36,941 EUR 33,801 36,754 19-Jan-16 187USD 17,477 EUR 15,947 17,341 29-Jan-16 136USD 20,384 EUR 18,635 20,263 25-Jan-16 121USD 20,934 EUR 19,164 20,838 19-Jan-16 96USD 10,137 EUR 9,275 10,086 19-Jan-16 51USD 5,454 EUR 4,988 5,423 19-Jan-16 31USD 4,408 EUR 4,033 4,386 19-Jan-16 22USD 1,898 EUR 1,732 1,883 19-Jan-16 15USD 973 EUR 889 967 29-Jan-16 6USD 298 EUR 272 296 29-Jan-16 2USD 2 CNH 12 2 19-Jan-16 —USD 5 CHF 4 5 29-Jan-16 —
JP Morgan Chase & Co. CAD 1,368,000 USD 981,803 974,738 19-Jan-16 7,065
Total 21,566
Total Financial Assets at fair value through profi t or loss 83,707,740

Janus Global Unconstrained Bond Fund
PORTFOLIO INVESTMENTS
The accompanying notes are an integral part of the fi nancial statements.
2 0 2 J a n u s C a p i t a l F u n d s P l c / 3 1 D e c e m b e r 2 0 1 5
Financial Liabilities at fair value through profi t or loss
Contract Amount
Percentage of Net
Assets (%) Fair Value
(USD)
Schedule of Written Options – Calls (4,417,000) CDX USD 5 Year, expires
February 2016, exercise price USD 70 (covered) — (289)
(13,302,000) CDX USD 5 Year, expires January 2016, exercise price USD 70 (covered) — (7)
(31,419,000) CDX USD 5 Year, expires January 2016, exercise price USD 80 (covered) — (4,594)
(1,192) EURO-BOBL Future, expires January 2016, 1,192 contracts, exercise price EUR 132 (covered) — (12,952)
(51) EURO-BOBL Future, expires January 2016, 51 contracts, exercise price EUR 133 (covered) — (277)
(33) S&P 500 EMINI INDEX, expires February 2016, 33 contracts, exercise price USD 2,100 (covered) — (26,400)
(37,914,000) U.S. 3M LIBOR, expires February 2016, exercise price USD 2.30 (covered) — (98,033)
(8,836,000) U.S. 3M LIBOR, expires February 2016, exercise price USD 2.40 (covered) — (33,017)
(53,563,000) U.S. 3M LIBOR, expires January 2016, exercise price USD 0.70 (covered) — —
(26,818,000) U.S. 3M LIBOR, expires January 2016, exercise price USD 0.90 (covered) — —
(3,261,619) USD/CAD Currency Option, expires March 2016, exercise price USD 1.42 (covered) — (24,198)
Total Schedule of Written Options – Calls — (199,767)
Contract Amount Schedule of Written Options – Puts
(17,902,000) CDX USD 5 Year, expires February 2016, exercise price USD 90 (covered) — (53,085)
(31,087,000) CDX USD 5 Year, expires January 2016, exercise price USD 100 (covered) — (14,847)
(38) EURO-BUND Future, expires February 2016, 38 contracts, exercise price EUR 156 (covered) — (27,665)
(4,452,000) MARKIT CDX USD 5 Year, expires January 2016, exercise price USD 95 (covered) — (3,722)
(21) PRECISION CASTPARTS CORP., expires March 2016, 21 contracts, exercise price USD 240 (covered) — (16,892)
(4,417,000) U.S. 3M LIBOR, expires February 2016, exercise price USD 1.25 (covered) — (5,898)
(1,039) U.S. 5 Year Treasury Note Future, expires January 2016, exercise price USD 117 (covered) — (40,586)
Total Schedule of Written Options – Puts — (162,695)
Credit Default Swaps
Counterparty Reference Asset Notional
Amount (USD) Termination
Date
Unrealised Appreciation
(USD)
JP Morgan Chase & Co.
Federal Republic of Brazil CDS 1,935,000 20-Mar-16 (514)
JP Morgan Chase & Co.
Federal Republic of Brazil CDS 967,000 20-Mar-16 (257)
BNP ParibasFederal Republic of Brazil CDS 967,000 20-Mar-16 (257)
Goldman Sachs Group, Inc.
Petrobras International Finance Co. 468,000 20-Mar-16 (5,198)
BNP ParibasFederal Republic of Brazil CDS 2,395,000 20-Mar-16 (636)
BNP ParibasFederal Republic of Brazil CDS 6,917,000 20-Jun-16 (12,717)
Goldman Sachs Group, Inc.
Federal Republic of Brazil CDS 4,672,000 20-Mar-16 (1,242)
Goldman Sachs Group, Inc.
Arab Republic of Egypt CDS 450,000 20-Jun-16 (4,712)
Total (25,533)
Forward Currency Contracts, Open as at 31 December 2015
Currency Purchased
Currency Sold
Current Market
Value (USD) Settle Date
Unrealised (Depreciation)
(USD)
Citibank CAD 3,625 USD 2,621 2,622 19-Jan-16 (1)CHF 60 USD 61 62 19-Jan-16 (1)CHF 2,485 USD 2,519 2,552 19-Jan-16 (33)CHF 9,021 USD 9,069 9,116 29-Jan-16 (47)CHF 445,281 USD 447,618 449,934 29-Jan-16 (2,316)EUR 495 USD 539 540 19-Jan-16 (1)EUR 167 USD 183 184 19-Jan-16 (1)EUR 230 USD 251 252 19-Jan-16 (1)EUR 4,966 USD 5,450 5,501 29-Jan-16 (51)EUR 9,980 USD 10,917 10,982 19-Jan-16 (65)EUR 9,980 USD 10,937 11,023 19-Jan-16 (86)EUR 14,364 USD 15,765 15,912 19-Jan-16 (147)EUR 22,001 USD 24,087 24,251 19-Jan-16 (164)EUR 27,613 USD 30,231 30,437 19-Jan-16 (206)EUR 54,565 USD 59,739 60,146 19-Jan-16 (407)GBP 634 USD 944 954 19-Jan-16 (10)GBP 6,072 USD 9,067 9,183 29-Jan-16 (116)GBP 119,665 USD 178,686 180,972 29-Jan-16 (2,286)SGD 12,392 USD 8,744 8,753 29-Jan-16 (9)USD 15,838 EUR 14,628 15,906 19-Jan-16 (68)
JP Morgan Chase & Co. USD 986,216 CAD 1,368,000 988,868 19-Jan-16 (2,652)
Total (8,668)
Total Financial Liabilities at fair value through profi t or loss (396,663)

The accompanying notes are an integral part of the fi nancial statements.
J a n u s C a p i t a l F u n d s P l c / 3 1 D e c e m b e r 2 0 1 5 2 0 3
Share or Principal Amount
Percentage of Net
Assets (%) Fair
Value (USD)
Financial Assets at fair value through profi t or loss Asset-Backed/Commercial Mortgage-Backed
Securities 2,556,000 AmeriCredit Automobile Receivables
Trust 2012-2, 3.3800%, due 9/4/18 . . . . . . . . . . . . . . . . . . . . . . . . . . 0.8 2,586,239
969,000 Americredit Automobile Receivables Trust 2014-4, 1.8700%, due 9/12/19 . . . . . . . . . . . . . . . . . . . . . . . . . 0.3 965,844
2,385,000 AmeriCredit Automobile Receivables Trust, 1.9300%, due 8/8/18 . . . . . . . . . . . . . 0.7 2,389,579
1,144,000 Capital Auto Receivables Asset Trust 2015-1, 2.1000%, due 21/1/20 . . . . . . . . . . . 0.3 1,135,343
260,392 Citigroup Commercial Mortgage Trust 2014-GC25, 1.4850%, due 10/10/47 . . . . . . . . . . . . . . . . . . . . . . . . 0.1 258,018
438,496 Citigroup Commercial Mortgage Trust 2015-GC27, 1.3530%, due 10/2/48 . . . . . . . . . . . . . . . . . . . . . . . . . 0.1 432,975
321,107 COMM 2014-CCRE19 Mortgage Trust, 1.4150%, due 10/8/47 . . . . . . . . . . . . 0.1 317,944
251,673 COMM 2014-CCRE20 Mortgage Trust, 1.3240%, due 10/11/47 . . . . . . . . . . . 0.1 245,829
315,519 COMM 2014-UBS4 Mortgage Trust, 1.3090%, due 10/8/47 . . . . . . . . . . . . . . . . . 0.1 312,157
360,803 COMM 2015-CCRE25 Mortgage Trust, 1.7370%, due 10/8/48 . . . . . . . . . . . . 0.1 359,009
420,956 COMM 2015-DC1 Mortgage Trust, 1.4880%, due 10/2/48 . . . . . . . . . . . . . . . . . 0.1 417,862
337,083 COMM 2015-LC19 Mortgage Trust, 1.3990%, due 10/2/48 . . . . . . . . . . . . . . . . . 0.1 333,982
262,394 Commercial Mortgage Pass Through Certifi cates, 1.4450%, due 10/12/47 . . . . . . . . . . . . . . . . . . . . . . . . 0.1 260,051
303,952 Csail 2015-C2 Commercial Mortgage Trust, 1.4544%, due 15/6/57 . . . . . . . . . . . . 0.1 300,548
237,664 GS Mortgage Securities Trust 2014-GC24, 1.5090%, due 10/9/47 . . . . . . . . . . . . . . . . . . . . . . . . . 0.1 235,842
437,015 GS Mortgage Securities Trust 2014-GC26, 1.4340%, due 10/11/47 . . . . . . . . . . . . . . . . . . . . . . . . 0.1 432,631
255,159 GS Mortgage Securities Trust 2015-GC28, 1.5280%, due 10/2/48 . . . . . . . . . . . . . . . . . . . . . . . . . 0.1 252,952
269,786 JP MBB Commercial Mortgage Securities Trust 2015-C27, 1.4137%, due 15/2/48 . . . . . . . . . . . . . . . . . 0.1 265,817
351,998 JP MBB Commercial Mortgage Securities Trust 2015-C28, 1.4451%, due 15/10/48 . . . . . . . . . . . . . . . . 0.1 346,994
299,218 JPMBB Commercial Mortgage Securities Trust 2014-C26, 1.5962%, due 15/1/48 . . . . . . . . . . . . . . . . . 0.1 295,818
333,399 JPMBB Commercial Mortgage Securities Trust 2015-C30, 1.7384%, due 15/7/48 . . . . . . . . . . . . . . . . . 0.1 330,506
642,046 Morgan Stanley Bank of America Merrill Lynch Trust 2015-C25, 1.6150%, due 15/10/48 . . . . . . . . . . . . . . . . 0.2 635,259
2,194,000 Santander Drive Auto Receivables Trust 2015-1, 1.9700%, due 15/11/19 . . . . . . . . . . . . . . . . . . . . . . . . 0.6 2,198,077
1,937,000 Santander Drive Auto Receivables Trust 2015-2, 1.8300%, due 15/1/20 . . . . . . . . . . . . . . . . . . . . . . . . . 0.6 1,929,696
Share or Principal Amount
Percentage of Net
Assets (%) Fair
Value (USD)
1,871,000 Santander Drive Auto Receivables Trust 2015-4, 2.2600%, due 15/6/20 . . . . . . . . . . . . . . . . . . . . . . . . . 0.5 1,871,416
1,064,000 Santander Drive Auto Receivables Trust 2015-5, 2.7400%, due 15/12/21 . . . . . . . . . . . . . . . . . . . . . . . . 0.3 1,055,963
998,266 Santander Drive Auto Receivables Trust, 1.9400%, due 15/3/18 . . . . . . . . . . . . 0.3 999,700
1,634,000 Santander Drive Auto Receivables Trust, 3.3000%, due 17/9/18 . . . . . . . . . . . . 0.5 1,656,861
81,977 SMART Trust, 0.9700%, due 14/3/17 . . . . . . . . . . . . . . . . . . . . . . . . . . — 81,919
248,649 Wells Fargo Commercial Mortgage Trust 2014-LC18, 1.4370%, due 15/12/47 . . . . . . . . . . . . . . . . . . . . . . . . 0.1 246,123
267,532 Wells Fargo Commercial Mortgage Trust 2015-C27, 1.7300%, due 15/2/48 . . . . . . . . . . . . . . . . . . . . . . . . . 0.1 265,878
261,108 Wells Fargo Commercial Mortgage Trust 2015-LC20, 1.4710%, due 15/4/50 . . . . . . . . . . . . . . . . . . . . . . . . . 0.1 258,308
359,981 Wells Fargo Commercial Mortgage Trust 2015-Lc22, 1.6390%, due 15/9/58 . . . . . . . . . . . . . . . . . . . . . . . . . 0.1 356,746
501,095 Wells Fargo Commercial Mortgage Trust 2015-NXS3, 1.5040%, due 15/9/57 . . . . . . . . . . . . . . . . . . . . . . . . . 0.1 495,491
308,463 Wells Fargo Commercial Mortgage Trust 2015-SG1, 1.5680%, due 15/12/47 . . . . . . . . . . . . . . . . . . . . . . . . 0.1 306,077
231,443 WFRBS Commercial Mortgage Trust 2014-C21, 1.4130%, due 15/8/47 . . . . . . . . . . . . . . . . . . . . . . . . . . — 229,914
Total Asset-Backed/Commercial Mortgage-Backed Securities . . . . . . . . . . . . . . . . . . . . . . . . . . . . . . . . . . . . . . . . . 7. 4 25,063,368
Corporate Bonds Aerospace and Defence – Equipment
1,364,000 Exelis, Inc., 4.2500%, due 1/10/16 . . . . . . . . . . 0.4 1,388,7241,383,000 Harris Corp., 1.9990%, due 27/4/18 . . . . . . . . . 0.4 1,368,230
0.8 2,756,954
Apparel Manufacturers 1,111,000 Hanesbrands, Inc., 6.3750%,
due 15/12/20 . . . . . . . . . . . . . . . . . . . . . . . . 0.3 1,150,163
Automotive – Cars and Light Trucks 1,709,000 Ford Motor Credit Co., LLC,
2.5510%, due 5/10/18 . . . . . . . . . . . . . . . . . 0.5 1,697,9821,774,000 Ford Motor Credit Co., LLC,
3.9840%, due 15/6/16 . . . . . . . . . . . . . . . . . 0.5 1,793,8903,198,000 General Motors Co., 3.5000%,
due 2/10/18 . . . . . . . . . . . . . . . . . . . . . . . . . 0.9 3,238,103369,000 General Motors Financial Co., Inc.,
3.1000%, due 15/1/19 . . . . . . . . . . . . . . . . . 0.1 368,7282.0 7,098,703
Brewery 3,572,000 SABMiller Holdings, Inc., 1.0189%,
due 1/8/18 (144A) . . . . . . . . . . . . . . . . . . . . 1.0 3,546,021
Building – Residential and Commercial 1,147,000 DR Horton, Inc., 5.6250%,
due 15/1/16 . . . . . . . . . . . . . . . . . . . . . . . . . 0.3 1,148,434460,000 Meritage Homes Corp., 4.5000%,
due 1/3/18 . . . . . . . . . . . . . . . . . . . . . . . . . . 0.1 462,3000.4 1,610,734
Building Products – Cement and Aggregate 91,000 Hanson, Ltd., 6.1250%, due 15/8/16 . . . . . . . . . . — 93,616
Janus US Short-Term Bond Fund
PORTFOLIO INVESTMENTS

Janus US Short-Term Bond Fund
PORTFOLIO INVESTMENTS
The accompanying notes are an integral part of the fi nancial statements.
2 0 4 J a n u s C a p i t a l F u n d s P l c / 3 1 D e c e m b e r 2 0 1 5
Share or Principal Amount
Percentage of Net
Assets (%) Fair
Value (USD)
2,021,000 Martin Marietta Materials, Inc., 1.7031%, due 30/6/17 . . . . . . . . . . . . . . . . . 0.6 2,007,672
1,701,000 Vulcan Materials Co., 7.0000%, due 15/6/18 . . . . . . . . . . . . . . . . . . . . . . . . . 0.6 1,896,615
1.2 3,997,903
Cable/Satellite TV 1,280,000 CCO Safari II LLC, 3.5790%,
due 23/7/20 (144A) . . . . . . . . . . . . . . . . . . . 0.4 1,273,3912,388,000 CCO Safari II LLC, 4.4640%,
due 23/7/22 (144A) . . . . . . . . . . . . . . . . . . . 0.7 2,382,3431.1 3,655,734
Chemicals – Specialty 1,633,000 Albemarle Corp., 3.0000%,
due 1/12/19 . . . . . . . . . . . . . . . . . . . . . . . . . 0.5 1,603,2011,696,000 Ashland, Inc., 3.8750%,
due 15/4/18 . . . . . . . . . . . . . . . . . . . . . . . . . 0.5 1,736,280. . . . . . . 1.0 3,339,481
Commercial Banks – Eastern U.S. 5,432,000 CIT Group, Inc., 5.0000%,
due 15/5/17 . . . . . . . . . . . . . . . . . . . . . . . . . 1.6 5,608,5402,168,000 Citizens Bank N.A./Providence RI,
2.3000%, due 3/12/18 . . . . . . . . . . . . . . . . . 0.6 2,166,9551,074,000 Discover Bank/Greenwood D.E.,
2.6000%, due 13/11/18 . . . . . . . . . . . . . . . . 0.3 1,073,8753,667,000 PNC Bank N.A., 1.6000%,
due 1/6/18 . . . . . . . . . . . . . . . . . . . . . . . . . . 1.1 3,640,9281,344,000 PNC Bank N.A., 1.8500%,
due 20/7/18 . . . . . . . . . . . . . . . . . . . . . . . . . 0.4 1,341,8684.0 13,832,166
Commercial Banks – Non U.S. 200,000 Intesa Sanpaolo SpA, 2.3750%,
due 13/1/17 . . . . . . . . . . . . . . . . . . . . . . . . . 0.1 200,7011,922,000 Intesa Sanpaolo SpA, 3.1250%,
due 15/1/16 . . . . . . . . . . . . . . . . . . . . . . . . . 0.6 1,922,9730.7 2,123,674
Computers – Memory Devices 2,860,000 Seagate HDD Cayman, 3.7500%,
due 15/11/18 . . . . . . . . . . . . . . . . . . . . . . . . 0.8 2,840,455
Data Processing and Management 3,557,000 Fidelity National Information Services,
Inc., 2.8500%, due 15/10/18 . . . . . . . . . . . . 1.0 3,571,9291,722,000 Fidelity National Information Services,
Inc., 3.6250%, due 15/10/20 . . . . . . . . . . . . 0.5 1,746,3041.5 5,318,233
Diversifi ed Banking Institutions 2,406,000 Bank of America Corp., 1.2500%,
due 11/1/16 . . . . . . . . . . . . . . . . . . . . . . . . . 0.7 2,406,1902,893,000 Bank of America Corp., 3.6250%,
due 17/3/16 . . . . . . . . . . . . . . . . . . . . . . . . . 0.9 2,908,029914,000 Bank of America Corp., 3.7500%,
due 12/7/16 . . . . . . . . . . . . . . . . . . . . . . . . . 0.3 925,580436,000 Bank of America Corp., 6.0500%,
due 16/5/16 . . . . . . . . . . . . . . . . . . . . . . . . . 0.1 443,2314,179,000 Citigroup, Inc., 1.8500%,
due 24/11/17 . . . . . . . . . . . . . . . . . . . . . . . . 1.2 4,174,754912,000 Goldman Sachs Group, Inc.,
2.7500%, due 15/9/20 . . . . . . . . . . . . . . . . . 0.3 912,3994,453,000 Goldman Sachs Group, Inc.,
3.6250%, due 7/2/16 . . . . . . . . . . . . . . . . . . 1.3 4,464,3861,599,000 Goldman Sachs Group, Inc.,
5.6250%, due 15/1/17 . . . . . . . . . . . . . . . . . 0.5 1,661,2603,870,000 Morgan Stanley, 1.0564%,
due 23/7/19 . . . . . . . . . . . . . . . . . . . . . . . . . 1.1 3,839,3191,683,000 Morgan Stanley, 1.8750%,
due 5/1/18 . . . . . . . . . . . . . . . . . . . . . . . . . . 0.5 1,682,170
Share or Principal Amount
Percentage of Net
Assets (%) Fair
Value (USD)
930,000 Morgan Stanley, 3.8000%, due 29/4/16 . . . . . . . . . . . . . . . . . . . . . . . . . 0.3 937,947
3,510,000 Royal Bank of Scotland Group PLC, 1.8750%, due 31/3/17 . . . . . . . . . . . . . . . . . 1.0 3,496,374
2,377,000 Royal Bank of Scotland Group PLC, 4.7000%, due 3/7/18 . . . . . . . . . . . . . . . . . . 0.7 2,468,857
2,316,000 UBS A.G./Stamford CT, 1.8000%, due 26/3/18 . . . . . . . . . . . . . . . . . . . . . . . . . 0.7 2,312,876
9.6 32,633,372
Diversifi ed Financial Services 1,385,000 General Electric Capital Corp.,
5.0000%, due 8/1/16 . . . . . . . . . . . . . . . . . . 0.4 1,385,335
Electric – Integrated 5,595,000 PPL WEM Holdings PLC, 3.9000%,
due 1/5/16 (144A) . . . . . . . . . . . . . . . . . . . . 1.6 5,617,788
Electric Products – Miscellaneous 1,513,000 Molex Electronic Technologies LLC,
2.8780%, due 15/4/20 (144A) . . . . . . . . . . . 0.4 1,475,599
Electronic Measuring Instruments 2,638,000 FLIR Systems, Inc., 3.7500%,
due 1/9/16 . . . . . . . . . . . . . . . . . . . . . . . . . . 0.8 2,676,517
Entertainment 1,139,000 GLP Capital L.P. / GLP Financing II,
Inc., 4.3750%, due 1/11/18 . . . . . . . . . . . . . 0.3 1,133,305
Finance – Auto Loans 932,000 Ally Financial, Inc., 3.1250%,
due 15/1/16 . . . . . . . . . . . . . . . . . . . . . . . . . 0.3 932,5831,776,000 Ally Financial, Inc., 3.2500%,
due 5/11/18 . . . . . . . . . . . . . . . . . . . . . . . . . 0.5 1,747,1401,851,000 Ally Financial, Inc., 3.6000%,
due 21/5/18 . . . . . . . . . . . . . . . . . . . . . . . . . 0.5 1,855,6281,635,000 Ally Financial, Inc., 8.0000%,
due 31/12/18 . . . . . . . . . . . . . . . . . . . . . . . . 0.5 1,794,4132,147,000 General Motors Financial Co., Inc.,
2.7500%, due 15/5/16 . . . . . . . . . . . . . . . . . 0.6 2,153,4692.4 8,483,233
Finance – Consumer Loans 1,053,000 Synchrony Financial, 1.8750%,
due 15/8/17 . . . . . . . . . . . . . . . . . . . . . . . . . 0.3 1,048,587
Finance – Investment Bankers/Brokers 3,376,000 Raymond James Financial, Inc.,
4.2500%, due 15/4/16 . . . . . . . . . . . . . . . . . 1.0 3,401,897
Finance – Leasing Company 1,925,000 AerCap Ireland Capital, Ltd. / AerCap
Global Aviation Trust, 2.7500%, due 15/5/17 . . . . . . . . . . . . . . . . . . . . . . . . . 0.6 1,917,781
958,000 International Lease Finance Corp., 2.4620%, due 15/6/16 . . . . . . . . . . . . . . . . . 0.3 958,000
1,613,000 International Lease Finance Corp., 6.7500%, due 1/9/16 (144A) . . . . . . . . . . . . 0.5 1,659,374
1.4 4,535,155
Finance – Other Services 897,000 Intercontinental Exchange, Inc.,
2.7500%, due 1/12/20 . . . . . . . . . . . . . . . . . 0.3 897,391
Food – Confectionery 1,936,000 Wm Wrigley Jr Co., 1.4000%,
due 21/10/16 (144A) . . . . . . . . . . . . . . . . . . 0.6 1,934,387
Food – Miscellaneous/Diversifi ed 2,199,000 HJ Heinz Co., 1.6000%, due 30/6/17
(144A) . . . . . . . . . . . . . . . . . . . . . . . . . . . . . 0.6 2,193,430
Life and Health Insurance 366,000 CNO Financial Group, Inc.,
4.5000%, due 30/5/20 . . . . . . . . . . . . . . . . . 0.1 374,235

PORTFOLIO INVESTMENTS
The accompanying notes are an integral part of the fi nancial statements.
J a n u s C a p i t a l F u n d s P l c / 3 1 D e c e m b e r 2 0 1 5 2 0 5
Share or Principal Amount
Percentage of Net
Assets (%) Fair
Value (USD)
Linen Supply and Related Items 689,000 Cintas Corp. No 2, 2.8500%,
due 1/6/16 . . . . . . . . . . . . . . . . . . . . . . . . . . 0.2 691,764
Machinery – Farm 418,000 CNH Capital LLC, 3.6250%,
due 15/4/18 . . . . . . . . . . . . . . . . . . . . . . . . . 0.1 413,611275,000 CNH Industrial America LLC,
7.2500%, due 15/1/16 . . . . . . . . . . . . . . . . . 0.1 275,4130.2 689,024
Medical – Generic Drugs 2,733,000 Actavis Funding SCS, 1.8500%,
due 1/3/17 . . . . . . . . . . . . . . . . . . . . . . . . . . 0.8 2,738,6823,188,000 Actavis Funding SCS, 2.3500%,
due 12/3/18 . . . . . . . . . . . . . . . . . . . . . . . . . 0.9 3,193,012979,000 Actavis, Inc., 1.8750%, due 1/10/17 . . . . . . . . . 0.3 978,250
1,636,000 Mylan, Inc., 1.3500%, due 29/11/16 . . . . . . . . . . . . . . . . . . . . . . . . 0.5 1,622,642
4,122,000 Perrigo Co., PLC, 1.3000%, due 8/11/16 . . . . . . . . . . . . . . . . . . . . . . . . . 1.2 4,093,698
3.7 12,626,284
Medical Products 1,880,000 Mallinckrodt International Finance
S.A. / Mallinckrodt CB LLC, 4.8750%, due 15/4/20 (144A) . . . . . . . . . . . 0.5 1,818,900
1,340,000 Zimmer Holdings, Inc., 1.4500%, due 1/4/17 . . . . . . . . . . . . . . . . . . . . . . . . . . 0.4 1,333,880
1,393,000 Zimmer Holdings, Inc., 2.0000%, due 1/4/18 . . . . . . . . . . . . . . . . . . . . . . . . . . 0.4 1,385,170
1.3 4,537,950
Multimedia 1,600,000 NBCUniversal Enterprise, Inc.,
0.8575%, due 15/4/16 (144A) . . . . . . . . . . . 0.5 1,599,280
Oil and Gas Drilling 2,229,000 Rowan Cos., Inc., 5.0000%,
due 1/9/17 . . . . . . . . . . . . . . . . . . . . . . . . . . 0.6 2,213,103
Oil Companies – Integrated 3,564,000 Shell International Finance B.V.,
1.6250%, due 10/11/18 . . . . . . . . . . . . . . . . 1. 1 3,546,797
Oil Refi ning and Marketing 1,884,000 Chevron Phillips Chemical Co.,
LLC / Chevron Phillips Chemical Co., L.P., 1.7000%, due 1/5/18 (144A) . . . . . . . . . . . . . . . . . . . . . . . . . . . . . 0.5 1,861,132
1,103,000 Chevron Phillips Chemical Co., LLC / Chevron Phillips Chemical Co., L.P., 2.4500%, due 1/5/20 (144A) . . . . . . . . . . . . . . . . . . . . . . . . . . . . . 0.3 1,090,092
0.8 2,951,224
Pipelines 890,000 Enbridge, Inc., 0.8662%,
due 2/6/17 . . . . . . . . . . . . . . . . . . . . . . . . . . 0.3 871,989799,000 EnLink Midstream Partners L.P.,
2.7000%, due 1/4/19 . . . . . . . . . . . . . . . . . . 0.2 729,5691,429,000 Kinder Morgan Energy Partners L.P.,
2.6500%, due 1/2/19 . . . . . . . . . . . . . . . . . . 0.4 1,322,0261,122,000 Kinder Morgan Finance Co., LLC,
5.7000%, due 5/1/16 . . . . . . . . . . . . . . . . . . 0.3 1,122,0003,574,000 Kinder Morgan, Inc., 3.0500%,
due 1/12/19 . . . . . . . . . . . . . . . . . . . . . . . . . 1.0 3,310,7681,272,000 Spectra Energy Partners L.P., 2.9500%,
due 25/9/18 . . . . . . . . . . . . . . . . . . . . . . . . . 0.4 1,250,6252.6 8,606,977
Property and Casualty Insurance 2,070,000 ACE INA Holdings, Inc., 2.3000%,
due 3/11/20 . . . . . . . . . . . . . . . . . . . . . . . . . 0.6 2,056,514
Share or Principal Amount
Percentage of Net
Assets (%) Fair
Value (USD)
REIT – Offi ce Property 2,634,000 Reckson Operating Partnership L.P.,
6.0000%, due 31/3/16 . . . . . . . . . . . . . . . . . 0. 9 2,658,725
Retail – Drug Store 2,640,000 CVS Health Corp., 1.9000%,
due 20/7/18 . . . . . . . . . . . . . . . . . . . . . . . . . 0. 9 2,640,053
Semiconductor Components/Integrated Circuits 1,618,000 TSMC Global, Ltd., 0.9500%,
due 3/4/16 (144A) . . . . . . . . . . . . . . . . . . . . 0.5 1,614,9451,893,000 TSMC Global, Ltd., 1.6250%,
due 3/4/18 (144A) . . . . . . . . . . . . . . . . . . . . 0.5 1,856,3911.0 3,471,336
Steel – Producers 2,552,000 ArcelorMittal, 5.5000%, due 25/2/17 . . . . . . . . 0.7 2,477,737
Super – Regional Banks 2,688,000 Bank of America N.A., 1.6500%,
due 26/3/18 . . . . . . . . . . . . . . . . . . . . . . . . . 0.8 2,668,6491,795,000 Bank of America N.A., 1.7500%,
due 5/6/18 . . . . . . . . . . . . . . . . . . . . . . . . . . 0.5 1,784,0881.3 4,452,737
Telecommunication Equipment 433,000 CommScope Holding Co., Inc.,
6.6250%, due 1/6/20 (144A) . . . . . . . . . . . . 0.1 439,4951,339,000 CommScope, Inc., 4.3750%,
due 15/6/20 (144A) . . . . . . . . . . . . . . . . . . . 0.4 1,352,3900.5 1,791,885
Telephone – Integrated 972,000 Level 3 Financing, Inc., 7.0000%,
due 1/6/20 . . . . . . . . . . . . . . . . . . . . . . . . . . 0.3 1,018,1701,358,000 Verizon Communications, Inc.,
2.5000%, due 15/9/16 . . . . . . . . . . . . . . . . . 0.4 1,368,8330.7 2,387,003
Trucking and Leasing 2,156,000 Penske Truck Leasing Co., L.P. /
PTL Finance Corp., 2.5000%, due 15/3/16 (144A) . . . . . . . . . . . . . . . . . . . 0.6 2,159,833
2,292,000 Penske Truck Leasing Co., Lp / PTL Finance Corp., 3.2000%, due 15/7/20 (144A) . . . . . . . . . . . . . . . . . . . 0.7 2,271,370
1.3 4,431,203
Total Corporate Bonds . . . . . . . . . . . . . . . . . . . . . . . . . . . . . . . . 53. 5 182,890,048
Government Obligations U.S. Treasury Notes/Bonds
2,042,000 0.3750%, due 31/10/16 . . . . . . . . . . . . . . . . . . 0.6 2,035,9373,287,000 0.5000%, due 30/11/16 . . . . . . . . . . . . . . . . . . 1.0 3,278,7176,087,000 0.5000%, due 30/9/16 . . . . . . . . . . . . . . . . . . . 1.8 6,077,9675,503,000 0.5000%, due 31/3/17 . . . . . . . . . . . . . . . . . . . 1.6 5,478,6007,097,000 0.5000%, due 31/8/16 . . . . . . . . . . . . . . . . . . . 2.1 7,089,7891,978,000 0.6250%, due 30/6/17 . . . . . . . . . . . . . . . . . . . 0.6 1,968,3048,471,000 0.6250%, due 30/9/17 . . . . . . . . . . . . . . . . . . . 2.5 8,413,423
16,567,000 0.6250%, due 31/12/16 . . . . . . . . . . . . . . . . . . 4.8 16,541,7682,166,000 0.6250%, due 31/7/17 . . . . . . . . . . . . . . . . . . . 0.6 2,154,1974,096,000 0.7500%, due 15/4/18 . . . . . . . . . . . . . . . . . . . 1.2 4,056,8011,397,000 0.7500%, due 30/6/17 . . . . . . . . . . . . . . . . . . . 0.4 1,392,8261,402,000 0.7500%, due 31/12/17 . . . . . . . . . . . . . . . . . . 0.4 1,392,7171,403,000 0.7500%, due 31/3/18 . . . . . . . . . . . . . . . . . . . 0.4 1,390,6145,942,000 0.8750%, due 15/1/18 . . . . . . . . . . . . . . . . . . . 1.7 5,915,7722,482,000 0.8750%, due 15/10/17 . . . . . . . . . . . . . . . . . . 0.7 2,474,8744,679,000 0.8750%, due 15/10/18 . . . . . . . . . . . . . . . . . . 1.4 4,628,0979,071,000 0.8750%, due 15/11/17 . . . . . . . . . . . . . . . . . . 2.6 9,040,8847,343,000 0.8750%, due 15/7/18 . . . . . . . . . . . . . . . . . . . 2.1 7,277,4563,159,000 0.8750%, due 15/8/17 . . . . . . . . . . . . . . . . . . . 0.9 3,152,3981,580,000 0.8750%, due 15/9/16 . . . . . . . . . . . . . . . . . . . 0.5 1,582,1911,852,000 0.8750%, due 30/11/17 . . . . . . . . . . . . . . . . . . 0.5 1,846,792

Janus US Short-Term Bond Fund
PORTFOLIO INVESTMENTS
The accompanying notes are an integral part of the fi nancial statements.
2 0 6 J a n u s C a p i t a l F u n d s P l c / 3 1 D e c e m b e r 2 0 1 5
Share or Principal Amount
Percentage of Net
Assets (%) Fair
Value (USD)
1,611,000 1.0000%, due 15/12/17 . . . . . . . . . . . . . . . . . . 0.5 1,608,9862,413,000 1.0000%, due 15/9/17 . . . . . . . . . . . . . . . . . . . 0.7 2,411,9175,007,000 1.0000%, due 15/9/18 . . . . . . . . . . . . . . . . . . . 1.5 4,971,8911,384,000 1.3750%, due 30/6/18 . . . . . . . . . . . . . . . . . . . 0.4 1,389,7031,383,000 1.3750%, due 30/9/18 . . . . . . . . . . . . . . . . . . . 0.4 1,387,6191,390,000 1.3750%, due 31/12/18 . . . . . . . . . . . . . . . . . . 0.4 1,391,3042,738,000 1.6250%, due 30/6/20 . . . . . . . . . . . . . . . . . . . 0.8 2,727,1441,151,000 1.6250%, due 31/7/20 . . . . . . . . . . . . . . . . . . . 0.3 1,145,604
277,000 3.5000%, due 15/2/18 . . . . . . . . . . . . . . . . . . . 0.1 290,904
Total Government Obligations . . . . . . . . . . . . . . . . . . . . . . . . . . 33.5 114,515,196
Tranche Loans Electronic Components – Semiconductors
6,094,611 Avago Technologies (Cayman), Ltd., 3.0000%, due 6/5/21 . . . . . . . . . . . . . . . . . . 1.8 6,074,305
3,824,000 Avago Technologies (Cayman), Ltd., 3.5000%, due 11/11/22 . . . . . . . . . . . . . . . . 1.1 3,778,609
2.9 9,852,914
Hotels and Motels 2,244,809 Hilton Worldwide Finance LLC,
2.5000%, due 26/10/20 . . . . . . . . . . . . . . . . 0.7 2,238,501
Investment Companies 345,261 RPI Finance Trust, 2.7500%,
due 9/11/20 . . . . . . . . . . . . . . . . . . . . . . . . . 0.1 343,427Oil and Gas Companies – Exploration and
Production 448,000 Chief Exploration, 6.5000%,
due 16/5/21 . . . . . . . . . . . . . . . . . . . . . . . . . 0.1 298,668
REIT – Hotels 1,442,001 ESH Hospitality, Inc., 4.2500%,
due 24/6/19 . . . . . . . . . . . . . . . . . . . . . . . . . 0.4 1,445,606
Telecommunications 881,000 Charter Communications, 2.7500%,
due 21/1/23 . . . . . . . . . . . . . . . . . . . . . . . . . 0.3 879,168
Total Tranche Loans . . . . . . . . . . . . . . . . . . . . . . . . . . . . . . . . . . . 4.5 15,058,284
Total Investments . . . . . . . . . . . . . . . . . . . . . . . . . . . . . . . . . . . . 98.7 337,526,896
Forward Currency Contracts, Open as at 31 December 2015
Currency Purchased
Currency Sold
Current Market
Value (USD) Settle Date
Unrealised Appreciation
(USD)
Citibank AUD 3,369 USD 2,420 2,390 29-Jan-16 30EUR 13,605,765 USD 14,785,425 14,776,568 29-Jan-16 8,857EUR 7,389,152 USD 8,029,813 8,025,003 29-Jan-16 4,810EUR 435,209 USD 472,942 472,659 29-Jan-16 283EUR 394,772 USD 429,000 428,743 7-Jan-16 257EUR 7,921 USD 8,576 8,539 29-Jan-16 37USD 907,834 EUR 831,069 903,668 29-Jan-16 4,166USD 304,236 CHF 302,715 302,731 29-Jan-16 1,505USD 99,362 CHF 97,961 97,967 29-Jan-16 1,395USD 97,198 EUR 88,938 96,707 29-Jan-16 491USD 29,172 CHF 28,830 28,832 29-Jan-16 340USD 19,390 CHF 19,200 19,201 7-Jan-16 189USD 31,453 EUR 28,755 31,267 29-Jan-16 186USD 23,892 EUR 21,862 23,771 29-Jan-16 121USD 9,620 CHF 9,524 9,524 29-Jan-16 96USD 5,653 CHF 5,574 5,574 7-Jan-16 79USD 16,386 EUR 15,000 16,311 29-Jan-16 75USD 10,023 EUR 9,159 9,960 29-Jan-16 63USD 5,909 EUR 5,403 5,876 29-Jan-16 33USD 5,190 EUR 4,742 5,157 29-Jan-16 33USD 1,787 EUR 1,628 1,771 29-Jan-16 16USD 1,392 CHF 1,379 1,380 29-Jan-16 12USD 634 EUR 578 628 29-Jan-16 6USD 662 EUR 604 656 29-Jan-16 6USD 284 CHF 280 280 7-Jan-16 4USD 555 CHF 552 553 29-Jan-16 2USD 376 EUR 344 374 29-Jan-16 2USD 333 EUR 305 331 29-Jan-16 2USD 60 EUR 55 59 29-Jan-16 1USD 68 EUR 62 67 29-Jan-16 1USD 2 GBP 1 2 29-Jan-16 —USD 2,888 EUR 2,656 2,888 29-Jan-16 —USD 166 EUR 153 166 29-Jan-16 —USD 1 AUD 1 1 7-Jan-16 —USD 183 EUR 169 183 7-Jan-16 —USD 30 EUR 28 30 7-Jan-16 —USD 53 CHF 53 53 7-Jan-16 —USD 33 EUR 31 33 7-Jan-16 —USD 125 EUR 115 125 29-Jan-16 —USD 18 EUR 17 18 29-Jan-16 —USD 24 CHF 24 24 29-Jan-16 —USD 17 EUR 15 17 7-Jan-16 —USD 41 EUR 38 41 29-Jan-16 —USD 47 EUR 43 47 29-Jan-16 —
Total 23,098
Total Financial Assets at fair value through profi t or loss 337,549,994
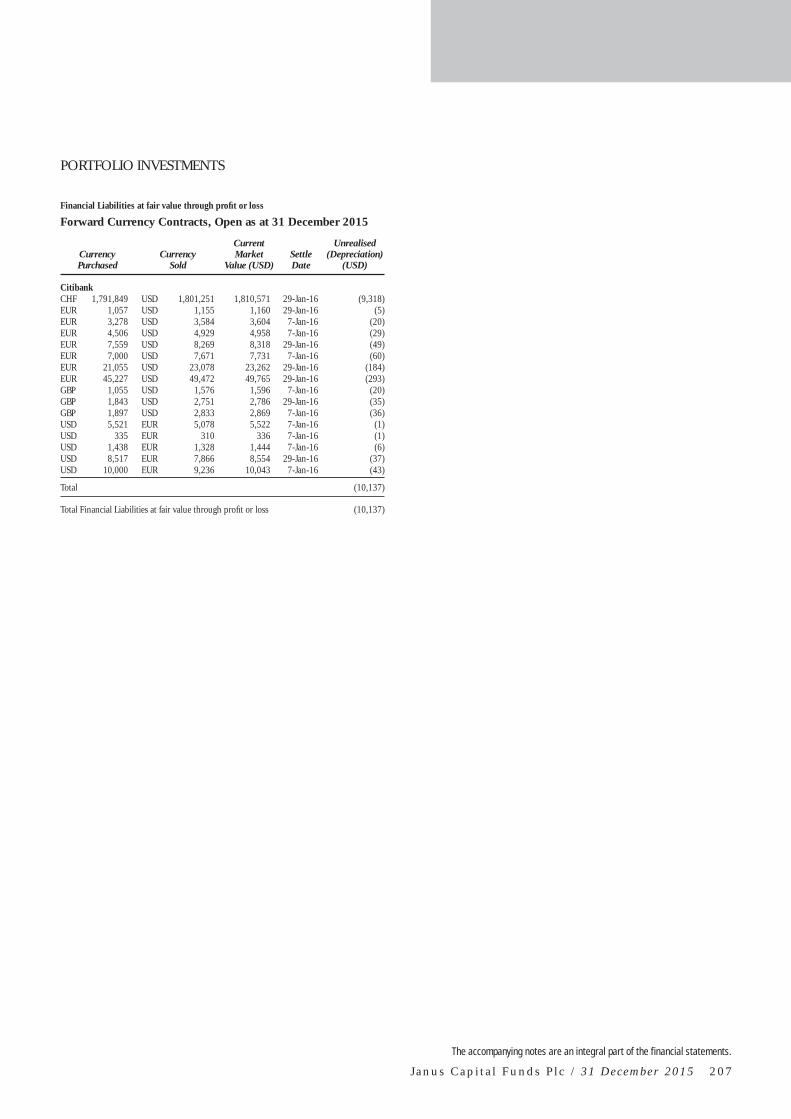
PORTFOLIO INVESTMENTS
The accompanying notes are an integral part of the fi nancial statements.
J a n u s C a p i t a l F u n d s P l c / 3 1 D e c e m b e r 2 0 1 5 2 0 7
Financial Liabilities at fair value through profi t or loss
Forward Currency Contracts, Open as at 31 December 2015
Currency Purchased
Currency Sold
Current Market
Value (USD) Settle Date
Unrealised (Depreciation)
(USD)
Citibank CHF 1,791,849 USD 1,801,251 1,810,571 29-Jan-16 (9,318)EUR 1,057 USD 1,155 1,160 29-Jan-16 (5)EUR 3,278 USD 3,584 3,604 7-Jan-16 (20)EUR 4,506 USD 4,929 4,958 7-Jan-16 (29)EUR 7,559 USD 8,269 8,318 29-Jan-16 (49)EUR 7,000 USD 7,671 7,731 7-Jan-16 (60)EUR 21,055 USD 23,078 23,262 29-Jan-16 (184)EUR 45,227 USD 49,472 49,765 29-Jan-16 (293)GBP 1,055 USD 1,576 1,596 7-Jan-16 (20)GBP 1,843 USD 2,751 2,786 29-Jan-16 (35)GBP 1,897 USD 2,833 2,869 7-Jan-16 (36)USD 5,521 EUR 5,078 5,522 7-Jan-16 (1)USD 335 EUR 310 336 7-Jan-16 (1)USD 1,438 EUR 1,328 1,444 7-Jan-16 (6)USD 8,517 EUR 7,866 8,554 29-Jan-16 (37)USD 10,000 EUR 9,236 10,043 7-Jan-16 (43)
Total (10,137)
Total Financial Liabilities at fair value through profi t or loss (10,137)

The accompanying notes are an integral part of the fi nancial statements.
2 0 8 J a n u s C a p i t a l F u n d s P l c / 3 1 D e c e m b e r 2 0 1 52 0 8 J a n u s C a p i t a l F u n d s P l c / 3 1 D e c e m b e r 2 0 1 5
The table below shows the total fair value of assets split by the holding type for the financial year 31 December 2014:
Percentage of Net Assets (%)
Asset-Backed/Commercial
Mortgage-Backed Securities
Percentage of Net Assets (%) Common Stocks
Percentage of Net Assets (%) Corporate Bonds
Janus Asia Frontier Markets Fund(g) (US$) — — 92.7% 2,660,660 — —Janus Asia Growth Drivers Fund(c) (US$) — — 91.9% 2,527,678 — —Janus Asia Fund (US$) — — 81.2% 97,575,914 — —Janus Balanced Fund (US$) 2.0% 12,989,363 38.7% 248,778,120 25.9% 166,830,034Janus Emerging Markets Fund (US$) — — 87.8% 4,095,454 — —Janus Europe Fund (€) — — 99.7% 206,953,718 — —Janus Global Life Sciences Fund (US$) — — 95.1% 688,235,957 — —Janus Global Research Fund (US$) — — 99.1% 40,238,315 — —Janus Global Technology Fund (US$) — — 99.8% 79,665,880 — —Janus Japan Emerging Opportunities Fund(g) (¥) — — 98.8% 344,769,150 — —Janus Japan Fund(g) (¥) — — 97.5% 216,788,650 — —Janus Opportunistic Alpha Fund (US$) — — 93.6% 90,516,694 — —Janus US Fund (US$) — — 99.7% 1,615,782 — —Janus US Research Fund (US$) — — 98.5% 189,674,555 — —Janus US Twenty Fund (US$) — — 97.6% 344,865,237 — —Janus US Venture Fund (US$) — — 91.3% 265,967,554 — —Perkins Global Value Fund (US$) — — 90.8% 157,621,625 — —Perkins US Strategic Value Fund (US$) — — 95.0% 411,925,356 — —INTECH European Core Fund(d) (€) — — 99.3% 85,070,578 — —INTECH Global All Country Low Volatility Fund(e) (US$) — — 98.6% 161,345,457 — —INTECH Global Dividend Fund (US$) — — 98.6% 2,386,173 — —INTECH US Core Fund (US$) — — 99.4% 158,418,020 — —Janus Global Diversified Alternatives Fund (US$) — — — — — —Janus Global Real Estate Fund (US$) — — 97.1% 159,577,998 — —Janus Flexible Income Fund (US$) 7.9% 76,164,383 — — 38.0% 365,325,620Janus Global Flexible Income Fund (US$) 10.9% 2,343,340 — — 28.0% 5,998,216Janus Global High Yield Fund (US$) 1.9% 1,474,788 0.5% 399,137 87.3% 68,550,022Janus Global Investment Grade Bond Fund (US$) 3.7% 2,438,226 — — 87.6% 58,575,945Janus High Yield Fund (US$) 1.4% 11,325,021 0.7% 5,606,477 83.7% 680,461,174Janus Global Unconstrained Bond Fund(f) (US$) 4.3% 3,350,251 5.5% 4,251,414 71.2% 54,977,191Janus US Short-Term Bond Fund (US$) 3.3% 19,185,832 — — 62.5% 367,942,145
Percentage of Net Assets (%)
Mortgage Backed Securities
Percentage of Net Assets (%) Preferred Stock
Percentage of Net Assets (%)
Schedule of Purchased Options
Janus Asia Frontier Markets Fund(g) (US$) — — — — — —Janus Asia Growth Drivers Fund(c) (US$) — — — — — —Janus Asia Fund (US$) — — 0.9% 1,092,110 — —Janus Balanced Fund (US$) 7.6% 48,922,127 0.6% 4,041,880 — —Janus Emerging Markets Fund (US$) — — 0.7% 34,626 — —Janus Europe Fund (€) — — — — — —Janus Global Life Sciences Fund (US$) — — — — — —Janus Global Research Fund (US$) — — — — — —Janus Global Technology Fund (US$) — — — — — —Janus Japan Emerging Opportunities Fund(g) (¥) — — — — — —Janus Japan Fund(g) (¥) — — — — — —Janus Opportunistic Alpha Fund (US$) — — — — — —Janus US Fund (US$) — — — — 0.2% 3,631Janus US Research Fund (US$) — — — — — —Janus US Twenty Fund (US$) — — — — 0.1% 253,273Janus US Venture Fund (US$) — — — — — —Perkins Global Value Fund (US$) — — — — — —Perkins US Strategic Value Fund (US$) — — — — — —INTECH European Core Fund(d) (€) — — — — — —INTECH Global All Country Low Volatility Fund(e) (US$) — — 0.1% 126,129 — —INTECH Global Dividend Fund (US$) — — — — — —INTECH US Core Fund (US$) — — — — — —Janus Global Diversified Alternatives Fund (US$) — — — — — —Janus Global Real Estate Fund (US$) — — 0.1% 148,516 — —Janus Flexible Income Fund (US$) 15.2% 145,927,468 1.8% 16,981,480 — —Janus Global Flexible Income Fund (US$) — — 0.3% 70,244 — —Janus Global High Yield Fund (US$) — — 0.6% 484,859 — —Janus Global Investment Grade Bond Fund (US$) — — 0.6% 415,693 — —Janus High Yield Fund (US$) — — 0.9% 6,986,706 — —Janus Global Unconstrained Bond Fund(f) (US$) — — — — — —Janus US Short-Term Bond Fund (US$) — — — — — —
(c) This fund commenced operations on 19 September 2014. The information from this Fund is from the date of commencement of operations to 31 December 2014.
(d) This fund commenced operations on 31 January 2014. The information from this Fund is from the date of commencement of operations to 31 December 2014.
(e) This fund commenced operations on 3 November 2014. The information from this Fund is from the date of commencement of operations to 31 December 2014.
(f) This fund commenced operations on 29 September 2014. The information from this Fund is from the date of commencement of operations to 31 December 2014.
(g) This fund commenced operations on 26 September 2014. The information from this Fund is from the date of commencement of operations to 31 December 2014.

J a n u s C a p i t a l F u n d s P l c / 3 1 D e c e m b e r 2 0 1 5 2 0 9
Credit Default Swaps
Percentage of Net Assets (%)
Exchange Traded Funds
Fully Funded Equity Swaps
Percentage of Net Assets (%) Futures
Forward Currency Contracts
Percentage of Net Assets (%)
Government Obligations
— 4.4% 127,443 — — — 154 — —— 4.7% 129,660 — — — 1,103 — —— — — 8,897,100 — — 1 — —— — — — — — 45,556 23.6% 152,366,176— — — 175,266 — — 1,629 — —— — — — — — 214,375 — —— — — — — — 553,298 — —— — — — — — 246 — —— — — — — — 13,469 — —— — — — — — 254,741 — —— — — — — — 166,657 — —— — — — — — 3,169 — —— — — — — — 244 — —— — — — — — 73 — —— — — — — — 4,155 — —— 2.4% 7,040,816 — — — 1,037 — —— — — — — — 230,517 — —— — — — — — 4,178 — —— — — — — — — — —— — — — — — — — —— — — — — — 24 — —— — — — — — 1,566 — —— — — — 0.8% 18,401 682 73.1% 1,599,954— — — — — — 410 — —— — — — — — 20,649 34.3% 329,760,533— — — — — — 212,080 57.7% 12,348,057— — — — — — 120,676 — —— — — — — — 396,242 — —— — — — — — 28,135 — —
371,768 1.8% 1,413,507 — 0.2% 174,031 5,047 9.3% 7,169,319— — — — — — 3,248 31.2% 183,251,907
Total Return Swaps
Percentage of Net Assets (%) Tranche Loans
Percentage of Net Assets (%) Warrants
— — — — —— — — — —
899,930 — — — —— 0.8% 5,421,722 — —
18,441 — — — —364,309 — — 0.2% 418,112
— — — — —— — — — —— — — — —— — — — —— — — — —— — — — —— — — — —— — — — —— — — — —— — — — —— — — — —— — — — —— — — — —— — — — —— — — — —— — — — —
54,125 — — — —— — — — —— 2.1% 20,627,143 — —— 1.7% 361,846 — —— 8.5% 6,667,075 — —— 2.0% 1,314,632 — —— 6.1% 49,672,720 — —— — — — —— 1.9% 11,262,170 — —

The accompanying notes are an integral part of the fi nancial statements.
2 1 0 J a n u s C a p i t a l F u n d s P l c / 3 1 D e c e m b e r 2 0 1 5
The table below shows the total fair value of liabilities split by the holding type for the financial year 31 December 2014:
Credit Default Swaps
Percentage of Net Assets (%) Futures
Forward Currency Contracts
Janus Asia Frontier Markets Fund(g) (US$) — — — (6,309)Janus Asia Growth Drivers Fund(c) (US$) — — — (7,186)Janus Asia Fund (US$) — — — (339)Janus Balanced Fund (US$) — — — (1,871,364)Janus Emerging Markets Fund (US$) — — — (26,876)Janus Europe Fund (€) — — — (654)Janus Global Life Sciences Fund (US$) — — — (1,559,618)Janus Global Research Fund (US$) — — — (24,099)Janus Global Technology Fund (US$) — — — (246,673)Janus Japan Emerging Opportunities Fund(g) (¥) — — — (592,332)Janus Japan Fund(g) (¥) — — — (374,329)Janus Opportunistic Alpha Fund (US$) — — — (234,611)Janus US Fund (US$) — — — (9,408)Janus US Research Fund (US$) — — — (24,008)Janus US Twenty Fund (US$) — — — (694,379)Janus US Venture Fund (US$) — — — (544,415)Perkins Global Value Fund (US$) — — — (96,089)Perkins US Strategic Value Fund (US$) — — — (851,895)INTECH European Core Fund(d) (€) — — — —INTECH Global All Country Low Volatility Fund(e) (US$) — — — —INTECH Global Dividend Fund (US$) — (0.1)% (3,192) (6,020)INTECH US Core Fund (US$) — — — (709,416)Janus Global Diversified Alternatives Fund (US$) — — — (16,613)Janus Global Real Estate Fund (US$) — — — (135,662)Janus Flexible Income Fund (US$) — — — (3,743,363)Janus Global Flexible Income Fund (US$) — — — (250,278)Janus Global High Yield Fund (US$) — — — (591,594)Janus Global Investment Grade Bond Fund (US$) — — — (249,739)Janus High Yield Fund (US$) — — — (1,704,712)Janus Global Unconstrained Bond Fund(f) (US$) (489,035) (0.4)% (299,975) (192,076)Janus US Short-Term Bond Fund (US$) — — — (782,347)
Percentage of Net Assets (%)
Schedule of Written Options
Janus Asia Frontier Markets Fund(g) (US$) — —Janus Asia Growth Drivers Fund(c) (US$) — —Janus Asia Fund (US$) — —Janus Balanced Fund (US$) — —Janus Emerging Markets Fund (US$) — —Janus Europe Fund (€) (0.8)% (1,653,477)Janus Global Life Sciences Fund (US$) — —Janus Global Research Fund (US$) — —Janus Global Technology Fund (US$) — (15,684)Janus Japan Emerging Opportunities Fund(g) (¥) — —Janus Japan Fund(g) (¥) — —Janus Opportunistic Alpha Fund (US$) — —Janus US Fund (US$) — (591)Janus US Research Fund (US$) — —Janus US Twenty Fund (US$) — —Janus US Venture Fund (US$) — —Perkins Global Value Fund (US$) — —Perkins US Strategic Value Fund (US$) — —INTECH European Core Fund(d) (€) — —INTECH Global All Country Low Volatility Fund(e) (US$) — —INTECH Global Dividend Fund (US$) — —INTECH US Core Fund (US$) — —Janus Global Diversified Alternatives Fund (US$) — —Janus Global Real Estate Fund (US$) — (45,436)Janus Flexible Income Fund (US$) — —Janus Global Flexible Income Fund (US$) — —Janus Global High Yield Fund (US$) — —Janus Global Investment Grade Bond Fund (US$) — —Janus High Yield Fund (US$) — —Janus Global Unconstrained Bond Fund(f) (US$) (0.3)% (258,641)Janus US Short-Term Bond Fund (US$) — —
(c) This fund commenced operations on 19 September 2014. The information from this Fund is from the date of commencement of operations to 31 December 2014.
(d) This fund commenced operations on 31 January 2014. The information from this Fund is from the date of commencement of operations to 31 December 2014.
(e) This fund commenced operations on 3 November 2014. The information from this Fund is from the date of commencement of operations to 31 December 2014.
(f) This fund commenced operations on 29 September 2014. The information from this Fund is from the date of commencement of operations to 31 December 2014.
(g) This fund commenced operations on 26 September 2014. The information from this Fund is from the date of commencement of operations to 31 December 2014.

[Th is page intentionally left blank]


J a n u s C a p i t a l F u n d s P l c / 3 1 D e c e m b e r 2 0 1 5 2 1 3
Janus Balanced Fund
Janus Emerging Markets Fund
Janus Europe Fund
Janus Global Life Sciences Fund
Janus Global Research Fund
As of 31 December
2015
As of 31 December
2014
As of 31 December
2015
As of 31 December
2014
As of 31 December
2015
As of 31 December
2014
As of 31 December
2015
As of 31 December
2014
As of 31 December
2015
As of 31 December
2014(USD) (USD) (USD) (USD) (EUR) (EUR) (USD) (USD) (USD) (USD)
701,465,937 639,394,978 109,513,668 4,327,329 139,097,406 207,981,391 1,943,511,302 688,789,255 38,784,397 40,238,56118,299,438 4,005,597 2,184,528 335,270 669,158 24,771 23,578,975 22,625,417 388,046 194,625
— — 470,196 187,196 865,357 1,093,226 — — — —— — — — 872,493 — — — — —
— 226,210 10,611 128,789 6,248 2,309,977 7,293,425 125,071 31,871 193,810— — — 26 — — — 452 — —
2,303,696 2,310,571 — — 46,000 35,344 5,084,573 18,407,221 200 30,189493,763 380,824 217,011 859 92,246 124,790 318,196 92,906 24,618 21,958
1,840,910 2,712,633 — — 66,942 — 112,415 — — —10,060 — 21,039 8,217 — — — — 24,064 7,111
6,673 7,430 1,078 1,089 356,344 189,052 263,993 17,493 9,100 7,814724,420,477 649,038,243 112,418,131 4,988,775 142,072,194 211,758,551 1,980,162,879 730,057,815 39,262,296 40,694,068
49,621 1,871,364 71,340 28,789 8,571 1,685,008 561,429 1,559,618 353 24,099— — — 93,650 — 2,047,909 — — — —— — — — — — — — — —
1,753,985 — — 142,844 579,573 252,094 6,134,977 212,694 78,181 25,40689 — 39 — 907 25,529 6,516 — — 1,260
881,567 1,190,443 6,353 — 189,043 68,269 5,985,671 2,562,782 — —579,678 553,243 — — 20,471 68,047 2,383,987 901,237 — —
1,030,980 808,748 5,085 5,939 45,784 60,580 1,723,177 701,930 4,336 4,5168,807 9,647 606 756 — — 16,158 17,154 47 52
63,754 95,439 6,807 444 12,604 17,151 169,425 71,132 2,424 2,886164,566 63,199 58,860 54,366 12,686 27,061 385,473 106,016 23,976 40,366
4,533,047 4,592,083 149,090 326,788 869,639 4,251,648 17,366,813 6,132,563 109,317 98,585
719,887,430 644,446,160 112,269,041 4,661,987 141,202,555 207,506,903 1,962,796,066 723,925,252 39,152,979 40,595,483
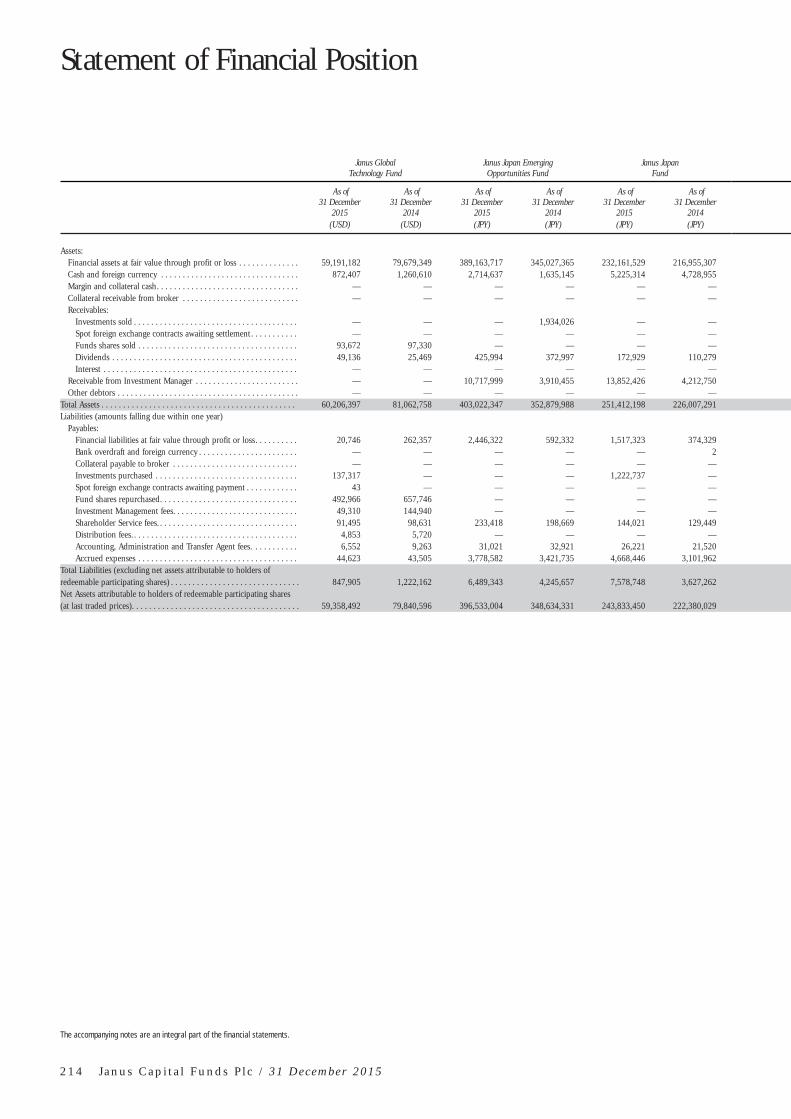
Statement of Financial Position
The accompanying notes are an integral part of the financial statements.
2 1 4 J a n u s C a p i t a l F u n d s P l c / 3 1 D e c e m b e r 2 0 1 5
Janus Global Technology Fund
Janus Japan Emerging Opportunities Fund
Janus Japan Fund
As of 31 December
2015
As of 31 December
2014
As of 31 December
2015
As of 31 December
2014
As of 31 December
2015
As of 31 December
2014(USD) (USD) (JPY) (JPY) (JPY) (JPY)
Assets:Financial assets at fair value through profit or loss . . . . . . . . . . . . . . 59,191,182 79,679,349 389,163,717 345,027,365 232,161,529 216,955,307Cash and foreign currency . . . . . . . . . . . . . . . . . . . . . . . . . . . . . . . . 872,407 1,260,610 2,714,637 1,635,145 5,225,314 4,728,955Margin and collateral cash. . . . . . . . . . . . . . . . . . . . . . . . . . . . . . . . . — — — — — —Collateral receivable from broker . . . . . . . . . . . . . . . . . . . . . . . . . . . — — — — — —Receivables:
Investments sold . . . . . . . . . . . . . . . . . . . . . . . . . . . . . . . . . . . . . . — — — 1,934,026 — —Spot foreign exchange contracts awaiting settlement. . . . . . . . . . . — — — — — —Funds shares sold . . . . . . . . . . . . . . . . . . . . . . . . . . . . . . . . . . . . . 93,672 97,330 — — — —Dividends . . . . . . . . . . . . . . . . . . . . . . . . . . . . . . . . . . . . . . . . . . . 49,136 25,469 425,994 372,997 172,929 110,279Interest . . . . . . . . . . . . . . . . . . . . . . . . . . . . . . . . . . . . . . . . . . . . . — — — — — —
Receivable from Investment Manager . . . . . . . . . . . . . . . . . . . . . . . . — — 10,717,999 3,910,455 13,852,426 4,212,750Other debtors . . . . . . . . . . . . . . . . . . . . . . . . . . . . . . . . . . . . . . . . . . — — — — — —
Total Assets . . . . . . . . . . . . . . . . . . . . . . . . . . . . . . . . . . . . . . . . . . . . . 60,206,397 81,062,758 403,022,347 352,879,988 251,412,198 226,007,291Liabilities (amounts falling due within one year)
Payables:Financial liabilities at fair value through profit or loss. . . . . . . . . . 20,746 262,357 2,446,322 592,332 1,517,323 374,329Bank overdraft and foreign currency . . . . . . . . . . . . . . . . . . . . . . . — — — — — 2Collateral payable to broker . . . . . . . . . . . . . . . . . . . . . . . . . . . . . — — — — — —Investments purchased . . . . . . . . . . . . . . . . . . . . . . . . . . . . . . . . . 137,317 — — — 1,222,737 —Spot foreign exchange contracts awaiting payment . . . . . . . . . . . . 43 — — — — —Fund shares repurchased. . . . . . . . . . . . . . . . . . . . . . . . . . . . . . . . 492,966 657,746 — — — —Investment Management fees. . . . . . . . . . . . . . . . . . . . . . . . . . . . . 49,310 144,940 — — — —Shareholder Service fees. . . . . . . . . . . . . . . . . . . . . . . . . . . . . . . . . 91,495 98,631 233,418 198,669 144,021 129,449Distribution fees.. . . . . . . . . . . . . . . . . . . . . . . . . . . . . . . . . . . . . . 4,853 5,720 — — — —Accounting, Administration and Transfer Agent fees. . . . . . . . . . . 6,552 9,263 31,021 32,921 26,221 21,520Accrued expenses . . . . . . . . . . . . . . . . . . . . . . . . . . . . . . . . . . . . . 44,623 43,505 3,778,582 3,421,735 4,668,446 3,101,962
Total Liabilities (excluding net assets attributable to holders of redeemable participating shares) . . . . . . . . . . . . . . . . . . . . . . . . . . . . . . 847,905 1,222,162 6,489,343 4,245,657 7,578,748 3,627,262Net Assets attributable to holders of redeemable participating shares (at last traded prices). . . . . . . . . . . . . . . . . . . . . . . . . . . . . . . . . . . . . . . 59,358,492 79,840,596 396,533,004 348,634,331 243,833,450 222,380,029

J a n u s C a p i t a l F u n d s P l c / 3 1 D e c e m b e r 2 0 1 5 2 1 5
Janus Opportunistic Alpha Fund
Janus US Fund
Janus US Research Fund
Janus US Twenty Fund
Janus US Venture Fund
As of 31 December
2015
As of 31 December
2014
As of 31 December
2015
As of 31 December
2014
As of 31 December
2015
As of 31 December
2014
As of 31 December
2015
As of 31 December
2014
As of 31 December
2015
As of 31 December
2014(USD) (USD) (USD) (USD) (USD) (USD) (USD) (USD) (USD) (USD)
48,449,782 90,519,863 1,761,048 1,619,657 191,743,639 189,674,628 361,062,264 345,122,665 206,242,908 273,009,4073,221,975 7,225,933 153,795 27,848 1,926,438 2,818,866 11,847,294 8,955,737 4,302,931 17,832,224
— — — — — — — — — —— — — — — — — — — —
— 467,942 2,798 — 228,324 — — — 46,296 —116 — — — — — 634 — — 60
46,176 1,808,033 — 6,052 221,712 — 1,478,363 1,238,125 639,820 7,532,30638,455 45,629 859 810 89,491 134,335 44,801 54,757 40,200 47,967
— — — — — — — — — —— — 1,729 4,477 9,018 — — — — —— — 56 62 — — 16,333 18,187 2,187 —
51,756,504 100,067,400 1,920,285 1,658,906 194,218,622 192,627,829 374,449,689 355,389,471 211,274,342 298,421,964
3,045 234,611 350 9,999 369 24,008 16,351 694,379 41,581 544,415— — — — — — — — — —— — — — — — — 490,000 — —— 2,089,854 4,310 — 491,410 29,964 — — 540,633 5,833,215— — — — — — — — 1,656 —
208,331 789,133 — — 308,919 3,377 1,295,828 298,689 1,149,011 285,45043,681 97,857 — — — 21,522 337,782 374,332 237,874 234,13187,515 133,196 2,792 1,903 22,765 24,140 337,667 326,848 194,274 152,182
2,862 5,054 275 284 178 294 9,189 11,805 2,123 2,7205,842 11,235 173 160 11,826 13,405 33,863 36,455 15,116 24,587
29,549 21,537 19,981 25,758 45,508 40,533 99,331 55,046 10,350 28,937
380,825 3,382,477 27,881 38,104 880,975 157,243 2,130,011 2,287,554 2,192,618 7,105,637
51,375,679 96,684,923 1,892,404 1,620,802 193,337,647 192,470,586 372,319,678 353,101,917 209,081,724 291,316,327

Statement of Financial Position
The accompanying notes are an integral part of the financial statements.
2 1 6 J a n u s C a p i t a l F u n d s P l c / 3 1 D e c e m b e r 2 0 1 5
Perkins Global Value Fund
Perkins US Strategic Value Fund
INTECH All-World Minimum Variance Core Fund(a)
As of 31 December
2015
As of 31 December
2014
As of 31 December
2015
As of 31 December
2014
As of 31 December
2015
As of 31 December
2014(USD) (USD) (USD) (USD) (USD) (USD)
Assets:Financial assets at fair value through profit or loss . . . . . . . . . . . . . . 152,833,750 157,852,142 196,950,009 411,929,534 756,106,013 —Cash and foreign currency . . . . . . . . . . . . . . . . . . . . . . . . . . . . . . . . 12,456,518 11,747,242 9,005,906 22,322,543 4,102,450 —Margin and collateral cash. . . . . . . . . . . . . . . . . . . . . . . . . . . . . . . . . — — — — — —Collateral receivable from broker . . . . . . . . . . . . . . . . . . . . . . . . . . . — — — — — —Receivables:
Investments sold . . . . . . . . . . . . . . . . . . . . . . . . . . . . . . . . . . . . . . 233,311 2,350,586 1,099,025 1,845,329 751,681 —Spot foreign exchange contracts awaiting settlement. . . . . . . . . . . — — 29 — 250 —Funds shares sold . . . . . . . . . . . . . . . . . . . . . . . . . . . . . . . . . . . . . — 18,033,955 145,325 422,184 — —Dividends . . . . . . . . . . . . . . . . . . . . . . . . . . . . . . . . . . . . . . . . . . . 268,698 313,769 267,369 645,782 1,036,807 —Interest . . . . . . . . . . . . . . . . . . . . . . . . . . . . . . . . . . . . . . . . . . . . . — — — — — —
Receivable from Investment Manager . . . . . . . . . . . . . . . . . . . . . . . . 29,253 — — — 84,340 —Other debtors . . . . . . . . . . . . . . . . . . . . . . . . . . . . . . . . . . . . . . . . . . 100,912 67,886 — — 13,599 —
Total Assets . . . . . . . . . . . . . . . . . . . . . . . . . . . . . . . . . . . . . . . . . . . . . 165,922,442 190,365,580 207,467,663 437,165,372 762,095,140 —Liabilities (amounts falling due within one year)
Payables:Financial liabilities at fair value through profit or loss. . . . . . . . . . 226,459 96,089 8,998 851,895 14,382,354 —Bank overdraft and foreign currency . . . . . . . . . . . . . . . . . . . . . . . 3 4 — — 6,326 —Collateral payable to broker . . . . . . . . . . . . . . . . . . . . . . . . . . . . . — — — — — —Investments purchased . . . . . . . . . . . . . . . . . . . . . . . . . . . . . . . . . 407,243 16,670,893 900,463 1,248,332 489,248 —Spot foreign exchange contracts awaiting payment . . . . . . . . . . . . — 13,919 — — — —Fund shares repurchased. . . . . . . . . . . . . . . . . . . . . . . . . . . . . . . . — — 551,816 286,651 — —Investment Management fees. . . . . . . . . . . . . . . . . . . . . . . . . . . . . — 8,022 258,460 592,268 — —Shareholder Service fees. . . . . . . . . . . . . . . . . . . . . . . . . . . . . . . . . 8,779 11,378 194,646 357,671 — —Distribution fees.. . . . . . . . . . . . . . . . . . . . . . . . . . . . . . . . . . . . . . — 6 1,304 1,772 — —Accounting, Administration and Transfer Agent fees. . . . . . . . . . . 9,742 10,673 27,935 41,095 44,251 —Accrued expenses . . . . . . . . . . . . . . . . . . . . . . . . . . . . . . . . . . . . . 55,550 46,080 84,591 58,090 231,118 —
Total Liabilities (excluding net assets attributable to holders of redeemable participating shares) . . . . . . . . . . . . . . . . . . . . . . . . . . . . . . 707,776 16,857,064 2,028,213 3,437,774 15,153,297 —Net Assets attributable to holders of redeemable participating shares (at last traded prices ). . . . . . . . . . . . . . . . . . . . . . . . . . . . . . . . . . . . . . . 165,214,666 173,508,516 205,439,450 433,727,598 746,941,843 —

J a n u s C a p i t a l F u n d s P l c / 3 1 D e c e m b e r 2 0 1 5 2 1 7
INTECH European Core Fund
INTECH Global All Country Low Volatility Fund
INTECH Global Dividend Fund
INTECH US Core Fund
Janus Global Diversified Alternatives Fund
As of 31 December
2015
As of 31 December
2014
As of 31 December
2015
As of 31 December
2014
As of 31 December
2015
As of 31 December
2014
As of 31 December
2015
As of 31 December
2014
As of 31 December
2015
As of 31 December
2014(EUR) (EUR) (USD) (USD) (USD) (USD) (USD) (USD) (USD) (USD)
95,280,358 85,070,578 160,711,101 161,471,586 1,828,982 2,386,197 165,623,369 158,419,586 1,258,052 1,691,577644,167 473,479 2,046,623 1,815,459 10,311 15,427 1,350,212 1,545,616 874,700 280,764
— — — — — — — — 201,616 262,375— — — — — — — — — —
— 18,839 600 1,278 — — — — — —— — 17 — — — 1,306 — — —— — — — — — 400,863 232,284 — —
59,086 65,175 283,524 233,273 2,391 4,166 169,945 167,057 — —— — — — — — — — — —
18,687 15,454 24,800 36,126 49,058 — — — 21,179 4,938134,884 73,649 10,409 123 34,396 84,202 — — — —
96,137,182 85,717,174 163,077,074 163,557,845 1,925,138 2,489,992 167,545,695 160,364,543 2,355,547 2,239,654
— — — — 101 6,020 17,097 709,416 76,228 38,220— — — — 129 — — — — —— — — — — — — — — —— — 334,132 — — — 486,877 — — —— — — — — — — — — —— — — — — — 179,011 81,386 — —— — — — — 1,756 127,987 138,438 — —3 3 — — 925 1,593 63,046 69,091 2,554 2,146
— — — — — — 215 249 — —5,557 5,755 9,565 10,790 180 276 14,553 15,407 203 227
38,023 35,455 18,527 36,171 29,241 61,355 33,336 37,584 15,433 9,000
43,583 41,213 362,224 46,961 30,576 71,000 922,122 1,051,571 94,418 49,593
96,093,599 85,675,961 162,714,850 163,510,884 1,894,562 2,418,992 166,623,573 159,312,972 2,261,129 2,190,061

Statement of Financial Position
The accompanying notes are an integral part of the financial statements.
2 1 8 J a n u s C a p i t a l F u n d s P l c / 3 1 D e c e m b e r 2 0 1 5
Janus Global Real Estate Fund
Janus Flexible Income Fund
Janus Global Flexible Income Fund
As of 31 December
2015
As of 31 December
2014
As of 31 December
2015
As of 31 December
2014
As of 31 December
2015
As of 31 December
2014(USD) (USD) (USD) (USD) (USD) (USD)
Assets:Financial assets at fair value through profit or loss . . . . . . . . . . . . . . 127,674,583 159,726,924 905,957,517 954,807,276 20,616,426 21,333,783Cash and foreign currency . . . . . . . . . . . . . . . . . . . . . . . . . . . . . . . . 3,807,830 4,657,128 15,431,873 3,930,437 830,776 314,923Margin and collateral cash. . . . . . . . . . . . . . . . . . . . . . . . . . . . . . . . . — — — — — —Collateral receivable from broker . . . . . . . . . . . . . . . . . . . . . . . . . . . — — — — — —Receivables:
Investments sold . . . . . . . . . . . . . . . . . . . . . . . . . . . . . . . . . . . . . . 1,042,554 2,969 — 2,124,442 — 18,862Spot foreign exchange contracts awaiting settlement. . . . . . . . . . . — — — — 106 —Funds shares sold . . . . . . . . . . . . . . . . . . . . . . . . . . . . . . . . . . . . . 55,368 279,076 1,073,793 857,934 33,337 63,915Dividends . . . . . . . . . . . . . . . . . . . . . . . . . . . . . . . . . . . . . . . . . . . 435,881 518,382 47,817 55,612 337 316Interest . . . . . . . . . . . . . . . . . . . . . . . . . . . . . . . . . . . . . . . . . . . . . 4,554 — 5,796,946 5,781,234 181,610 202,231
Receivable from Investment Manager . . . . . . . . . . . . . . . . . . . . . . . . — — — — 13,032 —Other debtors . . . . . . . . . . . . . . . . . . . . . . . . . . . . . . . . . . . . . . . . . . 51,760 54,067 — — — —
Total Assets . . . . . . . . . . . . . . . . . . . . . . . . . . . . . . . . . . . . . . . . . . . . . 133,072,530 165,238,546 928,307,946 967,556,935 21,675,624 21,934,030Liabilities (amounts falling due within one year)
Payables:Financial liabilities at fair value through profit or loss. . . . . . . . . . 14,889 181,098 11,019 3,743,363 190,065 250,278Bank overdraft and foreign currency . . . . . . . . . . . . . . . . . . . . . . . — — — — — 190,017Collateral payable to broker . . . . . . . . . . . . . . . . . . . . . . . . . . . . . — — — — — —Investments purchased . . . . . . . . . . . . . . . . . . . . . . . . . . . . . . . . . 929,153 6,329 5,515,310 — 125,820 —Spot foreign exchange contracts awaiting payment . . . . . . . . . . . . 1,026 — 1,393 — — —Fund shares repurchased. . . . . . . . . . . . . . . . . . . . . . . . . . . . . . . . 289,678 328,001 654,572 712,082 219,547 —Investment Management fees. . . . . . . . . . . . . . . . . . . . . . . . . . . . . 108,878 153,201 506,988 537,027 — 11,719Shareholder Service fees. . . . . . . . . . . . . . . . . . . . . . . . . . . . . . . . . 65,333 65,628 475,891 573,916 24,146 22,506Distribution fees.. . . . . . . . . . . . . . . . . . . . . . . . . . . . . . . . . . . . . . 1,099 1,362 4,944 8,589 — —Accounting, Administration and Transfer Agent fees. . . . . . . . . . . 12,604 16,666 76,784 88,601 1,910 2,026Accrued expenses . . . . . . . . . . . . . . . . . . . . . . . . . . . . . . . . . . . . . 126,982 148,177 131,725 118,376 42,990 43,845
Total Liabilities (excluding net assets attributable to holders of redeemable participating shares) . . . . . . . . . . . . . . . . . . . . . . . . . . . . . . 1,549,642 900,462 7,378,626 5,781,954 604,478 520,391Net Assets attributable to holders of redeemable participating shares (at last traded prices ). . . . . . . . . . . . . . . . . . . . . . . . . . . . . . . . . . . . . . . 131,522,888 164,338,084 920,929,320 961,774,981 21,071,146 21,413,639

J a n u s C a p i t a l F u n d s P l c / 3 1 D e c e m b e r 2 0 1 5 2 1 9
Janus Global High Yield Fund
Janus Global Investment Grade Bond Fund
Janus High Yield Fund
Janus Global Unconstrained Bond Fund
Janus US Short-Term Bond Fund
Company Total in US Dollar
As of 31 December
2015
As of 31 December
2014
As of 31 December
2015
As of 31 December
2014
As of 31 December
2015
As of 31 December
2014
As of 31 December
2015
As of 31 December
2014
As of 31 December
2015
As of 31 December
2014
As of 31 December
2015
As of 31 December
2014(USD) (USD) (USD) (USD) (USD) (USD) (USD) (USD) (USD) (USD) (USD) (USD)
44,828,404 77,696,557 42,917,914 63,140,738 557,701,966 754,080,233 83,707,740 71,712,528 337,549,994 581,645,302 7,581,283,899 6,403,473,3485,252,636 1,614,777 995,295 3,026,115 70,157,107 48,237,166 13,489,998 6,668,328 11,981,991 4,359,035 233,030,938 190,051,492
— — — — — — 9,456,435 136,810 — — 11,598,809 4,339,347— — — — — — — — — — 948,051 —
— 43,650 — 109,234 — 549,990 3,517 6,271 — 3,795,229 10,750,802 16,719,419— — — — — — — — 199 — 2,657 1,353
115,821 32,630 5,920 209,961 168,289 282,109 13,382 291,897 136,872 414,918 12,067,166 52,593,453— — 1,424 1,714 — — 32,721 13,986 — — 4,294,386 3,019,044
803,470 1,476,638 493,513 783,005 10,606,452 14,015,367 721,657 836,029 1,656,802 3,293,762 22,291,068 29,100,899— — 26,000 — — — — — — — 665,908 231,160
147 163 — — — — — — — — 1,044,411 576,36051,000,478 80,864,415 44,440,066 67,270,767 638,633,814 817,164,865 107,425,450 79,665,849 351,325,858 593,508,246 7,877,978,095 6,700,105,875
43,284 591,594 124,167 249,739 30,065 1,704,712 396,663 1,239,727 10,137 782,347 16,371,038 17,792,566— 1,312,358 — — — — — — — — 6,458 4,122,006— — — — — — — — — — — 490,000
444,510 — 222,750 — 10,360,350 — 20,494 962,615 3,785,760 2,937,116 33,802,861 36,441,548313 — — — 159 — 62 — — — 12,282 46,067
243,601 228,909 11,686 122,137 2,223,393 1,246,561 26,255 — 5,448,836 947,030 20,382,455 9,822,976617 24,336 8,235 34,242 361,613 509,859 84,542 58,114 202,014 300,850 5,313,890 4,779,425
58,575 109,747 30,951 45,005 398,841 533,777 137,142 81,324 346,307 495,313 5,364,861 4,708,131— 10 — 9 49,107 66,613 — — 2,755 4,530 104,522 136,626
3,862 7,035 3,291 5,563 60,823 86,483 12,333 6,929 30,983 54,290 652,175 647,61328,597 57,873 19,888 28,416 90,466 126,129 50,566 14,543 41,882 67,921 2,107,554 1,580,648
823,359 2,331,862 420,968 485,111 13,574,817 4,274,134 728,057 2,363,252 9,868,674 5,589,397 84,118,096 80,567,606
50,177,119 78,532,553 44,019,098 66,785,656 625,058,997 812,890,731 106,697,393 77,302,597 341,457,184 587,918,849 7,793,859,999 6,619,538,269

Statement of Comprehensive Income
Gains and losses are solely from continuing operations. There were no gains and losses other than those dealt with in the Statement of Comprehensive Income.
The accompanying notes are an integral part of the financial statements.
2 2 0 J a n u s C a p i t a l F u n d s P l c / 3 1 D e c e m b e r 2 0 1 5
Janus Asia Frontier Markets Fund( g)
Janus Asia Growth Drivers Fund(c)
Janus Asia Fund
For the fi nancial years ended 31 December 2015 and 31 December 2014
Year ended31 December
2015(USD)
Year ended31 December
2014(USD)
Year ended31 December
2015(USD)
Year ended31 December
2014(USD)
Year ended31 December
2015(USD)
Year ended31 December
2014(USD)
Revenue:Interest income . . . . . . . . . . . . . . . . . . . . . . . . . . . . . . . . . . . . . . . . . . . — — — — — —Dividend income . . . . . . . . . . . . . . . . . . . . . . . . . . . . . . . . . . . . . . . . . . 61,078 3,341 61,071 5,127 3,134,278 3,322,316Other income. . . . . . . . . . . . . . . . . . . . . . . . . . . . . . . . . . . . . . . . . . . . . 5,102 4,596 2,306 1,024 98,572 787
Net (loss)/gain on financial assets and liabilities at fair value through profit or loss . . . . . . . . . . . . . . . . . . . . . . . . . . . . . (522,949) (121,515) (442,605) (243,277) (8,375,029) 7,104,988
Total Investments (Loss)/Income. . . . . . . . . . . . . . . . . . . . . . . . . . . . . . . . . . . . . (456,769) (113,578) (379,228) (237,126) (5,142,179) 10,4 28, 091Expenses:
Investment Management fees . . . . . . . . . . . . . . . . . . . . . . . . . . . . . . . . . 28,468 7,973 27,617 8,509 12,254 7,147Shareholders Services fees . . . . . . . . . . . . . . . . . . . . . . . . . . . . . . . . . . . 6,190 1,797 5,932 1,911 6,675 4,134Distribution fees . . . . . . . . . . . . . . . . . . . . . . . . . . . . . . . . . . . . . . . . . . — — — — — —Accounting, Administration and Transfer Agent fees . . . . . . . . . . . . . . . 2,667 1,165 2,565 1,140 83,808 84,816 Depositary fees. . . . . . . . . . . . . . . . . . . . . . . . . . . . . . . . . . . . . . . . . . . . 6,377 3,851 6,175 5,364 72,465 54,297Listing fees. . . . . . . . . . . . . . . . . . . . . . . . . . . . . . . . . . . . . . . . . . . . . . . 5,600 1,733 5,600 1,733 5,600 2,093Audit fees. . . . . . . . . . . . . . . . . . . . . . . . . . . . . . . . . . . . . . . . . . . . . . . . 14,452 12,367 14,452 12,367 14,453 17,697Printing expenses. . . . . . . . . . . . . . . . . . . . . . . . . . . . . . . . . . . . . . . . . . 9,730 1,280 8,100 1,273 16,774 33,127Legal and other professional fees . . . . . . . . . . . . . . . . . . . . . . . . . . . . . . 7,337 4,177 5,784 4,000 32,692 55,880Other fees . . . . . . . . . . . . . . . . . . . . . . . . . . . . . . . . . . . . . . . . . . . . . . . 2,334 11,085 5,599 13,062 16,716 44,716
Total Expenses. . . . . . . . . . . . . . . . . . . . . . . . . . . . . . . . . . . . . . . . . . . . . . 83,155 45,428 81,824 49,359 261,437 303,907Less Expense Reimbursement . . . . . . . . . . . . . . . . . . . . . . . . . . . . . . . . . . (39,853) (33,224) (39,737) (36,320) (230,653) (234,877)Net Expenses after Expense Reimbursement . . . . . . . . . . . . . . . . . . . . . . . 43,302 12,204 42,087 13,039 30,784 69,030Net Operating (Loss)/Profit . . . . . . . . . . . . . . . . . . . . . . . . . . . . . . . . . . . . (500,071) (125,782) (421,315) (250,165) (5,172,963) 10, 359, 061Finance Costs:Total distributions to holders of redeemable ordinary shares . . . . . . . . . . — — — — (2,379,469) (4,474,946)Swap Interest Expense . . . . . . . . . . . . . . . . . . . . . . . . . . . . . . . . . . . . . . . — — — — (88,626) —Withholding tax on dividends and other investment income . . . . . . . . . . (9,736) (1,678) (7,830) (763) (394,626) (338,893)
Net (Decrease)/Increase in net assets attributable to holders of redeemable shares resulting from operations . . . . . . . . . . (509,807) (127,460) (429,145) (250,928) (8,035,684) 5, 545, 222
(c) This fund commenced operations on 19 September 2014. The information from this Fund is from the date of commencement of operations to 31 December 2014.(d) This fund commenced operations on 31 January 2014. The information from this Fund is from the date of commencement of operations to 31 December 2014.(e) This fund commenced operations on 3 November 2014. The information from this Fund is from the date of commencement of operations to 31 December 2014.(f) This fund commenced operations on 29 September 2014. The information from this Fund is from the date of commencement of operations to 31 December 2014.(g) This fund commenced operations on 26 September 2014. The information from this Fund is from the date of commencement of operations to 31 December 2014.

J a n u s C a p i t a l F u n d s P l c / 3 1 D e c e m b e r 2 0 1 5 2 2 1
Janus Balanced Fund
Janus Emerging Markets Fund
Janus Europe Fund
Janus Global Life Sciences Fund
Janus Global Research Fund
Year ended31 December
2015(USD)
Year ended31 December
2014(USD)
Year ended31 December
2015(USD)
Year ended31 December
2014(USD)
Year ended31 December
2015(EUR)
Year ended31 December
2014(EUR)
Year ended31 December
2015(USD)
Year ended31 December
2014(USD)
Year ended31 December
2015(USD)
Year ended31 December
2014(USD)
14,468,870 12,169,076 — — 50,940 — 112,415 21,474 — —9,068,077 6,068,518 1,054,275 130,409 4,563,495 4,422,027 12,638,821 2,581,181 685,727 732,068
202,674 176,086 403 — 18,221 73,341 609,197 133,013 2,748 2,591
(31,149,290) (2,055,210) (12,629,265) (826,282) 14,134,940 (5,541,807) (6,532,170) 89,538,558 (1,389,997) 2,211,696(7,409,669) 16, 358, 470 (11,574,587) (69 5, 873) 18,767,596 (1, 0 46, 439) 6,828,263 92, 274, 226 (701,522) 2,9 46, 355
6,877,362 4,673,633 52,231 64,762 943,434 1,193,720 24,266,594 6,100,398 23,888 55,8444,137,930 2,721,245 21,026 24,854 227,287 226,715 6,298,169 2,622,883 15,845 19,859
105,192 109,854 7,945 8,828 — — 221,242 173,883 67 71757,328 564,328 40,824 6,052 168,966 195,539 1,682,841 511,129 29,934 33,880148,542 77,472 58,002 31,474 101,055 61,159 285,093 107,345 34,378 24,210
9,013 6,198 5,600 3,868 4,938 1,777 8,392 5,799 7,778 5,135 13,005 16,108 16,013 17,170 11,893 13,253 14,564 17,819 16,013 19,407
147,437 78,087 7,370 7,248 28,025 21,648 274,348 55,436 13,513 11,336285,588 118,855 10,243 2,679 50,334 110,462 510,946 103,535 12,675 12,338 164,847 221,911 62,437 43,908 85,016 73,745 318,083 142,685 34,113 38,427
12,646,244 8,587,691 281,691 210,843 1,620,948 1,898,018 33,880,272 9,840,912 188,204 220,5079,449 12,238 (182,700) (84,723) (210,185) (122,113) (46,959) 18,200 (138,792) (122,997)
12,655,693 8,599,929 98,991 126,120 1,410,763 1,775,905 33,833,313 9,859,112 49,412 97,510(20,065,362) 7, 758, 541 (11,673,578) (82 1, 993) 17,356,833 ( 2, 822, 344) (27,005,050) 82, 415, 114 (750,934) 2,8 48, 845
(5,627,117) (2,234,063) (619,605) — (1,147,857) (224,260) — — (527,223) (499,168)— — (8,460) — (253) — — — — —
(2,231,189) (1,521,729) (132,910) (14,586) (487,949) (425,168) (3,191,331) (592,751) (142,138) (130,316)
(27,923,668) 4,002,749 (12,434,553) (83 6, 579) 15,720,774 (3, 4 71, 772) (30,196,381) 81, 822, 363 (1,420,295) 2,2 19, 361

Statement of Comprehensive Income
Gains and losses are solely from continuing operations. There were no gains and losses other than those dealt with in the Statement of Comprehensive Income.
The accompanying notes are an integral part of the financial statements.
2 2 2 J a n u s C a p i t a l F u n d s P l c / 3 1 D e c e m b e r 2 0 1 5
Janus Global Technology Fund
Janus Japan Emerging Opportunities Fund( g)
Janus Japan Fund( g)
For the fi nancial years ended 31 December 2015 and 31 December 2014
Year ended31 December
2015(USD)
Year ended31 December
2014(USD)
Year ended31 December
2015(JPY)
Year ended31 December
2014(JPY)
Year ended31 December
2015(JPY)
Year ended31 December
2014(JPY)
Revenue:Interest income . . . . . . . . . . . . . . . . . . . . . . . . . . . . . . . . . . . . . . . . . . . — — — — — —Dividend income . . . . . . . . . . . . . . . . . . . . . . . . . . . . . . . . . . . . . . . . . . 739,318 913,678 4,603,647 438,820 3,259,981 129,740Other income. . . . . . . . . . . . . . . . . . . . . . . . . . . . . . . . . . . . . . . . . . . . . 54,588 14,997 204,052 94,439 133,117 61,394
Net (loss)/gain on financial assets and liabilities at fair value through profit or loss . . . . . . . . . . . . . . . . . . . . . . . . . . . . . 1,129,345 4,636,975 49,963,644 35,859,585 22,053,037 13,815,402
Total Investments (Loss)/Income. . . . . . . . . . . . . . . . . . . . . . . . . . . . . . . . . . . . . 1,923,251 5,5 65, 650 54,771,343 36, 392, 844 25,446,135 1 4, 006, 536Expenses:
Investment Management fees . . . . . . . . . . . . . . . . . . . . . . . . . . . . . . . . . 1,068,353 1,235,875 4,041,182 894,213 2,188,348 508,346Shareholders Services fees . . . . . . . . . . . . . . . . . . . . . . . . . . . . . . . . . . . 408,464 421,416 888,101 198,669 546,772 129,449Distribution fees . . . . . . . . . . . . . . . . . . . . . . . . . . . . . . . . . . . . . . . . . . 60,470 68,171 — — — —Accounting, Administration and Transfer Agent fees . . . . . . . . . . . . . . . 92,578 110,318 181,023 117,898 181,023 88,010 Depositary fees. . . . . . . . . . . . . . . . . . . . . . . . . . . . . . . . . . . . . . . . . . . . 60,108 27,145 870,829 415,061 2,037,225 411,336Listing fees. . . . . . . . . . . . . . . . . . . . . . . . . . . . . . . . . . . . . . . . . . . . . . . 7,863 5,574 245,600 189,346 245,600 189,346Audit fees. . . . . . . . . . . . . . . . . . . . . . . . . . . . . . . . . . . . . . . . . . . . . . . . 14,564 17,819 1,748,433 1, 484, 624 1,748,433 1, 484, 624Printing expenses. . . . . . . . . . . . . . . . . . . . . . . . . . . . . . . . . . . . . . . . . . 23,369 18,023 1,109,850 122,564 1,109,850 120,247Legal and other professional fees . . . . . . . . . . . . . . . . . . . . . . . . . . . . . . 26,750 21,595 1,127,105 192,604 1,127,105 176,217Other fees . . . . . . . . . . . . . . . . . . . . . . . . . . . . . . . . . . . . . . . . . . . . . . . 51,281 39,708 7,636,755 899, 638 8,746,650 908, 317
Total Expenses. . . . . . . . . . . . . . . . . . . . . . . . . . . . . . . . . . . . . . . . . . . . . . 1,813,800 1,965,644 17,848,878 4,514,617 17,931,006 4,015,892Less Expense Reimbursement . . . . . . . . . . . . . . . . . . . . . . . . . . . . . . . . . . (44,403) 40,657 (11,687,013) (3,009,467) (14,427,241) (3,200,610)Net Expenses after Expense Reimbursement . . . . . . . . . . . . . . . . . . . . . . . 1,769,397 2,006,301 6,161,865 1,505,150 3,503,765 815,282Net Operating (Loss)/Profit . . . . . . . . . . . . . . . . . . . . . . . . . . . . . . . . . . . . 153,854 3,5 59, 349 48,609,478 34, 887, 694 21,942,370 1 3, 191, 254Finance Costs:Total distributions to holders of redeemable ordinary shares . . . . . . . . . . — — — — — —Swap Interest Expense . . . . . . . . . . . . . . . . . . . . . . . . . . . . . . . . . . . . . . . — — — — — —Withholding tax on dividends and other investment income . . . . . . . . . . (173,042) (234,483) (690,554) (65,823) (489,001) (19,461)
Net (Decrease)/Increase in net assets attributable to holders of redeemable shares resulting from operations . . . . . . . . . . (19,188) 3,3 24, 866 47,918,924 34, 821, 871 21,453,369 1 3, 171, 793

J a n u s C a p i t a l F u n d s P l c / 3 1 D e c e m b e r 2 0 1 5 2 2 3
Janus Opportunistic Alpha Fund
Janus US Fund
Janus US Research Fund
Janus US Twenty Fund
Janus US Venture Fund
Year ended31 December
2015(USD)
Year ended31 December
2014(USD)
Year ended31 December
2015(USD)
Year ended31 December
2014(USD)
Year ended31 December
2015(USD)
Year ended31 December
2014(USD)
Year ended31 December
2015(USD)
Year ended31 December
2014(USD)
Year ended31 December
2015(USD)
Year ended31 December
2014(USD)
— — — — — — — — — —1,008,594 765,789 17,048 14,611 3,063,692 2,726,562 4,928,922 4,565,718 2,113,686 1,804,363
15,722 94,861 264 228 17,116 9,651 36,627 39,295 96,453 88,731
(6,596,473) 13,366,298 (784) 108,310 855,827 18,554,064 19,777,295 30,994,083 (4,514,090) 21,757,186(5,572,157) 14,22 6, 948 16,528 123,1 49 3,936,635 21, 290, 277 24,742,844 35, 599, 096 (2,303,951) 23, 650, 280
870,784 978,844 21,771 17,370 197,426 219,690 4,075,624 4,161,579 3,069,528 1,996,977432,385 509,281 9,396 6,906 90,255 107,239 1,360,446 1,504,586 908,628 706,790
46,411 56,131 3,272 2,945 2,793 5,833 114,540 154,732 28,586 30,077100,791 115,930 1,577 1,757 140,659 141,204 402,053 445,918 291,150 279,575
24,226 13,713 10,951 11,229 27,651 24,080 55,734 49,156 67,266 48,5788,777 5,598 5,600 2,512 8,594 6,248 8,893 5,956 7,947 5,574
13,005 16,108 14,453 1 5, 459 14,564 17,819 13,005 16,108 13,005 16,10824,502 20,668 5,998 6,014 28,485 15,246 87,121 46,458 44,716 28,02529,384 16,795 3,271 1,651 35,789 34,314 127,129 118,689 66,637 32,703 42,821 43,567 6,022 1 7, 134 28,589 18,887 93,326 103,423 43,484 47,687
1,593,086 1,776,635 82,311 82,977 574,805 590,560 6,337,871 6,606,605 4,540,947 3,192,094(22,712) (5,394) (43,130) (51,912) (230,521) (187,139) 21,548 25,252 (78,070) (89,735)
1,570,374 1,771,241 39,181 31,065 344,284 403,421 6,359,419 6,631,857 4,462,877 3,102,359(7,142,531) 12,4 55, 707 (22,653) 92,0 84 3,592,351 20,88 6, 856 18,383,425 2 8, 967, 239 (6,766,828) 20, 547, 921
— — — — (2,289,327) (1,626,252) — — — —— — — — — — — — — —
(302,455) (226,586) (4,992) (3,776) (796,774) (721,387) (1,082,846) (923,757) (531,282) (402,829)
(7,444,986) 12,22 9, 121 (27,645) 88, 308 506,250 18,5 39, 217 17,300,579 28, 043, 482 (7,298,110) 20, 145, 092

Statement of Comprehensive Income
Gains and losses are solely from continuing operations. There were no gains and losses other than those dealt with in the Statement of Comprehensive Income.
The accompanying notes are an integral part of the financial statements.
2 2 4 J a n u s C a p i t a l F u n d s P l c / 3 1 D e c e m b e r 2 0 1 5
Perkins Global Value Fund
Perkins US Strategic Value Fund
INTECH All-World Minimum Variance Core Fund(a)
For the fi nancial years ended 31 December 2015 and 31 December 2014
Year ended31 December
2015(USD)
Year ended31 December
2014(USD)
Year ended31 December
2015(USD)
Year ended31 December
2014(USD)
Year ended31 December
2015(USD)
Year ended31 December
2014(USD)
Revenue:Interest income . . . . . . . . . . . . . . . . . . . . . . . . . . . . . . . . . . . . . . . . . . . — 1 — — — —Dividend income . . . . . . . . . . . . . . . . . . . . . . . . . . . . . . . . . . . . . . . . . . 4,949,588 4,561,132 5,684,575 9,743,183 12,206,595 —Other income. . . . . . . . . . . . . . . . . . . . . . . . . . . . . . . . . . . . . . . . . . . . . — — 223,940 60,877 24,050 —
Net (loss)/gain on financial assets and liabilities at fair value through profit or loss . . . . . . . . . . . . . . . . . . . . . . . . . . . . . (7,521,506) 3,613,014 (15,292,723) 31,198,396 (38,052,691) —
Total Investments (Loss)/Income. . . . . . . . . . . . . . . . . . . . . . . . . . . . . . . . . . . . . (2,571,918) 8, 174, 147 (9,384,208) 41, 002, 456 (25,822,046) —Expenses:
Investment Management fees . . . . . . . . . . . . . . . . . . . . . . . . . . . . . . . . . 64,976 72,607 4,121,440 7,347,637 — —Shareholders Services fees . . . . . . . . . . . . . . . . . . . . . . . . . . . . . . . . . . . 36,376 37,847 892,593 1,600,986 — —Distribution fees . . . . . . . . . . . . . . . . . . . . . . . . . . . . . . . . . . . . . . . . . . 60 66 17,031 19,355 — —Accounting, Administration and Transfer Agent fees . . . . . . . . . . . . . . . 117,727 101,418 285,347 536,061 338,754 — Depositary fees. . . . . . . . . . . . . . . . . . . . . . . . . . . . . . . . . . . . . . . . . . . . 40,715 29,940 45,969 57,045 197,449 —Listing fees. . . . . . . . . . . . . . . . . . . . . . . . . . . . . . . . . . . . . . . . . . . . . . . 5,709 2,512 7,359 5,652 7,600 —Audit fees. . . . . . . . . . . . . . . . . . . . . . . . . . . . . . . . . . . . . . . . . . . . . . . . 14,453 17,697 16,013 19,407 11,729 —Printing expenses. . . . . . . . . . . . . . . . . . . . . . . . . . . . . . . . . . . . . . . . . . 31,111 13,807 72,371 61,658 34,249 —Legal and other professional fees . . . . . . . . . . . . . . . . . . . . . . . . . . . . . . 36,394 22,875 106,822 126,612 85,305 —Other fees . . . . . . . . . . . . . . . . . . . . . . . . . . . . . . . . . . . . . . . . . . . . . . . 46,859 24,157 144,506 229,600 63,006 —
Total Expenses. . . . . . . . . . . . . . . . . . . . . . . . . . . . . . . . . . . . . . . . . . . . . . 394,380 322,926 5,709,451 10,004,013 738,092 —Less Expense Reimbursement . . . . . . . . . . . . . . . . . . . . . . . . . . . . . . . . . . (278,215) (197,609) 1,119 283 (661,471) —Net Expenses after Expense Reimbursement . . . . . . . . . . . . . . . . . . . . . . . 116,165 125,317 5,710,570 10,004,296 76,621 —Net Operating (Loss)/Profit . . . . . . . . . . . . . . . . . . . . . . . . . . . . . . . . . . . . (2,688,083) 8, 048, 830 (15,094,778) 3 0, 998, 160 (25,898,667) —Finance Costs:Total distributions to holders of redeemable ordinary shares . . . . . . . . . . (3,926,230) (3,537,017) — — —Swap Interest Expense . . . . . . . . . . . . . . . . . . . . . . . . . . . . . . . . . . . . . . . — — — — — —Withholding tax on dividends and other investment income . . . . . . . . . . (978,384) (893,324) (1,569,762) (2,666,686) (2,264,630) —
Net (Decrease)/Increase in net assets attributable to holders of redeemable shares resulting from operations . . . . . . . . . . (7,592,697) 3,6 18, 489 (16,664,540) 28,3 31, 474 (28,163,297) —
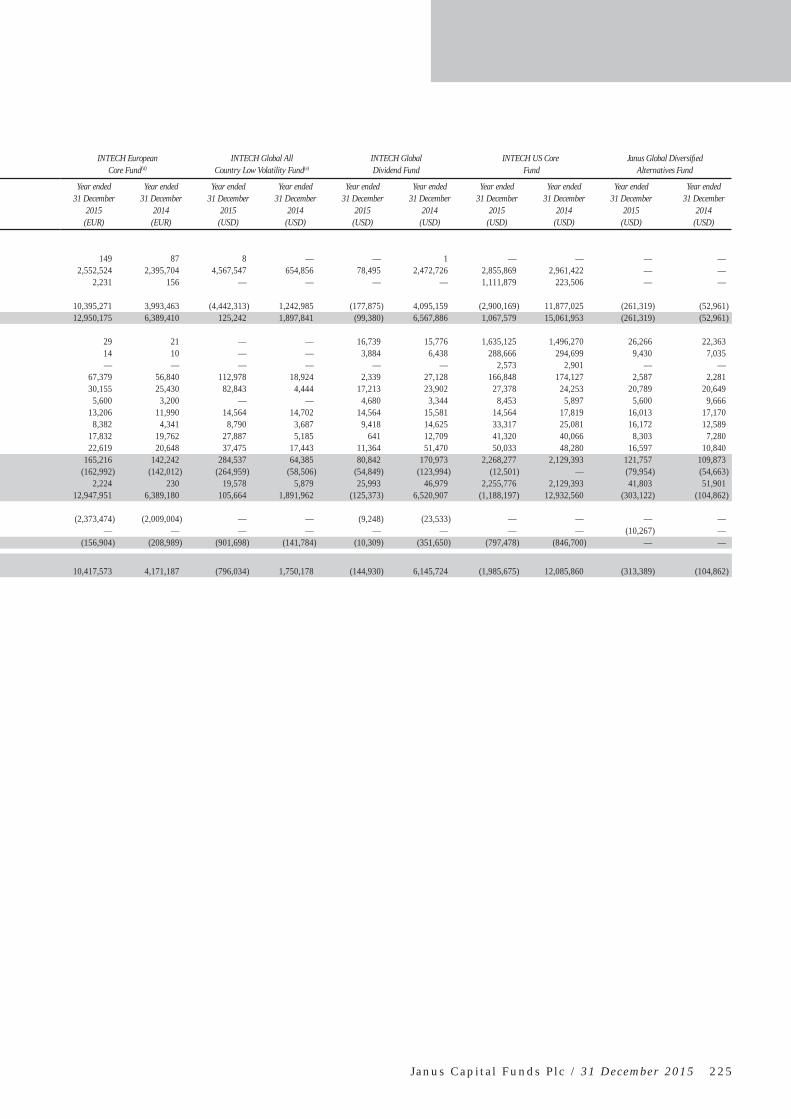
J a n u s C a p i t a l F u n d s P l c / 3 1 D e c e m b e r 2 0 1 5 2 2 5
INTECH European Core Fund(d)
INTECH Global All Country Low Volatility Fund(e)
INTECH Global Dividend Fund
INTECH US Core Fund
Janus Global Diversifi ed Alternatives Fund
Year ended31 December
2015(EUR)
Year ended31 December
2014(EUR)
Year ended31 December
2015(USD)
Year ended31 December
2014(USD)
Year ended31 December
2015(USD)
Year ended31 December
2014(USD)
Year ended31 December
2015(USD)
Year ended31 December
2014(USD)
Year ended31 December
2015(USD)
Year ended31 December
2014(USD)
149 87 8 — — 1 — — — —2,552,524 2,395,704 4,567,547 654,856 78,495 2,472,726 2,855,869 2,961,422 — —
2,231 156 — — — — 1,111,879 223,506 — —
10,395,271 3,993,463 (4,442,313) 1,242,985 (177,875) 4,095,159 (2,900,169) 11,877,025 (261,319) (52,961)12,950,175 6,3 89, 410 125,242 1,8 97, 841 (99,380) 6, 567, 886 1,067,579 15,0 61, 953 (261,319) (52,9 61)
29 21 — — 16,739 15,776 1,635,125 1,496,270 26,266 22,36314 10 — — 3,884 6,438 288,666 294,699 9,430 7,035— — — — — — 2,573 2,901 — —
67,379 56,840 112,978 18,924 2,339 27,128 166,848 174,127 2,587 2,28130,155 25,430 82,843 4,444 17,213 23,902 27,378 24,253 20,789 20, 649
5,600 3,200 — — 4,680 3,344 8,453 5,897 5,600 9,666 13,206 11,990 14,564 14,702 14,564 1 5, 581 14,564 17,819 16,013 1 7, 170
8,382 4,341 8,790 3,687 9,418 14,625 33,317 25,081 16,172 12,58917,832 19,762 27,887 5,185 641 12,709 41,320 40,066 8,303 7,280 22,619 20,648 37,475 17,443 11,364 51, 470 50,033 48,280 16,597 10, 840
165,216 142,242 284,537 64,385 80,842 170,973 2,268,277 2,129,393 121,757 10 9, 873(162,992) (142,012) (264,959) (58,506) (54,849) (123,994) (12,501) — (79,954) (54,663)
2,224 230 19,578 5,879 25,993 46,979 2,255,776 2,129,393 41,803 51,90112,947,951 6,3 89, 180 105,664 1,8 91, 962 (125,373) 6,5 20, 907 (1,188,197) 12,9 32, 560 (303,122) (104,8 62)
(2,373,474) (2,009,004) — — (9,248) (23,533) — — — —— — — — — — — — (10,267) —
(156,904) (208,989) (901,698) (141,784) (10,309) (351,650) (797,478) (846,700) — —
10,417,573 4,1 71, 187 (796,034) 1, 750, 178 (144,930) 6,1 45, 724 (1,985,675) 12,08 5, 860 (313,389) (104,8 62)

Statement of Comprehensive Income
Gains and losses are solely from continuing operations. There were no gains and losses other than those dealt with in the Statement of Comprehensive Income.
The accompanying notes are an integral part of the financial statements.
2 2 6 J a n u s C a p i t a l F u n d s P l c / 3 1 D e c e m b e r 2 0 1 5
Janus Global Real Estate Fund
Janus Flexible Income Fund
Janus Global Flexible Income Fund
For the fi nancial years ended 31 December 2015 and 31 December 2014
Year ended31 December
2015(USD)
Year ended31 December
2014(USD)
Year ended31 December
2015(USD)
Year ended31 December
2014(USD)
Year ended31 December
2015(USD)
Year ended31 December
2014(USD)
Revenue:Interest income . . . . . . . . . . . . . . . . . . . . . . . . . . . . . . . . . . . . . . . . . . . 12,533 28 31,796,338 39,163,326 654,522 491,745Dividend income . . . . . . . . . . . . . . . . . . . . . . . . . . . . . . . . . . . . . . . . . . 4,328,370 4,751,345 925,016 1,348,851 5,080 6,060Other income. . . . . . . . . . . . . . . . . . . . . . . . . . . . . . . . . . . . . . . . . . . . . 250,223 34,591 75,344 153,502 521 1,504
Net (loss)/gain on financial assets and liabilities at fair value through profit or loss . . . . . . . . . . . . . . . . . . . . . . . . . . . . . (8,382,182) 20,098,075 (52,326,820) (18,911,713) (2,914,214) (1,064,215)
Total Investments (Loss)/Income. . . . . . . . . . . . . . . . . . . . . . . . . . . . . . . . . . . . . (3,791,056) 24, 884, 039 (19,530,122) 2 1, 753, 966 (2,254,091) (5 64, 906)Expenses:
Investment Management fees . . . . . . . . . . . . . . . . . . . . . . . . . . . . . . . . . 1,534,374 1,828,963 6,055,633 6,764,613 194,092 117,347Shareholders Services fees . . . . . . . . . . . . . . . . . . . . . . . . . . . . . . . . . . . 275,166 258,615 1,900,523 2,357,820 95,942 58,709Distribution fees . . . . . . . . . . . . . . . . . . . . . . . . . . . . . . . . . . . . . . . . . . 2,891 6,629 83,453 100,601 — —Accounting, Administration and Transfer Agent fees . . . . . . . . . . . . . . . 160,528 207,202 965,285 1,118,670 22,431 13,575 Depositary fees. . . . . . . . . . . . . . . . . . . . . . . . . . . . . . . . . . . . . . . . . . . . 51,971 46,149 144,726 127,704 51,451 30,824Listing fees. . . . . . . . . . . . . . . . . . . . . . . . . . . . . . . . . . . . . . . . . . . . . . . 8,146 5,729 8,469 7,112 5,600 2,068Audit fees. . . . . . . . . . . . . . . . . . . . . . . . . . . . . . . . . . . . . . . . . . . . . . . . 16,013 19,407 16,013 19,407 16,013 19,407Printing expenses. . . . . . . . . . . . . . . . . . . . . . . . . . . . . . . . . . . . . . . . . . 37,820 30,370 162,490 127,214 14,161 10,043Legal and other professional fees . . . . . . . . . . . . . . . . . . . . . . . . . . . . . . 47,495 45,220 345,516 300,004 14,959 6,510Other fees . . . . . . . . . . . . . . . . . . . . . . . . . . . . . . . . . . . . . . . . . . . . . . . 52,908 195,015 177,886 398,104 26,121 11,243
Total Expenses. . . . . . . . . . . . . . . . . . . . . . . . . . . . . . . . . . . . . . . . . . . . . . 2,187,312 2,643,299 9,859,994 11,321,249 440,770 269,726Less Expense Reimbursement . . . . . . . . . . . . . . . . . . . . . . . . . . . . . . . . . . (22,623) (7,675) 29,213 (162,092) (93,115) (59,527)Net Expenses after Expense Reimbursement . . . . . . . . . . . . . . . . . . . . . . . 2,164,689 2,635,624 9,889,207 11,159,157 347,655 210,199Net Operating (Loss)/Profit . . . . . . . . . . . . . . . . . . . . . . . . . . . . . . . . . . . . (5,955,745) 22, 248, 415 (29,419,329) 1 0, 594, 809 (2,601,746) (7 75, 105)Finance Costs:Total distributions to holders of redeemable ordinary shares . . . . . . . . . . (2,110,006) (1,939,668) (12,016,753) (18,159,999) (81,330) (90,753)Swap Interest Expense . . . . . . . . . . . . . . . . . . . . . . . . . . . . . . . . . . . . . . . — — — — — —Withholding tax on dividends and other investment income . . . . . . . . . . (638,090) (809,100) (461,368) (890,001) (4,638) (4,621)
Net (Decrease)/Increase in net assets attributable to holders of redeemable shares resulting from operations . . . . . . . . . . (8,703,841) 19, 499, 647 (41,897,450) ( 8, 455, 191) (2,687,714) (8 70, 479)

J a n u s C a p i t a l F u n d s P l c / 3 1 D e c e m b e r 2 0 1 5 2 2 7
Janus Global High Yield Fund
Janus Global Investment Grade Bond Fund
Janus High Yield Fund
Janus Global Unconstrained Bond Fund(f)
Janus US Short-Term Bond Fund
Company Total in US Dollar
Year ended31 December
2015(USD)
Year ended31 December
2014(USD)
Year ended31 December
2015(USD)
Year ended31 December
2014(USD)
Year ended31 December
2015(USD)
Year ended31 December
2014(USD)
Year ended31 December
2015(USD)
Year ended31 December
2014(USD)
Year ended31 December
2015(USD)
Year ended31 December
2014(USD)
Year ended31 December
2015(USD)
Year ended31 December
2014(USD)
4,148,856 5,929,612 1,962,761 2,384,223 49,391,205 70,110,084 4,713,191 714,926 10,862,727 16,795,153 118,179,770 147,779,76415,972 5,541 24,784 58,558 237,735 79,191 153,744 11,523 — — 82,520,965 59,335,594 (1,023) 190,719 6,566 7,848 94,970 263,420 1,288,758 29,370 13,375 919 4,255,718 1,631,099
(7,888,499) (13,009,290) (5,370,338) (2,692,652) (62,596,344) (66,560,736) (9,399,526) (742,766) (11,166,848) (15,785,254) (251,434,770) 136,636,515(3,724,694) (6, 8 83, 418) (3,376,227) (2 42, 023) (12,872,434) 3, 891, 959 (3,243,833) 13,053 (290,746) 1, 010, 818 (46,478,317) 345,382,972.00
327,462 575,669 221,608 256,449 5,082,703 7,262,106 1,257,638 143,213 2,782,762 3,155,963 65,004,722 50,185,372256,580 439,029 136,610 163,148 1,709,753 2,546,977 578,990 81,324 1,484,445 1,890,974 21,632,842 18,700,510
100 119 90 18,232 635,296 897,366 — — 42,861 54,224 1,374,873 1,710,01853,088 87,611 47,165 57,071 849,062 1,244,730 141,043 19,232 447,707 626,984 7,605,313 6,868,93736,585 30,114 42,812 28,219 108,668 121,700 27,889 5,081 70,702 76,910 1,992,872 1,226,976
4,640 2,709 4,640 2,489 9,254 7,115 5,865 2,000 9,169 6,583 206,123 130,816 16,013 19,407 16,013 19,407 16,013 19,407 16,013 15,974 13,115 16,229 469,236 522,91523,113 24,264 12,336 18,372 136,315 123,310 32,137 2,050 82,729 69,156 1,456,491 895,07433,767 31,121 17,943 18,909 225,720 271,028 54,500 8,656 140,975 147,212 2,435,582 1,746,692 34,688 82,769 17,812 33,594 138,890 309,848 72,757 7,374 79,674 146,530 2,094,357 2,493,604
786,036 1,292,812 517,029 615,890 8,911,674 12,803,587 2,186,832 284,904 5,154,139 6,190,765 104,272,411 84,480,914(99,354) (113,273) (92,858) (103,142) (106,197) (103,275) (25,488) (7,437) 14,847 (160,119) (3,440,353) (2,308,903)686,682 1,179,539 424,171 512,748 8,805,477 12,700,312 2,161,344 277,467 5,168,986 6,030,646 100,832,058 82,172,011
(4,411,376) (8, 0 62, 957) (3,800,398) (7 54, 771) (21,677,911) ( 8, 808, 353) (5,405,177) ( 264, 414) (5,459,732) (5, 019, 828) (147,310,375) 263,210,961
(3,811,991) (4,637,827) (1,551,180) (1,823,192) (26,014,646) (36,999,462) (186,673) (1,277) (938,295) (1,111,557) (65,972,647) (80,114,359)— — — — — — (268,453) — — — (376,085) —
(4,559) — (28,776) (49,570) (47,357) — (99,290) (12,893) — — (17,528,426) (12,621,783)
(8,227,926) (12,7 00, 784) (5,380,354) (2,6 27, 533) (47,739,914) (4 5, 807, 815) (5,959,593) ( 278, 584) (6,398,027) (6,1 31, 385) (231,187,533) 170,474,819

Statement of Changes in Net Assets Attributable to Redeemable Participating Shareholders
The accompanying notes are an integral part of the financial statements.
2 2 8 J a n u s C a p i t a l F u n d s P l c / 3 1 D e c e m b e r 2 0 1 5
Janus Asia Frontier Markets Fund( g)
Janus Asia Growth Drivers Fund(c)
Janus Asia Fund
For the financial years ended 31 December 2015 and 31 December 2014
Year ended31 December
2015(USD)
Year ended31 December
2014(USD)
Year ended31 December
2015(USD)
Year ended31 December
2014(USD)
Year ended31 December
2015(USD)
Year ended31 December
2014(USD)
(Decrease)/Increase in net assets attributable to holders of redeemable ordinary shares from operations . . . . . . . . . . . . . . . . . (509,807) (127,460) (429,145) (250,928) (8,035,684) 5,545,222
Capital Share Transactions of redeemable ordinary shares:Proceeds from redeemable ordinary shares sold . . . . . . . . . . . . . . . . 44,353 2,999,543 — 2,999,508 802,671 469,723Redemption of redeemable ordinary shares . . . . . . . . . . . . . . . . . . . (11,284) — — — (426,077) (116,639)Dilution Levy — — — — — —
Net Increase/(Decrease) from Capital Share Transactions of redeemable ordinary shares . . . . . . . . . . . . . . . . . . . . . . . . . . . . . 33,069 2,999,543 — 2,999,508 376,594 353,084
Net Increase/(Decrease) in Net Assets attributable to holders of redeemable ordinary shares . . . . . . . . . . . . . . . . . . . . . . . . . . . . . (476,738) 2,872,083 (429,145) 2,748,580 (7,659,090) 5,898,306
Net Assets attributable to holders of redeemable shares at 1 January 2015 . . . . . . . . . . . . . . . . . . . . . . . . . . . . . . . . . . . . . . . 2,872,083 — 2,748,580 — 120,135,557 114,237,251Notional FX (Loss) . . . . . . . . . . . . . . . . . . . . . . . . . . . . . . . . . . . . . . — — — — — —
Net Assets attributable to holders of redeemable ordinary shares at 31 December 2015 . . . . . . . . . . . . . . . . . . . . . . . 2,395,345 2,872,083 2,319,435 2,748,580 112,476,467 120,135,557
Janus Global Technology Fund
Janus Japan Emerging Opportunities Fund( g)
Janus Japan Fund( g)
For the financial years ended 31 December 2015 and 31 December 2014
Year ended31 December
2015(USD)
Year ended31 December
2014(USD)
Year ended31 December
2015(JPY)
Year ended31 December
2014(JPY)
Year ended31 December
2015(JPY)
Year ended31 December
2014(JPY)
(Decrease)/Increase in net assets attributable to holders of redeemable ordinary shares from operations . . . . . . . . . . . . . . . . . (19,188) 3,324,866 47,918,924 34,821,871 21,453,369 13,171,793
Capital Share Transactions of redeemable ordinary shares:Proceeds from redeemable ordinary shares sold . . . . . . . . . . . . . . . . 136,059,762 67,228,500 2,643,180 313,812,460 52 209,208,236Redemption of redeemable ordinary shares . . . . . . . . . . . . . . . . . . . (156,522,678) (69,186,706) (2,663,431) — — —Dilution Levy — — — — — —
Net Increase/(Decrease) from Capital Share Transactions of redeemable ordinary shares . . . . . . . . . . . . . . . . . . . . . . . . . . . . . (20,462,916) (1,958,206) (20,251) 313,812,460 52 209,208,236
Net Increase/(Decrease) in Net Assets attributable to holders of redeemable ordinary shares . . . . . . . . . . . . . . . . . . . . . . . . . . . . . (20,482,104) 1,366,660 47,898,673 348,634,331 21,453,421 222,380,029
Net Assets attributable to holders of redeemable shares at 1 January 2015 . . . . . . . . . . . . . . . . . . . . . . . . . . . . . . . . . . . . . . . 79,840,596 78,473,936 348,634,331 — 222,380,029 —Notional FX (Loss) . . . . . . . . . . . . . . . . . . . . . . . . . . . . . . . . . . . . . . — — — —
Net Assets attributable to holders of redeemable ordinary shares at 31 December 2015 . . . . . . . . . . . . . . . . . . . . . . . 59,358,492 79,840,596 396,533,004 348,634,331 243,833,450 222,380,029
(c) This fund commenced operations on 19 September 2014. The information from this Fund is from the date of commencement of operations to 31 December 2014.(d) This fund commenced operations on 31 January 2014. The information from this Fund is from the date of commencement of operations to 31 December 2014.(e) This fund commenced operations on 3 November 2014. The information from this Fund is from the date of commencement of operations to 31 December 2014.(f) This fund commenced operations on 29 September 2014. The information from this Fund is from the date of commencement of operations to 31 December 2014.(g) This fund commenced operations on 26 September 2014. The information from this Fund is from the date of commencement of operations to 31 December 2014.

J a n u s C a p i t a l F u n d s P l c / 3 1 D e c e m b e r 2 0 1 5 2 2 9
Janus Balanced Fund
Janus Emerging Markets Fund
Janus Europe Fund
Janus Global Life Sciences Fund
Janus Global Research Fund
Year ended31 December
2015(USD)
Year ended31 December
2014(USD)
Year ended31 December
2015(USD)
Year ended31 December
2014(USD)
Year ended31 December
2015(EUR)
Year ended31 December
2014(EUR)
Year ended31 December
2015(USD)
Year ended31 December
2014(USD)
Year ended31 December
2015(USD)
Year ended31 December
2014(USD)
(27,923,668) 4,002,749 (12,434,553) (836,579) 15,720,774 (3,471,772) (30,196,381) 81,822,363 (1,420,295) 2,219,361
501,011,056 648,568,556 120,267,313 3,386,923 20,861,185 183,491,409 2,920,836,547 1,211,904,355 1,192,074 1,719,991(397,646,118) (362,252,559) (225,706) (2,977,468) (102,886,307) (123,942,595) (1,651,769,352) (758,544,630) (1,214,283) (6,839,924)
— — — — — — — — — —
103,364,938 286,315,997 120,041,607 409,455 (82,025,122) 59,548,814 1,269,067,195 453,359,725 (22,209) (5,119,933)
75,441,270 290,318,746 107,607,054 (427,124) (66,304,348) 56,077,042 1,238,870,814 535,182,088 (1,442,504) (2,900,572)
644,446,160 354,127,414 4,661,987 5,089,111 207,506,903 151,429,861 723,925,252 188,743,164 40,595,483 43,496,055— — — — — — — — —
719,887,430 644,446,160 112,269,041 4,661,987 141,202,555 207,506,903 1,962,796,066 723,925,252 39,152,979 40,595,483
Janus Opportunistic Alpha Fund
Janus US Fund
Janus US Research Fund
Janus US Twenty Fund
Janus US Venture Fund
Year ended31 December
2015(USD)
Year ended31 December
2014(USD)
Year ended31 December
2015(USD)
Year ended31 December
2014(USD)
Year ended31 December
2015(USD)
Year ended31 December
2014(USD)
Year ended31 December
2015(USD)
Year ended31 December
2014(USD)
Year ended31 December
2015(USD)
Year ended31 December
2014(USD)
(7,444,986) 12,229,121 (27,645) 88,308 506,250 18,539,217 17,300,579 28,043,482 (7,298,110) 20,145,092
26,396,027 55,278,990 459,824 180,948 11,567,874 6,292,402 201,441,971 161,436,017 286,965,326 206,927,421(64,260,285) (51,286,426) (160,577) (156,028) (11,207,063) (15,082,878) (199,524,789) (225,858,840) (361,901,819) (265,081,134)
— — — — — — — — — —
(37,864,258) 3,992,564 299,247 24,920 360,811 (8,790,476) 1,917,182 (64,422,823) (74,936,493) (58,153,713)
(45,309,244) 16,221,685 271,602 113,228 867,061 9,748,741 19,217,761 (36,379,341) (82,234,603) (38,008,621)
96,684,923 80,463,238 1,620,802 1,507,574 192,470,586 182,721,845 353,101,917 389,481,258 291,316,327 329,324,948— — — — — — — — — —
51,375,679 96,684,923 1,892,404 1,620,802 193,337,647 192,470,586 372,319,678 353,101,917 209,081,724 291,316,327

Statement of Changes in Net Assets Attributable to Redeemable Participating Shareholders
The accompanying notes are an integral part of the financial statements.
2 3 0 J a n u s C a p i t a l F u n d s P l c / 3 1 D e c e m b e r 2 0 1 5
Perkins Global Value Fund
Perkins US Strategic Value Fund
INTECH All-World Minimum Variance Core Fund(a)
For the financial years ended 31 December 2015 and 31 December 2014
Year ended31 December
2015(USD)
Year ended31 December
2014(USD)
Year ended31 December
2015(USD)
Year ended31 December
2014(USD)
Year ended31 December
2015(USD)
Year ended31 December
2014(USD)
(Decrease)/Increase in net assets attributable to holders of redeemable ordinary shares from operations . . . . . . . . . . . . . . . . . (7,592,697) 3,618,489 (16,664,540) 28,331,474 (28,163,297) —
Capital Share Transactions of redeemable ordinary shares:Proceeds from redeemable ordinary shares sold . . . . . . . . . . . . . . . . 6,025,310 48,149,487 46,515,109 126,899,479 775,105,140 —Redemption of redeemable ordinary shares . . . . . . . . . . . . . . . . . . . (6,726,463) (7,543,298) (258,138,717) (310,580,772) — —Dilution Levy — — — — — —
Net Increase/(Decrease) from Capital Share Transactions of redeemable ordinary shares . . . . . . . . . . . . . . . . . . . . . . . . . . . . . (701,153) 40,606,189 (211,623,608) (183,681,293) 775,105,140 —
Net Increase/(Decrease) in Net Assets attributable to holders of redeemable ordinary shares . . . . . . . . . . . . . . . . . . . . . . . . . . . . . (8,293,850) 44,224,678 (228,288,148) (155,349,819) 746,941,843 —
Net Assets attributable to holders of redeemable shares at 1 January 2015 . . . . . . . . . . . . . . . . . . . . . . . . . . . . . . . . . . . . . . . 173,508,516 129,283,838 433,727,598 589,077,417 — —Notional FX (Loss) . . . . . . . . . . . . . . . . . . . . . . . . . . . . . . . . . . . . . . — — — — — —
Net Assets attributable to holders of redeemable ordinary shares at 31 December 2015 . . . . . . . . . . . . . . . . . . . . . . . 165,214,666 173,508,516 205,439,450 433,727,598 746,941,843 —
Janus Global Real Estate Fund
Janus Flexible Income Fund
Janus Global Flexible Income Fund
For the financial years ended 31 December 2015 and 31 December 2014
Year ended31 December
2015(USD)
Year ended31 December
2014(USD)
Year ended31 December
2015(USD)
Year ended31 December
2014(USD)
Year ended31 December
2015(USD)
Year ended31 December
2014(USD)
(Decrease)/Increase in net assets attributable to holders of redeemable ordinary shares from operations . . . . . . . . . . . . . . . . . (8,703,841) 19,499,647 (41,897,450) (8,455,191) (2,687,714) (870,479)
Capital Share Transactions of redeemable ordinary shares:Proceeds from redeemable ordinary shares sold . . . . . . . . . . . . . . . . 43,243,965 44,056,259 405,998,497 333,292,442 7,747,051 12,431,314Redemption of redeemable ordinary shares . . . . . . . . . . . . . . . . . . . (67,355,320) (109,920,302) (404,946,708) (427,189,661) (5,401,830) (499,922)Dilution Levy — — — — — —
Net Increase/(Decrease) from Capital Share Transactions of redeemable ordinary shares . . . . . . . . . . . . . . . . . . . . . . . . . . . . . (24,111,355) (65,864,043) 1,051,789 (93,897,219) 2,345,221 11,931,392
Net Increase/(Decrease) in Net Assets attributable to holders of redeemable ordinary shares . . . . . . . . . . . . . . . . . . . . . . . . . . . . . (32,815,196) (46,364,396) (40,845,661) (102,352,410) (342,493) 11,060,913
Net Assets attributable to holders of redeemable shares at 1 January 2015 . . . . . . . . . . . . . . . . . . . . . . . . . . . . . . . . . . . . . . . 164,338,084 210,702,480 961,774,981 1,064,127,391 21,413,639 10,352,726Notional FX (Loss) . . . . . . . . . . . . . . . . . . . . . . . . . . . . . . . . . . . . . . — — — — — —
Net Assets attributable to holders of redeemable ordinary shares at 31 December 2015 . . . . . . . . . . . . . . . . . . . . . . . 131,522,888 164,338,084 920,929,320 961,774,981 21,071,146 21,413,639

J a n u s C a p i t a l F u n d s P l c / 3 1 D e c e m b e r 2 0 1 5 2 3 1
INTECH European Core Fund(d)
INTECH Global All Country Low Volatility Fund(e)
INTECH Global Dividend Fund
INTECH US Core Fund
Janus Global Diversified Alternatives Fund
Year ended31 December
2015(EUR)
Year ended31 December
2014(EUR)
Year ended31 December
2015(USD)
Year ended31 December
2014(USD)
Year ended31 December
2015(USD)
Year ended31 December
2014(USD)
Year ended31 December
2015(USD)
Year ended31 December
2014(USD)
Year ended31 December
2015(USD)
Year ended31 December
2014(USD)
10,417,573 4,171,187 (796,034) 1,750,178 (144,930) 6,145,724 (1,985,675) 12,085,860 (313,389) (104,862)
65 81,504,774 — 161,760,706 233,334 36,439,639 102,328,877 60,721,612 497,964 2,090,923— — — — (612,834) (92,054,051) (93,032,601) (57,121,402) (113,507) (1,796,000)— — — — — (56,113) — — — —
65 81,504,774 — 161,760,706 (379,500) (55,670,525) 9,296,276 3,600,210 384,457 294,923
10,417,638 85,675,961 (796,034) 163,510,884 (524,430) (49,524,801) 7,310,601 15,686,070 71,068 190,061
85,675,961 — 163,510,884 — 2,418,992 51,943,793 159,312,972 143,626,902 2,190,061 2,000,000— — — — — — — — — —
96,093,599 85,675,961 162,714,850 163,510,884 1,894,562 2,418,992 166,623,573 159,312,972 2,261,129 2,190,061
Janus Global High Yield Fund
Janus Global Investment Grade Bond Fund
Janus High Yield Fund
Janus Global Unconstrained Bond Fund(f)
Janus US Short-Term Bond Fund
Company Total in US Dollar
Year ended31 December
2015(USD)
Year ended31 December
2014(USD)
Year ended31 December
2015(USD)
Year ended31 December
2014(USD)
Year ended31 December
2015(USD)
Year ended31 December
2014(USD)
Year ended31 December
2015(USD)
Year ended31 December
2014(USD)
Year ended31 December
2015(USD)
Year ended31 December
2014(USD)
Year ended31 December
2015(USD)
Year ended31 December
2014(USD)
(8,227,926) (12,700,784) (5,380,354) (2,627,533) (47,739,914) (45,807,815) (5,959,593) (278,584) (6,398,027) (6,131,385) (231,187,533) 170,474,819
6,827,503 45,351,665 11,725,749 36,576,759 215,953,597 413,296,513 143,273,398 77,815,965 148,702,627 532,097,199 6,144,251,915 4,656,497,438(26,955,011) (27,594,582) (29,111,953) (20,701,884) (356,045,417) (602,776,042) (107,919,009) (234,784) (388,766,265) (414,564,324) (4,703,487,413) (3,994,522,518)
— — — — — — — — — — — (56,113)
(20,127,508) 17,757,083 (17,386,204) 15,874,875 (140,091,820) (189,479,529) 35,354,389 77,581,181 (240,063,638) 117,532,875 1,440,764,502 661,918,807
(28,355,434) 5,056,299 (22,766,558) 13,247,342 (187,831,734) (235,287,344) 29,394,796 77,302,597 (246,461,665) 111,401,490 1,209,576,969 832,393,626
78,532,553 73,476,254 66,785,656 53,538,314 812,890,731 1,048,178,075 77,302,597 — 587,918,849 476,517,359 6,619,538,269 5,828,797,251— — — — — — — — — — (35,255,239) (41,652,608)
50,177,119 78,532,553 44,019,098 66,785,656 625,058,997 812,890,731 106,697,393 77,302,597 341,457,184 587,918,849 7,793,859,999 6,619,538,269

Notes to the Financial Statements
2 3 2 J a n u s C a p i t a l F u n d s P l c / 3 1 D e c e m b e r 2 0 1 5
1. ACCOUNTING POLICIES
The significant accounting policies and estimation techniques adopted by the Company are as follows:
STATEMENT OF COMPLIANCE
For the year ended 31 December 2014, the financial statements were prepared under Irish GAAP. For the year ended 31 December 2015 the Board of Directors has elected to prepare the financial statements in accordance with FRS 102 Financial Reporting Standard applicable in the UK and Republic of Ireland issued by the Financial Reporting Council (FRC) and promulgated by the Institute of Chartered Accountants in Ireland (“FRS 102”) and the European Communities (Undertakings for Collective Investment in Transferable Securities) Regulations, 2011, as amended and Central Bank (Supervision and Enforcement) Act 2013 (Section 48(1)) (Undertakings for Collective Investment in Transferable Securities) Regulations 2015 (the “Central Bank UCITS Regulations”). FRS 102 is adopted for accounting periods beginning on or after 1 January 2015. The Board of Directors have taken the option to apply the standard in the preparation of these financial statements.
The format and certain wordings of the financial statements have been adapted from those contained in the FRS 102 and the Companies Act 2014 so that, in the opinion of the Directors, they more appropriately reflect the nature of the Company’s business as an investment fund.
FIRST-TIME ADOPTION OF FRS 102The Company has adopted FRS 102 for the financial year ended 31 December 2015. In the prior financial year, the financial statements were prepared in accordance with Accounting Standards issued by the FRC and promulgated by the Institute of Chartered Accountants in Ireland (“Generally Accepted Accounting Practice in Ireland”). Accordingly, the Company has restated the comparative prior financial year amounts in the primary statements to comply with FRS 102.
In March 2016 amendments were made to paragraphs 34.22 and 34.42 of FRS 102, revising the fair value hierarchy disclosure requirements. An entity shall apply these amendments for accounting periods beginning on or after 1 January 2017. Early application is permitted. The Company has early adopted the amendment to FRS102.
The Board of Directors have considered how the transition from Irish GAAP to FRS 102 has affected the Company’s reported financial position and financial performance. The Company has also availed of the exemption available under FRS 102 not to prepare a statement of cash flows.
FAIR VALUE MEASUREMENT
On initial application of FRS 102, in accounting for its financial instruments a reporting entity is required to apply either a) the full requirements of FRS 102 relating to Basic Financial Instruments and Other Financial Instruments, b) the recognition and measurement provisions of IAS 39 Financial Instruments: Recognition and only
the disclosure requirements of FRS 102 relating to Basic Financial Instruments and Other Financial Instruments, or c) the recognition and measurement provisions of IFRS 9 Financial Instruments and only the disclosure requirements of FRS 102 relating to Basic Financial Instruments and Other Financial Instruments. The Company has chosen to apply the recognition and measurement provisions of IAS 39 Financial Instruments: Recognition and only the disclosure requirements of FRS 102 relating to Basic Financial Instruments and Other Financial Instruments.
FAIR VALUE DISCLOSURES As a result of FRS 102 adoption, the Company has changed its valuation input for financial assets and liabilities to last traded prices. Therefore the adjustment from bid to last traded prices in the Statement of Financial Position is no longer required.
In addition, the Company has adopted FRS 102 requirements for the fair value hierarchy which have removed the disclosure of the reconciliation table for investments with significant unobservable inputs (Level 3) that was previously required under Irish GAAP.
Management makes estimates and assumptions concerning the future. The resulting accounting estimates will, by definition, seldom equal the related actual results. The estimates and assumptions that have a significant risk of causing a material adjustment to the carrying amounts of assets and liabilities within the next financial year are outlined below.
The Financial Statements of the Company have been prepared on a going concern basis.
VALUATION
The financial statements have been prepared as at the 31 December. Due to Asia holidays there was no dealing valuation processed for Janus Asia Frontiers Markets Fund on the 30 December 2015 and 31 December 2015 and there was no dealing valuation processed for the Janus Asia Growth Drivers Fund and the Janus Japan Emerging Opportunities Fund on the 31 December 2015. An analysis was undertaken and the below lists the securities held on these funds where the price on the dealing valuation date was greater than 5BPs of the price available on the 31 December 2015. The remaining Funds financial statements have been prepared using a dealing valuation date of 31 December 2015.
ID1000125909 Matahari Putra Market Value Prima Tbk PT Movement $1,705
Financial year ended 31 December 2014: US57060U7616 Market Vectors Market Value Vietnam ETF Movement $5,175
HISTORICAL COST CONVENTION
The financial statements are prepared under the historical cost convention as modified to include financial assets held at fair value through profit or loss.

Notes to the Financial Statements
J a n u s C a p i t a l F u n d s P l c / 3 1 D e c e m b e r 2 0 1 5 2 3 3
Fund Name Security Name Fair Value at 31 December 2015
Fair Value as a % of Net Assets
Janus Europe Fund Avatera Medical Investment GmbH, 5.0000%, due 7/8/18 €3,680,000 2.60% Janus Global Life Sciences ACERTA PHARMA B.V. PP $12,865,586 0.70% Janus Global Life Sciences Clementia Pharmaceuticals, Inc. $5,499,949 0.30% Janus Global Life Sciences HLS Therapeutics Inc. $7,924,500 0.40% Janus Global Life Sciences Intellia Therapeutics, Inc. $3,982,850 0.20% Janus Global Life Sciences Regenxbio, Inc. $10,711,189 0.50% Janus Global Life Sciences Solid GT, LLC $2,906,820 0.10%Janus Opportunistic Alpha Fund HLS Therapeutics Inc. $310,430 0.60% INTECH Global All-Country Low Volatility Fund Hanergy Thin Film Power Group, Ltd. $55,234 — INTECH Global All-Country Low Volatility Fund Safeway Casa $7,815 — INTECH Global All-Country Low Volatility Fund Safeway, Inc. $376 — INTECH All-World Minimum Variance Core Fund Hanergy Thin Film Power Group, Ltd. $83,048 —
Fund Name Security Name Fair Value at31 December 2014
Fair Value as a %of Net Assets
Janus Europe Fund MSCI Daily Trust Gross Emerging Markets Index €(30,877) —Janus Europe Fund Primecity Investment PLC €2,640,000 1.3%Janus Global Life Sciences Fund Diplomat Pharmacy Inc. $3,373,120 0.5%Janus US Venture Fund Diplomat Pharmacy Inc. $2,301,092 0.8%
INVESTMENT VALUATION
The Company has changed its valuation input for both financial assets and financial liabilities at fair value from bid prices to last traded prices which resulted in the removal of adjustment from bid to last traded prices from the Statement of Financial Position and Statement of Comprehensive Income. Gains and losses arising from changes in their fair value are included in the Statement of Comprehensive Income in the year in which they arise.
All the Company’s assets and liabilities are held for the purpose of being traded.
The following table presents the positions that were fair valued by Janus Global Pricing Committee at 31 December 2015. These estimated fair values may not reflect amounts that could be realised upon immediate sale or amounts that ultimately may be realised.
The following table presents the positions that were fair valued by Janus Global Pricing Committee at 31 December 2014. These estimated fair values may not reflect amounts
that could be realised upon immediate sale or amounts that ultimately may be realised.
LISTED SECURITIES
Securities listed on a recognised stock exchange or traded on any other organised market are valued at the latest available market price (as required by FRS 102) on that regulated market, as at the close of the regular trading session of the New York Stock Exchange (“NYSE”) on the relevant Business Day (normally 4:00 p.m., New York time, Monday through Friday) or, if unavailable or, in the opinion of the Administrator unrepresentative of fair value, the last available market price on the principal exchange. If for specific assets the latest available prices do not, in the opinion of the Administrator, reflect their fair value or if prices are unavailable, the value shall be calculated by the Administrator in consultation with the Investment Adviser or the relevant Sub-Investment Advise on the basis of the probable realisation value for such assets as at the close of the regular trading session of the NYSE on the relevant Business Day. The Administrator may use a systematic fair valuation model provided by an independent third party to value equity securities in order to adjust for stale pricing which may occur between the close of foreign exchanges and the relevant Valuation Point.
CASH AND OTHER LIQUID ASSETS
Cash and other liquid assets will be valued at their fair value with the relevant interest accrued, where applicable, and charged to the Statement of Comprehensive Income when incurred at
the close of the regular trading session of the New York Stock Exchange (“NYSE”) on the relevant Business Day (normally 4:00 p.m., New York time, Monday through Friday).
COLLECTIVE INVESTMENT SCHEMES
Units or shares in collective investment schemes will be valued at the latest available unaudited net asset value estimated by the underlying administrator or, if listed or traded on a Regulated Market, at the latest quoted trade price or a mid-quotation (or, if unavailable, a bid quotation) or, if unavailable or unrepresentative, the latest available unaudited net asset value estimated by the underlying administrator as deemed relevant to the collective investment scheme.
EXPENSES
Expenses are accounted for on an accruals basis and are charged to the Statement of Comprehensive Income when incurred.
EXCHANGE TRADED DERIVATIVE INSTRUMENTS
Exchange traded derivative instruments will be valued at the close of the regular trading session of the NYSE on the relevant Business Day at the settlement price for such instruments on such market. If the settlement price of an exchange traded derivative instrument is not available, the value of such

Notes to the Financial Statements
2 3 4 J a n u s C a p i t a l F u n d s P l c / 3 1 D e c e m b e r 2 0 1 5
instrument shall be the probable realisation value estimated with care and in good faith by the Administrator or other competent person approved for the purpose by the Depositary. All derivatives are carried as assets when the fair value is positive and as a liability when the fair value is negative.
SHORT-TERM INVESTMENTS
Amortised cost calculated using the effective yield method, which approximates fair value, is used to value discounted debt obligations with 60 days or less remaining to maturity, unless the Company’s Directors determine that this does not represent fair value. All other short-term investments, including time deposits, are valued at cost, which approximates their fair value. When calculating the effective interest rate, the Company estimates cash flows considering all contractual terms of the financial instrument but does not consider future credit losses.
FUTURES CONTRACTS ON SECURITIES
Futures are contracts for delayed delivery of securities or money market instruments in which the seller agrees to make delivery at a specified future date of an instrument, at a specified price or yield. Initial margin deposits are made upon entering into future contracts and are generally made in cash or cash equivalents. Futures contracts are fair valued based upon their daily quoted daily settlement price. For open futures contracts, changes in the fair value of the contract are recognised as unrealised gains or losses by “marking-to-market” the value of the contract at the Statement of Financial Position date. When the contract is closed, the difference between the proceeds from (or cost of) the closing transactions and the original transaction is recorded as a realised gain or loss. Futures contracts are held at fair value through profit or loss. The Variation margin receivable or payable at the year end date is reported as an asset or liability, as applicable, in the Statement of Financial Position, gains and losses arising from changes in the fair value of the futures contracts are included in the Statement of Comprehensive Income in the year which they arise.
OPTIONS
Options are rights to buy or sell an underlying asset or instrument for a specified price (the exercise price) during, or at the end of, a specified year. The seller (or writer) of the option receives a payment, or premium, from the buyer, which the writer keeps regardless of whether the buyer uses (or exercises) the option. The premium on purchased put options exercised is subtracted from the proceeds of the sale of the underlying security or foreign currency in determining the realised gain or loss. The premium on purchased call options exercised is added to the cost of the securities or foreign currencies purchased. Premiums paid from the purchase of options, which expire unexercised are treated as realised losses. The premium on written call options exercised is added to the proceeds from the sale of the underlying security of foreign currency in determining the realised gain or loss. The premium on written put options exercised is subtracted from the cost of the securities or foreign currencies purchased. Premiums received from written options, which expire unexercised are treated as realised gains. A call option gives the holder (buyer) the right to buy the underlying asset from the seller (writer) of the option. A put option gives the holder the right to sell the underlying asset to the writer of the option. Options can trade on exchanges
or in the OTC market and may be bought or sold on a wide variety of underlying assets or instruments, including financial indices, individual securities, and other derivative instruments, such as futures contracts, foreign currencies, forward contracts, structured investments (derivative securities which are specifically designed to combine the characteristics of one or more underlying securities in a single note) and yield curve options. Options that are written on futures contracts will be subject to margin requirements similar to those applied to futures contracts.
Options, held at fair value though profit or loss, are fair valued daily based upon the quotation provided by counterparty on the principal exchange on which the option is traded. Realised and unrealised gains and losses arising from option contracts are included in the Statement of Comprehensive Income in the year in which they arise.
Options held by Janus Asia Fund, Janus Emerging Markets Fund and Janus Global Unconstrained Bond Fund with Goldman Sachs and Citibank as at 31 December 2015 are detailed in the Portfolio Statements. Options held by Janus Global Unconstrained Bond Fund with Goldman Sachs are cleared centrally through Goldman Sachs network of companies.
SWAPS
A swap is an agreement that obligates two parties to exchange a series of cash flows at specified intervals based upon or calculated by reference to changes in specified prices or rates for a specified amount of an underlying asset. The Company may utilise swap agreements as a means to gain exposure to certain common stocks and/or to “hedge” or protect their portfolios from adverse movements in securities prices or interest rates. The Company is subject to equity risk and interest rate risk in the normal course of pursuing their investment objectives through investments in swap contracts. Swap agreements entail the risk that a party will default on its payment obligation to a Fund. If the other party to a swap defaults, a Fund would risk the loss of the net amount of the payments that it contractually is entitled to receive. If a Fund utilises a swap at the wrong time or judges market conditions incorrectly, the swap may result in a loss to the Fund and reduce the Fund’s total return. Swap contracts of the Company are reported as an asset or liability on the Statement of Financial Position (if applicable). Realised gains and losses of the Funds are reported in “Net gain/(loss) on financial assets and liabilities at fair value through profit or loss” on the Statement of Comprehensive Income (if applicable).
Total return swaps involve an exchange by two parties in which one party makes payments based on a set rate, either fixed or variable, while the other party makes payments based on the return of an underlying asset, which includes both the income it generates and any capital gains over the payment financial year. The Funds’ maximum risk of loss for total return swaps from counterparty risk or credit risk is the discounted value of the payments to be received from/paid to the counterparty over the contract’s remaining life, to the extent that the amount is positive. The risk is mitigated by having a netting arrangement between the Funds and the counterparty and by the posting of collateral to the Funds to cover the Funds’ exposure to the counterparty.

Notes to the Financial Statements
J a n u s C a p i t a l F u n d s P l c / 3 1 D e c e m b e r 2 0 1 5 2 3 5
Equity swaps involve an exchange of cash flows between two parties that allows each party to diversify its income, while still holding its original assets. The two sets of nominally equal cash flows are exchanged as per the terms of the swap, which may involve an equity-based cash flow (such as from a stock asset) that is traded for a fixed-income cash flow (such as a benchmark rate).
Financial derivative instruments shall be valued at the settlement price for such instruments on such market. Over-the-counter financial derivative instruments shall be valued daily using either the counterparty valuation or an alternative valuation, such as a valuation calculated by the Company or by an independent pricing vendor appointed by the Company provided the Company or other party has adequate human and technical means to perform the valuation and approved for that purpose by the Depositary. The counterparty to derivative instruments not traded on an exchange must be prepared to value the contract and to close out the transaction at the request of the Company at fair value. Where the counterparty valuation is used, the valuation must be approved or verified by an independent party who is approved for the purpose by the Depositary and who is independent of the counterparty at least weekly. The independent verification shall be carried out at least monthly. Where an alternative valuation is used, the Company shall follow international best practice and shall adhere to the principles on the valuation of over-the-counter instruments established by bodies such as IOSCO and AIMA such valuation shall be reconciled on a monthly basis to the valuation provided by the counterparty to such instrument. Where significant differences arise these will be promptly investigated and explained.
Swaps held by Janus Asia Fund, Janus Emerging Markets Fund, Janus Europe Fund, Janus Global Diversified Alternative Fund and Janus Global Unconstrained Bond Fund with Goldman Sachs & Co., Credit Suisse, UBS, Morgan Stanley & Co., Inc, Barclays, BNP Paribas, JP Morgan and Citibank as at 31 December 2015 are detailed in the Portfolio Statements.
CREDIT DEFAULT SWAPS
Credit default swap agreements (“CDS”) enable the Company to buy or sell credit protection on an individual issuer or basket of issuers. The Company may enter into CDS to gain long or short exposure to sovereign bond markets. Long CDS positions are utilised to gain exposure to a sovereign bond market (similar to buying a bond) and are akin to selling insurance on the bond. Short CDS positions are utilised to short exposure to a sovereign bond market (similar to shorting a bond) and are akin to buying/selling insurance on the bond. In response to recent market events, certain regulators have proposed regulation of the CDS market. These regulations may limit the Company’s ability to use CDS and/or the benefits of CDS. CDS and similarly structured products involve risks, including the risk that the counterparty may be unable to fulfil the transaction or that the Company may be required to purchase securities to meet delivery obligations. The Company may have difficulty, be unable or may incur additional costs to acquire such securities. CDS are valued daily by independent vendor MARKIT.
TRANCHE LOANS
The Company may invest in direct debt instruments which are interests in amounts owed to lenders or lending syndicates by corporate, governmental, or other borrowers. A Fund’s
investment in loans may be in the form of participations in loans or assignments of all or a portion of loans from third parties. A loan is often administered by a bank or other financial institution (the “lender”) that acts as agent for all holders. The agent administers the terms of the loan, as specified in the loan agreement. A Fund may invest in multiple series or tranches of a loan, which may have varying terms and carry different associated risks. A Fund generally has no right to enforce compliance with the terms of the loan agreement with the borrower. As a result, a Fund may be subject to the credit risk of both the borrower and the lender that is selling the loan agreement. When a Fund purchases assignments from lenders it acquires direct rights against the borrower of the loan.
When investing in a tranche loan, a Fund has the right to receive payments of principal, interest and any fees to which it is entitled only from the lender selling the loan agreement and only upon receipt of payments by the lender from the borrower. Tranche loans are fair valued based on valuations provided by the pricing vendor Market. Fees earned or paid and the receipt of payments of principal are recorded as a component of Net gain/(loss) on financial assets and liabilities at fair value through profit or loss in the Statement of Comprehensive Income. At the 31 December 2015 tranche loans were held on Janus Balanced Fund, Janus Flexible Income Fund, Janus Global Flexible Income Fund, Janus Global High Yield Fund, Janus Global Investment Grade Bond Fund, Janus High Yield Fund and Janus US Short-Term Bond Fund.
INVESTMENT TRANSACTIONS AND INVESTMENT INCOME
Investment transactions are accounted for as of the date purchased or sold. Gains and losses arising from changes in the fair value of the financial assets at fair value through profit or loss are included in the Statement of Comprehensive Income in the year in which they arise. The weighted average cost basis is used to calculate realised gains and losses on the sale of investments.
Dividends are credited to the Statement of Comprehensive Income on the dates on which the relevant securities are listed as “ex-dividend.” Interest income is accrued on a daily effective yield basis. Income is shown gross of non-recoverable withholding tax. Withholding tax is shown net of any reclaim receivable.
TRANSACTION COSTS
Transaction costs include fees and commissions paid to agents (including employees acting as selling agents), advisers, brokers and dealers, levies by regulatory agencies and securities exchanges, and transfer taxes and duties. Transaction costs do not include debt premiums or discounts, financing costs or internal administrative costs. Transaction costs per sub-fund are presented in Note 12.
DISTRIBUTIONS PAYABLE TO HOLDERS OF REDEEMABLE ORDINARY SHARES
Proposed distributions to holders of redeemable shares are recognised in the Statement of Comprehensive Income when they are appropriately authorised and no longer at the discretion of the Company. Distributions paid to holders of redeemable ordinary Shares are classified as finance costs in the Statement of Comprehensive Income.

Notes to the Financial Statements
2 3 6 J a n u s C a p i t a l F u n d s P l c / 3 1 D e c e m b e r 2 0 1 5
Class of ShareFrequency of
Dividend DeclarationNet Investment
IncomeNet Realised Capital Gains
Distribution Frequency
Accumulating (acc) Share Classes –All Accumulating (acc) Share Classes
Not applicable Not applicable Not applicable Not applicable
Distributing (dis or inc)Share Classes
Janus Asia Frontier Markets Fund – All Distributing (inc) Share Classes
Monthly Monthly Included Monthly, normally on the fifteenth day of each month unless the
fifteenth day is not a Business Day in which case the distribution will be
made on the last Business Day before the fifteenth day of the month
Janus Asia Growth Drivers Fund – All Distributing (inc) Share Classes
Monthly Monthly Included Monthly, normally on the fifteenth day of each month unless the
fifteenth day is not a Business Day in which case the distribution will be
made on the last Business Day before the fifteenth day of the month
Janus Asia Fund – All Distributing (inc) Share Classes
Annually or semi-annually or such other dates or more frequently at the
discretion of the Directors
Annually or semi-annually or such other dates or more
frequently at the discretion of the Directors
Included† Annually or semi-annually on or about 15 April and/or 15 October, or such other dates or more frequently
at the discretion of the Directors
Janus Balanced Fund – All Distributing (inc) Share Classes
Monthly Monthly Included Monthly, normally on the fifteenth day of each month unless the
fifteenth day is not a Business Day in which case the distribution will be
made on the last Business Day before the fifteenth day of the month
Janus Emerging Markets Fund – All Distributing (inc) Share Classes
Annually or semi-annually or such other dates or more frequently at the
discretion of the Directors
Annually or semi-annually or such other dates or more
frequently at the discretion of the Directors
Included† Annually or semi-annually on or about 15 April and/or 15 October, or such other dates or more frequently
at the discretion of the Directors
Janus Europe Fund – All Distributing (inc) Share Classes
Annually or semi-annually or such other dates or more frequently at the
discretion of the Directors
Annually or semi-annually or such other dates or more
frequently at the discretion of the Directors
Included† Annually or semi-annually on or about 15 April and/or 15 October, or such other dates or more frequently
at the discretion of the Directors
Janus Global Adaptive Multi-Asset Fund – All Distributing (inc) Share Classes
Monthly Monthly Included Monthly, normally on the fifteenth day of each month unless the
fifteenth day is not a Business Day in which case the distribution will be
made on the last Business Day before the fifteenth day of the month
Janus Global Life Sciences Fund – All Distributing (inc) Share Classes
Annually or semi-annually or such other dates or more frequently at the
discretion of the Directors
Annually or semi-annually or such other dates or more
frequently at the discretion of the Directors
Included† Annually or semi-annually on or about 15 April and/or 15 October, or such other dates or more frequently
at the discretion of the Directors
Janus Global Research Fund – AllDistributing (dis or inc) Share Classeswith the exception of the A$dis,B$inc and I$dis Share Classes
Annually or semi-annuallyor such other dates ormore frequently at the
discretion of the Directors
Annually or semi-annually orsuch other dates or more
frequently at the discretionof the Directors
Included† Annually or semi-annually on orabout 15 April and/or 15 October, orsuch other dates or more frequently
at the discretion of the Directors
Janus Global Research Fund – A$dis, B$inc and I$dis Share Classes
Annually or more frequently at the discretion
of the Directors
Annually or more frequently at the discretion of the
Directors
Included† Annually on or about 15 May, or more frequently at the discretion of
the Directors
Janus Global Technology Fund – All Distributing (inc) Share Classes
Annually or semi-annually or such other dates or more frequently at the
discretion of the Directors
Annually or semi-annually or such other dates or more
frequently at the discretion of the Directors
Included† Annually or semi-annually on or about 15 April and/or 15 October, or such other dates or more frequently
at the discretion of the Directors
Janus Japan Emerging Opportunities Fund – All Distributing (inc) Share Classes
Monthly Monthly Included Monthly, normally on the fifteenth day of each month unless the
fifteenth day is not a Business Day in which case the distribution will be
made on the last Business Day before the fifteenth day of the month
Janus Japan Fund – All Distributing (inc) Share Classes
Monthly Monthly Included Monthly, normally on the fifteenth day of each month unless the
fifteenth day is not a Business Day in which case the distribution will be
made on the last Business Day before the fifteenth day of the month
The following table presents the distribution policy applicable to each Class of Shares:

Notes to the Financial Statements
J a n u s C a p i t a l F u n d s P l c / 3 1 D e c e m b e r 2 0 1 5 2 3 7
Class of ShareFrequency of
Dividend DeclarationNet Investment
IncomeNet Realised Capital Gains
Distribution Frequency
Janus Opportunistic Alpha Fund – All Distributing (dis or inc) Share Classes with the exception of the A$dis and I$dis Share Classes
Annually or semi-annually or such other dates or more frequently at the
discretion of the Directors
Annually or semi-annually or such other dates or more
frequently at the discretion of the Directors
Included† Annually or semi-annually on or about 15 April and/or 15 October, or such other dates or more frequently
at the discretion of the Directors
Janus Opportunistic Alpha Fund – A$dis and I$dis Share Classes
Annually or more frequently at the discretion
of the Directors
Annually or more frequently at the discretion of the
Directors
Included† Annually on or about 15 May, or more frequently at the discretion of
the Directors
Janus US Fund – All Distributing (inc) Share Classes
Annually or semi-annually or such other dates or more frequently at the
discretion of the Directors
Annually or semi-annually or such other dates or more
frequently at the discretion of the Directors
Included† Annually or semi-annually on or about 15 April and/or 15 October, or such other dates or more frequently
at the discretion of the Directors
Janus US Research Fund – All Distributing (dis or inc) Share Classes with the exception of the A$dis, B$inc and I$dis Share Classes
Annually or semi-annually or such other dates or more frequently at the
discretion of the Directors
Annually or semi-annually or such other dates or more
frequently at the discretion of the Directors
Included† Annually or semi-annually on or about 15 April and/or 15 October, or such other dates or more frequently
at the discretion of the Directors
Janus US Research Fund – A$dis, B$inc and I$dis Share Classes
Annually or more frequently at the discretion
of the Directors
Annually or more frequently at the discretion of the
Directors
Included† Annually on or about 15 May, or more frequently at the discretion of
the Directors
Janus US Twenty Fund – All Distributing (dis or inc) Share Classes with the exception of the A$dis and I$dis Share Classes
Annually or semi-annually or such other dates or more frequently at the
discretion of the Directors
Annually or semi-annually or such other dates or more
frequently at the discretion of the Directors
Included† Annually or semi-annually on or about 15 April and/or 15 October, or such other dates or more frequently
at the discretion of the Directors
Janus US Twenty Fund – A$dis and I$dis Share Classes
Annually or more frequently at the discretion
of the Directors
Annually or more frequently at the discretion of the
Directors
Included† Annually on or about 15 May, or more frequently at the discretion of
the Directors
Janus US Venture Fund – All Distributing (dis or inc) Share Classes with the exception of the A$dis and I$dis Share Classes
Annually or semi-annually or such other dates or more frequently at the
discretion of the Directors
Annually or semi-annually or such other dates or more
frequently at the discretion of the Directors
Included† Annually or semi-annually on or about 15 April and/or 15 October, or such other dates or more frequently
at the discretion of the Directors
Janus US Venture Fund – A$dis and I$dis Share Classes
Annually or more frequently at the discretion
of the Directors
Annually or more frequently at the discretion of the
Directors
Included† Annually on or about 15 May, or more frequently at the discretion of
the Directors
Perkins Global Value Fund – All Distributing (inc) Share Classes
Annually or semi-annually or such other dates or more frequently at the
discretion of the Directors
Annually or semi-annually or such other dates or more
frequently at the discretion of the Directors
Included† Annually or semi-annually on or about 15 April and/or 15 October, or such other dates or more frequently
at the discretion of the Directors
Perkins US Strategic Value Fund – All Distributing (dis or inc) Share Classes with the exception of the A$dis and I$dis Share Classes
Annually or semi-annually or such other dates or more frequently at the
discretion of the Directors
Annually or semi-annually or such other dates or more
frequently at the discretion of the Directors
Included† Annually or semi-annually on or about 15 April and/or 15 October, or such other dates or more frequently
at the discretion of the Directors
Perkins US Strategic Value Fund – A$dis and I$dis Share Classes
Annually or more frequently at the discretion
of the Directors
Annually or more frequently at the discretion of the
Directors
Included† Annually on or about 15 May, or more frequently at the discretion of
the Directors
INTECH All-World Minimum Variance Core Fund(a) – All Distributing (inc) Share Classes
Annually or semi-annually or such other dates or more frequently at the
discretion of the Directors
Annually or semi-annually or such other dates or more
frequently at the discretion of the Directors
Included† Annually or semi-annually on or about 15 April and/or 15October, or such other dates or more frequently
at the discretion of the Directors
INTECH European Core Fund – All Distributing (inc) Share Classes
Annually or more frequently at the discretion
of the Directors
Annually or more frequently at the discretion of the
Directors
Included† Annually on or about 15 October, or more frequently at the discretion of
the Directors
INTECH Global All Country Volatility Fund – All Distributing (inc) Share Classes
Annually or semi-annually or such other dates or more frequently at the
discretion of the Directors
Annually or semi-annually or such other dates or more
frequently at the discretion of the Directors
Included† Annually or semi-annually on or about 15 April and/or 15 October, or such other dates or more frequently
at the discretion of the Directors
INTECH Global Dividend Fund – All Distributing (inc) Share Classes
Monthly Monthly Included Monthly, normally on the fifteenth day of each month unless the
fifteenth day is not a Business Day in which case the distribution will be
made on the last Business Day before the fifteenth day of the month
INTECH US Core Fund – All Distributing (dis or inc) Share Classes with the exception of the A$dis and I$dis Share Classes
Annually or semi-annually or such other dates or more frequently at the
discretion of the Directors
Annually or semi-annually or such other dates or more
frequently at the discretion of the Directors
Included† Annually or semi-annually on or about 15 April and/or 15 October, or such other dates or more frequently
at the discretion of the Directors
INTECH US Core Fund – A$dis and I$dis Share Classes
Annually or more frequently at the discretion
of the Directors
Annually or more frequently at the discretion of the
Directors
Included† Annually on or about 15 May, or more frequently at the discretion of
the Directors

Notes to the Financial Statements
2 3 8 J a n u s C a p i t a l F u n d s P l c / 3 1 D e c e m b e r 2 0 1 5
Class of ShareFrequency of
Dividend DeclarationNet Investment
IncomeNet Realised Capital Gains
Distribution Frequency
Janus Global Diversified Alternatives Fund – All Distributing (inc) Share Classes
Annually or semi-annually or such other dates or more frequently at the
discretion of the Directors
Annually or semi-annually or such other dates or more
frequently at the discretion of the Directors
Included† Annually or semi-annually on or about 15 April and/or 15 October, or such other dates or more frequently
at the discretion of the Directors
Janus Global Real Estate Fund – All Distributing (inc) Share Classes
Quarterly Quarterly Included† Quarterly, normally on 15 February, 15 May, 15 August and 15 November
unless one of these days is not a Business Day in which case the
distribution will be made on the last Business Day before the
aforementioned dates
Janus Flexible Income Fund – All Distributing (inc) Share Classes
Monthly Monthly Included† Monthly, normally on the fifteenth day of each month unless the
fifteenth day is not a Business Day in which case the distribution will be
made on the last Business Day before the fifteenth day of the month
Janus Global Flexible Income Fund – All Distributing (inc) Share Classes
Monthly Monthly Included† Monthly, normally on the fifteenth day of each month unless the
fifteenth day is not a Business Day in which case the distribution will be
made on the last Business Day before the fifteenth day of the month
Janus Global High Yield Fund – All Distributing (inc) Share Classes with the exception of the Z$inc
Monthly Monthly Included† Monthly, normally on the fifteenth day of each month unless the
fifteenth day is not a Business Day in which case the distribution will be
made on the last Business Day before the fifteenth day of the month
Janus Global High Yield Fund – Z$inc Share Class
Annually or semi-annually or such other dates or more frequently at the
discretion of the Directors
Annually or semi-annually or such other dates or more
frequently at the discretion of the Directors
Included† Annually or semi-annually on or about 15 February and/or
15 August, or such other dates or more frequently at the discretion
of the Directors
Janus Global Investment Grade Bond Fund – All Distributing (inc) Share Classes with the exception of the Z$inc
Monthly Monthly Included† Monthly, normally on the fifteenth day of each month unless the
fifteenth day is not a Business Day in which case the distribution will be
made on the last Business Day before the fifteenth day of the month
Janus Global Investment Grade Bond Fund – Z$inc Share Class
Annually or semi-annually or such other dates or more frequently at the
discretion of the Directors
Annually or semi-annually or such other dates or more
frequently at the discretion of the Directors
Included† Annually or semi-annually on or about 15 April and/or 15 October, or such other dates or more frequently
at the discretion of the Directors
Janus High Yield Fund – All Distributing (inc) Share Classes
Monthly Monthly Included† Monthly, normally on the fifteenth day of each month unless the
fifteenth day is not a Business Day in which case the distribution will be
made on the last Business Day before the fifteenth day of the month
Janus Global Unconstrained BondFund – All Distributing (inc)Share Classes
Monthly Monthly Included† Monthly, normally on the fifteenthday of each month unless the
fifteenth day is not a Business Day inwhich case the distribution will be
made on the last Business Day beforethe fifteenth day of the month
Janus US Short-Term BondFund – All Distributing (inc)Share Classes
Monthly Monthly Included† Monthly, normally on the fifteenthday of each month unless the
fifteenth day is not a Business Day inwhich case the distribution will be
made on the last Business Day beforethe fifteenth day of the month
† In respect of each dividend declared, the Board of Directors may determine if, and to what extent, such dividend is to be paid out of net realised capital gains.

Notes to the Financial Statements
J a n u s C a p i t a l F u n d s P l c / 3 1 D e c e m b e r 2 0 1 5 2 3 9
Accumulating (acc) Share ClassesThe Company will not declare or make dividend payments on any accumulating (acc) Class of Shares. All net income and net realised capital gains will not be distributed and will be reflected in the net asset value per Share.
Distributing (dis or inc) Share ClassesThe distributing (dis or inc) share classes intend to declare and distribute dividends, which are comprised of net investment income as disclosed below. Any net capital gains realised (i.e. net capital gains less realised and unrealised losses) by the above Classes of Shares on sales of portfolio assets are declared and distributed financial annually. During the distribution year, prior to the day that the distributions are declared, the undistributed net investment income and undistributed net realised capital gains will be retained and reflected in the net asset value of each Share Class.
It should also be noted that the Class A$inc, Class AHK$inc, Class AAUD$inc (Hedged), Class ARMB(CNH)inc (Hedged), Class IRMB(CNH)inc (Hedged), Class ANZD$inc (Hedged) and ASGD$inc (Hedged) Shares of the Janus High Yield Fund, Class A$inc, Class AHK$inc, Class AAUD$inc (Hedged), Class ARMB(CNH)inc (Hedged), Class ANZD$inc (Hedged) and ASGD$inc (Hedged) Shares of the Janus Flexible Income Fund, Class A$inc, Class A€inc (Hedged), Class AHK$inc, Class AAUD$inc (Hedged), Class ACHFinc (Hedged), Class ACAD$inc (Hedged), Class ARMB(CNH)inc (Hedged), Class ASEKinc (Hedged), Class ANZD$inc (Hedged) and Class ASGD$inc (Hedged) of the Janus Balanced Fund, the INTECH Global Dividend Fund, the Janus Global Real Estate Fund, the Janus Global High Yield Fund and the Janus Global Investment Grade Bond Fund, Class A$inc (Hedged), Class A€inc, Class AHK$inc (Hedged), Class AAUD$inc (Hedged), Class ACHFinc (Hedged), Class ACAD$inc (Hedged), Class ARMB(CNH)inc (Hedged), Class ASEKinc (Hedged), Class ANZD$inc (Hedged) and Class ASGD$inc (Hedged) of the Janus Europe Allocation Fund, Janus Europe Flexible Income Fund, Class A$inc, Class A£inc (Hedged), Class A€inc (Hedged), Class AHK$inc, Class AAUD$inc (Hedged), Class ACHFinc (Hedged), Class ACAD$inc (Hedged), Class ARMB(CNH)inc (Hedged), Class ASEKinc (Hedged), Class ANZD$inc (Hedged) and Class ASGD$inc (Hedged) of the Janus Global Unconstrained Bond Fund and Class Einc and Vinc Shares of all Funds may charge certain fees and expenses to capital rather than income, which may result in the erosion of capital and in an increased risk that Shareholders in these Share Classes may not receive back the full amount invested when redeeming their holding.
Where the above Share Classes operate equalisation distributions made by such Share Classes will include an amount of income equalisation. This amount corresponds to the equalisation income included in the net asset value per Share of such Share Class. Certification as a “reporting fund” has been obtained from the United Kingdom HM Revenue & Customs for financial years beginning on or after 1 January 2015 in respect of the Class I$acc of the Janus Asia Fund, Classes I£acc and I£inc of the Janus Short Term Bond Fund and the $acc Classes of all Equity Investing Funds, except the Janus Asia Fund, the $acc and the €acc Classes of the Janus Europe Fund and the U Classes in respect of all funds (to the extent such Classes were in issue at such date).
Certification has also been obtained for the active distributing Share Classes. It is the current intention of the Directors to seek to maintain such approvals and to seek reporting fund status in respect of any new Classes falling within such descriptions with effect from the date on which such Classes become available to investors in the United Kingdom, although no guarantees can be given that such status will be obtained or maintained. The Directors reserve the right to seek approval as a “reporting fund” in respect of any other Class. A full list of approved reporting funds is published on the website of HM Revenue & Customs.
INCOME EQUALISATION
All Funds operating an income or distributing share class intend to operate income equalisation. Income equalisation prevents the dilution of current shareholders’ earnings by applying a portion of the proceeds from Shares issued or redeemed to undistributed income. When Shares are purchased or redeemed the price may include an element of income. Equalisation is this element of income paid out to shareholders who have purchased or redeemed during this financial year and it is accounted for in the Statement of Changes in the Proceeds from/Redemption of redeemable ordinary shares.
DILUTION LEVY
A Fund may suffer dilution which is a reduction in the value of the assets as a result of the costs incurred in dealing in its underlying investments and of any spread between the buying and the selling prices of such investments which is not reflected in the issue or redemption price paid by or to shareholders. With a view to countering this (which, if it is significant, disadvantages existing or continuing shareholders), the Directors may make an adjustment to the share price on a daily and quarterly basis. The dilution adjustment may apply to redemptions or to subscriptions and if charged, the value of the dilution adjustment will be paid into the Fund and will become part of the property attributed to the relevant Fund.
FOREIGN EXCHANGE TRANSLATION
Functional and Presentation CurrencyItems included in the Company’s financial statements are measured using the currency of the primary economic environment in which the Company operates (the “functional currency”), which is the US Dollar. All amounts disclosed in the financial statements are in USD (the “presentational currency”), with the exception of the Janus Europe Fund and INTECH European Core Fund, the functional currency of which is the Euro, and the Janus Japan Emerging Opportunities Fund and Janus Japan Fund, the functional currency of which is JPY. Please see exchange rates note for further details on notional FX on accumulation.
Transactions and BalancesAssets and liabilities denominated in currencies other than the functional currency are translated into the functional currency at the exchange rates ruling at the Statement of Financial Position date. Transactions in currencies other than the functional currency are translated into the functional currency at the exchange rates ruling at the dates of the transactions. Gains and losses on foreign exchange transactions are recognised in the Statement of Comprehensive Income in determining the result for the year.

Notes to the Financial Statements
2 4 0 J a n u s C a p i t a l F u n d s P l c / 3 1 D e c e m b e r 2 0 1 5
FOREIGN FORWARD CURRENCY CONTRACTS
The Company may, without limitation, enter into three types of forward foreign exchange currency contracts: Australian Dollar, British Pound, Canadian Dollar, Chinese Renminbi, Euro, Hong Kong Dollar, Japanese Yen, Singapore Dollar, Swedish Kronor and Swiss Franc Class level hedging, foreign security hedging and security transaction level hedging.
The unrealised appreciation or depreciation on open forward exchange contracts is calculated by reference to the difference between the contracted rate and the rate to close out the contract. Realised gains or losses include net gains on contracts, which have been settled or offset by other contracts.
For foreign security hedges and security transaction level hedges, realised and unrealised gains and losses are allocated at Fund level. For AUD, CAD, CHF, CNH, EUR, GBP, HKD, JPY, SEK, SGD and USD Class level hedge the realised and unrealised gains and losses are allocated solely to the relevant Class. While the Company will attempt to hedge against currency exposure in the AUD, CAD, CHF, CNH, EUR, GBP, HKD, JPY, SEK, SGD and USD Classes, there can be no guarantee that the value of these Classes will not be affected by the value of these currencies relative to the Euro, Japanese Yen or US Dollar as applicable.
Offsetting financial instrumentsFinancial assets and liabilities are offset and the net amount reported in the Statement of Financial Position where the Company has a legally enforceable right to set-off the recognised amounts and there is an intention to settle on a net basis or realise the asset and settle the liability simultaneously.
2. SHARE CAPITAL
AUTHORISED
The paid up share capital of the Company shall at all times equal the combined net asset value of the Funds. The Directors are authorised to issue up to 500 billion Shares of no par value each. For accounting purposes, these are deemed to be either subscriber shares or redeemable ordinary Shares (“Ordinary Shares”).
SUBSCRIBER SHARES
There are currently 30,000 subscriber shares in issue of no par value, held by three subscriber shareholders. The subscriber shares do not form part of the net asset value of the Company and are thus not disclosed in the financial statements except by way of this note only. The subscriber shares entitle the shareholders holding them to attend and vote at all meetings of the Company, but do not entitle the holders to participate in the dividends or net asset value of any Fund or of the Company.
REDEEMABLE ORDINARY SHARES
The Company issues redeemable shares, which are redeemable at the holder’s option and are classified as financial liabilities. Redeemable shares can be put back to the Company at any time for cash equal to a proportionate share of the net asset value per share of the relevant Fund. The redeemable share is carried at the redemption amount that is payable at the Statement of
Financial Position date if the holder exercises the right to put the share back to the Company at that date. Holders of redeemable ordinary shares are entitled to attend and vote at meetings of the Company and of the fund represented by those Shares.
Redeemable shares are issued and redeemed at the holder’s option at prices based on the net asset value per share of the relevant Fund at the time of issue or redemption. The net asset value per share of the relevant Fund is calculated by dividing the net assets attributable to the holders of redeemable shares in that class by the total number of outstanding redeemable shares in that class (adjusted to the nearest whole unit of the base currency). In accordance with the provisions of the Company’s articles of association and prospectus, investment positions which are listed or traded on a regulated market for which market quotations are readily available are valued based on the last quoted trade price for the purpose of determining the net asset value per Share for subscriptions and redemptions.
Distributions on these Ordinary Shares are recognised in the Statement of Comprehensive Income as finance costs.
3. RELATED PARTY TRANSACTIONS
Janus Capital International Limited (“JCIL”) acts as Investment Adviser and Distributor to the Company. JCIL is a company incorporated under the laws of England and Wales, which is authorised and regulated by the Financial Conduct Authority (“FCA”) in the UK. JCIL holds 29,998 Subscriber Shares of the Company as of 31 December 2015 (31 December 2014: 29,998).
JCIL has delegated to Janus Capital Management LLC (“JCM”) responsibility for providing discretionary investment management and advisory services to the whole or part of the assets of the Equity & Allocation Funds (except for the Janus Asia Frontier Markets Fund, Janus Asia Growth Drivers Fund, Janus Asia Fund, Janus Japan Emerging Opportunities Fund, Janus Japan Fund, Perkins Global Value Fund and Perkins US Strategic Value Fund), the Alternative Investment Funds and the Fixed Income Funds pursuant to an Investment Management Delegation Agreement dated 17 August, 1999, as amended. JCM is registered as an investment adviser with the US Securities and Exchange Commission. JCM which indirectly owns JCIL is owned by Janus Capital Group Inc. JCM holds 2 Subscriber Shares of the Company as of 31 December 2015 (31 December 2014: 2).
JCIL has delegated to Janus Capital Singapore Pte. Limited (“JCSL”) responsibility for providing discretionary investment management and advisory services the whole or part of the assets of the Janus Asia Fund and Janus Emerging Markets Fund, pursuant to an Investment Management Delegation Agreement dated 30 August 2011, amended on 21 December 2012. JCSL has been in the fund management and investment management business since 2007 and acts as the securities trader and execution agent of JCM. As of 31 December 2015 JCM had assets under management of approximately $136.3 billion (31 December 2014: $119.9 billion). JCSL is registered with the Securities and Exchange Commission as an investment adviser

Notes to the Financial Statements
J a n u s C a p i t a l F u n d s P l c / 3 1 D e c e m b e r 2 0 1 5 2 4 1
and has been granted a licence by the Monetary Authority of Singapore to deal in securities and to manage funds.
JCIL has delegated to INTECH responsibility for providing discretionary investment management and advisory services to the INTECH Sub-Advised Funds pursuant to an Investment Management Delegation Agreement dated 6 January, 2003, as amended. INTECH has been in the investment advisory business since 1987 and serves as investment adviser or sub-adviser to a number of mutual funds, institutional investors and separately managed accounts. As of 31 December 2015, approximately 96.81% (31 December 2014: 96.81%) of the outstanding voting shares of INTECH was ultimately owned by Janus Capital Group Inc.
JCIL has delegated to DIAM International Ltd. (“DIAM UK”) responsibility for providing discretionary investment management and advisory services to the Janus Asia Frontier Markets Fund, Janus Asia Growth Drivers Fund, Janus Japan Emerging Opportunities Fund and Janus Japan Fund pursuant to an investment management delegation agreement dated 28 July 2014. DIAM UK is a company incorporated under the laws of England and Wales and is authorized and regulated by the FCA. As of 31 December 2015, DIAM UK had assets under management of approximately US$6.76 billion.
Up to 12 April 2015 DIAM UK has appointed DIAM Asset Management (HK) Limited as sub-sub-investment manager of the Janus Asia Frontier Markets Fund and the Janus Asia Growth Drivers Fund. With effect from 20 May 2015, DIAM Singapore Pte. Ltd has been appointed as sub-sub-investment manager to these sub-funds.
JCIL has delegated to Perkins Investment Management LLC (“Perkins”) responsibility for providing discretionary investment
management and advisory services to the Perkins Global Value Fund and Perkins US Strategic Value Fund pursuant to an Investment Management Delegation Agreement dated 11 July, 2003, as amended. Perkins serves as investment adviser or sub-adviser to a number of US domiciled mutual funds, institutional investors and individually managed accounts. As of 31 December 2015, JCM owned 100% (31 December 2014: 100%) of Perkins. Perkins is ultimately owned by Janus Capital Group, Inc.
Mr. Cheh is an officer of Janus Capital Group Inc., which indirectly owns JCIL, Mr. Cheh did not receive Directors’ fees from the Company. All transactions with related parties Directors or any party in which they have a material interest are entered into in the ordinary course of business and on normal commercial terms. During the financial year ended 31 December 2015, Arthur Cox invoiced fees of €125,745 (31December 2014 €155,918) for services to the Company, all of which were paid during the financial year.
None of the Directors have entered into an employment or service contract with the Company. Directors’ remuneration is detailed in Note 18 to the financial statements.
INVESTMENT MANAGEMENT FEES
The Investment Adviser was entitled to receive an investment management fee in respect of Class A, B, E, I, U and V Shares for each launched Fund for the financial year ended 31 December 2015 calculated daily and paid monthly in arrears, as set out in the following schedule:
In respect of the Class Z Shares, the Investment Adviser is entitled to an investment management fee which will be payable under a separate agreement with the Investment Adviser into which each investor must enter (and maintain) prior to their initial subscription for Class Z Shares in the Fund.
Investment Management Fees Funds
Annual Percentage (of a Fund’s Net Asset Value for
Class A, B, E and V Shares)*
Annual Percentage (of a Fund’s Net Asset Value for Class I Shares)*
Annual Percentage (of a Fund’s Net Asset Value for
Class U Shares)*
Janus Asia Frontier Markets Fund ............................................................... 1.25% 1.00% 0.80%Janis Asia Growth Drivers Fund ................................................................. 1.25% 1.00% 0.80%Janus Asia Fund .......................................................................................... 1.25% 1.00% 0.80%Janus Balanced Fund ................................................................................... 1.00% 0.80% 0.80%Janus Emerging Markets Fund .................................................................... 1.25% 1.10% 0.80%Janus Europe Fund ...................................................................................... 1.25% 1.00% 0.80%Janus Global Life Sciences Fund ................................................................. 1.50% 1.50% 0.80%Janus Global Research Fund ....................................................................... 1.25% 1.00% 0.80%Janus Global Technology Fund ................................................................... 1.50% 1.50% 0.80%Janus Japan Emerging Opportunities Fund ................................................ 1.25% 1.00% 0.80%Janus Japan Fund ........................................................................................ 1.00% 0.90% 0.80%Janus Opportunistic Alpha Fund. ............................................................... 1.25% 0.95% 0.80%Janus US Fund ............................................................................................. 1.25% 0.95% 0.80%Janus US Research Fund ............................................................................. 1.50% 0.95% 0.80%Janus US Twenty Fund ................................................................................ 1.25% 0.95% 0.80%Janus US Venture Fund .............................................................................. 1.50% 1.50% 0.80%Perkins Global Value Fund .......................................................................... 1.25% 1.00% 0.80%Perkins US Strategic Value Fund ................................................................. 1.50% 1.50% 0.80%INTECH All-World Minimum Variance Core Fund(a) ................................. 0.85% 0.80% 0.75%INTECH European Core Fund .................................................................... 1.00% 1.00% 0.75%
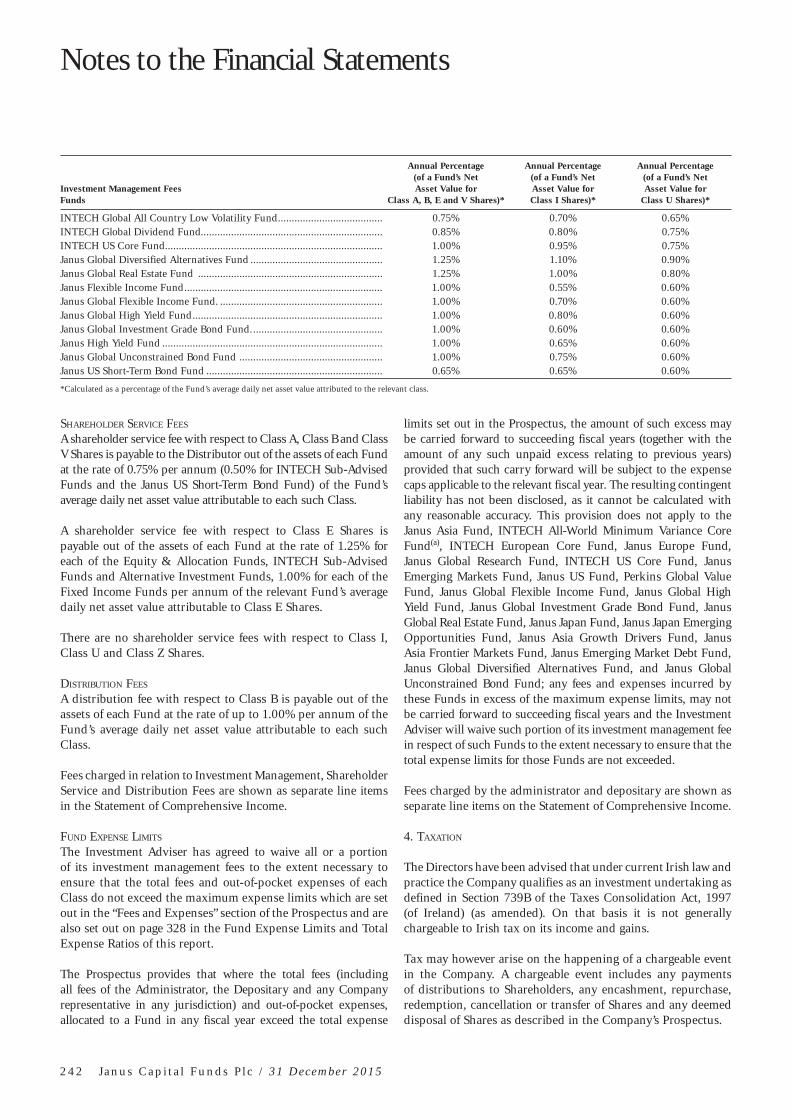
Notes to the Financial Statements
2 4 2 J a n u s C a p i t a l F u n d s P l c / 3 1 D e c e m b e r 2 0 1 5
SHAREHOLDER SERVICE FEES
A shareholder service fee with respect to Class A, Class B and Class V Shares is payable to the Distributor out of the assets of each Fund at the rate of 0.75% per annum (0.50% for INTECH Sub-Advised Funds and the Janus US Short-Term Bond Fund) of the Fund’s average daily net asset value attributable to each such Class.
A shareholder service fee with respect to Class E Shares is payable out of the assets of each Fund at the rate of 1.25% for each of the Equity & Allocation Funds, INTECH Sub-Advised Funds and Alternative Investment Funds, 1.00% for each of the Fixed Income Funds per annum of the relevant Fund’s average daily net asset value attributable to Class E Shares.
There are no shareholder service fees with respect to Class I, Class U and Class Z Shares.
DISTRIBUTION FEES
A distribution fee with respect to Class B is payable out of the assets of each Fund at the rate of up to 1.00% per annum of the Fund’s average daily net asset value attributable to each such Class.
Fees charged in relation to Investment Management, Shareholder Service and Distribution Fees are shown as separate line items in the Statement of Comprehensive Income.
FUND EXPENSE LIMITS
The Investment Adviser has agreed to waive all or a portion of its investment management fees to the extent necessary to ensure that the total fees and out-of-pocket expenses of each Class do not exceed the maximum expense limits which are set out in the “Fees and Expenses” section of the Prospectus and are also set out on page 328 in the Fund Expense Limits and Total Expense Ratios of this report.
The Prospectus provides that where the total fees (including all fees of the Administrator, the Depositary and any Company representative in any jurisdiction) and out-of-pocket expenses, allocated to a Fund in any fiscal year exceed the total expense
limits set out in the Prospectus, the amount of such excess may be carried forward to succeeding fiscal years (together with the amount of any such unpaid excess relating to previous years) provided that such carry forward will be subject to the expense caps applicable to the relevant fiscal year. The resulting contingent liability has not been disclosed, as it cannot be calculated with any reasonable accuracy. This provision does not apply to the Janus Asia Fund, INTECH All-World Minimum Variance Core Fund(a), INTECH European Core Fund, Janus Europe Fund, Janus Global Research Fund, INTECH US Core Fund, Janus Emerging Markets Fund, Janus US Fund, Perkins Global Value Fund, Janus Global Flexible Income Fund, Janus Global High Yield Fund, Janus Global Investment Grade Bond Fund, Janus Global Real Estate Fund, Janus Japan Fund, Janus Japan Emerging Opportunities Fund, Janus Asia Growth Drivers Fund, Janus Asia Frontier Markets Fund, Janus Emerging Market Debt Fund, Janus Global Diversified Alternatives Fund, and Janus Global Unconstrained Bond Fund; any fees and expenses incurred by these Funds in excess of the maximum expense limits, may not be carried forward to succeeding fiscal years and the Investment Adviser will waive such portion of its investment management fee in respect of such Funds to the extent necessary to ensure that the total expense limits for those Funds are not exceeded.
Fees charged by the administrator and depositary are shown as separate line items on the Statement of Comprehensive Income.
4. TAXATION
The Directors have been advised that under current Irish law and practice the Company qualifies as an investment undertaking as defined in Section 739B of the Taxes Consolidation Act, 1997 (of Ireland) (as amended). On that basis it is not generally chargeable to Irish tax on its income and gains.
Tax may however arise on the happening of a chargeable event in the Company. A chargeable event includes any payments of distributions to Shareholders, any encashment, repurchase, redemption, cancellation or transfer of Shares and any deemed disposal of Shares as described in the Company’s Prospectus.
Investment Management Fees Funds
Annual Percentage (of a Fund’s Net Asset Value for
Class A, B, E and V Shares)*
Annual Percentage (of a Fund’s Net Asset Value for Class I Shares)*
Annual Percentage (of a Fund’s Net Asset Value for
Class U Shares)*
INTECH Global All Country Low Volatility Fund ...................................... 0.75% 0.70% 0.65%INTECH Global Dividend Fund.................................................................. 0.85% 0.80% 0.75%INTECH US Core Fund ............................................................................... 1.00% 0.95% 0.75%Janus Global Diversified Alternatives Fund ................................................ 1.25% 1.10% 0.90%Janus Global Real Estate Fund ................................................................... 1.25% 1.00% 0.80%Janus Flexible Income Fund ........................................................................ 1.00% 0.55% 0.60%Janus Global Flexible Income Fund. ........................................................... 1.00% 0.70% 0.60%Janus Global High Yield Fund ..................................................................... 1.00% 0.80% 0.60%Janus Global Investment Grade Bond Fund. ............................................... 1.00% 0.60% 0.60%Janus High Yield Fund ................................................................................ 1.00% 0.65% 0.60%Janus Global Unconstrained Bond Fund .................................................... 1.00% 0.75% 0.60%Janus US Short-Term Bond Fund ................................................................ 0.65% 0.65% 0.60%
*Calculated as a percentage of the Fund’s average daily net asset value attributed to the relevant class.

Notes to the Financial Statements
J a n u s C a p i t a l F u n d s P l c / 3 1 D e c e m b e r 2 0 1 5 2 4 3
No Irish tax will arise on the Company in respect of chargeable events in respect of:
(i) a Shareholder who is neither resident nor ordinarily resident in Ireland at the time of the chargeable event and has made the necessary signed statutory declarations to that effect which are held by the Company or the Company has been authorised by the Irish Revenue to make gross payments in the absence of appropriate declarations; and
(ii) Certain exempted Irish resident investors as defined in the Prospectus and who have provided the Company with the necessary signed statutory declarations.
Dividends, interest and capital gains (if any) received on investments made by the Company may be subject to withholding taxes imposed by the country from which the investment income/gains are received and such taxes may not be recoverable by the Company or its shareholders.
5. CASH AT BANK
All cash balances, for the financial year ended 31 December 2015 and 31 December 2014, were held by the Depositary , with the exception of cash held as collateral. As at the 31 December 2015, UBS, Goldman Sachs, JP Morgan, BNP, Credit Suisse and Morgan Stanley held cash as collateral for financial derivatives such as futures, options and swaps on Janus Asia Fund, Janus Emerging Markets Fund, Janus Global Diversified Alternatives Fund, Janus Global Unconstrained Bond Fund and Janus Europe Fund.
Cash collateral provided by the Fund is identified in the Statement of Financial Position as margin and collateral cash and is not included as a component of cash and foreign currency. For collateral other than cash, if the party to whom the collateral is provided has the right by contract or custom to sell or re-pledge the collateral, the Fund classifies that asset in its Statement of Financial Position separately from other assets and identifies the asset as pledged collateral. Where the party to whom the collateral is provided does not have the right to sell or re-pledge, a disclosure of the collateral provided is made in the notes to the financial statements. At 31 December 2015 the Janus Unconstrained Bond Fund had 7,200 Shares, of Sigma- AGL Resources, Inc with a value of $229,716, held as non-cash collateral with Goldman Sachs. At 31 December 2014 the Janus Unconstrained Bond Fund had 2,100,000 shares, of United States Treasury Inflation Indexed Bond 2.375% 15/01/25 with a value of $2,938,007, held as non-cash collateral with Goldman Sachs.
6. OTHER INCOME
Included in other income are amounts relating to litigation income and to a commission recapture program.
The Company has entered into a commission recapture agreement with Russell Investment Group enabling the
Company to benefit from brokerage discounts. Income from the Frank Russell Securities, Inc. commission recapture program for the financial year ended 31 December 2015 amounted to $271,255 (31 December 2014: $221,618).
7. SECURITIES LENDING
As at 31 December 2015 and 31 December 2014 the Company had no securities on loan.
8. SOFT COMMISSION ARRANGEMENTS
The Company commenced a soft commission arrangement in July 2007 where the Investment Adviser and connected persons have entered into arrangements with brokers in respect of which certain goods and services used to support the investment decision process are received. The Investment Adviser and connected persons do not make direct payment for these services but do transact an agreed amount of business with the brokers on behalf of the Company and commission is paid on these transactions. The goods and services utilised for the Company include computer hardware and software used for economic and political analysis, portfolio analysis including valuation and performance measurement, market analysis, data and quotation services and investment related publications. The Investment Adviser considers these arrangements are to the benefit of the Company and has satisfied itself that it obtains best execution on behalf of the Company.
9. CROSS LIABILITY
The Company has segregated liability between Funds. This ensures that the liabilities incurred on behalf of a Fund will generally be discharged solely out of the assets of that Fund and there generally can be no recourse to the other Funds to satisfy those liabilities. Notwithstanding the foregoing, there can be no assurance that, should an action be brought against the Company in the courts of another jurisdiction, the segregated nature of the Funds would necessarily be upheld. In addition, whether or not there is a cross-liability between Funds, proceedings involving an individual Fund could involve the Company as a whole which could potentially affect the operation of all Funds.
10. EFFICIENT PORTFOLIO MANAGEMENT
The Company may, for the purposes of efficient portfolio management and hedging of currency risks, enter into futures and swaps contracts or write covered call options and purchased covered put options on currencies provided that these transactions may only concern contracts which are traded on a regulated market operating regularly, being organised and open to the public. The Company may also enter into forward purchases or sales of currencies or exchange currencies on the basis of “over the counter” arrangements with highly rated financial institutions specialising in this type of transaction. During the year, the Company entered into futures contracts

Notes to the Financial Statements
2 4 4 J a n u s C a p i t a l F u n d s P l c / 3 1 D e c e m b e r 2 0 1 5
and forward currency transactions for the purpose of hedging currency risk on investment and cash holdings, to hedge benchmark risk and also to attempt to hedge the value of certain Classes of Australian Dollar, British Pound, Canadian Dollar, Chinese Renminbi, Euro, Hong Kong Dollar, Japanese Yen, Singapore Dollar, Swedish Kronor and Swiss Franc denominated Shares. Contracts outstanding at 31 December 2015 are disclosed in the relevant Funds Portfolio Investments.
For UCITS which have invested in financial derivative instruments and/or engaged in efficient portfolio management techniques, disclosures are required under UCITS Regulations. The Investment Manager of the Funds has identified all financial derivative instruments which are forward currency contracts, futures, options, swaps, fully funded equity swaps and total return swaps, all which are detailed further in the accounting policies note 1.
During the financial year, forward currency contracts, futures, options, swaps, fully funded equity swaps and total return swaps transactions were entered into for the purpose of efficient portfolio management in order to hedge currency and market exposure and/or for investment purposes. Details of all open transactions at the financial year end are disclosed in the Portfolio Investments.
The Funds did not engage in any efficient portfolio management techniques of repurchase, reverse repurchase and stock lending arrangements.
11. EXCHANGE RATES
The functional and presentational currency of the Company is US Dollar. All amounts disclosed in the financial statements are in US Dollar, with the exception of the Janus Europe Fund, and INTECH European Core Fund which are Euro and Janus Japan Emerging Opportunities Fund and Janus Japan Fund which are JPY. An average foreign exchange rate of Euro/USD: 0.90 was used in the aggregation of the financial statements for the Janus Europe Fund and the INTECH European Core Fund. An average foreign exchange rate of JPY/USD: 120.98 was used in the aggregation of the financial statements for the Janus Emerging Opportunities Fund and the Janus Japan Fund. (31 December 2014: An average foreign exchange rate of Euro/USD: 0.7529 was used in the aggregation of the financial statements for the Janus Europe Fund and Euro/USD: 0.7559 was used in the aggregation of the financial statements for the INTECH European Core Fund reflecting the average rate from the launch date of this Fund. An average foreign exchange rate of JPY/USD: 113.8803 was used in the aggregation of the financial statements for the Janus Emerging Opportunities Fund and the Janus Japan Fund, reflecting the average rate from the launch date of these Funds).
The Statement of Financial Position is translated using exchange rates at the financial year end and the Statement of Comprehensive Income and Statement of Changes in Net Assets Attributable to Redeemable Participating Shareholders are translated at an
average rate over the financial year for inclusion in the combined financial statements of the Company. The resulting notional currency gain/(loss) and the notional currency gain/(loss) on retranslation of opening net assets is included in the Statement of Changes in Net Assets Attributable to Redeemable Participating Shareholders. The method of translation has no effect on the value of net assets allocated to the individual Funds.
The following exchange rates have been used to translate assets and liabilities in currencies other than US Dollar:
As at 31 December 2015: As at 31 December 2014:
AED 3.6729 AED 3.6728AUD 1.3727 AUD 1.2252BRL 3.9550 BRL 2.6572CAD 1.3835 CAD 1.1615CHF 1.0013 CHF 0.9939CLP 707.7141 CLP 606.4281CNH 6.5661 CNH 6.2158CNY 6.4936 CNY 6.2040COP 3,164.5570 COP 2,375.2969CZK 24.8466 CZK 22.8770DKK 6.8660 DKK 6.1533EGP 7.8300 EGP 7.1500EUR 0.9203 EUR 0.8265GBP 0.6784 GBP 0.6417HKD 7.7498 HKD 7.7538HUF 289.4013 HUF 261.3286IDR 13,779.7988 IDR 12,379.3018ILS 3.8900 ILS 3.8942INR 66.1507 INR 63.1154JPY 120.1800 JPY 119.7600KRW 1,172.3055 KRW 1,098.9977MXN 17.2280 MXN 14.7506MYR 4.2900 MYR 3.4950NOK 8.8486 NOK 7.4479NZD 1.4626 NZD 1.2824PEN — PEN 2.9790PHP 47.0389 PHP 44.7247PLN 3.9156 PLN 3.5371RON — RON 3.7023SEK 8.4356 SEK 7.7904SGD 1.4173 SGD 1.3243THB 35.9699 THB 32.8904TRY 2.9157 TRY 2.3315TWD 32.8407 TWD 31.5996ZAR 15.4502 ZAR 11.5578
The following exchange rates have been used to translate assets and liabilities in the Janus Europe Fund and the INTECH European Core Fund in currencies other than Euro:
As at 31 December 2015: As at 31 December 2014:
AED — AED 4.4437CHF 1.0880 CHF 1.2025DKK 7.4606 DKK 7.4449GBP 1.3565 GBP 0.7764 HKD — HKD 9.3813HUF 314.4634 HUF 316.1815NOK 9.6149 NOK 9.0112PLN 4.2547 PLN 4.2795SEK 9.1661 SEK 9.4256USD 1.0866 USD 1.2099

Notes to the Financial Statements
J a n u s C a p i t a l F u n d s P l c / 3 1 D e c e m b e r 2 0 1 5 2 4 5
The following exchange rates have been used to translate assets and liabilities in the Janus Japan Fund and the Janus Japan Emerging Opportunities Fund, in currencies other than JPY:
As at 31 December 2015: As at 31 December 2014:
AUD 87.8156 AUD 97.7271CAD 86.7978 CAD 102.9729CNH 18.3522 CNH 19.2234EUR 131.7174 EUR 145.2523GBP 178.5596 GBP 185.8823HKD 15.5472 HKD 15.4061USD 0.8298 USD 119.7600
12. TRANSACTION COSTS
The following table details the transaction costs for the financial year ended 31 December 2015 and 31 December 201 4.
Fund Name
Financial year ended
31 December 2015
Financial year ended
31 December 2014
Janus Asia Frontier Markets Fund $7,939 $11,291
Janus Asia Fund $411,793 $271,071
Janus Asia Growth Drivers Fund $10,163 $12,276
Janus Balanced Fund $320,847 $102,024
Janus Emerging Markets Fund $467,183 $28,886
Janus Europe Fund € 960,676 €1,114,455
Janus Global Life Sciences Fund $1,909,025 $763,525
Janus Global Research Fund $43,133 $44,390
Janus Global Technology Fund $103,120 $93,731
Janus Japan Emerging Opportunities Fund ¥354,569 ¥133,631
Janus Japan Fund ¥805,915 ¥354,145
Janus Opportunistic Alpha Fund $126,175 $182,017
Janus US Fund $1,037 $1,105
Janus US Research Fund $84,918 $89,232
Janus US Twenty Fund $179,314 $134,577
Janus US Venture Fund $242,818 $423,767
Perkins Global Value Fund $103,502 $170,642
Perkins US Strategic Value Fund $193,360 $431,594
INTECH All-World Minimum Variance Core Fund(a) $1,653,152 —
INTECH European Core Fund €280,815 €448,163
INTECH Global All Country Low Volatility Fund $317,742 $118,131
INTECH Global Dividend Fund $1,915 $142,522
INTECH US Core Fund $158,617 $146,033
Janus Global Diversified Alternatives Fund — —
Janus Global Real Estate Fund $63,567 $165,253
Janus Flexible Income Fund $120 $181
Janus Global Flexible Income Fund $2 $41
Janus Global High Yield Fund $2,129 $3,261
Janus Global Investment Grade Bond Fund $1 $32
Janus High Yield Fund $29,466 $28,115
Janus Global Unconstrained Bond Fund $17,065 $3,663
Janus US Short-Term Bond Fund — —
13. FINANCIAL INSTRUMENTS AND FINANCIAL DERIVATIVE INSTRUMENTS
As an an investment company, in pursuing their investment objectives set out in the Prospectus, the Funds hold a number of financial instruments, and derivatives for efficient portfolio management, which means that the assessment and monitoring of these risks attached to these instruments is fundamental to the financial position and results of the Company. These comprise of:
• Equity and non-equity shares, fixed income securities and floating rate securities. These are held in accordance with the Fund’s investment objectives and policies;
• Cash, liquid resources and short-term debtors and creditors that arise directly from operations; and
• Redeemable ordinary Shares which represent investors’ monies which are invested on their behalf.
Risk can be separated into the following components: Market Risk, Credit Risk and Liquidity Risk. Each type of risk is discussed in turn below and qualitative and quantitative analyses are provided where relevant to give the reader an understanding of the risk management methods used by the Investment Adviser and the Board of Directors. The main risks arising from the Company’s financial instruments are market price, foreign currency, interest rate, liquidity and credit risk. The main risks relating to the Company’s use of financial derivative instruments are counterparty risk, credit risk, increased margin calls and unlimited risk of loss. Further details of these and other risks are set out in the Prospectus under the heading “Risk Factors and Special Considerations”.
ASSESSMENT AND MONITORING OF RISK
Day-to-day risk management of the Company is undertaken by the Investment Adviser. The Investment Adviser together with the Sub-Investment Advisers identify, monitor and manage all applicable risks pertaining to the Company to the extent required under the UCITS. The Investment Adviser has undertaken to report to the designated Directors on a monthly basis matters arising in relation to the monitoring of certain material risks arising from a Fund’s investments in financial instruments. In addition to the Investment Adviser undertaking a daily review of its investments in financial instruments, other risk management issues are also reported on a monthly basis to the designated Directors by the individual or individuals within the relevant service providers responsible for monitoring risk including certain operational risks relating to the Company’s key service providers.
The Investment Adviser has appointed the following four Sub-Investment Advisers with responsibility for investing and managing the assets of the Funds and for assisting in identifying, monitoring and managing the relevant risks.

Notes to the Financial Statements
2 4 6 J a n u s C a p i t a l F u n d s P l c / 3 1 D e c e m b e r 2 0 1 5
1. JANUS CAPITAL MANAGEMENT LLC (“JCM”) AND JANUS CAPITAL SINGAPORE PTE. LIMITED (“JCSL”)
JCM and JCSL generally take a “bottom-up” approach to building portfolios. In other words, they seek to identify individual companies with earnings growth potential that may not be recognised by the market at large. Those Funds in the Fundamental Equity and Allocation Funds and Alternative Fixed Income Investment Funds categories with the exception of the Perkins US Strategic Value Fund and Perkins Global Value Fund follow an investment strategy in which companies are considered principally on their own fundamental qualitative and quantitative characteristics. Commonly referred to as stock picking or bottom up investing, portfolios of fundamental based investment funds are built one security at a time following intensive in house research into each company. Areas of research focus can include the company’s management, financials, competitive strengths and weaknesses, earnings growth prospects and numerous other metrics. This approach rests on a belief that some companies have inherent strengths for creating shareholder value over time, have superior prospects to their peer groups and should therefore outperform even in challenging industry and economic circumstances. The purpose of a fundamental investment approach is to identify and invest in such companies.
2. INTECH INVESTMENT MANAGEMENT LLC (“INTECH”)
INTECH, the Sub-Investment Adviser for the Risk Managed Equity Funds, applies a mathematical approach to building portfolios. INTECH developed the formulas underlying this mathematical process. The process is designed to take advantage of market volatility (variation in stock prices), rather than using research or market/economic trends to predict the future stocks. The process seeks to generate a return in excess of the relevant Risk Managed Equity Fund’s benchmark over the long term, while controlling the risk relative to the benchmark.
INTECH’s investment and risk process is unique in that it is based on a rigorous mathematical theory – its risk process employs a proprietary optimisation process to identify the target security weights in the portfolio. Using a precise mathematical formula and applying that within specific risk constraints, the process attempts to identify a portfolio that is more efficient than the benchmark index.
3. PERKINS INVESTMENT MANAGEMENT LLC (“PERKINS”)
Perkins, the Sub-Investment Adviser for the Perkins Global Value Fund and Perkins US Strategic Value Fund, generally takes a “value” approach to building portfolios. The “value” approach emphasises investments in companies that Perkins believes are undervalued relative to their intrinsic worth.
Perkins seeks investment in companies with solid balance sheets and strong cash flows, which are trading at low prices relative to their competitors or which are trading at low price/ earnings, or price/book ratios, or low price/cash flow.
Within Perkins’s investment process, there are several factors which Perkins uses to manage risk. In addition to those referred to above, Perkins aims to calculate and carefully monitor the risk/reward ratio for each security in the portfolio, seeking a minimum of a 1.5:1 reward to risk ratio, but ideally aiming for a ratio of 2:1, Perkins monitors position sizes carefully and is price sensitive. Perkins may also consult with JCMs Risk Committee regarding the Funds’ exposures and risk levels.
4. DIAM UK
DIAM UK, the Sub-Investment Advisor for the Janus Asia Frontier Markets Fund, Janus Asia Growth Drivers Fund, Janus Japan Emerging Opportunities Fund and Janus Japan Fund manage the investment portfolios by focusing on bottom-up research which aims to capture attractive investment opportunities while controlling portfolio risk levels properly.
MARKET RISK
This risk comprises of three types of risk, Market Price Risk, Foreign Currency Risk and Interest Rate Risk.
MARKET PRICE RISK
Market price risk arises mainly from uncertainty about future prices of financial instruments held, which are classified as financial assets at fair value through profit or loss. It represents the potential loss the Company might suffer through holding market positions in the face of price movements. The value of Shares of a Fund and the related income may rise or fall, as the fair value price of the securities in which the Fund invests may fluctuate. Each Fund seeks to maintain a diversified portfolio but certain Funds may be less diversified leading to an increased concentration of investments which will increase the risk of that Fund suffering proportionately higher loss should a particular investment decline in value. The applicable investment concentrations within the portfolio for each Fund are disclosed in the Portfolio Investments. There can be no assurance that the Funds will achieve their investment objectives. Certain Sub-Investment Advisers may take a “bottom up” approach to building portfolios. In other words, they seek to identify individual companies with earnings growth potential that may not be recognised by the market at large.

[This page intentionally left blank]

Notes to the Financial Statements
2 4 8 J a n u s C a p i t a l F u n d s P l c / 3 1 D e c e m b e r 2 0 1 5
The table below sets out the overall exposure to market price risk of each sub-fund as at 31 December 2015:
Analysis by Investment Type
Asset-Backed/Commercial
Mortgage-Backed Securities Common Stocks
Corporate Bonds
Credit Default Swaps
Exchange Traded Funds
Fully Funded Equity Swaps
Janus Asia Frontier Markets Fund (US$) — 2,226,132 — — 102,396 —Janus Asia Growth Drivers Fund (US$) — 2,189,555 — — 79,866 —Janus Asia Fund (US$) — 90,153,672 — — — 6,631,001Janus Balanced Fund (US$) 19,500,614 433,417,430 117,794,046 — — —Janus Emerging Markets Fund (US$) — 102,849,104 — — — 5,199,077 Janus Europe Fund (€) — 134,366,889 3,680,000 — — —Janus Global Life Sciences Fund (US$) — 1,933,613,905 8,976,695 — — —Janus Global Research Fund (US$) — 38,783,759 — — — —Janus Global Technology Fund (US$) — 59,141,405 — — — —Janus Japan Emerging Opportunities Fund (¥) — 389,148,700 — — — —Janus Japan Fund (¥) — 232,148,276 — — — —Janus Opportunistic Alpha Fund (US$) — 48,444,278 — — — —Janus US Fund (US$) — 1,760,365 — — — —Janus US Research Fund (US$) — 191,743,008 — — — —Janus US Twenty Fund (US$) — 361,014,490 — — — —Janus US Venture Fund (US$) — 206,115,675 — — — —Perkins Global Value Fund (US$) — 152,774,056 — — — —Perkins US Strategic Value Fund (US$) — 196,932,166 — — — —INTECH All-World Minimum Variance Core Fund(a) (US$) — 755,749,988 — — — —INTECH European Core Fund (€) — 95,280,358 — — — —INTECH Global All Country Low Volatility Fund (US$) — 160,502,858 — — — —INTECH Global Dividend Fund (US$) — 1,828,859 — — — —INTECH US Core Fund (US$) — 165,595,381 — — — —Janus Global Diversified Alternatives Fund (US$) — — — — — —Janus Global Real Estate Fund (US$) — 127,324,447 346,132 — — —Janus Flexible Income Fund (US$) 143,137,615 — 360,554,040 — — —Janus Global Flexible Income Fund (US$) 3,012,554 — 7,962,908 — — —Janus Global High Yield Fund (US$) 2,456,822 177,188 39,611,347 — — —Janus Global Investment Grade Bond Fund (US$) 2,586,004 — 37,204,471 — — —Janus High Yield Fund (US$) 11,520,387 2,179,547 503,684,935 — — —Janus Global Unconstrained Bond Fund (US$) 17,478,565 4,498,725 57,146,666 232,996 2,710,469 —Janus US Short-Term Bond Fund (US$) 25,063,368 — 182,890,048 — — —
The table below sets out the overall exposure to market price risk of each sub-fund as at 31 December 2014:
Analysis by Investment Type
Asset-Backed/Commercial
Mortgage-Backed Securities Common Stocks
Corporate Bonds
Credit Default Swaps
Exchange Traded Funds
Fully Funded Equity Swaps
Janus Asia Frontier Markets Fund (US$) — 2,660,660 — — 127,443 —Janus Asia Growth Drivers Fund (US$) — 2,527,678 — — 129,660 —Janus Asia Fund (US$) — 97,575,914 — — — 8,897,100Janus Balanced Fund (US$) 12,989,363 248,778,120 166,830,034 — — —Janus Emerging Markets Fund (US$) — 4,095,454 — — — 175,266Janus Europe Fund (€) — 206,953,718 — — — —Janus Global Life Sciences Fund (US$) — 688,235,957 — — — —Janus Global Research Fund (US$) — 40,238,315 — — — —Janus Global Technology Fund (US$) — 79,665,880 — — — —Janus Japan Emerging Opportunities Fund (¥) — 344,769,150 — — — —Janus Japan Fund (¥) — 216,788,650 — — — —Janus Opportunistic Alpha Fund (US$) — 90,516,694 — — — —Janus US Fund (US$) — 1,615,782 — — — —Janus US Research Fund (US$) — 189,674,555 — — — —Janus US Twenty Fund (US$) — 344,865,237 — — — —Janus US Venture Fund (US$) — 265,967,554 — — 7,040,816 —Perkins Global Value Fund (US$) — 157,621,625 — — — —Perkins US Strategic Value Fund (US$) — 411,925,356 — — — —INTECH European Core Fund (€) — 85,070,578 — — — —INTECH Global All Country Low Volatility Fund(d) (US$) — 161,345,457 — — — —INTECH Global Dividend Fund (US$) — 2,386,173 — — — —INTECH US Core Fund (US$) — 158,418,020 — — — —Janus Global Diversified Alternatives Fund (US$) — — — — — —Janus Global Real Estate Fund (US$) — 159,577,998 — — — —Janus Flexible Income Fund (US$) 76,164,383 — 365,325,620 — — —Janus Global Flexible Income Fund (US$) 2,343,340 — 5,998,216 — — —Janus Global High Yield Fund (US$) 1,474,788 399,137 68,550,022 — — —Janus Global Investment Grade Bond Fund (US$) 2,438,226 — 58,575,945 — — —Janus High Yield Fund (US$) 11,325,021 5,606,477 680,461,174 — — —Janus Global Unconstrained Bond Fund (US$) 3,350,251 4,251,414 54,977,191 (117,267) 1,413,507 —Janus US Short-Term Bond Fund (US$) 19,185,832 — 367,942,145 — — —

Notes to the Financial Statements
J a n u s C a p i t a l F u n d s P l c / 3 1 D e c e m b e r 2 0 1 5 2 4 9
FuturesGovernment Obligations
Interest Rate Swaps
Mortgage Backed Securities Preferred Stock
Schedule of Purchased
OptionsSchedule of
Written OptionsTotal Return
Swaps Tranche Loans Warrants
— — — — — — — — — —— — — — — — — — — —— — — — 1,540,218 224,861 — 264,346 — —— 59,003,243 — 61,062,038 3,355,650 — — — 7,010,900 —— — — — 1,132,595 224,002 — 50,660 — 1,381 — — — — 757,426 — — 62,103 — 129,321 — — — — — — — — — —— — — — — — — — — —— — — — — — — — — —— — — — — — — — — —— — — — — — — — — —— — — — — — — — — —— — — — — — — — — —— — — — — — — — — —— — — — — — — — — —— — — — — — — — — —— — — — — — — — — —— — — — — — — — — —— — — — 324,113 — — — — —— — — — — — — — — —— — — — 208,243 — — — — —— — — — — — — — — —— — — — — — — — — —
(10,017) 1,199,751 — — — — — (8,350) — —— — — — — — — — — —— 254,619,523 — 116,842,676 10,815,431 — — — 19,832,358 —— 9,015,154 — — 78,116 — — — 468,229 —— — — — — — — — 2,481,337 —— — — — 344,782 — — — 2,728,939 —— — — — 939,002 — — — 39,263,200 —— 1,536,913 56,308 — — — (362,463) — — —
— 114,515,196 — — — — — — 15,058,284 —
FuturesGovernment Obligations
Interest Rate Swaps
Mortgage Backed Securities Preferred Stock
Schedule of Purchased
Options
Schedule of Written Options
Total Return Swaps Tranche Loans Warrants
— — — — — — — — — —— — — — — — — — — —— — — — 1,092,110 — — 899,930 — —— 152,366,176 — 48,922,127 4,041,880 — — — 5,421,722 —— — — — 34,626 — — 18,441 — —— — — — — — (1,653,477) 364,309 — 418,112— — — — — — — — — —— — — — — — — — — —— — — — — — (15,684) — — —— — — — — — — — — —— — — — — — — — — —— — — — — — — — — —— — — — — 3,631 (591) — — —— — — — — — — — — —— — — — — 253,273 — — — —— — — — — — — — — —— — — — — — — — — —— — — — — — — — — —— — — — — — — — — —— — — — 126,129 — — — — —— — — — — — — — — —— — — — — — — — — —
15,209 1,599,954 — — — — — 54,125 — —— — — — 148,516 — (45,436) — — —— 329,760,533 — 145,927,468 16,981,480 — — — 20,627,143 —— 12,348,057 — — 70,244 — — — 361,846 —— — — — 484,859 — — — 6,667,075 —— — — — 415,693 — — — 1,314,632 —— — — — 6,986,706 — — — 49,672,720 —
(125,944) 7,169,319 — — — — (258,641) — — —— 183,251,907 — — — — — — 11,262,170 —

Notes to the Financial Statements
2 5 0 J a n u s C a p i t a l F u n d s P l c / 3 1 D e c e m b e r 2 0 1 5
As at the 31 December 2015 and 31 December 2014, for the funds listed in the following table, should the market value have increased or decreased by 5% (2014:5%) with all other
variables remaining constant, the increase or decrease in net assets attributable to holders of participating shares for the year is shown:
Fund
Volatilty
Increase or decrease in financial assets or liabilities at
fair value through profit or loss
Currency 2015 2014 2015 2014
Janus Asia Frontier Markets Fund USD 5.00% 5.00% 115,162 112,918
Janus Asia Growth Drivers Fund USD 5.00% 5.00% 116,294 110,280
Janus Asia Fund USD 5.00% 5.00% 5,155,980 5,702,761
Janus Balanced Fund USD 5.00% 5.00% 39,777,616 27,033,028
Janus Emerging Markets Fund USD 5.00% 5.00% 5,649,436 218,804
Janus Europe Fund EUR 5.00% 5.00% 6,632,202 11,343,021
Janus Global Life Sciences Fund USD 5.00% 5.00% 110,917,642 38,574,360
Janus Global Research Fund USD 5.00% 5.00% 2,045,397 2,097,238
Janus Global Technology Fund USD 5.00% 5.00% 2,985,329 4,105,176
Janus Japan Emerging Opportunities Fund JPY 5.00% 5.00% 19,407,146 17,410,842
Janus Japan Fund JPY 5.00% 5.00% 11,580,555 11,923,376
Janus Opportunistic Alpha Fund USD 5.00% 5.00% 2,713,428 5,053,524
Janus US Fund USD 5.00% 5.00% 84,864 84,192
Janus US Research Fund USD 5.00% 5.00% 9,890,401 9,646,355
Janus US Twenty Fund USD 5.00% 5.00% 19,262,708 19,066,226
Janus US Venture Fund USD 5.00% 5.00% 9,284,366 12,305,607
Perkins Global Value Fund USD 5.00% 5.00% 6,354,969 6,101,651
INTECH All-World Minimum Variance Core Fund(a) USD 5.00% — 36,755,580 —
INTECH European Core Fund EUR 5.00% 5.00% 4,457,313 3,913,247
INTECH Global All Country Low Volatility Fund USD 5.00% 5.00% 6,031,089 5,812,977
Perkins US Strategic Value Fund USD 5.00% 5.00% 8,567,874 18,168,637
INTECH US Core Fund USD 5.00% 5.00% 7,766,270 7,918,571
INTECH Global Dividend Fund USD 5.00% 5.00% 86, 401 115,729
Janus Global Diversified Alternatives Fund USD 5.00% — 2,775 —
Janus Global Real Estate Fund USD 5.00% 5.00% 6,021,414 7,584,850
The analysis is based on the last traded prices as incorporated in the fi nancial year end Dealing Net Asset Value.
GLOBAL DERIVATIVE EXPOSURE
For all Funds other than the Janus Global Diversified Alternatives Fund and Janus Global Unconstrained Bond Fund, the Investment Manager uses the “commitment approach” to quantitatively measure the Fund’s global exposure when using financial derivative instruments (“FDI”). In the case of the Janus Global Diversified Alternatives Fund and Janus Global Unconstrained Bond Fund the Investment Manager uses the Value at Risk (“VaR”) method.
The Investment Manager has deemed absolute VAR and the VaR model selected (i.e. Monte Carlo) to be the most appropriate method of calculation of global exposure for the Janus Global Diversified Alternatives Fund and the Janus Global Unconstrained Bond Fund, based on the risk profile, investment strategy and complexity/ type of the FDI that will be utilised by these Funds. Under the absolute VaR approach, the Investment Manager will use a 10 day time horizon and therefore the VaR may not exceed 14.1% of the Net Asset Value.
The VaR of the Janus Global Diversified Alternatives Fund and the Janus Global Unconstrained Bond Fund, are set to a time
horizon of 10 days and a one-tailed confidence level of 99% such that the resulting VaR number represents the level of loss that should occur in only one out of one hundred periods. The models and methods are continuously back-tested in each Fund’s specific environment to ensure they are capturing the extreme risks of a Fund to within an accepted tolerance level. The Funds are stress tested continuously, with a review of these tests being carried out quarterly.
The number of forward-looking days used to calculate VaR is known as the investment horizon period. The Investment Manager has chosen to use a 10 day time horizon. As the Central Bank’s Guidance Note 3/03 specifies a 20 day limit of 20% of the NAV, this scales to a 10 day limit of 14.1% of the NAV. Operating with a 99% one tailed confidence level, the expectation is that on only one time horizon period per hundred, a Fund should lose more than 14% of its NAV or twice as much as its index, hence, cash settled FDI commitments are more than fully covered. In the case of physically settled FDI, in all cases the instruments to be delivered are highly liquid and are readily available to purchase in the market to meet delivery commitments.
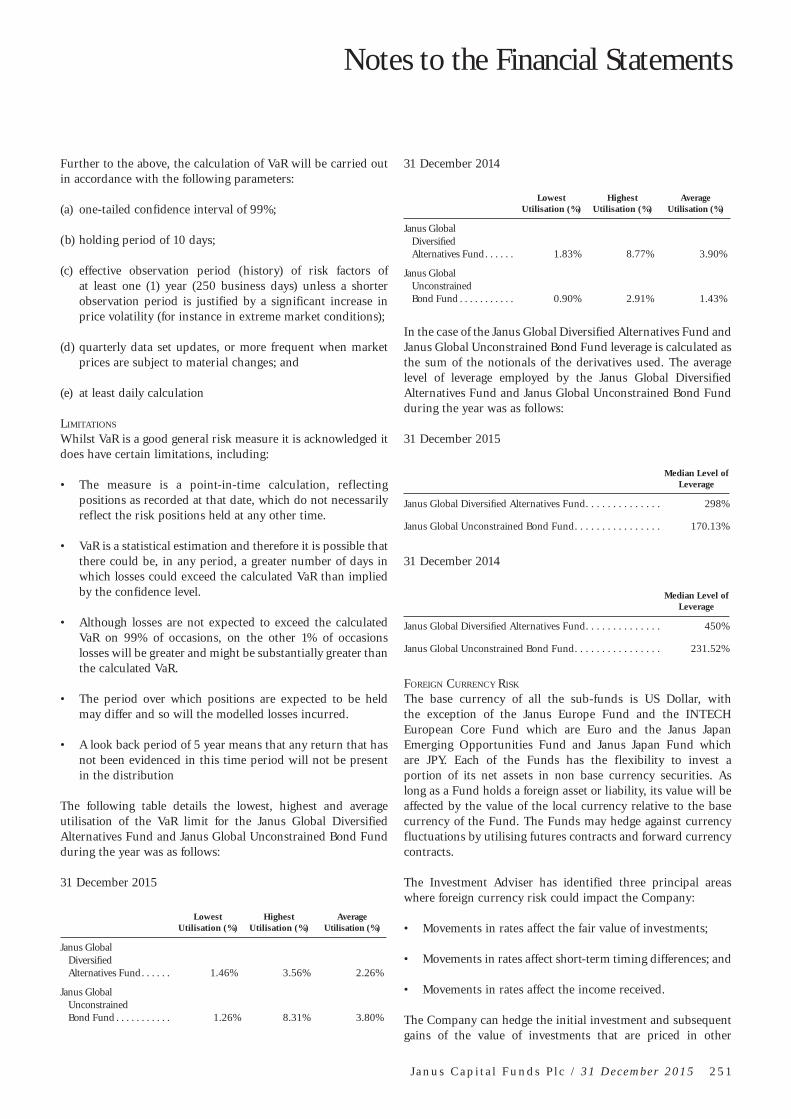
Notes to the Financial Statements
J a n u s C a p i t a l F u n d s P l c / 3 1 D e c e m b e r 2 0 1 5 2 5 1
Further to the above, the calculation of VaR will be carried out in accordance with the following parameters:
(a) one-tailed confidence interval of 99%;
(b) holding period of 10 days;
(c) effective observation period (history) of risk factors of at least one (1) year (250 business days) unless a shorter observation period is justified by a significant increase in price volatility (for instance in extreme market conditions);
(d) quarterly data set updates, or more frequent when market prices are subject to material changes; and
(e) at least daily calculation
LIMITATIONS
Whilst VaR is a good general risk measure it is acknowledged it does have certain limitations, including:
• The measure is a point-in-time calculation, reflecting positions as recorded at that date, which do not necessarily reflect the risk positions held at any other time.
• VaR is a statistical estimation and therefore it is possible that there could be, in any period, a greater number of days in which losses could exceed the calculated VaR than implied by the confidence level.
• Although losses are not expected to exceed the calculated VaR on 99% of occasions, on the other 1% of occasions losses will be greater and might be substantially greater than the calculated VaR.
• The period over which positions are expected to be held may differ and so will the modelled losses incurred.
• A look back period of 5 year means that any return that has not been evidenced in this time period will not be present in the distribution
The following table details the lowest, highest and average utilisation of the VaR limit for the Janus Global Diversified Alternatives Fund and Janus Global Unconstrained Bond Fund during the year was as follows:
31 December 2015
Lowest Utilisation (%)
Highest Utilisation (%)
Average Utilisation (%)
Janus Global Diversifi ed Alternatives Fund . . . . . . 1.46% 3.56% 2.26%
Janus Global Unconstrained Bond Fund . . . . . . . . . . . 1.26% 8.31% 3.80%
31 December 2014
Lowest Utilisation (%)
Highest Utilisation (%)
Average Utilisation (%)
Janus Global Diversifi ed Alternatives Fund . . . . . . 1. 83% 8. 77% 3. 90%
Janus Global Unconstrained Bond Fund . . . . . . . . . . . 0.90% 2.91% 1.43%
In the case of the Janus Global Diversified Alternatives Fund and Janus Global Unconstrained Bond Fund leverage is calculated as the sum of the notionals of the derivatives used. The average level of leverage employed by the Janus Global Diversified Alternatives Fund and Janus Global Unconstrained Bond Fund during the year was as follows:
31 December 2015
Median Level of Leverage
Janus Global Diversifi ed Alternatives Fund . . . . . . . . . . . . . . 298%
Janus Global Unconstrained Bond Fund . . . . . . . . . . . . . . . . 170.1 3%
31 December 2014
Median Level of Leverage
Janus Global Diversifi ed Alternatives Fund . . . . . . . . . . . . . . 450%
Janus Global Unconstrained Bond Fund . . . . . . . . . . . . . . . . 231. 52%
FOREIGN CURRENCY RISK
The base currency of all the sub-funds is US Dollar, with the exception of the Janus Europe Fund and the INTECH European Core Fund which are Euro and the Janus Japan Emerging Opportunities Fund and Janus Japan Fund which are JPY. Each of the Funds has the flexibility to invest a portion of its net assets in non base currency securities. As long as a Fund holds a foreign asset or liability, its value will be affected by the value of the local currency relative to the base currency of the Fund. The Funds may hedge against currency fluctuations by utilising futures contracts and forward currency contracts.
The Investment Adviser has identified three principal areas where foreign currency risk could impact the Company:
• Movements in rates affect the fair value of investments;
• Movements in rates affect short-term timing differences; and
• Movements in rates affect the income received.
The Company can hedge the initial investment and subsequent gains of the value of investments that are priced in other

Notes to the Financial Statements
2 5 2 J a n u s C a p i t a l F u n d s P l c / 3 1 D e c e m b e r 2 0 1 5
currencies. The hedging is done by buying forward currency contracts to minimise the amount of foreign currency risk. For more information on forward currency contracts please refer to the section “Forward Currency Contracts” in the Portfolio Investments of the Financial Statements. The Investment Adviser also employs forward currency contracts to hedge the currency exposure of the Classes and the US Dollar and Euro as applicable provided the conditions set out in the Prospectus are met. (“Class Level Hedging”).
The Company may be subject to short-term exposure to exchange rate movements, for instance, where there is an exchange difference between the date an investment purchase or sale is entered into and the date when settlement of the proceeds occurs. When the Company enters into such a transaction which will involve the buying and selling of foreign currency in order to complete it, a forward currency contract can be entered into at the same time as the initial transaction in order to minimise exchange rate risk.
The Company receives income in currencies other than US Dollar, and Euro in the case of the Janus Europe Fund and INTECH European Core Fund and JPY in the case of the Janus Japan Emerging Opportunities Fund and Janus Japan Fund, and the value of this income can be affected by movements in exchange rates. The Company converts all receipts of income into US Dollar, Euro and Japanese Yen as appropriate
on or near the date of receipt. However it does not hedge or otherwise seek to avoid movement risk on income accrued but not received.
Perkins US Strategic Value Fund, Janus US Research Fund, INTECH US Core Fund, Janus Short-term Bond Fund, Janus Japan Fund, Janus Japan Emerging Opportunities Fund, Janus Flexible Income Fund and Janus High Yield Fund had partial but insignificant exposure to foreign currencies other than their functional currency.
The following sets out the total exposure to foreign currency risk including short-term assets and liabilities of Janus Asia Frontier Markets Fund, Janus Asia Growth Drivers Fund, Janus Asia Fund, Janus Balanced Fund, Janus Emerging Markets Fund, Janus Europe Fund, Janus Global Life Sciences Fund, Janus Global Research Fund, Janus Global Technology Fund, Janus Opportunistic Alpha Fund, Janus US Fund, Janus US Twenty Fund, Janus US Venture Fund, Perkins Global Value Fund, INTECH All-World Minimum Variance Core Fund, INTECH European Core Fund, INTECH Global All Country Low Volatility Fund, INTECH Global Dividend Fund, Janus Global Diversified Alternatives Fund, Janus Global Real Estate Fund, Janus Global Flexible Income Fund, Janus Global High Yield Fund, Janus Global Investment Grade Bond Fund, Janus Global Unconstrained Bond Fund as at 31 December 2015 and 31 December 2014 as applicable:
Fund CurrencyMonetary Assets
in USD Monetary Liabilities
in USD Non-Monetary Assets
in USD Non-Monetary Liabilities
in USD Hedging Net Exposure
Janus Asia Frontier Markets Fund as at 31 December 2015 HKD $ 361 $ — $ 828,786 $ — $ — $ 829,147
IDR — — 505,847 — — 505,847 KRW 885 — 107,975 — — 108,860 PHP 272 — 550,571 — — 550,843 SGD — — 82,861 — — 82,861 THB — — 31,364 — — 31,364
TWD — — 69,615 — — 69,615 1,518 — 2,177,019 — — 2,178,537
Fund CurrencyMonetary Assets
in USD Monetary Liabilities
in USD Non-Monetary Assets
in USD Non-Monetary Liabilities
in USD Hedging Net Exposure
Janus Asia Frontier Markets Fund as at 31 December 2014 AUD $ 6,480 $ — $ — $ — $ — $ 6,480
CAD 2,829 — — — — 2,829EUR 6,019 — — — — 6,019GBP — (178) — — — (178)
HKD — (48,199) 533,731 — — 485,532IDR 177 — 613,785 — — 613,962
KRW — — 109,944 — — 109,944MYR 462 — 203,796 — — 204,258PHP 184 — 694,440 — — 694,624SGD 83 — 261,684 — — 261,767THB — — 220,259 — — 220,259
16,234 (48,377) 2,637,639 — — 2,605,496

Notes to the Financial Statements
J a n u s C a p i t a l F u n d s P l c / 3 1 D e c e m b e r 2 0 1 5 2 5 3
Fund CurrencyMonetary Assets
in USD Monetary Liabilities
in USD Non-Monetary Assets
in USD Non-Monetary Liabilities
in USD Hedging Net Exposure
Janus Asia Growth Drivers Fund as at 31 December 2015 HKD $ 348 $ — $ 818,864 $ — $ — $ 819,212
IDR — — 226,379 — — 226,379 KRW 1,850 — 255,128 — — 256,978 MYR 226 — 124,234 — — 124,460 PHP 86 — 214,269 — — 214,355 SGD — — 21,480 — — 21,480 THB 388 — 131,142 — — 131,530
TWD — — 221,069 — — 221,069 2,898 — 2,012,565 — — 2,015,463
Fund CurrencyMonetary Assets
in USD Monetary Liabilities
in USD Non-Monetary Assets
in USD Non-Monetary Liabilities
in USD Hedging Net Exposure
Janus Asia Growth Drivers Fund as at 31 December 2014 HKD $ — $ — $ 750,447 $ — $ — $ 750,447
IDR — — 320,284 — — 320,284KRW — — 385,493 — — 385,493MYR 908 — 256,057 — — 256,965PHP 167 — 283,450 — — 283,617SGD 91 — 207,212 — — 207,303THB 16,265 — 258,769 — — 275,034
17,431 — 2,461,712 — — 2,479,143
Fund CurrencyMonetary Assets
in USD Monetary Liabilities
in USD Non-Monetary Assets
in USD Non-Monetary Liabilities
in USD Hedging Net Exposure
Janus Asia Fund as at 31 December 2015 AUD $ 1,445 $ — $ — $ — $ — $ 1,445
HKD 66,109 — 39,973,912 — — 40,040,021 IDR — — 2,735,537 — — 2,735,537 JPY 193 — 926,958 — — 927,151
KRW 225,957 — 19,869,449 — — 20,095,406 MYR 9,141 — 1,337,550 — — 1,346,691 PHP — — 2,631,561 — — 2,631,561 SGD 22,020 — 3,114,517 — — 3,136,537 THB — — 1,102,734 — — 1,102,734
TWD — — 14,415,977 — — 14,415,977 INR 20,708 — — — — 20,708
345,573 — 86,108,195 — — 86,453,768
Fund CurrencyMonetary Assets
in USD Monetary Liabilities
in USD Non-Monetary Assets
in USD Non-Monetary Liabilities
in USD Hedging Net Exposure
Janus Asia Fund as at 31 December 2014 AUD $ 1,619 $ — $ 612,639 $ — $ — $ 614,258
HKD 2,614,152 (2,533,789) 43,999,039 — — 44,079,402IDR — — 1,772,038 — — 1,772,038JPY 194 — 479,981 — — 480,175
KRW 596,636 (4,091,096) 22,628,515 — — 19,134,055MYR 661,887 — 1,502,187 — — 2,164,074PHP — — 3,029,577 — — 3,029,577SGD 12,152 — 4,605,408 — — 4,617,560THB — — 1,654,051 — — 1,654,051
TWD 1,110,691 — 15,499,015 — — 16,609,7064,997,331 (6,624,885) 95,782,450 — — 94,154,896

Notes to the Financial Statements
2 5 4 J a n u s C a p i t a l F u n d s P l c / 3 1 D e c e m b e r 2 0 1 5
Fund CurrencyMonetary Assets
in USD Monetary Liabilities
in USD Non-Monetary Assets
in USD Non-Monetary Liabilities
in USD Hedging Net Exposure
Janus Balanced Fund as at 31 December 2015 AUD $ 57,744 $ (57,744) $ — $ — $ — $ —
EUR 166,205 (159,515) — — — 6,690GBP — — 8,744,421 — (4,391,273) 4,353,148
HKD 17,444 (17,444) — — — —241,393 (234,703) 8,744,421 — (4,391,273) 4,359,838
Fund CurrencyMonetary Assets
in USD Monetary Liabilities
in USD Non-Monetary Assets
in USD Non-Monetary Liabilities
in USD Hedging Net Exposure
Janus Balanced Fund as at 31 December 2014 CAD $ 3,481 $ — $ — $ — $ — $ 3,481
EUR 7,448 — — — — 7,448GBP — — 4,806,601 — (4,418,825) 387,776
CNH 11 — — — — 1110,940 — 4,806,601 — (4,418,825) 398,716
Fund CurrencyMonetary Assets
in USD Monetary Liabilities
in USD Non-Monetary Assets
in USD Non-Monetary Liabilities
in USD Hedging Net Exposure
Janus Emerging Markets Fundas at 31 December 2015 AED $ 101,105 $ — $ 556,897 $ — $ — $ 658,002
BRL 45,081 — 3,557,825 — — 3,602,906 CLP — — 2,191,813 — — 2,191,813 EUR 6,451 (6,353) 945,056 — — 945,154 GBP — — 1,868,822 — — 1,868,822
HKD 71 — 25,519,785 — — 25,519,856 HUF 61 — — — — 61 IDR — — 2,164,072 — — 2,164,072 JPY — — 932,160 — (874,862) 57,298
KRW 181,276 — 16,697,608 — — 16,878,884 MXN 3,031 — 5,748,886 — — 5,751,917 MYR 8,805 — 1,349,370 — — 1,358,175 PHP — — 1,664,129 — — 1,664,129 SGD 10,354 — 558,799 — — 569,153 THB — — 1,141,151 — — 1,141,151 TRY — — 1,720,057 — — 1,720,057
TWD 5,661 — 11,917,986 — — 11,923,647 ZAR 444,081 — 3,972,529 — — 4,416,610 INR — (4,182) 8,162,508 — — 8,158,326
CNY 3,038 — — — 3,038 809,015 (10,535) 90,669,453 — (874,862) 90,593,071
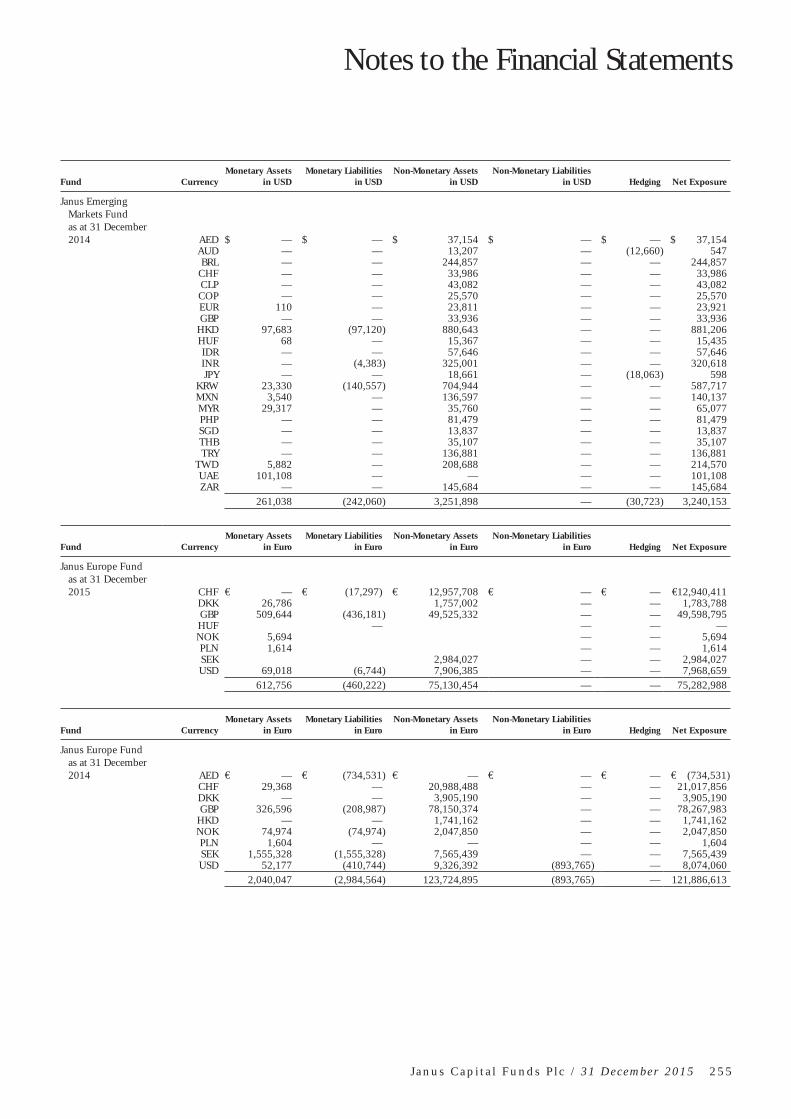
Notes to the Financial Statements
J a n u s C a p i t a l F u n d s P l c / 3 1 D e c e m b e r 2 0 1 5 2 5 5
Fund CurrencyMonetary Assets
in USD Monetary Liabilities
in USD Non-Monetary Assets
in USD Non-Monetary Liabilities
in USD Hedging Net Exposure
Janus Emerging Markets Fundas at 31 December 2014 AED $ — $ — $ 37,154 $ — $ — $ 37,154
AUD — — 13,207 — (12,660) 547BRL — — 244,857 — — 244,857
CHF — — 33,986 — — 33,986CLP — — 43,082 — — 43,082COP — — 25,570 — — 25,570EUR 110 — 23,811 — — 23,921GBP — — 33,936 — — 33,936
HKD 97,683 (97,120) 880,643 — — 881,206HUF 68 — 15,367 — — 15,435IDR — — 57,646 — — 57,646INR — (4,383) 325,001 — — 320,618JPY — — 18,661 — (18,063) 598
KRW 23,330 (140,557) 704,944 — — 587,717MXN 3,540 — 136,597 — — 140,137MYR 29,317 — 35,760 — — 65,077PHP — — 81,479 — — 81,479SGD — — 13,837 — — 13,837THB — — 35,107 — — 35,107TRY — — 136,881 — — 136,881
TWD 5,882 — 208,688 — — 214,570UAE 101,108 — — — — 101,108ZAR — — 145,684 — — 145,684
261,038 (242,060) 3,251,898 — (30,723) 3,240,153
Fund CurrencyMonetary Assets
in Euro Monetary Liabilities
in Euro Non-Monetary Assets
in Euro Non-Monetary Liabilities
in Euro Hedging Net Exposure
Janus Europe Fund as at 31 December 2015 CHF € — € (17,297) € 12,957,708 € — € — €12,940,411
DKK 26,786 1,757,002 — — 1,783,788 GBP 509,644 (436,181) 49,525,332 — — 49,598,795 HUF — — — — NOK 5,694 — — 5,694 PLN 1,614 — — 1,614 SEK 2,984,027 — — 2,984,027 USD 69,018 (6,744) 7,906,385 — — 7,968,659
612,756 (460,222) 75,130,454 — — 75,282,988
Fund CurrencyMonetary Assets
in Euro Monetary Liabilities
in Euro Non-Monetary Assets
in Euro Non-Monetary Liabilities
in Euro Hedging Net Exposure
Janus Europe Fund as at 31 December 2014 AED € — € (734,531) € — € — € — € (734,531)
CHF 29,368 — 20,988,488 — — 21,017,856DKK — — 3,905,190 — — 3,905,190GBP 326,596 (208,987) 78,150,374 — — 78,267,983
HKD — — 1,741,162 — — 1,741,162NOK 74,974 (74,974) 2,047,850 — — 2,047,850PLN 1,604 — — — — 1,604SEK 1,555,328 (1,555,328) 7,565,439 — — 7,565,439USD 52,177 (410,744) 9,326,392 (893,765) — 8,074,060
2,040,047 (2,984,564) 123,724,895 (893,765) — 121,886,613

Notes to the Financial Statements
2 5 6 J a n u s C a p i t a l F u n d s P l c / 3 1 D e c e m b e r 2 0 1 5
Fund CurrencyMonetary Assets
in USD Monetary Liabilities
in USD Non-Monetary Assets
in USD Non-Monetary Liabilities
in USD Hedging Net Exposure
Janus Global Life Sciences Fund as at 31 December 2015 AUD $ 27,808 $ (27,808) $ — $ — $ — $ —
CHF 435,844 (235,931) 78,741,064 — (39,569,728) 39,371,249 DKK 956,260 (917,743) 39,736,003 — — 39,774,520 EUR 1,224,800 (999,297) 66,958,178 — — 67,183,681 GBP 1,497,977 (1,492,694) 51,527,228 — — 51,532,511
HKD 28,018 (28,018) — — — — SEK 37,325 (37,325) 12,569,386 — (6,301,839) 6,267,547
4,208,032 (3,738,816) 249,531,859 — (45,871,567) 204,129,508
Fund CurrencyMonetary Assets
in USD Monetary Liabilities
in USD Non-Monetary Assets
in USD Non-Monetary Liabilities
in USD Hedging Net Exposure
Janus Global Life Sciences Fund as at 31 December 2014 CAD $ — $ — $ 3,851,453 $ — $ — $ 3,851,453
CHF — — 33,415,596 — (16,151,735) 17,263,861DKK 110,067 (110,067) 6,354,723 — — 6,354,723EUR 17,523 — 13,585,886 — — 13,603,409GBP — — 4,206,081 — — 4,206,081
HKD — — 5,090,615 — — 5,090,615SEK 143,772 (143,772) 6,802,240 — (3,300,517) 3,501,723
271,362 (253,839) 73,306,594 — (19,452,252) 53,871,865
Fund CurrencyMonetary Assets
in USD Monetary Liabilities
in USD Non-Monetary Assets
in USD Non-Monetary Liabilities
in USD Hedging Net Exposure
Janus Global Research Fund as at 31 December 2015 CAD $ 15,753 $ (14,858) $ 1,072,014 $ — $ — $ 1,072,909
CHF 20,777 — 1,592,382 — — 1,613,159 EUR 36,118 — 2,506,785 — — 2,542,903 GBP 4,751 — 3,159,853 — — 3,164,604
HKD — — 1,452,660 — — 1,452,660 IDR — — 65,061 — — 65,061 JPY — — 1,670,967 — — 1,670,967
KRW 5,683 — 470,765 — — 476,448 TWD — — 365,765 — — 365,765
INR — (3,253) — — — (3,253) 83,082 (18,111) 12,356,252 — — 12,421,223
Fund CurrencyMonetary Assets
in USD Monetary Liabilities
in USD Non-Monetary Assets
in USD Non-Monetary Liabilities
in USD Hedging Net Exposure
Janus Global Research Fund as at 31 December 2014 CAD $ 2,249 $ — $ 1,567,531 $ — $ — $ 1,569,780
CHF 7,170 — 1,459,135 — — 1,466,305EUR 23,052 — 2,451,828 — — 2,474,880GBP 62,565 (58,864) 2,745,498 — — 2,749,199
HKD 27,337 (25,406) 1,477,241 — — 1,479,172IDR — — 158,331 — — 158,331INR — (3,409) 190,964 — — 187,555JPY 12,183 (11,995) 2,177,501 — — 2,177,689
KRW — — 394,328 — — 394,328SEK 122,952 (122,952) 250,241 — — 250,241
TWD — — 300,089 — — 300,089257,508 (222,626) 13,172,687 — — 13,207,569

Notes to the Financial Statements
J a n u s C a p i t a l F u n d s P l c / 3 1 D e c e m b e r 2 0 1 5 2 5 7
Fund CurrencyMonetary Assets
in USD Monetary Liabilities
in USD Non-Monetary Assets
in USD Non-Monetary Liabilities
in USD Hedging Net Exposure
Janus Global Technology Fund as at 31 December 2015 CAD $ — $ — $ 871,470 $ — $ — $ 871,470
EUR 6,689 (6,689) 233,127 — — 233,127 GBP 1,020 — 2,624,978 — (682,755) 1,943,243
HKD 268,367 (268,367) 1,182,647 — — 1,182,647 JPY 1,712 — 1,009,154 — (758,563) 252,303
KRW 26,273 — 2,176,481 — — 2,202,754 TWD 1 — 1,123,422 — — 1,123,423
304,062 (275,056) 9,221,279 — (1,441,318) 7,808,967
Fund CurrencyMonetary Assets
in USD Monetary Liabilities
in USD Non-Monetary Assets
in USD Non-Monetary Liabilities
in USD Hedging Net Exposure
Janus Global Technology Fund as at 31 December 2014 GBP $ — $ — $ 3,246,366 $ — $ (797,766) $ 2,448,600
HKD — — 522,337 — — 522,337JPY — — 1,157,297 — (900,715) 256,582
KRW — — 2,150,848 — — 2,150,848TWD 1 — 2,022,878 — — 2,022,879
1 — 9,099,726 — (1,698,481) 7,401,246
Fund CurrencyMonetary Assets
in USD Monetary Liabilities
in USD Non-Monetary Assets
in USD Non-Monetary Liabilities
in USD Hedging Net Exposure
Janus Opportunistic Alpha Fund as at 31 December 2015 EUR $ 19,634 $ (19,039) $ — $ — $ — $ 595
GBP — — 1,130,790 — — 1,130,79019,634 (19,039) 1,130,790 — — 1,131,385
Fund CurrencyMonetary Assets
in USD Monetary Liabilities
in USD Non-Monetary Assets
in USD Non-Monetary Liabilities
in USD Hedging Net Exposure
Janus Opportunistic Alpha Fund as at 31 December 2014 CAD $ — $ — $ 1,668,793 $ — $ — $ 1,668,793
— — 1,668,793 — — 1,668,793
Fund CurrencyMonetary Assets
in USD Monetary Liabilities
in USD Non-Monetary Assets
in USD Non-Monetary Liabilities
in USD Hedging Net Exposure
Janus US Fund as at 31 December 2015 CAD $ 32 $ — $ — $ — $ — $ 32
EUR 56 — — — — 56GBP — — 14,825 — — 14,825
88 — 14,825 — — 14,913
Fund CurrencyMonetary Assets
in USD Monetary Liabilities
in USD Non-Monetary Assets
in USD Non-Monetary Liabilities
in USD Hedging Net Exposure
Janus US Fund as at 31 December 2014 CAD $ 17 $ — $ — $ — $ — $ 17
EUR 63 — 998 — (641) 420GBP — — 51,053 — (33,433) 17,620
80 — 52,051 — (34,074) 18,057

Notes to the Financial Statements
2 5 8 J a n u s C a p i t a l F u n d s P l c / 3 1 D e c e m b e r 2 0 1 5
Fund CurrencyMonetary Assets
in USD Monetary Liabilities
in USD Non-Monetary Assets
in USD Non-Monetary Liabilities
in USD Hedging Net Exposure
Janus US Twenty Fund as at 31 December 2015 EUR $ 129,736 $ (113,402) $ — $ — $ — $ 16,334
129,736 (113,402) — — — 16,334
Fund CurrencyMonetary Assets
in USD Monetary Liabilities
in USD Non-Monetary Assets
in USD Non-Monetary Liabilities
in USD Hedging Net Exposure
Janus US Twenty Fund as at 31 December 2014 EUR $ 18,187 $ — $ — $ — $ — $ 18,187
GBP — — 3,500,760 — — 3,500,76018,187 — 3,500,760 — — 3,518,947
Fund CurrencyMonetary Assets
in USD Monetary Liabilities
in USD Non-Monetary Assets
in USD Non-Monetary Liabilities
in USD Hedging Net Exposure
Janus US Venture Fund as at 31 December 2015 EUR $ 98,589 $ (96,403) $ 3,209,676 $ — $ (2,410,173) $ 801,689
GBP 224,530 (224,530) 1,895,209 — (2,275,812) (380,603)323,119 (320,933) 5,104,885 — (4,685,985) 421,086
Fund CurrencyMonetary Assets
in USD Monetary Liabilities
in USD Non-Monetary Assets
in USD Non-Monetary Liabilities
in USD Hedging Net Exposure
Janus US Venture Fund as at 31 December 2014 CAD $ 25,746 $ (25,746) $ 1,183,059 $ — $ — $ 1,183,059
EUR — — 3,323,813 — — 3,323,813GBP — — 1,443,569 — — 1,443,569
25,746 (25,746) 5,950,441 — — 5,950,441
Fund CurrencyMonetary Assets
in USD Monetary Liabilities
in USD Non-Monetary Assets
in USD Non-Monetary Liabilities
in USD Hedging Net Exposure
Perkins Global Value Fund as at 31 December 2015 CAD $ 21,948 $ — $ 5,091,520 $ — $ — $ 5,113,468
CHF — — 8,007,469 — — 8,007,469DKK 7,008 — 1,339,083 — — 1,346,091EUR 70,784 (3) 9,621,504 — (4,728,440) 4,963,845GBP 71,144 — 17,590,505 — — 17,661,649
HKD — — 2,040,059 — — 2,040,059JPY 33,056 — 11,662,487 — (6,862,122) 4,833,421
KRW — — 3,824,791 — — 3,824,791MXN 25,239 — 3,082,118 — — 3,107,357NOK 23,120 — 1,697,748 — — 1,720,868SEK — — 3,701,354 — — 3,701,354
252,299 (3) 67,658,638 — (11,590,562) 56,320,372

Notes to the Financial Statements
J a n u s C a p i t a l F u n d s P l c / 3 1 D e c e m b e r 2 0 1 5 2 5 9
Fund CurrencyMonetary Assets
in USD Monetary Liabilities
in USD Non-Monetary Assets
in USD Non-Monetary Liabilities
in USD Hedging Net Exposure
Perkins Global Value Fund as at 31 December 2014 CAD $ 795,589 $ (748,787) $ 7,122,259 $ — $ — $ 7,169,061
CHF 850,126 (850,126) 8,250,565 — — 8,250,565DKK 242,477 (242,477) 1,577,029 — — 1,577,029EUR 1,084,347 (1,038,561) 12,597,256 — (5,606,008) 7,037,034GBP 3,233,651 (3,155,376) 21,487,066 — — 21,565,341
HKD — — 1,234,915 — — 1,234,915JPY 515,729 (481,141) 8,801,693 — (5,592,511) 3,243,770
KRW — — 866,848 — — 866,848MXN 491,553 (462,074) 4,490,705 — — 4,520,184NOK 399,946 (377,849) 3,719,014 — — 3,741,111SEK 419,418 (419,418) 3,246,259 — — 3,246,259
8,032,836 (7,775,809) 73,393,609 — (11,198,519) 62,452,117
Fund CurrencyMonetary Assets
in USD Monetary Liabilities
in USD Non-Monetary Assets
in USD Non-Monetary Liabilities
in USD Hedging Net Exposure
INTECH All-World Minimum Variance Core Fund(a) as at 31 December 2015 AED $ — $ — $ 1,258,824 $ — $ — $ 1,258,824
AUD 100,286 — 23,607,691 — (19,785,974) 3,922,003BRL — — 2,278,024 — — 2,278,024
CAD 21,421 — 12,518,592 — (12,884,951) (344,938)CHF — — 15,168,047 — (15,980,151) (812,104)CLP — — 1,064,964 — — 1,064,964CZK — — 353,987 — — 353,987DKK 3,601 — 1,639,419 — (3,058,113) (1,415,093)EGP — — 2,612,533 — — 2,612,533EUR 34,506 — 18,830,215 — (35,656,353) (16,791,632)GBP 101,542 — 23,871,970 — 709,534,559 733,508,071
HKD 5,860 — 52,261,850 — (48,572,615) 3,695,095HUF — — 482,225 — — 482,225IDR 13,765 — 1,382,529 — — 1,396,294ILS 896 — 9,784,629 — (10,326,542) (541,017)
INR — — — — (16,514,947) (16,514,947)JPY 154,480 — 107,012,485 — (120,457,181) (13,290,216)
KRW — (281,314) 31,984,481 — (32,703,948) (1,000,781)MXN — — 1,094,372 — — 1,094,372MYR 6,719 — 10,519,017 — (15,824,444) (5,298,708)NOK — — 73,272 — — 73,272NZD — — 7,585,883 — (6,475,762) 1,110,121PHP — — 9,276,515 — — 9,276,515PLN — (94) 868,664 — (2,445,039) (1,576,469)SEK — — 86,817 — — 86,817SGD — — 4,609,212 — (16,395,811) (11,786,599)THB — — 3,191,013 — (10,854,402) (7,663,389)TRY — — 8,734 — — 8,734
TWD — — 22,735,667 — (25,042,438) (2,306,771)ZAR — — 4,555,016 — (5,129,330) (574,314)
443,076 (281,408) 370,716,647 — 311,426,558 682,304,873

Notes to the Financial Statements
2 6 0 J a n u s C a p i t a l F u n d s P l c / 3 1 D e c e m b e r 2 0 1 5
Fund CurrencyMonetary Assets
in USD Monetary Liabilities
in USD Non-Monetary Assets
in USD Non-Monetary Liabilities
in USD Hedging Net Exposure
INTECH Global All Country Low Volatility Fund as at 31 December 2015 AUD $ 16,016 $ — $ 2,506,248 $ — $ — $ 2,522,264
BRL 4,903 — 978,825 — — 983,728CAD 6,095 — 3,817,905 — — 3,824,000CHF 46,024 — 5,835,607 — — 5,881,631CLP — — 45,478 — — 45,478CZK — — 998,596 — — 998,596DKK 2,462 — 974,471 — — 976,933EGP 17 — — — — 17EUR 11,577 — 11,268,358 — — 11,279,935GBP 17,827 — 11,952,913 — — 11,970,740
HKD 334,132 (334,132) 2,549,030 — — 2,549,030HUF — — 646,013 — — 646,013
ILS — — 2,385,860 — — 2,385,860JPY 33,055 — 12,314,528 — — 12,347,583
KRW 43,599 — 4,771,641 — — 4,815,240MXN 3,841 — 43,412 — — 47,253MYR — — 1,512,643 — — 1,512,643NOK 207 — — — — 207NZD — — 881,878 — — 881,878PHP — — 128,972 — — 128,972PLN — — 3,627,498 — — 3,627,498SEK — — 1,837,776 — — 1,837,776SGD 11,192 — 3,359,903 — — 3,371,095THB — — 541,071 — — 541,071TRY — — 161,438 — — 161,438
TWD — (2,245) 3,303,277 — — 3,301,032ZAR — — 2,029,290 — — 2,029,290QAR — — 677,373 — — 677,373
530,947 (336,377) 79,150,004 — — 79,344,574
Fund CurrencyMonetary Assets
in Euro Monetary Liabilities
in Euro Non-Monetary Assets
in Euro Non-Monetary Liabilities
in Euro Hedging Net Exposure
INTECH European Core Fund as at 31 December 2015 CHF € 183,605 € — € 11,731,213 € — € — €11,914,818
DKK 8,037 — 2,529,613 — — 2,537,650GBP 86,436 — 31,478,094 — — 31,564,530
NOK 6,756 — 719,220 — — 725,976SEK — — 3,435,090 — — 3,435,090USD 3,613 — — — — 3,613
288,447 — 49,893,230 — — 50,181,677
Fund CurrencyMonetary Assets
in Euro Monetary Liabilities
in Euro Non-Monetary Assets
in Euro Non-Monetary Liabilities
in Euro Hedging Net Exposure
INTECH European Core Fund as at 31 December 2014 CHF € — € — € 10,270,073 € — € — €10,270,073
DKK 379 — 1,566,291 — — 1,566,670GBP 98,617 — 27,555,547 — — 27,654,164
NOK 4,827 — 1,374,201 — — 1,379,028SEK — — 4,815,726 — — 4,815,726
103,823 — 45,581,838 — — 45,685,661

Notes to the Financial Statements
J a n u s C a p i t a l F u n d s P l c / 3 1 D e c e m b e r 2 0 1 5 2 6 1
Fund CurrencyMonetary Assets
in USD Monetary Liabilities
in USD Non-Monetary Assets
in USD Non-Monetary Liabilities
in USD Hedging Net Exposure
INTECH Global All Country Low Volatility Fund as at 31 December 2014 AUD $ — $ — $ 927,685 $ — $ — $ 927,685
BRL 567 — 525,540 — — 526,107CAD 9,654 — 7,100,647 — — 7,110,301CHF — — 5,004,288 — — 5,004,288CLP — — 77,040 — — 77,040COP — — 301,616 — — 301,616CNY 5,991 — — — — 5,991CZK — — 257,264 — — 257,264DKK — — 661,208 — — 661,208EGP — — 633,333 — — 633,333EUR — — 5,182,640 — — 5,182,640GBP 24,933 — 12,742,942 — — 12,767,875
HKD — — 4,576,728 — — 4,576,728HUF — — 171,289 — — 171,289IDR — — 719,438 — — 719,438ILS — — 2,672,351 — — 2,672,351JPY 44,366 — 16,916,728 — — 16,961,094
KRW 2,931 — 6,702,528 — — 6,705,459MXN 1,226 — 341,657 — — 342,883MYR 30,142 — 5,190,454 — — 5,220,596NOK 123 — 190,322 — — 190,445NZD — — 1,060,137 — — 1,060,137PHP — — 149,825 — — 149,825SEK — — 384,893 — — 384,893SGD 2,516 — 2,102,288 — — 2,104,804THB 1,275 — 1,600,799 — — 1,602,074TRY — — 138,009 — — 138,009
TWD — — 5,054,098 — — 5,054,098ZAR 1,324 — 1,554,350 — — 1,555,674
125,048 — 82,940,097 — — 83,065,145
Fund CurrencyMonetary Assets
in USD Monetary Liabilities
in USD Non-Monetary Assets
in USD Non-Monetary Liabilities
in USD Hedging Net Exposure
INTECH Global Dividend Fund as at 31 December 2015 AUD $ 64 $ 93,775 $ — $ — $ 93,839
CAD 2,063 — 70,008 — — 72,071CHF 1,476 — 69,118 — — 70,594DKK 67 — 7,662 — — 7,729EUR 29,071 (65) 303,861 — — 332,867GBP 538 (64) 282,045 — — 282,519
HKD — — 129,928 — — 129,928ILS 2,049 — — — — 2,049JPY 53 — 70,891 — — 70,944
NOK 3,251 — 30,803 — — 34,054NZD — — 14,471 — — 14,471SEK — — 35,625 — — 35,625SGD 288 — 62,149 — — 62,437
38,920 (129) 1,170,336 — — 1,209,127

Notes to the Financial Statements
2 6 2 J a n u s C a p i t a l F u n d s P l c / 3 1 D e c e m b e r 2 0 1 5
Fund CurrencyMonetary Assets
in USD Monetary Liabilities
in USD Non-Monetary Assets
in USD Non-Monetary Liabilities
in USD Hedging Net Exposure
INTECH Global Dividend Fund as at 31 December 2014 AUD $ 72 $ — $ 116,964 $ — $ — $ 117,036
CAD 2,870 — 206,256 — — 209,126CHF — — 56,714 — — 56,714DKK 34 — 14,766 — — 14,800EUR 65,142 — 322,848 — — 387,990GBP 1,548 — 349,000 — — 350,548
HKD — — 171,859 — — 171,859ILS 2,047 — 3,027 — — 5,074JPY 60 — 116,661 — — 116,721
NOK 18,392 — 52,068 — — 70,460NZD 1 — 24,045 — — 24,046SEK — — 65,040 — — 65,040SGD 263 — 73,450 — — 73,713
90,429 — 1,572,698 — — 1,663,127
Fund CurrencyMonetary Assets
in USD Monetary Liabilities
in USD Non-Monetary Assets
in USD Non-Monetary Liabilities
in USD Hedging Net Exposure
Janus Global Diversifi ed Alternatives Fund as at 31 December 2015 EUR $ 54,840 $ — $ — $ — $ — $ 54,840
54,840.00 — — — — 54,840.00
Fund CurrencyMonetary Assets
in USD Monetary Liabilities
in USD Non-Monetary Assets
in USD Non-Monetary Liabilities
in USD Hedging Net Exposure
Janus Global Diversifi ed Alternatives Fund as at 31 December 2014 AUD $ — $ — $ — $ — $ 28,548 $ 28,548
CAD — — — — (4,304) (4,304)CHF — — — — (23,144) (23,144)EUR 50,632 — 7,375 — 16,940 74,947GBP — — — — 3,117 3,117JPY — — — — (23,382) (23,382)
NOK — — — — 12,081 12,081NZD — — — — 21,034 21,034SEK — — — — (20,539) (20,539)
50,632 — 7,375 — 10,351 68,358
Fund CurrencyMonetary Assets
in USD Monetary Liabilities
in USD Non-Monetary Assets
in USD Non-Monetary Liabilities
in USD Hedging Net Exposure
Janus Global Real Estate Fund as at 31 December 2015 AUD $ 311,852 $ — $ 6,763,472 $ — $ — $ 7,075,324
BRL — — 1,274,197 — — 1,274,197CAD 17,272 — 2,719,004 — — 2,736,276EUR 643,191 (194,426) 13,939,268 — — 14,388,033GBP 13,091 — 7,495,987 — — 7,509,078
HKD 1,224 (759) 7,140,461 — — 7,140,926JPY 100,036 — 11,118,059 — — 11,218,095
MXN 200,502 — 2,903,072 — — 3,103,574SGD 157,284 — 6,156,993 — — 6,314,277
TWD — — 251,269 — 251,269INR — (89,833) 1,576,081 — — 1,486,248
1,444,452 (285,018) 61,337,863 — — 62,497,297

Notes to the Financial Statements
J a n u s C a p i t a l F u n d s P l c / 3 1 D e c e m b e r 2 0 1 5 2 6 3
Fund CurrencyMonetary Assets
in USD Monetary Liabilities
in USD Non-Monetary Assets
in USD Non-Monetary Liabilities
in USD Hedging Net Exposure
Janus Global Real Estate Fund as at 31 December 2014 AUD $ 334,448 $ — $ 7,709,247 $ — $ — $ 8,043,695
BRL — — 3,191,584 — — 3,191,584CAD 24,702 — 3,998,332 — — 4,023,034EUR 342,818 — 8,871,693 — — 9,214,511GBP 22,765 — 11,674,199 — — 11,696,964
HKD 465 — 10,415,022 — — 10,415,487INR — (104,686) 2,178,199 — — 2,073,513JPY 23,461 — 11,460,496 — — 11,483,957
MXN 110,679 — 4,822,353 — — 4,933,032SGD 133,316 — 7,814,983 — — 7,948,299
TWD — — 436,072 — — 436,072992,654 (104,686) 72,572,180 — — 73,460,148
Fund CurrencyMonetary Assets
in USD Monetary Liabilities
in USD Non-Monetary Assets
in USD Non-Monetary Liabilities
in USD Hedging Net Exposure
Janus Global Flexible Income Fund as at 31 December 2015 AUD $ — $ — $ 189,365 $ — $ (192,984) $ ($3,619)
CAD 737 — 41,944 — 388,154 430,835EUR 28,113 (28,113) 5,634,830 — (2,951,685) 2,683,145GBP — — 2,637,655 — 80,186 2,717,841 INR — — — — 423,417 423,417 JPY — — — — 2,353,980 2,353,980
MXN — — 441,060 — 415,932 856,992NOK — — 113,496 — (114,704) (1,208)NZD — — 1,512,493 — (1,528,779) (16,286)SEK — — 707,823 — (77,421) 630,402
28,850 (28,113) 11,278,666 — (1,203,904) 10,075,499
Fund CurrencyMonetary Assets
in USD Monetary Liabilities
in USD Non-Monetary Assets
in USD Non-Monetary Liabilities
in USD Hedging Net Exposure
Janus Global Flexible Income Fund as at 31 December 2014 AUD $ — $ — $ 135,786 $ — $ 70,890 $ 206,676
CAD — — 184,789 — 1,315,786 1,500,575EUR 83,786 — 7,143,739 — (7,242,900) (15,375)GBP 226,304 — 3,303,194 — (947,334) 2,582,164
KRW — — — — 194,852 194,852NOK — — 136,280 — 58,638 194,918NZD — — 1,812,294 — (1,392,435) 419,859PLN 4,834 — — — — 4,834PHP — — — — 194,755 194,755SEK — — 1,004,473 — (1,017,006) (12,533)
314,924 — 13,720,555 — (8,764,754) 5,270,725
Fund CurrencyMonetary Assets
in USD Monetary Liabilities
in USD Non-Monetary Assets
in USD Non-Monetary Liabilities
in USD Hedging Net Exposure
Janus Global High Yield Fund as at 31 December 2015 EUR $ 497,557 $ (180,494) $ 8,500,342 $ — $ (477,094) $ 8,340,311
GBP 30,559 — 8,699,540 — (2,144,685) 1,652,077528,116 (180,494) 12,266,545 — (2,621,779) 9,992,388
Fund CurrencyMonetary Assets
in USD Monetary Liabilities
in USD Non-Monetary Assets
in USD Non-Monetary Liabilities
in USD Hedging Net Exposure
Janus Global High Yield Fund as at 31 December 2014 EUR $ 3,416 $ — $ 15,514,972 $ — $ (2,242,460) $ 13,275,928
GBP 1,705,968 — 8,699,540 — (5,891,233) 4,514,2751,709,384 — 24,214,512 — (8,133,693) 17,790,203

Notes to the Financial Statements
2 6 4 J a n u s C a p i t a l F u n d s P l c / 3 1 D e c e m b e r 2 0 1 5
Fund CurrencyMonetary Assets
in USD Monetary Liabilities
in USD Non-Monetary Assets
in USD Non-Monetary Liabilities
in USD Hedging Net Exposure
Janus Global Investment Grade Bond Fund as at 31 December 2015 AUD $ — $ — $ 445,161 $ — $ (203,908) $ 241,253
CAD 2,153 — 254,083 — 919,427 1,175,663 CHF — — — — 330,696 330,696EUR — — 13,674,886 — (4,510,123) 9,164,763GBP — — 3,747,912 — (952,211) 2,795,701 JPY — — — — 961,728 961,728
2,153 — 18,122,042 — (3,454,391) 14,669,804
Fund CurrencyMonetary Assets
in USD Monetary Liabilities
in USD Non-Monetary Assets
in USD Non-Monetary Liabilities
in USD Hedging Net Exposure
Janus Global Investment Grade Bond Fund as at 31 December 2014 AUD $ — $ — $ 626,508 $ — $ (249,334) $ 377,174
CAD — — 910,010 — 1,141,093 2,051,103CHF — — — — 418,722 418,722EUR 404,646 — 30,411,657 — (15,474,516) 15,341,787GBP 483,858 — 4,622,685 — 99,721 5,206,264JPY — — — — 1,506,127 1,506,127
888,504 — 36,570,860 — (12,558,187) 24,901,177
Fund CurrencyMonetary Assets
in USD Monetary Liabilities
in USD Non-Monetary Assets
in USD Non-Monetary Liabilities
in USD Hedging Net Exposure
Janus Global Unconstrained Bond Fund as at 31 December 2015 EUR $ 31,093 $ (476,758) $ — $ (40,894) $ — $ (486,559)
GBP 470,901 — — — — 470,901 MXN — (802) — — — (802)
501,994 (477,560) — (40,894) — (16,460)
Fund CurrencyMonetary Assets
in USD Monetary Liabilities
in USD Non-Monetary Assets
in USD Non-Monetary Liabilities
in USD Hedging Net Exposure
Janus Global Unconstrained Bond Fund as at 31 December 2014 EUR $ 6,202 $ — $ — $ (5,724) $ — $ 478
JPY 69 — — (67) — 26,271 — — (5,791) — 480
Certain Class level hedges as included in the analysis of the Portfolio Investments are entered into in order to hedge the value of the AUD, CAD, CHF, CNH, EUR, GBP, HKD, JPY, SEK, SGD and USD Share Classes and are not included in the above analysis.
The following table demonstrates the impact on net assets attributable to holders of shares of a movement in local currencies against the Funds’ functional currency by way of illustration. In the interests of providing consistent comparisons
across the Funds the table assumes a 5% upward movement in the value of the local currencies (a negative 5% would have similar negative results).
As at 31 December 2015 and 31 December 2014, had the exchange rate between the local currencies held by the Funds and its functional currency increased or decreased by 5% with all other variables held constant, the increase or decrease respectively in net assets attributable to holders of participating shares is listed in the table below.
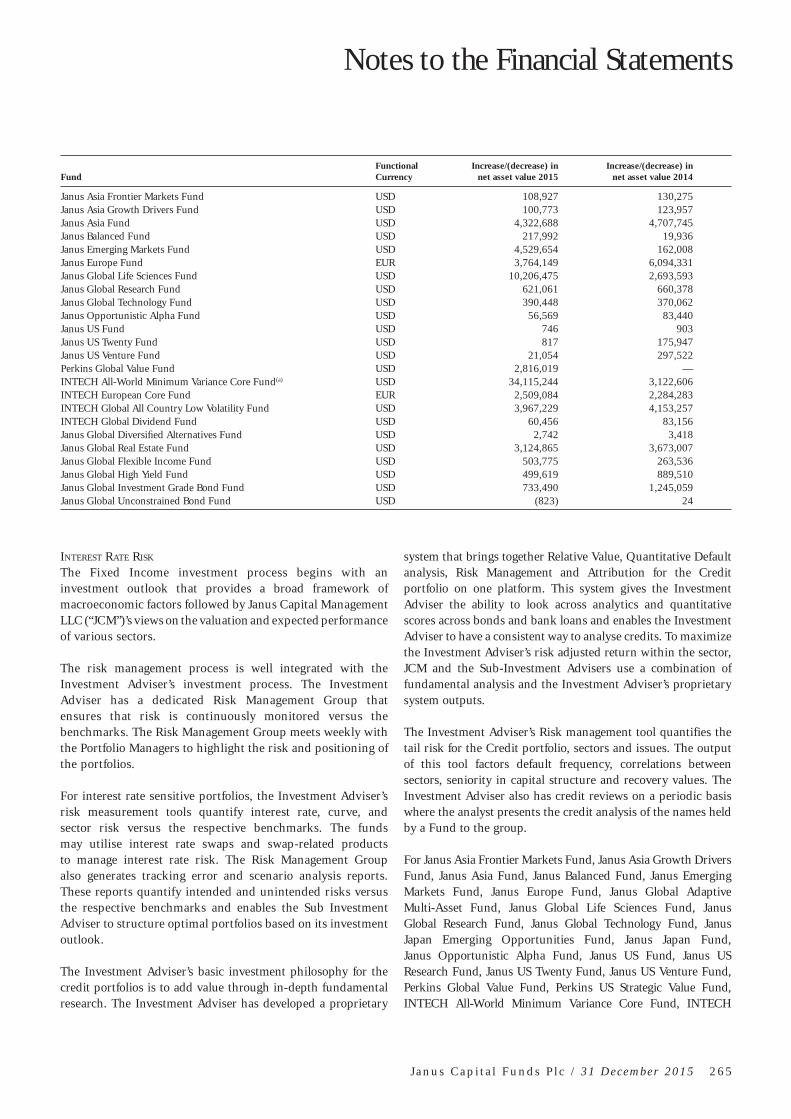
Notes to the Financial Statements
J a n u s C a p i t a l F u n d s P l c / 3 1 D e c e m b e r 2 0 1 5 2 6 5
FundFunctionalCurrency
Increase/(decrease) in net asset value 2015
Increase/(decrease) in net asset value 2014
Janus Asia Frontier Markets Fund USD 108,927 130,275 Janus Asia Growth Drivers Fund USD 100,773 123,957 Janus Asia Fund USD 4,322,688 4,707,745 Janus Balanced Fund USD 217,992 19,936 Janus Emerging Markets Fund USD 4,529,654 162,008 Janus Europe Fund EUR 3,764,149 6,094,331 Janus Global Life Sciences Fund USD 10,206,475 2,693,593 Janus Global Research Fund USD 621,061 660,378 Janus Global Technology Fund USD 390,448 370,062 Janus Opportunistic Alpha Fund USD 56,569 83,440 Janus US Fund USD 746 903 Janus US Twenty Fund USD 817 175,947 Janus US Venture Fund USD 21,054 297,522 Perkins Global Value Fund USD 2,816,019 — INTECH All-World Minimum Variance Core Fund(a) USD 34,115,244 3,122,606 INTECH European Core Fund EUR 2,509,084 2,284,283 INTECH Global All Country Low Volatility Fund USD 3,967,229 4,153,257 INTECH Global Dividend Fund USD 60,456 83,156 Janus Global Diversifi ed Alternatives Fund USD 2,742 3,418 Janus Global Real Estate Fund USD 3,124,865 3,673,007 Janus Global Flexible Income Fund USD 503,775 263,536 Janus Global High Yield Fund USD 499,619 889,510 Janus Global Investment Grade Bond Fund USD 733,490 1,245,059 Janus Global Unconstrained Bond Fund USD (823) 24
INTEREST RATE RISK
The Fixed Income investment process begins with an investment outlook that provides a broad framework of macroeconomic factors followed by Janus Capital Management LLC (“JCM”)’s views on the valuation and expected performance of various sectors.
The risk management process is well integrated with the Investment Adviser’s investment process. The Investment Adviser has a dedicated Risk Management Group that ensures that risk is continuously monitored versus the benchmarks. The Risk Management Group meets weekly with the Portfolio Managers to highlight the risk and positioning of the portfolios.
For interest rate sensitive portfolios, the Investment Adviser’s risk measurement tools quantify interest rate, curve, and sector risk versus the respective benchmarks. The funds may utilise interest rate swaps and swap-related products to manage interest rate risk. The Risk Management Group also generates tracking error and scenario analysis reports. These reports quantify intended and unintended risks versus the respective benchmarks and enables the Sub Investment Adviser to structure optimal portfolios based on its investment outlook.
The Investment Adviser’s basic investment philosophy for the credit portfolios is to add value through in-depth fundamental research. The Investment Adviser has developed a proprietary
system that brings together Relative Value, Quantitative Default analysis, Risk Management and Attribution for the Credit portfolio on one platform. This system gives the Investment Adviser the ability to look across analytics and quantitative scores across bonds and bank loans and enables the Investment Adviser to have a consistent way to analyse credits. To maximize the Investment Adviser’s risk adjusted return within the sector, JCM and the Sub-Investment Advisers use a combination of fundamental analysis and the Investment Adviser’s proprietary system outputs.
The Investment Adviser’s Risk management tool quantifies the tail risk for the Credit portfolio, sectors and issues. The output of this tool factors default frequency, correlations between sectors, seniority in capital structure and recovery values. The Investment Adviser also has credit reviews on a periodic basis where the analyst presents the credit analysis of the names held by a Fund to the group.
For Janus Asia Frontier Markets Fund, Janus Asia Growth Drivers Fund, Janus Asia Fund, Janus Balanced Fund, Janus Emerging Markets Fund, Janus Europe Fund, Janus Global Adaptive Multi-Asset Fund, Janus Global Life Sciences Fund, Janus Global Research Fund, Janus Global Technology Fund, Janus Japan Emerging Opportunities Fund, Janus Japan Fund, Janus Opportunistic Alpha Fund, Janus US Fund, Janus US Research Fund, Janus US Twenty Fund, Janus US Venture Fund, Perkins Global Value Fund, Perkins US Strategic Value Fund, INTECH All-World Minimum Variance Core Fund, INTECH

Notes to the Financial Statements
2 6 6 J a n u s C a p i t a l F u n d s P l c / 3 1 D e c e m b e r 2 0 1 5
European Core Fund, INTECH Global All Country Low Volatility Fund, INTECH Global Dividend Fund, INTECH US Core Fund, and Janus Global Real Estate Fund the majority of the financial assets are equity shares which neither pay interest nor have a maturity date. These assets and liabilities are not subject to significant amounts of risk due to fluctuations in prevailing levels of market interest rates. The cash positions are monitored daily by the Investment Adviser and any overdraft positions are on a short term basis. Any excess cash and cash equivalents are invested at short term interest rates.
Janus Balanced, Janus Flexible Income, Janus Global Flexible Fund, Janus Global High Yield Fund, Janus Global Investment Grade Bond Fund, Janus High Yield Fund, Janus Global Unconstrained Bond Fund, and the Janus US Short-Term Bond Funds invest in floating and fixed rate bonds. The basis of calculation for the floating rate notes is based on the date of change of each coupon rate as opposed to the bond maturity date in the Portfolio Investments. The floating rate notes held by the Funds at the financial year end are tracking the US LIBOR one or three month indices.
The performance of the debt or interest bearing component depends primarily on interest rates. Generally, the value of debt securities will tend to decrease in value when interest rates rise and vice versa. Shorter-term securities are less sensitive to interest rate changes than longer-term securities, but they also usually offer lower yields. Each of the above Funds varies the average maturity profile of its portfolio based on an analysis of interest rate trends and other factors.
Any change to the interest rates relevant for particular securities may result in either income increasing or decreasing, or the Sub-Investment Adviser being unable to secure similar returns on the expiry of contracts or the sale of securities. In addition, changes to prevailing rates or changes in expectations of future rates may result in an increase or decrease in the value of securities held.
At the Balance Sheet date the following sub-funds are exposed to interest rate risk to the extent disclosed in the following Interest Risk Table. It includes for each Sub-Fund the assets and liabilities at fair value, categorised by the earlier of contractual repricing or maturity dates:
Interest rate risk
Janus Balanced Fund Less than Over Non interest Total1 year 1-5 years 5 years bearing 2015
$ $ $ $ $AssetsFinancial assets at fair value through profi t or loss 2,685,490 64,811,670 200,229,331 433,739,446 701,465,937 Cash and foreign currency 18,299,438 — — — 18,299,438 Debtors — — — 4,655,102 4,655,102
Total assets 20,984,928 64,811,670 200,229,331 438,394,548 724,420,477
LiabilitiesFinancial liabilities at fair value through profi t or loss — — — 49,621 49,621 Bank overdraft and foreign currency — — — — — Creditors - amounts falling due within one year 4,483,426 4,483,426
Total liabilities excluding net assets — — — 4,533,047 4,533,047
Total interest sensitivity gap 20,984,928 64,811,670 200,229,331
Janus Flexible Income Fund Less than Over Non interest Total1 year 1-5 years 5 years bearing 2015
$ $ $ $ $
AssetsFinancial assets at fair value through profi t or loss 8,882,936 289,079,255 607,839,452 155,874 905,957,517Cash and foreign currency 15,431,873 — — 15,431,873Debtors — — — 6,918,556 6,918,556
Total assets 24,314,809 289,079,255 607,839,452 7,074,430 928,307,946
LiabilitiesFinancial liabilities at fair value through profi t or loss — — — 11,019 11,019Bank overdraft and foreign currency — — — — —Creditors - amounts falling due within one year — — — 7,367,607 7,367,607
Total liabilities excluding net assets — — — 7,378,626 7,378,626
Total interest sensitivity gap 24,314,809 289,079,255 607,839,452

Notes to the Financial Statements
J a n u s C a p i t a l F u n d s P l c / 3 1 D e c e m b e r 2 0 1 5 2 6 7
Janus Global Flexible Income Fund Less than Over Non interest Total1 year 1-5 years 5 years bearing 2015
$ $ $ $ $AssetsFinancial assets at fair value through profi t or loss 62,895 5,125,234 15,348,832 79,465 20,616,426Cash and foreign currency 830,776 — — — 830,776Debtors — — — 228,422 228,422
Total assets 893,671 5,125,234 15,348,832 307,887 21,675,624
LiabilitiesFinancial liabilities at fair value through profi t or loss — — — 190,065 190,065Bank overdraft and foreign currency — — — — —Creditors - amounts falling due within one year — — — 414,413 414,413
Total liabilities excluding net assets — — — 604,478 604,478
Total interest sensitivity gap 893,671 5,125,234 15,348,832
Janus Global High Yield Fund Less than Over Non interest Total1 year 1-5 years 5 years bearing 2015
$ $ $ $ $
AssetsFinancial assets at fair value through profi t or loss 436,977 20,084,173 24,028,356 278,898 44,828,404Cash and foreign currency 5,252,636 — — — 5,252,636Debtors — — — 919,438 919,438
Total assets 5,689,613 20,084,173 24,028,356 1,198,336 51,000,478
LiabilitiesFinancial liabilities at fair value through profi t or loss — — — 43,284 43,284Bank overdraft and foreign currency — — — — —Creditors - amounts falling due within one year — — — 780,075 780,075
Total liabilities excluding net assets — — — 823,359 823,359
Total interest sensitivity gap 5,689,613 20,084,173 24,028,356
Janus Global Investment Grade Bond Fund Less than Over Non interest Total1 year 1-5 years 5 years bearing 2015
$ $ $ $ $AssetsFinancial assets at fair value through profi t or loss 267,759 9,051,945 33,544,492 53,718 42,917,914Cash and foreign currency 995,295 — — — 995,295Debtors — — — 526,857 526,857
Total assets 1,263,054 9,051,945 33,544,492 580,575 44,440,066
LiabilitiesFinancial liabilities at fair value through profi t or loss — — — 124,167 124,167Bank overdraft and foreign currency — — — — —Creditors - amounts falling due within one year — — — 296,801 296,801
Total liabilities excluding net assets — — — 420,968 420,968
Total interest sensitivity gap 1,263,054 9,051,945 33,544,492
Janus High Yield Fund Less than Over Non interest Total1 year 1-5 years 5 years bearing 2015
$ $ $ $ $
AssetsFinancial assets at fair value through profi t or loss — 218,837,724 336,569,800 2,294,442 557,701,966Cash and foreign currency 70,157,107 — — — 70,157,107Debtors — — — 10,774,741 10,774,741
Total assets 70,157,107 218,837,724 336,569,800 13,069,183 638,633,814
LiabilitiesFinancial liabilities at fair value through profi t or loss — — — 30,065 30,065Bank overdraft and foreign currency — — — — —Creditors - amounts falling due within one year — — — 13,544,752 13,544,752
Total liabilities excluding net assets — — — 13,574,817 13,574,817
Total interest sensitivity gap 70,157,107 218,837,724 336,569,800

Notes to the Financial Statements
2 6 8 J a n u s C a p i t a l F u n d s P l c / 3 1 D e c e m b e r 2 0 1 5
Janus Global Unconstrained Bond Fund Less than Over Non interest Total1 year 1-5 years 5 years bearing 2015
$ $ $ $ $AssetsFinancial assets at fair value through profi t or loss — 57,355,348 19,121,632 7,230,760 83,707,740 Cash and foreign currency 22,946,433 — — — 22,946,433 Debtors — — — 771,277 771,277
Total assets 22,946,433 57,355,348 19,121,632 8,002,037 107,425,450
LiabilitiesFinancial liabilities at fair value through profi t or loss (25,533) — — 422,196 396,663 Bank overdraft and foreign currency — — — — —Creditors - amounts falling due within one year — — — 331,394 331,394
Total liabilities excluding net assets (25,533) — — 753,590 728,057
Total interest sensitivity gap 22,920,900 57,355,348 19,121,632
Janus US Short-Term Bond Fund Less than Over Non interest Total1 year 1-5 years 5 years bearing 2015
$ $ $ $ $
AssetsFinancial assets at fair value through profi t or loss — 314,865,109 22,661,787 23,098 337,549,994Cash and foreign currency 11,981,991 — — — 11,981,991Debtors — — — 1,793,873 1,793,873
Total assets 11,981,991 314,865,109 22,661,787 1,816,971 351,325,858
LiabilitiesFinancial liabilities at fair value through profi t or loss — — — 10,137 10,137Bank overdraft and foreign currency — — — — —Creditors - amounts falling due within one year — — — 9,858,537 9,858,537
Total liabilities excluding net assets — — — 9,868,674 9,868,674
Total interest sensitivity gap 11,981,991 314,865,109 22,661,787
The interest rate profile of these Funds’ financial assets and liabilities at 31 December 2014 was:Interest rate risk
Janus Balanced Fund Less than Over Non interest Total1 year 1-5 years 5 years bearing 2014
$ $ $ $ $AssetsFinancial assets at fair value through profi t or loss 4,632,242 148,930,845 237,008,217 248,823,674 639,394,978Cash and foreign currency 4,005,597 — — — 4,005,597Debtors — — — 5,637,668 5,637,668
Total assets 8,637,839 148,930,845 237,008,217 254,461,342 649,038,243
LiabilitiesFinancial liabilities at fair value through profi t or loss — — — 1,871,364 1,871,364Bank overdraft and foreign currency — — — — —Creditors - amounts falling due within one year — — — 2,720,719 2,720,719
Total liabilities excluding net assets — — — 4,592,083 4,592,083
Total interest sensitivity gap 8,637,839 148,930,845 237,008,217
Janus Flexible Income Fund Less than Over Non interest Total1 year 1-5 years 5 years bearing 2014
$ $ $ $ $
AssetsFinancial assets at fair value through profi t or loss 20,440,471 351,351,934 582,994,223 20,648 954,807,276Cash and foreign currency 3,930,437 — — — 3,930,437Debtors — — — 8,819,222 8,819,222
Total assets 24,370,908 351,351,934 582,994,223 8,839,870 967,556,935
LiabilitiesFinancial liabilities at fair value through profi t or loss — — — 3,743,363 3,743,363Bank overdraft and foreign currency — — — — —Creditors - amounts falling due within one year — — — 2,038,591 2,038,591
Total liabilities excluding net assets — — — 5,781,954 5,781,954
Total interest sensitivity gap 24,370,908 351,351,934 582,994,223

Notes to the Financial Statements
J a n u s C a p i t a l F u n d s P l c / 3 1 D e c e m b e r 2 0 1 5 2 6 9
Janus Global Flexible Income Fund Less than Over Non interest Total1 year 1-5 years 5 years bearing 2014
$ $ $ $ $AssetsFinancial assets at fair value through profi t or loss 157,379 8,240,912 12,723,413 212,079 21,333,783Cash and foreign currency 314,923 — — — 314,923Debtors — — — 285,324 285,324
Total assets 472,302 8,240,912 12,723,413 497,403 21,934,030
LiabilitiesFinancial liabilities at fair value through profi t or loss — — — 250,278 250,278Bank overdraft and foreign currency 190,017 — — — 190,017Creditors - amounts falling due within one year — — — 80,096 80,096
Total liabilities excluding net assets 190,017 — — 330,374 520,391
Total interest sensitivity gap 282,285 8,240,912 12,723,413
Janus Global High Yield Fund Less than Over Non interest Total1 year 1-5 years 5 years bearing 2014
$ $ $ $ $
AssetsFinancial assets at fair value through profi t or loss 4,242,977 21,743,064 51,190,703 519,813 77,696,557Cash and foreign currency 1,614,777 — — — 1,614,777Debtors — — — 1,553,081 1,553,081
Total assets 5,857,754 21,743,064 51,190,703 2,072,894 80,864,415
LiabilitiesFinancial liabilities at fair value through profi t or loss — — — 591,594 591,594Bank overdraft and foreign currency 1,312,358 — — — 1,312,358Creditors - amounts falling due within one year — — — 427,910 427,910
Total liabilities excluding net assets 1,312,358 — — 1,019,504 2,331,862
Total interest sensitivity gap 4,545,396 21,743,064 51,190,703
Janus Global Investment Grade Bond Fund Less than Over Non interest Total1 year 1-5 years 5 years bearing 2014
$ $ $ $ $AssetsFinancial assets at fair value through profi t or loss 379,145 18,462,595 43,902,756 396,242 63,140,738Cash and foreign currency 3,026,115 — — — 3,026,115Debtors — — — 1,103,914 1,103,914
Total assets 3,405,260 18,462,595 43,902,756 1,500,156 67,270,767
LiabilitiesFinancial liabilities at fair value through profi t or loss — — — 249,739 249,739Bank overdraft and foreign currency — — — — —Creditors - amounts falling due within one year — — — 235,372 235,372
Total liabilities excluding net assets — — — 485,111 485,111
Total interest sensitivity gap 3,405,260 18,462,595 43,902,756
Janus High Yield Fund Less than Over Non interest Total1 year 1-5 years 5 years bearing 2014
$ $ $ $ $
AssetsFinancial assets at fair value through profi t or loss 16,977,571 196,355,252 535,112,798 5,634,612 754,080,233Cash and foreign currency 48,237,166 — — — 48,237,166Debtors — — — 14,847,466 14,847,466
Total assets 65,214,737 196,355,252 535,112,798 20,482,078 817,164,865
LiabilitiesFinancial liabilities at fair value through profi t or loss — — — 1,704,712 1,704,712Bank overdraft and foreign currency — — — — —Creditors - amounts falling due within one year — — — 2,569,422 2,569,422
Total liabilities excluding net assets — — — 4,274,134 4,274,134
Total interest sensitivity gap 65,214,737 196,355,252 535,112,798
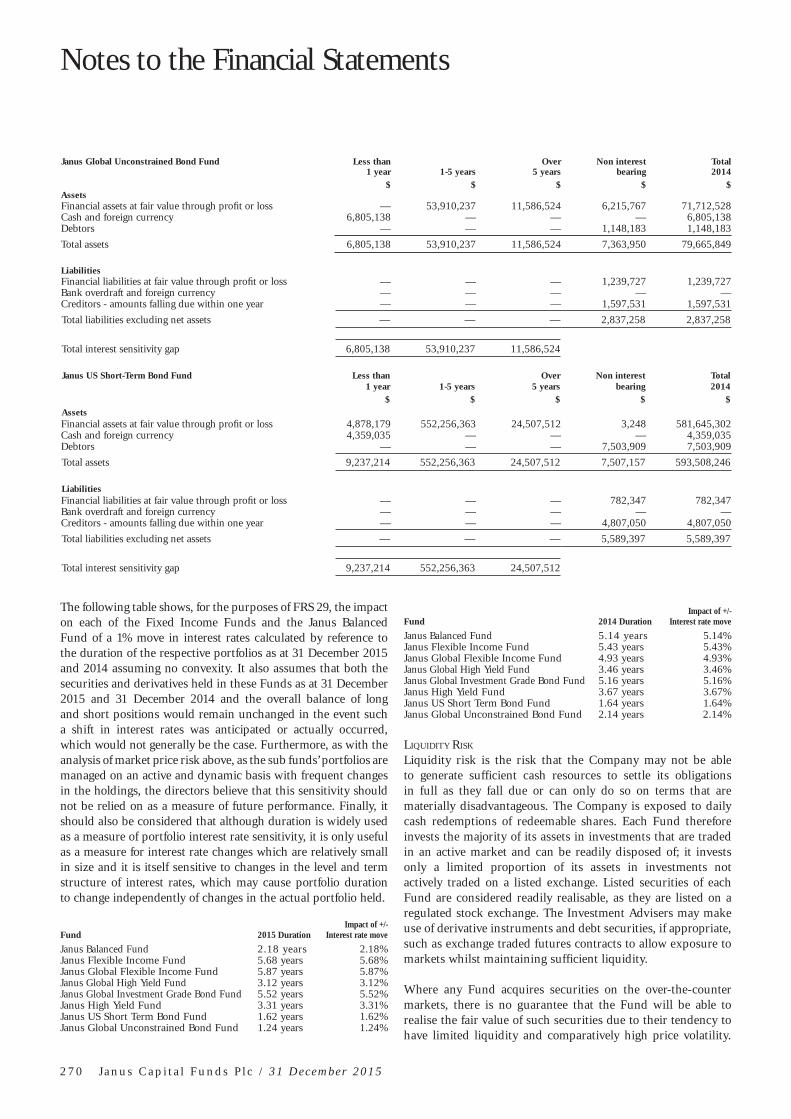
Notes to the Financial Statements
2 7 0 J a n u s C a p i t a l F u n d s P l c / 3 1 D e c e m b e r 2 0 1 5
Janus Global Unconstrained Bond Fund Less than Over Non interest Total1 year 1-5 years 5 years bearing 2014
$ $ $ $ $AssetsFinancial assets at fair value through profi t or loss — 53,910,237 11,586,524 6,215,767 71,712,528Cash and foreign currency 6,805,138 — — — 6,805,138Debtors — — — 1,148,183 1,148,183
Total assets 6,805,138 53,910,237 11,586,524 7,363,950 79,665,849
LiabilitiesFinancial liabilities at fair value through profi t or loss — — — 1,239,727 1,239,727Bank overdraft and foreign currency — — — — —Creditors - amounts falling due within one year — — — 1,597,531 1,597,531
Total liabilities excluding net assets — — — 2,837,258 2,837,258
Total interest sensitivity gap 6,805,138 53,910,237 11,586,524
Janus US Short-Term Bond Fund Less than Over Non interest Total1 year 1-5 years 5 years bearing 2014
$ $ $ $ $
AssetsFinancial assets at fair value through profi t or loss 4,878,179 552,256,363 24,507,512 3,248 581,645,302Cash and foreign currency 4,359,035 — — — 4,359,035Debtors — — — 7,503,909 7,503,909
Total assets 9,237,214 552,256,363 24,507,512 7,507,157 593,508,246
LiabilitiesFinancial liabilities at fair value through profi t or loss — — — 782,347 782,347Bank overdraft and foreign currency — — — — —Creditors - amounts falling due within one year — — — 4,807,050 4,807,050
Total liabilities excluding net assets — — — 5,589,397 5,589,397
Total interest sensitivity gap 9,237,214 552,256,363 24,507,512
The following table shows, for the purposes of FRS 29, the impact on each of the Fixed Income Funds and the Janus Balanced Fund of a 1% move in interest rates calculated by reference to the duration of the respective portfolios as at 31 December 2015 and 2014 assuming no convexity. It also assumes that both the securities and derivatives held in these Funds as at 31 December 2015 and 31 December 2014 and the overall balance of long and short positions would remain unchanged in the event such a shift in interest rates was anticipated or actually occurred, which would not generally be the case. Furthermore, as with the analysis of market price risk above, as the sub funds’ portfolios are managed on an active and dynamic basis with frequent changes in the holdings, the directors believe that this sensitivity should not be relied on as a measure of future performance. Finally, it should also be considered that although duration is widely used as a measure of portfolio interest rate sensitivity, it is only useful as a measure for interest rate changes which are relatively small in size and it is itself sensitive to changes in the level and term structure of interest rates, which may cause portfolio duration to change independently of changes in the actual portfolio held.
Fund 2015 DurationImpact of +/-
Interest rate move
Janus Balanced Fund 2.18 years 2.18%Janus Flexible Income Fund 5.68 years 5.68%Janus Global Flexible Income Fund 5.87 years 5.87%Janus Global High Yield Fund 3.12 years 3.12%Janus Global Investment Grade Bond Fund 5.52 years 5.52%Janus High Yield Fund 3.31 years 3.31%Janus US Short Term Bond Fund 1.62 years 1.62%Janus Global Unconstrained Bond Fund 1.24 years 1.24%
Fund 2014 DurationImpact of +/-
Interest rate move
Janus Balanced Fund 5.14 years 5.14%Janus Flexible Income Fund 5.43 years 5.43%Janus Global Flexible Income Fund 4.93 years 4.93%Janus Global High Yield Fund 3.46 years 3.46%Janus Global Investment Grade Bond Fund 5.16 years 5.16%Janus High Yield Fund 3.67 years 3.67%Janus US Short Term Bond Fund 1.64 years 1.64%Janus Global Unconstrained Bond Fund 2.14 years 2.14%
LIQUIDITY RISK
Liquidity risk is the risk that the Company may not be able to generate sufficient cash resources to settle its obligations in full as they fall due or can only do so on terms that are materially disadvantageous. The Company is exposed to daily cash redemptions of redeemable shares. Each Fund therefore invests the majority of its assets in investments that are traded in an active market and can be readily disposed of; it invests only a limited proportion of its assets in investments not actively traded on a listed exchange. Listed securities of each Fund are considered readily realisable, as they are listed on a regulated stock exchange. The Investment Advisers may make use of derivative instruments and debt securities, if appropriate, such as exchange traded futures contracts to allow exposure to markets whilst maintaining sufficient liquidity.
Where any Fund acquires securities on the over-the-counter markets, there is no guarantee that the Fund will be able to realise the fair value of such securities due to their tendency to have limited liquidity and comparatively high price volatility.

Notes to the Financial Statements
J a n u s C a p i t a l F u n d s P l c / 3 1 D e c e m b e r 2 0 1 5 2 7 1
The Company has the ability to borrow in the short term to ensure settlement. In order to manage the Company’s overall liquidity and to facilitate an orderly disposition of securities the Directors are able to refuse to repurchase any shares in excess of one tenth of the shares in issue in a Fund on any one valuation day by way of the provisions in the prospectus. The Company did not withhold any redemptions during 2015 and 2014.
All securities investments present a risk of loss of capital. The maximum loss of capital on purchased options, long equity and debt securities is limited to the fair value of those positions. On written call options, and short future positions the maximum loss of capital can be unlimited. The maximum loss of capital on written put options, long futures and forward currency contracts is limited to the notional contract values of those positions. Credit default swaps are transactions under which the parties’ obligations depend on whether a credit event has occurred in relation to the reference asset. The credit events are specified in the contract and are intended to identify the occurrence of a significant deterioration in the creditworthiness of the reference asset. The buyer in a credit default swap contract is obligated to pay the seller a periodic stream of payments over the term of the contract provided that no event of default on an underlying reference asset has occurred. If a credit event occurs, the seller must pay the buyer the full notional value of the reference asset that may have little or no value.
The assets of the Funds comprise mainly readily realizable securities. The main liability of the Funds tends to be outstanding payables on the purchase of investments and the redemption of
any redeemable ordinary Shares that investors wish to sell. Substantially all financial liabilities of each sub fund are payable within two months.
CREDIT RISK
The Company will be exposed to a credit risk on parties with whom it trades and will also bear the risk of settlement default. The Company minimises concentrations of credit risk by undertaking transactions with a large number of customers and counterparties on recognised and reputable exchanges.
All Fund assets are currently held within Citibank International Limited, Ireland branch’s depositary network, with the exception of Term Loans and Financial Derivative Instruments as appropriate. Bankruptcy or insolvency of the Depositary may cause Funds’ rights with respect to securities held by the Depositary to be delayed or limited. The Company monitors this risk by monitoring the credit quality and financial position of the Depositary. The Depositary’s credit rating at 31 December 2015 is A (31 December 2014: A).
The Company may invest in financial assets which are rated (by well known rating agencies) or unrated. Unrated securities are treated by the Investment Adviser as non-investment grade securities unless the Investment Adviser or relevant Sub-Investment Adviser determines that such securities are the equivalent of investment grade securities.
Details of the credit rating carried of investments held in corporate and government bonds are as follows:
As at 31 December 2015
Janus Balanced
Fund
Janus Global Life
Sciences Fund
Janus Flexible Income
Fund
Janus Global
Flexible Income Fund
Janus Global
High Yield Fund
Janus Global Investment
Grade Bond Fund
Janus High Yield
Fund
Janus US Short Term Bond Fund
Janus Global Unconstrained
Bond Fund
Janus Global Diversifi ed
Alternatives Fund
Rating % % % % % % % % % %A 1.8% — 4.4% 15.6% — 16.9% — 9.4% 5.7% — AA 0.5% — 1.2% 14.2% — 5.3% — 4.3% 0.1% — AAA 8.3% — — 15.8% — — — 36.6% — — B 0.5% — 0.8% 3.6% 43.5% 2.1% 38.5% 0.4% 4.4% — BB 4.5% — 10.5% 8.4% 25.2% 15.4% 29.2% 8.9% 26.2% — BBB 12.6% — 29.3% 36.1% 0.3% 55.1% 3.2% 35.5% 21.9% — C — — — — — — — — 0.7% — CC — — — — — — — — 0.6% — CCC 0.2% — — 0.5% 14.7% — 12.0% — 6.1% — D — — — — 0.7% — 0.2% — 3.4% — Unrated 69.1% — 52.2% 3.2% 4.8% 2.6% 6.1% 3.8% 9.0% 53.1%
As at 31 December 2014
Janus Balanced
Fund
Janus Global Life
Sciences Fund
Janus Flexible Income
Fund
Janus Global
Flexible Income Fund
Janus Global
High Yield Fund
Janus Global Investment
Grade Bond Fund
Janus High Yield
Fund
Janus US Short Term Bond Fund
Janus Global Unconstrained
Bond Fund
Janus Global Diversifi ed
Alternatives Fund
Rating % % % % % % % % % %A 1.5% — 4.2% 11.6% — 22.5% — 15.3% 4.0% —AA 0.3% — 1.0% 18.6% — 4.7% — 3.1% 2.2% —AAA — — 0.1% 8.3% — 1.5% — 2.2% — —B 6.8% — 1.6% 2.3% 45.3% 2.0% 45.3% 2.3% 4.1% —BB 9.6% — 14.9% 11.4% 25.6% 14.3% 25.6% 10.2% 33.2% —BBB 9.2% — 23.8% 26.5% — 46.4% — 33.7% 29.0% —C — — — — — — — — 1.1% —CCC 1.9% — — — 16.4% — 16.4% — 1.3% —D — — — — — — — — 1.1% —Unrated 31.3% — 53.6% 19.9% 4.8% 2.6% 4.8% 32.2% 9.3% 73.1%

Notes to the Financial Statements
2 7 2 J a n u s C a p i t a l F u n d s P l c / 3 1 D e c e m b e r 2 0 1 5
COUNTERPARTY RISK
JCIL undertakes a detailed review of all counterparties before any arrangements are entered into. The credit quality of all counterparties is monitored on a regular basis. JCIL reports to the board on a commitment basis as part of the UCITS IV monthly reporting.
Details of the counterparties are included in the Portfolio Investments.
FAIR VALUE ESTIMATION
The Company under FRS 102 is required to classify fair value measurements for Funds using a fair value hierarchy that reflects the significance of the inputs used in making the measurements.
In March 2016 amendments were made to paragraphs 34.22 and 34.42 of FRS 102, revising the fair value hierarchy disclosure requirements. An entity shall apply these amendments for accounting periods beginning on or after 1 January 2017. Early application is permitted. The Company has early adopted the amendment to FRS102.
For financial instruments held at fair value in the statement of financial position, a financial institution shall disclose for each class of financial instrument, an analysis of the level in the following fair value hierarchy into which the fair value measurements are categorised. A fair value measurement is categorised in its entirety on the basis of the lowest level input that is significant to the fair value measurement in its entirety.
• Level 1: The unadjusted quoted price in an active market for identical assets or liabilities that the entity can access at the measurement date.
• Level 2: Inputs other than quoted prices included within Level 1 that are observable (ie developed using market data) for the asset or liability, either directly or indirectly.
• Level 3: Inputs are unobservable (ie for which market data is unavailable) for the asset or liability.
The inputs or methodology used for valuing securities are not necessarily an indication of the risk associated with investing in those securities. The table below provides a summary within the fair value hierarchy of the Fund’s financial assets and liabilities measured at last traded prices at 31 December 2015.
31 December 2015
Level 1 - Quoted Prices
Level 2 - Other Signifi cant
Observable Inputs
Level 3 - Signifi cant
Unobservable Inputs Total
Janus Asia Frontier Markets FundCommon Stocks $ 2,226,132 $ — $ — $ 2,226,132 Exchange Traded Funds 102,396 — — 102,396Forward Currency Contracts — 2,938 — 2,938Total Investments in Securities 2,328,528 2,938 — 2,331,466
Janus Asia Growth Drivers FundCommon Stocks $ 2,189,555 $ — $ — $ 2,189,555 Exchange Traded Funds 79,866 — — 79,866Forward Currency Contracts — (10) — (10)Total Investments in Securities 2,269,421 (10) — 2,269,411
Janus Asia FundCommon Stocks $ 90,153,672 $ — $ — $ 90,153,672 Forward Currency Contracts — 111 — 111Fully Funded Equity Swaps — 6,631,001 — 6,631,001Options Purchased — 224,861 — 224,861Preferred Stocks — 1,540,218 — 1,540,218Total Return Swaps — 264,346 — 264,346Total Investments in Securities 90,153,672 8,660,537 — 98,814,209
Janus Balanced FundCommon Stocks $ 433,417,430 $ — $ — $ 433,417,430 Corporate Bonds — 117,794,046 — 117,794,046Mortgage Backed Securities — 61,062,038 — 61,062,038Government Obligations — 59,003,243 — 59,003,243Asset Backed Securities — 19,500,614 — 19,500,614Preferred Stocks — 3,355,650 — 3,355,650Tranche Loans — 7,010,900 — 7,010,900Forward Currency Contracts — 272,395 — 272,395Total Investments in Securities 433,417,430 267,998,886 — 701,416,316

Notes to the Financial Statements
J a n u s C a p i t a l F u n d s P l c / 3 1 D e c e m b e r 2 0 1 5 2 7 3
31 December 2015
Level 1 - Quoted Prices
Level 2 - Other Signifi cant
Observable Inputs
Level 3 - Signifi cant
Unobservable Inputs Total
Janus Emerging Markets FundCommon Stocks $ 102,849,104 $ — $ — $ 102,849,104 Forward Currency Contracts — (14,491) — (14,491)Fully Funded Equity Swaps — 5,199,077 — 5,199,077Options Purchased — 224,002 — 224,002Preferred Stocks — 1,132,595 — 1,132,595Total Return Swaps — 50,660 — 50,660Warrant — 1,381 — 1,381Total Investments in Securities 102,849,104 6,593,224 — 109,442,328
Janus Europe FundCommon Stocks € 134,366,889 € — € — € 134,366,889 Corporate Bonds — — 3,680,000 3,680,000Forward Currency Contracts — 93,096 — 93,096Preferred Stocks — 757,426 — 757,426Total Return Swaps — 62,103 — 62,103Warrant — 129,321 — 129,321Total Investments in Securities 134,366,889 1,041,946 3,680,000 139,088,835
Janus Global Life Sciences FundCommon Stocks $ 1,889,723,011 $ — $ 43,890,894 $ 1,933,613,905 Corporate Bonds — 8,976,695 — 8,976,695Forward Currency Contracts — 359,273 — 359,273Total Investments in Securities 1,889,723,011 9,335,968 43,890,894 1,942,949,873
Janus Global Research FundCommon Stocks $ 38,783,759 $ — $ — $ 38,783,759 Forward Currency Contracts — 285 — 285Total Investments in Securities 38,783,759 285 — 38,784,044
Janus Global Technology FundCommon Stocks $ 59,141,405 $ — $ — $ 59,141,405 Forward Currency Contracts — 29,031 — 29,031Total Investments in Securities 59,141,405 29,031 — 59,170,436
Janus Japan Emerging Opportunities FundCommon Stocks ¥ 389,148,700 ¥ — ¥ — ¥ 389,148,700Forward Currency Contracts — (2,431,305) — (2,431,305)Total Investments in Securities 389,148,700 (2,431,305) — 386,717,395
Janus Japan FundCommon Stocks ¥ 232,148,276 ¥ — ¥ — ¥ 232,148,276Forward Currency Contracts — (1,504,070) — (1,504,070)Total Investments in Securities 232,148,276 (1,504,070) — 230,644,206
Janus Opportunistic Alpha FundCommon Stocks $ 48,133,848 $ — $ 310,430 $ 48,444,278 Forward Currency Contracts — 2,459 — 2,459Total Investments in Securities 48,133,848 2,459 310,430 48,446,737
Janus US FundCommon Stocks $ 1,760,365 $ — $ — $ 1,760,365 Forward Currency Contracts — 333 — 333Total Investments in Securities 1,760,365 333 — 1,760,698
Janus US Research FundCommon Stocks $ 191,743,008 $ — $ — $ 191,743,008 Forward Currency Contracts — 262 — 262Total Investments in Securities 191,743,008 262 — 191,743,270

Notes to the Financial Statements
2 7 4 J a n u s C a p i t a l F u n d s P l c / 3 1 D e c e m b e r 2 0 1 5
31 December 2015
Level 1 - Quoted Prices
Level 2 - Other Signifi cant
Observable Inputs
Level 3 - Signifi cant
Unobservable Inputs Total
Janus US Twenty FundCommon Stocks $ 361,014,490 $ — $ — $ 361,014,490 Forward Currency Contracts — 31,423 — 31,423Total Investments in Securities 361,014,490 31,423 — 361,045,913
Janus US Venture Fund Common Stocks $ 206,115,675 $ — $ — $ 206,115,675 Forward Currency Contracts — 85,652 — 85,652Total Investments in Securities 206,115,675 85,652 — 206,201,327
Perkins Global Value FundCommon Stocks $ 152,774,056 $ — $ — $ 152,774,056 Forward Currency Contracts — (166,765) — (166,765)Total Investments in Securities 152,774,056 (166,765) — 152,607,291
Perkins US Strategic Value FundCommon Stocks $ 196,932,166 $ — $ — $ 196,932,166 Forward Currency Contracts — 8,845 — 8,845Total Investments in Securities 196,932,166 8,845 — 196,941,011
INTECH All-World Minimum Variance Core Fund(a) Common Stocks $ 755,749,988 $ — $ — $ 755,749,988 Forward Currency Contracts - (14,350,442) — (14,350,442)Preferred Stocks — 324,113 — 324,113Total Investments in Securities 755,749,988 (14,026,329) — 741,723,659
INTECH European Core FundCommon Stocks € 95,280,358 € — € — € 95,280,358 Total Investments in Securities 95,280,358 — — 95,280,358
INTECH Global All Country Low Volatility FundCommon Stocks $ 160,439,433 $ — $ 63,425 $ 160,502,858 Preferred Stocks — 208,243 — 208,243Total Investments in Securities 160,439,433 208,243 63,425 160,711,101
INTECH Global Dividend FundCommon Stocks $ 1,828,859 $ — $ — $ 1,828,859 Forward Currency Contracts — 22 — 22Total Investments in Securities 1,828,859 22 — 1,828,881
INTECH US Core FundCommon Stocks $ 165,595,381 $ — $ — $ 165,595,381 Forward Currency Contracts — 10,891 — 10,891Total Investments in Securities 165,595,381 10,891 — 165,606,272
Janus Global Diversifi ed Alternatives FundFutures $ — $ (10,017) $ — $ (10,017)Forward Currency Contracts — 440 — 440Government Obligations — 1,199,751 — 1,199,751Total Return Swaps — (8,350) — (8,350)Total Investments in Securities — 1,181,824 — 1,181,824
Janus Global Real Estate FundCommon Stocks $ 127,324,447 $ — $ — $ 127,324,447 Corporate Bonds — 346,132 — 346,132Forward Currency Contracts — (10,885) — (10,885)Total Investments in Securities 127,324,447 335,247 — 127,659,694
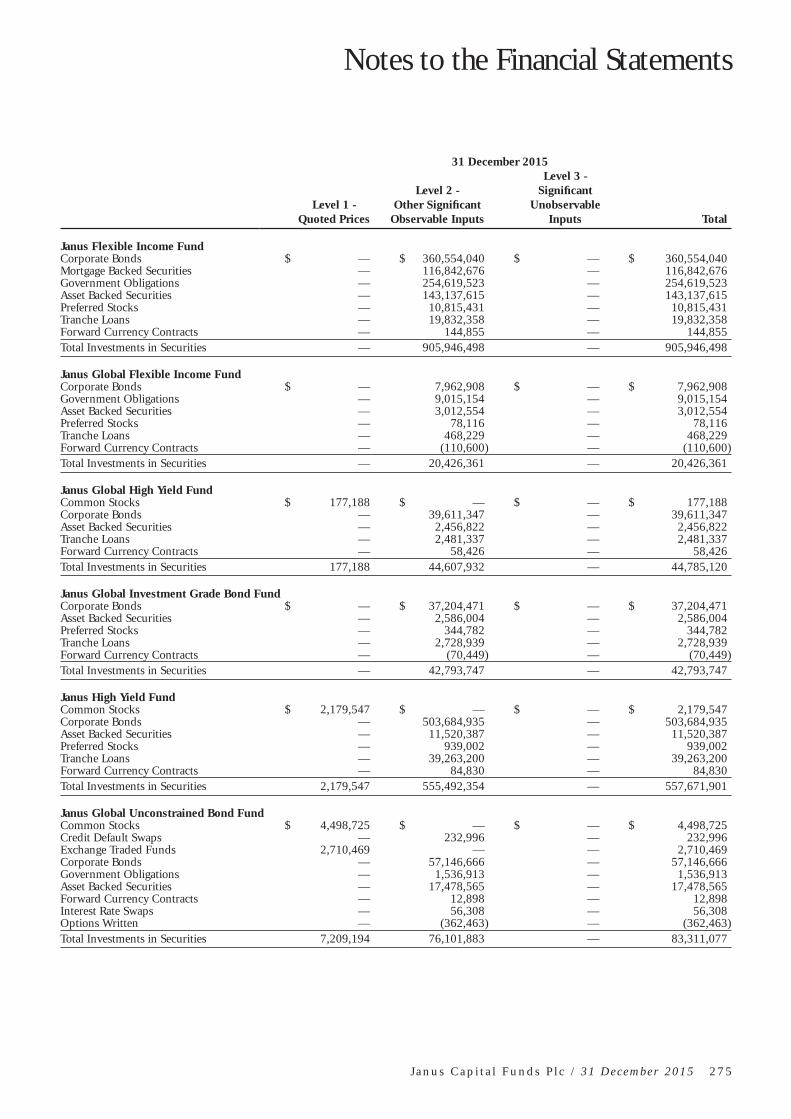
Notes to the Financial Statements
J a n u s C a p i t a l F u n d s P l c / 3 1 D e c e m b e r 2 0 1 5 2 7 5
31 December 2015
Level 1 - Quoted Prices
Level 2 - Other Signifi cant
Observable Inputs
Level 3 - Signifi cant
Unobservable Inputs Total
Janus Flexible Income FundCorporate Bonds $ — $ 360,554,040 $ — $ 360,554,040 Mortgage Backed Securities — 116,842,676 — 116,842,676Government Obligations — 254,619,523 — 254,619,523Asset Backed Securities — 143,137,615 — 143,137,615Preferred Stocks — 10,815,431 — 10,815,431Tranche Loans — 19,832,358 — 19,832,358Forward Currency Contracts — 144,855 — 144,855Total Investments in Securities — 905,946,498 — 905,946,498
Janus Global Flexible Income FundCorporate Bonds $ — 7,962,908 $ — $ 7,962,908 Government Obligations — 9,015,154 — 9,015,154Asset Backed Securities — 3,012,554 — 3,012,554Preferred Stocks — 78,116 — 78,116Tranche Loans — 468,229 — 468,229Forward Currency Contracts — (110,600) — (110,600)Total Investments in Securities — 20,426,361 — 20,426,361
Janus Global High Yield Fund Common Stocks $ 177,188 $ — $ — $ 177,188 Corporate Bonds — 39,611,347 — 39,611,347Asset Backed Securities — 2,456,822 — 2,456,822Tranche Loans — 2,481,337 — 2,481,337Forward Currency Contracts — 58,426 — 58,426Total Investments in Securities 177,188 44,607,932 — 44,785,120
Janus Global Investment Grade Bond FundCorporate Bonds $ — $ 37,204,471 $ — $ 37,204,471 Asset Backed Securities — 2,586,004 — 2,586,004Preferred Stocks — 344,782 — 344,782Tranche Loans — 2,728,939 — 2,728,939Forward Currency Contracts — (70,449) — (70,449)Total Investments in Securities — 42,793,747 — 42,793,747
Janus High Yield FundCommon Stocks $ 2,179,547 $ — $ — $ 2,179,547 Corporate Bonds — 503,684,935 — 503,684,935Asset Backed Securities — 11,520,387 — 11,520,387Preferred Stocks — 939,002 — 939,002Tranche Loans — 39,263,200 — 39,263,200Forward Currency Contracts — 84,830 — 84,830Total Investments in Securities 2,179,547 555,492,354 — 557,671,901
Janus Global Unconstrained Bond FundCommon Stocks $ 4,498,725 $ — $ — $ 4,498,725 Credit Default Swaps — 232,996 — 232,996Exchange Traded Funds 2,710,469 — — 2,710,469Corporate Bonds — 57,146,666 — 57,146,666Government Obligations — 1,536,913 — 1,536,913Asset Backed Securities — 17,478,565 — 17,478,565Forward Currency Contracts — 12,898 — 12,898Interest Rate Swaps — 56,308 — 56,308Options Written — (362,463) — (362,463)Total Investments in Securities 7,209,194 76,101,883 — 83,311,077

Notes to the Financial Statements
2 7 6 J a n u s C a p i t a l F u n d s P l c / 3 1 D e c e m b e r 2 0 1 5
31 December 2015
Level 1 - Quoted Prices
Level 2 - Other Signifi cant
Observable Inputs
Level 3 - Signifi cant
Unobservable Inputs Total
Janus US Short-Term Bond FundCorporate Bonds $ — $ 182,890,048 $ — $ 182,890,048 Government Obligations — 114,515,196 — 114,515,196Asset Backed Securities — 25,063,368 — 25,063,368Tranche Loans — 15,058,284 — 15,058,284Forward Currency Contracts — 12,961 — 12,961Total Investments in Securities — 337,539,857 — 337,539,857
As at 31 December 2015, the analysis of fair value hierarchy is based on last traded prices.
Forward currency contracts, future contracts and swap contracts are reported at their unrealised appreciation/(depreciation) at measurement date, which represents the change in the contract’s value from trade date. Options are reported at their market value at the measurement date as at 31 December 2015.
31 December 2014
Level 1 - Quoted Prices
Level 2 - Other Signifi cant
Observable Inputs
Level 3 - Signifi cant
Unobservable Inputs Total
Janus Asia Frontier Markets FundCommon Stocks $ 2,660,660 $ — $ — $ 2,660,660Exchange Traded Funds 127,443 — — 127,443Forward Currency Contracts — (6,155) — (6,155)Total Investments in Securities 2,788,103 (6,155) — 2,781,948
Janus Asia Growth Drivers FundCommon Stocks $ 65,964 $ 2,461,714 $ — $ 2,527,678Exchange Traded Funds 129,660 — — 129,660Forward Currency Contracts — (6,083) — (6,083)Total Investments in Securities 195,624 2,455,631 — 2,651,255
Janus Asia FundCommon Stocks $ 2,885,566 $ 94,690,348 $ — $ 97,575,914Forward Currency Contracts — (338) — (338)Fully Funded Equity Swaps — 8,897,100 — 8,897,100Preferred Stocks — 1,092,110 — 1,092,110Total Return Swaps — 899,930 — 899,930Total Investments in Securities 2,885,566 105,579,150 — 108,464,716
Janus Balanced FundCommon Stocks $ 243,971,520 $ 4,806,600 $ — $ 248,778,120Corporate Bonds — 166,830,034 — 166,830,034Mortgage Backed Securities — 48,922,127 — 48,922,127Government Obligations — 152,366,176 — 152,366,176Asset Backed Securities — 12,989,363 — 12,989,363Preferred Stocks — 4,041,880 — 4,041,880Tranche Loans — 5,421,722 — 5,421,722Forward Currency Contracts — (1,825,808) — (1,825,808)Total Investments in Securities 243,971,520 393,552,094 — 637,523,614
Janus Emerging Markets FundCommon Stocks $ 1,130,465 $ 2,964,989 $ — $ 4,095,454Forward Currency Contracts — (25,247) — (25,247)Fully Funded Equity Swaps — 175,266 — 175,266Preferred Stocks — 34,626 — 34,626Total Return Swaps — 18,441 — 18,441Total Investments in Securities 1,130,465 3,168,075 — 4,298,540

Notes to the Financial Statements
J a n u s C a p i t a l F u n d s P l c / 3 1 D e c e m b e r 2 0 1 5 2 7 7
31 December 2014
Level 1 - Quoted Prices
Level 2 - Other Signifi cant
Observable Inputs
Level 3 - Signifi cant
Unobservable Inputs Total
Janus Europe FundCommon Stocks € 4,854,923 € 202,098,795 € — € 206,953,718Warrant — 418,112 — 418,112Forward Currency Contracts — 213,721 — 213,720Options Written — (1,653,477) — (1,653,476)Total Return Swaps — 364,309 — 364,309Total Investments in Securities 4,854,923 201,441,460 — 206,296,383
Janus Global Life Sciences FundCommon Stocks $ 615,407,696 $ 69,455,141 $ 3,373,120 $ 688,235,957Forward Currency Contracts — (1,006,320) — (1,006,320)Total Investments in Securities 615,407,696 68,448,821 3,373,120 687,229,637
Janus Global Research FundCommon Stocks $ 28,633,158 $ 11,605,157 $ — $ 40,238,315Forward Currency Contracts — (23,853) — (23,853)Total Investments in Securities 28,633,158 11,581,304 — 40,214,462
Janus Global Technology FundCommon Stocks $ 70,566,154 $ 9,099,726 $ — $ 79,665,880Forward Currency Contracts — (233,204) — (233,204)Options Written — (15,684) — (15,684)Total Investments in Securities 70,566,154 8,850,838 — 79,416,992
Janus Japan Emerging Opportunities Fund(a)
Common Stocks ¥ 344,769,150 ¥ — ¥ — ¥ 344,769,150Forward Currency Contracts — (337,591) — (337,591)Total Investments in Securities 344,769,150 (337,591) — 344,435,544
Janus Japan Fund(a)
Common Stocks ¥ 216,788,650 ¥ — ¥ — ¥ 216,788,650Forward Currency Contracts — (207,672) — (207,672)Total Investments in Securities 216,788,650 (207,672) — 216,580,978
Janus Opportunistic Alpha FundCommon Stocks $ 90,516,694 $ — $ — $ 90,516,694Forward Currency Contracts — (231,442) — (231,442)Total Investments in Securities 90,516,694 (231,442) — 90,285,252
Janus US FundCommon Stocks $ 1,563,732 $ 52,050 $ — $ 1,615,782Forward Currency Contracts — (9,164) — (9,164)Options Purchased — 3,194 — 3,194Options Written — (591) — (591)Total Investments in Securities 1,563,732 45,489 — 1,609,658
Janus US Research FundCommon Stocks $ 189,674,555 $ — $ — $ 189,674,555Forward Currency Contracts — (23,935) — (23,935)Total Investments in Securities 189,674,555 (23,935) — 189,650,620
Janus US Twenty FundCommon Stocks $ 341,364,477 $ 3,500,760 $ — $ 344,865,237Forward Currency Contracts — (690,224) — (690,224)Options Purchased — 253,273 — 253,273Total Investments in Securities 341,364,477 3,063,809 — 344,428,286
Janus US Venture FundCommon Stocks $ 258,899,080 $ 4,767,382 $ 2,301,092 $ 265,967,554Exchange Traded Funds 7,040,816 — — 7,040,816Forward Currency Contracts — (543,378) — (543,378)Total Investments in Securities 265,939,896 4,224,004 2,301,092 272,464,992

Notes to the Financial Statements
2 7 8 J a n u s C a p i t a l F u n d s P l c / 3 1 D e c e m b e r 2 0 1 5
31 December 2014
Level 1 - Quoted Prices
Level 2 - Other Signifi cant
Observable Inputs
Level 3 - Signifi cant
Unobservable Inputs Total
Perkins Global Value FundCommon Stocks $ 95,840,976 $ 61,780,649 $ — $ 157,621,625Forward Currency Contracts — 134,428 — 134,428Total Investments in Securities 95,840,976 61,915,077 — 157,756,053
Perkins US Strategic Value FundCommon Stocks $ 411,925,356 $ — $ — $ 411,925,356Forward Currency Contracts — (847,717) — (847,717)Total Investments in Securities 411,925,356 (847,717) — 411,077,639
INTECH European Core Fund(c) Common Stocks € — € 85,070,578 € — € 85,070,578Total Investments in Securities — 85,070,578 — 85,070,578
INTECH Global All Country Low Volatility Fund(d)
Common Stocks $ 86,751,852 $ 74,593,605 $ — $ 161,345,457Preferred Stocks — 126,129 — 126,129Total Investments in Securities 86,751,852 74,719,734 — 161,471,586
INTECH Global Dividend FundCommon Stocks $ 1,019,723 $ 1,366,450 $ — $ 2,386,173Forward Currency Contracts — (5,996) — (5,996)Total Investments in Securities 1,019,723 1,360,454 — 2,380,177
INTECH US Core FundCommon Stocks $ 158,418,020 $ — $ — $ 158,418,020Forward Currency Contracts — (707,850) — (707,850)Total Investments in Securities 158,418,020 (707,850) — 157,710,170
Janus Global Diversifi ed Alternatives Fund(e)
Forward Currency Contracts $ — $ (15,931) $ — $ (15,931)Futures — 15,209 — 15,209Government Obligations — 1,599,954 — 1,599,954Total Return Swaps — 52,014 2,111 54,125Total Investments in Securities — 1,651,246 2,111 1,653,357
Janus Global Real Estate FundCommon Stocks $ 99,018,076 $ 60,559,922 $ — $ 159,577,998Preferred Stocks — 148,516 — 148,516Forward Currency Contracts — (135,252) — (135,252)Options Written — (45,436) — (45,436)Total Investments in Securities 99,018,076 60,527,750 — 159,545,826
Janus Flexible Income FundCorporate Bonds $ — $ 365,325,620 $ — $ 365,325,620Mortgage Backed Securities — 145,927,468 — 145,927,468Government Obligations — 329,760,533 — 329,760,533Asset Backed Securities — 76,164,383 — 76,164,383Preferred Stocks — 16,981,480 — 16,981,480Tranche Loans — 20,627,143 — 20,627,143Forward Currency Contracts — (3,722,714) — (3,722,714)Total Investments in Securities — 951,063,913 — 951,063,913

Notes to the Financial Statements
J a n u s C a p i t a l F u n d s P l c / 3 1 D e c e m b e r 2 0 1 5 2 7 9
31 December 2014
Level 1 - Quoted Prices
Level 2 - Other Signifi cant
Observable Inputs
Level 3 - Signifi cant
Unobservable Inputs Total
Janus Global Flexible Income FundCorporate Bonds $ — $ 5,998,216 $ — $ 5,998,216Government Obligations — 12,348,057 — 12,348,057Asset Backed Securities — 2,207,060 136,280 2,343,340Preferred Stocks — 70,244 — 70,244Tranche Loans — 361,846 — 361,846Forward Currency Contracts — (38,198) — (38,198)Total Investments in Securities — 20,947,225 136,280 21,083,505
Janus Global High Yield FundCommon Stocks $ 399,137 $ — $ — $ 399,137Corporate Bonds — 68,550,022 — 68,550,022Asset Backed Securities — 1,474,788 — 1,474,788Preferred Stocks — 484,859 — 484,859Tranche Loans — 6,667,075 — 6,667,075Forward Currency Contracts — (470,918) — (470,918)Total Investments in Securities 399,137 76,705,826 — 77,104,963
Janus Global Investment Grade Bond FundCorporate Bonds $ — $ 58,575,945 $ — $ 58,575,945Asset Backed Securities — 2,438,226 — 2,438,226Preferred Stocks — 415,693 — 415,693Tranche Loans — 1,314,632 — 1,314,632Forward Currency Contracts — 146,503 — 146,503Total Investments in Securities — 62,890,999 — 62,890,999
Janus High Yield FundCommon Stocks $ 5,606,477 $ — $ — $ 5,606,477Corporate Bonds — 680,461,174 — 680,461,174Asset Backed Securities — 11,325,021 — 11,325,021Preferred Stocks — 6,986,706 — 6,986,706Tranche Loans — 49,672,720 — 49,672,720Forward Currency Contracts — (1,676,577) — (1,676,577)Total Investments in Securities 5,606,477 746,769,044 — 752,375,521
Janus Global Unconstrained Bond FundCommon Stocks 4,251,414 — — 4,251,414Credit Default Swaps — (117,267) — (117,267)Exchange Traded Funds 1,413,507 — — 1,413,507Corporate Bonds — 54,977,191 — 54,977,191Government Obligations — 7,169,319 — 7,169,319Asset Backed Securities — 3,350,251 — 3,350,251Forward Currency Contracts — (187,029) — (187,029)Options Written — (258,641) — (258,641)Futures — (125,944) — (125,944)Total Investments in Securities 5,664,921 64,807,880 — 70,472,801
Janus US Short-Term Bond FundCorporate Bonds $ — $ 367,942,145 $ — $ 367,942,145Government Obligations — 183,251,970 — 183,251,970Asset Backed Securities — 19,185,832 — 19,185,832Tranche Loans — 11,262,170 — 11,262,170Forward Currency Contracts — (779,099) — (779,099)Total Investments in Securities — 580,863,018 — 580,863,018
As at 31 December 2014, the analysis of fair value hierarchy is based on last traded prices.
Forward currency contracts, future contracts and swap contracts are reported at their unrealised appreciation/(depreciation) at measurement date, which represents the change in the contract’s value from trade date. Options are reported at their market value at the measurement date as at 31 December 2014.
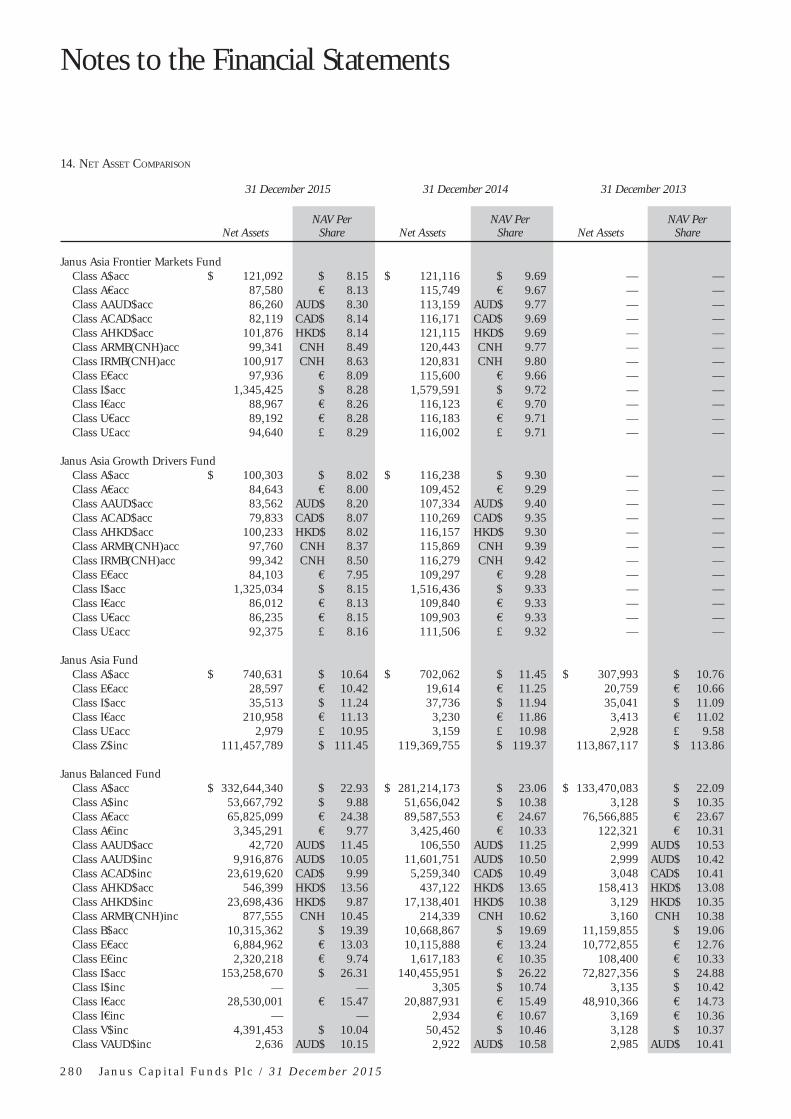
Notes to the Financial Statements
2 8 0 J a n u s C a p i t a l F u n d s P l c / 3 1 D e c e m b e r 2 0 1 5
14. NET ASSET COMPARISON
31 December 2015 31 December 2014 31 December 2013
Net Assets NAV Per
Share Net AssetsNAV Per
Share Net AssetsNAV Per
Share
Janus Asia Frontier Markets FundClass A$acc $ 121,092 $ 8.15 $ 121,116 $ 9.69 — —Class A€acc 87,580 € 8.13 115,749 € 9.67 — —Class AAUD$acc 86,260 AUD$ 8.30 113,159 AUD$ 9.77 — —Class ACAD$acc 82,119 CAD$ 8.14 116,171 CAD$ 9.69 — —Class AHKD$acc 101,876 HKD$ 8.14 121,115 HKD$ 9.69 — —Class ARMB(CNH)acc 99,341 CNH 8.49 120,443 CNH 9.77 — —Class IRMB(CNH)acc 100,917 CNH 8.63 120,831 CNH 9.80 — —Class E€acc 97,936 € 8.09 115,600 € 9.66 — —Class I$acc 1,345,425 $ 8.28 1,579,591 $ 9.72 — —Class I€acc 88,967 € 8.26 116,123 € 9.70 — —Class U€acc 89,192 € 8.28 116,183 € 9.71 — —Class U£acc 94,640 £ 8.29 116,002 £ 9.71 — —
Janus Asia Growth Drivers FundClass A$acc $ 100,303 $ 8.02 $ 116,238 $ 9.30 — —Class A€acc 84,643 € 8.00 109,452 € 9.29 — —Class AAUD$acc 83,562 AUD$ 8.20 107,334 AUD$ 9.40 — —Class ACAD$acc 79,833 CAD$ 8.07 110,269 CAD$ 9.35 — —Class AHKD$acc 100,233 HKD$ 8.02 116,157 HKD$ 9.30 — —Class ARMB(CNH)acc 97,760 CNH 8.37 115,869 CNH 9.39 — —Class IRMB(CNH)acc 99,342 CNH 8.50 116,279 CNH 9.42 — —Class E€acc 84,103 € 7.95 109,297 € 9.28 — —Class I$acc 1,325,034 $ 8.15 1,516,436 $ 9.33 — —Class I€acc 86,012 € 8.13 109,840 € 9.33 — —Class U€acc 86,235 € 8.15 109,903 € 9.33 — —Class U£acc 92,375 £ 8.16 111,506 £ 9.32 — —
Janus Asia FundClass A$acc $ 740,631 $ 10.64 $ 702,062 $ 11.45 $ 307,993 $ 10.76Class E€acc 28,597 € 10.42 19,614 € 11.25 20,759 € 10.66Class I$acc 35,513 $ 11.24 37,736 $ 11.94 35,041 $ 11.09Class I€acc 210,958 € 11.13 3,230 € 11.86 3,413 € 11.02Class U£acc 2,979 £ 10.95 3,159 £ 10.98 2,928 £ 9.58Class Z$inc 111,457,789 $ 111.45 119,369,755 $ 119.37 113,867,117 $ 113.86
Janus Balanced FundClass A$acc $ 332,644,340 $ 22.93 $ 281,214,173 $ 23.06 $ 133,470,083 $ 22.09Class A$inc 53,667,792 $ 9.88 51,656,042 $ 10.38 3,128 $ 10.35Class A€acc 65,825,099 € 24.38 89,587,553 € 24.67 76,566,885 € 23.67Class A€inc 3,345,291 € 9.77 3,425,460 € 10.33 122,321 € 10.31Class AAUD$acc 42,720 AUD$ 11.45 106,550 AUD$ 11.25 2,999 AUD$ 10.53Class AAUD$inc 9,916,876 AUD$ 10.05 11,601,751 AUD$ 10.50 2,999 AUD$ 10.42Class ACAD$inc 23,619,620 CAD$ 9.99 5,259,340 CAD$ 10.49 3,048 CAD$ 10.41Class AHKD$acc 546,399 HKD$ 13.56 437,122 HKD$ 13.65 158,413 HKD$ 13.08Class AHKD$inc 23,698,436 HKD$ 9.87 17,138,401 HKD$ 10.38 3,129 HKD$ 10.35Class ARMB(CNH)inc 877,555 CNH 10.45 214,339 CNH 10.62 3,160 CNH 10.38Class B$acc 10,315,362 $ 19.39 10,668,867 $ 19.69 11,159,855 $ 19.06Class E€acc 6,884,962 € 13.03 10,115,888 € 13.24 10,772,855 € 12.76Class E€inc 2,320,218 € 9.74 1,617,183 € 10.35 108,400 € 10.33Class I$acc 153,258,670 $ 26.31 140,455,951 $ 26.22 72,827,356 $ 24.88Class I$inc — — 3,305 $ 10.74 3,135 $ 10.42Class I€acc 28,530,001 € 15.47 20,887,931 € 15.49 48,910,366 € 14.73Class I€inc — — 2,934 € 10.67 3,169 € 10.36Class V$inc 4,391,453 $ 10.04 50,452 $ 10.46 3,128 $ 10.37Class VAUD$inc 2,636 AUD$ 10.15 2,922 AUD$ 10.58 2,985 AUD$ 10.41

Notes to the Financial Statements
J a n u s C a p i t a l F u n d s P l c / 3 1 D e c e m b e r 2 0 1 5 2 8 1
31 December 2015 31 December 2014 31 December 2013
Net Assets NAV Per
Share Net AssetsNAV Per
Share Net AssetsNAV Per
Share
Janus Emerging Markets FundClass A$acc $ 1,064,546 $ 7.62 $ 1,138,802 $ 8.70 $ 1,206,816 $ 9.09Class A€acc 713,627 € 7.28 992,652 € 8.36 1,149,724 € 8.74Class B$acc 710,271 $ 7.23 834,123 $ 8.34 880,196 $ 8.80Class E€acc 44,745 € 7.22 2,098 € 8.31 2,513 € 8.76Class I$acc 798,825 $ 7.99 904,376 $ 9.04 936,357 $ 9.36Class I€acc 621,732 € 7.80 787,126 € 8.87 910,601 € 9.02Class U£acc 2,493 £ 9.16 2,814 £ 9.78 2,904 £ 9.50Class Z$inc 108,312,802 $ 86.57 — — — —
Janus Europe FundClass A$acc € 10,234,011 $ 10.58 € 11,071,498 $ 10.11 € 3,389,036 $ 10.31Class A€acc 11,579,202 £ 23.32 18,435,895 € 22.15 8,457,650 € 22.54Class ASEKacc — — 2,079 SEK 10.08 2,247 SEK 10.22Class E€acc 1,447,124 € 15.26 1,670,430 € 14.57 2,305,116 € 14.90Class I€acc 41,717,603 € 25.45 58,127,524 € 23.92 101,650,328 € 24.10Class ISEKacc 8,066,627 SEK 10.41 7,415,355 SEK 9.84 — —Class U$acc 2,946 $ 10.67 2,493 $ 10.05 2,211 $ 10.14Class U€acc 11,035 € 10.83 9,316 € 10.16 2,256 € 10.21Class Z€acc 13,915,422 € 113.41 59,352,016 € 105.33 35,621,017 € 104.81Class Z€inc 54,228,585 € 98.95 51,420,299 € 93.82 — —
Janus Global Life Sciences FundClass A$acc $ 754,458,477 $ 28.79 $ 340,497,019 $ 27.24 $ 96,013,746 $ 20.52Class A€acc 89,639,119 € 29.02 89,952,412 € 27.52 60,799,663 € 20.75Class AAUD$acc 21,783,953 AUD$ 15.85 4,502,361 AUD$ 14.83 3,106 AUD$ 10.93Class AHKD$acc 4,366,301 HKD$ 9.60 — — — —Class ARMB(CNH)acc 318,515 CNH 11.97 3,258 CNH 10.95 — —Class B$acc 19,074,678 $ 24.49 18,474,744 $ 23.39 17,872,886 $ 17.80Class E$acc 4,684,536 $ 15.01 337,223 $ 14.27 3,243 $ 10.81Class E€acc 2,554,195 € 14.83 690,428 € 14.14 17,524 € 10.72Class I$acc 893,319,105 $ 33.03 227,276,255 $ 31.00 13,817,693 $ 23.19Class I€acc 48,958,546 € 27.47 8,960,277 € 25.80 204,104 € 19.40Class IU€acc 5,463,606 € 14.25 66,265 € 12.02Class U$acc 53,041,642 $ 15.85 21,219,017 $ 14.78 3,292 $ 10.97Class U$inc 40,262,634 $ 12.19 1,264,054 $ 11.37Class U €acc 1,490,716 € 15.89 1,425,032 € 14.84
Class UU€acc 3,656 € 14.37 3,409 € 12.03 3,357 € 11.04Class U£acc 4,786,267 £ 24.16 2,725,897 £ 21.30 4,550 £ 14.89Class U£inc 18,584,181 £ 13.38 6,527,597 £ 11.80 — —Class V€acc 2,897 € 10.13 — — — —Class V$acc 3,042 $ 10.14 — — — —
Janus Global Research FundClass A$acc $ 747,529 $ 14.78 $ 441,072 $ 15.42 $ 306,808 $ 14.74Class A$dis — — 3,864 $ 12.59 3,695 $ 12.04Class A€acc 732,417 € 13.15 1,118,578 € 13.80 1,736,111 € 13.22Class B$acc — — 7,254 $ 14.14 7,006 $ 13.66Class E€acc 287,855 € 12.68 458,815 € 13.46 304,015 € 12.97Class I$acc 43,355 $ 16.52 44,661 $ 17.01 4,412,919 $ 16.06Class I$dis — — 6,443 $ 13.59 6,084 $ 12.84Class I€acc 6,732 € 14.05 7,759 € 14.55 294,172 € 14.37Class U£acc 3,784 £ 13.91 3,890 £ 13.52 3,666 £ 11.99Class Z$inc 37,331,307 $ 124.43 38,503,147 $ 128.33 36,421,579 $ 121.39

Notes to the Financial Statements
2 8 2 J a n u s C a p i t a l F u n d s P l c / 3 1 D e c e m b e r 2 0 1 5
31 December 2015 31 December 2014 31 December 2013
Net Assets NAV Per
Share Net AssetsNAV Per
Share Net AssetsNAV Per
Share
Janus Global Technology FundClass A$acc $ 33,254,733 $ 7.02 $ 36,439,671 $ 6.90 $ 31,276,420 $ 6.48Class A€acc 4,593,870 € 7.13 9,319,711 € 7.04 17,162,059 € 6.62Class AAUD$acc 1,620,519 AUD$ 11.43 566,564 AUD$ 11.00 — —Class AHKD$acc 736,846 HKD$ 10.94 209,231 HKD$ 10.68 — —Class ARMB(CNH)acc 4,374 CNH 11.50 4,385 CNH 10.92 — —Class B$acc 5,518,373 $ 6.01 6,320,077 $ 5.97 7,582,671 $ 5.66Class I$acc 10,194,058 $ 8.07 20,444,016 $ 7.87 15,718,852 $ 7.32Class I€acc 3,423,830 € 19.06 5,328,204 € 18.61 6,727,387 € 17.33Class U$acc 3,625 $ 12.08 36,790 $ 11.69 3,241 $ 10.80Class U€acc 2,351 € 9.79 1,171,948 € 11.75 3,306 € 10.87Class V€acc 2,885 € 10.08 — — — —Class V$acc $ 3,028 $ 10.09 — — — —
Janus Opportunistic Alpha FundClass A$acc $ 31,790,396 $ 17.33 $ 55,469,568 $ 19.03 $ 45,942,392 $ 15.96Class A$dis 229,502 $ 13.43 265,828 $ 14.74 292,200 $ 12.36Class A€acc 7,909,222 € 17.61 15,701,604 € 19.39 18,974,986 € 16.28Class ARMB(CNH)acc 2,824 CNH 10.03 3,170 CNH 10.66 — —Class B$acc 3,288,426 $ 14.65 6,977,665 $ 16.25 6,230,285 $ 13.76Class E€acc 20,879 € 12.25 40,504 € 13.60 46,866 € 11.46Class I$acc 6,627,229 $ 20.02 17,495,367 $ 21.73 8,759,028 $ 18.02Class I$dis 1,279,559 $ 14.59 158,952 $ 15.83 131,838 $ 13.13Class I€acc 61,821 € 13.48 232,573.14 € 14.79 75,455 € 12.01Class U€acc 39,896 € 11.89 48,317 € 12.93 3,263 € 10.73Class U$acc 121,774 $ 11.88 286,875 $ 12.88 3,199 $ 10.66Class U£acc 4,151 £ 15.26 4,499 £ 15.64 3,726 £ 12.19
Janus Japan Emerging Opportunities FundClass A$acc ¥ 17,193,592 $ 12.37 ¥ 14,764,992 $ 10.71 — —Class A€acc 14,822,470 € 12.38 14,134,535 € 10.71 — —Class AAUD$acc 14,580,999 AUD$ 12.63 13,885,059 AUD$ 10.81 — —Class ACAD$acc 13,827,126 CAD$ 12.38 14,202,327 CAD$ 10.72 — —Class AHKD$acc 17,234,490 HKD$ 12.39 14,789,009 HKD$ 10.73 — —Class ARMB(CNH)acc 16,770,603 CNH 12.88 14,742,679 CNH 10.81 — —Class IRMB(CNH)acc 17,037,658 CNH 13.08 14,790,566 CNH 10.84 — —Class E€acc 14,731,012 € 12.31 14,116,184 € 10.69 — —Class I$acc 17,475,364 $ 12.56 14,820,712 $ 10.74 — —Class I€acc 15,057,735 € 12.58 14,180,492 € 10.74 — —Class U€acc 15,096,534 € 12.61 14,187,861 € 10.75 — —Class U£acc 16,045,514 £ 12.65 14,211,729 £ 10.76 — —Class IJPYacc 206,659,907 JPY 1,271.03 175,808,187 JPY 1,081.28 — —
Janus Japan FundClass A$acc ¥ 10,578,529 $ 11.41 ¥ 9,418,170 $ 10.25 — —Class A€acc 9,124,404 € 11.43 9,017,101 € 10.25 — —Class AAUD$acc 8,972,042 AUD$ 11.66 8,857,574 AUD$ 10.34 — —Class ACAD$acc 8,499,886 CAD$ 11.42 9,058,189 CAD$ 10.26Class AHKD$acc 10,602,213 HKD$ 11.43 9,433,220 HKD$ 10.26 — —Class ARMB(CNH)acc 10,315,400 CNH 11.88 9,404,162 CNH 10.34 — —Class IRMB(CNH)acc 10,461,910 CNH 12.05 9,431,062 CNH 10.37Class E€acc 9,066,789 € 11.36 9,005,474 € 10.23 — —Class I$acc 10,731,638 $ 11.57 9,450,004 $ 10.28 — —Class I€acc 9,251,823 € 11.59 9,042,927 € 10.27 — —Class U€acc 9,263,495 € 11.61 9,045,268 € 10.28 — —Class U£acc 9,836,315 £ 11.63 9,057,390 £ 10.29 — —Class IJPYacc 127,129,006 JPY 1,172.83 112,159,488 JPY 1,034.73 — —

Notes to the Financial Statements
J a n u s C a p i t a l F u n d s P l c / 3 1 D e c e m b e r 2 0 1 5 2 8 3
31 December 2015 31 December 2014 31 December 2013
Net Assets NAV Per
Share Net AssetsNAV Per
Share Net AssetsNAV Per
Share
Janus US FundClass A$acc $ 405,051 $ 16.98 $ 335,455 $ 16.44 $ 306,670 $ 14.88Class A€acc 531,408 € 16.36 332,147 € 15.88 304,598 € 14.39Class B$acc 322,212 $ 16.11 315,092 $ 15.75 288,145 $ 14.41Class I$acc 358,847 $ 17.94 343,797 $ 17.19 308,018 $ 15.40Class I€acc 274,886 € 17.24 294,310 € 16.58 300,143 € 14.87
Janus US Research FundClass A$acc $ 10,784,506 $ 21.66 $ 11,391,325 $ 21.86 $ 18,789,223 $ 20.04Class A$dis — — 403,105 $ 14.86 459,130 $ 13.60Class A€acc 972,218 € 19.34 1,593,641 € 19.60 1,743,743 € 17.97Class B$acc 208,185 $ 18.79 326,346 $ 19.15 772,799 $ 17.72Class I$acc 2,382,635 $ 25.51 325,460 $ 25.39 205,888 $ 22.91Class I$dis — — 218,534 $ 16.29 231,315 $ 14.70Class I€acc 4,849 € 15.57 5,392 € 15.55 5,538 € 14.05Class Z$inc 178,985,254 $ 137.68 178,206,781 $ 137.08 160,514,209 $ 123.47
Janus US Twenty FundClass A$acc $ 133,103,096 $ 22.80 $ 123,193,883 $ 21.60 $ 144,026,224 $ 19.71Class A$dis — — 4,943 $ 15.10 154,798 $ 13.78Class A€acc 36,637,602 € 23.27 44,561,226 € 22.12 64,343,886 € 20.21Class AAUD$acc 1,532,668 AUD$ 13.22 3,220 AUD$ 12.39 3,134 AUD$ 11.03Class ARMB$acc 3,262 CNH 11.58 3,159 CNH 10.62 — —Class B$acc 10,751,858 $ 19.24 12,808,918 $ 18.41 18,200,142 $ 16.97Class E€acc 283,426 € 17.75 310,336 € 16.94 163,830 € 15.52Class I$acc 181,961,231 $ 25.88 170,828,419 $ 24.26 161,523,105 $ 21.92Class I$dis 6,780,643 $ 17.19 4,855 $ 16.12 4,385 $ 14.56Class I€acc 999,770 € 27.68 1,140,471 € 26.01 1,051,222 € 23.52Class U$acc 188,124 $ 12.75 167,627 $ 11.93 3,227 $ 10.76Class U€acc 67,355 € 12.76 70,407 € 11.98 3,292 € 10.83Class U£acc 4,754 £ 17.47 4,450 £ 15.47 4,013 £ 13.13Class V€acc 2,873 € 10.04 — — — —Class V$acc 3,016 $ 10.05 — — — —
Janus US Venture FundClass A$acc $ 80,453,385 $ 20.48 $ 86,496,351 $ 21.04 $ 71,640,923 $ 19.15Class A$dis 386,151 $ 18.21 1,486,824 $ 18.71 127,920 $ 17.01Class A€acc 15,228,562 € 21.71 21,591,792 € 22.36 25,684,732 € 20.40Class AAUD$acc 1,537,041 AUD$ 12.04 3,187 AUD$ 12.27 3,091 AUD$ 10.88Class B$acc 2,401,331 $ 17.49 3,163,696 $ 18.14 3,731,527 $ 16.69Class I$acc 66,959,247 $ 23.34 20,378,917 $ 23.79 23,093,096 $ 21.48Class I$dis — — 36,270 $ 19.97 89,306 $ 18.02Class I€acc 12,853,297 € 17.53 14,978,929 € 17.92 1,880,539 € 16.19Class U$acc 2,442,116 $ 11.92 3,617 $ 12.06 3,243 $ 10.81Class U€acc — — 3,242 € 12.12 3,308 € 10.88Class U£acc 11,679,923 £ 17.06 11,809,620 £ 16.33 23,739,517 £ 13.78Class Z$acc 4,147 $ 151.27 89,891,178 $ 151.57 179,327,746 $ 134.50Class Z€acc 15,136,524 € 152.34 41,472,700 € 137.10 — —

Notes to the Financial Statements
2 8 4 J a n u s C a p i t a l F u n d s P l c / 3 1 D e c e m b e r 2 0 1 5
31 December 2015 31 December 2014 31 December 2013
Net Assets NAV Per
Share Net AssetsNAV Per
Share Net AssetsNAV Per
Share
Perkins Global Value FundClass A$acc $ 2,476,207 $ 14.27 $ 3,289,118 $ 14.85 $ 1,283,463 $ 14.27Class A€acc 1,549,229 € 13.72 2,352,709 € 14.37 1,627,084 € 13.82Class B$acc — — 6,634 $ 14.16 6,436 $ 13.74Class E€acc 125,483 € 10.06 159,929 € 10.63 31,064 € 10.31Class I$acc 8,068 $ 15.07 8,317 $ 15.53 1,658,941 $ 14.74Class I€acc 29,909 € 14.44 2,957,168 € 20.18 8,210 € 19.24Class U$acc 3,158 $ 10.53 3,250 $ 10.83 3,084 $ 10.28Class U€acc 2,525 € 10.51 2,911 € 10.88 3,145 € 10.35Class Z$inc 161,020,087 $ 110.19 164,728,478 $ 114.97 124,662,411 $ 111.08
Perkins US Strategic Value FundClass A$acc $ 59,799,645 $ 20.11 $ 128,544,748 $ 21.02 $ 171,741,290 $ 19.49Class A$dis 6,873,061 $ 13.83 10,415,715 $ 14.46 19,615,742 $ 13.41Class A€acc 22,566,982 € 17.75 40,414,529 € 18.64 62,484,251 € 17.31Class B$acc 1,554,302 $ 17.20 1,951,930 $ 18.16 1,873,812 $ 17.01Class E€acc 95,792 € 13.25 145,531 € 14.01 105,592 € 13.08Class I$acc 110,240,912 $ 22.66 234,525,322 $ 23.51 310,465,453 $ 21.65Class I$dis 1,069,336 $ 14.74 1,171,053 $ 15.29 1,126,277 $ 14.07Class I€acc 3,029,155 € 13.84 15,127,246 € 14. 44 21,651,241 € 13.30Class I€Uacc — — 4,080 € 14.4 3 3,756 € 11.69Class U$acc 163,062 $ 11.02 618,997 $ 11.36 3,114 $ 10.38Class U€acc 43,261 € 10.94 804,383 € 11.40 3,177 € 10.45Class U£acc 3,942 £ 14.49 4,061 £ 14.12 3,712 £ 12.17
INTECH All-World Minimum Variance Core Fund(a)
Class Z£acc $ 746,941,843 £ 99.36 — — — —
INTECH European Core FundClass A€acc € 2,886 € 11.39 € 2,552 € 10.08 — —Class Z€inc 96,090,713 € 117.90 85,673,409 € 105.12 — —
INTECH Global All Country Low Volatility Fund
Class Z£acc $ 162,714,850 £ 109.02 $ 163,510,884 £ 103.62 — —
INTECH Global Dividend FundClass A$acc $ 326,529 $ 10.33 $ 249,326 $ 10.86 $ 3,339 $ 11.13Class A$inc 25,720 $ 9.54 357,052 $ 10.33 250,444 $ 10.87Class A€acc 17,668 € 10.10 44,732 € 10.67 73,637 € 10.91Class A€inc 92,682 € 9.30 193,868 € 10.19 156,170 € 10.74Class E€acc 2,519 € 9.91 26,550 € 10.59 17,530 € 10.97Class E€inc 69,810 € 9.19 125,624 € 10.12 66,726 € 10.77Class I$acc 1,339,464 $ 10.49 1,399,822 $ 10.97 3,353 $ 11.17Class I$inc 3,148 $ 9.92 3,290 $ 10.57 3,352 $ 10.95Class I€acc 2,624 € 10.32 3,082 € 10.89 3,578 € 11.12Class I€inc 2,623 € 9.75 3,081 € 10.50 3,578 € 10.90Class U$acc 2,884 $ 9.61 3,012 $ 10.04 3,067 $ 10.22Class U€acc 2,297 € 9.57 2,695 € 10.08 3,129 € 10.29Class U£inc 3,152 £ 10.23 3,293 £ 10.31 3,354 £ 10.05Class Z€acc 3,442 € 131.42 3,565 € 122.24 51,352,536 € 108.51
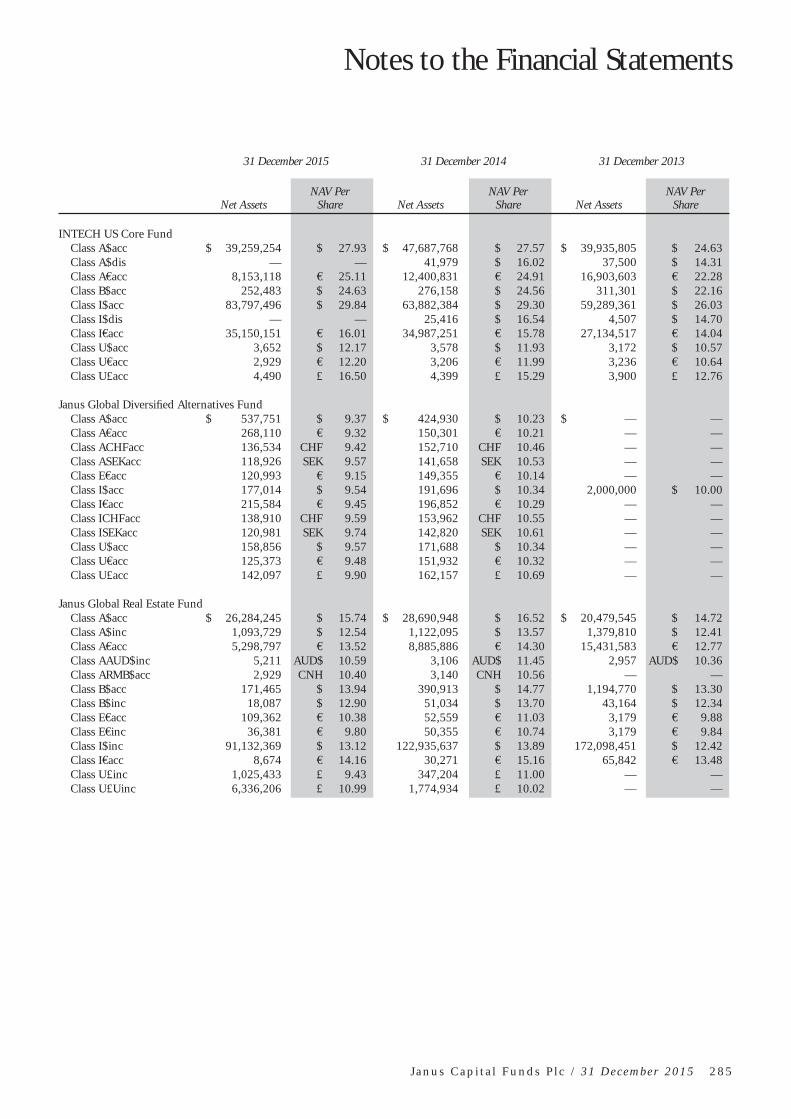
Notes to the Financial Statements
J a n u s C a p i t a l F u n d s P l c / 3 1 D e c e m b e r 2 0 1 5 2 8 5
31 December 2015 31 December 2014 31 December 2013
Net Assets NAV Per
Share Net AssetsNAV Per
Share Net AssetsNAV Per
Share
INTECH US Core FundClass A$acc $ 39,259,254 $ 27.93 $ 47,687,768 $ 27.57 $ 39,935,805 $ 24.63Class A$dis — — 41,979 $ 16.02 37,500 $ 14.31Class A€acc 8,153,118 € 25.11 12,400,831 € 24.91 16,903,603 € 22.28Class B$acc 252,483 $ 24.63 276,158 $ 24.56 311,301 $ 22.16Class I$acc 83,797,496 $ 29.84 63,882,384 $ 29.30 59,289,361 $ 26.03Class I$dis — — 25,416 $ 16.54 4,507 $ 14.70Class I€acc 35,150,151 € 16.01 34,987,251 € 15.78 27,134,517 € 14.04Class U$acc 3,652 $ 12.17 3,578 $ 11.93 3,172 $ 10.57Class U€acc 2,929 € 12.20 3,206 € 11.99 3,236 € 10.64Class U£acc 4,490 £ 16.50 4,399 £ 15.29 3,900 £ 12.76
Janus Global Diversifi ed Alternatives FundClass A$acc $ 537,751 $ 9.37 $ 424,930 $ 10.23 $ — —Class A€acc 268,110 € 9.32 150,301 € 10.21 — —Class ACHFacc 136,534 CHF 9.42 152,710 CHF 10.46 — —Class ASEKacc 118,926 SEK 9.57 141,658 SEK 10.53 — —Class E€acc 120,993 € 9.15 149,355 € 10.14 — —Class I$acc 177,014 $ 9.54 191,696 $ 10.34 2,000,000 $ 10.00Class I€acc 215,584 € 9.45 196,852 € 10.29 — —Class ICHFacc 138,910 CHF 9.59 153,962 CHF 10.55 — —Class ISEKacc 120,981 SEK 9.74 142,820 SEK 10.61 — —Class U$acc 158,856 $ 9.57 171,688 $ 10.34 — —Class U€acc 125,373 € 9.48 151,932 € 10.32 — —Class U£acc 142,097 £ 9.90 162,157 £ 10.69 — —
Janus Global Real Estate FundClass A$acc $ 26,284,245 $ 15.74 $ 28,690,948 $ 16.52 $ 20,479,545 $ 14.72Class A$inc 1,093,729 $ 12.54 1,122,095 $ 13.57 1,379,810 $ 12.41Class A€acc 5,298,797 € 13.52 8,885,886 € 14.30 15,431,583 € 12.77Class AAUD$inc 5,211 AUD$ 10.59 3,106 AUD$ 11.45 2,957 AUD$ 10.36Class ARMB$acc 2,929 CNH 10.40 3,140 CNH 10.56 — —Class B$acc 171,465 $ 13.94 390,913 $ 14.77 1,194,770 $ 13.30Class B$inc 18,087 $ 12.90 51,034 $ 13.70 43,164 $ 12.34Class E€acc 109,362 € 10.38 52,559 € 11.03 3,179 € 9.88Class E€inc 36,381 € 9.80 50,355 € 10.74 3,179 € 9.84Class I$inc 91,132,369 $ 13.12 122,935,637 $ 13.89 172,098,451 $ 12.42Class I€acc 8,674 € 14.16 30,271 € 15.16 65,842 € 13.48Class U£inc 1,025,433 £ 9.43 347,204 £ 11.00 — —Class U£Uinc 6,336,206 £ 10.99 1,774,934 £ 10.02 — —

Notes to the Financial Statements
2 8 6 J a n u s C a p i t a l F u n d s P l c / 3 1 D e c e m b e r 2 0 1 5
31 December 2015 31 December 2014 31 December 2013
Net Assets NAV Per
Share Net AssetsNAV Per
Share Net AssetsNAV Per
Share
Janus Flexible Income FundClass A$acc $ 78,437,455 $ 19.92 $ 82,056,938 $ 20.15 $ 75,634,380 $ 19.48Class A$inc 28,490,926 $ 11.43 31,746,816 $ 11.94 18,930,886 $ 12.00Class A€acc 75,365,484 € 22.21 128,067,731 € 22.63 205,316,320 € 21.93Class AAUD$acc — — 2,807 AUD$ 10.77 2,894 AUD$ 10.16Class AAUD$inc 3,102,500 AUD$ 9.22 1,839,173 AUD$ 9.54 476,441 AUD$ 9.54Class AHKD$acc — — 3,058 HKD$ 10.18 2,955 HKD$ 9.84Class AHKD$inc 497,439 HKD$ 9.09 554,328 HKD$ 9.50 24,624 HKD$ 9.58Class ARMB(CNH)inc 3,063 CNH 9.82 3,160 CNH 9.91 3,068 CNH 9.73Class B$acc 2,318,446 $ 16.99 2,599,689 $ 17.35 2,805,534 $ 16.95Class B$inc 3,108,339 $ 12.07 6,769,945 $ 12.35 7,212,777 $ 12.15Class B€inc 272,338 € 11.05 705,537 € 11.40 1,074,454 € 11.24Class E€acc 5,141,278 € 10.54 9,002,470 € 10.77 15,983,217 € 10.47Class E€inc 7,444,091 € 9.45 20,809,750 € 9.97 26,935,038 € 10.06Class I$acc 161,397,345 $ 10.85 25,862,550 $ 10.84 20,158,887 $ 10.36Class I$inc 420,018,929 $ 12.12 463,381,195 $ 12.40 615,737,785 $ 12.19Class I€acc 49,829,565 € 23.29 84,671,430 € 23.45 62,863,941 € 22.46Class U$acc 3,132 $ 10.44 3,131 $ 10.44 2,993 $ 9.98Class U€acc 8,094,325 € 10.43 7,998,403 € 10.49 10,942,639 € 10.05Class U£acc 113,335 £ 10.55 3,031 £ 10.54 3,072 £ 10.05Class U£inc 193,929 £ 9.64 2,028,749 £ 9.94 3,072 £ 9.78Class V$inc 1,876,949 $ 8.96 558,524 $ 9.36 9,835 $ 9.41Class VAUD$inc 377,682 AUD$ 9.36 163,279 AUD$ 9.66 2,579 AUD$ 9.62Class Z$acc 74,842,770 $ 104.38 92,943,293 $ 103.52 — —
Janus Global Flexible Income FundClass A$acc $ 6,167,673 $ 9.52 $ 5,842,970 $ 10.03 $ 2,451,006 $ 9.64Class A€acc 3,063,948 € 9.29 4,084,912 € 9.89 2,619,846 € 9.52Class E€acc 470,252 € 9.27 422,645 € 9.91 127,369 € 9.60Class E€inc 1,107,986 € 8.48 1,448,630 € 9.31 118,502 € 9.33Class I$inc 2,500,758 $ 9.15 2,566,943 $ 9.68 2,440,838 $ 9.43Class I€acc 7,738,057 € 9.62 7,021,979 € 10.13 2,583,090 € 9.64Class U$acc 3,030 $ 10.10 3,155 $ 10.52 2,997 $ 9.99Class U€acc 14,026 € 10.03 16,433 € 10.55 3,058 € 10.06Class U£acc 2,708 £ 9.95 2,986 £ 10.38 3,010 £ 9.85Class U£Uinc 2,708 £ 9.29 2,986 £ 9.84 3,010 £ 9.57
Janus Global High Yield FundClass A$acc $ 2,042,603 $ 11.95 $ 2,461,776 $ 12.34 $ 1,958,418 $ 12.55Class A$inc 5,868,079 $ 8.87 7,359,891 $ 9.81 1,949,101 $ 10.66Class A€acc 1,926,920 € 11.66 4,200,817 € 12.16 5,992,926 € 12.38Class A€inc 5,956,619 € 8.66 19,163,951 € 9.68 20,015,993 € 10.54Class AAUD$inc — — 3,225 AUD$ 10.70 3,498 AUD$ 11.45Class B$acc — — 3,942 $ 11.83 4,047 $ 12.15Class B$inc — — 3,230 $ 10.08 3,316 $ 10.70Class B€inc — — 3,905 € 10.34 4,569 € 11.00Class E€acc 393,229 € 11.44 918,400 € 11.99 1,324,537 € 12.22Class E€inc 5,344,450 € 8.93 10,529,318 € 10.02 9,902,349 € 10.96Class I$acc 3,482 $ 12.55 3,563 $ 12.84 3,588 $ 12.93Class I$inc 1,260,792 $ 9.32 1,392,809 $ 10.09 1,149,704 $ 10.71Class IAUD$inc — — 3,321 AUD$ 10.71 3,567 AUD$ 11.46Class I€acc — — 2,864,960 € 12.93 8,837 € 13.11Class I€inc 4,566 € 9.57 5,253 € 10.46 5,926 € 10.94Class U£acc 2,900 £ 10.66 3,133 £ 10.89 3,340 £ 10.93Class U£inc 2,899 £ 9.02 3,133 £ 9.77 3,340 £ 10.36Class Z$inc 27,370,580 $ 91.22 29,607,918 $ 98.68 31,139,198 $ 103.79

Notes to the Financial Statements
J a n u s C a p i t a l F u n d s P l c / 3 1 D e c e m b e r 2 0 1 5 2 8 7
31 December 2015 31 December 2014 31 December 2013
Net Assets NAV Per
Share Net AssetsNAV Per
Share Net AssetsNAV Per
Share
Janus Global Investment Grade Bond FundClass A$acc $ 3,274,296 $ 10.77 $ 4,518,246 $ 11.46 $ 1,532,652 $ 11.25Class A$inc 6,562,068 $ 9.38 8,038,438 $ 10.33 1,430,664 $ 10.56Class A€acc 911,372 € 10.58 2,131,584 € 11.38 2,223,714 € 11.20Class A€inc 1,474,595 € 9.21 5,315,802 € 10.26 5,381,617 € 10.51Class B$acc — — 3,586 $ 10.99 917,033 $ 10.90Class B$inc — — 3,586 $ 10.64 974,069 $ 10.61Class B€inc — — 3,210 € 10.53 974,747 € 10.57Class E€acc 201,562 € 10.04 739,845 € 10.83 636,658 € 10.71Class E€inc 630,850 € 8.99 2,081,717 € 10.06 1,547,079 € 10.36Class I$acc 1,075,746 $ 11.43 3,075,030 $ 12.02 3,306,685 $ 11.67Class I$inc 3,438 $ 9.89 95,564 $ 10.65 1,060,636 $ 10.62Class I£inc 768,539 £ 9.01 9,396,776 £ 9.71 — —Class I€acc 6,363 € 10.50 18,297 € 11.02 1,181,488 € 11.54Class I€inc 3,876 € 9.69 4,587 € 10.54 1,043,455 € 10.58Class Z$inc 29,106,393 $ 97.01 31,359,396 $ 104.52 31,327,817 $ 104.41
Janus High Yield FundClass A$acc $ 40,881,561 $ 23.36 $ 53,874,083 $ 24.01 $ 102,471,096 $ 24.15Class A$inc 53,112,897 $ 8.01 64,631,015 $ 8.81 64,789,124 $ 9.50Class A€acc 24,266,223 € 25.84 36,580,725 € 26.74 66,377,563 € 26.93Class AAUD$acc — — 2,772 AUD$ 10.64 2,973 AUD$ 10.44Class AAUD$inc 2,235,448 AUD$ 9.51 3,152,998 AUD$ 10.39 11,946,519 AUD$ 11.09Class AHKD$acc 188,645 HKD$ 11.78 218,407 HKD$ 12.12 143,743 HKD$ 12.19Class AHKD$inc 6,328,904 HKD$ 9.00 8,477,594 HKD$ 9.90 181,086 HKD$ 10.68Class ARMB(CNH)inc 161,402 CNH 9.47 180,832 CNH 10.06 920,216 CNH 10.62Class B$acc 2,645,399 $ 19.94 1,928,858 $ 20.71 1,896,335 $ 21.03Class B$inc 46,364,449 $ 8.49 58,352,858 $ 9.13 81,645,967 $ 9.64Class B€inc 7,381,323 € 8.65 11,329,701 € 9.37 17,865,276 € 9.91Class E€acc 280,246 € 11.40 695,490 € 11.84 1,282,738 € 11.97Class E€inc 3,347,098 € 8.85 11,636,336 € 9.83 12,557,697 € 10.66Class I$acc 49,603,697 $ 14.88 72,749,718 $ 15.13 60,746,378 $ 15.05Class I$inc 257,094,942 $ 8.49 351,371,246 $ 9.14 489,418,027 $ 9.65Class I€acc 39,627,884 € 22.23 55,191,707 € 22.72 55,319,651 € 22.62Class IAUD$inc — — 4,585 AUD$ 14.95 3,506 AUD$ 11.26Class IRMB(CNH)inc 3,625 CNH 9.77 3,761 CNH 10.27 3,756 CNH 10.72Class U£acc 2,909 £ 10.69 3,122 £ 10.85 3,292 £ 10.77Class U£inc 2,909 £ 8.98 3,122 £ 9.65 3,293 £ 10.17Class V$inc 7,390,542 $ 8.45 474,519 $ 9.29 10,863 $ 10.02Class VAUD$inc 3,070,038 AUD$ 8.77 316,236 AUD$ 9.51 9,640 AUD$ 10.01Class Z$acc 81,068,856 $ 112.06 81,711,045 $ 112.95 80,579,336 $ 111.39

Notes to the Financial Statements
2 8 8 J a n u s C a p i t a l F u n d s P l c / 3 1 D e c e m b e r 2 0 1 5
31 December 2015 31 December 2014 31 December 2013
Net Assets NAV Per
Share Net AssetsNAV Per
Share Net AssetsNAV Per
Share
Janus Global Unconstrained Bond FundClass A$acc $ 50,732,736 $ 9.76 $ 43,563,285 $ 10.01 — —Class A$inc 4,539,064 $ 9.46 2,301,981 $ 9.97 — —Class A€acc 5,335,064 € 9.69 1,875,919 € 9.99 — —Class AAUD$inc 2,760 AUD$ 9.53 — — — —Class A€inc 775,542 € 9.45 258,531 € 10.02 — —Class ACAD$inc 2,639 CAD$ 9.51 — — — —Class ACHFacc 447,921 CHF 9.64 9,499 CHF 10.02 — —Class ACHFinc 9,066 CHF 9.37 9,499 CHF 10.01 — —Class AHKD$acc 2,904 HKD$ 9.46 — — — —Class ARMB(CNH)inc 2,861 CNH 9.73 — — — —Class ASGDinc 8,814 SGD$ 9.57 9,574 SGD$ 9.98 — —Class E€acc 4,329,715 € 9.79 9,455 € 10.01 — —Class E€inc 2,391,869 € 9.44 45,634 € 10.00 — —Class I€acc 10,229,678 € 9.81 9,941,666 € 10.02 — —Class I$acc 27,541,735 $ 9.89 19,218,799 $ 10.04 — —Class U$acc 9,872 $ 9.87 9,996 $ 10.00 — —Class U$inc 107,202 $ 9.68 9,996 $ 9.97 — —Class U€acc 31,116 € 9.86 9,484 € 10.04 — —Class U£acc 177,947 £ 9.86 9,644 £ 10.01 — —Class U£inc 9,868 £ 10.61 9,644 £ 10.34 — —Class UU£inc 9,020 £ 9.70 9,992 £ 9.98 — —
Janus US Short-Term Bond FundClass A$acc $ 193,979,600 $ 16.45 $ 284,347,177 $ 16.52 $ 264,391,461 $ 16.52Class A$inc 27,998,609 $ 11.07 39,784,224 $ 11.17 29,447,336 $ 11.24Class A€acc 13,870,557 € 18.32 35,323,886 € 18.51 54,777,431 € 18.55Class AAUD$inc 2,456 AUD$ 10.11 2,710 AUD$ 10.11 2,891 AUD$ 10.09Class ACHFinc 1,324,387 CHF 9.61 2,428,832 CHF 9.87 2,344,611 CHF 9.97Class B$acc 655,337 $ 14.45 978,767 $ 14.63 1,150,140 $ 14.74Class B$inc 3,359,513 $ 11.03 5,277,551 $ 11.16 6,208,510 $ 11.25Class E€acc 472,356 € 10.02 1,080,615 € 10.15 1,643,628 € 10.23Class E€inc 426,657 € 9.19 670,060 € 9.61 811,521 € 9.95Class I$acc 33,469,398 $ 10.29 40,732,762 $ 10.28 11,739,687 $ 10.23Class I$inc 57,455,678 $ 11.10 88,731,289 $ 11.20 59,827,829 $ 11.28Class I€acc 7,935,621 € 12.45 11,479,248 € 12.46 11,246,571 € 12.47Class I£acc — — 3,106,256 £ 10.20 1,680,426 £ 10.13Class I£inc 1,554 £ 5.42 2,428,455 £ 9.88 4,380,460 £ 9.93Class ICHFinc — — 53,211 CHF 9.96 228,473 CHF 10.06Class U$acc 239,002 $ 10.07 1,144,694 $ 10.06 205,831 $ 10.01Class U$inc 247,123 $ 9.83 367,830 $ 9.93 120,034 $ 9.99Class U£acc 2,796 £ 10.28 2,951 £ 10.26 3,113 £ 10.19Class U£inc 2,716 £ 9.62 2,866 £ 9.70 173,985 £ 10.05Class Z$acc 13,824 $ 102.52 69,975,460 $ 101.59 26,133,421 $ 100.25

Notes to the Financial Statements
J a n u s C a p i t a l F u n d s P l c / 3 1 D e c e m b e r 2 0 1 5 2 8 9
15. CAPITAL SHARE TRANSACTIONS
For the explanation of the table below, please refer to the note Distributions payable to holders of redeemable ordinary shares.
For the fi nancial year ended 31 December 2015
Janus Asia Frontier Markets Fund
Class A$acc Class A€acc Class AAUD$acc Class ACAD$acc Class AHK$acc Class ARMB(CNH)acc Class E€acc Class I$acc Class I€acc Class IRMB(CNH)acc Class U€acc Class U£acc
Shares Hedged Shares Hedged Shares Hedged Shares Shares Hedged Shares Hedged Shares Shares Hedged Shares Hedged Shares Hedged Shares Hedged Shares
At beginning of the year . . . . . 12,500 9,846 14,240 13,935 96,965 76,886 9,846 162,500 9,846 76,886 9,846 7,699 Shares issued. . . . . . . . . . . . . . 2,358 — — — — — 2,531 — — — — —Shares redeemed . . . . . . . . . . . — — — — — — (1,302) — — — — —
At end of year . . . . . . . . . . . . . 14,858 9,846 14,240 13,935 96,965 76,886 11,075 162,500 9,846 76,886 9,846 7,699
Janus Asia Growth Drivers Fund
Class A$acc Class A€acc Class AAUD$acc Class ACAD$acc Class AKH$acc Class ARMB(CNH)acc Class E€acc Class I$acc Class I€acc Class IRMB(CNH)acc Class U€acc Class U£acc
Shares Hedged Shares Hedged Shares Hedged Shares Hedged Shares Hedged Shares Hedged Shares Shares Hedged Shares Hedged Shares Hedged Shares Hedged Shares
At beginning of the year . . . . . 12,500 9,734 13,987 13,691 96,819 76,716 9,734 162,500 9,734 76,716 9,734 7,679 Shares issued. . . . . . . . . . . . . . — — — — — — — — — — — —Shares redeemed . . . . . . . . . . . — — — — — — — — — — — —
At end of year . . . . . . . . . . . . . 12,500 9,734 13,987 13,691 96,819 76,716 9,734 162,500 9,734 76,716 9,734 7,679
Janus Asia Fund
Class A$acc Class E€acc Class I$acc Class I€acc Class U£acc Class Z$inc
Shares Hedged Shares Shares Hedged Shares Shares Shares
At beginning of the year . . . . . 61,329 1,440 3,160 225 185 1,000,032Shares issued. . . . . . . . . . . . . . 38,642 6,372 — 17,215 — 1Shares redeemed . . . . . . . . . . . (30,359) (5,286) — — — —
At end of year . . . . . . . . . . . . . 69,612 2,526 3,160 17,440 185 1,000,033
Janus Balanced Fund
Class A$acc Class A$inc Class A€acc Class A€inc Class AAUD$acc Class AAUD$inc Class ACAD$inc Class AHK$acc Class AHK$inc Class ARMB(CNH)inc Class B$acc Class E€acc Class E€inc Class I$acc
Shares Shares Hedged Shares Hedged Shares Hedged Shares Hedged Shares Hedged Shares Shares Shares Hedged Shares Shares Hedged Shares Hedged Shares Shares
At beginning of the year . . . . . 12,195,905 4,974,997 3,001,300 274,194 11,606 1,353,978 582,301 248,319 12,804,761 125,440 541,736 631,546 129,173 5,357,343 Shares issued. . . . . . . . . . . . . . 8,963,534 8,333,247 821,316 262,376 5,155 2,853,092 3,449,647 236,274 32,313,880 1,100,508 139,590 136,219 166,003 1,704,433 Shares redeemed . . . . . . . . . . . (6,649,937) (7,878,262) (1,338,233) (221,396) (11,638) (2,852,263) (761,076) (172,390) (26,516,375) (674,545) (149,221) (281,594) (75,971) (1,237,378)
At end of year . . . . . . . . . . . . . 14,509,502 5,429,982 2,484,383 315,174 5,123 1,354,807 3,270,872 312,203 18,602,266 551,403 532,105 486,171 219,205 5,824,398
Janus Balanced Fund
Class I$inc Class I€acc Class I€inc Class V$inc Class VAUD$inc
Shares Hedged Shares Shares Shares Hedged Shares
At beginning of the year . . . . . 308 1,114,703 227 4,822 338 Shares issued. . . . . . . . . . . . . . 356,671 1,363,105 4 483,524 19 Shares redeemed . . . . . . . . . . . (356,979) (780,662) (231) (50,972) —
At end of year . . . . . . . . . . . . . — 1,697,146 — 437,374 357
Janus Emerging Markets Fund
Class A$acc Class A€acc Class B$acc Class E€acc Class I$acc Class I€acc Class U£acc Class Z€inc
Shares Hedged Shares Shares Hedged Shares Shares Hedged Shares Shares Shares
At beginning of the year . . . . . 130,900 98,150 100,000 209 100,000 73,368 185 — Shares issued. . . . . . . . . . . . . . 18,468 5,956 — 5,493 — — — 1,251,183 Shares redeemed . . . . . . . . . . . (9,586) (13,952) (1,744) — — — — —
At end of year . . . . . . . . . . . . . 139,782 90,154 98,256 5,702 100,000 73,368 185 1,251,183
Janus Europe Fund
Class A$acc Class A€acc Class ASEKacc Class E€acc Class I€acc Class ISEKacc Class U$acc Class U€acc Class Z€acc Class Z€inc
Hedged Shares Shares Shares Shares Shares Hedged Shares Hedged Shares Shares Shares Shares
At beginning of the year . . . . . 1,324,328 832,398 1,945 114,669 2,429,708 7,104,690 300 917 563,466 548,059 Shares issued. . . . . . . . . . . . . . 451,512 217,405 — 31,460 371,248 — — 102 — — Shares redeemed . . . . . . . . . . . (724,556) (553,231) (1,945) (51,269) (1,161,777) — — — (440,767) —
At end of year . . . . . . . . . . . . . 1,051,284 496,572 — 94,860 1,639,179 7,104,690 300 1,019 122,699 548,059
Janus Global Life Sciences Fund
Class A$acc Class A€acc Class AAUD$acc Class AHK$acc Class ARMB$acc Class B$acc Class E$acc Class E€acc Class I$acc Class I€acc Class I€acc Class U$acc Class U$inc Class U€acc
Shares Hedged Shares Shares Shares Hedged Shares Shares Shares Hedged Shares Shares Shares Hedged Shares Shares Shares Hedged Shares
At beginning of the year . . . . . 12,501,186 2,702,026 371,947 — 1,849 789,975 23,630 40,345 7,330,355 4,557 287,029 1,435,649 111,214 79,384 Shares issued. . . . . . . . . . . . . . 52,168,219 2,272,195 10,765,521 7,729,970 172,900 580,908 360,401 173,824 26,462,138 577,926 1,599,500 1,949,100 4,366,833 17,645 Shares redeemed . . . . . . . . . . . (38,466,861) (2,131,866) (9,251,322) (4,203,827) — (591,883) (71,969) (55,650) (6,743,261) (229,678) (246,507) (39,075) (1,175,368) (10,694)
At end of year . . . . . . . . . . . . . 26,202,544 2,842,355 1,886,146 3,526,143 174,749 779,000 312,062 158,519 27,049,232 352,805 1,640,022 3,345,674 3,302,679 86,335
Janus Global Life Sciences Fund
Class U€acc Class U£inc Class U£acc Class V€acc Class V$acc
Shares Shares Shares Hedged Shares Shares
At beginning of the year . . . . . 234 355,046 82,120 — — Shares issued. . . . . . . . . . . . . . 728 636,289 57,819 263 300 Shares redeemed . . . . . . . . . . . (728) (49,032) (5,516) — —
At end of year . . . . . . . . . . . . . 234 942,303 134,423 263 300
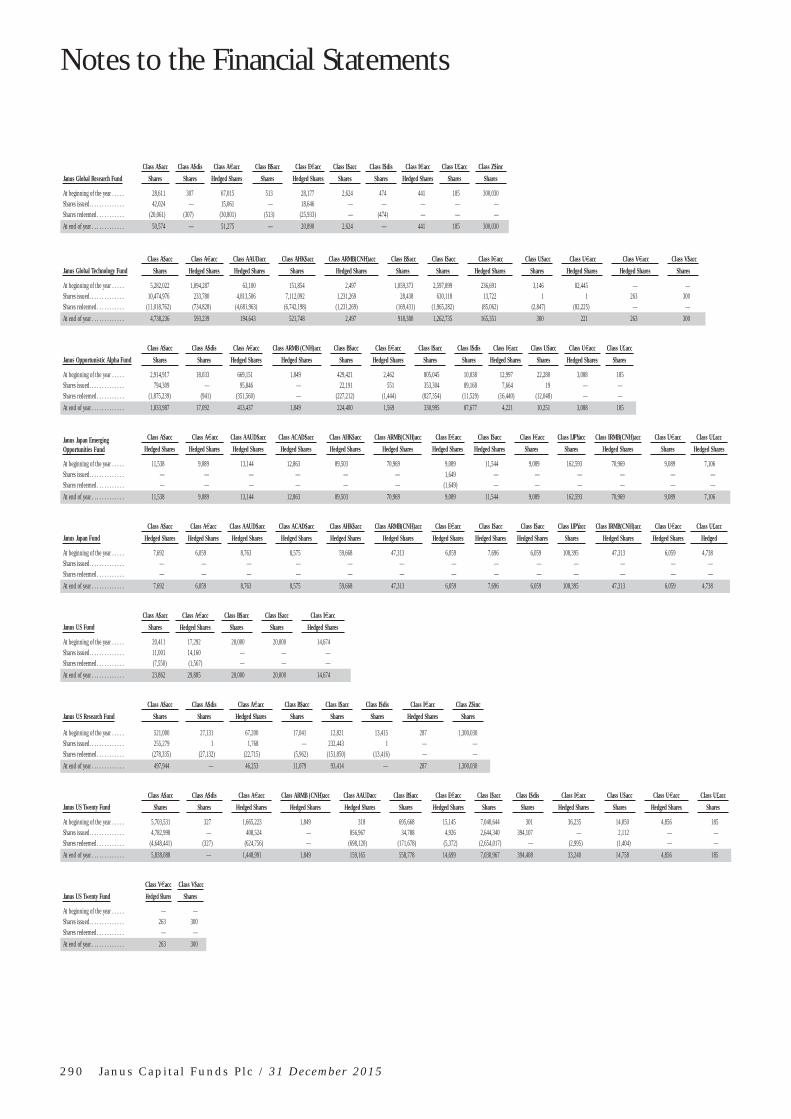
Notes to the Financial Statements
2 9 0 J a n u s C a p i t a l F u n d s P l c / 3 1 D e c e m b e r 2 0 1 5
Janus Global Research Fund
Class A$acc Class A$dis Class A€acc Class B$acc Class E€acc Class I$acc Class I$dis Class I€acc Class U£acc Class Z$inc
Shares Shares Hedged Shares Shares Hedged Shares Shares Shares Hedged Shares Shares Shares
At beginning of the year . . . . . 28,611 307 67,015 513 28,177 2,624 474 441 185 300,030 Shares issued. . . . . . . . . . . . . . 42,024 — 15,061 — 18,646 — — — — — Shares redeemed . . . . . . . . . . . (20,061) (307) (30,801) (513) (25,933) — (474) — — —
At end of year . . . . . . . . . . . . . 50,574 — 51,275 — 20,890 2,624 — 441 185 300,030
Janus Global Technology Fund
Class A$acc Class A€acc Class AAUDacc Class AHK$acc Class ARMB(CNH)acc Class B$acc Class I$acc Class I€acc Class U$acc Class U€acc Class V€acc Class V$acc
Shares Hedged Shares Hedged Shares Shares Hedged Shares Shares Shares Hedged Shares Shares Hedged Shares Hedged Shares Shares
At beginning of the year . . . . . 5,282,022 1,094,287 63,100 151,854 2,497 1,059,373 2,597,899 236,691 3,146 82,445 — — Shares issued. . . . . . . . . . . . . . 10,474,976 233,780 4,813,506 7,112,092 1,231,269 28,438 630,118 13,722 1 1 263 300 Shares redeemed . . . . . . . . . . . (11,018,762) (734,828) (4,681,963) (6,742,198) (1,231,269) (169,431) (1,965,282) (85,062) (2,847) (82,225) — —
At end of year . . . . . . . . . . . . . 4,738,236 593,239 194,643 521,748 2,497 918,380 1,262,735 165,351 300 221 263 300
Janus Opportunistic Alpha Fund
Class A$acc Class A$dis Class A€acc Class ARMB (CNH)acc Class B$acc Class E€acc Class I$acc Class I$dis Class I€acc Class U$acc Class U€acc Class U£acc
Shares Shares Hedged Shares Hedged Shares Shares Hedged Shares Shares Shares Hedged Shares Shares Hedged Shares Shares
At beginning of the year . . . . . 2,914,917 18,033 669,151 1,849 429,421 2,462 805,045 10,038 12,997 22,280 3,088 185 Shares issued. . . . . . . . . . . . . . 794,309 — 95,846 — 22,191 551 353,304 89,168 7,664 19 — — Shares redeemed . . . . . . . . . . . (1,875,239) (941) (351,560) — (227,212) (1,444) (827,354) (11,529) (16,440) (12,048) — —
At end of year . . . . . . . . . . . . . 1,833,987 17,092 413,437 1,849 224,400 1,569 330,995 87,677 4,221 10,251 3,088 185
Janus Japan Emerging Opportunities Fund
Class A$acc Class A€acc Class AAUD$acc Class ACAD$acc Class AHK$acc Class ARMB(CNH)acc Class E€acc Class I$acc Class I€acc Class IJPYacc Class IRMB(CNH)acc Class U€acc Class U£acc
Hedged Shares Hedged Shares Hedged Shares Hedged Shares Hedged Shares Hedged Shares Hedged Shares Hedged Shares Shares Shares Hedged Shares Shares Hedged Shares
At beginning of the year . . . . . 11,538 9,089 13,144 12,863 89,503 70,969 9,089 11,544 9,089 162,593 70,969 9,089 7,106 Shares issued. . . . . . . . . . . . . . — — — — — — 1,649 — — — — — — Shares redeemed . . . . . . . . . . . — — — — — — (1,649) — — — — — —
At end of year . . . . . . . . . . . . . 11,538 9,089 13,144 12,863 89,503 70,969 9,089 11,544 9,089 162,593 70,969 9,089 7,106
Janus Japan Fund
Class A$acc Class A€acc Class AAUD$acc Class ACAD$acc Class AHK$acc Class ARMB(CNH)acc Class E€acc Class I$acc Class I$acc Class IJPYacc Class IRMB(CNH)acc Class U€acc Class U£acc
Hedged Shares Hedged Shares Hedged Shares Hedged Shares Hedged Shares Hedged Shares Hedged Shares Hedged Shares Hedged Shares Shares Hedged Shares Hedged Shares Hedged
At beginning of the year . . . . . 7,692 6,059 8,763 8,575 59,668 47,313 6,059 7,696 6,059 108,395 47,313 6,059 4,738 Shares issued. . . . . . . . . . . . . . — — — — — — — — — — — — — Shares redeemed . . . . . . . . . . . — — — — — — — — — — — — —
At end of year . . . . . . . . . . . . . 7,692 6,059 8,763 8,575 59,668 47,313 6,059 7,696 6,059 108,395 47,313 6,059 4,738
Janus US Fund
Class A$acc Class A€acc Class B$acc Class I$acc Class I€acc
Shares Hedged Shares Shares Shares Hedged Shares
At beginning of the year . . . . . 20,411 17,292 20,000 20,000 14,674 Shares issued. . . . . . . . . . . . . . 11,001 14,160 — — — Shares redeemed . . . . . . . . . . . (7,550) (1,567) — — —
At end of year . . . . . . . . . . . . . 23,862 29,885 20,000 20,000 14,674
Janus US Research Fund
Class A$acc Class A$dis Class A€acc Class B$acc Class I$acc Class I$dis Class I€acc Class Z$inc
Shares Shares Hedged Shares Shares Shares Shares Hedged Shares Shares
At beginning of the year . . . . . 521,000 27,131 67,200 17,041 12,821 13,415 287 1,300,030 Shares issued. . . . . . . . . . . . . . 255,279 1 1,768 — 232,443 1 — — Shares redeemed . . . . . . . . . . . (278,335) (27,132) (22,715) (5,962) (151,850) (13,416) — —
At end of year . . . . . . . . . . . . . 497,944 — 46,253 11,079 93,414 — 287 1,300,030
Janus US Twenty Fund
Class A$acc Class A$dis Class A€acc Class ARMB (CNH)acc Class AAUDacc Class B$acc Class E€acc Class I$acc Class I$dis Class I€acc Class U$acc Class U€acc Class U£acc
Shares Shares Hedged Shares Hedged Shares Hedged Shares Shares Hedged Shares Shares Shares Hedged Shares Shares Hedged Shares Shares
At beginning of the year . . . . . 5,703,531 327 1,665,223 1,849 318 695,668 15,145 7,040,644 301 36,235 14,050 4,856 185 Shares issued. . . . . . . . . . . . . . 4,782,998 — 408,524 — 856,967 34,788 4,926 2,644,340 394,107 — 2,112 — — Shares redeemed . . . . . . . . . . . (4,648,441) (327) (624,756) — (698,120) (171,678) (5,372) (2,654,017) — (2,995) (1,404) — —
At end of year . . . . . . . . . . . . . 5,838,088 — 1,448,991 1,849 159,165 558,778 14,699 7,030,967 394,408 33,240 14,758 4,856 185
Janus US Twenty Fund
Class V€acc Class V$acc
Hedged Shares Shares
At beginning of the year . . . . . — — Shares issued. . . . . . . . . . . . . . 263 300 Shares redeemed . . . . . . . . . . . — —
At end of year . . . . . . . . . . . . . 263 300

Notes to the Financial Statements
J a n u s C a p i t a l F u n d s P l c / 3 1 D e c e m b e r 2 0 1 5 2 9 1
Janus US Venture Fund
Class A$acc Class A$dis Class A€acc Class AAUDacc Class B$acc Class I$acc Class I$dis Class I€acc Class U$acc Class U€acc Class U£acc Class Z$acc Class Z€acc
Shares Shares Hedged Shares Hedged Shares Shares Shares Shares Hedged Shares Shares Hedged Shares Shares Shares Shares
At beginning of the year . . . . . 4,110,701 79,484 798,140 318 174,359 856,796 1,817 690,673 300 221 463,975 593,076 250,022 Shares issued. . . . . . . . . . . . . . 7,113,152 32,821 298,265 390,337 43,760 4,741,326 110 66,556 209,720 21,101 1,928 2 — Shares redeemed . . . . . . . . . . . (7,295,279) (91,105) (450,751) (215,405) (80,802) (2,728,658) (1,927) (82,295) (5,075) (21,322) (1,443) (593,051) (158,580)
At end of year . . . . . . . . . . . . . 3,928,574 21,200 645,654 175,250 137,317 2,869,464 — 674,934 204,945 — 464,460 27 91,442
Perkins Global Value Fund
Class A$acc Class A€acc Class B$acc Class E€acc Class I$acc Class I€acc Class U$acc Class U€acc Class Z$inc
Shares Hedged Shares Shares Hedged Shares Shares Hedged Shares Shares Hedged Shares Shares
At beginning of the year . . . . . 221,434 135,341 469 12,434 536 121,095 300 221 1,432,850 Shares issued. . . . . . . . . . . . . . 47,992 34,107 — 7,026 4 924 — — 41,100 Shares redeemed . . . . . . . . . . . (95,842) (65,541) (469) (7,983) (5) (120,113) — — (12,671)
At end of year . . . . . . . . . . . . . 173,584 103,907 — 11,477 535 1,906 300 221 1,461,279
Perkins US Strategic Value Fund
Class A$acc Class A$dis Class A€acc Class B$acc Class E€acc Class I$acc Class I$dis Class I€acc Class I€acc Class U$acc Class U€acc Class U£acc
Shares Shares Hedged Shares Shares Hedged Shares Shares Shares Hedged Shares Shares Shares Hedged Shares Shares
At beginning of the year . . . . . 6,115,959 720,520 1,792,143 107,489 8,586 9,974,497 76,608 865,938 234 54,509 58,342 185 Shares issued. . . . . . . . . . . . . . 496,156 1,448 99,334 2,877 4,286 1,354,274 — 173,195 — 927 19 — Shares redeemed . . . . . . . . . . . (3,638,197) (224,994) (721,194) (20,001) (6,220) (6,464,506) (4,040) (837,708) (234) (40,635) (54,721) —
At end of year . . . . . . . . . . . . . 2,973,918 496,974 1,170,283 90,365 6,652 4,864,265 72,568 201,425 — 14,801 3,640 185
IINTECH All-World Minimum Variance Core Fund(a)
Class Z£acc
Shares
At beginning of the year . . . . . — Shares issued. . . . . . . . . . . . . . 5,100,000 Shares redeemed . . . . . . . . . . . —
At end of year . . . . . . . . . . . . . 5,100,000
INTECH European Core Fund
Class A€acc Class Z€inc
Shares Shares
At beginning of the year . . . . . 253 815,022 Shares issued. . . . . . . . . . . . . . — 1 Shares redeemed . . . . . . . . . . . — —
At end of year . . . . . . . . . . . . . 253 815,023
INTECH Global All Country Low Volatility Fund
Class Z£acc
Shares
At beginning of the year . . . . . 1,012,587 Shares issued. . . . . . . . . . . . . . — Shares redeemed . . . . . . . . . . . —
At end of year . . . . . . . . . . . . . 1,012,587
INTECH Global Dividend Fund
Class A$acc Class A$inc Class A€acc Class A€inc Class E€acc Class E€inc Class I$acc Class I$inc Class I€acc Class I€inc Class U$acc Class U€acc Class U£inc Class Z€acc
Shares Shares Hedged Shares Hedged Shares Hedged Shares Hedged Shares Shares Shares Hedged Shares Hedged Shares Shares Hedged Shares Shares Shares
At beginning of the year . . . . . 22,961 34,562 3,466 15,717 2,072 10,263 127,634 311 234 243 300 221 205 24 Shares issued. . . . . . . . . . . . . . 11,886 936 932 5,138 — 2,261 — 6 — 4 — — 4 — Shares redeemed . . . . . . . . . . . (3,248) (32,801) (2,789) (11,680) (1,838) (5,530) — — — — — — — —
At end of year . . . . . . . . . . . . . 31,599 2,697 1,609 9,175 234 6,994 127,634 317 234 247 300 221 209 24
INTECH US Core Fund
Class A$acc Class A$dis Class A€acc Class B$acc Class I$acc Class I$dis Class I€acc Class U$acc Class U€acc Class U£acc
Shares Shares Hedged Shares Shares Shares Shares Hedged Shares Shares Hedged Shares Shares
At beginning of the year . . . . . 1,729,752 2,621 411,385 11,246 2,180,453 1,537 1,832,655 300 221 185 Shares issued. . . . . . . . . . . . . . 743,605 — 91,565 110 1,108,964 — 2,554,593 — — — Shares redeemed . . . . . . . . . . . (1,067,576) (2,621) (204,186) (1,104) (481,343) (1,537) (2,366,762) — — —
At end of year . . . . . . . . . . . . . 1,405,781 — 298,764 10,252 2,808,074 — 2,020,486 300 221 185
Janus Global Diversified Alternatives Fund
Class A$acc Class A€acc Class ACHFacc Class ASEKacc Class E€acc Class I$acc Class I€acc Class ICHFacc Class ISEKacc Class U$acc Class U€acc Class U£acc
Shares Hedged Shares Hedged Shares Hedged Shares Hedged Shares Shares Hedged Shares Hedged Shares Hedged Shares Shares Hedged Shares Hedged Shares
At beginning of the year . . . . . 41,525 12,172 14,507 104,822 12,172 18,548 15,806 14,507 104,822 16,600 12,172 9,733 Shares issued. . . . . . . . . . . . . . 24,039 15,262 — — — — 7,087 — — — — — Shares redeemed . . . . . . . . . . . (8,147) (966) — — — — (1,898) — — — — —
At end of year . . . . . . . . . . . . . 57,417 26,468 14,507 104,822 12,172 18,548 20,995 14,507 104,822 16,600 12,172 9,733

Notes to the Financial Statements
2 9 2 J a n u s C a p i t a l F u n d s P l c / 3 1 D e c e m b e r 2 0 1 5
Janus Global Real Estate Fund
Class A$acc Class A$inc Class A€acc Class AAUDinc Class ARMB (CNH)acc Class B$acc Class B$inc Class E€acc Class E€inc Class I$inc Class I€acc Class U£inc Class U£inc
Shares Shares Hedged Shares Hedged Shares Hedged Shares Shares Shares Hedged Shares Hedged Shares Shares Hedged Shares Hedged Shares Shares
At beginning of the year . . . . . 1,737,026 82,698 513,760 332 1,849 26,460 3,725 3,937 3,875 8,852,152 1,650 22,240 103,523 Shares issued. . . . . . . . . . . . . . 861,005 70,128 81,556 343 — 524 1 7,506 16 1,428,705 414 111,635 296,290 Shares redeemed . . . . . . . . . . . (927,800) (65,574) (234,518) — — (14,680) (2,324) (1,748) (473) (3,335,527) (1,500) (60,117) (8,566)
At end of year . . . . . . . . . . . . . 1,670,231 87,252 360,798 675 1,849 12,304 1,402 9,695 3,418 6,945,330 564 73,758 391,247
Janus Flexible Income Fund
Class A$acc Class A$inc Class A€acc Class AAUDacc Class AAUDinc Class AHK$acc Class AHK$inc Class ARMB(CNH)inc Class B$acc Class B$inc Class B€inc
Shares Shares Hedged Shares Hedged Shares Hedged Shares Shares Shares Hedged Shares Shares Shares Hedged Shares
At beginning of the year . . . . . 4,072,970 2,657,993 4,676,823 319 236,219 2,329 452,480 1,983 149,837 548,084 51,136 Shares issued. . . . . . . . . . . . . . 1,708,718 2,209,951 608,807 — 1,228,534 — 799,435 65 200,904 271,296 83 Shares redeemed . . . . . . . . . . . (1,844,370) (2,375,396) (2,163,154) (319) (1,002,855) (2,329) (827,601) — (214,246) (561,865) (28,547)
At end of year . . . . . . . . . . . . . 3,937,318 2,492,548 3,122,476 — 461,898 — 424,314 2,048 136,495 257,515 22,672
Janus Flexible Income Fund
Class E€acc Class E€inc Class I$acc Class I$inc Class I€acc Class U$acc Class U€acc Class U£acc Class U£inc Class V$inc Class VAUD$inc Class Z$acc
Hedged Shares Hedged Shares Shares Shares Hedged Shares Shares Hedged Shares Hedged Shares Hedged Shares Shares Hedged Shares Shares
At beginning of the year . . . . . 690,821 1,724,915 2,385,686 37,378,347 2,983,803 300 630,267 185 130,909 59,648 20,702 897,789 Shares issued. . . . . . . . . . . . . . 67,451 143,327 18,689,146 4,334,704 1,655,078 — 173,603 7,105 39,649 185,843 37,852 28,341 Shares redeemed . . . . . . . . . . . (309,540) (1,143,218) (6,198,861) (7,055,884) (2,669,482) — (89,895) — (156,908) (36,019) (3,191) (209,090)
At end of year . . . . . . . . . . . . . 448,732 725,024 14,875,971 34,657,167 1,969,399 300 713,975 7,290 13,650 209,472 55,363 717,040
Janus Global Flexible Income Fund
Class A$acc Class A€acc Class E€acc Class E€inc Class I$inc Class I€acc Class U$acc Class U€acc Class U£acc Class U£inc
Shares Hedged Shares Hedged Shares Hedged Shares Shares Hedged Shares Shares Hedged Shares Hedged Shares Hedged Shares
At beginning of the year . . . . . 582,723 341,480 35,261 128,563 265,066 573,072 300 1,287 185 195 Shares issued. . . . . . . . . . . . . . 270,287 62,032 25,989 79,123 11,240 282,942 — — — 3 Shares redeemed . . . . . . . . . . . (204,807) (100,061) (14,570) (87,466) (2,869) (116,001) — — — —
At end of year . . . . . . . . . . . . . 648,203 303,451 46,680 120,220 273,437 740,013 300 1,287 185 198
Janus Global High Yield Fund
Class A$acc Class A$inc Class A€acc Class A€inc Class AAUD$inc Class B$acc Class B$inc Class B€inc Class E€acc Class E€inc Class I$acc Class I$inc
Shares Shares Hedged Shares Hedged Shares Shares Shares Shares Hedged Shares Hedged Shares Hedged Shares Shares Shares
At beginning of the year . . . . . 199,433 750,093 285,620 1,636,252 369 333 321 312 63,322 868,637 277 138,094 Shares issued. . . . . . . . . . . . . . 65,772 240,281 41,700 213,368 29 — 11 11 2,370 87,365 — 135 Shares redeemed . . . . . . . . . . . (94,241) (328,578) (175,279) (1,216,291) (398) (333) (332) (323) (34,055) (405,415) — (3,000)
At end of year . . . . . . . . . . . . . 170,964 661,796 152,041 633,329 — — — — 31,637 550,587 277 135,229
Janus Global High Yield Fund
Class IAUD$inc Class I€acc Class I€inc Class U£acc Class U£inc Class Z$inc
Hedged Shares Hedged Shares Hedged Shares Hedged Shares Hedged Shares Shares
At beginning of the year . . . . . 380 183,187 415 185 206 300,036 Shares issued. . . . . . . . . . . . . . 32 2,504 24 — 12 3 Shares redeemed . . . . . . . . . . . (412) (185,691) — — — —
At end of year . . . . . . . . . . . . . — — 439 185 218 300,039
Janus Global Investment Grade Bond Fund
Class A$acc Class A$inc Class A€acc Class A€inc Class B$acc Class B$inc Class B€inc Class E€acc Class E€inc Class I$acc Class I$inc
Shares Shares Hedged Shares Hedged Shares Shares Shares Hedged Shares Hedged Shares Hedged Shares Shares Shares
At beginning of the year . . . . . 394,379 778,011 154,815 428,082 326 337 252 56,482 170,980 255,789 8,973 Shares issued. . . . . . . . . . . . . . 61,331 417,809 37,123 36,099 — 1 1 2,617 6,843 200,592 9 Shares redeemed . . . . . . . . . . . (151,691) (495,919) (112,655) (316,829) (326) (338) (253) (40,618) (113,224) (362,253) (8,634)
At end of year . . . . . . . . . . . . . 304,019 699,901 79,283 147,352 — — — 18,481 64,599 94,128 348
Janus Global Investment Grade Bond Fund
Class I€acc Class I€inc Class I£inc Class Z$inc
Hedged Shares Hedged Shares Hedged Shares Shares
At beginning of the year . . . . . 1,372 360 621,072 300,035 Shares issued. . . . . . . . . . . . . . 382 8 240,661 1 Shares redeemed . . . . . . . . . . . (1,196) — (803,844) —
At end of year . . . . . . . . . . . . . 558 368 57,889 300,036

Notes to the Financial Statements
J a n u s C a p i t a l F u n d s P l c / 3 1 D e c e m b e r 2 0 1 5 2 9 3
Janus High Yield Fund
Class A$acc Class A$inc Class A€acc Class AAUD$acc Class AAUD$inc Class AHK$acc Class AHK$inc Class ARMB(CNH)inc Class B$acc Class B$inc Class B€inc Class E€acc
Shares Shares Hedged Shares Hedged Shares Hedged Shares Shares Shares Hedged Shares Shares Shares Hedged Shares Hedged Shares
At beginning of the year . . . . . 2,243,795 7,337,772 1,130,484 319 371,896 139,739 6,642,054 111,767 93,158 6,388,089 998,973 48,542 Shares issued. . . . . . . . . . . . . . 883,418 2,393,078 160,937 — 392,472 — 603,382 157 134,507 717,572 39,957 2,522 Shares redeemed . . . . . . . . . . . (1,377,160) (3,101,410) (427,021) (319) (441,597) (15,678) (1,794,215) — (95,025) (1,644,175) (253,508) (28,449)
At end of year . . . . . . . . . . . . . 1,750,053 6,629,440 864,400 — 322,771 124,061 5,451,221 111,924 132,640 5,461,486 785,422 22,615
Janus High Yield Fund
Class E€inc Class I$acc Class I$inc Class I€acc Class IAUD$inc Class IRMB(CNH)inc Class U£acc Class U£inc Class V$inc Class VAUD$inc Class Z$acc
Hedged Shares Shares Shares Hedged Shares Hedged Shares Hedged Shares Hedged Shares Hedged Shares Shares Hedged Shares Shares
At beginning of the year . . . . . 977,966 4,808,426 38,450,618 2,007,394 376 2,277 185 208 51,096 40,740 723,409 Shares issued. . . . . . . . . . . . . . 114,712 1,518,811 9,245,624 1,324,133 23 159 — 12 914,732 469,305 — Shares redeemed . . . . . . . . . . . (744,749) (2,994,468) (17,421,089) (1,690,982) (399) — — — (90,691) (29,266) —
At end of year . . . . . . . . . . . . . 347,929 3,332,769 30,275,153 1,640,545 — 2,436 185 220 875,137 480,779 723,409
Janus Global Unconstrained Bond Fund
Class A$acc Class A$inc Class A€acc Class AAUD$inc Class A€inc Class ACAD$inc Class ACHFacc Class ACHFinc Class AHK$inc Class ARMB(CNH)inc Class ASGDinc Class E€acc Class E€inc Class I$acc
Shares Shares Hedged Shares Hedged Shares Hedged Shares Hedged Shares Hedged Shares Hedged Shares Shares Hedged Shares Hedged Shares Hedged Shares Shares Shares
At beginning of the year . . . . . 4,353,665 230,986 155,270 — 21,334 — 942 943 — — 1,270 781 3,773 1,914,946 Shares issued. . . . . . . . . . . . . . 4,088,215 308,349 572,275 398 87,159 384 45,600 26 2,380 1,930 35 542,066 313,255 4,865,682 Shares redeemed . . . . . . . . . . . (3,246,019) (59,392) (220,681) — (32,929) — — — — — — (135,655) (83,966) (3,997,204)
At end of year . . . . . . . . . . . . . 5,195,861 479,943 506,864 398 75,564 384 46,542 969 2,380 1,930 1,305 407,192 233,062 2,783,424
Janus Global Unconstrained Bond Fund
Class I€acc Class U$acc Class U$inc Class U€acc Class U£acc Class U£inc Class U£inc
Hedged Shares Shares Shares Hedged Shares Hedged Shares Shares Hedged Shares
At beginning of the year . . . . . 820,045 1,000 1,003 781 618 620 620 Shares issued. . . . . . . . . . . . . . 2,950,754 — 10,075 2,124 11,620 11 11 Shares redeemed . . . . . . . . . . . (2,811,005) — — — — — —
At end of year . . . . . . . . . . . . . 959,794 1,000 11,078 2,905 12,238 631 631
Janus US Short-Term Bond Fund
Class A$acc Class A$inc Class A€acc Class AAUD$inc Class ACHFinc Class B$acc Class B$inc Class E€acc Class E€inc Class I$acc Class I$inc
Shares Shares Hedged Shares Hedged Shares Hedged Shares Shares Shares Hedged Shares Hedged Shares Shares Shares
At beginning of the year . . . . . 17,214,561 3,561,084 1,577,123 328 244,491 66,910 473,029 87,994 57,653 3,961,401 7,919,528 Shares issued. . . . . . . . . . . . . . 2,995,208 793,096 448,142 6 18,194 47,634 19,255 47,539 8,974 4,245,723 2,659,186 Shares redeemed . . . . . . . . . . . (8,414,429) (1,823,822) (1,328,301) — (124,629) (69,201) (187,583) (92,130) (23,904) (4,953,543) (5,401,465)
At end of year . . . . . . . . . . . . . 11,795,340 2,530,358 696,964 334 138,056 45,343 304,701 43,403 42,723 3,253,581 5,177,249
Janus US Short-Term Bond Fund
Class I€acc Class I£acc Class I£inc Class ICHFinc Class U$acc Class U$inc Class U£acc Class U£inc Class Z$acc
Hedged Shares Hedged Shares Hedged Shares Hedged Shares Shares Shares Hedged Shares Hedged Shares Shares
At beginning of the year . . . . . 761,705 195,506 157,690 5,308 113,787 37,044 185 190 688,815 Shares issued. . . . . . . . . . . . . . 334,156 2 3 4 98,717 5,348 — 2 2 Shares redeemed . . . . . . . . . . . (509,264) (195,508) (157,498) (5,312) (188,769) (17,259) — — (688,682)
At end of year . . . . . . . . . . . . . 586,597 — 195 — 23,735 25,133 185 192 135

Notes to the Financial Statements
2 9 4 J a n u s C a p i t a l F u n d s P l c / 3 1 D e c e m b e r 2 0 1 5
For the fi nancial year ended 31 December 2014
Janus Asia Frontier Markets Fund
Class A$acc Class A€acc Class AAUD$acc Class ACAD$acc Class AHK$acc Class ARMB(CNH)acc Class E€acc Class I$acc Class I€acc Class IRMB(CNH)acc Class U€acc Class U£acc
Shares Hedged Shares Hedged Shares Hedged Shares Shares Hedged Shares Hedged Shares Shares Hedged Shares Hedged Shares Hedged Shares Hedged Shares
At beginning of the year . . . . . — — — — — — — — — — — —Shares issued. . . . . . . . . . . . . . 12,500 9,846 14,240 13,935 96,965 76,886 9,846 162,500 9,846 76,886 9,846 7,699Shares redeemed . . . . . . . . . . . — — — — — — — — — — — —
At end of year . . . . . . . . . . . . . 12,500 9,846 14,240 13,935 96,965 76,886 9,846 162,500 9,846 76,886 9,846 7,699
Janus Asia Growth Drivers Fund
Class A$acc Class A€acc Class AAUD$acc Class ACAD$acc Class AKH$acc Class ARMB(CNH)acc Class E€acc Class I$acc Class I€acc Class IRMB(CNH)acc Class U€acc Class U£acc
Hedged Shares Hedged Shares Hedged Shares Hedged Shares Hedged Shares Hedged Shares Hedged Shares Hedged Shares Hedged Shares Hedged Shares Hedged Shares Hedged Shares
At beginning of the year . . . . . — — — — — — — — — — — —Shares issued. . . . . . . . . . . . . . 12,500 9,734 13,987 13,691 96,819 76,716 9,734 162,500 9,734 76,716 9,734 7,679Shares redeemed . . . . . . . . . . . — — — — — — — — — — — —
At end of year . . . . . . . . . . . . . 12,500 9,734 13,987 13,691 96,819 76,716 9,734 162,500 9,734 76,716 9,734 7,679
Janus Asia Fund
Class A$acc Class E€acc Class I$acc Class I€acc Class U£acc Class Z$inc
Shares Shares Shares Shares Shares Shares
At beginning of the year . . . . . 28,612 1,415 3,160 225 185 1,000,031Shares issued. . . . . . . . . . . . . . 42,394 448 — — — 1Shares redeemed . . . . . . . . . . . (9,677) (423) — — — —
At end of year . . . . . . . . . . . . . 61,329 1,440 3,160 225 185 1,000,032
Janus Balanced Fund
Class A$acc Class A$inc Class A€acc Class A€inc Class AAUD$acc Class AAUD$inc Class ACAD$inc Class AHK$acc Class AHK$inc Class ARMB(CNH)inc Class B$acc Class E€acc Class E€inc Class I$acc
Shares Shares Shares Shares Shares Shares Shares Shares Shares Shares Shares Shares Shares Shares
At beginning of the year . . . . . 6,041,642 302 2,351,641 8,628 319 323 311 93,940 2,343 1,845 585,589 613,647 7,625 2,926,838Shares issued. . . . . . . . . . . . . . 10,321,812 10,527,834 1,740,411 453,757 12,395 4,417,524 1,542,078 154,429 37,409,978 1,433,453 76,763 249,713 133,178 3,422,363Shares redeemed . . . . . . . . . . . (4,167,549) (5,553,139) (1,090,752) (188,190) (1,107) (3,063,869) (960,088) (50) (24,607,560) (1,309,858) (120,616) (231,814) (11,630) (991,858)
At end of year . . . . . . . . . . . . . 12,195,905 4,974,997 3,001,300 274,194 11,606 1,353,978 582,301 248,319 12,804,761 125,440 541,736 631,546 129,173 5,357,343
Janus Balanced Fund
Class I$inc Class I€acc Class I€inc Class V$inc Class VAUD$inc
Shares Shares Shares Shares Shares
At beginning of the year . . . . . 301 2,413,274 222 302 321Shares issued. . . . . . . . . . . . . . 7 1,907,310 5 4,520 17Shares redeemed . . . . . . . . . . . — (3,205,880) — — —
At end of year . . . . . . . . . . . . . 308 1,114,703 227 4,822 338
Janus Emerging Markets Fund
Class A$acc Class A€acc Class B$acc Class E€acc Class I$acc Class I€acc Class U£acc
Shares Shares Shares Shares Shares Shares Shares
At beginning of the year . . . . . 132,763 95,618 100,000 209 100,000 73,368 185Shares issued. . . . . . . . . . . . . . 59,957 14,558 — — — 202,021 —Shares redeemed . . . . . . . . . . . (61,820) (12,025) — — — (202,021) —
At end of year . . . . . . . . . . . . . 130,900 98,150 100,000 209 100,000 73,368 185
Janus Europe Fund
Class A$acc Class A€acc Class ASEKacc Class E€acc Class I€acc Class ISEKacc Class U$acc Class U€acc Class Z€acc Class Z€inc
Shares Shares Shares Shares Shares Shares Shares Shares Shares Shares
At beginning of the year . . . . . 452,112 375,269 1,945 154,743 4,217,987 — 300 221 339,878 —Shares issued. . . . . . . . . . . . . . 1,398,903 936,271 — 79,659 2,420,017 7,106,587 — 699 256,706 548,059Shares redeemed . . . . . . . . . . . (526,687) (479,142) — (119,733) (4,208,295) (1,897) — (3) (33,118) —
At end of year . . . . . . . . . . . . . 1,324,328 832,398 1,945 114,669 2,429,708 7,104,690 300 917 563,466 548,059
Janus Global Life Sciences Fund
Class A$acc Class A€acc Class ARMB$acc Class AAUD$acc Class B$acc Class E$acc Class E€acc Class I$acc Class I€acc Class I€acc Class U$acc Class U$inc Class U€acc Class U€acc Class U£inc Class U£acc
Shares Shares Shares Shares Shares Shares Shares Shares Hedged Shares Hedged Shares Shares Shares Hedged Shares Shares Shares Shares
At beginning of the year . . . . . 4,678,830 2,130,300 — 318 1,004,169 300 1,188 595,914 7,649 — 300 — 221 — — 185Shares issued. . . . . . . . . . . . . . 33,989,870 2,737,804 1849 1,213,247 332,572 23,330 43,933 8,542,756 459,736 4,557 1,435,350 111,214 79,165 234 356,996 85,060Shares redeemed . . . . . . . . . . . (26,167,514) (2,166,078) — (841,618) (546,766) (4,776) (1,808,315) (180,356) — (1) — (2) — (1950) (3,125)
At end of year . . . . . . . . . . . . . 12,501,186 2,702,026 1,849 371,947 789,975 23,630 40,345 7,330,355 287,029 4,557 1,435,649 111,214 79,384 234 355,046 82,120
Janus Global Research Fund
Class A$acc Class A$dis Class A€acc Class B$acc Class E€acc Class I$acc Class I$dis Class I€acc Class U£acc Class Z$inc
Shares Shares Shares Shares Shares Shares Shares Shares Shares Shares
At beginning of the year . . . . . 20,814 307 95,484 513 17,043 274,756 474 14,882 185 300,030Shares issued. . . . . . . . . . . . . . 16,075 — 59,717 — 23,447 186 — 1 — —Shares redeemed . . . . . . . . . . . (8,278) — (88,186) — (12,312) (272,317) — (14,442) — —
At end of year . . . . . . . . . . . . . 28,611 307 67,015 513 28,177 2,624 474 441 185 300,030

Notes to the Financial Statements
J a n u s C a p i t a l F u n d s P l c / 3 1 D e c e m b e r 2 0 1 5 2 9 5
Janus Global Technology Fund
Class A$acc Class A€acc Class AAUDacc Class AHKDacc Class ARMB$acc Class B$acc Class I$acc Class I€acc Class U$acc Class U€acc
Shares Shares Shares Shares Shares Shares Shares Shares Shares Shares
At beginning of the year . . . . . 4,829,306 1,884,458 — — — 1,340,554 2,147,214 282,211 300 221Shares issued. . . . . . . . . . . . . . 6,539,073 780,065 285,225 310,907 109,547 14,868 1,580,760 57,261 2,847 82,224Shares redeemed . . . . . . . . . . . (6,086,358) (1,570,236) (222,124) (159,053) (107,050) (296,050) (1,130,074) (102,781) (1) —
At end of year . . . . . . . . . . . . . 5,282,022 1,094,287 63,100 151,854 2,497 1,059,373 2,597,899 236,691 3,146 82,445
Janus Opportunistic Alpha Fund
Class A$acc Class A$dis Class A€acc Class ARMB (CNH)acc Class B$acc Class E€acc Class I$acc Class I$dis Class I€acc Class U$acc Class U€acc Class U£acc
Shares Shares Hedged Shares Hedged Shares Shares Hedged Shares Shares Shares Hedged Shares Shares Hedged Shares Shares
At beginning of the year . . . . . 2,878,869 23,637 847,142 — 452,687 2,972 485,948 10,038 4,567 300 221 185Shares issued. . . . . . . . . . . . . . 1,897,013 1,924 183,339 1,849 116,824 1,650 617,718 — 156,566 23,172 2,867 —Shares redeemed . . . . . . . . . . . (1,860,966) (7,528) (361,330) — (140,090) (2,161) (298,621) — (148,136) (1,192) — —
At end of year . . . . . . . . . . . . . 2,914,917 18,033 669,151 1,849 429,421 2,462 805,045 10,038 12,997 22,280 3,088 185
Janus Japan Emerging Opportunities Fund
Class A$acc Class A€acc Class AAUD$acc Class ACAD$acc Class AHK$acc Class ARMB(CNH)acc Class E€acc Class I$acc Class I€acc Class IJPYacc Class IRMB(CNH)acc Class U€acc Class U£acc
Hedged Shares Hedged Shares Hedged Shares Hedged Shares Hedged Shares Hedged Shares Hedged Shares Hedged Shares Hedged Shares Shares Hedged Shares Hedged Shares Hedged Shares
At beginning of the year . . . . . — — — — — — — — — — — — —Shares issued. . . . . . . . . . . . . . 11,538 9,089 13,144 12,863 89,503 70,969 9,089 11,544 9,089 162,593 70,969 9,089 7,106Shares redeemed . . . . . . . . . . . — — — — — — — — — — — — —
At end of year . . . . . . . . . . . . . 11,538 9,089 13,144 12,863 89,503 70,969 9,089 11,544 9,089 162,593 70,969 9,089 7,106
Janus Japan Fund
Class A$acc Class A€acc Class AAUD$acc Class ACAD$acc Class AHK$acc Class ARMB(CNH)acc Class E€acc Class I$acc Class I$acc Class IJPYacc Class IRMB(CNH)acc Class U€acc Class U£acc
Hedged Shares Hedged Shares Hedged Shares Hedged Shares Hedged Shares Hedged Shares Hedged Shares Hedged Shares Hedged Shares Shares Hedged Shares Hedged Shares Hedged
At beginning of the year . . . . . — — — — — — — — — — — — —Shares issued. . . . . . . . . . . . . . 7,692 6,059 8,763 8,575 59,668 47,313 6,059 7,696 6,059 108,395 47,313 6,059 4,738Shares redeemed . . . . . . . . . . . — — — — — — — — — — — — —
At end of year . . . . . . . . . . . . . 7,692 6,059 8,763 8,575 59,668 47,313 6,059 7,696 6,059 108,395 47,313 6,059 4,738
Janus US Fund
Class A$acc Class A€acc Class B$acc Class I$acc Class I€acc
Shares Hedged Shares Shares Shares Hedged Shares
At beginning of the year . . . . . 20,609 15,386 20,000 20,000 14,674Shares issued. . . . . . . . . . . . . . 9,857 1,906 — — —Shares redeemed . . . . . . . . . . . (10,055) — — — —
At end of year . . . . . . . . . . . . . 20,411 17,292 20,000 20,000 14,674
Janus US Research Fund
Class A$acc Class A$dis Class A€acc Class B$acc Class I$acc Class I$dis Class I€acc Class Z$inc
Shares Shares Hedged Shares Shares Shares Shares Hedged Shares Shares
At beginning of the year . . . . . 937,751 33,754 70,531 43,604 8,989 15,739 287 1,300,030Shares issued. . . . . . . . . . . . . . 277,961 219 13,658 — 6,299 688 — —Shares redeemed . . . . . . . . . . . (694,712) (6,842) (16,989) (26,563) (2,467) (3,012) — —
At end of year . . . . . . . . . . . . . 521,000 27,131 67,200 17,041 12,821 13,415 287 1,300,030
Janus US Twenty Fund
Class A$acc Class A$dis Class A€acc Class ARMB (CNH)acc Class AAUDacc Class B$acc Class E€acc Class I$acc Class I$dis Class I€acc Class U$acc Class U€acc Class U£acc
Shares Shares Hedged Shares Hedged Shares Hedged Shares Shares Hedged Shares Shares Shares Hedged Shares Shares Hedged Shares Shares
At beginning of the year . . . . . 7,306,072 11,235 2,314,427 — 318 1,072,394 7,675 7,369,790 301 32,487 300 221 185Shares issued. . . . . . . . . . . . . . 4,375,348 1 356,973 1,849 — 37,367 11,575 2,840,052 — 5,164 18,456 4,635 —Shares redeemed . . . . . . . . . . . (5,977,889) (10,909) (1,006,177) — — (414,093) (4,105) (3,169,197) — (1,416) (4,706) — —
At end of year . . . . . . . . . . . . . 5,703,531 327 1,665,223 1,849 318 695,668 15,145 7,040,644 301 36,235 14,050 4,856 185
Janus US Venture Fund
Class A$acc Class A$dis Class A€acc Class AAUDacc Class B$acc Class I$acc Class I$dis Class I€acc Hedged Class U$acc Class U€acc Class U£acc Class Z$acc Class Z€acc
Shares Shares Hedged Shares Hedged Shares Shares Shares Shares Shares Shares Hedged Shares Shares Shares Shares
At beginning of the year . . . . . 3,741,071 7,519 915,125 318 223,547 1,075,213 4,955 84,436 300 221 1,040,685 1,333,248 —Shares issued. . . . . . . . . . . . . . 5,736,930 84,879 517,724 — 48,363 1,114,139 2,409 696,824 42,501 — 214,383 — 250,022Shares redeemed . . . . . . . . . . . (5,367,301) (12,914) (634,709) — (97,551) (1,332,556) (5,547) (90,587) (42,501) — (791,093) (740,172) —
At end of year . . . . . . . . . . . . . 4,110,701 79,484 798,140 318 174,359 856,796 1,817 690,673 300 221 463,975 593,076 250,022
Perkins Global Value Fund
Class A$acc Class A€acc Hedged Class B$acc Class E€acc Hedged Class I$acc Class I€acc Hedged Class U$acc Class U€acc Hedged Class Z$inc
Shares Shares Shares Shares Shares Shares Shares Shares Shares
At beginning of the year . . . . . 89,970 85,592 469 2,189 112,556 310 300 221 1,122,250Shares issued. . . . . . . . . . . . . . 185,350 130,835 — 14,596 228,414 121,073 — — 310,600Shares redeemed . . . . . . . . . . . (53,886) (81,086) — (4,351) (340,435) (288) — — —
At end of year . . . . . . . . . . . . . 221,434 135,341 469 12,434 536 121,095 300 221 1,432,850
Perkins US Strategic Value Fund
Class A$acc Class A$dis Class A€acc Class B$acc Class E€acc Class I$acc Class I$dis Class I€acc Hedged Class I€acc Class U$acc Class U€acc Class U£acc
Shares Shares Hedged Shares Shares Hedged Shares Shares Shares Shares Shares Shares Hedged Shares Shares
At beginning of the year . . . . . 8,809,870 1,462,982 2,624,561 110,153 5,871 14,343,110 80,037 1,183,465 234 300 221 185Shares issued. . . . . . . . . . . . . . 1,838,054 34,630 313,316 12,361 5,251 2,883,962 334 935,444 — 66,531 63,470 —Shares redeemed . . . . . . . . . . . (4,531,965) (777,091) (1,145,734) (15,025) (2,536) (7,252,574) (3,763) (1,252,971) — (12,323) (5,349) —
At end of year . . . . . . . . . . . . . 6,115,959 720,520 1,792,143 107,489 8,586 9,974,497 76,608 865,938 234 54,509 58,342 185
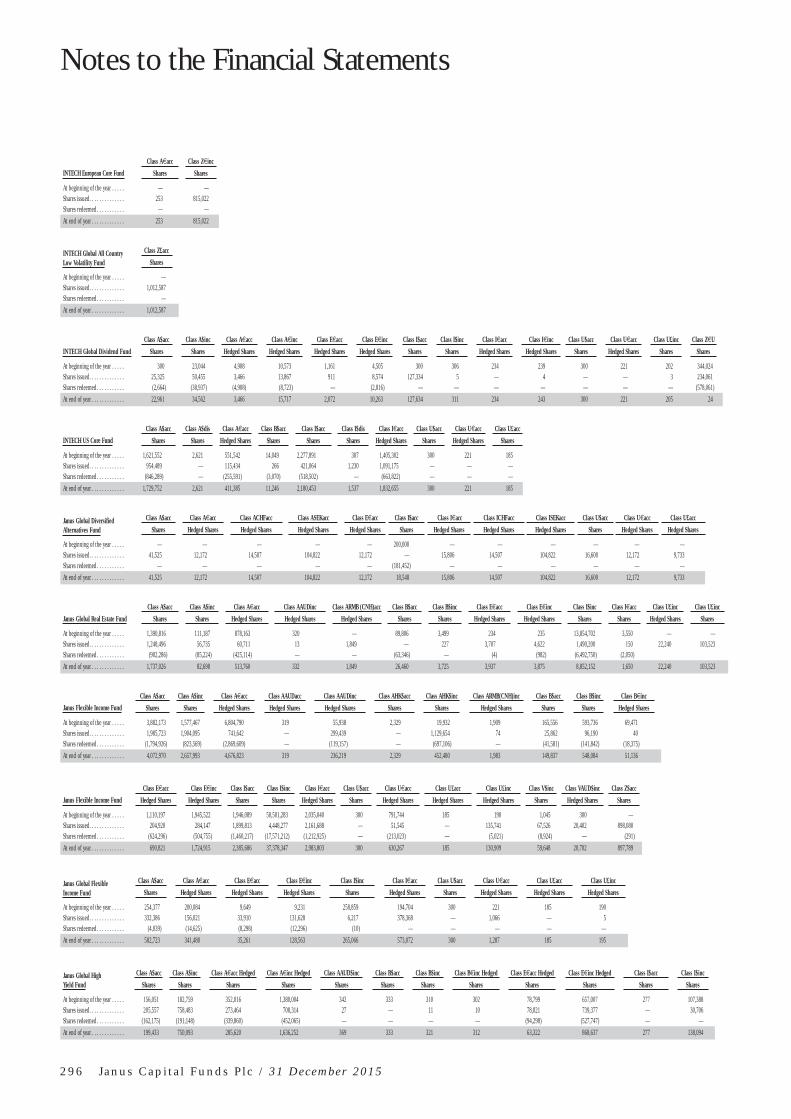
Notes to the Financial Statements
2 9 6 J a n u s C a p i t a l F u n d s P l c / 3 1 D e c e m b e r 2 0 1 5
INTECH European Core Fund
Class A€acc Class Z€inc
Shares Shares
At beginning of the year . . . . . — —Shares issued. . . . . . . . . . . . . . 253 815,022Shares redeemed . . . . . . . . . . . — —
At end of year . . . . . . . . . . . . . 253 815,022
INTECH Global All Country Low Volatility Fund
Class Z£acc
Shares
At beginning of the year . . . . . —Shares issued. . . . . . . . . . . . . . 1,012,587Shares redeemed . . . . . . . . . . . —
At end of year . . . . . . . . . . . . . 1,012,587
INTECH Global Dividend Fund
Class A$acc Class A$inc Class A€acc Class A€inc Class E€acc Class E€inc Class I$acc Class I$inc Class I€acc Class I€inc Class U$acc Class U€acc Class U£inc Class Z€U
Shares Shares Hedged Shares Hedged Shares Hedged Shares Hedged Shares Shares Shares Hedged Shares Hedged Shares Shares Hedged Shares Shares Shares
At beginning of the year . . . . . 300 23,044 4,908 10,573 1,161 4,505 300 306 234 239 300 221 202 344,024Shares issued. . . . . . . . . . . . . . 25,325 50,455 3,466 13,867 911 8,574 127,334 5 — 4 — — 3 234,061Shares redeemed . . . . . . . . . . . (2,664) (38,937) (4,908) (8,723) — (2,816) — — — — — — — (578,061)
At end of year . . . . . . . . . . . . . 22,961 34,562 3,466 15,717 2,072 10,263 127,634 311 234 243 300 221 205 24
INTECH US Core Fund
Class A$acc Class A$dis Class A€acc Class B$acc Class I$acc Class I$dis Class I€acc Class U$acc Class U€acc Class U£acc
Shares Shares Hedged Shares Shares Shares Shares Hedged Shares Shares Hedged Shares Shares
At beginning of the year . . . . . 1,621,552 2,621 551,542 14,049 2,277,891 307 1,405,302 300 221 185Shares issued. . . . . . . . . . . . . . 954,489 — 115,434 266 421,064 1,230 1,091,175 — — —Shares redeemed . . . . . . . . . . . (846,289) — (255,591) (3,070) (518,502) — (663,822) — — —
At end of year . . . . . . . . . . . . . 1,729,752 2,621 411,385 11,246 2,180,453 1,537 1,832,655 300 221 185
Janus Global Diversified Alternatives Fund
Class A$acc Class A€acc Class ACHFacc Class ASEKacc Class E€acc Class I$acc Class I€acc Class ICHFacc Class ISEKacc Class U$acc Class U€acc Class U£acc
Shares Hedged Shares Hedged Shares Hedged Shares Hedged Shares Shares Hedged Shares Hedged Shares Hedged Shares Shares Hedged Shares Hedged Shares
At beginning of the year . . . . . — — — — — 200,000 — — — — — —Shares issued. . . . . . . . . . . . . . 41,525 12,172 14,507 104,822 12,172 — 15,806 14,507 104,822 16,600 12,172 9,733Shares redeemed . . . . . . . . . . . — — — — — (181,452) — — — — — —
At end of year . . . . . . . . . . . . . 41,525 12,172 14,507 104,822 12,172 18,548 15,806 14,507 104,822 16,600 12,172 9,733
Janus Global Real Estate Fund
Class A$acc Class A$inc Class A€acc Class AAUDinc Class ARMB (CNH)acc Class B$acc Class B$inc Class E€acc Class E€inc Class I$inc Class I€acc Class U£inc Class U£inc
Shares Shares Hedged Shares Hedged Shares Hedged Shares Shares Shares Hedged Shares Hedged Shares Shares Shares Hedged Shares Shares
At beginning of the year . . . . . 1,390,816 111,187 878,163 320 — 89,806 3,499 234 235 13,854,702 3,550 — —Shares issued. . . . . . . . . . . . . . 1,248,496 56,735 60,711 13 1,849 — 227 3,707 4,622 1,490,200 150 22,240 103,523Shares redeemed . . . . . . . . . . . (902,286) (85,224) (425,114) — — (63,346) — (4) (982) (6,492,750) (2,050)
At end of year . . . . . . . . . . . . . 1,737,026 82,698 513,760 332 1,849 26,460 3,725 3,937 3,875 8,852,152 1,650 22,240 103,523
Janus Flexible Income Fund
Class A$acc Class A$inc Class A€acc Class AAUDacc Class AAUDinc Class AHK$acc Class AHK$inc Class ARMB(CNH)inc Class B$acc Class B$inc Class B€inc
Shares Shares Hedged Shares Hedged Shares Hedged Shares Shares Shares Hedged Shares Shares Shares Hedged Shares
At beginning of the year . . . . . 3,882,173 1,577,467 6,804,790 319 55,938 2,329 19,932 1,909 165,556 593,736 69,471Shares issued. . . . . . . . . . . . . . 1,985,723 1,904,095 741,642 — 299,439 — 1,129,654 74 25,862 96,190 40Shares redeemed . . . . . . . . . . . (1,794,926) (823,569) (2,869,609) — (119,157) — (697,106) — (41,581) (141,842) (18,375)
At end of year . . . . . . . . . . . . . 4,072,970 2,657,993 4,676,823 319 236,219 2,329 452,480 1,983 149,837 548,084 51,136
Janus Flexible Income Fund
Class E€acc Class E€inc Class I$acc Class I$inc Class I€acc Class U$acc Class U€acc Class U£acc Class U£inc Class V$inc Class VAUD$inc Class Z$acc
Hedged Shares Hedged Shares Shares Shares Hedged Shares Shares Hedged Shares Hedged Shares Hedged Shares Shares Hedged Shares Shares
At beginning of the year . . . . . 1,110,197 1,945,522 1,946,089 50,501,283 2,035,040 300 791,744 185 190 1,045 300 —Shares issued. . . . . . . . . . . . . . 204,920 284,147 1,899,813 4,448,277 2,161,688 — 51,545 — 135,741 67,526 20,402 898,080Shares redeemed . . . . . . . . . . . (624,296) (504,755) (1,460,217) (17,571,212) (1,212,925) — (213,023) — (5,021) (8,924) — (291)
At end of year . . . . . . . . . . . . . 690,821 1,724,915 2,385,686 37,378,347 2,983,803 300 630,267 185 130,909 59,648 20,702 897,789
Janus Global Flexible Income Fund
Class A$acc Class A€acc Class E€acc Class E€inc Class I$inc Class I€acc Class U$acc Class U€acc Class U£acc Class U£inc
Shares Hedged Shares Hedged Shares Hedged Shares Shares Hedged Shares Shares Hedged Shares Hedged Shares Hedged Shares
At beginning of the year . . . . . 254,377 200,084 9,649 9,231 258,859 194,704 300 221 185 190Shares issued. . . . . . . . . . . . . . 332,386 156,021 33,910 131,628 6,217 378,368 — 1,066 — 5Shares redeemed . . . . . . . . . . . (4,039) (14,625) (8,298) (12,296) (10) — — — — —
At end of year . . . . . . . . . . . . . 582,723 341,480 35,261 128,563 265,066 573,072 300 1,287 185 195
Janus Global High Yield Fund
Class A$acc Class A$inc Class A€acc Hedged Class A€inc Hedged Class AAUD$inc Class B$acc Class B$inc Class B€inc Hedged Class E€acc Hedged Class E€inc Hedged Class I$acc Class I$inc
Shares Shares Shares Shares Shares Shares Shares Shares Shares Shares Shares Shares
At beginning of the year . . . . . 156,051 182,759 352,016 1,380,004 342 333 310 302 78,799 657,007 277 107,388Shares issued. . . . . . . . . . . . . . 205,557 758,483 273,464 708,314 27 — 11 10 78,821 739,377 — 30,706Shares redeemed . . . . . . . . . . . (162,175) (191,148) (339,860) (452,065) — — — — (94,298) (527,747) — —
At end of year . . . . . . . . . . . . . 199,433 750,093 285,620 1,636,252 369 333 321 312 63,322 868,637 277 138,094

Notes to the Financial Statements
J a n u s C a p i t a l F u n d s P l c / 3 1 D e c e m b e r 2 0 1 5 2 9 7
Janus Global High Yield Fund
Class IAUD$inc Hedged Class I€acc Hedged Class I€inc Hedged Class U£acc Hedged Class U£inc Hedged Class Z$inc
Shares Shares Shares Shares Shares Shares
At beginning of the year . . . . . 349 490 394 185 195 300,034Shares issued. . . . . . . . . . . . . . 31 364,697 5,375 — 11 2Shares redeemed . . . . . . . . . . . — (182,000) (5,353) — — —
At end of year . . . . . . . . . . . . . 380 183,187 415 185 206 300,036
Janus Global Investment Grade Bond Fund
Class A$acc Class A$inc Class A€acc Class A€inc Class B$acc Class B$inc Class B€inc Hedge Class E€acc Hedged Class E€inc Hedged Class I$acc Class I$inc
Shares Shares Shares Shares Shares Shares Shares Shares Shares Shares Shares
At beginning of the year . . . . . 136,258 135,495 144,317 372,062 84,142 91,766 67,028 43,225 108,513 283,407 99,840Shares issued. . . . . . . . . . . . . . 346,630 850,792 108,199 229,883 1 451 326 25,846 135,862 176,907 85,129Shares redeemed . . . . . . . . . . . (88,510) (208,276) (97,701) (173,862) (83,816) (91,880) (67,102) (12,589) (73,395) (204,525) (175,996)
At end of year . . . . . . . . . . . . . 394,379 778,011 154,815 428,082 326 337 252 56,482 170,980 255,789 8,973
Janus Global Investment Grade Bond Fund
Class I€acc Hedged Class I€inc Hedged Class I£inc Hedged Class Z$inc
Shares Shares Shares Shares
At beginning of the year . . . . . 74,426 71,692 — 300,034Shares issued. . . . . . . . . . . . . . 163,918 1,329 631,296 1Shares redeemed . . . . . . . . . . . (236,972) (72,661) (10,224) —
At end of year . . . . . . . . . . . . . 1,372 360 621,072 300,035
Janus High Yield Fund
Class A$acc Class A$inc Class A€acc Class AAUD$acc Class AAUD$inc Class AHK$acc Class AHK$inc Class ARMB(CNH)inc Class B$acc Class B$inc Class B€inc Class E€acc
Shares Shares Hedged Shares Hedged Shares Hedged Shares Shares Shares Hedged Shares Shares Shares Hedged Shares Hedged Shares
At beginning of the year . . . . . 4,243,695 6,818,355 1,791,528 319 1,207,035 91,470 131,509 524,980 90,169 8,467,340 1,310,418 77,935Shares issued. . . . . . . . . . . . . . 2,711,910 4,199,070 333,310 — 1,225,249 90,200 20,087,970 497,262 168,574 436,049 6,197 23,428Shares redeemed . . . . . . . . . . . (4,711,810) (3,679,653) (994,354) — (2,060,389) (41,931) (13,577,425) (910,475) (165,585) 2,515,300 (317,643) (52,821)
At end of year . . . . . . . . . . . . . 2,243,795 7,337,772 1,130,484 319 371,896 139,739 6,642,054 111,767 93,158 6,388,089 998,973 48,542
Janus High Yield Fund
Class E€inc Class I$acc Class I$inc Class I€acc Class IAUD$inc Class IRMB(CNH)inc Class U£acc Class U£inc Class V$inc Class VAUD$inc Class Z$acc
Hedged Shares Shares Shares Hedged Shares Hedged Shares Hedged Shares Hedged Shares Hedged Shares Shares Hedged Shares Shares
At beginning of the year . . . . . 856,634 4,036,207 50,730,721 1,777,498 349 2,123 185 195 1,084 1,070 723,409Shares issued. . . . . . . . . . . . . . 364,119 3,760,768 13,801,095 1,431,346 78,057 154 — 12 95,816 41,975 —Shares redeemed . . . . . . . . . . . (242,787) (2,988,550) (26,081,197) (1,201,451) (78,030) — — — (45,804) (2,305) —
At end of year . . . . . . . . . . . . . 977,966 4,808,426 38,450,618 2,007,394 376 2,277 185 208 51,096 40,740 723,409
Janus Global Unconstrained Bond Fund
Class A$acc Class A$inc Class A€acc Class A€inc Class ACHFacc Class ACHFinc Class ASGDinc Class E€acc Class E€inc Class I$acc Class I€acc Class U$acc Class U$inc Class U€acc
Shares Shares Hedged Shares Hedged Shares Hedged Shares Hedged Shares Hedged Shares Hedged Shares Hedged Shares Shares Hedged Shares Shares Shares Hedged Shares
At beginning of the year . . . . . — — — — — — — — — — — — — —Shares issued. . . . . . . . . . . . . . 4,371,696 230,986 158,345 21,837 942 943 1,270 781 3,773 1,915,942 820,045 1,000 1,003 781Shares redeemed . . . . . . . . . . . (18,031) — (3,075) (503) — — — — — (996) — — — —
At end of year . . . . . . . . . . . . . 4,353,665 230,986 155,270 21,334 942 943 1,270 781 3,773 1,914,946 820,045 1,000 1,003 781
Janus Global Unconstrained Bond Fund
Class U£acc Class U£inc Class U£inc Hedged
Hedged Shares Shares Hedged Shares
At beginning of the year . . . . . — — —Shares issued. . . . . . . . . . . . . . 618 620 620Shares redeemed . . . . . . . . . . . — — —
At end of year . . . . . . . . . . . . . 618 620 620
Janus US Short-Term Bond Fund
Class A$acc Class A$inc Class A€acc Hedged Class AAUD$inc Hedged Class ACHFinc Hedged Class B$acc Class B$inc Class E€acc Hedged Class E€inc Class I$acc Class I$inc
Shares Shares Shares Shares Shares Shares Shares Shares Shares Shares Shares
At beginning of the year . . . . . 16,003,856 2,619,073 2,146,342 321 209,694 78,022 552,078 116,842 59,301 1,147,326 5,304,372Shares issued. . . . . . . . . . . . . . 9,305,837 2,484,134 347,199 7 206,652 37,763 12,578 24,882 53,976 4,655,367 5,054,363Shares redeemed . . . . . . . . . . . (8,095,132) (1,542,123) (916,418) — (171,855) (48,876) (91,627) (53,729) (55,624) (1,841,292) (2,439,207)
At end of year . . . . . . . . . . . . . 17,214,561 3,561,084 1,577,123 328 244,491 66,910 473,029 87,994 57,653 3,961,401 7,919,528
Janus US Short-Term Bond Fund
Class I€acc Hedged Class I£acc Hedged Class I£inc Hedged Class ICHFinc Hedged Class U$acc Class U$inc Class U£acc Hedged Class U£inc Class Z$acc
Shares Shares Shares Hedged Shares Shares Shares Hedged Shares Hedged Shares Shares
At beginning of the year . . . . . 655,715 100,162 266,425 20,256 20,570 12,011 185 10,457 260,672Shares issued. . . . . . . . . . . . . . 797,029 99,300 38,128 13 93,987 25,034 — 2 2,139,461Shares redeemed . . . . . . . . . . . (691,039) (3,956) (146,863) (14,961) (770) — — (10,269) (1,711,318)
At end of year . . . . . . . . . . . . . 761,705 195,506 157,690 5,308 113,787 37,044 185 190 688,815

Notes to the Financial Statements
2 9 8 J a n u s C a p i t a l F u n d s P l c / 3 1 D e c e m b e r 2 0 1 5
16. NET GAINS AND LOSSES ON FINANCIAL ASSETS AND LIABILITIES AT FAIR VALUE THROUGH PROFIT OR LOSS
The following table details the gains and losses from financial assets and liabilities at fair value through profit or loss for the financial year ended 31 December 2015 and 31 December 2014.
Janus Global Technology Fund
Janus Japan Emerging Opportunities Fund
Janus Japan Fund
For the financial year ended 31 December 2015 and 31 December 2014
Year Ended31 December
2015
Year Ended31 December
2014
Year Ended31 December
2015
Year Ended31 December
2014
Year Ended31 December
2015
Year Ended31 December
2014
Net realised gain/(loss) Net realised gain/(loss) on Investments . . . . . . . . . . . . . . . . . . . . . . . . . . . . . . . . . . . . . . $11,847,203 $9,041,075 ¥ 23,114,407 ¥2,499,923 ¥ 36,257,671 ¥(38,487) Net realised gain/(loss) on Futures. . . . . . . . . . . . . . . . . . . . . . . . . . . . . . . . . . . . . . . . . . — — — — — — Net realised gain/(loss) on Options . . . . . . . . . . . . . . . . . . . . . . . . . . . . . . . . . . . . . . . . . 23,189 66,049 — — — — Net realised gain/(loss) on Swaps. . . . . . . . . . . . . . . . . . . . . . . . . . . . . . . . . . . . . . . . . . . 38 — — — — — Net realised gain/(loss) on Forward Currency Contracts . . . . . . . . . . . . . . . . . . . . . . . . . 3,947,414 (1,950,760) 34,091,277 9,374,684 21,230,467 6,137,408 Net realised (loss)/gain on Foreign Exchange. . . . . . . . . . . . . . . . . . . . . . . . . . . . . . . . . . (9,529,510) 18 (48,491,396) 299,455 (41,965,478) 199,702
Net unrealised gain/(loss) Net unrealised (loss)/gain on Investments . . . . . . . . . . . . . . . . . . . . . . . . . . . . . . . . . . . . (5,413,720) (2,059,609) 43,343,070 23,684,415 7,826,771 7,485,852 Net unrealised gain/(loss) on Futures. . . . . . . . . . . . . . . . . . . . . . . . . . . . . . . . . . . . . . . . — — — — — — Net unrealised gain/(loss) on Options . . . . . . . . . . . . . . . . . . . . . . . . . . . . . . . . . . . . . . . (7,505) (16,762) — — — — Net unrealised gain/(loss) on Swaps. . . . . . . . . . . . . . . . . . . . . . . . . . . . . . . . . . . . . . . . . — — — — — — Net unrealised gain/(loss) on Forward Currency Contracts . . . . . . . . . . . . . . . . . . . . . . . 262,236 (419,185) (2,093,714) (337,592) (1,296,394) (207,673) Net unrealised gain/(loss) on Foreign Exchange. . . . . . . . . . . . . . . . . . . . . . . . . . . . . . . . — — — — — —
Net (loss)/gain on financial assets and liabilities at fair value through profit or loss . . . . . . $1,129,345 $4,660,826 ¥ 49,963,644 ¥35,520,885 ¥ 22,053,037 ¥13,576,802
Janus Asia Frontier Markets Fund
Janus Asia Growth Drivers Fund
Janus Asia Fund
For the financial year ended 31 December 2015 and 31 December 2014
Year Ended 31 December
2015
Year Ended31 December
2014
Year Ended31 December
2015
Year Ended31 December
2014
Year Ended31 December
2015
Year Ended31 December
2014
Net realised gain/(loss) Net realised gain/(loss) on Investments . . . . . . . . . . . . . . . . . . . . . . . . . . . . . . . . . . . . . . $40,874 $(46,314) $56,727 $(90,763) $12,184,459 $11,325,321 Net realised gain/(loss) on Futures. . . . . . . . . . . . . . . . . . . . . . . . . . . . . . . . . . . . . . . . . . — — — — — — Net realised gain/(loss) on Options . . . . . . . . . . . . . . . . . . . . . . . . . . . . . . . . . . . . . . . . . — — — — — — Net realised gain/(loss) on Swaps. . . . . . . . . . . . . . . . . . . . . . . . . . . . . . . . . . . . . . . . . . . — — — — 8,062,702 1,087,299 Net realised gain/(loss) on Forward Currency Contracts . . . . . . . . . . . . . . . . . . . . . . . . . 144,827 (4,157) 147,879 (43,052) 198,248 12,595 Net realised (loss)/gain on Foreign Exchange. . . . . . . . . . . . . . . . . . . . . . . . . . . . . . . . . . (381,783) (9,138) (363,618) (3,069) (15,307,538) (87,832)
Net unrealised gain/(loss) Net unrealised (loss)/gain on Investments . . . . . . . . . . . . . . . . . . . . . . . . . . . . . . . . . . . . (354,465) (52,290) (289,665) (105,607) (11,782,468) (6,902,288) Net unrealised gain/(loss) on Futures. . . . . . . . . . . . . . . . . . . . . . . . . . . . . . . . . . . . . . . . — — — — — — Net unrealised gain/(loss) on Options . . . . . . . . . . . . . . . . . . . . . . . . . . . . . . . . . . . . . . . — — — — 107,017 — Net unrealised gain/(loss) on Swaps. . . . . . . . . . . . . . . . . . . . . . . . . . . . . . . . . . . . . . . . . — — — — (1,837,898) 1,737,840 Net unrealised gain/(loss) on Forward Currency Contracts . . . . . . . . . . . . . . . . . . . . . . . 27,598 (24,725) 6,072 (6,084) 449 (474) Net unrealised gain/(loss) on Foreign Exchange. . . . . . . . . . . . . . . . . . . . . . . . . . . . . . . . — — — — — —
Net (loss)/gain on financial assets and liabilities at fair value through profit or loss . . . . . . $(522,949) $(136,624) $(442,605) $(248,575) $(8,375,029) $7,172,461

Notes to the Financial Statements
J a n u s C a p i t a l F u n d s P l c / 3 1 D e c e m b e r 2 0 1 5 2 9 9
Janus Opportunistic Alpha Fund
Janus US Fund
Janus US Research Fund
Janus US Twenty Fund
Janus US Venture Fund
Year Ended31 December
2015
Year Ended31 December
2014
Year Ended31 December
2015
Year Ended31 December
2014
Year Ended31 December
2015
Year Ended31 December
2014
Year Ended31 December
2015
Year Ended31 December
2014
Year Ended31 December
2015
Year Ended31 December
2014
$13,455,872 $24,583,263 $180,437 $255,922 $13,363,657 $17,302,909 $46,284,503 $60,269,247 $36,335,209 $39,823,982— — — — — — — — — —— — 4,821 667 — — — 907,744 — —18 2 1 (25) 13 (49,090) 185 30 253 19
2,190,645 (1,934,728) 150,070 (65,896) 228,600 (187,511) 7,844,442 (5,563,474) 8,122,597 (2,882,681)(12,901,047) 14,950 (297,842) 208 (7,968,568) (88) (25,391,198) (31,256) (29,160,889) (88,063)
(9,575,865) (8,961,233) (46,505) (69,894) (4,792,069) 1,524,305 (9,735,713) (23,431,808) (20,440,293) (14,347,529)— — — — — — — — — —— — (1,262) (315) — — 53,427 (53,427) — —— — — — — — — — — —
233,904 (339,596) 9,496 (12,401) 24,194 (33,662) 721,649 (1,054,864) 629,033 (694,765)— — — — — — — — — —
$(6,596,473) $13,362,658 $(784) $108,266 $855,827 $18,556,863 $19,777,295 $31,042,192 $(4,514,090) $21,810,963
Janus Balanced Fund
Janus Emerging Markets Fund
Janus Europe Fund
Janus Global Life Sciences Fund
Janus Global Research Fund
Year Ended31 December
2015
Year Ended31 December
2014
Year Ended31 December
2015
Year Ended31 December
2014
Year Ended31 December
2015
Year Ended31 December
2014
Year Ended31 December
2015
Year Ended31 December
2014
Year Ended31 December
2015
Year Ended31 December
2014
$23,761,671 $11,646,739 $1,546,388 $(152,715) €39,738,908 €6,826,351 $155,444,292 $43,558,149 $3,135,547 $3,808,431— — — — 1,059,292 724,502 — — — —— — — — 4,407,092 981,678 — — — —
196,592 8 563,047 4,439 3,074,547 (425,377) 180 6,896,081 3 (16,530)25,986,850 (14,136,078) 668,865 (293,957) 5,869,766 745,014 45,745,804 (8,907,053) 270,035 (196,153)
(73,803,991) (155,347) (7,008,762) (24,752) (35,004,551) (21,369) (118,545,453) (62,318) (2,277,716) (7,009)
(9,388,620) 2,811,322 (8,548,383) (340,643) (5,038,934) (14,956,901) (90,542,586) 49,196,741 (2,542,006) (1,328,741)— — — — — 187,675 — — — —— — 106,608 — 451,646 (511,650) — — — —— — 32,219 19,545 (302,206) 364,309 — — — —
2,098,208 (2,529,543) 10,753 (40,323) (120,620) 233,050 1,365,593 (1,323,196) 24,140 (37,018)— — — — — — — — — —
$(31,149,290) $(2,362,899) $(12,629,265) $(828,406) €14,134,940 €(5,852,718) $(6,532,170) $89,358,404 $(1,389,997) $2,222,980

Notes to the Financial Statements
3 0 0 J a n u s C a p i t a l F u n d s P l c / 3 1 D e c e m b e r 2 0 1 5
Janus Global Unconstrained Bond Fund
Janus US Short-Term Bond Fund
Company Total in US Dollar
For the financial year ended 31 December 2015 and 31 December 2014
Year Ended31 December
2015
Year Ended31 December
2014
Year Ended31 December
2015
Year Ended31 December
2014
Year Ended31 December
2015
Year Ended31 December
2014
Net realised gain/(loss) Net realised gain/(loss) on Investments . . . . . . . . . . . . . . . . . . . . . . . . . . . . . . . . . . . . . . $136,382 $11,540 $(2,079,823) $(2,249,588) $494,653,619 $383,692,505 Net realised gain/(loss) on Futures. . . . . . . . . . . . . . . . . . . . . . . . . . . . . . . . . . . . . . . . . . 2,579,085 247,745 — — 3,902,575 1,364,297 Net realised gain/(loss) on Options . . . . . . . . . . . . . . . . . . . . . . . . . . . . . . . . . . . . . . . . . 6,989,167 (185,925) — — 12,233,107 2,321,175 Net realised gain/(loss) on Swaps. . . . . . . . . . . . . . . . . . . . . . . . . . . . . . . . . . . . . . . . . . . 3,551,908 (21,048) 213 30 16,962,729 7,274,647 Net realised gain/(loss) on Forward Currency Contracts . . . . . . . . . . . . . . . . . . . . . . . . . 7,742,386 45,240 6,063,579 (5,891,766) 295,742,662 (107,137,340) Net realised (loss)/gain on Foreign Exchange. . . . . . . . . . . . . . . . . . . . . . . . . . . . . . . . . . (30,421,885) (7,708) (17,476,224) (34,858) (762,972,233) (1,993,915)
Net unrealised gain/(loss) Net unrealised (loss)/gain on Investments . . . . . . . . . . . . . . . . . . . . . . . . . . . . . . . . . . . . (1,169,458) (645,813) 1,533,347 (6,363,210) (311,842,683) (132,132,270) Net unrealised gain/(loss) on Futures. . . . . . . . . . . . . . . . . . . . . . . . . . . . . . . . . . . . . . . . — (125,944) — — 100,718 138,528 Net unrealised gain/(loss) on Options . . . . . . . . . . . . . . . . . . . . . . . . . . . . . . . . . . . . . . . 870,494 235,163 — — 1,421,868 (590,970) Net unrealised gain/(loss) on Swaps. . . . . . . . . . . . . . . . . . . . . . . . . . . . . . . . . . . . . . . . . 122,467 (237,390) — — (876,781) 2,057,980 Net unrealised gain/(loss) on Forward Currency Contracts . . . . . . . . . . . . . . . . . . . . . . . 199,928 (187,029) 792,060 (1,255,190) (816,379) (19,004,323) Net unrealised gain/(loss) on Foreign Exchange. . . . . . . . . . . . . . . . . . . . . . . . . . . . . . . . — — — — 56,028 (76,549)
Net (loss)/gain on financial assets and liabilities at fair value through profit or loss . . . . . . $(9,399,526) $(871,169) $(11,166,848) $(15,794,582) $(251,434,770) $135,913,766
Perkins Global Value Fund
Perkins US Strategic Value Fund
INTECH All-World Minimum Variance Core Fund(a)
For the financial year ended 31 December 2015 and 31 December 2014
Year Ended31 December
2015
Year Ended31 December
2014
Year Ended31 December
2015
Year Ended31 December
2014
Year Ended31 December
2015
Year Ended31 December
2014
Net realised gain/(loss) Net realised gain/(loss) on Investments . . . . . . . . . . . . . . . . . . . . . . . . . . . . . . . . . . . . . . $3,250,007 $4,078,096 $58,969,300 $63,601,881 $11,813,103 $— Net realised gain/(loss) on Futures. . . . . . . . . . . . . . . . . . . . . . . . . . . . . . . . . . . . . . . . . . — — — — — — Net realised gain/(loss) on Options . . . . . . . . . . . . . . . . . . . . . . . . . . . . . . . . . . . . . . . . . — — — — — — Net realised gain/(loss) on Swaps. . . . . . . . . . . . . . . . . . . . . . . . . . . . . . . . . . . . . . . . . . . 116 (20,382) 93 (317,495) — — Net realised gain/(loss) on Forward Currency Contracts . . . . . . . . . . . . . . . . . . . . . . . . . 3,523,115 853,962 7,569,137 (7,269,840) 83,681,956 — Net realised (loss)/gain on Foreign Exchange. . . . . . . . . . . . . . . . . . . . . . . . . . . . . . . . . . (4,297,437) (68,593) (20,454,495) (20,064) (113,561,455) —
Net unrealised gain/(loss) Net unrealised (loss)/gain on Investments . . . . . . . . . . . . . . . . . . . . . . . . . . . . . . . . . . . . (9,696,113) (1,151,407) (62,233,319) (23,436,205) (5,635,855) — Net unrealised gain/(loss) on Futures. . . . . . . . . . . . . . . . . . . . . . . . . . . . . . . . . . . . . . . . — — — — — — Net unrealised gain/(loss) on Options . . . . . . . . . . . . . . . . . . . . . . . . . . . . . . . . . . . . . . . — — — — — — Net unrealised gain/(loss) on Swaps. . . . . . . . . . . . . . . . . . . . . . . . . . . . . . . . . . . . . . . . . — — — — — — Net unrealised gain/(loss) on Forward Currency Contracts . . . . . . . . . . . . . . . . . . . . . . . (301,194) (21,271) 856,561 (1,323,789) (14,350,440) — Net unrealised gain/(loss) on Foreign Exchange. . . . . . . . . . . . . . . . . . . . . . . . . . . . . . . . — — — — — —
Net (loss)/gain on financial assets and liabilities at fair value through profit or loss . . . . . . $(7,521,506) $3,670,405 $(15,292,723) $31,234,488 $(38,052,691) $—
Janus Global Diversified Alternatives Fund
Janus Global Real Estate Fund
Janus Flexible Income Fund
For the financial year ended 31 December 2015 and 31 December 2014
Year Ended31 December
2015
Year Ended31 December
2014
Year Ended31 December
2015
Year Ended31 December
2014
Year Ended31 December
2015
Year Ended31 December
2014
Net realised gain/(loss) Net realised gain/(loss) on Investments . . . . . . . . . . . . . . . . . . . . . . . . . . . . . . . . . . . . . . $494 $541 $13,920,847 $23,776,118 $6,974,870 $11,201,900 Net realised gain/(loss) on Futures. . . . . . . . . . . . . . . . . . . . . . . . . . . . . . . . . . . . . . . . . . 155,234 154,297 — — — — Net realised gain/(loss) on Options . . . . . . . . . . . . . . . . . . . . . . . . . . . . . . . . . . . . . . . . . — — 355,501 228,815 — — Net realised gain/(loss) on Swaps. . . . . . . . . . . . . . . . . . . . . . . . . . . . . . . . . . . . . . . . . . . 702,725 (100,238) 8 (19,300) 67 16 Net realised gain/(loss) on Forward Currency Contracts . . . . . . . . . . . . . . . . . . . . . . . . . 323,129 (161,083) 1,528,642 (1,196,618) 31,345,577 (30,440,834) Net realised (loss)/gain on Foreign Exchange. . . . . . . . . . . . . . . . . . . . . . . . . . . . . . . . . . (1,372,205) 88 (5,337,795) (237,252) (75,210,195) (79,782)
Net unrealised gain/(loss) Net unrealised (loss)/gain on Investments . . . . . . . . . . . . . . . . . . . . . . . . . . . . . . . . . . . . 636 21 (18,968,501) (2,048,554) (19,304,699) 6,667,600 Net unrealised gain/(loss) on Futures. . . . . . . . . . . . . . . . . . . . . . . . . . . . . . . . . . . . . . . . (25,226) 15,210 — — — — Net unrealised gain/(loss) on Options . . . . . . . . . . . . . . . . . . . . . . . . . . . . . . . . . . . . . . . — — (5,249) (76,076) — — Net unrealised gain/(loss) on Swaps. . . . . . . . . . . . . . . . . . . . . . . . . . . . . . . . . . . . . . . . . (62,475) 54,124 — — — — Net unrealised gain/(loss) on Forward Currency Contracts . . . . . . . . . . . . . . . . . . . . . . . 16,369 (15,931) 124,365 (222,928) 3,867,560 (5,570,848) Net unrealised gain/(loss) on Foreign Exchange. . . . . . . . . . . . . . . . . . . . . . . . . . . . . . . . — — — — — —
Net (loss)/gain on financial assets and liabilities at fair value through profit or loss . . . . . . $(261,319) $(52,971) $(8,382,182) $20,204,205 $(52,326,820) $(18,221,948)

Notes to the Financial Statements
J a n u s C a p i t a l F u n d s P l c / 3 1 D e c e m b e r 2 0 1 5 3 0 1
INTECH European Core Fund
INTECH Global All Country Low Volatility Fund
INTECH Global Dividend Fund
INTECH US Core Fund
Year Ended31 December
2015
Year Ended31 December
2014
Year Ended31 December
2015
Year Ended31 December
2014
Year Ended31 December
2015
Year Ended31 December
2014
Year Ended31 December
2015
Year Ended31 December
2014
€10,864,391 €(950,002) $9,178,266 $100,582 $53,239 $8,452,471 $15,079,349 $33,612,139— — — — — — — —— — — — — — — —— (21,921) 18 (2,308) — — 6 (8,509)
181,007 245,132 572,707 155,434 45,351 95,245 9,630,785 (5,176,267)(2,952,522) (280,680) (10,558,364) (96,313) (170,110) (107,336) (25,900,294) (89)
2,302,395 4,986,070 (3,634,940) 1,003,344 (112,368) (4,299,782) (2,428,752) (15,600,533)— — — — — — — —— — — — — — — —— — — — — — — —— — — — 6,013 (7,805) 718,737 (954,195)— — — — — — — —
€10,395,271 €3,978,599 $(4,442,313) $1,160,739 $(177,875) $4,132,793 $(2,900,169) $11,872,546
Janus Global Flexible Income Fund
Janus Global High Yield Fund
Janus Global Investment Grade Bond Fund
Janus High Yield Fund
Year Ended31 December
2015
Year Ended31 December
2014
Year Ended31 December
2015
Year Ended31 December
2014
Year Ended31 December
2015
Year Ended31 December
2014
Year Ended31 December
2015
Year Ended31 December
2014
$(758,204) $122,674 $(1,748,031) $130,726 $(3,636,008) $1,035,650 $9,563,620 $10,660,886— — — — — — — —— — — — — — — —— — 46,105 7,752 — 3 447,627 427,862
6,555,574 (515,682) 6,294,443 (5,202,716) 8,415,283 (1,026,210) 19,674,264 (16,649,413)(7,988,067) (36,709) (14,136,961) (219,468) (9,089,739) (152,555) (81,449,870) (82,505)
(658,249) (572,711) 1,111,290 (7,084,113) (876,500) (2,611,727) (12,593,388) (57,382,877)— — — — — — — —— — — — — — — —— — — — — — — —
(72,404) (76,259) 529,343 (671,543) (216,954) 68,405 1,761,403 (2,556,667)7,136 (9,243) 15,312 (22,859) 33,580 (44,447) — —
$(2,914,214) $(1,087,930) $(7,888,499) $(13,062,221) $(5,370,338) $(2,730,881) $(62,596,344) $(65,582,714)

Notes to the Financial Statements
3 0 2 J a n u s C a p i t a l F u n d s P l c / 3 1 D e c e m b e r 2 0 1 5
Janus Asia Frontier Markets Fund
Janus Asia Growth Drivers Fund
Janus Asia Fund
Janus Balanced Fund
Janus Emerging Markets Fund
Janus Europe Fund
Janus Global Life Sciences Fund
Janus Global Research Fund
Janus Global Technology Fund
Janus Japan Emerging Opportunities Fund
Fair Value USD
% of Total Assets
Fair Value USD
% of Total Assets
Fair Value USD
% of Total Assets
Fair Value USD
% of Total Assets
Fair Value USD
% of Total Assets
Fair Value USD
% of Net Asset
Fair Value USD
% of Total Assets
Fair Value USD
% of Total Assets
Fair Value USD
% of Total Assets
Fair Value USD
% of Total Assets
Transferable securitiesadmitted to official stock exchanges or traded on a regulated market. . . . . . . 2,328,528 96.08% 2,269,421 96.25% 91,693,890 81.47% 694,133,021 95.81% 103,983,080 92.50% 138,933,636 97.79% 1,942,590,600 98.10% 38,783,759 98.77% 59,141,405 98.25% 389,148,700 96.56%
Ancillary Liquid Assets(Deposits) . . . . . . . . . . — 0.00% — 0.00% — 0.00% 7,010,900 0.97% — 0.00% — 0.00% — 0.00% — 0.00% — 0.00% — 0.00%
Collective InvestmentSchemes . . . . . . . . . . . — 0.00% — 0.00% — 0.00% — 0.00% — 0.00% — 0.00% — 0.00% — 0.00% — 0.00% — 0.00%
Financial derivativeinstruments dealt in on a regulated market. . . . . . . — 0.00% — 0.00% — 0.00% — 0.00% — 0.00% — 0.00% — 0.00% — 0.00% — 0.00% — 0.00%
OTC financial derivativeinstruments . . . . . . . . . 2,938 0.12% (10) 0.00% 7,120,319 6.33% 272,395 0.04% 5,459,248 4.86% 155,199 0.11% 359,273 0.02% 285 0.00% 29,031 0.05% (2,431,305) (0.60)%
Other assets . . . . . . . . . . . . . . . . 91,215 3.76% 86,977 3.69% 13,708,937 12.18% 22,954,540 3.17% 2,904,463 2.58% 2,974,788 2.09% 36,651,577 1.85% 477,899 1.22% 1,015,215 1.69% 13,858,630 3.44%
Total assets (net of derivativeliabilities in portfolio) . . . . 2,422,681 99.96% 2,356,388 99.94% 112,523,146 99.98% 724,370,856 99.99% 112,346,791 99.94% 142,063,623 99.99% 1,979,601,450 99.97% 39,261,943 99.99% 60,185,651 99.99% 400,576,025 99.40%
Janus Global Diversified
Alternatives FundJanus Global Real
Estate FundJanus Flexible Income
Fund
Janus Global Flexible Income
FundJanus Global High
Yield FundJanus Global Investment
Grade Bond FundJanus High Yield
Fund
Janus Global Unconstrained Bond
FundJanus US Short-Term Bond
Fund
Fair Value USD
% of Total Assets
Fair Value USD
% of Total Assets
Fair Value USD
% of Total Assets
Fair Value USD
% of Total Assets
Fair Value USD
% of Total Assets
Fair Value USD
% of Total Assets
Fair Value USD
% of Total Assets
Fair Value USD
% of Total Assets
Fair Value USD
% of Total Assets
Transferable securitiesadmitted to official stock exchanges or traded on a regulated market. . . . . . . 1,199,751 50.93% 127,670,579 95.94% 885,969,285 95.42% 20,068,732 92.59% 42,245,357 82.83% 40,135,257 90.31% 518,323,871 81.16% 83,371,338 77.61% 322,468,612 91.78%
Ancillary Liquid Assets(Deposits) . . . . . . . . . . — 0.00% — 0.00% 19,832,358 2.14% 468,229 2.16% 2,481,337 4.87% 2,728,939 6.14% 39,263,200 6.15% — 0.00% 15,058,284 4.29%
Collective InvestmentSchemes . . . . . . . . . . . — 0.00% — 0.00% — 0.00% — 0.00% — 0.00% — 0.00% — 0.00% — 0.00% — 0.00%
Financial derivativeinstruments dealt in on a regulated market. . . . . . . (10,017) (0.43)% — 0.00% — 0.00% — 0.00% — 0.00% — 0.00% — 0.00% — 0.00% — 0.00%
OTC financial derivativeinstruments . . . . . . . . . (7,910) (0.34)% (10,885) (0.01)% 144,855 0.02% (110,600) (0.51)% 58,426 0.11% (70,449) (0.16)% 84,830 0.01% (60,261) (0.06)% 12,961 0.00%
Other assets . . . . . . . . . . . . . . . . 1,097,495 46.59% 5,397,947 4.06% 22,350,429 2.41% 1,059,198 4.89% 6,172,074 12.10% 1,522,152 3.43% 80,931,848 12.67% 23,717,710 22.08% 13,775,864 3.92%
Total assets (net of derivativeliabilities in portfolio) 2,279,319 96.75% 133,057,641 99.99% 928,296,927 99.99% 21,485,559 99.13% 50,957,194 99.91% 44,315,899 99.72% 638,603,749 99.99% 107,028,787 99.63% 351,315,721 99.99%
17. PORTFOLIO ANALYSIS
As at 31 December 2015

Notes to the Financial Statements
J a n u s C a p i t a l F u n d s P l c / 3 1 D e c e m b e r 2 0 1 5 3 0 3
Janus Japan FundJanus Opportunistic
Alpha FundJanus US
FundJanus US Research
FundJanus US Twenty
FundJanus US Venture
FundPerkins Global Value
FundPerkins US Strategic
Value Fund
INTECH All-World Minimum Variance
Core Fund(a)INTECH European
Core Fund
INTECH Global All Country Low Volatility
FundINTECH Global Dividend Fund
INTECH US Core Fund
Fair Value USD
% of Total Assets
Fair Value USD
% of Total Assets
Fair Value USD
% of Total Assets
Fair Value USD
% of Total Assets
Fair Value USD
% of Total Assets
Fair Value USD
% of Total Assets
Fair Value USD
% of Total Assets
Fair Value USD
% of Total Assets
Fair Value USD
% of Total Assets
Fair Value USD
% of Total Assets
Fair Value USD
% of Total Assets
Fair Value USD
% of Total Assets
Fair Value USD
% of Total Assets
232,148,276 92.34% 48,444,278 93.60% 1,760,365 91.67% 191,743,008 98.72% 361,014,490 96.40% 206,115,675 97.56% 152,774,056 92.08% 196,932,166 94.92% 756,074,101 99.21% 95,280,358 99.10% 160,711,101 98.54% 1,828,859 95.00% 165,595,381 98.83%
— 0.00% — 0.00% — 0.00% — 0.00% — 0.00% — 0.00% — 0.00% — 0.00% — 0.00% — 0.00% — 0.00% — 0.00% — 0.00%
— 0.00% — 0.00% — 0.00% — 0.00% — 0.00% — 0.00% — 0.00% — 0.00% — 0.00% — 0.00% — 0.00% — 0.00% — 0.00%
— 0.00% — 0.00% — 0.00% — 0.00% — 0.00% — 0.00% — 0.00% — 0.00% — 0.00% — 0.00% — 0.00% — 0.00% — 0.00%
(1,504,070) (0.60)% 2,459 0.00% 333 0.02% 262 0.00% 31,423 0.01% 85,652 0.04% (166,765) (0.10)% 8,845 0.00% (14,350,442) (1.88)% — 0.00% — 0.00% 22 0.00% 10,891 0.01%
19,250,669 7.66% 3,306,722 6.39% 159,237 8.29% 2,474,983 1.27% 13,387,425 3.58% 5,031,434 2.38% 13,088,692 7.89% 10,517,654 5.07% 5,989,127 0.79% 856,824 0.89% 2,365,973 1.45% 96,156 4.99% 1,922,326 1.15%
249,894,875 99.40% 51,753,459 99.99% 1,919,935 99.98% 194,218,253 99.99% 374,433,338 99.99% 211,232,761 99.98% 165,695,983 99.87% 207,458,665 99.99% 747,712,786 98.12% 96,137,182 99.99% 163,077,074 99.99% 1,925,037 99.99% 167,528,598 99.99%

Notes to the Financial Statements
3 0 4 J a n u s C a p i t a l F u n d s P l c / 3 1 D e c e m b e r 2 0 1 5
Janus Asia Frontier Markets Fund(a)
Janus Asia Growth Drivers Fund(b)
Janus Asia Fund
Janus Balanced Fund
Janus Emerging Markets Fund
Janus Europe Fund
Janus Global Life Sciences Fund
Janus Global Research Fund
Janus Global Technology Fund
Janus Japan Emerging Opportunities Fund(a)
Fair Value USD
% of Total Assets
Fair Value USD
% of Total Assets
Fair Value USD
% of Total Assets
Fair Value USD
% of Total Assets
Fair Value USD
% of Total Assets
Fair Value EUR
% of Net Asset Value
Fair Value USD
% of Total Assets
Fair Value USD
% of Total Assets
Fair Value USD
% of Total Assets
Fair Value JPY
% of Total Assets
Transferable securitiesadmitted to official stock exchanges or traded on a regulated market. . . . . . . 2,772,994 93.60% 2,652,040 95.35% 98,520,946 78.14% 633,232,350 97.67% 4,117,163 82.74% 206,972,566 97.92% 687,950,300 94.27% 40,226,479 98.88% 79,651,108 98.28% 344,433,924 97.70%
Ancillary Liquid Assets(Deposits) . . . . . . . . . . — 0.00% — 0.00% — 0.00% 5,241,722 0.81% — 0.00% — 0.00% — 0.00% — 0.00% — 0.00% — 0.00%
Collective InvestmentSchemes . . . . . . . . . . . — 0.00% — 0.00% — 0.00% — 0.00% — 0.00% — 0.00% — 0.00% — 0.00% — 0.00% — 0.00%
Financial derivativeinstruments dealt in on a regulated market. . . . . . . — 0.00% — 0.00% — 0.00% — 0.00% — 0.00% — 0.00% — 0.00% — 0.00% — 0.00% — 0.00%
OTC financial derivativeinstruments . . . . . . . . . (6,155) (0.21)% (6,083) (0.22)% 9,796,692 7.77% (1,825,808) (0.28)% 168,460 3.39% (1,075,447) (0.51)% (1,006,320) (0.14)% (23,853) (0.06)% (248,888) (0.31)% (337,591) (0.10)%
Other assets . . . . . . . . . . . . . . . . 189,305 6.39% 128,313 4.61% 17,723,887 14.06% 9,643,265 1.49% 661,446 13.29% 3,777,160 1.79% 41,268,560 5.65% 455,507 1.12% 1,383,409 1.72% 7,852,623 2.23%
Total assets (net of derivativeliabilities in portfolio) . . . . 2,956,144 99.78% 2,774,270 99.74% 126,041,525 99.97% 646,291,529 99.69% 4,947,069 99.42% 209,674,279 99.20% 728,212,540 99.78% 40,658,133 99.94% 80,785,629 99.69% 351,948,956 99.83%
Janus Global Real Estate Fund
Janus Flexible Income Fund
Janus Global Flexible Income Fund
Janus Global High Yield Fund
Janus Global Investment Grade
Bond FundJanus High Yield
Fund
Janus Global Unconstrained Bond
Fund(f)Janus US Short-Term
Bond Fund
Fair Value USD
% of Total Assets
Fair Value USD
% of Total Assets
Fair Value USD
% of Total Assets
Fair Value USD
% of Total Assets
Fair Value USD
% of Total Assets
Fair Value USD
% of Total Assets
Fair Value USD
% of Total Assets
Fair Value USD
% of Total Assets
Transferable securitiesadmitted to official stock exchanges or traded on a regulated market. . . . . . . 159,572,692 96.66% 933,005,218 96.54% 20,723,420 94.64% 70,587,205 87.64% 61,255,295 91.29% 701,271,748 86.15% 71,033,279 89.31% 569,857,724 96.10%
Ancillary Liquid Assets(Deposits) . . . . . . . . . . — 0.00% 20,627,143 2.13% 361,846 1.65% 6,667,075 8.28% 1,314,632 1.96% 49,672,720 6.10% — 0.00% 11,262,170 1.90%
Collective InvestmentSchemes . . . . . . . . . . . — 0.00% — 0.00% — 0.00% — 0.00% — 0.00% — 0.00% — 0.00% — 0.00%
Financial derivativeinstruments dealt in on a regulated market. . . . . . . — 0.00% — 0.00% — 0.00% — 0.00% — 0.00% — 0.00% (125,944) (0.16)% — 0.00%
OTC financial derivativeinstruments . . . . . . . . . (180,688) (0.11)% (3,722,714) (0.39)% (38,198) (0.17)% (470,918) (0.58)% 146,503 0.22% (1,676,577) (0.21)% (562,937) (0.71)% (779,099) (0.13)%
Other assets . . . . . . . . . . . . . . . . 5,511,622 3.34% 12,749,659 1.32% 600,247 2.74% 3,167,858 3.93% 4,130,029 6.16% 63,084,632 7.75% 7,953,321 10.00% 11,862,944 2.00%
Total assets (net of derivativeliabilities in portfolio) 164,903,626 99.89% 962,659,306 99.60% 21,647,315 98.86% 79,951,220 99.27% 66,846,459 99.63% 812,352,523 99.79% 78,297,719 98.44% 592,203,739 99.87%
As at 31 December 2014

Notes to the Financial Statements
J a n u s C a p i t a l F u n d s P l c / 3 1 D e c e m b e r 2 0 1 5 3 0 5
Janus Japan Fund(a)Janus Opportunistic
Alpha FundJanus US
FundJanus US Research
FundJanus US Twenty
FundJanus US Venture
FundPerkins Global Value
FundPerkins US Strategic
Value FundINTECH European
Core Fund(c)
INTECH Global All Country Low Volatility
Fund(d)INTECH Global Dividend Fund
INTECH US Core Fund
Janus Global Diversified
Alternatives Fund(e)
Fair Value JPY
% of Total Assets
Fair Value USD
% of Total Assets
Fair Value USD
% of Total Assets
Fair Value USD
% of Total Assets
Fair Value USD
% of Total Assets
Fair Value USD
% of Total Assets
Fair Value USD
% of Total Assets
Fair Value USD
% of Total Assets
Fair Value EUR
% of Total Assets
Fair Value USD
% of Total Assets
Fair Value USD
% of Total Assets
Fair Value USD
% of Total Assets
Fair Value USD
% of Total Assets
216,550,050 95.92% 90,476,282 90.45% 1,615,425 97.40% 189,637,160 98.47% 344,791,705 97.04% 272,862,843 91.48% 157,585,720 82.80% 411,846,253 94.23% 85,055,714 99.25% 161,389,340 98.72% 2,385,478 95.83% 158,391,434 98.79% 1,599,944 71.49%
— 0.00% — 0.00% — 0.00% — 0.00% — 0.00% — 0.00% — 0.00% — 0.00% — 0.00% — 0.00% — 0.00% — 0.00% — 0.00%
— 0.00% — 0.00% — 0.00% — 0.00% — 0.00% — 0.00% — 0.00% — 0.00% — 0.00% — 0.00% — 0.00% — 0.00% — 0.00%
— 0.00% — 0.00% — 0.00% — 0.00% — 0.00% — 0.00% — 0.00% — 0.00% — 0.00% — 0.00% — 0.00% — 0.00% 15,209 0.68%
(207,672) (0.09)% (231,442) (0.23)% (6,124) (0.37)% (23,935) (0.01)% (436,951) (0.12)% (543,378) (0.18)% 134,428 0.07% (847,717) (0.19)% — 0.00% — 0.00% (5,996) (0.24)% (707,850) (0.44)% 38,194 1.71%
9,051,984 4.01% 9,547,537 9.54% 39,249 2.37% 2,953,201 1.53% 10,266,806 2.89% 25,412,557 8.52% 32,513,438 17.08% 25,235,838 5.77% 646,596 0.75% 2,086,259 1.28% 103,795 4.17% 1,944,957 1.21% 546,457 24.42%
225,394,362 99.84% 99,792,377 99.76% 1,648,550 99.40% 192,566,426 99.99% 354,621,560 99.81% 297,732,022 99.82% 190,233,586 99.95% 436,234,374 99.81% 85,702,310 100.00% 163,475,599 100.00% 2,483,277 99.76% 159,628,541 99.56% 2,199,804 98.30%

Notes to the Financial Statements
3 0 6 J a n u s C a p i t a l F u n d s P l c / 3 1 D e c e m b e r 2 0 1 5
18. DIRECTORS’ REMUNERATION
The Articles of Association provide that the Directors shall be entitled to a fee by way of remuneration for their services at a rate to be determined from time to time by the Directors. The Directors have agreed that the current aggregate amount of Directors’ remuneration in any one year may not exceed €300,000. Directors’ fees paid up to 31 December 2015 were $210,009 (approximately € 205,000). Directors’ fees paid up to 31 December 2014 were $225,787 (approximately €170,000).
19. AUDITOR’S REMUNERATION
Fees and expenses paid to our statutory auditors, PricewatehouseCoopers Ireland, in respect of the financial year are as follows ( includes VAT):
31 December2015
31 December 2014
$ $Audit of financial statements 576,706 514,619Other assurance services — —Out of pocket expenses 454 —
577,160 514,619
20. SIGNIFICANT EVENTS DURING THE FINANCIAL YEAR
During the financial year ended 31 December 2015:
Effective from 31 December 2015, the Depositary Citibank International Limited, Ireland Branch changed its name to Citi Depositary Services Ireland Limited. The change is reflected in the Prospectus issued on 4 January 2016.
On 1 November 2015, the Central Bank (Supervision and Enforcement) Act 2013 (Section 48(1)) (Undertaking for Collective Investment in Transferable Securities) Regulations 2015 came into effect.
Effective from 30 November 2015 share classes were closed: Janus Balanced Fund I€inc SharesJanus Balanced Fund I$inc SharesJanus Europe Fund ASEKacc SharesJanus Global Research Fund B$acc SharesJanus Global Research Fund I$dis SharesJanus Global Research Fund A$dis SharesJanus US Research Fund A$dis SharesJanus US Research Fund I$dis SharesJanus US Twenty Fund A$dis SharesJanus US Venture Fund U€acc Hedged SharesJanus US Venture Fund I$dis SharesPerkins Global Value Fund B$acc SharesPerkins US Strategic Value Fund I€acc SharesINTECH US Core Fund A$dis SharesINTECH US Core Fund I$dis SharesJanus Flexible Income Fund AHKDacc SharesJanus Flexible Income Fund AAUD$acc Shares
Janus Global High Yield Fund AAUD$incJanus Global High Yield Fund IAUD$incJanus Global High Yield Fund I€acc Hedged SharesJanus Global High Yield Fund B€inc SharesJanus Global High Yield Fund B$inc SharesJanus Global High Yield Fund B$acc SharesJanus Global Investment Grade B$acc SharesBond FundJanus Global Investment Grade B€inc SharesBond FundJanus Global Investment Grade B$inc SharesBond FundJanus High Yield Fund IAUDinc SharesJanus High Yield Fund AAUD$acc SharesJanus US Short-Term Bond Fund ICHFinc SharesJanus US Short-Term Bond Fund I£acc Shares
On 16 October 2015 new share classes launched:Janus Global Life Sciences Fund V$acc SharesJanus Global Life Sciences Fund V€acc Hedged SharesJanus Global Technology Fund V$acc SharesJanus Global Technology Fund V€acc Hedged SharesJanus US Twenty Fund V$acc SharesJanus US Twenty Fund V€acc Hedged Shares
INTECH All-World Minimum Variance Core Fund(a) commenced operations on 01 May 2015.
The Company issued an updated Prospectus dated 28 January 2015. A summary of the main changes incorporated in this update is disclosed on pages 10-1 2.
Up to 12 April 2015 DIAM UK has appointed DIAM Asset Management (HK) Limited as sub-sub-investment manager of the Janus Asia Frontier Markets Fund and the Janus Asia Growth Drivers Fund. With effect from 20 May 2015, DIAM Singapore Pte. Ltd has been appointed as sub-sub-investment manager to these sub-funds.
The Company issued an updated prospectus dated 10 July 2015. A summary of the main changes incorporated in this update is disclosed on pages 12-13. There have been no other significant events affecting the Company since the financial year end.
21. SUBSEQUENT EVENTS
The Company issued an updated prospectus dated 4 January 201 6. A summary of the main changes incorporated in this update is disclosed on pages 13-14.
On 19 February Janus Balanced Fund launched ICAD$acc (Hedged) Share Class.
The Company issued a new Prospectus dated 1 April 2016. A summary of the main changes incorporated in this update is disclosed on pages 14-1 6.

Notes to the Financial Statements
J a n u s C a p i t a l F u n d s P l c / 3 1 D e c e m b e r 2 0 1 5 3 0 7
On 5 April Janus Global Multi-Asset Fund was launched.
There have been no other significant events affecting the company since the financial year end.
22. APPROVAL OF FINANCIAL STATEMENTS
The financial statements were approved by the Board on 20 April 2016.

Explanation of Portfolio Investmentsand Primary Statements (unaudited)
3 0 8 J a n u s C a p i t a l F u n d s P l c / 3 0 J u n e 2 0 1 5
1. PORTFOLIO INVESTMENTS
These schedules report the industry concentrations and types of financial assets at fair value through profit or loss held in each Fund’s portfolio on the last day of the reporting year. Financial assets are usually listed by type (Common Stock, Corporate Bonds, U.S. Government Obligations, etc.) and by industry classification (Banking, Communications, Insurance, etc.).
The fair value of each financial asset is presented at the mid/ last traded prices as of the last business day of the reporting year. The value of financial asset denominated in currencies other than the base currency of the Fund are translated into the reporting currency of the Fund.
2. STATEMENT OF FINANCIAL POSITION
This is often referred to as the “Statement of Assets and Liabilities.” It lists the assets and liabilities of the Funds on the last day of the reporting year. The Funds’ assets are calculated by adding the value of the financial assets at fair value through profit or loss owned, the receivable for securities sold but not yet settled, the receivable for dividends declared but not yet received on stocks owned and the receivable for Fund Shares sold to investors but not yet settled. The Funds’ liabilities include payables for securities purchased but not yet settled, Fund Shares redeemed but not yet paid and expenses owed but not yet paid. Additionally, there may be other assets and liabilities such as forward currency contracts. Net assets attributable to holders of redeemable ordinary Shares are classified as liabilities.
3. STATEMENT OF COMPREHENSIVE INCOME
This statement details each Fund’s income, expenses, gains and losses on securities and currency transactions, and appreciation or depreciation of current portfolio holdings.
The first section in this statement, entitled investment Income reports the dividends earned from stocks and interest earned from interest-bearing securities in the portfolio gross of non-recoverable withholding tax. The net gain/loss on financial assets and liabilities at fair value through profit or loss are also disclosed. This incorporates realised and unrealised gains or losses.
The next section reports the expenses and expense offsets incurred by the Funds, including the advisory fee paid to the Investment Adviser, administration fees, shareholder servicing expenses and printing and postage for mailing statements, financial reports and prospectuses. Also included are costs and commissions on the purchase and sale of financial assets and liabilities at fair value through profit or loss.
The next section lists out the finance costs associated with redeemable ordinary Shares. This is the distributions which were paid during the year.
4. STATEMENT OF CHANGES IN NET ASSETS ATTRIBUTABLE TO HOLDERS OF REDEEMABLE ORDINARY SHARES
This statement reports the increase or decrease in the Funds’ net assets attributable to holders of redeemable ordinary Shares during the reporting year. Changes in the Funds’ net assets are attributable to investment operations, dividends, distributions and capital Share transactions. This is important to investors because it shows exactly what caused the Funds’ net assets size to change during the year.
The first section summarises the information from the Statement of Comprehensive Income regarding changes in net assets because of the Funds’ investment performance.
“Capital Shares” refers to the money investors contribute to the Funds through purchases or withdraw via redemptions. The reinvestment of dividends is included under “Capital Share Transactions.” The Funds’ net assets will increase and decrease in value as investors purchase and redeem Shares from the Fund.
The next section refers to the opening net asset value for the Funds.
5. STATEMENT OF CHANGES IN COMPOSITION OF PORTFOLIO
This statement details all aggregate purchases or sales in excess of 1% of total purchases or sales. At a minimum the top twenty purchases and sales are disclosed

J a n u s C a p i t a l F u n d s P l c / 3 1 D e c e m b e r 2 0 1 5 3 0 9
JANUS ASIA FRONTIER MARKETS FUND
Major Purchases for the year ended 31 December 2015
Shares orPrincipalAmount Cost Major Sales for the year ended 31 December 2015
Shares orPrincipalAmount Proceeds
GF Securities Co., Ltd. 34,800 85,493 GF Securities Co., Ltd. 24,600 70,957
Ping An Insurance Group Co., of China, Ltd. 6,000 44,175 JG Summit Holdings, Inc. 34,000 53,946
Taiwan Semiconductor Manufacturing Co., Ltd. 9,000 42,571 Cosmax, Inc. 310 50,897
Huatai Securities Co., Ltd. 12,000 38,779 China Construction Bank Corp. 56,000 50,627
Industrial & Commercial Bank of China, Ltd. 48,000 35,528 United Overseas Bank, Ltd. 3,000 49,216
CK Hutchison Holdings, Ltd. 2,000 34,475 ComfortDelGro Corp., Ltd. 20,000 42,503
Techtronic Industries Co., Ltd. 10,000 32,800 Premium Leisure Corp. 1,000,000 40,442
Great Wall Motor Co., Ltd. 16,500 31,238 SIIC Environment Holdings, Ltd. 277,200 37,553
Haitong Securities Co., Ltd. 9,600 30,861 Cheung Kong Holdings, Ltd. 2,000 34,475
FLEXium Interconnect, Inc. 10,207 29,213 Techtronic Industries Co., Ltd. 10,000 33,793
Sinopharm Group Co., Ltd. 7,200 27,746 Advanced Info Service PCL 4,600 33,120
Samsung Electronics Co., Ltd. 22 27,279 Tenaga Nasional Bhd 8,500 32,938
SmarTone Telecommunications Holdings, Ltd. 16,000 27,120 Keppel Corp., Ltd. 5,000 32,194
SIIC Environment Holdings, Ltd. 169,200 26,975 Gamuda Bhd 22,300 31,808
SIIC Environment Holdings, Ltd. 33,840 26,975 Siam Cement PCL (NVDR) 2,100 30,251
Guotai Junan International Holdings, Ltd. 42,000 26,828 SmarTone Telecommunications Holdings, Ltd. 16,000 30,021
PAX Global Technology, Ltd. 26,000 26,454 China CITIC Bank Corp., Ltd. 40,000 29,402
China Resources Land, Ltd. 10,000 24,849 Cahya Mata Sarawak Bhd 24,800 27,969
Hilong Holding, Ltd. 74,000 24,606 BTS Group Holdings PCL (NVDR) 84,500 24,114
China Construction Bank Corp. 28,000 24,350 Minor International PCL (NVDR) 26,070 24,104
CGN Power Co, Ltd. 42,000 24,285 Thai Union Group PCL 38,800 23,135
Huadian Power International Corp., Ltd. 22,000 23,839 Berjaya Auto Bhd 37,160 22,722
Anhui Conch Cement Co., Ltd. 7,500 23,739 Sunway BHD Swb MK 26,500 22,681
Hengan International Group Co., Ltd. 2,000 23,229 PAX Global Technology, Ltd. 24,000 22,159
Alibaba Group Holding, Ltd. (ADR) 280 23,051 Baidu, Inc. (ADR) 100 21,048
Beijing Enterprises Water Group, Ltd. 28,000 22,991 Malayan Banking Bhd 7,600 19,530
Samsonite International S.A. 7,000 22,865 China Power International Development, Ltd. 28,000 19,401
Lenovo Group, Ltd. 16,000 22,368 RHB Capital Bhd 8,500 18,946
China Railway Construction Corp., Ltd. 16,000 21,290 Axiata Group Bhd 9,600 18,649
TPK Holding Co., Ltd. 3,000 21,176 CGN Power Co, Ltd. 42,000 18,634
Matahari Putra Prima Tbk PT 111,700 19,985 Huaneng Renewables Corp., Ltd. – Class H 56,000 18,558
Bumi Serpong Damai Tbk PT 120,000 19,342 Home Product Center PCL (NVDR) 65,925 17,055
Himax Technologies, Inc. (ADR) 2,500 18,723 FLEXium Interconnect, Inc. 5,000 16,417
Haier Electronics Group Co., Ltd. 10,000 18,228 Himax Technologies, Inc. (ADR) 2,500 16,149
BAIC Motor Corp., Ltd. 12,000 17,025 Huadian Fuxin Energy Corp., Ltd. - Class H 34,000 15,714
JG Summit Holdings, Inc. 12,000 16,598 China Gas Holdings, Ltd. 10,000 15,623
Zhuzhou CSR Times Electric Co., Ltd. 2,000 16,561 OSIM International, Ltd. 11,000 15,282
HKBN, Ltd. 14,000 16,407 CIMB Group Holdings Bhd 9,500 15,280
Cahya Mata Sarawak Bhd 14,000 15,881 CK Hutchison Holdings, Ltd. - 14,617
Cheung Kong Property Holdings, Ltd. 2,000 14,617 China Merchants Bank Co., Ltd. 6,000 14,584
Xurpas, Inc. 48,000 14,566 Huadian Power International Corp., Ltd. 22,000 14,131
AMOREPACIFIC Corp. 42 14,135 Hyundai Motor Co. 101 14,039
Vipshop Holdings, Ltd. 700 13,957 Hilong Holding, Ltd. 74,000 13,875
ENN Energy Holdings, Ltd. 2,000 13,871 Universal Robina Corp. 3,120 13,765
Statements of Changes in Composition of Portfolio (unaudited)

Statements of Changes in Composition of Portfolio (unaudited)
3 1 0 J a n u s C a p i t a l F u n d s P l c / 3 1 D e c e m b e r 2 0 1 5
JANUS ASIA GROWTH DRIVERS FUND
Major Purchases for the year ended 31 December 2015
Shares orPrincipalAmount Cost Major Sales for the year ended 31 December 2015
Shares orPrincipalAmount Proceeds
GF Securities Co., Ltd. 33,200 81,563 CK Hutchison Holdings, Ltd. 2,500 67,365
CK Hutchison Holdings, Ltd. 4,368 78,204 GF Securities Co., Ltd. 23,400 67,105
Tata Motors, Ltd. 900 43,636 iShares MSCI Taiwan ETF 4,200 65,490
FLEXium Interconnect, Inc. 14,373 39,587 Cheung Kong Holdings, Ltd. 3,000 52,683
Huatai Securities Co., Ltd. 12,000 38,779 Tenaga Nasional Bhd 11,600 45,608
Ping An Insurance Group Co., of China, Ltd. 5,500 37,998 Cheung Kong Infrastructure Holdings, Ltd. 6,000 45,340
Infosys, Ltd. 1,800 32,888 DBS Group Holdings, Ltd. 3,000 45,112
Great Wall Motor Co., Ltd. 16,500 31,333 Matahari Department Store Tbk PT 37,000 44,657
Lenovo Group, Ltd. 22,000 30,772 Cosmax, Inc. 295 39,987
Fubon Financial Holding Co., Ltd. 15,000 30,761 Hutchison Whampoa, Ltd. 3,000 38,232
Cheung Kong Property Holdings, Ltd. 3,868 29,435 KEPCO Plant Service & Engineering Co., Ltd. 355 36,494
Taiwan Semiconductor Manufacturing Co., Ltd. 1,300 29,373 Techtronic Industries Co., Ltd. 9,000 34,357
Techtronic Industries Co., Ltd. 9,000 29,234 SmarTone Telecommunications Holdings, Ltd. 19,000 34,280
ICICI Bank, Ltd. 2,400 29,220 United Overseas Bank, Ltd. 2,000 33,015
TPK Holding Co., Ltd. 4,000 29,091 Kossan Rubber Industries 17,400 32,987
Hengan International Group Co., Ltd. 2,500 28,944 Advanced Info Service PCL 4,500 32,342
China Overseas Land & Investment, Ltd. 9,000 28,257 Beijing Enterprises Water Group, Ltd. 54,000 31,566
Catcher Technology Co., Ltd. 3,000 28,213 ComfortDelGro Corp., Ltd. 15,000 30,731
Sinopharm Group Co., Ltd. 7,200 27,770 China Construction Bank Corp. 33,000 29,833
Zhen Ding Technology Holding, Ltd. 8,000 26,885 JG Summit Holdings, Inc. 19,000 29,723
JG Summit Holdings, Inc. 19,000 26,281 Raffles Medical Group, Ltd. 10,000 28,912
China Merchants Bank Co., Ltd. 9,000 26,134 Samsung Electronics Co., Ltd. 23 28,756
Samsung Electronics Co., Ltd. 20 25,652 PAX Global Technology, Ltd. 31,000 28,313
China Minsheng Banking Corp., Ltd. 19,500 25,558 Sinotrans, Ltd. 40,000 28,194
Everlight Electronics Co., Ltd. 10,000 25,065 Express Transindo Utama Tbk PT 454,000 27,004
China Resources Land, Ltd. 10,000 24,849 Premium Leisure Corp. 700,000 26,794
Chipbond Technology Corp. 12,000 23,275 Minor International PCL (NVDR) 26,300 26,085
Inari Amertron Bhd 26,100 23,040 Keppel Corp., Ltd. 4,000 25,819
Samsonite International S.A. 7,000 22,927 Com2uSCorp 154 25,581
Cathay Financial Holding Co., Ltd. 15,000 22,179 Gamuda Bhd 17,500 24,732
Cheng Uei Precision Industry Co., Ltd. 12,000 22,048 Hotel Shilla Co., Ltd. 266 23,883
Bank Rakyat Indonesia Persero Tbk PT 27,700 21,815 SIIC Environment Holdings, Ltd. 173,800 23,193
iShares MSCI India ETF 700 21,091 Haitong Securities Co., Ltd. 10,000 21,805
Siliconware Precision Industries Co., Ltd. 2,500 20,494 Baidu, Inc. (ADR) 100 21,048
China Petroleum & Chemical Corp. 28,000 19,469 OSIM International, Ltd. 15,000 20,989
CNOOC, Ltd. 17,000 19,332 Sunway BHD Swb MK 25,000 19,910
Matahari Putra Prima Tbk PT 107,600 19,289 Sands China, Ltd. 5,000 19,490
Pakuwon Jati Tbk PT 500,000 19,171 Astra Agro Lestari Tbk PT 10,300 19,058
BAIC Motor Corp., Ltd. 13,500 19,153 Home Product Center PCL (NVDR) 77,625 18,774
Taiwan Semiconductor Manufacturing Co., Ltd. 4,000 18,716 China Gas Holdings, Ltd. 12,000 18,730
Alibaba Group Holding, Ltd. (ADR) 230 18,697 Shanghai Electric Group Co., Ltd. 30,000 18,708
Motech Industries, Inc. 17,000 18,006 Coway Co., Ltd. 246 17,789
Hilong Holding, Ltd. 48,000 17,965
United Overseas Bank, Ltd. 1,000 17,419
Himax Technologies, Inc. (ADR) 2,300 17,229
PAX Global Technology, Ltd. 17,000 17,222
Largan Precision Co., Ltd. 200 17,145
Bumi Serpong Damai Tbk PT 117,200 16,835
Zhuzhou CSR Times Electric Co., Ltd. 2,000 16,561

J a n u s C a p i t a l F u n d s P l c / 3 1 D e c e m b e r 2 0 1 5 3 1 1
JANUS ASIA FUND
Major Purchases for the year ended 31 December 2015
Shares orPrincipalAmount Cost Major Sales for the year ended 31 December 2015
Shares orPrincipalAmount Proceeds
BNP Paribas, 0.0000%, due 26/6/15 13,300,000 13,299,963 BNP Paribas, 0.0000%, due 30/6/15 13,300,000 13,300,000
BNP Paribas, 0.0000%, due 30/6/15 13,300,000 13,299,963 BNP Paribas, 0.0000%, due 26/6/15 13,300,000 13,300,000
BNP Paribas, 0.0000%, due 29/6/15 13,200,000 13,199,890 BNP Paribas, 0.0000%, due 29/6/15 13,200,000 13,200,000
BNP Paribas, 0.0000%, due 8/7/15 12,700,000 12,699,965 BNP Paribas, 0.0000%, due 8/7/15 12,700,000 12,700,000
Societe Generale, 0.0000%, due 14/4/15 12,300,000 12,299,966 Societe Generale, 0.0000%, due 14/4/15 12,300,000 12,300,000
BNP Paribas, 0.0000%, due 4/8/15 12,200,000 12,199,966 BNP Paribas, 0.0000%, due 3/8/15 12,200,000 12,200,000
BNP Paribas, 0.0000%, due 11/8/15 12,200,000 12,199,963 BNP Paribas, 0.0000%, due 4/8/15 12,200,000 12,200,000
BNP Paribas, 0.0000%, due 12/8/15 12,200,000 12,199,963 BNP Paribas, 0.0000%, due 11/8/15 12,200,000 12,200,000
BNP Paribas, 0.0000%, due 3/8/15 12,200,000 12,199,929 BNP Paribas, 0.0000%, due 12/8/15 12,200,000 12,200,000
Societe Generale, 0.0000%, due 20/4/15 12,200,000 12,199,898 Societe Generale, 0.0000%, due 20/4/15 12,200,000 12,200,000
Societe Generale, 0.0000%, due 21/4/15 12,100,000 12,099,966 BNP Paribas, 0.0000%, due 7/8/15 12,100,000 12,100,000
BNP Paribas, 0.0000%, due 7/8/15 12,100,000 12,099,966 BNP Paribas, 0.0000%, due 6/8/15 12,100,000 12,100,000
BNP Paribas, 0.0000%, due 6/8/15 12,100,000 12,099,966 Societe Generale, 0.0000%, due 21/4/15 12,100,000 12,100,000
BNP Paribas, 0.0000%, due 5/8/15 12,100,000 12,099,966 BNP Paribas, 0.0000%, due 5/8/15 12,100,000 12,100,000
BNP Paribas, 0.0000%, due 13/8/15 12,000,000 11,999,963 BNP Paribas, 0.0000%, due 13/8/15 12,000,000 12,000,000
BNP Paribas, 0.0000%, due 31/7/15 12,000,000 11,999,963 BNP Paribas, 0.0000%, due 31/7/15 12,000,000 12,000,000
BNP Paribas, 0.0000%, due 18/8/15 11,900,000 11,899,960 BNP Paribas, 0.0000%, due 17/8/15 11,900,000 11,900,000
BNP Paribas, 0.0000%, due 10/8/15 11,900,000 11,899,901 BNP Paribas, 0.0000%, due 18/8/15 11,900,000 11,900,000
BNP Paribas, 0.0000%, due 17/8/15 11,900,000 11,899,881 BNP Paribas, 0.0000%, due 10/8/15 11,900,000 11,900,000
BNP Paribas, 0.0000%, due 7/7/15 11,800,000 11,799,967 BNP Paribas, 0.0000%, due 7/7/15 11,800,000 11,800,000
JANUS BALANCED FUND
Major Purchases for the year ended 31 December 2015
Shares orPrincipalAmount Cost Major Sales for the year ended 31 December 2015
Shares orPrincipalAmount Proceeds
U.S. Treasury Notes/Bonds, 0.6250%, due 31/12/16 37,705,000 37,782,321 U.S. Treasury Notes/Bonds, 0.6250%, due 31/12/16 45,884,000 46,066,145
BNP Paribas, 0.0000%, due 15/9/15 33,600,000 33,599,888 U.S. Treasury Notes/Bonds, 2.2500%, due 15/11/24 40,463,000 41,542,667
U.S. Treasury Notes/Bonds, 0.3750%, due 31/5/16 32,840,000 32,871,294 U.S. Treasury Notes/Bonds, 0.3750%, due 31/5/16 38,679,000 38,715,645
BNP Paribas, 0.0000%, due 26/1/15 30,400,000 30,399,797 BNP Paribas, 0.0000%, due 15/9/15 33,600,000 33,600,000
Societe Generale, 0.0000%, due 18/2/15 30,100,000 30,099,916 BNP Paribas, 0.0000%, due 26/1/15 30,400,000 30,400,000
U.S. Treasury Notes/Bonds, 2.5000%, due 15/2/45 31,505,000 29,916,238 Societe Generale, 0.0000%, due 18/2/15 30,100,000 30,100,000
BNP Paribas, 0.0000%, due 28/10/15 29,100,000 29,099,911 U.S. Treasury Notes/Bonds, 2.5000%, due 15/2/45 31,088,000 29,274,513
U.S. Treasury Notes/Bonds, 3.0000%, due 15/5/45 28,774,000 28,648,846 BNP Paribas, 0.0000%, due 28/10/15 29,100,000 29,100,000
Societe Generale, 0.0000%, due 17/2/15 28,200,000 28,199,687 Societe Generale, 0.0000%, due 17/2/15 28,200,000 28,200,000
BNP Paribas, 0.0000%, due 2/12/15 26,400,000 26,399,919 U.S. Treasury Notes/Bonds, 3.0000%, due 15/5/45 28,146,000 28,075,146
Rabobank USA Financial Corp., 0.0000%, due 30/1/15 25,400,000 25,399,944 BNP Paribas, 0.0000%, due 2/12/15 26,400,000 26,400,000
Societe Generale, 0.0000%, due 13/2/15 24,600,000 24,599,932 Rabobank USA Financial Corp., 0.0000%, due 30/1/15 25,400,000 25,400,000
U.S. Treasury Notes/Bonds, 2.0000%, due 15/2/25 24,205,000 24,101,744 Societe Generale, 0.0000%, due 13/2/15 24,600,000 24,600,000
Societe Generale, 0.0000%, due 12/2/15 23,600,000 23,599,934 U.S. Treasury Notes/Bonds, 2.0000%, due 15/2/25 23,832,000 23,698,789
U.S. Treasury Notes/Bonds, 2.2500%, due 15/11/24 22,682,000 23,519,814 Societe Generale, 0.0000%, due 12/2/15 23,600,000 23,600,000
BNP Paribas, 0.0000%, due 15/12/15 23,400,000 23,399,922 BNP Paribas, 0.0000%, due 15/12/15 23,400,000 23,400,000
BNP Paribas, 0.0000%, due 23/1/15 22,700,000 22,699,950 U.S. Treasury Notes/Bonds, 3.0000%, due 15/11/44 21,053,000 23,261,962
BNP Paribas, 0.0000%, due 18/5/15 21,600,000 21,599,820 U.S. Treasury Notes/Bonds, 0.5000%, due 30/11/16 23,190,000 23,223,393
U.S. Treasury Notes/Bonds, 0.5000%, due 31/1/17 21,548,000 21,503,011 BNP Paribas, 0.0000%, due 23/1/15 22,700,000 22,700,000
U.S. Treasury Notes/Bonds, 3.0000%, due 15/11/44 18,892,000 21,309,403 BNP Paribas, 0.0000%, due 18/5/15 21,600,000 21,600,000

Statements of Changes in Composition of Portfolio (unaudited)
3 1 2 J a n u s C a p i t a l F u n d s P l c / 3 1 D e c e m b e r 2 0 1 5
JANUS EMERGING MARKETS FUND
Major Purchases for the year ended 31 December 2015
Shares orPrincipalAmount Cost Major Sales for the year ended 31 December 2015
Shares orPrincipalAmount Proceeds
BNP Paribas, 0.0000%, due 12/8/15 12,000,000 11,999,963 BNP Paribas, 0.0000%, due 12/8/15 12,000,000 12,000,000
BNP Paribas, 0.0000%, due 13/8/15 11,800,000 11,799,964 BNP Paribas, 0.0000%, due 13/8/15 11,800,000 11,800,000
BNP Paribas, 0.0000%, due 14/8/15 11,200,000 11,199,963 BNP Paribas, 0.0000%, due 14/8/15 11,200,000 11,200,000
BNP Paribas, 0.0000%, due 17/11/15 7,600,000 7,599,977 BNP Paribas, 0.0000%, due 17/11/15 7,600,000 7,600,000
BNP Paribas, 0.0000%, due 16/11/15 6,500,000 6,499,940 BNP Paribas, 0.0000%, due 16/11/15 6,500,000 6,500,000
BNP Paribas, 0.0000%, due 6/7/15 6,400,000 6,399,929 BNP Paribas, 0.0000%, due 6/7/15 6,400,000 6,400,000
BNP Paribas, 0.0000%, due 9/11/15 5,900,000 5,899,946 BNP Paribas, 0.0000%, due 17/8/15 5,900,000 5,900,000
BNP Paribas, 0.0000%, due 17/8/15 5,900,000 5,899,941 BNP Paribas, 0.0000%, due 9/11/15 5,900,000 5,900,000
BNP Paribas, 0.0000%, due 18/11/15 5,700,000 5,699,983 BNP Paribas, 0.0000%, due 18/11/15 5,700,000 5,700,000
BNP Paribas, 0.0000%, due 20/11/15 5,600,000 5,599,983 BNP Paribas, 0.0000%, due 20/11/15 5,600,000 5,600,000
BNP Paribas, 0.0000%, due 13/11/15 5,400,000 5,399,984 BNP Paribas, 0.0000%, due 24/11/15 5,400,000 5,400,000
BNP Paribas, 0.0000%, due 24/11/15 5,400,000 5,399,984 BNP Paribas, 0.0000%, due 13/11/15 5,400,000 5,400,000
BNP Paribas, 0.0000%, due 23/11/15 5,300,000 5,299,951 BNP Paribas, 0.0000%, due 23/11/15 5,300,000 5,300,000
Samsung Electronics Co., Ltd. 4,983 5,252,771 BNP Paribas, 0.0000%, due 6/11/15 5,100,000 5,100,000
BNP Paribas, 0.0000%, due 2/12/15 5,100,000 5,099,984 BNP Paribas, 0.0000%, due 2/12/15 5,100,000 5,100,000
BNP Paribas, 0.0000%, due 6/11/15 5,100,000 5,099,984 BNP Paribas, 0.0000%, due 12/11/15 4,900,000 4,900,000
BNP Paribas, 0.0000%, due 12/11/15 4,900,000 4,899,970 BNP Paribas, 0.0000%, due 19/11/15 4,800,000 4,800,000
BNP Paribas, 0.0000%, due 19/11/15 4,800,000 4,799,985 BNP Paribas, 0.0000%, due 10/11/15 4,700,000 4,700,000
BNP Paribas, 0.0000%, due 10/11/15 4,700,000 4,699,986 BNP Paribas, 0.0000%, due 7/7/15 4,600,000 4,600,000
BNP Paribas, 0.0000%, due 7/7/15 4,600,000 4,599,987 BNP Paribas, 0.0000%, due 18/9/15 3,400,000 3,400,000
JANUS EUROPE FUND
Major Purchases for the year ended 31 December 2015
Shares orPrincipalAmount Cost Major Sales for the year ended 31 December 2015
Shares orPrincipalAmount Proceeds
Aroundtown Property Holdings PLC 2,521,089 8,195,800 Novartis A.G. 73,296 6,579,314
Nestle S.A. 117,900 8,074,612 Pets at Home Group PLC 1,784,156 6,217,630
Scout24 A.G. 198,180 5,945,400 Scout24 A.G. 198,180 5,987,018
Nobina A.B. 1,550,206 5,636,775 Nestle S.A. 79,830 5,480,684
Senator Entertainment A.G. 2,158,376 5,395,940 SWB Entertainmnt Investment B.V. 4,400,000 5,395,940
Europris A.S.A 977,482 4,992,037 Volkswagen A.G. 41,833 5,138,501
Ocean Rig UDW, Inc. 997,928 4,946,359 Syngenta A.G. 15,974 5,042,298
Ophir Energy PLC 2,757,221 4,314,112 Deutsche Bank A.G. 175,393 5,023,215
Rocket Internet S.E. 126,533 4,248,730 Nobina A.B. 1,369,696 4,998,976
Glencore Xstrata PLC 1,519,265 4,191,167 SABMiller PLC 96,267 4,775,154
Shawbrook Group, Ltd. 1,030,400 4,116,391 Aroundtown Property Holdings PLC 1,410,003 4,669,618
Julius Baer Multistock - Swiss Stock Fund 110,338 4,063,917 Shawbrook Group, Ltd. 1,030,400 4,602,594
SWB Entertainmnt Investment B.V. 4,400,000 3,966,600 Europris A.S.A 977,482 4,556,223
Avatera Medical Investment GmbH 4,000,000 3,725,580 TLG Immobilien A.G. 297,887 4,485,938
Asiakastieto Group Oyj 250,183 3,674,982 Banco Bilbao Vizcaya Argentaria S.A. 485,343 4,432,294
SABMiller PLC 74,013 3,651,445 Tullow Oil PLC 1,118,974 4,416,558
Tullow Oil PLC 947,681 3,532,758 Ophir Energy PLC 2,802,036 4,410,654
Ichor Coal N.V. 985,714 3,455,174 BG Group PLC 260,318 4,332,599
Intesa Sanpaolo SpA 1,065,765 3,423,116 Ichor Coal N.V. 985,714 4,330,636
Infrastrutture Wireless Italiane SpA 936,800 3,419,320 Magnolia Bostad A.B. 764,607 3,996,430
Enel SpA 843,500 3,382,435 Julius Baer Multistock - Swiss Stock Fund 107,189 3,896,818
Roche Holding A.G. 13,564 3,353,687 Petrofac, Ltd. 320,145 3,838,421
TLG Immobilien A.G. 226,070 3,276,642
Volkswagen A.G. 19,317 3,272,947
AstraZeneca PLC 53,939 3,212,908
Magnolia Bostad A.B. 764,607 3,120,384

J a n u s C a p i t a l F u n d s P l c / 3 1 D e c e m b e r 2 0 1 5 3 1 3
JANUS GLOBAL LIFE SCIENCES FUND
Major Purchases for the year ended 31 December 2015
Shares orPrincipalAmount Cost Major Sales for the year ended 31 December 2015
Shares orPrincipalAmount Proceeds
AbbVie, Inc. 1,024,168 77,342,475 BNP Paribas, 0.0000%, due 20/8/15 76,300,000 76,300,000
BNP Paribas, 0.0000%, due 20/8/15 76,300,000 76,299,745 BNP Paribas, 0.0000%, due 11/5/15 69,900,000 69,900,000
BNP Paribas, 0.0000%, due 11/5/15 69,900,000 69,899,417 BNP Paribas, 0.0000%, due 6/5/15 68,200,000 68,200,000
BNP Paribas, 0.0000%, due 6/5/15 68,200,000 68,199,810 BNP Paribas, 0.0000%, due 9/10/15 67,800,000 67,800,000
BNP Paribas, 0.0000%, due 9/10/15 67,800,000 67,799,793 Societe Generale, 0.0000%, due 7/4/15 66,300,000 66,300,000
Societe Generale, 0.0000%, due 7/4/15 66,300,000 66,299,816 BNP Paribas, 0.0000%, due 25/8/15 61,600,000 61,600,000
Sanofi 650,092 64,261,623 BNP Paribas, 0.0000%, due 5/5/15 60,400,000 60,400,000
Amgen, Inc. 398,980 62,555,259 BNP Paribas, 0.0000%, due 24/8/15 59,500,000 59,500,000
BNP Paribas, 0.0000%, due 25/8/15 61,600,000 61,599,794 BNP Paribas, 0.0000%, due 23/10/15 58,500,000 58,500,000
BNP Paribas, 0.0000%, due 5/5/15 60,400,000 60,399,832 BNP Paribas, 0.0000%, due 12/8/15 56,600,000 56,600,000
BNP Paribas, 0.0000%, due 24/8/15 59,500,000 59,499,405 BNP Paribas, 0.0000%, due 19/8/15 55,700,000 55,700,000
BNP Paribas, 0.0000%, due 23/10/15 58,500,000 58,499,821 BNP Paribas, 0.0000%, due 21/8/15 55,500,000 55,500,000
Valeant Pharmaceuticals International, Inc. 343,280 56,601,592 Rabobank USA Financial Corp., 0.0000%, due 28/4/15 55,200,000 55,200,000
BNP Paribas, 0.0000%, due 12/8/15 56,600,000 56,599,827 Societe Generale, 0.0000%, due 28/1/15 54,500,000 54,500,000
Allergan PLC 205,101 56,330,933 BNP Paribas, 0.0000%, due 1/5/15 54,400,000 54,400,000
BNP Paribas, 0.0000%, due 19/8/15 55,700,000 55,699,814 BNP Paribas, 0.0000%, due 17/9/15 53,700,000 53,700,000
BNP Paribas, 0.0000%, due 21/8/15 55,500,000 55,499,815 BNP Paribas Finance, Inc. 53,300,000 53,300,000
Rabobank USA Financial Corp., 0.0000%, due 28/4/15 55,200,000 55,199,831 BNP Paribas, 0.0000%, due 4/5/15 53,100,000 53,100,000
Societe Generale, 0.0000%, due 28/1/15 54,500,000 54,499,894 BNP Paribas, 0.0000%, due 7/8/15 52,600,000 52,600,000
BNP Paribas, 0.0000%, due 1/5/15 54,400,000 54,399,925 BNP Paribas, 0.0000%, due 27/10/15 52,400,000 52,400,000
JANUS GLOBAL RESEARCH FUND
Major Purchases for the year ended 31 December 2015
Shares orPrincipalAmount Cost Major Sales for the year ended 31 December 2015
Shares orPrincipalAmount Proceeds
BNP Paribas, 0.0000%, due 24/3/15 800,000 799,998 MarkWest Energy Partners L.P. 11,867 830,334
MPLX L.P. 13,147 758,031 BNP Paribas, 0.0000%, due 24/3/15 800,000 800,000
BNP Paribas, 0.0000%, due 30/9/15 700,000 699,998 BNP Paribas, 0.0000%, due 11/3/15 700,000 700,000
BNP Paribas, 0.0000%, due 11/3/15 700,000 699,998 BNP Paribas, 0.0000%, due 30/9/15 700,000 700,000
Exxon Mobil Corp. 7,331 660,494 Google, Inc. - Class C 1,276 610,725
Total S.A. 12,531 634,513 Apple, Inc. 4,932 601,868
Alphabet, Inc. 1,276 610,725 BNP Paribas, 0.0000%, due 21/9/15 600,000 600,000
BNP Paribas, 0.0000%, due 18/9/15 600,000 599,998 Societe Generale, 0.0000%, due 25/3/15 600,000 600,000
BNP Paribas, 0.0000%, due 11/8/15 600,000 599,998 BNP Paribas, 0.0000%, due 24/9/15 600,000 600,000
Societe Generale, 0.0000%, due 25/3/15 600,000 599,998 BNP Paribas, 0.0000%, due 19/3/15 600,000 600,000
BNP Paribas, 0.0000%, due 15/10/15 600,000 599,998 BNP Paribas, 0.0000%, due 18/9/15 600,000 600,000
BNP Paribas, 0.0000%, due 12/8/15 600,000 599,998 BNP Paribas, 0.0000%, due 7/8/15 600,000 600,000
BNP Paribas, 0.0000%, due 24/9/15 600,000 599,998 Societe Generale, 0.0000%, due 22/9/15 600,000 600,000
Societe Generale, 0.0000%, due 22/9/15 600,000 599,998 BNP Paribas, 0.0000%, due 29/9/15 600,000 600,000
BNP Paribas, 0.0000%, due 25/9/15 600,000 599,998 BNP Paribas, 0.0000%, due 25/9/15 600,000 600,000
BNP Paribas, 0.0000%, due 14/5/15 600,000 599,998 BNP Paribas, 0.0000%, due 28/9/15 600,000 600,000
BNP Paribas, 0.0000%, due 29/9/15 600,000 599,998 BNP Paribas, 0.0000%, due 14/5/15 600,000 600,000
BNP Paribas, 0.0000%, due 19/3/15 600,000 599,998 BNP Paribas, 0.0000%, due 14/10/15 600,000 600,000
BNP Paribas, 0.0000%, due 7/8/15 600,000 599,998 BNP Paribas, 0.0000%, due 16/10/15 600,000 600,000
BNP Paribas, 0.0000%, due 14/10/15 600,000 599,998 BNP Paribas, 0.0000%, due 10/8/15 600,000 600,000
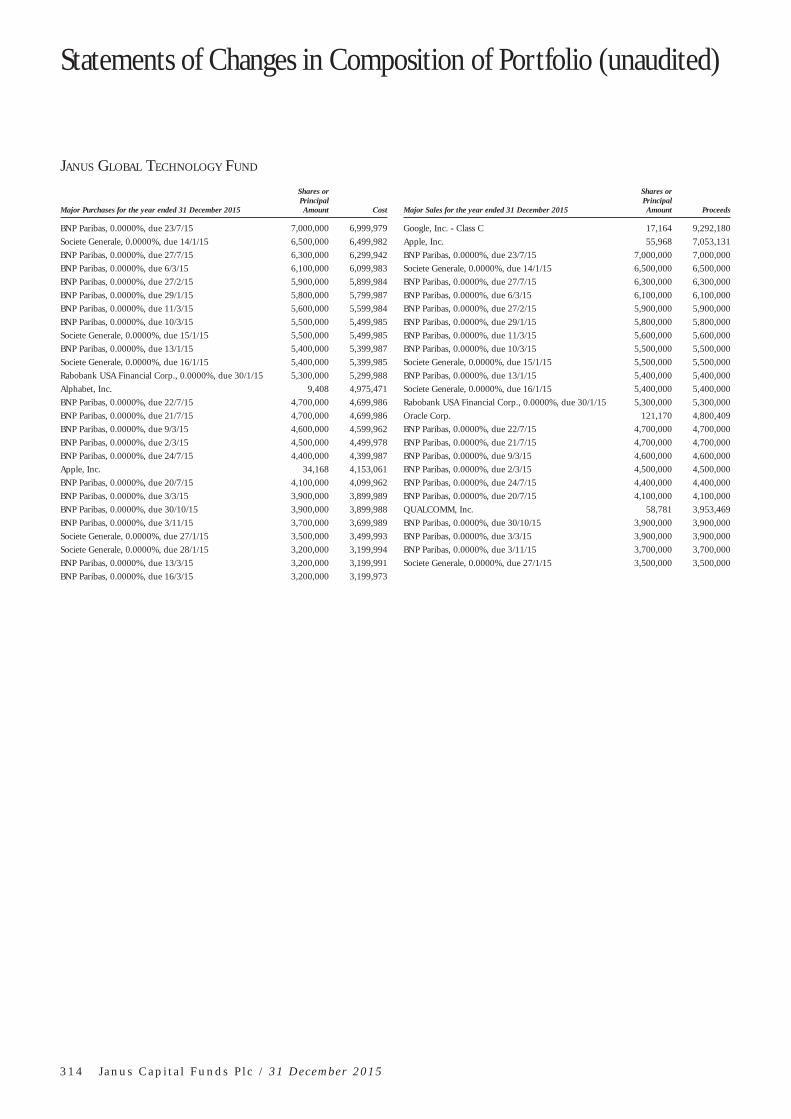
Statements of Changes in Composition of Portfolio (unaudited)
3 1 4 J a n u s C a p i t a l F u n d s P l c / 3 1 D e c e m b e r 2 0 1 5
JANUS GLOBAL TECHNOLOGY FUND
Major Purchases for the year ended 31 December 2015
Shares orPrincipalAmount Cost Major Sales for the year ended 31 December 2015
Shares orPrincipalAmount Proceeds
BNP Paribas, 0.0000%, due 23/7/15 7,000,000 6,999,979 Google, Inc. - Class C 17,164 9,292,180
Societe Generale, 0.0000%, due 14/1/15 6,500,000 6,499,982 Apple, Inc. 55,968 7,053,131
BNP Paribas, 0.0000%, due 27/7/15 6,300,000 6,299,942 BNP Paribas, 0.0000%, due 23/7/15 7,000,000 7,000,000
BNP Paribas, 0.0000%, due 6/3/15 6,100,000 6,099,983 Societe Generale, 0.0000%, due 14/1/15 6,500,000 6,500,000
BNP Paribas, 0.0000%, due 27/2/15 5,900,000 5,899,984 BNP Paribas, 0.0000%, due 27/7/15 6,300,000 6,300,000
BNP Paribas, 0.0000%, due 29/1/15 5,800,000 5,799,987 BNP Paribas, 0.0000%, due 6/3/15 6,100,000 6,100,000
BNP Paribas, 0.0000%, due 11/3/15 5,600,000 5,599,984 BNP Paribas, 0.0000%, due 27/2/15 5,900,000 5,900,000
BNP Paribas, 0.0000%, due 10/3/15 5,500,000 5,499,985 BNP Paribas, 0.0000%, due 29/1/15 5,800,000 5,800,000
Societe Generale, 0.0000%, due 15/1/15 5,500,000 5,499,985 BNP Paribas, 0.0000%, due 11/3/15 5,600,000 5,600,000
BNP Paribas, 0.0000%, due 13/1/15 5,400,000 5,399,987 BNP Paribas, 0.0000%, due 10/3/15 5,500,000 5,500,000
Societe Generale, 0.0000%, due 16/1/15 5,400,000 5,399,985 Societe Generale, 0.0000%, due 15/1/15 5,500,000 5,500,000
Rabobank USA Financial Corp., 0.0000%, due 30/1/15 5,300,000 5,299,988 BNP Paribas, 0.0000%, due 13/1/15 5,400,000 5,400,000
Alphabet, Inc. 9,408 4,975,471 Societe Generale, 0.0000%, due 16/1/15 5,400,000 5,400,000
BNP Paribas, 0.0000%, due 22/7/15 4,700,000 4,699,986 Rabobank USA Financial Corp., 0.0000%, due 30/1/15 5,300,000 5,300,000
BNP Paribas, 0.0000%, due 21/7/15 4,700,000 4,699,986 Oracle Corp. 121,170 4,800,409
BNP Paribas, 0.0000%, due 9/3/15 4,600,000 4,599,962 BNP Paribas, 0.0000%, due 22/7/15 4,700,000 4,700,000
BNP Paribas, 0.0000%, due 2/3/15 4,500,000 4,499,978 BNP Paribas, 0.0000%, due 21/7/15 4,700,000 4,700,000
BNP Paribas, 0.0000%, due 24/7/15 4,400,000 4,399,987 BNP Paribas, 0.0000%, due 9/3/15 4,600,000 4,600,000
Apple, Inc. 34,168 4,153,061 BNP Paribas, 0.0000%, due 2/3/15 4,500,000 4,500,000
BNP Paribas, 0.0000%, due 20/7/15 4,100,000 4,099,962 BNP Paribas, 0.0000%, due 24/7/15 4,400,000 4,400,000
BNP Paribas, 0.0000%, due 3/3/15 3,900,000 3,899,989 BNP Paribas, 0.0000%, due 20/7/15 4,100,000 4,100,000
BNP Paribas, 0.0000%, due 30/10/15 3,900,000 3,899,988 QUALCOMM, Inc. 58,781 3,953,469
BNP Paribas, 0.0000%, due 3/11/15 3,700,000 3,699,989 BNP Paribas, 0.0000%, due 30/10/15 3,900,000 3,900,000
Societe Generale, 0.0000%, due 27/1/15 3,500,000 3,499,993 BNP Paribas, 0.0000%, due 3/3/15 3,900,000 3,900,000
Societe Generale, 0.0000%, due 28/1/15 3,200,000 3,199,994 BNP Paribas, 0.0000%, due 3/11/15 3,700,000 3,700,000
BNP Paribas, 0.0000%, due 13/3/15 3,200,000 3,199,991 Societe Generale, 0.0000%, due 27/1/15 3,500,000 3,500,000
BNP Paribas, 0.0000%, due 16/3/15 3,200,000 3,199,973

J a n u s C a p i t a l F u n d s P l c / 3 1 D e c e m b e r 2 0 1 5 3 1 5
JANUS JAPAN EMERGING OPPORTUNITIES FUND
Major Purchases for the year ended 31 December 2015
Shares orPrincipalAmount Cost Major Sales for the year ended 31 December 2015
Shares orPrincipalAmount Proceeds
Nidec Corp. 700 6,060,979 Nidec Corp. 1,000 8,793,139
GMO Payment Gateway, Inc. 1,300 4,190,805 Unicharm Corp. 3,000 8,343,479
Ono Pharmaceutical Co., Ltd. 200 4,038,708 Cosmos Pharmaceutical Corp. 300 5,090,763
Cosmos Pharmaceutical Corp. 200 3,505,201 Makino Milling Machine Co., Ltd. 4,000 4,472,727
DMG Mori Co., Ltd. 1,500 3,489,472 Chugai Pharmaceutical Co., Ltd. 1,000 4,165,319
Eiken Chemical Co., Ltd. 1,700 3,208,180 UT Holdings Co., Ltd. 5,700 3,820,131
Unicharm Corp. 1,000 2,781,624 NS Solutions Corp. 1,000 3,676,085
Nippon Seiki Co., Ltd. 1,000 2,716,255 ORIX Corp. 2,300 3,631,000
Otsuka Corp. 500 2,691,902 GMO internet, Inc. 2,300 3,446,376
Freund Corp. 2,000 2,532,032 Eisai Co., Ltd. 500 3,298,239
Gurunavi, Inc. 1,100 2,479,915 Kawasaki Heavy Industries, Ltd. 6,000 3,220,296
GMO internet, Inc. 1,300 2,411,432 Hitachi Metals, Ltd. 2,000 3,166,307
Sawai Pharmaceutical Co., Ltd. 300 2,328,176 GMO Payment Gateway, Inc. 800 3,149,597
eGuarantee, Inc. 1,100 2,204,237 Toyo Tire & Rubber Co., Ltd. 1,100 3,006,894
Kato Works Co., Ltd. 3,000 2,177,609 TDK Corp. 400 2,863,742
Tsubakimoto Chain Co. 2,000 2,172,604 Don Quijote Holdings Co., Ltd. 300 2,789,078
Aichi Steel Corp. 4,000 2,157,652 Suzuki Motor Corp. 700 2,739,479
Daiichikosho Co., Ltd. 500 2,139,564 Lawson, Inc. 300 2,468,035
Outsourcing, Inc. 800 2,089,804 Proto Corp. 1,200 2,369,579
Nitori Holdings Co., Ltd. 200 2,042,447 Isuzu Motors, Ltd. 1,600 2,263,490
Horiba, Ltd. 400 1,959,224 Brother Industries, Ltd. 1,100 2,173,291
Koito Manufacturing Co., Ltd. 400 1,934,307 Kubota Corp. 1,000 2,059,027
Welcia Holdings Co., Ltd. 300 1,843,851 SMS Co., Ltd. 1,000 2,009,986
Lawson, Inc. 200 1,781,693 Shimadzu Corp. 1,000 1,972,630
Nicca Chemical Co., Ltd. 1,700 1,745,090 Omron Corp. 400 1,855,713
Shimano, Inc. 100 1,667,999 Kyosan Electric Manufacturing Co., Ltd. 5,000 1,840,958
Tokyu Corp. 2,000 1,578,892 Asics Corp. 600 1,789,865
Japan Medical Dynamic Marketing, Inc. 3,000 1,570,569 Rohto Pharmaceutical Co., Ltd. 1,000 1,772,821
TDK Corp. 200 1,568,880 W-Scope Corp. 1,400 1,747,522
Asahi Rubber, Inc. 1,100 1,532,732 Sanken Electric Co., Ltd. 4,000 1,737,659
SMS Co., Ltd. 1,000 1,530,830 Kato Works Co., Ltd. 3,000 1,695,998
Amano Corp. 900 1,518,558 Shimano, Inc. 100 1,683,167
Rohto Pharmaceutical Co., Ltd. 700 1,512,212 Freund Corp. 1,200 1,661,703
Ezaki Glico Co., Ltd. 300 1,464,254 Tokyu Corp. 2,000 1,636,035
CRE, Inc. 600 1,454,376 Nicca Chemical Co., Ltd. 1,700 1,632,641
Eagle Industry Co., Ltd. 600 1,449,147 Wellnet Corp. 600 1,628,674
DMG Mori Co., Ltd. 1,000 1,620,583

Statements of Changes in Composition of Portfolio (unaudited)
3 1 6 J a n u s C a p i t a l F u n d s P l c / 3 1 D e c e m b e r 2 0 1 5
JANUS JAPAN FUND
Major Purchases for the year ended 31 December 2015
Shares orPrincipalAmount Cost Major Sales for the year ended 31 December 2015
Shares orPrincipalAmount Proceeds
Mizuho Financial Group, Inc. 32,100 7,769,627 Mazda Motor Corp. 2,700 6,174,779
Kao Corp. 900 5,130,063 FFRI, Inc. 400 5,711,581
Otsuka Corp. 900 5,039,026 FUJIFILM Holdings Corp. 1,200 5,402,593
Kintetsu World Express, Inc. 1,500 5,011,710 Toshiba Corp. 12,000 5,230,884
Mitsubishi UFJ Financial Group, Inc. 6,300 4,880,121 ORIX Corp. 2,800 5,031,082
Mixi, Inc. 800 4,493,084 Terumo Corp. 1,500 4,982,988
FUJIFILM Holdings Corp. 1,000 4,317,313 Kao Corp. 700 4,341,406
Honda Motor Co., Ltd. 1,000 4,246,840 Topcon Corp. 1,600 4,318,236
GCA Savvian Corp. 2,800 4,232,822 SoftBank Group Corp. 600 4,123,085
Nippon Telegraph & Telephone Corp. 900 4,221,904 Kaken Pharmaceutical Co., Ltd. 1,000 4,068,964
Mitsubishi Heavy Industries, Ltd. 5,000 3,900,228 Tokyu Fudosan Holdings Corp. 4,200 3,962,772
NEC Corp. 10,000 3,778,684 Penta-Ocean Construction Co., Ltd. 8,000 3,805,032
DMG Mori Co., Ltd. 2,100 3,747,212 Mitsubishi Chemical Holdings Corp. 5,000 3,675,227
Fujitsu, Ltd. 5,000 3,652,267 Teijin, Ltd. 9,000 3,663,121
Rakuten, Inc. 1,700 3,639,715 COOKPAD, Inc. 1,200 3,657,085
Resorttrust, Inc. 1,100 3,521,819 Sumitomo Electric Industries, Ltd. 2,300 3,656,697
Aisin Seiki Co., Ltd. 800 3,475,587 Mixi, Inc. 800 3,626,846
Hazama Ando Corp. 5,100 3,472,254 Mitsubishi Heavy Industries, Ltd. 5,000 3,588,565
Tokyu Fudosan Holdings Corp. 4,200 3,469,903 Mizuho Financial Group, Inc. 15,300 3,533,278
Kyowa Hakko Kirin Co., Ltd. 2,000 3,457,053 TDK Corp. 400 3,484,318
Recruit Holdings Co., Ltd. 900 3,441,877
Nitori Holdings Co., Ltd. 400 3,436,767
JANUS OPPORTUNISTIC ALPHA FUND
Major Purchases for the year ended 31 December 2015
Shares orPrincipalAmount Cost Major Sales for the year ended 31 December 2015
Shares orPrincipalAmount Proceeds
BNP Paribas, 0.0000%, due 26/1/15 7,000,000 6,999,953 BNP Paribas, 0.0000%, due 26/1/15 7,000,000 7,000,000
Societe Generale, 0.0010%, due 6/1/15 6,800,000 6,799,981 Societe Generale, 0.0010%, due 6/1/15 6,800,000 6,800,000
BNP Paribas, 0.0000%, due 8/1/15 6,700,000 6,699,983 BNP Paribas, 0.0000%, due 8/1/15 6,700,000 6,700,000
Societe Generale, 0.0000%, due 7/1/15 6,700,000 6,699,981 Societe Generale, 0.0000%, due 7/1/15 6,700,000 6,700,000
BNP Paribas, 0.0000%, due 23/1/15 6,600,000 6,599,985 BNP Paribas, 0.0000%, due 23/1/15 6,600,000 6,600,000
BNP Paribas, 0.0000%, due 9/1/15 6,500,000 6,499,984 BNP Paribas, 0.0000%, due 9/1/15 6,500,000 6,500,000
BNP Paribas, 0.0000%, due 22/1/15 6,500,000 6,499,984 BNP Paribas, 0.0000%, due 22/1/15 6,500,000 6,500,000
BNP Paribas, 0.0000%, due 12/1/15 6,300,000 6,299,953 BNP Paribas, 0.0000%, due 12/1/15 6,300,000 6,300,000
Societe Generale, 0.0000%, due 5/2/15 6,100,000 6,099,983 Societe Generale, 0.0000%, due 5/2/15 6,100,000 6,100,000
Societe Generale, 0.0000%, due 5/1/15 6,100,000 6,099,944 Societe Generale, 0.0000%, due 17/2/15 6,100,000 6,100,000
Societe Generale, 0.0000%, due 17/2/15 6,100,000 6,099,932 Societe Generale, 0.0000%, due 5/1/15 6,100,000 6,100,000
BNP Paribas, 0.0000%, due 13/1/15 6,000,000 5,999,985 Societe Generale, 0.0000%, due 19/2/15 6,000,000 6,000,000
Societe Generale, 0.0000%, due 19/2/15 6,000,000 5,999,983 BNP Paribas, 0.0000%, due 13/1/15 6,000,000 6,000,000
Societe Generale, 0.0000%, due 12/2/15 6,000,000 5,999,983 Societe Generale, 0.0000%, due 12/2/15 6,000,000 6,000,000
Societe Generale, 0.0000%, due 6/2/15 5,900,000 5,899,985 Societe Generale, 0.0000%, due 18/2/15 5,900,000 5,900,000
Societe Generale, 0.0000%, due 10/2/15 5,900,000 5,899,985 Societe Generale, 0.0000%, due 10/2/15 5,900,000 5,900,000
Societe Generale, 0.0000%, due 18/2/15 5,900,000 5,899,984 Societe Generale, 0.0000%, due 6/2/15 5,900,000 5,900,000
Societe Generale, 0.0000%, due 13/2/15 5,900,000 5,899,984 Societe Generale, 0.0000%, due 13/2/15 5,900,000 5,900,000
Societe Generale, 0.0000%, due 9/2/15 5,800,000 5,799,957 BNP Paribas, 0.0000%, due 20/1/15 5,800,000 5,800,000
BNP Paribas, 0.0000%, due 20/1/15 5,800,000 5,799,942 Societe Generale, 0.0000%, due 9/2/15 5,800,000 5,800,000

J a n u s C a p i t a l F u n d s P l c / 3 1 D e c e m b e r 2 0 1 5 3 1 7
JANUS US FUND
Major Purchases for the year ended 31 December 2015
Shares orPrincipalAmount Cost Major Sales for the year ended 31 December 2015
Shares orPrincipalAmount Proceeds
BNP Paribas, 0.0000%, due 26/8/15 100,000 100,000 BNP Paribas, 0.0000%, due 17/12/15 100,000 100,000
BNP Paribas, 0.0000%, due 25/11/15 100,000 100,000 BNP Paribas, 0.0000%, due 23/9/15 100,000 100,000
BNP Paribas, 0.0000%, due 24/9/15 100,000 100,000 BNP Paribas, 0.0000%, due 31/8/15 100,000 100,000
BNP Paribas, 0.0000%, due 1/6/15 100,000 100,000 BNP Paribas, 0.0000%, due 1/6/15 100,000 100,000
BNP Paribas, 0.0000%, due 3/12/15 100,000 100,000 BNP Paribas, 0.0000%, due 16/11/15 100,000 100,000
BNP Paribas, 0.0000%, due 2/6/15 100,000 100,000 BNP Paribas, 0.0000%, due 2/6/15 100,000 100,000
BNP Paribas, 0.0000%, due 10/9/15 100,000 100,000 Societe Generale, 0.0000%, due 1/12/15 100,000 100,000
BNP Paribas, 0.0000%, due 3/6/15 100,000 100,000 BNP Paribas, 0.0000%, due 3/6/15 100,000 100,000
BNP Paribas, 0.0000%, due 16/10/15 100,000 100,000 BNP Paribas, 0.0000%, due 11/9/15 100,000 100,000
BNP Paribas, 0.0000%, due 4/6/15 100,000 100,000 BNP Paribas, 0.0000%, due 4/6/15 100,000 100,000
BNP Paribas, 0.0000%, due 20/10/15 100,000 100,000 BNP Paribas, 0.0000%, due 9/10/15 100,000 100,000
BNP Paribas, 0.0000%, due 5/6/15 100,000 100,000 BNP Paribas, 0.0000%, due 5/6/15 100,000 100,000
BNP Paribas, 0.0000%, due 29/7/15 100,000 100,000 BNP Paribas, 0.0000%, due 27/11/15 100,000 100,000
BNP Paribas, 0.0000%, due 9/6/15 100,000 100,000 BNP Paribas, 0.0000%, due 8/6/15 100,000 100,000
BNP Paribas, 0.0000%, due 2/9/15 100,000 100,000 BNP Paribas, 0.0000%, due 21/10/15 100,000 100,000
BNP Paribas, 0.0000%, due 10/6/15 100,000 100,000 BNP Paribas, 0.0000%, due 9/6/15 100,000 100,000
BNP Paribas, 0.0000%, due 17/9/15 100,000 100,000 BNP Paribas, 0.0000%, due 25/8/15 100,000 100,000
BNP Paribas, 0.0000%, due 11/6/15 100,000 100,000 BNP Paribas, 0.0000%, due 10/6/15 100,000 100,000
BNP Paribas, 0.0000%, due 2/10/15 100,000 100,000 BNP Paribas, 0.0000%, due 4/9/15 100,000 100,000
BNP Paribas, 0.0000%, due 16/6/15 100,000 100,000 BNP Paribas, 0.0000%, due 11/6/15 100,000 100,000
JANUS US RESEARCH FUND
Major Purchases for the year ended 31 December 2015
Shares orPrincipalAmount Cost Major Sales for the year ended 31 December 2015
Shares orPrincipalAmount Proceeds
BNP Paribas, 0.0000%, due 21/1/15 4,200,000 4,199,990 MarkWest Energy Partners L.P. 59,640 4,241,020
Alphabet, Inc. 8,729 4,129,727 BNP Paribas, 0.0000%, due 21/1/15 4,200,000 4,200,000
BNP Paribas, 0.0000%, due 9/1/15 3,900,000 3,899,990 Google, Inc. - Class C 8,729 4,129,727
MPLX L.P. 65,478 3,843,614 BNP Paribas, 0.0000%, due 9/1/15 3,900,000 3,900,000
Societe Generale, 0.0000%, due 16/1/15 3,700,000 3,699,990 Societe Generale, 0.0000%, due 16/1/15 3,700,000 3,700,000
BNP Paribas, 0.0000%, due 20/1/15 3,700,000 3,699,963 BNP Paribas, 0.0000%, due 20/1/15 3,700,000 3,700,000
Exxon Mobil Corp. 40,628 3,604,354 Societe Generale, 0.0000%, due 20/4/15 3,500,000 3,500,000
Societe Generale, 0.0000%, due 20/4/15 3,500,000 3,499,971 BNP Paribas, 0.0000%, due 12/1/15 3,400,000 3,400,000
Societe Generale, 0.0000%, due 17/4/15 3,400,000 3,399,991 Societe Generale, 0.0000%, due 17/4/15 3,400,000 3,400,000
BNP Paribas, 0.0000%, due 12/1/15 3,400,000 3,399,975 Chevron Corp. 33,547 3,333,984
Societe Generale, 0.0000%, due 22/4/15 3,300,000 3,299,991 Societe Generale, 0.0000%, due 22/4/15 3,300,000 3,300,000
Societe Generale, 0.0000%, due 21/4/15 3,300,000 3,299,991 BNP Paribas, 0.0000%, due 11/3/15 3,300,000 3,300,000
BNP Paribas, 0.0000%, due 11/3/15 3,300,000 3,299,991 Societe Generale, 0.0000%, due 21/4/15 3,300,000 3,300,000
Chevron Corp. 41,841 3,275,888 BNP Paribas, 0.0000%, due 20/11/15 3,200,000 3,200,000
Societe Generale, 0.0000%, due 14/1/15 3,200,000 3,199,991 Societe Generale, 0.0000%, due 14/1/15 3,200,000 3,200,000
BNP Paribas, 0.0000%, due 20/11/15 3,200,000 3,199,990 BNP Paribas, 0.0000%, due 26/2/15 3,100,000 3,100,000
BNP Paribas, 0.0000%, due 13/1/15 3,100,000 3,099,992 BNP Paribas, 0.0000%, due 13/1/15 3,100,000 3,100,000
BNP Paribas, 0.0000%, due 26/2/15 3,100,000 3,099,991 Societe Generale, 0.0000%, due 16/4/15 3,100,000 3,100,000
Societe Generale, 0.0000%, due 16/4/15 3,100,000 3,099,991 Pharmacyclics, Inc. 13,548 3,005,275
Baker Hughes, Inc. 53,712 3,014,051 Societe Generale, 0.0000%, due 15/1/15 3,000,000 3,000,000

Statements of Changes in Composition of Portfolio (unaudited)
3 1 8 J a n u s C a p i t a l F u n d s P l c / 3 1 D e c e m b e r 2 0 1 5
JANUS US TWENTY FUND
Major Purchases for the year ended 31 December 2015
Shares orPrincipalAmount Cost Major Sales for the year ended 31 December 2015
Shares orPrincipalAmount Proceeds
Societe Generale, 0.0000%, due 18/2/15 36,600,000 36,599,898 Societe Generale, 0.0000%, due 18/2/15 36,600,000 36,600,000
Societe Generale, 0.0000%, due 19/2/15 36,500,000 36,499,899 Societe Generale, 0.0000%, due 19/2/15 36,500,000 36,500,000
BNP Paribas, 0.0000%, due 22/7/15 36,300,000 36,299,889 BNP Paribas, 0.0000%, due 22/7/15 36,300,000 36,300,000
Societe Generale, 0.0000%, due 17/2/15 32,800,000 32,799,636 Societe Generale, 0.0000%, due 17/2/15 32,800,000 32,800,000
Societe Generale, 0.0000%, due 13/2/15 30,200,000 30,199,916 Societe Generale, 0.0000%, due 13/2/15 30,200,000 30,200,000
Societe Generale, 0.0000%, due 12/2/15 30,000,000 29,999,917 Societe Generale, 0.0000%, due 12/2/15 30,000,000 30,000,000
BNP Paribas, 0.0000%, due 3/3/15 29,300,000 29,299,919 BNP Paribas, 0.0000%, due 3/3/15 29,300,000 29,300,000
Societe Generale, 0.0000%, due 11/2/15 28,200,000 28,199,922 Societe Generale, 0.0000%, due 11/2/15 28,200,000 28,200,000
BNP Paribas, 0.0000%, due 29/1/15 26,700,000 26,699,941 BNP Paribas, 0.0000%, due 29/1/15 26,700,000 26,700,000
Rabobank USA Financial Corp., 0.0000%, due 30/1/15 26,500,000 26,499,941 Rabobank USA Financial Corp., 0.0000%, due 30/1/15 26,500,000 26,500,000
BNP Paribas, 0.0000%, due 24/7/15 26,100,000 26,099,920 BNP Paribas, 0.0000%, due 24/7/15 26,100,000 26,100,000
BNP Paribas, 0.0000%, due 30/7/15 25,600,000 25,599,922 BNP Paribas, 0.0000%, due 30/7/15 25,600,000 25,600,000
Societe Generale, 0.0000%, due 28/1/15 25,400,000 25,399,951 BNP Paribas, 0.0000%, due 27/7/15 25,400,000 25,400,000
Societe Generale, 0.0000%, due 6/2/15 25,400,000 25,399,937 BNP Paribas, 0.0000%, due 29/7/15 25,400,000 25,400,000
BNP Paribas, 0.0000%, due 29/7/15 25,400,000 25,399,922 Societe Generale, 0.0000%, due 6/2/15 25,400,000 25,400,000
BNP Paribas, 0.0000%, due 27/7/15 25,400,000 25,399,767 Societe Generale, 0.0000%, due 28/1/15 25,400,000 25,400,000
BNP Paribas, 0.0000%, due 23/7/15 25,200,000 25,199,923 BNP Paribas, 0.0000%, due 23/7/15 25,200,000 25,200,000
BNP Paribas, 0.0000%, due 26/10/15 25,200,000 25,199,769 BNP Paribas, 0.0000%, due 26/10/15 25,200,000 25,200,000
BNP Paribas, 0.0000%, due 28/7/15 25,000,000 24,999,924 BNP Paribas, 0.0000%, due 28/7/15 25,000,000 25,000,000
Societe Generale, 0.0000%, due 10/2/15 24,600,000 24,599,939 Societe Generale, 0.0000%, due 10/2/15 24,600,000 24,600,000
JANUS US VENTURE FUND
Major Purchases for the year ended 31 December 2015
Shares orPrincipalAmount Cost Major Sales for the year ended 31 December 2015
Shares orPrincipalAmount Proceeds
BNP Paribas, 0.0000%, due 31/3/15 34,400,000 34,399,904 BNP Paribas, 0.0000%, due 31/3/15 34,400,000 34,400,000
BNP Paribas, 0.0000%, due 2/3/15 33,700,000 33,699,832 BNP Paribas, 0.0000%, due 2/3/15 33,700,000 33,700,000
Rabobank USA Financial Corp., 0.0000%, due 30/3/15 32,800,000 32,799,781 Rabobank USA Financial Corp., 0.0000%, due 30/3/15 32,800,000 32,800,000
BNP Paribas, 0.0000%, due 4/3/15 32,100,000 32,099,911 BNP Paribas, 0.0000%, due 4/3/15 32,100,000 32,100,000
BNP Paribas, 0.0000%, due 3/3/15 32,000,000 31,999,911 BNP Paribas, 0.0000%, due 3/3/15 32,000,000 32,000,000
BNP Paribas, 0.0000%, due 5/3/15 31,600,000 31,599,912 BNP Paribas, 0.0000%, due 5/3/15 31,600,000 31,600,000
BNP Paribas, 0.0000%, due 9/3/15 30,400,000 30,399,747 BNP Paribas, 0.0000%, due 9/3/15 30,400,000 30,400,000
BNP Paribas, 0.0000%, due 27/2/15 30,300,000 30,299,916 BNP Paribas, 0.0000%, due 27/2/15 30,300,000 30,300,000
BNP Paribas, 0.0000%, due 6/3/15 29,200,000 29,199,919 BNP Paribas, 0.0000%, due 6/3/15 29,200,000 29,200,000
BNP Paribas, 0.0000%, due 27/3/15 28,500,000 28,499,921 BNP Paribas, 0.0000%, due 27/3/15 28,500,000 28,500,000
BNP Paribas, 0.0000%, due 18/5/15 28,300,000 28,299,764 BNP Paribas, 0.0000%, due 18/5/15 28,300,000 28,300,000
BNP Paribas, 0.0000%, due 13/3/15 27,600,000 27,599,923 BNP Paribas, 0.0000%, due 13/3/15 27,600,000 27,600,000
BNP Paribas, 0.0000%, due 11/3/15 27,300,000 27,299,924 BNP Paribas, 0.0000%, due 11/3/15 27,300,000 27,300,000
BNP Paribas, 0.0000%, due 12/3/15 27,200,000 27,199,924 BNP Paribas, 0.0000%, due 10/3/15 27,200,000 27,200,000
BNP Paribas, 0.0000%, due 10/3/15 27,200,000 27,199,924 BNP Paribas, 0.0000%, due 12/3/15 27,200,000 27,200,000
BNP Paribas, 0.0000%, due 17/3/15 27,100,000 27,099,925 BNP Paribas, 0.0000%, due 17/3/15 27,100,000 27,100,000
BNP Paribas, 0.0000%, due 18/3/15 27,000,000 26,999,918 BNP Paribas, 0.0000%, due 16/3/15 27,000,000 27,000,000
BNP Paribas, 0.0000%, due 16/3/15 27,000,000 26,999,775 BNP Paribas, 0.0000%, due 18/3/15 27,000,000 27,000,000
BNP Paribas, 0.0000%, due 7/5/15 26,200,000 26,199,927 BNP Paribas, 0.0000%, due 7/5/15 26,200,000 26,200,000
Societe Generale, 0.0000%, due 25/3/15 25,300,000 25,299,930 Societe Generale, 0.0000%, due 25/3/15 25,300,000 25,300,000

J a n u s C a p i t a l F u n d s P l c / 3 1 D e c e m b e r 2 0 1 5 3 1 9
PERKINS GLOBAL VALUE FUND
Major Purchases for the year ended 31 December 2015
Shares orPrincipalAmount Cost Major Sales for the year ended 31 December 2015
Shares orPrincipalAmount Proceeds
BNP Paribas, 0.0000%, due 26/1/15 15,000,000 14,999,900 BNP Paribas, 0.0000%, due 26/1/15 15,000,000 15,000,000
BNP Paribas, 0.0000%, due 23/1/15 14,900,000 14,899,967 BNP Paribas, 0.0000%, due 23/1/15 14,900,000 14,900,000
BNP Paribas, 0.0000%, due 8/1/15 14,900,000 14,899,963 Societe Generale, 0.0000%, due 16/1/15 14,900,000 14,900,000
Societe Generale, 0.0000%, due 16/1/15 14,900,000 14,899,959 BNP Paribas, 0.0000%, due 8/1/15 14,900,000 14,900,000
Societe Generale, 0.0000%, due 3/2/15 14,800,000 14,799,963 Societe Generale, 0.0000%, due 15/1/15 14,800,000 14,800,000
BNP Paribas, 0.0000%, due 21/1/15 14,800,000 14,799,963 Societe Generale, 0.0000%, due 6/1/15 14,800,000 14,800,000
Societe Generale, 0.0000%, due 4/2/15 14,800,000 14,799,963 Societe Generale, 0.0000%, due 4/2/15 14,800,000 14,800,000
Societe Generale, 0.0000%, due 7/1/15 14,800,000 14,799,959 Societe Generale, 0.0000%, due 7/1/15 14,800,000 14,800,000
Societe Generale, 0.0000%, due 15/1/15 14,800,000 14,799,959 BNP Paribas, 0.0000%, due 20/1/15 14,800,000 14,800,000
Societe Generale, 0.0000%, due 6/1/15 14,800,000 14,799,959 BNP Paribas, 0.0000%, due 21/1/15 14,800,000 14,800,000
BNP Paribas, 0.0000%, due 20/1/15 14,800,000 14,799,852 Societe Generale, 0.0000%, due 3/2/15 14,800,000 14,800,000
Rabobank USA Financial Corp., 0.0000%, due 30/1/15 14,700,000 14,699,967 BNP Paribas, 0.0000%, due 22/1/15 14,700,000 14,700,000
BNP Paribas, 0.0000%, due 22/1/15 14,700,000 14,699,963 Societe Generale, 0.0000%, due 9/2/15 14,700,000 14,700,000
Societe Generale, 0.0000%, due 6/2/15 14,700,000 14,699,963 Rabobank USA Financial Corp., 0.0000%, due 30/1/15 14,700,000 14,700,000
Societe Generale, 0.0000%, due 9/2/15 14,700,000 14,699,890 Societe Generale, 0.0000%, due 6/2/15 14,700,000 14,700,000
Societe Generale, 0.0000%, due 27/1/15 14,600,000 14,599,972 Societe Generale, 0.0000%, due 5/2/15 14,600,000 14,600,000
Societe Generale, 0.0000%, due 10/2/15 14,600,000 14,599,964 Societe Generale, 0.0000%, due 10/2/15 14,600,000 14,600,000
Societe Generale, 0.0000%, due 5/2/15 14,600,000 14,599,959 Societe Generale, 0.0000%, due 27/1/15 14,600,000 14,600,000
BNP Paribas, 0.0000%, due 29/1/15 14,500,000 14,499,968 BNP Paribas, 0.0000%, due 29/1/15 14,500,000 14,500,000
Societe Generale, 0.0000%, due 28/1/15 14,400,000 14,399,972 Societe Generale, 0.0000%, due 28/1/15 14,400,000 14,400,000
PERKINS US STRATEGIC VALUE FUND
Major Purchases for the year ended 31 December 2015
Shares orPrincipalAmount Cost Major Sales for the year ended 31 December 2015
Shares orPrincipalAmount Proceeds
Societe Generale, 0.0000%, due 3/2/15 26,700,000 26,699,933 Societe Generale, 0.0000%, due 3/2/15 26,700,000 26,700,000
BNP Paribas, 0.0000%, due 9/1/15 25,700,000 25,699,936 BNP Paribas, 0.0000%, due 9/1/15 25,700,000 25,700,000
Societe Generale, 0.0000%, due 4/2/15 25,200,000 25,199,937 Societe Generale, 0.0000%, due 4/2/15 25,200,000 25,200,000
Societe Generale, 0.0000%, due 6/2/15 24,900,000 24,899,938 Societe Generale, 0.0000%, due 6/2/15 24,900,000 24,900,000
BNP Paribas, 0.0000%, due 8/1/15 24,600,000 24,599,939 Societe Generale, 0.0000%, due 5/2/15 24,600,000 24,600,000
Societe Generale, 0.0000%, due 5/2/15 24,600,000 24,599,932 BNP Paribas, 0.0000%, due 8/1/15 24,600,000 24,600,000
BNP Paribas, 0.0000%, due 12/1/15 23,600,000 23,599,823 BNP Paribas, 0.0000%, due 12/1/15 23,600,000 23,600,000
Societe Generale, 0.0000%, due 7/1/15 23,500,000 23,499,935 Societe Generale, 0.0000%, due 7/1/15 23,500,000 23,500,000
BNP Paribas, 0.0000%, due 29/1/15 23,300,000 23,299,948 BNP Paribas, 0.0000%, due 29/1/15 23,300,000 23,300,000
Societe Generale, 0.0010%, due 6/1/15 23,100,000 23,099,936 Societe Generale, 0.0010%, due 6/1/15 23,100,000 23,100,000
Societe Generale, 0.0000%, due 14/1/15 22,800,000 22,799,937 Societe Generale, 0.0000%, due 14/1/15 22,800,000 22,800,000
Rabobank USA Financial Corp., 0.0000%, due 30/1/15 22,700,000 22,699,950 Rabobank USA Financial Corp., 0.0000%, due 30/1/15 22,700,000 22,700,000
BNP Paribas, 0.0000%, due 13/1/15 22,500,000 22,499,944 BNP Paribas, 0.0000%, due 13/1/15 22,500,000 22,500,000
Societe Generale, 0.0000%, due 5/1/15 22,300,000 22,299,796 Societe Generale, 0.0000%, due 5/1/15 22,300,000 22,300,000
BNP Paribas, 0.0000%, due 21/1/15 22,100,000 22,099,945 BNP Paribas, 0.0000%, due 21/1/15 22,100,000 22,100,000
BNP Paribas, 0.0000%, due 20/1/15 22,000,000 21,999,780 BNP Paribas, 0.0000%, due 20/1/15 22,000,000 22,000,000
Societe Generale, 0.0000%, due 16/1/15 21,200,000 21,199,941 Societe Generale, 0.0000%, due 15/1/15 21,200,000 21,200,000
Societe Generale, 0.0000%, due 15/1/15 21,200,000 21,199,941 Societe Generale, 0.0000%, due 16/1/15 21,200,000 21,200,000
Societe Generale, 0.0000%, due 28/1/15 20,000,000 19,999,961 Societe Generale, 0.0000%, due 27/1/15 20,000,000 20,000,000
Societe Generale, 0.0000%, due 27/1/15 20,000,000 19,999,961 Societe Generale, 0.0000%, due 28/1/15 20,000,000 20,000,000

Statements of Changes in Composition of Portfolio (unaudited)
3 2 0 J a n u s C a p i t a l F u n d s P l c / 3 1 D e c e m b e r 2 0 1 5
INTECH ALL-WORLD MINIMUM VARIANCE CORE FUND(a)
Major Purchases for the year ended 31 December 2015
Shares orPrincipalAmount Cost Major Sales for the year ended 31 December 2015
Shares orPrincipalAmount Proceeds
BNP Paribas, 0.0000%, due 6/5/15 77,000,000 76,999,786 BNP Paribas, 0.0000%, due 6/5/15 77,000,000 77,000,000
BNP Paribas, 0.0000%, due 11/5/15 76,500,000 76,499,362 BNP Paribas, 0.0000%, due 11/5/15 76,500,000 76,500,000
BNP Paribas, 0.0000%, due 8/5/15 76,400,000 76,399,788 BNP Paribas, 0.0000%, due 8/5/15 76,400,000 76,400,000
BNP Paribas, 0.0000%, due 7/5/15 76,000,000 75,999,789 BNP Paribas, 0.0000%, due 7/5/15 76,000,000 76,000,000
BNP Paribas, 0.0000%, due 12/5/15 29,800,000 29,799,917 BNP Paribas, 0.0000%, due 12/5/15 29,800,000 29,800,000
BNP Paribas, 0.0000%, due 14/8/15 23,600,000 23,599,921 BNP Paribas, 0.0000%, due 14/8/15 23,600,000 23,600,000
BNP Paribas, 0.0000%, due 13/8/15 23,300,000 23,299,929 BNP Paribas, 0.0000%, due 13/8/15 23,300,000 23,300,000
BNP Paribas, 0.0000%, due 12/8/15 23,200,000 23,199,929 BNP Paribas, 0.0000%, due 12/8/15 23,200,000 23,200,000
BNP Paribas, 0.0000%, due 17/8/15 20,400,000 20,399,796 BNP Paribas, 0.0000%, due 17/8/15 20,400,000 20,400,000
BNP Paribas, 0.0000%, due 13/5/15 19,700,000 19,699,945 BNP Paribas, 0.0000%, due 13/5/15 19,700,000 19,700,000
BNP Paribas, 0.0000%, due 10/12/15 18,300,000 18,299,944 BNP Paribas, 0.0000%, due 10/12/15 18,300,000 18,300,000
BNP Paribas, 0.0000%, due 12/11/15 17,200,000 17,199,895 BNP Paribas, 0.0000%, due 12/11/15 17,200,000 17,200,000
BNP Paribas, 0.0000%, due 15/6/15 16,500,000 16,499,863 BNP Paribas, 0.0000%, due 15/6/15 16,500,000 16,500,000
BNP Paribas, 0.0000%, due 11/6/15 15,800,000 15,799,956 BNP Paribas, 0.0000%, due 11/6/15 15,800,000 15,800,000
BNP Paribas, 0.0000%, due 10/6/15 15,600,000 15,599,957 BNP Paribas, 0.0000%, due 10/6/15 15,600,000 15,600,000
BNP Paribas, 0.0000%, due 14/5/15 14,200,000 14,199,961 BNP Paribas, 0.0000%, due 14/5/15 14,200,000 14,200,000
BNP Paribas, 0.0000%, due 30/11/15 12,600,000 12,599,885 BNP Paribas, 0.0000%, due 30/11/15 12,600,000 12,600,000
BNP Paribas, 0.0000%, due 15/5/15 12,500,000 12,499,965 BNP Paribas, 0.0000%, due 15/5/15 12,500,000 12,500,000
BNP Paribas, 0.0000%, due 19/11/15 11,400,000 11,399,965 BNP Paribas, 0.0000%, due 19/11/15 11,400,000 11,400,000
BNP Paribas, 0.0000%, due 18/5/15 10,800,000 10,799,910 BNP Paribas, 0.0000%, due 18/5/15 10,800,000 10,800,000
INTECH EUROPEAN CORE FUND
Major Purchases for the year ended 31 December 2015
Shares orPrincipalAmount Cost Major Sales for the year ended 31 December 2015
Shares orPrincipalAmount Proceeds
Intesa Sanpaolo SpA 547,915 1,762,588 Iberdrola S.A. 333,583 2,107,441
Fiat Chrysler Automobiles N.V. 117,314 1,404,806 Bank of Ireland 5,044,852 1,802,713
Bank of Ireland 4,585,739 1,368,911 Unibail-Rodamco S.E. 5,363 1,269,711
Julius Baer Group, Ltd. 29,029 1,272,205 Banco Santander S.A. 190,303 1,230,709
Renault S.A. 14,316 1,259,952 National Grid PLC 94,108 1,191,168
Luxottica Group SpA 16,383 980,548 Glencore Xstrata PLC 298,549 1,075,884
Elisa Oyj 29,690 951,875 SSE PLC 47,544 1,052,722
Taylor Wimpey PLC 349,526 944,849 Nokia Oyj 172,754 1,050,304
Valeo S.A. 6,638 937,614 Fortum Oyj 62,066 1,046,024
Barratt Developments PLC 103,075 920,672 Klepierre 25,365 1,011,999
Altice S.A. 9,704 918,375 UCB S.A. 14,863 1,002,465
UBS A.G. 47,976 898,308 Sonova Holding A.G. 7,460 987,285
Mondi PLC 43,354 870,934 Merck KGaA 10,600 959,184
3i Group PLC 131,556 843,354 Aviva PLC 135,135 951,954
London Stock Exchange Group PLC 25,955 831,678 BAE Systems PLC 141,761 927,463
Peugeot S.A. 47,239 819,233 Red Electrica Corp. S.A. 12,701 926,753
Travis Perkins PLC 29,136 811,432 Orange S.A. 63,068 919,070
Cap Gemini S.A. 10,475 810,549 Altice S.A. 9,704 918,375
KBC Groep N.V. 13,212 808,064 Repsol S.A. 47,248 839,533
Wolseley PLC 15,517 803,120 Novartis A.G. 10,585 839,382

J a n u s C a p i t a l F u n d s P l c / 3 1 D e c e m b e r 2 0 1 5 3 2 1
INTECH GLOBAL ALL COUNTRY LOW VOLATILITY FUND
Major Purchases for the year ended 31 December 2015
Shares orPrincipalAmount Cost Major Sales for the year ended 31 December 2015
Shares orPrincipalAmount Proceeds
BNP Paribas, 0.0000%, due 17/3/15 5,400,000 5,399,985 BNP Paribas, 0.0000%, due 17/3/15 5,400,000 5,400,000
BNP Paribas, 0.0000%, due 12/11/15 5,100,000 5,099,969 BNP Paribas, 0.0000%, due 12/11/15 5,100,000 5,100,000
Societe Generale, 0.0000%, due 14/4/15 4,600,000 4,599,987 Societe Generale, 0.0000%, due 14/4/15 4,600,000 4,600,000
BNP Paribas, 0.0000%, due 14/7/15 4,500,000 4,499,988 BNP Paribas, 0.0000%, due 14/7/15 4,500,000 4,500,000
BNP Paribas, 0.0000%, due 10/12/15 4,000,000 3,999,988 BNP Paribas, 0.0000%, due 10/12/15 4,000,000 4,000,000
BNP Paribas, 0.0000%, due 19/5/15 3,900,000 3,899,989 BNP Paribas, 0.0000%, due 19/5/15 3,900,000 3,900,000
BNP Paribas, 0.0000%, due 17/6/15 3,800,000 3,799,989 BNP Paribas, 0.0000%, due 17/6/15 3,800,000 3,800,000
BNP Paribas, 0.0000%, due 25/11/15 3,700,000 3,699,989 BNP Paribas, 0.0000%, due 15/6/15 3,700,000 3,700,000
BNP Paribas, 0.0000%, due 15/6/15 3,700,000 3,699,969 BNP Paribas, 0.0000%, due 25/11/15 3,700,000 3,700,000
BNP Paribas, 0.0000%, due 17/8/15 3,500,000 3,499,965 BNP Paribas, 0.0000%, due 17/8/15 3,500,000 3,500,000
Societe Generale, 0.0000%, due 18/2/15 3,400,000 3,399,991 Societe Generale, 0.0000%, due 18/2/15 3,400,000 3,400,000
BNP Paribas, 0.0000%, due 28/5/15 3,200,000 3,199,991 BNP Paribas, 0.0000%, due 28/5/15 3,200,000 3,200,000
BNP Paribas, 0.0000%, due 20/8/15 3,100,000 3,099,990 BNP Paribas, 0.0000%, due 20/8/15 3,100,000 3,100,000
BNP Paribas, 0.0000%, due 24/3/15 3,000,000 2,999,992 BNP Paribas, 0.0000%, due 27/5/15 3,000,000 3,000,000
BNP Paribas, 0.0000%, due 27/5/15 3,000,000 2,999,992 Societe Generale, 0.0000%, due 25/3/15 3,000,000 3,000,000
Societe Generale, 0.0000%, due 25/3/15 3,000,000 2,999,992 BNP Paribas, 0.0000%, due 27/11/15 3,000,000 3,000,000
BNP Paribas, 0.0000%, due 27/11/15 3,000,000 2,999,982 BNP Paribas, 0.0000%, due 24/3/15 3,000,000 3,000,000
BNP Paribas, 0.0000%, due 23/3/15 3,000,000 2,999,975 BNP Paribas, 0.0000%, due 23/3/15 3,000,000 3,000,000
BNP Paribas, 0.0000%, due 26/5/15 3,000,000 2,999,967 BNP Paribas, 0.0000%, due 26/5/15 3,000,000 3,000,000
BNP Paribas, 0.0000%, due 9/7/15 2,900,000 2,899,992 BNP Paribas, 0.0000%, due 24/8/15 2,900,000 2,900,000
INTECH GLOBAL DIVIDEND FUND
Major Purchases for the year ended 31 December 2015
Shares orPrincipalAmount Cost Major Sales for the year ended 31 December 2015
Shares orPrincipalAmount Proceeds
Rabobank USA Financial Corp., 0.0000%, due 28/4/15 100,000 100,000 Rabobank USA Financial Corp., 0.0000%, due 28/4/15 100,000 100,000
BNP Paribas, 0.0000%, due 9/6/15 100,000 100,000 BNP Paribas, 0.0000%, due 9/6/15 100,000 100,000
Exxon Mobil Corp. 400 33,782 Lorillard LLC 1,000 59,150
Imperial Brands PLC 416 22,846 Intel Corp. 1,400 43,616
Lockheed Martin Corp. 100 21,439 ConAgra Foods, Inc. 1,000 37,861
LyondellBasell Industries N.V. 200 20,435 AstraZeneca PLC 528 36,793
Reynolds American, Inc. 907 19,291 Eli Lilly & Co. 400 34,368
ITOCHU Corp. 1,400 18,198 TransCanada Corp. 600 27,148
Takeda Pharmaceutical Co., Ltd. 300 15,882 Bank of Montreal 400 25,652
Procter & Gamble Co. 200 15,732 Nucor Corp. 500 22,981
Atlas Copco A.B. 594 15,127 Daito Trust Construction Co., Ltd. 200 22,295
Paychex, Inc. 300 14,862 Belgacom S.A. 589 21,553
ITV PLC 3,638 14,510 Lockheed Martin Corp. 100 21,021
Eversource Energy 300 14,459 Altria Group, Inc. 400 20,817
International Business Machines Corp. 100 14,017 Nippon Telegraph & Telephone Corp. 300 20,126
Kellogg Co. 200 13,876 Takeda Pharmaceutical Co., Ltd. 400 20,089
Sky PLC 852 13,754 Direct Line Insurance Group PLC 4,432 19,727
Staples, Inc. 800 13,411 Royal Bank of Canada 300 18,696
Persimmon PLC 437 13,194 ConocoPhillips 300 17,826
Cie Generale des Etablissements Michelin 128 13,176 Daiichi Sankyo Co., Ltd. 800 17,017
Direct Line Insurance Group PLC 2,756 12,972 Yara International A.S.A 327 16,742
CA, Inc. 400 12,952 Seagate Technology PLC 300 16,528
Sekisui House, Ltd. 700 12,269 Koninklijke Ahold N.V. 718 15,977
Coca-Cola Co. 300 12,246 Delhaize Group 167 15,765
Legal & General Group PLC 2,994 12,139 Sun Hung Kai Properties, Ltd. 1,000 15,451
Kimberly-Clark Corp. 100 12,037 Mitsui & Co., Ltd. 1,200 15,442
Sumitomo Corp. 1,000 11,774
ProSiebenSat.1 Media A.G. 231 11,689
Daiichi Sankyo Co., Ltd. 600 11,401
Delhaize Group 125 11,203
SKF A.B. - Class B 455 10,995
Pearson PLC 535 10,636

Statements of Changes in Composition of Portfolio (unaudited)
3 2 2 J a n u s C a p i t a l F u n d s P l c / 3 1 D e c e m b e r 2 0 1 5
INTECH US CORE FUND
Major Purchases for the year ended 31 December 2015
Shares orPrincipalAmount Cost Major Sales for the year ended 31 December 2015
Shares orPrincipalAmount Proceeds
Societe Generale, 0.0000%, due 21/4/15 9,600,000 9,599,973 Societe Generale, 0.0000%, due 21/4/15 9,600,000 9,600,000
BNP Paribas, 0.0000%, due 11/6/15 5,400,000 5,399,985 BNP Paribas, 0.0000%, due 27/10/15 5,400,000 5,400,000
BNP Paribas, 0.0000%, due 27/10/15 5,400,000 5,399,984 BNP Paribas, 0.0000%, due 11/6/15 5,400,000 5,400,000
BNP Paribas, 0.0000%, due 12/6/15 5,300,000 5,299,985 BNP Paribas, 0.0000%, due 12/6/15 5,300,000 5,300,000
Societe Generale, 0.0000%, due 20/4/15 4,700,000 4,699,961 Societe Generale, 0.0000%, due 20/4/15 4,700,000 4,700,000
BNP Paribas, 0.0000%, due 28/10/15 3,800,000 3,799,988 LyondellBasell Industries N.V. 47,200 4,281,625
Lowe’s Cos., Inc. 47,000 3,357,366 BNP Paribas, 0.0000%, due 28/10/15 3,800,000 3,800,000
BNP Paribas, 0.0000%, due 29/5/15 2,500,000 2,499,993 Southwest Airlines Co. 98,100 3,786,644
BNP Paribas, 0.0000%, due 19/3/15 2,500,000 2,499,992 Gilead Sciences, Inc. 29,600 3,141,541
Netflix, Inc. 21,900 2,429,671 BNP Paribas, 0.0000%, due 29/5/15 2,500,000 2,500,000
BNP Paribas, 0.0000%, due 21/7/15 2,400,000 2,399,993 BNP Paribas, 0.0000%, due 19/3/15 2,500,000 2,500,000
BNP Paribas, 0.0000%, due 8/9/15 2,400,000 2,399,968 BNP Paribas, 0.0000%, due 21/7/15 2,400,000 2,400,000
Cigna Corp. 17,000 2,377,595 BNP Paribas, 0.0000%, due 8/9/15 2,400,000 2,400,000
BNP Paribas, 0.0000%, due 24/3/15 2,300,000 2,299,994 Union Pacific Corp. 24,200 2,315,748
BNP Paribas, 0.0000%, due 15/5/15 2,300,000 2,299,994 BNP Paribas, 0.0000%, due 15/5/15 2,300,000 2,300,000
Skyworks Solutions, Inc. 24,700 2,289,565 BNP Paribas, 0.0000%, due 24/3/15 2,300,000 2,300,000
Anthem, Inc. 14,800 2,233,610 BNP Paribas, 0.0000%, due 26/10/15 2,200,000 2,200,000
Electronic Arts, Inc. 36,900 2,203,111 BNP Paribas, 0.0000%, due 23/3/15 2,200,000 2,200,000
BNP Paribas, 0.0000%, due 23/3/15 2,200,000 2,199,982 BNP Paribas, 0.0000%, due 20/7/15 2,200,000 2,200,000
BNP Paribas, 0.0000%, due 26/10/15 2,200,000 2,199,980 Chipotle Mexican Grill, Inc. 3,200 2,161,369
JANUS GLOBAL DIVERSIFIED ALTERNATIVES FUND
Major Purchases for the year ended 31 December 2015
Shares orPrincipalAmount Cost Major Sales for the year ended 31 December 2015
Shares orPrincipalAmount Proceeds
U.S. Treasury Notes/Bonds, 0.0000%, due 24/9/15 500,000 499,996 U.S. Treasury Notes/Bonds, 0.0000%, due 24/9/15 500,000 500,000
United States Treasury Bill, 0.0000%, due 24/12/15 500,000 499,994 U.S. Treasury Notes/Bonds, 0.0000%, due 26/2/15 500,000 500,000
U.S. Treasury Notes/Bonds, 0.0000%, due 27/8/15 500,000 499,984 United States Treasury Bill, 0.0000%, due 10/12/15 500,000 500,000
U.S. Treasury Notes/Bonds, 0.0000%, due 10/9/15 500,000 499,980 U.S. Treasury Notes/Bonds, 0.0000%, due 12/3/15 500,000 500,000
U.S. Treasury Notes/Bonds, 0.0000%, due 28/5/15 500,000 499,978 U.S. Treasury Notes/Bonds, 0.0000%, due 10/9/15 500,000 500,000
U.S. Treasury Notes/Bonds, 0.0000%, due 11/6/15 500,000 499,978 U.S. Treasury Notes/Bonds, 0.0000%, due 28/5/15 500,000 500,000
United States Treasury Bill, 0.0000%, due 10/12/15 500,000 499,967 United States Treasury Bill, 0.0000%, due 27/11/15 500,000 500,000
U.S. Treasury Notes/Bonds, 0.0000%, due 25/6/15 500,000 499,965 U.S. Treasury Notes/Bonds, 0.0000%, due 11/6/15 500,000 500,000
United States Treasury Bill, 0.0000%, due 27/11/15 500,000 499,927 United States Treasury Bill, 0.0000%, due 24/12/15 500,000 500,000
United States Treasury Bill, 0.0000%, due 25/2/16 500,000 499,791 U.S. Treasury Notes/Bonds, 0.0000%, due 25/6/15 500,000 500,000
United States Treasury Bill, 0.0000%, due 10/3/16 500,000 499,674 U.S. Treasury Notes/Bonds, 0.0000%, due 27/8/15 500,000 500,000
Societe Generale, 0.0000%, due 4/2/15 200,000 200,000 U.S. Treasury Notes/Bonds, 0.0000%, due 26/3/15 500,000 500,000
Societe Generale, 0.0000%, due 29/4/15 200,000 200,000 BNP Paribas, 0.0000%, due 13/8/15 200,000 200,000
Societe Generale, 0.0000%, due 10/2/15 200,000 200,000 Federal Home Loan Bank Discount Notes, 0.0000%, due 3/6/15 200,000 200,000
BNP Paribas, 0.0000%, due 9/1/15 200,000 200,000 BNP Paribas, 0.0000%, due 7/10/15 200,000 200,000
BNP Paribas, 0.0000%, due 29/1/15 200,000 200,000 BNP Paribas, 0.0000%, due 26/5/15 200,000 200,000
BNP Paribas, 0.0000%, due 13/1/15 200,000 200,000 BNP Paribas, 0.0000%, due 22/7/15 200,000 200,000
Societe Generale, 0.0000%, due 6/2/15 200,000 200,000 BNP Paribas, 0.0000%, due 27/5/15 200,000 200,000
BNP Paribas, 0.0000%, due 21/1/15 200,000 200,000 BNP Paribas, 0.0000%, due 14/9/15 200,000 200,000
Societe Generale, 0.0000%, due 26/3/15 200,000 200,000 BNP Paribas, 0.0000%, due 28/5/15 200,000 200,000

J a n u s C a p i t a l F u n d s P l c / 3 1 D e c e m b e r 2 0 1 5 3 2 3
JANUS FLEXIBLE INCOME FUND
Major Purchases for the year ended 31 December 2015
Shares orPrincipalAmount Cost Major Sales for the year ended 31 December 2015
Shares orPrincipalAmount Proceeds
U.S. Treasury Notes/Bonds, 0.6250%, due 31/12/15 70,280,000 70,413,285 U.S. Treasury Notes/Bonds, 2.2500%, due 15/11/15 83,397,000 85,417,578
U.S. Treasury Notes/Bonds, 2.5000%, due 15/2/15 70,472,000 66,853,043 U.S. Treasury Notes/Bonds, 0.6250%, due 31/12/15 82,423,000 82,688,357
U.S. Treasury Notes/Bonds, 3.0000%, due 15/5/15 66,990,000 66,735,038 U.S. Treasury Notes/Bonds, 0.5000%, due 30/11/15 67,403,000 67,457,184
U.S. Treasury Notes/Bonds, 0.5000%, due 31/1/15 56,743,000 56,612,410 U.S. Treasury Notes/Bonds, 2.5000%, due 15/2/15 69,056,000 65,012,156
U.S. Treasury Notes/Bonds, 2.0000%, due 15/2/15 52,906,000 52,673,213 U.S. Treasury Notes/Bonds, 3.0000%, due 15/5/15 52,970,000 52,783,583
U.S. Treasury Notes/Bonds, 2.2500%, due 15/11/15 43,121,000 44,434,305 U.S. Treasury Notes/Bonds, 2.0000%, due 15/2/15 52,906,000 52,649,581
BNP Paribas, 0.0000%, due 31/8/15 44,300,000 44,299,557 U.S. Treasury Notes/Bonds, 0.3750%, due 31/5/15 50,296,000 50,329,968
United States Treasury Note/Bond, 2.8750%, due 15/8/45 42,403,000 42,507,881 U.S. Treasury Notes/Bonds, 0.5000%, due 31/1/15 45,644,000 45,688,812
U.S. Treasury Notes/Bonds, 0.3750%, due 31/5/15 41,948,000 41,991,252 U.S. Treasury Notes/Bonds, 5.0000%, due 31/8/15 44,996,000 45,121,291
U.S. Treasury Notes/Bonds, 0.5000%, due 30/11/15 41,888,000 41,907,784 BNP Paribas, 0.0000%, due 31/8/15 44,300,000 44,300,000
Rabobank USA Financial Corp., 0.0000%, due 28/4/15 37,300,000 37,299,886 U.S. Treasury Notes/Bonds, 3.0000%, due 15/11/15 38,013,000 41,900,550
U.S. Treasury Notes/Bonds, 2.1250%, due 15/5/15 37,461,000 36,886,960 United States Treasury Note/Bond, 2.8750%, due 15/8/45 40,669,000 40,266,098
U.S. Treasury Notes/Bonds, 3.0000%, due 15/11/15 31,227,000 34,680,002 Rabobank USA Financial Corp., 0.0000%, due 28/4/15 37,300,000 37,300,000
BNP Paribas, 0.0000%, due 26/5/15 33,100,000 33,099,632 U.S. Treasury Notes/Bonds, 2.1250%, due 15/5/15 37,461,000 36,991,816
BNP Paribas Finance, Inc. 32,600,000 32,599,728 BNP Paribas, 0.0000%, due 26/5/15 33,100,000 33,100,000
BNP Paribas, 0.0000%, due 1/9/15 32,300,000 32,299,955 BNP Paribas Finance, Inc. 32,600,000 32,600,000
United States Treasury Note/Bond, 2.0000%, due 15/8/25 31,698,000 31,502,169 BNP Paribas, 0.0000%, due 1/9/15 32,300,000 32,300,000
BNP Paribas, 0.0000%, due 4/5/15 31,400,000 31,399,738 BNP Paribas, 0.0000%, due 4/5/15 31,400,000 31,400,000
BNP Paribas, 0.0000%, due 22/5/15 31,300,000 31,299,913 BNP Paribas, 0.0000%, due 28/8/15 31,300,000 31,300,000
BNP Paribas, 0.0000%, due 28/8/15 31,300,000 31,299,896 BNP Paribas, 0.0000%, due 22/5/15 31,300,000 31,300,000
JANUS GLOBAL REAL ESTATE FUND
Major Purchases for the year ended 31 December 2015
Shares orPrincipalAmount Cost Major Sales for the year ended 31 December 2015
Shares orPrincipalAmount Proceeds
BNP Paribas, 0.0000%, due 10/11/15 8,600,000 8,599,974 BNP Paribas, 0.0000%, due 10/11/15 8,600,000 8,600,000
BNP Paribas, 0.0000%, due 13/11/15 8,500,000 8,499,974 BNP Paribas, 0.0000%, due 12/11/15 8,500,000 8,500,000
BNP Paribas, 0.0000%, due 12/11/15 8,500,000 8,499,948 BNP Paribas, 0.0000%, due 13/11/15 8,500,000 8,500,000
BNP Paribas, 0.0000%, due 6/11/15 7,800,000 7,799,976 BNP Paribas, 0.0000%, due 6/11/15 7,800,000 7,800,000
BNP Paribas, 0.0000%, due 5/11/15 7,700,000 7,699,976 BNP Paribas, 0.0000%, due 9/11/15 7,700,000 7,700,000
BNP Paribas, 0.0000%, due 9/11/15 7,700,000 7,699,929 BNP Paribas, 0.0000%, due 5/11/15 7,700,000 7,700,000
BNP Paribas, 0.0000%, due 16/11/15 7,700,000 7,699,929 BNP Paribas, 0.0000%, due 16/11/15 7,700,000 7,700,000
BNP Paribas, 0.0000%, due 19/11/15 7,500,000 7,499,977 BNP Paribas, 0.0000%, due 19/11/15 7,500,000 7,500,000
BNP Paribas, 0.0000%, due 18/11/15 7,300,000 7,299,978 BNP Paribas, 0.0000%, due 18/11/15 7,300,000 7,300,000
BNP Paribas, 0.0000%, due 17/11/15 7,200,000 7,199,978 BNP Paribas, 0.0000%, due 17/11/15 7,200,000 7,200,000
BNP Paribas, 0.0000%, due 20/11/15 6,300,000 6,299,981 BNP Paribas, 0.0000%, due 20/11/15 6,300,000 6,300,000
BNP Paribas, 0.0000%, due 24/11/15 6,200,000 6,199,981 BNP Paribas, 0.0000%, due 24/11/15 6,200,000 6,200,000
BNP Paribas, 0.0000%, due 23/11/15 6,200,000 6,199,943 BNP Paribas, 0.0000%, due 23/11/15 6,200,000 6,200,000
BNP Paribas, 0.0000%, due 2/12/15 5,600,000 5,599,983 BNP Paribas, 0.0000%, due 30/11/15 5,600,000 5,600,000
BNP Paribas, 0.0000%, due 25/11/15 5,600,000 5,599,983 BNP Paribas, 0.0000%, due 27/11/15 5,600,000 5,600,000
BNP Paribas, 0.0000%, due 27/11/15 5,600,000 5,599,966 BNP Paribas, 0.0000%, due 2/12/15 5,600,000 5,600,000
BNP Paribas, 0.0000%, due 30/11/15 5,600,000 5,599,949 BNP Paribas, 0.0000%, due 25/11/15 5,600,000 5,600,000
BNP Paribas, 0.0000%, due 19/10/15 5,600,000 5,599,949 BNP Paribas, 0.0000%, due 19/10/15 5,600,000 5,600,000
BNP Paribas, 0.0000%, due 27/2/15 5,500,000 5,499,985 BNP Paribas, 0.0000%, due 3/12/15 5,500,000 5,500,000
BNP Paribas, 0.0000%, due 3/12/15 5,500,000 5,499,983 BNP Paribas, 0.0000%, due 2/3/15 5,500,000 5,500,000
BNP Paribas, 0.0000%, due 2/3/15 5,500,000 5,499,973 BNP Paribas, 0.0000%, due 27/2/15 5,500,000 5,500,000
Societe Generale, 0.0000%, due 1/12/15 5,300,000 5,299,994
BNP Paribas, 0.0000%, due 20/10/15 5,300,000 5,299,984
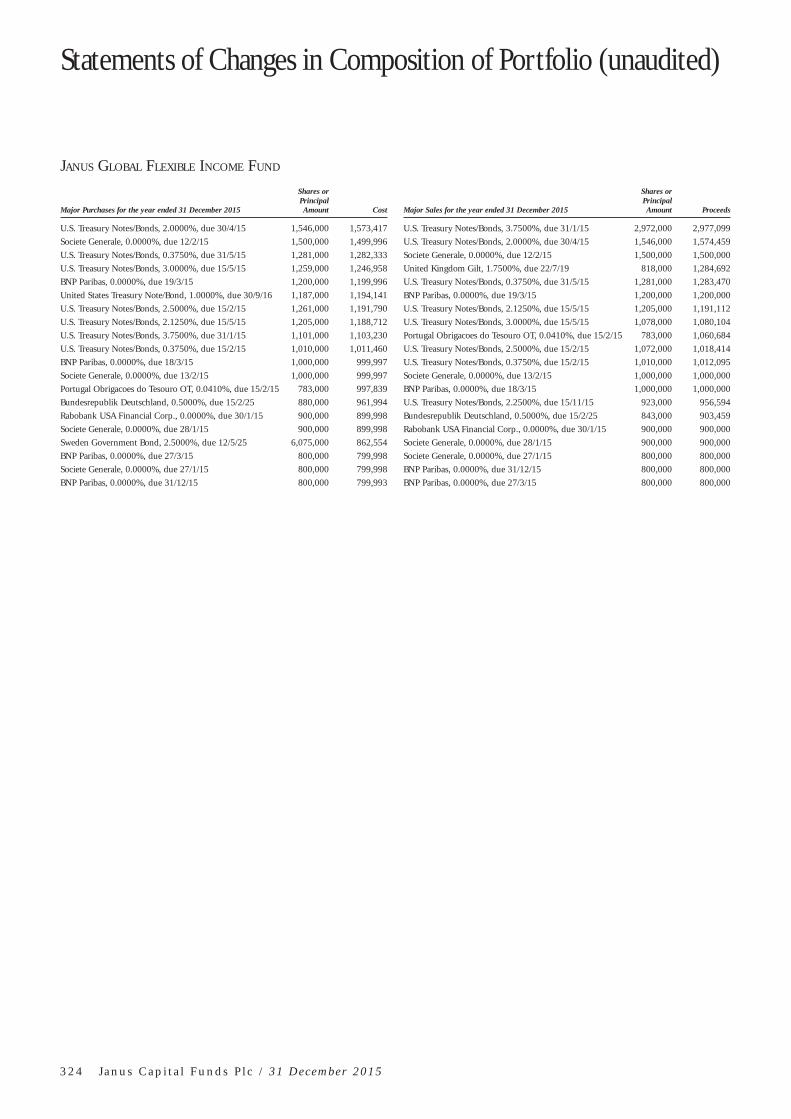
Statements of Changes in Composition of Portfolio (unaudited)
3 2 4 J a n u s C a p i t a l F u n d s P l c / 3 1 D e c e m b e r 2 0 1 5
JANUS GLOBAL FLEXIBLE INCOME FUND
Major Purchases for the year ended 31 December 2015
Shares orPrincipalAmount Cost Major Sales for the year ended 31 December 2015
Shares orPrincipalAmount Proceeds
U.S. Treasury Notes/Bonds, 2.0000%, due 30/4/15 1,546,000 1,573,417 U.S. Treasury Notes/Bonds, 3.7500%, due 31/1/15 2,972,000 2,977,099
Societe Generale, 0.0000%, due 12/2/15 1,500,000 1,499,996 U.S. Treasury Notes/Bonds, 2.0000%, due 30/4/15 1,546,000 1,574,459
U.S. Treasury Notes/Bonds, 0.3750%, due 31/5/15 1,281,000 1,282,333 Societe Generale, 0.0000%, due 12/2/15 1,500,000 1,500,000
U.S. Treasury Notes/Bonds, 3.0000%, due 15/5/15 1,259,000 1,246,958 United Kingdom Gilt, 1.7500%, due 22/7/19 818,000 1,284,692
BNP Paribas, 0.0000%, due 19/3/15 1,200,000 1,199,996 U.S. Treasury Notes/Bonds, 0.3750%, due 31/5/15 1,281,000 1,283,470
United States Treasury Note/Bond, 1.0000%, due 30/9/16 1,187,000 1,194,141 BNP Paribas, 0.0000%, due 19/3/15 1,200,000 1,200,000
U.S. Treasury Notes/Bonds, 2.5000%, due 15/2/15 1,261,000 1,191,790 U.S. Treasury Notes/Bonds, 2.1250%, due 15/5/15 1,205,000 1,191,112
U.S. Treasury Notes/Bonds, 2.1250%, due 15/5/15 1,205,000 1,188,712 U.S. Treasury Notes/Bonds, 3.0000%, due 15/5/15 1,078,000 1,080,104
U.S. Treasury Notes/Bonds, 3.7500%, due 31/1/15 1,101,000 1,103,230 Portugal Obrigacoes do Tesouro OT, 0.0410%, due 15/2/15 783,000 1,060,684
U.S. Treasury Notes/Bonds, 0.3750%, due 15/2/15 1,010,000 1,011,460 U.S. Treasury Notes/Bonds, 2.5000%, due 15/2/15 1,072,000 1,018,414
BNP Paribas, 0.0000%, due 18/3/15 1,000,000 999,997 U.S. Treasury Notes/Bonds, 0.3750%, due 15/2/15 1,010,000 1,012,095
Societe Generale, 0.0000%, due 13/2/15 1,000,000 999,997 Societe Generale, 0.0000%, due 13/2/15 1,000,000 1,000,000
Portugal Obrigacoes do Tesouro OT, 0.0410%, due 15/2/15 783,000 997,839 BNP Paribas, 0.0000%, due 18/3/15 1,000,000 1,000,000
Bundesrepublik Deutschland, 0.5000%, due 15/2/25 880,000 961,994 U.S. Treasury Notes/Bonds, 2.2500%, due 15/11/15 923,000 956,594
Rabobank USA Financial Corp., 0.0000%, due 30/1/15 900,000 899,998 Bundesrepublik Deutschland, 0.5000%, due 15/2/25 843,000 903,459
Societe Generale, 0.0000%, due 28/1/15 900,000 899,998 Rabobank USA Financial Corp., 0.0000%, due 30/1/15 900,000 900,000
Sweden Government Bond, 2.5000%, due 12/5/25 6,075,000 862,554 Societe Generale, 0.0000%, due 28/1/15 900,000 900,000
BNP Paribas, 0.0000%, due 27/3/15 800,000 799,998 Societe Generale, 0.0000%, due 27/1/15 800,000 800,000
Societe Generale, 0.0000%, due 27/1/15 800,000 799,998 BNP Paribas, 0.0000%, due 31/12/15 800,000 800,000
BNP Paribas, 0.0000%, due 31/12/15 800,000 799,993 BNP Paribas, 0.0000%, due 27/3/15 800,000 800,000

J a n u s C a p i t a l F u n d s P l c / 3 1 D e c e m b e r 2 0 1 5 3 2 5
JANUS GLOBAL HIGH YIELD FUND
Major Purchases for the year ended 31 December 2015
Shares orPrincipalAmount Cost Major Sales for the year ended 31 December 2015
Shares orPrincipalAmount Proceeds
BNP Paribas, 0.0000%, due 23/12/15 4,900,000 4,899,955 BNP Paribas, 0.0000%, due 23/12/15 4,900,000 4,900,000
BNP Paribas, 0.0000%, due 31/12/15 4,800,000 4,799,956 BNP Paribas, 0.0000%, due 31/12/15 4,800,000 4,800,000
BNP Paribas, 0.0000%, due 30/12/15 4,500,000 4,499,959 BNP Paribas, 0.0000%, due 30/12/15 4,500,000 4,500,000
BNP Paribas, 0.0000%, due 28/12/15 4,500,000 4,499,835 BNP Paribas, 0.0000%, due 28/12/15 4,500,000 4,500,000
BNP Paribas, 0.0000%, due 21/12/15 3,800,000 3,799,896 BNP Paribas, 0.0000%, due 21/12/15 3,800,000 3,800,000
BNP Paribas, 0.0000%, due 23/12/15 3,600,000 3,599,967 BNP Paribas, 0.0000%, due 23/12/15 3,600,000 3,600,000
BNP Paribas, 0.0000%, due 16/12/15 3,500,000 3,499,988 BNP Paribas, 0.0000%, due 16/12/15 3,500,000 3,500,000
BNP Paribas, 0.0000%, due 18/12/15 3,400,000 3,399,969 BNP Paribas, 0.0000%, due 18/12/15 3,400,000 3,400,000
BNP Paribas, 0.0000%, due 22/12/15 3,400,000 3,399,969 BNP Paribas, 0.0000%, due 22/12/15 3,400,000 3,400,000
BNP Paribas, 0.0000%, due 17/12/15 3,300,000 3,299,988 BNP Paribas, 0.0000%, due 17/12/15 3,300,000 3,300,000
BNP Paribas, 0.0000%, due 24/9/15 3,200,000 3,199,990 BNP Paribas, 0.0000%, due 24/9/15 3,200,000 3,200,000
BNP Paribas, 0.0000%, due 25/9/15 3,200,000 3,199,990 BNP Paribas, 0.0000%, due 25/9/15 3,200,000 3,200,000
BNP Paribas, 0.0000%, due 18/9/15 3,200,000 3,199,989 BNP Paribas, 0.0000%, due 18/9/15 3,200,000 3,200,000
BNP Paribas, 0.0000%, due 21/9/15 3,200,000 3,199,968 BNP Paribas, 0.0000%, due 21/9/15 3,200,000 3,200,000
BNP Paribas, 0.0000%, due 23/9/15 3,100,000 3,099,991 BNP Paribas, 0.0000%, due 23/9/15 3,100,000 3,100,000
BNP Paribas, 0.0000%, due 15/12/15 3,100,000 3,099,990 BNP Paribas, 0.0000%, due 15/12/15 3,100,000 3,100,000
BNP Paribas, 0.0000%, due 17/9/15 3,100,000 3,099,990 BNP Paribas, 0.0000%, due 17/9/15 3,100,000 3,100,000
Societe Generale, 0.0000%, due 22/9/15 3,100,000 3,099,989 Societe Generale, 0.0000%, due 22/9/15 3,100,000 3,100,000
BNP Paribas, 0.0000%, due 14/10/15 2,500,000 2,499,992 BNP Paribas, 0.0000%, due 14/10/15 2,500,000 2,500,000
BNP Paribas, 0.0000%, due 20/10/15 2,400,000 2,399,993 BNP Paribas, 0.0000%, due 20/10/15 2,400,000 2,400,000
BNP Paribas, 0.0000%, due 15/10/15 2,400,000 2,399,993 BNP Paribas, 0.0000%, due 15/9/15 2,400,000 2,400,000
BNP Paribas, 0.0000%, due 15/9/15 2,400,000 2,399,992 BNP Paribas, 0.0000%, due 14/9/15 2,400,000 2,400,000
BNP Paribas, 0.0000%, due 14/9/15 2,400,000 2,399,976 BNP Paribas, 0.0000%, due 15/10/15 2,400,000 2,400,000
BNP Paribas, 0.0000%, due 16/10/15 2,300,000 2,299,993
BNP Paribas, 0.0000%, due 11/9/15 2,300,000 2,299,992
BNP Paribas, 0.0000%, due 30/9/15 2,200,000 2,199,994
BNP Paribas, 0.0000%, due 10/9/15 2,200,000 2,199,993
BNP Paribas, 0.0000%, due 29/9/15 2,200,000 2,199,993
BNP Paribas, 0.0000%, due 13/10/15 2,200,000 2,199,973
BNP Paribas, 0.0000%, due 2/12/15 2,100,000 2,099,994
BNP Paribas, 0.0000%, due 8/10/15 2,100,000 2,099,994
BNP Paribas, 0.0000%, due 2/10/15 2,100,000 2,099,994
BNP Paribas, 0.0000%, due 9/10/15 2,100,000 2,099,994
BNP Paribas, 0.0000%, due 7/10/15 2,100,000 2,099,994
BNP Paribas, 0.0000%, due 6/10/15 2,100,000 2,099,994
BNP Paribas, 0.0000%, due 4/9/15 2,100,000 2,099,993
BNP Paribas, 0.0000%, due 28/9/15 2,100,000 2,099,981
BNP Paribas, 0.0000%, due 5/10/15 2,100,000 2,099,981
BNP Paribas, 0.0000%, due 19/10/15 2,100,000 2,099,981

Statements of Changes in Composition of Portfolio (unaudited)
3 2 6 J a n u s C a p i t a l F u n d s P l c / 3 1 D e c e m b e r 2 0 1 5
JANUS GLOBAL INVESTMENT GRADE BOND FUND
Major Purchases for the year ended 31 December 2015
Shares orPrincipalAmount Cost Major Sales for the year ended 31 December 2015
Shares orPrincipalAmount Proceeds
Societe Generale, 0.0000%, due 16/1/15 6,200,000 6,199,983 Societe Generale, 0.0000%, due 16/1/15 6,200,000 6,200,000
Societe Generale, 0.0000%, due 15/1/15 5,400,000 5,399,985 Societe Generale, 0.0000%, due 15/1/15 5,400,000 5,400,000
BNP Paribas, 0.0000%, due 8/7/15 4,900,000 4,899,986 BNP Paribas, 0.0000%, due 8/7/15 4,900,000 4,900,000
BNP Paribas, 0.0000%, due 9/7/15 4,800,000 4,799,987 BNP Paribas, 0.0000%, due 9/7/15 4,800,000 4,800,000
BNP Paribas, 0.0000%, due 21/1/15 4,400,000 4,399,989 BNP Paribas, 0.0000%, due 21/1/15 4,400,000 4,400,000
BNP Paribas, 0.0000%, due 20/1/15 3,600,000 3,599,964 BNP Paribas, 0.0000%, due 20/1/15 3,600,000 3,600,000
BNP Paribas, 0.0000%, due 26/1/15 3,400,000 3,399,977 BNP Paribas, 0.0000%, due 26/1/15 3,400,000 3,400,000
Rabobank USA Financial Corp., 0.0000%, due 30/1/15 2,900,000 2,899,994 BNP Paribas, 0.0000%, due 20/2/15 2,900,000 2,900,000
BNP Paribas, 0.0000%, due 20/2/15 2,900,000 2,899,992 Rabobank USA Financial Corp., 0.0000%, due 30/1/15 2,900,000 2,900,000
Societe Generale, 0.0000%, due 14/1/15 2,900,000 2,899,992 Societe Generale, 0.0000%, due 14/1/15 2,900,000 2,900,000
BNP Paribas, 0.0000%, due 23/1/15 2,700,000 2,699,994 BNP Paribas, 0.0000%, due 23/1/15 2,700,000 2,700,000
BNP Paribas, 0.0000%, due 13/1/15 2,700,000 2,699,993 BNP Paribas, 0.0000%, due 13/1/15 2,700,000 2,700,000
BNP Paribas, 0.0000%, due 21/5/15 2,600,000 2,599,993 BNP Paribas, 0.0000%, due 21/5/15 2,600,000 2,600,000
BNP Paribas, 0.0000%, due 22/5/15 2,600,000 2,599,993 BNP Paribas, 0.0000%, due 23/2/15 2,600,000 2,600,000
BNP Paribas, 0.0000%, due 23/2/15 2,600,000 2,599,978 BNP Paribas, 0.0000%, due 22/5/15 2,600,000 2,600,000
BNP Paribas, 0.0000%, due 22/1/15 2,500,000 2,499,994 Societe Generale, 0.0000%, due 19/2/15 2,500,000 2,500,000
Societe Generale, 0.0000%, due 19/2/15 2,500,000 2,499,993 BNP Paribas, 0.0000%, due 22/1/15 2,500,000 2,500,000
BNP Paribas, 0.0000%, due 12/1/15 2,500,000 2,499,981 BNP Paribas, 0.0000%, due 12/1/15 2,500,000 2,500,000
BNP Paribas, 0.0000%, due 12/6/15 2,400,000 2,399,993 BNP Paribas, 0.0000%, due 2/6/15 2,400,000 2,400,000
BNP Paribas, 0.0000%, due 13/5/15 2,400,000 2,399,993 BNP Paribas, 0.0000%, due 9/6/15 2,400,000 2,400,000
BNP Paribas, 0.0000%, due 2/6/15 2,400,000 2,399,993
BNP Paribas, 0.0000%, due 5/6/15 2,400,000 2,399,993
BNP Paribas, 0.0000%, due 9/6/15 2,400,000 2,399,993
JANUS HIGH YIELD FUND
Major Purchases for the year ended 31 December 2015
Shares orPrincipalAmount Cost Major Sales for the year ended 31 December 2015
Shares orPrincipalAmount Proceeds
Societe Generale, 0.0000%, due 13/2/15 81,700,000 81,699,773 Societe Generale, 0.0000%, due 13/2/15 81,700,000 81,700,000
Societe Generale, 0.0000%, due 12/2/15 81,000,000 80,999,775 Societe Generale, 0.0000%, due 12/2/15 81,000,000 81,000,000
Societe Generale, 0.0000%, due 14/1/15 79,000,000 78,999,780 Societe Generale, 0.0000%, due 14/1/15 79,000,000 79,000,000
Societe Generale, 0.0000%, due 15/1/15 78,700,000 78,699,781 Societe Generale, 0.0000%, due 15/1/15 78,700,000 78,700,000
Societe Generale, 0.0000%, due 16/1/15 78,300,000 78,299,782 Societe Generale, 0.0000%, due 16/1/15 78,300,000 78,300,000
Societe Generale, 0.0000%, due 11/2/15 76,800,000 76,799,787 Societe Generale, 0.0000%, due 11/2/15 76,800,000 76,800,000
BNP Paribas, 0.0000%, due 1/6/15 76,200,000 76,199,683 BNP Paribas, 0.0000%, due 1/6/15 76,200,000 76,200,000
BNP Paribas, 0.0000%, due 29/5/15 74,800,000 74,799,792 BNP Paribas, 0.0000%, due 29/5/15 74,800,000 74,800,000
BNP Paribas, 0.0000%, due 28/5/15 74,100,000 74,099,794 BNP Paribas, 0.0000%, due 28/5/15 74,100,000 74,100,000
BNP Paribas, 0.0000%, due 27/3/15 74,000,000 73,999,794 BNP Paribas, 0.0000%, due 27/3/15 74,000,000 74,000,000
Societe Generale, 0.0000%, due 17/2/15 73,000,000 72,999,188 Societe Generale, 0.0000%, due 17/2/15 73,000,000 73,000,000
Societe Generale, 0.0000%, due 25/3/15 72,700,000 72,699,798 Societe Generale, 0.0000%, due 25/3/15 72,700,000 72,700,000
Societe Generale, 0.0000%, due 26/3/15 72,600,000 72,599,900 Societe Generale, 0.0000%, due 26/3/15 72,600,000 72,600,000
BNP Paribas, 0.0000%, due 26/5/15 72,400,000 72,399,195 BNP Paribas, 0.0000%, due 26/5/15 72,400,000 72,400,000
BNP Paribas, 0.0000%, due 13/1/15 71,500,000 71,499,821 BNP Paribas, 0.0000%, due 27/5/15 71,500,000 71,500,000
BNP Paribas, 0.0000%, due 27/5/15 71,500,000 71,499,801 BNP Paribas, 0.0000%, due 13/1/15 71,500,000 71,500,000
BNP Paribas, 0.0000%, due 5/8/15 70,900,000 70,899,803 BNP Paribas, 0.0000%, due 5/8/15 70,900,000 70,900,000
Societe Generale, 0.0000%, due 9/4/15 70,800,000 70,799,803 Societe Generale, 0.0000%, due 9/4/15 70,800,000 70,800,000
Societe Generale, 0.0000%, due 10/4/15 70,700,000 70,699,804 BNP Paribas, 0.0000%, due 3/8/15 70,700,000 70,700,000
BNP Paribas, 0.0000%, due 3/8/15 70,700,000 70,699,587 Societe Generale, 0.0000%, due 10/4/15 70,700,000 70,700,000

J a n u s C a p i t a l F u n d s P l c / 3 1 D e c e m b e r 2 0 1 5 3 2 7
JANUS GLOBAL UNCONSTRAINED BOND FUND
Major Purchases for the year ended 31 December 2015
Shares orPrincipalAmount Cost Major Sales for the year ended 31 December 2015
Shares orPrincipalAmount Proceeds
Sigma-Aldrich Corp. 111,270 15,461,832 Sigma-Aldrich Corp. 127,726 17,881,640
BNP Paribas, 0.0000%, due 20/5/15 14,500,000 14,499,960 BNP Paribas, 0.0000%, due 21/5/15 14,500,000 14,500,000
BNP Paribas, 0.0000%, due 21/5/15 14,500,000 14,499,960 BNP Paribas, 0.0000%, due 20/5/15 14,500,000 14,500,000
BNP Paribas, 0.0000%, due 19/5/15 14,500,000 14,499,960 BNP Paribas, 0.0000%, due 19/5/15 14,500,000 14,500,000
BNP Paribas, 0.0000%, due 18/5/15 14,500,000 14,499,879 BNP Paribas, 0.0000%, due 18/5/15 14,500,000 14,500,000
BNP Paribas, 0.0000%, due 1/5/15 14,300,000 14,299,980 BNP Paribas, 0.0000%, due 1/5/15 14,300,000 14,300,000
BNP Paribas, 0.0000%, due 5/5/15 14,300,000 14,299,960 BNP Paribas, 0.0000%, due 5/5/15 14,300,000 14,300,000
BNP Paribas, 0.0000%, due 4/5/15 14,300,000 14,299,881 BNP Paribas, 0.0000%, due 4/5/15 14,300,000 14,300,000
Societe Generale, 0.0000%, due 29/4/15 14,100,000 14,099,973 BNP Paribas, 0.0000%, due 13/5/15 14,100,000 14,100,000
BNP Paribas, 0.0000%, due 15/5/15 14,100,000 14,099,961 BNP Paribas, 0.0000%, due 30/4/15 14,100,000 14,100,000
BNP Paribas, 0.0000%, due 30/4/15 14,100,000 14,099,961 Rabobank USA Financial Corp., 0.0000%, due 28/4/15 14,100,000 14,100,000
BNP Paribas, 0.0000%, due 14/5/15 14,100,000 14,099,961 BNP Paribas, 0.0000%, due 14/5/15 14,100,000 14,100,000
BNP Paribas, 0.0000%, due 13/5/15 14,100,000 14,099,961 BNP Paribas, 0.0000%, due 7/5/15 14,100,000 14,100,000
BNP Paribas, 0.0000%, due 7/5/15 14,100,000 14,099,961 BNP Paribas, 0.0000%, due 15/5/15 14,100,000 14,100,000
BNP Paribas, 0.0000%, due 6/5/15 14,100,000 14,099,961 BNP Paribas, 0.0000%, due 8/5/15 14,100,000 14,100,000
BNP Paribas, 0.0000%, due 8/5/15 14,100,000 14,099,961 BNP Paribas, 0.0000%, due 6/5/15 14,100,000 14,100,000
BNP Paribas, 0.0000%, due 12/5/15 14,100,000 14,099,961 BNP Paribas, 0.0000%, due 11/5/15 14,100,000 14,100,000
Rabobank USA Financial Corp., 0.0000%, due 28/4/15 14,100,000 14,099,957 BNP Paribas, 0.0000%, due 12/5/15 14,100,000 14,100,000
BNP Paribas, 0.0000%, due 11/5/15 14,100,000 14,099,883 Societe Generale, 0.0000%, due 29/4/15 14,100,000 14,100,000
BNP Paribas Finance, Inc. 13,700,000 13,699,886 BNP Paribas Finance, Inc. 13,700,000 13,700,000
JANUS US SHORT-TERM BOND FUND
Major Purchases for the year ended 31 December 2015
Shares orPrincipalAmount Cost Major Sales for the year ended 31 December 2015
Shares orPrincipalAmount Proceeds
BNP Paribas, 0.0000%, due 23/1/15 42,700,000 42,699,905 BNP Paribas, 0.0000%, due 23/1/15 42,700,000 42,700,000
BNP Paribas, 0.0000%, due 7/10/15 28,300,000 28,299,914 BNP Paribas, 0.0000%, due 7/10/15 28,300,000 28,300,000
BNP Paribas, 0.0000%, due 8/10/15 27,600,000 27,599,916 BNP Paribas, 0.0000%, due 8/10/15 27,600,000 27,600,000
BNP Paribas, 0.0000%, due 12/3/15 27,500,000 27,499,924 BNP Paribas, 0.0000%, due 12/3/15 27,500,000 27,500,000
BNP Paribas, 0.0000%, due 6/10/15 26,900,000 26,899,918 BNP Paribas, 0.0000%, due 6/10/15 26,900,000 26,900,000
BNP Paribas, 0.0000%, due 5/10/15 26,200,000 26,199,760 BNP Paribas, 0.0000%, due 5/10/15 26,200,000 26,200,000
BNP Paribas, 0.0000%, due 9/3/15 25,600,000 25,599,787 BNP Paribas, 0.0000%, due 9/3/15 25,600,000 25,600,000
United States Treasury Note/Bond, 0.5000%, due 31/8/16 25,334,000 25,339,239 BNP Paribas, 0.0000%, due 10/3/15 24,600,000 24,600,000
BNP Paribas, 0.0000%, due 10/3/15 24,600,000 24,599,932 BNP Paribas, 0.0000%, due 2/7/15 23,800,000 23,800,000
BNP Paribas, 0.0000%, due 2/7/15 23,800,000 23,799,934 United States Treasury Note/Bond, 0.5000%, due 31/8/16 22,937,000 22,986,566
BNP Paribas, 0.0000%, due 11/3/15 21,600,000 21,599,940 BNP Paribas, 0.0000%, due 17/7/15 21,600,000 21,600,000
BNP Paribas, 0.0000%, due 17/7/15 21,600,000 21,599,934 BNP Paribas, 0.0000%, due 11/3/15 21,600,000 21,600,000
BNP Paribas, 0.0000%, due 6/7/15 21,200,000 21,199,764 U.S. Treasury Notes/Bonds, 3.7500%, due 15/4/15 21,475,000 21,512,215
BNP Paribas, 0.0000%, due 7/7/15 20,500,000 20,499,943 BNP Paribas, 0.0000%, due 6/7/15 21,200,000 21,200,000
BNP Paribas, 0.0000%, due 25/9/15 19,900,000 19,899,939 BNP Paribas, 0.0000%, due 7/7/15 20,500,000 20,500,000
BNP Paribas, 0.0000%, due 15/10/15 19,800,000 19,799,940 BNP Paribas, 0.0000%, due 25/9/15 19,900,000 19,900,000
BNP Paribas, 0.0000%, due 14/10/15 19,600,000 19,599,940 BNP Paribas, 0.0000%, due 15/10/15 19,800,000 19,800,000
U.S. Treasury Notes/Bonds, 0.5000%, due 30/9/16 19,127,000 19,130,043 BNP Paribas, 0.0000%, due 14/10/15 19,600,000 19,600,000
Societe Generale, 0.0000%, due 16/1/15 19,100,000 19,099,947 BNP Paribas, 0.0000%, due 28/9/15 19,100,000 19,100,000
BNP Paribas, 0.0000%, due 28/9/15 19,100,000 19,099,825 Societe Generale, 0.0000%, due 16/1/15 19,100,000 19,100,000

3 2 8 J a n u s C a p i t a l F u n d s P l c / 3 1 D e c e m b e r 2 0 1 5
Fund Expense Limits and Total Expense Ratios (unaudited)
The Maximum Expense Limits table shows the total fees and out-of-pocket expenses allocated to a Fund in any fiscal year, excluding transactions costs and trade commissions, expressed as a percentage of the average daily net assets, for each Share Class (“Maximum Expense Limits”) under the terms of the Prospectus as set out in the “Fees and Expenses” section. The Average Total Expense Ratio table shows the actual expenses, excluding transactions costs and trade commissions, incurred by each Class for each Fund during the reporting year expressed as a percentage of the average net assets for the corresponding year, on an annualised basis.
Maximum Expense Limits
US Dollar/Euro/AUD$/HKD$/CHF/RMB(CNH/SGD/CAD/TPY/SEK) Share Classes
Funds
Class A and V Shares
Class B Class E Class I Class S Class U Class Z
Janus Asia Frontier Markets Fund 2.75% 3.75% 3.25% 1.25% NA 1.55% 0.00%Janus Asia Growth Drivers Fund 2.75% 3.75% 3.25% 1.25% NA 1.55% 0.00%Janus Asia Fund 2.75% 3.75% 3.25% 1.25% NA 1.55% 0.00%Janus Balanced Fund 2.50% 3.50% 3.00% 1.05% NA 1.55% 0.00%Janus Emerging Markets Fund 2.75% 3.75% 3.25% 1.35% NA 1.55% 0.00%Janus Europe Fund 2.75% 3.75% 3.25% 1.25% 1.85% 1.55% 0.00%Janus Global Life Sciences Fund 3.00% 4.00% 3.50% 1.75% NA 1.55% 0.00%Janus Global Research Fund 2.75% 3.75% 3.25% 1.25% NA 1.55% 0.00%Janus Global Technology Fund 3.00% 4.00% 3.50% 1.75% NA 1.55% 0.00%Janus Japan Emerging Opportunities Fund 2.75% 3.75% 3.25% 1.25% NA 1.55% 0.00%Janus Japan Fund 2.50% 3.50% 3.00% 1.15% NA 1.55% 0.00%Janus Opportunistic Alpha Fund 2.75% 3.75% 3.25% 1.20% NA 1.55% 0.00%Janus US Fund 2.75% 3.75% 3.25% 1.20% NA 1.55% 0.00%Janus US Research Fund 3.00% 4.00% 3.50% 1.20% NA 1.55% 0.00%Janus US Twenty Fund 2.75% 3.75% 3.25% 1.20% NA 1.55% 0.00%Janus US Venture Fund 3.00% 4.00% 3.50% 1.75% NA 1.55% 0.00%Perkins Global Value Fund 2.75% 3.75% 3.25% 1.25% NA 1.55% 0.00%Perkins US Strategic Value Fund 3.00% 4.00% 3.50% 1.75% NA 1.55% 0.00%INTECH All-World Minimum Variance Core Fund(a) 1.85% 2.85% 2.60% 1.05% NA 1.25% 0.00%INTECH European Core Fund 2.00% 3.00% 2.75% 1.25% NA 1.25% 0.00%INTECH Global All Country Low Volatility Fund 1.75% 2.75% 2.50% 0.95% NA 1.15% 0.00%INTECH Global Dividend Fund 1.85% 2.85% 2.60% 1.05% NA 1.25% 0.00%INTECH US Core Fund 2.00% 3.00% 2.75% 1.20% NA 1.25% 0.00%Janus Global Diversified Alternatives Fund 2.75% 3.75% 3.25% 1.35% NA 1.65% 0.00%Janus Global Real Estate Fund 2.75% 3.75% 3.25% 1.25% NA 1.55% 0.00%Janus Flexible Income Fund 2.50% 3.50% 2.75% 0.80% NA 1.35% 0.00%Janus Global Flexible Income Fund 2.50% 3.50% 2.75% 0.95% NA 1.35% 0.00%Janus Global High Yield Fund 2.50% 3.50% 2.75% 1.05% NA 1.35% 0.00%Janus Global Investment Grade Bond Fund 2.50% 3.50% 2.75% 0.85% NA 1.35% 0.00%Janus High Yield Fund 2.50% 3.50% 2.75% 0.90% NA 1.35% 0.00%Janus Global Unconstrained Bond Fund 2.50% 3.50% 2.75% 1.00% NA 1.35% 0.00%Janus US Short-Term Bond Fund 1.90% 2.90% 2.40% 0.90% NA 1.35% 0.00%
Average Total Expense Ratios for the Financial year Ended 31 December 2015
US Dollar Share Classes
Funds A acc A acc (H) A inc A dis B acc B inc E acc I acc I acc (H) I dis I inc U acc U acc (H) U inc V inc Z acc Z inc
Janus Asia Frontier Markets Fund . . . . . . . . . . . . . . 2.50% NA* NA* NA* NA* NA* NA* 1.25% NA* NA* NA* NA* NA* NA* NA* NA* NA*Janus Asia Growth Drivers Fund . . . . . . . . . . . . . . 2.50% NA* NA* NA* NA* NA* NA* 1.25% NA* NA* NA* NA* NA* NA* NA* NA* NA*Janus Asia Fund . . . . . . . . NA* 2.25% NA* NA* NA* NA* NA* NA* 1.15% NA* NA* NA* NA* NA* NA* NA* NA*Janus Balanced Fund . . . . . . 1.97% NA* 1.96% NA* 2.97% NA* NA* 1.02% NA* NA* 1.01% NA* NA* NA* 1.98% NA* NA*Janus Emerging Markets Fund . 2.25% NA* NA* NA* 3.25% NA* NA* 1.35% NA* NA* NA* NA* NA* NA* NA* NA* NA*Janus Europe Fund . . . . . . . NA* 2.24% NA* NA* NA* NA* NA* NA NA* NA* NA* NA* 1.00% NA* NA* NA* NA*Janus Global Life Sciences Fund . . . . . . . . . . . . . . 2.44% NA* NA* NA* 3.44% NA* 2.95% 1.69% NA* NA* NA* 0.99% NA* 0.99% NA* NA* NA*Janus Global Research Fund . . 2.50% NA* NA* 2.50% 3.50% NA* NA* 1.25% NA* 1.25% NA* NA* NA* NA* NA* NA* NA*

J a n u s C a p i t a l F u n d s P l c / 3 1 D e c e m b e r 2 0 1 5 3 2 9
Average Total Expense Ratios for the Financial year Ended 31 December 2015
US Dollar Share Classes
Funds A acc A acc (H) A inc A dis B acc B inc E acc I acc I acc (H) I dis I inc U acc U acc (H) U inc V inc Z acc Z inc
Janus Global Technology Fund . 2.60% NA* NA* NA* 3.61% NA* NA* 1.75% NA* NA* NA* 1.05% NA* NA* NA* NA* NA*Janus Japan Emerging Opportunities Fund . . . . . . NA* 2.50% NA* NA* NA* NA* NA* NA* 1.25% NA* NA* NA* NA* NA* NA* NA* NA*Janus Japan Fund. . . . . . . . NA* 2.25% NA* NA* NA* NA* NA* NA* 1.15% NA* NA* NA* NA* NA* NA* NA* NA*Janus Opportunistic Alpha Fund . . . . . . . . . . . . . . 2.32% NA* NA* 2.33% 3.32% NA* NA* 1.19% NA* 1.20% NA* 1.04% NA* NA* NA* NA* NA*Janus US Fund . . . . . . . . . 2.25% NA* NA* NA* 3.25% NA* NA* 1.20% NA* NA* NA* NA* NA* NA* NA* NA* NA*Janus US Research Fund . . . . 2.68% NA* NA* 2.57% 3.61% NA* NA* 1.20% NA* 1.20% NA* NA* NA* NA* NA* NA* NA*Janus US Twenty Fund . . . . . 2.22% NA* NA* 2.21% 3.22% NA* NA* 1.18% NA* 1.16% NA* 1.00% NA* NA* NA* NA* NA*Janus US Venture Fund . . . . . 2.47% NA* NA* 2.46% 3.49% NA* NA* 1.73% NA* 1.70% NA* 1.02% NA* NA* NA* NA* NA*Perkins Global Value Fund . . . 2.25% NA* NA* NA* 3.25% NA* NA* 1.25% NA* NA* NA* 1.05% NA* NA* NA* NA* NA*Perkins US Strategic Value Fund . . . . . . . . . . . . . . 2.50% NA* NA* 2.51% 3.51% NA* NA* 1.75% NA* 1.75% NA* 1.03% NA* NA* NA* NA* NA*INTECH All-World Minimum Variance Core Fund(a) . . . . . . NA* NA* NA* NA* NA* NA* NA* NA* NA* NA* NA* NA* NA* NA* NA* NA* NA*INTECH European Core Fund . . . . . . . . . . . . . . NA* NA* NA* NA* NA* NA* NA* NA* NA* NA* NA* NA* NA* NA* NA* NA* NA*INTECH Global All Country Low Volatility Fund . . . . . . . . . NA* NA* NA* NA* NA* NA* NA* NA* NA* NA* NA* NA* NA* NA* NA* NA* NA*INTECH Global Dividend Fund . . . . . . . . . . . . . . 1.60% NA* 1.59% NA* NA* NA* NA* 1.05% NA* NA* 1.05% 0.99% NA* NA* NA* NA* NA*INTECH US Core Fund . . . . 1.70% NA* NA* 1.69% 2.70% NA* NA* 1.15% NA* 1.14% NA* 0.96% NA* NA* NA* NA* NA*Janus Global Diversified Alternatives Fund. . . . . . . . 2.25% NA* NA* NA* NA* NA* NA* 1.35% NA* NA* NA* 1.15% NA* NA* NA* NA* NA*Janus Global Real Estate Fund . . . . . . . . . . . . . . 2.27% 2.27% 2.27% NA* 3.27% 3.26% NA* NA* 1.25% NA* 1.24% NA* NA* NA* NA* NA* NA*Janus Flexible Income Fund . . 1.95% 1.95% 1.95% NA* 2.96% 2.95% NA* 0.73% 0.75% NA* 0.77% 0.79% 0.79% NA* 1.95% NA* NA*Janus Global Flexible Income Fund . . . . . . . . . . . . . . 2.00% 2.00% NA* NA* NA* NA* NA* NA* 0.95% NA* 0.95% 0.85% 0.85% NA* NA* NA* NA*Janus Global High Yield Fund. . 2.00% 2.00% 2.00% NA* 3.00% 3.00% NA* 1.04% 1.05% NA* 1.05% NA* NA* NA* NA* NA* NA*Janus Global Investment Grade Bond Fund . . . . . . . . . . . 2.00% 2.00% 2.00% NA* 3.00% 3.00% NA* 0.85% 0.85% NA* 0.85% NA* NA* NA* NA* NA* NA*Janus High Yield Fund . . . . . 1.96% 1.96% 1.96% NA* 2.97% 2.97% NA* 0.86% 0.86% NA* 0.86% NA* NA* NA* 1.96% NA* NA*Janus Global Unconstrained Bond Fund . . . . . . . . . . . 2.02% 1.98% 1.99% NA* NA* NA* NA* 0.93% 0.93% NA* NA* 0.79% 0.78% 0.79% NA* NA* NA*Janus US Short-Term Bond Fund . . . . . . . . . . . . . . 1.36% 1.35% 1.35% NA* 2.10% 2.10% NA* 0.86% 0.85% NA* 0.84% 0.79% NA* 0.79% NA* NA* NA*
Average Total Expense Ratios for the Financial year Ended 31 December 2015
Euro Share Classes
Funds A acc A acc (H) A inc A inc (H) B inc B inc (H) E acc E acc (H) E inc E inc (H) I acc
Janus Asia Frontier Markets Fund . . . . . . . . . . . NA* 2.50% NA* NA* NA* NA* NA* 3.00% NA* NA* NA*Janus Asia Growth Drivers Fund . . . . . . . . . . . . NA* 2.50% NA* NA* NA* NA* NA* 3.00% NA* NA* NA*Janus Asia Fund . . . . . . . . . . . . . . . . . . . . NA* NA* NA* NA* NA* NA* NA* 3.00% NA* NA* NA*Janus Balanced Fund . . . . . . . . . . . . . . . . . . NA* 1.96% NA* 1.97% NA* NA* NA* 2.46% NA* 2.47% NA*Janus Emerging Markets Fund . . . . . . . . . . . . . NA* 2.25% NA* NA* NA* NA* NA* 3.00% NA* NA* NA*Janus Europe Fund . . . . . . . . . . . . . . . . . . . 2.23% NA* NA* NA* NA* NA* 2.73% NA* NA* NA* 1.20%Janus Global Life Sciences Fund . . . . . . . . . . . . NA* 2.44% NA* NA* NA* NA* NA* 2.95% NA* NA* 1.74%Janus Global Research Fund . . . . . . . . . . . . . . NA* 2.50% NA* NA* NA* NA* NA* 3.00% NA* NA* NA*Janus Global Technology Fund . . . . . . . . . . . . . NA* 2.59% NA* NA* NA* NA* NA* NA* NA* NA* NA*Janus Japan Emerging Opportunities Fund . . . . . . . NA* 2.50% NA* NA* NA* NA* NA* 3.00% NA* NA* NA*Janus Japan Fund. . . . . . . . . . . . . . . . . . . . NA* 2.25% NA* NA* NA* NA* NA* 2.75% NA* NA* NA*Janus Opportunistic Alpha Fund . . . . . . . . . . . . NA* 2.32% NA* NA* NA* NA* NA* 2.83% NA* NA* NA*Janus US Fund . . . . . . . . . . . . . . . . . . . . . NA* 2.25% NA* NA* NA* NA* NA* NA* NA* NA* NA*Janus US Research Fund . . . . . . . . . . . . . . . . NA* 2.61% NA* NA* NA* NA* NA* NA* NA* NA* NA*

3 3 0 J a n u s C a p i t a l F u n d s P l c / 3 1 D e c e m b e r 2 0 1 5
Fund Expense Limits and Total Expense Ratios (unaudited)
Average Total Expense Ratios for the Financial year Ended 31 December 2015
Euro Share Classes HKD Share Classes
Funds I acc (H) I inc I inc (H) U acc U acc (H) V acc (H) Z acc Z inc A acc A acc (H) A inc A inc (H)
Janus Asia Frontier Markets Fund . . . . . . . . . . . 1.25% NA* NA* NA* 1.05% NA* NA* NA* 2.50% NA* NA* NA*Janus Asia Growth Drivers Fund . . . . . . . . . . . . 1.25% NA* NA* NA* 1.05% NA* NA* NA* 2.50% NA* NA* NA*Janus Asia Fund . . . . . . . . . . . . . . . . . . . . . . . . . 1.25% NA* NA* NA* NA* NA* NA* NA* 2.50% NA* NA* NA*Janus Balanced Fund . . . . . . . . . . . . . . . . . . . . . 1.00% NA* 1.00% NA* NA* NA* NA* NA* 1.97% NA* 1.96% NA*Janus Emerging Markets Fund . . . . . . . . . . . . . . 1.35% NA* NA* NA* NA* NA* NA* NA* NA* NA* NA* NA*Janus Europe Fund . . . . . . . . . . . . . . . . . . . . . . NA* NA* NA* 1.00% NA* NA* NA* NA* NA* NA* NA* NA*Janus Global Life Sciences Fund. . . . . . . . . . . . . 1.69% NA* NA* 0.99% 0.98% 2.50% NA* NA* 2.45% NA* NA* NA*Janus Global Research Fund . . . . . . . . . . . . . . . . 1.25% NA* NA* NA* NA* NA* NA* NA* NA* NA* NA* NA*Janus Global Technology Fund . . . . . . . . . . . . . . 1.75% NA* NA* NA* 1.05% 2.76% NA* NA* 2.59% NA* NA* NA*Janus Japan Emerging Opportunities Fund . . . . 1.25% NA* NA* NA* 1.05% NA* NA* NA* NA* 2.50% NA* NA*Janus Japan Fund . . . . . . . . . . . . . . . . . . . . . . . . 1.15% NA* NA* NA* 1.05% NA* NA* NA* NA* 2.25% NA* NA*Janus Opportunistic Alpha Fund . . . . . . . . . . . . 1.19% NA* NA* NA* 1.05% NA* NA* NA* NA* NA* NA* NA*Janus US Fund . . . . . . . . . . . . . . . . . . . . . . . . . . 1.20% NA* NA* NA* NA* NA* NA* NA* NA* NA* NA* NA*Janus US Research Fund . . . . . . . . . . . . . . . . . . 1.20% NA* NA* NA* NA* NA* NA* NA* NA* NA* NA* NA*Janus US Twenty Fund . . . . . . . . . . . . . . . . . . . . 1.15% NA* NA* NA* 1.00% 2.31% NA* NA* NA* NA* NA* NA*Janus US Venture Fund . . . . . . . . . . . . . . . . . . . 1.71% NA* NA* NA* 1.01% NA* NA* NA* NA* NA* NA* NA*Perkins Global Value Fund . . . . . . . . . . . . . . . . . 1.23% NA* NA* NA* 1.05% NA* NA* NA* NA* NA* NA* NA*Perkins US Strategic Value Fund . . . . . . . . . . . . 1.73% NA* NA* NA* 1.05% NA* NA* NA* NA* NA* NA* NA*INTECH European Core Fund . . . . . . . . . . . . . . . . . . . NA* NA* NA* NA* NA* NA* NA* NA* NA* NA* NA* NA*INTECH Global All Country Low Volatility Fund . . . . NA* NA* NA* NA* NA* NA* NA* NA* NA* NA* NA* NA*INTECH Global Dividend Fund . . . . . . . . . . . . . . . . . . 1.05% NA* 1.05% NA* 0.95% NA* NA* NA* NA* NA* NA* NA*INTECH US Core Fund . . . . . . . . . . . . . . . . . . . 1.15% NA* NA* NA* 0.93% NA* NA* NA* NA* NA* NA* NA*INTECH All-World Minimum Variance Core Fund(a) . . NA* NA* NA* NA* NA* NA* NA* NA* NA* NA* NA* NA*Janus Global Diversified Alternatives Fund . . . . 1.35% NA* NA* NA* 1.15% NA* NA* NA* NA* NA* NA* NA*Janus Global Real Estate Fund . . . . . . . . . . . . . . 1.25% NA* NA* NA* NA* NA* NA* NA* NA* NA* NA* NA*Janus Flexible Income Fund . . . . . . . . . . . . . . . . 0.75% NA* NA* NA* 0.79% NA* NA* NA* 1.91% NA* 1.95% NA*Janus Global Flexible Income Fund . . . . . . . . . . 0.95% NA* NA* NA* 0.85% NA* NA* NA* NA* NA* NA* NA*Janus Global High Yield Fund . . . . . . . . . . . . . . 1.05% NA* 1.05% NA* NA* NA* NA* NA* NA* NA* NA* NA*Janus Global Investment Grade Bond Fund . . . . 0.85% NA* 0.85% NA* NA* NA* NA* NA* NA* NA* NA* NA*Janus High Yield Fund . . . . . . . . . . . . . . . . . . . . 0.86% NA* NA* NA* NA* NA* NA* NA* 1.96% NA* 1.96% NA*Janus Global Unconstrained Bond Fund . . . . . . 0.93% NA* NA* NA* 0.78% NA* NA* NA* NA* NA* 1.97% NA*Janus US Short-Term Bond Fund . . . . . . . . . . . . 0.85% NA* NA* NA* NA* NA* NA* NA* NA* NA* NA* NA*
Average Total Expense Ratios for the Financial year Ended 31 December 2015
Euro Share Classes
Funds A acc A acc (H) A inc A inc (H) B inc B inc (H) E acc E acc (H) E inc E inc (H) I acc
Janus US Twenty Fund . . . . . . . . . . . . . . . . . NA* 2.22% NA* NA* NA* NA* NA* 2.72% NA* NA* NA*Janus US Venture Fund . . . . . . . . . . . . . . . . . NA* 2.49% NA* NA* NA* NA* NA* NA* NA* NA* NA*Perkins Global Value Fund . . . . . . . . . . . . . . . NA* 2.25% NA* NA* NA* NA* NA* 2.93% NA* NA* NA*Perkins US Strategic Value Fund . . . . . . . . . . . . NA* 2.50% NA* NA* NA* NA* NA* 3.01% NA* NA* 1.75%INTECH European Core Fund . . . . . . . . . . . . . 1.75% NA* NA* NA* NA* NA* NA* NA* NA* NA* NA*INTECH Global All Country Low Volatility Fund . . . NA* NA* NA* NA* NA* NA* NA* NA* NA* NA* NA*INTECH Global Dividend Fund . . . . . . . . . . . . NA* 1.60% NA* 1.60% NA* NA* NA* 2.58% NA* 2.60% NA*INTECH US Core Fund . . . . . . . . . . . . . . . . NA* 1.70% NA* NA* NA* NA* NA* NA* NA* NA* NA*INTECH All-World Minimum Variance Core Fund(a) . . NA* NA* NA* NA* NA* NA* NA* NA* NA* NA* NA*Janus Global Diversified Alternatives Fund . . . . . . . NA* 2.25% NA* NA* NA* NA* NA* 3.00% NA* NA* NA*Janus Global Real Estate Fund . . . . . . . . . . . . . NA* 2.27% NA* NA* NA* NA* NA* 2.78% NA* 2.77% NA*Janus Flexible Income Fund . . . . . . . . . . . . . . NA* 1.95% NA* NA* NA* 2.95% NA* 2.20% NA* 2.20% NA*Janus Global Flexible Income Fund . . . . . . . . . . NA* 2.00% NA* NA* NA* NA* NA* 2.25% NA* 2.25% NA*Janus Global High Yield Fund . . . . . . . . . . . . . NA* 2.00% NA* 2.00% NA* 3.00% NA* 2.36% NA* 2.36% NA*Janus Global Investment Grade Bond Fund . . . . . . NA* 2.00% NA* 2.00% NA* 3.00% NA* 2.34% NA* 2.33% NA*Janus High Yield Fund . . . . . . . . . . . . . . . . . NA* 1.96% NA* NA* NA* 2.97% NA* 2.21% NA* 2.21% NA*Janus Global Unconstrained Bond Fund . . . . . . . . NA* 1.98% NA* 1.98% NA* NA* NA* 2.21% NA* 2.21% NA*Janus US Short-Term Bond Fund . . . . . . . . . . . . NA* 1.35% NA* NA* NA* NA* NA* 1.85% NA* 1.85% NA*

J a n u s C a p i t a l F u n d s P l c / 3 1 D e c e m b e r 2 0 1 5 3 3 1
Average Total Expense Ratios for the Financial year Ended 31 December 2015
AUD Share Classes RMB(CNH) Share Classes
Funds A acc A acc (H) A inc A inc (H) I inc I inc (H) V inc V inc (H) A acc A acc (H) A inc A inc (H) I acc (H) I inc I inc (H)
Janus Asia Frontier Markets Fund . . . . . NA* 2.50% NA* NA* NA* NA* NA* NA* NA* 2.50% NA* NA* 1.25% NA* NA*Janus Asia Growth Drivers Fund. . . . . . NA* 2.50% NA* NA* NA* NA* NA* NA* NA* 2.50% NA* NA* 1.25% NA* NA*Janus Asia Fund . . . . . . . . . . . . . . . . . . NA* 2.50% NA* NA* NA* NA* NA* NA* NA* 2.50% NA* NA* 1.25% NA* NA*Janus Balanced Fund. . . . . . . . . . . . . . . NA* 1.96% NA* 1.96% NA* NA* NA* 1.95% NA* NA* NA* 1.97% NA* NA* NA*Janus Emerging Markets Fund . . . . . . . NA* NA* NA* NA* NA* NA* NA* NA* NA* NA* NA* NA* NA* NA* NA*Janus Europe Fund . . . . . . . . . . . . . . . . NA* NA* NA* NA* NA* NA* NA* NA* NA* NA* NA* NA* NA* NA* NA*Janus Global Life Sciences Fund . . . . . . NA* 2.44% NA* NA* NA* NA* NA* NA* NA* 2.44% NA* NA* NA* NA* NA*Janus Global Research Fund . . . . . . . . . NA* NA* NA* NA* NA* NA* NA* NA* NA* NA* NA* NA* NA* NA* NA*Janus Global Technology Fund . . . . . . . NA* 2.60% NA* NA* NA* NA* NA* NA* NA* 2.57% NA* NA* NA* NA* NA*Janus Japan Emerging Opportunities Fund . . . . . . . . . . . . . . . . . . . . . . . . . . . NA* 2.50% NA* NA* NA* NA* NA* NA* NA* 2.50% NA* NA* 1.25% NA* NA*Janus Japan Fund . . . . . . . . . . . . . . . . . NA* 2.25% NA* NA* NA* NA* NA* NA* NA* 2.25% NA* NA* 1.15% NA* NA*Janus Opportunistic Alpha Fund. . . . . . NA* NA* NA* NA* NA* NA* NA* NA* NA* 2.35% NA* NA* NA* NA* NA*Janus US Fund . . . . . . . . . . . . . . . . . . . NA* NA* NA* NA* NA* NA* NA* NA* NA* NA* NA* NA* NA* NA* NA*Janus US Research Fund . . . . . . . . . . . . NA* NA* NA* NA* NA* NA* NA* NA* NA* NA* NA* NA* NA* NA* NA*Janus US Twenty Fund . . . . . . . . . . . . . NA* 2.24% NA* NA* NA* NA* NA* NA* NA* 2.23% NA* NA* NA* NA* NA*Janus US Venture Fund . . . . . . . . . . . . . NA* 2.50% NA* NA* NA* NA* NA* NA* NA* NA* NA* NA* NA* NA* NA*Perkins Global Value Fund . . . . . . . . . . NA* NA* NA* NA* NA* NA* NA* NA* NA* NA* NA* NA* NA* NA* NA*Perkins US Strategic Value Fund . . . . . . NA* NA* NA* NA* NA* NA* NA* NA* NA* NA* NA* NA* NA* NA* NA*INTECH All-World Minimum Variance Core Fund(a) . . . . . . . . . . . . . . . . . . . . . NA* NA* NA* NA* NA* NA* NA* NA* NA* NA* NA* NA* NA* NA* NA*INTECH European Core Fund . . . . . . . NA* NA* NA* NA* NA* NA* NA* NA* NA* NA* NA* NA* NA* NA* NA*INTECH Global All Country Low Volatility Fund. . . . . . . . . . . . . . . . . . . . NA* NA* NA* NA* NA* NA* NA* NA* NA* NA* NA* NA* NA* NA* NA*INTECH Global Dividend Fund . . . . . . NA* NA* NA* NA* NA* NA* NA* NA* NA* NA* NA* NA* NA* NA* NA*INTECH US Core Fund . . . . . . . . . . . . NA* NA* NA* NA* NA* NA* NA* NA* NA* NA* NA* NA* NA* NA* NA*Janus Global Diversified Alternatives Fund . . . . . . . . . . . . . . . . . . . . . . . . . . . NA* NA* NA* NA* NA* NA* NA* NA* NA* NA* NA* NA* NA* NA* NA*Janus Global Real Estate Fund. . . . . . . . NA* NA* NA* 2.27% NA* NA* NA* NA* NA* 2.27% NA* NA* NA* NA* NA*Janus Flexible Income Fund . . . . . . . . . NA* 1.95% NA* 1.94% NA* NA* NA* 1.94% NA* NA* NA* 1.97% NA* NA* NA*Janus Global Flexible Income Fund . . . NA* NA* NA* NA* NA* NA* NA* NA* NA* NA* NA* NA* NA* NA* NA*Janus Global High Yield Fund. . . . . . . . NA* NA* NA* 2.00% NA* 1.04% NA* NA* NA* NA* NA* NA* NA* NA* NA*Janus Global Investment Grade Bond Fund . . . . . . . . . . . . . . . . . . . . . . NA* NA* NA* NA* NA* NA* NA* NA* NA* NA* NA* NA* NA* NA* NA*Janus High Yield Fund . . . . . . . . . . . . . NA* 1.96% NA* 1.96% NA* 0.85% NA* 1.96% NA* NA* NA* 1.96% NA* NA* 0.87%Janus Global Unconstrained Bond Fund . . . . . . . . . . . . . . . . . . . . . . NA* NA* NA* 1.98% NA* NA* NA* NA* NA* NA* NA* 1.99% NA* NA* NA*Janus US Short-Term Bond Fund . . . . . NA* NA* NA* 1.33% NA* NA* NA* NA* NA* NA* NA* NA* NA* NA* NA*
Average Total Expense Ratios for the Financial year Ended 31 December 2015
GBP Share Classes
CAD Share Classes
SEK Share Classes
Funds A inc I acc I acc (H) I inc I inc (H) U acc U acc (H) U inc U inc (H) Z acc A acc (H) A inc A inc (H) A Acc (H) I acc (H)
Janus Asia Frontier Markets Fund . . . . . NA* NA* NA* NA* NA* NA* 1.05% NA* NA* NA* 2.50% NA* NA* NA* NA*Janus Asia Growth Drivers Fund. . . . . . NA* NA* NA* NA* NA* NA* 1.05% NA* NA* NA* 2.50% NA* NA* NA* NA*Janus Asia Fund . . . . . . . . . . . . . . . . . . NA* NA* NA* NA* NA* NA* 1.05% NA* NA* NA* 2.50% NA* NA* NA* NA*Janus Balanced Fund. . . . . . . . . . . . . . . NA* NA* NA* NA* NA* NA* NA* NA* NA* NA* NA* NA* 1.98% NA* NA*Janus Emerging Markets Fund . . . . . . . NA* NA* NA* NA* NA* 1.05% NA* NA* NA* NA* NA* NA* NA* NA* NA*Janus Europe Fund . . . . . . . . . . . . . . . . NA* NA* NA* NA* NA* NA* NA* NA* NA* NA* NA* NA* NA* 2.21% 1.20%Janus Global Life Sciences Fund . . . . . . NA* NA* NA* NA* NA* 0.98% NA* 0.99% NA* NA* NA* NA* NA* NA* NA*Janus Global Research Fund . . . . . . . . . NA* NA* NA* NA* NA* 1.05% NA* NA* NA* NA* NA* NA* NA* NA* NA*Janus Global Technology Fund . . . . . . . NA* NA* NA* NA* NA* NA* NA* NA* NA* NA* NA* NA* NA* NA* NA*

3 3 2 J a n u s C a p i t a l F u n d s P l c / 3 1 D e c e m b e r 2 0 1 5
Fund Expense Limits and Total Expense Ratios (unaudited)
Average Total Expense Ratios for the Financial year Ended 31 December 2015
GBP Share Classes
CAD Share Classes
SEK Share Classes
Funds A inc I acc I acc (H) I inc I inc (H) U acc U acc (H) U inc U inc (H) Z acc A acc (H) A inc A inc (H) A Acc (H) I acc (H)Janus Japan Emerging Opportunities Fund . . . . . . . . . . . . . . . . . . . . . . . . . . . NA* NA* NA* NA* NA* NA* 1.05% NA* NA* NA* 2.50% NA* NA* NA* NA*Janus Japan Fund . . . . . . . . . . . . . . . . . NA* NA* NA* NA* NA* NA* 1.05% NA* NA* NA* 2.25% NA* NA* NA* NA*Janus Opportunistic Alpha Fund. . . . . . NA* NA* NA* NA* NA* 1.05% NA* NA* NA* NA* NA* NA* NA* NA* NA*Janus US Fund . . . . . . . . . . . . . . . . . . . NA* NA* NA* NA* NA* NA* NA* NA* NA* NA* NA* NA* NA* NA* NA*Janus US Research Fund . . . . . . . . . . . . NA* NA* NA* NA* NA* NA* NA* NA* NA* NA* NA* NA* NA* NA* NA*Janus US Twenty Fund . . . . . . . . . . . . . NA* NA* NA* NA* NA* 1.00% NA* NA* NA* NA* NA* NA* NA* NA* NA*Janus US Venture Fund . . . . . . . . . . . . . NA* NA* NA* NA* NA* 1.01% NA* NA* NA* NA* NA* NA* NA* NA* NA*Perkins Global Value Fund . . . . . . . . . . NA* NA* NA* NA* NA* NA* NA* NA* NA* NA* NA* NA* NA* NA* NA*Perkins US Strategic Value Fund . . . . . . NA* NA* NA* NA* NA* 1.05% NA* NA* NA* NA* NA* NA* NA* NA* NA*INTECH All-World Minimum Variance Core Fund(a) . . . . . . . . . . . . . . . . . . . . . NA* NA* NA* NA* NA* NA* NA* NA* NA* NA* NA* NA* NA* NA* NA*INTECH European Core Fund . . . . . . . NA* NA* NA* NA* NA* NA* NA* NA* NA* NA* NA* NA* NA* NA* NA*INTECH Global All Country Low Volatility Fund. . . . . . . . . . . . . . . . . . . . NA* NA* NA* NA* NA* NA* NA* NA* NA* NA* NA* NA* NA* NA* NA*INTECH Global Dividend Fund . . . . . . NA* NA* NA* NA* NA* NA* NA* 1.00% NA* NA* NA* NA* NA* NA* NA*INTECH US Core Fund . . . . . . . . . . . . NA* NA* NA* NA* NA* 0.94% NA* NA* NA* NA* NA* NA* NA* NA* NA*Janus Global Diversified Alternatives Fund . . . . . . . . . . . . . . . . . . . . . . . . . . . NA* NA* NA* NA* NA* NA* 1.15% NA* NA* NA* NA* NA* NA* 2.25% 1.35%Janus Global Real Estate Fund. . . . . . . . NA* NA* NA* NA* NA* NA* NA* 1.05% 1.05% NA* NA* NA* NA* NA* NA*Janus Flexible Income Fund . . . . . . . . . NA* NA* NA* NA* NA* NA* 0.81% NA* 0.80% NA* NA* NA* NA* NA* NA*Janus Global Flexible Income Fund . . . NA* NA* NA* NA* NA* NA* 0.85% NA* 0.85% NA* NA* NA* NA* NA* NA*Janus Global High Yield Fund. . . . . . . . NA* NA* NA* NA* NA* NA* 0.84% NA* 0.84% NA* NA* NA* NA* NA* NA*Janus Global Investment Grade Bond Fund . . . . . . . . . . . . . . . . . . . . . . NA* NA* NA* NA* 0.85% NA* NA* NA* NA* NA* NA* NA* NA* NA* NA*Janus High Yield Fund . . . . . . . . . . . . . NA* NA* NA* NA* NA* NA* 0.80% NA* 0.80% NA* NA* NA* NA* NA* NA*Janus Global Unconstrained Bond Fund . . . . . . . . . . . . . . . . . . . . . . NA* NA* NA* NA* NA* NA* 0.77% 0.79% 0.79% NA* NA* NA* 1.99% NA* NA*Janus US Short-Term Bond Fund . . . . . NA* NA* 0.83% NA* 0.83% NA* 0.82% NA* 0.81% NA* NA* NA* NA* NA* NA*
Average Total Expense Ratios for the Financial year Ended 31 December 2015
CHF Share Classes JPY Share ClassesSGD Share
Classes
Funds A inc A inc (H) A acc A acc (H) I acc I acc (H) I inc (H) A inc (H) A acc (H) I acc (H) I Acc A Inc (H)
Janus Asia Frontier Markets Fund . . . . . NA* NA* NA* NA* NA* NA* NA* NA* NA* NA* NA* NA*Janus Asia Growth Drivers Fund. . . . . . NA* NA* NA* NA* NA* NA* NA* NA* NA* NA* NA* NA*Janus Asia Fund . . . . . . . . . . . . . . . . . . NA* NA* NA* NA* NA* NA* NA* NA* NA* NA* NA* NA*Janus Balanced Fund. . . . . . . . . . . . . . . NA* NA* NA* NA* NA* NA* NA* NA* NA* NA* NA* NA*Janus Emerging Markets Fund . . . . . . . NA* NA* NA* NA* NA* NA* NA* NA* NA* NA* NA* NA*Janus Europe Fund . . . . . . . . . . . . . . . . NA* NA* NA* NA* NA* NA* NA* NA* NA* NA* NA* NA*Janus Global Life Sciences Fund . . . . . . NA* NA* NA* NA* NA* NA* NA* NA* NA* NA* NA* NA*Janus Global Research Fund . . . . . . . . . NA* NA* NA* NA* NA* NA* NA* NA* NA* NA* NA* NA*Janus Global Technology Fund . . . . . . . NA* NA* NA* NA* NA* NA* NA* NA* NA* NA* NA* NA*Janus Japan Emerging Opportunities Fund . . . . . . . . . . . . . . . . . . . . . . . . . . . NA* NA* NA* NA* NA* NA* NA* NA* NA* NA* 1.25% NA*Janus Japan Fund . . . . . . . . . . . . . . . . . NA* NA* NA* NA* NA* NA* NA* NA* NA* NA* 1.15% NA*Janus Opportunistic Alpha Fund. . . . . . NA* NA* NA* NA* NA* NA* NA* NA* NA* NA* NA* NA*Janus US Fund . . . . . . . . . . . . . . . . . . . NA* NA* NA* NA* NA* NA* NA* NA* NA* NA* NA* NA*Janus US Research Fund . . . . . . . . . . . . NA* NA* NA* NA* NA* NA* NA* NA* NA* NA* NA* NA*Janus US Twenty Fund . . . . . . . . . . . . . NA* NA* NA* NA* NA* NA* NA* NA* NA* NA* NA* NA*Janus US Venture Fund . . . . . . . . . . . . . NA* NA* NA* NA* NA* NA* NA* NA* NA* NA* NA* NA*Perkins Global Value Fund . . . . . . . . . . NA* NA* NA* NA* NA* NA* NA* NA* NA* NA* NA* NA*

J a n u s C a p i t a l F u n d s P l c / 3 1 D e c e m b e r 2 0 1 5 3 3 3
Average Total Expense Ratios for the Financial year Ended 31 December 2015
CHF Share Classes JPY Share ClassesSGD Share
Classes
Funds A inc A inc (H) A acc A acc (H) I acc I acc (H) I inc (H) A inc (H) A acc (H) I acc (H) I Acc A Inc (H)Perkins US Strategic Value Fund . . . . . . NA* NA* NA* NA* NA* NA* NA* NA* NA* NA* NA* NA*INTECH All-World Minimum Variance Core Fund(a) . . . . . . . . . . . . . . . . . . . . . NA* NA* NA* NA* NA* NA* NA* NA* NA* NA* NA* NA*INTECH European Core Fund . . . . . . . NA* NA* NA* NA* NA* NA* NA* NA* NA* NA* NA* NA*INTECH Global All Country Low Volatility Fund. . . . . . . . . . . . . . . . . . . . NA* NA* NA* NA* NA* NA* NA* NA* NA* NA* NA* NA*INTECH Global Dividend Fund . . . . . . NA* NA* NA* NA* NA* NA* NA* NA* NA* NA* NA* NA*INTECH US Core Fund . . . . . . . . . . . . NA* NA* NA* NA* NA* NA* NA* NA* NA* NA* NA* NA*Janus Global Diversified Alternatives Fund . . . . . . . . . . . . . . . . . . . . . . . . . . . NA* NA* NA* 2.25% NA* 1.35% NA* NA* NA* NA* NA* NA*Janus Global Real Estate Fund. . . . . . . . NA* NA* NA* NA* NA* NA* NA* NA* NA* NA* NA* NA*Janus Flexible Income Fund . . . . . . . . . NA* NA* NA* NA* NA* NA* NA* NA* NA* NA* NA* NA*Janus Global Flexible Income Fund . . . NA* NA* NA* NA* NA* NA* NA* NA* NA* NA* NA* NA*Janus Global High Yield Fund. . . . . . . . NA* NA* NA* NA* NA* NA* NA* NA* NA* NA* NA* NA*Janus Global Investment Grade Bond Fund . . . . . . . . . . . . . . . . . . . . . . NA* NA* NA* NA* NA* NA* NA* NA* NA* NA* NA* NA*Janus High Yield Fund . . . . . . . . . . . . . NA* NA* NA* NA* NA* NA* NA* NA* NA* NA* NA* NA*Janus Global Unconstrained Bond Fund . . . . . . . . . . . . . . . . . . . . . . NA* 2.01% NA* 1.92% NA* NA* NA* NA* NA* NA* NA* 2.01%Janus US Short-Term Bond Fund . . . . . NA* 1.35% NA* NA* NA* NA* 0.83% NA* NA* NA* NA* NA*
NA* Share class not yet launched


Independent auditors' report to the members
of Janus Capital Funds Plc
Report on the financial statements
Our opinion
In our opinion, Janus Capital Funds Plc financial statements
(the "financial statements"):
• give a true and fair view of the company and Funds assets,
liabilities and financial position as at 31 December 2015 and Of their results for the year then ended;
• have been properly prepared in accordance with Generally Accepted Accounting Practice in Ireland; and
• have been properly prepared in accordance with the requirements of the Companies Act 2014 and the
European Communities (Undertakings for Collective Investment in Transferable Securities) Regulations 2011
(as amended).
What we have audited
The financial statements comprise:
• the Statement of Financial Position as at 31 December 2015;
• the Statement of Comprehensive Income for the year then ended;
• the Statement of Changes in Net Assets Attributable to Redeemable Participating Shareholders for the year then ended;
• the Portfolio Investments for each of the Funds as at 31 December 2015; and
• the notes to the financial statements for the company
and for each of its Funds which include a summary of significant accounting policies and other explanatory
information.
The financial reporting framework that has been applied in the preparation of the financial statements is Irish law and
accounting standards issued by the Financial Reporting Council and promulgated by the Institute of Chartered
Accountants in Ireland (Generally Accepted Accounting Practice in Ireland).
In applying the financial reporting framework, the directors
have made a number of subjective judgements, for example in
respect of significant accounting estimates. In making such estimates, they have made assumptions and considered future events.
Matters on which we are required to report by the Companies Act 2014
• We have obtained all the information and explanations
which we consider necessary for the purposes of our audit.
• In our opinion the accounting records of the company were sufficient to permit the financial statements to be readily
and properly audited.
• The financial statements are in agreement with the accounting records.
• In our opinion the information given in the Directors Report is consistent with the financial statements.
• In our opinion, based on the work undertaken in the course of our audit of the financial statements, the description Of the main features of the internal control and risk
management systems in relation to the financial reporting process included in the Corporate Governance Statement, is consistent with the financial statements and has been
prepared in accordance with section 1373(2)(c) of the Companies Act 2014.
Based on our knowledge and understanding of the company
and its environment, obtained in the course of our audit of the financial statements, we have not identified material
misstatements in the description of the main features of the internal control and risk management systems in relation to
the financial reporting process included in the Corporate Governance Statement.
• In our opinion, based on the work undertaken during the course of our audit of the financial statements, the information required by section 1373 (2)(a),(b),(e) and (f) is contained in the Corporate Governance Statement.
Matter on which we are required to report by exception
Directors' remuneration and transactions
Under the Companies Act 2014 we are required to report to you
if, in our opinion, the disclosures of directors' remuneration and
transactions specified by sections 305 to 312 of that Act have
not been made. We have no exceptions to report arising from this responsibility.
Responsibilities for the financial statements and the audit
Our responsibilities and those of the directors
As explained more fully in the Directors' Responsibilities set out
on page 17, the directors are responsible for the preparation of
the financial statements and for being satisfied that they give a true and fair view.
Our responsibility is to audit and express an opinion on the financial statements in accordance with Irish law and
International Standards on Auditing (UK and Ireland). Those
standards require us to comply with the Auditing Practices
Board's Ethical Standards for Auditors.
This report, including the opinions, has been prepared for
and only for the company's members as a body in accordance with section 391 of the Companies Act 2014 and for no other
Janus Capital Funds Plc / 31 Dcccmber 2015 335

Independent auditors' report to the members
of Janus Capital Funds Plc
purpose. We do not, in giving these opinions, accept or assume responsibility for any other purpose or to any other person to whom this report is shown or into whose hands it may come save where expressly agreed by our prior consent in writing.
What an audit of financial statements involves
We conducted our audit in accordance with International Standards on Auditing (UK and Ireland). An audit involves obtaining evidence about the amounts and disclosures in the financial statements sufficient to give reasonable assurance that the financial statements are free from material misstatement, whether caused by fraud or error. This includes an assessment of:
• whether the accounting policies are appropriate to the company's circumstances and have been consistently applied and adequately disclosed;
• the reasonableness of significant accounting estimates made by the directors; and
the overall presentation of the financial statements.
We primarily focus our work in these areas by assessing the directors' judgements against available evidence, forming our own judgements, and evaluating the disclosures in the financial statements.
We test and examine information, using sampling and other auditing techniques, to the extent we consider necessary to provide a reasonable basis for us to draw conclusions. We obtain audit evidence through testing the effectiveness of controls, substantive procedures or a combination of both.
In addition, we read all the financial and non-financial information in the Annual Report to identify material inconsistencies with the audited financial statements and to identify any information that is apparently materially incorrect based on, or materially inconsistent with, the knowledge acquired by us in the course of performing the audit. If we become aware of any apparent material misstatements or inconsistencies we consider the implications for our report.
4Fionada, for and on behalf of Pricewaterhouse Coopers, Chartered Accountants and Statutory Audit Firm, Dublin 27 April 2016
336 Janus Capital Funds Plc / 31 Dcccmbcr 2015

Directors and Other Information (unaudited)
J a n u s C a p i t a l F u n d s P l c / 3 1 D e c e m b e r 2 0 1 5 3 3 7
BOARD OF DIRECTORS Augustus Cheh (U.S.A.)Dennis Mullen (U.S.A.)*Carl O’Sullivan (Ireland)*Peter Sandys (Ireland)*Hans Vogel (Ireland)*
INDEPENDENT AUDITORS PricewaterhouseCoopersChartered AccountantsOne Spencer DockNorth Wall QuayDublin 1Ireland
INVESTMENT ADVISER Janus CapitalInternational Limited26th Floor, CityPoint1 Ropemaker StreetLondon EC2Y 9HTUnited Kingdom
SUB-INVESTMENT ADVISER Janus CapitalManagement LLC151 Detroit StreetDenver, Colorado80206United States of America
Janus Capital SingaporePte. Limited8 Shenton Way#36-02 AXA TowerSingapore 068811
Perkins InvestmentManagement LLC311 S. Wacker DriveSuite 6000Chicago, Illinois 60606United States of America
DIAM International Ltd.(DIAM UK)Bracken HouseOne Friday StreetLondon EC4M 9JAUnited Kingdom
INTECH InvestmentManagement LLCCityplace Tower525 Okeechobee BoulevardSuite 1800West Palm BeachFL 33401United States of America
SUB SUB-INVESTMENT ADVISER
(effective to 12 April 2015)DIAM Assest Management (HK) LimitedSuites 1221–22Two Pacific Place88 QueenswayHong Kong
(effective from 20 May 2015)DIAM Singapore Pte. Limited2 Shenton Way#12–01 SGX Centre 1Singapore 068804
ADMINISTRATOR,SHAREHOLDER SERVICING AGENT AND SECRETARY
Citibank Europe plc1 North Wall QuayDublin 1Ireland
DEPOSITARY (effective to 30 December 2015)Citibank International Limited,Ireland Branch1 North Wall QuayDublin 1Ireland
(effective from 31 December 2015)Citi Depositary ServicesIreland Limited,1 North Wall QuayDublin 1Ireland
REGISTERED OFFICE Arthur Cox Building Earlsfort Centre Earlsfort TerraceDublin 2Ireland
REGISTERED NO 296610
VAT NO IE 8296610E
LEGAL ADVISERS Arthur CoxEarlsfort Centre Earlsfort TerraceDublin 2Ireland
DISTRIBUTOR AND PROMOTER
Janus CapitalInternational Limited26th Floor, CityPoint1 Ropemaker StreetLondon EC2Y 9HTUnited Kingdom
SPONSORING BROKER J & E DavyDavy House49 Dawson StreetDublin 2Ireland* Independent Director
(all Directors are non-executive)

Directors and Other Information (unaudited)
3 3 8 J a n u s C a p i t a l F u n d s P l c / 3 1 D e c e m b e r 2 0 1 5
Below is a list of the Funds’ Representatives/Paying Agents as of 31 December 2015.
Country Representative/Paying Agent
Austria Unicredit Bank Austria AGSchottengasse 6-81010 WienAustria
Belgium Citibank Belgium NV S.A.263g Boulevard General Jacques1050 BrusselsBelgium
France BNP-ParibasSecurities Services3 Rue d’Antin75002 ParisFrance
Germany State Street Bank GmbHSolmsstrasse 8360486 FrankfurtGermany
Hong Kong Janus Capital Asia LimitedSuites 1911-15One International Finance Centre1 Harbour View Street CentralHong Kong
Italy 1. State Street Bank SpAVia Col Moschin 1620136 MilanItaly
2. BNP ParibasMilan BranchSecurities ServicesVia Ansperto 520123 MilanItaly
3. Allfunds Bank S.A. operatingthrough its Milan branchVia. Santa Margherita 720121 MilanItaly
Country Representative/Paying Agent
4. Sociètè Gènèrale SecuritiesServices SpA,Via S. Chiara 1910122 TurinoItaly
Luxembourg BGL BNP Paribas S.A.50 Avenue J.F. KennedyL-2951Luxembourg
Switzerland Swiss RepresentativeCarnegie Fund Services S.A. (CFS)11, rue du Gènèral-Dufour1204 GenèveSwitzerland
Swiss Paying AgentBanque Cantonale de Genève17 quai de I’lle1204 GenèveSwitzerland
Taiwan Janus Capital Taiwan LimitedSuite 45 A-1, Taipei 101 TowerNo. 7, Sec. 5 Xin Yi RoadXin Yi District, TaipeiTaiwan, R.O.C.
UK Janus Capital International LimitedCitipoint, 26th Floor1 Ropemaker StreetLondon EC2Y 9HTUnited Kingdom

Janus Capital International Limited United KingdomTel.: +44 20 7410 1900 Email: [email protected]
Janus Capital International Limited The Hague BranchTel.: +31 703 53 8122 Email: [email protected]
Janus Capital International Limited Milan BranchTel.: +39 02 863233 Email: [email protected]
Janus Capital International Limited Frankfurt BranchTel.: +49 069 667748 222Email: [email protected]
Janus Capital International Limited Paris BranchTel.: +33 1 534 55439Email: [email protected]
Janus Capital International Limited Tokyo BranchTel.: +81 3 6250 9820Email: [email protected]
Janus Capital Asia LimitedHong KongTel.: +852 3121 7000Email: [email protected]
Janus Capital Singapore PteLimited SingaporeTel.: +65 6511 8490Email: [email protected]
Janus Capital Funds plc