Semi-Annual Report 2014 - TeleTrader.com
342
Investment Company under Luxembourg Law (SICAV) UBS ETF Semi-Annual Report as of 30 June 2014 (Unaudited) UBS ETF - EURO STOXX 50 UCITS ETF UBS ETF - MSCI Canada 100% hedged to SGD UCITS ETF UBS ETF - MSCI Europe UCITS ETF UBS ETF - MSCI Switzerland 20/35 UCITS ETF UBS ETF - MSCI Europe ex UK UCITS ETF UBS ETF - MSCI Switzerland 20/35 100% hedged to EUR UCITS ETF UBS ETF - MSCI EMU UCITS ETF UBS ETF - MSCI Switzerland 20/35 100% hedged to USD UCITS ETF UBS ETF - MSCI EMU 100% hedged to CHF UCITS ETF UBS ETF - MSCI Switzerland 20/35 100% hedged to GBP UCITS ETF UBS ETF - MSCI EMU 100% hedged to USD UCITS ETF UBS ETF - MSCI Switzerland 20/35 100% hedged to SGD UCITS ETF UBS ETF - MSCI EMU 100% hedged to GBP UCITS ETF UBS ETF - MSCI World UCITS ETF UBS ETF - MSCI EMU 100% hedged to SGD UCITS ETF UBS ETF - MSCI Emerging Markets UCITS ETF UBS ETF - MSCI EMU Value UCITS ETF UBS ETF - MSCI World Socially Responsible UCITS ETF UBS ETF - MSCI EMU Small Cap UCITS ETF UBS ETF - MSCI North America Socially Responsible UCITS ETF UBS ETF - FTSE 100 UCITS ETF UBS ETF - MSCI Europe & Middle East Socially Responsible UCITS ETF UBS ETF - FTSE 250 UCITS ETF UBS ETF - MSCI Pacific Socially Responsible UCITS ETF UBS ETF - MSCI United Kingdom UCITS ETF UBS ETF - MSCI Japan Infrastructure 20/35 UCITS ETF UBS ETF - MSCI United Kingdom 100% hedged to CHF UCITS ETF UBS ETF - MSCI AC Asia ex Japan Infrastructure 20/35 UCITS ETF UBS ETF - MSCI United Kingdom 100% hedged to EUR UCITS ETF UBS ETF - MSCI Europe Infrastructure 20/35 UCITS ETF UBS ETF - MSCI United Kingdom 100% hedged to USD UCITS ETF UBS ETF - STOXX Global Rare Earth UCITS ETF UBS ETF - MSCI United Kingdom 100% hedged to SGD UCITS ETF UBS ETF - Barclays Capital US 1-3 Year Treasury Bond UCITS ETF UBS ETF - MSCI Turkey UCITS ETF UBS ETF - Barclays Capital US 3-5 Year Treasury Bond UCITS ETF UBS ETF - MSCI Japan UCITS ETF UBS ETF - Barclays Capital US 5-7 Year Treasury Bond UCITS ETF UBS ETF - MSCI Japan 100% hedged to CHF UCITS ETF UBS ETF - Barclays Capital US 7-10 Year Treasury Bond UCITS ETF UBS ETF - MSCI Japan 100% hedged to EUR UCITS ETF UBS ETF - Markit iBoxx € Germany 1-3 UCITS ETF UBS ETF - MSCI Japan 100% hedged to GBP UCITS ETF UBS ETF - Markit iBoxx € Germany 3-5 UCITS ETF UBS ETF - MSCI Japan 100% hedged to USD UCITS ETF UBS ETF - Markit iBoxx € Germany 5-10 UCITS ETF UBS ETF - MSCI Japan 100% hedged to SGD UCITS ETF UBS ETF - Markit iBoxx € Germany 7-10 UCITS ETF UBS ETF - MSCI Pacific (ex Japan) UCITS ETF UBS ETF - Markit iBoxx € Liquid Corporates UCITS ETF UBS ETF - MSCI USA UCITS ETF UBS ETF - Markit iBoxx € Sovereigns 1-5 UCITS ETF UBS ETF - MSCI Canada UCITS ETF UBS ETF - SBI® Foreign AAA-BBB 1-5 UCITS ETF UBS ETF - MSCI Canada 100% hedged to CHF UCITS ETF UBS ETF - SBI® Foreign AAA-BBB 5-10 UCITS ETF UBS ETF - MSCI Canada 100% hedged to EUR UCITS ETF UBS ETF - Barclays Euro Area Liquid Corporates 1-5 Year UCITS ETF UBS ETF - MSCI Canada 100% hedged to USD UCITS ETF UBS ETF - Barclays US Liquid Corporates UCITS ETF UBS ETF - MSCI Canada 100% hedged to GBP UCITS ETF No subscriptions can be received on the basis of financial reports. Subscriptions are only valid if made on the basis of the current Prospectus supplemented by the latest Annual Report and latest Semi-Annual Report if published thereafter. RCS Number: B-83626 Semi-Annual Report 2014
-
Upload
khangminh22 -
Category
Documents
-
view
0 -
download
0
Transcript of Semi-Annual Report 2014 - TeleTrader.com

Investment Company under Luxembourg Law (SICAV)
UBS ETF Semi-Annual Report as of 30 June 2014 (Unaudited)
UBS ETF - EURO STOXX 50 UCITS ETF UBS ETF - MSCI Canada 100% hedged to SGD UCITS ETF UBS ETF - MSCI Europe UCITS ETF UBS ETF - MSCI Switzerland 20/35 UCITS ETF UBS ETF - MSCI Europe ex UK UCITS ETF UBS ETF - MSCI Switzerland 20/35 100% hedged to EUR UCITS ETF UBS ETF - MSCI EMU UCITS ETF UBS ETF - MSCI Switzerland 20/35 100% hedged to USD UCITS ETF UBS ETF - MSCI EMU 100% hedged to CHF UCITS ETF UBS ETF - MSCI Switzerland 20/35 100% hedged to GBP UCITS ETF UBS ETF - MSCI EMU 100% hedged to USD UCITS ETF UBS ETF - MSCI Switzerland 20/35 100% hedged to SGD UCITS ETF UBS ETF - MSCI EMU 100% hedged to GBP UCITS ETF UBS ETF - MSCI World UCITS ETF UBS ETF - MSCI EMU 100% hedged to SGD UCITS ETF UBS ETF - MSCI Emerging Markets UCITS ETF UBS ETF - MSCI EMU Value UCITS ETF UBS ETF - MSCI World Socially Responsible UCITS ETF UBS ETF - MSCI EMU Small Cap UCITS ETF UBS ETF - MSCI North America Socially Responsible UCITS ETF UBS ETF - FTSE 100 UCITS ETF UBS ETF - MSCI Europe & Middle East Socially Responsible UCITS ETF UBS ETF - FTSE 250 UCITS ETF UBS ETF - MSCI Pacific Socially Responsible UCITS ETF UBS ETF - MSCI United Kingdom UCITS ETF UBS ETF - MSCI Japan Infrastructure 20/35 UCITS ETF UBS ETF - MSCI United Kingdom 100% hedged to CHF UCITS ETF UBS ETF - MSCI AC Asia ex Japan Infrastructure 20/35 UCITS ETF UBS ETF - MSCI United Kingdom 100% hedged to EUR UCITS ETF UBS ETF - MSCI Europe Infrastructure 20/35 UCITS ETF UBS ETF - MSCI United Kingdom 100% hedged to USD UCITS ETF UBS ETF - STOXX Global Rare Earth UCITS ETF UBS ETF - MSCI United Kingdom 100% hedged to SGD UCITS ETF UBS ETF - Barclays Capital US 1-3 Year Treasury Bond UCITS ETFUBS ETF - MSCI Turkey UCITS ETF UBS ETF - Barclays Capital US 3-5 Year Treasury Bond UCITS ETF UBS ETF - MSCI Japan UCITS ETF UBS ETF - Barclays Capital US 5-7 Year Treasury Bond UCITS ETF UBS ETF - MSCI Japan 100% hedged to CHF UCITS ETF UBS ETF - Barclays Capital US 7-10 Year Treasury Bond UCITS ETF UBS ETF - MSCI Japan 100% hedged to EUR UCITS ETF UBS ETF - Markit iBoxx € Germany 1-3 UCITS ETF UBS ETF - MSCI Japan 100% hedged to GBP UCITS ETF UBS ETF - Markit iBoxx € Germany 3-5 UCITS ETF UBS ETF - MSCI Japan 100% hedged to USD UCITS ETF UBS ETF - Markit iBoxx € Germany 5-10 UCITS ETF UBS ETF - MSCI Japan 100% hedged to SGD UCITS ETF UBS ETF - Markit iBoxx € Germany 7-10 UCITS ETF UBS ETF - MSCI Pacific (ex Japan) UCITS ETF UBS ETF - Markit iBoxx € Liquid Corporates UCITS ETF UBS ETF - MSCI USA UCITS ETF UBS ETF - Markit iBoxx € Sovereigns 1-5 UCITS ETF UBS ETF - MSCI Canada UCITS ETF UBS ETF - SBI® Foreign AAA-BBB 1-5 UCITS ETF UBS ETF - MSCI Canada 100% hedged to CHF UCITS ETF UBS ETF - SBI® Foreign AAA-BBB 5-10 UCITS ETFUBS ETF - MSCI Canada 100% hedged to EUR UCITS ETF UBS ETF - Barclays Euro Area Liquid Corporates 1-5 Year UCITS ETF UBS ETF - MSCI Canada 100% hedged to USD UCITS ETF UBS ETF - Barclays US Liquid Corporates UCITS ETF UBS ETF - MSCI Canada 100% hedged to GBP UCITS ETF
No subscriptions can be received on the basis of financial reports. Subscriptions are only valid if made on the basis of the current Prospectus supplemented by the latest Annual Report and latest Semi-Annual Report if published thereafter.
RCS Number: B-83626
Semi-Annual Report 2014

For the following Sub-Funds of UBS ETF no notification for distribution in the Federal Republic of Germany was submitted and shares in these Sub-Funds may NOT be offered to investors within the scope of the German Investment Code. As a consequence, the following sub-funds are NOT available to investors in Germany:
- UBS ETF - Barclays Capital US 10-20 Year Treasury Bond UCITS ETF - UBS ETF - Barclays Capital US 20+ Year Treasury Bond UCITS ETF - UBS ETF - Markit iBoxx € Germany 10+ UCITS ETF - UBS ETF - Markit iBoxx Sterling Inflation-Linked Index 10+UCITS ETF - UBS ETF - Markit iBoxx TIPS Inflation-Linked Index 10+ UCITS ETF - UBS ETF - Markit iBoxx TIPS Inflation-Linked Index 5-10 UCITS ETF - UBS ETF - MSCI Canada 100% hedged to SGD UCITS ETF - UBS ETF - MSCI EMU 100% hedged to SGD UCITS ETF - UBS ETF - MSCI Japan 100% hedged to SGD UCITS ETF - UBS ETF - MSCI Switzerland 20/35 100% hedged to SGD UCITS ETF - UBS ETF - MSCI United Kingdom 100% hedged to SGD UCITS ETF

Semi-Annual Report as of 30 June 2014
Contents Page
Management and Administration 4
Performance tables 5-7
Statement of Net Assets 8-23
Statement of Operations 24-39
Statement of Changes in Net Assets 40-55
Schedule of Investments UBS ETF - EURO STOXX 50 UCITS ETF 56-57
Schedule of Investments UBS ETF - MSCI Europe UCITS ETF 58-66
Schedule of Investments UBS ETF - MSCI Europe ex UK UCITS ETF 67-73
Schedule of Investments UBS ETF - MSCI EMU UCITS ETF 74-79
Schedule of Investments UBS ETF - MSCI EMU 100% hedged to CHF UCITS ETF 80-85
Schedule of Investments UBS ETF - MSCI EMU 100% hedged to USD UCITS ETF 86-91
Schedule of Investments UBS ETF - MSCI EMU 100% hedged to GBP UCITS ETF 92-97
Schedule of Investments UBS ETF - MSCI EMU Value UCITS ETF 98-101
Schedule of Investments UBS ETF - MSCI EMU Small Cap UCITS ETF 102-111
Schedule of Investments UBS ETF - FTSE 100 UCITS ETF 112-114
Schedule of Investments UBS ETF - FTSE 250 UCITS ETF 115-120
Schedule of Investments UBS ETF - MSCI United Kingdom UCITS ETF 121-123
Schedule of Investments UBS ETF - MSCI United Kingdom 100% hedged to CHF UCITS ETF 124-126
Schedule of Investments UBS ETF - MSCI United Kingdom 100% hedged to EUR UCITS ETF 127-129
Schedule of Investments UBS ETF - MSCI United Kingdom 100% hedged to USD UCITS ETF 130-132
Schedule of Investments UBS ETF - MSCI Turkey UCITS ETF 133
Schedule of Investments UBS ETF - MSCI Japan UCITS ETF 134-139
Schedule of Investments UBS ETF - MSCI Japan 100% hedged to CHF UCITS ETF 140-146
Schedule of Investments UBS ETF - MSCI Japan 100% hedged to EUR UCITS ETF 147-153
Schedule of Investments UBS ETF - MSCI Japan 100% hedged to GBP UCITS ETF 154-160
Schedule of Investments UBS ETF - MSCI Japan 100% hedged to USD UCITS ETF 161-167
Schedule of Investments UBS ETF - MSCI Pacific (ex Japan) UCITS ETF 168-171
Schedule of Investments UBS ETF - MSCI USA UCITS ETF 172-182
Schedule of Investments UBS ETF - MSCI Canada UCITS ETF 183-185
Schedule of Investments UBS ETF - MSCI Canada 100% hedged to CHF UCITS ETF 186-188
Schedule of Investments UBS ETF - MSCI Canada 100% hedged to EUR UCITS ETF 189-191
Schedule of Investments UBS ETF - MSCI Canada 100% hedged to USD UCITS ETF 192-194
Schedule of Investments UBS ETF - MSCI Canada 100% hedged to GBP UCITS ETF 195-197

Semi-Annual Report as of 30 June 2014
Contents (continued) Page
Schedule of Investments UBS ETF - MSCI Switzerland 20/35 UCITS ETF 198-199
Schedule of Investments UBS ETF - MSCI Switzerland 20/35 100% hedged to EUR UCITS ETF 200-201
Schedule of Investments UBS ETF - MSCI Switzerland 20/35 100% hedged to USD UCITS ETF 202-203
Schedule of Investments UBS ETF - MSCI Switzerland 20/35 100% hedged to GBP UCITS ETF 204-205
Schedule of Investments UBS ETF - MSCI World UCITS ETF 206-231
Schedule of Investments UBS ETF - MSCI Emerging Markets UCITS ETF 232-246
Schedule of Investments UBS ETF - MSCI World Socially Responsible UCITS ETF 247-254
Schedule of Investments UBS ETF - MSCI North America Socially Responsible UCITS ETF 255-259
Schedule of Investments UBS ETF - MSCI Europe & Middle East Socially Responsible UCITS ETF 260-263
Schedule of Investments UBS ETF - MSCI Pacific Socially Responsible UCITS ETF 264-266
Schedule of Investments UBS ETF - MSCI Japan Infrastructure 20/35 UCITS ETF 267
Schedule of Investments UBS ETF - MSCI AC Asia ex Japan Infrastructure 20/35 UCITS ETF 268-269
Schedule of Investments UBS ETF - MSCI Europe Infrastructure 20/35 UCITS ETF 270-271
Schedule of Investments UBS ETF - STOXX Global Rare Earth UCITS ETF 272
Schedule of Investments UBS ETF - Barclays Capital US 1-3 Year Treasury Bond UCITS ETF 273-274
Schedule of Investments UBS ETF - Barclays Capital US 3-5 Year Treasury Bond UCITS ETF 275
Schedule of Investments UBS ETF - Barclays Capital US 5-7 Year Treasury Bond UCITS ETF 276
Schedule of Investments UBS ETF - Barclays Capital US 7-10 Year Treasury Bond UCITS ETF 277
Schedule of Investments UBS ETF - Markit iBoxx € Germany 1-3 UCITS ETF 278
Schedule of Investments UBS ETF - Markit iBoxx € Germany 3-5 UCITS ETF 279
Schedule of Investments UBS ETF - Markit iBoxx € Germany 5-10 UCITS ETF 280
Schedule of Investments UBS ETF - Markit iBoxx € Germany 7-10 UCITS ETF 281
Schedule of Investments UBS ETF - Markit iBoxx € Liquid Corporates UCITS ETF 282-283
Schedule of Investments UBS ETF - Markit iBoxx € Sovereigns 1-5 UCITS ETF 284
Schedule of Investments UBS ETF - SBI® Foreign AAA-BBB 1-5 UCITS ETF 285-288
Schedule of Investments UBS ETF - SBI® Foreign AAA-BBB 5-10 UCITS ETF 289-290
Schedule of Investments UBS ETF - Barclays Euro Area Liquid Corporates 1-5 Year UCITS ETF 291-293
Schedule of Investments UBS ETF - Barclays US Liquid Corporates UCITS ETF 294-298
Notes to the Financial Statements 299-338
Additional Information 339-340
Additional Information for Investors in the Federal Republic of Germany 341 Sales Restrictions Shares of these Sub-Funds may not be offered, sold or distributed within the United States of America. The applicable selling restrictions are set out in the sales prospectus.

Management and Administration Registered Office 49, Avenue J.F. Kennedy L-1855 Luxembourg R.C.S. Luxembourg Nr. B-83626 Portfolio Managers of Sub-Funds Equity based ETFs UBS Global Asset Management (UK) Ltd 21 Lombard Street GB-London EC3V 9AH Fixed Income based ETFs UBS AG, UBS Global Asset Management, Basel and Zurich Aeschenvorstadt 1, CH-4002 Basel and Bahnhofstrasse 45, CH-8098 Zurich Auditor PricewaterhouseCoopers, Société coopérative 400, route d’Esch B.P. 1443 L-1014 Luxembourg Custodian Bank State Street Bank Luxembourg S.A. 49, Avenue J.F. Kennedy L-1855 Luxembourg Board of Directors
Mr Clemens Reuter (Chairman) Managing Director, UBS AG, Basel and Zurich
Mr Frank Müsel (Vice-Chairman) Executive Director, UBS AG, Basel and Zurich
Mr Ian Ashment Managing Director, UBS Global Asset Management (UK) Ltd, London
Mr Andreas Haberzeth Executive Director, UBS AG, Basel and Zurich Management Company UBS Fund Management (Luxembourg) S.A. 33A, Avenue J.F. Kennedy L-1855 Luxembourg R.C.S. Luxemburg N° B 154 210 Company Administrator State Street Bank Luxembourg S.A. 49, Avenue J.F. Kennedy L-1855 Luxembourg
Paying Agent in Austria Erste Bank der oesterreichischen Sparkassen AG Graben 21, A-1010 Vienna Paying Agent in Germany UBS Deutschland AG Bockenheimer Landstrasse 2-4, D-60306 Frankfurt am Main Paying Agent in Switzerland UBS AG Aeschenvorstadt 1, CH-4002 Basel and Bahnhofstrasse 45, CH-8098 Zurich and their branches in Switzerland Paying Agent in Liechtenstein Liechtensteinische Landesbank AG Städtle 44, FL-9490 Vaduz Distributor UBS AG Aeschenvorstadt 1, CH-4002 Basel and Bahnhofstrasse 45, CH-8098 Zurich Representation Agent in Austria Erste Bank der oesterreichischen Sparkassen AG Graben 21, A-1010 Vienna Information Agent in Germany UBS Deutschland AG Bockenheimer Landstrasse 2-4 D-60306 Frankfurt am Main Representation Agent in Switzerland UBS Fund Management (Switzerland) AG Brunngässlein 12, CH-4002 Basel Centralising and Financial Agent in France Société Générale S.A. 29, Boulevard Haussmann, F-75009 Paris Legal Advisers as to Luxembourg Law Clifford Chance 10, boulevard G.D. Charlotte B.P. 1147 L-1011 Luxembourg
4

Performance of the Sub-Fund
(in %) (1)
Performance of the tracked
index (in %) (2)
Tracking difference(in %) (3)
Tracking error(ex post)(in %) (4)
Total Expense Ratio (TER)
(in %) (5)6.67 6.04 0.63 0.24 0.15 6.42 6.15 0.27 0.14 0.20
(1.38) (1.38) 0.00 N/A* 0.20 6.02 5.60 0.42 0.25 0.23 5.76 5.42 0.34 N/A* 0.33
(0.57) (0.64) 0.07 N/A* 0.33 6.04 5.70 0.34 N/A* 0.33 6.12 5.74 0.38 N/A* 0.33 6.12 5.74 0.38 N/A* 0.33 8.46 7.83 0.63 0.30 0.25 8.14 8.16 (0.02) 0.20 0.33 1.79 1.90 (0.11) 0.04 0.20 1.19 1.20 (0.01) N/A* 0.25 1.81 1.88 (0.07) N/A* 0.20 1.81 1.88 (0.07) N/A* 0.20 1.49 1.54 (0.05) N/A* 0.30
(1.00) (0.98) (0.02) N/A* 0.30 1.58 1.71 (0.13) N/A* 0.30
(1.01) (1.00) (0.01) N/A* 0.30 1.76 1.87 (0.11) N/A* 0.30
20.98 21.36 (0.38) 0.06 0.43 (3.12) (2.96) (0.16) 0.11 0.35 (3.52) (3.27) (0.25) N/A* 0.45 2.00 2.05 (0.05) N/A* 0.45
(3.31) (3.10) (0.21) N/A* 0.45 (3.30) (2.98) (0.32) N/A* 0.45 (3.30) (2.98) (0.32) N/A* 0.45 2.03 2.07 (0.04) N/A* 0.45
(3.32) (3.05) (0.27) N/A* 0.45 7.29 7.40 (0.11) 0.09 0.30 6.72 6.83 (0.11) 0.03 0.20
11.84 11.87 (0.03) 0.05 0.33 11.02 11.26 (0.24) N/A* 0.43 11.25 11.47 (0.22) N/A* 0.43 11.35 11.50 (0.15) N/A* 0.43 11.30 11.47 (0.17) N/A* 0.43 11.30 11.47 (0.17) N/A* 0.43
6.57 6.62 (0.05) N/A* 0.20 6.57 6.62 (0.05) N/A* 0.20
(1.25) (1.23) (0.02) N/A* 0.30 6.73 6.80 (0.07) N/A* 0.30
(1.24) (1.24) 0.00 N/A* 0.30 6.74 6.84 (0.10) N/A* 0.30 6.78 6.92 (0.14) N/A* 0.30 6.78 6.92 (0.14) N/A* 0.30 6.16 6.18 (0.02) 0.06 0.30 5.75 6.14 (0.39) 0.21 0.45 5.02 5.15 (0.13) 0.04 0.38 6.46 6.62 (0.16) 0.04 0.33 3.91 3.79 0.12 0.15 0.28 3.57 3.78 (0.21) 0.10 0.40
(7.25) (7.03) (0.22) 0.60 0.48 5.96 6.32 (0.36) 0.48 0.48 9.75 9.71 0.04 0.21 0.48
(36.48) (37.74) 1.26 2.18 0.45 0.29 0.41 (0.12) 0.02 0.22 1.29 1.39 (0.10) 0.05 0.22 2.87 3.00 (0.13) 0.07 0.22 5.18 5.20 (0.02) 0.12 0.22 0.48 0.56 (0.08) 0.03 0.17 2.36 2.47 (0.11) 0.06 0.17 5.90 6.02 (0.12) 0.07 0.17 6.90 7.00 (0.10) 0.03 0.17 3.85 3.92 (0.07) 0.04 0.23 2.32 2.40 (0.08) N/A* 0.17 0.99 1.15 (0.16) N/A* 0.20 4.82 4.84 (0.02) N/A* 0.20 0.32 0.36 (0.04) N/A* 0.18 0.01 0.03 (0.02) N/A* 0.18 0.01 0.04 (0.03) N/A* 0.23
* The Sub-Fund was launched less than 12 months before the end of the reporting period. Therefore, no tracking error (ex post) has been calculated for this Sub-Fund.
Performance tables
UBS ETF - MSCI Europe UCITS ETF (EUR) A-disUBS ETF - MSCI Europe ex UK UCITS ETF (EUR) A-dis (a)UBS ETF - MSCI EMU UCITS ETF (EUR) A-disUBS ETF - MSCI EMU 100% hedged to CHF UCITS ETF (CHF) A-acc
Semi-Annual Report as of 30 June 2014
Performance from 1 January 2014 to 30 June 2014
Sub-FundsUBS ETF - EURO STOXX 50 UCITS ETF (EUR) A-dis
UBS ETF - MSCI EMU 100% hedged to USD UCITS ETF (USD) A-dis (b)UBS ETF - MSCI EMU 100% hedged to USD UCITS ETF (USD) A-accUBS ETF - MSCI EMU 100% hedged to GBP UCITS ETF (GBP) A-disUBS ETF - MSCI EMU 100% hedged to GBP UCITS ETF (GBP) A-accUBS ETF - MSCI EMU Value UCITS ETF (EUR) A-disUBS ETF - MSCI EMU Small Cap UCITS ETF (EUR) A-disUBS ETF - FTSE 100 UCITS ETF (GBP) A-disUBS ETF - FTSE 250 UCITS ETF (GBP) A-dis (a)UBS ETF - MSCI United Kingdom UCITS ETF (GBP) A-disUBS ETF - MSCI United Kingdom UCITS ETF (GBP) A-accUBS ETF - MSCI United Kingdom 100% hedged to CHF UCITS ETF (CHF) A-accUBS ETF - MSCI United Kingdom 100% hedged to EUR UCITS ETF (EUR) A-dis (b)UBS ETF - MSCI United Kingdom 100% hedged to EUR UCITS ETF (EUR) A-accUBS ETF - MSCI United Kingdom 100% hedged to USD UCITS ETF (USD) A-dis (b)UBS ETF - MSCI United Kingdom 100% hedged to USD UCITS ETF (USD) A-accUBS ETF - MSCI Turkey UCITS ETF (EUR) A-disUBS ETF - MSCI Japan UCITS ETF (JPY) A-disUBS ETF - MSCI Japan 100% hedged to CHF UCITS ETF (CHF) A-accUBS ETF - MSCI Japan 100% hedged to EUR UCITS ETF (EUR) A-dis (b)UBS ETF - MSCI Japan 100% hedged to EUR UCITS ETF (EUR) A-accUBS ETF - MSCI Japan 100% hedged to GBP UCITS ETF (GBP) A-disUBS ETF - MSCI Japan 100% hedged to GBP UCITS ETF (GBP) A-accUBS ETF - MSCI Japan 100% hedged to USD UCITS ETF (USD) A-dis (b)UBS ETF - MSCI Japan 100% hedged to USD UCITS ETF (USD) A-accUBS ETF - MSCI Pacific (ex Japan) UCITS ETF (USD) A-disUBS ETF - MSCI USA UCITS ETF (USD) A-disUBS ETF - MSCI Canada UCITS ETF (CAD) A-disUBS ETF - MSCI Canada 100% hedged to CHF UCITS ETF (CHF) A-accUBS ETF - MSCI Canada 100% hedged to EUR UCITS ETF (EUR) A-accUBS ETF - MSCI Canada 100% hedged to USD UCITS ETF (USD) A-accUBS ETF - MSCI Canada 100% hedged to GBP UCITS ETF (GBP) A-disUBS ETF - MSCI Canada 100% hedged to GBP UCITS ETF (GBP) A-accUBS ETF - MSCI Switzerland 20/35 UCITS ETF (CHF) A-disUBS ETF - MSCI Switzerland 20/35 UCITS ETF (CHF) A-accUBS ETF - MSCI Switzerland 20/35 100% hedged to EUR UCITS ETF (EUR) A-dis (b)UBS ETF - MSCI Switzerland 20/35 100% hedged to EUR UCITS ETF (EUR) A-acc
UBS ETF - MSCI Japan Infrastructure 20/35 UCITS ETF (JPY) A-dis
UBS ETF - MSCI Switzerland 20/35 100% hedged to USD UCITS ETF (USD) A-dis (b)UBS ETF - MSCI Switzerland 20/35 100% hedged to USD UCITS ETF (USD) A-accUBS ETF - MSCI Switzerland 20/35 100% hedged to GBP UCITS ETF (GBP) A-disUBS ETF - MSCI Switzerland 20/35 100% hedged to GBP UCITS ETF (GBP) A-accUBS ETF - MSCI World UCITS ETF (USD) A-dis
UBS ETF - Barclays US Liquid Corporates UCITS ETF (USD) A-dis (c)
UBS ETF - Barclays Capital US 5-7 Year Treasury Bond UCITS ETF (USD) A-disUBS ETF - Barclays Capital US 7-10 Year Treasury Bond UCITS ETF (USD) A-disUBS ETF - Markit iBoxx € Germany 1-3 UCITS ETF (EUR) A-disUBS ETF - Markit iBoxx € Germany 3-5 UCITS ETF (EUR) A-dis
UBS ETF - MSCI Emerging Markets UCITS ETF (USD) A-disUBS ETF - MSCI World Socially Responsible UCITS ETF (USD) A-disUBS ETF - MSCI North America Socially Responsible UCITS ETF (USD) A-disUBS ETF - MSCI Europe & Middle East Socially Responsible UCITS ETF (EUR) A-dis
UBS ETF - Markit iBoxx € Liquid Corporates UCITS ETF (EUR) A-dis
UBS ETF - MSCI Pacific Socially Responsible UCITS ETF (USD) A-dis
UBS ETF - Markit iBoxx € Sovereigns 1-5 UCITS ETF (EUR) A-disUBS ETF - SBI® Foreign AAA-BBB 1-5 UCITS ETF (CHF) A-dis
UBS ETF - MSCI AC Asia ex Japan Infrastructure 20/35 UCITS ETF (USD) A-disUBS ETF - MSCI Europe Infrastructure 20/35 UCITS ETF (EUR) A-disUBS ETF - STOXX Global Rare Earth UCITS ETF (USD) A-disUBS ETF - Barclays Capital US 1-3 Year Treasury Bond UCITS ETF (USD) A-disUBS ETF - Barclays Capital US 3-5 Year Treasury Bond UCITS ETF (USD) A-dis
UBS ETF - SBI® Foreign AAA-BBB 5-10 UCITS ETF (CHF) A-disUBS ETF - Barclays Euro Area Liquid Corporates 1-5 Year UCITS ETF (EUR) A-dis (c)
UBS ETF - Markit iBoxx € Germany 5-10 UCITS ETF (EUR) A-disUBS ETF - Markit iBoxx € Germany 7-10 UCITS ETF (EUR) A-dis
(c) from 30 May 2014 to 30 June 2014
UBS ETF - Barclays US Liquid Corporates UCITS ETF (hedged to EUR) A-acc (c)
(a) from 24 June 2014 to 30 June 2014(b) from 4 June 2014 to 30 June 2014
5

Performance of the Sub-Fund
(in %) (1)
Performance of the tracked
index (in %) (2)
Tracking difference(in %) (3)
Tracking error(ex post)(in %) (4)
Total Expense Ratio (TER)
(in %) (5)22.14 21.51 0.63 0.35 0.29 22.31 21.51 0.80 0.36 0.15 19.88 19.82 0.06 0.14 0.29 19.98 19.82 0.16 0.14 0.23 23.78 23.36 0.42 0.28 0.34 23.92 23.36 0.56 0.28 0.23 12.59 12.80 (0.21) N/A* 0.36 14.33 14.33 0.00 N/A* 0.33
3.08 3.07 0.01 N/A* 0.33 7.71 7.76 (0.05) N/A* 0.33
26.38 25.84 0.54 0.32 0.38 33.80 33.88 (0.08) 0.46 0.39 33.95 33.88 0.07 0.47 0.33 18.31 18.66 (0.35) 0.04 0.30 18.41 18.66 (0.25) 0.03 0.22
1.94 1.97 (0.03) N/A* 0.20 5.82 5.90 (0.08) N/A* 0.21 5.52 5.62 (0.10) N/A* 0.31 5.52 5.68 (0.16) N/A* 0.31 5.58 5.76 (0.18) N/A* 0.31
(30.32) (29.92) (0.40) 0.06 0.55 (30.23) (29.92) (0.31) 0.06 0.43 53.78 54.58 (0.80) 0.06 0.48 54.00 54.58 (0.58) 0.06 0.35
8.97 9.21 (0.24) N/A* 0.45 9.04 9.33 (0.29) N/A* 0.45 7.45 7.58 (0.13) N/A* 0.45 9.07 9.25 (0.18) N/A* 0.45 9.15 9.32 (0.17) N/A* 0.45 5.12 5.49 (0.37) 0.15 0.43 5.23 5.49 (0.26) 0.15 0.30
31.42 31.79 (0.37) 0.01 0.30 31.53 31.79 (0.26) 0.02 0.22 12.56 12.71 (0.15) 0.06 0.45 12.70 12.71 (0.01) 0.06 0.33
8.10 8.32 (0.22) N/A* 0.44 8.18 8.40 (0.22) N/A* 0.44 8.25 8.48 (0.23) N/A* 0.44 3.80 3.92 (0.12) N/A* 0.43 7.14 7.28 (0.14) N/A* 0.43
(0.57) (0.52) (0.05) N/A* 0.20 (0.19) (0.15) (0.04) N/A* 0.20 (0.15) (0.10) (0.05) N/A* 0.30 (0.14) (0.11) (0.03) N/A* 0.30 (0.12) (0.08) (0.04) N/A* 0.30 (0.12) (0.08) (0.04) N/A* 0.30 26.39 26.68 (0.29) 0.06 0.41 26.52 26.68 (0.16) 0.07 0.30 (3.18) (2.60) (0.58) 0.32 0.62 (3.01) (2.60) (0.41) 0.31 0.45 26.87 27.39 (0.52) 0.04 0.50 27.03 27.39 (0.36) 0.04 0.38 28.07 28.60 (0.53) 0.04 0.45 28.23 28.60 (0.37) 0.05 0.33 24.24 24.38 (0.14) 0.15 0.40 24.39 24.38 0.01 0.15 0.28 17.86 18.68 (0.82) 0.10 0.65 18.00 18.68 (0.68) 0.11 0.53 83.51 84.15 (0.64) 0.61 0.59 83.73 84.15 (0.42) 0.61 0.48
1.50 2.12 (0.62) 0.36 0.60 1.62 2.12 (0.50) 0.36 0.48
25.55 25.94 (0.39) 0.31 0.60 25.70 25.94 (0.24) 0.31 0.48
(40.14) (40.30) 0.16 0.34 0.56 (40.07) (40.30) 0.23 0.34 0.45
0.13 0.36 (0.23) 0.02 0.22 (1.16) (0.96) (0.20) 0.06 0.22 (3.81) (3.59) (0.22) 0.08 0.22 (6.28) (6.04) (0.24) 0.08 0.22 (0.42) (0.23) (0.19) 0.04 0.17 (0.87) (0.73) (0.14) 0.07 0.17 (1.66) (1.47) (0.19) 0.08 0.17 (1.75) (1.60) (0.15) 0.04 0.17 1.18 1.32 (0.14) 0.10 0.23
(0.31) (0.25) (0.06) N/A* 0.17 0.53 0.55 (0.02) N/A* 0.20 0.53 0.73 (0.20) N/A* 0.20
* The ETF Share Class was launched less than 12 months before the end of the reporting year ended 31 December 2013. Therefore, no tracking error (ex post) has
UBS ETF - Markit iBoxx € Germany 7-10 UCITS ETF (EUR) A-disUBS ETF - Markit iBoxx € Liquid Corporates UCITS ETF (EUR) A-disUBS ETF - Markit iBoxx € Sovereigns 1-5 UCITS ETF (EUR) A-dis (f)UBS ETF - SBI® Foreign AAA-BBB 1-5 UCITS ETF (CHF) A-dis (g)UBS ETF - SBI® Foreign AAA-BBB 5-10 UCITS ETF (CHF) A-dis (g)
been calculated for this ETF Share Class.
UBS ETF - Barclays Capital US 3-5 Year Treasury Bond UCITS ETF (USD) A-disUBS ETF - Barclays Capital US 5-7 Year Treasury Bond UCITS ETF (USD) A-disUBS ETF - Barclays Capital US 7-10 Year Treasury Bond UCITS ETF (USD) A-disUBS ETF - Markit iBoxx € Germany 1-3 UCITS ETF (EUR) A-disUBS ETF - Markit iBoxx € Germany 3-5 UCITS ETF (EUR) A-disUBS ETF - Markit iBoxx € Germany 5-10 UCITS ETF (EUR) A-dis
UBS ETF - MSCI AC Asia ex Japan Infrastructure 20/35 UCITS ETF (USD) I-disUBS ETF - MSCI Europe Infrastructure 20/35 UCITS ETF (EUR) A-disUBS ETF - MSCI Europe Infrastructure 20/35 UCITS ETF (EUR) I-disUBS ETF - STOXX Global Rare Earth UCITS ETF (USD) A-disUBS ETF - STOXX Global Rare Earth UCITS ETF (USD) I-disUBS ETF - Barclays Capital US 1-3 Year Treasury Bond UCITS ETF (USD) A-dis
UBS ETF - MSCI Europe & Middle East Socially Responsible UCITS ETF (EUR) I-disUBS ETF - MSCI Pacific Socially Responsible UCITS ETF (USD) A-disUBS ETF - MSCI Pacific Socially Responsible UCITS ETF (USD) I-disUBS ETF - MSCI Japan Infrastructure 20/35 UCITS ETF (JPY) A-disUBS ETF - MSCI Japan Infrastructure 20/35 UCITS ETF (JPY) I-disUBS ETF - MSCI AC Asia ex Japan Infrastructure 20/35 UCITS ETF (USD) A-dis
UBS ETF - MSCI Emerging Markets UCITS ETF (USD) I-disUBS ETF - MSCI World Socially Responsible UCITS ETF (USD) A-disUBS ETF - MSCI World Socially Responsible UCITS ETF (USD) I-disUBS ETF - MSCI North America Socially Responsible UCITS ETF (USD) A-disUBS ETF - MSCI North America Socially Responsible UCITS ETF (USD) I-disUBS ETF - MSCI Europe & Middle East Socially Responsible UCITS ETF (EUR) A-dis
UBS ETF - MSCI Switzerland 20/35 100% hedged to USD UCITS ETF (USD) A-acc (e)UBS ETF - MSCI Switzerland 20/35 100% hedged to GBP UCITS ETF (GBP) A-dis (e)UBS ETF - MSCI Switzerland 20/35 100% hedged to GBP UCITS ETF (GBP) A-acc (e)UBS ETF - MSCI World UCITS ETF (USD) A-disUBS ETF - MSCI World UCITS ETF (USD) I-disUBS ETF - MSCI Emerging Markets UCITS ETF (USD) A-dis
UBS ETF - MSCI Canada 100% hedged to USD UCITS ETF (USD) A-acc (b)UBS ETF - MSCI Canada 100% hedged to GBP UCITS ETF (GBP) A-dis (c)UBS ETF - MSCI Canada 100% hedged to GBP UCITS ETF (GBP) A-acc (d)UBS ETF - MSCI Switzerland 20/35 UCITS ETF (CHF) A-dis (f)UBS ETF - MSCI Switzerland 20/35 UCITS ETF (CHF) A-acc (e)UBS ETF - MSCI Switzerland 20/35 100% hedged to EUR UCITS ETF (EUR) A-acc (e)
UBS ETF - MSCI USA UCITS ETF (USD) A-disUBS ETF - MSCI USA UCITS ETF (USD) I-disUBS ETF - MSCI Canada UCITS ETF (CAD) A-disUBS ETF - MSCI Canada UCITS ETF (CAD) I-disUBS ETF - MSCI Canada 100% hedged to CHF UCITS ETF (CHF) A-acc (b)UBS ETF - MSCI Canada 100% hedged to EUR UCITS ETF (EUR) A-acc (b)
UBS ETF - MSCI Japan 100% hedged to EUR UCITS ETF (EUR) A-acc (d)UBS ETF - MSCI Japan 100% hedged to GBP UCITS ETF (GBP) A-dis (c)UBS ETF - MSCI Japan 100% hedged to GBP UCITS ETF (GBP) A-acc (d)UBS ETF - MSCI Japan 100% hedged to USD UCITS ETF (USD) A-acc (e)UBS ETF - MSCI Pacific (ex Japan) UCITS ETF (USD) A-disUBS ETF - MSCI Pacific (ex Japan) UCITS ETF (USD) I-dis
UBS ETF - MSCI United Kingdom 100% hedged to USD UCITS ETF (USD) A-acc (b)UBS ETF - MSCI Turkey UCITS ETF (EUR) A-disUBS ETF - MSCI Turkey UCITS ETF (EUR) I-disUBS ETF - MSCI Japan UCITS ETF (JPY) A-disUBS ETF - MSCI Japan UCITS ETF (JPY) I-disUBS ETF - MSCI Japan 100% hedged to CHF UCITS ETF (CHF) A-acc (d)
UBS ETF - FTSE 100 UCITS ETF (GBP) A-disUBS ETF - FTSE 100 UCITS ETF (GBP) I-disUBS ETF - MSCI United Kingdom UCITS ETF (GBP) A-dis (c)UBS ETF - MSCI United Kingdom UCITS ETF (GBP) A-acc (b)UBS ETF - MSCI United Kingdom 100% hedged to CHF UCITS ETF (CHF) A-acc (b)UBS ETF - MSCI United Kingdom 100% hedged to EUR UCITS ETF (EUR) A-acc (b)
UBS ETF - MSCI EMU 100% hedged to USD UCITS ETF (USD) A-acc (b)UBS ETF - MSCI EMU 100% hedged to GBP UCITS ETF (GBP) A-dis (c)UBS ETF - MSCI EMU 100% hedged to GBP UCITS ETF (GBP) A-acc (d)UBS ETF - MSCI EMU Value UCITS ETF (EUR) A-disUBS ETF - MSCI EMU Small Cap UCITS ETF (EUR) A-disUBS ETF - MSCI EMU Small Cap UCITS ETF (EUR) I-dis
UBS ETF - EURO STOXX 50 UCITS ETF (EUR) I-disUBS ETF - MSCI Europe UCITS ETF (EUR) A-disUBS ETF - MSCI Europe UCITS ETF (EUR) I-disUBS ETF - MSCI EMU UCITS ETF (EUR) A-disUBS ETF - MSCI EMU UCITS ETF (EUR) I-disUBS ETF - MSCI EMU 100% hedged to CHF UCITS ETF (CHF) A-acc (a)
Performance tables (continued) Semi-Annual Report as of 30 June 2014
Performance from 1 January 2013 to 31 December 2013
(d) from 30 September 2013 to 31 December 2013(e) from 31 October 2013 to 31 December 2013
Sub-FundsUBS ETF - EURO STOXX 50 UCITS ETF (EUR) A-dis
(a) from 31 July 2013 to 31 December 2013(b) from 30 August 2013 to 31 December 2013
(f) from 29 November 2013 to 31 December 2013(g) from 30 July 2013 to 31 December 2013
(c) from 21 October 2013 to 31 December 2013
6

Performance of the Sub-Fund
(in %) (1)
Performance of the tracked
index (in %) (2)
Tracking difference(in %) (3)
Total Expense Ratio (TER)
(in %) (5)18.52 18.06 0.46 0.35 18.77 18.06 0.71 0.15 17.22 17.29 (0.07) 0.35 17.36 17.29 0.07 0.23 19.68 19.31 0.37 0.40 19.88 19.31 0.57 0.23 15.70 15.51 0.19 0.40 23.58 23.86 (0.28) 0.50 23.78 23.86 (0.08) 0.33
9.61 9.97 (0.36) 0.35 9.74 9.97 (0.23) 0.23
60.63 61.69 (1.06) 0.60 60.92 61.69 (0.77) 0.43 20.90 21.57 (0.67) 0.55 21.13 21.57 (0.44) 0.35 23.92 24.57 (0.65) 0.45 24.11 24.57 (0.46) 0.30 14.96 15.33 (0.37) 0.35 15.10 15.33 (0.23) 0.23
6.40 6.67 (0.27) 0.50 6.58 6.67 (0.09) 0.33
15.58 15.83 (0.25) 0.45 15.75 15.83 (0.08) 0.30 17.36 18.22 (0.86) 0.70 17.66 18.22 (0.56) 0.45 12.66 13.25 (0.59) 0.55 12.85 13.25 (0.40) 0.38 10.37 10.87 (0.50) 0.50 10.58 10.87 (0.29) 0.33 18.24 18.64 (0.40) 0.45 18.45 18.64 (0.19) 0.28
8.84 9.63 (0.79) 0.70 9.02 9.63 (0.61) 0.53 3.70 4.47 (0.77) 0.65 3.87 4.47 (0.60) 0.48
10.57 10.97 (0.40) 0.65 10.66 10.97 (0.31) 0.48 (0.93) (0.73) (0.20) 0.65 (0.76) (0.73) (0.03) 0.48
(32.19) (33.78) 1.59 0.62 (32.08) (33.78) 1.70 0.45
0.05 0.33 (0.28) 0.22 0.88 1.18 (0.30) 0.22 2.43 2.69 (0.26) 0.22 3.12 3.37 (0.25) 0.22 0.43 0.57 (0.14) 0.17 2.65 2.85 (0.20) 0.17 6.41 6.61 (0.20) 0.17 7.23 7.46 (0.23) 0.17 9.37 9.69 (0.32) 0.23
1) The figures relating to the performances of the Sub-Funds reflect the percentages changes of NAV's per shares (cum dividends) over the reporting period. 2) The figures relating to the performances of tracked indexes reflect the percentages changes of the respective Net Return Indexes over the year, except for the FTSE 100
Indices which track the performance of the Declared Divided Index.3)
exceed 1%. One Sub-Fund, UBS ETF - STOXX Global Rare Earth UCITS ETF (USD) A-dis, had a tracking difference of more than 1% over a 6-month period.
As a result tracking error can be higher than other index products.4) Tracking error: annualised standard deviation.
and that Sub-Fund's index, below or equal to 1% under normal market conditions. However, exceptional circumstances may arise which cause a Sub-Fund's tracking error to exceed 1%. One Sub-Fund, UBS ETF - STOXX Global Rare Earth UCITS ETF (USD) A-dis, had tracking error of more than 1% over a 12-month period. Please refer to note 3 above for more details.Tracking error calculation:The tracking error for the last 12 months is calculated as follows: =STANDARD DEVIATION(Monthly Excess calculated each months over a 12-month period)*SQUARE ROOT(12)
5) Total Expense Ratio (TER): this ratio is calculated in accordance with the Swiss Funds & Asset Management Association (SFAMA) "Guidelines on the calculation anddisclosure of the TER and PTR" in the current version and expresses the sum of all costs and commissions charged on an ongoing basis to the net assets (operating expenses) taken retrospectively as a percentage of the net assets.
The performance of the Sub-Fund is calculated in accordance with Swiss Funds & Asset Management Association (SFAMA) guidelines.
Historical performance is no indicator of current or future performance.
The performance data does not take account of any commissions and costs charged when subscribing and redeeming units.
The performance data were not audited.
The STOXX Global Rare Earth Index is a concentrated index whose constituents often have a relatively low level of liquidity and high level of price volatility.
(a) from 6 July 2012 to 31 December 2012(b) from 2 February 2012 to 31 December 2012(c) from 26 January 2012 to 31 December 2012(d) from 24 January 2012 to 31 December 2012
Sub-Fund and that Sub-Fund's index will not exceed 1% under normal market conditions. However, exceptional circumstances may arise which cause a Sub-Fund's tracking accuracy to
The Sub-Fund's portfolio manager aims to keep the tracking error, defined as the volatility of the tracking difference between the performance of the shares of a Sub-Fund
UBS ETF - Barclays Capital US 7-10 Year Treasury Bond UCITS ETF (USD) A-dis (b)UBS ETF - Markit iBoxx € Germany 1-3 UCITS ETF (EUR) A-dis (d)
UBS ETF - STOXX Global Rare Earth UCITS ETF - I-disUBS ETF - Barclays Capital US 1-3 Year Treasury Bond UCITS ETF (USD) A-dis (b)UBS ETF - Barclays Capital US 3-5 Year Treasury Bond UCITS ETF (USD) A-dis (c)UBS ETF - Barclays Capital US 5-7 Year Treasury Bond UCITS ETF (USD) A-dis (c)
The tracking difference is attributable to fund expenses (see "TER"), as well as non reclaimable withholding taxes and to generation of securities lending income. The Sub-Fund's portfolio manager aims to achieve a level of tracking accuracy whereby the expected annual difference in returns, after expenses, between the performance of the shares of a
UBS ETF - Markit iBoxx € Germany 3-5 UCITS ETF (EUR) A-dis (d)UBS ETF - Markit iBoxx € Germany 5-10 UCITS ETF (EUR) A-dis (d)UBS ETF - Markit iBoxx € Germany 7-10 UCITS ETF (EUR) A-dis (d)UBS ETF - Markit iBoxx € Liquid Corporates UCITS ETF (EUR) A-dis (d)
UBS ETF - MSCI Japan Infrastructure 20/35 UCITS ETF - I-disUBS ETF - MSCI AC Asia ex Japan Infrastructure 20/35 UCITS ETF (USD) A-dis (a)UBS ETF - MSCI AC Asia ex Japan Infrastructure 20/35 UCITS ETF (USD) I-dis (a)UBS ETF - MSCI Europe Infrastructure 20/35 UCITS ETF - A-disUBS ETF - MSCI Europe Infrastructure 20/35 UCITS ETF - I-disUBS ETF - STOXX Global Rare Earth UCITS ETF - A-dis
UBS ETF - MSCI North America Socially Responsible UCITS ETF - I-disUBS ETF - MSCI Europe & Middle East Socially Responsible UCITS ETF - A-disUBS ETF - MSCI Europe & Middle East Socially Responsible UCITS ETF - I-disUBS ETF - MSCI Pacific Socially Responsible UCITS ETF - A-disUBS ETF - MSCI Pacific Socially Responsible UCITS ETF - I-disUBS ETF - MSCI Japan Infrastructure 20/35 UCITS ETF - A-dis
UBS ETF - MSCI World UCITS ETF - I-disUBS ETF - MSCI Emerging Markets UCITS ETF - A-disUBS ETF - MSCI Emerging Markets UCITS ETF - I-disUBS ETF - MSCI World Socially Responsible UCITS ETF - A-disUBS ETF - MSCI World Socially Responsible UCITS ETF - I-disUBS ETF - MSCI North America Socially Responsible UCITS ETF - A-dis
UBS ETF - MSCI Pacific (ex Japan) UCITS ETF - I-disUBS ETF - MSCI USA UCITS ETF - A-disUBS ETF - MSCI USA UCITS ETF - I-disUBS ETF - MSCI Canada UCITS ETF - A-disUBS ETF - MSCI Canada UCITS ETF - I-disUBS ETF - MSCI World UCITS ETF - A-dis
UBS ETF - FTSE 100 UCITS ETF - I-disUBS ETF - MSCI Turkey UCITS ETF - A-disUBS ETF - MSCI Turkey UCITS ETF - I-disUBS ETF - MSCI Japan UCITS ETF - A-disUBS ETF - MSCI Japan UCITS ETF - I-disUBS ETF - MSCI Pacific (ex Japan) UCITS ETF - A-dis
UBS ETF - MSCI EMU UCITS ETF - A-disUBS ETF - MSCI EMU UCITS ETF - I-disUBS ETF - MSCI EMU Value UCITS ETF - A-disUBS ETF - MSCI EMU Small Cap UCITS ETF - A-disUBS ETF - MSCI EMU Small Cap UCITS ETF - I-disUBS ETF - FTSE 100 UCITS ETF - A-dis
Semi-Annual Report as of 30 June 2014
Sub-FundsUBS ETF - EURO STOXX 50 UCITS ETF - A-disUBS ETF - EURO STOXX 50 UCITS ETF - I-disUBS ETF - MSCI Europe UCITS ETF - A-disUBS ETF - MSCI Europe UCITS ETF - I-dis
Performance tables (continued)
Performance from 1 January 2012 to 31 December 2012
7

Semi-Annual report as of 30 June 2014
The accompanying notes form an integral part of these financial statements.
Statement of Net Assets as of 30 June 2014 (Unaudited) ________________________________________________________________________________________________________________________________
UBS ETF Consolidated
Statement
EURO STOXX 50 UCITS ETF Sub-Fund
MSCI Europe UCITS ETF Sub-Fund
MSCI Europe ex UK UCITS ETF Sub-Fund
EUR EUR EUR EUR ________________________________________________________________________________________________________________________________ ASSETS Market value of investment in securities (Note 2b) 8,284,222,668 642,428,367 91,597,370 12,396,406 Unrealised gain on forward foreign exchange contracts (Notes 2f, 9) 3,895,597 – – – Unrealised gain on futures (Note 2e) 10,225 – – – Receivable for shares subscribed 1,577,685,713 411,334,707 16,219,177 – Receivable for investment securities sold 1,710,902 – 22,468 – Cash at banks 15,160,556 265,600 29,249 199,176 Interest receivable 3,369,676 18,689 2,326 – Dividends receivable 21,808,707 4,339,633 245,590 4,342 Other receivables 395,476 7,177 715 10,529 TOTAL ASSETS 9,908,259,520 1,058,394,173 108,116,895 12,610,453 LIABILITIES Payable for investment securities purchased 14,933,587 – 51,025 197,917 Unrealised loss on forward foreign exchange contracts (Notes 2f, 9)
8,226,936 – – –
Payable for shares redeemed 1,548,096,500 411,334,707 16,219,177 – Bank overdraft 14,105,368 4,761,799 130,077 – Management fees payable (Note 3) 2,598,467 67,621 74,133 362 Other payables 154 – – – TOTAL LIABILITIES 1,587,961,012 416,164,127 16,474,412 198,279
NET ASSETS AS OF 30 JUNE 2014 8,320,298,508 642,230,046 91,642,483 12,412,174
NUMBER OF SHARES OUTSTANDING AS OF 30 JUNE 2014 Class A-dis (*) 19,384,063 1,538,708 1,050,000 Class A-acc (*) – – – Class I-dis (*) – – – NET ASSET VALUE PER SHARE AS OF 30 JUNE 2014 Class A-dis (*) 33.1319 59.5581 11.8211 Class A-acc (*) – – – Class I-dis (*) – – – NET ASSET VALUE PER SHARE AS OF 31 DECEMBER 2013 Class A-dis (*) 31.2823 56.3424 – Class A-acc (*) – – – Class I-dis (*) 31,344.0838 56,209.5014 – NET ASSET VALUE PER SHARE AS OF 31 DECEMBER 2012 Class A-dis (*) 26.4922 48.4811 – Class A-acc (*) – – – Class I-dis (*) 26,555.2699 48,365.0227 – INITIAL OFFERING PRICE(**) Class A-dis (*) 35.2800 41.0300 11.9861 Class A-acc (*) – – – Class I-dis (*) 21,545.3000 41,034.1000 –
COST OF INVESTMENTS AS OF 30 JUNE 2014 7,247,699,992 530,583,206 83,483,681 12,584,394
(*) The Share Class is in the Sub-Fund’s base currency. (**) As of initial dealing day (see Note 1)
8

Semi-Annual report as of 30 June 2014
The accompanying notes form an integral part of these financial statements.
Statement of Net Assets as of 30 June 2014 (Unaudited) ________________________________________________________________________________________________________________________________
MSCI EMU UCITS ETF Sub-Fund
MSCI EMU 100% hedged to CHF
UCITS ETF Sub-Fund
MSCI EMU 100% hedged to USD
UCITS ETF Sub-Fund
MSCI EMU 100% hedged to GBP
UCITS ETF Sub-Fund
EUR CHF USD GBP ________________________________________________________________________________________________________________________________ ASSETS Market value of investment in securities (Note 2b) 1,321,435,945 117,458,457 458,917,373 122,564,173 Unrealised gain on forward foreign exchange contracts (Notes 2f, 9) – 512,383 – 1,945,367 Unrealised gain on futures (Note 2e) – – – – Receivable for shares subscribed 125,867,131 – – – Receivable for investment securities sold 960,288 72,533 291,538 73,479 Cash at banks 1,557,236 107,890 528,277 65,968 Interest receivable 63,847 6,305 22,428 6,487 Dividends receivable 3,951,024 281,500 995,986 280,448 Other receivables 270,867 – – – TOTAL ASSETS 1,454,106,338 118,439,068 460,755,602 124,935,922 LIABILITIES Payable for investment securities purchased 3,253,380 249,449 965,091 261,568 Unrealised loss on forward foreign exchange contracts (Notes 2f, 9) – – 1,734,554 – Payable for shares redeemed 125,867,131 – – – Bank overdraft 2,805,674 – – 22,261 Management fees payable (Note 3) 291,506 32,196 77,643 32,365 Other payables – – – – TOTAL LIABILITIES 132,217,691 281,645 2,777,288 316,194
NET ASSETS AS OF 30 JUNE 2014 1,321,888,647 118,157,423 457,978,314 124,619,728
NUMBER OF SHARES OUTSTANDING AS OF 30 JUNE 2014 Class A-dis (*) 12,265,430 – 700,000 6,056,829 Class A-acc (*) – 5,000,000 21,400,000 1,713,171 Class I-dis (*) – – – – NET ASSET VALUE PER SHARE AS OF 30 JUNE 2014 Class A-dis (*) 107.7735 – 20.6744 16.0320 Class A-acc (*) – 23.6315 20.7246 16.0617 Class I-dis (*) – – – – NET ASSET VALUE PER SHARE AS OF 31 DECEMBER 2013 Class A-dis (*) 102.4028 – – 15.1424 Class A-acc (*) – 22.3449 19.5448 15.1361 Class I-dis (*) 102,849.4830 – – – NET ASSET VALUE PER SHARE AS OF 31 DECEMBER 2012 Class A-dis (*) 85.3464 – – – Class A-acc (*) – – – – Class I-dis (*) 85,688.3796 – – – INITIAL OFFERING PRICE(**) Class A-dis (*) 18.6100 – 20.7927 14.6923 Class A-acc (*) – 19.8462 17.0947 14.0530 Class I-dis (*) 87,585.0000 – – –
COST OF INVESTMENTS AS OF 30 JUNE 2014 1,167,171,648 115,746,939 447,902,360 123,985,446
(*) The Share Class is in the Sub-Fund’s base currency. (**) As of initial dealing day (see Note 1)
9

Semi-Annual report as of 30 June 2014
The accompanying notes form an integral part of these financial statements.
Statement of Net Assets as of 30 June 2014 (Unaudited) ________________________________________________________________________________________________________________________________
MSCI EMU 100% hedged to SGD
UCITS ETF Sub-Fund
MSCI EMU Value UCITS ETF Sub-Fund
MSCI EMU Small Cap UCITS ETF Sub-Fund
FTSE 100 UCITS ETF Sub-Fund
SGD EUR EUR GBP ________________________________________________________________________________________________________________________________ ASSETS Market value of investment in securities (Note 2b) – 35,590,835 18,792,942 165,512,294 Unrealised gain on forward foreign exchange contracts (Notes 2f, 9) – – – – Unrealised gain on futures (Note 2e) – – – – Receivable for shares subscribed 7,402,860 – 3,312,966 58,989,828 Receivable for investment securities sold – – – 45,759 Cash at banks – 23,699 93,241 3,198 Interest receivable – 1,465 126 247 Dividends receivable – 428,132 26,303 810,289 Other receivables – 3 5,037 – TOTAL ASSETS 7,402,860 36,044,134 22,230,615 225,361,615 LIABILITIES Payable for investment securities purchased – 6,975 2,101 – Unrealised loss on forward foreign exchange contracts (Notes 2f, 9) – – – – Payable for shares redeemed – – 3,312,966 58,989,828 Bank overdraft – 230,894 – 634,929 Management fees payable (Note 3) – 13,509 4,697 32,613 Other payables – – – 59 TOTAL LIABILITIES – 251,378 3,319,764 59,657,429
NET ASSETS AS OF 30 JUNE 2014 7,402,860 35,792,756 18,910,851 165,704,186
NUMBER OF SHARES OUTSTANDING AS OF 30 JUNE 2014 Class A-dis (*) – 890,000 265,287 2,516,071 Class A-acc (*) 450,000 – – – Class I-dis (*) – – – – NET ASSET VALUE PER SHARE AS OF 30 JUNE 2014 Class A-dis (*) – 40.2166 71.2845 65.8583 Class A-acc (*) 16.4508 – – – Class I-dis (*) – – – – NET ASSET VALUE PER SHARE AS OF 31 DECEMBER 2013 Class A-dis (*) – 37.4611 65.9190 65.7155 Class A-acc (*) – – – – Class I-dis (*) – – 13,265.2528 13,699.9542 NET ASSET VALUE PER SHARE AS OF 31 DECEMBER 2012 Class A-dis (*) – 30.9172 50.4524 57.3893 Class A-acc (*) – – – – Class I-dis (*) – – 10,099.7772 11,934.3561 INITIAL OFFERING PRICE(**) Class A-dis (*) – 35.6500 43.7300 34.6900 Class A-acc (*) 16.4508 – – – Class I-dis (*) – – 8,746.5300 11,390.5600
COST OF INVESTMENTS AS OF 30 JUNE 2014 – 30,212,211 17,302,068 142,360,720
(*) The Share Class is in the Sub-Fund’s base currency. (**) As of initial dealing day (see Note 1)
10

Semi-Annual report as of 30 June 2014
The accompanying notes form an integral part of these financial statements.
Statement of Net Assets as of 30 June 2014 (Unaudited) ________________________________________________________________________________________________________________________________
FTSE 250 UCITS ETF Sub-Fund
MSCI United Kingdom
UCITS ETF Sub-Fund
MSCI United Kingdom 100% hedged to CHF
UCITS ETF Sub-Fund
MSCI United Kingdom 100% hedged to EUR
UCITS ETF Sub-Fund
GBP GBP CHF EUR ________________________________________________________________________________________________________________________________ ASSETS Market value of investment in securities (Note 2b) 14,211,511 432,091,211 193,853,728 105,680,930 Unrealised gain on forward foreign exchange contracts (Notes 2f, 9) – – – – Unrealised gain on futures (Note 2e) – – – – Receivable for shares subscribed – – – – Receivable for investment securities sold – 89,395 35,563 23,089 Cash at banks 283,597 2,969 83,120 1,821 Interest receivable – 421 183 100 Dividends receivable 8,769 2,125,872 948,320 524,823 Other receivables 68,532 – – – TOTAL ASSETS 14,572,409 434,309,868 194,920,914 106,230,763 LIABILITIES Payable for investment securities purchased 364,020 – – – Unrealised loss on forward foreign exchange contracts (Notes 2f, 9) – – 2,257,584 1,702,393 Payable for shares redeemed – – – – Bank overdraft – 1,671,517 827,797 369,692 Management fees payable (Note 3) 517 66,084 35,740 25,793 Other payables – – – – TOTAL LIABILITIES 364,537 1,737,601 3,121,121 2,097,878
NET ASSETS AS OF 30 JUNE 2014 14,207,872 432,572,267 191,799,793 104,132,885
NUMBER OF SHARES OUTSTANDING AS OF 30 JUNE 2014 Class A-dis (*) 1,350,000 1,150,000 – 100,000 Class A-acc (*) – 22,600,000 12,925,000 6,600,000 Class I-dis (*) – – – – NET ASSET VALUE PER SHARE AS OF 30 JUNE 2014 Class A-dis (*) 10.5243 18.1216 – 15.5821 Class A-acc (*) – 18.2182 14.8394 15.5416 Class I-dis (*) – – – – NET ASSET VALUE PER SHARE AS OF 31 DECEMBER 2013 Class A-dis (*) – 17.8998 – – Class A-acc (*) – 17.8935 14.6217 15.3004 Class I-dis (*) – – – – NET ASSET VALUE PER SHARE AS OF 31 DECEMBER 2012 Class A-dis (*) – – – – Class A-acc (*) – – – – Class I-dis (*) – – – – INITIAL OFFERING PRICE(**) Class A-dis (*) 10.4003 17.5618 – 15.7400 Class A-acc (*) – 16.9092 13.8570 14.5000 Class I-dis (*) – – – –
COST OF INVESTMENTS AS OF 30 JUNE 2014 14,120,828 436,092,712 193,114,906 102,697,508
(*) The Share Class is in the Sub-Fund’s base currency. (**) As of initial dealing day (see Note 1)
11

Semi-Annual report as of 30 June 2014
The accompanying notes form an integral part of these financial statements.
Statement of Net Assets as of 30 June 2014 (Unaudited) ________________________________________________________________________________________________________________________________
MSCI United Kingdom 100% hedged to USD
UCITS ETF Sub-Fund
MSCI United Kingdom 100% hedged to SGD
UCITS ETF Sub-Fund
MSCI Turkey UCITS ETF Sub-Fund
MSCI Japan UCITS ETF Sub-Fund
USD SGD EUR JPY ________________________________________________________________________________________________________________________________ ASSETS Market value of investment in securities (Note 2b) 139,852,658 – 9,532,691 88,020,791,128 Unrealised gain on forward foreign exchange contracts (Notes 2f, 9) – – – – Unrealised gain on futures (Note 2e) – – – – Receivable for shares subscribed – 7,081,335 3,891,826 25,103,345,310 Receivable for investment securities sold 25,130 – – – Cash at banks 27 – 42,867 63,698,736 Interest receivable 119 – – 1,520,065 Dividends receivable 617,443 – – 69,793,437 Other receivables 9,303 – – – TOTAL ASSETS 140,504,680 7,081,335 13,467,384 113,259,148,676 LIABILITIES Payable for investment securities purchased – – – – Unrealised loss on forward foreign exchange contracts (Notes 2f, 9) 2,609,990 – – – Payable for shares redeemed – – 3,891,826 25,103,345,310 Bank overdraft 540,219 – – 23,356,181 Management fees payable (Note 3) 32,334 – 7,221 29,867,761 Other payables – – – 540 TOTAL LIABILITIES 3,182,543 – 3,899,047 25,156,569,792
NET ASSETS AS OF 30 JUNE 2014 137,322,137 7,081,335 9,568,337 88,102,578,884
NUMBER OF SHARES OUTSTANDING AS OF 30 JUNE 2014 Class A-dis (*) 550,000 – 272,330 22,743,293 Class A-acc (*) 11,285,000 450,000 – – Class I-dis (*) – – – – NET ASSET VALUE PER SHARE AS OF 30 JUNE 2014 Class A-dis (*) 11.6324 – 35.1351 3,873.7829 Class A-acc (*) 11.6016 15.7363 – – Class I-dis (*) – – – – NET ASSET VALUE PER SHARE AS OF 31 DECEMBER 2013 Class A-dis (*) – – 29.0421 4,021.9601 Class A-acc (*) 11.4009 – – – Class I-dis (*) – – 7,252.7653 4,018,281.3952 NET ASSET VALUE PER SHARE AS OF 31 DECEMBER 2012 Class A-dis (*) – – 42.2995 2,652.7411 Class A-acc (*) – – – – Class I-dis (*) – – 10,563.3067 2,649,576.9095 INITIAL OFFERING PRICE(**) Class A-dis (*) 11.7506 – 25.7900 4,617.0000 Class A-acc (*) 10.7984 15.7363 – – Class I-dis (*) – – 6,447.5400 6,917,400.0000
COST OF INVESTMENTS AS OF 30 JUNE 2014 137,696,432 – 9,306,183 71,370,607,727
(*) The Share Class is in the Sub-Fund’s base currency. (**) As of initial dealing day (see Note 1)
12

Semi-Annual report as of 30 June 2014
The accompanying notes form an integral part of these financial statements.
Statement of Net Assets as of 30 June 2014 (Unaudited) ________________________________________________________________________________________________________________________________
MSCI Japan 100% hedged to CHF
UCITS ETF Sub-Fund
MSCI Japan 100% hedged to EUR
UCITS ETF Sub-Fund
MSCI Japan 100% hedged to GBP
UCITS ETF Sub-Fund
MSCI Japan 100% hedged to USD
UCITS ETF Sub-Fund
CHF EUR GBP USD ________________________________________________________________________________________________________________________________ ASSETS Market value of investment in securities (Note 2b) 102,596,835 61,180,553 34,550,415 152,247,558 Unrealised gain on forward foreign exchange contracts (Notes 2f, 9) 342,025 – 494,063 – Unrealised gain on futures (Note 2e) – – – – Receivable for shares subscribed – – – – Receivable for investment securities sold – – – – Cash at banks 264,296 104,814 79,440 217,083 Interest receivable 5,347 3,042 1,819 2,118 Dividends receivable 157,619 92,820 51,923 218,575 Other receivables – – – – TOTAL ASSETS 103,366,122 61,381,229 35,177,660 152,685,334 LIABILITIES Payable for investment securities purchased – 6,421 – 15,072 Unrealised loss on forward foreign exchange contracts (Notes 2f, 9) – 41,607 – 588,520 Payable for shares redeemed – – – – Bank overdraft 31,649 18,140 – – Management fees payable (Note 3) 37,142 21,188 12,560 50,853 Other payables – – – – TOTAL LIABILITIES 68,791 87,356 12,560 654,445
NET ASSETS AS OF 30 JUNE 2014 103,297,331 61,293,873 35,165,100 152,030,889
NUMBER OF SHARES OUTSTANDING AS OF 30 JUNE 2014 Class A-dis (*) – 100,000 1,545,000 350,000 Class A-acc (*) 9,170,000 3,800,000 500,000 8,205,000 Class I-dis (*) – – – – NET ASSET VALUE PER SHARE AS OF 30 JUNE 2014 Class A-dis (*) – 15.7845 17.1971 17.8399 Class A-acc (*) 11.2647 15.7146 17.1913 17.7681 Class I-dis (*) – – – – NET ASSET VALUE PER SHARE AS OF 31 DECEMBER 2013 Class A-dis (*) – – 17.7832 – Class A-acc (*) 11.6751 16.2528 17.7776 18.3788 Class I-dis (*) – – – – NET ASSET VALUE PER SHARE AS OF 31 DECEMBER 2012 Class A-dis (*) – – – – Class A-acc (*) – – – – Class I-dis (*) – – – – INITIAL OFFERING PRICE(**) Class A-dis (*) – 15.4750 16.5517 17.4850 Class A-acc (*) 10.7140 14.9060 16.3000 16.8380 Class I-dis (*) – – – –
COST OF INVESTMENTS AS OF 30 JUNE 2014 100,365,703 58,534,404 34,728,079 146,927,454
(*) The Share Class is in the Sub-Fund’s base currency. (**) As of initial dealing day (see Note 1)
13

Semi-Annual report as of 30 June 2014
The accompanying notes form an integral part of these financial statements.
Statement of Net Assets as of 30 June 2014 (Unaudited) ________________________________________________________________________________________________________________________________
MSCI Japan 100% hedged to SGD
UCITS ETF Sub-Fund
MSCI Pacific (ex Japan) UCITS ETF Sub-Fund
MSCI USA UCITS ETF Sub-Fund
MSCI Canada UCITS ETF Sub-Fund
SGD USD USD CAD ________________________________________________________________________________________________________________________________ ASSETS Market value of investment in securities (Note 2b) – 197,417,338 2,033,596,480 226,104,513 Unrealised gain on forward foreign exchange contracts (Notes 2f, 9) – – – – Unrealised gain on futures (Note 2e) – – – – Receivable for shares subscribed 18,036,000 80,553,856 237,563,817 65,957,219 Receivable for investment securities sold – – – – Cash at banks – 178,716 591 5,700,302 Interest receivable – 773 2,370 28,208 Dividends receivable – 1,269,611 1,843,481 412,290 Other receivables – 5 4,050 – TOTAL ASSETS 18,036,000 279,420,299 2,273,010,789 298,202,532 LIABILITIES Payable for investment securities purchased – 47,986 – 5,731,904 Unrealised loss on forward foreign exchange contracts (Notes 2f, 9) – – – – Payable for shares redeemed – 80,553,857 237,563,817 65,957,217 Bank overdraft – 845,642 140,621 – Management fees payable (Note 3) – 205,840 392,345 96,240 Other payables – – – 10 TOTAL LIABILITIES – 81,653,325 238,096,783 71,785,371
NET ASSETS AS OF 30 JUNE 2014 18,036,000 197,766,974 2,034,914,006 226,417,161
NUMBER OF SHARES OUTSTANDING AS OF 30 JUNE 2014 Class A-dis (*) – 4,263,700 10,779,823 5,862,286 Class A-acc (*) 1,500,000 – – – Class I-dis (*) – – – – NET ASSET VALUE PER SHARE AS OF 30 JUNE 2014 Class A-dis (*) – 46.3839 188.7706 38.6227 Class A-acc (*) 12.0240 – – – Class I-dis (*) – – – – NET ASSET VALUE PER SHARE AS OF 31 DECEMBER 2013 Class A-dis (*) – 43.7967 177.9485 34.8802 Class A-acc (*) – – – – Class I-dis (*) – 13,426.8849 178,300.6045 34,785.6463 NET ASSET VALUE PER SHARE AS OF 31 DECEMBER 2012 Class A-dis (*) – 45.0677 137.2176 31.6449 Class A-acc (*) – – – – Class I-dis (*) – 13,525.9360 137,321.6753 31,611.3768 INITIAL OFFERING PRICE(**) Class A-dis (*) – 35.9700 131.9600 29.9200 Class A-acc (*) 12.0240 – – – Class I-dis (*) – 12,379.2000 100,590.0000 30,083.5600
COST OF INVESTMENTS AS OF 30 JUNE 2014 – 190,408,797 1,501,576,810 197,728,820
(*) The Share Class is in the Sub-Fund’s base currency. (**) As of initial dealing day (see Note 1)
14

Semi-Annual report as of 30 June 2014
The accompanying notes form an integral part of these financial statements.
Statement of Net Assets as of 30 June 2014 (Unaudited) ________________________________________________________________________________________________________________________________
MSCI Canada 100% hedged to CHF
UCITS ETF Sub-Fund
MSCI Canada 100% hedged to EUR
UCITS ETF Sub-Fund
MSCI Canada 100% hedged to USD
UCITS ETF Sub-Fund
MSCI Canada 100% hedged to GBP
UCITS ETF Sub-Fund
CHF EUR USD GBP ________________________________________________________________________________________________________________________________ ASSETS Market value of investment in securities (Note 2b) 5,440,216 6,271,080 6,858,676 4,649,870 Unrealised gain on forward foreign exchange contracts (Notes 2f, 9) – – – – Unrealised gain on futures (Note 2e) – – – – Receivable for shares subscribed – – – – Receivable for investment securities sold – – – – Cash at banks 14,682 8,924 – 5,547 Interest receivable 725 841 837 674 Dividends receivable 13,711 16,140 16,997 12,069 Other receivables – – – – TOTAL ASSETS 5,469,334 6,296,985 6,876,510 4,668,160 LIABILITIES Payable for investment securities purchased 62 138 81 57 Unrealised loss on forward foreign exchange contracts (Notes 2f, 9) 63,821 99,036 130,645 2,512 Payable for shares redeemed – – – – Bank overdraft 21,746 17,379 8,099 12,099 Management fees payable (Note 3) 1,874 2,150 2,344 1,619 Other payables – – – – TOTAL LIABILITIES 87,503 118,703 141,169 16,287
NET ASSETS AS OF 30 JUNE 2014 5,381,831 6,178,282 6,735,341 4,651,873
NUMBER OF SHARES OUTSTANDING AS OF 30 JUNE 2014 Class A-dis (*) – – – 100,000 Class A-acc (*) 300,000 410,000 400,000 100,000 Class I-dis (*) – – – – NET ASSET VALUE PER SHARE AS OF 30 JUNE 2014 Class A-dis (*) – – – 23.2230 Class A-acc (*) 17.9394 15.0690 16.8384 23.2957 Class I-dis (*) – – – – NET ASSET VALUE PER SHARE AS OF 31 DECEMBER 2013 Class A-dis (*) – – – 20.9368 Class A-acc (*) 16.1581 13.5448 15.1223 20.9302 Class I-dis (*) – – – – NET ASSET VALUE PER SHARE AS OF 31 DECEMBER 2012 Class A-dis (*) – – – – Class A-acc (*) – – – – Class I-dis (*) – – – – INITIAL OFFERING PRICE(**) Class A-dis (*) – – – 20.1653 Class A-acc (*) 14.9480 12.5205 13.9696 19.5348 Class I-dis (*) – – – –
COST OF INVESTMENTS AS OF 30 JUNE 2014 4,847,249 5,580,234 5,827,947 4,301,964
(*) The Share Class is in the Sub-Fund’s base currency. (**) As of initial dealing day (see Note 1)
15

Semi-Annual report as of 30 June 2014
The accompanying notes form an integral part of these financial statements.
Statement of Net Assets as of 30 June 2014 (Unaudited) ________________________________________________________________________________________________________________________________
MSCI Canada 100% hedged to SGD
UCITS ETF Sub-Fund
MSCI Switzerland 20/35
UCITS ETF Sub-Fund
MSCI Switzerland 20/35 100% hedged to EUR UCITS ETF
Sub-Fund
MSCI Switzerland 20/35 100% hedged to USD UCITS ETF
Sub-Fund SGD CHF EUR USD
________________________________________________________________________________________________________________________________ ASSETS Market value of investment in securities (Note 2b) – 237,311,912 74,049,006 78,975,697 Unrealised gain on forward foreign exchange contracts (Notes 2f, 9) – – – – Unrealised gain on futures (Note 2e) – – – – Receivable for shares subscribed 7,838,685 1,608,980 – 359,256 Receivable for investment securities sold – – – – Cash at banks – 76,227 48,400 41,849 Interest receivable – – 12 39 Dividends receivable – – – – Other receivables – 483 – 180 TOTAL ASSETS 7,838,685 238,997,602 74,097,418 79,377,021 LIABILITIES Payable for investment securities purchased – 1,598,829 – 319,220 Unrealised loss on forward foreign exchange contracts (Notes 2f, 9) – – 324,435 610,582 Payable for shares redeemed – – – – Bank overdraft – – 16,096 – Management fees payable (Note 3) – 36,924 18,094 18,027 Other payables – – – – TOTAL LIABILITIES – 1,635,753 358,625 947,829
NET ASSETS AS OF 30 JUNE 2014 7,838,685 237,361,849 73,738,793 78,429,192
NUMBER OF SHARES OUTSTANDING AS OF 30 JUNE 2014 Class A-dis (*) – 2,515,000 100,000 350,000 Class A-acc (*) 450,000 12,235,000 5,500,000 4,020,000 Class I-dis (*) – – – – NET ASSET VALUE PER SHARE AS OF 30 JUNE 2014 Class A-dis (*) – 16.0911 13.1800 17.9680 Class A-acc (*) 17.4193 16.0926 13.1674 17.9454 Class I-dis (*) – – – – NET ASSET VALUE PER SHARE AS OF 31 DECEMBER 2013 Class A-dis (*) – 15.0990 – – Class A-acc (*) – 15.1002 12.3367 16.8122 Class I-dis (*) – – – – NET ASSET VALUE PER SHARE AS OF 31 DECEMBER 2012 Class A-dis (*) – – – – Class A-acc (*) – – – – Class I-dis (*) – – – – INITIAL OFFERING PRICE(**) Class A-dis (*) – 15.1897 13.3468 18.1945 Class A-acc (*) 17.4193 15.1293 12.3558 16.8365 Class I-dis (*) – – – –
COST OF INVESTMENTS AS OF 30 JUNE 2014 – 232,746,222 71,923,797 77,853,578
(*) The Share Class is in the Sub-Fund’s base currency. (**) As of initial dealing day (see Note 1)
16

Semi-Annual report as of 30 June 2014
The accompanying notes form an integral part of these financial statements.
Statement of Net Assets as of 30 June 2014 (Unaudited) ________________________________________________________________________________________________________________________________
MSCI Switzerland 20/35 100% hedged to GBP UCITS ETF
Sub-Fund
MSCI Switzerland 20/35 100% hedged to SGD UCITS ETF
Sub-Fund
MSCI World UCITS ETF Sub-Fund
MSCI Emerging Markets
UCITS ETF Sub-Fund
GBP SGD USD USD ________________________________________________________________________________________________________________________________ ASSETS Market value of investment in securities (Note 2b) 6,044,823 – 868,329,527 355,044,031 Unrealised gain on forward foreign exchange contracts (Notes 2f, 9) 72,163 – – – Unrealised gain on futures (Note 2e) – – – 14,000 Receivable for shares subscribed – 7,435,755 308,492,371 138,281,858 Receivable for investment securities sold – – 131,076 – Cash at banks 8,358 – 677,204 5,612,057 Interest receivable 3 – 17,617 322 Dividends receivable 342 – 1,627,395 1,252,146 Other receivables – – 7,227 – TOTAL ASSETS 6,125,689 7,435,755 1,179,282,417 500,204,414 LIABILITIES Payable for investment securities purchased – – 243,355 4,367,114 Unrealised loss on forward foreign exchange contracts (Notes 2f, 9) – – – – Payable for shares redeemed – – 308,492,371 138,281,858 Bank overdraft – – 618,521 10,829 Management fees payable (Note 3) 1,183 – 478,965 594,044 Other payables – – – – TOTAL LIABILITIES 1,183 – 309,833,212 143,253,845
NET ASSETS AS OF 30 JUNE 2014 6,124,506 7,435,755 869,449,205 356,950,569
NUMBER OF SHARES OUTSTANDING AS OF 30 JUNE 2014 Class A-dis (*) 175,000 – 4,915,863 3,391,334 Class A-acc (*) 375,000 450,000 – – Class I-dis (*) – – – – NET ASSET VALUE PER SHARE AS OF 30 JUNE 2014 Class A-dis (*) 11.1354 – 176.8660 105.2537 Class A-acc (*) 11.1355 16.5239 – – Class I-dis (*) – – – – NET ASSET VALUE PER SHARE AS OF 31 DECEMBER 2013 Class A-dis (*) 10.4282 – 167.7693 100.3796 Class A-acc (*) 10.4282 – – – Class I-dis (*) – – 167,625.7242 100,534.2439 NET ASSET VALUE PER SHARE AS OF 31 DECEMBER 2012 Class A-dis (*) – – 135.2366 105.7072 Class A-acc (*) – – – – Class I-dis (*) – – 135,166.8867 105,663.2145 INITIAL OFFERING PRICE(**) Class A-dis (*) 10.4404 – 142.8400 112.1200 Class A-acc (*) 10.4404 16.5239 – – Class I-dis (*) – – 109,936.0900 112,116.6000
COST OF INVESTMENTS AS OF 30 JUNE 2014 6,095,156 – 684,666,939 337,470,130
(*) The Share Class is in the Sub-Fund’s base currency. (**) As of initial dealing day (see Note 1)
17

Semi-Annual report as of 30 June 2014
The accompanying notes form an integral part of these financial statements.
Statement of Net Assets as of 30 June 2014 (Unaudited) ________________________________________________________________________________________________________________________________
MSCI World Socially Responsible UCITS ETF Sub-Fund
MSCI North America Socially Responsible
UCITS ETF Sub-Fund
MSCI Europe & Middle East Socially
Responsible UCITS ETF Sub-Fund
MSCI Pacific Socially Responsible UCITS ETF Sub-Fund
USD USD EUR USD ________________________________________________________________________________________________________________________________ ASSETS Market value of investment in securities (Note 2b) 71,195,681 112,935,426 14,538,651 13,934,327 Unrealised gain on forward foreign exchange contracts (Notes 2f, 9) – – – – Unrealised gain on futures (Note 2e) – – – – Receivable for shares subscribed 80,633,933 60,758,860 10,641,441 8,997,251 Receivable for investment securities sold – – – 38,606 Cash at banks 171,326 68,035 11,485 109,005 Interest receivable 987 1,455 190 140 Dividends receivable 192,002 109,411 68,386 72,171 Other receivables – – – – TOTAL ASSETS 152,193,929 173,873,187 25,260,153 23,151,500 LIABILITIES Payable for investment securities purchased 2,643 194 1,959 33,710 Unrealised loss on forward foreign exchange contracts (Notes 2f, 9) – – – – Payable for shares redeemed 80,633,933 60,758,860 10,641,441 8,997,251 Bank overdraft 182,157 – 57,391 150,936 Management fees payable (Note 3) 58,555 33,379 7,250 7,737 Other payables – – – – TOTAL LIABILITIES 80,877,288 60,792,433 10,708,041 9,189,634
NET ASSETS AS OF 30 JUNE 2014 71,316,641 113,080,754 14,552,112 13,961,866
NUMBER OF SHARES OUTSTANDING AS OF 30 JUNE 2014 Class A-dis (*) 912,263 1,353,427 200,157 217,351 Class A-acc (*) – – – – Class I-dis (*) – – – – NET ASSET VALUE PER SHARE AS OF 30 JUNE 2014 Class A-dis (*) 78.1755 83.5514 72.7035 64.2365 Class A-acc (*) – – – – Class I-dis (*) – – – – NET ASSET VALUE PER SHARE AS OF 31 DECEMBER 2013 Class A-dis (*) 74.9239 78.9434 70.3353 62.8008 Class A-acc (*) – – – – Class I-dis (*) 14,993.5696 15,792.1869 14,086.8022 12,594.4381 NET ASSET VALUE PER SHARE AS OF 31 DECEMBER 2012 Class A-dis (*) 60.0037 62.3434 58.2049 54.6673 Class A-acc (*) – – – – Class I-dis (*) 12,010.9832 12,481.8259 11,652.0073 10,942.9889 INITIAL OFFERING PRICE(**) Class A-dis (*) 51.7100 52.2900 46.0900 52.8100 Class A-acc (*) – – – – Class I-dis (*) 10,341.5000 10,458.2100 9,218.2000 10,561.9500
COST OF INVESTMENTS AS OF 30 JUNE 2014 59,176,782 99,896,039 11,952,252 12,204,514
(*) The Share Class is in the Sub-Fund’s base currency. (**) As of initial dealing day (see Note 1)
18

Semi-Annual report as of 30 June 2014
The accompanying notes form an integral part of these financial statements.
Statement of Net Assets as of 30 June 2014 (Unaudited) ________________________________________________________________________________________________________________________________
MSCI Japan Infrastructure 20/35
UCITS ETF Sub-Fund
MSCI AC Asia ex Japan Infrastructure
20/35 UCITS ETF Sub-Fund
MSCI Europe Infrastructure 20/35
UCITS ETF Sub-Fund
STOXX Global Rare Earth UCITS ETF Sub-Fund
JPY USD EUR USD ________________________________________________________________________________________________________________________________ ASSETS Market value of investment in securities (Note 2b) 629,060,000 8,352,124 4,235,088 8,095,151 Unrealised gain on forward foreign exchange contracts (Notes 2f, 9) – – – – Unrealised gain on futures (Note 2e) – – – – Receivable for shares subscribed 298,559,028 3,820,710 1,447,929 2,807,553 Receivable for investment securities sold – – – 353 Cash at banks 350,123 42,028 958 443,361 Interest receivable – 10 552 3,633 Dividends receivable – 16,385 51,088 – Other receivables – – – – TOTAL ASSETS 927,969,151 12,231,257 5,735,615 11,350,051 LIABILITIES Payable for investment securities purchased – – – 445,478 Unrealised loss on forward foreign exchange contracts (Notes 2f, 9) – – – – Payable for shares redeemed 298,559,028 3,820,710 1,447,928 2,807,553 Bank overdraft – 39,505 28,153 – Management fees payable (Note 3) 246,534 5,472 1,686 2,829 Other payables – – – – TOTAL LIABILITIES 298,805,562 3,865,687 1,477,767 3,255,860
NET ASSETS AS OF 30 JUNE 2014 629,163,589 8,365,570 4,257,848 8,094,191
NUMBER OF SHARES OUTSTANDING AS OF 30 JUNE 2014 Class A-dis (*) 90,017 260,000 75,067 1,325,008 Class A-acc (*) – – – – Class I-dis (*) – – – – NET ASSET VALUE PER SHARE AS OF 30 JUNE 2014 Class A-dis (*) 6,989.3863 32.1753 56.7206 6.1088 Class A-acc (*) – – – – Class I-dis (*) – – – – NET ASSET VALUE PER SHARE AS OF 31 DECEMBER 2013 Class A-dis (*) 7,564.9260 30.8357 52.3375 9.6165 Class A-acc (*) – – – – Class I-dis (*) 1,514,138.2494 12,339.1670 10,471.5169 1,926.1556 NET ASSET VALUE PER SHARE AS OF 31 DECEMBER 2012 Class A-dis (*) 4,180.2621 31.2052 43.7346 16.0641 Class A-acc (*) – – – – Class I-dis (*) 836,728.4600 12,492.3938 8,754.8038 3,219.3299 INITIAL OFFERING PRICE(**) Class A-dis (*) 4,187.0000 28.2200 47.5300 31.6300 Class A-acc (*) – – – – Class I-dis (*) 837,320.0000 11,288.6500 9,506.4000 6,326.6000
COST OF INVESTMENTS AS OF 30 JUNE 2014 407,198,514 7,490,550 3,950,568 15,817,051
(*) The Share Class is in the Sub-Fund’s base currency. (**) As of initial dealing day (see Note 1)
19

Semi-Annual report as of 30 June 2014
The accompanying notes form an integral part of these financial statements.
Statement of Net Assets as of 30 June 2014 (Unaudited) ________________________________________________________________________________________________________________________________
Barclays Capital US 1-3 Year Treasury Bond UCITS ETF
Sub-Fund
Barclays Capital US 3-5 Year Treasury Bond UCITS ETF
Sub-Fund
Barclays Capital US 5-7 Year Treasury Bond UCITS ETF
Sub-Fund
Barclays Capital US 7-10 Year Treasury Bond UCITS ETF
Sub-Fund USD USD USD USD
________________________________________________________________________________________________________________________________ ASSETS Market value of investment in securities (Note 2b) 14,262,387 9,711,558 6,652,343 17,632,923 Unrealised gain on forward foreign exchange contracts (Notes 2f, 9) – – – – Unrealised gain on futures (Note 2e) – – – – Receivable for shares subscribed – – – – Receivable for investment securities sold – – – – Cash at banks 22,942 10,618 11,638 8,729 Interest receivable 45,260 37,544 37,764 113,450 Dividends receivable – – – – Other receivables – – – – TOTAL ASSETS 14,330,589 9,759,720 6,701,745 17,755,102 LIABILITIES Payable for investment securities purchased – – – – Unrealised loss on forward foreign exchange contracts (Notes 2f, 9) – – – – Payable for shares redeemed – – – – Bank overdraft – – – – Management fees payable (Note 3) 2,589 1,760 1,193 3,189 Other payables – – – – TOTAL LIABILITIES 2,589 1,760 1,193 3,189
NET ASSETS AS OF 30 JUNE 2014 14,328,000 9,757,960 6,700,552 17,751,913
NUMBER OF SHARES OUTSTANDING AS OF 30 JUNE 2014 Class A-dis (*) 575,000 300,000 180,000 440,000 Class A-acc (*) – – – – Class I-dis (*) – – – – NET ASSET VALUE PER SHARE AS OF 30 JUNE 2014 Class A-dis (*) 24.9183 32.5265 37.2253 40.3453 Class A-acc (*) – – – – Class I-dis (*) – – – – NET ASSET VALUE PER SHARE AS OF 31 DECEMBER 2013 Class A-dis (*) 24.8657 32.2063 36.4067 38.6570 Class A-acc (*) – – – – Class I-dis (*) – – – – NET ASSET VALUE PER SHARE AS OF 31 DECEMBER 2012 Class A-dis (*) 24.8571 32.7195 38.1896 41.7935 Class A-acc (*) – – – – Class I-dis (*) – – – – INITIAL OFFERING PRICE(**) Class A-dis (*) 24.9100 32.6300 37.4100 40.7300 Class A-acc (*) – – – – Class I-dis (*) – – – –
COST OF INVESTMENTS AS OF 30 JUNE 2014 14,239,676 9,724,432 6,619,109 17,570,299
(*) The Share Class is in the Sub-Fund’s base currency. (**) As of initial dealing day (see Note 1)
20

Semi-Annual report as of 30 June 2014
The accompanying notes form an integral part of these financial statements.
Statement of Net Assets as of 30 June 2014 (Unaudited) ________________________________________________________________________________________________________________________________
Markit iBoxx € Germany 1-3 UCITS ETF Sub-Fund
Markit iBoxx € Germany 3-5 UCITS ETF Sub-Fund
Markit iBoxx € Germany 5-10
UCITS ETF Sub-Fund
Markit iBoxx € Germany 7-10
UCITS ETF Sub-Fund
EUR EUR EUR EUR ________________________________________________________________________________________________________________________________ ASSETS Market value of investment in securities (Note 2b) 59,563,958 2,763,061 5,355,656 7,692,883 Unrealised gain on forward foreign exchange contracts (Notes 2f, 9) – – – – Unrealised gain on futures (Note 2e) – – – – Receivable for shares subscribed – – – – Receivable for investment securities sold – – – – Cash at banks 113,870 3,331 5,066 5,742 Interest receivable 691,675 42,015 84,133 100,794 Dividends receivable – – – – Other receivables – – – – TOTAL ASSETS 60,369,503 2,808,407 5,444,855 7,799,419 LIABILITIES Payable for investment securities purchased – – – – Unrealised loss on forward foreign exchange contracts (Notes 2f, 9) – – – – Payable for shares redeemed – – – – Bank overdraft – – – – Management fees payable (Note 3) 9,493 343 590 1,174 Other payables – – – – TOTAL LIABILITIES 9,493 343 590 1,174
NET ASSETS AS OF 30 JUNE 2014 60,360,010 2,808,064 5,444,265 7,798,245
NUMBER OF SHARES OUTSTANDING AS OF 30 JUNE 2014 Class A-dis (*) 760,000 30,000 50,000 70,000 Class A-acc (*) – – – – Class I-dis (*) – – – – NET ASSET VALUE PER SHARE AS OF 30 JUNE 2014 Class A-dis (*) 79.4211 93.6021 108.8853 111.4035 Class A-acc (*) – – – – Class I-dis (*) – – – – NET ASSET VALUE PER SHARE AS OF 31 DECEMBER 2013 Class A-dis (*) 79.0382 91.7552 103.5121 104.9183 Class A-acc (*) – – – – Class I-dis (*) – – – – NET ASSET VALUE PER SHARE AS OF 31 DECEMBER 2012 Class A-dis (*) 79.3690 92.9145 106.4692 108.1993 Class A-acc (*) – – – – Class I-dis (*) – – – – INITIAL OFFERING PRICE(**) Class A-dis (*) 79.3100 90.6900 100.6200 101.5000 Class A-acc (*) – – – – Class I-dis (*) – – – –
COST OF INVESTMENTS AS OF 30 JUNE 2014 59,440,486 2,737,462 5,250,022 7,357,193
(*) The Share Class is in the Sub-Fund’s base currency. (**) As of initial dealing day (see Note 1)
21

Semi-Annual report as of 30 June 2014
The accompanying notes form an integral part of these financial statements.
Statement of Net Assets as of 30 June 2014 (Unaudited) ________________________________________________________________________________________________________________________________
Markit iBoxx € Liquid Corporates UCITS ETF Sub-Fund
Markit iBoxx € Sovereigns 1-5
UCITS ETF Sub-Fund
SBI® Foreign AAA-BBB 1-5
UCITS ETF Sub-Fund
SBI® Foreign AAA-BBB 5-10
UCITS ETF Sub-Fund
EUR EUR CHF CHF ________________________________________________________________________________________________________________________________ ASSETS Market value of investment in securities (Note 2b) 38,479,073 2,960,614 56,627,033 21,574,283 Unrealised gain on forward foreign exchange contracts (Notes 2f, 9) – – – – Unrealised gain on futures (Note 2e) – – – – Receivable for shares subscribed – – – – Receivable for investment securities sold – – – – Cash at banks 495,216 5,817 38,234 91,106 Interest receivable 536,144 44,015 686,545 228,627 Dividends receivable – – – – Other receivables – – – – TOTAL ASSETS 39,510,433 3,010,446 57,351,812 21,894,016 LIABILITIES Payable for investment securities purchased 403,557 – – – Unrealised loss on forward foreign exchange contracts (Notes 2f, 9) – – – – Payable for shares redeemed – – – – Bank overdraft – – – – Management fees payable (Note 3) 6,572 202 9,422 3,587 Other payables – – – – TOTAL LIABILITIES 410,129 202 9,422 3,587
NET ASSETS AS OF 30 JUNE 2014 39,100,304 3,010,244 57,342,390 21,890,429
NUMBER OF SHARES OUTSTANDING AS OF 30 JUNE 2014 Class A-dis (*) 400,000 250,000 4,800,000 1,600,000 Class A-acc (*) – – – – Class I-dis (*) – – – – NET ASSET VALUE PER SHARE AS OF 30 JUNE 2014 Class A-dis (*) 97.7508 12.0410 11.9463 13.6815 Class A-acc (*) – – – – Class I-dis (*) – – – – NET ASSET VALUE PER SHARE AS OF 31 DECEMBER 2013 Class A-dis (*) 94.9201 11.7737 11.8541 13.1101 Class A-acc (*) – – – – Class I-dis (*) – – – – NET ASSET VALUE PER SHARE AS OF 31 DECEMBER 2012 Class A-dis (*) 96.5869 – – – Class A-acc (*) – – – – Class I-dis (*) – – – – INITIAL OFFERING PRICE(**) Class A-dis (*) 88.3100 11.8107 11.7920 13.0390 Class A-acc (*) – – – – Class I-dis (*) – – – –
COST OF INVESTMENTS AS OF 30 JUNE 2014 37,640,190 2,921,001 56,353,980 20,960,299
(*) The Share Class is in the Sub-Fund’s base currency. (**) As of initial dealing day (see Note 1)
22

Semi-Annual report as of 30 June 2014
The accompanying notes form an integral part of these financial statements.
(*) The Share Class is in the Sub-Fund’s base currency. (**) The Class A-acc of Barclays US Liquid Corporates UCITS ETF is in EUR. (***) As of initial dealing day (see Note 1)
Statement of Net Assets as of 30 June 2014 (Unaudited) ___________________________________________________________________________________
Barclays Euro Area Liquid
Corporates 1-5 Year UCITS ETF Sub-Fund
Barclays US Liquid Corporates UCITS ETF Sub-Fund
EUR USD ____________________________________________________________________________________
ASSETS Market value of investment in securities (Note 2b) 35,937,185 47,280,194 Unrealised gain on forward foreign exchange contracts (Notes 2f, 9) – 75,740 Unrealised gain on futures (Note 2e) – – Receivable for shares subscribed – – Receivable for investment securities sold – – Cash at banks 555,891 208,913 Interest receivable 455,298 422,307 Dividends receivable – – Other receivables – – TOTAL ASSETS 36,948,374 47,987,154 LIABILITIES Payable for investment securities purchased – 99,207 Unrealised loss on forward foreign exchange contracts (Notes 2f, 9) – – Payable for shares redeemed – – Bank overdraft – – Management fees payable (Note 3) 5,278 7,652 Other payables – 95 TOTAL LIABILITIES 5,278 106,954
NET ASSETS AS OF 30 JUNE 2014 36,943,096 47,880,200
NUMBER OF SHARES OUTSTANDING AS OF 30 JUNE 2014 Class A-dis (*) 2,800,000 1,600,000 Class A-acc (*) – 1,000,000 Class I-dis (*) – – NET ASSET VALUE PER SHARE AS OF 30 JUNE 2014 Class A-dis (*) 13.1940 16.1476 Class A-acc (**) – 16.1005 Class I-dis (*) – – NET ASSET VALUE PER SHARE AS OF 31 DECEMBER 2013 Class A-dis (*) – – Class A-acc (*) – – Class I-dis (*) – – NET ASSET VALUE PER SHARE AS OF 31 DECEMBER 2012 Class A-dis (*) – – Class A-acc (*) – – Class I-dis (*) – – INITIAL OFFERING PRICE(***) Class A-dis (*) 13.1520 16.1460 Class A-acc (**) – 16.0990 Class I-dis (*) – –
COST OF INVESTMENTS AS OF 30 JUNE 2014 35,888,561 47,507,033
23

Semi-Annual report as of 30 June 2014
The accompanying notes form an integral part of these financial statements.
Statement of Operations for the period ended 30 June 2014 (Unaudited) _____________________________________________________________________________________________________________________________________
UBS ETF Consolidated
Statement
EURO STOXX 50 UCITS ETF Sub-Fund
MSCI Europe UCITS ETF
Sub-Fund
MSCI Europe ex UK UCITS ETF Sub-Fund
EUR EUR EUR EUR _____________________________________________________________________________________________________________________________________ INCOME Dividends (net of foreign withholding tax) (Note 2d) 157,844,327 17,236,203 2,103,669 4,342 Interest on bonds (net of foreign withholding tax) (Note 2d) 1,019,646 – – – Net income equalization (Note 5) 24,195,399 – 1,012,840 – Income on securities lending (Note 8) 1,676,330 249,551 25,713 – Interest on cash 147,235 88,557 2,526 – Other income 5,672,477 6,045 45,821 10,529 TOTAL INCOME 190,555,414 17,580,356 3,190,569 14,871 EXPENSES Management fees (Note 3) 9,226,760 477,751 62,883 363 Net income equalization 5,972,457 109,372 – – Transaction fees (Note 18) 347,314 6,189 7,404 – Debit interest on call account 76,172 – – – Other expenses 50 – – – TOTAL EXPENSES 15,622,753 593,312 70,287 363 NET INVESTMENT INCOME / (LOSS) (Note 5) 174,932,661 16,987,044 3,120,282 14,508 _____________________________________________________________________________________________________________________________________ Net realised gains / (losses) on: Investments 175,379,828 19,534,404 68,645 – Foreign currencies and forward foreign exchange contracts (6,948,113) 3,175 9,026 246 Swaps, futures and options contracts (26,940) – – – Net change in unrealised gains / (losses) on: Investments 12,133,836 3,583,932 1,298,494 (187,988) Foreign currencies (74,683) (941) 1,023 3 Forward foreign exchange contracts (5,691,502) – – – Swaps, futures and options contracts 10,225 – – – _____________________________________________________________________________________________________________________________________
39

Semi-Annual report as of 30 June 2014
The accompanying notes form an integral part of these financial statements.
Statement of Operations for the period ended 30 June 2014 (Unaudited) _____________________________________________________________________________________________________________________________________
MSCI EMU UCITS ETF
Sub-Fund
MSCI EMU 100% hedged to CHF
UCITS ETF Sub-Fund
MSCI EMU 100% hedged to USD
UCITS ETF Sub-Fund
MSCI EMU 100% hedged to GBP
UCITS ETF Sub-Fund
EUR CHF USD GBP _____________________________________________________________________________________________________________________________________ INCOME Dividends (net of foreign withholding tax) (Note 2d) 30,608,537 2,571,488 8,726,657 2,534,941 Interest on bonds (net of foreign withholding tax) (Note 2d) – – – – Net income equalization (Note 5) 2,243,850 538,535 2,495,319 1,095,392 Income on securities lending (Note 8) 613,241 51,347 171,509 51,864 Interest on cash 46,559 – – – Other income 27,222 148,320 500,963 162,942 TOTAL INCOME 33,539,409 3,309,690 11,894,448 3,845,139 EXPENSES Management fees (Note 3) 1,377,441 155,161 498,817 130,618 Net income equalization – – – – Transaction fees (Note 18) 11,591 28,064 34,228 12,926 Debit interest on call account – 500 1,182 183 Other expenses – – – – TOTAL EXPENSES 1,389,032 183,725 534,227 143,727 NET INVESTMENT INCOME / (LOSS) (Note 5) 32,150,377 3,125,965 11,360,221 3,701,412 _____________________________________________________________________________________________________________________________________ Net realised gains / (losses) on: Investments 12,823,023 695 29,105 (20,830) Foreign currencies and forward foreign exchange contracts 15,457 755,987 2,234,476 1,583,791 Swaps, futures and options contracts – – – – Net change in unrealised gains / (losses) on: Investments 29,281,163 851,220 7,256,341 (1,650,938) Foreign currencies (8,025) (485) 4,246 (666) Forward foreign exchange contracts – 520,320 (1,344,555) 1,948,016 Swaps, futures and options contracts – – – – _____________________________________________________________________________________________________________________________________
25

Semi-Annual report as of 30 June 2014
The accompanying notes form an integral part of these financial statements.
Statement of Operations for the period ended 30 June 2014 (Unaudited) ___________________________________________________________________________________________________________________________________
MSCI EMU 100% hedged to SGD
UCITS ETF Sub-Fund
MSCI EMU Value UCITS ETF Sub-Fund
MSCI EMU Small Cap UCITS ETF Sub-Fund
FTSE 100 UCITS ETFSub-Fund
SGD EUR EUR GBP ___________________________________________________________________________________________________________________________________ INCOME Dividends (net of foreign withholding tax) (Note 2d) – 1,113,837 263,633 10,075,751 Interest on bonds (net of foreign withholding tax) (Note 2d) – – – – Net income equalization (Note 5) – – 37,236 – Income on securities lending (Note 8) – 25,030 1,401 5,264 Interest on cash – 7,669 416 – Other income – 1,727 16,941 21,281 TOTAL INCOME – 1,148,263 319,627 10,102,296 EXPENSES Management fees (Note 3) – 46,062 23,984 182,822 Net income equalization – 17,011 – 1,927,498 Transaction fees (Note 18) – 4,359 9,973 3,885 Debit interest on call account – – – 11,146 Other expenses – – – – TOTAL EXPENSES – 67,432 33,957 2,125,351 NET INVESTMENT INCOME / (LOSS) (Note 5) – 1,080,831 285,670 7,976,945 ___________________________________________________________________________________________________________________________________ Net realised gains / (losses) on: Investments – 2,157,946 241,319 8,561,247 Foreign currencies and forward foreign exchange contracts – 357 (259) (13,764) Swaps, futures and options contracts – – – – Net change in unrealised gains / (losses) on: Investments – (275,421) 232,601 (15,380,246) Foreign currencies – 429 3 140 Forward foreign exchange contracts – – – – Swaps, futures and options contracts – – – – ___________________________________________________________________________________________________________________________________
26

Semi-Annual report as of 30 June 2014
The accompanying notes form an integral part of these financial statements.
Statement of Operations for the period ended 30 June 2014 (Unaudited) ___________________________________________________________________________________________________________________________________
FTSE 250 UCITS ETF Sub-Fund
MSCI United Kingdom UCITS ETF
Sub-Fund
MSCI United Kingdom 100% hedged to CHF
UCITS ETF Sub-Fund
MSCI United Kingdom 100% hedged to EUR
UCITS ETF Sub-Fund
GBP GBP CHF EUR ___________________________________________________________________________________________________________________________________ INCOME Dividends (net of foreign withholding tax) (Note 2d) 8,769 18,675,165 7,302,959 4,316,237 Interest on bonds (net of foreign withholding tax) (Note 2d) – – – – Net income equalization (Note 5) – 5,448,158 1,731,891 704,972 Income on securities lending (Note 8) – 1,164 419 199 Interest on cash – – – – Other income 68,532 1,244,318 1,456,669 605,936 TOTAL INCOME 77,301 25,368,805 10,491,938 5,627,344 EXPENSES Management fees (Note 3) 516 293,147 182,246 110,601 Net income equalization – – – – Transaction fees (Note 18) – 773 4,309 8,572 Debit interest on call account – 9,706 5,499 2,685 Other expenses – – – – TOTAL EXPENSES 516 303,626 192,054 121,858 NET INVESTMENT INCOME / (LOSS) (Note 5) 76,785 25,065,179 10,299,884 5,505,486 ___________________________________________________________________________________________________________________________________ Net realised gains / (losses) on: Investments – (2,496,570) (2,666,372) 41,890 Foreign currencies and forward foreign exchange contracts – 9,494 (1,796,844) (1,533,961) Swaps, futures and options contracts – – – – Net change in unrealised gains / (losses) on: Investments 90,683 (4,844,839) 176,364 2,251,622 Foreign currencies – (3,872) 8,232 5,435 Forward foreign exchange contracts – – (2,175,897) (1,601,316) Swaps, futures and options contracts – – – – ___________________________________________________________________________________________________________________________________
27

Semi-Annual report as of 30 June 2014
The accompanying notes form an integral part of these financial statements.
Statement of Operations for the period ended 30 June 2014 (Unaudited) ___________________________________________________________________________________________________________________________________
MSCI United Kingdom 100% hedged to USD
UCITS ETF Sub-Fund
MSCI United Kingdom 100% hedged to SGD
UCITS ETF Sub-Fund
MSCI Turkey UCITS ETF Sub-Fund
MSCI Japan UCITS ETF Sub-Fund
USD SGD EUR JPY ___________________________________________________________________________________________________________________________________ INCOME Dividends (net of foreign withholding tax) (Note 2d) 3,663,139 – 158,337 800,292,105 Interest on bonds (net of foreign withholding tax) (Note 2d) – – – – Net income equalization (Note 5) 176,798 – – – Income on securities lending (Note 8) 218 – – 11,388,843 Interest on cash – – – – Other income 760,522 – 4,700 2,626,799 TOTAL INCOME 4,600,677 – 163,037 814,307,747 EXPENSES Management fees (Note 3) 109,335 – 19,144 164,764,440 Net income equalization – – 3,549 244,231,152 Transaction fees (Note 18) 25,104 – 6,400 1,196,454 Debit interest on call account 1,889 – – 2,710,080 Other expenses – – – – TOTAL EXPENSES 136,328 – 29,093 412,902,126 NET INVESTMENT INCOME / (LOSS) (Note 5) 4,464,349 – 133,944 401,405,621 ___________________________________________________________________________________________________________________________________ Net realised gains / (losses) on: Investments (266,134) – 143,930 10,986,742,239 Foreign currencies and forward foreign exchange contracts (902,931) – (764,457) 357,340 Swaps, futures and options contracts – – – – Net change in unrealised gains / (losses) on: Investments 1,296,551 – 2,378,720 (17,083,592,718) Foreign currencies 7,940 – 634 (2,222,329) Forward foreign exchange contracts (2,487,507) – – – Swaps, futures and options contracts – – – – ___________________________________________________________________________________________________________________________________
28

Semi-Annual report as of 30 June 2014
The accompanying notes form an integral part of these financial statements.
Statement of Operations for the period ended 30 June 2014 (Unaudited) ____________________________________________________________________________________________________________________________________
MSCI Japan 100% hedged to CHF
UCITS ETF Sub-Fund
MSCI Japan 100% hedged to EUR
UCITS ETF Sub-Fund
MSCI Japan 100% hedged to GBP
UCITS ETF Sub-Fund
MSCI Japan 100% hedged to USD
UCITS ETF Sub-Fund
CHF EUR GBP USD ____________________________________________________________________________________________________________________________________ INCOME Dividends (net of foreign withholding tax) (Note 2d) 708,016 357,493 224,252 957,819 Interest on bonds (net of foreign withholding tax) (Note 2d) – – – – Net income equalization (Note 5) 4,030,008 2,449,791 – – Income on securities lending (Note 8) 5,345 3,029 1,857 8,198 Interest on cash – – – – Other income 47,779 25,646 13,448 65,387 TOTAL INCOME 4,791,148 2,835,959 239,557 1,031,404 EXPENSES Management fees (Note 3) 152,125 82,871 53,462 202,263 Net income equalization – – – – Transaction fees (Note 18) 24,985 15,225 13,377 45,876 Debit interest on call account 2,681 1,161 530 1,795 Other expenses – – – – TOTAL EXPENSES 179,791 99,257 67,369 249,934 NET INVESTMENT INCOME / (LOSS) (Note 5) 4,611,357 2,736,702 172,188 781,470 ____________________________________________________________________________________________________________________________________ Net realised gains / (losses) on: Investments (295,531) (47,986) (63,293) (246,854) Foreign currencies and forward foreign exchange contracts (737,801) (523,891) 119,124 (1,567,841) Swaps, futures and options contracts – – – – Net change in unrealised gains / (losses) on: Investments 2,236,845 2,665,393 (88,204) 4,959,918 Foreign currencies 96 1,375 (1,382) 2,066 Forward foreign exchange contracts (267,360) (519,613) 108,723 (1,057,862) Swaps, futures and options contracts – – – – ____________________________________________________________________________________________________________________________________
29

Semi-Annual report as of 30 June 2014
The accompanying notes form an integral part of these financial statements.
Statement of Operations for the period ended 30 June 2014 (Unaudited) ____________________________________________________________________________________________________________________________________
MSCI Japan 100% hedged to SGD
UCITS ETF Sub-Fund
MSCI Pacific (ex Japan) UCITS ETF
Sub-Fund
MSCI USA UCITS ETF
Sub-Fund
MSCI Canada UCITS ETF
Sub-Fund SGD USD USD CAD
____________________________________________________________________________________________________________________________________ INCOME Dividends (net of foreign withholding tax) (Note 2d) – 4,567,198 14,366,378 1,947,303 Interest on bonds (net of foreign withholding tax) (Note 2d) – – – – Net income equalization (Note 5) – – 1,501,445 643,859 Income on securities lending (Note 8) – 6,513 24,726 225,763 Interest on cash – – – – Other income – 40,575 29,248 12,826 TOTAL INCOME – 4,614,286 15,921,797 2,829,751 EXPENSES Management fees (Note 3) – 301,280 1,926,558 282,826 Net income equalization – 1,104,207 – – Transaction fees (Note 18) – 21,420 9,408 9,284 Debit interest on call account – 4,249 2,831 2,809 Other expenses – – – – TOTAL EXPENSES – 1,431,156 1,938,797 294,919 NET INVESTMENT INCOME / (LOSS) (Note 5) – 3,183,130 13,983,000 2,534,832 ____________________________________________________________________________________________________________________________________ Net realised gains / (losses) on: Investments – 2,982,488 51,399,509 3,161,474 Foreign currencies and forward foreign exchange contracts – (4,048,389) – 4,706 Swaps, futures and options contracts – – – – Net change in unrealised gains / (losses) on: Investments – 9,717,958 72,094,356 15,221,725 Foreign currencies – 7,833 (4) (4,123) Forward foreign exchange contracts – – – – Swaps, futures and options contracts – – – – ____________________________________________________________________________________________________________________________________
30

Semi-Annual report as of 30 June 2014
The accompanying notes form an integral part of these financial statements.
Statement of Operations for the period ended 30 June 2014 (Unaudited) ____________________________________________________________________________________________________________________________________
MSCI Canada 100% hedged to CHF
UCITS ETF Sub-Fund
MSCI Canada 100% hedged to EUR
UCITS ETF Sub-Fund
MSCI Canada 100% hedged to USD
UCITS ETF Sub-Fund
MSCI Canada 100% hedged to GBP
UCITS ETF Sub-Fund
CHF EUR USD GBP ____________________________________________________________________________________________________________________________________ INCOME Dividends (net of foreign withholding tax) (Note 2d) 56,311 65,019 70,148 48,439 Interest on bonds (net of foreign withholding tax) (Note 2d) – – – – Net income equalization (Note 5) – 54,462 – – Income on securities lending (Note 8) 4,070 4,931 5,248 3,759 Interest on cash – – – – Other income – 2,860 – – TOTAL INCOME 60,381 127,272 75,396 52,198 EXPENSES Management fees (Note 3) 10,844 12,438 13,549 9,365 Net income equalization – – – – Transaction fees (Note 18) 481 2,705 492 460 Debit interest on call account 26 203 11 22 Other expenses – – – – TOTAL EXPENSES 11,351 15,346 14,052 9,847 NET INVESTMENT INCOME / (LOSS) (Note 5) 49,030 111,926 61,344 42,351 ____________________________________________________________________________________________________________________________________ Net realised gains / (losses) on: Investments 27,604 154,604 32,408 14,567 Foreign currencies and forward foreign exchange contracts 115,100 (18,044) 101,373 170,986 Swaps, futures and options contracts – – – – Net change in unrealised gains / (losses) on: Investments 492,886 594,021 638,395 304,439 Foreign currencies (255) (136) 126 (176) Forward foreign exchange contracts (149,958) (157,324) (147,232) (59,777) Swaps, futures and options contracts – – – – ____________________________________________________________________________________________________________________________________
31

Semi-Annual report as of 30 June 2014
The accompanying notes form an integral part of these financial statements.
Statement of Operations for the period ended 30 June 2014 (Unaudited) ___________________________________________________________________________________________________________________________________
MSCI Canada 100% hedged to SGD
UCITS ETF Sub-Fund
MSCI Switzerland 20/35 UCITS ETF
Sub-Fund
MSCI Switzerland 20/35 100% hedged to EUR UCITS ETF
Sub-Fund
MSCI Switzerland 20/35 100% hedged to USD UCITS ETF
Sub-Fund SGD CHF EUR USD
___________________________________________________________________________________________________________________________________ INCOME Dividends (net of foreign withholding tax) (Note 2d) – 5,003,932 1,606,549 1,491,243 Interest on bonds (net of foreign withholding tax) (Note 2d) – – – – Net income equalization (Note 5) – – – – Income on securities lending (Note 8) – 58,032 9,622 9,094 Interest on cash – – – – Other income – 22,742 39,201 37,115 TOTAL INCOME – 5,084,706 1,655,372 1,537,452 EXPENSES Management fees (Note 3) – 174,684 80,228 74,453 Net income equalization – – – – Transaction fees (Note 18) – 15,949 2,680 5,452 Debit interest on call account – 813 365 572 Other expenses – – – – TOTAL EXPENSES – 191,446 83,273 80,477 NET INVESTMENT INCOME / (LOSS) (Note 5) – 4,893,260 1,572,099 1,456,975 ___________________________________________________________________________________________________________________________________ Net realised gains / (losses) on: Investments – 43,472 10,195 (18,315) Foreign currencies and forward foreign exchange contracts – (455) (50,967) 229,734 Swaps, futures and options contracts – – – – Net change in unrealised gains / (losses) on: Investments – 4,314,209 2,113,479 1,025,861 Foreign currencies – (121) 51 221 Forward foreign exchange contracts – – (308,337) (517,352) Swaps, futures and options contracts – – – – ___________________________________________________________________________________________________________________________________
32

Semi-Annual report as of 30 June 2014
The accompanying notes form an integral part of these financial statements.
Statement of Operations for the period ended 30 June 2014 (Unaudited) ____________________________________________________________________________________________________________________________________
MSCI Switzerland 20/35 100% hedged to GBP UCITS ETF
Sub-Fund
MSCI Switzerland 20/35 100% hedged to SGD UCITS ETF
Sub-Fund
MSCI World UCITS ETF
Sub-Fund
MSCI Emerging Markets UCITS ETF
Sub-Fund GBP SGD USD USD
____________________________________________________________________________________________________________________________________ INCOME Dividends (net of foreign withholding tax) (Note 2d) 124,134 – 12,333,815 4,243,624 Interest on bonds (net of foreign withholding tax) (Note 2d) – – – – Net income equalization (Note 5) – – 683,432 – Income on securities lending (Note 8) 748 – 140,605 10,740 Interest on cash – – 1,579 – Other income 1,074 – 129,037 209,277 TOTAL INCOME 125,956 – 13,288,468 4,463,641 EXPENSES Management fees (Note 3) 7,660 – 1,168,339 696,951 Net income equalization – – – 1,195 Transaction fees (Note 18) 750 – 20,328 26,407 Debit interest on call account – – – 4,024 Other expenses – – – 68 TOTAL EXPENSES 8,410 – 1,188,667 728,645 NET INVESTMENT INCOME / (LOSS) (Note 5) 117,546 – 12,099,801 3,734,996 ____________________________________________________________________________________________________________________________________ Net realised gains / (losses) on: Investments 1,650 – 13,699,341 (1,356,663) Foreign currencies and forward foreign exchange contracts 118,597 – (107,761) (2,241,382) Swaps, futures and options contracts – – – (36,885) Net change in unrealised gains / (losses) on: Investments 1,182 – 22,955,150 17,851,226 Foreign currencies (15) – 2,226 (103,698) Forward foreign exchange contracts 88,121 – – – Swaps, futures and options contracts – – – 14,000 ____________________________________________________________________________________________________________________________________
33

Semi-Annual report as of 30 June 2014
The accompanying notes form an integral part of these financial statements.
Statement of Operations for the period ended 30 June 2014 (Unaudited) ____________________________________________________________________________________________________________________________________
MSCI World Socially Responsible UCITS
ETF Sub-Fund
MSCI North America Socially Responsible
UCITS ETF Sub-Fund
MSCI Europe & Middle East Socially Responsible UCITS
ETF Sub-Fund
MSCI Pacific Socially Responsible UCITS
ETF Sub-Fund
USD USD EUR USD ____________________________________________________________________________________________________________________________________ INCOME Dividends (net of foreign withholding tax) (Note 2d) 2,219,602 569,781 834,278 184,707 Interest on bonds (net of foreign withholding tax) (Note 2d) – – – – Net income equalization (Note 5) – 193,810 – – Income on securities lending (Note 8) 15,359 11,588 4,003 999 Interest on cash – – 115 – Other income 17,032 7,518 – 350 TOTAL INCOME 2,251,993 782,697 838,396 186,056 EXPENSES Management fees (Note 3) 160,408 122,983 19,719 27,646 Net income equalization 533,137 – 9,679 27,437 Transaction fees (Note 18) 8,140 6,544 1,526 2,384 Debit interest on call account 1,188 44 – 693 Other expenses – – – – TOTAL EXPENSES 702,873 129,571 30,924 58,160 NET INVESTMENT INCOME / (LOSS) (Note 5) 1,549,120 653,126 807,472 127,896 ____________________________________________________________________________________________________________________________________ Net realised gains / (losses) on: Investments 8,470,668 1,285,313 224,478 548,573 Foreign currencies and forward foreign exchange contracts (340,271) (81,693) (3,095) (257,258) Swaps, futures and options contracts – – – – Net change in unrealised gains / (losses) on: Investments (7,261,497) 4,218,159 (493,328) 79,956 Foreign currencies 348 192 423 3,070 Forward foreign exchange contracts – – – – Swaps, futures and options contracts – – – – ____________________________________________________________________________________________________________________________________
34

Semi-Annual report as of 30 June 2014
The accompanying notes form an integral part of these financial statements.
Statement of Operations for the period ended 30 June 2014 (Unaudited) ___________________________________________________________________________________________________________________________________
MSCI Japan Infrastructure 20/35
UCITS ETF Sub-Fund
MSCI AC Asia ex Japan Infrastructure
20/35 UCITS ETF Sub-Fund
MSCI Europe Infrastructure 20/35
UCITS ETF Sub-Fund
STOXX Global Rare Earth UCITS ETF
Sub-Fund JPY USD EUR USD
___________________________________________________________________________________________________________________________________ INCOME Dividends (net of foreign withholding tax) (Note 2d) 4,018,091 130,415 487,756 – Interest on bonds (net of foreign withholding tax) (Note 2d) – – – – Net income equalization (Note 5) – 13 1,893 – Income on securities lending (Note 8) 27,838 334 1,015 36,484 Interest on cash – – 240 – Other income – – – – TOTAL INCOME 4,045,929 130,762 490,904 36,484 EXPENSES Management fees (Note 3) 1,463,553 18,763 9,630 18,547 Net income equalization 67,635 – – 50,031 Transaction fees (Note 18) 46,740 508 1,763 855 Debit interest on call account 11,999 48 – 8 Other expenses – – – – TOTAL EXPENSES 1,589,927 19,319 11,393 69,441 NET INVESTMENT INCOME / (LOSS) (Note 5) 2,456,002 111,443 479,511 (32,957) ___________________________________________________________________________________________________________________________________ Net realised gains / (losses) on: Investments 5,838,261 17,053 (12,849) (1,397,157) Foreign currencies and forward foreign exchange contracts 901 (5,142) 1,750 (134,872) Swaps, futures and options contracts – – – – Net change in unrealised gains / (losses) on: Investments (57,806,074) 340,751 (88,600) (2,375,738) Foreign currencies (6,669) 111 224 52 Forward foreign exchange contracts – – – – Swaps, futures and options contracts – – – – ___________________________________________________________________________________________________________________________________
35

Semi-Annual report as of 30 June 2014
The accompanying notes form an integral part of these financial statements.
Statement of Operations for the period ended 30 June 2014 (Unaudited) ___________________________________________________________________________________________________________________________________
Barclays Capital US 1-3 Year Treasury Bond UCITS ETF
Sub-Fund
Barclays Capital US 3-5 Year Treasury Bond UCITS ETF
Sub-Fund
Barclays Capital US 5-7 Year Treasury Bond UCITS ETF
Sub-Fund
Barclays Capital US 7-10 Year Treasury Bond UCITS ETF
Sub-Fund USD USD USD USD
___________________________________________________________________________________________________________________________________ INCOME Dividends (net of foreign withholding tax) (Note 2d) – – – – Interest on bonds (net of foreign withholding tax) (Note 2d) 23,734 98,886 37,982 267,539 Net income equalization (Note 5) 4,876 – 19,390 – Income on securities lending (Note 8) – – – – Interest on cash – – – – Other income – – – – TOTAL INCOME 28,610 98,886 57,372 267,539 EXPENSES Management fees (Note 3) 10,837 19,194 4,435 26,139 Net income equalization – 32,675 – 487,591 Transaction fees (Note 18) – – – – Debit interest on call account – 140 – 1 Other expenses – – – – TOTAL EXPENSES 10,837 52,009 4,435 513,731 NET INVESTMENT INCOME / (LOSS) (Note 5) 17,773 46,877 52,937 (246,192) ___________________________________________________________________________________________________________________________________ Net realised gains / (losses) on: Investments 2,265 (39,349) (1,047) (2,212,825) Foreign currencies and forward foreign exchange contracts – – – – Swaps, futures and options contracts – – – – Net change in unrealised gains / (losses) on: Investments 20,434 31,762 82,518 4,100,061 Foreign currencies – – – – Forward foreign exchange contracts – – – – Swaps, futures and options contracts – – – – ___________________________________________________________________________________________________________________________________
36

Semi-Annual report as of 30 June 2014
The accompanying notes form an integral part of these financial statements.
Statement of Operations for the period ended 30 June 2014 (Unaudited) ____________________________________________________________________________________________________________________________________
Markit iBoxx € Germany 1-3 UCITS
ETF Sub-Fund
Markit iBoxx € Germany 3-5 UCITS
ETF Sub-Fund
Markit iBoxx € Germany 5-10 UCITS
ETF Sub-Fund
Markit iBoxx € Germany 7-10 UCITS
ETF Sub-Fund
EUR EUR EUR EUR ____________________________________________________________________________________________________________________________________ INCOME Dividends (net of foreign withholding tax) (Note 2d) – – – – Interest on bonds (net of foreign withholding tax) (Note 2d) 41,854 3,778 13,202 55,884 Net income equalization (Note 5) – – 14,119 – Income on securities lending (Note 8) – – – – Interest on cash – – – – Other income – – – – TOTAL INCOME 41,854 3,778 27,321 55,884 EXPENSES Management fees (Note 3) 52,571 1,341 1,934 6,392 Net income equalization 28,557 2,500 – – Transaction fees (Note 18) 260 174 130 87 Debit interest on call account – – – – Other expenses – – – – TOTAL EXPENSES 81,388 4,015 2,064 6,479 NET INVESTMENT INCOME / (LOSS) (Note 5) (39,534) (237) 25,257 49,405 ____________________________________________________________________________________________________________________________________ Net realised gains / (losses) on: Investments (1,115) 2,300 3,905 47,370 Foreign currencies and forward foreign exchange contracts – – – – Swaps, futures and options contracts – – – – Net change in unrealised gains / (losses) on: Investments 150,178 30,445 117,174 408,314 Foreign currencies – – – – Forward foreign exchange contracts – – – – Swaps, futures and options contracts – – – – ____________________________________________________________________________________________________________________________________
37

Semi-Annual report as of 30 June 2014
The accompanying notes form an integral part of these financial statements.
Statement of Operations for the period ended 30 June 2014 (Unaudited) ____________________________________________________________________________________________________________________________________
Markit iBoxx € Liquid Corporates UCITS
ETF Sub-Fund
Markit iBoxx € Sovereigns 1-5
UCITS ETF Sub-Fund
SBI® Foreign AAA-BBB 1-5 UCITS ETF
Sub-Fund
SBI® Foreign AAA-BBB 5-10 UCITS ETF
Sub-Fund EUR EUR CHF CHF
____________________________________________________________________________________________________________________________________ INCOME Dividends (net of foreign withholding tax) (Note 2d) – – – – Interest on bonds (net of foreign withholding tax) (Note 2d) 279,826 13,192 130,270 109,042 Net income equalization (Note 5) 33,108 – 99,108 63,502 Income on securities lending (Note 8) – – – – Interest on cash – – – – Other income – – – – TOTAL INCOME 312,934 13,192 229,378 172,544 EXPENSES Management fees (Note 3) 38,535 2,513 43,351 17,961 Net income equalization – – – – Transaction fees (Note 18) 105 – 405 320 Debit interest on call account – 48 1,272 816 Other expenses – – – – TOTAL EXPENSES 38,640 2,561 45,028 19,097 NET INVESTMENT INCOME / (LOSS) (Note 5) 274,294 10,631 184,350 153,447 ____________________________________________________________________________________________________________________________________ Net realised gains / (losses) on: Investments 263,964 7,330 (3,678) 68,653 Foreign currencies and forward foreign exchange contracts – – – – Swaps, futures and options contracts – – – – Net change in unrealised gains / (losses) on: Investments 767,903 50,327 260,279 615,023 Foreign currencies – – – – Forward foreign exchange contracts – – – – Swaps, futures and options contracts – – – – ____________________________________________________________________________________________________________________________________
38

Semi-Annual report as of 30 June 2014
The accompanying notes form an integral part of these financial statements.
Statement of Operations for the period ended 30 June 2014 (Unaudited) ______________________________________________________________________________________
Barclays Euro Area Liquid Corporates 1-
5 Year UCITS ETFSub-Fund
Barclays US Liquid Corporates UCITS
ETF Sub-Fund
EUR USD ______________________________________________________________________________________ INCOME Dividends (net of foreign withholding tax) (Note 2d) – – Interest on bonds (net of foreign withholding tax) (Note 2d) 28,202 101,183 Net income equalization (Note 5) – – Income on securities lending (Note 8) – – Interest on cash – – Other income 40,984 324,366 TOTAL INCOME 69,186 425,549 EXPENSES Management fees (Note 3) 5,277 7,652 Net income equalization – – Transaction fees (Note 18) – – Debit interest on call account – – Other expenses – – TOTAL EXPENSES 5,277 7,652 NET INVESTMENT INCOME / (LOSS) (Note 5) 63,909 417,897 ______________________________________________________________________________________ Net realised gains / (losses) on: Investments 4,964 (187,961) Foreign currencies and forward foreign exchange contracts – – Swaps, futures and options contracts – – Net change in unrealised gains / (losses) on: Investments 48,624 (226,839) Foreign currencies – – Forward foreign exchange contracts – 75,740 Swaps, futures and options contracts – – ______________________________________________________________________________________
39

Semi-Annual report as of 30 June 2014
The accompanying notes form an integral part of these financial statements.
Statement of Changes in Net Assets for the period ended 30 June 2014 (Unaudited) ________________________________________________________________________________________________________________________________
UBS ETF Consolidated
Statement
EURO STOXX 50 UCITS ETF Sub-Fund
MSCI Europe UCITS ETF Sub-Fund
MSCI Europe ex UK UCITS ETF Sub-Fund
EUR EUR EUR EUR ________________________________________________________________________________________________________________________________
NET ASSETS AT THE BEGINNING OF THE PERIOD 5,991,616,561 706,596,425 58,729,758 –
Net investment income / (loss) 174,932,661 16,987,044 3,120,282 14,508
Net realised gains / (losses) on:
Investments 175,379,828 19,534,404 68,645 – Foreign currencies and forward foreign exchange contracts
(6,948,113) 3,175 9,026 246
Swaps, futures and options contracts (26,940) – – –
Net realised gains / (losses) for the period 168,404,775 19,537,579 77,671 246
Net change in unrealised gains / (losses) on:
Investments 12,133,836 3,583,932 1,298,494 (187,988) Foreign currencies (74,683) (941) 1,023 3 Forward foreign exchange contracts (5,691,502) – – – Swaps, futures and options contracts 10,225 – – –
Net change in unrealised gains / (losses) for the period 6,377,876 3,582,991 1,299,517 (187,985)
Net increase / (decrease) in net assets resulting from operations 349,715,312 40,107,614 4,497,470 (173,231)
Net increase / (decrease) in net assets from Fund shares transactions 1,945,762,685 (99,522,879) 28,952,665 12,585,405 Dividend distribution (Note 5) (41,447,166) (4,951,114) (537,410) –
INCREASE / (DECREASE) IN NET ASSETS 2,254,030,831 (64,366,379) 32,912,725 12,412,174
Exchange difference 74,651,116 – – –
NET ASSETS AS OF 30 JUNE 2014 8,320,298,508 642,230,046 91,642,483 12,412,174
Transactions on the Fund's own shares for the period ended 30 June 2014 ________________________________________________________________________________________________________________________________ NUMBER OF SHARES AT THE BEGINNING OF THE PERIOD Class A-dis (*) 8,667,296 777,000 – Class A-acc (*) – – – Class I-dis (*) 13,893 266 – NUMBER OF SHARES ISSUED Class A-dis (*) 14,013,822 784,533 1,050,000 Class A-acc (*) – – – Class I-dis (*) – 22 – NUMBER OF SHARES REPURCHASED Class A-dis (*) 3,297,055 22,825 – Class A-acc (*) – – – Class I-dis (*) 13,893 288 – NUMBER OF SHARES AS OF 30 JUNE 2014 Class A-dis (*) 19,384,063 1,538,708 1,050,000 Class A-acc (*) – – – Class I-dis (*) – – – ________________________________________________________________________________________________________________________________ (*) The Share Class is in the Sub-Fund’s base currency.
40

Semi-Annual report as of 30 June 2014
The accompanying notes form an integral part of these financial statements.
Statement of Changes in Net Assets for the period ended 30 June 2014 (Unaudited) ________________________________________________________________________________________________________________________________
MSCI EMU UCITS ETF Sub-Fund
MSCI EMU 100% hedged to CHF
UCITS ETF Sub-Fund
MSCI EMU 100% hedged to USD
UCITS ETF Sub-Fund
MSCI EMU 100% hedged to GBP
UCITS ETF Sub-Fund
EUR CHF USD GBP ________________________________________________________________________________________________________________________________
NET ASSETS AT THE BEGINNING OF THE PERIOD 1,041,529,463 12,289,716 85,020,019 3,784,824
Net investment income / (loss) 32,150,377 3,125,965 11,360,221 3,701,412
Net realised gains / (losses) on:
Investments 12,823,023 695 29,105 (20,830) Foreign currencies and forward foreign exchange contracts 15,457 755,987 2,234,476 1,583,791 Swaps, futures and options contracts – – – –
Net realised gains / (losses) for the period 12,838,480 756,682 2,263,581 1,562,961
Net change in unrealised gains / (losses) on:
Investments 29,281,163 851,220 7,256,341 (1,650,938) Foreign currencies (8,025) (485) 4,246 (666) Forward foreign exchange contracts – 520,320 (1,344,555) 1,948,016 Swaps, futures and options contracts – – – –
Net change in unrealised gains / (losses) for the period 29,273,138 1,371,055 5,916,032 296,412
Net increase / (decrease) in net assets resulting from operations 74,261,995 5,253,702 19,539,834 5,560,785
Net increase / (decrease) in net assets from Fund shares transactions 214,107,737 100,614,005 353,418,461 115,291,759 Dividend distribution (Note 5) (8,010,548) – – (17,640)
INCREASE / (DECREASE) IN NET ASSETS 280,359,184 105,867,707 372,958,295 120,834,904
Exchange difference – – – –
NET ASSETS AS OF 30 JUNE 2014 1,321,888,647 118,157,423 457,978,314 124,619,728
Transactions on the Fund's own shares for the period ended 30 June 2014 ________________________________________________________________________________________________________________________________ NUMBER OF SHARES AT THE BEGINNING OF THE PERIOD Class A-dis (*) 8,942,572 – – 125,000 Class A-acc (*) – 550,000 4,350,000 125,000 Class I-dis (*) 1,223 – – – NUMBER OF SHARES ISSUED Class A-dis (*) 4,357,910 – 700,000 6,090,515 Class A-acc (*) – 4,450,000 17,050,000 1,608,686 Class I-dis (*) – – – – NUMBER OF SHARES REPURCHASED Class A-dis (*) 1,035,052 – – 158,686 Class A-acc (*) – – – 20,515 Class I-dis (*) 1,223 – – – NUMBER OF SHARES AS OF 30 JUNE 2014 Class A-dis (*) 12,265,430 – 700,000 6,056,829 Class A-acc (*) – 5,000,000 21,400,000 1,713,171 Class I-dis (*) – – – – ________________________________________________________________________________________________________________________________ (*) The Share Class is in the Sub-Fund’s base currency.
41

Semi-Annual report as of 30 June 2014
The accompanying notes form an integral part of these financial statements.
Statement of Changes in Net Assets for the period ended 30 June 2014 (Unaudited) ________________________________________________________________________________________________________________________________
MSCI EMU 100% hedged to SGD
UCITS ETF Sub-Fund
MSCI EMU Value UCITS ETF Sub-Fund
MSCI EMU Small Cap UCITS ETF Sub-Fund
FTSE 100 UCITS ETF Sub-Fund
SGD EUR EUR GBP ________________________________________________________________________________________________________________________________
NET ASSETS AT THE BEGINNING OF THE PERIOD – 38,959,569 7,649,867 214,342,540
Net investment income / (loss) – 1,080,831 285,670 7,976,945
Net realised gains / (losses) on:
Investments – 2,157,946 241,319 8,561,247 Foreign currencies and forward foreign exchange contracts – 357 (259) (13,764) Swaps, futures and options contracts – – – –
Net realised gains / (losses) for the period – 2,158,303 241,060 8,547,483
Net change in unrealised gains / (losses) on:
Investments – (275,421) 232,601 (15,380,246) Foreign currencies – 429 3 140 Forward foreign exchange contracts – – – – Swaps, futures and options contracts – – – –
Net change in unrealised gains / (losses) for the period – (274,992) 232,604 (15,380,106)
Net increase / (decrease) in net assets resulting from operations – 2,964,142 759,334 1,144,322
Net increase / (decrease) in net assets from Fund shares transactions 7,402,860 (5,739,915) 10,569,384 (46,500,755) Dividend distribution (Note 5) – (391,040) (67,734) (3,281,921)
INCREASE / (DECREASE) IN NET ASSETS 7,402,860 (3,166,813) 11,260,984 (48,638,354)
Exchange difference – – – –
NET ASSETS AS OF 30 JUNE 2014 7,402,860 35,792,756 18,910,851 165,704,186
Transactions on the Fund's own shares for the period ended 30 June 2014 ________________________________________________________________________________________________________________________________ NUMBER OF SHARES AT THE BEGINNING OF THE PERIOD Class A-dis (*) – 1,040,000 108,000 2,202,628 Class A-acc (*) – – – – Class I-dis (*) – – 40 5,080 NUMBER OF SHARES ISSUED Class A-dis (*) – – 157,287 1,173,445 Class A-acc (*) 450,000 – – – Class I-dis (*) – – 300 – NUMBER OF SHARES REPURCHASED Class A-dis (*) – 150,000 – 860,002 Class A-acc (*) – – – – Class I-dis (*) – – 340 5,080 NUMBER OF SHARES AS OF 30 JUNE 2014 Class A-dis (*) – 890,000 265,287 2,516,071 Class A-acc (*) 450,000 – – – Class I-dis (*) – – – – ________________________________________________________________________________________________________________________________ (*) The Share Class is in the Sub-Fund’s base currency.
42

Semi-Annual report as of 30 June 2014
The accompanying notes form an integral part of these financial statements.
Statement of Changes in Net Assets for the period ended 30 June 2014 (Unaudited) ________________________________________________________________________________________________________________________________
FTSE 250 UCITS ETF Sub-Fund
MSCI United Kingdom
UCITS ETF Sub-Fund
MSCI United Kingdom 100% hedged to CHF
UCITS ETF Sub-Fund
MSCI United Kingdom 100% hedged to EUR
UCITS ETF Sub-Fund
GBP GBP CHF EUR ________________________________________________________________________________________________________________________________
NET ASSETS AT THE BEGINNING OF THE PERIOD – 26,842,810 10,966,246 15,300,407
Net investment income / (loss) 76,785 25,065,179 10,299,884 5,505,486
Net realised gains / (losses) on:
Investments – (2,496,570) (2,666,372) 41,890 Foreign currencies and forward foreign exchange contracts – 9,494 (1,796,844) (1,533,961) Swaps, futures and options contracts – – – –
Net realised gains / (losses) for the period – (2,487,076) (4,463,216) (1,492,071)
Net change in unrealised gains / (losses) on:
Investments 90,683 (4,844,839) 176,364 2,251,622 Foreign currencies – (3,872) 8,232 5,435 Forward foreign exchange contracts – – (2,175,897) (1,601,316) Swaps, futures and options contracts – – – –
Net change in unrealised gains / (losses) for the period 90,683 (4,848,711) (1,991,301) 655,741
Net increase / (decrease) in net assets resulting from operations 167,468 17,729,392 3,845,367 4,669,156
Net increase / (decrease) in net assets from Fund shares transactions 14,040,404 388,058,565 176,988,180 84,163,322 Dividend distribution (Note 5) – (58,500) – –
INCREASE / (DECREASE) IN NET ASSETS 14,207,872 405,729,457 180,833,547 88,832,478
Exchange difference – – – –
NET ASSETS AS OF 30 JUNE 2014 14,207,872 432,572,267 191,799,793 104,132,885
Transactions on the Fund's own shares for the period ended 30 June 2014 ________________________________________________________________________________________________________________________________ NUMBER OF SHARES AT THE BEGINNING OF THE PERIOD Class A-dis (*) – 400,000 – – Class A-acc (*) – 1,100,000 750,000 1,000,000 Class I-dis (*) – – – – NUMBER OF SHARES ISSUED Class A-dis (*) 1,350,000 800,000 – 100,000 Class A-acc (*) – 29,300,000 17,375,000 7,100,000 Class I-dis (*) – – – – NUMBER OF SHARES REPURCHASED Class A-dis (*) – 50,000 – – Class A-acc (*) – 7,800,000 5,200,000 1,500,000 Class I-dis (*) – – – – NUMBER OF SHARES AS OF 30 JUNE 2014 Class A-dis (*) 1,350,000 1,150,000 – 100,000 Class A-acc (*) – 22,600,000 12,925,000 6,600,000 Class I-dis (*) – – – – ________________________________________________________________________________________________________________________________ (*) The Share Class is in the Sub-Fund’s base currency.
43

Semi-Annual report as of 30 June 2014
The accompanying notes form an integral part of these financial statements.
Statement of Changes in Net Assets for the period ended 30 June 2014 (Unaudited) ________________________________________________________________________________________________________________________________
MSCI United Kingdom 100% hedged to USD
UCITS ETF Sub-Fund
MSCI United Kingdom 100% hedged to SGD
UCITS ETF Sub-Fund
MSCI Turkey UCITS ETF Sub-Fund
MSCI Japan UCITS ETF Sub-Fund
USD SGD EUR JPY ________________________________________________________________________________________________________________________________
NET ASSETS AT THE BEGINNING OF THE PERIOD 11,400,852 – 8,853,102 147,624,536,601
Net investment income / (loss) 4,464,349 – 133,944 401,405,621
Net realised gains / (losses) on:
Investments (266,134) – 143,930 10,986,742,239 Foreign currencies and forward foreign exchange contracts (902,931) – (764,457) 357,340 Swaps, futures and options contracts – – – –
Net realised gains / (losses) for the period (1,169,065) – (620,527) 10,987,099,579
Net change in unrealised gains / (losses) on:
Investments 1,296,551 – 2,378,720 (17,083,592,718) Foreign currencies 7,940 – 634 (2,222,329) Forward foreign exchange contracts (2,487,507) – – – Swaps, futures and options contracts – – – –
Net change in unrealised gains / (losses) for the period (1,183,016) – 2,379,354 (17,085,815,047)
Net increase / (decrease) in net assets resulting from operations 2,112,268 – 1,892,771 (5,697,309,847)
Net increase / (decrease) in net assets from Fund shares transactions 123,809,017 7,081,335 (1,177,536) (53,249,611,150) Dividend distribution (Note 5) – – – (575,036,720)
INCREASE / (DECREASE) IN NET ASSETS 125,921,285 7,081,335 715,235 (59,521,957,717)
Exchange difference – – – –
NET ASSETS AS OF 30 JUNE 2014 137,322,137 7,081,335 9,568,337 88,102,578,884
Transactions on the Fund's own shares for the period ended 30 June 2014 ________________________________________________________________________________________________________________________________ NUMBER OF SHARES AT THE BEGINNING OF THE PERIOD Class A-dis (*) – – 152,500 28,522,116 Class A-acc (*) 1,000,000 – – – Class I-dis (*) – – 610 8,190 NUMBER OF SHARES ISSUED Class A-dis (*) 50,000 – 239,848 8,904,859 Class A-acc (*) 1,000,000 450,000 – – Class I-dis (*) – – 150 – NUMBER OF SHARES REPURCHASED Class A-dis (*) 600,000 – 120,018 14,683,682 Class A-acc (*) 11,285,000 – – – Class I-dis (*) – – 760 8,190 NUMBER OF SHARES AS OF 30 JUNE 2014 Class A-dis (*) 550,000 – 272,330 22,743,293 Class A-acc (*) 11,285,000 450,000 – – Class I-dis (*) – – – – ________________________________________________________________________________________________________________________________ (*) The Share Class is in the Sub-Fund’s base currency.
44

Semi-Annual report as of 30 June 2014
The accompanying notes form an integral part of these financial statements.
Statement of Changes in Net Assets for the period ended 30 June 2014 (Unaudited) ________________________________________________________________________________________________________________________________
MSCI Japan 100% hedged to CHF
UCITS ETF Sub-Fund
MSCI Japan 100% hedged to EUR
UCITS ETF Sub-Fund
MSCI Japan 100% hedged to GBP
UCITS ETF Sub-Fund
MSCI Japan 100% hedged to USD
UCITS ETF Sub-Fund
CHF EUR GBP USD ________________________________________________________________________________________________________________________________
NET ASSETS AT THE BEGINNING OF THE PERIOD 15,177,674 13,002,258 10,668,248 18,378,839
Net investment income / (loss) 4,611,357 2,736,702 172,188 781,470
Net realised gains / (losses) on:
Investments (295,531) (47,986) (63,293) (246,854) Foreign currencies and forward foreign exchange contracts (737,801) (523,891) 119,124 (1,567,841) Swaps, futures and options contracts – – – –
Net realised gains / (losses) for the period (1,033,332) (571,877) 55,831 (1,814,695)
Net change in unrealised gains / (losses) on:
Investments 2,236,845 2,665,393 (88,204) 4,959,918 Foreign currencies 96 1,375 (1,382) 2,066 Forward foreign exchange contracts (267,360) (519,613) 108,723 (1,057,862) Swaps, futures and options contracts – – – –
Net change in unrealised gains / (losses) for the period 1,969,581 2,147,155 19,137 3,904,122
Net increase / (decrease) in net assets resulting from operations 5,547,606 4,311,980 247,156 2,870,897
Net increase / (decrease) in net assets from Fund shares transactions 82,572,051 43,979,635 24,249,696 130,781,153 Dividend distribution (Note 5) – – – –
INCREASE / (DECREASE) IN NET ASSETS 88,119,657 48,291,615 24,496,852 133,652,050
Exchange difference – – – –
NET ASSETS AS OF 30 JUNE 2014 103,297,331 61,293,873 35,165,100 152,030,889
Transactions on the Fund's own shares for the period ended 30 June 2014 ________________________________________________________________________________________________________________________________ NUMBER OF SHARES AT THE BEGINNING OF THE PERIOD Class A-dis (*) – – 300,000 – Class A-acc (*) 1,300,000 800,000 300,000 1,000,000 Class I-dis (*) – – – – NUMBER OF SHARES ISSUED Class A-dis (*) – 100,000 1,245,000 350,000 Class A-acc (*) 7,870,000 3,000,000 200,000 7,305,000 Class I-dis (*) – – – – NUMBER OF SHARES REPURCHASED Class A-dis (*) – – – – Class A-acc (*) – – – 100,000 Class I-dis (*) – – – – NUMBER OF SHARES AS OF 30 JUNE 2014 Class A-dis (*) – 100,000 1,545,000 350,000 Class A-acc (*) 9,170,000 3,800,000 500,000 8,205,000 Class I-dis (*) – – – – ________________________________________________________________________________________________________________________________ (*) The Share Class is in the Sub-Fund’s base currency.
45

Semi-Annual report as of 30 June 2014
The accompanying notes form an integral part of these financial statements.
Statement of Changes in Net Assets for the period ended 30 June 2014 (Unaudited) ________________________________________________________________________________________________________________________________
MSCI Japan 100% hedged to SGD
UCITS ETF Sub-Fund
MSCI Pacific (ex Japan) UCITS ETF Sub-Fund
MSCI USA UCITS ETF Sub-Fund
MSCI Canada UCITS ETF Sub-Fund
SGD USD USD CAD ________________________________________________________________________________________________________________________________
NET ASSETS AT THE BEGINNING OF THE PERIOD – 227,754,061 1,724,043,650 168,711,055
Net investment income / (loss) – 3,183,130 13,983,000 2,534,832
Net realised gains / (losses) on:
Investments – 2,982,488 51,399,509 3,161,474 Foreign currencies and forward foreign exchange contracts – (4,048,389) – 4,706 Swaps, futures and options contracts – – – –
Net realised gains / (losses) for the period – (1,065,901) 51,399,509 3,166,180
Net change in unrealised gains / (losses) on:
Investments – 9,717,958 72,094,356 15,221,725 Foreign currencies – 7,833 (4) (4,123) Forward foreign exchange contracts – – – – Swaps, futures and options contracts – – – –
Net change in unrealised gains / (losses) for the period – 9,725,791 72,094,352 15,217,602
Net increase / (decrease) in net assets resulting from operations – 11,843,020 137,476,861 20,918,614
Net increase / (decrease) in net assets from Fund shares transactions 18,036,000 (39,646,537) 185,476,052 38,463,130 Dividend distribution (Note 5) – (2,183,570) (12,082,557) (1,675,638)
INCREASE / (DECREASE) IN NET ASSETS 18,036,000 (29,987,087) 310,870,356 57,706,106
Exchange difference – – – –
NET ASSETS AS OF 30 JUNE 2014 18,036,000 197,766,974 2,034,914,006 226,417,161
Transactions on the Fund's own shares for the period ended 30 June 2014 ________________________________________________________________________________________________________________________________ NUMBER OF SHARES AT THE BEGINNING OF THE PERIOD Class A-dis (*) – 3,235,126 8,265,630 2,766,500 Class A-acc (*) – – – – Class I-dis (*) – 6,410 1,420 2,076 NUMBER OF SHARES ISSUED Class A-dis (*) – 2,180,684 3,605,611 3,490,795 Class A-acc (*) 1,500,000 – – – Class I-dis (*) – – 30 – NUMBER OF SHARES REPURCHASED Class A-dis (*) – 1,152,110 1,091,418 395,009 Class A-acc (*) – – – – Class I-dis (*) – 6,410 1,450 2,076 NUMBER OF SHARES AS OF 30 JUNE 2014 Class A-dis (*) – 4,263,700 10,779,823 5,862,286 Class A-acc (*) 1,500,000 – – – Class I-dis (*) – – – – ________________________________________________________________________________________________________________________________ (*) The Share Class is in the Sub-Fund’s base currency.
46

Semi-Annual report as of 30 June 2014
The accompanying notes form an integral part of these financial statements.
Statement of Changes in Net Assets for the period ended 30 June 2014 (Unaudited) ________________________________________________________________________________________________________________________________
MSCI Canada 100% hedged to CHF
UCITS ETF Sub-Fund
MSCI Canada 100% hedged to EUR
UCITS ETF Sub-Fund
MSCI Canada 100% hedged to USD
UCITS ETF Sub-Fund
MSCI Canada 100% hedged to GBP
UCITS ETF Sub-Fund
CHF EUR USD GBP ________________________________________________________________________________________________________________________________
NET ASSETS AT THE BEGINNING OF THE PERIOD 4,847,424 4,063,449 6,048,927 4,186,703
Net investment income / (loss) 49,030 111,926 61,344 42,351
Net realised gains / (losses) on:
Investments 27,604 154,604 32,408 14,567 Foreign currencies and forward foreign exchange contracts 115,100 (18,044) 101,373 170,986 Swaps, futures and options contracts – – – –
Net realised gains / (losses) for the period 142,704 136,560 133,781 185,553
Net change in unrealised gains / (losses) on:
Investments 492,886 594,021 638,395 304,439 Foreign currencies (255) (136) 126 (176) Forward foreign exchange contracts (149,958) (157,324) (147,232) (59,777) Swaps, futures and options contracts – – – –
Net change in unrealised gains / (losses) for the period 342,673 436,561 491,289 244,486
Net increase / (decrease) in net assets resulting from operations 534,407 685,047 686,414 472,390
Net increase / (decrease) in net assets from Fund shares transactions – 1,429,786 – – Dividend distribution (Note 5) – – – (7,220)
INCREASE / (DECREASE) IN NET ASSETS 534,407 2,114,833 686,414 465,170
Exchange difference – – – –
NET ASSETS AS OF 30 JUNE 2014 5,381,831 6,178,282 6,735,341 4,651,873
Transactions on the Fund's own shares for the period ended 30 June 2014 ________________________________________________________________________________________________________________________________ NUMBER OF SHARES AT THE BEGINNING OF THE PERIOD Class A-dis (*) – – – 100,000 Class A-acc (*) 300,000 300,000 400,000 100,000 Class I-dis (*) – – – – NUMBER OF SHARES ISSUED Class A-dis (*) – – – – Class A-acc (*) – 260,000 – – Class I-dis (*) – – – – NUMBER OF SHARES REPURCHASED Class A-dis (*) – – – – Class A-acc (*) – 150,000 – – Class I-dis (*) – – – – NUMBER OF SHARES AS OF 30 JUNE 2014 Class A-dis (*) – – – 100,000 Class A-acc (*) 300,000 410,000 400,000 100,000 Class I-dis (*) – – – – ________________________________________________________________________________________________________________________________ (*) The Share Class is in the Sub-Fund’s base currency.
47

Semi-Annual report as of 30 June 2014
The accompanying notes form an integral part of these financial statements.
Statement of Changes in Net Assets for the period ended 30 June 2014 (Unaudited) ________________________________________________________________________________________________________________________________
MSCI Canada 100% hedged to SGD
UCITS ETF Sub-Fund
MSCI Switzerland 20/35
UCITS ETF Sub-Fund
MSCI Switzerland 20/35 100% hedged to EUR UCITS ETF
Sub-Fund
MSCI Switzerland 20/35 100% hedged to USD UCITS ETF
Sub-Fund SGD CHF EUR USD
________________________________________________________________________________________________________________________________
NET ASSETS AT THE BEGINNING OF THE PERIOD – 12,079,374 4,317,838 5,884,256
Net investment income / (loss) – 4,893,260 1,572,099 1,456,975
Net realised gains / (losses) on:
Investments – 43,472 10,195 (18,315) Foreign currencies and forward foreign exchange contracts – (455) (50,967) 229,734 Swaps, futures and options contracts – – – –
Net realised gains / (losses) for the period – 43,017 (40,772) 211,419
Net change in unrealised gains / (losses) on:
Investments – 4,314,209 2,113,479 1,025,861 Foreign currencies – (121) 51 221 Forward foreign exchange contracts – – (308,337) (517,352) Swaps, futures and options contracts – – – –
Net change in unrealised gains / (losses) for the period – 4,314,088 1,805,193 508,730
Net increase / (decrease) in net assets resulting from operations – 9,250,365 3,336,520 2,177,124
Net increase / (decrease) in net assets from Fund shares transactions 7,838,685 216,032,110 66,084,435 70,367,812 Dividend distribution (Note 5) – – – –
INCREASE / (DECREASE) IN NET ASSETS 7,838,685 225,282,475 69,420,955 72,544,936
Exchange difference – – – –
NET ASSETS AS OF 30 JUNE 2014 7,838,685 237,361,849 73,738,793 78,429,192
Transactions on the Fund's own shares for the period ended 30 June 2014 ________________________________________________________________________________________________________________________________ NUMBER OF SHARES AT THE BEGINNING OF THE PERIOD Class A-dis (*) – 625,000 – – Class A-acc (*) – 175,000 350,000 350,000 Class I-dis (*) – – – – NUMBER OF SHARES ISSUED Class A-dis (*) – 1,890,000 100,000 350,000 Class A-acc (*) 450,000 12,150,000 5,250,000 3,670,000 Class I-dis (*) – – – – NUMBER OF SHARES REPURCHASED Class A-dis (*) – – – – Class A-acc (*) – 90,000 100,000 – Class I-dis (*) – – – – NUMBER OF SHARES AS OF 30 JUNE 2014 Class A-dis (*) – 2,515,000 100,000 350,000 Class A-acc (*) 450,000 12,235,000 5,500,000 4,020,000 Class I-dis (*) – – – – ________________________________________________________________________________________________________________________________ (*) The Share Class is in the Sub-Fund’s base currency.
48

Semi-Annual report as of 30 June 2014
The accompanying notes form an integral part of these financial statements.
Statement of Changes in Net Assets for the period ended 30 June 2014 (Unaudited) ________________________________________________________________________________________________________________________________
MSCI Switzerland 20/35 100%
hedged to GBP UCITS ETF Sub-Fund
MSCI Switzerland 20/35 100% hedged to SGD UCITS ETF
Sub-Fund
MSCI World UCITS ETF Sub-Fund
MSCI Emerging Markets
UCITS ETF Sub-Fund
GBP SGD USD USD ________________________________________________________________________________________________________________________________
NET ASSETS AT THE BEGINNING OF THE PERIOD 3,649,886 – 777,977,775 322,429,671
Net investment income / (loss) 117,546 – 12,099,801 3,734,996
Net realised gains / (losses) on:
Investments 1,650 – 13,699,341 (1,356,663) Foreign currencies and forward foreign exchange contracts 118,597 – (107,761) (2,241,382) Swaps, futures and options contracts – – – (36,885)
Net realised gains / (losses) for the period 120,247 – 13,591,580 (3,634,930)
Net change in unrealised gains / (losses) on:
Investments 1,182 – 22,955,150 17,851,226 Foreign currencies (15) – 2,226 (103,698) Forward foreign exchange contracts 88,121 – – – Swaps, futures and options contracts – – – 14,000
Net change in unrealised gains / (losses) for the period 89,288 – 22,957,376 17,761,528
Net increase / (decrease) in net assets resulting from operations 327,081 – 48,648,757 17,861,594
Net increase / (decrease) in net assets from Fund shares transactions 2,147,539 7,435,755 48,146,220 19,348,311 Dividend distribution (Note 5) – – (5,323,547) (2,689,007)
INCREASE / (DECREASE) IN NET ASSETS 2,474,620 7,435,755 91,471,430 34,520,898
Exchange difference – – – –
NET ASSETS AS OF 30 JUNE 2014 6,124,506 7,435,755 869,449,205 356,950,569
Transactions on the Fund's own shares for the period ended 30 June 2014 ________________________________________________________________________________________________________________________________ NUMBER OF SHARES AT THE BEGINNING OF THE PERIOD Class A-dis (*) 175,000 – 2,808,754 1,701,781 Class A-acc (*) 175,000 – – – Class I-dis (*) – – 1,830 1,508 NUMBER OF SHARES ISSUED Class A-dis (*) – – 2,550,741 2,014,560 Class A-acc (*) 200,000 450,000 – – Class I-dis (*) – – 43 – NUMBER OF SHARES REPURCHASED Class A-dis (*) – – 443,632 325,007 Class A-acc (*) – – – – Class I-dis (*) – – 1,873 1,508 NUMBER OF SHARES AS OF 30 JUNE 2014 Class A-dis (*) 175,000 – 4,915,863 3,391,334 Class A-acc (*) 375,000 450,000 – – Class I-dis (*) – – – – ________________________________________________________________________________________________________________________________ (*) The Share Class is in the Sub-Fund’s base currency.
49

Semi-Annual report as of 30 June 2014
The accompanying notes form an integral part of these financial statements.
Statement of Changes in Net Assets for the period ended 30 June 2014 (Unaudited) ________________________________________________________________________________________________________________________________
MSCI World Socially Responsible UCITS ETF Sub-Fund
MSCI North America Socially Responsible
UCITS ETF Sub-Fund
MSCI Europe & Middle East Socially
Responsible UCITS ETF Sub-Fund
MSCI Pacific Socially Responsible UCITS ETF Sub-Fund
USD USD EUR USD ________________________________________________________________________________________________________________________________
NET ASSETS AT THE BEGINNING OF THE PERIOD 109,586,738 58,430,058 14,081,865 12,585,869
Net investment income / (loss) 1,549,120 653,126 807,472 127,896
Net realised gains / (losses) on:
Investments 8,470,668 1,285,313 224,478 548,573 Foreign currencies and forward foreign exchange contracts (340,271) (81,693) (3,095) (257,258) Swaps, futures and options contracts – – – –
Net realised gains / (losses) for the period 8,130,397 1,203,620 221,383 291,315
Net change in unrealised gains / (losses) on:
Investments (7,261,497) 4,218,159 (493,328) 79,956 Foreign currencies 348 192 423 3,070 Forward foreign exchange contracts – – – – Swaps, futures and options contracts – – – –
Net change in unrealised gains / (losses) for the period (7,261,149) 4,218,351 (492,905) 83,026
Net increase / (decrease) in net assets resulting from operations 2,418,368 6,075,097 535,950 502,237
Net increase / (decrease) in net assets from Fund shares transactions (39,973,897) 48,955,493 9,493 1,027,111 Dividend distribution (Note 5) (714,568) (379,894) (75,196) (153,351)
INCREASE / (DECREASE) IN NET ASSETS (38,270,097) 54,650,696 470,247 1,375,997
Exchange difference – – – –
NET ASSETS AS OF 30 JUNE 2014 71,316,641 113,080,754 14,552,112 13,961,866
Transactions on the Fund's own shares for the period ended 30 June 2014 ________________________________________________________________________________________________________________________________ NUMBER OF SHARES AT THE BEGINNING OF THE PERIOD Class A-dis (*) 370,000 59,000 50,000 50,000 Class A-acc (*) – – – – Class I-dis (*) 5,460 3,405 750 750 NUMBER OF SHARES ISSUED Class A-dis (*) 1,142,142 1,294,427 150,157 167,351 Class A-acc (*) – – – – Class I-dis (*) – 520 – – NUMBER OF SHARES REPURCHASED Class A-dis (*) 599,879 – – – Class A-acc (*) – – – – Class I-dis (*) 5,460 3,925 750 750 NUMBER OF SHARES AS OF 30 JUNE 2014 Class A-dis (*) 912,263 1,353,427 200,157 217,351 Class A-acc (*) – – – – Class I-dis (*) – – – – ________________________________________________________________________________________________________________________________ (*) The Share Class is in the Sub-Fund’s base currency.
50

Semi-Annual report as of 30 June 2014
The accompanying notes form an integral part of these financial statements.
Statement of Changes in Net Assets for the period ended 30 June 2014 (Unaudited) ________________________________________________________________________________________________________________________________
MSCI Japan Infrastructure 20/35
UCITS ETF Sub-Fund
MSCI AC Asia ex Japan Infrastructure
20/35 UCITS ETF Sub-Fund
MSCI Europe Infrastructure 20/35
UCITS ETF Sub-Fund
STOXX Global Rare Earth UCITS ETF Sub-Fund
JPY USD EUR USD ________________________________________________________________________________________________________________________________
NET ASSETS AT THE BEGINNING OF THE PERIOD 681,102,777 8,018,864 3,931,101 7,456,585
Net investment income / (loss) 2,456,002 111,443 479,511 (32,957)
Net realised gains / (losses) on:
Investments 5,838,261 17,053 (12,849) (1,397,157) Foreign currencies and forward foreign exchange contracts 901 (5,142) 1,750 (134,872) Swaps, futures and options contracts – – – –
Net realised gains / (losses) for the period 5,839,162 11,911 (11,099) (1,532,029)
Net change in unrealised gains / (losses) on:
Investments (57,806,074) 340,751 (88,600) (2,375,738) Foreign currencies (6,669) 111 224 52 Forward foreign exchange contracts – – – – Swaps, futures and options contracts – – – –
Net change in unrealised gains / (losses) for the period (57,812,743) 340,862 (88,376) (2,375,686)
Net increase / (decrease) in net assets resulting from operations (49,517,579) 464,216 380,036 (3,940,672)
Net increase / (decrease) in net assets from Fund shares transactions 54,136 (37) (1,984) 4,580,998 Dividend distribution (Note 5) (2,475,745) (117,473) (51,305) (2,720)
INCREASE / (DECREASE) IN NET ASSETS (51,939,188) 346,706 326,747 637,606
Exchange difference – – – –
NET ASSETS AS OF 30 JUNE 2014 629,163,589 8,365,570 4,257,848 8,094,191
Transactions on the Fund's own shares for the period ended 30 June 2014 ________________________________________________________________________________________________________________________________ NUMBER OF SHARES AT THE BEGINNING OF THE PERIOD Class A-dis (*) 45,000 130,000 47,500 508,000 Class A-acc (*) – – – – Class I-dis (*) 225 325 138 1,335 NUMBER OF SHARES ISSUED Class A-dis (*) 45,017 130,000 27,567 829,529 Class A-acc (*) – – – – Class I-dis (*) – – – 62 NUMBER OF SHARES REPURCHASED Class A-dis (*) – – – 12,521 Class A-acc (*) – – – – Class I-dis (*) 225 325 138 1,397 NUMBER OF SHARES AS OF 30 JUNE 2014 Class A-dis (*) 90,017 260,000 75,067 1,325,008 Class A-acc (*) – – – – Class I-dis (*) – – – – ________________________________________________________________________________________________________________________________ (*) The Share Class is in the Sub-Fund’s base currency.
51

Semi-Annual report as of 30 June 2014
The accompanying notes form an integral part of these financial statements.
Statement of Changes in Net Assets for the period ended 30 June 2014 (Unaudited) ________________________________________________________________________________________________________________________________
Barclays Capital US 1-3 Year Treasury Bond UCITS ETF
Sub-Fund
Barclays Capital US 3-5 Year Treasury Bond UCITS ETF
Sub-Fund
Barclays Capital US 5-7 Year Treasury Bond UCITS ETF
Sub-Fund
Barclays Capital US 7-10 Year Treasury Bond UCITS ETF
Sub-Fund USD USD USD USD
________________________________________________________________________________________________________________________________
NET ASSETS AT THE BEGINNING OF THE PERIOD 5,594,790 4,025,786 2,184,404 68,036,336
Net investment income / (loss) 17,773 46,877 52,937 (246,192)
Net realised gains / (losses) on:
Investments 2,265 (39,349) (1,047) (2,212,825) Foreign currencies and forward foreign exchange contracts – – – – Swaps, futures and options contracts – – – –
Net realised gains / (losses) for the period 2,265 (39,349) (1,047) (2,212,825)
Net change in unrealised gains / (losses) on:
Investments 20,434 31,762 82,518 4,100,061 Foreign currencies – – – – Forward foreign exchange contracts – – – – Swaps, futures and options contracts – – – –
Net change in unrealised gains / (losses) for the period 20,434 31,762 82,518 4,100,061
Net increase / (decrease) in net assets resulting from operations 40,472 39,290 134,408 1,641,044
Net increase / (decrease) in net assets from Fund shares transactions 8,696,878 5,707,239 4,395,066 (51,821,189) Dividend distribution (Note 5) (4,140) (14,355) (13,326) (104,278)
INCREASE / (DECREASE) IN NET ASSETS 8,733,210 5,732,174 4,516,148 (50,284,423)
Exchange difference – – – –
NET ASSETS AS OF 30 JUNE 2014 14,328,000 9,757,960 6,700,552 17,751,913
Transactions on the Fund's own shares for the period ended 30 June 2014 ________________________________________________________________________________________________________________________________ NUMBER OF SHARES AT THE BEGINNING OF THE PERIOD Class A-dis (*) 225,000 125,000 60,000 1,760,000 Class A-acc (*) – – – – Class I-dis (*) – – – – NUMBER OF SHARES ISSUED Class A-dis (*) 350,000 700,000 120,000 200,000 Class A-acc (*) – – – – Class I-dis (*) – – – – NUMBER OF SHARES REPURCHASED Class A-dis (*) – 525,000 – 1,520,000 Class A-acc (*) – – – – Class I-dis (*) – – – – NUMBER OF SHARES AS OF 30 JUNE 2014 Class A-dis (*) 575,000 300,000 180,000 440,000 Class A-acc (*) – – – – Class I-dis (*) – – – – ________________________________________________________________________________________________________________________________ (*) The Share Class is in the Sub-Fund’s base currency.
52

Semi-Annual report as of 30 June 2014
The accompanying notes form an integral part of these financial statements.
Statement of Changes in Net Assets for the period ended 30 June 2014 (Unaudited) ________________________________________________________________________________________________________________________________
Markit iBoxx € Germany 1-3 UCITS ETF Sub-Fund
Markit iBoxx € Germany 3-5 UCITS ETF Sub-Fund
Markit iBoxx € Germany 5-10
UCITS ETF Sub-Fund
Markit iBoxx € Germany 7-10
UCITS ETF Sub-Fund
EUR EUR EUR EUR ________________________________________________________________________________________________________________________________
NET ASSETS AT THE BEGINNING OF THE PERIOD 12,646,115 917,552 1,035,121 7,344,284
Net investment income / (loss) (39,534) (237) 25,257 49,405
Net realised gains / (losses) on:
Investments (1,115) 2,300 3,905 47,370 Foreign currencies and forward foreign exchange contracts – – – – Swaps, futures and options contracts – – – –
Net realised gains / (losses) for the period (1,115) 2,300 3,905 47,370
Net change in unrealised gains / (losses) on:
Investments 150,178 30,445 117,174 408,314 Foreign currencies – – – – Forward foreign exchange contracts – – – – Swaps, futures and options contracts – – – –
Net change in unrealised gains / (losses) for the period 150,178 30,445 117,174 408,314
Net increase / (decrease) in net assets resulting from operations 109,529 32,508 146,336 505,089
Net increase / (decrease) in net assets from Fund shares transactions 47,604,366 1,861,196 4,276,990 – Dividend distribution (Note 5) – (3,192) (14,182) (51,128)
INCREASE / (DECREASE) IN NET ASSETS 47,713,895 1,890,512 4,409,144 453,961
Exchange difference – – – –
NET ASSETS AS OF 30 JUNE 2014 60,360,010 2,808,064 5,444,265 7,798,245
Transactions on the Fund's own shares for the period ended 30 June 2014 ________________________________________________________________________________________________________________________________ NUMBER OF SHARES AT THE BEGINNING OF THE PERIOD Class A-dis (*) 160,000 10,000 10,000 70,000 Class A-acc (*) – – – – Class I-dis (*) – – – – NUMBER OF SHARES ISSUED Class A-dis (*) 1,310,000 20,000 40,000 – Class A-acc (*) – – – – Class I-dis (*) – – – – NUMBER OF SHARES REPURCHASED Class A-dis (*) 710,000 – – – Class A-acc (*) – – – – Class I-dis (*) – – – – NUMBER OF SHARES AS OF 30 JUNE 2014 Class A-dis (*) 760,000 30,000 50,000 70,000 Class A-acc (*) – – – – Class I-dis (*) – – – – ________________________________________________________________________________________________________________________________ (*) The Share Class is in the Sub-Fund’s base currency.
53

Semi-Annual report as of 30 June 2014
The accompanying notes form an integral part of these financial statements.
Statement of Changes in Net Assets for the period ended 30 June 2014 (Unaudited) ________________________________________________________________________________________________________________________________
Markit iBoxx € Liquid Corporates UCITS ETF Sub-Fund
Markit iBoxx € Sovereigns 1-5
UCITS ETF Sub-Fund
SBI® Foreign AAA-BBB 1-5
UCITS ETF Sub-Fund
SBI® Foreign AAA-BBB 5-10
UCITS ETF Sub-Fund
EUR EUR CHF CHF ________________________________________________________________________________________________________________________________
NET ASSETS AT THE BEGINNING OF THE PERIOD 33,222,021 2,943,431 4,741,626 5,244,048
Net investment income / (loss) 274,294 10,631 184,350 153,447
Net realised gains / (losses) on:
Investments 263,964 7,330 (3,678) 68,653 Foreign currencies and forward foreign exchange contracts – – – – Swaps, futures and options contracts – – – –
Net realised gains / (losses) for the period 263,964 7,330 (3,678) 68,653
Net change in unrealised gains / (losses) on:
Investments 767,903 50,327 260,279 615,023 Foreign currencies – – – – Forward foreign exchange contracts – – – – Swaps, futures and options contracts – – – –
Net change in unrealised gains / (losses) for the period 767,903 50,327 260,279 615,023
Net increase / (decrease) in net assets resulting from operations 1,306,161 68,288 440,951 837,123
Net increase / (decrease) in net assets from Fund shares transactions 4,854,012 – 52,241,733 15,879,218 Dividend distribution (Note 5) (281,890) (1,475) (81,920) (69,960)
INCREASE / (DECREASE) IN NET ASSETS 5,878,283 66,813 52,600,764 16,646,381
Exchange difference – – – –
NET ASSETS AS OF 30 JUNE 2014 39,100,304 3,010,244 57,342,390 21,890,429
Transactions on the Fund's own shares for the period ended 30 June 2014 ________________________________________________________________________________________________________________________________ NUMBER OF SHARES AT THE BEGINNING OF THE PERIOD Class A-dis (*) 350,000 250,000 400,000 400,000 Class A-acc (*) – – – – Class I-dis (*) – – – – NUMBER OF SHARES ISSUED Class A-dis (*) 50,000 – 4,400,000 1,200,000 Class A-acc (*) – – – – Class I-dis (*) – – – – NUMBER OF SHARES REPURCHASED Class A-dis (*) – – – – Class A-acc (*) – – – – Class I-dis (*) – – – – NUMBER OF SHARES AS OF 30 JUNE 2014 Class A-dis (*) 400,000 250,000 4,800,000 1,600,000 Class A-acc (*) – – – – Class I-dis (*) – – – – ________________________________________________________________________________________________________________________________ (*) The Share Class is in the Sub-Fund’s base currency.
54

Semi-Annual report as of 30 June 2014
The accompanying notes form an integral part of these financial statements.
Statement of Changes in Net Assets for the period ended 30 June 2014 (Unaudited) ____________________________________________________________________________________
Barclays Euro Area Liquid
Corporates 1-5 Year UCITS ETF Sub-Fund
Barclays US Liquid Corporates UCITS ETF Sub-Fund
EUR USD ____________________________________________________________________________________
NET ASSETS AT THE BEGINNING OF THE PERIOD – –
Net investment income / (loss) 63,909 417,897
Net realised gains / (losses) on:
Investments 4,964 (187,961) Foreign currencies and forward foreign exchange contracts – – Swaps, futures and options contracts – –
Net realised gains / (losses) for the period 4,964 (187,961)
Net change in unrealised gains / (losses) on:
Investments 48,624 (226,839) Foreign currencies – – Forward foreign exchange contracts – 75,740 Swaps, futures and options contracts – –
Net change in unrealised gains / (losses) for the period 48,624 (151,099)
Net increase / (decrease) in net assets resulting from operations 117,497 78,837
Net increase / (decrease) in net assets from Fund shares transactions 36,825,599 47,801,363 Dividend distribution (Note 5) – –
INCREASE / (DECREASE) IN NET ASSETS 36,943,096 47,880,200
Exchange difference – –
NET ASSETS AS OF 30 JUNE 2014 36,943,096 47,880,200
Transactions on the Fund's own shares for the period ended 30 June 2014 ____________________________________________________________________________________ NUMBER OF SHARES AT THE BEGINNING OF THE PERIOD Class A-dis (*) – – Class A-acc (*) – – Class I-dis (*) – – NUMBER OF SHARES ISSUED Class A-dis (*) – 1,600,000 Class A-acc (**) – 1,000,000 Class I-dis (*) – – NUMBER OF SHARES REPURCHASED Class A-dis (*) 2,800,000 – Class A-acc (*) – – Class I-dis (*) – – NUMBER OF SHARES AS OF 30 JUNE 2014 Class A-dis (*) 2,800,000 1,600,000 Class A-acc (**) – 1,000,000 Class I-dis (*) – – ____________________________________________________________________________________ (*) The Share Class is in the Sub-Fund’s base currency. (**) The Class A-acc of Barclays US Liquid Corporates UCITS ETF is in EUR.
55

UBS ETF - EURO STOXX 50 UCITS ETF Semi-Annual Report as of 30 June 2014 Schedule of Investments as at 30 June 2014 (Expressed in EUR) (Unaudited)
The accompanying notes form an integral part of these financial statements.
Transferable securities listed on an Official Stock Exchange
Quantity Market
Value EUR % of
Net AssetsCommon Stocks Belgium (3.18%) Anheuser-Busch InBev 243,433 20,424,029 3.18 France (35.80%) Air Liquide 109,347 10,781,614 1.68Airbus Group 184,591 9,033,884 1.41AXA 658,041 11,486,106 1.79BNP Paribas 358,774 17,775,458 2.77Carrefour 198,091 5,336,572 0.83Compagnie de Saint-Gobain 154,460 6,364,524 0.99Danone 186,349 10,107,570 1.57Essilor International 68,691 5,320,118 0.83GDF Suez 486,661 9,784,319 1.52L'Oreal 75,947 9,557,930 1.49LVMH Moet Hennessy Louis Vuitton 85,164 11,991,091 1.87Orange 615,031 7,088,232 1.10Sanofi 384,443 29,825,088 4.64Schneider Electric 184,746 12,701,287 1.98Societe Generale 255,235 9,764,015 1.52Total 757,297 39,970,136 6.22Unibail-Rodamco 31,052 6,596,997 1.03Vinci 167,948 9,169,961 1.43Vivendi 404,789 7,233,579 1.13 Germany (30.63%) Allianz - Registered 144,124 17,539,891 2.73BASF 293,242 24,934,367 3.88Bayer - Registered 263,681 27,198,695 4.24Bayerische Motoren Werke 102,556 9,498,737 1.48Daimler - Registered 313,505 21,443,742 3.34Deutsche Bank - Registered 415,658 10,680,332 1.66Deutsche Post - Registered 303,252 8,008,885 1.25Deutsche Telekom - Registered 970,087 12,417,114 1.93E.ON 637,718 9,616,787 1.50Muenchener Rueckversicherungs - Registered 48,894 7,915,939 1.23RWE 154,341 4,840,906 0.75SAP 302,421 17,056,544 2.66Siemens - Registered 265,297 25,587,896 3.98 Ireland (0.68%) CRH 234,358 4,391,869 0.68 Italy (8.29%) Assicurazioni Generali 424,632 6,798,358 1.06Enel 2,036,579 8,663,607 1.35Eni 853,960 17,062,121 2.66Intesa Sanpaolo 4,457,870 10,056,955 1.56UniCredit 1,742,517 10,655,491 1.66 Netherlands (6.85%) ASML Holding 122,491 8,330,613 1.30ING Groep - CVA 1,233,933 12,660,153 1.97Koninklijke Philips 298,900 6,927,007 1.08Unilever - CVA 502,113 16,045,021 2.50 Spain (13.21%) Banco Bilbao Vizcaya Argentaria 1,879,133 17,492,849 2.72Banco Santander 3,754,038 28,643,310 4.46Iberdrola 1,691,790 9,445,264 1.47Inditex 67,696 7,609,030 1.19Repsol 299,224 5,763,054 0.90Telefonica 1,269,117 15,889,345 2.47
_______________________________________________________________________________________________________________ ____________________________________________________________
Total Common Stocks 633,486,392 98.64 _______________________________________________________________________________________________________________ ____________________________________________________________
Preferred Stocks Germany (1.37%) Volkswagen 45,927 8,808,799 1.37
56

UBS ETF - EURO STOXX 50 UCITS ETF Semi-Annual Report as of 30 June 2014 Schedule of Investments as at 30 June 2014 (Expressed in EUR) (Unaudited)
The accompanying notes form an integral part of these financial statements.
Transferable securities listed on an Official Stock Exchange
Quantity Market
Value EUR % of
Net Assets
Total Preferred Stocks 8,808,799 1.37 _______________________________________________________________________________________________________________ ____________________________________________________________
Rights Spain (0.02%) Repsol - Rights 267,932 133,162 0.02
_______________________________________________________________________________________________________________ ____________________________________________________________
Total Rights 133,162 0.02 _______________________________________________________________________________________________________________ ____________________________________________________________
Transferable securities non-listed on an Official Stock Exchange
Common Stocks
Belgium (0.00%) Ageas 13,992 14 0.00
_______________________________________________________________________________________________________________ ____________________________________________________________
Total Common Stocks 14 0.00 _______________________________________________________________________________________________________________ ____________________________________________________________
TOTAL INVESTMENTS (Cost EUR 530,583,206) 642,428,367 100.03Other net liabilities (198,321) (0.03)
_______________________________________________________________________________________________________________ ____________________________________________________________
TOTAL NET ASSETS 642,230,046 100.00 _______________________________________________________________________________________________________________ ____________________________________________________________ _______________________________________________________________________________________________________________ ____________________________________________________________
57

UBS ETF - MSCI Europe UCITS ETF Semi-Annual Report as of 30 June 2014 Schedule of Investments as at 30 June 2014 (Expressed in EUR) (Unaudited)
The accompanying notes form an integral part of these financial statements.
Transferable securities listed on an Official Stock Exchange
Quantity Market
Value EUR % of
Net AssetsCommon Stocks Advertising (0.51%) JCDecaux 840 22,890 0.02Publicis Groupe 2,479 153,549 0.17WPP 18,225 289,964 0.32 Aerospace & Defense (1.55%) Airbus Group 7,950 389,073 0.42BAE Systems 43,383 234,538 0.25Cobham 15,609 60,877 0.07Finmeccanica 6,092 42,309 0.05Meggitt 10,397 65,700 0.07Rolls-Royce Holdings 25,478 340,134 0.37Safran 3,621 173,138 0.19Thales 1,239 54,733 0.06Zodiac Aerospace 2,444 60,416 0.07 Agriculture (1.77%) British American Tobacco 25,633 1,113,360 1.22Imperial Tobacco Group 13,087 429,836 0.47Swedish Match 2,965 75,151 0.08 Airlines (0.17%) Deutsche Lufthansa - Registered 2,789 43,732 0.05easyJet 2,347 40,008 0.04International Consolidated Airlines Group 13,334 61,750 0.07Ryanair Holdings 1,121 7,746 0.01 Apparel (1.11%) adidas 2,913 215,475 0.24Burberry Group 6,074 112,492 0.12Christian Dior 753 109,411 0.12Hugo Boss 402 43,878 0.05LVMH Moet Hennessy Louis Vuitton 3,794 534,195 0.58 Auto Manufacturers (2.10%) Bayerische Motoren Werke 4,546 421,051 0.46Daimler - Registered 13,103 896,245 0.98Fiat 11,845 85,402 0.09Peugeot 5,498 59,351 0.06Renault 2,597 171,480 0.19Volkswagen 440 83,072 0.09Volvo - Class B 20,758 208,754 0.23 Auto Parts & Equipment (0.82%) Compagnie Generale des Etablissements Michelin 2,524 220,244 0.24Continental 1,510 255,416 0.28GKN 23,189 105,151 0.11Nokian Renkaat 1,557 44,375 0.05Pirelli & C. 2,626 30,777 0.03Valeo 1,011 99,169 0.11 Banks (13.26%) Banca Monte dei Paschi di Siena 57,759 81,729 0.09Banco Bilbao Vizcaya Argentaria 80,899 753,089 0.82Banco de Sabadell 46,878 116,820 0.13Banco Espirito Santo - Registered 29,484 17,749 0.02Banco Popolare 4,452 53,558 0.06Banco Popular Espanol 24,209 118,140 0.13Banco Santander 161,578 1,232,840 1.34Bank of Ireland 264,768 65,398 0.07Bankia 65,561 92,834 0.10Barclays 222,542 591,412 0.64BNP Paribas 14,373 712,110 0.78CaixaBank 24,434 110,124 0.12Commerzbank 13,238 151,972 0.17Credit Agricole 13,897 143,139 0.16Credit Suisse Group - Registered 20,598 430,227 0.47Danske Bank 9,034 186,489 0.20Deutsche Bank - Registered 18,804 483,169 0.53DNB 13,560 181,090 0.20
58

UBS ETF - MSCI Europe UCITS ETF Semi-Annual Report as of 30 June 2014 Schedule of Investments as at 30 June 2014 (Expressed in EUR) (Unaudited)
The accompanying notes form an integral part of these financial statements.
Transferable securities listed on an Official Stock Exchange
Quantity Market
Value EUR % of
Net Assets Banks (13.26%) (continued) Erste Group Bank 3,862 91,220 0.10HSBC Holdings 256,648 1,900,317 2.07Intesa Sanpaolo 158,561 357,714 0.39Intesa Sanpaolo - Rsp 7,513 14,590 0.02KBC Groep 3,562 141,590 0.15Lloyds Banking Group 779,821 723,099 0.79Mediobanca 8,695 63,300 0.07Natixis 13,446 62,954 0.07Nordea Bank 41,414 426,662 0.47Raiffeisen Bank International 1,435 33,457 0.04Royal Bank of Scotland Group 34,106 139,875 0.15Skandinaviska Enskilda Banken - Class A 20,950 204,390 0.22Societe Generale 9,832 376,123 0.41Standard Chartered 33,093 493,454 0.54Svenska Handelsbanken - Class A 7,027 251,117 0.27Swedbank - Class A 12,524 242,455 0.26UBS - Registered 49,752 666,686 0.73UniCredit 60,056 367,242 0.40Unione di Banche Italiane 11,724 74,096 0.08 Beverages (3.21%) Anheuser-Busch InBev 10,959 919,460 1.00Carlsberg - Class B 1,452 114,227 0.12Coca-Cola HBC 2,860 47,932 0.05Diageo 34,211 797,231 0.87Heineken 3,223 168,982 0.18Heineken Holding 1,416 67,989 0.07Pernod Ricard 2,881 252,664 0.28Remy Cointreau 349 23,449 0.03SABMiller 13,106 554,524 0.61 Building Materials (1.28%) Compagnie de Saint-Gobain 6,041 248,919 0.27CRH 9,551 178,986 0.20Geberit - Registered 548 140,502 0.15HeidelbergCement 1,951 121,606 0.13Holcim - Registered 3,120 200,306 0.22Imerys 473 29,109 0.03Lafarge 2,531 160,465 0.18Sika 31 92,579 0.10 Chemicals (3.92%) Air Liquide 4,654 458,884 0.50Akzo Nobel 3,324 181,989 0.20Arkema 709 50,396 0.06BASF 12,477 1,060,919 1.16Brenntag 722 94,221 0.10Croda International 1,881 51,703 0.06EMS-Chemie Holding - Registered 125 36,445 0.04Givaudan - Registered 129 157,138 0.17Johnson Matthey 2,824 109,328 0.12K+S - Registered 2,034 48,847 0.05Koninklijke DSM 2,393 127,284 0.14LANXESS 1,247 61,471 0.07Linde 2,536 393,841 0.43Lonza Group - Registered 716 56,907 0.06Novozymes - Class B 3,368 123,375 0.13OCI 1,323 37,705 0.04Solvay 824 103,577 0.11Syngenta - Registered 1,277 347,394 0.38Yara International 2,405 87,967 0.10 Commercial Services (1.64%) Abertis Infraestructuras 5,339 89,722 0.10Adecco - Registered 2,376 142,854 0.15Aggreko 3,526 72,656 0.08Atlantia 5,603 116,655 0.13Babcock International Group 6,814 98,882 0.11Bunzl 4,398 89,087 0.10Bureau Veritas 2,985 60,506 0.07
59

UBS ETF - MSCI Europe UCITS ETF Semi-Annual Report as of 30 June 2014 Schedule of Investments as at 30 June 2014 (Expressed in EUR) (Unaudited)
The accompanying notes form an integral part of these financial statements.
Transferable securities listed on an Official Stock Exchange
Quantity Market
Value EUR % of
Net Assets Commercial Services (1.64%) (continued) Capita 8,931 127,706 0.14Edenred 2,789 61,762 0.07Experian 13,452 165,978 0.18G4S 21,291 67,855 0.07Intertek Group 2,267 77,828 0.08Randstad Holding 1,677 66,392 0.07Securitas - Class B 3,249 28,130 0.03SGS - Registered 79 138,264 0.15Sodexo 1,315 103,293 0.11 Computers (0.27%) AtoS 1,141 69,418 0.08Cap Gemini 2,022 105,346 0.11Gemalto 1,014 76,760 0.08 Cosmetics & Personal Care (0.55%) Beiersdorf 1,336 94,415 0.10L'Oreal 3,228 406,244 0.45 Distribution & Wholesale (0.16%) Wolseley 3,694 147,761 0.16 Diversified Financial Services (0.82%) Aberdeen Asset Management 12,706 72,024 0.08Deutsche Boerse 2,652 150,315 0.17Hargreaves Lansdown 3,124 48,299 0.05ICAP 6,518 30,932 0.03Investec 6,482 43,632 0.05Julius Baer Group 2,963 89,220 0.10London Stock Exchange Group 2,119 53,111 0.06Old Mutual 66,518 164,230 0.18Partners Group Holding 245 48,913 0.05Schroders 1,509 47,225 0.05 Electric (2.77%) E.ON 27,286 411,473 0.45EDP - Energias de Portugal 33,486 122,693 0.13Electricite de France 3,298 75,854 0.08Enel 89,465 380,584 0.42Fortum 5,815 114,032 0.13GDF Suez 19,682 395,707 0.43Iberdrola 70,510 393,657 0.43Red Electrica 1,527 102,003 0.11RWE 6,714 210,585 0.23SSE 13,183 257,982 0.28Terna Rete Elettrica Nazionale 19,837 76,412 0.08 Electrical Components & Equipment (0.80%) Legrand 3,625 161,983 0.18OSRAM Licht 1,273 46,891 0.05Prysmian 2,446 40,359 0.04Schneider Electric - FR 6,902 474,513 0.52Schneider Electric - GB 147 10,106 0.01 Electronics (0.41%) Koninklijke Philips 13,242 306,883 0.34Rexel 3,806 65,007 0.07 Energy - Alternate Sources (0.18%) Enel Green Power 25,035 51,772 0.06Vestas Wind Systems 3,060 112,750 0.12 Engineering & Construction (1.47%) ABB - Registered 29,843 501,905 0.55ACS Actividades de Construccion y Servicios 2,175 72,645 0.08Aeroports de Paris 352 33,869 0.04Aker Solutions 2,063 26,176 0.03Bouygues 2,586 78,588 0.08Ferrovial 5,514 89,685 0.10Fraport Frankfurt Airport Services Worldwide 578 29,825 0.03
60

UBS ETF - MSCI Europe UCITS ETF Semi-Annual Report as of 30 June 2014 Schedule of Investments as at 30 June 2014 (Expressed in EUR) (Unaudited)
The accompanying notes form an integral part of these financial statements.
Transferable securities listed on an Official Stock Exchange
Quantity Market
Value EUR % of
Net Assets Engineering & Construction (1.47%) (continued) Hochtief 375 23,704 0.03Koninklijke Boskalis Westminster 1,221 51,142 0.05Skanska - Class B 4,751 79,155 0.09Vinci 6,545 357,357 0.39 Entertainment (0.05%) William Hill 10,352 42,404 0.05 Food (6.90%) Aryzta 1,214 83,989 0.09Associated British Foods 4,883 185,931 0.20Barry Callebaut - Registered 33 32,751 0.04Carrefour 8,348 224,895 0.25Casino Guichard Perrachon 762 73,784 0.08Colruyt 1,088 40,365 0.04Compass Group 24,221 307,624 0.34Danone 7,663 415,641 0.45Delhaize Group 1,430 70,656 0.08Distribuidora Internacional de Alimentacion 8,024 53,953 0.06J Sainsbury 16,920 66,666 0.07Jeronimo Martins 3,730 44,816 0.05Kerry Group - Class A 1,987 108,987 0.12Koninklijke Ahold 12,975 177,887 0.19Lindt & Spruengli 13 48,331 0.05Lindt & Spruengli - Registered 1 45,118 0.05Metro 2,256 71,809 0.08Nestle - Registered 43,761 2,476,094 2.70Tate & Lyle 6,046 51,683 0.06Tesco 110,288 391,434 0.43Unilever 17,352 574,468 0.63Unilever - CVA 22,189 709,050 0.77WM Morrison Supermarkets 28,409 65,067 0.07 Forest Products & Paper (0.31%) Stora Enso - Class R 6,475 46,037 0.05Svenska Cellulosa - Class B 7,878 149,844 0.16UPM-Kymmene 7,041 87,872 0.10 Gas (1.21%) Centrica 69,507 271,346 0.30Enagas 2,885 67,797 0.07Gas Natural SDG 4,964 114,495 0.12National Grid 50,978 534,772 0.58Snam 28,282 124,441 0.14 Hand & Machine Tools (0.28%) Sandvik 14,591 145,539 0.16Schindler Holding 688 76,384 0.08Schindler Holding - Registered 303 33,366 0.04 Healthcare Products (0.91%) Coloplast - Class B 1,579 104,288 0.11Elekta - Class B 5,177 48,075 0.05Essilor International 2,776 215,001 0.24Getinge - Class B 2,509 48,134 0.05Luxottica Group 2,367 100,053 0.11QIAGEN 3,276 57,985 0.06Smith & Nephew 12,123 157,302 0.17Sonova Holding - Registered 747 83,242 0.09William Demant Holding 351 23,277 0.03 Healthcare Services (0.37%) Fresenius & Co 1,735 188,942 0.21Fresenius Medical Care & Co 3,061 150,264 0.16 Holding Companies - Diversified Operations (0.22%) Bollore 72 34,128 0.04GEA Group 2,552 88,248 0.10Industrivarden - Class C 1,990 28,698 0.03Wendel 454 47,488 0.05
61

UBS ETF - MSCI Europe UCITS ETF Semi-Annual Report as of 30 June 2014 Schedule of Investments as at 30 June 2014 (Expressed in EUR) (Unaudited)
The accompanying notes form an integral part of these financial statements.
Transferable securities listed on an Official Stock Exchange
Quantity Market
Value EUR % of
Net Assets Home Builders (0.07%) Persimmon 4,115 65,419 0.07 Home Furnishings (0.06%) Electrolux - Class B 3,203 59,138 0.06 Household Products (0.81%) Henkel & Co 1,555 114,293 0.13Husqvarna - Class B 5,597 31,766 0.03Reckitt Benckiser Group 8,738 556,530 0.61Societe BIC 359 35,871 0.04 Insurance (6.07%) Admiral Group 2,658 51,418 0.06Aegon 25,236 160,854 0.18Ageas 3,211 93,552 0.10Allianz - Registered 6,194 753,810 0.82Assicurazioni Generali 15,564 249,180 0.27Aviva 39,857 254,101 0.28AXA 24,435 426,513 0.47Baloise Holding - Registered 581 50,005 0.05CNP Assurances 2,189 33,185 0.04Delta Lloyd 2,838 52,616 0.06Direct Line Insurance Group 21,406 72,125 0.08Friends Life Group 19,342 76,161 0.08Gjensidige Forsikring 2,881 37,721 0.04Hannover Rueck 848 55,807 0.06ING Groep - CVA 52,199 535,562 0.58Legal & General Group 80,334 226,131 0.25Mapfre 11,173 32,525 0.04Muenchener Rueckversicherungs - Registered 2,447 396,169 0.43Prudential 34,805 582,877 0.64RSA Insurance Group 13,759 81,584 0.09Sampo - Class A 6,261 231,344 0.25SCOR 1,860 46,723 0.05Standard Life 32,588 152,248 0.17Swiss Life Holding - Registered 434 75,171 0.08Swiss Re 4,856 315,558 0.34Tryg 272 20,066 0.02UnipolSai 11,456 26,899 0.03Vienna Insurance Group 441 17,239 0.02Zurich Insurance Group 2,056 452,632 0.49 Internet (0.17%) ASOS 636 23,510 0.03Iliad 354 78,146 0.08United Internet - Registered 1,622 52,188 0.06 Iron & Steel (0.38%) ArcelorMittal 14,449 156,483 0.17ThyssenKrupp 6,168 131,317 0.14Voestalpine 1,672 58,110 0.07 Leisure Time (0.11%) Carnival 2,501 68,964 0.08TUI Travel 5,861 29,131 0.03 Lodging (0.36%) Accor 2,330 88,517 0.09InterContinental Hotels Group 3,561 107,665 0.12Whitbread 2,518 138,644 0.15 Machinery - Construction & Mining (0.32%) Atlas Copco - Class A 8,898 187,715 0.21Atlas Copco - Class B 5,229 101,972 0.11 Machinery - Diversified (0.72%) Alstom 2,924 77,852 0.08Andritz 1,000 42,205 0.05CNH Industrial 13,341 100,057 0.11Hexagon - Class B 3,687 86,765 0.09
62

UBS ETF - MSCI Europe UCITS ETF Semi-Annual Report as of 30 June 2014 Schedule of Investments as at 30 June 2014 (Expressed in EUR) (Unaudited)
The accompanying notes form an integral part of these financial statements.
Transferable securities listed on an Official Stock Exchange
Quantity Market
Value EUR % of
Net Assets Machinery - Diversified (0.72%) (continued) Kone - Class B 4,362 132,954 0.14MAN 576 51,984 0.06Metso 1,668 46,154 0.05Weir Group 2,754 90,075 0.10Zardoya Otis 2,480 32,240 0.04 Media (1.26%) Axel Springer 535 24,048 0.03British Sky Broadcasting Group 13,858 156,450 0.17ITV 52,529 116,900 0.13Kabel Deutschland Holding 317 33,903 0.04Lagardere 1,629 38,746 0.04Pearson 11,072 159,565 0.17ProSiebenSat.1 Media - Registered 2,981 96,987 0.11Reed Elsevier - GB 16,055 188,471 0.20Reed Elsevier - NL 9,842 164,854 0.18RTL Group 439 35,664 0.04Sky Deutschland 6,281 42,259 0.05Wolters Kluwer 4,383 94,760 0.10 Metal Fabricate & Hardware (0.47%) Assa Abloy - Class B 4,454 165,445 0.18SKF - Class B 5,613 104,555 0.11Tenaris 6,461 111,129 0.12Vallourec 1,565 51,183 0.06 Mining (2.81%) Anglo American 18,838 336,417 0.37Antofagasta 5,371 51,178 0.05BHP Billiton 28,389 669,890 0.73Boliden 3,474 36,796 0.04Fresnillo 3,032 33,018 0.04Glencore 144,066 585,714 0.64Norsk Hydro 18,581 72,608 0.08Randgold Resources 1,188 72,297 0.08Rio Tinto 17,215 668,289 0.73Umicore 1,431 48,554 0.05 Miscellaneous Manufacturers (1.63%) Alfa Laval 4,179 78,619 0.09IMI 3,772 70,047 0.08Melrose Industries 15,004 48,755 0.05Orkla 11,048 71,865 0.08Siemens - Registered 10,777 1,039,442 1.13Smiths Group 5,010 81,149 0.09Sulzer - Registered 300 30,737 0.03Wartsila 2,071 75,012 0.08 Oil & Gas (9.18%) BG Group 46,448 716,375 0.78BP 251,541 1,617,478 1.76Eni 34,226 683,835 0.75Galp Energia 5,292 70,807 0.08Lundin Petroleum 3,059 45,184 0.05Neste Oil 1,510 21,518 0.02OMV 2,129 70,257 0.08Repsol 11,908 229,348 0.25Royal Dutch Shell - Class A 52,727 1,592,523 1.74Royal Dutch Shell - Class B 33,329 1,058,254 1.15Seadrill 5,063 146,620 0.16Statoil 15,284 342,736 0.37Total 28,973 1,529,195 1.67Transocean 4,919 161,487 0.18Tullow Oil 12,395 132,116 0.14 Oil & Gas Services (0.43%) AMEC 4,182 63,455 0.07Fugro - CVA 1,087 45,453 0.05Petrofac 3,542 53,213 0.06Saipem 3,647 71,846 0.08
63

UBS ETF - MSCI Europe UCITS ETF Semi-Annual Report as of 30 June 2014 Schedule of Investments as at 30 June 2014 (Expressed in EUR) (Unaudited)
The accompanying notes form an integral part of these financial statements.
Transferable securities listed on an Official Stock Exchange
Quantity Market
Value EUR % of
Net Assets Oil & Gas Services (0.43%) (continued) Subsea 7 3,851 52,437 0.05Technip 1,376 109,929 0.12 Other Finance (0.48%) Exor 1,397 41,896 0.05Groupe Bruxelles Lambert 1,221 92,662 0.10Investment Kinnevik - Class B 3,224 100,314 0.11Investor - Class B 6,221 170,388 0.19Pargesa Holding 485 31,816 0.03 Packaging & Containers (0.06%) Rexam 8,420 56,258 0.06 Pharmaceuticals & Biotechnology (11.60%) Actelion - Registered 1,326 122,535 0.13AstraZeneca 17,156 929,956 1.02Bayer - Registered 11,228 1,158,168 1.26Celesio 608 15,808 0.02GlaxoSmithKline 66,239 1,293,770 1.41Grifols 2,101 83,862 0.09Merck 1,786 113,215 0.12Novartis - Registered 31,359 2,073,963 2.26Novo Nordisk - Class B 27,156 912,813 1.00Orion - Class B 1,275 34,718 0.04Roche Holding 9,566 2,083,911 2.27Sanofi 16,173 1,254,701 1.37Shire 8,037 458,687 0.50UCB 1,559 96,393 0.11 Private Equity (0.11%) 3i Group 13,477 67,642 0.07Eurazeo 550 33,413 0.04 Real Estate (0.16%) Deutsche Wohnen 4,081 64,276 0.07IMMOFINANZ 13,241 34,162 0.04Swiss Prime Site - Registered 803 48,610 0.05 Real Estate Investment Trusts (0.96%) British Land 12,937 113,498 0.12Corio 990 36,927 0.04Fonciere Des Regions 358 28,346 0.03Gecina 235 25,028 0.03Hammerson 9,706 70,303 0.07ICADE 490 38,367 0.04Intu Properties 11,994 46,673 0.05Klepierre 1,454 54,111 0.06Land Securities Group 10,460 135,331 0.15Segro 10,392 44,800 0.05Unibail-Rodamco 1,369 290,844 0.32 Retail (2.56%) Compagnie Financiere Richemont - Registered 7,172 549,642 0.60Hennes & Mauritz - Class B 13,050 416,311 0.46Inditex 3,030 340,572 0.37Kering 1,023 163,833 0.18Kingfisher 32,995 147,928 0.16Marks & Spencer Group 22,587 119,938 0.13Next 2,152 174,016 0.19Pandora 1,600 89,601 0.10Sports Direct International 3,477 30,678 0.03Swatch Group 422 186,121 0.20Swatch Group - Registered 699 56,707 0.06Travis Perkins 3,344 68,405 0.08 Semiconductors (0.81%) ARM Holdings 19,154 210,738 0.23ASML Holding 4,911 333,997 0.36Infineon Technologies 15,575 142,184 0.16STMicroelectronics 8,525 55,856 0.06
64

UBS ETF - MSCI Europe UCITS ETF Semi-Annual Report as of 30 June 2014 Schedule of Investments as at 30 June 2014 (Expressed in EUR) (Unaudited)
The accompanying notes form an integral part of these financial statements.
Transferable securities listed on an Official Stock Exchange
Quantity Market
Value EUR % of
Net Assets Software (1.12%) Amadeus IT Holding - Class A 5,376 161,925 0.17Dassault Systemes 851 79,960 0.09Sage Group 16,016 76,825 0.08SAP 12,642 713,009 0.78 Telecommunications (5.94%) Alcatel-Lucent 35,524 92,647 0.10Altice 804 40,908 0.04Belgacom 2,263 54,844 0.06BT Group 108,110 519,661 0.57Deutsche Telekom - Registered 42,468 543,590 0.59Elisa 1,837 41,039 0.05Eutelsat Communications 2,075 52,653 0.06Inmarsat 6,088 56,832 0.06Koninklijke KPN 43,701 116,288 0.13Millicom International Cellular - SDR 927 61,981 0.07Nokia 51,063 282,378 0.31Orange 25,175 290,142 0.32SES 4,122 114,179 0.12Swisscom - Registered 332 140,958 0.15TDC 11,301 85,417 0.09Tele2 - Class B 3,593 30,893 0.03Telecom Italia 136,907 126,639 0.14Telecom Italia - Rsp 75,468 54,450 0.06Telefonaktiebolaget LM Ericsson - Class B 41,554 366,590 0.40Telefonica 55,883 699,655 0.76Telefonica Deutschland Holding 4,327 26,131 0.03Telekom Austria 3,136 22,391 0.02Telenet Group Holding 800 33,296 0.04Telenor 10,392 172,798 0.19TeliaSonera 32,283 172,150 0.19Vivendi 16,424 293,497 0.32Vodafone Group 360,800 878,633 0.96Ziggo 2,112 71,322 0.08 Transportation (0.98%) AP Moeller - Maersk - Class A 40 68,730 0.08AP Moeller - Maersk - Class B 91 165,148 0.18Deutsche Post - Registered 13,091 345,733 0.38DSV 2,469 58,783 0.06Groupe Eurotunnel - Registered 6,560 64,793 0.07Koninklijke Vopak 1,011 36,093 0.04Kuehne + Nagel International - Registered 683 66,378 0.07Royal Mail 7,775 48,452 0.05TNT Express 6,391 42,245 0.05 Water (0.34%) Severn Trent 3,038 73,300 0.08Suez Environnement 3,631 50,761 0.05United Utilities Group 9,755 107,449 0.12Veolia Environnement 5,669 78,884 0.09
_______________________________________________________________________________________________________________ ____________________________________________________________
Total Common Stocks 90,716,461 98.99 _______________________________________________________________________________________________________________ ____________________________________________________________
Preferred Stocks Auto Manufacturers (0.69%) Bayerische Motoren Werke 650 45,507 0.05Porsche Automobil Holding 2,084 158,572 0.17Volkswagen 2,248 431,166 0.47 Household Products (0.23%) Henkel & Co 2,516 212,426 0.23 Oil & Gas (0.03%) Fuchs Petrolub 818 27,010 0.03
_______________________________________________________________________________________________________________ ____________________________________________________________
Total Preferred Stocks 874,681 0.95 _______________________________________________________________________________________________________________ ____________________________________________________________
65

UBS ETF - MSCI Europe UCITS ETF Semi-Annual Report as of 30 June 2014 Schedule of Investments as at 30 June 2014 (Expressed in EUR) (Unaudited)
The accompanying notes form an integral part of these financial statements.
Transferable securities listed on an Official Stock Exchange
Quantity Market
Value EUR % of
Net Assets _______________________________________________________________________________________________________________ ____________________________________________________________ _______________________________________________________________________________________________________________ ____________________________________________________________
Rights Oil & Gas (0.01%) Repsol - Rights 10,700 5,318 0.01
_______________________________________________________________________________________________________________ ____________________________________________________________
Total Rights 5,318 0.01 _______________________________________________________________________________________________________________ ____________________________________________________________
Transferable securities non-listed on an Official Stock Exchange
Common Stocks
Banks (0.00%) CaixaBank 202 910 0.00
_______________________________________________________________________________________________________________ ____________________________________________________________
Total Common Stocks 910 0.00 _______________________________________________________________________________________________________________ ____________________________________________________________
TOTAL INVESTMENTS (Cost EUR 83,483,681) 91,597,370 99.95Other net assets 45,113 0.05
_______________________________________________________________________________________________________________ ____________________________________________________________
TOTAL NET ASSETS 91,642,483 100.00 _______________________________________________________________________________________________________________ ____________________________________________________________ _______________________________________________________________________________________________________________ ____________________________________________________________
66

UBS ETF - MSCI Europe ex UK UCITS ETF Semi-Annual Report as of 30 June 2014 Schedule of Investments as at 30 June 2014 (Expressed in EUR) (Unaudited)
The accompanying notes form an integral part of these financial statements.
Transferable securities listed on an Official Stock Exchange
Quantity Market
Value EUR % of
Net AssetsCommon Stocks Advertising (0.28%) JCDecaux 187 5,096 0.04Publicis Groupe 488 30,226 0.24 Aerospace & Defense (1.16%) Airbus Group 1,588 77,717 0.63Finmeccanica 1,101 7,646 0.06Safran 729 34,857 0.28Thales 247 10,911 0.09Zodiac Aerospace 505 12,484 0.10 Agriculture (0.11%) Swedish Match 542 13,738 0.11 Airlines (0.20%) Deutsche Lufthansa - Registered 660 10,349 0.08International Consolidated Airlines Group 2,794 12,939 0.10Ryanair Holdings 303 2,094 0.02 Apparel (1.45%) adidas 578 42,755 0.35Christian Dior 147 21,359 0.17Hugo Boss 83 9,059 0.07LVMH Moet Hennessy Louis Vuitton 757 106,586 0.86 Auto Manufacturers (3.09%) Bayerische Motoren Werke 910 84,284 0.68Daimler - Registered 2,623 179,413 1.45Fiat 2,359 17,008 0.14Peugeot 1,063 11,475 0.09Renault 523 34,534 0.28Volkswagen 78 14,727 0.12Volvo - Class B 4,137 41,604 0.33 Auto Parts & Equipment (1.06%) Compagnie Generale des Etablissements Michelin 501 43,717 0.35Continental 302 51,083 0.41Nokian Renkaat 315 8,978 0.07Pirelli & C. 639 7,489 0.06Valeo 206 20,207 0.17 Banks (13.30%) Banca Monte dei Paschi di Siena 11,220 15,876 0.13Banco Bilbao Vizcaya Argentaria 16,040 149,316 1.20Banco de Sabadell 9,239 23,024 0.19Banco Espirito Santo - Registered 6,962 4,191 0.03Banco Popolare 980 11,789 0.10Banco Popular Espanol 4,768 23,268 0.19Banco Santander 32,099 244,915 1.97Bank of Ireland 60,771 15,010 0.12Bankia 12,501 17,701 0.14BNP Paribas 2,869 142,145 1.15CaixaBank 4,821 21,728 0.18Commerzbank 2,631 30,204 0.24Credit Agricole 2,718 27,995 0.23Credit Suisse Group - Registered 4,118 86,012 0.69Danske Bank 1,790 36,951 0.30Deutsche Bank - Registered 3,743 96,176 0.77DNB 2,655 35,457 0.29Erste Group Bank 758 17,904 0.14Intesa Sanpaolo 31,640 71,380 0.58Intesa Sanpaolo - Rsp 2,175 4,224 0.03KBC Groep 702 27,905 0.22Mediobanca 1,614 11,750 0.09Natixis 2,543 11,906 0.10Nordea Bank 8,221 84,696 0.68Raiffeisen Bank International 315 7,344 0.06Skandinaviska Enskilda Banken - Class A 4,163 40,615 0.33Societe Generale 1,956 74,827 0.60Svenska Handelsbanken - Class A 1,361 48,637 0.39
67

UBS ETF - MSCI Europe ex UK UCITS ETF Semi-Annual Report as of 30 June 2014 Schedule of Investments as at 30 June 2014 (Expressed in EUR) (Unaudited)
The accompanying notes form an integral part of these financial statements.
Transferable securities listed on an Official Stock Exchange
Quantity Market
Value EUR % of
Net Assets Banks (13.30%) (continued) Swedbank - Class A 2,466 47,740 0.38UBS - Registered 9,906 132,742 1.07UniCredit 11,979 73,252 0.59Unione di Banche Italiane 2,318 14,650 0.12 Beverages (2.47%) Anheuser-Busch InBev 2,186 183,405 1.48Carlsberg - Class B 286 22,499 0.18Heineken 629 32,979 0.27Heineken Holding 284 13,636 0.11Pernod Ricard 571 50,077 0.40Remy Cointreau 63 4,233 0.03 Building Materials (1.87%) Compagnie de Saint-Gobain 1,200 49,446 0.40CRH 1,926 36,093 0.29Geberit - Registered 103 26,408 0.21HeidelbergCement 388 24,184 0.20Holcim - Registered 618 39,676 0.32Imerys 91 5,600 0.05Lafarge 508 32,207 0.26Sika 6 17,919 0.14 Chemicals (5.48%) Air Liquide 923 91,008 0.73Akzo Nobel 648 35,478 0.29Arkema 154 10,946 0.09BASF 2,494 212,065 1.71Brenntag 138 18,009 0.14EMS-Chemie Holding - Registered 23 6,706 0.05Givaudan - Registered 25 30,453 0.25K+S - Registered 472 11,335 0.09Koninklijke DSM 473 25,159 0.20LANXESS 253 12,472 0.10Linde 500 77,650 0.63Lonza Group - Registered 145 11,524 0.09Novozymes - Class B 645 23,628 0.19OCI 228 6,498 0.05Solvay 163 20,489 0.16Syngenta - Registered 254 69,098 0.56Yara International 498 18,215 0.15 Commercial Services (1.29%) Abertis Infraestructuras 1,051 17,662 0.14Adecco - Registered 462 27,777 0.23Atlantia 1,086 22,610 0.18Bureau Veritas 586 11,878 0.10Edenred 552 12,224 0.10Randstad Holding 340 13,461 0.11Securitas - Class B 873 7,559 0.06SGS - Registered 15 26,253 0.21Sodexo 255 20,030 0.16 Computers (0.41%) AtoS 216 13,141 0.11Cap Gemini 401 20,892 0.17Gemalto 218 16,503 0.13 Cosmetics & Personal Care (0.82%) Beiersdorf 288 20,353 0.16L'Oreal 651 81,928 0.66 Diversified Financial Services (0.46%) Deutsche Boerse 518 29,360 0.24Julius Baer Group 606 18,248 0.15Partners Group Holding 47 9,383 0.07 Electric (3.65%) E.ON 5,440 82,035 0.66EDP - Energias de Portugal 6,326 23,179 0.19
68

UBS ETF - MSCI Europe ex UK UCITS ETF Semi-Annual Report as of 30 June 2014 Schedule of Investments as at 30 June 2014 (Expressed in EUR) (Unaudited)
The accompanying notes form an integral part of these financial statements.
Transferable securities listed on an Official Stock Exchange
Quantity Market
Value EUR % of
Net Assets Electric (3.65%) (continued) Electricite de France 661 15,203 0.12Enel 17,847 75,921 0.61Fortum 1,209 23,709 0.19GDF Suez 3,916 78,731 0.63Iberdrola 13,937 77,810 0.63Red Electrica 298 19,906 0.16RWE 1,330 41,716 0.34Terna Rete Elettrica Nazionale 3,917 15,088 0.12 Electrical Components & Equipment (1.19%) Legrand 715 31,950 0.26OSRAM Licht 243 8,951 0.07Prysmian 553 9,124 0.08Schneider Electric 1,411 97,006 0.78 Electronics (0.59%) Koninklijke Philips 2,635 61,066 0.49Rexel 707 12,076 0.10 Energy - Alternate Sources (0.26%) Enel Green Power 4,698 9,716 0.08Vestas Wind Systems 610 22,476 0.18 Engineering & Construction (2.18%) ABB - Registered 5,979 100,556 0.81ACS Actividades de Construccion y Servicios 485 16,199 0.13Aeroports de Paris 77 7,409 0.06Aker Solutions 408 5,177 0.04Bouygues 516 15,681 0.13Ferrovial 1,129 18,363 0.15Fraport Frankfurt Airport Services Worldwide 98 5,057 0.04Hochtief 64 4,045 0.03Koninklijke Boskalis Westminster 239 10,011 0.08Skanska - Class B 1,034 17,227 0.14Vinci 1,298 70,871 0.57 Food (7.53%) Aryzta 241 16,673 0.13Barry Callebaut - Registered 6 5,955 0.05Carrefour 1,662 44,774 0.36Casino Guichard Perrachon 152 14,718 0.12Colruyt 210 7,791 0.06Danone 1,528 82,879 0.67Delhaize Group 283 13,983 0.11Distribuidora Internacional de Alimentacion 1,694 11,390 0.09Jeronimo Martins 678 8,146 0.07Kerry Group - Class A 406 22,269 0.18Koninklijke Ahold 2,550 34,961 0.28Lindt & Spruengli 6 22,307 0.18Metro 437 13,910 0.11Nestle - Registered 8,727 493,793 3.98Unilever - CVA 4,418 141,177 1.14 Forest Products & Paper (0.46%) Stora Enso - Class R 1,323 9,407 0.08Svenska Cellulosa - Class B 1,568 29,824 0.24UPM-Kymmene 1,427 17,809 0.14 Gas (0.48%) Enagas 558 13,113 0.10Gas Natural SDG 966 22,281 0.18Snam 5,533 24,345 0.20 Hand & Machine Tools (0.39%) Sandvik 2,887 28,796 0.23Schindler Holding 122 13,545 0.11Schindler Holding - Registered 60 6,607 0.05 Healthcare Products (1.08%) Coloplast - Class B 303 20,012 0.16
69

UBS ETF - MSCI Europe ex UK UCITS ETF Semi-Annual Report as of 30 June 2014 Schedule of Investments as at 30 June 2014 (Expressed in EUR) (Unaudited)
The accompanying notes form an integral part of these financial statements.
Transferable securities listed on an Official Stock Exchange
Quantity Market
Value EUR % of
Net Assets Healthcare Products (1.08%) (continued) Elekta - Class B 1,000 9,286 0.08Essilor International 555 42,985 0.35Getinge - Class B 548 10,513 0.08Luxottica Group 454 19,191 0.15QIAGEN 646 11,434 0.09Sonova Holding - Registered 145 16,158 0.13William Demant Holding 67 4,443 0.04 Healthcare Services (0.53%) Fresenius & Co 342 37,244 0.30Fresenius Medical Care & Co 579 28,423 0.23 Holding Companies - Diversified Operations (0.30%) Bollore 15 7,110 0.06GEA Group 491 16,979 0.13Industrivarden - Class C 319 4,600 0.04Wendel 83 8,682 0.07 Home Furnishings (0.10%) Electrolux - Class B 642 11,853 0.10 Household Products (0.29%) Henkel & Co 305 22,418 0.18Husqvarna - Class B 1,100 6,243 0.05Societe BIC 76 7,594 0.06 Insurance (6.53%) Aegon 4,940 31,488 0.26Ageas 607 17,685 0.14Allianz - Registered 1,233 150,056 1.21Assicurazioni Generali 3,120 49,951 0.40AXA 4,908 85,669 0.69Baloise Holding - Registered 117 10,070 0.08CNP Assurances 474 7,186 0.06Delta Lloyd 556 10,308 0.08Gjensidige Forsikring 551 7,214 0.06Hannover Rueck 165 10,859 0.09ING Groep - CVA 10,429 107,001 0.86Mapfre 2,575 7,496 0.06Muenchener Rueckversicherungs - Registered 484 78,360 0.63Sampo - Class A 1,213 44,820 0.36SCOR 413 10,375 0.08Swiss Life Holding - Registered 88 15,242 0.12Swiss Re 962 62,514 0.50Tryg 58 4,279 0.04UnipolSai 2,355 5,529 0.05Vienna Insurance Group 104 4,065 0.03Zurich Insurance Group 409 90,042 0.73 Internet (0.21%) Iliad 70 15,453 0.13United Internet - Registered 315 10,135 0.08 Iron & Steel (0.53%) ArcelorMittal 2,821 30,551 0.25ThyssenKrupp 1,217 25,910 0.21Voestalpine 269 9,349 0.07 Lodging (0.14%) Accor 463 17,589 0.14 Machinery - Construction & Mining (0.47%) Atlas Copco - Class A 1,815 38,290 0.31Atlas Copco - Class B 1,029 20,067 0.16 Machinery - Diversified (0.88%) Alstom 588 15,655 0.13Andritz 199 8,399 0.07CNH Industrial 2,538 19,035 0.16
70

UBS ETF - MSCI Europe ex UK UCITS ETF Semi-Annual Report as of 30 June 2014 Schedule of Investments as at 30 June 2014 (Expressed in EUR) (Unaudited)
The accompanying notes form an integral part of these financial statements.
Transferable securities listed on an Official Stock Exchange
Quantity Market
Value EUR % of
Net Assets Machinery - Diversified (0.88%) (continued) Hexagon - Class B 694 16,332 0.13Kone - Class B 863 26,304 0.21MAN 99 8,935 0.07Metso 315 8,716 0.07Zardoya Otis 409 5,317 0.04 Media (0.84%) Axel Springer 111 4,989 0.04Kabel Deutschland Holding 56 5,989 0.05Lagardere 323 7,683 0.06ProSiebenSat.1 Media - Registered 593 19,293 0.16Reed Elsevier 1,894 31,724 0.26RTL Group 100 8,124 0.07Sky Deutschland 1,185 7,973 0.06Wolters Kluwer 825 17,837 0.14 Metal Fabricate & Hardware (0.68%) Assa Abloy - Class B 901 33,468 0.27SKF - Class B 1,051 19,578 0.16Tenaris 1,281 22,033 0.17Vallourec 301 9,844 0.08 Mining (0.26%) Boliden 721 7,637 0.06Norsk Hydro 3,653 14,274 0.12Umicore 304 10,315 0.08 Miscellaneous Manufacturers (2.08%) Alfa Laval 867 16,311 0.13Orkla 2,170 14,115 0.11Siemens - Registered 2,150 207,368 1.67Sulzer - Registered 61 6,250 0.05Wartsila 400 14,488 0.12 Oil & Gas (5.31%) Eni 6,844 136,743 1.10Galp Energia 1,081 14,464 0.12Lundin Petroleum 607 8,966 0.07Neste Oil 353 5,030 0.04OMV 407 13,431 0.11Repsol 2,420 46,609 0.37Seadrill 1,018 29,480 0.24Statoil 3,015 67,610 0.54Total 5,776 304,857 2.46Transocean 981 32,206 0.26 Oil & Gas Services (0.45%) Fugro - CVA 209 8,740 0.07Saipem 716 14,105 0.12Subsea 7 762 10,376 0.08Technip 279 22,289 0.18 Other Finance (0.67%) Groupe Bruxelles Lambert 226 17,151 0.14Exor 260 7,797 0.06Investment Kinnevik - Class B 633 19,696 0.16Investor - Class B 1,221 33,442 0.27Pargesa Holding 82 5,379 0.04 Pharmaceuticals & Biotechnology (12.75%) Actelion - Registered 278 25,690 0.21Bayer - Registered 2,238 230,850 1.86Celesio 129 3,354 0.03Grifols 413 16,485 0.13Merck 354 22,440 0.18Novartis - Registered 6,231 412,094 3.32Novo Nordisk - Class B 5,395 181,346 1.46Orion - Class B 272 7,406 0.06Roche Holding 1,905 414,996 3.34Sanofi 3,214 249,342 2.01
71

UBS ETF - MSCI Europe ex UK UCITS ETF Semi-Annual Report as of 30 June 2014 Schedule of Investments as at 30 June 2014 (Expressed in EUR) (Unaudited)
The accompanying notes form an integral part of these financial statements.
Transferable securities listed on an Official Stock Exchange
Quantity Market
Value EUR % of
Net Assets Pharmaceuticals & Biotechnology (12.75%) (continued) UCB 308 19,044 0.15 Private Equity (0.05%) Eurazeo 101 6,136 0.05 Real Estate (0.22%) Deutsche Wohnen 758 11,938 0.10IMMOFINANZ 2,558 6,600 0.05Swiss Prime Site - Registered 150 9,080 0.07 Real Estate Investment Trusts (0.75%) Corio 197 7,348 0.06Fonciere Des Regions 62 4,909 0.04Gecina 51 5,432 0.05ICADE 98 7,673 0.06Klepierre 269 10,011 0.08Unibail-Rodamco 270 57,361 0.46 Retail (2.86%) Compagnie Financiere Richemont - Registered 1,415 108,442 0.87Hennes & Mauritz - Class B 2,568 81,922 0.66Inditex 589 66,203 0.53Kering 205 32,831 0.27Pandora 316 17,696 0.14Swatch Group 83 36,607 0.30Swatch Group - Registered 136 11,033 0.09 Semiconductors (0.85%) ASML Holding 969 65,901 0.53Infineon Technologies 3,099 28,291 0.23STMicroelectronics 1,746 11,440 0.09 Software (1.52%) Amadeus IT Holding - Class A 1,031 31,054 0.25Dassault Systemes 175 16,443 0.13SAP 2,503 141,169 1.14 Telecommunications (6.38%) Alcatel-Lucent 7,589 19,792 0.16Altice 165 8,395 0.07Belgacom 422 10,227 0.08Deutsche Telekom - Registered 8,452 108,186 0.87Elisa 394 8,802 0.07Eutelsat Communications 408 10,353 0.08Koninklijke KPN 8,690 23,124 0.19Millicom International Cellular 179 11,968 0.10Nokia 10,125 55,991 0.45Orange 5,005 57,683 0.46SES 822 22,769 0.18Swisscom - Registered 64 27,173 0.22TDC 2,170 16,402 0.13Tele2 - Class B 841 7,231 0.06Telecom Italia 27,208 25,167 0.20Telecom Italia - Rsp 16,005 11,548 0.09Telefonaktiebolaget LM Ericsson - Class B 8,229 72,596 0.59Telefonica 11,091 138,859 1.12Telefonica Deutschland Holding 717 4,330 0.04Telekom Austria 616 4,398 0.04Telenet Group Holding 145 6,035 0.05Telenor 2,051 34,104 0.27TeliaSonera 6,606 35,227 0.28Vivendi 3,254 58,149 0.47Ziggo 413 13,947 0.11 Transportation (1.36%) AP Moeller - Maersk - Class A 8 13,746 0.11AP Moeller - Maersk - Class B 18 32,667 0.26Deutsche Post - Registered 2,624 69,300 0.56DSV 505 12,023 0.10Groupe Eurotunnel - Registered 1,253 12,376 0.10
72

UBS ETF - MSCI Europe ex UK UCITS ETF Semi-Annual Report as of 30 June 2014 Schedule of Investments as at 30 June 2014 (Expressed in EUR) (Unaudited)
The accompanying notes form an integral part of these financial statements.
Transferable securities listed on an Official Stock Exchange
Quantity Market
Value EUR % of
Net Assets Transportation (1.36%) (continued) Koninklijke Vopak 193 6,890 0.06Kuehne + Nagel International - Registered 139 13,509 0.11TNT Express 1,195 7,899 0.06 Water (0.21%) Suez Environnement 776 10,849 0.09Veolia Environnement 1,127 15,682 0.12
_______________________________________________________________________________________________________________ ____________________________________________________________
Total Common Stocks 12,223,776 98.48 _______________________________________________________________________________________________________________ ____________________________________________________________
Preferred Stocks Auto Manufacturers (1.01%) Bayerische Motoren Werke 130 9,101 0.08Porsche Automobil Holding 410 31,197 0.25Volkswagen 442 84,776 0.68 Household Products (0.33%) Henkel & Co 487 41,117 0.33 Oil & Gas (0.05%) Fuchs Petrolub 195 6,439 0.05
_______________________________________________________________________________________________________________ ____________________________________________________________
Total Preferred Stocks 172,630 1.39 _______________________________________________________________________________________________________________ ____________________________________________________________
TOTAL INVESTMENTS (Cost EUR 12,584,394) 12,396,406 99.87Other net assets 15,768 0.13
_______________________________________________________________________________________________________________ ____________________________________________________________
TOTAL NET ASSETS 12,412,174 100.00 _______________________________________________________________________________________________________________ ____________________________________________________________ _______________________________________________________________________________________________________________ ____________________________________________________________
73

UBS ETF - MSCI EMU UCITS ETF Semi-Annual Report as of 30 June 2014 Schedule of Investments as at 30 June 2014 (Expressed in EUR) (Unaudited)
The accompanying notes form an integral part of these financial statements.
Transferable securities listed on an Official Stock Exchange
Quantity Market
Value EUR % of
Net AssetsCommon Stocks Advertising (0.42%) JCDecaux 26,909 733,270 0.05Publicis Groupe 78,158 4,841,107 0.37 Aerospace & Defense (1.68%) Airbus Group 246,820 12,079,371 0.91Finmeccanica 164,174 1,140,188 0.09Safran 116,500 5,570,448 0.42Thales 38,199 1,687,441 0.13Zodiac Aerospace 71,345 1,763,648 0.13 Airlines (0.30%) Deutsche Lufthansa - Registered 96,727 1,516,680 0.11International Consolidated Airlines Group 418,697 1,938,986 0.15Ryanair Holdings 73,196 505,784 0.04 Apparel (2.10%) adidas 88,199 6,524,080 0.49Christian Dior 22,984 3,339,575 0.25Hugo Boss 13,134 1,433,576 0.11LVMH Moet Hennessy Louis Vuitton 117,191 16,500,493 1.25 Auto Manufacturers (3.99%) Bayerische Motoren Werke 138,516 12,829,352 0.97Daimler - Registered 404,851 27,691,808 2.09Fiat 363,298 2,619,379 0.20Peugeot 170,504 1,840,591 0.14Renault 82,228 5,429,515 0.41Volkswagen 12,603 2,379,446 0.18 Auto Parts & Equipment (1.55%) Compagnie Generale des Etablissements Michelin 78,962 6,890,224 0.52Continental 47,028 7,954,786 0.60Nokian Renkaat 47,769 1,361,416 0.10Pirelli & C. 100,255 1,174,989 0.09Valeo 31,599 3,099,546 0.24 Banks (13.37%) Banca Monte dei Paschi di Siena 1,698,348 2,403,162 0.18Banco Bilbao Vizcaya Argentaria 2,501,819 23,289,433 1.76Banco de Sabadell 1,443,556 3,597,342 0.27Banco Espirito Santo - Registered 1,132,444 681,731 0.05Banco Popolare 152,389 1,833,240 0.14Banco Popular Espanol 715,271 3,490,522 0.26Banco Santander 4,964,157 37,876,518 2.86Bank of Ireland 9,804,638 2,421,746 0.18Bankia 1,930,355 2,733,383 0.21BNP Paribas 445,283 22,061,546 1.67CaixaBank 740,562 3,337,713 0.25Commerzbank 411,263 4,721,299 0.36Credit Agricole 446,680 4,600,804 0.35Deutsche Bank - Registered 577,650 14,842,717 1.12Erste Group Bank 113,529 2,681,555 0.20Intesa Sanpaolo 4,955,811 11,180,310 0.85Intesa Sanpaolo - Rsp 328,233 637,428 0.05KBC Groep 106,458 4,231,706 0.32Mediobanca 236,490 1,721,647 0.13Natixis 389,902 1,825,521 0.14Raiffeisen Bank International 49,898 1,163,372 0.09Societe Generale 306,357 11,719,687 0.89UniCredit 1,871,134 11,441,984 0.87Unione di Banche Italiane 356,860 2,255,355 0.17 Beverages (3.35%) Anheuser-Busch InBev 338,344 28,387,062 2.15Heineken 97,237 5,098,136 0.39Heineken Holding 42,647 2,047,696 0.15Pernod Ricard 90,815 7,964,475 0.60Remy Cointreau 11,159 749,773 0.06
74

UBS ETF - MSCI EMU UCITS ETF Semi-Annual Report as of 30 June 2014 Schedule of Investments as at 30 June 2014 (Expressed in EUR) (Unaudited)
The accompanying notes form an integral part of these financial statements.
Transferable securities listed on an Official Stock Exchange
Quantity Market
Value EUR % of
Net Assets Building Materials (1.73%) Compagnie de Saint-Gobain 181,874 7,494,118 0.57CRH 302,191 5,663,059 0.43HeidelbergCement 60,915 3,796,832 0.29Imerys 13,804 849,498 0.06Lafarge 80,369 5,095,395 0.38 Chemicals (6.15%) Air Liquide 144,991 14,296,113 1.08Akzo Nobel 102,430 5,608,043 0.42Arkema 24,868 1,767,617 0.13BASF 386,650 32,876,849 2.49Brenntag 21,774 2,841,507 0.22K+S - Registered 71,150 1,708,667 0.13Koninklijke DSM 71,759 3,816,861 0.29LANXESS 38,097 1,877,992 0.14Linde 78,181 12,141,509 0.92OCI 38,061 1,084,739 0.08Solvay 26,048 3,274,234 0.25 Commercial Services (1.16%) Abertis Infraestructuras 171,816 2,887,368 0.22Atlantia 168,070 3,499,217 0.27Bureau Veritas 92,578 1,876,556 0.14Edenred 85,633 1,896,343 0.14Randstad Holding 54,167 2,144,472 0.16Sodexo 39,222 3,080,888 0.23 Computers (0.59%) AtoS 31,358 1,907,821 0.14Cap Gemini 63,002 3,282,404 0.25Gemalto 34,712 2,627,698 0.20 Cosmetics & Personal Care (1.20%) Beiersdorf 43,914 3,103,402 0.23L'Oreal 101,915 12,826,003 0.97 Diversified Financial Services (0.36%) Deutsche Boerse 83,080 4,708,974 0.36 Electric (5.35%) E.ON 845,915 12,756,398 0.97EDP - Energias de Portugal 983,388 3,603,134 0.27Electricite de France 101,398 2,332,154 0.18Enel 2,802,576 11,922,158 0.90Fortum 188,901 3,704,349 0.28GDF Suez 605,906 12,181,740 0.92Iberdrola 2,140,599 11,950,964 0.90Red Electrica 47,273 3,157,837 0.24RWE 210,039 6,587,873 0.50Terna Rete Elettrica Nazionale 641,777 2,472,125 0.19 Electrical Components & Equipment (1.74%) Legrand 111,836 4,997,392 0.38OSRAM Licht 34,270 1,262,335 0.09Prysmian 86,583 1,428,620 0.11Schneider Electric 222,655 15,307,531 1.16 Electronics (0.85%) Koninklijke Philips 408,273 9,461,727 0.71Rexel 106,297 1,815,553 0.14 Energy - Alternate Sources (0.12%) Enel Green Power 738,861 1,527,965 0.12 Engineering & Construction (1.77%) ACS Actividades de Construccion y Servicios 74,265 2,480,451 0.19Aeroports de Paris 12,707 1,222,668 0.09Bouygues 84,608 2,571,237 0.19Ferrovial 176,337 2,868,121 0.22Fraport Frankfurt Airport Services Worldwide 15,374 793,299 0.06
75

UBS ETF - MSCI EMU UCITS ETF Semi-Annual Report as of 30 June 2014 Schedule of Investments as at 30 June 2014 (Expressed in EUR) (Unaudited)
The accompanying notes form an integral part of these financial statements.
Transferable securities listed on an Official Stock Exchange
Quantity Market
Value EUR % of
Net Assets Engineering & Construction (1.77%) (continued) Hochtief 12,544 792,906 0.06Koninklijke Boskalis Westminster 34,512 1,445,535 0.11Vinci 205,408 11,215,277 0.85 Food (4.66%) Carrefour 263,276 7,092,655 0.54Casino Guichard Perrachon 23,779 2,302,521 0.17Colruyt 33,917 1,258,321 0.10Danone 239,143 12,971,116 0.98Delhaize Group 42,611 2,105,409 0.16Distribuidora Internacional de Alimentacion 258,368 1,737,266 0.13Jeronimo Martins 106,131 1,275,164 0.10Kerry Group - Class A 64,538 3,539,909 0.27Koninklijke Ahold 386,963 5,305,263 0.40Metro 64,138 2,041,513 0.15Unilever - CVA 686,565 21,939,185 1.66 Forest Products & Paper (0.34%) Stora Enso - Class R 235,009 1,670,914 0.13UPM-Kymmene 224,509 2,801,872 0.21 Gas (0.70%) Enagas 86,242 2,026,687 0.15Gas Natural SDG 151,574 3,496,054 0.26Snam 857,192 3,771,645 0.29 Healthcare Products (0.88%) Essilor International 87,517 6,778,191 0.51Luxottica Group 73,377 3,101,646 0.24QIAGEN 99,024 1,752,725 0.13 Healthcare Services (0.79%) Fresenius & Co 53,865 5,865,899 0.44Fresenius Medical Care & Co 94,145 4,621,578 0.35 Holding Companies - Diversified Operations (0.38%) Bollore 2,003 949,422 0.07GEA Group 76,005 2,628,253 0.20Wendel 13,510 1,413,146 0.11 Household Products (0.38%) Henkel & Co 51,283 3,769,300 0.29Societe BIC 11,926 1,191,646 0.09 Insurance (7.33%) Aegon 784,934 5,003,169 0.38Ageas 97,938 2,853,424 0.22Allianz - Registered 192,409 23,416,175 1.77Assicurazioni Generali 491,328 7,866,161 0.59AXA 765,281 13,357,980 1.01CNP Assurances 78,583 1,191,318 0.09Delta Lloyd 80,208 1,487,056 0.11Hannover Rueck 25,487 1,677,300 0.13ING Groep - CVA 1,611,153 16,530,430 1.25Mapfre 405,090 1,179,217 0.09Muenchener Rueckversicherungs - Registered 76,153 12,329,171 0.93Sampo - Class A 187,642 6,933,372 0.52SCOR 65,119 1,635,789 0.12UnipolSai 378,422 888,535 0.07Vienna Insurance Group 15,523 606,794 0.05 Internet (0.29%) Iliad 10,957 2,418,758 0.18United Internet - Registered 45,396 1,460,616 0.11 Iron & Steel (0.78%) ArcelorMittal 424,276 4,594,909 0.35ThyssenKrupp 190,370 4,052,977 0.31Voestalpine 46,335 1,610,373 0.12
76

UBS ETF - MSCI EMU UCITS ETF Semi-Annual Report as of 30 June 2014 Schedule of Investments as at 30 June 2014 (Expressed in EUR) (Unaudited)
The accompanying notes form an integral part of these financial statements.
Transferable securities listed on an Official Stock Exchange
Quantity Market
Value EUR % of
Net Assets Lodging (0.20%) Accor 70,349 2,672,559 0.20 Machinery - Diversified (1.10%) Alstom 90,466 2,408,657 0.18Andritz 31,135 1,314,053 0.10CNH Industrial 397,435 2,980,762 0.23Kone - Class B 130,380 3,973,982 0.30MAN 16,447 1,484,342 0.11Metso 54,283 1,502,011 0.11Zardoya Otis 66,910 869,830 0.07 Media (1.24%) Axel Springer 16,549 743,878 0.06Kabel Deutschland Holding 9,355 1,000,517 0.08Lagardere 46,846 1,114,232 0.08ProSiebenSat.1 Media - Registered 92,462 3,008,251 0.23Reed Elsevier - NL 304,467 5,099,822 0.39RTL Group 16,735 1,359,552 0.10Sky Deutschland 186,830 1,256,992 0.09Wolters Kluwer 129,803 2,806,341 0.21 Metal Fabricate & Hardware (0.37%) Tenaris 199,029 3,423,299 0.26Vallourec 46,876 1,533,079 0.11 Mining (0.13%) Umicore 49,677 1,685,541 0.13 Miscellaneous Manufacturers (2.62%) Siemens - Registered 334,547 32,267,058 2.44Wartsila 66,092 2,393,852 0.18 Oil & Gas (6.14%) Eni 1,071,091 21,400,398 1.62Galp Energia 165,645 2,216,330 0.17Neste Oil 53,818 766,906 0.06OMV 65,906 2,174,898 0.16Repsol 360,557 6,944,328 0.53Total 902,065 47,610,991 3.60 Oil & Gas Services (0.53%) Fugro - CVA 33,427 1,397,750 0.11Saipem 111,030 2,187,291 0.16Technip 42,891 3,426,562 0.26 Other Finance (0.30%) Exor 41,996 1,259,460 0.10Groupe Bruxelles Lambert 34,844 2,644,311 0.20 Pharmaceuticals & Biotechnology (6.48%) Bayer - Registered 347,957 35,891,765 2.72Celesio 23,754 617,604 0.05Grifols 63,233 2,523,945 0.19Merck 54,638 3,463,503 0.26Orion - Class B 40,815 1,111,392 0.08Sanofi 503,235 39,040,971 2.95UCB 48,007 2,968,273 0.23 Private Equity (0.06%) Eurazeo 13,910 845,032 0.06 Real Estate (0.23%) Deutsche Wohnen 124,798 1,965,569 0.15IMMOFINANZ 404,011 1,042,348 0.08 Real Estate Investment Trusts (1.12%) Corio 32,594 1,215,756 0.09Fonciere Des Regions 13,739 1,087,854 0.08Gecina 8,923 950,299 0.07ICADE 14,921 1,168,314 0.09
77

UBS ETF - MSCI EMU UCITS ETF Semi-Annual Report as of 30 June 2014 Schedule of Investments as at 30 June 2014 (Expressed in EUR) (Unaudited)
The accompanying notes form an integral part of these financial statements.
Transferable securities listed on an Official Stock Exchange
Quantity Market
Value EUR % of
Net Assets Real Estate Investment Trusts (1.12%) (continued) Klepierre 40,780 1,517,628 0.12Unibail-Rodamco 41,459 8,807,965 0.67 Retail (1.18%) Inditex 93,433 10,501,869 0.79Kering 31,884 5,106,223 0.39 Semiconductors (1.24%) ASML Holding 152,133 10,346,565 0.78Infineon Technologies 473,118 4,319,094 0.33STMicroelectronics 271,072 1,776,064 0.13 Software (2.24%) Amadeus IT Holding - Class A 164,964 4,968,716 0.38Dassault Systemes 27,089 2,545,282 0.19SAP 390,829 22,042,756 1.67 Telecommunications (6.97%) Alcatel-Lucent 1,175,085 3,064,622 0.23Altice 30,487 1,551,179 0.12Belgacom 64,832 1,571,204 0.12Deutsche Telekom - Registered 1,318,316 16,874,445 1.27Elisa 57,816 1,291,609 0.10Eutelsat Communications 61,090 1,550,159 0.12Koninklijke KPN 1,346,286 3,582,467 0.27Nokia 1,600,060 8,848,332 0.67Orange 790,140 9,106,363 0.69SES 126,615 3,507,235 0.26Telecom Italia 4,240,107 3,922,099 0.30Telecom Italia - Rsp 2,470,931 1,782,777 0.13Telefonica 1,733,683 21,705,711 1.64Telefonica Deutschland Holding 112,899 681,797 0.05Telekom Austria 105,715 754,805 0.06Telenet Group Holding 21,297 886,381 0.07Vivendi 515,446 9,211,020 0.70Ziggo 66,335 2,240,133 0.17 Transportation (1.14%) Deutsche Post - Registered 404,338 10,678,566 0.81Groupe Eurotunnel - Registered 211,621 2,090,181 0.16Koninklijke Vopak 29,807 1,064,110 0.08TNT Express 186,177 1,230,630 0.09 Water (0.30%) Suez Environnement 118,108 1,651,150 0.13Veolia Environnement 164,646 2,291,049 0.17
_______________________________________________________________________________________________________________ ____________________________________________________________
Total Common Stocks 1,294,127,560 97.90 _______________________________________________________________________________________________________________ ____________________________________________________________
Preferred Stocks Auto Manufacturers (1.49%) Bayerische Motoren Werke 24,511 1,716,015 0.13Porsche Automobil Holding 64,156 4,881,630 0.37Volkswagen 68,249 13,090,159 0.99 Household Products (0.49%) Henkel & Co 76,375 6,448,341 0.49 Oil & Gas (0.07%) Fuchs Petrolub 28,912 954,674 0.07
_______________________________________________________________________________________________________________ ____________________________________________________________
Total Preferred Stocks 27,090,819 2.05 _______________________________________________________________________________________________________________ ____________________________________________________________
Rights Oil & Gas (0.02%) Repsol - Rights 360,557 179,197 0.02
78

UBS ETF - MSCI EMU UCITS ETF Semi-Annual Report as of 30 June 2014 Schedule of Investments as at 30 June 2014 (Expressed in EUR) (Unaudited)
The accompanying notes form an integral part of these financial statements.
Transferable securities listed on an Official Stock Exchange
Quantity Market
Value EUR % of
Net Assets
Total Rights 179,197 0.02 _______________________________________________________________________________________________________________ ____________________________________________________________
Transferable securities non-listed on an Official Stock Exchange
Common Stocks
Banks (0.00%) Anglo Irish Bank 22,720 0 0.00CaixaBank 8,512 38,364 0.00 Beverages (0.00%) Anheuser-Busch InBev 5,192 5 0.00
_______________________________________________________________________________________________________________ ____________________________________________________________
Total Common Stocks 38,369 0.00 _______________________________________________________________________________________________________________ ____________________________________________________________
TOTAL INVESTMENTS (Cost EUR 1,167,171,648) 1,321,435,945 99.97Other net assets 452,702 0.03
_______________________________________________________________________________________________________________ ____________________________________________________________
TOTAL NET ASSETS 1,321,888,647 100.00 _______________________________________________________________________________________________________________ ____________________________________________________________ _______________________________________________________________________________________________________________ ____________________________________________________________
79

UBS ETF - MSCI EMU 100% hedged to CHF UCITS ETF Semi-Annual Report as of 30 June 2014 Schedule of Investments as at 30 June 2014 (Expressed in CHF) (Unaudited)
The accompanying notes form an integral part of these financial statements.
Transferable securities listed on an Official Stock Exchange
Quantity Market
Value CHF % of
Net AssetsCommon Stocks Advertising (0.42%) JCDecaux 2,027 67,065 0.06Publicis Groupe 5,634 423,706 0.36 Aerospace & Defense (1.69%) Airbus Group 18,170 1,079,681 0.92Finmeccanica 12,499 105,396 0.09Safran 8,378 486,386 0.41Thales 2,880 154,471 0.13Zodiac Aerospace 5,654 169,700 0.14 Airlines (0.29%) Deutsche Lufthansa - Registered 7,349 139,911 0.12International Consolidated Airlines Group 31,310 176,049 0.15Ryanair Holdings - GB 291 2,429 0.00Ryanair Holdings - IE 3,159 26,504 0.02 Apparel (2.10%) adidas 6,523 585,841 0.49Christian Dior 1,653 291,619 0.25Hugo Boss 994 131,731 0.11LVMH Moet Hennessy Louis Vuitton 8,635 1,476,188 1.25 Auto Manufacturers (3.99%) Bayerische Motoren Werke 10,303 1,158,631 0.98Daimler - Registered 29,838 2,478,008 2.10Fiat 27,557 241,237 0.20Peugeot 11,709 153,468 0.13Renault 5,954 477,339 0.40Volkswagen 914 209,520 0.18 Auto Parts & Equipment (1.54%) Compagnie Generale des Etablissements Michelin 5,738 607,928 0.52Continental 3,417 701,768 0.59Nokian Renkaat 3,381 116,995 0.10Pirelli & C. 7,165 101,958 0.09Valeo 2,393 285,000 0.24 Banks (13.37%) Banca Monte dei Paschi di Siena 132,937 228,391 0.19Banco Bilbao Vizcaya Argentaria 183,120 2,069,739 1.75Banco de Sabadell 106,271 321,543 0.27Banco Espirito Santo - Registered 81,169 59,329 0.05Banco Popolare 11,158 162,978 0.14Banco Popular Espanol 54,646 323,784 0.27Banco Santander 365,896 3,389,682 2.87Bank of Ireland - GB 32,608 9,740 0.01Bank of Ireland - IE 665,036 199,443 0.17Bankia 144,122 247,782 0.21BNP Paribas 32,804 1,973,347 1.67CaixaBank 53,771 294,247 0.25Commerzbank 29,984 417,935 0.35Credit Agricole 32,094 401,364 0.34Deutsche Bank - Registered 42,367 1,321,762 1.12Erste Group Bank 8,579 246,033 0.21Intesa Sanpaolo 360,549 987,598 0.84Intesa Sanpaolo - Rsp 28,066 66,177 0.06KBC Groep 7,896 381,084 0.32Mediobanca 18,116 160,129 0.13Natixis 28,964 164,652 0.14Raiffeisen Bank International 3,738 105,816 0.09Societe Generale 22,333 1,037,318 0.88UniCredit 136,493 1,013,406 0.86Unione di Banche Italiane 27,158 208,397 0.18 Beverages (3.33%) Anheuser-Busch InBev 24,899 2,536,417 2.15Heineken 7,187 457,514 0.39Heineken Holding 3,093 180,316 0.15Pernod Ricard 6,555 697,990 0.59
80

UBS ETF - MSCI EMU 100% hedged to CHF UCITS ETF Semi-Annual Report as of 30 June 2014 Schedule of Investments as at 30 June 2014 (Expressed in CHF) (Unaudited)
The accompanying notes form an integral part of these financial statements.
Transferable securities listed on an Official Stock Exchange
Quantity Market
Value CHF % of
Net Assets Beverages (3.33%) (continued) Remy Cointreau 801 65,345 0.05 Building Materials (1.73%) Compagnie de Saint-Gobain 13,737 687,256 0.58CRH 22,274 506,809 0.43HeidelbergCement 4,403 333,214 0.28Imerys 1,010 75,467 0.06Lafarge 5,760 443,393 0.38 Chemicals (6.12%) Air Liquide 10,563 1,264,565 1.07Akzo Nobel 7,527 500,360 0.42Arkema 1,667 143,866 0.12BASF 28,480 2,940,282 2.49Brenntag 1,621 256,844 0.22K+S - Registered 5,332 155,471 0.13Koninklijke DSM 5,346 345,252 0.29LANXESS 2,841 170,040 0.14Linde 5,743 1,082,897 0.92OCI 2,624 90,800 0.08Solvay 1,873 285,858 0.24 Commercial Services (1.16%) Abertis Infraestructuras 12,254 250,031 0.21Atlantia 12,599 318,488 0.27Bureau Veritas 6,670 164,156 0.14Edenred 6,557 176,302 0.15Randstad Holding 3,953 190,016 0.16Sodexo 2,898 276,389 0.23 Computers (0.59%) AtoS 2,473 182,680 0.15Cap Gemini 4,401 278,398 0.24Gemalto 2,511 230,791 0.20 Cosmetics & Personal Care (1.19%) Beiersdorf 3,175 272,431 0.23L'Oreal 7,406 1,131,654 0.96 Diversified Financial Services (0.35%) Deutsche Boerse 5,980 411,536 0.35 Electric (5.32%) E.ON 62,094 1,136,915 0.96EDP - Energias de Portugal 71,900 319,861 0.27Electricite de France 7,689 214,721 0.18Enel 203,538 1,051,283 0.89Fortum 14,015 333,693 0.28GDF Suez 44,840 1,094,577 0.93Iberdrola 158,454 1,074,107 0.91Red Electrica 3,297 267,407 0.23RWE 15,203 578,964 0.49Terna Rete Elettrica Nazionale 45,431 212,479 0.18 Electrical Components & Equipment (1.73%) Legrand 8,197 444,727 0.38OSRAM Licht 2,881 128,849 0.11Prysmian 5,952 119,240 0.10Schneider Electric 16,135 1,346,848 1.14 Electronics (0.87%) Koninklijke Philips 30,122 847,579 0.72Rexel 8,402 174,240 0.15 Energy - Alternate Sources (0.11%) Enel Green Power 52,476 131,761 0.11 Engineering & Construction (1.73%) ACS Actividades de Construccion y Servicios 5,540 224,664 0.19Aeroports de Paris 850 99,303 0.08
81

UBS ETF - MSCI EMU 100% hedged to CHF UCITS ETF Semi-Annual Report as of 30 June 2014 Schedule of Investments as at 30 June 2014 (Expressed in CHF) (Unaudited)
The accompanying notes form an integral part of these financial statements.
Transferable securities listed on an Official Stock Exchange
Quantity Market
Value CHF % of
Net Assets Engineering & Construction (1.73%) (continued) Bouygues 5,829 215,081 0.18Ferrovial 12,743 251,653 0.21Fraport Frankfurt Airport Services Worldwide 1,077 67,475 0.06Hochtief 688 52,802 0.05Koninklijke Boskalis Westminster 2,773 141,021 0.12Vinci 14,900 987,770 0.84 Food (4.65%) Carrefour 19,041 622,822 0.53Casino Guichard Perrachon 1,738 204,332 0.17Colruyt 2,253 101,487 0.09Danone 17,520 1,153,800 0.98Delhaize Group 3,182 190,894 0.16Distribuidora Internacional de Alimentacion 18,996 155,084 0.13Jeronimo Martins 8,024 117,055 0.10Kerry Group - Class A - GB 231 15,305 0.01Kerry Group - Class A - IE 4,361 290,429 0.25Koninklijke Ahold 28,813 479,626 0.41Metro 5,027 194,278 0.16Unilever - CVA 50,624 1,964,139 1.66 Forest Products & Paper (0.34%) Stora Enso - Class R 16,855 145,504 0.13UPM-Kymmene 16,576 251,172 0.21 Gas (0.69%) Enagas 6,332 180,670 0.15Gas Natural SDG 10,758 301,274 0.26Snam 62,587 334,359 0.28 Healthcare Products (0.86%) Essilor International 6,292 591,680 0.50Luxottica Group 5,175 265,595 0.22QIAGEN 7,491 160,986 0.14 Healthcare Services (0.77%) Fresenius & Co 3,856 509,849 0.43Fresenius Medical Care & Co 6,754 402,560 0.34 Holding Companies - Diversified Operations (0.39%) Bollore 170 97,837 0.08GEA Group 5,692 238,983 0.20Wendel 1,028 130,558 0.11 Household Products (0.37%) Henkel & Co 3,646 325,372 0.28Societe BIC 899 109,066 0.09 Insurance (7.30%) Aegon 57,315 443,565 0.38Ageas 6,900 244,085 0.21Allianz - Registered 14,068 2,078,738 1.76Assicurazioni Generali 36,187 703,430 0.60AXA 55,994 1,186,693 1.00CNP Assurances 5,458 100,464 0.08Delta Lloyd 6,203 139,633 0.12Hannover Rueck 1,916 153,096 0.13ING Groep - CVA 118,841 1,480,439 1.25Mapfre 29,533 104,382 0.09Muenchener Rueckversicherungs - Registered 5,551 1,091,176 0.92Sampo - Class A 13,978 627,099 0.53SCOR 4,803 146,490 0.12UnipolSai 25,859 73,720 0.06Vienna Insurance Group 1,167 55,388 0.05 Internet (0.31%) Iliad 822 220,318 0.19United Internet - Registered 3,676 143,605 0.12
82

UBS ETF - MSCI EMU 100% hedged to CHF UCITS ETF Semi-Annual Report as of 30 June 2014 Schedule of Investments as at 30 June 2014 (Expressed in CHF) (Unaudited)
The accompanying notes form an integral part of these financial statements.
Transferable securities listed on an Official Stock Exchange
Quantity Market
Value CHF % of
Net Assets Iron & Steel (0.76%) ArcelorMittal 30,687 403,515 0.34ThyssenKrupp 14,006 362,049 0.30Voestalpine 3,271 138,030 0.12 Lodging (0.20%) Accor 5,227 241,101 0.20 Machinery - Diversified (1.07%) Alstom 6,856 221,634 0.19Andritz 2,000 102,488 0.09CNH Industrial 29,543 269,025 0.23Kone - Class B 9,694 358,752 0.30MAN 1,042 114,181 0.09Metso 3,554 119,400 0.10Zardoya Otis 5,006 79,015 0.07 Media (1.22%) Axel Springer 1,307 71,332 0.06Kabel Deutschland Holding 679 88,171 0.07Lagardere 3,420 98,766 0.08ProSiebenSat.1 Media - Registered 6,832 269,883 0.23Reed Elsevier 21,811 443,575 0.38RTL Group 1,214 119,747 0.10Sky Deutschland 13,145 107,380 0.09Wolters Kluwer 9,295 243,996 0.21 Metal Fabricate & Hardware (0.38%) Tenaris 14,676 306,488 0.26Vallourec 3,559 141,325 0.12 Mining (0.12%) Umicore 3,410 140,480 0.12 Miscellaneous Manufacturers (2.60%) Siemens - Registered 24,535 2,873,195 2.43Wartsila 4,587 201,722 0.17 Oil & Gas (6.11%) Eni 78,586 1,906,415 1.61Galp Energia 11,654 189,325 0.16Neste Oil 3,734 64,605 0.06OMV 4,434 177,659 0.15Repsol 26,634 622,830 0.53Total 66,202 4,242,455 3.59 Oil & Gas Services (0.52%) Fugro - CVA 2,255 114,487 0.10Saipem 7,970 190,634 0.16Technip 3,194 309,816 0.26 Other Finance (0.29%) Exor 2,969 108,109 0.09Groupe Bruxelles Lambert 2,514 231,647 0.20 Pharmaceuticals & Biotechnology (6.46%) Bayer - Registered 25,599 3,206,041 2.71Celesio 1,761 55,592 0.05Grifols 4,659 225,790 0.19Merck 3,944 303,553 0.26Orion - Class B 2,923 96,639 0.08Sanofi 36,891 3,474,938 2.94UCB 3,569 267,931 0.23 Private Equity (0.07%) Eurazeo 1,135 83,718 0.07 Real Estate (0.23%) Deutsche Wohnen 8,825 168,761 0.14IMMOFINANZ 31,702 99,308 0.09
83

UBS ETF - MSCI EMU 100% hedged to CHF UCITS ETF Semi-Annual Report as of 30 June 2014 Schedule of Investments as at 30 June 2014 (Expressed in CHF) (Unaudited)
The accompanying notes form an integral part of these financial statements.
Transferable securities listed on an Official Stock Exchange
Quantity Market
Value CHF % of
Net Assets Real Estate Investment Trusts (1.07%) Corio 2,083 94,335 0.08Fonciere Des Regions 805 77,391 0.06Gecina 664 85,861 0.07ICADE 1,018 96,780 0.08Klepierre 3,037 137,227 0.12Unibail-Rodamco 3,014 777,458 0.66 Retail (1.17%) Inditex 6,778 925,006 0.78Kering 2,333 453,648 0.39 Semiconductors (1.24%) ASML Holding 11,098 916,420 0.78Infineon Technologies 35,618 394,793 0.33STMicroelectronics 19,481 154,975 0.13 Software (2.22%) Amadeus IT Holding - Class A 11,813 432,008 0.37Dassault Systemes 2,020 230,447 0.19SAP 28,622 1,959,999 1.66 Telecommunications (6.89%) Alcatel-Lucent 84,890 268,807 0.23Altice 1,916 118,364 0.10Belgacom 4,662 137,180 0.11Deutsche Telekom - Registered 96,448 1,498,925 1.27Elisa 4,369 118,507 0.10Eutelsat Communications 4,653 143,356 0.12Koninklijke KPN 97,444 314,831 0.27Nokia 116,050 779,197 0.66Orange 57,340 802,371 0.68SES 9,434 317,287 0.27Telecom Italia 312,707 351,201 0.30Telecom Italia - Rsp 186,292 163,195 0.14Telefonica 126,853 1,928,332 1.63Telefonica Deutschland Holding 8,445 61,922 0.05Telekom Austria 6,499 56,341 0.05Telenet Group Holding 1,586 80,146 0.07Vivendi 37,206 807,262 0.68Ziggo 4,736 194,187 0.16 Transportation (1.13%) Deutsche Post - Registered 29,996 961,853 0.81Groupe Eurotunnel - Registered 15,042 180,388 0.15Koninklijke Vopak 2,119 91,849 0.08TNT Express 13,129 105,368 0.09 Water (0.31%) Suez Environnement 9,080 154,124 0.13Veolia Environnement 12,702 214,601 0.18
_______________________________________________________________________________________________________________ ____________________________________________________________
Total Common Stocks 115,044,607 97.36 _______________________________________________________________________________________________________________ ____________________________________________________________
Preferred Stocks Auto Manufacturers (1.48%) Bayerische Motoren Werke 1,709 145,271 0.12Porsche Automobil Holding 4,736 437,538 0.37Volkswagen 5,007 1,166,012 0.99 Household Products (0.48%) Henkel & Co 5,583 572,323 0.48 Oil & Gas (0.08%) Fuchs Petrolub 2,228 89,324 0.08
_______________________________________________________________________________________________________________ ____________________________________________________________
Total Preferred Stocks 2,410,468 2.04 _______________________________________________________________________________________________________________ ____________________________________________________________
84

UBS ETF - MSCI EMU 100% hedged to CHF UCITS ETF Semi-Annual Report as of 30 June 2014 Schedule of Investments as at 30 June 2014 (Expressed in CHF) (Unaudited)
The accompanying notes form an integral part of these financial statements.
_______________________________________________________________________________________________________________ ____________________________________________________________
Transferable securities listed on an Official Stock Exchange
Quantity Market
Value CHF % of
Net Assets Rights
Oil & Gas (0.01%) Repsol - Rights 26,634 16,072 0.01
_______________________________________________________________________________________________________________ ____________________________________________________________
Total Rights 16,072 0.01 _______________________________________________________________________________________________________________ ____________________________________________________________
Transferable securities non-listed on an Official Stock Exchange
Common Stocks
Banks (0.00%) CaixaBank 618 3,382 0.00
_______________________________________________________________________________________________________________ ____________________________________________________________
Total Common Stocks 3,382 0.00 _______________________________________________________________________________________________________________ ____________________________________________________________
TOTAL INVESTMENTS (Cost CHF 115,746,939) 117,458,457 99.41Other net assets 698,966 0.59
_______________________________________________________________________________________________________________ ____________________________________________________________
TOTAL NET ASSETS 118,157,423 100.00 _______________________________________________________________________________________________________________ ____________________________________________________________ _______________________________________________________________________________________________________________ ____________________________________________________________
Forward Foreign Exchange Contracts
Purchases Sales Maturity Date
Unrealised appreciation/ (depreciation)
CHF % of
Net AssetsCHF 118,968,000 EUR 97,562,019 3 July 2014 512,383 0.43
_______________________________________________________________________________________________________________ ____________________________________________________________
Total Forward Foreign Exchange Contracts 512,383 0.43 _______________________________________________________________________________________________________________ ____________________________________________________________
85

UBS ETF - MSCI EMU 100% hedged to USD UCITS ETF Semi-Annual Report as of 30 June 2014 Schedule of Investments as at 30 June 2014 (Expressed in USD) (Unaudited)
The accompanying notes form an integral part of these financial statements.
Transferable securities listed on an Official Stock Exchange
Quantity Market
Value USD % of
Net AssetsCommon Stocks Advertising (0.42%) JCDecaux 7,092 264,598 0.06Publicis Groupe 19,394 1,644,711 0.36 Aerospace & Defense (1.70%) Airbus Group 63,248 4,238,009 0.92Finmeccanica 41,926 398,664 0.09Safran 28,871 1,890,067 0.41Thales 9,888 598,048 0.13Zodiac Aerospace 19,912 673,929 0.15 Airlines (0.30%) Deutsche Lufthansa - Registered 25,674 551,177 0.12International Consolidated Airlines Group 107,272 680,162 0.15Ryanair Holdings 16,903 159,916 0.03 Apparel (2.12%) adidas 22,554 2,284,180 0.50Christian Dior 5,757 1,145,283 0.25Hugo Boss 3,450 515,578 0.11LVMH Moet Hennessy Louis Vuitton 29,957 5,775,001 1.26 Auto Manufacturers (4.03%) Bayerische Motoren Werke 35,854 4,546,671 0.99Daimler - Registered 103,328 9,676,655 2.11Fiat 92,261 910,761 0.20Peugeot 41,129 607,886 0.13Renault 20,433 1,847,245 0.41Volkswagen 3,291 850,709 0.19 Auto Parts & Equipment (1.55%) Compagnie Generale des Etablissements Michelin 19,735 2,357,781 0.51Continental 11,967 2,771,459 0.61Nokian Renkaat 12,047 470,083 0.10Pirelli & C. 26,185 420,176 0.09Valeo 8,104 1,088,367 0.24 Banks (13.47%) Banca Monte dei Paschi di Siena 464,065 899,055 0.20Banco Bilbao Vizcaya Argentaria 634,382 8,085,465 1.76Banco de Sabadell 365,780 1,248,013 0.27Banco Espirito Santo - Registered 255,028 210,201 0.05Banco Popolare 39,071 643,534 0.14Banco Popular Espanol 189,011 1,262,868 0.28Banco Santander 1,268,861 13,255,305 2.89Bank of Ireland 2,458,186 831,310 0.18Bankia 498,844 967,117 0.21BNP Paribas 113,727 7,714,620 1.68CaixaBank 190,829 1,177,560 0.26Commerzbank 103,687 1,629,736 0.36Credit Agricole 111,063 1,566,238 0.34Deutsche Bank - Registered 148,577 5,226,986 1.14Erste Group Bank 29,969 969,177 0.21Intesa Sanpaolo 1,243,820 3,841,915 0.84Intesa Sanpaolo - Rsp 89,401 237,707 0.05KBC Groep 27,144 1,477,278 0.32Mediobanca 65,129 649,168 0.14Natixis 97,633 625,863 0.14Raiffeisen Bank International 12,514 399,469 0.09Societe Generale 77,480 4,058,158 0.89UniCredit 471,391 3,946,652 0.86Unione di Banche Italiane 89,796 777,008 0.17 Beverages (3.37%) Anheuser-Busch InBev 86,587 9,946,397 2.17Heineken 24,857 1,784,348 0.39Heineken Holding 11,054 726,687 0.16Pernod Ricard 22,969 2,757,991 0.60Remy Cointreau 2,360 217,104 0.05
86

UBS ETF - MSCI EMU 100% hedged to USD UCITS ETF Semi-Annual Report as of 30 June 2014 Schedule of Investments as at 30 June 2014 (Expressed in USD) (Unaudited)
The accompanying notes form an integral part of these financial statements.
Transferable securities listed on an Official Stock Exchange
Quantity Market
Value USD % of
Net Assets Building Materials (1.74%) Compagnie de Saint-Gobain 48,100 2,713,602 0.59CRH 76,652 1,966,728 0.43HeidelbergCement 15,142 1,292,205 0.28Imerys 3,462 291,700 0.06Lafarge 19,858 1,723,756 0.38 Chemicals (6.17%) Air Liquide 36,862 4,976,305 1.09Akzo Nobel 25,416 1,905,208 0.42Arkema 5,803 564,743 0.12BASF 98,615 11,480,645 2.51Brenntag 5,453 974,310 0.21K+S - Registered 18,913 621,862 0.14Koninklijke DSM 18,508 1,347,847 0.29LANXESS 9,560 645,226 0.14Linde 20,031 4,259,172 0.93OCI 9,025 352,163 0.08Solvay 6,436 1,107,650 0.24 Commercial Services (1.17%) Abertis Infraestructuras 41,888 963,772 0.21Atlantia 43,604 1,242,963 0.27Bureau Veritas 24,233 672,531 0.15Edenred 21,484 651,391 0.14Randstad Holding 13,957 756,534 0.17Sodexo 9,753 1,048,903 0.23 Computers (0.60%) AtoS 8,444 703,378 0.15Cap Gemini 15,835 1,129,554 0.25Gemalto 8,668 898,392 0.20 Cosmetics & Personal Care (1.19%) Beiersdorf 10,846 1,049,436 0.23L'Oreal 25,523 4,397,806 0.96 Diversified Financial Services (0.35%) Deutsche Boerse 20,526 1,592,888 0.35 Electric (5.38%) E.ON 214,027 4,418,970 0.97EDP - Energias de Portugal 253,577 1,272,086 0.28Electricite de France 26,274 827,380 0.18Enel 706,549 4,115,200 0.90Fortum 48,394 1,299,332 0.28GDF Suez 155,505 4,280,550 0.93Iberdrola 551,468 4,215,403 0.92Red Electrica 11,767 1,076,201 0.24RWE 52,305 2,246,154 0.49Terna Rete Elettrica Nazionale 166,598 878,632 0.19 Electrical Components & Equipment (1.74%) Legrand 28,207 1,725,718 0.38OSRAM Licht 9,025 455,155 0.10Prysmian 22,385 505,699 0.11Schneider Electric 55,998 5,271,040 1.15 Electronics (0.87%) Koninklijke Philips 103,782 3,293,009 0.72Rexel 29,130 681,208 0.15 Energy - Alternate Sources (0.11%) Enel Green Power 180,819 511,971 0.11 Engineering & Construction (1.75%) ACS Actividades de Construccion y Servicios 18,404 841,608 0.18Aeroports de Paris 3,339 439,879 0.10Bouygues 20,180 839,659 0.18Ferrovial 43,655 972,163 0.21Fraport Frankfurt Airport Services Worldwide 3,928 277,506 0.06
87

UBS ETF - MSCI EMU 100% hedged to USD UCITS ETF Semi-Annual Report as of 30 June 2014 Schedule of Investments as at 30 June 2014 (Expressed in USD) (Unaudited)
The accompanying notes form an integral part of these financial statements.
Transferable securities listed on an Official Stock Exchange
Quantity Market
Value USD % of
Net Assets Engineering & Construction (1.75%) (continued) Hochtief 2,631 227,697 0.05Koninklijke Boskalis Westminster 9,312 534,014 0.12Vinci 51,852 3,876,228 0.85 Food (4.67%) Carrefour 65,642 2,421,199 0.53Casino Guichard Perrachon 6,108 809,767 0.18Colruyt 8,164 414,694 0.09Danone 60,399 4,485,393 0.98Delhaize Group 10,839 733,255 0.16Distribuidora Internacional de Alimentacion 65,004 598,438 0.13Jeronimo Martins 27,068 445,278 0.10Kerry Group - Class A 15,750 1,182,792 0.26Koninklijke Ahold 99,469 1,867,138 0.41Metro 17,312 754,458 0.16Unilever - CVA 175,099 7,660,791 1.67 Forest Products & Paper (0.33%) Stora Enso - Class R 55,963 544,781 0.12UPM-Kymmene 57,384 980,520 0.21 Gas (0.70%) Enagas 22,757 732,207 0.16Gas Natural SDG 37,595 1,187,229 0.26Snam 215,550 1,298,530 0.28 Healthcare Products (0.87%) Essilor International 21,733 2,304,582 0.50Luxottica Group 18,436 1,066,965 0.23QIAGEN 25,818 625,673 0.14 Healthcare Services (0.78%) Fresenius & Co 13,416 2,000,332 0.44Fresenius Medical Care & Co 23,282 1,564,820 0.34 Holding Companies - Diversified Operations (0.40%) Bollore 608 394,578 0.09GEA Group 20,077 950,550 0.21Wendel 3,330 476,900 0.10 Household Products (0.36%) Henkel & Co 12,409 1,248,749 0.27Societe BIC 3,036 415,342 0.09 Insurance (7.35%) Aegon 197,048 1,719,631 0.37Ageas 24,330 970,529 0.21Allianz - Registered 48,741 8,121,498 1.77Assicurazioni Generali 122,909 2,694,177 0.59AXA 193,194 4,617,050 1.01CNP Assurances 19,266 399,891 0.09Delta Lloyd 21,376 542,609 0.12Hannover Rueck 6,407 577,295 0.13ING Groep - CVA 412,950 5,800,908 1.27Mapfre 103,895 414,084 0.09Muenchener Rueckversicherungs - Registered 19,293 4,276,591 0.93Sampo - Class A 47,888 2,422,659 0.53SCOR 16,728 575,327 0.12UnipolSai 95,504 307,023 0.07Vienna Insurance Group 4,236 226,711 0.05 Internet (0.31%) Iliad 2,814 850,503 0.19United Internet - Registered 12,748 561,580 0.12 Iron & Steel (0.78%) ArcelorMittal 108,844 1,613,928 0.35ThyssenKrupp 48,137 1,403,156 0.31
88

UBS ETF - MSCI EMU 100% hedged to USD UCITS ETF Semi-Annual Report as of 30 June 2014 Schedule of Investments as at 30 June 2014 (Expressed in USD) (Unaudited)
The accompanying notes form an integral part of these financial statements.
Transferable securities listed on an Official Stock Exchange
Quantity Market
Value USD % of
Net Assets Iron & Steel (0.78%) (continued) Voestalpine 11,929 567,639 0.12 Lodging (0.21%) Accor 18,789 977,291 0.21 Machinery - Diversified (1.08%) Alstom 22,861 833,366 0.18Andritz 7,528 435,005 0.10CNH Industrial 100,556 1,032,572 0.23Kone - Class B 33,436 1,395,341 0.30MAN 3,923 484,749 0.11Metso 12,217 462,834 0.10Zardoya Otis 16,465 293,060 0.06 Media (1.22%) Axel Springer 4,435 272,945 0.06Kabel Deutschland Holding 2,215 324,344 0.07Lagardere 12,409 404,102 0.09ProSiebenSat.1 Media - Registered 23,340 1,039,687 0.23Reed Elsevier 74,755 1,714,377 0.37RTL Group 4,087 454,596 0.10Sky Deutschland 45,611 420,152 0.09Wolters Kluwer 33,063 978,699 0.21 Metal Fabricate & Hardware (0.38%) Tenaris 51,087 1,203,067 0.26Vallourec 11,901 532,904 0.12 Mining (0.12%) Umicore 11,708 543,898 0.12 Miscellaneous Manufacturers (2.63%) Siemens - Registered 85,128 11,241,539 2.46Wartsila 15,786 782,838 0.17 Oil & Gas (6.15%) Eni 271,665 7,431,565 1.62Galp Energia 41,955 768,583 0.17Neste Oil 13,414 261,712 0.06OMV 15,816 714,598 0.16Repsol 92,709 2,444,721 0.53Total 228,728 16,528,744 3.61 Oil & Gas Services (0.53%) Fugro - CVA 8,132 465,565 0.10Saipem 29,024 782,843 0.17Technip 10,963 1,199,149 0.26 Other Finance (0.29%) Exor 10,349 424,938 0.09Groupe Bruxelles Lambert 8,665 900,335 0.20 Pharmaceuticals & Biotechnology (6.51%) Bayer - Registered 88,753 12,534,396 2.74Celesio 5,617 199,953 0.04Grifols 16,609 907,676 0.20Merck 13,894 1,205,866 0.26Orion - Class B 10,876 405,478 0.09Sanofi 127,509 13,543,838 2.96UCB 11,951 1,011,707 0.22 Private Equity (0.08%) Eurazeo 4,156 345,679 0.08 Real Estate (0.21%) Deutsche Wohnen 30,694 661,889 0.14IMMOFINANZ 91,072 321,704 0.07 Real Estate Investment Trusts (1.10%) Corio 7,284 371,989 0.08
89

UBS ETF - MSCI EMU 100% hedged to USD UCITS ETF Semi-Annual Report as of 30 June 2014 Schedule of Investments as at 30 June 2014 (Expressed in USD) (Unaudited)
The accompanying notes form an integral part of these financial statements.
Transferable securities listed on an Official Stock Exchange
Quantity Market
Value USD % of
Net Assets Real Estate Investment Trusts (1.10%) (continued) Fonciere Des Regions 3,167 343,332 0.07Gecina 2,060 300,378 0.07ICADE 3,893 417,347 0.09Klepierre 10,884 554,572 0.12Unibail-Rodamco 10,539 3,065,542 0.67 Retail (1.17%) Inditex 23,313 3,587,696 0.78Kering 8,023 1,759,198 0.39 Semiconductors (1.25%) ASML Holding 38,361 3,572,020 0.78Infineon Technologies 121,893 1,523,537 0.33STMicroelectronics 68,391 613,513 0.14 Software (2.24%) Amadeus IT Holding - Class A 40,835 1,683,987 0.37Dassault Systemes 6,987 898,845 0.20SAP 99,146 7,656,062 1.67 Telecommunications (6.96%) Alcatel-Lucent 302,772 1,081,121 0.24Altice 6,814 474,680 0.10Belgacom 17,486 580,209 0.13Deutsche Telekom - Registered 333,000 5,835,866 1.27Elisa 15,516 474,585 0.10Eutelsat Communications 15,739 546,807 0.12Koninklijke KPN 344,412 1,254,799 0.27Nokia 404,402 3,061,890 0.67Orange 197,143 3,110,810 0.68SES 32,719 1,240,883 0.27Telecom Italia 1,071,417 1,356,911 0.30Telecom Italia - Rsp 656,174 648,196 0.14Telefonica 439,331 7,530,907 1.64Telefonica Deutschland Holding 29,235 241,724 0.05Telekom Austria 22,244 217,452 0.05Telenet Group Holding 5,598 318,997 0.07Vivendi 128,269 3,138,321 0.69Ziggo 16,426 759,476 0.17 Transportation (1.14%) Deutsche Post - Registered 103,189 3,731,238 0.82Groupe Eurotunnel - Registered 50,268 679,779 0.15Koninklijke Vopak 7,873 384,822 0.08TNT Express 47,453 429,453 0.09 Water (0.30%) Suez Environnement 28,705 549,434 0.12Veolia Environnement 43,866 835,723 0.18
_______________________________________________________________________________________________________________ ____________________________________________________________
Total Common Stocks 449,524,420 98.15 _______________________________________________________________________________________________________________ ____________________________________________________________
Preferred Stocks Auto Manufacturers (1.48%) Bayerische Motoren Werke 5,313 509,273 0.11Porsche Automobil Holding 16,223 1,690,090 0.37Volkswagen 17,463 4,585,837 1.00 Household Products (0.49%) Henkel & Co 19,361 2,238,081 0.49 Oil & Gas (0.08%) Fuchs Petrolub 7,911 357,651 0.08
_______________________________________________________________________________________________________________ ____________________________________________________________
Total Preferred Stocks 9,380,932 2.05 _______________________________________________________________________________________________________________ ____________________________________________________________
Rights Oil & Gas (0.01%) Repsol - Rights 92,709 63,086 0.01
90

UBS ETF - MSCI EMU 100% hedged to USD UCITS ETF Semi-Annual Report as of 30 June 2014 Schedule of Investments as at 30 June 2014 (Expressed in USD) (Unaudited)
The accompanying notes form an integral part of these financial statements.
Transferable securities listed on an Official Stock Exchange
Quantity Market
Value USD % of
Net Assets
Total Rights 63,086 0.01
Transferable securities non-listed on an Official Stock Exchange
Common Stocks
Banks (0.00%) CaixaBank 1,948 12,021 0.00
_______________________________________________________________________________________________________________ ____________________________________________________________
Total Common Stocks 12,021 0.00 _______________________________________________________________________________________________________________ ____________________________________________________________
TOTAL INVESTMENTS (Cost USD 447,902,360) 458,917,373 100.21Other net assets (939,059) (0.21)
_______________________________________________________________________________________________________________ ____________________________________________________________
TOTAL NET ASSETS 457,978,314 100.00 _______________________________________________________________________________________________________________ ____________________________________________________________ _______________________________________________________________________________________________________________ ____________________________________________________________
Forward Foreign Exchange Contracts
Purchases Sales Maturity Date
Unrealised appreciation/ (depreciation)
USD % of
Net AssetsUSD 459,949,000 EUR 337,203,165 3 July 2014 (1,734,554) (0.38)
_______________________________________________________________________________________________________________ ____________________________________________________________
Total Forward Foreign Exchange Contracts (1,734,554) (0.38) _______________________________________________________________________________________________________________ ____________________________________________________________ _______________________________________________________________________________________________________________ ____________________________________________________________
91

UBS ETF - MSCI EMU 100% hedged to GBP UCITS ETF Semi-Annual Report as of 30 June 2014 Schedule of Investments as at 30 June 2014 (Expressed in GBP) (Unaudited)
The accompanying notes form an integral part of these financial statements.
Transferable securities listed on an Official Stock Exchange
Quantity Market
Value GBP % of
Net AssetsCommon Stocks Advertising (0.42%) JCDecaux 3,524 76,895 0.06Publicis Groupe 8,891 440,976 0.36 Aerospace & Defense (1.67%) Airbus Group 28,891 1,132,192 0.91Finmeccanica 19,606 109,032 0.09Safran 13,158 503,787 0.40Thales 4,584 162,149 0.13Zodiac Aerospace 8,973 177,615 0.14 Airlines (0.29%) Deutsche Lufthansa - Registered 11,728 147,253 0.12International Consolidated Airlines Group 50,146 185,954 0.15Ryanair Holdings 6,014 33,276 0.02 Apparel (2.08%) adidas 10,224 605,578 0.49Christian Dior 2,655 308,904 0.25Hugo Boss 1,549 135,384 0.11LVMH Moet Hennessy Louis Vuitton 13,661 1,540,205 1.23 Auto Manufacturers (3.95%) Bayerische Motoren Werke 16,340 1,211,854 0.97Daimler - Registered 47,313 2,591,373 2.08Fiat 42,335 244,415 0.20Peugeot 19,202 165,982 0.13Renault 9,347 494,205 0.40Volkswagen 1,412 213,467 0.17 Auto Parts & Equipment (1.52%) Compagnie Generale des Etablissements Michelin 9,055 632,699 0.51Continental 5,442 737,096 0.59Nokian Renkaat 5,510 125,745 0.10Pirelli & C. 11,883 111,519 0.09Valeo 3,673 288,495 0.23 Banks (13.23%) Banca Monte dei Paschi di Siena 209,802 237,717 0.19Banco Bilbao Vizcaya Argentaria 289,456 2,157,640 1.73Banco de Sabadell 166,147 331,538 0.27Banco Espirito Santo - Registered 123,710 59,634 0.05Banco Popolare 17,598 169,521 0.14Banco Popular Espanol 85,430 333,829 0.27Banco Santander 579,359 3,539,694 2.84Bank of Ireland 1,125,168 222,540 0.18Bankia 224,388 254,423 0.20BNP Paribas 51,863 2,057,552 1.65CaixaBank 86,356 311,655 0.25Commerzbank 47,186 433,759 0.35Credit Agricole 50,977 420,441 0.34Deutsche Bank - Registered 67,765 1,394,272 1.12Erste Group Bank 13,536 256,014 0.20Intesa Sanpaolo 571,868 1,033,066 0.83Intesa Sanpaolo - Rsp 46,553 72,392 0.06KBC Groep 12,350 393,095 0.31Mediobanca 29,374 171,233 0.14Natixis 45,850 171,895 0.14Raiffeisen Bank International 5,436 101,486 0.08Societe Generale 35,476 1,086,716 0.87UniCredit 217,253 1,063,789 0.85Unione di Banche Italiane 41,278 208,896 0.17 Beverages (3.30%) Anheuser-Busch InBev 39,493 2,653,234 2.13Heineken 11,405 478,816 0.38Heineken Holding 4,977 191,354 0.15Pernod Ricard 10,464 734,836 0.59Remy Cointreau 1,080 58,106 0.05
92

UBS ETF - MSCI EMU 100% hedged to GBP UCITS ETF Semi-Annual Report as of 30 June 2014 Schedule of Investments as at 30 June 2014 (Expressed in GBP) (Unaudited)
The accompanying notes form an integral part of these financial statements.
Transferable securities listed on an Official Stock Exchange
Quantity Market
Value GBP % of
Net Assets Building Materials (1.71%) Compagnie de Saint-Gobain 21,941 723,935 0.58CRH 35,006 525,298 0.42HeidelbergCement 6,934 346,078 0.28Imerys 1,560 76,873 0.06Lafarge 9,118 462,895 0.37 Chemicals (6.06%) Air Liquide 16,814 1,327,521 1.06Akzo Nobel 11,664 511,358 0.41Arkema 2,808 159,822 0.13BASF 45,011 3,064,674 2.46Brenntag 2,486 259,780 0.21K+S - Registered 8,604 165,454 0.13Koninklijke DSM 8,396 357,599 0.29LANXESS 4,535 179,008 0.14Linde 9,105 1,132,256 0.91OCI 4,417 100,801 0.08Solvay 2,918 293,707 0.24 Commercial Services (1.16%) Abertis Infraestructuras 20,430 274,916 0.22Atlantia 19,684 328,162 0.26Bureau Veritas 10,573 171,611 0.14Edenred 10,257 181,882 0.15Randstad Holding 6,283 199,180 0.16Sodexo 4,583 288,263 0.23 Computers (0.58%) AtoS 3,937 191,800 0.15Cap Gemini 7,153 298,414 0.24Gemalto 3,885 235,494 0.19 Cosmetics & Personal Care (1.18%) Beiersdorf 5,101 288,658 0.23L'Oreal 11,737 1,182,779 0.95 Diversified Financial Services (0.34%) Deutsche Boerse 9,365 425,041 0.34 Electric (5.25%) E.ON 98,652 1,191,244 0.96EDP - Energias de Portugal 114,182 335,001 0.27Electricite de France 11,838 218,022 0.17Enel 322,970 1,100,153 0.88Fortum 21,893 343,776 0.28GDF Suez 70,407 1,133,479 0.91Iberdrola 249,620 1,115,939 0.89Red Electrica 5,295 283,228 0.23RWE 23,875 599,628 0.48Terna Rete Elettrica Nazionale 71,776 221,390 0.18 Electrical Components & Equipment (1.71%) Legrand 12,896 461,435 0.37OSRAM Licht 4,337 127,922 0.10Prysmian 9,730 128,555 0.11Schneider Electric 25,578 1,408,097 1.13 Electronics (0.84%) Koninklijke Philips 47,308 877,905 0.70Rexel 12,759 174,501 0.14 Energy - Alternate Sources (0.11%) Enel Green Power 84,086 139,241 0.11 Engineering & Construction (1.71%) ACS Actividades de Construccion y Servicios 8,627 230,728 0.19Aeroports de Paris 1,368 105,401 0.08Bouygues 9,202 223,927 0.18Ferrovial 19,547 254,582 0.20Fraport Frankfurt Airport Services Worldwide 1,679 69,373 0.06
108

UBS ETF - MSCI EMU 100% hedged to GBP UCITS ETF Semi-Annual Report as of 30 June 2014 Schedule of Investments as at 30 June 2014 (Expressed in GBP) (Unaudited)
The accompanying notes form an integral part of these financial statements.
Transferable securities listed on an Official Stock Exchange
Quantity Market
Value GBP % of
Net Assets Engineering & Construction (1.71%) (continued) Hochtief 1,316 66,609 0.05Koninklijke Boskalis Westminster 4,373 146,667 0.12Vinci 23,676 1,035,129 0.83 Food (4.58%) Carrefour 29,883 644,637 0.52Casino Guichard Perrachon 2,759 213,922 0.17Colruyt 3,510 104,274 0.08Danone 27,562 1,197,082 0.96Delhaize Group 5,053 199,920 0.16Distribuidora Internacional de Alimentacion 30,835 166,022 0.13Jeronimo Martins 12,163 117,019 0.10Kerry Group - Class A 7,429 326,287 0.26Koninklijke Ahold 45,687 501,561 0.40Metro 7,874 200,690 0.16Unilever - CVA 79,797 2,041,826 1.64 Forest Products & Paper (0.33%) Stora Enso - Class R 26,728 152,170 0.12UPM-Kymmene 25,719 257,017 0.21 Gas (0.69%) Enagas 10,029 188,720 0.15Gas Natural SDG 17,591 324,891 0.26Snam 98,691 347,715 0.28 Healthcare Products (0.86%) Essilor International 10,079 625,075 0.50Luxottica Group 8,281 280,291 0.23QIAGEN 11,751 166,549 0.13 Healthcare Services (0.76%) Fresenius & Co 6,084 530,531 0.43Fresenius Medical Care & Co 10,536 414,154 0.33 Holding Companies - Diversified Operations (0.38%) Bollore 272 103,238 0.08GEA Group 8,821 244,251 0.20Wendel 1,456 121,951 0.10 Household Products (0.36%) Henkel & Co 5,728 337,119 0.27Societe BIC 1,437 114,975 0.09 Insurance (7.21%) Aegon 89,649 457,563 0.37Ageas 10,890 254,060 0.20Allianz - Registered 22,308 2,173,925 1.74Assicurazioni Generali 57,140 732,529 0.59AXA 89,174 1,246,383 1.00CNP Assurances 8,299 100,744 0.08Delta Lloyd 9,989 148,295 0.12Hannover Rueck 2,969 156,457 0.13ING Groep - CVA 188,172 1,545,951 1.24Mapfre 42,967 100,155 0.08Muenchener Rueckversicherungs - Registered 8,725 1,131,112 0.91Sampo - Class A 21,838 646,131 0.52SCOR 7,421 149,271 0.12UnipolSai 45,062 84,723 0.07Vienna Insurance Group 1,774 55,528 0.04 Internet (0.30%) Iliad 1,255 221,839 0.18United Internet - Registered 5,709 147,086 0.12 Iron & Steel (0.77%) ArcelorMittal 50,159 434,981 0.35ThyssenKrupp 21,946 374,132 0.30Voestalpine 5,257 146,302 0.12
94

UBS ETF - MSCI EMU 100% hedged to GBP UCITS ETF Semi-Annual Report as of 30 June 2014 Schedule of Investments as at 30 June 2014 (Expressed in GBP) (Unaudited)
The accompanying notes form an integral part of these financial statements.
Transferable securities listed on an Official Stock Exchange
Quantity Market
Value GBP % of
Net Assets Lodging (0.20%) Accor 8,328 253,340 0.20 Machinery - Diversified (1.07%) Alstom 10,551 224,945 0.18Andritz 3,504 118,419 0.10CNH Industrial 45,425 272,803 0.22Kone - Class B 15,259 372,421 0.30MAN 1,801 130,153 0.10Metso 5,598 124,033 0.10Zardoya Otis 8,352 86,942 0.07 Media (1.21%) Axel Springer 2,073 74,614 0.06Kabel Deutschland Holding 1,057 90,521 0.07Lagardere 5,805 110,560 0.09ProSiebenSat.1 Media - Registered 10,626 276,831 0.22Reed Elsevier 35,021 469,718 0.38RTL Group 1,871 121,713 0.10Sky Deutschland 20,297 109,348 0.09Wolters Kluwer 14,866 257,361 0.20 Metal Fabricate & Hardware (0.37%) Tenaris 22,827 314,391 0.25Vallourec 5,456 142,884 0.12 Mining (0.12%) Umicore 5,601 152,175 0.12 Miscellaneous Manufacturers (2.57%) Siemens - Registered 38,833 2,999,139 2.41Wartsila 7,116 206,385 0.16 Oil & Gas (6.04%) Eni 123,988 1,983,666 1.59Galp Energia 19,038 203,972 0.16Neste Oil 6,687 76,302 0.06OMV 7,328 193,639 0.16Repsol 42,167 650,313 0.52Total 104,493 4,416,213 3.55 Oil & Gas Services (0.52%) Fugro - CVA 3,775 126,398 0.10Saipem 12,932 203,998 0.16Technip 4,969 317,874 0.26 Other Finance (0.29%) Exor 4,541 109,049 0.09Groupe Bruxelles Lambert 4,091 248,604 0.20 Pharmaceuticals & Biotechnology (6.39%) Bayer - Registered 40,512 3,346,157 2.69Celesio 2,593 53,985 0.04Grifols 7,328 234,215 0.19Merck 6,374 323,539 0.26Orion - Class B 4,739 103,330 0.08Sanofi 58,358 3,625,297 2.91UCB 5,622 278,345 0.22 Private Equity (0.07%) Eurazeo 1,734 84,351 0.07 Real Estate (0.22%) Deutsche Wohnen 13,996 176,513 0.14IMMOFINANZ 46,600 96,272 0.08 Real Estate Investment Trusts (1.09%) Corio 3,601 107,554 0.09Fonciere Des Regions 1,348 85,467 0.07Gecina 1,025 87,411 0.07ICADE 1,744 109,346 0.09
95

UBS ETF - MSCI EMU 100% hedged to GBP UCITS ETF Semi-Annual Report as of 30 June 2014 Schedule of Investments as at 30 June 2014 (Expressed in GBP) (Unaudited)
The accompanying notes form an integral part of these financial statements.
Transferable securities listed on an Official Stock Exchange
Quantity Market
Value GBP % of
Net Assets Real Estate Investment Trusts (1.09%) (continued) Klepierre 4,846 144,409 0.11Unibail-Rodamco 4,837 822,860 0.66 Retail (1.15%) Inditex 10,732 965,918 0.77Kering 3,693 473,587 0.38 Semiconductors (1.23%) ASML Holding 17,643 960,812 0.77Infineon Technologies 55,937 408,899 0.33STMicroelectronics 31,193 163,653 0.13 Software (2.19%) Amadeus IT Holding - Class A 18,515 446,552 0.36Dassault Systemes 3,166 238,203 0.19SAP 45,246 2,043,397 1.64 Telecommunications (6.81%) Alcatel-Lucent 135,861 283,724 0.23Altice 2,967 120,881 0.10Belgacom 7,266 141,004 0.11Deutsche Telekom - Registered 153,118 1,569,385 1.26Elisa 7,318 130,909 0.10Eutelsat Communications 7,112 144,508 0.12Koninklijke KPN 156,190 332,806 0.27Nokia 182,270 807,112 0.65Orange 90,116 831,642 0.67SES 14,623 324,347 0.26Telecom Italia 487,248 360,899 0.29Telecom Italia - Rsp 294,926 170,389 0.14Telefonica 200,695 2,012,029 1.61Telefonica Deutschland Holding 12,522 60,553 0.05Telekom Austria 11,546 66,012 0.05Telenet Group Holding 2,727 90,883 0.07Vivendi 58,649 839,225 0.67Ziggo 7,280 196,859 0.16 Transportation (1.12%) Deutsche Post - Registered 47,387 1,002,123 0.80Groupe Eurotunnel - Registered 22,791 180,252 0.15Koninklijke Vopak 3,546 101,368 0.08TNT Express 21,634 114,507 0.09 Water (0.31%) Suez Environnement 13,967 156,352 0.13Veolia Environnement 20,306 226,257 0.18
_______________________________________________________________________________________________________________ ____________________________________________________________
Total Common Stocks 120,032,260 96.32 _______________________________________________________________________________________________________________ ____________________________________________________________
Preferred Stocks Auto Manufacturers (1.46%) Bayerische Motoren Werke 2,627 147,270 0.12Porsche Automobil Holding 7,388 450,140 0.36Volkswagen 7,979 1,225,435 0.98 Household Products (0.48%) Henkel & Co 8,744 591,154 0.48 Oil & Gas (0.08%) Fuchs Petrolub 3,709 98,068 0.08
_______________________________________________________________________________________________________________ ____________________________________________________________
Total Preferred Stocks 2,512,067 2.02 _______________________________________________________________________________________________________________ ____________________________________________________________
Rights Oil & Gas (0.01%) Repsol - Rights 41,371 16,464 0.01
96

UBS ETF - MSCI EMU 100% hedged to GBP UCITS ETF Semi-Annual Report as of 30 June 2014 Schedule of Investments as at 30 June 2014 (Expressed in GBP) (Unaudited)
The accompanying notes form an integral part of these financial statements.
Transferable securities listed on an Official Stock Exchange
Quantity Market
Value GBP % of
Net Assets
Total Rights 16,464 0.01 _______________________________________________________________________________________________________________ ____________________________________________________________
Transferable securities non-listed on an Official Stock Exchange
Common Stocks
Banks (0.00%) CaixaBank 937 3,382 0.00
_______________________________________________________________________________________________________________ ____________________________________________________________
Total Common Stocks 3,382 0.00 _______________________________________________________________________________________________________________ ____________________________________________________________
TOTAL INVESTMENTS (Cost GBP 123,985,446) 122,564,173 98.35Other net assets 2,055,555 1.65
_______________________________________________________________________________________________________________ ____________________________________________________________
TOTAL NET ASSETS 124,619,728 100.00 _______________________________________________________________________________________________________________ ____________________________________________________________ _______________________________________________________________________________________________________________ ____________________________________________________________
Forward Foreign Exchange Contracts
Purchases Sales Maturity Date
Unrealisedappreciation/ (depreciation)
GBP % of
Net AssetsGBP 125,414,000 EUR 154,190,744 3 July 2014 1,945,347 1.56
_______________________________________________________________________________________________________________ ____________________________________________________________
Total Forward Foreign Exchange Contracts 1,945,367 1.56 _______________________________________________________________________________________________________________ ____________________________________________________________
97

UBS ETF - MSCI EMU Value UCITS ETF Semi-Annual Report as of 30 June 2014 Schedule of Investments as at 30 June 2014 (Expressed in EUR) (Unaudited)
The accompanying notes form an integral part of these financial statements.
Transferable securities listed on an Official Stock Exchange
Quantity Market
Value EUR % of
Net AssetsCommon Stocks Aerospace & Defense (0.29%) Finmeccanica 8,828 61,311 0.17Thales 979 43,247 0.12 Auto Manufacturers (3.59%) Bayerische Motoren Werke 2,512 232,661 0.65Daimler - Registered 10,331 706,640 1.97Peugeot 8,466 91,391 0.26Renault 2,022 133,513 0.37Volkswagen 645 121,776 0.34 Auto Parts & Equipment (1.10%) Compagnie Generale des Etablissements Michelin 4,018 350,611 0.98Nokian Renkaat 1,475 42,037 0.12 Banks (15.13%) Banco Bilbao Vizcaya Argentaria 63,284 589,111 1.65Banco Popolare 7,706 92,703 0.26Banco Santander 252,061 1,923,225 5.37BNP Paribas 22,776 1,128,437 3.15CaixaBank 38,471 173,389 0.48Credit Agricole 22,549 232,255 0.65Deutsche Bank - Registered 29,549 759,261 2.12Intesa Sanpaolo - Rsp 18,417 35,766 0.10Mediobanca 12,514 91,102 0.26Natixis 7,717 36,131 0.10Raiffeisen Bank International 2,562 59,733 0.17Societe Generale 7,675 293,607 0.82 Building Materials (1.49%) CRH 15,808 296,242 0.83HeidelbergCement 3,057 190,543 0.53Imerys 748 46,032 0.13 Chemicals (6.42%) Akzo Nobel 5,187 283,988 0.79Arkema 629 44,709 0.13BASF 19,762 1,680,363 4.70K+S - Registered 3,740 89,816 0.25Koninklijke DSM 3,724 198,080 0.55 Commercial Services (0.34%) Atlantia 5,791 120,569 0.34 Computers (0.23%) Cap Gemini 1,571 81,849 0.23 Diversified Financial Services (0.33%) Deutsche Boerse 2,104 119,255 0.33 Electric (10.04%) E.ON 42,938 647,505 1.81EDP - Energias de Portugal 48,935 179,298 0.50Electricite de France 5,248 120,704 0.34Enel 141,798 603,209 1.69Fortum 9,714 190,491 0.53GDF Suez 31,072 624,703 1.74Iberdrola 109,369 610,607 1.71Red Electrica 2,355 157,314 0.44RWE 10,595 332,312 0.93Terna Rete Elettrica Nazionale 32,736 126,099 0.35 Electrical Components & Equipment (0.09%) OSRAM Licht 863 31,789 0.09 Electronics (0.27%) Rexel 5,606 95,750 0.27 Energy - Alternate Sources (0.15%) Enel Green Power 26,302 54,393 0.15
98

UBS ETF - MSCI EMU Value UCITS ETF Semi-Annual Report as of 30 June 2014 Schedule of Investments as at 30 June 2014 (Expressed in EUR) (Unaudited)
The accompanying notes form an integral part of these financial statements.
Transferable securities listed on an Official Stock Exchange
Quantity Market
Value EUR % of
Net Assets Engineering & Construction (2.56%) ACS Actividades de Construccion y Servicios 3,805 127,087 0.36Bouygues 4,151 126,149 0.35Ferrovial 5,662 92,092 0.26Vinci 10,436 569,806 1.59 Food (1.08%) Delhaize Group 2,233 110,333 0.31Koninklijke Ahold 20,120 275,845 0.77 Forest Products & Paper (0.51%) Stora Enso - Class R 5,475 38,927 0.11UPM-Kymmene 11,537 143,982 0.40 Gas (1.30%) Enagas 4,162 97,807 0.27Gas Natural SDG 7,515 173,333 0.48Snam 44,399 195,356 0.55 Holding Companies - Diversified Operations (0.12%) Wendel 411 42,990 0.12 Insurance (12.67%) Aegon 39,903 254,342 0.71Ageas 4,771 139,003 0.39Allianz - Registered 9,819 1,194,972 3.34Assicurazioni Generali 25,287 404,845 1.13AXA 39,069 681,949 1.90CNP Assurances 3,747 56,804 0.16Delta Lloyd 4,335 80,371 0.22Hannover Rueck 1,313 86,408 0.24ING Groep - CVA 41,562 426,426 1.19Mapfre 20,442 59,507 0.17Muenchener Rueckversicherungs - Registered 3,874 627,201 1.75Sampo - Class A 9,646 356,420 1.00SCOR 3,322 83,449 0.23UnipolSai 19,572 45,955 0.13Vienna Insurance Group 965 37,722 0.11 Iron & Steel (0.89%) ArcelorMittal 21,664 234,621 0.65Voestalpine 2,456 85,358 0.24 Lodging (0.00%) Accor 21 798 0.00 Machinery - Diversified (0.80%) Alstom 4,674 124,445 0.35CNH Industrial 12,804 96,030 0.27Metso 1,707 47,233 0.13Zardoya Otis 1,392 18,096 0.05 Media (1.28%) Axel Springer 858 38,567 0.11Lagardere 2,436 57,940 0.16ProSiebenSat.1 Media - Registered 4,763 154,964 0.43RTL Group 793 64,424 0.18Wolters Kluwer 6,555 141,719 0.40 Metal Fabricate & Hardware (0.11%) Vallourec 1,180 38,592 0.11 Miscellaneous Manufacturers (4.58%) Siemens - Registered 16,981 1,637,817 4.58 Oil & Gas (11.13%) Eni 54,825 1,095,403 3.06Neste Oil 730 10,403 0.03OMV 3,214 106,062 0.29Repsol 18,578 357,812 1.00
99

UBS ETF - MSCI EMU Value UCITS ETF Semi-Annual Report as of 30 June 2014 Schedule of Investments as at 30 June 2014 (Expressed in EUR) (Unaudited)
The accompanying notes form an integral part of these financial statements.
Transferable securities listed on an Official Stock Exchange
Quantity Market
Value EUR % of
Net Assets Oil & Gas (11.13%) (continued) Total 45,765 2,415,477 6.75 Oil & Gas Services (0.18%) Fugro - CVA 1,517 63,433 0.18 Other Finance (0.37%) Groupe Bruxelles Lambert 1,767 134,098 0.37 Pharmaceuticals & Biotechnology (5.84%) Merck 920 58,319 0.16Orion - Class B 2,153 58,626 0.16Sanofi 25,451 1,974,489 5.52 Private Equity (0.06%) Eurazeo 350 21,262 0.06 Real Estate (0.30%) Deutsche Wohnen 3,293 51,865 0.14IMMOFINANZ 21,817 56,288 0.16 Real Estate Investment Trusts (2.07%) Corio 1,511 56,360 0.16Fonciere Des Regions 600 47,508 0.13Gecina 482 51,333 0.14ICADE 780 61,074 0.17Klepierre 2,165 80,571 0.23Unibail-Rodamco 2,082 442,321 1.24 Retail (0.72%) Kering 1,612 258,162 0.72 Semiconductors (0.13%) STMicroelectronics 6,930 45,405 0.13 Software (0.24%) Amadeus IT Holding - Class A 2,874 86,565 0.24 Telecommunications (9.61%) Belgacom 3,260 79,006 0.22Deutsche Telekom - Registered 66,958 857,062 2.39Elisa 3,068 68,539 0.19Koninklijke KPN 24,494 65,179 0.18Orange 40,157 462,809 1.29Telecom Italia 218,666 202,266 0.57Telecom Italia - Rsp 131,254 94,700 0.27Telefonica 88,115 1,103,200 3.08Telefonica Deutschland Holding 6,058 36,584 0.10Telekom Austria 1,174 8,382 0.02Vivendi 25,941 463,566 1.30 Water (0.57%) Suez Environnement 6,116 85,502 0.24Veolia Environnement 8,631 120,100 0.33
_______________________________________________________________________________________________________________ ____________________________________________________________
Total Common Stocks 34,572,943 96.59
_______________________________________________________________________________________________________________ ____________________________________________________________
Preferred Stocks Auto Manufacturers (2.81%) Bayerische Motoren Werke 1,223 85,622 0.24Porsche Automobil Holding 3,315 252,238 0.70Volkswagen 3,487 668,807 1.87
_______________________________________________________________________________________________________________ ____________________________________________________________
Total Preferred Stocks 1,006,667 2.81
_______________________________________________________________________________________________________________ ____________________________________________________________
Rights Oil & Gas (0.03%) Repsol - Rights 18,578 9,233 0.03
100

UBS ETF - MSCI EMU Value UCITS ETF Semi-Annual Report as of 30 June 2014 Schedule of Investments as at 30 June 2014 (Expressed in EUR) (Unaudited)
The accompanying notes form an integral part of these financial statements.
Transferable securities listed on an Official Stock Exchange
Quantity Market
Value EUR % of
Net Assets
Total Rights 9,233 0.03 _______________________________________________________________________________________________________________ ____________________________________________________________
Transferable securities non-listed on an Official Stock Exchange
Common Stocks
Banks (0.01%) CaixaBank 442 1,992 0.01
_______________________________________________________________________________________________________________ ____________________________________________________________
Total Common Stocks 1,992 0.01 _______________________________________________________________________________________________________________ ____________________________________________________________
TOTAL INVESTMENTS (Cost EUR 30,212,211) 35,590,835 99.44Other net assets 201,921 0.56
_______________________________________________________________________________________________________________ ____________________________________________________________
TOTAL NET ASSETS 35,792,756 100.00 _______________________________________________________________________________________________________________ ____________________________________________________________ _______________________________________________________________________________________________________________ ____________________________________________________________
101

UBS ETF - MSCI EMU Small Cap UCITS ETF Semi-Annual Report as of 30 June 2014 Schedule of Investments as at 30 June 2014 (Expressed in EUR) (Unaudited)
The accompanying notes form an integral part of these financial statements.
Transferable securities listed on an Official Stock Exchange
Quantity Market
Value EUR % of
Net AssetsCommon Stocks Advertising (1.53%) Havas 13,876 83,214 0.44IPSOS 1,844 50,535 0.27Stroeer Media 1,151 18,589 0.10Teleperformance 3,041 136,100 0.72 Aerospace & Defense (1.29%) Carbures Europe 703 23,789 0.12LISI 183 21,045 0.11MTU Aero Engines Holding 2,861 192,231 1.02OHB 318 7,344 0.04 Agriculture (0.21%) KWS Saat 141 36,307 0.19Societa per la Bonifica dei Terreni Ferraresi e Imprese Agricole 83 2,520 0.02 Airlines (0.16%) Aer Lingus Group 8,327 12,074 0.06Air Berlin 675 915 0.01Air France-KLM 1,883 17,327 0.09 Apparel (1.09%) Brunello Cucinelli 1,031 17,115 0.09Geox 3,298 8,898 0.05Gerry Weber International 1,473 52,601 0.28Moncler 5,420 65,636 0.34Tod's 675 62,741 0.33 Auto Parts & Equipment (2.35%) Brembo 1,476 39,350 0.21Compagnie Automotive 2,618 27,489 0.14ElringKlinger 1,761 53,068 0.28Faurecia 3,269 90,094 0.48Grammer 561 22,998 0.12MGI Coutier 46 6,716 0.03Montupet 364 22,652 0.12NORMA Group 1,717 69,375 0.37Plastic Omnium 3,264 74,843 0.40SAF-Holland 2,127 24,503 0.13Sogefi 3,172 12,593 0.07 Banks (5.56%) Aareal Bank 2,637 88,761 0.47Banca Carige 66,878 10,968 0.06Banca Generali 3,100 62,310 0.33Banca Popolare dell'Emilia Romagna 18,107 119,506 0.63Banca Popolare di Milano 226,069 148,075 0.78Banca Popolare di Sondrio 18,979 68,097 0.36Banca Profilo 4,360 1,546 0.01Banco BPI - Registered 19,742 30,185 0.16Banco Comercial Portugues - Class R 702,754 134,156 0.71BANIF - Banco Internacional do Funchal 1,933,936 18,566 0.10Bankinter 37,041 211,689 1.12Comdirect Bank 1,361 10,303 0.05Credito Emiliano 4,871 31,808 0.17Credito Valtellinese 58,990 60,996 0.32Liberbank 79,200 55,361 0.29 Beverages (1.09%) Belvedere 1,645 13,818 0.07C&C Group 19,192 87,228 0.46Davide Campari-Milano 16,335 103,237 0.55Vranken-Pommery Monopole 60 1,623 0.01 Building Materials (2.37%) Bauer 433 8,171 0.04Buzzi Unicem 3,956 48,619 0.26Buzzi Unicem - Rsp 1,946 13,525 0.07Cementir Holding 2,366 12,942 0.07
102

UBS ETF - MSCI EMU Small Cap UCITS ETF Semi-Annual Report as of 30 June 2014 Schedule of Investments as at 30 June 2014 (Expressed in EUR) (Unaudited)
The accompanying notes form an integral part of these financial statements.
Transferable securities listed on an Official Stock Exchange
Quantity Market
Value EUR % of
Net Assets Building Materials (2.37%) (continued) CENTROTEC Sustainable 457 8,306 0.04Italcementi 10,253 70,747 0.38Italmobiliare 313 8,802 0.05Italmobiliare - Rsp 670 13,333 0.07Kingspan Group 7,929 97,130 0.51Tarkett 964 26,703 0.14Vicat 915 58,377 0.31Wienerberger 6,608 80,948 0.43 Chemicals (2.62%) H&R 430 3,072 0.02Kemira 5,646 66,002 0.35Lenzing 484 22,801 0.12SGL Carbon 1,595 38,320 0.20Symrise 6,710 267,025 1.41Tessenderlo Chemie 1,263 26,668 0.14Wacker Chemie 858 72,355 0.38 Commercial Services (3.82%) Altran Technologies 7,135 55,660 0.29Amadeus Fire 262 14,648 0.08Assystem 263 5,889 0.03ASTM 1,750 20,230 0.11Bertrandt 283 32,885 0.17Brunel International 898 19,141 0.10Cegedim 271 6,959 0.04Cramo 1,835 32,608 0.17CTT-Correios de Portugal 5,719 41,520 0.22Evotec 5,395 19,341 0.10GL Events 411 7,221 0.04Groupe Crit 137 6,028 0.03Groupe Steria 1,565 29,939 0.16Hamburger Hafen und Logistik 1,282 24,864 0.13Kapsch TrafficCom 212 7,187 0.04Prosegur Companhia de Seguridad 15,188 79,585 0.42R Stahl 164 6,560 0.04Ramirent 3,043 24,861 0.13Sixt 546 16,246 0.09Societa Iniziative Autostradali e Servizi 3,147 29,519 0.16USG People 3,457 38,407 0.20Wirecard 6,422 202,486 1.07 Computers (3.08%) Alten 1,280 44,422 0.24Bechtle 812 50,807 0.27Bull 4,693 23,136 0.12CANCOM 768 28,750 0.15Econocom Group 3,408 23,600 0.12F-Secure 4,272 10,979 0.06Indra Sistemas 5,641 73,615 0.39Ingenico 2,406 152,901 0.81Sopra Group 402 32,092 0.17Tessi 78 7,800 0.04Tieto 2,960 63,966 0.34Wincor Nixdorf 1,671 69,606 0.37 Cosmetics & Personal Care (0.06%) Interparfums 451 12,105 0.06 Distribution & Wholesale (0.46%) D'ieteren 1,330 40,711 0.21Esprinet 1,292 9,806 0.05Jacquet Metal Service 612 9,437 0.05MARR 2,034 27,744 0.15 Diversified Financial Services (1.81%) ABC Arbitrage 1,686 8,582 0.05Azimut Holding 5,438 102,343 0.54Banca IFIS 1,111 15,087 0.08BinckBank 2,667 24,649 0.13
103

UBS ETF - MSCI EMU Small Cap UCITS ETF Semi-Annual Report as of 30 June 2014 Schedule of Investments as at 30 June 2014 (Expressed in EUR) (Unaudited)
The accompanying notes form an integral part of these financial statements.
Transferable securities listed on an Official Stock Exchange
Quantity Market
Value EUR % of
Net Assets Diversified Financial Services (1.81%) (continued) Bolsas y Mercados Espanoles 4,317 150,555 0.80FFP 381 17,736 0.09MLP 2,536 12,467 0.07Tamburi Investment Partners 4,125 10,271 0.05 Electric (1.62%) A2A 69,202 58,303 0.31ACEA 2,938 31,437 0.16Elia System Operator 1,748 64,501 0.34EVN 2,247 23,998 0.13Hera 32,769 68,159 0.36Iren 27,160 30,636 0.16Redes Energeticas Nacionais 11,020 29,644 0.16 Electrical Components & Equipment (2.69%) Bekaert 2,168 59,154 0.31Gamesa Tecnologica 11,014 100,437 0.53Leoni 1,795 104,325 0.55Mersen 823 18,830 0.10Nexans 1,533 58,683 0.31Saft Groupe 1,553 43,515 0.23SMA Solar Technology 497 13,643 0.07Solarworld 346 5,069 0.03TKH Group 2,041 50,831 0.27Vossloh 480 29,803 0.16Zumtobel 1,448 24,703 0.13 Electronics (0.59%) Austria Technologie & Systemtechnik 1,268 12,428 0.07Barco 651 37,855 0.20Datalogic 1,332 12,268 0.06EVS Broadcast Equipment 810 29,387 0.16LPKF Laser & Electronics 1,277 19,257 0.10 Energy - Alternate Sources (0.53%) Albioma 1,135 21,111 0.11CropEnergies 1,028 5,058 0.03Ence Energia y Celulosa 5,400 10,314 0.05Falck Renewables 5,224 6,791 0.04Nordex 3,491 56,659 0.30 Engineering & Construction (6.07%) Abengoa 1,663 7,841 0.04Abengoa - Class B 22,647 87,236 0.46Acciona 1,436 93,800 0.50Aeroporto di Venezia Marco Polo 531 6,797 0.04Akka Technologies 560 14,566 0.08Arcadis 3,360 84,571 0.45Astaldi 2,569 21,310 0.11Bilfinger 2,525 210,231 1.11Compagnie d'Entreprises 335 25,323 0.13Eiffage 2,141 106,311 0.56Flughafen Wien 626 42,568 0.23Fomento de Construcciones y Contratas 3,467 59,043 0.31Grontmij 4,127 17,948 0.10Koninklijke BAM Groep 12,408 44,396 0.23Mota-Engil 4,953 28,331 0.15Obrascon Huarte Lain 2,122 67,999 0.36Royal Imtech 16,230 11,783 0.06Sacyr 17,762 82,167 0.43Tecnicas Reunidas 1,758 79,418 0.42Trevi Finanziaria Industriale 1,649 10,892 0.06YIT 5,479 46,078 0.24 Entertainment (1.41%) Borussia Dortmund 2,474 11,682 0.06Club Mediterranee 494 9,638 0.05Compagnie des Alpes 605 9,801 0.05Euro Disney - Registered 732 2,906 0.02GTECH 3,884 69,330 0.37
104

UBS ETF - MSCI EMU Small Cap UCITS ETF Semi-Annual Report as of 30 June 2014 Schedule of Investments as at 30 June 2014 (Expressed in EUR) (Unaudited)
The accompanying notes form an integral part of these financial statements.
Transferable securities listed on an Official Stock Exchange
Quantity Market
Value EUR % of
Net Assets Entertainment (1.41%) (continued) Juventus Football Club 5,651 1,275 0.01Kinepolis Group 193 26,769 0.14Paddy Power - GB 42 2,016 0.01Paddy Power - IR 2,429 116,592 0.62Tipp24 321 15,766 0.08 Environmental Control (0.07%) Derichebourg 3,857 8,979 0.05Seche Environnement 180 4,824 0.02 Food (3.89%) Amsterdam Commodities 775 13,109 0.07Atria 622 4,398 0.02Bonduelle 653 13,981 0.08Corbion 3,792 58,397 0.31Deoleo 12,991 5,326 0.03DO & Co 305 14,060 0.08Ebro Foods 4,418 71,682 0.38Glanbia 9,845 108,492 0.57HKScan - Class A 1,504 5,956 0.03Kesko - Class B 3,619 104,481 0.55Koninklijke Wessanen 3,520 15,404 0.08Naturex 287 19,174 0.10Nutreco 3,939 127,131 0.67Pescanova 144 0 0.00Suedzucker 4,376 64,546 0.34Viscofan 2,499 108,806 0.58 Forest Products & Paper (1.68%) Altri 4,906 10,264 0.06Metsa Board 7,732 27,371 0.15Papeles y Cartones de Europa 2,045 8,293 0.04Portucel 9,447 32,318 0.17Semapa-Sociedade de Investimento e Gestao 3,101 32,002 0.17Smurfit Kappa Group 12,363 206,524 1.09 Gas (0.49%) Ascopiave 2,868 5,736 0.03Rubis 1,851 86,229 0.46 Hand & Machine Tools (1.28%) DMG Mori Seiki 3,386 86,106 0.45Industria Macchine Automatiche 589 20,344 0.11Konecranes 2,706 63,808 0.34KUKA 1,609 71,150 0.38 Healthcare Products (1.21%) Carl Zeiss Meditec 1,905 42,672 0.23Carmat 116 8,738 0.05DiaSorin 1,312 40,147 0.21Draegerwerk 145 10,571 0.06Guerbet 276 8,319 0.04Ion Beam Applications 965 11,117 0.06Safilo Group 1,694 27,002 0.14Sartorius Stedim Biotech 250 32,800 0.17Sorin 18,259 39,147 0.21STRATEC Biomedical 201 7,577 0.04 Healthcare Services (2.06%) Espirito Santo Saude 2,938 10,871 0.06Eurofins Scientific 469 105,337 0.56Korian-Medica 1,905 53,149 0.28Orpea 1,926 98,669 0.52Rhoen Klinikum 5,041 121,589 0.64 Holding Companies - Diversified Operations (0.80%) Ackermans & van Haaren 1,316 121,190 0.64CIR - Compagnie Industriali Riunite 20,317 22,349 0.12Cofide 15,921 8,263 0.04
105

UBS ETF - MSCI EMU Small Cap UCITS ETF Semi-Annual Report as of 30 June 2014 Schedule of Investments as at 30 June 2014 (Expressed in EUR) (Unaudited)
The accompanying notes form an integral part of these financial statements.
Transferable securities listed on an Official Stock Exchange
Quantity Market
Value EUR % of
Net Assets Home Builders (0.25%) Caverion 5,475 42,267 0.22Maisons France Confort 131 4,598 0.03 Home Furnishings (1.51%) De'Longhi 2,721 42,992 0.23Indesit 2,149 23,338 0.12Rational 202 47,682 0.25SEB 1,239 80,101 0.43Technicolor - Registered 15,357 90,699 0.48 Insurance (1.98%) April 971 17,361 0.09Euler Hermes Group 697 61,099 0.32FBD Holdings 759 11,499 0.06Grupo Catalana Occidente 2,260 59,913 0.32Mediolanum 11,573 65,156 0.35Societa Cattolica di Assicurazioni 2,331 38,019 0.20Unipol Gruppo Finanziario 10,522 43,435 0.23UNIQA Insurance Group 7,124 66,880 0.35Vittoria Assicurazioni 1,218 11,851 0.06 Internet (0.46%) Engineering 134 6,030 0.03Reply 194 10,922 0.06XING 111 10,045 0.06Yoox 2,700 53,190 0.28zooplus 139 6,140 0.03 Iron & Steel (1.81%) Acerinox 6,457 83,554 0.44AMAG Austria Metall 186 4,501 0.02Aperam - LU 532 13,119 0.07Aperam - NL 2,097 51,691 0.27Outokumpu 10,122 74,346 0.39Rautaruukki 4,216 43,256 0.23Salzgitter 2,065 63,478 0.34Tubos Reunidos 3,720 9,133 0.05 Leisure Time (1.76%) Accell Group 1,075 15,125 0.08Amer Sports 6,696 100,105 0.53Beneteau 1,669 22,223 0.12CTS Eventim 2,345 48,881 0.26IMMSI 10,658 7,141 0.04Piaggio & C. 7,801 20,283 0.11Trigano 476 8,401 0.04TUI 9,003 110,737 0.58 Lodging (0.38%) Melia Hotels International 2,415 21,650 0.11NH Hoteles 9,380 40,569 0.22Pierre & Vacances 297 10,030 0.05 Machinery - Construction & Mining (1.01%) Danieli & C Officine Meccaniche 742 17,177 0.09Danieli & C Officine Meccaniche - Rsp 1,945 31,840 0.17Duro Felguera 4,959 24,150 0.13Manitou BF 619 7,428 0.04Outotec 8,942 68,675 0.36Palfinger 491 13,159 0.07Wacker Neuson 1,612 27,678 0.15 Machinery - Diversified (2.82%) Deutz 5,053 29,403 0.15Duerr 1,407 91,174 0.48Haulotte Group 617 7,867 0.04Heidelberger Druckmaschinen 12,680 33,805 0.18Homag Group 196 4,706 0.02Interpump Group 3,849 38,683 0.20Kendrion 591 14,979 0.08
106

UBS ETF - MSCI EMU Small Cap UCITS ETF Semi-Annual Report as of 30 June 2014 Schedule of Investments as at 30 June 2014 (Expressed in EUR) (Unaudited)
The accompanying notes form an integral part of these financial statements.
Transferable securities listed on an Official Stock Exchange
Quantity Market
Value EUR % of
Net Assets Machinery - Diversified (2.82%) (continued) KION Group 1,111 35,185 0.19Krones 826 59,794 0.32Pfeiffer Vacuum Technology 560 45,097 0.24Rheinmetall 2,153 111,310 0.59Valmet 7,049 61,608 0.33 Media (3.24%) Arnoldo Mondadori Editore 6,078 6,236 0.03Atresmedia de Medios 3,627 37,938 0.20Cairo Communication 1,093 6,864 0.04Gruppo Editoriale L'Espresso 5,655 8,002 0.04Mediaset 38,491 137,028 0.73Mediaset Espana Comunicacion 10,398 88,570 0.47Metropole Television 3,014 44,713 0.24Numericable Group 2,019 87,827 0.46Promotora de Informaciones - Class A 31,794 11,287 0.06RCS MediaGroup 8,581 10,512 0.06Sanoma 4,107 21,480 0.11Societe Television Francaise 1 6,021 72,041 0.38Solocal Group 40,428 29,108 0.15Zon Optimus 10,558 50,678 0.27 Metal Fabricate & Hardware (0.84%) AMG Advanced Metallurgical Group 1,951 13,915 0.07Aurubis 1,860 69,387 0.37Kloeckner & Co 5,153 56,734 0.30Tubacex 3,753 13,680 0.07Viohalco 1,415 5,973 0.03 Mining (0.20%) Eramet 255 22,062 0.12Nyrstar 6,963 15,458 0.08 Miscellaneous Manufacturers (2.06%) Aalberts Industries 5,566 132,721 0.70AGFA-Gevaert 7,597 16,250 0.09Balda 1,964 6,499 0.04Faiveley Transport 398 21,074 0.11Gesco 148 11,417 0.06Indus Holding 1,366 49,504 0.26Jenoptik 2,566 30,548 0.16Koninklijke Ten Cate 1,541 30,134 0.16RHI 1,251 30,762 0.16Semperit Holding 470 21,033 0.11Uponor 2,990 40,215 0.21 Office & Business Equipment (0.53%) Neopost 1,849 101,140 0.53 Oil & Gas (0.68%) ERG 2,923 32,942 0.17Esso Francaise 159 5,645 0.03Etablissements Maurel et Prom 4,696 58,770 0.31MPI 5,102 20,816 0.11Saras 10,489 10,521 0.06 Oil & Gas Services (1.88%) Bourbon 2,408 55,240 0.29CAT Oil 1,174 22,065 0.12CGG 8,388 86,732 0.46Maire Tecnimont 4,840 11,258 0.06SBM Offshore 10,203 120,242 0.64Schoeller-Bleckmann Oilfield Equipment 627 59,088 0.31 Other Finance (0.53%) Corporacion Financiera Alba 853 40,509 0.21DeA Capital 2,861 4,091 0.02KBC Ancora 1,757 38,768 0.21RHJ International 4,689 16,679 0.09
107

UBS ETF - MSCI EMU Small Cap UCITS ETF Semi-Annual Report as of 30 June 2014 Schedule of Investments as at 30 June 2014 (Expressed in EUR) (Unaudited)
The accompanying notes form an integral part of these financial statements.
Transferable securities listed on an Official Stock Exchange
Quantity Market
Value EUR % of
Net Assets Packaging & Containers (1.26%) Gerresheimer 1,779 89,626 0.47Huhtamaki 4,875 93,113 0.49Mayr Melnhof Karton 532 46,289 0.25Zignago Vetro 1,701 9,151 0.05 Pharmaceuticals & Biotechnology (3.77%) AB Science 736 7,905 0.04Ablynx 2,266 20,394 0.11Almirall 3,421 40,539 0.21Arseus 1,764 73,762 0.39Boiron 382 24,261 0.13Faes Farma 10,584 24,449 0.13Galapagos 1,287 18,250 0.10Genfit 630 16,380 0.09Innate Pharma 1,913 17,083 0.09Ipsen 1,800 59,427 0.31Laboratorios Farmaceuticos Rovi 161 1,528 0.01MorphoSys 1,210 82,885 0.44Oriola-KD - Class B 3,311 7,847 0.04Recordati 4,929 60,528 0.32Stada Arzneimittel 3,280 114,095 0.60Stallergenes 175 9,851 0.05ThromboGenics 1,659 15,636 0.08Transgene 939 8,967 0.05Valneva 2,021 10,711 0.06Vilmorin & Cie 301 29,703 0.16Virbac 232 39,138 0.21Zeltia 9,869 29,113 0.15 Private Equity (0.51%) Altamir 1,426 16,185 0.09Aurelius 1,158 30,896 0.16Deutsche Beteiligungs 441 9,532 0.05Gimv 1,109 40,534 0.21 Real Estate (4.16%) BUWOG 2,545 35,910 0.19CA Immobilien Anlagen 4,213 58,350 0.31Citycon 11,477 30,758 0.16Conwert Immobilien Invest 3,683 31,935 0.17Deutsche Euroshop 2,448 88,373 0.47DIC Asset 2,586 20,688 0.11GAGFAH 6,742 89,635 0.48Inmobiliaria Colonial 110,958 64,578 0.34LEG Immobilien 2,810 138,238 0.73Nexity 1,409 47,223 0.25Patrizia Immobilien 1,822 17,673 0.09Prime Office 2,441 8,304 0.04Realia Business 4,019 6,149 0.03S IMMO 3,449 20,487 0.11Sponda 11,125 43,388 0.23TAG Immobilien 6,823 60,800 0.32Technopolis 5,367 23,722 0.13 Real Estate Investment Trusts (3.20%) Alstria Office REIT 4,469 43,224 0.23ANF Immobilier 288 6,687 0.04Befimmo 1,149 63,965 0.34Beni Stabili 51,060 34,210 0.18Cofinimmo 964 87,734 0.46Eurocommercial Properties 2,223 80,073 0.42Hamborner REIT 2,305 18,186 0.10Hibernia REIT 14,103 15,654 0.08Immobiliare Grande Distribuzione 8,762 11,312 0.06Intervest Offices & Warehouses 103 2,277 0.01Mercialys 2,522 42,924 0.23Nieuwe Steen Investments 7,557 34,762 0.18Societe de la Tour Eiffel 245 14,235 0.08Vastned Retail 1,134 42,174 0.22Warehouses De Pauw 624 34,145 0.18
108

UBS ETF - MSCI EMU Small Cap UCITS ETF Semi-Annual Report as of 30 June 2014 Schedule of Investments as at 30 June 2014 (Expressed in EUR) (Unaudited)
The accompanying notes form an integral part of these financial statements.
Transferable securities listed on an Official Stock Exchange
Quantity Market
Value EUR % of
Net Assets Real Estate Investment Trusts (3.20%) (continued) Wereldhave 1,089 73,943 0.39 Retail (2.28%) Amplifon 5,187 23,819 0.13Autogrill 7,331 47,175 0.25BayWa 818 33,198 0.17Bijou Brigitte 154 10,643 0.06Cewe Stiftung & Co 187 9,735 0.05Delticom 255 8,415 0.04Groupe Fnac 614 23,363 0.12Moleskine 5,870 7,390 0.04Rallye 1,181 47,045 0.25Salvatore Ferragamo 2,811 61,224 0.32Sonae 37,832 45,361 0.24Stockmann - Class B 1,783 19,970 0.11Takkt 1,570 21,022 0.11Tom Tailor Holding 779 10,945 0.06World Duty Free 7,017 62,451 0.33 Semiconductors (1.81%) Aixtron 5,888 62,236 0.33ASM International 2,866 86,840 0.46BE Semiconductor Industries 1,684 21,799 0.11Dialog Semiconductor 3,684 93,297 0.49Kontron 2,229 11,114 0.06Manz 147 11,406 0.06Melexis 1,174 37,997 0.20SOITEC 7,888 18,221 0.10 Software (1.60%) Axway Software 369 8,387 0.04Cegid Group 298 9,316 0.05CompuGroup Medical 1,342 27,927 0.15GameLoft 4,382 29,535 0.16Nemetschek 271 19,108 0.10PSI Gesellschaft Fuer Produkte und Systeme der Informationstechnologie 395 5,137 0.03RIB Software 1,039 13,663 0.07Software 3,441 90,722 0.48TomTom 5,686 32,461 0.17UBISOFT Entertainment 4,964 66,766 0.35 Telecommunications (3.15%) ADVA Optical Networking 1,750 5,572 0.03Drillisch 2,335 67,948 0.36Ei Towers 972 38,394 0.20Freenet 6,999 162,587 0.86Init Innovation In Traffic Systems 246 5,358 0.03Jazztel 12,005 124,852 0.66Let's GOWEX 1,688 33,608 0.18Mobistar 1,506 20,994 0.11Parrot 614 11,451 0.06PKC Group 1,055 22,071 0.12Portugal Telecom - Registered 32,598 87,232 0.46QSC 5,079 15,963 0.08 Transportation (2.30%) Ansaldo STS 6,189 48,274 0.26bpost 3,431 63,302 0.33Cargotec - Class B 2,113 58,826 0.31Compagnie Maritime Belge 666 12,811 0.07Construcciones y Auxiliar de Ferrocarriles 105 36,676 0.19Euronav 2,286 20,428 0.11Exmar 1,717 20,346 0.11Irish Continental Group 4,910 13,306 0.07Oesterreichische Post 1,944 70,519 0.37PostNL 23,742 81,910 0.43VTG 537 8,726 0.05
109

UBS ETF - MSCI EMU Small Cap UCITS ETF Semi-Annual Report as of 30 June 2014 Schedule of Investments as at 30 June 2014 (Expressed in EUR) (Unaudited)
The accompanying notes form an integral part of these financial statements.
Transferable securities listed on an Official Stock Exchange
Quantity Market
Value EUR % of
Net Assets _______________________________________________________________________________________________________________ ____________________________________________________________
Total Common Stocks 18,506,923 97.87 _______________________________________________________________________________________________________________ ____________________________________________________________
Preferred Stocks Building Materials (0.11%) Sto 130 20,092 0.11 Commercial Services (0.11%) Sixt 858 20,468 0.11 Electronics (0.24%) Sartorius 525 46,247 0.24 Healthcare Products (0.16%) Draegerwerk 387 30,383 0.16 Home Furnishings (0.03%) Villeroy & Boch 337 4,887 0.03 Insurance (0.28%) Unipol Gruppo Finanziario 14,106 53,377 0.28 Machinery - Diversified (0.22%) Jungheinrich 809 41,663 0.22 Pharmaceuticals & Biotechnology (0.19%) Biotest 384 36,338 0.19
_______________________________________________________________________________________________________________ ____________________________________________________________
Total Preferred Stocks 253,455 1.34 _______________________________________________________________________________________________________________ ____________________________________________________________
Rights Banks (0.15%) Banca Carige - Rights 66,878 13,442 0.07Banca Popolare dell'Emilia Romagna - Rights 18,107 11,281 0.06Banca Popolare di Sondrio - Rights 14,725 2,989 0.02 Iron & Steel (0.01%) Acerinox - Rights 6,457 2,861 0.01 Pharmaceuticals & Biotechnology (0.00%) Faes Farma - Rights 5 0 0.00 Semiconductors (0.01%) SOITEC - Rights 7,888 1,593 0.01
_______________________________________________________________________________________________________________ ____________________________________________________________
Total Rights 32,166 0.17 _______________________________________________________________________________________________________________ ____________________________________________________________
Transferable securities non-listed on an Official Stock Exchange
Common Stocks
Banks (0.00%) Bank of Cyprus 16,840 0 0.00Cyprus Popular Bank 23,005 0 0.00SNS Reaal 1,785 0 0.00 Chemicals (0.00%) Tessenderlo Chemie 14 0 0.00 Holding Companies - Diversified Operations (0.00%) Sequana - Registered 3 4 0.00 Pharmaceuticals & Biotechnology (0.00%) Faes Farma 149 345 0.00
_______________________________________________________________________________________________________________ ____________________________________________________________
Total Common Stocks 349 0.00 _______________________________________________________________________________________________________________ ____________________________________________________________
Rights
Engineering & Construction (0.00%) Mota-Engil - Rights 1,349 0 0.00
110

UBS ETF - MSCI EMU Small Cap UCITS ETF Semi-Annual Report as of 30 June 2014 Schedule of Investments as at 30 June 2014 (Expressed in EUR) (Unaudited)
The accompanying notes form an integral part of these financial statements.
Transferable securities non-listed on an Official Stock Exchange
Quantity Market
Value EUR % of
Net Assets Real Estate (0.00%) Citycon - Rights 11,473 49 0.00
Total Rights 49 0.00 _______________________________________________________________________________________________________________ ____________________________________________________________
TOTAL INVESTMENTS (Cost EUR 17,302,068) 18,792,942 99.38Other net assets 117,909 0.62
_______________________________________________________________________________________________________________ ____________________________________________________________
TOTAL NET ASSETS 18,910,851 100.00 _______________________________________________________________________________________________________________ ____________________________________________________________ _______________________________________________________________________________________________________________ ____________________________________________________________
111

UBS ETF - FTSE 100 UCITS ETF Semi-Annual Report as of 30 June 2014 Schedule of Investments as at 30 June 2014 (Expressed in GBP) (Unaudited)
The accompanying notes form an integral part of these financial statements.
Transferable securities listed on an Official Stock Exchange
Quantity Market
Value GBP % of
Net AssetsCommon Stocks Advertising (0.99%) WPP 129,350 1,647,919 0.99 Aerospace & Defense (2.22%) BAE Systems 308,497 1,335,483 0.81Meggitt 80,092 405,266 0.24Rolls-Royce Holdings 181,970 1,945,259 1.17 Agriculture (5.34%) British American Tobacco 183,533 6,383,278 3.85Imperial Tobacco Group 93,654 2,463,100 1.49 Airlines (0.64%) easyJet 23,657 322,918 0.20International Consolidated Airlines Group 197,006 729,907 0.44 Apparel (0.38%) Burberry Group 42,667 632,752 0.38 Auto Parts & Equipment (0.35%) GKN 158,059 573,912 0.35 Banks (12.85%) Barclays 1,586,443 3,375,951 2.04HSBC Holdings 1,856,829 11,009,139 6.64Lloyds Banking Group 5,266,812 3,910,608 2.36Royal Bank of Scotland Group 204,896 672,878 0.40Standard Chartered 195,373 2,332,754 1.41 Beverages (4.80%) Coca-Cola HBC 19,195 257,597 0.16Diageo 245,509 4,581,198 2.76SABMiller 92,192 3,123,465 1.88 Building Materials (0.64%) CRH 70,877 1,063,864 0.64 Chemicals (0.38%) Johnson Matthey 20,072 622,232 0.38 Commercial Services (2.66%) Aggreko 23,589 389,218 0.23Ashtead Group 48,795 426,956 0.26Babcock International Group 47,995 557,702 0.34Bunzl 31,991 518,894 0.31Capita 63,998 732,777 0.44Experian 97,432 962,628 0.58G4S 153,157 390,857 0.24Intertek Group 15,516 426,535 0.26 Distribution & Wholesale (0.50%) Wolseley 25,684 822,658 0.50 Diversified Financial Services (1.36%) Aberdeen Asset Management 93,251 423,266 0.26Hargreaves Lansdown 21,041 260,488 0.16London Stock Exchange Group 17,643 354,095 0.21Old Mutual 472,649 934,427 0.56Schroders 11,184 280,271 0.17 Electric (0.88%) SSE 93,445 1,464,283 0.88 Food (5.41%) Associated British Foods 33,788 1,030,196 0.62Compass Group 174,762 1,777,330 1.07J Sainsbury 136,172 429,623 0.26Tesco 784,120 2,228,469 1.34Unilever 117,887 3,125,184 1.89WM Morrison Supermarkets 208,354 382,121 0.23
112

UBS ETF - FTSE 100 UCITS ETF Semi-Annual Report as of 30 June 2014 Schedule of Investments as at 30 June 2014 (Expressed in GBP) (Unaudited)
The accompanying notes form an integral part of these financial statements.
Transferable securities listed on an Official Stock Exchange
Quantity Market
Value GBP % of
Net Assets Forest Products & Paper (0.23%) Mondi 36,256 385,039 0.23 Gas (2.77%) Centrica 492,368 1,539,142 0.93National Grid 362,471 3,044,757 1.84 Healthcare Products (0.54%) Smith & Nephew 86,926 903,161 0.54 Home Builders (0.44%) Barratt Developments 94,718 353,961 0.21Persimmon 29,462 375,051 0.23 Household Products (1.92%) Reckitt Benckiser Group 62,551 3,190,101 1.92 Insurance (5.13%) Admiral Group 18,243 282,584 0.17Aviva 287,580 1,468,096 0.89Friends Life Group 132,682 418,346 0.25Legal & General Group 574,515 1,294,957 0.78Prudential 248,253 3,329,072 2.01RSA Insurance Group 99,159 470,807 0.28St James's Place 49,277 375,491 0.23Standard Life 228,765 855,810 0.52 Leisure Time (0.35%) Carnival 17,806 393,157 0.24TUI Travel 48,141 191,601 0.11 Lodging (0.84%) InterContinental Hotels Group 25,192 609,898 0.37Whitbread 17,611 776,469 0.47 Machinery - Diversified (0.33%) Weir Group 20,783 544,307 0.33 Media (2.09%) British Sky Broadcasting Group 94,600 855,184 0.51ITV 365,255 650,885 0.39Pearson 78,895 910,448 0.55Reed Elsevier 112,206 1,054,736 0.64 Mining (8.06%) Anglo American 126,893 1,814,570 1.10Antofagasta 35,408 270,163 0.16BHP Billiton 205,468 3,882,318 2.34Fresnillo 15,509 135,239 0.08Glencore 934,489 3,042,229 1.84Randgold Resources 8,969 437,059 0.26Rio Tinto 121,663 3,781,894 2.28 Miscellaneous Manufacturers (0.54%) IMI 26,869 399,542 0.24Smiths Group 37,946 492,160 0.30 Oil & Gas (17.67%) BG Group 330,463 4,081,218 2.46BP 1,795,308 9,244,041 5.58Royal Dutch Shell - Class A 378,118 9,144,784 5.52Royal Dutch Shell - Class B 238,532 6,064,676 3.66Tullow Oil 86,895 741,649 0.45 Oil & Gas Services (0.19%) Petrofac 25,644 308,497 0.19 Packaging & Containers (0.22%) Rexam 67,832 362,901 0.22
113

UBS ETF - FTSE 100 UCITS ETF Semi-Annual Report as of 30 June 2014 Schedule of Investments as at 30 June 2014 (Expressed in GBP) (Unaudited)
The accompanying notes form an integral part of these financial statements.
Transferable securities listed on an Official Stock Exchange
Quantity Market
Value GBP % of
Net Assets Pharmaceuticals & Biotechnology (9.25%) AstraZeneca 122,280 5,307,563 3.20GlaxoSmithKline 473,081 7,398,987 4.47Shire 57,414 2,623,820 1.58 Private Equity (0.22%) 3i Group 89,469 359,576 0.22 Real Estate Investment Trusts (1.28%) British Land 98,144 689,462 0.42Hammerson 66,474 385,549 0.23Intu Properties 80,868 251,985 0.15Land Securities Group 76,095 788,344 0.48 Retail (1.81%) Kingfisher 229,563 824,131 0.50Marks & Spencer Group 159,687 678,989 0.41Next 14,591 944,767 0.57Sports Direct International 22,236 157,098 0.10Travis Perkins 23,710 388,370 0.23 Semiconductors (0.72%) ARM Holdings 136,317 1,200,953 0.72 Software (0.25%) Sage Group 106,770 410,104 0.25 Telecommunications (4.82%) BT Group 767,154 2,952,776 1.78Vodafone Group 2,581,425 5,033,778 3.04 Transportation (0.18%) Royal Mail 59,293 295,872 0.18 Water (0.63%) Severn Trent 23,352 451,161 0.27United Utilities Group 66,389 585,551 0.36
_______________________________________________________________________________________________________________ ____________________________________________________________
Total Common Stocks 165,512,294 99.88 _______________________________________________________________________________________________________________ ____________________________________________________________
TOTAL INVESTMENTS (Cost GBP 142,360,720) 165,512,294 99.88Other net assets 191,892 0.12
_______________________________________________________________________________________________________________ ____________________________________________________________
TOTAL NET ASSETS 165,704,186 100.00 _______________________________________________________________________________________________________________ ____________________________________________________________ _______________________________________________________________________________________________________________ ____________________________________________________________
114

UBS ETF - FTSE 250 UCITS ETF Semi-Annual Report as of 30 June 2014 Schedule of Investments as at 30 June 2014 (Expressed in GBP) (Unaudited)
The accompanying notes form an integral part of these financial statements.
Transferable securities listed on an Official Stock Exchange
Quantity Market
Value GBP % of
Net AssetsCommon Stocks Aerospace & Defense (2.02%) BBA Aviation 22,345 69,046 0.49Cobham 50,137 156,578 1.10Ultra Electronics Holdings 3,273 61,041 0.43 Agriculture (0.23%) Genus 2,800 32,116 0.23 Apparel (0.16%) Ted Baker 1,230 22,275 0.16 Banks (0.20%) Bank of Georgia Holdings 1,192 28,012 0.20 Beverages (1.02%) A.G.BARR 3,918 24,919 0.17Britvic 10,867 79,057 0.56Marston's 28,141 40,776 0.29 Chemicals (2.60%) Croda International 6,301 138,685 0.98Elementis 21,307 55,462 0.39Essentra 10,891 83,153 0.58Synthomer 12,230 28,386 0.20Victrex 3,782 64,369 0.45 Commercial Services (5.81%) Berendsen 8,027 78,584 0.55De La Rue 4,734 38,345 0.27Dignity 2,520 34,549 0.24Hays 65,090 95,097 0.67HomeServe 12,728 40,984 0.29Interserve 6,741 40,446 0.28ITE Group 11,156 26,429 0.19Michael Page International 14,052 60,564 0.43Northgate 6,241 32,734 0.23QinetiQ Group 30,476 63,024 0.44Rentokil Initial 83,987 93,562 0.66RPS Group 10,063 27,975 0.20Savills 5,835 36,702 0.26Serco Group 25,597 93,557 0.66WS Atkins 4,725 62,370 0.44 Computers (0.50%) Computacenter 3,646 21,840 0.15Domino Printing Sciences 5,198 31,188 0.22Xaar 3,487 18,167 0.13 Cosmetics & Personal Care (0.34%) PZ Cussons 13,861 48,028 0.34 Distribution & Wholesale (2.71%) DCC 3,892 139,450 0.98Diploma 5,207 33,377 0.23Entertainment One 9,419 29,199 0.21Inchcape 21,207 134,559 0.95SIG 25,910 48,866 0.34 Diversified Financial Services (8.69%) Ashmore Group 18,101 66,974 0.47Brewin Dolphin Holdings 12,069 37,378 0.26Close Brothers Group 6,827 87,249 0.61Henderson Group 48,073 115,856 0.82ICAP 24,954 94,825 0.67IG Group Holdings 16,901 99,293 0.70Intermediate Capital Group 18,700 73,005 0.51International Personal Finance 11,223 65,935 0.46Investec 23,466 126,482 0.89Jupiter Fund Management 19,250 76,904 0.54Just Retirement Group 8,362 12,242 0.09
115

UBS ETF - FTSE 250 UCITS ETF Semi-Annual Report as of 30 June 2014 Schedule of Investments as at 30 June 2014 (Expressed in GBP) (Unaudited)
The accompanying notes form an integral part of these financial statements.
Transferable securities listed on an Official Stock Exchange
Quantity Market
Value GBP % of
Net Assets Diversified Financial Services (8.69%) (continued) Man Group 74,302 78,166 0.55Paragon Group of Companies 14,166 49,878 0.35PayPoint 2,965 32,585 0.23Provident Financial 6,517 148,848 1.05Rathbone Brothers 2,216 43,877 0.31Tullett Prebon 9,706 25,682 0.18 Electrical Components & Equipment (0.21%) HellermannTyton Group 9,753 30,371 0.21 Electronics (3.38%) Electrocomponents 20,357 53,498 0.38Halma 17,443 102,827 0.72Oxford Instruments 2,481 32,253 0.23Premier Farnell 17,114 34,861 0.24Renishaw 1,699 28,153 0.20Rotork 4,016 107,227 0.75Spectris 5,495 121,989 0.86 Energy - Alternate Sources (0.07%) Infinis Energy 4,022 9,247 0.07 Engineering & Construction (1.51%) Balfour Beatty 31,812 74,281 0.52Carillion 19,870 65,790 0.46Keller Group 3,287 30,273 0.22Kier Group 2,476 43,949 0.31 Entertainment (2.63%) Betfair Group 4,350 44,544 0.31Bwin.Party Digital Entertainment 32,589 31,301 0.22Cineworld Group 9,159 29,941 0.21Ladbrokes 42,516 59,650 0.42Merlin Entertainments 15,717 56,298 0.40Perform Group 4,539 10,485 0.07Rank Group 5,186 8,666 0.06William Hill 40,567 133,060 0.94 Food (2.92%) Booker Group 68,118 88,349 0.62Cranswick 2,278 28,817 0.20Dairy Crest Group 6,446 30,328 0.21Greencore Group 18,703 49,675 0.35Ocado Group 18,732 69,552 0.49Tate & Lyle 21,681 148,407 1.05 Forest Products & Paper (0.85%) DS Smith 43,678 120,901 0.85 Healthcare Services (0.50%) Al Noor Hospitals Group 1,831 18,713 0.13NMC Health 2,866 14,330 0.10Synergy Health 2,674 37,703 0.27 Holding Companies - Diversified Operations (1.31%) Drax Group 18,676 119,620 0.84Exova Group 5,002 12,305 0.09Mitie Group 17,194 54,797 0.38 Home Builders (3.93%) Bellway 5,662 88,667 0.62Berkeley Group Holdings 5,855 141,574 1.00Bovis Homes Group 6,352 50,276 0.35Crest Nicholson Holdings 10,192 35,142 0.25Galliford Try 3,823 43,659 0.31Redrow 10,307 28,055 0.20Taylor Wimpey 149,978 170,975 1.20 Home Furnishings (1.00%) Howden Joinery Group 29,273 90,629 0.64
116

UBS ETF - FTSE 250 UCITS ETF Semi-Annual Report as of 30 June 2014 Schedule of Investments as at 30 June 2014 (Expressed in GBP) (Unaudited)
The accompanying notes form an integral part of these financial statements.
Transferable securities listed on an Official Stock Exchange
Quantity Market
Value GBP % of
Net Assets Home Furnishings (1.00%) (continued) Pace 14,443 51,273 0.36 Insurance (5.43%) Amlin 23,224 108,712 0.77Beazley 24,091 60,926 0.43Brit 4,542 11,128 0.08Catlin Group 15,646 83,706 0.59Direct Line Insurance Group 70,013 188,895 1.33esure Group 11,357 30,266 0.21Hiscox 14,686 103,830 0.73Jardine Lloyd Thompson Group 5,755 59,852 0.42Lancashire Holdings 8,523 55,741 0.39Phoenix Group Holdings 10,435 67,723 0.48 Internet (1.08%) Just Eat 7,837 19,984 0.14Moneysupermarket.com Group 20,578 38,749 0.27Rightmove 4,409 94,529 0.67 Iron & Steel (0.21%) Evraz 23,537 20,830 0.15Ferrexpo 6,655 8,718 0.06 Leisure Time (0.64%) Thomas Cook Group 67,629 90,285 0.64 Lodging (0.28%) Millennium & Copthorne Hotels 6,934 40,356 0.28 Machinery - Diversified (0.68%) Spirax-Sarco Engineering 3,510 95,928 0.68 Media (1.61%) Euromoney Institutional Investor 1,766 19,602 0.14Informa 27,811 133,215 0.94UBM 11,339 75,461 0.53 Metal Fabricate & Hardware (0.43%) Bodycote 8,963 61,621 0.43 Mining (1.90%) African Barrick Gold 7,127 14,660 0.10Centamin 50,108 31,819 0.22Kazakhmys 12,039 36,611 0.26Lonmin 20,007 47,457 0.33Petra Diamonds 17,771 33,463 0.24Polymetal International 9,230 53,395 0.38Vedanta Resources 4,705 52,178 0.37 Miscellaneous Manufacturers (2.50%) Alent 10,177 37,268 0.26Fenner 8,980 32,148 0.23Melrose Industries 49,855 129,723 0.91Morgan Advanced Materials 13,323 43,207 0.30Senior 19,405 54,955 0.39Vesuvius 12,667 58,091 0.41 Oil & Gas (2.88%) Afren 50,214 72,810 0.51Cairn Energy 26,724 53,448 0.38Caracal Energy 5,575 30,551 0.22EnQuest 33,659 47,527 0.33Heritage Oil 9,072 29,030 0.20Ophir Energy 23,459 51,680 0.36Premier Oil 24,552 81,979 0.58Soco International 10,275 42,395 0.30 Oil & Gas Services (2.82%) AMEC 13,847 168,241 1.18Hunting 6,420 55,083 0.39
117

UBS ETF - FTSE 250 UCITS ETF Semi-Annual Report as of 30 June 2014 Schedule of Investments as at 30 June 2014 (Expressed in GBP) (Unaudited)
The accompanying notes form an integral part of these financial statements.
Transferable securities listed on an Official Stock Exchange
Quantity Market
Value GBP % of
Net Assets Oil & Gas Services (2.82%) (continued) John Wood Group 16,784 135,363 0.95Kentz 4,526 41,911 0.30 Packaging & Containers (0.37%) RPC Group 8,410 52,773 0.37 Pharmaceuticals & Biotechnology (1.96%) BTG 16,658 105,445 0.74Dechra Pharmaceuticals 4,021 29,092 0.20Hikma Pharmaceuticals 6,257 104,992 0.74UDG Healthcare 11,449 39,213 0.28 Private Equity (0.58%) IP Group 20,934 41,826 0.29SVG Capital 9,881 41,154 0.29 Real Estate (2.77%) Capital & Counties Properties 33,889 110,377 0.78Countrywide 7,211 37,101 0.26Daejan Holdings 213 10,139 0.07Foxtons Group 10,445 31,366 0.22Grainger 19,009 39,957 0.28Kennedy Wilson Europe Real Estate 4,027 44,297 0.31Regus 29,380 53,383 0.38ST Modwen Properties 8,306 29,785 0.21Unite Group 9,538 37,580 0.26 Real Estate Investment Trusts (4.01%) Big Yellow Group 6,073 30,122 0.21Derwent London 4,283 114,742 0.81Great Portland Estates 15,886 102,306 0.72Hansteen Holdings 31,815 32,706 0.23Londonmetric Property 27,391 37,005 0.26Redefine International 39,859 21,384 0.15Segro 34,457 118,945 0.83Shaftesbury 12,954 84,978 0.60Workspace Group 4,954 28,238 0.20 Retail (5.91%) AO World 8,251 21,246 0.15Carphone Warehouse Group 17,172 55,397 0.39Debenhams 57,133 39,108 0.27Dixons Retail 170,502 84,893 0.60Domino's Pizza Group 6,375 33,405 0.23Dunelm Group 4,214 35,187 0.25Enterprise Inns 23,698 29,954 0.21Grafton Group 9,843 57,089 0.40Greene King 10,104 85,227 0.60Halfords Group 9,223 43,606 0.31Home Retail Group 38,204 67,545 0.48J D Wetherspoon 4,151 32,834 0.23JD Sports Fashion 2,520 10,130 0.07Mitchells & Butlers 10,964 42,727 0.30N Brown Group 7,254 30,684 0.22Pets at Home Group 9,749 19,986 0.14Poundland Group 6,880 21,810 0.15Restaurant Group 9,183 55,190 0.39SuperGroup 1,524 16,094 0.11WH Smith 5,396 57,737 0.41 Semiconductors (0.47%) CSR 7,837 46,395 0.33Imagination Technologies Group 9,337 19,710 0.14 Software (1.47%) AVEVA Group 2,944 59,999 0.42Fidessa Group 1,721 38,103 0.27Micro Focus International 6,515 56,550 0.40Playtech 8,787 54,172 0.38
118

UBS ETF - FTSE 250 UCITS ETF Semi-Annual Report as of 30 June 2014 Schedule of Investments as at 30 June 2014 (Expressed in GBP) (Unaudited)
The accompanying notes form an integral part of these financial statements.
Transferable securities listed on an Official Stock Exchange
Quantity Market
Value GBP % of
Net Assets Telecommunications (3.35%) Cable & Wireless Communications 117,269 57,755 0.41Colt Group 14,832 20,394 0.14Inmarsat 19,733 147,504 1.04Laird 12,558 35,640 0.25Spirent Communications 28,447 27,011 0.19TalkTalk Telecom Group 24,522 79,819 0.56Telecity Group 9,317 70,250 0.50Telecom Plus 2,798 37,409 0.26 Transportation (1.90%) Firstgroup 55,570 70,352 0.50Go-Ahead Group 2,003 47,431 0.33James Fisher & Sons 1,896 26,828 0.19National Express Group 19,668 51,491 0.36Stagecoach Group 19,801 74,452 0.52 Water (0.95%) Pennon Group 17,176 134,832 0.95
_______________________________________________________________________________________________________________ ____________________________________________________________
Total Common Stocks 12,330,963 86.79 _______________________________________________________________________________________________________________ ____________________________________________________________
Funds Alternative Investment (0.64%) BH Global 1,299 15,536 0.11BH Macro 2,027 39,750 0.28Bluecrest AllBlue Fund 19,468 35,704 0.25 Asset Allocation Funds (3.08%) 3i Infrastructure 27,988 38,148 0.27Alliance Trust 26,350 117,416 0.83International Public Partnerships 35,538 47,372 0.33John Laing Infrastructure Fund 30,646 35,733 0.25RIT Capital Partners 5,965 78,499 0.55Scottish Mortgage Investment Trust 57,415 120,571 0.85 Debt Funds (0.41%) NB Global Floating Rate Income Fund 58,677 57,855 0.41 Equity Funds (8.14%) Aberforth Smaller Companies Trust 4,371 45,721 0.32Bankers Investment Trust 5,134 29,007 0.20BlackRock World Mining Trust 8,435 39,063 0.28British Empire Securities and General Trust 6,866 34,124 0.24Caledonia Investments 1,553 34,554 0.24City of London Investment Trust 13,275 50,551 0.36Edinburgh Investment Trust 9,244 55,926 0.39Fidelity China Special Situations 25,890 26,693 0.19Fidelity European Values 19,232 30,387 0.21Foreign & Colonial Investment Trust 26,814 101,411 0.71Genesis Emerging Markets Fund 6,145 33,367 0.23HICL Infrastructure 56,492 79,032 0.56JPMorgan American Investment Trust 12,512 30,842 0.22JPMorgan Emerging Markets Investment Trust 5,522 30,702 0.22Law Debenture 5,342 27,698 0.19Mercantile Investment Trust 4,658 67,867 0.48Monks Investment Trust 10,560 40,814 0.29Murray International Trust 5,930 63,273 0.45Perpetual Income and Growth Investment Trust 10,680 40,798 0.29Personal Assets Trust 77 25,733 0.18Polar Capital Technology Trust 6,031 28,593 0.20Scottish Investment Trust 5,021 29,574 0.21Temple Bar Investment Trust 2,876 35,749 0.25Templeton Emerging Markets Investment Trust 15,132 84,891 0.60Witan Investment Trust 8,930 63,090 0.44Worldwide Healthcare Trust 2,117 27,585 0.19 Private Equity (0.39%) Electra Private Equity 1,671 44,816 0.32Riverstone Energy 1,111 10,277 0.07
119

UBS ETF - FTSE 250 UCITS ETF Semi-Annual Report as of 30 June 2014 Schedule of Investments as at 30 June 2014 (Expressed in GBP) (Unaudited)
The accompanying notes form an integral part of these financial statements.
Transferable securities listed on an Official Stock Exchange
Quantity Market
Value GBP % of
Net Assets Real Estate (0.58%) F&C Commercial Property Trust 22,567 27,035 0.19TR Property Investment Trust 15,151 39,014 0.28UK Commercial Property Trust 19,334 15,777 0.11
_______________________________________________________________________________________________________________ ____________________________________________________________
Total Funds 1,880,548 13.24 _______________________________________________________________________________________________________________ ____________________________________________________________
TOTAL INVESTMENTS (Cost GBP 14,120,828) 14,211,511 100.03Other net liabilities (3,639) (0.03)
_______________________________________________________________________________________________________________ ____________________________________________________________
TOTAL NET ASSETS 14,207,872 100.00 _______________________________________________________________________________________________________________ ____________________________________________________________ _______________________________________________________________________________________________________________ ____________________________________________________________
120

UBS ETF - MSCI United Kingdom UCITS ETF Semi-Annual Report as of 30 June 2014 Schedule of Investments as at 30 June 2014 (Expressed in GBP) (Unaudited)
The accompanying notes form an integral part of these financial statements.
Transferable securities listed on an Official Stock Exchange
Quantity Market
Value GBP % of
Net AssetsCommon Stocks Advertising (1.00%) WPP 339,584 4,326,300 1.00 Aerospace & Defense (2.41%) BAE Systems 807,690 3,496,490 0.81Cobham 285,196 890,667 0.21Meggitt 197,469 999,193 0.23Rolls-Royce Holdings 470,370 5,028,256 1.16 Agriculture (5.29%) British American Tobacco 474,492 16,502,832 3.82Imperial Tobacco Group 242,078 6,366,651 1.47 Airlines (0.13%) easyJet 40,209 548,853 0.13 Apparel (0.38%) Burberry Group 110,508 1,638,834 0.38 Auto Parts & Equipment (0.34%) GKN 409,753 1,487,813 0.34 Banks (13.13%) Barclays 4,107,857 8,741,520 2.02HSBC Holdings 4,732,768 28,060,582 6.49Lloyds Banking Group 14,355,810 10,659,189 2.46Royal Bank of Scotland Group 625,937 2,055,577 0.48Standard Chartered 609,660 7,279,340 1.68 Beverages (4.78%) Coca-Cola HBC 49,689 666,826 0.16Diageo 630,686 11,768,601 2.72SABMiller 242,693 8,222,439 1.90 Chemicals (0.54%) Croda International 34,094 750,409 0.17Johnson Matthey 51,529 1,597,399 0.37 Commercial Services (2.39%) Aggreko 65,290 1,077,285 0.25Babcock International Group 123,928 1,440,043 0.33Bunzl 84,936 1,377,662 0.32Capita 166,740 1,909,173 0.44Experian 248,105 2,451,277 0.57G4S 387,233 988,219 0.23Intertek Group 39,939 1,097,923 0.25 Distribution & Wholesale (0.50%) Wolseley 67,258 2,154,274 0.50 Diversified Financial Services (1.67%) Aberdeen Asset Management 237,857 1,079,633 0.25Hargreaves Lansdown 60,575 749,918 0.17ICAP 133,602 507,688 0.12Investec 145,307 783,205 0.18London Stock Exchange Group 44,182 886,733 0.21Old Mutual 1,235,512 2,442,607 0.56Schroders 31,726 795,053 0.18 Electric (0.88%) SSE 243,561 3,816,601 0.88 Entertainment (0.17%) William Hill 217,523 713,475 0.17 Food (5.63%) Associated British Foods 89,401 2,725,836 0.63Compass Group 446,283 4,538,698 1.05J Sainsbury 306,049 965,585 0.22Tate & Lyle 117,557 804,678 0.19
121

UBS ETF - MSCI United Kingdom UCITS ETF Semi-Annual Report as of 30 June 2014 Schedule of Investments as at 30 June 2014 (Expressed in GBP) (Unaudited)
The accompanying notes form an integral part of these financial statements.
Transferable securities listed on an Official Stock Exchange
Quantity Market
Value GBP % of
Net Assets Food (5.63%) (continued) Tesco 2,038,697 5,793,977 1.34Unilever 322,646 8,553,345 1.98WM Morrison Supermarkets 527,381 967,217 0.22 Gas (2.74%) Centrica 1,278,277 3,995,894 0.92National Grid 937,239 7,872,808 1.82 Healthcare Products (0.54%) Smith & Nephew 222,692 2,313,770 0.54 Home Builders (0.22%) Persimmon 74,682 950,702 0.22 Household Products (1.92%) Reckitt Benckiser Group 162,724 8,298,924 1.92 Insurance (5.11%) Admiral Group 48,893 757,353 0.17Aviva 738,774 3,771,441 0.87Direct Line Insurance Group 379,589 1,024,131 0.24Friends Life Group 350,252 1,104,344 0.26Legal & General Group 1,485,806 3,349,007 0.77Prudential 644,013 8,636,214 2.00RSA Insurance Group 257,778 1,223,930 0.28Standard Life 600,294 2,245,700 0.52 Internet (0.09%) ASOS 13,397 396,551 0.09 Leisure Time (0.36%) Carnival 46,701 1,031,158 0.24TUI Travel 130,391 518,956 0.12 Lodging (0.83%) InterContinental Hotels Group 64,575 1,563,361 0.36Whitbread 45,828 2,020,556 0.47 Machinery - Diversified (0.33%) Weir Group 54,216 1,419,917 0.33 Media (2.12%) British Sky Broadcasting Group 256,289 2,316,853 0.53ITV 969,463 1,727,583 0.40Pearson 206,547 2,383,552 0.55Reed Elsevier 293,059 2,754,755 0.64 Mining (8.32%) Anglo American 350,610 5,013,723 1.16Antofagasta 98,066 748,244 0.17BHP Billiton 531,045 10,034,095 2.32Fresnillo 56,164 489,750 0.11Glencore 2,670,642 8,694,275 2.01Randgold Resources 22,436 1,093,306 0.25Rio Tinto 319,573 9,933,927 2.30 Miscellaneous Manufacturers (0.69%) IMI 68,147 1,013,346 0.23Melrose Industries 261,876 681,401 0.16Smiths Group 99,511 1,290,658 0.30 Oil & Gas (17.45%) BG Group 856,544 10,578,318 2.44BP 4,643,416 23,908,949 5.53Royal Dutch Shell - Class A 969,068 23,436,910 5.42Royal Dutch Shell - Class B 614,981 15,635,892 3.61Tullow Oil 226,380 1,932,153 0.45 Oil & Gas Services (0.39%) AMEC 74,482 904,956 0.21
122

UBS ETF - MSCI United Kingdom UCITS ETF Semi-Annual Report as of 30 June 2014 Schedule of Investments as at 30 June 2014 (Expressed in GBP) (Unaudited)
The accompanying notes form an integral part of these financial statements.
Transferable securities listed on an Official Stock Exchange
Quantity Market
Value GBP % of
Net Assets Oil & Gas Services (0.39%) (continued) Petrofac 64,002 769,944 0.18 Packaging & Containers (0.22%) Rexam 174,698 934,634 0.22 Pharmaceuticals & Biotechnology (9.16%) AstraZeneca 316,869 13,753,699 3.18GlaxoSmithKline 1,221,125 19,098,395 4.42Shire 148,124 6,769,267 1.56 Private Equity (0.22%) 3i Group 241,024 968,675 0.22 Real Estate Investment Trusts (1.41%) British Land 237,668 1,669,618 0.39Hammerson 177,167 1,027,569 0.24Intu Properties 228,373 711,610 0.16Land Securities Group 196,040 2,030,974 0.47Segro 190,294 656,895 0.15 Retail (1.82%) Kingfisher 596,661 2,142,013 0.50Marks & Spencer Group 410,597 1,745,858 0.40Next 38,662 2,503,365 0.58Sports Direct International 69,701 492,438 0.11Travis Perkins 61,216 1,002,718 0.23 Semiconductors (0.72%) ARM Holdings 355,312 3,130,299 0.72 Software (0.24%) Sage Group 270,437 1,038,749 0.24 Telecommunications (4.95%) BT Group 1,985,912 7,643,775 1.77Inmarsat 110,660 827,184 0.19Vodafone Group 6,644,403 12,956,586 2.99 Transportation (0.19%) Royal Mail 161,572 806,244 0.19 Water (0.61%) Severn Trent 59,222 1,144,169 0.26United Utilities Group 169,081 1,491,294 0.35
_______________________________________________________________________________________________________________ ____________________________________________________________
Total Common Stocks 432,091,211 99.89 _______________________________________________________________________________________________________________ ____________________________________________________________
TOTAL INVESTMENTS (Cost GBP 436,092,712) 432,091,211 99.89Other net assets 481,056 0.11
_______________________________________________________________________________________________________________ ____________________________________________________________
TOTAL NET ASSETS 432,572,267 100.00 _______________________________________________________________________________________________________________ ____________________________________________________________ _______________________________________________________________________________________________________________ ____________________________________________________________
123

UBS ETF - MSCI United Kingdom 100% hedged to CHF UCITS ETF Semi-Annual Report as of 30 June 2014 Schedule of Investments as at 30 June 2014 (Expressed in CHF) (Unaudited)
The accompanying notes form an integral part of these financial statements.
Transferable securities listed on an Official Stock Exchange
Quantity Market
Value CHF % of
Net AssetsCommon Stocks Advertising (1.01%) WPP 100,021 1,932,164 1.01 Aerospace & Defense (2.44%) BAE Systems 237,301 1,557,652 0.81Cobham 85,824 406,410 0.21Meggitt 59,137 453,726 0.24Rolls-Royce Holdings 139,743 2,265,120 1.18 Agriculture (5.35%) British American Tobacco 140,305 7,399,223 3.86Imperial Tobacco Group 71,625 2,856,300 1.49 Airlines (0.13%) easyJet 11,676 241,663 0.13 Apparel (0.38%) Burberry Group 32,732 736,033 0.38 Auto Parts & Equipment (0.35%) GKN 121,016 666,273 0.35 Banks (13.29%) Barclays 1,216,765 3,926,104 2.05HSBC Holdings 1,400,261 12,588,497 6.56Lloyds Banking Group 4,247,878 4,782,466 2.49Royal Bank of Scotland Group 185,092 921,667 0.48Standard Chartered 180,623 3,270,098 1.71 Beverages (4.83%) Coca-Cola HBC 14,542 295,910 0.15Diageo 186,906 5,288,327 2.76SABMiller 71,788 3,687,896 1.92 Chemicals (0.55%) Croda International 10,066 335,939 0.17Johnson Matthey 15,471 727,216 0.38 Commercial Services (2.43%) Aggreko 19,369 484,590 0.25Babcock International Group 37,605 662,575 0.34Bunzl 24,911 612,668 0.32Capita 48,829 847,748 0.44Experian 73,865 1,106,570 0.58G4S 117,695 455,431 0.24Intertek Group 11,885 495,402 0.26 Distribution & Wholesale (0.50%) Wolseley 19,820 962,596 0.50 Diversified Financial Services (1.67%) Aberdeen Asset Management 68,274 469,893 0.24Hargreaves Lansdown 17,697 332,203 0.17ICAP 39,434 227,216 0.12Investec 40,516 331,130 0.17London Stock Exchange Group 13,016 396,103 0.21Old Mutual 363,623 1,090,038 0.57Schroders 9,348 355,208 0.19 Electric (0.89%) SSE 71,698 1,703,568 0.89 Entertainment (0.17%) William Hill 66,936 332,902 0.17 Food (5.70%) Associated British Foods 26,502 1,225,235 0.64Compass Group 132,563 2,044,216 1.07J Sainsbury 94,361 451,414 0.24Tate & Lyle 33,777 350,573 0.18
124

UBS ETF - MSCI United Kingdom 100% hedged to CHF UCITS ETF Semi-Annual Report as of 30 June 2014 Schedule of Investments as at 30 June 2014 (Expressed in CHF) (Unaudited)
The accompanying notes form an integral part of these financial statements.
Transferable securities listed on an Official Stock Exchange
Quantity Market
Value CHF % of
Net Assets Food (5.70%) (continued) Tesco 602,700 2,597,220 1.35Unilever 95,602 3,842,909 2.00WM Morrison Supermarkets 154,117 428,581 0.22 Gas (2.78%) Centrica 379,006 1,796,464 0.94National Grid 276,873 3,526,495 1.84 Healthcare Products (0.54%) Smith & Nephew 66,208 1,043,060 0.54 Home Builders (0.23%) Persimmon 22,522 434,729 0.23 Household Products (1.94%) Reckitt Benckiser Group 48,106 3,720,085 1.94 Insurance (5.17%) Admiral Group 13,827 324,760 0.17Aviva 218,176 1,688,831 0.88Direct Line Insurance Group 111,684 456,895 0.24Friends Life Group 106,470 509,020 0.27Legal & General Group 440,525 1,505,594 0.78Prudential 190,633 3,876,237 2.02RSA Insurance Group 75,977 546,986 0.29Standard Life 177,150 1,004,875 0.52 Internet (0.09%) ASOS 3,944 177,016 0.09 Leisure Time (0.35%) Carnival 13,383 448,060 0.23TUI Travel 37,116 223,989 0.12 Lodging (0.84%) InterContinental Hotels Group 19,398 712,091 0.37Whitbread 13,483 901,384 0.47 Machinery - Diversified (0.33%) Weir Group 15,769 626,214 0.33 Media (2.14%) British Sky Broadcasting Group 76,239 1,045,031 0.55ITV 283,305 765,500 0.40Pearson 60,815 1,064,143 0.55Reed Elsevier 86,504 1,232,956 0.64 Mining (8.42%) Anglo American 103,795 2,250,588 1.17Antofagasta 28,485 329,552 0.17BHP Billiton 157,319 4,507,248 2.35Fresnillo 15,692 207,481 0.11Glencore 790,860 3,903,918 2.04Randgold Resources 6,580 486,190 0.25Rio Tinto 94,730 4,465,004 2.33 Miscellaneous Manufacturers (0.69%) IMI 19,949 449,796 0.23Melrose Industries 78,072 308,025 0.16Smiths Group 29,264 575,516 0.30 Oil & Gas (17.66%) BG Group 253,553 4,748,092 2.47BP 1,374,074 10,727,943 5.59Royal Dutch Shell - Class A 286,509 10,506,735 5.48Royal Dutch Shell - Class B 181,971 7,015,305 3.66Tullow Oil 67,615 875,044 0.46 Oil & Gas Services (0.40%) AMEC 22,508 414,664 0.22
125

UBS ETF - MSCI United Kingdom 100% hedged to CHF UCITS ETF Semi-Annual Report as of 30 June 2014 Schedule of Investments as at 30 June 2014 (Expressed in CHF) (Unaudited)
The accompanying notes form an integral part of these financial statements.
Transferable securities listed on an Official Stock Exchange
Quantity Market
Value CHF % of
Net Assets Oil & Gas Services (0.40%) (continued) Petrofac 18,967 345,978 0.18 Packaging & Containers (0.22%) Rexam 52,184 423,326 0.22 Pharmaceuticals & Biotechnology (9.27%) AstraZeneca 93,830 6,175,397 3.22GlaxoSmithKline 361,238 8,566,701 4.47Shire 43,730 3,030,254 1.58 Private Equity (0.23%) 3i Group 72,176 439,839 0.23 Real Estate Investment Trusts (1.43%) British Land 71,596 762,638 0.40Hammerson 51,857 456,057 0.24Intu Properties 65,189 308,003 0.16Land Securities Group 58,581 920,238 0.48Segro 57,475 300,838 0.15 Retail (1.85%) Kingfisher 177,341 965,355 0.50Marks & Spencer Group 120,596 777,516 0.40Next 11,477 1,126,812 0.59Sports Direct International 20,674 221,473 0.12Travis Perkins 18,343 455,583 0.24 Semiconductors (0.73%) ARM Holdings 104,853 1,400,684 0.73 Software (0.25%) Sage Group 80,746 470,272 0.25 Telecommunications (5.01%) BT Group 588,665 3,435,576 1.79Inmarsat 31,436 356,305 0.19Vodafone Group 1,966,940 5,815,796 3.03 Transportation (0.19%) Royal Mail 47,447 358,999 0.19 Water (0.62%) Severn Trent 17,567 514,622 0.27United Utilities Group 50,792 679,277 0.35
_______________________________________________________________________________________________________________ ____________________________________________________________
Total Common Stocks 193,853,728 101.07 _______________________________________________________________________________________________________________ ____________________________________________________________
TOTAL INVESTMENTS (Cost CHF 193,114,906) 193,853,728 101.07Other net liabilities (2,053,935) (1.07)
_______________________________________________________________________________________________________________ ____________________________________________________________
TOTAL NET ASSETS 191,799,793 100.00 _______________________________________________________________________________________________________________ ____________________________________________________________ _______________________________________________________________________________________________________________ ____________________________________________________________
Forward Foreign Exchange Contracts
Purchases Sales Maturity Date
Unrealisedappreciation/ (depreciation)
CHF % of
Net AssetsCHF 195,220,000 GBP 130,239,062 3 July 2014 (2,257,584) (1.18)
_______________________________________________________________________________________________________________ ____________________________________________________________
Total Forward Foreign Exchange Contracts (2,257,584) (1.18) _______________________________________________________________________________________________________________ ____________________________________________________________
126

UBS ETF - MSCI United Kingdom 100% hedged to EUR UCITS ETF Semi-Annual Report as of 30 June 2014 Schedule of Investments as at 30 June 2014 (Expressed in EUR) (Unaudited)
The accompanying notes form an integral part of these financial statements.
Transferable securities listed on an Official Stock Exchange
Quantity Market
Value EUR % of
Net AssetsCommon Stocks Advertising (1.01%) WPP 66,056 1,050,965 1.01 Aerospace & Defense (2.44%) BAE Systems 156,768 847,523 0.81Cobham 55,805 217,647 0.21Meggitt 38,923 245,959 0.24Rolls-Royce Holdings 92,416 1,233,762 1.18 Agriculture (5.37%) British American Tobacco 92,998 4,039,334 3.88Imperial Tobacco Group 47,258 1,552,165 1.49 Airlines (0.13%) easyJet 7,663 130,629 0.13 Apparel (0.39%) Burberry Group 21,852 404,705 0.39 Auto Parts & Equipment (0.35%) GKN 80,953 367,084 0.35 Banks (13.34%) Barclays 803,758 2,136,011 2.05HSBC Holdings 927,143 6,864,909 6.59Lloyds Banking Group 2,819,485 2,614,405 2.51Royal Bank of Scotland Group 122,086 500,698 0.48Standard Chartered 119,368 1,779,913 1.71 Beverages (4.86%) Coca-Cola HBC 9,889 165,734 0.16Diageo 123,917 2,887,681 2.77SABMiller 47,393 2,005,230 1.93 Chemicals (0.56%) Croda International 6,807 187,104 0.18Johnson Matthey 10,106 391,244 0.38 Commercial Services (2.44%) Aggreko 12,619 260,025 0.25Babcock International Group 24,705 358,507 0.34Bunzl 16,530 334,835 0.32Capita 32,228 460,835 0.44Experian 48,792 602,022 0.58G4S 76,851 244,927 0.24Intertek Group 8,044 276,155 0.27 Distribution & Wholesale (0.50%) Wolseley 13,069 522,764 0.50 Diversified Financial Services (1.68%) Aberdeen Asset Management 44,913 254,588 0.25Hargreaves Lansdown 11,547 178,524 0.17ICAP 27,307 129,588 0.12Investec 27,368 184,221 0.18London Stock Exchange Group 8,782 220,114 0.21Old Mutual 241,021 595,070 0.57Schroders 6,086 190,467 0.18 Electric (0.89%) SSE 47,316 925,942 0.89 Entertainment (0.17%) William Hill 42,531 174,215 0.17 Food (5.72%) Associated British Foods 17,507 666,616 0.64Compass Group 87,672 1,113,496 1.07J Sainsbury 61,201 241,137 0.23Tate & Lyle 22,719 194,209 0.19
127

UBS ETF - MSCI United Kingdom 100% hedged to EUR UCITS ETF Semi-Annual Report as of 30 June 2014 Schedule of Investments as at 30 June 2014 (Expressed in EUR) (Unaudited)
The accompanying notes form an integral part of these financial statements.
Transferable securities listed on an Official Stock Exchange
Quantity Market
Value EUR % of
Net Assets Food (5.72%) (continued) Tesco 398,652 1,414,896 1.36Unilever 63,154 2,090,823 2.01WM Morrison Supermarkets 101,870 233,320 0.22 Gas (2.79%) Centrica 250,101 976,362 0.94National Grid 183,424 1,924,164 1.85 Healthcare Products (0.55%) Smith & Nephew 43,759 567,792 0.55 Home Builders (0.23%) Persimmon 14,999 238,450 0.23 Household Products (1.95%) Reckitt Benckiser Group 31,796 2,025,113 1.95 Insurance (5.20%) Admiral Group 9,715 187,932 0.18Aviva 144,959 924,161 0.89Direct Line Insurance Group 73,286 246,927 0.24Friends Life Group 69,909 275,273 0.26Legal & General Group 292,053 822,095 0.79Prudential 126,501 2,118,504 2.03RSA Insurance Group 49,940 296,119 0.28Standard Life 117,249 547,777 0.53 Internet (0.10%) ASOS 2,671 98,735 0.10 Leisure Time (0.36%) Carnival 9,090 250,651 0.24TUI Travel 24,692 122,729 0.12 Lodging (0.84%) InterContinental Hotels Group 12,773 386,184 0.37Whitbread 8,887 489,330 0.47 Machinery - Diversified (0.33%) Weir Group 10,580 346,041 0.33 Media (2.14%) British Sky Broadcasting Group 49,943 563,832 0.54ITV 188,007 418,397 0.40Pearson 40,196 579,289 0.56Reed Elsevier 57,080 670,067 0.64 Mining (8.45%) Anglo American 68,516 1,223,586 1.18Antofagasta 19,483 185,647 0.18BHP Billiton 104,296 2,461,054 2.36Fresnillo 10,701 116,533 0.11Glencore 522,451 2,124,075 2.04Randgold Resources 4,312 262,411 0.25Rio Tinto 62,576 2,429,211 2.33 Miscellaneous Manufacturers (0.71%) IMI 13,549 251,608 0.24Melrose Industries 52,567 170,816 0.17Smiths Group 19,483 315,575 0.30 Oil & Gas (17.73%) BG Group 167,561 2,584,321 2.48BP 909,493 5,848,289 5.62Royal Dutch Shell - Class A 189,721 5,730,178 5.50Royal Dutch Shell - Class B 120,327 3,820,592 3.67Tullow Oil 44,561 474,969 0.46 Oil & Gas Services (0.40%) AMEC 14,744 223,716 0.21
128

UBS ETF - MSCI United Kingdom 100% hedged to EUR UCITS ETF Semi-Annual Report as of 30 June 2014 Schedule of Investments as at 30 June 2014 (Expressed in EUR) (Unaudited)
The accompanying notes form an integral part of these financial statements.
Transferable securities listed on an Official Stock Exchange
Quantity Market
Value EUR % of
Net Assets Oil & Gas Services (0.40%) (continued) Petrofac 12,942 194,435 0.19 Packaging & Containers (0.23%) Rexam 35,220 235,315 0.23 Pharmaceuticals & Biotechnology (9.31%) AstraZeneca 62,227 3,373,069 3.24GlaxoSmithKline 239,411 4,676,139 4.49Shire 28,915 1,650,236 1.58 Private Equity (0.23%) 3i Group 47,115 236,474 0.23 Real Estate Investment Trusts (1.43%) British Land 46,909 411,537 0.40Hammerson 34,132 247,227 0.24Intu Properties 43,906 170,855 0.16Land Securities Group 38,894 503,210 0.48Segro 37,121 160,029 0.15 Retail (1.85%) Kingfisher 117,258 525,707 0.50Marks & Spencer Group 80,293 426,361 0.41Next 7,562 611,481 0.59Sports Direct International 13,154 116,058 0.11Travis Perkins 12,118 247,886 0.24 Semiconductors (0.73%) ARM Holdings 69,265 762,073 0.73 Software (0.25%) Sage Group 54,421 261,046 0.25 Telecommunications (5.02%) BT Group 389,204 1,870,819 1.79Inmarsat 20,891 195,019 0.19Vodafone Group 1,300,074 3,165,989 3.04 Transportation (0.19%) Royal Mail 32,300 201,284 0.19 Water (0.62%) Severn Trent 11,607 280,049 0.27United Utilities Group 33,603 370,129 0.35
_______________________________________________________________________________________________________________ ____________________________________________________________
Total Common Stocks 105,680,930 101.49 _______________________________________________________________________________________________________________ ____________________________________________________________
TOTAL INVESTMENTS (Cost EUR 102,697,508) 105,680,930 101.49Other net assets (1,548,045) (1.49)
_______________________________________________________________________________________________________________ ____________________________________________________________
TOTAL NET ASSETS 104,132,885 100.00 _______________________________________________________________________________________________________________ ____________________________________________________________ _______________________________________________________________________________________________________________ ____________________________________________________________
Forward Foreign Exchange Contracts
Purchases Sales Maturity Date
Unrealisedappreciation/ (depreciation)
EUR % of
Net AssetsEUR 105,991,000 GBP 86,235,761 3 July 2014 (1,702,393) (1.63)
_______________________________________________________________________________________________________________ ____________________________________________________________
Total Forward Foreign Exchange Contracts (1,702,393) (1.63) _______________________________________________________________________________________________________________ ____________________________________________________________
129

UBS ETF - MSCI United Kingdom 100% hedged to USD UCITS ETF Semi-Annual Report as of 30 June 2014 Schedule of Investments as at 30 June 2014 (Expressed in USD) (Unaudited)
The accompanying notes form an integral part of these financial statements.
Transferable securities listed on an Official Stock Exchange
Quantity Market
Value USD % of
Net AssetsCommon Stocks Advertising (1.02%) WPP 64,112 1,396,582 1.02 Aerospace & Defense (2.46%) BAE Systems 152,389 1,127,974 0.82Cobham 54,094 288,854 0.21Meggitt 37,551 324,885 0.24Rolls-Royce Holdings 89,468 1,635,322 1.19 Agriculture (5.39%) British American Tobacco 89,761 5,337,956 3.89Imperial Tobacco Group 45,847 2,061,695 1.50 Airlines (0.13%) easyJet 7,613 177,683 0.13 Apparel (0.38%) Burberry Group 20,904 530,064 0.38 Auto Parts & Equipment (0.35%) GKN 77,696 482,373 0.35 Banks (13.39%) Barclays 779,134 2,834,925 2.07HSBC Holdings 895,952 9,082,887 6.61Lloyds Banking Group 2,717,987 3,450,655 2.51Royal Bank of Scotland Group 117,257 658,415 0.48Standard Chartered 115,595 2,359,941 1.72 Beverages (4.87%) Coca-Cola HBC 9,178 210,600 0.15Diageo 119,619 3,816,538 2.78SABMiller 45,932 2,660,826 1.94 Chemicals (0.55%) Croda International 6,438 242,286 0.18Johnson Matthey 9,671 512,615 0.37 Commercial Services (2.43%) Aggreko 12,090 341,089 0.25Babcock International Group 23,500 466,908 0.34Bunzl 15,678 434,810 0.32Capita 30,953 605,991 0.44Experian 47,555 803,361 0.58G4S 74,073 323,220 0.24Intertek Group 7,613 357,840 0.26 Distribution & Wholesale (0.51%) Wolseley 12,833 702,818 0.51 Diversified Financial Services (1.69%) Aberdeen Asset Management 43,346 336,409 0.25Hargreaves Lansdown 11,277 238,711 0.17ICAP 27,076 175,924 0.13Investec 25,253 232,734 0.17London Stock Exchange Group 8,426 289,152 0.21Old Mutual 235,237 795,188 0.58Schroders 5,893 252,508 0.18 Electric (0.90%) SSE 46,015 1,232,895 0.90 Entertainment (0.17%) William Hill 41,993 235,509 0.17 Food (5.76%) Associated British Foods 17,088 890,854 0.65Compass Group 84,922 1,476,722 1.07J Sainsbury 58,804 317,222 0.23Tate & Lyle 22,313 261,149 0.19
130

UBS ETF - MSCI United Kingdom 100% hedged to USD UCITS ETF Semi-Annual Report as of 30 June 2014 Schedule of Investments as at 30 June 2014 (Expressed in USD) (Unaudited)
The accompanying notes form an integral part of these financial statements.
Transferable securities listed on an Official Stock Exchange
Quantity Market
Value USD % of
Net Assets Food (5.76%) (continued) Tesco 386,183 1,876,614 1.37Unilever 61,137 2,771,224 2.02WM Morrison Supermarkets 99,325 311,470 0.23 Gas (2.80%) Centrica 242,685 1,297,148 0.94National Grid 177,446 2,548,609 1.86 Healthcare Products (0.54%) Smith & Nephew 41,934 744,971 0.54 Home Builders (0.23%) Persimmon 14,505 315,721 0.23 Household Products (1.95%) Reckitt Benckiser Group 30,746 2,681,122 1.95 Insurance (5.20%) Admiral Group 9,002 238,423 0.17Aviva 140,311 1,224,744 0.89Direct Line Insurance Group 70,441 324,956 0.24Friends Life Group 67,176 362,156 0.27Legal & General Group 282,392 1,088,339 0.79Prudential 121,877 2,794,527 2.04RSA Insurance Group 47,914 388,986 0.28Standard Life 112,414 719,061 0.52 Internet (0.10%) ASOS 2,691 136,196 0.10 Leisure Time (0.35%) Carnival 8,668 327,247 0.24TUI Travel 23,538 160,181 0.11 Lodging (0.85%) InterContinental Hotels Group 12,170 503,783 0.37Whitbread 8,752 659,789 0.48 Machinery - Diversified (0.33%) Weir Group 10,090 451,840 0.33 Media (2.16%) British Sky Broadcasting Group 49,159 759,852 0.55ITV 180,078 548,689 0.40Pearson 38,543 760,517 0.56Reed Elsevier 55,686 895,018 0.65 Mining (8.49%) Anglo American 66,388 1,623,242 1.18Antofagasta 18,943 247,133 0.18BHP Billiton 100,564 3,248,981 2.37Fresnillo 10,364 154,526 0.11Glencore 505,565 2,814,184 2.05Randgold Resources 4,166 347,115 0.25Rio Tinto 60,572 3,219,441 2.35 Miscellaneous Manufacturers (0.71%) IMI 12,918 328,446 0.24Melrose Industries 52,223 232,341 0.17Smiths Group 18,545 411,268 0.30 Oil & Gas (17.80%) BG Group 162,274 3,426,681 2.50BP 878,722 7,736,279 5.63Royal Dutch Shell - Class A 183,478 7,587,310 5.53Royal Dutch Shell - Class B 116,392 5,059,899 3.68Tullow Oil 43,762 638,643 0.46 Oil & Gas Services (0.39%) AMEC 13,941 289,620 0.21
131

UBS ETF - MSCI United Kingdom 100% hedged to USD UCITS ETF Semi-Annual Report as of 30 June 2014 Schedule of Investments as at 30 June 2014 (Expressed in USD) (Unaudited)
The accompanying notes form an integral part of these financial statements.
Transferable securities listed on an Official Stock Exchange
Quantity Market
Value USD % of
Net Assets Oil & Gas Services (0.39%) (continued) Petrofac 12,305 253,107 0.18 Packaging & Containers (0.22%) Rexam 32,799 300,035 0.22 Pharmaceuticals & Biotechnology (9.34%) AstraZeneca 60,024 4,454,741 3.25GlaxoSmithKline 231,246 6,183,989 4.50Shire 27,985 2,186,750 1.59 Private Equity (0.23%) 3i Group 45,874 315,241 0.23 Real Estate Investment Trusts (1.44%) British Land 45,213 543,085 0.39Hammerson 33,266 329,903 0.24Intu Properties 42,897 228,550 0.17Land Securities Group 37,739 668,510 0.49Segro 35,340 208,591 0.15 Retail (1.86%) Kingfisher 112,217 688,828 0.50Marks & Spencer Group 77,044 560,131 0.41Next 7,418 821,267 0.60Sports Direct International 13,107 158,334 0.11Travis Perkins 11,633 325,809 0.24 Semiconductors (0.74%) ARM Holdings 67,354 1,014,605 0.74 Software (0.25%) Sage Group 51,698 339,528 0.25 Telecommunications (5.05%) BT Group 376,523 2,477,977 1.80Inmarsat 20,348 260,070 0.19Vodafone Group 1,258,685 4,196,714 3.06 Transportation (0.19%) Royal Mail 30,807 262,850 0.19 Water (0.62%) Severn Trent 11,196 369,852 0.27United Utilities Group 32,081 483,809 0.35
_______________________________________________________________________________________________________________ ____________________________________________________________
Total Common Stocks 139,852,658 101.84 _______________________________________________________________________________________________________________ ____________________________________________________________
TOTAL INVESTMENTS (Cost USD 137,696,432) 139,852,658 101.84Other net liabilities (2,530,521) (1.84)
_______________________________________________________________________________________________________________ ____________________________________________________________
TOTAL NET ASSETS 137,322,137 100.00 _______________________________________________________________________________________________________________ ____________________________________________________________ _______________________________________________________________________________________________________________ ____________________________________________________________
Forward Foreign Exchange Contracts
Purchases Sales Maturity Date
Unrealisedappreciation/ (depreciation)
USD % of
Net AssetsUSD 139,800,000 GBP 83,288,690 3 July 2014 (2,609,990) (1.90)
_______________________________________________________________________________________________________________ ____________________________________________________________
Total Forward Foreign Exchange Contracts (2,609,990) (1.90) _______________________________________________________________________________________________________________ ____________________________________________________________
132

UBS ETF - MSCI Turkey UCITS ETF Semi-Annual Report as of 30 June 2014 Schedule of Investments as at 30 June 2014 (Expressed in EUR) (Unaudited)
The accompanying notes form an integral part of these financial statements.
Transferable securities listed on an Official Stock Exchange
Quantity Market
Value EUR % of
Net AssetsCommon Stocks Airlines (2.41%) Turk Hava Yollari 103,266 230,863 2.41 Auto Manufacturers (2.43%) Ford Otomotiv Sanayi 13,381 121,687 1.27Tofas Turk Otomobil Fabrikasi 24,344 110,273 1.16 Banks (40.42%) Akbank 337,376 905,322 9.46Turkiye Garanti Bankasi 432,514 1,235,112 12.91Turkiye Halk Bankasi 117,453 643,299 6.72Turkiye Is Bankasi - Class C 295,345 582,956 6.09Turkiye Vakiflar Bankasi Tao - Class D 140,570 240,658 2.52Yapi ve Kredi Bankasi 163,576 260,323 2.72 Beverages (6.30%) Anadolu Efes Biracilik Ve Malt Sanayii 38,987 348,505 3.64Coca-Cola Icecek 14,121 254,401 2.66 Engineering & Construction (3.66%) Enka Insaat ve Sanayi 87,290 172,896 1.81TAV Havalimanlari Holding 30,605 177,641 1.85 Food (8.80%) BIM Birlesik Magazalar 39,940 668,646 6.99Ulker Biskuvi Sanayi 28,258 172,779 1.81 Holding Companies - Diversified Operations (10.54%) Haci Omer Sabanci Holding 171,030 582,666 6.09KOC Holding 118,893 425,933 4.45 Home Furnishings (2.07%) Arcelik 44,614 198,250 2.07 Iron & Steel (3.60%) Eregli Demir ve Celik Fabrikalari 263,562 344,091 3.60 Mining (0.76%) Koza Altin Isletmeleri 8,746 72,908 0.76 Oil & Gas (4.17%) Tupras Turkiye Petrol Rafinerileri 23,457 399,164 4.17 Other Consumer, Cyclical (1.07%) Turkiye Sise ve Cam Fabrikalari 99,600 102,241 1.07 Real Estate (3.44%) Emlak Konut Gayrimenkul Yatirim Ortakligi 359,503 329,409 3.44 Telecommunications (9.96%) Turk Telekomunikasyon 96,727 203,916 2.13Turkcell Iletisim Hizmetleri 164,048 748,752 7.83
_______________________________________________________________________________________________________________ ____________________________________________________________
Total Common Stocks 9,532,691 99.63 _______________________________________________________________________________________________________________ ____________________________________________________________
TOTAL INVESTMENTS (Cost EUR 9,306,183) 9,532,691 99.63Other net assets 35,646 0.37
_______________________________________________________________________________________________________________ ____________________________________________________________
TOTAL NET ASSETS 9,568,337 100.00 _______________________________________________________________________________________________________________ ____________________________________________________________ _______________________________________________________________________________________________________________ ____________________________________________________________
133

UBS ETF - MSCI Japan UCITS ETF Semi-Annual Report as of 30 June 2014 Schedule of Investments as at 30 June 2014 (Expressed in JPY) (Unaudited)
The accompanying notes form an integral part of these financial statements.
Transferable securities listed on an Official Stock Exchange
Quantity Market
Value JPY % of
Net AssetsCommon Stocks Advertising (0.40%) Dentsu 66,900 275,962,500 0.31Hakuhodo DY Holdings 73,800 74,242,800 0.09 Aerospace & Defense (0.22%) IHI 415,000 195,880,000 0.22 Agriculture (1.43%) Japan Tobacco 340,900 1,258,943,700 1.43 Airlines (0.23%) ANA Holdings 417,000 99,663,000 0.11Japan Airlines 18,600 104,160,000 0.12 Apparel (0.13%) Asics 48,200 113,896,600 0.13 Auto Manufacturers (11.11%) Daihatsu Motor 63,700 114,723,700 0.13Fuji Heavy Industries 186,300 522,571,500 0.59Hino Motors 82,000 114,390,000 0.13Honda Motor 510,500 1,805,638,500 2.05Isuzu Motors 368,000 246,560,000 0.28Mazda Motor 834,000 396,150,000 0.45Mitsubishi Motors 193,799 216,667,282 0.25Nissan Motor 774,900 744,678,900 0.85Suzuki Motor 116,400 369,337,200 0.42Toyota Motor 863,600 5,254,142,400 5.96 Auto Parts & Equipment (3.67%) Aisin Seiki 60,000 241,800,000 0.27Bridgestone 205,100 727,079,500 0.83Denso 151,000 730,085,000 0.83JTEKT 63,000 107,541,000 0.12Koito Manufacturing 29,100 75,514,500 0.09NGK Insulators 81,000 186,300,000 0.21NGK Spark Plug 57,000 162,906,000 0.18NHK Spring 51,000 48,450,000 0.06NOK 28,100 57,183,500 0.06Stanley Electric 45,700 120,693,700 0.14Sumitomo Electric Industries 233,700 333,022,500 0.38Sumitomo Rubber Industries 54,800 80,117,600 0.09Toyoda Gosei 18,400 38,713,600 0.04Toyota Industries 50,900 266,207,000 0.30Yokohama Rubber 66,000 57,816,000 0.07 Banks (9.56%) Aozora Bank 345,000 114,885,000 0.13Bank of Kyoto 89,000 81,969,000 0.09Bank of Yokohama 372,000 216,876,000 0.25Chiba Bank 227,000 162,305,000 0.18Chugoku Bank 46,200 71,979,600 0.08Fukuoka Financial Group 248,000 121,272,000 0.14Gunma Bank 138,000 82,662,000 0.09Hachijuni Bank 134,000 84,018,000 0.10Hiroshima Bank 154,000 74,536,000 0.09Hokuhoku Financial Group 361,000 77,976,000 0.09Iyo Bank 85,700 87,756,800 0.10Joyo Bank 218,000 117,720,000 0.13Mitsubishi UFJ Financial Group 3,981,200 2,472,325,200 2.81Mizuho Financial Group 7,193,700 1,496,289,600 1.70Resona Holdings 690,400 407,336,000 0.46Seven Bank 191,200 79,156,800 0.09Shinsei Bank 522,000 119,016,000 0.14Shizuoka Bank 173,000 189,435,000 0.22Sumitomo Mitsui Financial Group 401,100 1,702,268,400 1.93Sumitomo Mitsui Trust Holdings 1,034,999 479,204,537 0.54Suruga Bank 55,000 108,130,000 0.12Yamaguchi Financial Group 69,000 73,692,000 0.08
134

UBS ETF - MSCI Japan UCITS ETF Semi-Annual Report as of 30 June 2014 Schedule of Investments as at 30 June 2014 (Expressed in JPY) (Unaudited)
The accompanying notes form an integral part of these financial statements.
Transferable securities listed on an Official Stock Exchange
Quantity Market
Value JPY % of
Net Assets Beverages (1.06%) Asahi Group Holdings 121,900 387,642,000 0.44Kirin Holdings 258,900 378,770,700 0.43Suntory Beverage & Food 43,100 171,322,500 0.19 Building Materials (1.43%) Asahi Glass 313,000 186,861,000 0.21Daikin Industries 73,600 470,451,200 0.53LIXIL Group 83,000 226,922,000 0.26Rinnai 11,100 108,558,000 0.12Taiheiyo Cement 362,000 147,696,000 0.17TOTO 88,000 120,120,000 0.14 Chemicals (3.10%) Air Water 43,000 69,660,000 0.08Asahi Kasei 391,000 303,025,000 0.34Daicel 88,000 85,184,000 0.10Hitachi Chemical 30,900 51,788,400 0.06JSR 52,200 90,723,600 0.10Kaneka 90,000 57,060,000 0.07Kansai Paint 72,000 121,896,000 0.14Kuraray 104,400 134,049,600 0.15Mitsubishi Chemical Holdings 425,600 191,094,400 0.22Mitsubishi Gas Chemical 115,000 74,520,000 0.08Mitsui Chemicals 255,000 70,635,000 0.08Nippon Paint 53,150 113,953,600 0.13Nitto Denko 50,800 241,147,600 0.27Shin-Etsu Chemical 129,100 794,997,800 0.90Sumitomo Chemical 477,000 182,691,000 0.21Taiyo Nippon Sanso 73,000 65,481,000 0.07Teijin 329,000 83,566,000 0.10 Commercial Services (1.01%) Benesse Holdings 21,800 95,811,000 0.11Dai Nippon Printing 178,000 188,324,000 0.21Park24 31,300 57,654,600 0.07Secom 66,100 409,159,000 0.47Toppan Printing 172,000 134,848,000 0.15 Computers (1.12%) Fujitsu 577,000 437,943,000 0.50Itochu Techno-Solutions 7,800 34,359,000 0.04Nomura Research Institute 34,200 109,098,000 0.12NTT Data 38,300 148,987,000 0.17Otsuka 15,000 73,650,000 0.08TDK 38,800 184,300,000 0.21 Cosmetics & Personal Care (1.23%) Kao 163,700 652,671,900 0.74Shiseido 114,000 210,558,000 0.24Unicharm 37,100 223,972,700 0.25 Distribution & Wholesale (4.06%) Hitachi High-Technologies 20,900 50,369,000 0.06Itochu 469,900 611,339,900 0.69Marubeni 515,000 381,615,000 0.43Mitsubishi 437,500 921,812,500 1.05Mitsubishi Logistics 37,000 56,129,000 0.06Mitsui & Co 545,000 885,080,000 1.01Sumitomo 349,900 478,663,200 0.54Toyota Tsusho 65,200 189,927,600 0.22 Diversified Financial Services (2.85%) Acom 117,500 56,635,000 0.06AEON Financial Service 37,100 98,277,900 0.11Credit Saison 48,000 101,184,000 0.12Daiwa Securities Group 514,000 450,778,000 0.51Japan Exchange Group 81,200 202,594,000 0.23Mitsubishi UFJ Lease & Finance 169,700 98,765,400 0.11Nomura Holdings 1,127,900 808,704,300 0.92ORIX 412,000 691,748,000 0.79
135

UBS ETF - MSCI Japan UCITS ETF Semi-Annual Report as of 30 June 2014 Schedule of Investments as at 30 June 2014 (Expressed in JPY) (Unaudited)
The accompanying notes form an integral part of these financial statements.
Transferable securities listed on an Official Stock Exchange
Quantity Market
Value JPY % of
Net Assets Electric (1.56%) Chubu Electric Power 204,600 257,591,400 0.29Chugoku Electric Power 92,800 128,249,600 0.15Electric Power Development 34,800 114,492,000 0.13Hokuriku Electric Power 52,400 70,373,200 0.08Kansai Electric Power 224,800 214,684,000 0.24Kyushu Electric Power 135,300 154,377,300 0.18Shikoku Electric Power 55,400 78,335,600 0.09Tohoku Electric Power 143,600 170,740,400 0.19Tokyo Electric Power 446,300 188,338,600 0.21 Electrical Components & Equipment (2.05%) Brother Industries 73,800 129,519,000 0.15Casio Computer 67,000 98,490,000 0.11Hitachi 1,503,000 1,115,226,000 1.27Mabuchi Motor 8,100 62,208,000 0.07Nidec 64,200 399,067,200 0.45 Electronics (4.54%) Advantest 47,800 59,845,600 0.07Hamamatsu Photonics 22,900 113,813,000 0.13Hirose Electric 9,400 141,470,000 0.16Hoya 138,500 466,191,000 0.53Ibiden 35,900 73,236,000 0.08Japan Display 104,000 64,688,000 0.07Keyence 14,210 628,010,950 0.71Kyocera 101,300 487,050,400 0.55Murata Manufacturing 63,300 600,147,300 0.68NEC 796,000 257,108,000 0.29Nippon Electric Glass 115,000 67,850,000 0.08Omron 62,800 268,156,000 0.31Toshiba 1,258,000 595,034,000 0.68Yaskawa Electric 73,900 90,675,300 0.10Yokogawa Electric 67,700 86,723,700 0.10 Engineering & Construction (0.95%) Chiyoda 49,000 60,123,000 0.07JGC 65,000 200,070,000 0.23Kajima 249,000 111,552,000 0.13Obayashi 207,000 149,661,000 0.17Shimizu 192,000 137,664,000 0.15Taisei 317,000 177,837,000 0.20 Entertainment (0.48%) Oriental Land 16,000 277,680,000 0.31Sankyo 17,200 66,994,000 0.08Toho 33,400 79,358,400 0.09 Environmental Control (0.09%) Kurita Water Industries 33,600 78,859,200 0.09 Food (2.42%) Ajinomoto 179,000 284,252,000 0.32Calbee 20,500 57,277,000 0.07Kikkoman 51,000 107,610,000 0.12MEIJI Holdings 18,900 126,819,000 0.14NH Foods 55,000 108,845,000 0.12Nisshin Seifun Group 63,549 76,830,741 0.09Nissin Foods Holdings 17,900 93,259,000 0.11Seven & I Holdings 234,800 1,002,126,400 1.14Toyo Suisan Kaisha 29,000 90,625,000 0.10Yakult Honsha 28,600 146,718,000 0.17Yamazaki Baking 28,000 35,420,000 0.04 Forest Products & Paper (0.12%) Oji Holdings 260,000 108,420,000 0.12 Gas (0.87%) Osaka Gas 587,000 250,062,000 0.28Toho Gas 139,000 77,423,000 0.09Tokyo Gas 745,000 441,040,000 0.50
136

UBS ETF - MSCI Japan UCITS ETF Semi-Annual Report as of 30 June 2014 Schedule of Investments as at 30 June 2014 (Expressed in JPY) (Unaudited)
The accompanying notes form an integral part of these financial statements.
Transferable securities listed on an Official Stock Exchange
Quantity Market
Value JPY % of
Net Assets Hand & Machine Tools (0.96%) Fuji Electric 178,000 85,440,000 0.10Makita 35,500 222,230,000 0.25SMC 17,000 460,870,000 0.52THK 32,900 78,565,200 0.09 Healthcare Products (0.83%) Olympus 75,600 263,844,000 0.30Shimadzu 70,000 65,030,000 0.08Sysmex 47,000 178,835,000 0.20Terumo 97,000 219,705,000 0.25 Healthcare Services (0.10%) Miraca Holdings 18,500 90,835,000 0.10 Home Builders (0.96%) Daiwa House Industry 182,000 382,200,000 0.43Iida Group Holdings 47,748 73,484,172 0.08Sekisui Chemical 132,000 154,836,000 0.18Sekisui House 170,300 236,546,700 0.27 Home Furnishings (1.76%) Panasonic 688,700 849,855,800 0.96Sharp 474,500 154,212,500 0.18Sony 324,100 545,136,200 0.62 Insurance (2.44%) Dai-ichi Life Insurance 267,400 403,506,600 0.46MS&AD Insurance Group Holdings 158,900 388,828,300 0.44NKSJ Holdings 104,800 285,894,400 0.32Sony Financial Holdings 56,000 96,768,000 0.11T&D Holdings 179,100 246,620,700 0.28Tokio Marine Holdings 219,095 730,024,540 0.83 Internet (1.16%) Dena 36,000 49,320,000 0.06Gree 35,900 31,879,200 0.04Kakaku.com 45,664 81,053,600 0.09M3 58,500 94,302,000 0.11Nexon 40,400 39,066,800 0.04Rakuten 246,300 322,406,700 0.36SBI Holdings 65,230 80,885,200 0.09Trend Micro 34,000 113,390,000 0.13Yahoo Japan 448,100 209,710,800 0.24 Iron & Steel (1.62%) Daido Steel 83,000 42,994,000 0.05Hitachi Metals 64,000 98,176,000 0.11JFE Holdings 156,500 327,241,500 0.37Kobe Steel 935,000 142,120,000 0.16Nippon Steel & Sumitomo Metal 2,396,080 776,329,920 0.88Yamato Kogyo 12,300 36,531,000 0.05 Leisure Time (0.70%) Sega Sammy Holdings 57,500 114,597,500 0.13Shimano 24,500 275,380,000 0.31Yamaha 48,700 77,968,700 0.09Yamaha Motor 85,900 149,723,700 0.17 Machinery - Construction & Mining (1.73%) Hitachi Construction Machinery 37,600 75,876,800 0.09Komatsu 296,100 696,427,200 0.79Mitsubishi Electric 601,000 751,250,000 0.85 Machinery - Diversified (2.95%) Amada 112,000 115,360,000 0.13FANUC 59,900 1,046,453,000 1.19Kawasaki Heavy Industries 456,000 176,016,000 0.20Kubota 349,000 501,164,000 0.57Mitsubishi Heavy Industries 947,000 598,504,000 0.68Nabtesco 35,600 79,744,000 0.09
137

UBS ETF - MSCI Japan UCITS ETF Semi-Annual Report as of 30 June 2014 Schedule of Investments as at 30 June 2014 (Expressed in JPY) (Unaudited)
The accompanying notes form an integral part of these financial statements.
Transferable securities listed on an Official Stock Exchange
Quantity Market
Value JPY % of
Net Assets Machinery - Diversified (2.95%) (continued) Sumitomo Heavy Industries 168,000 80,976,000 0.09 Metal Fabricate & Hardware (0.27%) Maruichi Steel Tube 15,500 42,160,000 0.05NSK 146,000 192,282,000 0.22 Mining (0.45%) Mitsubishi Materials 347,000 123,185,000 0.14Sumitomo Metal Mining 164,000 269,780,000 0.31 Miscellaneous Manufacturers (0.84%) FUJIFILM Holdings 147,100 415,557,500 0.47Konica Minolta 151,000 151,151,000 0.17Nikon 111,000 177,045,000 0.20 Office & Business Equipment (1.81%) Canon 353,100 1,163,817,600 1.32Ricoh 218,400 263,608,800 0.30Seiko Epson 39,600 170,676,000 0.19 Oil & Gas (1.15%) Idemitsu Kosan 28,400 62,508,400 0.07Inpex 271,500 418,110,000 0.47JX Holdings 707,223 383,314,866 0.44Showa Shell Sekiyu 61,300 70,556,300 0.08TonenGeneral Sekiyu 85,000 81,770,000 0.09 Packaging & Containers (0.09%) Toyo Seikan Group Holdings 51,700 80,445,200 0.09 Pharmaceuticals & Biotechnology (5.19%) Alfresa Holdings 12,800 83,584,000 0.09Astellas Pharma 686,500 913,731,500 1.04Chugai Pharmaceutical 69,400 198,137,000 0.22Daiichi Sankyo 204,700 386,883,000 0.44Eisai 80,900 343,339,600 0.39Hisamitsu Pharmaceutical 18,800 85,164,000 0.10Kyowa Hakko Kirin 73,000 100,083,000 0.11Medipal Holdings 44,700 64,189,200 0.07Mitsubishi Tanabe Pharma 64,900 98,453,300 0.11Ono Pharmaceutical 26,200 233,704,000 0.27Otsuka Holdings 119,400 374,916,000 0.43Santen Pharmaceutical 23,000 131,100,000 0.15Shionogi & Co 89,900 190,048,600 0.22Sumitomo Dainippon Pharma 47,700 55,570,500 0.06Suzuken 22,700 85,579,000 0.10Taisho Pharmaceutical Holdings 9,800 72,422,000 0.08Takeda Pharmaceutical 244,900 1,150,785,100 1.31 Real Estate (3.73%) Aeon Mall 33,880 90,425,720 0.10Daito Trust Construction 23,600 281,076,000 0.32Hulic 77,800 103,863,000 0.12Mitsubishi Estate 393,000 982,893,000 1.11Mitsui Fudosan 289,000 987,224,000 1.12Nomura Real Estate Holdings 37,100 71,120,700 0.08NTT Urban Development 36,800 41,952,000 0.05Sumitomo Realty & Development 111,000 482,517,000 0.55Tokyo Tatemono 125,000 117,125,000 0.13Tokyu Fudosan Holdings 161,700 129,198,300 0.15 Real Estate Investment Trusts (1.09%) Japan Prime Realty Investment 258 93,783,000 0.11Japan Real Estate Investment 378 223,020,000 0.25Japan Retail Fund Investment 694 158,093,200 0.18Nippon Building Fund 433 256,336,000 0.29Nippon Prologis REIT 433 102,274,600 0.12United Urban Investment 748 122,298,000 0.14
138

UBS ETF - MSCI Japan UCITS ETF Semi-Annual Report as of 30 June 2014 Schedule of Investments as at 30 June 2014 (Expressed in JPY) (Unaudited)
The accompanying notes form an integral part of these financial statements.
Transferable securities listed on an Official Stock Exchange
Quantity Market
Value JPY % of
Net Assets Retail (2.40%) ABC-Mart 8,800 47,696,000 0.05Aeon 196,300 244,589,800 0.28Citizen Holdings 80,800 64,236,000 0.07Don Quijote Holdings 17,600 99,440,000 0.11FamilyMart 18,800 82,062,000 0.09Fast Retailing 16,500 549,945,000 0.62Isetan Mitsukoshi Holdings 110,400 145,728,000 0.17J Front Retailing 144,000 102,384,000 0.12Lawson 20,500 155,800,000 0.18Marui Group 68,000 66,164,000 0.07McDonald's Holdings 21,500 61,167,500 0.07Nitori Holdings 21,800 120,772,000 0.14Shimamura 7,300 72,708,000 0.08Takashimaya 82,000 80,606,000 0.09USS 71,000 122,759,000 0.14Yamada Denki 282,900 102,126,900 0.12 Semiconductors (0.62%) Rohm 29,500 171,395,000 0.19Tokyo Electron 55,000 376,640,000 0.43 Software (0.23%) GungHo Online Entertainment 123,800 80,965,200 0.09Konami 29,400 65,826,600 0.08Oracle Japan 12,100 53,603,000 0.06 Telecommunications (5.68%) Hikari Tsushin 4,200 32,130,000 0.04KDDI 182,100 1,125,195,900 1.28Nippon Telegraph & Telephone 117,000 739,206,000 0.84NTT DOCOMO 483,100 836,729,200 0.95SoftBank 300,900 2,269,688,700 2.57 Textile (0.35%) Toray Industries 462,000 307,692,000 0.35 Toys, Games & Hobbies (0.66%) Bandai Namco Holdings 56,300 133,543,600 0.15Nintendo 33,300 403,762,500 0.46Sanrio 16,200 47,676,600 0.05 Transportation (4.45%) Central Japan Railway 44,600 644,470,000 0.73East Japan Railway 103,700 827,422,300 0.94Hankyu Hanshin Holdings 352,000 203,456,000 0.23Kamigumi 78,000 72,696,000 0.08Keikyu 148,000 134,680,000 0.15Keio 190,000 151,240,000 0.17Keisei Electric Railway 77,000 77,693,000 0.09Kintetsu 579,000 213,651,000 0.24Mitsui OSK Lines 340,000 128,180,000 0.15Nagoya Railroad 239,000 96,556,000 0.11Nippon Express 255,000 125,205,000 0.14Nippon Yusen 542,000 158,264,000 0.18Odakyu Electric Railway 195,000 190,125,000 0.22Tobu Railway 326,000 172,780,000 0.20Tokyu 350,000 251,300,000 0.28West Japan Railway 52,900 235,934,000 0.27Yamato Holdings 112,000 235,088,000 0.27
_______________________________________________________________________________________________________________ ____________________________________________________________
Total Common Stocks 88,020,791,128 99.91 _______________________________________________________________________________________________________________ ____________________________________________________________
TOTAL INVESTMENTS (Cost JPY 71,370,607,727) 88,020,791,128 99.91Other net assets 81,787,756 0.09
_______________________________________________________________________________________________________________ ____________________________________________________________
TOTAL NET ASSETS 88,102,578,884 100.00 _______________________________________________________________________________________________________________ ____________________________________________________________ _______________________________________________________________________________________________________________ ____________________________________________________________
139

UBS ETF - MSCI Japan 100% hedged to CHF UCITS ETF Semi-Annual Report as of 30 June 2014 Schedule of Investments as at 30 June 2014 (Expressed in CHF) (Unaudited)
The accompanying notes form an integral part of these financial statements.
Transferable securities listed on an Official Stock Exchange
Quantity Market
Value CHF % of
Net AssetsCommon Stocks Advertising (0.40%) Dentsu 9,000 324,983 0.32Hakuhodo DY Holdings 9,700 85,421 0.08 Aerospace & Defense (0.22%) IHI 54,000 223,116 0.22 Agriculture (1.44%) Japan Tobacco 46,000 1,487,072 1.44 Airlines (0.21%) ANA Holdings 44,000 92,054 0.09Japan Airlines 2,500 122,553 0.12 Apparel (0.13%) Asics 6,700 138,590 0.13 Auto Manufacturers (11.02%) Daihatsu Motor 8,200 129,277 0.12Fuji Heavy Industries 24,700 606,492 0.59Hino Motors 10,800 131,884 0.13Honda Motor 68,100 2,108,516 2.04Isuzu Motors 49,000 287,386 0.28Mazda Motor 112,000 465,700 0.45Mitsubishi Motors 26,400 258,369 0.25Nissan Motor 103,200 868,156 0.84Suzuki Motor 15,200 422,191 0.41Toyota Motor 114,700 6,108,681 5.91 Auto Parts & Equipment (3.65%) Aisin Seiki 8,000 282,221 0.27Bridgestone 27,200 844,073 0.82Denso 20,200 854,954 0.83JTEKT 8,600 128,507 0.12Koito Manufacturing 4,100 93,136 0.09NGK Insulators 11,000 221,470 0.22NGK Spark Plug 7,000 175,128 0.17NHK Spring 6,200 51,560 0.05NOK 4,300 76,600 0.07Stanley Electric 6,000 138,712 0.13Sumitomo Electric Industries 31,500 392,934 0.38Sumitomo Rubber Industries 7,500 95,985 0.09Toyoda Gosei 2,600 47,887 0.05Toyota Industries 6,800 311,319 0.30Yokohama Rubber 8,000 61,346 0.06 Banks (9.47%) Aozora Bank 49,000 142,835 0.14Bank of Kyoto 14,000 112,871 0.11Bank of Yokohama 48,000 244,965 0.24Chiba Bank 31,000 194,027 0.19Chugoku Bank 7,100 96,832 0.09Fukuoka Financial Group 32,000 136,979 0.13Gunma Bank 15,000 78,653 0.08Hachijuni Bank 17,000 93,306 0.09Hiroshima Bank 20,000 84,737 0.08Hokuhoku Financial Group 44,000 83,196 0.08Iyo Bank 10,200 91,431 0.09Joyo Bank 28,000 132,357 0.13Mitsubishi UFJ Financial Group 529,200 2,876,777 2.79Mizuho Financial Group 948,900 1,727,741 1.67Resona Holdings 93,200 481,352 0.47Seven Bank 25,300 91,689 0.09Shinsei Bank 68,000 135,718 0.13Shizuoka Bank 22,000 210,878 0.20Sumitomo Mitsui Financial Group 53,200 1,976,432 1.91Sumitomo Mitsui Trust Holdings 139,000 563,366 0.55Suruga Bank 8,000 137,679 0.13Yamaguchi Financial Group 9,000 84,141 0.08
140

UBS ETF - MSCI Japan 100% hedged to CHF UCITS ETF Semi-Annual Report as of 30 June 2014 Schedule of Investments as at 30 June 2014 (Expressed in CHF) (Unaudited)
The accompanying notes form an integral part of these financial statements.
Transferable securities listed on an Official Stock Exchange
Quantity Market
Value CHF % of
Net Assets Beverages (1.05%) Asahi Group Holdings 16,100 448,175 0.43Kirin Holdings 34,300 439,272 0.42Suntory Beverage & Food 5,800 201,818 0.20 Building Materials (1.44%) Asahi Glass 42,000 219,492 0.21Daikin Industries 9,900 553,945 0.54LIXIL Group 11,200 268,047 0.26Rinnai 1,500 128,418 0.12Taiheiyo Cement 49,000 175,005 0.17TOTO 12,000 143,387 0.14 Chemicals (3.08%) Air Water 6,000 85,087 0.08Asahi Kasei 52,000 352,777 0.34Daicel 11,000 93,210 0.09Hitachi Chemical 4,200 61,619 0.06JSR 7,600 115,627 0.11Kaneka 12,000 66,599 0.07Kansai Paint 10,000 148,201 0.14Kuraray 14,700 165,225 0.16Mitsubishi Chemical Holdings 56,300 221,284 0.21Mitsubishi Gas Chemical 16,000 90,759 0.09Mitsui Chemicals 32,000 77,593 0.08Nippon Paint 7,000 131,376 0.13Nitto Denko 6,700 278,413 0.27Shin-Etsu Chemical 17,100 921,787 0.89Sumitomo Chemical 62,000 207,867 0.20Taiyo Nippon Sanso 10,000 78,521 0.08Teijin 37,000 82,268 0.08 Commercial Services (0.98%) Benesse Holdings 2,700 103,877 0.10Dai Nippon Printing 23,000 213,014 0.21Park24 4,200 67,723 0.06Secom 8,700 471,416 0.46Toppan Printing 23,000 157,848 0.15 Computers (1.12%) Fujitsu 78,000 518,240 0.50Itochu Techno-Solutions 1,000 38,561 0.04Nomura Research Institute 4,500 125,660 0.12NTT Data 5,200 177,071 0.17Otsuka 2,100 90,260 0.09TDK 5,100 212,060 0.20 Cosmetics & Personal Care (1.23%) Kao 21,700 757,357 0.73Shiseido 15,100 244,140 0.24Unicharm 5,100 269,517 0.26 Distribution & Wholesale (4.04%) Hitachi High-Technologies 2,400 50,632 0.05Itochu 61,300 698,124 0.68Marubeni 69,000 447,571 0.43Mitsubishi 58,600 1,080,829 1.05Mitsubishi Logistics 5,000 66,397 0.06Mitsui & Co 73,000 1,037,776 1.01Sumitomo 46,900 561,635 0.54Toyota Tsusho 8,900 226,947 0.22 Diversified Financial Services (2.83%) Acom 16,900 71,306 0.07AEON Financial Service 4,700 108,987 0.11Credit Saison 6,000 110,718 0.11Daiwa Securities Group 70,000 537,394 0.52Japan Exchange Group 10,700 233,695 0.23Mitsubishi UFJ Lease & Finance 21,200 108,007 0.10Nomura Holdings 150,500 944,605 0.91ORIX 54,800 805,427 0.78
141

UBS ETF - MSCI Japan 100% hedged to CHF UCITS ETF Semi-Annual Report as of 30 June 2014 Schedule of Investments as at 30 June 2014 (Expressed in CHF) (Unaudited)
The accompanying notes form an integral part of these financial statements.
Transferable securities listed on an Official Stock Exchange
Quantity Market
Value CHF % of
Net Assets Electric (1.57%) Chubu Electric Power 27,100 298,669 0.29Chugoku Electric Power 12,500 151,221 0.15Electric Power Development 4,900 141,119 0.14Hokuriku Electric Power 7,300 85,821 0.08Kansai Electric Power 29,500 246,615 0.24Kyushu Electric Power 18,100 180,784 0.17Shikoku Electric Power 7,600 94,072 0.09Tohoku Electric Power 19,100 198,797 0.19Tokyo Electric Power 60,500 223,492 0.22 Electrical Components & Equipment (2.04%) Brother Industries 9,900 152,092 0.15Casio Computer 8,600 110,665 0.11Hitachi 201,000 1,305,554 1.26Mabuchi Motor 1,100 73,952 0.07Nidec 8,500 462,514 0.45 Electronics (4.51%) Advantest 6,700 73,430 0.07Hamamatsu Photonics 3,000 130,518 0.13Hirose Electric 1,200 158,093 0.15Hoya 18,000 530,373 0.51Ibiden 4,900 87,503 0.08Japan Display 14,800 80,584 0.08Keyence 1,900 735,058 0.71Kyocera 13,400 563,980 0.55Murata Manufacturing 8,400 697,153 0.67NEC 109,000 308,194 0.30Nippon Electric Glass 16,000 82,635 0.08Omron 8,500 317,718 0.31Toshiba 166,000 687,328 0.67Yaskawa Electric 10,000 107,409 0.10Yokogawa Electric 9,000 100,922 0.10 Engineering & Construction (0.94%) Chiyoda 6,000 64,445 0.06JGC 9,000 242,497 0.23Kajima 35,000 137,259 0.13Obayashi 27,000 170,882 0.17Shimizu 24,000 150,635 0.15Taisei 42,000 206,256 0.20 Entertainment (0.48%) Oriental Land 2,100 319,035 0.31Sankyo 2,200 75,011 0.07Toho 4,800 99,835 0.10 Environmental Control (0.08%) Kurita Water Industries 4,200 86,289 0.08 Food (2.41%) Ajinomoto 24,000 333,623 0.32Calbee 3,000 73,374 0.07Kikkoman 6,000 110,823 0.11MEIJI Holdings 2,500 146,844 0.14NH Foods 7,000 121,266 0.12Nisshin Seifun Group 7,800 82,550 0.08Nissin Foods Holdings 2,400 109,457 0.11Seven & I Holdings 31,600 1,180,610 1.14Toyo Suisan Kaisha 4,000 109,422 0.11Yakult Honsha 3,600 161,664 0.16Yamazaki Baking 5,000 55,368 0.05 Forest Products & Paper (0.12%) Oji Holdings 33,000 120,461 0.12 Gas (0.85%) Osaka Gas 77,000 287,141 0.28Toho Gas 15,000 73,138 0.07Tokyo Gas 99,000 513,040 0.50
142

UBS ETF - MSCI Japan 100% hedged to CHF UCITS ETF Semi-Annual Report as of 30 June 2014 Schedule of Investments as at 30 June 2014 (Expressed in CHF) (Unaudited)
The accompanying notes form an integral part of these financial statements.
Transferable securities listed on an Official Stock Exchange
Quantity Market
Value CHF % of
Net Assets Hand & Machine Tools (0.98%) Fuji Electric 23,000 96,642 0.09Makita 4,900 268,513 0.26SMC 2,300 545,823 0.53THK 4,800 100,339 0.10 Healthcare Products (0.81%) Olympus 10,000 305,506 0.30Shimadzu 10,000 81,323 0.08Sysmex 5,900 196,518 0.19Terumo 12,700 251,806 0.24 Healthcare Services (0.10%) Miraca Holdings 2,300 98,856 0.10 Home Builders (0.98%) Daiwa House Industry 25,000 459,573 0.44Iida Group Holdings 7,000 94,304 0.09Sekisui Chemical 18,000 184,827 0.18Sekisui House 22,700 276,009 0.27 Home Furnishings (1.75%) Panasonic 91,500 988,396 0.96Sharp 63,000 179,233 0.17Sony 43,700 643,432 0.62 Insurance (2.42%) Dai-ichi Life Insurance 35,500 468,935 0.45MS&AD Insurance Group Holdings 21,100 451,972 0.44NKSJ Holdings 13,900 331,936 0.32Sony Financial Holdings 7,300 110,423 0.11T&D Holdings 24,300 292,911 0.28Tokio Marine Holdings 29,100 848,775 0.82 Internet (1.15%) Dena 4,700 56,365 0.05Gree 4,100 31,871 0.03Kakaku.com 6,200 96,335 0.09M3 7,900 111,477 0.11Nexon 5,800 49,096 0.05Rakuten 33,300 381,574 0.37SBI Holdings 8,100 87,923 0.09Trend Micro 4,400 128,453 0.12Yahoo Japan 59,700 244,577 0.24 Iron & Steel (1.60%) Daido Steel 11,000 49,879 0.05Hitachi Metals 9,000 120,854 0.12JFE Holdings 21,000 384,387 0.37Kobe Steel 120,000 159,669 0.15Nippon Steel & Sumitomo Metal 313,000 887,737 0.86Yamato Kogyo 1,900 49,397 0.05 Leisure Time (0.70%) Sega Sammy Holdings 7,800 136,081 0.13Shimano 3,300 324,695 0.32Yamaha 6,700 93,899 0.09Yamaha Motor 10,800 164,784 0.16 Machinery - Construction & Mining (1.72%) Hitachi Construction Machinery 4,700 83,026 0.08Komatsu 39,100 805,024 0.78Mitsubishi Electric 81,000 886,319 0.86 Machinery - Diversified (2.93%) Amada 15,000 135,246 0.13FANUC 8,000 1,223,426 1.18Kawasaki Heavy Industries 57,000 192,600 0.19Kubota 47,000 590,809 0.57Mitsubishi Heavy Industries 126,000 697,080 0.68Nabtesco 4,700 92,159 0.09
143

UBS ETF - MSCI Japan 100% hedged to CHF UCITS ETF Semi-Annual Report as of 30 June 2014 Schedule of Investments as at 30 June 2014 (Expressed in CHF) (Unaudited)
The accompanying notes form an integral part of these financial statements.
Transferable securities listed on an Official Stock Exchange
Quantity Market
Value CHF % of
Net Assets Machinery - Diversified (2.93%) (continued) Sumitomo Heavy Industries 23,000 97,044 0.09 Metal Fabricate & Hardware (0.27%) Maruichi Steel Tube 2,000 47,621 0.05NSK 20,000 230,574 0.22 Mining (0.45%) Mitsubishi Materials 47,000 146,056 0.14Sumitomo Metal Mining 22,000 316,799 0.31 Miscellaneous Manufacturers (0.83%) FUJIFILM Holdings 19,300 477,277 0.46Konica Minolta 20,000 175,250 0.17Nikon 14,500 202,453 0.20 Office & Business Equipment (1.82%) Canon 47,300 1,364,719 1.32Ricoh 29,400 310,634 0.30Seiko Epson 5,400 203,735 0.20 Oil & Gas (1.15%) Idemitsu Kosan 3,900 75,141 0.07Inpex 36,400 490,701 0.47JX Holdings 93,700 444,563 0.43Showa Shell Sekiyu 8,100 81,612 0.08TonenGeneral Sekiyu 12,000 101,054 0.10 Packaging & Containers (0.09%) Toyo Seikan Group Holdings 6,900 93,984 0.09 Pharmaceuticals & Biotechnology (5.17%) Alfresa Holdings 1,700 97,176 0.09Astellas Pharma 90,800 1,057,934 1.02Chugai Pharmaceutical 9,400 234,925 0.23Daiichi Sankyo 26,500 438,432 0.42Eisai 10,700 397,515 0.38Hisamitsu Pharmaceutical 2,600 103,102 0.10Kyowa Hakko Kirin 10,000 120,014 0.12Medipal Holdings 5,700 71,651 0.07Mitsubishi Tanabe Pharma 9,400 124,827 0.12Ono Pharmaceutical 3,400 265,484 0.26Otsuka Holdings 16,200 445,287 0.43Santen Pharmaceutical 3,000 149,689 0.15Shionogi & Co 12,600 233,169 0.23Sumitomo Dainippon Pharma 6,700 68,328 0.07Suzuken 2,900 95,705 0.09Taisho Pharmaceutical Holdings 1,300 84,097 0.08Takeda Pharmaceutical 32,900 1,353,306 1.31 Real Estate (3.72%) Aeon Mall 4,800 112,146 0.11Daito Trust Construction 3,100 323,198 0.31Hulic 9,800 114,526 0.11Mitsubishi Estate 52,000 1,138,444 1.10Mitsui Fudosan 39,000 1,166,211 1.13Nomura Real Estate Holdings 5,400 90,617 0.09NTT Urban Development 4,700 46,903 0.05Sumitomo Realty & Development 15,000 570,789 0.55Tokyo Tatemono 17,000 139,439 0.14Tokyu Fudosan Holdings 19,600 137,087 0.13 Real Estate Investment Trusts (1.07%) Japan Prime Realty Investment 33 105,006 0.10Japan Real Estate Investment 49 253,072 0.24Japan Retail Fund Investment 96 191,434 0.18Nippon Building Fund 57 295,387 0.29Nippon Prologis REIT 55 113,720 0.11United Urban Investment 105 150,280 0.15
144

UBS ETF - MSCI Japan 100% hedged to CHF UCITS ETF Semi-Annual Report as of 30 June 2014 Schedule of Investments as at 30 June 2014 (Expressed in CHF) (Unaudited)
The accompanying notes form an integral part of these financial statements.
Transferable securities listed on an Official Stock Exchange
Quantity Market
Value CHF % of
Net Assets Retail (2.37%) ABC-Mart 1,000 47,445 0.05Aeon 26,500 289,041 0.28Citizen Holdings 11,600 80,727 0.08Don Quijote Holdings 2,400 118,701 0.12FamilyMart 2,400 91,704 0.09Fast Retailing 2,200 641,879 0.62Isetan Mitsukoshi Holdings 13,700 158,303 0.15J Front Retailing 20,000 124,479 0.12Lawson 2,700 179,627 0.17Marui Group 9,400 80,064 0.08McDonald's Holdings 3,000 74,713 0.07Nitori Holdings 2,800 135,788 0.13Shimamura 900 78,469 0.08Takashimaya 11,000 94,655 0.09USS 9,200 139,244 0.13Yamada Denki 35,300 111,552 0.11 Semiconductors (0.61%) Rohm 3,900 198,351 0.19Tokyo Electron 7,200 431,610 0.42 Software (0.24%) GungHo Online Entertainment 17,500 100,187 0.10Konami 4,400 86,238 0.08Oracle Japan 1,600 62,047 0.06 Telecommunications (5.65%) Hikari Tsushin 700 46,876 0.04KDDI 24,200 1,308,966 1.27Nippon Telegraph & Telephone 15,600 862,778 0.83NTT DOCOMO 63,800 967,305 0.94SoftBank 40,200 2,654,392 2.57 Textile (0.34%) Toray Industries 61,000 355,630 0.34 Toys, Games & Hobbies (0.65%) Bandai Namco Holdings 7,400 153,653 0.15Nintendo 4,400 467,013 0.45Sanrio 2,100 54,101 0.05 Transportation (4.44%) Central Japan Railway 6,100 771,600 0.75East Japan Railway 14,100 984,832 0.95Hankyu Hanshin Holdings 47,000 237,805 0.23Kamigumi 10,000 81,585 0.08Keikyu 19,000 151,353 0.15Keio 24,000 167,232 0.16Keisei Electric Railway 12,000 105,991 0.10Kintetsu 73,000 235,800 0.23Mitsui OSK Lines 46,000 151,808 0.15Nagoya Railroad 31,000 109,632 0.11Nippon Express 34,000 146,135 0.14Nippon Yusen 68,000 173,815 0.17Odakyu Electric Railway 26,000 221,908 0.21Tobu Railway 42,000 194,859 0.19Tokyu 48,000 301,690 0.29West Japan Railway 6,900 269,388 0.26Yamato Holdings 15,400 282,962 0.27
_______________________________________________________________________________________________________________ ____________________________________________________________
Total Common Stocks 102,596,835 99.32 _______________________________________________________________________________________________________________ ____________________________________________________________
TOTAL INVESTMENTS (Cost CHF 100,365,703) 102,596,835 99.32Other net assets 700,496 0.68
_______________________________________________________________________________________________________________ ____________________________________________________________
TOTAL NET ASSETS 103,297,331 100.00 _______________________________________________________________________________________________________________ ____________________________________________________________ _______________________________________________________________________________________________________________ ____________________________________________________________
145

UBS ETF - MSCI Japan 100% hedged to CHF UCITS ETF Semi-Annual Report as of 30 June 2014 Schedule of Investments as at 30 June 2014 (Expressed in CHF) (Unaudited)
The accompanying notes form an integral part of these financial statements.
Forward Foreign Exchange Contracts
Purchases Sales Maturity Date
Unrealised appreciation/ (depreciation)
CHF % of
Net AssetsCHF 98,603,000 JPY 11,225,004,959 3 July 2014 342,025 0.33
_______________________________________________________________________________________________________________ ____________________________________________________________
Total Forward Foreign Exchange Contracts 342,025 0.33 _______________________________________________________________________________________________________________ ____________________________________________________________
146

UBS ETF - MSCI Japan 100% hedged to EUR UCITS ETF Semi-Annual Report as of 30 June 2014 Schedule of Investments as at 30 June 2014 (Expressed in EUR) (Unaudited)
The accompanying notes form an integral part of these financial statements.
Transferable securities listed on an Official Stock Exchange
Quantity Market
Value EUR % of
Net AssetsCommon Stocks Advertising (0.40%) Dentsu 6,400 190,336 0.31Hakuhodo DY Holdings 7,300 52,947 0.09 Aerospace & Defense (0.22%) IHI 39,000 132,716 0.22 Agriculture (1.45%) Japan Tobacco 33,300 886,628 1.45 Airlines (0.21%) ANA Holdings 29,000 49,971 0.08Japan Airlines 1,900 76,711 0.13 Apparel (0.14%) Asics 4,900 83,479 0.14 Auto Manufacturers (11.08%) Daihatsu Motor 5,800 75,311 0.12Fuji Heavy Industries 17,800 359,974 0.59Hino Motors 7,800 78,449 0.13Honda Motor 49,300 1,257,187 2.05Isuzu Motors 35,000 169,068 0.27Mazda Motor 82,000 280,818 0.46Mitsubishi Motors 19,200 154,761 0.25Nissan Motor 75,100 520,333 0.85Suzuki Motor 11,000 251,640 0.41Toyota Motor 83,100 3,645,090 5.95 Auto Parts & Equipment (3.69%) Aisin Seiki 5,800 168,520 0.28Bridgestone 19,700 503,501 0.82Denso 14,700 512,427 0.84JTEKT 6,200 76,303 0.12Koito Manufacturing 3,000 56,128 0.09NGK Insulators 8,000 132,659 0.22NGK Spark Plug 5,000 103,027 0.17NHK Spring 5,000 34,246 0.06NOK 2,800 41,081 0.07Stanley Electric 4,300 81,876 0.13Sumitomo Electric Industries 23,100 237,326 0.39Sumitomo Rubber Industries 5,300 55,865 0.09Toyoda Gosei 2,200 33,372 0.05Toyota Industries 4,900 184,763 0.30Yokohama Rubber 6,000 37,894 0.06 Banks (9.50%) Aozora Bank 34,000 81,628 0.13Bank of Kyoto 10,000 66,401 0.11Bank of Yokohama 35,000 147,114 0.24Chiba Bank 23,000 118,564 0.19Chugoku Bank 5,200 58,410 0.09Fukuoka Financial Group 23,000 81,088 0.13Gunma Bank 11,000 47,505 0.08Hachijuni Bank 12,000 54,246 0.09Hiroshima Bank 15,000 52,343 0.08Hokuhoku Financial Group 32,000 49,834 0.08Iyo Bank 7,400 54,632 0.09Joyo Bank 20,000 77,865 0.13Mitsubishi UFJ Financial Group 383,200 1,715,675 2.80Mizuho Financial Group 690,300 1,035,188 1.69Resona Holdings 68,100 289,679 0.47Seven Bank 17,800 53,130 0.09Shinsei Bank 49,000 80,547 0.13Shizuoka Bank 16,000 126,314 0.21Sumitomo Mitsui Financial Group 38,400 1,174,964 1.92Sumitomo Mitsui Trust Holdings 100,000 333,810 0.54Suruga Bank 5,000 70,871 0.12Yamaguchi Financial Group 7,000 53,900 0.09
147

UBS ETF - MSCI Japan 100% hedged to EUR UCITS ETF Semi-Annual Report as of 30 June 2014 Schedule of Investments as at 30 June 2014 (Expressed in EUR) (Unaudited)
The accompanying notes form an integral part of these financial statements.
Transferable securities listed on an Official Stock Exchange
Quantity Market
Value EUR % of
Net Assets Beverages (1.06%) Asahi Group Holdings 11,700 268,244 0.44Kirin Holdings 25,300 266,860 0.43Suntory Beverage & Food 4,100 117,500 0.19 Building Materials (1.44%) Asahi Glass 30,000 129,126 0.21Daikin Industries 7,100 327,200 0.53LIXIL Group 8,000 157,691 0.26Rinnai 1,100 77,562 0.13Taiheiyo Cement 35,000 102,955 0.17TOTO 9,000 88,571 0.14 Chemicals (3.08%) Air Water 5,000 58,399 0.10Asahi Kasei 38,000 212,326 0.35Daicel 8,000 55,832 0.09Hitachi Chemical 3,200 38,667 0.06JSR 5,500 68,918 0.11Kaneka 8,000 36,568 0.06Kansai Paint 7,000 85,442 0.14Kuraray 10,900 100,904 0.17Mitsubishi Chemical Holdings 40,000 129,487 0.21Mitsubishi Gas Chemical 11,000 51,391 0.08Mitsui Chemicals 24,000 47,930 0.08Nippon Paint 5,000 77,288 0.13Nitto Denko 4,700 160,855 0.26Shin-Etsu Chemical 12,400 550,528 0.90Sumitomo Chemical 44,000 121,498 0.20Taiyo Nippon Sanso 7,000 45,270 0.07Teijin 24,000 43,950 0.07 Commercial Services (1.00%) Benesse Holdings 2,000 63,373 0.10Dai Nippon Printing 17,000 129,674 0.21Park24 3,300 43,825 0.07Secom 6,300 281,157 0.46Toppan Printing 17,000 96,091 0.16 Computers (1.13%) Fujitsu 56,000 306,442 0.50Itochu Techno-Solutions 800 25,407 0.04Nomura Research Institute 3,300 75,897 0.12NTT Data 3,700 103,769 0.17Otsuka 1,500 53,099 0.09TDK 3,700 126,711 0.21 Cosmetics & Personal Care (1.23%) Kao 15,600 448,424 0.73Shiseido 10,900 145,148 0.24Unicharm 3,700 161,043 0.26 Distribution & Wholesale (4.07%) Hitachi High-Technologies 1,800 31,276 0.05Itochu 44,900 421,155 0.69Marubeni 49,000 261,777 0.43Mitsubishi 42,500 645,612 1.05Mitsubishi Logistics 4,000 43,749 0.07Mitsui & Co 52,700 617,042 1.01Sumitomo 34,000 335,338 0.55Toyota Tsusho 6,500 136,512 0.22 Diversified Financial Services (2.85%) Acom 11,200 38,921 0.06AEON Financial Service 3,400 64,935 0.11Credit Saison 4,500 68,391 0.11Daiwa Securities Group 51,000 322,469 0.53Japan Exchange Group 7,900 142,107 0.23Mitsubishi UFJ Lease & Finance 15,200 63,780 0.10Nomura Holdings 109,200 564,495 0.92ORIX 39,800 481,783 0.79
148

UBS ETF - MSCI Japan 100% hedged to EUR UCITS ETF Semi-Annual Report as of 30 June 2014 Schedule of Investments as at 30 June 2014 (Expressed in EUR) (Unaudited)
The accompanying notes form an integral part of these financial statements.
Transferable securities listed on an Official Stock Exchange
Quantity Market
Value EUR % of
Net Assets Electric (1.56%) Chubu Electric Power 20,000 181,541 0.30Chugoku Electric Power 8,900 88,678 0.14Electric Power Development 3,500 83,020 0.14Hokuriku Electric Power 5,400 52,286 0.08Kansai Electric Power 21,000 144,591 0.24Kyushu Electric Power 12,800 105,296 0.17Shikoku Electric Power 5,600 57,089 0.09Tohoku Electric Power 13,500 115,727 0.19Tokyo Electric Power 42,900 130,523 0.21 Electrical Components & Equipment (2.03%) Brother Industries 7,000 88,571 0.14Casio Computer 6,400 67,829 0.11Hitachi 145,000 775,693 1.27Mabuchi Motor 700 38,760 0.06Nidec 6,100 273,375 0.45 Electronics (4.57%) Advantest 5,200 46,938 0.08Hamamatsu Photonics 2,200 78,831 0.13Hirose Electric 900 97,656 0.16Hoya 13,200 320,336 0.52Ibiden 3,800 55,890 0.09Japan Display 10,600 47,535 0.08Keyence 1,400 446,087 0.73Kyocera 9,800 339,710 0.55Murata Manufacturing 6,100 416,967 0.68NEC 77,000 179,313 0.29Nippon Electric Glass 12,000 51,045 0.08Omron 6,100 187,791 0.31Toshiba 120,000 409,223 0.67Yaskawa Electric 6,900 61,040 0.10Yokogawa Electric 6,600 60,955 0.10 Engineering & Construction (0.93%) Chiyoda 5,000 44,232 0.07JGC 6,000 133,149 0.22Kajima 25,000 80,749 0.13Obayashi 19,000 99,040 0.16Shimizu 18,000 93,048 0.15Taisei 30,000 121,339 0.20 Entertainment (0.48%) Oriental Land 1,500 187,687 0.31Sankyo 1,500 42,123 0.07Toho 3,600 61,669 0.10 Environmental Control (0.09%) Kurita Water Industries 3,200 54,148 0.09 Food (2.42%) Ajinomoto 18,000 206,083 0.34Calbee 2,100 42,302 0.07Kikkoman 4,000 60,850 0.10MEIJI Holdings 1,800 87,079 0.14NH Foods 5,000 71,340 0.12Nisshin Seifun Group 5,900 51,428 0.08Nissin Foods Holdings 1,600 60,100 0.10Seven & I Holdings 22,800 701,580 1.14Toyo Suisan Kaisha 3,000 67,591 0.11Yakult Honsha 2,700 99,862 0.16Yamazaki Baking 4,000 36,481 0.06 Forest Products & Paper (0.12%) Oji Holdings 24,000 72,155 0.12 Gas (0.85%) Osaka Gas 55,000 168,923 0.28Toho Gas 11,000 44,174 0.07Tokyo Gas 72,000 307,307 0.50
149

UBS ETF - MSCI Japan 100% hedged to EUR UCITS ETF Semi-Annual Report as of 30 June 2014 Schedule of Investments as at 30 June 2014 (Expressed in EUR) (Unaudited)
The accompanying notes form an integral part of these financial statements.
Transferable securities listed on an Official Stock Exchange
Quantity Market
Value EUR % of
Net Assets Hand & Machine Tools (1.00%) Fuji Electric 17,000 58,831 0.10Makita 3,600 162,478 0.26SMC 1,700 332,274 0.54THK 3,500 60,259 0.10 Healthcare Products (0.81%) Olympus 7,100 178,649 0.29Shimadzu 7,000 46,885 0.08Sysmex 4,300 117,962 0.19Terumo 9,200 150,236 0.25 Healthcare Services (0.10%) Miraca Holdings 1,700 60,179 0.10 Home Builders (0.98%) Daiwa House Industry 18,000 272,527 0.44Iida Group Holdings 4,700 52,150 0.09Sekisui Chemical 13,000 109,941 0.18Sekisui House 16,500 165,236 0.27 Home Furnishings (1.76%) Panasonic 66,600 592,526 0.97Sharp 45,000 105,442 0.17Sony 31,500 381,992 0.62 Insurance (2.43%) Dai-ichi Life Insurance 25,900 281,778 0.46MS&AD Insurance Group Holdings 15,400 271,689 0.44NKSJ Holdings 9,900 194,714 0.32Sony Financial Holdings 5,300 66,030 0.11T&D Holdings 17,300 171,751 0.28Tokio Marine Holdings 21,000 504,478 0.82 Internet (1.16%) Dena 3,500 34,570 0.06Gree 3,300 21,127 0.04Kakaku.com 4,500 57,588 0.09M3 5,900 68,570 0.11Nexon 3,800 26,493 0.04Rakuten 24,300 229,332 0.38SBI Holdings 6,400 57,216 0.09Trend Micro 3,100 74,538 0.12Yahoo Japan 42,400 143,064 0.23 Iron & Steel (1.61%) Daido Steel 8,000 29,877 0.05Hitachi Metals 7,000 77,418 0.13JFE Holdings 15,000 226,133 0.37Kobe Steel 85,000 93,149 0.15Nippon Steel & Sumitomo Metal 228,000 532,596 0.87Yamato Kogyo 1,300 27,837 0.04 Leisure Time (0.70%) Sega Sammy Holdings 5,600 80,466 0.13Shimano 2,400 194,489 0.32Yamaha 5,100 58,868 0.09Yamaha Motor 7,800 98,019 0.16 Machinery - Construction & Mining (1.72%) Hitachi Construction Machinery 3,500 50,922 0.09Komatsu 28,300 479,890 0.78Mitsubishi Electric 58,000 522,704 0.85 Machinery - Diversified (2.96%) Amada 11,000 81,686 0.13FANUC 5,800 730,532 1.19Kawasaki Heavy Industries 42,000 116,884 0.19Kubota 34,000 352,007 0.57Mitsubishi Heavy Industries 91,000 414,645 0.68Nabtesco 3,600 58,139 0.10
150

UBS ETF - MSCI Japan 100% hedged to EUR UCITS ETF Semi-Annual Report as of 30 June 2014 Schedule of Investments as at 30 June 2014 (Expressed in EUR) (Unaudited)
The accompanying notes form an integral part of these financial statements.
Transferable securities listed on an Official Stock Exchange
Quantity Market
Value EUR % of
Net Assets Machinery - Diversified (2.96%) (continued) Sumitomo Heavy Industries 17,000 59,076 0.10 Metal Fabricate & Hardware (0.27%) Maruichi Steel Tube 1,600 31,376 0.05NSK 14,000 132,933 0.22 Mining (0.45%) Mitsubishi Materials 34,000 87,021 0.14Sumitomo Metal Mining 16,000 189,760 0.31 Miscellaneous Manufacturers (0.83%) FUJIFILM Holdings 14,100 287,181 0.47Konica Minolta 14,200 102,480 0.17Nikon 10,400 119,595 0.19 Office & Business Equipment (1.82%) Canon 34,200 812,702 1.32Ricoh 21,100 183,615 0.30Seiko Epson 3,900 121,188 0.20 Oil & Gas (1.16%) Idemitsu Kosan 2,700 42,845 0.07Inpex 26,600 295,339 0.48JX Holdings 66,500 259,860 0.43Showa Shell Sekiyu 5,800 48,130 0.08TonenGeneral Sekiyu 9,000 62,422 0.10 Packaging & Containers (0.09%) Toyo Seikan Group Holdings 5,000 56,092 0.09 Pharmaceuticals & Biotechnology (5.19%) Alfresa Holdings 1,300 61,203 0.10Astellas Pharma 65,400 627,587 1.03Chugai Pharmaceutical 6,800 139,969 0.23Daiichi Sankyo 19,300 262,989 0.43Eisai 7,600 232,545 0.38Hisamitsu Pharmaceutical 1,700 55,522 0.09Kyowa Hakko Kirin 7,000 69,192 0.11Medipal Holdings 4,300 44,519 0.07Mitsubishi Tanabe Pharma 6,900 75,466 0.12Ono Pharmaceutical 2,500 160,777 0.26Otsuka Holdings 11,700 264,870 0.43Santen Pharmaceutical 2,200 90,410 0.15Shionogi & Co 9,100 138,696 0.23Sumitomo Dainippon Pharma 5,100 42,836 0.07Suzuken 2,100 57,079 0.09Taisho Pharmaceutical Holdings 900 47,952 0.08Takeda Pharmaceutical 23,900 809,695 1.32 Real Estate (3.76%) Aeon Mall 3,500 67,350 0.11Daito Trust Construction 2,200 188,909 0.31Hulic 7,200 69,300 0.11Mitsubishi Estate 38,000 685,197 1.12Mitsui Fudosan 28,249 695,727 1.14Nomura Real Estate Holdings 4,100 56,666 0.09NTT Urban Development 3,200 26,301 0.04Sumitomo Realty & Development 11,000 344,747 0.56Tokyo Tatemono 13,000 87,821 0.14Tokyu Fudosan Holdings 14,300 82,376 0.14 Real Estate Investment Trusts (1.07%) Japan Prime Realty Investment 23 60,277 0.10Japan Real Estate Investment 35 148,881 0.24Japan Retail Fund Investment 69 113,324 0.19Nippon Building Fund 41 174,994 0.29Nippon Prologis REIT 40 68,117 0.11United Urban Investment 75 88,409 0.14
151

UBS ETF - MSCI Japan 100% hedged to EUR UCITS ETF Semi-Annual Report as of 30 June 2014 Schedule of Investments as at 30 June 2014 (Expressed in EUR) (Unaudited)
The accompanying notes form an integral part of these financial statements.
Transferable securities listed on an Official Stock Exchange
Quantity Market
Value EUR % of
Net Assets Retail (2.38%) ABC-Mart 700 27,354 0.05Aeon 19,000 170,683 0.28Citizen Holdings 8,400 48,146 0.08Don Quijote Holdings 1,700 69,249 0.11FamilyMart 1,800 56,647 0.09Fast Retailing 1,600 384,480 0.63Isetan Mitsukoshi Holdings 9,900 94,217 0.15J Front Retailing 14,000 71,765 0.12Lawson 1,900 104,108 0.17Marui Group 7,200 50,508 0.08McDonald's Holdings 2,200 45,126 0.07Nitori Holdings 2,100 83,878 0.14Shimamura 700 50,266 0.08Takashimaya 8,000 56,697 0.09USS 6,600 82,273 0.13Yamada Denki 25,500 66,369 0.11 Semiconductors (0.62%) Rohm 2,900 121,476 0.20Tokyo Electron 5,200 256,735 0.42 Software (0.23%) GungHo Online Entertainment 11,900 56,110 0.09Konami 3,200 51,656 0.08Oracle 1,100 35,133 0.06 Telecommunications (5.68%) Hikari Tsushin 500 27,577 0.04KDDI 17,600 784,060 1.28Nippon Telegraph & Telephone 11,400 519,281 0.85NTT DOCOMO 46,100 575,661 0.94SoftBank 29,000 1,577,103 2.57 Textile (0.34%) Toray Industries 44,000 211,273 0.34 Toys, Games & Hobbies (0.65%) Bandai Namco Holdings 5,300 90,638 0.15Nintendo 3,200 279,737 0.45Sanrio 1,400 29,705 0.05 Transportation (4.45%) Central Japan Railway 4,400 458,394 0.75East Japan Railway 10,200 586,768 0.96Hankyu Hanshin Holdings 34,000 141,685 0.23Kamigumi 7,000 47,036 0.07Keikyu 14,000 91,852 0.15Keio 17,000 97,562 0.16Keisei Electric Railway 9,000 65,471 0.11Kintetsu 53,000 141,000 0.23Mitsui OSK Lines 32,000 86,978 0.14Nagoya Railroad 24,000 69,905 0.11Nippon Express 25,000 88,499 0.14Nippon Yusen 48,000 101,051 0.16Odakyu Electric Railway 19,000 133,560 0.22Tobu Railway 30,000 114,635 0.19Tokyu 34,000 176,004 0.29West Japan Railway 5,100 163,992 0.27Yamato Holdings 10,900 164,952 0.27
_______________________________________________________________________________________________________________ ____________________________________________________________
Total Common Stocks 61,180,553 99.82 _______________________________________________________________________________________________________________ ____________________________________________________________
TOTAL INVESTMENTS (Cost EUR 58,534,404) 61,180,553 99.82Other net assets 113,320 0.18
_______________________________________________________________________________________________________________ ____________________________________________________________
TOTAL NET ASSETS 61,293,873 100.00 _______________________________________________________________________________________________________________ ____________________________________________________________ _______________________________________________________________________________________________________________ ____________________________________________________________
152

UBS ETF - MSCI Japan 100% hedged to EUR UCITS ETF Semi-Annual Report as of 30 June 2014 Schedule of Investments as at 30 June 2014 (Expressed in EUR) (Unaudited)
The accompanying notes form an integral part of these financial statements.
_______________________________________________________________________________________________________________ ____________________________________________________________ _______________________________________________________________________________________________________________ ____________________________________________________________
Forward Foreign Exchange Contracts
Purchases Sales Maturity Date
Unrealised appreciation/ (depreciation)
EUR % of
Net AssetsEUR 58,470,000 JPY 8,115,632,650 3 July 2014 (41,607) (0.07)
_______________________________________________________________________________________________________________ ____________________________________________________________
Total Forward Foreign Exchange Contracts (41,607) (0.07) _______________________________________________________________________________________________________________ ____________________________________________________________
153

UBS ETF - MSCI Japan 100% hedged to GBP UCITS ETF Semi-Annual Report as of 30 June 2014 Schedule of Investments as at 30 June 2014 (Expressed in GBP) (Unaudited)
The accompanying notes form an integral part of these financial statements.
Transferable securities listed on an Official Stock Exchange
Quantity Market
Value GBP % of
Net AssetsCommon Stocks Advertising (0.38%) Dentsu 4,500 107,164 0.30Hakuhodo DY Holdings 4,700 27,296 0.08 Aerospace & Defense (0.22%) IHI 28,000 76,298 0.22 Agriculture (1.43%) Japan Tobacco 23,500 501,024 1.43 Airlines (0.19%) ANA Holdings 21,000 28,975 0.08Japan Airlines 1,200 38,796 0.11 Apparel (0.14%) Asics 3,500 47,747 0.14 Auto Manufacturers (10.91%) Daihatsu Motor 4,200 43,669 0.12Fuji Heavy Industries 12,500 202,420 0.58Hino Motors 5,600 45,100 0.13Honda Motor 34,700 708,559 2.01Isuzu Motors 25,000 96,700 0.28Mazda Motor 57,000 156,308 0.44Mitsubishi Motors 14,000 90,361 0.26Nissan Motor 52,900 293,488 0.83Suzuki Motor 7,800 142,882 0.41Toyota Motor 58,600 2,058,250 5.85 Auto Parts & Equipment (3.64%) Aisin Seiki 4,000 93,063 0.26Bridgestone 13,900 284,474 0.81Denso 10,300 287,505 0.82JTEKT 4,400 43,361 0.12Koito Manufacturing 2,100 31,461 0.09NGK Insulators 6,000 79,669 0.23NGK Spark Plug 4,000 65,998 0.19NHK Spring 3,500 19,196 0.05NOK 2,000 23,496 0.07Stanley Electric 3,100 47,265 0.13Sumitomo Electric Industries 15,900 130,805 0.37Sumitomo Rubber Industries 3,700 31,229 0.09Toyoda Gosei 1,600 19,435 0.06Toyota Industries 3,400 102,658 0.29Yokohama Rubber 4,000 20,229 0.06 Banks (9.37%) Aozora Bank 26,000 49,984 0.14Bank of Kyoto 7,000 37,219 0.11Bank of Yokohama 24,000 80,778 0.23Chiba Bank 16,000 66,045 0.19Chugoku Bank 3,800 34,179 0.10Fukuoka Financial Group 16,000 45,169 0.13Gunma Bank 8,000 27,665 0.08Hachijuni Bank 8,000 28,958 0.08Hiroshima Bank 10,000 27,942 0.08Hokuhoku Financial Group 23,000 28,681 0.08Iyo Bank 5,600 33,105 0.09Joyo Bank 14,000 43,645 0.12Mitsubishi UFJ Financial Group 270,300 969,056 2.75Mizuho Financial Group 486,800 584,555 1.66Resona Holdings 47,500 161,792 0.46Seven Bank 11,500 27,486 0.08Shinsei Bank 35,000 46,069 0.13Shizuoka Bank 12,000 75,859 0.22Sumitomo Mitsui Financial Group 27,100 663,982 1.89Sumitomo Mitsui Trust Holdings 70,000 187,107 0.53Suruga Bank 4,000 45,400 0.13Yamaguchi Financial Group 5,000 30,828 0.09
154

UBS ETF - MSCI Japan 100% hedged to GBP UCITS ETF Semi-Annual Report as of 30 June 2014 Schedule of Investments as at 30 June 2014 (Expressed in GBP) (Unaudited)
The accompanying notes form an integral part of these financial statements.
Transferable securities listed on an Official Stock Exchange
Quantity Market
Value GBP % of
Net Assets Beverages (1.05%) Asahi Group Holdings 8,300 152,376 0.44Kirin Holdings 17,600 148,651 0.42Suntory Beverage & Food 2,900 66,550 0.19 Building Materials (1.41%) Asahi Glass 21,000 72,378 0.21Daikin Industries 5,000 184,509 0.52LIXIL Group 5,700 89,967 0.26Rinnai 800 45,169 0.13Taiheiyo Cement 24,000 56,531 0.16TOTO 6,000 47,282 0.13 Chemicals (3.04%) Air Water 3,000 28,057 0.08Asahi Kasei 27,000 120,803 0.34Daicel 6,000 33,530 0.10Hitachi Chemical 2,500 24,189 0.07JSR 4,000 40,135 0.11Kaneka 6,000 21,961 0.06Kansai Paint 5,000 48,870 0.14Kuraray 7,500 55,595 0.16Mitsubishi Chemical Holdings 28,100 72,839 0.21Mitsubishi Gas Chemical 8,000 29,928 0.09Mitsui Chemicals 16,000 25,587 0.07Nippon Paint 4,000 49,510 0.14Nitto Denko 3,300 90,437 0.26Shin-Etsu Chemical 8,700 309,293 0.88Sumitomo Chemical 31,000 68,544 0.19Taiyo Nippon Sanso 5,000 25,893 0.07Teijin 17,000 24,928 0.07 Commercial Services (0.99%) Benesse Holdings 1,400 35,522 0.10Dai Nippon Printing 12,000 73,296 0.21Park24 2,300 24,458 0.07Secom 4,500 160,810 0.46Toppan Printing 12,000 54,314 0.15 Computers (1.11%) Fujitsu 40,000 175,272 0.50Itochu Techno-Solutions 500 12,715 0.04Nomura Research Institute 2,300 42,358 0.12NTT Data 2,800 62,881 0.18Otsuka 900 25,512 0.07TDK 2,600 71,298 0.20 Cosmetics & Personal Care (1.20%) Kao 10,900 250,891 0.71Shiseido 7,700 82,105 0.23Unicharm 2,600 90,616 0.26 Distribution & Wholesale (4.01%) Hitachi High-Technologies 1,300 18,087 0.05Itochu 31,700 238,094 0.68Marubeni 35,000 149,726 0.43Mitsubishi 29,900 363,703 1.03Mitsubishi Logistics 3,000 26,274 0.07Mitsui & Co 37,100 347,833 0.99Sumitomo 24,000 189,543 0.54Toyota Tsusho 4,600 77,359 0.22 Diversified Financial Services (2.81%) Acom 7,800 21,705 0.06AEON Financial Service 2,400 36,703 0.10Credit Saison 3,200 38,943 0.11Daiwa Securities Group 36,000 182,269 0.52Japan Exchange Group 5,700 82,102 0.23Mitsubishi UFJ Lease & Finance 10,700 35,952 0.10Nomura Holdings 77,200 319,557 0.91ORIX 28,100 272,376 0.78
155

UBS ETF - MSCI Japan 100% hedged to GBP UCITS ETF Semi-Annual Report as of 30 June 2014 Schedule of Investments as at 30 June 2014 (Expressed in GBP) (Unaudited)
The accompanying notes form an integral part of these financial statements.
Transferable securities listed on an Official Stock Exchange
Quantity Market
Value GBP % of
Net Assets Electric (1.54%) Chubu Electric Power 14,000 101,757 0.29Chugoku Electric Power 6,300 50,264 0.14Electric Power Development 2,600 49,383 0.14Hokuriku Electric Power 3,700 28,687 0.08Kansai Electric Power 15,100 83,252 0.24Kyushu Electric Power 9,100 59,943 0.17Shikoku Electric Power 3,700 30,204 0.08Tohoku Electric Power 9,600 65,897 0.19Tokyo Electric Power 30,300 73,819 0.21 Electrical Components & Equipment (2.01%) Brother Industries 5,000 50,659 0.14Casio Computer 4,600 39,038 0.11Hitachi 103,000 441,217 1.26Mabuchi Motor 500 22,169 0.06Nidec 4,300 154,309 0.44 Electronics (4.49%) Advantest 3,300 23,852 0.07Hamamatsu Photonics 1,500 43,039 0.12Hirose Electric 600 52,131 0.15Hoya 9,300 180,721 0.51Ibiden 2,800 32,976 0.09Japan Display 7,900 28,368 0.08Keyence 1,000 255,144 0.73Kyocera 6,800 188,749 0.54Murata Manufacturing 4,300 235,361 0.67NEC 56,000 104,424 0.30Nippon Electric Glass 8,000 27,249 0.08Omron 4,300 106,001 0.30Toshiba 84,000 229,378 0.65Yaskawa Electric 5,000 35,418 0.10Yokogawa Electric 4,800 35,498 0.10 Engineering & Construction (0.90%) Chiyoda 3,000 21,251 0.06JGC 4,000 71,079 0.20Kajima 17,000 43,968 0.13Obayashi 14,000 58,435 0.17Shimizu 12,000 49,672 0.14Taisei 22,000 71,252 0.20 Entertainment (0.48%) Oriental Land 1,100 110,212 0.31Sankyo 1,000 22,486 0.07Toho 2,500 34,293 0.10 Environmental Control (0.09%) Kurita Water Industries 2,300 31,164 0.09 Food (2.36%) Ajinomoto 12,000 110,013 0.31Calbee 1,600 25,808 0.07Kikkoman 3,000 36,544 0.11MEIJI Holdings 1,300 50,359 0.14NH Foods 4,000 45,700 0.13Nisshin Seifun Group 4,200 29,315 0.08Nissin Foods Holdings 1,100 33,086 0.10Seven & I Holdings 16,100 396,699 1.13Toyo Suisan Kaisha 2,000 36,082 0.10Yakult Honsha 1,800 53,309 0.15Yamazaki Baking 2,000 14,606 0.04 Forest Products & Paper (0.11%) Oji Holdings 16,000 38,518 0.11 Gas (0.84%) Osaka Gas 39,000 95,915 0.27Toho Gas 8,000 25,725 0.07Tokyo Gas 51,000 174,302 0.50
156

UBS ETF - MSCI Japan 100% hedged to GBP UCITS ETF Semi-Annual Report as of 30 June 2014 Schedule of Investments as at 30 June 2014 (Expressed in GBP) (Unaudited)
The accompanying notes form an integral part of these financial statements.
Transferable securities listed on an Official Stock Exchange
Quantity Market
Value GBP % of
Net Assets Hand & Machine Tools (0.98%) Fuji Electric 11,000 30,482 0.09Makita 2,500 90,349 0.26SMC 1,200 187,812 0.53THK 2,600 35,844 0.10 Healthcare Products (0.79%) Olympus 5,000 100,741 0.29Shimadzu 5,000 26,816 0.07Sysmex 3,100 68,097 0.19Terumo 6,400 83,688 0.24 Healthcare Services (0.09%) Miraca Holdings 1,100 31,181 0.09 Home Builders (0.96%) Daiwa House Industry 13,000 157,606 0.45Iida Group Holdings 3,200 28,432 0.08Sekisui Chemical 9,000 60,947 0.17Sekisui House 11,500 92,217 0.26 Home Furnishings (1.73%) Panasonic 47,000 334,830 0.95Sharp 32,000 60,041 0.17Sony 22,100 214,600 0.61 Insurance (2.39%) Dai-ichi Life Insurance 18,000 156,810 0.44MS&AD Insurance Group Holdings 10,900 153,983 0.44NKSJ Holdings 7,100 111,818 0.32Sony Financial Holdings 3,800 37,909 0.11T&D Holdings 12,100 96,190 0.27Tokio Marine Holdings 14,800 284,694 0.81 Internet (1.12%) Dena 2,500 19,773 0.06Gree 2,000 10,253 0.03Kakaku.com 3,000 30,742 0.09M3 4,000 37,225 0.10Nexon 2,600 14,515 0.04Rakuten 16,800 126,958 0.36SBI Holdings 4,300 30,782 0.09Trend Micro 2,200 42,357 0.12Yahoo Japan 29,900 80,785 0.23 Iron & Steel (1.57%) Daido Steel 6,000 17,943 0.05Hitachi Metals 4,000 35,424 0.10JFE Holdings 10,700 129,166 0.37Kobe Steel 59,000 51,773 0.15Nippon Steel & Sumitomo Metal 161,000 301,150 0.86Yamato Kogyo 900 15,432 0.04 Leisure Time (0.70%) Sega Sammy Holdings 4,000 46,023 0.13Shimano 1,700 110,313 0.31Yamaha 3,600 33,274 0.10Yamaha Motor 5,700 57,357 0.16 Machinery - Construction & Mining (1.70%) Hitachi Construction Machinery 2,500 29,125 0.09Komatsu 20,000 271,568 0.77Mitsubishi Electric 41,000 295,873 0.84 Machinery - Diversified (2.91%) Amada 8,000 47,571 0.13FANUC 4,100 413,512 1.18Kawasaki Heavy Industries 29,000 64,624 0.18Kubota 24,000 198,965 0.57Mitsubishi Heavy Industries 64,000 233,512 0.66Nabtesco 2,600 33,623 0.10
157

UBS ETF - MSCI Japan 100% hedged to GBP UCITS ETF Semi-Annual Report as of 30 June 2014 Schedule of Investments as at 30 June 2014 (Expressed in GBP) (Unaudited)
The accompanying notes form an integral part of these financial statements.
Transferable securities listed on an Official Stock Exchange
Quantity Market
Value GBP % of
Net Assets Machinery - Diversified (2.91%) (continued) Sumitomo Heavy Industries 11,000 30,609 0.09 Metal Fabricate & Hardware (0.26%) Maruichi Steel Tube 1,000 15,703 0.04NSK 10,000 76,032 0.22 Mining (0.43%) Mitsubishi Materials 23,000 47,137 0.13Sumitomo Metal Mining 11,000 104,465 0.30 Miscellaneous Manufacturers (0.82%) FUJIFILM Holdings 9,900 161,460 0.46Konica Minolta 10,200 58,945 0.17Nikon 7,300 67,219 0.19 Office & Business Equipment (1.80%) Canon 24,100 458,581 1.30Ricoh 15,200 105,916 0.30Seiko Epson 2,800 69,670 0.20 Oil & Gas (1.14%) Idemitsu Kosan 1,900 24,143 0.07Inpex 18,800 167,144 0.48JX Holdings 47,000 147,065 0.42Showa Shell Sekiyu 4,400 29,237 0.08TonenGeneral Sekiyu 6,000 33,322 0.09 Packaging & Containers (0.09%) Toyo Seikan Group Holdings 3,500 31,440 0.09 Pharmaceuticals & Biotechnology (5.13%) Alfresa Holdings 900 33,929 0.10Astellas Pharma 46,100 354,234 1.01Chugai Pharmaceutical 4,700 77,467 0.22Daiichi Sankyo 13,700 149,484 0.43Eisai 5,400 132,306 0.38Hisamitsu Pharmaceutical 1,200 31,383 0.09Kyowa Hakko Kirin 5,000 39,575 0.11Medipal Holdings 2,800 23,213 0.07Mitsubishi Tanabe Pharma 5,000 43,789 0.12Ono Pharmaceutical 1,800 92,693 0.26Otsuka Holdings 8,400 152,272 0.43Santen Pharmaceutical 1,500 49,360 0.14Shionogi & Co 6,400 78,108 0.22Sumitomo Dainippon Pharma 3,700 24,885 0.07Suzuken 1,500 32,647 0.09Taisho Pharmaceutical Holdings 700 29,864 0.09Takeda Pharmaceutical 16,900 458,462 1.30 Real Estate (3.70%) Aeon Mall 2,300 35,440 0.10Daito Trust Construction 1,600 110,013 0.31Hulic 5,000 38,536 0.11Mitsubishi Estate 27,000 389,842 1.11Mitsui Fudosan 19,523 385,013 1.10Nomura Real Estate Holdings 2,600 28,775 0.08NTT Urban Development 2,400 15,795 0.04Sumitomo Realty & Development 8,000 200,766 0.57Tokyo Tatemono 9,000 48,685 0.14Tokyu Fudosan Holdings 10,300 47,511 0.14 Real Estate Investment Trusts (1.06%) Japan Prime Realty Investment 17 35,675 0.10Japan Real Estate Investment 25 85,154 0.24Japan Retail Fund Investment 49 64,441 0.18Nippon Building Fund 29 99,113 0.28Nippon Prologis REIT 28 38,181 0.11United Urban Investment 54 50,971 0.15
158

UBS ETF - MSCI Japan 100% hedged to GBP UCITS ETF Semi-Annual Report as of 30 June 2014 Schedule of Investments as at 30 June 2014 (Expressed in GBP) (Unaudited)
The accompanying notes form an integral part of these financial statements.
Transferable securities listed on an Official Stock Exchange
Quantity Market
Value GBP % of
Net Assets Retail (2.34%) ABC-Mart 500 15,645 0.04Aeon 13,500 97,110 0.28Citizen Holdings 5,500 25,243 0.07Don Quijote Holdings 1,200 39,142 0.11FamilyMart 1,200 30,240 0.09Fast Retailing 1,100 211,660 0.60Isetan Mitsukoshi Holdings 7,400 56,392 0.16J Front Retailing 10,000 41,047 0.12Lawson 1,300 57,039 0.16Marui Group 5,200 29,210 0.08McDonald's Holdings 1,600 26,279 0.08Nitori Holdings 1,400 44,776 0.13Shimamura 500 28,750 0.08Takashimaya 6,000 34,050 0.10USS 4,700 46,914 0.13Yamada Denki 18,000 37,514 0.11 Semiconductors (0.61%) Rohm 2,000 67,084 0.19Tokyo Electron 3,700 146,277 0.42 Software (0.23%) GungHo Online Entertainment 8,800 33,225 0.09Konami 2,100 27,145 0.08Oracle Japan 800 20,460 0.06 Telecommunications (5.58%) Hikari Tsushin 300 13,249 0.04KDDI 12,400 442,335 1.26Nippon Telegraph & Telephone 8,000 291,797 0.83NTT DOCOMO 32,500 324,970 0.92SoftBank 20,400 888,353 2.53 Textile (0.34%) Toray Industries 31,000 119,192 0.34 Toys, Games & Hobbies (0.65%) Bandai Namco Holdings 3,800 52,037 0.15Nintendo 2,300 160,998 0.45Sanrio 1,000 16,990 0.05 Transportation (4.41%) Central Japan Railway 3,100 258,607 0.74East Japan Railway 7,200 331,659 0.94Hankyu Hanshin Holdings 24,000 80,085 0.23Kamigumi 5,000 26,903 0.08Keikyu 10,000 52,535 0.15Keio 12,000 55,145 0.16Keisei Electric Railway 6,000 34,951 0.10Kintetsu 37,000 78,821 0.22Mitsui OSK Lines 24,000 52,235 0.15Nagoya Railroad 17,000 39,650 0.11Nippon Express 18,000 51,023 0.15Nippon Yusen 34,000 57,316 0.16Odakyu Electric Railway 14,000 78,803 0.22Tobu Railway 21,000 64,255 0.18Tokyu 24,000 99,483 0.28West Japan Railway 3,700 95,268 0.27Yamato Holdings 7,700 93,307 0.27
_______________________________________________________________________________________________________________ ____________________________________________________________
Total Common Stocks 34,550,415 98.25 _______________________________________________________________________________________________________________ ____________________________________________________________
TOTAL INVESTMENTS (Cost GBP 34,728,079) 34,550,415 98.25Other net assets 614,685 1.75
_______________________________________________________________________________________________________________ ____________________________________________________________
TOTAL NET ASSETS 35,165,100 100.00 _______________________________________________________________________________________________________________ ____________________________________________________________ _______________________________________________________________________________________________________________ ____________________________________________________________
159

UBS ETF - MSCI Japan 100% hedged to GBP UCITS ETF Semi-Annual Report as of 30 June 2014 Schedule of Investments as at 30 June 2014 (Expressed in GBP) (Unaudited)
The accompanying notes form an integral part of these financial statements.
Forward Foreign Exchange Contracts
Purchases Sales Maturity Date
Unrealised appreciation/ (depreciation)
GBP % of
Net AssetsGBP 33,567,000 JPY 5,728,682,820 3 July 2014 494,063 1.40
_______________________________________________________________________________________________________________ ____________________________________________________________
Total Forward Foreign Exchange Contracts 494,063 1.40 _______________________________________________________________________________________________________________ ____________________________________________________________
160

UBS ETF - MSCI Japan 100% hedged to USD UCITS ETF Semi-Annual Report as of 30 June 2014 Schedule of Investments as at 30 June 2014 (Expressed in USD) (Unaudited)
The accompanying notes form an integral part of these financial statements.
Transferable securities listed on an Official Stock Exchange
Quantity Market
Value USD % of
Net AssetsCommon Stocks Advertising (0.41%) Dentsu 12,000 488,624 0.32Hakuhodo DY Holdings 13,300 132,074 0.09 Aerospace & Defense (0.22%) IHI 71,000 330,803 0.22 Agriculture (1.45%) Japan Tobacco 60,500 2,205,483 1.45 Airlines (0.20%) ANA Holdings 56,000 132,116 0.09Japan Airlines 3,200 176,891 0.11 Apparel (0.14%) Asics 9,000 209,930 0.14 Auto Manufacturers (11.12%) Daihatsu Motor 10,800 192,002 0.13Fuji Heavy Industries 32,300 894,344 0.59Hino Motors 14,500 199,669 0.13Honda Motor 89,500 3,124,836 2.06Isuzu Motors 63,000 416,663 0.27Mazda Motor 148,000 693,944 0.46Mitsubishi Motors 35,700 393,985 0.26Nissan Motor 136,300 1,292,970 0.85Suzuki Motor 20,100 629,557 0.41Toyota Motor 151,000 9,068,496 5.96 Auto Parts & Equipment (3.70%) Aisin Seiki 10,400 413,721 0.27Bridgestone 35,800 1,252,761 0.82Denso 26,700 1,274,315 0.84JTEKT 11,000 185,351 0.12Koito Manufacturing 5,300 135,763 0.09NGK Insulators 15,000 340,556 0.22NGK Spark Plug 10,000 282,118 0.19NHK Spring 8,900 83,461 0.05NOK 5,200 104,457 0.07Stanley Electric 7,700 200,737 0.13Sumitomo Electric Industries 41,800 587,977 0.39Sumitomo Rubber Industries 10,000 144,317 0.09Toyoda Gosei 3,400 70,615 0.05Toyota Industries 8,700 449,149 0.30Yokohama Rubber 12,000 103,766 0.07 Banks (9.53%) Aozora Bank 64,000 210,375 0.14Bank of Kyoto 19,000 172,736 0.11Bank of Yokohama 64,000 368,314 0.24Chiba Bank 41,000 289,374 0.19Chugoku Bank 9,600 147,641 0.10Fukuoka Financial Group 41,000 197,907 0.13Gunma Bank 21,000 124,170 0.08Hachijuni Bank 23,000 142,352 0.09Hiroshima Bank 26,000 124,219 0.08Hokuhoku Financial Group 53,000 113,005 0.08Iyo Bank 14,600 147,578 0.10Joyo Bank 35,000 186,565 0.12Mitsubishi UFJ Financial Group 695,400 4,262,804 2.80Mizuho Financial Group 1,254,300 2,575,336 1.69Resona Holdings 123,700 720,428 0.47Seven Bank 31,300 127,913 0.09Shinsei Bank 85,000 191,304 0.13Shizuoka Bank 29,000 313,459 0.21Sumitomo Mitsui Financial Group 69,800 2,924,152 1.92Sumitomo Mitsui Trust Holdings 183,000 836,375 0.55Suruga Bank 10,000 194,068 0.13Yamaguchi Financial Group 12,000 126,509 0.08
161

UBS ETF - MSCI Japan 100% hedged to USD UCITS ETF Semi-Annual Report as of 30 June 2014 Schedule of Investments as at 30 June 2014 (Expressed in USD) (Unaudited)
The accompanying notes form an integral part of these financial statements.
Transferable securities listed on an Official Stock Exchange
Quantity Market
Value USD % of
Net Assets Beverages (1.07%) Asahi Group Holdings 21,500 674,893 0.45Kirin Holdings 45,400 655,646 0.43Suntory Beverage & Food 7,500 294,284 0.19 Building Materials (1.44%) Asahi Glass 57,000 335,906 0.22Daikin Industries 12,900 813,946 0.53LIXIL Group 15,000 404,817 0.27Rinnai 1,900 183,426 0.12Taiheiyo Cement 63,000 253,729 0.17TOTO 15,000 202,113 0.13 Chemicals (3.10%) Air Water 8,000 127,930 0.08Asahi Kasei 70,000 535,512 0.35Daicel 15,000 143,330 0.10Hitachi Chemical 5,900 97,610 0.06JSR 9,700 166,414 0.11Kaneka 15,000 93,875 0.06Kansai Paint 13,000 217,255 0.14Kuraray 19,300 244,620 0.16Mitsubishi Chemical Holdings 70,700 313,354 0.21Mitsubishi Gas Chemical 21,000 134,327 0.09Mitsui Chemicals 38,000 103,904 0.07Nippon Paint 10,000 211,638 0.14Nitto Denko 8,700 407,669 0.27Shin-Etsu Chemical 22,600 1,373,780 0.90Sumitomo Chemical 82,000 310,014 0.20Taiyo Nippon Sanso 13,000 115,108 0.08Teijin 47,000 117,842 0.08 Commercial Services (1.00%) Benesse Holdings 3,600 156,182 0.10Dai Nippon Printing 30,000 313,311 0.21Park24 5,800 105,460 0.07Secom 11,500 702,680 0.46Toppan Printing 31,000 239,909 0.16 Computers (1.13%) Fujitsu 102,000 764,207 0.50Itochu Techno-Solutions 1,200 52,179 0.04Nomura Research Institute 6,300 198,381 0.13NTT Data 6,700 257,273 0.17Otsuka 2,700 130,862 0.09TDK 6,600 309,462 0.20 Cosmetics & Personal Care (1.24%) Kao 28,300 1,113,786 0.73Shiseido 20,300 370,111 0.25Unicharm 6,700 399,269 0.26 Distribution & Wholesale (4.08%) Hitachi High-Technologies 3,600 85,642 0.06Itochu 81,700 1,049,225 0.69Marubeni 89,000 650,995 0.43Mitsubishi 77,100 1,603,570 1.05Mitsubishi Logistics 7,000 104,822 0.07Mitsui & Co 95,700 1,534,147 1.01Sumitomo 61,000 823,730 0.54Toyota Tsusho 12,100 347,933 0.23 Diversified Financial Services (2.85%) Acom 20,200 96,110 0.06AEON Financial Service 6,100 159,507 0.10Credit Saison 8,100 168,549 0.11Daiwa Securities Group 92,000 796,446 0.52Japan Exchange Group 14,400 354,652 0.23Mitsubishi UFJ Lease & Finance 28,200 162,010 0.11Nomura Holdings 198,800 1,407,034 0.93ORIX 72,000 1,193,307 0.79
162

UBS ETF - MSCI Japan 100% hedged to USD UCITS ETF Semi-Annual Report as of 30 June 2014 Schedule of Investments as at 30 June 2014 (Expressed in USD) (Unaudited)
The accompanying notes form an integral part of these financial statements.
Transferable securities listed on an Official Stock Exchange
Quantity Market
Value USD % of
Net Assets Electric (1.58%) Chubu Electric Power 35,100 436,216 0.29Chugoku Electric Power 16,700 227,821 0.15Electric Power Development 6,600 214,343 0.14Hokuriku Electric Power 9,900 131,244 0.09Kansai Electric Power 39,400 371,423 0.24Kyushu Electric Power 23,200 261,302 0.17Shikoku Electric Power 10,000 139,578 0.09Tohoku Electric Power 24,400 286,379 0.19Tokyo Electric Power 79,400 330,752 0.22 Electrical Components & Equipment (2.05%) Brother Industries 13,100 226,943 0.15Casio Computer 11,400 165,421 0.11Hitachi 264,000 1,933,646 1.27Mabuchi Motor 1,400 106,135 0.07Nidec 11,100 681,088 0.45 Electronics (4.55%) Advantest 9,200 113,700 0.07Hamamatsu Photonics 3,900 191,333 0.13Hirose Electric 1,600 237,698 0.16Hoya 23,800 790,788 0.52Ibiden 6,700 134,919 0.09Japan Display 18,400 112,974 0.07Keyence 2,500 1,090,642 0.72Kyocera 17,600 835,307 0.55Murata Manufacturing 11,100 1,038,834 0.68NEC 144,000 459,129 0.30Nippon Electric Glass 21,000 122,304 0.08Omron 11,300 476,294 0.31Toshiba 217,000 1,013,188 0.67Yaskawa Electric 12,200 147,766 0.10Yokogawa Electric 11,800 149,211 0.10 Engineering & Construction (0.97%) Chiyoda 8,000 96,895 0.06JGC 12,000 364,602 0.24Kajima 47,000 207,848 0.14Obayashi 36,000 256,927 0.17Shimizu 33,000 233,562 0.15Taisei 56,000 310,113 0.21 Entertainment (0.48%) Oriental Land 2,800 479,680 0.31Sankyo 2,600 99,965 0.07Toho 6,300 147,760 0.10 Environmental Control (0.09%) Kurita Water Industries 6,000 139,006 0.09 Food (2.42%) Ajinomoto 32,000 501,614 0.33Calbee 4,200 115,836 0.07Kikkoman 8,000 166,626 0.11MEIJI Holdings 3,300 218,578 0.14NH Foods 10,000 195,351 0.13Nisshin Seifun Group 10,400 124,116 0.08Nissin Foods Holdings 2,900 149,144 0.10Seven & I Holdings 41,400 1,744,190 1.15Toyo Suisan Kaisha 5,000 154,237 0.10Yakult Honsha 4,700 238,004 0.16Yamazaki Baking 6,000 74,922 0.05 Forest Products & Paper (0.12%) Oji Holdings 43,000 177,000 0.12 Gas (0.86%) Osaka Gas 99,000 416,307 0.28Toho Gas 22,000 120,962 0.08Tokyo Gas 131,000 765,530 0.50
163

UBS ETF - MSCI Japan 100% hedged to USD UCITS ETF Semi-Annual Report as of 30 June 2014 Schedule of Investments as at 30 June 2014 (Expressed in USD) (Unaudited)
The accompanying notes form an integral part of these financial statements.
Transferable securities listed on an Official Stock Exchange
Quantity Market
Value USD % of
Net Assets Hand & Machine Tools (0.98%) Fuji Electric 29,000 137,407 0.09Makita 6,500 401,658 0.26SMC 3,000 802,823 0.53THK 6,200 146,149 0.10 Healthcare Products (0.81%) Olympus 13,200 454,746 0.30Shimadzu 13,000 119,214 0.08Sysmex 7,700 289,211 0.19Terumo 16,700 373,382 0.24 Healthcare Services (0.10%) Miraca Holdings 3,000 145,403 0.10 Home Builders (0.99%) Daiwa House Industry 33,000 684,073 0.45Iida Group Holdings 8,900 135,206 0.09Sekisui Chemical 23,000 266,315 0.18Sekisui House 30,100 412,703 0.27 Home Furnishings (1.77%) Panasonic 121,000 1,473,906 0.97Sharp 83,000 266,275 0.18Sony 57,100 948,050 0.62 Insurance (2.44%) Dai-ichi Life Insurance 46,600 694,136 0.46MS&AD Insurance Group Holdings 27,600 666,672 0.44NKSJ Holdings 18,500 498,179 0.33Sony Financial Holdings 10,000 170,574 0.11T&D Holdings 31,300 425,449 0.28Tokio Marine Holdings 38,000 1,249,849 0.82 Internet (1.16%) Dena 6,400 86,551 0.06Gree 5,900 51,717 0.04Kakaku.com 7,800 136,667 0.09M3 10,600 168,671 0.11Nexon 6,900 65,863 0.04Rakuten 43,800 565,956 0.37SBI Holdings 11,300 138,315 0.09Trend Micro 5,800 190,938 0.13Yahoo Japan 76,900 355,256 0.23 Iron & Steel (1.61%) Daido Steel 15,000 76,699 0.05Hitachi Metals 12,000 181,709 0.12JFE Holdings 27,400 565,554 0.37Kobe Steel 158,000 237,066 0.16Nippon Steel & Sumitomo Metal 413,000 1,320,882 0.87Yamato Kogyo 2,200 64,498 0.04 Leisure Time (0.71%) Sega Sammy Holdings 10,700 210,504 0.14Shimano 4,300 477,094 0.31Yamaha 9,600 151,716 0.10Yamaha Motor 14,300 246,038 0.16 Machinery - Construction & Mining (1.72%) Hitachi Construction Machinery 6,100 121,512 0.08Komatsu 51,400 1,193,355 0.78Mitsubishi Electric 106,000 1,307,931 0.86 Machinery - Diversified (2.95%) Amada 19,000 193,179 0.13FANUC 10,500 1,810,720 1.19Kawasaki Heavy Industries 77,000 293,391 0.19Kubota 62,000 878,851 0.58Mitsubishi Heavy Industries 165,000 1,029,367 0.68Nabtesco 6,400 141,513 0.09
164

UBS ETF - MSCI Japan 100% hedged to USD UCITS ETF Semi-Annual Report as of 30 June 2014 Schedule of Investments as at 30 June 2014 (Expressed in USD) (Unaudited)
The accompanying notes form an integral part of these financial statements.
Transferable securities listed on an Official Stock Exchange
Quantity Market
Value USD % of
Net Assets Machinery - Diversified (2.95%) (continued) Sumitomo Heavy Industries 30,000 142,738 0.09 Metal Fabricate & Hardware (0.26%) Maruichi Steel Tube 2,800 75,179 0.05NSK 25,000 325,009 0.21 Mining (0.45%) Mitsubishi Materials 62,000 217,265 0.14Sumitomo Metal Mining 29,000 470,904 0.31 Miscellaneous Manufacturers (0.83%) FUJIFILM Holdings 25,500 711,095 0.47Konica Minolta 26,700 263,824 0.17Nikon 18,600 292,849 0.19 Office & Business Equipment (1.84%) Canon 62,200 2,023,703 1.33Ricoh 39,400 469,432 0.31Seiko Epson 7,200 306,322 0.20 Oil & Gas (1.16%) Idemitsu Kosan 5,300 115,150 0.07Inpex 48,100 731,198 0.48JX Holdings 121,900 652,187 0.43Showa Shell Sekiyu 9,800 111,345 0.07TonenGeneral Sekiyu 17,000 161,433 0.11 Packaging & Containers (0.09%) Toyo Seikan Group Holdings 9,400 144,380 0.09 Pharmaceuticals & Biotechnology (5.20%) Alfresa Holdings 2,400 154,701 0.10Astellas Pharma 119,000 1,563,486 1.03Chugai Pharmaceutical 12,000 338,187 0.22Daiichi Sankyo 35,000 652,979 0.43Eisai 14,100 590,695 0.39Hisamitsu Pharmaceutical 3,100 138,621 0.09Kyowa Hakko Kirin 13,000 175,934 0.12Medipal Holdings 7,700 109,148 0.07Mitsubishi Tanabe Pharma 12,700 190,177 0.12Ono Pharmaceutical 4,400 387,424 0.25Otsuka Holdings 21,500 666,403 0.44Santen Pharmaceutical 3,900 219,436 0.14Shionogi & Co 16,500 344,317 0.23Sumitomo Dainippon Pharma 8,800 101,199 0.07Suzuken 3,600 133,972 0.09Taisho Pharmaceutical Holdings 1,700 124,012 0.08Takeda Pharmaceutical 43,500 2,017,734 1.33 Real Estate (3.76%) Aeon Mall 6,400 168,616 0.11Daito Trust Construction 4,000 470,263 0.31Hulic 13,000 171,314 0.11Mitsubishi Estate 69,000 1,703,460 1.12Mitsui Fudosan 51,001 1,719,751 1.13Nomura Real Estate Holdings 6,800 128,677 0.09NTT Urban Development 7,100 79,897 0.05Sumitomo Realty & Development 20,000 858,201 0.57Tokyo Tatemono 22,000 203,485 0.13Tokyu Fudosan Holdings 27,200 214,528 0.14 Real Estate Investment Trusts (1.08%) Japan Prime Realty Investment 43 154,291 0.10Japan Real Estate Investment 64 372,736 0.25Japan Retail Fund Investment 125 281,082 0.19Nippon Building Fund 74 432,437 0.28Nippon Prologis REIT 73 170,205 0.11United Urban Investment 139 224,337 0.15
165

UBS ETF - MSCI Japan 100% hedged to USD UCITS ETF Semi-Annual Report as of 30 June 2014 Schedule of Investments as at 30 June 2014 (Expressed in USD) (Unaudited)
The accompanying notes form an integral part of these financial statements.
Transferable securities listed on an Official Stock Exchange
Quantity Market
Value USD % of
Net Assets Retail (2.40%) ABC-Mart 1,300 69,552 0.05Aeon 35,300 434,172 0.28Citizen Holdings 13,500 105,943 0.07Don Quijote Holdings 3,300 184,048 0.12FamilyMart 3,100 133,572 0.09Fast Retailing 2,900 954,119 0.63Isetan Mitsukoshi Holdings 18,300 238,448 0.16J Front Retailing 26,000 182,479 0.12Lawson 3,500 262,573 0.17Marui Group 12,400 119,098 0.08McDonald's Holdings 3,800 106,717 0.07Nitori Holdings 3,800 207,808 0.14Shimamura 1,300 127,812 0.08Takashimaya 14,000 135,847 0.09USS 12,400 211,634 0.14Yamada Denki 47,600 169,623 0.11 Semiconductors (0.62%) Rohm 5,300 303,963 0.20Tokyo Electron 9,400 635,420 0.42 Software (0.23%) GungHo Online Entertainment 21,500 138,799 0.09Konami 5,500 121,558 0.08Oracle Japan 2,000 87,459 0.06 Telecommunications (5.69%) Hikari Tsushin 900 67,963 0.05KDDI 32,000 1,951,809 1.28Nippon Telegraph & Telephone 20,500 1,278,506 0.84NTT DOCOMO 83,800 1,432,719 0.94SoftBank 52,700 3,923,953 2.58 Textile (0.35%) Toray Industries 81,000 532,511 0.35 Toys, Games & Hobbies (0.66%) Bandai Namco Holdings 9,600 224,779 0.15Nintendo 5,800 694,191 0.46Sanrio 2,800 81,342 0.05 Transportation (4.48%) Central Japan Railway 8,000 1,141,109 0.75East Japan Railway 18,600 1,464,976 0.96Hankyu Hanshin Holdings 62,000 353,744 0.23Kamigumi 13,000 119,599 0.08Keikyu 25,000 224,569 0.15Keio 30,000 235,724 0.16Keisei Electric Railway 15,000 149,400 0.10Kintetsu 96,000 349,677 0.23Mitsui OSK Lines 60,000 223,286 0.15Nagoya Railroad 46,000 183,446 0.12Nippon Express 47,000 227,797 0.15Nippon Yusen 87,000 250,768 0.16Odakyu Electric Railway 35,000 336,854 0.22Tobu Railway 56,000 292,977 0.19Tokyu 63,000 446,513 0.29West Japan Railway 9,200 405,034 0.27Yamato Holdings 19,700 408,176 0.27
_______________________________________________________________________________________________________________ ____________________________________________________________
Total Common Stocks 152,247,558 100.14 _______________________________________________________________________________________________________________ ____________________________________________________________
TOTAL INVESTMENTS (Cost USD 146,927,454) 152,247,558 100.14Other net liabilities (216,669) (0.14)
_______________________________________________________________________________________________________________ ____________________________________________________________
TOTAL NET ASSETS 152,030,889 100.00 _______________________________________________________________________________________________________________ ____________________________________________________________ _______________________________________________________________________________________________________________ ____________________________________________________________
166

UBS ETF - MSCI Japan 100% hedged to USD UCITS ETF Semi-Annual Report as of 30 June 2014 Schedule of Investments as at 30 June 2014 (Expressed in USD) (Unaudited)
The accompanying notes form an integral part of these financial statements.
Forward Foreign Exchange Contracts
Purchases Sales Maturity Date
Unrealised appreciation/ (depreciation)
USD % of
Net AssetsGBP 4,236,000 JPY 7,134,484 3 July 2014 74,016 0.05JPY 732,751,328 GBP 4,236,000 3 July 2014 (9,689) (0.01)USD 145,007,000 JPY 14,755,959,143 3 July 2014 (652,847) (0.43)
_______________________________________________________________________________________________________________ ____________________________________________________________
Total Forward Foreign Exchange Contracts (588,520) (0.39) _______________________________________________________________________________________________________________ ____________________________________________________________
167

UBS ETF - MSCI Pacific (ex Japan) UCITS ETF Semi-Annual Report as of 30 June 2014 Schedule of Investments as at 30 June 2014 (Expressed in USD) (Unaudited)
The accompanying notes form an integral part of these financial statements.
Transferable securities listed on an Official Stock Exchange
Quantity Market
Value USD % of
Net AssetsCommon Stocks Agriculture (0.19%) Golden Agri-Resources 864,000 384,647 0.19 Airlines (0.48%) Cathay Pacific Airways 141,000 263,431 0.13Qantas Airways 129,438 153,934 0.08Singapore Airlines 43,000 357,687 0.18Singapore Airlines 200 22,000 182,826 0.09 Apparel (0.15%) Yue Yuen Industrial Holdings 88,000 294,645 0.15 Banks (29.14%) Australia & New Zealand Banking Group 325,686 10,248,677 5.18Bank of East Asia 149,238 619,069 0.31Bank of Queensland 43,019 494,957 0.25Bendigo and Adelaide Bank 50,523 581,771 0.29BOC Hong Kong Holdings 437,000 1,265,833 0.64Commonwealth Bank of Australia 191,296 14,603,272 7.38DBS Group Holdings 203,825 2,738,595 1.39Hang Seng Bank 90,200 1,473,394 0.75National Australia Bank 279,366 8,643,420 4.37Oversea-Chinese Banking 309,062 2,367,579 1.20United Overseas Bank 154,276 2,786,905 1.41Westpac Banking 368,973 11,798,889 5.97 Beverages (0.49%) Coca-Cola Amatil 68,415 610,866 0.31Treasury Wine Estates 76,196 360,307 0.18 Building Materials (0.89%) Boral 90,881 450,335 0.23Fletcher Building 80,040 617,396 0.31James Hardie Industries 52,974 691,994 0.35 Chemicals (0.27%) Incitec Pivot 194,928 533,550 0.27 Commercial Services (1.54%) Brambles 184,350 1,599,049 0.81Transurban Group 208,121 1,451,655 0.73 Computers (0.34%) Computershare 56,513 665,681 0.34 Distribution & Wholesale (0.76%) Jardine Cycle & Carriage 13,000 461,541 0.24Li & Fung 698,000 1,033,894 0.52 Diversified Financial Services (2.89%) ASX 23,318 784,390 0.40Hong Kong Exchanges and Clearing 130,842 2,439,460 1.23Macquarie Group 34,250 1,927,652 0.98Singapore Exchange 101,000 563,069 0.28 Electric (3.28%) AGL Energy 65,828 961,800 0.49CLP Holdings 223,000 1,829,956 0.93Contact Energy 44,464 206,721 0.10Origin Energy 130,915 1,806,508 0.91Power Assets Holdings 164,000 1,433,612 0.72SP AusNet 206,889 258,736 0.13 Engineering & Construction (1.54%) Auckland International Airport 110,114 376,000 0.19Cheung Kong Infrastructure Holdings 73,000 503,442 0.26Leighton Holdings 12,174 226,706 0.11Sembcorp Industries 112,000 482,445 0.24Singapore Technologies Engineering 181,000 551,719 0.28Sydney Airport 127,411 507,484 0.26
168

UBS ETF - MSCI Pacific (ex Japan) UCITS ETF Semi-Annual Report as of 30 June 2014 Schedule of Investments as at 30 June 2014 (Expressed in USD) (Unaudited)
The accompanying notes form an integral part of these financial statements.
Transferable securities listed on an Official Stock Exchange
Quantity Market
Value USD % of
Net Assets Engineering & Construction (1.54%) (continued) WorleyParsons 23,987 394,165 0.20 Entertainment (0.80%) Genting Singapore 724,000 772,406 0.39Tabcorp Holdings 87,791 278,415 0.14Tatts Group 170,422 525,989 0.27 Food (3.14%) First Pacific 281,000 313,980 0.16Metcash 101,619 253,211 0.13Olam International 57,000 117,964 0.06Wilmar International 225,000 575,743 0.29Woolworths 148,925 4,950,626 2.50 Gas (0.82%) Hong Kong & China Gas 745,110 1,630,515 0.82 Hand & Machine Tools (0.26%) Techtronic Industries 160,500 514,612 0.26 Healthcare Products (0.20%) Cochlear 6,861 399,554 0.20 Healthcare Services (0.88%) Ramsay Health Care 15,594 669,687 0.34Ryman Healthcare 43,466 325,385 0.17Sonic Healthcare 45,077 737,321 0.37 Holding Companies - Diversified Operations (4.08%) Hutchison Whampoa 253,000 3,460,231 1.75Keppel 172,000 1,488,694 0.75Noble Group 509,545 559,962 0.29NWS Holdings 177,848 329,979 0.17Swire Pacific - Class A 76,000 935,493 0.47Wharf Holdings 178,900 1,288,022 0.65 Insurance (7.03%) AIA Group 1,426,000 7,166,477 3.62AMP 349,519 1,748,436 0.88Insurance Australia Group 276,249 1,522,708 0.77QBE Insurance Group 148,555 1,524,123 0.77Suncorp Group 152,737 1,951,938 0.99 Internet (0.29%) Seek 38,677 578,609 0.29 Iron & Steel (0.38%) Fortescue Metals Group 181,633 745,740 0.38 Leisure Time (0.14%) Flight Centre 6,752 283,274 0.14 Lodging (3.73%) City Developments 50,000 410,300 0.21Crown Resorts 43,932 626,954 0.32Galaxy Entertainment Group 276,000 2,207,900 1.11MGM China Holdings 111,600 387,343 0.19Sands China 287,600 2,172,674 1.10Shangri-La Asia 188,500 295,263 0.15SJM Holdings 228,000 571,298 0.29Wynn Macau 181,600 712,308 0.36 Media (0.32%) Singapore Press Holdings 187,000 625,508 0.32 Mining (9.25%) Alumina 300,920 383,432 0.19BHP Billiton 381,377 12,922,665 6.53Iluka Resources 48,759 374,152 0.19Newcrest Mining 91,225 905,801 0.46
169

UBS ETF - MSCI Pacific (ex Japan) UCITS ETF Semi-Annual Report as of 30 June 2014 Schedule of Investments as at 30 June 2014 (Expressed in USD) (Unaudited)
The accompanying notes form an integral part of these financial statements.
Transferable securities listed on an Official Stock Exchange
Quantity Market
Value USD % of
Net Assets Mining (9.25%) (continued) Orica 43,666 802,852 0.41Rio Tinto 51,900 2,905,350 1.47 Miscellaneous Manufacturers (0.20%) ALS 46,677 390,337 0.20 Oil & Gas (2.49%) Caltex Australia 15,624 318,087 0.16Santos 116,061 1,562,100 0.79Woodside Petroleum 78,399 3,039,054 1.54 Packaging & Containers (0.71%) Amcor 142,108 1,398,962 0.71 Pharmaceuticals & Biotechnology (1.82%) CSL 57,480 3,610,505 1.82 Pipelines (0.32%) APA Group 97,532 634,263 0.32 Real Estate (6.55%) CapitaLand 299,000 767,497 0.39Cheung Kong Holdings 165,000 2,927,287 1.48Global Logistic Properties 365,000 790,519 0.40Hang Lung Properties 263,000 811,021 0.41Henderson Land Development 124,877 730,699 0.37Hysan Development 74,438 348,642 0.18Keppel Land 79,000 214,190 0.11Kerry Properties 75,500 263,994 0.13Lend Lease Group 64,729 800,949 0.41New World Development 609,021 693,074 0.35REA Group 6,540 263,639 0.13Sino Land 351,624 578,906 0.29Sun Hung Kai Properties 192,113 2,634,928 1.33Swire Properties 137,600 402,129 0.20UOL Group 53,800 281,375 0.14Wheelock & Co 107,000 446,619 0.23 Real Estate Investment Trusts (5.67%) Ascendas Real Estate Investment Trust 247,000 455,701 0.23CapitaCommercial Trust 233,000 317,732 0.16CapitaMall Trust 277,000 438,836 0.22CFS Retail Property Trust Group 251,236 483,744 0.24Dexus Property Group 663,372 694,997 0.35Federation Centres 174,992 411,264 0.21Goodman Group 204,992 977,083 0.49GPT Group 199,776 724,065 0.37Link REIT 275,500 1,482,301 0.75Mirvac Group 432,534 728,722 0.37Scentre Group 631,879 1,908,476 0.97Stockland 273,138 1,000,269 0.51Westfield 234,734 1,584,109 0.80 Retail (2.80%) Harvey Norman Holdings 64,115 187,596 0.09Wesfarmers 135,731 5,360,112 2.71 Semiconductors (0.16%) ASM Pacific Technology 28,400 310,371 0.16 Shipping (0.27%) Sembcorp Marine 96,000 315,726 0.16Yangzijiang Shipbuilding Holdings 251,000 217,447 0.11 Software (0.09%) Xero 7,677 174,694 0.09 Telecommunications (3.54%) HKT Trust and HKT 310,000 365,183 0.18PCCW 491,893 293,218 0.15
170

UBS ETF - MSCI Pacific (ex Japan) UCITS ETF Semi-Annual Report as of 30 June 2014 Schedule of Investments as at 30 June 2014 (Expressed in USD) (Unaudited)
The accompanying notes form an integral part of these financial statements.
Transferable securities listed on an Official Stock Exchange
Quantity Market
Value USD % of
Net Assets Telecommunications (3.54%) (continued) Singapore Telecommunications 669,000 2,066,057 1.05Singapore Telecommunications 10 271,000 836,923 0.42StarHub 69,000 230,803 0.12Telecom of New Zealand 212,348 498,269 0.25Telstra 514,885 2,531,927 1.28TPG Telecom 32,777 170,461 0.09 Transportation (1.91%) Asciano 114,225 606,978 0.31Aurizon Holdings 250,785 1,178,783 0.60ComfortDelGro 248,000 497,333 0.25Hutchison Port Holdings Trust - Class U 638,393 459,643 0.23MTR 171,292 659,721 0.33Toll Holdings 79,675 383,526 0.19
_______________________________________________________________________________________________________________ ____________________________________________________________
Total Common Stocks 197,403,404 99.81 _______________________________________________________________________________________________________________ ____________________________________________________________
Rights
HKT Trust and HKT- Rights 47,160 13,934 0.01 _______________________________________________________________________________________________________________ ____________________________________________________________
Total Rights 13,934 0.01 _______________________________________________________________________________________________________________ ____________________________________________________________
TOTAL INVESTMENTS (Cost USD 190,408,797) 197,417,338 99.82Other net assets 349,636 0.18
_______________________________________________________________________________________________________________ ____________________________________________________________
TOTAL NET ASSETS 197,766,974 100.00 _______________________________________________________________________________________________________________ ____________________________________________________________ _______________________________________________________________________________________________________________ ____________________________________________________________
171

UBS ETF - MSCI USA UCITS ETF Semi-Annual Report as of 30 June 2014 Schedule of Investments as at 30 June 2014 (Expressed in USD) (Unaudited)
The accompanying notes form an integral part of these financial statements.
Transferable securities listed on an Official Stock Exchange
Quantity Market
Value USD % of
Net AssetsCommon Stocks Advertising (0.14%) Interpublic Group of Companies 46,884 914,707 0.04Omnicom Group 28,562 2,034,186 0.10 Aerospace & Defense (1.95%) B/E Aerospace 11,066 1,023,494 0.05Boeing 77,730 9,889,588 0.49General Dynamics 32,032 3,733,330 0.18L-3 Communications Holdings 9,631 1,162,943 0.06Lockheed Martin 29,841 4,796,344 0.23Northrop Grumman 23,170 2,771,827 0.14Raytheon 35,047 3,233,086 0.16Rockwell Collins 14,944 1,167,724 0.06TransDigm Group 5,437 909,393 0.04United Technologies 96,010 11,084,354 0.54 Agriculture (1.62%) Altria Group 218,424 9,160,703 0.45Archer-Daniels-Midland 72,885 3,214,958 0.16Bunge 16,052 1,214,173 0.06Lorillard 39,863 2,430,447 0.12Philip Morris International 175,823 14,823,637 0.73Reynolds American 34,812 2,100,904 0.10 Airlines (0.14%) American Airlines Group 20,216 868,480 0.04Delta Air Lines 22,143 857,377 0.04Southwest Airlines 21,627 580,901 0.03United Continental Holdings 11,447 470,128 0.03 Apparel (0.62%) Michael Kors Holdings 20,900 1,852,785 0.09NIKE - Class B 79,030 6,128,776 0.30Ralph Lauren 6,466 1,039,022 0.05Under Armour - Class A 18,843 1,120,970 0.06VF 39,539 2,490,957 0.12 Auto Manufacturers (0.82%) Ford Motor 408,252 7,038,264 0.34General Motors 140,427 5,097,500 0.25PACCAR 38,749 2,434,600 0.12Tesla Motors 9,249 2,220,315 0.11 Auto Parts & Equipment (0.49%) Autoliv 10,685 1,138,807 0.05BorgWarner 24,426 1,592,331 0.08Delphi Automotive 32,122 2,208,066 0.11Johnson Controls 75,994 3,794,381 0.19TRW Automotive Holdings 12,783 1,144,334 0.06 Banks (7.05%) Bank of America 1,167,978 17,951,822 0.88Bank of New York Mellon 127,610 4,782,823 0.24BB&T 77,498 3,055,746 0.15Capital One Financial 62,662 5,175,881 0.25CIT Group 19,968 913,736 0.04Citigroup 336,025 15,826,777 0.78Comerica 20,248 1,015,640 0.05Fifth Third Bancorp 97,388 2,079,234 0.10First Republic Bank 12,538 689,465 0.03Goldman Sachs Group 47,445 7,944,191 0.39JPMorgan Chase & Co 417,917 24,080,377 1.18KeyCorp 99,941 1,432,154 0.07M&T Bank 12,856 1,594,787 0.08Morgan Stanley 163,197 5,276,159 0.26Northern Trust 24,306 1,560,688 0.08PNC Financial Services Group 58,681 5,225,543 0.26Regions Financial 152,170 1,616,045 0.08State Street 48,038 3,231,036 0.16SunTrust Banks 57,697 2,311,342 0.11
202

UBS ETF - MSCI USA UCITS ETF Semi-Annual Report as of 30 June 2014 Schedule of Investments as at 30 June 2014 (Expressed in USD) (Unaudited)
The accompanying notes form an integral part of these financial statements.
Transferable securities listed on an Official Stock Exchange
Quantity Market
Value USD % of
Net Assets Banks (7.05%) (continued) US Bancorp 199,672 8,649,791 0.43Wells Fargo & Co 551,896 29,007,654 1.43 Beverages (2.12%) Brown-Forman - Class B 13,376 1,259,618 0.06Coca-Cola 437,783 18,544,488 0.91Coca-Cola Enterprises 27,061 1,292,975 0.06Constellation Brands - Class A 17,579 1,549,237 0.08Dr Pepper Snapple Group 22,344 1,308,911 0.06Keurig Green Mountain 13,819 1,721,986 0.09Molson Coors Brewing - Class B 17,000 1,260,720 0.06Monster Beverage 15,591 1,107,429 0.06PepsiCo 168,210 15,027,881 0.74 Building Materials (0.12%) Martin Marietta Materials 4,996 659,722 0.03Masco 39,093 867,864 0.04Vulcan Materials 14,440 920,550 0.05 Chemicals (2.64%) Air Products & Chemicals 23,214 2,985,785 0.15Airgas 6,951 757,034 0.04Albemarle 8,756 626,054 0.03Ashland 8,277 900,041 0.04Celanese - Class A 17,244 1,108,444 0.05CF Industries Holdings 6,353 1,528,087 0.07Dow Chemical 134,146 6,903,153 0.34E. I. du Pont de Nemours & Co 102,052 6,678,283 0.33Eastman Chemical 16,095 1,405,898 0.07Ecolab 30,090 3,350,221 0.16FMC 15,406 1,096,753 0.05International Flavors & Fragrances 9,086 947,488 0.05LyondellBasell Industries - Class A 51,339 5,013,253 0.25Monsanto 57,337 7,152,217 0.35Mosaic 35,300 1,745,585 0.09PPG Industries 16,118 3,387,198 0.17Praxair 32,335 4,295,381 0.21Rayonier Advanced Materials 4,758 184,360 0.01Sherwin-Williams 9,611 1,988,612 0.10Sigma-Aldrich 12,996 1,318,834 0.06Westlake Chemical 3,852 322,644 0.02 Coal (0.08%) CONSOL Energy 24,982 1,150,921 0.06Peabody Energy 28,649 468,411 0.02 Commercial Services (1.61%) ADT 19,231 671,931 0.03Alliance Data Systems 5,561 1,564,031 0.08Automatic Data Processing 53,450 4,237,516 0.21Cintas 11,941 758,731 0.04Equifax 14,117 1,024,047 0.05FleetCor Technologies 7,631 1,005,766 0.05H&R Block 31,116 1,043,008 0.05Hertz Global Holdings 50,166 1,406,153 0.07Iron Mountain 15,713 557,026 0.03Manpowergroup 8,369 710,110 0.03MasterCard - Class A 113,421 8,333,041 0.41McGraw Hill Financial 30,063 2,496,131 0.12Moody's 21,559 1,889,862 0.09Quanta Services 24,231 837,908 0.04Robert Half International 16,175 772,195 0.04SEI Investments 14,883 487,716 0.02Total System Services 20,072 630,462 0.03Towers Watson & Co - Class A 7,091 739,095 0.04United Rentals 10,802 1,131,293 0.06Vantiv - Class A 13,821 464,662 0.02Verisk Analytics - Class A 17,206 1,032,704 0.05Western Union 60,075 1,041,700 0.05
173

UBS ETF - MSCI USA UCITS ETF Semi-Annual Report as of 30 June 2014 Schedule of Investments as at 30 June 2014 (Expressed in USD) (Unaudited)
The accompanying notes form an integral part of these financial statements.
Transferable securities listed on an Official Stock Exchange
Quantity Market
Value USD % of
Net Assets Computers (5.77%) Accenture - Class A 70,101 5,666,965 0.28Apple 688,556 63,987,509 3.14Cognizant Technology Solutions - Class A 67,648 3,308,664 0.16Computer Sciences 15,652 989,206 0.05EMC 223,828 5,895,630 0.29Hewlett-Packard 210,277 7,082,129 0.35IHS - Class A 6,633 899,899 0.04International Business Machines 109,637 19,873,899 0.98NetApp 37,627 1,374,138 0.07SanDisk 25,362 2,648,554 0.13Seagate Technology 35,251 2,002,962 0.10Synopsys 16,687 647,789 0.03Teradata 17,566 706,153 0.04Western Digital 24,726 2,282,210 0.11 Cosmetics & Personal Care (1.62%) Avon Products 46,796 683,690 0.03Colgate-Palmolive 101,909 6,948,156 0.34Estee Lauder - Class A 25,971 1,928,606 0.10Procter & Gamble 298,766 23,480,020 1.15 Distribution & Wholesale (0.33%) Arrow Electronics 11,124 672,001 0.03Fastenal 30,025 1,485,937 0.07Fossil Group 5,346 558,764 0.03Genuine Parts 17,598 1,545,104 0.08LKQ 33,718 899,934 0.04WW Grainger 6,208 1,578,508 0.08 Diversified Financial Services (2.62%) Affiliated Managers Group 5,684 1,167,494 0.06American Express 105,803 10,037,531 0.49Ameriprise Financial 20,801 2,496,120 0.12BlackRock 14,582 4,660,407 0.23Charles Schwab 129,791 3,495,272 0.17CME Group 35,352 2,508,224 0.12Discover Financial Services 51,710 3,204,986 0.16Eaton Vance 12,722 480,764 0.02Franklin Resources 45,483 2,630,737 0.13Intercontinental Exchange 12,622 2,384,296 0.12Invesco 49,468 1,867,417 0.09Legg Mason 11,298 579,700 0.03NASDAQ OMX Group 14,442 557,750 0.03Navient 49,555 877,619 0.04Ocwen Financial 12,531 464,900 0.02Raymond James Financial 13,945 707,430 0.04T Rowe Price Group 29,188 2,463,759 0.12TD Ameritrade Holding 30,798 965,517 0.05Visa - Class A 55,725 11,741,815 0.58 Electric (2.80%) AES 71,721 1,115,262 0.05Alliant Energy 13,198 803,230 0.04Ameren 26,051 1,064,965 0.05American Electric Power 54,935 3,063,725 0.15Calpine 39,371 937,423 0.05CMS Energy 29,071 905,562 0.04Consolidated Edison 32,248 1,861,999 0.09Dominion Resources 64,935 4,644,151 0.23DTE Energy 19,580 1,524,695 0.08Duke Energy 78,694 5,838,308 0.29Edison International 32,747 1,902,928 0.09Entergy 20,629 1,693,435 0.08Exelon 95,577 3,486,649 0.17FirstEnergy 45,511 1,580,142 0.08Integrys Energy Group 8,235 585,756 0.03MDU Resources Group 19,492 684,169 0.03NextEra Energy 47,766 4,895,060 0.24Northeast Utilities 33,178 1,568,324 0.08NRG Energy 34,941 1,299,805 0.06
174

UBS ETF - MSCI USA UCITS ETF Semi-Annual Report as of 30 June 2014 Schedule of Investments as at 30 June 2014 (Expressed in USD) (Unaudited)
The accompanying notes form an integral part of these financial statements.
Transferable securities listed on an Official Stock Exchange
Quantity Market
Value USD % of
Net Assets Electric (2.80%) (continued) OGE Energy 21,213 829,004 0.04Pepco Holdings 30,488 837,810 0.04PG&E 50,238 2,412,429 0.12Pinnacle West Capital 11,804 682,743 0.03PPL 70,476 2,504,012 0.12Public Service Enterprise Group 54,317 2,215,590 0.11SCANA 14,202 764,210 0.04Southern 97,680 4,432,718 0.22Wisconsin Energy 24,789 1,163,100 0.06Xcel Energy 55,216 1,779,612 0.09 Electrical Components & Equipment (0.36%) AMETEK 27,409 1,432,943 0.07Emerson Electric 77,112 5,117,152 0.25Energizer Holdings 6,456 787,826 0.04 Electronics (1.38%) Agilent Technologies 36,560 2,100,006 0.10Amphenol - Class A 17,282 1,664,948 0.08Avnet 16,347 724,335 0.04Flextronics International 67,673 749,140 0.04FLIR Systems 14,668 509,420 0.03Garmin 13,201 803,941 0.04Honeywell International 82,021 7,623,852 0.37Mettler-Toledo International 3,235 819,037 0.04Sensata Technologies Holding 15,391 719,991 0.04TE Connectivity 45,605 2,820,213 0.14Thermo Fisher Scientific 43,110 5,086,980 0.25Trimble Navigation 28,067 1,037,076 0.05Tyco International 51,323 2,340,329 0.11Waters 9,732 1,016,410 0.05 Engineering & Construction (0.16%) Chicago Bridge & Iron 10,540 718,828 0.04Fluor 17,106 1,315,451 0.06Jacobs Engineering Group 14,610 778,421 0.04KBR 15,946 380,312 0.02 Environmental Control (0.22%) Republic Services 31,359 1,190,701 0.06Stericycle 9,409 1,114,214 0.05Waste Management 48,128 2,152,765 0.11 Food (1.58%) Campbell Soup 21,708 994,443 0.05ConAgra Foods 46,835 1,390,063 0.07General Mills 67,705 3,557,221 0.18Hershey 17,394 1,693,654 0.08Hormel Foods 15,561 767,935 0.04JM Smucker 11,834 1,261,149 0.06Kellogg 28,905 1,899,059 0.09Kraft Foods Group 65,450 3,923,728 0.19Kroger 53,256 2,632,444 0.13McCormick & Co 12,779 914,849 0.05Mondelez International - Class A 187,054 7,035,101 0.35Safeway 25,885 888,891 0.04Sysco 65,056 2,436,347 0.12Tyson Foods - Class A 28,723 1,078,261 0.05Whole Foods Market 41,584 1,606,390 0.08 Forest Products & Paper (0.16%) International Paper 46,660 2,354,930 0.12MeadWestvaco 19,769 874,976 0.04 Gas (0.26%) CenterPoint Energy 43,396 1,108,334 0.06NiSource 36,298 1,427,963 0.07Sempra Energy 25,509 2,671,048 0.13
190

UBS ETF - MSCI USA UCITS ETF Semi-Annual Report as of 30 June 2014 Schedule of Investments as at 30 June 2014 (Expressed in USD) (Unaudited)
The accompanying notes form an integral part of these financial statements.
Transferable securities listed on an Official Stock Exchange
Quantity Market
Value USD % of
Net Assets Hand & Machine Tools (0.07%) Stanley Black & Decker 16,667 1,463,696 0.07 Healthcare Products (1.86%) Baxter International 60,595 4,381,019 0.22Becton Dickinson & Co 21,444 2,536,825 0.12Boston Scientific 146,220 1,867,229 0.09CareFusion 23,086 1,023,864 0.05Covidien 48,772 4,398,259 0.22CR Bard 7,818 1,118,052 0.05DENTSPLY International 15,664 741,690 0.04Edwards Lifesciences 12,891 1,106,564 0.05Henry Schein 9,403 1,115,854 0.05Hologic 28,061 711,346 0.03Hospira 18,958 973,873 0.05Intuitive Surgical 4,215 1,735,737 0.09Medtronic 109,532 6,983,760 0.34Patterson 9,635 380,679 0.02ResMed 14,752 746,894 0.04St Jude Medical 31,964 2,213,507 0.11Stryker 36,123 3,045,891 0.15Varian Medical Systems 10,991 913,792 0.04Zimmer Holdings 18,650 1,936,989 0.10 Healthcare Services (1.31%) Aetna 40,053 3,247,497 0.16Cigna 30,938 2,845,368 0.14DaVita HealthCare Partners 20,268 1,465,782 0.07HCA Holdings 34,348 1,936,540 0.10Humana 17,144 2,189,632 0.11Laboratory Corporation of America Holdings 8,917 913,101 0.04Quest Diagnostics 14,860 872,133 0.04UnitedHealth Group 108,342 8,856,959 0.44Universal Health Services - Class B 9,938 951,663 0.05WellPoint 30,912 3,326,440 0.16 Holding Companies - Diversified Operations (0.05%) Leucadia National 35,397 928,109 0.05 Home Builders (0.15%) DR Horton 32,326 794,573 0.04Lennar - Class A 17,100 717,858 0.04PulteGroup 40,012 806,642 0.04Toll Brothers 19,105 704,975 0.03 Home Furnishings (0.06%) Whirlpool 8,659 1,205,506 0.06 Household Products (0.42%) Avery Dennison 10,837 555,396 0.03Church & Dwight 14,741 1,031,133 0.05Clorox 14,783 1,351,166 0.07Kimberly-Clark 41,632 4,630,311 0.23Newell Rubbermaid 29,860 925,362 0.04 Insurance (3.76%) ACE 36,676 3,803,301 0.19Aflac 50,628 3,151,593 0.16Alleghany 1,735 760,138 0.04Allstate 50,822 2,984,268 0.15American International Group 153,997 8,405,156 0.41Aon 31,089 2,800,808 0.14Arch Capital Group 14,106 810,249 0.04Assurant 8,672 568,450 0.03Axis Capital Holdings 9,976 441,737 0.02Berkshire Hathaway - Class B 123,575 15,639,652 0.77Chubb 27,333 2,519,283 0.12Cincinnati Financial 17,491 840,268 0.04Everest Re Group 5,191 833,104 0.04Fidelity National Financial - Class A 26,335 862,735 0.04Genworth Financial - Class A 55,494 965,596 0.05
176

UBS ETF - MSCI USA UCITS ETF Semi-Annual Report as of 30 June 2014 Schedule of Investments as at 30 June 2014 (Expressed in USD) (Unaudited)
The accompanying notes form an integral part of these financial statements.
Transferable securities listed on an Official Stock Exchange
Quantity Market
Value USD % of
Net Assets Insurance (3.76%) (continued) Hartford Financial Services Group 48,104 1,722,604 0.08Lincoln National 29,685 1,526,996 0.08Loews 37,179 1,636,248 0.08Marsh & McLennan 59,542 3,085,466 0.15MetLife 106,022 5,890,582 0.29PartnerRe 5,426 592,573 0.03Principal Financial Group 32,522 1,641,711 0.08Progressive 63,338 1,606,252 0.08Prudential Financial 49,915 4,430,954 0.22RenaissanceRe Holdings 4,665 499,155 0.02Torchmark 10,127 829,604 0.04Travelers 39,665 3,731,286 0.18Unum Group 28,623 994,935 0.05Voya Financial 12,556 456,285 0.02Willis Group Holdings 19,976 864,961 0.04WR Berkley 12,468 577,393 0.03XL Group 30,459 996,923 0.05 Internet (4.71%) Amazon.com 43,270 14,053,231 0.69eBay 135,200 6,768,112 0.33Equinix 5,202 1,092,888 0.05Expedia 11,237 885,026 0.04F5 Networks 8,449 941,556 0.05Facebook - Class A 207,032 13,931,183 0.69FireEye 6,134 248,734 0.01Google - Class A 31,029 18,141,725 0.89Google - Class C 31,615 18,187,477 0.90Liberty Interactive - Class A 53,135 1,560,044 0.08LinkedIn - Class A 10,915 1,871,595 0.09Netflix 6,154 2,711,452 0.13Priceline Group 5,743 6,908,829 0.34Rackspace Hosting 11,751 395,539 0.02Symantec 73,253 1,677,494 0.08TripAdvisor 13,224 1,436,920 0.07Twitter 14,180 580,955 0.03VeriSign 14,763 720,582 0.04Yahoo! 104,266 3,662,865 0.18 Iron & Steel (0.09%) Nucor 35,560 1,751,330 0.09 Leisure Time (0.26%) Carnival 42,758 1,609,839 0.08Harley-Davidson 24,412 1,705,178 0.08Polaris Industries 7,456 971,069 0.05Royal Caribbean Cruises 17,430 969,108 0.05 Lodging (0.53%) Las Vegas Sands 44,891 3,421,592 0.17Marriott International - Class A 25,684 1,646,344 0.08MGM Resorts International 42,649 1,125,934 0.06Starwood Hotels & Resorts Worldwide 20,374 1,646,627 0.08Wyndham Worldwide 14,785 1,119,520 0.05Wynn Resorts 9,002 1,868,455 0.09 Machinery - Construction & Mining (0.41%) Caterpillar 70,430 7,653,628 0.38Joy Global 11,376 700,534 0.03 Machinery - Diversified (0.62%) AGCO 10,652 598,855 0.03Cummins 19,988 3,083,948 0.15Deere & Co 38,301 3,468,156 0.17Flowserve 15,568 1,157,481 0.06Rockwell Automation 15,023 1,880,279 0.09Roper Industries 11,444 1,670,938 0.08Xylem 19,598 765,890 0.04
177

UBS ETF - MSCI USA UCITS ETF Semi-Annual Report as of 30 June 2014 Schedule of Investments as at 30 June 2014 (Expressed in USD) (Unaudited)
The accompanying notes form an integral part of these financial statements.
Transferable securities listed on an Official Stock Exchange
Quantity Market
Value USD % of
Net Assets Media (3.75%) Cablevision Systems - Class A 22,347 394,425 0.02CBS - Class B - Non-Voting Shares 60,851 3,781,281 0.18Charter Communications - Class A 7,698 1,219,209 0.06Comcast - Class A 234,664 12,596,763 0.62Comcast - Class A Special 51,870 2,766,227 0.14DIRECTV 53,512 4,549,055 0.22Discovery Communications - Class A 16,459 1,222,574 0.06Discovery Communications - Class C 9,533 692,000 0.03DISH Network - Class A 24,745 1,610,405 0.08Liberty Global - Class A 23,312 1,030,857 0.05Liberty Global - Class C 57,473 2,431,683 0.12Liberty Media - Class A 10,497 1,434,730 0.07News - Class A 41,338 741,604 0.04Nielsen 32,339 1,565,531 0.08Scripps Networks Interactive - Class A 8,719 707,460 0.03Sirius XM Holdings 350,072 1,211,249 0.06Time Warner 99,177 6,967,184 0.34Time Warner Cable 31,210 4,597,233 0.23Twenty-First Century Fox - Class A 161,144 5,664,212 0.28Twenty-First Century Fox - Class B 48,702 1,667,069 0.08Viacom - Class B 43,856 3,803,631 0.19Walt Disney 183,784 15,757,640 0.77 Metal Fabricate & Hardware (0.20%) Precision Castparts 16,003 4,039,157 0.20 Mining (0.36%) Alcoa 121,720 1,812,411 0.09Freeport-McMoRan Copper & Gold 112,384 4,102,016 0.20Newmont Mining 56,824 1,445,602 0.07 Miscellaneous Manufacturers (3.09%) 3M 69,873 10,008,608 0.49Danaher 69,298 5,455,832 0.27Dover 18,169 1,652,471 0.08Eaton 52,790 4,074,332 0.20General Electric 1,102,221 28,966,368 1.42Illinois Tool Works 45,197 3,957,449 0.19Ingersoll-Rand 31,796 1,987,568 0.10Leggett & Platt 15,104 517,765 0.03Pall 11,931 1,018,788 0.05Parker Hannifin 16,424 2,064,989 0.10Pentair 22,205 1,601,425 0.08SPX 4,375 473,419 0.02Textron 29,591 1,133,039 0.06 Office & Business Equipment (0.08%) Xerox 132,428 1,647,404 0.08 Oil & Gas (8.21%) Anadarko Petroleum 55,144 6,036,614 0.30Antero Resources 6,046 396,799 0.02Apache 43,346 4,361,474 0.21Cabot Oil & Gas 47,169 1,610,350 0.08Cheniere Energy 25,402 1,821,323 0.09Chesapeake Energy 59,702 1,855,538 0.09Chevron 210,235 27,446,179 1.35Cimarex Energy 9,976 1,431,157 0.07Cobalt International Energy 31,082 570,355 0.03Concho Resources 12,062 1,742,959 0.09ConocoPhillips 135,870 11,648,135 0.57Continental Resources 5,366 848,043 0.04Denbury Resources 37,571 693,561 0.03Devon Energy 43,154 3,426,428 0.17Diamond Offshore Drilling 8,004 397,239 0.02Energen 7,504 666,955 0.03Ensco - Class A 26,125 1,451,766 0.07EOG Resources 60,493 7,069,212 0.35EQT 16,096 1,720,662 0.08Exxon Mobil 476,123 47,936,064 2.36
193

UBS ETF - MSCI USA UCITS ETF Semi-Annual Report as of 30 June 2014 Schedule of Investments as at 30 June 2014 (Expressed in USD) (Unaudited)
The accompanying notes form an integral part of these financial statements.
Transferable securities listed on an Official Stock Exchange
Quantity Market
Value USD % of
Net Assets Oil & Gas (8.21%) (continued) Helmerich & Payne 11,336 1,316,223 0.06Hess 32,350 3,199,091 0.16HollyFrontier 20,196 882,363 0.04Marathon Oil 77,990 3,113,361 0.15Marathon Petroleum 33,559 2,619,951 0.13Murphy Oil 20,538 1,365,366 0.07Nabors Industries 31,083 912,908 0.05Noble 25,549 857,424 0.04Noble Energy 39,960 3,095,302 0.15Occidental Petroleum 87,806 9,011,530 0.44Phillips 66 63,255 5,087,600 0.25Pioneer Natural Resources 15,853 3,643,178 0.18QEP Resources 17,489 603,370 0.03Range Resources 18,306 1,591,707 0.08Southwestern Energy 40,017 1,820,373 0.09Tesoro 15,187 891,021 0.04Valero Energy 59,649 2,988,415 0.15Whiting Petroleum 12,476 1,001,199 0.05 Oil & Gas Services (1.90%) Baker Hughes 48,897 3,640,382 0.18Cameron International 25,950 1,757,075 0.09Core Laboratories 4,733 790,695 0.04FMC Technologies 25,105 1,533,162 0.07Halliburton 94,002 6,675,082 0.33National Oilwell Varco 46,167 3,801,853 0.19Oceaneering International 12,264 958,186 0.05Schlumberger 144,035 16,988,928 0.83Superior Energy Services 16,087 581,384 0.03Weatherford International 85,006 1,955,138 0.09 Packaging & Containers (0.18%) Ball 14,556 912,370 0.04Crown Holdings 14,730 732,965 0.04Owens-Illinois 16,597 574,920 0.03RockTenn - Class A 7,717 814,838 0.04Sealed Air 21,344 729,324 0.03 Pharmaceuticals & Biotechnology (9.61%) Abbott Laboratories 170,266 6,963,879 0.34AbbVie 175,160 9,886,030 0.49Actavis 19,000 4,237,950 0.21Alexion Pharmaceuticals 21,541 3,365,781 0.17Allergan 32,780 5,547,032 0.27AmerisourceBergen 24,572 1,785,402 0.09Amgen 83,283 9,858,209 0.48Biogen Idec 26,056 8,215,717 0.40BioMarin Pharmaceutical 15,727 978,377 0.05Bristol-Myers Squibb 181,711 8,814,801 0.43Cardinal Health 37,406 2,564,555 0.13Celgene 90,026 7,731,433 0.38Eli Lilly & Co 111,405 6,926,049 0.34Endo International 15,854 1,110,097 0.06Express Scripts Holding 85,555 5,931,528 0.29Forest Laboratories 26,716 2,644,884 0.13Gilead Sciences 169,906 14,086,906 0.69Herbalife 9,836 634,815 0.03Illumina 13,738 2,452,782 0.12Johnson & Johnson 311,687 32,608,694 1.60McKesson 25,474 4,743,514 0.23Mead Johnson Nutrition 22,722 2,117,009 0.10Merck & Co 324,783 18,788,697 0.92Mylan 40,893 2,108,443 0.10Omnicare 11,451 762,293 0.04Perrigo 15,087 2,199,081 0.11Pfizer 702,830 20,859,994 1.03Pharmacyclics 6,686 599,801 0.03Quintiles Transnational Holdings 6,740 359,175 0.02Regeneron Pharmaceuticals 8,563 2,418,791 0.12Vertex Pharmaceuticals 26,570 2,515,648 0.12
179

UBS ETF - MSCI USA UCITS ETF Semi-Annual Report as of 30 June 2014 Schedule of Investments as at 30 June 2014 (Expressed in USD) (Unaudited)
The accompanying notes form an integral part of these financial statements.
Transferable securities listed on an Official Stock Exchange
Quantity Market
Value USD % of
Net Assets Pharmaceuticals & Biotechnology (9.61%) (continued) Zoetis 54,920 1,772,268 0.09 Pipelines (0.63%) Kinder Morgan 73,859 2,678,127 0.13Kinder Morgan Management 12,224 964,840 0.05ONEOK 22,542 1,534,659 0.07Spectra Energy 75,235 3,195,983 0.16Williams 76,774 4,469,015 0.22 Real Estate (0.08%) CBRE Group - Class A 31,358 1,004,710 0.05Realogy Holdings 15,259 575,417 0.03 Real Estate Investment Trusts (2.59%) American Capital Agency 41,738 977,087 0.05American Realty Capital Properties 99,458 1,246,209 0.06American Tower 44,299 3,986,024 0.20Annaly Capital Management 104,436 1,193,703 0.06AvalonBay Communities 14,307 2,034,312 0.10Boston Properties 16,779 1,982,942 0.10Camden Property Trust 9,477 674,289 0.03Crown Castle International 36,010 2,674,103 0.13Digital Realty Trust 13,317 776,647 0.04Duke Realty 34,658 629,389 0.03Equity Residential 37,091 2,336,733 0.12Essex Property Trust 6,244 1,154,578 0.06Federal Realty Investment Trust 7,293 881,870 0.04General Growth Properties 59,541 1,402,786 0.07HCP 51,174 2,117,580 0.10Health Care REIT 31,970 2,003,560 0.10Host Hotels & Resorts 82,592 1,817,850 0.09Kimco Realty 44,035 1,011,924 0.05Liberty Property Trust 14,944 566,826 0.03Macerich 16,036 1,070,403 0.05Plum Creek Timber 19,591 883,554 0.04Prologis 55,720 2,289,535 0.11Public Storage 16,453 2,819,222 0.14Rayonier 14,273 507,405 0.03Realty Income 22,691 1,007,934 0.05Regency Centers 11,339 631,355 0.03Simon Property Group 34,628 5,757,944 0.28SL Green Realty 9,856 1,078,345 0.05UDR 30,653 877,595 0.04Ventas 32,812 2,103,249 0.10Vornado Realty Trust 19,427 2,073,444 0.10Weyerhaeuser 64,286 2,127,224 0.11 Retail (5.75%) Advance Auto Parts 7,916 1,068,027 0.05AutoNation 8,920 532,346 0.03AutoZone 3,969 2,128,337 0.10Bed Bath & Beyond 22,741 1,304,879 0.06Best Buy 30,975 960,535 0.05CarMax 25,549 1,328,804 0.07Chipotle Mexican Grill 3,363 1,992,611 0.10Coach 31,559 1,079,002 0.05Costco Wholesale 48,384 5,571,901 0.27CVS Caremark 131,034 9,876,033 0.48Darden Restaurants 13,797 638,387 0.03Dick's Sporting Goods 10,840 504,710 0.02Dollar General 34,921 2,003,069 0.10Dollar Tree 23,172 1,261,947 0.06Family Dollar Stores 11,500 760,610 0.04GameStop - Class A 13,151 532,221 0.03Gap 25,677 1,067,393 0.05Home Depot 154,667 12,521,840 0.62Kohl's 22,571 1,189,040 0.06L Brands 27,474 1,611,625 0.08Lowe's 115,194 5,528,160 0.27Lululemon Athletica 10,844 438,965 0.02
180

UBS ETF - MSCI USA UCITS ETF Semi-Annual Report as of 30 June 2014 Schedule of Investments as at 30 June 2014 (Expressed in USD) (Unaudited)
The accompanying notes form an integral part of these financial statements.
Transferable securities listed on an Official Stock Exchange
Quantity Market
Value USD % of
Net Assets Retail (5.75%) (continued) Macy's 39,823 2,310,530 0.11McDonald's 108,555 10,935,831 0.54Nordstrom 16,872 1,146,115 0.06O'Reilly Automotive 11,552 1,739,731 0.09PetSmart 10,573 632,265 0.03PVH 9,167 1,068,872 0.05Ross Stores 23,018 1,522,180 0.07Sears Holdings 4,537 181,299 0.01Staples 71,041 770,084 0.04Starbucks 84,102 6,507,813 0.32Target 67,154 3,891,574 0.19Tiffany & Co 14,176 1,421,144 0.07TJX 79,256 4,212,456 0.21Tractor Supply 15,763 952,085 0.05Ulta Salon Cosmetics & Fragrance 6,997 639,596 0.03Urban Outfitters 11,879 402,223 0.02Wal-Mart Stores 178,582 13,406,151 0.66Walgreen 99,869 7,403,289 0.36Yum! Brands 49,378 4,009,494 0.20 Savings & Loans (0.09%) Hudson City Bancorp 48,834 480,039 0.02New York Community Bancorp 46,195 738,196 0.04People's United Financial 36,048 546,848 0.03 Semiconductors (3.00%) Altera 36,609 1,272,529 0.06Analog Devices 34,464 1,863,469 0.09Applied Materials 131,671 2,969,181 0.15Avago Technologies 27,468 1,979,619 0.10Broadcom - Class A 59,070 2,192,678 0.11Cree 14,333 715,933 0.03Intel 547,475 16,916,978 0.83KLA-Tencor 18,250 1,325,680 0.06Lam Research 17,342 1,171,972 0.06Linear Technology 24,549 1,155,521 0.06Marvell Technology Group 44,864 642,901 0.03Maxim Integrated Products 30,465 1,030,022 0.05Microchip Technology 20,762 1,013,393 0.05Micron Technology 117,952 3,886,518 0.19NVIDIA 61,957 1,148,683 0.06QUALCOMM 185,996 14,730,883 0.72Texas Instruments 119,730 5,721,897 0.28Xilinx 29,505 1,395,882 0.07 Software (4.04%) Activision Blizzard 52,892 1,179,492 0.06Adobe Systems 51,809 3,748,899 0.18Akamai Technologies 20,522 1,253,073 0.06ANSYS 10,601 803,768 0.04Autodesk 25,705 1,449,248 0.07CA 34,651 995,870 0.05Cerner 34,063 1,756,969 0.09Citrix Systems 21,365 1,336,381 0.06Dun & Bradstreet 4,949 545,380 0.03Electronic Arts 32,702 1,173,021 0.06Fidelity National Information Services 32,009 1,752,173 0.09Fiserv 27,212 1,641,428 0.08Intuit 30,050 2,419,926 0.12Microsoft 869,666 36,265,072 1.78NetSuite 3,753 326,061 0.01Nuance Communications 28,631 537,404 0.03Oracle 398,563 16,153,758 0.79Paychex 36,505 1,517,148 0.07Red Hat 21,715 1,200,188 0.06salesforce.com 62,191 3,612,053 0.18ServiceNow 13,360 827,786 0.04VMware - Class A 9,915 959,871 0.05Workday - Class A 9,313 836,866 0.04
181

UBS ETF - MSCI USA UCITS ETF Semi-Annual Report as of 30 June 2014 Schedule of Investments as at 30 June 2014 (Expressed in USD) (Unaudited)
The accompanying notes form an integral part of these financial statements.
Transferable securities listed on an Official Stock Exchange
Quantity Market
Value USD % of
Net Assets Telecommunications (3.53%) AT&T 573,133 20,265,983 1.00CenturyLink 64,815 2,346,303 0.12Cisco Systems 566,972 14,089,254 0.69Corning 161,058 3,535,223 0.17Frontier Communications 108,883 635,877 0.03Harris 12,063 913,772 0.05Juniper Networks 54,948 1,348,424 0.07Level 3 Communications 20,641 906,346 0.04Motorola Solutions 24,891 1,656,994 0.08SBA Communications - Class A 14,052 1,437,520 0.07Sprint 103,866 885,977 0.04T-Mobile US 26,051 875,835 0.04Verizon Communications 457,369 22,379,065 1.10Windstream Holdings 57,344 571,146 0.03 Textile (0.05%) Mohawk Industries 7,090 980,831 0.05 Toys, Games & Hobbies (0.11%) Hasbro 13,320 706,626 0.04Mattel 38,358 1,494,811 0.07 Transportation (1.68%) CH Robinson Worldwide 15,791 1,007,308 0.05CSX 112,878 3,477,771 0.17Expeditors International of Washington 21,954 969,489 0.05FedEx 32,756 4,958,603 0.24JB Hunt Transport Services 10,324 761,705 0.04Kansas City Southern 12,352 1,327,963 0.07Norfolk Southern 33,731 3,475,305 0.17Union Pacific 100,410 10,015,897 0.49United Parcel Service - Class B 78,901 8,099,977 0.40 Water (0.05%) American Water Works 19,975 987,764 0.05
_______________________________________________________________________________________________________________ ____________________________________________________________
Total Common Stocks 2,033,596,480 99.94 _______________________________________________________________________________________________________________ ____________________________________________________________
TOTAL INVESTMENTS (Cost USD 1,501,576,810) 2,033,596,480 99.94Other net assets 1,317,526 0.06
_______________________________________________________________________________________________________________ ____________________________________________________________
TOTAL NET ASSETS 2,034,914,006 100.00 _______________________________________________________________________________________________________________ ____________________________________________________________ _______________________________________________________________________________________________________________ ____________________________________________________________
182

UBS ETF - MSCI Canada UCITS ETF Semi-Annual Report as of 30 June 2014 Schedule of Investments as at 30 June 2014 (Expressed in CAD) (Unaudited)
The accompanying notes form an integral part of these financial statements.
Transferable securities listed on an Official Stock Exchange
Quantity Market
Value CAD % of
Net AssetsCommon Stocks Aerospace & Defense (0.24%) CAE 38,347 535,324 0.24 Apparel (0.47%) Gildan Activewear 16,951 1,065,709 0.47 Auto Parts & Equipment (1.63%) Magna International 32,230 3,701,938 1.63 Banks (25.86%) Bank of Montreal 94,048 7,390,292 3.27Bank of Nova Scotia 177,015 12,592,847 5.56Canadian Imperial Bank of Commerce 57,994 5,631,217 2.49National Bank of Canada 47,607 2,154,693 0.95Royal Bank of Canada 210,189 16,033,217 7.08Toronto-Dominion Bank 268,421 14,744,366 6.51 Chemicals (3.54%) Agrium 21,131 2,065,555 0.91Methanex 14,120 931,497 0.41Potash Corporation of Saskatchewan 123,878 5,026,969 2.22 Computers (0.89%) BlackBerry 72,857 797,056 0.35CGI Group - Class A 32,256 1,219,922 0.54 Diversified Financial Services (0.84%) CI Financial 32,643 1,144,137 0.51IGM Financial 14,735 752,664 0.33 Electric (0.93%) Atco - Class I 10,856 561,472 0.25Fortis 31,570 1,025,078 0.45TransAlta 39,539 517,170 0.23 Engineering & Construction (0.55%) SNC-Lavalin Group 22,137 1,242,328 0.55 Food (2.08%) Empire - Class A 7,839 568,798 0.25George Weston 7,394 581,982 0.26Loblaw 32,269 1,536,650 0.68Metro 12,974 855,895 0.38Saputo 18,308 1,170,430 0.51 Gas (0.71%) Canadian Utilities - Class A 17,498 699,920 0.31Keyera 11,605 912,269 0.40 Hand & Machine Tools (0.33%) Finning International 25,315 755,400 0.33 Insurance (7.49%) Fairfax Financial Holdings 3,046 1,541,946 0.68Great-West Lifeco 43,866 1,323,876 0.59Industrial Alliance Insurance & Financial Services 14,502 678,113 0.30Intact Financial 19,165 1,410,161 0.62Manulife Financial 269,837 5,723,243 2.53Power Corporation of Canada 53,709 1,592,472 0.70Power Financial 36,510 1,212,497 0.54Sun Life Financial 88,479 3,470,146 1.53 Media (1.61%) Shaw Communications - Class B 56,832 1,554,923 0.69Thomson Reuters 53,867 2,092,733 0.92 Mining (8.67%) Agnico Eagle Mines 29,348 1,199,159 0.53Barrick Gold 169,817 3,318,224 1.47Cameco 57,789 1,209,524 0.54
183

UBS ETF - MSCI Canada UCITS ETF Semi-Annual Report as of 30 June 2014 Schedule of Investments as at 30 June 2014 (Expressed in CAD) (Unaudited)
The accompanying notes form an integral part of these financial statements.
Transferable securities listed on an Official Stock Exchange
Quantity Market
Value CAD % of
Net Assets Mining (8.67%) (continued) Eldorado Gold 104,602 853,552 0.38First Quantum Minerals 86,382 1,971,237 0.87Franco-Nevada 21,488 1,316,140 0.58Goldcorp 118,660 3,533,695 1.56Kinross Gold 165,162 730,016 0.32New Gold 73,178 495,415 0.22Silver Wheaton 52,465 1,473,217 0.65Teck Resources - Class B 82,882 2,019,006 0.89Turquoise Hill Resources 116,256 415,034 0.18Yamana Gold 124,384 1,092,092 0.48 Miscellaneous Manufacturers (0.35%) Bombardier - Class B 208,735 786,931 0.35 Oil & Gas (19.71%) ARC Resources 46,004 1,494,670 0.66Athabasca Oil 46,545 356,535 0.16Baytex Energy 18,064 889,652 0.39Canadian Natural Resources 157,985 7,746,005 3.42Canadian Oil Sands 70,891 1,714,144 0.76Cenovus Energy 110,414 3,819,220 1.69Crescent Point Energy 60,028 2,838,724 1.25Encana 107,983 2,729,810 1.21Enerplus 29,789 801,026 0.35Husky Energy 50,396 1,736,646 0.77Imperial Oil 43,426 2,441,844 1.08MEG Energy 22,804 886,848 0.39Pacific Rubiales Energy 46,178 1,001,139 0.44Pengrowth Energy 75,350 576,428 0.25Penn West Petroleum 71,290 742,842 0.33Peyto Exploration & Development 21,427 863,722 0.38Suncor Energy 215,344 9,798,152 4.33Talisman Energy 150,773 1,700,719 0.75Tourmaline Oil 24,622 1,385,234 0.61Vermilion Energy 14,855 1,102,984 0.49 Pharmaceuticals & Biotechnology (3.38%) Catamaran 30,028 1,414,919 0.62Valeant Pharmaceuticals International 46,289 6,246,238 2.76 Pipelines (7.02%) AltaGas 17,863 876,716 0.39Enbridge 121,136 6,133,116 2.71Inter Pipeline 45,217 1,497,587 0.66Pembina Pipeline 46,858 2,151,251 0.95TransCanada 102,969 5,244,211 2.31 Private Equity (0.38%) Onex 12,909 852,252 0.38 Real Estate (1.79%) Brookfield Asset Management - Class A 80,618 3,789,852 1.68First Capital Realty 13,533 251,985 0.11 Real Estate Investment Trusts (0.46%) H&R Real Estate Investment Trust 19,459 450,670 0.20RioCan Real Estate Investment Trust 22,016 601,257 0.26 Retail (2.19%) Alimentation Couche Tard - Class B 60,754 1,775,839 0.79Canadian Tire - Class A 11,194 1,145,930 0.51Dollarama 9,624 845,468 0.37Tim Hortons 20,270 1,183,160 0.52 Software (0.39%) Open Text 17,222 881,766 0.39 Telecommunications (2.47%) BCE 37,490 1,814,516 0.80Bell Aliant 11,243 313,567 0.14
184

UBS ETF - MSCI Canada UCITS ETF Semi-Annual Report as of 30 June 2014 Schedule of Investments as at 30 June 2014 (Expressed in CAD) (Unaudited)
The accompanying notes form an integral part of these financial statements.
Transferable securities listed on an Official Stock Exchange
Quantity Market
Value CAD % of
Net Assets Telecommunications (2.47%) (continued) Rogers Communications - Class B 52,807 2,267,533 1.00TELUS 30,149 1,199,026 0.53 Transportation (5.88%) Canadian National Railway 120,809 8,384,145 3.70Canadian Pacific Railway 25,498 4,929,018 2.18
_______________________________________________________________________________________________________________ ____________________________________________________________
Total Common Stocks 226,104,513 99.86 _______________________________________________________________________________________________________________ ____________________________________________________________
TOTAL INVESTMENTS (Cost CAD 197,728,820) 226,104,513 99.86Other net assets 312,648 0.14
_______________________________________________________________________________________________________________ ____________________________________________________________
TOTAL NET ASSETS 226,417,161 100.00 _______________________________________________________________________________________________________________ ____________________________________________________________ _______________________________________________________________________________________________________________ ____________________________________________________________
185

UBS ETF - MSCI Canada 100% hedged to CHF UCITS ETF Semi-Annual Report as of 30 June 2014 Schedule of Investments as at 30 June 2014 (Expressed in CHF) (Unaudited)
The accompanying notes form an integral part of these financial statements.
Transferable securities listed on an Official Stock Exchange
Quantity Market
Value CHF % of
Net AssetsCommon Stocks Aerospace & Defense (0.25%) CAE 1,158 13,459 0.25 Apparel (0.48%) Gildan Activewear 488 25,543 0.48 Auto Parts & Equipment (1.66%) Magna International 936 89,508 1.66 Banks (26.18%) Bank of Montreal 2,711 177,360 3.30Bank of Nova Scotia 5,124 303,485 5.64Canadian Imperial Bank of Commerce 1,685 136,218 2.53National Bank of Canada 1,363 51,360 0.95Royal Bank of Canada 6,078 385,999 7.17Toronto-Dominion Bank 7,757 354,747 6.59 Chemicals (3.59%) Agrium 603 49,074 0.91Methanex 418 22,958 0.43Potash Corporation of Saskatchewan 3,590 121,289 2.25 Computers (0.87%) BlackBerry 2,035 18,535 0.34CGI Group - Class A 904 28,465 0.53 Diversified Financial Services (0.84%) CI Financial 923 26,934 0.50IGM Financial 432 18,372 0.34 Electric (0.95%) Atco - Class I 302 13,004 0.24Fortis 932 25,195 0.47TransAlta 1,193 12,992 0.24 Engineering & Construction (0.55%) SNC-Lavalin Group 628 29,342 0.55 Food (2.11%) Empire - Class A 225 13,592 0.25George Weston 202 13,237 0.25Loblaw 932 36,951 0.69Metro 377 20,706 0.38Saputo 541 28,795 0.54 Gas (0.73%) Canadian Utilities - Class A 507 16,884 0.31Keyera 343 22,449 0.42 Hand & Machine Tools (0.34%) Finning International 739 18,359 0.34 Insurance (7.57%) Fairfax Financial Holdings 88 37,088 0.69Great-West Lifeco 1,251 31,433 0.58Industrial Alliance Insurance & Financial Services 428 16,662 0.31Intact Financial 541 33,142 0.62Manulife Financial 7,788 137,525 2.55Power Corporation of Canada 1,545 38,139 0.71Power Financial 1,067 29,502 0.55Sun Life Financial 2,572 83,983 1.56 Media (1.63%) Shaw Communications - Class B 1,641 37,380 0.69Thomson Reuters 1,560 50,458 0.94 Mining (8.73%) Agnico Eagle Mines 829 28,201 0.52Barrick Gold 4,932 80,235 1.49Cameco 1,702 29,658 0.55
186

UBS ETF - MSCI Canada 100% hedged to CHF UCITS ETF Semi-Annual Report as of 30 June 2014 Schedule of Investments as at 30 June 2014 (Expressed in CHF) (Unaudited)
The accompanying notes form an integral part of these financial statements.
Transferable securities listed on an Official Stock Exchange
Quantity Market
Value CHF % of
Net Assets Mining (8.73%) (continued) Eldorado Gold 3,088 20,979 0.39First Quantum Minerals 2,461 46,756 0.87Franco-Nevada 610 31,106 0.58Goldcorp 3,441 85,315 1.58Kinross Gold 4,878 17,951 0.33New Gold 1,991 11,222 0.21Silver Wheaton 1,498 35,021 0.65Teck Resources - Class B 2,378 48,229 0.90Turquoise Hill Resources 3,190 9,481 0.18Yamana Gold 3,520 25,731 0.48 Miscellaneous Manufacturers (0.36%) Bombardier - Class B 6,174 19,379 0.36 Oil & Gas (19.97%) ARC Resources 1,371 37,085 0.69Athabasca Oil 1,499 9,560 0.18Baytex Energy 533 21,855 0.41Canadian Natural Resources 4,575 186,753 3.47Canadian Oil Sands 2,054 41,350 0.77Cenovus Energy 3,189 91,838 1.71Crescent Point Energy 1,691 66,578 1.24Encana 3,126 65,793 1.22Enerplus 830 18,582 0.34Husky Energy 1,455 41,744 0.77Imperial Oil 1,273 59,595 1.11MEG Energy 627 20,301 0.38Pacific Rubiales Energy 1,370 24,728 0.46Pengrowth Energy 2,308 14,700 0.27Penn West Petroleum 2,117 18,366 0.34Peyto Exploration & Development 616 20,673 0.38Suncor Energy 6,223 235,736 4.38Talisman Energy 4,458 41,866 0.78Tourmaline Oil 691 32,366 0.60Vermilion Energy 410 25,345 0.47 Pharmaceuticals & Biotechnology (3.44%) Catamaran 868 34,052 0.63Valeant Pharmaceuticals International 1,344 150,992 2.81 Pipelines (7.09%) AltaGas 510 20,840 0.39Enbridge 3,482 146,775 2.73Inter Pipeline 1,278 35,240 0.66Pembina Pipeline 1,357 51,868 0.96TransCanada 2,988 126,698 2.35 Private Equity (0.40%) Onex 392 21,546 0.40 Real Estate (1.80%) Brookfield Asset Management - Class A 2,327 91,075 1.69First Capital Realty 370 5,736 0.11 Real Estate Investment Trusts (0.46%) H&R Real Estate Investment Trust 567 10,933 0.20RioCan Real Estate Investment Trust 605 13,756 0.26 Retail (2.24%) Alimentation Couche Tard - Class B 1,768 43,025 0.80Canadian Tire - Class A 324 27,614 0.51Dollarama 297 21,723 0.40Tim Hortons 583 28,332 0.53 Software (0.40%) Open Text 500 21,314 0.40 Telecommunications (2.47%) BCE 1,081 43,560 0.81Bell Aliant 298 6,919 0.13
202

UBS ETF - MSCI Canada 100% hedged to CHF UCITS ETF Semi-Annual Report as of 30 June 2014 Schedule of Investments as at 30 June 2014 (Expressed in CHF) (Unaudited)
The accompanying notes form an integral part of these financial statements.
Transferable securities listed on an Official Stock Exchange
Quantity Market
Value CHF % of
Net Assets Telecommunications (2.47%) (continued) Rogers Communications - Class B 1,526 54,555 1.01TELUS 847 28,045 0.52 Transportation (5.97%) Canadian National Railway 3,496 201,997 3.75Canadian Pacific Railway 742 119,419 2.22
_______________________________________________________________________________________________________________ ____________________________________________________________
Total Common Stocks 5,440,216 101.08 _______________________________________________________________________________________________________________ ____________________________________________________________
TOTAL INVESTMENTS (Cost CHF 4,847,249) 5,440,216 101.08Other net liabilities (58,385) (1.08)
_______________________________________________________________________________________________________________ ____________________________________________________________
TOTAL NET ASSETS 5,381,831 100.00 _______________________________________________________________________________________________________________ ____________________________________________________________ _______________________________________________________________________________________________________________ ____________________________________________________________
Forward Foreign Exchange Contracts
Purchases Sales Maturity Date
Unrealised appreciation/ (depreciation)
CHF % of
Net AssetsCHF 5,175,000 CAD 6,292,643 4 July 2014 (63,821) (1.19)
Total Forward Foreign Exchange Contracts (63,821) (1.19) _______________________________________________________________________________________________________________ ____________________________________________________________
188

UBS ETF - MSCI Canada 100% hedged to EUR UCITS ETF Semi-Annual Report as of 30 June 2014 Schedule of Investments as at 30 June 2014 (Expressed in EUR) (Unaudited)
The accompanying notes form an integral part of these financial statements.
Transferable securities listed on an Official Stock Exchange
Quantity Market
Value EUR % of
Net AssetsCommon Stocks Aerospace & Defense (0.24%) CAE 1,560 14,933 0.24 Apparel (0.48%) Gildan Activewear 693 29,875 0.48 Auto Parts & Equipment (1.67%) Magna International 1,309 103,097 1.67 Banks (26.27%) Bank of Montreal 3,791 204,270 3.31Bank of Nova Scotia 7,168 349,663 5.66Canadian Imperial Bank of Commerce 2,354 156,734 2.54National Bank of Canada 1,895 58,812 0.95Royal Bank of Canada 8,504 444,807 7.20Toronto-Dominion Bank 10,852 408,750 6.61 Chemicals (3.60%) Agrium 849 56,907 0.92Methanex 575 26,011 0.42Potash Corporation of Saskatchewan 5,020 139,686 2.26 Computers (0.88%) BlackBerry 2,865 21,492 0.35CGI Group - Class A 1,255 32,547 0.53 Diversified Financial Services (0.82%) CI Financial 1,292 31,052 0.50IGM Financial 568 19,895 0.32 Electric (0.95%) Atco - Class I 486 17,236 0.28Fortis 1,254 27,920 0.45TransAlta 1,511 13,552 0.22 Engineering & Construction (0.57%) SNC-Lavalin Group 920 35,403 0.57 Food (2.17%) Empire - Class A 344 17,116 0.28George Weston 322 17,379 0.28Loblaw 1,305 42,613 0.69Metro 516 23,342 0.38Saputo 765 33,535 0.54 Gas (0.75%) Canadian Utilities - Class A 725 19,885 0.32Keyera 487 26,251 0.43 Hand & Machine Tools (0.34%) Finning International 1,021 20,891 0.34 Insurance (7.64%) Fairfax Financial Holdings 130 45,125 0.73Great-West Lifeco 1,785 36,940 0.60Industrial Alliance Insurance & Financial Services 550 17,635 0.29Intact Financial 788 39,758 0.64Manulife Financial 10,895 158,455 2.57Power Corporation of Canada 2,163 43,976 0.71Power Financial 1,474 33,567 0.54Sun Life Financial 3,593 96,628 1.56 Media (1.61%) Shaw Communications - Class B 2,240 42,024 0.68Thomson Reuters 2,160 57,542 0.93 Mining (8.74%) Agnico Eagle Mines 1,178 33,005 0.53Barrick Gold 6,808 91,218 1.48Cameco 2,272 32,607 0.53
189

UBS ETF - MSCI Canada 100% hedged to EUR UCITS ETF Semi-Annual Report as of 30 June 2014 Schedule of Investments as at 30 June 2014 (Expressed in EUR) (Unaudited)
The accompanying notes form an integral part of these financial statements.
Transferable securities listed on an Official Stock Exchange
Quantity Market
Value EUR % of
Net Assets Mining (8.74%) (continued) Eldorado Gold 4,374 24,474 0.40First Quantum Minerals 3,358 52,545 0.85Franco-Nevada 835 35,070 0.57Goldcorp 4,724 96,466 1.56Kinross Gold 7,163 21,710 0.35New Gold 3,126 14,512 0.23Silver Wheaton 2,138 41,166 0.67Teck Resources - Class B 3,302 55,156 0.89Turquoise Hill Resources 5,053 12,370 0.20Yamana Gold 4,927 29,663 0.48 Miscellaneous Manufacturers (0.38%) Bombardier - Class B 9,179 23,729 0.38 Oil & Gas (20.03%) ARC Resources 1,890 42,107 0.68Athabasca Oil 1,957 10,279 0.17Baytex Energy 746 25,193 0.41Canadian Natural Resources 6,395 215,001 3.48Canadian Oil Sands 2,790 46,259 0.75Cenovus Energy 4,444 105,405 1.71Crescent Point Energy 2,404 77,955 1.26Encana 4,362 75,614 1.22Enerplus 1,209 22,292 0.36Husky Energy 2,021 47,755 0.77Imperial Oil 1,765 68,054 1.10MEG Energy 864 23,040 0.37Pacific Rubiales Energy 1,856 27,592 0.45Pengrowth Energy 3,272 17,164 0.28Penn West Petroleum 3,017 21,557 0.35Peyto Exploration & Development 842 23,274 0.38Suncor Energy 8,701 271,468 4.39Talisman Energy 6,276 48,543 0.79Tourmaline Oil 973 37,536 0.61Vermilion Energy 613 31,210 0.50 Pharmaceuticals & Biotechnology (3.46%) Catamaran 1,240 40,065 0.65Valeant Pharmaceuticals International 1,880 173,955 2.81 Pipelines (7.14%) AltaGas 731 24,601 0.40Enbridge 4,873 169,177 2.74Inter Pipeline 1,846 41,924 0.68Pembina Pipeline 1,912 60,191 0.97TransCanada 4,164 145,420 2.35 Private Equity (0.38%) Onex 516 23,359 0.38 Real Estate (1.82%) Brookfield Asset Management - Class A 3,248 104,699 1.69First Capital Realty 608 7,763 0.13 Real Estate Investment Trusts (0.46%) H&R Real Estate Investment Trust 761 12,085 0.20RioCan Real Estate Investment Trust 864 16,180 0.26 Retail (2.22%) Alimentation Couche Tard - Class B 2,450 49,106 0.79Canadian Tire - Class A 463 32,501 0.53Dollarama 386 23,252 0.38Tim Hortons 805 32,220 0.52 Software (0.41%) Open Text 718 25,208 0.41 Telecommunications (2.48%) BCE 1,501 49,815 0.81Bell Aliant 440 8,415 0.14
190

UBS ETF - MSCI Canada 100% hedged to EUR UCITS ETF Semi-Annual Report as of 30 June 2014 Schedule of Investments as at 30 June 2014 (Expressed in EUR) (Unaudited)
The accompanying notes form an integral part of these financial statements.
Transferable securities listed on an Official Stock Exchange
Quantity Market
Value EUR % of
Net Assets Telecommunications (2.48%) (continued) Rogers Communications - Class B 2,128 62,657 1.01TELUS 1,185 32,316 0.52 Transportation (5.99%) Canadian National Railway 4,884 232,420 3.76Canadian Pacific Railway 1,037 137,458 2.23
_______________________________________________________________________________________________________________ ____________________________________________________________
Total Common Stocks 6,271,080 101.50 _______________________________________________________________________________________________________________ ____________________________________________________________
TOTAL INVESTMENTS (Cost EUR 5,580,234) 6,271,080 101.50Other net liabilities (92,798) (1.50)
_______________________________________________________________________________________________________________ ____________________________________________________________
TOTAL NET ASSETS 6,178,282 100.00 _______________________________________________________________________________________________________________ ____________________________________________________________ _______________________________________________________________________________________________________________ ____________________________________________________________
Forward Foreign Exchange Contracts
Purchases Sales Maturity Date
Unrealised appreciation/ (depreciation)
EUR % of
Net AssetsEUR 5,937,000 CAD 8,802,909 4 July 2014 (99,036) (1.60)
_______________________________________________________________________________________________________________ ____________________________________________________________
Total Forward Foreign Exchange Contracts (99,036) (1.60) _______________________________________________________________________________________________________________ ____________________________________________________________
191

UBS ETF - MSCI Canada 100% hedged to USD UCITS ETF Semi-Annual Report as of 30 June 2014 Schedule of Investments as at 30 June 2014 (Expressed in USD) (Unaudited)
The accompanying notes form an integral part of these financial statements.
Transferable securities listed on an Official Stock Exchange
Quantity Market
Value USD % of
Net AssetsCommon Stocks Aerospace & Defense (0.23%) CAE 1,197 15,688 0.23 Apparel (0.50%) Gildan Activewear 566 33,408 0.50 Auto Parts & Equipment (1.67%) Magna International 1,045 112,687 1.67 Banks (26.39%) Bank of Montreal 3,032 223,682 3.32Bank of Nova Scotia 5,731 382,766 5.68Canadian Imperial Bank of Commerce 1,882 171,565 2.55National Bank of Canada 1,546 65,692 0.97Royal Bank of Canada 6,797 486,762 7.23Toronto-Dominion Bank 8,672 447,217 6.64 Chemicals (3.64%) Agrium 689 63,230 0.94Methanex 467 28,924 0.43Potash Corporation of Saskatchewan 4,015 152,963 2.27 Computers (0.90%) BlackBerry 2,356 24,198 0.36CGI Group - Class A 1,019 36,181 0.54 Diversified Financial Services (0.83%) CI Financial 1,032 33,959 0.50IGM Financial 464 22,252 0.33 Electric (0.93%) Atco - Class I 350 16,995 0.25Fortis 983 29,966 0.45TransAlta 1,249 15,337 0.23 Engineering & Construction (0.58%) SNC-Lavalin Group 742 39,094 0.58 Food (2.12%) Empire - Class A 254 17,303 0.26George Weston 235 17,365 0.26Loblaw 1,021 45,646 0.68Metro 438 27,128 0.40Saputo 589 35,352 0.52 Gas (0.73%) Canadian Utilities - Class A 585 21,969 0.33Keyera 368 27,159 0.40 Hand & Machine Tools (0.33%) Finning International 797 22,328 0.33 Insurance (7.56%) Fairfax Financial Holdings 96 45,625 0.68Great-West Lifeco 1,363 38,619 0.57Industrial Alliance Insurance & Financial Services 450 19,755 0.29Intact Financial 633 43,727 0.65Manulife Financial 8,692 173,081 2.57Power Corporation of Canada 1,646 45,819 0.68Power Financial 1,164 36,292 0.54Sun Life Financial 2,885 106,229 1.58 Media (1.64%) Shaw Communications - Class B 1,806 46,390 0.69Thomson Reuters 1,758 64,121 0.95 Mining (8.83%) Agnico Eagle Mines 927 35,560 0.53Barrick Gold 5,544 101,704 1.51Cameco 1,920 37,728 0.56
192

UBS ETF - MSCI Canada 100% hedged to USD UCITS ETF Semi-Annual Report as of 30 June 2014 Schedule of Investments as at 30 June 2014 (Expressed in USD) (Unaudited)
The accompanying notes form an integral part of these financial statements.
Transferable securities listed on an Official Stock Exchange
Quantity Market
Value USD % of
Net Assets Mining (8.83%) (continued) Eldorado Gold 3,577 27,403 0.41First Quantum Minerals 2,724 58,360 0.87Franco-Nevada 716 41,173 0.61Goldcorp 3,843 107,445 1.59Kinross Gold 5,255 21,806 0.32New Gold 2,311 14,688 0.22Silver Wheaton 1,628 42,918 0.64Teck Resources - Class B 2,677 61,223 0.91Turquoise Hill Resources 3,704 12,414 0.18Yamana Gold 3,936 32,444 0.48 Miscellaneous Manufacturers (0.35%) Bombardier - Class B 6,633 23,477 0.35 Oil & Gas (20.08%) ARC Resources 1,518 46,303 0.69Athabasca Oil 1,475 10,607 0.16Baytex Energy 615 28,436 0.42Canadian Natural Resources 5,122 235,771 3.50Canadian Oil Sands 2,352 53,393 0.79Cenovus Energy 3,602 116,972 1.74Crescent Point Energy 1,897 84,222 1.25Encana 3,495 82,950 1.23Enerplus 957 24,160 0.36Husky Energy 1,621 52,443 0.78Imperial Oil 1,422 75,068 1.12MEG Energy 666 24,317 0.36Pacific Rubiales Energy 1,532 31,182 0.46Pengrowth Energy 2,379 17,086 0.25Penn West Petroleum 2,232 21,835 0.32Peyto Exploration & Development 650 24,599 0.37Suncor Energy 6,973 297,866 4.42Talisman Energy 4,989 52,834 0.78Tourmaline Oil 762 40,248 0.60Vermilion Energy 464 32,345 0.48 Pharmaceuticals & Biotechnology (3.48%) Catamaran 997 44,105 0.65Valeant Pharmaceuticals International 1,502 190,283 2.83 Pipelines (7.16%) AltaGas 592 27,278 0.41Enbridge 3,893 185,047 2.75Inter Pipeline 1,429 44,433 0.66Pembina Pipeline 1,537 66,248 0.98TransCanada 3,326 159,032 2.36 Private Equity (0.38%) Onex 418 25,908 0.38 Real Estate (1.83%) Brookfield Asset Management - Class A 2,623 115,765 1.72First Capital Realty 429 7,500 0.11 Real Estate Investment Trusts (0.46%) H&R Real Estate Investment Trust 590 12,829 0.19RioCan Real Estate Investment Trust 702 17,999 0.27 Retail (2.28%) Alimentation Couche Tard - Class B 2,001 54,912 0.82Canadian Tire - Class A 378 36,329 0.54Dollarama 320 26,392 0.39Tim Hortons 651 35,675 0.53 Software (0.41%) Open Text 576 27,687 0.41 Telecommunications (2.51%) BCE 1,207 54,846 0.81Bell Aliant 346 9,060 0.14
193

UBS ETF - MSCI Canada 100% hedged to USD UCITS ETF Semi-Annual Report as of 30 June 2014 Schedule of Investments as at 30 June 2014 (Expressed in USD) (Unaudited)
The accompanying notes form an integral part of these financial statements.
Transferable securities listed on an Official Stock Exchange
Quantity Market
Value USD % of
Net Assets Telecommunications (2.51%) (continued) Rogers Communications - Class B 1,703 68,654 1.02TELUS 979 36,553 0.54 Transportation (6.01%) Canadian National Railway 3,902 254,235 3.78Canadian Pacific Railway 829 150,452 2.23
_______________________________________________________________________________________________________________ ____________________________________________________________
Total Common Stocks 6,858,676 101.83 _______________________________________________________________________________________________________________ ____________________________________________________________
TOTAL INVESTMENTS (Cost USD 5,827,947) 6,858,676 101.83Other net liabilities (123,335) (1.83)
_______________________________________________________________________________________________________________ ____________________________________________________________
TOTAL NET ASSETS 6,735,341 100.00 _______________________________________________________________________________________________________________ ____________________________________________________________ _______________________________________________________________________________________________________________ ____________________________________________________________
Forward Foreign Exchange Contracts
Purchases Sales Maturity Date
Unrealised appreciation/ (depreciation)
USD % of
Net AssetsUSD 6,473,000 CAD 7,034,727 7 July 2014 (130,645) (1.94)
_______________________________________________________________________________________________________________ ____________________________________________________________
Total Forward Foreign Exchange Contracts (130,645) (1.94) _______________________________________________________________________________________________________________ ____________________________________________________________
194

UBS ETF - MSCI Canada 100% hedged to GBP UCITS ETF Semi-Annual Report as of 30 June 2014 Schedule of Investments as at 30 June 2014 (Expressed in GBP) (Unaudited)
The accompanying notes form an integral part of these financial statements.
Transferable securities listed on an Official Stock Exchange
Quantity Market
Value GBP % of
Net AssetsCommon Stocks Aerospace & Defense (0.24%) CAE 1,471 11,275 0.24 Apparel (0.47%) Gildan Activewear 629 21,713 0.47 Auto Parts & Equipment (1.65%) Magna International 1,214 76,563 1.65 Banks (25.88%) Bank of Montreal 3,520 151,875 3.26Bank of Nova Scotia 6,610 258,194 5.55Canadian Imperial Bank of Commerce 2,186 116,547 2.51National Bank of Canada 1,752 43,539 0.94Royal Bank of Canada 7,883 330,167 7.10Toronto-Dominion Bank 10,060 303,417 6.52 Chemicals (3.56%) Agrium 791 42,455 0.91Methanex 535 19,379 0.42Potash Corporation of Saskatchewan 4,654 103,698 2.23 Computers (0.85%) BlackBerry 2,601 15,624 0.34CGI Group - Class A 1,153 23,943 0.51 Diversified Financial Services (0.83%) CI Financial 1,197 23,036 0.49IGM Financial 556 15,594 0.34 Electric (0.92%) Atco - Class I 383 10,876 0.23Fortis 1,202 21,430 0.46TransAlta 1,471 10,565 0.23 Engineering & Construction (0.56%) SNC-Lavalin Group 850 26,192 0.56 Food (2.10%) Empire - Class A 319 12,709 0.27George Weston 257 11,107 0.24Loblaw 1,189 31,089 0.67Metro 515 18,655 0.40Saputo 687 24,115 0.52 Gas (0.73%) Canadian Utilities - Class A 691 15,176 0.33Keyera 436 18,819 0.40 Hand & Machine Tools (0.33%) Finning International 938 15,369 0.33 Insurance (7.47%) Fairfax Financial Holdings 111 30,853 0.66Great-West Lifeco 1,665 27,591 0.59Industrial Alliance Insurance & Financial Services 523 13,428 0.29Intact Financial 739 29,856 0.64Manulife Financial 10,121 117,868 2.53Power Corporation of Canada 1,956 31,844 0.69Power Financial 1,320 24,070 0.52Sun Life Financial 3,345 72,033 1.55 Media (1.61%) Shaw Communications - Class B 2,142 32,178 0.69Thomson Reuters 2,005 42,770 0.92 Mining (8.64%) Agnico Eagle Mines 1,075 24,118 0.52Barrick Gold 6,367 68,311 1.47Cameco 2,185 25,110 0.54
195

UBS ETF - MSCI Canada 100% hedged to GBP UCITS ETF Semi-Annual Report as of 30 June 2014 Schedule of Investments as at 30 June 2014 (Expressed in GBP) (Unaudited)
The accompanying notes form an integral part of these financial statements.
Transferable securities listed on an Official Stock Exchange
Quantity Market
Value GBP % of
Net Assets Mining (8.64%) (continued) Eldorado Gold 3,939 17,649 0.38First Quantum Minerals 3,106 38,918 0.84Franco-Nevada 823 27,678 0.59Goldcorp 4,396 71,881 1.54Kinross Gold 6,192 15,027 0.32New Gold 2,883 10,717 0.23Silver Wheaton 1,917 29,556 0.64Teck Resources - Class B 3,148 42,106 0.90Turquoise Hill Resources 4,638 9,091 0.20Yamana Gold 4,562 21,993 0.47 Miscellaneous Manufacturers (0.34%) Bombardier - Class B 7,559 15,647 0.34 Oil & Gas (19.73%) ARC Resources 1,755 31,308 0.67Athabasca Oil 1,904 8,008 0.17Baytex Energy 677 18,307 0.39Canadian Natural Resources 5,929 159,616 3.43Canadian Oil Sands 2,622 34,811 0.75Cenovus Energy 4,133 78,496 1.69Crescent Point Energy 2,209 57,358 1.23Encana 4,050 56,217 1.21Enerplus 1,156 17,068 0.37Husky Energy 1,903 36,007 0.77Imperial Oil 1,622 50,078 1.08MEG Energy 816 17,425 0.37Pacific Rubiales Energy 1,766 21,022 0.45Pengrowth Energy 2,947 12,379 0.27Penn West Petroleum 2,685 15,362 0.33Peyto Exploration & Development 771 17,065 0.37Suncor Energy 8,068 201,562 4.33Talisman Energy 5,670 35,118 0.76Tourmaline Oil 950 29,346 0.63Vermilion Energy 522 21,281 0.46 Pharmaceuticals & Biotechnology (3.40%) Catamaran 1,134 29,339 0.63Valeant Pharmaceuticals International 1,742 129,069 2.77 Pipelines (7.05%) AltaGas 702 18,918 0.41Enbridge 4,513 125,460 2.70Inter Pipeline 1,690 30,733 0.66Pembina Pipeline 1,767 44,543 0.96TransCanada 3,868 108,166 2.32 Private Equity (0.39%) Onex 498 18,053 0.39 Real Estate (1.78%) Brookfield Asset Management - Class A 3,019 77,926 1.68First Capital Realty 469 4,795 0.10 Real Estate Investment Trusts (0.47%) H&R Real Estate Investment Trust 721 9,169 0.20RioCan Real Estate Investment Trust 842 12,626 0.27 Retail (2.22%) Alimentation Couche Tard - Class B 2,263 36,320 0.78Canadian Tire - Class A 432 24,282 0.52Dollarama 377 18,185 0.39Tim Hortons 758 24,294 0.53 Software (0.38%) Open Text 634 17,823 0.38 Telecommunications (2.46%) BCE 1,377 36,594 0.79Bell Aliant 385 5,896 0.13
211

UBS ETF - MSCI Canada 100% hedged to GBP UCITS ETF Semi-Annual Report as of 30 June 2014 Schedule of Investments as at 30 June 2014 (Expressed in GBP) (Unaudited)
The accompanying notes form an integral part of these financial statements.
Transferable securities listed on an Official Stock Exchange
Quantity Market
Value GBP % of
Net Assets Telecommunications (2.46%) (continued) Rogers Communications - Class B 1,999 47,131 1.01TELUS 1,135 24,785 0.53 Transportation (5.90%) Canadian National Railway 4,530 172,619 3.71Canadian Pacific Railway 960 101,896 2.19
_______________________________________________________________________________________________________________ ____________________________________________________________
Total Common Stocks 4,649,870 99.96 _______________________________________________________________________________________________________________ ____________________________________________________________
TOTAL INVESTMENTS (Cost GBP 4,301,964) 4,649,870 99.96Other net assets 2,003 0.04
_______________________________________________________________________________________________________________ ____________________________________________________________
TOTAL NET ASSETS 4,651,873 100.00 _______________________________________________________________________________________________________________ ____________________________________________________________ _______________________________________________________________________________________________________________ ____________________________________________________________
Forward Foreign Exchange Contracts
Purchases Sales Maturity Date
Unrealised appreciation/ (depreciation)
GBP % of
Net AssetsGBP 4,473,000 CAD 8,151,148 4 July 2014 (2,512) (0.05)
_______________________________________________________________________________________________________________ ____________________________________________________________
Total Forward Foreign Exchange Contracts (2,512) (0.05) _______________________________________________________________________________________________________________ ____________________________________________________________
197

UBS ETF - MSCI Switzerland 20/35 UCITS ETF Semi-Annual Report as of 30 June 2014 Schedule of Investments as at 30 June 2014 (Expressed in CHF) (Unaudited)
The accompanying notes form an integral part of these financial statements.
Transferable securities listed on an Official Stock Exchange
Quantity Market
Value CHF % of
Net AssetsCommon Stocks Banks (8.90%) Credit Suisse Group - Registered 327,632 8,308,747 3.50UBS - Registered 788,066 12,821,834 5.40 Building Materials (3.40%) Geberit - Registered 8,134 2,532,114 1.07Holcim - Registered 49,497 3,858,291 1.62Sika 462 1,675,212 0.71 Chemicals (4.76%) EMS-Chemie Holding - Registered 1,713 606,402 0.26Givaudan - Registered 1,998 2,955,042 1.24Lonza Group - Registered 11,339 1,094,214 0.46Syngenta - Registered 20,107 6,641,342 2.80 Commercial Services (2.19%) Adecco - Registered 36,913 2,694,649 1.14SGS - Registered 1,176 2,499,000 1.05 Diversified Financial Services (1.11%) Julius Baer Group 48,016 1,755,465 0.74Partners Group Holding 3,676 891,063 0.37 Engineering & Construction (4.08%) ABB - Registered 474,653 9,692,414 4.08 Food (21.93%) Aryzta 18,793 1,578,612 0.66Barry Callebaut - Registered 477 574,785 0.24Lindt & Spruengli 200 902,800 0.38Lindt & Spruengli - Registered 22 1,205,160 0.51Nestle - Registered 695,720 47,795,964 20.14 Hand & Machine Tools (0.82%) Schindler Holding 9,960 1,342,608 0.57Schindler Holding - Registered 4,476 598,441 0.25 Healthcare Products (0.66%) Sonova Holding - Registered 11,491 1,554,732 0.66 Insurance (7.20%) Baloise Holding - Registered 10,034 1,048,553 0.44Swiss Life Holding - Registered 6,865 1,443,709 0.61Swiss Re 76,114 6,005,395 2.53Zurich Insurance Group 32,170 8,599,041 3.62 Miscellaneous Manufacturers (0.27%) Sulzer - Registered 5,075 631,330 0.27 Oil & Gas (1.31%) Transocean 78,250 3,119,045 1.31 Other Finance (0.22%) Pargesa Holding 6,618 527,124 0.22 Pharmaceuticals & Biotechnology (34.72%) Actelion - Registered 21,959 2,463,800 1.04Novartis - Registered 496,302 39,853,051 16.79Roche Holding 151,583 40,093,703 16.89 Real Estate (0.38%) Swiss Prime Site - Registered 12,224 898,464 0.38 Retail (6.35%) Compagnie Financiere Richemont - Registered 112,677 10,484,595 4.42Swatch Group 6,628 3,549,294 1.49Swatch Group - Registered 10,618 1,045,873 0.44 Telecommunications (1.10%) Swisscom - Registered 5,044 2,600,182 1.10
198

UBS ETF - MSCI Switzerland 20/35 UCITS ETF Semi-Annual Report as of 30 June 2014 Schedule of Investments as at 30 June 2014 (Expressed in CHF) (Unaudited)
The accompanying notes form an integral part of these financial statements.
Transferable securities listed on an Official Stock Exchange
Quantity Market
Value CHF % of
Net Assets Transportation (0.58%) Kuehne + Nagel International - Registered 11,609 1,369,862 0.58
_______________________________________________________________________________________________________________ ____________________________________________________________
Total Common Stocks 237,311,912 99.98 _______________________________________________________________________________________________________________ ____________________________________________________________
TOTAL INVESTMENTS (Cost CHF 232,746,222) 237,311,912 99.98Other net assets 49,937 0.02
_______________________________________________________________________________________________________________ ____________________________________________________________
TOTAL NET ASSETS 237,361,849 100.00 _______________________________________________________________________________________________________________ ____________________________________________________________ _______________________________________________________________________________________________________________ ____________________________________________________________
199

UBS ETF - MSCI Switzerland 20/35 100% hedged to EUR UCITS ETF Semi-Annual Report as of 30 June 2014 Schedule of Investments as at 30 June 2014 (Expressed in EUR) (Unaudited)
The accompanying notes form an integral part of these financial statements.
Transferable securities listed on an Official Stock Exchange
Quantity Market
Value EUR % of
Net AssetsCommon Stocks Banks (8.93%) Credit Suisse Group - Registered 123,906 2,588,003 3.51UBS - Registered 298,388 3,998,454 5.42 Building Materials (3.41%) Geberit - Registered 3,056 783,530 1.06Holcim - Registered 18,809 1,207,550 1.64Sika 175 522,623 0.71 Chemicals (4.80%) EMS-Chemie Holding - Registered 685 199,718 0.27Givaudan - Registered 760 925,774 1.26Lonza Group - Registered 4,301 341,838 0.46Syngenta - Registered 7,627 2,074,844 2.81 Commercial Services (2.21%) Adecco - Registered 14,008 842,213 1.14SGS - Registered 450 787,580 1.07 Diversified Financial Services (1.11%) Julius Baer Group 18,085 544,563 0.74Partners Group Holding 1,383 276,107 0.37 Engineering & Construction (4.10%) ABB - Registered 179,753 3,023,118 4.10 Food (22.00%) Aryzta 7,170 496,046 0.67Barry Callebaut - Registered 173 171,694 0.23Lindt & Spruengli 77 286,270 0.39Lindt & Spruengli - Registered 8 360,940 0.49Nestle - Registered 263,505 14,909,696 20.22 Hand & Machine Tools (0.82%) Schindler Holding 3,802 422,110 0.57Schindler Holding - Registered 1,677 184,666 0.25 Healthcare Products (0.67%) Sonova Holding - Registered 4,433 493,991 0.67 Insurance (7.25%) Baloise Holding - Registered 3,856 331,877 0.45Swiss Life Holding - Registered 2,638 456,917 0.62Swiss Re 28,880 1,876,711 2.55Zurich Insurance Group 12,174 2,680,127 3.63 Miscellaneous Manufacturers (0.27%) Sulzer - Registered 1,901 194,772 0.27 Oil & Gas (1.32%) Transocean 29,667 973,944 1.32 Other Finance (0.22%) Pargesa Holding 2,420 158,754 0.22 Pharmaceuticals & Biotechnology (34.86%) Actelion - Registered 8,266 763,856 1.04Novartis - Registered 187,964 12,431,210 16.86Roche Holding 57,408 12,506,083 16.96 Real Estate (0.39%) Swiss Prime Site - Registered 4,747 287,362 0.39 Retail (6.38%) Compagnie Financiere Richemont - Registered 42,655 3,268,959 4.43Swatch Group 2,533 1,117,166 1.52Swatch Group - Registered 3,945 320,042 0.43 Telecommunications (1.10%) Swisscom - Registered 1,915 813,056 1.10
200

UBS ETF - MSCI Switzerland 20/35 100% hedged to EUR UCITS ETF Semi-Annual Report as of 30 June 2014 Schedule of Investments as at 30 June 2014 (Expressed in EUR) (Unaudited)
The accompanying notes form an integral part of these financial statements.
Transferable securities listed on an Official Stock Exchange
Quantity Market
Value EUR % of
Net Assets Transportation (0.58%) Kuehne + Nagel International - Registered 4,392 426,842 0.58
_______________________________________________________________________________________________________________ ____________________________________________________________
Total Common Stocks 74,049,006 100.42 _______________________________________________________________________________________________________________ ____________________________________________________________
TOTAL INVESTMENTS (Cost EUR 71,923,797) 74,049,006 100.42Other net liabilities (310,213) (0.42)
_______________________________________________________________________________________________________________ ____________________________________________________________
TOTAL NET ASSETS 73,738,793 100.00 _______________________________________________________________________________________________________________ ____________________________________________________________ _______________________________________________________________________________________________________________ ____________________________________________________________
Forward Foreign Exchange Contracts
Purchases Sales Maturity Date
Unrealisedappreciation/ (depreciation)
EUR % of
Net AssetsEUR 74,989,000 CHF 91,442,342 3 July 2014 (324,435) (0.44)
_______________________________________________________________________________________________________________ ____________________________________________________________
Total Forward Foreign Exchange Contracts (324,435) (0.44) _______________________________________________________________________________________________________________ ____________________________________________________________
201

UBS ETF - MSCI Switzerland 20/35 100% hedged to USD UCITS ETF Semi-Annual Report as of 30 June 2014 Schedule of Investments as at 30 June 2014 (Expressed in USD) (Unaudited)
The accompanying notes form an integral part of these financial statements.
Transferable securities listed on an Official Stock Exchange
Quantity Market
Value USD % of
Net AssetsCommon Stocks Banks (8.97%) Credit Suisse Group - Registered 96,689 2,765,035 3.53UBS - Registered 232,444 4,264,619 5.44 Building Materials (3.41%) Geberit - Registered 2,396 841,086 1.07Holcim - Registered 14,508 1,275,258 1.63Sika 137 560,173 0.71 Chemicals (4.80%) EMS-Chemie Holding - Registered 531 211,969 0.27Givaudan - Registered 587 978,995 1.25Lonza Group - Registered 3,358 365,412 0.46Syngenta - Registered 5,934 2,210,194 2.82 Commercial Services (2.20%) Adecco - Registered 10,821 890,768 1.14SGS - Registered 348 833,897 1.06 Diversified Financial Services (1.13%) Julius Baer Group 14,189 584,968 0.75Partners Group Holding 1,104 301,770 0.38 Engineering & Construction (4.11%) ABB - Registered 140,050 3,224,877 4.11 Food (22.08%) Aryzta 5,541 524,858 0.67Barry Callebaut - Registered 144 195,670 0.25Lindt & Spruengli 63 320,683 0.41Lindt & Spruengli - Registered 6 370,636 0.47Nestle - Registered 205,331 15,906,901 20.28 Hand & Machine Tools (0.83%) Schindler Holding 2,925 444,621 0.57Schindler Holding - Registered 1,360 205,043 0.26 Healthcare Products (0.66%) Sonova Holding - Registered 3,405 519,504 0.66 Insurance (7.26%) Baloise Holding - Registered 3,015 355,286 0.45Swiss Life Holding - Registered 2,032 481,878 0.61Swiss Re 22,448 1,997,234 2.55Zurich Insurance Group 9,492 2,861,087 3.65 Miscellaneous Manufacturers (0.28%) Sulzer - Registered 1,552 217,714 0.28 Oil & Gas (1.31%) Transocean 22,892 1,028,953 1.31 Other Finance (0.23%) Pargesa Holding 1,981 177,928 0.23 Pharmaceuticals & Biotechnology (34.97%) Actelion - Registered 6,487 820,750 1.05Novartis - Registered 146,472 13,263,083 16.91Roche Holding 44,738 13,343,709 17.01 Real Estate (0.39%) Swiss Prime Site - Registered 3,657 303,100 0.39 Retail (6.40%) Compagnie Financiere Richemont - Registered 33,241 3,487,906 4.45Swatch Group 1,955 1,180,540 1.50Swatch Group - Registered 3,149 349,770 0.45 Telecommunications (1.09%) Swisscom - Registered 1,472 855,679 1.09
202

UBS ETF - MSCI Switzerland 20/35 100% hedged to USD UCITS ETF Semi-Annual Report as of 30 June 2014 Schedule of Investments as at 30 June 2014 (Expressed in USD) (Unaudited)
The accompanying notes form an integral part of these financial statements.
Transferable securities listed on an Official Stock Exchange
Quantity Market
Value USD % of
Net Assets Transportation (0.58%) Kuehne + Nagel International - Registered 3,413 454,143 0.58
_______________________________________________________________________________________________________________ ____________________________________________________________
Total Common Stocks 78,975,697 100.70 _______________________________________________________________________________________________________________ ____________________________________________________________
TOTAL INVESTMENTS (Cost USD 77,853,578) 78,975,697 100.70Other net liabilities (546,505) (0.70)
_______________________________________________________________________________________________________________ ____________________________________________________________
TOTAL NET ASSETS 78,429,192 100.00 _______________________________________________________________________________________________________________ ____________________________________________________________ _______________________________________________________________________________________________________________ ____________________________________________________________
Forward Foreign Exchange Contracts
Purchases Sales Maturity Date
Unrealisedappreciation/ (depreciation)
USD % of
Net AssetsUSD 79,744,000 CHF 71,257,859 3 July 2014 (610,582) (0.78)
_______________________________________________________________________________________________________________ ____________________________________________________________
Total Forward Foreign Exchange Contracts (610,582) (0.78) _______________________________________________________________________________________________________________ ____________________________________________________________
203

UBS ETF - MSCI Switzerland 20/35 100% hedged to GBP UCITS ETF Semi-Annual Report as of 30 June 2014 Schedule of Investments as at 30 June 2014 (Expressed in GBP) (Unaudited)
The accompanying notes form an integral part of these financial statements.
Transferable securities listed on an Official Stock Exchange
Quantity Market
Value GBP % of
Net AssetsCommon Stocks Banks (8.77%) Credit Suisse Group - Registered 12,579 210,384 3.43UBS - Registered 30,461 326,850 5.34 Building Materials (3.37%) Geberit - Registered 320 65,697 1.07Holcim - Registered 1,902 97,779 1.60Sika 18 43,044 0.70 Chemicals (4.67%) EMS-Chemie Holding - Registered 66 15,409 0.25Givaudan - Registered 77 75,106 1.23Lonza Group - Registered 427 27,175 0.44Syngenta - Registered 773 168,385 2.75 Commercial Services (2.14%) Adecco - Registered 1,411 67,931 1.11SGS - Registered 45 63,065 1.03 Diversified Financial Services (1.11%) Julius Baer Group 1,888 45,522 0.74Partners Group Holding 141 22,541 0.37 Engineering & Construction (4.04%) ABB - Registered 18,368 247,363 4.04 Food (21.72%) Aryzta 738 40,884 0.67Barry Callebaut - Registered 18 14,305 0.23Lindt & Spruengli 7 20,839 0.34Lindt & Spruengli - Registered 1 36,127 0.59Nestle - Registered 26,882 1,217,965 19.89 Hand & Machine Tools (0.79%) Schindler Holding 374 33,249 0.54Schindler Holding - Registered 171 15,078 0.25 Healthcare Products (0.65%) Sonova Holding - Registered 443 39,529 0.65 Insurance (7.09%) Baloise Holding - Registered 384 26,464 0.43Swiss Life Holding - Registered 260 36,060 0.59Swiss Re 2,928 152,358 2.49Zurich Insurance Group 1,244 219,299 3.58 Miscellaneous Manufacturers (0.26%) Sulzer - Registered 195 15,998 0.26 Oil & Gas (1.29%) Transocean 3,012 79,179 1.29 Other Finance (0.22%) Pargesa Holding 255 13,395 0.22 Pharmaceuticals & Biotechnology (34.30%) Actelion - Registered 861 63,711 1.04Novartis - Registered 19,177 1,015,577 16.58Roche Holding 5,857 1,021,686 16.68 Real Estate (0.38%) Swiss Prime Site - Registered 474 22,976 0.38 Retail (6.27%) Compagnie Financiere Richemont - Registered 4,352 267,068 4.36Swatch Group 257 90,763 1.48Swatch Group - Registered 407 26,439 0.43 Telecommunications (1.07%) Swisscom - Registered 193 65,615 1.07
219

UBS ETF - MSCI Switzerland 20/35 100% hedged to GBP UCITS ETF Semi-Annual Report as of 30 June 2014 Schedule of Investments as at 30 June 2014 (Expressed in GBP) (Unaudited)
The accompanying notes form an integral part of these financial statements.
Transferable securities listed on an Official Stock Exchange
Quantity Market
Value GBP % of
Net Assets Transportation (0.56%) Kuehne + Nagel International - Registered 437 34,008 0.56
_______________________________________________________________________________________________________________ ____________________________________________________________
Total Common Stocks 6,044,823 98.70 _______________________________________________________________________________________________________________ ____________________________________________________________
TOTAL INVESTMENTS (Cost GBP 6,095,156) 6,044,823 98.70Other net assets 79,683 1.30
_______________________________________________________________________________________________________________ ____________________________________________________________
TOTAL NET ASSETS 6,124,506 100.00 _______________________________________________________________________________________________________________ ____________________________________________________________ _______________________________________________________________________________________________________________ ____________________________________________________________
Forward Foreign Exchange Contracts
Purchases Sales Maturity Date
Unrealisedappreciation/ (depreciation)
GBP
% of Net Assets
GBP 6,224,000 CHF 9,327,847 3 July 2014 72,163 1.18 _______________________________________________________________________________________________________________ ____________________________________________________________
Total Forward Foreign Exchange Contracts 72,163 1.18 _______________________________________________________________________________________________________________ ____________________________________________________________
205

UBS ETF - MSCI World UCITS ETF Semi-Annual Report as of 30 June 2014 Schedule of Investments as at 30 June 2014 (Expressed in USD) (Unaudited)
The accompanying notes form an integral part of these financial statements.
Transferable securities listed on an Official Stock Exchange
Quantity Market
Value USD % of
Net AssetsCommon Stocks Advertising (0.28%) Dentsu 5,600 228,024 0.03Hakuhodo DY Holdings 10,800 107,249 0.01Interpublic Group of Companies 9,100 177,541 0.02JCDecaux 2,881 107,488 0.01Omnicom Group 7,589 540,489 0.06Publicis Groupe 5,543 470,075 0.06WPP 36,374 792,352 0.09 Aerospace & Defense (1.54%) Airbus Group 15,750 1,055,348 0.12B/E Aerospace 2,500 231,225 0.03BAE Systems 82,917 613,746 0.07Boeing 18,147 2,308,843 0.27CAE 8,600 112,713 0.01Cobham 33,921 181,133 0.02Finmeccanica 16,560 157,465 0.02General Dynamics 7,789 907,808 0.11IHI 32,000 149,094 0.02L-3 Communications Holdings 2,261 273,016 0.03Lockheed Martin 7,148 1,148,898 0.13Meggitt 24,160 209,028 0.02Northrop Grumman 5,144 615,377 0.07Raytheon 8,356 770,841 0.09Rockwell Collins 3,418 267,082 0.03Rolls-Royce Holdings 47,501 868,237 0.10Safran 6,501 425,594 0.05Thales 1,779 107,598 0.01TransDigm Group 1,400 234,164 0.03United Technologies 22,798 2,632,029 0.30Zodiac Aerospace 3,590 121,505 0.01 Agriculture (1.49%) Altria Group 52,537 2,203,402 0.25Archer-Daniels-Midland 17,780 784,276 0.09British American Tobacco 49,225 2,927,339 0.34Bunge 3,353 253,621 0.03Imperial Tobacco Group 25,097 1,128,588 0.13Japan Tobacco 27,700 1,009,783 0.11Lorillard 9,603 585,495 0.07Philip Morris International 41,263 3,478,883 0.40Reynolds American 7,418 447,676 0.05Swedish Match 5,160 179,066 0.02 Airlines (0.16%) American Airlines Group 4,800 206,208 0.03Cathay Pacific Airways 55,000 102,757 0.01Delta Air Lines 6,600 255,552 0.03Deutsche Lufthansa - Registered 6,464 138,771 0.02easyJet 4,650 108,528 0.01International Consolidated Airlines Group - ES 10,033 63,614 0.01International Consolidated Airlines Group - GB 15,431 97,755 0.01Qantas Airways 17,066 20,296 0.00Singapore Airlines 13,000 108,138 0.01Southwest Airlines 6,900 185,334 0.02United Continental Holdings 1,873 76,924 0.01 Apparel (0.65%) adidas 5,796 586,996 0.07Asics 4,600 107,298 0.01Burberry Group 9,904 251,136 0.03Christian Dior 1,254 249,468 0.03Gildan Activewear 2,362 139,416 0.02Hugo Boss 652 97,437 0.01LVMH Moet Hennessy Louis Vuitton 7,090 1,366,784 0.16Michael Kors Holdings 5,200 460,980 0.05NIKE - Class B 17,953 1,392,255 0.16Ralph Lauren 1,367 219,663 0.02Under Armour - Class A 4,600 273,654 0.03VF 8,352 526,176 0.06
206

UBS ETF - MSCI World UCITS ETF Semi-Annual Report as of 30 June 2014 Schedule of Investments as at 30 June 2014 (Expressed in USD) (Unaudited)
The accompanying notes form an integral part of these financial statements.
Transferable securities listed on an Official Stock Exchange
Quantity Market
Value USD % of
Net Assets Apparel (0.65%) (continued) Yue Yuen Industrial Holdings 6,000 20,090 0.00 Auto Manufacturers (1.94%) Bayerische Motoren Werke 8,443 1,070,663 0.12Daihatsu Motor 5,000 88,890 0.01Daimler - Registered 25,071 2,347,896 0.27Fiat 19,279 190,314 0.02Ford Motor 92,550 1,595,562 0.18Fuji Heavy Industries 14,300 395,948 0.05General Motors 33,344 1,210,387 0.14Hino Motors 8,000 110,162 0.01Honda Motor 43,300 1,511,792 0.17Isuzu Motors 33,000 218,252 0.03Mazda Motor 76,000 356,350 0.04Mitsubishi Motors 21,100 232,859 0.03Nissan Motor 60,500 573,915 0.07PACCAR 9,064 569,491 0.07Peugeot 7,387 109,180 0.01Renault 4,817 435,481 0.05Suzuki Motor 11,200 350,798 0.04Tesla Motors 2,200 528,132 0.06Toyota Motor 69,700 4,185,922 0.48Volkswagen 738 190,770 0.02Volvo - Class B 43,760 602,527 0.07 Auto Parts & Equipment (0.88%) Aisin Seiki 4,400 175,036 0.02Autoliv 3,000 319,740 0.04BorgWarner 5,220 340,292 0.04Bridgestone 16,600 580,889 0.07Compagnie Generale des Etablissements Michelin 4,683 559,488 0.06Continental 2,827 654,710 0.08Delphi Automotive 7,900 543,046 0.06Denso 13,900 663,407 0.08GKN 35,312 219,233 0.02Johnson Controls 17,945 895,994 0.10JTEKT 4,200 70,770 0.01Koito Manufacturing 4,700 120,394 0.01Magna International 5,516 594,816 0.07NGK Insulators 10,000 227,037 0.03NGK Spark Plug 4,000 112,847 0.01NHK Spring 3,000 28,133 0.00NOK 1,100 22,097 0.00Nokian Renkaat 3,483 135,909 0.02Pirelli & C. 7,659 122,900 0.01Stanley Electric 4,400 114,707 0.01Sumitomo Electric Industries 24,300 341,814 0.04Sumitomo Rubber Industries 3,400 49,068 0.01Toyoda Gosei 1,200 24,923 0.00Toyota Industries 3,300 170,367 0.02TRW Automotive Holdings 3,600 322,272 0.04Valeo 1,634 219,446 0.02Yokohama Rubber 7,000 60,530 0.01 Banks (10.91%) Aozora Bank 24,000 78,891 0.01Australia & New Zealand Banking Group 70,140 2,207,163 0.25Banca Monte dei Paschi di Siena 88,699 171,841 0.02Banco Bilbao Vizcaya Argentaria 154,831 1,973,386 0.23Banco de Sabadell 88,291 301,242 0.03Banco Espirito Santo - Registered 53,033 43,711 0.01Banco Popolare 9,639 158,763 0.02Banco Popular Espanol 49,852 333,084 0.04Banco Santander 306,711 3,204,092 0.37Bank Hapoalim 34,980 202,407 0.02Bank Leumi Le-Israel 30,842 120,445 0.01Bank of America 272,233 4,184,221 0.48Bank of East Asia 42,154 174,863 0.02Bank of Ireland 388,256 131,300 0.01Bank of Kyoto 7,000 63,640 0.01
207

UBS ETF - MSCI World UCITS ETF Semi-Annual Report as of 30 June 2014 Schedule of Investments as at 30 June 2014 (Expressed in USD) (Unaudited)
The accompanying notes form an integral part of these financial statements.
Transferable securities listed on an Official Stock Exchange
Quantity Market
Value USD % of
Net Assets Banks (10.91%) (continued) Bank of Montreal 17,508 1,291,629 0.15Bank of New York Mellon 29,814 1,117,429 0.13Bank of Nova Scotia 31,927 2,132,363 0.25Bank of Queensland 13,757 158,282 0.02Bank of Yokohama 34,000 195,667 0.02Bankia 127,485 247,157 0.03Barclays 420,298 1,529,279 0.18BB&T 18,026 710,765 0.08Bendigo and Adelaide Bank 14,794 170,353 0.02BNP Paribas 27,929 1,894,551 0.22BOC Hong Kong Holdings 94,500 273,733 0.03CaixaBank 43,801 270,286 0.03Canadian Imperial Bank of Commerce 10,512 958,283 0.11Capital One Financial 14,743 1,217,772 0.14Chiba Bank 17,000 119,984 0.01Chugoku Bank 4,000 61,517 0.01CIT Group 5,321 243,489 0.03Citigroup 79,465 3,742,802 0.43Comerica 4,221 211,725 0.02Commerzbank 28,619 449,829 0.05Commonwealth Bank of Australia 41,723 3,185,076 0.37Credit Agricole 29,022 409,275 0.05Credit Suisse Group - Registered 39,659 1,134,137 0.13Danske Bank 16,041 453,374 0.05DBS Group Holdings 46,028 618,433 0.07Deutsche Bank - Registered 36,627 1,288,550 0.15DNB 26,358 481,946 0.06Erste Group Bank 8,292 268,158 0.03Fifth Third Bancorp 20,169 430,608 0.05First Republic Bank 3,900 214,461 0.02Fukuoka Financial Group 31,000 149,637 0.02Goldman Sachs Group 11,524 1,929,579 0.22Hachijuni Bank 25,000 154,731 0.02Hang Seng Bank 19,700 321,795 0.04HSBC Holdings 486,606 4,933,063 0.57Intesa Sanpaolo 290,123 896,133 0.10Intesa Sanpaolo - Rsp 52,362 139,225 0.02Iyo Bank 6,000 60,649 0.01Joyo Bank 5,000 26,652 0.00JPMorgan Chase & Co 98,062 5,650,332 0.65KBC Groep 6,652 362,027 0.04KeyCorp 21,664 310,445 0.04Lloyds Banking Group 1,454,424 1,846,483 0.21M&T Bank 2,948 365,699 0.04Mediobanca 11,569 115,313 0.01Mitsubishi UFJ Financial Group 322,000 1,973,861 0.23Mizrahi Tefahot Bank 2,333 30,197 0.00Mizuho Financial Group 555,300 1,140,145 0.13Morgan Stanley 36,971 1,195,272 0.14National Australia Bank 63,032 1,950,173 0.22National Bank of Canada 7,314 310,784 0.04Natixis 16,607 106,457 0.01Nordea Bank 78,943 1,113,528 0.13Northern Trust 5,227 335,626 0.04Oversea-Chinese Banking 65,263 499,949 0.06PNC Financial Services Group 14,024 1,248,837 0.14Raiffeisen Bank International 3,299 105,310 0.01Regions Financial 37,600 399,312 0.05Resona Holdings 47,400 276,057 0.03Royal Bank of Canada 35,880 2,569,522 0.30Royal Bank of Scotland Group 64,426 361,761 0.04Seven Bank 17,000 69,473 0.01Shinsei Bank 23,000 51,765 0.01Shizuoka Bank 11,000 118,898 0.01Skandinaviska Enskilda Banken - Class A 39,411 526,435 0.06Societe Generale 19,120 1,001,445 0.11Standard Chartered 63,464 1,295,655 0.15State Street 11,900 800,394 0.09Sumitomo Mitsui Financial Group 34,000 1,424,372 0.16Sumitomo Mitsui Trust Holdings 86,000 393,051 0.04
208

UBS ETF - MSCI World UCITS ETF Semi-Annual Report as of 30 June 2014 Schedule of Investments as at 30 June 2014 (Expressed in USD) (Unaudited)
The accompanying notes form an integral part of these financial statements.
Transferable securities listed on an Official Stock Exchange
Quantity Market
Value USD % of
Net Assets Banks (10.91%) (continued) SunTrust Banks 15,084 604,265 0.07Suruga Bank 7,000 135,847 0.02Svenska Handelsbanken - Class A 12,794 625,983 0.07Swedbank - Class A 22,814 604,701 0.07Toronto-Dominion Bank 48,052 2,478,051 0.28UBS - Registered 96,191 1,764,803 0.20UniCredit 109,935 920,415 0.11Unione di Banche Italiane 19,560 169,253 0.02United Overseas Bank 32,711 590,905 0.07US Bancorp 48,431 2,098,031 0.24Wells Fargo & Co 129,013 6,780,923 0.78Westpac Banking 82,491 2,637,868 0.30Yamaguchi Financial Group 6,000 63,255 0.01 Beverages (2.15%) Anheuser-Busch InBev 21,196 2,434,821 0.28Asahi Group Holdings 11,600 364,128 0.04Brown-Forman - Class B 3,150 296,635 0.03Carlsberg - Class B 2,324 250,317 0.03Coca-Cola 102,960 4,361,386 0.50Coca-Cola Amatil 19,042 170,023 0.02Coca-Cola Enterprises 5,837 278,892 0.03Coca-Cola HBC 4,684 107,480 0.01Constellation Brands - Class A 4,400 387,772 0.05Diageo 65,133 2,078,119 0.24Dr Pepper Snapple Group 6,103 357,514 0.04Heineken 5,699 409,100 0.05Heineken Holding 1,967 129,310 0.02Keurig Green Mountain 2,822 351,649 0.04Kirin Holdings 23,000 332,155 0.04Molson Coors Brewing - Class B 4,557 337,947 0.04Monster Beverage 3,824 271,619 0.03PepsiCo 38,905 3,475,773 0.40Pernod Ricard 5,379 645,881 0.07Remy Cointreau 595 54,736 0.01SABMiller 24,680 1,429,705 0.16Suntory Beverage & Food 2,300 90,247 0.01Treasury Wine Estates 16,740 79,158 0.01 Building Materials (0.57%) Asahi Glass 25,000 147,327 0.02Boral 19,929 98,753 0.01Compagnie de Saint-Gobain 12,533 707,060 0.08CRH 14,229 365,086 0.04Daikin Industries 6,600 416,438 0.05Fletcher Building 14,360 110,767 0.01Geberit - Registered 952 334,188 0.04HeidelbergCement 3,633 310,037 0.04Holcim - Registered 6,377 560,540 0.06Imerys 471 39,685 0.00James Hardie Industries 10,574 138,127 0.02Lafarge 5,043 437,753 0.05LIXIL Group 8,200 221,300 0.03Martin Marietta Materials 900 118,845 0.01Masco 10,000 222,000 0.03Rinnai 1,100 106,194 0.01Sika 53 216,710 0.03Taiheiyo Cement 25,000 100,686 0.01TOTO 8,000 107,793 0.01Vulcan Materials 2,880 183,600 0.02 Chemicals (2.95%) Agrium 3,671 336,892 0.04Air Liquide 8,928 1,205,264 0.14Air Products & Chemicals 5,233 673,069 0.08Air Water 4,000 63,965 0.01Airgas 1,588 172,949 0.02Akzo Nobel 5,864 439,571 0.05Albemarle 1,800 128,700 0.01Arkema 1,348 131,186 0.02
209

UBS ETF - MSCI World UCITS ETF Semi-Annual Report as of 30 June 2014 Schedule of Investments as at 30 June 2014 (Expressed in USD) (Unaudited)
The accompanying notes form an integral part of these financial statements.
Transferable securities listed on an Official Stock Exchange
Quantity Market
Value USD % of
Net Assets Chemicals (2.95%) (continued) Asahi Kasei 29,000 221,855 0.03Ashland 1,900 206,606 0.02BASF 23,839 2,775,309 0.32Brenntag 1,066 190,467 0.02Celanese - Class A 3,863 248,314 0.03CF Industries Holdings 1,392 334,818 0.04Croda International 5,124 192,835 0.02Daicel 11,000 105,108 0.01Dow Chemical 32,115 1,652,638 0.19E. I. du Pont de Nemours 23,107 1,512,122 0.17Eastman Chemical 4,486 391,852 0.05Ecolab 7,263 808,662 0.09EMS-Chemie Holding - Registered 270 107,781 0.01FMC 3,500 249,165 0.03Givaudan - Registered 278 463,647 0.05Hitachi Chemical 5,500 90,993 0.01Incitec Pivot 22,306 61,055 0.01International Flavors & Fragrances 1,766 184,159 0.02Israel Chemicals 16,505 141,523 0.02Johnson Matthey 5,035 266,882 0.03JSR 5,400 92,643 0.01K+S - Registered 4,851 159,502 0.02Kaneka 3,000 18,775 0.00Kansai Paint 8,000 133,695 0.02Koninklijke DSM 4,232 308,196 0.04Kuraray 5,300 67,175 0.01LANXESS 1,882 127,020 0.01Linde 4,860 1,033,377 0.12Lonza Group - Registered 1,437 156,372 0.02LyondellBasell Industries - Class A 11,679 1,140,454 0.13Methanex 2,300 142,450 0.02Mitsubishi Chemical Holdings 33,000 146,261 0.02Mitsubishi Gas Chemical 15,000 95,948 0.01Mitsui Chemicals 11,000 30,078 0.00Monsanto 13,499 1,683,865 0.19Mosaic 9,491 469,330 0.05Nippon Paint 5,000 105,819 0.01Nitto Denko 4,200 196,806 0.02Novozymes - Class B 7,123 357,249 0.04OCI 1,976 77,105 0.01Potash Corporation of Saskatchewan 22,255 847,869 0.10PPG Industries 3,533 742,460 0.09Praxair 7,139 948,345 0.11Rayonier Advanced Materials 1,114 43,180 0.00Sherwin-Williams 1,979 409,475 0.05Shin-Etsu Chemical 10,900 662,575 0.08Sigma-Aldrich 2,835 287,696 0.03Solvay 1,805 310,644 0.04Sumitomo Chemical 30,000 113,420 0.01Syngenta - Registered 2,406 896,146 0.10Taiyo Nippon Sanso 7,000 61,981 0.01Teijin 50,000 125,364 0.01Westlake Chemical 1,200 100,512 0.01Yara International 4,177 209,180 0.02 Coal (0.05%) CONSOL Energy 6,800 313,276 0.04Peabody Energy 5,579 91,217 0.01 Commercial Services (1.47%) Abertis Infraestructuras 9,777 224,955 0.03Adecco - Registered 4,431 364,753 0.04ADT 4,811 168,096 0.02Aggreko 5,319 150,062 0.02Alliance Data Systems 1,200 337,500 0.04Atlantia 12,658 360,825 0.04Automatic Data Processing 12,621 1,000,593 0.12Babcock International Group 13,990 277,960 0.03Benesse Holdings 1,300 56,399 0.01Brambles 42,434 368,072 0.04
210

UBS ETF - MSCI World UCITS ETF Semi-Annual Report as of 30 June 2014 Schedule of Investments as at 30 June 2014 (Expressed in USD) (Unaudited)
The accompanying notes form an integral part of these financial statements.
Transferable securities listed on an Official Stock Exchange
Quantity Market
Value USD % of
Net Assets Commercial Services (1.47%) (continued) Bunzl 8,067 223,728 0.03Bureau Veritas 4,717 130,909 0.02Capita 18,138 355,102 0.04Cintas 2,257 143,410 0.02Dai Nippon Printing 16,000 167,099 0.02Edenred 3,735 113,245 0.01Equifax 2,800 203,112 0.02Experian 22,575 381,366 0.04FleetCor Technologies 1,700 224,060 0.03G4S 45,125 196,905 0.02H&R Block 6,027 202,025 0.02Hertz Global Holdings 11,400 319,542 0.04Intertek Group 4,376 205,688 0.02Iron Mountain 2,963 105,038 0.01Manpowergroup 1,900 161,215 0.02Master Card 27,440 2,016,017 0.23McGraw-Hill Financial 7,104 589,845 0.07Moody's 4,418 387,282 0.04Park24 3,700 67,276 0.01Quanta Services 5,551 191,954 0.02Randstad Holding 2,772 150,255 0.02Robert Half International 2,732 130,426 0.02Secom 6,400 391,057 0.04Securitas - Class B 13,998 165,936 0.02SEI Investments 2,951 96,704 0.01SGS - Registered 150 359,438 0.04Sodexo 1,933 207,888 0.02Toppan Printing 16,000 123,824 0.01Total System Services 3,500 109,935 0.01Towers Watson & Co - Class A 1,500 156,345 0.02Transurban Group 47,694 332,668 0.04United Rentals 2,400 251,352 0.03Vantiv - Class A 2,600 87,412 0.01Verisk Analytics - Class A 3,996 239,840 0.03Western Union 14,967 259,528 0.03 Computers (3.39%) Accenture - Class A 16,697 1,349,785 0.16Apple 161,516 15,009,682 1.73AtoS 1,581 131,696 0.01BlackBerry 9,918 101,866 0.01Cap Gemini 4,505 321,354 0.04CGI Group - Class A 6,600 234,344 0.03Cognizant Technology Solutions - Class A 15,094 738,248 0.08Computer Sciences 3,376 213,363 0.02Computershare 16,366 192,779 0.02EMC 53,789 1,416,802 0.16Fujitsu 54,000 404,580 0.05Gemalto 1,802 186,768 0.02Hewlett-Packard 48,695 1,640,048 0.19IHS - Class A 1,300 176,371 0.02International Business Machines 25,760 4,669,515 0.54Itochu Techno-Solutions 700 30,438 0.00NetApp 8,155 297,821 0.03Nomura Research Institute 1,600 50,383 0.01NTT Data 2,800 107,517 0.01Otsuka 900 43,621 0.01SanDisk 5,617 586,583 0.07Seagate Technology 9,174 521,267 0.06Synopsys 3,551 137,850 0.02TDK 4,300 201,619 0.02Teradata 3,330 133,866 0.02Western Digital 6,058 559,153 0.06 Cosmetics & Personal Care (1.13%) Avon Products 10,191 148,891 0.01Beiersdorf 2,634 254,860 0.03Colgate-Palmolive 23,028 1,570,049 0.18Estee Lauder - Class A 6,883 511,132 0.06Kao 12,700 499,826 0.06
211

UBS ETF - MSCI World UCITS ETF Semi-Annual Report as of 30 June 2014 Schedule of Investments as at 30 June 2014 (Expressed in USD) (Unaudited)
The accompanying notes form an integral part of these financial statements.
Transferable securities listed on an Official Stock Exchange
Quantity Market
Value USD % of
Net Assets Cosmetics & Personal Care (1.13%) (continued) L'Oreal 5,953 1,025,747 0.12Procter & Gamble 69,541 5,465,227 0.63Shiseido 10,600 193,260 0.02Unicharm 2,700 160,899 0.02 Distribution & Wholesale (0.58%) Arrow Electronics 2,299 138,883 0.02Fastenal 7,439 368,156 0.04Fossil Group 1,200 125,424 0.01Genuine Parts 4,020 352,956 0.04Itochu 35,600 457,190 0.05Jardine Cycle & Carriage 2,000 71,006 0.01Li & Fung 164,000 242,921 0.03LKQ 9,600 256,224 0.03Marubeni 36,000 263,324 0.03Mitsubishi 34,700 721,711 0.08Mitsubishi Logistics 4,000 59,898 0.01Mitsui & Co 43,000 689,324 0.08Sumitomo 29,200 394,310 0.05Toyota Tsusho 5,100 146,649 0.02Wolseley 6,574 360,035 0.04WW Grainger 1,493 379,625 0.04 Diversified Financial Services (2.05%) Aberdeen Asset Management 25,454 197,549 0.02AEON Financial Service 3,500 91,521 0.01Affiliated Managers Group 1,200 246,480 0.03American Express 24,343 2,309,420 0.27Ameriprise Financial 4,771 572,520 0.07ASX 5,615 188,882 0.02BlackRock 3,474 1,110,290 0.13Charles Schwab 29,015 781,374 0.09CI Financial 5,600 184,274 0.02CME Group 8,141 577,604 0.07Credit Saison 5,200 108,204 0.01Daiwa Securities Group 40,000 346,281 0.04Deutsche Boerse 5,767 447,539 0.05Discover Financial Services 12,883 798,488 0.09Eaton Vance 2,617 98,896 0.01Franklin Resources 10,475 605,874 0.07Hargreaves Lansdown 6,167 130,543 0.01Hong Kong Exchanges and Clearing 31,280 583,194 0.07ICAP 11,875 77,157 0.01IGM Financial 2,300 110,298 0.01IntercontinentalExchange Group 2,779 524,953 0.06Invesco 12,118 457,454 0.05Investec 10,060 92,714 0.01Japan Exchange Group 7,200 177,326 0.02Julius Baer Group 5,491 226,377 0.03Legg Mason 2,625 134,689 0.02London Stock Exchange Group 4,531 155,489 0.02Macquarie Group 7,158 402,865 0.05Mitsubishi UFJ Lease & Finance 10,000 57,450 0.01NASDAQ OMX Group 3,300 127,446 0.01Nomura Holdings 91,100 644,773 0.07Ocwen Financial 2,800 103,880 0.01Old Mutual 109,826 371,253 0.04ORIX 37,600 623,172 0.07Partners Group Holding 371 101,410 0.01Raymond James Financial 3,000 152,190 0.02Schroders 4,221 180,865 0.02Singapore Exchange 23,000 128,224 0.01T Rowe Price Group 6,703 565,800 0.07TD Ameritrade Holding 7,651 239,859 0.03Visa - Class A 13,228 2,787,272 0.32 Electric (2.64%) AES 22,000 342,100 0.04AGL Energy 15,443 225,635 0.03Alliant Energy 2,627 159,879 0.02
212

UBS ETF - MSCI World UCITS ETF Semi-Annual Report as of 30 June 2014 Schedule of Investments as at 30 June 2014 (Expressed in USD) (Unaudited)
The accompanying notes form an integral part of these financial statements.
Transferable securities listed on an Official Stock Exchange
Quantity Market
Value USD % of
Net Assets Electric (2.64%) (continued) Ameren 5,305 216,868 0.02American Electric Power 13,758 767,284 0.09Atco - Class I 1,600 77,690 0.01Calpine 8,500 202,385 0.02Chubu Electric Power 14,900 185,174 0.02Chugoku Electric Power 6,200 84,580 0.01CLP Holdings 50,000 410,304 0.05CMS Energy 7,800 242,970 0.03Consolidated Edison 7,526 434,551 0.05Dominion Resources 14,185 1,014,511 0.12DTE Energy 4,377 340,837 0.04Duke Energy 18,185 1,349,145 0.16E.ON 51,038 1,053,771 0.12Edison International 8,645 502,361 0.06EDP - Energias de Portugal 64,999 326,072 0.04Electric Power Development 3,500 113,667 0.01Electricite de France 5,163 162,585 0.02Enel 168,692 982,524 0.11Entergy 5,251 431,055 0.05Exelon 22,033 803,764 0.09FirstEnergy 11,510 399,627 0.05Fortis 6,405 195,250 0.02Fortum 12,355 331,720 0.04GDF Suez 37,688 1,037,429 0.12Hokuriku Electric Power 3,200 42,422 0.00Iberdrola 139,603 1,067,121 0.12Integrys Energy Group 2,700 192,051 0.02Kansai Electric Power 24,700 232,846 0.03Kyushu Electric Power 10,200 114,883 0.01MDU Resources Group 3,710 130,221 0.01NextEra Energy 10,815 1,108,321 0.13Northeast Utilities 6,684 315,953 0.04NRG Energy 9,729 361,919 0.04OGE Energy 5,200 203,216 0.02Origin Energy 28,673 395,661 0.05Pepco Holdings 6,972 191,591 0.02PG&E 12,623 606,156 0.07Pinnacle West Capital 2,423 140,146 0.02Power Assets Holdings 39,500 345,291 0.04PPL 14,524 516,038 0.06Public Service Enterprise Group 14,173 578,117 0.07Red Electrica 3,285 300,444 0.03RWE 12,685 544,737 0.06SCANA 3,579 192,586 0.02Shikoku Electric Power 4,800 66,998 0.01Southern 22,375 1,015,378 0.12SSE 26,737 716,373 0.08Terna Rete Elettrica Nazionale 33,760 178,049 0.02Tohoku Electric Power 11,000 129,105 0.01Tokyo Electric Power 30,700 127,885 0.01TransAlta 4,445 54,584 0.01Wisconsin Energy 5,012 235,163 0.03Xcel Energy 13,386 431,431 0.05 Electrical Components & Equipment (0.58%) AMETEK 5,925 309,759 0.04Brother Industries 3,800 65,831 0.01Casio Computer 3,300 47,885 0.01Emerson Electric 19,173 1,272,320 0.15Energizer Holdings 1,300 158,639 0.02Hitachi 125,000 915,552 0.10Legrand 6,843 418,658 0.05Mabuchi Motor 100 7,581 0.00Nidec 5,000 306,796 0.03OSRAM Licht 2,072 104,497 0.01Prysmian 4,530 102,337 0.01Schneider Electric - FR 13,459 1,266,883 0.15Schneider Electric - GB 283 26,639 0.00
213

UBS ETF - MSCI World UCITS ETF Semi-Annual Report as of 30 June 2014 Schedule of Investments as at 30 June 2014 (Expressed in USD) (Unaudited)
The accompanying notes form an integral part of these financial statements.
Transferable securities listed on an Official Stock Exchange
Quantity Market
Value USD % of
Net Assets Electronics (1.25%) Advantest 5,400 66,737 0.01Agilent Technologies 8,619 495,075 0.06Amphenol - Class A 4,296 413,877 0.05Avnet 3,159 139,975 0.02Flextronics International 19,700 218,079 0.02FLIR Systems 4,526 157,188 0.02Garmin 2,650 161,385 0.02Hamamatsu Photonics 2,600 127,555 0.01Hirose Electric 600 89,137 0.01Honeywell International 19,773 1,837,900 0.21Hoya 11,600 385,426 0.04Ibiden 4,400 88,604 0.01Keyence 1,190 519,146 0.06Koninklijke Philips 26,286 834,056 0.09Kyocera 8,400 398,669 0.05Mettler-Toledo International 400 101,272 0.01Murata Manufacturing 5,700 533,456 0.06NEC 52,000 165,796 0.02Nippon Electric Glass 12,000 69,888 0.01Omron 4,800 202,320 0.02Rexel 7,556 176,698 0.02Sensata Technologies Holding 4,400 205,832 0.02TE Connectivity 10,970 678,385 0.08Thermo Fisher Scientific 10,109 1,192,862 0.14Toshiba 87,000 406,209 0.05Trimble Navigation 6,600 243,870 0.03Tyco International 11,362 518,107 0.06Waters 2,782 290,552 0.03Yaskawa Electric 6,000 72,672 0.01Yokogawa Electric 5,600 70,812 0.01 Energy - Alternate Sources (0.06%) Delek Group 228 94,425 0.01Enel Green Power 42,805 121,198 0.01Vestas Wind Systems 5,837 294,466 0.04 Engineering & Construction (0.68%) ABB - Registered 57,486 1,323,708 0.15ACS Actividades de Construccion y Servicios 5,277 241,315 0.03Aeroports de Paris 547 72,062 0.01Aker Solutions 3,325 57,762 0.01Auckland International Airport 23,911 81,648 0.01Bouygues 4,670 194,312 0.02Cheung Kong Infrastructure Holdings 13,000 89,654 0.01Chicago Bridge & Iron 2,300 156,860 0.02Chiyoda 5,000 60,560 0.01Ferrovial 9,418 209,732 0.02Fluor 3,986 306,523 0.04Fraport Frankfurt Airport Services Worldwide 891 62,947 0.01Hochtief 621 53,744 0.01Jacobs Engineering Group 3,682 196,177 0.02JGC 7,000 212,684 0.03Kajima 23,000 101,713 0.01KBR 4,000 95,400 0.01Koninklijke Boskalis Westminster 2,685 153,976 0.02Leighton Holdings 1,910 35,568 0.00Obayashi 22,000 157,011 0.02SembCorp Industries 33,000 142,149 0.02Shimizu 12,000 84,932 0.01Singapore Technologies Engineering 33,000 100,590 0.01Skanska - Class B 8,844 201,741 0.02SNC-Lavalin Group 5,297 279,085 0.03Sydney Airport 30,913 123,128 0.01Taisei 22,000 121,830 0.01Vinci 11,845 885,480 0.10WorleyParsons 4,388 72,105 0.01 Entertainment (0.08%) Genting Singapore 160,000 170,697 0.01Oriental Land 1,100 188,446 0.02
214

UBS ETF - MSCI World UCITS ETF Semi-Annual Report as of 30 June 2014 Schedule of Investments as at 30 June 2014 (Expressed in USD) (Unaudited)
The accompanying notes form an integral part of these financial statements.
Transferable securities listed on an Official Stock Exchange
Quantity Market
Value USD % of
Net Assets Entertainment (0.08%) (continued) Sankyo 1,600 61,517 0.01Tabcorp Holdings 15,086 47,843 0.01Tatts Group 29,864 92,172 0.01Toho 2,000 46,908 0.01William Hill 20,625 115,671 0.01 Environmental Control (0.13%) Kurita Water Industries 5,000 115,838 0.01Republic Services 6,449 244,869 0.03Stericycle 1,770 209,603 0.02Waste Management 12,519 559,975 0.07 Food (3.24%) Ajinomoto 13,000 203,781 0.02Aryzta 2,166 205,169 0.02Associated British Foods 8,194 427,180 0.05Barry Callebaut - Registered 82 111,423 0.01Calbee 2,800 77,224 0.01Campbell Soup 4,219 193,272 0.02Carrefour 16,107 594,105 0.07Casino Guichard Perrachon 1,064 141,060 0.02Colruyt 2,131 108,245 0.01Compass Group 46,605 810,422 0.09ConAgra Foods 10,907 323,720 0.04Danone 14,616 1,085,424 0.12Delhaize Group 3,201 216,547 0.02Distribuidora Internacional de Alimentacion 15,900 146,378 0.02Empire - Class A 1,600 108,995 0.01First Pacific 63,000 70,394 0.01General Mills 17,118 899,380 0.10George Weston 1,100 81,285 0.01Hershey 4,093 398,535 0.05Hormel Foods 4,658 229,872 0.03J Sainsbury 31,723 171,132 0.02Jeronimo Martins 5,948 97,847 0.01JM Smucker 2,554 272,180 0.03Kellogg 7,778 511,015 0.06Kerry Group - Class A 3,335 250,452 0.03Kikkoman 5,000 104,141 0.01Koninklijke Ahold 27,665 519,301 0.06Kraft Foods Group 15,856 950,567 0.11Kroger 12,399 612,883 0.07Lindt & Spruengli 32 162,887 0.02Lindt & Spruengli - Registered 2 123,545 0.01Loblaw 6,885 307,810 0.03McCormick & Co - Non-Voting Shares 3,040 217,634 0.02MEIJI Holdings 2,100 139,095 0.02Metcash 24,937 62,137 0.01Metro - CA 2,000 123,870 0.01Metro - DE 5,189 226,137 0.03Mondelez International - Class A 42,989 1,616,816 0.19Nestle - Registered 83,968 6,504,964 0.75NH Foods 5,000 97,675 0.01Nisshin Seifun Group 4,950 59,075 0.01Nissin Foods Holdings 900 46,286 0.01Safeway 6,444 221,287 0.02Saputo 2,700 162,053 0.02Seven & I Holdings 18,700 787,835 0.09Sysco 14,574 545,796 0.06Tate & Lyle 14,017 164,054 0.02Tesco 215,386 1,046,645 0.12Toyo Suisan Kaisha 3,000 92,542 0.01Tyson Foods - Class A 6,800 255,272 0.03Unilever 33,268 1,507,975 0.17Unilever - CVA 42,916 1,877,626 0.22Whole Foods Market 10,344 399,589 0.05Wilmar International 54,000 138,178 0.02WM Morrison Supermarkets 47,961 150,399 0.02Woolworths 32,161 1,069,109 0.12Yakult Honsha 1,900 96,214 0.01
215

UBS ETF - MSCI World UCITS ETF Semi-Annual Report as of 30 June 2014 Schedule of Investments as at 30 June 2014 (Expressed in USD) (Unaudited)
The accompanying notes form an integral part of these financial statements.
Transferable securities listed on an Official Stock Exchange
Quantity Market
Value USD % of
Net Assets Food (3.24%) (continued) Yamazaki Baking 5,000 62,435 0.01 Forest Products & Paper (0.19%) International Paper 11,415 576,115 0.06MeadWestvaco 5,751 254,539 0.03Oji Holdings 16,000 65,861 0.01Stora Enso - Class R 16,011 155,862 0.02Svenska Cellulosa - Class B 14,276 371,776 0.04UPM-Kymmene 13,786 235,561 0.03 Gas (0.60%) Canadian Utilities - Class A 4,200 157,724 0.02CenterPoint Energy 10,800 275,832 0.03Centrica 127,860 683,410 0.08Enagas 4,858 156,306 0.02Gas Natural SDG 9,162 289,331 0.03Hong Kong & China Gas 161,597 353,621 0.04Keyera 1,825 134,688 0.01National Grid 97,095 1,394,549 0.16NiSource 8,200 322,588 0.04Osaka Gas 32,000 134,564 0.01Sempra Energy 6,486 679,149 0.08Snam 41,199 248,194 0.03Toho Gas 10,000 54,983 0.01Tokyo Gas 58,000 338,937 0.04 Hand & Machine Tools (0.23%) Finning International 5,400 151,280 0.02Fuji Electric 17,000 80,549 0.01Makita 2,500 154,484 0.02Sandvik 26,970 368,322 0.04Schindler Holding 1,376 209,162 0.02SMC 1,500 401,412 0.05Stanley Black & Decker 4,401 386,496 0.04Techtronic Industries 30,000 96,189 0.01THK 6,100 143,791 0.02 Healthcare Products (1.36%) Baxter International 13,450 972,435 0.11Becton Dickinson & Co 4,800 567,840 0.06Boston Scientific 37,796 482,655 0.06CareFusion 5,006 222,016 0.03Cochlear 2,812 163,758 0.02Coloplast - Class B 2,759 249,492 0.03Covidien 11,591 1,045,276 0.12CR Bard 1,767 252,699 0.03DENTSPLY International 2,951 139,730 0.02Edwards Lifesciences 2,500 214,600 0.02Elekta - Class B 9,815 124,792 0.01Essilor International 5,515 584,814 0.07Getinge - Class B 4,505 118,330 0.01Henry Schein 2,127 252,411 0.03Hologic 9,119 231,167 0.03Hospira 5,006 257,158 0.03Intuitive Surgical 870 358,266 0.04Luxottica Group 3,904 225,940 0.03Medtronic 26,592 1,695,506 0.19Olympus 7,800 268,713 0.03Patterson 1,925 76,057 0.01QIAGEN 6,109 148,045 0.02ResMed 3,800 192,394 0.02Shimadzu 7,000 64,192 0.01Smith & Nephew 20,187 358,629 0.04Sonova Holding - Registered 1,559 237,858 0.03St Jude Medical 7,948 550,399 0.06Stryker 8,309 700,615 0.08Sysmex 3,600 135,216 0.02Terumo 6,000 134,149 0.02Varian Medical Systems 2,351 195,462 0.02William Demant Holding 1,123 101,964 0.01
216

UBS ETF - MSCI World UCITS ETF Semi-Annual Report as of 30 June 2014 Schedule of Investments as at 30 June 2014 (Expressed in USD) (Unaudited)
The accompanying notes form an integral part of these financial statements.
Transferable securities listed on an Official Stock Exchange
Quantity Market
Value USD % of
Net Assets Healthcare Products (1.36%) (continued) Zimmer Holdings 4,556 473,186 0.05 Healthcare Services (0.88%) Aetna 9,609 779,098 0.09Cigna 6,714 617,487 0.07DaVita HealthCare Partners 4,780 345,690 0.04Fresenius & Co 3,079 459,080 0.05Fresenius Medical Care & Co 5,728 384,988 0.04HCA Holdings 8,400 473,592 0.05Humana 4,428 565,544 0.07Laboratory Corporation of America Holdings 1,791 183,398 0.02Miraca Holdings 1,000 48,467 0.01Quest Diagnostics 3,712 217,857 0.03Ramsay Health Care 3,638 156,235 0.02Ryman Healthcare 11,816 88,454 0.01Sonic Healthcare 8,960 146,558 0.02UnitedHealth Group 25,739 2,104,163 0.24Universal Health Services - Class B 2,100 201,096 0.02WellPoint 7,895 849,581 0.10 Holding Companies - Diversified Operations (0.27%) Bollore 159 103,187 0.01GEA Group 3,673 173,899 0.02Hutchison Whampoa 53,000 724,871 0.08Industrivarden - Class C 4,435 87,568 0.01Keppel 35,200 304,663 0.04Leucadia National 6,847 179,528 0.02Noble Group 84,363 92,710 0.01NWS Holdings 28,052 52,048 0.01Swire Pacific - Class A 14,500 178,482 0.02Wendel 757 108,412 0.01Wharf Holdings 41,100 295,907 0.04 Home Builders (0.18%) Daiwa House Industry 14,000 290,213 0.03DR Horton 6,400 157,312 0.02Iida Group Holdings 3,700 56,209 0.01Lennar - Class A 3,400 142,732 0.02Persimmon 7,605 165,533 0.02PulteGroup 11,000 221,760 0.03Sekisui Chemical 10,000 115,789 0.01Sekisui House 15,700 215,264 0.02Toll Brothers 6,010 221,769 0.02 Home Furnishings (0.21%) Electrolux - Class B 7,804 197,278 0.02Panasonic 61,700 751,570 0.09Sharp 49,000 157,199 0.02Sony 28,600 474,855 0.05Whirlpool 1,700 236,674 0.03 Household Products (0.45%) Avery Dennison 1,945 99,681 0.01Church & Dwight 3,988 278,961 0.03Clorox 3,216 293,942 0.04Henkel & Co 2,797 281,469 0.03Husqvarna - Class B 9,675 75,182 0.01Kimberly-Clark 10,301 1,145,677 0.13Newell Rubbermaid 6,418 198,894 0.02Reckitt Benckiser Group 16,719 1,457,935 0.17Societe BIC 314 42,957 0.01 Insurance (4.57%) ACE 8,323 863,095 0.10Admiral Group 5,504 145,776 0.02Aegon 48,946 427,150 0.05Aflac 11,375 708,094 0.08Ageas 5,422 216,285 0.02AIA Group 286,400 1,439,326 0.17
232

UBS ETF - MSCI World UCITS ETF Semi-Annual Report as of 30 June 2014 Schedule of Investments as at 30 June 2014 (Expressed in USD) (Unaudited)
The accompanying notes form an integral part of these financial statements.
Transferable securities listed on an Official Stock Exchange
Quantity Market
Value USD % of
Net Assets Insurance (4.57%) (continued) Alleghany 400 175,248 0.02Allianz - Registered 12,206 2,033,832 0.23Allstate 12,856 754,904 0.09American International Group 37,027 2,020,934 0.23AMP 69,817 349,253 0.04Aon 7,003 630,900 0.07Arch Capital Group 2,879 165,370 0.02Assicurazioni Generali 28,002 613,807 0.07Assurant 2,064 135,295 0.02Aviva 70,474 615,152 0.07AXA 44,011 1,051,798 0.12Axis Capital Holdings 2,221 98,346 0.01Baloise Holding - Registered 1,062 125,145 0.01Berkshire Hathaway - Class B 28,840 3,649,990 0.42Chubb 6,483 597,538 0.07Cincinnati Financial 3,952 189,854 0.02CNP Assurances 5,593 116,090 0.01Dai-ichi Life Insurance 21,200 315,787 0.04Delta Lloyd 3,799 96,434 0.01Direct Line Insurance Group 45,439 209,618 0.02Everest Re Group 1,392 223,402 0.03Fairfax Financial Holdings 400 190,103 0.02Fidelity National Financial - Class A 7,500 245,700 0.03Friends Life Group 28,682 154,629 0.02Genworth Financial - Class A 13,000 226,200 0.03Gjensidige Forsikring 3,176 56,933 0.01Great-West Lifeco 7,900 223,839 0.03Hannover Rueck 1,124 101,277 0.01Hartford Financial Services Group 11,189 400,678 0.05Industrial Alliance Insurance & Financial Services 2,700 118,530 0.01ING Groep - CVA 98,031 1,377,089 0.16Insurance Australia Group 58,597 322,992 0.04Intact Financial 3,387 233,972 0.03Legal & General Group 146,018 562,753 0.06Lincoln National 8,100 416,664 0.05Loews 8,577 377,474 0.04Manulife Financial 47,814 952,105 0.11Mapfre 24,353 97,061 0.01Marsh & McLennan 14,484 750,561 0.09MetLife 24,281 1,349,052 0.16MS&AD Insurance Group Holdings 12,700 306,766 0.04Muenchener Rueckversicherungs - Registered 4,629 1,026,089 0.12NKSJ Holdings 7,700 207,350 0.02PartnerRe 1,151 125,701 0.01Power Corporation of Canada 10,869 302,554 0.03Power Financial 6,039 188,288 0.02Principal Financial Group 8,696 438,974 0.05Progressive 13,825 350,602 0.04Prudential 65,918 1,511,439 0.17Prudential Financial 12,084 1,072,697 0.12QBE Insurance Group 38,392 393,889 0.05RenaissanceRe Holdings 1,200 128,400 0.01RSA Insurance Group 29,423 238,867 0.03Sampo - Class A 11,089 560,994 0.06SCOR 2,897 99,637 0.01Sony Financial Holdings 4,000 68,230 0.01Standard Life 56,428 360,944 0.04Sun Life Financial 16,070 591,715 0.07Suncorp Group 35,169 449,450 0.05Swiss Life Holding - Registered 693 164,341 0.02Swiss Re 9,378 834,375 0.10T&D Holdings 11,800 160,393 0.02Tokio Marine Holdings 19,900 654,526 0.08Torchmark 2,052 168,100 0.02Travelers 9,622 905,142 0.10Tryg 1,249 126,157 0.01UnipolSai 24,796 79,713 0.01Unum Group 7,681 266,992 0.03Vienna Insurance Group 1,219 65,241 0.01Voya Financial 2,800 101,752 0.01
218

UBS ETF - MSCI World UCITS ETF Semi-Annual Report as of 30 June 2014 Schedule of Investments as at 30 June 2014 (Expressed in USD) (Unaudited)
The accompanying notes form an integral part of these financial statements.
Transferable securities listed on an Official Stock Exchange
Quantity Market
Value USD % of
Net Assets Insurance (4.57%) (continued) Willis Group Holdings 4,235 183,375 0.02WR Berkley 3,251 150,554 0.02XL Group 6,416 209,996 0.02Zurich Insurance Group 3,819 1,151,126 0.13 Internet (2.74%) Amazon.com 10,105 3,281,902 0.38ASOS 1,201 60,784 0.01Dena 4,200 56,799 0.01eBay 32,343 1,619,091 0.19Equinix 1,100 231,099 0.03Expedia 2,725 214,621 0.02F5 Networks 1,600 178,304 0.02Facebook - Class A 48,900 3,290,481 0.38FireEye 3,000 121,650 0.01Google - Class A 7,294 4,264,583 0.49Google - Class C 7,388 4,250,169 0.49Gree 2,100 18,408 0.00Iliad 759 229,400 0.03Kakaku.com 3,900 68,333 0.01Liberty Interactive - Class A 11,400 334,704 0.04LinkedIn - Class A 2,500 428,675 0.05M3 8,500 135,255 0.01Netflix 1,300 572,780 0.07Priceline Group 1,326 1,595,178 0.18Rackspace Hosting 2,300 77,418 0.01Rakuten 21,800 281,686 0.03SBI Holdings 8,380 102,573 0.01Seek 9,048 135,358 0.01Symantec 19,075 436,817 0.05Trend Micro 2,200 72,425 0.01TripAdvisor 2,800 304,248 0.03Twitter 3,100 127,007 0.01United Internet - Registered 2,170 95,594 0.01VeriSign 4,717 230,237 0.03Yahoo Japan 30,200 139,515 0.02Yahoo! 23,997 843,015 0.10 Iron & Steel (0.28%) ArcelorMittal 25,029 371,127 0.04Fortescue Metals Group 35,288 144,884 0.02Hitachi Metals 7,000 105,997 0.01JFE Holdings 13,000 268,328 0.03Kobe Steel 55,000 82,523 0.01Nippon Steel & Sumitomo Metal 180,895 578,550 0.07Nucor 9,243 455,218 0.05ThyssenKrupp 11,259 328,191 0.04Voestalpine 2,610 124,196 0.01Yamato Kogyo 400 11,727 0.00 Leisure Time (0.25%) Carnival - GB 3,886 146,710 0.02Carnival - US 8,888 334,633 0.04Flight Centre 2,267 95,110 0.01Harley-Davidson 5,755 401,987 0.05Polaris Industries 1,700 221,408 0.02Royal Caribbean Cruises 4,993 277,611 0.03Sega Sammy Holdings 7,300 143,615 0.02Shimano 2,200 244,094 0.03TUI Travel 9,950 67,712 0.01Yamaha 4,600 72,697 0.01Yamaha Motor 7,800 134,203 0.01 Lodging (0.58%) Accor 3,766 195,885 0.02City Developments 8,000 65,648 0.01Crown Resorts 11,469 163,674 0.02Galaxy Entertainment Group 65,000 519,977 0.06InterContinental Hotels Group 8,303 343,706 0.04Las Vegas Sands 10,364 789,944 0.09
219

UBS ETF - MSCI World UCITS ETF Semi-Annual Report as of 30 June 2014 Schedule of Investments as at 30 June 2014 (Expressed in USD) (Unaudited)
The accompanying notes form an integral part of these financial statements.
Transferable securities listed on an Official Stock Exchange
Quantity Market
Value USD % of
Net Assets Lodging (0.58%) (continued) Marriott International - Class A 5,855 375,305 0.04MGM China Holdings 26,800 93,018 0.01MGM Resorts International 10,759 284,038 0.03Sands China 58,800 444,204 0.05Shangri-La Asia 13,000 20,363 0.00SJM Holdings 35,000 87,699 0.01Starwood Hotels & Resorts Worldwide 5,710 461,482 0.05Whitbread 4,624 348,591 0.04Wyndham Worldwide 4,200 318,024 0.04Wynn Macau 39,600 155,327 0.02Wynn Resorts 1,903 394,987 0.05 Machinery - Construction & Mining (0.46%) Atlas Copco - Class A 19,129 552,523 0.06Atlas Copco - Class B 9,169 244,814 0.03Caterpillar 16,113 1,751,000 0.20Hitachi Construction Machinery 3,200 63,744 0.01Joy Global 3,851 237,144 0.03Komatsu 23,600 547,922 0.06Mitsubishi Electric 49,000 604,610 0.07 Machinery - Diversified (0.74%) AGCO 2,569 144,429 0.02Alstom 4,936 179,935 0.02Amada 12,000 122,008 0.01Andritz 1,539 88,931 0.01CNH Industrial 20,510 210,610 0.02Cummins 4,422 682,270 0.08Deere & Co 9,661 874,804 0.10FANUC 4,800 827,758 0.10Flowserve 3,200 237,920 0.03Hexagon - Class B 4,960 159,810 0.02Kawasaki Heavy Industries 33,000 125,739 0.01Kone - Class B 8,064 336,524 0.04Kubota 28,000 396,900 0.05MAN 1,012 125,049 0.01Metso 3,494 132,368 0.02Mitsubishi Heavy Industries 72,000 449,178 0.05Nabtesco 3,700 81,812 0.01Rockwell Automation 3,380 423,041 0.05Roper Industries 2,679 391,161 0.04Sumitomo Heavy Industries 11,000 52,337 0.01Weir Group 4,859 217,591 0.02Xylem 4,481 175,117 0.02Zardoya Otis 1,303 23,192 0.00 Media (2.46%) Axel Springer 1,038 63,882 0.01British Sky Broadcasting Group 25,501 394,170 0.04Cablevision Systems - Class A 9,283 163,845 0.02CBS - Class B 14,048 872,943 0.10Charter Communications - Class A 1,700 269,246 0.03Comcast - Class A 54,756 2,939,302 0.34Comcast - Class A Special 11,507 613,668 0.07DIRECTV 12,325 1,047,748 0.12Discovery Communications - Class A 3,565 264,808 0.03Discovery Communications - Class C 1,906 138,357 0.01DISH Network - Class A 5,518 359,111 0.04ITV 81,848 249,387 0.03Kabel Deutschland Holding 972 142,331 0.02Lagardere 2,886 93,983 0.01Liberty Global - Class A 6,189 273,678 0.03Liberty Global - Class C 13,291 562,342 0.06Liberty Media - Class A 2,000 273,360 0.03News - Class A 9,940 178,324 0.02Nielsen 7,400 358,234 0.04Pearson 18,930 373,520 0.04ProSiebenSat.1 Media - Registered 5,122 228,161 0.03Reed Elsevier - GB 32,253 518,389 0.06Reed Elsevier - NL 18,893 433,278 0.05
220

UBS ETF - MSCI World UCITS ETF Semi-Annual Report as of 30 June 2014 Schedule of Investments as at 30 June 2014 (Expressed in USD) (Unaudited)
The accompanying notes form an integral part of these financial statements.
Transferable securities listed on an Official Stock Exchange
Quantity Market
Value USD % of
Net Assets Media (2.46%) (continued) RTL Group 685 76,192 0.01Scripps Networks Interactive - Class A 2,882 233,845 0.03Shaw Communications - Class B 8,936 229,535 0.03Singapore Press Holdings 44,000 147,178 0.02Sirius XM Holdings 65,100 225,246 0.02Sky Deutschland 7,440 68,535 0.01Thomson Reuters 9,441 344,349 0.04Time Warner 22,788 1,600,857 0.18Time Warner Cable 7,016 1,033,457 0.12Twenty First Century Fox - Class A 37,361 1,313,239 0.15Twenty First Century Fox - Class B 13,000 444,990 0.05Viacom - Class B 10,684 926,623 0.11Walt Disney 43,512 3,730,719 0.43Wolters Kluwer 7,817 231,391 0.03 Metal Fabricate & Hardware (0.26%) Assa Abloy - Class B 9,775 497,132 0.06Maruichi Steel Tube 1,000 26,850 0.00NSK 14,000 182,005 0.02Precision Castparts 3,900 984,360 0.11SKF - Class B 9,299 237,157 0.03Tenaris 10,649 250,777 0.03Vallourec 2,242 100,392 0.01 Mining (1.86%) Agnico Eagle Mines 6,920 265,457 0.03Alcoa 25,011 372,414 0.04Alumina 37,668 47,997 0.01Anglo American 36,119 883,140 0.10Antofagasta 8,732 113,919 0.01Barrick Gold 30,094 552,069 0.06BHP Billiton - AU 83,230 2,820,184 0.32BHP Billiton - GB 55,475 1,792,264 0.21Boliden 7,979 115,710 0.01Cameco 11,998 235,758 0.03Eldorado Gold 17,900 137,130 0.01First Quantum Minerals 15,344 328,733 0.04Franco-Nevada 4,368 251,176 0.03Freeport-McMoRan Copper & Gold 26,427 964,586 0.11Fresnillo 3,842 57,284 0.01Glencore 284,357 1,582,849 0.18Goldcorp 22,552 630,520 0.07Iluka Resources 8,247 63,283 0.01Kinross Gold 25,155 104,384 0.01Mitsubishi Materials 25,000 87,607 0.01New Gold 11,200 71,186 0.01Newcrest Mining 17,167 170,456 0.02Newmont Mining 12,439 316,448 0.04Norsk Hydro 33,690 180,246 0.02Orica 12,977 238,598 0.03Randgold Resources 2,067 172,224 0.02Rio Tinto - AU 11,194 626,638 0.07Rio Tinto - GB 33,216 1,765,452 0.20Silver Wheaton 8,737 230,329 0.03Sumitomo Metal Mining 17,000 276,048 0.03Teck Resources - Class B 13,259 303,234 0.03Turquoise Hill Resources 20,948 70,210 0.01Umicore 3,021 140,341 0.02Yamana Gold 29,395 242,302 0.03 Miscellaneous Manufacturers (2.23%) 3M 16,493 2,362,457 0.27Alfa Laval 8,121 209,179 0.02ALS 9,841 82,296 0.01Bombardier - Class B 40,700 144,054 0.02Danaher 16,523 1,300,856 0.15Dover 3,951 359,343 0.04Eaton 12,452 961,045 0.11FUJIFILM Holdings 14,300 398,771 0.05General Electric 259,807 6,827,728 0.79
221

UBS ETF - MSCI World UCITS ETF Semi-Annual Report as of 30 June 2014 Schedule of Investments as at 30 June 2014 (Expressed in USD) (Unaudited)
The accompanying notes form an integral part of these financial statements.
Transferable securities listed on an Official Stock Exchange
Quantity Market
Value USD % of
Net Assets Miscellaneous Manufacturers (2.23%) (continued) Illinois Tool Works 10,700 936,892 0.11IMI 5,705 145,052 0.02Ingersoll-Rand 7,206 450,447 0.05Konica Minolta 10,000 98,811 0.01Leggett & Platt 2,786 95,504 0.01Melrose Industries 24,856 110,585 0.01Nikon 7,700 121,233 0.01Orkla 18,763 167,104 0.02Pall 2,526 215,695 0.03Parker Hannifin 3,586 450,868 0.05Pentair 4,828 348,195 0.04Siemens - Registered 20,575 2,717,022 0.31Smiths Group 10,425 231,193 0.03SPX 1,100 119,031 0.01Sulzer - Registered 444 62,284 0.01Textron 7,465 285,835 0.03Wartsila 3,802 188,544 0.02 Office & Business Equipment (0.20%) Canon 26,100 849,174 0.10Ricoh 22,000 262,119 0.03Seiko Epson 5,300 225,488 0.03Xerox 30,723 382,194 0.04 Oil & Gas (8.08%) Anadarko Petroleum 13,234 1,448,726 0.17Antero Resources 1,600 105,008 0.01Apache 10,190 1,025,318 0.12ARC Resources 8,181 249,543 0.03Athabasca Oil 7,400 53,217 0.01Baytex Energy 2,576 119,108 0.01BG Group 87,229 1,841,983 0.21BP 471,045 4,147,086 0.48Cabot Oil & Gas 11,408 389,469 0.04Caltex Australia 3,464 70,523 0.01Canadian Natural Resources 29,545 1,359,988 0.16Canadian Oil Sands 11,986 272,094 0.03Cenovus Energy 20,425 663,288 0.08Cheniere Energy 6,500 466,050 0.05Chesapeake Energy 13,733 426,822 0.05Chevron 49,114 6,411,833 0.74Cimarex Energy 2,000 286,920 0.03Cobalt International Energy 6,800 124,780 0.01Concho Resources 2,400 346,800 0.04ConocoPhillips 31,625 2,711,211 0.31Continental Resources 900 142,236 0.02Crescent Point Energy 9,060 402,241 0.05Denbury Resources 13,700 252,902 0.03Devon Energy 9,907 786,616 0.09Diamond Offshore Drilling 1,524 75,636 0.01Encana 18,520 439,549 0.05Energen 2,500 222,200 0.02Enerplus 6,155 155,385 0.02Eni 64,593 1,766,982 0.20Ensco - Class A 6,256 347,646 0.04EOG Resources 14,076 1,644,921 0.19EQT 3,523 376,609 0.04Exxon Mobil 111,290 11,204,677 1.29Galp Energia 13,453 246,449 0.03Helmerich & Payne 2,950 342,524 0.04Hess 7,937 784,890 0.09HollyFrontier 4,022 175,721 0.02Husky Energy 9,731 314,820 0.04Idemitsu Kosan 3,200 69,525 0.01Imperial Oil 7,881 416,043 0.05Inpex 24,200 367,879 0.04JX Holdings 54,700 292,655 0.03Lundin Petroleum 5,212 105,404 0.01Marathon Oil 16,794 670,416 0.08Marathon Petroleum 7,408 578,343 0.07
222

UBS ETF - MSCI World UCITS ETF Semi-Annual Report as of 30 June 2014 Schedule of Investments as at 30 June 2014 (Expressed in USD) (Unaudited)
The accompanying notes form an integral part of these financial statements.
Transferable securities listed on an Official Stock Exchange
Quantity Market
Value USD % of
Net Assets Oil & Gas (8.08%) (continued) MEG Energy 3,100 113,185 0.01Murphy Oil 4,407 292,977 0.03Nabors Industries 6,045 177,542 0.02Neste Oil 2,382 46,474 0.01Noble 7,465 250,525 0.03Noble Energy 9,788 758,178 0.09Occidental Petroleum 20,603 2,114,486 0.24OMV 3,125 141,194 0.02Pacific Rubiales Energy 9,500 193,362 0.02Pengrowth Energy 9,803 70,406 0.01Penn West Petroleum 11,768 115,122 0.01Peyto Exploration & Development 3,300 124,887 0.01Phillips 66 14,035 1,128,835 0.13Pioneer Natural Resources 3,904 897,178 0.10QEP Resources 3,982 137,379 0.02Range Resources 4,118 358,060 0.04Repsol 22,839 602,261 0.07Royal Dutch Shell - Class A 100,401 4,151,852 0.48Royal Dutch Shell - Class B 64,096 2,786,439 0.32Santos 24,520 330,022 0.04Seadrill 9,017 357,518 0.04Showa Shell Sekiyu 5,600 63,626 0.01Southwestern Energy 8,487 386,074 0.04Statoil 29,624 909,532 0.10Suncor Energy 37,954 1,621,281 0.19Talisman Energy 23,863 252,711 0.03Tesoro 3,100 181,877 0.02TonenGeneral Sekiyu 7,000 66,472 0.01Total 55,240 3,991,850 0.46Tourmaline Oil 5,200 274,658 0.03Transocean - CH 9,660 434,199 0.05Transocean - US 288 12,969 0.00Tullow Oil 25,333 369,699 0.04Valero Energy 13,995 701,149 0.08Vermilion Energy 2,500 174,271 0.02Whiting Petroleum 3,600 288,900 0.03Woodside Petroleum 18,451 715,233 0.08 Oil & Gas Services (1.16%) AMEC 8,427 175,068 0.02Baker Hughes 11,689 870,246 0.10Cameron International 6,770 458,397 0.05Core Laboratories 800 133,648 0.02FMC Technologies 6,742 411,734 0.05Fugro - CVA 1,825 104,483 0.01Halliburton 21,887 1,554,196 0.18National Oilwell Varco 10,788 888,392 0.10Oceaneering International 2,600 203,138 0.02Petrofac 5,700 117,246 0.01Saipem 7,172 193,445 0.02Schlumberger 33,538 3,955,807 0.46Subsea 7 5,968 111,262 0.01Superior Energy Services 3,876 140,079 0.02Technip 2,476 270,828 0.03Weatherford International 21,331 490,613 0.06 Other Finance (0.13%) Exor 3,509 144,082 0.02Groupe Bruxelles Lambert 1,803 187,340 0.02Investment Kinnevik - Class B 7,177 305,745 0.03Investor - Class B 10,690 400,874 0.05Israel 81 46,185 0.01Pargesa Holding 410 36,825 0.00 Packaging & Containers (0.17%) Amcor 37,534 369,498 0.04Ball 2,904 182,023 0.02Crown Holdings 4,961 246,859 0.03Owens-Illinois 3,252 112,649 0.01Rexam 17,127 156,674 0.02
223

UBS ETF - MSCI World UCITS ETF Semi-Annual Report as of 30 June 2014 Schedule of Investments as at 30 June 2014 (Expressed in USD) (Unaudited)
The accompanying notes form an integral part of these financial statements.
Transferable securities listed on an Official Stock Exchange
Quantity Market
Value USD % of
Net Assets Packaging & Containers (0.17%) (continued) Rock Tenn - Class A 1,500 158,385 0.02Sealed Air 6,500 222,105 0.02Toyo Seikan Group Holdings 3,000 46,079 0.01 Pharmaceuticals & Biotechnology (9.24%) Abbott Laboratories 41,030 1,678,127 0.19AbbVie 41,093 2,319,289 0.27Actavis 4,759 1,061,495 0.12Actelion - Registered 2,680 339,080 0.04Alexion Pharmaceuticals 5,320 831,250 0.10Alfresa Holdings 1,500 96,688 0.01Allergan 7,930 1,341,915 0.15AmerisourceBergen 6,401 465,097 0.05Amgen 19,918 2,357,694 0.27Astellas Pharma 51,500 676,635 0.08AstraZeneca 31,381 2,328,972 0.27Bayer - Registered 21,210 2,995,443 0.34Biogen Idec 5,993 1,889,653 0.22BioMarin Pharmaceutical 3,000 186,630 0.02Bristol-Myers Squibb 42,532 2,063,227 0.24Cardinal Health 8,529 584,748 0.07Catamaran 4,600 203,494 0.02Celesio 1,665 59,270 0.01Celgene 19,988 1,716,569 0.20Chugai Pharmaceutical 6,500 183,184 0.02CSL 12,991 816,007 0.09Daiichi Sankyo 18,000 335,818 0.04Eisai 5,800 242,981 0.03Eli Lilly & Co 25,866 1,608,089 0.18Endo International 3,500 245,070 0.03Express Scripts Holding 19,950 1,383,133 0.16Forest Laboratories 5,716 565,884 0.07Gilead Sciences 39,493 3,274,365 0.38GlaxoSmithKline 123,492 3,302,428 0.38Grifols 4,936 269,751 0.03Herbalife 1,618 104,426 0.01Hisamitsu Pharmaceutical 1,800 80,490 0.01Illumina 3,110 555,259 0.06Johnson & Johnson 73,002 7,637,469 0.88Kyowa Hakko Kirin 6,000 81,200 0.01McKesson 5,993 1,115,956 0.13Mead Johnson Nutrition 4,974 463,428 0.05Medipal Holdings 2,300 32,602 0.00Merck 4,050 351,501 0.04Merck & Co 75,663 4,377,104 0.50Mitsubishi Tanabe Pharma 4,500 67,386 0.01Mylan 9,600 494,976 0.06Novartis - Registered 60,074 5,439,718 0.63Novo Nordisk - Class B 50,893 2,342,207 0.27Omnicare 2,200 146,454 0.02Ono Pharmaceutical 2,400 211,322 0.02Orion - Class B 4,166 155,317 0.02Otsuka Holdings 10,300 319,254 0.04Perrigo 3,172 462,351 0.05Pfizer 163,776 4,860,872 0.56Pharmacyclics 1,900 170,449 0.02Quintiles Transnational Holdings 1,900 101,251 0.01Regeneron Pharmaceuticals 2,000 564,940 0.06Roche Holding 18,327 5,466,274 0.63Sanofi 30,704 3,261,338 0.38Santen Pharmaceutical 1,500 84,399 0.01Shionogi & Co 8,800 183,636 0.02Shire 15,080 1,178,353 0.14Sumitomo Dainippon Pharma 1,600 18,400 0.00Suzuken 2,800 104,200 0.01Taisho Pharmaceutical Holdings 900 65,653 0.01Takeda Pharmaceutical 20,900 969,440 0.11Teva Pharmaceutical Industries 21,704 1,148,263 0.13UCB 2,517 213,075 0.02Valeant Pharmaceuticals International 8,595 1,088,869 0.13
224

UBS ETF - MSCI World UCITS ETF Semi-Annual Report as of 30 June 2014 Schedule of Investments as at 30 June 2014 (Expressed in USD) (Unaudited)
The accompanying notes form an integral part of these financial statements.
Transferable securities listed on an Official Stock Exchange
Quantity Market
Value USD % of
Net Assets Pharmaceuticals & Biotechnology (9.24%) (continued) Vertex Pharmaceuticals 5,481 518,941 0.06Zoetis 13,637 440,066 0.05 Pipelines (0.68%) AltaGas 3,000 138,234 0.02APA Group 27,575 179,324 0.02Enbridge 21,762 1,034,418 0.12Inter Pipeline 7,252 225,495 0.03Kinder Morgan 17,970 651,592 0.07Kinder Morgan Management 3,519 277,755 0.03ONEOK 4,766 324,469 0.04Pembina Pipeline 7,000 301,713 0.03Spectra Energy 17,812 756,654 0.09TransCanada 19,368 926,078 0.11Williams 18,283 1,064,254 0.12 Private Equity (0.07%) 3i Group 34,556 237,465 0.03Eurazeo 1,376 114,450 0.01Onex 3,500 216,936 0.03 Real Estate (0.81%) Aeon Mall 3,720 98,008 0.01Brookfield Asset Management - Class A 14,733 650,235 0.07CapitaLand 76,850 197,265 0.02CBRE Group - Class A 9,200 294,768 0.03Cheung Kong Holdings 36,000 638,681 0.07Daito Trust Construction 1,800 211,618 0.02Deutsche Wohnen 8,157 175,899 0.02First Capital Realty 3,700 64,680 0.01Global Logistic Properties 69,000 149,441 0.02Hang Lung Properties 56,000 172,689 0.02Henderson Land Development 37,622 220,139 0.03Hulic 6,400 84,339 0.01Hysan Development 11,236 52,626 0.01IMMOFINANZ 32,332 114,210 0.01Keppel Land 18,000 48,803 0.01Kerry Properties 9,500 33,218 0.00Lend Lease Group 12,561 155,428 0.02Mitsubishi Estate 34,000 839,386 0.10Mitsui Fudosan 22,000 741,839 0.09New World Development 130,416 148,415 0.02Nomura Real Estate Holdings 4,400 83,261 0.01NTT Urban Development 1,200 13,504 0.00REA Group 2,698 108,761 0.01Realogy Holdings 2,800 105,588 0.01Sino Land 78,960 129,998 0.02Sumitomo Realty & Development 8,000 343,280 0.04Sun Hung Kai Properties 39,008 535,015 0.06Swire Properties 22,400 65,463 0.01Swiss Prime Site - Registered 1,633 135,347 0.02Tokyo Tatemono 8,000 73,994 0.01Tokyu Fudosan Holdings 15,900 125,404 0.01UOL Group 17,546 91,766 0.01Wheelock & Co 30,000 125,220 0.01 Real Estate Investment Trusts (2.08%) American Capital Agency 8,500 198,985 0.02American Realty Capital Properties 26,367 330,379 0.04American Tower 10,793 971,154 0.11Annaly Capital Management 21,162 241,882 0.03Ascendas Real Estate Investment Trust 32,000 59,038 0.01AvalonBay Communities 3,468 493,115 0.06Boston Properties 3,642 430,412 0.05British Land 21,942 263,560 0.03Camden Property Trust 3,000 213,450 0.02CapitaCommercial Trust 72,000 98,183 0.01CapitaMall Trust 65,000 102,976 0.01CFS Retail Property Trust Group 60,910 117,279 0.01Corio 3,477 177,568 0.02
225

UBS ETF - MSCI World UCITS ETF Semi-Annual Report as of 30 June 2014 Schedule of Investments as at 30 June 2014 (Expressed in USD) (Unaudited)
The accompanying notes form an integral part of these financial statements.
Transferable securities listed on an Official Stock Exchange
Quantity Market
Value USD % of
Net Assets Real Estate Investment Trusts (2.08%) (continued) Crown Castle International 8,960 665,370 0.08Dexus Property Group 106,033 111,088 0.01Digital Realty Trust 3,158 184,175 0.02Duke Realty 11,200 203,392 0.02Equity Residential 9,418 593,334 0.07Essex Property Trust 1,300 240,383 0.03Federal Realty Investment Trust 1,600 193,472 0.02Fonciere Des Regions 530 57,457 0.01Gecina 881 128,463 0.02General Growth Properties 12,924 304,489 0.04Goodman Group 44,264 210,982 0.02GPT Group 32,922 119,322 0.01H&R Real Estate Investment Trust 3,500 76,102 0.01Hammerson 15,644 155,143 0.02HCP 12,253 507,029 0.06Health Care REIT 8,132 509,632 0.06Host Hotels & Resorts 21,340 469,693 0.05ICADE 988 105,918 0.01Intu Properties 17,858 95,145 0.01Japan Prime Realty Investment 17 60,999 0.01Japan Real Estate Investment 28 163,072 0.02Japan Retail Fund Investment 76 170,898 0.02Kimco Realty 10,815 248,529 0.03Klepierre 2,713 138,235 0.02Land Securities Group 20,796 368,381 0.04Liberty Property Trust 4,095 155,323 0.02Link REIT 68,500 368,558 0.04Macerich 3,989 266,266 0.03Mirvac Group 74,172 124,963 0.01Nippon Building Fund 40 233,750 0.03Nippon Prologis REIT 40 93,263 0.01Plum Creek Timber 4,331 195,328 0.02Prologis 13,185 541,772 0.06Public Storage 3,844 658,669 0.08Rayonier 3,343 118,844 0.01Realty Income 6,100 270,962 0.03Regency Centers 2,000 111,360 0.01RioCan Real Estate Investment Trust 3,618 92,764 0.01Scentre Group 111,032 335,352 0.04Segro 16,635 98,186 0.01Simon Property Group 8,176 1,359,505 0.16SL Green Realty 1,900 207,879 0.02Stockland 41,057 150,356 0.02UDR 7,500 214,725 0.03Unibail-Rodamco 2,680 779,548 0.09United Urban Investment 72 116,204 0.01Ventas 8,177 524,146 0.06Vornado Realty Trust 4,203 448,586 0.05Westfield 50,523 340,956 0.04Weyerhaeuser 15,526 513,755 0.06 Retail (4.30%) ABC-Mart 400 21,401 0.00Advance Auto Parts 1,711 230,848 0.03Aeon 20,600 253,370 0.03Alimentation Couche Tard - Class B 9,288 254,883 0.03AutoNation 1,800 107,424 0.01AutoZone 813 435,963 0.05Bed Bath & Beyond 5,535 317,598 0.04Best Buy 6,509 201,844 0.02Canadian Tire - Class A 1,900 182,606 0.02CarMax 5,998 311,956 0.04Chipotle Mexican Grill 721 427,200 0.05Citizen Holdings 3,400 26,682 0.00Coach 7,894 269,896 0.03Compagne Financiere Richemont - Registered 13,350 1,400,787 0.16Costco Wholesale 11,415 1,314,551 0.15CVS Caremark 30,468 2,296,373 0.26Darden Restaurants 3,741 173,096 0.02Dick's Sporting Goods 2,600 121,056 0.01
241

UBS ETF - MSCI World UCITS ETF Semi-Annual Report as of 30 June 2014 Schedule of Investments as at 30 June 2014 (Expressed in USD) (Unaudited)
The accompanying notes form an integral part of these financial statements.
Transferable securities listed on an Official Stock Exchange
Quantity Market
Value USD % of
Net Assets Retail (4.30%) (continued) Dollar General 8,128 466,222 0.05Dollar Tree 4,961 270,176 0.03Dollarama 2,000 164,953 0.02Don Quijote Holdings 1,500 83,658 0.01Family Dollar Stores 2,864 189,425 0.02FamilyMart 2,000 86,175 0.01Fast Retailing 1,500 493,510 0.06GameStop - Class A 3,000 121,410 0.01Gap 6,273 260,769 0.03Hennes & Mauritz - Class B 25,813 1,127,450 0.13Home Depot 36,017 2,915,936 0.34Inditex 5,872 903,657 0.10Isetan Mitsukoshi Holdings 11,500 149,845 0.02J Front Retailing 17,000 119,313 0.01Kering 1,976 433,276 0.05Kingfisher 68,327 419,416 0.05Kohl's 5,131 270,301 0.03L Brands 7,316 429,157 0.05Lawson 1,400 105,029 0.01Lowe's 27,192 1,304,944 0.15Lululemon Athletica 3,937 159,370 0.02Macy's 10,477 607,876 0.07Marks & Spencer Group 38,388 279,091 0.03Marui Group 5,700 54,747 0.01McDonald's 25,140 2,532,604 0.29McDonald's Holdings 2,700 75,825 0.01Next 3,522 389,930 0.05Nitori Holdings 1,500 82,030 0.01Nordstrom 4,355 295,835 0.03O'Reilly Automotive 2,616 393,970 0.05Pandora 2,939 225,342 0.03PetSmart 3,590 214,682 0.02PVH 1,800 209,880 0.02Ross Stores 4,978 329,195 0.04Sears Holdings 1,082 43,237 0.01Shimamura 1,200 117,980 0.01Sports Direct International 7,322 88,450 0.01Staples 15,499 168,009 0.02Starbucks 19,985 1,546,439 0.18Swatch Group 751 453,496 0.05Swatch Group - Registered 1,061 117,849 0.01Takashimaya 9,000 87,330 0.01Target 16,231 940,586 0.11Tiffany & Co 3,411 341,953 0.04Tim Hortons 3,876 212,404 0.02TJX 18,566 986,783 0.11Tractor Supply 3,800 229,520 0.03Travis Perkins 5,367 150,315 0.02Ulta Salon Cosmetics & Fragrance 1,200 109,692 0.01Urban Outfitters 2,528 85,598 0.01USS 9,600 163,846 0.02Wal-Mart Stores 41,157 3,089,656 0.36Walgreen 23,877 1,770,002 0.20Wesfarmers 30,508 1,204,782 0.14Yamada Denki 19,700 70,201 0.01Yum! Brands 11,317 918,940 0.11 Savings & Loans (0.05%) Hudson City Bancorp 7,807 76,743 0.01New York Community Bancorp 10,900 174,182 0.02People's United Financial 9,849 149,409 0.02 Semiconductors (1.93%) Altera 9,854 342,525 0.04Analog Devices 7,949 429,802 0.05Applied Materials 30,960 698,148 0.08ARM Holdings 37,765 568,883 0.06ASM Pacific Technology 6,900 75,407 0.01ASML Holding 9,405 875,755 0.10Avago Technologies 6,800 490,076 0.06
227

UBS ETF - MSCI World UCITS ETF Semi-Annual Report as of 30 June 2014 Schedule of Investments as at 30 June 2014 (Expressed in USD) (Unaudited)
The accompanying notes form an integral part of these financial statements.
Transferable securities listed on an Official Stock Exchange
Quantity Market
Value USD % of
Net Assets Semiconductors (1.93%) (continued) Broadcom - Class A 13,796 512,108 0.06Cree 2,449 122,328 0.01Infineon Technologies 27,941 349,234 0.04Intel 128,753 3,978,468 0.46KLA-Tencor 3,753 272,618 0.03Lam Research 3,898 263,427 0.03Linear Technology 5,303 249,612 0.03Marvell Technology Group 11,600 166,228 0.02Maxim Integrated Products 5,946 201,034 0.02Microchip Technology 4,123 201,244 0.02Micron Technology 27,100 892,945 0.10NVIDIA 15,419 285,868 0.03QUALCOMM 44,201 3,500,719 0.40Rohm 2,400 137,644 0.02STMicroelectronics 19,016 170,586 0.02Texas Instruments 28,501 1,362,063 0.16Tokyo Electron 5,000 337,989 0.04Xilinx 6,842 323,695 0.04 Shipping (0.01%) SembCorp Marine 23,000 75,643 0.01 Software (2.57%) Activision Blizzard 10,429 232,567 0.03Adobe Systems 12,237 885,469 0.10Akamai Technologies 4,913 299,988 0.03Amadeus IT Holding - Class A 10,572 435,977 0.05ANSYS 2,400 181,968 0.02Autodesk 4,851 273,499 0.03CA 9,074 260,787 0.03Cerner 7,800 402,324 0.05Citrix Systems 4,795 299,927 0.03Dassault Systemes 1,459 187,694 0.02Dun & Bradstreet 974 107,335 0.01Electronic Arts 8,528 305,899 0.04Fidelity National Information Services 7,215 394,949 0.05Fiserv 6,266 377,965 0.04GungHo Online Entertainment 19,800 127,824 0.01Intuit 6,881 554,127 0.06Konami 4,700 103,877 0.01Microsoft 204,165 8,513,681 0.98Navient 10,400 184,184 0.02NetSuite 900 78,192 0.01Nuance Communications 5,139 96,459 0.01Open Text 2,784 133,822 0.02Oracle - US 92,130 3,734,029 0.43Oracle - JP 1,900 83,086 0.01Paychex 8,533 354,632 0.04Red Hat 4,107 226,994 0.03Sage Group 34,707 227,939 0.03salesforce.com 14,228 826,362 0.10SAP 24,097 1,860,772 0.21ServiceNow 2,900 179,684 0.02VMware - Class A 2,700 261,387 0.03Workday - Class A 2,000 179,720 0.02 Telecommunications (4.30%) Alcatel-Lucent 65,717 234,659 0.03Altice 1,333 92,860 0.01AT&T 133,802 4,731,239 0.54BCE 7,966 361,972 0.04Belgacom 2,985 99,046 0.01Bell Aliant 1,277 33,437 0.00Bezeq Israeli Telecommunication 31,983 59,978 0.01BT Group 213,558 1,405,470 0.16CenturyLink 13,993 506,547 0.06Cisco Systems 136,317 3,387,477 0.39Corning 36,634 804,116 0.09Deutsche Telekom - Registered 82,288 1,442,107 0.17Elisa 3,040 92,984 0.01
228

UBS ETF - MSCI World UCITS ETF Semi-Annual Report as of 30 June 2014 Schedule of Investments as at 30 June 2014 (Expressed in USD) (Unaudited)
The accompanying notes form an integral part of these financial statements.
Transferable securities listed on an Official Stock Exchange
Quantity Market
Value USD % of
Net Assets Telecommunications (4.30%) (continued) Eutelsat Communications 5,044 175,240 0.02Frontier Communications 18,146 105,973 0.01Harris 2,900 219,675 0.03HKT Trust and HKT 72,000 84,817 0.01Inmarsat 7,672 98,057 0.01Juniper Networks 11,956 293,400 0.03KDDI 15,000 914,910 0.11Koninklijke KPN 87,525 318,881 0.04Level 3 Communications 4,344 190,745 0.02Millicom International Cellular - SDR - 1,529 139,970 0.02Motorola Solutions 5,816 387,171 0.04NICE Systems 929 37,986 0.00Nippon Telegraph & Telephone 9,200 573,768 0.07Nokia 94,733 717,261 0.08NTT DOCOMO 41,400 707,811 0.08Orange 47,074 742,802 0.09Rogers Communications - Class B 9,449 380,923 0.04SBA Communications - Class A 3,219 329,304 0.04SES 8,270 313,644 0.04Singapore Telecommunications 170,000 525,007 0.06Singapore Telecommunications 10 4,000 12,353 0.00SoftBank 24,900 1,854,012 0.21Sprint 29,378 250,594 0.03StarHub 33,000 110,384 0.01Swisscom - Registered 568 330,180 0.04T-Mobile US 5,822 195,736 0.02TDC 21,055 217,889 0.03Tele2 - Class B 6,338 74,611 0.01Telecom Italia 279,560 354,053 0.04Telecom Italia - Rsp 126,452 124,915 0.01Telecom of New Zealand 44,730 104,958 0.01Telefonaktiebolaget LM Ericsson - Class B 75,713 914,511 0.11Telefonica 106,942 1,833,174 0.21Telefonica Deutschland Holding 7,923 65,510 0.01Telekom Austria 7,199 70,375 0.01Telenet Group Holding 1,664 94,821 0.01Telenor 21,976 500,309 0.06TeliaSonera 61,876 451,759 0.05Telstra 104,086 511,839 0.06TELUS 5,862 218,872 0.03Verizon Communications 76,516 3,743,928 0.43Verizon Communications 30,329 1,486,121 0.17Vivendi 30,071 735,739 0.08Vodafone Group 702,585 2,342,563 0.27Windstream Holdings 11,618 115,715 0.01Ziggo 4,179 193,221 0.02 Textile (0.04%) Mohawk Industries 1,300 179,842 0.02Toray Industries 32,000 210,375 0.02 Toys, Games & Hobbies (0.11%) Bandai Namco Holdings 3,700 86,633 0.01Hasbro 3,203 169,919 0.02Mattel 9,065 353,263 0.04Nintendo 2,800 335,127 0.04Sanrio 1,300 37,766 0.00 Transportation (1.91%) AP Moeller - Maersk - Class A 90 211,728 0.02AP Moeller - Maersk - Class B 189 469,619 0.05Asciano 24,991 132,799 0.02Aurizon Holdings 63,756 299,677 0.03Canadian National Railway 20,984 1,367,215 0.16Canadian Pacific Railway 4,359 791,098 0.09Central Japan Railway 3,800 542,027 0.06CH Robinson Worldwide 3,533 225,370 0.03ComfortDelGro 76,000 152,408 0.02CSX 27,723 854,146 0.10Deutsche Post - Registered 26,693 965,199 0.11
229

UBS ETF - MSCI World UCITS ETF Semi-Annual Report as of 30 June 2014 Schedule of Investments as at 30 June 2014 (Expressed in USD) (Unaudited)
The accompanying notes form an integral part of these financial statements.
Transferable securities listed on an Official Stock Exchange
Quantity Market
Value USD % of
Net Assets Transportation (1.91%) (continued) DSV 3,869 126,120 0.01East Japan Railway 9,400 740,364 0.09Expeditors International of Washington 5,182 228,837 0.03FedEx 7,841 1,186,971 0.14Groupe Eurotunnel - Registered 15,443 208,837 0.02Hankyu Hanshin Holdings 33,000 188,283 0.02Hutchison Port Holdings Trust - Class U 41,000 29,520 0.00JB Hunt Transport Services 2,969 219,053 0.03Kamigumi 8,000 73,599 0.01Kansas City Southern 2,883 309,951 0.04Keikyu 16,000 143,724 0.02Keio 13,000 102,147 0.01Keisei Electric Railway 4,000 39,840 0.00Kintetsu 36,000 131,129 0.01Koninklijke Vopak 2,193 107,191 0.01Kuehne + Nagel International - Registered 1,404 186,820 0.02Mitsui OSK Lines 36,000 133,972 0.02MTR 38,489 148,238 0.02Nippon Express 8,000 38,774 0.00Nippon Yusen 41,000 118,178 0.01Norfolk Southern 8,007 824,961 0.09Odakyu Electric Railway 15,000 144,366 0.02Royal Mail 21,175 180,668 0.02TNT Express 11,871 107,434 0.01Tobu Railway 18,000 94,171 0.01Tokyu 20,000 141,750 0.02Toll Holdings 17,907 86,198 0.01Union Pacific 23,314 2,325,571 0.27United Parcel Service - Class B 17,674 1,814,413 0.21West Japan Railway 5,600 246,543 0.03Yamato Holdings 8,400 174,045 0.02 Water (0.12%) American Water Works 5,236 258,920 0.03Severn Trent 5,387 177,956 0.02Suez Environnement 7,132 136,511 0.02United Utilities Group 16,232 244,793 0.03Veolia Environnement 10,336 196,919 0.02
_______________________________________________________________________________________________________________ ____________________________________________________________
Total Common Stocks 866,047,567 99.61 _______________________________________________________________________________________________________________ ____________________________________________________________
Preferred Stocks Auto Manufacturers (0.19%) Bayerische Motoren Werke 1,026 98,346 0.01Porsche Automobil Holding 4,061 423,070 0.05Volkswagen 4,357 1,144,161 0.13 Household Products (0.06%) Henkel & Co 4,494 519,494 0.06 Oil & Gas (0.01%) Fuchs Petrolub 1,646 74,415 0.01
_______________________________________________________________________________________________________________ ____________________________________________________________
Total Preferred Stocks 2,259,486 0.26 _______________________________________________________________________________________________________________ ____________________________________________________________
Rights Oil & Gas (0.00%) Repsol - Rights 22,839 15,541 0.00
_______________________________________________________________________________________________________________ ____________________________________________________________
Total Rights 15,541 0.00 _______________________________________________________________________________________________________________ ____________________________________________________________
Transferable securities non-listed on an Official Stock Exchange
Common Stocks
Banks (0.00%) Anglo Irish Bank 1,990 0 0.00CaixaBank 503 3,104 0.00
230

UBS ETF - MSCI World UCITS ETF Semi-Annual Report as of 30 June 2014 Schedule of Investments as at 30 June 2014 (Expressed in USD) (Unaudited)
The accompanying notes form an integral part of these financial statements.
Transferable securities non-listed on an Official Stock Exchange
Quantity Market
Value USD % of
Net Assets
Total Common Stocks 3,104 0.00 _______________________________________________________________________________________________________________ ____________________________________________________________
Rights
Telecommunications (0.00%) HKT Trust and HKT- Rights 12,960 3,829 0.00
_______________________________________________________________________________________________________________ ____________________________________________________________
Total Rights 3,829 0.00 _______________________________________________________________________________________________________________ ____________________________________________________________
TOTAL INVESTMENTS (Cost USD 684,666,939) 868,329,527 99.87Other net assets 1,119,678 0.13
_______________________________________________________________________________________________________________ ____________________________________________________________
TOTAL NET ASSETS 869,449,205 100.00 _______________________________________________________________________________________________________________ ____________________________________________________________ _______________________________________________________________________________________________________________ ____________________________________________________________
231

UBS ETF - MSCI Emerging Markets UCITS ETF Semi-Annual Report as of 30 June 2014 Schedule of Investments as at 30 June 2014 (Expressed in USD) (Unaudited)
The accompanying notes form an integral part of these financial statements.
Transferable securities listed on an Official Stock Exchange
Quantity Market
Value USD % of
Net AssetsCommon Stocks Advertising (0.06%) Cheil Worldwide 9,190 207,088 0.06 Aerospace & Defense (0.25%) AviChina Industry & Technology - Class H 264,000 149,196 0.04Embraer 45,200 414,041 0.12Embraer - ADR 3,702 134,864 0.04Korea Aerospace Industries 2,900 89,424 0.02Samsung Techwin 2,241 117,388 0.03 Agriculture (1.06%) Astra Agro Lestari 35,000 83,182 0.02British American Tobacco Malaysia 8,200 167,371 0.05Chaoda Modern Agriculture Holdings 80,000 103 0.00Charoen Pokphand Indonesia 592,500 188,421 0.05China Agri-Industries Holdings 189,800 72,243 0.02Genting Plantations 28,500 102,959 0.03Gudang Garam 40,300 181,868 0.05IOI 269,700 440,961 0.13ITC 185,952 1,004,966 0.28KT&G 9,737 861,298 0.24Kuala Lumpur Kepong 43,700 329,349 0.09Souza Cruz 32,800 338,849 0.10 Airlines (0.28%) Air China - Class H 106,000 62,093 0.02AirAsia 65,500 46,917 0.01China Airlines 115,308 39,584 0.01Eva Airways 318,100 152,881 0.04Korean Air Lines 2,645 87,313 0.03Latam Airlines Group 33,631 452,527 0.13Turk Hava Yollari 49,103 150,299 0.04 Apparel (0.20%) Eclat Textile 10,000 121,241 0.03Far Eastern New Century 280,865 302,425 0.08Pou Chen 168,000 202,277 0.06Shenzhou International Group Holdings 29,000 98,970 0.03 Auto Manufacturers (2.24%) Brilliance China Automotive Holdings 256,000 480,267 0.14Byd - Class H 62,000 356,384 0.10China Motor 29,000 28,944 0.01Chongqing Changan Automobile - Class B 53,400 105,417 0.03Dongfeng Motor Group - Class H 268,000 479,958 0.13Ford Otomotiv Sanayi 5,791 72,104 0.02Geely Automobile Holdings 340,000 119,762 0.03Great Wall Motor - Class H 94,750 352,087 0.10Guangzhou Automobile Group - Class H 162,000 187,703 0.05Hyundai Motor 13,497 3,061,437 0.86Kia Motors 22,957 1,284,213 0.36Mahindra & Mahindra 27,700 528,347 0.15Tata Motors 71,354 511,680 0.14Tofas Turk Otomobil Fabrikasi 13,431 83,298 0.02UMW Holdings 45,500 154,737 0.04Yulon Motor 127,000 206,718 0.06 Auto Parts & Equipment (0.83%) Cheng Shin Rubber Industry 133,423 341,400 0.10Halla Visteon Climate Control 2,660 120,407 0.03Hankook Tire 7,424 443,180 0.13Hyundai Mobis 5,828 1,635,849 0.46Hyundai Wia 998 193,327 0.05Weichai Power - Class H 55,000 212,539 0.06 Banks (14.33%) Abu Dhabi Commercial Bank 111,641 214,601 0.06African Bank Investments 132,482 84,554 0.02Agricultural Bank of China - Class H 1,685,000 743,541 0.21Akbank 152,832 561,506 0.16
232

UBS ETF - MSCI Emerging Markets UCITS ETF Semi-Annual Report as of 30 June 2014 Schedule of Investments as at 30 June 2014 (Expressed in USD) (Unaudited)
The accompanying notes form an integral part of these financial statements.
Transferable securities listed on an Official Stock Exchange
Quantity Market
Value USD % of
Net Assets Banks (14.33%) (continued) Alliance Financial Group 119,600 175,806 0.05Alpha Bank 372,250 346,573 0.10AMMB Holdings 163,100 361,654 0.10Banco Bradesco 54,390 795,578 0.22Banco Bradesco - ADR 35,210 511,249 0.14Banco de Chile 1,822,983 242,101 0.07Banco de Credito e Inversiones 3,847 222,272 0.06Banco do Brasil 79,800 899,701 0.25Banco Santander Brasil 75,500 517,926 0.15Banco Santander Brasil - ADR 13,521 93,565 0.03Banco Santander Chile 6,624,336 436,103 0.12Bangkok Bank - NVDR 82,700 491,792 0.14Bangkok Bank - Registered 12,400 73,930 0.02Bank Central Asia 1,091,700 1,012,965 0.28Bank Danamon Indonesia 209,903 73,391 0.02Bank Handlowy w Warszawie 3,529 139,163 0.04Bank Mandiri Persero 836,292 686,035 0.19Bank Millennium 13,529 34,617 0.01Bank Negara Indonesia Persero 872,615 350,739 0.10Bank of China - Class H 6,769,000 3,030,628 0.85Bank of Communications - Class H 797,299 550,369 0.15Bank of the Philippine Islands 68,273 142,333 0.04Bank Pekao 11,435 654,650 0.18Bank Rakyat Indonesia Persero 998,500 869,634 0.24Bank Zachodni WBK 2,435 295,885 0.08Barclays Africa Group 26,691 405,179 0.11BDO Unibank 153,428 328,649 0.09Chang Hwa Commercial Bank 324,051 200,782 0.06China CITIC Bank - Class H 680,600 412,732 0.12China Construction Bank - Class H 6,342,000 4,795,154 1.34China Everbright Bank - Class H 269,000 123,908 0.04China Merchants Bank - Class H 408,159 804,695 0.23China Minsheng Banking - Class H 513,000 464,658 0.13Chongqing Rural Commercial Bank - Class H 112,000 51,734 0.01CIMB Group Holdings 441,650 1,006,813 0.28Commercial Bank of Qatar 6,650 113,068 0.03Commercial International Bank Egypt 89,026 443,259 0.12Compartamos 68,400 131,812 0.04Corpbanca 19,406,204 239,392 0.07Corporacion Financiera Colombiana 9,413 191,991 0.05Credicorp 5,600 870,632 0.24Dubai Islamic Bank 58,746 103,167 0.03Eurobank Ergasias 696,957 352,114 0.10First Gulf Bank 36,124 156,385 0.04FirstRand 245,846 941,673 0.26Getin Noble Bank 117,323 121,314 0.03Grupo Financiero Banorte - Class O 224,800 1,607,893 0.45Grupo Financiero Inbursa - Class O 196,900 584,037 0.16Grupo Financiero Santander Mexico - Class B 148,200 393,433 0.11HDFC Bank 39,813 543,825 0.15Hong Leong Bank 54,080 232,421 0.07ICICI Bank 19,909 469,431 0.13Industrial & Commercial Bank of China - Class H 6,440,227 4,071,702 1.14Industrial Bank of Korea 8,190 109,276 0.03Kasikornbank 123,400 779,448 0.22Kasikornbank - NVDR 44,100 277,196 0.08Komercni Banka 1,365 313,864 0.09Kotak Mahindra Bank 27,892 409,743 0.12Krung Thai Bank 257,250 165,661 0.05Malayan Banking 401,954 1,230,522 0.35Masraf Al Rayan 34,436 430,379 0.12mBank 1,417 235,646 0.07Metropolitan Bank & Trust 42,984 86,066 0.02National Bank of Abu Dhabi 47,132 182,225 0.05National Bank of Greece 139,613 510,374 0.14Nedbank Group 13,175 283,803 0.08OTP Bank 22,926 440,955 0.12Piraeus Bank 141,996 314,950 0.09Powszechna Kasa Oszczednosci Bank Polski 79,865 991,507 0.28Public Bank 223,900 1,365,295 0.38
233

UBS ETF - MSCI Emerging Markets UCITS ETF Semi-Annual Report as of 30 June 2014 Schedule of Investments as at 30 June 2014 (Expressed in USD) (Unaudited)
The accompanying notes form an integral part of these financial statements.
Transferable securities listed on an Official Stock Exchange
Quantity Market
Value USD % of
Net Assets Banks (14.33%) (continued) Qatar Islamic Bank 3,524 79,470 0.02Qatar National Bank 5,243 235,176 0.07RHB Capital 51,786 137,892 0.04Sberbank of Russia 941,909 2,337,319 0.66Siam Commercial Bank 133,200 679,236 0.19Standard Bank Group 102,759 1,400,546 0.39State Bank of India 13,110 585,531 0.16Taiwan Business Bank 225,366 70,271 0.02Turkiye Garanti Bankasi 206,264 806,456 0.23Turkiye Halk Bankasi 50,306 377,242 0.11Turkiye Is Bankasi - Class C 166,396 449,676 0.13Turkiye Vakiflar Bankasi Tao - Class D 66,385 155,607 0.04VTB Bank 461,087,554 556,533 0.16Yapi ve Kredi Bankasi 95,910 208,982 0.06Yes Bank 19,166 172,413 0.05 Beverages (1.81%) AMBEV 414 2,898 0.00AMBEV 327,255 2,339,975 0.66AMBEV - ADR 78,840 555,034 0.16Anadolu Efes Biracilik Ve Malt Sanayii 18,273 223,640 0.06Arca Continental 40,916 277,263 0.08Coca-Cola Femsa - Class L 35,700 405,020 0.11Coca-Cola Icecek 5,667 139,784 0.04Companhia Cervecerias Unidas 16,117 188,836 0.05Fomento Economico Mexicano 175,200 1,642,070 0.46Tsingtao Brewery - Class H 32,000 250,208 0.07United Breweries 7,207 83,693 0.02United Spirits 7,432 296,075 0.08Vina Concha y Toro 36,886 74,615 0.02 Building Materials (1.47%) ACC 5,828 142,369 0.04Ambuja Cements 43,807 160,675 0.04Anhui Conch Cement - Class H 111,000 380,963 0.11Asia Cement 201,626 276,191 0.08BBMG - Class H 86,500 55,804 0.02Cementos Argos 45,244 284,498 0.08Cemex 985,359 1,304,900 0.37Cemex Latam Holdings 18,935 185,346 0.05China National Building Material - Class H 254,000 223,838 0.06China Resources Cement Holdings 118,000 73,994 0.02Duratex 28,241 115,573 0.03Grupo Argos 25,964 312,162 0.09Indocement Tunggal Prakarsa 141,000 268,203 0.07Lafarge Malaysia 24,900 76,383 0.02PPC 28,688 84,537 0.02Semen Indonesia Persero 320,200 407,171 0.11Taiwan Cement 348,000 526,814 0.15Taiwan Glass Industry 67,820 57,240 0.02Titan Cement 5,045 163,566 0.05Ultratech Cement 3,046 131,267 0.04 Chemicals (3.12%) Asian Paints 19,201 189,632 0.05Braskem - ADR 5,300 68,105 0.02China BlueChemical - Class H 88,000 48,029 0.01Formosa Chemicals & Fibre 295,400 747,948 0.21Formosa Plastics 356,600 953,067 0.27Grupa Azoty 3,868 92,334 0.03Hanwha Chemical 8,550 155,063 0.04Indorama Ventures 72,167 61,705 0.02Industries Qatar 4,639 215,347 0.06IRPC 487,500 50,770 0.01KCC 307 187,210 0.05Kingboard Chemical Holdings 51,000 105,154 0.03LG Chem 3,926 1,148,543 0.32Lotte Chemical 1,434 261,487 0.07Mexichem 77,689 321,463 0.09Nan Ya Plastics 438,820 1,056,707 0.30
234

UBS ETF - MSCI Emerging Markets UCITS ETF Semi-Annual Report as of 30 June 2014 Schedule of Investments as at 30 June 2014 (Expressed in USD) (Unaudited)
The accompanying notes form an integral part of these financial statements.
Transferable securities listed on an Official Stock Exchange
Quantity Market
Value USD % of
Net Assets Chemicals (3.12%) (continued) OCI 1,669 283,720 0.08Petronas Chemicals Group 217,400 458,361 0.13PTT Global Chemical 131,382 273,249 0.08Sasol 48,002 2,853,206 0.80Sinopec Shanghai Petrochemical - Class H 177,000 49,329 0.01Synthos 36,340 52,894 0.02Taiwan Fertilizer 56,000 111,032 0.03TSRC 36,960 52,238 0.02Ultrapar Participacoes 31,200 744,576 0.21Uralkali - GDR - Registered 22,098 509,359 0.14Yingde Gases Group 69,000 74,873 0.02 Coal (0.60%) Adaro Energy 1,392,000 137,967 0.04Banpu - Class A - Registered 90,000 81,806 0.02China Coal Energy - Class H 405,000 210,590 0.06China Shenhua Energy - Class H 263,000 760,120 0.21Coal India 41,693 266,850 0.08Exxaro Resources 12,293 160,036 0.04Indo Tambangraya Megah 54,500 124,125 0.03Inner Mongolia Yitai Coal - Class B 105,200 134,656 0.04Jastrzebska Spolka Weglowa 2,943 45,550 0.01Tambang Batubara Bukit Asam Persero 117,500 106,300 0.03Yanzhou Coal Mining - Class H 174,000 131,561 0.04 Commercial Services (1.32%) Adani Ports and Special Economic Zone 26,733 108,319 0.03Anhanguera Educacional Participacoes 35,700 298,026 0.08Cielo 60,312 1,245,041 0.35Companhia de Concessoes Rodoviarias 75,700 618,212 0.17DP World 12,395 244,181 0.07EcoRodovias Infraestrutura e Logistica 15,400 105,783 0.03Estacio Participacoes 26,100 346,366 0.10International Container Terminal Services 59,050 150,162 0.04Jasa Marga Persero 115,000 57,961 0.02Jiangsu Expressway - Class H 84,000 99,386 0.03Kroton Educacional 19,700 553,792 0.15Localiza Rent a Car 13,120 216,911 0.06OHL Mexico 82,400 252,859 0.07Qualicorp 18,500 219,069 0.06S-1 1,340 107,804 0.03Zhejiang Expressway - Class H 98,000 99,260 0.03 Computers (2.45%) Acer 277,000 198,069 0.06Advantech 12,100 103,339 0.03Asustek Computer 60,180 671,175 0.19Chicony Electronics 49,774 134,362 0.04Citic 21CN 156,000 121,171 0.03Clevo 29,530 52,517 0.02Compal Electronics 367,000 299,913 0.08Foxconn Technology 93,867 227,610 0.06Infosys 39,145 2,118,854 0.59Innolux 415,598 194,868 0.06Inventec 245,630 235,281 0.07Lenovo Group 548,000 748,075 0.21Lite-On Technology 201,002 335,587 0.09Quanta Computer 245,000 713,879 0.20SK C&C 1,826 300,483 0.08Tata Consultancy Services 39,304 1,584,968 0.44Wipro 56,448 512,814 0.14Wistron 217,289 198,310 0.06 Cosmetics & Personal Care (0.43%) Amorepacific 314 472,955 0.13Amorepacific Group 376 277,596 0.08Dabur India 30,839 96,140 0.03LG Household & Health Care 842 379,058 0.11Natura Cosmeticos 17,300 292,376 0.08
235

UBS ETF - MSCI Emerging Markets UCITS ETF Semi-Annual Report as of 30 June 2014 Schedule of Investments as at 30 June 2014 (Expressed in USD) (Unaudited)
The accompanying notes form an integral part of these financial statements.
Transferable securities listed on an Official Stock Exchange
Quantity Market
Value USD % of
Net Assets Distribution & Wholesale (0.34%) Adani Enterprises 11,238 85,025 0.02Daewoo International 3,180 115,031 0.03Hanwha 2,933 74,934 0.02Samsung C&T 11,690 861,903 0.24SK Networks 8,410 89,353 0.03 Diversified Financial Services (4.48%) Alior Bank 4,698 128,407 0.04BM&FBovespa 168,800 887,615 0.25BS Financial Group 9,080 133,714 0.04CETIP - Mercados Organizados 21,860 311,917 0.09China Cinda Asset Management - Class H 339,000 168,399 0.05China Development Financial Holding 1,058,768 348,218 0.10China Everbright 112,000 150,579 0.04CITIC Securities - Class H 99,000 218,429 0.06Coronation Fund Managers 12,514 112,345 0.03COSCO Pacific 179,261 248,410 0.07CTBC Financial Holding 1,003,031 668,508 0.19Daewoo Securities 26,080 224,765 0.06DGB Financial Group 6,910 103,466 0.03Dubai Financial Market 185,269 131,658 0.04E.Sun Financial Holding 494,992 317,473 0.09Far East Horizon 108,000 78,871 0.02First Financial Holding 636,566 409,340 0.11Fubon Financial Holding 620,078 896,120 0.25Haitong Securities - Class H 153,600 238,218 0.07Hana Financial Group 24,435 905,626 0.25Hong Leong Financial Group 4,800 24,127 0.01Housing Development Finance 125,423 2,069,808 0.58Hua Nan Financial Holdings 376,694 235,923 0.07Investec 18,081 165,671 0.05KB Financial Group 33,830 1,176,928 0.33Korea Investment Holdings 2,790 110,850 0.03LIC Housing Finance 22,354 121,666 0.03Mahindra & Mahindra Financial Services 20,553 96,383 0.03Mega Financial Holding 802,234 667,677 0.19Mirae Asset Securities 1,828 81,030 0.02Moscow Exchange MICEX-RTS 98,934 195,966 0.05Power Finance 35,765 182,616 0.05RMB Holdings 65,320 322,893 0.09Rural Electrification 34,098 203,698 0.06Samsung Card 2,748 117,193 0.03Samsung Securities 6,762 296,063 0.08Shinhan Financial Group 36,336 1,682,488 0.47Shriram Transport Finance 8,288 124,716 0.03SinoPac Financial Holdings 418,111 188,345 0.05Taishin Financial Holding 648,695 332,408 0.09Taiwan Cooperative Financial Holding 347,411 198,966 0.06Woori Finance Holdings 25,330 301,667 0.08Woori Investment & Securities 15,557 134,229 0.04Yuanta Financial Holding 527,584 285,367 0.08 Electric (2.30%) Aboitiz Power 132,100 110,916 0.03AES Gener 222,397 115,101 0.03Centrais Eletricas Brasileiras 24,900 72,189 0.02Centrais Eletricas Brasileiras - ADR 16,235 47,406 0.01CEZ 14,000 422,466 0.12China Resources Power Holdings 164,000 465,527 0.13Colbun 884,026 221,777 0.06Companhia Energetica de Minas Gerais - ADR 21,981 175,628 0.05Companhia Paranaense de Energia - ADR 4,450 68,130 0.02CPFL Energia 26,700 246,273 0.07Datang International Power Generation - Class H 110,000 43,005 0.01EDP - Energias do Brasil 15,300 75,316 0.02Empresa Nacional de Electricidad 277,953 416,425 0.12Enea 23,071 120,039 0.03Energa 28,463 193,834 0.05Energy Development 516,600 74,561 0.02Enersis 1,707,402 574,818 0.16
236

UBS ETF - MSCI Emerging Markets UCITS ETF Semi-Annual Report as of 30 June 2014 Schedule of Investments as at 30 June 2014 (Expressed in USD) (Unaudited)
The accompanying notes form an integral part of these financial statements.
Transferable securities listed on an Official Stock Exchange
Quantity Market
Value USD % of
Net Assets Electric (2.30%) (continued) Glow Energy 39,800 102,091 0.03Huaneng Power International - Class H 250,000 282,245 0.08Interconexion Electrica 40,101 195,625 0.06Isagen 95,279 157,130 0.04Korea Electric Power 24,124 889,331 0.25NTPC 153,198 397,864 0.11Polska Grupa Energetyczna 64,205 457,746 0.13Power Grid Corporation of India 73,066 169,104 0.05Public Power 8,798 135,997 0.04Qatar Electricity & Water 2,624 124,619 0.04Reliance Infrastructure 15,516 199,545 0.06Reliance Power 72,154 129,984 0.04RusHydro - ADR 86,689 162,108 0.05Tata Power 69,362 124,320 0.04Tauron Polska Energia 70,272 119,639 0.03Tenaga Nasional 219,550 832,799 0.23Tractebel Energia 15,400 230,570 0.06YTL Power International 95,130 43,551 0.01 Electrical Components & Equipment (0.71%) Bharat Heavy Electricals 49,618 206,491 0.06Delta Electronics 144,000 1,048,965 0.29Hermes Microvision 3,000 119,064 0.03LG Electronics 9,768 717,298 0.20LG Innotek 958 137,290 0.04LS Industrial Systems 1,025 66,760 0.02Siemens 4,854 77,150 0.02Walsin Lihwa 192,000 68,484 0.02Zhuzhou CSR Times Electric - Class H 34,000 103,311 0.03 Electronics (1.77%) AAC Technologies Holdings 69,000 449,148 0.13AU Optronics 514,000 217,768 0.06Hon Hai Precision Industry 959,421 3,213,280 0.90Kinsus Interconnect Technology 43,000 192,980 0.05LG Display 19,560 614,754 0.17Pegatron 122,000 232,902 0.07Phison Electronics 8,000 64,438 0.02Radiant Opto-Electronics 29,705 127,344 0.04Samsung Electro-Mechanics 5,313 306,136 0.09Simplo Technology 16,170 100,189 0.03Synnex Technology International 113,000 190,364 0.05TPK Holding 21,034 209,931 0.06Unimicron Technology 84,000 81,305 0.02WPG Holdings 166,700 229,465 0.06Zhen Ding Technology Holding 22,050 72,594 0.02 Energy - Alternate Sources (0.14%) China Longyuan Power Group - Class H 257,000 278,874 0.08GCL-Poly Energy Holdings 668,000 223,231 0.06 Engineering & Construction (1.41%) Airports of Thailand 38,700 236,695 0.07Arabtec Holding 116,886 83,063 0.02Beijing Capital International Airport - Class H 106,000 72,897 0.02China Communications Construction - Class H 371,000 248,918 0.07China Railway Construction - Class H 218,000 191,831 0.05China Railway Group - Class H 273,000 133,500 0.04China State Construction International Holdings 126,000 221,100 0.06CTCI 84,000 145,448 0.04Daelim Industrial 2,099 174,882 0.05Daewoo Engineering & Construction 7,650 66,308 0.02DMCI Holdings 112,320 190,417 0.05Enka Insaat ve Sanayi 40,550 109,967 0.03Gamuda 118,300 173,526 0.05Grupo Aeroportuario del Pacifico - Class B 36,800 248,491 0.07Grupo Aeroportuario del Sureste - Class B 19,000 241,583 0.07GS Engineering & Construction 3,500 116,574 0.03Hyundai Engineering & Construction 5,997 341,399 0.10Jaiprakash Associates 70,370 90,324 0.02
237

UBS ETF - MSCI Emerging Markets UCITS ETF Semi-Annual Report as of 30 June 2014 Schedule of Investments as at 30 June 2014 (Expressed in USD) (Unaudited)
The accompanying notes form an integral part of these financial statements.
Transferable securities listed on an Official Stock Exchange
Quantity Market
Value USD % of
Net Assets Engineering & Construction (1.41%) (continued) Larsen & Toubro 27,929 790,203 0.22Malaysia Airports Holdings 84,834 210,830 0.06Multiplan Empreendimentos Imobiliarios 7,200 167,579 0.05Promotora y Operadora de Infraestructura 24,300 324,687 0.09Samsung Engineering 3,322 262,989 0.07TAV Havalimanlari Holding 25,864 205,541 0.06 Entertainment (0.14%) Berjaya Sports Toto 54,391 65,723 0.02OPAP 16,719 297,581 0.08Paradise 3,334 123,237 0.04 Environmental Control (0.19%) China Everbright International 222,000 317,374 0.09Coway 4,456 373,022 0.10 Food (3.11%) Bidvest Group 27,940 742,125 0.21BIM Birlesik Magazalar 19,406 444,810 0.12BRF 38,400 930,339 0.26BRF - ADR 16,986 412,930 0.12Cencosud 122,099 400,476 0.11Charoen Pokphand Foods 153,500 128,882 0.04China Mengniu Dairy 117,000 541,195 0.15CJ CheilJedang 761 259,107 0.07Cosan Industria e Comercio 14,400 261,985 0.07Eurocash 8,863 117,358 0.03Felda Global Ventures Holdings 85,600 110,899 0.03Gruma - Class B 11,300 135,229 0.04Grupo Bimbo - Class A 144,500 424,043 0.12Grupo Lala 47,100 123,986 0.03Indofood CBP Sukses Makmur 79,500 67,060 0.02Indofood Sukses Makmur 419,600 237,142 0.07JBS 64,400 222,059 0.06JG Summit Holdings 191,000 224,255 0.06Lotte Confectionery 55 105,021 0.03M Dias Branco 2,200 97,538 0.03Magnit - GDR - Registered 20,050 1,182,950 0.33Nestle India 1,053 86,309 0.02Orion 358 327,996 0.09PPB Group 37,300 175,871 0.05Shoprite Holdings 36,378 526,586 0.15SPAR Group 18,156 212,317 0.06Standard Foods 24,242 67,389 0.02Tiger Brands 11,386 328,178 0.09Tingyi Cayman Islands Holding 140,000 391,982 0.11Ulker Biskuvi Sanayi 11,302 94,614 0.03Uni-President China Holdings 122,400 93,809 0.03Uni-President Enterprises 354,378 636,167 0.18Universal Robina 67,380 238,184 0.07Want Want China Holdings 520,000 747,424 0.21 Forest Products & Paper (0.32%) Empresas CMPC 136,897 297,966 0.08Fibria Celulose 26,100 253,765 0.07Klabin 46,400 233,674 0.07Lee & Man Paper Manufacturing 109,000 57,943 0.02Nine Dragons Paper Holdings 119,000 80,916 0.02Sappi 57,203 205,772 0.06 Gas (0.75%) Beijing Enterprises Holdings 47,500 449,544 0.13China Gas Holdings 160,000 331,959 0.09China Resources Gas Group 72,000 226,674 0.06ENN Energy Holdings 68,000 488,701 0.14GAIL India 32,924 253,478 0.07Korea Gas 2,138 116,641 0.03Perusahaan Gas Negara Persero 899,100 422,816 0.12Petronas Gas 48,500 370,056 0.11
238

UBS ETF - MSCI Emerging Markets UCITS ETF Semi-Annual Report as of 30 June 2014 Schedule of Investments as at 30 June 2014 (Expressed in USD) (Unaudited)
The accompanying notes form an integral part of these financial statements.
Transferable securities listed on an Official Stock Exchange
Quantity Market
Value USD % of
Net Assets Healthcare Products (0.45%) Aspen Pharmacare Holdings 29,213 820,724 0.23Hengan International Group 64,000 673,828 0.19Shandong Weigao Group Medical Polymer - Class H 124,000 121,114 0.03 Healthcare Services (0.42%) Apollo Hospitals Enterprise 7,219 119,432 0.03Bangkok Dusit Medical Services 310,000 159,513 0.04Bumrungrad Hospital 65,300 235,406 0.07IHH Healthcare 209,900 286,316 0.08Life Healthcare Group Holdings 91,768 357,886 0.10Mediclinic International 22,329 171,454 0.05Netcare 66,495 179,383 0.05 Holding Companies - Diversified Operations (1.77%) Aboitiz Equity Ventures 88,600 113,668 0.03Aditya Birla Nuvo 3,342 76,697 0.02Alfa - Class A 241,500 668,486 0.19Alliance Global Group 287,200 191,467 0.05Ayala 14,120 209,455 0.06Barloworld 13,482 128,309 0.04China Merchants Holdings International 83,379 260,346 0.07CJ 1,963 271,615 0.08Empresas COPEC 43,915 571,084 0.16Grupo Carso - Class A1 47,700 248,115 0.07Haci Omer Sabanci Holding 71,356 332,835 0.09IJM 76,900 160,458 0.05Imperial Holdings 14,955 281,142 0.08KOC Holding 60,206 295,308 0.08LS 1,981 145,472 0.04MMC 90,300 71,430 0.02Remgro 36,806 795,712 0.22Siam Cement - Registered 37,600 528,288 0.15Sime Darby 287,232 865,006 0.24YTL 234,133 118,124 0.03 Home Builders (0.04%) Hyundai Development Co-Engineering & Construction 4,700 149,343 0.04 Home Furnishings (0.47%) Arcelik 16,058 97,698 0.03Haier Electronics Group 97,000 253,440 0.07LG 7,639 471,869 0.13Steinhoff International Holdings 152,727 850,577 0.24 Household Products (0.42%) Biostime International Holdings 13,000 72,126 0.02Godrej Consumer Products 5,888 80,706 0.02Hindustan Unilever 64,734 667,682 0.19Kimberly-Clark de Mexico - Class A 130,700 365,815 0.10Turkiye Sise ve Cam Fabrikalari 24,401 34,294 0.01Unilever Indonesia 114,100 281,761 0.08 Insurance (3.33%) BB Seguridade Participacoes 63,500 934,595 0.26Cathay Financial Holding 693,475 1,083,482 0.30China Life Insurance 220,869 203,796 0.06China Life Insurance - Class H 668,000 1,749,650 0.49China Pacific Insurance Group - Class H 247,800 874,455 0.24China Taiping Insurance Holdings 110,000 196,998 0.06Discovery 21,583 197,090 0.05Dongbu Insurance 4,604 236,616 0.07Hanwha Life Insurance 21,650 138,228 0.04Hyundai Marine & Fire Insurance 4,460 127,170 0.04Liberty Holdings 9,347 114,215 0.03MMI Holdings 106,181 261,990 0.07New China Life Insurance - Class H 72,200 239,414 0.07Odontoprev 17,500 75,428 0.02People's Insurance Group of China - Class H 524,000 206,886 0.06PICC Property & Casualty - Class H 277,056 419,676 0.12Ping An Insurance Group of China - Class H 185,500 1,436,064 0.40
239

UBS ETF - MSCI Emerging Markets UCITS ETF Semi-Annual Report as of 30 June 2014 Schedule of Investments as at 30 June 2014 (Expressed in USD) (Unaudited)
The accompanying notes form an integral part of these financial statements.
Transferable securities listed on an Official Stock Exchange
Quantity Market
Value USD % of
Net Assets Insurance (3.33%) (continued) Porto Seguro 7,900 114,194 0.03Powszechny Zaklad Ubezpieczen 4,704 687,391 0.19Reliance Capital 12,884 140,633 0.04Samsung Fire & Marine Insurance 2,784 708,519 0.20Samsung Life Insurance 5,191 523,307 0.15Sanlam 155,471 902,393 0.25Shin Kong Financial Holding 766,392 236,401 0.07Sul America 9,810 69,655 0.02 Internet (2.56%) B2W Cia Digital 8,300 105,440 0.03NAVER 2,407 1,986,406 0.56NCSoft 1,287 232,138 0.06Tencent Holdings 447,200 6,820,213 1.91 Iron & Steel (1.79%) CAP 8,576 121,561 0.03China Steel 962,563 809,175 0.23CITIC Pacific 143,000 250,562 0.07Companhia Siderurgica Nacional 30,000 127,943 0.04Companhia Siderurgica Nacional - ADR 32,799 139,724 0.04Eregli Demir ve Celik Fabrikalari 124,807 223,090 0.06Hyundai Steel 6,179 454,356 0.13Jindal Steel & Power 36,780 197,246 0.06JSW Steel 6,057 124,554 0.03Kumba Iron Ore 6,908 220,121 0.06POSCO 5,901 1,772,983 0.50Severstal 18,458 151,231 0.04Severstal - GDR - Registered 5,775 46,922 0.01Tata Steel 29,196 256,500 0.07Vale 103,700 1,375,703 0.39Vale - ADR 7,993 105,747 0.03 Leisure Time (0.27%) Bajaj Auto 7,781 299,648 0.08Giant Manufacturing 34,000 264,753 0.08Hero MotoCorp 7,416 324,858 0.09Merida Industry 12,000 79,577 0.02 Lodging (0.40%) Formosa International Hotels 3,751 45,603 0.01Genting 155,100 482,544 0.14Genting Malaysia 278,300 364,017 0.10Hotel Shilla 2,764 249,683 0.07Kangwon Land 9,240 271,228 0.08 Machinery - Construction & Mining (0.12%) Doosan Infracore 6,350 81,273 0.02United Tractors 126,112 245,735 0.07Zoomlion Heavy Industry Science and Technology - Class H 154,240 95,525 0.03 Machinery - Diversified (0.30%) CSR - Class H 223,000 167,746 0.05Doosan Heavy Industries & Construction 6,990 242,142 0.07Haitian International Holdings 40,000 93,415 0.03Shanghai Electric Group - Class H 136,000 54,749 0.01Teco Electric and Machinery 157,000 180,620 0.05WEG 24,570 315,360 0.09 Media (1.75%) Astro Malaysia Holdings 91,300 99,802 0.03BEC World 104,300 156,667 0.04Cyfrowy Polsat 9,262 68,168 0.02Global Mediacom 391,000 70,086 0.02Grupo Televisa - Class CPO 231,800 1,590,420 0.44Media Nusantara Citra 299,500 69,728 0.02Naspers - Class N 34,775 4,092,426 1.15Surya Citra Media 350,200 105,902 0.03
240

UBS ETF - MSCI Emerging Markets UCITS ETF Semi-Annual Report as of 30 June 2014 Schedule of Investments as at 30 June 2014 (Expressed in USD) (Unaudited)
The accompanying notes form an integral part of these financial statements.
Transferable securities listed on an Official Stock Exchange
Quantity Market
Value USD % of
Net Assets Metal Fabricate & Hardware (0.19%) Catcher Technology 61,000 568,977 0.16Hyosung 1,507 100,685 0.03 Mining (2.06%) African Rainbow Minerals 11,425 200,852 0.06Alrosa 99,992 122,742 0.04Aluminum Corporation of China - Class H 436,000 156,390 0.04Anglo American Platinum 6,473 280,532 0.08AngloGold Ashanti 33,513 560,243 0.16Assore 4,551 152,571 0.04Companhia de Minas Buenaventura - ADR 20,100 237,381 0.07Gold Fields 72,129 260,346 0.07Grupo Mexico - Class B 325,804 1,085,679 0.30Harmony Gold Mining 33,904 99,270 0.03Hindalco Industries 78,976 215,610 0.06Impala Platinum Holdings 42,803 430,012 0.12Industrias Penoles 11,055 276,447 0.08Jiangxi Copper - Class H 118,000 186,660 0.05KGHM Polska Miedz 13,042 534,487 0.15Korea Zinc 849 333,122 0.09Minera Frisco - Class A1 41,800 82,356 0.02MMC Norilsk Nickel - ADR 44,483 881,208 0.25Northam Platinum 38,038 162,682 0.05Sesa Sterlite 113,127 549,882 0.15Southern Copper 14,490 440,061 0.12Zijin Mining Group - Class H 515,000 116,950 0.03 Miscellaneous Manufacturers (0.43%) Cheil Industries 4,347 307,980 0.09China International Marine Containers Group - Class H 48,700 93,877 0.03Doosan 344 42,499 0.01Fosun International 172,500 229,248 0.06Hiwin Technologies 11,041 136,265 0.04Kumho Petrochemical 891 78,110 0.02Largan Precision 8,000 637,685 0.18 Oil & Gas (8.01%) Bharat Petroleum 21,590 215,523 0.06Cairn India 35,559 215,825 0.06China Petroleum & Chemical - Class H 2,250,200 2,145,578 0.60CNOOC 1,581,000 2,839,552 0.80Ecopetrol 462,987 839,891 0.23Formosa Petrochemical 98,000 255,355 0.07Gazprom - ADR 514,643 4,485,114 1.26Grupa Lotos 3,868 47,129 0.01GS Holdings 4,975 221,756 0.06Kunlun Energy 280,000 461,708 0.13Lukoil - ADR 44,689 2,673,296 0.75MOL Hungarian Oil and Gas 4,134 221,275 0.06NOVATEK - GDR - Registered 7,023 873,661 0.24Oil & Natural Gas 70,571 498,497 0.14PetroChina - Class H 1,846,000 2,331,810 0.65Petroleo Brasileiro 187,300 1,380,043 0.39Petroleo Brasileiro - ADR 38,395 561,719 0.16Petroleo Brasileiro - Sponsored ADR 31,785 497,117 0.14Petronas Dagangan 31,400 235,084 0.07Polski Koncern Naftowy Orlen 29,930 404,100 0.11Polskie Gornictwo Naftowe i Gazownictwo 176,160 304,554 0.08PTT 79,573 779,671 0.22PTT Exploration & Production 123,848 639,179 0.18Reliance Industries 113,339 1,913,449 0.54Rosneft - GDR - Registered 105,109 768,872 0.22S-Oil 3,841 216,004 0.06SK Holdings 1,822 328,637 0.09SK Innovation 4,973 555,395 0.16Surgutneftegas - ADR 74,419 575,259 0.16Tatneft - Class S 123,557 805,078 0.23Thai Oil 43,700 70,017 0.02Tupras Turkiye Petrol Rafinerileri 9,695 225,880 0.06
241

UBS ETF - MSCI Emerging Markets UCITS ETF Semi-Annual Report as of 30 June 2014 Schedule of Investments as at 30 June 2014 (Expressed in USD) (Unaudited)
The accompanying notes form an integral part of these financial statements.
Transferable securities listed on an Official Stock Exchange
Quantity Market
Value USD % of
Net Assets Oil & Gas Services (0.28%) China Oilfield Services - Class H 158,000 379,998 0.11Dialog Group 99,400 117,324 0.03SapuraKencana Petroleum 319,000 435,135 0.12Sinopec Engineering Group - Class H 72,500 81,571 0.02 Other Finance (0.17%) Grupo de Inversiones Suramericana 23,136 491,090 0.14Rand Merchant Insurance Holdings 40,992 126,304 0.03 Packaging & Containers (0.03%) Nampak 31,931 110,421 0.03 Pharmaceuticals & Biotechnology (1.10%) Aurobindo Pharma 11,029 135,852 0.04Celltrion 4,414 203,075 0.06Cipla 25,254 183,910 0.05CSPC Pharmaceutical Group 90,000 71,881 0.02Divi's Laboratories 4,200 101,894 0.03Dr Reddy's Laboratories 9,273 404,569 0.11Genomma Lab Internacional - Class B 78,300 212,393 0.06Hypermarcas 30,900 269,872 0.07Kalbe Farma 1,450,000 203,037 0.06Piramal Enterprises 11,034 127,163 0.04Ranbaxy Laboratories 8,580 73,696 0.02Richter Gedeon Nyrt 8,743 167,852 0.05ScinoPharm Taiwan 45,760 113,412 0.03Shanghai Fosun Pharmaceutical Group - Class H 32,500 121,188 0.03Sihuan Pharmaceutical Holdings Group 450,000 275,213 0.08Sino Biopharmaceutical 272,000 220,398 0.06Sinopharm Group - Class H 86,800 240,229 0.07Sun Pharmaceutical Industries 62,287 712,451 0.20Yuhan 486 86,940 0.02 Real Estate (2.02%) Agile Property Holdings 102,000 71,857 0.02Aldar Properties 270,125 227,997 0.06Ayala Land 525,200 366,978 0.10Barwa Real Estate 8,950 87,273 0.02BR Malls Participacoes 35,400 301,946 0.08BR Properties 21,000 126,814 0.04Bumi Serpong Damai 572,000 71,651 0.02Central Pattana 146,200 220,730 0.06Chailease Holding 64,900 163,239 0.05China Overseas Land & Investment 366,000 887,805 0.25China Resources Land 178,000 325,668 0.09China Vanke - Class H 87,200 154,815 0.04Country Garden Holdings 403,558 160,374 0.05Cyrela Brazil Realty Empreendimentos e Participacoes 20,500 128,538 0.04DLF 47,152 168,593 0.05Emaar Properties 173,650 397,625 0.11Emlak Konut Gayrimenkul Yatirim Ortakligi 124,990 156,805 0.04Evergrande Real Estate Group 563,000 218,652 0.06Farglory Land Development 14,929 20,325 0.01Franshion Properties China 174,000 45,799 0.01Growthpoint Properties 182,836 425,006 0.12Guangzhou R&F Properties - Class H 102,800 126,936 0.04Highwealth Construction 37,600 84,121 0.02IOI Properties Group 89,900 70,554 0.02Lippo Karawaci 1,321,000 106,973 0.03Longfor Properties 127,500 157,106 0.04Megaworld 1,124,000 115,876 0.03New World China Land 190,000 113,504 0.03Poly Property Group 138,000 57,512 0.02Redefine Properties 278,869 251,378 0.07Ruentex Development 85,277 154,514 0.04Shanghai Industrial Holdings 68,000 207,062 0.06Shimao Property Holdings 112,000 205,782 0.06Shui On Land 130,000 31,702 0.01Sino-Ocean Land Holdings 339,493 172,148 0.05SM Prime Holdings 683,050 248,183 0.07
257

UBS ETF - MSCI Emerging Markets UCITS ETF Semi-Annual Report as of 30 June 2014 Schedule of Investments as at 30 June 2014 (Expressed in USD) (Unaudited)
The accompanying notes form an integral part of these financial statements.
Transferable securities listed on an Official Stock Exchange
Quantity Market
Value USD % of
Net Assets Real Estate (2.02%) (continued) SOHO China 145,000 114,311 0.03Talaat Moustafa Group 136,761 163,347 0.05UEM Sunrise 117,900 74,537 0.02Yuexiu Property 192,000 36,664 0.01 Real Estate Investment Trusts (0.16%) Fibra Uno Administracion 163,400 570,193 0.16 Retail (2.98%) Almacenes Exito 18,290 307,469 0.09ANTA Sports Products 61,000 96,966 0.03Astra International 1,718,500 1,054,584 0.30Belle International Holdings 431,000 478,249 0.13China Resources Enterprise 110,000 305,148 0.09Controladora Comercial Mexicana 27,800 104,167 0.03CP ALL 346,500 512,463 0.14E-Mart 1,871 429,010 0.12El Puerto de Liverpool - Class C1 19,600 232,079 0.06Far Eastern Department Stores 137,383 129,064 0.04Folli Follie 3,142 125,184 0.04Foschini Group 13,165 137,976 0.04Golden Eagle Retail Group 82,000 99,559 0.03GOME Electrical Appliances Holding 477,197 78,195 0.02Hotai Motor 19,000 242,448 0.07Hyundai Department Store 1,594 218,982 0.06Intime Retail Group 75,500 66,145 0.02Jollibee Foods 29,900 120,559 0.03JUMBO 8,471 138,713 0.04Lojas Renner 10,100 324,432 0.09Lotte Shopping 953 290,572 0.08Massmart Holdings 6,309 78,279 0.02Matahari Department Store 158,100 184,039 0.05Minor International - Class A 132,900 119,776 0.03Mr Price Group 21,959 373,202 0.10Pick n Pay Stores 30,999 169,670 0.05President Chain Store 38,000 304,173 0.09Raia Drogasil 14,800 122,477 0.03Ruentex Industries 40,728 105,305 0.03SACI Falabella 83,897 759,160 0.21Shanghai Pharmaceuticals Holding - Class H 57,100 118,763 0.03Shinsegae 468 101,065 0.03SM Investments 15,160 283,403 0.08Sun Art Retail Group 235,000 268,949 0.08Truworths International 38,113 268,649 0.08Wal-Mart de Mexico - Class V 485,600 1,298,876 0.36Woolworths Holdings 68,134 500,498 0.14Zhongsheng Group Holdings 56,000 72,977 0.02 Semiconductors (8.02%) Advanced Semiconductor Engineering 518,044 674,057 0.19Epistar 62,000 153,661 0.04Hanergy Solar Group 574,000 88,133 0.03Inotera Memories 204,000 370,996 0.10MediaTek 121,606 2,056,770 0.58Novatek Microelectronics 41,000 201,855 0.06Powertech Technology 55,900 101,099 0.03Realtek Semiconductor 33,974 107,641 0.03Samsung Electronics 9,653 12,612,439 3.53Siliconware Precision Industries 282,000 463,263 0.13SK Hynix 50,352 2,416,080 0.68Taiwan Semiconductor Manufacturing 2,049,000 8,681,040 2.43Transcend Information 18,000 61,792 0.02United Microelectronics 932,000 466,655 0.13Vanguard International Semiconductor 97,000 155,776 0.04 Shipping (0.36%) Daewoo Shipbuilding & Marine Engineering 7,130 181,104 0.05Hyundai Heavy Industries 3,767 658,983 0.18Hyundai Mipo Dockyard 575 83,255 0.02Samsung Heavy Industries 14,070 376,155 0.11
258

UBS ETF - MSCI Emerging Markets UCITS ETF Semi-Annual Report as of 30 June 2014 Schedule of Investments as at 30 June 2014 (Expressed in USD) (Unaudited)
The accompanying notes form an integral part of these financial statements.
Transferable securities listed on an Official Stock Exchange
Quantity Market
Value USD % of
Net Assets Software (0.32%) HCL Technologies 19,960 497,847 0.14Kingsoft 71,000 213,906 0.06Tech Mahindra 7,462 266,992 0.08Totvs 9,000 155,165 0.04 Telecommunications (6.94%) Advanced Info Service - Registered 86,500 586,350 0.16America Movil - Class L 2,939,000 3,047,063 0.85Asia Pacific Telecom 181,000 108,813 0.03Axiata Group 174,500 378,781 0.11Bharti Airtel 52,860 296,093 0.08China Communications Services - Class H 110,400 53,702 0.02China Mobile 533,000 5,171,586 1.45China Telecom - Class H 1,214,000 593,658 0.17China Unicom Hong Kong 448,000 692,490 0.19Chunghwa Telecom 331,400 1,067,743 0.30DiGi.Com 286,100 510,543 0.14ENTEL Chile 9,769 120,156 0.03Far EasTone Telecommunications 132,000 300,623 0.08Global Telecom Holding 234,721 168,407 0.05Globe Telecom 4,235 155,235 0.04Hellenic Telecommunications Organization 24,439 361,375 0.10HTC 60,100 277,775 0.08Idea Cellular 94,746 208,648 0.06KT 6,130 185,087 0.05LG Uplus 20,710 188,719 0.05Maxis 186,300 391,630 0.11MegaFon - GDR - Registered 7,573 238,550 0.07Mobile Telesystems - ADR 46,500 917,910 0.26MTN Group 148,343 3,123,238 0.88O2 Czech Republic 7,000 99,157 0.03Oi - ADR 33,930 29,115 0.01Ooredoo 8,884 290,147 0.08Orange Polska 48,703 155,570 0.04Philippine Long Distance Telephone 4,545 311,122 0.09Reliance Communications 39,467 96,002 0.03Rostelecom - ADR 14,869 228,239 0.06Samsung SDI 2,826 452,473 0.13Sistema - GDR - Registered 12,407 382,136 0.11SK Telecom 1,041 243,325 0.07Taiwan Mobile 133,500 413,136 0.12Telecom Egypt 20,349 38,136 0.01Telekom Malaysia 76,035 150,365 0.04Telekomunikasi Indonesia Persero 4,358,900 906,342 0.25Tim Participacoes 25,400 148,890 0.04Tim Participacoes - ADR 9,666 280,604 0.08Tower Bersama Infrastructure 162,500 110,344 0.03True 383,700 112,905 0.03Turk Telekomunikasyon 69,027 199,238 0.06Turkcell Iletisim Hizmetleri 62,467 390,364 0.11Vodacom Group 26,019 321,485 0.09Vodafone Qatar 36,051 155,469 0.04XL Axiata 84,500 36,352 0.01ZTE - Class H 42,240 83,277 0.02 Textile (0.01%) Formosa Taffeta 33,000 36,473 0.01 Transportation (0.33%) America Latina Logistica 49,300 186,320 0.05BTS Group Holdings - Class A 403,900 107,649 0.03Bumi Armada 81,000 85,768 0.02China COSCO Holdings - Class H 175,000 68,190 0.02China Shipping Container Lines - Class H 255,000 65,803 0.02Evergreen Marine 158,399 86,473 0.03Hyundai Glovis 1,067 284,203 0.08Hyundai Merchant Marine 7,239 65,536 0.02MISC 54,700 110,729 0.03U-Ming Marine Transport 48,000 81,024 0.02Yang Ming Marine Transport 50,600 20,336 0.01
244

UBS ETF - MSCI Emerging Markets UCITS ETF Semi-Annual Report as of 30 June 2014 Schedule of Investments as at 30 June 2014 (Expressed in USD) (Unaudited)
The accompanying notes form an integral part of these financial statements.
Transferable securities listed on an Official Stock Exchange
Quantity Market
Value USD % of
Net Assets Water (0.29%) Aguas Andinas - Class A 228,021 143,644 0.04Beijing Enterprises Water Group 316,000 211,201 0.06Companhia de Saneamento Basico do Estado de Sao Paulo 12,000 128,216 0.04Companhia de Saneamento Basico do Estado de Sao Paulo - ADR 6,746 72,317 0.02Companhia de Saneamento de Minas Gerais 2,800 51,449 0.01Guangdong Investment 280,000 322,979 0.09Metro Pacific Investments 1,020,000 117,072 0.03
_______________________________________________________________________________________________________________ ____________________________________________________________
Total Common Stocks 335,175,092 93.90 _______________________________________________________________________________________________________________ ____________________________________________________________
Preferred Stocks Auto Manufacturers (0.23%) Hyundai Motor 1,611 241,220 0.07Hyundai Motor 2nd 3,749 592,844 0.16 Banks (1.83%) Banco Bradesco 145,480 2,115,437 0.59Banco Davivienda 8,857 142,862 0.04Banco do Estado do Rio Grande do Sul - Class B 8,800 42,920 0.01Bancolombia 37,207 544,324 0.15Itau Unibanco Holding 193,479 2,806,371 0.79Itau Unibanco Holding - ADR 44,494 639,822 0.18Sberbank of Russia 119,211 241,556 0.07 Beverages (0.04%) Embotelladora Andina - Class B 33,934 127,481 0.04 Building Materials (0.06%) Grupo Argos 18,349 218,655 0.06 Chemicals (0.14%) LG Chem 843 160,802 0.05Sociedad Quimica y Minera de Chile - Class B 11,181 326,340 0.09 Electric (0.20%) AES Tiete 6,600 58,212 0.02Centrais Eletricas Brasileiras - ADR 11,293 53,755 0.01Centrais Eletricas Brasileiras - Class B 4,500 21,437 0.01Companhia Energetica de Minas Gerais 49,171 360,065 0.10Companhia Energetica de Sao Paulo - Class B 15,900 200,544 0.05Companhia Paranaense de Energia - Class B 1,400 21,520 0.01 Food (0.15%) Companhia Brasileira de Distribuicao Grupo Pao de Acucar 11,623 543,103 0.15 Forest Products & Paper (0.02%) Suzano Papel e Celulose - Class A 21,300 81,079 0.02 Holding Companies - Diversified Operations (0.30%) Itausa - Investimentos Itau 269,640 1,063,096 0.30 Iron & Steel (0.75%) Gerdau 79,600 467,322 0.13Metalurgica Gerdau 25,600 181,538 0.05Usinas Siderurgicas de Minas Gerais - Class A 27,000 92,854 0.03Vale 155,900 1,863,783 0.52Vale - ADR 6,735 80,147 0.02 Oil & Gas (0.80%) Petroleo Brasileiro 308,200 2,417,666 0.68Surgutneftegas - ADR 51,373 424,341 0.12 Other Finance (0.16%) Bradespar 20,600 189,261 0.05Grupo Aval Acciones y Valores 140,749 101,083 0.03Grupo de Inversiones Suramericana 13,153 278,489 0.08 Pipelines (0.10%) AK Transneft 160 349,861 0.10
245

UBS ETF - MSCI Emerging Markets UCITS ETF Semi-Annual Report as of 30 June 2014 Schedule of Investments as at 30 June 2014 (Expressed in USD) (Unaudited)
The accompanying notes form an integral part of these financial statements.
Transferable securities listed on an Official Stock Exchange
Quantity Market
Value USD % of
Net Assets Retail (0.08%) Lojas Americanas 43,946 281,132 0.08 Semiconductors (0.52%) Samsung Electronics 1,769 1,853,271 0.52 Telecommunications (0.18%) Oi 130,906 115,815 0.03Telefonica Brasil 25,895 528,685 0.15
_______________________________________________________________________________________________________________ ____________________________________________________________
Total Preferred Stocks 19,828,693 5.56 _______________________________________________________________________________________________________________ ____________________________________________________________
Rights Banks (0.01%) Public Bank - Rights 20,670 35,405 0.01 Diversified Financial Services (0.00%) BS Financial Group - Rights 1,540 3,273 0.00 Forest Products & Paper (0.00%) Empresas CMPC - Rights 7,205 1,562 0.00Klabin - Rights 1,406 6 0.00
_______________________________________________________________________________________________________________ ____________________________________________________________
Total Rights 40,246 0.01 _______________________________________________________________________________________________________________ ____________________________________________________________
TOTAL INVESTMENTS (Cost USD 337,470,130) 355,044,031 99.47Other net assets 1,906,538 0.53
_______________________________________________________________________________________________________________ ____________________________________________________________
TOTAL NET ASSETS 356,950,569 100.00 _______________________________________________________________________________________________________________ ____________________________________________________________ _______________________________________________________________________________________________________________ ____________________________________________________________
Futures contracts
Number of contracts Description Currency Maturity
Commitment USD
Unrealised appreciation/(depreciation)
USD % of Net Assets
40 SGX MSCI Taiwan Index Futures USD 30 July 2014 1,329,600 14,000 0.00Total Futures Contracts 1,329,600 14,000 0.00
246
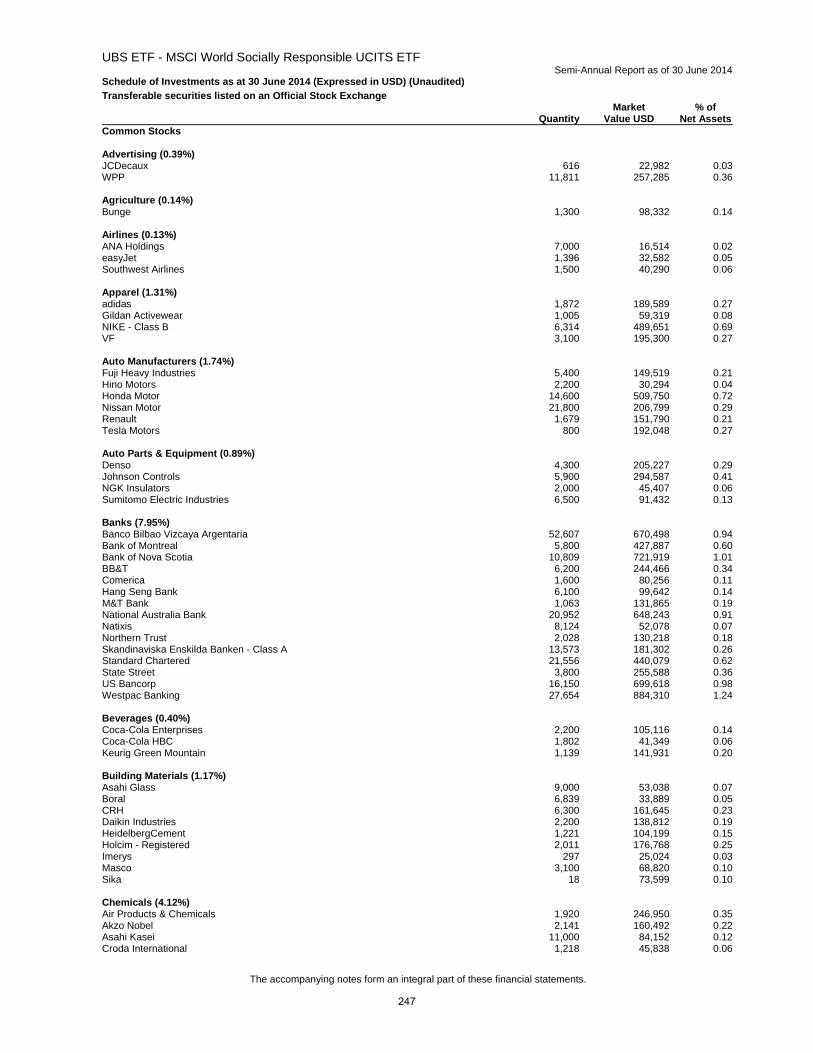
UBS ETF - MSCI World Socially Responsible UCITS ETF Semi-Annual Report as of 30 June 2014 Schedule of Investments as at 30 June 2014 (Expressed in USD) (Unaudited)
The accompanying notes form an integral part of these financial statements.
Transferable securities listed on an Official Stock Exchange
Quantity Market
Value USD % of
Net AssetsCommon Stocks Advertising (0.39%) JCDecaux 616 22,982 0.03WPP 11,811 257,285 0.36 Agriculture (0.14%) Bunge 1,300 98,332 0.14 Airlines (0.13%) ANA Holdings 7,000 16,514 0.02easyJet 1,396 32,582 0.05Southwest Airlines 1,500 40,290 0.06 Apparel (1.31%) adidas 1,872 189,589 0.27Gildan Activewear 1,005 59,319 0.08NIKE - Class B 6,314 489,651 0.69VF 3,100 195,300 0.27 Auto Manufacturers (1.74%) Fuji Heavy Industries 5,400 149,519 0.21Hino Motors 2,200 30,294 0.04Honda Motor 14,600 509,750 0.72Nissan Motor 21,800 206,799 0.29Renault 1,679 151,790 0.21Tesla Motors 800 192,048 0.27 Auto Parts & Equipment (0.89%) Denso 4,300 205,227 0.29Johnson Controls 5,900 294,587 0.41NGK Insulators 2,000 45,407 0.06Sumitomo Electric Industries 6,500 91,432 0.13 Banks (7.95%) Banco Bilbao Vizcaya Argentaria 52,607 670,498 0.94Bank of Montreal 5,800 427,887 0.60Bank of Nova Scotia 10,809 721,919 1.01BB&T 6,200 244,466 0.34Comerica 1,600 80,256 0.11Hang Seng Bank 6,100 99,642 0.14M&T Bank 1,063 131,865 0.19National Australia Bank 20,952 648,243 0.91Natixis 8,124 52,078 0.07Northern Trust 2,028 130,218 0.18Skandinaviska Enskilda Banken - Class A 13,573 181,302 0.26Standard Chartered 21,556 440,079 0.62State Street 3,800 255,588 0.36US Bancorp 16,150 699,618 0.98Westpac Banking 27,654 884,310 1.24 Beverages (0.40%) Coca-Cola Enterprises 2,200 105,116 0.14Coca-Cola HBC 1,802 41,349 0.06Keurig Green Mountain 1,139 141,931 0.20 Building Materials (1.17%) Asahi Glass 9,000 53,038 0.07Boral 6,839 33,889 0.05CRH 6,300 161,645 0.23Daikin Industries 2,200 138,812 0.19HeidelbergCement 1,221 104,199 0.15Holcim - Registered 2,011 176,768 0.25Imerys 297 25,024 0.03Masco 3,100 68,820 0.10Sika 18 73,599 0.10 Chemicals (4.12%) Air Products & Chemicals 1,920 246,950 0.35Akzo Nobel 2,141 160,492 0.22Asahi Kasei 11,000 84,152 0.12Croda International 1,218 45,838 0.06
247

UBS ETF - MSCI World Socially Responsible UCITS ETF Semi-Annual Report as of 30 June 2014 Schedule of Investments as at 30 June 2014 (Expressed in USD) (Unaudited)
The accompanying notes form an integral part of these financial statements.
Transferable securities listed on an Official Stock Exchange
Quantity Market
Value USD % of
Net Assets Chemicals (4.12%) (continued) Ecolab 2,389 265,991 0.37Hitachi Chemical 800 13,235 0.02International Flavors & Fragrances 690 71,953 0.10Johnson Matthey 1,766 93,607 0.13JSR 1,500 25,734 0.04K+S - Registered 1,492 49,057 0.07Kaneka 3,000 18,775 0.03Kansai Paint 2,000 33,424 0.05Kuraray 3,300 41,826 0.06Linde 1,659 352,752 0.49Nippon Paint 2,000 42,328 0.06Nitto Denko 1,400 65,602 0.09Novozymes - Class B 2,160 108,333 0.15Potash Corporation of Saskatchewan 7,554 287,792 0.40Praxair 2,669 354,550 0.50Sherwin-Williams 800 165,528 0.23Shin-Etsu Chemical 3,600 218,832 0.31Sigma-Aldrich 1,098 111,425 0.16Sumitomo Chemical 13,000 49,149 0.07Teijin 11,000 27,580 0.04 Commercial Services (1.51%) Abertis Infraestructuras 3,566 82,048 0.12Benesse Holdings 700 30,369 0.04Brambles 13,430 116,492 0.16Bureau Veritas 1,663 46,153 0.07Dai Nippon Printing 5,000 52,218 0.07FleetCor Technologies 700 92,260 0.13Intertek Group 1,376 64,677 0.09Iron Mountain 1,544 54,735 0.08Manpowergroup 700 59,395 0.08Quanta Services 1,800 62,244 0.09Robert Half International 1,200 57,288 0.08SGS - Registered 51 122,209 0.17Toppan Printing 5,000 38,695 0.06Transurban Group 14,367 100,211 0.14United Rentals 900 94,257 0.13 Computers (4.75%) Accenture - Class A 5,700 460,788 0.65CGI Group - Class A 2,100 74,564 0.10EMC 18,000 474,120 0.66Hewlett-Packard 16,841 567,205 0.80IHS - Class A 611 82,894 0.12International Business Machines 8,814 1,597,714 2.24Nomura Research Institute 900 28,340 0.04NTT Data 1,100 42,239 0.06Teradata 1,456 58,531 0.08 Cosmetics & Personal Care (3.51%) Beiersdorf 939 90,856 0.13Estee Lauder - Class A 2,092 155,352 0.22L'Oreal 2,114 364,258 0.51Procter & Gamble 24,100 1,894,019 2.65 Distribution & Wholesale (0.56%) Hitachi High-Technologies 500 11,895 0.02LKQ 2,600 69,394 0.10Toyota Tsusho 1,800 51,759 0.07Wolseley 2,353 128,865 0.18WW Grainger 538 136,797 0.19 Diversified Financial Services (3.22%) Aberdeen Asset Management 8,118 63,004 0.09AEON Financial Service 900 23,534 0.03American Express 8,514 807,723 1.13BlackRock 1,159 370,416 0.52Charles Schwab 10,500 282,765 0.40CME Group 2,830 200,789 0.28Franklin Resources 3,732 215,859 0.30
248

UBS ETF - MSCI World Socially Responsible UCITS ETF Semi-Annual Report as of 30 June 2014 Schedule of Investments as at 30 June 2014 (Expressed in USD) (Unaudited)
The accompanying notes form an integral part of these financial statements.
Transferable securities listed on an Official Stock Exchange
Quantity Market
Value USD % of
Net Assets Diversified Financial Services (3.22%) (continued) Intercontinental Exchange 1,050 198,345 0.28Investec 4,717 43,472 0.06Legg Mason 900 46,179 0.07Schroders 1,062 45,505 0.06 Electric (0.86%) AGL Energy 4,628 67,619 0.10Consolidated Edison 2,544 146,890 0.21Integrys Energy Group 720 51,214 0.07Northeast Utilities 2,732 129,142 0.18Pepco Holdings 2,200 60,456 0.08Red Electrica 1,026 93,837 0.13Terna Rete Elettrica Nazionale 11,627 61,320 0.09 Electrical Components & Equipment (0.81%) Legrand 2,308 141,205 0.20Schneider Electric 4,598 432,805 0.61 Electronics (2.20%) Agilent Technologies 2,947 169,276 0.24Flextronics International 5,400 59,778 0.08Ibiden 900 18,123 0.03Koninklijke Philips 8,701 276,083 0.39Kyocera 2,900 137,636 0.19Mettler-Toledo International 250 63,295 0.09Murata Manufacturing 1,800 168,460 0.24Omron 1,800 75,870 0.11TE Connectivity 3,600 222,624 0.31Trimble Navigation 2,300 84,985 0.12Tyco International 4,122 187,963 0.26Waters 764 79,792 0.11Yaskawa Electric 2,000 24,224 0.03 Energy - Alternate Sources (0.06%) Enel Green Power 15,060 42,641 0.06 Engineering & Construction (1.10%) Aeroports de Paris 248 32,671 0.05Aker Solutions 1,451 25,207 0.03Auckland International Airport 9,561 32,647 0.05Chiyoda 2,000 24,224 0.03Ferrovial 3,887 86,560 0.12Fraport Frankfurt Airport Services Worldwide 311 21,972 0.03Hochtief 263 22,761 0.03Obayashi 6,000 42,821 0.06Shimizu 5,000 35,388 0.05Skanska - Class B 3,441 78,493 0.11Sydney Airport 10,046 40,014 0.06Vinci 4,197 313,749 0.44WorleyParsons 1,731 28,445 0.04 Food (3.88%) Ajinomoto 5,000 78,377 0.11Campbell Soup 1,800 82,458 0.11Casino Guichard Perrachon 481 63,769 0.09ConAgra Foods 3,900 115,752 0.16Danone 4,999 371,239 0.52Distribuidora Internacional de Alimentacion 5,126 47,191 0.06General Mills 5,600 294,224 0.41J Sainsbury 10,440 56,319 0.08Kellogg 2,400 157,680 0.22Kikkoman 1,000 20,828 0.03Koninklijke Ahold 8,178 153,510 0.21Lindt & Spruengli 8 40,722 0.06Lindt & Spruengli - Registered 1 61,773 0.09Metcash 10,373 25,847 0.04Metro - CA 700 43,354 0.06Metro - DE 1,454 63,365 0.09Mondelez International - Class A 15,119 568,626 0.80Seven & I Holdings 6,800 286,485 0.40
264

UBS ETF - MSCI World Socially Responsible UCITS ETF Semi-Annual Report as of 30 June 2014 Schedule of Investments as at 30 June 2014 (Expressed in USD) (Unaudited)
The accompanying notes form an integral part of these financial statements.
Transferable securities listed on an Official Stock Exchange
Quantity Market
Value USD % of
Net Assets Food (3.88%) (continued) Tate & Lyle 4,050 47,401 0.07Whole Foods Market 3,322 128,329 0.18WM Morrison Supermarkets 19,871 62,313 0.09 Forest Products & Paper (0.37%) Stora Enso - Class R 4,874 47,447 0.07Svenska Cellulosa - Class B 5,146 134,012 0.19UPM-Kymmene 4,765 81,419 0.11 Gas (1.82%) Canadian Utilities - Class A 1,000 37,553 0.05CenterPoint Energy 3,721 95,034 0.13Enagas 1,844 59,331 0.08National Grid 33,038 474,516 0.67NiSource 2,700 106,218 0.15Osaka Gas 17,000 71,487 0.10Sempra Energy 2,100 219,891 0.31Snam 17,992 108,389 0.15Tokyo Gas 22,000 128,562 0.18 Healthcare Products (0.73%) Becton Dickinson & Co 1,714 202,766 0.28Edwards Lifesciences 938 80,518 0.11Henry Schein 759 90,070 0.13Patterson 700 27,657 0.04Sysmex 1,200 45,072 0.06Varian Medical Systems 900 74,826 0.11 Healthcare Services (1.06%) Aetna 3,231 261,970 0.37Cigna 2,400 220,728 0.31WellPoint 2,551 274,513 0.38 Holding Companies - Diversified Operations (0.28%) Exor 872 35,805 0.05Keppel 12,000 103,862 0.14Swire Pacific - Class A 5,000 61,546 0.09 Home Builders (0.30%) Daiwa House Industry 5,000 103,647 0.15Sekisui Chemical 4,000 46,316 0.06Sekisui House 4,700 64,442 0.09 Home Furnishings (0.55%) Panasonic 19,600 238,749 0.34Sony 9,100 151,090 0.21 Household Products (1.10%) Avery Dennison 800 41,000 0.06Clorox 1,116 102,002 0.14Henkel & Co 1,041 104,759 0.15Reckitt Benckiser Group 5,716 498,448 0.70Societe BIC 258 35,296 0.05 Insurance (5.81%) ACE 2,976 308,611 0.43Allianz - Registered 4,072 678,499 0.95AMP 25,723 128,677 0.18Aviva 25,943 226,451 0.32AXA 16,018 382,806 0.54Chubb 2,234 205,908 0.29CNP Assurances 1,561 32,401 0.05Delta Lloyd 1,734 44,016 0.06Insurance Australia Group 20,241 111,570 0.16Legal & General Group 51,987 200,358 0.28Marsh & McLennan 5,000 259,100 0.36Muenchener Rueckversicherungs - Registered 1,600 354,665 0.50NKSJ Holdings 3,100 83,479 0.12PartnerRe 411 44,885 0.06Principal Financial Group 2,600 131,248 0.18
250

UBS ETF - MSCI World Socially Responsible UCITS ETF Semi-Annual Report as of 30 June 2014 Schedule of Investments as at 30 June 2014 (Expressed in USD) (Unaudited)
The accompanying notes form an integral part of these financial statements.
Transferable securities listed on an Official Stock Exchange
Quantity Market
Value USD % of
Net Assets Insurance (5.81%) (continued) Prudential 22,702 520,536 0.73RSA Insurance Group 8,800 71,441 0.10T&D Holdings 5,000 67,963 0.09Travelers 3,117 293,216 0.41 Internet (0.24%) Rackspace Hosting 1,000 33,660 0.05Symantec 6,100 139,690 0.19 Iron & Steel (0.23%) Hitachi Metals 2,000 30,285 0.04Nucor 2,779 136,866 0.19 Lodging (0.51%) Accor 1,410 73,340 0.10City Developments 3,000 24,618 0.04Marriott International - Class A 2,131 136,597 0.19Whitbread 1,682 126,801 0.18 Machinery - Construction & Mining (1.17%) Caterpillar 5,700 619,419 0.87Hitachi Construction Machinery 900 17,928 0.02Komatsu 8,500 197,345 0.28 Machinery - Diversified (1.22%) AGCO 800 44,976 0.06CNH Industrial 8,277 84,993 0.12Cummins 1,612 248,716 0.35Deere & Co 3,087 279,528 0.39Rockwell Automation 1,200 150,192 0.21Xylem 1,600 62,528 0.09 Media (2.45%) Charter Communications - Class A 700 110,866 0.15Discovery Communications - Class A 1,300 96,564 0.13Discovery Communications - Class C 700 50,813 0.07Liberty Global - Class C 4,672 197,672 0.28Reed Elsevier - GB 10,233 164,471 0.23Reed Elsevier - NL 6,506 149,204 0.21Scripps Networks Interactive - Class A 700 56,798 0.08TIME 1 12 0.00Time Warner 7,900 554,975 0.78Time Warner Cable 2,500 368,250 0.52 Metal Fabricate & Hardware (0.35%) Assa Abloy - Class B 2,976 151,352 0.21SKF - Class B 3,757 95,817 0.14 Mining (0.58%) Agnico Eagle Mines 1,475 56,582 0.08Kinross Gold 10,900 45,231 0.06Norsk Hydro 12,973 69,407 0.10Sumitomo Metal Mining 5,000 81,191 0.11Teck Resources - Class B 4,900 112,063 0.16Umicore 986 45,805 0.07 Miscellaneous Manufacturers (1.19%) Dover 1,547 140,700 0.20FUJIFILM Holdings 4,300 119,910 0.17Ingersoll-Rand 2,438 152,399 0.21Konica Minolta 4,000 39,524 0.06Nikon 2,900 45,659 0.06Orkla 6,760 60,205 0.09Pall 1,038 88,635 0.12Parker Hannifin 1,353 170,113 0.24Sulzer - Registered 212 29,739 0.04 Office & Business Equipment (0.17%) Xerox 9,600 119,424 0.17
251

UBS ETF - MSCI World Socially Responsible UCITS ETF Semi-Annual Report as of 30 June 2014 Schedule of Investments as at 30 June 2014 (Expressed in USD) (Unaudited)
The accompanying notes form an integral part of these financial statements.
Transferable securities listed on an Official Stock Exchange
Quantity Market
Value USD % of
Net Assets Oil & Gas (5.21%) ARC Resources 2,737 83,486 0.12BG Group 30,219 638,124 0.89Cenovus Energy 6,712 217,968 0.31Denbury Resources 3,200 59,072 0.08Devon Energy 3,442 273,295 0.38Encana 6,500 154,269 0.22Energen 600 53,328 0.07EOG Resources 4,824 563,733 0.79Galp Energia 3,513 64,355 0.09Hess 2,618 258,894 0.36Inpex 7,600 115,532 0.16Neste Oil 1,125 21,949 0.03Noble 2,153 72,255 0.10OMV 1,393 62,939 0.09Penn West Petroleum 4,400 43,044 0.06Pioneer Natural Resources 1,266 290,939 0.41QEP Resources 1,549 53,441 0.08Repsol 7,761 204,656 0.29Southwestern Energy 3,111 141,519 0.20Tullow Oil 7,986 116,544 0.16Woodside Petroleum 5,896 228,552 0.32 Oil & Gas Services (0.85%) AMEC 2,635 54,741 0.08Baker Hughes 3,900 290,355 0.41FMC Technologies 2,100 128,247 0.18Fugro - CVA 626 35,839 0.05Petrofac 2,269 46,672 0.06Superior Energy Services 1,345 48,609 0.07 Packaging & Containers (0.27%) Ball 1,200 75,216 0.10Rexam 5,996 54,854 0.08Rock Tenn - Class A 600 63,354 0.09 Pharmaceuticals & Biotechnology (7.29%) Actelion - Registered 898 113,617 0.16Alfresa Holdings 400 25,783 0.04AmerisourceBergen 2,100 152,586 0.21Astellas Pharma 19,000 249,632 0.35Cardinal Health 3,000 205,680 0.29Chugai Pharmaceutical 1,900 53,546 0.08Eisai 2,300 96,355 0.13Gilead Sciences 13,721 1,137,608 1.60Kyowa Hakko Kirin 2,000 27,067 0.04Merck 1,110 96,337 0.13Novo Nordisk - Class B 17,704 814,777 1.14Roche Holding 6,243 1,862,059 2.61Suzuken 600 22,329 0.03Vertex Pharmaceuticals 2,063 195,325 0.27Zoetis 4,600 148,442 0.21 Pipelines (1.09%) APA Group 7,411 48,195 0.07Enbridge 7,424 352,886 0.50ONEOK 1,827 124,382 0.17Spectra Energy 5,900 250,632 0.35 Private Equity (0.08%) 3i Group 8,619 59,229 0.08 Real Estate (0.69%) CapitaLand 25,000 64,172 0.09CBRE Group - Class A 2,700 86,508 0.12Keppel Land 8,000 21,690 0.03Lend Lease Group 4,846 59,964 0.09Mitsui Fudosan 7,000 236,040 0.33Swire Properties 7,800 22,795 0.03
252

UBS ETF - MSCI World Socially Responsible UCITS ETF Semi-Annual Report as of 30 June 2014 Schedule of Investments as at 30 June 2014 (Expressed in USD) (Unaudited)
The accompanying notes form an integral part of these financial statements.
Transferable securities listed on an Official Stock Exchange
Quantity Market
Value USD % of
Net Assets Real Estate Investment Trusts (3.83%) American Tower 3,498 314,750 0.44AvalonBay Communities 1,183 168,211 0.23Boston Properties 1,348 159,307 0.22British Land 8,339 100,165 0.14CapitaMall Trust 23,000 36,438 0.05CFS Retail Property Trust Group 21,610 41,609 0.06Dexus Property Group 53,238 55,776 0.08Digital Realty Trust 1,066 62,169 0.09Equity Residential 3,013 189,819 0.27Goodman Group 15,236 72,621 0.10GPT Group 15,726 56,997 0.08Hammerson 6,185 61,337 0.09HCP 4,000 165,520 0.23Land Securities Group 7,009 124,158 0.17Liberty Property Trust 1,253 47,526 0.07Mirvac Group 34,237 57,682 0.08Plum Creek Timber 1,533 69,138 0.10Prologis 4,331 177,961 0.25Segro 6,232 36,784 0.05Stockland 20,894 76,517 0.11UDR 2,200 62,986 0.09Unibail-Rodamco 888 258,298 0.36Vornado Realty Trust 1,548 165,218 0.23Weyerhaeuser 5,200 172,068 0.24 Retail (5.42%) Aeon 5,400 66,417 0.09Canadian Tire - Class A 676 64,969 0.09CarMax 2,100 109,221 0.15Darden Restaurants 1,100 50,897 0.07GameStop - Class A 1,000 40,470 0.06Gap 2,200 91,454 0.13Hennes & Mauritz - Class B 8,429 368,158 0.52Inditex 1,913 294,396 0.41Kingfisher 20,933 128,494 0.18Lawson 500 37,511 0.05Marks & Spencer Group 14,168 103,005 0.15McDonald's 8,751 881,576 1.24McDonald's Holdings 500 14,042 0.02Next 1,364 151,012 0.21Nordstrom 1,290 87,630 0.12PVH 700 81,620 0.12Staples 5,800 62,872 0.09Starbucks 6,707 518,988 0.73Tiffany & Co 1,132 113,483 0.16Tim Hortons 1,200 65,760 0.09Tractor Supply 1,200 72,480 0.10Travis Perkins 2,131 59,684 0.08Wesfarmers 10,178 401,936 0.56 Savings & Loans (0.06%) People's United Financial 2,800 42,476 0.06 Semiconductors (3.56%) Analog Devices 2,900 156,803 0.22Applied Materials 10,900 245,795 0.34ASML Holding 3,193 297,319 0.42Lam Research 1,389 93,868 0.13QUALCOMM 15,000 1,188,000 1.67Texas Instruments 9,600 458,784 0.64Tokyo Electron 1,500 101,397 0.14 Software (2.09%) Autodesk 1,939 109,321 0.15CA 3,000 86,220 0.12Cerner 2,728 140,710 0.20Dun & Bradstreet 350 38,570 0.05Intuit 2,383 191,903 0.27salesforce.com 5,000 290,400 0.41SAP 8,220 634,749 0.89
253

UBS ETF - MSCI World Socially Responsible UCITS ETF Semi-Annual Report as of 30 June 2014 Schedule of Investments as at 30 June 2014 (Expressed in USD) (Unaudited)
The accompanying notes form an integral part of these financial statements.
Transferable securities listed on an Official Stock Exchange
Quantity Market
Value USD % of
Net Assets Telecommunications (5.10%) BT Group 70,165 461,770 0.65Cisco Systems 45,751 1,136,912 1.59Corning 12,300 269,985 0.38KDDI 5,200 317,169 0.44Motorola Solutions 2,000 133,140 0.19NTT DOCOMO 13,400 229,098 0.32Rogers Communications - Class B 3,300 133,035 0.19SBA Communications - Class A 1,142 116,827 0.16Sprint 6,876 58,652 0.08Vodafone Group 234,726 782,625 1.10 Textile (0.24%) Mohawk Industries 600 83,004 0.12Toray Industries 13,000 85,465 0.12 Toys, Games & Hobbies (0.25%) Hasbro 1,054 55,915 0.08Mattel 3,100 120,807 0.17 Transportation (2.70%) Canadian National Railway 7,354 479,151 0.67CH Robinson Worldwide 1,350 86,117 0.12East Japan Railway 3,000 236,286 0.33Expeditors International of Washington 1,800 79,488 0.11Koninklijke Vopak 614 30,012 0.04Mitsui OSK Lines 10,000 37,214 0.05MTR 14,000 53,920 0.08Norfolk Southern 2,712 279,417 0.39United Parcel Service - Class B 6,288 645,526 0.91
_______________________________________________________________________________________________________________ ____________________________________________________________
Total Common Stocks 71,001,976 99.56 _______________________________________________________________________________________________________________ ____________________________________________________________
Preferred Stocks Household Products (0.26%) Henkel & Co 1,630 188,424 0.26
_______________________________________________________________________________________________________________ ____________________________________________________________
Total Preferred Stocks 188,424 0.26 _______________________________________________________________________________________________________________ ____________________________________________________________
Rights Oil & Gas (0.01%) Repsol - Rights 7,761 5,281 0.01
_______________________________________________________________________________________________________________ ____________________________________________________________
Total Rights 5,281 0.01 _______________________________________________________________________________________________________________ ____________________________________________________________
TOTAL INVESTMENTS (Cost USD 59,176,782) 71,195,681 99.83Other net assets 120,960 0.17
_______________________________________________________________________________________________________________ ____________________________________________________________
TOTAL NET ASSETS 71,316,641 100.00 _______________________________________________________________________________________________________________ ____________________________________________________________ _______________________________________________________________________________________________________________ ____________________________________________________________
254

UBS ETF - MSCI North America Socially Responsible UCITS ETF Semi-Annual Report as of 30 June 2014 Schedule of Investments as at 30 June 2014 (Expressed in USD) (Unaudited)
The accompanying notes form an integral part of these financial statements.
Transferable securities listed on an Official Stock Exchange
Quantity Market
Value USD % of
Net AssetsCommon Stocks Agriculture (0.24%) Bunge 3,639 275,254 0.24 Airlines (0.11%) Southwest Airlines 4,465 119,930 0.11 Apparel (1.86%) Gildan Activewear 2,939 173,473 0.15NIKE - Class B 17,701 1,372,713 1.22VF 8,819 555,597 0.49 Auto Manufacturers (0.46%) Tesla Motors 2,153 516,849 0.46 Auto Parts & Equipment (0.73%) Johnson Controls 16,591 828,389 0.73 Banks (6.69%) Bank of Montreal 16,134 1,190,264 1.05Bank of Nova Scotia 30,380 2,029,041 1.79BB&T 17,793 701,578 0.62Comerica 4,483 224,867 0.20M&T Bank 2,911 361,110 0.32Northern Trust 5,576 358,035 0.32State Street 10,789 725,668 0.64US Bancorp 45,594 1,975,132 1.75 Beverages (0.59%) Coca-Cola Enterprises 5,997 286,537 0.25Keurig Green Mountain 3,061 381,431 0.34 Building Materials (0.17%) Masco 8,669 192,452 0.17 Chemicals (3.70%) Air Products & Chemicals 5,315 683,615 0.60Ecolab 6,774 754,217 0.67International Flavors & Fragrances 2,072 216,068 0.19Potash Corporation of Saskatchewan 21,338 812,934 0.72Praxair 7,355 977,038 0.86Sherwin-Williams 2,112 436,994 0.39Sigma-Aldrich 2,956 299,975 0.27 Commercial Services (1.04%) FleetCor Technologies 1,867 246,071 0.22Iron Mountain 4,054 143,714 0.13Manpowergroup 2,024 171,736 0.15Quanta Services 5,449 188,427 0.17Robert Half International 3,549 169,429 0.15United Rentals 2,408 252,190 0.22 Computers (8.21%) Accenture - Class A 15,935 1,288,186 1.14CGI Group - Class A 5,654 200,755 0.18EMC 50,582 1,332,330 1.18Hewlett-Packard 47,552 1,601,551 1.42IHS - Class A 1,613 218,836 0.19International Business Machines 24,737 4,484,076 3.96Teradata 3,936 158,227 0.14 Cosmetics & Personal Care (5.11%) Estee Lauder - Class A 6,015 446,674 0.40Procter & Gamble 67,797 5,328,166 4.71 Distribution & Wholesale (0.53%) LKQ 7,698 205,460 0.18WW Grainger 1,538 391,067 0.35 Diversified Financial Services (5.28%) American Express 23,914 2,268,721 2.01
270

UBS ETF - MSCI North America Socially Responsible UCITS ETF Semi-Annual Report as of 30 June 2014 Schedule of Investments as at 30 June 2014 (Expressed in USD) (Unaudited)
The accompanying notes form an integral part of these financial statements.
Transferable securities listed on an Official Stock Exchange
Quantity Market
Value USD % of
Net Assets Diversified Financial Services (5.28%) (continued) BlackRock 3,348 1,070,021 0.95Charles Schwab 29,200 786,356 0.69CME Group 8,016 568,735 0.50Franklin Resources 10,287 595,000 0.53IntercontinentalExchange Group 2,848 537,987 0.47Legg Mason 2,774 142,334 0.13 Electric (0.99%) Consolidated Edison 7,415 428,142 0.38Integrys Energy Group 2,006 142,687 0.13Northeast Utilities 7,801 368,753 0.33Pepco Holdings 6,420 176,422 0.15 Electronics (2.18%) Agilent Technologies 8,381 481,405 0.43Flextronics International 15,375 170,201 0.15Mettler-Toledo International 741 187,606 0.17TE Connectivity 10,294 636,581 0.56Trimble Navigation 6,584 243,279 0.21Tyco International 11,597 528,823 0.47Waters 2,075 216,713 0.19 Food (3.44%) Campbell Soup 4,983 228,271 0.20ConAgra Foods 10,395 308,524 0.27General Mills 15,583 818,731 0.73Kellogg 6,776 445,183 0.39Metro 2,190 135,637 0.12Mondelez International - Class A 42,500 1,598,425 1.41Whole Foods Market 9,316 359,877 0.32 Gas (1.14%) Canadian Utilities - Class A 3,056 114,763 0.10CenterPoint Energy 9,961 254,404 0.23NiSource 7,757 305,160 0.27Sempra Energy 5,842 611,716 0.54 Healthcare Products (1.20%) Becton Dickinson & Co 4,845 573,163 0.51Edwards Lifesciences 2,646 227,133 0.20Henry Schein 2,167 257,158 0.23Patterson 2,161 85,381 0.07Varian Medical Systems 2,562 213,005 0.19 Healthcare Services (1.88%) Aetna 9,067 735,152 0.65Cigna 6,847 629,719 0.56WellPoint 7,057 759,404 0.67 Household Products (0.37%) Avery Dennison 2,482 127,203 0.11Clorox 3,200 292,480 0.26 Insurance (3.08%) ACE 8,428 873,984 0.77Chubb 6,156 567,398 0.50Marsh & McLennan 13,746 712,318 0.63PartnerRe 1,124 122,752 0.11Principal Financial Group 7,506 378,903 0.34Travelers 8,779 825,840 0.73 Internet (0.44%) Rackspace Hosting 3,045 102,495 0.09Symantec 17,076 391,040 0.35 Iron & Steel (0.34%) Nucor 7,875 387,844 0.34 Lodging (0.33%) Marriott International - Class A 5,814 372,677 0.33
256

UBS ETF - MSCI North America Socially Responsible UCITS ETF Semi-Annual Report as of 30 June 2014 Schedule of Investments as at 30 June 2014 (Expressed in USD) (Unaudited)
The accompanying notes form an integral part of these financial statements.
Transferable securities listed on an Official Stock Exchange
Quantity Market
Value USD % of
Net Assets Machinery - Construction & Mining (1.53%) Caterpillar 15,952 1,733,504 1.53 Machinery - Diversified (1.97%) AGCO 2,210 124,246 0.11Cummins 4,447 686,127 0.61Deere & Co 8,794 796,297 0.71Rockwell Automation 3,462 433,304 0.38Xylem 4,724 184,614 0.16 Media (3.58%) Charter Communications - Class A 1,850 293,003 0.26Discovery Communications - Class A 3,750 278,550 0.25Discovery Communications - Class C 2,000 145,180 0.13Liberty Global - Class C 13,352 564,923 0.50Scripps Networks Interactive - Class A 2,133 173,071 0.15Time 0 3 0.00Time Warner 22,319 1,567,910 1.39Time Warner Cable 6,939 1,022,115 0.90 Mining (0.56%) Agnico Eagle Mines 5,135 196,983 0.18Kinross Gold 28,367 117,713 0.10Teck Resources - Class B 14,045 321,209 0.28 Miscellaneous Manufacturers (1.34%) Dover 4,235 385,173 0.34Ingersoll-Rand 6,880 430,069 0.38Pall 2,820 240,800 0.21Parker Hannifin 3,695 464,572 0.41 Office & Business Equipment (0.31%) Xerox 27,964 347,872 0.31 Oil & Gas (5.67%) ARC Resources 7,664 233,773 0.21Cenovus Energy 19,083 619,707 0.55Denbury Resources 8,730 161,156 0.14Devon Energy 9,711 771,053 0.68Encana 18,293 434,162 0.38Energen 1,852 164,606 0.15EOG Resources 13,678 1,598,411 1.41Hess 7,333 725,160 0.64Noble 6,502 218,207 0.19Penn West Petroleum 12,386 121,168 0.11Pioneer Natural Resources 3,548 815,366 0.72QEP Resources 4,204 145,038 0.13Southwestern Energy 8,913 405,452 0.36 Oil & Gas Services (1.16%) Baker Hughes 10,945 814,855 0.72FMC Technologies 5,829 355,977 0.31Superior Energy Services 4,088 147,741 0.13 Packaging & Containers (0.35%) Ball 3,327 208,536 0.18Rock Tenn - Class A 1,776 187,528 0.17 Pharmaceuticals & Biotechnology (4.56%) AmerisourceBergen 5,788 420,556 0.37Cardinal Health 8,584 588,519 0.52Gilead Sciences 38,441 3,187,143 2.82Vertex Pharmaceuticals 5,958 564,104 0.50Zoetis 12,326 397,760 0.35 Pipelines (1.81%) Enbridge 20,830 990,116 0.87ONEOK 5,123 348,774 0.31Spectra Energy 16,810 714,089 0.63
257

UBS ETF - MSCI North America Socially Responsible UCITS ETF Semi-Annual Report as of 30 June 2014 Schedule of Investments as at 30 June 2014 (Expressed in USD) (Unaudited)
The accompanying notes form an integral part of these financial statements.
Transferable securities listed on an Official Stock Exchange
Quantity Market
Value USD % of
Net Assets Real Estate (0.21%) CBRE Group - Class A 7,603 243,600 0.21 Real Estate Investment Trusts (4.40%) American Tower 9,874 888,462 0.79AvalonBay Communities 3,229 459,131 0.41Boston Properties 3,800 449,084 0.40Digital Realty Trust 3,112 181,492 0.16Equity Residential 8,633 543,879 0.48HCP 11,500 475,870 0.42Liberty Property Trust 3,715 140,910 0.12Plum Creek Timber 4,547 205,070 0.18Prologis 12,584 517,077 0.46UDR 6,425 183,948 0.16Vornado Realty Trust 4,174 445,491 0.39Weyerhaeuser 14,575 482,287 0.43 Retail (5.59%) Canadian Tire - Class A 1,934 185,874 0.16CarMax 5,495 285,795 0.25Darden Restaurants 3,344 154,727 0.14GameStop - Class A 2,989 120,965 0.11Gap 6,052 251,582 0.22McDonald's 24,767 2,495,027 2.21Nordstrom 3,556 241,559 0.21PVH 2,009 234,249 0.21Staples 16,570 179,619 0.16Starbucks 18,903 1,462,714 1.29Tiffany & Co 3,164 317,191 0.28Tim Hortons 3,464 189,826 0.17Tractor Supply 3,459 208,924 0.18 Savings & Loans (0.11%) People's United Financial 7,905 119,919 0.11 Semiconductors (5.33%) Analog Devices 7,909 427,639 0.38Applied Materials 30,363 684,686 0.61Lam Research 3,996 270,050 0.24QUALCOMM 42,284 3,348,893 2.96Texas Instruments 27,077 1,294,010 1.14 Software (2.15%) Autodesk 5,527 311,612 0.28CA 8,142 234,001 0.21Cerner 7,825 403,614 0.36Dun & Bradstreet 966 106,453 0.09Intuit 6,788 546,638 0.48salesforce.com 14,316 831,473 0.73 Telecommunications (4.59%) Cisco Systems 128,742 3,199,239 2.83Corning 34,876 765,528 0.68Motorola Solutions 5,634 375,055 0.33Rogers Communications - Class B 8,942 360,484 0.32SBA Communications - Class A 3,170 324,291 0.28Sprint 19,560 166,847 0.15 Textile (0.19%) Mohawk Industries 1,533 212,075 0.19 Toys, Games & Hobbies (0.43%) Hasbro 2,993 158,779 0.14Mattel 8,404 327,504 0.29 Transportation (3.92%) Canadian National Railway 20,756 1,352,360 1.19CH Robinson Worldwide 3,673 234,301 0.21Expeditors International of Washington 5,021 221,727 0.20Norfolk Southern 7,748 798,277 0.70United Parcel Service - Class B 17,805 1,827,861 1.62
258

UBS ETF - MSCI North America Socially Responsible UCITS ETF Semi-Annual Report as of 30 June 2014 Schedule of Investments as at 30 June 2014 (Expressed in USD) (Unaudited)
The accompanying notes form an integral part of these financial statements.
Transferable securities listed on an Official Stock Exchange
Market
Value USD % of
Net Assets
Total Common Stocks 112,935,426 99.87 _______________________________________________________________________________________________________________ ____________________________________________________________
TOTAL INVESTMENTS (Cost USD 99,896,039) 112,935,426 99.87Other net assets 145,328 0.13
_______________________________________________________________________________________________________________ ____________________________________________________________
TOTAL NET ASSETS 113,080,754 100.00 _______________________________________________________________________________________________________________ ____________________________________________________________ _______________________________________________________________________________________________________________ ____________________________________________________________
259

UBS ETF - MSCI Europe & Middle East Socially Responsible UCITS ETF Semi-Annual Report as of 30 June 2014 Schedule of Investments as at 30 June 2014 (Expressed in EUR) (Unaudited)
The accompanying notes form an integral part of these financial statements.
Transferable securities listed on an Official Stock Exchange
Quantity Market
Value EUR % of
Net AssetsCommon Stocks Advertising (1.36%) JCDecaux 557 15,179 0.11WPP 11,458 182,299 1.25 Airlines (0.16%) easyJet 1,393 23,746 0.16 Apparel (0.91%) adidas 1,791 132,480 0.91 Auto Manufacturers (0.75%) Renault 1,653 109,148 0.75 Banks (6.54%) Banco Bilbao Vizcaya Argentaria 51,067 475,383 3.27Natixis 8,166 38,233 0.26Skandinaviska Enskilda Banken - Class A 13,074 127,551 0.87Standard Chartered 20,863 311,091 2.14 Beverages (0.18%) Coca-Cola HBC 1,541 25,826 0.18 Building Materials (2.70%) CRH 6,268 117,462 0.81HeidelbergCement 1,212 75,544 0.52Holcim - Registered 1,964 126,090 0.86Imerys 276 16,985 0.12Sika 19 56,742 0.39 Chemicals (3.93%) Akzo Nobel 2,064 113,004 0.78Croda International 1,071 29,438 0.20Johnson Matthey 1,761 68,175 0.47K+S - Registered 1,404 33,717 0.23Linde 1,622 251,897 1.73Novozymes - Class B 2,078 76,121 0.52 Commercial Services (1.56%) Abertis Infraestructuras 3,549 59,641 0.41Bureau Veritas 1,756 35,594 0.25Intertek Group 1,372 47,102 0.32SGS - Registered 48 84,008 0.58 Cosmetics & Personal Care (2.22%) Beiersdorf 880 62,190 0.43L'Oreal 2,073 260,887 1.79 Distribution & Wholesale (0.61%) Wolseley 2,204 88,161 0.61 Diversified Financial Services (0.75%) Aberdeen Asset Management 7,304 41,403 0.28Investec 4,680 31,502 0.22Schroders 1,156 36,178 0.25 Electric (0.75%) Red Electrica 925 61,790 0.43Terna Rete Elettrica Nazionale 12,150 46,802 0.32 Electrical Components & Equipment (2.78%) Legrand 2,263 101,122 0.69Schneider Electric 4,419 303,806 2.09 Electronics (1.32%) Koninklijke Philips 8,320 192,816 1.32 Energy - Alternate Sources (0.21%) Enel Green Power 14,955 30,927 0.21
260

UBS ETF - MSCI Europe & Middle East Socially Responsible UCITS ETF Semi-Annual Report as of 30 June 2014 Schedule of Investments as at 30 June 2014 (Expressed in EUR) (Unaudited)
The accompanying notes form an integral part of these financial statements.
Transferable securities listed on an Official Stock Exchange
Quantity Market
Value EUR % of
Net Assets Engineering & Construction (2.84%) Aeroports de Paris 257 24,729 0.17Aker Solutions 1,419 18,004 0.12Ferrovial 3,437 55,903 0.38Fraport Frankfurt Airport Services Worldwide 320 16,512 0.11Hochtief 223 14,096 0.10Skanska - Class B 3,301 54,997 0.38Vinci 4,199 229,265 1.58 Food (4.80%) Casino Guichard Perrachon 486 47,059 0.32Danone 4,913 266,481 1.83Distribuidora Internacional de Alimentacion 5,212 35,046 0.24J Sainsbury 11,369 44,795 0.31Koninklijke Ahold 7,980 109,406 0.75Lindt & Spruengli 8 29,742 0.21Lindt & Spruengli - Registered 1 45,118 0.31Metro 1,436 45,708 0.31Tate & Lyle 3,964 33,885 0.23WM Morrison Supermarkets 18,224 41,740 0.29 Forest Products & Paper (1.28%) Stora Enso - Class R 4,836 34,384 0.23Svenska Cellulosa - Class B 5,031 95,693 0.66UPM-Kymmene 4,553 56,821 0.39 Gas (3.13%) Enagas 1,803 42,371 0.29National Grid 31,998 335,667 2.31Snam 17,555 77,242 0.53 Household Products (3.14%) Henkel & Co 1,039 76,366 0.52Reckitt Benckiser Group 5,587 355,841 2.45Societe BIC 248 24,780 0.17 Insurance (12.20%) Allianz - Registered 3,952 480,958 3.31Aviva 24,775 157,949 1.09AXA 15,381 268,475 1.84CNP Assurances 1,286 19,496 0.13Delta Lloyd 1,814 33,631 0.23Legal & General Group 50,948 143,413 0.99Muenchener Rueckversicherungs - Registered 1,558 252,240 1.73Prudential 21,975 368,014 2.53RSA Insurance Group 8,599 50,988 0.35 Lodging (0.98%) Accor 1,413 53,680 0.37Whitbread 1,615 88,924 0.61 Machinery - Diversified (0.43%) CNH Industrial 8,319 62,393 0.43 Media (1.48%) Reed Elsevier - GB 9,839 115,501 0.79Reed Elsevier - NL 5,966 99,930 0.69 Metal Fabricate & Hardware (1.16%) Assa Abloy - Class B 2,867 106,495 0.73SKF - Class B 3,306 61,582 0.43 Mining (0.54%) Norsk Hydro 11,537 45,082 0.31Umicore 989 33,557 0.23 Miscellaneous Manufacturers (0.45%) Orkla 6,826 44,402 0.31Sulzer - Registered 204 20,901 0.14
261

UBS ETF - MSCI Europe & Middle East Socially Responsible UCITS ETF Semi-Annual Report as of 30 June 2014 Schedule of Investments as at 30 June 2014 (Expressed in EUR) (Unaudited)
The accompanying notes form an integral part of these financial statements.
Transferable securities listed on an Official Stock Exchange
Quantity Market
Value EUR % of
Net Assets Oil & Gas (5.35%) BG Group 29,296 451,837 3.10Galp Energia 3,207 42,910 0.29Neste Oil 1,296 18,468 0.13OMV 1,241 40,953 0.28Repsol 7,480 144,065 0.99Tullow Oil 7,579 80,783 0.56 Oil & Gas Services (0.70%) AMEC 2,497 37,888 0.26Fugro - CVA 718 30,023 0.20Petrofac 2,301 34,569 0.24 Other Finance (0.19%) Exor 908 27,231 0.19 Packaging & Containers (0.28%) Rexam 6,043 40,373 0.28 Pharmaceuticals & Biotechnology (14.05%) Actelion - Registered 876 80,950 0.56Merck 1,112 70,490 0.48Novo Nordisk - Class B 17,077 574,021 3.94Roche Holding 6,056 1,319,273 9.07 Private Equity (0.27%) 3i Group 7,767 38,983 0.27 Real Estate Investment Trusts (2.79%) British Land 8,005 70,229 0.48Hammerson 6,131 44,408 0.30Land Securities Group 6,729 87,060 0.60Segro 6,332 27,297 0.19Unibail-Rodamco 836 177,608 1.22 Retail (5.49%) Hennes & Mauritz - Class B 8,265 263,664 1.81Inditex 1,921 215,921 1.49Kingfisher 20,440 91,639 0.63Marks & Spencer Group 13,908 73,852 0.51Next 1,355 109,569 0.75Travis Perkins 2,130 43,571 0.30 Semiconductors (1.43%) ASML Holding 3,067 208,587 1.43 Software (3.06%) SAP 7,893 445,165 3.06 Telecommunications (6.07%) BT Group 68,822 330,812 2.28Vodafone Group 226,660 551,971 3.79 Transportation (0.15%) Koninklijke Vopak 610 21,777 0.15
_______________________________________________________________________________________________________________ ____________________________________________________________
Total Common Stocks 14,405,249 98.99 _______________________________________________________________________________________________________________ ____________________________________________________________
Preferred Stocks Household Products (0.89%) Henkel & Co 1,536 129,684 0.89
_______________________________________________________________________________________________________________ ____________________________________________________________
Total Preferred Stocks 129,684 0.89 _______________________________________________________________________________________________________________ ____________________________________________________________
Rights Oil & Gas (0.03%) Repsol - Rights 7,480 3,718 0.03
262

UBS ETF - MSCI Europe & Middle East Socially Responsible UCITS ETF Semi-Annual Report as of 30 June 2014 Schedule of Investments as at 30 June 2014 (Expressed in EUR) (Unaudited)
The accompanying notes form an integral part of these financial statements.
Transferable securities listed on an Official Stock Exchange
Market
Value EUR % of
Net Assets
Total Rights 3,718 0.03 _______________________________________________________________________________________________________________ ____________________________________________________________
TOTAL INVESTMENTS (Cost EUR 11,952,252) 14,538,651 99.91Other net assets 13,461 0.09
_______________________________________________________________________________________________________________ ____________________________________________________________
TOTAL NET ASSETS 14,552,112 100.00 _______________________________________________________________________________________________________________ ____________________________________________________________ _______________________________________________________________________________________________________________ ____________________________________________________________
263

UBS ETF - MSCI Pacific Socially Responsible UCITS ETF Semi-Annual Report as of 30 June 2014 Schedule of Investments as at 30 June 2014 (Expressed in USD) (Unaudited)
The accompanying notes form an integral part of these financial statements.
Transferable securities listed on an Official Stock Exchange
Quantity Market
Value USD % of
Net AssetsCommon Stocks Airlines (0.22%) ANA Holdings 13,000 30,670 0.22 Auto Manufacturers (8.37%) Fuji Heavy Industries 6,800 188,283 1.35Hino Motors 3,000 41,311 0.30Honda Motor 19,000 663,373 4.75Nissan Motor 29,000 275,100 1.97 Auto Parts & Equipment (3.32%) Denso 5,700 272,045 1.95NGK Insulators 3,000 68,111 0.49Sumitomo Electric Industries 8,800 123,785 0.88 Banks (15.38%) Hang Seng Bank 8,900 145,379 1.04National Australia Bank 27,350 846,193 6.06Westpac Banking 36,128 1,155,289 8.28 Building Materials (2.05%) Asahi Glass 12,000 70,717 0.51Boral 9,068 44,934 0.32Daikin Industries 2,700 170,361 1.22 Chemicals (5.73%) Asahi Kasei 15,000 114,753 0.82Hitachi Chemical 1,200 19,853 0.14JSR 2,100 36,028 0.26Kaneka 3,000 18,775 0.14Kansai Paint 3,000 50,136 0.36Kuraray 4,000 50,698 0.36Nippon Paint 2,000 42,328 0.30Nitto Denko 1,800 84,345 0.60Shin-Etsu Chemical 4,800 291,776 2.09Sumitomo Chemical 17,000 64,271 0.46Teijin 11,000 27,580 0.20 Commercial Services (3.26%) Benesse Holdings 800 34,707 0.25Brambles 18,255 158,344 1.14Dai Nippon Printing 7,000 73,106 0.52Toppan Printing 6,000 46,434 0.33Transurban Group 20,405 142,326 1.02 Computers (0.71%) Nomura Research Institute 1,300 40,936 0.30NTT Data 1,500 57,598 0.41 Distribution & Wholesale (0.63%) Hitachi High-Technologies 700 16,653 0.12Toyota Tsusho 2,500 71,887 0.51 Diversified Financial Services (0.24%) AEON Financial Service 1,300 33,993 0.24 Electric (0.69%) AGL Energy 6,556 95,788 0.69 Electronics (4.03%) Ibiden 1,400 28,192 0.20Kyocera 3,700 175,604 1.26Murata Manufacturing 2,400 224,613 1.61Omron 2,400 101,160 0.73Yaskawa Electric 2,700 32,702 0.23 Engineering & Construction (1.85%) Auckland International Airport 11,159 38,104 0.27Chiyoda 2,000 24,224 0.17Obayashi 8,000 57,095 0.41Shimizu 7,000 49,543 0.35
264

UBS ETF - MSCI Pacific Socially Responsible UCITS ETF Semi-Annual Report as of 30 June 2014 Schedule of Investments as at 30 June 2014 (Expressed in USD) (Unaudited)
The accompanying notes form an integral part of these financial statements.
Transferable securities listed on an Official Stock Exchange
Quantity Market
Value USD % of
Net Assets Engineering & Construction (1.85%) (continued) Sydney Airport 12,538 49,939 0.36WorleyParsons 2,427 39,882 0.29 Food (3.92%) Ajinomoto 7,000 109,728 0.79Kikkoman 2,000 41,656 0.30Metcash 10,196 25,406 0.18Seven & I Holdings 8,800 370,746 2.65 Gas (1.83%) Osaka Gas 22,000 92,513 0.66Tokyo Gas 28,000 163,624 1.17 Healthcare Products (0.46%) Sysmex 1,700 63,852 0.46 Holding Companies - Diversified Operations (1.71%) Keppel 17,000 147,138 1.05Swire Pacific - Class A 7,500 92,319 0.66 Home Builders (2.08%) Daiwa House Industry 7,000 145,106 1.04Sekisui Chemical 5,000 57,895 0.41Sekisui House 6,400 87,751 0.63 Home Furnishings (3.68%) Panasonic 25,700 313,053 2.24Sony 12,100 200,900 1.44 Insurance (3.71%) AMP 34,476 172,463 1.24Insurance Australia Group 27,271 150,320 1.08NKSJ Holdings 3,800 102,328 0.73T&D Holdings 6,800 92,430 0.66 Iron & Steel (0.22%) Hitachi Metals 2,000 30,285 0.22 Lodging (0.29%) City Developments 5,000 41,030 0.29 Machinery - Construction & Mining (1.98%) Hitachi Construction Machinery 1,300 25,896 0.18Komatsu 10,800 250,744 1.80 Mining (0.70%) Sumitomo Metal Mining 6,000 97,428 0.70 Miscellaneous Manufacturers (1.92%) FUJIFILM Holdings 5,400 150,585 1.08Konica Minolta 5,500 54,346 0.39Nikon 4,000 62,978 0.45 Oil & Gas (3.24%) Inpex 10,200 155,056 1.11Woodside Petroleum 7,655 296,738 2.13 Pharmaceuticals & Biotechnology (4.51%) Alfresa Holdings 500 32,229 0.23Astellas Pharma 25,300 332,405 2.38Chugai Pharmaceutical 2,600 73,274 0.53Eisai 2,900 121,491 0.87Kyowa Hakko Kirin 3,000 40,600 0.29Suzuken 800 29,771 0.21 Pipelines (0.45%) APA Group 9,749 63,399 0.45 Real Estate (4.22%) CapitaLand 30,000 77,006 0.55
265

UBS ETF - MSCI Pacific Socially Responsible UCITS ETF Semi-Annual Report as of 30 June 2014 Schedule of Investments as at 30 June 2014 (Expressed in USD) (Unaudited)
The accompanying notes form an integral part of these financial statements.
Transferable securities listed on an Official Stock Exchange
Quantity Market
Value USD % of
Net Assets Real Estate (4.22%) (continued) Keppel Land 8,000 21,690 0.16Lend Lease Group 6,454 79,861 0.57Mitsui Fudosan 11,000 370,920 2.66Swire Properties 13,400 39,161 0.28 Real Estate Investment Trusts (3.53%) CapitaMall Trust 27,000 42,774 0.31CFS Retail Property Trust Group 24,122 46,446 0.33Dexus Property Group 63,204 66,217 0.47Goodman Group 20,176 96,168 0.69GPT Group 19,574 70,944 0.51Mirvac Group 42,719 71,972 0.51Stockland 27,041 99,028 0.71 Retail (4.95%) Aeon 7,400 91,016 0.65Lawson 700 52,515 0.38McDonald's Holdings 800 22,467 0.16Wesfarmers 13,284 524,594 3.76 Semiconductors (0.97%) Tokyo Electron 2,000 135,196 0.97 Telecommunications (5.15%) KDDI 6,800 414,759 2.97NTT DOCOMO 17,800 304,325 2.18 Textile (0.80%) Toray Industries 17,000 111,761 0.80 Transportation (3.00%) East Japan Railway 3,900 307,172 2.20Mitsui OSK Lines 13,000 48,379 0.35MTR 16,500 63,549 0.45
_______________________________________________________________________________________________________________ ____________________________________________________________
Total Common Stocks 13,934,327 99.80 _______________________________________________________________________________________________________________ ____________________________________________________________
TOTAL INVESTMENTS (Cost USD 12,204,514) 13,934,327 99.80Other net assets 27,539 0.20
_______________________________________________________________________________________________________________ ____________________________________________________________
TOTAL NET ASSETS 13,961,866 100.00 _______________________________________________________________________________________________________________ ____________________________________________________________ _______________________________________________________________________________________________________________ ____________________________________________________________
266

UBS ETF - MSCI Japan Infrastructure 20/35 UCITS ETF Semi-Annual Report as of 30 June 2014 Schedule of Investments as at 30 June 2014 (Expressed in JPY) (Unaudited)
The accompanying notes form an integral part of these financial statements.
Transferable securities listed on an Official Stock Exchange
Quantity Market
Value JPY % of
Net AssetsCommon Stocks Commercial Services (1.33%) Benesse Holdings 1,900 8,350,500 1.33 Distribution & Wholesale (0.96%) Mitsubishi Logistics 4,000 6,068,000 0.96 Electric (18.77%) Chubu Electric Power 19,000 23,921,000 3.80Chugoku Electric Power 8,700 12,023,400 1.91Hokuriku Electric Power 5,000 6,715,000 1.07Kansai Electric Power 20,700 19,768,500 3.14Kyushu Electric Power 12,600 14,376,600 2.29Shikoku Electric Power 5,300 7,494,200 1.19Tohoku Electric Power 13,300 15,813,700 2.51Tokyo Electric Power 42,600 17,977,200 2.86 Gas (11.37%) Osaka Gas 55,000 23,430,000 3.72Toho Gas 12,000 6,684,000 1.06Tokyo Gas 70,000 41,440,000 6.59 Telecommunications (66.51%) KDDI 17,200 106,278,800 16.89Nippon Telegraph & Telephone 8,400 53,071,200 8.44NTT DOCOMO 34,200 59,234,400 9.41SoftBank 26,500 199,889,500 31.77 Transportation (1.04%) Kamigumi 7,000 6,524,000 1.04
_______________________________________________________________________________________________________________ ____________________________________________________________
Total Common Stocks 629,060,000 99.98 _______________________________________________________________________________________________________________ ____________________________________________________________
TOTAL INVESTMENTS (Cost JPY 407,198,514) 629,060,000 99.98Other net assets 103,589 0.02
_______________________________________________________________________________________________________________ ____________________________________________________________
TOTAL NET ASSETS 629,163,589 100.00 _______________________________________________________________________________________________________________ ____________________________________________________________ _______________________________________________________________________________________________________________ ____________________________________________________________
267

UBS ETF - MSCI AC Asia ex Japan Infrastructure 20/35 UCITS ETF Semi-Annual Report as of 30 June 2014 Schedule of Investments as at 30 June 2014 (Expressed in USD) (Unaudited)
The accompanying notes form an integral part of these financial statements.
Transferable securities listed on an Official Stock Exchange
Quantity Market
Value USD % of
Net AssetsCommon Stocks Commercial Services (1.65%) International Container Terminal Services 13,610 34,610 0.42Jasa Marga Persero 53,700 27,065 0.32Jiangsu Expressway - Class H 32,000 37,861 0.45Zhejiang Expressway - Class H 38,000 38,489 0.46 Computers (0.58%) Citic 21CN 62,000 48,158 0.58 Diversified Financial Services (0.75%) COSCO Pacific 45,385 62,892 0.75 Electric (15.38%) CLP Holdings 49,000 402,098 4.81Korea Electric Power 6,634 244,562 2.92Power Assets Holdings 36,000 314,696 3.76Reliance Infrastructure - GDR 840 31,458 0.38Tenaga Nasional 72,900 276,525 3.30YTL Power International 38,785 17,756 0.21 Engineering & Construction (2.97%) Airports of Thailand 11,100 67,889 0.81Beijing Capital International Airport - Class H 38,000 26,133 0.31Cheung Kong Infrastructure Holdings 16,000 110,344 1.32Malaysia Airports Holdings 17,657 43,881 0.53 Gas (12.60%) China Gas Holdings 52,000 107,887 1.29China Resources Gas Group 24,000 75,558 0.90ENN Energy Holdings 20,000 143,735 1.72GAIL India - GDR 1,361 62,933 0.75Hong Kong & China Gas 162,690 356,013 4.26Korea Gas 723 39,444 0.47Perusahaan Gas Negara Persero 282,600 132,897 1.59Petronas Gas 17,800 135,814 1.62 Healthcare Services (1.92%) Bangkok Dusit Medical Services - Class F 80,000 41,165 0.49Bumrungrad Hospital 9,300 33,526 0.40IHH Healthcare 63,300 86,345 1.03 Holding Companies - Diversified Operations (1.80%) China Merchants Holdings International 30,000 93,673 1.12YTL 112,500 56,758 0.68 Telecommunications (54.87%) Advanced Info Service - Registered 26,900 182,345 2.18Asia Pacific Telecom 43,000 25,851 0.31Axiata Group 66,000 143,264 1.71China Communications Services - Class H 62,000 30,159 0.36China Mobile 156,500 1,518,486 18.15China Telecom - Class H 360,000 176,044 2.10China Unicom Hong Kong 124,000 191,671 2.29Chunghwa Telecom 98,000 315,748 3.78DiGi.Com 80,400 143,473 1.72Far EasTone Telecommunications 41,000 93,375 1.12Globe Telecom 875 32,073 0.38HKT Trust and HKT 68,000 80,105 0.96KT 1,700 51,329 0.61LG Uplus 5,519 50,292 0.60Maxis 48,300 101,534 1.21PCCW 104,472 62,276 0.74Philippine Long Distance Telephone 1,125 77,010 0.92Singapore Telecommunications 204,000 630,008 7.53Singapore Telecommunications 10 2,000 6,177 0.07SK Telecom 254 59,370 0.71StarHub 15,000 50,175 0.60Taiwan Mobile 43,000 133,070 1.59Telekom Malaysia 28,642 56,642 0.68Telekomunikasi Indonesia Persero 1,305,300 271,410 3.25
268

UBS ETF - MSCI AC Asia ex Japan Infrastructure 20/35 UCITS ETF Semi-Annual Report as of 30 June 2014 Schedule of Investments as at 30 June 2014 (Expressed in USD) (Unaudited)
The accompanying notes form an integral part of these financial statements.
Transferable securities listed on an Official Stock Exchange
Quantity/ Nominal
Market Value USD
% of Net Assets
Telecommunications (54.87%) (continued) Tower Bersama Infrastructure 48,400 32,865 0.39True 146,300 43,049 0.52XL Axiata 75,400 32,437 0.39 Transportation (1.25%) Hutchison Port Holdings Trust - Class U 145,000 104,400 1.25 Water (1.76%) Beijing Enterprises Water Group 110,000 73,519 0.88Guangdong Investment 64,000 73,824 0.88
_______________________________________________________________________________________________________________ ____________________________________________________________
Total Common Stocks 7,992,146 95.53 _______________________________________________________________________________________________________________ ____________________________________________________________
Corporate Bonds Diversified Financial Services (1.57%) Credit Suisse 15/09/2014 (zero coupon) 20,221 44,530 0.53Credit Suisse 27/10/2014 (zero coupon) 15,491 86,772 1.04
_______________________________________________________________________________________________________________ ____________________________________________________________
Total Corporate Bonds 131,302 1.57 _______________________________________________________________________________________________________________ ____________________________________________________________
Warrants Commercial Services (0.62%) Adani Ports and Special Economic Zone 12,815 51,645 0.62 Electric (1.11%) Power Grid Corporation of India 20,529 47,541 0.57Tata Power 25,400 45,552 0.54 Healthcare Services (0.40%) Apollo Hospitals Enterprise 2,000 33,108 0.40 Telecommunications (0.57%) Idea Cellular 6,939 15,196 0.18Reliance Communications 13,450 32,549 0.39
_______________________________________________________________________________________________________________ ____________________________________________________________
Total Warrants 225,591 2.70 _______________________________________________________________________________________________________________ ____________________________________________________________
Transferable securities non-listed on an Official Stock Exchange
Rights
Telecommunications (0.04%) HKT Trust and HKT- Rights 10,440 3,085 0.04
_______________________________________________________________________________________________________________ ____________________________________________________________
Total Rights 3,085 0.04 _______________________________________________________________________________________________________________ ____________________________________________________________
TOTAL INVESTMENTS (Cost USD 7,490,550) 8,352,124 99.84Other net assets 13,446 0.16
_______________________________________________________________________________________________________________ ____________________________________________________________
TOTAL NET ASSETS 8,365,570 100.00 _______________________________________________________________________________________________________________ ____________________________________________________________ _______________________________________________________________________________________________________________ ____________________________________________________________
269

UBS ETF - MSCI Europe Infrastructure 20/35 UCITS ETF Semi-Annual Report as of 30 June 2014 Schedule of Investments as at 30 June 2014 (Expressed in EUR) (Unaudited)
The accompanying notes form an integral part of these financial statements.
Transferable securities listed on an Official Stock Exchange
Quantity Market
Value EUR % of
Net AssetsCommon Stocks Commercial Services (2.38%) Abertis Infraestructuras 2,679 45,021 1.06Atlantia 2,697 56,151 1.32 Electric (28.53%) E.ON 13,119 197,834 4.65EDP - Energias de Portugal 15,101 55,330 1.30Electricite de France 1,556 35,788 0.84Enel 43,011 182,969 4.30Fortum 2,883 56,536 1.33GDF Suez 9,463 190,254 4.47Iberdrola 33,438 186,684 4.38Red Electrica 702 46,894 1.10RWE 3,212 100,744 2.36SSE 6,291 123,111 2.89Terna Rete Elettrica Nazionale 10,024 38,612 0.91 Engineering & Construction (0.72%) Aeroports de Paris 189 18,186 0.43Fraport Frankfurt Airport Services Worldwide 245 12,642 0.29 Gas (12.35%) Centrica 32,818 128,117 3.01Enagas 1,315 30,903 0.73Gas Natural SDG 2,311 53,303 1.25National Grid 24,270 254,598 5.98Snam 13,392 58,925 1.38 Internet (0.88%) Iliad 169 37,307 0.88 Telecommunications (50.03%) Belgacom 981 23,775 0.56BT Group 51,287 246,525 5.79Deutsche Telekom - Registered 20,407 261,210 6.13Elisa 914 20,419 0.48Inmarsat 2,750 25,671 0.60Koninklijke KPN 21,148 56,275 1.32Millicom International Cellular 444 29,686 0.70Orange 12,114 139,614 3.28Swisscom - Registered 153 64,960 1.53TDC 5,414 40,921 0.96Tele2 - Class B 2,047 17,600 0.41Telecom Italia 66,342 61,366 1.44Telecom Italia - Rsp 38,595 27,846 0.65Telefonica 26,713 334,447 7.86Telefonica Deutschland Holding 1,951 11,782 0.28Telekom Austria 1,438 10,267 0.24Telenor 4,937 82,092 1.93TeliaSonera 15,598 83,177 1.95Vivendi 7,857 140,405 3.30Vodafone Group 172,228 419,416 9.85Ziggo 967 32,656 0.77 Transportation (1.10%) Groupe Eurotunnel - Registered 3,095 30,569 0.72Koninklijke Vopak 453 16,172 0.38 Water (3.48%) Severn Trent 1,536 37,060 0.87Suez Environnement 1,811 25,318 0.59United Utilities Group 4,410 48,575 1.14Veolia Environnement 2,686 37,375 0.88
270

UBS ETF - MSCI Europe Infrastructure 20/35 UCITS ETF Semi-Annual Report as of 30 June 2014 Schedule of Investments as at 30 June 2014 (Expressed in EUR) (Unaudited)
The accompanying notes form an integral part of these financial statements.
Transferable securities listed on an Official Stock Exchange
Market
Value EUR % of
Net Assets
Total Common Stocks 4,235,088 99.47 _______________________________________________________________________________________________________________ ____________________________________________________________
TOTAL INVESTMENTS (Cost EUR 3,950,568) 4,235,088 99.47Other net assets 22,760 0.53
_______________________________________________________________________________________________________________ ____________________________________________________________
TOTAL NET ASSETS 4,257,848 100.00 _______________________________________________________________________________________________________________ ____________________________________________________________ _______________________________________________________________________________________________________________ ____________________________________________________________
271

UBS ETF - STOXX Global Rare Earth UCITS ETF Semi-Annual Report as of 30 June 2014 Schedule of Investments as at 30 June 2014 (Expressed in USD) (Unaudited)
The accompanying notes form an integral part of these financial statements.
Transferable securities listed on an Official Stock Exchange
Quantity Market
Value USD % of
Net AssetsCommon Stocks Mining (100.01%) Alkane Resources 2,388,424 597,393 7.38Avalon Rare Metals 944,800 430,200 5.32Canada Carbon 644,010 114,878 1.42China Rare Earth Holdings 9,386,754 1,186,917 14.67Geomega Resources 370,732 130,521 1.61Gold Canyon Resources 1,084,907 346,307 4.28Great Western Minerals Group 3,359,938 252,354 3.12Greenland Minerals & Energy 4,989,037 470,890 5.82Lynas 11,280,269 1,384,095 17.10Makena Resources 220,088 8,265 0.10Molycorp 537,646 1,381,750 17.07Quest Rare Minerals 571,645 163,688 2.02Rare Element Resources - CA 30,448 40,592 0.50Rare Element Resources - US 374,440 486,772 6.01Tasman Metals 556,865 538,488 6.65Ucore Rare Metals 1,662,045 561,739 6.94
_______________________________________________________________________________________________________________ ____________________________________________________________
Total Common Stocks 8,094,849 100.01 _______________________________________________________________________________________________________________ ____________________________________________________________
Rights Mining (0.00%) Greenland Minerals & Energy - Rights 320,000 302 0.00
_______________________________________________________________________________________________________________ ____________________________________________________________
Total Rights 302 0.00 _______________________________________________________________________________________________________________ ____________________________________________________________
TOTAL INVESTMENTS (Cost USD 15,817,051) 8,095,151 100.01Other net liabilities (960) (0.01)
_______________________________________________________________________________________________________________ ____________________________________________________________
TOTAL NET ASSETS 8,094,191 100.00 _______________________________________________________________________________________________________________ ____________________________________________________________ _______________________________________________________________________________________________________________ ____________________________________________________________
272

UBS ETF - Barclays Capital US 1-3 Year Treasury Bond UCITS ETF Semi-Annual Report as of 30 June 2014 Schedule of Investments as at 30 June 2014 (Expressed in USD) (Unaudited)
The accompanying notes form an integral part of these financial statements.
Transferable securities listed on an Official Stock Exchange
Nominal Market
Value USD % of
Net AssetsGovernment Bonds Sovereign Bonds (99.54%) United States Treasury Bond 10.625% 15/08/2015 21,000 23,462 0.16United States Treasury Bond 9.875% 15/11/2015 25,000 28,312 0.20United States Treasury Bond 9.250% 15/02/2016 17,000 19,467 0.14United States Treasury Bond 7.250% 15/05/2016 71,000 80,054 0.56United States Treasury Bond 7.500% 15/11/2016 59,000 68,586 0.48United States Treasury Bond 8.750% 15/05/2017 40,000 49,014 0.34United States Treasury Note 0.250% 15/05/2015 16,000 16,019 0.11United States Treasury Note 4.125% 15/05/2015 16,000 16,557 0.12United States Treasury Note 0.250% 31/05/2015 18,000 18,022 0.13United States Treasury Note 2.125% 31/05/2015 20,000 20,363 0.14United States Treasury Note 0.375% 15/06/2015 188,000 188,419 1.32United States Treasury Note 0.375% 30/06/2015 202,000 202,459 1.41United States Treasury Note 1.875% 30/06/2015 226,000 229,876 1.60United States Treasury Note 0.250% 15/07/2015 185,000 185,174 1.29United States Treasury Note 0.250% 31/07/2015 203,000 203,199 1.42United States Treasury Note 1.750% 31/07/2015 211,000 214,612 1.50United States Treasury Note 0.250% 15/08/2015 184,000 184,166 1.29United States Treasury Note 4.250% 15/08/2015 179,000 187,189 1.31United States Treasury Note 0.375% 31/08/2015 193,000 193,467 1.35United States Treasury Note 1.250% 31/08/2015 209,000 211,669 1.48United States Treasury Note 0.250% 15/09/2015 182,000 182,171 1.27United States Treasury Note 0.250% 30/09/2015 187,000 187,191 1.31United States Treasury Note 1.250% 30/09/2015 207,000 209,774 1.46United States Treasury Note 0.250% 15/10/2015 182,000 182,186 1.27United States Treasury Note 0.250% 31/10/2015 182,000 182,149 1.27United States Treasury Note 1.250% 31/10/2015 203,000 205,838 1.44United States Treasury Note 0.375% 15/11/2015 184,000 184,423 1.29United States Treasury Note 4.500% 15/11/2015 134,000 141,881 0.99United States Treasury Note 0.250% 30/11/2015 180,000 180,079 1.26United States Treasury Note 1.375% 30/11/2015 207,000 210,335 1.47United States Treasury Note 0.250% 15/12/2015 184,000 184,035 1.28United States Treasury Note 0.250% 31/12/2015 184,000 184,009 1.28United States Treasury Note 2.125% 31/12/2015 209,000 214,842 1.50United States Treasury Note 0.375% 15/01/2016 182,000 182,289 1.27United States Treasury Note 0.375% 31/01/2016 182,000 182,266 1.27United States Treasury Note 2.000% 31/01/2016 196,000 201,302 1.41United States Treasury Note 0.375% 15/02/2016 181,000 181,217 1.26United States Treasury Note 4.500% 15/02/2016 111,000 118,552 0.83United States Treasury Note 0.250% 29/02/2016 178,000 177,820 1.24United States Treasury Note 2.125% 29/02/2016 88,000 90,644 0.63United States Treasury Note 2.625% 29/02/2016 70,000 72,692 0.51United States Treasury Note 0.375% 15/03/2016 182,000 182,104 1.27United States Treasury Note 0.375% 31/03/2016 186,000 186,037 1.30United States Treasury Note 2.250% 31/03/2016 122,000 126,030 0.88United States Treasury Note 2.375% 31/03/2016 93,000 96,294 0.67United States Treasury Note 0.250% 15/04/2016 180,000 179,590 1.25United States Treasury Note 0.375% 30/04/2016 179,000 178,944 1.25United States Treasury Note 2.000% 30/04/2016 133,000 136,922 0.96United States Treasury Note 2.625% 30/04/2016 79,500 82,753 0.58United States Treasury Note 0.250% 15/05/2016 174,000 173,502 1.21United States Treasury Note 5.125% 15/05/2016 91,000 99,026 0.69United States Treasury Note 0.375% 31/05/2016 162,000 161,848 1.13United States Treasury Note 1.750% 31/05/2016 137,000 140,476 0.98United States Treasury Note 3.250% 31/05/2016 94,000 99,108 0.69United States Treasury Note 0.500% 15/06/2016 185,000 185,228 1.29United States Treasury Note 1.500% 30/06/2016 182,500 186,267 1.30United States Treasury Note 3.250% 30/06/2016 95,000 100,288 0.70United States Treasury Note 0.625% 15/07/2016 184,000 184,572 1.29United States Treasury Note 1.500% 31/07/2016 202,000 206,202 1.44United States Treasury Note 3.250% 31/07/2016 129,000 136,407 0.95United States Treasury Note 0.625% 15/08/2016 182,000 182,450 1.27United States Treasury Note 4.875% 15/08/2016 93,000 101,604 0.71United States Treasury Note 1.000% 31/08/2016 202,000 204,091 1.42United States Treasury Note 3.000% 31/08/2016 131,000 138,015 0.96United States Treasury Note 0.875% 15/09/2016 178,000 179,296 1.25United States Treasury Note 1.000% 30/09/2016 200,000 201,956 1.41United States Treasury Note 3.000% 30/09/2016 137,000 144,532 1.01United States Treasury Note 0.625% 15/10/2016 164,000 164,167 1.15United States Treasury Note 1.000% 31/10/2016 200,000 201,884 1.41
273

UBS ETF - Barclays Capital US 1-3 Year Treasury Bond UCITS ETF Semi-Annual Report as of 30 June 2014 Schedule of Investments as at 30 June 2014 (Expressed in USD) (Unaudited)
The accompanying notes form an integral part of these financial statements.
Transferable securities listed on an Official Stock Exchange
Nominal Market
Value USD % of
Net Assets Sovereign Bonds (99.54%) (continued) United States Treasury Note 3.125% 31/10/2016 152,000 160,957 1.12United States Treasury Note 0.625% 15/11/2016 165,000 165,036 1.15United States Treasury Note 4.625% 15/11/2016 105,000 114,961 0.80United States Treasury Note 0.875% 30/11/2016 200,000 201,226 1.40United States Treasury Note 2.750% 30/11/2016 137,000 144,001 1.01United States Treasury Note 0.625% 15/12/2016 169,000 168,904 1.18United States Treasury Note 0.875% 31/12/2016 201,000 202,055 1.41United States Treasury Note 3.250% 31/12/2016 128,000 136,209 0.95United States Treasury Note 0.750% 15/01/2017 169,000 169,277 1.18United States Treasury Note 0.875% 31/01/2017 191,000 191,861 1.34United States Treasury Note 3.125% 31/01/2017 155,000 164,670 1.15United States Treasury Note 0.625% 15/02/2017 167,000 166,586 1.16United States Treasury Note 4.625% 15/02/2017 88,000 96,982 0.68United States Treasury Note 0.875% 28/02/2017 187,000 187,699 1.31United States Treasury Note 3.000% 28/02/2017 118,000 125,052 0.87United States Treasury Note 0.750% 15/03/2017 174,000 173,988 1.21United States Treasury Note 1.000% 31/03/2017 186,000 187,112 1.31United States Treasury Note 3.250% 31/03/2017 129,000 137,709 0.96United States Treasury Note 0.875% 15/04/2017 169,000 169,402 1.18United States Treasury Note 0.875% 30/04/2017 194,000 194,347 1.36United States Treasury Note 3.125% 30/04/2017 115,000 122,445 0.85United States Treasury Note 0.875% 15/05/2017 152,000 152,198 1.06United States Treasury Note 4.500% 15/05/2017 72,000 79,513 0.56United States Treasury Note 0.625% 31/05/2017 180,000 178,805 1.25United States Treasury Note 2.750% 31/05/2017 110,000 116,018 0.81
_______________________________________________________________________________________________________________ ____________________________________________________________
Total Government Bonds 14,262,387 99.54 _______________________________________________________________________________________________________________ ____________________________________________________________
TOTAL INVESTMENTS (Cost USD 14,239,676) 14,262,387 99.54Other net assets 65,613 0.46
_______________________________________________________________________________________________________________ ____________________________________________________________
TOTAL NET ASSETS 14,328,000 100.00 _______________________________________________________________________________________________________________ ____________________________________________________________ _______________________________________________________________________________________________________________ ____________________________________________________________
274

UBS ETF - Barclays Capital US 3-5 Year Treasury Bond UCITS ETF Semi-Annual Report as of 30 June 2014 Schedule of Investments as at 30 June 2014 (Expressed in USD) (Unaudited)
The accompanying notes form an integral part of these financial statements.
Transferable securities listed on an Official Stock Exchange
Nominal Market
Value USD % of
Net AssetsGovernment Bonds Sovereign Bonds (99.52%) United States Treasury Bond 8.875% 15/08/2017 34,000 42,316 0.43United States Treasury Bond 9.125% 15/05/2018 22,000 28,609 0.29United States Treasury Bond 9.000% 15/11/2018 23,000 30,455 0.31United States Treasury Bond 8.875% 15/02/2019 37,000 49,305 0.51United States Treasury Note 0.750% 30/06/2017 236,000 235,056 2.41United States Treasury Note 2.500% 30/06/2017 142,000 148,763 1.52United States Treasury Note 0.500% 31/07/2017 225,000 222,021 2.27United States Treasury Note 2.375% 31/07/2017 155,000 161,818 1.66United States Treasury Note 4.750% 15/08/2017 111,000 124,095 1.27United States Treasury Note 0.625% 31/08/2017 244,000 241,318 2.47United States Treasury Note 1.875% 31/08/2017 188,000 193,341 1.98United States Treasury Note 0.625% 30/09/2017 224,000 221,227 2.27United States Treasury Note 1.875% 30/09/2017 161,000 165,452 1.70United States Treasury Note 0.750% 31/10/2017 218,000 215,877 2.21United States Treasury Note 1.875% 31/10/2017 181,000 186,025 1.91United States Treasury Note 4.250% 15/11/2017 122,000 134,976 1.38United States Treasury Note 0.625% 30/11/2017 236,000 232,403 2.38United States Treasury Note 2.250% 30/11/2017 156,000 162,148 1.66United States Treasury Note 0.750% 31/12/2017 225,000 222,156 2.28United States Treasury Note 2.750% 31/12/2017 119,000 125,762 1.29United States Treasury Note 0.875% 31/01/2018 157,000 155,505 1.59United States Treasury Note 2.625% 31/01/2018 118,000 124,186 1.27United States Treasury Note 3.500% 15/02/2018 167,000 180,908 1.85United States Treasury Note 0.750% 28/02/2018 210,000 206,711 2.12United States Treasury Note 2.750% 28/02/2018 92,000 97,250 1.00United States Treasury Note 0.750% 31/03/2018 176,000 172,922 1.77United States Treasury Note 2.875% 31/03/2018 106,500 113,074 1.16United States Treasury Note 0.625% 30/04/2018 233,000 227,513 2.33United States Treasury Note 2.625% 30/04/2018 64,000 67,349 0.69United States Treasury Note 3.875% 15/05/2018 94,000 103,421 1.06United States Treasury Note 1.000% 31/05/2018 238,000 235,420 2.41United States Treasury Note 2.375% 31/05/2018 78,000 81,317 0.83United States Treasury Note 1.375% 30/06/2018 172,000 172,394 1.77United States Treasury Note 2.375% 30/06/2018 96,000 100,074 1.03United States Treasury Note 1.375% 31/07/2018 215,000 215,286 2.21United States Treasury Note 2.250% 31/07/2018 71,000 73,602 0.75United States Treasury Note 4.000% 15/08/2018 101,000 111,927 1.15United States Treasury Note 1.500% 31/08/2018 319,000 320,671 3.29United States Treasury Note 1.375% 30/09/2018 342,000 341,572 3.50United States Treasury Note 1.250% 31/10/2018 220,000 218,295 2.24United States Treasury Note 1.750% 31/10/2018 94,500 95,846 0.98United States Treasury Note 3.750% 15/11/2018 193,000 212,312 2.18United States Treasury Note 1.250% 30/11/2018 224,000 221,982 2.27United States Treasury Note 1.375% 30/11/2018 97,000 96,731 0.99United States Treasury Note 1.375% 31/12/2018 120,000 119,489 1.22United States Treasury Note 1.500% 31/12/2018 250,000 250,155 2.56United States Treasury Note 1.250% 31/01/2019 169,000 167,102 1.71United States Treasury Note 1.500% 31/01/2019 244,000 243,856 2.50United States Treasury Note 2.750% 15/02/2019 181,000 191,038 1.96United States Treasury Note 1.375% 28/02/2019 170,000 168,776 1.73United States Treasury Note 1.500% 28/02/2019 243,000 242,611 2.49United States Treasury Note 1.500% 31/03/2019 80,000 79,829 0.82United States Treasury Note 1.625% 31/03/2019 251,000 251,725 2.58United States Treasury Note 1.250% 30/04/2019 70,000 68,957 0.71United States Treasury Note 1.625% 30/04/2019 245,000 245,461 2.52United States Treasury Note 3.125% 15/05/2019 240,000 257,412 2.64United States Treasury Note 1.125% 31/05/2019 87,000 85,036 0.87United States Treasury Note 1.500% 31/05/2019 252,000 250,720 2.57
_______________________________________________________________________________________________________________ ____________________________________________________________
Total Government Bonds 9,711,558 99.52 _______________________________________________________________________________________________________________ ____________________________________________________________
TOTAL INVESTMENTS (Cost USD 9,724,432) 9,711,558 99.52Other net assets 46,402 0.48
_______________________________________________________________________________________________________________ ____________________________________________________________
TOTAL NET ASSETS 9,757,960 100.00 _______________________________________________________________________________________________________________ ____________________________________________________________ _______________________________________________________________________________________________________________ ____________________________________________________________
275

UBS ETF - Barclays Capital US 5-7 Year Treasury Bond UCITS ETF Semi-Annual Report as of 30 June 2014 Schedule of Investments as at 30 June 2014 (Expressed in USD) (Unaudited)
The accompanying notes form an integral part of these financial statements.
Transferable securities listed on an Official Stock Exchange
Nominal Market
Value USD % of
Net AssetsGovernment Bonds Sovereign Bonds (99.28%) United States Treasury Bond 8.125% 15/08/2019 43,300 57,159 0.85United States Treasury Bond 8.500% 15/02/2020 21,000 28,610 0.43United States Treasury Bond 8.750% 15/05/2020 17,500 24,296 0.36United States Treasury Bond 8.750% 15/08/2020 37,500 52,434 0.78United States Treasury Bond 7.875% 15/02/2021 24,000 32,813 0.49United States Treasury Bond 8.125% 15/05/2021 21,000 29,236 0.44United States Treasury Note 3.125% 15/05/2019 28,000 30,031 0.45United States Treasury Note 1.125% 31/05/2019 10,000 9,774 0.15United States Treasury Note 1.000% 30/06/2019 87,500 84,809 1.27United States Treasury Note 0.875% 31/07/2019 113,800 109,441 1.63United States Treasury Note 3.625% 15/08/2019 213,000 233,912 3.49United States Treasury Note 1.000% 31/08/2019 126,400 122,107 1.82United States Treasury Note 1.000% 30/09/2019 154,400 148,974 2.22United States Treasury Note 1.250% 31/10/2019 108,000 105,486 1.57United States Treasury Note 3.375% 15/11/2019 273,500 297,256 4.44United States Treasury Note 1.000% 30/11/2019 165,500 159,097 2.37United States Treasury Note 1.125% 31/12/2019 164,700 159,138 2.38United States Treasury Note 1.375% 31/01/2020 174,100 170,244 2.54United States Treasury Note 3.625% 15/02/2020 330,100 363,113 5.42United States Treasury Note 1.250% 29/02/2020 144,500 140,120 2.09United States Treasury Note 1.125% 31/03/2020 137,300 131,960 1.97United States Treasury Note 1.125% 30/04/2020 178,000 170,804 2.55United States Treasury Note 3.500% 15/05/2020 237,600 259,804 3.88United States Treasury Note 1.375% 31/05/2020 181,000 175,968 2.63United States Treasury Note 1.875% 30/06/2020 121,000 120,891 1.80United States Treasury Note 2.000% 31/07/2020 172,000 172,931 2.58United States Treasury Note 2.625% 15/08/2020 260,000 270,624 4.04United States Treasury Note 2.125% 31/08/2020 197,800 199,863 2.98United States Treasury Note 2.000% 30/09/2020 156,000 156,301 2.33United States Treasury Note 1.750% 31/10/2020 210,000 207,033 3.09United States Treasury Note 2.625% 15/11/2020 424,000 440,447 6.57United States Treasury Note 2.000% 30/11/2020 190,000 189,915 2.83United States Treasury Note 2.375% 31/12/2020 175,000 178,801 2.67United States Treasury Note 2.125% 31/01/2021 199,000 199,989 2.99United States Treasury Note 3.625% 15/02/2021 342,000 376,467 5.62United States Treasury Note 2.000% 28/02/2021 210,000 209,162 3.12United States Treasury Note 2.250% 31/03/2021 210,000 212,281 3.17United States Treasury Note 2.250% 30/04/2021 217,000 219,135 3.27United States Treasury Note 3.125% 15/05/2021 197,000 210,349 3.14United States Treasury Note 2.000% 31/05/2021 193,000 191,568 2.86
_______________________________________________________________________________________________________________ ____________________________________________________________
Total Government Bonds 6,652,343 99.28 _______________________________________________________________________________________________________________ ____________________________________________________________
TOTAL INVESTMENTS (Cost USD 6,619,109) 6,652,343 99.28Other net assets 48,209 0.72
_______________________________________________________________________________________________________________ ____________________________________________________________
TOTAL NET ASSETS 6,700,552 100.00 _______________________________________________________________________________________________________________ ____________________________________________________________ _______________________________________________________________________________________________________________ ____________________________________________________________
276

UBS ETF - Barclays Capital US 7-10 Year Treasury Bond UCITS ETF Semi-Annual Report as of 30 June 2014 Schedule of Investments as at 30 June 2014 (Expressed in USD) (Unaudited)
The accompanying notes form an integral part of these financial statements.
Transferable securities listed on an Official Stock Exchange
Nominal Market
Value USD % of
Net AssetsGovernment Bonds Sovereign Bonds (99.33%) United States Treasury Bond 8.125% 15/08/2021 94,000 131,770 0.74United States Treasury Bond 8.000% 15/11/2021 301,500 422,320 2.38United States Treasury Bond 7.250% 15/08/2022 151,000 207,521 1.17United States Treasury Bond 7.625% 15/11/2022 83,500 117,754 0.66United States Treasury Bond 7.125% 15/02/2023 155,500 214,189 1.21United States Treasury Bond 6.250% 15/08/2023 262,000 345,599 1.95United States Treasury Note 2.125% 15/08/2021 1,331,300 1,330,421 7.49United States Treasury Note 2.000% 15/11/2021 1,360,500 1,343,548 7.57United States Treasury Note 2.000% 15/02/2022 990,900 975,472 5.50United States Treasury Note 1.750% 15/05/2022 875,200 842,424 4.75United States Treasury Note 1.625% 15/08/2022 737,500 700,153 3.94United States Treasury Note 1.625% 15/11/2022 1,216,300 1,149,610 6.48United States Treasury Note 2.000% 15/02/2023 1,699,000 1,649,695 9.29United States Treasury Note 1.750% 15/05/2023 1,930,000 1,827,961 10.30United States Treasury Note 2.500% 15/08/2023 1,489,000 1,497,830 8.44United States Treasury Note 2.750% 15/11/2023 1,925,000 1,973,010 11.11United States Treasury Note 2.750% 15/02/2024 2,070,000 2,116,844 11.92United States Treasury Note 2.500% 15/05/2024 788,000 786,802 4.43
_______________________________________________________________________________________________________________ ____________________________________________________________
Total Government Bonds 17,632,923 99.33 _______________________________________________________________________________________________________________ ____________________________________________________________
TOTAL INVESTMENTS (Cost USD 17,570,299) 17,632,923 99.33Other net assets 118,990 0.67
_______________________________________________________________________________________________________________ ____________________________________________________________
TOTAL NET ASSETS 17,751,913 100.00 _______________________________________________________________________________________________________________ ____________________________________________________________ _______________________________________________________________________________________________________________ ____________________________________________________________
277

UBS ETF - Markit iBoxx € Germany 1-3 UCITS ETF Semi-Annual Report as of 30 June 2014 Schedule of Investments as at 30 June 2014 (Expressed in EUR) (Unaudited)
The accompanying notes form an integral part of these financial statements.
Transferable securities listed on an Official Stock Exchange
Nominal Market
Value EUR % of
Net AssetsGovernment Bonds Sovereign Bonds (98.68%) Bundesobligation 1.750% 09/10/2015 3,649,300 3,729,313 6.18Bundesobligation 2.000% 26/02/2016 3,649,300 3,768,397 6.24Bundesobligation 2.750% 08/04/2016 4,106,100 4,303,039 7.13Bundesobligation 1.250% 14/10/2016 3,649,900 3,751,825 6.22Bundesobligation 0.750% 24/02/2017 3,649,600 3,717,653 6.16Bundesobligation 0.500% 07/04/2017 4,105,600 4,155,447 6.89Bundesrepublik Deutschland 3.250% 04/07/2015 4,790,500 4,944,812 8.19Bundesrepublik Deutschland 3.500% 04/01/2016 5,246,700 5,522,012 9.15Bundesrepublik Deutschland 6.000% 20/06/2016 877,000 979,299 1.62Bundesrepublik Deutschland 4.000% 04/07/2016 5,246,700 5,662,534 9.38Bundesrepublik Deutschland 3.750% 04/01/2017 4,561,700 4,986,654 8.26Bundesschatzanweisungen 12/06/2015 (zero coupon) 3,411,700 3,410,616 5.65Bundesschatzanweisungen 0.250% 11/09/2015 3,421,300 3,430,349 5.68Bundesschatzanweisungen 11/12/2015 (zero coupon) 3,207,600 3,206,305 5.31Bundesschatzanweisungen 0.250% 11/03/2016 2,955,500 2,966,352 4.91Bundesschatzanweisungen 0.250% 10/06/2016 1,025,000 1,029,351 1.71
_______________________________________________________________________________________________________________ ____________________________________________________________
Total Government Bonds 59,563,958 98.68 _______________________________________________________________________________________________________________ ____________________________________________________________ _______________________________________________________________________________________________________________ ____________________________________________________________
TOTAL INVESTMENTS (Cost EUR 59,440,486) 59,563,958 98.68Other net assets 796,052 1.32
_______________________________________________________________________________________________________________ ____________________________________________________________
TOTAL NET ASSETS 60,360,010 100.00 _______________________________________________________________________________________________________________ ____________________________________________________________ _______________________________________________________________________________________________________________ ____________________________________________________________
278

UBS ETF - Markit iBoxx € Germany 3-5 UCITS ETF Semi-Annual Report as of 30 June 2014 Schedule of Investments as at 30 June 2014 (Expressed in EUR) (Unaudited)
The accompanying notes form an integral part of these financial statements.
Transferable securities listed on an Official Stock Exchange
Nominal Market
Value EUR % of
Net AssetsGovernment Bonds Sovereign Bonds (98.40%) Bundesobligation 0.500% 13/10/2017 237,700 240,874 8.58Bundesobligation 0.500% 23/02/2018 252,700 255,902 9.11Bundesobligation 0.250% 13/04/2018 252,700 253,401 9.02Bundesobligation 1.000% 12/10/2018 252,700 260,750 9.29Bundesobligation 1.000% 22/02/2019 237,700 245,208 8.73Bundesobligation 0.500% 12/04/2019 75,000 75,533 2.69Bundesrepublik Deutschland 4.250% 04/07/2017 281,500 316,816 11.28Bundesrepublik Deutschland 4.000% 04/01/2018 297,400 337,973 12.04Bundesrepublik Deutschland 4.250% 04/07/2018 312,400 363,318 12.94Bundesrepublik Deutschland 3.750% 04/01/2019 357,100 413,286 14.72
_______________________________________________________________________________________________________________ ____________________________________________________________
Total Government Bonds 2,763,061 98.40 _______________________________________________________________________________________________________________ ____________________________________________________________
TOTAL INVESTMENTS (Cost EUR 2,737,462) 2,763,061 98.40Other net assets 45,003 1.60
_______________________________________________________________________________________________________________ ____________________________________________________________
TOTAL NET ASSETS 2,808,064 100.00 _______________________________________________________________________________________________________________ ____________________________________________________________ _______________________________________________________________________________________________________________ ____________________________________________________________
279

UBS ETF - Markit iBoxx € Germany 5-10 UCITS ETF Semi-Annual Report as of 30 June 2014 Schedule of Investments as at 30 June 2014 (Expressed in EUR) (Unaudited)
The accompanying notes form an integral part of these financial statements.
Transferable securities listed on an Official Stock Exchange
Nominal Market
Value EUR % of
Net AssetsGovernment Bonds Sovereign Bonds (98.37%) Bundesrepublik Deutschland 3.500% 04/07/2019 403,100 466,598 8.57Bundesrepublik Deutschland 3.250% 04/01/2020 369,800 426,832 7.84Bundesrepublik Deutschland 3.000% 04/07/2020 369,800 424,312 7.79Bundesrepublik Deutschland 2.250% 04/09/2020 269,500 297,280 5.46Bundesrepublik Deutschland 2.500% 04/01/2021 319,600 358,014 6.57Bundesrepublik Deutschland 3.250% 04/07/2021 319,400 375,029 6.89Bundesrepublik Deutschland 2.250% 04/09/2021 270,600 299,069 5.49Bundesrepublik Deutschland 2.000% 04/01/2022 334,800 363,659 6.68Bundesrepublik Deutschland 1.750% 04/07/2022 404,300 430,647 7.91Bundesrepublik Deutschland 1.500% 04/09/2022 299,500 312,433 5.74Bundesrepublik Deutschland 1.500% 15/02/2023 302,400 313,986 5.77Bundesrepublik Deutschland 1.500% 15/05/2023 299,500 310,196 5.70Bundesrepublik Deutschland 2.000% 15/08/2023 302,400 325,559 5.98Bundesrepublik Deutschland 6.250% 04/01/2024 170,900 249,864 4.59Bundesrepublik Deutschland 1.750% 15/02/2024 300,900 315,738 5.80Bundesrepublik Deutschland 1.500% 15/05/2024 84,500 86,440 1.59
_______________________________________________________________________________________________________________ ____________________________________________________________
Total Government Bonds 5,355,656 98.37 _______________________________________________________________________________________________________________ ____________________________________________________________
TOTAL INVESTMENTS (Cost EUR 5,250,022) 5,355,656 98.37Other net assets 88,609 1.63
_______________________________________________________________________________________________________________ ____________________________________________________________
TOTAL NET ASSETS 5,444,265 100.00 _______________________________________________________________________________________________________________ ____________________________________________________________ _______________________________________________________________________________________________________________ ____________________________________________________________
280

UBS ETF - Markit iBoxx € Germany 7-10 UCITS ETF Semi-Annual Report as of 30 June 2014 Schedule of Investments as at 30 June 2014 (Expressed in EUR) (Unaudited)
The accompanying notes form an integral part of these financial statements.
Transferable securities listed on an Official Stock Exchange
Nominal Market
Value EUR % of
Net AssetsGovernment Bonds Sovereign Bonds (98.65%) Bundesrepublik Deutschland 3.250% 04/07/2021 720,600 846,105 10.85Bundesrepublik Deutschland 2.250% 04/09/2021 610,400 674,619 8.65Bundesrepublik Deutschland 2.000% 04/01/2022 763,100 828,877 10.63Bundesrepublik Deutschland 1.750% 04/07/2022 915,800 975,480 12.51Bundesrepublik Deutschland 1.500% 04/09/2022 686,900 716,562 9.19Bundesrepublik Deutschland 1.500% 15/02/2023 686,900 713,217 9.15Bundesrepublik Deutschland 1.500% 15/05/2023 687,000 711,535 9.12Bundesrepublik Deutschland 2.000% 15/08/2023 686,900 739,505 9.48Bundesrepublik Deutschland 6.250% 04/01/2024 391,200 571,953 7.34Bundesrepublik Deutschland 1.750% 15/02/2024 686,800 720,667 9.24Bundesrepublik Deutschland 1.500% 15/05/2024 190,000 194,363 2.49
_______________________________________________________________________________________________________________ ____________________________________________________________
Total Government Bonds 7,692,883 98.65 _______________________________________________________________________________________________________________ ____________________________________________________________
TOTAL INVESTMENTS (Cost EUR 7,357,193) 7,692,883 98.65Other net assets 105,362 1.35
_______________________________________________________________________________________________________________ ____________________________________________________________
TOTAL NET ASSETS 7,798,245 100.00 _______________________________________________________________________________________________________________ ____________________________________________________________ _______________________________________________________________________________________________________________ ____________________________________________________________
281

UBS ETF - Markit iBoxx € Liquid Corporates UCITS ETF Semi-Annual Report as of 30 June 2014 Schedule of Investments as at 30 June 2014 (Expressed in EUR) (Unaudited)
The accompanying notes form an integral part of these financial statements.
Transferable securities listed on an Official Stock Exchange
Nominal Market
Value EUR % of
Net AssetsCorporate Bonds Auto Manufacturers (9.27%) BMW Finance 3.250% 14/01/2019 1,095,000 1,209,555 3.09Daimler 1.000% 08/07/2016 951,000 960,543 2.46Volkswagen International Finance 1.875% 15/05/2017 1,409,000 1,454,540 3.72 Auto Parts & Equipment (1.85%) Conti-Gummi Finance 2.500% 20/03/2017 694,000 723,768 1.85 Banks (34.26%) ABN AMRO Bank 3.625% 06/10/2017 814,000 886,835 2.27Bank of America 2.500% 27/07/2020 888,000 936,203 2.39Barclays Bank 4.125% 15/03/2016 757,000 802,910 2.05BNP Paribas 3.750% 25/11/2020 1,135,000 1,284,394 3.28Commerzbank 3.625% 10/07/2017 579,000 628,083 1.61Deutsche Pfandbriefbank 2.000% 19/07/2016 553,000 562,271 1.44ING Bank 4.250% 13/01/2017 732,000 797,283 2.04Intesa Sanpaolo 4.000% 09/11/2017 978,000 1,063,969 2.72JPMorgan Chase & Co 2.625% 23/04/2021 889,000 949,048 2.43Morgan Stanley 2.375% 31/03/2021 942,000 972,847 2.49National Australia Bank 2.000% 12/11/2020 633,000 657,438 1.68Nordea Bank 1.375% 12/04/2018 952,000 972,188 2.49Rabobank Nederland 3.875% 20/04/2016 2,130,000 2,256,276 5.77UBS 3.125% 18/01/2016 601,000 625,956 1.60 Beverages (4.60%) Carlsberg Breweries 3.375% 13/10/2017 906,000 977,353 2.50Heineken 2.500% 19/03/2019 766,000 821,626 2.10 Chemicals (4.97%) BASF 2.000% 05/12/2022 945,000 979,258 2.51Linde 1.750% 17/09/2020 928,000 962,717 2.46 Commercial Services (2.38%) Atlantia 3.375% 18/09/2017 864,000 929,395 2.38 Diversified Financial Services (11.20%) Citigroup 4.000% 26/11/2015 673,000 704,795 1.80Credit Suisse 2.875% 24/09/2015 1,065,000 1,095,592 2.80GE Capital European Funding 1.000% 02/05/2017 800,000 808,896 2.07Goldman Sachs Group 2.625% 19/08/2020 767,000 808,730 2.07Toyota Motor Credit 1.250% 01/08/2017 941,000 960,499 2.46 Electric (7.50%) GDF Suez 3.500% 18/10/2022 822,000 936,033 2.39RWE Finance 3.000% 17/01/2024 707,000 765,278 1.96Terna Rete Elettrica Nazionale 4.750% 15/03/2021 1,030,000 1,230,944 3.15 Food (2.12%) Nestle Finance International 1.750% 12/09/2022 813,000 831,148 2.12 Miscellaneous Manufacturers (3.10%) Siemens Financieringsmaatschappij 1.750% 12/03/2021 1,174,000 1,213,357 3.10 Oil & Gas (4.86%) BP Capital Markets 3.830% 06/10/2017 854,000 938,575 2.40Eni 3.500% 29/01/2018 882,000 962,200 2.46 Oil & Gas Services (2.42%) Schlumberger Finance 2.750% 01/12/2015 917,000 947,220 2.42 Pharmaceuticals & Biotechnology (2.44%) Roche Finance Europe 2.000% 25/06/2018 905,000 953,425 2.44 Telecommunications (7.44%) Deutsche Telekom International Finance 2.125% 18/01/2021 1,171,000 1,230,109 3.15Koninklijke KPN 3.750% 21/09/2020 853,000 956,166 2.44Telekom Finanzmanagement 3.125% 03/12/2021 664,000 721,650 1.85
282

UBS ETF - Markit iBoxx € Liquid Corporates UCITS ETF Semi-Annual Report as of 30 June 2014 Schedule of Investments as at 30 June 2014 (Expressed in EUR) (Unaudited)
The accompanying notes form an integral part of these financial statements.
Transferable securities listed on an Official Stock Exchange
Market
Value EUR % of
Net Assets
Total Corporate Bonds 38,479,073 98.41 _______________________________________________________________________________________________________________ ____________________________________________________________
TOTAL INVESTMENTS (Cost EUR 37,640,190) 38,479,073 98.41Other net assets 621,231 1.59
_______________________________________________________________________________________________________________ ____________________________________________________________
TOTAL NET ASSETS 39,100,304 100.00 _______________________________________________________________________________________________________________ ____________________________________________________________ _______________________________________________________________________________________________________________ ____________________________________________________________
283

UBS ETF - Markit iBoxx € Sovereigns 1-5 UCITS ETF Semi-Annual Report as of 30 June 2014 Schedule of Investments as at 30 June 2014 (Expressed in EUR) (Unaudited)
The accompanying notes form an integral part of these financial statements.
Transferable securities listed on an Official Stock Exchange
Nominal Market
Value EUR % of
Net AssetsGovernment Bonds Sovereign Bonds (98.35%) Austria Government Bond 3.500% 15/07/2015 17,000 17,605 0.58Austria Government Bond 4.000% 15/09/2016 29,000 31,486 1.05Austria Government Bond 4.300% 15/09/2017 5,000 5,651 0.19Austria Government Bond 4.300% 15/09/2017 25,000 28,256 0.94Austria Government Bond 1.150% 19/10/2018 10,000 10,334 0.34Austria Government Bond 4.350% 15/03/2019 15,000 17,718 0.59Belgium Government Bond 3.750% 28/09/2015 27,000 28,229 0.94Belgium Government Bond 3.250% 28/09/2016 35,000 37,452 1.24Belgium Government Bond 3.500% 28/06/2017 16,000 17,554 0.58Belgium Government Bond 4.000% 28/03/2018 31,000 35,222 1.17Belgium Government Bond 4.000% 28/03/2019 33,000 38,350 1.27Bundesobligation 2.750% 08/04/2016 80,000 83,837 2.79Bundesobligation 1.250% 14/10/2016 58,000 59,620 1.98Bundesobligation 0.750% 24/02/2017 65,000 66,212 2.20Bundesobligation 0.500% 07/04/2017 21,000 21,255 0.71Bundesobligation 0.500% 13/10/2017 49,000 49,654 1.65Bundesobligation 0.500% 23/02/2018 64,000 64,811 2.15Bundesobligation 1.000% 22/02/2019 58,000 59,832 1.99Bundesrepublik Deutschland 3.250% 04/07/2015 55,000 56,772 1.89Bundesrepublik Deutschland 3.500% 04/01/2016 75,000 78,935 2.62Bundesrepublik Deutschland 4.000% 04/01/2018 20,000 22,728 0.76Bundesrepublik Deutschland 4.250% 04/07/2018 54,000 62,801 2.09Finland Government Bond 4.250% 04/07/2015 7,000 7,296 0.24Finland Government Bond 1.750% 15/04/2016 9,000 9,271 0.31Finland Government Bond 1.875% 15/04/2017 7,000 7,332 0.24Finland Government Bond 3.875% 15/09/2017 9,000 10,055 0.33Finland Government Bond 1.125% 15/09/2018 6,000 6,196 0.21France Government Bond OAT 3.000% 25/10/2015 78,000 81,010 2.69France Government Bond OAT 0.250% 25/11/2015 64,000 64,173 2.13France Government Bond OAT 3.250% 25/04/2016 62,000 65,558 2.18France Government Bond OAT 3.750% 25/04/2017 69,000 75,913 2.52France Government Bond OAT 4.250% 25/10/2017 63,000 71,360 2.37France Government Bond OAT 4.000% 25/04/2018 45,000 51,305 1.70France Government Bond OAT 1.000% 25/05/2018 28,000 28,714 0.95France Government Bond OAT 1.000% 25/11/2018 150,000 153,745 5.11French Treasury Note BTAN 1.750% 25/02/2017 102,000 106,356 3.53Ireland Government Bond 4.600% 18/04/2016 15,000 16,159 0.54Ireland Government Bond 5.500% 18/10/2017 9,000 10,470 0.35Ireland Government Bond 4.500% 18/10/2018 13,000 15,058 0.50Italy Buoni Poliennali Del Tesoro 3.750% 01/08/2015 33,000 34,160 1.13Italy Buoni Poliennali Del Tesoro 3.750% 15/04/2016 73,000 77,114 2.56Italy Buoni Poliennali Del Tesoro 3.750% 01/08/2016 89,000 94,697 3.15Italy Buoni Poliennali Del Tesoro 2.750% 15/11/2016 80,000 83,732 2.78Italy Buoni Poliennali Del Tesoro 5.250% 01/08/2017 55,000 62,222 2.07Italy Buoni Poliennali Del Tesoro 4.500% 01/02/2018 59,000 66,083 2.20Italy Buoni Poliennali Del Tesoro 4.500% 01/08/2018 175,000 198,093 6.58Italy Certificati di Credito del Tesoro 30/06/2015 (zero coupon) 45,000 44,790 1.49Italy Certificati di Credito del Tesoro 31/12/2015 (zero coupon) 70,000 69,382 2.30Netherlands Government Bond 3.250% 15/07/2015 42,000 43,395 1.44Netherlands Government Bond 4.000% 15/07/2016 51,000 55,046 1.83Netherlands Government Bond 0.500% 15/04/2017 3,000 3,028 0.10Netherlands Government Bond 4.500% 15/07/2017 38,000 42,949 1.43Netherlands Government Bond 1.250% 15/01/2019 41,000 42,522 1.41Slovakia Government Bond 3.500% 24/02/2016 4,000 4,205 0.14Slovakia Government Bond 4.625% 19/01/2017 3,000 3,315 0.11Spain Government Bond 3.750% 31/10/2015 50,000 52,219 1.73Spain Government Bond 3.250% 30/04/2016 55,000 57,760 1.92Spain Government Bond 4.250% 31/10/2016 102,000 110,492 3.67Spain Government Bond 5.500% 30/07/2017 51,000 58,197 1.93Spain Government Bond 4.100% 30/07/2018 74,000 82,928 2.76
_______________________________________________________________________________________________________________ ____________________________________________________________
Total Government Bonds 2,960,614 98.35 _______________________________________________________________________________________________________________ ____________________________________________________________
TOTAL INVESTMENTS (Cost EUR 2,921,001) 2,960,614 98.35Other net assets 49,630 1.65
_______________________________________________________________________________________________________________ ____________________________________________________________
TOTAL NET ASSETS 3,010,244 100.00 _______________________________________________________________________________________________________________ ____________________________________________________________ _______________________________________________________________________________________________________________ ____________________________________________________________
284

UBS ETF - SBI® Foreign AAA-BBB 1-5 UCITS ETF Semi-Annual Report as of 30 June 2014 Schedule of Investments as at 30 June 2014 (Expressed in CHF) (Unaudited)
The accompanying notes form an integral part of these financial statements.
Transferable securities listed on an Official Stock Exchange
Nominal Market
Value CHF % of
Net AssetsCorporate Bonds Agriculture (1.33%) Philip Morris International 1.000% 06/12/2016 750,000 763,500 1.33 Auto Manufacturers (2.17%) BMW Finance 1.750% 29/09/2017 150,000 157,050 0.28Daimler International Finance 1.625% 12/10/2016 200,000 206,500 0.36Toyota Motor Credit 2.875% 20/09/2016 830,000 878,970 1.53 Banks (51.99%) Abbey National Treasury Services 2.500% 08/06/2015 215,000 219,537 0.38ABN AMRO Bank 2.500% 30/12/2015 400,000 413,800 0.72ABN AMRO Bank 2.375% 02/02/2016 200,000 206,300 0.36ABN AMRO Bank 1.625% 28/10/2016 230,000 238,050 0.41Achmea Bank 3.500% 22/08/2017 100,000 109,550 0.19ASB Finance Ltd 2.125% 17/11/2016 200,000 208,600 0.36Australia & New Zealand Banking Group 2.000% 08/07/2016 100,000 103,450 0.18Australia & New Zealand Banking Group 1.500% 13/02/2019 300,000 316,650 0.55Banco de Chile 1.125% 25/07/2017 100,000 101,600 0.18Banco de Chile 1.125% 23/05/2018 150,000 152,625 0.27Banco de Chile 1.250% 21/03/2019 200,000 204,400 0.36Banco de Credito e Inversiones 0.750% 23/12/2015 150,000 150,225 0.26Banco de Credito e Inversiones 1.250% 26/09/2016 150,000 151,875 0.26Banco Santander Chile 1.000% 31/07/2017 200,000 201,300 0.35Bank Nederlandse Gemeenten 2.750% 03/07/2015 400,000 410,560 0.72Bank Nederlandse Gemeenten 2.750% 11/05/2016 275,000 288,337 0.50Bank Nederlandse Gemeenten 2.625% 09/02/2017 250,000 266,250 0.46Bank Nederlandse Gemeenten 3.125% 02/07/2018 400,000 446,200 0.78Bank Nederlandse Gemeenten 2.125% 06/11/2018 300,000 324,450 0.57Bank of America 3.000% 23/12/2016 280,000 296,800 0.52Bank of America 2.500% 28/09/2017 100,000 105,950 0.18Bank of Communications 0.875% 26/06/2017 200,000 199,400 0.35Banque Federative du Credit Mutuel 1.125% 12/02/2019 200,000 203,700 0.36Barclays Bank 2.500% 29/03/2016 285,000 296,257 0.52Bayerische Landesbank 2.875% 17/07/2015 150,000 154,275 0.27Bayerische Landesbank 4.000% 21/09/2015 300,000 313,530 0.55Bayerische Landesbank 3.125% 27/06/2018 150,000 167,250 0.29Caisse Francaise de Financement Local 2.375% 09/02/2016 200,000 206,900 0.36Caisse Francaise de Financement Local 2.500% 02/05/2018 750,000 813,375 1.42Canadian Imperial Bank of Commerce 1.750% 30/06/2017 830,000 871,085 1.52China Construction Bank Asia 1.375% 28/05/2019 100,000 101,150 0.18Citigroup 2.375% 23/09/2015 1,000,000 1,025,000 1.79Commonwealth Bank of Australia 3.000% 09/11/2017 150,000 163,350 0.28Commonwealth Bank of Australia 1.000% 25/09/2018 300,000 307,350 0.54Compagnie de Financement Foncier 3.000% 19/08/2016 360,000 381,780 0.67Compagnie de Financement Foncier 2.750% 15/11/2016 200,000 212,100 0.37Compagnie de Financement Foncier 2.375% 24/08/2018 605,000 656,122 1.14Cooperative Centrale Raiffeisen-Boerenleenbank 3.000% 10/06/2016 150,000 157,950 0.28Cooperative Centrale Raiffeisen-Boerenleenbank 2.125% 11/10/2017 230,000 243,340 0.42Cooperative Centrale Raiffeisen-Boerenleenbank 2.000% 06/02/2019 300,000 320,850 0.56Credit Suisse 4.875% 14/03/2018 230,000 260,015 0.45Danske Bank 3.500% 02/07/2015 80,000 82,632 0.14Danske Bank 2.375% 13/01/2017 1,000,000 1,056,000 1.84Depfa ACS Bank 2.125% 13/10/2017 100,000 104,150 0.18DEPFA Deutsche Pfandbriefbank 2.500% 09/03/2017 155,000 164,455 0.29Deutsche Hypothekenbank 2.375% 09/12/2015 200,000 206,300 0.36Deutsche Hypothekenbank 2.500% 08/03/2018 155,000 167,633 0.29DNB Bank 2.125% 12/11/2015 200,000 205,000 0.36DNB Bank 1.875% 02/02/2016 750,000 768,375 1.34Erste Europaeische Pfandbrief und Kommunalkreditbank 2.250% 23/06/2016 80,000 82,640 0.14Erste Europaeische Pfandbrief und Kommunalkreditbank 3.000% 14/10/2016 400,000 421,800 0.74Erste Europaeische Pfandbrief und Kommunalkreditbank 2.500% 27/03/2019 105,000 111,353 0.19Erste Group Bank 3.250% 10/07/2017 200,000 216,400 0.38Gazprombank OJSC Via GPB Eurobond Finance 3.375% 05/08/2015 155,000 157,418 0.27HSBC Bank 1.875% 01/09/2016 200,000 206,800 0.36HSBC SFH France 2.000% 23/04/2019 300,000 322,800 0.56HYPO NOE Gruppe Bank 2.875% 22/02/2016 115,000 119,543 0.21HYPO NOE Gruppe Bank 2.625% 07/02/2017 200,000 211,200 0.37HYPO NOE Gruppe Bank 2.250% 02/08/2017 200,000 211,000 0.37Hypo Tirol Bank 2.375% 21/03/2017 330,000 346,665 0.60Hypo Tirol Bank 2.375% 13/09/2017 200,000 211,800 0.37
285

UBS ETF - SBI® Foreign AAA-BBB 1-5 UCITS ETF Semi-Annual Report as of 30 June 2014 Schedule of Investments as at 30 June 2014 (Expressed in CHF) (Unaudited)
The accompanying notes form an integral part of these financial statements.
Transferable securities listed on an Official Stock Exchange
Nominal Market
Value CHF % of
Net Assets Banks (51.99%) (continued) ING Bank 2.125% 07/10/2016 200,000 207,700 0.36KFW 3.375% 30/08/2017 400,000 442,000 0.77KFW 2.750% 11/10/2018 200,000 222,900 0.39Kommunalkredit Austria 2.375% 15/03/2017 150,000 156,600 0.27Korea Development Bank 1.500% 23/05/2016 150,000 153,000 0.27Korea Finance 1.375% 02/07/2018 200,000 206,700 0.36Landesbank Hessen-Thueringen Girozentrale 3.000% 29/12/2015 80,000 83,360 0.15Landwirtschaftliche Rentenbank 2.625% 07/07/2016 100,000 105,250 0.18Macquarie Bank 3.000% 09/08/2017 150,000 160,350 0.28Macquarie Bank 2.125% 29/11/2018 305,000 321,470 0.56Morgan Stanley 2.500% 17/11/2015 150,000 154,170 0.27Muenchener Hypothekenbank 3.000% 12/06/2017 250,000 270,500 0.47National Australia Bank 2.250% 14/07/2017 150,000 158,700 0.28National Australia Bank 1.125% 07/11/2018 400,000 411,800 0.72Nederlandse Financierings Maatschappij voor Ontwikkelingslanden 2.625% 22/09/2015 500,000 515,000 0.90Nederlandse Waterschapsbank 1.750% 22/07/2016 200,000 206,800 0.36Nederlandse Waterschapsbank 2.500% 27/12/2018 350,000 385,175 0.67Nordea Bank 2.250% 06/05/2016 80,000 82,960 0.14Nordea Bank 1.500% 29/09/2017 150,000 155,775 0.27Nordea Bank 0.875% 25/09/2018 600,000 612,000 1.07Nordea Hypotek 1.875% 07/06/2016 200,000 206,500 0.36Oberoesterreichische Landesbank 2.500% 20/06/2017 150,000 159,225 0.28Oesterreichische Kontrollbank 3.000% 23/10/2015 300,000 311,220 0.54Oesterreichische Kontrollbank 1.750% 14/06/2017 750,000 785,250 1.37Oesterreichische Kontrollbank 1.125% 24/05/2018 150,000 155,400 0.27Oesterreichische Postsparkasse 4.500% 16/10/2015 200,000 209,960 0.37Pfandbriefstelle der Oesterreichischen Landes-Hypothekenbanken 2.125% 07/11/2016 280,000 291,760 0.51Pfandbriefstelle der Oesterreichischen Landes-Hypothekenbanken 2.875% 21/07/2017 850,000 915,875 1.60PKO Finance 2.536% 21/12/2015 300,000 307,500 0.54Rheinland-Pfalz Bank 3.500% 30/10/2015 80,000 83,424 0.15Royal Bank of Canada 0.750% 23/10/2018 140,000 143,080 0.25Royal Bank of Scotland 2.750% 08/10/2015 150,000 153,975 0.27SBAB Bank 2.000% 17/02/2016 100,000 102,750 0.18Sberbank of Russia Via SB Capital 3.100% 14/09/2015 230,000 235,037 0.41Sberbank of Russia Via SB Capital 2.065% 28/02/2017 150,000 151,125 0.26Societe Generale 1.875% 19/10/2015 100,000 102,120 0.18Stadshypotek 2.000% 01/12/2016 650,000 679,575 1.18State Bank of India 3.375% 22/02/2016 300,000 310,950 0.54Sveriges Sakerstallda Obligationer 2.125% 08/06/2016 80,000 83,040 0.14Swedbank Hypotek 2.125% 26/08/2016 80,000 83,360 0.15UBS 2.750% 28/04/2016 80,000 83,600 0.15Vnesheconombank Via VEB Finance 3.750% 17/02/2016 280,000 284,900 0.50Vorarlberger Landes- und Hypothekenbank 2.625% 09/11/2015 80,000 82,520 0.14Vorarlberger Landes- und Hypothekenbank 2.500% 15/02/2016 200,000 206,700 0.36Vorarlberger Landes- und Hypothekenbank 2.375% 09/08/2017 325,000 344,337 0.60Vorarlberger Landes- und Hypothekenbank 1.375% 25/07/2018 250,000 254,875 0.44VTB Bank OJSC Via VTB Capital 5.000% 17/11/2015 180,000 186,678 0.33VTB Bank OJSC Via VTB Capital 3.150% 16/12/2016 200,000 203,000 0.35VTB Bank OJSC Via VTB Capital 2.900% 25/05/2018 100,000 100,900 0.18Westpac Banking 3.125% 21/12/2018 120,000 133,860 0.23Westpac Securities NZ 1.875% 25/08/2015 100,000 101,900 0.18 Distribution & Wholesale (0.27%) Wuerth Finance International 3.875% 03/08/2015 150,000 156,015 0.27 Diversified Financial Services (8.39%) Bavarian Sky Europe 0.313% 15/05/2016 150,000 150,075 0.26Caisse de Refinancement de l'Habitat 1.500% 21/09/2015 80,000 81,280 0.14Caisse de Refinancement de l'Habitat 1.750% 29/03/2016 800,000 822,000 1.43Credit Agricole Home Loan SFH 1.750% 27/07/2017 200,000 209,600 0.37General Electric Capital 3.000% 16/10/2015 250,000 258,950 0.45General Electric Capital 2.250% 19/12/2016 350,000 366,625 0.64General Electric Capital 2.875% 27/02/2017 150,000 160,050 0.28General Electric Capital 1.625% 19/10/2017 500,000 520,250 0.91General Electric Capital 2.500% 08/02/2018 130,000 139,750 0.24General Electric Capital 3.375% 19/06/2018 150,000 167,250 0.29General Electric Capital 4.500% 09/10/2018 230,000 268,985 0.47HSBC Finance 3.250% 14/07/2016 580,000 611,900 1.07
286

UBS ETF - SBI® Foreign AAA-BBB 1-5 UCITS ETF Semi-Annual Report as of 30 June 2014 Schedule of Investments as at 30 June 2014 (Expressed in CHF) (Unaudited)
The accompanying notes form an integral part of these financial statements.
Transferable securities listed on an Official Stock Exchange
Nominal Market
Value CHF % of
Net Assets Diversified Financial Services (8.39%) (continued) Hyundai Capital Services 3.000% 27/05/2016 150,000 157,725 0.28LGT Finance 2.750% 08/12/2016 700,000 739,900 1.29RCI Banque 2.500% 16/07/2015 150,000 152,850 0.27 Electric (3.55%) Electricite de France 4.000% 27/03/2017 155,000 170,655 0.30Electricite de France 2.250% 29/09/2017 330,000 349,635 0.61Enel Finance International 2.750% 17/12/2018 200,000 215,900 0.38GDF Suez 1.500% 20/10/2017 150,000 155,700 0.27Korea Electric Power 1.500% 23/04/2019 300,000 309,450 0.54Korea Western Power 1.625% 26/03/2019 150,000 155,775 0.27SGSP Australia Assets 2.500% 09/08/2016 150,000 156,000 0.27SPI Electricity & Gas Australia Holdings 2.625% 08/09/2015 150,000 153,735 0.27SPI Electricity & Gas Australia Holdings 1.500% 21/02/2017 150,000 153,600 0.27SPI Electricity & Gas Australia Holdings 1.125% 18/04/2019 210,000 213,780 0.37 Engineering & Construction (1.10%) Heathrow Funding 2.500% 08/02/2017 500,000 525,750 0.92Vinci 2.125% 15/12/2017 100,000 105,100 0.18 Gas (0.57%) Korea Gas 2.250% 06/10/2015 200,000 204,740 0.36Korea Gas 2.000% 11/10/2016 120,000 124,080 0.21 Insurance (1.16%) ASIF III Jersey 3.000% 29/12/2015 200,000 207,900 0.36Metropolitan Life Global Funding I 0.750% 17/04/2019 250,000 252,125 0.44New York Life Funding 2.375% 22/02/2016 200,000 207,200 0.36 Mining (0.79%) Glencore Finance Europe 3.625% 06/04/2016 280,000 293,860 0.51Glencore Finance Europe 2.625% 03/12/2018 150,000 160,125 0.28 Oil & Gas (3.45%) Empresa Nacional del Petroleo 2.875% 05/12/2018 100,000 104,450 0.18Korea National Oil 2.625% 12/05/2016 80,000 83,240 0.14Korea National Oil 1.875% 08/03/2017 300,000 310,500 0.54Korea National Oil 1.625% 29/11/2018 135,000 140,265 0.24Petroleos Mexicanos 2.500% 10/04/2019 105,000 111,982 0.20Total Capital 3.125% 29/09/2015 240,000 248,880 0.43Total Capital 2.375% 13/01/2016 325,000 335,725 0.59Total Capital 3.125% 28/06/2018 580,000 645,540 1.13 Pharmaceuticals & Biotechnology (0.92%) Sanofi 3.375% 21/12/2015 280,000 293,300 0.51Teva Pharmaceutical Finance V 1.500% 25/10/2018 225,000 233,550 0.41 Sovereign Bonds (1.54%) Svensk Exportkredit 2.625% 09/02/2017 830,000 883,950 1.54 Supranational Banks (3.24%) Black Sea Trade and Development Bank 2.500% 04/10/2016 200,000 207,500 0.36Central American Bank for Economic Integration 0.625% 16/12/2016 100,000 100,550 0.18Corporacion Andina de Fomento 2.625% 05/11/2015 280,000 288,960 0.50Corporacion Andina de Fomento 1.500% 11/09/2018 150,000 155,925 0.27European Investment Bank 2.000% 29/08/2016 250,000 260,500 0.46European Investment Bank 3.250% 30/04/2018 240,000 268,680 0.47European Investment Bank 2.500% 08/02/2019 520,000 574,860 1.00 Telecommunications (1.87%) America Movil 2.000% 27/12/2017 100,000 105,300 0.18America Movil 1.125% 12/09/2018 350,000 357,175 0.62Deutsche Telekom 2.250% 08/07/2016 230,000 238,625 0.42Orange 1.625% 13/10/2016 100,000 102,700 0.18Telefonica Emisiones 2.718% 14/12/2018 150,000 162,600 0.28Telstra 1.750% 14/12/2018 100,000 105,650 0.19 Transportation (2.24%) Deutsche Bahn Finance 1.500% 18/12/2017 350,000 366,450 0.64Kazakhstan Temir Zholy 2.590% 20/06/2019 150,000 149,625 0.26
287

UBS ETF - SBI® Foreign AAA-BBB 1-5 UCITS ETF Semi-Annual Report as of 30 June 2014 Schedule of Investments as at 30 June 2014 (Expressed in CHF) (Unaudited)
The accompanying notes form an integral part of these financial statements.
Transferable securities listed on an Official Stock Exchange
Nominal Market
Value CHF % of
Net Assets Transportation (2.24%) (continued) Russian Railways via RZD Capital 2.177% 26/02/2018 220,000 218,680 0.38Societe Nationale des Chemins de Fer Francais 2.750% 11/06/2018 500,000 548,750 0.96
_______________________________________________________________________________________________________________ ____________________________________________________________
Total Corporate Bonds 48,500,105 84.58 _______________________________________________________________________________________________________________ ____________________________________________________________
Government Bonds Diversified Financial Services (0.35%) Fondo MIVIVIENDA 1.250% 13/06/2018 200,000 200,900 0.35 Oil & Gas (0.18%) EBN 0.750% 03/10/2016 100,000 101,450 0.18 Real Estate (0.38%) Bundesimmobiliengesellschaft 3.250% 02/10/2017 200,000 219,600 0.38 Regional Bonds (4.56%) Municipality Finance 2.375% 11/03/2016 600,000 623,100 1.09Province of British Columbia 2.875% 27/12/2017 200,000 219,300 0.38Province of Ontario Canada 3.750% 30/07/2018 440,000 503,140 0.88Province of Quebec Canada 2.625% 21/06/2017 400,000 429,600 0.75Province of Quebec Canada 3.375% 19/01/2018 200,000 222,600 0.39Province of Quebec Canada 3.875% 11/12/2018 100,000 116,150 0.20Region of Ile de France 3.250% 27/11/2018 250,000 282,000 0.49State of North Rhine-Westphalia 2.250% 01/03/2019 200,000 218,600 0.38 Sovereign Bonds (8.32%) Austria Government International Bond 2.500% 14/07/2016 390,000 408,720 0.71Banco Nacional de Desenvolvimento Economico e Social 2.750% 15/12/2016 750,000 780,375 1.36Czech Republic International 2.875% 23/11/2016 330,000 350,625 0.61Instituto de Credito Oficial 2.000% 15/12/2016 580,000 600,010 1.05Italy Government International Bond 2.500% 30/01/2018 880,000 927,080 1.62Lithuania Government International Bond 2.000% 11/04/2018 100,000 104,150 0.18Poland Government International Bond 2.750% 25/02/2016 130,000 135,200 0.24Poland Government International Bond 3.625% 21/04/2017 1,000,000 1,090,000 1.90Poland Government International Bond 2.250% 15/05/2018 180,000 191,160 0.33Regie Autonome des Transports Parisiens 3.250% 09/10/2017 90,000 98,640 0.17Slovak Republic 2.125% 25/04/2018 80,000 84,960 0.15 Transportation (0.38%) Korea Railroad 1.000% 16/11/2018 100,000 101,600 0.18Reseau Ferre de France 3.000% 24/04/2019 105,000 117,968 0.20
_______________________________________________________________________________________________________________ ____________________________________________________________
Total Government Bonds 8,126,928 14.17 _______________________________________________________________________________________________________________ ____________________________________________________________
TOTAL INVESTMENTS (Cost CHF 56,353,980) 56,627,033 98.75Other net assets 715,357 1.25
_______________________________________________________________________________________________________________ ____________________________________________________________
TOTAL NET ASSETS 57,342,390 100.00 _______________________________________________________________________________________________________________ ____________________________________________________________ _______________________________________________________________________________________________________________ ____________________________________________________________
288

UBS ETF - SBI® Foreign AAA-BBB 5-10 UCITS ETF Semi-Annual Report as of 30 June 2014 Schedule of Investments as at 30 June 2014 (Expressed in CHF) (Unaudited)
The accompanying notes form an integral part of these financial statements.
Transferable securities listed on an Official Stock Exchange
Nominal Market
Value CHF % of
Net AssetsCorporate Bonds Agriculture (2.82%) Philip Morris International 0.750% 16/12/2019 200,000 202,100 0.92Philip Morris International 1.000% 18/09/2020 300,000 306,300 1.40Philip Morris International 2.000% 06/12/2021 100,000 108,200 0.50 Banks (46.99%) ABN AMRO Bank 1.125% 24/04/2020 150,000 152,550 0.70ASB Finance 0.875% 11/06/2019 220,000 224,070 1.02Banco do Brasil 2.500% 20/06/2019 120,000 122,460 0.56Banco Santander Chile 1.750% 26/09/2019 240,000 245,880 1.12Bank Nederlandse Gemeenten 2.500% 14/10/2019 200,000 222,500 1.02Bank Nederlandse Gemeenten 2.250% 14/10/2020 565,000 626,867 2.86Bank Nederlandse Gemeenten 2.250% 23/02/2021 250,000 277,750 1.27Banque Federative du Credit Mutuel 1.125% 22/05/2020 200,000 201,300 0.92BNP Paribas 1.875% 12/09/2022 200,000 210,700 0.96Caisse Francaise de Financement Local 2.625% 12/08/2019 300,000 333,300 1.52Caisse Francaise de Financement Local 3.500% 28/08/2019 120,000 138,300 0.63Citigroup 3.125% 27/09/2021 100,000 113,250 0.52Commonwealth Bank of Australia 1.500% 13/09/2019 225,000 237,937 1.09Compagnie de Financement Foncier 2.250% 13/10/2021 400,000 442,600 2.02Compagnie de Financement Foncier 3.000% 07/06/2022 105,000 122,115 0.56Credit Agricole 2.125% 30/10/2024 150,000 156,000 0.71Erste Europaeische Pfandbrief und Kommunalkreditbank AG in Luxembourg 2.750% 07/02/2020
250,000 269,375 1.23
Erste Europaeische Pfandbrief und Kommunalkreditbank AG in Luxembourg 2.750% 09/02/2022
200,000 214,700 0.98
Goldman Sachs Group 1.625% 06/02/2020 100,000 103,650 0.47HSH Nordbank 3.000% 14/06/2019 150,000 166,950 0.76Hypo Pfandbrief Bank International 3.125% 31/08/2020 145,000 159,863 0.73Hypothekenbank Frankfurt International 2.750% 07/02/2020 200,000 214,300 0.98Kiwibank 1.000% 23/12/2020 150,000 154,500 0.71Kommunalkredit Austria 2.375% 26/08/2020 400,000 429,000 1.96Macquarie Bank 3.000% 29/11/2022 100,000 111,350 0.51National Australia Bank 1.000% 17/04/2020 100,000 102,150 0.47National Australia Bank 1.625% 05/09/2023 100,000 104,100 0.48Nederlandse Waterschapsbank 1.875% 03/02/2020 200,000 216,200 0.99Nederlandse Waterschapsbank 2.375% 19/08/2020 440,000 490,600 2.24Nederlandse Waterschapsbank 2.375% 27/01/2023 530,000 598,635 2.74Nordea Bank 1.125% 02/10/2020 105,000 108,255 0.49Oesterreichische Kontrollbank 2.125% 23/07/2019 105,000 114,450 0.52Oesterreichische Kontrollbank 2.750% 28/01/2020 200,000 226,000 1.03Oesterreichische Kontrollbank 1.000% 28/09/2021 255,000 262,777 1.20Oesterreichische Kontrollbank 3.000% 14/06/2022 300,000 352,350 1.61Oesterreichische Kontrollbank 1.750% 24/05/2023 105,000 112,718 0.52Rabobank Nederland 3.625% 02/07/2019 105,000 121,118 0.55Rabobank Nederland 1.125% 08/04/2021 200,000 204,600 0.93Rabobank Nederland 2.000% 16/09/2021 475,000 514,187 2.35Rabobank Nederland 3.500% 31/08/2023 100,000 120,150 0.55Raiffeisen Bank International 4.750% 24/10/2022 105,000 112,298 0.51Royal Bank of Canada 2.250% 21/04/2021 255,000 283,432 1.30Svenska Handelsbanken 1.250% 20/12/2019 350,000 365,400 1.67UniCredit Bank Ireland 4.250% 19/10/2022 200,000 226,500 1.03 Building Materials (0.55%) Holcim Overseas Finance 3.375% 10/06/2021 105,000 121,118 0.55 Diversified Financial Services (4.92%) Caisse de Refinancement de l'Habitat 2.500% 29/03/2021 305,000 342,972 1.57Caisse de Refinancement de l'Habitat 1.375% 15/03/2023 325,000 336,863 1.54General Electric Capital 3.125% 06/12/2019 350,000 396,550 1.81 Electric (0.94%) GDF Suez 1.125% 09/10/2020 200,000 205,800 0.94 Gas (0.51%) Korea Gas 1.125% 12/02/2020 110,000 111,925 0.51 Mining (0.72%) Glencore Finance Europe 2.125% 23/12/2019 150,000 157,800 0.72
289

UBS ETF - SBI® Foreign AAA-BBB 5-10 UCITS ETF Semi-Annual Report as of 30 June 2014 Schedule of Investments as at 30 June 2014 (Expressed in CHF) (Unaudited)
The accompanying notes form an integral part of these financial statements.
Transferable securities listed on an Official Stock Exchange
Nominal Market
Value CHF % of
Net Assets Oil & Gas (2.83%) BP Capital Markets 1.000% 28/08/2020 200,000 204,800 0.93BP Capital Markets 1.750% 28/02/2024 150,000 158,100 0.72Gazprom Via Gaz Capital 2.850% 25/10/2019 250,000 257,875 1.18 Supranational Banks (12.70%) Central American Bank for Economic Integration 1.500% 04/02/2020 300,000 310,350 1.42Corporacion Andina de Fomento 1.500% 13/08/2020 300,000 311,700 1.42Corporation Andina de Fomento 1.375% 11/02/2021 105,000 107,625 0.49Corporation Andina de Fomento 2.000% 05/02/2024 200,000 210,500 0.96European Investment Bank 1.250% 02/08/2019 280,000 294,420 1.35European Investment Bank 2.375% 10/07/2020 450,000 503,550 2.30European Investment Bank 2.000% 24/08/2022 400,000 441,600 2.02European Investment Bank 1.125% 26/04/2023 250,000 257,500 1.18European Investment Bank 1.625% 23/11/2023 320,000 342,240 1.56 Telecommunications (2.53%) Telefonica Emisiones 2.595% 23/10/2020 270,000 292,410 1.33Bharti Airtel International Netherlands 3.000% 31/03/2020 250,000 261,875 1.20 Transportation (10.12%) Deutsche Bahn Finance 1.750% 03/06/2020 105,000 113,085 0.52Deutsche Bahn Finance 1.375% 24/07/2023 500,000 523,000 2.39Kazakhstan Temir Zholy 3.638% 20/06/2022 100,000 100,100 0.46Korea Railroad 1.500% 02/12/2019 250,000 259,000 1.18Network Rail Infrastructure Finance 2.750% 06/10/2021 400,000 460,200 2.10Norges Statsbaner 2.125% 14/02/2020 200,000 219,200 1.00Russian Railways via RZD Capital 2.730% 26/02/2021 150,000 147,450 0.67Societe Nationale des Chemins de Fer Francais 2.375% 24/07/2019 250,000 274,500 1.26Societe Nationale des Chemins de Fer Francais 2.625% 13/12/2021 105,000 118,598 0.54
_______________________________________________________________________________________________________________ ____________________________________________________________
Total Corporate Bonds 18,746,493 85.63 _______________________________________________________________________________________________________________ ____________________________________________________________
Government Bonds Oil & Gas (1.25%) EBN 0.625% 04/07/2019 105,000 107,205 0.49EBN 2.125% 27/04/2020 150,000 165,450 0.76 Real Estate (2.04%) Akademiska Hus 2.250% 22/02/2021 400,000 446,200 2.04 Regional Bonds (5.23%) Municipality Finance 3.000% 15/04/2021 300,000 351,300 1.61Province of Ontario Canada 2.500% 04/12/2019 320,000 357,920 1.64Province of Ontario Canada 2.375% 07/05/2020 105,000 117,022 0.53Province of Quebec Canada 1.125% 22/02/2023 105,000 107,573 0.49Province of Quebec Canada 1.500% 05/02/2024 200,000 209,900 0.96 Sovereign Bonds (4.41%) Caisse d'Amortissement de la Dette Sociale 2.375% 19/04/2023 320,000 357,120 1.63Instituto de Credito Oficial 3.250% 28/06/2024 100,000 110,950 0.51Kommunekredit 2.250% 16/08/2019 150,000 165,075 0.75Slovak Republic 1.375% 16/10/2019 105,000 108,675 0.50Slovakia Government International Bond 2.750% 25/04/2022 200,000 223,400 1.02
_______________________________________________________________________________________________________________ ____________________________________________________________
Total Government Bonds 2,827,790 12.93 _______________________________________________________________________________________________________________ ____________________________________________________________
TOTAL INVESTMENTS (Cost CHF 20,960,299) 21,574,283 98.56Other net assets 316,146 1.44
_______________________________________________________________________________________________________________ ____________________________________________________________
TOTAL NET ASSETS 21,890,429 100.00 _______________________________________________________________________________________________________________ ____________________________________________________________ _______________________________________________________________________________________________________________ ____________________________________________________________
290

UBS ETF - Barclays Euro Area Liquid Corporates 1-5 Year UCITS ETF Semi-Annual Report as of 30 June 2014 Schedule of Investments as at 30 June 2014 (Expressed in EUR) (Unaudited)
The accompanying notes form an integral part of these financial statements.
Transferable securities listed on an Official Stock Exchange
Nominal Market
Value EUR % of
Net AssetsCorporate Bonds Advertising (0.28%) JCDecaux 2.000% 08/02/2018 100,000 103,410 0.28 Aerospace & Defense (0.56%) Thales 1.625% 20/03/2018 200,000 205,118 0.56 Apparel (0.30%) LVMH Moet Hennessy Louis Vuitton 4.000% 06/04/2018 100,000 112,341 0.30 Auto Manufacturers (9.06%) BMW Finance 3.250% 28/01/2016 300,000 312,768 0.85BMW Finance 1.000% 24/10/2016 450,000 454,271 1.23BMW Finance 3.250% 14/01/2019 200,000 220,994 0.60BMW US Capital 1.000% 18/07/2017 200,000 201,790 0.55Daimler 1.000% 08/07/2016 350,000 353,552 0.96Daimler 1.500% 19/11/2018 350,000 360,045 0.97Volkswagen Bank 1.500% 13/02/2019 250,000 255,200 0.69Volkswagen International Finance 1.000% 26/10/2016 500,000 504,350 1.37Volkswagen International Finance FRN Perpetual 170,000 179,155 0.48Volkswagen Leasing 1.500% 15/09/2015 300,000 303,825 0.82Volkswagen Leasing 1.000% 04/10/2017 200,000 201,380 0.54 Auto Parts & Equipment (0.71%) Conti-Gummi Finance 2.500% 20/03/2017 250,000 260,930 0.71 Banks (41.99%) ABN AMRO Bank 4.250% 11/04/2016 200,000 213,072 0.58ABN AMRO Bank 4.750% 11/01/2019 300,000 349,149 0.95Banque Federative du Credit Mutuel 1.625% 11/01/2018 500,000 511,745 1.39BBVA Senior Finance 3.250% 21/03/2016 600,000 625,194 1.69BBVA Senior Finance 3.750% 17/01/2018 300,000 327,225 0.89BBVA Subordinated Capital FRN 11/04/2024 200,000 206,310 0.56Belfius Bank 1.125% 22/05/2017 200,000 201,154 0.54Berlin Hyp 1.625% 29/01/2019 100,000 102,957 0.28BNP Paribas 3.500% 07/03/2016 600,000 628,680 1.70BNP Paribas 2.875% 27/11/2017 300,000 319,449 0.86BNP Paribas 2.000% 28/01/2019 200,000 206,660 0.56BPCE 1.750% 14/03/2016 600,000 611,046 1.65BPCE 1.375% 22/05/2019 300,000 301,497 0.82CaixaBank 3.250% 22/01/2016 200,000 207,464 0.56CaixaBank 3.125% 14/05/2018 200,000 213,580 0.58Caja de Ahorros y Pensiones de Barcelona 2.375% 09/05/2019 100,000 101,932 0.28Commerzbank 3.625% 10/07/2017 350,000 379,600 1.03Cooperatieve Centrale Raiffeisen-Boerenleenbank 3.875% 20/04/2016 450,000 476,726 1.29Cooperatieve Centrale Raiffeisen-Boerenleenbank 3.375% 21/04/2017 250,000 268,605 0.73Cooperatieve Centrale Raiffeisen-Boerenleenbank 1.750% 22/01/2019 400,000 414,448 1.12Credit Agricole 3.625% 08/03/2016 300,000 315,351 0.85Credit Agricole 1.750% 12/03/2018 200,000 205,844 0.56Credit Agricole 3.875% 13/02/2019 200,000 225,150 0.61Deutsche Pfandbriefbank 2.000% 19/07/2016 350,000 357,059 0.97Erste Group Bank 3.375% 28/03/2017 300,000 320,847 0.87HSBC France 1.625% 03/12/2018 200,000 205,758 0.56ING Bank 4.250% 13/01/2017 500,000 544,570 1.47ING Bank 1.875% 27/02/2018 300,000 310,572 0.84ING Bank FRN 21/11/2023 170,000 177,012 0.48Intesa Sanpaolo 4.125% 14/01/2016 300,000 314,259 0.85Intesa Sanpaolo 4.125% 19/09/2016 500,000 533,285 1.44Intesa Sanpaolo 4.000% 09/11/2017 200,000 217,518 0.59Intesa Sanpaolo 3.000% 28/01/2019 300,000 318,720 0.86KBC Internationale Financieringsmaatschappij 4.500% 27/03/2017 300,000 330,411 0.89KBC Internationale Financieringsmaatschappij 2.125% 10/09/2018 100,000 104,714 0.28Mediobanca 2.250% 18/03/2019 200,000 205,082 0.56Pohjola Bank 2.625% 20/03/2017 200,000 210,656 0.57Pohjola Bank 1.750% 29/08/2018 200,000 206,744 0.56Raiffeisen Bank International 1.875% 08/11/2018 200,000 204,882 0.55Santander Consumer Finance 1.150% 02/10/2015 400,000 401,684 1.09Santander Consumer Finance 1.450% 29/01/2016 500,000 504,710 1.37Santander International Debt 1.375% 25/03/2017 400,000 403,936 1.09Societe Generale 4.000% 20/04/2016 400,000 424,348 1.15Societe Generale 2.375% 28/02/2018 300,000 315,291 0.85
291

UBS ETF - Barclays Euro Area Liquid Corporates 1-5 Year UCITS ETF Semi-Annual Report as of 30 June 2014 Schedule of Investments as at 30 June 2014 (Expressed in EUR) (Unaudited)
The accompanying notes form an integral part of these financial statements.
Transferable securities listed on an Official Stock Exchange
Nominal Market
Value EUR % of
Net Assets Banks (41.99%) (continued) UniCredit 4.375% 11/09/2015 250,000 260,137 0.70UniCredit 4.875% 07/03/2017 400,000 438,528 1.19UniCredit 3.625% 24/01/2019 150,000 163,211 0.44UniCredit Bank Austria 2.625% 30/01/2018 200,000 208,604 0.56Unione di Banche Italiane 2.750% 28/04/2017 400,000 416,380 1.13 Beverages (1.72%) Anheuser-Busch InBev 1.250% 24/03/2017 300,000 305,688 0.83Heineken 2.500% 19/03/2019 100,000 107,268 0.29Pernod Ricard 5.000% 15/03/2017 200,000 222,146 0.60 Building Materials (0.76%) Compagnie de St-Gobain 4.000% 08/10/2018 250,000 280,598 0.76 Chemicals (1.58%) Akzo Nobel 4.000% 17/12/2018 100,000 112,588 0.30BASF 1.500% 01/10/2018 250,000 258,028 0.70Linde Finance 3.125% 12/12/2018 100,000 109,968 0.30Solvay Finance FRN Perpetual 100,000 103,835 0.28 Commercial Services (2.61%) Atlantia 4.500% 08/02/2019 250,000 286,255 0.77Edenred 3.625% 06/10/2017 100,000 108,171 0.29HIT Finance 5.750% 09/03/2018 200,000 233,574 0.63Societe Des Autoroutes Paris-Rhin-Rhone 5.000% 12/01/2017 200,000 220,550 0.60Societe Des Autoroutes Paris-Rhin-Rhone 4.875% 21/01/2019 100,000 116,399 0.32 Diversified Financial Services (2.96%) Deutsche Boerse 1.125% 26/03/2018 100,000 101,693 0.28FGA Capital Ireland 2.625% 17/04/2019 250,000 256,875 0.70LeasePlan 2.500% 19/09/2016 200,000 207,450 0.56RCI Banque 4.000% 16/03/2016 300,000 315,756 0.85RCI Banque 2.875% 22/01/2018 200,000 212,304 0.57 Electric (6.96%) Enel Finance International 4.125% 12/07/2017 400,000 436,812 1.18Enel Finance International 3.625% 17/04/2018 300,000 326,733 0.89GDF Suez 1.500% 01/02/2016 350,000 355,985 0.96GDF Suez 1.500% 20/07/2017 150,000 154,011 0.42GDF Suez FRN Perpetual 100,000 104,720 0.28Iberdrola Finanzas 3.500% 13/10/2016 150,000 159,337 0.43Iberdrola International 4.250% 11/10/2018 200,000 226,062 0.61Iberdrola International FRN Perpetual 100,000 109,330 0.30Red Electrica Financiaciones 4.750% 16/02/2018 100,000 113,345 0.31RWE 4.625% Perpetual 250,000 257,100 0.70Terna Rete Elettrica Nazionale 4.125% 17/02/2017 300,000 325,557 0.88 Electrical Components & Equipment (0.90%) Schneider Electric 3.750% 12/07/2018 300,000 333,516 0.90 Engineering & Construction (0.88%) Bouygues 4.000% 12/02/2018 100,000 110,387 0.30Ferrovial Emisiones 3.375% 30/01/2018 100,000 107,554 0.29Vinci 4.125% 20/02/2017 100,000 108,821 0.29 Entertainment (0.31%) GTECH 5.375% 02/02/2018 100,000 113,671 0.31 Food (3.39%) Carrefour 1.875% 19/12/2017 150,000 155,215 0.42Carrefour 1.750% 22/05/2019 200,000 206,040 0.56Casino Guichard Perrachon 4.379% 08/02/2017 150,000 163,842 0.44Danone 1.125% 27/11/2017 200,000 203,178 0.55Groupe Auchan 3.000% 02/12/2016 300,000 317,031 0.86Metro Finance 2.250% 11/05/2018 200,000 208,754 0.56 Gas (4.35%) Enagas Financiaciones 4.250% 05/10/2017 200,000 220,850 0.60Gas Natural Capital Markets 4.125% 24/04/2017 300,000 327,057 0.88Gas Natural Capital Markets 5.000% 13/02/2018 200,000 228,002 0.62
292

UBS ETF - Barclays Euro Area Liquid Corporates 1-5 Year UCITS ETF Semi-Annual Report as of 30 June 2014 Schedule of Investments as at 30 June 2014 (Expressed in EUR) (Unaudited)
The accompanying notes form an integral part of these financial statements.
Transferable securities listed on an Official Stock Exchange
Nominal Market
Value EUR % of
Net Assets Gas (4.35%) (continued) Snam 4.375% 11/07/2016 200,000 214,590 0.58Snam 2.375% 30/06/2017 350,000 364,522 0.99Snam 1.500% 24/04/2019 250,000 252,160 0.68 Healthcare Products (0.30%) Luxottica Group 3.625% 19/03/2019 100,000 111,583 0.30 Insurance (1.60%) Aegon 3.000% 18/07/2017 150,000 159,690 0.43Delta Lloyd 4.250% 17/11/2017 100,000 109,311 0.30Intesa Sanpaolo Vita 5.350% 18/09/2018 100,000 110,589 0.30Mapfre 5.125% 16/11/2015 200,000 211,736 0.57 Lodging (0.86%) Accor 2.875% 19/06/2017 300,000 316,605 0.86 Machinery - Diversified (1.28%) Alstom 3.875% 02/03/2016 300,000 315,663 0.86MAN 2.125% 13/03/2017 150,000 155,490 0.42 Metal Fabricate & Hardware (0.59%) Vallourec 4.250% 14/02/2017 200,000 217,088 0.59 Oil & Gas (1.51%) Repsol International Finance 4.250% 12/02/2016 200,000 211,300 0.57Repsol International Finance 4.875% 19/02/2019 200,000 232,072 0.63OMV FRN Perpetual 100,000 113,670 0.31 Oil & Gas Services (0.56%) Schlumberger Finance 1.500% 04/03/2019 200,000 205,592 0.56 Pharmaceuticals & Biotechnology (0.55%) Bayer 1.125% 24/01/2018 100,000 101,561 0.28Sanofi 1.000% 14/11/2017 100,000 101,560 0.27 Real Estate (0.55%) Deutsche Annington Finance BV 2.125% 25/07/2016 200,000 204,864 0.55 Real Estate Investment Trusts (3.04%) Gecina 4.750% 11/04/2019 200,000 230,936 0.62Klepierre 4.000% 13/04/2017 150,000 162,946 0.44Societe Fonciere Lyonnaise 3.500% 28/11/2017 100,000 107,447 0.29Unibail-Rodamco 3.500% 06/04/2016 200,000 210,014 0.57Unibail-Rodamco 1.625% 26/06/2017 150,000 153,716 0.42Unibail-Rodamco 1.875% 08/10/2018 250,000 258,305 0.70 Retail (0.56%) Kering 1.875% 08/10/2018 200,000 206,624 0.56 Telecommunications (5.72%) Eutelsat 4.125% 27/03/2017 300,000 325,704 0.88Orange 1.875% 03/09/2018 300,000 310,032 0.84Telefonica Emisiones 4.967% 03/02/2016 200,000 213,350 0.58Telefonica Emisiones 4.750% 07/02/2017 300,000 329,109 0.89Telefonica Emisiones 4.797% 21/02/2018 400,000 451,892 1.22Vivendi 4.000% 31/03/2017 150,000 163,602 0.44Vivendi 4.125% 18/07/2017 100,000 110,138 0.30Vivendi 2.375% 21/01/2019 200,000 210,366 0.57 Transportation (0.70%) Deutsche Post Finance 1.875% 27/06/2017 250,000 258,732 0.70 Water (0.14%) Suez Environnement FRN Perpetual 50,000 51,685 0.14
_______________________________________________________________________________________________________________ ____________________________________________________________
Total Corporate Bonds 35,937,185 97.28 _______________________________________________________________________________________________________________ ____________________________________________________________
TOTAL INVESTMENTS (Cost EUR 35,888,561) 35,937,185 97.28Other net assets 1,005,911 2.72
_______________________________________________________________________________________________________________ ____________________________________________________________
TOTAL NET ASSETS 36,943,096 100.00 _______________________________________________________________________________________________________________ ____________________________________________________________
293

UBS ETF - Barclays US Liquid Corporates UCITS ETF Semi-Annual Report as of 30 June 2014 Schedule of Investments as at 30 June 2014 (Expressed in USD) (Unaudited)
The accompanying notes form an integral part of these financial statements.
Transferable securities listed on an Official Stock Exchange
Nominal Market
Value USD % of
Net AssetsCorporate Bonds Aerospace & Defense (1.16%) General Dynamics 2.250% 15/11/2022 150,000 141,538 0.30Lockheed Martin 4.070% 15/12/2042 125,000 120,523 0.25Northrop Grumman 3.250% 01/08/2023 150,000 148,398 0.31Raytheon 2.500% 15/12/2022 150,000 143,812 0.30 Agriculture (1.39%) Altria Group 4.000% 31/01/2024 250,000 256,451 0.53Altria Group 5.375% 31/01/2044 200,000 218,418 0.46Reynolds American 3.250% 01/11/2022 100,000 96,326 0.20Reynolds American 4.750% 01/11/2042 100,000 95,369 0.20 Auto Manufacturers (0.42%) Ford Motor 4.750% 15/01/2043 200,000 202,220 0.42 Banks (24.07%) Bank of America 1.500% 09/10/2015 475,000 478,965 1.00Bank of America 2.000% 11/01/2018 350,000 351,834 0.73Bank of America 2.600% 15/01/2019 350,000 354,109 0.74Bank of America 3.300% 11/01/2023 675,000 664,268 1.39Bank of America 4.000% 01/04/2024 325,000 332,174 0.69Bank of America 4.875% 01/04/2044 325,000 337,822 0.71Citigroup 1.250% 15/01/2016 375,000 376,722 0.79Citigroup 1.350% 10/03/2017 425,000 424,502 0.89Citigroup 2.550% 08/04/2019 300,000 302,743 0.63Citigroup 3.875% 25/10/2023 275,000 281,646 0.59Citigroup 5.500% 13/09/2025 300,000 334,049 0.70Citigroup 5.300% 06/05/2044 100,000 104,158 0.22Goldman Sachs Group 1.600% 23/11/2015 250,000 252,389 0.53Goldman Sachs Group 2.375% 22/01/2018 800,000 812,296 1.70Goldman Sachs Group 3.625% 22/01/2023 250,000 251,051 0.52Goldman Sachs Group 4.000% 03/03/2024 250,000 254,668 0.53JPMorgan Chase & Co 1.100% 15/10/2015 200,000 200,822 0.42JPMorgan Chase & Co 2.000% 15/08/2017 550,000 558,956 1.17JPMorgan Chase & Co 3.200% 25/01/2023 675,000 671,119 1.40JPMorgan Chase & Co 3.375% 01/05/2023 225,000 220,734 0.46JPMorgan Chase & Co 3.625% 13/05/2024 150,000 150,710 0.31JPMorgan Chase & Co 5.625% 16/08/2043 100,000 112,370 0.23JPMorgan Chase & Co 4.850% 01/02/2044 100,000 106,045 0.22Morgan Stanley 1.750% 25/02/2016 250,000 253,230 0.53Morgan Stanley 2.500% 24/01/2019 225,000 227,661 0.48Morgan Stanley 3.750% 25/02/2023 450,000 457,736 0.96Morgan Stanley 5.000% 24/11/2025 445,000 476,242 0.99Morgan Stanley 6.375% 24/07/2042 225,000 285,524 0.60State Street 3.700% 20/11/2023 175,000 181,074 0.38US Bancorp 2.950% 15/07/2022 275,000 269,827 0.56Wells Fargo & Co 1.250% 20/07/2016 475,000 478,773 1.00Wells Fargo & Co 2.125% 22/04/2019 475,000 475,408 0.99Wells Fargo & Co 5.606% 15/01/2044 425,000 482,507 1.01 Beverages (3.43%) Anheuser-Busch InBev Finance 2.150% 01/02/2019 350,000 351,890 0.73Anheuser-Busch InBev Finance 3.700% 01/02/2024 125,000 128,173 0.27Anheuser-Busch InBev Worldwide 2.500% 15/07/2022 450,000 431,931 0.90Anheuser-Busch InBev Worldwide 3.750% 15/07/2042 50,000 45,551 0.10Coca-Cola 1.650% 01/11/2018 200,000 200,200 0.42Coca-Cola 3.200% 01/11/2023 250,000 251,656 0.53PepsiCo 3.600% 01/03/2024 225,000 231,577 0.48 Chemicals (0.87%) Dow Chemical 3.000% 15/11/2022 100,000 98,414 0.21Dow Chemical 4.375% 15/11/2042 100,000 95,549 0.20EI du Pont de Nemours & Co 2.800% 15/02/2023 125,000 121,465 0.25Monsanto 4.400% 15/07/2044 100,000 100,180 0.21 Commercial Services (0.27%) MasterCard 3.375% 01/04/2024 125,000 127,159 0.27 Computers (1.57%) EMC 2.650% 01/06/2020 500,000 504,760 1.05
294

UBS ETF - Barclays US Liquid Corporates UCITS ETF Semi-Annual Report as of 30 June 2014 Schedule of Investments as at 30 June 2014 (Expressed in USD) (Unaudited)
The accompanying notes form an integral part of these financial statements.
Transferable securities listed on an Official Stock Exchange
Nominal Market
Value USD % of
Net Assets Computers (1.57%) (continued) Hewlett-Packard 2.750% 14/01/2019 150,000 152,464 0.32International Business Machines 4.000% 20/06/2042 100,000 96,105 0.20 Cosmetics & Personal Care (0.32%) Procter & Gamble 1.600% 15/11/2018 150,000 150,392 0.32 Diversified Financial Services (4.30%) American Express 1.550% 22/05/2018 475,000 471,867 0.98American Express 2.650% 02/12/2022 200,000 194,571 0.41General Electric Capital 1.500% 12/07/2016 600,000 608,093 1.27General Electric Capital 2.300% 14/01/2019 500,000 509,398 1.06General Electric Capital 3.150% 07/09/2022 275,000 276,627 0.58 Electronics (0.33%) Thermo Fisher Scientific 4.150% 01/02/2024 150,000 156,643 0.33 Food (0.72%) ConAgra Foods 1.900% 25/01/2018 100,000 100,255 0.21ConAgra Foods 3.200% 25/01/2023 150,000 144,884 0.30ConAgra Foods 4.650% 25/01/2043 100,000 97,541 0.21 Healthcare Products (0.40%) Medtronic 2.750% 01/04/2023 200,000 193,213 0.40 Healthcare Services (0.52%) Aetna 2.750% 15/11/2022 100,000 96,235 0.20WellPoint 4.650% 15/01/2043 150,000 152,888 0.32 Insurance (1.39%) American International Group 4.125% 15/02/2024 175,000 183,612 0.38Berkshire Hathaway 4.500% 11/02/2043 75,000 76,469 0.16Berkshire Hathaway Finance 0.950% 15/08/2016 200,000 201,014 0.42MetLife 3.600% 10/04/2024 150,000 152,380 0.32MetLife 4.875% 13/11/2043 50,000 53,900 0.11 Machinery - Construction & Mining (0.55%) Caterpillar 3.400% 15/05/2024 100,000 101,087 0.21Caterpillar 3.803% 15/08/2042 175,000 162,255 0.34 Machinery - Diversified (0.15%) Deere & Co 3.900% 09/06/2042 75,000 71,330 0.15 Media (0.82%) Time Warner Cable 4.500% 15/09/2042 125,000 121,698 0.25Walt Disney 1.100% 01/12/2017 275,000 272,854 0.57 Mining (0.69%) Freeport-McMoRan Copper & Gold 3.875% 15/03/2023 150,000 149,639 0.31Freeport-McMoRan Copper & Gold 5.450% 15/03/2043 175,000 180,656 0.38 Miscellaneous Manufacturers (2.20%) General Electric 0.850% 09/10/2015 275,000 276,084 0.58General Electric 2.700% 09/10/2022 325,000 318,661 0.66General Electric 4.500% 11/03/2044 350,000 364,118 0.76Illinois Tool Works 3.900% 01/09/2042 100,000 94,138 0.20 Oil & Gas (5.41%) Chevron 1.718% 24/06/2018 375,000 377,150 0.79Chevron 3.191% 24/06/2023 400,000 404,998 0.85ConocoPhillips 2.400% 15/12/2022 250,000 240,005 0.50Exxon Mobil 1.819% 15/03/2019 425,000 427,694 0.89Marathon Oil 2.800% 01/11/2022 175,000 169,570 0.36Noble Energy 5.250% 15/11/2043 100,000 110,170 0.23Phillips 66 4.300% 01/04/2022 250,000 269,850 0.56Phillips 66 5.875% 01/05/2042 150,000 179,600 0.38Plains Exploration & Production 6.875% 15/02/2023 350,000 408,625 0.85 Oil & Gas Services (0.94%) Halliburton 3.500% 01/08/2023 150,000 153,587 0.32National Oilwell Varco 3.950% 01/12/2042 150,000 142,636 0.30
295

UBS ETF - Barclays US Liquid Corporates UCITS ETF Semi-Annual Report as of 30 June 2014 Schedule of Investments as at 30 June 2014 (Expressed in USD) (Unaudited)
The accompanying notes form an integral part of these financial statements.
Transferable securities listed on an Official Stock Exchange
Nominal Market
Value USD % of
Net Assets Oil & Gas Services (0.94%) (continued) Schlumberger Investment 3.650% 01/12/2023 150,000 155,722 0.32 Pharmaceuticals & Biotechnology (4.05%) Actavis 3.250% 01/10/2022 250,000 245,769 0.51Actavis 4.625% 01/10/2042 50,000 48,658 0.10McKesson 3.796% 15/03/2024 200,000 203,641 0.42Merck & Co 0.700% 18/05/2016 200,000 200,303 0.42Merck & Co 1.300% 18/05/2018 100,000 98,928 0.21Merck & Co 2.800% 18/05/2023 250,000 243,314 0.51Merck & Co 4.150% 18/05/2043 125,000 121,729 0.25Pfizer 1.100% 15/05/2017 275,000 275,665 0.58Pfizer 2.100% 15/05/2019 150,000 150,915 0.31Pfizer 3.400% 15/05/2024 100,000 101,109 0.21Zoetis 3.250% 01/02/2023 125,000 123,453 0.26Zoetis 4.700% 01/02/2043 125,000 127,372 0.27 Pipelines (1.15%) Enterprise Products Operating 3.350% 15/03/2023 125,000 125,021 0.26Enterprise Products Operating 5.100% 15/02/2045 275,000 294,979 0.62Williams Partners 4.300% 04/03/2024 125,000 130,140 0.27 Real Estate Investment Trusts (0.72%) American Tower 3.400% 15/02/2019 150,000 156,017 0.32American Tower 5.000% 15/02/2024 175,000 190,060 0.40 Retail (3.61%) CVS Caremark 2.250% 05/12/2018 100,000 101,156 0.21CVS Caremark 4.000% 05/12/2023 225,000 236,161 0.49Home Depot 3.750% 15/02/2024 175,000 182,780 0.38Home Depot 4.875% 15/02/2044 225,000 244,821 0.51Target 2.300% 26/06/2019 65,000 65,650 0.14Target 4.000% 01/07/2042 50,000 47,268 0.10Wal-Mart Stores 1.950% 15/12/2018 275,000 277,490 0.58Wal-Mart Stores 3.300% 22/04/2024 225,000 226,888 0.47Wal-Mart Stores 4.300% 22/04/2044 175,000 176,478 0.37Walgreen 3.100% 15/09/2022 175,000 171,665 0.36 Software (1.50%) Fidelity National Information Services 3.500% 15/04/2023 100,000 98,379 0.21Oracle 2.375% 15/01/2019 300,000 305,409 0.64Oracle 2.500% 15/10/2022 325,000 312,050 0.65 Telecommunications (13.76%) AT&T 0.900% 12/02/2016 350,000 350,399 0.73AT&T 2.300% 11/03/2019 350,000 351,613 0.74AT&T 3.900% 11/03/2024 225,000 233,149 0.49AT&T 4.350% 15/06/2045 425,000 402,246 0.84Verizon Communications 2.500% 15/09/2016 400,000 412,532 0.86Verizon Communications 3.650% 14/09/2018 425,000 453,339 0.95Verizon Communications 4.500% 15/09/2020 600,000 657,431 1.37Verizon Communications 5.150% 15/09/2023 1,100,000 1,231,863 2.57Verizon Communications 6.400% 15/09/2033 600,000 734,178 1.53Verizon Communications 6.550% 15/09/2043 1,400,000 1,762,030 3.68 Transportation (0.22%) Burlington Northern Santa Fe 4.900% 01/04/2044 100,000 106,816 0.22
_______________________________________________________________________________________________________________ ____________________________________________________________
Total Corporate Bonds 36,833,236 76.93 _______________________________________________________________________________________________________________ ____________________________________________________________
Transferable securities and money market instruments dealt in on a regulated market Corporate Bonds Banks (1.59%) JPMorgan Chase & Co 2.350% 28/01/2019 375,000 379,462 0.79Wells Fargo & Co 4.100% 03/06/2026 375,000 380,037 0.80 Beverages (0.73%) Anheuser-Busch InBev Finance 1.125% 27/01/2017 350,000 350,714 0.73
296

UBS ETF - Barclays US Liquid Corporates UCITS ETF Semi-Annual Report as of 30 June 2014 Schedule of Investments as at 30 June 2014 (Expressed in USD) (Unaudited)
The accompanying notes form an integral part of these financial statements.
Transferable securities and money market instruments dealt in on a regulated market
Nominal Market
Value USD % of
Net Assets Computers (4.64%) Apple 0.450% 03/05/2016 200,000 199,493 0.42Apple 1.000% 03/05/2018 625,000 611,642 1.28Apple 2.850% 06/05/2021 200,000 201,788 0.42Apple 2.400% 03/05/2023 750,000 709,258 1.48Apple 3.850% 04/05/2043 350,000 321,436 0.67Seagate HDD Cayman 4.750% 01/06/2023 175,000 175,875 0.37 Diversified Financial Services (0.21%) BlackRock 3.500% 18/03/2024 100,000 100,923 0.21 Food (1.41%) Kraft Foods Group 3.500% 06/06/2022 275,000 281,756 0.59Kraft Foods Group 5.000% 04/06/2042 175,000 186,538 0.39Mondelez International 4.000% 01/02/2024 200,000 206,819 0.43 Insurance (0.56%) Prudential Financial FRN 15/06/2043 250,000 266,562 0.56 Internet (1.19%) Amazon.com 2.500% 29/11/2022 200,000 189,925 0.40eBay 1.350% 15/07/2017 275,000 276,274 0.58Google 3.375% 25/02/2024 100,000 102,214 0.21 Media (2.81%) 21st Century Fox America 3.000% 15/09/2022 100,000 98,441 0.21Comcast 3.600% 01/03/2024 275,000 282,982 0.59Comcast 4.250% 15/01/2033 175,000 179,092 0.37Comcast 4.750% 01/03/2044 275,000 289,948 0.61DIRECTV Holdings / DIRECTV Financing 4.450% 01/04/2024 100,000 105,817 0.22Viacom 4.250% 01/09/2023 125,000 131,273 0.28Viacom 5.850% 01/09/2043 225,000 255,481 0.53 Oil & Gas (0.47%) Continental Resources 3.800% 01/06/2024 225,000 227,043 0.47 Pharmaceuticals & Biotechnology (4.49%) AbbVie 1.200% 06/11/2015 725,000 730,058 1.52AbbVie 2.900% 06/11/2022 275,000 265,125 0.55AbbVie 4.400% 06/11/2042 250,000 242,150 0.51Amgen 2.200% 22/05/2019 250,000 249,010 0.52Celgene 3.250% 15/08/2022 200,000 199,043 0.42Celgene 4.625% 15/05/2044 100,000 99,931 0.21Gilead Sciences 3.700% 01/04/2024 175,000 179,695 0.37Gilead Sciences 4.800% 01/04/2044 175,000 185,571 0.39 Real Estate Investment Trusts (0.26%) ARC Properties Operating Partnership /Clark Acquisition 2.000% 06/02/2017 125,000 125,427 0.26 Retail (1.04%) Costco Wholesale 1.125% 15/12/2017 275,000 273,523 0.57Home Depot 2.000% 15/06/2019 225,000 225,356 0.47 Semiconductors (0.83%) Intel 1.350% 15/12/2017 275,000 274,682 0.57Intel 2.700% 15/12/2022 125,000 121,602 0.26 Software (0.75%) Microsoft 1.625% 06/12/2018 125,000 124,878 0.26Microsoft 3.625% 15/12/2023 225,000 236,107 0.49 Telecommunications (0.84%) Cisco Systems 2.125% 01/03/2019 300,000 301,315 0.63Cisco Systems 3.625% 04/03/2024 100,000 102,692 0.21
297

UBS ETF - Barclays US Liquid Corporates UCITS ETF Semi-Annual Report as of 30 June 2014 Schedule of Investments as at 30 June 2014 (Expressed in USD) (Unaudited)
The accompanying notes form an integral part of these financial statements.
Transferable securities and money market instruments dealt in on a regulated market
Market
Value USD % of
Net Assets
Total Corporate Bonds 10,446,958 21.82 _______________________________________________________________________________________________________________ ____________________________________________________________
TOTAL INVESTMENTS (Cost USD 47,507,033) 47,280,194 98.75Other net assets 600,006 1.25
_______________________________________________________________________________________________________________ ____________________________________________________________
TOTAL NET ASSETS 47,880,200 100.00 _______________________________________________________________________________________________________________ ____________________________________________________________ _______________________________________________________________________________________________________________ ____________________________________________________________
Forward Foreign Exchange Contracts
Purchases Sales Maturity Date
Unrealised appreciation/ (depreciation)
USD % of
Net Assets EUR 16,150,734 USD 22,037,031 3 July 2014 75,835 0.16 USD 17,704 EUR 13,000 3 July 2014 (95) (0.00)
_______________________________________________________________________________________________________________ ____________________________________________________________
Total Forward Foreign Exchange Contracts 75,740 0.16 _______________________________________________________________________________________________________________ ____________________________________________________________
298

Semi-Annual Report as of 30 June 2014
Notes to Financial Statements
Note 1 Description of the Fund
UBS ETF (the "Company") was incorporated in the Grand Duchy of Luxembourg as an open-ended investment company (a "Société d'Investissement à Capital Variable") on 7 September 2001 for an unlimited period under the original name of "Fresco". The Company qualifies as a self-managed SICAV and is governed by the Luxembourg Law of 10 August 1915 on commercial companies, as amended, and by Part I of the Luxembourg Law of 17 December 2010 on undertakings for collective investments. Accordingly, each Sub-Fund has been established for an unlimited period. The registered office of the company is established at 49, Avenue J.F. Kennedy, L-1855 Luxembourg. The Company's Articles of Incorporation (the "Articles") have been published in their original version in the Mémorial, Recueil des Sociétés et Associations (the "Mémorial") dated 11 October 2001. The notarial deed containing the minutes of the extraordinary general meeting held on 29 November 2004 deciding the change of the denomination of the company into has been published in the Mémorial dated 23 December 2004, and the notarial deed containing the minutes of the extraordinary general meeting held on 27 December 2005 deciding amendments to the Articles related to the compliance by the Company with the rules of the amended directive 2009/65/EC has been published in the Mémorial dated 30 January 2006. Moreover, the consolidated version of the Articles has been deposited with the Luxembourg company register. The Company has been established to provide investors with an opportunity to purchase Shares in its Sub-Funds, the investment objective of each of which is to aim to track a specific Index. Each Sub-Fund aims to replicate or track, before expenses, the price and income performance of its Index by holding a portfolio of transferable securities that comprises all or substantially all of the component securities of its Index. Each Sub-Fund will have Shares listed on one or more Listing Stock Exchanges to be an Exchange Traded Fund (“ETF”). With the exceptions detailed in the prospectus, only institutions qualifying as Authorised Participants are able to subscribe or redeem Shares by delivery of in kind stocks, which mostly are stocks composing the relevant index or versus cash. Those subscriptions and redemptions minimise fund turnover and lower trading expenses. A secondary market is created through such Authorised Participants. Persons who are not Authorised Participants are able to buy or sell Shares in a Sub-Fund on a Listing Stock Exchange at prices which should approximate to the Indicative Intra-Day NAV per Share from other investors in Shares who are acting as market makers or broker/dealers. In order to allow participants in the secondary market to have access to a real-time estimate of the Daily NAV per Share, an Indicative Intra-Day NAV per Share is calculated by a calculation agent. As of 30 June 2014, the following ETF share classes of the following Sub-Funds are available:
Sub-Funds ETF Share Classes Initial Dealing Day
UBS ETF – EURO STOXX 50 UCITS ETF (EUR) A-dis 29 October 2001
UBS ETF – EURO STOXX 50 UCITS ETF (EUR) A-acc Not yet launched
UBS ETF – MSCI Europe UCITS ETF (EUR) A-dis 5 October 2009
UBS ETF – MSCI Europe UCITS ETF (EUR) A-acc Not yet launched
UBS ETF – MSCI Europe ex UK UCITS ETF (EUR) A-dis 24 June 2014
UBS ETF – MSCI Europe ex UK UCITS ETF (EUR) A-acc Not yet launched
UBS ETF – MSCI EMU UCITS ETF (EUR) A-dis 19 September 2002
UBS ETF – MSCI EMU UCITS ETF (EUR) A-acc Not yet launched
UBS ETF – MSCI EMU 100% hedged to CHF UCITS ETF (CHF) A-dis Not yet launched
UBS ETF – MSCI EMU 100% hedged to CHF UCITS ETF (CHF) A-acc 31 July 2013
UBS ETF – MSCI EMU 100% hedged to USD UCITS ETF (USD) A-dis 4 June 2014
UBS ETF – MSCI EMU 100% hedged to USD UCITS ETF (USD) A-acc 30 August 2013
UBS ETF – MSCI EMU 100% hedged to GBP UCITS ETF (GBP) A-dis 21 October 2013
UBS ETF – MSCI EMU 100% hedged to GBP UCITS ETF (GBP) A-acc 30 September 2013
299

Semi-Annual Report as of 30 June 2014
Notes to Financial Statements
Note 1 Description of the Fund (continued)
Sub-Funds ETF Share Classes Initial Dealing Day
UBS ETF – MSCI EMU 100% hedged to SGD UCITS ETF (SGD) A-dis Not yet launched
UBS ETF – MSCI EMU 100% hedged to SGD UCITS ETF (SGD) A-acc 30 June 2014
UBS ETF – MSCI EMU Value UCITS ETF (EUR) A-dis 5 October 2009
UBS ETF – MSCI EMU Value UCITS ETF (EUR) A-acc Not yet launched
UBS ETF – MSCI EMU Small Cap UCITS ETF (EUR) A-dis 17 October 2011
UBS ETF – MSCI EMU Small Cap UCITS ETF (EUR) A-acc Not yet launched
UBS ETF – FTSE 100 UCITS ETF (GBP) A-dis 31 October 2001
UBS ETF – FTSE 100 UCITS ETF (GBP) A-acc Not yet launched
UBS ETF – FTSE 250 UCITS ETF (GBP) A-dis 24 June 2014
UBS ETF – FTSE 250 UCITS ETF (GBP) A-acc Not yet launched
UBS ETF – MSCI United Kingdom UCITS ETF (GBP) A-dis 21 October 2013
UBS ETF – MSCI United Kingdom UCITS ETF (GBP) A-acc 30 August 2013
UBS ETF – MSCI United Kingdom 100% hedged to CHF UCITS ETF (CHF) A-dis Not yet launched
UBS ETF – MSCI United Kingdom 100% hedged to CHF UCITS ETF (CHF) A-acc 30 August 2013
UBS ETF – MSCI United Kingdom 100% hedged to EUR UCITS ETF (EUR) A-dis 4 June 2014
UBS ETF – MSCI United Kingdom 100% hedged to EUR UCITS ETF (EUR) A-acc 30 August 2013
UBS ETF – MSCI United Kingdom 100% hedged to USD UCITS ETF (USD) A-dis 4 June 2014
UBS ETF – MSCI United Kingdom 100% hedged to USD UCITS ETF (USD) A-acc 30 August 2013
UBS ETF – MSCI United Kingdom 100% hedged to SGD UCITS ETF (SGD) A-dis Not yet launched
UBS ETF – MSCI United Kingdom 100% hedged to SGD UCITS ETF (SGD) A-acc 30 June 2014
UBS ETF – MSCI Turkey UCITS ETF (EUR) A-dis 18 August 2011
UBS ETF – MSCI Turkey UCITS ETF (EUR) A-acc Not yet launched
UBS ETF – MSCI Japan UCITS ETF (JPY) A-dis 30 October 2001
UBS ETF – MSCI Japan UCITS ETF (JPY) A-acc Not yet launched
UBS ETF – MSCI Japan 100% hedged to CHF UCITS ETF (CHF) A-dis Not yet launched
UBS ETF – MSCI Japan 100% hedged to CHF UCITS ETF (CHF) A-acc 30 September 2013
UBS ETF – MSCI Japan 100% hedged to EUR UCITS ETF (EUR) A-dis 4 June 2014
UBS ETF – MSCI Japan 100% hedged to EUR UCITS ETF (EUR) A-acc 30 September 2013
UBS ETF – MSCI Japan 100% hedged to GBP UCITS ETF (GBP) A-dis 21 October 2013
UBS ETF – MSCI Japan 100% hedged to GBP UCITS ETF (GBP) A-acc 30 September 2013
UBS ETF – MSCI Japan 100% hedged to USD UCITS ETF (USD) A-dis 4 June 2014
UBS ETF – MSCI Japan 100% hedged to USD UCITS ETF (USD) A-acc 31 October 2013
UBS ETF – MSCI Japan 100% hedged to SGD UCITS ETF (SGD) A-dis Not yet launched
UBS ETF – MSCI Japan 100% hedged to SGD UCITS ETF (SGD) A-acc 30 June 2014
UBS ETF – MSCI Pacific (ex Japan) UCITS ETF (USD) A-dis 2 October 2009
UBS ETF – MSCI Pacific (ex Japan) UCITS ETF (USD) A-acc Not yet launched
UBS ETF – MSCI USA UCITS ETF (USD) A-dis 29 October 2001
UBS ETF – MSCI USA UCITS ETF (USD) A-acc Not yet launched
UBS ETF – MSCI Canada UCITS ETF (CAD) A-dis 30 September 2009
UBS ETF – MSCI Canada UCITS ETF (CAD) A-acc Not yet launched
UBS ETF – MSCI Canada 100% hedged to CHF UCITS ETF (CHF) A-dis Not yet launched
UBS ETF – MSCI Canada 100% hedged to CHF UCITS ETF (CHF) A-acc 30 August 2013
UBS ETF – MSCI Canada 100% hedged to EUR UCITS ETF (EUR) A-dis Not yet launched
UBS ETF – MSCI Canada 100% hedged to EUR UCITS ETF (EUR) A-acc 30 August 2013
UBS ETF – MSCI Canada 100% hedged to USD UCITS ETF (USD) A-dis Not yet launched
UBS ETF – MSCI Canada 100% hedged to USD UCITS ETF (USD) A-acc 30 August 2013
UBS ETF – MSCI Canada 100% hedged to GBP UCITS ETF (GBP) A-dis 21 October 2013
UBS ETF – MSCI Canada 100% hedged to GBP UCITS ETF (GBP) A-acc 30 September 2013
UBS ETF – MSCI Canada 100% hedged to SGD UCITS ETF (SGD) A-dis Not yet launched
UBS ETF – MSCI Canada 100% hedged to SGD UCITS ETF (SGD) A-acc 30 June 2014
300

Semi-Annual Report as of 30 June 2014
Notes to Financial Statements
Note 1 Description of the Fund (continued)
Sub-Funds ETF Share Classes Initial Dealing Day
UBS ETF – MSCI Switzerland 20/35 UCITS ETF (CHF) A-dis 29 November 2013
UBS ETF – MSCI Switzerland 20/35 UCITS ETF (CHF) A-acc 31 October 2013
UBS ETF – MSCI Switzerland 20/35 100% hedged to EUR UCITS ETF (EUR) A-dis 4 June 2014
UBS ETF – MSCI Switzerland 20/35 100% hedged to EUR UCITS ETF (EUR) A-acc 31 October 2013
UBS ETF – MSCI Switzerland 20/35 100% hedged to USD UCITS ETF (USD) A-dis 4 June 2014
UBS ETF – MSCI Switzerland 20/35 100% hedged to USD UCITS ETF (USD) A-acc 31 October 2013
UBS ETF – MSCI Switzerland 20/35 100% hedged to GBP UCITS ETF (GBP) A-dis 31 October 2013
UBS ETF – MSCI Switzerland 20/35 100% hedged to GBP UCITS ETF (GBP) A-acc 31 October 2013
UBS ETF – MSCI Switzerland 20/35 100% hedged to SGD UCITS ETF (SGD) A-dis Not yet launched
UBS ETF – MSCI Switzerland 20/35 100% hedged to SGD UCITS ETF (SGD) A-acc 30 June 2014
UBS ETF – MSCI World UCITS ETF (USD) A-dis 25 June 2008
UBS ETF – MSCI World UCITS ETF (USD) A-acc Not yet launched
UBS ETF – MSCI Emerging Markets UCITS ETF (USD) A-dis 12 November 2010
UBS ETF – MSCI Emerging Markets UCITS ETF (USD) A-acc Not yet launched
UBS ETF – MSCI Emerging Markets Socially Responsible UCITS ETF (USD) A-dis Not yet launched
UBS ETF – MSCI Emerging Markets Socially Responsible UCITS ETF (USD) A-acc Not yet launched
UBS ETF – MSCI World Socially Responsible UCITS ETF (USD) A-dis 22 August 2011
UBS ETF – MSCI World Socially Responsible UCITS ETF (USD) A-acc Not yet launched
UBS ETF – MSCI North America Socially Responsible UCITS ETF (USD) A-dis 18 August 2011
UBS ETF – MSCI North America Socially Responsible UCITS ETF (USD) A-acc Not yet launched
UBS ETF – MSCI Europe & Middle East Socially Responsible UCITS ETF (EUR) A-dis 18 August 2011
UBS ETF – MSCI Europe & Middle East Socially Responsible UCITS ETF (EUR) A-acc Not yet launched
UBS ETF – MSCI Pacific Socially Responsible UCITS ETF (USD) A-dis 22 August 2011
UBS ETF – MSCI Pacific Socially Responsible UCITS ETF (USD) A-acc Not yet launched
UBS ETF – MSCI Japan Infrastructure 20/35 UCITS ETF (JPY) A-dis 14 October 2011
UBS ETF – MSCI Japan Infrastructure 20/35 UCITS ETF (JPY) A-acc Not yet launched
UBS ETF – MSCI AC Asia ex Japan Infrastructure 20/35 UCITS ETF (USD) A-dis 6 July 2012
UBS ETF – MSCI AC Asia ex Japan Infrastructure 20/35 UCITS ETF (USD) A-acc Not yet launched
UBS ETF – MSCI Europe Infrastructure 20/35 UCITS ETF (EUR) A-dis 14 October 2011
UBS ETF – MSCI Europe Infrastructure 20/35 UCITS ETF (EUR) A-acc Not yet launched
UBS ETF – STOXX Global Rare Earth UCITS ETF (USD) A-dis 14 October 2011
UBS ETF – STOXX Global Rare Earth UCITS ETF (USD) A-acc Not yet launched
UBS ETF – Barclays Capital US 1-3 Year Treasury Bond UCITS ETF (USD) A-dis 2 February 2012
UBS ETF – Barclays Capital US 1-3 Year Treasury Bond UCITS ETF (USD) A-acc Not yet launched
UBS ETF – Barclays Capital US 3-5 Year Treasury Bond UCITS ETF (USD) A-dis 26 January 2012
UBS ETF – Barclays Capital US 3-5 Year Treasury Bond UCITS ETF (USD) A-acc Not yet launched
UBS ETF – Barclays Capital US 5-7 Year Treasury Bond UCITS ETF (USD) A-dis 26 January 2012
UBS ETF – Barclays Capital US 5-7 Year Treasury Bond UCITS ETF (USD) A-acc Not yet launched
UBS ETF – Barclays Capital US 7-10 Year Treasury Bond UCITS ETF (USD) A-dis 2 February 2012
UBS ETF – Barclays Capital US 7-10 Year Treasury Bond UCITS ETF (USD) A-acc Not yet launched
UBS ETF – Barclays Capital US 10-20 Year Treasury Bond UCITS ETF (USD) A-dis Not yet launched
UBS ETF – Barclays Capital US 10-20 Year Treasury Bond UCITS ETF (USD) A-acc Not yet launched
UBS ETF – Barclays Capital US 20+ Year Treasury Bond UCITS ETF (USD) A-dis Not yet launched
UBS ETF – Barclays Capital US 20+ Year Treasury Bond UCITS ETF (USD) A-acc Not yet launched
UBS ETF – Markit iBoxx € Germany 1-3 UCITS ETF (EUR) A-dis 24 January 2012
UBS ETF – Markit iBoxx € Germany 1-3 UCITS ETF (EUR) A-acc Not yet launched
UBS ETF – Markit iBoxx € Germany 3-5 UCITS ETF (EUR) A-dis 24 January 2012
UBS ETF – Markit iBoxx € Germany 3-5 UCITS ETF (EUR) A-acc Not yet launched
UBS ETF – Markit iBoxx € Germany 5-10 UCITS ETF (EUR) A-dis 24 January 2012
UBS ETF – Markit iBoxx € Germany 5-10 UCITS ETF (EUR) A-acc Not yet launched
301
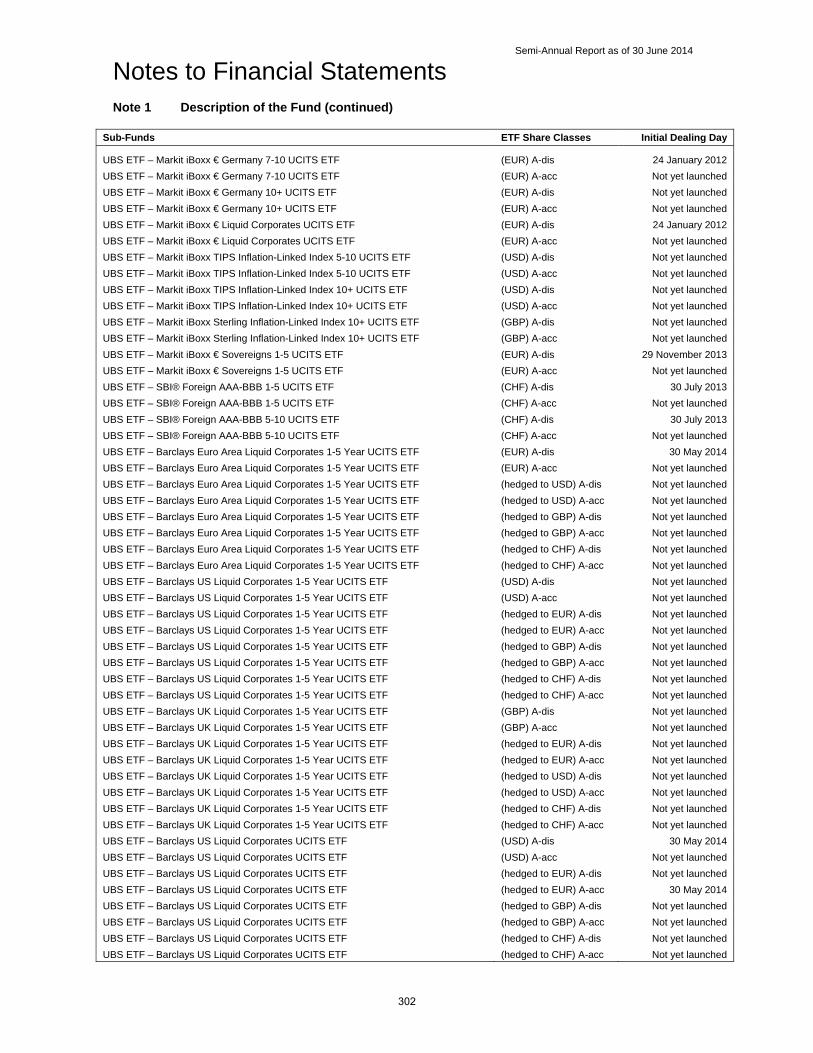
Semi-Annual Report as of 30 June 2014
Notes to Financial Statements
Note 1 Description of the Fund (continued)
Sub-Funds ETF Share Classes Initial Dealing Day
UBS ETF – Markit iBoxx € Germany 7-10 UCITS ETF (EUR) A-dis 24 January 2012
UBS ETF – Markit iBoxx € Germany 7-10 UCITS ETF (EUR) A-acc Not yet launched
UBS ETF – Markit iBoxx € Germany 10+ UCITS ETF (EUR) A-dis Not yet launched
UBS ETF – Markit iBoxx € Germany 10+ UCITS ETF (EUR) A-acc Not yet launched
UBS ETF – Markit iBoxx € Liquid Corporates UCITS ETF (EUR) A-dis 24 January 2012
UBS ETF – Markit iBoxx € Liquid Corporates UCITS ETF (EUR) A-acc Not yet launched
UBS ETF – Markit iBoxx TIPS Inflation-Linked Index 5-10 UCITS ETF (USD) A-dis Not yet launched
UBS ETF – Markit iBoxx TIPS Inflation-Linked Index 5-10 UCITS ETF (USD) A-acc Not yet launched
UBS ETF – Markit iBoxx TIPS Inflation-Linked Index 10+ UCITS ETF (USD) A-dis Not yet launched
UBS ETF – Markit iBoxx TIPS Inflation-Linked Index 10+ UCITS ETF (USD) A-acc Not yet launched
UBS ETF – Markit iBoxx Sterling Inflation-Linked Index 10+ UCITS ETF (GBP) A-dis Not yet launched
UBS ETF – Markit iBoxx Sterling Inflation-Linked Index 10+ UCITS ETF (GBP) A-acc Not yet launched
UBS ETF – Markit iBoxx € Sovereigns 1-5 UCITS ETF (EUR) A-dis 29 November 2013
UBS ETF – Markit iBoxx € Sovereigns 1-5 UCITS ETF (EUR) A-acc Not yet launched
UBS ETF – SBI® Foreign AAA-BBB 1-5 UCITS ETF (CHF) A-dis 30 July 2013
UBS ETF – SBI® Foreign AAA-BBB 1-5 UCITS ETF (CHF) A-acc Not yet launched
UBS ETF – SBI® Foreign AAA-BBB 5-10 UCITS ETF (CHF) A-dis 30 July 2013
UBS ETF – SBI® Foreign AAA-BBB 5-10 UCITS ETF (CHF) A-acc Not yet launched
UBS ETF – Barclays Euro Area Liquid Corporates 1-5 Year UCITS ETF (EUR) A-dis 30 May 2014
UBS ETF – Barclays Euro Area Liquid Corporates 1-5 Year UCITS ETF (EUR) A-acc Not yet launched
UBS ETF – Barclays Euro Area Liquid Corporates 1-5 Year UCITS ETF (hedged to USD) A-dis Not yet launched
UBS ETF – Barclays Euro Area Liquid Corporates 1-5 Year UCITS ETF (hedged to USD) A-acc Not yet launched
UBS ETF – Barclays Euro Area Liquid Corporates 1-5 Year UCITS ETF (hedged to GBP) A-dis Not yet launched
UBS ETF – Barclays Euro Area Liquid Corporates 1-5 Year UCITS ETF (hedged to GBP) A-acc Not yet launched
UBS ETF – Barclays Euro Area Liquid Corporates 1-5 Year UCITS ETF (hedged to CHF) A-dis Not yet launched
UBS ETF – Barclays Euro Area Liquid Corporates 1-5 Year UCITS ETF (hedged to CHF) A-acc Not yet launched
UBS ETF – Barclays US Liquid Corporates 1-5 Year UCITS ETF (USD) A-dis Not yet launched
UBS ETF – Barclays US Liquid Corporates 1-5 Year UCITS ETF (USD) A-acc Not yet launched
UBS ETF – Barclays US Liquid Corporates 1-5 Year UCITS ETF (hedged to EUR) A-dis Not yet launched
UBS ETF – Barclays US Liquid Corporates 1-5 Year UCITS ETF (hedged to EUR) A-acc Not yet launched
UBS ETF – Barclays US Liquid Corporates 1-5 Year UCITS ETF (hedged to GBP) A-dis Not yet launched
UBS ETF – Barclays US Liquid Corporates 1-5 Year UCITS ETF (hedged to GBP) A-acc Not yet launched
UBS ETF – Barclays US Liquid Corporates 1-5 Year UCITS ETF (hedged to CHF) A-dis Not yet launched
UBS ETF – Barclays US Liquid Corporates 1-5 Year UCITS ETF (hedged to CHF) A-acc Not yet launched
UBS ETF – Barclays UK Liquid Corporates 1-5 Year UCITS ETF (GBP) A-dis Not yet launched
UBS ETF – Barclays UK Liquid Corporates 1-5 Year UCITS ETF (GBP) A-acc Not yet launched
UBS ETF – Barclays UK Liquid Corporates 1-5 Year UCITS ETF (hedged to EUR) A-dis Not yet launched
UBS ETF – Barclays UK Liquid Corporates 1-5 Year UCITS ETF (hedged to EUR) A-acc Not yet launched
UBS ETF – Barclays UK Liquid Corporates 1-5 Year UCITS ETF (hedged to USD) A-dis Not yet launched
UBS ETF – Barclays UK Liquid Corporates 1-5 Year UCITS ETF (hedged to USD) A-acc Not yet launched
UBS ETF – Barclays UK Liquid Corporates 1-5 Year UCITS ETF (hedged to CHF) A-dis Not yet launched
UBS ETF – Barclays UK Liquid Corporates 1-5 Year UCITS ETF (hedged to CHF) A-acc Not yet launched
UBS ETF – Barclays US Liquid Corporates UCITS ETF (USD) A-dis 30 May 2014
UBS ETF – Barclays US Liquid Corporates UCITS ETF (USD) A-acc Not yet launched
UBS ETF – Barclays US Liquid Corporates UCITS ETF (hedged to EUR) A-dis Not yet launched
UBS ETF – Barclays US Liquid Corporates UCITS ETF (hedged to EUR) A-acc 30 May 2014
UBS ETF – Barclays US Liquid Corporates UCITS ETF (hedged to GBP) A-dis Not yet launched
UBS ETF – Barclays US Liquid Corporates UCITS ETF (hedged to GBP) A-acc Not yet launched
UBS ETF – Barclays US Liquid Corporates UCITS ETF (hedged to CHF) A-dis Not yet launched
UBS ETF – Barclays US Liquid Corporates UCITS ETF (hedged to CHF) A-acc Not yet launched
302

Semi-Annual Report as of 30 June 2014
Notes to Financial Statements
Note 1 Description of the Fund (continued)
With effect as of 20 February 2014, the Board resolved to convert the I Shares of the following Sub-Funds into A Shares:
Sub-Funds I Share Classes Conversion into A Share Classes
UBS ETF – EURO STOXX 50 UCITS ETF (EUR) I-dis (EUR) A-dis UBS ETF – MSCI Europe UCITS ETF (EUR) I-dis (EUR) A-dis UBS ETF – MSCI EMU UCITS ETF (EUR) I-dis (EUR) A-dis UBS ETF – MSCI EMU Small Cap UCITS ETF (EUR) I-dis (EUR) A-dis UBS ETF – FTSE 100 UCITS ETF (GBP) I-dis (GBP) A-dis UBS ETF – MSCI Turkey UCITS ETF (EUR) I-dis (EUR) A-dis UBS ETF – MSCI Japan UCITS ETF (JPY) I-dis (JPY) A-dis UBS ETF – MSCI Pacific (ex Japan) UCITS ETF (USD) I-dis (USD) A-dis UBS ETF – MSCI USA UCITS ETF (USD) I-dis (USD) A-dis UBS ETF – MSCI Canada UCITS ETF (CAD) I-dis (CAD) A-dis UBS ETF – MSCI World UCITS ETF (USD) I-dis (USD) A-dis UBS ETF – MSCI Emerging Markets UCITS ETF (USD) I-dis (USD) A-dis UBS ETF – MSCI World Socially Responsible UCITS ETF (USD) I-dis (USD) A-dis UBS ETF – MSCI North America Socially Responsible UCITS ETF (USD) I-dis (USD) A-dis UBS ETF – MSCI Europe & Middle East Socially Responsible UCITS ETF (EUR) I-dis (EUR) A-dis UBS ETF – MSCI Pacific Socially Responsible UCITS ETF (USD) I-dis (USD) A-dis UBS ETF – MSCI Japan Infrastructure 20/35 UCITS ETF (JPY) I-dis (JPY) A-dis UBS ETF – MSCI AC Asia ex Japan Infrastructure 20/35 UCITS ETF (USD) I-dis (USD) A-dis UBS ETF – MSCI Europe Infrastructure 20/35 UCITS ETF (EUR) I-dis (EUR) A-dis UBS ETF – STOXX Global Rare Earth UCITS ETF (USD) I-dis (USD) A-dis
Sub-Funds ETF Share Class Listing Stock Exchanges Trading Currency
UBS ETF – EURO STOXX 50 UCITS ETF (EUR) A-dis SIX Swiss Exchange SIX Swiss Exchange SIX Swiss Exchange Xetra/Deutsche Börse Boerse Stuttgart Borsa Italiana London Stock Exchange London Stock Exchange
CHF EUR GBP EUR EUR EUR EUR GBp
UBS ETF – EURO STOXX 50 UCITS ETF (EUR) A-acc Not yet launched Not yet launched
UBS ETF – MSCI Europe UCITS ETF (EUR) A-dis SIX Swiss Exchange SIX Swiss Exchange Xetra/Deutsche Börse Boerse Stuttgart Borsa Italiana London Stock Exchange
EUR GBP EUR EUR EUR GBp
UBS ETF – MSCI Europe UCITS ETF (EUR) A-acc Not yet launched Not yet launched
UBS ETF – MSCI Europe ex UK UCITS ETF (EUR) A-dis Xetra/Deutsche Börse EUR
UBS ETF – MSCI Europe ex UK UCITS ETF (EUR) A-acc Not yet launched Not yet launched
UBS ETF – MSCI EMU UCITS ETF (EUR) A-dis SIX Swiss Exchange SIX Swiss Exchange Xetra/Deutsche Börse Boerse Stuttgart Borsa Italiana London Stock Exchange
CHF EUR EUR EUR EUR GBp
UBS ETF – MSCI EMU UCITS ETF (EUR) A-acc Not yet launched Not yet launched
UBS ETF – MSCI EMU 100% hedged to CHF UCITS ETF
(CHF) A-dis Not yet launched Not yet launched
UBS ETF – MSCI EMU 100% hedged to CHF UCITS ETF
(CHF) A-acc SIX Swiss Exchange CHF
303

Semi-Annual Report as of 30 June 2014
Notes to Financial Statements
Note 1 Description of the Fund (continued)
Sub-Funds ETF Share Class Listing Stock Exchanges Trading Currency
UBS ETF – MSCI EMU 100% hedged to USD UCITS ETF
(USD) A-dis SIX Swiss Exchange USD
UBS ETF – MSCI EMU 100% hedged to USD UCITS ETF
(USD) A-acc SIX Swiss Exchange USD
UBS ETF – MSCI EMU 100% hedged to GBP UCITS ETF
(GBP) A-dis SIX Swiss Exchange London Stock Exchange
GBP GBp
UBS ETF – MSCI EMU 100% hedged to GBP UCITS ETF
(GBP) A-acc SIX Swiss Exchange London Stock Exchange
GBP GBp
UBS ETF – MSCI EMU 100% hedged to SGD UCITS ETF
(SGD) A-dis Not yet launched Not yet launched
UBS ETF – MSCI EMU 100% hedged to SGD UCITS ETF
(SGD) A-acc N/A1 N/A
1
UBS ETF – MSCI EMU Value UCITS ETF (EUR) A-dis SIX Swiss Exchange Xetra/Deutsche Börse Boerse Stuttgart Borsa Italiana London Stock Exchange
EUR EUR EUR EUR GBp
UBS ETF – MSCI EMU Value UCITS ETF (EUR) A-acc Not yet launched Not yet launched
UBS ETF – MSCI EMU Small Cap UCITS ETF (EUR) A-dis SIX Swiss Exchange SIX Swiss Exchange Xetra/Deutsche Börse Borsa Italiana London Stock Exchange
CHF EUR EUR EUR GBp
UBS ETF – MSCI EMU Small Cap UCITS ETF (EUR) A-acc Not yet launched Not yet launched
UBS ETF – FTSE 100 UCITS ETF (GBP) A-dis SIX Swiss Exchange SIX Swiss Exchange Xetra/Deutsche Börse Boerse Stuttgart Borsa Italiana London Stock Exchange
CHF GBP EUR EUR EUR GBp
UBS ETF – FTSE 100 UCITS ETF (GBP) A-acc Not yet launched Not yet launched
UBS ETF – FTSE 250 UCITS ETF (GBP) A-dis Xetra/Deutsche Börse EUR
UBS ETF – FTSE 250 UCITS ETF (GBP) A-acc Not yet launched Not yet launched
UBS ETF – MSCI United Kingdom UCITS ETF (GBP) A-dis SIX Swiss Exchange SIX Swiss Exchange London Stock Exchange
CHF GBP GBp
UBS ETF – MSCI United Kingdom UCITS ETF (GBP) A-acc SIX Swiss Exchange SIX Swiss Exchange London Stock Exchange
CHF GBP GBp
UBS ETF – MSCI United Kingdom 100% hedged to CHF UCITS ETF
(CHF) A-dis Not yet launched Not yet launched
UBS ETF – MSCI United Kingdom 100% hedged to CHF UCITS ETF
(CHF) A-acc SIX Swiss Exchange
CHF
UBS ETF – MSCI United Kingdom 100% hedged to EUR UCITS ETF
(EUR) A-dis SIX Swiss Exchange
EUR
UBS ETF – MSCI United Kingdom 100% hedged to EUR UCITS ETF
(EUR) A-acc SIX Swiss Exchange Xetra/Deutsche Börse Borsa Italiana
EUR EUR EUR
UBS ETF – MSCI United Kingdom 100% hedged to USD UCITS ETF
(USD) A-dis SIX Swiss Exchange
USD
UBS ETF – MSCI United Kingdom 100% hedged to USD UCITS ETF
(USD) A-acc SIX Swiss Exchange
USD
UBS ETF – MSCI United Kingdom 100% hedged to SGD UCITS ETF
(SGD) A-dis Not yet launched Not yet launched
UBS ETF – MSCI United Kingdom 100% hedged to SGD UCITS ETF
(SGD) A-acc N/A1 N/A
1
UBS ETF – MSCI Turkey UCITS ETF (EUR) A-dis SIX Swiss Exchange SIX Swiss Exchange Xetra/Deutsche Börse Borsa Italiana London Stock Exchange
CHF EUR EUR EUR GBp
UBS ETF – MSCI Turkey UCITS ETF (EUR) A-acc Not yet launched Not yet launched
1 The Sub-Fund was launched on 30 June 2014.
304

Semi-Annual Report as of 30 June 2014
Notes to Financial Statements
Note 1 Description of the Fund (continued)
Sub-Funds ETF Share Class Listing Stock Exchanges Trading Currency
UBS ETF – MSCI Japan UCITS ETF (JPY) A-dis SIX Swiss Exchange SIX Swiss Exchange SIX Swiss Exchange Xetra/Deutsche Börse Boerse Stuttgart Borsa Italiana London Stock Exchange London Stock Exchange
CHF GBP JPY EUR EUR EUR GBp USD
UBS ETF – MSCI Japan UCITS ETF (JPY) A-acc Not yet launched Not yet launched
UBS ETF – MSCI Japan 100% hedged to CHF UCITS ETF
(CHF) A-dis Not yet launched Not yet launched
UBS ETF – MSCI Japan 100% hedged to CHF UCITS ETF
(CHF) A-acc SIX Swiss Exchange CHF
UBS ETF – MSCI Japan 100% hedged to EUR UCITS ETF
(EUR) A-dis SIX Swiss Exchange EUR
UBS ETF – MSCI Japan 100% hedged to EUR UCITS ETF
(EUR) A-acc SIX Swiss Exchange Xetra/Deutsche Börse Borsa Italiana
EUR EUR EUR
UBS ETF – MSCI Japan 100% hedged to GBP UCITS ETF
(GBP) A-dis SIX Swiss Exchange London Stock Exchange
GBP GBp
UBS ETF – MSCI Japan 100% hedged to GBP UCITS ETF
(GBP) A-acc SIX Swiss Exchange London Stock Exchange
GBP GBp
UBS ETF – MSCI Japan 100% hedged to USD UCITS ETF
(USD) A-dis SIX Swiss Exchange USD
UBS ETF – MSCI Japan 100% hedged to USD UCITS ETF
(USD) A-acc SIX Swiss Exchange USD
UBS ETF – MSCI Japan 100% hedged to SGD UCITS ETF
(SGD) A-dis Not yet launched Not yet launched
UBS ETF – MSCI Japan 100% hedged to SGD UCITS ETF
(SGD) A-acc N/A1 N/A
1
UBS ETF – MSCI Pacific (ex Japan) UCITS ETF (USD) A-dis SIX Swiss Exchange SIX Swiss Exchange Xetra/Deutsche Börse Boerse Stuttgart Borsa Italiana London Stock Exchange
GBP USD EUR EUR EUR GBp
UBS ETF – MSCI Pacific (ex Japan) UCITS ETF (USD) A-acc Not yet launched Not yet launched
UBS ETF – MSCI USA UCITS ETF
(USD) A-dis SIX Swiss Exchange SIX Swiss Exchange SIX Swiss Exchange Xetra/Deutsche Börse Boerse Stuttgart Borsa Italiana
CHF GBP USD EUR EUR EUR
UBS ETF – MSCI USA UCITS ETF (USD) A-acc Not yet launched Not yet launched
UBS ETF – MSCI Canada UCITS ETF (CAD) A-dis SIX Swiss Exchange Xetra/Deutsche Börse Boerse Stuttgart Borsa Italiana London Stock Exchange
CAD EUR EUR EUR GBp
UBS ETF – MSCI Canada UCITS ETF (CAD) A-acc Not yet launched Not yet launched
UBS ETF – MSCI Canada 100% hedged to CHF UCITS ETF
(CHF) A-dis Not yet launched Not yet launched
UBS ETF – MSCI Canada 100% hedged to CHF UCITS ETF
(CHF) A-acc SIX Swiss Exchange CHF
1 The Sub-Fund was launched on 30 June 2014.
305

Semi-Annual Report as of 30 June 2014
Notes to Financial Statements
Note 1 Description of the Fund (continued)
Sub-Funds ETF Share Class Listing Stock Exchanges Trading Currency
UBS ETF – MSCI Canada 100% hedged to EUR UCITS ETF
(EUR) A-dis Not yet launched Not yet launched
UBS ETF – MSCI Canada 100% hedged to EUR UCITS ETF
(EUR) A-acc SIX Swiss Exchange Xetra/Deutsche Börse Borsa Italiana
EUR EUR EUR
UBS ETF – MSCI Canada 100% hedged to USD UCITS ETF
(USD) A-dis Not yet launched Not yet launched
UBS ETF – MSCI Canada 100% hedged to USD UCITS ETF
(USD) A-acc SIX Swiss Exchange USD
UBS ETF – MSCI Canada 100% hedged to GBP UCITS ETF
(GBP) A-dis SIX Swiss Exchange London Stock Exchange
GBP GBp
UBS ETF – MSCI Canada 100% hedged to GBP UCITS ETF
(GBP) A-acc SIX Swiss Exchange London Stock Exchange
GBP GBp
UBS ETF – MSCI Canada 100% hedged to SGD UCITS ETF
(SGD) A-dis Not yet launched Not yet launched
UBS ETF – MSCI Canada 100% hedged to SGD UCITS ETF
(SGD) A-acc N/A1 N/A
1
UBS ETF – Switzerland 20/35 UCITS ETF (CHF) A-dis SIX Swiss Exchange CHF
UBS ETF – Switzerland 20/35 UCITS ETF (CHF) A-acc SIX Swiss Exchange Borsa Italiana
CHF EUR
UBS ETF – Switzerland 20/35 100% hedged to EUR UCITS ETF
(EUR) A-dis SIX Swiss Exchange
EUR
UBS ETF – Switzerland 20/35 100% hedged to EUR UCITS ETF
(EUR) A-acc SIX Swiss Exchange Borsa Italiana
EUR EUR
UBS ETF – Switzerland 20/35 100% hedged to USD UCITS ETF
(USD) A-dis SIX Swiss Exchange USD
UBS ETF – Switzerland 20/35 100% hedged to USD UCITS ETF
(USD) A-acc SIX Swiss Exchange USD
UBS ETF – Switzerland 20/35 100% hedged to GBP UCITS ETF
(GBP) A-dis SIX Swiss Exchange London Stock Exchange
GBP GBp
UBS ETF – Switzerland 20/35 100% hedged to GBP UCITS ETF
(GBP) A-acc SIX Swiss Exchange London Stock Exchange
GBP GBp
UBS ETF – Switzerland 20/35 100% hedged to SGD UCITS ETF
(SGD) A-dis Not yet launched Not yet launched
UBS ETF – Switzerland 20/35 100% hedged to SGD UCITS ETF
(SGD) A-acc N/A1 N/A
1
UBS ETF – MSCI World UCITS ETF (USD) A-dis SIX Swiss Exchange SIX Swiss Exchange SIX Swiss Exchange Xetra/Deutsche Börse Boerse Stuttgart Borsa Italiana London Stock Exchange London Stock Exchange
CHF GBP USD EUR EUR EUR GBp USD
UBS ETF – MSCI World UCITS ETF (USD) A-acc Not yet launched Not yet launched
UBS ETF – MSCI Emerging Markets UCITS ETF (USD) A-dis SIX Swiss Exchange SIX Swiss Exchange Xetra/Deutsche Börse Borsa Italiana London Stock Exchange London Stock Exchange
CHF USD EUR EUR GBp USD
UBS ETF – MSCI Emerging Markets UCITS ETF (USD) A-acc Not yet launched Not yet launched
UBS ETF – MSCI Emerging Markets Socially Responsible UCITS ETF
(USD) A-dis Not yet launched Not yet launched
UBS ETF – MSCI Emerging Markets Socially Responsible UCITS ETF
(USD) A-acc Not yet launched Not yet launched
UBS ETF – MSCI World Socially Responsible UCITS ETF
(USD) A-dis SIX Swiss Exchange SIX Swiss Exchange Xetra/Deutsche Börse Borsa Italiana London Stock Exchange
CHF USD EUR EUR GBp
UBS ETF – MSCI World Socially Responsible UCITS ETF
(USD) A-acc Not yet launched Not yet launched
1 The Sub-Fund was launched on 30 June 2014.
306

Semi-Annual Report as of 30 June 2014
Notes to Financial Statements
Note 1 Description of the Fund (continued)
Sub-Funds ETF Share Class Listing Stock Exchanges Trading Currency
UBS ETF – MSCI North America Socially Responsible UCITS ETF
(USD) A-dis SIX Swiss Exchange SIX Swiss Exchange Xetra/Deutsche Börse Borsa Italiana London Stock Exchange
CHF USD EUR EUR GBp
UBS ETF – MSCI North America Socially Responsible UCITS ETF
(USD) A-acc Not yet launched Not yet launched
UBS ETF – MSCI Europe & Middle East Socially Responsible UCITS ETF
(EUR) A-dis SIX Swiss Exchange SIX Swiss Exchange Xetra/Deutsche Börse Borsa Italiana London Stock Exchange
CHF EUR EUR EUR GBp
UBS ETF – MSCI Europe & Middle East Socially Responsible UCITS ETF
(EUR) A-acc Not yet launched Not yet launched
UBS ETF – MSCI Pacific Socially Responsible UCITS ETF
(USD) A-dis SIX Swiss Exchange SIX Swiss Exchange Xetra/Deutsche Börse Borsa Italiana London Stock Exchange
CHF USD EUR EUR GBp
UBS ETF – MSCI Pacific Socially Responsible UCITS ETF
(USD) A-acc Not yet launched Not yet launched
UBS ETF – MSCI Japan Infrastructure 20/35 UCITS ETF
(JPY) A-dis SIX Swiss Exchange SIX Swiss Exchange Xetra/Deutsche Börse Borsa Italiana London Stock Exchange
CHF JPY EUR EUR GBp
UBS ETF – MSCI Japan Infrastructure 20/35 UCITS ETF
(JPY) A-acc Not yet launched Not yet launched
UBS ETF – MSCI AC Asia ex Japan Infrastructure 20/35 UCITS ETF
(USD) A-dis SIX Swiss Exchange SIX Swiss Exchange
CHF USD
UBS ETF – MSCI AC Asia ex Japan Infrastructure 20/35 UCITS ETF
(USD) A-acc Not yet launched Not yet launched
UBS ETF – MSCI Europe Infrastructure 20/35 UCITS ETF
(EUR) A-dis SIX Swiss Exchange SIX Swiss Exchange Xetra/Deutsche Börse Borsa Italiana London Stock Exchange
CHF EUR EUR EUR GBp
UBS ETF – MSCI Europe Infrastructure 20/35 UCITS ETF
(EUR) A-acc Not yet launched Not yet launched
UBS ETF – STOXX Global Rare Earth UCITS ETF (USD) A-dis SIX Swiss Exchange SIX Swiss Exchange Xetra/Deutsche Börse Borsa Italiana London Stock Exchange
CHF USD EUR EUR GBp
UBS ETF – STOXX Global Rare Earth UCITS ETF (USD) A-acc Not yet launched Not yet launched
UBS ETF – Barclays Capital US 1-3 Year Treasury Bond UCITS ETF
(USD) A-dis SIX Swiss Exchange SIX Swiss Exchange Xetra/Deutsche Börse Borsa Italiana London Stock Exchange
CHF USD EUR EUR GBp
UBS ETF – Barclays Capital US 1-3 Year Treasury Bond UCITS ETF
(USD) A-acc Not yet launched Not yet launched
UBS ETF – Barclays Capital US 3-5 Year Treasury Bond UCITS ETF
(USD) A-dis SIX Swiss Exchange SIX Swiss Exchange Xetra/Deutsche Börse Borsa Italiana London Stock Exchange
CHF USD EUR EUR GBp
UBS ETF – Barclays Capital US 3-5 Year Treasury Bond UCITS ETF
(USD) A-acc Not yet launched Not yet launched
307

Semi-Annual Report as of 30 June 2014
Notes to Financial Statements
Note 1 Description of the Fund (continued)
Sub-Funds ETF Share Class Listing Stock Exchanges Trading Currency
UBS ETF – Barclays Capital US 5-7 Year Treasury Bond UCITS ETF
(USD) A-dis SIX Swiss Exchange SIX Swiss Exchange Xetra/Deutsche Börse Borsa Italiana London Stock Exchange
CHF USD EUR EUR GBp
UBS ETF – Barclays Capital US 5-7 Year Treasury Bond UCITS ETF
(USD) A-acc Not yet launched Not yet launched
UBS ETF – Barclays Capital US 7-10 Year Treasury Bond UCITS ETF
(USD) A-dis SIX Swiss Exchange SIX Swiss Exchange Xetra/Deutsche Börse Borsa Italiana London Stock Exchange
CHF USD EUR EUR GBp
UBS ETF – Barclays Capital US 7-10 Year Treasury Bond UCITS ETF
(USD) A-acc Not yet launched Not yet launched
UBS ETF – Barclays Capital US 10-20 Year Treasury Bond UCITS ETF
(USD) A-dis Not yet launched Not yet launched
UBS ETF – Barclays Capital US 10-20 Year Treasury Bond UCITS ETF
(USD) A-acc Not yet launched Not yet launched
UBS ETF – Barclays Capital US 20+ Year Treasury Bond UCITS ETF
(USD) A-dis Not yet launched Not yet launched
UBS ETF – Barclays Capital US 20+ Year Treasury Bond UCITS ETF
(USD) A-acc Not yet launched Not yet launched
UBS ETF – Markit iBoxx € Germany 1-3 UCITS ETF
(EUR) A-dis SIX Swiss Exchange SIX Swiss Exchange Xetra/Deutsche Börse Borsa Italiana London Stock Exchange
CHF EUR EUR EUR GBp
UBS ETF – Markit iBoxx € Germany 1-3 UCITS ETF
(EUR) A-acc Not yet launched Not yet launched
UBS ETF – Markit iBoxx € Germany 3-5 UCITS ETF
(EUR) A-dis SIX Swiss Exchange SIX Swiss Exchange Xetra/Deutsche Börse Borsa Italiana London Stock Exchange
CHF EUR EUR EUR GBp
UBS ETF – Markit iBoxx € Germany 3-5 UCITS ETF
(EUR) A-acc Not yet launched Not yet launched
UBS ETF – Markit iBoxx € Germany 5-10 UCITS ETF
(EUR) A-dis SIX Swiss Exchange SIX Swiss Exchange Xetra/Deutsche Börse Borsa Italiana London Stock Exchange
CHF EUR EUR EUR GBp
UBS ETF – Markit iBoxx € Germany 5-10 UCITS ETF
(EUR) A-acc Not yet launched Not yet launched
UBS ETF – Markit iBoxx € Germany 7-10 UCITS ETF
(EUR) A-dis SIX Swiss Exchange SIX Swiss Exchange Xetra/Deutsche Börse Borsa Italiana London Stock Exchange
CHF EUR EUR EUR GBp
UBS ETF – Markit iBoxx € Germany 7-10 UCITS ETF
(EUR) A-acc Not yet launched Not yet launched
UBS ETF – Markit iBoxx € Germany 10+ UCITS ETF
(EUR) A-dis Not yet launched Not yet launched
UBS ETF – Markit iBoxx € Germany 10+ UCITS ETF
(EUR) A-acc Not yet launched Not yet launched
UBS ETF – Markit iBoxx € Liquid Corporates UCITS ETF
(EUR) A-dis SIX Swiss Exchange SIX Swiss Exchange Xetra/Deutsche Börse Borsa Italiana London Stock Exchange
CHF EUR EUR EUR GBp
UBS ETF – Markit iBoxx € Liquid Corporates UCITS ETF
(EUR) A-acc Not yet launched Not yet launched
308

Semi-Annual Report as of 30 June 2014
Notes to Financial Statements
Note 1 Description of the Fund (continued)
Sub-Funds ETF Share Class Listing Stock Exchanges Trading Currency
UBS ETF – Markit iBoxx TIPS Inflation-Linked Index 5-10 UCITS ETF
(USD) A-dis Not yet launched Not yet launched
UBS ETF – Markit iBoxx TIPS Inflation-Linked Index 5-10 UCITS ETF
(USD) A-acc Not yet launched Not yet launched
UBS ETF – Markit iBoxx TIPS Inflation-Linked Index 10+ UCITS ETF
(USD) A-dis Not yet launched Not yet launched
UBS ETF – Markit iBoxx TIPS Inflation-Linked Index 10+ UCITS ETF
(USD) A-acc Not yet launched Not yet launched
UBS ETF – Markit iBoxx Sterling Inflation-Linked Index 10+ UCITS ETF
(GBP) A-dis Not yet launched Not yet launched
UBS ETF – Markit iBoxx Sterling Inflation-Linked Index 10+ UCITS ETF
(GBP) A-acc Not yet launched Not yet launched
UBS ETF – Markit iBoxx € Sovereigns 1-5 UCITS ETF
(EUR) A-dis SIX Swiss Exchange SIX Swiss Exchange Borsa Italiana
CHF EUR EUR
UBS ETF – Markit iBoxx € Sovereigns 1-5 UCITS ETF
(EUR) A-acc Not yet launched Not yet launched
UBS ETF – SBI® Foreign AAA-BBB 1-5 UCITS ETF
(CHF) A-dis SIX Swiss Exchange Xetra/Deutsche Börse Borsa Italiana
CHF EUR EUR
UBS ETF – SBI® Foreign AAA-BBB 1-5 UCITS ETF
(CHF) A-acc Not yet launched Not yet launched
UBS ETF – SBI® Foreign AAA-BBB 5-10 UCITS ETF
(CHF) A-dis SIX Swiss Exchange Xetra/Deutsche Börse Borsa Italiana
CHF EUR EUR
UBS ETF – SBI® Foreign AAA-BBB 5-10 UCITS ETF
(CHF) A-acc Not yet launched Not yet launched
UBS ETF – Barclays Euro Area Liquid Corporates 1-5 Year UCITS ETF
(EUR) A-dis Xetra/Deutsche Börse Borsa Italiana
EUR EUR
UBS ETF – Barclays Euro Area Liquid Corporates 1-5 Year UCITS ETF
(EUR) A-acc Not yet launched Not yet launched
UBS ETF – Barclays Euro Area Liquid Corporates 1-5 Year UCITS ETF
(hedged to USD) A-dis Not yet launched Not yet launched
UBS ETF – Barclays Euro Area Liquid Corporates 1-5 Year UCITS ETF
(hedged to USD) A-acc Not yet launched Not yet launched
UBS ETF – Barclays Euro Area Liquid Corporates 1-5 Year UCITS ETF
(hedged to GBP) A-dis Not yet launched Not yet launched
UBS ETF – Barclays Euro Area Liquid Corporates 1-5 Year UCITS ETF
(hedged to GBP) A-acc Not yet launched Not yet launched
UBS ETF – Barclays Euro Area Liquid Corporates 1-5 Year UCITS ETF
(hedged to CHF) A-dis Not yet launched Not yet launched
UBS ETF – Barclays Euro Area Liquid Corporates 1-5 Year UCITS ETF
(hedged to CHF) A-acc Not yet launched Not yet launched
UBS ETF – Barclays US Liquid Corporates 1-5 Year UCITS ETF
(USD) A-dis Not yet launched Not yet launched
UBS ETF – Barclays US Liquid Corporates 1-5 Year UCITS ETF
(USD) A-acc Not yet launched Not yet launched
UBS ETF – Barclays US Liquid Corporates 1-5 Year UCITS ETF
(hedged to EUR) A-dis Not yet launched Not yet launched
UBS ETF – Barclays US Liquid Corporates 1-5 Year UCITS ETF
(hedged to EUR) A-acc Not yet launched Not yet launched
UBS ETF – Barclays US Liquid Corporates 1-5 Year UCITS ETF
(hedged to GBP) A-dis Not yet launched Not yet launched
UBS ETF – Barclays US Liquid Corporates 1-5 Year UCITS ETF
(hedged to GBP) A-acc Not yet launched Not yet launched
UBS ETF – Barclays US Liquid Corporates 1-5 Year UCITS ETF
(hedged to CHF) A-dis Not yet launched Not yet launched
UBS ETF – Barclays US Liquid Corporates 1-5 Year UCITS ETF
(hedged to CHF) A-acc Not yet launched Not yet launched
UBS ETF – Barclays UK Liquid Corporates 1-5 Year UCITS ETF
(GBP) A-dis Not yet launched Not yet launched
UBS ETF – Barclays UK Liquid Corporates 1-5 Year UCITS ETF
(GBP) A-acc Not yet launched Not yet launched
UBS ETF – Barclays UK Liquid Corporates 1-5 Year UCITS ETF
(hedged to EUR) A-dis Not yet launched Not yet launched
UBS ETF – Barclays UK Liquid Corporates 1-5 Year UCITS ETF
(hedged to EUR) A-acc Not yet launched Not yet launched
309

Semi-Annual Report as of 30 June 2014
Notes to Financial Statements
Note 1 Description of the Fund (continued)
Sub-Funds ETF Share Class Listing Stock Exchanges Trading Currency
UBS ETF – Barclays UK Liquid Corporates 1-5 Year UCITS ETF
(hedged to USD) A-dis Not yet launched Not yet launched
UBS ETF – Barclays UK Liquid Corporates 1-5 Year UCITS ETF
(hedged to USD) A-acc Not yet launched Not yet launched
UBS ETF – Barclays UK Liquid Corporates 1-5 Year UCITS ETF
(hedged to CHF) A-dis Not yet launched Not yet launched
UBS ETF – Barclays UK Liquid Corporates 1-5 Year UCITS ETF
(hedged to CHF) A-acc Not yet launched Not yet launched
UBS ETF – Barclays US Liquid Corporates UCITS ETF
(USD) A-dis Xetra/Deutsche Börse
EUR
UBS ETF – Barclays US Liquid Corporates UCITS ETF
(USD) A-acc Not yet launched Not yet launched
UBS ETF – Barclays US Liquid Corporates UCITS ETF
(hedged to EUR) A-dis Not yet launched Not yet launched
UBS ETF – Barclays US Liquid Corporates UCITS ETF
(hedged to EUR) A-acc Xetra/Deutsche Börse Borsa Italiana
EUR EUR
UBS ETF – Barclays US Liquid Corporates UCITS ETF
(hedged to GBP) A-dis Not yet launched Not yet launched
UBS ETF – Barclays US Liquid Corporates UCITS ETF
(hedged to GBP) A-acc Not yet launched Not yet launched
UBS ETF – Barclays US Liquid Corporates UCITS ETF
(hedged to CHF) A-dis Not yet launched Not yet launched
UBS ETF – Barclays US Liquid Corporates UCITS ETF
(hedged to CHF) A-acc Not yet launched Not yet launched
Additional technical listings on the Irish Stock Exchange exist for some ETF Share Classes.
Note 2 Summary of Significant Accounting Policies
A) Presentation of Financial Statements
The financial statements have been prepared in accordance with the generally accepted accounting principles for investment funds in Luxembourg.
B) Main Investment Valuation Principles
Securities listed on a recognised stock exchange or dealt in on any other Regulated Market are valued at their last available closing prices, or, in the event that there are several such markets, on the basis of their last available closing prices on the principal market for the relevant security provided that such closing prices used are normally the same as those used by the Index Provider in calculating the value of each Sub-Fund’s Index, but in the event that the last available price does not truly reflect the fair market value of the relevant securities, the value of such securities is defined by the Board of Directors based on the reasonably foreseeable sales price determined prudently and in good faith. Securities not listed or traded on a stock exchange or not dealt in on another Regulated Market are valued on the basis of the probable sales price determined prudently and in good faith by the Board of Directors. The liquidating value of futures, forward foreign exchange or options contracts not traded on exchanges or on other Regulated Markets means their net liquidating value determined, pursuant to the policies established by the Board of Directors, on a basis consistently applied for each different variety of contracts. The liquidating value of futures, forward foreign exchange or options contracts traded on exchanges or on other Regulated Markets are based upon the last available settlement prices of these contracts on exchanges and Regulated Markets on which the particular futures, forward foreign exchange or options contracts are traded by the Company; provided that if a futures, forward foreign exchange or options contract cannot be liquidated on the day with respect to which net assets are being determined, the basis for determining the liquidating value of such contract is such value as the Board of Directors may deem fair and reasonable.
310

Semi-Annual Report as of 30 June 2014
Notes to Financial Statements
Note 2 Summary of Significant Accounting Policies (continued)
C) Treatment of Currencies
The books and records of each Sub-Fund are denominated in the Base Currencies as described in Note 1.
All assets and liabilities of the Sub-Funds expressed in a currency other than the Base Currency are converted into the Base Currency at the exchange rate prevailing on the principal Regulated Market of such asset on the Dealing Day preceding the Valuation Time. In order to prepare combined financial statements, financial statements of each Sub-Fund that is not EUR denominated have been converted into EUR at the following exchange rates:
1 EUR = 1.4584 CAD 1 EUR = 138.7018 JPY 1 EUR = 1.2142 CHF 1 EUR = 1.7069 SGD 1 EUR = 0.8007 GBP 1 EUR = 1.3692 USD
D) Security Transactions and Investment Income
The net realised gain or loss on portfolio securities sold or paid out in kind as part of the redemption price for shares is determined on the average cost basis. The assets of the Company include all stocks, stock dividends, cash dividends and cash distributions receivable by the Company to the extent that information therein is reasonably available to the Company and all interest accrued on any interest-bearing portfolio securities owned by the Company, except to the extent that it is included or reflected in the principal amount of such security. Dividends and interest income are accrued net of related withholding tax.
E) Options and Futures Contracts
For the purpose of efficient portfolio management, the Company may enter into futures contracts as set forth in the prospectus. Initial margin deposits made upon entering into futures contracts are included in deposits on financial futures in the Statement of Net Assets. The unrealised appreciation or depreciation on open futures contracts is calculated as the difference between the contract price at trade date and the current day price on the last Business Day of the reporting year or period. For the purpose of efficient portfolio management, the Company may furthermore purchase and write (sell) options as set forth in the prospectus.
The risk associated with purchasing an option is that the Company pays a premium whether or not the option is exercised. Additionally, the Company bears the risk of loss of the premium and any change in market value should the counterparty not perform under the contract. Put and call options purchased are accounted for in the same manner as portfolio securities. The cost of portfolio securities acquired through the exercise of call options is increased by premium paid. The proceeds from portfolio securities sold through the exercise of put options are decreased by the premiums paid.
311

Semi-Annual Report as of 30 June 2014
Notes to Financial Statements
Note 2 Summary of Significant Accounting Policies (continued)
E) Options and Futures Contracts (continued)
When the Company writes an option the premium received by the Company is recorded as a liability and is subsequently adjusted to the current market value of the option written. The Company records premiums received from written options that expire unexercised on the expiration date as realised gains from option transactions. The difference between the premium and the amount paid on the effective closing purchase transaction, including brokerage commissions, is also treated as a realised gain, or if the premium is less than the amount paid for the closing purchase transaction, as a realised loss. If a written call option is exercised, the premium is added to the proceeds from the sale of the underlying security in determining whether the Company has realised a gain or a loss. If a written put option is exercised, the premium reduces the cost basis of the security purchased by the Company. In writing covered options, the Company bears the market risk of unfavourable change in the price of the security underlying the written option. Exercise of an option written by the Company could result in the Company selling or buying a security at a price different from the current market value. Losses from written market index options may be unlimited. As of 30 June 2014, the Company had outstanding futures contracts as disclosed in the Schedules of Investments.
F) Forward Foreign Exchange Contracts
As described in the prospectus, each Sub-Fund is authorised to enter into forward foreign exchange contracts in order to protect a Sub-Fund or one or more specific share classes against adverse movement in the value of a Sub-Fund’s Base Currency. Each Sub-Fund/share class may enter into contracts for the purchase or sale of a specific foreign currency at a fixed price on a future date as a hedge or cross-hedge against either specific transactions or portfolio positions. The aggregate principal amounts are reflected net in the accompanying Statement of Net Assets if a Sub-Fund/share class intends to settle the contract prior to delivery. All commitments are marked-to-market at the applicable translation rates and any resulting unrealised gains or losses are recorded in each Sub-Fund’s/share class’ financial statements.
Each Sub-Fund/share class records realised gains or losses at the time the forward foreign exchange contract is offset by entry into a closing transaction or extinguished by delivery of the currency. Risks may arise upon entering these contracts from the potential inability of counterparties to meet the terms of their contracts and from unanticipated movements in the value of a foreign currency relative to the Base Currency. As of 30 June 2014, the Company had outstanding forward foreign exchange contracts as disclosed in the Schedules of Investments.
312

Semi-Annual Report as of 30 June 2014
Notes to Financial Statements
Note 2 Summary of Significant Accounting Policies (continued)
G) Swap Contracts
The Company may enter into swap contracts in which the Company and the counterparty agree to exchange the returns generated by a security, instrument, basket or index thereof for the return generated by another security, instrument, basket or index thereof. The payments made by the Company to the counterparty and vice versa are calculated by reference to a specific security, index, or instrument and an agreed upon notional amount. The relevant indices include, but are not limited to, currencies, fixed interest rates, prices and total return on interest rate indices, fixed income indices and stock indices. The commitment arising on a swap transaction is equal to the value of the net position under the contract marked to market daily. As of 30 June 2014, the Company had no outstanding swap contracts.
Note 3 Agreements
For all ETF share classes, each Sub-Fund pays a Management Fee. The Management Fee is allocated by the Company among the Sub-Funds and paid directly by the Company to the custodian bank and to the Management Company. The Management Company will pay out of its fees the company administrator, the portfolio manager and the distributor, each of which is a service provider. The Management Fee also includes the costs for the Sub-Funds' administration (comprising the costs of the Company administrator and custodian bank), asset management and distribution, as well as other costs and expenses incurred in the Sub-Fund's course of business, as detailed in the Prospectus. The Management Fee is a flat fee calculated on the average daily NAV of the Sub-Fund attributable to the relevant class of shares and is payable monthly in arrears.
Sub-Funds ETF Share Classes Management Fee
UBS ETF – EURO STOXX 50 UCITS ETF (EUR) A-dis 15 bps per annum UBS ETF – EURO STOXX 50 UCITS ETF (EUR) A-acc Not yet launched UBS ETF – MSCI Europe UCITS ETF (EUR) A-dis 20 bps per annum UBS ETF – MSCI Europe UCITS ETF (EUR) A-acc Not yet launched UBS ETF – MSCI Europe ex UK UCITS ETF (EUR) A-dis 20 bps per annum UBS ETF – MSCI Europe ex UK UCITS ETF (EUR) A-acc Not yet launched UBS ETF – MSCI EMU UCITS ETF (EUR) A-dis 23 bps per annum UBS ETF – MSCI EMU UCITS ETF (EUR) A-acc Not yet launched UBS ETF – MSCI EMU 100% hedged to CHF UCITS ETF (CHF) A-dis Not yet launched UBS ETF – MSCI EMU 100% hedged to CHF UCITS ETF (CHF) A-acc 33 bps per annum UBS ETF – MSCI EMU 100% hedged to USD UCITS ETF (USD) A-dis 33 bps per annum UBS ETF – MSCI EMU 100% hedged to USD UCITS ETF (USD) A-acc 33 bps per annum UBS ETF – MSCI EMU 100% hedged to GBP UCITS ETF (GBP) A-dis 33 bps per annum UBS ETF – MSCI EMU 100% hedged to GBP UCITS ETF (GBP) A-acc 33 bps per annum UBS ETF – MSCI EMU 100% hedged to SGD UCITS ETF (SGD) A-dis Not yet launched UBS ETF – MSCI EMU 100% hedged to SGD UCITS ETF (SGD) A-acc 33 bps per annum
1
UBS ETF – MSCI EMU Value UCITS ETF (EUR) A-dis 25 bps per annum UBS ETF – MSCI EMU Value UCITS ETF (EUR) A-acc Not yet launched UBS ETF – MSCI EMU Small Cap UCITS ETF (EUR) A-dis 33 bps per annum UBS ETF – MSCI EMU Small Cap UCITS ETF (EUR) A-acc Not yet launched UBS ETF – FTSE 100 UCITS ETF (GBP) A-dis 20 bps per annum UBS ETF – FTSE 100 UCITS ETF (GBP) A-acc Not yet launched
1 The Sub-Fund was launched on 30 June 2014. Therefore, no Management Fee was paid during the period under review.
313

Semi-Annual Report as of 30 June 2014
Notes to Financial Statements
Note 3 Agreements (continued)
Sub-Funds ETF Share Classes Management Fee
UBS ETF – FTSE 250 UCITS ETF (GBP) A-dis 25 bps per annum UBS ETF – FTSE 250 UCITS ETF (GBP) A-acc Not yet launched UBS ETF – MSCI United Kingdom UCITS ETF (GBP) A-dis 20 bps per annum UBS ETF – MSCI United Kingdom UCITS ETF (GBP) A-acc 20 bps per annum UBS ETF – MSCI United Kingdom 100% hedged to CHF UCITS ETF (CHF) A-dis Not yet launched UBS ETF – MSCI United Kingdom 100% hedged to CHF UCITS ETF (CHF) A-acc 30 bps per annum UBS ETF – MSCI United Kingdom 100% hedged to EUR UCITS ETF (EUR) A-dis 30 bps per annum UBS ETF – MSCI United Kingdom 100% hedged to EUR UCITS ETF (EUR) A-acc 30 bps per annum UBS ETF – MSCI United Kingdom 100% hedged to USD UCITS ETF (USD) A-dis 30 bps per annum UBS ETF – MSCI United Kingdom 100% hedged to USD UCITS ETF (USD) A-acc 30 bps per annum UBS ETF – MSCI United Kingdom 100% hedged to SGD UCITS ETF (SGD) A-dis Not yet launched UBS ETF – MSCI United Kingdom 100% hedged to SGD UCITS ETF (SGD) A-acc 30 bps per annum
1
UBS ETF – MSCI Turkey UCITS ETF (EUR) A-dis 43 bps per annum UBS ETF – MSCI Turkey UCITS ETF (EUR) A-acc Not yet launched UBS ETF – MSCI Japan UCITS ETF (JPY) A-dis 35 bps per annum UBS ETF – MSCI Japan UCITS ETF (JPY) A-acc Not yet launched UBS ETF – MSCI Japan 100% hedged to CHF UCITS ETF (CHF) A-dis Not yet launched UBS ETF – MSCI Japan 100% hedged to CHF UCITS ETF (CHF) A-acc 45 bps per annum UBS ETF – MSCI Japan 100% hedged to EUR UCITS ETF (EUR) A-dis 45 bps per annum UBS ETF – MSCI Japan 100% hedged to EUR UCITS ETF (EUR) A-acc 45 bps per annum UBS ETF – MSCI Japan 100% hedged to GBP UCITS ETF (GBP) A-dis 45 bps per annum UBS ETF – MSCI Japan 100% hedged to GBP UCITS ETF (GBP) A-acc 45 bps per annum UBS ETF – MSCI Japan 100% hedged to USD UCITS ETF (USD) A-dis 45 bps per annum UBS ETF – MSCI Japan 100% hedged to USD UCITS ETF (USD) A-acc 45 bps per annum UBS ETF – MSCI Japan 100% hedged to SGD UCITS ETF (SGD) A-dis Not yet launched UBS ETF – MSCI Japan 100% hedged to SGD UCITS ETF (SGD) A-acc 45 bps per annum
1
UBS ETF – MSCI Pacific (ex Japan) UCITS ETF (USD) A-dis 30 bps per annum UBS ETF – MSCI Pacific (ex Japan) UCITS ETF (USD) A-acc Not yet launched UBS ETF – MSCI USA UCITS ETF (USD) A-dis 20 bps per annum UBS ETF – MSCI USA UCITS ETF (USD) A-acc Not yet launched UBS ETF – MSCI Canada UCITS ETF (CAD) A-dis 33 bps per annum UBS ETF – MSCI Canada UCITS ETF (CAD) A-acc Not yet launched UBS ETF – MSCI Canada 100% hedged to CHF UCITS ETF (CHF) A-dis Not yet launched UBS ETF – MSCI Canada 100% hedged to CHF UCITS ETF (CHF) A-acc 43 bps per annum UBS ETF – MSCI Canada 100% hedged to EUR UCITS ETF (EUR) A-dis Not yet launched UBS ETF – MSCI Canada 100% hedged to EUR UCITS ETF (EUR) A-acc 43 bps per annum UBS ETF – MSCI Canada 100% hedged to USD UCITS ETF (USD) A-dis Not yet launched UBS ETF – MSCI Canada 100% hedged to USD UCITS ETF (USD) A-acc 43 bps per annum UBS ETF – MSCI Canada 100% hedged to GBP UCITS ETF (GBP) A-dis 43 bps per annum UBS ETF – MSCI Canada 100% hedged to GBP UCITS ETF (GBP) A-acc 43 bps per annum UBS ETF – MSCI Canada 100% hedged to SGD UCITS ETF (SGD) A-dis Not yet launched UBS ETF – MSCI Canada 100% hedged to SGD UCITS ETF (SGD) A-acc 43 bps per annum
1
UBS ETF – MSCI Switzerland 20/35 UCITS ETF (CHF) A-dis 20 bps per annum UBS ETF – MSCI Switzerland 20/35 UCITS ETF (CHF) A-acc 20 bps per annum UBS ETF – MSCI Switzerland 20/35 100% hedged to EUR UCITS ETF (EUR) A-dis 30 bps per annum UBS ETF – MSCI Switzerland 20/35 100% hedged to EUR UCITS ETF (EUR) A-acc 30 bps per annum UBS ETF – MSCI Switzerland 20/35 100% hedged to USD UCITS ETF (USD) A-dis 30 bps per annum
UBS ETF – MSCI Switzerland 20/35 100% hedged to USD UCITS ETF (USD) A-acc 30 bps per annum UBS ETF – MSCI Switzerland 20/35 100% hedged to GBP UCITS ETF (GBP) A-dis 30 bps per annum UBS ETF – MSCI Switzerland 20/35 100% hedged to GBP UCITS ETF (GBP) A-acc 30 bps per annum UBS ETF – MSCI Switzerland 20/35 100% hedged to SGD UCITS ETF (SGD) A-dis Not yet launched UBS ETF – MSCI Switzerland 20/35 100% hedged to SGD UCITS ETF (SGD) A-acc 30 bps per annum
1
UBS ETF – MSCI World UCITS ETF (USD) A-dis 30 bps per annum UBS ETF – MSCI World UCITS ETF (USD) A-acc Not yet launched UBS ETF – MSCI Emerging Markets UCITS ETF (USD) A-dis 45 bps per annum UBS ETF – MSCI Emerging Markets UCITS ETF (USD) A-acc Not yet launched
1 The Sub-Fund was launched on 30 June 2014. Therefore, no Management Fee was paid during the period under review.
314

Semi-Annual Report as of 30 June 2014
Notes to Financial Statements
Note 3 Agreements (continued)
Sub-Funds ETF Share Classes Management Fee
UBS ETF – MSCI Emerging Markets Socially Responsible UCITS ETF (USD) A-dis Not yet launched UBS ETF – MSCI Emerging Markets Socially Responsible UCITS ETF (USD) A-acc Not yet launched UBS ETF – MSCI World Socially Responsible UCITS ETF (USD) A-dis 38 bps per annum UBS ETF – MSCI World Socially Responsible UCITS ETF (USD) A-acc Not yet launched UBS ETF – MSCI North America Socially Responsible UCITS ETF (USD) A-dis 33 bps per annum UBS ETF – MSCI North America Socially Responsible UCITS ETF (USD) A-acc Not yet launched UBS ETF – MSCI Europe & Middle East Socially Responsible UCITS ETF (EUR) A-dis 28 bps per annum UBS ETF – MSCI Europe & Middle East Socially Responsible UCITS ETF (EUR) A-acc Not yet launched UBS ETF – MSCI Pacific Socially Responsible UCITS ETF 1 (USD) A-dis 40 bps per annum UBS ETF – MSCI Pacific Socially Responsible UCITS ETF (USD) A-acc Not yet launched UBS ETF – MSCI Japan Infrastructure 20/35 UCITS ETF (JPY) A-dis 48 bps per annum UBS ETF – MSCI Japan Infrastructure 20/35 UCITS ETF (JPY) A-acc Not yet launched UBS ETF – MSCI AC Asia ex Japan Infrastructure 20/35 UCITS ETF (USD) A-dis 48 bps per annum UBS ETF – MSCI AC Asia ex Japan Infrastructure 20/35 UCITS ETF (USD) A-acc Not yet launched UBS ETF – MSCI Europe Infrastructure 20/35 UCITS ETF (EUR) A-dis 48 bps per annum UBS ETF – MSCI Europe Infrastructure 20/35 UCITS ETF (EUR) A-acc Not yet launched UBS ETF – STOXX Global Rare Earth UCITS ETF (USD) A-dis 45 bps per annum UBS ETF – STOXX Global Rare Earth UCITS ETF (USD) A-acc Not yet launched UBS ETF – Barclays Capital US 1-3 Year Treasury Bond UCITS ETF (USD) A-dis 22 bps per annum UBS ETF – Barclays Capital US 1-3 Year Treasury Bond UCITS ETF (USD) A-acc Not yet launched UBS ETF – Barclays Capital US 3-5 Year Treasury Bond UCITS ETF (USD) A-dis 22 bps per annum UBS ETF – Barclays Capital US 3-5 Year Treasury Bond UCITS ETF (USD) A-acc Not yet launched UBS ETF – Barclays Capital US 5-7 Year Treasury Bond UCITS ETF (USD) A-dis 22 bps per annum UBS ETF – Barclays Capital US 5-7 Year Treasury Bond UCITS ETF (USD) A-acc Not yet launched UBS ETF – Barclays Capital US 7-10 Year Treasury Bond UCITS ETF (USD) A-dis 22 bps per annum UBS ETF – Barclays Capital US 7-10 Year Treasury Bond UCITS ETF (USD) A-acc Not yet launched UBS ETF – Barclays Capital US 10-20 Year Treasury Bond UCITS ETF (USD) A-dis Not yet launched UBS ETF – Barclays Capital US 10-20 Year Treasury Bond UCITS ETF (USD) A-acc Not yet launched UBS ETF – Barclays Capital US 20+ Year Treasury Bond UCITS ETF (USD) A-dis Not yet launched UBS ETF – Barclays Capital US 20+ Year Treasury Bond UCITS ETF (USD) A-acc Not yet launched UBS ETF – Markit iBoxx € Germany 1-3 UCITS ETF (EUR) A-dis 17 bps per annum UBS ETF – Markit iBoxx € Germany 1-3 UCITS ETF (EUR) A-acc Not yet launched UBS ETF – Markit iBoxx € Germany 3-5 UCITS ETF (EUR) A-dis 17 bps per annum UBS ETF – Markit iBoxx € Germany 3-5 UCITS ETF (EUR) A-acc Not yet launched UBS ETF – Markit iBoxx € Germany 5-10 UCITS ETF (EUR) A-dis 17 bps per annum UBS ETF – Markit iBoxx € Germany 5-10 UCITS ETF (EUR) A-acc Not yet launched UBS ETF – Markit iBoxx € Germany 7-10 UCITS ETF (EUR) A-dis 17 bps per annum UBS ETF – Markit iBoxx € Germany 7-10 UCITS ETF (EUR) A-acc Not yet launched UBS ETF – Markit iBoxx € Germany 10+ UCITS ETF (EUR) A-dis Not yet launched UBS ETF – Markit iBoxx € Germany 10+ UCITS ETF (EUR) A-acc Not yet launched UBS ETF – Markit iBoxx € Liquid Corporates UCITS ETF (EUR) A-dis 23 bps per annum UBS ETF – Markit iBoxx € Liquid Corporates UCITS ETF (EUR) A-acc Not yet launched UBS ETF – Markit iBoxx TIPS Inflation-Linked Index 5-10 UCITS ETF (USD) A-dis Not yet launched UBS ETF – Markit iBoxx TIPS Inflation-Linked Index 5-10 UCITS ETF (USD) A-acc Not yet launched UBS ETF – Markit iBoxx TIPS Inflation-Linked Index 10+ UCITS ETF (USD) A-dis Not yet launched UBS ETF – Markit iBoxx TIPS Inflation-Linked Index 10+ UCITS ETF (USD) A-acc Not yet launched UBS ETF – Markit iBoxx Sterling Inflation-Linked Index 10+ UCITS ETF (GBP) A-dis Not yet launched UBS ETF – Markit iBoxx Sterling Inflation-Linked Index 10+ UCITS ETF (GBP) A-acc Not yet launched UBS ETF – Markit iBoxx € Sovereigns 1-5 UCITS ETF (EUR) A-dis 17 bps per annum UBS ETF – Markit iBoxx € Sovereigns 1-5 UCITS ETF (EUR) A-acc Not yet launched UBS ETF – SBI® Foreign AAA-BBB 1-5 UCITS ETF (CHF) A-dis 20 bps per annum UBS ETF – SBI® Foreign AAA-BBB 1-5 UCITS ETF (CHF) A-acc Not yet launched UBS ETF – SBI® Foreign AAA-BBB 5-10 UCITS ETF (CHF) A-dis 20 bps per annum UBS ETF – SBI® Foreign AAA-BBB 5-10 UCITS ETF (CHF) A-acc Not yet launched UBS ETF – Barclays Euro Area Liquid Corporates 1-5 Year UCITS ETF (EUR) A-dis 18 bps per annum UBS ETF – Barclays Euro Area Liquid Corporates 1-5 Year UCITS ETF (EUR) A-acc Not yet launched
1 As of 20 February 2014, the Management Fee changed from 53 bps to 40 bps per annum.
315

Semi-Annual Report as of 30 June 2014
Notes to Financial Statements
Note 3 Agreements (continued)
Sub-Funds ETF Share Classes Management Fee
UBS ETF – Barclays Euro Area Liquid Corporates 1-5 Year UCITS ETF (hedged to USD) A-dis Not yet launched UBS ETF – Barclays Euro Area Liquid Corporates 1-5 Year UCITS ETF (hedged to USD) A-acc Not yet launched UBS ETF – Barclays Euro Area Liquid Corporates 1-5 Year UCITS ETF (hedged to GBP) A-dis Not yet launched UBS ETF – Barclays Euro Area Liquid Corporates 1-5 Year UCITS ETF (hedged to GBP) A-acc Not yet launched UBS ETF – Barclays Euro Area Liquid Corporates 1-5 Year UCITS ETF (hedged to CHF) A-dis Not yet launched UBS ETF – Barclays Euro Area Liquid Corporates 1-5 Year UCITS ETF (hedged to CHF) A-acc Not yet launched UBS ETF – Barclays US Liquid Corporates 1-5 Year UCITS ETF (USD) A-dis Not yet launched UBS ETF – Barclays US Liquid Corporates 1-5 Year UCITS ETF (USD) A-acc Not yet launched UBS ETF – Barclays US Liquid Corporates 1-5 Year UCITS ETF (hedged to EUR) A-dis Not yet launched UBS ETF – Barclays US Liquid Corporates 1-5 Year UCITS ETF (hedged to EUR) A-acc Not yet launched UBS ETF – Barclays US Liquid Corporates 1-5 Year UCITS ETF (hedged to GBP) A-dis Not yet launched UBS ETF – Barclays US Liquid Corporates 1-5 Year UCITS ETF (hedged to GBP) A-acc Not yet launched
UBS ETF – Barclays US Liquid Corporates 1-5 Year UCITS ETF (hedged to CHF) A-dis Not yet launched
UBS ETF – Barclays US Liquid Corporates 1-5 Year UCITS ETF (hedged to CHF) A-acc Not yet launched UBS ETF – Barclays UK Liquid Corporates 1-5 Year UCITS ETF (GBP) A-dis Not yet launched UBS ETF – Barclays UK Liquid Corporates 1-5 Year UCITS ETF (GBP) A-acc Not yet launched UBS ETF – Barclays UK Liquid Corporates 1-5 Year UCITS ETF (hedged to EUR) A-dis Not yet launched UBS ETF – Barclays UK Liquid Corporates 1-5 Year UCITS ETF (hedged to EUR) A-acc Not yet launched UBS ETF – Barclays UK Liquid Corporates 1-5 Year UCITS ETF (hedged to USD) A-dis Not yet launched UBS ETF – Barclays UK Liquid Corporates 1-5 Year UCITS ETF (hedged to USD) A-acc Not yet launched UBS ETF – Barclays UK Liquid Corporates 1-5 Year UCITS ETF (hedged to CHF) A-dis Not yet launched UBS ETF – Barclays UK Liquid Corporates 1-5 Year UCITS ETF (hedged to CHF) A-acc Not yet launched UBS ETF – Barclays US Liquid Corporates UCITS ETF (USD) A-dis 18 bps per annum UBS ETF – Barclays US Liquid Corporates UCITS ETF (USD) A-acc Not yet launched
UBS ETF – Barclays US Liquid Corporates UCITS ETF (hedged to EUR) A-dis Not yet launched UBS ETF – Barclays US Liquid Corporates UCITS ETF (hedged to EUR) A-acc 23 bps per annum UBS ETF – Barclays US Liquid Corporates UCITS ETF (hedged to GBP) A-dis Not yet launched UBS ETF – Barclays US Liquid Corporates UCITS ETF (hedged to GBP) A-acc Not yet launched UBS ETF – Barclays US Liquid Corporates UCITS ETF (hedged to CHF) A-dis Not yet launched UBS ETF – Barclays US Liquid Corporates UCITS ETF (hedged to CHF) A-acc Not yet launched
The fees of the service providers and any other costs or expenses in respect of each Sub-Fund and/or ETF share class do together not exceed the Management Fee payable by the assets attributable to the relevant ETF share class in that Sub-Fund. Any additional fees, costs or expenses, not met out of the Management Fee is paid by the distributor.
The Management Company appointed:
a) UBS Global Asset Management (UK) Ltd, 21 Lombard Street, GB-London EC3V 9AH (the “Portfolio Manager”) to act as Portfolio Manager of all the current equity based listed Sub-Funds.
b) UBS AG, UBS Global Asset Management, Basel und Zurich, Aeschenvorstadt 1, CH-4002 Basel, and Bahnhofstrasse 45, CH-8098 Zurich, to act as Portfolio Manager of all the current fixed income based listed Sub-Funds.
The Portfolio Manager is commissioned to manage the securities portfolio and will execute all relevant transactions in conformity with the specified investment restrictions. The Portfolio Managers are entitled to receive a fee for their services rendered payable out of the Management Fee based on the average daily NAV of the Sub-Funds and payable monthly in arrears. UBS AG is the ultimate parent company of the Portfolio Manager.
316

Semi-Annual Report as of 30 June 2014
Notes to Financial Statements
Note 3 Agreements (continued)
UBS AG (the “Distributor”) is acting as distributor and is responsible for assisting the Company in the marketing of the Shares and promoting the establishment and operation of a secondary market in Shares as well as other general marketing activities on behalf of the Company. State Street Bank Luxembourg S.A., 49, Avenue J.F. Kennedy, L-1855 Luxembourg, acts as the Company's administrator, domiciliary, corporate and paying agent in Luxembourg, registrar and transfer agent and is responsible for the general administrative duties involved in administering the Company as prescribed by Luxembourg laws and acting as the transfer agent. These duties include domiciliation, calculation of the Daily NAV per Share and the keeping of the Company's accounts, as well as reporting. Moreover, the administrative agent will be responsible for the issue and redemption of shares in the Company, and all related operations, including processing all subscriptions, redemptions and conversions to or from Authorized Participants.
Note 4 Taxation
Investors should be aware that tax regulations and their application or interpretation by the relevant taxation authorities can change periodically. The following should not be taken as constituting legal or tax advice. Investors should obtain information and, if necessary, should consult their professional advisers on the possible tax or other consequences of buying, holding, transferring or selling the Shares under the laws of their countries of origin citizenship, residence or domicile. Under current laws and practice, the Company is not liable to any Luxembourg income tax, nor are dividends paid by the Company liable to any Luxembourg withholding tax. Starting from 1 January 2011, ETFs (whether UCITS or not) are exempt from the Taxe d’Abonnement if their securities are listed or traded on at least one stock exchange or another regulated market operating regularly, recognized and open to the public. No stamp duty or other tax is payable in Luxembourg on the issue of shares by the Company. Certain Sub-Funds will be subject to the European Savings Directive (Council Directive 2003/48/EC) and tax on savings income in the form of interest payments could apply under specific circumstances. Investors should seek tax advice in relation to the impact of the European Savings Directive on their investment. The Directors intend that all share classes in each Sub-Fund will be certified by HM Revenue & Customs in the UK as reporting funds. The reporting fund status will remain in place permanently provided that the annual reporting requirements are satisfied. In broad terms, a "reporting fund" is an offshore fund that meets certain annual reporting requirements to HM Revenue & Customs and its investors. The Directors intend to manage the affairs of the Company so that these annual duties are met and will continue to be met on an ongoing basis. Each Sub-Fund of the Company is subject to taxation on capital gains, interest and dividends in certain jurisdictions in which each Sub-Fund invests. It is the policy of each Sub-Fund to accrue for such taxes when the dividend is declared or interest is earned. At each valuation date, taxation on unrealised appreciation of securities is accrued for at applicable rates.
317

Semi-Annual Report as of 30 June 2014
Notes to Financial Statements
Note 5 Distribution
Within the limits provided by Luxembourg law, the Board of Directors determines how the income of each Sub-Fund shall be dealt with, and may from time to time declare distributions. The Board of Directors may decide to pay interim dividends in compliance with the conditions set forth by Luxembourg law. The Company intends for each Sub-Fund to distribute its net income in order to achieve the maximum tracking accuracy of the relevant Index. An income equalization amount will be calculated by reference to the amount of the Daily NAV Per Share representing the accrued net income (or deficit) at the time when a subscription or a redemption in kind is made so that the dividend representing the net investment income corresponds to the net income return of the Index. During the period ended 30 June 2014, the Company resolved to pay to all shareholders of the Sub-Funds mentioned below, dividends out of the income net of all costs and expenses incurred by the respective Sub-Fund as detailed in the following table.
Sub-Funds (ETF Share Classes)
Ex- Dividend Date
Payment Date
Currency Number of
Shares
Dividend Per
Share
Total Amount of
Dividends Paid
Net Investment
Income
UBS ETF – EURO STOXX 50 UCITS ETF (EUR) A-dis
31 Jan 2014 5 Feb 2014 EUR 8,912,296 0.2155 1,920,600
UBS ETF – EURO STOXX 50 UCITS ETF (EUR) I-dis
31 Jan 2014 5 Feb 2014 EUR 13,648 222.0482 3,030,514
4,951,114 16,987,044
UBS ETF – MSCI Europe UCITS ETF (EUR) A-dis
31 Jan 2014 5 Feb 2014 EUR 757,000 0.3696 279,787
UBS ETF – MSCI Europe UCITS ETF (EUR) I-dis
31 Jan 2014 5 Feb 2014 EUR 286 900.7782 257,623
537,410 3,120,282
UBS ETF – MSCI EMU UCITS ETF (EUR) A-dis
31 Jan 2014 5 Feb 2014 EUR 9,932,572 0.7298 7,248,791
UBS ETF – MSCI EMU UCITS ETF (EUR) I-dis
31 Jan 2014 5 Feb 2014 EUR 1,233 617.8078 761,757
8,010,548 32,150,377
UBS ETF - MSCI EMU 100% hedged to GBP UCITS ETF
(GBP) A-dis
31 Jan 2014 5 Feb 2014 GBP 525,000 0.0336 17,640
17,640 3,701,412
UBS ETF – MSCI EMU Value
UCITS ETF (EUR) A-dis
31 Jan 2014 5 Feb 2014 EUR 1,040,000 0.3760 391,040
391,040 1,080,831
318

Semi-Annual Report as of 30 June 2014
Notes to Financial Statements
Note 5 Distribution (continued)
Sub-Funds (ETF Share Classes)
Ex- Dividend Date
Payment Date
Currency Number of
Shares
Dividend Per
Share
Total Amount of
Dividends Paid
Net Investment
Income
UBS ETF – MSCI EMU Small Cap UCITS ETF (EUR) I-dis
31 Jan 2014 5 Feb 2014 EUR 240 282.2250 67,734
67,734 285,670
UBS ETF – FTSE 100
UCITS ETF (GBP) A-dis
31 Jan 2014 5 Feb 2014 GBP 2,417,628 0.9827 2,375,803
UBS ETF – FTSE 100
UCITS ETF (GBP) I-dis
31 Jan 2014 5 Feb 2014 GBP 4,555 198.9281 906,118
3,281,921 7,976,945
UBS ETF - MSCI United Kingdom
UCITS ETF (GBP) A-dis
31 Jan 2014 5 Feb 2014 GBP 600,000 0.0975 58,500
58,500 25,065,179
UBS ETF – MSCI Japan UCITS ETF (JPY) A-dis
31 Jan 2014 5 Feb 2014 JPY 18,504,116 21.8222 403,800,542
UBS ETF – MSCI Japan UCITS ETF (JPY) I-dis
31 Jan 2014 5 Feb 2014 JPY 7,508 22,807.1628 171,236,178
575,036,720 401,405,621
UBS ETF – MSCI Pacific (ex Japan) UCITS ETF (USD) A-dis
31 Jan 2014 5 Feb 2014 USD 2,734,126 0.5325 1,455,923
UBS ETF – MSCI Pacific (ex Japan) UCITS ETF (USD) I-dis
31 Jan 2014 5 Feb 2014 USD 6,180 117.7423 727,647
2,183,570 3,183,130
UBS ETF – MSCI USA UCITS ETF (USD) A-dis
31 Jan 2014 5 Feb 2014 USD 10,354,630 1.0319 10,684,943
UBS ETF – MSCI USA UCITS ETF (USD) I-dis
31 Jan 2014 5 Feb 2014 USD 1,344 1,039.8915 1,397,614
12,082,557 13,983,000
319

Semi-Annual Report as of 30 June 2014
Notes to Financial Statements
Note 5 Distribution (continued)
Sub-Funds (ETF Share Classes)
Ex- Dividend Date
Payment Date
Currency Number of
Shares
Dividend Per
Share
Total Amount of
Dividends Paid
Net Investment
Income
UBS ETF – MSCI Canada
UCITS ETF (CAD) A-dis
31 Jan 2014 5 Feb 2014 CAD 2,786,500 0.3487 971,653
UBS ETF – MSCI Canada
UCITS ETF (CAD) I-dis
31 Jan 2014 5 Feb 2014 CAD 2,006 350.9398 703,985
1,675,638 2,534,832 UBS ETF - MSCI
Canada 100% hedged to GBP
UCITS ETF (GBP) A-dis
31 Jan 2014 5 Feb 2014 GBP 100,000 0.0722 7,220
7,220 42,351 UBS ETF – MSCI World UCITS ETF (USD) A-dis
31 Jan 2014 5 Feb 2014 USD 2,821,754 1.1204 3,161,493
UBS ETF – MSCI World UCITS ETF (USD) I-dis
31 Jan 2014 5 Feb 2014 USD 1,837 1,176.9481 2,162,054
5,323,547 12,099,801
UBS ETF – MSCI Emerging
Markets UCITS ETF (USD) A-dis
31 Jan 2014 5 Feb 2014 USD 1,855,781 0.7932 1,472,006
UBS ETF – MSCI Emerging
Markets UCITS ETF (USD) I-dis
31 Jan 2014 5 Feb 2014 USD 1,454 837.0023 1,217,001
2,689,007 3,734,996
UBS ETF – MSCI World Socially
Responsible UCITS ETF (USD) A-dis
31 Jan 2014 5 Feb 2014 USD 370,000 0.4643 171,791
UBS ETF – MSCI World Socially
Responsible UCITS ETF (USD) I-dis
31 Jan 2014 5 Feb 2014 USD 5,460 99.4097 542,777
714,568 1,549,120
UBS ETF – MSCI North America
Socially Responsible UCITS ETF (USD) A-dis
31 Jan 2014 5 Feb 2014 USD 59,000 0.4414 26,042
UBS ETF – MSCI North America
Socially Responsible UCITS ETF (USD) I-dis
31 Jan 2014 5 Feb 2014 USD 3,905 90.6150 353,852
379,894 653,126
320

Semi-Annual Report as of 30 June 2014
Notes to Financial Statements
Note 5 Distribution (continued)
Sub-Funds (ETF Share Classes)
Ex- Dividend Date
Payment Date
Currency Number of
Shares
Dividend Per
Share
Total Amount of
Dividends Paid
Net Investment
Income
UBS ETF – MSCI Europe &
Middle East Socially Responsible UCITS ETF (EUR) A-dis
31 Jan 2014 5 Feb 2014 EUR 50,000 0.3583 17,915
UBS ETF – MSCI Europe &
Middle East Socially Responsible UCITS ETF (EUR) I-dis
31 Jan 2014 5 Feb 2014 EUR 750 76.3747 57,281
75,196 807,472
UBS ETF – MSCI Pacific
Socially Responsible UCITS ETF (USD) A-dis
31 Jan 2014 5 Feb 2014 USD 50,000 0.7492 37,460
UBS ETF – MSCI Pacific
Socially Responsible UCITS ETF (USD) I-dis
31 Jan 2014 5 Feb 2014 USD 750 154.5213 115,891
153,351 127,896
UBS ETF – MSCI Japan Infrastructure
20/35 UCITS ETF (JPY) A-dis
31 Jan 2014 5 Feb 2014 JPY 45,000 26.3515 1,185,818
UBS ETF – MSCI Japan Infrastructure
20/35 UCITS ETF (JPY) I-dis
31 Jan 2014 5 Feb 2014 JPY 225 5,733.0089 1,289,927
2,475,745 2,456,002
UBS ETF – MSCI AC Asia ex
Japan Infrastructure 20/35 UCITS ETF
(USD) A-dis
31 Jan 2014 5 Feb 2014 USD 130,000 0.4461 57,993
UBS ETF – MSCI AC Asia ex
Japan Infrastructure 20/35 UCITS ETF
(USD) I-dis
31 Jan 2014 5 Feb 2014 USD 325 183.0154 59,480
117,473 111,443
UBS ETF – MSCI Europe
Infrastructure 20/35 UCITS ETF (EUR) A-dis
31 Jan 2014 5 Feb 2014 EUR 47,500 0.6544 31,084
UBS ETF – MSCI Europe
Infrastructure 20/35 UCITS ETF (EUR) I-dis
31 Jan 2014 5 Feb 2014 EUR 138 146.5290 20,221
51,305 479,511
321

Semi-Annual Report as of 30 June 2014
Notes to Financial Statements
Note 5 Distribution (continued)
Sub-Funds (ETF Share Classes)
Ex- Dividend Date
Payment Date
Currency Number of
Shares
Dividend Per
Share
Total Amount of
Dividends Paid
Net Investment
Income
UBS ETF – STOXX Global Rare Earth
UCITS ETF (USD) I-dis
31 Jan 2014 5 Feb 2014 USD 1,397 1.9468 2,720
2,720 (32,957)
UBS ETF – Barclays Capital US
1-3 Year Treasury Bond
UCITS ETF (USD) A-dis
31 Jan 2014 5 Feb 2014 USD 225,000 0.0184 4,140
4,140 17,773
UBS ETF – Barclays Capital US
3-5 Year Treasury Bond
UCITS ETF (USD) A-dis
31 Jan 2014 5 Feb 2014 USD 150,000 0.0957 14,355
14,355 46,877
UBS ETF – Barclays Capital US
5-7 Year Treasury Bond
UCITS ETF (USD) A-dis
31 Jan 2014 5 Feb 2014 USD 60,000 0.2221 13,326
13,326 52,937
UBS ETF – Barclays Capital US
7-10 Year Treasury Bond
UCITS ETF (USD) A-dis
31 Jan 2014 5 Feb 2014 USD 340,000 0.3067 104,278
104,278 (246,192)
UBS ETF – Markit iBoxx € Germany 3-5 UCITS ETF (EUR) A-dis
31 Jan 2014 5 Feb 2014 EUR 10,000 0.3192 3,192
3,192 (237)
UBS ETF – Markit iBoxx € Germany 5-10
UCITS ETF (EUR) A-dis
31 Jan 2014 5 Feb 2014 EUR 20,000 0.7091 14,182
14,182 25,257
UBS ETF – Markit iBoxx € Germany 7-10
UCITS ETF (EUR) A-dis
31 Jan 2014 5 Feb 2014 EUR 70,000 0.7304 51,128
51,128 49,405
UBS ETF – Markit iBoxx €
Liquid Corporates UCITS ETF (EUR) A-dis
31 Jan 2014 5 Feb 2014 EUR 350,000 0.8054 281,890
281,890 274,294
UBS ETF - Markit iBoxx € Sovereigns
1-5 UCITS ETF (EUR) A-dis
31 Jan 2014 5 Feb 2014 EUR 250,000 0.0059 1,475
1,475 10,631
322

Semi-Annual Report as of 30 June 2014
Notes to Financial Statements
Note 5 Distribution (continued)
Sub-Funds (ETF Share Classes)
Ex- Dividend Date
Payment Date
Currency Number of
Shares
Dividend Per
Share
Total Amount of
Dividends Paid
Net Investment
Income
UBS ETF - SBI® Foreign AAA-BBB
1-5 UCITS ETF (CHF) A-dis
31 Jan 2014 5 Feb 2014 CHF 3,200,000 0.0256 81,920
81,920 184,350
UBS ETF - SBI® Foreign AAA-BBB 5-10 UCITS ETF
(CHF) A-dis
31 Jan 2014 5 Feb 2014 CHF 1,200,000 0.0583 69,960
69,960 153,447
Note 6 Income Equalization
The Company intends for each Sub-Fund and ETF share class to distribute its net income in order to maintain the maximum tracking accuracy of the relevant index. An income equalization amount will be calculated by reference to the amount of the Daily NAV Per Share representing accrued net income (or deficit) at the time when a subscription or a redemption is made so that the dividend representing net investment income corresponds to the net income return of the index.
Note 7 Transactions by the Company
As a result of each Sub-Fund typically receiving (or delivering) securities through in kind subscriptions (or redemptions) made by Authorized Participants or versus cash, Sub-Funds will normally not incur high levels of investment transactions. In accordance with the investment policy of each Sub-Fund investment transactions may be entered into periodically by the Company in seeking to achieve the Sub-Fund’s Investment Objectives.
Subject to the investment policy established by the Board of Directors, the Portfolio Manager of each Sub-Fund is responsible for the execution of each Sub-Fund’s investment transactions and the allocation of the brokerage commissions and will select brokers who will provide the best overall service to the Company. The Company has no obligation to deal with any specific broker or group of brokers in execution of transactions in securities for a Sub-Fund. However, the Company contemplates that a substantial amount of such transactions will be conducted through Authorized Participants or their affiliates or affiliates of the relevant Portfolio Manager; provided always that any such person will endeavor to transact such transactions on a best execution basis. Certain transactions may be subject to a commission or dealer mark-up which may not be the lowest commission or spread available.
323

Semi-Annual Report as of 30 June 2014
Notes to Financial Statements
Note 8 Securities Lending Securities lending is the temporary transfer of securities from the lender (UBS ETFs) to a third party borrower through an appointed lending agent. In exchange for the lent security the borrower provides collateral, prior to the delivery of securities, and pays a fee over the period of the loan. All loans within the lending program are open and rolled daily such that they can be terminated on demand. UBS ETFs engage in securities lending for selected, physically replicated Funds with the aim of reducing the investor's net costs. Securities lending with UBS ETFs is always over-collateralised with at least 105% margin across all asset classes. An additional safeguard, introduced 1 April 2014, is that on loan balances are capped at 50% of each Sub-Fund’s AUM. In general, lending may only be effected via the Securities Lending Agent (State Street Bank GmbH, London Branch) with the protection of an indemnity against borrower default provided for by State Street Bank and Trust Company. Collateral is held in a custody account that is ring-fenced from the lending agents balance sheet. Mark to markets take place on a daily basis to ensure that the required margin levels are consistently maintained. Whilst State Street Bank and Trust Company provides a borrower indemnity and carefully selects its underlying list of borrowers an additional level of oversight is provided for by UBS Credit & Risk to structure a bespoke approved borrower list. It should be noted that securities lending is subject to a certain risk where the borrower does not return the borrowed securities according to their obligation, and where the value of the collateral provided does not cover the costs of repurchase of the securities. In such cases, State Street Bank and Trust Company, under the terms of the borrower default indemnity, shall cover the cost of purchasing the replacement securities, subject to certain conditions.
324

Semi-Annual Report as of 30 June 2014
Notes to Financial Statements
* Additional information can be found in the text above the table and on www.ubs.com/etf. Collateralisation of the securities lending is continually reviewed and adjusted as necessary. It can therefore be subject to change. More details about Securities Lending Borrowers and collateral details including a full list of collateral as of 30 June 2014 can be found at www.ubs.com/etf (unaudited). ** Only for fixed income. Classifications are based on several rating agencies. *** Based on monthly averages for the reporting period from 1 January 2014 to 30 June 2014 **** Entity related to custodian ***** Ultimate parent company of the Management Company
Note 8 Securities Lending (continued)
Reporting Period: 1 January 2014 - 30 June 2014 UBS ETF – EURO STOXX 50
UCITS ETF
UBS ETF – MSCI Europe UCITS ETF
UBS ETF – MSCI EMU UCITS ETF
UBS ETF – MSCI EMU 100% hedged to CHF
UCITS ETF
UBS ETF – MSCI EMU 100% hedged to USD
UCITS ETF
Counterparty Exposure from Securities Lending as of 30 June 2014 State Street* - Market value of securities lent 1'000 EUR 75,703 4,549 194,764 6,654 23,691 - Collateral 1'000 EUR 82,469 4,954 211,815 7,180 25,852 Collateral Breakdown from Securities Lending (Weight in %) as of 30 June 2014by Asset Type: - Bonds 10.7% 13.4% 13.8% 23.0% 19.3% - Equities 89.3% 86.6% 86.2% 77.0% 80.7% by Country: United States – 31.0% United States – 27.6% United States – 29.9% United States – 22.0% United States – 22.0% Germany – 17.4% Britain – 19.3% Britain – 20.6% Britain – 16.6% Britain – 14.7% Britain – 16.7% Japan – 10.2% Germany – 12.1% Japan – 12.1% Japan – 14.0% France – 11.3% France – 8.3% France – 11.1% France – 10.9% France – 10.4% Japan – 6.2% Italy – 6.7% Japan – 7.6% Germany – 7.0% Germany – 6.5% Netherlands – 5.4% Germany – 5.9% Netherlands – 4.5% Canada – 6.5% Italy – 6.2% Italy – 3.6% Hong Kong – 4.6% Italy – 2.9% Hong Kong – 5.8% Hong Kong – 5.8% Spain – 2.0% Canada – 3.2% Hong Kong – 2.7% Netherlands – 4.4% Canada – 5.6% Hong Kong – 1.9% Switzerland – 3.0% Canada – 2.2% Italy – 4.3% Switzerland – 4.2% Canada – 1.7% Spain – 2.9% Switzerland – 1.8% Switzerland – 3.8% Netherlands – 3.6% Residual – 2.8% Residual – 8.3% Residual – 4.5% Residual – 6.6% Residual – 7.0%
by Credit Rating**: - Rating > AA- 100.0% 100.0% 100.0% 100% 100.0% - Rating <=AA- 0.0% 0.0% 0.0% 0.0% 0.0% - Non-Investment Grade 0.0% 0.0% 0.0% 0.0% 0.0% Securities Lending Assets and Revenues / Ratios*** Average Invested Assets 1'000 EUR (1) 655,437 58,275 871,101 40,772 115,713
Average Securities Lent 1'000 EUR (2) 103,669 7,049 216,691 8,628 24,678
Average Collateral received 1'000 EUR (3) 112,341 7,777 239,876 10,018 28,524
Average Securities Lending Collateral Ratio (3):(2) 108.4% 110.3% 110.7% 116.1% 115.6%
Average Securities Lending Ratio (2):(1) 15.8% 12.1% 24.9% 21.2% 21.3%
Securities Lending Revenues 1'000 EUR State Street 1'000 EUR 416.0 42.9 1,022.0 70.5 208.9 Securities Lending Operational Costs/Fees to: 1'000 EUR 166.4 17.2 408.8 28.2 83.6 State Street (Lending Agent)**** 1'000 EUR 83.2 8.6 204.4 14.1 41.8 UBS AG***** 1'000 EUR 83.2 8.6 204.4 14.1 41.8 Securities Lending Fund Revenues 1'000 EUR 249.6 25.7 613.2 42.3 125.3
325

Semi-Annual Report as of 30 June 2014
Notes to Financial Statements
* Additional information can be found in the text above the table and on www.ubs.com/etf. Collateralisation of the securities lending is continually reviewed and adjusted as necessary. It can therefore be subject to change. More details about Securities Lending Borrowers and collateral details including a full list of collateral as of 30 June 2014 can be found at www.ubs.com/etf (unaudited). ** Only for fixed income. Classifications are based on several rating agencies. *** Based on monthly averages for the reporting period from 1 January 2014 to 30 June 2014 **** Entity related to custodian ***** Ultimate parent company of the Management Company
Note 8 Securities Lending (continued)
Reporting Period: 1 January 2014 - 30 June 2014
UBS ETF – MSCI EMU 100% hedged to GBP
UCITS ETF
UBS ETF – MSCI EMU Value
UCITS ETF
UBS ETF – MSCI EMU Small Cap
UCITS ETF
UBS ETF – FTSE 100
UCITS ETF
UBS ETF – MSCI United Kingdom
UCITS ETF
Counterparty Exposure from Securities Lending as of 30 June 2014 State Street* - Market value of securities lent 1'000 EUR 10,343 2,121 344 6,219 4,669 - Collateral 1'000 EUR 11,158 2,317 378 6,803 5,384 Collateral Breakdown from Securities Lending (Weight in %) as of 30 June 2014by Asset Type: - Bonds 23.5% 15.7% 25.6% 2.3% 4.9% - Equities 76.5% 84.3% 74.4% 97.7% 95.1% by Country: United States – 23.8% United States – 27.4% Britain – 35.9% Britain – 32.3% Japan – 28.4% Britain – 16.0% Britain – 17.0% United States – 28.4% United States – 23.3% United States – 14.0% Japan – 11.5% Japan – 13.2% Germany – 8.3% Japan – 11.5% Italy – 14.0% France – 10.6% France – 10.4% France – 8.0% France – 10.2% France – 10.5% Germany – 7.1% Germany – 5.4% Belgium – 5.1% Germany – 5.9% Switzerland – 8.1% Canada – 6.3% Italy – 5.2% Netherlands – 5.1% Italy – 5.5% Spain – 7.9% Hong Kong – 5.5% Hong Kong – 4.8% Italy – 3.2% Switzerland – 4.1% Hong Kong – 6.7% Netherlands – 4.6% Switzerland – 4.3% Japan – 2.8% Hong Kong – 2.9% Britain – 5.1% Italy – 4.3% Canada – 4.2% Spain – 1.8% Spain – 1.8% Germany – 4.5% Switzerland – 3.6% Spain – 2.9% Hong Kong – 0.7% Sweden – 1.2% Luxembourg – 0.3% Residual – 6.7% Residual – 5.2% Residual – 0.7% Residual – 1.3% Residual – 0.5%
by Credit Rating**: - Rating > AA- 100.0% 100.0% 100.0% 100% 100.0% - Rating <=AA- 0.0% 0.0% 0.0% 0.0% 0.0% - Non-Investment Grade 0.0% 0.0% 0.0% 0.0% 0.0% Securities Lending Assets and Revenues / Ratios*** Average Invested Assets 1'000 EUR (1) 49,860 50,146 9,952 222,362 182,700
Average Securities Lent 1'000 EUR (2) 12,068 4,516 446 19,586 2,562
Average Collateral received 1'000 EUR (3) 13,931 4,902 491 21,262 2,915
Average Securities Lending Collateral Ratio (3):(2) 115.4% 108.6% 110.0% 108.6% 113.8%
Average Securities Lending Ratio (2):(1) 24.2% 9.0% 4.5% 8.8% 1.4%
Securities Lending Revenues 1'000 EUR State Street 1'000 EUR 108.0 41.6 2.4 11.0 2.5 Securities Lending Operational Costs/Fees to: 1'000 EUR 43.2 16.6 1.0 4.4 1.0 State Street (Lending Agent)**** 1'000 EUR 21.6 8.3 0.5 2.2 0.5 UBS AG***** 1'000 EUR 21.6 8.3 0.5 2.2 0.5 Securities Lending Fund Revenues 1'000 EUR 64.8 25.0 1.4 6.6 1.5
326

Semi-Annual Report as of 30 June 2014
Notes to Financial Statements
* Additional information can be found in the text above the table and on www.ubs.com/etf. Collateralisation of the securities lending is continually reviewed and adjusted as necessary. It can therefore be subject to change. More details about Securities Lending Borrowers and collateral details including a full list of collateral as of 30 June 2014 can be found at www.ubs.com/etf (unaudited). ** Only for fixed income. Classifications are based on several rating agencies. *** Based on monthly averages for the reporting period from 1 January 2014 to 30 June 2014 **** Entity related to custodian ***** Ultimate parent company of the Management Company
Note 8 Securities Lending (continued)
Reporting Period: 1 January 2014 – 30 June 2014
UBS ETF – MSCI United Kingdom 100% hedged to CHF
UCITS ETF
UBS ETF – MSCI United Kingdom 100% hedged to EUR
UCITS ETF
UBS ETF – MSCI United Kingdom 100% hedged to USD
UCITS ETF
UBS ETF – MSCI Turkey UCITS ETF
UBS ETF – MSCI Japan UCITS ETF
Counterparty Exposure from Securities Lending as of 30 June 2014 State Street* - Market value of securities lent 1'000 EUR 1,213 795 650 - 48,092 - Collateral 1'000 EUR 1,408 925 763 - 52,269 Collateral Breakdown from Securities Lending (Weight in %) as of 30 June 2014by Asset Type: - Bonds 4.7% 4.7% 4.5% - 1.5% - Equities 95.3% 95.3% 95.5% - 98.5% by Country: Japan – 28.3% Japan – 28.2% Japan – 27.9% - United States – 40.1% Italy – 15.3% Italy – 15.5% Italy – 17.3% - Britain – 36.3% United States – 12.7% United States – 12.5% United States – 11.0% - France – 4.9% France – 10.0% France – 10.0% Spain – 9.9% - Germany – 3.9% Spain – 8.7% Spain – 8.8% France – 9.3% - Spain – 2.8% Switzerland – 7.9% Switzerland – 7.8% Switzerland – 7.5% - Japan – 2.2% Hong Kong – 6.6% Hong Kong – 6.6% Hong Kong – 6.4% - Hong Kong – 2.2% Britain – 5.3% Britain – 5.3% Britain – 5.5% - Canada – 2.1% Germany – 4.3% Germany – 4.3% Germany – 4.1% - Switzerland – 1.6% Luxembourg – 0.3% Luxembourg – 0.3% Luxembourg – 0.4% - Australia – 1.1% Residual – 0.6% Residual – 0.7% Residual – 0.7% - Residual – 2.8% by Credit Rating**: - Rating > AA- 100.0% 100.0% 100.0% - 100.0% - Rating <=AA- 0.0% 0.0% 0.0% - 0.0% - Non-Investment Grade 0.0% 0.0% 0.0% - 0.0% Securities Lending Assets and Revenues / Ratios*** Average Invested Assets 1'000 EUR (1) 51,373 38,880 28,460 10,008 835,916
Average Securities Lent 1'000 EUR (2) 505 307 244 - 35,785
Average Collateral received 1'000 EUR (3) 562 340 271 - 39,854
Average Securities Lending Collateral Ratio (3):(2) 111.1% 110.9% 111.3% - 111.4%
Average Securities Lending Ratio (2):(1) 1.0% 0.8% 0.9% - 4.3%
Securities Lending Revenues 1'000 EUR State Street 1'000 EUR 0.5 0.4 0.4 - 136.9 Securities Lending Operational Costs/Fees to: 1'000 EUR 0.2 0.2 0.2 - 54.8 State Street (Lending Agent)**** 1'000 EUR 0.1 0.1 0.1 - 27.4 UBS AG***** 1'000 EUR 0.1 0.1 0.1 - 27.4 Securities Lending Fund Revenues 1'000 EUR 0.3 0.2 0.2 - 82.1
327

Semi-Annual Report as of 30 June 2014
Notes to Financial Statements
* Additional information can be found in the text above the table and on www.ubs.com/etf. Collateralisation of the securities lending is continually reviewed and adjusted as necessary. It can therefore be subject to change. More details about Securities Lending Borrowers and collateral details including a full list of collateral as of 30 June 2014 can be found at www.ubs.com/etf (unaudited). ** Only for fixed income. Classifications are based on several rating agencies. *** Based on monthly averages for the reporting period from 1 January 2014 to 30 June 2014 **** Entity related to custodian ***** Ultimate parent company of the Management Company
Note 8 Securities Lending (continued)
Reporting Period: 1 January 2014 – 30 June 2014
UBS ETF – MSCI Japan 100%
hedged to CHF UCITS ETF
UBS ETF – MSCI Japan 100%
hedged to EUR UCITS ETF
UBS ETF – MSCI Japan 100%
hedged to GBP UCITS ETF
UBS ETF – MSCI Japan 100%
hedged to USD UCITS ETF
UBS ETF – MSCI Pacific (ex Japan) UCITS ETF
Counterparty Exposure from Securities Lending as of 30 June 2014 State Street* - Market value of securities lent 1'000 EUR 5,144 3,404 2,775 6,076 10,273 - Collateral 1'000 EUR 5,616 3,709 3,025 6,624 12,558 Collateral Breakdown from Securities Lending (Weight in %) as of 30 June 2014by Asset Type: - Bonds 2.2% 2.3% 2.0% 2.7% 2.7% - Equities 97.8% 97.7% 98.0% 97.3% 97.3% by Country: United States – 70.5% United States – 64.9% United States – 66.9% United States – 65.4% Italy – 22.8% Britain – 7.6% Britain – 9.5% Britain – 9.0% Britain – 9.3% Japan – 20.2% Switzerland – 2.7% Germany – 3.5% Spain – 3.2% France – 3.4% United States – 19.0% France – 2.7% Spain – 3.5% Germany – 3.1% Germany – 3.0% Spain – 13.2% Germany – 2.6% France – 3.1% France – 3.0% Canada – 2.9% Britain – 8.4% Spain – 2.5% Canada – 3.0% Canada – 2.8% Spain – 2.8% France – 4.4% Japan – 2.4% Hong Kong – 2.8% Hong Kong – 2.6% Hong Kong – 2.8% Switzerland – 4.3% Canada – 2.4% Switzerland – 2.5% Switzerland – 2.6% Japan – 2.8% Hong Kong – 4.2% Hong Kong – 2.3% Japan – 2.3% Japan – 2.2% Switzerland – 2.6% Germany – 2.3% Italy – 1.8% Italy – 1.8% Italy – 1.7% Italy – 1.9% Luxembourg – 0.5% Residual – 2.5% Residual – 3.1% Residual – 2.9% Residual – 3.1% Residual – 0.7% by Credit Rating**: - Rating > AA- 100.0% 100.0% 100.0% 100.0% 100.0% - Rating <=AA- 0.0% 0.0% 0.0% 0.0% 0.0% - Non-Investment Grade 0.0% 0.0% 0.0% 0.0% 0.0% Securities Lending Assets and Revenues / Ratios*** Average Invested Assets 1'000 EUR (1) 30,864 21,924 17,661 35,475 137,578
Average Securities Lent 1'000 EUR (2) 2,619 1,759 1,352 2,983 9,173
Average Collateral received 1'000 EUR (3) 2,868 1,921 1,480 3,288 9,833
Average Securities Lending Collateral Ratio (3):(2) 109.5% 109.2% 109.5% 110.2% 107.2%
Average Securities Lending Ratio (2):(1) 8.5% 8.0% 7.7% 8.4% 6.7%
Securities Lending Revenues 1'000 EUR State Street 1'000 EUR 7.4 5.0 4.3 10.0 8.0 Securities Lending Operational Costs/Fees to: 1'000 EUR 3.0 2.0 2.0 4.0 3.2 State Street (Lending Agent)**** 1'000 EUR 1.5 1.0 1.0 2.0 1.6 UBS AG***** 1'000 EUR 1.5 1.0 1.0 2.0 1.6 Securities Lending Fund Revenues 1'000 EUR 4.4 3.0 2.3 6.0 4.8
328

Semi-Annual Report as of 30 June 2014
Notes to Financial Statements
* Additional information can be found in the text above the table and on www.ubs.com/etf. Collateralisation of the securities lending is continually reviewed and adjusted as necessary. It can therefore be subject to change. More details about Securities Lending Borrowers and collateral details including a full list of collateral as of 30 June 2014 can be found at www.ubs.com/etf (unaudited). ** Only for fixed income. Classifications are based on several rating agencies. *** Based on monthly averages for the reporting period from 1 January 2014 to 30 June 2014 **** Entity related to custodian ***** Ultimate parent company of the Management Company
Note 8 Securities Lending (continued)
Reporting Period: 1 January 2014 – 30 June 2014 UBS ETF – MSCI USA UCITS ETF
UBS ETF – MSCI Canada
UCITS ETF
UBS ETF – MSCI Canada 100%
hedged to CHF UCITS ETF
UBS ETF – MSCI Canada 100%
hedged to EUR UCITS ETF
UBS ETF – MSCI Canada 100%
hedged to USD UCITS ETF
Counterparty Exposure from Securities Lending as of 30 June 2014State Street* - Market value of securities lent 1'000 EUR 23,741 56,851 1,938 2,707 2,126 - Collateral 1'000 EUR 26,253 61,882 2,116 2,956 2,323 Collateral Breakdown from Securities Lending (Weight in %) as of 30 June 2014by Asset Type: - Bonds 2.6% 6.2% 1.2% 1.7% 1.2% - Equities 97.4% 93.8% 98.8% 98.3% 98.8% by Country: United States – 53.4% United States – 83.8% United States – 95.8% United States – 95.6% United States – 95.8% Britain – 8.1% Germany – 3.6% Switzerland – 3.0% Switzerland – 3.0% Switzerland – 3.0% Japan – 7.5% Britain – 2.6% Britain – 0.3% Britain – 0.3% Britain – 0.3% France – 7.0% Switzerland – 2.5% Belgium – 0.3% Belgium – 0.3% Belgium – 0.3% Italy – 5.2% Netherlands – 2.1% Netherlands – 0.2% Netherlands – 0.3% Netherlands – 0.2% Hong Kong – 4.0% France – 1.7% Sweden – 0.1% Sweden – 0.2% Sweden – 0.1% Germany – 2.7% Belgium – 0.9% Germany – 0.1% Germany – 0.1% Germany – 0.1% Spain – 2.6% Australia – 0.7% France – 0.1% France – 0.1% France – 0.1% Switzerland – 1.8% Sweden – 0.6% Canada – 0.1% Canada – 0.1% Canada – 0.1% Canada – 1.8% Canada – 0.6% - - - Residual – 5.9% Residual – 0.9% - - - by Credit Rating**: - Rating > AA- 100.0% 100.0% 100.0% 100.0% 100.0% - Rating <=AA- 0.0% 0.0% 0.0% 0.0% 0.0% - Non-Investment Grade 0.0% 0.0% 0.0% 0.0% 0.0%
Securities Lending Assets and Revenues / Ratios*** Average Invested Assets 1'000 EUR (1) 1,334,752 117,870 3,335 4,207 3,737
Average Securities Lent 1'000 EUR (2) 24,636 48,154 1,020 1,522 1,066
Average Collateral received 1'000 EUR (3) 26,717 52,750 1,124 1,677 1,175
Average Securities Lending Collateral Ratio (3):(2) 108.5% 109.6% 110.2% 110.2% 110.2%
Average Securities Lending Ratio (2):(1) 1.9% 40.9% 30.6% 36.2% 28.5%
Securities Lending Revenues 1'000 EUR State Street 1'000 EUR 30.1 258.0 5.6 8.1 6.4 Securities Lending Operational Costs/Fees to: 1'000 EUR 12.0 103.2 2.2 3.2 2.6 State Street (Lending Agent)**** 1'000 EUR 6.0 51.6 1.1 1.6 1.3 UBS AG***** 1'000 EUR 6.0 51.6 1.1 1.6 1.3 Securities Lending Fund Revenues 1'000 EUR 18.1 154.8 3.4 4.9 3.8
329

Semi-Annual Report as of 30 June 2014
Notes to Financial Statements
* Additional information can be found in the text above the table and on www.ubs.com/etf. Collateralisation of the securities lending is continually reviewed and adjusted as necessary. It can therefore be subject to change. More details about Securities Lending Borrowers and collateral details including a full list of collateral as of 30 June 2014 can be found at www.ubs.com/etf (unaudited). ** Only for fixed income. Classifications are based on several rating agencies. *** Based on monthly averages for the reporting period from 1 January 2014 to 30 June 2014 **** Entity related to custodian ***** Ultimate parent company of the Management Company
Note 8 Securities Lending (continued)
Reporting Period: 1 January 2014 – 1 June 2014
UBS ETF – MSCI Canada 100%
hedged to GBP UCITS ETF
UBS ETF – MSCI Switzerland 20/35
UCITS ETF
UBS ETF – MSCI Switzerland 20/35
100% hedged to EUR UCITS ETF
UBS ETF – MSCI Switzerland 20/35
100% hedged to USD UCITS ETF
UBS ETF – MSCI Switzerland 20/35 100% hedged to GBP
UCITS ETF Counterparty Exposure from Securities Lending as of 30 June 2014State Street* - Market value of securities lent 1'000 EUR 2,288 - - 341 47 - Collateral 1'000 EUR 2,498 - - 372 51 Collateral Breakdown from Securities Lending (Weight in %) as of 30 June 2014by Asset Type: - Bonds 0.7% - - 0.0% 0.0% - Equities 99.3% - - 100.0% 100.0% by Country: United States – 96.3% - - United States – 96.9% United States – 96.8% Switzerland – 3.1% - - Switzerland – 3.1% Switzerland – 3.1% Britain – 0.1% - - Britain – 0.1% Britain – 0.1% Belgium – 0.1% - - - - Netherlands – 0.1% - - - - Germany – 0.1% - - - - France – 0.1% - - - - Canada – 0.1% - - - - Sweden – 0.0% - - - - - - - - - - - - - - by Credit Rating**: - Rating > AA- 100.0% 0.0% 0.0% 0.0% 0.0% - Rating <=AA- 0.0% 0.0% 0.0% 0.0% 0.0% - Non-Investment Grade 0.0% 0.0% 0.0% 0.0% 0.0%
Securities Lending Assets and Revenues / Ratios*** Average Invested Assets 1'000 EUR (1) 3,905 73,019 27,750 19,040 3,842
Average Securities Lent 1'000 EUR (2) 1,273 8,836 3,216 1,223 140
Average Collateral received 1'000 EUR (3) 1,402 9,628 3,445 1,326 150
Average Securities Lending Collateral Ratio (3):(2) 110.1% 109.0% 107.1% 108.5% 107.7%
Average Securities Lending Ratio (2):(1) 32.6% 12.1% 11.6% 6.4% 3.6%
Securities Lending Revenues 1'000 EUR State Street 1'000 EUR 7.9 79.7 16.0 11.0 1.5 Securities Lending Operational Costs/Fees to: 1'000 EUR 3.2 31.8 6.4 4.4 0.6 State Street (Lending Agent)**** 1'000 EUR 1.6 15.9 3.2 2.2 0.3 UBS AG***** 1'000 EUR 1.6 15.9 3.2 2.2 0.3 Securities Lending Fund Revenues 1'000 EUR 4.7 47.8 9.6 6.6 0.9
330

Semi-Annual Report as of 30 June 2014
Notes to Financial Statements
* Additional information can be found in the text above the table and on www.ubs.com/etf. Collateralisation of the securities lending is continually reviewed and adjusted as necessary. It can therefore be subject to change. More details about Securities Lending Borrowers and collateral details including a full list of collateral as of 30 June 2014 can be found at www.ubs.com/etf (unaudited). ** Only for fixed income. Classifications are based on several rating agencies. *** Based on monthly averages for the reporting period from 1 January 2014 to 30 June 2014 **** Entity related to custodian ***** Ultimate parent company of the Management Company
Note 8 Securities Lending (continued)
Reporting Period: 1 January 2014 – 30 June 2014 UBS ETF – MSCI World UCITS ETF
UBS ETF – MSCI Emerging Markets
UCITS ETF
UBS ETF – MSCI World
Socially Responsible UCITS ETF
UBS ETF – MSCI North America Socially Responsible
UCITS ETF
UBS ETF – MSCI Europe & Middle East
Socially Responsible UCITS ETF
Counterparty Exposure from Securities Lending as of 30 June 2014State Street* - Market value of securities lent 1'000 EUR 44,780 1,343 3,147 4,298 702 - Collateral 1'000 EUR 49,308 1,472 3,587 4,733 802 Collateral Breakdown from Securities Lending (Weight in %) as of 30 June 2014by Asset Type: - Bonds 5.7% 2.8% 4.8% 1.7% 20.4% - Equities 94.3% 97.2% 95.2% 98.3% 79.6% by Country: United States – 52.3% United States – 40.7% United States – 39.1% United States – 75.7% Japan – 19.4% Britain – 11.5% Britain – 35.8% Britain – 13.9% Japan – 8.0% United States – 17.2% Germany – 6.8% France – 8.1% Japan – 12.7% Switzerland – 4.9% Italy – 13.2% France – 6.3% Italy – 4.7% Italy – 9.1% France – 4.5% France – 10.1% Japan – 6.1% Japan – 3.1% France – 6.0% Hong Kong – 2.1% Britain – 7.8% Italy – 3.4% Spain – 2.1% Spain – 5.5% Britain – 2.1% Spain – 7.6% Switzerland – 2.4% Germany – 2.1% Switzerland – 4.1% Germany – 1.8% Germany – 6.4% Hong Kong – 2.4% Hong Kong – 1.3% Germany – 3.4% Spain – 0.3% Switzerland – 5.3% Netherlands – 2.2% Netherlands – 0.9% Hong Kong – 2.8% Italy – 0.2% Hong Kong – 4.7% Spain – 2.0% Belgium – 0.6% Belgium – 1.1% Netherlands – 0.1% Netherlands – 3.5% Residual – 4.6% Residual – 0.6% Residual – 2.3% Residual – 0.3% Residual – 4.8% by Credit Rating**: - Rating > AA- 100.0% 100.0% 100.0% 100.0% 100.0% - Rating <=AA- 0.0% 0.0% 0.0% 0.0% 0.0% - Non-Investment Grade 0.0% 0.0% 0.0% 0.0% 0.0%
Securities Lending Assets and Revenues / Ratios*** Average Invested Assets 1'000 EUR (1) 550,482 225,905 69,370 46,487 13,736
Average Securities Lent 1'000 EUR (2) 44,231 2,881 6,075 3,323 1,516
Average Collateral received 1'000 EUR (3) 48,495 3,148 6,709 3,661 1,710
Average Securities Lending Collateral Ratio (3):(2) 109.6% 109.3% 110.4% 110.2% 112.8%
Average Securities Lending Ratio (2):(1) 8.0% 1.3% 8.8% 7.2% 11.0%
Securities Lending Revenues 1'000 EUR State Street 1'000 EUR 171.1 13.0 18.6 14.1 6.6 Securities Lending Operational Costs/Fees to: 1'000 EUR 68.4 5.2 7.4 5.6 2.6 State Street (Lending Agent)**** 1'000 EUR 34.2 2.6 3.7 2.8 1.3 UBS AG***** 1'000 EUR 34.2 2.6 3.7 2.8 1.3 Securities Lending Fund Revenues 1'000 EUR 102.7 7.8 11.2 8.5 4.0
331

Semi-Annual Report as of 30 June 2014
Notes to Financial Statements
* Additional information can be found in the text above the table and on www.ubs.com/etf. Collateralisation of the securities lending is continually reviewed and adjusted as necessary. It can therefore be subject to change. More details about Securities Lending Borrowers and collateral details including a full list of collateral as of 30 June 2014 can be found at www.ubs.com/etf (unaudited). ** Only for fixed income. Classifications are based on several rating agencies. *** Based on monthly averages for the reporting period from 1 January 2014 to 30 June 2014 **** Entity related to custodian ***** Ultimate parent company of the Management Company
Note 8 Securities Lending (continued)
Reporting Period: 1 January 2014 – 30 June 2014
UBS ETF – MSCI Pacific Socially
Responsible UCITS ETF
UBS ETF – MSCI Japan
Infrastructure 20/35 UCITS ETF
UBS ETF – MSCI AC Asia ex Japan
Infrastructure 20/35 UCITS ETF
UBS ETF – MSCI Europe
Infrastructure 20/35 UCITS ETF
UBS ETF – STOXX Global
Rare Earth UCITS ETF
Counterparty Exposure from Securities Lending as of 30 June 2014State Street* - Market value of securities lent 1'000 EUR 1,694 - 44 159 556 - Collateral 1'000 EUR 1,978 - 47 172 636
Collateral Breakdown from Securities Lending (Weight in %) as of 30 June 2014by Asset Type: - Bonds 1.6% - 0.0% 1.4% 0.5% - Equities 98.4% - 100.0% 98.6% 99.5% by Country: Britain – 30.9% - Japan – 76.9% Britain – 78.9% Italy – 27.5% United States – 14.7% - United States – 23.1% France – 8.9% Japan – 14.5% Italy – 14.6% - - United States – 6.6% Spain – 12.9% Japan – 13.3% - - Germany – 5.0% Australia – 12.9% Spain – 10.0% - - Belgium – 0.3% Hong Kong – 9.2% Germany – 4.3% - - Netherlands – 0.3% Britain – 7.6% Hong Kong – 3.5% - - Sweden – 0.0% Luxembourg – 2.8% France – 3.3% - - Italy – 0.0% France – 2.7% Switzerland – 3.0% - - Spain – 0.0% Canada – 1.9% Canada – 0.8% - - Hong Kong – 0.0% New Zealand – 1.8% Residual – 1.6% - - - Residual – 6.2% by Credit Rating**: - Rating > AA- 100.0% 0.0% 0.0% 100.0% 100.0% - Rating <=AA- 0.0% 0.0% 0.0% 0.0% 0.0% - Non-Investment Grade 0.0% 0.0% 0.0% 0.0% 0.0%
Securities Lending Assets and Revenues / Ratios*** Average Invested Assets 1'000 EUR (1) 9,243 4,440 5,894 3,852 5,843
Average Securities Lent 1'000 EUR (2) 1,241 101 504 259 1,043
Average Collateral received 1'000 EUR (3) 1,369 110 536 286 1,151
Average Securities Lending Collateral Ratio (3):(2) 110.3% 108.9% 106.5% 110.3% 110.3%
Average Securities Lending Ratio (2):(1) 13.4% 2.3% 8.6% 6.7% 17.9%
Securities Lending Revenues 1'000 EUR State Street 1'000 EUR 1.1 0.4 0.4 1.6 44.4 Securities Lending Operational Costs/Fees to: 1'000 EUR 0.4 0.2 0.2 0.6 17.8 State Street (Lending Agent)**** 1'000 EUR 0.2 0.1 0.1 0.3 8.9 UBS AG***** 1'000 EUR 0.2 0.1 0.1 0.3 8.9 Securities Lending Fund Revenues 1'000 EUR 0.7 0.2 0.2 1.0 26.6
During the reporting period, fixed income ETFs, an equity ETF (UBS ETF – MSCI Europe ex UK UCITS ETF) and the ETFs launched during the period did not participate in the lending program.
332

Semi-Annual Report as of 30 June 2014
Notes to Financial Statements
Note 9 OTC derivatives contracts As of 30 June 2014, the Company had OTC derivative contracts as follows:
Reporting Date: 1 January 2014 – 30 June 2014 UBS ETF – MSCI EMU 100% hedged to CHF
UCITS ETF
UBS ETF – MSCI EMU 100% hedged to USD
UCITS ETF
UBS ETF – MSCI EMU 100% hedged to GBP
UCITS ETF
OTC Derivatives Exposure as of 30 June 2014
OTC Financial Derivative Instrument - Forward foreign exchange contracts - Gross exposure 1’000 EUR 97,562 337,203 154,191 - Unrealised gain / (loss) 1’000 EUR 422 (1,267) 2,429
Counterparty Exposure from OTC Derivatives State Street Bank London - Gross exposure of OTC contracts 1'000 EUR 97,562 337,203 154,191 - Collateral 1'000 EUR - - - UBS AG London - Gross exposure of OTC contracts 1'000 EUR - - - - Collateral 1'000 EUR - - -
Reporting Date: 1 January 2014 – 30 June 2014 UBS ETF – MSCI United Kingdom 100% hedged
to CHF UCITS ETF
UBS ETF – MSCI United Kingdom 100% hedged
to EUR UCITS ETF
UBS ETF – MSCI United Kingdom 100% hedged
to USD UCITS ETF
OTC Derivatives Exposure as of 30 June 2014
OTC Financial Derivative Instrument - Forward foreign exchange contracts - Gross exposure 1’000 EUR 160,786 105,991 102,107 - Unrealised gain / (loss) 1’000 EUR (1,859) (1,702) (1,906)
Counterparty Exposure from OTC Derivatives State Street Bank London - Gross exposure of OTC contracts 1'000 EUR 160,786 105,991 102,107 - Collateral 1'000 EUR - - - UBS AG London - Gross exposure of OTC contracts 1'000 EUR - - - - Collateral 1'000 EUR - - -
Reporting Date: 1 January 2014 – 30 June 2014 UBS ETF – MSCI Japan
100% hedged to CHF UCITS ETF
UBS ETF – MSCI Japan 100% hedged to EUR
UCITS ETF
UBS ETF – MSCI Japan 100% hedged to GBP
UCITS ETF
OTC Derivatives Exposure as of 30 June 2014
OTC Financial Derivative Instrument - Forward foreign exchange contracts - Gross exposure 1’000 EUR 81,211 58,470 41,920 - Unrealised gain / (loss) 1’000 EUR 282 (42) 617
Counterparty Exposure from OTC Derivatives State Street Bank London - Gross exposure of OTC contracts 1'000 EUR 81,211 58,470 41,920 - Collateral 1'000 EUR - - - UBS AG London - Gross exposure of OTC contracts 1'000 EUR - - - - Collateral 1'000 EUR - - -
333

Semi-Annual Report as of 30 June 2014
Notes to Financial Statements
Note 9 OTC derivatives contracts (continued)
Reporting Date: 1 January 2014 – 30 June 2014 UBS ETF – MSCI Japan
100% hedged to USD UCITS ETF
UBS ETF – MSCI Canada 100% hedged to
CHF UCITS ETF
UBS ETF – MSCI Canada 100% hedged to
EUR UCITS ETF
OTC Derivatives Exposure as of 30 June 2014
OTC Financial Derivative Instrument - Forward foreign exchange contracts - Gross exposure 1’000 EUR 116,363 4,262 5,937 - Unrealised gain / (loss) 1’000 EUR (430) (53) (99)
Counterparty Exposure from OTC Derivatives State Street Bank London - Gross exposure of OTC contracts 1'000 EUR 112,638 4,262 5,937 - Collateral 1'000 EUR - - - UBS AG London - Gross exposure of OTC contracts 1'000 EUR 3,725 - - - Collateral 1'000 EUR - - -
Reporting Date: 1 January 2014 – 30 June 2014 UBS ETF – MSCI
Canada 100% hedged to USD UCITS ETF
UBS ETF – MSCI Canada 100% hedged to
GBP UCITS ETF
UBS ETF – MSCI Switzerland 20/35 100% hedged to EUR UCITS
OTC Derivatives Exposure as of 30 June 2014
OTC Financial Derivative Instrument - Forward foreign exchange contracts - Gross exposure 1’000 EUR 4,728 5,586 74,989 - Unrealised gain / (loss) 1’000 EUR (95) (3) (324)
Counterparty Exposure from OTC Derivatives State Street Bank London - Gross exposure of OTC contracts 1'000 EUR 4,728 5,586 74,989 - Collateral 1'000 EUR - - - UBS AG London - Gross exposure of OTC contracts 1'000 EUR - - - - Collateral 1'000 EUR - - -
Reporting Date: 1 January 2014 – 30 June 2014 UBS ETF – MSCI
Switzerland 20/35 100% hedged to USD UCITS
UBS ETF – MSCI Switzerland 20/35 100% hedged to GBP UCITS
UBS ETF - Barclays US Liquid Corporates
UCITS ETF
OTC Derivatives Exposure as of 30 June 2014
OTC Financial Derivative Instrument - Forward foreign exchange contracts - Gross exposure 1’000 EUR 58,243 7,773 16,108 - Unrealised gain / (loss) 1’000 EUR (446) 90 55
Counterparty Exposure from OTC Derivatives State Street Bank London - Gross exposure of OTC contracts 1'000 EUR 58,243 7,773 16,108 - Collateral 1'000 EUR - - - UBS AG London - Gross exposure of OTC contracts 1'000 EUR - - - - Collateral 1'000 EUR - - -
Note 10 Changes in Investment Portfolio A copy of the list of changes in the portfolio during the reference year may be obtained free of charge at the custodian, at the paying agents and information agent in Germany, at the Swiss representation office in Switzerland as well as at the Austrian representative and French centralizing and financial agent.
334

Semi-Annual Report as of 30 June 2014
Notes to Financial Statements
Note 11 Fund documentation
Information about UBS ETF, SICAV and available ETF share classes, the full prospectus as well as the key investor information documents, the latest annual and semi-annual reports, can be obtained free of charge, in English from the Fund Management Company, the Central Administrator, the Custodian Bank, the Funds distributors or online at www.ubs.com/etf or from the German information/paying agent, the Swiss representative or paying agent, the Austrian information/paying agent, or from the French centralizing and financial agent.
Note 12 For German residents only
The Company has appointed UBS Deutschland AG, Bockenheimer Landstrasse 2-4, D-60306 Frankfurt am Main as paying and information agent in Germany.
Note 13 For Swiss residents only
The Company has appointed UBS Fund Management (Switzerland) AG, Brunngässlein 12, CH-4002 Basel as representation agent of the Company in Switzerland. The Company has appointed UBS AG, Aeschenvorstadt 1, CH-4002 Basel and Bahnhofstrasse 45, CH-8098 Zurich and all offices in Switzerland as paying agent of the Company in Switzerland. The sales prospectus, the KIID, management regulations, annual and semi-annual reports as well as the portfolio movements of the investment fund mentioned in this publication are available free of charge from UBS AG, CH-4002 Basel and from UBS Fund Management (Switzerland) AG, CH-4002 Basel.
Note 14 For French residents only
The Company has appointed Société Générale S.A., 29, Boulevard Haussmann, F-75009 Paris as centralizing and financial agent in France.
Note 15 For Austrian residents only
The Company has appointed Erste Bank der oesterreichischen Sparkassen AG, Graben 21, A-1010 Vienna as the Austrian information agent to provide information to potential investors in Austria.
The Company has appointed Erste Bank der oesterreichischen Sparkassen AG, Graben 21, A-1010 Vienna as paying agent in Austria.
Note 16 For Liechtenstein residents only
The Company has appointed Liechtensteinische Landesbank AG, Städte 44, FL-9490 Vaduz as paying agent in Liechtenstein.
Note 17 Soft commission arrangements
During the period ended 30 June 2014, no soft commissions arrangements were entered into on behalf of UBS ETF, SICAV and soft dollar commissions amount to nil.
Note 18 Transaction Fees
Transaction Fees are the brokerage costs and commissions and correspondence fees for transferring securities or investments or other interests.
335

Semi-Annual Report as of 30 June 2014
Notes to Financial Statements
Note 19 Risk Management
In terms of risk management the Board of Directors of the Management Company decided to adopt the commitment approach as a method of determining the global exposure.
Note 20 Applicable law, place of performance and authoritative language
The Luxembourg District Court is the place of performance for all legal disputes between the shareholders, the Company, the Management Company and the custodian bank. Luxembourg law applies. However, in matters concerning the claims of investors from other countries, the Company, Management Company and/or custodian bank can elect to make themselves subject to the jurisdictions of the countries in which the shares were bought and sold. The English version of the prospectus is the authoritative version. This prospectus may also be translated into other languages. To the extent that there is any inconsistency between the English language prospectus and a version in another language, the English language prospectus will prevail, except, to the extent required by the law of any jurisdiction where the shares are sold.
Note 21 Significant events during the reporting period
Effective 14 March 2014, Christel Müller resigned as an Executive Director of the Management Company.
Note 22 Subsequent events
The following listings took place on 15 July 2014:
Sub-Funds ETF Share Class Listing Stock Exchanges Trading
Currency
UBS ETF – MSCI EMU 100% hedged to SGD UCITS ETF
(SGD) A-acc SIX Swiss Exchange SGD
UBS ETF – MSCI United Kingdom 100% hedged to SGD UCITS ETF
(SGD) A-acc SIX Swiss Exchange SGD
UBS ETF – MSCI Japan 100% hedged to SGD UCITS ETF
(SGD) A-acc SIX Swiss Exchange SGD
UBS ETF – MSCI Canada 100% hedged to SGD UCITS ETF
(SGD) A-acc SIX Swiss Exchange SGD
UBS ETF – Switzerland 20/35 100% hedged to SGD UCITS ETF
(SGD) A-acc SIX Swiss Exchange SGD
After the period under review, the Company has launched or intends to launch the following Sub-Funds and ETF share classes:
Sub-Funds ETF Share Classes
Initial Dealing Day
UBS ETF – EURO STOXX 50 UCITS ETF (EUR) A-acc Not determined UBS ETF – MSCI Europe UCITS ETF (EUR) A-acc Not determined UBS ETF – MSCI Europe ex UK UCITS ETF (EUR) A-acc Not determined UBS ETF – MSCI EMU UCITS ETF (EUR) A-acc Not determined UBS ETF – MSCI EMU 100% hedged to CHF UCITS ETF (CHF) A-dis Not determined UBS ETF – MSCI EMU 100% hedged to SGD UCITS ETF (SGD) A-dis Not determined UBS ETF – MSCI EMU Value UCITS ETF (EUR) A-acc Not determined UBS ETF – MSCI EMU Small Cap UCITS ETF (EUR) A-acc Not determined UBS ETF – FTSE 100 UCITS ETF (GBP) A-acc Not determined UBS ETF – FTSE 250 UCITS ETF (GBP) A-acc Not determined UBS ETF – MSCI United Kingdom 100% hedged to CHF UCITS ETF (CHF) A-dis Not determined UBS ETF – MSCI United Kingdom 100% hedged to SGD UCITS ETF (SGD) A-dis Not determined UBS ETF – MSCI Turkey UCITS ETF (EUR) A-acc Not determined UBS ETF – MSCI Japan UCITS ETF (JPY) A-acc Not determined UBS ETF – MSCI Japan 100% hedged to CHF UCITS ETF (CHF) A-dis Not determined UBS ETF – MSCI Japan 100% hedged to SGD UCITS ETF (SGD) A-dis Not determined UBS ETF – MSCI Pacific (ex Japan) UCITS ETF (USD) A-acc Not determined UBS ETF – MSCI USA UCITS ETF (USD) A-acc Not determined UBS ETF – MSCI Canada UCITS ETF (CAD) A-acc Not determined
336

Semi-Annual Report as of 30 June 2014
Notes to Financial Statements
Note 22 Subsequent events (continued)
Sub-Funds ETF Share Classes Initial Dealing
DayUBS ETF – MSCI Canada 100% hedged to CHF UCITS ETF (CHF) A-dis Not determined UBS ETF – MSCI Canada 100% hedged to EUR UCITS ETF (EUR) A-dis Not determined UBS ETF – MSCI Canada 100% hedged to USD UCITS ETF (USD) A-dis Not determined UBS ETF – MSCI Canada 100% hedged to SGD UCITS ETF (SGD) A-dis Not determined UBS ETF – MSCI Switzerland 20/35 100% hedged to SGD UCITS ETF (SGD) A-dis Not determined UBS ETF – MSCI World UCITS ETF (USD) A-acc Not determined UBS ETF – MSCI Emerging Markets UCITS ETF (USD) A-acc Not determined UBS ETF – MSCI Emerging Markets Socially Responsible UCITS ETF (USD) A-dis 15 July 2014 UBS ETF – MSCI Emerging Markets Socially Responsible UCITS ETF (USD) A-acc Not determined UBS ETF – MSCI World Socially Responsible UCITS ETF (USD) A-acc Not determined UBS ETF – MSCI North America Socially Responsible UCITS ETF (USD) A-acc Not determined UBS ETF – MSCI Europe & Middle East Socially Responsible UCITS ETF (EUR) A-acc Not determined UBS ETF – MSCI Pacific Socially Responsible UCITS ETF (USD) A-acc Not determined UBS ETF – MSCI Japan Infrastructure 20/35 UCITS ETF (JPY) A-acc Not determined UBS ETF – MSCI AC Asia ex Japan Infrastructure 20/35 UCITS ETF (USD) A-acc Not determined UBS ETF – MSCI Europe Infrastructure 20/35 UCITS ETF (EUR) A-acc Not determined UBS ETF – STOXX Global Rare Earth UCITS ETF (USD) A-acc Not determined UBS ETF – Barclays Capital US 1-3 Year Treasury Bond UCITS ETF (USD) A-acc Not determined UBS ETF – Barclays Capital US 3-5 Year Treasury Bond UCITS ETF (USD) A-acc Not determined UBS ETF – Barclays Capital US 5-7 Year Treasury Bond UCITS ETF (USD) A-acc Not determined UBS ETF – Barclays Capital US 7-10 Year Treasury Bond UCITS ETF (USD) A-acc Not determined UBS ETF – Barclays Capital US 10-20 Year Treasury Bond UCITS ETF (USD) A-dis Not determined UBS ETF – Barclays Capital US 10-20 Year Treasury Bond UCITS ETF (USD) A-acc Not determined UBS ETF – Barclays Capital US 20+ Year Treasury Bond UCITS ETF (USD) A-dis Not determined UBS ETF – Barclays Capital US 20+ Year Treasury Bond UCITS ETF (USD) A-acc Not determined UBS ETF – Markit iBoxx € Germany 1-3 UCITS ETF (EUR) A-acc Not determined UBS ETF – Markit iBoxx € Germany 3-5 UCITS ETF (EUR) A-acc Not determined UBS ETF – Markit iBoxx € Germany 5-10 UCITS ETF (EUR) A-acc Not determined UBS ETF – Markit iBoxx € Germany 7-10 UCITS ETF (EUR) A-acc Not determined UBS ETF – Markit iBoxx € Germany 10+ UCITS ETF (EUR) A-dis Not determined UBS ETF – Markit iBoxx € Germany 10+ UCITS ETF (EUR) A-acc Not determined UBS ETF – Markit iBoxx € Liquid Corporates UCITS ETF (EUR) A-acc Not determined UBS ETF – Markit iBoxx TIPS Inflation-Linked Index 5-10 UCITS ETF (USD) A-dis Not determined UBS ETF – Markit iBoxx TIPS Inflation-Linked Index 5-10 UCITS ETF (USD) A-acc Not determined UBS ETF – Markit iBoxx TIPS Inflation-Linked Index 10+ UCITS ETF (USD) A-dis Not determined UBS ETF – Markit iBoxx TIPS Inflation-Linked Index 10+ UCITS ETF (USD) A-acc Not determined UBS ETF – Markit iBoxx Sterling Inflation-Linked Index 10+ UCITS ETF (GBP) A-dis Not determined UBS ETF – Markit iBoxx Sterling Inflation-Linked Index 10+ UCITS ETF (GBP) A-acc Not determined UBS ETF – Markit iBoxx € Sovereigns 1-5 UCITS ETF (EUR) A-acc Not determined UBS ETF – SBI® Foreign AAA-BBB 1-5 UCITS ETF (CHF) A-acc Not determined UBS ETF – SBI® Foreign AAA-BBB 5-10 UCITS ETF (CHF) A-acc Not determined UBS ETF – Barclays Euro Area Liquid Corporates 1-5 Year UCITS ETF (EUR) A-acc Not determined UBS ETF – Barclays Euro Area Liquid Corporates 1-5 Year UCITS ETF (hedged to USD) A-dis Not determined UBS ETF – Barclays Euro Area Liquid Corporates 1-5 Year UCITS ETF (hedged to USD) A-acc 31 July 2014 UBS ETF – Barclays Euro Area Liquid Corporates 1-5 Year UCITS ETF (hedged to GBP) A-dis 31 July 2014 UBS ETF – Barclays Euro Area Liquid Corporates 1-5 Year UCITS ETF (hedged to GBP) A-acc Not determined UBS ETF – Barclays Euro Area Liquid Corporates 1-5 Year UCITS ETF (hedged to CHF) A-dis Not determined UBS ETF – Barclays Euro Area Liquid Corporates 1-5 Year UCITS ETF (hedged to CHF) A-acc 31 July 2014 UBS ETF – Barclays US Liquid Corporates 1-5 Year UCITS ETF (USD) A-dis 15 July 2014 UBS ETF – Barclays US Liquid Corporates 1-5 Year UCITS ETF (USD) A-acc Not determined UBS ETF – Barclays US Liquid Corporates 1-5 Year UCITS ETF (hedged to EUR) A-dis Not determined UBS ETF – Barclays US Liquid Corporates 1-5 Year UCITS ETF (hedged to EUR) A-acc 15 July 2014 UBS ETF – Barclays US Liquid Corporates 1-5 Year UCITS ETF (hedged to GBP) A-dis 31 July 2014 UBS ETF – Barclays US Liquid Corporates 1-5 Year UCITS ETF (hedged to GBP) A-acc Not determined UBS ETF – Barclays US Liquid Corporates 1-5 Year UCITS ETF (hedged to CHF) A-dis Not determined UBS ETF – Barclays US Liquid Corporates 1-5 Year UCITS ETF (hedged to CHF) A-acc 15 July 2014 UBS ETF – Barclays UK Liquid Corporates 1-5 Year UCITS ETF (GBP) A-dis 31 July 2014 UBS ETF – Barclays UK Liquid Corporates 1-5 Year UCITS ETF (GBP) A-acc Not determined UBS ETF – Barclays UK Liquid Corporates 1-5 Year UCITS ETF (hedged to EUR) A-dis Not determined UBS ETF – Barclays UK Liquid Corporates 1-5 Year UCITS ETF (hedged to EUR) A-acc Not determined
337

Semi-Annual Report as of 30 June 2014
Notes to Financial Statements
Note 22 Subsequent events (continued)
Sub-Funds ETF Share Classes Initial Dealing
DayUBS ETF – Barclays UK Liquid Corporates 1-5 Year UCITS ETF (hedged to USD) A-acc Not determined UBS ETF – Barclays UK Liquid Corporates 1-5 Year UCITS ETF (hedged to USD) A-dis Not determined UBS ETF – Barclays UK Liquid Corporates 1-5 Year UCITS ETF (hedged to CHF) A-dis Not determined UBS ETF – Barclays UK Liquid Corporates 1-5 Year UCITS ETF (hedged to CHF) A-acc 31 July 2014 UBS ETF – Barclays US Liquid Corporates UCITS ETF (USD) A-acc Not determined UBS ETF – Barclays US Liquid Corporates UCITS ETF (hedged to EUR) A-dis Not determined UBS ETF – Barclays US Liquid Corporates UCITS ETF (hedged to GBP) A-dis Not determined UBS ETF – Barclays US Liquid Corporates UCITS ETF (hedged to GBP) A-acc Not determined UBS ETF – Barclays US Liquid Corporates UCITS ETF (hedged to CHF) A-dis Not determined UBS ETF – Barclays US Liquid Corporates UCITS ETF (hedged to CHF) A-acc 15 July 2014
338

Semi-Annual Report as of 30 June 2014
Additional Information
Portfolio Turnover Rate (PTR)
The PTR is considered an indicator of the relevance of the additional costs incurred when buying and selling investments. It shows how many security transactions occurred as a result of voluntary investment shifts in relation to the average net assets. Transactions that resulted from uncontrollable subscriptions and redemptions are not included in this rate.
The PTR is calculated in accordance with Swiss Funds & Asset Management Association (SFAMA) “Guidelines on the calculation and disclosure of the TER and PTR” in the current version and is equal to the total of purchases and sales of securities netted against the value of the subscriptions and redemptions, over the average net assets of the Sub-Fund for the past 12 months.
PTR:
UBS ETF - EURO STOXX 50 UCITS ETF 5.10% UBS ETF - MSCI Europe UCITS ETF 8.85% UBS ETF - MSCI Europe ex UK UCITS ETF (0.01%) * UBS ETF - MSCI EMU UCITS ETF 6.97% UBS ETF - MSCI EMU 100% hedged to CHF UCITS ETF 7.23% UBS ETF - MSCI EMU 100% hedged to USD UCITS ETF 10.52% UBS ETF - MSCI EMU 100% hedged to GBP UCITS ETF 10.71% UBS ETF - MSCI EMU 100% hedged to SGD UCITS ETF N/A **UBS ETF - MSCI EMU Value UCITS ETF 42.15% UBS ETF - MSCI EMU Small Cap UCITS ETF 21.05% UBS ETF - FTSE 100 UCITS ETF 11.15% UBS ETF - FTSE 250 UCITS ETF 0.63% * UBS ETF - MSCI United Kingdom UCITS ETF 14.81% UBS ETF - MSCI United Kingdom 100% hedged to CHF UCITS ETF 22.57% UBS ETF - MSCI United Kingdom 100% hedged to EUR UCITS ETF 15.43% UBS ETF - MSCI United Kingdom 100% hedged to USD UCITS ETF 10.32% UBS ETF - MSCI United Kingdom 100% hedged to SGD UCITS ETF N/A **UBS ETF - MSCI Turkey UCITS ETF 4.28% UBS ETF - MSCI Japan UCITS ETF 5.00% UBS ETF - MSCI Japan 100% hedged to CHF UCITS ETF 21.10% UBS ETF - MSCI Japan 100% hedged to EUR UCITS ETF 12.42% UBS ETF - MSCI Japan 100% hedged to GBP UCITS ETF 14.79% UBS ETF - MSCI Japan 100% hedged to USD UCITS ETF 9.76% UBS ETF - MSCI Japan 100% hedged to SGD UCITS ETF N/A **UBS ETF - MSCI Pacific (ex Japan) UCITS ETF 8.73% UBS ETF - MSCI USA UCITS ETF 2.54% UBS ETF - MSCI Canada UCITS ETF 9.62% UBS ETF - MSCI Canada 100% hedged to CHF UCITS ETF 13.98% UBS ETF - MSCI Canada 100% hedged to EUR UCITS ETF 12.16% UBS ETF - MSCI Canada 100% hedged to USD UCITS ETF 14.42% UBS ETF - MSCI Canada 100% hedged to GBP UCITS ETF 12.32% UBS ETF - MSCI Canada 100% hedged to SGD UCITS ETF N/A **UBS ETF - MSCI Switzerland 20/35 UCITS ETF 4.24% UBS ETF - MSCI Switzerland 20/35 100% hedged to EUR UCITS ETF 5.85% UBS ETF - MSCI Switzerland 20/35 100% hedged to USD UCITS ETF 6.91% UBS ETF - MSCI Switzerland 20/35 100% hedged to GBP UCITS ETF 7.74% UBS ETF - MSCI Switzerland 20/35 100% hedged to SGD UCITS ETF N/A **
* PTR figures are calculated on the period starting at the launch date of the relevant Sub-Fund until 30 June 2014.
** The Sub-Fund was launched on 30 June 2014. Therefore, no PTR has been calculated.
339

Semi-Annual Report as of 30 June 2014
Additional Information
Portfolio Turnover Rate (PTR) (continued)
UBS ETF - MSCI World UCITS ETF 2.44% UBS ETF - MSCI Emerging Markets UCITS ETF 5.71% UBS ETF - MSCI World Socially Responsible UCITS ETF 23.43% UBS ETF - MSCI North America Socially Responsible UCITS ETF 28.53% UBS ETF - MSCI Europe & Middle East Socially Responsible UCITS ETF 28.50% UBS ETF - MSCI Pacific Socially Responsible UCITS ETF 51.58% UBS ETF - MSCI Japan Infrastructure 20/35 UCITS ETF 12.17% UBS ETF - MSCI AC Asia ex Japan Infrastructure 20/35 UCITS ETF 8.16% UBS ETF - MSCI Europe Infrastructure 20/35 UCITS ETF 28.98% UBS ETF - STOXX Global Rare Earth UCITS ETF 56.62% UBS ETF - Barclays Capital US 1-3 Year Treasury Bond UCITS ETF 72.67% UBS ETF - Barclays Capital US 3-5 Year Treasury Bond UCITS ETF 59.78% UBS ETF - Barclays Capital US 5-7 Year Treasury Bond UCITS ETF 65.23% UBS ETF - Barclays Capital US 7-10 Year Treasury Bond UCITS ETF 60.78% UBS ETF - Markit iBoxx € Germany 1-3 UCITS ETF 122.19% UBS ETF - Markit iBoxx € Germany 3-5 UCITS ETF 64.53% UBS ETF - Markit iBoxx € Germany 5-10 UCITS ETF 36.79% UBS ETF - Markit iBoxx € Germany 7-10 UCITS ETF 51.31% UBS ETF - Markit iBoxx € Liquid Corporates UCITS ETF 54.16% UBS ETF - Markit iBoxx € Sovereigns 1-5 UCITS ETF 97.88% UBS ETF - SBI® Foreign AAA-BBB 1-5 UCITS ETF 49.57% UBS ETF - SBI® Foreign AAA-BBB 5-10 UCITS ETF 52.27% UBS ETF - Barclays Euro Area Liquid Corporates 1-5 Year UCITS ETF 4.04% * UBS ETF - Barclays US Liquid Corporates UCITS ETF 37.97% *
* PTR figures are calculated on the period starting at the launch date of the relevant Sub-Fund until 30 June 2014.
340

Semi-Annual Report as of 30 June 2014
Additional Information for Investors in the Federal Republic of Germany
UBS Deutschland AG, Bockenheimer Landstrasse 2-4, D-60306 Frankfurt am Main, has undertaken the function of Paying and Information Agent for the Company in the Federal Republic of Germany (the “German Paying and Information Agent”). Applications for the redemption and conversion of shares may be sent to the German Paying and Information Agent. All payments to investors, including redemption proceeds and potential distributions, may, upon request, be paid through the German Paying and Information Agent. The prospectus, the key investor information documents (KIIDs), the articles of incorporation of the Company and the annual and semi-annual reports may be obtained, free of charge, in hardcopy form at the office of the German Paying and Information Agent during normal opening hours.Issue, redemption and conversion prices of shares and any notices to the shareholders are also available, free of charge, from the German Paying and Information Agent. The issue, redemption and conversion prices of shares will be published on the following website http://www.ubs.com/de/de/asset_management/etfs/etf- private/etf_products/etf_product_overview.0.20.sc_asc.filters.funddomicile__lu.html. Any notices to the shareholders will be published in Germany in the Federal Gazette (www.bundesanzeiger.de).
341