2014 ANNUAL REPORT - Prysmian Group
352
2014 ANNUAL REPORT
-
Upload
khangminh22 -
Category
Documents
-
view
1 -
download
0
Transcript of 2014 ANNUAL REPORT - Prysmian Group

2014ANNUALREPORT


2014ANNUAL REPORT

Prysmian Group will build the second high voltage submarine power line between Europe and Asia across the Dardanelles strait in Turkey. This link will complement the interconnection that Prysmian Group is currently laying along the same route. It will also ensure reliable and cost-effective power flow from the Asian generation sites to the major consumption centres in European territory, including the congested Istanbul area, thus completing the electricity ring around the Sea of Marmara.

3
DISCLAIMERThis document contains forward-looking statements, specifically in the sections entitled "Significant events after the reporting period" and "Business outlook", that relate to future events and the operating, economic and financial results of the Prysmian Group. By their nature, forward-looking statements involve risk and uncertainty because they depend on the occurrence of future events and circumstances. Actual results may differ materially from those reflected in forward-looking statements due to a variety of factors.
CONTENTSLETTER TO STAKEHOLDERSCONSOLIDATED FINANCIAL REPORT DIRECTORS' REPORT Directors and auditors Financial highlights Prysmian Group Prysmian and the financial markets Significant events during the year Reference scenario Group performance and results Review of Energy Projects Operating Segment Review of Energy Products Operating Segment Review of Telecom Operating Segment Group statement of financial position Alternative performance indicators The internal control and risk management system Risk factors and uncertainties Sustainable approach to managing the business Incentive plans Significant events after the reporting period Business outlook Other information Certification pursuant to art. 2.6.2 of the Italian Stockmarket Regulations regarding the conditions contained in art. 36 of the Market Regulations
CONSOLIDATED FINANCIAL REPORT Consolidated statement of financial position Consolidated income statement Consolidated statement of comprehensive income Consolidated statement of changes in equity Consolidated statement of cash flows
EXPLANATORY NOTES
CERTIFICATION OF THE CONSOLIDATED FINANCIAL STATEMENTS PURSUANT TO ART. 81-TER OF CONSOB REGULATION 11971 DATED 14 MAY 1999 AND SUBSEQUENT AMENDMENTS AND ADDITIONS
AUDIT REPORT
PARENT COMPANY ANNUAL REPORT DIRECTORS’ REPORT
PARENT COMPANY FINANCIAL REPORT
EXPLANATORY NOTES
CERTIFICATION OF THE FINANCIAL STATEMENTS PURSUANT TO ART. 81-TER OF CONSOB REGULATION 11971 DATED 14 MAY 1999 AND SUBSEQUENT AMENDMENTS AND ADDITIONS
AUDIT REPORT
REPORT BY THE BOARD OF STATUTORY AUDITORS
4788
10122836424448546268748488
100118119120120
121
123124125126127128
129
255
257
263263
273
279
337
339
343

2014 Annual Report Prysmian Group
4
LETTER TO STAKEHOLDERS
Our Group's performance in 2014 confirms signs of a slight recovery in sales volumes, accompanied by a generally stable level of profitability. The decisive contributions to this result were from the strategic submarine cables and systems businesses, with strong growth, and from optical cables, with recovering volumes and profitability. This is a particu-larly significant result, having been achieved in a still difficult scenario, that has seen demand recover for some businesses, like optical cables and renewables, contrasting with weakness in the more cyclical sectors, like power distribution cables, and a slowdown in the Oil & Gas market. Extraordinary events also had a significant impact on the Group's results, such as the technical problems encountered with the important Western Link project, which we promptly reported to the customer and the market. I am pleased to say that the Group was able to deal with and manage even this crisis situation, the effects of which are in line with previous announcements and whose recovery plan is proceeding according to schedule.
Business performanceGroup Sales amounted to Euro 6,840 million, posting organic growth of +1.8% assuming the same group perimeter and excluding metal price and exchange rate effects. Excluding the adverse impact of the Western Link project, organic growth would have been +2.7%. The decisive contribution to this good sales performance came from submarine cables and systems, where the Group had double-digit growth. Telecom cables also posted a solid recovery, while Trade & Installers saw a slight upturn in volumes. Performance by High Voltage cables and the SURF business was broadly in line with 2013, while there were no signs of recovery for Power Distribution and the OEM and Oil & Gas segments of the industrial cables market. In terms of profitability, Adjusted EBITDA came in at Euro 509 million, compared with Euro 613 million in 2013. Excluding the adverse impact of the Western Link project, Adjusted EBITDA would have been Euro 603 million, basically in line with its

5
level in 2013. The decisive contribution to this result came from high value-added businesses, in particular submarine cables and systems, along with the significant improvement in profitability posted by the Telecom business. However, pressure on prices continued to impact the profitability of the more cyclical businesses (Trade & Installers and Power Distribution), which nonetheless found a stabilisation point. Within the Industrial cables business, the various segments had widely differing performances, with Renewables and Elevators making a good contribution, while others were less positive, such as Oil & Gas, affected by the fall in oil prices, and some slowing sub-segments of Specialties & OEMs. The Group confirmed its solid financial structure with a net financial position at the end of December 2014 of Euro 802 million (Euro 805 million in 2013), well ahead of initial expectations, achieved thanks to the Group's significant cash-generating capacity. Synergies arising from integration with Draka amounted to Euro 140 million. Strategy developmentIndustrial investmentsIn this context, the Group has relentlessly pursued its growth strategy by focusing on investments in its high value-added businesses, on ongoing actions to reduce costs and improve the efficiency of its organisational structure and manufactur-ing footprint. In particular, we are driving forward the process of concen-trating high-tech product manufacturing in a smaller number of plants, with the goal of creating centres of excellence with high levels of know-how, where economies of scale can be achieved by improving manufacturing efficiency and reducing capital employed. In the standard businesses, the focus has been on pursuing greater manufacturing efficiency, while nonetheless maintaining a wide geographical presence to minimise distribution costs. The Group's overall capital expenditure totalled Euro 163 million in 2014, up from 2013. Investments to increase pro-duction capacity and improve the mix accounted for around 30% of the total and were particularly focused on the Energy Projects and Telecom segments. In the submarine cables business, investments to increase production capacity and develop additional technological capabilities were made at all three production sites located in Arco Felice (Italy), Pikkala (Finland) and Drammen (Norway). Also of note was the upgrade of the "Cable Enterprise" cable-laying ship which will additionally boost the Group's submarine project execution capabilities. There were two main capex projects in the high voltage underground business: the first in Abbeville (United States) to build a second production line and the second in Slatina (Romania). The Telecom segment's main capital ex-
penditure was to upgrade the optical fibre plant in Sorocaba (Brazil) and to increase production capacity at the plant in Slatina, confirmed as one of Europe's centres of excellence for optical cables. The Energy Products segments made tactical capital investments to support the development of promising markets.A significant proportion of overall capital expenditure was devoted to improving efficiency in order to reduce fixed and variable costs, with a focus on product design and exper-imentation with new materials. In the optical fibre field, the investment programme to recover fibre manufacturing competitiveness continued to move ahead. Lastly, the Research & Development department worked on several projects, particularly in the submarine cables area, with the aim of further strengthening the Group's undisputed technological leadership; projects also focused on Extra High Voltage underground cables and P-Laser cables and on Oil & Gas cable product development and technology transfer between Group factories. The Telecom business introduced innovations to optical fibres to boost their capacity and per-formance and to optical cables and connectivity to meet the specific requirements of broadband cabling projects.
Human Capital DevelopmentThe quality of human resources is confirmed as a strategic factor for the Group's competitiveness. Prysmian carried out several important People Development projects in 2014. The Graduate Program attracted more than 16,000 applicants from all over the world, leading to the selection of 50 high-potential new graduates to join the 130 already recruited. Attention was also given to fostering the value of senior resources under the Experience Counts project. The Prysmian Group Academy, a school of managerial and professional education, saw as many as 600 employees pass through its doors during the year. Equally successful were other projects concerning Talent & Succession Management and performance appraisal. Lastly, the Group employee share purchase plan (YES Plan) reported a strong take-up, with around 5,000 employees signing up in 2014, year one of the plan, confirming their great sense of corporate belonging and their confidence in the Group's future.
Value creationAmong the principles underlying the Prysmian management approach is the ability to satisfy the expectations of our stakeholders and shareholders, through a constant focus on value creation. We are pleased to have achieved the 2014 targets announced to the market and we are able to reward our shareholders, for their continued confidence in our man-agement, with a proposed dividend in line with 2014.
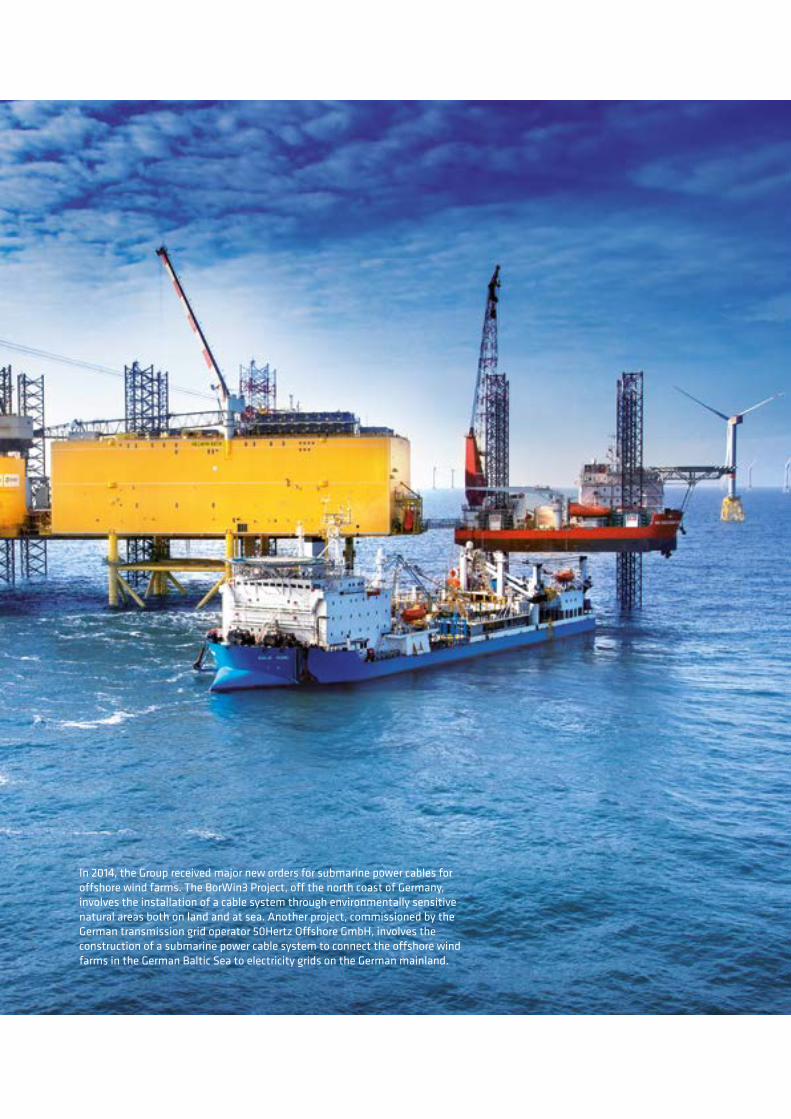
In 2014, the Group received major new orders for submarine power cables for offshore wind farms. The BorWin3 Project, off the north coast of Germany, involves the installation of a cable system through environmentally sensitive natural areas both on land and at sea. Another project, commissioned by the German transmission grid operator 50Hertz Offshore GmbH, involves the construction of a submarine power cable system to connect the offshore wind farms in the German Baltic Sea to electricity grids on the German mainland.

7
Consolidated Financial Report
DIRECTORS’REPORT

2014 Annual Report Prysmian Group
8
(*) Independent directors as per Italy's Unified Financial Act(**) Independent directors as per Italy's Self-Regulatory Code of
Corporate Governance(***) Prysmian Group company
(1) Appointed by the Shareholders' Meeting held on 18 April 2012(2) Members of the Control and Risks Committee(3) Members of the Compensation and Nominations Committee(4) Appointed on 16 April 2014The appointments of the directors listed above refer to the positions they held as at 31 December 2014 in companies listed on regulated markets, or in financial, banking and insurance companies.
Consolidated Financial Report | DIRECTORS’ REPORT
DIRECTORS AND AUDITORS
BOARD POSITION NAME AND SURNAME OTHER APPOINTMENTS
Chairman Massimo Tononi (*) (3)
Chairman of BoD of Borsa Italiana S.p.A. Chairman of ISA – Istituto Atesino di Sviluppo S.p.A. and of Cassa di Compensazione e Garanzia S.p.A. Director of Italmobilare S.p.A., Sorin S.p.A., the London Stock Exchange and Castello SGR S.p.A.
Chief Executive Officer & Valerio BattistaGeneral Manager
Directors Maria Elena Cappello (*) (**) (2) Director of Sace S.p.A.
Cesare d’Amico (*) (**)
Deputy Chairman of Tamburi Investment Partners S.p.A. and The Standard Club Europe Ltd. Director of d’Amico International Shipping S.A.
Claudio De Conto (*) (**) (2) (3) Chairman of Star Capital SGR S.p.A. CEO of Artsana Group
Giulio Del Ninno (*) (**) (3) Deputy Chairman of Italgen S.p.A.
Massimo Battaini (4)
Pier Francesco Facchini Chairman of BoD of Prysmian Treasury S.r.l. (***)
Fritz Wilhelm Fröhlich (*) (**) (2) Chairman of Randstad NV. Director of ASML NV and Rexel SA.
Fabio Ignazio Romeo Director of Oman Cables Industry (S.A.O.G.)
Giovanni Tamburi (*) (**) Chairman and CEO of Tamburi Investment Partners S.p.A.
Director of Amplifon S.p.A., Interpump S.p.A. and Zignago Vetro S.p.A.
(5) Appointed by the Shareholders’ Meeting held on 16 April 2013
BOARD OF STATUTORY AUDITORS (5)
BOARD OF DIRECTORS (1)
Chairman Pellegrino Libroia
Standing Statutory Auditors Paolo Francesco Lazzati
Maria Luisa Mosconi
Alternate Statutory Auditors Marcello Garzia
Claudia Mezzabotta
INDEPENDENT AUDITORSPricewaterhouseCoopers S.p.A.

9

2014 Annual Report Prysmian Group
10
2014 2013 (**) Change % 2012 (**)
Sales 6,840 6,995 -2.2% 7,574
Adjusted EBITDA before share of net profit/(loss)of equity-accounted companies
466 578 -19.5% 619
Adjusted EBITDA (2) 509 613 -17.0% 650
EBITDA (1) 496 563 -12.2% 549
Adjusted operating income (3) 365 465 -21.5% 494
Operating income 312 368 -15.6% 373
Profit/(loss) before taxes 172 218 -21.3% 239
Net profit/(loss) for the year 115 153 -24.7% 167
31 December 2014 31 December 2013 (**) Change 31 December 2012 (**)
Net capital employed 2,345 2,296 49 2,379
Employee benefit obligations 360 308 52 344
Equity 1,183 1,183 - 1,147
of which attributable to non-controlling interests 33 36 (3) 35
Net financial position 802 805 (3) 888
2014 2013 (**) Change % 2012 (**)
Capital expenditure (4) 163 136 19.9% 139
Employees (at period end) 19,436 19,232 1.1% 19,769
Earnings/(loss) per share
- basic 0.54 0.71 0.79
- diluted 0.54 0.71 0.78
Patents (***) 5,836 5,731 5,644
Number of plants 89 91 91
Percentage of plants certified ISO 14001 93% 86% 82%
Percentage of plants certified OHSAS 18001 59% 49% 42%
(1) EBITDA is defined as earnings/(loss) for the year, before the fair value change in metal derivatives and in other fair value items, amortisation, depreciation, and impairment, finance costs and income and dividends from other companies and taxes.
(2) Adjusted EBITDA is defined as EBITDA before non-recurring income/(expenses).(3) Adjusted operating income is defined as operating income before non-recurring income/(expenses) and the fair value change in metal derivatives and in
other fair value items.(4) Capital expenditure refers to increases in Property, plant and equipment and Intangible assets, gross of leased assets.(*) All percentages contained in this report have been calculated with reference to amounts expressed in thousands of Euro.(**) The previously published prior year comparative figures have been restated following the introduction of IFRS 10 and IFRS 11 and a new method of classifying
the share of net profit (loss) of associates and joint ventures.(***) These are the total number of patents, comprising patents granted plus patent applications pending worldwide.
MAIN FINANCIAL AND OPERATING DATA (*)
(in millions of Euro)
(in millions of Euro)
(in millions of Euro)
Consolidated Financial Report | DIRECTORS’ REPORT
FINANCIAL HIGHLIGHTS

11
Euro 6,840 million Euro 6,840 million
EMEA* 64%North America 15%
APAC 13%South and Central America 8%
Energy Projects 20%
E&I 39%of which
Industrial & Network Components 25%Other 2%
Telecom 14%
SALES 2014 BY BUSINESS AREA SALES 2014 BY GEOGRAPHICAL AREA
Energy Products 66%
(*) Europe – Middle East – Africa
KEY FINANCIALS (*)
Amounts in millions of Euro – Percentages on sales
2012 2013 2014
888
805 802
NET FINANCIAL POSITION
ADJ. EBITDA (2)
2012 2013 2014
650613
509
8.6% 8.8%
7.4%
2012 2013 2014
494465
365
ADJ. OPERATING INCOME (3)
2012 2013 2014
279269
186
ADJ. NET PROFIT (4)
2012 2013 2014
440
392423
NET OPERATING WORKING CAPITAL (5)
SALES
2012 2013 2014
7,574
6,995 6,840
-3.3% (1) 1.8% (1)
6.5% 6.7%
5.3% 3.7% 3.8%2.7%
6.0%5.8%
5.8%
(*) The previously published prior year comparative figures have been restated following the introduction of IFRS 10 and IFRS 11 and a new method of classifying the share of net profit (loss) of associates and joint ventures.
1) Organic growth is defined as growth in sales calculated net of changes in the scope of consolidation, change in metal prices and exchange rates effects.2) Adjusted EBITDA is defined as EBITDA before non-recurring income/(expenses).3) Adjusted Operating Income is defined as Operating Income before non-recurring income/(expenses) and the fair value change in metal derivatives and in
other fair value items.4) Adjusted Net Profit is defined as net profit/(loss) before non-recurring income/(expenses), the effect of derivatives and of other fair value items, exchange
rate differences, non-monetary interest on the convertible bond and the related tax effects.5) Net Operating Working Capital means Net Working Capital excluding the effect of derivatives. The percentage is calculated as Net Working Capital/
Annualised last-quarter sales.

Consolidated Financial Report | DIRECTORS’ REPORT
2014 Annual Report Prysmian Group
12
The Prysmian Group provides its customers worldwide with superior cables solutions based on pioneering technology and consistent exellence in execution, ultimately delivering sustainable growth and profit.
The Prysmian Group believes in the effective, efficient and sustainable supply of Energy and Information as a primary driver in the development of communities.
Excellence. Every day we relentlessly pursue exellence in all we do.
Integrity. We uphold the highest standards of integrity in our actions.
Understanding. We listen closely to our customers to really understand their needs.
Consolidated Financial Report | DIRECTORS’ REPORT
VISION
MISSION
VALUES
PRYSMIAN GROUP
Market, innovation and technology leader in the global cables industry.
Prysmian Group is the world leader in the energy and telecom cables and systems industry. With over 130 years of experi-ence, sales of around Euro 7 billion in 2014, more than 19,000 employees in 50 countries and 89 production sites, the Group offers the widest possible range of products, services, tech-nology and know-how for every type of industry thanks to an extensive commercial presence and 17 R&D centres in Europe, the United States, South America and China, with more than 500 qualified R&D professionals.
Prysmian is a public company, listed on the Italian Stock Exchange in the FTSE MIB index.
The Group is organised into the operating segments of Energy Projects, Energy Products and Telecom, and is active in the design, manufacture, supply and installation of cables for a wide range of applications.
The company operates in the business of underground and submarine cables and systems for the transmission and dis-tribution of energy, of special cables for applications in many different industrial sectors and of medium and low voltage cables for the construction and infrastructure industries.For the telecommunications industry, the Group manufac-tures cables and accessories for voice, video and data trans-

13
The Group also supports the petrochemicals industry by offering solutions for both upstream exploration and produc-tion activities, and downstream hydrocarbon processing and storage. These solutions range from power, instrumentation and control cables to SURF products and services, which include umbilical cables for offshore platforms and high-tech flexible pipes used in oil extraction.In the renewable energy market, Prysmian technologies support the development of some of the most important solar and wind farms in the world, such as the Ohotnikovo photovoltaic plant in Ukraine and the top wind farms in Southern Italy.
The Group’s fire-resistant cables can be found at the very heart of the most spectacular, state-of-the-art constructions, like the Wimbledon tennis stadium, the futuristic Marina Bay Sands in Singapore and the Shard skyscraper in London, the tallest in Western Europe. In Milan, Prysmian Group cable solutions will help to ensure the safety of the 20 million visitors expected at the International Exhibition in 2015.
In the Elevator business, the Group's elevator cables are present in some of the world's tallest or most prestigious buildings, like the new World Trade Center in New York City. By cabling the Burj Khalifa in Dubai, the world's tallest building at 828 metres high, Prysmian has guaranteed the safety of every one of its 162 floors with elevator cables and fire-resis-tant cables the length of which is more than 1,300 times the tower's height.
Even in the transport business Prysmian has reached many exceptional milestones: it has cabled some of the world's biggest aircraft and ships, like the Airbus 380 or the Royal Caribbean's GENESIS fleet, some of the fastest trains, and some of the most innovative metro systems, like the one recently inaugurated in Shanghai. Three million passengers on the London Underground travel each day through 400 km of tunnels, thanks to Prysmian and Draka fire-resistant cables.
Lastly, with a wide range of fibre solutions for voice, video and data, continuous investment in R&D and around 30 dedicated factories, Prysmian Group is the world's top manufacturer of Telecom cables, with which it contributes to developing infra-structure in support of information flows and communication between communities around the world. The quality of optical fibre and level of innovation used in its cables allow the Group to meet the most difficult and ambitious challenges. In Australia Prysmian is helping the local government to achieve the goal of creating a Fi-bre-to-the-Premises network that will connect 93% of the country's residential and commercial buildings. This project confirms the Group's central role in the largest infrastructure challenge ever faced in Australia's history.
mission, offering a comprehensive range of optical fibres, optical and copper cables and connectivity systems.
Over the years Prysmian Group has achieved important milestones through realising projects with innovative, lead-ing-edge solutions to satisfy the highest customer expecta-tions and create value for stakeholders and the Group itself.
The Prysmian Group has worked for utilities and grid operators on some of the principal submarine power inter-connection projects. These include the recent project for the link between some of the Cyclades Islands and the Greek mainland, as well as the record Western Link project in the United Kingdom, which boasts a number of industry firsts for voltage (600 kV) and world records for insulated cable rating (2200 MW) and length of route (more than 400 km). The Trans Bay, Neptune and Hudson projects in the United States are illuminating large areas between San Francisco and New York City with energy from different sources. The Group is also a world leader in submarine connections for offshore wind farms. In addition to its involvement in major European projects of recent years, Prysmian has just worked on the cable to link several wind farms in the West of Adlergrund cluster in the Baltic Sea with mainland electricity grids in Germany.In the area of onshore infrastructure, the Prysmian Group has been involved in the construction of electricity grids in some of the world's largest metropolises, from New York to Buenos Aires, London to St. Petersburg, and Hong Kong to Sydney.
Consolidated Financial Report | DIRECTORS’ REPORT
2014 Annual Report Prysmian Group
14
The Energy Projects Operating Segment covers high-tech and high value-added businesses whose focus is on projects and their execution, as well as on product customisation: High Voltage underground, Submarine and SURF (umbilical cables, flexible pipes and special DHT (Downhole Technology) cables for the oil industry).• Prysmian engineers, manufactures and installs high and
extra high voltage cables for underground and submarine power transmission directly from power stations to the primary distribution networks. Through Prysmian PowerLink S.r.l., the Group develops the most advanced "turnkey" submarine cable systems for installation at depths of up to 2,000 metres, possible thanks to the "Giulio Verne", one of the largest and most technologically advanced cable-laying ships in the world. Prysmian also offers advanced services for the construction of submarine power lines for offshore wind farms, ranging from project management to cable installation with the assistance of the "Cable Enterprise", its other cable-laying ship. The Group's technological solutions for this business cover wind turbine, inter-array and export cables.
• The Group also offers a full range of SURF (Subsea Umbilical, Riser and Flowline) products and services for offshore exploration activities by the oil industry. The product range includes multipurpose umbilical cables for transporting energy, telecommunications, fluids and chemicals; high-tech flexible pipes and ducting for offshore oil extraction; special DHT cables, which include cables to control downhole instrumentation, power cables and hydraulic fluid cables.
The Energy Products Operating Segment covers the busi-nesses offering a complete and innovative product portfolio designed to meet the various and many demands of the market: Energy & Infrastructure, (including Power Distribu-tion and Trade & Installers) and Industrial & Network Com-ponents (comprising Specialties & OEM, Oil & Gas, Elevators, Automotive and Network Components).• In the field of power transmission and distribution, the
Group manufactures medium voltage cables and systems to connect industrial and residential buildings to primary distribution grids and low voltage ones for power distri-bution and the wiring of buildings. Prysmian solutions are developed to support utilities and grid operators, industrial companies, installers and wholesalers in the electricity sector. In particular, the products made for the Trade & Installers market include cables and systems for distributors and installers for the wiring of buildings and distribution of power to or within commercial and residen-tial structures. Fire-resistant and low smoke halogen-free cables complete one of the widest and most comprehen-sive product ranges in the world.
• The Group's offer of integrated cabling solutions for the Industrial market constitutes the most comprehensive and technologically advanced response to the needs of a wide variety of industries. For the Specialties and OEM business, Prysmian offers cable systems for various specific industrial applications such as trains, aircraft, ships, port systems, cranes, mines, the nuclear industry, defence, the electro-medical sector and renewable energy. Products for the petrochemicals market include power, instrumentation and control cables used in the various ac-tivities of exploration, production, processing and storage. Other solutions are produced for the elevator market, such as flexible connectorised cables and hoistway cables, and for the automotive industry, in which the Group collaborates with the sector's leading international man-ufacturers. The product range is completed with network accessories and components to connect cables and other network elements.

15
The Telecom Operating Segment is engaged in the manu-facture of cable systems and connectivity products used in telecommunication networks. The product portfolio includes optical fibre, optical cables, connectivity components and accessories, OPGW (Optical Ground Wire) and copper cables.
With centres of excellence in Battipaglia (Italy), Eindhoven (the Netherlands) and Douvrin (France), and 5 production sites around the world, Prysmian Group is one of the leading manufacturers of the core component of every type of optical cable: optical fibre. A wide range of optical fibres is designed and made to cater to the broadest possible spectrum of customer applications, including single-mode, multimode and specialty fibres. The Group also has at its disposal every currently available technology for the manufacture of optical fibre, allowing it to achieve optimal solutions for the different applications. Optical fibres are employed in the production of a wide range of standard optical cables or those specifically designed for challenging or inaccessible environments, from underground ducts to overhead electricity lines, from road and rail tunnels to gas and sewerage networks. Prysmian Group also supplies passive connectivity solutions that ensure efficient management of optical fibre within networks. Growing demand for higher bandwidth has seen the deployment of optical fibre moving closer to the end user. The Group is extremely active in this rapidly growing sector of the market, known as FTTx, where its approach is based on combining existing technologies with innovative, new solutions allowing fibres to be deployed in high-rise buildings and multi-dwelling units. Many of the cables used in FTTx systems feature Prysmian's bend-insensitive Bend-Brightxs optical fibre, which has been specially developed for this application. Prysmian Group also produces a wide range of copper cables for underground and overhead cabling solutions and for resi-dential as well as commercial buildings. The product portfolio comprises cables of different capacity, including broadband xDSL cables and those designed for high transmission, low interference and electromagnetic compatibility. The Group also produces cable solutions serving communi-cation needs in infrastructure, industry and transport, for a diverse range of applications: cables for television and film studios, cables for rail networks such as underground cables for long-distance telecommunications, light-signalling cables and cables for track switching devices, as well as cables for mobile telecommunications antennae and for communication networks.

Consolidated Financial Report | DIRECTORS’ REPORT
2014 Annual Report Prysmian Group
16
MELAKA
ABIDJIAN
CIKAMPEK
WUHAN
Energy (60) Combined Energy and Telecom (9)
HQ O ces (34)
Telecom (20)
BRØNDBY
NASSJO
NEUF PRÉ
ASCOLI P.
VILANOVA Y LA GELTRÙPIGNATARO M.
VILANOVA Y LA GELTRÙ
SANTA PERPETUA
MILANO
Consolidated Financial Report | DIRECTORS’ REPORT
50 COUNTRIES89 PLANTS17 R&D CENTRES19,000 EMPLOYEES
GLOBAL PRESENCE
NORTHAMERICA
9plants
SOUTHAMERICA
7plants
EMEA Ivory CoastAbidjianDenmarkBrØndbyEstoniaKeilaFinlandPikkalaOuluFranceAmfrevilleAngyCharvieuChavanozGronNeuf PréParonXoulcesDouvrinCalaisSainte GenevieveGermanyNeustadtSchwerinNurnbergWuppertalBerlinItalyArco FeliceAscoli PicenoBattipagliaGiovinazzoLivornoMerlinoPignataro MaggioreQuattordioNorwayDrammenNetherlandsEindhovenDelftAmsterdamEmmen
NORTH AMERICA CanadaPrescottMexicoDurangoUSAAbbevilleLexingtonNorth DightonBridgewaterRocky MountClaremontSchuylkill Haven
SOUTH AMERICA ArgentinaLa RosaQuilmes BrazilJoinvilleSorocaba (2)Santo AndrèVila Velha
DelfzijlNieuw BergenCzech RepublicVelke MeziriciRomaniaSlatinaRussiaRybinskSlovakiaPresovSpainVilanova y la Geltru (2)SantanderSanta PerpetuaSwedenNassjoTunisiaGrombaliaTurkeyMudanyaU.A.E.Fujairah UKAberdareBishopstokeWrexhamWashingtonHungaryBalassagyarmatKistelek
APAC AustraliaDee WhyLiverpoolChinaBaoyingTianjinWuxiWuhan (2)HaixunShanghaiSuzhouZhongyaoPhilippinesCebuIndiaPuneChiplunIndonesiaCikampekMalaysiaKuala LumpurMelakaNew ZealandAucklandThailandRayong

17
MELAKA
ABIDJIAN
CIKAMPEK
WUHAN
Energy (60) Combined Energy and Telecom (9)
HQ O ces (34)
Telecom (20)
BRØNDBY
NASSJO
NEUF PRÉ
ASCOLI P.
VILANOVA Y LA GELTRÙPIGNATARO M.
VILANOVA Y LA GELTRÙ
SANTA PERPETUA
MILANO
50 COUNTRIES89 PLANTS17 R&D CENTRES19,000 EMPLOYEES EMEA
51plants
APAC
22plants
Consolidated Financial Report | DIRECTORS’ REPORT
2014 Annual Report Prysmian Group
18
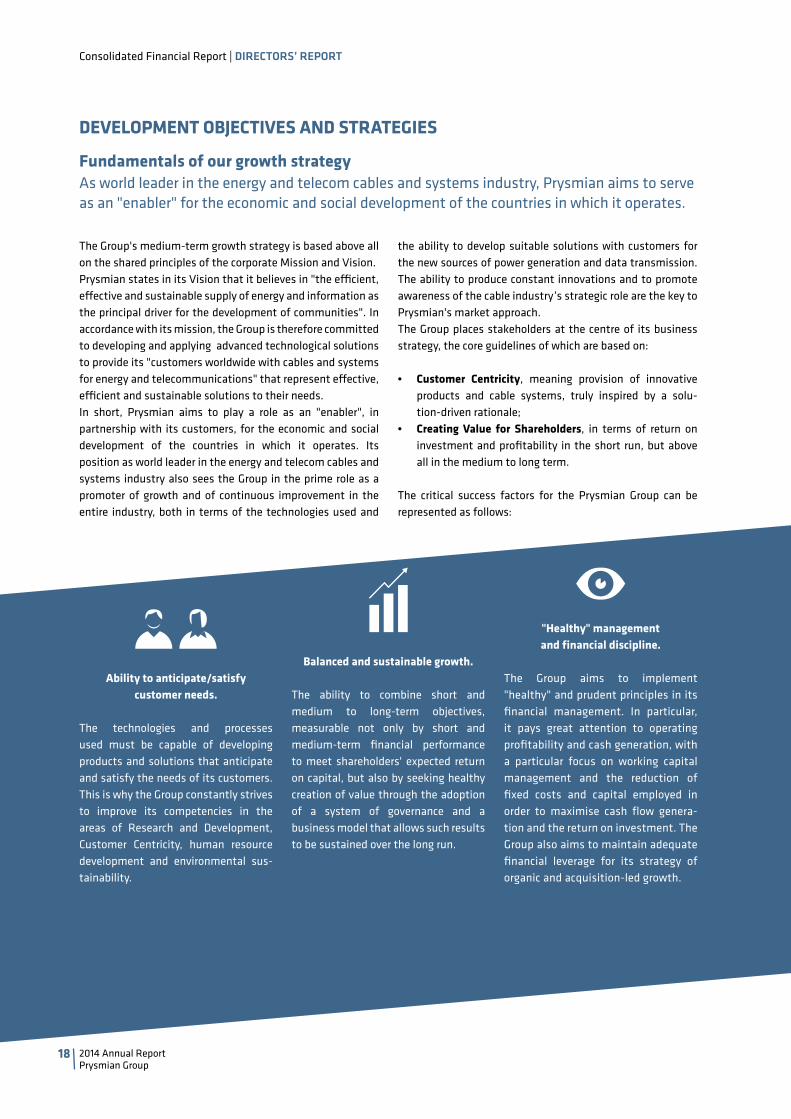
The Group's medium-term growth strategy is based above all on the shared principles of the corporate Mission and Vision. Prysmian states in its Vision that it believes in "the efficient, effective and sustainable supply of energy and information as the principal driver for the development of communities". In accordance with its mission, the Group is therefore committed to developing and applying advanced technological solutions to provide its "customers worldwide with cables and systems for energy and telecommunications" that represent effective, efficient and sustainable solutions to their needs.In short, Prysmian aims to play a role as an "enabler", in partnership with its customers, for the economic and social development of the countries in which it operates. Its position as world leader in the energy and telecom cables and systems industry also sees the Group in the prime role as a promoter of growth and of continuous improvement in the entire industry, both in terms of the technologies used and
the ability to develop suitable solutions with customers for the new sources of power generation and data transmission. The ability to produce constant innovations and to promote awareness of the cable industry’s strategic role are the key to Prysmian's market approach.The Group places stakeholders at the centre of its business strategy, the core guidelines of which are based on:
• Customer Centricity, meaning provision of innovative products and cable systems, truly inspired by a solu-tion-driven rationale;
• Creating Value for Shareholders, in terms of return on investment and profitability in the short run, but above all in the medium to long term.
The critical success factors for the Prysmian Group can be represented as follows:
DEVELOPMENT OBJECTIVES AND STRATEGIES
As world leader in the energy and telecom cables and systems industry, Prysmian aims to serve as an "enabler" for the economic and social development of the countries in which it operates.
The technologies and processes used must be capable of developing products and solutions that anticipate and satisfy the needs of its customers. This is why the Group constantly strives to improve its competencies in the areas of Research and Development, Customer Centricity, human resource development and environmental sus-tainability.
Ability to anticipate/satisfy customer needs. The ability to combine short and
medium to long-term objectives, measurable not only by short and medium-term financial performance to meet shareholders' expected return on capital, but also by seeking healthy creation of value through the adoption of a system of governance and a business model that allows such results to be sustained over the long run.
Balanced and sustainable growth. The Group aims to implement "healthy" and prudent principles in its financial management. In particular, it pays great attention to operating profitability and cash generation, with a particular focus on working capital management and the reduction of fixed costs and capital employed in order to maximise cash flow genera-tion and the return on investment. The Group also aims to maintain adequate financial leverage for its strategy of organic and acquisition-led growth.
"Healthy" management and financial discipline.
Fundamentals of our growth strategy

19
The Group pays particular attention to its relations with financial markets, shareholders and investors, also because of its public company status. Its focus in this sense is on ensuring precise maintenance of commitments and delivery of target results. Transpar-ency and credibility are also expressed in a system of corporate governance based on strict interpretation and application of the relevant regulations and the adoption of principles and decisions drawn from international best practices.
Transparency, corporate governance and market and investor confidence
The Group's development strategy follows the dual track of growth in size and continuous improvement in profit-ability. The Group pursues both organic growth of the business, based on a selective investment policy and devel-opment of commercial and production synergies, and acquisition-led growth. The search for growth opportunities is primarily focused on higher value-add-ed high-tech businesses while in terms of geographical expansion, the Group mainly invests in countries and markets capable of ensuring high rates of growth and profitability.
Expansion and growth.Prysmian has consolidated over time the ability to optimise its industrial processes, including by integrating and rationalising acquired companies. In fact, the Group has been successfully conducting the process of integration with Draka started in 2011 and is on track with its targets. It intends to push ahead with the plan to extract synergies from rationalising its organi-sation and industrial footprint, as well as from procurement activities. The de-velopment of synergies with Draka also covers the commercial sphere, involving the integration of product ranges and enhancement of customer service.
Rationalisation and efficiency of industrial and commercial processes.
Consolidated Financial Report | DIRECTORS’ REPORT
2014 Annual Report Prysmian Group
20
(1) "Italian Stock Exchange Self-Regulatory Code for Listed Companies - Ed. 2014" drawn up by the Corporate Governance Committee of Borsa Italiana S.p.A.
Customer centrality and satisfaction are a strategic approach that is implemented by having a fast, smooth organisation throughout the supply chain, capable of expediting deci-sion-making and time to market by adapting itself to the needs of the various industries through continuous invest-ment in innovation. One of the ways of implementing customer centricity is through "Factory Reliability", a process that makes it possible not only to improve the reliability of planning and the execution of manufacturing output, in terms of both mix and volumes in ever faster response times, but also to have stricter control over inventory levels for every type of stock (raw materials, intermediate and finished goods); this enables the Group to deal effectively and efficiently with upswings and downswings in sales volumes and consequent variation in manufacturing output. In addition to the Customer Centricity and Factory Reliability propositions, Prysmian Group has also started Supply Chain Integration projects with some of its most important global customers with the goal of improving process effectiveness and efficiency throughout the supply chain, from the producers of raw materials and intermediate goods used in manufacturing through to the end cable user.
Prysmian Group has perfected a market approach over the years that puts the customer at the centre of its strategic, organisational and business choices. Its commitment to analysing customer expectations and their evolution over time allows the Group to develop organisational and operating models that translate into fast, efficient and targeted responses to the markets concerned. At the heart of this approach is "Customer Centricity", which expresses itself in the ability to anticipate and satisfy customer needs through its constant presence, from product design through to delivery, and its provision of a level of service that is monitored against specific, agreed parameters.The Prysmian Group is able to develop solutions that not only meet specific standards but also satisfy precise customer needs. In particular, the Group is able to serve very different segments and markets thanks to its ad hoc matrix organi-sational structure that lets it have a local presence even for major global projects. This means that markets with high local specificity are served by country commercial and development teams, and that markets with global products and customers are followed by integrated business unit teams, while other segments requiring a local presence and cooperation between countries draw on the matrix structure's potential.
MARKET APPROACH
CORPORATE GOVERNANCEThe Prysmian Group keeps its corporate governance system constantly in line with latest recommendations and regulations, adhering to international best practices.
Prysmian is aware of the importance of a good corporate governance system in order to achieve strategic objectives and create long-term sustainable value, by having a system that is effective in complying with the legal and regulatory framework, efficient in terms of cost-effectiveness, and fair towards all the Group's stakeholders. Accordingly, the Prysmian Group keeps its corporate gover-nance system constantly in line with latest recommenda-tions and regulations, adhering to national and international best practices.In addition, the Group has put in place standards, rules and procedures that govern and guide the conduct of activities by all its organisational and operating structures, as well as ensuring that all business transactions are carried out effectively and transparently.
During 2014, with a view to continuous improvement of its corporate governance system, Prysmian Group undertook several initiatives to implement the recommendations of
the Self-Regulatory Code1, adopted by the Group, and to strengthen the principles of transparency and integrity.
Corporate Governance Structure. Prysmian's corporate gov-ernance structure is based on the central role of the Board of Directors (as the most senior body responsible for managing the Company in the interests of shareholders) in providing strategic guidance, in ensuring the transparency of the decision-making process and in establishing an effective system of internal control and risk management, including decision-making processes for both internal and external matters. The model of governance and control adopted by Prysmian is the traditional one, with the presence of a general Shareholders' Meeting, a Board of Directors and a Board of Statutory Auditors.
An overview of the Company's corporate governance structure now follows, along with a description of its main features.

21
In accordance with art. 14 of the By-laws, the Company is currently managed by a Board of Directors consisting of eleven directors - who will remain in office until the date of the annual general meeting that approves the financial statements for the year ended 31 December 2014 - of whom seven are non-executive. The Board of Directors is vested with the broadest possible powers of ordinary and extraor-dinary administration, except those which by law are the exclusive prerogative of the shareholders in general meeting. In line with the recommendations of the Self-Regulatory Code, the non-executive directors are sufficiently numerous and have enough authority to ensure that their judgement carries significant weight in Board decision-making. Six of the non-executive directors are independent within the meaning of art. 148, par. 3 of the Unified Financial Act and of art. 3.C.1. and art. 3.C.2. of the Self-Regulatory Code, while one non-executive director is independent within the meaning of art. 148, par. 3 of the Unified Financial Act. The Board of Directors has appointed a Chief Executive Officer and General Manager from among its members and granted him all the authority and powers of ordinary administration needed or useful for fulfilling the Company's business purpose.
Management of the Company is the sole responsibility of the
directors, who take the necessary actions to implement its business purpose. The Board of Directors is also responsible for the Group's internal control and risk management system and is therefore required to verify its adequacy and to adopt specific guidelines for this system, with the support of the other parties involved in the internal control and risk man-agement system, namely the Control and Risks Committee, the Director in charge of establishing and maintaining the internal control and risk management system, the Head of Internal Audit, the Managers responsible for preparing the corporate accounting documents, as well as the Compensa-tion and Nominations Committee, the Board of Statutory Auditors and the Company's Monitoring Board.Further information (i) on the corporate governance system of Prysmian S.p.A. (ii) on its ownership structure, as required by art.123-bis of Legislative Decree 58 dated 24 February 1998 (the "Unified Financial Act") and (iii) on directors' disclosures about directorships or statutory auditorships held in other listed or relevant companies, can be found in the "Report on Corporate Governance and Ownership Structure", prepared in accordance with art. 123-bis of Legislative Decree 58 dated 24 February 1998 (the "Unified Financial Act") and available in the Investor Relations/Corporate Governance section of the Company's website at www.prysmiangroup.com.
BOARD OF STATUTORY AUDITORS
P. Libroia (Chairman)P. F. Lazzati
M. L. Mosconi
SHAREHOLDERS'MEETING
MANAGERS RESPONSIBLE FOR PREPARING CORPORATE ACCOUNTING DOCUMENTS
A. Bott and C. Soprano
MONITORING BOARD PURSUANT TO Leg. Decree 231/01
P. F. Lazzati (Chairman)M. MilanoM. Sinagra
C. De Conto (Chairman)M. E. Cappello
F. Fröhlich
CONTROL AND RISKS COMMITTEE COMPENSATION AND NOMINATIONS COMMITTEE
G. Del Ninno (Chairman)C. De ContoM. Tononi
HEAD OF INTERNAL AUDIT
M. Sinagra
BOARD OF DIRECTORSCHAIRMAN
M. Tononi
DIRECTORS
EXECUTIVEV. Battista, CEO and GMP. F. Facchini, CFOF. I. Romeo M. Battaini
INDEPENDENTM.E. Cappello
C. d'AmicoC. De Conto
G. Del NinnoF. Fröhlich
G. Tamburi
INDEPENDENT AUDITORS
PricewaterhouseCoopers S.p.A.
GOVERNANCE STRUCTURE
Consolidated Financial Report | DIRECTORS’ REPORT
2014 Annual Report Prysmian Group
22
NK Wuhan CableCo. Ltd.21
60%
Draka ComteqGermany
VerwaltungsGmbH
Draka ComteqSlovakia s.r.o.
Draka ComteqKablo Limited
Sirketi15
99.5%
Draka ComteqCabos Brasil S.A.23
Draka Kabely s.r.o.
Prysmian CableSystems Pte Ltd.1
SICABLESocieté Ivoirienne
de Cables S.A.
Prysmian PowerLinkSaudi LLC
LLC“Rybinskelektrokabel”
PrysmianCables et Systemes
France SAS
Prysmian CablesAsia-Pacific Pte Ltd.
PrysmianKabler og Systemer
A.S.
Prysmian EnergiaCables y Sistemasde Argentina S.A.
Auto CablesTunisie S.A.
PrysmianInstalaciones
Chile S.A.
EurelectricTunisie S.A.3
P.T. PrysmianCables Indonesia2
Turk PrysmianKablo Ve
Sistemleri A.S.
Prysmian ConsultoraConductores e
Instalaciones SAIC4
Prysmian PowerCables and Systems
Canada Ltd.
Prysmian ReCompany Ltd.
PrysmianCabluri Si Sisteme
S.A.5
PrysmianCables and Systems
S.A.
Limited LiabilityCompany Prysmian
RUS6
Prysmian (French)Holdings S.A.S.
GSCP Athena(French) Holdings II
S.A.S.
AS Draka KeilaCables
Draka KabelSverige AB
Draka IndustrialCable Russia LLC
Neva Cables Ltd
Prysmian PowerCables & SystemsAustralia Pty Ltd.
Draka Sweden AB
Draka DurangoS. De R.L. de C.V.
Draka NK Cables(Asia) Pte Ltd.
Prysmian PowerCables & SystemsNew Zealand Ltd
PrysmianDenmark A/S
Draka DenmarkHolding A/S
Draka MexicoHoldings
S.A. de CV10
Draka TransportUSA, LLC
NK MexicoHoldings S.A. de CV
Prysmian TelecomCables & SystemsAustralia Pty Ltd.
Draka NorskKabel A.S.
Draka Norway A.S.
DrakaParicable S.A.S
PrysmianCables and Systems
(US) INC.
Draka CableteqUSA Inc.
PrysmianConstructionServices Inc
Prysmian Cablesand Systems
USA LLC
Draka ElevatorProducts Inc.
Draka ComteqFrance S.A.S.
PrysmianFinland OY9
DrakaFileca S.A.S.
DrakaFrance S.A.S.
PrysmianElectronics S.r.l.
Prysmian TianjinCables Co. Ltd
Prysmian AngelTianjin Cable
Co. Ltd.
Prysmian(China) Investment
Company Ltd.
PrysmianCables and Systems
International Ltd.
PrysmianHong Kong
Holding Ltd.
PrysmianTreasury (Lux)
S.à r.l.
PrysmianWuxi Cable
Company Ltd.
Prysmian Cable(Shanghai) Co. Ltd.
Prysmian -OEKW GmbH
DrakaBelgium N.V.16
PrysmianKablo s.r.o7
Prysmian BaoshengCable Co. Ltd.
PrysmianMKM Magyar
Kabel Muvek KFT
Prysmian SurflexUmbilicais e Tubos
Flexíveisdo Brasil Ltda11
Prysmian DrakaBrasil S.A.12
Prysmian Fibras Oticas Brasil Ltda13
Comergy Ltd.
Prysmian UKGroup Ltd.
Prysmian Powerlink
Services Ltd.
Prysmian TelecomCables and Systems
UK Ltd.
PrysmianMetals Ltd.
Draka DistributionAberdeen Ltd.
Draka ComteqUK Ltd.
PrysmianCables & Systems
Ltd.
Prysmian Cables(2000) Ltd.
Prysmian Cables(Supertension) Ltd.
PrysmianConstruction
Company Ltd.
Draka U.K. Ltd.
Draka UK PensionPlan Trust
Company Ltd.
Prysmian EnergiaCabos e Sistemas
do Brasil S.A.22
DrakaComteq B.V.
Prysmian Treasury (The Netherlands)
B.V.
NKF Vastgoed IB.V.17
Draka SarphatiB.V.
Draka ComteqFibre B.V.
MarmavilS.L.U.
Prysmian SpainS.A.U.
Draka Holding N.V.y CIA Soc. Col.25
Draka ComteqIberica S.L.U.
USB-elektroKabelkonfektions
Gmbh i.L.
Draka DeutschlandGmbH
Hohn GmbHDraka Cable
Wuppertal GmbH
Draka ComteqBerlin GmbH
& Co. KG20
Kaiser KabelGmbH
Draka ComteqSingapore Pte Ltd.
JaguarCommunication
Consultancy ServicesPrivate Ltd.8
Submarine CableInstallation
Sdn Bhd
Draka ComteqGermany GmbH
& Co. KG
NKF Holding(Deutschland)
GmbH
Draka DeutschlandErste Beteiligungs
GmbH
Draka ServiceGmbH
Prysmian KabelUnd Systeme
GmbH19
Draka DeutschlandVerwaltungs
GmbH
Draka KabeltechnikGmbH
Kaiser KableVetriebes GmbH i.L.
PrysmianUnterstuetzun-gseinrichtung Lynen GmbH
Draka IstanbulAsansor IthalatIhracat ÜretimTicaret Ltd. Şti.
Draka Cables(Hong Kong) Ltd.
Draka O®shoreAsia Pacific Pte Ltd.
MCI-DrakaCable Co. Ltd.14
AssociatedCables PVT Ltd.18
Draka U.K.Group Ltd.
CableMakers Propertiesand Services Ltd.
Draka ShanghaiOptical FibreCable Co. Ltd.
Sindutch CableManufacturer
Sdn Bhd
Singapore CablesManufacturers
Pte Ltd.
Cable Supply andConsulting
Company Pte Ltd.
Draka (Malaysia)Sdn Bhd
Draka Marketingand Services
Sdn Bhd
DrakaPhilippines Inc.
PRYSMIAN S.P.A.
100%
95%
4.986374%
94.475068%
50%
100%
99.48%
100%
100%
51%
99.946%
50.998%
100%
100%100%
100% 100%
100%100% 0.004% 99.999998%
PrysmianCables y Sistemas
de Mexico S. De R.L.De C.V.24
99.967%
99.996% 100%
100%
100% 100%100%
100% 99.9999975%
100%
100%
100% 75%
75%
100%
19.93%
100%100%100%
77.8%
100%
67%
100%
100%
67%
100% 100% 100%
100%
99.857%
99.000000004%
55.88510%
99.99%
0.05704%
100% 100%
99.99997%
100%
100%99.995%
99.9995%
99%
83.746%
95%
100%
100%
99.8%
100%
100%
100%
70.250172%
100%
100%
100%
100%
100%
100%
100%
100%
100%
100%
100%
99.99999%
100%
100%
100%
100%
55%
100%
100%
28%
32%
100%
100%
100%
100%
Draka DeutschlandZweite Beteiligungs
GmbH
100%
DonneDraad B.V.
100%
Draka KabelB.V.
100%
NKF VastgoedIII B.V.
1%
99%
90%100% 10% 49.9%
100%
100%
100%
60%93.75%
100%
100%
100%
100%
100%
100%
100%
100%
99%
100%100%
100%
77.836%
100%
100%
99.99999%
74.99%
100%
100%
100%
47.835%
52.165%
80%
100% 100% 100% 100% 100%
100%
100% 100%
Quoroon S.A.S.
100%
100%
100%
100%
100%
100%
100%
PrysmianNetherlandsHolding B.V.
100%
PrysmianNetherlands
B.V.
100%
100%
NK ChinaInvestments B.V.
100%
WagnerManagement-undProjektgesellshaft
mbH i.L.
Nantong HaixumDraka Elevator
Products Co. Ltd.
Nantong ZhongyaoDraka Elevator
Products Co. Ltd.
PrysmianPowerLink S.r.l.
Fibre Ottiche Sud - FOS S.r.l.
PrysmianTreasury S.r.l.
PrysmianPension Scheme
Trustee Ltd.
PrysmianCavi e Sistemi
Italia S.r.l.
Draka CableteqAsia Pacific
Holding Pte Ltd.
DrakaHolding B.V.
98.52%
Suzhou DrakaCable Co. Ltd.
Prysmian Cables(Industrial) Ltd.
PrysmianCavi e Sistemi
S.r.l.
Italy
UK - Ireland
France
Netherlands
Nordics
Germany
Spain
Danubian Area
Switzerland
Oceania
Asia Pacific
China
Russia
South America
North America
Turkey
Africa
Luxembourg
Third-party ownership
Wholly owned
1. Prysmian Cables & Systems Ltd. 50%2. Prysmian Cavi e Sistemi S.r.l. 0.52%3. Prysmian (French) Holdings S.A.S. 0.009%, Prysmian Cavi e Sistemi S.r.l. 0.009%4. Prysmian Cavi e Sistemi S.r.l. 5%5. Prysmian Cavi e Sistemi S.r.l. 0.0005%6. Prysmian Cavi e Sistemi S.r.l. 1%7. Prysmian S.p.A. 0.005%8. Prysmian S.p.A. 0.00003%9. Draka Holding B.V. 2.27%, Draka Holding B.V. 19.93%10. Draka Comteq B.V. 0.000002%11. Prysmian S.p.A. 0.999999996%12. Draka Comteq B.V. 34.84990%, Draka Holding B.V. 9.20681%, Prysmian Cavi e Sistemi S.r.l. 0.057040%, Prysmian Netherlands B.V. 0.000630%, Draka Kabel B.V. 0.000120%.13. Prysmian Energia Cabos e Sistemas do Brasil S.A. 0.01%14. Draka (Malaysia) Sdn Bhd 0.000023%, Sindutch Cable Manufacturer Sdn Bhd 0.000023%, Singapore Cables Manufacturers Pte Ltd 0.000023%15. Prysmian Netherlands B.V. 0.5%16. Draka Kabel B.V. 1.48%17. Prysmian Netherlands B.V. 1%18. Oman Cables Industry (SAOG) 40%19. Prysmian S.p.A. 6.25%20. Prysmian Netherlands B.V. 50.10%21. Yangtze Optical Fibre and Cable Joint Stock Limited Co. 5.62%22. Prysmian S.p.A. 0.143%23. Prysmian Energia Cabos e Sistemas do Brasil S.A. 22.164%24. Draka Holding B.V. 0.033%25. Marmavil S.L.U. 0.00001%
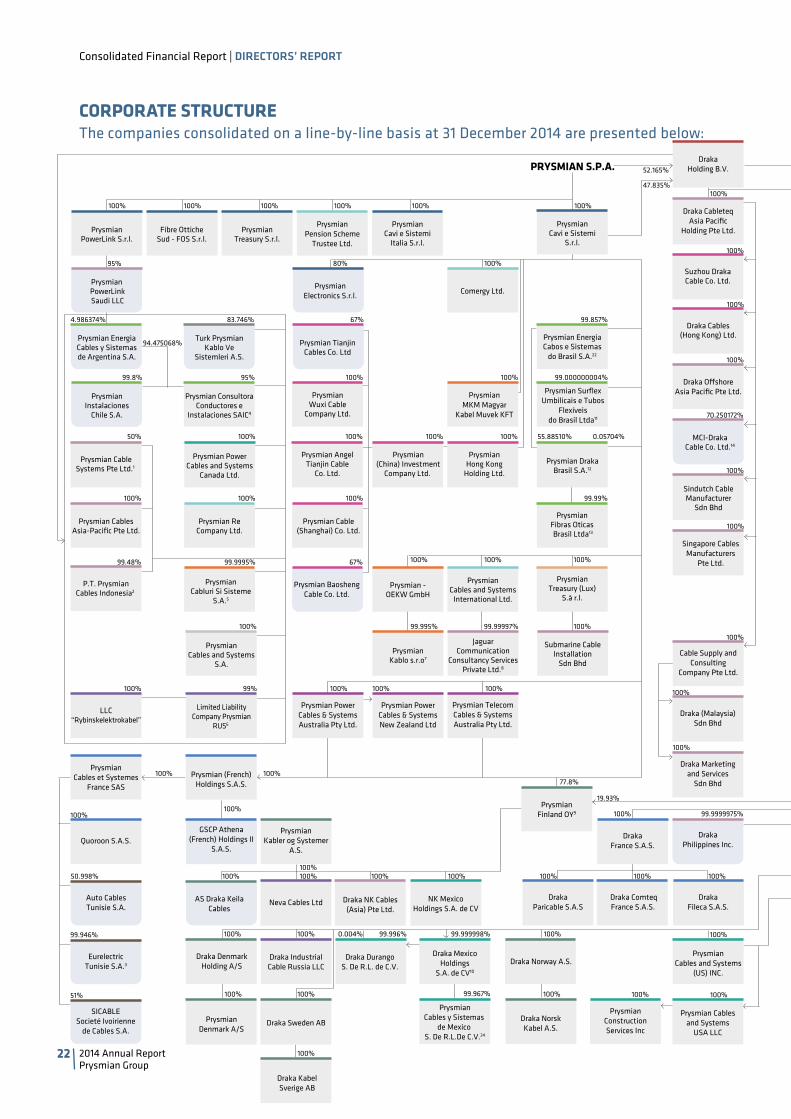
The companies consolidated on a line-by-line basis at 31 December 2014 are presented below:CORPORATE STRUCTURE

23
NK Wuhan CableCo. Ltd.21
60%
Draka ComteqGermany
VerwaltungsGmbH
Draka ComteqSlovakia s.r.o.
Draka ComteqKablo Limited
Sirketi15
99.5%
Draka ComteqCabos Brasil S.A.23
Draka Kabely s.r.o.
Prysmian CableSystems Pte Ltd.1
SICABLESocieté Ivoirienne
de Cables S.A.
Prysmian PowerLinkSaudi LLC
LLC“Rybinskelektrokabel”
PrysmianCables et Systemes
France SAS
Prysmian CablesAsia-Pacific Pte Ltd.
PrysmianKabler og Systemer
A.S.
Prysmian EnergiaCables y Sistemasde Argentina S.A.
Auto CablesTunisie S.A.
PrysmianInstalaciones
Chile S.A.
EurelectricTunisie S.A.3
P.T. PrysmianCables Indonesia2
Turk PrysmianKablo Ve
Sistemleri A.S.
Prysmian ConsultoraConductores e
Instalaciones SAIC4
Prysmian PowerCables and Systems
Canada Ltd.
Prysmian ReCompany Ltd.
PrysmianCabluri Si Sisteme
S.A.5
PrysmianCables and Systems
S.A.
Limited LiabilityCompany Prysmian
RUS6
Prysmian (French)Holdings S.A.S.
GSCP Athena(French) Holdings II
S.A.S.
AS Draka KeilaCables
Draka KabelSverige AB
Draka IndustrialCable Russia LLC
Neva Cables Ltd
Prysmian PowerCables & SystemsAustralia Pty Ltd.
Draka Sweden AB
Draka DurangoS. De R.L. de C.V.
Draka NK Cables(Asia) Pte Ltd.
Prysmian PowerCables & SystemsNew Zealand Ltd
PrysmianDenmark A/S
Draka DenmarkHolding A/S
Draka MexicoHoldings
S.A. de CV10
Draka TransportUSA, LLC
NK MexicoHoldings S.A. de CV
Prysmian TelecomCables & SystemsAustralia Pty Ltd.
Draka NorskKabel A.S.
Draka Norway A.S.
DrakaParicable S.A.S
PrysmianCables and Systems
(US) INC.
Draka CableteqUSA Inc.
PrysmianConstructionServices Inc
Prysmian Cablesand Systems
USA LLC
Draka ElevatorProducts Inc.
Draka ComteqFrance S.A.S.
PrysmianFinland OY9
DrakaFileca S.A.S.
DrakaFrance S.A.S.
PrysmianElectronics S.r.l.
Prysmian TianjinCables Co. Ltd
Prysmian AngelTianjin Cable
Co. Ltd.
Prysmian(China) Investment
Company Ltd.
PrysmianCables and Systems
International Ltd.
PrysmianHong Kong
Holding Ltd.
PrysmianTreasury (Lux)
S.à r.l.
PrysmianWuxi Cable
Company Ltd.
Prysmian Cable(Shanghai) Co. Ltd.
Prysmian -OEKW GmbH
DrakaBelgium N.V.16
PrysmianKablo s.r.o7
Prysmian BaoshengCable Co. Ltd.
PrysmianMKM Magyar
Kabel Muvek KFT
Prysmian SurflexUmbilicais e Tubos
Flexíveisdo Brasil Ltda11
Prysmian DrakaBrasil S.A.12
Prysmian Fibras Oticas Brasil Ltda13
Comergy Ltd.
Prysmian UKGroup Ltd.
Prysmian Powerlink
Services Ltd.
Prysmian TelecomCables and Systems
UK Ltd.
PrysmianMetals Ltd.
Draka DistributionAberdeen Ltd.
Draka ComteqUK Ltd.
PrysmianCables & Systems
Ltd.
Prysmian Cables(2000) Ltd.
Prysmian Cables(Supertension) Ltd.
PrysmianConstruction
Company Ltd.
Draka U.K. Ltd.
Draka UK PensionPlan Trust
Company Ltd.
Prysmian EnergiaCabos e Sistemas
do Brasil S.A.22
DrakaComteq B.V.
Prysmian Treasury (The Netherlands)
B.V.
NKF Vastgoed IB.V.17
Draka SarphatiB.V.
Draka ComteqFibre B.V.
MarmavilS.L.U.
Prysmian SpainS.A.U.
Draka Holding N.V.y CIA Soc. Col.25
Draka ComteqIberica S.L.U.
USB-elektroKabelkonfektions
Gmbh i.L.
Draka DeutschlandGmbH
Hohn GmbHDraka Cable
Wuppertal GmbH
Draka ComteqBerlin GmbH
& Co. KG20
Kaiser KabelGmbH
Draka ComteqSingapore Pte Ltd.
JaguarCommunication
Consultancy ServicesPrivate Ltd.8
Submarine CableInstallation
Sdn Bhd
Draka ComteqGermany GmbH
& Co. KG
NKF Holding(Deutschland)
GmbH
Draka DeutschlandErste Beteiligungs
GmbH
Draka ServiceGmbH
Prysmian KabelUnd Systeme
GmbH19
Draka DeutschlandVerwaltungs
GmbH
Draka KabeltechnikGmbH
Kaiser KableVetriebes GmbH i.L.
PrysmianUnterstuetzun-gseinrichtung Lynen GmbH
Draka IstanbulAsansor IthalatIhracat ÜretimTicaret Ltd. Şti.
Draka Cables(Hong Kong) Ltd.
Draka O®shoreAsia Pacific Pte Ltd.
MCI-DrakaCable Co. Ltd.14
AssociatedCables PVT Ltd.18
Draka U.K.Group Ltd.
CableMakers Propertiesand Services Ltd.
Draka ShanghaiOptical FibreCable Co. Ltd.
Sindutch CableManufacturer
Sdn Bhd
Singapore CablesManufacturers
Pte Ltd.
Cable Supply andConsulting
Company Pte Ltd.
Draka (Malaysia)Sdn Bhd
Draka Marketingand Services
Sdn Bhd
DrakaPhilippines Inc.
PRYSMIAN S.P.A.
100%
95%
4.986374%
94.475068%
50%
100%
99.48%
100%
100%
51%
99.946%
50.998%
100%
100%100%
100% 100%
100%100% 0.004% 99.999998%
PrysmianCables y Sistemas
de Mexico S. De R.L.De C.V.24
99.967%
99.996% 100%
100%
100% 100%100%
100% 99.9999975%
100%
100%
100% 75%
75%
100%
19.93%
100%100%100%
77.8%
100%
67%
100%
100%
67%
100% 100% 100%
100%
99.857%
99.000000004%
55.88510%
99.99%
0.05704%
100% 100%
99.99997%
100%
100%99.995%
99.9995%
99%
83.746%
95%
100%
100%
99.8%
100%
100%
100%
70.250172%
100%
100%
100%
100%
100%
100%
100%
100%
100%
100%
100%
99.99999%
100%
100%
100%
100%
55%
100%
100%
28%
32%
100%
100%
100%
100%
Draka DeutschlandZweite Beteiligungs
GmbH
100%
DonneDraad B.V.
100%
Draka KabelB.V.
100%
NKF VastgoedIII B.V.
1%
99%
90%100% 10% 49.9%
100%
100%
100%
60%93.75%
100%
100%
100%
100%
100%
100%
100%
100%
99%
100%100%
100%
77.836%
100%
100%
99.99999%
74.99%
100%
100%
100%
47.835%
52.165%
80%
100% 100% 100% 100% 100%
100%
100% 100%
Quoroon S.A.S.
100%
100%
100%
100%
100%
100%
100%
PrysmianNetherlandsHolding B.V.
100%
PrysmianNetherlands
B.V.
100%
100%
NK ChinaInvestments B.V.
100%
WagnerManagement-undProjektgesellshaft
mbH i.L.
Nantong HaixumDraka Elevator
Products Co. Ltd.
Nantong ZhongyaoDraka Elevator
Products Co. Ltd.
PrysmianPowerLink S.r.l.
Fibre Ottiche Sud - FOS S.r.l.
PrysmianTreasury S.r.l.
PrysmianPension Scheme
Trustee Ltd.
PrysmianCavi e Sistemi
Italia S.r.l.
Draka CableteqAsia Pacific
Holding Pte Ltd.
DrakaHolding B.V.
98.52%
Suzhou DrakaCable Co. Ltd.
Prysmian Cables(Industrial) Ltd.
PrysmianCavi e Sistemi
S.r.l.
Italy
UK - Ireland
France
Netherlands
Nordics
Germany
Spain
Danubian Area
Switzerland
Oceania
Asia Pacific
China
Russia
South America
North America
Turkey
Africa
Luxembourg
Third-party ownership
Wholly owned
1. Prysmian Cables & Systems Ltd. 50%2. Prysmian Cavi e Sistemi S.r.l. 0.52%3. Prysmian (French) Holdings S.A.S. 0.009%, Prysmian Cavi e Sistemi S.r.l. 0.009%4. Prysmian Cavi e Sistemi S.r.l. 5%5. Prysmian Cavi e Sistemi S.r.l. 0.0005%6. Prysmian Cavi e Sistemi S.r.l. 1%7. Prysmian S.p.A. 0.005%8. Prysmian S.p.A. 0.00003%9. Draka Holding B.V. 2.27%, Draka Holding B.V. 19.93%10. Draka Comteq B.V. 0.000002%11. Prysmian S.p.A. 0.999999996%12. Draka Comteq B.V. 34.84990%, Draka Holding B.V. 9.20681%, Prysmian Cavi e Sistemi S.r.l. 0.057040%, Prysmian Netherlands B.V. 0.000630%, Draka Kabel B.V. 0.000120%.13. Prysmian Energia Cabos e Sistemas do Brasil S.A. 0.01%14. Draka (Malaysia) Sdn Bhd 0.000023%, Sindutch Cable Manufacturer Sdn Bhd 0.000023%, Singapore Cables Manufacturers Pte Ltd 0.000023%15. Prysmian Netherlands B.V. 0.5%16. Draka Kabel B.V. 1.48%17. Prysmian Netherlands B.V. 1%18. Oman Cables Industry (SAOG) 40%19. Prysmian S.p.A. 6.25%20. Prysmian Netherlands B.V. 50.10%21. Yangtze Optical Fibre and Cable Joint Stock Limited Co. 5.62%22. Prysmian S.p.A. 0.143%23. Prysmian Energia Cabos e Sistemas do Brasil S.A. 22.164%24. Draka Holding B.V. 0.033%25. Marmavil S.L.U. 0.00001%

Consolidated Financial Report | DIRECTORS’ REPORT
2014 Annual Report Prysmian Group
24
Excellence. Integrity.Understanding.
Linking people, places,projects and passion.
150326_poster10_50x70.indd 6 3/31/15 10:10

25
Integrated BU Intermediate BU
GROUP FUNCTIONS
COO
BUSINESS AREAS REGIONS/COUNTRIES
R&D
M. Andrade
CORPORATE AFFAIRS
E. Bernasconi
FINANCE ADMIN & CONTROL & IT
P.F. Facchini
HR &ORGANISATION
F. Rutschmann
GROUP CORPORATE & BUSINESS
COMMUNICATION
L. Caruso
CORPORATE STRATEGY & DEV.
F. Romeo
L.Tardif
SOUTH EUROPE (1)
P. Atkinson
UK
F. Fanciulli
CENTRAL EAST EUROPE
W. Hendrikx
NETHERLANDS
R. Majenburg
NORTH EUROPE
H. Hoegstedt
ITALY
M. Del Brenna
SOUTH AMERICA
E. Aydogdu
TURKEY
H. Ozmen
NORTH AMERICA
L. Migliorini
CHINA
F. Grosse
ASEAN
F. Persson
AUSTRALIA & NEW ZEALAND
PURCHASINGMANUFACTURING
TELECOMMANUFACTURING
ENERGY
AUTOMOTIVE ELEVATORS
SUPPLY CHAINENGINEERING & INVESTMENTS QUALITY HSE
A. Pirondini
COO
MMSTELECOM SOLUTIONS
OPTICAL FIBRE
SURF SUBMARINE HV
INTERNAL AUDIT
M. Sinagra
PRYSMIAN CEO
V. Battista
H. Nieman
ENERGY PRODUCTS
OIL & GAS INDUSTRIALNETWORK COMPONENTS
L. Roberts
NEW MARKETS
M. Battaini
ENERGY PROJECTS
P. Vanhille
TELECOM
(*) The organisation chart reflects the organisational structure as from 1 January 2015.(1) France delegated for Aerospace, Spain for OPGW.
ORGANISATIONAL STRUCTURE (*)

Consolidated Financial Report | DIRECTORS’ REPORT
2014 Annual Report Prysmian Group
26
A graduate in Mechanical Engineering from Florence Univer-sity, Valerio Battista is a manager with extensive knowledge and understanding of the industrial sector after more than 20 years of experience, initially with the Pirelli Group and then with the Prysmian Group, which he has headed since 2005. He held positions of increasing responsibility within the Pirelli Group, including for the restructuring and reor-
ganisation of Pirelli Cavi, which in the period 2002-2004 was transformed into one of the most profitable and competitive companies in its industry. In 2005 he played a key part in the creation of the Prysmian Group, leading to its flotation in 2007. The Group of which he is currently CEO is world leader in the energy and telecom cables industry, with approximately 19,000 employees and 89 plants around the world.
Fabio Romeo has been Chief Strategy Officer since January 2014. After graduating in Electronic Engineering from Milan's Polytechnic University in 1979, he then obtained an M.S. and a Ph.D. in Electrical Engineering and Computer Sciences from the University of California, Berkeley. He began his career with Tema (ENI Group) as Product Manager for its chemical plants and in 1982 he moved to Honeywell as a technical advisor to the Group's CEO. In 1989 he joined Magneti Marelli as Innovation Manager of the Electronics division, later becoming Director of the Electronics Systems division. In 2001 he moved to the Pirelli Group, where he held the positions of Director in charge of the Truck business unit and Director in charge of the Pirelli Cable division's Utilities business. From 2005, he held the position of Director of Prysmian’s Energy Cables division, becoming the Group's Executive Vice President of the Energy Business in 2011.
TOP MANAGERS
FABIOROMEOChief Strategy Officer
PIERFRANCESCOFACCHINIChief Strategy Officer
Pier Francesco Facchini became CFO of the Prysmian Group in January 2007. He graduated in Business Economics in 1991 from the "Luigi Bocconi" University in Milan. His first professional experience was with Nestlè Italia, where he held different positions in the Accounting and Finance department between 1991 and 1995. From 1995 to 2001, he worked for the Panalpina Group where he held the position of Regional Financial Controller for the Asia-Pacific region. During his career with the Panalpina Group he was also appointed CFO of Panalpina Korea (Seoul) and Panalpina Italia Trasporti Internazionali S.p.A.. In April 2001 he was appointed Finance Director of Fiat Auto's Consumer Services business unit, leaving in 2003 to become CFO of the Benetton Group, a post he held until November 2006.
VALERIO BATTISTAChief Executive Officer
27
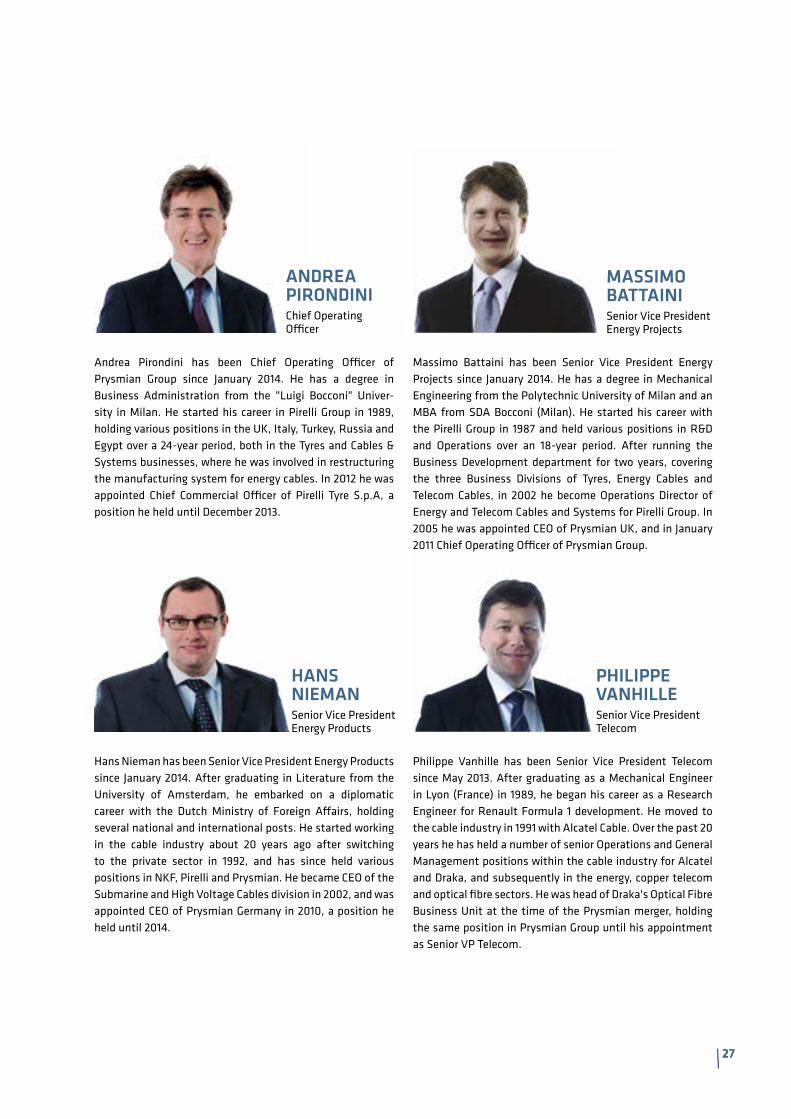
Andrea Pirondini has been Chief Operating Officer of Prysmian Group since January 2014. He has a degree in Business Administration from the "Luigi Bocconi" Univer-sity in Milan. He started his career in Pirelli Group in 1989, holding various positions in the UK, Italy, Turkey, Russia and Egypt over a 24-year period, both in the Tyres and Cables & Systems businesses, where he was involved in restructuring the manufacturing system for energy cables. In 2012 he was appointed Chief Commercial Officer of Pirelli Tyre S.p.A, a position he held until December 2013.
Hans Nieman has been Senior Vice President Energy Products since January 2014. After graduating in Literature from the University of Amsterdam, he embarked on a diplomatic career with the Dutch Ministry of Foreign Affairs, holding several national and international posts. He started working in the cable industry about 20 years ago after switching to the private sector in 1992, and has since held various positions in NKF, Pirelli and Prysmian. He became CEO of the Submarine and High Voltage Cables division in 2002, and was appointed CEO of Prysmian Germany in 2010, a position he held until 2014.
Massimo Battaini has been Senior Vice President Energy Projects since January 2014. He has a degree in Mechanical Engineering from the Polytechnic University of Milan and an MBA from SDA Bocconi (Milan). He started his career with the Pirelli Group in 1987 and held various positions in R&D and Operations over an 18-year period. After running the Business Development department for two years, covering the three Business Divisions of Tyres, Energy Cables and Telecom Cables, in 2002 he become Operations Director of Energy and Telecom Cables and Systems for Pirelli Group. In 2005 he was appointed CEO of Prysmian UK, and in January 2011 Chief Operating Officer of Prysmian Group.
Philippe Vanhille has been Senior Vice President Telecom since May 2013. After graduating as a Mechanical Engineer in Lyon (France) in 1989, he began his career as a Research Engineer for Renault Formula 1 development. He moved to the cable industry in 1991 with Alcatel Cable. Over the past 20 years he has held a number of senior Operations and General Management positions within the cable industry for Alcatel and Draka, and subsequently in the energy, copper telecom and optical fibre sectors. He was head of Draka's Optical Fibre Business Unit at the time of the Prysmian merger, holding the same position in Prysmian Group until his appointment as Senior VP Telecom.
PHILIPPEVANHILLESenior Vice President Telecom
MASSIMO BATTAINISenior Vice President Energy Projects
HANS NIEMANSenior Vice President Energy Products
ANDREA PIRONDINIChief Operating Officer
Consolidated Financial Report | DIRECTORS’ REPORT
2014 Annual Report Prysmian Group
28
Consolidated Financial Report | DIRECTORS’ REPORT
PRYSMIAN AND THE FINANCIAL MARKETS
OWNERSHIP STRUCTURE
The listing of Prysmian's ordinary shares, resulting from the sale of 46% of the shares held by the Goldman Sachs Group Inc., took place on 3 May 2007 at a price of Euro 15.0 per share, corresponding to a capitalisation of Euro 2.7 billion. Subsequent to the listing, the Goldman Sachs Group Inc. gradually reduced its interest in the company, control of which it had acquired in July 2005, by placing the remaining 54% of the shares with institutional and selected investors in several successive stages: i) approx. 22% in November 2007, ii) approx. 14% in November 2009, iii) approx. 17% in March 2010. Valerio Battista, Prysmian's Chief Executive Officer, announced on occasion of the last sale that he had purchased 1,500,000 shares, corresponding to around 0.8% of share capital and taking his total shareholding to 1.2%,
which he raised to approximately 1.5% during the course of subsequent years.At 31 December 2014, the Company's free float was equal to 100% of the outstanding shares and major shareholdings (in excess of 2%) accounted for approximately 28% of total share capital, meaning there were no majority or controlling interests. Prysmian is now one of Italy’s few globally present industrial companies to have achieved Public Company status in recent years.At 31 December 2014, the share capital of Prysmian S.p.A. amounted to Euro 21,671,397.70, comprising 216,712,397 ordinary shares with a nominal value of Euro 0.10 each. The ownership structure at this date is shown below.
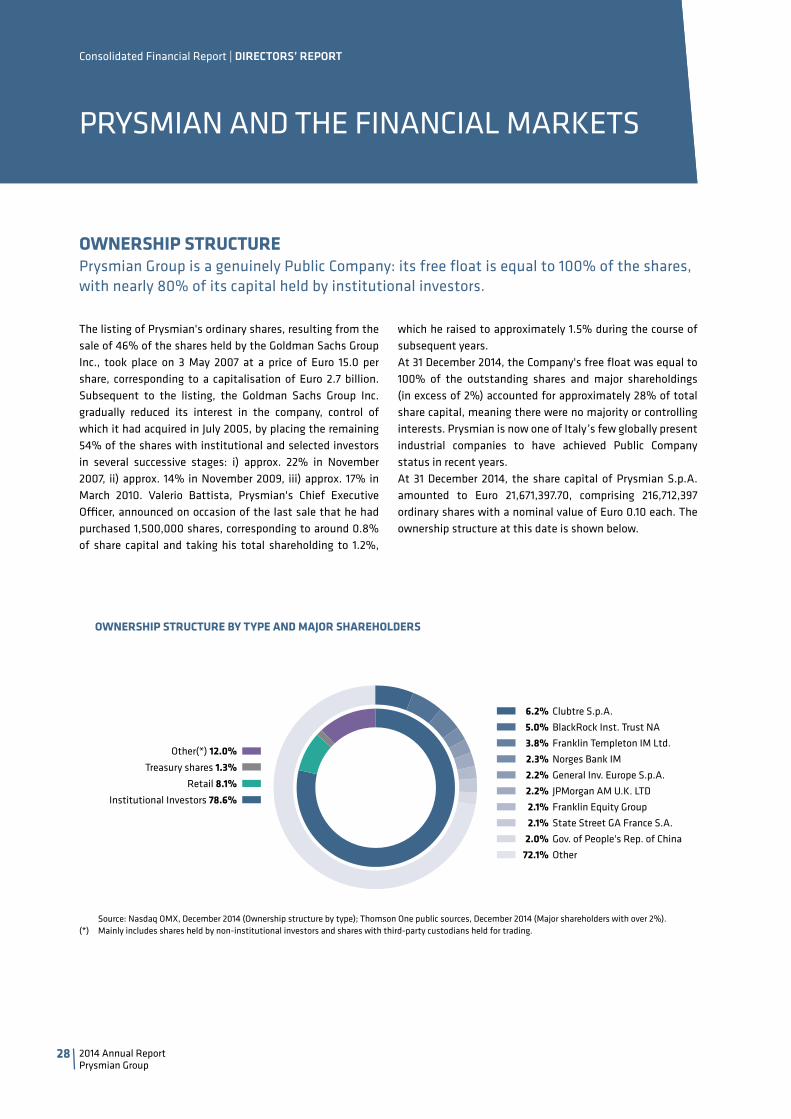
Institutional Investors 78.6%Retail 8.1%
Treasury shares 1.3%Other(*) 12.0%
6.2% Clubtre S.p.A. 5.0% BlackRock Inst. Trust NA 3.8% Franklin Templeton IM Ltd. 2.3% Norges Bank IM 2.2% General Inv. Europe S.p.A. 2.2% JPMorgan AM U.K. LTD 2.1% Franklin Equity Group 2.1% State Street GA France S.A. 2.0% Gov. of People's Rep. of China 72.1% Other
OWNERSHIP STRUCTURE BY TYPE AND MAJOR SHAREHOLDERS
Source: Nasdaq OMX, December 2014 (Ownership structure by type); Thomson One public sources, December 2014 (Major shareholders with over 2%).(*) Mainly includes shares held by non-institutional investors and shares with third-party custodians held for trading.
Prysmian Group is a genuinely Public Company: its free float is equal to 100% of the shares, with nearly 80% of its capital held by institutional investors.

29
US 27%UK 18%
Italy 16%France 11%Ireland 5%
Norway 4%
Netherlands 4%Germany 3%
Rest of Europe 6%Hong Kong / China 3%
Rest of the world 3%
INSTITUTIONAL INVESTORS BY GEOGRAPHICAL AREA
INSTITUTIONAL INVESTORS BY INVESTMENT APPROACH
Growth 29%GARP 21%
Index 11%Private Equity 8%
Value 21%
Hedge Fund 2%Other 8%
The ownership structure by geographical area confirms the predominant presence of US and British investors, who at the end of 2014 accounted for around 45% of the capital held by institutional investors. They were followed by Italian institutional investors with 16% and by the French with 11%, both higher than the previous year. The proportion of Asian investors was stable. Approximately 71% of the share capital held by institutional
investors is represented by investment funds with Value, Growth or GARP strategies, therefore focused on a medium to long-term investment horizon. The proportion of investors adopting an Index investment strategy, based on the principal stock indexes, was stable compared with the prior year as was the share of Private Equity fund investors, represented by a single Italian fund with a long-term investment horizon and one of the Company's shareholders for several years.
Source: Nasdaq OMX

Consolidated Financial Report | DIRECTORS’ REPORT
2014 Annual Report Prysmian Group
30
ANNUAL GENERAL MEETING
The Annual General Meeting of shareholders of Prysmian S.p.A. was held on 16 April 2014 in single call to vote on several agenda items, including the approval of the 2013 financial statements, the appointment of a Director, the authorisation of a share buy-back and disposal programme, the approval of an incentive plan for Group employees, the authorisation of a bonus capital increase serving the incentive plan and the approval of the Remuneration Report. The meeting, which was attended by over one thousand two hundred shareholders, in person or by proxy, representing more than 59% of the share capital (the highest attendance
since Prysmian's listing), approved all items on the agenda by a large majority (more than 95%). In particular, the motions regarding the Group employee incentive plan and the bonus capital increase were adopted with a more than 97% vote in favour, thus confirming the shareholders' full support for these decisions taken by the Board of Directors.The Annual General Meeting also approved the distribution of a dividend of Euro 0.42 per share, in line with the amount distributed the previous year. The dividend was paid on 25 April 2014, involving a total pay-out of approximately Euro 89 million.
Record attendance at the Annual General Meeting: more than 59% of share capital represented.

31
ANNUAL GENERAL MEETING: SHARE CAPITAL
2008 2009 2010 2011 Jan 2011 Apr 2012 2013 2014
Public Company (no controlling shareholders)
Capital rappresented at the Annual General Meeting
Attendance by main shareholder at the Annual General Meeting
70%
60%
50%
40%
30%
20%
10%
0
ANNUAL GENERAL MEETING: NUMBER OF ATTENDEES IN PERSON OR BY PROXY
2008 2009 2010 2011 Jan 2011 Apr 2012 2013 2014
Public Company (no controlling shareholders)
Number of shareholders attending the Annual General Meeting
1,400
1,200
1,000
800
600
400
200
0
FINANCIAL CALENDAR 2015
25 February 2015 Group Annual Report and draft Annual Report of Prysmian S.p.A. at 31 December 2014
16 April 2015 Annual General Meeting to approve Annual Report at 31 December 2014
7 May 2015 First-Quarter Report at 31 March 2015
30 July 2015 Half-Year Report at 30 June 2015
5 November 2015 Third-Quarter Report at 30 September 2015
Consolidated Financial Report | DIRECTORS’ REPORT
2014 Annual Report Prysmian Group
32
FINANCIAL MARKET PERFORMANCE
Prysmian S.p.A. has been listed on the Italian Stock Exchange since 3 May 2007 and has been included since September 2007 in the FTSE MIB index, comprising the top 40 Italian companies by capitalisation and stock liquidity. The Prysmian stock has since entered the principal world and sector indexes, including the Morgan Stanley Capital International index and the Dow Jones Stoxx 600, made up of the world’s largest companies by capitalisation, and the FTSE ECPI Italia SRI Leaders, composed of a select basket of stocks of Italian companies that demonstrate excellent Environmental, Social and Governance (ESG) practice.World economic growth in 2014 was rather limited, like in the previous two years, reflecting persistent weakness in the Eurozone and further slowdown by emerging market economies, partly offset by a solid recovery in both the United States and United Kingdom. In particular, the weakening of emerging market economies was mainly due to the geopo-litical problems in Russia, as well as the sharp slowdown by the Brazilian economy, faced with high inflation, collapse of the local currency and declining investment. In the United States, the combination of important monetary and fiscal expansionary policies resulted in an acceleration of growth during the year, with a steady fall in unemployment to the lowest levels since 2009, increased consumer confidence and consumer spending, and new record highs for US equity markets. In Europe, economic recovery gradually lost momentum after the first quarter of the year, exacerbated by the extreme rigidity of the deficit-cutting measures in several Eurozone countries and by the limited impact of intervention by the European Central Bank, as well as by renewed uncertainty over the political and financial situation in Greece. Despite the partial improvement in competi-tiveness and gradual recovery in exports, also thanks to a weaker Euro against the Dollar, Europe continued to display significant structural weakness in many countries, especially with regard to the lack of recovery in domestic demand and continued high unemployment in countries like Spain, Greece, Portugal and Italy.The main world equity markets generally reflected the un-certainties arising from wide disparities in global economic performance, in turn also impacted by rising geopolitical tensions in different parts of the world (Middle East, Rus-sia-Ukraine, Hong Kong), and related consequences for oil prices, which halved from over USD 110 a barrel in June to USD 57 in late December. In fact, while US indexes performed well, with rises of between 8% (Dow Jones, to new record highs) and 13% (Nasdaq), European exchanges presented a
mixed performance: weakly positive in Germany (+3%) and Spain (+4%), stable in Italy and negative in France (-1%) and Britain (-3%). Asian and emerging market indexes also had a mixed performance: sharp rebound in China (+64%) after a negative 2013, strong progress in India (+37%), positive in Japan (+7%) and Hong Kong (+1%), negative in Brazil (-3%) and Korea (-5%).In this context, the Prysmian stock lost approximately 19% of its value over the course of the year, going from Euro 18.71 at the end of 2013 to Euro 15.15 at the end of 2014. The stock's negative performance was almost entirely due to the technical problems encountered in executing the Western HVDC Link contract which, as explained later, had a negative impact on the share price of almost Euro 3, equating to more than Euro 600 million in capitalisation. Despite this extraor-dinary event, the Prysmian stock nonetheless continued to outperform its main cable industry competitors, who were faced with stagnant demand and major restructuring processes. The stock's performance, including dividend pay-outs (total shareholder return), was -17% over the course of 2014 and +17% since its listing date. Among Prysmian's benchmark indexes, the Euro Stoxx Industrial posted a fall of 2% over the year, confirming the general weakness of the capital goods market in Europe, and of 11% since Prysmian's listing date, while the FTSE MIB was stable in 2014 but down -57% since the Company's IPO, thus confirming the stock's good performance over the medium to long term.In particular, the first four months of 2014 saw a general stable Prysmian share price, in the wake of a solid set of results for 2013 and in line with analyst expectations, moving in a range between Euro 17.50 and Euro 19.50, that also reflected trends in the sector indexes and the major European markets. At the time of publishing the first-quarter results in early May, Prysmian announced that in the previous few days it had encountered some technical problems in the manufacture of submarine cables for the Western HVDC Link project in the United Kingdom. The stock was initially affected by the uncertainty prevailing until the company had all the facts to estimate the impact of this technical problem more accurately and so fell by 14% in the three days following publication of the results to a price of Euro 15.70 per share. Subsequently, from June to mid-October, the major international markets headed slowly downwards, affected by continuing geopolitical tensions and slower growth by emerging market countries. Recovery in the Eurozone also lost momentum, abetted by fears linked to the political and financial situation in Greece. The
The macro environment in 2014 was marked by a gradual strengthening of the US economy but continued overall weakness in Europe, despite tentative signs of recovery, especially in the first part of the year.

33
Prysmian stock was affected by this downward trend, as well as by profit warnings by its main competitors, reaching a low for the year of Euro 12.80 in mid-October. Conditions on international financial markets and in the Eurozone slowly improved in the last two months of 2014, thanks to growing expectations of an imminent quantitative easing in Europe by the ECB and to GDP growth in the United States, back to +5% in the third quarter, a rate not seen since 2003. In this context, the stock entered a bullish phase, supported
by publication of the Group's nine-month results for 2014, confirmation of the full-year guidance and the ability to manage the Western Link problem, as well as by a gradual improvement in the recommendations of financial analysts, 67% of whom expressed Positive recommendations (the remaining 33% maintained a Neutral rating and no one gave a Negative rating). The Prysmian stock therefore closed 2014 at a price of Euro 15.15, down 19% from Euro 18.71 at the end of 2013, but nonetheless higher than its original IPO price.
May-07 Nov-07 May-08 Nov-08 May-09 Nov-09 May-10 Nov-10 May-11 Nov-11 May-12 Nov-12 May-13 Nov-13 May-14 Nov-14
Volume - Mln sharesPrice - Euro24
21
18
15
12
9
6
3
6.0
7.0
5.0
4.0
3.0
2.0
1.0
0
Volumes
Prysmian
PERFORMANCE OF PRYSMIAN STOCK SINCE IPO
140
120
100
80
60
40
20
0
Prysmian
FTSE MIB
EURO STOXX Industrials
PERFORMANCE OF PRYSMIAN STOCK VERSUS BENCHMARKS SINCE IPO
May-07 Nov-07 May-08 Nov-08 May-09 Nov-09 May-10 Nov-10 May-11 Nov-11 May-12 Nov-12 May-13 Nov-13 May-14 Nov-14

Consolidated Financial Report | DIRECTORS’ REPORT
2014 Annual Report Prysmian Group
34
(*) Period of reference: 3 May (stock listing date) – 31 December 2007 Source: data processing Nasdaq OMX.
PRYSMIAN STOCK: PRINCIPAL DATA
2014 2013 2012 2011 2010 2009 2008 2007 (*)
Price at 31 December 15.15 € 18.71 € 15.01 € 9.60 € 12.75 € 12.19 € 11.10 € 16.89 €
Change over period -19.0% 24.7% 56.4% -24.7% 4.6% 9.8% -34.3% 12.6%
Average price 16.38 € 16.68 € 13.00 € 12.90 € 13.13 € 10.60 € 13.76 € 18.36 €
Maximum price 19.54 € 19.30 € 15.43 € 15.95 € 15.81 € 13.84 € 18.54 € 21.00 €
Minimum price 12.78 € 14.03 € 9.77 € 9.25 € 11.27 € 6.10 € 6.21 € 15.34 €
Market capitalisation at period end 3,283 Mil € 4,015 Mil € 3,220 Mil € 2,057 Mil € 2,321 Mil € 2,209 Mil € 2,004 Mil € 3,004 Mil €
Average capitalisation 3,512 Mil € 3,578 Mil € 2,787 Mil € 2,701 Mil € 2,388 Mil € 1,918 Mil € 2,482 Mil € 3,305 Mil €
Average daily trading volume 1.4 Mil 1.2 Mil 1.5 Mil 2.2 Mil 2.3 Mil 1.9 Mil 1.3 Mil 1.0 Mil
Average daily turnover 23 Mil € 20 Mil € 20 Mil € 28 Mil € 30 Mil € 19 Mil € 18 Mil € 17 Mil €
Number of shares at 31 December 216,712,397 214,591,710 214,508,781 214,393,481 182,029,302 181,235,039 180,546,227 180,000,000
(in millions of Euro)
During 2014, the stock's liquidity held steady at average daily trading volumes of approximately 1.4 million shares, with an average daily turnover of Euro 23 million, well up on the previous year.

35
INVESTOR RELATIONS
Creating value for shareholders, and other stakeholders, is a key priority for Prysmian, whose policy of strategic and financial communication is directed towards the highest standards of accuracy, clarity and transparency. The Group's actions and procedures are designed to provide the market with credible information, with the goal of boosting market confidence in the company by seeking to encourage a long-term investment approach, avoiding unequal access to information and ensuring effective compliance with the principle that all existing and potential investors have the right to receive the same information so as to make informed investment decisions.On occasion of the publication of its quarterly results, the Group organises conference calls with institutional investors and financial analysts and also invites industry press represen-tatives to take part. In addition, the Group promptly informs existing and potential shareholders of any action or decision that could have a material impact on their investment.There was intense contact with the financial market during 2014, particularly after the technical problems emerging with the Western HVDC Link project, with more than 400 encounters involving conference calls and one-to-one or group meetings at the Company's offices. The Company also undertook numerous road shows in the major financial centres of Europe and North America, and took part in conferences organised by major international brokers. In addition, the increasing attention paid to the Group's activities by socially
responsible investors (SRI) was confirmed by their growing number at SRI dedicated meetings and road shows. Lastly, the Group organised several visits during the year for institutional investors and financial analysts to see its production facilities and R&D centres in Europe, the United States and Asia, in order to give them more detailed knowledge of its products and production processes.Coverage of the Prysmian stock remained very high and geo-graphically diversified. There are 23 independent analysts who regularly cover the Prysmian stock: Banca Akros, Banca Aletti, Banca IMI, Banca Profilo, Barclays Capital, Berenberg, BofA Merrill Lynch, Citi, Credit Suisse, Equita, Espirito Santo, Exane BNP Paribas, Fidentiis, Goldman Sachs, Hammer Partners, HSBC, Intermonte, JP Morgan, Kepler Cheuvreux, Mediobanca, Morgan Stanley, Natixis and UBS. The Investor Relations office has also maintained regular contacts with institutional investors through the website www.prysmiangroup.com, with its updated graphics and content, which contains recordings of conference calls and pre-sentations to the financial community, corporate documents, press releases and all other information concerning the Group, in Italian and English. The Investor Relations section also includes the financial calendar, documents relating to share-holders' meetings, the Code of Ethics, the contact details of analysts who cover the stock as well as specific sections about Corporate Governance, Risk Factors and Share Performance.
Investor Relations contact details:
Maria Cristina Bifulco - IR Director+39 02 6449 [email protected]
Investor Relations Office+39 02 6449 1 [email protected]
Transparency in communication, growth in market confidence in the company and promotion of a long-term investment approach to its stock.

Consolidated Financial Report | DIRECTORS’ REPORT
2014 Annual Report Prysmian Group
36
Italian Prime Minister Matteo Renzi visiting the Dee Why plant, Australia, on the occasion of the 2014 G20 summit.
37
Consolidated Financial Report | DIRECTORS’ REPORT
SIGNIFICANT EVENTS DURING THE YEAR
NEW INDUSTRIAL PROJECTS AND INITIATIVES
During 2014, the Prysmian Group entered into numerous contracts, many of which in the Energy Projects operating segment.
In the submarine interconnections business, the Group concluded agreements for the construction of cable systems for major new projects in different parts of the world. In April, Prysmian was awarded a contract worth approximately Euro 30 million by Emirates Holding, a UAE-based construction company for the supply of around 200 km of medium voltage submarine cable to replace power lines supplying the Zakum offshore oil field in Abu Dhabi.In the same month, a contract was signed worth approxi-mately Euro 40 million with ESB (Ireland) for the "Shannon River Crossing" project to install a power line between Kilpaddoge and Moneypoint on opposite banks of the River Shannon. The project involves the supply and installation of high voltage double-circuit cable, comprising 21 km of submarine cable complete with integrated optical fibre system. Early in August, the Group announced it had won a new contract worth approximately Euro 95 million from IPTO (In-dependent Power Transmission Operator), the transmission system operator of the Greek electricity grid, for the inter-connection between Syros, one of the Cyclades islands, and the mainland Greek power transmission system at Lavrion. The project involves supplying a "turnkey" high voltage cable system for an overall distance of more than 110 km, allowing the island of Syros to be connected to Greece's national grid and paving the way for future extension to the other Cyclades islands (Paros, Mykonos, Tinos). Another contract, worth approximately Euro 64 million, was awarded in December by TEIAS, a Turkish power transmis-sion utility, for the construction of a second high voltage submarine power line between Europe and Asia across the Dardanelles strait in Turkey. This second link across the Dar-danelles will complement the interconnector that Prysmian Group is currently laying along the same route, under the first contract awarded by TEIAS in September 2012, and will play a strategic role in completing Turkey's power transmission grid. The project will ensure a reliable and cost-competi-
tive power flow from generation sites in Asia to the major consumption centres in European territory, including the congested Istanbul area, by completing the electricity ring around the Sea of Marmara.Lastly, just before Christmas the Group announced another contract in the high-potential, strategic Asia Pacific market, with the award by NGCP (National Grid Corporation of the Philippines) of a project worth around Euro 90 million for a submarine power line between the islands of Negros and Panay. This interconnection is the first stage of a larger development programme by NGCP intended to connect the islands of Cebu, Negros and Panay to each other and to strengthen the country's power transmission network.
During the year the Group also won new orders in the business of submarine connections for offshore wind farms. In April, Prysmian was awarded a contract worth more than Euro 250 million by TenneT, the Dutch-German grid operator, for the connection of offshore wind farms in the North Sea to the German mainland. The project, known as BorWin3, involves the construction of a high voltage direct current (HVDC) cable along a route running 29 km onshore and 130 km underwater. The system, which will connect Emden Ost in Lower Saxony to BorWin Gamma, the offshore converter platform in the "BorWin" cluster, about 120 km north of the German coast, will be installed in natural areas of great environmental im-portance, both onshore and at sea, including along the Ems estuary. This is the second DC interconnection commissioned by TenneT along this same route (which runs in parallel with that of the DolWin3 project awarded to the Group the year before).In May, 50Hertz Offshore GmbH, a grid operator in Germany, awarded Prysmian a contract worth up to some Euro 730 million (including options for grid connections for approxi-mately Euro 250 million). The project involves the construc-tion of high voltage submarine cables to connect the West of Adlergrund offshore wind farm cluster in the German Baltic Sea to electricity grids on the German mainland. The cable, running along a route of about 90 km, will connect wind farms some 40 km north-east of Rügen Island with north-east Germany. Marine installation will be performed
Numerous contracts in the Energy Projects segment, both for submarine and onshore connections. Intense activity not only commercially but also on the technological innovation front.
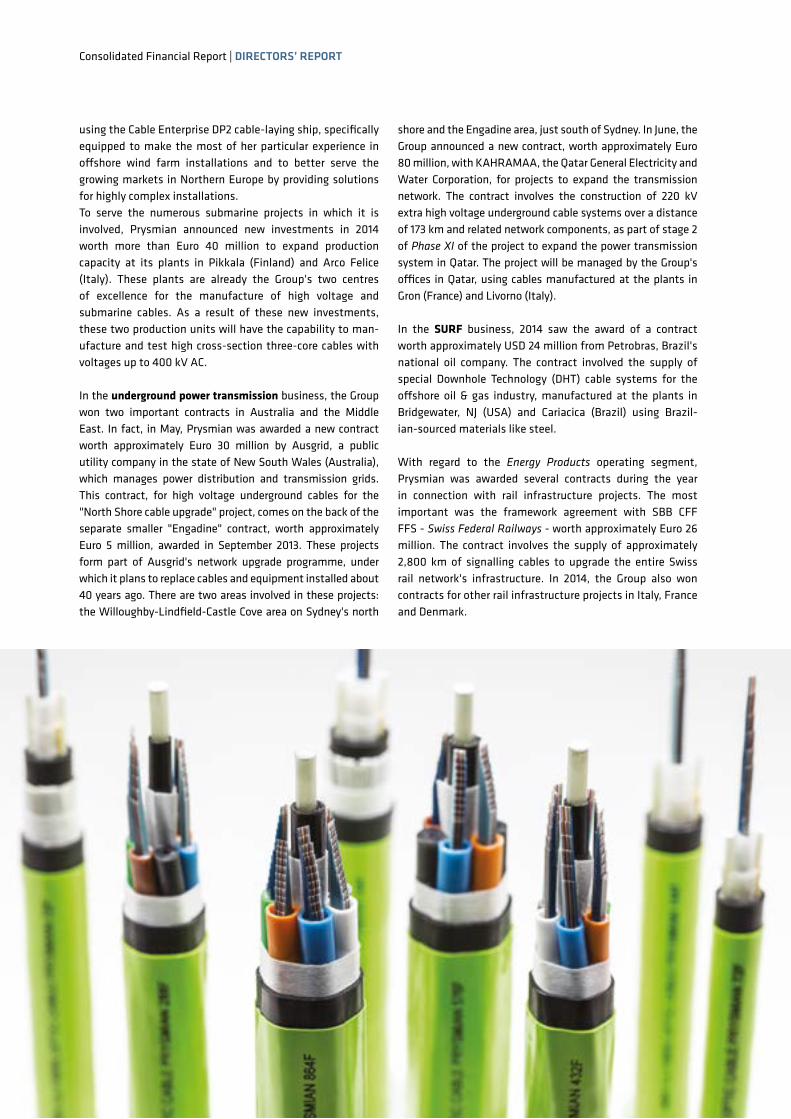
Consolidated Financial Report | DIRECTORS’ REPORT
2014 Annual Report Prysmian Group
38
using the Cable Enterprise DP2 cable-laying ship, specifically equipped to make the most of her particular experience in offshore wind farm installations and to better serve the growing markets in Northern Europe by providing solutions for highly complex installations. To serve the numerous submarine projects in which it is involved, Prysmian announced new investments in 2014 worth more than Euro 40 million to expand production capacity at its plants in Pikkala (Finland) and Arco Felice (Italy). These plants are already the Group's two centres of excellence for the manufacture of high voltage and submarine cables. As a result of these new investments, these two production units will have the capability to man-ufacture and test high cross-section three-core cables with voltages up to 400 kV AC.
In the underground power transmission business, the Group won two important contracts in Australia and the Middle East. In fact, in May, Prysmian was awarded a new contract worth approximately Euro 30 million by Ausgrid, a public utility company in the state of New South Wales (Australia), which manages power distribution and transmission grids. This contract, for high voltage underground cables for the "North Shore cable upgrade" project, comes on the back of the separate smaller "Engadine" contract, worth approximately Euro 5 million, awarded in September 2013. These projects form part of Ausgrid's network upgrade programme, under which it plans to replace cables and equipment installed about 40 years ago. There are two areas involved in these projects: the Willoughby-Lindfield-Castle Cove area on Sydney's north
shore and the Engadine area, just south of Sydney. In June, the Group announced a new contract, worth approximately Euro 80 million, with KAHRAMAA, the Qatar General Electricity and Water Corporation, for projects to expand the transmission network. The contract involves the construction of 220 kV extra high voltage underground cable systems over a distance of 173 km and related network components, as part of stage 2 of Phase XI of the project to expand the power transmission system in Qatar. The project will be managed by the Group's offices in Qatar, using cables manufactured at the plants in Gron (France) and Livorno (Italy).
In the SURF business, 2014 saw the award of a contract worth approximately USD 24 million from Petrobras, Brazil's national oil company. The contract involved the supply of special Downhole Technology (DHT) cable systems for the offshore oil & gas industry, manufactured at the plants in Bridgewater, NJ (USA) and Cariacica (Brazil) using Brazil-ian-sourced materials like steel.
With regard to the Energy Products operating segment, Prysmian was awarded several contracts during the year in connection with rail infrastructure projects. The most important was the framework agreement with SBB CFF FFS - Swiss Federal Railways - worth approximately Euro 26 million. The contract involves the supply of approximately 2,800 km of signalling cables to upgrade the entire Swiss rail network's infrastructure. In 2014, the Group also won contracts for other rail infrastructure projects in Italy, France and Denmark.
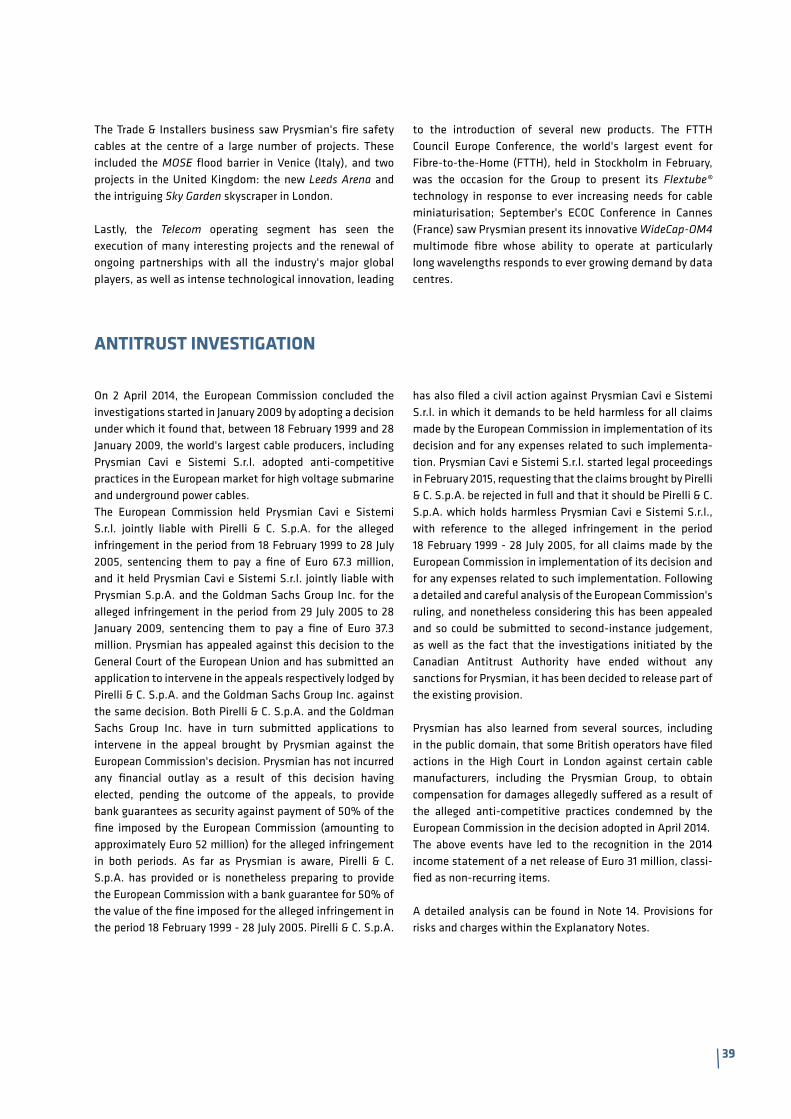
39
ANTITRUST INVESTIGATION
On 2 April 2014, the European Commission concluded the investigations started in January 2009 by adopting a decision under which it found that, between 18 February 1999 and 28 January 2009, the world's largest cable producers, including Prysmian Cavi e Sistemi S.r.l. adopted anti-competitive practices in the European market for high voltage submarine and underground power cables.The European Commission held Prysmian Cavi e Sistemi S.r.l. jointly liable with Pirelli & C. S.p.A. for the alleged infringement in the period from 18 February 1999 to 28 July 2005, sentencing them to pay a fine of Euro 67.3 million, and it held Prysmian Cavi e Sistemi S.r.l. jointly liable with Prysmian S.p.A. and the Goldman Sachs Group Inc. for the alleged infringement in the period from 29 July 2005 to 28 January 2009, sentencing them to pay a fine of Euro 37.3 million. Prysmian has appealed against this decision to the General Court of the European Union and has submitted an application to intervene in the appeals respectively lodged by Pirelli & C. S.p.A. and the Goldman Sachs Group Inc. against the same decision. Both Pirelli & C. S.p.A. and the Goldman Sachs Group Inc. have in turn submitted applications to intervene in the appeal brought by Prysmian against the European Commission's decision. Prysmian has not incurred any financial outlay as a result of this decision having elected, pending the outcome of the appeals, to provide bank guarantees as security against payment of 50% of the fine imposed by the European Commission (amounting to approximately Euro 52 million) for the alleged infringement in both periods. As far as Prysmian is aware, Pirelli & C. S.p.A. has provided or is nonetheless preparing to provide the European Commission with a bank guarantee for 50% of the value of the fine imposed for the alleged infringement in the period 18 February 1999 - 28 July 2005. Pirelli & C. S.p.A.
has also filed a civil action against Prysmian Cavi e Sistemi S.r.l. in which it demands to be held harmless for all claims made by the European Commission in implementation of its decision and for any expenses related to such implementa-tion. Prysmian Cavi e Sistemi S.r.l. started legal proceedings in February 2015, requesting that the claims brought by Pirelli & C. S.p.A. be rejected in full and that it should be Pirelli & C. S.p.A. which holds harmless Prysmian Cavi e Sistemi S.r.l., with reference to the alleged infringement in the period 18 February 1999 - 28 July 2005, for all claims made by the European Commission in implementation of its decision and for any expenses related to such implementation. Following a detailed and careful analysis of the European Commission's ruling, and nonetheless considering this has been appealed and so could be submitted to second-instance judgement, as well as the fact that the investigations initiated by the Canadian Antitrust Authority have ended without any sanctions for Prysmian, it has been decided to release part of the existing provision.
Prysmian has also learned from several sources, including in the public domain, that some British operators have filed actions in the High Court in London against certain cable manufacturers, including the Prysmian Group, to obtain compensation for damages allegedly suffered as a result of the alleged anti-competitive practices condemned by the European Commission in the decision adopted in April 2014.The above events have led to the recognition in the 2014 income statement of a net release of Euro 31 million, classi-fied as non-recurring items.
A detailed analysis can be found in Note 14. Provisions for risks and charges within the Explanatory Notes.
The Trade & Installers business saw Prysmian's fire safety cables at the centre of a large number of projects. These included the MOSE flood barrier in Venice (Italy), and two projects in the United Kingdom: the new Leeds Arena and the intriguing Sky Garden skyscraper in London.
Lastly, the Telecom operating segment has seen the execution of many interesting projects and the renewal of ongoing partnerships with all the industry's major global players, as well as intense technological innovation, leading
to the introduction of several new products. The FTTH Council Europe Conference, the world's largest event for Fibre-to-the-Home (FTTH), held in Stockholm in February, was the occasion for the Group to present its Flextube® technology in response to ever increasing needs for cable miniaturisation; September's ECOC Conference in Cannes (France) saw Prysmian present its innovative WideCap-OM4 multimode fibre whose ability to operate at particularly long wavelengths responds to ever growing demand by data centres.

Consolidated Financial Report | DIRECTORS’ REPORT
2014 Annual Report Prysmian Group
40
FINANCE AND M&A ACTIVITIES
On 18 December 2013, Prysmian S.p.A. entered into a loan agreement with the European Investment Bank (EIB) for Euro 100 million, to fund the Group's European Research & Development (R&D) programmes over the period 2013-2016. The EIB Loan is particularly intended to support projects developed in the Group's R&D centres in six countries (France, Great Britain, the Netherlands, Spain, Germany and Italy) and represents about 50% of the Prysmian Group's planned in-vestment expenditure in Europe during the period concerned.The EIB Loan was received on 5 February 2014; it will be repaid in 12 equal half-yearly instalments starting on 5 August 2015 and ending on 5 February 2021.
On 19 February 2014, Prysmian S.p.A. signed a credit agreement for Euro 100 million (the "Revolving Credit Facility 2014") with Mediobanca - Banca di Credito Finanziario S.p.A.. Under this five-year agreement, Mediobanca has provided the Group with a line of credit intended to refinance existing debt and working capital requirements.
On 28 February 2014, the Prysmian Group prepaid the out-standing balance owed under the Term Loan Facility 2010, amounting to Euro 184 million that had been due on 31 December 2014.
On 27 June 2014, Prysmian S.p.A. signed an agreement (the "Credit Agreement 2014") under which a syndicate of premier banks made available a long-term credit facility for Euro 1,000 million (the "Syndicated Revolving Credit Facility 2014"). The facility, which expires on 27 June 2019, can also be used for the issue of guarantees. The new revolving facility is intended to refinance the Revolving Credit Facility 2010 and to finance the Group's other operating activities. On the same date as agreeing this new facility, Prysmian S.p.A. extinguished early the Revolving Credit Facility 2010, originally due to expire on 31 December 2014 and carrying a maximum permitted drawdown of Euro 400 million.
Acquisition purchase price adjustment: Global Marine Systems Energy Ltd (now renamed Prysmian PowerLink Services Ltd)The purchase price adjustment process relating to the acqui-sition of Global Marine Systems Energy Ltd (now renamed Prysmian PowerLink Services Ltd) was completed on 28 March 2014, with a price adjustment of GBP 20 million in the Prysmian Group's favour. Since this process was completed
more than a year from the acquisition date of 15 November 2012, the difference between the adjusted final price and that previously estimated has been accounted for in the income statement with the recognition of Euro 22 million in non-re-curring income.
Acquisition of non-controlling interest in AS Draka Keila CablesOn 9 July 2014, Prysmian Group finalised the acquisition of the remaining 34% of the subsidiary AS Draka Keila Cables, becoming the sole shareholder of this Estonian company. The purchase price was Euro 6.2 million. The investment in Keila Cables will allow the Group to further accelerate its growth strategy in this high-potential region.
Stock listing of the joint venture Yangtze Optical Fibre and Cable Joint Stock Limited CompanyOn 1 August 2014, Yangtze Optical Fibre and Cable Joint Stock Limited Company, based in Wuhan (People's Republic of China) and in which the Group held a 37.5% interest, filed an application to list its shares on the Main Board of the Hong Kong Stock Exchange.The company is a joint venture between the Prysmian Group and two other partners (China Huaxin Post and Telecom-munications Economy Development Center and Wuhan Yangtze Communications Industry Group Co. Ltd., with equity interests of 37.5% and 25% respectively) and specialises in the production of optical fibre and optical cables for telecom-munications.The prospectus for the public offering and the listing of the company's shares was published on 26 November 2014 upon completion of the authorisation process.Following closure of the offering period, the company's shares commenced trading on the Main Board of the Hong Kong Stock Exchange on 10 December 2014. The offering involved an increase in the company's share capital, with a consequent dilution of the Prysmian Group's holding to 28.12%. This dilution has resulted in the recognition of a non-recurring gain of Euro 8 million.
Share buy-backUnder the share buy-back and disposal programme autho-rised by the shareholders at their meeting on 16 April 2014, Prysmian S.p.A. purchased a total of 1,390,000 treasury shares during the months of November and December 2014 at a cost of approximately Euro 20 million.
In 2014, Prysmian signed an agreement under which a syndicate of premier banks made available a long-term credit facility for Euro 1,000 million.

41
OTHER SIGNIFICANT EVENTS
Western HVDC Link Contract (UK)During the last few days of April 2014, the manufacture of the cables for the Western HVDC Link project in the United Kingdom encountered some technical problems, which were duly placed under detailed technical investigation.Following tests on the quality of the cable produced and analysis of the materials and the manufacturing process, the Directors felt able to make a reliable estimate of the project's revenues and costs.The total impact on the 2014 results has been Euro 53 million, resulting from the full elimination of the margins previously recognised on the contract and the recognition of a provision to cover the expected contract loss.Including non-recognition of the margin originally expected on this project in the period, the overall negative impact of the Western HVDC Link (UK) project on the 2014 results is Euro 94 million.
Plant closuresOn 6 July 2014, the Management Board of Prysmian Nether-lands informed trade union representatives of the intention to close the plant in Amsterdam - 78 employees - and transfer production to the plants in Delft and Emmen. Agreements for the plant's closure have been reached, with the process of shutdown currently in progress and due to last for part of 2015. On 16 July 2014, Draka Paricable (France) initiated a consul-tation process with the trade unions for the closure of the Aubevoye plant - 92 employees - and the transfer of production to the Group’s plants in Amfreville and Gron. The process of discussions with the unions and the related agreements was completed by the end of 2014, as well as the plant's closure.These plant closures are in response to the need to optimise manufacturing footprint at individual country level, with the aim of realigning industrial presence with the potential of the relevant business/market and of improving production capacity utilisation, as well as overall economic performance, through economies of scale.
Consequent impairment testing of the assets of the plants involved in this restructuring has not resulted in the recog-nition of any impairment losses. Other restructuring costs have been estimated based on the outcome of negotiations with the trade unions; at 31 December 2014, these costs were recognised as far as could be reasonably estimated. Further details can be found in Note 14. Provisions for risks and charges.
AMT Explorer cable bargeOn 3 July 2014, the AMT Explorer cable barge, chartered to transport power cables for the Deutsche Bucht and Butendiek offshore wind farms in Germany, capsized while under tow in transit from Arco Felice (Naples) to Bremenhaven (Germany). The rotating platform owned by the Prysmian Group and its load sank as a result. The value of the cables transported, unrecoverable given the depth of the water in the area of the sinking, amounted to approximately Euro 28 million. The lost cables were fully insured and as at 31 December 2014 Prysmian PowerLink S.r.l. had collected the full amount of the loss claimed from the insurers. At 31 December 2014, the value of the rotating platform has been written off in full (Euro 5 million) and an insurance reimbursement for the same amount has been recognised. Prysmian and TenneT, the partner in the wind farm projects, are working to avoid any consequences that could affect the project execution timetable.
Second cycle of Group employee share purchase plan (YES Plan)During the month of December 2014, employees were informed of the opening of the plan's second cycle in 2015. Employees had until the third week of February 2015 to sign up for the second cycle and to communicate the amount they intended to invest. The total amount collected will be used to make purchases of the Company's shares on the Milan Stock Exchange (MTA) during the month of July 2015.

Consolidated Financial Report | DIRECTORS’ REPORT
2014 Annual Report Prysmian Group
42
Consolidated Financial Report | DIRECTORS’ REPORT
REFERENCE SCENARIO
MACROECONOMIC SCENARIO
The economic environment in 2014 was characterised by uncertainty and rising geopolitical tensions in several areas of the world, with a further slowdown in emerging market economies (China, Brazil and Russia in particular) and in Japan but a gradual recovery in North America (USA and Canada), the United Kingdom and Germany. The economies of several European countries such as Italy and Greece continued to be stagnant or in decline.Economic activity carried on expanding in the first part of the year, despite some signs of weakness in emerging market countries: in China because of the growing level of private debt, in Russia because of the political and diplomatic crisis with neighbouring Ukraine, and in Brazil because of sharp economic slowdown. The macroeconomy gradually recovered force in the United States and United Kingdom, but weakened in some emerging market countries (Brazil, Russia) and in Japan. Growth in the Eurozone remained subdued, with asymmetries and disparities between the various countries, despite the economic support measures implemented by the European Central Bank such as the introduction of negative rates on deposit facilities and several refinancing operations to ease monetary conditions and support the provision of credit to households and businesses. The European recov-ery’s loss of momentum was also affected by growing uncer-tainties about the political and financial situation in Greece. Meanwhile, globally, geopolitical tensions steadily increased in some oil-producing nations (Iraq and the Middle East), thereby augmenting the risks of further economic slowdown.In the last part of the year, economic activity accelerated significantly in the United States, rebounding ahead of expectations. The short and medium-term outlook for the global economy has nonetheless remained uncertain
because of persistent weakness in the Eurozone and Japan, the prolonged slowdown in China and the sharp downturn in Russia, hit by economic sanctions imposed by the inter-national community. The sharp fall in oil prices, triggered by both greater supply and weaker demand, could help sustain growth in the coming quarters, but not without risks for the financial stability of the oil exporting nations.The major international research institutes progressively revised down their growth estimates for 2014 and 2015 over the course of the year, confirming the growing uncertainties around the globe. Despite the difficult political and mac-roeconomic scenario, global demand in 2014 nonetheless reported an overall increase: in fact, global GDP grew by +3.3%* on the previous year (compared with growth of +3.3%* and +3.4%* in 2013 and 2012 respectively), driven by the significant growth achieved by Asia's emerging market economies.China, in particular, has confirmed a high growth rate (+7.4%*), even if down from the previous year (+7.8%*) but still a far cry from that in the recent past (+11.2% average annual growth in the period 2006-2010), reflecting some dif-ficulties in its domestic market. India too, after two years of modest performance, returned to growth of more than 5%.In the United States, positive signs on the domestic demand front and a gradual decline in unemployment contributed to an acceleration in growth on the previous year: GDP grew by +2.4%* in 2014, up from +2.2%* the previous year.Europe saw a slight improvement in economic activity, albeit with specific idiosyncrasies in the different countries. Eurozone GDP grew by +0.8%* on 2013, compared with -0.5%* in the previous year, returning to expansionary mode after two consecutive years of recession.
In the face of an uncertain geopolitical environment with growing tensions in various areas of the globe, the macroeconomic scenario in 2014 was marked by a slowdown in emerging market economies (China, Brazil and Russia) offset by robust recovery in the United States, United Kingdom and India. Europe was still weak, although with signs of a slight recovery.
* Source: IMF, World Economic Outlook Update – January 2015
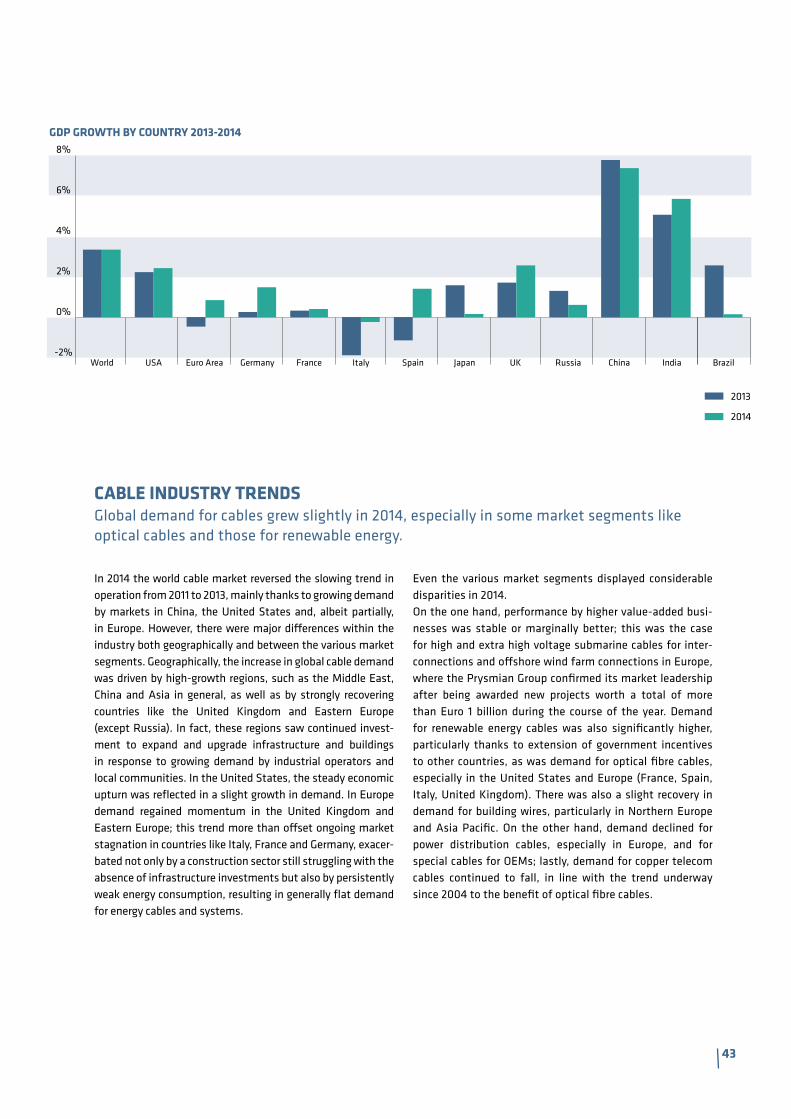
43
CABLE INDUSTRY TRENDS
In 2014 the world cable market reversed the slowing trend in operation from 2011 to 2013, mainly thanks to growing demand by markets in China, the United States and, albeit partially, in Europe. However, there were major differences within the industry both geographically and between the various market segments. Geographically, the increase in global cable demand was driven by high-growth regions, such as the Middle East, China and Asia in general, as well as by strongly recovering countries like the United Kingdom and Eastern Europe (except Russia). In fact, these regions saw continued invest-ment to expand and upgrade infrastructure and buildings in response to growing demand by industrial operators and local communities. In the United States, the steady economic upturn was reflected in a slight growth in demand. In Europe demand regained momentum in the United Kingdom and Eastern Europe; this trend more than offset ongoing market stagnation in countries like Italy, France and Germany, exacer-bated not only by a construction sector still struggling with the absence of infrastructure investments but also by persistently weak energy consumption, resulting in generally flat demand for energy cables and systems.
USA Russia China India Brazil
2013
2014
8%
6%
4%
2%
0%
-2%Germany Italy Spain Japan UKFranceEuro Area World
GDP GROWTH BY COUNTRY 2013-2014
Even the various market segments displayed considerable disparities in 2014. On the one hand, performance by higher value-added busi-nesses was stable or marginally better; this was the case for high and extra high voltage submarine cables for inter-connections and offshore wind farm connections in Europe, where the Prysmian Group confirmed its market leadership after being awarded new projects worth a total of more than Euro 1 billion during the course of the year. Demand for renewable energy cables was also significantly higher, particularly thanks to extension of government incentives to other countries, as was demand for optical fibre cables, especially in the United States and Europe (France, Spain, Italy, United Kingdom). There was also a slight recovery in demand for building wires, particularly in Northern Europe and Asia Pacific. On the other hand, demand declined for power distribution cables, especially in Europe, and for special cables for OEMs; lastly, demand for copper telecom cables continued to fall, in line with the trend underway since 2004 to the benefit of optical fibre cables.
Global demand for cables grew slightly in 2014, especially in some market segments like optical cables and those for renewable energy.

Consolidated Financial Report | DIRECTORS’ REPORT
2014 Annual Report Prysmian Group
44
Consolidated Financial Report | DIRECTORS’ REPORT
GROUP PERFORMANCE AND RESULTS
INTRODUCTION
Adoption of IFRS 10-11Following the adoption of IFRS 10 - Consolidated Financial Statements and IFRS 11 - Joint Arrangements, applicable retrospectively from 1 January 2014, the Group's consolidated figures have been restated as from 1 January 2013.The main effects of applying the new standards relate to use of the equity method to consolidate Yangtze Optical Fibre and Cable Joint Stock Limited Co., Yangtze Optical Fibre and Cable (Hong Kong) Co. Ltd., Precision Fiber Optics Ltd. and Power Cables Malaysia Sdn Bhd, previously consolidated using the proportionate method, and Yangtze Optical Fibre & Cable (Shanghai) Co. Ltd., previously consolidated line-by-line.
Reclassification of share of net profit/(loss) of equity-accounted companiesThe Group has adopted a new method of classifying its share of the net profit/(loss) of associates and joint ventures, whereby it recognises this amount as a component of "Operating income" when relating to companies that operate in the same sector as the Group. The comparative figures have been reclassified accordingly.
Change in segment reportingFrom 1 January 2014 the Group embarked on a process of organisational change, which has involved redefining its segment information, in keeping with the new management model adopted by the Group.
Under the new organisational structure, the Energy segment has been divided into two Operating Segments: Energy Projects and Energy Products. However, the structure of the Telecom Operating Segment has remained unchanged. The Energy Projects Operating Segment covers high-tech and high value-added businesses whose focus is on projects and their execution, as well as on product customisation, namely: High Voltage underground, Submarine and SURF (comprising umbilical cables, flexible pipes and special DHT (Downhole Technology) cables). The Energy Products Operating Segment covers the busi-nesses offering a complete and innovative product portfolio designed to meet the various and many demands of the market, namely: Energy & Infrastructure (including Trade & Installers and Power Distribution) and Industrial & Network Components (comprising Specialties & OEM, Oil & Gas, Elevators, Automotive and Network Components). Reporting systems in support of the new model were fully implemented in 2014 and have been used for the purposes of preparing the current document. The Board of Directors approved the adoption of the new structure for segment reporting in its meeting on 23 January 2015.More details can be found in the section on Alternative Performance Indicators contained in the present Directors' Report.
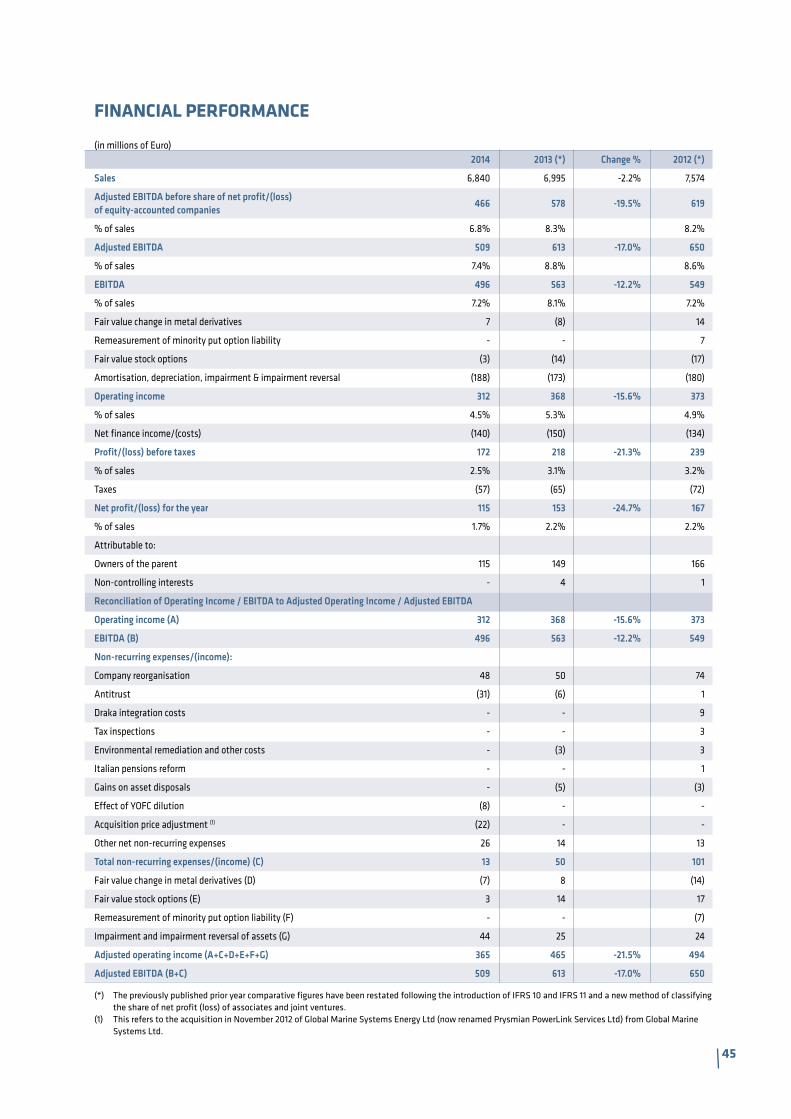
45
2014 2013 (*) Change % 2012 (*)
Sales 6,840 6,995 -2.2% 7,574
Adjusted EBITDA before share of net profit/(loss) of equity-accounted companies 466 578 -19.5% 619
% of sales 6.8% 8.3% 8.2%
Adjusted EBITDA 509 613 -17.0% 650
% of sales 7.4% 8.8% 8.6%
EBITDA 496 563 -12.2% 549
% of sales 7.2% 8.1% 7.2%
Fair value change in metal derivatives 7 (8) 14
Remeasurement of minority put option liability - - 7
Fair value stock options (3) (14) (17)
Amortisation, depreciation, impairment & impairment reversal (188) (173) (180)
Operating income 312 368 -15.6% 373
% of sales 4.5% 5.3% 4.9%
Net finance income/(costs) (140) (150) (134)
Profit/(loss) before taxes 172 218 -21.3% 239
% of sales 2.5% 3.1% 3.2%
Taxes (57) (65) (72)
Net profit/(loss) for the year 115 153 -24.7% 167
% of sales 1.7% 2.2% 2.2%
Attributable to:
Owners of the parent 115 149 166
Non-controlling interests - 4 1
Reconciliation of Operating Income / EBITDA to Adjusted Operating Income / Adjusted EBITDA
Operating income (A) 312 368 -15.6% 373
EBITDA (B) 496 563 -12.2% 549
Non-recurring expenses/(income):
Company reorganisation 48 50 74
Antitrust (31) (6) 1
Draka integration costs - - 9
Tax inspections - - 3
Environmental remediation and other costs - (3) 3
Italian pensions reform - - 1
Gains on asset disposals - (5) (3)
Effect of YOFC dilution (8) - -
Acquisition price adjustment (1) (22) - -
Other net non-recurring expenses 26 14 13
Total non-recurring expenses/(income) (C) 13 50 101
Fair value change in metal derivatives (D) (7) 8 (14)
Fair value stock options (E) 3 14 17
Remeasurement of minority put option liability (F) - - (7)
Impairment and impairment reversal of assets (G) 44 25 24
Adjusted operating income (A+C+D+E+F+G) 365 465 -21.5% 494
Adjusted EBITDA (B+C) 509 613 -17.0% 650
FINANCIAL PERFORMANCE
(*) The previously published prior year comparative figures have been restated following the introduction of IFRS 10 and IFRS 11 and a new method of classifying the share of net profit (loss) of associates and joint ventures.
(1) This refers to the acquisition in November 2012 of Global Marine Systems Energy Ltd (now renamed Prysmian PowerLink Services Ltd) from Global Marine Systems Ltd.
(in millions of Euro)
Consolidated Financial Report | DIRECTORS’ REPORT
2014 Annual Report Prysmian Group
46
During 2014, the Group's profitability was largely stable while sales volumes recovered; in particular, the Energy Products segment reported a slight recovery for the Trade & Installers business, offset by a downturn for Power Distribution and some sectors of the Industrial business; the Energy Projects segment enjoyed a positive trend mainly thanks to the perfor-mance of the Submarine business (excluding the adjustments for the Western HVDC Link project), as offset by weakness in the High Voltage business; growth by the Telecom segment was mainly due to increased demand for optical fibre cables, which offset the deteriorating performance of copper cables.
During the last few days of April 2014, some technical problems were uncovered in relation to the manufacture of the cables for the Western HVDC Link project, which have affected the full-year results. In this Annual Financial Report, the effects of the Western HVDC Link project have been determined with respect to the results forecast prior to discovering the above technical problems; such effects amount to Euro 61 million on sales and Euro 94 million on operating income.
The Group's sales in 2014 came to Euro 6,840 million, compared with Euro 6,995 million in the prior year, posting a negative change of Euro 155 million (-2.2%). Excluding the negative impact on expected revenue from the Western HVDC Link project, the Group's sales would have been Euro 6,901 million (-1.3%). The decrease in sales was attributable to the following factors:• increase of Euro 127 million (+1.8%) from organic growth;
excluding adjustments for the Western HVDC Link project, organic growth would have been Euro 188 million (+2.7%);
• reduction of Euro 178 million (-2.5%) due to negative exchange rate effects;
• reduction of Euro 104 million (-1.5%) in sales prices following fluctuations in metal prices (copper, aluminium and lead).
The organic growth in sales of +1.8%, is analysed between the three operating segments as follows:
Energy Projects +1.7%; (+6.1% excluding adjustments for the Western HVDC Link project);Energy Products +1.4%;Telecom + 4.0%.
Group Adjusted EBITDA (before Euro 13 million in non-recur-ring expenses) came to Euro 509 million, posting a decrease of Euro 104 million on the corresponding figure in 2013 of Euro 613 million (-17.0%). Excluding the negative impact of the Western HVDC Link project, Adjusted EBITDA would have been Euro 603 million. The full-year result for 2014 reflects the negative impact of Euro 14 million in higher exchange rate effects than in the prior year, arising from the depreciation of the Brazilian Real, the US Dollar, Australian Dollar, the Turkish Lira, certain North European currencies (Swedish Krona and Norwegian Krone) and the Argentine Peso.
EBITDA includes Euro 13 million in net non-recurring expenses (Euro 50 million in 2013). Such net non-recurring expenses in 2014 mainly include Euro 22 million in income from the purchase price adjustment against the acquisi-tion of Global Marine Systems Energy Ltd (now renamed Prysmian PowerLink Services Ltd.), Euro 31 million in income from the net release from the antitrust provision, Euro 48 million in expenses for reorganisation and improving indus-trial efficiency, Euro 8 million in income from the dilution

47
of the shareholding in Yangtze Optical Fibre and Cable Joint Stock Limited Company, Euro 8 million in expenses for restructuring the pension plan of certain Dutch companies and Euro 9 million to write down an unrecoverable tax credit of a Brazilian company.
Group operating income was Euro 312 million for 2014, compared with Euro 368 million in the prior year, posting a decrease of Euro 56 million. This reduction is mainly attrib-utable to the adjustments against the Western HVDC Link project, and to higher impairment losses recognised against assets; this reduction has been partially offset by lower net non-recurring expenses and by the positive change in the fair value of metal derivatives. Excluding the negative impact on expected profit margin for the Western HVDC Link project, operating income would have been Euro 406 million.
Net finance costs came to Euro 140 million for 2014, down from Euro 150 million (-6.6%) in the prior year.
The reduction of Euro 10 million is mainly attributable to the reduction in finance costs relating to the Group's borrowings.
Taxes came to Euro 57 million, representing an effective tax rate of around 33.1%.
Net profit for 2014 was Euro 115 million, compared with Euro 153 million in 2013. Excluding the adjustments for the Western HVDC Link project, net profit for 2014 would have been Euro 178 million.
Adjusted net profit1 was Euro 186 million, versus Euro 269 million the year before. Excluding the adjustments for the Western HVDC Link project, adjusted net profit for 2014 would have been Euro 252 million.
(1) Adjusted net profit is defined as net profit/(loss) before non-recurring income and expenses, the fair value change in metal derivatives and in other fair value items, the effect of currency and interest rate derivatives, exchange rate differences, non-monetary interest on the convertible bond and the related tax effects.

Consolidated Financial Report | DIRECTORS’ REPORT
2014 Annual Report Prysmian Group
48
Consolidated Financial Report | DIRECTORS’ REPORT
REVIEW OF ENERGY PROJECTS OPERATING SEGMENT
Energy Projects is one of the two Operating Segments into which the Energy business has been divided: what is its perimeter?It covers high-tech and high value-added businesses focused on projects and their execution, as well as on product cus-tomisation, in other words, the High Voltage underground business, Submarine systems and SURF (comprising umbilical cables, flexible pipes and special Downhole Tech-nology cables for the oil industry). These are businesses with high technology content and high value-added: we engineer, manufacture and install high and extra high voltage cables for underground and submarine power transmission directly from power stations to the primary distribution networks. Through Prysmian PowerLink Services S.r.l., we develop the most advanced turnkey submarine systems, including for installation at depths of up to 2,000 metres with the assistance of our cable-laying ship, the "Giulio Verne".
What does it mean for a global leader like Prysmian to offer turnkey solutions?It means being able to act as a strategic partner for coun-try-systems, and in so doing, to strengthen its leadership and dictate new standards for the entire industry. Take the case of Germany, Europe's largest and strongest economy. Germany has a very ambitious goal where energy is concerned: to shift from fossil fuels to renewables. Prysmian is a genuine strategic partner to Germany in this strategic project: its ultra high-tech solutions are allowing the grid to be fed with increasing amounts of energy generated by offshore wind farms, while its turnkey cables and systems solutions are able to respond to ever more technically difficult and complex challenges. A glance at the connections maps for the North Sea gives an immediate idea of the scale of our activities and the importance of our contribution.
INTERVIEW WITH MASSIMO BATTAINI, Senior Vice President Energy Projects
The frontier of innovation and technology is moving ever further ahead ...Yes, we saw this in 2014, a year in which we consolidated our leadership but also faced new challenges, like the Western HVDC Link project, with its unprecedented levels of work and com-plexity, in which we encountered some technical difficulties that were later fully overcome thanks to our trademark technological excellence. In such a complex business we managed to achieve organic growth once again in 2014, which would have been higher but for the Western Link problems, subsequently resolved in full. This growth reflects a combination of equivocal factors: on the one hand, we had a positive trend for submarine systems and the SURF business, while on the other, we had to cope with weakness in the High Voltage business over the past year.
What are the prospects for the Energy Projects Operating Segment in the future?Submarine sales grew in 2014 compared with 2013, with work still in progress on major projects, like Helwin 2, Sylwin 1 and Borwin 2 and 3 for offshore wind farms in Germany. While it's true that High Voltage performance has been generally negative in Europe, demand is still showing a positive trend in the Middle and Far East and in some North European markets. Prysmian is perfectly equipped to cope with increased demand, especially in the high value-added market segment, also thanks to recent investments in our European plants.

49

Consolidated Financial Report | DIRECTORS’ REPORT
2014 Annual Report Prysmian Group
50
2014 2013 (*) Change % 2012 (*)
Sales 1,355 1,360 -0.3% 1,250
Adjusted EBITDA before share of net profit/(loss) of equity-accounted companies 154 232 -33.6% 197
% of sales 11.4% 17.0% 15.8%
Adjusted EBITDA 154 231 -33.5% 197
% of sales 11.3% 17.0% 15.8%
EBITDA 195 234 -16,7% 196
% of sales 14.4% 17.2% 15.7%
Amortisation and depreciation (40) (39) (37)
Adjusted operating income 114 192 -40.9% 162
% of sales 8.4% 14.1% 13.0%
Reconciliation of Operating Income / EBITDA to Adjusted Operating Income / Adjusted EBITDA
EBITDA (A) 195 234 -16.7% 196
Non-recurring expenses/(income):
Company reorganisation 1 4 3
Antitrust (31) (6) 1
Gains on asset disposals - (2) (2)
Acquisition price adjustment (1) (22) - -
Other net non-recurring expenses/(income) 11 1 (1)
Total non-recurring expenses/(income) (B) (41) (3) 1
Adjusted EBITDA (A+B) 154 231 -33.5% 197
(*) The previously published prior year comparative figures have been restated following the introduction of IFRS 10 and IFRS 11 and a new method of classifying the share of net profit (loss) of associates and joint ventures.
(1) This refers to the acquisition in November 2012 of Global Marine Systems Energy Ltd (now renamed Prysmian PowerLink Services Ltd) from Global Marine Systems Ltd.
The Energy Projects Operating Segment covers high-tech businesses whose focus is on projects and their execution, as well as on product customisation: High Voltage underground, Submarine and SURF (umbilicals, flexible pipes and special DHT (Downhole Technology) solutions for the oil industry).The Group engineers, produces and installs high and extra high voltage cables for electricity transmission both from power stations and within transmission and primary distri-
bution grids. These highly specialised, high-tech products include cables insulated with oil or fluid-impregnated paper for voltages up to 1100 kV and extruded polymer insulated cables for voltages up to 500 kV. These are complemented by laying and post-laying services, grid monitoring and preven-tive maintenance services, power line repair and maintenance services, as well as emergency services, including intervention in the event of damage.
REVIEW OF ENERGY PROJECTS OPERATING SEGMENT
(in millions of Euro)

51
Stable demand in the submarine cables business, like in mature markets for the high voltage underground business. Positive trend for umbilicals confirmed in Brazil.
Market Overview
The submarine cable business faced an essentially stable market in 2014 compared with the previous year. Demand for offshore wind farm projects confirmed the stabilising trend commencing late in 2013 (after the boom in 2011, 2012 and part of 2013), the consequence of the high overall implemen-tation costs of such projects and their subsequent transfer to the end consumer. Once again in 2014, the market was dominated by a few large global players who were awarded almost all of the projects up for tender. The much more frag-mented medium voltage segment of the market underwent a slowdown, with every supplier exposed to the weakness in the market for inter-array connections.Demand in the high voltage underground business was es-sentially stable in the mature markets of Europe and North America. The imbalance between high production capacity
and limited demand continued to exert pressure on prices in these markets. By contrast, demand continued to grow in the Middle and Far East, where prices and profitability none-theless remained well below those in mature markets due to competition from local manufacturers and importers.The SURF business reported a positive market trend for umbilicals in Brazil, as well as a strong demand for flexible pipes used in pre-salt fields, in which, however, the Group is not yet present. By contrast, there was limited demand for the post-salt products in which Prysmian competes. The Downhole Technology product segment enjoyed a positive market trend, thanks to growth in demand by global operators for projects in both the United States and other geographical areas, such as Central and South America, Europe, Far East and Middle East.
In addition, Prysmian Group engineers, produces and installs "turnkey" submarine cable systems for power transmission and distribution. The products offered include cables with different types of insulation (cables insulated with layers of oil or fluid-impregnated paper for AC and DC transmission up to 500 kV; cables insulated with extruded polymer for AC transmission up to 400 kV and DC transmission up to 300 kV). The Group offers specific technological solutions for power transmission and distribution in underwater environments, which also satisfy the strictest international standards. The range of products for the offshore oil industry includes not only submarine cables to link offshore platforms to mainland
power grids but also solutions for use in the extraction and storage of hydrocarbons. The wide portfolio includes all the SURF (Subsea Umbilical, Riser and Flowline) products and services: multifunction umbilicals for transmitting energy and telecommunications and for hydraulic powering of wellheads by offshore platforms and/or by FPSOs (Floating, Production, Storage and Offloading vessels); high-tech flexible pipes for oil extraction; special DHT (Downhole Technology) solutions, which include cables encased in insulated tubing to control and power systems inside extraction machinery below the seabed's surface and for the flow of hydraulic power fluids to such machinery.
Consolidated Financial Report | DIRECTORS’ REPORT
2014 Annual Report Prysmian Group
52
Financial Performance
Sales to third parties by the Energy Projects segment amounted to Euro 1,355 million in 2014, compared with Euro 1,360 million in 2013, posting a negative change of Euro 5 million (-0.3%). Excluding the negative impact of the Western HVDC Link project, sales to third parties would have been Euro 1,416 million.
The decrease in sales can be broken down into the following main factors:
• positive organic growth of Euro 22 million (+1.7%); excluding adjustments for the Western HVDC Link project, organic growth would have been a positive Euro 83 million (+6.1%);
• reduction of Euro 22 million (-1.7%) for exchange rate fluctuations;
• sales price reduction of Euro 5 million (-0.3%) for metal price fluctuations.
Positive organic growth in 2014 reflects a combination of opposing factors, such as the positive trends in the Submarine and SURF businesses, as partially offset by weakness in the High Voltage business.The High Voltage business performed poorly in some of the major European markets (Italy and North European countries) in the wake of lower demand for energy infrastructure. The Group increased its exposure to markets in the Middle and Far East, characterised by growing demand for energy infra-structure but also by lower profitability. Demand in Russia continued to be limited due to the uncertain local political situation causing delays in the implementation of previously planned major projects.Sales by the Submarine business were up on 2013, despite the delay in the Western HVDC Link (UK). The main projects on which work was performed in the year were the Helwin 2, Sylwin 1 and Borwin 2 and 3 offshore wind farms in Germany. With regard to execution of the Western HVDC Link (UK) project, initiated in the third quarter of 2012, some technical
problems were encountered with the cable manufacturing process, resulting in a downward revision of Euro 61 million to expected sales.The value of the Group's Submarine order book was in excess of Euro 2.3 billion at the end of 2014, providing sales visibility for a period of about three years. The order book mainly consists of the following contracts: the inter-connector between Greece and the Cyclades islands, the interconnectors in the Balearic Islands (Mallorca-Ibiza) and over the Dardanelles Strait, the link between Montenegro and Italy (Monita), the contracts for offshore wind platform connections (DolWin3, Deutsche Bucht, 50Hertz), the link between offshore wind farms in the North Sea and the German mainland (BorWin3), the interconnection of the Philippine islands of Panay and Negros, the Shannon River crossing in Ireland, the interconnector between the UK and Scotland (WesternLink) and the contract for the supply and installation of submarine cables for part of the offshore operations of ExxonMobil Corporation in the United States. In order to satisfy these contracts, investments have been made to upgrade production capacity at the Pikkala plant in Finland, already operational since the end of 2011, and at the Arco Felice plant in Italy.The SURF business reported a good performance for DHT cables in the North American market, in the face of a weak result in the flexible pipes segment. Performance in the umbilical cables segment was basically stable.As a result of the events described in the Submarine business, an impoverished geographical mix of projects in the High Voltage underground business and stability in the SURF business, Adjusted EBITDA for the Energy Projects operating segment came to Euro 154 million (Euro 248 million without the negative impact of the Western HVDC Link project). This is a decrease of Euro 77 million from Euro 231 million in 2013, of which Euro 94 million is the adverse impact of the Western HVDC Link project; excluding this effect, Adjusted EBITDA would have reported an increase of Euro 17 million.

53

Consolidated Financial Report | DIRECTORS’ REPORT
2014 Annual Report Prysmian Group
54
Consolidated Financial Report | DIRECTORS’ REPORT
REVIEW OF ENERGY PRODUCTS OPERATING SEGMENT
What is the perimeter of the Energy Products operating segment, one of the two segments into which the Energy business has been divided?The Energy Products Operating Segment is able to offer a broad portfolio of products for two lines of business: the first is Energy & Infrastructure, which in turn includes Trade & Installers and Power Distribution; the second is Industrial & Network Components, which comprises Specialties & OEM, Oil & Gas, Elevators, Automotive and Network Compo-nents. In practice, the segment aims to cover the needs of different industries and has a customer base consisting of top companies the world over.
What does it mean to be a leader and remain a leader in energy cables?It means setting the standards for the global cable industry at ever higher levels of quality, efficiency and safety, and opening up ever new frontiers of technological innova-tion. Even in low voltage, which is mistakenly seen as a commodity, our Group aims to stand out by making top quality its hallmark. The planet's construction industry landmarks, real symbols of design and engineering materi-alising into increasingly bold and spectacular buildings, are made safe thanks to Prysmian fire-resistant cables, able to save lives in the event of fire. These products are constantly being improved by our research and development labs, helping raise industry standards ever higher.
Why has Prysmian been selected for these world leading projects?For its ability to put the customer first, to anticipate their needs, to have an ever-ready response to the challenge of quality and excellence, to act as a one-stop-shop
INTERVIEW WITH HANS NIEMAN, Senior Vice President Energy Products
where customers can find all the answers to their questions, even those they haven't yet asked. Obviously there aren't just buildings: our customers are also in the transportation industry, from the sea to the skies, in the Oil & Gas industry, and the elevators and renewable energy indus-tries, always positioned at the very top end of the market. It's obvious that safety plays a critical role in all these industries, not only because extensive asset management services help get the best out of all components over their life cycle, but also because higher quality cables can minimise risks and make infrastructure safer. Like in the case of mid-ocean oil platforms, the Airbus 380, or the historic London Tube that transports millions of people every day.
What are the prospects for the Energy Products Operating Segment?We closed 2014 with slightly lower revenues mainly because of the economic situation in some areas of the global market, like South America. Our focus on the high end of the market, i.e. that of high value-added products, and our ongoing commitment to research and innovation, culminating in the introduction of ever new products, allow us to take a positive medium-term view. We're optimistic about 2015 and confident that investments in power distribution networks will regain momentum in several parts of the world, as anticipated by Jean-Claude Juncker for Europe. If this is the case, we'll be ready.

55

Consolidated Financial Report | DIRECTORS’ REPORT
2014 Annual Report Prysmian Group
56
2014 2013 (*) Change % 2012 (*)
Sales 4,491 4,649 -3.4% 5,122
Adjusted EBITDA before share of net profit/(loss) of equity-accounted companies 221 259 -15.0% 289
% of sales 4.9% 5.6% 5.6%
Adjusted EBITDA 239 276 -13.6% 304
% of sales 5.3% 5.9% 5.9%
EBITDA 195 250 -22.0% 235
% of sales 4.3% 5.4% 4.6%
Amortisation and depreciation (62) (66) (72)
Adjusted operating income 177 210 -16.2% 232
% of sales 3.9% 4.5% 4.5%
Reconciliation of Operating Income / EBITDA to Adjusted Operating Income / Adjusted EBITDA
EBITDA (A) 195 250 -22.0% 235
Non-recurring expenses/(income):
Company reorganisation 38 29 50
Draka integration costs - - 4
Tax inspections - - 1
Environmental remediation and other costs - (3) 3
Gains on asset disposals - (2) (1)
Other net non-recurring expenses 6 2 11
Total non-recurring expenses/(income) (B) 44 26 69
Adjusted EBITDA (A+B) 239 276 -13.6% 304
(*) The previously published prior year comparative figures have been restated following the introduction of IFRS 10 and IFRS 11 and a new method of classifying the share of net profit (loss) of associates and joint ventures.
The Energy Products Operating Segment, covering the busi-nesses offering a complete and innovative product portfolio for a variety of industries, is organised into the businesses of Energy & Infrastructure (including Power Distribution, Trade & Installers) and Industrial & Network Components (comprising Specialties & OEM, Oil & Gas, Elevators, Automotive and Network Components).
Sales to third parties by the Energy Products operating segment amounted to Euro 4,491 million in 2014, compared with Euro 4,649 million in 2013, posting a negative change of Euro 158 million (-3.4%), due to the combined effect of the following main factors:
• increase of Euro 65 million (+1.4%) due to organic sales growth, reflecting volume recovery in Northern and Eastern Europe and growth in Asian countries, as partially offset by negative organic growth in South America;
• reduction of Euro 130 million (-2.0%) for exchange rate fluctuations;
• sales price reduction of Euro 93 million (-2.8%) for metal price fluctuations.
Adjusted EBITDA for 2014 came to Euro 239 million, down Euro 37 million (-13.6%) from Euro 276 million in 2013.
The following paragraphs describe market trends and financial performance in each of the business areas of the Energy Products operating segment.
REVIEW OF ENERGY PRODUCTS OPERATING SEGMENT
(in millions of Euro)
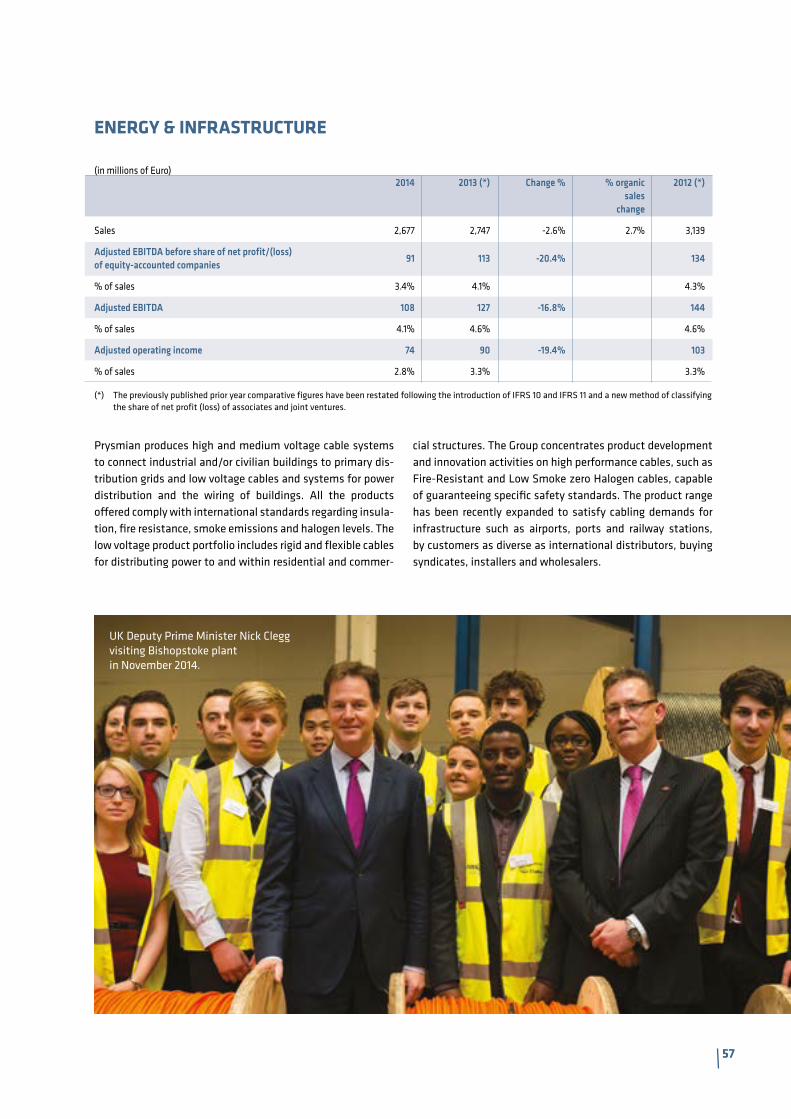
57
2014 2013 (*) Change % % organic 2012 (*) sales change
Sales 2,677 2,747 -2.6% 2.7% 3,139
Adjusted EBITDA before share of net profit/(loss) of equity-accounted companies 91 113 -20.4% 134
% of sales 3.4% 4.1% 4.3%
Adjusted EBITDA 108 127 -16.8% 144
% of sales 4.1% 4.6% 4.6%
Adjusted operating income 74 90 -19.4% 103
% of sales 2.8% 3.3% 3.3%
Prysmian produces high and medium voltage cable systems to connect industrial and/or civilian buildings to primary dis-tribution grids and low voltage cables and systems for power distribution and the wiring of buildings. All the products offered comply with international standards regarding insula-tion, fire resistance, smoke emissions and halogen levels. The low voltage product portfolio includes rigid and flexible cables for distributing power to and within residential and commer-
cial structures. The Group concentrates product development and innovation activities on high performance cables, such as Fire-Resistant and Low Smoke zero Halogen cables, capable of guaranteeing specific safety standards. The product range has been recently expanded to satisfy cabling demands for infrastructure such as airports, ports and railway stations, by customers as diverse as international distributors, buying syndicates, installers and wholesalers.
ENERGY & INFRASTRUCTURE
UK Deputy Prime Minister Nick Clegg visiting Bishopstoke plant in November 2014.
(in millions of Euro)
(*) The previously published prior year comparative figures have been restated following the introduction of IFRS 10 and IFRS 11 and a new method of classifying the share of net profit (loss) of associates and joint ventures.

Consolidated Financial Report | DIRECTORS’ REPORT
2014 Annual Report Prysmian Group
58
Market Overview
The reference markets have distinct geographical character-istics (despite international product standards) both in terms of customer and supplier fragmentation and the range of items produced and sold. Throughout the year persistent uncertainty about the construction industry's future prospects prevailed over the positive effects of lower metal and commodity prices; as a result, the largest industry players continued to maintain low stocks and constant pressure on sales prices. As noted in the nine-month report, countries in Europe, such as Spain and Italy, were particularly hard hit because of the negative impact on the property market of severe restrictions on bank credit. Even Germany and the Netherlands were affected by a stationary trend in demand for new build; this led to growing price pressure, also due to ever increasing competition by small foreign operators from Southern Europe and North Africa seeking outlets for their surplus capacity in the richer markets of Central and Northern Europe.The North American market, already affected by largely flat demand for products serving infrastructure construction, was partly affected in 2014 by the delay in defining tax incentives for energy-efficient buildings. Nonetheless, Canada saw good growth in demand in the renewables sector (for wind farms).
Markets in South America reversed the previous year’s volume gains after reporting a downturn in demand caused by slowdown in the industrial and residential construction sectors.Lastly, despite the Australian dollar's depreciation during the year, demand continued to stagnate on the Australian construction market, defined by strong competitive pressures from Asian operators.Demand for the Power Distribution business line slowed in 2014, confirming and reinforcing the downward trend already seen in 2013.This trend reflected generally stagnant energy consumption in the principal European countries, which in turn adversely affected demand by the major utilities. The latter, operating in a recessionary economic environment, either maintained an extremely cautious approach given the difficulties in fore-casting future growth, or else they concentrated on restruc-turing to improve efficiency and reduce supply-side costs. As a result, the competitive environment in terms of price and mix remained extremely challenging almost everywhere.Markets in the Americas showed signs of general stability in 2014 compared with the previous year.
Uncertainty about the construction industry's future prospects prevailed over the positive effects of lower metal and commodity prices. Demand for the Power Distribution business line slowed, confirming and reinforcing the downward trend already seen in 2013.
Financial Performance
Sales to third parties by the E&I business area amounted to Euro 2,677 million in 2014, compared with Euro 2,747 million in 2013, posting a negative change of Euro 70 million (-2.6%) due to the combined effect of the following main factors:
• positive organic growth of Euro 75 million (+2.7%);• reduction of Euro 89 million (-3.3%) for exchange rate
fluctuations;• sales price reduction of Euro 56 million (-2.0%) for metal
price fluctuations.
Prysmian Group continued its strategy in this business area of focusing on commercial relationships with top internation-al customers and its development of tactical actions to avoid losing sales opportunities, by differentiating its offer in the various markets and by increasing its market share in specific
geographical areas. This has led to a very complex commercial strategy, not only focused where possible on improving the sales mix, but also aimed at regaining market share while seeking to minimise the impact on sales margins. The general precariousness of demand for infrastructure, combined with the state of energy consumption in most European markets, certainly affected the performance of the Group, which was nonetheless able to benefit from growth opportunities in Asian and North American markets.By contrast, Prysmian Group's sales suffered in South America, where the trend in demand remained negative and where pressure on prices started to be felt.
Given the factors described above, Adjusted EBITDA for 2014 came to Euro 108 million, down from Euro 127 million in the previous year.
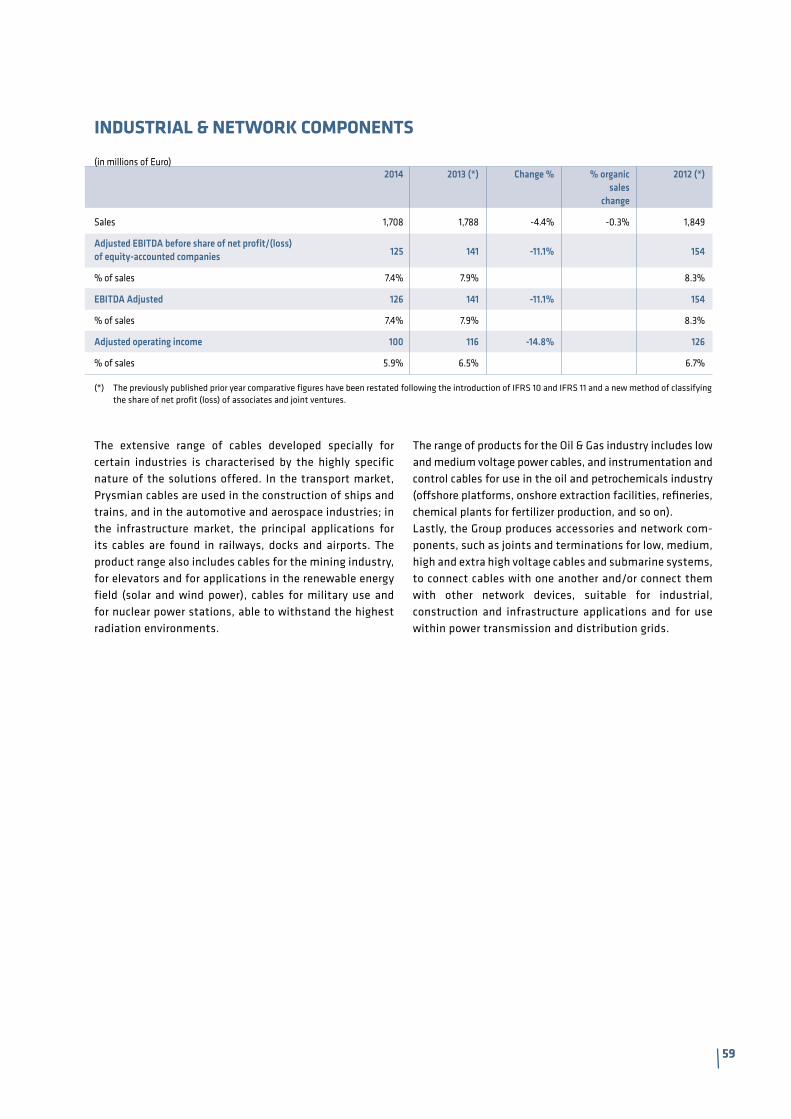
59
2014 2013 (*) Change % % organic 2012 (*) sales change
Sales 1,708 1,788 -4.4% -0.3% 1,849
Adjusted EBITDA before share of net profit/(loss) of equity-accounted companies 125 141 -11.1% 154
% of sales 7.4% 7.9% 8.3%
EBITDA Adjusted 126 141 -11.1% 154
% of sales 7.4% 7.9% 8.3%
Adjusted operating income 100 116 -14.8% 126
% of sales 5.9% 6.5% 6.7%
The extensive range of cables developed specially for certain industries is characterised by the highly specific nature of the solutions offered. In the transport market, Prysmian cables are used in the construction of ships and trains, and in the automotive and aerospace industries; in the infrastructure market, the principal applications for its cables are found in railways, docks and airports. The product range also includes cables for the mining industry, for elevators and for applications in the renewable energy field (solar and wind power), cables for military use and for nuclear power stations, able to withstand the highest radiation environments.
The range of products for the Oil & Gas industry includes low and medium voltage power cables, and instrumentation and control cables for use in the oil and petrochemicals industry (offshore platforms, onshore extraction facilities, refineries, chemical plants for fertilizer production, and so on).Lastly, the Group produces accessories and network com-ponents, such as joints and terminations for low, medium, high and extra high voltage cables and submarine systems, to connect cables with one another and/or connect them with other network devices, suitable for industrial, construction and infrastructure applications and for use within power transmission and distribution grids.
(*) The previously published prior year comparative figures have been restated following the introduction of IFRS 10 and IFRS 11 and a new method of classifying the share of net profit (loss) of associates and joint ventures.
INDUSTRIAL & NETWORK COMPONENTS
(in millions of Euro)

Consolidated Financial Report | DIRECTORS’ REPORT
2014 Annual Report Prysmian Group
60
Market Overview
Trends on Industrial cable markets in 2014 displayed consid-erable inconsistencies between the various business lines and large disparities between the different geographical areas. The common tendency was for more fragmented and erratic demand, concentrated on smaller scale but technologically more complex projects than in the past, ac-companied by more exacting requirements regarding quality and after-sales service. Some segments of the Industrial market showed stable or growing demand, like certain top sectors of OEMs (like rolling stock), Oil & Gas (Offshore) and the Elevator market, accom-panied by a recovery in demand in the renewable energy market; by contrast, other market segments experienced a contraction in volumes, like the Onshore Oil & Gas segment, affected by delays in investment projects, and the low-end mining and infrastructure ranges for the OEM market, where demand depends on specific geographical factors. In addition, international demand in the standard segments of the Oil & Gas market (MRO) declined in the second half of the year with the falling price of oil.Demand in the industrial infrastructure and mining sectors
was weak and below that in 2013, primarily due to falling commodity prices and significant production overcapacity. As far as applications for the transport sector are concerned, the major European players adopted a cautious stance due to poor visibility as to when to resume investments and to recent deficit-cutting policies in the Eurozone's major economies; demand in other parts of the world remained buoyant, especially in China and the Far East. A conflicting pattern of demand was also confirmed in the Automotive sector. While volumes increased on the prior year in areas outside Europe, mainly the Americas and Asia, the restrictive financial policies in Europe forced the ending of incentives in support of the automotive industry with a consequent impact on levels of demand in local markets.Lastly, the renewable energy market reported particularly positive demand outside Europe, especially in China and North America. In Europe, however, demand remained weak in the wake of restrictive financial policies adopted by the main governments which either cut special incentives or made it more difficult to access credit for onshore wind projects.
Considerable inconsistencies between the various business lines and large disparities between the different geographical areas. General recovery in demand for renewables.
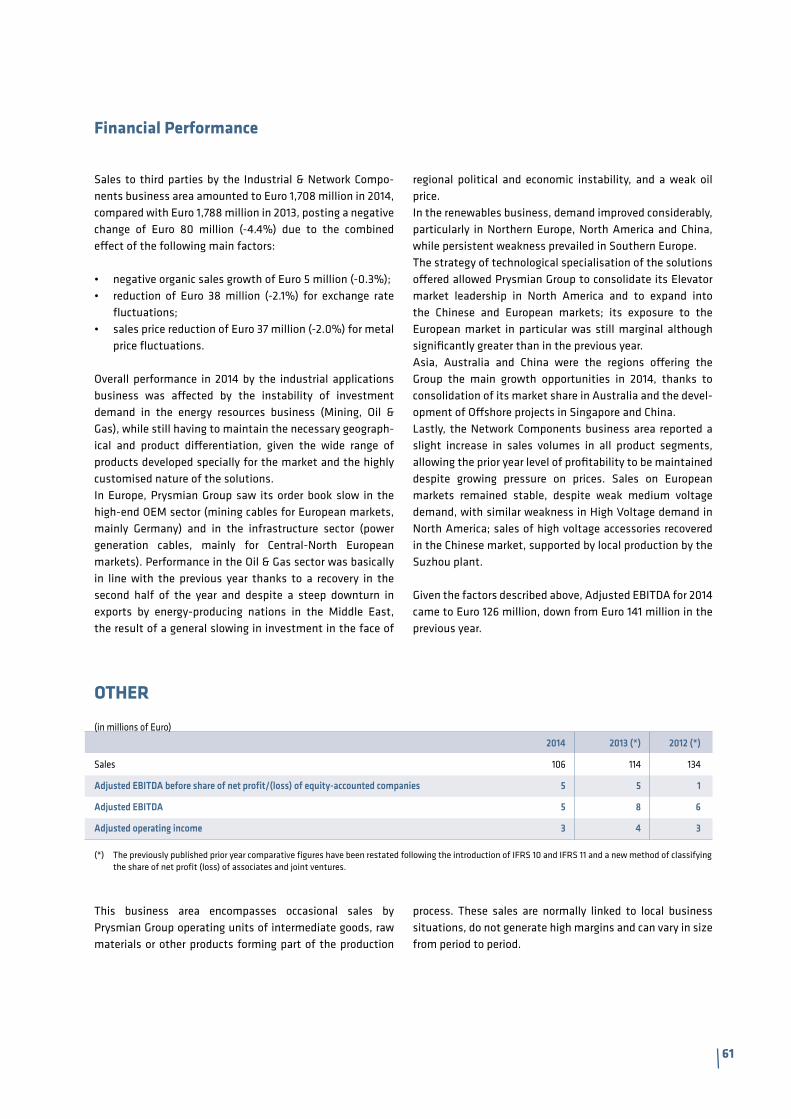
61
Financial Performance
Sales to third parties by the Industrial & Network Compo-nents business area amounted to Euro 1,708 million in 2014, compared with Euro 1,788 million in 2013, posting a negative change of Euro 80 million (-4.4%) due to the combined effect of the following main factors:
• negative organic sales growth of Euro 5 million (-0.3%);• reduction of Euro 38 million (-2.1%) for exchange rate
fluctuations;• sales price reduction of Euro 37 million (-2.0%) for metal
price fluctuations.
Overall performance in 2014 by the industrial applications business was affected by the instability of investment demand in the energy resources business (Mining, Oil & Gas), while still having to maintain the necessary geograph-ical and product differentiation, given the wide range of products developed specially for the market and the highly customised nature of the solutions. In Europe, Prysmian Group saw its order book slow in the high-end OEM sector (mining cables for European markets, mainly Germany) and in the infrastructure sector (power generation cables, mainly for Central-North European markets). Performance in the Oil & Gas sector was basically in line with the previous year thanks to a recovery in the second half of the year and despite a steep downturn in exports by energy-producing nations in the Middle East, the result of a general slowing in investment in the face of
regional political and economic instability, and a weak oil price.In the renewables business, demand improved considerably, particularly in Northern Europe, North America and China, while persistent weakness prevailed in Southern Europe.The strategy of technological specialisation of the solutions offered allowed Prysmian Group to consolidate its Elevator market leadership in North America and to expand into the Chinese and European markets; its exposure to the European market in particular was still marginal although significantly greater than in the previous year.Asia, Australia and China were the regions offering the Group the main growth opportunities in 2014, thanks to consolidation of its market share in Australia and the devel-opment of Offshore projects in Singapore and China.Lastly, the Network Components business area reported a slight increase in sales volumes in all product segments, allowing the prior year level of profitability to be maintained despite growing pressure on prices. Sales on European markets remained stable, despite weak medium voltage demand, with similar weakness in High Voltage demand in North America; sales of high voltage accessories recovered in the Chinese market, supported by local production by the Suzhou plant.
Given the factors described above, Adjusted EBITDA for 2014 came to Euro 126 million, down from Euro 141 million in the previous year.
2014 2013 (*) 2012 (*)
Sales 106 114 134
Adjusted EBITDA before share of net profit/(loss) of equity-accounted companies 5 5 1
Adjusted EBITDA 5 8 6
Adjusted operating income 3 4 3
This business area encompasses occasional sales by Prysmian Group operating units of intermediate goods, raw materials or other products forming part of the production
process. These sales are normally linked to local business situations, do not generate high margins and can vary in size from period to period.
(*) The previously published prior year comparative figures have been restated following the introduction of IFRS 10 and IFRS 11 and a new method of classifying the share of net profit (loss) of associates and joint ventures.
OTHER
(in millions of Euro)
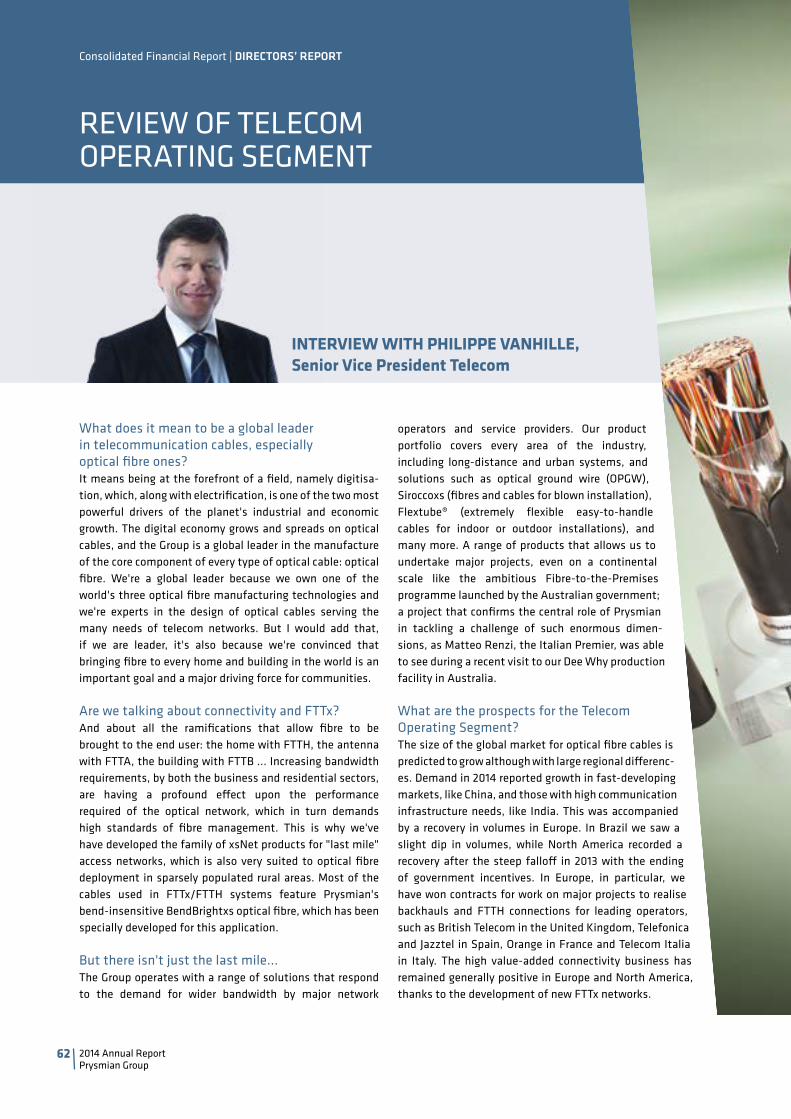
Consolidated Financial Report | DIRECTORS’ REPORT
2014 Annual Report Prysmian Group
62
Consolidated Financial Report | DIRECTORS’ REPORT
REVIEW OF TELECOM OPERATING SEGMENT
What does it mean to be a global leader in telecommunication cables, especially optical fibre ones?It means being at the forefront of a field, namely digitisa-tion, which, along with electrification, is one of the two most powerful drivers of the planet's industrial and economic growth. The digital economy grows and spreads on optical cables, and the Group is a global leader in the manufacture of the core component of every type of optical cable: optical fibre. We're a global leader because we own one of the world's three optical fibre manufacturing technologies and we're experts in the design of optical cables serving the many needs of telecom networks. But I would add that, if we are leader, it's also because we're convinced that bringing fibre to every home and building in the world is an important goal and a major driving force for communities.
Are we talking about connectivity and FTTx?And about all the ramifications that allow fibre to be brought to the end user: the home with FTTH, the antenna with FTTA, the building with FTTB ... Increasing bandwidth requirements, by both the business and residential sectors, are having a profound effect upon the performance required of the optical network, which in turn demands high standards of fibre management. This is why we've have developed the family of xsNet products for "last mile" access networks, which is also very suited to optical fibre deployment in sparsely populated rural areas. Most of the cables used in FTTx/FTTH systems feature Prysmian's bend-insensitive BendBrightxs optical fibre, which has been specially developed for this application.
But there isn't just the last mile...The Group operates with a range of solutions that respond to the demand for wider bandwidth by major network
INTERVIEW WITH PHILIPPE VANHILLE, Senior Vice President Telecom
operators and service providers. Our product portfolio covers every area of the industry, including long-distance and urban systems, and solutions such as optical ground wire (OPGW), Siroccoxs (fibres and cables for blown installation), Flextube® (extremely flexible easy-to-handle cables for indoor or outdoor installations), and many more. A range of products that allows us to undertake major projects, even on a continental scale like the ambitious Fibre-to-the-Premises programme launched by the Australian government; a project that confirms the central role of Prysmian in tackling a challenge of such enormous dimen-sions, as Matteo Renzi, the Italian Premier, was able to see during a recent visit to our Dee Why production facility in Australia.
What are the prospects for the Telecom Operating Segment?The size of the global market for optical fibre cables is predicted to grow although with large regional differenc-es. Demand in 2014 reported growth in fast-developing markets, like China, and those with high communication infrastructure needs, like India. This was accompanied by a recovery in volumes in Europe. In Brazil we saw a slight dip in volumes, while North America recorded a recovery after the steep falloff in 2013 with the ending of government incentives. In Europe, in particular, we have won contracts for work on major projects to realise backhauls and FTTH connections for leading operators, such as British Telecom in the United Kingdom, Telefonica and Jazztel in Spain, Orange in France and Telecom Italia in Italy. The high value-added connectivity business has remained generally positive in Europe and North America, thanks to the development of new FTTx networks.

63
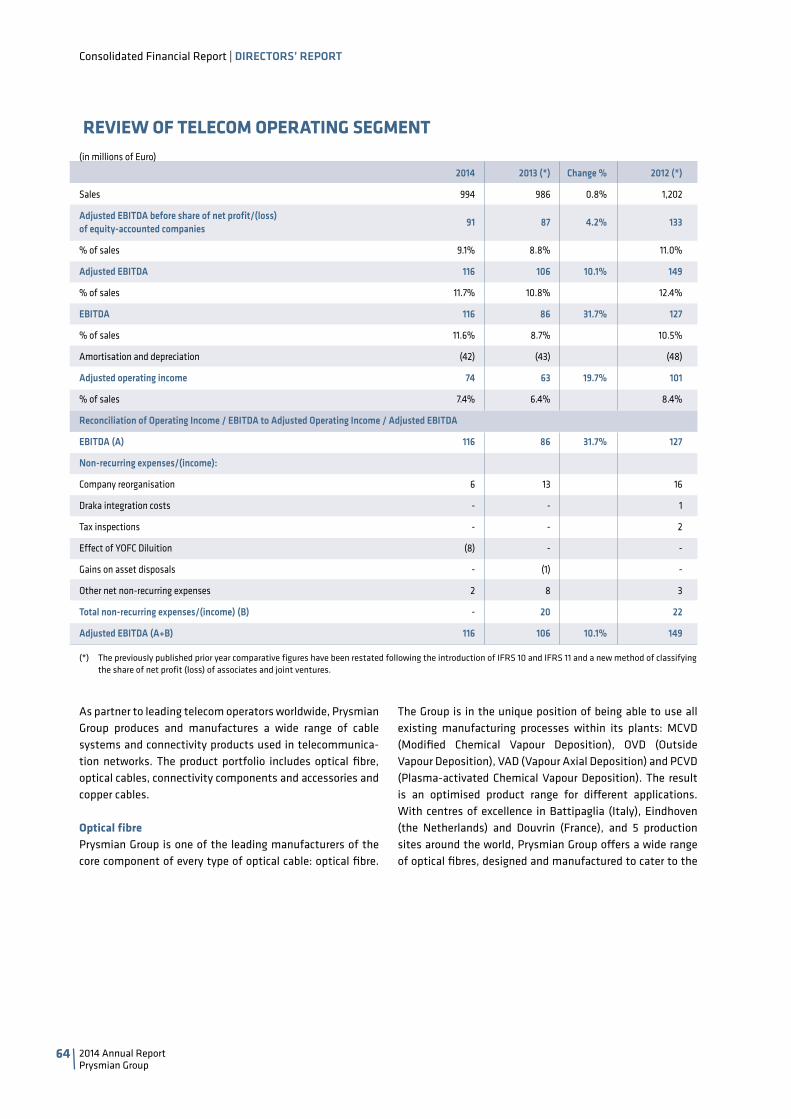
Consolidated Financial Report | DIRECTORS’ REPORT
2014 Annual Report Prysmian Group
64
2014 2013 (*) Change % 2012 (*)
Sales 994 986 0.8% 1,202
Adjusted EBITDA before share of net profit/(loss) of equity-accounted companies 91 87 4.2% 133
% of sales 9.1% 8.8% 11.0%
Adjusted EBITDA 116 106 10.1% 149
% of sales 11.7% 10.8% 12.4%
EBITDA 116 86 31.7% 127
% of sales 11.6% 8.7% 10.5%
Amortisation and depreciation (42) (43) (48)
Adjusted operating income 74 63 19.7% 101
% of sales 7.4% 6.4% 8.4%
Reconciliation of Operating Income / EBITDA to Adjusted Operating Income / Adjusted EBITDA
EBITDA (A) 116 86 31.7% 127
Non-recurring expenses/(income):
Company reorganisation 6 13 16
Draka integration costs - - 1
Tax inspections - - 2
Effect of YOFC Diluition (8) - -
Gains on asset disposals - (1) -
Other net non-recurring expenses 2 8 3
Total non-recurring expenses/(income) (B) - 20 22
Adjusted EBITDA (A+B) 116 106 10.1% 149
(*) The previously published prior year comparative figures have been restated following the introduction of IFRS 10 and IFRS 11 and a new method of classifying the share of net profit (loss) of associates and joint ventures.
As partner to leading telecom operators worldwide, Prysmian Group produces and manufactures a wide range of cable systems and connectivity products used in telecommunica-tion networks. The product portfolio includes optical fibre, optical cables, connectivity components and accessories and copper cables.
Optical fibrePrysmian Group is one of the leading manufacturers of the core component of every type of optical cable: optical fibre.
The Group is in the unique position of being able to use all existing manufacturing processes within its plants: MCVD (Modified Chemical Vapour Deposition), OVD (Outside Vapour Deposition), VAD (Vapour Axial Deposition) and PCVD (Plasma-activated Chemical Vapour Deposition). The result is an optimised product range for different applications. With centres of excellence in Battipaglia (Italy), Eindhoven (the Netherlands) and Douvrin (France), and 5 production sites around the world, Prysmian Group offers a wide range of optical fibres, designed and manufactured to cater to the
REVIEW OF TELECOM OPERATING SEGMENT (in millions of Euro)

65
broadest possible spectrum of customer applications, such as single-mode, multimode and specialty fibres.
Optical cablesOptical fibres are employed in the production of standard optical cables or those specially designed for challenging or inaccessible environments. The optical cables, constructed using just a single fibre or up to as many as 1,728 fibres, can be pulled (or blown) into ducts, buried directly underground or suspended on overhead devices such as telegraph poles or electricity pylons. Cables are also installed in road and rail tunnels, gas and sewerage networks and inside various buildings where they must satisfy specific fire-resistant requirements. Prysmian Group operates in the telecommu-nications market with a wide range of cable solutions and systems that respond to the demand for wider bandwidth by major network operators and service providers. The product portfolio covers every area of the industry, including long-distance and urban systems, and solutions such as optical ground wire (OPGW), Rapier (easy break-out), Siroccoxs (fibres and cables for blown installation), Flextube® (extremely flexible easy-to-handle cables for indoor or outdoor installations), Airbag (dielectric direct buried cable) and many more.
ConnectivityWhether deployed in outdoor or indoor applications, Prysmian Group's OAsys connectivity solutions are designed for versatility, covering all cable management needs whatever the network type.These include aerial and underground installations, as well as cabling in central offices (or exchanges) or customer premises. Prysmian Group has been designing, developing and making cable and fibre management products for more than two decades and is at the forefront of designing next-generation products specifically for Fibre-To-The-Home (FTTH) networks.
FTTxIncreasing bandwidth requirements, by both business and residential customers, are having a profound effect upon the
optical network performance level required, which in turn demands high standards of fibre management. Optimal fibre management in every section of the network is increasingly a matter of priority in order to minimise power loss and overcome the problems caused by ever greater space limita-tions. The Group has developed the suite of xsNet products for "last mile" access networks, which is also very suited to optical fibre deployment in sparsely populated rural areas. Most of the cables used in FTTx/FTTH systems feature Prysmian's bend-insensitive BendBrightxs optical fibre, which has been specially developed for this application.
FTTA (Fibre-To-The-Antenna)xsMobile, which offers Fibre-To-The-Antenna (FTTA) solutions, is an extensive passive portfolio which enables mobile operators to upgrade their networks easily and quickly. Incorporating Prysmian's experience in Fibre-to-the-Home (FTTH) and its unique fibre innovations, xsMobile consists of different product solutions for three applications: antenna towers, roof-top antennas and Distributed Antenna Systems (DAS) for small cell deployment. The technology offers three access types for outdoor and indoor FTTA de-ployment, as well as backhaul solutions – incorporating the latest fibre technologies.
Copper cablesPrysmian Group also produces a wide range of copper cables for underground and overhead cabling solutions and for both residential and commercial buildings. The product portfolio comprises cables of different capacity, including broadband xDSL cables and those designed for high transmission, low interference and electromagnetic compatibility.
Multimedia SolutionsThe Group produces cable solutions for a variety of appli-cations serving communication needs in infrastructure, industry and transport: cables for television and film studios, cables for rail networks such as underground cables for long-distance telecommunications, light-signalling cables and cables for track switching devices, as well as cables for mobile telecommunications antennae and for data centres.
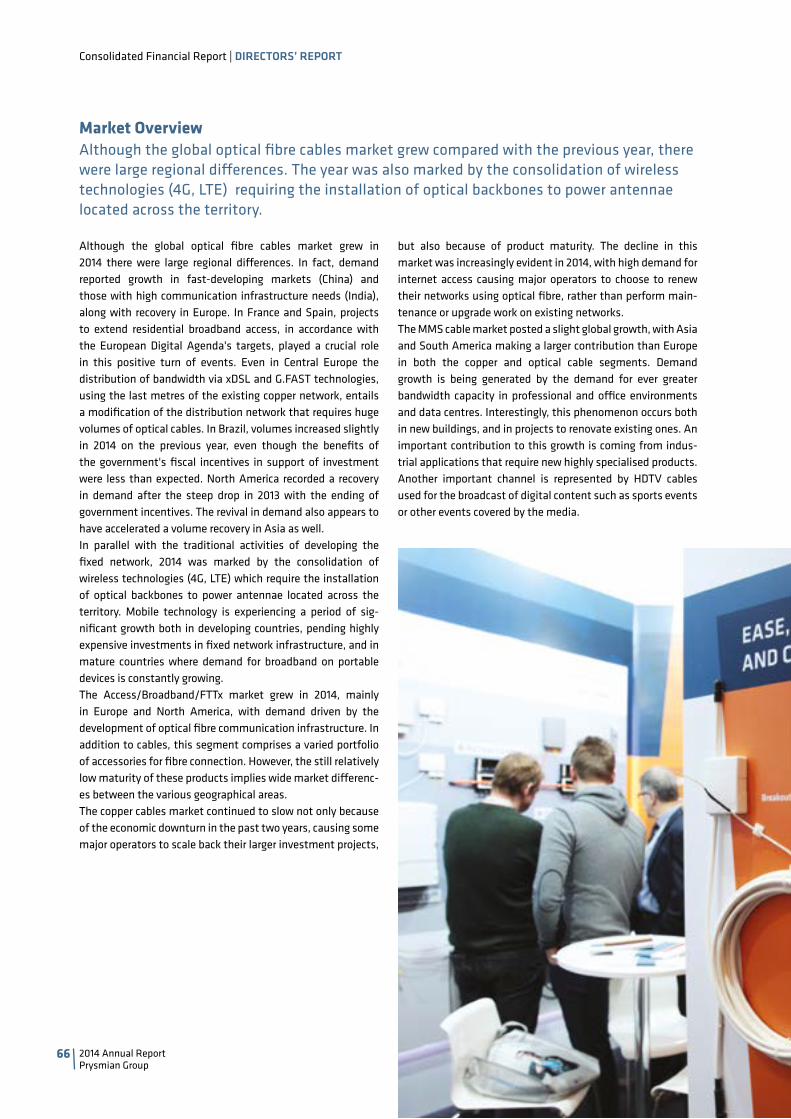
Consolidated Financial Report | DIRECTORS’ REPORT
2014 Annual Report Prysmian Group
66
Market Overview
Although the global optical fibre cables market grew in 2014 there were large regional differences. In fact, demand reported growth in fast-developing markets (China) and those with high communication infrastructure needs (India), along with recovery in Europe. In France and Spain, projects to extend residential broadband access, in accordance with the European Digital Agenda's targets, played a crucial role in this positive turn of events. Even in Central Europe the distribution of bandwidth via xDSL and G.FAST technologies, using the last metres of the existing copper network, entails a modification of the distribution network that requires huge volumes of optical cables. In Brazil, volumes increased slightly in 2014 on the previous year, even though the benefits of the government's fiscal incentives in support of investment were less than expected. North America recorded a recovery in demand after the steep drop in 2013 with the ending of government incentives. The revival in demand also appears to have accelerated a volume recovery in Asia as well.In parallel with the traditional activities of developing the fixed network, 2014 was marked by the consolidation of wireless technologies (4G, LTE) which require the installation of optical backbones to power antennae located across the territory. Mobile technology is experiencing a period of sig-nificant growth both in developing countries, pending highly expensive investments in fixed network infrastructure, and in mature countries where demand for broadband on portable devices is constantly growing.The Access/Broadband/FTTx market grew in 2014, mainly in Europe and North America, with demand driven by the development of optical fibre communication infrastructure. In addition to cables, this segment comprises a varied portfolio of accessories for fibre connection. However, the still relatively low maturity of these products implies wide market differenc-es between the various geographical areas.The copper cables market continued to slow not only because of the economic downturn in the past two years, causing some major operators to scale back their larger investment projects,
but also because of product maturity. The decline in this market was increasingly evident in 2014, with high demand for internet access causing major operators to choose to renew their networks using optical fibre, rather than perform main-tenance or upgrade work on existing networks. The MMS cable market posted a slight global growth, with Asia and South America making a larger contribution than Europe in both the copper and optical cable segments. Demand growth is being generated by the demand for ever greater bandwidth capacity in professional and office environments and data centres. Interestingly, this phenomenon occurs both in new buildings, and in projects to renovate existing ones. An important contribution to this growth is coming from indus-trial applications that require new highly specialised products. Another important channel is represented by HDTV cables used for the broadcast of digital content such as sports events or other events covered by the media.
Although the global optical fibre cables market grew compared with the previous year, there were large regional differences. The year was also marked by the consolidation of wireless technologies (4G, LTE) requiring the installation of optical backbones to power antennae located across the territory.

67
Financial Performance
Sales to third parties by the Telecom operating segment amounted to Euro 994 million in 2014, compared with Euro 986 million in 2013, posting a positive change of Euro 8 million (+0.8%).
This change is attributable to the following factors:• organic sales growth of Euro 40 million (+4.0%), thanks
to volume recovery for optical fibre cables;• reduction of Euro 26 million (-2.6%) for exchange rate
fluctuations;• sales price reduction of Euro 6 million (-0.6%) for metal
price fluctuations.
The organic growth in sales in 2014 was mainly driven by the recovery in demand for optical fibre cable, which offset lower demand for copper cables and OPGW products, in turn due to the postponement of investment projects in areas affected by geopolitical turmoil, such as Iraq and Libya. Optical cables enjoyed a strong upsurge in demand in all the major markets, while the general price pressure seen in the first part of the year seemed to have stabilised, also
thanks to US dollar appreciation. In Europe, in particular, the Group won contracts for work on major projects to realise backbones and FTTH connections for leading operators, such as British Telecom in the United Kingdom, Telefonica and Jazztel in Spain, Orange in France and Telecom Italia in Italy. Even North America displayed a recovery in domestic demand during the year mainly involving development of 4G LTE infrastructure and new FTTx networks. In South America government tax measures in support of investment did not bring any significant improvements in 2014. Lastly, the Asia Pacific region saw work resume on the NBN project in Australia and demand follow a positive trend in Singapore. The Multimedia Solutions business posted a recovery in profitability thanks to the strategy of focusing on higher value-added products, such as data centres in Europe, and of rationalising its presence in lower margin businesses.The high value-added connectivity business enjoyed a positive trend, thanks to the development of new FTTx networks (for last mile broadband access) in Europe and North America.Lastly, copper cables continued their steady decline due to the retirement of traditional networks in favour of next-generation ones.Adjusted EBITDA for 2014 came to Euro 116 million, reporting an increase of Euro 10 million (+10.1%) from Euro 106 million in 2013, also thanks to the contribution of Yangtze Optical Fibre and Cable Joint Stock Limited Company in China.

Consolidated Financial Report | DIRECTORS’ REPORT
2014 Annual Report Prysmian Group
68
Consolidated Financial Report | DIRECTORS’ REPORT
GROUP STATEMENT OF FINANCIAL POSITION
31 December 31 December Change 31 December 2014 2013 (*) 2012 (*)
Net fixed assets 2,219 2,207 12 2,301
Net working capital 407 386 21 433
Provisions (281) (297) 16 (355)
Net capital employed 2,345 2,296 49 2,379
Employee benefit obligations 360 308 52 344
Total equity 1,183 1,183 - 1,147
of which attributable to non-controlling interests 33 36 (3) 35
Net financial position 802 805 (3) 888
Total equity and sources of funds 2,345 2,296 49 2,379
31 December 31 December Change 31 December 2014 2013 (*) 2012 (*)
Property, plant and equipment 1,414 1,390 24 1,484
Intangible assets 561 588 (27) 608
Equity-accounted investments 225 205 20 193
Available-for-sale financial assets 12 12 - 12
Assets held for sale 7 12 (5) 4
Net fixed assets 2,219 2,207 12 2,301
(*) The previously published prior year comparative figures have been restated following the introduction of IFRS 10 and IFRS 11.
RECLASSIFIED STATEMENT OF FINANCIAL POSITION
(*) The previously published prior year comparative figures have been restated following the introduction of IFRS 10 and IFRS 11.
NET FIXED ASSETS
Net fixed assets amounted to Euro 2,219 million at 31 December 2014, compared with Euro 2,207 million at 31 December 2013, posting an increase of Euro 12 million mainly due to the combined effect of the following factors:• Euro 163 million in investments in property, plant and
equipment and intangible assets;• Euro 188 million in depreciation, amortisation and impair-
ment charges and reversals for the year;• Euro 20 million for the net increase in equity-accounted
investments. This increase mainly consists of Euro 43 million for the share of net profit/(loss) of equity-account-ed companies, net of Euro 36 million in dividend receipts, and Euro 8 million as the positive effect of the share dilution relating to Yangtze Optical Fibre and Cable Joint Stock Limited Company;
• Euro 6 million in disposals of assets held for sale;• Euro 24 million in positive currency translation differences.
(in millions of Euro)
(in millions of Euro)

69
31 December 31 December Change 31 December 2014 2013 (*) 2012 (*)
Inventories 981 881 100 866
Trade receivables 952 933 19 1,083
Trade payables (1,415) (1,409) (6) (1,416)
Other receivables/(payables) (95) (13) (82) (93)
Net operating working capital 423 392 31 440
Derivatives (16) (6) (10) (7)
Net working capital 407 386 21 433
NET WORKING CAPITAL
The following table analyses the main components of net working capital:
(*) The previously published prior year comparative figures have been restated following the introduction of IFRS 10 and IFRS 11.
Net working capital of Euro 407 million at 31 December 2014 was Euro 21 million higher than the corresponding figure of Euro 386 million at 31 December 2013, or Euro 32 million higher excluding the impact of the fair value change in derivatives. Net operating working capital amounted to Euro 423 million (5.8% of sales) at 31 December 2014, compared with Euro 392 million (5.8% of sales) at 31 December 2013, and was affected by the following factors:
• a significant reduction in working capital employed in multi-year Submarine projects, linked to their stage of completion with respect to contractual deadlines, and to
the delay and negative economic impact of the Western HVDC Link project;
• an increase following payment of the 2011-2013 long-term incentive plan, classified among payables to employees at 31 December 2013;
• an increase in the level of the level of inventories of finished goods, semi-finished products and raw materials in view of the expectation of growing volumes during the year, which it had not been possible to fully absorb by year end;
• a reduction of Euro 28 million in without-recourse factoring transactions;
• an increase of Euro 13 million for exchange rate differences.
(in millions of Euro)

Consolidated Financial Report | DIRECTORS’ REPORT
2014 Annual Report Prysmian Group
70
EQUITY
The following table reconciles the Group's equity and net profit/(loss) for 2014 with the corresponding figures reported by Prysmian S.p.A., the Parent Company.
Equity Net profit/ Equity Net profit/ 31 December (loss) for 31 December (loss) for 2014 2014 2013 (*) 2013 (*)
Parent Company Financial Statements 1,107 192 1,021 184
Share of equity and net profit of consolidated subsidiaries, net of the carrying amount of the related investments
97 139 188 189
Reversal of dividends distributed to the Parent Company by consolidated subsidiaries
- (221) - (220)
Deferred taxes on earnings/reserves distributable by subsidiaries (14) 5 (19) (1)
Elimination of intercompany profits and losses included in inventories
(7) - (7) 1
Net effect of other consolidation journals - - - -
Non-controlling interests (33) - (36) (4)
Consolidated Financial Statements 1,150 115 1,147 149
(*) The previously published prior year comparative figures have been restated following the introduction of IFRS 10 and IFRS 11.
(in millions of Euro)

71
31 December 31 December Change 31 December 2014 2013 (*) 2012 (*)
Long-term financial payables
- Term Loan Facility 2011 400 400 - 947
- Bank fees (2) (3) 1 (11)
EIB Loan 92 - 92 -
Non-convertible bond - 399 (399) 398
Convertible bond 271 263 8 -
Derivatives 3 4 (1) 35
Other financial payables 56 60 (4) 94
Total long-term financial payables 820 1,123 (303) 1,463
Short-term financial payables
- Term Loan Facility 2010 - 183 (183) 124
- Revolving Facility - 3 (3) 4
- Revolving Credit Facility 2014 in pool - - - -
EIB Loan 9 - 9 -
Non-convertible bond 415 15 400 15
Convertible bond 1 1 - -
Securitization - - - 75
Revolving facility 2014 30 - 30 -
Derivatives 8 19 (11) 7
Other financial payables 113 90 24 93
Total short-term financial payables 576 311 265 318
Total financial liabilities 1,396 1,434 (38) 1,781
Long-term financial receivables 2 4 (2) 9
Long-term bank fees 5 - 5 4
Short-term derivatives 5 5 - 3
Short-term financial receivables 9 12 (3) 7
Short-term bank fees 3 5 (2) 5
Financial assets held for trading 76 93 (17) 78
Cash and cash equivalents 494 510 (16) 787
Total financial assets 594 629 (35) 893
Net financial position 802 805 (3) 888
NET FINANCIAL POSITION
(*) The previously published prior year comparative figures have been restated following the introduction of IFRS 10 and IFRS 11.
The following table provides a detailed breakdown of the net financial position:
(in millions of Euro)

Consolidated Financial Report | DIRECTORS’ REPORT
2014 Annual Report Prysmian Group
72
The net financial position of Euro 802 million at 31 December 2014 has decreased by Euro 3 million from Euro 805 million at 31 December 2013. The main factors affecting the year-end balance were:
• generation of Euro 400 million in cash from operating activities (before changes in net working capital);
• substantial stability in net working capital (increase of Euro 1 million);
• payment of Euro 72 million in taxes;• receipt of Euro 36 million in dividends from investments
in equity-accounted companies, up from the previous year following the extraordinary dividend of Euro 21 million distributed by Yangtze Optical Fibre and Cable Joint Stock Limited Company;
• net receipt of Euro 9 million from business combinations (comprising the net receipt of Euro 15 million upon com-pleting the purchase price adjustment process for the acquisition of Global Marine Systems Energy Ltd, and the payment of Euro 6 million to acquire the remaining 34% of the subsidiary AS Draka Keila Cables);
• net operating investments of Euro 155 million;• payment of Euro 110 million in net finance costs;• payment of Euro 90 million in dividends;• purchase of treasury shares for Euro 20 million.
More details about the change in net financial position can be found in the subsequent comments accompanying the statement of cash flows.
2014 2013 (*) Change 2012 (*)
EBITDA 496 563 (67) 549
Changes in provisions (including employee benefit obligations) (23) (69) 46 13
(Gains)/losses on disposal of property, plant and equipment, intangible assets and non-current assets
(8) (7) (1) (14)
Share of net profit/(loss) of equity-accounted companies (43) (35) (8) (31)
Acquisition price adjustment (1) (22) - (22) -
Net cash flow provided by operating activities (before changes in net working capital) 400 452 (52) 517
Changes in net working capital (1) (6) 5 69
Taxes paid (72) (60) (12) (72)
Dividends from investments in equity-accounted companies 36 16 20 16
Net cash flow provided/(used) by operating activities 363 402 (39) 530
Acquisitions 9 - 9 (86)
Net cash flow used in operational investing activities (155) (107) (48) (129)
Free cash flow (unlevered) 217 295 (78) 317
Net finance costs (110) (124) 14 (126)
Free cash flow (levered) 107 171 (64) 191
Increases in share capital and other changes in equity (20) - (20) 1
Dividend distribution (90) (92) 2 (44)
Net cash flow provided/(used) in the year (3) 79 (82) 148
Opening net financial position (805) (888) 83 (1.026)
Net cash flow provided/(used) in the year (3) 79 (82) 148
Convertible bond equity component - 39 (39) -
Other changes 6 (35) 41 (10)
Closing net financial position (802) (805) 3 (888)
STATEMENT OF CASH FLOWS
(*) The previously published prior year comparative figures have been restated following the introduction of IFRS 10 and IFRS 11 and a new method of classifying the share of net profit (loss) of associates and joint ventures.
(1) This refers to the acquisition in November 2012 of Global Marine Systems Energy Ltd (now renamed Prysmian PowerLink Services Ltd) from Global Marine Systems Ltd.
(in milions of Euro)

73
Net cash flow provided by operating activities (before changes in net working capital) amounted to Euro 400 million at the end of 2014. The increase of Euro 1 million in working capital described earlier absorbed only a small part of the above cash flow. After Euro 72 million in tax payments and Euro 36 million in dividend receipts, net cash flow from operating activities in the year was therefore a positive Euro 363 million.
Net operating investments in 2014 amounted to Euro 155 million; investments by the Energy Products segment mainly referred to the conversion of the cable ship owned by Prysmian PowerLink Services Ltd to allow it to perform different types of installation work according to customer needs, to the purchase of the Pikkala site in Finland, and
to production capacity increases at the Arco Felice plant in Naples and the Drammen plant in Norway for the realisa-tion of the Exxon Mobile and Baltic 2 submarine projects; expenditure by the Energy Products segment was mainly to increase production capacity at the Abbeville plant in the United States to cope with the growth in local demand for the E&I business, while expenditure by the Telecom segment was mostly to increase production capacity at the Sorocaba plant in Brazil for the construction of preforms needed in optical fibre manufacturing.
A total of Euro 110 million in net finance costs and Euro 90 million in dividends were also paid during the year, while Euro 20 million was spent on purchasing treasury shares.

Consolidated Financial Report | DIRECTORS’ REPORT
2014 Annual Report Prysmian Group
74
Consolidated Financial Report | DIRECTORS’ REPORT
ALTERNATIVE PERFORMANCE INDICATORS
In addition to the standard financial reporting formats and indicators required under IFRS, this document contains a number of reclassified statements and alternative per-formance indicators. The purpose is to help users better evaluate the Group's economic and financial performance. However, these statements and indicators should not be treated as a substitute for the standard ones required by IFRS.The alternative indicators used for reviewing the income statement include:
• Adjusted net profit/(loss): net profit/(loss) before non-recurring income and expenses, the fair value change in metal derivatives and in other fair value items, the effect of currency and interest rate derivatives, exchange rate differences, non-monetary interest on the convertible bond and the related tax effects;
• Adjusted operating income: operating income before non-recurring income and expenses and the fair value change in metal derivatives and in other fair value items, as reported in the consolidated income statement. The purpose of this indicator is to present the Group's operating profitability without the effects of events considered to be outside its recurring operations;
• EBITDA: operating income before the fair value change in metal price derivatives and in other fair value items and before amortisation, depreciation and impairment. The purpose of this indicator is to present the Group's operating profitability before the main non-monetary items;
• Adjusted EBITDA: EBITDA as defined above calculated before non-recurring income and expenses, as reported in the consolidated income statement. The purpose of this indicator is to present the Group's operating prof-itability before the main non-monetary items, without the effects of events considered to be outside the Group's recurring operations;
• Adjusted EBITDA before share of net profit/(loss) of equity-accounted companies: Adjusted EBITDA as defined above calculated before the share of net profit/(loss) of equity-accounted companies;
• Organic growth: growth in sales calculated net of changes in the scope of consolidation, changes in metal prices and exchange rate effects.
The alternative indicators used for reviewing the reclassified statement of financial position include:
• Net fixed assets: sum of the following items contained in the statement of financial position:- Intangible assets- Property, plant and equipment- Equity-accounted investments- Available-for-sale financial assets, net of non-current
securities classified as long-term financial receivables in the net financial position
• Net working capital: sum of the following items contained in the statement of financial position:- Inventories- Trade receivables- Trade payables- Other non-current receivables and payables, net of
long-term financial receivables classified in the net financial position
75
- Other current receivables and payables, net of short-term financial receivables classified in the net financial position
- Derivatives net of financial instruments for hedging interest rate and currency risks relating to financial transactions, classified in the net financial position
- Current tax payables• Net operating working capital: sum of the following
items contained in the statement of financial position:- Inventories- Trade receivables- Trade payables- Other non-current receivables and payables, net of
long-term financial receivables classified in the net financial position
- Other current receivables and payables, net of short-term financial receivables classified in the net financial position
- Current tax payables
• Provisions: sum of the following items contained in the statement of financial position:- Provisions for risks and charges – current portion- Provisions for risks and charges – non-current portion- Provisions for deferred tax liabilities- Deferred tax assets
• Net capital employed: sum of Net fixed assets, Net working capital and Provisions.
• Employee benefit obligations and Total equity: these indicators correspond to Employee benefit obligations and Total equity reported in the statement of financial position.
• Net financial position: sum of the following items:- Borrowings from banks and other lenders - non-cur-
rent portion- Borrowings from banks and other lenders - current
portion- Derivatives for financial transactions recorded
as Non-current derivatives and classified under Long-term financial receivables
- Derivatives for financial transactions recorded as Current derivatives and classified under Short-term financial receivables
- Derivatives for financial transactions recorded as Non-current derivatives and classified under Long-term financial payables
- Derivatives for financial transactions recorded as Current derivatives and classified under Short-term financial payables
- Medium/long-term financial receivables recorded in Other non-current receivables
- Bank fees on loans recorded in Other non-current receivables
- Short-term financial receivables recorded in Other current receivables
- Bank fees on loans recorded in Other current receiv-ables
- Short/long-term available-for-sale financial assets, not instrumental to the Group's activities
- Financial assets held for trading- Cash and cash equivalents.

Consolidated Financial Report | DIRECTORS’ REPORT
2014 Annual Report Prysmian Group
76
31 December 2014 31 December 2013 (*) Note Partial amounts Total amounts Partial amounts Total amounts from financial from financial from financial from financial statements statements statements statements
Net fixed assets
Property, plant and equipment 1,414 1,390
Intangible assets 561 588
Equity-accounted investments 225 205
Available-for-sale financial assets 12 12
Assets held for sale 7 12
Total net fixed assets A 2,219 2,207
Net working capital
Inventories B 981 881
Trade receivables C 952 933
Trade payables D (1,415) (1,409)
Other receivables/payables - net E (95) (13)
of which:
Other receivables - non-current 5 20 24
Tax receivables 5 14 13
Receivables from employees 5 2 2
Other 5 4 9
Other receivables - current 5 754 705
Tax receivables 5 157 109
Receivables from employees and pension plans 5 5 5
Advances to suppliers 5 19 17
Other 5 126 99
Construction contracts 5 447 475
Other payables - non-current 13 (13) (20)
Tax and social security payables 13 (7) (12)
Accrued expenses 13 - (3)
Other 13 (6) (5)
Other payables - current 13 (827) (688)
Tax and social security payables 13 (144) (99)
Advances from customers 13 (381) (241)
Payables to employees 13 (64) (98)
Accrued expenses 13 (100) (136)
Other 13 (138) (114)
Current tax payables (29) (34)
Total net operating working capital F = B+C+D+E 423 392
Derivatives G (16) (6)
of which:
Forward currency contracts on commercial transactions (cash flow hedges) - non current 8 (2) -
Forward currency contracts on commercial transactions (cash flow hedges) - current 8 (7) 1
Forward currency contracts on commercial transactions - current 8 (2) 6
Metal derivatives - non-current 8 1 (1)
Metal derivatives - current 8 (6) (12)
Total net working capital H = F+G 407 386
RECONCILIATION BETWEEN THE RECLASSIFIED STATEMENT OF FINANCIAL POSITION PRESENTED IN THE DIRECTORS' REPORT AND THE STATEMENT OF FINANCIAL POSITION CONTAINED IN THE CONSOLIDATED FINANCIAL STATEMENTS AND EXPLANATORY NOTES AT 31 DECEMBER 2014
(*) The previously published prior year comparative figures have been restated following the introduction of IFRS 10 and IFRS 11.
(in millions of Euro)

77
31 December 2014 31 December 2013 (*) Note Partial amounts Total amounts Partial amounts Total amounts from financial from financial from financial from financial statements statements statements statementsProvisions for risks and charges - non-current 14 (74) (51)Provisions for risks and charges - current 14 (269) (279)Deferred tax assets 16 115 130 Deferred tax liabilities 16 (53) (97)Total provisions I (281) (297) Net capital employed L = A+H+I 2,345 2,296 Employee benefit obligations M 15 360 308 Total equity N 11 1,183 1,183
Equity attributable to non-controlling interests 33 36 Net financial position Total long-term financial payables O 820 1,123 Term loan facility 12 400 400 Bank fees 12 (2) (3) Credit Agreements 12 398 397 EIB Loan 12 92 - Non-convertible bond 12 - 399 Convertible bond 12 271 263 Derivatives 3 4 of which:
Interest rate swaps 8 3 4 Other payables 56 60 of which:
Finance lease obligations 12 16 15 Other financial payables 12 40 45
Total short-term financial payables P 576 311 Term loan facility 12 - 184 Bank fees 12 - (1) EIB Loan 12 9 - Non-convertible bond 12 415 15 Convertible bond 12 1 1 Revolving Credit Facility 2011 12 - 3 Revolving Credit Facility 2014 12 30 - Derivatives 8 19 of which:
Interest rate swaps 8 - 14 Forward currency contracts on financial transactions 8 8 5
Other payables 113 90 of which:
Finance lease obligations 12 2 2 Other financial payables 12 111 88
Total financial liabilities Q = O+P 1,396 1,434 Long-term financial receivables R 5 (2) (4) Long-term bank fees R 5 (5) - Short-term financial receivables R 5 (9) (12) Short-term derivatives R (5) (5) of which:
Forward currency contracts on financial transactions (current) 8 (5) (5) Short-term bank fees R 5 (3) (5) Available-for-sale financial assets (current) S - - Financial assets held for trading T (76) (93)Cash and cash equivalents U (494) (510)Total financial assets V = R+S+T+U (594) (629)Total net financial position W = Q+V 802 805 Total equity and sources of funds 2,345 2,296
(*) The previously published prior year comparative figures have been restated following the introduction of IFRS 10 and IFRS 11.
(in millions of Euro)
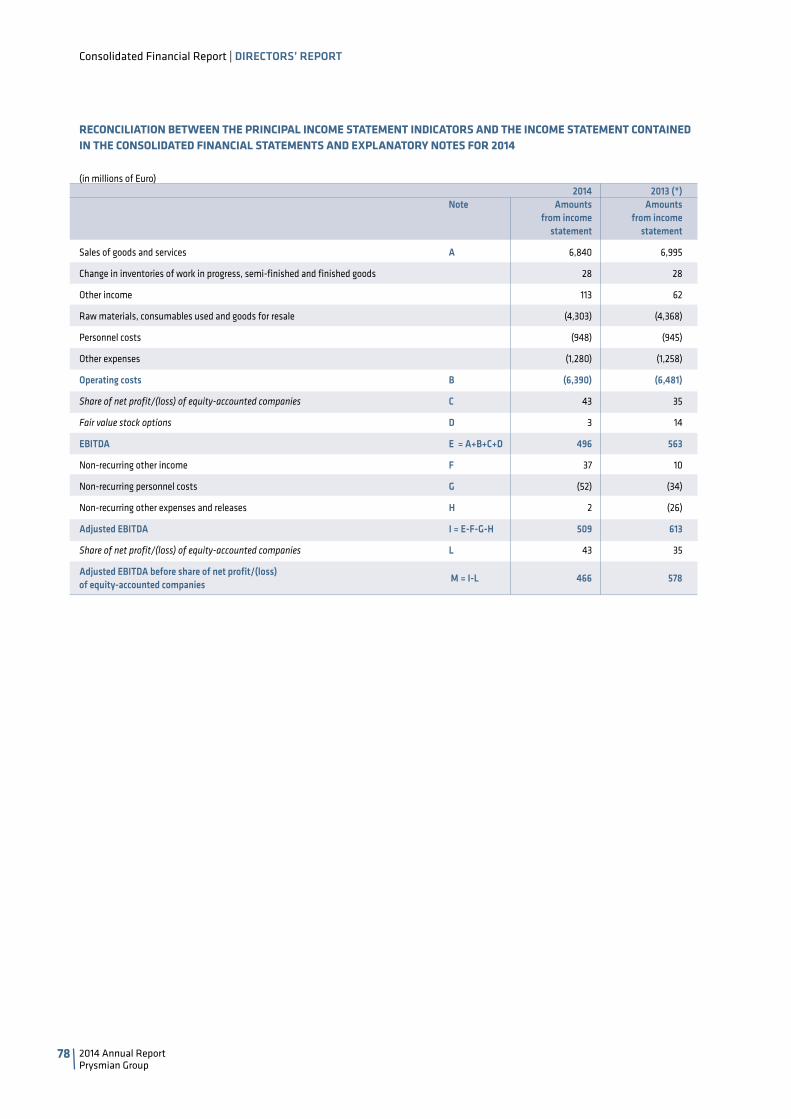
Consolidated Financial Report | DIRECTORS’ REPORT
2014 Annual Report Prysmian Group
78
2014 2013 (*) Note Amounts Amounts from income from income statement statement
Sales of goods and services A 6,840 6,995
Change in inventories of work in progress, semi-finished and finished goods 28 28
Other income 113 62
Raw materials, consumables used and goods for resale (4,303) (4,368)
Personnel costs (948) (945)
Other expenses (1,280) (1,258)
Operating costs B (6,390) (6,481)
Share of net profit/(loss) of equity-accounted companies C 43 35
Fair value stock options D 3 14
EBITDA E = A+B+C+D 496 563
Non-recurring other income F 37 10
Non-recurring personnel costs G (52) (34)
Non-recurring other expenses and releases H 2 (26)
Adjusted EBITDA I = E-F-G-H 509 613
Share of net profit/(loss) of equity-accounted companies L 43 35
Adjusted EBITDA before share of net profit/(loss) of equity-accounted companies M = I-L 466 578
RECONCILIATION BETWEEN THE PRINCIPAL INCOME STATEMENT INDICATORS AND THE INCOME STATEMENT CONTAINED IN THE CONSOLIDATED FINANCIAL STATEMENTS AND EXPLANATORY NOTES FOR 2014
(in millions of Euro)
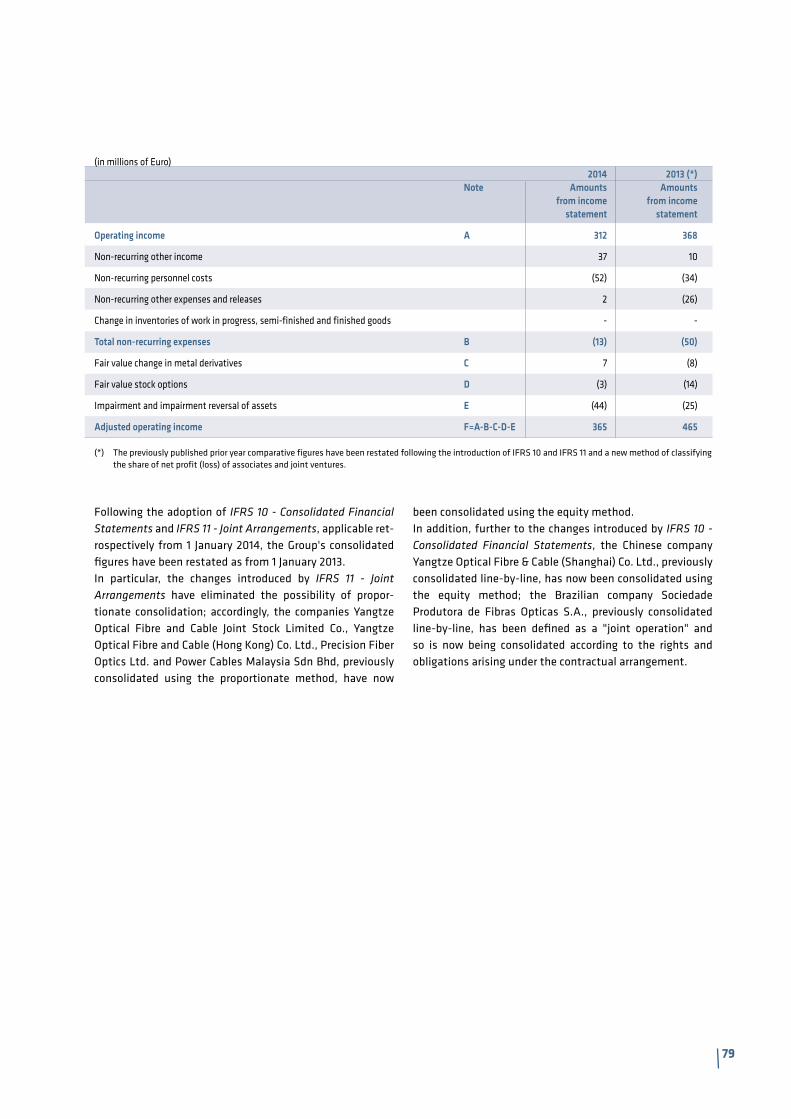
79
2014 2013 (*) Note Amounts Amounts from income from income statement statement
Operating income A 312 368
Non-recurring other income 37 10
Non-recurring personnel costs (52) (34)
Non-recurring other expenses and releases 2 (26)
Change in inventories of work in progress, semi-finished and finished goods - -
Total non-recurring expenses B (13) (50)
Fair value change in metal derivatives C 7 (8)
Fair value stock options D (3) (14)
Impairment and impairment reversal of assets E (44) (25)
Adjusted operating income F=A-B-C-D-E 365 465
(*) The previously published prior year comparative figures have been restated following the introduction of IFRS 10 and IFRS 11 and a new method of classifying the share of net profit (loss) of associates and joint ventures.
Following the adoption of IFRS 10 - Consolidated Financial Statements and IFRS 11 - Joint Arrangements, applicable ret-rospectively from 1 January 2014, the Group's consolidated figures have been restated as from 1 January 2013.In particular, the changes introduced by IFRS 11 - Joint Arrangements have eliminated the possibility of propor-tionate consolidation; accordingly, the companies Yangtze Optical Fibre and Cable Joint Stock Limited Co., Yangtze Optical Fibre and Cable (Hong Kong) Co. Ltd., Precision Fiber Optics Ltd. and Power Cables Malaysia Sdn Bhd, previously consolidated using the proportionate method, have now
been consolidated using the equity method.In addition, further to the changes introduced by IFRS 10 - Consolidated Financial Statements, the Chinese company Yangtze Optical Fibre & Cable (Shanghai) Co. Ltd., previously consolidated line-by-line, has now been consolidated using the equity method; the Brazilian company Sociedade Produtora de Fibras Opticas S.A., previously consolidated line-by-line, has been defined as a "joint operation" and so is now being consolidated according to the rights and obligations arising under the contractual arrangement.
(in millions of Euro)

Consolidated Financial Report | DIRECTORS’ REPORT
2014 Annual Report Prysmian Group
80
31 December 2012 Effects application 31 December 2012 Published (*) IFRS 10-11 Restated
Net fixed assets 2,300 1 2,301
Net working capital 482 (49) 433
Provisions (361) 6 (355)
Net capital employed 2,421 (42) 2,379
Employee benefit obligations 344 - 344
Total equity 1,159 (12) 1,147
of which attributable to non-controlling interests 47 (12) 35
Net financial position 918 (30) 888
Total equity and sources of funds 2,421 (42) 2,379
RECLASSIFIED STATEMENT OF FINANCIAL POSITION
Alternative performance indicators at 31 December 2012:
(*) Restated following finalisation of the accounting for the business combination of Global Marine Systems Energy Ltd (now renamed Prysmian PowerLink Services Ltd) which had been accounted for provisionally at 31 December 2012. Further details can be found in the 2013 Annual Report.
NET WORKING CAPITAL
31 December 2012 Effects application 31 December 2012 Published (*) IFRS 10-11 Restated
Inventories 897 (31) 866
Trade receivables 1,163 (80) 1,083
Trade payables (1,450) 34 (1,416)
Other receivables/(payables) (121) 28 (93)
Net operating working capital 489 (49) 440
Derivatives (7) - (7)
Net working capital 482 (49) 433
(*) Restated following finalisation of the accounting for the business combination of Global Marine Systems Energy Ltd (now renamed Prysmian PowerLink Services Ltd) which had been accounted for provisionally at 31 December 2012. Further details can be found in the 2013 Annual Report.
INCOME STATEMENT
FY 2012 Effects application Other companies/ FY 2012 Published IFRS 10-11 reclassifications Restated
Adjusted EBITDA before share of net profit/(loss) of equity-accounted companies
647 (28) - 619
Adjusted EBITDA 647 (12) 15 650
EBITDA 546 (12) 15 549
Adjusted operating income 483 (4) 15 494
Adjusted net profit 280 (1) - 279
The alternative performance indicators at 31 December 2012 and at 31 December 2013 have therefore been restated as follows:
(in millions of Euro)
(in millions of Euro)
(in millions of Euro)
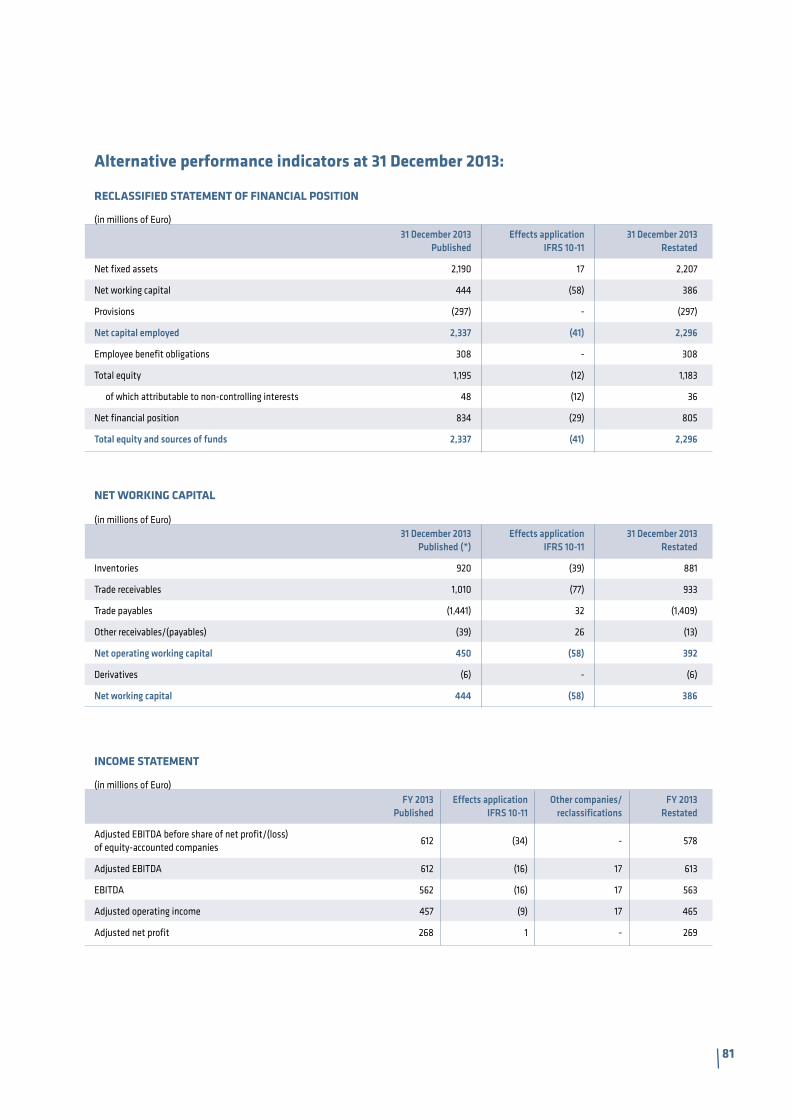
81
31 December 2013 Effects application 31 December 2013 Published IFRS 10-11 Restated
Net fixed assets 2,190 17 2,207
Net working capital 444 (58) 386
Provisions (297) - (297)
Net capital employed 2,337 (41) 2,296
Employee benefit obligations 308 - 308
Total equity 1,195 (12) 1,183
of which attributable to non-controlling interests 48 (12) 36
Net financial position 834 (29) 805
Total equity and sources of funds 2,337 (41) 2,296
RECLASSIFIED STATEMENT OF FINANCIAL POSITION
Alternative performance indicators at 31 December 2013:
NET WORKING CAPITAL
31 December 2013 Effects application 31 December 2013 Published (*) IFRS 10-11 Restated
Inventories 920 (39) 881
Trade receivables 1,010 (77) 933
Trade payables (1,441) 32 (1,409)
Other receivables/(payables) (39) 26 (13)
Net operating working capital 450 (58) 392
Derivatives (6) - (6)
Net working capital 444 (58) 386
INCOME STATEMENT
FY 2013 Effects application Other companies/ FY 2013 Published IFRS 10-11 reclassifications Restated
Adjusted EBITDA before share of net profit/(loss) of equity-accounted companies
612 (34) - 578
Adjusted EBITDA 612 (16) 17 613
EBITDA 562 (16) 17 563
Adjusted operating income 457 (9) 17 465
Adjusted net profit 268 1 - 269
(in millions of Euro)
(in millions of Euro)
(in millions of Euro)

Consolidated Financial Report | DIRECTORS’ REPORT
2014 Annual Report Prysmian Group
82
The alternative performance indicators for 2012 and 2013 have been restated following adoption of the new organisational structure as follows:
INCOME STATEMENT
2012 Published (*) Restated Energy - Products Energy - Total Projects Energy E&I Industrial Other Total Products & NWC
Sales 2,278 980 147 - 1,127 1,151 2,278
Adjusted EBITDA before share of net profit/(loss) of equity-accounted companies
269 57 30 - 87 182 269
Adjusted EBITDA 275 63 30 - 93 182 275
Adjusted operating income 239 50 28 - 78 161 239
Sales 2,159 2,159 - - 2,159 - 2,159
Adjusted EBITDA before share of net profit/(loss) of equity-accounted companies
77 77 - - 77 - 77
Adjusted EBITDA 81 81 - - 81 - 81
Adjusted operating income 53 53 - - 53 - 53
Sales 1,801 - 1,702 - 1,702 99 1,801
Adjusted EBITDA before share of net profit/(loss) of equity-accounted companies
139 - 124 - 124 15 139
Adjusted EBITDA 139 - 124 - 124 15 139
Adjusted operating income 99 - 98 - 98 1 99
Sales 134 - - 134 134 - 134
Adjusted EBITDA before share of net profit/(loss) of equity-accounted companies
1 - - 1 1 - 1
Adjusted EBITDA 6 - - 6 6 - 6
Adjusted operating income 3 - - 3 3 - 3
Sales 6,372 3,139 1,849 134 5,122 1,250 6,372
Adjusted EBITDA before share of net profit/(loss) of equity-accounted companies 486 134 154 1 289 197 486
Adjusted EBITDA 501 144 154 6 304 197 501
Adjusted operating income 394 103 126 3 232 162 394
Alternative performance indicators for 2012
Utili
ties
Trad
e & In
stal
lers
Indu
stria
lOt
her
Ener
gy
(*) The previously published prior year comparative figures have been restated following the introduction of IFRS 10 and IFRS 11 and a new method of classifying the share of net profit (loss) of associates and joint ventures.
(in millions of Euro)

83
INCOME STATEMENT
Alternative performance indicators for 2013
2013 Published (*) Restated Energy - Products Energy - Total Projects Energy E&I Industrial Other Total Products & NWC
Sales 2,217 833 136 - 969 1,248 2,217
Adjusted EBITDA before share of net profit/(loss) of equity-accounted companies
282 42 24 - 66 216 282
Adjusted EBITDA 287 48 24 - 72 215 287
Adjusted operating income 247 36 21 - 57 190 247
Sales 1,914 1,914 - - 1,914 - 1,914
Adjusted EBITDA before share of net profit/(loss) of equity-accounted companies
71 71 - - 71 - 71
Adjusted EBITDA 79 79 - - 79 - 79
Adjusted operating income 54 54 - - 54 - 54
Sales 1,764 - 1,652 - 1,652 112 1,764
Adjusted EBITDA before share of net profit/(loss) of equity-accounted companies
134 - 117 1 118 16 134
Adjusted EBITDA 133 - 117 - 117 16 133
Adjusted operating income 97 - 95 - 95 2 97
Sales 114 - - 114 114 - 114
Adjusted EBITDA before share of net profit/(loss) of equity-accounted companies
4 - - 4 4 - 4
Adjusted EBITDA 8 - - 8 8 - 8
Adjusted operating income 4 - - 4 4 - 4
Sales 6,009 2,747 1,788 114 4,649 1,360 6,009
Adjusted EBITDA before share of net profit/(loss) of equity-accounted companies 491 113 141 5 259 232 491
Adjusted EBITDA 507 127 141 8 276 231 507
Adjusted operating income 402 90 116 4 210 192 402
Utili
ties
Trad
e & In
stal
lers
Indu
stria
lOt
her
Ener
gy
(*) The previously published prior year comparative figures have been restated following the introduction of IFRS 10 and IFRS 11 and a new method of classifying the share of net profit (loss) of associates and joint ventures.
(in millions of Euro)
Consolidated Financial Report | DIRECTORS’ REPORT
2014 Annual Report Prysmian Group
84
Consolidated Financial Report | DIRECTORS’ REPORT
THE INTERNAL CONTROL AND RISK MANAGEMENT SYSTEM
The Group's internal control and risk management system involves the following bodies, each with their own duties and responsibilities:• the Board of Directors, which is responsible for establish-
ing the guidelines and assessing the adequacy and ef-fectiveness of the internal control and risk management system;
• the Control and Risks Committee, with powers to advise and make proposals to the Board of Directors, including to allow the Board to discharge its duties concerning management of the internal control and risk manage-ment system;
• the Director in charge of establishing and maintaining the internal control and risk management system, as identified in the person of the Chief Executive Officer, who is responsible for the design, implementation and management of the internal control system, and for keeping its adequacy and effectiveness under constant review;
• the Managers responsible for preparing the corporate ac-counting documents, as second-level figures of control, are responsible for establishing adequate administra-tive and accounting procedures for the preparation of financial reports;
• the Head of Internal Audit, who tests - acting in an inde-pendent capacity - the operation and suitability of the internal control and risk management system, including the ERM process, in accordance with the annual audit plan approved by the Board of Directors, itself the result of a structured process of analysing and prioritising key risks;
• the Compensation and Nominations Committee, with powers to advise and make proposals to the Board of Directors, including with reference to the remuneration of the directors and top management of Prysmian S.p.A., the appointment/replacement of independent directors, and the size and composition of the Board itself;
• the Board of Statutory Auditors, which is required to monitor the Company's compliance with the law and its memorandum of association, as well as the observance of good management principles in the conduct of its business, and to control the adequacy of the Company's organisational structure, internal control and risk man-agement system and administrative-accounting system;
The Prysmian Group has adopted an internal control and risk management system in compliance with the Self-Regulatory Code1 and which is in line with the best practices in the field and based on tools and information flows that allow the Board of Directors to take strategic decisions and define the system's guidelines in an informed manner.
(1) "Italian Stock Exchange Self-Regulatory Code for Listed Companies - Ed. 2014" drawn up by the Corporate Governance Committee of Borsa Italiana S.p.A..
85
• the Monitoring Board, with the task of supervising the operation of and compliance with the Organisational Model adopted under Legislative Decree 231/2001, as well as to oversee its updating by presenting the Board of Directors with proposed revisions and amendments.
Furthermore, in light of the increasing complexity of its activities and in response to changes in the legislative environment, in 2012 the Board of Directors decided to step up the Group's attention to the internal control and risk management system, by implementing a dynamic system of Enterprise Risk Management (ERM) and by appointing a specific Internal Risk Management Committee, consisting of the Group's Senior Management, with the mission of iden-tifying, measuring, analysing and evaluating risk situations or events that could affect the achievement of the Group's strategic objectives and priorities. The establishment of the new system was completed during 2013, and a Chief Risk Officer was appointed to manage the ERM process. This person reports to the Internal Risk Management Committee.
More comprehensive information about the system of business risk management can be found in the "Risk Factors and Uncertainties" section of this report. Also of relevance to the internal control and risk management system are the Group's Code of Ethics and the Organisation and Management Model adopted by the Prysmian Group under Legislative Decree 231/2001.
System of internal control over financial reportingIn accordance with Law 262/2005 ("Provisions for the pro-tection of savings and the regulation of financial markets") and under art. 19 of the By-laws, the Board of Directors, after consulting the Board of Statutory Auditors, has appointed Andreas Bott (Head of Planning & Controlling) and Carlo Soprano (Head of Financial Statements & Compliance) as joint managers responsible for preparing corporate account-ing documents. In this role, they certify at least every six months, the accuracy of the financial information disclosed to the market, the existence of adequate procedures and internal controls relating to financial reporting and the

Consolidated Financial Report | DIRECTORS’ REPORT
2014 Annual Report Prysmian Group
86
(2) ”COSO Framework - Committee of Sponsoring Organizations of the Treadway Commission”.
consistency of financial data communicated externally through the financial statements. The Board of Directors has also appointed the Head of Internal Audit as responsible for verifying that the system of internal control over financial reporting is always operating adequately and effectively. To this end, the Internal Audit Department draws up an annual audit plan using a structured approach to risk assessment, in line with the Group's ERM model. This plan is first approved by the Control and Risks Committee and then by the Board of Directors. The audit planning activity is not only based on the findings of the ERM process but also takes account of specific risks identified through interviews with Senior Man-agement, and also includes any areas for which remediation actions have been previously recommended. In conducting Internal Audit activities, internal auditors are given complete access to all relevant data and information to enable them to perform each audit. The Head of Internal Audit attends every meeting of the Control and Risks Committee. The results of internal auditing activities are reported to the committee along with key findings and remediation actions. The status of the audit plan is reported during each meeting and any significant deviations or anticipated deviations are discussed and confirmed. The implementation status of previous audit recommendations or remediation actions is also reported to this committee.
For the purposes of ensuring a reliable system of internal control over the financial reporting process, Prysmian Group has adopted a set of administrative and accounting procedures, as well as a series of operating policies, proce-dures and instructions such as to guarantee an effective flow of information with its operating companies. The
administrative and accounting procedures include the Group Accounting Manual (rules for the use and application of ac-counting policies), the Administrative Processes Manual, the procedures for creating and publishing financial information and other procedures for the preparation of the consolidated financial statements and interim financial reports (including the chart of accounts, the consolidation procedures and procedures for related party transactions). Prysmian Group Head Office functions are responsible for distributing this documentation to operating companies, which can be accessed through the Group's intranet site. The operating companies also issue local policies, procedures and rules that comply with the Group's guidelines. The Group has adopted a centrally coordinated evaluation system and attestation process for the purposes of assessing the adequacy and effectiveness of the internal control system, which includes controls over the financial reporting process. This system has been developed using the "COSO Framework2" to identify key risks and thus the required key controls to adopt to mitigate the risks identified and to ensure the internal control system operates effectively. A scoping exercise is carried out annually to identify the companies, processes and sub-processes to be audited. In fact, the Internal Audit Department, serving in an indepen-dent capacity, tests the operation of the controls previously identified for each of the Group's "in-scope" operating companies and processes. The Chief Executive Officer and Chief Financial Officer of every Group operating company, and the Heads of the relevant Head Office Functions and Departments, are responsible for maintaining an adequate system of internal control; this includes periodically testing the key controls, identified and tested by the Internal Audit

87
Department during the implementation phase of the centrally co-ordinated evaluation system, to confirm that they continue to operate effectively and efficiently. These officers are required to submit an attestation every six months con-firming that the internal control system is operating properly. This signed attestation is sent to Prysmian Group's Chief Financial Officer, the Managers responsible for preparing corporate accounting documents, and to the Head of Internal Audit. To support this attestation the officers must also confirm that they have specifically tested the operation of key controls and that evidence supporting their conclusions has been retained for future independent review. To achieve this, Prysmian requires each operating company to submit a detailed "Internal Control Questionnaire" (ICQ). These ICQs document the key controls for each critical business process and describe how the control works in that reporting entity and what type of tests have been performed in the reporting period to confirm the adequacy of the control. The ICQs are updated every six months by the owners of each process. The Internal Audit Department centrally reviews the ICQ sub-missions and accordingly will select a number of reporting entities or processes for detailed follow-up audits to confirm the integrity of the submission. An action plan is agreed with each reporting entity to strengthen existing controls or rectify any specific weaknesses.
The Group believes that the number of processes analysed and reporting entities incorporated within the evaluation system is sufficient to satisfy its ongoing Law 262/05 ob-ligations.

Consolidated Financial Report | DIRECTORS’ REPORT
2014 Annual Report Prysmian Group
88
Consolidated Financial Report | DIRECTORS’ REPORT
RISK FACTORS AND UNCERTAINTIES
The policy of value creation that motivates the Prysmian Group has always been based on effective risk management. Since 2012, by adopting the provisions on risk management introduced by the "Italian Stock Exchange Self-Regulatory Code for Listed Companies - Ed. 2014" (Self-Regulatory Code), Prysmian has taken the opportunity to strengthen its governance model and implement an advanced system of Risk Management that promotes proactive management of risks using a structured and systematic tool to support the main business decision-making processes. In fact, this Enterprise Risk Management (ERM) model, developed in line with internationally recognised models and best practice, allows the Board of Directors and management to consciously evaluate the risk scenarios that could compro-mise achievement of the strategic objectives and to adopt additional tools able to anticipate, mitigate or manage significant exposures. The Group Chief Risk Officer (CRO), designated to govern the ERM process, is responsible for ensuring, together with management, that the main risks facing Prysmian and its subsidiaries are promptly identified, evaluated and
monitored over time. A special Internal Risk Management Committee (consisting of the Group's Senior Management) also ensures, through the CRO, that the ERM process is developed in a dynamic way by taking account of changes in the business, of needs and events that have an impact on the Group over time. The CRO reports periodically (at least twice a year) on such developments to the top management. Please refer to the "Corporate Governance" section of this report for a discussion of the governance structure adopted and the responsibilities designated to the bodies involved.The ERM model adopted (and formalised within the Group ERM Policy issued in accordance with the guidelines on the Internal Control and Risk Management System approved by the Board of Directors on 25 February 2014) follows a top-down approach, whereby it is steered by Senior Man-agement and by medium to long-term business objectives and strategies. It extends to all the types of risk/opportunity for the Group, represented in the Risk Model - shown in the following diagram - that classifies the risks of an internal or external nature characterising the Prysmian business model in five categories:

89
THE PRYSMIAN RISK MODEL
Strategic Financial Operational Legal & Compliance Planning & Reporting
• Changes in macroeconomic and competitive environment and
in demand
• Key customers and business partners Emerging market risk
• M&A/JVs and related
integration process
• Commodity price fluctuation
• Exchange rate fluctuations
• Interest rate fluctuation
• Financial instruments
• Credit risk
• Liquidity / Working capital
• Availability / Cost of capital
• Financial counterparties
• Business interruption / catastrophic events
• Contract performance / contractual liability
• Product quality / product liability
• Environment
• Compliance with laws
and regulations
• Compliance with Code of Ethics, policy and procedures
• Budget & strategic planning
• Tax planning & financial planning
• Management reporting
• Financial reporting
Members of management involved in the ERM process are required to use a clearly defined common method to measure and assess specific risk events in terms of Impact, Probability of occurrence and adequacy of the existing Level of Risk Management, meaning:• economic-financial impact on expected EBITDA or cash
flow, net of any insurance cover and countermeasures in place and/or qualitative type of impact on reputation and/or efficiency and/or business continuity, measured using a scale that goes from negligible (1) to critical (4);
• probability that a particular event may occur within the specific planning period, measured using a scale that goes from remote (1) to high (4);
• level of control meaning the maturity and efficiency of existing risk management systems and processes, measured using to a scale that goes from adequate (green) to inadequate (red).
The overall assessment must also take into account the future outlook for risk, or the possibility that in the period considered the exposure is increasing, constant or decreasing.The results of measuring exposure to the risks analysed are then represented on a 4x4 heat map diagram, which, by combining the variables in question, provides an immediate overview of the risk events considered most significant.
• Strategic Risks: risks arising from external or internal factors such as changes in the market environment, bad and/or improperly implemented corporate decisions and failure to react to changes in the competitive en-vironment, which could therefore threaten the Group's competitive position and achievement of its strategic objectives;
• Financial Risks: risks associated with the amount of financial resources available, with the ability to manage currency and interest rate volatility efficiently;
• Operational Risks: risks arising from the occurrence of events or situations that, by limiting the effectiveness
and efficiency of key processes, affect the Group's ability to create value;
• Legal and Compliance Risks: risks related to violations of national, international and sector-specific legal and regulatory requirements, to unprofessional conduct in conflict with company ethical policies, exposing the Group to possible penalties and undermining its reputa-tion on the market;
• Planning and Reporting Risks: risks related to the adverse effects of incomplete, incorrect and/or untimely information with possible impacts on the Group's strategic, operational and financial decisions.
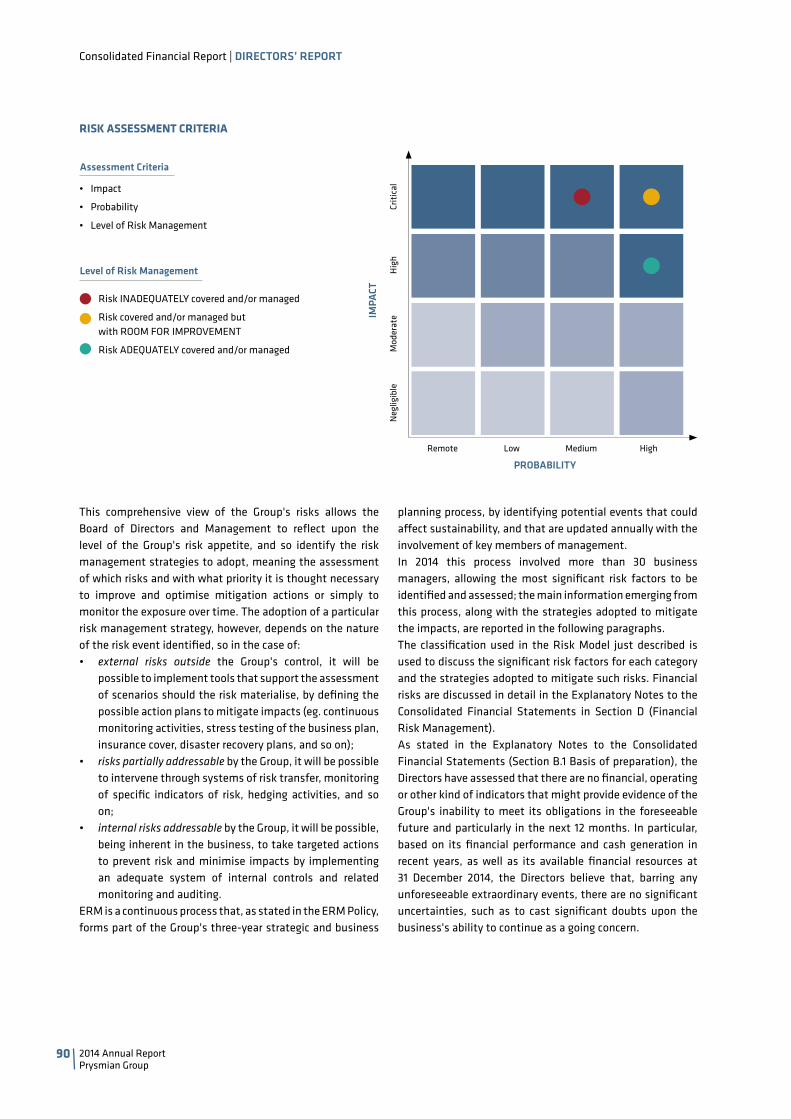
Consolidated Financial Report | DIRECTORS’ REPORT
2014 Annual Report Prysmian Group
90
This comprehensive view of the Group's risks allows the Board of Directors and Management to reflect upon the level of the Group's risk appetite, and so identify the risk management strategies to adopt, meaning the assessment of which risks and with what priority it is thought necessary to improve and optimise mitigation actions or simply to monitor the exposure over time. The adoption of a particular risk management strategy, however, depends on the nature of the risk event identified, so in the case of:• external risks outside the Group's control, it will be
possible to implement tools that support the assessment of scenarios should the risk materialise, by defining the possible action plans to mitigate impacts (eg. continuous monitoring activities, stress testing of the business plan, insurance cover, disaster recovery plans, and so on);
• risks partially addressable by the Group, it will be possible to intervene through systems of risk transfer, monitoring of specific indicators of risk, hedging activities, and so on;
• internal risks addressable by the Group, it will be possible, being inherent in the business, to take targeted actions to prevent risk and minimise impacts by implementing an adequate system of internal controls and related monitoring and auditing.
ERM is a continuous process that, as stated in the ERM Policy, forms part of the Group's three-year strategic and business
planning process, by identifying potential events that could affect sustainability, and that are updated annually with the involvement of key members of management. In 2014 this process involved more than 30 business managers, allowing the most significant risk factors to be identified and assessed; the main information emerging from this process, along with the strategies adopted to mitigate the impacts, are reported in the following paragraphs.The classification used in the Risk Model just described is used to discuss the significant risk factors for each category and the strategies adopted to mitigate such risks. Financial risks are discussed in detail in the Explanatory Notes to the Consolidated Financial Statements in Section D (Financial Risk Management).As stated in the Explanatory Notes to the Consolidated Financial Statements (Section B.1 Basis of preparation), the Directors have assessed that there are no financial, operating or other kind of indicators that might provide evidence of the Group's inability to meet its obligations in the foreseeable future and particularly in the next 12 months. In particular, based on its financial performance and cash generation in recent years, as well as its available financial resources at 31 December 2014, the Directors believe that, barring any unforeseeable extraordinary events, there are no significant uncertainties, such as to cast significant doubts upon the business's ability to continue as a going concern.
RISK ASSESSMENT CRITERIA
Assessment Criteria
IMPA
CT
Level of Risk Management
• Impact
• Probability
• Level of Risk Management
Risk INADEQUATELY covered and/or managed
Risk covered and/or managed but with ROOM FOR IMPROVEMENT
Risk ADEQUATELY covered and/or managed
Remote
Neg
ligib
le
Low
Mod
erat
e
Medium
Hig
h
High
Criti
cal
PROBABILITY

91
STRATEGIC RISKS
Risks associated with the competitive environmentMany of the products offered by the Prysmian Group, primarily in the Trade & Installers and Power Distribution businesses, are made in conformity with specific industrial standards and so are interchangeable with those offered by major competitors. Price is therefore a key factor in customer choice of supplier. The entry into mature markets (eg. Europe) of non-traditional competitors, meaning small to medium manufacturing companies with low production costs and the need to saturate production capacity, together with a possible contraction in demand translate into strong competitive pressure on prices with possible consequences for the Group's expected margins.
In addition, although barriers to entry, linked to diffi-cult-to-replicate ownership of technology, know-how and track record, limit the number of operators able to compete effectively on a global scale in high value-added segments like High Voltage underground cables, Optical Cables, and, albeit to a much lesser extent, Submarine cables, it is not possible to rule out potential new entrants in these market segments or an escalation in competition from operators already on the market, with potentially negative impacts on both sales volumes and sales prices.The strategy of rationalising production facilities currently in progress, the consequent optimisation of the cost structure, the policy of geographical diversification and, last but not least, the ongoing search for innovative technological solutions, all help the Group to address the potential effects arising from the competitive environment.
Risks associated with changes in the macroeconomic environment and in demandFactors such as changes in GDP and interest rates, the ease of getting credit, the cost of raw materials, and the overall level of energy consumption, significantly affect the energy demand of countries which in turn, faced with continuing economic difficulties, reduce their investments in market de-velopment. Similarly, government incentives for alternative energy sources are also reduced. Within the Prysmian Group, the submarine cable business (and to a lesser extent that of high voltage cables) is being affected by the contraction of demand in the European market, in which it is highly concen-trated, due to the ongoing local economic downturn.
To counter this risk, the Group is pursuing, on the one hand, a policy of geographical diversification in non-European countries (eg. Vietnam, Philippines, etc.) and, on the other, a strategy to reduce costs by rationalising its production structure globally in order to mitigate possible negative effects on the Group's performance from reduced sales and shrinking margins.
Risks associated with dependence on key customersIn the SURF business, the Prysmian Group has a significant business relationship with Petrobras, a Brazilian oil company, for the supply of umbilical cables and flexible pipes, developed and manufactured at the factory in Vila Velha, Brazil. A possible decline in demand for umbilical cables and/or a change in technological demand for flexible pipes by Petrobras could in the short to medium term have an impact on the partial or other sustainability of the business in Brazil.While committed to maintaining and strengthening its business relationship with this customer over time, the Group has initiated progressive diversification of its customer portfolio by evaluating the possibility of opening up to the export market.
Risk of instability in emerging countries where the Group operatesThe Prysmian Group operates and has production facilities and/or companies in Asia, Latin America, the Middle East and Eastern Europe. The Group's activities in these countries are exposed to different risks linked to local regulatory and legal systems, the imposition of tariffs or taxes, political and economic instability, and exchange rate risks. Significant changes in the macroeconomic, political, tax or legislative environment of such countries could have an adverse impact on the Group's business, results of opera-tions and financial condition.
Risks in relation to acquisitionsThe Group reviews acquisition targets on an ongoing basis and may from time to time incur additional indebtedness to finance such acquisitions. If the Group completes new acqui-sitions in the near future, it could also face risks associated with the integration process.

Consolidated Financial Report | DIRECTORS’ REPORT
2014 Annual Report Prysmian Group
92
FINANCIAL RISKS
The Prysmian Group's risk management strategy focuses on the unpredictability of markets and aims to minimise the potentially negative impact on the Group's financial perfor-mance. Some types of risk are mitigated by using financial instruments (including derivatives).Financial risk management is centralised with the Group Finance Department which identifies, assesses and hedges financial risks in close cooperation with the Group's operating companies.The Group Finance, Administration and Control Department provides written guidelines on monitoring risk management, as well as on specific areas such as exchange rate risk, interest rate risk, credit risk, the use of derivative and non-derivative instruments, and how to invest excess liquidity. Such financial instruments are used solely to hedge risks and not for speculative purposes.
Risks associated with availability of financial resources and their cost The volatility of the international banking and financial system could represent a potential risk factor in terms of raising finance and its associated cost. Prysmian Group believes that it has significantly mitigated such a risk insofar as, in recent years, it has always been able to raise sufficient financial resources, and at a competitive cost. In particular, in June 2014, the Group obtained a five-year revolving credit facility for Euro 1,000 million (Credit Agreement 2014) from a syndicate of premier banks. This agreement is notable not only for the large sum secured thanks to strong interest by the lenders involved, but also for its more competitive cost than existing facilities. The agreement also confirms the more relaxed level of financial covenants already applied to the Group for the facility obtained from Mediobanca - Banca di Credito Finanziario S.p.A. discussed below. On the same date as entering this new agreement, the Group extin-guished early the Revolving Credit Facility 2010, originally due to expire on 31 December 2014 and carrying a maximum permitted drawdown of Euro 400 million. The Term Loan Facility 2010, also maturing on 31 December 2014, was ex-tinguished early on 28 February 2014 with repayment of the outstanding balance of Euro 184 million. In February 2014, the Group obtained a five-year revolving facility for Euro
100 million from Mediobanca – Banca di Credito Finanziario S.p.A. and in December 2013 a loan for Euro 100 million from the European Investment Bank (EIB) to fund the Group's European R&D plans over the period 2013-2016. In March 2013, Prysmian completed the placement of a convertible bond with institutional investors for Euro 300 million, with a 1.25% coupon and maturity in March 2018. Before this, in March 2011, the Group had entered into a long-term loan agreement for Euro 800 million (Credit Agreement 2011) with a syndicate of leading banks. This five-year agreement comprises a loan for Euro 400 million (Term Loan Facility 2011) and a revolving facility for Euro 400 million (Revolving Credit Facility 2011). In addition, the placement of an unrated bond with institutional investors on the Eurobond market was completed in March 2010 for a nominal total of Euro 400 million with a 5.25% coupon and maturity in April 2015.
The annual interest rate on the Credit Agreements is equal to the sum of:• EURIBOR;• an annual spread determined on the basis of the ratio
between consolidated net financial position and consoli-dated EBITDA.
As at 31 December 2014, the Group's total financial resources, comprising cash and cash equivalents and undrawn committed credit lines, came to in excess of Euro 1 billion.
A detailed analysis of "Borrowings from banks and other lenders" can be found in the Explanatory Notes to the Con-solidated Financial Statements.
Financial covenants The credit agreements mentioned in the preceding paragraph contain a series of financial and non-financial covenants with which the Group must comply. These covenants could restrict the Group's ability to increase its net debt, other con-ditions remaining equal; should it fail to satisfy one of the covenants, this would lead to a default event which, unless resolved under the terms of the respective agreements, could lead to their termination and/or an early repayment of any amounts drawn down. In such an eventuality, the Group

93
might be unable to repay the amounts demanded early, which in turn would give rise to a liquidity risk. The financial covenants are measured at the half-year close on 30 June and at the full-year close on 31 December. All covenants, financial or otherwise, were fully observed at 31 December 2014. In particular:(i) the ratio between EBITDA and Net finance costs, as
defined in the credit agreements, was 5.82x (against a required covenant of not less than 5.50x for the credit agreements signed before December 2013 and 4.00x for those signed in 2014);
(ii) the ratio between Net Financial Position and EBITDA, as defined in the credit agreements, was 1.50x (against a required covenant of below 2.50x for the credit agree-ments signed before December 2013 and 3.00x for those signed in 2014).
As things stand and in view of the level of the financial covenants reported above, Prysmian Group believes that it will not have to face this risk in the near future. A more detailed analysis of the risk in question can be found in the Explanatory Notes to the Consolidated Financial Statements.
Exchange rate fluctuationThe Prysmian Group operates internationally and is therefore exposed to exchange rate risk for the various currencies in which it operates (principally the US Dollar, British Pound, Brazilian Real, Turkish Lira and Chinese Renminbi). Exchange rate risk occurs when future transactions or assets and lia-bilities recognised in the statement of financial position are denominated in a currency other than the functional currency of the company which undertakes the transaction.To manage exchange rate risk arising from future trade trans-actions and from the recognition of foreign currency assets and liabilities, most Prysmian Group companies use forward contracts arranged by Group Treasury, which manages the various positions in each currency.However, since Prysmian prepares its consolidated financial statements in Euro, fluctuations in the exchange rates used to translate the financial statements of subsidiaries, origi-nally expressed in a foreign currency, could affect the Group's results of operations and financial condition.A more detailed analysis of the risk in question can none-theless be found in the "Financial Risk Management" section of the Explanatory Notes to the Consolidated Financial Statements.
Interest rate fluctuationChanges in interest rates affect the market value of the Prysmian Group's financial assets and liabilities as well as its net finance costs. The interest rate risk to which the Group is exposed is mainly on long-term financial liabilities, carrying both fixed and variable rates.Fixed rate debt exposes the Group to a fair value risk. The Group does not operate any particular hedging policies in relation to the risk arising from such contracts since it considers this risk to be immaterial. Variable rate debt exposes the Group to a rate volatility risk (cash flow risk). The Group uses interest rate swaps (IRS) to hedge this risk, which transform variable rates into fixed ones, thus reducing the rate volatility risk. Under such IRS contracts, the Group agrees with the other parties to swap on specific dates the difference between the contracted fixed rates and the variable rate calculated on the loan's notional value. A potential rise in interest rates, from the record lows reached in recent years, is a risk factor in coming quarters. A more detailed analysis of the risk in question can none-theless be found in the "Financial Risk Management" section of the Explanatory Notes to the Consolidated Financial Statements.
Credit riskCredit risk is the Prysmian Group's exposure to potential losses arising from the failure of trade or financial counter-parties to discharge their obligations. This risk is monitored centrally by the Group Finance Department, while cus-tomer-related credit risk is managed operationally by the individual subsidiaries. The Group does not have significant concentrations of credit risk. It nonetheless has procedures for ensuring that its trade counterparties are of recognised reliability and that its financial counterparties have high credit ratings. In addition, in mitigation of credit risk, the Group has a global trade credit insurance policy covering all its operating units.A more detailed analysis of the risk in question can none-theless be found in the "Financial Risk Management" section of the Explanatory Notes to the Consolidated Financial Statements.
Consolidated Financial Report | DIRECTORS’ REPORT
2014 Annual Report Prysmian Group
94
Liquidity riskLiquidity risk is the risk that an entity does not have suffi-cient financial resources to meet its obligations to trade or financial counterparties on the agreed due dates.With regard to the Prysmian Group's working capital cash re-quirements, these increase significantly during the first half of the year when it commences production in anticipation of order intake, with a consequent temporary increase in net financial debt.Prudent management of liquidity risk involves the main-tenance of adequate levels of cash, cash equivalents and short-term securities, the maintenance of an adequate amount of committed credit lines, and timely renegotiation of loans before their maturity. Due to the dynamic nature of the business in which the Prysmian Group operates, the Group Finance Department favours flexible arrangements for sourcing funds in the form of committed credit lines. As at 31 December 2014, the Group's total financial resources, comprising cash and cash equivalents and undrawn committed credit lines, came to in excess of Euro 1 billion.A more detailed analysis of the risk in question can none-theless be found in the "Financial Risk Management" section of the Explanatory Notes to the Consolidated Financial Statements.
Risks associated with fluctuations in commodity pricesThe main commodities purchased by the Prysmian Group are copper and aluminium, accounting for more than 50% of the total raw materials used to manufacture its products. The Group neutralises the impact of possible rises in the price of copper and its other principal raw materials through hedging activities and automatic sales price adjustment mechanisms.Hedging activities are based on sales contracts or sales forecasts, which if not met, could expose the Group to risks of fluctuations in commodity prices.The Group Purchasing Department performs a central monitoring and coordination of sales transactions requiring the purchase of raw materials and of the related hedging activities carried out by each subsidiary.In addition, if the oil price were to stabilise at current levels, this could make the extraction market less appealing, which in turn could adversely affect revenues from the SURF and Oil & Gas businesses, although without a significant impact on the Group. In fact, these businesses account for only 5% of the Group's Sales and Adjusted EBITDA.A more detailed analysis of the risk in question can none-theless be found in the "Financial Risk Management" section of the Explanatory Notes to the Consolidated Financial Statements.
95
OPERATIONAL RISKS
Responsibility for product quality/defectsAny defects in the design and manufacture of the Prysmian Group's products could give rise to civil or criminal liability in relation to customers or third parties. Therefore, the Group, like other companies in the industry, is exposed to the risk of legal action for product liability in the countries where it operates. In line with the practice followed by many industry operators, the Group has taken out insurance which it considers provides adequate protection against the risks arising from such liability. However, should such insurance coverage be insufficient, the Group's results of operations and financial condition could be adversely affected.In addition, the Group's involvement in this kind of legal action and any resulting liability could expose it to a damage in reputation, with potential additional adverse consequenc-es for its results of operations and financial condition.
Risks associated with non-compliance with the contractual terms of turnkey projectsProjects relating to submarine or underground connections with high/medium voltage cables feature contractual forms that entail "turnkey" project management and so require compliance with deadlines and quality standards, guaran-teed by penalties calculated as an agreed percentage of the contract value and even involving the possibility of contract termination.The application of such penalties, the obligation to compen-sate any damages as well as indirect effects on the supply chain in the event of late delivery or production problems, could significantly affect project performance and hence the Group's margins (for example, the Western HVDC Link project). Possible damage to market reputation cannot be ruled out.Given the complexity of "turnkey" projects, Prysmian has implemented a quality management process involving extensive testing of cables and accessories before delivery and installation, as well as specific ad hoc insurance coverage, often through a pool of insurers, able to mitigate exposure to risks arising from production through to delivery.Moreover, the ERM findings for this particular risk have led the Risk Management department, with the support of the
Commercial area, to implement a systematic process of risk assessment for "turnkey" projects from as early as the bidding stage, with the aim of identifying, assessing and monitoring over time the Group's exposure to specific risks and of taking the necessary mitigation actions. The decision to present a bid proposal to the customer therefore also depends on the results of risk assessment.In particular, during the last few days of April, the manu-facture of the cables for the Western HVDC Link project in the United Kingdom encountered some technical problems, which were duly placed under technical investigation. As a result, for the purposes of the Quarterly Financial Report at 31 March 2014, the Directors had felt unable to estimate reliably the outcome of this contract, and so its revenues were recognised to the extent of the costs incurred. Following subsequent testing of the quality of the cable produced and analysis of the materials and the manufacturing process, the Directors felt able to make a reliable estimate of the project's revenues and costs. This led to the full elimination of the margins previously recognised on the contract and the recognition of a provision to cover the expected contract loss, with a total impact of Euro 53 million. In addition, the technical problems described above have resulted in the non-recognition of Euro 41 million in margins originally expected in 2014. Consequently, including non-recognition of the margin originally expected on this project in the year, the overall negative impact of the Western HVDC Link (UK) project on the results for 2014 was Euro 94 million.It is not possible to exclude that in the future, in the face of any further technical problems on the Western HVDC Link contract, the Group may incur additional losses on top of those estimated by the Directors in the current Annual Financial Report.
Risk of business interruption through dependence on key assetsThe submarine cables business is heavily dependent on certain key assets, such as the Arco Felice plant in Italy for the production of a particular type of cable and the cable-laying ships, the "Giulio Verne" and the "Cable Enterprise", some of whose technical capabilities are hard to find on the market.
Consolidated Financial Report | DIRECTORS’ REPORT
2014 Annual Report Prysmian Group
96
Any loss of one of these assets due to unforeseen natural disasters (eg. earthquakes, storms, etc.) or other accidents (eg. fire, terrorist attacks, etc.) and the consequent prolonged business interruption could have a critical economic impact on the Group's performance.Prysmian addresses this risk through its systematic Loss Prevention program, under which specific inspections of the above assets allow it to identify the level of local risk and define actions that could be necessary to mitigate such risk.As at 31 December 2014, all of the plants inspected were clas-sified as "Excellent HPR", "Good HPR" or "Good not HPR"; no plant was classified as medium or high risk. In addition, specific disaster recovery plans have been developed that, by predetermining loss scenarios, allow all the appropriate countermeasures to be activated as soon as possible in order to minimise the impact of a catastrophic event. Lastly, specific insurance cover for damage to assets and loss of associated contribution margin help minimise the risk's financial impact on cash flow.
Environmental risksThe Group's production activities in Italy and abroad are subject to specific environmental regulations, of which
particularly important are those on soil and subsoil and on the presence/use of hazardous materials and substances, including for human health. Such regulations are imposing increasingly strict standards on companies, who are therefore forced to incur significant compliance costs.With more than 89 plants, there is a theoretically high proba-bility of an accident with consequences for the environment, as well as for the continuity of production. The resulting economic and reputational impact would be critical.The Group's policy of acquisition-led growth could augment its exposure to environmental risks, with the addition of manufacturing facilities that fall short of its standards.The management of environmental issues is centralised with the Health Safety & Environment (HSE) function that, by coordinating the local HSE functions, is responsible for organising specific training activities, for adopting systems to ensure strict adherence to regulations in accordance with best practices, as well as for monitoring risk exposures using specific indicators and internal and external auditing activities.Lastly, it is reported that 93% of the Group's sites are certified under ISO 14001 (for environmental management systems) and 58% for OHSAS 18001 (for safety management).
97
LEGAL AND COMPLIANCE RISKS
Compliance risks associated with laws, regulations, Code of Ethics, Policies and ProceduresCompliance risk is the risk of incurring legal or administrative sanctions, material financial losses or reputational damage as a result of violations of laws, regulations, procedures, codes of conduct and best practices. Right at its inception, the Prysmian Group approved a Code of Ethics, a document which contains ethical standards and guidelines for conduct to be observed by all those engaged in activities on behalf of Prysmian or its subsidiaries, including managers, officers, employees, agents, representatives, contractors, suppliers and consultants. In particular, the Code of Ethics requires full compliance with current regulations and the avoidance of any kind of misconduct or illegal behaviour. The Group put in place organisational procedures designed to prevent violation of the principles of legality, transparency, fairness and honesty and is committed to ensuring their observance and practical application. Although the Group is committed to ongoing compliance with applicable regulations and to close supervision to identify any misconduct, it is not possible to rule out episodes in the future of non-compliance or viola-tions of laws, regulations, procedures or codes of conduct by those engaged in performing activities on Prysmian's behalf, which could result in legal sanctions, fines or reputational damage, even on a material scale.
Risks relating to legal and tax proceedingsPrysmian S.p.A. and some Prysmian Group companies are currently involved in tax and legal proceedings in connec-tion with their business, involving civil and administrative actions. In some of these cases, the company might not be able to accurately quantify the potential losses or penalties associated with such proceedings. In the event of an adverse outcome to such proceedings, the Group cannot rule out an impact, even for a material amount, on its business, results of operations and financial condition, as well as reputational damages that are hard to estimate.
Risks of non-compliance with Antitrust lawIts strong international presence in more than 50 countries means the Group is subject to antitrust law in Europe and every other country in the world in which it operates, each with more or less strict rules on the civil, administrative and
criminal liability of the perpetrators of anti-competitive practices. In the last decade, local Antitrust Authorities have shown increasing attention to commercial activities by market players, also revealing a tendency for international collaboration between authorities themselves.The geographical dispersion of its employees, the lack of knowledge at times of local regulations as well as market dynamics, make it difficult to monitor anti-competitive conduct by third parties like suppliers and competitors, exposing the Group to the risk of incurring economic sanctions with extremely high negative repercussions for the reputation and credibility of the Group's system of governance.In line with the priorities identified by the ERM process, the Legal Department has taken steps, with the support of Group Compliance, to raise awareness of the issues at stake through the adoption of an Antitrust Code of Conduct that all Group employees, directors and managers are required to know and observe in the conduct their duties and in their dealings with third parties. These activities represent a first step in establishing an "antitrust culture" within the Group by stimulating pro-competitive conduct and by heightening individual accountability for professional conduct.More specifically, the European Commission, the US Depart-ment of Justice and the Japanese antitrust authority started investigations in late January 2009 into several European and Asian electrical cable manufacturers to verify the existence of alleged anti-competitive practices in the high voltage un-derground and submarine cables markets. Subsequently, the Australian Competition and Consumers Commission ("ACCC") and the New Zealand Commerce Commission also started similar investigations. During 2011, the Canadian antitrust authority also started an investigation into a high voltage submarine project dating back to 2006. The investigations in Japan, New Zealand and Canada have ended without any sanctionsfor Prysmian. The other investigations are still in progress, except for the one by the European Commission, which has ended with the adoption of the decision described below.In Australia, the ACCC has filed a case before the Federal Court arguing that Prysmian Cavi e Sistemi S.r.l. and two other companies violated antitrust rules in connection with a high voltage underground cable project awarded in 2003.
Consolidated Financial Report | DIRECTORS’ REPORT
2014 Annual Report Prysmian Group
98
Prysmian Cavi e Sistemi S.r.l. has filed its objections and presented its defence. In Brazil, the local antitrust authority has started an investi-gation into several cable manufacturers, including Prysmian, that operate in the high voltage underground and submarine cables market. Prysmian has presented its preliminary defence, which has been rejected by the local competition au-thorities in a statement issued during the month of February 2015. The preliminary stage of the proceedings will now ensue, at the end of which the authorities will publish their concluding observations, to which the parties may respond with all their arguments in defence before a final decision is taken. During the month of December 2013, ABB and one of this company's senior managers signed an agreement with the Brazilian antitrust authority, under which they admitted the conduct alleged by the authority and pledged to cooperate with it and to each pay an agreed fine.On 2 April 2014, the European Commission adopted a decision under which it found that, between 18 February 1999 and 28 January 2009, the world's largest cable producers, including Prysmian Cavi e Sistemi S.r.l., adopted anti-competitive practices in the European market for high voltage submarine and underground power cables. The European Commission held Prysmian Cavi e Sistemi S.r.l. jointly liable with Pirelli & C. S.p.A. for the alleged infringement in the period from 18 February 1999 to 28 July 2005, sentencing them to pay a fine of Euro 67.3 million, and it held Prysmian Cavi e Sistemi S.r.l. jointly liable with Prysmian S.p.A. and the Goldman Sachs Group Inc. for the alleged infringement in the period from 29 July 2005 to 28 January 2009, sentencing them to pay a fine of Euro 37.3 million. Prysmian has appealed against this decision to the General Court of the European Union and has submitted an application to intervene in the appeals respectively lodged by Pirelli & C. S.p.A. and the Goldman Sachs Group Inc. against the same decision. Both Pirelli & C. S.p.A. and the Goldman Sachs Group Inc. have in turn submitted applications to intervene in the appeal brought by Prysmian against the European Commission's decision. Prysmian has not incurred any financial outlay as a result of this decision having elected, pending the outcome of the appeals, to provide bank guarantees as security against payment of 50% of the fine imposed by the European Com-
PLANNING AND REPORTING RISKS
Planning and reporting risks are related to the adverse effects that irrelevant, untimely or incorrect information might have on the Group's strategic, operational and financial decisions.
mission (amounting to approximately Euro 52 million) for the alleged infringement in both periods. As far as Prysmian is aware, Pirelli & C. S.p.A. has provided or is nonetheless preparing to provide the European Commission with a bank guarantee for 50% of the value of the fine imposed for the alleged infringement in the period 18 February 1999 - 28 July 2005. Pirelli & C. S.p.A. has also filed a civil action against Prysmian Cavi e Sistemi S.r.l. in which it demands to be held harmless for all claims made by the European Commission in implementation of its decision and for any expenses related to such implementation.Prysmian Cavi e Sistemi S.r.l. started legal proceedings in February 2015, requesting that the claims brought by Pirelli & C. S.p.A. be rejected in full and that it should be Pirelli & C. S.p.A. which holds harmless Prysmian Cavi e Sistemi S.r.l., with reference to the alleged infringement in the period 18 February 1999 - 28 July 2005, for all claims made by the European Commission in implementation of its decision and for any expenses related to such implementation. Following a detailed and careful analysis of the European Commission's ruling, and nonetheless considering this has been appealed and so could be submitted to second-in-stance judgement, as well as the fact that the investigations initiated by the Canadian Antitrust Authority have ended without any sanctions for Prysmian, it has been decided to partially release the existing provision.Prysmian has also learned from several sources, including in the public domain, that some British utilities have filed actions in the High Court in London against certain cable manufacturers, including the Prysmian Group, to obtain compensation for damages allegedly suffered as a result of the alleged anti-competitive conduct condemned by the European Commission in the decision adopted in April 2014.
As at 31 December 2014, the amount of the provision is ap-proximately Euro 170 million. Despite the uncertainty of the outcome of the investigations in progress and potential legal action by customers as a result of the European Commis-sion's decision, the amount of this provision is considered to represent the best estimate of the liability based on the information now available.
At present and in view of the reliability and effectiveness of internal procedures for reporting and planning, these risks are not considered to be relevant for the Group.

99
Excellence.Integrity.
Understanding.Our values defi ne our business.
150324_EXE_poster10_50x70_P.indd 1 24/03/15 10:42

Consolidated Financial Report | DIRECTORS’ REPORT
2014 Annual Report Prysmian Group
100
Consolidated Financial Report | DIRECTORS’ REPORT
A SUSTAINABLE APPROACH TO MANAGING THE BUSINESS
In line with its Vision statement, focused on promoting "the efficient, effective and sustainable supply of energy and information as the principal driver for the development of communities", Prysmian's commitment over the years means that sustainability is now an ever more integrated part of the Group's activities. Responsible operation is a conscious policy choice by Prysmian, in the knowledge that this will contribute to long-term value generation.In constantly seeking to satisfy customer needs, Prysmian holds true to its corporate Mission and develops sustainable, quality products, by investing in technological solutions able to enhance the value of its product offering. The Group expresses its approach to sustainability on a daily basis, by engaging every business function across the board and directing its growth strategy towards key areas, like the sustainable, technological innovation of its solutions, the environmental responsibility of its production processes, the management of relations with the local communities in which Prysmian operates, as well as attention to safety at work and the development of personnel.This approach is characterised by the importance given to the many stakeholders with whom the Group interacts globally. Accordingly, Prysmian has a day-by-day commit-ment to establishing relationships of trust with its stake-holders, based on the principles of transparency, openness and readiness to listen. The year 2014 saw the launch of several projects and initia-tives marking significant steps in the Group's path towards sustainability and which demonstrate the deep, ongoing commitment that has allowed it to achieve significant results. Aware of the important role of stakeholders in strength-ening Prysmian's commitment to corporate responsibility, in 2014 the Group took an important step in its relations with stakeholders, by organising its first Multi-Stakeholder Engagement event in Milan on the subject of sustainabil-
The Prysmian Group has embarked on a path towards sustainability in recent years, allowing it to create value and improve relations with all its stakeholders. Sustainability has now become one of the Group's distinguishing factors and an important competitive advantage for managing its business and future strategies.
ity. The event provided an opportunity for representatives of various stakeholder categories to participate actively, through open discussions and workshops in which they were free to express and exchange ideas, opinions and perspectives on a range of topics relating to sustainability and corporate social responsibility. These forums led to a long discussion on Prysmian's approach to sustainability, serving to highlight those commitments and issues viewed by stakeholders as priorities for steering the Group towards new and broader future horizons. In addition, during the course of debate, the stakeholders suggested potential sus-tainability initiatives and targets that the business should adopt in the long term, in order to improve its path towards sustainability.Prysmian also gave attention to sustainability in its relations with business partners: aware of the effects that its suppliers' activities have on the environment and society, the Group decided in 2014 to adopt a Code of Business Conduct, aimed at disseminating responsible business practices by defining principles of economic, environmental and social responsibility for application throughout the Group's value chain. This Code, which applies to all Group employees and suppliers, will be adopted from 2015.The Group promotes the development of its employees by providing continuing education and ongoing individual enrichment opportunities within an international working environment. The Prysmian Group Academy, an interna-tional school of managerial and professional education whose mission is to consolidate and develop management expertise, carried on its activities during the course of 2014.The Group's socially responsible commitment to the territory in which it operates was also demonstrated by its decision to promote the value of innovative studies on sustainable technologies applicable to its own business, by offering a financial reward and practical training to young people who had excelled in this area. In particular, in collaboration with

101
Human Foundation, a foundation active in the field of social innovation, Prysmian promoted a degree thesis competition entitled "Technology for human beings", for students on three-year and master's engineering and physics degree courses at Italian universities. The competition was directed at students who had focused on the applicability of new technologies for sustainable development and who had analysed these topics from a technical standpoint and in terms of their application in developing contexts and countries. The awards, made in February 2015, involved cash prizes for the six winning theses, plus a six-month intern-ship in Prysmian for the winners in each category. Prysmian’s steadfast commitment to sustainability is also reflected in transparent, structured communication to all its stakeholders through the annual publication of the Sustainability Report, offering its readers the chance to learn more about the policy promoted by Prysmian and its economic, environmental and social performance. Updating the work of previous years, in 2014 this Report was prepared in accordance with the new "Sustainability Reporting Guide-lines G4" published by the Global Reporting Initiative (GRI)
in 2013, and reflecting Prysmian's ongoing commitment to make the reporting process ever more complete and effective, by increasing the breadth and depth of the topics covered. The GRI Reporting Framework is a universally accepted model for sustainability reporting, which includes common practices for different types of entities and contains topics of a general nature as well as industry-spe-cific ones with the aim of communicating an organisation's sustainability performance. The Sustainability Report has also been audited by a recognised external firm to provide all stakeholders with assurance as to the reliability of the information contained therein. Reference should be made to the 2014 Sustainability Report for a complete account of how the Group manages the economic, environmental, and social impacts deemed of importance for itself and its stakeholders and its performance in these areas.Lastly, in continuity with past practice, Prysmian will partic-ipate in the top international assessments of sustainability for 2014, namely the RobecoSAM Assessment for the Dow Jones Sustainability Index (DJSI) and the Carbon Disclosure Project questionnaire.

Consolidated Financial Report | DIRECTORS’ REPORT
2014 Annual Report Prysmian Group
102
Over a period spanning more than 130 years, the Prysmian Group has built its success and achieved important milestones thanks to the skills of its employees who, generation after generation, have been able to pass on to younger colleagues their values, experience and sense of belonging to the Group.The human capital strategy of Prysmian seeks to pursue this path: fostering and shaping the passion, motivation and competencies of employees into the real competitive edge over competitors.
In line with the Group's objectives, the human capital strategy is underpinned by a number of pillars:• The development and dissemination of a shared common
identity: everyone must feel part of the team, contribut-ing to a common project in which they believe.
• An inspiring model of Leadership: a management class of high moral and professional standing is essential for aspiring to ambitious goals and for achieving stable, long-term results.
• The development and management of talent: involving the right people in the professional challenges, knowing how to select them and developing and making the most of their skills; training them, challenging them and engaging them. These activities, like others, require planning and method in order to prime the Group to face the challenges of the future. The Group aims to create a "people pipeline" that will drive and support Prysmian's growth.
• The ability to attract the highest quality people on the market, by offering professional, intellectual and chal-lenging career alternatives, that are dynamic but also able to offer attractive long-term prospects.
• The development of an organisation that, in terms of size, structure and processes, will allow the Group to compete effectively on the market.
• The importance of internal communication and social relations, key to managing a large organisation and being able to engage internal and external stakeholders.
• The international and multicultural dimensions of our workplaces, consistent with our industrial and commer-cial presence worldwide.
Leadership Alignment / Organisational efficiency The process of optimising organisational structures carried on in 2014, especially with a view to improving their effec-
tiveness in the business. In particular, the structure of the business units was revised with the creation of the new High Voltage business unit and a reallocation of the activities of the E&I business unit. Another significant action, announced in 2014 but effective from January 2015, was the process of rationalising Country structures in Europe with a view to regionalisation that will improve commercial synergies in an increasingly integrated European market. Lastly, the Group decided to increase its focus on developing new markets by creating a new dedicated business area.
People Development: investing in peopleIntellectual capital and talent are strategic assets for achieving Prysmian's goals of profitability and value creation, which is why they must be supported by appropriate actions to develop and enhance them. Robust processes of resource management, incentivisation and individual motivation, along with chances for international exchanges, give Group employees opportunities for personal and professional growth.
Talent ManagementThe Group's talent management system responds to the need to attract, develop, promote and retain talented people in the business. Prysmian has adopted a series of processes aimed at creating a "people pipeline", meaning a "line-up" of talent ready to enter the field, which can support and nurture the growth of the business, while ensuring leadership continuity. The talent management system is based on a series of processes: Talent Acquisition, Performance Management, Training and Development, Talent Measurement and Succes-sion.
Talent Acquisition Building the management team of the future begins with selecting the best talents on the market, with particular attention to recent graduates. "Build the Future, the Graduate Program" is the Group's international recruitment programme to place young high-potential graduates in different business functions and geographical locations. Launched in 2012, the programme has resulted in the recruitment of around 130 young people from around the world. Over 16,000 applica-tions were received for the 2014/2015 cohort, out of which 50 recent graduates were selected from every continent; this was the outcome of an intensive campaign of employer
HUMAN RESOURCESThe HR strategy is rooted in the development and dissemination of a shared common identity: everyone must feel part of the team, contributing to a common project in which they believe.
103
branding in partnership with professional social networks like LinkedIn and Monster as well as local ones (eg. GraduateLand, ChinaJob), the use of online portals, attendance at careers fairs at the world's top engineering and economics universi-ties, and FaceBook, all geared to maximising media exposure and receiving the largest number of applications possible.
Performance ManagementTo achieve company targets and continue to improve the results, each employee must be able to make their daily contribution by being set clear objectives, agreed with their manager, and having the possibility of receiving continuous feedback on their work and the results achieved. This is why the Prysmian People Performance system (P3) was created in 2012 as a tool to motivate and engage employees through a process of appraising and improving individual performance. Following the pilot project in 2012, in 2013/14 the programme was rolled out to all Group countries and businesses, covering the entire employee population.
Training and DevelopmentPrysmian has also created, in partnership with SDA Bocconi, the Prysmian Group Academy, an international school of managerial and professional education whose mission is to develop and consolidate the technical and professional skills of Group management. The Academy's training activities involved about 600 employees in 2014, with another 600 expected to be involved during 2015.
Talent Measurement and SuccessionThe Academy introduced a leadership assessment and de-velopment process during 2014. Each programme, developed in partnership with the consulting firm CEB, adopts the very latest in career management practices. To date around 250 employees have been involved, including executives, middle managers and technicians. The aim of these programmes is to prepare the future pipeline and to plan succession, through a clear and timely exchange of information based on hard, reliable and consistent evidence of an individual's potential and ability (i.e. their readiness) to cover different positions.
International mobilityAt 31 December 2014, the Prysmian Group had an expatriate population of about 175 people from 35 different nationalities (of whom slightly more than 38% were Italian), who had moved to 35 different destination countries; of this total 61% were non-executive staff and 8% women. A total of 82 people embarked on new international assignments during the year.The above numbers demonstrate the importance of interna-tional mobility within the Prysmian Group. In fact, this tool is an integral part of the policy of developing and growing talent
within the Group. On the one hand, it allows the culture and values of Prysmian to spread to all its countries and all its subsidiaries, a particularly important requirement after the Draka Group's acquisition in 2011. On the other hand, it allows local organisational needs to be met by allowing the transfer of both managerial and technical know-how from one country to another. International experience is also central to the professional and managerial growth of young talents participating in the "Graduate" program. In 2014, 50 recent graduates from 24 different countries were recruited for a two-year international experience in as many as 19 different countries of destination.The Prysmian Group's attention to internationalism and the development of transnational resources is matched by the considerable energy it devotes to fostering the cultural diversity of the individual countries in which it operates. Of the Group's senior executives, 45% work in their country of origin.The focus of international mobility in 2015 will be on ensuring the success of international assignments by measuring their effectiveness in terms of know-how transfer and local team professional development and by improving the career planning for expatriates once they finish their international assignments. Key to the success of the international mobility policy is that expats manage to share and strengthen the Prysmian sense of identity, its corporate culture and values within the local teams, while leveraging the diversity of talents beyond geographical borders in order to achieve superior results for the organisation.
Remuneration policiesThe Compensation & Benefits policies adopted by the Prysmian Group are designed to attract and retain highly professional resources, particularly for key positions, with the right skills for the complexity and specialisation of the business, while also having a view to the sustainability of costs and results over time. The business's growing inter-nationalisation means constantly monitoring the different geographical situations to secure distinctive talents in a competitive market environment. These policies are defined and implemented centrally for the Executive population (about 300 employees) and for expatriates (about 175 employees), while these activities are delegated to the local level for the rest of the workforce. Over the next few years, centralised management will also extend to the population of experienced employees, meaning those with extensive know-how linked to length of service.In line with best market practice, executive remuneration packages contain a fixed component as well as short and long-term variable components. All components of remu-
Consolidated Financial Report | DIRECTORS’ REPORT
2014 Annual Report Prysmian Group
104
neration are performance-related and the variable ones in particular account for an important percentage of the overall compensation package offered. The fixed portion of remuneration is reviewed annually and revised if necessary to take account of competitiveness versus market compensation data, internal equity and indi-vidual performance, all of which in compliance with local reg-ulations. This meritocratic approach is based on the P3 global performance appraisal system which is applied uniformly and consistently throughout the Group.The executive population and 500 other managers of the Group participate annually in the MBO (Management by Objectives) plan under which an annual incentive is paid upon meeting predetermined Group objectives in line with the pri-orities identified in the business plan. In 2014 these objectives (on-off conditions) were represented by the Group's NFP (Net Financial Position) and EBITDA. The value of the incentive paid depends on the percentage achieved of the predeter-mined business and/or functional and/or individual objec-tives, defined with the aim of aligning individual behaviour with the organisation's annual strategic objectives. Where possible, individual sustainability objectives are included. In some cases, a multiplier is applied to the final value of the MBO, depending on the P3 performance appraisal. Also taken into consideration when determining the bonus payable are the employee's qualitative performance and overall conduct. The MBO has very strict rules which are communicated clearly and transparently to all participants.In a spirit of continuity with the past, and convinced of the importance of linking executive remuneration to business short-term as well as long-term results, the Prysmian Group has started to study a new long-term incentive plan, which will be submitted for shareholder approval.
Group employee share purchase plan (YES Plan)The Prysmian Group has also launched the YES Plan (Your Employee Shares Plan), open to all Group employees. The Plan was introduced in 28 countries at the end of 2013, after an intense communication campaign and detailed presentations. The YES Plan's regulations allow participating employees to buy Prysmian shares, during specific purchase windows in 2014, 2015 and 2016, on preferential terms and on condition that they retain the shares for at least 36 months from the purchase date. Plan participants can buy Prysmian shares at a discount, that varies from 1% for the CEO and Senior Managers, to 15% for executives and 25% for the
remaining workforce, thereby encouraging employee partic-ipation at every level. Moreover, all participants are given 6 shares as a one-off entry bonus.The objectives pursued in launching this plan are to increase employees’ sense of closeness and belonging to the Group as well as their engagement with and understanding of the business, in order to converge the long-term interests of shareholders, customers and employees and to strengthen the internal perception of Prysmian Group as one, single company, a real "One Company". In brief, the Group's intent is to have its employees become stable shareholders, thus making them owners of a small part of the Group in which they work.Plan participation in the launch year confirmed the expecta-tions: around 5,000 employees, or 32% of the total (of whom about 55% were BC personnel) signed up to the Plan in 2014, confirming their great sense of corporate belonging and their confidence in Prysmian's people and in its future.Plan participation in certain countries was very high, with for example, nearly all employees signing up in Romania, about 83% at the headquarters in Milan and 74% in Turkey.
Social and internal relations The Group maintains constant and positive relations with employee representatives and trade unions based on mutual respect and fair discussion, in the belief that, with due respect for each other's roles, common interests can be pursued through constructive dialogue.Employee and trade union representatives therefore operate freely in compliance with local laws and practices.During 2014 a number of industrial restructurings in France and the Netherlands were the subject of discussions with the unions, leading to agreements for the definition of the relevant social plans. Meetings of Prysmian's European Works Council were held in May and October and were attended by the body's delegate members. Both meetings were prepared beforehand by the Select Committee which decided the content in terms of information about the business, its most significant initia-tives, and information about the shareholders, with ample room left for further questions.
For a more detailed understanding of the Prysmian Group's commitment to human resources, please refer to the 2014 Sustainability Report.

105
RESEARCH AND DEVELOPMENT
Prysmian Group has always given key strategic importance to Research & Development to maintain its market leader-ship, with the aim of differentiating itself and of providing its customers with technologically innovative solutions at increasingly competitive costs. The Group currently has 17 Centres of Excellence, with headquarters in Milan, and over 500 skilled professionals. With around 5,800 patents
granted or filed and partnerships with major universities and research centres in many countries where it is present, the Prysmian Group intends to be industry leader in R&D. The Group's spending on Research, Development and Innovation amounted to approximately Euro 70 million in 2014, broadly in line with the previous year and confirming its steadfast commitment to and focus on long-term sustainable growth.
With 17 Centres of Excellence, over 500 professionals, about 5,800 patents and partnerships with universities and research centres in many countries, the Prysmian Group intends to be an innovation leader in the cable industry.
R&D HeadquartersR&D Centres
17 R&D Centres Over 500 professionals Over 5,000 patents
R&D Headquarters
PRYSMIAN GROUP R&D CENTRES
In the Energy Projects and Energy Products operating segments, the main achievements of the year included:
• In the submarine cables area, work continued to optimise 220 kV AC three-core cables; in particular, a prototype with 1600 mm² aluminium conductors was made, to achieve IEC prequalification for the Arco Felice and Pikkala plants, and a prototype with 1200 mm² copper conductors, for qualification testing as part of the "50 Hertz" project, one of the largest ever performed in terms of volume and value. Internal qualification testing was completed for the flexible 400 kV AC joint. Still in the submarine cables area, particular resources were devoted to the recovery plan for the Western Link
project and its 600 kV DC cables insulated with PPL (Paper Polypropylene Laminate).
• In the field of EHV underground cables, development was completed of the prototype 400 kV cable with a Milliken 3500 mm² copper conductor, the largest copper conductor ever developed by the Group. In addition, the Gron plant in France produced prototype Milliken aluminium conductors measuring 4000 mm², while the Delft plant in the Netherlands produced similar proto-types measuring 3500 mm², which will be used for the TenneT contract for the 380 kV Randstaadt connection. Additional work was performed to develop the prototype 500 kV XLPE cable with a Milliken 2500 mm² copper
Consolidated Financial Report | DIRECTORS’ REPORT
2014 Annual Report Prysmian Group
106
conductor, featuring a weight-optimised conductor and a copper-wire screen with copper laminated foil, specially designed for the American market. EHV product development also saw the start of a major project to develop the HVDC 525 kV system with extruded XLPE insulated cables and related accessories. This project, also intended for the production of submarine cables, includes several alternative solutions in terms of both cables and accessories, in order to meet every possible customer requirement. The high voltage underground cables area reported the development of an aluminium wire screen with protective aluminium laminated foil, allowing a cost saving of up to 15% compared with the corresponding copper wire screen solution with aluminium laminated foil. Lastly, work continued on starting up and qualifying the Rybinsk plant in Russia: in fact, 110 kV qualification was achieved and the 330 kV prototype with a Milliken 2500 mm² aluminium conductor was produced for the subsequent phases of testing.
• With reference to developments in P-Laser technology, the 150 kV class passed its qualification test; the test, conducted on a system complete with accessories (joints and terminations), was completed with a series of additional high-temperature high-voltage tests. In view of the promising results obtained during internal prequalification testing conducted in 2013, qualification testing started for a P-Laser HVDC 320 kV cable and related accessories. The P-Laser system is particularly suitable for high voltage direct current (HVDC) appli-cations because of the greater chemical stability of its insulating material for which no kind of treatment (degassing) before commissioning is required.
• The Oil & Gas cables business reported continued product development and related technology transfer between Group factories. In particular, to meet the needs of our customers in the global change of the business (increased production from new offshore platforms in China and Brazil), technology and know-how for offshore NEK606 compliant cables were transferred to the Chinese plant in Tianjin, with related training of its technical staff and preparation of appropriate manuals in English and Chinese; during the year similar activities were also carried out at the Suzhou plant. In terms of products, new solutions were developed for harsh envi-ronmental conditions and to allow vital communication by emergency systems even in extreme conditions. The
Drilling Package, a complete cabling solution for Oil & Gas drilling applications both onshore and offshore, was also launched globally.
• With regard to the development of Prycam technology, two important new innovations were developed in 2014. These included the Prycam DLoG, a digital data logger with 4 analogue inputs and 4 totally configurable digital inputs to accept temperature, pressure, current, voltage sensors, and so on; this device is designed to monitor electrical parameters in fixed installations and, like other members of the Prycam family, it allows users to see data acquired wirelessly and to send that data to the common Pry-Mon monitoring platform. The Pry-Mon platform was enhanced to accept data from Prycam Portable, from Prycam Grids and from DTS systems. The second innovation in the family was the new Prycam Wings sensor. Developed using the experience of the Prycam Portable sensor to measure partial discharges, Prycam Wings also includes temperature and current sensoring.
Achievements in the Telecom operating segment included:
• In the optical fibre field, several of the Group's factories were got ready for full production of bend-resistant BendBrightxs fibres, which have much better micro and macro-bending performances than competitor products. A number of improvements were also made at several factories to secure a significant reduction in fibre production costs. In the area of multimode fibre, WideCAP OM4 was launched, a new fibre capable of 40Gb bidirectional transmission with two channels at 850 and 900nm, and potential upgrade to 4 * 25Gb to meet the future needs of the 100Gb superfast network.
• In the optical cables field, the Flextube family of cables was enlarged with the addition of a record density product containing 4.2 fibres per mm² in a 1728 fibre 23 mm diameter cable, made using fibres measuring 200 micrometres in diameter. These products represent an excellent solution for use in conduits congested with other cables. Dry/dry technology was also developed for Flextube cables in order to reduce cable installation time even further and so reduce overall installation costs. At the Slatina plant in Romania, now one of the major European centres of optical cable production, investments continued for a significant increase in production capacity of the Flextube and Drop cables. In

107
the connectivity field, Prysmian continued to develop several new accessories for use in FTTH (Fibre to the Home) applications.
In terms of industrial innovation, the strategic role played by materials in cable and accessories technology is leading Prysmian Group to step up its exploratory studies in this area. The main achievements in the year included:
• Successful completion of the study of semi-conducting compounds for P-Laser cables up to 500kV HVDC. These compounds were successfully extruded on prototype cables.
• Completion of the development of a proprietary formu-lation of high temperature acrylic for use in fibres for sensors.
• In the petrochemicals sector, completion of testing of aluminium clad armouring for flexible pipes: this material showed an excellent performance in extreme environments and at great depths.
• Continued study of composite materials for use, instead of steel armouring, in submarine cables and umbilicals; this work was conducted in partnership with several suppliers for the realisation of the desired materials.
Lastly, work on cost optimisation continued throughout the year. The package of DTC (Design to Cost) projects was
further extended to cover more than 1,700 projects, which, combined with compound rationalisation and better use of materials, allowed the Group to achieve major cost savings in support of greater competitiveness.
Intellectual property rightsProtecting its portfolio of patents and trademarks is a key part of the Group's business, particularly in view of its strategy of growth in high-tech market segments. In particular, the Group's intense R&D activities, in the Energy Projects, Energy Products and Telecom operating segments, have allowed it to continue to add to its patent portfolio, especially in high-tech and higher value-added areas, in order to support its major investments in these areas in recent years and to protect the related businesses, both now and in the future.
As at 31 December 2014, the Prysmian Group had 5,836 patents and pending patent applications throughout the world, covering 932 inventions (of which 278 in the Energy Projects and Energy Products segments and 654 in the Telecom segment). During 2014, 45 new patent applications were filed (+21% compared with 2013), of which 32 in the Telecom area and 13 in the Energy area, and 187 patents were granted after examination, of which 33 by the European Patent Office (EPO) and 61 in the United States.
5,900
5,600
5,300
5,000
02011 2012 2013 2014
Patents granted and patent applications pending
PATENTS GRANTED AND PATENT APPLICATIONS PENDING
The most important products, typically distinguished by particular characteristics or a specific production process, are protected by trademarks that allow them to be identified and guarantee their uniqueness. As at 31 December 2014, the
Prysmian Group owned 605 trademarks, corresponding to 2,920 trademark registrations in its countries of operation, covering the names and identifying symbols of its companies, activities, products and product lines.

Consolidated Financial Report | DIRECTORS’ REPORT
2014 Annual Report Prysmian Group
108
The main raw materials used by the Group in its production processes are copper, aluminium, lead, special glass and coating for optical fibres, as well as various petroleum deriv-atives, such as PVC and polyethylene.
In a market environment characterised by continued global economic fragility with only a slight recovery in volumes, average prices of the principal commodities were generally lower in 2014 than in the previous year. In the case of base metals, copper and lead prices were significantly lower than the year before, down by as much as 6%, reflecting persistent stagnation in some West European countries and a gradual slowdown by emerging market economies (China, Russia, Brazil) leading to fears about possible reductions in future demand by these countries. Aluminium went against this trend, posting a slightly higher price than the previous year mainly due to increased use of this metal in the automotive sector. The Brent crude price was generally in line with 2013 during the first half of the year but went into steep decline from August, to close the last session of 2014 at USD 57/barrel, representing a loss of about 50% from the year's highs in June. Among the petroleum derivatives, the price of ethylene fell significantly, leading to a consequent reduction in polyethylene prices, especially in the second half of the year. Even PVC and plasticiser prices fell, reflecting the lower
commodity costs and still weak demand in the construction industry.
Once again in 2014, the Prysmian Group was able to deal with fluctuations in base metal prices through strict appli-cation of its hedging policies and daily matching between purchase and sales commitments. Sales price adjustment mechanisms, combined with attentive hedging, helped in fact to mitigate the impact of price fluctuations on the income statement. As for other raw materials, work continued to rationalise and consolidate the supplier base, using all the synergy and volume levers offered by the Group's size. Risk management activities also continued with regard to the supplier portfolio, aimed on the one hand at reducing dependence on individual suppliers, and on the other at strengthening partnerships with core suppliers or suppliers of critical technologies. The added strengthening of commercial relationships with key suppliers over the year allowed the Group to minimise costs and the risk of dis-ruption in supplies, ensuring benefits not only in the short term but also in the medium and long terms. Lastly, during the year the Procurement function's new organisational structure, introduced in 2013, entered full operation in terms of organisational model, common processes and shared performance indicators.
SOURCINGOnce again in 2014, the Group was able to deal with fluctuations in base metal prices through strict application of its hedging policies and daily matching between purchase and sales commitments.
AN INTEGRATED SUPPLY CHAIN

109
CopperThe average cash settlement price per tonne of copper on the London Metal Exchange (LME) was USD 6,860 (Euro 5,167) in 2014, representing a 6% decline on the prior year
average price in both USD and Euro. Fluctuating between a low of USD 6,306 and a high of USD 7,422, the price was less volatile than in 2013 (low 6,637 – high 8,242).
Jan-
14
Feb-
14
Mar
-14
Apr-
14
May
-14
Jun-
14
Jul-1
4
Aug-
14
Set-
14
Oct-
14
Nov
-14
Dec-
14
Jan-
13
Feb-
13
Mar
-13
Apr-
13
May
-13
Jun-
13
Jul-1
3
Aug-
13
Set-
13
Oct-
13
Nov
-13
Dec-
13Avg FY
2012
9,000
8,000
7,000
6,000
5,000
4,000
3,000
2,000
1,000
0Avg FY
2013
Avg FY
2014
USD
EUR
COPPER
USD EURO Source: LME data. Price per tonne
Jan-
14
Feb-
14
Mar
-14
Apr-
14
May
-14
Jun-
14
Jul-1
4
Aug-
14
Set-
14
Oct-
14
Nov
-14
Dec-
14
Jan-
13
Feb-
13
Mar
-13
Apr-
13
May
-13
Jun-
13
Jul-1
3
Aug-
13
Set-
13
Oct-
13
Nov
-13
Dec-
13Avg FY
2012
2,500
2,000
1,500
1,000
500
0Avg FY
2013
Avg FY
2014
USD
EUR
ALUMINIUM
USD EURO Source: LME data. Price per tonne
AluminiumThe average price of aluminium increased by about 1% during 2014, both in USD and Euro, reflecting a growing imbalance between supply and demand. Stocks in the official London Metal Exchange warehouses fell by 1
million tonnes, from over 5 million tonnes at the beginning of 2014 to just over 4 million at year end. This situation put pressure on conversion premiums. The average price per tonne of aluminium was USD 1,866 (Euro 1,409) in 2014, compared with USD 1,846 (Euro 1,391) in 2013.

Consolidated Financial Report | DIRECTORS’ REPORT
2014 Annual Report Prysmian Group
110
OilBrent crude prices remained largely stable in the first seven months of 2014, ranging between USD 105 and USD 115; prices started to fall steadily from August, until reaching USD 57/barrel at the end of December. Brent crude had an average price per barrel for the whole of 2014 of USD 100, down 9%
on 2013 (USD 109). Even the price expressed in euros was 9% lower, declining from Euro 82/barrel in 2013 to Euro 75/barrel in 2014. Ethylene prices declined more moderately, in the order of 6%. Even the other principal petroleum derivatives reported lower prices than in the previous year as a result.
Jan-
14
Feb-
14
Mar
-14
Apr-
14
May
-14
Jun-
14
Jul-1
4
Aug-
14
Set-
14
Oct-
14
Nov
-14
Dec-
14
Jan-
13
Feb-
13
Mar
-13
Apr-
13
May
-13
Jun-
13
Jul-1
3
Aug-
13
Set-
13
Oct-
13
Nov
-13
Dec-
13Avg FY
2012
2,500
2,000
1,500
1,000
500
0Avg FY
2013
Avg FY
2014
USD
EUR
LEAD
USD EURO Source: LME data. Price per tonne
Jan-
14
Feb-
14
Mar
-14
Apr-
14
May
-14
Jun-
14
Jul-1
4
Aug-
14
Set-
14
Oct-
14
Nov
-14
Dec-
14
Jan-
13
Feb-
13
Mar
-13
Apr-
13
May
-13
Jun-
13
Jul-1
3
Aug-
13
Set-
13
Oct-
13
Nov
-13
Dec-
13Avg FY
2012
140
120
100
80
60
40
20
0Avg FY
2013
Avg FY
2014
USD
EUR
BRENT
USD EURO Source: ICE data. Price per barrel
LeadThe average price per tonne of lead on the London Metal Exchange was USD 2,096 (Euro 1,578) in 2014, down 2% in both USD and Euro terms on the previous year.

111
The Prysmian Group's manufacturing activities are carried out through a highly decentralised model, involving 89 plants in 33 different countries. The widespread distribution of plants is a strategic factor in allowing the Group to react quickly to different market needs worldwide. Over the course of 2014 the Prysmian Group continued to implement an in-dustrial strategy based on the following rationale: (i) focus on higher value-added high-tech products, by concentrating their production in a limited number of plants that become centres of excellence with high levels of technological expertise, where it is possible to benefit from economies of scale, by improving manufacturing efficiency and reducing capital employed; (ii) ongoing pursuit of greater manufac-turing efficiency in the commodities area by maintaining a wide geographical presence to minimise distribution costs.Capital expenditure totalled Euro 163 million in 2014, up from Euro 138 million the previous year, mainly reflecting the Group's ever increasing commitment to developing its activities in the Submarine cables business. Investments to increase production capacity and change its mix accounted for 30% of the total: these investments were mainly in the Energy Projects and Telecom operating segments, as described in due course. In addition, the process of ratio-nalising production capacity proceeded throughout the year: in fact, the plants in St. Petersburg (Russia) and Aubevoye (France) were both closed, resulting in the transfer of machinery to other factories within the Group. The purpose of concentrating production sites was to optimise cost structure within individual countries and to rationalise the Group's industrial footprint in order to restore a sufficient level of capacity utilisation within the various countries.
Energy ProjectsWork was completed during the year to increase capacity at the Arco Felice Submarine cables plant in Italy to allow it to fulfil the contract for the Western HVDC Link between England and Scotland. Also in the Submarine business, in-vestments were completed at the Drammen plant in Norway to get production lines ready for the manufacture of cables to connect some of ExxonMobil's offshore platforms off the west coast of the United States to the mainland. A major new investment was started at the plants in Arco Felice and Pikkala (Finland) to increase capability for the "50 Hertz" contract, worth more than Euro 700 million and awarded to the Group during the year; this contract involves the design, supply and installation of high voltage submarine systems between offshore wind farms in German territorial
waters. Within the High Voltage business, two of the main investments were: i) at the Abbeville plant (United States) for the construction of a second vertical insulation line for Extra High Voltage extruded cables, in order to intercept the volume growth in this continuously expanding market; ii) at the Slatina plant (Romania), to satisfy growing demand in the markets of South-East Europe.
Energy ProductsIn the Oil & Gas sector, investment projects were completed at the Sorocaba and Santo André and Sorocaba plants in Brazil, allowing them to produce cables for the Jurong and Keppel Fels Shipyards. At the same time, the Group continued to invest in countries with the best growth potential: in Russia, the plant in Rybinsk expanded its capability for the produc-tion of low voltage cables; in China, the plants in Suzhou and Tianjin increased their cable production capacity for the Trade & Installers and Rolling Stock markets; in Hungary, the plant in Kistelek started a project to construct a production line for rubber cables serving the Central European market.
TelecomThe Telecom operating segment's main investment was in the Sorocaba plant in Brazil for the verticalisation of the optical fibre production process, aimed at serving the South American market and particularly the Brazilian one; there was also continued investment to increase optical cable production capacity at the new factory in Slatina (Romania), confirmed as one of Europe's centres of excellence for optical telecom cables.
EfficiencyCapital expenditure on achieving efficiencies to reduce fixed and variable costs, particularly in relation to materials usage and product design, accounted for approximately 20% of the total. In particular, the Energy Products segment made significant investments in efficiency, particularly in the metallurgical area, following the Group's decision to complete the process of vertical production at some of its plants (Schuylkill Haven in North America, Durango in Mexico, and Schwerin in Germany). In the Telecom segment, its European optical fibre manufacturing facilities in Bat-tipaglia (Italy) and Douvrin (France) continued to invest in efficiency with a view to achieving a significant reduction in fibre manufacturing cost. In particular, the Italian plant is about to complete the construction of a trigeneration plant that will reduce its energy costs; at the same time, work has
INDUSTRIAL ACTIVITIESDuring the year Prysmian continued to invest in the higher value-added business of submarine cables, confirming once again its world leadership in this segment.

Consolidated Financial Report | DIRECTORS’ REPORT
2014 Annual Report Prysmian Group
112
continued on the project to increase the size of preforms. Lastly, in South America, the Telecom plants in Sorocaba (one former Prysmian, the other former Draka) completed their rationalisation aimed at consolidating production of optical cables and Multimedia & Specials.
IT, R&DSome 12% of capital expenditure was devoted to the ongoing upgrade and development of information systems and to research and development (the portion of expenditure not expensed to income). In particular, there was continued spending on rolling out the "SAP Consolidation" project, aimed at standardising the information system in all the
Group's operations over the next few years: in 2014, the new ERP system was rolled out to the Netherlands, Canada and the United States, only partially.
Base-loadCapital expenditure on structural maintenance work accounted for about 10% of the total, in line with previous years.
OtherThis category (accounting for 28% of total expenditure) contains three investments of particular importance for the Group: first and foremost, the work to upgrade the "Cable

113
*Europe - Middle East - Africa**Asia - Pacific
Euro163 million
EMEA* 79%
North America 8%South and Central America 10%
APAC** 3%
CAPITAL EXPENDITURE IN 2014
Euro163 million
Increase capacity/product mix 30%
Energy Projects 18%Energy Products 5%Telecom 7%Base-load 10%
E�ciency 20%IT, R&D 12%
Other 28%
Enterprise" cable ship in order to provide it with an advanced "DP2" manoeuvring and dynamic positioning system; this work will be completed in early 2015, allowing the Group to use the ship for submarine cable laying and installation ac-tivities for the rest of the year. The other major investments were the acquisition of the industrial building in Pikkala
(Finland) and continued work at the Ansaldo 20 industrial site, in the Bicocca district of Milan, on building the Group's new headquarters, which will extend over an area of more than 20,000 m2 and allow the Group to consolidate all its Milan-based company functions in one place, with a resulting saving in running costs.
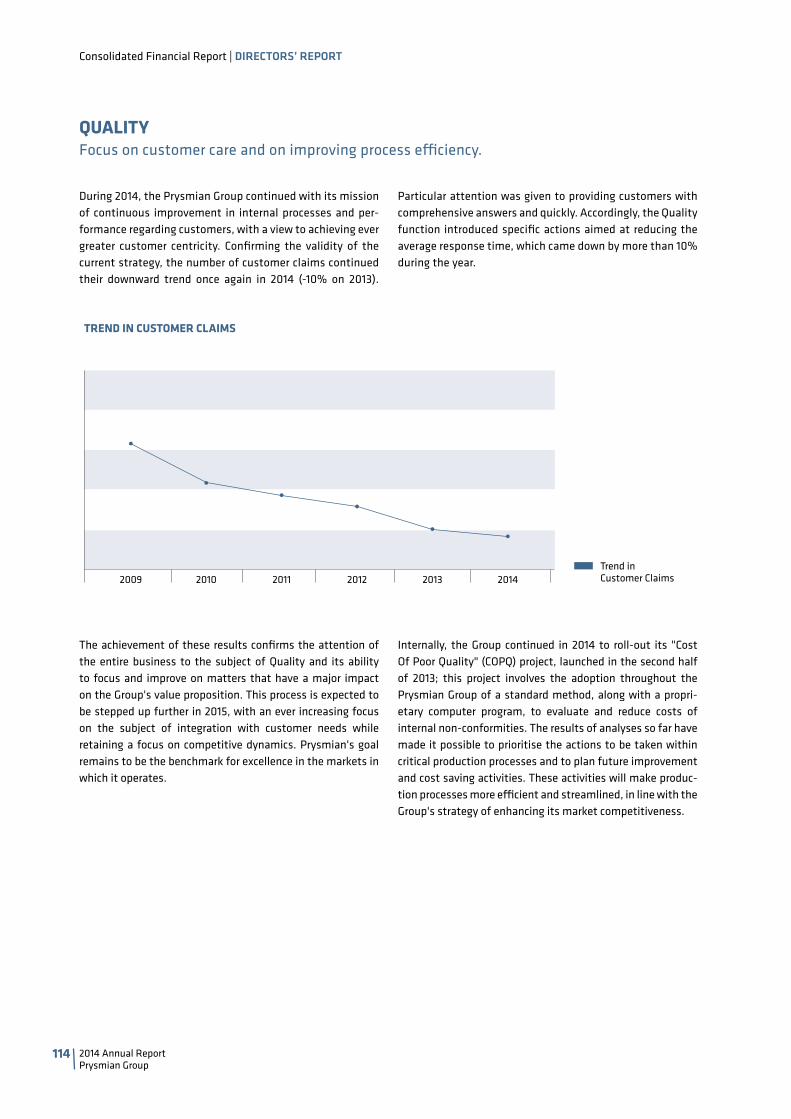
Consolidated Financial Report | DIRECTORS’ REPORT
2014 Annual Report Prysmian Group
114
During 2014, the Prysmian Group continued with its mission of continuous improvement in internal processes and per-formance regarding customers, with a view to achieving ever greater customer centricity. Confirming the validity of the current strategy, the number of customer claims continued their downward trend once again in 2014 (-10% on 2013).
Particular attention was given to providing customers with comprehensive answers and quickly. Accordingly, the Quality function introduced specific actions aimed at reducing the average response time, which came down by more than 10% during the year.
QUALITYFocus on customer care and on improving process efficiency.
2014Trend in Customer Claims
TREND IN CUSTOMER CLAIMS
20132012201120102009
The achievement of these results confirms the attention of the entire business to the subject of Quality and its ability to focus and improve on matters that have a major impact on the Group's value proposition. This process is expected to be stepped up further in 2015, with an ever increasing focus on the subject of integration with customer needs while retaining a focus on competitive dynamics. Prysmian's goal remains to be the benchmark for excellence in the markets in which it operates.
Internally, the Group continued in 2014 to roll-out its "Cost Of Poor Quality" (COPQ) project, launched in the second half of 2013; this project involves the adoption throughout the Prysmian Group of a standard method, along with a propri-etary computer program, to evaluate and reduce costs of internal non-conformities. The results of analyses so far have made it possible to prioritise the actions to be taken within critical production processes and to plan future improvement and cost saving activities. These activities will make produc-tion processes more efficient and streamlined, in line with the Group's strategy of enhancing its market competitiveness.
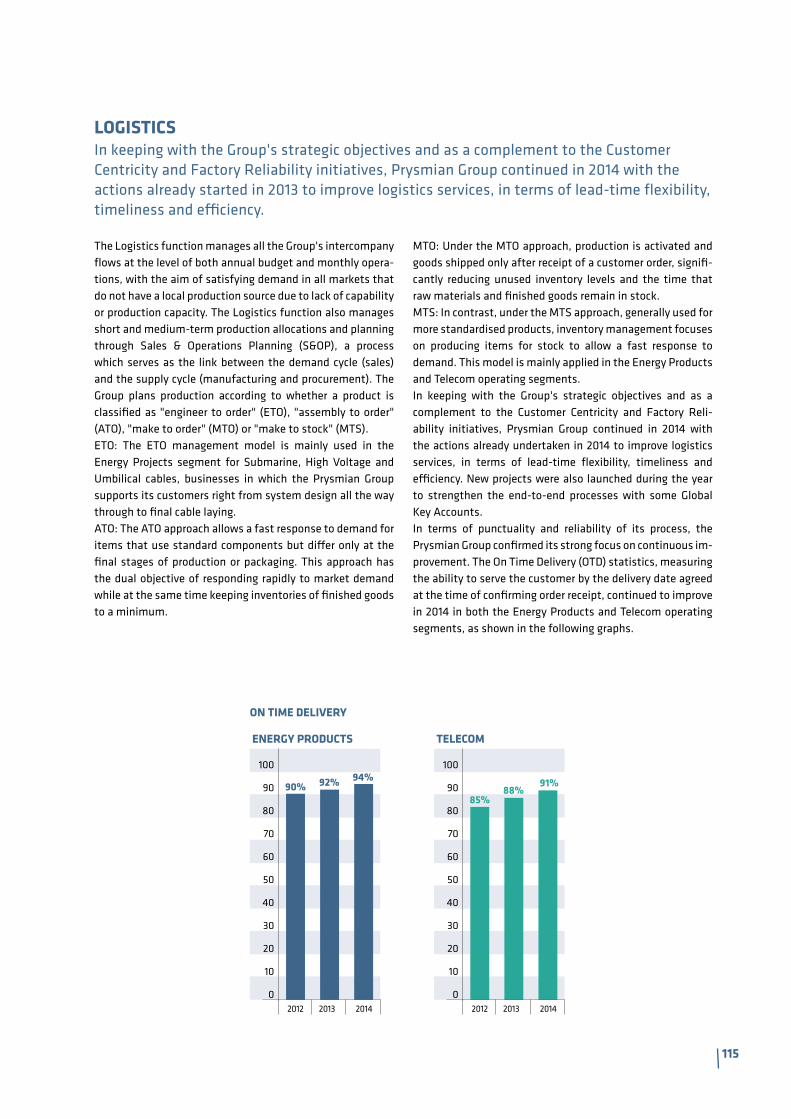
115
The Logistics function manages all the Group's intercompany flows at the level of both annual budget and monthly opera-tions, with the aim of satisfying demand in all markets that do not have a local production source due to lack of capability or production capacity. The Logistics function also manages short and medium-term production allocations and planning through Sales & Operations Planning (S&OP), a process which serves as the link between the demand cycle (sales) and the supply cycle (manufacturing and procurement). The Group plans production according to whether a product is classified as "engineer to order" (ETO), "assembly to order" (ATO), "make to order" (MTO) or "make to stock" (MTS). ETO: The ETO management model is mainly used in the Energy Projects segment for Submarine, High Voltage and Umbilical cables, businesses in which the Prysmian Group supports its customers right from system design all the way through to final cable laying.ATO: The ATO approach allows a fast response to demand for items that use standard components but differ only at the final stages of production or packaging. This approach has the dual objective of responding rapidly to market demand while at the same time keeping inventories of finished goods to a minimum.
MTO: Under the MTO approach, production is activated and goods shipped only after receipt of a customer order, signifi-cantly reducing unused inventory levels and the time that raw materials and finished goods remain in stock. MTS: In contrast, under the MTS approach, generally used for more standardised products, inventory management focuses on producing items for stock to allow a fast response to demand. This model is mainly applied in the Energy Products and Telecom operating segments.In keeping with the Group's strategic objectives and as a complement to the Customer Centricity and Factory Reli-ability initiatives, Prysmian Group continued in 2014 with the actions already undertaken in 2014 to improve logistics services, in terms of lead-time flexibility, timeliness and efficiency. New projects were also launched during the year to strengthen the end-to-end processes with some Global Key Accounts.In terms of punctuality and reliability of its process, the Prysmian Group confirmed its strong focus on continuous im-provement. The On Time Delivery (OTD) statistics, measuring the ability to serve the customer by the delivery date agreed at the time of confirming order receipt, continued to improve in 2014 in both the Energy Products and Telecom operating segments, as shown in the following graphs.
LOGISTICSIn keeping with the Group's strategic objectives and as a complement to the Customer Centricity and Factory Reliability initiatives, Prysmian Group continued in 2014 with the actions already started in 2013 to improve logistics services, in terms of lead-time flexibility, timeliness and efficiency.
ENERGY PRODUCTS
2012 2013 2014
100
90
80
70
60
50
40
30
20
10
0
90% 92% 94%
TELECOM
2012 2013 2014
100
90
80
70
60
50
40
30
20
10
0
85%88%
91%
ON TIME DELIVERY
Jan-
14
Feb-
14
Mar
-14
Apr-
14
May
-14
Jun-
14
Jul-1
4
Aug-
14
Sep-
14
Oct
-14
Nov
-14
Dec-
14
Jan-
13
Feb-
13
Mar
-13
Apr-
13
May
-13
Jun-
13
Jul-1
3
Aug-
13
Sep-
13
Oct-
13
Nov
-13
Dec-
13
100
95
90
85
80
LOGISTICS
Energy Products
Telecom

Consolidated Financial Report | DIRECTORS’ REPORT
2014 Annual Report Prysmian Group
116
ENERGY PRODUCTS
2012 2013 2014
100
90
80
70
60
50
40
30
20
10
0
90% 92% 94%
TELECOM
2012 2013 2014
100
90
80
70
60
50
40
30
20
10
0
85%88%
91%
ON TIME DELIVERY
Jan-
14
Feb-
14
Mar
-14
Apr-
14
May
-14
Jun-
14
Jul-1
4
Aug-
14
Sep-
14
Oct-
14
Nov
-14
Dec-
14
Jan-
13
Feb-
13
Mar
-13
Apr-
13
May
-13
Jun-
13
Jul-1
3
Aug-
13
Sep-
13
Oct-
13
Nov
-13
Dec-
13
100
95
90
85
80
LOGISTICS
Energy Products
Telecom
Synergies between distribution networks, warehouses and distribution centres, initiated after the Draka acquisition, continued to be achieved during 2014 and enhanced by actions like the launch of the Supply Chain Integration project, intended to make the most of the unique platform offered by the "SAP 1 Client" system, whose roll-out is now complete in Europe (with the sole exception of the UK which will be added in the course of 2015).Actions and projects of this kind confirm the Group's commitment to increasingly efficient use of resources, to greater sharing of information and to significant reductions in response time to market needs.The ongoing attention to flexibility of response to the market's ever more challenging demands has improved the
reliability of planning and the execution of manufacturing output, in terms of both mix and volumes in ever faster response times.This, together with strict control over every type of inventory (raw materials, intermediate products and finished goods) allowed the Group to respond effectively and efficiently to the volatility in 2014, which saw some business areas, regions and product ranges clearly expanding in volume terms compared with other areas where demand was stagnant or sinking.Lastly, all Group operating units have continued to focus, in partnership with customers and suppliers, on actions to recycle, recondition and reuse packaging in order to minimise environmental impact.
117
Commitment to environmental stewardship and to the conservation of natural resources is critical for the Group to create sustainable value, benefiting both the organisation and its stakeholders. This approach is expressed not only in the product's intrinsic characteristics, but also in the management of production systems, where the focus is on prevention and reduction of environmental impact through, for example, efficient use of natural resources, optimisation of logistics and responsible waste management.
On the basis of the environmental performance indicators viewed as relevant at Group level, Prysmian's Health Safety & Environment (HSE) function, working together with other functions and with the backing of the Board of Directors, established the Group's HSE objectives for 2013-2014. These objectives were communicated to all Country and Organisa-tional Unit managers and, where possible, individual targets were set.
In 2014, HSE further consolidated its action at various levels of the Group's organisation (Corporate, countries or regions, business units and production units), by centralising ac-tivities and coordinating the work of local HSE functions. The Health, Safety and Environment policy, Management Procedures and corporate Technical Standards have been introduced and applied in the operating units. With the support of the Group's team of auditors, the HSE function has periodically checked the effectiveness and correct im-plementation of HSE rules locally.
The aspects that HSE monitors, through the use of indica-tors, include compliance with health and safety standards, energy consumption, waste management, the use of water resources and atmospheric emissions of greenhouse gases. These indicators are presented in the Sustainability Report. In particular, with regard to greenhouse gas emissions, the Group has started to collect energy consumption data to keep a track of "direct" emissions (arising from the produc-tion process), and "indirect" ones (arising from bought-in energy). This monitoring and reporting system has allowed Prysmian to participate, once again in 2014, in the Carbon Disclosure Project (CDP), an international initiative that aims to contribute to achievement of the Kyoto Protocol’s targets for worldwide reduction in greenhouse gases.
During the year, the Prysmian Group also defined and applied the methodology for assessing the environmental impact of
certain types of products. In addition, the process continued of obtaining certification for the Group’s HSE management systems. At the end of 2014, 93% and 59% of the sites were certified in accordance with ISO 14001 and OHSAS 18001 respectively.
During the year a total of 125 inspections were carried out at the various plants, of which a quarter by Prysmian auditors aimed at verifying compliance with the required standard, while the rest of the inspections were conducted by the Group's main certification body. In addition to these, there were other internal audits on specific matters and inspec-tions by other bodies.
In addition to numerous training initiatives, Prysmian managed and carried out a series of activities, coordinated by the HSE function, including:• completion of the environmental and safety section of
the RobecoSAM corporate sustainability assessment questionnaire for admission to the Dow Jones Sustain-ability Index (DJSI), with a major improvement on the prior year score. The HSE function has already planned and launched several other initiatives in this regard to ensure more complete reporting and to highlight in more detail the connection between environmental improve-ments and the resulting economic impacts;
• active participation in various working groups and com-mittees of industry associations (the Europacable ECOE Committee, the Orgalime "Substances Task Force", the ANIE Environment Committee, the AICE environment working group, and the IEC Maintenance Team which is developing the standard for the environmental statement specific to energy cables).
The integration process represents an opportunity for improvement, in which the HSE function will coordinate the development of additional policies and operating proce-dures to manage health, safety and the environment at all the Group’s operating units. In this context, Prysmian Group monitors its environmental, health and workplace safety performance using qualitative and quantitative measures, some of which are published in the Sustainability Report. This document, to which reference should be made for further details, describes not only the Group's performance, but also the existing management models and lines of development for future action.
PRYSMIAN FOR THE ENVIRONMENTAt the end of 2014, 93% and 59% of the sites were certified in accordance with ISO 14001 and OHSAS 18001 respectively.

Consolidated Financial Report | DIRECTORS’ REPORT
2014 Annual Report Prysmian Group
118
INCENTIVE PLANS
Long-term incentive plan 2011-2013On 14 April 2011, the Ordinary Shareholders' Meeting of Prysmian S.p.A. had approved, pursuant to art. 114-bis of Leg-islative Decree 58/98, a long-term incentive plan for the period 2011-2013 for employees of the Prysmian Group, including certain members of the Board of Directors of Prysmian S.p.A., and granted the Board of Directors the necessary authority to establish and execute the plan. The plan's purpose was to incentivise the process of integration following Prysmian's acquisition of the Draka Group.The plan involved 268 employees of Group companies and es-tablished that the number of options granted would depend on the achievement of common business and financial per-formance objectives for all the participants.The plan was dependent upon achievement of a minimum performance objective of at least Euro 1.75 billion in aggregate Adj. EBITDA for the Group in the period 2011-2013 (the Target), as well as upon continuation of a professional relationship with the Group up until 31 December 2013. The plan also set an upper limit for Adj. EBITDA as the Target plus 20% (i.e. Euro 2.1 billion), that would determine the maximum number of exercisable options granted to each participant.Access to the plan was conditional upon each participant's acceptance that part of their annual bonus would be co-in-vested, if achieved and payable in relation to financial years 2011 and 2012.The allotted options carried the right to receive or subscribe to ordinary shares in Prysmian S.p.A., the Parent Company. These shares partly comprised treasury shares and partly new shares, obtained through a capital increase that excluded pre-emptive rights under art. 2441, par. 8 of the Italian Civil
Code. Such a capital increase involved the issue in 2014 of 2,120,687 new ordinary shares of nominal value Euro 0.10 each, for a total nominal value of Euro 212,069, as approved by the shareholders in the extraordinary session of their meeting on 14 April 2011. The shares obtained from the Company's holding of treasury shares were allotted for zero consideration, while the shares obtained from the above capital increase were allotted to participants upon payment of an exercise price corresponding to the nominal value of the Company's shares.
In accordance with IFRS 2, the options allotted in respect of both new and treasury shares were measured at their grant date fair value. The number of options was determined according to the actual aggregate Adj. EBITDA achieved, which lay between the Target and the Adj. EBITDA upper limit.
Long-term incentive plan 2014-2016The Shareholders' Meeting held on 16 April 2014 approved an incentive plan for the Group's employees, including members of the Board of Directors of Prysmian S.p.A., and granted the Board of Directors the necessary powers to establish and implement this plan.As a result of the effects of the Western HVDC Link contract (UK), the Board of Directors has decided not to execute the mandate received from the shareholders allowing implemen-tation of this plan.
Additional information about the incentive plans can be found in Note 21 to the Consolidated Financial Statements.

119
SIGNIFICANT EVENTS AFTER THE REPORTING PERIOD
On 3 February 2015, the Prysmian Group signed a Memo-randum of Understanding with Transelectrica, a Romanian electricity transmission system operator, Unicredit Bank and the law firm Tonucci & Partners to carry out studies and analyses on the potential development of a submarine link between Romania and Turkey. The memorandum's aim is to support further development of the region's energy sector, by offering Romanian power suppliers the opportunity to export their surplus generation to other countries such as Turkey. The Prysmian Group also announced the construc-tion of new optical cable manufacturing facilities within Slatina's new Industrial Park; the new facilities will be capable of producing a full range of new generation optical fibre cables to support the most advanced applications and usages by public and private, national and international operators, having obtained all the required quality certifica-tions. Phase one of the project is due to reach completion by 2017. By the end of the project, the new plant will also have created 300 permanent jobs. The Group also plans to start production in Slatina of high voltage submarine cables for power transmission lines up to 150 kV; completion of the project and commencement of production are scheduled for July 2015. Lastly, with the goal of further developing highly skilled local human resources, Prysmian has also announced the launch of an international training programme in support of its industrial development with the recruitment of new and qualified local staff.
On 6 February 2015, Prysmian Cavi e Sistemi S.r.l. started legal proceedings, requesting that the claims brought by Pirelli & C. S.p.A. be rejected in full and that it should be Pirelli & C. S.p.A. which holds harmless Prysmian Cavi e Sistemi S.r.l., with reference to the alleged infringement in the period 18 February 1999 - 28 July 2005, for all claims made by the European Commission in implementation of its decision and for any expenses related to such implementa-tion.
On 11 February 2015, Prysmian was awarded a new contract worth a total of approximately Euro 60 million by Iberdrola
Renovables Offshore Deutschland GmbH - a German subsidiary of Iberdrola, the world-leading developer and operator of wind farms - to supply and install wind turbine inter-array cables for the Wikinger offshore wind farm, located within the West of Adlergrund cluster in the German Baltic Sea. Under the Wikinger contract, Prysmian is responsible for the design, manufacture, installation, burial, termination and testing of 81 km of 33 kV submarine cables in different cross-sections to connect the 70 wind turbines and an offshore substation that form the 350 MW wind farm. Cables will be produced at Prysmian’s facility in Drammen, Norway, one of the Group’s centres of excellence for submarine cables. Installation work is scheduled to be complete by the end of 2016.
On 16 February 2015, the Prysmian Group was awarded two major new orders worth a total of more than Euro 50 million for projects to expand the power transmission system in Kuwait. More specifically, the contracts refer to the "MEW 06 Jaber Al Ahmed City" project, awarded directly by MEW - the Kuwait Ministry of Electricity & Water - and the "Jamal Abdel Al Nasser Street" project, awarded by ROBT (JV), a joint venture of Rizzani de Eccher-OHL under a wider contract with MPW – the Kuwait Ministry of Public Works - on behalf of MEW as end-user.The "MEW 06 Jaber Al Ahmed City" project is part of the plan to expand Kuwait's power transmission with a view to strengthening its main transmission networks and securing power supplies for industrial and residential users through-out the country. The "Jamal Abdel Al Nasser Street" project is part of the plan to upgrade and transform one of the main traffic arteries running through the middle of Kuwait City into an expressway, a process that will involve diverting an underground electricity line. The contracts involve the design, engineering, supply, con-struction, installation and commission of HV underground cable systems, requiring a total of 210 km of 132 kV cable and related network components for both projects that will be executed by the Group’s offices in Kuwait. Installation will start in 2015 with completion scheduled in 2016.
Consolidated Financial Report | DIRECTORS’ REPORT
2014 Annual Report Prysmian Group
120
BUSINESS OUTLOOK
The macro environment in 2014 was marked by a gradual strengthening of the US economy but continued overall weakness in Europe, despite tentative signs of recovery, especially in the first part of the year. Growing geopolitical tensions emerging in the Middle East and Russia, combined with slowdown in some economies like China and Brazil, nevertheless raise further uncertainty over the short and medium-term outlook for the world economy.In such an economic context, the Group's expectation for FY 2015 is that demand for medium voltage power distri-bution cables used by utilities will remain weak, while the building wires business is likely to see a continuation of the stabilising trend observed in the second half of 2014. In the Industrial Oil & Gas and SURF cables business, the sudden drop in oil prices could affect investments and thus the busi-ness's order book over the medium term. The Group confirms a generally stable trend for its high value-added power transmission businesses, with potential growth areas in the submarine business, although offset by weak demand in the
high voltage underground market, also penalised by growing competition in several geographical areas. With reference to its submarine cables business, the Group expects that the impact of the Western HVDC Link project posted in 2014 (€94 million on Adjusted EBITDA) will be significantly lower in 2015. In the Telecom business, demand for optical fibre cables is expected to carry on recovering in the coming quarters, especially in Europe and the United States, albeit at a slower pace than in 2014. During 2015 the Prysmian Group will continue to integrate and rationalise activities with the goal of achieving its projected cost synergies and of further strengthening its presence in all areas of the business. Lastly, it is conceivable that exchange rate effects, which had an adverse impact of about €14 million on Adjusted EBITDA in 2014, will have a positive impact on the 2015 results, assuming constancy of the rates at the start of the year, through the pure effect of translating profits expressed in other currencies into the Group’s reporting currency.
OTHER INFORMATION
Related party transactionsRelated party transactions do not qualify as either atypical or unusual but fall into the normal course of business by Group companies. Such transactions take place under market terms and conditions, according to the type of goods and services provided. Information about related party transactions, including that required by the CONSOB Communication dated 28 July 2006, is presented in Note 33 to the Consolidated Financial Statements at 31 December 2014.
Atypical and/or unusual transactionsIn accordance with the disclosures required by CONSOB Com-munication DEM/6064293 dated 28 July 2006, it is reported
that no atypical and/or unusual transactions took place during 2014.
Secondary offices and key corporate informationThe list of secondary offices and key corporate information of the legal entities making up the Group can be found in Appendix A of the Explanatory Notes to the Consolidated Financial Statements.
Financial risk managementThe management of financial risks is discussed in the Ex-planatory Notes to the Consolidated Financial Statements, in Section D. Financial risk management.

121
CERTIFICATION PURSUANT TO ART. 2.6.2 OF THE ITALIAN STOCKMARKET REGULATIONS REGARDING THE CONDITIONS CONTAINED IN ART. 36 OF THE MARKET REGULATIONS
The Company is compliant with the provisions of art. 36.1 of the above Regulations with regard to "Conditions for the listing of shares of companies which control companies established and regulated under the law of non-EU countries" specified in articles 36 and 39 of the Market Regulations.
Milan, 25 February 2015 Massimo Tononi FOR THE BOARD OF DIRECTORS THE CHAIRMAN

In 2014, the Brazilian oil company Petrobras awarded the Group a new contract for the supply of special Down Hole Technology (DHT) systems for offshore oil and gas extraction application to be manufactured in the plants at Bridgewater, NJ (USA), and Cariacica (Brazil), using materials sourced in Brazil (e.g., steel).

123
CONSOLIDATED FINANCIAL REPORT

2014 Annual Report Prysmian Group
124
Consolidated Financial Report
CONSOLIDATED STATEMENT OF FINANCIAL POSITION Note 31 December of which 31 December of which 1 January of which 2014 related parties 2013 (*) related parties 2013 (*) related (Note 33) (Note 33) partiesNon-current assets Property, plant and equipment 1 1,414 1,390 1,484
Intangible assets 2 561 588 608
Equity-accounted investments 3 225 225 205 205 193 193
Available-for-sale financial assets 4 12 12 12
Derivatives 8 1 2 3
Deferred tax assets 16 115 130 125
Other receivables 5 27 28 40
Total non-current assets 2,355 2,355 2,465 Current assets
Inventories 6 981 881 866
Trade receivables 5 952 7 933 10 1,083 19
Other receivables 5 766 3 722 3 560 4
Financial assets held for trading 7 76 93 78
Derivatives 8 29 23 16
Cash and cash equivalents 9 494 510 787
Total current assets 3,298 3,162 3,390 Assets held for sale 10 7 12 4
Total assets 5,660 5,529 5,859 Equity attributable to the Group: 1,150 1,147 1,112 Share capital 11 21 21 21
Reserves 11 1,014 977 925
Net profit/(loss) for the year 115 149 166
Equity attributable to non-controlling interests: 33 36 35 Share capital and reserves 33 32 33
Net profit/(loss) for the year - 4 2
Total equity 1,183 1,183 1,147 Non-current liabilities Borrowings from banks and other lenders 12 817 1,119 1,428
Other payables 13 13 20 23
Provisions for risks and charges 14 74 51 73
Derivatives 8 5 7 41
Deferred tax liabilities 16 53 97 91
Employee benefit obligations 15 360 308 344 6
Total non-current liabilities 1,322 1,602 2,000 Current liabilities Borrowings from banks and other lenders 12 568 292 311
Trade payables 13 1,415 4 1,409 3 1,416 5
Other payables 13 827 4 688 18 616 7
Derivatives 8 47 42 24
Provisions for risks and charges 14 269 279 317
Current tax payables 29 34 28
Total current liabilities 3,155 2,744 2,712 Total liabilities 4,477 4,346 4,712 Total equity and liabilities 5,660 5,529 5,859
(*) The previously published prior year consolidated financial statements have been restated following the adoption of IFRS 10 and IFRS 11. Further details can be found in Section C. Restatement of comparative figures.
(in millions of Euro)

125
Note 2014 of which 2013 (*) of which related parties related parties (Note 33) (Note 33)
Sales of goods and services 17 6,840 43 6,995 52
Change in inventories of work in progress, semi-finished and finished goods 18 28 28
Other income 19 113 3 62 6
of which non-recurring other income 36 37 10
Raw materials, consumables used and goods for resale 20 (4,303) (20) (4,368) (12)
Fair value change in metal derivatives 7 (8)
Personnel costs 21 (948) (6) (945) (16)
of which non-recurring personnel costs 36 (52) (34)
of which personnel costs for stock option fair value (3) (14)
Amortisation, depreciation, impairment and impairment reversal 22 (188) (173)
of which non-recurring impairment and impairment reversal 36 (44) (25)
Other expenses 23 (1,280) (1) (1,258) (1)
of which non-recurring other expenses and releases 36 2 (26)
Share of net profit/(loss) of equity-accounted companies 24 43 43 35 35
Operating income 312 368
Finance costs 25 (479) (435)
of which non-recurring finance costs 36 (18) (22)
Finance income 26 339 285
of which non-recurring finance income 36 4 -
Dividens from other companies - -
Profit/(loss) before taxes 172 218
Taxes 27 (57) (65)
Net profit/(loss) for the year 115 153
Attributable to:
Owners of the parent 115 149
Non-controlling interests - 4
Basic earnings/(loss) per share (in Euro) 28 0.54 0.71
Diluted earnings/(loss) per share (in Euro)) 28 0.54 0.71
(*) The previously published prior year comparative figures have been restated following the introduction of IFRS 10 and IFRS 11 and a new method of classifying the share of net profit/(loss) of associates and joint ventures. Further details can be found in Section C. Restatement of comparative figures.
CONSOLIDATED INCOME STATEMENT(in millions of Euro)

2014 Annual Report Prysmian Group
126
Consolidated Financial Report
2014 2013 (*)
Net profit/(loss) for the year 115 153
Comprehensive income/(loss) for the year:
- items that may be reclassified subsequently to profit or loss:
Fair value gains/(losses) on cash flow hedges - gross of tax (8) 9
Fair value gains/(losses) on cash flow hedges - tax effect 2 (4)
Release of cash flow hedge reserve after discontinuing cash flow hedging - gross of tax 4 15
Release of cash flow hedge reserve after discontinuing cash flow hedging - tax effect (1) (5)
Currency translation differences 32 (96)
Total items that may be reclassified, net of tax 29 (81)
- items that will NOT be reclassified subsequently to profit or loss:
Actuarial gains/(losses) on employee benefits - gross of tax (50) 3
Recognition of pension plan asset ceiling 8 -
Actuarial gains/(losses) on employee benefits - tax effect 11 (2)
Total items that will NOT be reclassified, net of tax (31) 1
Total comprehensive income/(loss) for the year 113 73
Attributable to:
Owners of the parent 111 71
Non-controlling interests 2 2
(*) The previously published prior year consolidated financial statements have been restated following the adoption of IFRS 10 and IFRS 11. Further details can be found in Section C. Restatement of comparative figures.
CONSOLIDATED STATEMENT OF COMPREHENSIVE INCOME
(in millions of Euro)
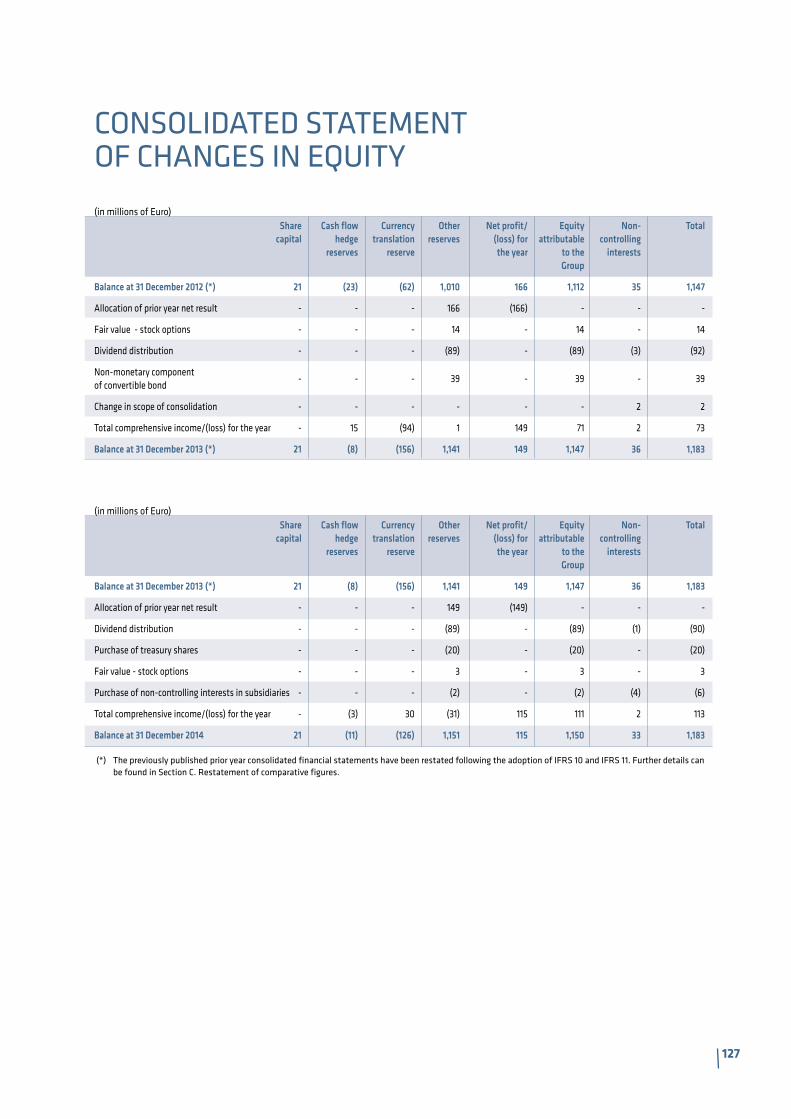
127
Share Cash flow Currency Other Net profit/ Equity Non- Total capital hedge translation reserves (loss) for attributable controlling reserves reserve the year to the interests Group
Balance at 31 December 2013 (*) 21 (8) (156) 1,141 149 1,147 36 1,183
Allocation of prior year net result - - - 149 (149) - - -
Dividend distribution - - - (89) - (89) (1) (90)
Purchase of treasury shares - - - (20) - (20) - (20)
Fair value - stock options - - - 3 - 3 - 3
Purchase of non-controlling interests in subsidiaries - - - (2) - (2) (4) (6)
Total comprehensive income/(loss) for the year - (3) 30 (31) 115 111 2 113
Balance at 31 December 2014 21 (11) (126) 1,151 115 1,150 33 1,183
CONSOLIDATED STATEMENT OF CHANGES IN EQUITY Share Cash flow Currency Other Net profit/ Equity Non- Total capital hedge translation reserves (loss) for attributable controlling reserves reserve the year to the interests Group
Balance at 31 December 2012 (*) 21 (23) (62) 1,010 166 1,112 35 1,147
Allocation of prior year net result - - - 166 (166) - - -
Fair value - stock options - - - 14 - 14 - 14
Dividend distribution - - - (89) - (89) (3) (92)
Non-monetary component of convertible bond
- - - 39 - 39 - 39
Change in scope of consolidation - - - - - - 2 2
Total comprehensive income/(loss) for the year - 15 (94) 1 149 71 2 73
Balance at 31 December 2013 (*) 21 (8) (156) 1,141 149 1,147 36 1,183
(*) The previously published prior year consolidated financial statements have been restated following the adoption of IFRS 10 and IFRS 11. Further details can be found in Section C. Restatement of comparative figures.
(in millions of Euro)
(in millions of Euro)

2014 Annual Report Prysmian Group
128
Consolidated Financial Report
2014 of which 2013 (*) of which related parties related parties (Note 33) (Note 33) Profit/(loss) before taxes 172 218
Depreciation, impairment and impairment reversals of property, plant and equipment 137 141
Amortisation and impairment of intangible assets 51 32
Net gains on disposal of property, plant and equipment, intangible assets and acquisition purchase price adjustment
(30) (7)
Share of net profit/(loss) of equity-accounted companies (43) (43) (35) (35)
Share-based payments 3 14
Fair value change in metal derivatives and other fair value items
(7) 8
Net finance costs 140 150
Changes in inventories (76) (58)
Changes in trade receivables/payables (16) 4 144 7
Changes in other receivables/payables 90 (12) (93) 12
Changes in receivables/payables for derivatives 1 1
Taxes paid (72) (60)
Dividends received from equity-accounted companies 36 36 16 16
Utilisation of provisions (including employee benefit obligations) (193) (154)
Increases in provisions (including employee benefit obligations) 170 85
A. Net cash flow provided by/(used in) operating activities 363 402 Acquisitions (1) 9 -
Investments in property, plant and equipment (143) (95)
Disposals of property, plant and equipment and assets held for sale 6 6
Investments in intangible assets (18) (18)
Investments in financial assets held for trading (8) (40)
Disposals of financial assets held for trading 25 7
B. Net cash flow provided by/(used in) investing activities (129) (140) Capital contributions and other changes in equity - -
Dividend distribution (90) (92)
Purchase of treasury shares (20) -
EIB Loan 100 -
Proceeds from convertible bond (2) - 296
Early repayment of credit agreement (184) (486)
Finance costs paid (3) (440) (373)
Finance income received (4) 330 249
Changes in other net financial payables 46 (103)
C. Net cash flow provided by/(used in) financing activities (258) (509) D. Currency translation gains/(losses) on cash and cash equivalents 8 (30)
E. Total cash flow provided/(used) in the year (A+B+C+D) (16) (277) F. Net cash and cash equivalents at the beginning of the year 510 787 G. Net cash and cash equivalents at the end of the year (E+F) 494 510
(*) The previously published prior year comparative figures have been restated following the introduction of IFRS 10 and IFRS 11 and a new method of classifying the share of net profit/(loss) of associates and joint ventures. Further details can be found in Section C. Restatement of comparative figures.
(1) This refers to the receipt of Euro 15 million for the purchase price adjustment regarding Global Marine Systems Energy Ltd (now renamed Prysmian PowerLink Services Ltd) and to the outlay of Euro 6 million for the acquisition of the remaining 34% of the subsidiary AS Draka Keila Cables.
(2) The Bond became convertible following the resolution adopted by the Shareholders’ Meeting on 16 April 2013.(3) Finance costs paid of Euro 440 million include Euro 53 million in interest payments in 2014 (Euro 65 million in 2013).(4) Finance income received of Euro 330 million includes Euro 7 million in interest income (Euro 7 million in 2013).
CONSOLIDATED STATEMENT OF CASH FLOWS(in millions of Euro)

Consolidated Financial Report
EXPLANATORYNOTES
2014 Annual Report Prysmian Group
130
EXPLANATORY NOTES
A. GENERAL INFORMATION
Prysmian S.p.A. (“the Company”) is a company incorporated and domiciled in Italy and organised under the laws of the Republic of Italy.
The Company has its registered office in Viale Sarca, 222 - Milan (Italy).
Prysmian S.p.A. has been listed on the Italian Stock Exchange
since 3 May 2007 and has been included since September 2007 in the FTSE MIB index, comprising the top 40 Italian companies by capitalisation and stock liquidity.
The Company and its subsidiaries (together “the Group” or “Prysmian Group”) produce, distribute and sell cables and systems and related accessories for the energy and telecom-munications industries worldwide.
Consolidated Financial Report | EXPLANATORY NOTES
A.1 SIGNIFICANT EVENTS IN 2014
Antitrust investigationOn 2 April 2014, the European Commission concluded the investigations started in January 2009 by adopting a decision under which it found that, between 18 February 1999 and 28 January 2009, the world’s largest cable producers, including Prysmian Cavi e Sistemi S.r.l., adopted anti-competitive practices in the European market for high voltage submarine and underground power cables.The European Commission held Prysmian Cavi e Sistemi S.r.l. jointly liable with Pirelli & C. S.p.A. for the alleged infringe-ment in the period from 18 February 1999 to 28 July 2005, sentencing them to pay a fine of Euro 67.3 million, and it held Prysmian Cavi e Sistemi S.r.l. jointly liable with Prysmian S.p.A. and The Goldman Sachs Group Inc. for the alleged infringement in the period from 29 July 2005 to 28 January 2009, sentencing them to pay a fine of Euro 37.3 million. Prysmian has appealed against this decision to the General Court of the European Union and has submitted an applica-tion to intervene in the appeals respectively lodged by Pirelli & C. S.p.A. and The Goldman Sachs Group Inc. against the same decision. Both Pirelli & C. S.p.A. and The Goldman Sachs Group Inc. have in turn submitted applications to intervene in the appeal brought by Prysmian against the European Com-mission’s decision. Prysmian has not incurred any financial outlay as a result of this decision having elected, pending the outcome of the appeals, to provide bank guarantees as security against payment of 50% of the fine imposed by the European Commission (amounting to approximately Euro 52 million) for the alleged infringement in both periods. As far as Prysmian is aware, Pirelli & C. S.p.A. has provided or is none-
theless preparing to provide the European Commission with a bank guarantee for 50% of the value of the fine imposed for the alleged infringement in the period 18 February 1999 - 28 July 2005. Pirelli & C. S.p.A. has also filed a civil action against Prysmian Cavi e Sistemi S.r.l. in which it demands to be held harmless for all claims made by the European Commission in implementation of its decision and for any expenses related to such implementation. Prysmian Cavi e Sistemi S.r.l. filed its reply in February 2015, requesting that the claims brought by Pirelli & C. S.p.A. be rejected in full and that it should be Pirelli & C. S.p.A. which holds harmless Prysmian Cavi e Sistemi S.r.l., with reference to the alleged infringement in the period 18 February 1999 - 28 July 2005, for all claims made by the European Commission in implementation of its decision and for any expenses related to such implementation. Following a detailed and careful analysis of the European Commission’s ruling, and nonetheless considering this has been appealed and so could be submitted to second-instance judgement, as well as the fact that the investigations initiated by the Canadian Antitrust Authority have ended without any sanctions for Prysmian, it has been decided to release part of the existing provision.It also reported that the investigations initiated by the Canadian Antitrust Authority have ended without any sanctions for Prysmian. Prysmian has also learned from several sources, including in the public domain, that some British operators have filed actions in the High Court in London against certain cable manufacturers, including the Prysmian Group, to obtain compensation for damages allegedly suffered as a result of
131
the alleged anti-competitive practices condemned by the European Commission in the decision adopted in April 2014. The above events have led to the recognition in the 2014 income statement of a net release of Euro 31 million, classi-fied as non-recurring items.
Finance ActivitiesEIB LoanOn 18 December 2013, Prysmian S.p.A. entered into a loan agreement with the European Investment Bank (EIB) for Euro 100 million, to fund the Group’s European Research & Development (R&D) programmes over the period 2013-2016. The EIB Loan is particularly intended to support projects developed in the Group’s R&D centres in six countries (France, Great Britain, the Netherlands, Spain, Germany and Italy) and represents about 50% of the Prysmian Group’s planned in-vestment expenditure in Europe during the period concerned.The EIB Loan was received on 5 February 2014; it will be repaid in 12 equal half-yearly instalments starting on 5 August 2015 and ending on 5 February 2021.
Revolving Credit Facility 2014 On 19 February 2014, Prysmian S.p.A signed a credit agreement for Euro 100 million (the “Revolving Credit Facility 2014”) with Mediobanca - Banca di Credito Finanziario S.p.A.. Under this five-year agreement, Mediobanca has provided the Group with a line of credit intended to refinance existing debt and working capital requirements.
Credit Agreements 2010 and 2014On 28 February 2014, the Prysmian Group prepaid the outstanding balance owed under the Term Loan Facility 2010, amounting to Euro 184 million that had been due on 31 December 2014.On 27 June 2014, Prysmian S.p.A. signed an agreement (the “Credit Agreement 2014”) under which a syndicate of premier banks made available a long-term credit facility for Euro 1,000 million (the “Syndicated Revolving Credit Facility 2014”). The facility, which expires on 27 June 2019, can also be used for the issue of guarantees. The new revolving facility is intended to refinance the Revolving Credit Facility 2010 and to finance the Group’s other operating activities. On the same date as agreeing this new facility, Prysmian S.p.A. extinguished early the Revolving Credit Facility 2010, originally due to expire on 31 December 2014 and carrying a maximum permitted drawdown of Euro 400 million.
Share buy-backUnder the share buy-back and disposal programme autho-rised by the shareholders at their meeting on 16 April 2014, Prysmian S.p.A. purchased a total of 1,390,000 treasury shares during the months of November and December 2014 at a cost of approximately Euro 20 million.
Mergers & AcquisitionsAcquisition price adjustment Global Marine Systems Energy Ltd (now renamed Prysmian PowerLink Services Ltd)The price adjustment process relating to the acquisition of Global Marine Systems Energy Ltd (now renamed Prysmian PowerLink Services Ltd) was completed on 28 March 2014, with a price adjustment of GBP 20 million in the Prysmian Group’s favour. Since this process was completed more than a year from the acquisition date of 15 November 2012, the dif-ference between the adjusted final price and that previously estimated has been accounted for in the income statement with the recognition of Euro 22 million in non-recurring income.
Acquisition of non-controlling interest in AS Draka Keila CablesOn 9 July 2014, Prysmian Group finalised the acquisition of the remaining 34% of the subsidiary AS Draka Keila Cables, becoming the sole shareholder of this Estonian company. The purchase price was Euro 6.2 million. The investment in Keila Cables will allow the Group to further accelerate its growth strategy in this high-potential region.
Stock listing of the joint venture Yangtze Optical Fibre and Cable Joint Stock Limited CompanyOn 1 August 2014, Yangtze Optical Fibre and Cable Joint Stock Limited Company, based in Wuhan (People’s Republic of China) and in which the Group held a 37.5% interest, filed an application to list its shares on the Main Board of the Hong Kong Stock Exchange.The company is a joint venture between the Prysmian Group and two other partners (China Huaxin Post and Telecom-munications Economy Development Center and Wuhan Yangtze Communications Industry Group Co. Ltd., with equity interests of 37.5% and 25% respectively) and specialises in the production of optical fibre and optical cables for telecom-munications.The prospectus for the public offering and the listing of the company’s shares was published on 26 November 2014 upon completion of the authorisation process.Following closure of the offering period, the company’s shares commenced trading on the Main Board of the Hong Kong Stock Exchange on 10 December 2014. The offering involved an increase in the company’s share capital, with a consequent dilution of the Prysmian Group’s holding to 28.12%. This dilution has resulted in the recognition of a non-recurring gain of Euro 8 million.
Other significant eventsWestern HVDC Link Contract (UK)During the last few days of April 2014, the manufacture of the cables for the Western HVDC Link project in the United Kingdom encountered some technical problems, which were

Consolidated Financial Report | EXPLANATORY NOTES
2014 Annual Report Prysmian Group
132
duly placed under detailed technical investigation.Following tests on the quality of the cable produced and analysis of the materials and the manufacturing process, the Directors felt able to make a reliable estimate of the impact of the above problems on the project’s revenues and costs. The total impact on the 2014 results has been Euro 53 million, resulting from the full elimination of the margins previously recognised on the contract and the recognition of a provision to cover the expected contract loss.Including non-recognition of the margin originally expected on this project in the period, the overall negative impact of the Western HVDC Link (UK) project on the 2014 results would have been Euro 94 million.
Plant closuresOn 6 July 2014, the Management Board of Prysmian Nether-lands informed trade union representatives of the intention to close the plant in Amsterdam - 78 employees - and transfer production to the plants in Delft and Emmen.Agreements for the plant’s closure have been reached, with the process of shutdown currently in progress and due to last for part of 2015.On 16 July 2014, Draka Paricable (France) initiated a con-sultation process with the trade unions for the closure of the Aubevoye plant - 92 employees - and the transfer of production to the plants in Amfreville and Gron. The process of discussions with the unions and the related agreements completed by the end of 2014, as well as the plant’s closure.These plant closures are in response to the need to optimise manufacturing footprint at individual country level, with the aim of realigning industrial presence with the potential of the relevant business/market and of improving production capacity utilisation, as well as overall economic performance, through economies of scale.Consequent impairment testing of the assets of the plants involved in this restructuring has not resulted in the recogni-tion of any impairment losses. Other restructuring costs have been estimated based on the outcome of negotiations with the trade unions; at 31 December 2014, these costs were recognised as far as could be reasonably estimated. Further details can be found in Note 14. Provisions for risks and charges.
AMT Explorer cable bargeOn 3 July 2014, the AMT Explorer cable barge, chartered to transport power cables for the Deutsche Bucht and Butendiek offshore wind farms in Germany, capsized while under tow in transit from Arco Felice (Naples) to Bremerhaven (Germany). The rotating platform owned by the Prysmian Group and its load sank as a result. The value of the cables transported, unrecoverable given the depth of the water in the area of the sinking, amounted to approximately Euro 28 million. The lost cables were fully insured and as at 31 December 2014 Prysmian PowerLink S.r.l. had collected the full amount of the loss claimed from the insurers. At 31 December 2014 the value of the rotating platform was fully impaired (Euro 5 million) and an insurance reimbursement for the same amount has been recognised.Prysmian and TenneT, the partner in the wind farm projects, are working to avoid any consequences that could affect the project execution timetable.
Second cycle of Group employee share purchase plan (YES Plan)During the month of December 2014, employees were informed of the opening of the plan’s second cycle in 2015. Employees had until the third week of February 2015 to sign up for the second cycle and to communicate the amount they intended to invest. The total amount collected will be used to make purchases of the Company’s shares on the Milan Stock Exchange (MTA) during the month of July 2015.
The consolidated financial statements contained herein were approved by the Board of Directors on 25 February 2015.
In application of art. 264b HGB of the German Commercial Code (“Hundelsgesetzbuch”), the present financial state-ments exempt Draka Comteq Berlin GMBH & Co.KG and Draka Comteq Germany GMBH & Co.KG. from the requirement to present statutory financial statements.
Note: all amounts shown in the tables in the following Notes are expressed in millions of Euro, unless otherwise stated.

133
B.1 BASIS OF PREPARATION
The present financial statements have been prepared on a going concern basis, with the directors having assessed that there are no financial, operating or other kind of indicators that might provide evidence of the Group’s inability to meet its obligations in the foreseeable future and particularly in the next 12 months.
In particular, the Group’s estimates and projections have been prepared taking into account possible developments in the investigations by the European Commission and other jurisdictions into alleged anti-competitive practices in the High Voltage underground and Submarine cables market, as well as the risk factors described in the Directors’ Report. The assessments carried out confirm Prysmian Group’s ability to operate as a going concern and to comply with its financial covenants.Section D. Financial risk management and Section D.1 Capital risk management of these Explanatory Notes contain a de-scription of how the Group manages financial risks, including liquidity and capital risks.
In application of Legislative Decree 38 of 28 February 2005 “Exercise of the options envisaged by article 5 of European Regulation 1606/2002 on international accounting standards”, the Company has prepared its consolidated financial state-ments in accordance with the international accounting and financial reporting standards (hereafter also “IFRS”) adopted by the European Union.The term “IFRS” refers to all the International Financial Reporting Standards, all the International Accounting Standards (“IAS”), and all the interpretations of the Inter-national Financial Reporting Interpretations Committee (“IFRIC”), previously known as the Standing Interpretations Committee (“SIC”). IFRS have been applied consistently to all the periods reported in this document. The consolidated financial statements have been prepared in accordance with IFRS and related best practice; any future guidance and new interpretations will be reflected in subsequent years, in the manner established from time to time by the relevant accounting standards. The Group has elected to present its income statement according to the nature of expenses, whereas assets and liabilities in the statement of financial position are classified as current or non-current. The statement of cash flows has been prepared using the indirect method. The Group has also
applied the provisions of CONSOB Resolution 15519 dated 27 July 2006 concerning financial statement formats and the requirements of CONSOB Communication 6064293 dated 28 July 2006 regarding disclosures.
During 2009 and 2010, CONSOB (the Italian Securities and Exchange Commission), together with the Bank of Italy and ISVAP (the Italian insurance industry regulator), issued two documents (numbers 2 and 4): “Disclosures in financial reports about business continuity, financial risks, asset impairment tests and uncertainties in the use of estimates” and “Disclo-sures in financial reports about asset impairment tests, about contractual clauses in debt financing, about debt restructuring and about the fair value hierarchy”, which have been taken into account when preparing the present document.
The financial statements have been prepared on the historical cost basis, except for the valuation of certain financial assets and liabilities, including derivatives, which must be reported using the fair value method.
Changes to the financial statementsThe consolidated financial statements for 2013, presented in the current annual financial report for comparative purposes, have undergone some amendments compared with the pre-viously published figures. These amendments reflect:
• Application of IFRS 10 and IFRS 11 Investments in associates and joint ventures accounted
for using the equity method have been presented in a separate line of the consolidated statement of financial position.
• Reclassification of share of net profit/(loss) of equity-accounted companies The Group has adopted a new method of classifying
its share of the net profit/(loss) of associates and joint ventures, whereby it recognises this amount as a component of “Operating income” when relating to companies that operate in the same market as the Group. The comparative figures have been reclassified accordingly.
Further details can be found in Section C. Restatement of comparative figures.
B. ACCOUNTING POLICIES AND STANDARDS
The main accounting policies and standards used to prepare the consolidated financial statements and Group financial infor-mation are set out below.

Consolidated Financial Report | EXPLANATORY NOTES
2014 Annual Report Prysmian Group
134
Change in Segment ReportingFrom 1 January 2014 the Group embarked on a process of orga-nisational change, which has involved redefining its segment information, in keeping with the new management model adopted by the Group.Under the new organisational structure, the Energy segment has been divided into two Operating Segments: Energy Projects and Energy Products. However, the structure of the Telecom Operating Segment has remained unchanged.The Energy Projects Operating Segment covers high-tech and high value-added businesses whose focus is on projects and their implementation, as well as product customisation, namely: High Voltage underground, Submarine and SURF, which comprises umbilical cables, flexible pipes and special DHT (Downhole Technology) cables. The Energy Products Operating Segment covers the businesses offering a complete and innovative product portfolio designed to meet the various and many demands of the market, namely: Energy & Infrastructure (including Trade & Installers and Power
Distribution) and Industrial & Network Components (compri-sing Specialties & OEM, Oil & Gas, Elevators, Automotive and Network Components). This change has resulted in the reallocation of goodwill; the Cash Generating Units (CGUs) have also been redefined.Reporting systems in support of the new model were fully implemented in 2014 and have been used for the purposes of preparing the current document. The Board of Directors approved the adoption of the new structure for segment reporting in its meeting on 23 January 2015. Further details can be found in Section F. Segment information and in Section B.8 Impairment of property, plant and equipment and finite-life intangible assets.
Other changesLastly, some reclassifications have been made between “Historical cost” and “Accumulated depreciation and impai-rment” in “Property, plant and equipment”, as shown in Note 1. Property, plant and equipment.
135
B.2 BASIS OF CONSOLIDATION
The financial statements of Group operating companies used for consolidation purposes have been prepared for the year ended 31 December 2014 and the year ended 31 December 2013. They have been adjusted, where necessary, to bring them into line with Group accounting policies and standards. All the financial statements of companies included in the con-solidation end their financial year at 31 December, except for Yangtze Optical Fibre and Cable Joint Stock Limited Company, consolidated using the equity method, which, following its listing on the Hong Kong Stock Exchange, has published its figures for the first nine months of 2014. These figures have been combined with this company’s estimated results for the last quarter of the year.
SubsidiariesThe Group consolidated financial statements include the financial statements of Prysmian S.p.A. (the Parent Company) and the subsidiaries over which the Parent Company exercises direct or indirect control. Subsidiaries are consolidated from the date control is acquired until the date such control ceases. Control is connected with the ongoing existence of all the following conditions:• power over the investee;• the possibility of achieving a return resulting from
ownership of the investment;• the investor’s ability to use its power over the investee to
affect the amount of its return.The existence of potential voting rights exercisable at the reporting date is also taken into consideration for the purposes of determining control.Subsidiaries are consolidated on a line-by-line basis. The criteria adopted for line-by-line consolidation are as follows:• assets and liabilities, expenses and income of consolida-
ted entities are aggregated line-by-line and non-control-ling interests are allocated, where applicable, the relevant portions of equity and profit for the period, which are then reported separately within equity and the consolidated income statement;
• gains and losses, including the relevant tax effect, arising from transactions between consolidated companies are eliminated if not realised with third parties; unrealised losses are not eliminated if there is evidence that the asset transferred is impaired. The following are also eliminated: intercompany payables and receivables, intercompany expenses and income, and intercompany finance income and costs;
• business combinations through which control of an entity is acquired are recorded using the acquisition method of accounting. The acquisition cost is measured as the acquisition-date fair value of the assets acquired, the lia-bilities incurred or assumed and the equity instruments issued. The assets, liabilities and contingent liabilities
acquired are recognised at their acquisition-date fair values. The excess of acquisition cost over the fair value of the Group’s share of the identifiable net assets acquired is recorded as goodwill under intangible assets. If the acquisition cost is less than the Group’s share of the fair value of the identifiable net assets acquired, the difference is recognised as a gain directly in the income statement, but only after reassessing that the fair values of the net assets acquired and the acquisition cost have been measured correctly;
• if non-controlling interests are acquired in entities which are already under the Group’s control, the Group recogni-ses any difference between the acquisition cost and the related share of net assets acquired directly in equity;
• gains or losses arising on the disposal of ownership interests that result in a loss of control of consolidated companies are recognised in the income statement at the amount equal to the difference between the sale conside-ration and the corresponding share of consolidated equity sold;
• gains or losses from the deconsolidation of an investee’s net assets, resulting from the difference between the fair value of the equity interest and the corresponding portion of equity, are recognised in “Finance income” and “Finance costs” respectively.
In compliance with IAS 32, put options granted to minority shareholders of subsidiary companies are recognised in “Other payables” at their present value. The matching entry differs according to whether:A. the minority shareholders have a direct interest in the
performance of the subsidiary’s business in relation to the transfer of the risks and rewards of the shares subject to the put option. One of the indicators that such interest exists is fair value measurement of the option exercise price. In addition to the presence of this indicator, the Group assesses on a case-by-case basis the facts and circumstances characterising existing transactions. In these circumstances, the present value of the option is initially deducted from the equity reserves attributable to the Group. Any subsequent changes in the measure-ment of the option exercise price are recognised through the income statement, as “Other income” or “Other expenses”.
B. the minority shareholders do not have a direct interest in the performance of the business (eg. predetermined option exercise price). The duly discounted option exercise price is deducted from the corresponding amount of capital and reserves attributable to non-controlling interests. Any subsequent changes in the measurement of the option exercise price follow the same treatment, with no impact on the income statement.

Consolidated Financial Report | EXPLANATORY NOTES
2014 Annual Report Prysmian Group
136
There are currently no cases of this kind in the Prysmian Group financial statements. The treatment described would be modified in the event of different interpretations or ac-counting standards in this regard.
Associates and joint arrangements: joint ventures and joint operationsAssociates are those entities over which the Group has signi-ficant influence, generally accompanying a shareholding of between 20% and 50% of the voting rights. Investments in associates are accounted for using the equity method and are initially recorded at cost. Joint arrangements are arrangements in which two or more parties have joint control. They are classified as either joint ventures or joint operations depending on the rights and obligations of the parties to the arrangement.Joint ventures are those companies characterised by the presence of an arrangement for joint control whereby the parties are entitled to a share of the net assets or profit or loss arising from the arrangement. Joint ventures are accounted for using the equity method. Joint operations are arrangements whereby the parties that have joint control of the arrangement have rights to the assets and obligations for the liabilities relating to the arran-gement. The assets, liabilities, revenues and expenses of a joint operation are consolidated according to the rights and obligations under the related arrangement.Under the equity method, used to account for associates and joint ventures:• the book value of these investments reflects the value of
equity as adjusted, where necessary, to reflect the appli-cation of IFRS and includes any higher values identified on acquisition attributed to assets, liabilities and any goodwill;
• the Group’s share of profits or losses is recognised from the date significant influence is acquired until the date it ceases. If a company valued under this method has negative equity due to losses, the book value of the investment is reduced to zero and additional losses are provided for and a liability is recognised, only to the extent that the Group is committed to fulfilling legal or constructive obligations of the investee company; changes in the equity of companies valued under the equity method which are not accounted for through profit or loss, are recognised directly in equity;
• unrealised gains arising from transactions between the Parent Company/subsidiaries and equity-accounted companies, are eliminated to the extent of the Group’s interest in the investee company; unrealised losses are also eliminated unless they represent impairment.
Special purpose entities During 2007 the Group had defined and adopted a trade receivables securitization programme for a number of Group companies. The securitization programme was terminated on 25 July 2013 upon reaching its end date. At 31 December 2014, the special purpose entity known as Prysmian Financial Services Ireland Ltd was essentially inactive, with the procedures for its liquidation in the process of being completed.
Translation of foreign company financial statementsThe financial statements of subsidiaries, associates and joint ventures are prepared in the currency of the primary economic environment in which they operate (the “functio-nal currency”). The consolidated financial statements are presented in Euro, which is the Prysmian Group’s functional and presentation currency for its consolidated financial reporting.
The rules for the translation of financial statements expressed in currencies other than the Euro are as follows:• assets and liabilities are translated using the exchange
rates applicable at the end of the reporting period; • revenues and expenses are translated at the average rate
for the period/year;• the “currency translation reserve” includes both the
translation differences generated by translating income statement items at a different exchange rate from the period-end rate and the differences generated by transla-ting opening equity amounts at a different exchange rate from the period-end rate;
• goodwill and fair value adjustments arising from the acquisition of a foreign entity are treated as assets and liabilities of the foreign entity and translated at the period-end exchange rate.
If a foreign entity operates in a hyperinflationary economy, revenues and expenses are translated using the exchange rate current at the reporting date. All amounts in the income statement are restated by applying the change in the general price index between the date when income and expenses were initially recorded in the financial statements and the reporting date. Corresponding figures for the previous reporting period/year are restated by applying a general price index so that the comparative financial statements are presented in terms of the exchange rate current at the end of the reporting period/year.As at 31 December 2014, there are no consolidated companies that operate in hyperinflationary economies.

137
Closing rates at Average rates 31 December 2014 31 December 2013 12 months 2014 12 months 2013
Europe
British Pound 0.779 0.834 0.806 0.849
Swiss Franc 1.202 1.228 1.215 1.231
Hungarian Forint 315.540 297.040 308.706 296.916
Norwegian Krone 9.042 8.363 8.354 7.804
Swedish Krona 9.393 8.859 9.099 8.649
Czech Koruna 27.735 27.427 27.536 25.976
Danish Krone 7.445 7.459 7.455 7.458
Romanian Leu 4.483 4.471 4.444 4.419
Turkish Lira 2.826 2.942 2.910 2.535
Polish Zloty 4.273 4.154 4.184 4.198
Russian Rouble 72.337 45.325 50.952 42.317
North America
US Dollar 1.214 1.379 1.329 1.328
Canadian Dollar 1.406 1.467 1.466 1.368
South America
Brazilian Real 3.225 3.231 3,128 2.868
Argentine Peso 10.382 8.993 10.787 7.275
Chilean Peso 736.837 724.372 757.887 657.452
Mexican Peso 17.861 18.068 17.672 16.943
Oceania
Australian Dollar 1.483 1.542 1.472 1.377
New Zealand Dollar 1.553 1.676 1.600 1.620
Africa
CFA Franc 655.957 655.957 655.957 655.957
Tunisian Dinar 2.262 2.260 2.255 2.156
Asia
Chinese Renminbi (Yuan) 7.536 8.349 8.186 8.162
United Arab Emirates Dirham 4.459 5.065 4.879 4.876
Hong Kong Dollar 9.417 10.693 10.302 10.297
Singapore Dollar 1.606 1.741 1.682 1.661
Indian Rupee 76.525 85.417 81.037 77.728
Indonesian Rupiah 15,076.100 16,764.780 15,748.918 13,837.912
Japanese Yen 145.230 144.720 140.306 129.601
Thai Baht 39.910 45.178 43.147 40.796
Philippine Peso 54.436 61.289 58.979 56.389
Omani Rial 0.467 0.531 0.511 0.511
Malaysian Ringgit 4.247 4.522 4.345 4.183
Saudi Riyal 4.556 5.172 4.983 4.979
The exchange rates applied are as follows:
(in millions of Euro)

Consolidated Financial Report | EXPLANATORY NOTES
2014 Annual Report Prysmian Group
138
Changes in the scope of consolidationThe Group’s scope of consolidation includes the financial statements of Prysmian S.p.A. (the Parent Company) and of the companies over which it exercises direct or indirect control, which are consolidated from the date when control is obtained until the date when such control ceases.
The following changes in the scope of consolidation took place during 2014:
Name changesOn 13 February 2014, the Dutch company Draka Holding N.V. changed its name to Draka Holding B.V..
On 24 October 2014, the Canadian company Prysmian Power Cables and Systems Canada Ltd changed its name to Prysmian Cables and Systems Canada Ltd.
MergersOn 1 February 2014, the merger was completed of Prysmian (Dutch) Holdings B.V. into Draka Holding N.V..
On 24 February 2014, the merger was completed of Fastighets AB Spannbucklan and Fastighets AB Hygget into Draka Kabel Sverige AB.
On 24 April 2014, the merger was completed of Cables Opticos Y Metalicos para Telecomunicaciones Telcon s.r.l. into Prysmian Energia Cables y Sistemas de Argentina S.A..
On 1 May 2014, the merger was completed of Kabelbedrijven Draka Nederland B.V. into Prysmian Netherlands B.V..
LiquidationsOn 1 October 2014, the process of winding up Prysmian Com-munications Financial Services US LLC and Prysmian Power Financial US LCC was completed with their removal from the local company registry.
On 27 November 2014, the process of winding up Draka Comteq Sweden AB was completed with its removal from the local company registry.
On 19 December 2014, the process of winding up NK Cables Sverige AB and Prysmian Kablar och System AB was completed with their removal from the local company registry.
On 30 December 2014, the process of winding up Sociedade Productora de Fibras Opticas S.A. was completed with its removal from the local company registry.
On 31 December 2014, the process of winding up Doiter Industria e Comercio Ltda was completed with its removal from the local company registry.
AcquisitionsOn 9 July 2014, Prysmian Finland OY acquired the remaining 34% of the subsidiary AS Draka Keila Cables.
Appendix A to these notes contains a list of the companies included in the scope of consolidation at 31 December 2014.
139
B.3 ACCOUNTING STANDARDS, AMENDMENTS AND INTERPRETATIONS APPLIED IN 2014
The basis of consolidation, the methods applied for translating foreign company financial statements into the presentation currency, the accounting standards as well as the accounting estimates adopted are the same as those used for the conso-lidated financial statements at 31 December 2013, except for the accounting standards and amendments discussed below and obligatorily applied with effect from 1 January 2014 after being endorsed by the competent authorities.
On 12 May 2011, the IASB issued IFRS 10, IFRS 11 and IFRS 12 and amendments to IAS 27 and IAS 28. The principal changes were as follows:
IFRS 10 - Consolidated Financial StatementsThis standard supersedes SIC 12 - Consolidation: Special Purpose Entities and parts of IAS 27 - Separate Financial Statements. The objective of the new standard is to define a single control model, which is applicable to all companies, including special purpose entities. The standard provides guidance on defining the new concept of control, which is more detailed than in the past, in order to assist in the determination of control where this is difficult to assess. IAS 27 - Separate Financial StatementsIAS 27 - Separate Financial Statements has been revised following publication of IFRS 10 - Consolidated Financial Statements. The new document, from which all references to consolidation have been removed, prescribes the accounting treatment for investments when an entity prepares separate financial statements.
IFRS 11 - Joint Arrangements This document supersedes IAS 31 - Interests in Joint Ventures and SIC 13 - Jointly Controlled Entities: Non-Monetary Contri-butions by Venturers and establishes principles for identifying a joint arrangement on the basis of the rights and obligations arising from the arrangement, rather than its legal form. The accounting treatment differs according to whether the arran-gement is classified as a joint operation or a joint venture. In addition, the existing policy choice of proportionate consolida-tion for joint ventures has been eliminated.
IFRS 12 - Disclosure of Interests in Other EntitiesThis document refers to the disclosures concerning interests in other entities, including subsidiaries, associates and joint ventures. The objective is to disclose information that enables users of financial statements to evaluate the nature of risks associa-ted with interests in strategic investments (consolidated and otherwise) intended to be held over the medium to long term.
IFRSs 10, 11 and 12 and IAS 27 were published in the Official Journal of the European Union on 29 December 2012 and apply at the latest from the commencement date of the first financial year starting on or after 1 January 2014.In November 2013, Investment Entities (Amendments to IFRS 10, IFRS 12 and IAS 27), a document issued by the IASB on 31 October 2012, was published in the Official Journal of the European Union. These amendments are intended to provide an exception to the consolidation obligations of IFRS 10 for companies that manage and measure their investments on a fair value basis. These amendments apply to financial years beginning on or after 1 January 2014 and have not entailed any significant effects for the Group. Further details about the effects of the above amendments can be found in Section C. Restatement of comparative figures.
On 16 December 2011, the IASB published amendments to IAS 32 - Financial Instruments: Presentation to clarify the criteria for offsetting financial instruments. The amendments clarify that:• the right of set-off between financial assets and liabilities
must be available at the financial reporting date and not contingent on a future event;
• this right must be enforceable by all counterparties both in the normal course of business and in the event of insol-vency or bankruptcy.
The document was published in the Official Journal of the European Union on 29 December 2012. The amendments, which apply retrospectively to financial years beginning on or after 1 January 2014, have not entailed any significant changes for the Group.

Consolidated Financial Report | EXPLANATORY NOTES
2014 Annual Report Prysmian Group
140
On 20 May 2013, the IASB issued IFRIC 21 - Levies, an inter-pretation of IAS 37 - Provisions, Contingent Liabilities and Contingent Assets. The interpretation, which addresses the recognition of liabilities for the payment of taxes other than income taxes, provides guidance on identifying the event that gives rise to the obligation and when to recognise the liability. The interpretation applies to financial years beginning on or after 17 June 2014. The introduction of this interpretation is not expected to entail any significant effects for the Group.
On 29 May 2013, the IASB issued an amendment to IAS 36 - Im-pairment of Assets: Recoverable Amount Disclosures for Non-Financial Assets to clarify the disclosure of information about the recoverable amount of impaired assets, if that amount is based on fair value less costs of disposal. The amendment requires disclosures about the recoverable amount of such
assets or cash-generating units only when impairment is recognised or a previous impairment is reversed. This amendment applies to financial years beginning on or after 1 January 2014 and has not entailed any significant effects for the Group.
On 27 June 2013, the IASB published an amendment to IAS 39 - Financial Instruments: Recognition and Measurement - Novation of Derivatives and Continuation of Hedge Accounting which clarifies that it is permitted to continue hedge ac-counting for a derivative designated as a hedging instrument, where novation is required by legislation/regulation, provided specific conditions are met. This amendment applies to financial years beginning on or after 1 January 2014 and has not entailed any significant effects for the Group. The amendment will also appear in IFRS 9 – Financial Instruments.
141
B.4 ACCOUNTING STANDARDS, AMENDMENTS AND INTERPRETATIONS NOT YET APPLICABLE AND NOT ADOPTED EARLY BY THE GROUP
On 21 November 2013, the IASB published an amendment to IAS 19 - Employee Contributions with the aim of providing more information about the accounting treatment of pension plans which require plan participants to pay in contributions. This amendment is effective for financial years beginning on or after 1 February 2015.
On 12 December 2013, the IASB published the documents Annual Improvements 2010-2012 and Annual Improvements 2011-2013 as part of its programme of annual improvements to its standards; most of the changes involve clarifications or corrections to existing IFRSs or amendments resulting from other changes previously made to the IFRSs. The Annual Improvements 2010-2012 are effective for financial years beginning on or after 1 February 2015, while in the case of the Annual Improvements 2011-2013 the European Union had not yet completed the endorsement process needed for their application.
On 6 May 2014, the IASB issued amendments to IFRS 11 - Joint Arrangements to provide guidance on how to account for the acquisition of an interest in a joint operation that constitutes a business. These amendments are effective retrospectively for financial years beginning on or after 1 January 2016.
On 13 May 2014, the IASB published amendments to IAS 16 - Property, Plant and Equipment and IAS 38 - Intangible Assets to provide guidance on acceptable methods of depreciation and amortisation. In particular, the amendments clarify that revenue-based methods to calculate depreciation or amor-tisation are applicable only in limited circumstances. These amendments are effective retrospectively for financial years beginning on or after 1 January 2016.
On 29 May 2014, the IASB issued IFRS 15 - Revenue from Contracts with Customers with the aim of improving the quality and uniformity of revenue reporting. The publication of this standard is part of the convergence project with the FASB to improve the comparability of financial statements. The objective of the standard is to define the time of transfer of control as a factor in revenue recognition and the amount that the company is entitled to receive. The standard therefore defines the following steps to follow for the reco-gnition of revenue: 1) Identify the contract with the customer;2) Identify the performance obligations in the contract;3) Determine the transaction price;4) Allocate the transaction price to the performance obliga-
tions in the contract;
5) Recognise revenue when (or as) the entity satisfies a performance obligation.
This standard applies to financial years beginning on or after 1 January 2017.
On 24 July 2014, the IASB issued IFRS 9 - Financial Instru-ments, divided into the following sections:• classification and measurement of derivative instru-
ments;• impairment methodology for financial instruments;• rules for the application of hedge accounting;• accounting for changes in the reporting entity’s own
credit when measuring the fair value of liabilities.This standard will apply to financial years beginning on or after 1 January 2018.
On 12 August 2014, the IASB published some amendments to IAS 27 – Separate Financial Statements. The purpose is to allow entities to use the equity method to account for investments in associates and joint ventures even in their separate financial statements. These amendments are effective for financial years beginning on or after 1 January 2016.
On 11 September 2014, the IASB published amendments to IFRS 10 – Consolidated Financial Statements and to IAS 28 – Investments in Associates and Joint Ventures. The purpose is to clarify how to account for the results of a sale or contribu-tion of assets between group companies and their associates and joint ventures. These amendments are effective for financial years beginning on or after 1 January 2016.
On 25 September 2014, the IASB published Annual Impro-vements 2012-2014 as an integral part of its programme of annual improvements to its standards; most of the changes are clarifications of existing IFRSs. As at the present document date, the European Union had not yet completed the endorsement process needed for the application of these amendments.
On 18 December 2014, the IASB published amendments to IAS 1 – Presentation of Financial Statements, designed to clarify how to apply the concept of materiality. The amendments make clear that materiality applies to the financial state-ments as a whole and that information must be disclosed only if it is material. If information exists that is necessary for the reader to understand the financial statements as a whole, such additional information must be presented in the financial disclosures even if not required by international accounting standards. As at the present document date, the

Consolidated Financial Report | EXPLANATORY NOTES
2014 Annual Report Prysmian Group
142
European Union had not yet completed the endorsement process needed for the application of these amendments.
On 18 December 2014, the IASB also published amendments to IFRS 10, IFRS 12 and IAS 28 with the aim of clarifying the
consolidation rules applying to investment entities. As at the present document date, the European Union had not yet completed the endorsement process needed for the applica-tion of these amendments.
B.5 TRANSLATION OF TRANSACTIONS IN CURRENCIES OTHER THAN THE FUNCTIONAL CURRENCY
Transactions in currencies other than the functional currency of the company which undertakes the transaction are transla-ted using the exchange rate applicable at the transaction date. Prysmian Metals Limited (Great Britain), Prysmian Cables and Systems S.A. (Switzerland), P.T. Prysmian Cables Indonesia (Indonesia), Draka NK Cables (Asia) Pte Ltd (Singapore) and Draka Philippines Inc. (Philippines) present their financial
statements in a currency other than that of the country they operate in, as their main transactions are not carried out in their local currency but in their reporting currency. Foreign currency exchange gains and losses arising on comple-tion of transactions or on the year-end translation of assets and liabilities denominated in foreign currencies are recogni-sed in the income statement.
B.6 PROPERTY, PLANT AND EQUIPMENT
Property, plant and equipment are stated at the cost of acquisition or production, net of accumulated depreciation and any impairment. Cost includes expenditure directly incurred to prepare the assets for use, as well as any costs for their dismantling and removal which will be incurred as a consequence of contractual or legal obligations requiring the asset to be restored to its original condition. Borrowing costs directly attributable to the acquisition, construction or pro-duction of qualifying assets are capitalised and depreciated over the useful life of the asset to which they refer.
Costs incurred subsequent to acquiring an asset and the cost of replacing certain parts of assets recognised in this category are capitalised only if they increase the future economic benefits of the asset to which they refer. All other
costs are recognised in profit or loss as incurred. When the replacement cost of certain parts of an asset is capitalised, the residual value of the parts replaced is expensed to profit or loss.
Depreciation is charged on a straight-line, monthly basis using rates that allow assets to be depreciated until the end of their useful lives. When assets consist of different iden-tifiable components, whose useful lives differ significantly from each other, each component is depreciated separately using the component approach.
The useful indicative lives estimated by the Group for the various categories of property, plant and equipment are as follows:
Land Not depreciated
Buildings 25-50 years
Plant 10-15 years
Machinery 10-20 years
Equipment and other assets 3-10 years

143
The residual values and useful lives of property, plant and equipment are reviewed and adjusted, if appropriate, at least at each financial year-end.
Property, plant and equipment acquired through finance leases, whereby the risks and rewards of the assets are sub-stantially transferred to the Group, are accounted for as Group assets at their fair value or, if lower, at the present value of the minimum lease payments, including any sum payable to exercise a purchase option. The corresponding lease liability is recorded under financial payables. The assets are depreciated using the method and rates described earlier for “Property, plant and equipment”, unless the term of the lease is less than the useful life represented by such rates and ownership of the leased asset is not reasonably certain to be transferred
at the lease’s natural expiry; in this case the depreciation period will be represented by the term of the lease. Any capital gains realised on the disposal of assets which are leased back under finance leases are recorded under liabilities as deferred income and released to the income statement over the term of the lease. Leases where the lessor substantially retains all the risks and rewards of ownership of the assets are treated as operating leases. Payments made under operating leases are charged to the income statement on a straight-line basis over the term of the lease.
Non-current assets classified as held for sale are measured at the lower of carrying amount and fair value less costs to sell from the moment they qualify as held for sale under the related accounting standard.
Consolidated Financial Report | EXPLANATORY NOTES
2014 Annual Report Prysmian Group
144
B.7 INTANGIBLE ASSETS
Intangible assets are non-monetary assets which are sepa-rately identifiable, have no physical nature, are under the company’s control and are able to generate future economic benefits. Such assets are recognised at acquisition cost and/or production cost, including all costs directly attributable to make the assets available for use, net of accumulated amortisation and impairment, if any. Borrowing costs directly attributable to the acquisition or development of qualifying assets are capitalised and amortised over the useful life of the asset to which they refer. Amortisation commences when the asset is available for use and is calculated on a straight-line basis over the asset’s estimated useful life.
(a) GoodwillGoodwill represents the difference between the cost incurred for acquiring a controlling interest (in a business) and the fair value of the assets and liabilities identified at the acquisition date. Goodwill is not amortised, but is tested for impairment at least annually to identify any impairment losses. This test is carried out with reference to the cash generating unit (“CGU”) or group of CGUs to which goodwill is allocated and at which level it is monitored. Reductions in the value of goodwill are recognised if the recoverable amount of goodwill is less than its carrying amount. Recoverable amount is defined as the higher of the fair value of the CGU or group of CGUs, less costs to sell, and the related value in use (see Section B.8 Impairment of property, plant and equipment and finite-life intangible assets for more details about how value in use is calculated). An impairment loss recognised against goodwill cannot be reversed in a subsequent period. If an impairment loss identified by the impairment test is higher than the value of goodwill allocated to that CGU or group of CGUs, the residual difference is allocated to the assets included in the CGU or group of CGUs in proportion to their carrying amount.
Such allocation shall not reduce the carrying amount of an asset below the highest of:• its fair value, less costs to sell; • its value in use, as defined above;• zero.
(b) Patents, concessions, licences, trademarks and similar rightsThese assets are amortised on a straight-line basis over their useful lives.
(c) Computer softwareSoftware licence costs are capitalised on the basis of purchase costs and costs to make the software ready for use. These costs are amortised on a straight-line basis over the useful life of the software. Costs relating to the development of software programs are capitalised, in accordance with IAS 38, when it is likely that the asset’s use will generate future economic benefits and when the conditions described below are met (see paragraph (d) on Research and Development costs).
(d) Research and Development costsResearch and Development costs are expensed to the income statement when they are incurred, except for development costs which are recorded as intangible assets when all the following conditions are met: • the project is clearly identified and the related costs can
be reliably identified and measured;• the technical feasibility of the project can be demonstra-
ted;• the intention to complete the project and to sell its output
can be demonstrated;• there is a potential market for the output of the intangi-
ble asset or, if the intangible asset is to be used internally, its usefulness can be demonstrated;
• there are sufficient technical and financial resources to complete the project.
Development costs capitalised as intangible assets start to be amortised once the output of the project is marketable.

145
B.8 IMPAIRMENT OF PROPERTY, PLANT AND EQUIPMENT AND FINITE-LIFE INTANGIBLE ASSETS
Property, plant and equipment and finite-life intangible assets are analysed at each reporting date for any evidence of impai-rment. If such evidence is identified, the recoverable amount of these assets is estimated and any impairment loss relative to carrying amount is recognised in profit or loss. The recoverable amount is the higher of the fair value of an asset, less costs to sell, and its value in use, where the latter is the present value of the estimated future cash flows of the asset. The recoverable amount of an asset which does not generate largely indepen-dent cash flows is determined in relation to the cash genera-ting unit to which the asset belongs. In calculating an asset’s value in use, the expected future cash flows are discounted using a discount rate reflecting current market assessments of the time value of money, in relation to the period of the investment and the specific risks associated with the asset. An impairment loss is recognised in the income statement when the asset’s carrying amount exceeds its recoverable amount. If the reasons for impairment cease to exist, the asset’s carrying amount is restored with the resulting increase recognised through profit or loss; however, the carrying amount may not
exceed the net carrying amount that this asset would have had if no impairment had been recognised and the asset had been depreciated/amortised instead.In the Prysmian Group, up until 31 December 2013 the smallest CGU of the Energy operating segment was identified on the basis of location of the registered office of the operating units (country), while the smallest CGU for the Telecom operating segment was the operating segment itself. Following the change in the Group’s organisational structure, as from 1 January 2014 the Energy segment has been divided into two operating segments: Energy Products and Energy Projects. However, the structure of the Telecom Operating Segment has remained unchanged.
The smallest CGUs for the Energy Projects segment can be identified as the High Voltage, Submarine and SURF busi-nesses; the smallest CGU for the Energy Products segment can be identified on the basis of the country or region[1] of the operating units; the smallest CGU for the Telecom segment can be identified with the segment itself.
B.9 FINANCIAL ASSETS
Financial assets are initially recorded at fair value and clas-sified in one of the following categories on the basis of their nature and the purpose for which they were acquired:
(a) Financial assets at fair value through profit or loss;(b) Loans and receivables;(c) Available-for-sale financial assets.
Purchases and sales of financial assets are accounted for at the settlement date.Financial assets are derecognised when the right to receive cash flows from the instrument expires and the Group has substantially transferred all the risks and rewards relating to the instrument and its control.
(a) Financial assets at fair value through profit or lossFinancial assets classified in this category are represented by securities held for trading, having been acquired with the purpose of selling them in the short term. Derivatives are treated as securities held for trading, unless they are desi-
gnated as hedging instruments and are therefore classified under “Derivatives”. Financial assets at fair value through profit or loss are initially recorded at fair value and the related transaction costs are expensed immediately to the income statement. Subsequently, financial assets at fair value through profit or loss are measured at fair value. Assets in this category are classified as current assets (except for Derivatives falling due after more than 12 months). Gains and losses from changes in the fair value of financial assets at fair value through profit or loss are reported in the income statement as “Finance income” and “Finance costs”, in the period in which they arise. This does not apply to metal derivatives, whose fair value changes are reported in “Fair value change in metal derivatives”. Any dividends from financial assets at fair value through profit or loss are recognised as revenue when the Group’s right to receive payment is established and are classified in the income statement under “Share of net profit/(loss) of associates and dividends from other companies”.
(1) If the operating units of one country almost exclusively serve other countries, the smallest CGU is given by the group of these countries.

Consolidated Financial Report | EXPLANATORY NOTES
2014 Annual Report Prysmian Group
146
(b) Loans and receivablesLoans and receivables are non-derivative financial instru-ments with fixed or determinable payments that are not quoted in an active market. Loans and receivables are classified in the statement of financial position as “Trade and other receivables” and treated as current assets, except for those with contractual due dates of more than twelve months from the reporting date, which are classified as non-current (See Note 5. Trade and other receivables). These assets are valued at amortised cost, using the effective interest rate. The process of assessment to identify any impairment of trade and other receivables is described in Note 5.
(c) Available-for-sale financial assets Available-for-sale assets are non-derivative financial instru-ments that are explicitly designated as available for sale, or that cannot be classified in any of the previous categories; they are classified as non-current assets, unless manage-ment intends to dispose of them within twelve months of the end of the reporting period. All the financial assets in this category are initially recorded at fair value plus any related transaction costs. Subsequen-tly, available-for-sale financial assets are measured at fair value and gains or losses on valuation are recorded in an equity reserve. “Finance income” and “Finance costs” are recognised in the income statement only when the financial asset is effectively disposed of.
The fair value of listed financial instruments is based on the current bid price; these instruments belong to Level 1 of the fair value hierarchy. If the market for a financial asset is not active (or refers to
unlisted securities), the Group measures fair value using valuation techniques whose inputs are based on observable market-based data (Level 2) or unobservable data (Level 3). More details can be found in Section D.2 Fair value. When performing such valuations, the Group gives preferen-ce to market data rather than to internal data specifically connected to the nature of the business in which the Group operates.
Any dividends arising from investments recorded as available-for-sale financial assets are recognised as revenue when the Group’s right to receive payment is established and are classified in the income statement under “Share of net profit/(loss) of equity-accounted companies”. The Group assesses at every reporting date if there is objective evidence of impairment of its financial assets. In the case of investments classified as available-for-sale financial assets, a prolonged or significant reduction in the fair value of the investment below initial cost is treated as an indicator of impairment. Should such evidence exist, the accumulated loss relating to the available-for-sale financial assets - calculated as the difference between their acquisition cost and fair value at the reporting date, net of any impairment losses previously recognised in profit or loss - is transferred from equity and reported in the income statement as “Finance costs”. Such losses are realised ones and therefore cannot be subsequently reversed. For debt securities, the related yields are recognised using the amortised cost method and are recorded in the income statement as “Finance income”, together with any exchange rate effects, while exchange rate effects relating to in-vestments classified as available-for-sale financial assets are recognised in the specific equity reserve.

147
B.10 DERIVATIVES
Derivatives are accounted for at fair value at the contract inception date and, unless accounted for as hedging instruments, any changes in the fair value following initial recognition are recorded as finance income or costs for the period, except for fair value changes in metal derivatives. If derivatives satisfy the requirements for classification as hedging instruments, the subsequent changes in fair value are accounted for using the specific criteria set out below. The Group designates some derivatives as hedging instru-ments for particular risks associated with highly probable transactions (“cash flow hedges”). For each derivative which qualifies for hedge accounting, there is documentation on its relationship to the item being hedged, including the risk ma-nagement objectives, the hedging strategy and the methods for checking the hedge’s effectiveness. The effectiveness of each hedge is reviewed both at the derivative’s inception and during its life cycle. In general, a cash flow hedge is consi-dered highly “effective” if, both at its inception and during its life cycle, the changes in the cash flows expected in the future from the hedged item are largely offset by changes in the fair value of the hedge. The fair values of the various derivatives used as hedges are disclosed in Note 8. Derivatives. Movements in the “Cash flow hedge reserve” forming part of equity are reported in Note 11. Share capital and reserves.The fair value of a hedging derivative is classified as a non-current asset or liability if the hedged item has a maturity of more than twelve months; if the maturity of the hedged item is less than twelve months, the fair value of the hedge is classified as a current asset or liability.Derivatives not designated as hedges are classified as current or non-current assets or liabilities according to their contractual due dates.
Cash flow hedgesIn the case of hedges intended to neutralise the risk of changes in cash flows arising from the future execution of contractual obligations existing at the reporting date (“cash flow hedges”), changes in the fair value of the derivative following initial recognition are recorded in equity “Cash flow hedge reserve”, but only to the extent that they relate to the effective portion of the hedge. When the effects of the hedged item are reported in profit or loss, the reserve is transferred to the income statement and classified in the same line items that report the effects of the hedged item. If a hedge
is not fully effective, the change in fair value of its ineffective portion is immediately recognised in the income statement as “Finance income” or “Finance costs”. If, during the life of a derivative, the hedged forecast cash flows are no longer considered to be highly probable, the portion of the “Cash flow hedge reserve” relating to the derivative is taken to the period’s income statement and treated as “Finance income” or “Finance costs”. Conversely, if the derivative is disposed of or no longer qualifies as an effective hedge, the portion of “Cash flow hedge reserve” representing the changes in the instrument’s fair value recorded up to then remains in equity until the original hedged transaction occurs, at which point it is then taken to the income statement, where it is classified on the basis described above.
At 31 December 2014, the Group had designated derivatives to hedge the following risks: • exchange rate risk on construction contracts or orders:
these hedges aim to reduce the volatility of cash flows due to changes in exchange rates on future transactions. In particular, the hedged item is the amount of the cash flow expressed in another currency that is expected to be received/paid in relation to a contract or an order for amounts above the minimum limits identified by the Group Finance Committee: all cash flows thus identified are therefore designated as hedged items in the hedging relationship. The reserve originating from changes in the fair value of derivatives is transferred to the income statement according to the stage of completion of the contract itself, where it is classified as contract revenue/costs;
• exchange rate risk on intercompany financial transac-tions: these hedges aim to reduce volatility arising from changes in exchange rates on intercompany transactions, when such transactions create an exposure to exchange rate gains or losses that are not completely eliminated on consolidation. The economic effects of the hedged item and the related transfer of the reserve to the income statement occur at the same time as recognising the exchange gains and losses on intercompany positions in the consolidated financial statements;
• interest rate risk: these hedges aim to reduce the vo-latility of cash flows relating to finance costs arising on variable rate debt.
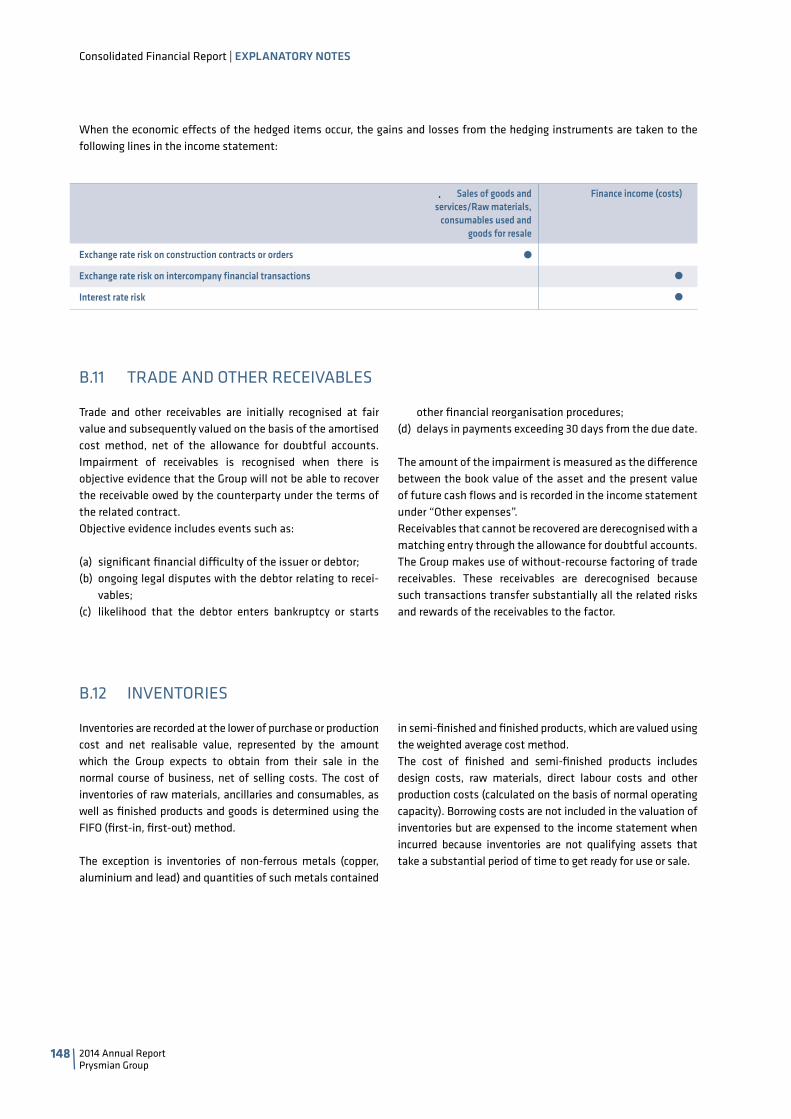
Consolidated Financial Report | EXPLANATORY NOTES
2014 Annual Report Prysmian Group
148
Sales of goods and Finance income (costs) services/Raw materials, consumables used and goods for resale
Exchange rate risk on construction contracts or orders
Exchange rate risk on intercompany financial transactions
Interest rate risk
B.11 TRADE AND OTHER RECEIVABLES
Trade and other receivables are initially recognised at fair value and subsequently valued on the basis of the amortised cost method, net of the allowance for doubtful accounts. Impairment of receivables is recognised when there is objective evidence that the Group will not be able to recover the receivable owed by the counterparty under the terms of the related contract. Objective evidence includes events such as:
(a) significant financial difficulty of the issuer or debtor;(b) ongoing legal disputes with the debtor relating to recei-
vables;(c) likelihood that the debtor enters bankruptcy or starts
other financial reorganisation procedures;(d) delays in payments exceeding 30 days from the due date.
The amount of the impairment is measured as the difference between the book value of the asset and the present value of future cash flows and is recorded in the income statement under “Other expenses”.Receivables that cannot be recovered are derecognised with a matching entry through the allowance for doubtful accounts. The Group makes use of without-recourse factoring of trade receivables. These receivables are derecognised because such transactions transfer substantially all the related risks and rewards of the receivables to the factor.
B.12 INVENTORIES
Inventories are recorded at the lower of purchase or production cost and net realisable value, represented by the amount which the Group expects to obtain from their sale in the normal course of business, net of selling costs. The cost of inventories of raw materials, ancillaries and consumables, as well as finished products and goods is determined using the FIFO (first-in, first-out) method.
The exception is inventories of non-ferrous metals (copper, aluminium and lead) and quantities of such metals contained
in semi-finished and finished products, which are valued using the weighted average cost method. The cost of finished and semi-finished products includes design costs, raw materials, direct labour costs and other production costs (calculated on the basis of normal operating capacity). Borrowing costs are not included in the valuation of inventories but are expensed to the income statement when incurred because inventories are not qualifying assets that take a substantial period of time to get ready for use or sale.
When the economic effects of the hedged items occur, the gains and losses from the hedging instruments are taken to the following lines in the income statement:
149
B.13 CONSTRUCTION CONTRACTS
Construction contracts (hereafter also “contracts”) are reco-gnised at the value agreed in the contract, in accordance with the percentage of completion method, taking into account the progress of the project and the expected contractual risks. The progress of a project is measured by reference to the contract costs incurred at the reporting date in relation to the total estimated costs for each contract.When the outcome of a contract cannot be estimated reliably, the contract revenue is recognised only to the extent that the costs incurred are likely to be recovered. When the outcome of a contract can be estimated reliably, and it is probable that the contract will be profitable, contract revenue is recognised over the term of the contract. When it is probable that total contract costs will exceed total contract revenue, the potential
loss is immediately recognised in the income statement.
The Group reports as an asset the gross amount due from customers for construction contracts, where the costs incurred, plus recognised profits (less recognised losses), exceed the billing of work-in-progress; such assets are reported under “Other receivables”. Amounts invoiced but not yet paid by customers are reported under “Trade receivables”.
The Group reports as a liability the gross amount due to customers for all construction contracts where billing of work-in-progress exceeds the costs incurred plus recognised profits (less recognised losses). Such liabilities are reported under “Other liabilities”.
B.14 CASH AND CASH EQUIVALENTS
Cash and cash equivalents include cash, demand bank deposits and other short-term investments, with original maturities of three months or less. Current account overdrafts are classified
as financial payables under current liabilities in the statement of financial position.

Consolidated Financial Report | EXPLANATORY NOTES
2014 Annual Report Prysmian Group
150
B.15 ASSETS HELD FOR SALE
Assets held for sale are classified as such if the carrying amount will be recovered principally through a sale transaction; for this to be the case, the sale must be highly probable and the related assets must be available for immediate sale in their present condition. Assets held for sale are measured at the lower of carrying amount and fair value less costs to sell.
B.16 TRADE AND OTHER PAYABLES
Trade and other payables are initially recognised at fair value and subsequently valued on the basis of the amortised cost method.
B.17 BORROWINGS FROM BANKS AND OTHER LENDERS
Borrowings from banks and other lenders are initially recogni-sed at fair value, less directly attributable costs. Subsequen-tly, they are measured at amortised cost, using the effective interest method. If the estimated expected cash flows should change, the value of the liabilities is recalculated to reflect this change using the present value of the expected new cash flows and the effective internal rate originally established. Borrowings from banks and other lenders are classified as current liabilities, except where the Group has an unconditio-
nal right to defer their payment for at least twelve months after the reporting date.
Borrowings from banks and other lenders are derecognised when they are extinguished and when the Group has tran-sferred all the risks and costs relating to such instruments.
Purchases and sales of financial liabilities are accounted for at the settlement date.
B.18 EMPLOYEE BENEFITS
Pension plansThe Group operates both defined contribution plans and defined benefit plans.
A defined contribution plan is a plan under which the Group pays fixed contributions to third-party fund managers and to which there are no legal or other obligations to pay further contributions should the fund not have sufficient assets to meet the obligations to employees for current and prior periods. In the case of defined contribution plans, the Group pays contributions, voluntarily or as established by contract, to public and private pension insurance funds. The Group has no obligations subsequent to payment of such contributions,
which are recognised as personnel costs on an accrual basis. Prepaid contributions are recognised as an asset which will be repaid or used to offset future payments, should they be due.A defined benefit plan is a plan not classifiable as a defined contribution plan. In defined benefit plans, the total benefit payable to the employee can be quantified only after the employment relationship ceases, and is linked to one or more factors, such as age, years of service and remuneration; the related cost is therefore charged to the period’s income statement on the basis of an actuarial calculation. The liability recognised for defined benefit plans corresponds to the present value of the obligation at the reporting date, less the fair value of the plan assets, where applicable. Obliga-

151
tions for defined benefit plans are determined annually by an independent actuary using the projected unit credit method. The present value of a defined benefit plan is determined by discounting the future cash flows at an interest rate equal to that of high-quality corporate bonds issued in the liability’s settlement currency and which reflects the duration of the related pension plan. Actuarial gains and losses arising from the above adjustments and the changes in actuarial assumptions are recorded directly in equity.
Past service costs resulting from a plan amendment are re-cognised immediately in the income statement in the period the plan amendment occurs.
Other post-employment obligations Some Group companies provide medical benefit plans for retired employees. The expected cost of these benefits is accrued over the period of employment using the same accounting method as for defined benefit plans. Actuarial gains and losses arising from the valuation and the effects of changes in the actuarial assumptions are accounted for
in equity. These liabilities are valued annually by a qualified independent actuary.
Termination benefits The Group recognises termination benefits when it can be shown that the termination of employment complies with a formal plan communicated to the parties concerned that establishes termination of employment, or when payment of the benefit is the result of voluntary redundancy incentives. Termination benefits payable more than twelve months after the reporting date are discounted to present value.
Share-based payments (equity-settled) Stock options are valued on the basis of the fair value deter-mined on their grant date. This value is charged to the income statement on a straight-line basis over the option vesting period with a matching entry in equity. This recognition is based on an estimate of the number of stock options that will effectively vest in favour of eligible employees, taking into consideration any vesting conditions, irrespective of the market value of the shares.
B.19 PROVISIONS FOR RISKS AND CHARGES
Provisions for risks and charges are recognised for losses and charges of a definite nature, whose existence is certain or probable, but the amount and/or timing of which cannot be determined reliably. A provision is recognised only when there is a current (legal or constructive) obligation for a future outflow of economic resources as the result of past events and it is likely that this outflow is required to settle the obligation. Such amount is the best estimate of the ex-penditure required to settle the obligation. Where the effect of the time value of money is material and the obligation settlement date can be estimated reliably, the provisions are stated at the present value of the expected outlay, using a rate that reflects market conditions, the variation in the cost of money over time, and the specific risk attached to the obligation.
Increases in the provision due to changes in the time value of money are accounted for as interest expense.Risks for which the emergence of a liability is only possible but not remote are indicated in the disclosures about com-mitments and contingencies and no provision is recognised.Any contingent liabilities accounted for separately when allocating the cost of a business combination, are valued at the higher of the amount obtained using the method described above for provisions for risks and charges and the liability’s originally determined present value. Further details can be found in Note 29. Contingent liabilities.
The provisions for risks and charges include the estimated legal costs to be incurred if such costs are incidental to the extinguishment of the provision to which they refer.
Consolidated Financial Report | EXPLANATORY NOTES
2014 Annual Report Prysmian Group
152
B.20 REVENUE RECOGNITION
Revenue is recognised at the fair value of the consideration received for the sale of goods and services in the ordinary course of the Group’s business. Revenue is recognised net of value-added tax, expected returns, rebates and discounts. Revenue is accounted for as follows:
(a) Sales of goodsRevenue from the sale of goods is recognised when the risks and rewards of the goods are transferred to the customer; this usually occurs when the goods have been dispatched or delivered to the customer and the customer has accepted them.
(b) Sales of servicesThe sale of services is recognised in the accounting period in which the services are rendered, with reference to the progress of the service supplied and in relation to the total services still to be rendered.
In both cases, revenue recognition depends on there being reasonable assurance that the related consideration will be received.
The method of recognising revenue for construction contracts is outlined in Section B.13 Construction contracts.
B.21 GOVERNMENT GRANTS
Government grants are recognised on an accrual basis in direct relation to the costs incurred when there is a formal resolution approving the allocation and, when the right to the grant is assured since it is reasonably certain that the Group will comply with the conditions attaching to its receipt and that the grant will be received. (a) Grants related to assetsGovernment grants relating to investments in property, plant and equipment are recorded as deferred income in
“Other payables”, classified under current and non-current liabilities for the respective long-term and short-term portion of such grants. Deferred income is recognised in “Other income” in the income statement on a straight-line basis over the useful life of the asset to which the grant refers.
(b) Grants related to incomeGrants other than those related to assets are credited to the income statement as “Other income”.
B.22 COST RECOGNITION
Costs are recognised when they relate to assets and services acquired or consumed during the year or to make a systematic allocation to match costs with revenues.

153
B.23 TAXATION
Current taxes are calculated on the basis of the taxable income for the year, applying the tax rates effective at the end of the reporting period.Deferred taxes are calculated on all the differences emerging between the taxable base of an asset or liability and the related carrying amount, except for goodwill and those differences arising from investments in subsidiaries, where the timing of the reversal of such differences is controlled by the Group and it is likely that they will not reverse in a reasonably foreseeable future. Deferred tax assets, including those relating to past tax losses, not offset by deferred tax liabilities, are recognised to the extent that it is likely that future taxable profit will be available against which they can be recovered. Deferred taxes are determined using tax rates
that are expected to apply in the years when the differences are realised or extinguished, on the basis of tax rates that have been enacted or substantively enacted by the end of the reporting period.
Current and deferred taxes are recognised in the income statement with the exception of those relating to items re-cognised directly in equity; such taxes are also accounted for directly in equity. Income taxes are offset if they are levied by the same taxation authority, if there is a legal entitlement to offset them and if the net balance is expected to be settled.
Other taxes not related to income, such as property tax, are reported in “Other expenses”.
B.24 EARNINGS PER SHARE
(a) Basic earnings per shareBasic earnings per share are calculated by dividing the profit attributable to owners of the parent by the weighted average number of ordinary shares outstanding during the year, excluding treasury shares.
(b) Diluted earnings per shareDiluted earnings per share are calculated by dividing the profit attributable to owners of the parent by the weighted
average number of ordinary shares outstanding during the year, excluding treasury shares. For the purposes of calculating diluted earnings per share, the weighted average number of outstanding shares is adjusted so as to include the exercise, by all those entitled, of rights with a poten-tially dilutive effect, while the profit attributable to owners of the parent is adjusted to account for any effects, net of taxes, of exercising such rights.
B.25 TREASURY SHARES
Treasury shares are reported as a deduction from equity. The original cost of treasury shares and revenue arising from any subsequent sales are treated as movements in equity.

Consolidated Financial Report | EXPLANATORY NOTES
2014 Annual Report Prysmian Group
154
C. RESTATEMENT OF COMPARATIVE FIGURES
The consolidated financial statements at 1 January 2013 and at 31 December 2013, presented in the current annual financial report for comparative purposes, have undergone some amendments compared with the previously published figures. Details of these amendments are discussed below:
Adoption of IFRS 10 and IFRS 11Following the adoption of IFRS 10 - Consolidated Financial Statements and IFRS 11 - Joint Arrangements, applicable retrospectively from 1 January 2014, the Group’s consolidated figures have been restated as from 1 January 2013. In particular, the changes introduced by IFRS 11 - Joint Ar-rangements have eliminated the possibility of proportionate consolidation; accordingly, the companies Yangtze Optical Fibre and Cable Joint Stock Limited Co., Yangtze Optical Fibre
and Cable (Hong Kong) Co. Ltd., Precision Fiber Optics Ltd. and Power Cables Malaysia Sdn Bhd, previously consolidated using the proportionate method, have now been consolidated using the equity method.In addition, further to the changes introduced by IFRS 10 - Consolidated Financial Statements, the Chinese company Yangtze Optical Fibre & Cable (Shanghai) Co. Ltd., previously consolidated line-by-line, has now been consolidated using the equity method; the Brazilian company Sociedade Produtora de Fibras Opticas S.A., previously consolidated line-by-line, has been defined as a “joint operation” and so is now being consolidated according to the rights and obliga-tions arising under the contractual arrangement.The following table summarises the changes made to the scope of consolidation:
Reclassification of share of net profit/(loss) of equity-accounted companiesThe Group has adopted a new method of classifying its share of the net profit/(loss) of associates and joint ventures, whereby it recognises this amount as a component of
“Operating income” when relating to companies that operate in the same market as the Group. The comparative figures have been reclassified accordingly.The consolidated financial statements at 1 January 2013 and at 31 December 2013 have therefore been restated as follows:
Method of consolidation 31 December 2012 From 1 January 2013
China
Yangtze Optical Fibre and Cable Joint Stock Limited Co. Proportionate Equity
Yangtze Optical Fibre and Cable (Hong Kong) Co. Ltd. Proportionate Equity
Yangtze Optical Fibre & Cable (Shanghai) Co. Ltd. Line-by-line Equity
Japan
Precision Fiber Optics Ltd. Proportionate Equity
Malaysia
Power Cables Malaysia Sdn Bhd Proportionate Equity
Brazil
Sociedade Produtora de Fibras Opticas S.A. Line-by-line Line-by-line (*)
(*) Company defined as a joint operation, which is being consolidated line-by-line according to the rights and obligations arising under the contractual arrangement.

155
1 January 2013 Effects application 1 January 2013 IFRS 10-11 Restated
Non-current assets
Property, plant and equipment 1,539 (55) 1,484
Intangible assets 644 (36) 608
Equity-accounted investments 99 94 193
Available-for-sale financial assets 14 (2) 12
Derivatives 3 - 3
Deferred tax assets 127 (2) 125
Other receivables 41 (1) 40
Total non-current assets 2,467 (2) 2,465
Current assets
Inventories 897 (31) 866
Trade receivables 1,163 (80) 1,083
Other receivables 573 (13) 560
Financial assets held for trading 78 - 78
Derivatives 16 - 16
Cash and cash equivalents 812 (25) 787
Total current assets 3,539 (149) 3,390
Assets held for sale 4 - 4
Total assets 6,010 (151) 5,859
Equity attributable to the Group: 1,112 - 1,112
Share capital 21 - 21
Reserves 925 - 925
Net profit/(loss) for the year 166 - 166
Equity attributable to non-controlling interests: 47 (12) 35
Share capital and reserves 44 (11) 33
Net profit/(loss) for the year 3 (1) 2
Total equity 1,159 (12) 1,147
Non-current liabilities
Borrowings from banks and other lenders 1,433 (5) 1,428
Other payables 27 (4) 23
Provisions for risks and charges 76 (3) 73
Derivatives 41 - 41
Deferred tax liabilities 95 (4) 91
Employee benefit obligations 344 - 344
Total non-current liabilities 2,016 (16) 2,000
Current liabilities
Borrowings from banks and other lenders 361 (50) 311
Trade payables 1,450 (34) 1,416
Other payables 654 (38) 616
Derivatives 24 - 24
Provisions for risks and charges 317 - 317
Current tax payables 29 (1) 28
Total current liabilities 2,835 (123) 2,712
Total liabilities 4,851 (139) 4,712
Total equity and liabilities 6,010 (151) 5,859
CONSOLIDATED STATEMENT OF FINANCIAL POSITION AT 1 JANUARY 2013:
(in millions of Euro)

Consolidated Financial Report | EXPLANATORY NOTES
2014 Annual Report Prysmian Group
156
31 December 2013 Effects application 31 December 2013 IFRS 10-11 Restated
Non-current assets
Property, plant and equipment 1,441 (51) 1,390
Intangible assets 623 (35) 588
Equity-accounted investments 99 106 205
Available-for-sale financial assets 15 (3) 12
Derivatives 2 - 2
Deferred tax assets 134 (4) 130
Other receivables 29 (1) 28
Total non-current assets 2,343 12 2,355
Current assets
Inventories 920 (39) 881
Trade receivables 1,010 (77) 933
Other receivables 739 (17) 722
Financial assets held for trading 94 (1) 93
Derivatives 23 - 23
Cash and cash equivalents 561 (51) 510
Total current assets 3,347 (185) 3,162
Assets held for sale 12 - 12
Total assets 5,702 (173) 5,529
Equity attributable to the Group: 1,147 - 1,147
Share capital 21 - 21
Reserves 977 - 977
Net profit/(loss) for the year 149 - 149
Equity attributable to non-controlling interests: 48 (12) 36
Share capital and reserves 43 (11) 32
Net profit/(loss) for the year 5 (1) 4
Total equity 1,195 (12) 1,183
Non-current liabilities
Borrowings from banks and other lenders 1,154 (35) 1,119
Other payables 24 (4) 20
Provisions for risks and charges 52 (1) 51
Derivatives 7 - 7
Deferred tax liabilities 100 (3) 97
Employee benefit obligations 308 - 308
Total non-current liabilities 1,645 (43) 1,602
Current liabilities
Borrowings from banks and other lenders 338 (46) 292
Trade payables 1,441 (32) 1,409
Other payables 728 (40) 688
Derivatives 42 - 42
Provisions for risks and charges 279 - 279
Current tax payables 34 - 34
Total current liabilities 2,862 (118) 2,744
Total liabilities 4,507 (161) 4,346
Total equity and liabilities 5,702 (173) 5,529
CONSOLIDATED STATEMENT OF FINANCIAL POSITION AT 31 DECEMBER 2013:
(in millions of Euro)

157
2013 Effects application Other 2013 Published IFRS 10-11 reclassifications Restated
Sales of goods and services 7,273 (273) (5) 6,995
Change in inventories of work in progress, semi-finished and finished goods
26 2 - 28
Other income 65 (3) - 62
of which non-recurring other income 10 - - 10
Raw materials, consumables used and goods for resale (4,571) 201 2 (4,368)
Fair value change in metal derivatives (8) - - (8)
Personnel costs (965) 19 1 (945)
of which non-recurring personnel costs (34) - - (34)
of which personnel costs for stock option fair value (14) - - (14)
Amortisation, depreciation and impairment (180) 7 - (173)
of which non-recurring impairment (25) - - (25)
Other expenses (1,280) 20 2 (1,258)
of which non-recurring other expenses (26) - - (26)
Share of net profit/(loss) of equity-accounted companies - 18 17 35
Operating income 360 (9) 17 368
Finance costs (440) 5 - (435)
of which non-recurring finance costs (22) - - (22)
Finance income 287 (2) - 285
Share of net profit/(loss) of associates and dividends from other companies 15 2 (17) -
Profit/(loss) before taxes 222 (4) - 218
Taxes (68) 3 - (65)
Net profit/(loss) for the year 154 (1) - 153
Attributable to:
Owners of the parent 149 - - 149
Non-controlling interests 5 (1) - 4
CONSOLIDATED INCOME STATEMENT AT 31 DECEMBER 2013:
(in millions of Euro)

Consolidated Financial Report | EXPLANATORY NOTES
2014 Annual Report Prysmian Group
158
2013 Effects application 2013 Published IFRS 10-11 Restated
Net profit/(loss) for the year 154 (1) 153
Comprehensive income/(loss) for the year:
- items that may be reclassified subsequently to profit or loss:
Fair value gains/(losses) on cash flow hedges - gross of tax 9 - 9
Fair value gains/(losses) on cash flow hedges - tax effect (4) - (4)
Release of cash flow hedge reserve after discontinuing cash flow hedging - gross of tax 15 - 15
Release of cash flow hedge reserve after discontinuing cash flow hedging - tax effect (5) - (5)
Currency translation differences (97) 1 (96)
Total items that may be reclassified, net of tax (82) 1 (81)
- items that will NOT be reclassified subsequently to profit or loss:
Actuarial gains/(losses) on employee benefits - gross of tax 3 - 3
Actuarial gains/(losses) on employee benefits - tax effect (2) - (2)
Total items that will NOT be reclassified, net of tax 1 - 1
Total comprehensive income/(loss) for the year 73 - 73
Attributable to:
Owners of the parent 71 - 71
Non-controlling interests 2 - 2
CONSOLIDATED STATEMENT OF COMPREHENSIVE INCOME AT 31 DECEMBER 2013:
(in millions of Euro)

159
2013 Effects application Other 2013 Published IFRS 10-11 reclassifications Restated Profit/(loss) before taxes 222 (4) - 218
Depreciation and impairment of property, plant and equipment 147 (6) - 141
Amortisation and impairment of intangible assets 33 (1) - 32
Net gains on disposal of property, plant and equipment, intangible assets and other non-current assets
(7) - - (7)
Share of net profit/(loss) of equity-accounted companies (15) (20) - (35)
Share-based payments 14 - - 14
Fair value change in metal derivatives and other fair value items
8 - - 8
Net finance costs 153 (3) - 150
Changes in inventories (67) 9 - (58)
Changes in trade receivables/payables 143 1 - 144
Changes in other receivables/payables (96) 3 - (93)
Changes in receivables/payables for derivatives 1 - - 1
Taxes paid (64) 4 - (60)
Dividends received from equity-accounted companies - 5 11 16
Utilisation of provisions (including employee benefit obligations) (157) 3 - (154)
Increases in provisions (including employee benefit obligations) 84 1 - 85
A. Net cash flow provided by/(used in) operating activities 399 (8) 11 402 Acquisitions - - - -
Investments in property, plant and equipment (103) 8 - (95)
Disposals of property, plant and equipment and assets held for sale 7 (1) - 6
Investments in intangible assets (18) - - (18)
Disposals of intangible assets - - - -
Investments in financial assets held for trading (40) - - (40)
Disposals of financial assets held for trading 7 - - 7
Investments in available-for-sale financial assets - - - -
Disposals of available-for-sale financial assets - - - -
Investments in associates - - - -
Disposals of associates - - - -
Dividends received 11 - (11) -
B. Net cash flow provided by/(used in) investing activities (136) 7 (11) (140) Capital contributions and other changes in equity - - - -
Dividend distribution (92) - - (92)
EIB loan - - - -
Purchase of treasury shares - - - -
Proceeds from convertible bond 296 - - 296
Early repayment of credit agreement (486) - - (486)
Finance costs paid (377) 4 - (373)
Finance income received 251 (2) - 249
Changes in other net financial payables (75) (28) - (103)
C. Net cash flow provided by/(used in) financing activities (483) (26) - (509)D. Currency translation gains/(losses) on cash and cash equivalents (31) 1 - (30)
E. Total cash flow provided/(used) in the year (A+B+C+D) (251) (26) - (277)
F. Net cash and cash equivalents at the beginning of the year 812 (25) - 787G. Net cash and cash equivalents at the end of the year (E+F) 561 (51) - 510
CONSOLIDATED STATEMENT OF CASH FLOWS 2013:
(in millions of Euro)

Consolidated Financial Report | EXPLANATORY NOTES
2014 Annual Report Prysmian Group
160
D. FINANCIAL RISK MANAGEMENT
The Group’s activities are exposed to various forms of risk: market risk (including exchange rate, interest rate and price risks), credit risk and liquidity risk. The Group’s risk mana-gement strategy focuses on the unpredictability of markets and aims to minimise the potentially negative impact on the Group’s results. Some types of risk are mitigated using derivatives. Monitoring of key financial risks is centrally coordinated by the Group Finance Department, and by the Purchasing De-partment where price risk is concerned, in close cooperation with the Group’s operating companies. Risk management policies are approved by the Group Finance, Administration and Control Department, which provides written guidelines on managing the above risks and on using (derivative and non-derivative) financial instruments.
The impact on profit and equity described in the following sensitivity analyses has been determined net of tax, calcula-ted using the Group’s weighted average theoretical tax rate.
[a] Exchange rate riskThe Group operates worldwide and is therefore exposed to exchange rate risk caused by changes in the value of trade and financial flows expressed in a currency other than the accounting currency of individual Group companies.
The principal exchange rates affecting the Group are: • Euro/British Pound: in relation to trade and financial
transactions by Eurozone companies on the British market and vice versa;
• Euro/US Dollar: in relation to trade and financial tran-sactions in US dollars by Eurozone companies on the North American and Middle Eastern markets, and similar transactions in Euro by North American companies on the European market;
• United Arab Emirates Dirham/Euro: in relation to trade and financial transactions by Eurozone companies on the United Arab Emirates market;
• Euro/Norwegian Krone: in relation to trade and financial transactions by Eurozone companies on the Norwegian market and vice versa;
• Euro/Qatari Riyal: in relation to trade and financial tran-sactions by Eurozone companies on the Qatari market;
• Turkish Lira/US Dollar: in relation to trade and financial transactions in US dollars by Turkish companies on foreign markets and vice versa;
• Euro/Australian Dollar: in relation to trade and financial transactions by Eurozone companies on the Australian market and vice versa;
• Brazilian Real/US Dollar: in relation to trade and financial transactions in US dollars by Brazilian companies on foreign markets and vice versa.
• Euro/Swedish Krona: in relation to trade and financial transactions by Eurozone companies on the Swedish market and vice versa;
• Euro/Hungarian Forint: in relation to trade and financial transactions by Hungarian companies on the Eurozone market and vice versa;
• Euro/Czech Koruna: in relation to trade and financial transactions by Czech companies on the European market and vice versa;
• Renmimbi/US Dollar: in relation to trade and financial transactions in US dollars by Chinese companies on foreign market and vice versa.
In 2014, trade and financial flows exposed to the above exchange rates accounted for around 90.0% of the total exposure to exchange rate risk arising from trade and financial transactions (85.5% in 2013).The Group is also exposed to significant exchange rate risks on the following exchange rates: Euro/Romanian Leu, Euro/Singapore Dollar, Argentine Peso/US Dollar and Euro/New

161
2014 2013 (*) -5% +5% -5% +5%
Euro (1.70) 1.54 (1.59) 1.44
US Dollar (0.91) 0.82 (2.05) 1.85
Other currencies (0.80) 0.72 (0.71) 0.64
Total (3.41) 3.08 (4.35) 3.93
2014 2013 (*) -10% +10% -10% + 10%
Euro (3.59) 2.93 (3.35) 2.74
US Dollar (1.91) 1.57 (4.32) 3.53
Other currencies (1.68) 1.37 (1.49) 1.22
Total (7.18) 5.87 (9.16) 7.49
(*) The previously published prior year consolidated financial statements have been restated following the adoption of IFRS 10 and IFRS 11. Further details can be found in Section C. Restatement of comparative figures.
Zealand Dollar; none of these exposures, taken individually, accounted for more than 1.45% of the overall exposure to transactional exchange rate risk in 2014 (1.6% in 2013). It is the Group’s policy to hedge, where possible, exposures in currencies other than the accounting currencies of its indivi-dual companies. In particular, the Group hedges:• Definite cash flows: invoiced trade flows and exposures
arising from loans and borrowings;
• Projected cash flows: trade and financial flows arising from firm or highly probable contractual commitments.
The above hedges are arranged using derivative contracts.The following sensitivity analysis shows the effects on net profit of a 5% and 10% increase/decrease in exchange rates versus closing exchange rates at 31 December 2014 and 31 December 2013.
(in millions of Euro)
(in millions of Euro)
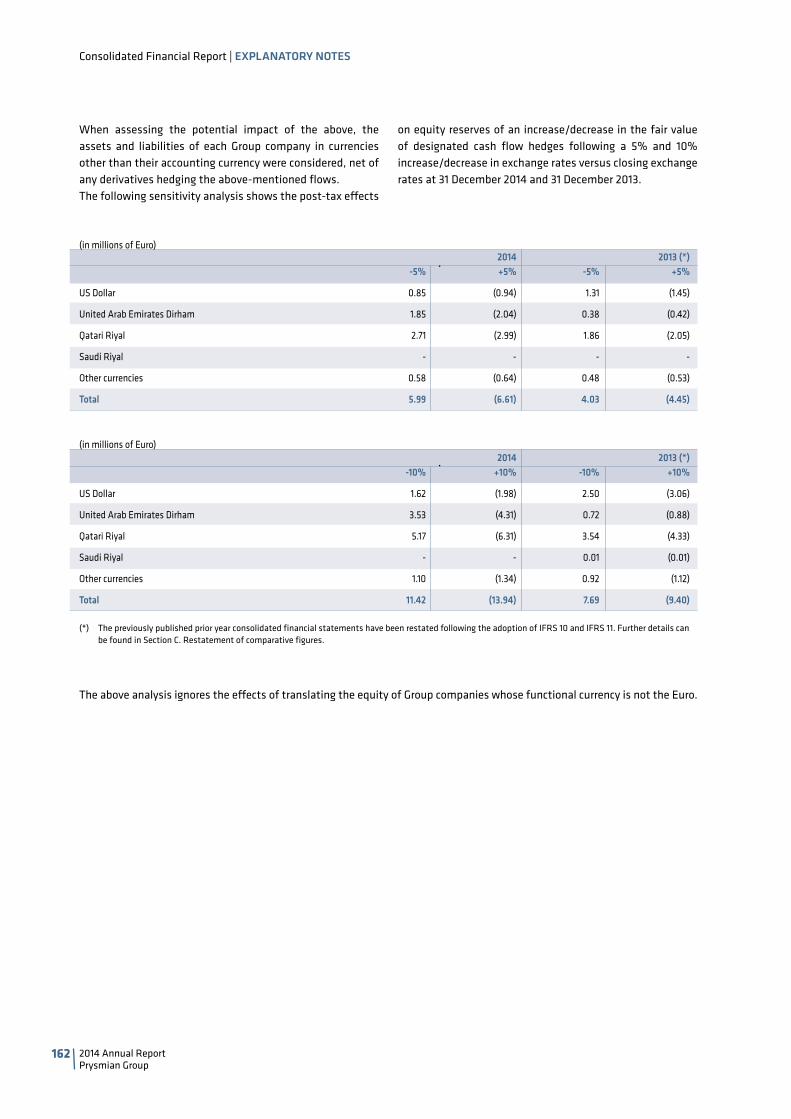
Consolidated Financial Report | EXPLANATORY NOTES
2014 Annual Report Prysmian Group
162
When assessing the potential impact of the above, the assets and liabilities of each Group company in currencies other than their accounting currency were considered, net of any derivatives hedging the above-mentioned flows. The following sensitivity analysis shows the post-tax effects
on equity reserves of an increase/decrease in the fair value of designated cash flow hedges following a 5% and 10% increase/decrease in exchange rates versus closing exchange rates at 31 December 2014 and 31 December 2013.
2014 2013 (*) -5% +5% -5% +5%
US Dollar 0.85 (0.94) 1.31 (1.45)
United Arab Emirates Dirham 1.85 (2.04) 0.38 (0.42)
Qatari Riyal 2.71 (2.99) 1.86 (2.05)
Saudi Riyal - - - -
Other currencies 0.58 (0.64) 0.48 (0.53)
Total 5.99 (6.61) 4.03 (4.45)
2014 2013 (*) -10% +10% -10% +10%
US Dollar 1.62 (1.98) 2.50 (3.06)
United Arab Emirates Dirham 3.53 (4.31) 0.72 (0.88)
Qatari Riyal 5.17 (6.31) 3.54 (4.33)
Saudi Riyal - - 0.01 (0.01)
Other currencies 1.10 (1.34) 0.92 (1.12)
Total 11.42 (13.94) 7.69 (9.40)
(*) The previously published prior year consolidated financial statements have been restated following the adoption of IFRS 10 and IFRS 11. Further details can be found in Section C. Restatement of comparative figures.
The above analysis ignores the effects of translating the equity of Group companies whose functional currency is not the Euro.
(in millions of Euro)
(in millions of Euro)
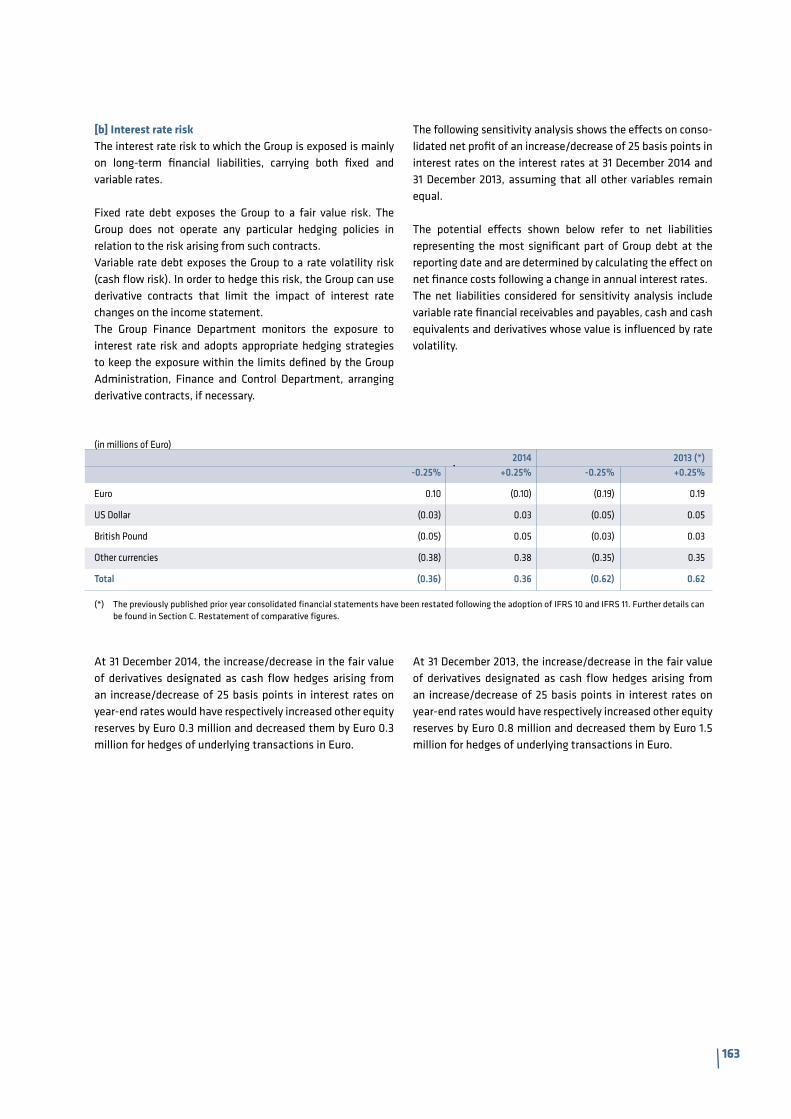
163
[b] Interest rate riskThe interest rate risk to which the Group is exposed is mainly on long-term financial liabilities, carrying both fixed and variable rates.
Fixed rate debt exposes the Group to a fair value risk. The Group does not operate any particular hedging policies in relation to the risk arising from such contracts. Variable rate debt exposes the Group to a rate volatility risk (cash flow risk). In order to hedge this risk, the Group can use derivative contracts that limit the impact of interest rate changes on the income statement.The Group Finance Department monitors the exposure to interest rate risk and adopts appropriate hedging strategies to keep the exposure within the limits defined by the Group Administration, Finance and Control Department, arranging derivative contracts, if necessary.
The following sensitivity analysis shows the effects on conso-lidated net profit of an increase/decrease of 25 basis points in interest rates on the interest rates at 31 December 2014 and 31 December 2013, assuming that all other variables remain equal.
The potential effects shown below refer to net liabilities representing the most significant part of Group debt at the reporting date and are determined by calculating the effect on net finance costs following a change in annual interest rates.The net liabilities considered for sensitivity analysis include variable rate financial receivables and payables, cash and cash equivalents and derivatives whose value is influenced by rate volatility.
2014 2013 (*) -0.25% +0.25% -0.25% +0.25%
Euro 0.10 (0.10) (0.19) 0.19
US Dollar (0.03) 0.03 (0.05) 0.05
British Pound (0.05) 0.05 (0.03) 0.03
Other currencies (0.38) 0.38 (0.35) 0.35
Total (0.36) 0.36 (0.62) 0.62
(*) The previously published prior year consolidated financial statements have been restated following the adoption of IFRS 10 and IFRS 11. Further details can be found in Section C. Restatement of comparative figures.
At 31 December 2014, the increase/decrease in the fair value of derivatives designated as cash flow hedges arising from an increase/decrease of 25 basis points in interest rates on year-end rates would have respectively increased other equity reserves by Euro 0.3 million and decreased them by Euro 0.3 million for hedges of underlying transactions in Euro.
At 31 December 2013, the increase/decrease in the fair value of derivatives designated as cash flow hedges arising from an increase/decrease of 25 basis points in interest rates on year-end rates would have respectively increased other equity reserves by Euro 0.8 million and decreased them by Euro 1.5 million for hedges of underlying transactions in Euro.
(in millions of Euro)

Consolidated Financial Report | EXPLANATORY NOTES
2014 Annual Report Prysmian Group
164
[c] Price riskThe Group is exposed to price risk in relation to purchases and sales of strategic materials, whose purchase price is subject to market volatility. The main raw materials used by the Group in its own production processes consist of strategic metals such as copper, aluminium and lead. The cost of purchasing such strategic materials accounted for approximately 51.2% of the Group’s total cost of materials in 2014 (56.3% in 2013), forming part of its overall production costs.
In order to manage the price risk on future trade transactions, the Group negotiates derivative contracts on strategic metals, setting the price for projected future purchases. Although the ultimate aim of the Group is to hedge risks to
which it is exposed, these contracts do not qualify as hedging instruments for accounting purposes.
The derivative contracts entered into by the Group are ne-gotiated with major financial counterparties on the basis of strategic metal prices quoted on the London Metal Exchange (“LME”), the New York market (“COMEX”) and the Shanghai Futures Exchange (“SFE”).
The following sensitivity analysis shows the effect on net profit and consolidated equity of a 10% increase/decrease in strategic material prices versus prices at 31 December 2014 and 31 December 2013, assuming that all other variables remain equal.
2014 2013 (*) -10% +10% -10% +10%
LME (12.63) 12.63 (13.85) 13.85
COMEX 0.21 (0.21) (0.78) 0.78
SFE (5.42) 5.42 (4.88) 4.88
Total (17.84) 17.84 (19.51) 19.51
(*) The previously published prior year consolidated financial statements have been restated following the adoption of IFRS 10 and IFRS 11. Further details can be found in Section C. Restatement of comparative figures.
The potential impact shown above is solely attributable to increases and decreases in the fair value of derivatives on strategic material prices which are directly attributable to changes in the prices themselves. It does not refer to the impact on the income statement of the purchase cost of strategic materials.
[d] Credit riskCredit risk is connected with trade receivables, cash and cash equivalents, financial instruments, and deposits with banks and other financial institutions.
Customer-related credit risk is managed by the individual subsidiaries and monitored centrally by the Group Finance Department. The Group does not have significant concen-trations of credit risk. It nonetheless has procedures aimed at ensuring that sales of products and services are made to reliable customers, taking account of their financial position, track record and other factors. Credit limits for major
customers are based on internal and external assessments within ceilings approved by local country management. The utilisation of credit limits is periodically monitored at local level.
During 2014 the Group had a global insurance policy in place to provide coverage for part of its trade receivables against any losses.
As for credit risk relating to the management of financial and cash resources, this risk is monitored by the Group Finance De-partment, which implements procedures intended to ensure that Group companies deal with independent, high standing, reliable counterparties. In fact, at 31 December 2014 (like at 31 December 2013) almost all the Group’s financial and cash resources were held with investment grade counterparties. Credit limits relating to the principal financial counterparties are based on internal and external assessments, within ceilings defined by the Group Finance Department.
(in millions of Euro)
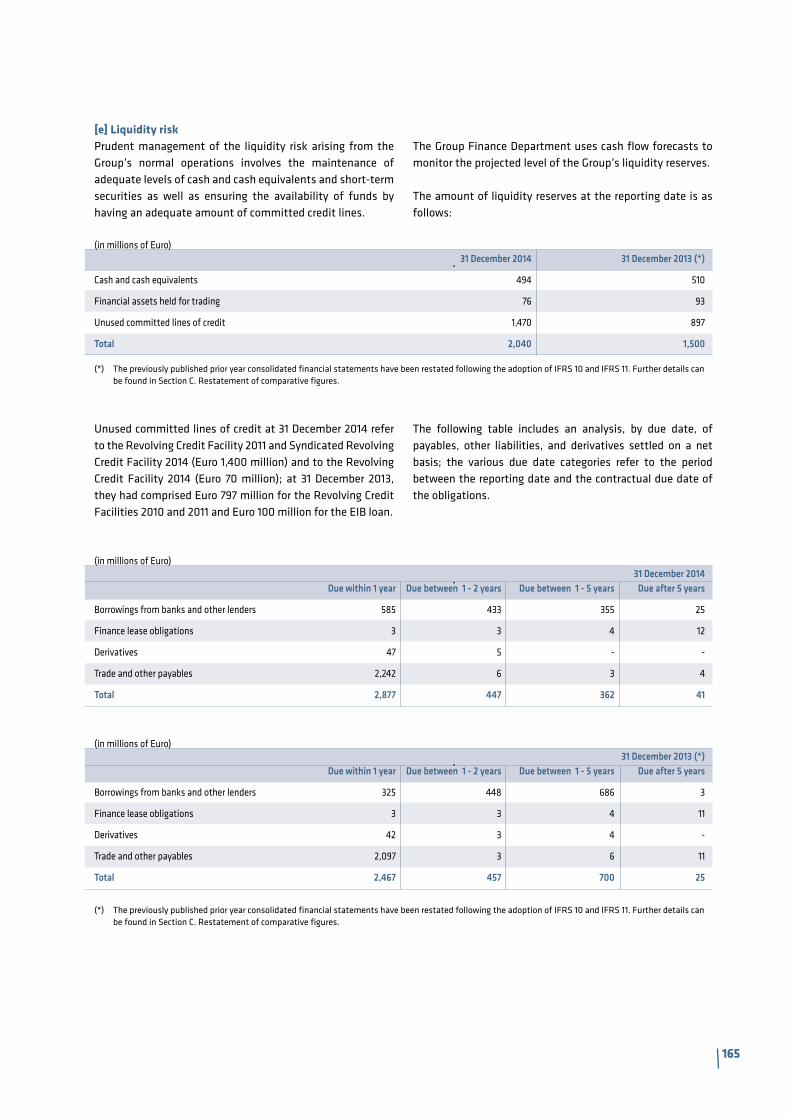
165
[e] Liquidity riskPrudent management of the liquidity risk arising from the Group’s normal operations involves the maintenance of adequate levels of cash and cash equivalents and short-term securities as well as ensuring the availability of funds by having an adequate amount of committed credit lines.
The Group Finance Department uses cash flow forecasts to monitor the projected level of the Group’s liquidity reserves.
The amount of liquidity reserves at the reporting date is as follows:
31 December 2014 31 December 2013 (*)
Cash and cash equivalents 494 510
Financial assets held for trading 76 93
Unused committed lines of credit 1,470 897
Total 2,040 1,500
(*) The previously published prior year consolidated financial statements have been restated following the adoption of IFRS 10 and IFRS 11. Further details can be found in Section C. Restatement of comparative figures.
Unused committed lines of credit at 31 December 2014 refer to the Revolving Credit Facility 2011 and Syndicated Revolving Credit Facility 2014 (Euro 1,400 million) and to the Revolving Credit Facility 2014 (Euro 70 million); at 31 December 2013, they had comprised Euro 797 million for the Revolving Credit Facilities 2010 and 2011 and Euro 100 million for the EIB loan.
The following table includes an analysis, by due date, of payables, other liabilities, and derivatives settled on a net basis; the various due date categories refer to the period between the reporting date and the contractual due date of the obligations.
31 December 2014 Due within 1 year Due between 1 - 2 years Due between 1 - 5 years Due after 5 years
Borrowings from banks and other lenders 585 433 355 25
Finance lease obligations 3 3 4 12
Derivatives 47 5 - -
Trade and other payables 2,242 6 3 4
Total 2,877 447 362 41
31 December 2013 (*) Due within 1 year Due between 1 - 2 years Due between 1 - 5 years Due after 5 years
Borrowings from banks and other lenders 325 448 686 3
Finance lease obligations 3 3 4 11
Derivatives 42 3 4 -
Trade and other payables 2,097 3 6 11
Total 2,467 457 700 25
(*) The previously published prior year consolidated financial statements have been restated following the adoption of IFRS 10 and IFRS 11. Further details can be found in Section C. Restatement of comparative figures.
(in millions of Euro)
(in millions of Euro)
(in millions of Euro)
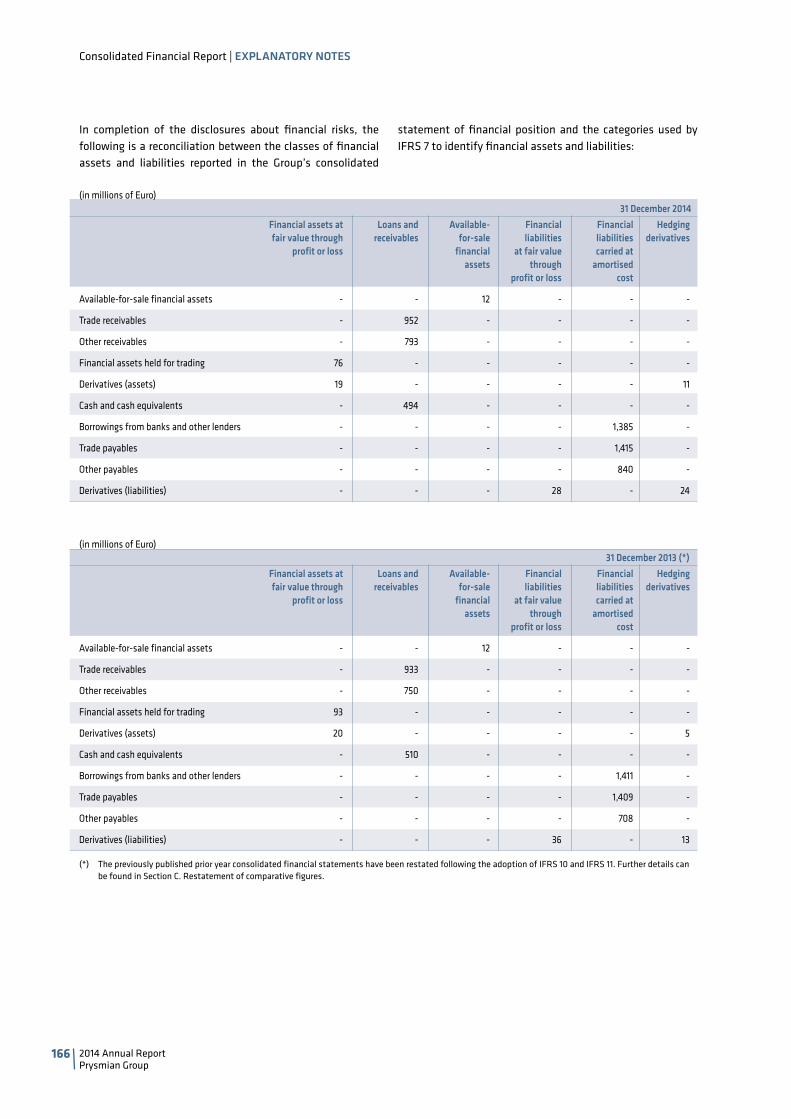
Consolidated Financial Report | EXPLANATORY NOTES
2014 Annual Report Prysmian Group
166
In completion of the disclosures about financial risks, the following is a reconciliation between the classes of financial assets and liabilities reported in the Group’s consolidated
statement of financial position and the categories used by IFRS 7 to identify financial assets and liabilities:
31 December 2014 Financial assets at Loans and Available- Financial Financial Hedging fair value through receivables for-sale liabilities liabilities derivatives profit or loss financial at fair value carried at assets through amortised profit or loss cost
Available-for-sale financial assets - - 12 - - -
Trade receivables - 952 - - - -
Other receivables - 793 - - - -
Financial assets held for trading 76 - - - - -
Derivatives (assets) 19 - - - - 11
Cash and cash equivalents - 494 - - - -
Borrowings from banks and other lenders - - - - 1,385 -
Trade payables - - - - 1,415 -
Other payables - - - - 840 -
Derivatives (liabilities) - - - 28 - 24
31 December 2013 (*) Financial assets at Loans and Available- Financial Financial Hedging fair value through receivables for-sale liabilities liabilities derivatives profit or loss financial at fair value carried at assets through amortised profit or loss cost
Available-for-sale financial assets - - 12 - - -
Trade receivables - 933 - - - -
Other receivables - 750 - - - -
Financial assets held for trading 93 - - - - -
Derivatives (assets) 20 - - - - 5
Cash and cash equivalents - 510 - - - -
Borrowings from banks and other lenders - - - - 1,411 -
Trade payables - - - - 1,409 -
Other payables - - - - 708 -
Derivatives (liabilities) - - - 36 - 13
(*) The previously published prior year consolidated financial statements have been restated following the adoption of IFRS 10 and IFRS 11. Further details can be found in Section C. Restatement of comparative figures.
(in millions of Euro)
(in millions of Euro)
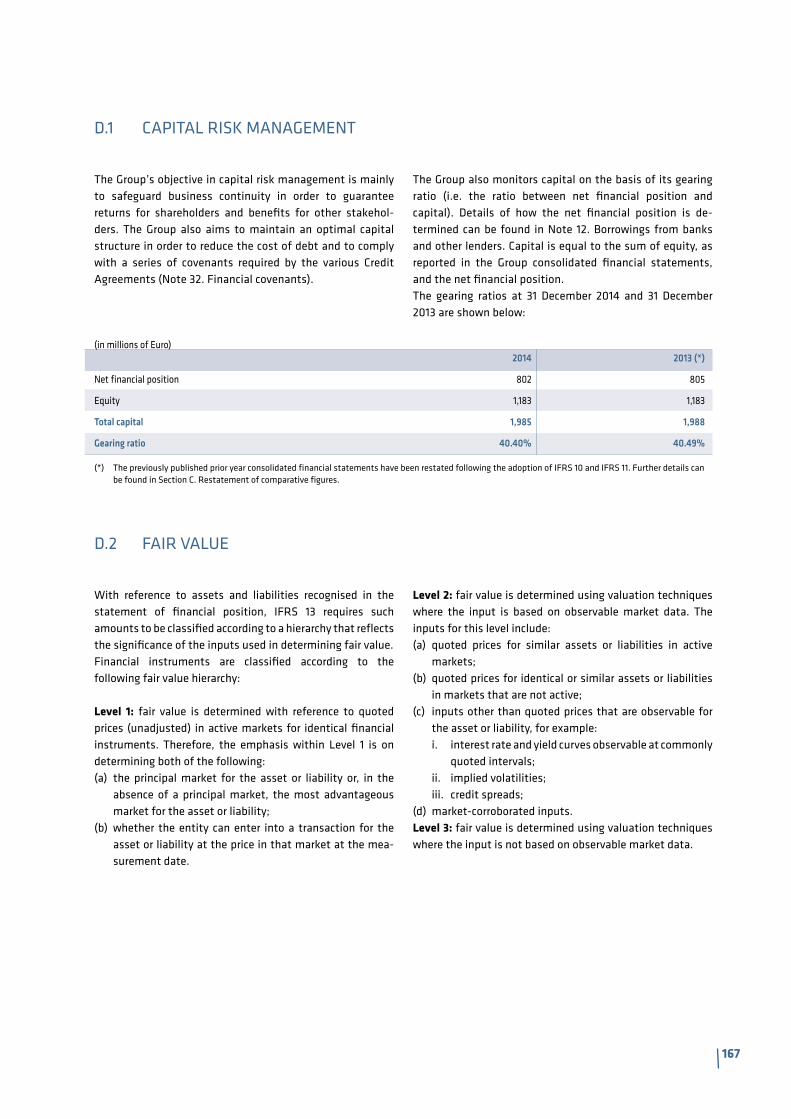
167
D.1 CAPITAL RISK MANAGEMENT
The Group’s objective in capital risk management is mainly to safeguard business continuity in order to guarantee returns for shareholders and benefits for other stakehol-ders. The Group also aims to maintain an optimal capital structure in order to reduce the cost of debt and to comply with a series of covenants required by the various Credit Agreements (Note 32. Financial covenants).
The Group also monitors capital on the basis of its gearing ratio (i.e. the ratio between net financial position and capital). Details of how the net financial position is de-termined can be found in Note 12. Borrowings from banks and other lenders. Capital is equal to the sum of equity, as reported in the Group consolidated financial statements, and the net financial position.The gearing ratios at 31 December 2014 and 31 December 2013 are shown below:
D.2 FAIR VALUE
With reference to assets and liabilities recognised in the statement of financial position, IFRS 13 requires such amounts to be classified according to a hierarchy that reflects the significance of the inputs used in determining fair value.Financial instruments are classified according to the following fair value hierarchy:
Level 1: fair value is determined with reference to quoted prices (unadjusted) in active markets for identical financial instruments. Therefore, the emphasis within Level 1 is on determining both of the following:(a) the principal market for the asset or liability or, in the
absence of a principal market, the most advantageous market for the asset or liability;
(b) whether the entity can enter into a transaction for the asset or liability at the price in that market at the mea-surement date.
Level 2: fair value is determined using valuation techniques where the input is based on observable market data. The inputs for this level include:(a) quoted prices for similar assets or liabilities in active
markets; (b) quoted prices for identical or similar assets or liabilities
in markets that are not active; (c) inputs other than quoted prices that are observable for
the asset or liability, for example: i. interest rate and yield curves observable at commonly
quoted intervals; ii. implied volatilities; iii. credit spreads;
(d) market-corroborated inputs.Level 3: fair value is determined using valuation techniques where the input is not based on observable market data.
2014 2013 (*)
Net financial position 802 805
Equity 1,183 1,183
Total capital 1,985 1,988
Gearing ratio 40.40% 40.49%
(*) The previously published prior year consolidated financial statements have been restated following the adoption of IFRS 10 and IFRS 11. Further details can be found in Section C. Restatement of comparative figures.
(in millions of Euro)
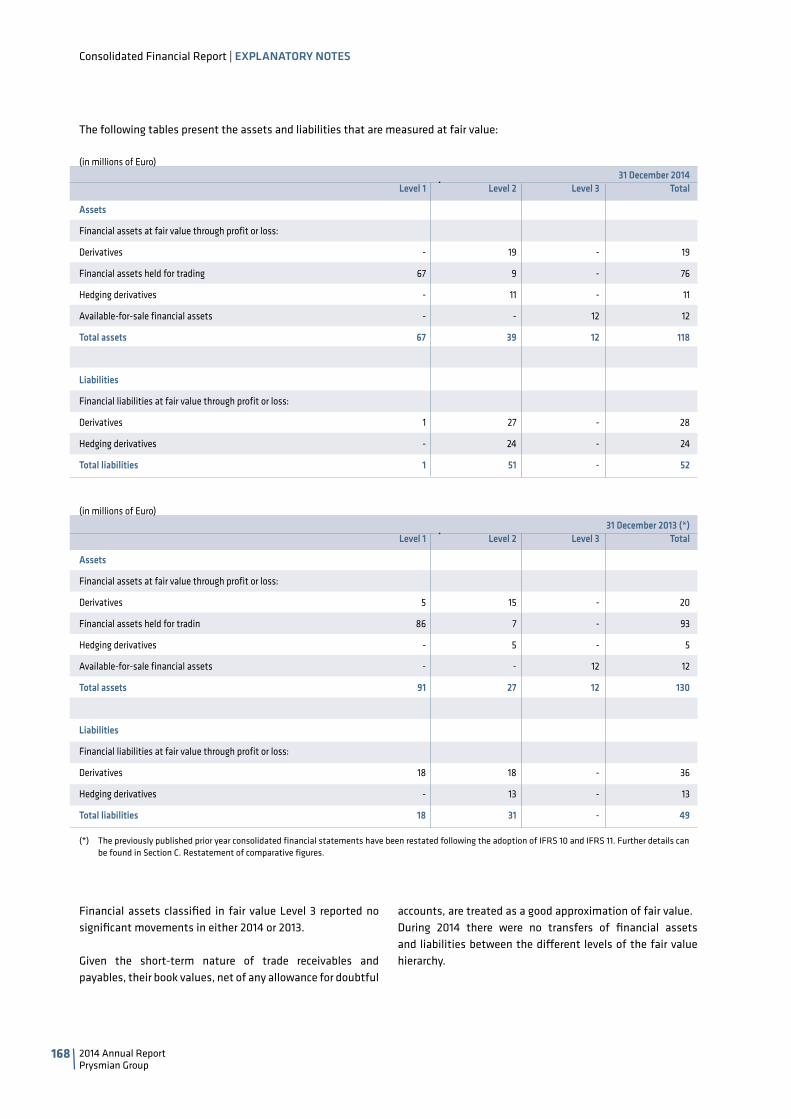
Consolidated Financial Report | EXPLANATORY NOTES
2014 Annual Report Prysmian Group
168
The following tables present the assets and liabilities that are measured at fair value:
31 December 2014 Level 1 Level 2 Level 3 Total
Assets
Financial assets at fair value through profit or loss:
Derivatives - 19 - 19
Financial assets held for trading 67 9 - 76
Hedging derivatives - 11 - 11
Available-for-sale financial assets - - 12 12
Total assets 67 39 12 118
Liabilities
Financial liabilities at fair value through profit or loss:
Derivatives 1 27 - 28
Hedging derivatives - 24 - 24
Total liabilities 1 51 - 52
(*) The previously published prior year consolidated financial statements have been restated following the adoption of IFRS 10 and IFRS 11. Further details can be found in Section C. Restatement of comparative figures.
31 December 2013 (*) Level 1 Level 2 Level 3 Total
Assets
Financial assets at fair value through profit or loss:
Derivatives 5 15 - 20
Financial assets held for tradin 86 7 - 93
Hedging derivatives - 5 - 5
Available-for-sale financial assets - - 12 12
Total assets 91 27 12 130
Liabilities
Financial liabilities at fair value through profit or loss:
Derivatives 18 18 - 36
Hedging derivatives - 13 - 13
Total liabilities 18 31 - 49
Financial assets classified in fair value Level 3 reported no significant movements in either 2014 or 2013.
Given the short-term nature of trade receivables and payables, their book values, net of any allowance for doubtful
accounts, are treated as a good approximation of fair value. During 2014 there were no transfers of financial assets and liabilities between the different levels of the fair value hierarchy.
(in millions of Euro)
(in millions of Euro)

169
VALUATION TECHNIQUES
Level 1: The fair value of financial instruments quoted in an active market is based on market price at the reporting date. The market price used for derivatives is the bid price, while for financial liabilities the ask price is used.
Level 2: Derivative financial instruments classified in this category include interest rate swaps, forward currency contracts and metal derivative contracts that are not quoted in active markets. Fair value is determined as follows: • for interest rate swaps, it is calculated on the basis of the
present value of forecast future cash flows; • for forward currency contracts, it is determined using the
forward exchange rate at the reporting date, appropriately discounted;
• for metal derivative contracts, it is determined using the prices of such metals at the reporting date, appropriately discounted.
Level 3: The fair value of instruments not quoted in an active market is mainly determined using valuation techniques based on estimated discounted cash flows.
An increase/decrease in the Group’s credit rating at 31 December 2014 would not have had significant effects on net profit at that date.
E. ESTIMATES AND ASSUMPTIONS
The preparation of financial statements requires mana-gement to apply accounting policies and methods which, at times, rely on judgements and estimates based on past experience and assumptions deemed to be reasonable and realistic according to the related circumstances. The appli-cation of these estimates and assumptions influences the amounts reported in the financial statements, meaning the statement of financial position, the income statement, the statement of comprehensive income and the statement of cash flows, as well as the accompanying disclosures. Ultimate amounts, previously reported on the basis of estimates and assumptions, may differ from original estimates because of the uncertain nature of the assumptions and conditions on which the estimates were based. The following is a brief description of the accounting policies that require the Prysmian Group’s management to exercise greater subjectivity of judgement when preparing estimates and for which a change in underlying assumptions could have a significant impact on the consolidated financial statements.
(a) Provisions for risks and chargesProvisions are recognised for legal and tax risks and reflect the risk of a negative outcome. The value of the provisions recorded in the financial statements against such risks represents the best estimate by management at that date. This estimate requires the use of assumptions depending on factors which may change over time and which could, therefore, have a significant impact on the current estimates made by management to prepare the Group consolidated financial statements.
(b) Impairment of assetsGoodwillIn accordance with its adopted accounting standards and impairment testing procedures, the Group tests annually whether its goodwill has suffered an impairment loss. Up to 31 December 2013 goodwill was allocated to the two operating segments: Energy and Telecom at which level it was monitored and tested. Following the change in the Group’s organisational structure, as from 1 January 2014 the Energy segment has been divided into two operating segments: Energy Projects and Energy Products. However, the structure of the Telecom operating segment has remained unchanged. The Energy Segment’s goodwill has therefore been reallo-cated to the new operating segments Energy Products and Energy Projects. The value of Goodwill has therefore been tested for the following operating segments: Energy Products, Energy Projects and Telecom. The recoverable amount has been determined by calculating value in use, which requires the use of estimates. As at 31 December 2014, the Prysmian Group had capitali-sed Euro 380 million in Goodwill; this Goodwill reflects the effects of:• the adoption of IFRS 10 and IFRS 11: this has resulted
in the restatement of the Group’s consolidated figures with effect from 1 January 2013. In particular, goodwill has been allocated to the value of the investments in Yangtze Optical Fibre and Cable Joint Stock Limited Co. and Yangtze Optical Fibre and Cable (Shanghai) Co. Ltd, which changed their method of consolidation from proportionate and line-by-line respectively to the equity

Consolidated Financial Report | EXPLANATORY NOTES
2014 Annual Report Prysmian Group
170
method. The reallocation was performed on the basis of the value of net invested capital at 1 January 2013.
• the redefinition of the operating segments after adopting the new organisational structure: this has resulted in reallocating goodwill previously allocated to the Energy segment to the new operating segments: Energy Products and Energy Projects. The reallocation was performed on the basis of the value of net invested capital at 1 January 2014 (the date of the organisational change).
More details about the impairment test for Goodwill can be found in Note 2. Intangible assets.
Property, plant and equipment and finite-life intangible assetsIn accordance with the Group’s adopted accounting standards and impairment testing procedures, property, plant and equipment and intangible assets with finite useful lives are tested for impairment. Any impairment loss is recognised by means of a write-down, when indicators suggest it will be difficult to recover the related net book value through use of the assets. Verification of the existence of these indicators requires management to make subjective judgements based on the information available within the Group and from the market, as well as from past experience. In addition, if an impairment loss is identified, the Group determines the amount of such impairment using suitable valuation techni-ques. Correct identification of indicators of potential impai-rment as well as the estimates for determining its amount depend on factors which can vary over time, thus influencing judgements and estimates made by management.The Prysmian Group has assessed at year end whether there is any evidence that its CGUs might be impaired and has consequently tested for impairment those CGUs potentially at “risk”. Based on this test, the Group has partially written down the assets of certain CGUs within the Energy Products segment for the following countries and regions: Italy, Oceania and Germany. As for the Energy Projects segment, the Group has recognised impairment losses against other assets which, although belonging to larger CGUs for which there was no specific evidence of impairment, had recove-rable amounts below their net book value due to particular market circumstances. In particular, an impairment loss has been recognised against development costs relating to the flexible pipes business within the SURF CGU.Following the redefinition of the CGUs, the Group has verified that if impairment had been calculated on the basis of the previous structure, the effects recognised, comprising impairment losses net of reversals, would not have been substantially different from those recognised in the 2014 income statement.
The outcome of impairment tests at 31 December 2014 does not mean that future results will be the same, especially in
the event of currently unforeseeable developments in the business environment.Further information can be found in Note 1. Property, plant and equipment.
(c) Depreciation and amortisationThe cost of property, plant and equipment and intangible assets is depreciated/amortised on a straight-line basis over the estimated useful lives of the assets concerned. The useful economic life of Group property, plant and equipment and intangible assets is determined by management when the asset is acquired. This is based on past experience for similar assets, market conditions and expectations regarding future events that could impact useful life, including changes in technology. Therefore, actual economic life may differ from estimated useful life. The Group periodically reviews technological and sector changes to update residual useful lives. This periodic update may lead to a variation in the depreciation/amortisation period and therefore also in the depreciation/amortisation charge for future years.
(d) Recognition of construction contract revenues and costs The Group uses the percentage of completion method to record construction contracts. The margins recognised in the income statement depend on the progress of the contract and its estimated margins upon completion. Thus, correct recognition of work-in-progress and margins relating to as yet incomplete work implies that management has correctly estimated contract costs, potential contract variations, as well as delays, and any extra costs and penalties that might reduce the expected profit. The percentage of completion method requires the Group to estimate the completion costs and involves making estimates dependent on factors which may change over time and could therefore have a significant impact on current values. Should actual cost differ from estimated cost, this variation will impact future results.
(e) TaxesConsolidated companies are subject to different tax ju-risdictions. A significant degree of estimation is needed to establish the expected tax payable globally. There are a number of transactions for which the relevant taxes are difficult to estimate at year end. The Group records liabilities for tax risks on the basis of estimates, possibly made with the assistance of outside experts.
(f) Inventory valuationInventories are recorded at the lower of purchase cost (measured using the weighted average cost formula for non-ferrous metals and the FIFO formula for all others) and net realisable value, net of selling costs. Net realisable value is in turn represented by the value of firm orders in the order book, or otherwise by the replacement cost of supplies or raw materials. If significant reductions in the price of non-ferrous
171
metals are followed by order cancellations, the loss in the value of inventories may not be fully offset by the penalties charged to customers for cancelling their orders.
(g) Employee benefit obligationsThe present value of the pension plans reported in the financial statements depends on an independent actuarial calculation and on a number of different assumptions. Any changes in assumptions and in the discount rate used are duly reflected in the present value calculation and may have a significant impact on the consolidated figures. The assumptions used for the actuarial calculation are examined by the Group annually.Present value is calculated by discounting future cash flows at an interest rate equal to that on high-quality corporate bonds issued in the currency in which the liability will be
settled and which takes account of the duration of the related pension plan. Further information can be found in Note 15. Employee benefit obligations and Note 21. Personnel costs.
(h) Incentive plansThe employee share purchase plan involves granting options to almost all of the Group’s employees. The operation of this plan is described in Note 21. Personnel costs.The grant of options is subject to an employee’s continued professional relationship with the Group in the months between signing up to one of the plan’s purchase windows and the purchase of the shares themselves on the stock market. The plan’s financial and economic impact has therefore been estimated on the basis of the best possible estimates and information currently available.

Consolidated Financial Report | EXPLANATORY NOTES
2014 Annual Report Prysmian Group
172
F. SEGMENT INFORMATION
From 1 January 2014 the Group embarked on a process of orga-nisational change, which has involved redefining its segment information, in keeping with the new management model adopted by the Group. Following this change, the Group’s operating segments have been redefined as follows: • Energy Projects;• Energy Products; • Telecom.
Reporting systems in support of the new model were intro-duced in 2014 and fully implemented prior to the preparation of the current document. Accordingly the criteria used to identify the reportable segments are consistent with the new organisational model. The Board of Directors approved the adoption of the new structure for segment reporting in its meeting on 23 January 2015.Segment information is currently structured in the same way as the report periodically prepared in order to review business performance. This report presents operating performance by macro type of business (Energy Projects, Energy Products and Telecom) and the results of operating segments primarily on the basis of Adjusted EBITDA, defined as earnings (loss) for the period before non-recurring items (e.g. restructuring costs), the fair value change in metal price derivatives and in other fair value items, amortisation, depreciation and impairment, finance costs and income and taxes. This report also provides information about the statement of financial position for the Group as a whole and not by operating segment.In order to provide users of the financial statements with clearer information, certain economic data is also reported for the following sales channels and business areas within the individual operating segments:
A) Energy Projects operating segment: covers high-tech and high value-added businesses whose focus is on projects and their execution, as well as on product customisation: High Voltage underground, Submarine and SURF (umbilical cables, flexible pipes and special DHT (Downhole Technology) cables for the oil industry).
B) Energy Products operating segment: covers the busines-ses offering a complete and innovative product portfolio designed to meet the various and many demands of the market, namely: 1. Energy & Infrastructure (E&I): which includes Trade and
Installers and Power Distribution;2. Industrial & Network components: which comprises Spe-
cialties and OEM, Oil & Gas, Elevators, Automotive and Network Components;
3. Other: occasional sales of residual products.
C) Telecom operating segment: produces cable systems and connectivity products used in telecommunication networks. The segment is organised in the following lines of business: optical fibre, optical cables, connectivity components and accessories, OPGW (Optical Ground Wire) and copper cables.
All Corporate fixed costs are allocated to the Energy Products, Energy Projects and Telecom operating segments. Revenues and costs are allocated to each operating segment by iden-tifying all revenues and costs directly attributable to that segment and by allocating indirect costs on the basis of Corporate resources (personnel, space used, etc.) absorbed by the operating segments. Group operating activities are organised and managed sepa-rately according to the nature of the products and services provided: each segment offers different products and services to different markets. Sales of goods and services are analysed geographically on the basis of the location of the registered office of the company that issues the invoices, regardless of the geographic destination of the products sold. This type of presentation does not produce significantly different results from analysing sales of goods and services by destination of the products sold. All transfer prices are set using the same conditions applied to other transactions between Group companies and are generally determined by applying a mark-up to production costs.
Assets and liabilities by operating segment are not included in the data reviewed by management and so, as permitted by IFRS 8, this information is not reported.
It should be noted that the comparative figures have been restated compared with the previously published figures to reflect the following:• The redefinition of the operating segments after adopting
the new organisational structure;• The adoption of IFRS 10 and IFRS 11, which has involved
restating the Group’s consolidated figures with effect from 1 January 2013.
• The new method of classifying the share of the net profit/(loss) of associates and joint ventures, which has involved recognising this amount as a component of “Operating income” when relating to companies that operate in the same market as the Group.
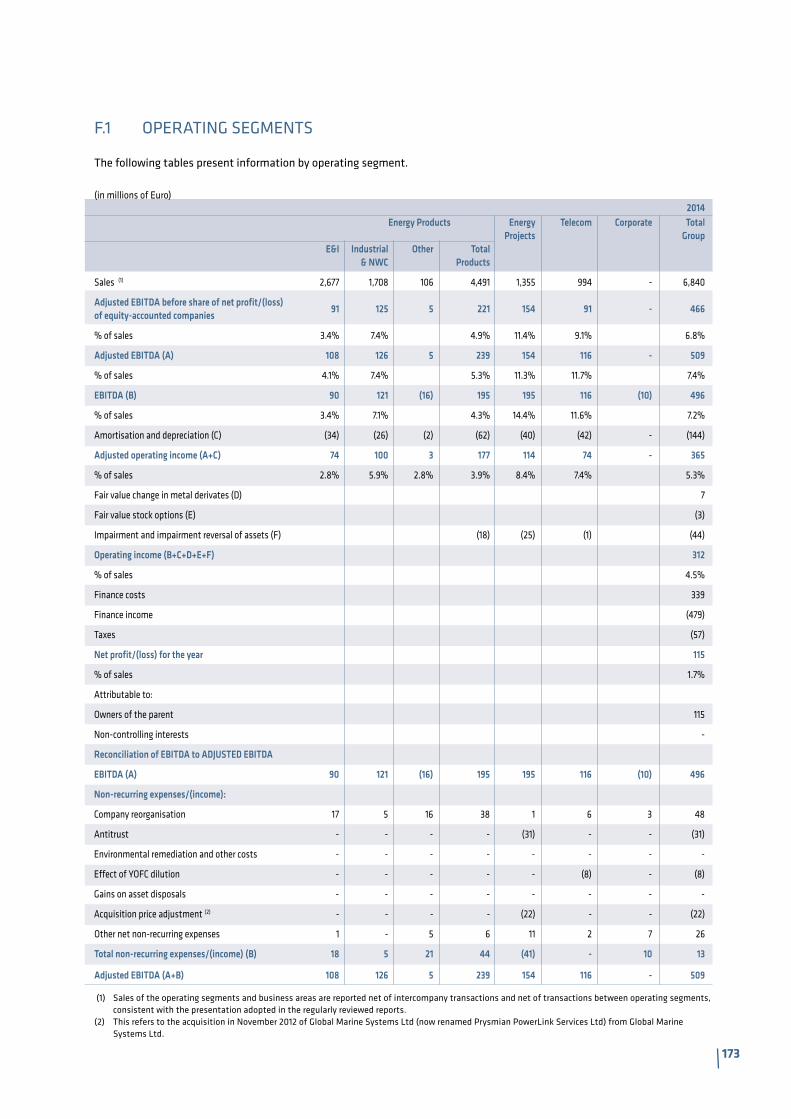
173
F.1 OPERATING SEGMENTS
(1) Sales of the operating segments and business areas are reported net of intercompany transactions and net of transactions between operating segments, consistent with the presentation adopted in the regularly reviewed reports.
(2) This refers to the acquisition in November 2012 of Global Marine Systems Ltd (now renamed Prysmian PowerLink Services Ltd) from Global Marine Systems Ltd.
The following tables present information by operating segment.
2014 Energy Products Energy Telecom Corporate Total Projects Group E&I Industrial Other Total & NWC Products
Sales (1) 2,677 1,708 106 4,491 1,355 994 - 6,840
Adjusted EBITDA before share of net profit/(loss) of equity-accounted companies 91 125 5 221 154 91 - 466
% of sales 3.4% 7.4% 4.9% 11.4% 9.1% 6.8%
Adjusted EBITDA (A) 108 126 5 239 154 116 - 509
% of sales 4.1% 7.4% 5.3% 11.3% 11.7% 7.4%
EBITDA (B) 90 121 (16) 195 195 116 (10) 496
% of sales 3.4% 7.1% 4.3% 14.4% 11.6% 7.2%
Amortisation and depreciation (C) (34) (26) (2) (62) (40) (42) - (144)
Adjusted operating income (A+C) 74 100 3 177 114 74 - 365
% of sales 2.8% 5.9% 2.8% 3.9% 8.4% 7.4% 5.3%
Fair value change in metal derivates (D) 7
Fair value stock options (E) (3)
Impairment and impairment reversal of assets (F) (18) (25) (1) (44)
Operating income (B+C+D+E+F) 312
% of sales 4.5%
Finance costs 339
Finance income (479)
Taxes (57)
Net profit/(loss) for the year 115
% of sales 1.7%
Attributable to:
Owners of the parent 115
Non-controlling interests -
Reconciliation of EBITDA to ADJUSTED EBITDA
EBITDA (A) 90 121 (16) 195 195 116 (10) 496
Non-recurring expenses/(income):
Company reorganisation 17 5 16 38 1 6 3 48
Antitrust - - - - (31) - - (31)
Environmental remediation and other costs - - - - - - - -
Effect of YOFC dilution - - - - - (8) - (8)
Gains on asset disposals - - - - - - - -
Acquisition price adjustment (2) - - - - (22) - - (22)
Other net non-recurring expenses 1 - 5 6 11 2 7 26
Total non-recurring expenses/(income) (B) 18 5 21 44 (41) - 10 13
Adjusted EBITDA (A+B) 108 126 5 239 154 116 - 509
(in millions of Euro)
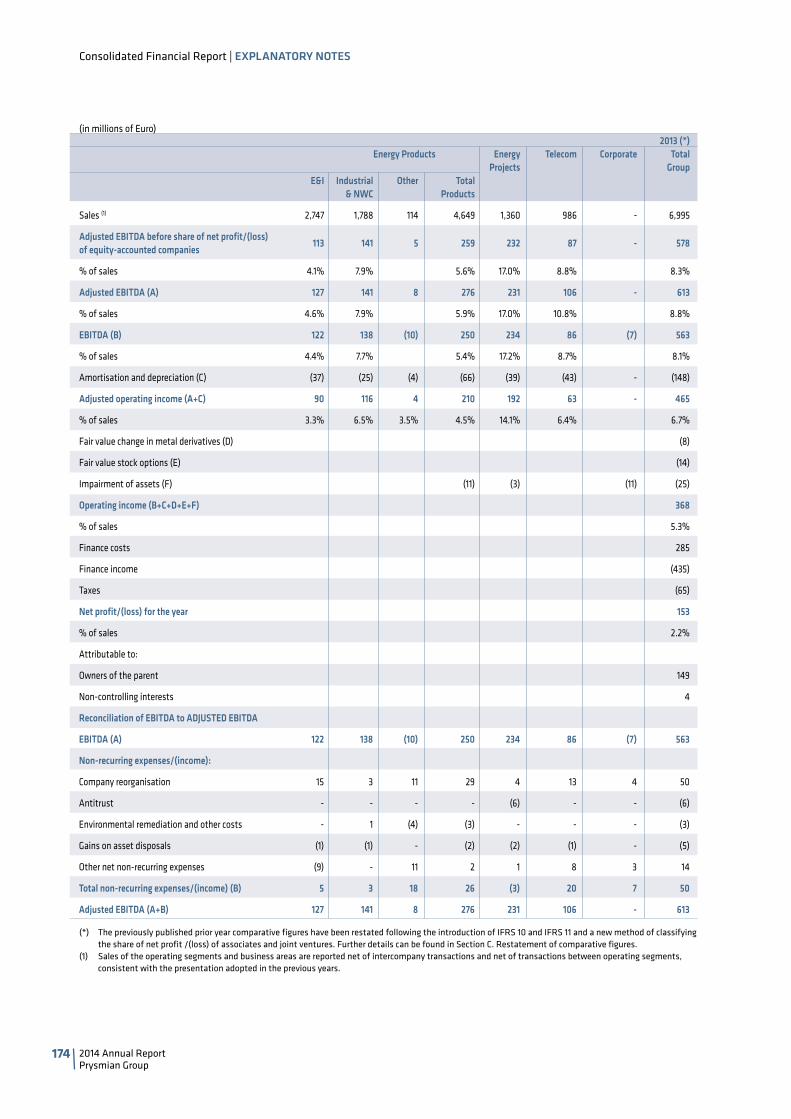
Consolidated Financial Report | EXPLANATORY NOTES
2014 Annual Report Prysmian Group
174
2013 (*) Energy Products Energy Telecom Corporate Total Projects Group E&I Industrial Other Total & NWC Products
Sales (1) 2,747 1,788 114 4,649 1,360 986 - 6,995
Adjusted EBITDA before share of net profit/(loss) of equity-accounted companies 113 141 5 259 232 87 - 578
% of sales 4.1% 7.9% 5.6% 17.0% 8.8% 8.3%
Adjusted EBITDA (A) 127 141 8 276 231 106 - 613
% of sales 4.6% 7.9% 5.9% 17.0% 10.8% 8.8%
EBITDA (B) 122 138 (10) 250 234 86 (7) 563
% of sales 4.4% 7.7% 5.4% 17.2% 8.7% 8.1%
Amortisation and depreciation (C) (37) (25) (4) (66) (39) (43) - (148)
Adjusted operating income (A+C) 90 116 4 210 192 63 - 465
% of sales 3.3% 6.5% 3.5% 4.5% 14.1% 6.4% 6.7%
Fair value change in metal derivatives (D) (8)
Fair value stock options (E) (14)
Impairment of assets (F) (11) (3) (11) (25)
Operating income (B+C+D+E+F) 368
% of sales 5.3%
Finance costs 285
Finance income (435)
Taxes (65)
Net profit/(loss) for the year 153
% of sales 2.2%
Attributable to:
Owners of the parent 149
Non-controlling interests 4
Reconciliation of EBITDA to ADJUSTED EBITDA
EBITDA (A) 122 138 (10) 250 234 86 (7) 563
Non-recurring expenses/(income):
Company reorganisation 15 3 11 29 4 13 4 50
Antitrust - - - - (6) - - (6)
Environmental remediation and other costs - 1 (4) (3) - - - (3)
Gains on asset disposals (1) (1) - (2) (2) (1) - (5)
Other net non-recurring expenses (9) - 11 2 1 8 3 14
Total non-recurring expenses/(income) (B) 5 3 18 26 (3) 20 7 50
Adjusted EBITDA (A+B) 127 141 8 276 231 106 - 613
(*) The previously published prior year comparative figures have been restated following the introduction of IFRS 10 and IFRS 11 and a new method of classifying the share of net profit /(loss) of associates and joint ventures. Further details can be found in Section C. Restatement of comparative figures.
(1) Sales of the operating segments and business areas are reported net of intercompany transactions and net of transactions between operating segments, consistent with the presentation adopted in the previous years.
(in millions of Euro)
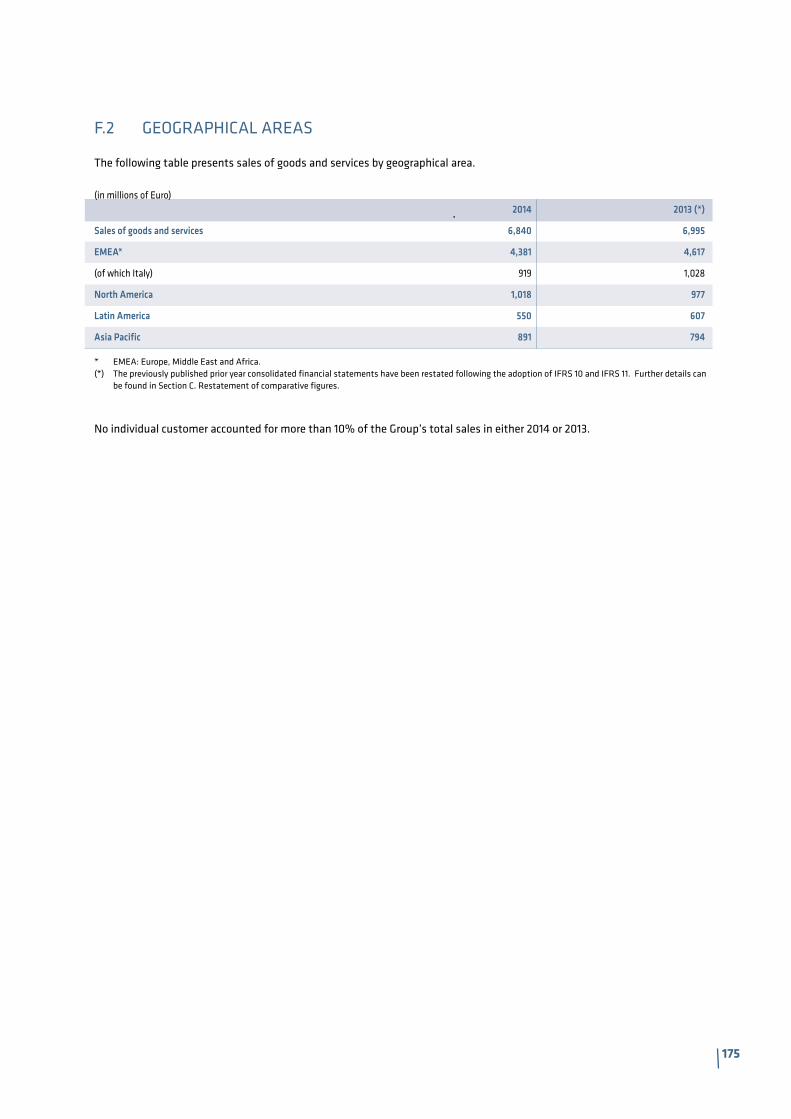
175
F.2 GEOGRAPHICAL AREAS
2014 2013 (*)
Sales of goods and services 6,840 6,995
EMEA* 4,381 4,617
(of which Italy) 919 1,028
North America 1,018 977
Latin America 550 607
Asia Pacific 891 794
* EMEA: Europe, Middle East and Africa.(*) The previously published prior year consolidated financial statements have been restated following the adoption of IFRS 10 and IFRS 11. Further details can
be found in Section C. Restatement of comparative figures.
No individual customer accounted for more than 10% of the Group’s total sales in either 2014 or 2013.
The following table presents sales of goods and services by geographical area.
(in millions of Euro)

Consolidated Financial Report | EXPLANATORY NOTES
2014 Annual Report Prysmian Group
176
1. PROPERTY, PLANT AND EQUIPMENT
Details of this line item and related movements are as follows:
Land Buildings Plant and Equipment Other assets Assets under Total machinery construction and advances
Balance at 31 December 2013 (*) 244 501 454 19 48 124 1,390
Movements in 2014:
- Investments 9 7 23 3 1 102 145
- Disposals - - (1) - - - (1)
- Depreciation - (24) (73) (7) (10) - (114)
- Impairment - (11) (18) (7) (2) (3) (41)
- Impairment reversals - - 15 1 - 2 18
- Currency translation differences 2 8 3 - 4 (2) 15
- Reclassifications to Assets held for sale (1) - - - - - (1)
- Other 1 11 50 17 - (76) 3
Total movements 11 (9) (1) 7 (7) 23 24
Balance at 31 December 2014 255 492 453 26 41 147 1,414
Of which:
- Historical cost 262 687 1.091 85 96 150 2,371
- Accumulated depreciation and impairment (7) (195) (638) (59) (55) (3) (957)
Net book value 255 492 453 26 41 147 1,414
(in millions of Euro)
(*) The previously published prior year consolidated financial statements have been restated following the adoption of IFRS 10 and IFRS 11. Further details can be found in Section C. Restatement of comparative figures.

177
(*) The previously published prior year consolidated financial statements have been restated following the adoption of IFRS 10 and IFRS 11. Further details can be found in Section C. Restatement of comparative figures.
Gross investments in property, plant and equipment amount to Euro 145 million in 2014.The investments made during 2014 are analysed as follows:• Euro 62 million, approximately 43% of the total, for
structural projects. These projects mainly relate to: the conversion of the cable ship owned by Prysmian PowerLink Services Ltd to allow it to perform different types of installation work; the purchase of the Pikkala site in Finland, to ensure production capacity for the Submarine business and other high value-added busines-ses; and lastly, work on buildings and production lines for compliance with the latest regulations;
• Euro 46 million, approximately 32% of the total, for projects to increase production capacity and develop new products. In particular, these investments concerned: the Arco Felice plant in Naples and the Drammen plant in Norway for the realisation of the Exxon Mobile and Baltic 2 submarine projects; the Sorocaba plant in Brazil for the construction of preforms needed in optical fibre manufac-turing; the Abbeville plant in the United States to cope with the growth in local demand for the E&I business;
• Euro 31 million, approximately 21% of the total, for projects to improve industrial efficiency. In particular these projects have involved the installation of a trige-
neration system at the Battipaglia plant in Italy in order to generate electricity and reuse exhaust gases for air conditioning, which will significantly reduce energy costs; lastly, other investments to improve efficiency and reduce optical fibre manufacturing costs have been made at the plants in Douvrin (France), Eindhoven (Netherlands) and Battipaglia (Italy);
• Euro 6 million, approximately 4% of the total, for projects to improve the R&D facilities.
There are liens for Euro 10 million against the value of machinery in connection with long-term loans (Euro 12 million at 31 December 2013).
When closing the present financial year, the Prysmian Group reviewed whether there was any evidence that its CGUs might be impaired, and then tested for impairment those CGUs potentially at “risk”. This test has led to the full impairment of Plant and machinery, Equipment, Other assets and Assets under con-struction for the CGU Energy Products - Italy (Euro 16 million) and for the CGU Energy Products - Oceania (Euro 7 million). The net book value of the Land and Buildings of the Italy and Oceania CGUs has been compared with their fair value at the
Land Buildings Plant and Equipment Other assets Assets under Total machinery construction and advances
Balance at 31 December 2012 (*) 246 543 502 21 54 118 1,484
Movements in 2014:
- Investments 13 15 16 2 2 70 118
- Disposals (1) (2) (1) - - - (4)
- Depreciation - (25) (76) (6) (9) - (116)
- Impairment (3) (11) (9) (1) - (2) (26)
- Impairment reversals - 1 - - - - 1
- Currency translation differences (8) (18) (25) - (4) (7) (62)
- Reclassifications to Assets held for sale (3) (8) - - - - (11)
- Other - 6 47 3 5 (55) 6
Total movements (2) (42) (48) (2) (6) 6 (94)
Balance at 31 December 2013 (*) 244 501 454 19 48 124 1,390
Of which:
- Historical cost 250 668 1.023 68 93 126 2,228
- Accumulated depreciation and impairment (6) (167) (569) (49) (45) (2) (838)
Net book value 244 501 454 19 48 124 1,390
(in millions of Euro)

Consolidated Financial Report | EXPLANATORY NOTES
2014 Annual Report Prysmian Group
178
2. INTANGIBLE ASSETS
Details of this line item and related movements are as follows:
Patents Concessions, Goodwill Software Other intangible Intangibles in Total licences, trademarks assets progress and similar rights and advances
Balance at 31 December 2013 (*) 19 5 377 32 133 22 588
Movements in 2014:
- Business combinations - - - - - - -
- Investments - - - - 1 8 9
- Internally generated intangible assets - - - 4 - 5 9
- Disposals - - - - - - -
- Amortisation (7) (1) - (7) (15) - (30)
- Impairment - - - - (2) (19) (21)
- Currency translation differences 1 - 3 - - - 4
- Other - 1 - 4 - (3) 2
Total movements (6) - 3 1 (16) (9) (27)
Balance at 31 December 2014 13 5 380 33 117 13 561
Of which:
- Historical cost 46 55 400 84 196 32 813
- Accumulated amortisation and impairment (33) (50) (20) (51) (79) (19) (252)
Net book value 13 5 380 33 117 13 561
reporting date; this has resulted in the recognition of Euro 2 million in impairment for the Italy CGU and Euro 5 million for the Oceania CGU. In this particular case, the cash flow forecasts for 2015-2017 have been determined by projecting forward the cash flows expected by management in 2015 (at constant growth rates); the WACC (Weighted Average Cost of Capital as defined in the paragraph “Goodwill impairment test”), used to discount cash flows for determining value in use for the Italy CGU is 6.7% and 7.9% for the Oceania CGU. The perpetuity growth rate (G) projected after 2017 is 2%.Furthermore, the Group has tested other assets for impai-rment which, although belonging to larger CGUs for which there was no specific evidence of impairment, presented impairment indicators in relation to particular market cir-cumstances. This has led to the recognition of Euro 11 million in additional impairment losses in 2014, mainly due to:• impairment of Euro 5 million recognised against the
Wuppertal site (Germany);• impairment of Euro 5 million recognised against the
rotating platform loaded aboard the AMT Explorer cable
barge, which capsized at sea in July 2014. The insurance reimbursement for the same amount has been recogni-sed in “Other income”.
In addition, the creation of territorial organisations has led to the redefinition of the CGUs; this has meant that the conditions no longer applied under which some assets had been impaired in previous years, resulting in the write-back of Euro 18 million to income. Given this change, the Group has verified that if impairment had been calculated on the basis of the previous structure, the effects would not have been substantially different from those recognised in the 2014 income statement.
“Buildings” include assets under finance lease with a net book value of Euro 17 million at 31 December 2014, largely unchanged since 31 December 2013. The maturity dates of finance leases are reported in Note 12. Borrowings from banks and other lenders; such leases generally include purchase options.
(in millions of Euro)
(*) The previously published prior year consolidated financial statements have been restated following the adoption of IFRS 10 and IFRS 11. Further details can be found in Section C. Restatement of comparative figures.
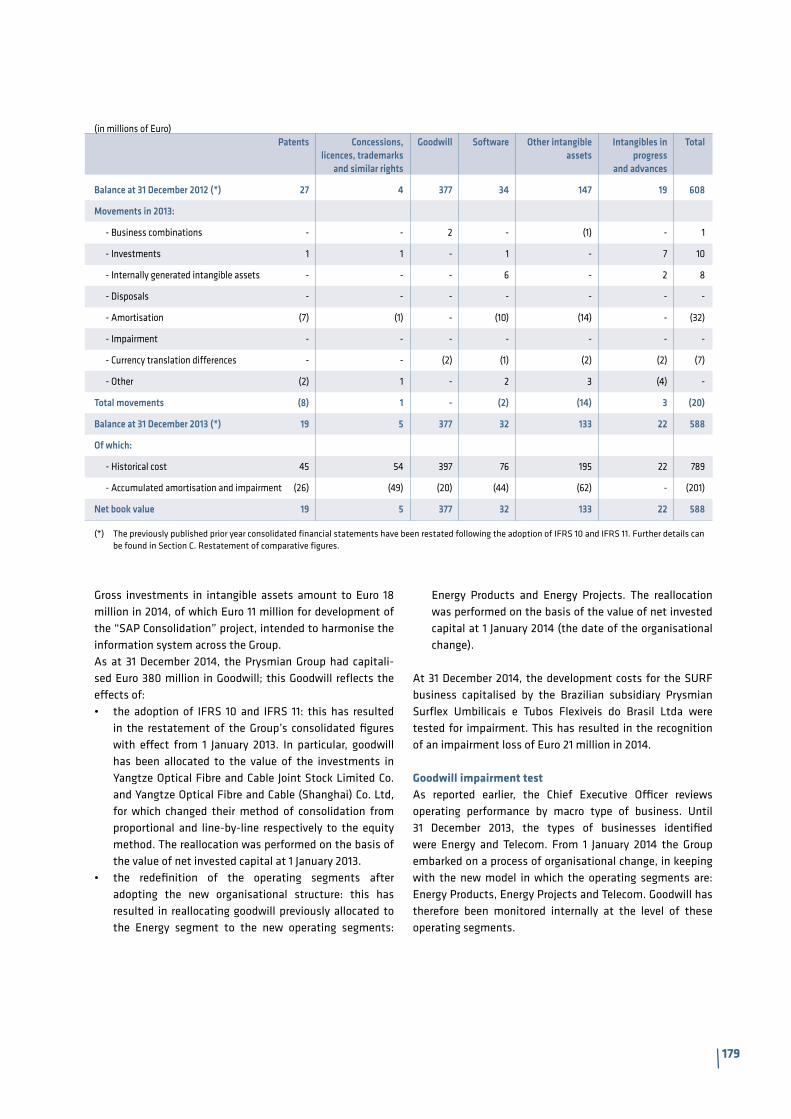
179
(*) The previously published prior year consolidated financial statements have been restated following the adoption of IFRS 10 and IFRS 11. Further details can be found in Section C. Restatement of comparative figures.
Gross investments in intangible assets amount to Euro 18 million in 2014, of which Euro 11 million for development of the “SAP Consolidation” project, intended to harmonise the information system across the Group.As at 31 December 2014, the Prysmian Group had capitali-sed Euro 380 million in Goodwill; this Goodwill reflects the effects of:• the adoption of IFRS 10 and IFRS 11: this has resulted
in the restatement of the Group’s consolidated figures with effect from 1 January 2013. In particular, goodwill has been allocated to the value of the investments in Yangtze Optical Fibre and Cable Joint Stock Limited Co. and Yangtze Optical Fibre and Cable (Shanghai) Co. Ltd, for which changed their method of consolidation from proportional and line-by-line respectively to the equity method. The reallocation was performed on the basis of the value of net invested capital at 1 January 2013.
• the redefinition of the operating segments after adopting the new organisational structure: this has resulted in reallocating goodwill previously allocated to the Energy segment to the new operating segments:
Energy Products and Energy Projects. The reallocation was performed on the basis of the value of net invested capital at 1 January 2014 (the date of the organisational change).
At 31 December 2014, the development costs for the SURF business capitalised by the Brazilian subsidiary Prysmian Surflex Umbilicais e Tubos Flexiveis do Brasil Ltda were tested for impairment. This has resulted in the recognition of an impairment loss of Euro 21 million in 2014.
Goodwill impairment test As reported earlier, the Chief Executive Officer reviews operating performance by macro type of business. Until 31 December 2013, the types of businesses identified were Energy and Telecom. From 1 January 2014 the Group embarked on a process of organisational change, in keeping with the new model in which the operating segments are: Energy Products, Energy Projects and Telecom. Goodwill has therefore been monitored internally at the level of these operating segments.
Patents Concessions, Goodwill Software Other intangible Intangibles in Total licences, trademarks assets progress and similar rights and advances
Balance at 31 December 2012 (*) 27 4 377 34 147 19 608
Movements in 2013:
- Business combinations - - 2 - (1) - 1
- Investments 1 1 - 1 - 7 10
- Internally generated intangible assets - - - 6 - 2 8
- Disposals - - - - - - -
- Amortisation (7) (1) - (10) (14) - (32)
- Impairment - - - - - - -
- Currency translation differences - - (2) (1) (2) (2) (7)
- Other (2) 1 - 2 3 (4) -
Total movements (8) 1 - (2) (14) 3 (20)
Balance at 31 December 2013 (*) 19 5 377 32 133 22 588
Of which:
- Historical cost 45 54 397 76 195 22 789
- Accumulated amortisation and impairment (26) (49) (20) (44) (62) - (201)
Net book value 19 5 377 32 133 22 588
(in millions of Euro)
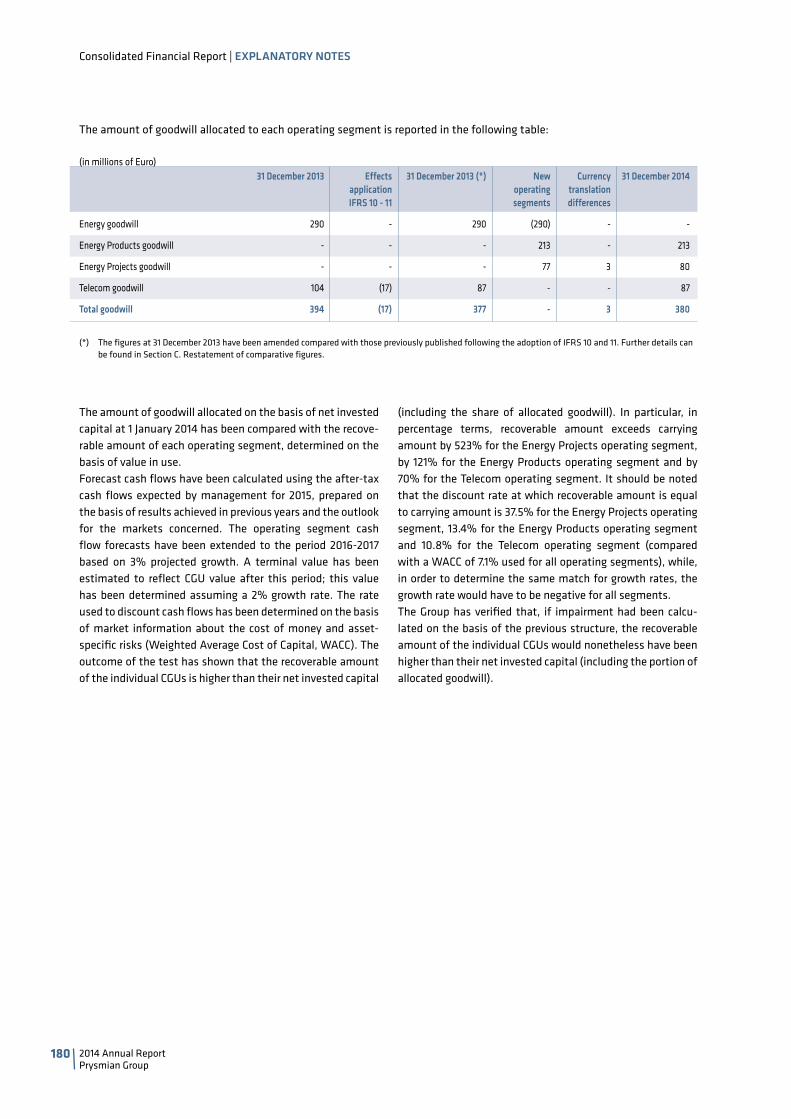
Consolidated Financial Report | EXPLANATORY NOTES
2014 Annual Report Prysmian Group
180
The amount of goodwill allocated on the basis of net invested capital at 1 January 2014 has been compared with the recove-rable amount of each operating segment, determined on the basis of value in use.Forecast cash flows have been calculated using the after-tax cash flows expected by management for 2015, prepared on the basis of results achieved in previous years and the outlook for the markets concerned. The operating segment cash flow forecasts have been extended to the period 2016-2017 based on 3% projected growth. A terminal value has been estimated to reflect CGU value after this period; this value has been determined assuming a 2% growth rate. The rate used to discount cash flows has been determined on the basis of market information about the cost of money and asset-specific risks (Weighted Average Cost of Capital, WACC). The outcome of the test has shown that the recoverable amount of the individual CGUs is higher than their net invested capital
(including the share of allocated goodwill). In particular, in percentage terms, recoverable amount exceeds carrying amount by 523% for the Energy Projects operating segment, by 121% for the Energy Products operating segment and by 70% for the Telecom operating segment. It should be noted that the discount rate at which recoverable amount is equal to carrying amount is 37.5% for the Energy Projects operating segment, 13.4% for the Energy Products operating segment and 10.8% for the Telecom operating segment (compared with a WACC of 7.1% used for all operating segments), while, in order to determine the same match for growth rates, the growth rate would have to be negative for all segments.The Group has verified that, if impairment had been calcu-lated on the basis of the previous structure, the recoverable amount of the individual CGUs would nonetheless have been higher than their net invested capital (including the portion of allocated goodwill).
31 December 2013 Effects 31 December 2013 (*) New Currency 31 December 2014 application operating translation IFRS 10 - 11 segments differences
Energy goodwill 290 - 290 (290) - -
Energy Products goodwill - - - 213 - 213
Energy Projects goodwill - - - 77 3 80
Telecom goodwill 104 (17) 87 - - 87
Total goodwill 394 (17) 377 - 3 380
(*) The figures at 31 December 2013 have been amended compared with those previously published following the adoption of IFRS 10 and 11. Further details can be found in Section C. Restatement of comparative figures.
(in millions of Euro)
The amount of goodwill allocated to each operating segment is reported in the following table:

181
3. EQUITY-ACCOUNTED INVESTMENTS
These are detailed as follows:
31 December 2014 31 December 2013 (*)
Investments in associates 198 78
Investments in joint ventures 27 127
Total equity-accounted investments 225 205
(*) The previously published prior year consolidated financial statements have been restated following the adoption of IFRS 10 and IFRS 11. Further details can be found in Section C. Restatement of comparative figures.
Movements over the period are as follows:
31 December 2014 Investments in Investments Total associates in joint ventures
Opening balance 78 127 205
Movements:
- Reclassification from investments in JV to associates 119 (119) -
- Effect of YOFC dilution 8 - 8
- Currency translation differences 2 2 4
- Investments - - -
- Share of net profit/(loss) 26 17 43
- Dividends (36) - (36)
- Other movements 1 - 1
Total movements 120 (100) 20
Closing balance 198 27 225
(*) The previously published prior year consolidated financial statements have been restated following the adoption of IFRS 10 and IFRS 11. Further details can be found in Section C. Restatement of comparative figures.
31 December 2013 (*) Investments in Investments Total associates in joint ventures
Opening balance 74 119 193
Movements:
- Currency translation differences (5) (3) (8)
- Investments - - -
- Share of net profit/(loss) 17 18 35
- Dividends (9) (7) (16)
- Other movements 1 - 1
Total movements 4 8 12
Closing balance 78 127 205
(in millions of Euro)
(in millions of Euro)
(in millions of Euro)

Consolidated Financial Report | EXPLANATORY NOTES
2014 Annual Report Prysmian Group
182
Details of investments in equity-accounted companies are as follows:
31 December 2014 31 December 2013 (*)
Yangtze Optical Fibre and Cable Joint Stock Limited Company 109 -
Oman Cables Industry (SAOG) 67 55
Kabeltrommel Gmbh & Co.K.G. 8 8
Elkat Ltd. 8 10
Rodco Ltd. 3 2
Eksa Sp.Zo.o 3 3
Total investments in associates 198 78
Yangtze Optical Fibre and Cable Joint Stock Limited Company - 104
Yangtze Optical Fibre & Cable (Shanghai) Co. Ltd. 21 17
Power Cables Malaysia Sdn Bhd 5 5
Precision Fiber Optics Ltd. 1 1
Total investments in joint ventures 27 127
Total investments in equity-accounted companies 225 205
(*) The previously published prior year consolidated financial statements have been restated following the adoption of IFRS 10 and IFRS 11. Further details can be found in Section C. Restatement of comparative figures.
Investments in associatesInformation about the nature of the main investments in associates:
Company name Registered office % owned
Yangtze Optical Fibre and Cable Joint Stock Limited Company China 28.12%
Oman Cables Industry (SAOG) Sultanate of Oman 34.78%
Kabeltrommel Gmbh & Co.K.G. Germany 43.18%
Elkat Ltd. Russia 40.00%
Yangtze Optical Fibre and Cable Joint Stock Limited Company, a Chinese company formed in 1988, is a joint venture between three partners: China Telecommunications Corporation, Wuhan Yangtze Communications Industry Group Company Ltd. and the Prysmian Group. The company is one of the industry’s most important manufacturers of optical fibre and cables. The company’s products and solutions are sold in more than 50 countries, including the United States, Japan, the Middle East and Africa.The prospectus for the public offering and the listing of the company’s shares was published on 26 November 2014.
Following closure of the offering period, the company’s shares commenced trading on the Main Board of the Hong Kong Stock Exchange on 10 December 2014. The offering involved an increase in the company’s share capital, with a consequent dilution of the Prysmian Group’s holding to 28.12%. This dilution has resulted in the recognition of a non-recurring gain of Euro 8 million. In accordance with the IFRS 10 definition of control, the value of the investment has been reclassified from investments in joint ventures to investments in associates.At 31 December 2014, the fair value of the investment in
(in millions of Euro)
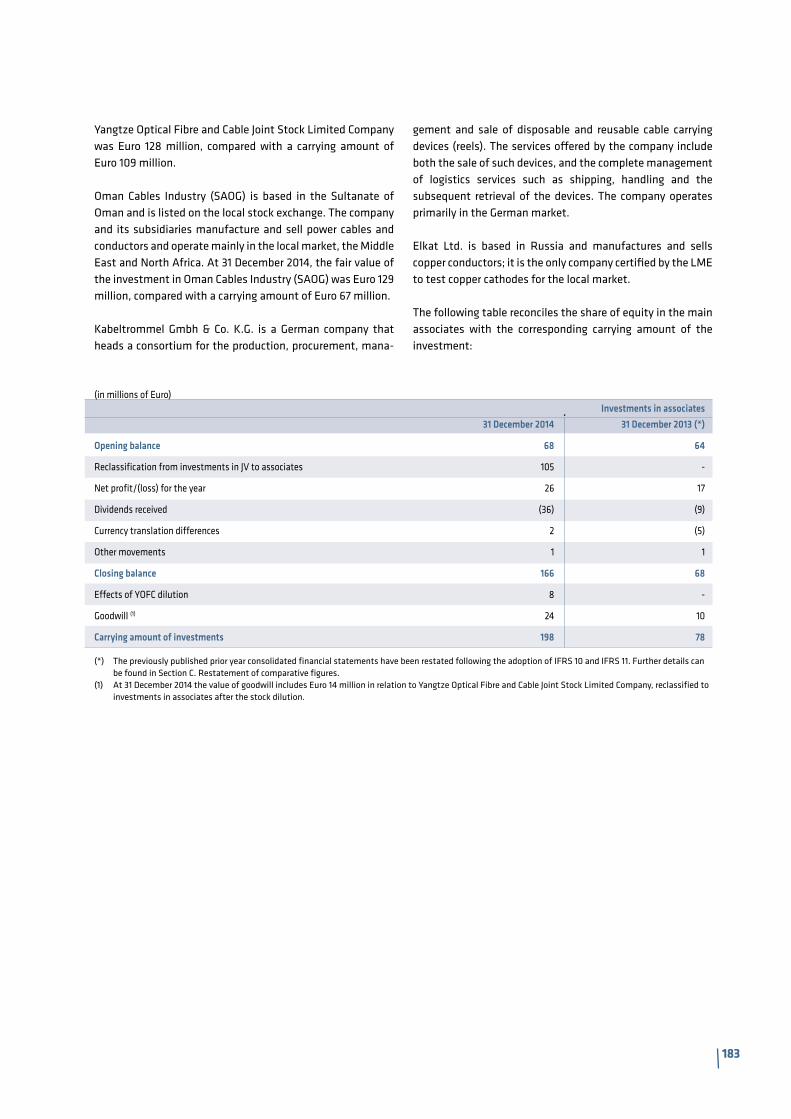
183
Yangtze Optical Fibre and Cable Joint Stock Limited Company was Euro 128 million, compared with a carrying amount of Euro 109 million.
Oman Cables Industry (SAOG) is based in the Sultanate of Oman and is listed on the local stock exchange. The company and its subsidiaries manufacture and sell power cables and conductors and operate mainly in the local market, the Middle East and North Africa. At 31 December 2014, the fair value of the investment in Oman Cables Industry (SAOG) was Euro 129 million, compared with a carrying amount of Euro 67 million.
Kabeltrommel Gmbh & Co. K.G. is a German company that heads a consortium for the production, procurement, mana-
gement and sale of disposable and reusable cable carrying devices (reels). The services offered by the company include both the sale of such devices, and the complete management of logistics services such as shipping, handling and the subsequent retrieval of the devices. The company operates primarily in the German market.
Elkat Ltd. is based in Russia and manufactures and sells copper conductors; it is the only company certified by the LME to test copper cathodes for the local market.
The following table reconciles the share of equity in the main associates with the corresponding carrying amount of the investment:
(*) The previously published prior year consolidated financial statements have been restated following the adoption of IFRS 10 and IFRS 11. Further details can be found in Section C. Restatement of comparative figures.
(1) At 31 December 2014 the value of goodwill includes Euro 14 million in relation to Yangtze Optical Fibre and Cable Joint Stock Limited Company, reclassified to investments in associates after the stock dilution.
Investments in associates 31 December 2014 31 December 2013 (*)
Opening balance 68 64
Reclassification from investments in JV to associates 105 -
Net profit/(loss) for the year 26 17
Dividends received (36) (9)
Currency translation differences 2 (5)
Other movements 1 1
Closing balance 166 68
Effects of YOFC dilution 8 -
Goodwill (1) 24 10
Carrying amount of investments 198 78
(in millions of Euro)

Consolidated Financial Report | EXPLANATORY NOTES
2014 Annual Report Prysmian Group
184
Oman Cables Kabeltrommel Elkat Ltd. Yangtze Optical Fibre Industry (SAOG) Gmbh & Co.K.G. and Cable Joint Stock Limited Company 31 December 31 December 31 December 31 December 31 December 31 December 30 September 31 December 2014 2013 2014 2013 2014 2013 2014 2013
Non-current assets 86 77 n.a 12 5 7 n.a 417
Current assets 257 238 n.a 17 23 33 n.a 196
Total Assets 343 315 n.a 29 28 40 785 613
Equity 179 136 14 14 25 31 254 184
Non-current liabilities 12 14 n.a 8 - - n.a 110
Current liabilities 152 165 n.a 7 3 9 n.a 319
Total Liabilities 164 179 n.a 15 3 9 531 429
2014 2013 2014 2013 2014 2013 2014 2013
Sales of goods and services 593 599 n.a 34 168 218 507 570
Net profit/(loss) for the year 39 36 n.a 6 6 6 43 51
Comprehensive income/(loss) for the year 39 36 n.a 6 6 6 n.a n.a
Dividends received 5 4 n.a 3 - 1 n.a n.a
The following table reports key financial figures for the major investments in associates:
As a result of its listing on the Hong Kong Stock Exchange, Yangtze Optical Fibre and Cable Joint Stock Limited Company has published its financial results for the first nine months of 2014.
Investments in joint venturesInformation about the nature of the main investments in joint ventures:
Company name Registered office % owned
Yangtze Optical Fibre and Cable (Shanghai) Co. Ltd China 46.090%
Power Cables Malaysia Sdn Bhd Malaysia 40.00%
Precision Fiber Optics Ltd. Japan 50.00%
Yangtze Optical Fibre & Cable (Shanghai) Co. Ltd, formed in 2002, is based in Shanghai (China) and is a joint venture between Yangtze Optical Fibre and Cable Joint Stock Limited Company and the Prysmian Group. The company specialises in the manufacture and sale of optical fibre and cables, offering a wide range of optical fibre cables and accessories, services and FTTx solutions.Power Cables Malaysia Sdn Bhd is a joint venture based in
Malaysia between the Prysmian Group and the Armed Forces Fund Board (LTAT), a Malaysian government retirement benefits fund. The company, a leader in the local market, manufactures and sells power cables and conductors and is mainly specialised in High Voltage products.
Lastly, Precision Fiber Optics Ltd., based in Japan, manufactu-res and sells optical fibre cables in the local market.
(in millions of Euro)
185
Yangtze Optical Fibre & Cable (Shanghai) Co. Ltd Power Cables Malaysia Sdn Bhd 31 December 2014 31 December 2013 31 December 2014 31 December 2013
Non-current assets 10 11 12 13
Current assets 43 41 7 9
of which Cash and cash equivalents 4 5 - 1
Equity 33 28 11 12
Non-current liabilities 2 2 1 2
of which Financial liabilities - - - -
Current liabilities 18 22 7 8
of which Financial liabilities - 6 - 1
2014 2013 2014 2013
Sales of goods and services 67 49 18 30
Amortisation, depreciation and impairment (1) (1) (1) (1)
Profit/(loss) before taxes 4 2 (2) (2)
Taxes (1) - 1 1
Net profit/(loss) for the year 3 2 (1) (1)
Other comprehensive income - - - -
Comprehensive income/(loss) for the year 3 2 (1) (1)
Dividends received - - - -
The following table reports key financial figures for the major investments in joint ventures:
(in millions of Euro)
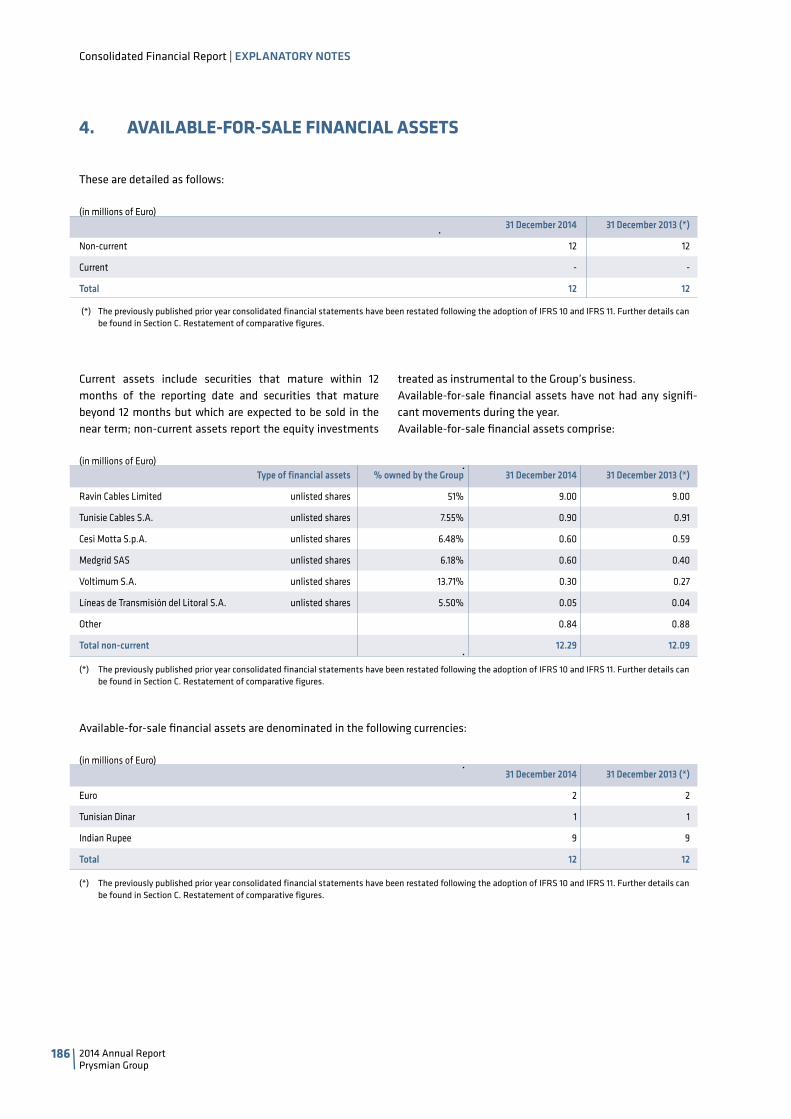
Consolidated Financial Report | EXPLANATORY NOTES
2014 Annual Report Prysmian Group
186
4. AVAILABLE-FOR-SALE FINANCIAL ASSETS
These are detailed as follows:
31 December 2014 31 December 2013 (*)
Non-current 12 12
Current - -
Total 12 12
(*) The previously published prior year consolidated financial statements have been restated following the adoption of IFRS 10 and IFRS 11. Further details can be found in Section C. Restatement of comparative figures.
Current assets include securities that mature within 12 months of the reporting date and securities that mature beyond 12 months but which are expected to be sold in the near term; non-current assets report the equity investments
treated as instrumental to the Group’s business. Available-for-sale financial assets have not had any signifi-cant movements during the year. Available-for-sale financial assets comprise:
Available-for-sale financial assets are denominated in the following currencies:
(*) The previously published prior year consolidated financial statements have been restated following the adoption of IFRS 10 and IFRS 11. Further details can be found in Section C. Restatement of comparative figures.
31 December 2014 31 December 2013 (*)
Euro 2 2
Tunisian Dinar 1 1
Indian Rupee 9 9
Total 12 12
(*) The previously published prior year consolidated financial statements have been restated following the adoption of IFRS 10 and IFRS 11. Further details can be found in Section C. Restatement of comparative figures.
Type of financial assets % owned by the Group 31 December 2014 31 December 2013 (*)
Ravin Cables Limited unlisted shares 51% 9.00 9.00
Tunisie Cables S.A. unlisted shares 7.55% 0.90 0.91
Cesi Motta S.p.A. unlisted shares 6.48% 0.60 0.59
Medgrid SAS unlisted shares 6.18% 0.60 0.40
Voltimum S.A. unlisted shares 13.71% 0.30 0.27
Líneas de Transmisión del Litoral S.A. unlisted shares 5.50% 0.05 0.04
Other 0.84 0.88
Total non-current 12.29 12.09
(in millions of Euro)
(in millions of Euro)
(in millions of Euro)
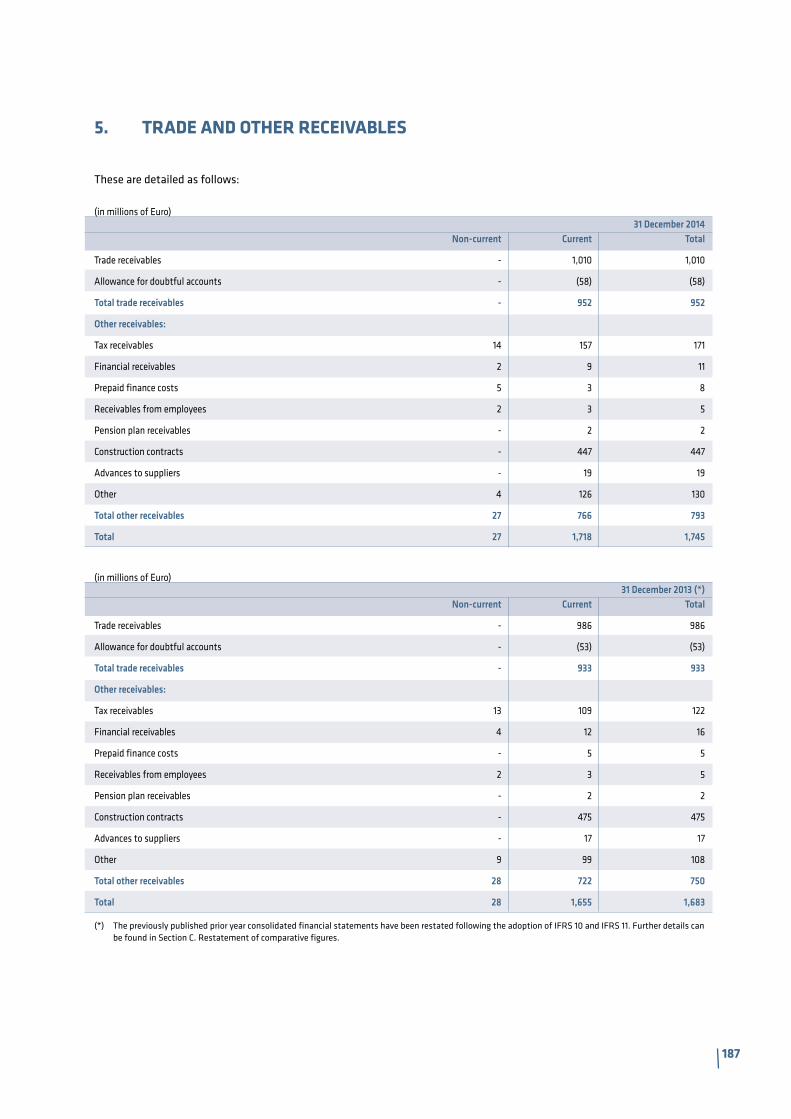
187
5. TRADE AND OTHER RECEIVABLES
These are detailed as follows:
31 December 2014 Non-current Current Total
Trade receivables - 1,010 1,010
Allowance for doubtful accounts - (58) (58)
Total trade receivables - 952 952
Other receivables:
Tax receivables 14 157 171
Financial receivables 2 9 11
Prepaid finance costs 5 3 8
Receivables from employees 2 3 5
Pension plan receivables - 2 2
Construction contracts - 447 447
Advances to suppliers - 19 19
Other 4 126 130
Total other receivables 27 766 793
Total 27 1,718 1,745
(*) The previously published prior year consolidated financial statements have been restated following the adoption of IFRS 10 and IFRS 11. Further details can be found in Section C. Restatement of comparative figures.
31 December 2013 (*) Non-current Current Total
Trade receivables - 986 986
Allowance for doubtful accounts - (53) (53)
Total trade receivables - 933 933
Other receivables:
Tax receivables 13 109 122
Financial receivables 4 12 16
Prepaid finance costs - 5 5
Receivables from employees 2 3 5
Pension plan receivables - 2 2
Construction contracts - 475 475
Advances to suppliers - 17 17
Other 9 99 108
Total other receivables 28 722 750
Total 28 1,655 1,683
(in millions of Euro)
(in millions of Euro)

Consolidated Financial Report | EXPLANATORY NOTES
2014 Annual Report Prysmian Group
188
Trade receivablesThe gross amount of past due receivables that are totally or partially impaired is Euro 211 million at 31 December 2014
(Euro 194 million at 31 December 2013).The ageing of past due impaired receivables is as follows:
31 December 2014 31 December 2013 (*)
1 to 30 days past due 77 73
31 to 90 days past due 45 46
91 to 180 days past due 24 18
181 to 365 days past due 20 19
More than 365 days past due 45 38
Total 211 194
(*) The previously published prior year consolidated financial statements have been restated following the adoption of IFRS 10 and IFRS 11. Further details can be found in Section C. Restatement of comparative figures.
The value of trade receivables past due but not impaired is Euro 30 million at 31 December 2014 (Euro 66 million at 31 December 2013). These receivables mainly relate to customers in the Energy Products operating segment, which have been insured against the risk of any bad debts arising
from effective or legal customer insolvency.
The ageing of receivables that are past due but not impaired is as follows:
31 December 2014 31 December 2013 (*)
1 to 30 days past due 16 44
31 to 90 days past due 3 9
91 to 180 days past due 1 8
181 to 365 days past due 8 4
More than 365 days past due 2 1
Total 30 66
(*) The previously published prior year consolidated financial statements have been restated following the adoption of IFRS 10 and IFRS 11. Further details can be found in Section C. Restatement of comparative figures.
The value of trade receivables not past due is Euro 769 million at 31 December 2014 (Euro 726 million at 31 December 2013). There are no particular problems with the quality of these
receivables and there are no material amounts that would otherwise be past due if their original due dates had not been renegotiated.
(in millions of Euro)
(in millions of Euro)

189
31 December 2014 31 December 2013 (*)
Euro 744 806
US Dollar 311 241
Chinese Renminbi (Yuan) 155 135
Brazilian Real 114 103
British Pound 88 109
Qatari Riyal 35 4
Turkish Lira 76 51
Australian Dollar 37 22
Norwegian Krone 19 18
Singapore Dollar 11 7
Canadian Dollar 17 11
Argentine Peso 11 16
Swedish Krona 14 19
Romanian Leu 10 11
Other currencies 103 130
Total 1,745 1,683
(*) The previously published prior year consolidated financial statements have been restated following the adoption of IFRS 10 and IFRS 11. Further details can be found in Section C. Restatement of comparative figures.
The allowance for doubtful accounts amounts to Euro 58 million at 31 December 2014 (Euro 53 million at the end of 2013). Movements in this allowance are shown in the following table:
31 December 2014 31 December 2013 (*)
Opening balance 53 58
Movements:
- Business combinations - -
- Increases in allowance 10 10
- Releases (3) (2)
- Bad debt write-offs (2) (11)
- Currency translation differences and other movements - (2)
Total movements 5 (5)
Closing balance 58 53
(*) The previously published prior year consolidated financial statements have been restated following the adoption of IFRS 10 and IFRS 11. Further details can be found in Section C. Restatement of comparative figures.
Increases in and releases from the allowance for doubtful accounts are reported in “Other expenses” in the income statement.
The following table breaks down trade and other receivables according to the currency in which they are expressed:
(in millions of Euro)
(in millions of Euro)
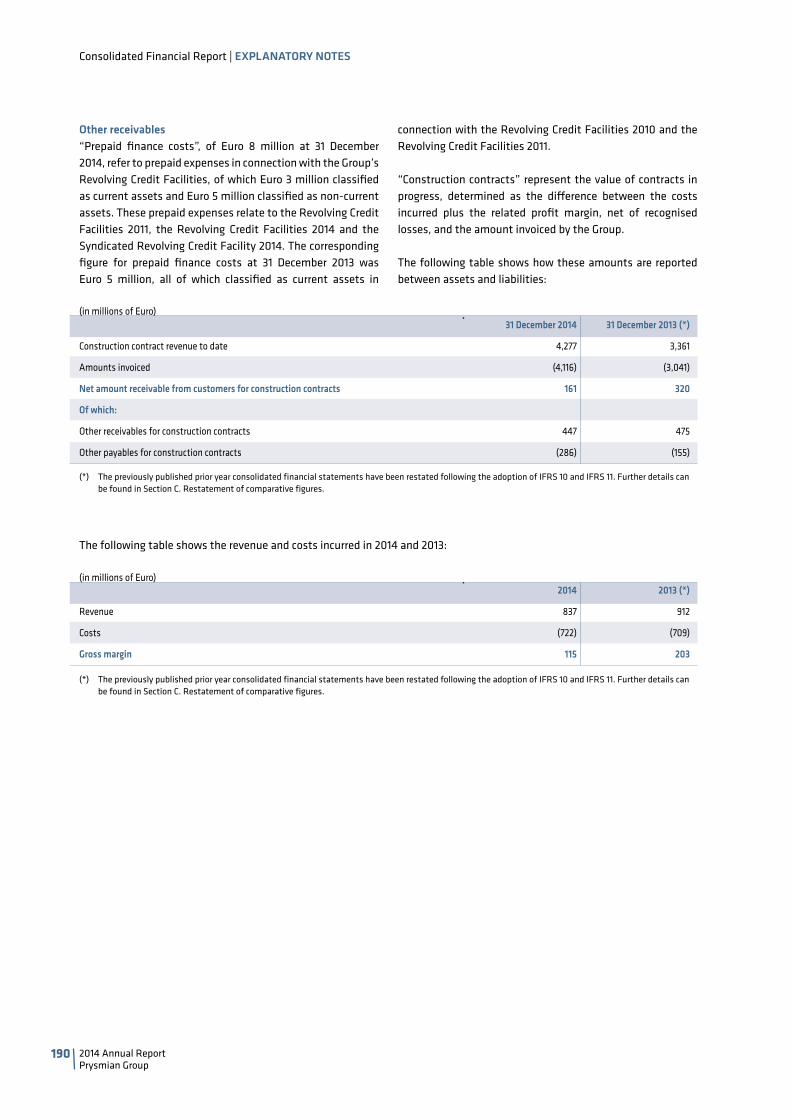
Consolidated Financial Report | EXPLANATORY NOTES
2014 Annual Report Prysmian Group
190
Other receivables“Prepaid finance costs”, of Euro 8 million at 31 December 2014, refer to prepaid expenses in connection with the Group’s Revolving Credit Facilities, of which Euro 3 million classified as current assets and Euro 5 million classified as non-current assets. These prepaid expenses relate to the Revolving Credit Facilities 2011, the Revolving Credit Facilities 2014 and the Syndicated Revolving Credit Facility 2014. The corresponding figure for prepaid finance costs at 31 December 2013 was Euro 5 million, all of which classified as current assets in
connection with the Revolving Credit Facilities 2010 and the Revolving Credit Facilities 2011.
“Construction contracts” represent the value of contracts in progress, determined as the difference between the costs incurred plus the related profit margin, net of recognised losses, and the amount invoiced by the Group.
The following table shows how these amounts are reported between assets and liabilities:
31 December 2014 31 December 2013 (*)
Construction contract revenue to date 4,277 3,361
Amounts invoiced (4,116) (3,041)
Net amount receivable from customers for construction contracts 161 320
Of which:
Other receivables for construction contracts 447 475
Other payables for construction contracts (286) (155)
(*) The previously published prior year consolidated financial statements have been restated following the adoption of IFRS 10 and IFRS 11. Further details can be found in Section C. Restatement of comparative figures.
The following table shows the revenue and costs incurred in 2014 and 2013:
2014 2013 (*)
Revenue 837 912
Costs (722) (709)
Gross margin 115 203
(*) The previously published prior year consolidated financial statements have been restated following the adoption of IFRS 10 and IFRS 11. Further details can be found in Section C. Restatement of comparative figures.
(in millions of Euro)
(in millions of Euro)

191
6. INVENTORIES
These are detailed as follows:
31 December 2014 31 December 2013 (*)
Raw materials 292 249
of which allowance for obsolete and slow-moving raw materials (47) (29)
Work in progress and semi-finished goods 241 227
of which allowance for obsolete and slow-moving work in progress and semi-finished goods (5) (5)
Finished goods (**) 448 405
of which allowance for obsolete and slow-moving finished goods (50) (48)
Total 981 881
(*) The previously published prior year consolidated financial statements have been restated following the adoption of IFRS 10 and IFRS 11. Further details can be found in Section C. Restatement of comparative figures.
(**) Finished goods also include goods for resale.
7. FINANCIAL ASSETS HELD FOR TRADING
These are detailed as follows:
31 December 2014 31 December 2013 (*)
Listed securities (Brazilian Real area) 67 86
Unlisted securities 9 7
Total 76 93
(*) The previously published prior year consolidated financial statements have been restated following the adoption of IFRS 10 and IFRS 11. Further details can be found in Section C. Restatement of comparative figures.
Financial assets held for trading basically refer to units in funds that mainly invest in short and medium-term go-vernment securities.These assets are mostly held by subsidiaries in Brazil and
Argentina which invest temporarily available liquidity in such funds.
Movements in this balance are detailed as follows:
31 December 2014 31 December 2013 (*)
Opening balance 93 78
Movements:
- Currency translation differences - (18)
- Purchase of securities 8 40
- Disposal of securities (25) (7)
Total movements (17) 15
Closing balance 76 93
(*) The previously published prior year consolidated financial statements have been restated following the adoption of IFRS 10 and IFRS 11. Further details can be found in Section C. Restatement of comparative figures.
(in millions of Euro)
(in millions of Euro)
(in millions of Euro)

Consolidated Financial Report | EXPLANATORY NOTES
2014 Annual Report Prysmian Group
192
8. DERIVATIVES
These are detailed as follows:
31 December 2014 Asset Liability
Non-current
Interest rate swaps (cash flow hedges) - 3
Forward currency contracts on commercial transactions (cash flow hedges) - 2
Total hedging derivatives - 5
Metal derivatives 1 -
Total other derivatives 1 -
Total non-current 1 5
Current
Forward currency contracts on financial transactions (cash flow hedges) - 1
Forward currency contracts on commercial transactions (cash flow hedges) 11 18
Total hedging derivatives 11 19
Forward currency contracts on commercial transactions 8 10
Forward currency contracts on financial transactions 5 7
Metal derivatives 5 11
Total other derivatives 18 28
Total current 29 47
Total 30 52
(in millions of Euro)

193
(*) The previously published prior year consolidated financial statements have been restated following the adoption of IFRS 10 and IFRS 11. Further details can be found in Section C. Restatement of comparative figures.
31 December 2013 (*) Asset Liability
Non-current
Interest rate swaps (cash flow hedges) - 4
Forward currency contracts on commercial transactions (cash flow hedges) 1 1
Total hedging derivatives 1 5
Metal derivatives 1 2
Total other derivatives 1 2
Total non-current 2 7
Current
Interest rate swaps (cash flow hedges) - 5
Forward currency contracts on commercial transactions (cash flow hedges) 4 3
Total hedging derivatives 4 8
Forward currency contracts on commercial transactions 9 3
Forward currency contracts on financial transactions 5 5
Interest rate swaps - 9
Metal derivatives 5 17
Total other derivatives 19 34
Total current 23 42
Total 25 49
The Prysmian Group entered into no new interest rate swaps during 2014.The early repayment of the remaining balance on the Term Loan Facility 2010, originally due to mature on 31 December 2014, has led to the discontinued effectiveness of the related cash flow hedges outstanding as at the date of repayment. The contracts for which hedge accounting was discontinued in 2014 expired on 31 December 2014 and had a notional value of Euro 180 million. In addition, 31 December 2014 was the expiry date of the interest rate swaps, with a notional value of Euro 300 million, for which hedge accounting was discontinued in 2013 following early repayment of the Term Loan Facility 2010.
Interest rate swaps have a notional value of Euro 200 million at 31 December 2014 (down from Euro 480 million at 31 December 2013), all of which refer to derivatives designated
as cash flow hedges. Such financial instruments convert the variable component of interest rates on loans received into a fixed rate of between 1.1% and 1.7%.
Forward currency contracts have a notional value of Euro 1,679 million at 31 December 2014 (Euro 2,332 million at 31 December 2013); total notional value at 31 December 2014 includes Euro 512 million in derivatives designated as cash flow hedges (Euro 691 million at 31 December 2013).
At 31 December 2014, like at 31 December 2013, almost all the derivative contracts had been entered into with major financial institutions.
Metal derivatives have a notional value of Euro 523 million at 31 December 2014 (Euro 482 million at 31 December 2013).
(in millions of Euro)

Consolidated Financial Report | EXPLANATORY NOTES
2014 Annual Report Prysmian Group
194
The following tables show the impact of offsetting assets and liabilities for derivative instruments, done on the basis of master netting arrangements (ISDA and similar agreements).
They also show the effect of potential offsetting in the event of currently unforeseen default events:
31 December 2014 Gross derivatives Amounts Derivatives Amounts not Net derivatives offset recognised in offset (1)
statement of financial position
Assets
Forward currency contracts 24 - 24 (14) 10
Interest rate swaps - - - - -
Metal derivatives 6 - 6 (4) 2
Total assets 30 - 30 (18) 12
Liabilities
Forward currency contracts 38 - 38 (14) 24
Interest rate swaps 3 - 3 - 3
Metal derivatives 11 - 11 (4) 7
Total liabilities 52 - 52 (18) 34
31 December 2013 (*) Gross derivatives Amounts Derivatives Amounts not Net derivatives offset recognised in offset (1)
statement of financial position
Assets
Forward currency contracts 19 - 19 (7) 12
Interest rate swaps - - - - -
Metal derivatives 6 - 6 (3) 3
Total assets 25 - 25 (10) 15
Liabilities
Forward currency contracts 12 - 12 (7) 5
Interest rate swaps 18 - 18 - 18
Metal derivatives 19 - 19 (3) 16
Total liabilities 49 - 49 (10) 39
(*) The previously published prior year consolidated financial statements have been restated following the adoption of IFRS 10 and IFRS 11. Further details can be found in Section C. Restatement of comparative figures.
(1) Derivatives potentially offsettable in the event of default events under master agreements.
(in millions of Euro)
(in millions of Euro)

195
The following table shows movements in both reporting periods in the cash flow hedge reserve for designated hedging deriva-tives:
2014 2013 (*) Gross reserve Tax effect Gross reserve Tax effect
Opening balance (10) 2 (34) 11
Changes in fair value (11) 3 3 (1)
Reserve for other finance costs/(income) 4 (1) 11 (4)
Reserve for exchange losses/(gains) (5) 1 (1) -
Reclassification to other reserves - - - -
Release to finance costs/(income) - - 1 -
Discontinued hedge accounting for interest rate swaps 4 (1) 15 (5)
Release to construction contract costs/(revenues) 4 (1) (5) 1
Closing balance (14) 3 (10) 2
(*) The previously published prior year consolidated financial statements have been restated following the adoption of IFRS 10 and IFRS 11. Further details can be found in Section C. Restatement of comparative figures.
The early repayment of the remaining balance on the Term Loan Facility 2010 has led to discontinuance of the related interest rate cash flow hedges, resulting in the recognition of
Euro 3 million in net losses for hedge ineffectiveness, net of Euro 1 million in tax effects.
9. CASH AND CASH EQUIVALENTS
These are detailed as follows:
31 December 2014 31 December 2013 (*)
Cash and cheques 1 -
Bank and postal deposits 493 510
Total 494 510
(*) The previously published prior year consolidated financial statements have been restated following the adoption of IFRS 10 and IFRS 11. Further details can be found in Section C. Restatement of comparative figures.
Cash and cash equivalents, deposited with major financial in-stitutions, are managed centrally through the Group’s treasury company or in its various operating units.
Cash and cash equivalents managed by the Group’s treasury
company amount to Euro 226 million at 31 December 2014, compared with Euro 208 million at 31 December 2013.
Further details about the change in cash and cash equivalents can be found in Note 37. Statement of cash flows.
(in millions of Euro)
(in millions of Euro)
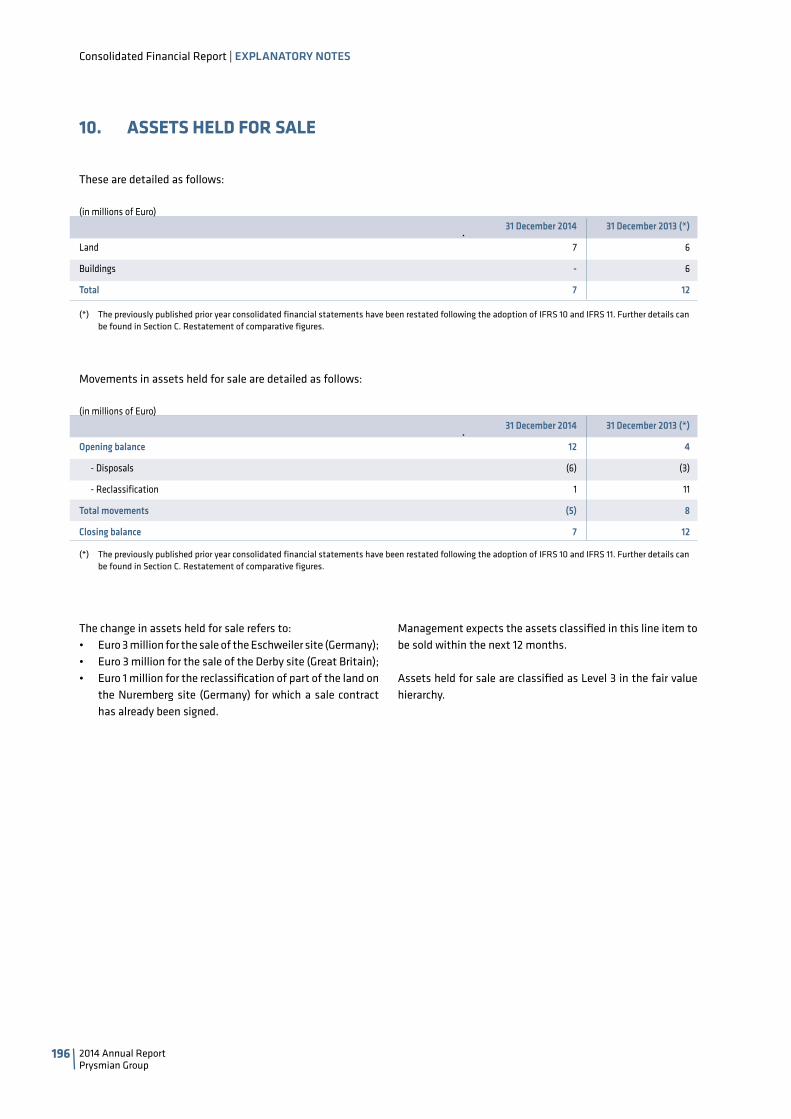
Consolidated Financial Report | EXPLANATORY NOTES
2014 Annual Report Prysmian Group
196
10. ASSETS HELD FOR SALE
These are detailed as follows:
31 December 2014 31 December 2013 (*)
Land 7 6
Buildings - 6
Total 7 12
(*) The previously published prior year consolidated financial statements have been restated following the adoption of IFRS 10 and IFRS 11. Further details can be found in Section C. Restatement of comparative figures.
Movements in assets held for sale are detailed as follows:
31 December 2014 31 December 2013 (*)
Opening balance 12 4
- Disposals (6) (3)
- Reclassification 1 11
Total movements (5) 8
Closing balance 7 12
(*) The previously published prior year consolidated financial statements have been restated following the adoption of IFRS 10 and IFRS 11. Further details can be found in Section C. Restatement of comparative figures.
The change in assets held for sale refers to:• Euro 3 million for the sale of the Eschweiler site (Germany);• Euro 3 million for the sale of the Derby site (Great Britain);• Euro 1 million for the reclassification of part of the land on
the Nuremberg site (Germany) for which a sale contract has already been signed.
Management expects the assets classified in this line item to be sold within the next 12 months.
Assets held for sale are classified as Level 3 in the fair value hierarchy.
(in millions of Euro)
(in millions of Euro)

197
11. SHARE CAPITAL AND RESERVES
Consolidated equity is the same as at 31 December 2013, mainly reflecting the effect of:
• positive currency translation differences of Euro 32 million;• the release of a positive Euro 3 million, net of tax, from the
cash flow hedge reserve as a result of discontinuing cash flow hedge accounting, following early repayment of the Term Loan Facility 2010;
• the negative post-tax change of Euro 6 million in the fair value of derivatives designated as cash flow hedges;
• the positive change of Euro 3 million in the share-based compensation reserve linked to the stock option plan;
• the negative change of Euro 31 million in the reserve for
actuarial gains on employee benefits;• the negative change of Euro 6 million in the scope of
consolidation due to the acquisition of the remaining 34% of AS Draka Keila Cables;
• the purchase of treasury shares for Euro 20 million;• the net profit for the year of Euro 115 million; • the distribution of Euro 90 million in dividends.
At 31 December 2014, the share capital of Prysmian S.p.A. comprises 216,712,397 shares with a total value of Euro 21,671,239.70.Movements in the ordinary shares and treasury shares of Prysmian S.p.A. are reported in the following table:
Ordinary shares Treasury shares Total
Balance at 31 December 2012 214,508,781 (3,039,169) 211,469,612
Capital increase (1) 82,929 - 82,929
Treasury shares - - -
Balance at 31 December 2013 214,591,710 (3,039,169) 211,552,541
Ordinary shares Treasury shares Total
Balance at 31 December 2013 214,591,710 (3,039,169) 211,552,541
Capital increase (2) 2,120,687 - 2,120,687
Treasury shares (3) - 208,851 208,851
Balance at 31 December 2014 216,712,397 (2,830,318) 213,882,079
(1) Capital increase following exercise of part of the options under the Stock Option Plan 2007-2012.(2) Capital increase following exercise of the options under the Long-term incentive plan 2011-2013.(3) The movement in treasury shares reflects the allotment of 187,299 shares under the Group employee share purchase plan (YES Plan), the allotment of
1,411,552 shares under the Long-term incentive plan 2011-2013, and the purchase of 1,390,000 shares.

Consolidated Financial Report | EXPLANATORY NOTES
2014 Annual Report Prysmian Group
198
Treasury sharesThe treasury shares held at the beginning of the year were acquired under the shareholders’ resolution dated 15 April 2008, which gave the Board of Directors the authority for an 18-month maximum period to buy up to 18,000,000 ordinary shares. The number of treasury shares increased in 2011
following the acquisition of Draka Holding N.V. (now renamed Draka Holding B.V.), which holds 10,669 Prysmian S.p.A. shares.Movements in treasury shares are shown in the following table:
Number Total % of share Average unit Total of shares nominal value capital value (in Euro) carrying value (in Euro) (in Euro)
At 31 December 2012 3,039,169 303,917 1.42% 9,963 30,279,078
- Purchases - - - - -
- Sales - - - - -
At 31 December 2013 3,039,169 303,917 1.42% 9,963 30,279,078
- Purchases 1,390,000 139,000 - 14,356 19,954,278
- Allotments under stock option plans (1) (1,598,851) (159,885) - 10,139 (16,209,987)
At 31 December 2014 2,830,318 283,032 1.31% 12,021 34,023,369
(1) This consists of the allotment of 162,650 shares under the Group employee share purchase plan (YES Plan), the sale of 24,649 shares to employees under the same plan and the allotment of 1,411,552 shares under the Long-term incentive plan 2011-2013.
The Shareholders’ Meeting held on 16 April 2014 authorised a new share buy-back and disposal programme, and revoked the previous programme at the same time.The new programme provides the opportunity to purchase, on one or more occasions, a maximum number of ordinary shares whose total cannot exceed 10% of share capital, equal to 18,420,002 ordinary shares as at the date of the Shareholders’ Meeting, after deducting the treasury shares already held by the Company.Purchases may not exceed the amount of undistributed earnings and available reserves reported in the most recently approved annual financial statements of the Parent Company. The authorisation to buy back treasury shares will last for 18 months commencing from the date of the Sha-
reholders’ Meeting; the authorisation to dispose of treasury shares has no time limit.
During the months of May, June and July 2014, the number of treasury shares decreased by 187,299 for those shares allotted to employees that had signed up to the first phase of the YES employee share purchase plan.During the last few months of 2014, the number of treasury shares decreased by another 1,411,552 after allotting shares under the Long-term incentive plan 2011-2013. More details can be found in Note 21. Personnel costs. In addition, during the months of November and December 2014, the Parent Company also purchased 1,390,000 shares under the buy-back programme authorised by the shareholders.
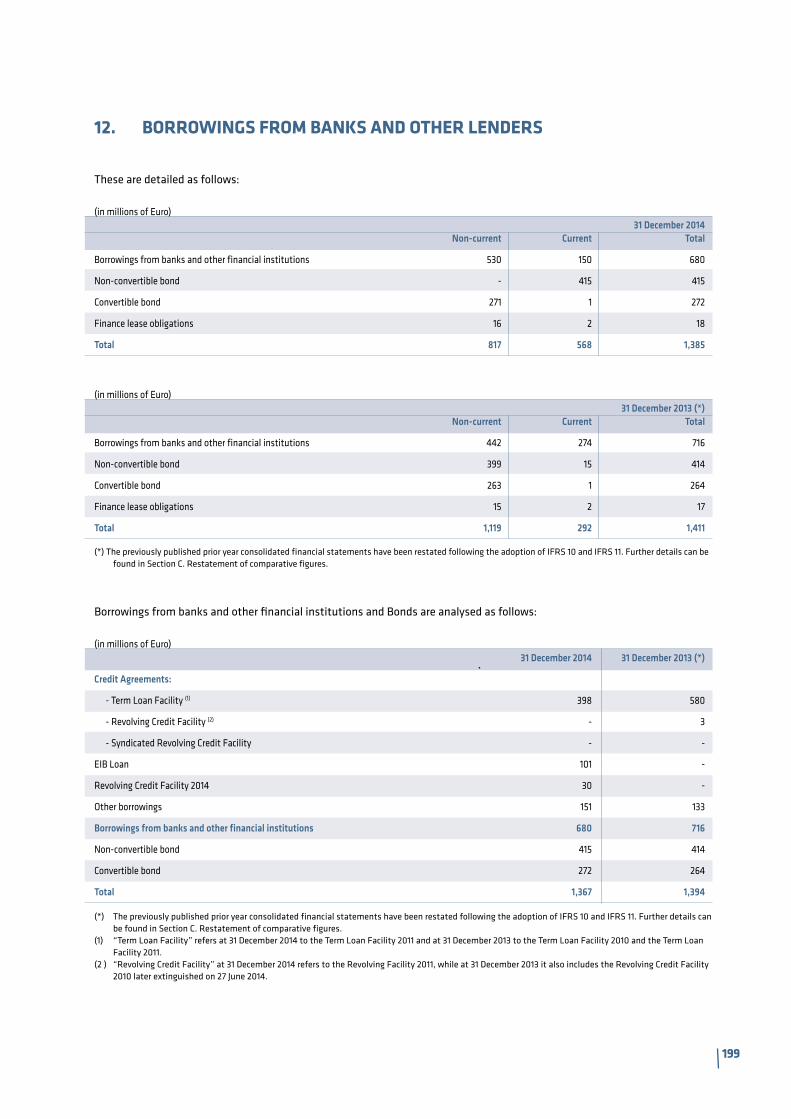
199
12. BORROWINGS FROM BANKS AND OTHER LENDERS
These are detailed as follows:
31 December 2014 Non-current Current Total
Borrowings from banks and other financial institutions 530 150 680
Non-convertible bond - 415 415
Convertible bond 271 1 272
Finance lease obligations 16 2 18
Total 817 568 1,385
31 December 2013 (*) Non-current Current Total
Borrowings from banks and other financial institutions 442 274 716
Non-convertible bond 399 15 414
Convertible bond 263 1 264
Finance lease obligations 15 2 17
Total 1,119 292 1,411
(*) The previously published prior year consolidated financial statements have been restated following the adoption of IFRS 10 and IFRS 11. Further details can be found in Section C. Restatement of comparative figures.
Borrowings from banks and other financial institutions and Bonds are analysed as follows:
31 December 2014 31 December 2013 (*)
Credit Agreements:
- Term Loan Facility (1) 398 580
- Revolving Credit Facility (2) - 3
- Syndicated Revolving Credit Facility - -
EIB Loan 101 -
Revolving Credit Facility 2014 30 -
Other borrowings 151 133
Borrowings from banks and other financial institutions 680 716
Non-convertible bond 415 414
Convertible bond 272 264
Total 1,367 1,394
(*) The previously published prior year consolidated financial statements have been restated following the adoption of IFRS 10 and IFRS 11. Further details can be found in Section C. Restatement of comparative figures.
(1) “Term Loan Facility” refers at 31 December 2014 to the Term Loan Facility 2011 and at 31 December 2013 to the Term Loan Facility 2010 and the Term Loan Facility 2011.
(2 ) “Revolving Credit Facility” at 31 December 2014 refers to the Revolving Facility 2011, while at 31 December 2013 it also includes the Revolving Credit Facility 2010 later extinguished on 27 June 2014.
(in millions of Euro)
(in millions of Euro)
(in millions of Euro)

Consolidated Financial Report | EXPLANATORY NOTES
2014 Annual Report Prysmian Group
200
Credit Agreements:As at the date of 31 December 2014, the Prysmian Group has the following Credit Agreements in place:
Credit Agreement 2011The Credit Agreement 2011 is an agreement, entered into by Prysmian on 7 March 2011 with a syndicate of major banks, for Euro 800 million with a five-year maturity. This agreement comprises a loan for Euro 400 million (the “Term Loan Facility 2011”) and a revolving facility for Euro 400 million (the “Revolving Credit Facility 2011”). The entire amount of the Term Loan Facility 2011 is scheduled for repayment on 7 March 2016; the loan has therefore been classified in non-current liabilities.As at 31 December 2014, the Revolving Credit Facility 2011 was not being used (like at 31 December 2013).The fair value of the Credit Agreement 2011 at 31 December 2014 approximates its related carrying amount. Fair value has been determined using valuation techniques that refer to observable market data (Level 2 of the fair value hierarchy).
Syndicated Revolving Credit Facility 2014On 27 June 2014, Prysmian S.p.A. signed an agreement (the “Credit Agreement 2014”) under which a syndicate of premier banks made available a long-term credit facility for Euro 1,000 million (the “Syndicated Revolving Credit Facility 2014”). The facility, which expires on 27 June 2019, can also be used for the issue of guarantees. The new revolving facility is intended to refinance the Revolving Credit Facility 2010 and to finance the Group’s other operating activities. As at 31 December 2014, this facility was not being used. On 27 June 2014, Prysmian S.p.A. therefore extinguished early the Revolving Credit Facility 2010, originally due to expire on 31 December 2014 and carrying a maximum permitted drawdown of Euro 400 million. The Term Loan Facility 2010,
also maturing on 31 December 2014, had been extinguished early on 28 February 2014 with repayment of the outstanding balance of Euro 184 million.
In addition to the Credit Agreements described above, the Group’s other major credit agreements are as follows:
Revolving Credit Facility 2014On 19 February 2014, Prysmian S.p.A signed a credit agreement for Euro 100 million (the “Revolving Credit Facility 2014”) with Mediobanca - Banca di Credito Finanziario S.p.A.. Under this five-year agreement, Mediobanca has provided the Group with a line of credit intended to refinance existing debt and working capital requirements.As at 31 December 2014, the Revolving Credit Facility 2014 had been drawn down by Euro 30 million.
EIB LoanOn 18 December 2013, Prysmian S.p.A. entered into a loan agreement with the European Investment Bank (EIB) for Euro 100 million, to fund the Group’s European research & development (R&D) programmes over the period 2013-2016.The EIB Loan is particularly intended to support projects developed in the Group’s R&D centres in six countries (France, Great Britain, the Netherlands, Spain, Germany and Italy) and represents about 50% of the Prysmian Group’s planned investment expenditure in Europe during the period concerned.The EIB Loan was received on 5 February 2014; it will be repaid in 12 equal half-yearly instalments starting on 5 August 2015 and ending on 5 February 2021.The fair value of the EIB Loan at 31 December 2014 approxi-mates the related carrying amount. Fair value has been de-termined using valuation techniques that refer to observable market data (Level 2 of the fair value hierarchy).
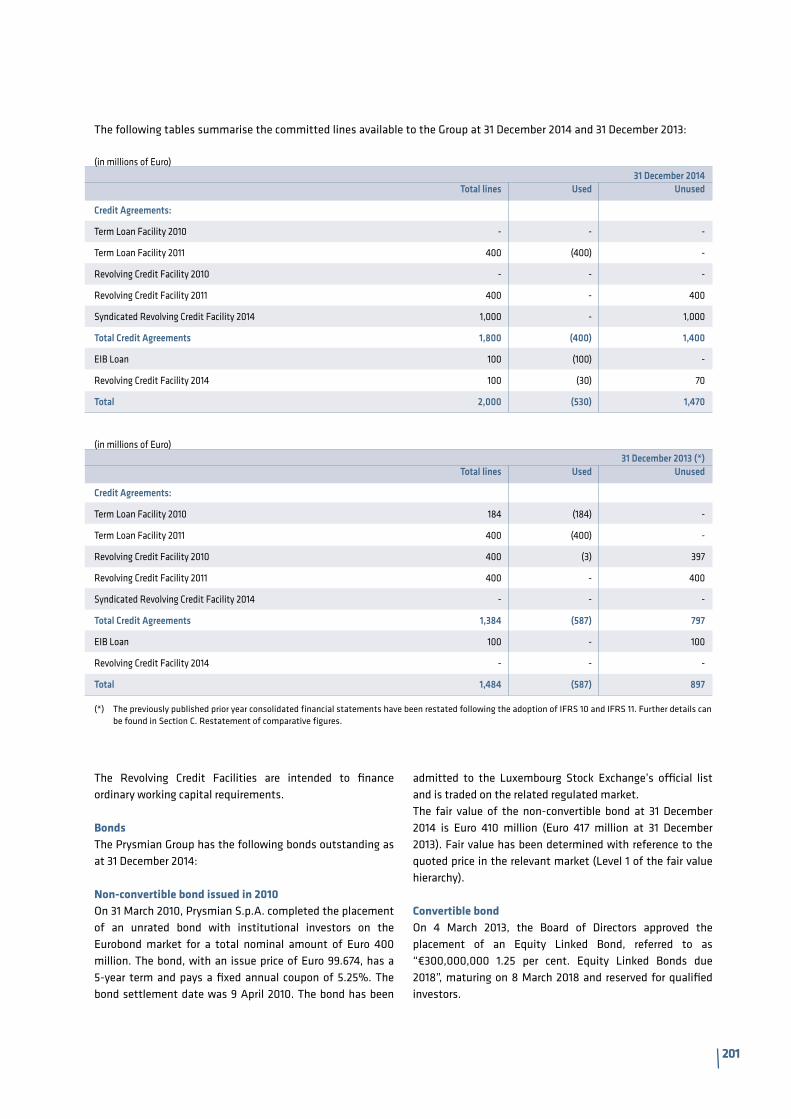
201
31 December 2014 Total lines Used Unused
Credit Agreements:
Term Loan Facility 2010 - - -
Term Loan Facility 2011 400 (400) -
Revolving Credit Facility 2010 - - -
Revolving Credit Facility 2011 400 - 400
Syndicated Revolving Credit Facility 2014 1,000 - 1,000
Total Credit Agreements 1,800 (400) 1,400
EIB Loan 100 (100) -
Revolving Credit Facility 2014 100 (30) 70
Total 2,000 (530) 1,470
31 December 2013 (*) Total lines Used Unused
Credit Agreements:
Term Loan Facility 2010 184 (184) -
Term Loan Facility 2011 400 (400) -
Revolving Credit Facility 2010 400 (3) 397
Revolving Credit Facility 2011 400 - 400
Syndicated Revolving Credit Facility 2014 - - -
Total Credit Agreements 1,384 (587) 797
EIB Loan 100 - 100
Revolving Credit Facility 2014 - - -
Total 1,484 (587) 897
(*) The previously published prior year consolidated financial statements have been restated following the adoption of IFRS 10 and IFRS 11. Further details can be found in Section C. Restatement of comparative figures.
The Revolving Credit Facilities are intended to finance ordinary working capital requirements.
BondsThe Prysmian Group has the following bonds outstanding as at 31 December 2014:
Non-convertible bond issued in 2010On 31 March 2010, Prysmian S.p.A. completed the placement of an unrated bond with institutional investors on the Eurobond market for a total nominal amount of Euro 400 million. The bond, with an issue price of Euro 99.674, has a 5-year term and pays a fixed annual coupon of 5.25%. The bond settlement date was 9 April 2010. The bond has been
admitted to the Luxembourg Stock Exchange’s official list and is traded on the related regulated market. The fair value of the non-convertible bond at 31 December 2014 is Euro 410 million (Euro 417 million at 31 December 2013). Fair value has been determined with reference to the quoted price in the relevant market (Level 1 of the fair value hierarchy).
Convertible bondOn 4 March 2013, the Board of Directors approved the placement of an Equity Linked Bond, referred to as “€300,000,000 1.25 per cent. Equity Linked Bonds due 2018”, maturing on 8 March 2018 and reserved for qualified investors.
The following tables summarise the committed lines available to the Group at 31 December 2014 and 31 December 2013:
(in millions of Euro)
(in millions of Euro)

Consolidated Financial Report | EXPLANATORY NOTES
2014 Annual Report Prysmian Group
202
On 16 April 2013, the Shareholders’ Meeting authorised the convertibility of the Bond at a value of Euro 22.3146 per share. As a result, the shareholders approved the proposal to increase share capital for cash, in single or multiple issues, with the exclusion of pre-emptive rights under art. 2441, par. 5 of the Italian Civil Code, by a maximum nominal amount of Euro 1,344,411.30, by issuing, in single or multiple instal-ments, up to 13,444,113 ordinary shares of the Company with the same characteristics as its other outstanding ordinary shares.
The Company will be entitled to redeem the bonds early and in full in the cases detailed in the Bond Regulations, in line with market practice, including:(i) at nominal value (plus accrued interest), starting from 23
March 2016, if the trading price of the Company’s ordinary shares rises to more than 130% of the conversion price in a given period of time;
(ii) at nominal value (plus accrued interest), if at least 85% of the original nominal amount of the Bond is converted, redeemed and/or repurchased;
(iii) at nominal value (plus accrued interest), if specific changes take place in the tax regime applying to the Bonds.
In the event of a change of control, every bondholder will be entitled to request early redemption at nominal value plus accrued interest.The convertible Bond has a 5-year maturity ending on 8 March 2018 and pays a fixed annual coupon of 1.25%. The placement of the Bonds was completed on 8 March 2013, while their settlement took place on 15 March 2013.On 3 May 2013, the Company sent a physical settlement notice to holders of the Bonds, granting them the right, with effect from 17 May 2013, to convert them into the Company’s existing or new ordinary shares.On 24 May 2013, the securities were admitted to trading on the unregulated Third Market (a multilateral trading facility or MTF) on the Vienna Stock Exchange.
The accounting treatment for the convertible Bond has resulted in the recognition of an equity component of Euro 39 million and a debt component of Euro 261 million, determined at the bond issue date.
Issue value of convertible bond 300
Equity reserve for convertible bond (39)
Issue date net balance 261
Interest - non-monetary 13
Interest - monetary accrued 7
Interest - monetary paid (5)
Related costs (4)
Balance at 31 December 2014 272
The fair value of the convertible bond (equity component and debt component) is Euro 306 million at 31 December 2014 (Euro 339 million at 31 December 2013), of which the fair value of the debt component is Euro 264 million (Euro
265 million at 31 December 2013). In the absence of trading on the relevant market, fair value has been determined using valuation techniques that refer to observable market data (Level 2 of the fair value hierarchy).
(in millions of Euro)
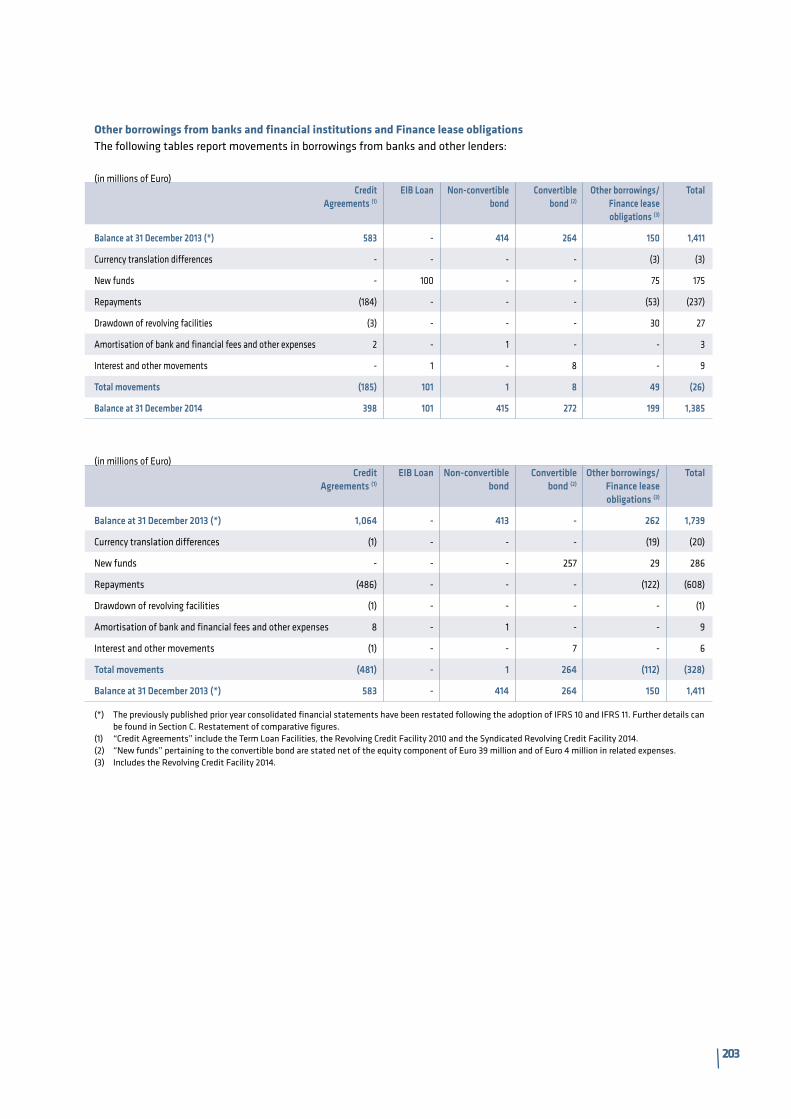
203
Credit EIB Loan Non-convertible Convertible Other borrowings/ Total Agreements (1) bond bond (2) Finance lease obligations (3)
Balance at 31 December 2013 (*) 583 - 414 264 150 1,411
Currency translation differences - - - - (3) (3)
New funds - 100 - - 75 175
Repayments (184) - - - (53) (237)
Drawdown of revolving facilities (3) - - - 30 27
Amortisation of bank and financial fees and other expenses 2 - 1 - - 3
Interest and other movements - 1 - 8 - 9
Total movements (185) 101 1 8 49 (26)
Balance at 31 December 2014 398 101 415 272 199 1,385
Credit EIB Loan Non-convertible Convertible Other borrowings/ Total Agreements (1) bond bond (2) Finance lease obligations (3)
Balance at 31 December 2013 (*) 1,064 - 413 - 262 1,739
Currency translation differences (1) - - - (19) (20)
New funds - - - 257 29 286
Repayments (486) - - - (122) (608)
Drawdown of revolving facilities (1) - - - - (1)
Amortisation of bank and financial fees and other expenses 8 - 1 - - 9
Interest and other movements (1) - - 7 - 6
Total movements (481) - 1 264 (112) (328)
Balance at 31 December 2013 (*) 583 - 414 264 150 1,411
Other borrowings from banks and financial institutions and Finance lease obligationsThe following tables report movements in borrowings from banks and other lenders:
(*) The previously published prior year consolidated financial statements have been restated following the adoption of IFRS 10 and IFRS 11. Further details can be found in Section C. Restatement of comparative figures.
(1) “Credit Agreements” include the Term Loan Facilities, the Revolving Credit Facility 2010 and the Syndicated Revolving Credit Facility 2014.(2) “New funds” pertaining to the convertible bond are stated net of the equity component of Euro 39 million and of Euro 4 million in related expenses. (3) Includes the Revolving Credit Facility 2014.
(in millions of Euro)
(in millions of Euro)
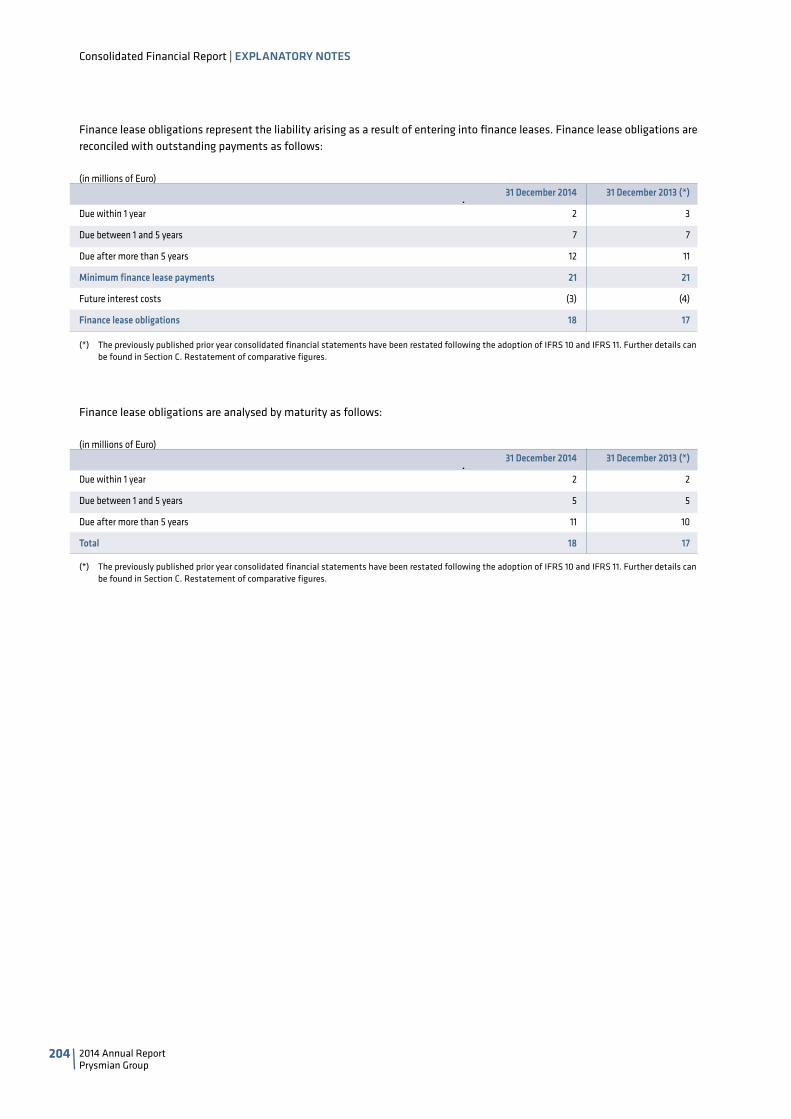
Consolidated Financial Report | EXPLANATORY NOTES
2014 Annual Report Prysmian Group
204
Finance lease obligations represent the liability arising as a result of entering into finance leases. Finance lease obligations are reconciled with outstanding payments as follows:
31 December 2014 31 December 2013 (*)
Due within 1 year 2 3
Due between 1 and 5 years 7 7
Due after more than 5 years 12 11
Minimum finance lease payments 21 21
Future interest costs (3) (4)
Finance lease obligations 18 17
(*) The previously published prior year consolidated financial statements have been restated following the adoption of IFRS 10 and IFRS 11. Further details can be found in Section C. Restatement of comparative figures.
Finance lease obligations are analysed by maturity as follows:
31 December 2014 31 December 2013 (*)
Due within 1 year 2 2
Due between 1 and 5 years 5 5
Due after more than 5 years 11 10
Total 18 17
(*) The previously published prior year consolidated financial statements have been restated following the adoption of IFRS 10 and IFRS 11. Further details can be found in Section C. Restatement of comparative figures.
(in millions of Euro)
(in millions of Euro)

205
Variable interest rate Fixed interest rate Total Euro USD GBP Other Euro and other currencies currencies
Due within 1 year 42 9 - 34 483 568
Due between 1 and 2 years 415 - - 2 12 429
Due between 2 and 3 years 17 - - - 23 40
Due between 3 and 4 years 17 - - - 275 292
Due between 4 and 5 years 17 - - - 3 20
Due after more than 5 years 34 - - - 2 36
Total 542 9 - 36 798 1,385
Average interest rate in period, as per contract 1.6% 2.2% 0.0% 8.3% 4.9% 3.6%
Average interest rate in period, including IRS effect (A) 2.1% 2.2% 0.0% 8.3% 4.9% 3.9%
Variable interest rate Fixed interest rate Total Euro USD GBP Other Euro and other currencies currencies
Due within 1 year 164 27 - 36 66 293
Due between 1 and 2 years - - - 6 423 429
Due between 2 and 3 years 397 - - 2 8 407
Due between 3 and 4 years - - - - 3 3
Due between 4 and 5 years - - - - 266 266
Due after more than 5 years 9 - - - 4 13
Total 570 27 - 44 770 1,411
Average interest rate in period, as per contract 1.7% 2.1% 0.0% 7.2% 5.0% 3.6%
Average interest rate in period, including IRS effect (B) 3.1% 2.1% 0.0% 7.2% 5.0% 4.3%
The following tables provide a breakdown of borrowings from banks and other lenders by maturity and currency at 31 December 2014 and 2013:
(A) There are interest rate swaps to hedge interest rate risk on variable rate loans in Euro. The total hedged amount at 31 December 2014 equates to 36.9% of Euro-denominated debt at that date. In particular, interest rate hedges consist of interest rate swaps which exchange a variable rate (3 and 6-month Euribor for loans in Euro) with an average fixed rate (fixed rate + spread) of 3.0% for Euro-denominated debt. The percentages representing the average fixed rate refer to 31 December 2014.
(*) The previously published prior year consolidated financial statements have been restated following the adoption of IFRS 10 and IFRS 11. Further details can be found in Section C. Restatement of comparative figures.
(B) There are interest rate swaps to hedge interest rate risk on variable rate loans in Euro. The total hedged amount at 31 December 2013 equates to 66.4% of Euro-denominated debt at that date. In particular, interest rate hedges consist of interest rate swaps which exchange a variable rate (3 and 6-month Euribor for loans in Euro) with an average fixed rate (fixed rate + spread) of 3.8% for Euro-denominated debt. The percentages representing the average fixed rate refer to 31 December 2013.
31 December 2014
31 December 2013 (*)
The Credit Agreement 2010 and Credit Agreement 2011 do not require any collateral security. Further information can be found in Note 32. Financial covenants. Risks relating to
sources of finance and to financial investments/receivables are discussed in the section entitled “Risks factors and uncer-tainties” forming part of the Directors’ Report.
(in millions of Euro)
(in millions of Euro)

Consolidated Financial Report | EXPLANATORY NOTES
2014 Annual Report Prysmian Group
206
Note 31 December 2014 31 December 2013 (*)
Long-term financial payables
- Term Loan Facility 2011 400 400
- Bank fees (2) (3)
Credit Agreements 12 398 397
EIB Loan 12 92 -
Non-convertible bond 12 - 399
Convertible bond 12 271 263
Finance leases 12 16 15
Interest rate swaps 8 3 4
Other financial payables 12 40 45
Total long-term financial payables 820 1,123
Short-term financial payables
- Term Loan Facility 2010 12 - 184
- Bank fees 12 - (1)
- Revolving Credit Facility (1) 12 - 3
- Syndicated Revolving Credit Facility 2014 12 - -
Credit Agreements 12 - 186
EIB Loan 12 9 -
Non-convertible bond 12 415 15
Convertible bond 12 1 1
Finance leases 12 2 2
Interest rate swaps 8 - 14
Forward currency contracts on financial transactions 8 8 5
Revolving Credit Facility 2014 12 30 -
Other financial payables 12 111 88
Total short-term financial payables 576 311
Total financial liabilities 1,396 1,434
Long-term financial receivables 5 2 4
Long-term bank fees 5 5 -
Forward currency contracts on financial transactions (current) 8 5 5
Short-term financial receivables 5 9 12
Short-term bank fees 5 3 5
Financial assets held for trading 7 76 93
Cash and cash equivalents 9 494 510
Net financial position 802 805
NET FINANCIAL POSITION
(*) The previously published prior year consolidated financial statements have been restated following the adoption of IFRS 10 and IFRS 11. Further details can be found in Section C. Restatement of comparative figures.
(1) “Revolving Credit Facility” refers at 31 December 2014 to the Revolving Credit Facility 2011 and at 31 December 2013 to the Revolving Credit Facility 2010 later extinguished on 27 June 2014.
(in millions of Euro)
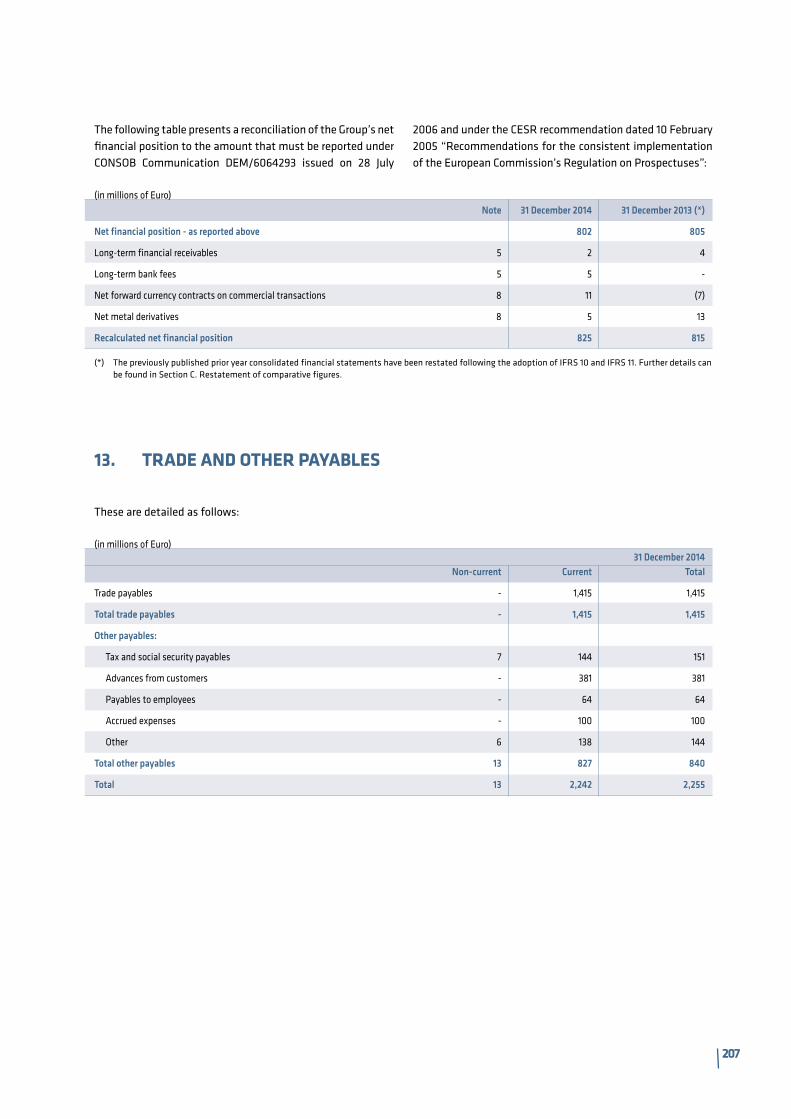
207
The following table presents a reconciliation of the Group’s net financial position to the amount that must be reported under CONSOB Communication DEM/6064293 issued on 28 July
2006 and under the CESR recommendation dated 10 February 2005 “Recommendations for the consistent implementation of the European Commission’s Regulation on Prospectuses”:
Note 31 December 2014 31 December 2013 (*)
Net financial position - as reported above 802 805
Long-term financial receivables 5 2 4
Long-term bank fees 5 5 -
Net forward currency contracts on commercial transactions 8 11 (7)
Net metal derivatives 8 5 13
Recalculated net financial position 825 815
31 December 2014 Non-current Current Total
Trade payables - 1,415 1,415
Total trade payables - 1,415 1,415
Other payables:
Tax and social security payables 7 144 151
Advances from customers - 381 381
Payables to employees - 64 64
Accrued expenses - 100 100
Other 6 138 144
Total other payables 13 827 840
Total 13 2,242 2,255
(*) The previously published prior year consolidated financial statements have been restated following the adoption of IFRS 10 and IFRS 11. Further details can be found in Section C. Restatement of comparative figures.
13. TRADE AND OTHER PAYABLES
These are detailed as follows:
(in millions of Euro)
(in millions of Euro)

Consolidated Financial Report | EXPLANATORY NOTES
2014 Annual Report Prysmian Group
208
31 December 2013 (*) Non-current Current Total
Trade payables - 1,409 1,409
Total trade payables - 1,409 1,409
Other payables:
Tax and social security payables 12 99 111
Advances from customers - 241 241
Payables to employees - 98 98
Accrued expenses 3 136 139
Other 5 114 119
Total other payables 20 688 708
Total 20 2,097 2,117
(*) The previously published prior year consolidated financial statements have been restated following the adoption of IFRS 10 and IFRS 11. Further details can be found in Section C. Restatement of comparative figures.
Trade payables include around Euro 176 million (Euro 183 million at 31 December 2013) for the supply of strategic metals (copper, aluminium and lead), whose payment terms, in some cases, are longer than normal for this type of transaction.
Advances from customers report the liability for construction contracts, amounting to Euro 286 million at 31 December 2014 compared with Euro 155 million at 31 December 2013. This liability represents the gross amount by which work invoiced
exceeds costs incurred plus accumulated profits (or losses) recognised using the percentage of completion method.
Payables to employees at 31 December 2014 have decreased following settlement of the liability for the Long-term incentive plan 2011-2013, amounting to Euro 36 million at 31 December 2013.The following table breaks down trade and other payables according to the currency in which they are expressed:
31 December 2014 31 December 2013 (*)
Euro 1,214 1,177
US Dollar 371 309
Chinese Renminbi (Yuan) 170 145
Brazilian Real 125 126
British Pound 151 141
Australian Dollar 34 35
Canadian Dollar 15 11
Norwegian Krone 13 10
Romanian Leu 28 23
United Arab Emirates Dirham 14 33
Turkish Lira 6 13
Malaysian Ringgit 14 19
Swedish Krona 13 14
Other currencies 87 61
Total 2,255 2,117
(*) The previously published prior year consolidated financial statements have been restated following the adoption of IFRS 10 and IFRS 11. Further details can be found in Section C. Restatement of comparative figures.
(in millions of Euro)
(in millions of Euro)
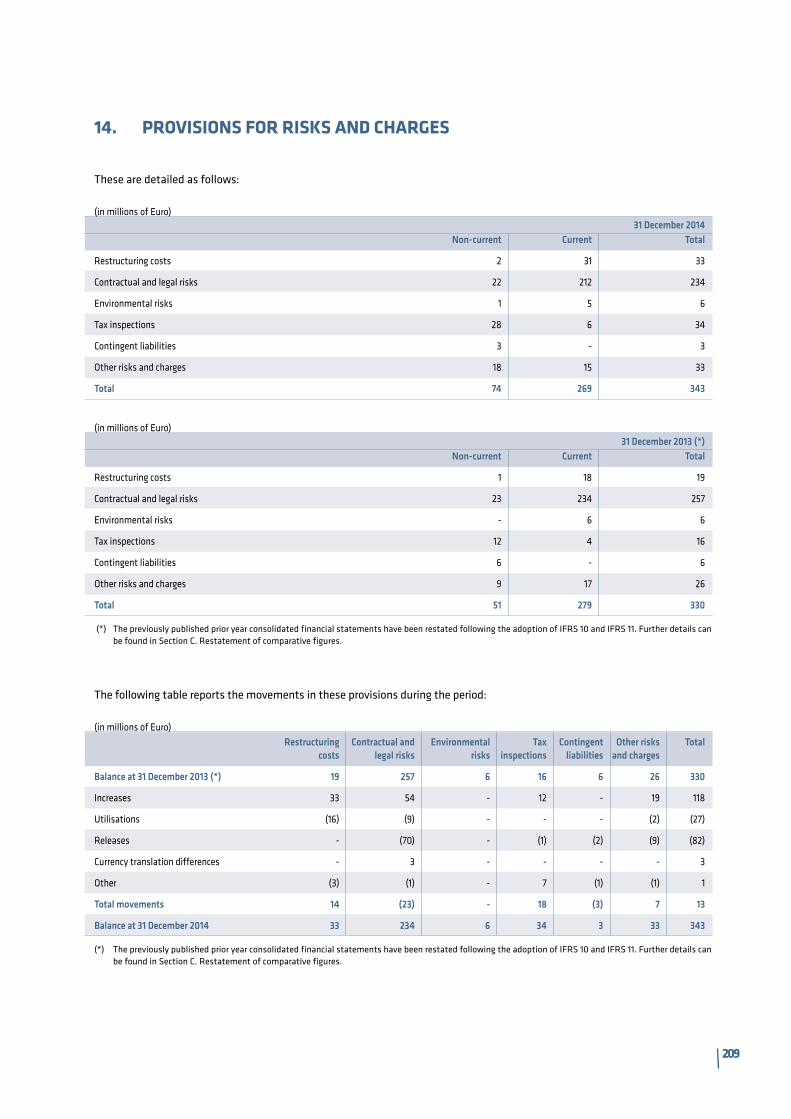
209
Restructuring Contractual and Environmental Tax Contingent Other risks Total costs legal risks risks inspections liabilities and charges
Balance at 31 December 2013 (*) 19 257 6 16 6 26 330
Increases 33 54 - 12 - 19 118
Utilisations (16) (9) - - - (2) (27)
Releases - (70) - (1) (2) (9) (82)
Currency translation differences - 3 - - - - 3
Other (3) (1) - 7 (1) (1) 1
Total movements 14 (23) - 18 (3) 7 13
Balance at 31 December 2014 33 234 6 34 3 33 343
31 December 2014 Non-current Current Total
Restructuring costs 2 31 33
Contractual and legal risks 22 212 234
Environmental risks 1 5 6
Tax inspections 28 6 34
Contingent liabilities 3 - 3
Other risks and charges 18 15 33
Total 74 269 343
14. PROVISIONS FOR RISKS AND CHARGES
These are detailed as follows:
31 December 2013 (*) Non-current Current Total
Restructuring costs 1 18 19
Contractual and legal risks 23 234 257
Environmental risks - 6 6
Tax inspections 12 4 16
Contingent liabilities 6 - 6
Other risks and charges 9 17 26
Total 51 279 330
(*) The previously published prior year consolidated financial statements have been restated following the adoption of IFRS 10 and IFRS 11. Further details can be found in Section C. Restatement of comparative figures.
The following table reports the movements in these provisions during the period:
(*) The previously published prior year consolidated financial statements have been restated following the adoption of IFRS 10 and IFRS 11. Further details can be found in Section C. Restatement of comparative figures.
(in millions of Euro)
(in millions of Euro)
(in millions of Euro)

Consolidated Financial Report | EXPLANATORY NOTES
2014 Annual Report Prysmian Group
210
The provision for restructuring costs reports a net increase of Euro 14 million.In particular, Euro 33 million in new provisions has been recognised during the period, while Euro 16 million has been utilised, mostly in connection with projects underway in the Netherlands, Germany and France.
The provision for contractual and legal risks, amounting to Euro 234 million at 31 December 2014, has decreased by Euro 23 million since 31 December 2013, mainly due to a net reduction of Euro 29 million in the provision for antitrust investigations in different jurisdictions. More specifically, the European Commission, the US De-partment of Justice and the Japanese Antitrust Authority started investigations in late January 2009 into several European and Asian electrical cable manufacturers to verify the existence of alleged anti-competitive practices in the high voltage underground and submarine cables markets. Subsequently, the Australian Competition and Consumers Commission (“ACCC”) and the New Zealand Commerce Commission also started similar investigations. During 2011, the Canadian Antitrust Authority also started an investiga-tion into a high voltage submarine project dating back to 2006. The investigations in Japan, New Zealand and Canada have ended without any sanctions for Prysmian; the other investigations are still in progress, except for the one by the European Commission, which has ended with the adoption of the decision described below.In Australia, the ACCC has filed a case before the Federal Court arguing that Prysmian Cavi e Sistemi S.r.l. and two other companies violated antitrust rules in connection with a high voltage underground cable project awarded in 2003. Prysmian Cavi e Sistemi S.r.l. has filed its objections and presented its defence.In Brazil, the local antitrust authority has started an investi-gation into several cable manufacturers, including Prysmian, that operate in the high voltage underground and submarine cables market. Prysmian has presented its preliminary defence, which has been rejected by the local competition au-thorities in a statement issued during the month of February 2015. The preliminary stage of the proceedings will now ensue, at the end of which the authorities will publish their concluding observations, to which the parties may respond with all their arguments in defence before a final decision is taken. During the month of December 2013, ABB and one of this company’s senior managers signed an agreement with the Brazilian Antitrust Authority, under which they admitted the conduct alleged by the authority and pledged to cooperate with it and to each pay an agreed fine.On 2 April 2014, the European Commission adopted a decision
under which it found that, between 18 February 1999 and 28 January 2009, the world’s largest cable producers, including Prysmian Cavi e Sistemi S.r.l., adopted anti-competitive practices in the European market for high voltage submarine and underground power cables. The European Commission held Prysmian Cavi e Sistemi S.r.l. jointly liable with Pirelli & C. S.p.A. for the alleged infringement in the period from 18 February 1999 to 28 July 2005, sentencing them to pay a fine of Euro 67.3 million, and it held Prysmian Cavi e Sistemi S.r.l. jointly liable with Prysmian S.p.A. and the Goldman Sachs Group Inc. for the alleged infringement in the period from 29 July 2005 to 28 January 2009, sentencing them to pay a fine of Euro 37.3 million. Prysmian has filed an appeal against this decision with the General Court of the European Union and an application to intervene in the appeals respectively lodged by Pirelli & C. S.p.A. and the Goldman Sachs Group Inc. against the same decision. Both Pirelli & C. S.p.A. and the Goldman Sachs Group Inc. have in turn submitted applications to intervene in the appeal brought by Prysmian against the European Commission’s decision. Prysmian has not incurred any financial outlay as a result of this decision having elected, pending the outcome of the appeals, to provide bank guarantees as security against payment of 50% of the fine imposed by the European Commission (amounting to appro-ximately Euro 52 million) for the alleged infringement in both periods. As far as Prysmian is aware, Pirelli & C. S.p.A. has provided or is nonetheless preparing to provide the European Commission with a bank guarantee for 50% of the value of the fine imposed for the alleged infringement in the period 18 February 1999 - 28 July 2005. Pirelli & C. S.p.A. has also filed a civil action against Prysmian Cavi e Sistemi S.r.l. in which it demands to be held harmless for all claims made by the European Commission in implementation of its decision and for any expenses related to such implementation. Prysmian Cavi e Sistemi S.r.l. filed its reply in February 2015, requesting that the claims brought by Pirelli & C. S.p.A. be rejected in full and that it should be Pirelli & C. S.p.A. which holds harmless Prysmian Cavi e Sistemi S.r.l., with reference to the alleged infringement in the period 18 February 1999 - 28 July 2005, for all claims made by the European Commission in implementation of its decision and for any expenses related to such implementation. Following a detailed and careful analysis of the European Commission’s ruling, and none-theless considering this has been appealed and so could be submitted to second-instance judgement, as well as the fact that the investigations initiated by the Canadian Antitrust Authority have ended without any sanctions for Prysmian, it has been decided to release part of the existing provision.Prysmian has also learned from several sources, including sources in the public domain, that some British operators

211
have filed actions in the High Court in London against certain cable manufacturers, including certain Prysmian Group companies, to obtain compensation for damages allegedly suffered as a result of the alleged anti-competitive practices condemned by the European Commission in the decision adopted in April 2014.The above events have led to the recognition in the 2014 income statement of a net release of Euro 31 million, classi-fied as non-recurring items.
As at 31 December 2014, the amount of the provision is approximately Euro 170 million.
Despite the uncertainty of the outcome of the investigations underway and potential legal action by customers as a result of the decision adopted by the European Commission, the amount of this provision is considered to represent the best estimate of the liability based on the information now available.
15. EMPLOYEE BENEFIT OBLIGATIONS
The Group provides a number of post-employment benefits through programmes that include defined benefit plans and defined contribution plans. The defined contribution plans require the Group to pay, under legal or contractual obligations, contributions into public or private insurance institutions. The Group fulfils its obliga-tions through payment of the contributions. At the financial reporting date, any amounts accrued but not yet paid to the above institutions are recorded in “Other payables”, while the related costs, accrued on the basis of the service rendered by
employees, are recognised in “Personnel costs”.The defined benefit plans mainly refer to Pension plans, Employee indemnity liability (for Italian companies), Medical benefit plans and other benefits such as seniority bonuses.The liabilities arising from these plans, net of any assets serving such plans, are recognised in Employee benefit obliga-tions and are measured using actuarial techniques. Employee benefit obligations are analysed as follows:
31 December 2014 31 December 2013 (*)
Pension plans 275 230
Employee indemnity liability (Italian TFR) 24 22
Medical benefit plans 25 23
Termination and other benefits 36 33
Incentive plans - -
Total 360 308
(*) The previously published prior year consolidated financial statements have been restated following the adoption of IFRS 10 and IFRS 11. Further details can be found in Section C. Restatement of comparative figures.
Pension plan amendments in 2014During 2014, the liabilities accrued after 1996 relating to the pension plan managed by Stichting Pensioenfonds Draka Holding, to which three Dutch legal entities were party, were transferred to Pensioenfonds van de Metalektro - PME, an industry-wide multi-employer plan. Liabilities accrued before 1996 have remained with the employer companies and are fully funded, meaning that the full value of this liability is covered by the value of assets.This transaction has resulted in the recognition in the 2014 income statement of the asset ceiling, deemed to be un-
recoverable, in accordance with the accounting treatment prescribed by IFRIC 14. The related loss of Euro 8 million has been classified as a non-recurring item.
PENSION PLANSPension plans relate to defined benefit pension schemes that can be “Funded” and “Unfunded”. Pension plan liabilities are generally calculated according to employee length of service with the company and the remuneration paid in the period preceding cessation of em-ployment.
(in millions of Euro)

Consolidated Financial Report | EXPLANATORY NOTES
2014 Annual Report Prysmian Group
212
Liabilities for “Funded pension plans” are funded by con-tributions made by the employer and, in some cases, by employees, into a separately managed pension fund. The fund independently manages and administers the amounts received, investing in financial assets and paying benefits directly to employees. The Group’s contributions to such funds are defined according to the legal requirements esta-blished in individual countries. Liabilities for “Unfunded pension plans” are managed directly by the employer who sees to providing the benefits to employees. These plans have no assets to cover the liabilities.At 31 December 2014, the most significant plans in terms of accrued employee benefit liabilities are the plans managed in the following countries:• Germany;
• Great Britain;• The Netherlands.
Pension plans in the above countries account for approxima-tely 80% of the related liability. The principal risks to which they are exposed are described below:
Germany There are thirteen pension plans in Germany. These are mostly final salary plans in which the retirement age is generally set at 65. Although most plans are closed to new members, additional costs may need to be recognised in the future. As at 31 December 2014, the plans had an average duration of 15.7 years (14.8 years at 31 December 2013).Total plan membership is made up as follows:
31 December 2014 31 December 2013 Number of participants Number of participants
Active 975 1,023
Deferred 1,067 1,118
Pensioners 1,724 1,644
Total membership 3,766 3,785
The German plans do not have any assets that fund the liabi-lities; the Prysmian Group pays these benefits directly. During the next year the benefits payable will amount to Euro 6 million (unchanged compared with 31 December 2013). The increase in benefits, and so in the recorded liability and in service costs, will mainly depend on inflation, salary growth and the life expectancy of plan members. Another variable to consider when determining the amount of the liability and of service costs is the discount rate, identified by reference to market yields of AA corporate bonds denominated in Euro.
Great BritainTwo defined benefit plans were in operation at 31 December 2014: the Draka pension fund and the Prysmian pension fund. Both funds are final salary plans, in which the retirement age is generally set at 65 for the majority of plan participants. The plans will not admit any new members or accrue any new liabilities after 31 December 2014.As at 31 December 2014, the plans had an average duration of approximately 20.3 years (approximately 20.9 years at 31 December 2013).

213
Total plan membership is made up as follows:
31 December 2014 31 December 2013 Draka Prysmian Total Draka Prysmian Total pension fund pension fund pension fund pension fund Number of Number of Number of Number of Number of Number of participants participants participants participants participants participants
Active - - - - - -
Deferred 563 615 1.178 583 630 1,213
Pensioners 411 327 738 395 312 707
Total membership 974 942 1,916 978 942 1,920
Both plans operate under trust law and are managed and administered by a Board of Trustees on behalf of members and in accordance with the terms of the Trust Deed and Rules and current legislation. The assets that fund the liabilities are held by the Trust, for both plans.For the purposes of determining the level of funding, the Trustees appoint an actuary to value the plans every three years, with annual updates. The latest valuations of the Draka pension fund and the Prysmian pension fund were conducted on 25 March 2013 and 31 December 2011 respectively. The valuation for the Prysmian Fund at 31 December 2014 will be carried out and completed by 31 March 2016.Even the contribution levels are set every three years at the time of performing the valuation to determine the level of plan funding. Currently, the contribution levels are set at Euro 1.8 million a year for the Draka pension fund (Euro 1.7 million at 31 December 2013) and Euro 0.2 million a year for the Prysmian pension fund (unchanged since the prior year).The Trustees decide on the investment strategy in agreement with the company. The strategies differ for both plans. In particular, the Draka pension fund has invested a large proportion of its assets in equities; the fund’s investment split is as follows: 20% in equities, 38% in bonds and 42% in other financial instruments. The Prysmian pension fund has invested its assets as follows: 56% in bonds and the
remaining 44% in other financial instruments.The main risk for the Prysmian Group in Great Britain is that mismatches between the expected return and the actual return on plan assets would require contribution levels to be revised.The liabilities and service costs are sensitive to the following variables: inflation, salary growth, life expectancy of plan par-ticipants and future growth in benefit levels. Another variable to consider when determining the amount of the liability is the discount rate, identified by reference to market yields of AA corporate bonds denominated in GB pounds.
The NetherlandsDuring 2014, the liabilities accrued after 1996 relating to the pension plan managed by Stichting Pensioenfonds Draka Holding, to which three Dutch legal entities were party, were transferred to Pensioenfonds van de Metalektro - PME, an industry-wide multi-employer plan. Liabilities accrued before 1996 have remained with the employer companies and are fully covered. The rules of the plan were the same for all the participating entities and involved the payment of benefits according to an average length of service and a general reti-rement age of 65.
Total plan membership is made up as follows:
31 December 2014 31 December 2013 Number of participants Number of participants
Active 411 402
Deferred 512 608
Pensioners 1,084 1,038
Total membership 2,007 2,048

Consolidated Financial Report | EXPLANATORY NOTES
2014 Annual Report Prysmian Group
214
The transfer of the liabilities described above means the Group no longer has to pay into this plan.The remaining liabilities at 31 December 2014 are fully covered and so do not represent a risk factor for the Prysmian Group.The liabilities and service costs are sensitive to the following variables: inflation, salary growth, life expectancy of plan participants and future growth in benefit levels. Another variable to consider when determining the amount of the
liability is the discount rate, identified by reference to market yields of AA corporate bonds denominated in Euro.During 2014 the local legislation regarding pension benefits underwent significant change. As from 1 January 2014, the retirement age was raised from 65 to 67, with the contribu-tion rate going from 2.2% to 1.84%.
Pension plan obligations and assets are analysed as follows at 31 December 2014:
31 December 2014 Germany Great Britain The Netherlands Other countries Total
Funded pension obligations:
Present value of obligation - 190 27 50 267
Fair value of plan assets - (126) (27) (38) (191)
Asset ceiling - - - - -
Unfunded pension obligations:
Present value of obligations 167 - - 32 199
Total 167 64 - 44 275
31 December 2013 (*) Germany Great Britain The Netherlands Other countries Total
Funded pension obligations:
Present value of obligation - 156 97 45 298
Fair value of plan assets - (108) (99) (36) (243)
Asset ceiling - - 2 1 3
Unfunded pension obligations:
Present value of obligations 143 - - 29 172
Total 143 48 - 39 230
(*) The previously published prior year consolidated financial statements have been restated following the adoption of IFRS 10 and IFRS 11. Further details can be found in Section C. Restatement of comparative figures.
At 31 December 2014, “Other countries” mainly refer to:• United States: funded pension obligations have a present
value of Euro 31 million compared with a fair value of Euro 23 million for plan assets;
• Norway: funded pension obligations have a present value of Euro 3 million compared with a fair value of Euro 1 million for plan assets;
• Canada: funded pension obligations have a present value
of Euro 10 million compared with a fair value of Euro 9 million for plan assets;
• France: pension obligations have a present value of Euro 24 million compared with a fair value of Euro 3 million for plan assets;
• Sweden: unfunded pension obligations have a present value of Euro 8 million.
(in millions of Euro)
(in millions of Euro)
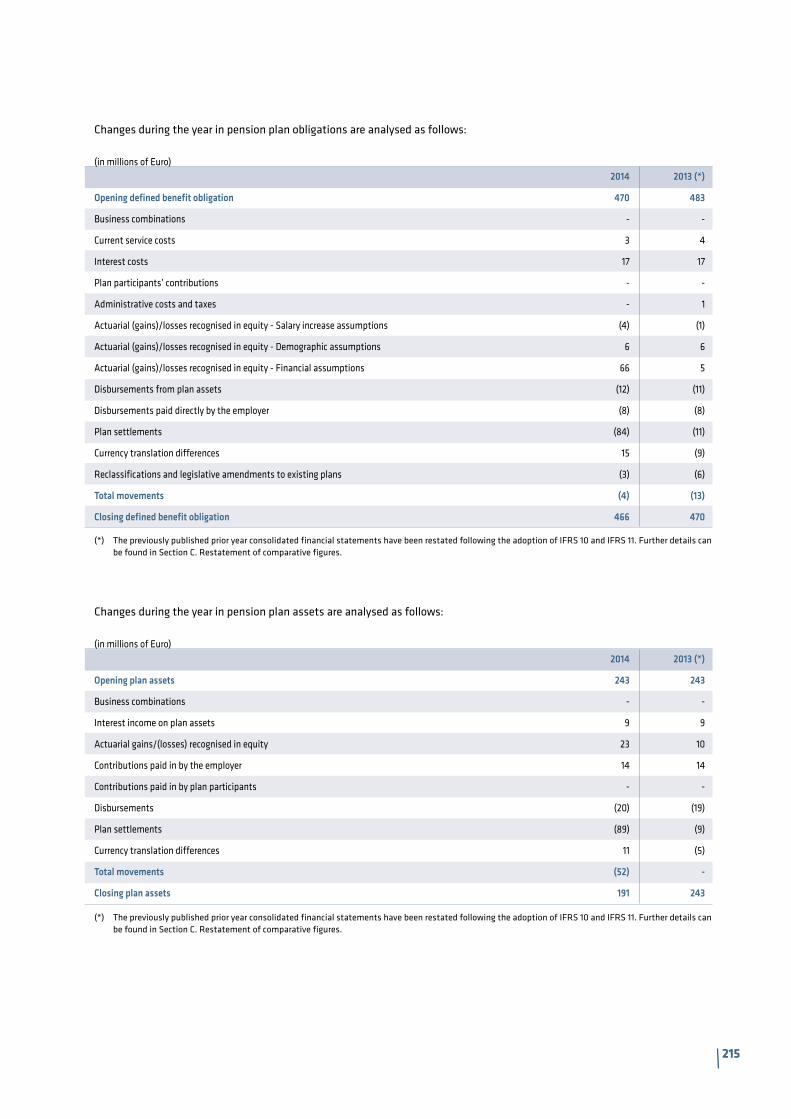
215
2014 2013 (*)
Opening defined benefit obligation 470 483
Business combinations - -
Current service costs 3 4
Interest costs 17 17
Plan participants’ contributions - -
Administrative costs and taxes - 1
Actuarial (gains)/losses recognised in equity - Salary increase assumptions (4) (1)
Actuarial (gains)/losses recognised in equity - Demographic assumptions 6 6
Actuarial (gains)/losses recognised in equity - Financial assumptions 66 5
Disbursements from plan assets (12) (11)
Disbursements paid directly by the employer (8) (8)
Plan settlements (84) (11)
Currency translation differences 15 (9)
Reclassifications and legislative amendments to existing plans (3) (6)
Total movements (4) (13)
Closing defined benefit obligation 466 470
(*) The previously published prior year consolidated financial statements have been restated following the adoption of IFRS 10 and IFRS 11. Further details can be found in Section C. Restatement of comparative figures.
Changes during the year in pension plan assets are analysed as follows:
2014 2013 (*)
Opening plan assets 243 243
Business combinations - -
Interest income on plan assets 9 9
Actuarial gains/(losses) recognised in equity 23 10
Contributions paid in by the employer 14 14
Contributions paid in by plan participants - -
Disbursements (20) (19)
Plan settlements (89) (9)
Currency translation differences 11 (5)
Total movements (52) -
Closing plan assets 191 243
(*) The previously published prior year consolidated financial statements have been restated following the adoption of IFRS 10 and IFRS 11. Further details can be found in Section C. Restatement of comparative figures.
Changes during the year in pension plan obligations are analysed as follows:
(in millions of Euro)
(in millions of Euro)

Consolidated Financial Report | EXPLANATORY NOTES
2014 Annual Report Prysmian Group
216
At 31 December 2014, pension plan assets consisted of equities (13.3% versus 47.5% in 2013), government bonds (21.8% versus 33.7% in 2013), corporate bonds (19.5% versus
2014 2013 (*)
Opening asset ceiling 3 1
Interest costs - -
Changes in assets recognised in equity (3) 2
Currency translation differences - -
Total movements (3) 2
Closing asset ceiling - 3
(*) The previously published prior year consolidated financial statements have been restated following the adoption of IFRS 10 and IFRS 11. Further details can be found in Section C. Restatement of comparative figures.
13.7% in 2013), and other assets (45.4% versus 5.1% in 2013).
Movements in the asset ceiling over the period are as follows:
Pension plan costs recognised in the income statement are analysed as follows:
2014 Germany Great Britain The Netherlands Other countries Total
Personnel costs 1 - 7 (1) 7
Interest costs 4 7 2 4 17
Expected returns on plan assets - (5) (2) (2) (9)
Total pension plan costs 5 2 7 1 15
2013 (*) Germany Great Britain The Netherlands Other countries Total
Personnel costs 1 - 1 1 3
Interest costs 5 6 3 3 17
Expected returns on plan assets - (4) (3) (2) (9)
Total pension plan costs 6 2 1 2 11
(*) The previously published prior year consolidated financial statements have been restated following the adoption of IFRS 10 and IFRS 11. Further details can be found in Section C. Restatement of comparative figures.
More details can be found in Note 21. Personnel costs.
(in millions of Euro)
(in millions of Euro)
(in millions of Euro)

217
Germany Great Britain The Netherlands
Interest rate 2.03% 3.70% 2.25%
Expected future salary increase 2.00% n.a. n.a.
Expected increase in pensions 2.00% n.a. n.a.
Inflation rate 2.00% 3.30% n.a.
Life expectancy at age 65: Male Female Male Female Male Female
People currently aged 65 19.49 21.56 22.30 24.30 21.70 24.30
People currently aged 50 21.50 25.47 23.70 25.70 23.50 25.80
Germany Great Britain The Netherlands
Interest rate 3.25% 4.40% 3.25%
Expected future salary increase 2.00% n.a. 2.00%
Expected increase in pensions 2.00% n.a. 2.00%
Inflation rate 2.00% 3.50% 2.00%
Life expectancy at age 65: Male Female Male Female Male Female
People currently aged 65 19.35 23.42 22.10 24.40 21.90 23.80
People currently aged 50 21.37 25.35 23.50 25.70 23.30 24.60
31 December 2014
31 December 2013
The weighted average actuarial assumptions used to value the pension plans are as follows:
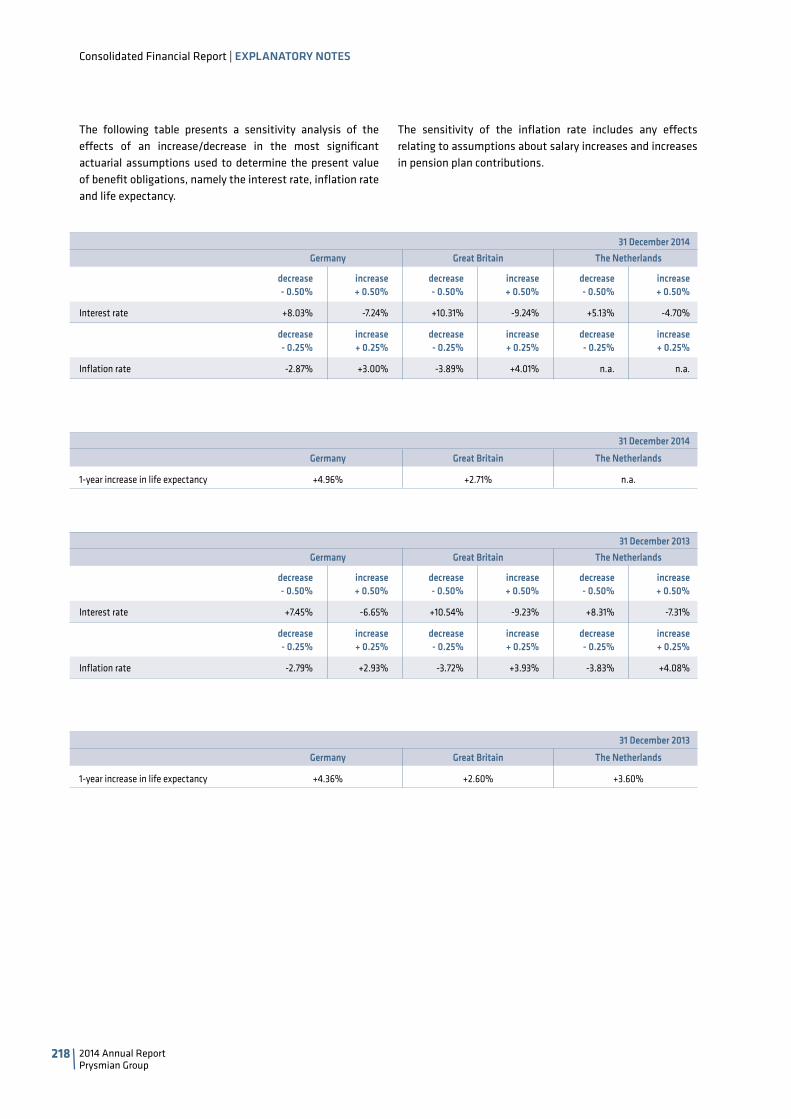
Consolidated Financial Report | EXPLANATORY NOTES
2014 Annual Report Prysmian Group
218
decrease increase decrease increase decrease increase - 0.50% + 0.50% - 0.50% + 0.50% - 0.50% + 0.50%
Interest rate +8.03% -7.24% +10.31% -9.24% +5.13% -4.70%
decrease increase decrease increase decrease increase - 0.25% + 0.25% - 0.25% + 0.25% - 0.25% + 0.25%
Inflation rate -2.87% +3.00% -3.89% +4.01% n.a. n.a.
decrease increase decrease increase decrease increase - 0.50% + 0.50% - 0.50% + 0.50% - 0.50% + 0.50%
Interest rate +7.45% -6.65% +10.54% -9.23% +8.31% -7.31%
decrease increase decrease increase decrease increase - 0.25% + 0.25% - 0.25% + 0.25% - 0.25% + 0.25%
Inflation rate -2.79% +2.93% -3.72% +3.93% -3.83% +4.08%
31 December 2014
31 December 2013
The following table presents a sensitivity analysis of the effects of an increase/decrease in the most significant actuarial assumptions used to determine the present value of benefit obligations, namely the interest rate, inflation rate and life expectancy.
The sensitivity of the inflation rate includes any effects relating to assumptions about salary increases and increases in pension plan contributions.
31 December 2014
31 December 2013
Germany Great Britain The Netherlands
Germany Great Britain The Netherlands
Germany Great Britain The Netherlands
1-year increase in life expectancy +4.96% +2.71% n.a.
Germany Great Britain The Netherlands
1-year increase in life expectancy +4.36% +2.60% +3.60%
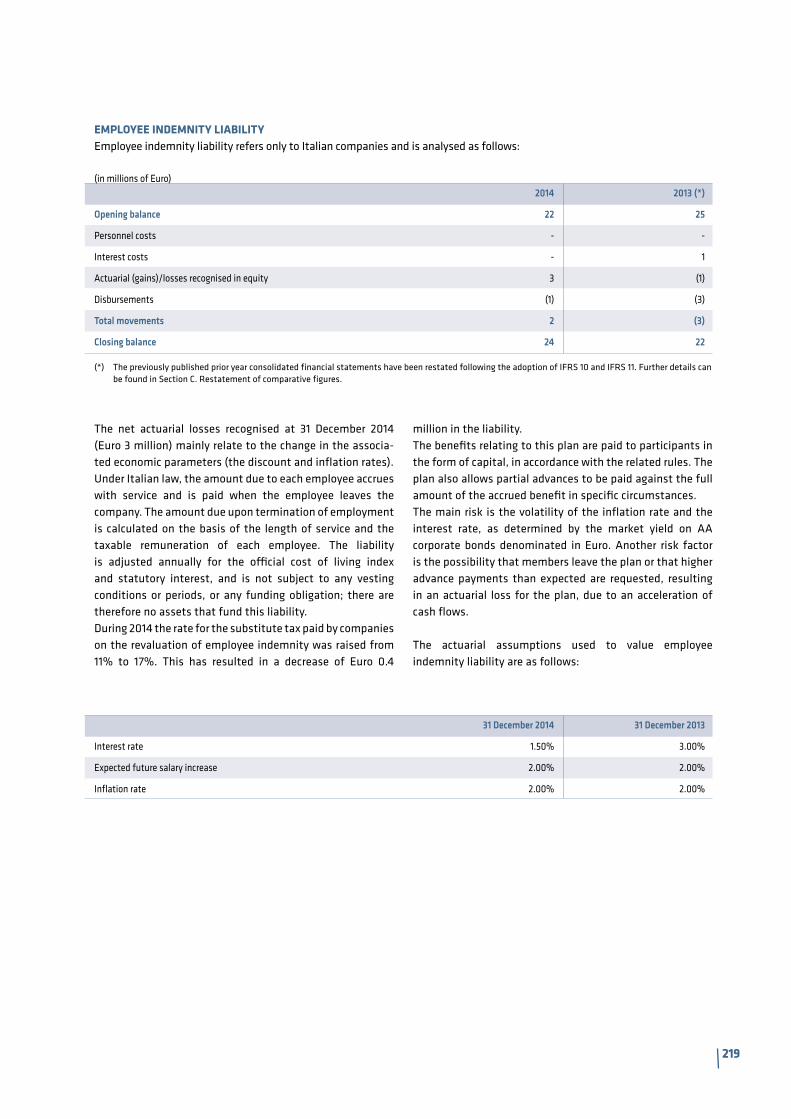
219
EMPLOYEE INDEMNITY LIABILITYEmployee indemnity liability refers only to Italian companies and is analysed as follows:
2014 2013 (*)
Opening balance 22 25
Personnel costs - -
Interest costs - 1
Actuarial (gains)/losses recognised in equity 3 (1)
Disbursements (1) (3)
Total movements 2 (3)
Closing balance 24 22
(*) The previously published prior year consolidated financial statements have been restated following the adoption of IFRS 10 and IFRS 11. Further details can be found in Section C. Restatement of comparative figures.
The net actuarial losses recognised at 31 December 2014 (Euro 3 million) mainly relate to the change in the associa-ted economic parameters (the discount and inflation rates).Under Italian law, the amount due to each employee accrues with service and is paid when the employee leaves the company. The amount due upon termination of employment is calculated on the basis of the length of service and the taxable remuneration of each employee. The liability is adjusted annually for the official cost of living index and statutory interest, and is not subject to any vesting conditions or periods, or any funding obligation; there are therefore no assets that fund this liability.During 2014 the rate for the substitute tax paid by companies on the revaluation of employee indemnity was raised from 11% to 17%. This has resulted in a decrease of Euro 0.4
million in the liability.The benefits relating to this plan are paid to participants in the form of capital, in accordance with the related rules. The plan also allows partial advances to be paid against the full amount of the accrued benefit in specific circumstances.The main risk is the volatility of the inflation rate and the interest rate, as determined by the market yield on AA corporate bonds denominated in Euro. Another risk factor is the possibility that members leave the plan or that higher advance payments than expected are requested, resulting in an actuarial loss for the plan, due to an acceleration of cash flows.
The actuarial assumptions used to value employee indemnity liability are as follows:
31 December 2014 31 December 2013
Interest rate 1.50% 3.00%
Expected future salary increase 2.00% 2.00%
Inflation rate 2.00% 2.00%
(in millions of Euro)
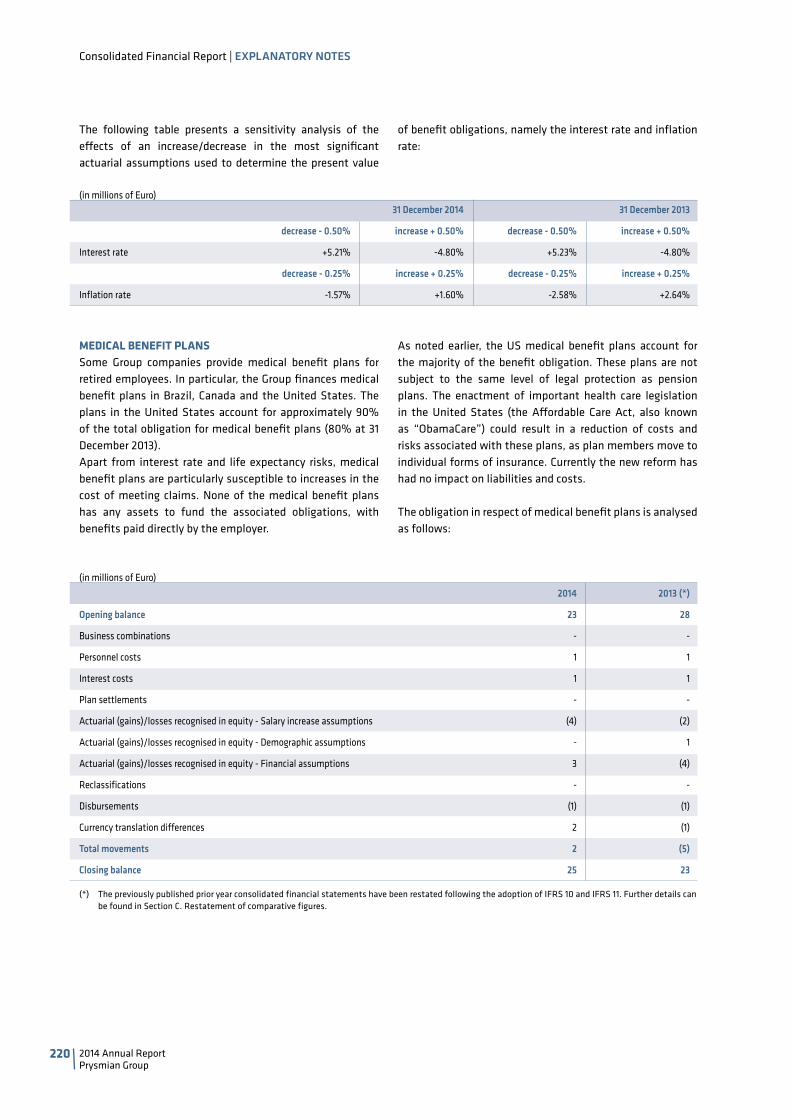
Consolidated Financial Report | EXPLANATORY NOTES
2014 Annual Report Prysmian Group
220
The following table presents a sensitivity analysis of the effects of an increase/decrease in the most significant actuarial assumptions used to determine the present value
of benefit obligations, namely the interest rate and inflation rate:
MEDICAL BENEFIT PLANSSome Group companies provide medical benefit plans for retired employees. In particular, the Group finances medical benefit plans in Brazil, Canada and the United States. The plans in the United States account for approximately 90% of the total obligation for medical benefit plans (80% at 31 December 2013).Apart from interest rate and life expectancy risks, medical benefit plans are particularly susceptible to increases in the cost of meeting claims. None of the medical benefit plans has any assets to fund the associated obligations, with benefits paid directly by the employer.
As noted earlier, the US medical benefit plans account for the majority of the benefit obligation. These plans are not subject to the same level of legal protection as pension plans. The enactment of important health care legislation in the United States (the Affordable Care Act, also known as “ObamaCare”) could result in a reduction of costs and risks associated with these plans, as plan members move to individual forms of insurance. Currently the new reform has had no impact on liabilities and costs.
The obligation in respect of medical benefit plans is analysed as follows:
2014 2013 (*)
Opening balance 23 28
Business combinations - -
Personnel costs 1 1
Interest costs 1 1
Plan settlements - -
Actuarial (gains)/losses recognised in equity - Salary increase assumptions (4) (2)
Actuarial (gains)/losses recognised in equity - Demographic assumptions - 1
Actuarial (gains)/losses recognised in equity - Financial assumptions 3 (4)
Reclassifications - -
Disbursements (1) (1)
Currency translation differences 2 (1)
Total movements 2 (5)
Closing balance 25 23
(*) The previously published prior year consolidated financial statements have been restated following the adoption of IFRS 10 and IFRS 11. Further details can be found in Section C. Restatement of comparative figures.
31 December 2014 31 December 2013
decrease - 0.50% increase + 0.50% decrease - 0.50% increase + 0.50%
Interest rate +5.21% -4.80% +5.23% -4.80%
decrease - 0.25% increase + 0.25% decrease - 0.25% increase + 0.25%
Inflation rate -1.57% +1.60% -2.58% +2.64%
(in millions of Euro)
(in millions of Euro)

221
The actuarial assumptions used to value medical benefit plans are as follows:
The following table presents a sensitivity analysis of the effects of an increase/decrease in the most significant actuarial assumptions used to determine the present value of
benefit obligations, such as the interest rate, inflation rate/growth in medical care costs and life expectancy.
decrease - 0.50% increase + 0.50% decrease - 0.50% increase + 0.50%
Interest rate +9.17% -8.14% +7.40% -6.62%
decrease - 0.26% increase + 0.26% decrease - 0.25% increase + 0.25%
Inflation rate -4.38% +4.81% -3.22% +3.54%
31 December 2014 31 December 2013
1-year increase in life expectancy +3.83% +4.27%
31 December 2014 31 December 2013
Interest rate 4.43% 5.63%
Expected future salary increase 2.85% 3.00%
Increase in claims 5.33% 5.42%
Life expectancy at age 65: Male Female Male Female
People currently aged 65 22.61 24.43 19.16 21.17
People currently aged 50 23.79 25.59 19.37 21.29
31 December 2014 31 December 2013
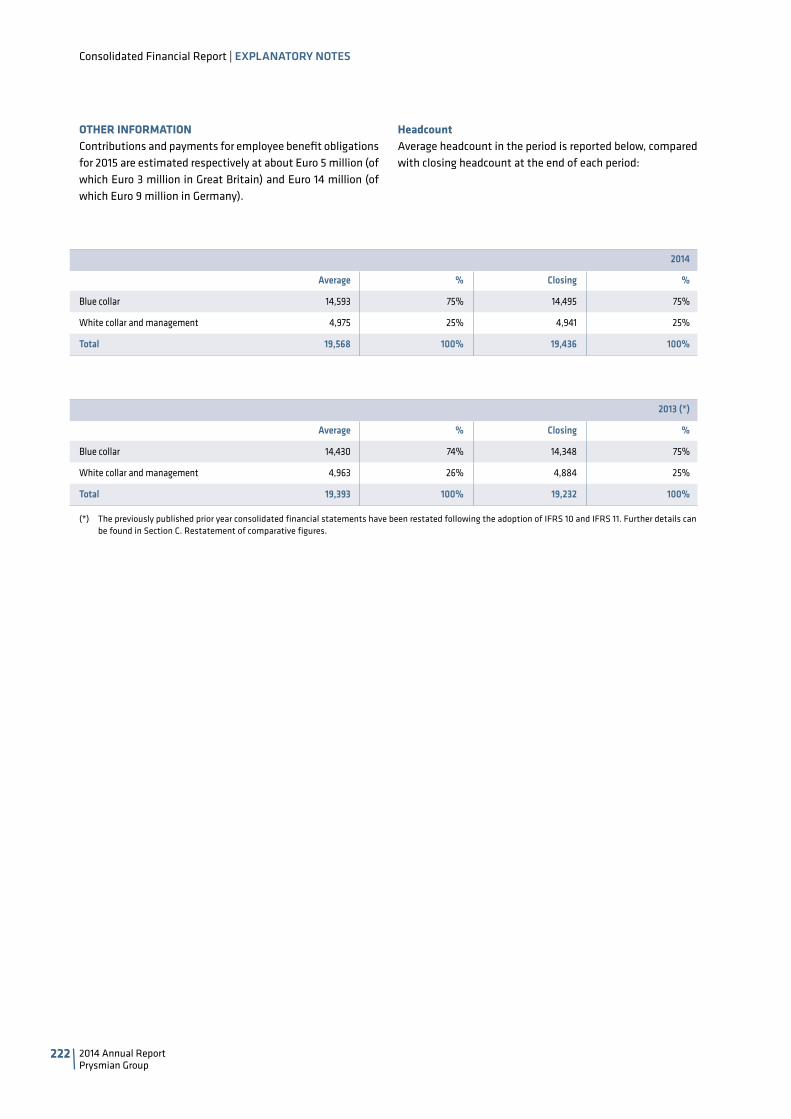
Consolidated Financial Report | EXPLANATORY NOTES
2014 Annual Report Prysmian Group
222
OTHER INFORMATIONContributions and payments for employee benefit obligations for 2015 are estimated respectively at about Euro 5 million (of which Euro 3 million in Great Britain) and Euro 14 million (of which Euro 9 million in Germany).
HeadcountAverage headcount in the period is reported below, compared with closing headcount at the end of each period:
2014
Average % Closing %
Blue collar 14,593 75% 14,495 75%
White collar and management 4,975 25% 4,941 25%
Total 19,568 100% 19,436 100%
2013 (*)
Average % Closing %
Blue collar 14,430 74% 14,348 75%
White collar and management 4,963 26% 4,884 25%
Total 19,393 100% 19,232 100%
(*) The previously published prior year consolidated financial statements have been restated following the adoption of IFRS 10 and IFRS 11. Further details can be found in Section C. Restatement of comparative figures.
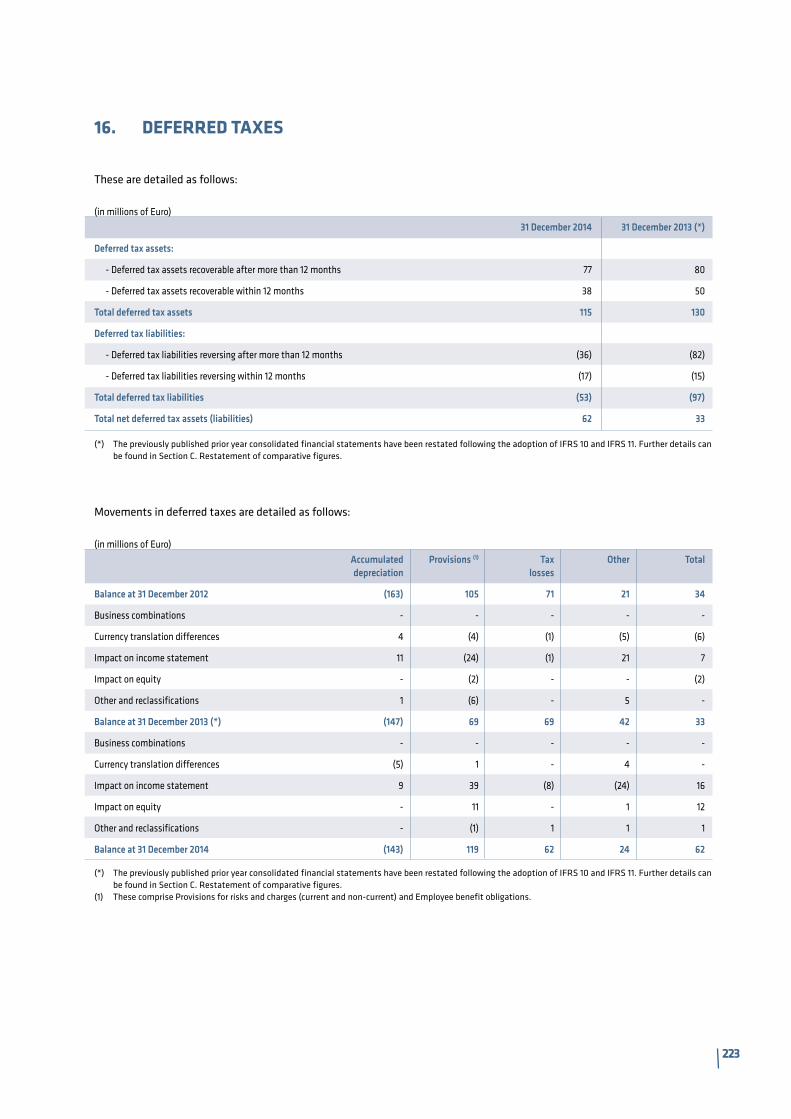
223
16. DEFERRED TAXES
These are detailed as follows:
31 December 2014 31 December 2013 (*)
Deferred tax assets:
- Deferred tax assets recoverable after more than 12 months 77 80
- Deferred tax assets recoverable within 12 months 38 50
Total deferred tax assets 115 130
Deferred tax liabilities:
- Deferred tax liabilities reversing after more than 12 months (36) (82)
- Deferred tax liabilities reversing within 12 months (17) (15)
Total deferred tax liabilities (53) (97)
Total net deferred tax assets (liabilities) 62 33
(*) The previously published prior year consolidated financial statements have been restated following the adoption of IFRS 10 and IFRS 11. Further details can be found in Section C. Restatement of comparative figures.
Movements in deferred taxes are detailed as follows:
Accumulated Provisions (1) Tax Other Total depreciation losses
Balance at 31 December 2012 (163) 105 71 21 34
Business combinations - - - - -
Currency translation differences 4 (4) (1) (5) (6)
Impact on income statement 11 (24) (1) 21 7
Impact on equity - (2) - - (2)
Other and reclassifications 1 (6) - 5 -
Balance at 31 December 2013 (*) (147) 69 69 42 33
Business combinations - - - - -
Currency translation differences (5) 1 - 4 -
Impact on income statement 9 39 (8) (24) 16
Impact on equity - 11 - 1 12
Other and reclassifications - (1) 1 1 1
Balance at 31 December 2014 (143) 119 62 24 62
(*) The previously published prior year consolidated financial statements have been restated following the adoption of IFRS 10 and IFRS 11. Further details can be found in Section C. Restatement of comparative figures.
(1) These comprise Provisions for risks and charges (current and non-current) and Employee benefit obligations.
(in millions of Euro)
(in millions of Euro)
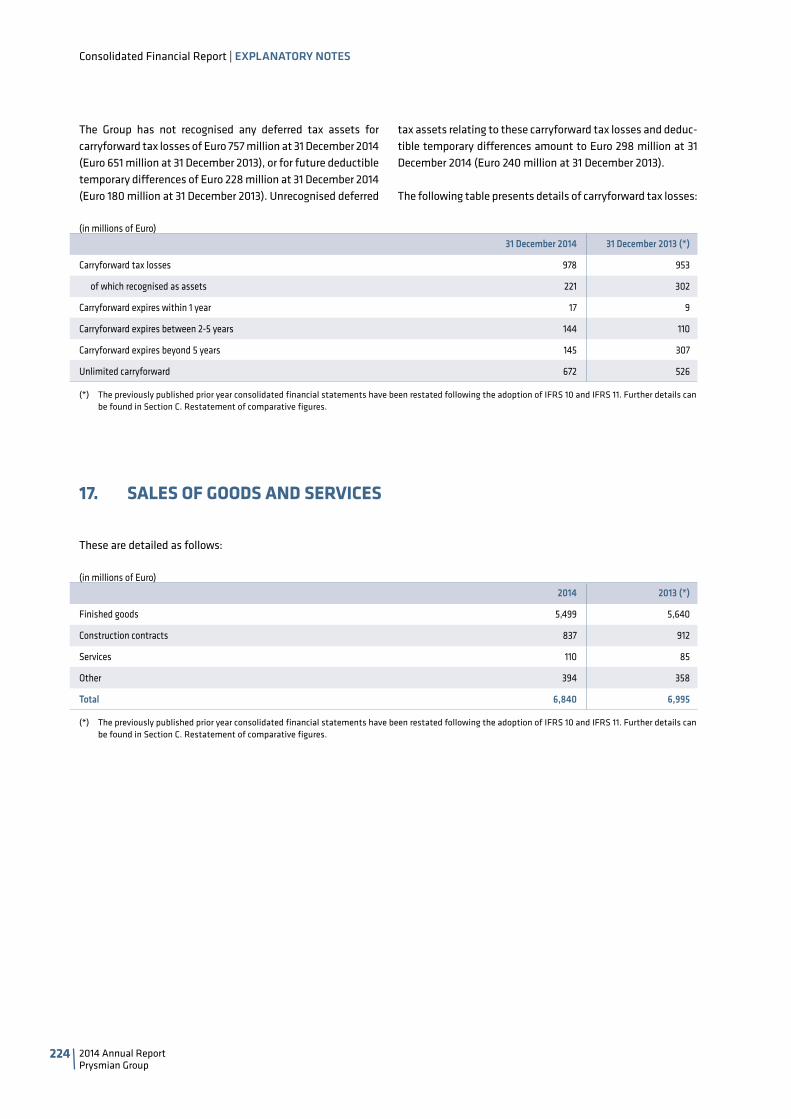
Consolidated Financial Report | EXPLANATORY NOTES
2014 Annual Report Prysmian Group
224
The Group has not recognised any deferred tax assets for carryforward tax losses of Euro 757 million at 31 December 2014 (Euro 651 million at 31 December 2013), or for future deductible temporary differences of Euro 228 million at 31 December 2014 (Euro 180 million at 31 December 2013). Unrecognised deferred
tax assets relating to these carryforward tax losses and deduc-tible temporary differences amount to Euro 298 million at 31 December 2014 (Euro 240 million at 31 December 2013).
The following table presents details of carryforward tax losses:
31 December 2014 31 December 2013 (*)
Carryforward tax losses 978 953
of which recognised as assets 221 302
Carryforward expires within 1 year 17 9
Carryforward expires between 2-5 years 144 110
Carryforward expires beyond 5 years 145 307
Unlimited carryforward 672 526
(*) The previously published prior year consolidated financial statements have been restated following the adoption of IFRS 10 and IFRS 11. Further details can be found in Section C. Restatement of comparative figures.
17. SALES OF GOODS AND SERVICES
These are detailed as follows:
2014 2013 (*)
Finished goods 5,499 5,640
Construction contracts 837 912
Services 110 85
Other 394 358
Total 6,840 6,995
(*) The previously published prior year consolidated financial statements have been restated following the adoption of IFRS 10 and IFRS 11. Further details can be found in Section C. Restatement of comparative figures.
(in millions of Euro)
(in millions of Euro)

225
18. CHANGE IN INVENTORIES OF WORK IN PROGRESS, SEMI-FINISHED AND FINISHED GOODS
This is detailed as follows:
2014 2013 (*)
Finished goods 18 18
Work in progress 10 10
Total 28 28
(*) The previously published prior year consolidated financial statements have been restated following the adoption of IFRS 10 and IFRS 11. Further details can be found in Section C. Restatement of comparative figures.
19. OTHER INCOME
This is detailed as follows:
2014 2013 (*)
Rental income 1 1
Insurance reimbursements and indemnities 38 6
Gains on disposal of property 1 2
Other income 36 43
Non-recurring other income:
Effect of YOFC dilution 8 -
Gains on asset disposals - 5
Acquisition purchase price adjustment 22 -
Non-recurring other income 7 5
Total non-recurring other income 37 10
Total 113 62
(*) The previously published prior year consolidated financial statements have been restated following the adoption of IFRS 10 and IFRS 11. Further details can be found in Section C. Restatement of comparative figures.
“Insurance reimbursements and indemnities” include the compensation paid by insurance companies for the value of the cables transported on the AMT Explorer rotating platform which sank in July 2014.
“Non-recurring other income” includes Euro 5 million for the insurance reimbursement received for the rotating platform loaded aboard the AMT Explorer cable barge, which capsized at sea in July 2014.
(in millions of Euro)
(in millions of Euro)
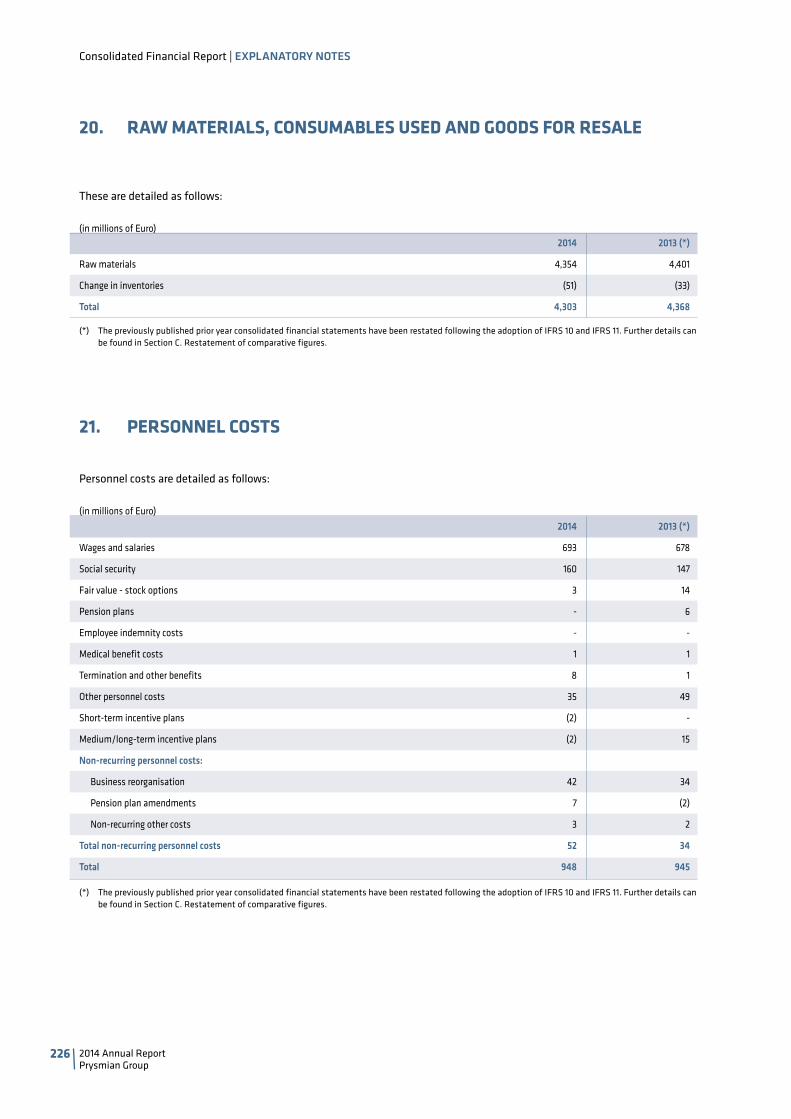
Consolidated Financial Report | EXPLANATORY NOTES
2014 Annual Report Prysmian Group
226
20. RAW MATERIALS, CONSUMABLES USED AND GOODS FOR RESALE
These are detailed as follows:
2014 2013 (*)
Raw materials 4,354 4,401
Change in inventories (51) (33)
Total 4,303 4,368
(*) The previously published prior year consolidated financial statements have been restated following the adoption of IFRS 10 and IFRS 11. Further details can be found in Section C. Restatement of comparative figures.
21. PERSONNEL COSTS
Personnel costs are detailed as follows:
2014 2013 (*)
Wages and salaries 693 678
Social security 160 147
Fair value - stock options 3 14
Pension plans - 6
Employee indemnity costs - -
Medical benefit costs 1 1
Termination and other benefits 8 1
Other personnel costs 35 49
Short-term incentive plans (2) -
Medium/long-term incentive plans (2) 15
Non-recurring personnel costs:
Business reorganisation 42 34
Pension plan amendments 7 (2)
Non-recurring other costs 3 2
Total non-recurring personnel costs 52 34
Total 948 945
(*) The previously published prior year consolidated financial statements have been restated following the adoption of IFRS 10 and IFRS 11. Further details can be found in Section C. Restatement of comparative figures.
(in millions of Euro)
(in millions of Euro)

227
Share-based paymentsAt 31 December 2014 and 31 December 2013, the Prysmian Group had share-based compensation plans in place for managers and employees of Group companies and for members of the Parent Company’s Board of Directors. These plans are described below.
Long-term incentive plan 2011-2013On 14 April 2011, the Ordinary Shareholders’ Meeting of Prysmian S.p.A. had approved, pursuant to art. 114-bis of Legi-slative Decree 58/98, a long-term incentive plan for the period 2011-2013 for employees of the Prysmian Group, including certain members of the Board of Directors of Prysmian S.p.A., and granted the Board of Directors the necessary authority to establish and execute the plan. The plan’s purpose was to incentivise the process of integration following Prysmian’s acquisition of the Draka Group.The plan involved 268 employees of Group companies and established that the number of options granted would depend on the achievement of common business and financial perfor-mance objectives for all the participants.The plan was dependent upon achievement of a minimum performance objective of at least Euro 1.75 billion in aggregate Adj. EBITDA for the Group in the period 2011-2013 (the Target), as well as upon continuation of a professional relationship with the Group up until 31 December 2013. The plan also set an upper limit for Adj. EBITDA as the Target plus 20% (i.e. Euro 2.1 billion), that would determine the maximum number of exercisable options granted to each participant.
Access to the plan was conditional upon each participant’s acceptance that part of their annual bonus would be co-invested, if achieved and payable in relation to financial years 2011 and 2012.The allotted options carried the right to receive or subscribe to ordinary shares in Prysmian S.p.A., the Parent Company. These shares partly comprised treasury shares and partly new shares, obtained through a capital increase that excluded pre-emptive rights under art. 2441, par. 8 of the Italian Civil Code. Such a capital increase has involved the issue of 2,120,687 new ordinary shares of nominal value Euro 0.10 each, for a total nominal value of Euro 212,069, as approved by the sharehol-ders in the extraordinary session of their meeting on 14 April 2011. The shares obtained from the Company’s holding of treasury shares were allotted for zero consideration, while the shares obtained from the above capital increase were allotted to participants upon payment of an exercise price correspon-ding to the nominal value of the Company’s shares.
In accordance with IFRS 2, the options allotted in respect of both new and treasury shares were measured at their grant date fair value. The number of options actually allocated to each participant was determined according to the actual aggregate Adj. EBITDA achieved, which lay between the Target and the Adj. EBITDA upper limit.
The following table provides additional details about the plan:
For consideration For no consideration Number of options (*) Exercise price Number of options (*) Exercise price
Options at start of year 2,131,500 0.10 1,416,309 -
Granted - - - -
Variation for target remeasurement - - 2,429 -
Cancelled (2,288) 0.10 (1,521) -
Exercised (2,120,687) 0.10 (1,411,552) -
Options at end of year 8,525 0.10 5,665 -
of which vested at end of year 8,525 0.10 5,665 -
of which exercisable 8,525 0.10 5,665 -
of which not vested at end of year - - - -
(*) The number of options shown was determined based on cumulative EBITDA for the three years 2011-2013.
(in Euro)

Consolidated Financial Report | EXPLANATORY NOTES
2014 Annual Report Prysmian Group
228
Since the plan vested in full at 31 December 2013, no further costs were recognised in 2014.As at 31 December 2014, the options had vested and been exercised as follows:• 2,120,687 exercised for consideration (exercise price of
Euro 0.10);• 1,411,552 exercised for no consideration.
Group employee share purchase plan (YES Plan)On 16 April 2013, the shareholders approved a share purchase plan reserved for employees of Prysmian S.p.A. and/or of its subsidiaries, including some of the Company’s Directors, and granted the Board of Directors the relevant powers to establish and implement this plan.The reasons behind the introduction of the Plan are: • to strengthen the sense of belonging to the Group
by offering employees an opportunity to share in its successes, through equity ownership;
• to align the interests of the Prysmian Group’s stakehol-ders (its employees and shareholders), by identifying a common goal of creating long-term value;
• to help consolidate the integration process started in the wake of the Draka Group’s acquisition.
The Plan offers the opportunity to purchase Prysmian’s ordinary shares on preferential terms, with a maximum discount of 25% on the stock price, given in the form of treasury shares, except for certain managers, for whom the discount is 15%, and the executive Directors and key management personnel, for whom the discount is 1% of the stock price.The Plan therefore qualifies as “of particular relevance” within the meaning of art. 84-bis, par. 2 of the Issuer Re-gulations.A maximum number of 500,000 treasury shares have been earmarked to serve the discounted purchases envisaged by the Plan. During the month of October 2013, the plan was presented and explained to some 16,000 of the Group’s employees in 27 countries. Employees had until the end of December 2013
to communicate their wish to participate in the Plan, the amount they intended to invest in the first purchase window and the method of payment. The amount collected in the month of April 2014, totalling Euro 6.4 million, was used to make purchases of the Company’s ordinary shares on the Milan Stock Exchange (MTA) over a period of 5 consecutive business days during the month of May 2014. The number of treasury shares allotted to each participant was determined by taking into account the average share purchase price (Euro 16.2629), the individual investment and the applicable discount percentage.All the plan’s participants also received an entry bonus of six free shares, also taken from the Company’s portfolio of treasury shares, only available at the time of first purchase.The shares purchased by participants, as well as those received by way of discount and entry bonus, are generally subject to a retention period during which they cannot be sold and the length of which varies according to local regu-lations.On 9 June 2014, an additional purchase window was opened for plan participants in the “Manager” category who had already bought shares in the purchase window in May and who were so entitled under the plan’s regulations. Managers opting to participate in this additional window were able to buy an additional quantity of shares at a 25% discount. The total of Euro 0.7 million collected in this additional window was used to make purchases of the Company’s ordinary shares on the Milan Stock Exchange over a period of 5 consecutive business days during the month of July 2014. The number of treasury shares allotted to each participant was determined by taking into account the average share purchase price (Euro 16.3585), the individual investment and the applicable discount.During the month of December 2014, employees were informed of the opening of the plan’s second cycle in 2015. Employees had until the third week of February 2015 to sign up for the second cycle and to communicate the amount they intended to invest. The total amount collected will be used to make purchases of the Company’s shares on the Milan Stock Exchange (MTA) during the month of July 2015.

229
1st Window (2014) 2nd Window (2015) 3rd Window (2016)
Grant date 13 November 2013 13 November 2013 13 November 2013
Share purchase date 19 May 2014 19 May 2015 19 May 2016
End of retention period 19 May 2017 19 May 2018 19 May 2019
Residual life at grant date (in years) 0.35 1.35 2.35
Share price at grant date (Euro) 18.30 18.30 18.30
Expected volatility 29.27% 30.11% 36.79%
Risk-free interest rate 0.03% 0.05% 0.20%
Expected dividend % 2.83% 2.83% 2.83%
Option fair value at grant date (Euro) 18.04 17.54 17.11
A total of Euro 3 million in costs for the fair value of options granted under this plan have been recognised as “Personnel costs” in the income statement for the year ended 31
December 2014.The following table provides additional details about movements in the plan:
31 December 2014 31 December 2013 Number of options Number of options
Options at start of year 300,682 -
Granted (*) 43,725 300,682
Change in expected adhesions (**) (17,748) -
Cancelled - -
Exercised (162,650) -
Options at end of year 164,009 300,682
of which vested at end of year - -
of which exercisable - -
of which not vested at end of year 164,009 300,682
(*) The number of options refers to the adhesions to the additional purchase windows reserved for Managers (actual numbers for the first year and expected numbers for the next two years).
(**) The number of options has been revised for the actual number of adhesions in the first window.
The information memorandum, prepared under art. 114-bis of Legislative Decree 58/98 and describing the characteristics of the above plan, is publicly available on the Company’s website at www.prysmiangroup.com, from its registered offices and from Borsa Italiana S.p.A.. As at 31 December 2014, there are no outstanding loans or guarantees by the Parent Company or its subsidiaries to any of the directors, senior managers or statutory auditors.
Long-term incentive plan 2014-2016The Shareholders’ Meeting held on 16 April 2014 approved an incentive plan for the Group’s employees, including members of the Board of Directors of Prysmian S.p.A., and granted the Board of Directors the necessary powers to establish and implement this plan.As a result of the effects of the Western HVDC Link contract (UK), the Board of Directors has decided not to execute the mandate received from the shareholders allowing implemen-tation of this plan.
The fair value of the options has been determined using the Montecarlo model, based on the following assumptions:

Consolidated Financial Report | EXPLANATORY NOTES
2014 Annual Report Prysmian Group
230
22. AMORTISATION, DEPRECIATION AND IMPAIRMENT
These are detailed as follows:
2014 2013 (*)
Depreciation of buildings, plant, machinery and equipment 104 107
Depreciation of other property, plant and equipment 10 9
Amortisation of intangible assets 30 32
Non-recurring impairment:
Net impairment of property, plant and equipment (1) 23 25
Net impairment of intangible assets 21 -
Total non-recurring impairment 44 25
Total 188 173
(*) The previously published prior year consolidated financial statements have been restated following the adoption of IFRS 10 and IFRS 11. Further details can be found in Section C. Restatement of comparative figures.
(1) The figure at 31 December 2014 includes Euro 18 million in reinstatements of value of previously impaired assets (at 31 December 2013 reinstatements amounted to Euro 1 million).
(in millions of Euro)
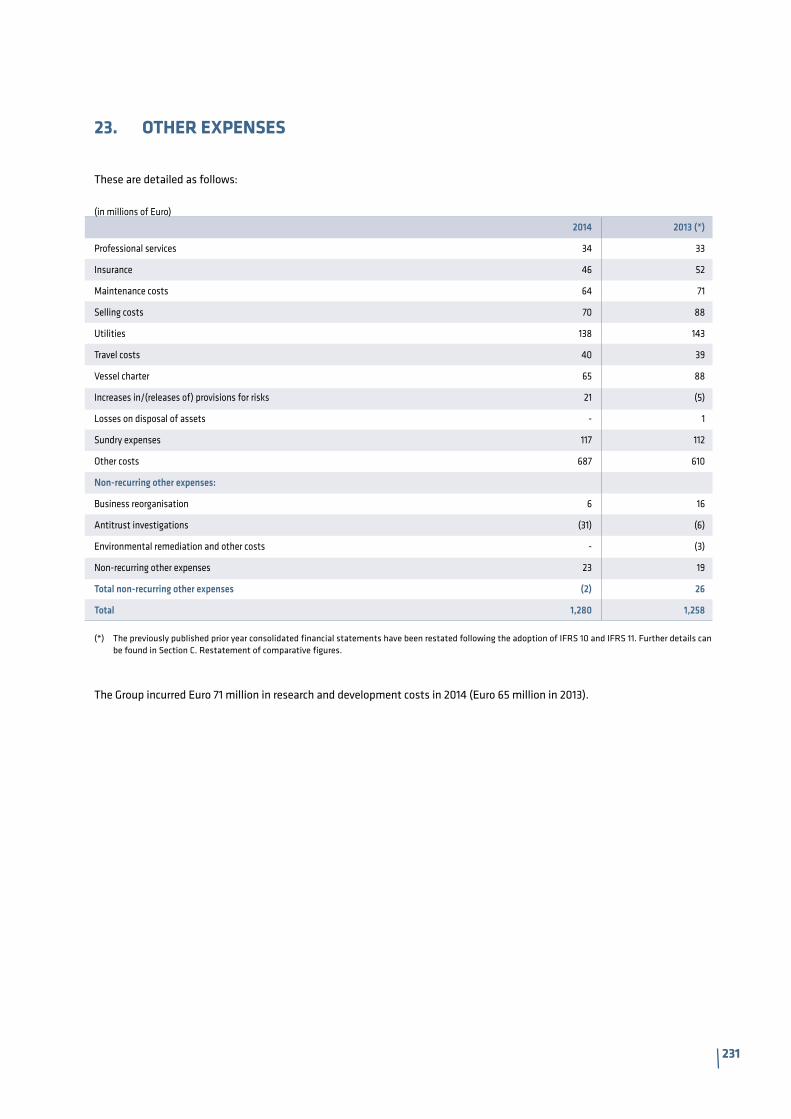
231
23. OTHER EXPENSES
These are detailed as follows:
2014 2013 (*)
Professional services 34 33
Insurance 46 52
Maintenance costs 64 71
Selling costs 70 88
Utilities 138 143
Travel costs 40 39
Vessel charter 65 88
Increases in/(releases of) provisions for risks 21 (5)
Losses on disposal of assets - 1
Sundry expenses 117 112
Other costs 687 610
Non-recurring other expenses:
Business reorganisation 6 16
Antitrust investigations (31) (6)
Environmental remediation and other costs - (3)
Non-recurring other expenses 23 19
Total non-recurring other expenses (2) 26
Total 1,280 1,258
(*) The previously published prior year consolidated financial statements have been restated following the adoption of IFRS 10 and IFRS 11. Further details can be found in Section C. Restatement of comparative figures.
The Group incurred Euro 71 million in research and development costs in 2014 (Euro 65 million in 2013).
(in millions of Euro)

Consolidated Financial Report | EXPLANATORY NOTES
2014 Annual Report Prysmian Group
232
24. SHARE OF NET PROFIT/(LOSS) OF EQUITY-ACCOUNTED COMPANIES
This is detailed as follows:
2014 2013 (*)
Share of net profit/(loss) of equity-accounted associates 26 16
Share of net profit/(loss) of equity-accounted joint ventures 17 19
Total 43 35
(*) The previously published prior year consolidated financial statements have been restated following the adoption of IFRS 10 and IFRS 11. Further details can be found in Section C. Restatement of comparative figures.
Futher information can be found in Note 3. Equity-accounted investments.
25. FINANCE COSTS
These are detailed as follows:
2014 2013 (*)
Interest on syndicated loans 9 12
Interest on non-convertible bond 21 21
Interest on convertible bond - non-monetary component 8 6
Interest on convertible bond - monetary component 4 3
Amortisation of bank and financial fees and other expenses 7 8
Employee benefit interest costs 11 11
Other bank interest 17 18
Costs for undrawn credit lines 5 4
Sundry bank fees 12 14
Non-recurring other finance costs 14 7
Other 22 26
Finance costs 130 130
Net losses on forward currency contracts 12 -
Non-recurring net losses on interest rate swaps 4 15
Losses on derivatives 16 15
Foreign currency exchange losses 333 290
Total finance costs 479 435
(*) The previously published prior year consolidated financial statements have been restated following the adoption of IFRS 10 and IFRS 11. Further details can be found in Section C. Restatement of comparative figures.
(in millions of Euro)
(in millions of Euro)

233
26. FINANCE INCOME
This is detailed as follows:
2014 2013 (*)
Interest income from banks and other financial institutions 7 7
Other finance income 1 2
Non-recurring other finance income 4 -
Finance income 12 9
Net gains on interest rate swaps 14 6
Net gains on forward currency contracts - 7
Gains on derivatives 14 13
Foreign currency exchange gains 313 263
Total finance income 339 285
(*) The previously published prior year consolidated financial statements have been restated following the adoption of IFRS 10 and IFRS 11. Further details can be found in Section C. Restatement of comparative figures.
Non-recurring other finance costs report Euro 2 million for the accelerated amortisation of bank fees relating to the Credit Agreement 2010, after repaying the Term Loan Facility 2010 early and extinguishing the Revolving Credit Facility 2010. This early repayment has also led to the discontinuance of cash flow hedge accounting, resulting in the recognition of net losses of Euro 4 million on interest rate swaps, which have been classified in “Non-recurring net losses on interest rate swaps”.
“Other” finance costs include Euro 17 million for differentials accruing on interest rate swaps, of which Euro 14 million in relation to instruments for which hedge accounting was discontinued following the early repayment above. This last figure is largely offset by the fair value measurement of the related derivatives, reported in “Net gains on interest rate swaps”. In addition to the costs concerning the Credit Agreement 2010, non-recurring other finance costs include Euro 9 million in interest and charges accruing on legal disputes.
Non-recurring other finance income includes Euro 4 million in interest received in connection with a legal dispute.
27. TAXES
These are detailed as follows:
2014 2013 (*)
Current income taxes 73 72
Deferred income taxes (16) (7)
Total 57 65
(*) The previously published prior year consolidated financial statements have been restated following the adoption of IFRS 10 and IFRS 11. Further details can be found in Section C. Restatement of comparative figures.
(in millions of Euro)
(in millions of Euro)
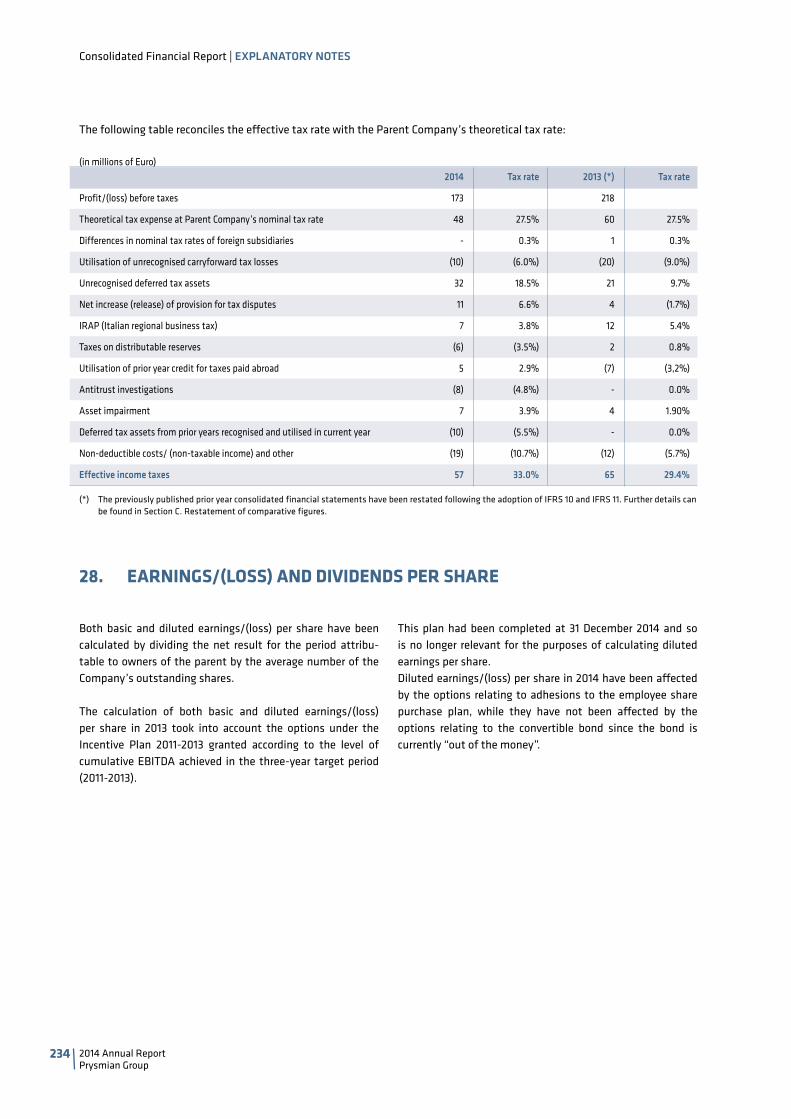
Consolidated Financial Report | EXPLANATORY NOTES
2014 Annual Report Prysmian Group
234
The following table reconciles the effective tax rate with the Parent Company’s theoretical tax rate:
2014 Tax rate 2013 (*) Tax rate
Profit/(loss) before taxes 173 218
Theoretical tax expense at Parent Company’s nominal tax rate 48 27.5% 60 27.5%
Differences in nominal tax rates of foreign subsidiaries - 0.3% 1 0.3%
Utilisation of unrecognised carryforward tax losses (10) (6.0%) (20) (9.0%)
Unrecognised deferred tax assets 32 18.5% 21 9.7%
Net increase (release) of provision for tax disputes 11 6.6% 4 (1.7%)
IRAP (Italian regional business tax) 7 3.8% 12 5.4%
Taxes on distributable reserves (6) (3.5%) 2 0.8%
Utilisation of prior year credit for taxes paid abroad 5 2.9% (7) (3,2%)
Antitrust investigations (8) (4.8%) - 0.0%
Asset impairment 7 3.9% 4 1.90%
Deferred tax assets from prior years recognised and utilised in current year (10) (5.5%) - 0.0%
Non-deductible costs/ (non-taxable income) and other (19) (10.7%) (12) (5.7%)
Effective income taxes 57 33.0% 65 29.4%
(*) The previously published prior year consolidated financial statements have been restated following the adoption of IFRS 10 and IFRS 11. Further details can be found in Section C. Restatement of comparative figures.
28. EARNINGS/(LOSS) AND DIVIDENDS PER SHARE
Both basic and diluted earnings/(loss) per share have been calculated by dividing the net result for the period attribu-table to owners of the parent by the average number of the Company’s outstanding shares.
The calculation of both basic and diluted earnings/(loss) per share in 2013 took into account the options under the Incentive Plan 2011-2013 granted according to the level of cumulative EBITDA achieved in the three-year target period (2011-2013).
This plan had been completed at 31 December 2014 and so is no longer relevant for the purposes of calculating diluted earnings per share.Diluted earnings/(loss) per share in 2014 have been affected by the options relating to adhesions to the employee share purchase plan, while they have not been affected by the options relating to the convertible bond since the bond is currently “out of the money”.
(in millions of Euro)
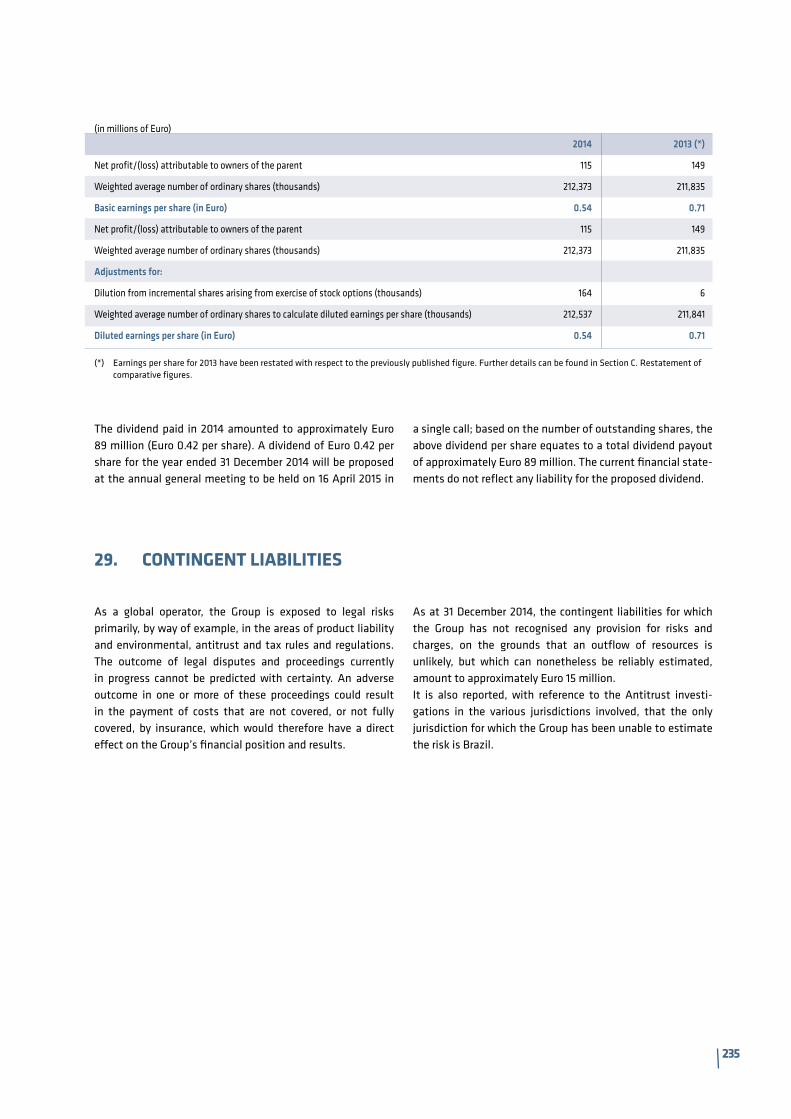
235
2014 2013 (*)
Net profit/(loss) attributable to owners of the parent 115 149
Weighted average number of ordinary shares (thousands) 212,373 211,835
Basic earnings per share (in Euro) 0.54 0.71
Net profit/(loss) attributable to owners of the parent 115 149
Weighted average number of ordinary shares (thousands) 212,373 211,835
Adjustments for:
Dilution from incremental shares arising from exercise of stock options (thousands) 164 6
Weighted average number of ordinary shares to calculate diluted earnings per share (thousands) 212,537 211,841
Diluted earnings per share (in Euro) 0.54 0.71
(*) Earnings per share for 2013 have been restated with respect to the previously published figure. Further details can be found in Section C. Restatement of comparative figures.
The dividend paid in 2014 amounted to approximately Euro 89 million (Euro 0.42 per share). A dividend of Euro 0.42 per share for the year ended 31 December 2014 will be proposed at the annual general meeting to be held on 16 April 2015 in
a single call; based on the number of outstanding shares, the above dividend per share equates to a total dividend payout of approximately Euro 89 million. The current financial state-ments do not reflect any liability for the proposed dividend.
29. CONTINGENT LIABILITIES
As a global operator, the Group is exposed to legal risks primarily, by way of example, in the areas of product liability and environmental, antitrust and tax rules and regulations. The outcome of legal disputes and proceedings currently in progress cannot be predicted with certainty. An adverse outcome in one or more of these proceedings could result in the payment of costs that are not covered, or not fully covered, by insurance, which would therefore have a direct effect on the Group’s financial position and results.
As at 31 December 2014, the contingent liabilities for which the Group has not recognised any provision for risks and charges, on the grounds that an outflow of resources is unlikely, but which can nonetheless be reliably estimated, amount to approximately Euro 15 million. It is also reported, with reference to the Antitrust investi-gations in the various jurisdictions involved, that the only jurisdiction for which the Group has been unable to estimate the risk is Brazil.
(in millions of Euro)
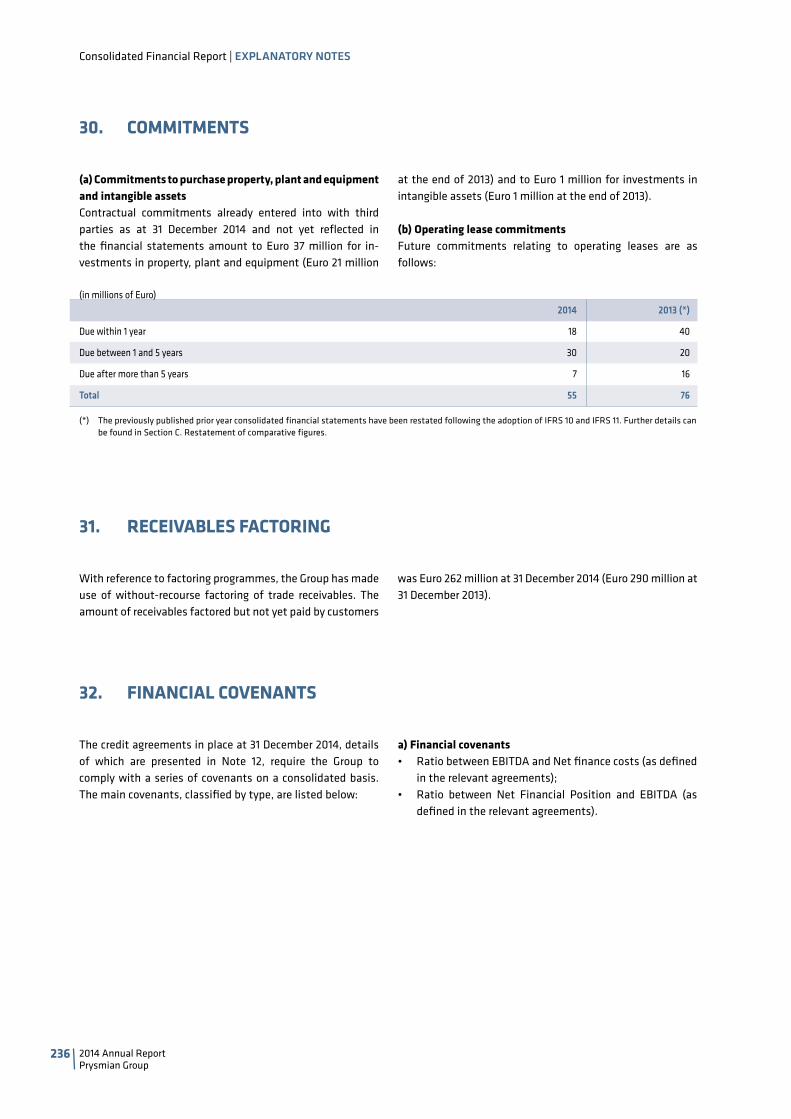
Consolidated Financial Report | EXPLANATORY NOTES
2014 Annual Report Prysmian Group
236
30. COMMITMENTS
(a) Commitments to purchase property, plant and equipment and intangible assetsContractual commitments already entered into with third parties as at 31 December 2014 and not yet reflected in the financial statements amount to Euro 37 million for in-vestments in property, plant and equipment (Euro 21 million
at the end of 2013) and to Euro 1 million for investments in intangible assets (Euro 1 million at the end of 2013).
(b) Operating lease commitmentsFuture commitments relating to operating leases are as follows:
2014 2013 (*)
Due within 1 year 18 40
Due between 1 and 5 years 30 20
Due after more than 5 years 7 16
Total 55 76
(*) The previously published prior year consolidated financial statements have been restated following the adoption of IFRS 10 and IFRS 11. Further details can be found in Section C. Restatement of comparative figures.
31. RECEIVABLES FACTORING
With reference to factoring programmes, the Group has made use of without-recourse factoring of trade receivables. The amount of receivables factored but not yet paid by customers
was Euro 262 million at 31 December 2014 (Euro 290 million at 31 December 2013).
32. FINANCIAL COVENANTS
The credit agreements in place at 31 December 2014, details of which are presented in Note 12, require the Group to comply with a series of covenants on a consolidated basis. The main covenants, classified by type, are listed below:
a) Financial covenants• Ratio between EBITDA and Net finance costs (as defined
in the relevant agreements);• Ratio between Net Financial Position and EBITDA (as
defined in the relevant agreements).
(in millions of Euro)

237
The covenants contained in the various credit agreements are as follows:
EBITDA/Net finance costs (1) Net financial position/EBITDA (1) not less than not more than
Credit Agreement 2011 5.50x 2.50x
EIB Loan 5.50x 2.50x
Credit Agreement 2014 4.00x 3.00x
Revolving Credit Facility 2014 4.00x 3.00x
b) Non-financial covenantsA number of non-financial covenants have been established in line with market practice applying to transactions of a similar size and nature. These covenants involve a series of restrictions on the grant of secured guarantees to third parties, on the conduct of acquisitions or equity transactions, and on amendments to the Company’s by-laws.
Default eventsThe main default events are as follows: • default on loan repayment obligations; • breach of financial covenants;• breach of some of the non-financial covenants;
• declaration of bankruptcy or subjection of Group companies to other insolvency proceedings;
• issuance of particularly significant judicial rulings; • occurrence of events that may adversely and significantly
affect the business, the assets or the financial conditions of the Group.
Should a default event occur, the lenders are entitled to demand full or partial repayment of the amounts lent and not yet repaid, together with interest and any other amount due. No collateral security is required.
Actual financial ratios reported at period end are as follows:
(1) The ratios are calculated on the basis of the definitions contained in the relevant credit agreements.
31 December 2014 31 December 2013 (*)
EBITDA / Net finance costs (1) 5.82 6.99
Net financial position / EBITDA (1) 1.50 1.27
(1) The ratios are calculated on the basis of the definitions contained in the relevant credit agreements.(*) The financial covenants have been recalculated following restatement of the previously published figures for the adoption of IFRS 10 and 11, the adoption
of a new method of classifying the share of net profit/(loss) of associates and joint ventures and of different timing for recognising the cash component of the 2011-2013 incentive plan.
The above financial ratios comply with both the covenants contained in the relevant credit agreements and there are no instances of non-compliance with the financial and non-financial covenants indicated above.

Consolidated Financial Report | EXPLANATORY NOTES
2014 Annual Report Prysmian Group
238
33. RELATED PARTY TRANSACTIONS
Transactions between Prysmian S.p.A. and its subsidiaries and associates mainly refer to:• trade relations involving intercompany purchases and
sales of raw materials and finished goods;• services (technical, organisational and general) provided
by head office for the benefit of group companies;• recharge of royalties for the use of trademarks, patents
and technological know-how by group companies;• financial relations maintained by Group treasury
companies on behalf of, and with, Group companies.
The disclosures of related party transactions also include the compensation paid to Directors, Statutory Auditors and Key Management Personnel.
All the above transactions form part of the Group’s continuing operations.
The following tables summarise related party transactions in the years ended 31 December 2014 and 31 December 2013:
31 December 2014 Equity-accounted Trade and other Trade and other investments receivables payables
Equity-accounted companies 225 10 7
Other related parties:
Compensation of Directors, Statutory Auditors and Key Management Personnel - - 1
Total 225 10 8
31 December 2013 (*) Equity-accounted Trade and other Trade and other investments receivables payables
Equity-accounted companies 205 13 5
Other related parties:
Compensation of Directors, Statutory Auditors and Key Management Personnel - - 16
Total 205 13 21
(*) The previously published prior year consolidated financial statements have been restated following the adoption of IFRS 10 and IFRS 11. Further details can be found in Section C. Restatement of comparative figures.
(in millions of Euro)
(in millions of Euro)
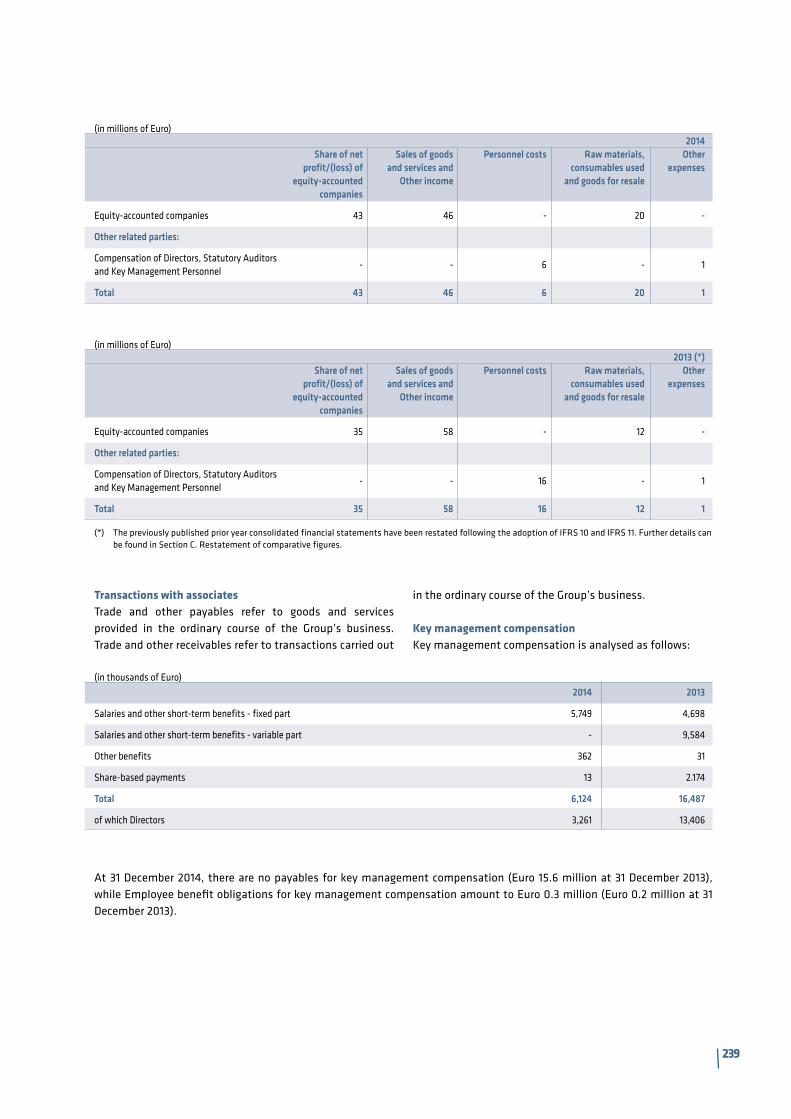
239
2014 Share of net Sales of goods Personnel costs Raw materials, Other profit/(loss) of and services and consumables used expenses equity-accounted Other income and goods for resale companies
Equity-accounted companies 43 46 - 20 -
Other related parties:
Compensation of Directors, Statutory Auditorsand Key Management Personnel
- - 6 - 1
Total 43 46 6 20 1
2013 (*) Share of net Sales of goods Personnel costs Raw materials, Other profit/(loss) of and services and consumables used expenses equity-accounted Other income and goods for resale companies
Equity-accounted companies 35 58 - 12 -
Other related parties:
Compensation of Directors, Statutory Auditorsand Key Management Personnel
- - 16 - 1
Total 35 58 16 12 1
(*) The previously published prior year consolidated financial statements have been restated following the adoption of IFRS 10 and IFRS 11. Further details can be found in Section C. Restatement of comparative figures.
Transactions with associates Trade and other payables refer to goods and services provided in the ordinary course of the Group’s business. Trade and other receivables refer to transactions carried out
in the ordinary course of the Group’s business.
Key management compensationKey management compensation is analysed as follows:
2014 2013
Salaries and other short-term benefits - fixed part 5,749 4,698
Salaries and other short-term benefits - variable part - 9,584
Other benefits 362 31
Share-based payments 13 2.174
Total 6,124 16,487
of which Directors 3,261 13,406
At 31 December 2014, there are no payables for key management compensation (Euro 15.6 million at 31 December 2013), while Employee benefit obligations for key management compensation amount to Euro 0.3 million (Euro 0.2 million at 31 December 2013).
(in thousands of Euro)
(in millions of Euro)
(in millions of Euro)

Consolidated Financial Report | EXPLANATORY NOTES
2014 Annual Report Prysmian Group
240
34. COMPENSATION OF DIRECTORS AND STATUTORY AUDITORS
The compensation of the Directors of Prysmian S.p.A. amounts to Euro 3.7 million in 2014 (Euro 13.6 million in 2013). The compensation of the Statutory Auditors of Prysmian S.p.A. amounts to Euro 0.22 million in 2014, the same as in 2013. Compensation includes emoluments, and
any other types of remuneration, pension and medical benefits, received for their service as Directors or Statutory Auditors of Prysmian S.p.A. and other companies included in the scope of consolidation, and that have constituted a cost for Prysmian.
35. ATYPICAL AND/OR UNUSUAL TRANSACTIONS
In accordance with the disclosures required by CONSOB Communication DEM/6064293 dated 28 July 2006, it is reported that no atypical and/or unusual transactions took place during 2014.

241
36. SIGNIFICANT NON-RECURRING EVENTS AND TRANSACTIONS
As required by CONSOB Communication DEM/6064293 dated 28 July 2006, the effects of non-recurring events and transac-tions on the income statement are shown below, involving
total net non-recurring expenses of Euro 71 million in 2014 and Euro 97 million in 2013.
2014 2013 (*)
Non-recurring other income:
Gains on asset disposals - 5
Acquisition purchase price adjustment 22 -
Effect of YOFC dilution 8 -
Non-recurring other income 7 5
Total non-recurring other income 37 10
Non-recurring personnel costs:
Business reorganisation (42) (34)
Pension plan amendments (7) 2
Non-recurring other costs (3) (2)
Total non-recurring personnel costs (52) (34)
Non-recurring impairment:
Impairment of property, plant and equipment (41) (26)
Impairment reversal of property, plant and equipment 18 1
Impairment of intangible assets (21) -
Total non-recurring impairment (44) (25)
Non-recurring other expenses/releases:
Antitrust investigations 31 6
Business reorganisation (6) (16)
Environmental remediation and other costs - 3
Non-recurring other expenses: (23) (19)
Total non-recurring other expenses 2 (26)
Non-recurring other finance costs:
Non-recurring net losses on interest rate swaps (4) (15)
Non-recurring other finance costs (14) (7)
Non-recurring other foreign currency exchange losses - -
Total non-recurring other finance costs (18) (22)
Non-recurring other finance income:
Non-recurring other finance income 4 -
Total non-recurring other finance income 4 -
Total (71) (97)
(*) The previously published prior year consolidated financial statements have been restated following the adoption of IFRS 10 and IFRS 11. Further details can be found in Section C. Restatement of comparative figures.
(in millions of Euro)
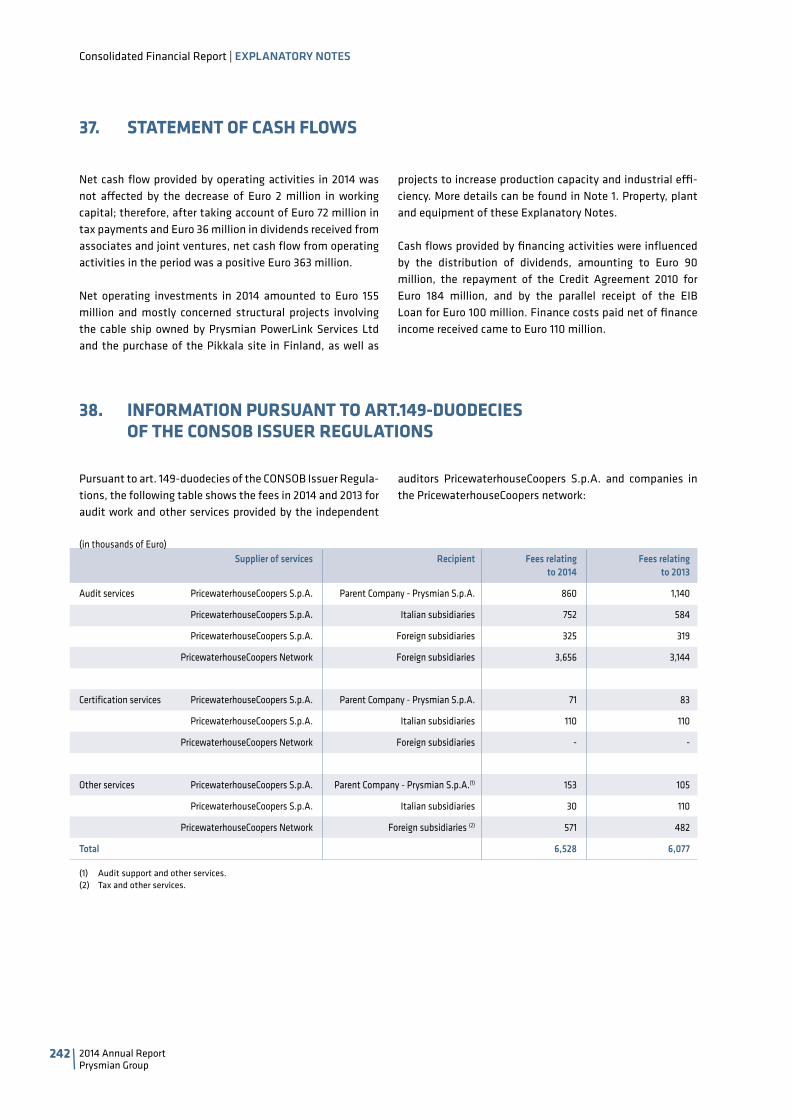
Consolidated Financial Report | EXPLANATORY NOTES
2014 Annual Report Prysmian Group
242
37. STATEMENT OF CASH FLOWS
Net cash flow provided by operating activities in 2014 was not affected by the decrease of Euro 2 million in working capital; therefore, after taking account of Euro 72 million in tax payments and Euro 36 million in dividends received from associates and joint ventures, net cash flow from operating activities in the period was a positive Euro 363 million.
Net operating investments in 2014 amounted to Euro 155 million and mostly concerned structural projects involving the cable ship owned by Prysmian PowerLink Services Ltd and the purchase of the Pikkala site in Finland, as well as
projects to increase production capacity and industrial effi-ciency. More details can be found in Note 1. Property, plant and equipment of these Explanatory Notes.
Cash flows provided by financing activities were influenced by the distribution of dividends, amounting to Euro 90 million, the repayment of the Credit Agreement 2010 for Euro 184 million, and by the parallel receipt of the EIB Loan for Euro 100 million. Finance costs paid net of finance income received came to Euro 110 million.
38. INFORMATION PURSUANT TO ART.149-DUODECIES OF THE CONSOB ISSUER REGULATIONS
Pursuant to art. 149-duodecies of the CONSOB Issuer Regula-tions, the following table shows the fees in 2014 and 2013 for audit work and other services provided by the independent
auditors PricewaterhouseCoopers S.p.A. and companies in the PricewaterhouseCoopers network:
Supplier of services Recipient Fees relating Fees relating to 2014 to 2013
Audit services PricewaterhouseCoopers S.p.A. Parent Company - Prysmian S.p.A. 860 1,140
PricewaterhouseCoopers S.p.A. Italian subsidiaries 752 584
PricewaterhouseCoopers S.p.A. Foreign subsidiaries 325 319
PricewaterhouseCoopers Network Foreign subsidiaries 3,656 3,144
Certification services PricewaterhouseCoopers S.p.A. Parent Company - Prysmian S.p.A. 71 83
PricewaterhouseCoopers S.p.A. Italian subsidiaries 110 110
PricewaterhouseCoopers Network Foreign subsidiaries - -
Other services PricewaterhouseCoopers S.p.A. Parent Company - Prysmian S.p.A.(1) 153 105
PricewaterhouseCoopers S.p.A. Italian subsidiaries 30 110
PricewaterhouseCoopers Network Foreign subsidiaries (2) 571 482
Total 6,528 6,077
(1) Audit support and other services.(2) Tax and other services.
(in thousands of Euro)
243
39. SUBSEQUENT EVENTS
On 3 February 2015, the Prysmian Group signed a Memo-randum of Understanding with Transelectrica, a Romanian electricity transmission system operator, Unicredit Bank and the law firm Tonucci & Partners to carry out studies and analyses on the potential development of a submarine link between Romania and Turkey. The memorandum’s aim is to support further development of the region’s energy sector, by offering Romanian power suppliers the opportunity to export their surplus generation to other countries such as Turkey. The Prysmian Group also announced the construction of new optical cable manufacturing facilities within Slatina’s new Industrial Park; the new facilities will be capable of producing a full range of new generation optical fibre cables to support the most advanced applications and usages by public and private, national and international operators, having obtained all the required quality certifications. Phase one of the project is due to reach completion by 2017. By the end of the project, the new plant will also have created 300 permanent jobs. The Group also plans to start production in Slatina of high voltage submarine cables for power transmission lines up to 150 kV; completion of the project and commencement of production are scheduled for July 2015. Lastly, with the goal of further developing highly skilled local human resources, Prysmian has also announced the launch of an international training programme in support of its industrial development with the recruitment of new and qualified local staff.
On 6 February 2015, Prysmian Cavi e Sistemi S.r.l. started legal proceedings, requesting that the claims brought by Pirelli & C. S.p.A. be rejected in full and that it should be Pirelli & C. S.p.A. which holds harmless Prysmian Cavi e Sistemi S.r.l., with reference to the alleged infringement in the period 18 February 1999 - 28 July 2005, for all claims made by the European Commission in implementation of its decision and for any expenses related to such implementation.
On 11 February 2015, Prysmian was awarded a new contract worth a total of approximately Euro 60 million by Iberdrola Renovables Offshore Deutschland GmbH - a German subsi-diary of Iberdrola, the world-leading developer and operator of wind farms - to supply and install wind turbine inter-array
cables for the Wikinger offshore wind farm, located within the West of Adlergrund cluster in the German Baltic Sea. Under the Wikinger contract, Prysmian is responsible for the design, manufacture, installation, burial, termination and testing of 81 km of 33 kV submarine cables in different cross-sections to connect the 70 wind turbines and an offshore substation that form the 350 MW wind farm. Cables will be produced at Prysmian’s facility in Drammen, Norway, one of the Group’s centres of excellence for submarine cables. Installation work is scheduled to be complete by the end of 2016.
On 16 February 2015, the Prysmian Group was awarded two major new orders worth a total of more than Euro 50 million for projects to expand the power transmission system in Kuwait. More specifically, the contracts refer to the “MEW 06 Jaber Al Ahmed City” project, awarded directly by MEW - the Kuwait Ministry of Electricity & Water - and the “Jamal Abdel Al Nasser Street” project, awarded by ROBT (JV), a joint venture of Rizzani de Eccher-OHL under a wider contract with MPW – the Kuwait Ministry of Public Works - on behalf of MEW as end-user. The “MEW 06 Jaber Al Ahmed City” project is part of the plan to expand Kuwait’s power transmission with a view to strengthening its main transmission networks and securing power supplies for industrial and residential users throughout the country. The “Jamal Abdel Al Nasser Street” project is part of the plan to upgrade and transform one of the main traffic arteries running through the middle of Kuwait City into an expressway, a process that will involve diverting an underground electricity line. The contracts involve the design, engineering, supply, construction, instal-lation and commission of HV underground cable systems, requiring a total of 210 km of 132 kV cable and related network components for both projects that will be executed by the Group’s offices in Kuwait. Installation will start in 2015 with completion scheduled in 2016.
Milan, 25 February 2015
ON BEHALF OF THE BOARD OF DIRECTORSTHE CHAIRMANMassimo Tononi

2014 Annual Report Prysmian Group
244
Fully consolidated subsidiaries on a line-by-line basis: Legal name Office Currency Share capital % ownership Direct parent company
EUROPE
Austria
Prysmian OEKW GmbH Vienna Euro 2,053,008 100.00% Prysmian Cavi e Sistemi S.r.l.
Belgium
Draka Belgium N.V. Antwerp Euro 61,973 98.52% Draka Holding B.V.
1.48% Draka Kabel B.V.
Denmark
Prysmian Denmark A/S Brøndby Danish Krone 40,001,000 100.00% Draka Denmark Holding A/S
Draka Denmark Holding A/S Brøndby Danish Krone 91,194,000 100.00% Draka Holding B.V.
Estonia
AS Draka Keila Cables Keila Euro 1,664,000 100.00% Prysmian Finland OY
Finland
Prysmian Finland OY Kirkkonummi Euro 100,000 77.80% Prysmian Cavi e Sistemi S.r.l.
19.93% Draka Holding B.V.
2.27% Draka Comteq B.V.
France
Prysmian (French) Holdings S.A.S. Paron Euro 173,487,250 100.00% Prysmian Cavi e Sistemi S.r.l.
GSCP Athena (French) Holdings II S.A.S. Paron Euro 47,000 100.00% Prysmian (French) Holdings S.A.S.
Prysmian Cables et Systèmes France S.A.S. Paron Euro 136,800,000 100.00% Prysmian (French) Holdings S.A.S.
Draka Comteq France S.A.S. Paron Euro 246,554,316 100.00% Draka France S.A.S.
Draka Fileca S.A.S. Sainte Geneviève Euro 5,439,700 100.00% Draka France S.A.S.
Draka Paricable S.A.S. Sainte Geneviève Euro 5,177,985 100.00% Draka France S.A.S.
Draka France S.A.S. Marne La Vallée Euro 261,551,700 100.00% Draka Holding B.V.
Quoroon S.A.S. Paron Euro 10,000 100.00% Prysmian Cables et Systèmes France S.A.S.
Germany
Prysmian Kabel und Systeme GmbH Berlin Euro 15,000,000 93.75% Draka Cable Wuppertal GmbH
6.25% Prysmian S.p.A.
Prysmian Unterstuetzungseinrichtung Lynen GmbH
Eschweiler Deutsche Mark 50,000 100.00% Prysmian Kabel und Systeme GmbH
Draka Cable Wuppertal GmbH Wuppertal Euro 25,000 100.00% Draka Deutschland GmbH
Draka Comteq Berlin GmbH & Co. KG Berlin Deutsche Mark 46,000,000 50.10% Prysmian Netherlands B.V.
1 49.90% Draka Deutschland GmbH
The following companies have been consolidated line-by-line:
SCOPE OF CONSOLIDATION – APPENDIX A
Consolidated Financial Report | EXPLANATORY NOTES

245
Fully consolidated subsidiaries on a line-by-line basis: Legal name Office Currency Share capital % ownership Direct parent company
Draka Comteq Germany Verwaltungs GmbH Koln Euro 25,000 100.00% Draka Comteq B.V.
Draka Comteq Germany GmbH & Co. KG Koln Euro 26,000 100.00% Draka Comteq B.V.
Draka Deutschland Erste Beteiligungs GmbH Wuppertal Euro 25,000 100.00% Draka Holding B.V.
Draka Deutschland GmbH Wuppertal Euro 25,000 90.00% Draka Deutschland Erste
Beteiligungs GmbH
10.00%
Draka Deutschland Zweite Beteiligungs GmbH
Draka Deutschland Verwaltungs GmbH Wuppertal Deutsche Mark 50,000 100.00% Draka Cable Wuppertal GmbH
Draka Deutschland Zweite Beteiligungs GmbH Wuppertal Euro 25,000 100.00% Prysmian Netherlands B.V.
Draka Kabeltechnik GmbH Wuppertal Euro 25,000 100.00% Draka Cable Wuppertal GmbH
Draka Service GmbH Nurnmberg Euro 25,000 100.00% Draka Cable Wuppertal GmbH
Höhn GmbH Wuppertal Deutsche Mark 1,000,000 100.00% Draka Deutschland GmbH
Kaiser Kabel GmbH Wuppertal Deutsche Mark 9,000,000 100.00% Draka Deutschland GmbH
Kaiser Kabel Vertriebs GmbH i.L. Wuppertal Euro 25,100 100.00% Kaiser Kabel GmbH
NKF Holding (Deutschland) GmbH Wuppertal Euro 25,000 100.00% Prysmian Netherlands B.V.
usb-elektro Kabelkonfektions- GmbH i.L. Bendorf Deutsche Mark 2,750,000 100.00% Draka Holding B.V.
Wagner Management- und Projektgesellschaft mit beschränkter Haftung i. L.
Berlin Deutsche Mark 50,000 60.00% Draka Cable Wuppertal GmbH
40.00% Third parties
U.K.
Prysmian Cables & Systems Ltd. Eastleigh British Pound 45,292,120 100.00% Prysmian UK Group Ltd.
Prysmian Construction Company Ltd. Eastleigh British Pound 1 100.00% Prysmian Cables & Systems Ltd.
Prysmian Cables (2000) Ltd. Eastleigh British Pound 1 100.00% Prysmian Cables & Systems Ltd.
Prysmian Cables (Industrial) Ltd. Eastleigh British Pound 1 100.00% Prysmian Cables & Systems Ltd.
Prysmian Cables (Supertension) Ltd. Eastleigh British Pound 1 100.00% Prysmian Cables & Systems Ltd.
Prysmian Cables and Systems International Ltd. Eastleigh Euro 100,000 100.00% Prysmian Cavi e Sistemi S.r.l.
Cable Makers Properties & Services Ltd. Hampton British Pound 33 74.99% Prysmian Cables & Systems Ltd.
25.01% Third parties
Prysmian Telecom Cables and Systems UK Ltd. Eastleigh British Pound 1 100.00% Prysmian Cables & Systems Ltd.
Prysmian Metals Ltd. Eastleigh British Pound 1 100.00% Prysmian Cables & Systems Ltd.
Comergy Ltd. Eastleigh British Pound 1,000,000 100.00% Prysmian Cavi e Sistemi S.r.l.
Prysmian Pension Scheme Trustee Ltd. Eastleigh British Pound 1 100.00% Prysmian S.p.A.
Prysmian UK Group Ltd. Eastleigh British Pound 40,011,000 100.00% Draka Holding B.V.
Draka Distribution Aberdeen Ltd. Eastleigh British Pound 1 100.00% Draka UK Group Ltd.
Draka Comteq UK Ltd. Eastleigh British Pound 9,000,002 100.00% Prysmian UK Group Ltd.
Draka UK Ltd. Eastleigh British Pound 202,000 100.00% Draka UK Group Ltd.
Draka UK Group Ltd. Eastleigh British Pound 10,000,103 99.99999% Prysmian UK Group Ltd.
0.00001% Third parties
Draka UK Pension Plan Trust Company Ltd. Eastleigh British Pound 1 100.00% Draka UK Ltd.
Prysmian PowerLink Services Ltd. Eastleigh British Pound 16,000,100 100.00% Prysmian UK Group Ltd.
Ireland
Prysmian Financial Services Ireland Ltd. Dublin Euro 1,000 100.00% Third parties
Prysmian Re Company Ltd. Dublin Euro 5,000,000 100.00% Draka Holding B.V.

Consolidated Financial Report | EXPLANATORY NOTES
2014 Annual Report Prysmian Group
246
Italy
Prysmian Cavi e Sistemi S.r.l. Milan Euro 100,000,000 100.00% Prysmian S.p.A.
Prysmian Cavi e Sistemi Italia S.r.l. Milan Euro 77,143,249 100.00% Prysmian S.p.A.
Prysmian Treasury S.r.l. Milan Euro 30,000,000 100.00% Prysmian S.p.A.
Prysmian PowerLink S.r.l. Milan Euro 100,000,000 100.00% Prysmian S.p.A.
Fibre Ottiche Sud - F.O.S. S.r.l. Battipaglia Euro 47,700,000 100.00% Prysmian S.p.A.
Prysmian Electronics S.r.l. Milan Euro 10,000 80.00% Prysmian Cavi e Sistemi S.r.l.
20.00% Third parties
Luxembourg
Prysmian Treasury (Lux) S.à r.l. Luxembourg Euro 3,050,000 100.00% Prysmian Cavi e Sistemi S.r.l.
Norway
Prysmian Kabler og Systemer A.S. Ski Norwegian Krone 100,000 100.00% Prysmian Finland OY
Draka Norsk Kabel A.S. Drammen Norwegian Krone 22,500,000 100.00% Draka Norway A.S.
Draka Norway A.S. Drammen Norwegian Krone 112,000 100.00% Draka Holding B.V.
The Netherlands
Draka Comteq B.V. Amsterdam Euro 1,000,000 100.00% Draka Holding B.V.
Draka Comteq Fibre B.V. Eindhoven Euro 18,000 100.00% Prysmian Netherlands Holding B.V.
Draka Holding B.V. Amsterdam Euro 52,229,321 52.165% Prysmian S.p.A.
47.835% Prysmian Cavi e Sistemi S.r.l.
Draka Kabel B.V. Amsterdam Euro 2,277,977 100.00% Prysmian Netherlands B.V.
Donne Draad B.V. Nieuw Bergen Euro 28,134 100.00% Prysmian Netherlands B.V.
Prysmian Treasury (The Netherlands) B.V. Delft Euro 2,268,901 100.00% Draka Holding B.V.
NK China Investments B.V. Delft Euro 19,000 100.00% Prysmian Netherlands B.V.
NKF Vastgoed I B.V. Delft Euro 18,151 99.00% Draka Holding B.V.
1.00% Prysmian Netherlands B.V.
NKF Vastgoed III B.V. Amsterdam Euro 18,151 99.00% Draka Deutschland GmbH
1.00% Prysmian Netherlands B.V.
Draka Sarphati B.V. Amsterdam Euro 18,151 100.00% Draka Holding B.V.
Prysmian Netherlands B.V. Delft Euro 1 100.00% Prysmian Netherlands Holding B.V.
Prysmian Netherlands Holding B.V. Amsterdam Euro 1 100.00% Draka Holding B.V.
Czech Republic
Draka Kabely, s.r.o. Velke Mezirici Czech Koruna 255,000,000 100.00% Draka Holding B.V.
Romania
Prysmian Cabluri Si Sisteme S.A. Slatina Romanian Leu 103,850,920 99.9995% Draka Holding B.V.
0.0005% Prysmian Cavi e Sistemi S.r.l.
Russia
Limited Liability Company Prysmian RUS Rybinsk city Russian Rouble 230,000,000 99.00% Draka Holding B.V.
1.00% Prysmian Cavi e Sistemi S.r.l.
Limited Liability Company “Rybinskelektrokabel” Rybinsk city Russian Rouble 90,312,000 100.00% Limited Liability Company Prysmian RUS
Draka Industrial Cable Russia LLC St. Petersburg Russian Rouble 100,000 100.00% Draka Holding B.V.
Neva Cables Ltd. St. Petersburg Russian Rouble 194,000 100.00% Prysmian Finland OY
Fully consolidated subsidiaries on a line-by-line basis: Legal name Office Currency Share capital % ownership Direct parent company

247
Slovakia
Prysmian Kablo s.r.o. Bratislava Euro 21,246,001 99.995% Prysmian Cavi e Sistemi S.r.l.
0.005% Prysmian S.p.A.
Draka Comteq Slovakia s.r.o. Prešov Euro 1,506,639 100.00% Draka Comteq B.V.
Spain
Prysmian Spain S.A.U. Vilanova I la Geltrù
Euro 58,178,234 100.00% Draka Holding N.V. Y CIA Soc. Col.
Marmavil S.L.U. Santa Perpetua de Mogoda
Euro 3,006 100.00% Draka Holding B.V.
Draka Holding N.V. Y CIA Soc. Col. Santa Perpetua de Mogoda
Euro 24,000,000 99.99999% Draka Holding B.V.
0.00001% Marmavil.S.L.U.
Draka Comteq Iberica, S.L.U. Maliaño Euro 4,000,040 100.00% Draka Holding N.V. Y CIA Soc. Col.
Sweden
Draka Sweden AB Nässjö Swedish Krona 100,100 100.00% Draka Holding B.V.
Draka Kabel Sverige AB Nässjö Swedish Krona 100,000 100.00% Draka Sweden AB
Switzerland
Prysmian Cables and Systems S.A. Manno Swiss Franc 500,000 100.00% Draka Holding B.V.
Turkey
Turk Prysmian Kablo Ve Sistemleri A.S. Mudanya Turkish new Lira 112,233,652 83.746% Draka Holding B.V.
16.254% Third parties
Draka Istanbul Asansor İthalatİhracat Üretim Ticaret Ltd. Şti.
Istanbul Turkish new Lira 180,000 100.00% Draka Holding B.V.
Draka Comteq Kablo Limited Sirketi Istanbul Turkish new Lira 45,818,775 99.50% Draka Comteq B.V.
0.50% Prysmian Netherlands B.V.
Hungary
Prysmian MKM Magyar Kabel Muvek Kft. Budapest Hungarian Forint 5,000,000,000 100.00% Prysmian Cavi e Sistemi S.r.l.
NORTH AMERICA
Canada
Prysmian Cables and Systems Canada Ltd. Saint John Canadian Dollar 1,000,000 100.00% Draka Holding B.V.
Draka Elevator Products Incorporated Brantford Canadian Dollar n/a 100.00% Draka Cableteq USA Inc.
U.S.A.
Prysmian Cables and Systems (US) Inc Carson City US Dollar 330,517,608 100.00% Draka Holding B.V.
Prysmian Cables and Systems USA LLC Wilmington US Dollar 10 100.00% Prysmian Cables and Systems (US) Inc.
Prysmian Construction Services Inc. Wilmington US Dollar 1,000 100.00% Prysmian Cables and Systems USA LLC
Draka Cableteq USA Inc. Boston US Dollar 10 100.00% Prysmian Cables and Systems (US) Inc.
Draka Elevator Products, Inc. Boston US Dollar 1 100.00% Draka Cableteq USA Inc.
Draka Transport USA, LLC Boston US Dollar n/a 100.00% Draka Cableteq USA Inc.
Fully consolidated subsidiaries on a line-by-line basis: Legal name Office Currency Share capital % ownership Direct parent company
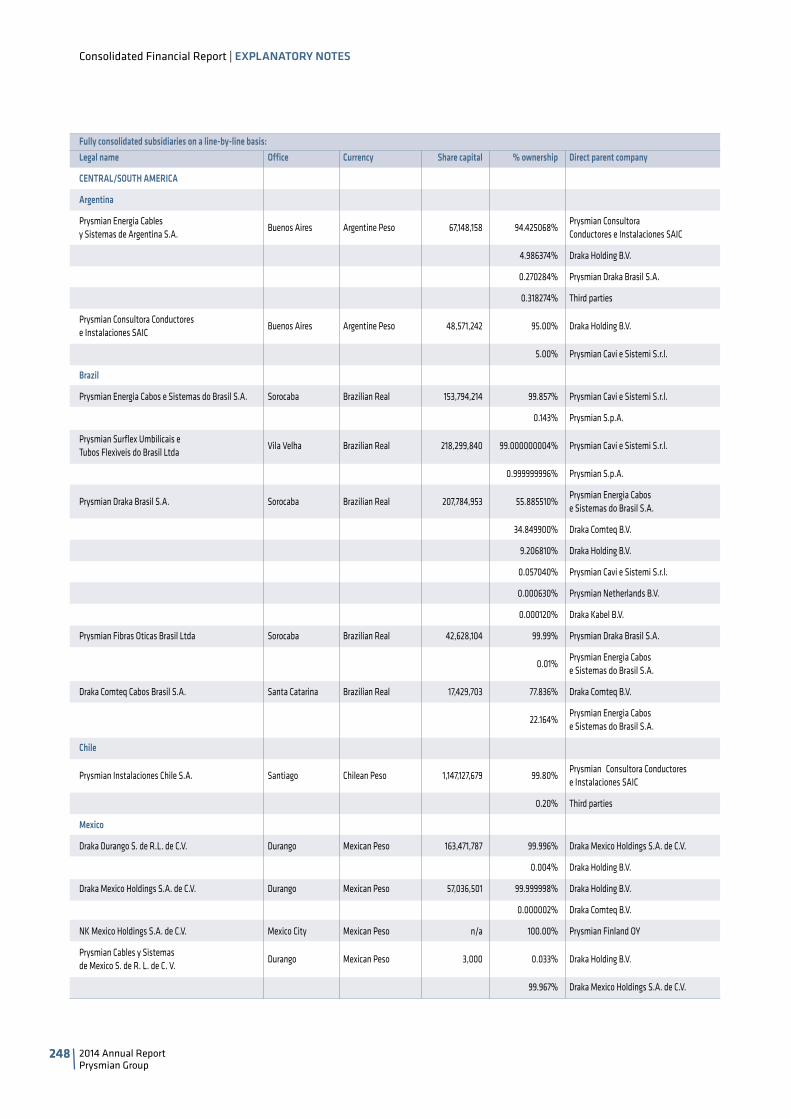
Consolidated Financial Report | EXPLANATORY NOTES
2014 Annual Report Prysmian Group
248
CENTRAL/SOUTH AMERICA
Argentina
Prysmian Energia Cables Prysmian Consultora y Sistemas de Argentina S.A.
Buenos Aires Argentine Peso 67,148,158 94.425068% Conductores e Instalaciones SAIC
4.986374% Draka Holding B.V.
0.270284% Prysmian Draka Brasil S.A.
0.318274% Third parties
Prysmian Consultora Conductores e Instalaciones SAIC
Buenos Aires Argentine Peso 48,571,242 95.00% Draka Holding B.V.
5.00% Prysmian Cavi e Sistemi S.r.l.
Brazil
Prysmian Energia Cabos e Sistemas do Brasil S.A. Sorocaba Brazilian Real 153,794,214 99.857% Prysmian Cavi e Sistemi S.r.l.
0.143% Prysmian S.p.A.
Prysmian Surflex Umbilicais e Tubos Flexìveis do Brasil Ltda
Vila Velha Brazilian Real 218,299,840 99.000000004% Prysmian Cavi e Sistemi S.r.l.
0.999999996% Prysmian S.p.A.
Prysmian Draka Brasil S.A. Sorocaba Brazilian Real 207,784,953 55.885510% Prysmian Energia Cabos
e Sistemas do Brasil S.A.
34.849900% Draka Comteq B.V.
9.206810% Draka Holding B.V.
0.057040% Prysmian Cavi e Sistemi S.r.l.
0.000630% Prysmian Netherlands B.V.
0.000120% Draka Kabel B.V.
Prysmian Fibras Oticas Brasil Ltda Sorocaba Brazilian Real 42,628,104 99.99% Prysmian Draka Brasil S.A.
0.01%
Prysmian Energia Cabos e Sistemas do Brasil S.A.
Draka Comteq Cabos Brasil S.A. Santa Catarina Brazilian Real 17,429,703 77.836% Draka Comteq B.V.
22.164%
Prysmian Energia Cabos e Sistemas do Brasil S.A.
Chile
Prysmian Instalaciones Chile S.A. Santiago Chilean Peso 1,147,127,679 99.80% Prysmian Consultora Conductores
e Instalaciones SAIC
0.20% Third parties
Mexico
Draka Durango S. de R.L. de C.V. Durango Mexican Peso 163,471,787 99.996% Draka Mexico Holdings S.A. de C.V.
0.004% Draka Holding B.V.
Draka Mexico Holdings S.A. de C.V. Durango Mexican Peso 57,036,501 99.999998% Draka Holding B.V.
0.000002% Draka Comteq B.V.
NK Mexico Holdings S.A. de C.V. Mexico City Mexican Peso n/a 100.00% Prysmian Finland OY
Prysmian Cables y Sistemas de Mexico S. de R. L. de C. V.
Durango Mexican Peso 3,000 0.033% Draka Holding B.V.
99.967% Draka Mexico Holdings S.A. de C.V.
Fully consolidated subsidiaries on a line-by-line basis: Legal name Office Currency Share capital % ownership Direct parent company
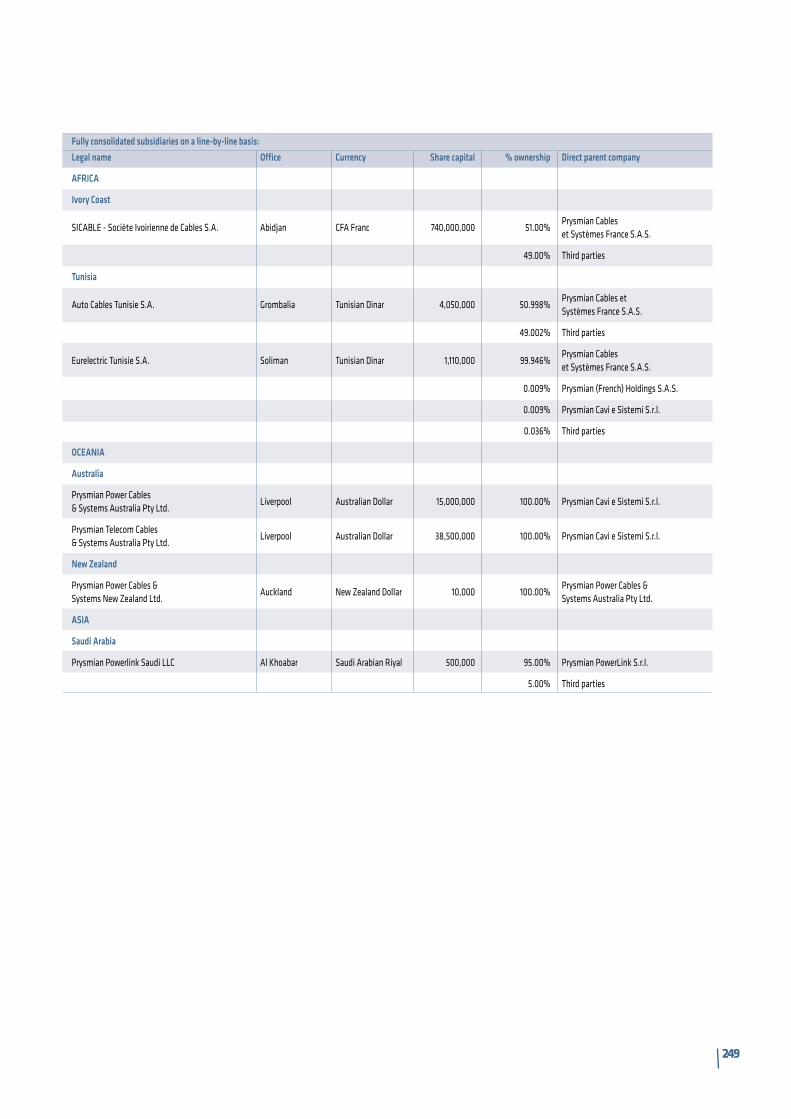
249
AFRICA
Ivory Coast
SICABLE - Sociète Ivoirienne de Cables S.A. Abidjan CFA Franc 740,000,000 51.00% Prysmian Cables
et Systèmes France S.A.S.
49.00% Third parties
Tunisia
Auto Cables Tunisie S.A. Grombalia Tunisian Dinar 4,050,000 50.998% Prysmian Cables et
Systèmes France S.A.S.
49.002% Third parties
Eurelectric Tunisie S.A. Soliman Tunisian Dinar 1,110,000 99.946% Prysmian Cables
et Systèmes France S.A.S.
0.009% Prysmian (French) Holdings S.A.S.
0.009% Prysmian Cavi e Sistemi S.r.l.
0.036% Third parties
OCEANIA
Australia
Prysmian Power Cables & Systems Australia Pty Ltd.
Liverpool Australian Dollar 15,000,000 100.00% Prysmian Cavi e Sistemi S.r.l.
Prysmian Telecom Cables & Systems Australia Pty Ltd.
Liverpool Australian Dollar 38,500,000 100.00% Prysmian Cavi e Sistemi S.r.l.
New Zealand
Prysmian Power Cables & New Zealand Dollar
Prysmian Power Cables &Systems New Zealand Ltd.
Auckland 10,000 100.00% Systems Australia Pty Ltd.
ASIA
Saudi Arabia
Prysmian Powerlink Saudi LLC Al Khoabar Saudi Arabian Riyal 500,000 95.00% Prysmian PowerLink S.r.l.
5.00% Third parties
Fully consolidated subsidiaries on a line-by-line basis: Legal name Office Currency Share capital % ownership Direct parent company

Consolidated Financial Report | EXPLANATORY NOTES
2014 Annual Report Prysmian Group
250
China
Prysmian Tianjin Cables Co. Ltd. Tianjin US Dollar 36,790,000 67.00% Prysmian (China) Investment
Company Ltd.
33.00% Third parties
Prysmian Cable (Shanghai) Co. Ltd. Shanghai US Dollar 5,000,000 100.00% Prysmian (China) Investment
Company Ltd.
Prysmian Baosheng Cable Co. Ltd. Jiangsu US Dollar 35,000,000 67.00% Prysmian (China) Investment
Company Ltd.
33.00% Third parties
Prysmian Wuxi Cable Co. Ltd. Wuxi US Dollar 29,941,250 100.00% Prysmian (China) Investment
Company Ltd.
Prysmian Angel Tianjin Cable Co. Ltd. Tianjin US Dollar 14,000,000 100.00% Prysmian (China) Investment
Company Ltd.
Prysmian Hong Kong Holding Ltd. Hong Kong Euro 55,000,000 100.00% Prysmian Cavi e Sistemi S.r.l.
Prysmian (China) Investment Company Ltd. Beijing Euro 59,500,000 100.00% Prysmian Hong Kong Holding Ltd.
Nantong Haixun Draka Elevator Products Co. LTD
Nantong US Dollar 2,400,000 75.00% Draka Elevator Products, Inc.
25.00% Third parties
Nantong Zhongyao Draka Elevator Products Co. LTD
Nantong US Dollar 2,000,000 75.00% Draka Elevator Products, Inc.
25.00% Third parties
Draka Cables (Hong Kong) Limited Hong Kong Hong Kong Dollar 6,500,000 100.00% Draka Cableteq Asia Pacific
Holding Pte Ltd.
Draka Shanghai Optical Fibre Cable Co. Ltd. Shanghai US Dollar 15,580,000 55.00% Draka Comteq Germany GmbH & Co. KG
45.00% Third parties
Suzhou Draka Cable Co. Ltd. Suzhou Chinese Renminbi
174,500,000 100.00% Draka Cableteq Asia Pacific
(Yuan) Holding Pte Ltd.
NK Wuhan Cable Co. Ltd. Wuhan US Dollar 12,000,000 60.00% NK China Investments B.V.
20.00%
Yangtze Optical Fibre and Cable Joint Stock Limited Co.
20.00% Third parties
Philippines
Draka Philippines Inc. Cebu Philippine Peso 253,652,000 99.9999975% Draka Holding B.V.
0.0000025% Third parties
India
Associated Cables Pvt. Ltd. Mumbai Indian Rupee 61,261,900 32.00% Draka UK Group Ltd.
28.00% Prysmian Treasury (The Netherlands) B.V.
40.00% Oman Cables Industry (SAOG)
Jaguar Communication Consultancy Services Private Ltd.
Mumbai Indian Rupee 34,432,100 99.99997% Prysmian Cavi e Sistemi S.r.l.
0.00003% Prysmian S.p.A.
Fully consolidated subsidiaries on a line-by-line basis: Legal name Office Currency Share capital % ownership Direct parent company

251
Fully consolidated subsidiaries on a line-by-line basis: Legal name Office Currency Share capital % ownership Direct parent company
Indonesia
P.T.Prysmian Cables Indonesia Cikampek US Dollar 67,300,000 99.48% Draka Holding B.V.
0.52% Prysmian Cavi e Sistemi S.r.l.
Malaysia
Submarine Cable Installation Sdn Bhd Kuala Lumpur Malaysian Ringgit 10,000 100.00% Prysmian Cavi e Sistemi S.r.l.
Sindutch Cable Manufacturer Sdn Bhd Malacca Malaysian Ringgit 500,000 100.00% Draka Cableteq Asia Pacific
Holding Pte Ltd.
Draka Marketing and Services Sdn Bhd Malacca Malaysian Ringgit 500,000 100.00% Cable Supply and Consulting
Company Pte Ltd.
Draka (Malaysia) Sdn Bhd Malacca Malaysian Ringgit 8,000,002 100.00% Cable Supply and Consulting
Company Pte Ltd.
Singapore
Prysmian Cables Asia-Pacific Pte Ltd. Singapore Singapore Dollar 213,324,290 100.00% Draka Holding B.V.
Prysmian Cable Systems Pte Ltd. Singapore Singapore Dollar 25,000 50.00% Draka Holding B.V.
50.00% Prysmian Cables & Systems Ltd.
Draka Offshore Asia Pacific Pte Ltd. Singapore Singapore Dollar 51,000 100.00% Draka Cableteq Asia Pacific
Holding Pte Ltd.
Draka Cableteq Asia Pacific Holding Pte Ltd. Singapore Singapore Dollar 28,630,542 100.00% Draka Holding B.V.
Singapore Cables Manufacturers Pte Ltd. Singapore Singapore Dollar 990,000 100.00% Draka Cableteq Asia Pacific
Holding Pte Ltd.
Cable Supply and Consulting Company Pte Ltd. Singapore Singapore Dollar 50,000 100.00% Draka Cableteq Asia Pacific
Holding Pte Ltd.
Draka Comteq Singapore Pte Ltd. Singapore Singapore Dollar 500,000 100.00% Draka Comteq B.V.
Draka NK Cables (Asia) Pte Ltd. Singapore Singapore Dollar 200,000 100.00% Prysmian Finland OY
Thailand
MCI-Draka Cable Co. Ltd. Bangkok Thai Baht 435,900,000 70.250172% Draka Cableteq Asia Pacific
Holding Pte Ltd.
0.000023% Draka (Malaysia) Sdn Bhd
0.000023% Sindutch Cable Manufacturer Sdn Bhd
0.000023% Singapore Cables Manufacturers Pte Ltd.
29.749759% Third parties

Consolidated Financial Report | EXPLANATORY NOTES
2014 Annual Report Prysmian Group
252
Equity-accounted companies: Legal name Office Currency Share capital % ownership Direct parent company
EUROPE
Germany
Kabeltrommel GmbH & CO.KG Troisdorf Euro 10,225,838 29.68% Prysmian Kabel und Systeme GmbH
13.50% Draka Cable Wuppertal GmbH
56.82% Third parties
Kabeltrommel GmbH Troisdorf Deutsche Mark 51,000 17.65% Prysmian Kabel und Systeme GmbH
23.53% Draka Cable Wuppertal GmbH
58.82% Third parties
KTG Europe GmbH Troisdorf Euro 100,000 100.00% Kabeltrommel GmbH & CO.KG
U.K.
Rodco Ltd. Weybridge British Pound 5,000,000 40.00% Prysmian Cables & Systems Ltd.
60.00% Third parties
Poland
Eksa Sp.z.o.o Sokolów Polish Zloty 394,000 29.949% Prysmian Cavi e Sistemi S.r.l.
70.051% Third parties
Russia
Elkat Ltd. Moscow Russian Rouble 10,000 40.00% Prysmian Finland OY
60.00% Third parties
ASIA
China
Yangtze Optical Fibre and Chinese RenminbiCable Joint Stock Limited Co.
Wuhan (Yuan)
639,462,598 28.12% Draka Comteq B.V.
71.88% Third parties
Yangtze Optical Fibre and Cable Yangtze Optical FibreCompany (Hong Kong) Ltd.
Hong Kong Hong Kong Dollar 80,000 100.00% and Cable Joint Stock Limited Co.
Yangtze Optical Fibre & Cable (Shanghai) Co. Ltd. Shanghai US Dollar 12,000,000 75,00% Yangtze Optical Fibre
and Cable Joint Stock Limited Co.
25.00% Draka Comteq B.V.
EverPro Technologies Company Limited Wuhan Chinese Renminbi Yangtze Optical Fibre
(Yuan) 325,000,000 69.23%
and Cable Joint Stock Limited Co.
30.77% Third parties
EverProsper Technologies Company Limited Hong Kong Chinese Renminbi
(Yuan) 6,800,000 100.00% EverPro Technologies Company Limited
Jiangsu Yangtze Zhongli Optical Fibre Chinese Renminbi Yangtze Optical Fibre and& Cable Co. Ltd.
Changshu (Yuan)
92,880,000 51.00% Cable Joint Stock Limited Co.
49.00% Third parties
Yangtze Optical Fibre & Cable Sichuan Co. Ltd. Emeishan City Chinese Renminbi Yangtze Optical Fibre
(Yuan) 53,800,000 51.00%
and Cable Joint Stock Limited Co.
49.00% Third parties
Tianjin YOFC XMKJ Optical Chinese Renminbi Yangtze Optical Fibre Communications Co. Ltd.
Tianjin (Yuan)
220,000,000 49.00% and Cable Joint Stock Limited Co.
51.00% Third parties
The following companies have been accounted for using the equity method:
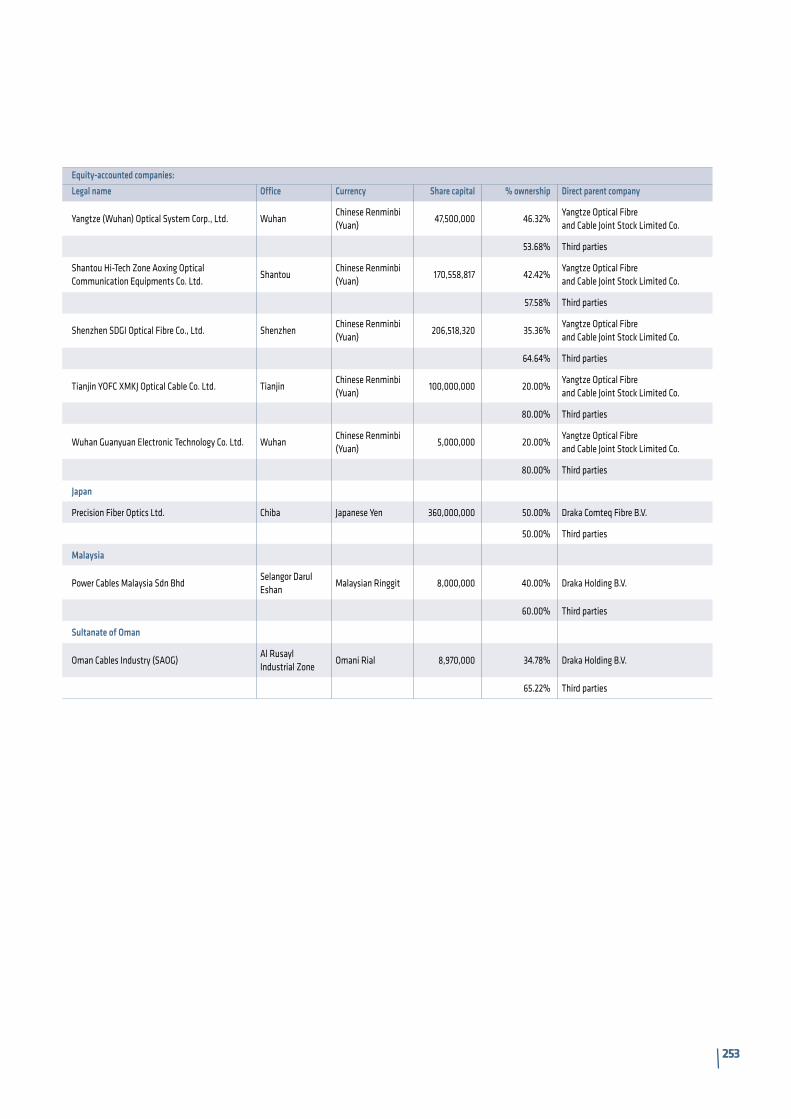
253
Yangtze (Wuhan) Optical System Corp., Ltd. Wuhan Chinese Renminbi Yangtze Optical Fibre
(Yuan) 47,500,000 46.32%
and Cable Joint Stock Limited Co.
53.68% Third parties
Shantou Hi-Tech Zone Aoxing Optical Chinese Renminbi Yangtze Optical FibreCommunication Equipments Co. Ltd.
Shantou (Yuan)
170,558,817 42.42% and Cable Joint Stock Limited Co.
57.58% Third parties
Shenzhen SDGI Optical Fibre Co., Ltd. Shenzhen Chinese Renminbi Yangtze Optical Fibre
(Yuan) 206,518,320 35.36%
and Cable Joint Stock Limited Co.
64.64% Third parties
Tianjin YOFC XMKJ Optical Cable Co. Ltd. Tianjin Chinese Renminbi Yangtze Optical Fibre
(Yuan) 100,000,000 20.00%
and Cable Joint Stock Limited Co.
80.00% Third parties
Wuhan Guanyuan Electronic Technology Co. Ltd. Wuhan Chinese Renminbi Yangtze Optical Fibre
(Yuan) 5,000,000 20.00%
and Cable Joint Stock Limited Co.
80.00% Third parties
Japan
Precision Fiber Optics Ltd. Chiba Japanese Yen 360,000,000 50.00% Draka Comteq Fibre B.V.
50.00% Third parties
Malaysia
Power Cables Malaysia Sdn Bhd Selangor Darul
Eshan Malaysian Ringgit 8,000,000 40.00% Draka Holding B.V.
60.00% Third parties
Sultanate of Oman
Oman Cables Industry (SAOG) Al Rusayl
Omani Rial Industrial Zone
8,970,000 34.78% Draka Holding B.V.
65.22% Third parties
Equity-accounted companies: Legal name Office Currency Share capital % ownership Direct parent company
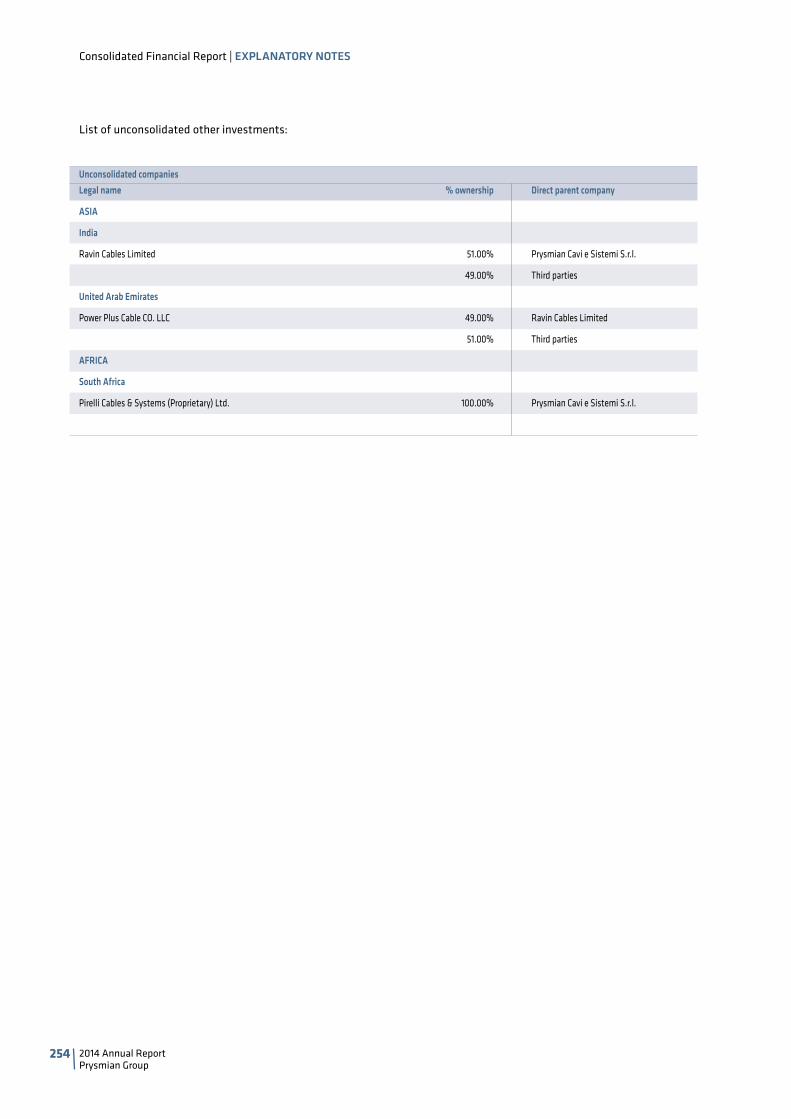
Consolidated Financial Report | EXPLANATORY NOTES
2014 Annual Report Prysmian Group
254
List of unconsolidated other investments:
Unconsolidated companies Legal name % ownership Direct parent company
ASIA
India
Ravin Cables Limited 51.00% Prysmian Cavi e Sistemi S.r.l.
49.00% Third parties
United Arab Emirates
Power Plus Cable CO. LLC 49.00% Ravin Cables Limited
51.00% Third parties
AFRICA
South Africa
Pirelli Cables & Systems (Proprietary) Ltd. 100.00% Prysmian Cavi e Sistemi S.r.l.

255
CERTIFICATION OF THE CONSOLIDATED FINANCIAL STATEMENTS PURSUANT TO ART. 81-TER OF CONSOB REGULATION 11971 DATED 14 MAY 1999 AND SUBSEQUENT AMENDMENTS AND ADDITIONS
1. The undersigned Valerio Battista, as Chief Executive Officer, and Carlo Soprano and Andreas Bott, as managers responsible for preparing the corporate accounting documents of Prysmian S.p.A., certify, also taking account of the provisions of paragraphs 3 and 4, art. 154-bis of Italian Legislative Decree 58 dated 24 February 1998, that during 2014 the accounting and administrative processes for preparing the consolidated financial statements:
• have been adequate in relation to the business’s characteristics and• have been effectively applied.
2. The adequacy of the accounting and administrative processes for preparing the consolidated financial statements at 31 December 2014 has been evaluated on the basis of a procedure established by Prysmian in compliance with the internal control framework published by the Committee of Sponsoring Organizations of the Treadway Commission, which represents the generally accepted standard model internationally.
3. They also certify that:
3.1 The consolidated financial statements at 31 December 2014:a. have been prepared in accordance with applicable international accounting standards recognised by the European Union under
Regulation (EC) 1606/2002 of the European Parliament and Council dated 19 July 2002;b. correspond to the underlying accounting records and books of account;c. are able to provide a true and fair view of the issuer’s statement of financial position and results of operations and of the group
of companies included in the consolidation.
3.2 The directors’ report contains a fair review of performance and the results of operations, and of the situation of the issuer and the group of companies included in the consolidation, together with a description of the principal risks and uncertainties to which they are exposed.
Milan, 25 February 2015 Valerio Battista Carlo Soprano Andreas BottCHIEF EXECUTIVE OFFICER MANAGERS RESPONSIBLE FOR PREPARING CORPORATE ACCOUNTING DOCUMENTS


Consolidated Financial Report
AUDIT REPORT
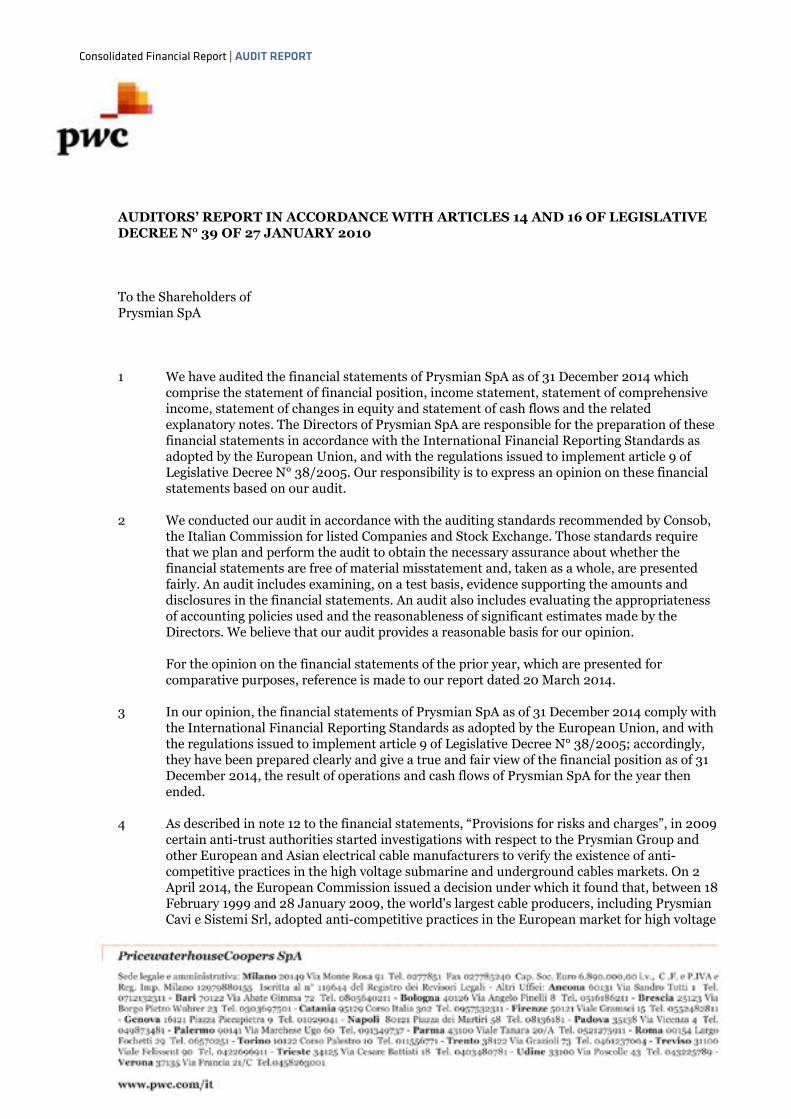
2014 Annual Report Prysmian Group
258
Consolidated Financial Report | AUDIT REPORT
AUDITORS’ REPORT IN ACCORDANCE WITH ARTICLES 14 AND 16 OF LEGISLATIVEDECREE N° 39 OF 27 JANUARY 2010
To the Shareholders ofPrysmian SpA
1 We have audited the financial statements of Prysmian SpA as of 31 December 2014 whichcomprise the statement of financial position, income statement, statement of comprehensiveincome, statement of changes in equity and statement of cash flows and the relatedexplanatory notes. The Directors of Prysmian SpA are responsible for the preparation of thesefinancial statements in accordance with the International Financial Reporting Standards asadopted by the European Union, and with the regulations issued to implement article 9 ofLegislative Decree N° 38/2005. Our responsibility is to express an opinion on these financialstatements based on our audit.
2 We conducted our audit in accordance with the auditing standards recommended by Consob,the Italian Commission for listed Companies and Stock Exchange. Those standards requirethat we plan and perform the audit to obtain the necessary assurance about whether thefinancial statements are free of material misstatement and, taken as a whole, are presentedfairly. An audit includes examining, on a test basis, evidence supporting the amounts anddisclosures in the financial statements. An audit also includes evaluating the appropriatenessof accounting policies used and the reasonableness of significant estimates made by theDirectors. We believe that our audit provides a reasonable basis for our opinion.
For the opinion on the financial statements of the prior year, which are presented forcomparative purposes, reference is made to our report dated 20 March 2014.
3 In our opinion, the financial statements of Prysmian SpA as of 31 December 2014 comply withthe International Financial Reporting Standards as adopted by the European Union, and withthe regulations issued to implement article 9 of Legislative Decree N° 38/2005; accordingly,they have been prepared clearly and give a true and fair view of the financial position as of 31December 2014, the result of operations and cash flows of Prysmian SpA for the year thenended.
4 As described in note 12 to the financial statements, “Provisions for risks and charges”, in 2009certain anti-trust authorities started investigations with respect to the Prysmian Group andother European and Asian electrical cable manufacturers to verify the existence of anti-competitive practices in the high voltage submarine and underground cables markets. On 2April 2014, the European Commission issued a decision under which it found that, between 18February 1999 and 28 January 2009, the world's largest cable producers, including PrysmianCavi e Sistemi Srl, adopted anti-competitive practices in the European market for high voltage
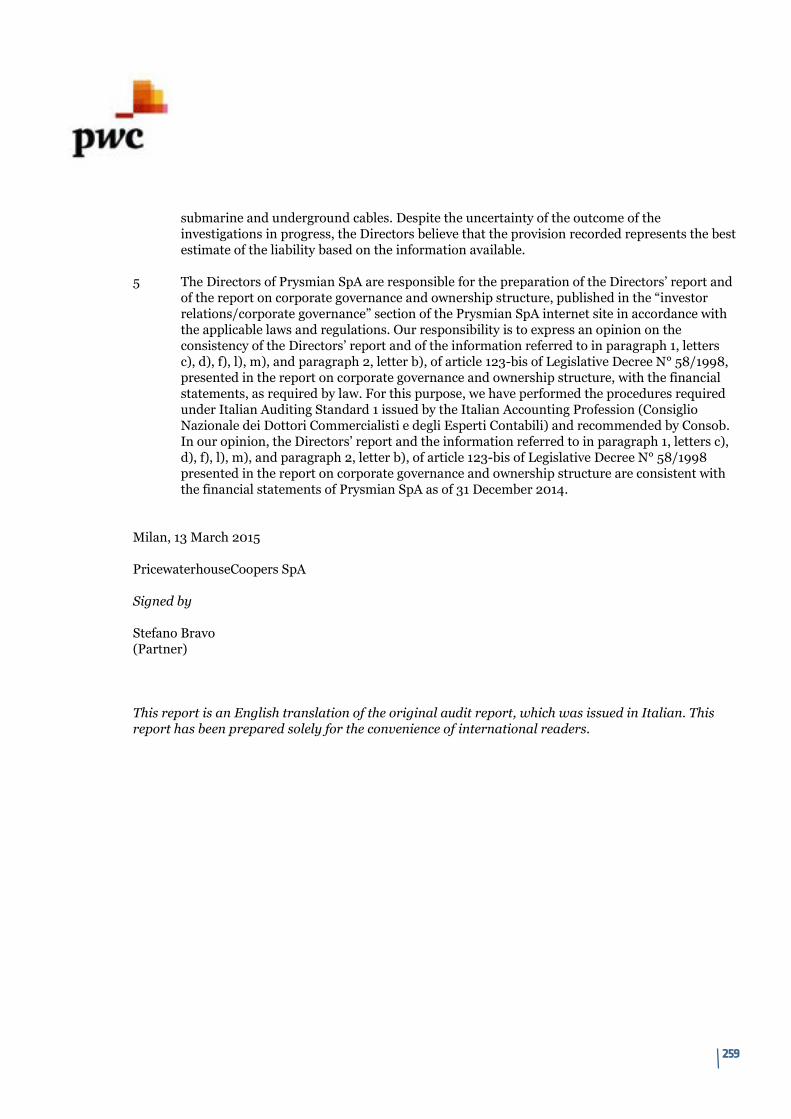
259
2 of 2
submarine and underground cables. Despite the uncertainty of the outcome of theinvestigations in progress, the Directors believe that the provision recorded represents the bestestimate of the liability based on the information available.
5 The Directors of Prysmian SpA are responsible for the preparation of the Directors’ report andof the report on corporate governance and ownership structure, published in the “investorrelations/corporate governance” section of the Prysmian SpA internet site in accordance withthe applicable laws and regulations. Our responsibility is to express an opinion on theconsistency of the Directors’ report and of the information referred to in paragraph 1, lettersc), d), f), l), m), and paragraph 2, letter b), of article 123-bis of Legislative Decree N° 58/1998,presented in the report on corporate governance and ownership structure, with the financialstatements, as required by law. For this purpose, we have performed the procedures requiredunder Italian Auditing Standard 1 issued by the Italian Accounting Profession (ConsiglioNazionale dei Dottori Commercialisti e degli Esperti Contabili) and recommended by Consob.In our opinion, the Directors’ report and the information referred to in paragraph 1, letters c),d), f), l), m), and paragraph 2, letter b), of article 123-bis of Legislative Decree N° 58/1998presented in the report on corporate governance and ownership structure are consistent withthe financial statements of Prysmian SpA as of 31 December 2014.
Milan, 13 March 2015
PricewaterhouseCoopers SpA
Signed by
Stefano Bravo(Partner)
This report is an English translation of the original audit report, which was issued in Italian. Thisreport has been prepared solely for the convenience of international readers.

The Group was awarded two major contracts in Australia, to supply high voltage underground cables — North Shore cable upgrade and Engadine — as part of the upgrade project of Ausgrid’s network, whereby cables and equipment installed about 40 years ago are being replaced. The projects will be carried out in two areas: the coastline area in the North of Sydney, Willoughby-Lindfield-Castle Cove, and the Engadine area, just south of Sydney.
261
CONTENTSPARENT COMPANY ANNUAL REPORT DIRECTORS’ REPORT Financial performance of Prysmian S.p.A. Human resources, environment and safety Direction and coordination Intercompany and related party transactions Secondary offices Share capital and corporate governance Atypical and/or unusual transactions Risk factors Financial risk management policies Events after the reporting period Proposal to approve the financial statements and to allocate net profit for 2014
PARENT COMPANY FINANCIAL REPORT Statement of financial position Income statement Statement of comprehensive income Statement of changes in equity Statement of cash flows
EXPLANATORY NOTES CERTIFICATION OF THE FINANCIAL STATEMENTS PURSUANT TO ART. 81-TER OF CONSOB REGULATION 11971 DATED 14 MAY 1999 AND SUBSEQUENT AMENDMENTS AND ADDITIONS
AUDIT REPORT
REPORT BY THE BOARD OF STATUTORY AUDITORS
263264268 268 268 268 269269269270 270
271
273274275276277278
279
337
339
343

Prysmian will build the interconnection between Syros island (Cyclades) and the Greek mainland power transmission system in Lavrion. The project will provide a turn-key high-voltage alternating current cable system along a total route of more than 110km, thus interconnecting the island of Syros to the Greek national power transmission system. It also envisages a future expansion to other Cyclades islands (Paros, Mykonos, Tinos).

263
DIRECTORS’REPORT

Parent Company Financial Report | DIRECTORS’ REPORT
2014 Annual Report Prysmian Group
264
Parent Company Financial Report | DIRECTORS’ REPORT
FINANCIAL PERFORMANCE OF PRYSMIAN S.P.A.
The tables presented and discussed below have been prepared by reclassifying the financial statements at 31 December 2014, which in turn have been drawn up in accordance with the International Financial Reporting Standards (IFRS) issued by the International Accounting Standards Board (IASB) and endorsed by the European Union, and with the provisions implementing art. 9 of Legislative Decree 38/2005.As from 1 July 2013, the activities of purchasing strategic materials (copper, aluminium and lead) from third-party suppliers and reselling them to the Group's operating
INCOME STATEMENT
companies have been centralised in Prysmian S.p.A.. This operation is part of the reorganisation of activities within the Prysmian Group with the goal of having greater control over what is considered a strategic business for the Group.Following this centralisation, Prysmian S.p.A.'s "Revenue from ordinary operations" relates to the sale of strategic metals to Group operating companies, while "Other income" primarily refers to services provided and royalties from the licensing of patents and know-how to Group companies or even third parties.
2014 2013
Revenue from ordinary operations 1,090,578 452,225
Other income 106,624 102,068
of which non-recurring other income - 333
Operating costs (1,130,685) (501,444)
of which non-recurring income/(expenses) (2,186) (2,463)
of which personnel costs for stock option fair value (496) (4,599)
Other expenses (47,348) (67,031)
of which non-recurring other expenses 17,835 (1,666)
Amortisation, depreciation and impairment (9,493) (10,463)
Operating income 9,676 (24,645)
Net finance income/(costs) (38,862) (38,775)
of which non-recurring net finance income/(costs) (1,790) (2,311)
Net income from investments 204,606 219,861
Profit/(loss) before taxes 175,420 156,441
Income taxes 16,136 28,244
Net profit/(loss) for the year 191,556 184,685
(in thousands of Euro)

265
The Parent Company's statement of financial position is summarised as follows:
STATEMENT OF FINANCIAL POSITION
31 December 2014 31 December 2013
Net fixed assets 1,896,019 1,787,648
of which: Investments in subsidiaries 1,818,399 1,728,516
Net working capital (41,906) (116,147)
Provisions (13,129) (31,477)
Net capital employed 1,840,984 1,640,024
Employee benefit obligations 7,576 6,305
Equity 1,107,027 1,021,052
Net financial position 726,381 612,667
Total equity and sources of funds 1,840,984 1,640,024
Unless specifically indicated below, the reasons behind the more significant changes in individual items within the Prysmian S.p.A. income statement are described in the Explanatory Notes to the Parent Company Financial State-ments, to which reference should be made.The Parent Company's income statement for 2014 reports Euro 191,556 thousand in net profit, an increase of Euro 6,871 thousand on the prior year.
The items contributing to this result will now be discussed:Revenue from ordinary operations of Euro 1,090,578 thousand (Euro 452,225 thousand in 2013) comprises Euro 1,091,702 thousand from the resale of strategic materials (copper, aluminium and lead) to Group operating companies after this activity was centralised in the Parent Company from July 2013, and Euro 1,125 thousand from the negative change in inventories of such strategic materials.Other income of Euro 106,624 thousand (Euro 102,068 thousand in 2013) mostly refers to amounts charged back by Prysmian S.p.A. to Group companies for coordination activi-ties, for services provided by headquarters functions and for royalties relating to patents and know-how. Operating costs of Euro 1,130,685 thousand in 2014 versus Euro 501,444 thousand in 2013, refer to purchases of strategic materials (Euro 1,088,416 thousand in 2014 versus Euro 450,063 thousand in 2013), purchases of other consumables (Euro 2,356 thousand in 2014 versus Euro 2,952 thousand in 2013), the fair value change in metal derivatives (a negative Euro 32 thousand in 2014 versus a positive Euro 38 thousand in 2013) and personnel costs (Euro 39,881 thousand in 2014
versus Euro 48,467 thousand in 2013). Net finance costs amount to Euro 38,862 thousand (Euro 38,775 thousand in 2013), mainly relating to interest accruing on the bonds and to interest payable on the Credit Agreement 2011, the EIB Loan, the Revolving Credit Facility 2014 and the Syndicated Revolving Credit Facility 2014. Net income from investments amounts to Euro 204,606 thousand, compared with Euro 219,861 thousand in the prior year, and comprises dividends received from the subsidiaries Prysmian Cavi e Sistemi S.r.l. and Prysmian Powerlink S.r.l. (Euro 221,071 thousand) less impairment of the investment in Fibre Ottiche Sud -F.O.S. S.r.l. (Euro 16,465 thousand).Income taxes are a positive Euro 16,136 thousand (Euro 28,244 thousand in 2013) and comprise the recognition of a negative Euro 1,363 thousand for deferred taxes and a positive Euro 17,499 thousand for current taxes. The latter mainly reflect the net positive effects of the relief provided by tax losses transferred from some Italian companies under the rules of the group tax consolidation. More details about the Italian companies which have elected to file for tax on a group basis with Prysmian S.p.A. can be found in Note 22. Taxes, contained in the Explanatory Notes to the Parent Company Financial Statements.Research and development costs are fully expensed to income as incurred and amount to Euro 16,244 thousand in the period under review (Euro 16,507 thousand in 2013); more details can be found in Note 32. Research and development, contained in the Explanatory Notes to the Parent Company Financial Statements.
Note: the composition and method of calculating the above indicators are discussed in the Directors' Report contained in the Group Annual Report.
(in thousands of Euro)

Parent Company Financial Report | DIRECTORS’ REPORT
2014 Annual Report Prysmian Group
266
Unless specifically indicated below, the reasons behind the more significant changes in individual items within the Prysmian S.p.A. statement of financial position are described in the Explanatory Notes to the Parent Company Financial Statements, to which reference should be made.Net fixed assets basically comprise the controlling interests in Prysmian Cavi e Sistemi S.r.l., Draka Holding B.V. and in the Group's other Italian companies. The increase in investments in subsidiaries of Euro 89,883 thousand since 2013 reflects a capital increase by Prysmian PowerLink S.r.l. (Euro 50,000 thousand), and capital contributions paid to Fibre Ottiche Sud – F.O.S. S.r.l. (Euro 5,000 thousand), Prysmian PowerLink S.r.l. (Euro 30,000 thousand) and Draka Holding B.V. (Euro 33,000 thousand). The overall increase also reflects a decrease in the value of the investment in Fibre Ottiche Sud – F.O.S. S.r.l. following its spin-off of the Ansaldo 20 property complex (Euro 14,772 thousand), the impairment of the investment in the same subsidiary (Euro 16,465 thousand) and increases totalling Euro 3,120 thousand for the pay-related component of stock option plans, with underlying Prysmian S.p.A. shares, for employees of other Group companies. Investments in "Property, plant and equipment" and "Intan-gible assets" totalled Euro 28,159 thousand in 2014 (Euro 24,094 thousand in 2013). These investments mainly reflect the effects of spinning off the Ansaldo 20 property complex from the subsidiary Fibre Ottiche Sud – F.O.S. S.r.l. for con-version into the new headquarters of the Prysmian Group (Euro 14,772 thousand), and software costs (Euro 10,951 thousand), mostly in connection with the SAP Consolidation project. More details can be found in Note 1. Property, plant
and equipment and Note 2. Intangible assets, contained in the Explanatory Notes to the Parent Company Financial Statements.Net working capital is a negative Euro 41,906 thousand and comprises:• Euro 105,745 thousand as the net negative balance
between trade receivables and trade payables (see Notes 6 and 11 to the Parent Company Financial Statements);
• Euro 63,839 thousand as the net positive balance of other receivables/payables and financial receivables/payables (see Notes 6 and 11 to the Parent Company Financial Statements).
Provisions, presented above net of deferred tax assets, amount to Euro 13,129 thousand at 31 December 2014 (see Notes 4 and 12 to the Parent Company Financial Statements) compared with Euro 31,477 thousand at 31 December 2013.Equity amounts to Euro 1,107,027 thousand at 31 December 2014, reporting a net increase of Euro 85,975 thousand since 31 December 2013, mainly due to the net profit for the year, net of the dividend distribution and the purchase of treasury shares.A more detailed analysis of the changes in equity can be found in the specific table presented as part of the Parent Company Financial Statements.The Group's consolidated equity at 31 December 2014 and consolidated net profit for 2014 are reconciled with the cor-responding figures for the Parent Company Prysmian S.p.A. in a table presented in the Directors' Report contained in the Group Annual Report. The Net financial position reports Euro 726,381 thousand in net debt at 31 December 2014, compared with Euro 612,667 thousand at 31 December 2013.

267
Note 10 to the Parent Company Financial Statements presents the reconciliation of the Company's net financial position to the amount that must be reported under Consob Communication DEM/6064293 dated 28 July 2006 in compliance with the CESR recommendation dated 10 February 2005 "Recommendations for the consistent im-
The composition of Net financial position is presented in detail in the following table.
plementation of the European Commission's Regulation on Prospectuses".
A more detailed analysis of cash flows is presented in the statement of cash flows, forming part of the Parent Company Financial Statements presented in the following pages.
31 December 2014 31 December 2013
Long-term financial payables
Term Loan Facility 2011 400,000 400,000
Bank fees (1,661) (3,024)
Credit Agreements 398,339 396,976
EIB Loan 91,546 -
Non-convertible bond - 398,576
Convertible bond 271,536 263,401
Finance leases 10,677 11,098
Total long-term financial payables 772,098 1,070,051
Short-term financial payables
Credit Agreements 418 87,818
EIB Loan 8,854 -
Non-convertible bond 414,997 15.305
Convertible bond 1,187 1.187
Revolving Credit Facility 2014 30,232 -
Finance leases 467 537
Other borrowings 65 223
Total short-term financial payablese 456,220 105,070
Total financial liabilities 1,228,318 1,175,121
Long-term financial receivables 22 26
Long-term bank fees 5,219 -
Short-term financial receivables 3,306 55
Short-term bank fees 1,525 4,029
Short-term financial receivables from Group companies 489,552 553,744
Cash and cash equivalents 2,314 4,600
Total financial assets 501,937 562,454
Net financial position 726,381 612,667
(in thousands of Euro)

Parent Company Financial Report | DIRECTORS’ REPORT
2014 Annual Report Prysmian Group
268
HUMAN RESOURCES, ENVIRONMENT AND SAFETY
DIRECTION AND COORDINATION
INTERCOMPANY AND RELATED PARTY TRANSACTIONS
SECONDARY OFFICES
Prysmian S.p.A. had a total of 309 employees at 31 December 2014 (325 at 31 December 2013), of whom 274 management/white-collar staff (290 at 31 December 2013) and 35 blue-col-lar staff (35 at 31 December 2013).The Company has taken systematic, ongoing steps to
Prysmian S.p.A. is not under the direction and coordination of other companies or entities but decides its general and operational strategy in complete autonomy. Pursuant to art. 2497-bis of the Italian Civil Code, the direct and indirect subsidiaries of Prysmian S.p.A. have identified it as the entity
Information on related party transactions, including that required by the Consob Communication dated 28 July 2006, is presented in Note 25 to the Parent Company Financial Statements.
The Company does not have any secondary offices.
implement all the fundamental activities required to manage issues relating to the environment, and the health and safety of its employees. More details can be found in the Directors' Report contained in the Group Annual Report.
which exercises direction and coordination for them. Such direction and coordination involves identifying general and operational strategies for the Group as a whole and defining and implementing internal control systems, models of gover-nance and corporate structure.
269
SHARE CAPITAL AND CORPORATE GOVERNANCE
ATYPICAL AND/OR UNUSUAL TRANSACTIONS
RISK FACTORS
Share capital amounts to Euro 21,671,239 at 31 December 2014, consisting of 216,712,397 ordinary shares (including 2,819,649 treasury shares), with a nominal value of Euro 0.10 each. The total number of outstanding voting shares
In accordance with the disclosures required by Consob Communication DEM/6064293 dated 28 July 2006, it is reported that no atypical and/or unusual transactions took place during 2014.
Prysmian S.p.A. is exposed in the normal conduct of its business to a number of financial and non-financial risk factors which, if they should arise, could also have a material impact on its results of operations and financial condition. Prysmian S.p.A. adopts specific procedures to manage the risk factors that might influence its business results. These procedures are the result of corporate policy which has always sought to maximise value for shareholders by taking every necessary action to prevent the risks inherent in the Company's business. For this purpose, the Board of Directors voted on 24 January 2006 to adopt a model of organisation, management and control ("Organisational Model"), designed to prevent commission of the criminal offences envisaged by Legislative Decree 231/01. In order to reflect the intervening organisational changes since first adopting the Organisational Model, and changes in the above law, the Company's Board of Directors voted on 27 August 2008 to adopt a revised Organisational Model. The revised model has been drawn up on the basis of recent pronouncements by the legal and academic profession and
is 213,882,079, stated net of 10,669 treasury shares held indirectly.Information about Corporate Governance can be found in the Directors' Report contained in the Group Annual Report.
the Guidelines of Confindustria (Italian confederation of industry) and addresses the need for keeping the Company's system of corporate governance constantly updated. The Prysmian Group's Code of Ethics, forming part of its Organisational Model, was updated during 2014 to bring it into line with best practice. The revised Code was approved by the Company's Board of Directors on 8 May 2014.The Company's corporate governance structure is based on the recommendations and rules contained in the "Italian Stock Exchange Self-Regulatory Code for Listed Companies - Ed. 2014", which the Company has adopted. Based on its financial performance and cash generation in recent years, as well as its available financial resources at 31 December 2014, the Company believes that, barring any extraordinary events, there are no material uncertainties, such as to cast significant doubt upon the business's ability to continue as a going concern. More details about risk factors can be found in the Directors' Report contained in the Group Annual Report.

Parent Company Financial Report | DIRECTORS’ REPORT
2014 Annual Report Prysmian Group
270
FINANCIAL RISK MANAGEMENT POLICIES
EVENTS AFTER THE REPORTING PERIOD
Financial risk management policies are discussed in Sections C and C.1 of the Explanatory Notes to the Parent Company Financial Statements.
On 6 February 2015, Prysmian Cavi e Sistemi S.r.l. started legal proceedings, requesting that the claims brought by Pirelli & C. S.p.A. be rejected in full and that it should be Pirelli & C. S.p.A. which holds harmless Prysmian Cavi e Sistemi S.r.l., with reference to the alleged infringement in the period 18 February 1999 - 28 July 2005, for all claims made by the
European Commission in implementation of its decision and for any expenses related to such implementation.
With regard to business outlook, please refer to the Directors' Report contained in the Group Annual Report.
271
PROPOSAL TO APPROVE THE FINANCIAL STATEMENTS AND TO ALLOCATE NET PROFIT FOR 2014
Massimo Tononi ON BEHALF OF THE BOARD OF DIRECTORS THE CHAIRMAN
Shareholders,We are submitting the financial statements for the year ended 31 December 2014 for your approval and propose that you adopt the following:
RESOLUTION
The Shareholders' Meeting:• acknowledges the report by the Board of Directors,• acknowledges the reports by the Board of Statutory Auditors and by the Independent Auditors,• has examined the financial statements at 31 December 2014, which close with a net profit of Euro 191,556,235, and
RESOLVES
a) to approve:• the report on operations by the Board of Directors;• the financial statements at 31 December 2014; as presented by the Board of Directors - as a whole and in their individual parts, along with the proposed provisions - which
report a net profit of Euro 191,556,235; b) to allocate net profit for the year of Euro 191,556,235 as follows:• Euro 42,414 to the Legal Reserve, thereby reaching one-fifth of share capital at 31 December 2014, as required by art. 2430
of the Italian Civil Code;• approximately Euro 90 million to pay a gross dividend of Euro 0.42 to each ordinary voting share (taking account of directly
held treasury shares, currently numbering 2,813,984);• the remainder of approximately Euro 102 million to retained earnings.The dividend will be paid out from 22 April 2015 (record date 21 April) to those shares outstanding on the ex-div date of 20 April 2015.
Milan, 25 February 2015

In 2014, the Group was awarded several projects in the railway infrastructure industry. In this context, the most significant one was the frame agreement signed with SBB CFF FFS, the Swiss Federal Railways, involving the supply of approximately 2,800km of signalling cables to upgrade the whole Swiss railway infrastructure. In 2014, the Group received orders related to railway infrastructures of other countries, such as the Italian, French and Dutch railways.

273
PARENT COMPANY FINANCIAL REPORT

2014 Annual Report Prysmian Group
274
Parent Company Financial Report
STATEMENT OF FINANCIAL POSITION
Note 31 December 2014 of which 31 December 2013 of which related parties related parties (Note 25) (Note 25)
Non-current assets
Property, plant and equipment 1 33,626,451 17,948,649
Intangible assets 2 43,993,725 41,182,998
Investments in subsidiaries 3 1,818,399,274 1,818,399,274 1,728,516,487 1,728,516,487
Derivatives 7 - 36,364 36,364
Deferred tax assets 4 1,584,004 2,962,042
Other receivables 6 5,266,663 65,024
Total non-current assets 1,902,870,117 1,790,711,564
Current assets
Inventories 5 - 1,124,530
Trade receivables 6 149,574,290 146,458,069 100,221,795 97,820,527
Other receivables 6 569,284,117 526,218,309 666,239,014 636,137,595
Derivatives 7 196,737 196,737 99,475 99,475
Cash and cash equivalents 8 2,314,234 4,600,296
Total current assets 721,369,378 772,285,110
Total assets 2,624,239,495 2,562,996,674
Capital and reserves:
Share capital 9 21,671,239 21,459,171
Reserves 9 893,799,487 814,907,778
Net profit/(loss) for the year 9 191,556,235 184,684,558
Total equity 1,107,026,961 1,021,051,507
Non-current liabilities
Borrowings from banks and other lenders 10 772,097,616 1,070,051,250
Derivatives 7 - 36,364 36,364
Employee benefit obligations 13 7,576,241 313,144 6,305,285 161,000
Total non-current liabilities 779,673,857 1,076,392,899
Current liabilities
Borrowings from banks and other lenders 10 456,219,674 105,069,712
Trade payables 11 255,319,731 9,759,023 295,791,143 6,003,696
Other payables 11 11,080,849 429,053 29,260,044 15,744,043
Derivatives 7 176,126 176,126 88,266 88,266
Provisions for risks and charges 12 14,713,092 34,438,944
Current tax payables 29,205 29,205 904,159 35,892
Total current liabilities 737,538,677 465,552,268
Total liabilities 1,517,212,534 1,541,945,167
Total equity and liabilities 2,624,239,495 2,562,996,674
(in Euro)

275
INCOME STATEMENT
Note 2014 of which 2013 of which related parties related parties (Note 25) (Note 25)
Sales of goods and services 14 1,091,702,248 1,091,594,320 451,099,905 449,437,400
Change in inventories of work in progress, semi-finished and finished goods
(1,124,530) - 1,124,530 -
Other income 15 106,624,599 99,870,994 102,068,048 97,293,623
of which non-recurring other income 26 - - 333,438 333,438
Raw materials, consumables used and goods for resale 16 (1,090,772,337) (1,954,805) (453,014,043) (511,335)
Fair value change in metal derivatives (31,880) (31,880) 38,249 38,249
Personnel costs 17 (39,880,929) (5,685,416) (48,467,095) (12,648,676)
of which non-recurring personnel costs 26 (2,185,838) (2,462,737) (1,687,000)
of which personnel costs for fair value of stock options 17 (495,887) (12,736) (4,599,442) (1,670,829)
Amortisation, depreciation and impairment 18 (9,492,951) (10,463,424)
Other expenses 19 (47,348,242) (14,862,427) (67,030,778) (18,551,644)
of which non-recurring other (expenses)/releases 26 17,835,905 (1,264,152) (1,666,229) (1,731,992)
Operating income 9,675,978 (24,644,608)
Finance costs 20 (58,414,473) (3,196,232) (53,323,707) (1,208,533)
of which non-recurring finance costs (2,048,425) (2,310,817)
Finance income 20 19,552,167 19,386,018 14,547,994 14,340,956
of which non-recurring finance income 257,837 257,837 -
Dividends from subsidiaries 21 221,071,176 221,071,176 219,861,163 219,861,163
(Impairment)/Reversal of impairment of investments in subsidiaries (16,465,310) (16,465,310) -
Profit before taxes 175,419,538 156,440,842
Taxes 22 16,136,697 13,256,634 28,243,716 27,115,381
Net profit/(loss) for the year 191,556,235 184,684,558
(in Euro)

2014 Annual Report Prysmian Group
276
Parent Company Financial Report
STATEMENT OF COMPREHENSIVE INCOME
Note 2014 2013
Net profit/(loss) for the year 9 191,556 184,685
- items that may be reclassified subsequently to profit or loss:
Fair value gains/(losses) on cash flow hedges - gross of tax 9 (27) -
Fair value gains/(losses) on cash flow hedges - tax effect 9 7 -
Total items that may be reclassified, net of tax 9 (20) -
- items that will NOT be reclassified subsequently to profit or loss:
Actuarial gains/(losses) on employee benefits - gross of tax 9 (973) 149
Actuarial gains/(losses) on employee benefits - tax effect 9 268 (41)
Total items that will NOT be reclassified, net of tax 9 (705) 108
Total comprehensive income/(loss) for the year 190,831 184,793
(in thousands of Euro)
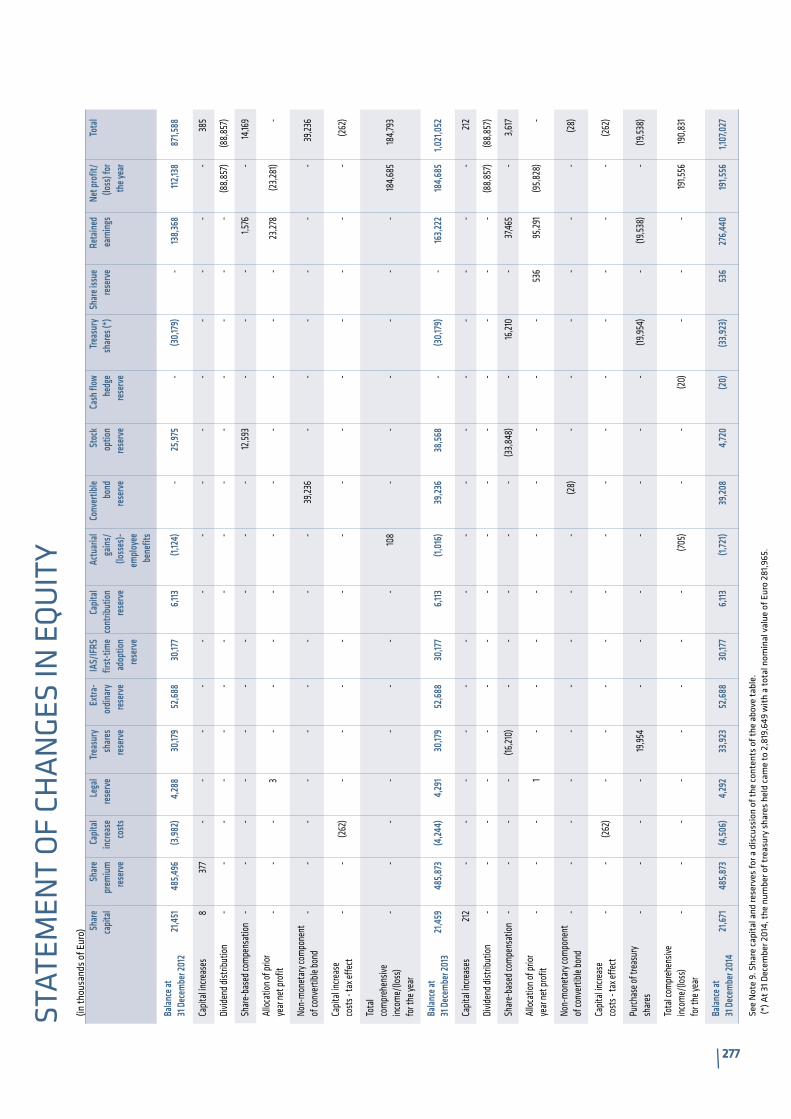
277
STAT
EMEN
T OF
CH
ANGE
S IN
EQU
ITY
See
Not
e 9.
Sha
re c
apita
l and
rese
rves
for a
dis
cuss
ion
of th
e co
nten
ts o
f the
abo
ve ta
ble.
(*) A
t 31 D
ecem
ber 2
014,
the
num
ber o
f tre
asur
y sh
ares
hel
d ca
me
to 2
,819
,649
with
a to
tal n
omin
al v
alue
of E
uro
281,9
65.
Sh
are
Share
Ca
pital
Le
gal
Treas
ury
Extra
- IA
S/IFR
S Ca
pital
Actu
arial
Co
nvert
ible
Stoc
k Ca
sh flo
w Tre
asur
y Sh
are is
sue
Reta
ined
Net p
rofit
/ To
tal
ca
pital
prem
ium
increa
se
reserv
e sh
ares
ordin
ary
first-
time
cont
ribut
ion
gains
/ bo
nd
optio
n he
dge
share
s (*)
reserv
e ea
rning
s (lo
ss) f
or
reserv
e co
sts
res
erve
reserv
e ad
optio
n res
erve
(loss
es)-
reserv
e res
erve
reserv
e
the y
ear
res
erve
em
ploye
e
be
nefit
s
Balan
ce at
21
,451
485,4
96
(3,98
2)
4,288
30
,179
52,68
8 30
,177
6,113
(1,
124)
-
25,97
5 -
(30,17
9)
- 13
8,368
112
,138
871,5
88
31 De
cemb
er 20
12
Capit
al inc
rease
s 8
377
- -
- -
- -
- -
- -
- -
- -
385
Divid
end d
istrib
ution
-
- -
- -
- -
- -
- -
- -
- -
(88,
857)
(88,
857)
Shar
e-ba
sed c
ompe
nsat
ion
- -
- -
- -
- -
- -
12,59
3 -
- -
1,576
-
14
,169
Alloc
ation
of pr
ior
year
net p
rofit
-
- -
3 -
- -
- -
- -
- -
- 23
,278
(23,2
81)
-
Non-
mon
etar
y com
pone
nt
of co
nvert
ible b
ond
- -
- -
- -
- -
- 39
,236
- -
- -
- -
39,23
6
Capit
al inc
rease
co
sts -
tax e
ffect
- -
(262
) -
- -
- -
- -
- -
- -
- -
(262
)
Tota
l co
mpr
ehen
sive
incom
e/(lo
ss)
for t
he ye
ar
- -
- -
- -
- -
108
- -
- -
- -
184,6
85
184,7
93
Balan
ce at
21
,459
485,8
73
(4,24
4)
4,291
30
,179
52,68
8 30
,177
6,113
(1,
016)
39
,236
38,56
8 -
(30,17
9)
- 16
3,222
18
4,685
1,0
21,0
52
31 De
cemb
er 20
13
Capit
al inc
rease
s 21
2 -
- -
- -
- -
- -
- -
- -
- -
212
Divid
end d
istrib
ution
-
- -
- -
- -
- -
- -
- -
- -
(88,
857)
(88,
857)
Shar
e-ba
sed c
ompe
nsat
ion
- -
- -
(16,21
0)
- -
- -
- (3
3,848
) -
16,21
0 -
37,46
5 -
3,617
Alloc
ation
of pr
ior
year
net p
rofit
-
- -
1 -
- -
- -
- -
- -
536
95,29
1 (9
5,828
) -
Non-
mon
etar
y com
pone
ntof
conv
ertibl
e bon
d -
- -
- -
- -
- -
(28)
-
- -
- -
- (2
8)
Capit
al inc
rease
co
sts -
tax e
ffect
- -
(262
) -
- -
- -
- -
- -
- -
- -
(262
)
Purch
ase o
f trea
sury
sh
ares
-
- -
- 19
,954
- -
- -
- -
- (19
,954)
-
(19,53
8)
- (19
,538)
Tota
l com
preh
ensiv
e
incom
e/(lo
ss)
for t
he ye
ar
- -
- -
- -
- -
(705)
-
- (2
0)
- -
- 19
1,556
19
0,83
1
Balan
ce at
21
,671
485,8
73
(4,50
6)
4,292
33
,923
52,68
8 30
,177
6,113
(1,
721)
39,20
8 4,7
20
(20)
(33
,923)
536
276,4
40
191,5
56
1,107
,027
31 De
cemb
er 20
14
(in th
ousa
nds o
f Eur
o)

2014 Annual Report Prysmian Group
278
Parent Company Financial Report
2014 of which 2013 of which
related parties related parties (Note 25) (Note 25) Profit before taxes 175,420 156,441
Depreciation and impairment of property, plant and equipment 1,344 841
Amortisation and impairment of intangible assets 8,149 9,622
Impairment/(Reversal of impairment) of investments in subsidiaries 16,465 -
Net gains on disposal of property, plant and equipment, intangible assets and other non-current assets (85) (62)
Share-based compensation 496 4,599
Dividends (221,071) (221,071) (219,861) (219,861)
Fair value change in metal derivatives 32 32 (38) (38)
Net finance costs 38,862 16,190 38,776 13,132
Changes in inventories 1,125 (1,125)
Changes in trade receivables/payables (89,824) (44,882) 275,595 (2,291)
Changes in other receivables/payables 13,314 30,323 (12,013) (50,775)
Taxes collected/(paid) 1 18,701 18,701 27,097 27,061
Utilisation of provisions (including employee benefit obligations) (1,200) (1,104)
Increases in/(Release of) provisions (including employee benefit obligations) (18,454) 4,578
Transfer of employee benefit obligations - (36)
A. Net cash flow provided by/(used in) operating activities (56,726) 283,310
Investments in property, plant and equipment (2,436) (2,769)
Disposals of property, plant and equipment 263 90
Investments in intangible assets (10,951) (9,738)
Investments to recapitalise subsidiaries (118,000) (118,000) (65,757) (65,757)
Dividends received 221,071 221,071 202,286 202,286
B. Net cash flow provided by/(used in) investing activities 89,947 124,112 Capital increases 2 212 385
Dividend distribution (88,857) (88,857)
Purchase of treasury shares (19,954) -
Sale of treasury shares 416 -
Proceeds from convertible bond 3 - 296,150
EIB Loan 100,000 -
Early repayment of Credit Agreement (87,916) (232,084)
Finance costs paid 4 (37,361) (1,747) (38,448) (980)
Finance income received 5 19,226 17,600 14,514 14,341
Changes in financial receivables/payables 78,727 64,192 (355,163) (356,304)
C. Net cash flow provided by/(used in) financing activities (35,507) (403,503) D. Total cash flow provided/(used) in the year (A+B+C) (2,286) 3,919 E. Net cash and cash equivalents at the beginning of the year 4,600 681 F Net cash and cash equivalents at the end of the year (D+E) 2,314 4,600
STATEMENT OF CASH FLOWS
1 Refer to receipts relating to tax consolidation receivables from Italian Group companies for the transfer of IRES (Italian corporate income tax), net of the Company’s payments of IRES and other taxes.
2 Refer to increases in share capital (Euro 212 thousand in 2014 and Euro 8 thousand in 2013) and in the share premium reserve (Euro 377 thousand in 2013), as a result of exercising stock options.
3 The Bond became convertible following the resolution adopted by the Shareholders' Meeting on 16 April 2013.4 Finance costs paid of Euro 37,361 thousand include Euro 33,569 thousand in interest expense paid in 2014 (Euro 32,517 thousand in 2013).5 Finance income received of Euro 19,226 thousand includes Euro 7 thousand in interest receipts (Euro 2 thousand in 2013) as well as amounts collected from
Group companies for recharged fees for guarantees given by the Company on their behalf.
(in thousands of Euro)

Parent Company Financial Report
EXPLANATORY NOTES
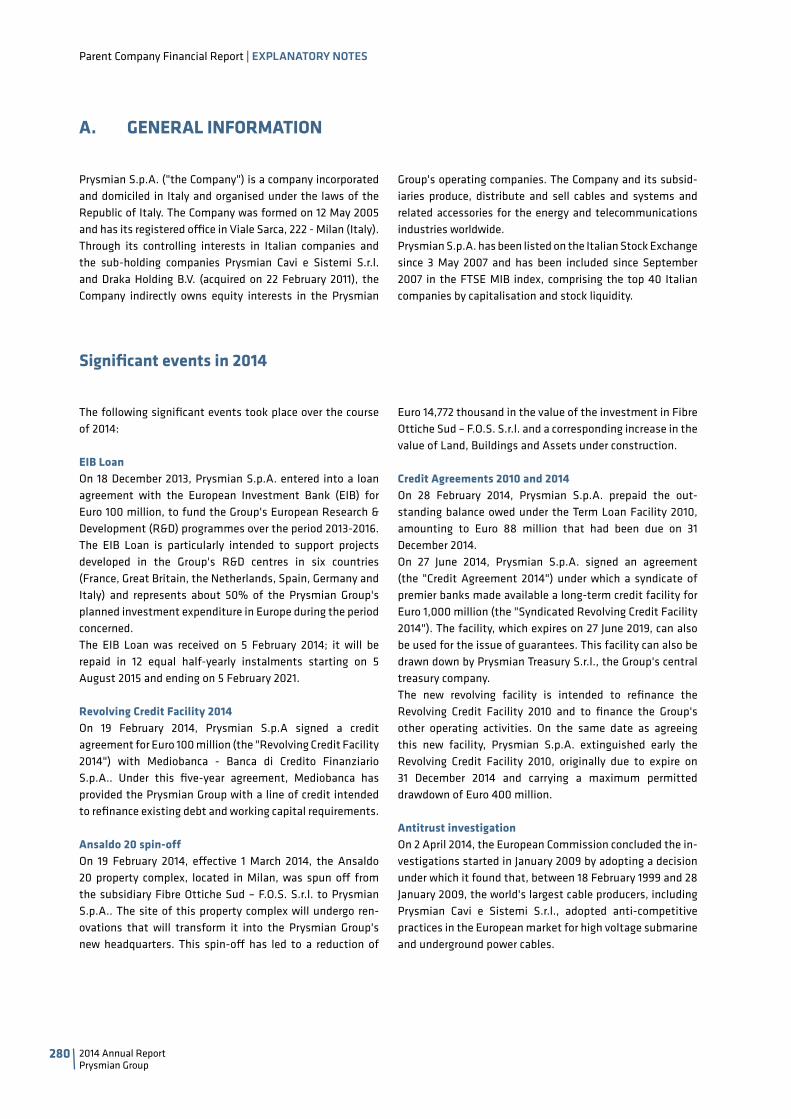
Parent Company Financial Report | EXPLANATORY NOTES
2014 Annual Report Prysmian Group
280
Significant events in 2014
A. GENERAL INFORMATION
Prysmian S.p.A. ("the Company") is a company incorporated and domiciled in Italy and organised under the laws of the Republic of Italy. The Company was formed on 12 May 2005 and has its registered office in Viale Sarca, 222 - Milan (Italy). Through its controlling interests in Italian companies and the sub-holding companies Prysmian Cavi e Sistemi S.r.l. and Draka Holding B.V. (acquired on 22 February 2011), the Company indirectly owns equity interests in the Prysmian
The following significant events took place over the course of 2014:
EIB LoanOn 18 December 2013, Prysmian S.p.A. entered into a loan agreement with the European Investment Bank (EIB) for Euro 100 million, to fund the Group's European Research & Development (R&D) programmes over the period 2013-2016. The EIB Loan is particularly intended to support projects developed in the Group's R&D centres in six countries (France, Great Britain, the Netherlands, Spain, Germany and Italy) and represents about 50% of the Prysmian Group's planned investment expenditure in Europe during the period concerned.The EIB Loan was received on 5 February 2014; it will be repaid in 12 equal half-yearly instalments starting on 5 August 2015 and ending on 5 February 2021.
Revolving Credit Facility 2014 On 19 February 2014, Prysmian S.p.A signed a credit agreement for Euro 100 million (the "Revolving Credit Facility 2014") with Mediobanca - Banca di Credito Finanziario S.p.A.. Under this five-year agreement, Mediobanca has provided the Prysmian Group with a line of credit intended to refinance existing debt and working capital requirements.
Ansaldo 20 spin-offOn 19 February 2014, effective 1 March 2014, the Ansaldo 20 property complex, located in Milan, was spun off from the subsidiary Fibre Ottiche Sud – F.O.S. S.r.l. to Prysmian S.p.A.. The site of this property complex will undergo ren-ovations that will transform it into the Prysmian Group's new headquarters. This spin-off has led to a reduction of
Group's operating companies. The Company and its subsid-iaries produce, distribute and sell cables and systems and related accessories for the energy and telecommunications industries worldwide.Prysmian S.p.A. has been listed on the Italian Stock Exchange since 3 May 2007 and has been included since September 2007 in the FTSE MIB index, comprising the top 40 Italian companies by capitalisation and stock liquidity.
Euro 14,772 thousand in the value of the investment in Fibre Ottiche Sud – F.O.S. S.r.l. and a corresponding increase in the value of Land, Buildings and Assets under construction.
Credit Agreements 2010 and 2014On 28 February 2014, Prysmian S.p.A. prepaid the out-standing balance owed under the Term Loan Facility 2010, amounting to Euro 88 million that had been due on 31 December 2014.On 27 June 2014, Prysmian S.p.A. signed an agreement (the "Credit Agreement 2014") under which a syndicate of premier banks made available a long-term credit facility for Euro 1,000 million (the "Syndicated Revolving Credit Facility 2014"). The facility, which expires on 27 June 2019, can also be used for the issue of guarantees. This facility can also be drawn down by Prysmian Treasury S.r.l., the Group's central treasury company.The new revolving facility is intended to refinance the Revolving Credit Facility 2010 and to finance the Group's other operating activities. On the same date as agreeing this new facility, Prysmian S.p.A. extinguished early the Revolving Credit Facility 2010, originally due to expire on 31 December 2014 and carrying a maximum permitted drawdown of Euro 400 million.
Antitrust investigationOn 2 April 2014, the European Commission concluded the in-vestigations started in January 2009 by adopting a decision under which it found that, between 18 February 1999 and 28 January 2009, the world's largest cable producers, including Prysmian Cavi e Sistemi S.r.l., adopted anti-competitive practices in the European market for high voltage submarine and underground power cables.
281
The European Commission held Prysmian Cavi e Sistemi S.r.l. jointly liable with Pirelli & C. S.p.A. for the alleged infringement in the period from 18 February 1999 to 28 July 2005, sentencing them to pay a fine of Euro 67.3 million, and it held Prysmian Cavi e Sistemi S.r.l. jointly liable with Prysmian S.p.A. and the Goldman Sachs Group Inc. for the alleged infringement in the period from 29 July 2005 to 28 January 2009, sentencing them to pay a fine of Euro 37.3 million. Prysmian has appealed against this decision to the General Court of the European Union and has submitted an application to intervene in the appeals respectively lodged by Pirelli & C. S.p.A. and the Goldman Sachs Group Inc. against the same decision. Both Pirelli & C. S.p.A. and the Goldman Sachs Group Inc. have in turn submitted applications to intervene in the appeal brought by Prysmian against the European Commission's decision. Prysmian has not incurred any financial outlay as a result of this decision having elected, pending the outcome of the appeals, to provide bank guarantees as security against payment of 50% of the fine imposed by the European Commission (amounting to approximately Euro 52 million) for the alleged infringement in both periods. As far as Prysmian is aware, Pirelli & C. S.p.A. has provided or is nonetheless preparing to provide the European Com-mission with a bank guarantee for 50% of the value of the fine imposed for the alleged infringement in the period 18 February 1999 - 28 July 2005. Pirelli & C. S.p.A. has also filed a civil action against Prysmian Cavi e Sistemi S.r.l. in which it demands to be held harmless for all claims made by the European Commission in implementation of its decision and for any expenses related to such implementation. Prysmian Cavi e Sistemi S.r.l. started legal proceedings in February 2015, requesting that the claims brought by Pirelli & C. S.p.A. be rejected in full and that it should be Pirelli & C. S.p.A. which holds harmless Prysmian Cavi e Sistemi S.r.l., with reference to the alleged infringement in the period 18 February 1999 - 28 July 2005, for all claims made by the European Commission in implementation of its decision and for any expenses related to such implementation. Following a detailed and careful analysis of the European Commission's ruling, and nonetheless considering this has been appealed and so could be submitted to second-in-stance judgement, as well as the fact that the investigations initiated by the Canadian Antitrust Authority have ended without any sanctions for Prysmian, it has been decided to partially release the existing provision.The above events have led to the recognition in the 2014 consolidated income statement of a net release of Euro 31 million (of which about Euro 20 million recorded by Prysmian S.p.A.), classified as non-recurring items.
Investments in subsidiariesOn 1 February 2014, Prysmian (Dutch) Holdings B.V., a company owned by the subsidiary Prysmian Cavi e Sistemi S.r.l., was merged with Draka Holding B.V.. This transac-tion, effective 1 January 2014 for accounting purposes, has increased the interest of Prysmian Cavi e Sistemi S.r.l. in Draka Holding B.V. to 47.83%, and decreased the interest of Prysmian S.p.A. in the same subsidiary to 52.17%.On 13 February 2014, the Dutch company Draka Holding N.V. changed its name to Draka Holding B.V.. On 8 April 2014, the share capital of the subsidiary Prysmian Powerlink S.r.l. was increased by Euro 50,000 thousand.On 8 August 2014, a capital contribution of Euro 5,000 thousand was paid to the subsidiary Fibre Ottiche Sud – F.O.S. S.r.l..On 26 August 2014, capital contributions were paid to the subsidiaries Prysmian Powerlink S.r.l. (Euro 30,000 thousand) and Draka Holding B.V. (Euro 33,000 thousand).After reviewing the carrying amounts of its investments in subsidiaries at year end, the Company has recognised an impairment loss of Euro 16,465 thousand against the investment in Fibre Ottiche Sud – F.O.S. S.r.l..
Second cycle of Group employee share purchase plan (YES Plan)During the month of December 2014, employees were informed of the opening of the plan's second cycle in 2015. Employees had until the third week of February 2015 to sign up for the second cycle and to communicate the amount they intended to invest. The total amount collected will be used to make purchases of the Company's shares on the Milan Stock Exchange (MTA) during the month of July 2015.
Treasury sharesThe Shareholders' Meeting held on 16 April 2014 authorised a new share buy-back and disposal programme, revoking at the same time the programme approved on 16 April 2013. The new programme provides the opportunity to purchase, on one or more occasions, a maximum number of ordinary shares whose total cannot exceed 10% of share capital, equal to 18,420,002 ordinary shares as at the date of the Shareholders' Meeting, after deducting the treasury shares already held by the Company. Purchases may not exceed the amount of undistributed earnings and available reserves reported in the most recently approved annual financial statements. The authorisation to buy back treasury shares will last for 18 months commencing from the date of the Shareholders' Meeting; the authorisation to dispose of treasury shares has no time limit.Under this programme, the Company purchased a total of

Parent Company Financial Report | EXPLANATORY NOTES
2014 Annual Report Prysmian Group
282
1,390,000 treasury shares during the months of November and December 2014 at a cost of Euro 19,954 thousand.
Share capitalThe share capital of Prysmian S.p.A. increased during 2014 following the exercise of 2,120,687 options under the
The 2014 financial statements represent the separate financial statements of Prysmian S.p.A., the Parent Company.The present financial statements have been prepared on a going concern basis, with the directors having assessed that there are no financial, operating or other kind of indicators that might provide evidence of the Company's inability to meet its obligations in the foreseeable future and particularly in the next 12 months. Section C. Financial risk management and Section C.1 Capital risk management of these Explanatory Notes contain a description of how the Company manages financial risks, including liquidity and capital risks.Under Legislative Decree 38 of 28 February 2005 "Exercise of the options envisaged by art. 5 of European Regulation 1606/2002 on international accounting standards", issuers are required to prepare not only consolidated financial state-ments but also separate financial statements for the Parent Company in accordance with the International Financial Reporting Standards (IFRS) issued by the International Ac-counting Standards Board (IASB) and published in the Official Journal of the European Union.
The Company has elected to present its income statement according to the nature of expenses, whereas assets and liabilities in the statement of financial position have been classified as either current or non-current. The statement of cash flows has been prepared using the indirect method.
stock option plan, taking the total number of shares at 31 December 2014 to 216,712,397 (including 2,819,649 treasury shares).
The financial statements contained herein were approved by the Board of Directors on 25 February 2015.
Basis of preparation
Reporting formats and disclosures
The term IFRS refers to all the International Financial Reporting Standards, all the International Accounting Standards (IAS), and all the interpretations of the Interna-tional Financial Reporting Interpretations Committee (IFRIC), previously known as the Standing Interpretations Committee (SIC).
IFRS have been applied consistently to all the periods presented in this document. The Company's financial statements have, therefore, been prepared in accordance with IFRS and related best practice; any future guidance and new interpretations will be reflected in subsequent years, in the manner established from time to time by the relevant accounting standards.
The financial statements have been prepared on the historical cost basis, except for the valuation of certain financial assets and liabilities, including derivatives, which must be reported using the fair value method.
The Company has also applied the provisions of Consob Resolution 15519 dated 27 July 2006 concerning financial statement formats and the requirements of Consob Commu-nication 6064293 dated 28 July 2006 regarding disclosures.
All the amounts shown in the tables in the following Notes are expressed in thousands of Euro, unless otherwise stated.
283
The accounting policies and standards adopted are the same as those used for preparing the consolidated financial statements, to which reference should be made, except as described below.
Dividend income is recognised in the income statement when the right to receive the dividends is established, normally coinciding with the shareholders' resolution declaring the same, irrespective of whether such dividends are paid out of
Stock options are valued on the basis of the difference between grant date fair value and purchase price, and, in the case of most subsidiary company employees, on the basis of the difference between vesting date fair value and purchase price. This value is recognised:a) as an expense in the income statement, with a matching
credit to an equity reserve, for options vesting in favour of the Company's employees;
b) if the related cost is recharged, the part relating to the grant date fair value is recognised in equity, while the dif-ference between the grant date fair value and the vesting
Investments in subsidiaries are carried at cost, less any impair-ment losses.If there is specific evidence of impairment, the value of investments in subsidiaries, determined on the basis of cost, is tested for impairment. This involves comparing the carrying amount of investments with their recoverable amount, defined as the higher of fair value, less costs to sell, and value in use.
The value of investments is tested for impairment in at least one of the following circumstances:• the carrying amount of the investment in the separate
financial statements exceeds the carrying amount in the consolidated financial statements of the investee's net assets, including any associated goodwill;
• the investee's reported EBITDA is less than 50% of the same amount projected in the business plan, if this perfor-mance indicator is relevant to the company in question;
B. ACCOUNTING POLICIES
B.1 DIVIDENDS
B.2 SHARE-BASED PAYMENTS
B.3 INVESTMENTS IN SUBSIDIARIES
an investee company's pre- or post-acquisition earnings.The distribution of dividends to shareholders is recognised as a liability in the Company's financial statements when the distribution of such dividends is approved.
date fair value is recognised as a dividend in the income statement;
c) as an increase in the value of investments in subsidiaries, with a matching credit to an equity reserve, for options vesting in favour of employees of Group companies.
In all cases, the value is recognised on a straight-line basis over the option vesting period; this recognition is based on the estimated number of stock options that will effectively vest in favour of eligible employees, taking into consideration any vesting conditions that are not based on the market value of the shares.
• the dividend distributed by the investee exceeds the total comprehensive income of the investee in the period to which the dividend refers.
If the recoverable amount of an investment is less than its carrying amount, then the carrying amount is reduced to the recoverable amount. This reduction represents an impairment loss, which is recognised through the income statement.
For the purposes of impairment testing, the fair value of in-vestments in listed companies is determined with reference to market value, regardless of the size of holding. The fair value of investments in unlisted companies is determined using valuation techniques. Value in use is determined using the "Discounted Cash Flow - equity side" method: this involves calculating the present

Parent Company Financial Report | EXPLANATORY NOTES
2014 Annual Report Prysmian Group
284
value of estimated future cash flows generated by a subsidiary, including cash flows from operating activities and the consid-eration arising from the investment's ultimate sale, net of the financial position at the valuation date.
If the reasons for a previously recognised impairment loss cease to apply, the carrying amount of the investment is re-instated but to no more than its original cost, with the related revaluation recognised through the income statement.
Treasury shares are reported as a deduction from equity. The original cost of treasury shares and revenue arising from any subsequent sales are treated as movements in equity.
Prysmian S.p.A. measures and manages its exposure to financial risks in accordance with the Group's policies.The main financial risks are centrally coordinated and monitored by the Group Finance Department. Risk manage-ment policies are approved by the Group Finance, Admin-istration and Control Department, which provides written guidelines on managing the different kinds of risks and on using financial instruments. The financial risks to which Prysmian S.p.A. is exposed, directly or indirectly through its subsidiaries, are the same as those of the companies of which it is the Parent Company. Reference should therefore be made to Section D. Financial risk management of the Explanatory Notes to the Group's Consolidated Financial Statements.
The principal types of risks to which the Company is exposed are discussed below:
(a) Exchange rate riskThis arises from commercial or financial transactions not yet completed and from assets and liabilities in foreign currency already recognised in the accounts. The Company mitigates this risk by using forward contracts entered into with the Group's central treasury company (Prysmian Treasury S.r.l.), which manages the various currency positions. The foreign currency debtor and creditor positions and related financial hedging instruments reported by Prysmian S.p.A. at 31 December 2014 were of limited relevance. More information can be found in Note 7. Derivatives.
(b) Interest rate riskThe interest rate risk to which the Company is exposed is mainly due to long-term financial liabilities, carrying both fixed and variable rates.
B.4 TREASURY SHARES
C. FINANCIAL RISK MANAGEMENT
Fixed rate debt exposes the Company to a fair value risk. The Company does not operate any particular hedging policies in relation to the risk arising from such contracts.The Group Finance Department monitors the exposure to interest rate risk and adopts appropriate hedging strategies to keep the exposure within the limits defined by the Group Finance, Administration and Control Department, arranging derivative contracts, if necessary. The net liabilities considered for sensitivity analysis include variable rate financial receivables and payables and cash and cash equivalents whose value is influenced by rate volatility. The Company calculates the pre-tax impact on the income statement of changes in interest rates. The simulations carried out for balances at 31 December 2014 indicate that, with all other variables remaining equal, an increase of 25 basis points in interest rates would have decreased financial payables by Euro 115 thousand (2013: decrease of Euro 146 thousand) while a 25-point decrease would have increased financial payables by Euro 115 thousand (2013: increase of Euro 146 thousand). This simulation exercise is carried out on a regular basis to ensure that the maximum potential loss is within the limits set by management.
(c) Price riskThis risk relates to the possibility of fluctuations in the price of strategic materials, whose purchase price is subject to market volatility and for which the Company centrally manages their purchase from third-party suppliers and their resale to Group operating companies. The Company is exposed to a residual price risk on those buying positions that have not been promptly recharged to Group operating companies. More information about metal derivatives can be found in Note 7. Derivatives.

285
31 December 2013 Due within 1 year Due between 1-2 years Due between 2-5 years Due after 5 years
Borrowings from banks and other lenders 140,204 418,298 672,715 -
Finance lease obligations 778 651 1,954 10,626
Derivatives 88 36 - -
Trade and other payables 325,051 - - -
Total 466,121 418,985 674,669 10,626
31 December 2014 Due within 1 year Due between 1-2 years Due between 2-5 years Due after 5 years
Borrowings from banks and other lenders 474,328 420,612 348,484 8,337
Finance lease obligations 699 652 1,911 9,960
Derivatives 176 - - -
Trade and other payables 255,320 - - -
Total 730,523 421,264 350,395 18,297
(d) Credit riskThe Company does not have significant concentrations of credit risk insofar as almost all its customers are companies belonging to the Group. There are also no significant past due receivables that have not been written down.
(e) Liquidity riskPrudent management of the liquidity risk arising from the Company's normal operations involves the maintenance of adequate levels of cash and cash equivalents, short-term securities and funds obtainable from an adequate amount of committed credit lines. The Company's Finance Department prefers flexibility when sourcing funds by using committed credit lines.
At 31 December 2014, cash and cash equivalents stood at Euro 2,314 thousand, compared with Euro 4,600 thousand at 31 December 2013. The Company can draw down on the credit lines granted to the Group in the form of the Revolving Credit Facility 2011 (Euro 400 million), the Revolving Credit Facility 2014 (Euro 100 million) and the Syndicated Revolving Credit Facility 2014 (Euro 1,000 million). More details can be found in the Explanatory Notes to the Consolidated Financial Statements (Section D. Financial risk management).
The following table presents an analysis, by due date, of the payables and liabilities settled on a net basis. The various due date categories refer to the period between the reporting date and the contractual due date of the obligations.
(in thousands of Euro)
(in thousands of Euro)
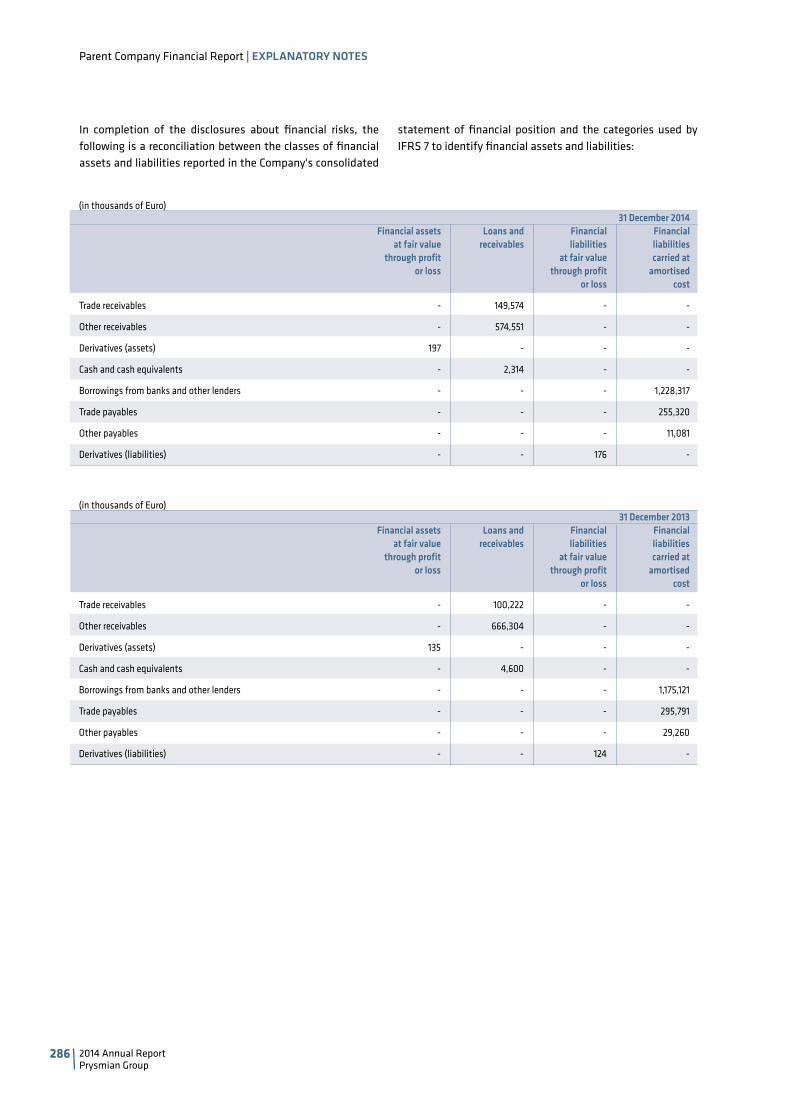
Parent Company Financial Report | EXPLANATORY NOTES
2014 Annual Report Prysmian Group
286
In completion of the disclosures about financial risks, the following is a reconciliation between the classes of financial assets and liabilities reported in the Company's consolidated
statement of financial position and the categories used by IFRS 7 to identify financial assets and liabilities:
31 December 2014 Financial assets Loans and Financial Financial at fair value receivables liabilities liabilities through profit at fair value carried at or loss through profit amortised or loss cost
Trade receivables - 149,574 - -
Other receivables - 574,551 - -
Derivatives (assets) 197 - - -
Cash and cash equivalents - 2,314 - -
Borrowings from banks and other lenders - - - 1,228,317
Trade payables - - - 255,320
Other payables - - - 11,081
Derivatives (liabilities) - - 176 -
31 December 2013 Financial assets Loans and Financial Financial at fair value receivables liabilities liabilities through profit at fair value carried at or loss through profit amortised or loss cost
Trade receivables - 100,222 - -
Other receivables - 666,304 - -
Derivatives (assets) 135 - - -
Cash and cash equivalents - 4,600 - -
Borrowings from banks and other lenders - - - 1,175,121
Trade payables - - - 295,791
Other payables - - - 29,260
Derivatives (liabilities) - - 124 -
(in thousands of Euro)
(in thousands of Euro)
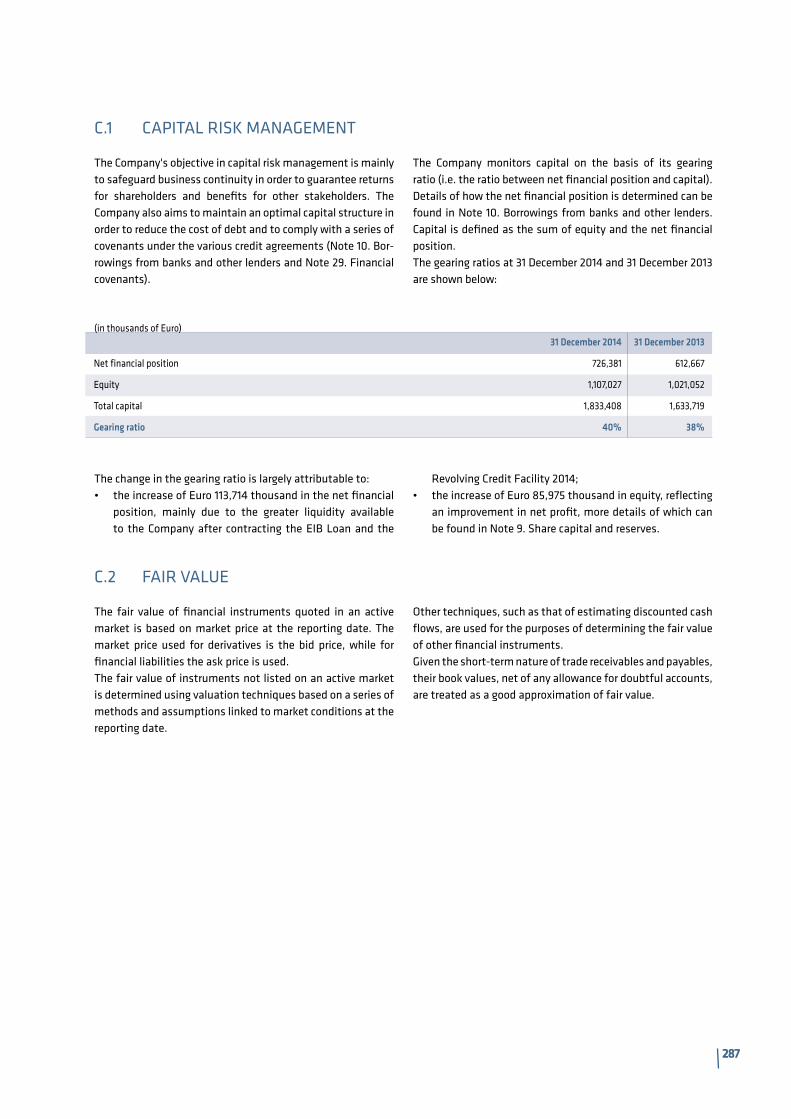
287
The Company's objective in capital risk management is mainly to safeguard business continuity in order to guarantee returns for shareholders and benefits for other stakeholders. The Company also aims to maintain an optimal capital structure in order to reduce the cost of debt and to comply with a series of covenants under the various credit agreements (Note 10. Bor-rowings from banks and other lenders and Note 29. Financial covenants).
The fair value of financial instruments quoted in an active market is based on market price at the reporting date. The market price used for derivatives is the bid price, while for financial liabilities the ask price is used. The fair value of instruments not listed on an active market is determined using valuation techniques based on a series of methods and assumptions linked to market conditions at the reporting date.
The change in the gearing ratio is largely attributable to:• the increase of Euro 113,714 thousand in the net financial
position, mainly due to the greater liquidity available to the Company after contracting the EIB Loan and the
C.1 CAPITAL RISK MANAGEMENT
C.2 FAIR VALUE
The Company monitors capital on the basis of its gearing ratio (i.e. the ratio between net financial position and capital). Details of how the net financial position is determined can be found in Note 10. Borrowings from banks and other lenders. Capital is defined as the sum of equity and the net financial position.The gearing ratios at 31 December 2014 and 31 December 2013 are shown below:
Other techniques, such as that of estimating discounted cash flows, are used for the purposes of determining the fair value of other financial instruments.Given the short-term nature of trade receivables and payables, their book values, net of any allowance for doubtful accounts, are treated as a good approximation of fair value.
Revolving Credit Facility 2014;• the increase of Euro 85,975 thousand in equity, reflecting
an improvement in net profit, more details of which can be found in Note 9. Share capital and reserves.
31 December 2014 31 December 2013
Net financial position 726,381 612,667
Equity 1,107,027 1,021,052
Total capital 1,833,408 1,633,719
Gearing ratio 40% 38%
(in thousands of Euro)
Parent Company Financial Report | EXPLANATORY NOTES
2014 Annual Report Prysmian Group
288
The preparation of financial statements requires manage-ment to apply accounting policies and methods which, at times, rely on subjective judgements and estimates based on past experience and assumptions deemed to be reasonable and realistic according to the circumstances. The application of these estimates and assumptions influences the amounts reported in the financial statements, meaning the statement of financial position, the income statement, the statement of comprehensive income and the statement of cash flows, as well as the accompanying disclosures. Ultimate amounts, previously reported on the basis of estimates and assumptions, may differ from original estimates because of the uncertain nature of the assumptions and conditions on which the estimates were based.
The following is a brief description of the accounting policies that require the management of Prysmian S.p.A. to exercise greater subjectivity of judgement when preparing estimates and for which a change in underlying assumptions could have a significant impact on the financial statements.
(a) Provisions for risks and chargesProvisions are recognised for legal and tax risks and reflect the risk of a negative outcome. The value of the provisions recorded in the financial statements against such risks represents the best estimate by management at that date. This estimate requires the use of assumptions depending on factors which may change over time and which could, therefore, have a significant impact on the current estimates made by management to prepare the Company's financial statements.
D. ESTIMATES AND ASSUMPTIONS
(b) Impairment of assetsIn accordance with the accounting standards applied by the Group, property, plant and equipment and intangible assets with finite useful lives and equity investments are tested for impairment. Any impairment loss is recognised by means of a write-down, when indicators suggest it will be difficult to recover the related net book value through use of the assets. Verification of the existence of these indica-tors requires management to make subjective judgements based on information available within the Company and from the market, as well as on past experience. In addition, if a potential impairment loss is identified, the Company determines the amount of such impairment using suitable valuation techniques. Correct identification of indicators of potential impairment, as well as the estimates for deter-mining its amount, depend on factors which can vary over time, thus influencing judgements and estimates made by management. Irrespective of the existence of indicators of potential im-pairment or otherwise, all intangible assets not yet ready for use must be tested for impairment once a year.
(c) Depreciation and amortisationThe cost of property, plant and equipment and intangible assets is depreciated/amortised on a straight-line basis over the estimated useful lives of the assets concerned. The useful economic life of the Company's property, plant and equipment and intangible assets is determined by man-agement when assets are acquired. This is based on past experience for similar assets, market conditions and expec-tations regarding future events that could impact useful life,

289
including changes in technology. Therefore, actual economic life may differ from estimated useful life. The Company periodically reviews technological and sector changes to update residual useful lives. This periodic update may lead to a variation in the depreciation/amortisation period and therefore also in the depreciation/amortisation charge for future years.
(d) TaxesCurrent taxes are calculated on the basis of the taxable income for the year, applying the tax rates effective at the end of the reporting period.Deferred tax assets are recognised to the extent that it is likely that future taxable income will be available against which they can be recovered.
(e) Employee benefit obligationsThe present value of the pension plans reported in the financial statements depends on an independent actuarial calculation and on a number of different assumptions. Any changes in assumptions and in the discount rate used are duly reflected in the present value calculation and may have a significant impact on the figures reported in the financial
statements. The assumptions used for the actuarial calcula-tion are examined by the Company annually.
Present value is calculated by discounting future cash flows at an interest rate equal to that on high-quality corporate bonds issued in the currency in which the liability will be settled and which takes account of the duration of the related pension plan.
Further information can be found in Note 13. Employee benefit obligations and Note 17. Personnel costs.
(f) Incentive planThe employee share purchase plan involves granting options to almost all of the Group's employees. The operation of this plan is described in Note 17. Personnel costs.The grant of options is subject to an employee's continued professional relationship with the Group in the months between signing up to one of the plan's purchase windows and the purchase of the shares themselves on the stock market. The plan's financial and economic impact has therefore been estimated on the basis of the best possible estimates and information currently available.

Parent Company Financial Report | EXPLANATORY NOTES
2014 Annual Report Prysmian Group
290
Details of this line item and related movements are as follows:
1. PROPERTY, PLANT AND EQUIPMENT
Land and Plant and Equipment Other assets Assets under Total buildings machinery construction and advances
Balance at 31 December 2013 13,124 948 425 1,504 1,948 17,949
Movements in 2014:
- Spin-off FOS S.r.l. property complex 11,402 - - - 3,370 14,772
- Investments - 216 511 61 1,648 2,436
- Disposals - (90) - (88) - (178)
- Depreciation (514) (183) (167) (480) - (1,344)
- Reclassifications 22 997 290 301 (1,619) (9)
Total movements 10,910 940 634 (206) 3,399 15,677
Balance at 31 December 2014 24,034 1,888 1,059 1,298 5,347 33,626
Of which:
- Historical cost 35,977 6,458 2,311 3,502 5,347 53,595
- Accumulated depreciation and impairment (11,943) (4,570) (1,252) (2,204) - (19,969)
Net book value 24,034 1,888 1,059 1,298 5,347 33,626
Land and Plant and Equipment Other assets Assets under Total buildings machinery construction and advances
Balance at 31 December 2012 148 1,064 325 1,463 1,242 4,242
Movements in 2013:
- Investments 13,093 80 - 60 1,123 14,356
- Disposals - (28) - - - (28)
- Depreciation (117) (179) (148) (397) - (841)
- Reclassifications - 11 248 378 (417) 220
Total movements 12,976 (116) 100 41 706 13,707
Balance at 31 December 2013 13,124 948 425 1,504 1,948 17,949
Of which:
- Historical cost 13,513 5,335 1,511 3,457 1,948 25,764
- Accumulated depreciation and impairment (389) (4,387) (1,086) (1,953) - (7,815)
Net book value 13,124 948 425 1,504 1,948 17,949
(in thousands of Euro)
(in thousands of Euro)
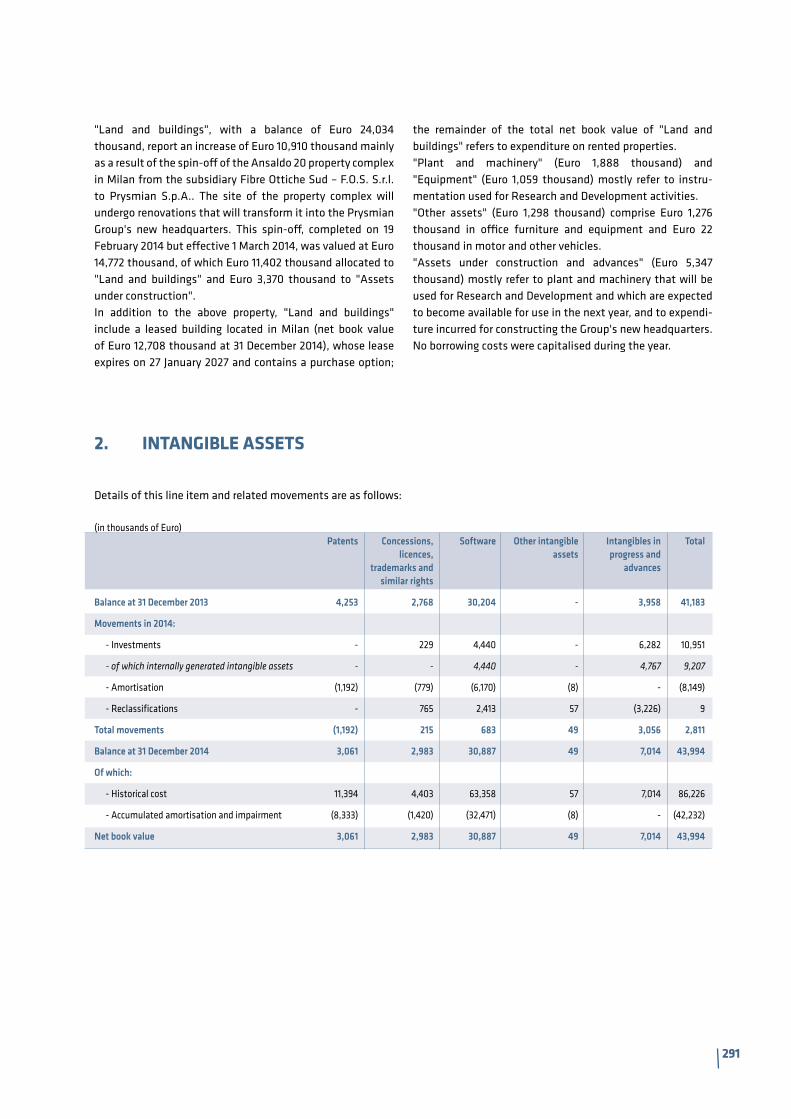
291
Details of this line item and related movements are as follows:
2. INTANGIBLE ASSETS
"Land and buildings", with a balance of Euro 24,034 thousand, report an increase of Euro 10,910 thousand mainly as a result of the spin-off of the Ansaldo 20 property complex in Milan from the subsidiary Fibre Ottiche Sud – F.O.S. S.r.l. to Prysmian S.p.A.. The site of the property complex will undergo renovations that will transform it into the Prysmian Group's new headquarters. This spin-off, completed on 19 February 2014 but effective 1 March 2014, was valued at Euro 14,772 thousand, of which Euro 11,402 thousand allocated to "Land and buildings" and Euro 3,370 thousand to "Assets under construction".In addition to the above property, "Land and buildings" include a leased building located in Milan (net book value of Euro 12,708 thousand at 31 December 2014), whose lease expires on 27 January 2027 and contains a purchase option;
the remainder of the total net book value of "Land and buildings" refers to expenditure on rented properties. "Plant and machinery" (Euro 1,888 thousand) and "Equipment" (Euro 1,059 thousand) mostly refer to instru-mentation used for Research and Development activities."Other assets" (Euro 1,298 thousand) comprise Euro 1,276 thousand in office furniture and equipment and Euro 22 thousand in motor and other vehicles. "Assets under construction and advances" (Euro 5,347 thousand) mostly refer to plant and machinery that will be used for Research and Development and which are expected to become available for use in the next year, and to expendi-ture incurred for constructing the Group's new headquarters.No borrowing costs were capitalised during the year.
Patents Concessions, Software Other intangible Intangibles in Total licences, assets progress and trademarks and advances similar rights
Balance at 31 December 2013 4,253 2,768 30,204 - 3,958 41,183
Movements in 2014:
- Investments - 229 4,440 - 6,282 10,951
- of which internally generated intangible assets - - 4,440 - 4,767 9,207
- Amortisation (1,192) (779) (6,170) (8) - (8,149)
- Reclassifications - 765 2,413 57 (3,226) 9
Total movements (1,192) 215 683 49 3,056 2,811
Balance at 31 December 2014 3,061 2,983 30,887 49 7,014 43,994
Of which:
- Historical cost 11,394 4,403 63,358 57 7,014 86,226
- Accumulated amortisation and impairment (8,333) (1,420) (32,471) (8) - (42,232)
Net book value 3,061 2,983 30,887 49 7,014 43,994
(in thousands of Euro)

Parent Company Financial Report | EXPLANATORY NOTES
2014 Annual Report Prysmian Group
292
"Patents" refer to the patent portfolio held by Prysmian S.p.A. and licensed to Group companies. "Concessions, licences, trademarks and similar rights" refer to purchases of software licences. "Software" reports a net increase of Euro 683 thousand, mainly in connection with progress in the SAP Consolidation project that aims to harmonise this information system's use throughout the Group. This system, with a net book value (inclusive of intangibles in progress) of Euro 34,869 thousand at 31 December 2013, entered service in 2009;
during 2014 the useful life of the investment was revised, taking the amortisation period from 8 to 10 years, reflecting deferral in the system's full roll-out at Group level."Intangibles in progress and advances" refer to investments still in progress at year end, which have therefore not been amortised. The balance at 31 December 2014 includes Euro 7,014 thousand in expenditure on rolling out the SAP Con-solidation project, and on developing other software in the research and development area.No borrowing costs were capitalised during the year.
Patents Concessions, Software Intangibles in Total licences, trademarks progress and and similar rights advances
Balance at 31 December 2012 5,445 1,349 29,588 4,905 41,287
Movements in 2013:
- Investments - 586 5,838 3,314 9,738
- of which internally generated intangible assets - - 5,828 2,374 8,202
- Amortisation (1,192) (368) (8,062) - (9,622)
- Reclassifications - 1,201 2,840 (4,261) (220)
Total movements (1,192) 1,419 616 (947) (104)
Balance at 31 December 2013 4,253 2,768 30,204 3,958 41,183
Of which:
- Historical cost 11,394 3,409 56,504 3,958 75,265
- Accumulated amortisation and impairment (7,141) (641) (26,300) - (34,082)
Net book value 4,253 2,768 30,204 3,958 41,183
(in thousands of Euro)

293
With a balance of Euro 1,818,399 thousand at 31 December 2014, these investments report the following movements over the year:
3. INVESTMENTS IN SUBSIDIARIES
The change of Euro 89,883 thousand in the value of invest-ments in subsidiaries is mainly attributable to the following transactions:• on 1 February 2014, as part of the corporate rationalisa-
tion following acquisition of the Draka Group, Prysmian (Dutch) Holdings B.V., a company owned by the sub-sidiary Prysmian Cavi e Sistemi S.r.l., was merged with Draka Holding B.V.. This transaction, effective 1 January 2014 for accounting purposes, has increased the interest of Prysmian Cavi e Sistemi S.r.l. in Draka Holding B.V. to 47.83%, and decreased the interest of Prysmian S.p.A. in the same subsidiary from 63.43% to 52.17%;
• on 19 February 2014, the Ansaldo 20 property complex, located in Milan, was spun off from the subsidiary Fibre Ottiche Sud – F.O.S. S.r.l. to Prysmian S.p.A., more details of which can be found in Note 1. Property, plant and equipment. This spin-off, which was effective 1 March 2014, has led to a reduction of Euro 14,772 thousand in the value of the investment in Fibre Ottiche Sud – F.O.S. S.r.l.;
• on 8 April 2014, the share capital of the subsidiary Prysmian PowerLink S.r.l. was increased by Euro 50,000 thousand;
• on 8 August 2014, a capital contribution of Euro 5,000
thousand was paid to the subsidiary Fibre Ottiche Sud – F.O.S. S.r.l;
• on 26 August 2014, capital contributions were paid to the subsidiaries Prysmian PowerLink S.r.l. (Euro 30,000 thousand) and Draka Holding B.V. (Euro 33,000 thousand);
• increases totalling Euro 3,120 thousand for the compen-sation-related component of stock options over Prysmian S.p.A. shares held by managers employed by other Group companies, as explained in Note 17. Personnel costs. This component has been treated like a capital contribution and so reported as an increase in the value of the invest-ments in the subsidiaries in which the plan beneficiaries are directly or indirectly employees. These increases are matched by a corresponding movement in the specific equity reserve. Further information can be found in Note 9. Share capital and reserves.
The Company reviews the carrying amounts of its invest-ments in accordance with the policy set out in Section B. Accounting policies. In particular, as a result of impairment testing, the Company has recognised an impairment loss of Euro 16,465 thousand against the value of its investment in Fibre Ottiche Sud – F.O.S. S.r.l..
31 December 2013 Capital (Impairment)/ Capital Effect 31 December 2014 contributions Reversal of contributions of partial impairment of for stock spin-off investments options
Prysmian Cavi e Sistemi S.r.l. 278,522 - - 449 - 278,971
Draka Holding B.V. 1,216,954 33,000 - 1,652 - 1,251,606
Prysmian Cavi e Sistemi Italia S.r.l. 49,159 - - 712 - 49,871
Prysmian Power Link Srl 63,586 80,000 - 307 - 143,893
Fibre Ottiche Sud - F.O.S. S.r.l. 80,383 5,000 (16,465) - (14,772) 54,146
Prysmian Treasury Srl 37,757 - - - - 37,757
Prysmian Kabel und Systeme GmbH 2,154 - - - - 2,154
Prysmian Kablo SRO 1 - - - - 1
Prysmian Pension Scheme Trustee Limited - - - - - -
Prysmian Surflex Umbilicais e Tubos Flexiveis do Brasil Ltda - - - - - -
Jaguar Communication Consultancy Services Private Ltd. - - - - - -
Prysmian Energia Cabos e Sistemas do Brasil S.A. - - - - - -
Total investments in subsidiaries 1,728,516 118,000 (16,465) 3,120 (14,772) 1,818,399
(in thousands of Euro)

Parent Company Financial Report | EXPLANATORY NOTES
2014 Annual Report Prysmian Group
294
Company name Registered office Share capital % owned 2014 % owned 2013
Prysmian Cavi e Sistemi S.r.l. Milan EUR 100,000,000 100 100
Draka Holding B.V. Amsterdam EUR 52,229,321 52.165 63.43
Prysmian Cavi e Sistemi Italia S.r.l. Milan EUR 77,143,249 100 100
Prysmian PowerLink S.r.l. Milan EUR 100,000,000 100 100
Fibre Ottiche Sud - F.O.S. S.r.l. Battipaglia EUR 47,700,000 100 100
Prysmian Treasury S.r.l. Milan EUR 30,000,000 100 100
Prysmian Kabel Und Systeme GmbH Berlin EUR 15,000,000 6.25 6.25
Prysmian Pension Scheme Trustee L. Hampshire GBP 1 100 100
Prysmian Kablo SRO (1) Bratislava EUR 21,246,001 0.005 0.005
Jaguar Communication Consultancy Services Private Ltd. (1) Mumbai INR 34,432,100 0.00003 0.00003
Prysmian Surflex Umbilicais e Tubos Flexiveis do Brasil Ltda. (1) Vila Velha BRL 218,299,840 0.99999 0.000001
Prysmian Energia Cabos e Sistemas do Brasil S.A. (1) Sorocaba BRL 153,974,214 0.143 0.143
These are detailed as follows:
4. DEFERRED TAX ASSETS
31 December 2014 31 December 2013
Deferred tax assets:
- Deferred tax assets recoverable beyond 12 months 750 1,100
- Deferred tax assets recoverable within 12 months 834 1,862
Total deferred tax assets 1,584 2,962
(in thousands of Euro)
The following table summarises key information about investments held in subsidiaries:
(1) Controlled indirectly
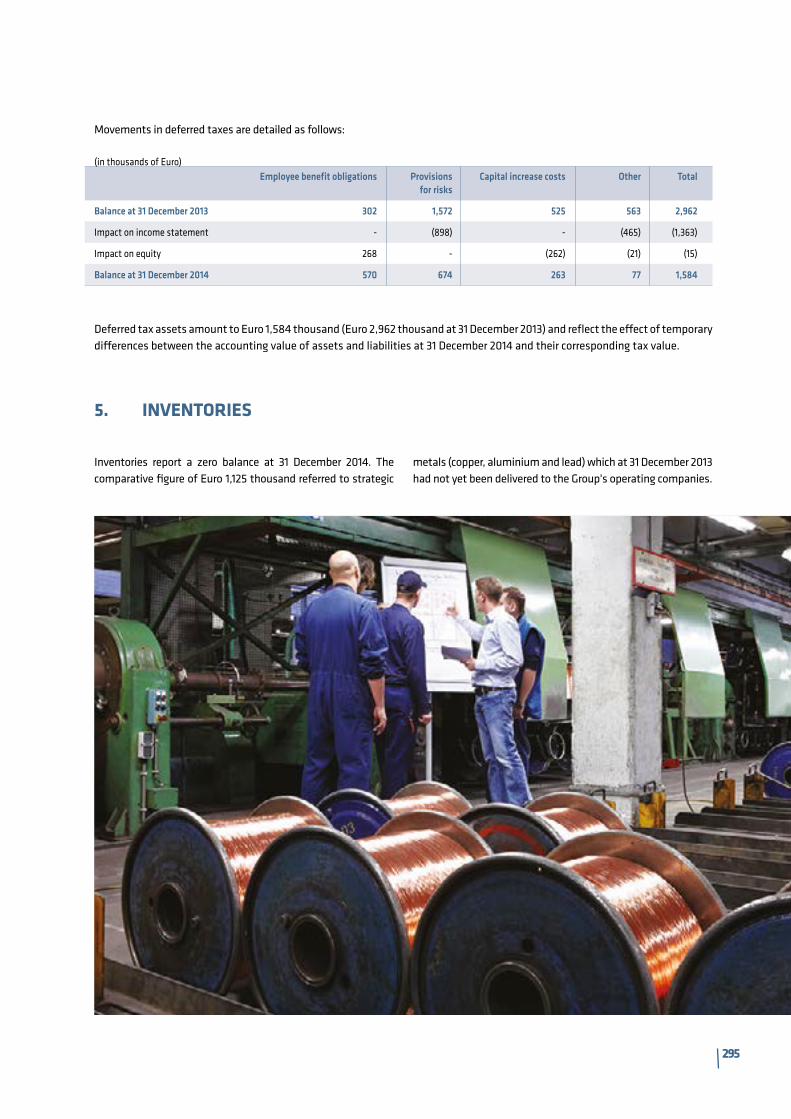
295
Movements in deferred taxes are detailed as follows:
Employee benefit obligations Provisions Capital increase costs Other Total for risks
Balance at 31 December 2013 302 1,572 525 563 2,962
Impact on income statement - (898) - (465) (1,363)
Impact on equity 268 - (262) (21) (15)
Balance at 31 December 2014 570 674 263 77 1,584
Deferred tax assets amount to Euro 1,584 thousand (Euro 2,962 thousand at 31 December 2013) and reflect the effect of temporary differences between the accounting value of assets and liabilities at 31 December 2014 and their corresponding tax value.
Inventories report a zero balance at 31 December 2014. The comparative figure of Euro 1,125 thousand referred to strategic
5. INVENTORIES
metals (copper, aluminium and lead) which at 31 December 2013 had not yet been delivered to the Group's operating companies.
(in thousands of Euro)
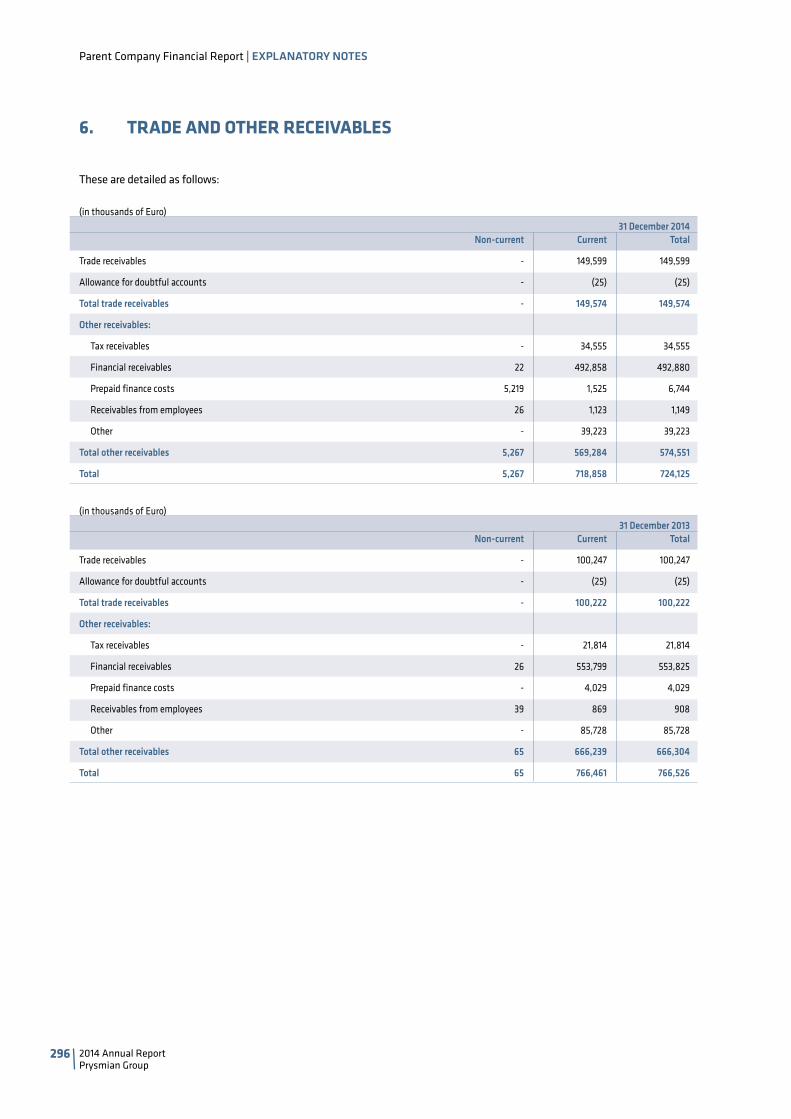
Parent Company Financial Report | EXPLANATORY NOTES
2014 Annual Report Prysmian Group
296
These are detailed as follows:
6. TRADE AND OTHER RECEIVABLES
31 December 2014 Non-current Current Total
Trade receivables - 149,599 149,599
Allowance for doubtful accounts - (25) (25)
Total trade receivables - 149,574 149,574
Other receivables:
Tax receivables - 34,555 34,555
Financial receivables 22 492,858 492,880
Prepaid finance costs 5,219 1,525 6,744
Receivables from employees 26 1,123 1,149
Other - 39,223 39,223
Total other receivables 5,267 569,284 574,551
Total 5,267 718,858 724,125
31 December 2013 Non-current Current Total
Trade receivables - 100,247 100,247
Allowance for doubtful accounts - (25) (25)
Total trade receivables - 100,222 100,222
Other receivables:
Tax receivables - 21,814 21,814
Financial receivables 26 553,799 553,825
Prepaid finance costs - 4,029 4,029
Receivables from employees 39 869 908
Other - 85,728 85,728
Total other receivables 65 666,239 666,304
Total 65 766,461 766,526
(in thousands of Euro)
(in thousands of Euro)

297
The following table breaks down trade and other receivables according to the currency in which they are expressed:
31 December 2014 31 December 2013
Euro 703,404 666,994
British Pound 19,064 95,823
US Dollar 1,657 3,004
Australian Dollar - 468
Other currencies - 237
Total 724,125 766,526
"Trade receivables" at 31 December 2014 mainly refer to charges made by Prysmian S.p.A. to its subsidiaries for head office services and the resale of strategic materials.The book value of trade receivables approximates their fair value.Trade receivables are all due within the next year and do not include any significant past due balances.
"Tax receivables" of Euro 34,555 thousand mainly refer to:• tax credits for withholdings paid abroad (Euro 10,361
thousand);• residual credits for IRES - Italian corporate income tax
(Euro 4,890 thousand), after duly offsetting against the provision of Euro 4,904 thousand;
• VAT credits (Euro 17,579 thousand). "Financial receivables" mostly comprise the credit balance of Euro 489,552 thousand on the current account with Prysmian Treasury S.r.l., the Group's central treasury company (Euro 553,744 thousand at 31 December 2013). "Prepaid finance costs" of Euro 6,744 thousand mainly relate to:• Euro 6,274 thousand for the Company's portion of the
costs incurred for the Syndicated Revolving Credit
Facility 2014 agreed with a syndicate of leading banks on 27 June 2014 (for more details, see Note 10. Borrowings from banks and other lenders); the Company is amortis-ing these costs over the term of the agreement, i.e. until 27 June 2019;
• Euro 451 thousand for the Company's portion of the costs incurred for the Euro 100 million Revolving Credit Facility 2014 agreed with Mediobanca – Banca di Credito Finanziario S.p.A. on 19 February 2014 (for more details, see Note 10. Borrowings from banks and other lenders); the Company is amortising these costs over the term of the agreement, i.e. until 19 February 2019.
At 31 December 2014, "Other" mainly comprises:• Euro 8,976 thousand in receivables from Group
companies for the chargeback of user licences for patents and know-how;
• Euro 24,385 thousand in receivables from Italian Group companies for the transfer of IRES (Italian corporate income tax) under the group tax consolidation (art. 117 et seq of the Italian Income Tax Code).
The book value of financial receivables and other current receivables approximates the respective fair value.
(in thousands of Euro)

Parent Company Financial Report | EXPLANATORY NOTES
2014 Annual Report Prysmian Group
298
Details of these balances are presented below:
7. DERIVATIVES
31 December 2013 Asset Liability
Non-current
Metal derivatives 36 36
Total non-current derivatives 36 36
Current
Forward currency contracts on commercial transactions 46 73
Metal derivatives 53 15
Total other derivatives 99 88
Total 135 124
The above derivatives have all been entered into with Prysmian Treasury S.r.l., the Group's central treasury company. Forward currency contracts have a notional value of Euro
16,536 thousand at 31 December 2014, of which those designated as cash flow hedges have a value of Euro 5,641 thousand and refer to a service agreement.
31 December 2014 Asset Liability
Current
Forward currency contracts on commercial transactions (cash flow hedges) - 27
Total non-current derivatives - 27
Forward currency contracts on commercial transactions 113 71
Metal derivatives 84 78
Total other derivatives 197 149
Total current derivatives 197 176
Total 197 176
(in thousands of Euro)
(in thousands of Euro)

299
These amount to Euro 2,314 thousand at 31 December 2014, compared with Euro 4,600 thousand at 31 December 2013, and relate to the cash held on Euro bank current accounts repayable on demand. The credit risk associated with cash and cash equivalents is
Equity amounts to Euro 1,107,027 thousand at 31 December 2014, reporting an increase of Euro 85,975 thousand since 31 December 2013. The changes over this period are discussed in the following paragraphs about the individual compo-nents of equity.
Share capitalShare capital amounts to Euro 21,671 thousand at 31 December 2014, consisting of 216,712,397 ordinary shares
8. CASH AND CASH EQUIVALENTS
9. SHARE CAPITAL AND RESERVES
limited insofar as the counterparties are major national and international banks.
The value of cash and cash equivalents is considered to be in line with the respective fair value.
(including 2,819,649 treasury shares), with a nominal value of Euro 0.10 each. The total number of outstanding voting shares is 213,882,079, stated net of 10,669 treasury shares held indirectly.
The following table reconciles the number of outstanding shares at 31 December 2012, at 31 December 2013 and 31 December 2014:
Ordinary shares Treasury shares Total
Balance at 31 December 2012 214,508,781 (3,028,500) 211,480,281
Capital increase (1) 82,929 - 82,929
Treasury shares - - -
Balance at 31 December 2013 214,591,710 (3,028,500) 211,563,210
Capital increase (2) 2,120,687 - 2,120,687
Treasury shares - allotments (3) - 1,574,202 1,574,202
Treasury shares - sales - 24,649 24,649
Treasury shares - purchases - (1,390,000) (1,390,000)
Balance at 31 December 2014 216,712,397 (2,819,649) 213,892,748
(1) Capital increase following exercise of part of the options under the Stock Option Plan 2007-2012.(2) Capital increase following exercise of the options under the Long-term incentive plan 2011-2013.(3) The movement in treasury shares refers to the allotment of 162,650 shares under the Group employee share purchase plan (YES Plan) and to the allotment
of 1,411,552 shares under the Long-term incentive plan 2011-2013.
More details about treasury shares can be found in the sub-sequent note on "Treasury shares".
Share premium reserveThis amounts to Euro 485,873 thousand at 31 December 2014, the same as at 31 December 2013.
Capital increase costsThis reserve, which reports a post-tax negative balance of
Euro 4,506 thousand at 31 December 2014, relates to the costs incurred for the capital increase serving the public mixed exchange and cash offer for the ordinary shares of Draka Holding B.V., announced on 22 November 2010 and formalised on 5 January 2011.
Legal reserveThis amounts to Euro 4,292 thousand at 31 December 2014, and is Euro 1 thousand higher than at 31 December 2013

Parent Company Financial Report | EXPLANATORY NOTES
2014 Annual Report Prysmian Group
300
following apportionment of part of the prior year's net profit, as approved by the shareholders on 16 April 2014.
Treasury shares reserveThis reserve amounts to Euro 33,923 thousand at 31 December 2014, in compliance with the legal limit (art. 2357-ter of the Italian Civil Code). It was formed during 2008 after the share-holders adopted a resolution on 15 April 2008 authorising a programme to buy back up to 10% of the Company's shares. Under this resolution, purchases and sales of shares had to meet the following conditions: (i) the minimum price could be no more than 10% below the stock's official price reported in the trading session on the day before carrying out each individual purchase transaction; (ii) the maximum price could be no more than 10% above the stock's official price reported in the trading session on the day before carrying out each individual purchase transaction; (iii) the maximum number of shares purchased per day could not exceed 25% of the average daily volume of trades in Prysmian shares on the Milan Stock Exchange in the 20 trading days prior to the purchase date; (iv) the purchase price could not be greater than the higher of the price of the last independent transac-tion and the highest independent bid price currently quoted on the market. On 7 October 2008, the Board of Directors subsequently granted the Chief Executive Officer and Chief Financial Officer separate powers to purchase up to 4 million of the Company's shares by 31 December 2008. At that date a total of 3,028,500 shares had been bought back for Euro 30.2 million. On 9 April 2009, the shareholders renewed the authorisation to buy and dispose of treasury shares, while cancelling the
previous resolution adopted on 15 April 2008. The authori-sation permitted the purchase of shares representing no more than 10% of the Company's share capital at any time, including any treasury shares already held by the Company. Purchases could not exceed the amount of undistributed earnings and distributable reserves reported in the most recently approved annual financial statements. The programme was to last for a maximum of 18 months com-mencing from the date of the shareholders' approval and therefore expired on 9 October 2010.
The Shareholders' Meeting held on 16 April 2014 authorised a share buy-back and disposal programme, and revoked the previous programme at the same time. The new programme provides the opportunity to purchase, on one or more occasions, a maximum number of ordinary shares whose total cannot exceed 10% of share capital, equal to 18,420,002 ordinary shares as at the date of 16 April 2014, after deducting the treasury shares already held by the Company; the programme also provides that purchases may not exceed the amount of undistributed earnings and dis-tributable reserves reported in the most recently approved annual financial statements. The authorisation to buy back treasury shares lasts for 18 months commencing from the date of the Shareholders' Meeting, while the authorisation to dispose of treasury shares has no time limit. During the months of November and December 2014, a total of 1,390,000 treasury shares were purchased for a total of Euro 19,954 thousand.
Movements in treasury shares are as follows:
Number of shares Total nominal value % of share Average unit Total carrying value (in Euro) capital value (in Euro) (in Euro)
At 31 December 2012 3,028,500 302,850 1.41% 10 30,179,003
- Purchases - - - - -
- Sales/Allotments - - - - -
At 31 December 2013 3,028,500 302,850 1.41% 10 30,179,003
- Purchases 1,390,000 139,000 - 14 19,954,278
- Sales/Allotments (1,598,851) (159,885) - 10 (16,209,986)
At 31 December 2014 2,819,649 281,965 1.30% 12 33,923,294

301
During the months of May, June and July 2014, the number of treasury shares decreased by 187,299 following the allotment of 162,650 shares to employees that had signed up to the first phase of the YES employee share purchase plan and the sale of 24,649 shares to employees under the same plan.During the months of September, October, November and December 2014, the number of treasury shares decreased by another 1,411,552 after allotting shares under the Long-term incentive plan 2011-2013.
Extraordinary reserveThis reserve amounts to Euro 52,688 thousand at 31 December 2014 and was formed following the apportionment of net profit for 2006, as approved by the shareholders on 28 February 2007.
IAS/IFRS first-time adoption reserveThis reserve was created in accordance with IFRS 1 and reflects the differences arising on first-time adoption of IAS/IFRS. It amounts to Euro 30,177 thousand at 31 December 2014, the same as at 31 December 2013.
Convertible bond reserveThis reserve amounts to Euro 39,208 thousand (net of the related tax effect) at 31 December 2014 and refers to the non-monetary components of the bond, discussed in more detail in Note 10. Borrowings from banks and other lenders.
Stock option reserveThis reserve amounts to Euro 4,720 thousand at 31 December 2014, reporting a net decrease of Euro 33,848 thousand since 31 December 2013 due to:
• the total cost of Euro 496 thousand recognised in the income statement during the year (Euro 4,599 thousand in 2013) for stock option plans (YES Plan) involving Prysmian S.p.A. shares;
• an increase of Euro 3,120 thousand in the carrying amount of investments in subsidiaries, in which beneficiaries of stock option plans (YES Plan) involving Prysmian S.p.A. shares are directly or indirectly employees;
• the reclassification to retained earnings of Euro 37,464 thousand in respect of the Stock Option Plan 2011-2013, all of whose options are now fully vested and exercised.
Further information can be found in Note 17. Personnel costs.
Share issue reserveThe share issue reserve amounts to Euro 536 thousand at 31 December 2014, having been created from the apportionment of net profit for 2013 under the shareholders' resolution dated 16 April 2014.
Retained earningsRetained earnings amount to Euro 276,440 thousand at 31 December 2014, having increased by Euro 113,218 thousand since 31 December 2013, reflecting the apportionment of net profit for 2013 (Euro 95,291 thousand), the reclassification of the reserve for the Stock Option Plan 2011-2013 (Euro 37,465 thousand), an increase for the sale of treasury shares (Euro 416 thousand) and a reduction for the purchase of treasury shares (Euro 19,954 thousand).In compliance with art. 2427, no. 7-bis of the Italian Civil Code, the following table analyses each component of equity, indi-cating its origin, permitted use and availability for distribution, as well as how it has been used in previous years.
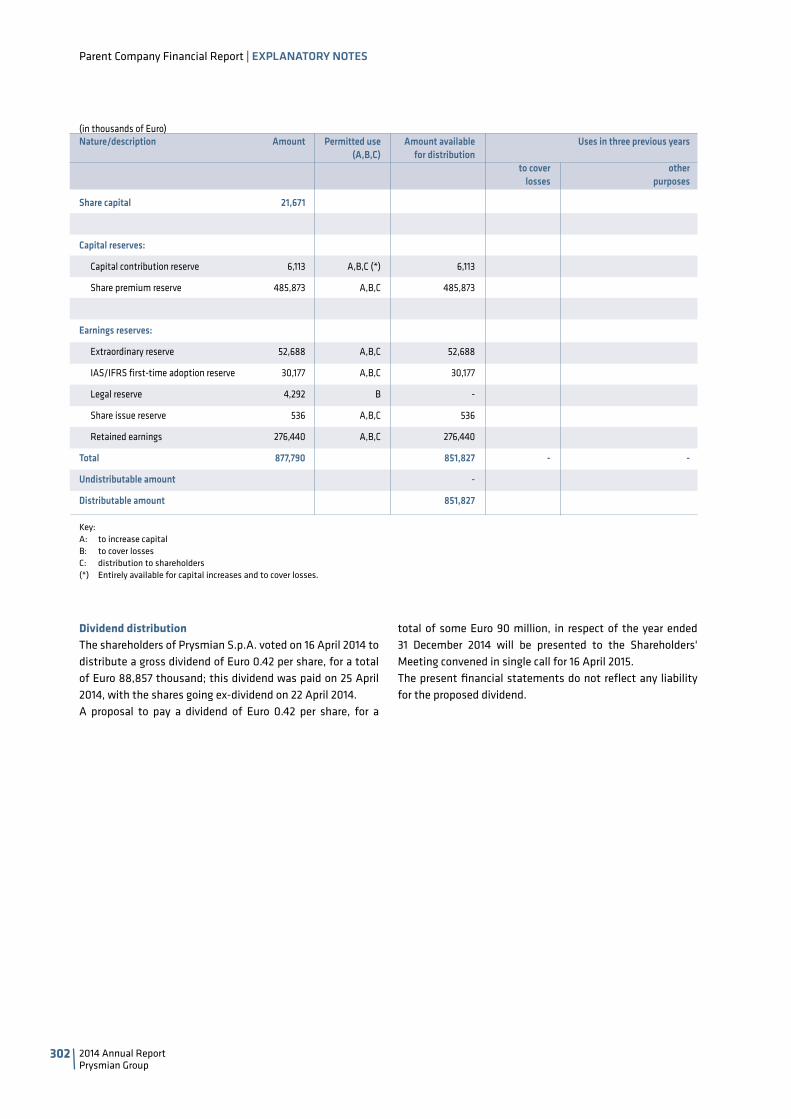
Parent Company Financial Report | EXPLANATORY NOTES
2014 Annual Report Prysmian Group
302
Key: A: to increase capital B: to cover losses C: distribution to shareholders (*) Entirely available for capital increases and to cover losses.
Dividend distributionThe shareholders of Prysmian S.p.A. voted on 16 April 2014 to distribute a gross dividend of Euro 0.42 per share, for a total of Euro 88,857 thousand; this dividend was paid on 25 April 2014, with the shares going ex-dividend on 22 April 2014.A proposal to pay a dividend of Euro 0.42 per share, for a
total of some Euro 90 million, in respect of the year ended 31 December 2014 will be presented to the Shareholders' Meeting convened in single call for 16 April 2015.The present financial statements do not reflect any liability for the proposed dividend.
Nature/description Amount Permitted use Amount available Uses in three previous years (A,B,C) for distribution to cover other losses purposes
Share capital 21,671
Capital reserves:
Capital contribution reserve 6,113 A,B,C (*) 6,113
Share premium reserve 485,873 A,B,C 485,873
Earnings reserves:
Extraordinary reserve 52,688 A,B,C 52,688
IAS/IFRS first-time adoption reserve 30,177 A,B,C 30,177
Legal reserve 4,292 B -
Share issue reserve 536 A,B,C 536
Retained earnings 276,440 A,B,C 276,440
Total 877,790 851,827 - -
Undistributable amount -
Distributable amount 851,827
(in thousands of Euro)
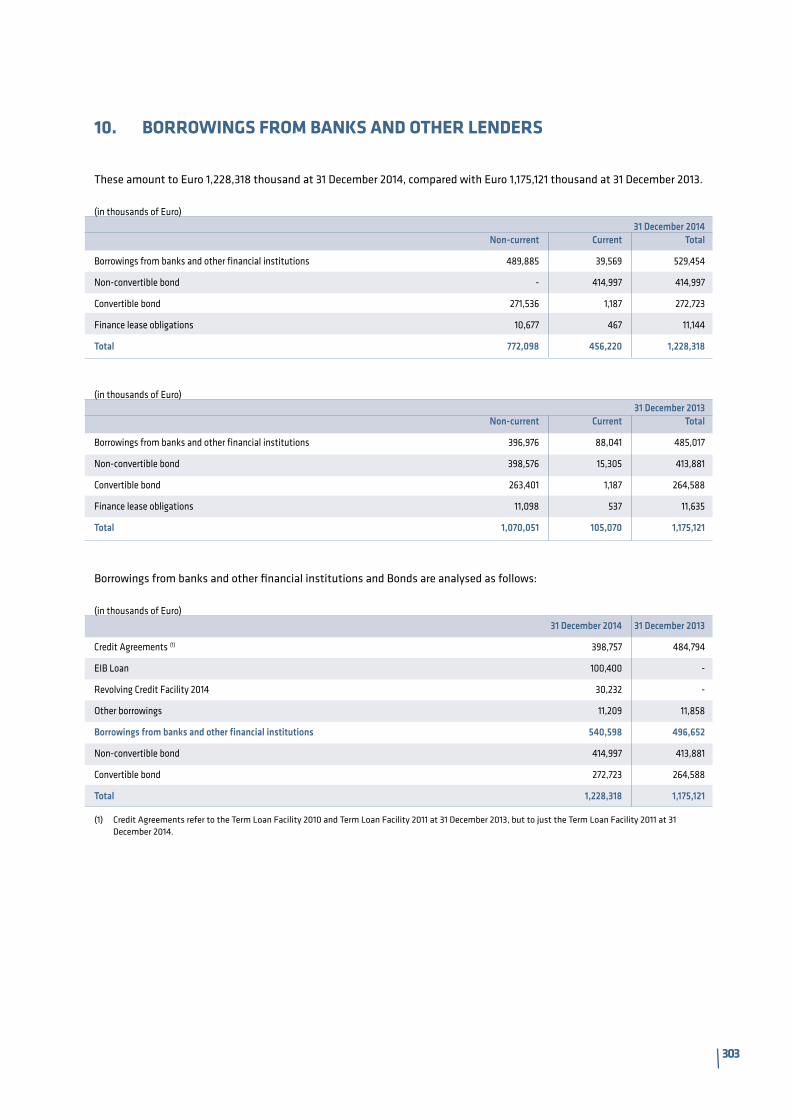
303
These amount to Euro 1,228,318 thousand at 31 December 2014, compared with Euro 1,175,121 thousand at 31 December 2013.
10. BORROWINGS FROM BANKS AND OTHER LENDERS
Borrowings from banks and other financial institutions and Bonds are analysed as follows:
(1) Credit Agreements refer to the Term Loan Facility 2010 and Term Loan Facility 2011 at 31 December 2013, but to just the Term Loan Facility 2011 at 31 December 2014.
31 December 2014 Non-current Current Total
Borrowings from banks and other financial institutions 489,885 39,569 529,454
Non-convertible bond - 414,997 414,997
Convertible bond 271,536 1,187 272,723
Finance lease obligations 10,677 467 11,144
Total 772,098 456,220 1,228,318
31 December 2013 Non-current Current Total
Borrowings from banks and other financial institutions 396,976 88,041 485,017
Non-convertible bond 398,576 15,305 413,881
Convertible bond 263,401 1,187 264,588
Finance lease obligations 11,098 537 11,635
Total 1,070,051 105,070 1,175,121
31 December 2014 31 December 2013
Credit Agreements (1) 398,757 484,794
EIB Loan 100,400 -
Revolving Credit Facility 2014 30,232 -
Other borrowings 11,209 11,858
Borrowings from banks and other financial institutions 540,598 496,652
Non-convertible bond 414,997 413,881
Convertible bond 272,723 264,588
Total 1,228,318 1,175,121
(in thousands of Euro)
(in thousands of Euro)
(in thousands of Euro)
Parent Company Financial Report | EXPLANATORY NOTES
2014 Annual Report Prysmian Group
304
Credit Agreements
As at the date of 31 December 2014, Prysmian S.p.A. has the following Credit Agreements in place:
Credit Agreement 2011The Credit Agreement 2011 is an agreement, entered into by Prysmian on 7 March 2011 with a syndicate of major banks, for Euro 800 million with a five-year maturity. This agreement comprises a loan for Euro 400 million (the "Term Loan Facility 2011") and a revolving facility for Euro 400 million (the "Revolving Credit Facility 2011"). The entire amount of the Term Loan Facility 2011 is scheduled for repayment on 7 March 2016; the loan has therefore been classified in non-current liabilities.As at 31 December 2014, the Revolving Credit Facility 2011 was not being used (like at 31 December 2013).The fair value of the Credit Agreement 2011 at 31 December 2014 approximates its related carrying amount. Fair value has been determined using valuation techniques that refer to observable market data.No collateral security is required for the Credit Agreement 2011; further information can be found in Note 29. Financial covenants.
Syndicated Revolving Credit Facility 2014On 27 June 2014, Prysmian S.p.A. signed an agreement (the "Credit Agreement 2014") under which a syndicate of premier banks made available a long-term credit facility for Euro 1,000 million (the "Syndicated Revolving Credit Facility 2014"). This facility can also be drawn down by Prysmian Treasury S.r.l., the Group's central treasury company.On the same date as entering this new agreement, Prysmian S.p.A. extinguished early the Revolving Credit Facility 2010, originally due to expire on 31 December 2014 and carrying a maximum permitted drawdown of Euro 400 million. The Term Loan Facility 2010, also maturing on 31 December 2014, had been extinguished early on 28 February 2014 with repayment
of the outstanding balance of Euro 87,916 thousand.The Credit Agreement 2014, which expires on 27 June 2019, can also be used for the issue of guarantees. The new revolving facility is intended to refinance the Revolving Credit Facility 2010 and to finance the Group's other operating activities. As at 31 December 2014, this facility was not being used.
In addition to the Credit Agreements described above, Prysmian S.p.A.'s other major credit agreements are as follows:
Revolving Credit Facility 2014On 19 February 2014, Prysmian S.p.A. signed a credit agreement for Euro 100 million (the "Revolving Credit Facility 2014") with Mediobanca - Banca di Credito Finanziario S.p.A.. Under this five-year agreement, Mediobanca has provided the Group with a line of credit intended to refinance existing debt and working capital requirements.As at 31 December 2014, the Revolving Credit Facility 2014 had been drawn down by Euro 30,000 thousand.
EIB LoanOn 18 December 2013, Prysmian S.p.A. entered into a loan agreement with the European Investment Bank (EIB) for Euro 100 million, to fund the Group's European Research & Development (R&D) programmes over the period 2013-2016.The EIB Loan is particularly intended to support projects developed in the Group's R&D centres in six countries (France, Great Britain, the Netherlands, Spain, Germany and Italy) and represents about 50% of the Prysmian Group's planned investment expenditure in Europe during the period concerned. The EIB Loan was received on 5 February 2014; it will be repaid in 12 equal half-yearly instalments starting on 5 August 2015 and ending on 5 February 2021.The fair value of the EIB Loan at 31 December 2014 approxi-mates the related carrying amount. Fair value has been de-termined using valuation techniques that refer to observable market data.

305
31 December 2013 Total lines Used Unused
Term Loan Facility 2010 87,916 (87,916) -
Term Loan Facility 2011 400,000 (400,000) -
Total Credit Agreements 487,916 (487,916) -
EIB Loan 100,000 - 100,000
Total 587,916 (487,916) 100,000
At the Group level there is also another committed facility in the form of the Revolving Credit Facility 2011 for Euro 400 million. This line is available to a certain number of Group companies, including Prysmian S.p.A.. As at 31 December 2014 and 31 December 2013, the Company had not drawn down the above Group credit facility.
More details about the nature and drawdown of the Group-level facilities shown above can be found in the Ex-planatory Notes to the Consolidated Financial Statements (Note 12. Borrowings from banks and other lenders).
BondsPrysmian S.p.A. has the following bonds outstanding as at 31 December 2014:
Non-convertible bondFurther to the resolution adopted by the Board of Directors on 3 March 2010, Prysmian S.p.A. completed the placement of an unrated bond with institutional investors on the Eurobond market on 30 March 2010 for a total nominal amount of Euro 400 million. The bond, with an issue price of Euro 99.674, has a 5-year term and pays a fixed annual coupon of 5.25%. The bond settlement date was 9 April 2010. The bond has been
admitted to the Luxembourg Stock Exchange's official list and is traded on the related regulated market. The fair value of the non-convertible bond at 31 December 2014 was Euro 410,468 thousand (Euro 417,440 thousand at 31 December 2013). Fair value has been determined with reference to the quoted price in the relevant market.
Convertible bondOn 4 March 2013, the Board of Directors approved the placement of an Equity Linked Bond, referred to as "€300,000,000 1.25 per cent. Equity Linked Bonds due 2018", maturing on 8 March 2018 and reserved for qualified investors.
On 16 April 2013, the Shareholders' Meeting authorised the convertibility of the Bond at a value of Euro 22.3146 per share. As a result, the shareholders approved the proposal to increase share capital for cash, in single or multiple issues, with the exclusion of pre-emptive rights under art. 2441, par. 5 of the Italian Civil Code, by a maximum nominal amount of Euro 1,344,411.30, by issuing, in single or multiple instal-ments, up to 13,444,113 ordinary shares of the Company with the same characteristics as its other outstanding ordinary shares.
The following tables summarise the Committed Lines available to the Company at 31 December 2014 and 31 December 2013:
31 December 2014 Total lines Used Unused
Term Loan Facility 2011 400,000 (400,000) -
Syndacated Revolving Credit Facility 2014 1,000,000 - 1,000,000
Total Credit Agreements 1,400,000 (400,000) 1,000,000
Revolving Credit Facility 2014 100,000 (30,000) 70,000
EIB Loan 100,000 (100,000) -
Total 1,600,000 (530,000) 1,070,000
(in thousands of Euro)
(in thousands of Euro)

Parent Company Financial Report | EXPLANATORY NOTES
2014 Annual Report Prysmian Group
306
The Company will be entitled to redeem the bonds early and in full in the cases detailed in the Bond Regulations, in line with market practice, including:I. at nominal value (plus accrued interest), starting from 23
March 2016, if the trading price of the Company's ordinary shares rises to more than 130% of the conversion price in a given period of time;
II. at nominal value (plus accrued interest), if at least 85% of the original nominal amount of the Bond is converted, redeemed and/or repurchased;
III. at nominal value (plus accrued interest), if specific changes take place in the tax regime applying to the Bonds.
In the event of a change of control, every bondholder will be entitled to request early redemption at nominal value plus accrued interest.
The convertible Bond has a 5-year maturity ending on 8 March 2018 and pays a fixed annual coupon of 1.25%. The placement of the Bonds was completed on 8 March 2013, while their settlement took place on 15 March 2013.
On 3 May 2013, the Company sent a physical settlement notice to holders of the Bonds, granting them the right, with effect from 17 May 2013, to convert them into the Company's existing or new ordinary shares.
On 24 May 2013, the securities were admitted to trading on the unregulated Third Market (a multilateral trading facility or MTF) on the Vienna Stock Exchange.
The accounting treatment for the convertible Bond has resulted in the recognition of an equity component of Euro 39,632 thousand and a debt component of Euro 260,368 thousand, determined at the bond issue date.
The fair value of the convertible bond (equity component and debt component) is Euro 305,520 thousand at 31 December 2014 (Euro 338,844 thousand at 31 December 2013), of which the fair value of the debt component is Euro 263,556 thousand (Euro 265,388 thousand at 31 December 2013). In the absence of trading on the relevant market, fair value has been determined using valuation techniques that
refer to observable market data.
Finance lease obligationsFinance lease obligations refer to the liability arising after taking over a finance lease for a building on 14 November 2013; this lease expires on 20 January 2027 and carries an indexed interest rate, equating to 2.11% for 2014.
Issue value of convertible bond 300,000
Equity reserve for convertible bond (39,632)
Issue date net balance 260,368
Interest - non-monetary 13,441
Interest - monetary accrued 6,812
Interest - monetary paid (5,625)
Related costs (2,273)
Balance at 31 December 2014 272,723
(in thousands of Euro)

307
The finance lease obligation (Euro 11,144 thousand at 31 December 2014) is reconciled with outstanding payments as follows:
The finance lease obligation is analysed by maturity as follows:
Credit EIB Revolving Credit Non-convertible Convertible Other Total Agreements Loan Facility 2014 bond bond borrowings
Balance at 31 December 2013 484,794 - - 413,881 264,588 11,858 1,175,121
Drawdowns/new funds - 99,850 30,000 - - - 129,850
Repayments (87,916) - - - - (491) (88,407)
Amortisation of bank and financial fees and other expenses (1)
1,932 29 - 1,116 607 - 3,684
Interest and other movements (53) 521 232 - 7,528 (158) 8,070
Total movements (86,037) 100,400 30,232 1,116 8,135 (649) 53,197
Balance at 31 December 2014 398,757 100,400 30,232 414,997 272,723 11,209 1,228,318
(1) Includes the accelerated amortisation of Euro 1,643 thousand in bank fees following the early repayments of the Credit Agreement 2010.
31 December 2014 31 December 2013
Due within 1 year 699 778
Due between 1 and 5 years 2,563 2,605
Due after more than 5 years 9,960 10,626
Minimum finance lease payments 13,222 14,009
Future interest costs (2,078) (2,374)
Finance lease obligations 11,144 11,635
31 December 2014 31 December 2013
Due within 1 year 467 537
Due between 1 and 5 years 1,773 1,729
Due after more than 5 years 8,904 9,369
Total 11,144 11,635
(in thousands of Euro)
(in thousands of Euro)
The following tables report movements in borrowings from banks and other lenders:
(in thousands of Euro)
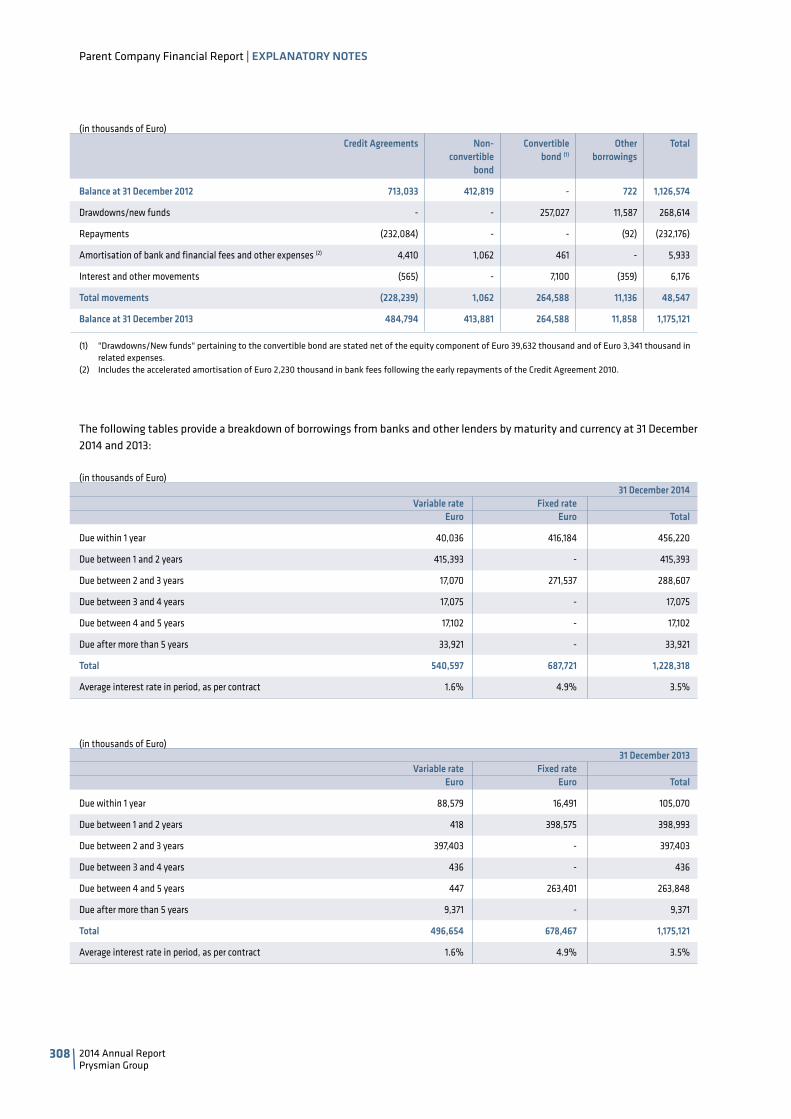
Parent Company Financial Report | EXPLANATORY NOTES
2014 Annual Report Prysmian Group
308
(1) "Drawdowns/New funds" pertaining to the convertible bond are stated net of the equity component of Euro 39,632 thousand and of Euro 3,341 thousand in related expenses.
(2) Includes the accelerated amortisation of Euro 2,230 thousand in bank fees following the early repayments of the Credit Agreement 2010.
The following tables provide a breakdown of borrowings from banks and other lenders by maturity and currency at 31 December 2014 and 2013:
Credit Agreements Non- Convertible Other Total convertible bond (1) borrowings bond
Balance at 31 December 2012 713,033 412,819 - 722 1,126,574
Drawdowns/new funds - - 257,027 11,587 268,614
Repayments (232,084) - - (92) (232,176)
Amortisation of bank and financial fees and other expenses (2) 4,410 1,062 461 - 5,933
Interest and other movements (565) - 7,100 (359) 6,176
Total movements (228,239) 1,062 264,588 11,136 48,547
Balance at 31 December 2013 484,794 413,881 264,588 11,858 1,175,121
31 December 2014 Variable rate Fixed rate Euro Euro Total
Due within 1 year 40,036 416,184 456,220
Due between 1 and 2 years 415,393 - 415,393
Due between 2 and 3 years 17,070 271,537 288,607
Due between 3 and 4 years 17,075 - 17,075
Due between 4 and 5 years 17,102 - 17,102
Due after more than 5 years 33,921 - 33,921
Total 540,597 687,721 1,228,318
Average interest rate in period, as per contract 1.6% 4.9% 3.5%
31 December 2013 Variable rate Fixed rate Euro Euro Total
Due within 1 year 88,579 16,491 105,070
Due between 1 and 2 years 418 398,575 398,993
Due between 2 and 3 years 397,403 - 397,403
Due between 3 and 4 years 436 - 436
Due between 4 and 5 years 447 263,401 263,848
Due after more than 5 years 9,371 - 9,371
Total 496,654 678,467 1,175,121
Average interest rate in period, as per contract 1.6% 4.9% 3.5%
(in thousands of Euro)
(in thousands of Euro)
(in thousands of Euro)

309
Net financial position
The Company's net financial position is reconciled below to the amount that must be reported under Consob Communi-cation DEM/6064293 issued on 28 July 2006 in compliance
with the CESR recommendation dated 10 February 2005 "Recommendations for the consistent implementation of the European Commission's Regulation on Prospectuses":
Note 31 December 2014 of which 31 December 2013 of which related parties related parties
Long-term financial payables
Term loan facilities 400,000 400,000
Bank fees (1,661) (3,024)
Credit Agreements 10 398,339 396,976
EIB Loan 10 91,546 -
Non-convertible bond 10 - 398,576
Convertible bond 10 271,536 263,401
Finance leases 10 10,677 11,098
Total long-term financial payables 772,098 1,070,051
Short-term financial payables
Credit Agreements 10 418 88,388
Bank fees 10 - (570)
EIB Loan 10 8,854 -
Non-convertible bond 10 414,997 15,305
Convertible bond 10 1,187 1,187
Finance leases 10 467 537
Revolving Credit Facility 2014 10 30,232 -
Other financial payables 10 65 223
Total short-term financial payables 456,220 105,070
Total financial liabilities 1,228,318 1,175,121
Long-term financial receivables 6 22 26
Long-term bank fees 6 5,219 -
Short-term financial receivables 6 3,306 55
Short-term financial receivables from Group companies 6 489,552 489,552 553,744 553,744
Short-term bank fees 6 1,525 4,029
Cash and cash equivalents 8 2,314 4,600
Net financial position 726,381 612,667
(in thousands of Euro)

Parent Company Financial Report | EXPLANATORY NOTES
2014 Annual Report Prysmian Group
310
Note 31 December 2014 of which related 31 December 2013 of which related parties (Note 25) parties (Note 25)
Net financial position - as reported above 726,381 612,667
Long-term financial receivables 3 22 26
Long-term bank fees 3 5,219 -
Net forward currency contracts on commercial transactions
5 (15) (15) 27 27
Net metal derivatives 5 (6) (6) (38) (38)
Recalculated net financial position 731,601 612,682
These are detailed as follows:
11. TRADE AND OTHER PAYABLES
Trade payables mostly refer to charges by suppliers of strategic metals and only partly to those by suppliers of other goods and services provided by external consultants in the organisational, legal and IT spheres.Other payables comprise:• social security payables relating to contributions on
employee wages and salaries and amounts payable into supplementary pension funds;
• tax payables mainly relating to tax withheld from employees and not yet paid to the tax authorities;
• payables to employees for accrued wages and salaries not yet paid;
• other payables, which mainly relate to amounts due to Group companies for the transfer of recoverable withhold-ing taxes to the Company under the group tax consolida-tion (art. 117 et seq of the Italian Income Tax Code).
At 31 December 2014, the liabilities for trade payables and other payables are all due within 12 months.
Trade payables include around Euro 25,138 thousand for the supply of strategic metals, whose payment terms are longer than normal for this type of transaction.
31 December 2014 31 December 2013
Trade payables 255,320 295,791
Total trade payables 255,320 295,791
Other payables:
Tax and social security payables 5,461 4,293
Payables to employees 4,077 23,102
Accrued expenses 264 45
Other 1,279 1,820
Total other payables 11,081 29,260
Total 266,401 325,051
(in thousands of Euro)
(in thousands of Euro)

311
The following table reports movements in this balance during the period:
12. PROVISIONS FOR RISKS AND CHARGES
The following table breaks down trade payables according to the currency in which they are expressed:
31 December 2014 31 December 2013
Euro 254,050 290,141
US Dollar 139 4,746
British Pound 687 503
Australian Dollar 265 121
Brazilian Real - 118
Chinese Renminbi (Yuan) 35 109
Other currencies 144 53
Total 255,320 295,791
Contractual and legal risks Other risks and charges Total
Balance at 31 December 2013 31,674 2,765 34,439
Movements in 2014:
- Increases 1,980 850 2,830
- Utilisations (915) - (915)
- Releases (20,803) (1,375) (22,178)
- Reclassifications - 537 537
Total movements (19,738) 12 (19,726)
Balance at 31 December 2014 11,936 2,777 14,713
Contractual and legal risks Other risks and charges Total
Balance at 31 December 2012 33,583 37 33,620
Movements in 2013:
- Increases - 2,728 2,728
- Utilisations (474) - (474)
- Releases (1,529) - (1,529)
- Reclassifications 94 - 94
Total movements (1,909) 2,728 819
Balance at 31 December 2013 31,674 2,765 34,439
(in thousands of Euro)
(in thousands of Euro)
(in thousands of Euro)

Parent Company Financial Report | EXPLANATORY NOTES
2014 Annual Report Prysmian Group
312
The provision for contractual and legal risks, amounting to Euro 11,936 thousand at 31 December 2014, has decreased by Euro 19,738 thousand since 31 December 2013, mainly due to a net reduction of Euro 20,803 thousand in the provision for antitrust investigations in different jurisdictions. More specifically, the European Commission, the US De-partment of Justice and the Japanese antitrust Authority started investigations in late January 2009 into several European and Asian electrical cable manufacturers to verify the existence of alleged anti-competitive practices in the high voltage underground and submarine cables markets. Subsequently, the Australian Competition and Consumers Commission ("ACCC") and the New Zealand Commerce Com-mission also started similar investigations. During 2011, the Canadian Antitrust Authority also started an investigation into a high voltage submarine project dating back to 2006. The investigations in Japan, New Zealand and Canada have ended without any sanctions for Prysmian; the other investigations are still in progress, except for the one by the European Commission, which has ended with the adoption of the decision described below.In Australia, the ACCC has filed a case before the Federal Court arguing that Prysmian Cavi e Sistemi S.r.l. and two other companies violated antitrust rules in connection with a high voltage underground cable project awarded in 2003. Prysmian Cavi e Sistemi S.r.l. has filed its objections and presented its preliminary defence.In Brazil, the local antitrust authority has started an investi-gation into several cable manufacturers, including Prysmian, that operate in the high voltage underground and submarine cables market. Prysmian has presented its preliminary defence, which has been rejected by the local competition au-thorities in a statement issued during the month of February 2015. The preliminary stage of the proceedings will now ensue, at the end of which the authorities will publish their concluding observations, to which the parties may respond with all their arguments in defence before the final decision is taken. During the month of December 2013, ABB and one of this company's senior managers signed an agreement with the Brazilian Antitrust Authority, under which they admitted the conduct alleged by the authority and pledged to cooperate with it and to each pay an agreed fine.On 2 April 2014, the European Commission adopted a decision under which it found that, between 18 February 1999 and 28 January 2009, the world's largest cable producers, including Prysmian Cavi e Sistemi S.r.l., adopted anti-competitive practices in the European market for high voltage submarine and underground power cables. The European Commission held Prysmian Cavi e Sistemi S.r.l. jointly liable with Pirelli & C. S.p.A. for the alleged infringement in the period from 18 February 1999 to 28 July 2005, sentencing them to pay a fine of Euro 67.3 million, and it held Prysmian Cavi e Sistemi S.r.l.
jointly liable with Prysmian S.p.A. and the Goldman Sachs Group Inc. for the alleged infringement in the period from 29 July 2005 to 28 January 2009, sentencing them to pay a fine of Euro 37.3 million. Prysmian has appealed against this decision to the General Court of the European Union and has submitted an application to intervene in the appeals respectively lodged by Pirelli & C. S.p.A. and the Goldman Sachs Group Inc. against the same decision. Both Pirelli & C. S.p.A. and the Goldman Sachs Group Inc. have in turn submitted applications to intervene in the appeal brought by Prysmian against the European Commission's decision. Prysmian has not incurred any financial outlay as a result of this decision having elected, pending the outcome of the appeals, to provide bank guarantees as security against payment of 50% of the fine imposed by the European Com-mission (amounting to approximately Euro 52 million) for the alleged infringement in both periods. As far as Prysmian is aware, Pirelli & C. S.p.A. has provided or is nonetheless preparing to provide the European Commission with a bank guarantee for 50% of the value of the fine imposed for the alleged infringement in the period 18 February 1999 - 28 July 2005. Pirelli & C. S.p.A. has also filed a civil action against Prysmian Cavi e Sistemi S.r.l. in which it demands to be held harmless for all claims made by the European Commission in implementation of its decision and for any expenses related to such implementation. Prysmian Cavi e Sistemi S.r.l. started legal proceedings in February 2015, requesting that the claims brought by Pirelli & C. S.p.A. be rejected in full and that it should be Pirelli & C. S.p.A. which holds harmless Prysmian Cavi e Sistemi S.r.l., with reference to the alleged infringement in the period 18 February 1999 - 28 July 2005, for all claims made by the European Commission in implementation of its decision and for any expenses related to such implementation. Following a detailed and careful analysis of the European Commission's ruling, and nonetheless considering this has been appealed and so could be submitted to second-instance judgement, as well as the fact that the investigations initiated by the Canadian Antitrust Authority have ended without any sanctions for Prysmian, it has been decided to partially release the existing provision.The above events have led to the recognition in the 2014 income statement of a net release of Euro 19,901 thousand, classified as non-recurring items.
As at 31 December 2014, the amount of the provision reported by Prysmian S.p.A. is approximately Euro 10,725 thousand.
Despite the uncertainty of the outcome of the investiga-tions in progress, the amount of this provision is considered to represent the best estimate of the liability based on the information now available.

313
Prysmian S.p.A. provides post-employment benefits through programmes that include defined benefit plans, like the employee indemnity liability and seniority bonuses.
13. EMPLOYEE BENEFIT OBLIGATIONS
Employee benefit obligations amount to Euro 7,576 thousand at 31 December 2014 (Euro 6,305 thousand at 31 December 2013) and are detailed as follows:
The income and expenses relating to employee benefit obligations are as follows:
Movements in this balance are as follows:
Employee indemnity liability
31 December 2014 31 December 2013
Employee indemnity liability (Italian TFR) 5,566 4,545
Termination and other benefits 2,010 1,760
Total 7,576 6,305
31 December 2014 31 December 2013
Employee indemnity liability (Italian TFR) 246 289
Termination and other benefits 337 139
Total 583 428
2014 2013
Opening balance 4,545 5,029
Current service costs 117 156
Interest cost 129 133
Actuarial (gains)/losses recognised in equity 973 (149)
Staff transfer - (36)
Disbursements (198) (588)
Total movements 1,021 (484)
Closing balance 5,566 4,545
(in thousands of Euro)
(in thousands of Euro)
(in thousands of Euro)

Parent Company Financial Report | EXPLANATORY NOTES
2014 Annual Report Prysmian Group
314
The actuarial losses recognised at 31 December 2014 (Euro 973 thousand) mainly relate to the change in the associated economic parameters (the discount and inflation rates).Under Italian law, the amount due to each employee accrues with service and is paid when the employee leaves the company. The amount due upon termination of employ-ment is calculated on the basis of the length of service and the taxable remuneration of each employee. The liability is adjusted annually for the official cost of living index and statutory interest, and is not subject to any vesting condi-tions or periods, or any funding obligation; there are therefore no assets that fund this liability.
The rules governing this liability were revised by Legislative Decree 252/2005 and Law 296/2006 (Finance Act 2007): amounts accruing since 2007 by companies with at least 50 employees now have to be paid into the INPS Treasury Fund or to supplementary pension schemes, as decided by employees, which now take the form of "defined contribution plans". All companies nonetheless still account for revalua-
tions of amounts accrued before 2007, while those companies with fewer than 50 employees continue to accrue amounts in respect of this liability that are not intended for supplemen-tary pension schemes.
The benefits relating to this plan are paid to participants in the form of capital, in accordance with the related rules. The plan also allows partial advances to be paid against the full amount of the accrued benefit in specific circumstances.The main risk is the volatility of the inflation rate and the discount rate, as determined by the market yield on AA corporate bonds denominated in Euro. Another risk factor is the possibility that members leave the plan earlier than expected or that higher advance payments than expected are requested, resulting in an actuarial loss for the plan, due to an acceleration of cash flows.
The actuarial assumptions used to value employee indemnity liability are as follows:
31 December 2014 31 December 2013
Discount rate 1.50% 3.00%
Future expected salary increase 2.00% 2.00%
Inflation rate 2.00% 2.00%
31 December 2014
Change in inflation rate -0.25% 0.25%
Effects on liability -1.58% 1.61%
Change in discount rate -0.50% 0.50%
Effects on liability 5.10% -4.69%
The following table presents a sensitivity analysis of the effects of an increase/decrease in the most significant actuarial assumptions used to determine the present value
of the employee indemnity liability, namely the discount rate and inflation rate:
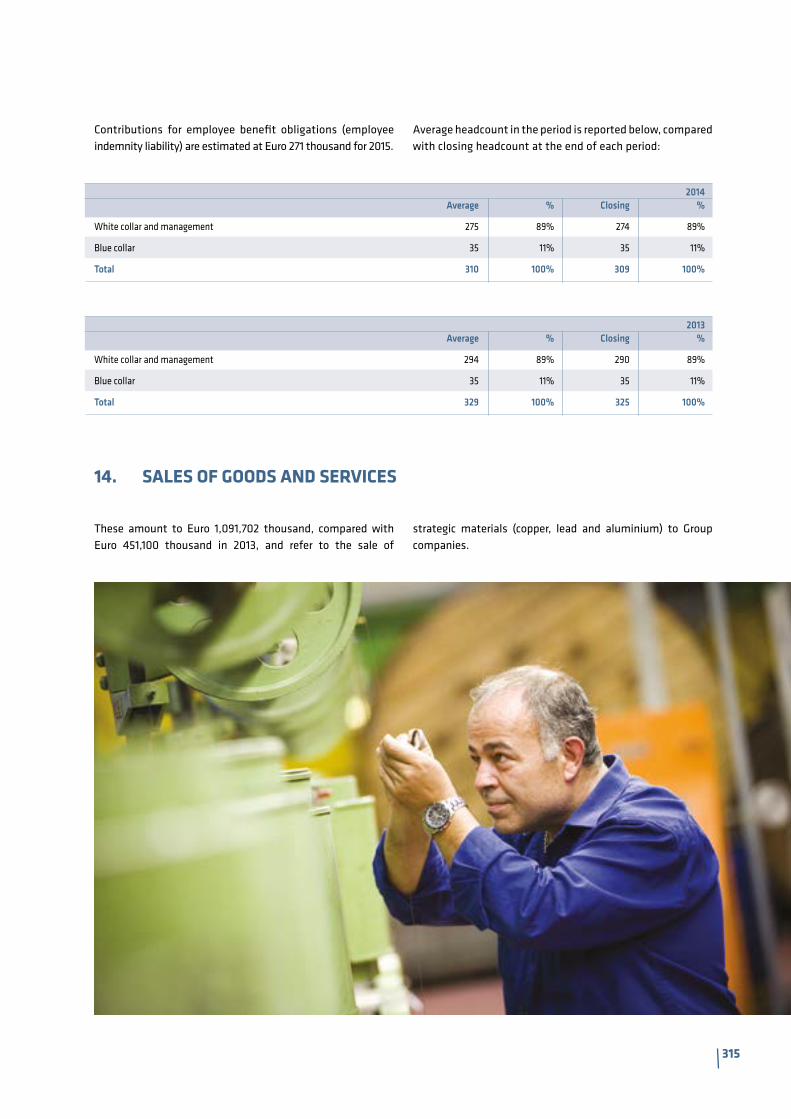
315
Contributions for employee benefit obligations (employee indemnity liability) are estimated at Euro 271 thousand for 2015.
Average headcount in the period is reported below, compared with closing headcount at the end of each period:
2014 Average % Closing %
White collar and management 275 89% 274 89%
Blue collar 35 11% 35 11%
Total 310 100% 309 100%
2013 Average % Closing %
White collar and management 294 89% 290 89%
Blue collar 35 11% 35 11%
Total 329 100% 325 100%
These amount to Euro 1,091,702 thousand, compared with Euro 451,100 thousand in 2013, and refer to the sale of
14. SALES OF GOODS AND SERVICES
strategic materials (copper, lead and aluminium) to Group companies.
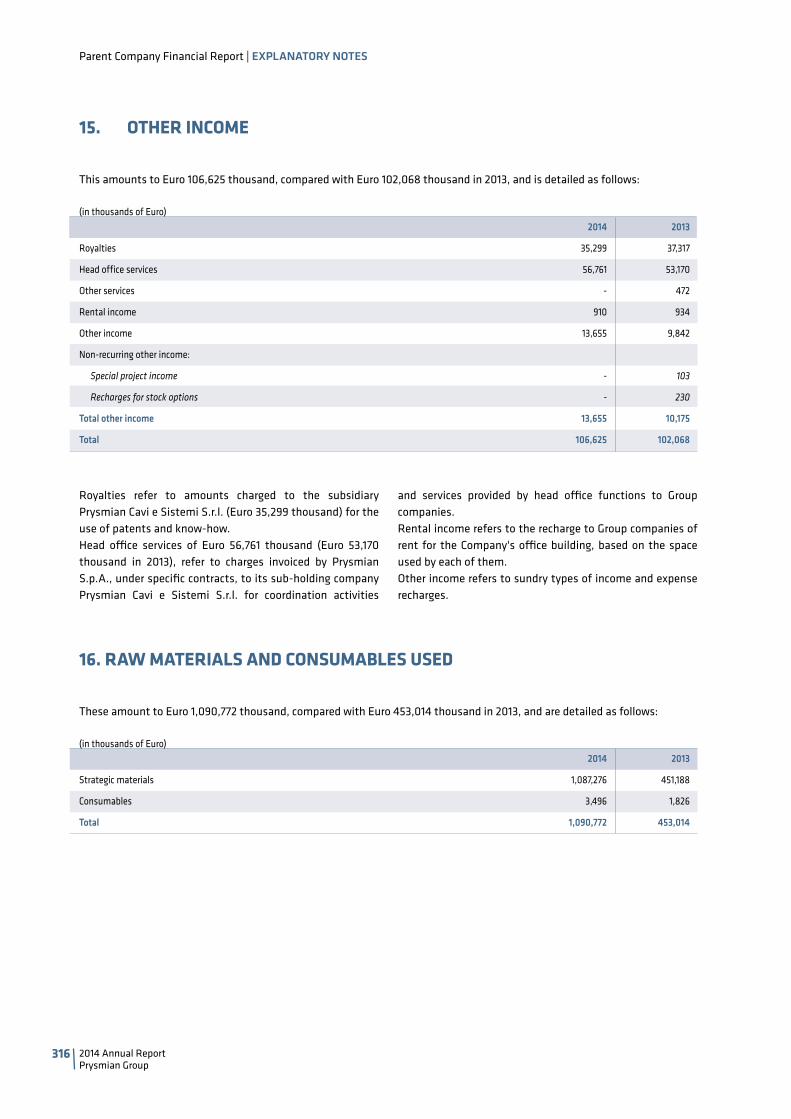
Parent Company Financial Report | EXPLANATORY NOTES
2014 Annual Report Prysmian Group
316
Royalties refer to amounts charged to the subsidiary Prysmian Cavi e Sistemi S.r.l. (Euro 35,299 thousand) for the use of patents and know-how. Head office services of Euro 56,761 thousand (Euro 53,170 thousand in 2013), refer to charges invoiced by Prysmian S.p.A., under specific contracts, to its sub-holding company Prysmian Cavi e Sistemi S.r.l. for coordination activities
and services provided by head office functions to Group companies.Rental income refers to the recharge to Group companies of rent for the Company's office building, based on the space used by each of them.Other income refers to sundry types of income and expense recharges.
This amounts to Euro 106,625 thousand, compared with Euro 102,068 thousand in 2013, and is detailed as follows:
15. OTHER INCOME
These amount to Euro 1,090,772 thousand, compared with Euro 453,014 thousand in 2013, and are detailed as follows:
16. RAW MATERIALS AND CONSUMABLES USED
2014 2013
Royalties 35,299 37,317
Head office services 56,761 53,170
Other services - 472
Rental income 910 934
Other income 13,655 9,842
Non-recurring other income:
Special project income - 103
Recharges for stock options - 230
Total other income 13,655 10,175
Total 106,625 102,068
2014 2013
Strategic materials 1,087,276 451,188
Consumables 3,496 1,826
Total 1,090,772 453,014
(in thousands of Euro)
(in thousands of Euro)

317
These are detailed as follows:
17. PERSONNEL COSTS
Share-based paymentsAt 31 December 2014 and 31 December 2013, Prysmian S.p.A. had share-based compensation plans in place for managers of Group companies and members of the Company's Board of Directors. These plans are described below.
Long-term incentive plan 2011-2013On 14 April 2011, the Ordinary Shareholders' Meeting of Prysmian S.p.A. had approved, pursuant to art. 114-bis of Leg-islative Decree 58/98, a long-term incentive plan for the period 2011-2013 for employees of the Prysmian Group, including certain members of the Board of Directors of Prysmian S.p.A., and granted the Board of Directors the necessary authority to establish and execute the plan. The plan's purpose was to incentivise the process of integration following Prysmian's acquisition of the Draka Group.The plan involved 268 employees (*) of Group companies and established that the number of options granted would depend on the achievement of common business and financial performance objectives for all the participants.
The plan was dependent upon achievement of a minimum performance objective of at least Euro 1.75 billion in aggregate
Adj. EBITDA for the Group in the period 2011-2013 (the Target), as well as upon continuation of a professional relationship with the Group up until 31 December 2013. The plan also set an upper limit for Adj. EBITDA as the Target plus 20% (i.e. Euro 2.1 billion), that would determine the maximum number of exercisable options granted to each participant.Access to the plan was conditional upon each participant's acceptance that part of their annual bonus would be co-in-vested, if achieved and payable in relation to financial years 2011 and 2012.The allotted options carried the right to receive or subscribe to ordinary shares in Prysmian S.p.A., the Parent Company. These shares partly comprised treasury shares and partly new shares, obtained through a capital increase that excluded pre-emptive rights under art. 2441, par. 8 of the Italian Civil Code. Such a capital increase has involved the issue of 2,120,687 new ordinary shares of nominal value Euro 0.10 each, for a total nominal value of Euro 212,069, as approved by the shareholders in the extraordinary session of their meeting on 14 April 2011. The shares obtained from the Company's holding of treasury shares were allotted for zero consideration, while the shares obtained from the above capital increase were allotted to participants upon payment
2014 2013
Wages and salaries 27,993 30,746
Social security 6,791 6,813
Retirement pension costs 1,860 1,737
Employee indemnity costs 117 156
Non-recurring personnel costs (income):
Company reorganisation 2,186 2,463
Total non-recurring personnel costs (income) 2,186 2,463
Other personnel costs 934 6,552
Total 39,881 48,467
(in thousands of Euro)

Parent Company Financial Report | EXPLANATORY NOTES
2014 Annual Report Prysmian Group
318
of an exercise price corresponding to the nominal value of the Company's shares. In accordance with IFRS 2, the options allotted in respect of both new and treasury shares were measured at their grant date fair value. The number of options was determined according to the
actual aggregate Adj. EBITDA achieved, which lay between the Target and the Adj. EBITDA upper limit.
The following table provides additional details about movements in the plan:
Since the plan had vested in full at 31 December 2013, no further costs were recognised in 2014.As at 31 December 2014, the options had vested and had been fully exercised as follows:• 2,120,678 exercised for consideration (exercise price of
Euro 0.10);• 1,411,552 exercised for no consideration.
Group employee share purchase plan (YES Plan)On 16 April 2013, the shareholders approved a share purchase plan reserved for employees of Prysmian S.p.A. and/or of its subsidiaries, including some of the Company's Directors, and granted the Board of Directors the relevant powers to establish and implement this plan.
The reasons behind the introduction of the Plan are: • to strengthen the sense of belonging to the Group
by offering employees an opportunity to share in its successes, through equity ownership;
• to align the interests of the Prysmian Group's stakehold-ers (its employees and shareholders), by identifying a common goal of creating long-term value;
• to help consolidate the integration process started in the wake of the Draka Group's acquisition.
The Plan offers the opportunity to purchase Prysmian's ordinary shares on preferential terms, with a maximum discount of 25% on the stock price, given in the form of treasury shares, except for certain managers, for whom
For consideration For no consideration Number of options (*) Exercise price Number of options (*) Exercise price
Options at start of year 2,131,500 0.10 1,416,309 -
Granted - - - -
Variation for target remeasurement - - 2,429 -
Cancelled (2,288) 0.10 (1,521) -
Exercised (2,120,687) 0.10 (1,411,552) -
Options at end of year 8,525 0.10 5,665 -
of which for Prysmian Spa employees - - - -
of which vested at end of year 8,525 0.10 5,665 -
of which exercisable 8,525 0.10 5,665 -
of which not vested at end of year - - - -
of which for Prysmian Spa employees - - - -
(in Euro)
(*) The number of Prysmian S.p.A. employees participating in the plan was 45.

319
the discount is 15%, and the executive Directors and key management personnel, for whom the discount is 1% on the stock price.The Plan therefore qualifies as "of particular relevance" within the meaning of art. 84-bis, par. 2 of the Issuer Regulations. A maximum number of 500,000 treasury shares have been earmarked to serve the discounted purchases envisaged by the Plan. During the month of October 2013, the plan was presented and explained to some 16,000 of the Group's employees in 27 countries. Employees had until the end of December 2013 to communicate their wish to participate in the Plan, the amount they intended to invest in the first purchase window and the method of payment. The amount collected in the month of April 2014, totalling Euro 6.4 million, was used to make purchases of the Company's ordinary shares on the Milan Stock Exchange (MTA) over a period of 5 consecutive business days during the month of May 2014. The number of treasury shares allotted to each participant was determined by taking into account the average share purchase price (Euro 16.2629), the individual investment and the applicable discount percentage.All the plan's participants also received an entry bonus of six free shares, also taken from the Company's portfolio of treasury shares, only available at the time of first purchase.The shares purchased by participants, as well as those received by way of discount and entry bonus, are generally
subject to a retention period during which they cannot be sold and the length of which varies according to local regulations.On 9 June 2014, an additional purchase window was opened for plan participants in the "Manager" category who had already bought shares in the purchase window in May and who were so entitled under the plan's regulations. Managers opting to participate in this additional window were able to buy an additional quantity of shares at a 25% discount. The total of Euro 0.7 million collected in this additional window was used to make purchases of the Company's ordinary shares on the Milan Stock Exchange over a period of 5 consecutive business days during the month of July 2014. The number of treasury shares allotted to each participant was determined by taking into account the average share purchase price (Euro 16.3585), the individual investment and the applicable discount.During the month of December 2014, employees were informed of the opening of the plan's second cycle in 2015. Employees had until the third week of February 2015 to sign up for the second cycle and to communicate the amount they intended to invest. The total amount collected will be used to make purchases of the Company's shares on the Milan Stock Exchange (MTA) during the month of July 2015.
The fair value of the options has been determined using the Montecarlo binomial pricing model, based on the following assumptions:
1st Window (2014) 2nd Window (2015) 3rd Window (2016)
Grant date 13 November 2013 13 November 2013 13 November 2013
Share purchase date 19 May 2014 19 May 2015 19 May 2016
End of retention period 19 May 2017 19 May 2018 19 May 2019
Residual life at grant date (in years) - 1 2
Share price at grant date (Euro) 18 18 18
Expected volatility 29.27% 30.11% 36.79%
Risk-free interest rate 0.03% 0.05% 0.20%
Expected dividend % 2.83% 2.83% 2.83%
Option fair value at grant date (Euro) 18 18 17
A total of Euro 496 thousand in costs for the fair value of options granted under this plan have been recognised as "Personnel costs" in the income statement for the year ended 31 December 2014.
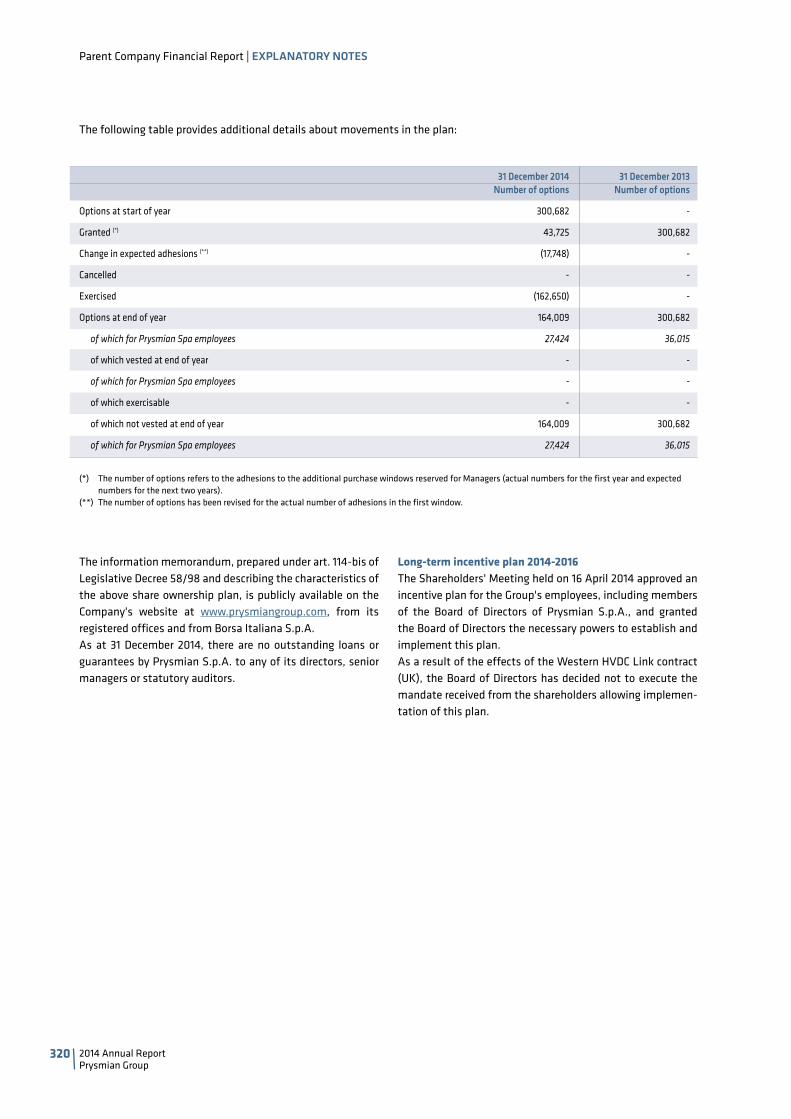
Parent Company Financial Report | EXPLANATORY NOTES
2014 Annual Report Prysmian Group
320
The following table provides additional details about movements in the plan:
31 December 2014 31 December 2013 Number of options Number of options
Options at start of year 300,682 -
Granted (*) 43,725 300,682
Change in expected adhesions (**) (17,748) -
Cancelled - -
Exercised (162,650) -
Options at end of year 164,009 300,682
of which for Prysmian Spa employees 27,424 36,015
of which vested at end of year - -
of which for Prysmian Spa employees - -
of which exercisable - -
of which not vested at end of year 164,009 300,682
of which for Prysmian Spa employees 27,424 36,015
(*) The number of options refers to the adhesions to the additional purchase windows reserved for Managers (actual numbers for the first year and expected numbers for the next two years).
(**) The number of options has been revised for the actual number of adhesions in the first window.
The information memorandum, prepared under art. 114-bis of Legislative Decree 58/98 and describing the characteristics of the above share ownership plan, is publicly available on the Company's website at www.prysmiangroup.com, from its registered offices and from Borsa Italiana S.p.A. As at 31 December 2014, there are no outstanding loans or guarantees by Prysmian S.p.A. to any of its directors, senior managers or statutory auditors.
Long-term incentive plan 2014-2016The Shareholders' Meeting held on 16 April 2014 approved an incentive plan for the Group's employees, including members of the Board of Directors of Prysmian S.p.A., and granted the Board of Directors the necessary powers to establish and implement this plan.As a result of the effects of the Western HVDC Link contract (UK), the Board of Directors has decided not to execute the mandate received from the shareholders allowing implemen-tation of this plan.
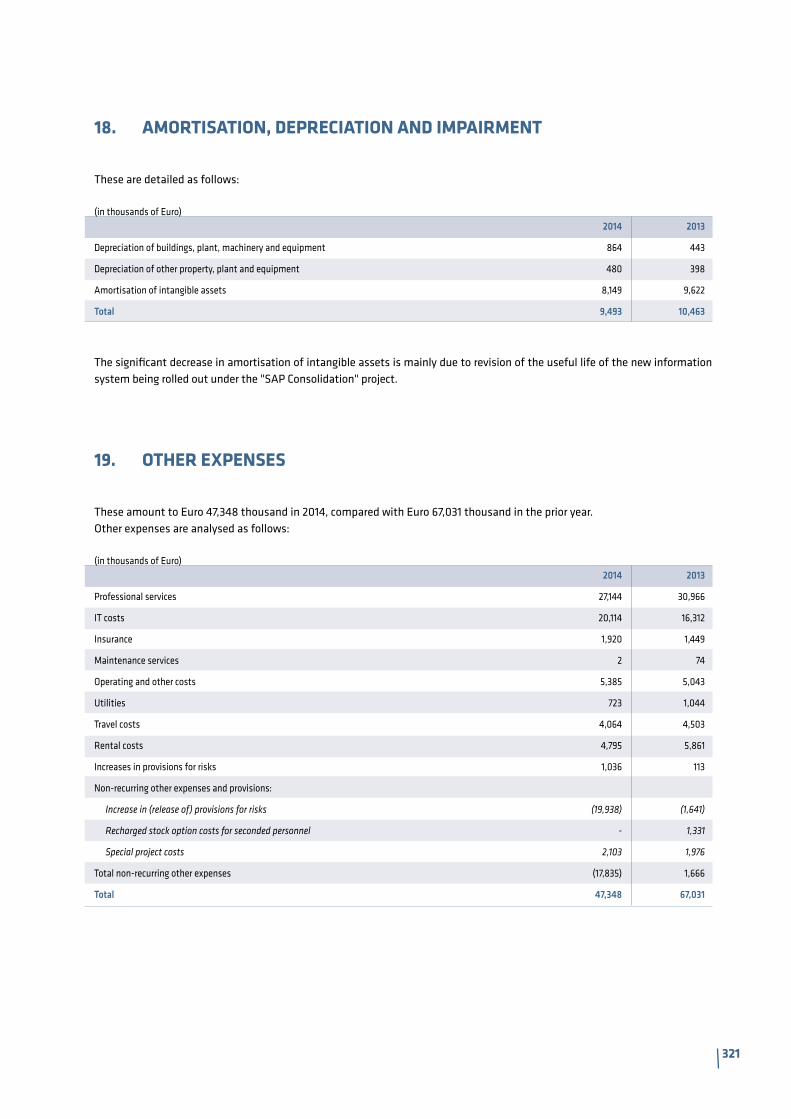
321
These are detailed as follows:
18. AMORTISATION, DEPRECIATION AND IMPAIRMENT
2014 2013
Depreciation of buildings, plant, machinery and equipment 864 443
Depreciation of other property, plant and equipment 480 398
Amortisation of intangible assets 8,149 9,622
Total 9,493 10,463
The significant decrease in amortisation of intangible assets is mainly due to revision of the useful life of the new information system being rolled out under the "SAP Consolidation" project.
These amount to Euro 47,348 thousand in 2014, compared with Euro 67,031 thousand in the prior year. Other expenses are analysed as follows:
19. OTHER EXPENSES
2014 2013
Professional services 27,144 30,966
IT costs 20,114 16,312
Insurance 1,920 1,449
Maintenance services 2 74
Operating and other costs 5,385 5,043
Utilities 723 1,044
Travel costs 4,064 4,503
Rental costs 4,795 5,861
Increases in provisions for risks 1,036 113
Non-recurring other expenses and provisions:
Increase in (release of) provisions for risks (19,938) (1,641)
Recharged stock option costs for seconded personnel - 1,331
Special project costs 2,103 1,976
Total non-recurring other expenses (17,835) 1,666
Total 47,348 67,031
(in thousands of Euro)
(in thousands of Euro)
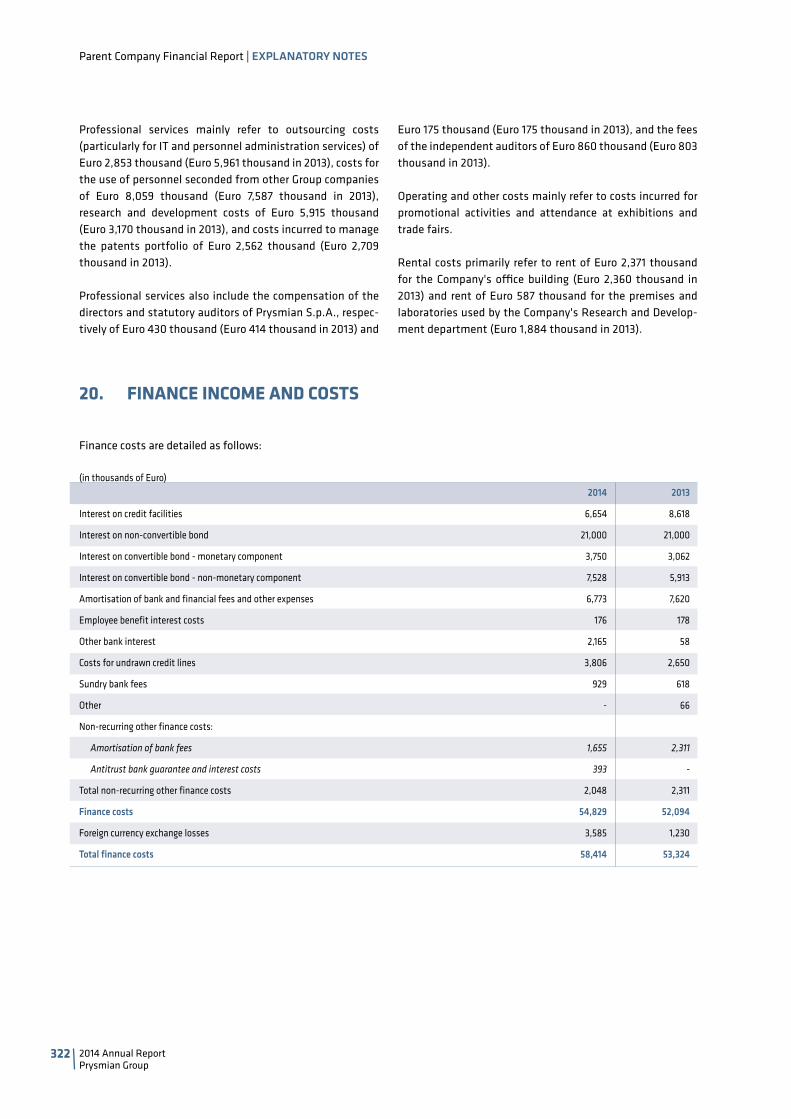
Parent Company Financial Report | EXPLANATORY NOTES
2014 Annual Report Prysmian Group
322
Professional services mainly refer to outsourcing costs (particularly for IT and personnel administration services) of Euro 2,853 thousand (Euro 5,961 thousand in 2013), costs for the use of personnel seconded from other Group companies of Euro 8,059 thousand (Euro 7,587 thousand in 2013), research and development costs of Euro 5,915 thousand (Euro 3,170 thousand in 2013), and costs incurred to manage the patents portfolio of Euro 2,562 thousand (Euro 2,709 thousand in 2013).
Professional services also include the compensation of the directors and statutory auditors of Prysmian S.p.A., respec-tively of Euro 430 thousand (Euro 414 thousand in 2013) and
Euro 175 thousand (Euro 175 thousand in 2013), and the fees of the independent auditors of Euro 860 thousand (Euro 803 thousand in 2013).
Operating and other costs mainly refer to costs incurred for promotional activities and attendance at exhibitions and trade fairs.
Rental costs primarily refer to rent of Euro 2,371 thousand for the Company's office building (Euro 2,360 thousand in 2013) and rent of Euro 587 thousand for the premises and laboratories used by the Company's Research and Develop-ment department (Euro 1,884 thousand in 2013).
Finance costs are detailed as follows:
20. FINANCE INCOME AND COSTS
2014 2013
Interest on credit facilities 6,654 8,618
Interest on non-convertible bond 21,000 21,000
Interest on convertible bond - monetary component 3,750 3,062
Interest on convertible bond - non-monetary component 7,528 5,913
Amortisation of bank and financial fees and other expenses 6,773 7,620
Employee benefit interest costs 176 178
Other bank interest 2,165 58
Costs for undrawn credit lines 3,806 2,650
Sundry bank fees 929 618
Other - 66
Non-recurring other finance costs:
Amortisation of bank fees 1,655 2,311
Antitrust bank guarantee and interest costs 393 -
Total non-recurring other finance costs 2,048 2,311
Finance costs 54,829 52,094
Foreign currency exchange losses 3,585 1,230
Total finance costs 58,414 53,324
(in thousands of Euro)
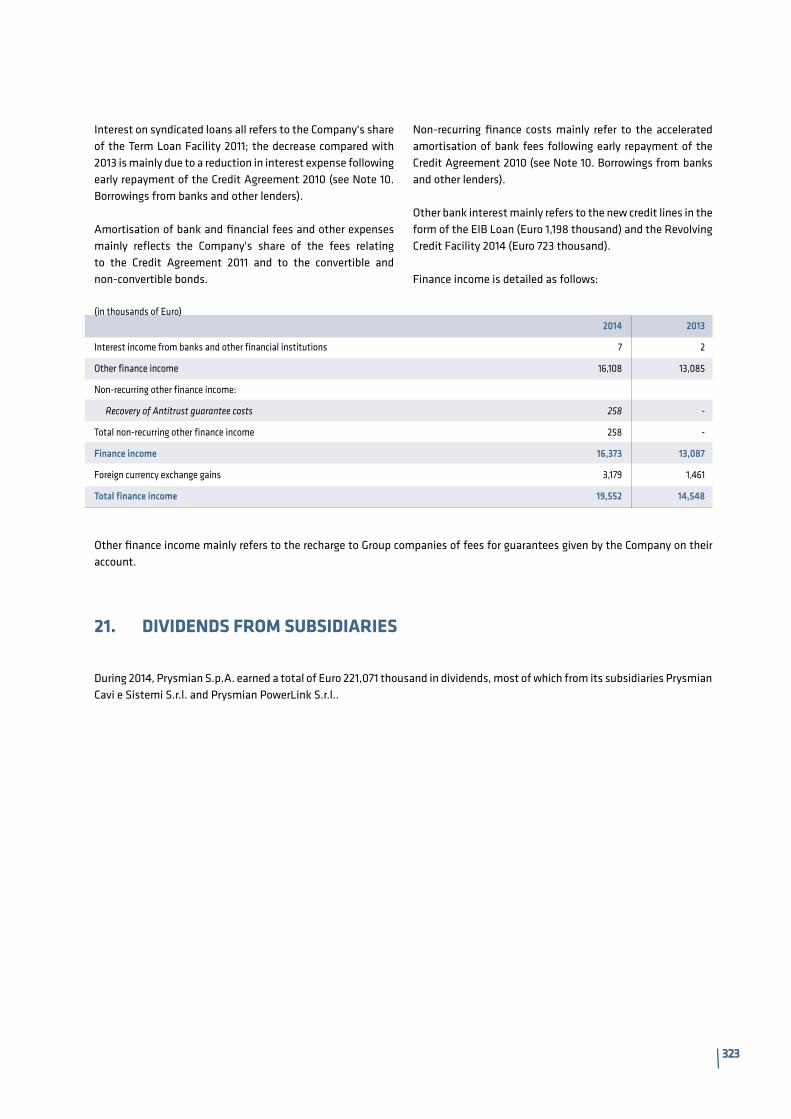
323
Interest on syndicated loans all refers to the Company's share of the Term Loan Facility 2011; the decrease compared with 2013 is mainly due to a reduction in interest expense following early repayment of the Credit Agreement 2010 (see Note 10. Borrowings from banks and other lenders).
Amortisation of bank and financial fees and other expenses mainly reflects the Company's share of the fees relating to the Credit Agreement 2011 and to the convertible and non-convertible bonds.
Non-recurring finance costs mainly refer to the accelerated amortisation of bank fees following early repayment of the Credit Agreement 2010 (see Note 10. Borrowings from banks and other lenders).
Other bank interest mainly refers to the new credit lines in the form of the EIB Loan (Euro 1,198 thousand) and the Revolving Credit Facility 2014 (Euro 723 thousand).
Finance income is detailed as follows:
2014 2013
Interest income from banks and other financial institutions 7 2
Other finance income 16,108 13,085
Non-recurring other finance income:
Recovery of Antitrust guarantee costs 258 -
Total non-recurring other finance income 258 -
Finance income 16,373 13,087
Foreign currency exchange gains 3,179 1,461
Total finance income 19,552 14,548
Other finance income mainly refers to the recharge to Group companies of fees for guarantees given by the Company on their account.
During 2014, Prysmian S.p.A. earned a total of Euro 221,071 thousand in dividends, most of which from its subsidiaries Prysmian Cavi e Sistemi S.r.l. and Prysmian PowerLink S.r.l..
21. DIVIDENDS FROM SUBSIDIARIES
(in thousands of Euro)

Parent Company Financial Report | EXPLANATORY NOTES
2014 Annual Report Prysmian Group
324
These are detailed as follows:
22. TAXES
2014 2013
Current income taxes (17,499) (31,091)
Deferred income taxes 1,363 2,847
Total (16,136) (28,244)
Current income taxes report a positive Euro 17,499 thousand in 2014, compared with Euro 31,091 thousand in 2013, and mainly reflect the net positive effects of the relief provided by tax losses transferred from some Italian companies under the rules of the group tax consolidation.
Information about deferred taxes can be found in Note 4. Deferred tax assets.
Taxes charged on profit before taxes differ from those calcu-lated using the theoretical tax rate applying to the Company for the following reasons:
2014 Tax rate 2013 Tax rate
Profit before taxes 175,420 156,441
Theoretical tax expense at Parent Company's nominal tax rate
48,241 27.5% 43,021 27.5%
Dividends from subsidiaries (57,755) (32.9%) (57,439) (32.7%)
Other permanent differences (2,812) (1.6%) 407 0.2%
Tax credit paid abroad (186) (0.1%) (8,192) (4.7%)
Impairment/(Reversal of impairment) of investments in subsidiaries
4,528 2.6% - 0.0%
Other (1,985) (1.1%) 1,237 0.7%
Net effect of group tax consolidation for the year (6,168) (3.5%) (7,278) (4.1%)
Effective income taxes (16,136) (9.2%) (28,244) (16.1%)
Since 2006 the Company, along with all its Italian resident sub-sidiaries, has opted to file for tax on a group basis, pursuant to art. 117 et seq of the Italian Income Tax Code, with the Company acting as the head of this group. The intercompany transac-tions arising under such a group tax consolidation are governed by specific rules and an agreement between the participating companies, which involve common procedures for applying the tax laws and regulations.
These rules were updated in 2008 to reflect the amendments and additions introduced by Law 244 of 24 December 2007 (Finance Act 2008) and Legislative Decree 112 of 25 June 2008.These rules were amended on 26 March 2012 to incorporate in the transactions between the head of the tax group and the in-dividual participating companies, the amendments introduced by Legislative Decree 201/2011 and the Ministerial Decree dated 14 March 2012 concerning Aid for Economic Growth.
(in thousands of Euro)
(in thousands of Euro)

325
Prysmian S.p.A. acts as the head of the tax group and calculates a single taxable base for companies in the Italian tax group; this has the benefit of being able to offset taxable profits against tax losses in a single tax return, thereby ensuring optimisation of the tax charge.
On 7 June 2012, the head of the tax group sent the required notice of renewal of the group tax election for the three years 2012 – 2013 – 2014 for the following companies:
• Fibre Ottiche Sud – F.O.S. S.r.l.• Prysmian Cavi e Sistemi S.r.l.• Prysmian Cavi e Sistemi Italia S.r.l.• Prysmian Treasury S.r.l.
This notice also included the election to include Prysmian Electronics S.r.l. in the group tax consolidation with effect from 2012. Prysmian PowerLink S.r.l. renewed its election to file for tax on a group basis for the three years 2014 - 2015 – 2016 on 3 June 2014.The rate used to calculate the tax charge is 27.5% for IRES (Italian corporate income tax), and 5.57% for IRAP (Italian regional business tax).
As a global operator, the Company is exposed to legal risks primarily, by way of example, in the areas of product liability, and environmental, antitrust and tax rules and regulations. Outlays relating to current or future proceedings cannot be predicted with certainty. The outcome of such proceedings could result in the payment of costs that are not covered, or
23. CONTINGENT LIABILITIES
not fully covered, by insurance, which would therefore have a direct effect on the Company's financial position and results. It is also reported, with reference to the Antitrust investi-gations in the various jurisdictions involved, that the only jurisdiction for which Prysmian S.p.A. has been unable to estimate the related risk is Brazil.
The Company has the following types of commitments at 31 December 2014:a) Commitments to purchase property, plant and equipment and intangible assetsContractual commitments, already given to third parties at 31 December 2014 and not yet reflected in the financial state-ments, amount to Euro 3,276 thousand (Euro 941 thousand
24. COMMITMENTS
at 31 December 2013), of which Euro 402 thousand in relation to the SAP Consolidation project (Euro 264 thousand at 31 December 2013).b) Operating lease commitmentsFuture commitments relating to operating leases are as follows:
2014 2013
Due within 1 year 3,804 2,175
Due between 1 and 5 years 5,580 2,029
Due after more than 5 years 66 -
Total 9,450 4,204
(in thousands of Euro)
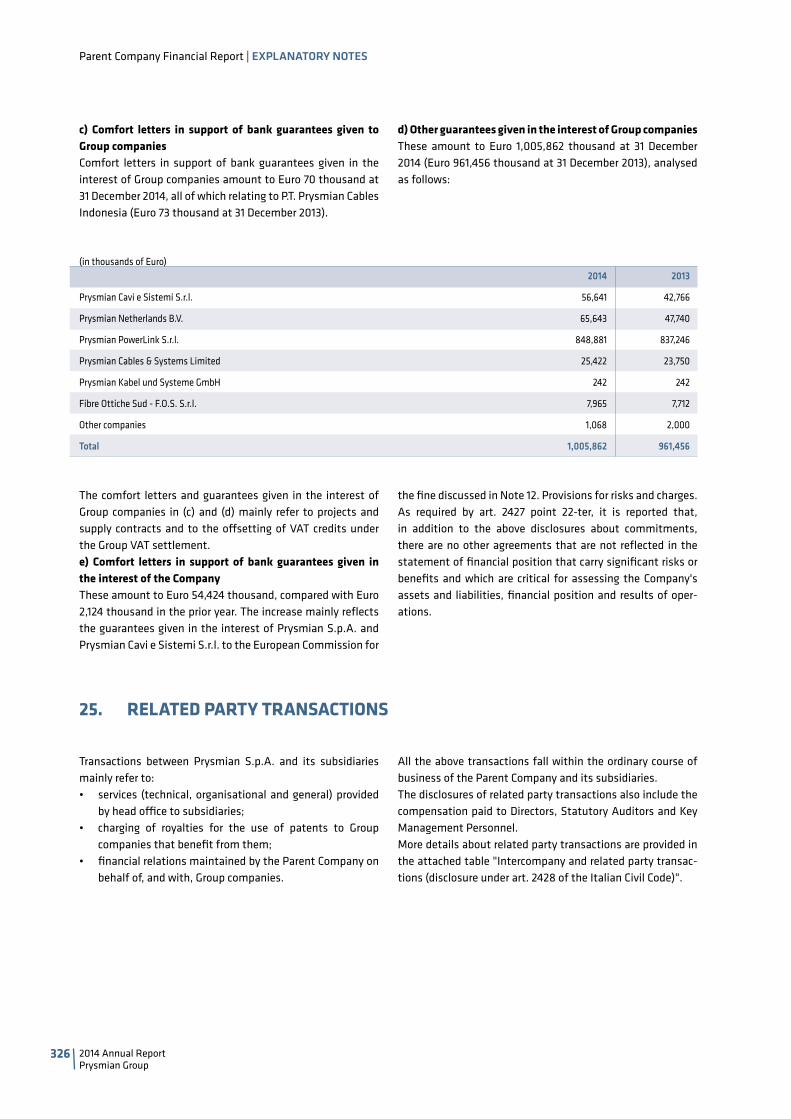
Parent Company Financial Report | EXPLANATORY NOTES
2014 Annual Report Prysmian Group
326
c) Comfort letters in support of bank guarantees given to Group companiesComfort letters in support of bank guarantees given in the interest of Group companies amount to Euro 70 thousand at 31 December 2014, all of which relating to P.T. Prysmian Cables Indonesia (Euro 73 thousand at 31 December 2013).
d) Other guarantees given in the interest of Group companiesThese amount to Euro 1,005,862 thousand at 31 December 2014 (Euro 961,456 thousand at 31 December 2013), analysed as follows:
2014 2013
Prysmian Cavi e Sistemi S.r.l. 56,641 42,766
Prysmian Netherlands B.V. 65,643 47,740
Prysmian PowerLink S.r.l. 848,881 837,246
Prysmian Cables & Systems Limited 25,422 23,750
Prysmian Kabel und Systeme GmbH 242 242
Fibre Ottiche Sud - F.O.S. S.r.l. 7,965 7,712
Other companies 1,068 2,000
Total 1,005,862 961,456
The comfort letters and guarantees given in the interest of Group companies in (c) and (d) mainly refer to projects and supply contracts and to the offsetting of VAT credits under the Group VAT settlement. e) Comfort letters in support of bank guarantees given in the interest of the Company These amount to Euro 54,424 thousand, compared with Euro 2,124 thousand in the prior year. The increase mainly reflects the guarantees given in the interest of Prysmian S.p.A. and Prysmian Cavi e Sistemi S.r.l. to the European Commission for
the fine discussed in Note 12. Provisions for risks and charges.As required by art. 2427 point 22-ter, it is reported that, in addition to the above disclosures about commitments, there are no other agreements that are not reflected in the statement of financial position that carry significant risks or benefits and which are critical for assessing the Company's assets and liabilities, financial position and results of oper-ations.
Transactions between Prysmian S.p.A. and its subsidiaries mainly refer to:• services (technical, organisational and general) provided
by head office to subsidiaries;• charging of royalties for the use of patents to Group
companies that benefit from them;• financial relations maintained by the Parent Company on
behalf of, and with, Group companies.
25. RELATED PARTY TRANSACTIONS
All the above transactions fall within the ordinary course of business of the Parent Company and its subsidiaries. The disclosures of related party transactions also include the compensation paid to Directors, Statutory Auditors and Key Management Personnel. More details about related party transactions are provided in the attached table "Intercompany and related party transac-tions (disclosure under art. 2428 of the Italian Civil Code)".
(in thousands of Euro)
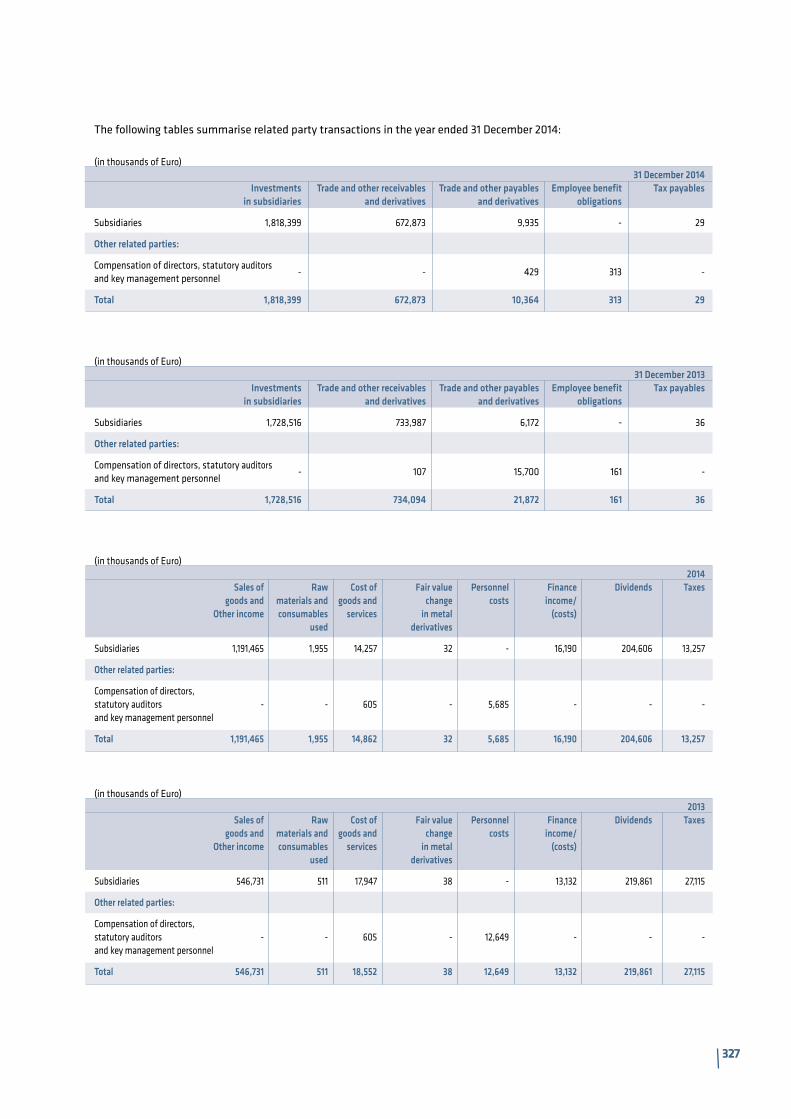
327
31 December 2014 Investments Trade and other receivables Trade and other payables Employee benefit Tax payables in subsidiaries and derivatives and derivatives obligations
Subsidiaries 1,818,399 672,873 9,935 - 29
Other related parties:
Compensation of directors, statutory auditors and key management personnel
- - 429 313 -
Total 1,818,399 672,873 10,364 313 29
31 December 2013 Investments Trade and other receivables Trade and other payables Employee benefit Tax payables in subsidiaries and derivatives and derivatives obligations
Subsidiaries 1,728,516 733,987 6,172 - 36
Other related parties:
Compensation of directors, statutory auditors and key management personnel
- 107 15,700 161 -
Total 1,728,516 734,094 21,872 161 36
2014 Sales of Raw Cost of Fair value Personnel Finance Dividends Taxes goods and materials and goods and change costs income/ Other income consumables services in metal (costs) used derivatives
Subsidiaries 1,191,465 1,955 14,257 32 - 16,190 204,606 13,257
Other related parties:
Compensation of directors,statutory auditors and key management personnel
- - 605 - 5,685 - - -
Total 1,191,465 1,955 14,862 32 5,685 16,190 204,606 13,257
2013 Sales of Raw Cost of Fair value Personnel Finance Dividends Taxes goods and materials and goods and change costs income/ Other income consumables services in metal (costs) used derivatives
Subsidiaries 546,731 511 17,947 38 - 13,132 219,861 27,115
Other related parties:
Compensation of directors,statutory auditors and key management personnel
- - 605 - 12,649 - - -
Total 546,731 511 18,552 38 12,649 13,132 219,861 27,115
The following tables summarise related party transactions in the year ended 31 December 2014:
(in thousands of Euro)
(in thousands of Euro)
(in thousands of Euro)
(in thousands of Euro)

Parent Company Financial Report | EXPLANATORY NOTES
2014 Annual Report Prysmian Group
328
Transactions with subsidiariesThese refer to services supplied to and received from Group companies and to current account transactions with the Group's central treasury company.
Key management compensationKey management compensation is analysed as follows:
2014 2013
Salaries and other short-term benefits - fixed part 5,435 3,951
Salaries and other short-term benefits - variable part - 6,989
Other benefits 237 38
Share-based payments 13 1,671
Total 5,685 12,649
of which Directors 4,047 11,073
As required by Consob Communication DEM/6064293 dated 28 July 2006, the effects of non-recurring events and transac-tions on the Company's income statement are shown below,
26. SIGNIFICANT NON-RECURRING EVENTS AND TRANSACTIONS
involving net non-recurring income totalling Euro 13,859 thousand in 2014 and net non-recurring expenses of Euro 6,107 thousand in 2013.
2014 2013
Non-recurring other income:
Special project income - 103
Recharges for stock options - 230
Total non-recurring other income - 333
Non-recurring other personnel costs:
Company reorganisation (2,186) (2,463)
Total non-recurring other personnel costs (2,186) (2,463)
Non-recurring other expenses:
Special project costs (2,103) (1,976)
Recharged stock option costs for seconded personnel - (1,331)
(Increases in)/releases of provisions for risks 19,938 1,641
Total non-recurring other expenses 17,835 (1,666)
Non-recurring finance costs (2,048) (2,311)
Non-recurring finance income 258 -
Total 13,859 (6,107)
The statement of financial position and the net financial position contain no material amounts in connection with non-recur-ring events.
(in thousands of Euro)
(in thousands of Euro)
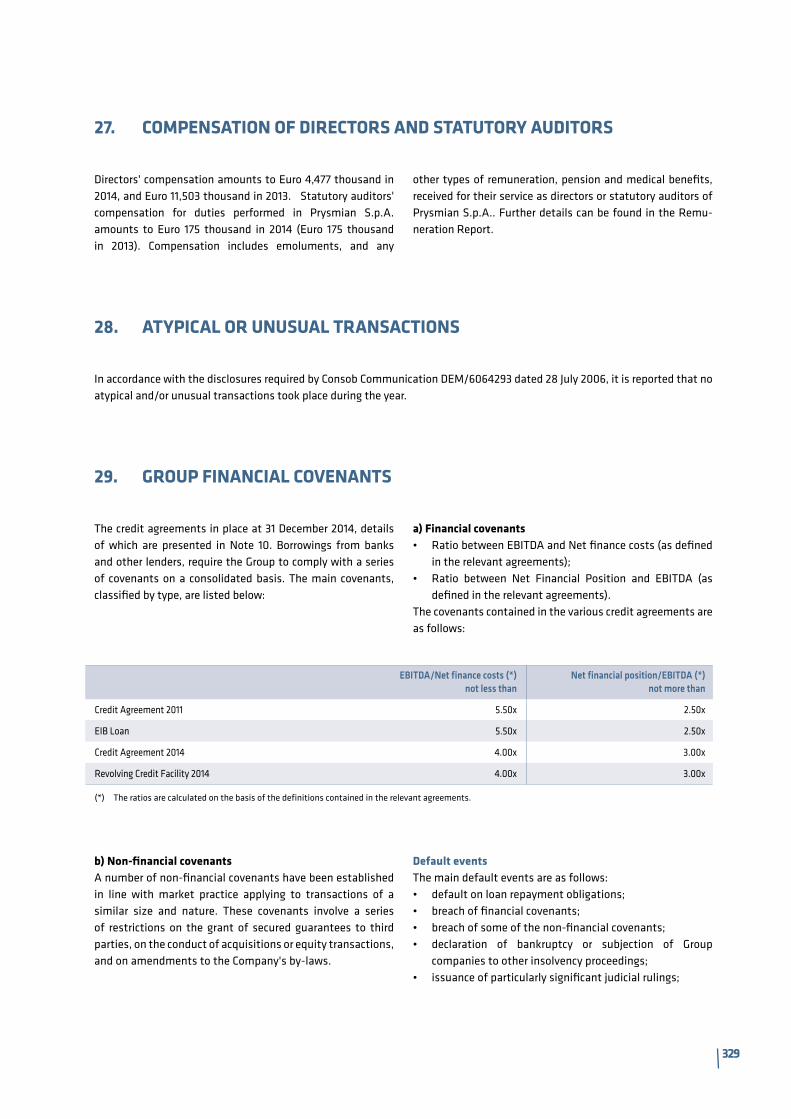
329
other types of remuneration, pension and medical benefits, received for their service as directors or statutory auditors of Prysmian S.p.A.. Further details can be found in the Remu-neration Report.
Directors' compensation amounts to Euro 4,477 thousand in 2014, and Euro 11,503 thousand in 2013. Statutory auditors' compensation for duties performed in Prysmian S.p.A. amounts to Euro 175 thousand in 2014 (Euro 175 thousand in 2013). Compensation includes emoluments, and any
27. COMPENSATION OF DIRECTORS AND STATUTORY AUDITORS
In accordance with the disclosures required by Consob Communication DEM/6064293 dated 28 July 2006, it is reported that no atypical and/or unusual transactions took place during the year.
28. ATYPICAL OR UNUSUAL TRANSACTIONS
a) Financial covenants• Ratio between EBITDA and Net finance costs (as defined
in the relevant agreements);• Ratio between Net Financial Position and EBITDA (as
defined in the relevant agreements).The covenants contained in the various credit agreements are as follows:
The credit agreements in place at 31 December 2014, details of which are presented in Note 10. Borrowings from banks and other lenders, require the Group to comply with a series of covenants on a consolidated basis. The main covenants, classified by type, are listed below:
29. GROUP FINANCIAL COVENANTS
EBITDA/Net finance costs (*) Net financial position/EBITDA (*) not less than not more than
Credit Agreement 2011 5.50x 2.50x
EIB Loan 5.50x 2.50x
Credit Agreement 2014 4.00x 3.00x
Revolving Credit Facility 2014 4.00x 3.00x
Default eventsThe main default events are as follows: • default on loan repayment obligations; • breach of financial covenants;• breach of some of the non-financial covenants; • declaration of bankruptcy or subjection of Group
companies to other insolvency proceedings;• issuance of particularly significant judicial rulings;
b) Non-financial covenantsA number of non-financial covenants have been established in line with market practice applying to transactions of a similar size and nature. These covenants involve a series of restrictions on the grant of secured guarantees to third parties, on the conduct of acquisitions or equity transactions, and on amendments to the Company's by-laws.
(*) The ratios are calculated on the basis of the definitions contained in the relevant agreements.

Parent Company Financial Report | EXPLANATORY NOTES
2014 Annual Report Prysmian Group
330
demand full or partial repayment of the amounts lent and not yet repaid, together with interest and any other amount due. No collateral security is required.Actual financial ratios reported at period end, calculated at a consolidated level for the Prysmian Group, are as follows:
• occurrence of events that may adversely and significantly affect the business, the assets or the financial conditions of the Group.
Should a default event occur, the lenders are entitled to
31 December 2014 31 December2013 (*)
EBITDA / Net finance costs (1) 5.82 6.99
Net financial position / EBITDA (1) 1.50 1.27
(*) The ratios are calculated on the basis of the definitions contained in the relevant agreements.(1) The financial covenants have been recalculated following restatement of the previously published figures for the adoption of IFRS 10 and 11, the adoption of
a new method of classifying the share of net profit/(loss) of associates and joint ventures and of different timing for recognising the cash component of the 2011-2013 incentive plan.
instances of non-compliance with the financial and non-fi-nancial covenants indicated above.
The above financial ratios comply with both the covenants contained in the relevant credit agreements and there are no
excluding these items, net cash finance costs reflected in the statement of cash flows amounted to Euro 18,135 thousand, most of which referring to interest expense, bank fees and other incidental expenses in connection with the Credit Agreement 2011, the EIB Loan, the convertible bond and the non-convertible bond.Net cash flow used by financing activities includes the receipt of the EIB Loan and the early repayment of the Credit Agreement 2010.
Net cash flow used by operating activities was a negative Euro 56,726 thousand in 2014, inclusive of Euro 18,701 thousand in taxes collected by the Group's Italian companies for IRES transferred under the group tax consolidation (art. 117 et seq of the Italian Income Tax Code). Investing activities provided a net positive Euro 89,947 thousand in cash flow, after collecting Euro 221,071 thousand in dividends from subsidiaries.Net finance costs recognised in the income statement came to Euro 38,862 thousand inclusive of non-cash items;
30. STATEMENT OF CASH FLOWS

331
auditors PricewaterhouseCoopers S.p.A. and companies in the PricewaterhouseCoopers network:
Pursuant to art. 149-duodecies of the Consob Issuer Regula-tions, the following table shows the fees in 2014 and 2013 for audit work and other services provided by the independent
31. INFORMATION PURSUANT TO ART.149-DUODECIES OF THE CONSOB ISSUER REGULATIONS
Supplier of services Fees relating to 2014 Fees relating to 2013
Audit services PricewaterhouseCoopers S.p.A. 860 1,140
Certification services PricewaterhouseCoopers S.p.A. (1) 71 83
Other services PricewaterhouseCoopers S.p.A. (2) 153 105
Total 1,084 1,328
(1) Audit support and other services.(2) Tax and other services.
advances were made in the area of materials and optical fibre technology.R&D costs incurred in 2014 and expensed to income amounted to Euro 16,244 thousand, compared with Euro 16,507 thousand in 2013.
The Group's research and development activities are mostly concentrated in Prysmian S.p.A.. The central team, in coor-dination with R&D and engineering centres in the various countries, developed numerous projects over the year in the field of both energy and telecom cables; significant
32. RESEARCH AND DEVELOPMENT
S.r.l., with reference to the alleged infringement in the period 18 February 1999 - 28 July 2005, for all claims made by the European Commission in implementation of its decision and for any expenses related to such implementation.
On 6 February 2015, Prysmian Cavi e Sistemi S.r.l. started legal proceedings, requesting that the claims brought by Pirelli & C. S.p.A. be rejected in full and that it should be Pirelli & C. S.p.A. which holds harmless Prysmian Cavi e Sistemi
33. EVENTS AFTER THE REPORTING PERIOD
The financial statements of the sub-holding company Prysmian Cavi e Sistemi S.r.l. will be filed at the registered office in Viale Sarca 222, Milan; the financial statements of the sub-holding company Draka Holding B.V. will not be presented, as permitted by Dutch law.
Prysmian S.p.A.'s financial statements at 31 December 2014 will be filed within the legally required term at its registered office in Viale Sarca 222, Milan and at Borsa Italiana S.p.A. and published on the website at www.prysmiangroup.com.
34. FILING OF FINANCIAL STATEMENTS
Milan, 25 February 2015 Massimo Tononi ON BEHALF OF THE BOARD OF DIRECTORS THE CHAIRMAN
(in thousands of Euro)

Parent Company Financial Report | EXPLANATORY NOTES
2014 Annual Report Prysmian Group
332
LIST OF EQUITY INVESTMENTS IN SUBSIDIARIES AT 31 DECEMBER 2014
Registered Book % owned Share capital Total Prysmian Net profit/ office value equity share of (loss) for equity the year
Italian subsidiaries
Prysmian Cavi e Sistemi S.r.l. Milan, Viale Sarca 222 278,971 100 100,000 313,122 313,122 43,125
Prysmian Cavi e Sistemi Italia S.r.l. Milan, Viale Sarca 222 49,871 100 77,143 72,275 72,275 (25,295)
Prysmian PowerLink S.r.l. Milan, Viale Sarca 222 143,893 100 100,000 150,643 150,643 27,542
Fibre Ottiche Sud - F.O.S. S.r.l. Battipaglia,
Strada Provinciale 135 54,146 100 47,700 54,230 54,230 (18,535)
Prysmian Treasury S.r.l. Milan, Viale Sarca 222 37,757 100 30,000 55,097 55,097 8,759
Total Italian subsidiaries 564,638
Foreign subsidiaries
Draka Holding B.V. Amsterdam, Netherlands 1,251,606 52.165 49,789 1,785,787 931,556 49,916
Prysmian Kabel und Systeme GmbH Berlin, Germany 2,154 6.25 15,000 (966) (60) 6,698
Prysmian Kablo SRO Bratislava, Slovakia 1 0.005 21,246 2,258 - (313)
Jaguar Communication Consultancy Services Private Ltd.
Mumbai, India - 0.00003 450 109 - (51)
Prysmian Surflex Umbilicais e Tubos Flexiveis do Brasil Ltda
Vila Velha, Brazil - 0.99999 67,692 66,507 - (35,911)
Prysmian Energia Cabos e Sistemas do Brasil S.A.
Sorocaba, Brazil - 0.143 47,690 85,647 - 5,127
Total foreign subsidiaries 1,253,761
Grand total 1,818,399
(in thousands of Euro)
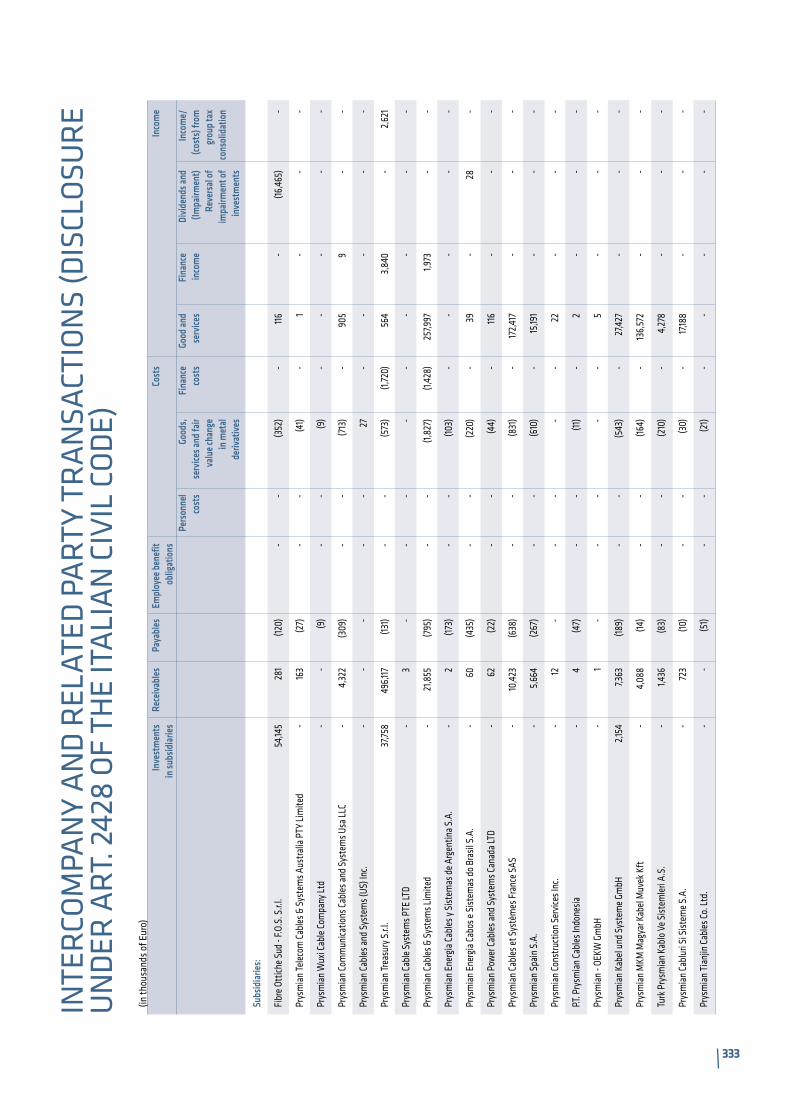
333
INTE
RCOM
PAN
Y AN
D RE
LATE
D PA
RTY
TRAN
SACT
ION
S (D
ISCL
OSUR
E U
NDE
R AR
T. 2
428
OF T
HE
ITAL
IAN
CIV
IL C
ODE)
In
vest
men
ts
Rece
ivabl
es
Paya
bles
Em
ploy
ee be
nefit
Co
sts
In
com
e
in su
bsid
iaries
ob
ligat
ions
Perso
nnel
Good
s,
Finan
ce
Good
and
Fina
nce
Divid
ends
and
Inco
me/
cost
s se
rvice
s and
fair
co
sts
serv
ices
inco
me
(Impa
irmen
t)
(cost
s) fro
m
valu
e cha
nge
Re
versa
l of
grou
p tax
in
met
al
impa
irmen
t of
cons
olida
tion
deriv
ative
s
inve
stm
ents
Subs
idiar
ies:
Fibr
e Otti
che S
ud -
F.O.S
. S.r.
l. 54
,145
281
(120)
-
- (3
52)
- 116
-
(16,46
5)
-
Prys
mian
Telec
om Ca
bles
& S
yste
ms A
ustra
lia P
TY Li
mite
d -
163
(27)
-
- (4
1) -
1 -
- -
Prys
mian
Wux
i Cab
le Co
mpa
ny Lt
d -
- (9
) -
- (9
) -
- -
- -
Prys
mian
Com
mun
icatio
ns Ca
bles
and S
yste
ms U
sa LL
C -
4,32
2 (3
09)
- -
(713
) -
905
9 -
-
Prys
mian
Cabl
es an
d Sys
tem
s (US
) Inc
. -
- -
- -
27
- -
- -
-
Prys
mian
Trea
sury
S.r.
l. 37
,758
496,1
17
(131)
- -
(573
) (1,
720)
56
4 3,8
40
- 2,6
21
Prys
mian
Cabl
e Sys
tem
s PTE
LTD
- 3
- -
- -
- -
- -
-
Prys
mian
Cabl
es &
Sys
tem
s Lim
ited
- 21
,855
(7
95)
- -
(1,82
7)
(1,42
8)
257,9
97
1,973
-
-
Prys
mian
Ene
rgia
Cabl
es y
Sist
emas
de A
rgen
tina S
.A.
- 2
(173)
-
- (10
3)
- -
- -
-
Prys
mian
Ene
rgia
Cabo
s e S
istem
as do
Bra
sil S
.A.
- 60
(4
35)
- -
(220
) -
39
- 28
-
Prys
mian
Pow
er Ca
bles
and S
yste
ms C
anad
a LTD
-
62
(22)
-
- (4
4)
- 116
-
- -
Prys
mian
Cabl
es et
Sys
tèm
es Fr
ance
SAS
-
10,42
3 (6
38)
- -
(831
) -
172,4
17
- -
-
Prys
mian
Spa
in S
.A.
- 5,
664
(267
) -
- (6
10)
- 15
,191
- -
-
Prys
mian
Cons
truct
ion S
ervic
es In
c. -
12
- -
- -
- 22
-
- -
P.T. P
rysm
ian Ca
bles
Indo
nesia
-
4 (4
7)
- -
(11)
- 2
- -
-
Prys
mian
- OE
KW G
mbH
-
1 -
- -
- -
5 -
- -
Prys
mian
Kab
el un
d Sys
tem
e Gm
bH
2,154
7,3
63
(189)
-
- (5
43)
- 27
,427
- -
-
Prys
mian
MKM
Mag
yar K
abel
Muv
ek K
ft -
4,08
8 (14
) -
- (16
4)
- 13
6,57
2 -
- -
Turk
Pry
smian
Kab
lo V
e Sist
emler
i A.S
. -
1,436
(8
3)
- -
(210
) -
4,27
8 -
- -
Prys
mian
Cabl
uri S
i Sist
eme S
.A.
- 72
3 (10
) -
- (3
0)
- 17,
188
- -
-
Prys
mian
Tian
jin Ca
bles
Co. L
td.
- -
(51)
- -
(21)
- -
- -
-
(in th
ousa
nds o
f Eur
o)

Parent Company Financial Report | EXPLANATORY NOTES
2014 Annual Report Prysmian Group
334
In
vest
men
ts
Rece
ivabl
es
Paya
bles
Em
ploy
ee be
nefit
Co
sts
In
com
e
in su
bsid
iaries
ob
ligat
ions
Perso
nnel
Good
s,
Finan
ce
Good
and
Fina
nce
Divid
ends
and
Inco
me/
cost
s se
rvice
s and
fair
co
sts
serv
ices
inco
me
(Impa
irmen
t)
(cost
s) fro
m
valu
e cha
nge
Re
versa
l of
grou
p tax
in
met
al
impa
irmen
t of
cons
olida
tion
deriv
ative
s
inve
stm
ents
Prys
mian
Kab
lo S
RO
1 25
0 -
- -
- -
3 -
- -
Prys
mian
Finl
and O
Y -
8,91
9 (6
8)
- -
(598
) -
107,4
99
- -
-
Prys
mian
Net
herla
nds B
.V.
- 6,
236
(121)
- -
(339
) -
95,33
1 71
4 -
-
Prys
mian
Cavi
e Sist
emi It
alia S
.r.l.
49,8
70
3,200
(7
57)
- -
(1,119
) -
31,79
9 -
- -
Prys
mian
Cabl
es A
sia-P
acifi
c PTE
LTD
- -
(10)
- -
(10)
- -
- -
-
Prys
mian
Bao
shen
g Cab
le Co
., Ltd
-
13
(5)
- -
(5)
- -
5 -
-
Prys
mian
Cabl
es (S
hang
hai)
Tradi
ng CO
. Ltd
-
- (16
) -
- (16
) -
- -
- -
Prys
mian
Pow
er Ca
bles
& S
yste
ms A
ustra
lia P
TY Li
mite
d -
1,166
(3
26)
- -
(911)
(5
) 10
7 1
- -
Prys
mian
Cavi
e Sist
emi S
.r.l.
278,
975
50,17
8 (18
1) -
- (2
20)
- 87
,947
25
8 96
,187
6,70
3
Prys
mian
Pow
er Ca
bles
& S
yste
ms N
ew Z
ealan
d Lim
ited
- -
- -
- -
- 2
- -
-
Prys
mian
Pow
erLin
k S.r.
l. 14
3,892
24
,413
(107)
-
- (12
1) -
37,8
10
12,45
0 12
4,85
1 3,9
17
Prys
mian
(CHI
NA) I
nves
tmen
t Com
pany
Ltd
- 13
(4
0)
- -
(15)
- 4
- -
-
LLC I
nves
titsio
nno –
Pro
mys
hlen
naya
Kom
pani
ya R
ybin
skele
ktro
kabe
l -
405
(6)
- -
16
- (3
8)
- -
-
LLC R
ybin
skele
ktro
kabe
l -
780
(8)
- -
(1,34
5)
- 54
8 -
- -
Ravin
Cabl
es Li
mite
d (In
dia)
-
25
- -
- -
- -
- -
-
Prys
mian
Sur
flex u
nilic
ais e
tubo
s flex
iveis
do B
rasil
ltda
-
9 (5
84)
- -
(424
) -
- -
5 -
Eure
lectri
c Tun
isie S
.A.
- 81
-
- -
- -
81
- -
-
Prys
mian
Elec
troni
cs S
.r.l.
- 52
(5
) -
- (5
) -
29
- -
16
Drak
a Hol
ding
B.V.
1,2
51,6
04
3,200
(3
,523
) -
- (3
,364)
-
15
- -
-
Drak
a Com
teq F
ibre
B.V.
-
590
(39)
-
- (10
0)
- 85
-
- -
Drak
a Cab
leteq
USA
INC
- 95
6 -
- -
(85)
-
104
3 -
-
Drak
a Elev
ator
Pro
duct
s INC
-
735
- -
- -
- -
- -
-
Drak
a Com
teq F
ranc
e SAS
-
1,169
(16
8)
- -
(168)
-
305
- -
-
Drak
a Par
icabl
e SAS
-
307
- -
- -
- 5,
049
- -
-
(in th
ousa
nds o
f Eur
o)
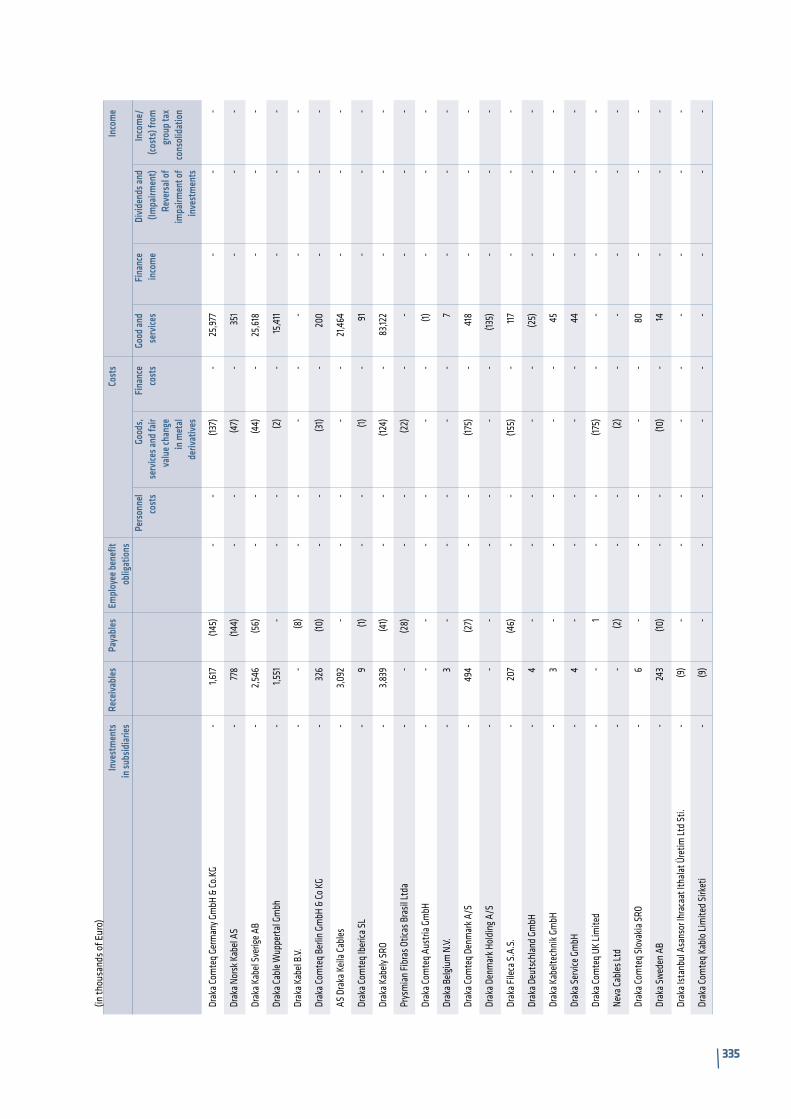
335
In
vest
men
ts
Rece
ivabl
es
Paya
bles
Em
ploy
ee be
nefit
Co
sts
In
com
e
in su
bsid
iaries
ob
ligat
ions
Perso
nnel
Good
s,
Finan
ce
Good
and
Fina
nce
Divid
ends
and
Inco
me/
cost
s se
rvice
s and
fair
co
sts
serv
ices
inco
me
(Impa
irmen
t)
(cost
s) fro
m
valu
e cha
nge
Re
versa
l of
grou
p tax
in
met
al
impa
irmen
t of
cons
olida
tion
deriv
ative
s
inve
stm
ents
Drak
a Com
teq G
erm
any G
mbH
& Co
.KG
- 1,6
17
(145)
-
- (13
7)
- 25
,977
-
- -
Drak
a Nor
sk K
abel
AS
- 77
8 (14
4)
- -
(47)
-
351
- -
-
Drak
a Kab
el Sv
erige
AB
- 2,5
46
(56)
-
- (4
4)
- 25
,618
-
- -
Drak
a Cab
le W
uppe
rtal G
mbh
-
1,551
-
- -
(2)
- 15
,411
- -
-
Drak
a Kab
el B.V
. -
- (8
) -
- -
- -
- -
-
Drak
a Com
teq B
erlin
Gm
bH &
Co K
G -
326
(10)
- -
(31)
- 20
0 -
- -
AS D
raka
Keil
a Cab
les
- 3,0
92
- -
- -
- 21
,464
- -
-
Drak
a Com
teq I
beric
a SL
- 9
(1)
- -
(1)
- 91
-
- -
Drak
a Kab
ely S
RO
- 3,8
39
(41)
- -
(124)
-
83,12
2 -
- -
Prys
mian
Fibr
as O
ticas
Bra
sil Lt
da
- -
(28)
-
- (2
2)
- -
- -
-
Drak
a Com
teq A
ustri
a Gm
bH
- -
- -
- -
- (1)
-
- -
Drak
a Belg
ium
N.V.
-
3 -
- -
- -
7 -
- -
Drak
a Com
teq D
enm
ark A
/S
- 49
4 (2
7)
- -
(175)
-
418
- -
-
Drak
a Den
mar
k Hol
ding
A/S
-
- -
- -
- -
(135)
-
- -
Drak
a File
ca S
.A.S
. -
207
(46)
-
- (15
5)
- 117
-
- -
Drak
a Deu
tsch
land G
mbH
-
4 -
- -
- -
(25)
-
- -
Drak
a Kab
eltec
hnik
GmbH
-
3 -
- -
- -
45
- -
-
Drak
a Ser
vice G
mbH
-
4 -
- -
- -
44
- -
-
Drak
a Com
teq U
K Lim
ited
- -
1 -
- (17
5)
- -
- -
-
Neva
Cabl
es Lt
d -
- (2
) -
- (2
) -
- -
- -
Drak
a Com
teq S
lovak
ia SR
O -
6 -
- -
- -
80
- -
-
Drak
a Swe
den A
B -
243
(10)
- -
(10)
- 14
-
- -
Drak
a Ist
anbu
l Asa
nsor
Ihra
caat
Itha
lat Ü
retim
Ltd S
ti.
- (9
) -
- -
- -
- -
- -
Drak
a Com
teq K
ablo
Lim
ited S
irket
i -
(9)
- -
- -
- -
- -
-
(in th
ousa
nds o
f Eur
o)
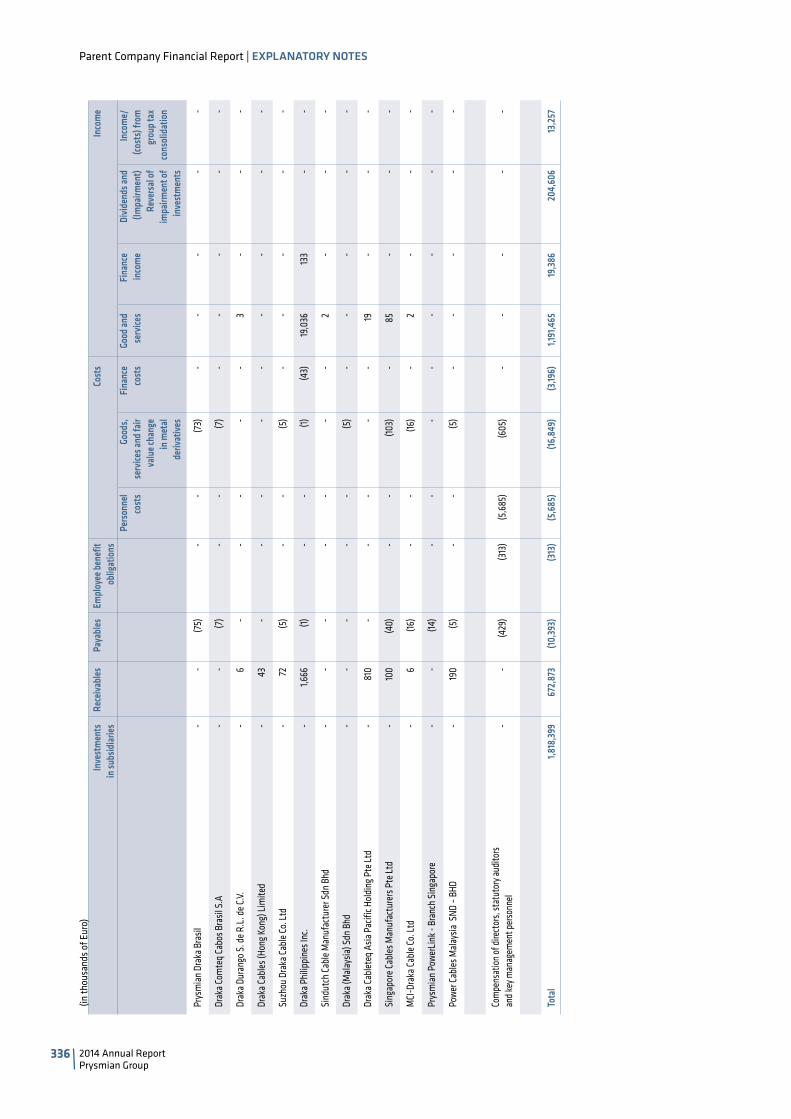
Parent Company Financial Report | EXPLANATORY NOTES
2014 Annual Report Prysmian Group
336
In
vest
men
ts
Rece
ivabl
es
Paya
bles
Em
ploy
ee be
nefit
Co
sts
In
com
e
in su
bsid
iaries
ob
ligat
ions
Perso
nnel
Good
s,
Finan
ce
Good
and
Fina
nce
Divid
ends
and
Inco
me/
cost
s se
rvice
s and
fair
co
sts
serv
ices
inco
me
(Impa
irmen
t)
(cost
s) fro
m
valu
e cha
nge
Re
versa
l of
grou
p tax
in
met
al
impa
irmen
t of
cons
olida
tion
deriv
ative
s
inve
stm
ents
Prys
mian
Dra
ka B
rasil
-
- (7
5)
- -
(73)
-
- -
- -
Drak
a Com
teq C
abos
Bra
sil S
.A
- -
(7)
- -
(7)
- -
- -
-
Drak
a Dur
ango
S. d
e R.L
. de C
.V.
- 6
- -
- -
- 3
- -
-
Drak
a Cab
les (H
ong K
ong)
Lim
ited
- 43
-
- -
- -
- -
- -
Suzh
ou D
raka
Cabl
e Co.
Ltd
- 72
(5
) -
- (5
) -
- -
- -
Drak
a Phi
lippi
nes I
nc.
- 1,6
66
(1)
- -
(1)
(43)
19
,036
13
3 -
-
Sind
utch
Cabl
e Man
ufac
ture
r Sdn
Bhd
-
- -
- -
- -
2 -
- -
Drak
a (M
alays
ia) S
dn B
hd
- -
- -
- (5
) -
- -
- -
Drak
a Cab
leteq
Asia
Pac
ific H
oldi
ng P
te Lt
d -
810
- -
- -
- 19
-
- -
Sing
apor
e Cab
les M
anuf
actu
rers
Pte L
td
- 10
0 (4
0)
- -
(103)
-
85
- -
-
MCI
-Dra
ka Ca
ble C
o. Lt
d -
6 (16
) -
- (16
) -
2 -
- -
Prys
mian
Pow
erLin
k - B
ranc
h Sin
gapo
re
- -
(14)
- -
- -
- -
- -
Powe
r Cab
les M
alays
ia S
ND –
BHD
- 19
0 (5
) -
- (5
) -
- -
- -
Com
pens
ation
of di
recto
rs, st
atut
ory a
udito
rs an
d key
man
agem
ent p
erso
nnel
- -
(429
) (3
13)
(5,6
85)
(605
) -
- -
- -
Tota
l 1,8
18,39
9 67
2,873
(10
,393)
(3
13)
(5,6
85)
(16,8
49)
(3,19
6)
1,191
,465
19
,386
204,
606
13,25
7
(in th
ousa
nds o
f Eur
o)

337
CERTIFICATION OF THE FINANCIAL STATEMENTS PURSUANT TO ART, 81-TER OF CONSOB REGULATION 11971 DATED 14 MAY 1999 AND SUBSEQUENT AMENDMENTS AND ADDITIONS
1. The undersigned Valerio Battista, as Chief Executive Officer, and Carlo Soprano and Andreas Bott, as managers responsible for preparing the corporate accounting documents of Prysmian S,p,A,, certify, also taking account of the provisions of paragraphs 3 and 4, art, 154-bis of Italian Legislative Decree 58 dated 24 February 1998, that during 2014 the accounting and administrative processes for preparing the financial statements:
• have been adequate in relation to the business's characteristics and,• have been effectively applied.
2. The adequacy of the accounting and administrative processes for preparing the financial statements at 31 December 2014 has been evaluated on the basis of a procedure established by Prysmian in compliance with the internal control framework published by the Committee of Sponsoring Organizations of the Treadway Commission, which represents the generally accepted standard model internationally.
3. They also certify that:
3.1 The financial statements at 31 December 2014:a. have been prepared in accordance with applicable international accounting standards recognised by the European Union under
Regulation (EC) 1606/2002 of the European Parliament and Council dated 19 July 2002;b. correspond to the underlying accounting records and books of account;c. are able to provide a true and fair view of the issuer's statement of financial position and results of operations.
3.2 The directors' report contains a fair review of performance and the results of operations, and of the issuer's situation, together with a description of the principal risks and uncertainties to which it is exposed.
Milan, 25 February 2015 Valerio Battista Carlo Soprano Andreas BottCHIEF EXECUTIVE OFFICER MANAGERS RESPONSIBLE FOR PREPARING CORPORATE ACCOUNTING DOCUMENTS


Parent Company Financial Report
AUDIT REPORT

Parent Company Financial Report | AUDIT REPORT
2014 Annual Report Prysmian Group
340

341


Parent Company Financial Report
REPORT BY THE BOARD OF STATUTORY AUDITORS
Parent Company Financial Report | REPORT BY THE BOARD OF STATUTORY AUDITORS
2014 Annual Report Prysmian Group
344
REPORT BY THE BOARD OF STATUTORY AUDITORS (ART. 153 LEGISLATIVE DECREE 58/1998 AND ART. 2429 ITALIAN CIVIL CODE)
Shareholders,This report refers to the activities performed by the Board of Statutory Auditors of Prysmian S.p.A. (the "Company" and together with its subsidiaries, the "Group") during the year ended 31 December 2014 (the "Financial Year").
1. In performing its supervisory and control activities, the Board of Statutory Auditors reports that:
a) it has monitored compliance with the law and the Company's By-laws and the observance of good management practices, in accordance with its duties set out in art. 2403 of the Italian Civil Code, art. 149 of Legislative Decree 58/1998 (Italy's Unified Financial Act, hereinafter "UFA") and Consob Communication 1025564 dated 6 April 2001 and subsequent amendments, and with reference to the standards of conduct established by the Italian Accountancy Profession;
b) it has attended meetings of the Board of Directors and the Control and Risks Committee, set up under art. 19 of the By-laws, and it has received regular information from the Directors about the Company's performance and outlook, and about transactions with the most significant impact on its results of operations, financial position and cash flows that were approved and actioned during the Financial Year by the Company and Group companies, including those transactions specifically mentioned in art. 150. par. 1. UFA. The Board of Statutory Auditors is able to provide reasonable assurance that the transactions approved and put into action complied with the law and the By-laws and were not manifestly imprudent, risky, in potential conflict of interest, in contrast with resolutions adopted by the shareholders in general meetings, nor such as to compromise the integrity of the Company's net assets. Resolutions adopted by the Board of Directors have been faithfully executed by management and the organisation;
c) it has not observed the existence of atypical and/or unusual transactions with Group companies or with third or related parties, nor has it received information in this regard from the Board of Directors, the Independent Auditors, or the director in charge of supervising the internal control and risk management system. The Directors' Report, prepared by the Board of Directors, contains adequate information about the effects of ordinary transactions entered into with subsidiaries on an arm's length basis that have an important impact on results of operations, financial position and cash flows. The Board of Statutory Auditors is of the opinion that related party transactions (including those between Group companies) are adequately controlled, also basing its conclusion on the results of work carried out by the Internal Audit department. In this regard, the Board of Statutory Auditors notes that the Company has adopted a set of procedures for related party transactions in compliance with the provisions of Consob Regulation 17221 dated 12 March 2010 and the Consob Communication dated 24 September 2010, as well as specific rules contained in the Group's Ethical Code, which set out how to avoid or manage situations in which the Directors have a

345
conflict of interest or a personal interest. In accordance with art. 4 of the above Consob Regulation, the Board of Statutory Auditors has verified that the procedures adopted by the Company comply with the Regulation's principles, and that such procedures have been observed;
d) it has obtained information about and monitored (i) the adequacy of the Company's organisational structure, within the scope of its remit, and (ii) the observance of good management practices, by acquiring information from heads of the relevant departments and by holding meetings with representatives from PricewaterhouseCoopers S.p.A., the auditing firm engaged to perform the statutory audit (the "Independent Auditors"), including for the purpose of exchanging relevant in-formation and data; no critical issues have emerged as a result of these meetings. No critical issues have emerged as a result of meetings with the Boards of Statutory Auditors and sole Statutory Auditors of the Company's Italian subsidiaries (Prysmian Cavi e Sistemi S.r.l.; Prysmian Powerlink S.r.l.; Prysmian Cavi e Sistemi Italia S.r.l.; Prysmian Treasury S.r.l.; Fibre Ottiche Sud - F.O.S. S.r.l. and Prysmian Electronics S.r.l.);
e) it has assessed and monitored, to the extent of its remit under art, 19 of Legislative Decree 39/2010, the financial reporting process, the adequacy of systems of internal control, administration and ac-counting, and the latter's reliability for the purposes of fairly representing business performance, by:
i. regularly exchanging information with executive directors and particularly with the Managers responsible for preparing corporate accounting documents, whose role is governed by art. 154-bis, UFA;
ii. examining the reports prepared by the Head of Internal Audit, including information on the outcome of any remedial actions implemented as a result of auditing activities;
iii. obtaining information from the heads of departments;iv. holding meetings and exchanging information with the statutory auditors of the Italian subsid-
iaries (Prysmian Cavi e Sistemi S.r.l.; Prysmian Powerlink S.r.l.; Prysmian Cavi e Sistemi Italia S.r.l.; Prysmian Treasury S.r.l.; Fibre Ottiche Sud - F.O.S. S.r.l., and Prysmian Electronics S.r.l.) as permitted by paragraphs 1 and 2 of art. 151, UFA, during which the Board of Statutory Auditors obtained information about the management and control systems of these subsidiaries and general trends in their business;
v. examining the activities of the Independent Auditors and reviewing the results of their work;vi. attending meetings of the Control and Risks Committee and, when matters so required, ad-
dressing such matters jointly with this Committee,
These activities have not revealed any anomalies that could be considered evidence of inadequacies in the internal control and risk management system;
Parent Company Financial Report | REPORT BY THE BOARD OF STATUTORY AUDITORS
2014 Annual Report Prysmian Group
346
f) as required by art. 150, par. 3, UFA and art. 19 of Legislative Decree 39/2010, it has had meetings with senior management from the firm of Independent Auditors, during which no facts or situations emerged that would require disclosure in this report, and it has performed the supervisory activities prescribed by art. 19 of Legislative Decree 39/2010;
g) it has monitored the arrangements for implementing the Self-Regulatory Code for listed companies promoted by Borsa Italiana S.p.A., adopted by the Company, as described in the Report on Corporate Governance and Ownership Structure approved by the Board of Directors on 25 February 2015. The Board of Statutory Auditors has also verified the correct application of the criteria and procedures adopted by the Board of Directors to evaluate the independence of its members. The Board of Statutory Auditors has also verified that its own members comply with the independence require-ments, laid down in the Self-Regulatory Code;
h) it has examined and obtained information about the activities of an organisational and procedural nature implemented under Legislative Decree 231/2001 on corporate criminal liability. The Monitor-ing Board instituted by the Company has reported on its activities during the Financial Year and has not notified the Board of Statutory Auditors of any significant matters;
i) it has verified that the flow of information provided by subsidiaries located outside the European Union is adequate for the audit of the annual and interim financial reports, as required by art. 36 of the Market Regulations adopted under Consob resolution 16191 dated 29 October 2007;
j) it has followed the implementation of organisational measures connected with developments in the business.
During the meeting of the Board of Directors on 25 February 2014, the Board of Statutory Auditors approved the resolution, adopted under art. 2386 of the Italian Civil Code, concerning the appointment by co-optation of a new Director following the resignation of a serving Director.The Board of Statutory Auditors met eleven times during 2014 and also attended meetings of the Board of Directors and the Control and Risks Committee; it also met with the Boards of Statutory Auditors and sole Statutory Auditors of the subsidiaries mentioned earlier.As regards exchange of information with the Monitoring Board (instituted under Legislative Decree 231/2001), the Chairman of the Monitoring Board reports systematically to the Board of Statutory Auditors on its supervisory activities involving the Organisational Model adopted by the Company under Legislative Decree 231/2001.
Based on the information obtained, the Board of Statutory Auditors considers that the business is run in accordance with good management practices and that as a whole, its organisational structure, system of internal controls and administrative and accounting systems are appropriate for its business needs.
347
2. With regard to relations with the Independent Auditors, the Board of Statutory Auditors reports that:
a) PricewaterhouseCoopers S.p.A. has issued today its "annual independence confirmation", under art. 17, par. 9 a) of Legislative Decree 39/2010;
b) on 31 March 2014, PricewaterhouseCoopers S.p.A. issued its report, required by art. 19, par. 3 of Legislative Decree 39/2010, for the year ended 31 December 2013, which showed that there were no material weaknesses in the internal controls relating to the financial reporting process;
c) PricewaterhouseCoopers S.p.A. has issued reports, also dated today, under art. 14 and art. 16 of Legislative Decree 39/2010, which state that:
i. the separate financial statements and consolidated financial statements for the year ended 31 December 2014 have been prepared clearly and give a true and fair view of the financial position as of 31 December 2014, the results of operations and changes in equity and cash flows of the Company and the Group for the Financial Year then ended;
ii. the Directors' Report and the information referred to in paragraph 1, letters c), d), f), l) m) and paragraph 2, letter b) of art. 123-bis UFA, presented in the Report on Corporate Governance and Ownership Structure, are consistent with the separate financial statements and the consolidat-ed financial statements;
d) in addition to the duties prescribed by listed company regulations, PricewaterhouseCoopers S.p.A. and member companies of the PricewaterhouseCoopers S.p.A. network were engaged to perform other non-audit services for a total of Euro 935,000 during the Financial Year, as disclosed in the notes to the separate and consolidated financial statements; the nature of such services is consis-tent with art. 17 of Legislative Decree 39/2010.
The Board of Statutory Auditors believes, also based on the foregoing information, that there are no critical issues concerning the independence of PricewaterhouseCoopers S.p.A.;
3. On 6 March 2015, the Board of Statutory Auditors presented a reasoned proposal, under art. 13 of Legislative Decree 39 dated 27 January 2010, for the statutory audit engagement for financial years 2016-2024 – as already illustrated to the Board of Directors at the meeting on 25 February 2015 –, expressing its unanimous opinion in favour of the proposal submitted by Reconta Ernst & Young S.p.A., which met the agreed selection criteria and was the one that best corresponded to the needs of the Prysmian Group.
Parent Company Financial Report | REPORT BY THE BOARD OF STATUTORY AUDITORS
2014 Annual Report Prysmian Group
348
4. The Board of Auditors is not aware of any matters or complaints of which the Shareholders' Meeting should be informed. During the course of its activities and based on the information obtained, the Board of Statutory Auditors has not observed any omissions, misconduct, irregularities or any other circumstances that would require reporting to the external Supervisory Authority or disclosure in the present report.
5. The Board of Directors has promptly provided the Board of Statutory Auditors with copies of the financial statements and the Directors' Report. Within the scope of its remit, the Board of Statutory Auditors observes that the formats used are in accordance with the law, that the ac-counting policies adopted, as described in the accompanying notes, are adequate in relation to the activities and operations carried out by the Company, that the procedure adopted for testing the impairment of goodwill and trademarks presented in the financial statements is adequate and that the financial statements correspond to the facts and information of which the Board of Statutory Auditors is aware as a result of attending meetings of the Company's governing bodies and of its own supervisory activities.
6. Given the results of specific work performed by the Independent Auditors to test accounting controls and check the reliability of the financial statements, as well as the Board of Statutory Auditors' own supervisory activities, the Board of Statutory Auditors expresses a favourable opinion concerning the approval of the financial statements for the year ended 31 December 2014.
FOR THE BOARD OF STATUTORY AUDITORS THE CHAIRMAN Pellegrino Libroia
Milan, 13 March 2015

PRYSMIAN S.P.A.Viale Sarca 222 - 20126 Milano, Italiatel. +39 02 64491www.prysmiangroup.com
CopyrightPrysmian Group
Graphic designCabiria BrandUniverse
Printed in Italy by RS Print Time2015 June
Cover printed on Garda GardaMatt Art woodfree coated, acid-free paper produced in neutral environment; inner pages printed on Fedrigoni Symbol Matt Plus Premium White paper, made with ECF pure pulp with a high content of selected recycled material.