ANNUAL REPORT - Brickability Group plc
120
ANNUAL REPORT & ACCOUNTS 2019/20
-
Upload
khangminh22 -
Category
Documents
-
view
2 -
download
0
Transcript of ANNUAL REPORT - Brickability Group plc
ANNUAL REPORT & ACCOUNTS
2019/20

Annual Report & Accounts for the year ended 31 March 2020
Telephone 0870 143 3332
Email [email protected]
Website www.brickabilitygroupplc.com
2

INTRODUCTION
Annual Report & Accounts for the year ended 31 March 2020
Strategic Report PageBrickability at a Glance 0404Chairman’s Statement 0606Chief Executive’s Review 0808Business Model 1010The Complete Solution 1212Group Strategy and Delivery 1414Key Performance Indicators 1616Risk Management 1818Principal Risks and Uncertainties 2020Section 172 (1) Statement 2222Chief Financial Officer’s Review 2424Going Concern and Outlook 2626Corporate Responsibility 2828
Corporate GovernanceBoard of Directors 3030Group Management Board 3232Corporate Governance Statement 3434Report of the Audit Committee 3636Report of the Remuneration Committee 3939Report of the Directors 4747Statement of Directors’ Responsibilities 5050Independent Auditor’s Report 5151
Financial StatementsConsolidated Statement of Profit or Loss and other Comprehensive Income 6060Consolidated Balance Sheet 6161Company Balance Sheet 6262Consolidated Statement of Changes in Equity 6363Company Statement of Changes in Equity 6464Consolidated Statement of Cash Flows 6565Notes to the Financial Statements 6666Company Information and Financial Calendar 119119
Contents
I N T R O D U C T I O N 3

Brickability at a Glance…
• Full year results are in line with market expectations at IPO.
• Seven strategic acquisitions.
• Encouraging market recovery in the light of Brexit uncertainty, the General Election during quarter 3 and record rainfall in quarter 4.
• Robust Covid 19 protocols in place.
BRICKABILITY KEY FACTS….
Three Core DivisionsBricks and Building Materials; 13 businesses operating from 24 sites
Roofing Products and Services; 4 businesses operating from 3 sites.
Heating, Plumbing and Joinery; 4 businesses operating from 3 sites.
The Group currently employs in excess of 280 skilled and experienced personnel.
£187m (£163m 2019)Revenue
£37.7m (£32.7m 2019)Gross Profit Gross Profit % 20.1% (20.1% 2019)
£19.5m (£17.7m 2019)EBITDA*
£2.3m (2019: £19.5m net debt)Net Cash***
£14.7m (2019 £13.1m)PBIT
4.03p (2019 2.80p)
4.79p (2019 4.51p)
Adjusted EPS
EPS
Revenue by Division
BRI CK
S AN
D BU
ILDING MATERIALS
HEATIN
G, PLU
MBI
NG
AN
D JO
INER
Y
ROOFING PRODUCTS
£143.9M
£
26.1M
£17.1M
BRICKS AND BUILDING MATERIAL
ROOFING PRODUCTS
HEATING, PLUMBING AND JOINERY
Revenue by Division* Adjusted EBITDA is defined as earnings before interest, tax, depreciation, amortisation, exceptional and acquisition costs.
** Adjusted EPS is calculated by dividing the profit for the year by the number of ordinary shares at IPO.
***Net cash is defined as cash less bank debt.
4

£187m (£163m 2019)
Gross Profit Gross Profit % 20.1% (20.1% 2019)
The Group distributes, and in many cases installs superior
quality and strategically important building materials from major
UK and European manufacturing partners, providing product
solutions to both private and commercial specifiers,
contractors, developers and builders.
£19.5m (£17.7m 2019)EBITDA*
£14.7m (2019 £13.1m)
4.03p (2019 2.80p)
4.79p (2019 4.51p)
5S T R A T E G I C R E P O R T

Chairman’s Statement
John RichardsChairman
I am delighted to report on our first year as a public company which saw a successful listing, seven strategic acquisitions and an adjusted EBITDA of £19.5M.
Bearing in mind the market challenges of the pre-General Election period, the unusually wet weather in late January and February and the early ramifications of the COVID-19 lockdown from mid-March, the result is one with which we are very satisfied.
6

At our IPO, we made our growth and bolt-on acquisition strategy very clear and I am pleased to note that we have been able to deliver against those ambitions.
The market for the year ending 31st March 2020 began robustly, particularly the demand for new build housing, but softened during the third quarter reflecting both political and economic uncertainty as we went through the Brexit process and approached the General Election. The market for new build housing began to improve at the start of 2020 only to slow again in the face of record levels of rainfall and turned down sharply as a result of the effects of the COVID-19 pandemic. These market challenges again show the Group’s performance in a positive light.
From mid-May 2020, construction and the new build housing market have begun to significantly improve as businesses return to work, although initial output levels were restricted as builders came to terms with the new health and safety protocols around which they now operate. Higher levels of market activity have now returned and consequently product demand, and the fundamentals for construction and in particular for new build housing remain strong as does government support for increasing the UK housing supply.
The business continues to operate with strong focus on costs. This ‘lean’ approach has enabled the Group to cut overheads quickly as the restrictions driven by ‘lockdown’ took hold. After a tough April the business returned to profitability in May and in June sales returned to 83% of June 2019. In July the performance was even stronger.
Details of the Group’s acquisitions can be found in the Chief Executive’s Review, however, all of them are already contributing to performance, have added to our management strength and have helped broaden our distribution offering. Our pipeline of acquisitions is very encouraging and provided that those businesses meet our very stringent criteria that include sustainability credentials, EBITDA multiples and limits to upfront payment, we will continue to follow that strategy as outlined at the time of the IPO. Potential acquisitions include those businesses that distribute factory assembled building components and those that are involved with Modern Methods of Construction.
Shareholder Returns & DividendsThe Group paid an interim dividend of 0.87p per ordinary share on 20th December 2019. While the Board expected to pay a final dividend of 1.74p per ordinary share for the year ended 31 March 2020, bearing in mind the ramifications of the COVID-19 pandemic and our prudent approach, we have determined that we will pay a dividend 1.085p per ordinary share. Subject to shareholder approval, the final dividend will be paid on 23rd October 2020 to shareholders on the register on 25th September 2020.
Corporate GovernanceI am pleased to report that the Group is fully compliant with the Quoted Companies Alliances’ Ten Principles of Corporate Governance. Further details of the activities of our Board and its Committees during the year can be found in this report in the Corporate Governance section.
EmployeesI would like to thank all of our employees for their remarkable commitment and performance during the challenges of our first year as a public company. Despite the political and economic demands of the third quarter and the record rainfall and ramifications of the Government’s response to the COVID-19 pandemic in the final quarter, their determination, the excellence of their customer contacts and their focus have enabled the Group’s performance to remain on schedule. My sincere thanks also for our employees’ patience, understanding and discipline during the early parts of 2020-21. Our employees are able to work within our new health and safety protocols which are now well established.
7S T R A T E G I C R E P O R T

Chief Executive’s ReviewWe delivered against our strategy of bolt-on acquisitions, with a total of seven new businesses joining the Group during the year. These businesses brought with them excellent management which has strengthened our position and this influx of talent has been added to by some recruitment of excellent management from outside the Group that has, in particular, strengthened our Finance team.
The market in the early months of the year ending 31 March 2020 was mostly stable and, in places, was encouraging particularly in the new build housing market. Quarter 3 saw challenging trading conditions as the market slowed in the face of both Brexit and the upcoming General Election. The final quarter began well and indeed a bounce in both activity and demand was apparent before the record levels of rainfall caused interruptions to construction activity and before the implications of the Government response to the COVID-19 pandemic caused a much steeper decline in demand.
Despite these challenges the Group was able to achieve revenue in the year to 31 March 2020 of £187million (2019 £163million) with Group adjusted EBITDA of £19.5million (2019 £17.7million).
Our strong balance sheet and cash conversion have enabled us to continue with our strategy of growth and acquisitions. Seven acquisitions were made during the year; LBT Facades and Brickmongers, which strengthened our brick distribution in the North West and the South Coast along with our range of cladding materials. Bespoke Brick and the Brick Slip Business brought us further strength in imported bricks, while DSH Flooring is our first venture into this area of construction materials. UPlastics has significantly strengthened our cement fibreboard offering, while McCann Roofing brings further product ranges and geographic coverage to our roofing distribution. We have also continued to grow organically with the creation of a new cladding division headed up by one of that industry’s most experienced Sales Managers.
All of our acquisitions have met our demanding investment criteria:
• Every acquisition has to complement our established routes to market.
• We aim to pay a maximum of 60% upfront for a business with the remainder deferred and contingent upon performance.
• We have defined limits of EBITDA multiples that we will pay along with expected minimum margin levels.
• We also demand that businesses bring with them high quality management whenever possible.
Alan SimpsonChief Executive Officer
I am pleased to report a first year of performance as a public company in line with expectations.
8

I am pleased to report that our acquisition pipeline continues to be in a very healthy position and I am excited about some of the potential opportunities. We expect to continue to fund our bolt-on acquisition programme from our cash generation and we will consider businesses that strengthen our current product ranges or our geographic coverage, along with those that can bring expertise in new products that serve our existing markets.
The health and safety of everyone who works within this business is a critical priority. The year to 31 March 2020 we re-evaluated all of our health and safety processes and procedures, along with our training guided by our external partner, Safety Forward. Every business within the Group now has an enhanced plan, a set of revised standards and responsibilities and an accelerated timeframe for health and safety. The return to work protocols following the COVID-19 pandemic have presented their own challenges, however, they are now in place, are robust and included a comprehensive briefing for each person on their return to work, along with a risk assessment to be completed for every employee who has a need to visit a third party site or premises. The same robust protocols and risk assessments apply to visitors to any of our premises. Health and safety is reviewed at each scheduled Board meeting and indeed Group Management Board meeting.We have continued to develop and strengthen our relationships with our key suppliers, both in the UK and abroad, and have prepared accordingly to ensure that our final relationship with the EU will not affect our ability to obtain and distribute product to our customers, whatever form that relationship might take. The same focus applies with our customers, and, with each acquisition, we either gain new customers or are able to offer newly acquired businesses access to the strength of our existing customer base.
In terms of outlook, while the market for building materials was at very low levels in April, we have seen a continued increase in demand since, albeit employing new and very different safety and social distancing measures. All of our sites are open and we have applied stringent control of costs during the ‘lock down’ period and continue to do so. While the outlook for the remainder of this financial year continues to be uncertain, the underlying fundamentals for construction and in particular new build homes remain robust. Looking to the long-term, we believe the outlook for our market remains positive, supporting our confidence in the prospects for the Group.
The health and safety of everyone who works within this business is a critical priority.
9S T R A T E G I C R E P O R T

Business Model
ROUTES TO MARKET• Established regional sales network
The Group has 30 locations throughout the UK servicing local customers.
• Established Regional brands The Group over a number of years has acquired regional companies and have maintained the local branding while adding the advantage of being part of a large Group with stronger buying power.
• National contracts with local delivery The Group has central agreements with larger customers which are delivered by the regional offices.
OUR STRENGTHS• Regional sales network
• Specialist knowledge
• Access to a broad range of quality products from UK and Europe
• Strong balance sheet
• Scale / buying power
• Established track record
• Strong and long standing customer relationships
We have unrivalled customer relationships and understanding of their needs
• Highly experienced management team
• Long term supplier relationships
HOW WE CREATE VALUE FOR OUR STAKEHOLDERS?• For shareholders
Share price growth with a focus on acquisitions. A progressive dividend policy that balances growth and income.
• For customers Working closely with customers and suppliers we source products that meet customer requirements, are priced competitively, and delivered on time.
• For employees and local communities The Group has over 280 employees across the UK. We provide employment in our local regional communities and opportunities for long term career development. The Group also aims to raise money for local causes.
• Supplier satisfaction We pay our supply chain on time and they are confident about investing in their relationship with the group.
Brickability
Satisfied customer base
Our vision is to be the leading specialist supplier of products to house builders and developers.
Summary of how the group works (most
include a flow chart type diagram).
Trained Staff
Complementary products &
services
Geographic coverage
Supplier relationships
UNR
IVAL
LED PRODUCTS
EXCEPTIONAL CUSTOMER SERVICE
VALUE & SUPPORT
SUPERIOR QUALITY
10

Builders MerchantSpecialist
Builders MerchantSpecialist
Our Brands
ROOFING PRODUCTS AND SERVICES
HEATING, PLUMBING & JOINERY
BRICKS AND BUILDING MATERIALS
11S T R A T E G I C R E P O R T

ROOFING
Crest RoofingCrown RoofingExcel RoofingMcCann Roofing Products
The Complete Solution
Together we are stronger and will take advantage of our individual specialisms to provide a supply hub of extraordinary efficiency and service.
The Group has been formed to pool the combined success of individual businesses into one cohesive structure that will maximise revenue and growth.
Frazer Simpson
EXTERNAL DOORS
Frazer Simpson
WINDOWS
UPlastics
CLADDING
12

Towelrads Radiators Online
DSH Flooring
Brickability Apex Brick CuttersMatching BrickThe Bespoke Brick CompanyBricklinkBrick Mongers Wessex
Brick ServicesCPG Building SuppliesCrest BrickLBT Brick & FacadesPlansureAlfiam Building Supplies
FSN Doors
INTERNAL DOORS
Towelrads
UNDERFLOOR HEATING
FLOORING SERVICES
BRICK SUPPLY & SERVICES
TOWEL RAILS & RADIATORS
FASCIAS, SOFFITS & GUTTERING
UPlastics
13STRATEGIC REPORT
ROOFING
Crest RoofingCrown RoofingExcel RoofingMcCann Roofing Products
The Complete Solution
Together we are stronger and will take advantage of our individual specialisms to provide a supply hub of extraordinary efficiency and service.
The Group has been formed to pool the combined success of individual businesses into one cohesive structure that will maximise revenue and growth.
Frazer Simpson
EXTERNAL DOORS
Frazer Simpson
WINDOWS
UPlastics
CLADDING
12
Towelrads Radiators Online
DSH Flooring
Brickability Apex Brick CuttersMatching BrickThe Bespoke Brick CompanyBricklinkBrick Mongers Wessex
Brick ServicesCPG Building SuppliesCrest BrickLBT Brick & FacadesPlansureAlfiam Building Supplies
FSN Doors
INTERNAL DOORS
Towelrads
UNDERFLOOR HEATING
FLOORING SERVICES
BRICK SUPPLY & SERVICES
TOWEL RAILS & RADIATORS
FASCIAS, SOFFITS & GUTTERING
UPlastics
13STRATEGIC REPORT
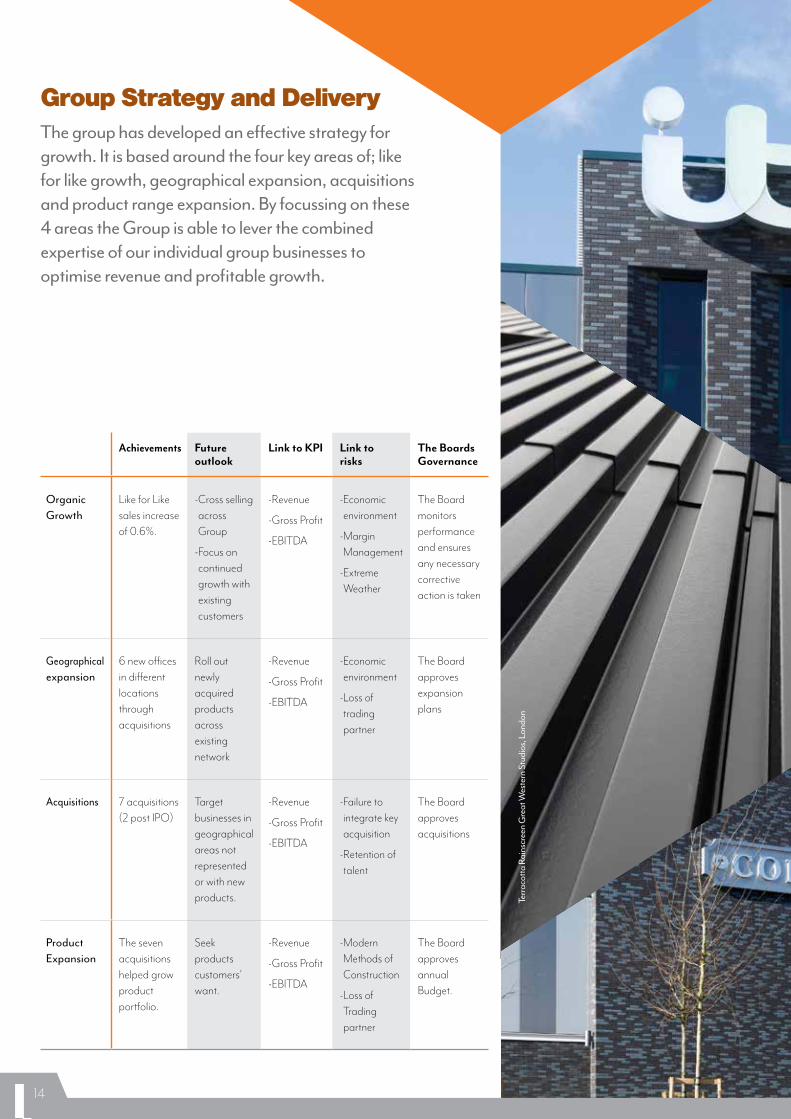
The group has developed an effective strategy for growth. It is based around the four key areas of; like for like growth, geographical expansion, acquisitions and product range expansion. By focussing on these 4 areas the Group is able to lever the combined expertise of our individual group businesses to optimise revenue and profitable growth.
Group Strategy and Delivery
Achievements Future outlook
Link to KPI Link to risks
The Boards Governance
Organic Growth
Like for Like sales increase of 0.6%.
- Cross selling across Group
- Focus on continued growth with existing customers
-Revenue
-Gross Profit
-EBITDA
- Economic environment
- Margin Management
- Extreme Weather
The Board monitors performance and ensures any necessary corrective action is taken
Geographical expansion
6 new offices in different locations through acquisitions
Roll out newly acquired products across existing network
-Revenue
-Gross Profit
-EBITDA
- Economic environment
- Loss of trading partner
The Board approves expansion plans
Acquisitions 7 acquisitions (2 post IPO)
Target businesses in geographical areas not represented or with new products.
-Revenue
-Gross Profit
-EBITDA
- Failure to integrate key acquisition
- Retention of talent
The Board approves acquisitions
Product Expansion
The seven acquisitions helped grow product portfolio.
Seek products customers’ want.
-Revenue
-Gross Profit
-EBITDA
- Modern Methods of Construction
- Loss of Trading partner
The Board approves annual Budget.
Terra
cotta
Rai
nscr
een
Gre
at W
este
rn S
tudi
os, L
ondo
n
14

Case Study - LBT Brick & FacadesThe acquisition of LBT Brick and Facades is an excellent example of the Brickability Group’s ‘bolt-on’ growth strategy in action. The business, established for almost 30 years has developed a strong position with specifiers and housing associations in the major North West conurbations as well as supplying a number of prestigious projects in London area.
LBT Brick and Facades brings to the Group an experienced management team with a demonstrable track record in both product design and business development. They also bring extra sources of products supply from leading European manufacturers as well as supporting many of our partners in our existing supplier network. These include; terracotta, premium bricks, stone, precast and prefabricated building components and brick cladding systems. LBT Brick and Facades have developed many close relationships with specifiers in the North West and have been involved in many major commercial and Housing Association projects. They take a ‘concept to reality’ approach where they help develop the facade design with the specifier, source the facade products and then working with the specialist subcontractors to ensure that the final building meets the client expectation. There are many examples whereby working together with other Brickability businesses, their expertise in alternative facade materials has enabled our customers to benefit from additional product solutions.
LBT Brick and Facades represents a valuable addition to the Group and working within the the Brickability framework will continue to develop and contribute to the success of the Group as a whole.
S T R A T E G I C R E P O R T
Besp
oke B
rick B
lend
Cor
onat
ion
Stre
et S
tudi
os, M
anch
este
r
Terracotta Rainscreen Bickerdike Court, Manchester
Besp
oke B
rick B
lend
Cor
onat
ion
Stre
et S
tudi
os, M
anch
este
r
15S T R A T E G I C R E P O R T

£187m 2018
£163m
£187m
18/19
19/20
Revenue growth is a key driver of profit growth
REVENUE
£20.9m £23.6m
£20.9m
18/19
19/20
CASH GENERATED FROM OPERATIONS
Earning before Interest, Tax, Depreciation and Amortisation and exceptional income and costs.
£19.5m £17.7m
£19.5m
18/19
19/20
ADJUSTED EBITDA
2018
£2.3m Net cash
£19.5m Net debt18/19
19/20£2.3mThe net cash position after deducting the cash held from the amount of bank debt.
NET CASH
Gross Profit percentage acts as a cross check against Revenue growth to ensure new sales maintain margin.
£37.7m 2018
2019
£32.7m (20.1%)
£37.7m (20.1%)
18/19
19/20
GROSS PROFIT
Key Performance Indicators
16
The following charts/tables illustrate a number of the key performance indicators that the Group reviews on a regular basis and by which overall business performance is measured.
17S T R A T E G I C R E P O R T

The following charts/tables illustrate a number of the key performance indicators that the Group reviews on a regular basis and by which overall business performance is measured.
17S T R A T E G I C R E P O R T
The following charts/tables illustrate a number of the key performance indicators that the Group reviews on a regular basis and by which overall business performance is measured.
17S T R A T E G I C R E P O R T

Risk management
MANAGING RISK IN ORDER TO DELIVER OUR STRATEGYThe Group is exposed to a number of risks in the markets it serves. The Board considers the risks to the business and the adequacy of internal controls with regard to the risks identified at every scheduled Board meeting. It formally reviews and updates the risk register to the business at least annually.
02030405
IDENTIFY RISKThe Board has overall responsibility for monitoring the Group’s systems of internal control, for identification of risks and for taking appropriate action to prevent, mitigate or manage those risks. The Board will continually assess and review the business and operating environment to identify any new risks to be managed.
ASSESS RISKA detailed schedule of risks is considered at each scheduled Board meeting under the following categories: Competitors, Economic environment, Financial Risk, People and Suppliers. These risks are graded against a criteria of likelihood and potential impact in order to identify the key risks impacting the Group (see page 19).
MITIGATE RISKThe Board seeks to ensure that the Group’s activities do not expose it to significant risk. The Group’s aim is to diversify sufficiently to ensure it is not exposed to risk of concentration in product, market or channel.
UPDATE RISK REGISTERThe risk register is updated at each scheduled Board meeting and in-between as necessary.
REVIEW AND EVALUATE RISKSThe Board and Group Management Board are all responsible for reviewing and evaluating risk. The Group Management Board meet at least monthly to review ongoing trading performance, discuss budgets and forecasts and consider new risks associated with ongoing trading. Feedback from these meetings regarding changes to existing risks or the emergence of new risks is then provided to the Board.
01RISK MANAGEMENT STRUCTURE
18

RISK HEAT MAPThe risk heat map summarises the potential impact of a range of risks and uncertainties identified by the management team. They are logged on the ‘Risk Matrix’ and reported on and reviewed regularly.
Competitors This includes: • Margin Management • Change in employment
status for group subcontractors
Economic environment This includes: • COVID 19 impact • Brexit • Extreme weather events
Financial risk This includes: • Margin management • Change in employment status
of group subcontractors• Failure to integrate key
acquisitions
People This includes: • Retention of talent• Failure to integrate
key acquisitions
Suppliers This includes: • Loss of key trading partner • Modern methods of
construction
LIKELIHOOD
SEVERE
MINOR
LOW HIGH
IMPA
CT
01Identify
risk
02Assess
risk
05Review and
evaluate risks
Board of Directors
03Mitigate
risk
04Update
risk register
Remuneration Committee
Audit Committee
Nomination Committee
Group Management Board and Subsidiary company boards
Divisional and functional teams
E
P C
F
SE
C
P
S
F
19S T R A T E G I C R E P O R T

Principal risks and uncertaintiesThe Board has overall responsibility for monitoring internal and external risks to which the Group and its businesses may be subject. The Group has established internal controls and systems to identify and assess such risks. The Board reviews such risks and our ability to effectively monitor them at each scheduled Board meeting. Where appropriate specific up-dates and reports are circulated to Board members in between such meetings.
A report, the ‘risk matrix’ is maintained on a rolling basis by our chief financial officer and the subject of regular review by the Group’s Management Board team with each senior manager responsible for underlying operating Group companies reporting into the operating board’s review. The Group’s Management Board meets monthly, is attended by each executive director and is chaired by John Richards, chairman of the Board. As part of these meetings the Management Board meet to review on-going trading, budgets and forecast and consider new and on-going risks and uncertainties to the Group’s operating businesses. Where appropriate additional, separate analyses or follow-up is undertaken of particular risks and issues identified.
In recent months the COVID-19 pandemic has given rise to significant additional risks and uncertainties. These have been the subject of specific contingency planning and risk mitigation. As our customers and suppliers businesses have resumed trading so have we and indeed we have continued where possible to support key clients throughout the pandemic. Our priority throughout this period has been the health and wellbeing of all of our stakeholders, including colleagues, clients, our contractors and the communities within which we work as well as the commercial and financial health of our businesses and the preservation of shareholder value. Board meetings have increased in frequency as we continue to monitor the current situation, its risks and uncertainties and the rapidly changing environment in which we are doing business.
20
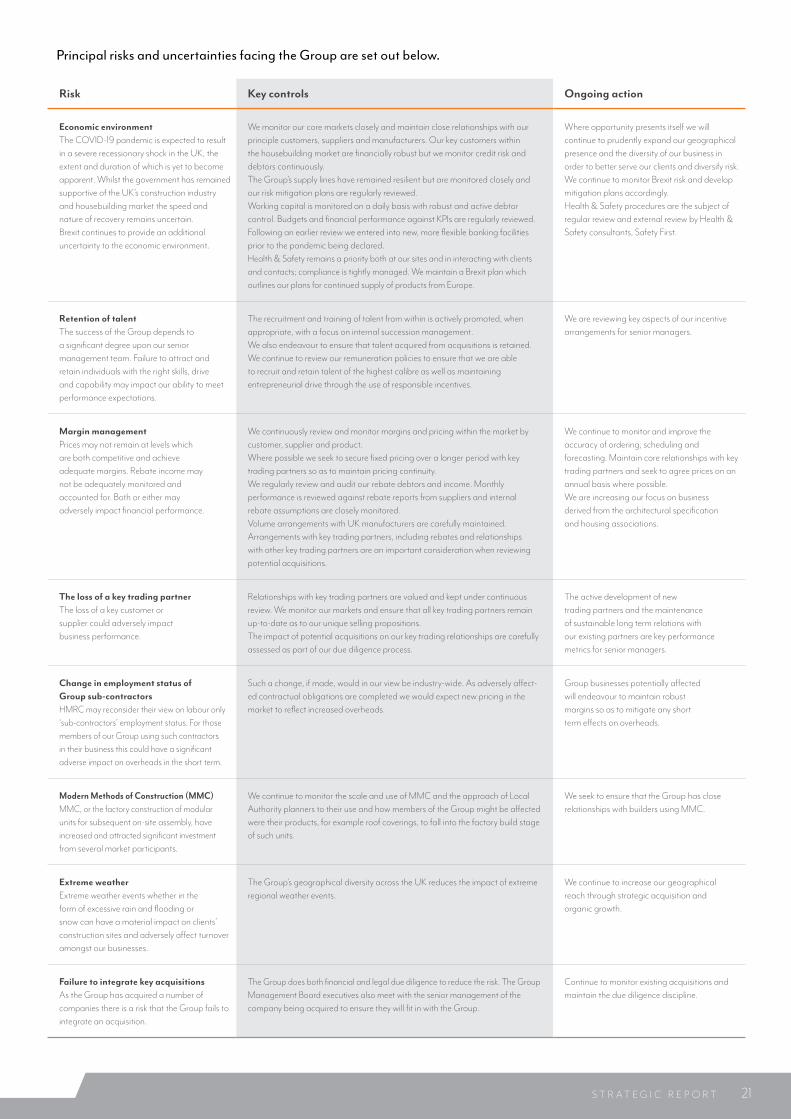
Risk Key controls Ongoing action
Economic environmentThe COVID-19 pandemic is expected to result in a severe recessionary shock in the UK, the extent and duration of which is yet to become apparent. Whilst the government has remained supportive of the UK’s construction industry and housebuilding market the speed and nature of recovery remains uncertain. Brexit continues to provide an additional uncertainty to the economic environment.
We monitor our core markets closely and maintain close relationships with our principle customers, suppliers and manufacturers. Our key customers within the housebuilding market are financially robust but we monitor credit risk and debtors continuously.The Group’s supply lines have remained resilient but are monitored closely and our risk mitigation plans are regularly reviewed.Working capital is monitored on a daily basis with robust and active debtor control. Budgets and financial performance against KPIs are regularly reviewed. Following an earlier review we entered into new, more flexible banking facilities prior to the pandemic being declared.Health & Safety remains a priority both at our sites and in interacting with clients and contacts; compliance is tightly managed. We maintain a Brexit plan which outlines our plans for continued supply of products from Europe.
Where opportunity presents itself we will continue to prudently expand our geographical presence and the diversity of our business in order to better serve our clients and diversify risk.We continue to monitor Brexit risk and develop mitigation plans accordingly.Health & Safety procedures are the subject of regular review and external review by Health & Safety consultants, Safety First.
Retention of talentThe success of the Group depends to a significant degree upon our senior management team. Failure to attract and retain individuals with the right skills, drive and capability may impact our ability to meet performance expectations.
The recruitment and training of talent from within is actively promoted, when appropriate, with a focus on internal succession management.We also endeavour to ensure that talent acquired from acquisitions is retained. We continue to review our remuneration policies to ensure that we are able to recruit and retain talent of the highest calibre as well as maintaining entrepreneurial drive through the use of responsible incentives.
We are reviewing key aspects of our incentive arrangements for senior managers.
Margin managementPrices may not remain at levels which are both competitive and achieve adequate margins. Rebate income may not be adequately monitored and accounted for. Both or either may adversely impact financial performance.
We continuously review and monitor margins and pricing within the market by customer, supplier and product.Where possible we seek to secure fixed pricing over a longer period with key trading partners so as to maintain pricing continuity.We regularly review and audit our rebate debtors and income. Monthly performance is reviewed against rebate reports from suppliers and internal rebate assumptions are closely monitored.Volume arrangements with UK manufacturers are carefully maintained.Arrangements with key trading partners, including rebates and relationships with other key trading partners are an important consideration when reviewing potential acquisitions.
We continue to monitor and improve the accuracy of ordering, scheduling and forecasting. Maintain core relationships with key trading partners and seek to agree prices on an annual basis where possible.We are increasing our focus on business derived from the architectural specification and housing associations.
The loss of a key trading partnerThe loss of a key customer or supplier could adversely impact business performance.
Relationships with key trading partners are valued and kept under continuous review. We monitor our markets and ensure that all key trading partners remain up-to-date as to our unique selling propositions.The impact of potential acquisitions on our key trading relationships are carefully assessed as part of our due diligence process.
The active development of new trading partners and the maintenance of sustainable long term relations with our existing partners are key performance metrics for senior managers.
Change in employment status of Group sub-contractorsHMRC may reconsider their view on labour only ‘sub-contractors’ employment status. For those members of our Group using such contractors in their business this could have a significant adverse impact on overheads in the short term.
Such a change, if made, would in our view be industry-wide. As adversely affect-ed contractual obligations are completed we would expect new pricing in the market to reflect increased overheads.
Group businesses potentially affected will endeavour to maintain robust margins so as to mitigate any short term effects on overheads.
Modern Methods of Construction (MMC)MMC, or the factory construction of modular units for subsequent on-site assembly, have increased and attracted significant investment from several market participants.
We continue to monitor the scale and use of MMC and the approach of Local Authority planners to their use and how members of the Group might be affected were their products, for example roof coverings, to fall into the factory build stage of such units.
We seek to ensure that the Group has close relationships with builders using MMC.
Extreme weatherExtreme weather events whether in the form of excessive rain and flooding or snow can have a material impact on clients’ construction sites and adversely affect turnover amongst our businesses.
The Group’s geographical diversity across the UK reduces the impact of extreme regional weather events.
We continue to increase our geographical reach through strategic acquisition and organic growth.
Failure to integrate key acquisitionsAs the Group has acquired a number of companies there is a risk that the Group fails to integrate an acquisition.
The Group does both financial and legal due diligence to reduce the risk. The Group Management Board executives also meet with the senior management of the company being acquired to ensure they will fit in with the Group.
Continue to monitor existing acquisitions and maintain the due diligence discipline.
Principal risks and uncertainties facing the Group are set out below.
21S T R A T E G I C R E P O R T

In compliance with the Companies Act 2006, the Board of Directors are required to act in accordance with a set of general duties. During the year to 31 March 2020, the Board of Directors consider that they have, individually and collectively, acted in a way they consider, in good faith, would be most likely to promote the success of the Company for the benefit of its shareholders as a whole, having regard to a number of broader matters including the likely consequence of decisions for the long term and the Company’s wider relationships. In doing so, the Board has had regard to the matters contained in section 172(1) (a)-(f) of the Companies Act 2006.
Our directors have regard, amongst other matters, to the:
• likely consequences of any decisions in the long-term;
• interests of the company’s employees;
• need to foster the company’s business relationships with suppliers, customers and others;
• impact of the company’s operations on the community and environment;
• desirability of the company maintaining a reputation for high standards of business conduct; and
• need to act fairly between members of the company.
This statement focuses on matters material to shareholders. The Group’s key resources and relationships are detailed in the Business Model on pages 10 and 11. The Board recognises the importance of building and maintaining relationships with its key stakeholders, and considering the external impact of the Group’s operations, in order to achieve long term success. The Board’s understanding of the interests of the Group’s stakeholders is informed by the Board’s programme of stakeholder engagement.
Matters that have impacted key decisions and strategies during the year ended 31 March 2020 are set out below.
Floatation Floatation was key event this year and a key strategic step for the business to enable the continued growth of the business. The Board believes that the floatation was the best option for all stakeholders in the Group by de-gearing the Group and widening the shareholder base.
Link to strategy: Organic Growth and Acquisitions
Acquisitions During the year, the Group acquired seven companies. The acquisitions provided the Group with additional scale, geographical diversity and additional product ranges. The acquisitions provided enhanced sales opportunities and revenue generation, providing returns to shareholders in the longer term and enhanced employment opportunities as part of a wider Group. Prior to the acquisitions the Board considered the
effects it would have on the Group’s gearing and creditors but reached the conclusion that creditors’ interests would not be impacted significantly and any impact would be offset by the positive effects of the acquisition on the Group.
Link to strategy: Acquisitions, Geographical expansion and Product Expansion.
Retention of staff Promoting the success of our business for the benefit of our shareholders, whether large institutions or small retail investors, is fundamental and has to be aligned with employees. The Board believes that the issue of CSOP shares to all staff that had been with the Group over 2 years ensures alignment of interest between the shareholders and employees.
Link to strategy: Organic Growth
Section 172(1) statement
22
The directors also take into account the views and interests of a wider set of stakeholders when making decisions. During the year the Board received information to enable them to consider the impact of the company’s decisions on its key stakeholders. This information was distributed in a range of different formats, including through reports and presentations on our financial and operational performance, non-financial KPIs and risk. We acknowledge that every decision we make will not necessarily result in a positive outcome for all of our stakeholders and the Board frequently has to make difficult decisions based on competing priorities. By considering the company’s purpose and values, together with its strategic priorities and having a process in place for decision-making, we do, however, aim to balance those different perspectives.
The Group has identified six main stakeholder groups which are relevant to the proper discharge of the duty of the Directors of relevant group companies under section 172(1) to promote the success of their company.
These are: • the Group’s customers
• industry regulators and other public bodies involved in the UK Housing industry
• the Group’s suppliers
• the Group’s external lenders
• the Group’s employees
• the Group’s shareholders. Details of these groups, and the main methods that the Directors have used to engage with those stakeholders during the course of the year, is set out in the Company’s corporate governance statement set out on pages 34 to 35 of the Annual report and Financial Statements of the Company for the year ended 31 March 2020.
As the parent company of the Group, the Board of the Company is responsible for setting the Group’s overall strategy and maintaining oversight of its activities. The Board therefore believes that having regard to each of these stakeholder groups is relevant to the proper discharge of the duties of the Directors of the Company under section 172(1).
Impact on the environment and the community in addition to understanding and having regard to the interests of these stakeholder groups, the Group is committed to reducing the environmental impact of its operations and to making a positive impact in the community. Further information on the steps taken to reduce the environmental impact of the Group’s operations, and its charitable activities, are set out on in the corporate governance statement set out on pages 34 to 35 of the Annual report and Financial Statements of the Company for the year ended 31 March 2020.
23S T R A T E G I C R E P O R T

2020 was a solid performance, given the political events at the end of 2019 and the poor weather in the first two months of 2020. Overall business performance is shown in our key performance indicators on page 16.
REVENUERevenue totalled £187.1 million for the year ended 31 March 2020. This represented an increase of 14.6% over the previous year (2019: £163.3 million).
Division 2019 2020 %Increase
Bricks & Building Materials 123.4 144.0 16.6%
HPJ 23.3 26.1 11.7%
Roofing 16.5 17.1 3.6%
Total 163.3 187.1 14.6%
Sales performance was very different in the two halves of the year as shown in the table below on a like for like basis.
Brick Roofing HPJ Total
H1 4.7% 14.3% -1.5% 4.8%
H2 -4.3% -5.0% 0.4% -3.7%
Full year 0.2% 5.0% -0.5% 0.6%
GROSS PROFITGross profit for the year increased to £37.7m from £32.9m with a consistent gross margin of 20.1% over both years.
ADJUSTED EBITDAAdjusted EBITDA increased by 10.1% to £19.5m for the year ended 31 March 2020. Detailed segmental analysis is per note 6 of the Financial Statements. Heating, Plumbing & Joinery Adjusted EBITDA increased from £4.9m to £6.2m through the strong performance of Towelrads, the improved performance of Frazer Simpson and FSN Doors and the addition of DSH Flooring. Roofing adjusted EBITDA decreased by £0.1m from £3.8m to £3.7m on the back of the poor turnover in the second half of the
year. Bricks & Building Material adjusted EBITDA increased from £10.8m to £11.5m.
PROFIT BEFORE TAXProfit before taxation was £12.2million, an increase of £3.6 million on 2019 (£8.6m) of which £2.0m was due to the reduced finance expenses.
EPS Earnings per share increased from 4.51p to 4.79p per share. The Adjusted EPS based on the numbers of shares at 31 March 2020 was up 43.9% to 4.03p (2019 2.80p).
Chief Financial Officer’s Review
£187m £37.7m £12.2m£19.5mRevenue growth of 14.6% to £187 million, with like-for-like growth of 0.6%.
Gross Profit increased by 15.2% to £37.7m
Adjusted EBITDA increased by 10.1% to £19.5m
Profit before tax increased by 41.7% over 2019
24

w
DIVIDENDSThe Board proposed a final dividend of 1.085p per share giving a total dividend for the year of 1.9528p. This final dividend is expected to be paid on 23 October 2020 to shareholders on the register on 25 September 2020 with an ex-dividend date of 24 September 2020. Our dividend is 2.1x times Profit after tax and 4.3x Adjusted EBITDA. The Board considers this to be a prudent level of cover. The Group remains committed to a progressive dividend policy.
TAXATIONThe charge for taxation was £2.9 million (2019: £2.1 million), an effective rate of taxation (Tax expense divided by Profit before tax) of 23.7% (2019: 24.9%).
CASH FLOW AND NET DEBTOperating cash flows before movements in working capital increased to £21.0m up from £17.3m in 2019. Cash generated from operations decreased to £20.9m from £23.6m due to the reversal of creditor movement at the year ended 31 March 2019 and the additional working capital balances from acquisitions made during the year.
At 31 March 2020, net cash was £2.3 million representing a £21.8 million improvement on 31 March 2019 (net debt of £19.5 million). This was after new equity subscription capital investment of £43.9 million, acquisition of new businesses of £11.4m, dividend payments of £2 million and tax of £4.7 million. We continue to expect that the Brickability Group will remain a business that is cash generative.
BANK FACILITIESThe Group has agreed new debt facilities with HSBC, totalling £30 million and a standby government backed loan of £5m. This consists of a £25 million revolving credit facility repayable in full in March 2023 (with the option of two one year extensions), a £5 million overdraft facility until March 2023, and a £5m standby government backed loan. The Board do not plan to use the standby government loan however it is credit approved.
INTEREST AND FINANCING COSTS Finance costs reduced substantially following the listing as the investor loan notes were repaid as part of the process. The Company refinanced to HSBC on the 3 March 2020 which has lower margin than the previous facility.
25S T R A T E G I C R E P O R T

The business activities of the Group, its current operations and factors likely to affect its future development, performance and position are set out in the Chief Executive’s Statement on page 8 and in the Financial Review on page 24. In addition, note 32 of the Financial Statements includes an analysis of the Group’s financial risk management objectives, details of its financial instruments and hedging activities and its exposures to credit and liquidity risk.
The Group has a formalised process of monthly budgeting, reporting and review, and information is provided to the Board of Directors in order to allow sufficient review to be performed to enable the Board to ensure the adequacy of resources available for the Group to achieve its business objectives and in particular the impact of the Covid 19.
Budget scenarios have been prepared comparing a number of scenarios however the Board focussed on two cases: a) an operating budget case (assuming c40% drop in turnover but varying specifically to each company in the Group); and b) a low case assuming a second COVID 19 wave (where for the 2 months of lock down sales dropped a further 50%). There models where assessed and used to evaluate how the virus could impact the Group in the period to 31 March 2022. In determining these the Group considered macro-economic and industry wide projections as well as matters specific to the Group. In
both scenarios, the Group has sufficient liquidity and would expect to remain in compliance with the exiting bank covenants.
In addition, the Group prepared various periods of shut down to evaluate at which the bank covenants would be breached, before any further mitigating actions were taken. The models indicated that it would take a 6 month complete shut down before the Group breached its bank covenant. In such an extreme circumstance, the Group would reasonably expect to renegotiate the terms of the bank facility and amend the bank’s covenant terms.
Going Concern and Outlook
At the year end the Group had net cash of £2.3million and unutilised bank facilities with available funding of £10 million. Cash generated from operations was strong during the year at 20.9 million (2019: £23.6 million).
26

At the year end the Group had net cash of £2.3 million and had unutilised bank facilities with available funding of £10 million. Cash generated from Operations was strong during the year at £20.9 million (2019: £23.6 million).
The Group sells throughout the UK and has a spread of customers, with credit insurance covering the main brick business. The Group sources a range of products from third-party suppliers both in UK and Europe.
After making enquiries and reviewing the various scenarios, budgets and forecasts for the Group, the Directors have a reasonable expectation that the Company and the Group have adequate resources to continue in operational existence for the foreseeable future. Accordingly, they continue to adopt the going concern basis in preparing the Annual Report and Accounts.
OUTLOOKWhile we still face economic and political uncertainties including Brexit and COVID-19, we have great confidence in our performance during 2020-21 and current trading along with the strength of our order books reinforces this confidence. While it is still too early to give accurate guidance bearing in mind these uncertainties, we will update the market as soon as it is possible.
Our strategy remains unchanged. We are focused on driving profitable sales growth through organic development and acquisition. We remain confident in our ability to deliver shareholder value in the short, medium and long term.
Approved by the Board of Directors and signed on behalf of the Board.
27S T R A T E G I C R E P O R T

CORPORATE AND SOCIAL RESPONSIBILITYWe are committed to fairness, integrity and doing the right thing. We believe in treating our people well and giving back to the communities where our people work.
SAFETY AND WELL-BEINGThe safety and well-being of colleagues is the Group’s first priority. The Group promotes a positive health and safety culture throughout the business to ensure that all our people consider health, safety and welfare issues while at work. A workforce that is safe and physically and mentally healthy is key to the success of the Group.
All new employees receive in-house health and safety training with further training undertaken as the employee role or need requires. All our processes and procedures are reviewed regularly by an external agency.
DIVERSITY AND GENDER Building a diverse workforce and maintaining an inclusive workplace is vitally important to the Group. A diverse workforce and an inclusive workplace ensures everyone feels welcome and valued. As a Group we strive to eliminate any gender bias in our pay and employment policies and practices. We have a robust recruitment policy that the Group will recruit, train and reward based on merit and provide opportunities for our employees to fulfill their ambitions regardless of gender. The Group reached the threshold on 5th April 2020 to report gender pay gap and will therefore publish their gender pay report by 5th April 2021.
OUR PEOPLE Growing our business generates opportunities for our employees and creates value for our shareholders and stakeholders. Our focus is to create a high performance entrepreneurial culture through effective employee engagement, people development plans and effective resource management.
Our people are our key asset. The Group’s performance and its success within our marketplace are directly related to the effectiveness of our people, who deliver the high quality products and provide exceptional services. The Group aims to attract, retain and motivate the highest calibre of employees.
TRAINING & DEVELOPMENT Developing talent and supporting diversity across our Group helps to ensure that we have the best teams motivated to deliver our goals. In an industry that is keen to attract young talent, development programmes allow the Group to retain and nurture new staff.
The Group has need focused on recruiting younger staff to ensure the skills are transferred but also to help with succession planning. A number of the acquisitions recently make have had young management teams who we hope will develop over time to provide the talent the Group needs as growth continues.
REWARD AND RECOGNITIONKey to the retention of our employees is recognizing and rewarding their hard work. Our reward strategy aims to align the interests of the employee and the company. As a sales organisation the sales persons rewards are based on bonus/commission based on sales achieved.
As part of the IPO staff that had been with the Group for more than 2 years received options over shares to ensure staff interests are aligned with the Group.
EMPLOYEE ENGAGEMENTWe recognise highly competent and engaged staff is key for customers. Our customers are central to our success and the day to day relationships staff have with customers is key. Many of these relationships have been built over many years so it is important that we maintain a high employee retention rate.
A variety of methods are used to engage with employees, including office and team meetings and an annual in house Conference. We will use one or more of these channels to brief employees about our business performance and financial and economic factors affecting us.
COMMUNITY AND SOCIAL The communities where our offices and premises are based are important to us and we try and encourage our employees to make a difference within our local communities by being involved in local charities.
Most of our financial contributions to charities come from the efforts and personal involvement of our employees. During the year ended 31 March 2020 the company made £14,283 donations to charities.
ETHICS AND RELATIONSHIPSOur vision to be a leading specialist supplier in the house building sector will only be maintained through a culture of honesty, integrity and openness and by respecting human rights and the interests of our employees, customers and third parties.
Corporate Responsibility
28

RELATIONS WITH EMPLOYEESThe Group has policies for dealing with gifts, hospitality, bribery, corruption, modern slavery, whistle-blowing and inside information.
RELATIONS WITH CUSTOMERSThe Group is committed to putting its customers at the heart of everything it does by providing high quality products and service. All employees are expected to behave respectfully and honestly in all their dealings with customers and the general public.
RELATIONS WITH SUPPLIERSThe Group expects its suppliers to adhere to business principles consistent with the Group’s own. Suppliers are expected to adopt and implement acceptable health and safety, environmental, product quality, labour, human rights, social and legal standards. Conformance to these standards is assessed by on site supplier visits on a regular basis.
RELATIONS WITH THIRD PARTIESThe Group does not make political donations and charitable donations are made only where legal and ethical according to local laws and practices.
ENVIRONMENTALThe Group is dedicated to being environmentally responsible through our commitment to eliminate waste and wasteful practices. We strive for operational excellence whilst reducing environmental impact.
Policies are designed and implemented to reduce damage that might be caused by the Group’s activities. Initiatives to reduce the Group’s impact on the environment include the recycling of waste, reducing carbon emissions and utilisation of recyclable packaging materials.
Strategic Report on pages 4 to 29 was reviewed and approved by the Board on 15 September 2020.
Alan J. Simpson Chief Executive Officer
Brick-ability Limited being the largest subsidiary has reported on all the emissions’ sources required under the Companies Act 2006 (Strategic Report and Directors Reports) Regulation 2013. Other parts of the group are outside the reporting requirement. Scope 1 and 2 emissions are calculated using the UK Government Conversion Factors for Company Reporting 2019 on an operational control basis. 86% of Scope 1 and 2 data is from measured sources with the remainder extrapolated from either expenditure on fuel or distance travelled. The increase in Scope 2 in 2020 relates to the increased use of electricity for the new Alfiam warehouse.
Carbon Dioxide Equivalent (CO2e) Tonnes 2020 2019
Scope 1 25.8 27.2
Scope 2 29.6 21.5
Intensity Tonnes of CO2e from scope 1 and 2 sources per £m of turnover 0.79 0.69
29S T R A T E G I C R E P O R T

Board of Directors
John Richards joined the building materials industry after serving a graduate traineeship with the Delta Engineering Group. He served at Ibstock Brick for 31 years as Sales and Marketing Director, Director and General Manager and as Managing Director of several of the group’s subsidiaries.He now also serves as Chairman of ADF, a leading supplier of trailers and logistics to the TV and film industry, Chairman of JR and M Investments, a supplier of finance to contractors and is a Director of Birmingham Moseley Rugby Club. John joined the Board of Brickability in March 2018 as Chairman.
Alan Simpson joined Building Materials Distribution with Taylor Maxwell in 1983 and five years later moved to Brick-ability. He became Sales Director and a shareholder, graduating to the position of Managing Director. He founded Towelrads, Frazer Simpson and FSN Doors, all of which are now part of the Group.Alan became a Director in 1996 before stepping up to Chief Executive Officer of the Group following the successful management buyout of Peter Milton, the founder of the Brickability business, in September 2016.
Stuart Overend is a Chartered Accountant (KPMG) and qualified Corporate Treasurer with a mix of industrial and investment experience. His previous experience includes a high growth pan European Pharmaceutical business and running and operating a private equity fund.Stuart joined the Board of Brickability in May 2018 as Chief Financial Officer.
JOHN RICHARDS Chairman
ALAN SIMPSONChief Executive Officer
STUART OVEREND Chief Financial Officer
Our board of directors has exceptional experience within the supply and manufacture of building materials for the construction industry. Within the Group businesses there is a large pool of talented people who bring dynamism and growth to our operations.
30

Clive Norman has over 30 years’ experience in the radiator import and service business throughout both Europe and the UK. As the Vice-President of Delonghi Heating and CEO of Ferroli, a commercial producer of boilers, radiators, towelrails and air conditioning, he oversaw sales growth to substantial numbers.Clive joined the Board of Brickability in March 2018 as Non-Executive Director.
David Simpson, an Accountant by profession, has significant experience in the housebuilding sector, having worked with luxury home developer, Millgate for over 17 years, including as Managing Director for nine years. He was appointed to the Executive Committee Board of Countryside Properties plc from 2014 to 2018, following its merger with Millgate.David joined the Board of Brickability in July 2019 as a Non-Executive Director.
Giles Beale, a Solicitor by profession, has over 30 years’ experience of working with listed and quoted companies and their corporate governance. As a Corporate Lawyer he also has significant experience of mergers and acquisitions and related matters both domestically and internationally. He is a Freeman of the City of London.Giles joined the Board of Brickability in August 2019 as a Non-Executive Director.
CLIVE NORMAN Non-Executive Director
DAVID SIMPSON Non-Executive Director
GILES BEALE Non-Executive Director
Total Meetings held BoardAudit Committee
RemunerationCommittee
Nomination Committee
Meetings attended 4 3 4 0
J Richards (Chairman)
A J Simpson (CEO) N/A N/A
G Beale (Non Executive)
C Norman (Non Executive) N/A N/A
S J Overend (CFO) N/A N/A
D Simpson (Non Executive)
31C O R P O R A T E G O V E R N A N C E

Group Management Board
Alan Simpson joined Building Materials Distribution with Taylor Maxwell in 1983 and five years later moved to Brick-ability. He became Sales Director and a shareholder, graduating to the position of Managing Director. He founded Towelrads, Frazer Simpson and FSN Doors, all of which are now part of the Group.Alan became a Director in 1996 before stepping up to Chief Executive Officer of the Group following the successful management buyout of Peter Milton, the founder of the Brickability business, in September 2016.
Stuart Overend is a Chartered Accountant (KPMG) and qualified Corporate Treasurer with a mix of industrial and investment experience. His previous experience includes a high growth pan European Pharmaceutical business and running and operating a private equity fund.Stuart joined the Board of Brickability in May 2018 as Chief Financial Officer.
JOHN RICHARDS Chairman
ALAN SIMPSONChief Executive Officer
STUART OVEREND Chief Financial Officer
John Richards joined the building materials industry after serving a graduate traineeship with the Delta Engineering Group. He served at Ibstock Brick for 31 years as Sales and Marketing Director, Director and General Manager and as Managing Director of several of the group’s subsidiaries.He now also serves as Chairman of ADF, a leading supplier of trailers and logistics to the TV and film industry, Chairman of JR and M Investments, a supplier of finance to contractors and is a Director of Birmingham Moseley Rugby Club. John joined the Board of Brickability in March 2018 as Chairman.
32

The Management Board is responsible for the day to day operations of the Group. The members are drawn from key managers within individual Brickability Group businesses.
Simon Mellor has over 30 years’ experience in the brick market. He first gained experience in brick manufacturing at Steetley Brick as a Regional Sales Manager. He joined Brickability in 1995 as Wales Sales Manager and was appointed Managing Director of The Matching Brick Company in 2007 and of Brickability Limited in 2009, overseeing a number of acquisitions and developing relationships with European suppliers.
Simon Pearson has over 35 years of construction and roofing sector experience, having first joining the industry in 1981 and setting up his first roofing business in 1984. He formed Crest Building Products in 1989 and Crest Roofing in 1993, which became part of the Group in 2018 and has been Managing Director of the Roofing Division since.
Paul Hamilton has 15 years’ experience in the heating and building supplier market. He joined the Towelrads business in 2004 and became a shareholder and Director in 2008. Paul has overseen the growth of the Towelrads business from sales of less than £1 million to over £15 million a year. He led a management buyout of the Towelrads business in 2016 and was a founder of DSH Flooring. Paul is currently Managing Director of Towelrads, DSH Flooring, Frazer Simpson and FSN Doors.
Arnold Van Huet has over 35 years’ experience in the brick and tile market across Europe, having been heavily involved in import and exports markets and the development of many brick and roofing products in Europe. He was the founder of the Crest Group of companies over 30 years ago which became part of the Group in 2018. He has also held senior and board positions in Desimpel Brick plc, Hanson Brick and Enhobel plc.
Andy joined the brick industry in 2004 after graduating with 2:1 BA Hons from Nottingham Trent University. Andy served as Regional Sales Manager for Traditional Brick & Stone Ltd before joining Wienerberger as Southern Specification Manager. In 2014 Andy founded The Bespoke Brick Co Ltd, followed by The Brick Slip Business Ltd in 2016. He later co founded William Wilson Properties Ltd in April 2019. Andy joined the Management Board of Brickability Group in May 2019.
SIMON MELLOR Managing Director of Bricks Division
SIMON PEARSON Managing Director of Roofing Division
PAUL HAMILTON Managing Director of Heating, Plumbing and Joinery Division
ARNOLD VAN HUET Managing Director of Crest Group
ANDY WILSON Managing Director of The Bespoke Brick Co
33C O R P O R A T E G O V E R N A N C E

QCA CODE OF CORPORATE GOVERNANCE AND AIM RULE 26 The Board recognises the importance of good corporate governance and since our flotation on the AIM in August 2019 we have chosen to adopt the Quoted Companies Alliance Corporate Governance Code which we believe will provide a meaningful set of ten core principles that should provide our shareholders with confidence in how the Company operates.
The 10 QCA principles are:
MAINTAIN A DYNAMIC MANAGEMENT FRAMEWORK5. Maintain the Board as a well-functioning,
balanced team led by the chair.
6. Ensure that between them the Directors have the necessary up-to-date experience, skills and capabilities.
All our directors have expertise in the relevant areas and we use our professional advisers to ensure that their knowledge and skill sets are kept up to date.
7. Evaluate Board performance based on clear and relevant objectives, seeking continuous improvement.
We evaluate the Board’s performance against the companies objectives laid out at the time of IPO. This evaluation also extends to performance in areas of compliance, risk management, remuneration and communication amongst others.
8. Promote a corporate culture that is based on ethical values and behaviours.
The Board’s assessment is that the corporate culture is consistent with ethical values and behaviors.
9. Maintain governance structures and processes that are fit for purpose and support good decision-making by the Board.
Corporate Governance
DELIVER GROWTH 1. Establish a strategy and business model which
promote long-term value for shareholders.
2. Seek to understand and meet shareholder needs and expectations.
We have ensured that presentations have been made to both shareholders and potential investors. Both have been able to make comment to and question the directors. We also regularly get questions from private shareholders by email, all of which are dealt with.
3. Take into account wider stakeholder and social responsibilities and their implications for long-term success.
4. Embed effective risk management, considering both opportunities and threats, throughout the organisation.
Our growth is being delivered both organically and through acquisition and this will continue to be the case. Both these routes of growth are subject to rigorous analysis and this includes their value to the business and it’s shareholders, their focus on social responsibility, their management of their staff and of risk, their quality of management and their corporate culture. The Board monitors corporate culture to ensure that it is consistent with the required standards.
34

BUILD TRUST 10. Communicate how the
Company is governed and is performing by maintaining a dialogue with shareholders and other relevant stakeholders.
The corporate governance culture will be measured against the QCA Code fundamentals and regularly reviewed with developments and changes communicated to shareholders. The QCA Code is built on the three fundamentals of delivering growth, maintaining a dynamic management framework and building trust. The Board is committed to each one of the fundamentals, as it believes these will support the Company’s medium to long-term success.
35C O R P O R A T E G O V E R N A N C E

DUTIES, ROLE AND RESPONSIBILITIES OF THE AUDIT COMMITTEEThe main duties of the Audit Committee are set out in its terms of reference which can be found at www.brickabiltygroupplc.com
COMMITTEE CALENDAR During the year the committee met on three occasions.
Areas of focus in 2019/20
Delivering the FPPP action plan
Review of the FY 2019/20 audit plan
Review of the interim results
Consideration of key audit matters and how they are addressed
Reviewing significant accounting and reporting judgements
Going concern review
Monitoring and reviewing the effectiveness of the Group’s external audit
Monitoring auditor independence
Meeting the external auditor without management present
Considering the external audit report
Reviewing the Financial Statements and Annual Report
Developing and implementing policy on non-audit services provided by the external auditor
Review of risk management and internal control systems
Reviewing the Group’s procedures for detecting and preventing fraud, bribery and the governance of anti-money laundering systems and controls
Monitoring the Groups integrity of the Group’s Financial Statements and formal announcements.
Report of the Audit Committee On behalf of the Board I am pleased to present my report to you as Chair of the Audit Committee for the financial year to 31st March 2020. This report provides shareholders with an overview of the activities carried out by the Committee during the year.
COMMITTEE CHAIRMANDavid Simpson
OTHER MEMBERSJohn RichardsGiles Beale
36

COVID-19With a year-end date of 31st March the impact of Covid-19 on the financial performance of the Group has been minimal. The year-end audit programme however has been impacted in that certain stock takes were not attended by the auditor on the actual year end date. However since then stock takes have been conducted in the presence of the auditor and to the extent there has only been minimal stock deliveries and despatches between the year-end and the actual physical stock take, enabling management and the auditor to retrospectively verify the 31st March physical stock count. The Audit Committee is satisfied with the accuracy of the stock records.
ROLE OF THE EXTERNAL AUDITORThe Audit Committee monitors the relationship with the external auditor, BDO LLP, to ensure that auditor independence and objectivity is maintained. As part of its review the Committee monitors the provision of non-audit services by the external auditor. The Breakdown of fees between audit and non-audit services is provided in Note 9 to the Financial Statements. The non-audit fees relate to reporting accountants work and share options plans at the IPO. Having reviewed the auditor’s independence and performance the Committee recommends that BDO LLP be re-appointed as the Group’s auditor at the inaugural AGM.
EXTERNAL AUDIT PROCESSThe Group CFO and the chair of the Audit Committee liaise with the auditor throughout the year to ensure that if there are areas of significant risk, or other matters of audit relevance, they are regularly communicated. The external auditor prepares a plan for its audit of the Financial Statements. The audit plan sets out the scope of the audit, areas to be targeted and the audit timetable. The plan is reviewed and by the Committee. Following the audit, the auditor presents their findings to Audit Committee for discussion. No major areas of concern were highlighted by the auditor during the year.
EXTERNAL AUDIT TENDER This year as part of the IPO process the Board, prior to the formation of the Audit Committee, have conducted a tender for the future provision of external audit services in compliance with legislation and Financial Reporting Council (FRC) on best practice, in particular ensuring independence in respect of potential audit firms.
This concluded in the appointment of BDO LLP. BDO LLP replaced Kilsby Williams who have admirably served as Group auditor for the last 8 years. The Board would like to place on record their thanks to Kilsby Williams LLP for their work up to 2019 as Group auditor.
RISK MANAGEMENT AND INTERNAL CONTROLSThe Board, assisted by the Audit Committee, is responsible for regularly reviewing the operation and effectiveness of the Group’s internal controls. The internal control system is designed to manage, rather than eliminate, the risk of failure to achieve business objectives.The Group’s key internal control procedures include a review of the Group’s strategy and the performance of subsidiaries. This involves a comprehensive system of reporting based on variances to annual budgets, key performance indicators and regular forecasting. The Audit Committee recommended the appointment of additional experienced and qualified staff to support the Group CFO, in the Group’s first year post IPO, primarily in the arena of subsidiary internal controls and improving consistent management reporting.The Audit Committee in partnership with the Board is responsible for reviewing the risk management and internal control framework and ensuring that it operates effectively. During the period, the Committee is satisfied that the internal control systems in place were operating effectively.
GOING CONCERNThe Group is required to assess its ability to trade as a going concern for a period of 12 months from the period of signing the annual Financial Statements. The Committee reviewed the Board’s assessment page 26 and concluded that it remained appropriate to continue to adopt the going concern basis in preparing the Financial Statements.
WHISTLEBLOWINGThe Group has in place a whistleblowing policy which sets out the formal process by which an employee of the Group may, in confidence raise concerns about possible improprieties in financial reporting or other matters. No concerns were raised during the period.
ANTI-BRIBERYThe Group has in place an anti-bribery and corruption policy which sets out a zero tolerance position and provides information and guidance to those working for the Group on how to recognise and deal with bribery and corruption matters. The Committee relies upon assurances from senior management in satisfying itself that the current policy is operating effectively. During the period the Committee is satisfied that the policy in place has been operating effectively.
Approved by the Audit Committee on 14 September 2020.
David SimpsonChair of Audit Committee
ASimpson
37C O R P O R A T E G O V E R N A N C E

This image of our wonderful, bespoke brick showroom gives some indication of the breadth of brick product range that we are able to offer our customers. Product selection, technical assistance and the start of the service delivery journey all take place here.
38
This image of our wonderful, bespoke brick showroom gives some indication of the breadth of brick product range that we are able to offer our customers. Product selection, technical assistance and the start of the service delivery journey all take place here.
38

Report of the Remuneration Committee
On behalf of the Board I am pleased to present my report to you as Chair of the Remuneration Committee for the financial year to 31st March 2020. The purpose of this report is to provide shareholders with the information necessary to understand our remuneration policy, its linkage to the Group’s performance, strategy and core values as well as providing a clear explanation of how our directors have been rewarded over the period.Whilst not subject to the Large and Medium-sized Companies and Groups (Accounts and Reports) (Amendment) Regulations or the UK Corporate Governance Code we have adopted, where considered appropriate, a similar format. Where we have done so but departed from aspects of that format we explain why. This report has not been audited.
Given that the company’s IPO occurred during the period being reported on and that there has been no subsequent change in the company’s remuneration policy or that of its directors following the IPO, no shareholder vote regarding this report or its content will be proposed at the company’s 2020 AGM.
We recognise the importance of shareholder views and their feedback on remuneration policy. Engagement is valued and I welcome feedback from our shareholders on the content of this report.
THE COMMITTEE, ITS CONSTITUTION AND TERMS OF REFERENCEThe Remuneration Committee’s members comprise Giles Beale, David Simpson and John Richards. Giles Beale and David Simpson are considered independent by the Board within the meaning of the QCA Code. John Richards, Chairman and the Chairman of the Group Management Board, is also a member of the committee. The Board regard John as independent for this purpose; his experience and role in liaising with shareholders assists the committee and his membership is considered both appropriate and beneficial. Since its establishment Giles Beale has chaired the committee.
39C O R P O R A T E G O V E R N A N C E

THE COMMITTEE, ITS CONSTITUTION AND TERMS OF REFERENCE CONT.The committee was established on 21st August 2019. The company’s articles of association under which it was established, together with the committee’s terms of reference, are available at www.brickabilitygrouplpc.com. The committee’s core role is to assist the Board in ensuring that the Group’s remuneration policy rewards fairly and responsibly with a clear link to individual performance. Key roles include the determination of executive directors’ remuneration, to monitor and recommend that of the Group’s wider senior management team and the oversight and administration of Group share plans. No member of the committee has a personal interest (save as a shareholder in the company) in the outcome of its decisions.
The committee gives due regard to the interests of shareholders and the financial and commercial health of the company. No director is party to a decision or recommendation regarding their own remuneration.
The committee meets at least twice a year and further as necessary to fulfil its role. Over the period the committee met four times. Jurit LLP and Travers Smith LLP provided advice during the period. When required, the Chief Executive and Chief Financial Officer attended deliberations of the committee by invitation.
REMUNERATION POLICY; OBJECTIVES AND APPLICATIONThe Remuneration Committee is responsible for determining, with the Board, the framework for the executive directors and Group’s senior management remuneration as well as the administration of the Group’s share plans. Remuneration for executive and other senior management include, where appropriate, pensions, bonuses, incentive arrangements, share options and other share based awards. The Remuneration Committee’s focus is to reward fairly and responsibly with the establishment of a common remuneration policy throughout the Group.
The Group has historically grown by acquisition through which it has inherited several differing remuneration arrangements often embedded by contract. Growth by acquisition remains an important element of the company’s strategy.
In several cases, members of the senior management team are party to on-going earn-out arrangements. A number of the Group’s senior management are significant shareholders of the company and some are also party to a concert party identified by the Panel on Takeovers and Mergers identified and disclosed at the time of the company’s IPO.
The committee considers it important, subject to regulatory constraints, to establish a consistent remuneration policy that supports and encourages senior managers and Group employees generally with a clear link to individual performance as well as the financial health of the company and the interests of its shareholders as a whole.
The directors believe that the success of the Group depends to a significant degree on the future performance of its senior management team. The Board and the committee also recognise the importance of ensuring that all Group employees remain well motivated and identify closely with its success. The committee reviews information regarding the remuneration and reward levels of other Group employees to provide context when considering remuneration policy and the remuneration of the senior management team including that of the executive directors.
The remuneration packages of our senior management team are designed to attract, motivate and retain executives of the highest calibre and to reward them for enhancing shareholder value.
The determination of executive directors’ annual remuneration, including bonus and related performance criteria is undertaken by the committee. In addition, the committee reviews and recommends the level and structure of the wider senior management team to the Board. In each case these include some or all of the following elements:
• basic salary and benefits;
• annual bonus and/or commission arrangements;
• share plans including awards under the Group’s LTIP;
• pension arrangements (all of which are defined contribution).
We consider it important that a significant proportion of the executives and senior management teams’ remuneration should be performance related with the objective of enhancing shareholder returns as well as the long term financial health and stability of the company. This includes, as appropriate, the exploitation of Group synergies, the development and enhancement of our potential and existing senior management team, specific unit performance and the upholding of our values and culture. Objectives for individuals will vary depending upon their role within the Group but we consider that a consistent, transparent remuneration programme based upon common principles is important to ensure that overall Group performance and shareholder value is enhanced.
The committee is responsible for the administration of the company’s share plans, being the company’s employee share option plan and a long term incentive plan LTIP. It is not the committee’s current policy to make annual grants under either plan. Rather, the committee’s purpose is to make meaningful, individual grants, under the LTIP, that align grantees interests with the enhancement of shareholder value. Where appropriate grants under the company’s employee share option plan may also be utilised. No grants under the LTIP scheme were issued in the year. The committee’s policy regarding the administration of grants under these plans may develop to accommodate changing needs of the Group.
40

Members of the Group operate several defined benefit pension schemes. In addition there is an auto enrolment Group pension scheme managed by Scottish Widows. Generally contributions are 5% employee and 3% employer; in some cases each of the proportions rise to 10%.
The remuneration policies within the Group were established prior to the IPO. The committee will review these during the current financial year to ensure that they best serve the core objectives outlined above and, in particular, are consistent with a common Group remuneration policy that continues to promote the enhancement of shareholder value. Any significant changes in existing policy will be the subject of consultation with our key shareholders.
41C O R P O R A T E G O V E R N A N C E

EXECUTIVE DIRECTORS’ REMUNERATIONThe table below summarises the key elements of our executive directors’ remuneration under their current service contracts being those made on 21st August 2019 in anticipation of the company’s IPO. The tables set out on page 44 and 45 set out our executive directors total remuneration for the financial year ended 31st March 2020 as well as their post-IPO annual salary with effect from the IPO.
Note: Because of his membership of a concert party identified by the Panel on Takeovers and Mergers and disclosed at the time of the IPO the Chief Executive is unable to participate in Group share option plans. Several members of the wider senior management team are similarly constrained. Details of the concert party are set out in the company’s admission document which is available on the company’s website (www.brickabilitygroupplc.com).
Purpose and link to strategy Operation Maximum potential value Performance conditions
Base salaryThe provision of a com-petitive, fixed salary that attracts and retains key individuals reflecting their experience and role.
To be reviewed on an annual basis having regard to our competitors, industry and needs as well as pay levels elsewhere within the Group, its size and complexity.
Total salaries paid during the period are set out on page 44. Changes in the scope of responsibilities or role may require an adjustment to salary levels.
Assessment of personal and corpo-rate performance.
BenefitsTo provide market benefits on a cost-effective basis.
A car allowance, private medical insurance and reimbursement for reasonable business expenses. Other benefits may be offered in line with market practice if it is considered appropriate to do so.
The maximum potential value is the cost to the company in providing these benefits.
Not applicable.
PensionTo assist executive directors in providing for retirement where this is considered an aid in attracting and retaining the individual.
Our policy is to provide a contribution (or cash allowance in lieu) to a personal pension plan as a capped proportion of basic salary if it is considered appropriate to do so.
The Chief Executive Officer does not receive a pension contribution or allowance. The Chief Financial Officer receives a contribution to a personal pension plan of 10% of his basic salary.
Not applicable.
Annual bonusTo recognise an executive’s achievement of annual objectives that support the Group’s strategy and financial well-being.
The current performance targets were set prior to the establishment of the committee. Going forward the committee will consider annual bonus targets as part of its review of remuneration policy.
Each executive director is entitled to receive a cash bonus of up to 50% of basic salary on the attainment of performance objectives.
The Remuneraion Committee reviews the performance measures annually.
Share plansTo encourage value creation by way of share price growth through the delivery of shares. The purpose of the LTIP is to provide meaningful awards based upon demanding performance criteria that provide a significant incentive to grantees that is aligned with our shareholders’ interests.
The Chief Financial Officer as part of the IPO arrangements received a grant under the company’s employee share option plan and an award under the LTIP that has still to be issued.
Grants may not normally exceed 200% of the grantee’s base salary.
Grants are the subject of discretionary good leaver/bad leaver provisions and, in the case of the [LTIP], malpus and clawback provisions.
Further details of the share plans and their operation are set out on note 35 of the Financial Statements.
Subject to exercise or vesting, the market value of the shares the subject of the grant less any cost payable by the grantee on exercise or vesting. Under the LTIP, a grantee maybe entitled to a dividend equivalent to the value of dividends paid on a vested share had it been in issue from the date of the grant.
Options granted under the company share plans may be subject to performance conditions. The options granted during the period under the employee share option plan were granted prior to the IPO and are not subject to performance conditions.
Our policy for grants under the LTIP is that they are the subject of performance conditions which will be measured. Performance conditions are divided equally between two metrics; compound annual growth in adjusted EBITDA and compound annual growth in total shareholder return.
42
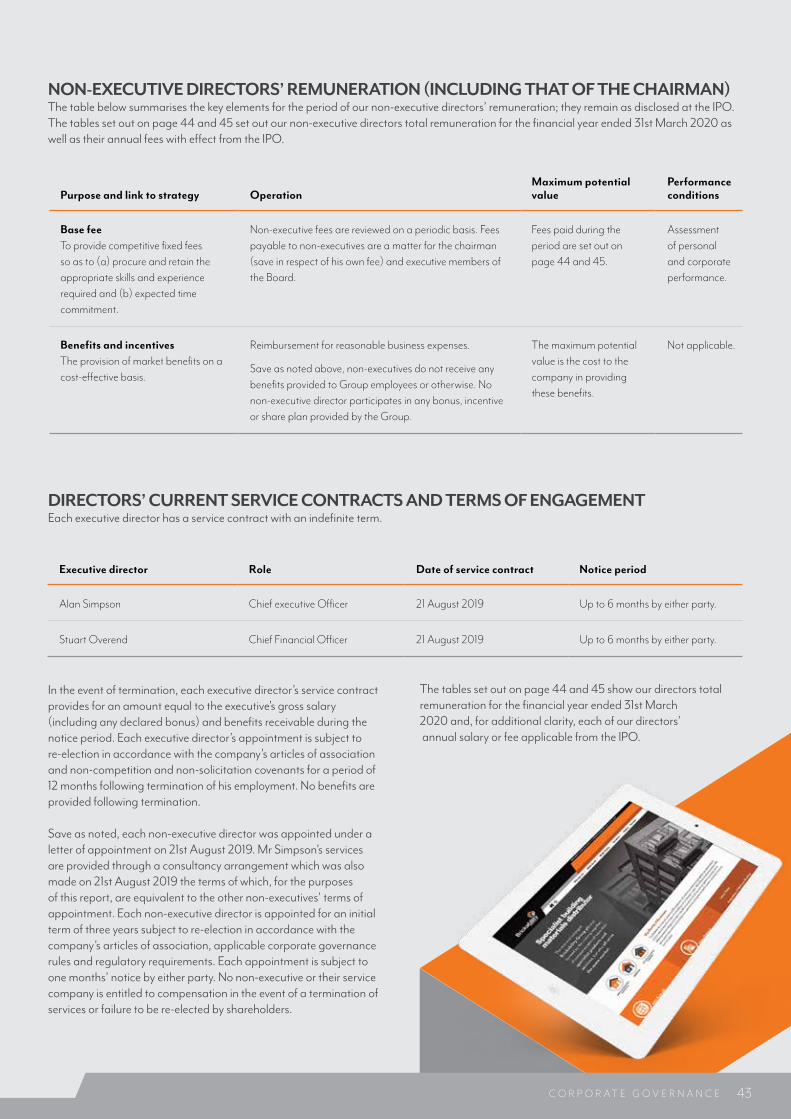
NON-EXECUTIVE DIRECTORS’ REMUNERATION (INCLUDING THAT OF THE CHAIRMAN)The table below summarises the key elements for the period of our non-executive directors’ remuneration; they remain as disclosed at the IPO. The tables set out on page 44 and 45 set out our non-executive directors total remuneration for the financial year ended 31st March 2020 as well as their annual fees with effect from the IPO.
DIRECTORS’ CURRENT SERVICE CONTRACTS AND TERMS OF ENGAGEMENTEach executive director has a service contract with an indefinite term.
In the event of termination, each executive director’s service contract provides for an amount equal to the executive’s gross salary (including any declared bonus) and benefits receivable during the notice period. Each executive director’s appointment is subject to re-election in accordance with the company’s articles of association and non-competition and non-solicitation covenants for a period of 12 months following termination of his employment. No benefits are provided following termination.
Save as noted, each non-executive director was appointed under a letter of appointment on 21st August 2019. Mr Simpson’s services are provided through a consultancy arrangement which was also made on 21st August 2019 the terms of which, for the purposes of this report, are equivalent to the other non-executives’ terms of appointment. Each non-executive director is appointed for an initial term of three years subject to re-election in accordance with the company’s articles of association, applicable corporate governance rules and regulatory requirements. Each appointment is subject to one months’ notice by either party. No non-executive or their service company is entitled to compensation in the event of a termination of services or failure to be re-elected by shareholders.
The tables set out on page 44 and 45 show our directors total remuneration for the financial year ended 31st March 2020 and, for additional clarity, each of our directors’ annual salary or fee applicable from the IPO.
Executive director Role Date of service contract Notice period
Alan Simpson Chief executive Officer 21 August 2019 Up to 6 months by either party.
Stuart Overend Chief Financial Officer 21 August 2019 Up to 6 months by either party.
Purpose and link to strategy OperationMaximum potential value
Performance conditions
Base feeTo provide competitive fixed fees so as to (a) procure and retain the appropriate skills and experience required and (b) expected time commitment.
Non-executive fees are reviewed on a periodic basis. Fees payable to non-executives are a matter for the chairman (save in respect of his own fee) and executive members of the Board.
Fees paid during the period are set out on page 44 and 45.
Assessment of personal and corporate performance.
Benefits and incentivesThe provision of market benefits on a cost-effective basis.
Reimbursement for reasonable business expenses.
Save as noted above, non-executives do not receive any benefits provided to Group employees or otherwise. No non-executive director participates in any bonus, incentive or share plan provided by the Group.
The maximum potential value is the cost to the company in providing these benefits.
Not applicable.
43C O R P O R A T E G O V E R N A N C E

The aggregate directors’ remuneration paid by Group members were as follows:
Each individual director’s total remuneration paid over the period by Group members is summarised below together with a total comparison for the financial year ended 31st March 2019.
Prior to the IPO a Group company provided a loan to Mr Stuart Overend of £838,584 and Mr John Richards of £139,764 to purchase shares in the Group as disclosed in the Admission document. The loans are unsecured and interest free and repayable on the sale of the shares.
The tables on page 44 and 45 have been audited.
** Part time for the year ending 31 March 2019.
Year ended 31st March 2020£’000
Year ended 31st March 2019£’000
Aggregate remuneration (net of pension contributions) 930 1,268
Aggregate pension contributions 26 85
DirectorSalary or fee£’000
Taxable benefits£’000
Bonus£,000
Pension contributions£’000
Total Year ended 31st March 2020£’000
Total Year ended 31st March 2019£’000
Executive
A.J. Simpson 380 3 80 - 463 346
S.J. Overend 260 - 55 26 341 137**
Non-executive
G.W.K. Beale 32 - - - 32
C.S. Norman 29 - - - 29 36
J. Richards 59 - - - 59 36
D. Simpson 32 - - - 32
Directors’ remuneration in the year ended 31st March 2020
44

Note: That these terms may change in the event of a review or change of role or responsibility prior to their annual review. No such change occurred in the period.
During the period Mr Stuart Overend received a grant of options under the company’s employee share option plan resulting in options over 72,443 shares. The grant was made prior to the IPO as part of a wider grant to Group employees in August 2019 in anticipation of the IPO, none of which were the subject of performance conditions and which are further described at note 35 of the Financial Statements.
No share options were exercised by directors in the period and there were no gains made by directors from other long term incentive schemes.
The table below sets out the annual salary or fee of each director under their current service contracts or terms of engagement, in each case being those entered into on 21st August 2019. The core terms of these contracts and terms of engagement are summarised on page 43.
DirectorBase salary or fee£’000 Potential annual bonus (maximum)
Executive
A.J. Simpson 400 50%
S.J. Overend 275 50%
Non-executive
G.W.K. Beale 55
C.S. Norman 50
J. Richards 75
D. Simpson 55
45C O R P O R A T E G O V E R N A N C E

The employee share option plan was adopted on 2nd August 2019. As part of a corporate reorganisation conducted prior to the IPO, options over the equivalent of 3,681,311 shares under the employee share option plan were granted effective as at the IPO to Group employees including members of the senior management team. These options are exercisable at an effective exercise price of 41p between the third and tenth anniversary of grant 2nd August 2019) subject to the grantee remaining an employee but are not subject to performance conditions. The LTIP provides for the grant to selected employees and full time directors of Group members. Grants may not be made over shares having a market value in excess of 200% of a grantee’s salary in a financial year. Grants may take the form of options (which must be exercised within ten years of grant) with a nominal or nil exercise price or as an award of conditional rights to acquire
shares. At the time of the IPO awards were proposed to be granted on or shortly after the company’s IPO. The proposed awards were to be the subject of performance conditions, 50% of which to be based on compound annual growth in adjusted EBITDA and 50% based on compound annual growth in total shareholder return, in each case, of between 6% and 10% over a three year performance period measured on a pro rata straight-line basis. The proposed awards were the subject of revised proposals and have yet to be granted. It is the intention of the committee that awards or options the subject of appropriate performance conditions be granted as soon as possible.Grants under the share plans are the subject of discretionary good/bad leaver provisions and, in the case of the LTIP, malpus and clawback arrangements.
This report has been approved by each of the Remuneration Committee and the Board and signed on behalf of both by:
Giles Beale, Chair of the Remuneration Committee
Share plansThe company operates two share plans, the Brickability 2019 Share Option Plan (employee share option plan) and the Brickability Group plc Long Term Incentive Plan 2019 (LTIP). Grants made under the share plans may be made to selected employees and full time directors of Group members. The operation of both plans are overseen by the remuneration committee. Grants under the share plans, including grants under any other share based incentive plan that may be adopted by the Group, may not exceed 10% of the company’s issued share capital in any ten year period. No other share based plans are currently operated by Group members.
A Beale
46

15.9%36,595,012 Alan Jonathan Simpson
13.4%30,798,898Paul Michael Hamilton
6.0%13,858,492 Sarah Simpson
11.1%25,500,149Liontrust AssetManagement
5.0%11,548,476Arnold Bernard Geradus van Huet
4.3%9,897,133BlackRock Investment Management
4.0%9,230,000Soros Fund Management
3.7%8,545,588Canaccord Genuity Wealth Management
3.3%7,500,000Ruffer
5.0%11,602,900Otus CapitalManagement
Shareholder Percentage of Enlarged Share Capital No. of Ordinary Shares as of 31 August 2020
REPORT OF THE DIRECTORS The Directors have pleasure in presenting their Annual Report on the affairs of the Group, together with the audited Financial Statements of the Company and its subsidiary undertakings for the year ended 31 March 2020. The Corporate Governance Statement set out on pages 34 to 35 forms part of this report. The Company is a public limited company, registered in England and Wales and is listed on AIM of the London Stock Exchange. The Company has been permanently domiciled in the UK since incorporation and is the ultimate parent company of the Brickability Group.
As permitted by Paragraph 1A of Schedule 7 to the Large and Medium-sized Companies and Groups (Accounts and Reports) Regulations 2008 certain matters which are required to be disclosed in the Report of the Directors have been omitted as they are included in the Strategic Report on pages 1 to 28. These matters relate to a full review of the performance of the Group for the year, current trading and future outlook.
Information about the use of financial instruments by the Company and its subsidiaries is given in note 32 of the Financial Statements. This note also includes information of financial risk including an assessment of the Group’s exposure to financial risk.
REVIEW OF THE BUSINESS The Strategic report on pages 4 to 29 provides an operating and financial review of the business, the Group’s trading for the year ended 31 March 2020, as well as risk management and an indication of future developments.
RESULT AND DIVIDEND The Group has reported its Consolidated Financial Statements in accordance with International Financial Reporting Standards as adopted by the European Union applying FRS101 reduced disclosure framework for the Company. The Group’s results for the year are set out in the Consolidated statement of comprehensive income on page 60.
The Directors recommend a final dividend for the year of 1.085p per share payable on 23 October 2020 (2019: 0p per share). An interim dividend of 0.8678p was paid during the year (2019: 0p). The estimated final dividend to be paid is £2.5m (2019: £0m).
DIRECTORS The Directors of the Company are listed on pages 30 and 31 together with biographical and Committee membership details. David Simpson and Giles Beal joined the Board on 31 July 2019 and 21 August 2019 respectively. All other Directors served throughout the year ended 31 March 2020. Directors’ remuneration, share options, long-term executive plans, pension contributions, benefits and interests are set out in the Directors’ remuneration report on pages 39 to 46.
In accordance with our commitment to good corporate governance practice that is relevant to our business, the Board has voluntarily adopted the policy that in normal circumstances all continuing Directors stand for re-election on an annual basis in line with the recommendations.
The Company maintains liability insurance for its Directors and Officers, the Company’s articles of association allow the indemnification of Directors out of the assets of the Company to the extent permitted by law. These indemnities came into force on 29 August 2019 and remain in force as at the date of this Annual Report and Accounts.
SHARE CAPITAL AND SUBSTANTIAL SHAREHOLDINGS Full details of the authorised and issued share capital of the Company are set out in note 33 to the Financial Statements. At 31 August 2020, the latest practicable date prior to the approval of this document, the Company had been notified of the following interests amounting to 3% or more of the voting rights attaching to the Company’s issued share capital: Significant Shareholder as at 31 August 2020.
47C O R P O R A T E G O V E R N A N C E

SIGNIFICANT AGREEMENTS (CHANGE OF CONTROL)The Company is required to disclose any significant agreements that take effect, alter or terminate on a change of control of the Company following a takeover bid.The Company has committed debt facilities all of which are directly or indirectly subject to change of control provisions, albeit the facilities do not necessarily require mandatory prepayments on a change of control.In the event of a takeover or other change of control outstanding awards under the Group share plans will become excercisable.
EMPLOYEE INVOLVEMENT PROCESS The Directors believe that the involvement of employees is an important part of the business culture. Employees are its most important asset and contribute to the successes achieved to date (view our Corporate Responsibility statement on pages 28 and 29).
EQUAL OPPORTUNITIES The Group is committed to eliminating discrimination and encouraging diversity. Its aim is that each employee is able to perform to the best of their ability. The Group will not make assumptions about a person’s ability to carry out their work, for example on their ethnic origin, gender, sexual orientation, marital status, religion or beliefs, age or disability.
DISABLED EMPLOYEES In the event of an employee becoming disabled, every effort is made to retain them in order that their employment with the Group may continue. It is the policy of the Group that training, career development and promotion opportunities should be available to all employees.
ENVIRONMENTAL POLICY Maintaining and improving the quality of the environment in which we live is an important concern for the Group, our staff, customers, suppliers, sub-contractors and communities. We have adopted high standards of environmental practices and aim to minimise our impact on the environment wherever this is practical. In particular, we comply with, and endeavour to exceed the requirements of all laws and regulations relating to the environment. For further details see our Corporate Responsibility statement on pages 28 and 29.
48
HEALTH AND SAFETY The Group recognises the importance of maintaining high standards of health and safety for everyone working within our business and also for anyone who may be affected by our business. Further details on health and safety are given on page 28.
POLITICAL AND CHARITABLE DONATIONS Donations of £14,283 were made by the Group for charitable purposes during the year (2019: £17,000). The Groupdoes not make political donations. Further details on our charitable initiatives are given on page 28.
FINANCIAL RISK MANAGEMENT Information in respect of the financial risk management of the Group, is contained in note 27 on borrowings and note 32 on financial instruments of the financial statements.
RELATED PARTY TRANSACTIONS Any related party transactions required to be disclosed under the AIM rules are disclosed in note 37 to the Financial Statements.
MODERN SLAVERY ACT Our Anti-slavery policy, which sets out our commitment to preventing modern slavery and human trafficking from occurring within any part of our business and supply chain, is available on our website www.brickabilitygroupplc.com.
STATEMENT, AS TO DISCLOSURE OF INFORMATION TO AUDITORS The Directors in office on 11th September 2020 have confirmed that, as far as they are aware, there is no relevant audit information of which the auditor is unaware. Each of the Directors have confirmed that they have taken all steps that they ought to have taken as Directors in order to make themselves aware of any relevant audit information and to establish that it has been communicated to the auditor.
FUTURE DEVELOPMENTS The Board intends to continue to pursue its business strategy as outlined in the Strategic report on pages 4 to 28.
ANNUAL GENERAL MEETING The AGM will be held on 29th September 2020 at 11am at Queensgate House, Cookham Road, Bracknell.
GOING CONCERN The Directors are satisfied that the Group has adequate resources to continue in operation for the foreseeable future and that it is appropriate to prepare Financial Statements on the going concern basis. Further details are given in page 26.
APPROVAL This Directors’ report was approved by the Board of Directors and signed on behalf of the Board on 15 September 2020.
Stuart J. Overend Director & Company Secretary15 September 2020
49C O R P O R A T E G O V E R N A N C E

Statement of Directors’ ResponsibilitiesThe directors are responsible for preparing the Strategic Report, the Report of the Directors and the Financial Statements in accordance with applicable law and regulations.Company law requires the directors to prepare Financial Statements for each financial year. Under that law the Directors have prepared the Group and Company Financial Statements in accordance with International Financial Reporting Standards (IFRS) as adopted by the European Union.
International Accounting Standard 1 requires that IFRS Financial Statements present fairly for each financial year the Group
and Company financial position, financial performance and cash flows. This requires the fair representation of the effects of transactions, other events and conditions in accordance with the definitions and recognition criteria for assets, liabilities, income and expenses set out in the International Accounting Standards Board’s “Framework for the preparation and presentation of Financial Statements”.
In virtually all circumstances, a fair presentation will be achieved by compliance with all applicable IFRS. Directors are also required to: • properly select and apply accounting policies; • make judgements and accounting estimates that are reasonable and prudent; • state whether IFRS as adopted by the European Union have been followed subject to any material departures disclosed
and explained in the Financial Statements; • present information, including accounting policies, in a manner that provides relevant, reliable, comparable and
understandable information; and • provide additional disclosures when compliance with the specific requirements in IFRS are insufficient to enable users
to understand the impact of particular transactions, other events and conditions on the entity’s financial position and financial performance.
The Directors have elected to prepare the Company Financial Statements in accordance with International Financial Reporting Standards (IFRS) as adopted by the European Union. The Company Financial Statements are required by law to give a true and fair view of the state of affairs of the Company.
In preparing these Financial Statements, the Directors are required to: • select suitable accounting policies and then apply them consistently; • make judgements and estimates that are reasonable and prudent; • state whether IFRS as adopted by the European Union have been followed subject to any material departures disclosed
and explained in the Financial Statements; and • prepare the Financial Statements on the going concern basis unless it is inappropriate to presume that the Company will
continue in business.The Directors are responsible for keeping proper accounting records that disclose with reasonable accuracy at any time the financial position of the Group and the Company and enable them to ensure that the Group and the Company Financial Statements comply with the Companies Act 2006. They are also responsible for safeguarding the assets of the Group and the Company and hence for taking reasonable steps for the prevention and detection of fraud and other irregularities.The Directors are responsible for the maintenance and integrity of the corporate and financial information included on the Group’s website. Legislation in the United Kingdom governing the preparation and dissemination of Financial Statements may differ from legislation in other jurisdictions.
These statements were approved by the Board of Directors on 15 September 2020 and signed on its behalf by:
Alan J. Simpson Chief Executive
Stuart J. Overend Chief Financial Officer
50

Independent Auditor’s Reportto the members of Brickability Group PLCOpinion
We have audited the financial statements of Brickability Group plc (the ‘Parent Company’) and its subsidiaries (the ‘Group’) for the year ended 31 March 2020 which comprise the Consolidated Statement of Profit or Loss and Other Comprehensive Income, the Consolidated and parent Company Balance Sheet, the Consolidated and parent Company Statement of Changes in Equity, the Consolidated and parent Company Statement of Cash Flows and notes to the financial statements, including summaries of significant accounting policies applicable to the consolidated and parent company financial statements.
The financial reporting framework that has been applied in the preparation of the Group financial statements is applicable law and International Financial Reporting Standards (IFRSs) as adopted by the European Union. The financial reporting framework that has been applied in the preparation of the Parent Company financial statements is applicable law and United Kingdom Accounting Standards, including Financial Reporting Standard 101 Reduced Disclosure Framework, (United Kingdom Generally Accepted Accounting Practice).
Basis for opinionWe conducted our audit in accordance with International Standards on Auditing (UK) (ISAs (UK)) and applicable law. Our responsibilities under those standards are further described in the Auditor’s responsibilities for the audit of the financial statements section of our report. We are independent of the Group and the Parent Company in accordance with the ethical requirements that are relevant to our audit of the financial statements in the UK, including the FRC’s Ethical Standard as applied to listed entities, and we have fulfilled our other ethical responsibilities in accordance with these requirements. We believe that the audit evidence we have obtained is sufficient and appropriate to provide a basis for our opinion.
• the financial statements give a true and fair view of the state of the Group’s and of the Parent Company’s affairs as at 31 March 2020 and of the Group’s profit for the year then ended;
• the Group financial statements have been properly prepared in accordance with IFRSs as adopted by the European Union;
• the Parent Company financial statements have been properly prepared in accordance with United Kingdom Generally Accepted Accounting Practice; and
• the financial statements have been prepared in accordance with the requirements of the Companies Act 2006.
In our opinion:
51S T R A T E G I C R E P O R T
Conclusions relating to going concernWe have nothing to report in respect of the following matters in relation to which the ISAs (UK) require us to report to you where:
• the Directors’ use of the going concern basis of accounting in the preparation of the financial statements is not appropriate; or
• the Directors have not disclosed in the financial statements any identified material uncertainties that may cast significant doubt about the Group’s or the Parent Company’s ability to continue to adopt the going concern basis of accounting for a period of at least twelve months from the date when the financial statements are authorised for issue.
Key audit mattersKey audit matters are those matters that, in our professional judgment, were of most significance in our audit of the financial statements of the current period and include the most significant assessed risks of material misstatement (whether or not due to fraud) we identified, including those which had the greatest effect on: the overall audit strategy, the allocation of resources in the audit; and directing the efforts of the engagement team. These matters were addressed in the context of our audit of the financial statements as a whole, and in forming our opinion thereon, and we do not provide a separate opinion on these matters.
Risk – Manual adjustments to Revenue Our response to the risk
Risk of inappropriate revenue recognition through manual adjustments.
See note 3.4 to the financial statements for the directors’ disclosures of the related revenue recognition accounting policies.
In all three of the key divisions, we consider that there is a risk of inappropriate revenue recognition arising from manual adjustments to automatically generated figures or from inaccurate calculation of adjustments relating to rebates and warranties.
The majority of the Groups’ brick revenues are supported by a control which does not permit a sales invoice to be made unless there is a corresponding purchase.
This therefore highlights the principal risk of fraud or error being derived from manual journals made by management.
Regarding the roofing and heating, plumbing & joinery divisions, the principal risk of fraud or error exists from manual adjustments to revenue arising as a result of period end adjustments for accruals or deferrals.
We performed end to end process notes of the Group’s sales cycles for all revenue streams. From performing this audit procedure we generated an understanding of the IT systems in the Group used to process revenue transactions, the degree and significance of management intervention and the identification of key controls operated within the Group.
We identified and investigated any instances of unusual manual entries made to revenue accounts made by management by assessing the journal entries made to revenue accounts;
For revenues recognised in the period, we agreed a sample of invoices raised through to supporting documentation (goods despatch documentation, corresponding purchase order from 3rd party supplier and where appropriate, cash receipts from the customer) and gained assurance over the appropriateness over the occurrence of the revenue recognised, investigating any manual adjustments made to these items.
We agreed a sample of sales invoices recognised around the period end through to supporting third party documentation, to confirm that the Group has satisfied its performance obligations and revenue was appropriately accrued or deferred.
We reviewed rebate agreements key to the Group with respect to the requirements of IFRS 15, variable consideration. We challenged management on the appropriateness of any estimates made, and where appropriate, agreed the settlement of these rebates to post period end documentation.
We reviewed the key service agreements held within the roofing division, Group for the existence of any non-standard warranty arrangements which may give rise to separate performance obligations in the context of IFRS 15.
Key observations communicated to the Audit Committee:We did not identify any material misstatements regarding manual adjustments to revenue.
Independent Auditor’s Reportto the members of Brickability Group PLC
52
Risk – Existence of Inventory Our response to the risk
There is a risk that inventory does not exist or cannot be verified at the balance sheet date.
The emergence and spread of Coronavirus is having an effect on the operations of many businesses in the UK. The UK entered lockdown on the 23 March 2020, at which point only a small proportion of the Group’s annual stock takes had taken place. These procedures were deferred until such a time that restrictions were eased and when management considered it to be safe for employees to return to operational sites.
As a result of the length of time between the year-end date and the date of the annual stock counts, we considered that there was an increased risk of misstatement in the determination of the Group’s inventory holding as at 31 March 2020.
We obtained an understanding of the nature and timing of stock count procedures performed by the group for each different stock location.
We performed test counts at a sample of these significant locations and at a time when it was deemed practical and safe for BDO staff to be able to access the sites after the easing of restrictions from the UK lockdown.
We audited management’s roll back of the purchases and sales and other stock movements from the date of the count (after year end) to the year-end for all perpetual stock systems.
We performed additional procedures to obtain evidence for the movement of purchases and sales and other stock movements for those not on accounted for on a perpetual stock system, including an understanding of management’s procedures for accounting for these transactions and we assessed the accuracy of the audit trail presented to us by management.
We obtained confirmations of stock held on a consignment basis or at warehouses managed by third party logistics companies and compared these confirmations to the quantities included in the financial statements.
Key observations communicated to the Audit Committee: We did not identify any material misstatements regarding the existence of inventory.
Risk – Acquisition Accounting Our response to the risk
Accounting for acquisitions under IFRS 3 Business combinations can represent an inherently judgemental exercise. In particular, judgement is required in determining the appropriate assumptions to use to value the acquired customer relationships and the brands purchased by Brickability Group.
Refer to note 21 for detailed disclosures in relation to these items.
Management are required to fair value the assets and liabilities to account for the acquired entities under IFRS 3, business combinations. This includes identifying and valuing any intangible assets as part of the purchase price allocation method detailed in the standard. This involves an area of significant and inherent management judgement.
In particular, judgement is required in determining the appropriate assumptions used to value the acquired customer relationships and the brands. It also requires judgement in defining the cash generating units (“CGU”) under which future impairment testing is required.
We obtained and reviewed the key contracts associated with the acquisitions, including the sale and purchase agreement, to confirm that significant terms and conditions were appropriately accounted for.
With support of BDO business valuations specialists, we evaluated management’s determination of the fair values of the assets and liabilities acquired and in particular the valuation of intangible assets. We audited the key assumptions made by management such as the useful economic lives, discount rates applied and the forecast future cash flows within the identified CGU.
We audited the accuracy and completeness of the current and deferred tax balances included in the acquisition balance sheet (where applicable), including the impact on the tax balances of the fair value adjustments applied in the acquisition accounting.
We considered the disclosures made in respect of the acquisitions with reference to the requirements of IFRS 3 business combinations.
Key observations communicated to the Audit Committee:We consider the judgements made in the identification and valuation of the intangible assets and in defining the CGUs to be reasonable and we consider the disclosures made in the financial statements to be appropriate.
53S T R A T E G I C R E P O R T
Risk - Carrying value of goodwill and intangible assets Our response to the risk
The carrying amounts of the Group’s goodwill and acquired intangible assets are assessed each year for impairment against potential future cash flows. There is a risk that the year-end values assigned to goodwill and intangible assets are materially misstated.
As this is subjective and judgemental, this increases the risk of error.
Refer to note 4 to the financial statements for the directors’ disclosures on the critical accounting estimates and judgements related to impairment.
As a consequence of the Group’s growth strategy a significant value of goodwill and intangible assets has arisen from acquisitions. There is a risk that cash generating units (‘CGUs’) may not be identified correctly as well as not achieving the anticipated business performance to support the carrying value of these assets. This risk has been heightened by uncertainty over future trading prospects and cash flows caused by the Covid-19 pandemic. This may lead to an impairment charge that has not been recognised by management.
We examined management’s methodology for reviewing impairments and their models for assessing the valuation of significant goodwill and intangible balances to understand the composition of management’s future cash flow forecasts, and the process undertaken to prepare them.
We assessed management’s determination of the CGUs under which these cash flows are grouped. These procedures included confirming the underlying cash flows were consistent with the Board approved budgets, which reflected the forecasted impact of COVID-19 on the business and reasonableness of the assumptions. We re-performed the calculations in the model to test the mathematical integrity.
For all CGUs we calculated the degree to which the key assumptions would need to fluctuate before an impairment was triggered and considered the likelihood of this occurring. In respect of the CGUs identified as having impairment indicators or lower levels of headroom we performed detailed testing with support from our valuation specialists to critically assess and corroborate the key inputs of the forecast cash flows including:
An assessment of the discount rate used by obtaining the underlying data used in the calculation and benchmarking it against comparable organisations and market data;
A consideration of the length of the period for which cash flows were modelled and the growth rates assumed in the cash flows as well as the terminal value, by comparing them to economic and industry forecasts; and
An analysis of the historical accuracy of budgets to actual results to determine whether forecast cash flows are reliable based on past experience and ensuring that sensitivities applied to the models are in excess of any forecasting inaccuracy.
We considered the disclosures in respect of goodwill and intangibles with reference to the requirements of IAS 36 and confirmed their consistency with the audited impairment models.
Key observations communicated to the Audit Committee:We consider that the assumptions used in the impairment models including the cash flow forecasts, the discount rate applied and management’s assessment of the identification of CGUs was appropriate.
Independent Auditor’s Reportto the members of Brickability Group PLC
54
Risk – Going Concern Our response to the risk
There is a risk that management’s forecasts do not adequately capture reasonably possible scenarios which may cast doubt on the Group’s ability to maintain compliance with its financial covenants and continue as a going concern.
Refer to pages 26 to 27 of the Strategic Report for the directors’ assessment of going concern and note 4 for the directors’ disclosures for the critical accounting estimates and judgements.
The emergence and spread of Covid-19 has had and will continue to have, an effect on the operations of many businesses in the UK. The UK entered lockdown on the 23 March 2020, which had a material impact on the operation of the business and the trading activities during this period.
Following the pandemic and the economic uncertainty which quickly followed, there is heightened risk that Management’s forecasts do not adequately capture reasonably possible scenarios which may cast doubt on the Group’s ability to maintain compliance with its financial covenants and continue as a going concern.
We audited the Group’s trading and cash flow forecast for at least 12 months from the planned sign-off of the consolidated financial statements. We agreed the mathematical accuracy of the forecasts made by management;
We audited the key management assumptions in relation to future sales performances in each part of the business, capital expenditure, working capital movements, cost savings initiatives included in the forecast and assumptions included in relation to the impact of Covid-19.
Where possible, we performed an assessment of management’s historical ability to forecast by reviewing previous forecasts made and track current year performance against the business cases and forecasts previously presented to the Board.
We assessed the liquidity available to the Group and the performance against the available credit facilities and its relevant covenants.
We considered the Group’s ability to be able to comply with any covenants and tested management’s calculations of forecast covenant compliance.
We challenged the Board on the nature and appropriateness of the sensitivities adopted in their going concern assessment and challenged management in light of the implications of Covid-19 that the sensitivities adopted represent scenarios which are reasonably plausible in light of the current macro-economic uncertainty. We performed our own sensitivities and stress testing over management’s models and review the likelihood of these circumstances arising.
We evaluated the adequacy of the directors’ disclosure of their basis for determining that the going concern basis of preparation of the financial statements is appropriate.
Our application of materialityWe apply the concept of materiality both in planning and performing our audit, and in evaluating the effect of misstatements. We consider materiality to be the magnitude by which misstatements, including omissions, could influence the economic decisions of reasonable users that are taken on the basis of the financial statements. Importantly, misstatements below these levels will not necessarily be evaluated as immaterial as we also take account of the nature of identified misstatements, and the particular circumstances of their occurrence, when evaluating their effect on the financial statements as a whole.
We determined materiality for the financial statements as a whole as follows:
Group materiality £600,000 Basis for materiality 4.9% group profit before taxation
Rationale for the benchmark adopted: We consider that statutory profit before tax is a key performance measure to the stakeholders of the entity and therefore determined materiality based on this number.
Parent company materiality £495,000 Basis of materiality 26% of net assets capped at 60% of group materiality
Rationale for benchmark adopted: The parent company does not recognise any external revenue therefore a net asset value measure is considered appropriate as the company holds the investments in subsidiaries and does not trade.
55S T R A T E G I C R E P O R T

Our application of materiality (continued) In considering individual account balances and classes of transactions we apply a lower level of materiality (performance materiality) in order to reduce to an appropriately low level the probability that the aggregate of uncorrected and undetected misstatements exceeds materiality. In setting the level of performance materiality we considered a number of factors including the areas of estimation with the financial statements and the type of audit testing to be completed. Group performance materiality was set at £400,000 and the Parent company performance materiality was set at £326,000 representing 65% of materiality.
For each significant component in the group we allocated a planning materiality lower than our overall group planning materiality in the range of £118,000 to £495,000 with a similar restriction of 65% for performance materiality. The materiality level was calculated by reference to a proportion of group materiality appropriate to the relative size and risk of the component concerned, based on revenue.
We agreed with the audit committee that we would report to the committee all individual audit differences identified during the audit in excess of £14,000 for group purposes and £14,000 for the parent company only. We also agreed to report differences below these thresholds that, in our view, warranted reporting on qualitative grounds.
An overview of the scope of our auditOur assessment of audit risk, our evaluation of materiality and our allocation of performance materiality determine our audit scope for each entity within the Group. Taken together, this enables us to form an opinion on the consolidated financial statements. Our Group audit was scoped by obtaining and understanding of the Group and its environment, including the Group’s system of internal control, and assessing the risks of material misstatement in the financial statements at the Group level.
In determining the scope of our audit we considered the size and nature of each component within the group to determine the level of work to be performed at each in order to ensure sufficient assurance was gained to allow us to express an opinion on the financial statements as a whole.
6 components were identified as significant components of the group (Brick-ability Limited, Brick Services Limited, Crest Brick Slate & Tile Limited, Towelrads.com Limited, Crest Roofing Limited and Brickability Group plc,) and were subject to a full scope audit by BDO LLP. The significant components represent 67% of revenue, 111% of profit before taxation and 74% of net assets of the Group.
There are 22 other components within the Group that were not considered to be significant components. For these components, we performed other procedures, including analytical review, testing of consolidation journals, intercompany eliminations, enquiries of management to respond to any potential risks of material misstatement to the Group financial statements and substantive audit procedures on any individual balances or items considered significant with reference to the Group materiality threshold. These audit procedures performed increase the level of coverage obtained from our audit over revenue, profit before taxation and net assets.
We obtained an understanding of the internal control environment related to the financial reporting process and assessed the appropriateness, completeness and accuracy of the group journals and other adjustments performed on consolidation.
Independent Auditor’s Reportto the members of Brickability Group PLC
56
Our application of materiality (continued) In considering individual account balances and classes of transactions we apply a lower level of materiality (performance materiality) in order to reduce to an appropriately low level the probability that the aggregate of uncorrected and undetected misstatements exceeds materiality. In setting the level of performance materiality we considered a number of factors including the areas of estimation with the financial statements and the type of audit testing to be completed. Group performance materiality was set at £400,000 and the Parent company performance materiality was set at £326,000 representing 65% of materiality.
For each significant component in the group we allocated a planning materiality lower than our overall group planning materiality in the range of £118,000 to £495,000 with a similar restriction of 65% for performance materiality. The materiality level was calculated by reference to a proportion of group materiality appropriate to the relative size and risk of the component concerned, based on revenue.
We agreed with the audit committee that we would report to the committee all individual audit differences identified during the audit in excess of £14,000 for group purposes and £14,000 for the parent company only. We also agreed to report differences below these thresholds that, in our view, warranted reporting on qualitative grounds.
An overview of the scope of our auditOur assessment of audit risk, our evaluation of materiality and our allocation of performance materiality determine our audit scope for each entity within the Group. Taken together, this enables us to form an opinion on the consolidated financial statements. Our Group audit was scoped by obtaining and understanding of the Group and its environment, including the Group’s system of internal control, and assessing the risks of material misstatement in the financial statements at the Group level.
In determining the scope of our audit we considered the size and nature of each component within the group to determine the level of work to be performed at each in order to ensure sufficient assurance was gained to allow us to express an opinion on the financial statements as a whole.
6 components were identified as significant components of the group (Brick-ability Limited, Brick Services Limited, Crest Brick Slate & Tile Limited, Towelrads.com Limited, Crest Roofing Limited and Brickability Group plc,) and were subject to a full scope audit by BDO LLP. The significant components represent 67% of revenue, 111% of profit before taxation and 74% of net assets of the Group.
There are 22 other components within the Group that were not considered to be significant components. For these components, we performed other procedures, including analytical review, testing of consolidation journals, intercompany eliminations, enquiries of management to respond to any potential risks of material misstatement to the Group financial statements and substantive audit procedures on any individual balances or items considered significant with reference to the Group materiality threshold. These audit procedures performed increase the level of coverage obtained from our audit over revenue, profit before taxation and net assets.
We obtained an understanding of the internal control environment related to the financial reporting process and assessed the appropriateness, completeness and accuracy of the group journals and other adjustments performed on consolidation.
Independent Auditor’s Reportto the members of Brickability Group PLC
56 57S T R A T E G I C R E P O R T

57S T R A T E G I C R E P O R T 57S T R A T E G I C R E P O R T

Other informationThe Directors are responsible for the other information. The other information comprises the information included in the annual report, other than the financial statements and our auditor’s report thereon. Our opinion on the financial statements does not cover the other information and, except to the extent otherwise explicitly stated in our report, we do not express any form of assurance conclusion thereon.
In connection with our audit of the financial statements, our responsibility is to read the other information and, in doing so,
consider whether the other information is materially inconsistent with the financial statements or our knowledge obtained in the audit or otherwise appears to be materially misstated. If we identify such material inconsistencies or apparent material misstatements, we are required to determine whether there is a material misstatement in the financial statements or a material misstatement of the other information. If, based on the work we have performed, we conclude that there is a material misstatement of this other information, we are required to report that fact. We have nothing to report in this regard.
Opinions on other matters prescribed by the Companies Act 2006In our opinion, based on the work undertaken in the course of the audit:
• the information given in the strategic report and the Directors’ report for the financial year for which the financial statements are prepared is consistent with the financial statements; and
• the strategic report and the Directors’ report have been prepared in accordance with applicable legal requirements.
Matters on which we are required to report by exceptionIn the light of the knowledge and understanding of the Group and the Parent Company and its environment obtained in the course of the audit, we have not identified material misstatements in the strategic report or the Directors’ report.
We have nothing to report in respect of the following matters in relation to which the Companies Act 2006 requires us to report to you if, in our opinion:
• adequate accounting records have not been kept by the Parent Company, or returns adequate for our audit have not been received from branches not visited by us; or
• the Parent Company financial statements are not in agreement with the accounting records and returns; or
• certain disclosures of Directors’ remuneration specified by law are not made; or
• we have not received all the information and explanations we require for our audit.
Responsibilities of DirectorsAs explained more fully in the Directors’ responsibilities statement set out on page 50, the Directors are responsible for the preparation of the financial statements and for being satisfied that they give a true and fair view, and for such internal control as the Directors determine is necessary to enable the preparation of financial statements that are free from material misstatement, whether due to fraud or error.
In preparing the financial statements, the Directors are responsible for assessing the Group’s and the Parent Company’s ability to continue as a going concern, disclosing, as applicable, matters related to going concern and using the going concern basis of accounting unless the Directors either intend to liquidate the Group or the Parent Company or to cease operations, or have no realistic alternative but to do so.
Independent Auditor’s Reportto the members of Brickability Group PLC
58

Auditor’s responsibilities for the audit of the financial statements
Our objectives are to obtain reasonable assurance about whether the financial statements as a whole are free from material misstatement, whether due to fraud or error, and to issue an auditor’s report that includes our opinion. Reasonable assurance is a high level of assurance, but is not a guarantee that an audit conducted in accordance with ISAs (UK) will always detect a material misstatement when it exists.
Misstatements can arise from fraud or error and are considered material if, individually or in the aggregate, they could reasonably be expected to influence the economic decisions of users taken on the basis of these financial statements.
A further description of our responsibilities for the audit of the financial statements is located on the Financial Reporting Council’s website: www.frc.org.uk/auditorsresponsibilities. This description forms part of our auditor’s report.
Use of our reportThis report is made solely to the Parent Company’s members, as a body, in accordance with Chapter 3 of Part 16 of the Companies Act 2006. Our audit work has been undertaken so that we might state to the Parent Company’s members those matters we are required to state to them in an auditor’s report and for no other purpose. To the fullest extent permitted by law, we do not accept or assume responsibility to anyone other than the Parent Company and the Parent Company’s members as a body, for our audit work, for this report, or for the opinions we have formed.
Sarah Joannidi (Senior Statutory Auditor)For and on behalf of BDO LLP, Statutory AuditorBristol15 September 2020
BDO LLP is a limited liability partnership registered in England and Wales (with registered number OC305127).
59S T R A T E G I C R E P O R T

All results relate to continuing operations.
Notes2020
£’000
2019 (Restated)
£’000
Revenue 5 187,126 163,294
Cost of sales (149,442) (130,577)
Gross profit 37,684 32,717
Other operating income 7 26 96
Administrative expenses (17,766) (14,540)
Impairment losses on financial assets 24 (433) (542)
Depreciation and amortisation (4,387) (3,555)
Finance income 11 71 31
Finance expense 12 (2,527) (4,489)
Share of post-tax (loss)/ profit of equity accounted associates 22 (32) (13)
Fair value gains/ (losses) 13 (45) (1,135)
Exceptional income 14 2,000 -
Exceptional expenses 14 (2,407) -
Profit before tax 8 12,184 8,596
Tax expense 15 (2,893) (2,141)
Profit for the year and total comprehensive income 9,291 6,455
Attributable to:
Equity holders of the parent 9,291 6,455
Earnings per share
Basic earnings per share 17 4.79p 4.51 p
Diluted earnings per share 17 4.77p 4.51 p
CONSOLIDATED STATEMENT OF PROFIT OR LOSS AND OTHER COMPREHENSIVE INCOME FOR THE YEAR ENDED 31 MARCH 2020
Financial Statements
60

Notes2020
£’000
2019 (Restated)
£’000
As at1 Apr 2018 (Restated)
£’000
Non-current assets
Property, plant and equipment 18 4,173 3,514 3,262
Right of use asset 28 6,375 2,173 1,617
Intangible assets 19 78,050 66,753 67,216
Investments in equity accounted associates 22 352 1,292 636
Deferred tax assets 30 205 744 300
Trade and other receivables 24 391 333 146
Total non-current assets 89,546 74,809 73,177
Current assets
Inventories 23 9,791 5,422 5,031
Trade and other receivables 24 36,560 34,137 27,770
Cash and cash equivalents 25 27,269 17,001 5,346
Total current assets 73,620 56,560 38,147
Total assets 163,166 131,369 111,324
Current liabilities
Trade and other payables 26 (41,912) (35,094) (23,034)
Current income tax liabilities (277) (1,688) (1,798)
Loans and borrowings 27 - (3,053) (3,158)
Lease liabilities 28 (776) (428) (340)
Total current liabilities (42,965) (40,263) (28,330)
Non-current liabilities
Trade and other payables 26 (2,402) (4,507) (7,095)
Loans and borrowings 27 (24,912) (62,335) (59,718)
Lease liabilities 28 (5,802) (1,705) (1,259)
Derivative financial liabilities - (106) -
Provisions 29 (1,389) (1,975) (2,338)
Deferred tax liabilities 30 (5,631) (4,092) (4,453)
Total non-current liabilities (40,136) (74,720) (74,863)
Total liabilities (83,101) (114,983) (103,193)
Net assets 80,065 16,386 8,131
Equity
Called up share capital 33 2,305 4 4
Share premium account 34 49,999 8,970 7,170
Capital redemption reserve 34 2 - -
Share-based payment reserve 34 56 - -
Merger reserve 34 1,245 1,245 1,245
Retained earnings 34 26,458 6,167 (288)
Total equity 80,065 16,386 8,131
CONSOLIDATED BALANCE SHEET31 MARCH 2020
These Financial Statements were approved by the Board of Directors and authorised for issue on 15 September 2020. They were signed on its behalf by:
Alan J. Simpson DirectorStuart J. Overend Director
Company registration number: 11123804
61F I N A N C I A L S T A T E M E N T S

Notes2020
£’000
2019 (Restated)
£’000
As at 1 Apr 2018 (Restated)
£’000
Non-current assets
Investment in subsidiaries 20 6,542 6,542 6,542
Trade and other receivables 24 9,343 7,802 6,845
Total non-current assets 15,885 14,344 13,387
Current assets
Trade and other receivables 24 79,819 1,837 337
Total current assets 79,819 1,837 337
Total assets 95,704 16,181 13,724
Current liabilities
Trade and other payables 26 (166) (8) -
Current income tax liabilities (15) (125) (8)
Total current liabilities (181) (133) (8)
Non-current liabilities
Loans and borrowings 27 (24,912) - -
Total current liabilities (24,912) - -
Total liabilities (25,093) (133) (8)
Net assets 70,611 16,048 13,716
Equity
Called up share capital 33 2,305 4 4
Share premium account 34 56,505 15,476 7,170
Capital redemption reserve 34 2 - -
Share-based payment reserve 34 56 - -
Merger reserve 34 6,506 6,506 6,506
Retained earnings 34 11,743 568 36
Total equity 70,611 16,048 13,716
COMPANY BALANCE SHEET31 MARCH 2020
The profit of the Company for the financial year was £174,000 (£2019: £532,000).These Financial Statements were approved by the Board of Directors and authorised for issue on 15 September 2020. They are signed on behalf of the Board by:
Alan J. Simpson DirectorStuart J. Overend Director
Company registration number: 11123804
Financial Statements
62

Share capital£’000
Share premium account £’000
Capital redemption
£’000
Share based payment reserve£’000
Merger reserve£’000
RetainedEarnings
£’000Total
£’000
At 1 April 2018 (restated*) 4 7,170 - - 1,245 (288) 8,131
Profit for the year - - - - - 6,455 6,455
Total comprehensive income for the year - - - - - 6,455 6,455
Issue of paid shares (note 36) - 1,500 - - - - 1,500
Conversion of debt to equity (note 36) - 300 - - - - 300
Total contributions by and distributions to owners - 1,800 - - - - 1,800
At 31 March 2019 4 8,970 - - 1,245 6,167 16,386
Profit for the year - - - - - 9,291 9,291
Total comprehensive income for the year - - - - - 9,291 9,291
Dividends paid - - - - - (2,000) (2,000)
Issue of paid shares (note 36) 678 44,223 - - - - 44,901
Bonus issue of shares 1,429 (1,429) - - - - -
Conversion of debt to equity (note 36) 196 13,736 - - - - 13,932
Purchase of own shares (2) 2 - - - -
Increase in share-based payment reserve - - - 56 - - 56
Transfer on exercise or lapse of options - - - - - - -
Share issue costs - (2,501) - - - - (2,501)
Share premium reduction - (13,000) - - - (13,000) -
Total contributions by and distributions to owners 2,301 41,029 2 56 - 11,000 54,388
At 31 March 2020 2,305 49,999 2 56 1,245 26,458 80,065
CONSOLIDATED STATEMENT OF CHANGES IN EQUITYFOR THE YEAR ENDED 31 MARCH 2020
*See note 39 for details of restatement.
63F I N A N C I A L S T A T E M E N T S

Share capital£’000
Share premium account £’000
Capital redemption
£’000
Share based
payments£’000
Merger Reserve£’000
RetainedEarnings
£’000Total
£’000
At 1 April 2018 (restated*) 4 7,170 - - 6,506 36 13,716
Profit for the year - - - - - 532 532
Total comprehensive income for the year - - - - - 532 532
Issue of paid shares (note 36) - 1,500 - - - - 1,500
Conversion of debt to equity - 300 - - - - 300
Total contributions by and distributions to owners - 1,800 - - - - 1,800
At 31 March 2019 4 8,970 - - 6,506 568 16,048
Profit for the year - - - - - 175 175
Total comprehensive income for the year - - - - - 175 175
Dividends paid - - - - - (2,000) (2,000)
Issue of paid shares (note 36) 678 44,223 - - - - 44,901
Bonus issue of shares 1,429 (1,429) - - - - -
Conversion of debt to equity (note 36) 196 13,736 - - - - 13,932
Purchase of own shares (2) - 2 - - - -
Increase in share-based payment reserve - - - 56 - - 56
Share issue costs - (2,501) - - - - (2,501)
Share premium reduction - (13,000) - - - 13,000 -
Total contributions by and distributions to owners 2,301 41,029 2 56 - 11,000 54,388
At 31 March 2020 2,305 49,999 2 56 6,506 11,743 70,611
COMPANY STATEMENT OF CHANGES IN EQUITY FOR THE YEAR ENDED 31 MARCH 2020
Financial Statements
*See note 39 for details of restatement.
64

Notes2020
£’000
2019 (Restated)
£’000
Operating activities
Operating profit for the year 9,291 6,455
Adjustments for:
Depreciation of property, plant and equipment 18 595 529
Depreciation of right of use assets 28 717 451
Amortisation of intangible assetss 19 3,059 2,575
Gain on disposal of property, plant & equipment and right of use assets 8 (8) (47)
Foreign exchange losses 4 71
Share-based payments expense 35 56 -
Share of post-tax loss/ (profit) in equity accounted associates 22 32 (13)
Impairment of goodwill 19 16 -
Fair value changes in contingent consideration 13 45 1,135
Movements in provisions 29 (586) (363)
Finance income 11 (71) (31)
Finance expense 12 2,527 4,489
Exceptional expenses 14 2,407 -
Income tax expense 15 2,893 2,141
Amortisation of loan note issue costs 2 7
Operating cash flows before movements in working capital 20,979 17,399
Changes in working capital:
Increase in inventories (1,890) (371)
Decrease/ (Increase) in trade and other receivables 6,862 (5,058)
(Decrease)/ Increase in trade and other payables (5,024) 11,588
Cash generated from operations 20,927 23,558
Payment of exceptional acquisition expenses (320) -
Interest received 70 31
Interest paid (6,049) (1,488)
Income taxes paid (4,710) (3,210)
Net cash from operating activities 9,918 18,891
Investing activities
Purchase of property, plant and equipment 18 (941) (628)
Proceeds from sale of property, plant and equipment 25 47
Purchase of right of use assets 28 (32) -
Proceeds from sale of right of use assets - 21
Purchase of intangible assets - (4)
Acquisition of subsidiaries 21 (11,426) (2,645)
Net cash acquired with subsidiary undertakings 21 5,146 (4)
Acquisition of interests in associates - (194)
Dividends received from associates 22 33 36
Net cash used in investing activities (7,195) (3,371)
CONSOLIDATED STATEMENT OF CASH FLOWSFOR THE YEAR ENDED 31 MARCH 2020
65F I N A N C I A L S T A T E M E N T S

1. General Information Brickability Group plc is a company incorporated in England and Wales. The address of the registered office is shown on page 119. The nature of the Group’s operations and its principal activities are set out in the Strategic Report on pages 4 to 29.
2. Basis of Preparation The consolidated financial statements have been prepared in accordance with International Financial Reporting Standards (IFRS) adopted for use in the European Union and the Companies Act 2006 applicable to companies reporting under IFRS.For periods up to and including 31 March 2019, the Group prepared its financial statements in accordance with FRS 102, ‘The Financial Reporting Standard applicable in the UK and the Republic of Ireland’ (United Kingdom Generally Accepted Accounting Practice (UK GAAP)). As part of the AIM listing process, the Group transitioned to IFRS and the first set of annual financial statements prepared under IFRS was included within the AIM listing admission document. The Group transitioned from FRS 102 to IFRS as at 22 December 2017.These consolidated financial statements are the first statutory financial statements that the Group has prepared in accordance with IFRS, since listing. Details of how the transition to IFRS has impacted the reported financial position, financial performance and cash flows is outlined in note 39. Reconciliation has been included to both the FRS 102 results reported previously and the first set of IFRS financial statements included in the admission document.
The Company, as the ultimate parent of the Group, has elected prepare its individual financial statements in accordance with FRS 101 Reduced Disclosure Framework. The Company’s individual financial statements are presented within these Group financial statementsThe Company has adopted the following disclosure exemptions:i. the requirements of IFRS 7 Financial Instruments: Disclosures;ii. the requirement to present a cash flow statement
under IAS 7 Statement of Cash Flows; iii. the requirement to disclose key management personnel
compensation; andiv. the requirement to disclose related party transactions with wholly
owned members of the Group.The financial statements are presented in pounds sterling, which is the functional currency of the Group. Amounts are rounded to the nearest thousand, unless otherwise stated.The financial statements are prepared on the historical cost basis, with the exception of derivative financial instruments which are stated at fair value. After making appropriate enquiries, the Directors have a reasonable expectation that the Company and Group have adequate resources to continue in operational existence for the foreseeable future and for at least twelve months from the date of signing these financial statements. For this reason, they continue to adopt the going concern basis in preparing the financial statements. The Group’s going concern basis has been considered further on pages 26 to 27 of the Strategic Report.
CONSOLIDATED STATEMENT OF CASH FLOWSFOR THE YEAR ENDED 31 MARCH 2020
Financial Statements
NOTES TO THE FINANCIAL STATEMENTSYEAR ENDED 31 MARCH 2020
Notes2020
£’000
2019 (Restated)
£’000
Financing activities
Equity dividends paid 16 (2,000) -
Proceeds from issue of ordinary shares 43,923 1,500
Payment of share issue costs (414) -
Payment of exceptional financing costs (490) -
Proceeds from bank borrowings 13,015 1,500
Repayment of bank borrowings (25,000) (3,158)
Proceeds from loan notes issued - 1,500
Repayment of loan notes (14,562) -
Payment of lease liabilities 28 (871) (541)
Payment of deferred consideration 36 (5,885) (4,663)
Payment of transaction costs relating to loans and borrowings (70) -
Settlement of derivative financial instruments 36 (105) -
Net cash outflow from financing activities 7,541 (3,862)
Net increase in cash and cash equivalents 10,264 11,658
Cash and cash equivalents at beginning of year 17,001 5,346
Effect of changes in foreign exchange rates 4 (3)
Cash and cash equivalents at end of year 25 27,269 17,001
The notes on pages 66 to 118 form part of these financial statements.
66

3. Significant Accounting Policies The accounting policies which follow set out those policies which were applied in preparing the Financial Statements for the year ended 31 March 2020.
3.1 Basis of consolidation The consolidated Financial Statements comprise the Financial Statements of Brickability Group plc and its subsidiary undertakings. Control is achieved when the Group:
• has power over the investee;
• is exposed or has rights to variable returns from its involvement with the investee; and
• has the ability to use its power to affect those variable returns.
The results of subsidiaries acquired or disposed of during the year are included from or to the date that control passes. Intra-group transactions and balances are eliminated fully on consolidation and the consolidated Financial Statements reflect external transactions only. Subsidiaries’ accounting policies are amended where necessary to ensure consistency with the policies adopted by the Group.
All accounts for subsidiary undertakings have been prepared for the year ended 31 March 2020 except for the accounts of McCann Roofing Products Limited and U Plastics Limited, which both have a year end of 31 December 2019. The Group accounts therefore include interim financial information to 31 March 2020 for each of these, following acquisition.
The Company has applied the exemption under section 408 of the Companies Act 2006 and not presented its individual income statement.
3.2 Investments Non-current asset investments by the Company in subsidiaries and associates are initially recorded at cost and subsequently stated at cost less any accumulated provision for impairment.
3.3 Investment in associates and joint ventures An associate is an entity over which the Group has significant influence. Significant influence is the power to participate in the financial and operating policy decisions of the investee but is not control or joint control over those policies.
Investments in associates are accounted for using the equity method of accounting. Under the equity method, investments are initially recognised at cost and subsequently adjusted to reflect changes in the Group’s share of the net assets of the associate or joint venture since the acquisition date.
Where a Group company transacts with an associate of the Group, unrealised profits and losses are eliminated to the extent of the Group’s interest in the relevant entity.
3.4 Revenue recognition Revenue is recognised when the Group has satisfied its performance obligations to the customer. Revenue is measured at the fair value of the consideration received or receivable and represents amounts receivable for goods and services provided in the normal course of business, net of discounts and Value Added Tax.
The Group generates revenue through three main activities:• the sale of superior quality building materials to all sectors of
the construction industry including national house builders, developers, contractors, general builders and retail to members of the public;
• the supply of roofing construction services, primarily within the residential construction sector; and
• the sale of high-performance joinery materials and the distribution of radiators and associated parts and accessories.
The Group considers itself to be the principal in its revenue arrangements as it typically controls the goods or services before transferring them to the customer.
Revenue from the sale of goods is recognised when control of the goods has transferred to the buyer. This is usually when the goods are delivered to the customer.
Revenue for completed bespoke goods, attributable to specific customer contracts but yet to be delivered to the customer, is recognised within contract assets. It is measured at the fair value of the consideration receivable, as the Group’s performance creates an asset with no alternative use to the entity and has an enforceable right to payment for those goods. Upon delivery to the customer, the amount recognised as a contract asset is reclassified to trade receivables.
Revenue from contracts for the provision of services, in relation to roof installations, is recognised over time by reference to the stage of completion. Jobs in progress are reviewed and invoiced at the end of each month to reflect the value of work carried out in the period.
The Group has applied the practical expedients within IFRS 15 in respect of the following:
• not accounting for significant financing components where the time difference between receiving consideration and transferring control of the goods or services to its customers is one year or less; and
• expensing the incremental costs of obtaining a contract when the amortisation period of the asset otherwise recognised is one year or less.
Customer rebates The Group offers customer rebates in respect of volume discounts. These customer rebates give rise to variable consideration. Where the consideration in a contract includes a variable amount, the Group estimates the amount of consideration to which it will be entitled in exchange for transferring its goods to the customer. The Group applies the most likely amount method to estimate the variable consideration in the contract.
Where the Group has rebate agreements with its customers, rebates payable are deducted from revenue in the period that the associated revenue is recognised. The value of rebates payable is based on the terms of the individual contracts in place, to the extent that it is highly probable that the variable consideration estimated will not result in a significant reversal in the amount of cumulative revenue recognised when the uncertainty associated with the variable contract is subsequently resolved.
67F I N A N C I A L S T A T E M E N T S

3.5 Foreign currencies The individual Financial Statements of each Group company are presented in the currency of the primary economic environment in which it operates (its functional currency). The results and financial position of each Group company are expressed in pounds sterling, which is also the functional currency of the Company and the presentation currency for the consolidated Financial Statements.
Transactions in foreign currencies are initially recorded in the functional currency by applying the spot exchange rate on the dates of the transactions. Monetary assets and liabilities, that are denominated in foreign currencies, are retranslated at the exchange rates ruling at the reporting date.
Exchange differences arising on the settlement of monetary items, and on the retranslation of monetary items, are included in profit or loss for the year.
Non-monetary items that are measured in terms of historical cost in a foreign currency are translated using the exchange rate at the date of the transaction and not retranslated at the reporting date. Non-monetary items that are measured at fair value in a foreign currency are translated using the exchange rate at the date at which the fair value is determined.
3.6 Group pension schemes Payments to defined contribution retirement benefit schemes are recognised as an expense in the period in which the related service is provided. Prepaid contributions are recognised as an asset to the extent that the prepayment will lead to a reduction in future payments or a cash refund.
3.7 Government grants Government grants are recognised where there is reasonable assurance that the grant will be received and all attached conditions will be complied with. Grants relating to expense items are recognised as income on a systemic basis over the period that the related costs, for which the grant is intended to compensate, are expensed. Grants relating to assets are recognised as deferred income and transferred to income in the profit or loss on a systemic basis over the expected useful life of the related assets.
3.8 Taxation The tax expense represents the sum of the tax currently payable and deferred tax. Tax is recognised in the statement of profit or loss, except to the extent that it relates to items recognised in other comprehensive income or directly in equity. In this case, tax is recognised in other comprehensive income or directly in equity, respectively.
Current tax Current tax is the expected tax payable or recoverable based on taxable profit for the year and any adjustment to tax
payable in respect of prior years. Current tax is calculated using tax rates and laws that have been enacted or substantively enacted at the reporting date.
Deferred tax Deferred tax is the tax expected to be payable or recoverable on differences between the carrying amounts of assets and liabilities in the Financial Statements and the corresponding tax bases used in the computation of taxable profit. It is accounted for using the balance sheet liability method.
Deferred tax assets and liabilities are recognised where the carrying value of an asset or liability in the consolidated statement of financial position differs from its tax base, except for differences arising on:
• the initial recognition of goodwill;
• the initial recognition of an asset or liability in a transaction which is not a business combination and at the time of the transaction affects neither accounting or taxable profit; and
• investments in subsidiaries and joint arrangements where the Group is able to control the timing of the reversal of the difference and it is probable that the difference will not reverse in the foreseeable future.
Deferred tax assets are recognised to the extent that it is probable that taxable profits will be available against which deductible temporary differences can be utilised.
The carrying amount of deferred tax assets is reviewed at each reporting date and reduced to the extent that it is no longer probable that sufficient taxable profits will be available to allow all or part of the asset to be recovered. Unrecognised deferred tax assets are also re-assessed at each reporting date and recognised to the extent that it has become probable that future taxable profits will allow the deferred tax asset to be recovered.
Deferred tax assets and liabilities are measured at the tax rates that are expected to apply in the year when the asset is realised or the liability is settled, based on the tax rates and laws that have been enacted or substantively enacted at the reporting date.
Deferred tax assets and liabilities are offset when there is a legally enforceable right to set off current tax assets against current tax liabilities and when the deferred tax assets and liabilities relate to income taxes levied by the same taxation authority on either the same taxable group company or different taxable group companies which intend either to settle current tax assets and liabilities on a net basis, or to realise the assets and settle the liabilities simultaneously, in each future period in which significant amounts of deferred tax assets or liabilities are expected to be recovered or settled.
Financial Statements
NOTES TO THE FINANCIAL STATEMENTSYEAR ENDED 31 MARCH 2020
68

3.9 Property, plant and equipment Property, plant and equipment is initially recorded at cost and subsequently stated at cost less any accumulated depreciation and impairment losses. Any property, plant and equipment carried at revalued amounts are recorded at the fair value at the date of revaluation less any subsequent accumulated depreciation and impairment losses.
An increase in the carrying value of an asset, as a result of a valuation, is recognised in other comprehensive income and accumulated in equity, except to the extent that it reverses a revaluation decrease of the same asset previously recognised in the statement of profit or loss. A decrease in the carrying value of an asset, as a result of revaluation, is recognised in other comprehensive income to the extent of any previously recognised revaluation increase accumulated in equity in respect of that asset. Where a revaluation decrease exceeds the accumulated revaluation gains accumulated in equity, in respect of that asset, the excess is recognised in the statement of profit or loss.
Depreciation is charged so as to write off the cost or valuation of an asset, less its residual value, over the estimated useful life of that asset, using the straight-line or reducing balance method, as follows:
Freehold property 2% – 25% per annum
Leasehold property Over the term of the lease
Plant and machinery 20% to 33% per annum
Fixtures, fittings and equipment 10% to 33% per annum
Motor vehicles 10% to 25% per annum
Freehold land is not depreciated.
3.10 Leases The Group assesses, at the inception of a contract, whether a contract is, or contains, a lease. A contract is, or contains, a lease if it conveys the right to control the use of an identified asset for a period of time in exchange for consideration. Control is conveyed when the Group has both the right to direct the identified asset’s use and to obtain substantially all the economic benefits from that use.
For contracts that both convey a right to the Group to use an identified asset and require services to be provided to the Group by the lessor, the Group has elected not to separate non-lease components and thus account for the entire contract as a lease.
Lessee accounting All leases are accounted for by recognising a right of use asset and a lease liability except for:
• leases of low value assets; and • leases with a term of 12 months or less.
Lease payments for short-term (those with a term of 12 months or less) and low value asset leases are recognised as an expense, in the statement of profit or loss, on a straight-line basis over the lease term.
Right of use assets At the lease commencement date, right of use assets are measured at the amount of the corresponding lease liability, less any lease incentives received, plus the following:
• lease payments made at or before the lease commencement date;
• initial direct costs incurred;
• the amount of any provision recognised where the Group is contractually obliged to dismantle, remove or restore the leased asset or site on which the leased asset is located.
Right of use assets are presented as a separate line in the consolidated statement of financial position.
Right of use assets are subsequently measured at cost less accumulated depreciation and impairment losses.
Right of use assets are depreciated, on a straight-line basis, over the shorter period of the lease term and useful life of the underlying asset. If a lease transfers ownership of the underlying asset, or the cost reflects that the Group expects to exercise a purchase option, the related right of use asset is depreciated over the useful life of the asset.
Lease liabilities At the lease commencement date, lease liabilities are measured at the present value of the lease payments due to the lessor over the lease term, discounted at the rate implicit in the lease, where this can be readily determined. Where the rate cannot be readily determined, the Group uses its incremental borrowing rate.
Lease payments included in the measurement of the lease liability include:
• fixed lease payments (including in-substance fixed payments), less any lease incentives receivable;
• variable lease payments that depend on an index or rate; • amounts expected to be paid under residual value
guarantees; • the exercise price of any purchase option, if it is reasonably
certain to be exercised by the Group; and • any penalties payable for terminating the lease, if the lease
term reflects the Group exercising the option to terminate.Variable lease payments that do not depend on an index or a rate are recognised as an expense, in the statement of profit or loss, in the period to which they relate.
Lease liabilities are presented as a separate line in the consolidated statement of financial position.
Lease liabilities are subsequently increased to reflect interest charged on the lease liability, using the effective interest method, and reduced for lease payments made.
69F I N A N C I A L S T A T E M E N T S

Lease liabilities are remeasured if there is a modification (and the lease modification is not accounted for as a separate lease), a change in the lease term, a change in the lease payments due to changes in an index or rate, a change in the expected payment under a guaranteed residual value or a change in the assessment to exercise a purchase option.In the event of a lease modification, change in lease term or change in the assessment of a purchase option, the lease liability is remeasured by discounting the revised lease payments using a revised discount rate.In the event of a change in the lease payments, the lease liability is remeasured by discounting the revised lease payments using an unchanged discount rate, unless the lease payment change is due to a change in a floating interest rate, in which case a revised discount rate is used,When a lease liability is remeasured, a corresponding adjustment is made to the carrying value of the right of use asset, with the revised asset value being depreciated over the remaining lease term.Lessor accounting The Group enters into lease agreements as a lessor in respect of sub-leasing some of its leasehold property. Where the Group is an intermediate lessor, it accounts for the head lease and the sub-lease as two separate contracts. The sub-lease is classified as an operating lease by reference to the right of use asset arising from the head lease.Rental income from operating leases is recognised on a straight-line basis over the term of the lease. Initial direct costs incurred in negotiating and arranging an operating lease are added to the carrying amount of the underlying asset and recognised on a straight-line basis over the lease term.3.11 Intangible assets Intangible assets acquired separately are initially recognised at cost. The cost of intangible assets acquired as part of a business combination is their fair value at the acquisition date. Intangible assets are subsequently stated at cost less any accumulated amortisation and impairment losses.Amortisation is charged so as to write off the cost of the asset, less its residual value, over the estimated useful life of that asset, using the straight-line method, as follows:
Brands 10% – 12% per annum
Customer and supplier relationships and other intangibles
10% – 25% per annum
If there is an indication that there has been a change in the amortisation rate, useful life or residual value of an intangible asset, the amortisation charge is revised prospectively to reflect the new estimates.
3.12 Business combinations and goodwill Business combinations are accounted for using the acquisition method. The cost of an acquisition is measured as the aggregate of the consideration transferred, measured at acquisition date fair value, and the amount of any non-controlling interests in the acquiree. For each business combination, the Group elects whether to measure the non-controlling interests in the acquiree at fair value or the proportionate share of the acquiree’s identifiable net assets. Acquisition related costs are expensed as incurred and included in profit or loss.
When the Group acquires a business, it assesses the financial assets and liabilities assumed for appropriate classification and designation in accordance with the contractual terms, economic circumstances and pertinent conditions as at the acquisition date. This includes the separation of embedded derivatives in host contracts by the acquiree.
If the business combination is achieved in stages, any previously held equity interest is remeasured at its acquisition date fair value and any resulting gain or loss is recognised in profit or loss.
Contingent consideration is recognised at fair value at the acquisition date. Contingent consideration classified as equity is not remeasured and its subsequent settlement is accounted for within equity. Contingent consideration classified as an asset or liability that is a financial instrument, and within the scope of IFRS 9 Financial Instruments, is measured at fair value at the reporting date with changes in fair value recognised in the statement of profit or loss in accordance with IFRS 9. Other contingent consideration, that is not within the scope of IFRS 9, is measured at fair value at each reporting date, with changes in fair value recognised in profit or loss.
Goodwill is initially measured at cost, being the excess of the aggregate of the consideration transferred and the amount recognised for non-controlling interests, and any previous interest held, over the net identifiable assets acquired and liabilities assumed. If the fair value of the net assets acquired is in excess of the aggregate consideration transferred, the Group reassesses whether it has correctly identified all of the assets acquired and all of the liabilities assumed and reviews the procedures used to measure the amounts to be recognised at the acquisition date. If the reassessment still results in an excess of the fair value of net assets acquired over the aggregate consideration transferred, then the gain is recognised in profit or loss.
Financial StatementsNOTES TO THE FINANCIAL STATEMENTSYEAR ENDED 31 MARCH 2020
70

After initial recognition, goodwill is measured at cost less any accumulated impairment losses. For the purpose of impairment testing, goodwill acquired in a business combination is, from the acquisition date, allocated to each of the Group’s cash-generating units that are expected to benefit from the combination, irrespective of whether other assets or liabilities of the acquiree are assigned to those units.
Where goodwill has been allocated to a cash-generating unit and part of the operation within that unit is disposed of, the goodwill associated with the disposed operation is included in the carrying amount of the operation when determining the gain or loss on disposal. Goodwill disposed of in these circumstances is remeasured based on the relative values of the disposed operation and the portion of the cash-generating unit retained.
3.13 Group re-organisations The Group acquired Brickability Enterprises Investments Limited and its subsidiary undertakings on 6 March 2018. The directors consider that the insertion of Brickability Group plc as the new parent of Brickability Enterprises Investments Limited is not a business combination but rather a group re-organisation and thus falls outside the scope of IFRS 3. IFRS does not specifically state how group re-organisations are accounted for. Therefore, in accordance with IAS 8, the Directors have considered the accounting for group re-organisations using merger accounting principles, as set out in FRS 102, The Financial Reporting Standard applicable in the UK and Republic of Ireland.
Under merger accounting, the assets and liabilities are not remeasured to fair value but are initially recorded at their previous carrying amounts. The difference between the carrying value of the assets and liabilities and the value of the consideration issued is recorded in a merger reserve. The results of Brickability Enterprises Investments Limited and its subsidiary undertakings have been included in the Group consolidated Financial Statements from the acquisition date.
3.14 Impairment of non-financial assets The Group assesses, at each reporting date, whether there is an indication that an asset may be impaired. If any indication exists, or when annual impairment testing for an asset is required, the Group estimates the recoverable amount of the asset. The recoverable amount is the higher of the value in use and the fair value less costs of disposal.
The recoverable amount is determined for an individual asset, unless the asset does not generate cash inflows that are largely independent of those from other assets or groups of assets, in which case the recoverable amount is estimated for the smallest group of assets to which it belongs and for which there are separately identifiable cash flows (its cash generating unit (CGU)).
When the carrying value of an asset or CGU exceeds its recoverable amount, the asset is considered impaired and is written down to its recoverable amount. Impairment losses are recognised as an expense in the statement of profit or loss, except to the extent that they reverse gains previously recognised in other comprehensive income, in which case the impairment loss is also recognised in other comprehensive income up to the amount of any previous gain.
In assessing value in use, the estimated future cash flows are discounted to their present value using a pre-tax discount rate that reflects current market assessments of the time value of money and the risks specific to the asset.
In determining fair value less costs of disposal, recent market transactions are taken into account. If no such transactions can be identified, an appropriate valuation model is used.
For assets, excluding goodwill, an assessment is made at each reporting date to determine whether there is an indication that previously recognised impairment losses no longer exist or have decreased. If such indication exists, the Group estimates the recoverable amount of the asset or CGU. When an impairment loss subsequently reverses, the carrying amount of the asset is increased to the revised recoverable amount but only to the extent that the carrying value does not exceed the carrying amount that would have been determined, net of amortisation or depreciation, had no impairment loss been recognised for the asset in prior years. The reversal of an impairment loss is recognised in the statement of profit or loss.
Goodwill is not amortised but is reviewed for impairment at least annually. CGUs, to which goodwill has been allocated, are tested for impairment annually, or more frequently when there is an indication that the unit may be impaired. If the recoverable amount of the CGU is less than its carrying value, an impairment loss is recognised. It is allocated first to reduce the carrying amount of any goodwill allocated to the unit and then to the other assets of the unit pro-rata on the basis of the carrying amount of each asset of the unit. An impairment loss recognised for goodwill is not reversed in a subsequent period.
3.15 Inventories Inventories are stated at the lower of cost and net realisable value. Cost comprises direct materials and costs that have been incurred in bringing the inventories to their present location and condition. Net realisable value represents the estimated selling price less all estimated costs of completion and sale.
71F I N A N C I A L S T A T E M E N T S

3.16 Financial instruments A financial instrument is any contract that gives rise to a financial asset of one entity and a financial liability or equity instrument of another entity. Financial assets and liabilities are recognised in the Group’s statement of financial position when the Group becomes party to the contractual provisions of the instrument.
Financial assets Financial assets, on initial recognition, are classified as those to be subsequently measured at amortised cost or those to be subsequently measured at fair value (either through profit or loss or through other comprehensive income). The classification depends on the financial asset’s contractual cash flow characteristics and the Group’s business model for managing them.
Financial assets held at amortised cost comprise trade and other receivables and cash and cash equivalents in the statement of financial position. They are assets held for the collection of contractual cash flows where those cash flows represent solely payments of the principal and interest.
They are initially recognised at fair value plus transaction costs that are directly attributable to their acquisition. They are subsequently stated at amortised cost, using the effective interest rate method, less provision for impairment.
Impairment provisions for trade receivables are recognised based on the simplified approach within IFRS 9, using lifetime expected credit losses. During this process, the probability of the non-payment of the trade receivables is assessed and multiplied by the amount of the expected loss arising from default to determine the lifetime expected credit loss for the trade receivables. For trade receivables that are reported net, such provisions are recorded in a separate provision account with the loss being recognised within in the statement of profit or loss. The gross carrying amount of a financial asset is reduced when the Group has no reasonable expectation of recovering the financial asset in its entirety or a portion thereof.
Assets measured at fair value are subsequently remeasured at fair value, with gains and losses being recognised in profit or loss. Transaction costs of financial assets carried at fair value through profit or loss are expensed in profit or loss.
Financial liabilities Financial liabilities, on initial recognition, are classified as those to be subsequently measured at amortised cost or those to be subsequently measured at fair value through profit or loss.
All financial liabilities are initially recognised at fair value and, in the case of loans and borrowings and payables, net of directly attributable transaction costs.
Financial liabilities measured at amortised cost include trade and other payables and loans and other borrowings, including bank overdrafts. These are subsequently stated at amortised cost, using the effective interest rate method. The interest expense includes initial transaction costs and any premium payable on redemption, as well as any interest or coupon payable while the liability is outstanding.
Financial liabilities measured at fair value are subsequently remeasured at fair value, with gains and losses recognised in profit or loss.
Derivative financial instruments The Group uses derivative financial instruments, such as forward currency contracts and interest rate swaps, to hedge its exposure to foreign currency exchange risk and interest risk. The Group does not enter into speculative financial instruments.
Such derivative financial instruments are initially recognised at fair value on the date on which the derivative contract is entered into and subsequently remeasured at fair value, with gains and losses recognised in profit or loss.
Derivatives are held as financial assets when their fair value is positive and as financial liabilities when the fair value is negative.
Equity instruments An equity instrument is any contract that evidences a residual interest in the assets of an entity after deducting all of its liabilities.
Dividends are recognised in other income in profit or loss when the Group’s right to receive payment of the dividend is established
Repurchase of the Company’s own equity instruments is recognised and deducted directly in equity. No gain or loss is recognised in profit or loss on the purchase, sale, issue or cancellation of the Company’s own equity instruments.
Fair value measurement
All assets and liabilities for which fair value is measured or disclosed in the Financial Statements are categorised within the fair value hierarchy, based on the degree to which the fair value is observable, as follows:
• Level 1 fair value measurements are those derived from quoted prices (unadjusted) in active markets for identical assets or liabilities;
Financial Statements
NOTES TO THE FINANCIAL STATEMENTSYEAR ENDED 31 MARCH 2020
72
• Level 2 fair value measurements are those derived from inputs other than quoted prices included within level 1 that are observable for the asset or liability, either directly (i.e. as prices) or indirectly (i.e derived from prices); and
• Level 3 fair value measurements are those derived from valuation techniques that include inputs for the asset or liability that are not based on observable market data (unobservable inputs).
Details of significant unobservable inputs used in determining fair values within level 3 are disclosed in note 32.
3.17 Provisions Provisions are recognised when the Group has a present obligation (legal or constructive) as a result of a past event, it is probable that the Group will be required to transfer economic benefits to settle that obligation and a reliable estimate can be made of the amount of the obligation. Provisions are recognised as a liability in the balance sheet with a corresponding expense recognised in profit or loss.
The amount recognised as a provision is the best estimate of the consideration required to settle the present obligation at the reporting date, taking into account the risks and uncertainties surrounding the obligation. When the effect of the time value of money is material, provisions are discounted using a pre-tax rate that reflects, where appropriate, the risks specific to the liability. When discounting is used, the increase in the provision due to the passage of time is recognised as a finance expense.
When some or all of the economic benefits required to settle a provision are expected to be recovered from a third party, a receivable is recognised as an asset if it is virtually certain that reimbursement will be received and the receivable can be measured reliably.
Warranties The Group provides for the expected cost of warranty obligations for defects that existed at the time of sale, as required by law. Provision is based on historical experience and management’s best estimate of the amount required to settle the Group’s obligation. Further details are outlined in note 29.
Dilapidations The Group provides for the expected cost of restoring its operating premises to their original state in accordance with its lease terms. Provision is based on management’s best estimate of the work and cost involved in completing this restoration. The cost is recognised as part of the right of use asset and is depreciated over the remaining term of the lease.
3.18 Share-based payments Equity-settled share option schemes and long-term incentive plans are measured at the fair value of the equity instruments at the grant date. The fair value excludes the effect of non-market-based vesting conditions. Details regarding the determination of the fair value of equity-settled share-based transactions are set out in note 35.
The fair value, determined at the grant date of the equity-settled share-based payments, is expensed on a straight-line basis over the vesting period, based on the Group’s estimate of equity instruments that will eventually vest. At each reporting date, the Group revises its estimate of the number of equity instruments expected to vest as a result of the effect of non-market-based vesting conditions. The impact of the revision of the original estimates, if any, is recognised in profit or loss such that the cumulative expense reflects the revised estimate, with a corresponding adjustment to equity reserves.
73F I N A N C I A L S T A T E M E N T S

4. Critical Accounting Judgements and Key Sources of Estimation Uncertainty In the application of the Group’s accounting policies, which are described in note 3, the Directors are required to make judgements, estimates and assumptions about the carrying amounts of assets and liabilities that are not readily apparent from other sources. The estimates and associated assumptions are based on historical experience and other factors that are considered to be relevant. Actual results may differ from these estimates.
The estimates and underlying assumptions are reviewed on an ongoing basis. Revisions to accounting estimates are recognised in the year in which the estimate is revised if the revision affects only that year, or in the year of the revision and future years if the revision affects both current and future years.
Critical judgements in applying the Group’s accounting policies The following are the critical judgements that the Directors have made in the process of applying the Group’s accounting policies and that have the most significant effect on the amounts recognised in the Financial Statements.
Associates Investments in associates are accounted for using the equity method of accounting, whereby the investment is initially recognised at the transaction price and subsequently adjusted to reflect the Group’s share of the profit or loss, other comprehensive income and equity of the associate. Judgements are made as to whether the Group has significant influence (but not control or joint control), being the power to participate in the financial and operating policy decisions of the associate or not.
Provisions Provisions are a key area of the Financial Statements and are subject to both judgement and estimation uncertainty. Provisions are recognised on product defect warranties when claims are made in relation to the products and services supplied. This requires judgement as to whether a claim would likely give rise to a provision based on the Group’s knowledge of its products, services and customers. The provision would then need to be estimated based on management’s assessment of the likely work and cost required to rectify any defect. This estimate is subjective and based on management’s knowledge of the products, services and past customerexperience (see note 29).
Lease term Judgement is required in determining the lease term where a lease includes periods covered by an option to extend the lease or an option to terminate the lease. The Directors apply judgement in evaluating whether it is reasonably certain or not that an option will be exercised. When recognising the lease, all relevant factors are taken into account, including the Group’s intentions and any factors that create an economic incentive to exercise an option. After the commencement date, the lease term will be re-assessed if there is a significant event or change in circumstances that is within the Group’s control and affects its ability to exercise an option.
3.19 Invoice discounting facilities The Group has in place an invoice discount facility based on the value of trade receivables. Under this arrangement, the Group has retained both the credit and late payment risk associated with the receivables. As the Group has retained substantially all the risk and rewards of ownership of the receivables, it continues to recognise the receivables in the balance sheet, with advances from the facility provider recognised as a separate liability.The expenses associated with the facility are included within the finance expense within the statement of profit or loss.IAS 7 requires cash flows to be presented in a manner which is most appropriate to an entity’s business. Cash inflows and outflows relating to the invoice discounting facility are assessed to be operating cash flows as it includes cash flows from the receivables as if the factoring has not been entered into. Management feel that the operating cash flow presentation best reflects the substance of the relationship entered into.
3.20 Alternative performance measures Alternative performance measures (APMs) are disclosed within the 2020 Annual Report and Accounts where management believes it is necessary to do so to provide further understanding of the financial performance of the Group.Underlying results are used in the day to day management of the Group. They represent statutory measures adjusted for items which could distort the understanding of performance and comparability year on year.
Adjusted EBITDA Adjusted EBITDA is the primary non-statutory measure which is used by the Group. This is represented by earnings before interest, tax, depreciation, amortisation and exceptional items, including acquisition costs. A reconciliation between adjusted EBITDA and statutory IFRS measures is included in note 6.Exceptional items are those which the Group considers to be significant in nature and quantum but not in the normal course of business. Details of exceptional items are disclosed in note 14.
Adjusted basic EPS Adjusted basic EPS is defined as profit for the year divided by the total number of shares in issue following the Initial Public Offering (IPO). Adjusted basic EPS is outlined in note 17.
Net Cash Net cash is defined as cash and cash equivalents less bank borrowings.
74

Key sources of estimation uncertainty The key assumptions concerning the future and other key sources of estimation uncertainty at the reporting date, that may have a significant risk of causing a material adjustment to the carrying amounts of assets and liabilities within the next financial year, are described below.
Impairment of non-financial assets The Group acquires intangible assets and goodwill during a business combination. These assets are primarily the assets subject to an impairment review. They are initially recorded at fair value and subsequently at cost less any amortisation (in the case of intangible assets) and impairment losses. Goodwill is reviewed for impairment annually while other assets are assessed when an indication of impairment is identified. In assessing whether an asset is impaired, the asset’s or CGU’s value in use is calculated based on a discounting cash flow model. The cash flows are derived from forecasts covering the next three years. The recoverable amount is therefore sensitive to the assumptions and estimates used in determining the amount and timing of future cash flows, the discount factor applied and the growth rate used for extrapolation purposes. Details of the key assumptions, including consideration of sensitivity, are disclosed further in note 19.
Intangible assets The Group recognises identifiable intangible assets acquired through business combinations, such as brands and customer and supplier relationships, at fair value on acquisition. Any excess paid over the value of net assets acquired is included as goodwill. Estimates are required to determine the purchase price allocation (PPA) between intangible assets and goodwill, with the fair value of intangibles sensitive to these estimates. The key estimates involved in establishing the fair values are the future cash flows forecast for the acquired entity, inputs into appropriate valuation models and the expected useful life of the assets.
Projected cash flows underpin the valuation of all identifiable intangible assets. These are based on management’s best estimate of the expected levels of trade and profits following acquisition, taking into account actual results around the time of acquisition. Forecasts are prepared for a three year period, with an inflationary 2% growth rate applied thereafter.
The fair value of brands is based on a relief from royalty method. The royalty rates applied in this model are based on a percentage of earnings before interest and tax (EBIT), discounted to reflect the size of the entity and its limited reach, given it is largely a business to business operation. The brand value is therefore sensitive to the discount rate applied and subsequent royalty rate incorporated into the model. For acquisitions during the year, the Group applied a discount of 60% to an implied royalty rate based on 25% of the EBIT margin.
Intangible assets are amortised over their expected useful life. The annual amortisation charge and carrying value of the asset is therefore sensitive to the estimated useful life. The useful life is based on the period over which management expects to benefit from the intangible assets, based on past experience and knowledge of the business acquired.
Provision for expected credit losses (ECLs) The Group uses a provision matrix to calculate the ECLs for trade receivables. The provision rates are based on days past due for groupings of customers with similar credit risk characteristics. The provision matrix is initially based on the Group’s historical observed default rates. However, the historical rate is adjusted to consider forward looking information, which may lead to a change in the expected number of defaults. The assessment of correlation between the historically observed default rates and forecast economic conditions is therefore a significant estimate. The ECLs calculated are sensitive to changes in circumstances and forecast economic conditions as the historical experience and forecasts may not be representative of a customer’s actual default in the future. Details of the ECLs on the Group’s trade receivables and contract assets, are disclosed in note 24.
Share-based payments Key estimates are used in determining the fair value of share-based payment transactions, including selecting the most appropriate valuation model and related inputs into that model. The Group operates a Company Share Option Plan (CSOP) with equity settled transactions. Fair value is measured using a binomial model at the grant date. Estimates are also required, at each reporting date, in determining the number of options that are expected to vest. Details of the assumptions and model used are disclosed in note 35.
Fair value measurement of financial instruments When fair values cannot be measured based on quoted prices in an active market, the fair value is measured using valuation techniques, including the discounted cash flow model. Inputs into this model are taken from observable markets where possible but a degree of judgement is required where this is not possible. Expert valuers are engaged by the Group where appropriate.
Contingent consideration, resulting from business combinations, is valued at fair value at the acquisition date as part of the business combination. When contingent consideration meets the definition of a financial asset or liability, it is subsequently remeasured to fair value at each reporting date. The fair value is determined using discounted cash flows. The key estimates are therefore the probability of the performance target being met and the discount rate used. Further details are disclosed in note 32.
75F I N A N C I A L S T A T E M E N T S

6. Segmental Analysis For management purposes, the Group is organised into segments based on its products and services. The Group generates revenue through three main activities and thus has three reportable segments, as follows:
5. Revenue
An analysis of the Group’s revenue is as follows: 2020£’000
2019£’000
Sale of goods 170,022 147,797
Rendering of services 17,104 15,497
187,126 163,294
All of the Group’s revenue is derived from contracts with customers and generated within the UK. Revenue in relation to the sale of goods comprises amounts receivable from the sale of building and joinery materials. Revenue in connection with the rendering of services relates to amounts receivable from the provision of roofing construction and installation services. Revenue by segment is included in note 6.
Trade receivables and contract assets arising are disclosed in note 24. The Group does not have a significant level of contract assets. These arise where bespoke goods are prepared
specifically for a customer, for which the Group has a right to consideration but the goods have not yet been transferred to the customer.
Included within other payables is an amount of £202,000 (2019: £128,000) (1 April 2018: £89,000) in relation to contract liabilities in respect of amounts paid or invoiced in advance of goods being transferred to the customer. Due to the nature of the business and short turnaround between orders being placed and goods being delivered, liabilities at the reporting date are recognised within revenue in the following year.
Financial Statements
4. Critical Accounting Judgements and Key Sources of Estimation Uncertainty (continued)
Lease incremental borrowing rate Where the interest rate in a lease cannot be readily determined, the Group uses its incremental borrowing rate to measure the lease liability. The incremental borrowing rate is that which the Group would have to pay to borrow over a similar term, and with a similar security, the funds necessary to obtain an asset of a similar value to the right of use asset in a similar economic environment. This rate therefore requires estimation when no observable rates are available. The Group estimates the rate by assessing the rates implied in similar agreements and using observable inputs, such as market interest rates, when available.
COVID-19 On 31 December 2019, China reported a pneumonia outbreak of unknown cause to the World Health Organisation (“WHO”). On 30 January 2020, the WHO declared a Public Health Emergency of International Concern.On 11 March 2020 the WHO declared the virus a pandemic and, from 16 March 2020, the UK Government announced major government-backed loans. From this date, day-to-day life in the UK also began to be impacted through announced social distancing measures, with additional stay at home
measures being enforced soon after. The scale of the Government interventions and impact on daily life in the UK gave rise to significant market movements, with global lock downs occurring before the Group’s reporting date of 31 March 2020.The assessment of the impact of COVID-19 on the consolidated Financial Statements requires judgement and affects the estimates included in certain areas, including the assessment of the appropriateness of the going concern basis in preparing the Financial Statements and the testing for impairment of assets (see note 19).Given the timing of the global pandemic, management determined that the conditions in relation to COVID- 19 existed at the balance sheet date and therefore the events which quickly unfolded, subsequent to 31 March 2020, provide additional information about conditions which existed at the balance sheet date. Information available to management after the balance sheet date has been considered in the Group’s impairment assessment, assessment of recoverability of trade receivables and other relevant areas of the balance sheet. The impact of COVID-19 is considered by the Board to be an adjusting event for the Group.
NOTES TO THE FINANCIAL STATEMENTSYEAR ENDED 31 MARCH 2020
76

2020
Bricks and BuildingMaterials
£’000
Roofing Productsand Services
£’000
Heating, Plumbing and Joinery
£’000
Consolidated £’000
Revenue 143,954 17,104 26,068 187,126
EBITDA 11,469 3,683 6,156 21,308
Centralised costs (1,805)
Profit on disposal of assets 8
Group adjusted EBITDA 19,511
Impairment of goodwill (16)
Depreciation (1,312)
Amortisation (3,059)
Finance income 71
Finance expense (2,527)
Share of results of associates (32)
Fair value gains and losses (45)
Exceptional income 2,000
Exceptional expenses (2,407)
Group profit before tax 12,184
2019 (Restated)
Bricks and BuildingMaterials
£’000
Roofing Productsand Services
£’000
Heating, Plumbing and Joinery
£’000
Consolidated £’000
Revenue 123,442 16,513 23,339 163,294
EBITDA 10,774 3,874 4,892 19,540
Centralised costs (1,856)
Profit on disposal of assets 47
Group adjusted EBITDA 17,731
Depreciation (980)
Amortisation (2,575)
Finance income 31
Finance expense (4,489)
Share of results of associates 13
Fair value gains and losses (1,135)
Group profit before tax 8,596
• Bricks and Building Materials, which incorporates the sale of superior quality building materials to all sectors of the construction industry including national house builders, developers, contractors, general builders and retail to members of the public;
• Roofing Products and Services, which incorporates the supply of roofing construction services, primarily within the residential construction sector; and
• Heating, Plumbing and Joinery, which incorporates the sale of high-performance joinery materials and the distribution of radiators and associated parts and accessories.
The Group’s segments are strategic business units that offer different products and services. Operating segments are reported in a manner consistent with the internal reporting provided to the chief operating decision-maker (CODM). The CODM, who is responsible for allocating resources and assessing performance of the operating segments, has been identified as the steering committee that makes strategic decisions.
The accounting policies of the reportable segments are the same as the Group’s accounting policies as described in note 3. Segment performance is evaluated based on EBITDA, without allocation of depreciation and amortisation, finance expenses and income, impairment losses, fair value movements or the share of results of associates. This is the measure reported to the CODM for the purpose of resource allocation and assessment of segment performance.The whole of the Group’s revenue is generated in the United Kingdom. Included within revenue is a total of £31,282,000 (2019: £32,182,000) in respect of a customer accounting for more than 10% of the Group’s total revenue. Revenue from this customer is included within all three reportable segments.Inter-segment sales are eliminated from the results reported to the CODM and from the consolidated Financial Statements.
77F I N A N C I A L S T A T E M E N T S

6. Segmental Analysis (continued)
For the purposes of monitoring segment performance and allocating resources between segments, the CODM monitors the total non-current and current assets attributable to each segment. All assets are allocated to reportable segments with the exception of those used primarily for corporate purposes (head office), investments in associates and deferred tax assets. Goodwill has been allocated to reportable segments as detailed in note 19. No other assets are used jointly by reportable segments.
2020
Bricks and BuildingMaterials
£’000
Roofing Productsand Services
£’000
Heating, Plumbing and Joinery
£’000
Consolidated £’000
Non-current segment assets 42,166 19,684 27,134 88,984
Current segment assets 51,856 3,798 10,837 66,491
Total segment assets 94,022 23,482 37,971 155,475
Investment in associates 352
Deferred tax assets 205
Head office 7,134
Group assets 163,166
Total segment liabilities (34,205) (2,265) (4,744) (41,214)
Loans and borrowings (excluding leases and overdrafts)
(24,912)
Deferred tax liabilities (5,631)
Other unallocated central liabilities (11,344)
Group liabilities (83,101)
2019 (Restated)
Bricks and BuildingMaterials
£’000
Roofing Productsand Services
£’000
Heating, Plumbing and Joinery
£’000
Consolidated £’000
Non-current segment assets 24,309 19,956 28,499 72,764
Current segment assets 41,104 3,924 9,615 54,643
Total segment assets 65,413 23,880 38,114 127,407
Investment in associates 1,292
Deferred tax assets 744
Head office 1,926
Group assets 131,369
Total segment liabilities (27,683) (3,397) (4,691) (35,771)
Loans and borrowings (excluding leases and overdrafts)
(36,422)
Derivative financial liabilities (106)
Deferred tax liabilities (4,092)
Other unallocated central liabilities (38,592)
Group liabilities (114,983)
Financial Statements
NOTES TO THE FINANCIAL STATEMENTSYEAR ENDED 31 MARCH 2020
78

As at 1 April 2018 (Restated)
Bricks and BuildingMaterials
£’000
Roofing Productsand Services
£’000
Heating, Plumbing and Joinery
£’000
Consolidated £’000
Non-current segment assets 21,583 20,373 30,270 72,226
Current segment assets 25,292 3,297 8,954 37,543
Total segment assets 46,875 23,670 39,224 109,769
Investment in associates 636
Deferred tax assets 300
Head office 619
Group assets 111,324
Total segment liabilities (15,188) (2,811) (5,180) (23,179)
Loans and borrowings (excluding leases and overdrafts)
(37,975)
Deferred tax liabilities (4,453)
Other unallocated central liabilities (37,586)
Group liabilities (103,193)
7. Other Operating Income
2020£’000
2019£’000
Rental income 9 6
Other 17 90
26 96
8. Profit before tax
Profit before tax is stated after charging/ (crediting): 2020
£’0002019
(Restated) £’000
Amortisation of intangible assets 3,059 2,575
Impairment of goodwill 16 -
Depreciation of property, plant and equipment 595 529
Depreciation of right of use assets 717 451
(Gain)/ loss on disposal of property, plant and equipment and right of use assets (8) (47)
Cost of inventories recognised as an expense 25,424 17,646
Impairment of trade receivables 433 542
Net foreign exchange gains (170) (206)
Adjusted EBITDA for the year, as defined in paragraph 3.20 of the accounting policies, is £19,511,000 (2019: £17,731,000).
79F I N A N C I A L S T A T E M E N T S

9. Auditors’ remuneration During the year, the Group incurred the following costs for services provided by the Company’s auditor:
2020£’000
2019 (Restated)£’000
Fees payable for audit services:
Audit of the company annual Financial Statements 13 9
Audit of the company’s subsidiaries 169 131
Total audit related fees 182 140
Fees payable for other services:
Reporting accountant 292 -
Tax compliance services - 22
Other services 41 -
Total non-audit fees 333 22
Total auditors’ remuneration 515 162
Auditors’ remuneration reported for the prior year relates to amounts charged by the Group’s former auditor.
10. Staff numbers and costs The average number of persons employed by the Group during the year, including the directors, amounted to:
2020Number
2019Number
Production staff 9 12
Distribution staff 24 10
Administrative staff 51 48
Management staff 32 24
Sales staff 169 131
285 225
The aggregate remuneration costs incurred during the year were:
2020£’000
2019 (Restated)£’000
Staff costs:
Wages and salaries 10,757 9,416
Social security costs 1,198 970
Other pension costs (note 31) 463 382
Share-based payments expense (note 35) 56 -
12,474 10,768
Financial StatementsNOTES TO THE FINANCIAL STATEMENTSYEAR ENDED 31 MARCH 2020
80

The directors’ aggregate remuneration in respect of qualifying services was:
2020£’000
2019 (Restated)£’000
Directors’ emoluments:
Remuneration 1,248 1,405
Pension contributions 42 85
1,290 1,490
The number of directors who accrued benefits under company pension plans was as follows:
2020£’000
2019£’000
Defined contribution pension plans 1 2
Remuneration of the highest paid director in respect of qualifying services was:
2020£’000
2019£’000
Remuneration 463 413
Pension contributions - 23
463 436
Full details of directors’ remuneration is included within the report of the remuneration committee on pages 39– 46.
81F I N A N C I A L S T A T E M E N T S

11. Finance income 2020£’000
2019£’000
Interest on cash and cash equivalents 70 31
Gain on fair value adjustment of financial liabilities at fair value through profit or loss 1 -
71 31
12. Finance expense 2020£’000
2019 (Restated)£’000
Interest on bank loans and overdrafts 1,013 1,615
Interest on lease liabilities 280 106
Loss on fair value adjustment of financial liabilities at fair value through profit or loss - 106
Interest payable on loan notes 977 2,275
Interest payable on deferred consideration 13 60
Unwinding of discount on contingent consideration 227 317
Other interest payable 17 10
2,527 4,489
13. Fair value gains and losses 2020£’000
2019 (Restated)£’000
Loss on re-measurement of contingent consideration (notes 21 & 32) (45) (1,135)
14. Exceptional income and expenses Exceptional items are those which the Group consider to be significant, one-off items that are not incurred aspart of the Group’s normal operations.
2020£’000
2019£’000
Exceptional income
Insurance proceeds in respect of keyman policies 2,000 -
2,000 -
The exceptional income relates to a recovery under keyman insurance policies, following a medical diagnosis, in connection with a member of key management.
2020£’000
2019£’000
Exceptional expenses
IPO costs (522) -
Refinancing costs (585) -
Acquisition costs (425) -
Impairment of investments in associates (note 22) (875) -
Total exceptional expenses (2,407) -
Financial Statements
NOTES TO THE FINANCIAL STATEMENTSYEAR ENDED 31 MARCH 2020
82

15. Tax on profit The major components of the income tax expense are:
2020£’000
2019 (Restated)£’000
Current tax
UK current tax expense 2,885 3,150
Adjustments in respect of prior periods (618) (83)
Total current tax 2,267 3,067
Deferred tax
Origination and reversal of temporary differences 626 (926)
Total tax on profit 2,893 2,141
Reconciliation of tax expense The standard rate of corporation tax in the UK is 19% (2019: 19%). The charge for the year can be reconciled, to the standard rate applied to the profit before tax, as follows:
2020£’000
2019 (Restated)£’000
Profit on ordinary activities before taxation 12,184 8,596
Tax on profit on ordinary activities at standard rate 2,315 1,633
Adjustments to tax charge in respect of prior periods (109) (50)
Effect of expenses not deductible for tax purposes 94 451
Effect of capital allowances and depreciation 26 30
Effect of changes in UK tax rates 549 61
Effect of utilisation of tax losses 2 9
Changes in unrecognised deferred tax assets (1) 7
Other tax adjustments 17 -
Tax on profit 2,893 2,141
On 17 March 2020, a future rate of corporation tax in the United Kingdom of 19% was substantively enacted. Previously, the rate of corporation tax expected to apply from 1 April 2020 was 17%. As such, deferred tax assets and liabilities were recognised at 17% in the prior year but have been remeasured at 19% at the reporting date.
During the year, the Company completed an IPO. Exceptional legal and professional fees of £522,000 are included within the profit or loss in connection with the IPO. Transactions costs of £2,501,000, directly attributable to the issue of shares, have been included as a reduction in the share premium account.
The Group also undertook a re-financing exercise, incurring exceptional costs of £585,000 in respect of the release of loan arrangement fees, following repayment of the previous term loan on listing, and legal fees associated with the re-financing.
During the year, the Group acquired seven subsidiaries, incurring costs of £425,000. This comprised transaction costs on acquisition of £103,000, in relation to stamp duty, and £322,000 in respect of legal and professional fees directly associated with these acquisitions.
Further details regarding the impairment of investments in associates is disclosed in note 22.
83F I N A N C I A L S T A T E M E N T S
16. Dividends 2020£’000
2019£’000
Amounts recognised as distributions to equity holders in the year:
Interim dividend for the year ended 31 March 2020 of 0.8678p per share(2019: for the year ended 31 March 2019 of nil p per share)
2,000 -
Total dividends paid in the year 2,000 -
The Directors did not recommend that a dividend was paid for the year ended 31 March 2019. The Directors recommend that a final dividend for 2020 of 1.085p (2019: nil p) per ordinary share be paid. The final dividend will be paid, subject to shareholders’ approval at the Annual General Meeting, to shareholders on the register at the close of business on 25 September 2020. This dividend has not been included as a liability in these Financial Statements.
The Board of Directors recently become aware of a technical issue in respect of the Company’s procedure for the payment of the Interim Dividend of 0.8678p per ordinary share, in aggregate £1,999,921.65, paid to shareholders in December 2019. The Company had sufficient profits to pay the Interim Dividend at the relevant time. However, under the Companies Act 2006, a public company can only pay a dividend out of its distributable profits as shown in the last accounts filed with Companies House. A public company can prepare and file interim accounts with Companies House showing a more recent distributable profit position if the last filed accounts do not show sufficient distributable profits. When the Company paid the Interim Dividend, although it had sufficient distributable reserves to make such payment, the last accounts filed at Companies House for the year ended 31 March 2019 showed distributable profits of only £567,732. Interim accounts showing the requisite level of distributable profits for the whole of the Interim Dividend had been prepared but, due to an oversight, they had not been filed with the Registrar of Companies. As a result, part of the Interim Dividend, to the extent of £1,432,189.65 was paid in technical infringement of the Companies Act 2006. A resolution at the AGM (Number 16) has been proposed to fix the technical breach. The effect of the resolution proposed is to return all parties to the position that they would have been in had the interim dividend been made in compliance with the Companies Act 2006.
Financial Statements
NOTES TO THE FINANCIAL STATEMENTSYEAR ENDED 31 MARCH 2020
84

17. Earnings per share Earnings per share (EPS) is calculated by dividing the profit for the year, attributable to ordinary equity holders of the parent, by the weighted average number of ordinary shares outstanding during the year.
Diluted EPS is calculated by dividing the profit for the year, attributable to ordinary equity holders after adjusting for interest on convertible preference shares, by the weighted average number of ordinary shares outstanding during the year plus the weighted average number of ordinary shares that would be issued on conversion of all the dilutive potential ordinary shares into ordinary shares.
The calculation of basic and diluted earnings per share is based on the following data:
2020 2019 (Restated)
Earnings£’000
Weighted average
number of shares
Earningsper share
(p)Earnings
£’000
Weightedaverage
number ofshares
Earningsper share
(p)
Basic earnings per share 9,291 194,093,236 4.79 6,455 143,168,012 4.51
Effect of dilutive securities Employee share options - 582,220 - - - -
Diluted earnings per share 9,291 194,675,456 4.77 6,455 143,168,012 4.51
Based on the 230,458,821 shares in issue after the IPO, basic EPS would have been 4.03p at the year end compared to 2.80p in the prior year, had the same number of shares been in issue.
18. Property, plant and equipmentLand and buildings
£’000
Plant and machinery
£’000
Fixtures, fittings and equipment
£’000
Motor vehicles£’000
Total£’000
Cost
At 1 April 2018 (restated) 2,602 221 183 293 3,299
Additions 233 105 56 250 644
Acquisition through business combinations 190 10 3 10 213
Disposals - - - (87) (87)
At 31 March 2019 3,025 336 242 466 4,069
Additions 398 299 67 187 951
Acquisition through business combinations 60 63 62 144 329
Disposals - (1) - (43) (44)
At 31 March 2020 3,483 697 371 754 5,305
Depreciation
At 1 April 2018 (restated) 8 10 5 14 37
Charge for the year 205 113 88 123 529
On disposals - - - (11) (11)
At 31 March 2019 213 123 93 126 555
Charge for the year 247 141 81 126 595
On disposals - - - (18) (18)
At 31 March 2020 460 264 174 234 1,132
Net book value
At 31 March 2020 3,023 433 197 520 4,173
At 31 March 2019 2,812 213 149 340 3,514
At 1 April 2018 2,594 211 178 279 3,262
The Company has no property, plant and equipment. Included within land and buildings is freehold land amounting to £348,000 (2019: £348,000) which is not depreciated. Property, plant and equipment with a carrying value of £2,983,000 (2019: £2,623,000) is pledged as security for the Group’s bank loans.
85F I N A N C I A L S T A T E M E N T S

19. Intangible assetsBrands£’000
Customer & supplier relationships and other intangibles
£’000 Goodwill
£’000Total
£’000
Cost
At 1 April 2018 (restated) 5,157 20,306 41,965 67,428
Additions - 5 - 5
Acquisition through business combinations 194 490 1,423 2,107
At 31 March 2019 5,351 20,801 43,388 69,540
Additions - - - -
Acquisition through business combinations 2,564 5,734 6,074 14,372
Disposals - - - -
At 31 March 2020 7,915 26,535 49,462 83,912
Amortisation
At 1 April 2018 (restated) 43 169 - 212
Charge for the year 523 2,052 - 2,575
At 31 March 2019 566 2,221 - 2,787
Charge for the year 639 2,420 - 3,059
Impairment - - 16 16
On disposals - - - -
At 31 March 2020 1,205 4,641 16 5,862
Net book value
At 31 March 2020 6,710 21,894 49,446 78,050
At 31 March 2019 4,785 18,580 43,388 66,753
At 1 April 2018 5,114 20,137 41,965 67,216
Financial Statements
NOTES TO THE FINANCIAL STATEMENTSYEAR ENDED 31 MARCH 2020
The Company has no intangible assets.
Goodwill is reviewed annually for impairment. As outlined within the key sources of estimation uncertainty, in note 4 of the Financial Statements, the COVID-19 pandemic led to significant changes in the market in which the Group operates. This has given rise to an indication of potential impairment. As such, impairment reviews have also been carried out in respect of other intangible assets and other non financial assets, including property, plant and equipment and right of use assets. Investments in associates have also been assessed for impairment, details of which are disclosed in note 22.The carrying amount of goodwill and impairment losses by segment are as follows:
Bricks and Building Materials
£’000
Roofing Products and Services and
Heating £’000
Plumbing and Joinery £’000
Consolidated£’000
At 1 April 2018 (restated) 16,976 12,299 12,690 41,965
Recognised on acquisitions 1,423 - - 1,423
At 31 March 2019 18,399 12,299 12,690 43,388
Recognised on acquisitions 5,940 - 134 6,074
Impairment (16) - - (16)
At 31 March 2020 24,323 12,299 12,824 49,446 Impairment losses regarding goodwill are included within the depreciation and amortisation expense in the statement of profit or loss.
86

The goodwill allocated to the Brick-ability trading group, PVH trading group and HHG trading group CGUs is considered significant in comparison with the Group’s total carrying amount of goodwill. CGUs within the Other CGU category represent between 0.03% and 6.22% of the total goodwill and relate to the business operations of entities acquired during the current and previous year.The Group estimates the recoverable amount of each CGU using a value in use model by projecting cash flows for the next three years together with a terminal value using a growth rate. The key assumptions underpinning the recoverable amounts of the CGUs tested for impairment are forecast revenues and EBITDA and the discount rate applied.Revenue and EBITDA forecast in the impairment models are based on management’s past experience and future expectations of performance. Projections also incorporate the potential downturn in revenues anticipated in the short-term as a result of the COVID-19 pandemic. For each CGU, a growth rate of 2% (2019 and 1 April 2018: 2%) is used to extrapolate cash flow projections beyond the three year period covered by the most recent forecasts.
This rate does not exceed the average long-term growth rate for the relevant markets. The rate used to discount the forecast cash flows is 10.00% (2019: 10.21%) (1 April 2018: 11.42%), derived from the CGU’s weighted average cost of capital (WACC).The impairment loss of £16,000 in the period relates to goodwill held in a subsidiary and is included within the Other CGU total above. This goodwill arose following incorporation of that subsidiary and acquisition of the business previously operating as a partnership. Given the age of the goodwill asset, management no longer consider that economic benefits generated by that subsidiary are attributable to this asset. Its carrying amount has therefore been written down to £nil, based on its value in use. The total recoverable amount in respect of goodwill arising on consolidation, other intangibles and other non-financial assets, as assessed by management using the above assumptions, is greater than the carrying amount. No further impairment loss has therefore been recorded, in either the current or previous year. Management currently consider that it is not reasonably possible for the assumptions to change so significantly as to eliminate the excess.
20. Subsidiaries
Company 2020 £’000
2019 £’000
Shares in group undertakings
Cost and carrying value 6,542 6,542
The carrying amount of goodwill is allocated to CGUs as follows:2020
£’000 2019 (Restated)
£’000As at 1 Apr 2018
(Restated) £’000
Brick-ability trading group 12,845 12,845 12,845
PVH trading group 16,399 16,399 16,399
HHG trading group 12,690 12,690 12,690
Other CGUs 7,512 1,454 31
Total 49,446 43,388 41,965
87F I N A N C I A L S T A T E M E N T S

20. Subsidiaries (continued) At the reporting date, the Company had the following subsidiary undertakings, all of which are included in these consolidated Financial Statements:
SubsidiaryCountry of operation
and incorporationClass of
share heldProportion of shares
held 2020Proportion of shares
held 2019
Brickability Enterprises Holding Limited England and Wales Ordinary 100% 100%
Brickability Enterprises Investments Limited England and Wales Ordinary 100% 100%
Brickability UK Holdings Limited (1) England and Wales Ordinary 100% 100%
Brick-ability Ltd. (2) England and Wales Ordinary 100% 100%
Brick Services Limited (2) England and Wales Ordinary 100% 100%
The Matching Brick Company Limited (2) England and Wales Ordinary 100% 100%
Brick-Link Limited (2) England and Wales Ordinary 100% 100%
Plansure Building Products Limited (2) England and Wales Ordinary 100% 100%
P V H Holdings Limited (1) England and Wales Ordinary 100% 100%
Crest Brick Slate & Tile Limited (3) England and Wales Ordinary 100% 100%
Crest Roofing Limited (3) England and Wales Ordinary 100% 100%
Crown Roofing (Centres) Limited (5) England and Wales Ordinary 100% 100%
Excel Roofing Services Limited (5) England and Wales Ordinary 100% 100%
Hamilton Heating Group Limited (1) England and Wales Ordinary 100% 100%
Towelrads.com Limited (6) England and Wales Ordinary 100% 100%
Radiatorsonline.com Ltd (6) England and Wales Ordinary 100% 100%
Frazer Simpson Limited (1) England and Wales Ordinary 100% 100%
FSN Doors Limited (1) England and Wales Ordinary 100% 100%
DSH Flooring Limited (6) England and Wales Ordinary 100% -
CPG Building Supplies Limited (1) England and Wales Ordinary 100% 100%
Brickwise Ltd (1) England and Wales Ordinary 100% 100%
The Bespoke Brick Company Limited (1) England and Wales Ordinary 100% -
The Brick Slip Business Limited (1) England and Wales Ordinary 100% -
Brickmongers (Wessex) Ltd (2) England and Wales Ordinary 100% -
LBT Brick & Facades Limited (2) England and Wales Ordinary 100% -
McCann Roofing Products Limited (4) England and Wales Ordinary 100% -
U Plastics Limited (1) England and Wales Ordinary 100% -
Financial Statements
NOTES TO THE FINANCIAL STATEMENTSYEAR ENDED 31 MARCH 2020
(1) Wholly owned by Brickability Enterprises Investments Limited.(2) Wholly owned by Brickability UK Holdings Limited.
(3) Wholly owned by P V H Holdings Limited.(4) Wholly owned by Crest Brick Slate & Tile Limited.
(5) Wholly owned by Crest Roofing Limited.(6) Wholly owned by Hamilton Heating Group Limited.
By virtue of section 479A of the Companies Act 2006, the following subsidiaries are exempt from the requirements relating to the audit of individual accounts, with the ultimate parent company, Brickability Group plc, providing a guarantee for these companies under section 479C:
Subsidiary Company number Subsidiary Company number
Brickability Enterprises Holding Limited 10332050 P V H Holdings Limited 02484708
Brickability Enterprises Investments Limited 10332505 Hamilton Heating Group Limited 09921801
Brickability UK Holdings Limited 07805178 CPG Building Supplies Limited 02937329
Brick-Link Limited 02245364 The Brick Slip Business Limited 09707800
The Directors believe that the likelihood of the guarantee being called upon is remote, based on the above subsidiaries either being intermediate parents within the group, with primarily just group debt balances, or considered extremely low risk.
88

21. Business combinations
The Group acquired the entire share capital and 100% of the voting rights in the following companies during the year:
Company acquired Acquisition date Company acquired Acquisition date
DSH Flooring Limited 1 April 2019 Brickmongers (Wessex) Ltd 5 July 2019
LBT Brick & Facades Limited 15 May 2019 McCann Roofing Products Limited 13 February 2020
The Bespoke Brick Company Limited 17 May 2019 U Plastics Limited 10 March 2020
The Brick Slip Business Limited 17 May 2019
The fair value of the assets acquired and liabilities assumed on acquisition are as follows:
DSH Flooring Limited£’000
LBT Brick & Facades
Limited£’000
The Bespoke Brick
Company Limited£’000
The Brick Slip Business
Limited£’000
Brickmongers (Wessex) Ltd
£’000
McCann Roofing Products Limited£’000
U Plastics Limited£’000
Property plant and equipment 3 33 24 - 47 3 219
Right of use assets - - 49 55 - 9 836
Identifiable intangible assets - 1,595 1.999 - 614 1,285 2,805
Inventory 182 - 658 11 433 429 766
Trade and other receivables 517 1,379 3,159 13 736 1,227 1,697
Cash and cash equivalents 7 697 701 24 339 1,105 2,273
Trade and other payables (543) (1,198) (2,480) (36) (757) (1,180) (2,167)
Lease liabilities - - (49) (55) - (9) (871)
Deferred tax - (276) (344) - (106) (220) (506)
Total identifiable net assets 166 2,230 3,717 12 1,306 2,649 5,052
Goodwill 134 382 3,075 13 217 148 2,105
Total consideration 300 2,612 6,792 25 1,523 2,797 7,157
Satisfied by:
Cash 300 2,612 4,913 20 831 2,750 -
Loan notes - - 955 5 554 - -
Deferred consideration - - 924 - - 47 4,950
Contingent consideration (note 32)
- - - - 138 - 2,207
Total consideration 300 2,612 6,792 25 1,523 2,797 7,157
Included in the consolidated Financial Statements are the following amounts of revenue and profit in respect of the subsidiaries acquired
DSH Flooring Limited£’000
LBT Brick & Facades
Limited£’000
The Bespoke Brick Company
Limited£’000
The Brick Slip Business
Limited£’000
Brickmongers (Wessex) Ltd
£’000
McCann Roofing Products
Limited £’000
U Plastics Limited£’000
Revenue 2,828 6,316 10,253 18 3,617 1,256 615
Net profit 161 385 704 - 129 57 53
Had the business combinations taken place at the beginning of the financial year, the Group’s revenue for the year would have been £206,278,000 and Group profit would have been £11,215,000.
89F I N A N C I A L S T A T E M E N T S
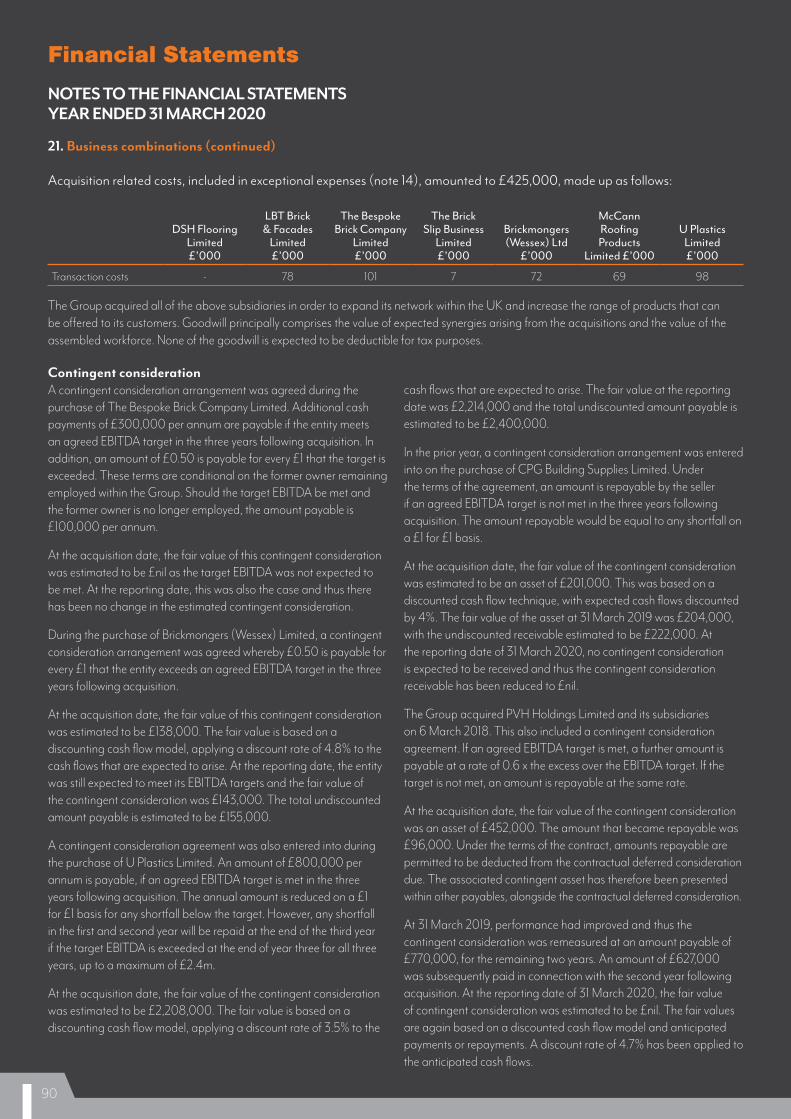
21. Business combinations (continued)
Acquisition related costs, included in exceptional expenses (note 14), amounted to £425,000, made up as follows:
DSH Flooring Limited£’000
LBT Brick & Facades
Limited£’000
The Bespoke Brick Company
Limited£’000
The Brick Slip Business
Limited£’000
Brickmongers (Wessex) Ltd
£’000
McCann Roofing Products
Limited £’000
U Plastics Limited£’000
Transaction costs - 78 101 7 72 69 98
The Group acquired all of the above subsidiaries in order to expand its network within the UK and increase the range of products that can be offered to its customers. Goodwill principally comprises the value of expected synergies arising from the acquisitions and the value of the assembled workforce. None of the goodwill is expected to be deductible for tax purposes.
Contingent consideration A contingent consideration arrangement was agreed during the purchase of The Bespoke Brick Company Limited. Additional cash payments of £300,000 per annum are payable if the entity meets an agreed EBITDA target in the three years following acquisition. In addition, an amount of £0.50 is payable for every £1 that the target is exceeded. These terms are conditional on the former owner remaining employed within the Group. Should the target EBITDA be met and the former owner is no longer employed, the amount payable is £100,000 per annum.
At the acquisition date, the fair value of this contingent consideration was estimated to be £nil as the target EBITDA was not expected to be met. At the reporting date, this was also the case and thus there has been no change in the estimated contingent consideration.
During the purchase of Brickmongers (Wessex) Limited, a contingent consideration arrangement was agreed whereby £0.50 is payable for every £1 that the entity exceeds an agreed EBITDA target in the three years following acquisition.
At the acquisition date, the fair value of this contingent consideration was estimated to be £138,000. The fair value is based on a discounting cash flow model, applying a discount rate of 4.8% to the cash flows that are expected to arise. At the reporting date, the entity was still expected to meet its EBITDA targets and the fair value of the contingent consideration was £143,000. The total undiscounted amount payable is estimated to be £155,000.
A contingent consideration agreement was also entered into during the purchase of U Plastics Limited. An amount of £800,000 per annum is payable, if an agreed EBITDA target is met in the three years following acquisition. The annual amount is reduced on a £1 for £1 basis for any shortfall below the target. However, any shortfall in the first and second year will be repaid at the end of the third year if the target EBITDA is exceeded at the end of year three for all three years, up to a maximum of £2.4m.
At the acquisition date, the fair value of the contingent consideration was estimated to be £2,208,000. The fair value is based on a discounting cash flow model, applying a discount rate of 3.5% to the
cash flows that are expected to arise. The fair value at the reporting date was £2,214,000 and the total undiscounted amount payable is estimated to be £2,400,000.
In the prior year, a contingent consideration arrangement was entered into on the purchase of CPG Building Supplies Limited. Under the terms of the agreement, an amount is repayable by the seller if an agreed EBITDA target is not met in the three years following acquisition. The amount repayable would be equal to any shortfall on a £1 for £1 basis.
At the acquisition date, the fair value of the contingent consideration was estimated to be an asset of £201,000. This was based on a discounted cash flow technique, with expected cash flows discounted by 4%. The fair value of the asset at 31 March 2019 was £204,000, with the undiscounted receivable estimated to be £222,000. At the reporting date of 31 March 2020, no contingent consideration is expected to be received and thus the contingent consideration receivable has been reduced to £nil.
The Group acquired PVH Holdings Limited and its subsidiaries on 6 March 2018. This also included a contingent consideration agreement. If an agreed EBITDA target is met, a further amount is payable at a rate of 0.6 x the excess over the EBITDA target. If the target is not met, an amount is repayable at the same rate.
At the acquisition date, the fair value of the contingent consideration was an asset of £452,000. The amount that became repayable was £96,000. Under the terms of the contract, amounts repayable are permitted to be deducted from the contractual deferred consideration due. The associated contingent asset has therefore been presented within other payables, alongside the contractual deferred consideration.
At 31 March 2019, performance had improved and thus the contingent consideration was remeasured at an amount payable of £770,000, for the remaining two years. An amount of £627,000 was subsequently paid in connection with the second year following acquisition. At the reporting date of 31 March 2020, the fair value of contingent consideration was estimated to be £nil. The fair values are again based on a discounted cash flow model and anticipated payments or repayments. A discount rate of 4.7% has been applied to the anticipated cash flows.
Financial Statements
NOTES TO THE FINANCIAL STATEMENTSYEAR ENDED 31 MARCH 2020
90

22. Associates At the reporting date, the Group had the following associated undertakings, all of which are included in the consolidated Financial Statements using the equity method:
SubsidiaryCountry of operation
and incorporationClass of
share held Proportion of shares held
Apex Brickcutters Limited England and Wales Ordinary 50%
Financewell Limited England and Wales Ordinary 25%
Interest in associates 2020£’000
2019 (Restated)£’000
At 1 April 1,292 636
Additions - 679
Dividends received from associates (33) (36)
Share of profit or loss (32) 13
Impairment of investments (note 14) (875) -
At 31 March 352 1,292
Aggregate information of associates that are not individually material 2020£’000
2019£’000
Group’s share of profit or loss from continuing operations (32) 13
Group’s share of other comprehensive income - -
Group’s share of total comprehensive income (32) 13
During the year, an impairment loss of £509,000 was recognised in relation to the investment in Financewell Limited. The company is not trading profitably and further losses are anticipated. Since the reporting date, an agreement in principle has been reached to sell the investment for consideration of £125,000. The investment has therefore been written down to its recoverable amount of £125,000, based on fair value less costs of disposal. Costs of disposal are expected to be minimal. As the fair value Is based on the price agreed in an active market, but is not quoted, it is considered to be at level 2 of the fair value hierarchy.
During the year, an impairment loss of £366,000 was also recognised in relation to Apex Brickcutters Limited as the company is not trading as profitably as it had been historically.
The investment in Apex Brickcutters Limited has been written down to its recoverable amount of £227,000, based on its fair value less costs of disposal. The fair value has been based on an amount equal to the Group’s share of the net assets of the associate, based on its latest Financial Statements. As the associate is unquoted but its net asset value is observable, with its carrying value of assets and liabilities not expected to be subject to significant adjustments to reflect fair value, it is considered to be at level 2 of the fair value hierarchy.
Investments in associates are not attributed to the Group’s reportable segments. Impairment losses in respect of investments in associates are included within exceptional expenses within the statement of profit or loss (note 14).
Group Company
23. Inventories 2020£’000
2019 (Restated)
£’000
As at1 Apr 2018 (Restated)
£’0002020
£’0002019
£’000
Goods for resale 9,791 5,422 5,031 - -
91F I N A N C I A L S T A T E M E N T S

24. Trade and other receivables
Group Company
2020£’000
2019 (Restated)
£’000
As at1 Apr 2018(Restated)
£’0002020
£’000
2019 (Restated)
£’000
Current
Trade receivables 33,696 31,680 26,425 - -
Less allowance for expected credit loss (592) (710) (457) - -
33,104 30,970 25,968 - -
Contract assets 37 36 - - -
Amounts owed by group undertakings - - - 79,819 1,837
Prepayments and accrued income 1,911 1,798 1,169 - -
Directors’ loan accounts 978 21 - - -
Other receivables 530 1,312 633 - -
36,560 34,137 27,770 79,819 1,837
Non-current
Trade receivables 391 155 146 - -
Other receivables - 178 - 9,343 7,802
- 333 146 9,343 7,802
36,951 34,470 27,916 89,162 9,639
Other receivables for the Company relate to loan notes receivable. The balance is due on the 10th anniversary of the loan note instrument, and is receivable from 6 March 2028. Interest is accrued at 9.5% per annum and is receivable when the loan notes are repaid.
Trade receivables are non-interest bearing. The allowance for credit losses has been determined by reference to past default experience and a review of specific customers’ debts at the year end. The Group considers a financial asset to be in default when contractual payments are 90 days past due. However, the Group may also consider a financial asset to be in default when internal or external information indicates that the Group is unlikely to receive the outstanding contractual amounts in full before taking into account any credit enhancements held by the Group. Trade receivables are written off when there is no reasonable expectation of recovering the amounts due, for example when a customer has entered liquidation.
In determining the recoverability of a trade receivable, the Group considers any change in the credit quality of the trade receivable from the date credit was initially granted up to the reporting date. The concentration of credit risk is limited due to the customer base being large and unrelated.
An impairment analysis is performed at each reporting date using a provision matrix to measure expected credit losses. The provision rates are based on days past due for groupings of various customer segments that have similar credit risk and loss patterns, for example by customer type, size or credit rating.
The provision matrix is initially based on the Group’s historical observed default rates over the previous 2 years.
The Group will then adjust the historical loss rate to take into account forward looking information, for example when forecast economic conditions, such as gross domestic product or unemployment rates, are expected to deteriorate. At each reporting date, the historical default rates are updated and forward looking estimates reassessed.
At the reporting date, the COVID-19 pandemic gave rise to an indication of a potential increase in credit risk for certain customers given the significant impact on the UK market. The forward looking estimates have therefore taken into account this increased risk. The Group does, however, have credit insurance for its main customers within the Bricks and Building Materials segment which will mitigate some of this risk. Market recovery following the initial lock down period has also been considered. Details of the Group’s credit exposure is included in note 32.
Financial Statements
NOTES TO THE FINANCIAL STATEMENTSYEAR ENDED 31 MARCH 2020
92

Set out below is the risk profile of trade receivables and contract assets based on the Group’s provision matrix. Any reasonable change in rates applied would not result in a material adjustment to the expected credit loss recognised.
Trade Receivables and Contract AssetsDays past due
31 March 2020Current£’000
< 30 days£’000
30-60 days£’000
61-90 days£’000
>91 days£’000
Total£’000
Expected credit loss rate 0.19% 0.29% 9.31% 4.24% 15.69%
Gross carrying amount 16,899 12,444 2,990 307 1,484 34,124
Expected credit loss 32 36 278 13 233 592
Trade Receivables and Contract AssetsDays past due
31 March 2019Current£’000
< 30 days£’000
30-60 days£’000
61-90 days£’000
>91 days£’000
Total£’000
Expected credit loss rate 0.24% 0.29% 12.98% 4.12% 23.94%
Gross carrying amount 17,608 10,136 2,589 328 1,210 31,871
Expected credit loss 42 29 336 14 289 710
Trade Receivables and Contract AssetsDays past due
1 April 2018Current£’000
< 30 days£’000
30-60 days£’000
61-90 days£’000
>91 days£’000
Total£’000
Expected credit loss rate 0.19% 0.28% 14.22% 5.40% 1.81%
Gross carrying amount 13,310 9,546 2,628 343 744 26,571
Expected credit loss 25 26 374 19 13 457
Movement in the allowance for expected credit losses 2020£’000
2019£’000
Balance at the beginning of the year 710 457
Impairment losses recognised 433 542
Amounts written off as uncollectable (551) (289)
592 710
93F I N A N C I A L S T A T E M E N T S

25. Cash and Cash Equivalents
Group Company
2020£’000
2019£’000
As at1 Apr 2018
£’0002020
£’0002019
£’000
Cash and cash equivalents 27,269 17,001 5,346 - -
Cash and cash equivalents comprise cash and short-term bank deposits with an original maturity of three months or less. The carrying amount of these assets approximates to their fair value.
26. Trade and other payables
Group Company
2020£’000
2019 (Restated)
£’000
As at1 Apr 2018 (Restated)
£’0002020
£’0002019
£’000
Current
Trade payables 27,159 24,490 12,776 -
Amounts owed to group undertakings - - - 120 8
Accruals and deferred income 3,289 3,692 3,830 46 -
Other taxation and social security 3,070 2,492 2,108 -
Deferred consideration 8,020 3,942 4,078 -
Other payables 374 478 242 -
41,912 35,094 23,034 166 8
Non-current
Other payables 2,402 4,507 7,095 - -
44,314 39,601 30,129 166 8
Trade payables are non-interest bearing and principally comprise amounts outstanding for trade purchases and ongoing costs. The Group’s policy is to pay all payables within its pre-agreed credit terms, which, for the majority of suppliers, is a period of 30 days. The Directors consider that the carrying amount of trade payables approximates to their fair value.
Financial Statements
NOTES TO THE FINANCIAL STATEMENTSYEAR ENDED 31 MARCH 2020
94
27. Loans and borrowings
Group Company
2020£’000
2019 (Restated)
£’000
As at1 Apr 2018
(Restated) £’0002020
£’0002019
£’000
Current
Bank loans - 3,053 3,158 - -
- 3,053 3,158 - -
Non-current
Bank loans 24,912 33,369 34,817 24,912 -
Loan notes - 28,966 24,901 - -
24,912 62,335 59,718 24,912 -
24,912 65,388 62,876 24,912 -
The Directors consider that the carrying amount of loans and borrowings approximates to their fair value.
The bank loans are secured by a fixed charge over the Group’s freehold property and floating charges over the remaining assets of the Group, including all property, investments and assets of the Company’s subsidiary undertakings. A guarantee has also been provided by trading subsidiaries.
Included within non-current borrowings is an amount of £ nil (2019: £28,966,000) in respect of liabilities payable or repayable otherwise than by instalments which fall due for
payment after more than five years from the reporting date. These liabilities were A series, B series and B1 series loan notes which accrued interest at 9.5% per annum. Both interest and capital were repayable on the loan notes redemption date of 13 September 2026. The loan notes were secured by fixed and floating charges over the assets of the Company.
These loan notes were settled during the year by way of cash settlement and conversion to equity. A reconciliation of the change in loan note liabilities arising from financing activities is included in note 36.
95
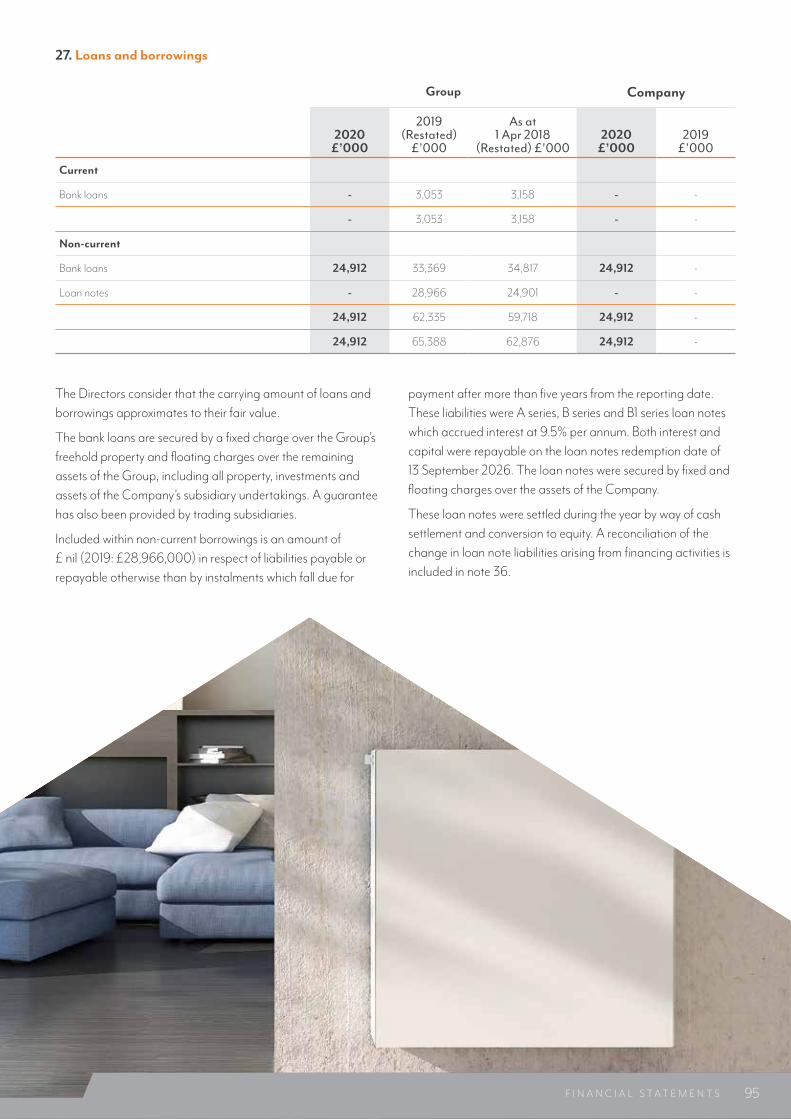
27. Loans and borrowings
Group Company
2020£’000
2019 (Restated)
£’000
As at1 Apr 2018
(Restated) £’0002020
£’0002019
£’000
Current
Bank loans - 3,053 3,158 - -
- 3,053 3,158 - -
Non-current
Bank loans 24,912 33,369 34,817 24,912 -
Loan notes - 28,966 24,901 - -
24,912 62,335 59,718 24,912 -
24,912 65,388 62,876 24,912 -
The Directors consider that the carrying amount of loans and borrowings approximates to their fair value.
The bank loans are secured by a fixed charge over the Group’s freehold property and floating charges over the remaining assets of the Group, including all property, investments and assets of the Company’s subsidiary undertakings. A guarantee has also been provided by trading subsidiaries.
Included within non-current borrowings is an amount of £ nil (2019: £28,966,000) in respect of liabilities payable or repayable otherwise than by instalments which fall due for
payment after more than five years from the reporting date. These liabilities were A series, B series and B1 series loan notes which accrued interest at 9.5% per annum. Both interest and capital were repayable on the loan notes redemption date of 13 September 2026. The loan notes were secured by fixed and floating charges over the assets of the Company.
These loan notes were settled during the year by way of cash settlement and conversion to equity. A reconciliation of the change in loan note liabilities arising from financing activities is included in note 36.
95F I N A N C I A L S T A T E M E N T S

28. Leases
Group as lessee Right of use assets
Land and buildings£’000
Plant and vehicles£’000
Equipment£’000
Total£’000
Cost
At 1 April 2018 (restated) 1,368 255 24 1,647
Additions 767 180 76 1,023
Acquisition through business combinations - 17 - 17
Disposals - (46) - (46)
At 31 March 2019 2,135 406 100 2,641
Additions 3,364 563 43 3,970
Acquisition through business combinations 891 58 - 949
Disposals (19) (31) - (50)
At 31 March 2020 6,371 996 143 7,510
Depreciation
At 1 April 2018 (restated) 21 8 1 30
Charge for the year 305 129 17 451
Depreciation on disposals - (13) - (13)
At 31 March 2019 326 124 18 468
Charge for the year 522 169 26 717
Depreciation on disposals (19) (31) - (50)
At 31 March 2020 829 262 44 1,135
Carrying value
At 31 March 2020 5,542 734 99 6,375
At 31 March 2019 1,809 282 82 2,173
At 1 April 2018 1,347 247 23 1,617
Financial Statements
NOTES TO THE FINANCIAL STATEMENTSYEAR ENDED 31 MARCH 2020
96

Lease liabilitiesLand and buildings
£’000 Plant and vehicles
£’000Equipment
£’000Total
£’000
At 1 April 2018 (restated) 1,324 251 24 1,599
Additions 767 130 76 973
Acquisition through business combinations - 17 - 17
Interest expense 87 15 4 106
Lease payments (364) (175) (23) (562)
At 31 March 2019 1,814 238 81 2,133
Additions 3,477 532 43 4,052
Acquisition through business combinations 926 58 - 984
Interest expense 257 19 4 280
Lease payments (624) (219) (28) (871)
At 31 March 2020 5,850 628 100 6,578
Maturity analysis
2020 £’000
2019 (Restated)£’000
As at1 Apr 2018 (Restated)
£’000
Due within 1 year 776 428 340
Due between 1 and 5 years 2,034 1,086 1,008
Due after 5 years 3,768 619 251
6,578 2,133 1,599
The undiscounted maturity analysis in respect of lease payments is disclosed in note 32.
Included within administration expenses within the consolidated statement of profit or loss is an amount of £69,000 (2019: £25,000) in respect of short-term leases and an amount of £3,000 (2019: £2,000) in respect of low value asset leases.
The lease liabilities are secured over the assets to which they relate. The Group is not permitted to pledge these assets as security for any other borrowings or to sell them to another entity.
The Company does not have any right of use assets or lease liabilities.
Group as lessor The Group does not have significant leasing activities acting as a lessor. Operating leases, in which the Group is the lessor relate to the sub-let of part of its leasehold property.
Rental income on operating leases recognised in the statement of profit or loss is as follows:
2020 £’000
2019£’000
Rental income 9 6
97F I N A N C I A L S T A T E M E N T S
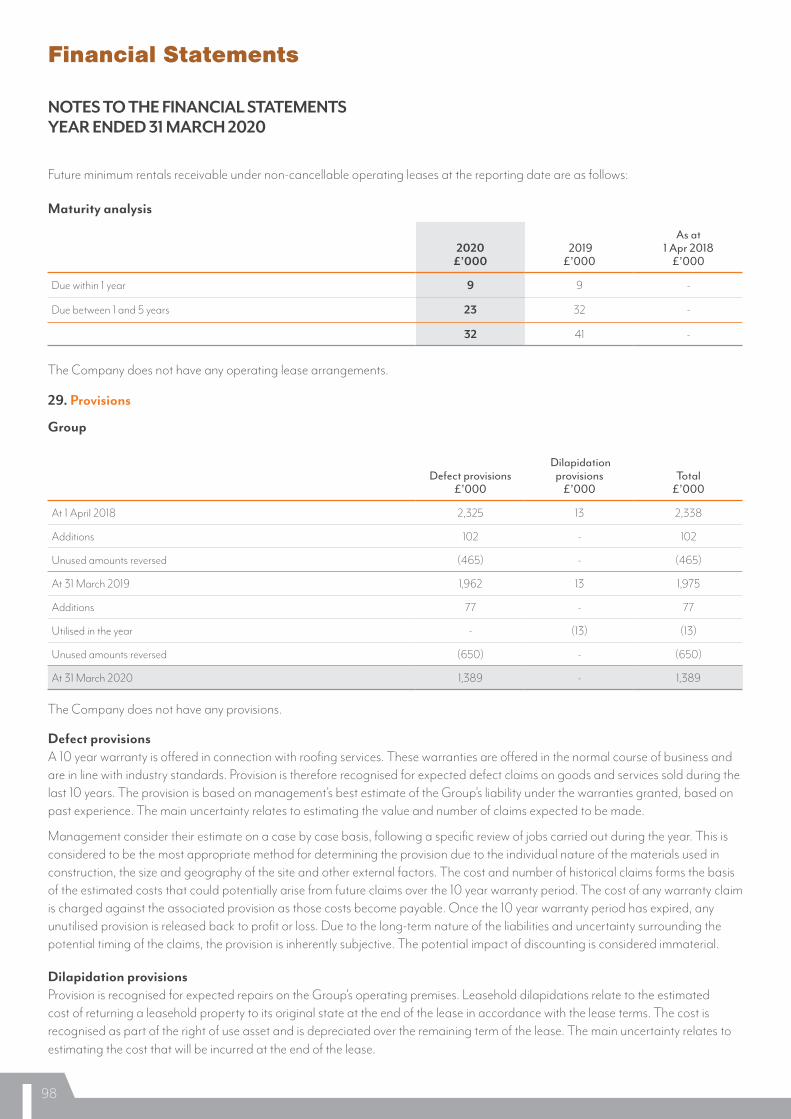
Future minimum rentals receivable under non-cancellable operating leases at the reporting date are as follows:
Maturity analysis
2020 £’000
2019£’000
As at1 Apr 2018
£’000
Due within 1 year 9 9 -
Due between 1 and 5 years 23 32 -
32 41 -
The Company does not have any operating lease arrangements.
29. Provisions
Group
Defect provisions£’000
Dilapidation provisions
£’000Total
£’000
At 1 April 2018 2,325 13 2,338
Additions 102 - 102
Unused amounts reversed (465) - (465)
At 31 March 2019 1,962 13 1,975
Additions 77 - 77
Utilised in the year - (13) (13)
Unused amounts reversed (650) - (650)
At 31 March 2020 1,389 - 1,389
The Company does not have any provisions.
Defect provisions A 10 year warranty is offered in connection with roofing services. These warranties are offered in the normal course of business and are in line with industry standards. Provision is therefore recognised for expected defect claims on goods and services sold during the last 10 years. The provision is based on management’s best estimate of the Group’s liability under the warranties granted, based on past experience. The main uncertainty relates to estimating the value and number of claims expected to be made.
Management consider their estimate on a case by case basis, following a specific review of jobs carried out during the year. This is considered to be the most appropriate method for determining the provision due to the individual nature of the materials used in construction, the size and geography of the site and other external factors. The cost and number of historical claims forms the basis of the estimated costs that could potentially arise from future claims over the 10 year warranty period. The cost of any warranty claim is charged against the associated provision as those costs become payable. Once the 10 year warranty period has expired, any unutilised provision is released back to profit or loss. Due to the long-term nature of the liabilities and uncertainty surrounding the potential timing of the claims, the provision is inherently subjective. The potential impact of discounting is considered immaterial.
Dilapidation provisions Provision is recognised for expected repairs on the Group’s operating premises. Leasehold dilapidations relate to the estimated cost of returning a leasehold property to its original state at the end of the lease in accordance with the lease terms. The cost is recognised as part of the right of use asset and is depreciated over the remaining term of the lease. The main uncertainty relates to estimating the cost that will be incurred at the end of the lease.
Financial Statements
NOTES TO THE FINANCIAL STATEMENTSYEAR ENDED 31 MARCH 2020
98
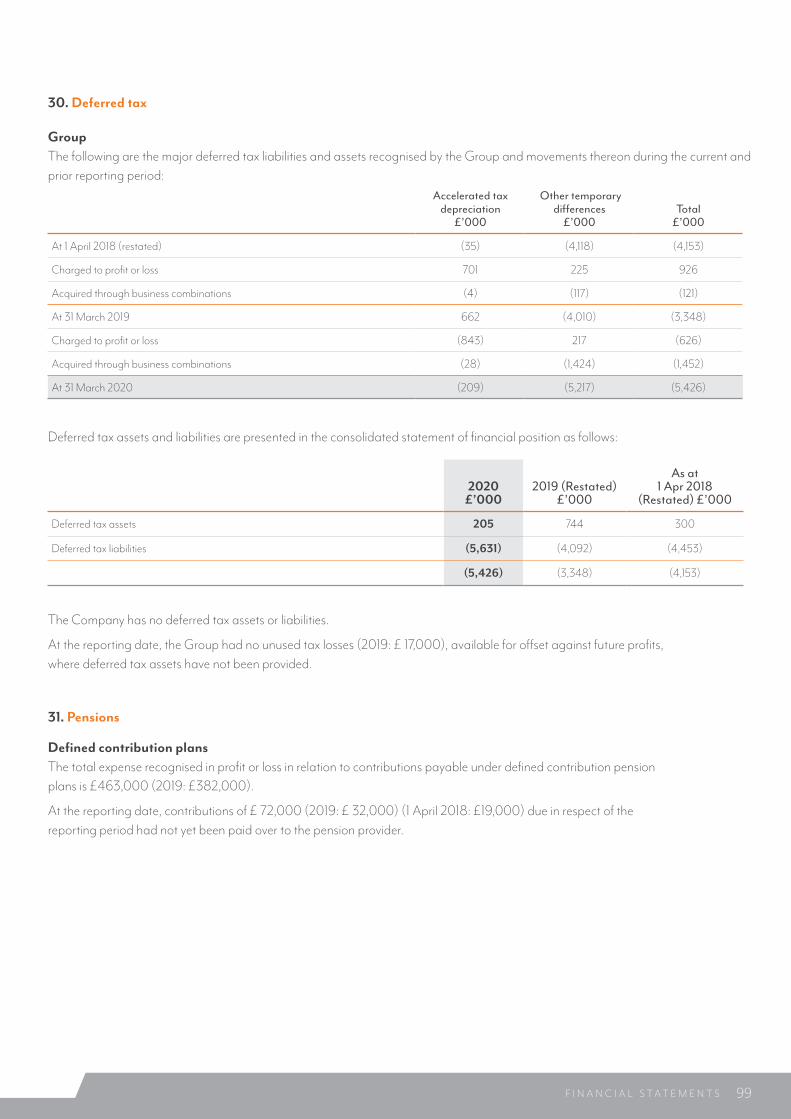
30. Deferred tax
Group The following are the major deferred tax liabilities and assets recognised by the Group and movements thereon during the current and prior reporting period:
Accelerated tax depreciation
£’000
Other temporary differences
£’000Total
£’000
At 1 April 2018 (restated) (35) (4,118) (4,153)
Charged to profit or loss 701 225 926
Acquired through business combinations (4) (117) (121)
At 31 March 2019 662 (4,010) (3,348)
Charged to profit or loss (843) 217 (626)
Acquired through business combinations (28) (1,424) (1,452)
At 31 March 2020 (209) (5,217) (5,426)
Deferred tax assets and liabilities are presented in the consolidated statement of financial position as follows:
2020£’000
2019 (Restated)£’000
As at1 Apr 2018
(Restated) £’000
Deferred tax assets 205 744 300
Deferred tax liabilities (5,631) (4,092) (4,453)
(5,426) (3,348) (4,153)
The Company has no deferred tax assets or liabilities.
At the reporting date, the Group had no unused tax losses (2019: £ 17,000), available for offset against future profits, where deferred tax assets have not been provided.
31. Pensions
Defined contribution plans The total expense recognised in profit or loss in relation to contributions payable under defined contribution pension plans is £463,000 (2019: £382,000).
At the reporting date, contributions of £ 72,000 (2019: £ 32,000) (1 April 2018: £19,000) due in respect of the reporting period had not yet been paid over to the pension provider.
99F I N A N C I A L S T A T E M E N T S

32. Financial instruments
The Group has the following financial assets and liabilities:
Financial assets2020
£’000
2019 (Restated)
£’000
As at1 Apr 2018 (Restated)
£’000
Financial assets measured at amortised cost
Cash and cash equivalents 27,269 17,001 5,346
Trade and other receivables 35,040 32,468 26,747
62,309 49,469 32,093
Financial assets measured at fair value through profit or loss
Contingent consideration - 204 452
Total financial assets 62,309 49,673 32,545
Financial liabilities2020
£’0002019
£’000
As at1 Apr 2018
£’000
Financial liabilities measured at amortised cost
Trade and other payables 38,887 36,339 28,473
Loans and borrowings 24,912 65,388 62,876
Lease liabilities 6,578 2,133 1,599
70,377 103,860 92,948
Financial liabilities measured at fair value through profit or loss
Derivatives - 106 -
Contingent consideration 2,357 770 -
2,357 876 -
Total financial liabilities 72,734 104,736 92,948
Fair values Financial instruments not measured at fair value include cash and cash equivalents, trade and other receivables, trade and other payables, loans and borrowings and lease liabilities.
Due to their short-term nature, the carrying value of cash and cash equivalents, trade and other receivables and trade and
other payables approximates their fair value. For details of the fair value of loans and borrowings, refer to note 27.
Interest rate swaps are valued using present value valuation techniques, which employ the use of market observable inputs.
Financial Statements
NOTES TO THE FINANCIAL STATEMENTSYEAR ENDED 31 MARCH 2020
100

Financial risk management objectives The Group’s activities expose it to a variety of financial risks: market risk (including cash flow, interest rate and currency risk), investment risk, liquidity risk and credit risk. Risk management is carried out by the directors. The Group finances its operations through a mixture of debt finance, cash and liquid resources and various items such as trade receivables and payables which arise directly from the Group’s operations.
Interest rate risk Interest rate risk is the risk that the fair value of future cash flows associated with an instrument will fluctuate due to changes in market interest rates. Interest bearing assets, including cash and cash equivalents, are considered to the short-term liquid assets. It is the Group’s policy to settle trade payables within the credit terms allowed and thus the Group does not incur interest on overdue balances. The Group’s exposure to interest rate risk is therefore primarily in respect of its long-term floating rate borrowings.
The Group has a portfolio with an appropriate mix of fixed and floating rate borrowings and purchases interest rate swaps to
manage interest rate risk volatility and hedge against interest exposure on future firm commitments. The fair values of the assets and liabilities held at fair value through profit or loss at the reporting date are determined using quoted prices. Where quoted prices are not available for derivatives, the fair value of derivatives has been calculated by discounting the expected future cash flows at prevailing interest rates.
The Group also has the facility to offset cash and cash equivalents against its bank borrowings in order to minimise its interest charge.
Interest rate sensitivity analysis The following table demonstrates the impact on the Group’s profit before tax and equity based on the sensitivity of a reasonably possible change in interest rates on the Group’s floating rate borrowings, with all other variables held constant. The analysis is prepared assuming the liability outstanding at the reporting date was outstanding for the whole year.
The significant unobservable inputs used in the fair value measurements categorised within level 3 of the fair value hierarchy, together with a quantitative sensitivity analysis at 31 March 2020, 31 March 2019 and 1 April 2018 are shown below:
Financial instrument
Valuation technique
SignificantUnobservable inputs
Range/ estimate Sensitivity of the input to fair value
Contingent Consideration in a business combination (note 21)
Present value of future cash flows
Assumed probability adjustedEBITDA of acquired entities
2020: £1,231,000 –£3,750,000
2019: £1,182,000 –£11,584,000
2018: £14,230,000
The higher the adjusted EBITDA, the higher the fair value. If forecast EBITDA was 10% higher, while all other variables remained constant, the fair value of the overall contingent consideration liability would increase by £67,000. A 10% decrease in EBITDA would result in a decrease in the liability of £404,000. (2019: increase of £771,000 and decrease of £778,000) (1 April 18: increase and decrease of £803,000)
Discount rate 2020: 3.5% - 4.8%
2019: 4.0% - 4.7%
2018: 4.7%
The higher the discount rate, the lower the fair value. If the discount rate applied was 2% higher, while all other variables remained constant, the fair value of the overall contingent consideration liability would decrease by £103,000. A 2% decrease in the rate would result in an increase in the liabilityof £109,000. (2019: decrease and increase of £4,000) (2018: increase and decrease of £4,000)
Reconciliation of level 3 fair value measurements of financial instruments.
Contingent consideration£’000
At 1 April 2018 452
Additions through business combinations 201
Finance expense charged to profit or loss 12
Settlement (96)
Fair value losses recognised in profit or loss (1,135)
At 31 March 2019 (566)
Additions through business combinations (2,345)
Finance expense credited to profit or loss (28)
Settlement 627
Fair value losses recognised in profit or loss (45)
At 31 March 2020 2,357
101F I N A N C I A L S T A T E M E N T S

32. Financial instruments (continued)
2020 2019
Change in rateEffect on profit
before tax £’000Changein rate
Effect on profitbefore tax £’000
Sterling + 0.25% (63) +0.5% (184)
-0.25% 63 -0.5% 184
The change in interest rate is based on the observable market environment.
Foreign currency risk The Group undertakes transactions denominated in foreign currencies and thus there is the risk of exposure to changes in foreign currency exchange rates. The Group enters into forward foreign exchange contracts in order to hedge against fluctuations in exchange rates.
The carrying amounts of the Group’s foreign currency denominated monetary assets and liabilities at the reporting date are as follows:
Assets Liabilities
2020 £’000
2019£’000
As at1 Apr 2018
£’0002020
£’0002019
£’000
As at1 Apr 2018
£’000
Euro 132 527 211 2,190 1,323 706
USD 12 - - - 6 37
144 527 211 2,190 1,329 742
Foreign currency sensitivity analysis
The Group is mainly exposed to the Euro currency.
The following table demonstrates the Group’s sensitivity to a reasonably possible change in the Euro exchange rates, with all other variables held constant. The impact on the Group’s profit before tax is due to changes in the fair value of monetary assets and liabilities, including non-designated foreign currency derivatives. The impact on equity is due to changes in the fair value of forward contracts and changes as a result of translating outstanding foreign currency denominated monetary items at the revised exchange rates.
2020 2019
Change in rate
Effect on profitand equitybefore tax
Changein rate
Effect on profitand equitybefore tax
Euro + 10% 187 + 10% 72
- 10% (229) - 10% (88)
USD + 10% (1) + 10% 1
- 10% 1 - 10% (1)
The change in exchange rate is based on management’s assessment of the reasonably possible change in foreign exchange rates.
Financial Statements
NOTES TO THE FINANCIAL STATEMENTSYEAR ENDED 31 MARCH 2020
102

Liquidity risk The Group manages liquidity risk by maintaining sufficient cash balances and reserves and by ensuring it has adequate banking and borrowing facilities available. Management reviews cash flow forecasts on a regular basis to determine whether the Group has sufficient cash reserves to meet future working capital requirements and to take advantage of business opportunities.
Liquidity and inherent risk tables The following tables detail the Group’s remaining contractual maturity for its financial liabilities, based on the undiscounted cash flows
31 March 2020 < 1 year £’000
1 – 5 years £’000
> 5 years £’000
Total £’000
Non-derivative financial liabilities
Trade and other payables 39,023 2,515 - 41,538
Lease liabilities 1,078 2,933 4,936 8,947
Bank loans - 25,000 - 25,000
Total financial liabilities 40,101 30,448 4,936 75,485
31 March 2019 < 1 year £’000
1 – 5 years £’000
> 5 years £’000
Total £’000
Non-derivative financial liabilities
Trade and other payables 32,804 4,550 - 37,354
Lease liabilities 524 1,296 727 2,547
Bank loans 3,158 33,684 - 36,842
Loan notes - - 29,017 29,017
36,486 39,530 29,744 105,760
Derivative financial liabilities
Interest rate swaps - 106 - 106
- 106 - 106
Total financial liabilities 36,486 39,636 29,744 105,866
As at 1 April 2018 < 1 year £’000
1 – 5 years £’000
> 5 years £’000
Total £’000
Non-derivative financial liabilities
Trade and other payables 20,979 7,576 - 28,555
Lease liabilities 395 1,147 287 1,829
Bank loans 3,158 35,342 - 38,500
Loan notes - - 24,959 24,959
Total financial liabilities 24,532 44,065 25,246 93,843
103F I N A N C I A L S T A T E M E N T S

32. Financial instruments (continued)
Capital risk management The capital structure of the Group consists of cash and cash equivalents, debt and equity. Equity comprises share capital, share premium, retained earnings and the merger reserve which is equal to the amount shown as ‘Equity’ in the balance sheet. Debt comprises various items which are set out in further detail in note 27.
The Group’s objectives when maintaining capital are to: • Safeguard the Group’s ability to remain a going concern so that it can continue to pursue its growth plans; • Provide a reasonable expectation of future returns to shareholders; and • Maintain adequate financial flexibility to preserve its ability to meet financial obligations, both current and long term.
The Group is not subject to any externally imposed capital requirements.
The Board reviews the capital structure annually, considering the cost of capital and the risks associated with each class of capital.
The Group’s gearing ratio at the reporting date is as follows:
2020 £’000
2019£’000
As at1 Apr 2018
£’000
Debt 31,490 67,521 64,475
Cash and cash equivalents (27,269) (17,001) (5,346)
Net debt 4,221 50,520 59,129
Equity 80,065 16,386 8,131
Net debt to equity ratio 5% 308% 727%
Debt is defined as short and long-term loans and borrowings and lease liabilities as detailed in notes 27 and 28. Equity includes all capital and reserves.
Credit risk and impairment Credit risk refers to the risk that a counterparty will default on its contractual obligations, resulting in a financial loss to the Group. In order to minimise the risk, the Group endeavours to only deal with companies which are demonstrably creditworthy. This, together with the aggregate financial exposure, is continuously monitored; Credit approval processes are in place for new customers and regular reviews of credit limits carried out. Credit insurance is also taken out where appropriate. Policies in place primarily cover customers within the Bricks and Building Materials segment.
The maximum exposure to credit risk is the carrying value of the Group’s financial assets, including trade and other receivables
and cash and cash equivalents. The Group does not consider that there is any concentration of risk within either trade or other receivables. The age of receivables is analysed and evaluated on a regular basis for potential credit losses, considering historic, current and forward-looking information. Details regarding the credit risk exposure on trade receivables is outlined in note 24.
Credit risk on cash and cash equivalents is considered to be very low as the counterparties are all substantial banks with high credit ratings.
The Group does not hold any collateral or other credit enhancements to cover its credit risks associated with its financial assets.
Financial Statements
NOTES TO THE FINANCIAL STATEMENTSYEAR ENDED 31 MARCH 2020
104

33. Share capitalGroup and Company
2020 2019 As at1 Apr 2018
Number £ Number £ Number £
Authorised, issued and fully paid
Ordinary shares of £0.01 each 230,458,821 2,304,588 - - - -
Ordinary A shares of £0.01 each - - 17,088 171 17,088 171
Ordinary B shares of £0.01 each - - 82,912 829 82,912 829
Ordinary C shares of £1 each - - 2,085 2,085 2,085 2085.00
Ordinary D shares of £0.01 each - - 138,317 1,383 123,065 1,231
230,458,821 2,304,588 240,402 4,468 225,150 4,316
During the year, the Company sub-divided 2,085 Ordinary C shares of £1 each into 208,500 Ordinary C shares of £0.01 each. 206,415 Ordinary C shares were re-designated as deferred shares of £0.01 which were then purchased by the Company and subsequently cancelled.
The Company issued 9,791,424 new bonus Ordinary A shares of £0.01 each, 47,508,576 new bonus Ordinary B shares of £0.01 each, 1,194,705 new bonus Ordinary C shares of £0.01each and 84,451,489 new Ordinary D shares of £0.01 each. Of the Ordinary D shares issued, 4,761 were issued on the conversion of loan notes to equity, 4,291 were issued for consideration (see note 37) and 84,442,437 were bonus shares.
The Company’s Ordinary A, B, C and D shares were re-designated as Ordinary shares. Following the redesignation, the Company issued 87,272,225 new Ordinary shares of £0.01 each.
Any profits distributed shall be applied pari passu amongst the holders of the ordinary shares. In the event of a liquidation, the surplus assets shall be applied pari passu amongst the holders of the ordinary shares.
The Company has a share option scheme under which options have been granted to certain employees to acquire ordinary shares. Further details are included in note 35.
105F I N A N C I A L S T A T E M E N T S

34. Reserves The share capital reserve represents the nominal value received for shares issued.
The share premium reserve represents the amount received, for shares issued, in excess of the nominal value, less transaction costs.
The capital redemption reserve represents the par value of shares purchased back by the Company and subsequently cancelled.
The share-based payment reserve represents the value of equity settled share-based payments provided to employees, including key management personnel, as part of their remuneration. See note 35.
The retained earnings reserve represents the total of all current and prior period retained profits and losses.
The merger reserve in the consolidated balance sheet represents the difference between the carrying value of the assets and liabilities acquired and the value of consideration transferred on a previous group reorganisation.
Within the company balance sheet, it represents the merger relief arising on a share for share exchange in which the Company acquired a subsidiary.
Financial Statements
NOTES TO THE FINANCIAL STATEMENTSYEAR ENDED 31 MARCH 2020
106

35. Share based payments
Equity settled share option plans The Company operates a Company Share Option Plan (CSOP) for certain employees, including senior management and directors.
Company Share Option Plan (CSOP) Options are exercisable at a price equal to the market value per ordinary share at the grant date. Options have a vesting period of three years and a contractual life of ten years. Options are forfeited if the employee leaves employment before the options vest.
Details of the share options outstanding during the year are as follows:
2020 2020
Number of share options
Weighted average exercise price £
Numberof shareoptions
Weightedaverage
exercise price£
Outstanding at 1 April - - - -
Granted during the year 3,681,311 0.41
Forfeited during the year (45,889) - - -
Outstanding at 31 March 3,635,422 0.41 - -
Exercisable at 31 March - - - -
No share options were exercised during the year. The options outstanding at 31 March have an exercise price of £0.41 and a remaining contractual life of 9.33 years.
During the year, options were granted on 2 August 2019. The aggregate of the estimated fair value of those options is £257,692.
The fair value was determined using the binomial option pricing model. The inputs into this model are as follows:
2020 2019
Weighted average share price £0.41 -
Weighted average exercise price £0.41 -
Expected volatility 23% -
Option life 10 years -
Expected dividend yield 2.6% -
Risk free interest rate 0.34% -
Sub-optimal exercise multiple 4.5x -
The sub-optimal exercise multiple builds into the binomial option pricing model the assumption that once a vested option’s intrinsic value reaches a certain multiple of the exercise price, the option-holder will choose to ‘cash in’ and exercise the option before it reaches the end of its contractual life.
Expected volatility was determined using the average volatility of listed companies in the Building Materials FTSE ICB Subsector weighted by market cap, as obtained from the LBS Risk Measurement Service’s report for the relevant period.
107F I N A N C I A L S T A T E M E N T S

36. Notes to the statement of cash flows
Changes in liabilities arising from financing activities
The table below outlines the changes in the Group’s liabilities arising from financing activities, including both cash and non-cash changes.
Non-cash changes
1 April 2019 £’000
Financing cash flows (1) £’000
New leases £’000
Acquisition of
subsidiaries £’000
Conversionto equity
£’000
Changes In fair value
£’000
Other changes (2)
£’00031 March
2020 £’000
Bank borrowings (note 27) 36,422 (12,055) - - - - 545 24,912
Loan notes (note 27) 28,966 (14,562) - 1,514 (11,845) - (4,073) -
Lease liabilities (note 28) 2,133 (871) 5,036 - - - 280 6,578
Deferred consideration 8,449 (5,885) - 8,266 - (167) (241) 10,422
Derivative financial instruments 106 (105) - - - (1) - -
Total liabilities from financing activities 76,076 (33,478) 5,036 9,780 (11,845) (168) (3,489) 41,912
(1) The cash flows make up the net amount of proceeds and repayments of loans and borrowings in the cash flow statement. (2) Other changes include interest and fee accruals and payments.
Non-cash changes
1 April 2018 £’000
Financing cash flows (1) £’000
New leases £’000
Acquisition of
subsidiaries £’000
Conversionto equity
£’000
Changes In fair value
£’000
Other changes (2)
£’00031 March
2019 £’000
Bank borrowings (note 27) 37,975 (1,658) - - - - 105 36,422
Loan notes (note 27) 24,901 1,500 - 600 (300) - 2,265 28,966
Lease liabilities (note 28) 1,599 (541) 973 17 - - 85 2,133
Deferred consideration 11,173 (4,663) - 485 - 1,135 319 8,449
Derivative financial instruments - - - - - 106 - 106
Total liabilities from financing activities 75,648 (5,362) 973 1,102 (300) 1,241 2,774 76,076
(1) The cash flows make up the net amount of proceeds and repayments of loans and borrowings in the cash flow statement.(2) Other changes include interest and fee accruals and payments. Other changes within lease liabilities also includes settlement of a lease liability directly from
proceeds on the disposal of the corresponding right of use asset.
Non cash changes in equity arising from financing activities
Financial Statements
NOTES TO THE FINANCIAL STATEMENTSYEAR ENDED 31 MARCH 2020
Shares issued for consideration of £978,000 were funded by directors’ loans (note 37). The cash inflow of £43,923,000 as proceeds from the issue of ordinary shares is therefore £978,000 less than the total reported in the Consolidated and Company Statement of Changes in Equity, for the issue of paid shares.
In addition to the conversion of loan notes into equity, amounting to £11,845,000 (2019: £300,000), fees of £2,087,000 (2019:
£nil), in connection with the IPO, were settled by the issue of shares in the Company. Total debt converted to equity was therefore £13,932,000 (2019: £300,000).
The above mentioned fees of £2,087,000 and the £414,000 of share issue costs paid, form the total share issue costs of £2,501,000, as presented in the Consolidated and Company Statement of Changes in Equity.
108

37. Related party transactions
Group
Transactions and balances between the Company and its subsidiaries, which are related parties, have been eliminated on consolidation and are not disclosed in this note.
Transactions with directors
Included within receivables are the following balances due from directors:
2020£’000
2019£’000
As at 1 Apr2018 £’000
Directors’ loan accounts 978 21 -
In respect of directors who had an overdrawn loan account during the year, the following transactions took place between the directors and the Group:
The amounts advanced were for the purpose of paying up the subscription price for ordinary D shares of £0.01 each. The loans are unsecured and interest free and are repayable on the sale of any of the shares held in the Company by those directors.
Included within non-current loans and borrowings is an amount of £nil (2019: 17,784,000) (1 April 2018: £15,314,000) payable to directors in respect of loan notes and interest. During the year, interest of £317,000 (2019: £1,432,000) was charged, at a rate of 9.5% per annum, to profit or loss in respect of loan notes payable to directors.
During the year, loan notes payable to directors amounting to £5,883,000 (2019: £nil) were exchanged for shares in the
Company. Loan notes and accrued interest amounting to £3,818,000 (2019: £nil) were paid to directors. Included within the deferred consideration liability is an amount of £nil (2019: £798,000) (1 April 2018: £1,566,000) in respect of deferred consideration payable to directors in relation to acquisitions made by the Group on 6 March 2018. A finance expense of £nil (2019: £29,000) was recognised in respect of the unwinding of the discount applied to deferred consideration due to directors.
During the year, interest of £279,000 (2019: £nil) was charged, at a rate of 9.5% per annum, to profit or loss in respect of loan notes payable to key management personnel. Loan notes payable to key management personnel amounting to £3,850,000 (2019: £nil) were exchanged for shares in the Company. Loan notes and accrued interest amounting to £4,403,000 (2019: £nil) were paid to key management personnel.
Included within the deferred consideration liabilities is an amount of £1,001,000 (2019 and 1 April 2018: £nil) in respect of deferred consideration payable to key management personnel,
in connection with acquisitions made by the Group on 6 March 2018. A finance expense of £85,000 (2019: £nil) was recognised in respect of the unwinding of the discount applied to deferred consideration due to key management.
During the year, the Group made sales amounting to £68,000 (2019: £13,000) to a member of key management. A balance of £33,000 (2019: £nil) was included within trade receivables at the reporting date, in respect of these sales. The Group also purchased a motor vehicle from a member of key management personnel for £35,000 (2019: £nil). No balance was outstanding at the reporting date in respect of this purchase.
Key management personnel
2020 £’000 2019 £’000
Key management personnel compensation - -
Short-term employee benefits 2,033 1,571
Post-employment benefits 66 85
Share-based payment expense 2
2,101 1,656
£’000
Opening balance 21
Amounts advanced 978
Amounts repaid (21)
Closing balance 978
109F I N A N C I A L S T A T E M E N T S

37. Related party transactions
Other related parties
Included within receivables/ liabilities are the following amounts due from/ to other related parties, at the reporting date:
Amounts owed by related parties Amounts owed to related parties
2020 £’000
2019£’000
As at1 Apr 2018
£’0002020
£’0002019
£’000
As at1 Apr 2018
£’000
Associates 120 - - 44 196 41
Other related parties - 90 3 - - -
120 90 3 44 196 41
Transactions undertaken between the Group and its related parties during the year were as follows:
Sales to related parties Purchases from related parties
2020£’000
2019£’000
2020£’000
2019£’000
Associates 100 - 565 377
Other related parties - 3 178 224
100 3 743 601
Other related parties comprise of entities owned by directors or key management. Purchases relate to rent and administrative expenses.
Included within non-current loans and borrowings is an amount of £nil (2019: 1,977,000) (1 April 2018: £1,414,000) in respect of loan notes and interest payable a close relative of a director. Interest of £71,000 (2019: £325,000) was accrued during the year in respect of these loan notes, at a rate of 9.5% per annum. £2,048,000 was paid to this close relative, in respect of these loan notes, in the year.
Included within the deferred consideration liability is an amount of £1,363,000 (2019 and 1 April 2018: £ nil) in respect of deferred consideration payable to close relatives of key management, in connection with acquisitions made by the Group on 6 March 2018. A finance expense of £116,000 (2019: £nil) was recognised in respect of the unwinding of the discount applied to deferred consideration due to these close relatives.
In the prior year, one of the members of key management was a director. The amount payable at 31 March 2019 to the close relative of this director was £1,457,000 (1 April 2018: £2,133,000). A finance expense of £78,000 was recognised in respect of the unwinding of the discount applied to this deferred consideration in the year ended 31 March 2019.
During the year, the Group was charged £50,000 (2019: £120,000), in respect of monitoring fees, by an entity in which members of that entity have significant influence over the Group.
Included within non-current loans and borrowings is an amount of £nil (2019: 6,767,000) (1 April 2018: £6,249,000) in respect of loan notes and interest payable to an entity in which members of that entity have significant influence over the Group. Interest of £211,000 (2019: 518,000) was accrued during the year in respect of the loan notes issued. The loan notes were secured with interest payable, at 9.5% per annum, on redemption. The loan notes were redeemable on 13 September 2026 but were settled during the year, with a total of £6,978,000 paid on settlement.
Company
In accordance with the exemption under FRS 101, transactions and balances with wholly owned Group members and key management personnel are not disclosed.
Financial Statements
NOTES TO THE FINANCIAL STATEMENTSYEAR ENDED 31 MARCH 2020
110

38. Post balance sheet events
There have been no subsequent events requiring further disclosure or adjustments to these financial statements.
39. Reconciliation to previously reported results
As reported in note 2, these are the first statutory financial statements that the Group has prepared under IFRS, since listing. Accordingly, the Group has prepared financial statements that comply with IFRS applicable as at 31 March 2020, together with the comparative period data for the period ended 31 March 2019 and as at 1 April 2018, as described in the summary of significant accounting policies.
This note explains the principal adjustments made by the Group in restating its financial statements prepared under UK GAAP, including the balance sheet as at 1 April 2018 and the financial statements as of, and for, the year ended 31 March 2019. This note also outlines the prior period adjustments compared to the first financial statements prepared under IFRS, as reported within the AIM admission document.
Group reconciliation of equity from FRS 102 as at 1 April 2018
1 April2018
FRS 102£’000
IFRS 3£’000
IFRS 16£’000
Deferred tax£’000
IAS 28£’000
Group re-organisation
and re-classification
£’000
1 April2018IFRS
£’000
Non-current assets
Property, plant and equipment 3,317 - (55) - - 3,262
Right of use asset - - 1,617 - - 1,617
Intangible assets 69,644 2,832 1 - - (5,261) 67,216
Investments in associates 632 - - - 4 - 636
Deferred tax assets - - - - - 300 300
Trade and other receivables - - - - - 146 146
Total non-current assets 73,593 2,832 1,563 - 4 (4,815) 73,177
Current assets
Inventories 5,031 - - - - 5,031
Trade and other receivables 28,216 - - - - (446) 27,770
Cash and cash equivalents 5,346 - - - - 5,346
Total current assets 38,593 - - - - (446) 38,147
Total assets 112,186 2,832 1,563 - 4 (5,261) 111,324
Current liabilities
Trade and other payables (23,146) 112 - - - - (23,035)
Current income tax (1,798) - - - - - (1,798)
Loans and borrowings (3,158) - - - - - (3,158)
Lease liabilities (45) - (295) - - - (340)
Total current liabilities (28,147) 112 (295) - - - (28,330)
111F I N A N C I A L S T A T E M E N T S
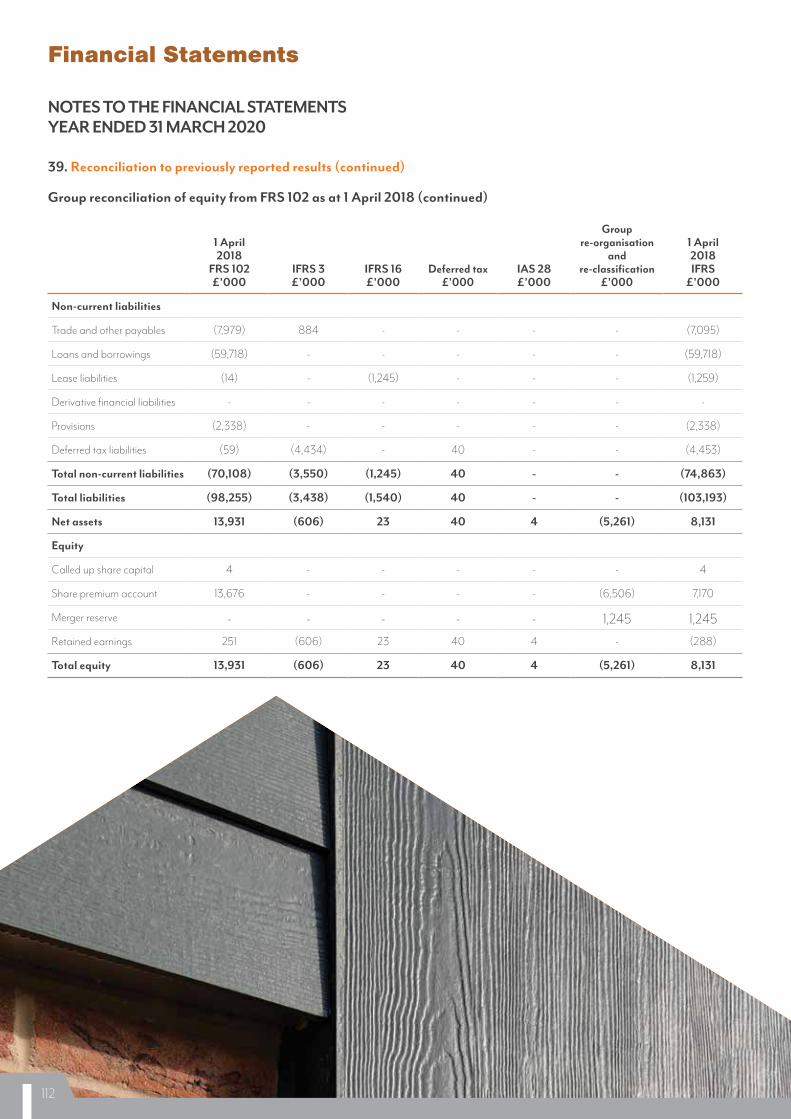
39. Reconciliation to previously reported results (continued)
Group reconciliation of equity from FRS 102 as at 1 April 2018 (continued)
1 April2018
FRS 102£’000
IFRS 3£’000
IFRS 16£’000
Deferred tax£’000
IAS 28£’000
Group re-organisation
and re-classification
£’000
1 April2018IFRS
£’000
Non-current liabilities
Trade and other payables (7,979) 884 - - - - (7,095)
Loans and borrowings (59,718) - - - - - (59,718)
Lease liabilities (14) - (1,245) - - - (1,259)
Derivative financial liabilities - - - - - - -
Provisions (2,338) - - - - - (2,338)
Deferred tax liabilities (59) (4,434) - 40 - - (4,453)
Total non-current liabilities (70,108) (3,550) (1,245) 40 - - (74,863)
Total liabilities (98,255) (3,438) (1,540) 40 - - (103,193)
Net assets 13,931 (606) 23 40 4 (5,261) 8,131
Equity
Called up share capital 4 - - - - - 4
Share premium account 13,676 - - - - (6,506) 7,170
Merger reserve - - - - - 1,245 1,245Retained earnings 251 (606) 23 40 4 - (288)
Total equity 13,931 (606) 23 40 4 (5,261) 8,131
Financial Statements
NOTES TO THE FINANCIAL STATEMENTSYEAR ENDED 31 MARCH 2020
112

Group reconciliation of equity from FRS 102 as at 31 March 2019
31 March2019
FRS 102£’000
IFRS 3£’000
IFRS 16£’000
Deferred tax£’000
IAS 28£’000
Group re-organisation
and re-classification
£’000
31 March2019IFRS
£’000
Non-current assets
Property, plant and equipment 3,623 - (109) - - - 3,514
Right of use asset - - 2,173 - - - 2,173
Intangible assets 65,285 6,725 4 - - (5,261) 66,753
Investments in associates 1,239 - - - 53 - 1,292
Deferred tax assets - - - - - 744 744
Trade and other receivables - 178 - - - 155 333
Total non-current assets 70,147 6,903 2,068 - 53 (4,362) 74,809
Current assets
Inventories 5,422 - - - - - 5,422
Trade and other receivables 35,010 26 - - - (899) 34,137
Cash and cash equivalents 17,001 - - - - - 17,001
Total current assets 57,433 26 - - - (899) 56,560
Total assets 127,580 6,929 2,068 - 53 (5,261) 131,369
Current liabilities
Trade and other payables (35,392) 298 - - - - (35,094)
Current income tax (1,688) - - - - - (1,688)
Loans and borrowings (3,053) - - - - - (3,053)
Lease liabilities (32) - (396) - - - (428)
Total current liabilities (40,165) 298 (396) - - - (40,263)
Non-current liabilities
Trade and other payables (4,550) 43 - - - - (4,507)
Loans and borrowings (62,335) - - - - - (62,335)
Lease liabilities (32) - (1,673) - - - (1,705)
Derivative financial liabilities (106) - - - - - (106)
Provisions (1,975) - - - - - (1,975)
Deferred tax liabilities (69) (4,552) - 529 - - (4,092)
Total non-current liabilities (69,067) (4,509) (1,673) 529 - - (74,720)
Total liabilities (109,232) 4,211 (2,069) 529 - - (114,983)
Net assets 18,348 2,718 (1) 529 53 (5,261) 16,386
Equity
Called up share capital 4 - - - - - 4
Share premium account 15,476 - - - - (6,506) 8,970
Merger reserve - - - - - (1,245) 1,245
Retained earnings 2,868 2,718 (1) 529 53 - 6,167
Total equity 18,348 2,718 (1) 529 53 (5,261) 16,386
113F I N A N C I A L S T A T E M E N T S

39. Reconciliation to previously reported results (continued)
Group reconciliation of total comprehensive income from FRS 102 for the year ended 31 March 2019
31 March2019
FRS 102£’000
IFRS 3£’000
IFRS 16£’000
Deferredtax
£’000IAS 28£’000
Group re-organisation
and re-classification
£’000
31 March2019IFRS
£’000
Revenue 163,294 - - - - - 163,294
Cost of sales (130,371) - - - - (206) (130,577)
Gross profit 32,923 - - - - (206) 32,717
Other operating income 96 - - - - - 96
Administrative expenses (15,217) (16) 487 - - 206 (18,746)
Impairment losses on financial assets
(542) - - - - - (542)
Depreciation and amortisation (7,936) 4,792 (411) (3,555)
Finance income 31 - - - - - 31
Finance expense (4,072) (317) (100) - - - (4,489)
Share of results of equity accounted associates
13 - - - - - (13)
Amounts written off investments (49) - - - 49 -
Fair value gains and losses - (1,135) - - - (1,135)
Profit before tax 5,247 3,324 (24) - 49 - 8,596
Tax expense (2,630) - - 489 - - (2,141)
Profit for the year 2,617 3,324 (24) 489 49 - 6,455
Statement of cash flows Cash flows arising from operating lease payments are classified as cash flows from operating activities under FRS 102. However, under IFRS, all lease payments are classified as cash flows from financing activities. The IFRS 16 adjustments on transition, as outlined later in this note, have therefore resulted in an increase in cash generated from operating activities of £487,000, with a corresponding decrease in cash flows from financing activities, for the year ended 31 March 2019. The impact of other transition adjustments on the statement of cash flows is not material.
The changes in accounting policies applied for the adoption of IFRS were as follows:
IFRS 3 Under FRS 102, goodwill recognised on the acquisition of subsidiaries is amortised over its useful life. However, goodwill under IFRS is not amortised but instead undergoes an annual impairment review. The amortisation charge included under FRS 102 has therefore been reversed in the IFRS financial statements.
This resulted in an increase in the carrying value of intangible assets and increase in profit or loss reserves of £592,000 at 1 April 2018. The equivalent adjustment in the prior year resulted in an increase in intangible assets and decrease in amortisation charge of £7,366,000.
Transaction costs incurred in connection with the acquisition of subsidiaries are capitalised as part of the cost of acquisition under FRS 102. However, under IFRS, they are expensed. Intangible assets and retained earnings have therefore been reduced by the value of costs directly associated with the business combination.
At 1 April 2018, transaction costs of £952,000 had been removed from goodwill, with a corresponding adjustment against profit or loss
reserves. The equivalent adjustment for the year ended 31 March 2019, resulted in an increase in administration expenses and decrease in goodwill of £16,000.
Intangible assets acquired during business combinations, in respect of brands, customer and supplier relationships were not separately identified and recognised under FRS 102. These have been recognised at fair value in the IFRS accounts. Deferred tax on these intangibles has also been recognised. The separately identifiable assets have then been amortised over their useful life.
Acquisitions in the period ended 31 March 2018, resulted in an adjustment of £4,434,000 at 1 April 2018 in order to record the intangible assets at fair value and recognise the deferred tax liability. The equivalent adjustment in the prior year resulted in an increase in intangible assets and deferred tax liabilities of £117,000. Amortisation that would have been charged prior to 1 April 2018, resulted in a decrease in opening reserves of £212,000. The equivalent charge in the prior year amounted to £2,574,000.
Financial Statements
NOTES TO THE FINANCIAL STATEMENTSYEAR ENDED 31 MARCH 2020
114
Contingent consideration on a business combination was not recognised under FRS 102 and subsequent changes in the consideration were adjusted against the carrying value of goodwill. However, under IFRS 3, contingent consideration is recognised at fair value at the acquisition date and subsequently re-measured at fair value at the reporting date. Deferred and contingent consideration had also not been discounted to take into account the time value of money.
IFRS 3 has been applied to acquisitions from 6 March 2018. At 1 April 2018, the recognition of contingent consideration and the discounting of deferred and contingent consideration resulted in a decrease in the carrying value of goodwill of £1,030,000 a nd a reduction in deferred consideration of £996,000. A finance expense, being the unwinding of the discount, resulted in a decrease of £34,000 in opening profit or loss reserves.
In the year ended 31 March 2019, the re-measurement of contingent consideration and unwinding of the discount resulted in a fair value loss of £1,135,000 and a finance expense of £317,000 in the profit or loss account, a reduction in reported goodwill of £1,000,000 and an increase in the overall deferred consideration liability of £452,000.
IFRS 16 Under FRS 102, leases are accounted for as either finance leases or operating leases, depending on the substance of the transaction. Operating lease payments are recognised as an expense, on a straight-line basis, over the term of the lease. However, under IFRS, a single recognition and measurement approach is applied for all leases, with the optional exception of short-term or low-value asset leases. A lease liability and right-of use asset is recognised, representing the right to use the underlying asset.
Payments, previously recognised in the statement of profit or loss, have therefore been removed from administration expenses and the appropriate liability and right-of-use asset recognised at the transition date.
Lease liabilities are subsequently reduced for lease payments made and increased for interest charged at a constant rate, with the interest expense recognised in the statement of profit or loss. Right-of-use assets are subsequently depreciated over the shorter of the term of the lease or the asset’s useful life, with the depreciation charge recognised as an expense in the statement of profit-or loss.
At 1 April 2018, the above adjustments resulted in an increase in right-of-use assets of £1,561,000, an increase in lease liabilities of £1,539,000 and an increase in retained earnings of £22,000.
Under IFRS 16, all leased assets must either be presented in a single line within right of use assets or within property, plant and equipment with a separate disclosure. The Group has elected to show all leased assets within the right of use asset line on the balance sheet. An adjustment has therefore also been made at 1 April 2018 to re-classify £55,000 from property, plant and equipment to right of use assets.
In the year ended 31 March 2019, the equivalent adjustments resulted in an increase in right-of-use assets of £559,000, a decrease in property, plant and equipment of £54,000, an increase in lease liabilities of £529,000, a decrease in administrative expenses of £487,000, an increase in depreciation of £411,000 and an increase in the finance expense of £100,000.
Lease liabilities acquired as part of a business combination are measured at the present value of the lease payments at the date of acquisition, with a corresponding right of use asset recognised.
At 1 April 2018, an adjustment was made to the fair value of an asset and liability acquired during a prior business combination, resulting in an increase in goodwill and retained earnings of £1,000. The equivalent adjustment in the prior year resulted in an increase in goodwill and decrease in the right of use asset value of £3,000.
Deferred tax Under FRS 102, internally generated intangible assets acquired in a business combination are subsumed within goodwill. However, under IFRS, identifiable intangible assets acquired in a business combination are recognised separately, at fair value. Deferred tax had not been recognised on these separately identifiable intangible assets and thus has been recognised as a transition adjustment, as noted above.
The deferred tax liability recognised on the identifiable intangibles is charged to the profit or loss account over the corresponding amortisation period of the related asset. At 1 April 2018, the deferred tax liability was reduced and profit or loss reserves increased by £40,000 to reflect the charge due in the period ended 31 March 2018.
The equivalent adjustment for the year ended 31 March 2019 resulted in a decrease in the deferred tax charge and reduction in deferred tax liability of £489,000.
IAS 28 Under FRS 102, any excess paid over the share in net assets acquired of an associate is treated as implied goodwill and amortised. However, under IAS 28, any goodwill remains as part of the investment cost and is not amortised. An adjustment has therefore been made on transition to exclude the amortisation charge. This has resulted in an increase in investments in associates of £4,000, with a corresponding increase in profit or loss reserves, as at 1 April 2018.
The equivalent adjustment in the year ended 31 March 2019 resulted in an increase in the investment in associates and decrease in the investment amortisation charge of £49,000.
Group re-organisation As noted in the accounting policies (3.13), the Directors consider the acquisition of Brickability Enterprises Investments Limited and its subsidiary undertakings to be a group re-organisation rather than a business combination. This is due to the transaction, in substance, relating to the insertion of a new parent company within the group structure. IFRS has been applied retrospectively to acquisitions from 6 March 2018 and thus an adjustment has been made on transition to reflect the transaction under merger accounting.
The transaction had previously been accounted for under acquisition accounting under FRS 102. The adjustment has resulted in a decrease in goodwill of £5,261,000, a decrease in the share premium balance of £6,506,000 and the formation of a merger reserve of £1,245,000.
Re-classifications Deferred tax assets and debtors due after one year were presented within current assets in the financial statements prepared under FRS 102. These have been re-classified to non-current assets under IFRS. A total of £446,000 was re-classified as at 1 April 2018. The equivalent adjustment for the year ended 31 March 2019 amounted to £899,000.
An amount of £206,000 has also been re-classified from cost of sales to administration expenses in the prior year in order to present foreign exchange gains within administration expenses, in line with the Group’s policy.
115F I N A N C I A L S T A T E M E N T S

Prior period errors and reconciliation to AIM admission document
On 22 August 2019, historical financial information (HFI) was prepared and published under IFRS, as part of the AIM listing admission document. This included the Group’s first financial statements prepared under IFRS and reported a profit of £7,496,000 for the year ended 31 March 2019. A loss of £294,000 was reported for the period ended 31 March 2018.
However, in preparing the Group’s annual statutory financial statements, for the year ended 31 March 2020, management has reviewed the conditions that existed at the time of transition to IFRS, and in the prior year, and certain assumptions made for the HFI have been re-assessed. This has resulted in prior period adjustments compared to the HFI reported in the admission
document. At 1 April 2018, the effect of these adjustments was an increase in profit or loss reserves of £6,000, with a corresponding increase in equity. At 31 March 2019, the effect was a decrease in profit or loss reserves and equity of £1,041,000.
The assumptions affected the fair value recognition and accounting for contingent consideration and separately identifiable intangible assets, on retrospective application of IFRS 3. The lease term for certain leases under IFRS 16 was also re-considered, following evaluation of whether the Group would likely exercise options within those lease agreements. The adjustments in connection with IAS 28 and re-classifications, as outlined earlier in this note, were also applied to the statutory financial statements.
Financial Statements
NOTES TO THE FINANCIAL STATEMENTS YEAR ENDED 31 MARCH 2020
The effect of these prior period adjustments can be reconciled as follows:
Reconciliation of equity from HFI as at 1 April 2018
1 April 2018HFI £’000
IFRS 3£’000
IFRS 16£’000
IAS 28£’000
Reclassificationand rounding
£’0001 April 2018IFRS £’000
Non-current assets
Property, plant and equipment 3,317 - (55) - - 3,262
Right of use asset 1,371 - 246 - - 1,617
Intangible assets 68,491 (1,275) - - - 67,216
Investments in associates 633 - - 4 (1) 636
Deferred tax assets 300 - - - - 300
Trade and other receivables 145 - - - 1 146
Total non-current assets 74,257 (1,275) 191 4 - 73,177
Current assets
Inventories 5,031 - - - - 5,031
Trade and other receivables 27,770 - - - - 27,770
Cash and cash equivalents 5,346 - - - - 5,346
Total current assets 38,147 - - - - 38,147
Total assets 112,404 (1,275) 191 4 - 111,324
Current liabilities
Trade and other payables (23,191) 112 - - 45 (23,034)
Current income tax (1,798) - - - - (1,798)
Loans and borrowings (3,158) - - - - (3,158)
Lease liabilities (308) - 13 - (45) (340)
Total current liabilities (28,455) 112 13 - - (28,330)
Non-current liabilities
Trade and other payables (1,683) 884 - - (6,296) (7,095)
Loans and borrowings (66,028) - - - 6,310 (59,718)
Lease liabilities (1,061) - (184) - (14) (1,259)
Provisions (2,338) - - - - (2,338)
Deferred tax liabilities (4,714) 261 - - - (4,453)
Total non-current liabilities (75,824) 1,145 (184) - - (74,863)
39. Reconciliation to previously reported results (continued)
116

1 April 2018HFI £’000
IFRS 3£’000
IFRS 16£’000
IAS 28£’000
Reclassificationand rounding
£’0001 April 2018IFRS £’000
Equity
Called up share capital 4 - - - - 4
Share premium account 7,170 - - - - 7,170
Merger reserve 1,245 - - - - 1,245
Retained earnings (294) (18) 20 4 - (288)
Total equity 8,125 (18) 20 4 - 8,131
Reconciliation of equity from HFI as at 31 March 2019
31 March 2019HFI £’000
IFRS 3£’000
IFRS 16£’000
IAS 28£’000
Reclassification£’000
31 March 2019IFRS £’000
Non-current assets
Property, plant and equipment 3,623 - (109) - - 3,514
Right of use asset 1,595 - 578 - - 2,173
Intangible assets 68,789 (2,040) 4 - - 66,753
Investments in associates 1,239 - - 53 - 1,292
Deferred tax assets 744 - - - - 744
Trade and other receivables 155 178 - - - 333
Total non-current assets 76,145 (1,862) 473 53 - 74,809
Current assets
Inventories 5,422 - - - - 5,422
Trade and other receivables 34,111 26 - - - 34,137
Cash and cash equivalents 17,001 - - - - 17,001
Total current assets 56,534 26 - - - 56,560
Total assets 132,679 (1,836) 473 53 - 131,369
Current liabilities
Trade and other payables (35,374) 280 - - - (35,094)
Current income tax (1,688) - - - - (1,688)
Loans and borrowings (3,085) - - - 32 (3,053)
Lease liabilities (378) - (18) - (32) (428)
Total current liabilities (40,525) 280 (18) - - (40,263)
Non-current liabilities
Trade and other payables (3,958) 60 - - (609) (4,507)
Loans and borrowings (62,977) - - - 642 (62,335)
Lease liabilities (1,227) - (445) - (33) (1,688)
Derivative financial liabilities (106) - - - - (3,053)
Provisions (1,975) - - - - (3,053)
Deferred tax liabilities (4,490) 398 - - - (428)
Total non-current liabilities (74,733) 458 (445) - - (74,720)
Total liabilities (115,258) 738 (463) - - (114,983)
Net assets 17,421 (1,098) 10 53 - 16,386
117F I N A N C I A L S T A T E M E N T S

31 March 2019FRS 102 £’000
IFRS 3£’000
IFRS 16£’000
IAS 28£’000
Reclassification£’000
31 March 2019IFRS £’000
Equity
Called up share capital 4 - - - - 4
Share premium account 8,970 - - - - 8,970
Merger reserve 1,245 - - - - 1,245
Retained earnings 7,202 (1,098) 10 53 - 6,167
Total equity 17,421 (1,098) 10 53 - 16,386
Reconciliation of total comprehensive income from HFI for the year ended 31 March 2019
31 March 2019HFI £’000
IFRS 3£’000
IFRS 16£’000
IAS 28£’000
Reclassification£’000
31 March 2019IFRS £’000
Revenue 163,294 - - - - 163,294
Cost of sales (130,371) - - - (206) (130,577)
Gross profit 32,923 - - - (206) 32,717
Other operating income 96 - - - - 96
Administrative expenses (14,752) - 6 - 206 (14,540)
Impairment losses on financial assets
(542) - - - - (542)
Depreciation and amortisation (3,655) 119 (19) (3,555)
Finance income 31 - - - - 31
Finance expense (4,222) (317) (1) 49 - (4,489)
Share of results of equity accounted associates
13 - - - - (13)
Fair value gains and losses - (1,135) - - (1,135)
Profit before tax 9,892 (1,333) (12) 49 - 8,596
Tax expense (2,396) 255 - - - (2,141)
Profit for the year 7,496 (1,078) (12) 49 - 6,455
The basic and diluted EPS reported in the HFI was 3,151 p for the year ended 31 March 2019. The effect of the above adjustments is to reduce this to 2,714 p. The comparative figure disclosed in note 17 has been restated further to reflect the bonus shares issued during the year.
Company prior period errors An adjustment has been made in the prior year, in the Company’s financial statements, to re-classify £7,802,000 of other receivables from current assets to non-current assets. An adjustment was also made at 1 April 2018 to re-classify £6,845,000 from current to non-current assets. These balances relate to loan notes receivable from 6 March 2018. There has been no impact on reported profit for the Company.
An adjustment was also made in the period ended 31 March 2018, to account for the merger relief arising on a share for share exchange in which the Company acquired a subsidiary on 6 March 2018. The effect of this has to been to reduce the share premium account and increase the merger reserve by £6,506,000, within equity.
Financial Statements
NOTES TO THE FINANCIAL STATEMENTS YEAR ENDED 31 MARCH 2020
39. Reconciliation to previously reported results (continued)
118

Board of Directors
Chairman John Richards
Chief Executive Officer Alan J Simpson
Chief Financial Officer Stuart J Overend
Non-executive Directors Giles W K Beale Cllive S Norman David Simpson
Company Secretary Stuart J Overend
Registered office and number c/o Brickability Limited South Road Bridgend Industrial Estate Bridgend United Kingdom CF31 3XG
Registered number: 1123804
Auditors BDO LLP Bridgewater House Finzels Reach Counterslip Bristol BS1 6BX
Solicitors Addleshaw Goddard LLP Cornerstone 107 West Regent Street Glasgow G2 2BA
Nominated Adviser and Broker Cenkos Securities plc Tel: +44 (0) 20 7387 8900
Financial PR Advisers Monfort Communications Tel: +44 (0) 20 3770 7916
Financial Statements
COMPANY INFORMATION
Annual General Meeting 29 September 2020
Interim Report November 2020
Dividends Interim announced November 2019 Paid December 2019
Final announced September 2020 Paid October 2020
Financial Calendar
119F I N A N C I A L S T A T E M E N T S

Group plc Head OfficeBrickability Group plcQueensgate HouseCookham RdBracknellBerkshireRG12 1RB
Telephone0870 143 3332