Consolidated-FS-2021.pdf - TCS GROUP Holding PLC
146
TCS Group Holding PLC International Financial Reporting Standards Consolidated Financial Statements and Independent Auditor’s Report 31 December 2021
-
Upload
khangminh22 -
Category
Documents
-
view
4 -
download
0
Transcript of Consolidated-FS-2021.pdf - TCS GROUP Holding PLC

TCS Group Holding PLC
International Financial Reporting Standards Consolidated Financial Statements and Independent Auditor’s Report
31 December 2021

TCS Group Holding PLC
CONTENTS
Board of directors and other officers Consolidated Management Report Independent Auditor’s Report
CONSOLIDATED FINANCIAL STATEMENTS Consolidated Statement of Financial Position ............................................................................................ 1 Consolidated Statement of Profit or Loss and Other Comprehensive Income .......................................... 2 Consolidated Statement of Changes in Equity ........................................................................................... 3 Consolidated Statement of Cash Flows ..................................................................................................... 4
NOTES TO THE CONSOLIDATED FINANCIAL STATEMENTS
1 Introduction ...................................................................................................................................................... 5 2 Operating Environment of the Group ............................................................................................................... 8 3 Critical Accounting Estimates and Judgements in Applying Accounting Policies .................................................. 9 4 Segment Analysis .......................................................................................................................................... 12 5 Cash and Cash Equivalents .......................................................................................................................... 17 6 Due from Other Banks ................................................................................................................................... 18 7 Investments in Securities and Repurchase Receivables ............................................................................... 19 8 Loans and Advances to Customers ............................................................................................................... 27 9 Guarantee Deposits with Payment Systems .................................................................................................. 47 10 Brokerage Receivables and Brokerage Payables.......................................................................................... 48 11 Tangible Fixed Assets, Intangible Assets and Right-of-use Assets ............................................................... 49 12 Other Financial and Non-financial Assets ...................................................................................................... 50 13 Due to Banks ................................................................................................................................................. 51 14 Customer Accounts ....................................................................................................................................... 52 15 Debt Securities in Issue ................................................................................................................................. 52 16 Other Borrowed Funds .................................................................................................................................. 53 17 Subordinated Debt ......................................................................................................................................... 53 18 Insurance Provisions ..................................................................................................................................... 54 19 Other Financial and Non-financial Liabilities .................................................................................................. 55 20 Share Capital, Share Premium and Treasury Shares .................................................................................... 57 21 Net Margin ..................................................................................................................................................... 59 22 Fee and Commission Income and Expense .................................................................................................. 60 23 Customer Acquisition Expense ...................................................................................................................... 61 24 Insurance Premiums Earned and Claims Incurred ........................................................................................ 62 25 Administrative and Other Operating Expenses .............................................................................................. 63 26 Other Operating Income ................................................................................................................................ 63 27 Income Taxes ................................................................................................................................................ 64 28 Dividends ....................................................................................................................................................... 67 29 Reconciliation of Liabilities Arising from Financing Activities ......................................................................... 68 30 Financial and Insurance Risk Management ................................................................................................... 68 31 Management of Capital ................................................................................................................................... 85 32 Contingencies and Commitments .................................................................................................................... 87 33 Offsetting Financial Assets and Financial Liabilities ...................................................................................... 90 34 Transfers of Financial Assets ........................................................................................................................ 91 35 Non-Controlling Interest ................................................................................................................................. 92 36 Financial Derivatives ...................................................................................................................................... 93 37 Fair Value of Financial Instruments .................................................................................................................. 93 38 Presentation of Financial Instruments by Measurement Category ................................................................... 100 39 Related Party Transactions............................................................................................................................ 102 40 Events after the End of the Reporting Period .................................................................................................. 105 41 Significant Accounting Policies....................................................................................................................... 106 42 Adoption of New or Revised Standards and Interpretations ........................................................................ 123 43 New Accounting Pronouncements ............................................................................................................... 123

TCS Group Holding PLC Board of directors and other officers
Board of directors
Except where stated all directors served throughout 2021 and through to the date of these consolidated financial statements.
Director Role Retirement Appointment
Martin Cocker Independent non-executive director - - Ashley Dunster Independent non-executive director 1 March 2022 11 May 2021 Constantinos Economides Chairman of the Board, Executive director - - Pavel Fedorov Group Co-CEO, Executive director - 10 September 2021 Maria Gordon Independent non-executive director - 11 May 2021 Margarita Hadjitofi Independent non-executive director - 11 May 2021 Nicholas Huber Independent non-executive director - 11 May 2021 Oliver Hughes Group Co-CEO, Executive director - 25 March 2021 Alexios Ioannides Executive director 11 May 2021 - Jacques Der Megreditchian Independent non-executive director 28 May 2021 - Marilou Pavlou Executive director - 10 September 2021 Nitin Saigal Independent non-executive director - 11 May 2021 Mary Trimithiotou Executive director - -
The Company’s Articles of Association include regulations for the retirement by rotation of Directors at each annual general meeting. These regulations will operate in 2022 on the basis of the composition of the Board at the relevant date. Company Secretary Caelion Secretarial Limited 25 Spyrou Araouzou Berengaria 25, 5th floor, 3036, Limassol, Cyprus Registered office 25 Spyrou Araouzou Berengaria 25, 5th floor, 3036, Limassol, Cyprus

TCS Group Holding PLC Consolidated Management Report
The Board of directors presents its report together with the audited consolidated financial statements of TCS Group Holding PLC (the “Company”) and its subsidiaries (collectively the “Group”) for the year ended 31 December 2021.
Principal activities and nature of operations of the Group
1. The Group’s principal activities are mainly undertaken within the Russian Federation and consist of on-line retail banking operations, through its subsidiary JSC “Tinkoff Bank” (the “Bank”), and other operations through its subsidiaries, such us insurance operations through JSC “Tinkoff Insurance” (the “Insurance Company”), mobile services through LLC “Tinkoff Mobile” and asset management through LLC “Tinkoff Capital” (Note 1).
2. The Bank specialises in consumer finance, retail banking for individuals, individual entrepreneurs (“IE”), small and medium enterprises (“SME”), acquiring and payments services and brokerage services. The Bank which is fully licensed by the Central Bank of Russia, launched its operations in the Summer of 2007 and is a member of the Russian Deposit Insurance System. The Insurance Company specialises in providing non-life insurance coverage such as accident, property, travel, credit protection and auto insurance. As at 31 December 2021 in accordance with IFRS 10 definition of control the Group has no ultimate controlling party.
Changes in the Group’s structure
3. In April 2021 the Group acquired a 77.4% shareholding in LLC “Beskontakt”. In July 2021 the Group exercised a call option agreement with the founders and remaining stakeholders of LLC “Beskontakt” and acquired an additional 8%. As a result, the Group’s shareholding increased to 85.4%. LLC “Beskontakt” is a fintech company developing the “Koshelek” app, which is a digital wallet and a mobile app aggregating bank and loyalty cards. The acquired entity will assist the expansion of the Group’s customer base through the marketing and cross-selling of its products to the app’s users. Refer to Note 41 for the details of this acquisition.
4. In August 2021 Mortgage agent TB-1 was established as a special purpose entity which issued bonds secured by portfolio of home equity loans (Note 16). The Group neither owns shares nor has voting rights in this company. However, this entity was consolidated as it was specifically set up for the purposes of the Group, and the Group has exposure to significant risks and rewards through the retention of a junior tranche in the transaction.
5. In November 2021, the Group acquired a 51.0% stake in “Dzhast Luk” LLC – the company that operates Jump.Finance, a fintech service that automates payments to individuals and the self-employed (Note 1).
6. In late 2021, the Group acquired a 83.2% stake in Aximetria GmbH – a Swiss financial services company providing cryptocurrency services (Note 1).
Review of developments, position and performance of the Group’s business
7. The Group operates a flexible business model. Its virtual network enables it to quickly and easily increase business or slow down customer acquisition depending upon the availability of funding and market conditions. The Bank’s primary customer acquisition channels are Internet and Mobile, but it also uses Direct Sales Agents and partnerships (co-brands) to acquire new customers. These customer acquisition models, combined with the Bank’s virtual network, afford it a geographic reach across all of Russia’s regions resulting in a highly diversified portfolio.
8. In October 2021 the Bank has been added to the Bank of Russia’s list of 13 systemically important banking institutions due to a recognition of the Bank’s growing presence in the financial market and expanding customer base of its ecosystem. As a result, the Bank will be obliged to comply with the additional capital adequacy buffers, as well as advanced risk management requirements. The Bank is operating with ample liquidity and capital buffers above regulatory minimums and intends to continue comfortably meeting all applicable requirements comfortably. Going forward management of the Group expects that it will have positive effect on the cost of funding as well as positively affect the Bank’s credit ratings.

TCS Group Holding PLC Consolidated Management Report
9. The key offerings of JSC “Tinkoff Insurance” are personal accident insurance, collective insurance against accidents and illnesses, travel insurance, motor vehicle insurance and property insurance, compulsory third party liability insurance (CTP) and voluntary third party liability insurance (VTP) (Note 24). The Insurance Company focuses on online sales.
10. In terms of financial performance the profit of the Group for the year ended 31 December 2021 was RR 63,368 million (2020: RR 44,213 million). This result is driven by two major continuing trends: the ongoing growth of the Group’s consumer finance business and a growing contribution from the non-credit fees-and-commission business lines. Net margin increased by 26.6% to RR 132,558 million (2020: increased by 19.1% to RR 104,702 million) on the back of growth in the underlying commission, credit and investment businesses. The growth of the credit portfolio was driven not only by credit card loans but also by other types of loans, such as secured, cash and POS loans. The Group aims to diversify its credit portfolio by the extension of collateralised credit products which represents a business line with lower credit risks. The 90 days plus overdue loans ratio (“NPL”) decreased to 8.6% as at 31 December 2021 (2020: 10.4%). The NPL coverage ratio reduced to 131.9% as at 31 December 2021 (2020: 153%). The Group’s Insurance business continues to develop at a good pace. This year insurance premiums earned increased by 24.2% to RR 23,063 million (2020: increase by 31.6% to RR 18,567 million). The increase was as a result of the growth in the sale of auto (including CTP and VTP) and travel insurance policies, especially to existing Group customers, as well as the growth of personal accident insurance policies sold along with the credit portfolio and providing a wider coverage of insured risks.
11. The value of the investment in securities portfolio decreased by 9.7% to RR 215,311 million as at 31 December 2021 (2020: increased by 76.4% to RR 238,454 ). As a result of attaining systemically important status, management made a decision to create a portfolio of investments in debt securities managed under a “hold to collect” business model. These securities will be accounted for amortised cost, as opposed to fair value, will be held until full maturity and will not be susceptible to market price fluctuations. Initially this portfolio will be created from the Bank’s existing portfolio of high-grade bonds, consisting of Russian government bonds. The Group effectively managed this portfolio under the “hold to collect” business model throughout 2021. The purpose of this decision is to create a source of low-risk, long term interest income while minimizing pressure on the Bank’s regulatory capital and capital adequacy position, as well as decreasing overall market risks of the Group.
12. In order to reflect appropriately the uncertainty associated with the COVID-19 pandemic, the Group has made changes to its ECL model, which resulted in approximately RR 3.5 billion of additional credit loss allowance as at 31 December 2021 (2020: RR 5.6 billion). Refer to Notes 2 and 3.
13. In September 2021 the Group issued perpetual subordinated loan participation notes in the amount
of USD 600 million (RR 43.5 billion). Refer to Note 17.
Environmental matters
14. As the Group is an online-only financial institution, the management of the Group believes that none of the Group’s business relationships, products or services are likely to have any significant actual or potential environmental impacts and do not believe its operations are exposed to any material environmental risks. Management, in reaching this view, have taken into account the risk of adverse impacts that may stem from the Company’s own activities as well as its business relationships including its supply and subcontracting chains. The Group is continuously reviewing its processes to identify opportunities to reduce their environmental impact adhering to best market practices. In 2021 the Group analysed and disclosed its greenhouse gas (GHG) inventory for all three scopes for the entire value chain. Emissions of the seven GHGs listed in the Kyoto Protocol were assessed. The analysis of the Company’s business processes shows that its operations result in CO₂, CH₄, N₂O (Scopes 1, Scope 2 and Scope 3), and HFCs (hydrofluorocarbons) (Scope 1) emissions. Total carbon footprint of the Group is significantly lower than traditional financial institutions and IT companies generally show. In 2021 Tinkoff became the first Russian financial institution to join the Science Based Targets initiative, a global body enabling businesses to set ambitious science based emissions reduction targets in line with the latest climate science.

TCS Group Holding PLC Consolidated Management Report
Human resources
15. Empowerment is an important ingredient in the success of our organization. To achieve this, decision-making is delegated to levels deep below the management team, discussion, idea generation and exchange and transparency are actively promoted and encouraged and an open leadership style ensures that information can move freely. The Group utilizes all types of forums to promote continual dialogue – such as email, online chat rooms, flash meetings, as well as formalized meeting structures. The Group offers clear far-reaching career path for its employees, a unique work environment and fair and transparent compensation.
16. Clear performance evaluation processes and fair compensation are essential. Compensation is a combination of fixed rate salary and supplemental bonuses and is based on employee performance. Employees are evaluated on a regular basis in order to monitor their achievement against their Key Performance Indicators as well as to provide feedback which can be used for their career development and to determine incentive compensation.
17. Prior to its IPO in 2013, the Group set up share-based management long term incentive plans as retention and motivational tools for key and senior managers. In March 2016, the Group announced a consolidated long-term management incentive and retention plan (MLTIP). Since then the Group has announced the expansion of MLTIP over the next 5 years. Each grant before 2020 is divided into 4 equal awards, and each award vests over 4 years in equal tranches. Each grant provided in 2020 and 2021 vests over 5 years.
18. In April 2020 the Group launched a key employees retention plan (KERP), which is a new long term incentive program for senior and middle management level employees. The purpose of the program is to retain and motivate key employees with high potential. In November 2021 the Group converted existing cash-settled equity-based KERP into an expanded equity-settled program MLTIP, which should put all the participants on the same footing. Additionally, Shareholders of the Company approved at the AGM in November 2021 granting the authority to the Board of Directors to fund the expanded MLTIP program via annual capital issuance of up to 1.5% (initially for a period of 5 years), which makes funding the MLTIP more capital efficient.
19. In the fourth quarter of 2021 the Group issued a new instrument that represents a share-based equity-settled compensation: 5-year warrants with an aggregate value equal to 1.2% of an increase in the market capitalisation of the Company as at 1 January 2027 (calculated as the volume-weighted average GDR price over the preceding six months, which amounted to 89.2 USD at the date of the grant) over a GDR price of USD 92 (the "Warrants"). The Warrants vest on 1 January 2027 and are exercisable at any time on or after that date. The Group has a unilateral right to terminate the Warrants at a one month's notice. When the Warrants are exercised, the Group is required to deliver the Ordinary Shares (GDRs) up to the value of the Warrants determined on 1 January 2027. The weighted-average fair value of the Warrants at the grant date was RR 1.1 bln and it was measured using the Black-Scholes model based on historical market quotes of GDRs. At the date of publication of the Group’s annual results, the share price of the Company was significantly below the strike price of the Warrants.
20. The total size of the unvested pool of the expanded MLTIP programs was 3.6% of the Group’s share capital as at 31 December 2021 (2020: 3.7%). The program is designed to grow the Group's value by aligning more closely managers’ interests with those of shareholders. The Group bel ieves that participation in its share capital is an effective motivation and retention tool. The program embraces more managers, for two main reasons: firstly, internal promotions as some employees were promoted to key managerial positions; and, secondly, as part of its expansion and transformation into a financial marketplace, the Group has hired a significant number of new managers to develop and manage new business lines and to strengthen internal controls, including cyber security.

TCS Group Holding PLC Consolidated Management Report
Non-Financial Information and Diversity Statement
21. The Group’s policies and other information that provide an understanding of the development, performance, position and impact of the Group’s activities in the areas of environmental, social and employee matters, respect for human rights, anti-corruption and bribery matters can be found in the Group’s most recently published Non-Financial Information and Diversity Statement (Sustainability Report). The Group will publish its Sustainability Report for the year ended 2021, as a part of the integrated annual report on the Company’s website, www.tcsgh.com.cy (and www.tinkoff.ru/eng) no later than 29 April 2022.
Principal risks and uncertainties
22. The Group’s business and financial results are impacted by uncertainties and volatilities in the Russian economic environment which can be impacted by global factors and/or by national factors.
23. The Group is subject to a number of principal risks which might adversely impact its performance. The principal activities of the Group are banking and insurance operations and so it is within this area that the principal risks occur. Management considers that those principal risks are financial risks, operational risks and legal risks. Financial risk comprises market risks (including currency risk, interest rate risk and other price risk), credit risk and liquidity risk.
24. The Board has put in place arrangements to identify, evaluate and manage the principal risks and uncertainties faced by the Group. The Group has an established risk management program that focuses on the unpredictability of financial markets and seeks to minimize potential adverse effects on the Group's financial performance. This is overseen by a dedicated Risk Management function, which works with senior management of the operating companies in Russia as well as the Board of directors in this area. The primary objectives of the financial risk management function are to establish acceptable risk limits, and then ensure that the exposures remain within these limits. The operational and legal risk management functions are intended to ensure the proper functioning of internal policies and procedures that minimize operational and legal risks. The risk management strategy is established so as to identify, assess, monitor and manage the risks arising from Group's activities. These risks as well as other risks and uncertainties, which affect the Group and how these are managed, are presented in Notes 30 and 32 of the consolidated financial statements.
25. Analysis of impact of COVID-19 pandemic on the Group is disclosed in the Note 2 of the consolidated financial statements.
Contingencies
26. The Group’s contingencies are disclosed in Note 32 to the consolidated financial statements.
Future developments
27. The Group's strategic objective is to grow its customer base profitably by building the most comprehensive, engaging, innovative, and sustainable financial and lifestyle ecosystem in the world.
Results
28. The Group’s results for the year are set out on page 2 of the consolidated financial statements. Information on distribution of profits is presented in Note 28.
Any important events for the Group that have occurred after the end of the financial year
29. In February 2022 economic situation in the Russian Federation was affected by escalated military and political conflict and the associated international sanctions against a number of Russian institutions, companies, banks and individuals. This requires the Group's business to adapt to the changing operating environment. More details are presented in Note 40.
Share capital, redesignation and conversion of class B shares
30. In the beginning of 2021 the Group underwent a major restructuring of its shareholder structure. As of 31 December 2020 the ultimate controlling party of the Company was Mr. Oleg Tinkov, who then controlled approximately 84.38% of the aggregated voting rights attached to the class A and B

TCS Group Holding PLC Consolidated Management Report
shares. However, on 7 January 2021 all issued 69,914,043 class B shares (35.08% of the total number of issued shares) held by The Rigi Trust and The Bernina Trust were converted to class A shares, and on the same date 100% of issued shares were reclassified and redesignated as ordinary shares. Following the conversion, each share carries a single vote, and the total number of votes capable of being exercised is equal to the total number of issued shares (currently 199,305,492 shares following the class B share conversion). The number of GDRs in issue was not affected by the conversion. Then the shares held by the two trusts were transferred to The New Rigi Trust. After the conversion the Trust’s voting rights dropped to 35.08%.
Treasury shares
31. At 31 December 2021 the Group held 1,237,583 (2020: 3,013,379 ) of its own GDRs, equivalent to approximately RR 2,567 million (2020: RR 3,238 million) and which represent 0.6% (2020: 1.5%) of the issued shares.
32. Treasury shares are GDRs of TCS Group Holding PLC include those that are held by a special purpose trust which has been specifically created for the long-term incentive program for the MLTIP (see Note 39 for further information).
33. During 2021 the Group repurchased 425,017 GDRs at market price for RR 1,877 million (2020: 650,000 GDRs at market price for RR 661 million).
34. During 2021 the Group transferred 2,200,813 GDRs (2020: 1,809,681 GDRs), representing 1.10% (2020: 0.91%) of the issued shares, upon vesting under the MLTIP. This resulted in a transfer of RR 2,548 million (2020: RR 587 million) out of treasury shares to retained earnings.
Research and development activities
35. During the years ended 31 December 2021 and 2020 the Group has undertaken research and development activities related to software including greater use of biometrics, voice assistant, social networking, machine learning and intelligence.
Board of directors
36. The members of the Board of directors as of 31 December 2021 and at the date of this report are presented above. All served throughout the year ended 31 December 2021 and through to the date of these consolidated financial statements, except where stated above.
37. There were significant changes in the structure and assignment of responsibilities of the Board of directors. New list of the Board of directors is presented above.
Branches
38. The Group did not operate through any branches during the year.
Independent auditor
39. The Independent Auditor, PricewaterhouseCoopers Limited, has expressed its willingness to continue in office. A resolution giving authority to the Board of directors to fix its remuneration will be proposed at the Annual General Meeting (AGM).
Going concern
40. The Directors have access to all information necessary to exercise their duties. The Directors continue to adopt the going concern basis in preparing the consolidated financial statements based on the fact that, after making enquiries and following a review of the Group’s budget for 2022, including cash flows and funding facilities, the Directors consider that the Group has adequate resources to continue in operation for the foreseeable future. This assessment was made with the available information to the Group as at the date of approving the financial statements.

TCS Group Holding PLC Consolidated Management Report
Corporate Governance Statement
GDRs of TCS Group Holding PLC (a Cyprus incorporated company), with each GDR issued under a deposit agreement dated on or about 24th October 2013 with JPMorgan Chase Bank N.A. as depositary representing one ordinary (formerly class A) share, are listed on London Stock Exchange. The Company’s GDRs are also listed on the Moscow Exchange. No shares of TCS Group Holding PLC are listed on any exchange.
The Company is required to comply with the UK corporate governance regime to the extent it applies to foreign issuers of GDRs listed on the London Stock Exchange. The Company has not adopted corporate governance measures of the same standard in all respects as those adopted by UK incorporated companies or companies with a premium listing on the London Stock Exchange.
As the shares themselves are not listed on the Cyprus Stock Exchange (or elsewhere), the Cypriot corporate governance regime, which only relates to companies that are listed on the Cyprus Stock Exchange, does not apply to the Company and accordingly the Company does not monitor its compliance with that regime.
Until 7 January 2021, the Company maintained a capital structure with two classes of shares, class A and class B. On 7 January 2021, all class B shares were converted to class A and simultaneously all shares were reclassified and redesignated as ordinary shares, all ranking pari passu for all purposes and in all respects with the other existing shares, with the provisions in the Articles of Association of the Company relating to class B shares deemed deleted.
The Company’s Home State is Cyprus.
A description of the terms and conditions of the GDRs can be found at “Terms and Conditions of the Global Depositary Receipts”, “Summary of the Provisions relating to the GDRs whilst still in Master Form” and “Description of Arrangements to Safeguard the Rights of the Holders of the GDRs” in the Prospectus issued by the Company dated 22 October 2013 and on the website at www.tinkoff.ru/eng.
Copies of the Articles of Association of the Company adopted on 19 November 2021, the terms of reference of the Committees, and other corporate governance related as well as investor relations related materials can also be found on the website www.tinkoff.ru/eng, at the Company’s main website www.tcsgh.com.cy, on the Company’s page on the London Stock Exchange website (www.londonstockexchange.com/exchange/prices-and-markets/stocks/summary) and at the official site of the Department of Registrar of Companies, Cyprus (http://www.mcit.gov.cy).
The Board of directors
The role of the Board is to provide entrepreneurial leadership to the Group within a framework of prudent and effective controls which enable risk to be assessed and managed. The Board sets the Group’s strategic objectives, ensures that the necessary financial and human resources are in place for the Group to meet its objectives and reviews management’s performance. The Board also sets the Group’s values and standards and ensures that its obligations towards the shareholders and other stakeholders are understood and met. The Board operates under a formal schedule of matters reserved to the Board for its decision, approved by shareholders in 2013.
The authorities of the members of the Board are specified by the Articles of Association of the Company and by law. The current ten strong Board of directors is comprised of five executive directors including the chairman, and five independent non-executive directors. The changes in the composition of the Board during the year are disclosed above.
The longest serving director Mr. Constantinos Economides took over the role of Chairman of the Board of directors in June 2015. The names of the people who served on the Board during 2021 are listed at the Board of directors and other officers.
The Group has established four Committees of the Board. Specific responsibilities have been delegated to those committees as described below.
The Board is required to undertake a formal and rigorous review annually of its own performance, that of its committees and of its individual directors. That review was recently carried out, in-house, in relation to 2021, looking at overall performance. All directors completed detailed questionnaires on the Board’s, the

TCS Group Holding PLC Consolidated Management Report
committees’ and individual director’s performance. The role of appraising the Chairman of the Board for 2021 was performed by the Chairman of the Audit Committee. Analysis of the resultant feedback will be discussed at a meeting of the Board of directors scheduled for 3 March 2022.
The Board has not appointed a senior independent director. As of the year ended 2021 there were six independent directors, representing the majority of the Board, of whom at least one will retire each year.
Number of directors
Unless and until otherwise determined by the Company in general meeting, the number of directors shall be no less than four, of whom two must be non-executive, and until 7 January 2021 was not permitted to exceed seven, when class B shares were in issue. From 7 January 2021, there has been no maximum number of directors.
The Articles of Association of the Company provide for the retirement by rotation of a number of directors at each Annual General Meeting (AGM). At the AGM on 19 November 2021 one director Mr Martin Cocker retired by rotation and he was duly re-elected to the Board. A number of other directors, whose initial appointment was made by the Board, also retired then and were duly reelected to the Board: Mr. Ashley Dunster (retired on 1 March 2022), Mr. Pavel Fedorov, Ms. Maria Gordon, Ms. Margarita Hadjitofi, Mr. Nicholas Huber and Mr. Nitin Saigal.
Committees of the Board of directors
The Company has established four Committees of the Board of directors: the Audit Committee, the Remuneration Committee, the Strategy Committee and the Risk and Emerging Risk (Sustainability) Committee. Their terms of reference are summarized below. The Audit Committee and the Remuneration Committees were formed in October 2013, whereas the other two were formed during 2021. The Board reserves the right to amend their terms of reference and arranges a periodic review of each Committee’s role and activities and considers the appropriateness of additional committees.
Committees-current composition
The Audit Committee comprises its chair Mr. Martin Cocker and three other independent non-executive directors.
The Remuneration Committee following the resignation of its chair on 1 March 2022, temporarily comprises one independent non-executive director.
The Risk and Emerging Risk (Sustainability) Committee comprises its chair Ms. Margarita Hadjitofi and two other independent non-executive directors.
The Strategy Committee comprises its chair Mr. Nitin Saigal, two other independent non-executive directors and two executive directors.
All the chairs are (or will be) independent. The current terms of reference of all Committees are available to the public and can be found on the Group’s websites. A short summary of them is set out below.
Role of the Audit Committee
The Audit Committee’s primary purpose and responsibility is to assist the Board in its oversight responsibilities. In executing this role the Audit Committee monitors the integrity of the financial statements of the Group prepared under International Financial Reporting Standards (“IFRS”) as adopted by the European Union (EU) and any formal announcements relating to the Group’s and the Company’s financial performance, reviewing significant financial reporting judgments contained in them, oversees the financial reporting controls and procedures implemented by the Group and monitors and assesses the effectiveness of the Company’s internal financial controls, risk management systems, internal audit function, the independence and qualifications of the independent auditor and the effectiveness of the external audit process. The Audit Committee is required to meet at appropriate times in the reporting and audit cycle but in practice meets more often as required.
Under its terms of reference, the Audit Committee is required, at least once each year, to review its own performance, constitution and terms of reference to ensure it is operating at maximum effectiveness and to recommend any changes it considers necessary for Board approval. The Audit Committee met this

TCS Group Holding PLC Consolidated Management Report
obligation through members participating in the main Board review described above. After consideration of the review, no changes were proposed to the committee’s terms of reference. The Audit Committee operates a structured framework around the extensive work it does on non-financial statements related matters holding at least two additional meetings annually, which would typically be held at the Bank’s head office in Moscow or via teleconference due to COVID-19 travel restrictions, to consider specific, non-financial statements related areas within its terms of reference.
Role of the Remuneration Committee
The Remuneration Committee is responsible for determining and reviewing among other things the framework of remuneration of the executive directors, senior management and its overall cost and the Group’s remuneration policies. The objective is to ensure that the executive management of the Group are provided with appropriate incentives to encourage enhanced performance and are in a fair and responsible manner rewarded for their individual contributions to the success of the Group. The Remuneration Committee’s terms of reference include reviewing the design and determining targets for any performance related pay schemes and reviewing the design of all share incentive plans for approval by the Board. The Remuneration Committee is required to meet at least twice a year but in practice meets far more often.
The Remuneration Committee continued with its work into 2021 on an ongoing review of the operation of the Group’s MLTIP which launched in 2016 and in considering additional awards to existing and new participants for this and subsequent years. It also with the assistance of external consultants carried out an in-depth review of chief executive officer level compensation packages.
The Committee has also been working on plans for an incentive and compensation arrangement within MLTIP for when, in the period 2022 to 2024, existing awards made to MLTIP joiners in 2016-2017 start to go into run off. During 2020 and 2021 the Remuneration Committee recommended that the Board approve new members of key management respectively be granted new awards under MLTIP.
In the end of Q2 2020 the Committee recommended that the Board approve the proposals of launching a new incentive and retention plan for more than 250 senior and middle managers (KERP). In 2021 the Committee considered an expansion of this program for over 400 senior and middle managers and that existing cash-settled equity-based KERP be converted into expanded equity-settled program MLTIP and recommended that the Board approve the expansion.
Refer to Note 39 for the details of MLTIP and KERP.
Under its terms of reference the Remuneration Committee is required at least once each year to review its own performance, constitution and terms of reference to ensure it is operating at maximum effectiveness and to recommend any changes it considers necessary for Board approval. The Remuneration Committee met this obligation through members participating in the main Board review (described above) under which detailed questionnaires were completed by all directors assessing the operation of the Board and both committees as well as individual directors. Although earlier reviews had resulted in certain minor changes to the Remuneration Committee’s terms of reference, no further changes were felt required based on the most recent review. The Committee continues to meet as required.
Role of the Risk and Emerging Risk (Sustainability) Committee
The primary purpose and responsibility of the Sustainability Committee is to oversee management and advise the Board of the Company on matters required to enable the Group to (a) operate on a sustainable basis for the benefit of current and future generations; (b) embed sustainable practices and adopt best industry practices across the full range of the Group’s businesses; (c) to enhance the Company’s reputation as a good corporate citizen; (d) drive sustainable growth by maintaining and enhancing the Group’s economic, environmental, human, technological and social capital in the long term; and (e) the effective management of the Group’s sustainability-related risks.
In this context Sustainable and Sustainability encompass the following elements (which are all of equal importance): social, environmental and governance, including climate change; health and safety; security and cybersecurity; diversity and inclusion; responsible lending and sustainable finance; relationships with employees; relationships with communities and other stakeholders; and ethical, elements affecting, or relevant to, the Group’s business or operations.
Under its terms of reference the Sustainability Committee is required at least once each year to review its own performance, constitution and terms of reference to ensure it is operating at maximum effectiveness

TCS Group Holding PLC Consolidated Management Report
and to recommend any changes it considers necessary for Board approval. The Sustainability Committee is relatively newly created and is considering how best to meet this obligation.
Role of the Strategy Committee
The primary purpose and responsibility of the Strategy Committee is (i) to assess the strategic development plans, business plans, major financing and investment proposals and other material issues that affect the development of the Group; (ii) define top-priority areas, strategic targets and major principles of strategic development of the Group and its sustainable development; and (iii) to provide fresh perspectives on strategy and economic trends, act as a sounding board for new ideas, to look at big picture, long range trends, disruptive new technologies and their potential to be or become opportunities or threats to the Group.
Under its terms of reference the Strategy Committee is required at least once each year to review its own performance, constitution and terms of reference to ensure it is operating at maximum effectiveness and to recommend any changes it considers necessary for Board approval. The Strategy Committee is relatively newly created and is considering how best to meet this obligation.
Appointment, retirement, rotation and removal of directors
The directors of the Company are appointed by the general meeting of shareholders with the sanction of an ordinary resolution. Such an appointment may be made to fill a vacancy or as an additional director. But no director may be appointed unless nominated by the Board of directors or a committee duly authorised by the Board of directors or by a shareholder or shareholders together holding or representing shares which in aggregate constitute or represent at least 5% in number of votes carried or conferred by the shares giving a right to vote at a general meeting.
The Board of directors may at any time appoint any person to the office of director either to fill a vacancy or as an additional director and every such director shall hold office only until the next following annual general meeting and shall not be taken into account in determining the directors who are to retire by rotation.
One third of the directors (or if their number is not a multiple of three, the number nearest to three but not exceeding one-third) shall retire by rotation at every annual general meeting. Directors holding an executive office are excluded from retirement by rotation.
Directors may be removed from office by the shareholders at a general meeting with the sanction of an ordinary resolution, subject to giving 28 days’ notice to that director in accordance with the Articles of Association.
The office of director shall be vacated if the director:
• becomes bankrupt or makes any arrangement or composition with his creditors generally; or
• becomes prohibited from being a director by reason of any court order made under Section 180 (disqualification from holding the position of director on the basis of fraudulent or other conduct) of the Cyprus Companies Law; or
• becomes, or may be, of unsound mind; or
• resigns his office by notice in writing to the Company left at the registered office; or
• is absent from meetings of the board for six consecutive months without permission of the Board of directors and his alternative director (if any) does not attend in his place and the Board of directors resolves that his office be vacated.
Changes in the top management team
In light of the continued rapid growth of Group’s Russian business, the launch of multiple new business lines and international expansion initiatives the Group announced the appointment of Oliver Hughes and Pavel Fedorov as co-CEOs of the Group.

TCS Group Holding PLC Consolidated Management Report
Significant direct/indirect holdings
For the significant direct and indirect shareholdings held in the share capital of the Company, please refer to Note 1 of the consolidated financial statements.
Internal control and risk management systems in relation to the financial reporting process
Policies, procedures and controls exist around financial reporting. Management is responsible for executing and assessing the effectiveness of these controls.
Financial reporting process
The Board of Directors is responsible for the preparation of the consolidated financial statements in accordance with International Financial Reporting Standards (IFRS) as adopted by the European Union (EU) and the requirements of the Cyprus Companies Law, Cap.113, and for such internal control as the Board of directors determines is necessary to enable the preparation of consolidated financial statements that are free from material misstatement, whether due to fraud or error. In preparing the consolidated financial statements, the Board of directors is responsible for assessing the Group’s ability to continue as a going concern, disclosing, as applicable, matters related to going concern and using the going concern basis of accounting unless the Board of directors either intends to liquidate the Group or to cease operations, or has no realistic alternative but to do so.
The Board has delegated to the Audit Committee the responsibility for reviewing the consolidated financial statements to ensure that they are in compliance with the applicable framework and legislation and for recommending these to the Board for approval. The Audit Committee is responsible for overseeing the Group’s financial reporting process.
Internal Controls and Risk Management
Management is responsible for setting the principles in relation to risk management. The risk management organization is divided between Policy Making Bodies and Policy Implementation Bodies. Policy Making Bodies are responsible for establishing risk management policies and procedures, including the establishment of limits. The main Policy Making Bodies are the Board of directors, the Management Board, the Finance Committee, the Credit Committee and the Business Development Committee.
The policy implementation level of the Group’s risk management organization consists of the Finance Department, the Risk Management Department, the Collections Department and the Internal Control Service.
In addition the Group has implemented an online analytical processing management system based on a common SAS data warehouse that is updated on a daily basis. The set of daily reports includes but is not limited to sales reports, application processing reports, reports on the risk characteristics of the card portfolios, vintage reports, transition matrix (roll rates) reports, reports on the pre-, early and late collections activities, reports on compliance with CBR requirements, capital adequacy and liquidity reports, operational liquidity forecast reports and information on intra-day cash flows.

TCS Group Holding PLC Consolidated Management Report
Diversity policy
The Group is committed to offering equal opportunity to all current and prospective employees, such that no applicant or employee is discriminated in favour of or against on the grounds of sex, racial or ethnic origin, religion or belief, disability, age or sexual orientation in recruitment, training, promotion or any other aspect of employment.
Recruitment, training and promotion are exclusively based on merit. All the Group employees involved in the recruitment and management of staff are responsible for ensuring the policy is fairly applied within their areas of responsibility. The Group applies this approach throughout, at all levels. This includes its administrative, management and supervisory bodies, including the Board of directors of the Company.
The composition and diversity information of the Board of directors of the Group for the year ended and as at 31 December 2021 is set out below:
Name Age Male/Female Educational/professional background
Martin Cocker 62 Male
ICAEW, BSc in Mathematics and Economics, experience in ‘Big Four’ professional services firms
Ashley Dunster (retired on 1 March 2022) 58 Male
Investment manager, Bachelor of Engineering Melbourne University, Masters Mathematical Modelling & Numerical Analysis, Oxford University
Constantinos Economides 46 Male
ICAEW, MSc in Management Sciences, experience in ‘Big Four’ professional services firms
Pavel Fedorov 47 Male
Banker, Diploma in Economics/Operations Research, Novosibirsk State university, MBA in Finance, Edmund Muskie Fellow, University of Washington
Maria Gordon 47 Female
Investment manager, BA in Political Science University of Wisconsin and MALD from the Fletcher School at Tufts University
Margarita Hadjitofi 41 Female
Lawyer, LLB (Law), Bachelor of Commerce (Business and Finance) Western Sydney University, LLM (Law) University of Sydney, Sustainability Leadership and Corporate Responsibility at London Business School
Nicholas Huber 32 Male
Investment manager, BSc in Finance Miami University Farmer School of Business
Oliver Hughes 51 Male
Banker, BA Russian and French University of Sussex, MA International Politics Leeds University, MSc Information Management and Technology City University
Marilou Pavlou 40 Female Lawyer, MA Modern History, Law at BPP Law School
Nitin Saigal 40 Male
Investment manager, BA Harvard College and MBA Harvard Business School
Mary Trimithiotou 43 Female
ICPAC, FCCA, Licensed insolvency practitioner, experience in ‘Big Four’ professional services firms
Further details of the corporate governance regime of the Company can be found on the website: https://www.tinkoff.ru/eng/investor-relations/corporate-governance/.
By Order of the Board
____________________ Constantinos Economides Chairman of the Board Limassol 3 March 2022

2
Independent Auditor’s Report To the Members of TCS Group Holding PLC
Report on the Audit of the Consolidated Financial Statements Our opinion In our opinion, the accompanying consolidated financial statements of TCS Group Holding PLC (the “Company”) and its subsidiaries (together the “Group”) give a true and fair view of the consolidated financial position of the Group as at 31 December 2021, and of its consolidated financial performance and its consolidated cash flows for the year then ended in accordance with International Financial Reporting Standards (IFRSs) as adopted by the European Union and the requirements of the Cyprus Companies Law, Cap. 113.
What we have audited We have audited the consolidated financial statements which are presented in pages 1 to 126 and comprise:
• the consolidated statement of financial position as at 31 December 2021;
• the consolidated statement of profit or loss and other comprehensive income for the year then ended;
• the consolidated statement of changes in equity for the year then ended;
• the consolidated statement of cash flows for the year then ended; and
• the notes to the consolidated financial statements, which include a summary of significant accounting policies.
The financial reporting framework that has been applied in the preparation of the consolidated financial statements is International Financial Reporting Standards as adopted by the European Union and the requirements of the Cyprus Companies Law, Cap. 113.
Basis for opinion We conducted our audit in accordance with International Standards on Auditing (ISAs). Our responsibilities under those standards are further described in the Auditor’s Responsibilities for the Audit of the Consolidated Financial Statements section of our report.
We believe that the audit evidence we have obtained is sufficient and appropriate to provide a basis for our opinion.
Independence We are independent of the Group in accordance with the International Ethics Standards Board for Accountants’ International Code of Ethics for Professional Accountants (including International Independence Standards) (IESBA Code) together with the ethical requirements that are relevant to our audit of the consolidated financial statements in Cyprus and we have fulfilled our other ethical responsibilities in accordance with these requirements and the IESBA Code.

3
Our audit approach
Overview
As part of designing our audit, we determined materiality and assessed the risks of material misstatement in the consolidated financial statements. In particular, we considered where the Board of Directors made subjective judgements; for example, in respect of significant accounting estimates that involved making assumptions and considering future events that are inherently uncertain. As in all of our audits, we also addressed the risk of management override of internal controls, including among other matters, consideration of whether there was evidence of bias that represented a risk of material misstatement due to fraud.
• Overall group materiality: Russian Roubles (“RR”) 4 052 million, which represents approximately 5% of profit before tax.
• We planned and conducted our audit to cover the two largest business components of the Group, being Banking and Insurance operations, for which we performed full scope audits of each of their complete financial information.
• For the other components, we performed substantive audit procedures where necessary.
We have identified the following key audit matter: • Credit loss allowance for loans and advances to
customers, using the expected credit loss model in line with the requirements of IFRS 9 “Financial Instruments”.
Materiality The scope of our audit was influenced by our application of materiality. An audit is designed to obtain reasonable assurance whether the consolidated financial statements are free from material misstatement. Misstatements may arise due to fraud or error. They are considered material if individually or in aggregate, they could reasonably be expected to influence the economic decisions of users taken on the basis of the consolidated financial statements.
Based on our professional judgement, we determined certain quantitative thresholds for materiality, including the overall group materiality for the consolidated financial statements as a whole as set out in the table below. These, together with qualitative considerations, helped us to determine the scope of our audit and the nature, timing and extent of our audit procedures and to evaluate the effect of misstatements, both individually and in aggregate on the consolidated financial statements as a whole.

4
Overall group materiality RR 4 052 million
How we determined it Approximately 5% of profit before tax.
Rationale for the materiality benchmark applied
We chose profit before tax as the benchmark because, in our view, it is the benchmark against which the performance of the Group is most commonly measured by the users of the consolidated financial statements, and it is a generally accepted benchmark. We chose 5%, which in our experience is an acceptable quantitative threshold for this materiality benchmark.
We agreed with the Audit Committee that we would report to them misstatements identified during our audit above RR 203 million as well as misstatements below that amount that, in our view, warranted reporting for qualitative reasons.
How we tailored our group audit scope
TCS Group Holding PLC is the parent of a group of companies. The financial information of this Group is included in the consolidated financial statements of TCS Group Holding PLC.
Considering our ultimate responsibility for the opinion on the Group’s consolidated financial statements we are responsible for the direction, supervision and performance of the group audit. In this context, we tailored the scope of our audit and determined the nature and extent of the audit procedures for the components of the Group to ensure that we perform sufficient work to enable us to provide an opinion on the consolidated financial statements as a whole, taking into account the structure of the Group, the significance and/or risk profile of the group entities or activities, the accounting processes and controls, and the industry in which the Group operates.
The Group has two primary business components, being Banking (which includes retail business for individuals and small and medium-sized entities business) and Insurance operations both of which operate primarily in the Russian Federation. The Banking business comprises a number of reporting units being JSC Tinkoff Bank, LLC Microfinance company Т-Finans, LLC Phoenix and LLC Tinkoff Capital. The Insurance business comprises solely JSC Tinkoff Insurance. Full scope audit procedures were performed in respect of the Banking and Insurance operations.
Other Group business reporting components are not considered to be primary business components for audit purposes. Where necessary, additional substantive audit procedures were carried out across these non-primary components at the financial statement item level in order to achieve the desired level of audit evidence. The consolidated financial statements are a consolidation of all of the above business reporting components.
We determined the level of involvement we needed to have in the audit work at the business reporting components to be able to conclude whether sufficient appropriate audit evidence was obtained as a basis for our opinion on the consolidated financial statements as a whole. We worked with other PwC network firms in relation to the activities of the Group in the Russian Federation. Overall, we have obtained sufficient and appropriate audit evidence regarding the consolidated financial information of the Group as a whole to provide a basis for our audit opinion on the consolidated financial statements.

5
Key audit matters Key audit matters are those matters that, in our professional judgement, were of most significance in our audit of the consolidated financial statements of the current period. These matters were addressed in the context of our audit of the consolidated financial statements as a whole, and in forming our opinion thereon, and we do not provide a separate opinion on these matters.
Key Audit Matter How our audit addressed the Key Audit Matter
Credit loss allowance for loans and advances to customers, using the expected credit loss model in line with the requirements of IFRS 9 “Financial Instruments”
This is a complex accounting standard for which models have been developed by the Group as a basis to calculate expected credit losses (“ECL”). These calculations involve the application of significant management judgement and estimates.
Therefore, we applied focus to the “expected credit loss” models used by the Management for the purpose of compliance with IFRS 9. These models are described in more detail in Note 41 “Significant Accounting Policies” and Note 30 “Financial and Insurance Risk Management” to the consolidated financial statements.
An assessment of the credit loss allowance for loans and advances to customers is performed on a portfolio basis, with the key assumptions being the probability of an account falling into arrears and subsequently defaulting (which is impacted by the definitions of “significant increase in credit risk” and “default”), the estimated recoveries from defaulted loans and the lifetime period for revolving credit facilities. Statistical models are used for the assessment of the probability of default, recovery rate and the lifetime period for revolving credit facilities. In addition, calculation of the expected credit loss allowance incorporates forward-looking information, taking into consideration different macro-economic scenarios and adjusting the probability of default.
In relation to the ECL models for measuring credit loss allowance we assessed the appropriateness of the key assumptions used in the methodologies and models of the Group and their compliance with the requirements of IFRS 9.
We reviewed the Group’s back-testing of probabilities of default estimated on the basis of the models by comparing them to the actual default rates evidenced in the loan portfolios. In addition we performed our own back-testing of default probabilities based on actual movements into Stage 3 category of loans in 2021 to ensure the reasonableness of the application of the policies and models used.
For a sample of inputs into estimation of recovery rate, we tested them for accuracy and criteria for inclusion into the calculation.
With regard to the controls relating to the credit loss allowance calculation process, we assessed and tested on a sample basis the design and operating effectiveness of the key controls over credit loss data and calculations. These key controls included those over classification of certain loans by loan portfolios, allocation of cash received from customers to respective loans and advances to customers, identification of the overdue loans and the data transfer from source systems to the credit loss allowance models.
We assessed if and to what extent we could place reliance upon these key controls for the purposes of our audit.
In addition, we performed testing, on a sample basis, of the accuracy of allocation of loans to the different “stages” and the completeness of restructured credit-impaired loans.

6
Key Audit Matter How our audit addressed the Key Audit Matter
We tested a sample of post model accounting adjustments where applicable, including considering the basis for the adjustment, the logic applied, the source data used, the key assumptions adopted and consistency with prior periods. We verified management assumptions in the context of the economic environment that is affected by the COVID-19 pandemic.
We assessed if the disclosures made in the consolidated financial statements comply with the relevant accounting standards in terms of completeness and accuracy.
Reporting on other information The Board of Directors is responsible for the other information. The other information comprises the information included in the Consolidated Management Report including the Corporate Governance Statement, which we obtained prior to the date of this auditor’s report, and the Group’s complete Annual Report and Non-Financial Information and Diversity Statement, which is expected to be made available to us after that date. Other information does not include the consolidated financial statements and our auditor’s report thereon.
Our opinion on the consolidated financial statements does not cover the other information and we do not and will not express any form of assurance conclusion thereon.
In connection with our audit of the consolidated financial statements, our responsibility is to read the other information identified above and, in doing so, consider whether the other information is materially inconsistent with the consolidated financial statements or our knowledge obtained in the audit, or otherwise appears to be materially misstated. If, based on the work we have performed, we conclude that there is a material misstatement of this other information, we are required to report that fact. We have nothing to report in this regard.
When we read the Group’s complete Annual Report and Non-Financial Information and Diversity Statement, if we conclude that there is a material misstatement therein, we are required to communicate the matter to those charged with governance and if not corrected, we will bring the matter to the attention of the members of the Company at the Company's Annual General Meeting and we will take such other action as may be required.
Responsibilities of the Board of Directors and those charged with governance for the Consolidated Financial Statements
The Board of Directors is responsible for the preparation of the consolidated financial statements that give a true and fair view in accordance with International Financial Reporting Standards as adopted by the European Union and the requirements of the Cyprus Companies Law, Cap. 113, and for such internal control as the Board of Directors determines is necessary to enable the

7
preparation of consolidated financial statements that are free from material misstatement, whether due to fraud or error.
In preparing the consolidated financial statements, the Board of Directors is responsible for assessing the Group’s ability to continue as a going concern, disclosing, as applicable, matters related to going concern and using the going concern basis of accounting unless the Board of Directors either intends to liquidate the Group or to cease operations, or has no realistic alternative but to do so.
Those charged with governance are responsible for overseeing the Group’s financial reporting process.
Auditor’s Responsibilities for the Audit of the Consolidated Financial Statements
Our objectives are to obtain reasonable assurance about whether the consolidated financial statements as a whole are free from material misstatement, whether due to fraud or error, and to issue an auditor’s report that includes our opinion. Reasonable assurance is a high level of assurance, but is not a guarantee that an audit conducted in accordance with ISAs will always detect a material misstatement when it exists. Misstatements can arise from fraud or error and are considered material if, individually or in the aggregate, they could reasonably be expected to influence the economic decisions of users taken on the basis of these consolidated financial statements.
As part of an audit in accordance with ISAs, we exercise professional judgement and maintain professional scepticism throughout the audit. We also:
• Identify and assess the risks of material misstatement of the consolidated financial statements, whether due to fraud or error, design and perform audit procedures responsive to those risks, and obtain audit evidence that is sufficient and appropriate to provide a basis for our opinion. The risk of not detecting a material misstatement resulting from fraud is higher than for one resulting from error, as fraud may involve collusion, forgery, intentional omissions, misrepresentations, or the override of internal control.
• Obtain an understanding of internal control relevant to the audit in order to design audit procedures that are appropriate in the circumstances, but not for the purpose of expressing an opinion on the effectiveness of the Group’s internal control.
• Evaluate the appropriateness of accounting policies used and the reasonableness of accounting estimates and related disclosures made by the Board of Directors.
• Conclude on the appropriateness of the Board of Directors’ use of the going concern basis of accounting and, based on the audit evidence obtained, whether a material uncertainty exists related to events or conditions that may cast significant doubt on the Group’s ability to continue as a going concern. If we conclude that a material uncertainty exists, we are required to draw attention in our auditor’s report to the related disclosures in the consolidated financial statements or, if such disclosures are inadequate, to modify our opinion. Our conclusions are based on the audit evidence obtained up to the date of our auditor’s report. However, future events or conditions may cause the Group to cease to continue as a going concern.
• Evaluate the overall presentation, structure and content of the consolidated financial statements, including the disclosures, and whether the consolidated financial statements represent the underlying transactions and events in a manner that achieves a true and fair view.

8
• Obtain sufficient appropriate audit evidence regarding the financial information of the entities or business activities within the Group to express an opinion on the consolidated financial statements. We are responsible for the direction, supervision and performance of the group audit. We remain solely responsible for our audit opinion.
We communicate with those charged with governance regarding, among other matters, the planned scope and timing of the audit and significant audit findings, including any significant deficiencies in internal control that we identify during our audit.
We also provide those charged with governance with a statement that we have complied with relevant ethical requirements regarding independence, and to communicate with them all relationships and other matters that may reasonably be thought to bear on our independence, and where applicable, actions taken to eliminate threats or safeguards applied.
From the matters communicated with those charged with governance, we determine those matters that were of most significance in the audit of the consolidated financial statements of the current period and are therefore the key audit matters. We describe these matters in our auditor’s report unless law or regulation precludes public disclosure about the matter or when, in extremely rare circumstances, we determine that a matter should not be communicated in our report because the adverse consequences of doing so would reasonably be expected to outweigh the public interest benefits of such communication.
Report on Other Legal Requirements
Pursuant to the additional requirements of the Auditors Law of 2017, we report the following:
• In our opinion, the consolidated management report has been prepared in accordance with the requirements of the Cyprus Companies Law, Cap. 113, and the information given is consistent with the consolidated financial statements.
• In our opinion, and in the light of the knowledge and understanding of the Group and its environment obtained in the course of the audit, we have not identified material misstatements in the consolidated management report.
• In our opinion, based on the work undertaken in the course of our audit, the information included in the corporate governance statement in accordance with the requirements of subparagraphs (iv) and (v) of paragraph 2(a) of Article 151 of the Cyprus Companies Law, Cap. 113, and which is included as a specific section of the consolidated management report, have been prepared in accordance with the requirements of the Cyprus Companies Law, Cap. 113, and is consistent with the consolidated financial statements.
• In our opinion, based on the work undertaken in the course of our audit, the corporate governance statement includes all information referred to in subparagraphs (i), (ii), (iii), (vi) and (vii) of paragraph 2(a) of Article 151 of the Cyprus Companies Law, Cap. 113.
• In light of the knowledge and understanding of the Group and its environment obtained in the course of the audit, we are required to report if we have identified material misstatements in the corporate governance statement in relation to the information disclosed for items (iv) and (v) of subparagraph 2(a) of Article 151 of the Cyprus Companies Law, Cap. 113. We have nothing to report in this respect.
Other Matters This report, including the opinion, has been prepared for and only for the Company’s members as a body in accordance with Section 69 of the Auditors Law of 2017 and for no other purpose. We do not, in giving this opinion, accept or assume responsibility for any other purpose or to any other person to whose knowledge this report may come to.

9
As required by the Financial Conduct Authority Disclosure Guidance and Transparency Rule 4.1.14R, these consolidated financial statements form part of the European Single Electronic Format (ESEF)-prepared annual financial report filed on the National Storage Mechanism of the Financial Conduct Authority in accordance with the ESEF Regulatory Technical Standard (ESEF RTS). This independent auditor’s report provides no assurance over whether the annual financial report has been prepared using the single electronic format specified in the ESEF RTS.
The engagement partner on the audit resulting in this independent auditor’s report is George C. Kazamias.
George C. Kazamias Certified Public Accountant and Registered Auditor for and on behalf of
PricewaterhouseCoopers Limited Certified Public Accountants and Registered Auditors
PwC Central, 43 Demostheni Severi Avenue CY-1080 Nicosia, Cyprus 3 March 2022

TCS Group Holding PLC Consolidated Statement of Financial Position
The notes № 1-43 are an integral part of these Consolidated Financial Statements. 1
In millions of RR Note 31 December
2021 31 December
2020
ASSETS Cash and cash equivalents 5 316,476 136,351 Mandatory cash balances with the CBRF 8,589 5,379 Due from other banks 6 542 1,887 Investments in securities 7 215,311 238,454 Repurchase receivables 7 5,826 29 Loans and advances to customers 8 606,308 376,521 Financial derivatives 36 5,963 5,035 Guarantee deposits with payment systems 9 15,171 15,475 Brokerage receivables 10 49,138 24,064 Current income tax assets 27 3,524 3,133 Deferred income tax assets 27 - 947 Tangible fixed assets and right-of-use assets 11 13,964 10,481 Intangible assets 11 15,069 7,082 Other financial assets 12 52,969 31,070 Other non-financial assets 12 8,895 3,386
TOTAL ASSETS 1,317,745 859,294
LIABILITIES Due to banks 13 11,313 4,819 Customer accounts 14 945,723 626,837 Debt securities in issue 15 21,680 23,910 Other borrowed funds 16 3,806 - Financial derivatives 36 90 109 Brokerage payables 10 9,634 9,206 Current income tax liabilities 27 125 - Deferred income tax liabilities 27 1,860 333 Subordinated debt 17 59,657 20,755 Insurance provisions 18 10,365 6,067 Other financial liabilities 19 69,302 34,337 Other non-financial liabilities 19 8,099 5,905
TOTAL LIABILITIES 1,141,654 732,278
EQUITY Share capital 20 230 230 Share premium 20 26,998 26,998 Treasury shares 20 (2,567) (3,238) Share-based payment reserve 39 4,745 1,548 Retained earnings 159,491 99,540 Revaluation reserve for investments in debt securities (13,131) 1,849
Equity attributable to shareholders of the Company 175,766 126,927 Non-controlling interest 325 89
TOTAL EQUITY 176,091 127,016
TOTAL LIABILITIES AND EQUITY 1,317,745 859,294
Approved for issue and signed on behalf of the Board of directors on 3 March 2022.
_____________________ ____________________ Constantinos Economides Mary Trimithiotou Director Director

TCS Group Holding PLC Consolidated Statement of Profit or Loss and Other Comprehensive Income
The notes № 1-43 are an integral part of these Consolidated Financial Statements. 2
In millions of RR Note 2021 2020
Interest income calculated using the effective interest rate method 21 163,620 128,084 Other similar income 21 192 83 Interest expense calculated using the effective interest rate method 21 (28,430) (21,581) Other similar expense 21 (80) (139)Expenses on deposit insurance programme 21 (2,744) (1,745)
Net margin 21 132,558 104,702
Credit loss allowance for loans and advances to customers and credit related commitments 8 (21,673) (38,972) Credit loss allowance for debt securities at FVOCI 8 (10) (369)
Total credit loss allowance for debt financial instruments (21,683) (39,341)
Net margin after сredit loss allowance 110,875 65,361
Fee and commission income 22 86,069 47,609 Fee and commission expense 22 (38,779) (22,215) Customer acquisition expense 23 (43,442) (22,588) Net (losses)/gains from derivatives revaluation (100) 4,163Net losses from foreign exchange translation (866) (6,850)Net (losses)/gains from operations with foreign currencies (730) 1,595Net gains from disposals of investments in securities 1,016 7,210 Net gains from financial assets at FVTPL 7,37 7,523 603 Insurance premiums earned 24 23,063 18,567 Insurance claims incurred 24 (4,964) (3,814) Administrative and other operating expenses 25 (59,449) (35,005) Net (losses)/gains from repurchase of subordinated debt (101) 168Other operating income 26 923 1,445
Profit before tax 81,038 56,249 Income tax expense 27 (17,670) (12,036)
Profit for the year 63,368 44,213
Other comprehensive loss Items that may be reclassified to profit or loss
Debt securities at FVOCI and Repurchase receivables: - Net (losses)/gains arising during the year, net of tax (14,367) 3,621 - Net gains reclassified to profit or loss upon disposal, net of tax (613) (5,768)
Other comprehensive loss for the year, net of tax (14,980) (2,147)
Total comprehensive income for the year 48,388 42,066
Profit/(loss) is attributable to:
- Shareholders of the Company 63,471 44,209 - Non-controlling interest (103) 4
Total comprehensive income/(loss) is attributable to: - Shareholders of the Company 48,491 42,062 - Non-controlling interest (103) 4
Earnings per share for profit attributable to the Shareholders of the Company, basic (expressed in RR per share) 20 321.80 225.60 Earnings per share for profit attributable to the Shareholders of the Company, diluted (expressed in RR per share) 20 314.88 223.73

TCS Group Holding PLC Consolidated Statement of Changes in Equity
The notes № 1-43 are an integral part of these Consolidated Financial Statements. 3
In millions of RR Note
Share capital
Share premium
Share-based
payment reserve
Revaluation reserve for
investments in debt securities
Treasury shares
Retained earnings
Total Non-control-
ling Interest
Total equity
Balance at 1 January 2020 230 26,998 1,039 3,996 (3,164) 66,880 95,979 103 96,082
Profit for the year - - - - - 44,209 44,209 4 44,213
Other comprehensive loss: Investments in debt securities at FVOCI and Repurchase receivables - - - (2,147) - - (2,147) - (2,147)
Total comprehensive (loss)/income for the year - - - (2,147) - 44,209 42,062 4 42,066
GDRs buy-back 20 - - - - (661) - (661) - (661) Share-based payment reserve 39 - - 509 - 587 (4) 1,092 - 1,092Dividends declared 28 - - - - - (11,545) (11,545) (18) (11,563)
Balance at 31 December 2020 230 26,998 1,548 1,849 (3,238) 99,540 126,927 89 127,016
Profit/(loss) for the year - - - - - 63,471 63,471 (103) 63,368
Other comprehensive loss: Investments in debt securities at FVOCI and Repurchase receivables - - - (14,980) - - (14,980) - (14,980)
Total comprehensive (loss)/income for the year - - - (14,980) - 63,471 48,491 (103) 48,388
GDRs buy-back 20 - - - - (1,877) 12 (1,865) - (1,865)Share-based payment reserve 39 - - 3,197 - 2,548 20 5,765 - 5,765Dividends declared 28 - - - - - (3,552) (3,552) (7) (3,559)Changes from business combinations and assets acquisitions - - - - - - - 346 346
Balance at 31 December 2021 230 26,998 4,745 (13,131) (2,567) 159,491 175,766 325 176,091
Attributable to shareholders of the Company

TCS Group Holding PLC Consolidated Statement of Cash Flows
The notes № 1-43 are an integral part of these Consolidated Financial Statements. 4
In millions of RR Note 2021 2020
Cash flows from/(used in) operating activities
Interest income received calculated using the effective interest rate method 162,165 129,555
Other similar income received 128 11
Interest expense paid calculated using the effective interest rate method (28,315) (22,280)
Recoveries from written-off loans 8 4,510 4,063
Expenses on deposits insurance paid (2,369) (1,792)
Fees and commissions received 86,069 47,613
Fees and commissions paid (43,554) (22,236)
Customer acquisition expense paid (44,213) (21,116)
Gains from operations with foreign currencies received 426 831
Losses from operations with derivatives paid (981) (934)
Insurance premiums received 25,379 18,193
Insurance claims paid (4,090) (3,629)
Recoveries from the purchased loans received 8 3,991 1,750
Other operating income received 1,093 1,053 Administrative and other operating expenses paid (47,462) (30,456)
Income tax paid (11,705) (12,930) Cash flows from operating activities before changes in operating assets and liabilities 101,072 87,696 Changes in operating assets and liabilities
Net increase in CBRF mandatory reserves (3,210) (1,931)
Net decrease in due from banks 1,345 197
Net increase in loans and advances to customers (255,612) (81,724)
Net increase in brokerage receivables (25,074) (21,265)
Net decrease/(increase) in debt securities measured at FVTPL 1,541 (3,788)
Net increase in guarantee deposits with payment systems (728) (4,325)
Net increase in other financial assets (18,916) (9,708)
Net increase in other non-financial assets (436) (1,038)
Net increase in due to banks 6,528 4,777
Net increase in customer accounts 320,992 201,922
Net increase in brokerage payables 428 7,999 Net increase in other financial liabilities 30,851 16,512
Net decrease in non-financial liabilities (354) (39) Net cash from operating activities 158,427 195,285 Cash flows (used in)/from investing activities
Acquisition of tangible fixed assets (5,272) (2,076)
Acquisition of intangible assets (6,884) (3,642)
Acquisition of investments in securities, repurchase receivables and other investments (33,727) (375,444)
Proceeds from sale and redemption of investments in securities 34,507 282,288 Net cash used in investing activities (11,376) (98,874) Cash flows from/(used in) financing activities
Proceeds from subordinated debt 17,29 45,362 710 Proceeds from securitisation 16 5,623 -
Repayment of subordinated debt 17,29 (7,745) (1,937) Dividends paid 28 (3,628) (11,853) Repayment of debt securities in issue 15,29 (2,247) (2,894)
GDR’s buy-back 20 (1,877) (661) Repayment of securitisation (1,823) -
Repayment of principal of lease liabilities 11 (820) (758) Proceeds from debt securities in issue 15,29 - 331 Net cash from/(used in) financing activities 32,845 (17,062) Effect of exchange rate changes on cash and cash equivalents 229 1,438 Net increase in cash and cash equivalents 180,125 80,787 Cash and cash equivalents at the beginning of the year 5 136,351 55,564 Cash and cash equivalents at the end of the year 5 316,476 136,351

TCS Group Holding PLC Notes to the Consolidated Financial Statements – 31 December 2021
5
1 Introduction
These consolidated financial statements have been prepared in accordance with International Financial Reporting Standards as adopted by the European Union (“IFRS”) for the year ended 31 December 2021 for TCS Group Holding PLC (the “Company”) and its subsidiaries (together referred to as the “Group”), and in accordance with the requirements of the Cyprus Companies Law, Cap.113.
The Company was incorporated, and is domiciled, in Cyprus in accordance with the provisions of the Companies Law, Cap. 113.
The Board of Directors of the Company at the date of authorisation of these consolidated financial statements consists of: Constantinos Economides, Margarita Hadjitofi, Martin Cocker, Mary Trimithiotou, Maria Gordon, Marilou Pavlou, Nicholas Huber, Nitin Saigal, Oliver Hughes and Pavel Fedorov.
The Company Secretary is Caelion Secretarial Limited, 25 Spyrou Araouzou, 25 Berengaria, 5th floor, Limassol 3036, Cyprus.
At 31 December 2021 the share capital of the Company is comprised of ordinary shares (2020: class A shares and class B shares). Each ordinary share has a nominal value of USD 0.04 per share and carries one vote. As at 31 December 2021 the number of issued ordinary shares is 199,305,492 (2020: the number of issued class A shares is 129,391,449 and class B shares is 69,914,043). Refer to Note 20 for further information on the share capital. On 25 October 2013 the Group completed an initial public offering of its class A ordinary shares in the form of global depository receipts (GDRs) listed on the London Stock Exchange plc. On 2 July 2019 the Group completed a secondary public offering (SPO) of its class A shares in the form of GDRs. On 28 October 2019 the Group’s GDRs started trading also on the Moscow Exchange.
As at 31 December 2021 and 2020 the entities and the individuals holding Company’s shares were:
31 December 2021 31 December 2020
Class of shares
Percentage on total issued shares
Class of shares
Percentage on total issued shares
Country of Incorporation
Guaranty Nominees Limited (JPMorgan Chase Bank NA)
Ordinary 64.92% Class A 64.92% United
Kingdom Virtue Trustees (Switzerland) AG as Trustee of the New Rigi Trust
Ordinary 35.08% - - Switzerland
Ioanna Georgiou Ordinary 0.00% Class A 0.00% Cyprus Panagiota Charalambous Ordinary 0.00% Class A 0.00% Cyprus Maria Vyra Ordinary 0.00% Class A 0.00% Cyprus Chloi Panagiotou Ordinary 0.00% Class A 0.00% Cyprus Leonora Chagianni Ordinary 0.00% Class A 0.00% Cyprus Antonis Strati Ordinary 0.00% Class A 0.00% Cyprus Virtue Trustees (Switzerland) AG as Trustee of the Bernina Trust
- - Class B 18.47% Switzerland
Virtue Trustees (Switzerland) AG as Trustee of the Rigi Trust
- - Class B 16.61% Switzerland
Total 100.00% 100.00%
Guaranty Nominees Limited is a company holding ordinary shares of the Company for which GDRs are issued under a deposit agreement made between the Company and JPMorgan Chase Bank NA signed in October 2013.

TCS Group Holding PLC Notes to the Consolidated Financial Statements – 31 December 2021
6
1 Introduction (Continued)
In the beginning of 2021 the Group underwent a major restructuring of its shareholder structure. While as of 31 December 2020 the ultimate controlling party of the Company was Mr. Oleg Tinkov, who then controlled approximately 84.38% of the aggregated voting rights attached to the class A and B shares, on 7 January 2021 all issued 69,914,043 class B shares (35.08% of the total number of issued shares) held by The Rigi Trust and The Bernina Trust were converted to class A shares, and on the same date 100% of issued shares were reclassified and redesignated as ordinary shares. Following the conversion, each share carries a single vote, and the total number of votes capable of being exercised is equal to the total number of issued shares (currently 199,305,492 shares following the class B share conversion). The number of GDRs in issue was not affected by the conversion. Then the shares held by the two trusts were transferred to The New Rigi Trust. After the conversion the Trust’s voting rights dropped to 35.08%.
As at 31 December 2021 in accordance with IFRS 10 definition of control the Group has no ultimate controlling party.
As at 31 December 2021 and 2020 the six individuals listed in the table above each held one share. The individuals hold them as nominees of Mr. Oleg Tinkov.
The material subsidiaries and associates of the Group are set out below. Except where stated the Group owns 100% of shares and has 100% of voting rights of each of these subsidiaries as at 31 December 2021 and 2020.
Percentage of ownership
Name Nature of business 31 December
2021 31 December
2020 Country of registration
JSC “Tinkoff Bank” (the “Bank”)
Banking operations 100.00% 100.00% Russia
JSC “Tinkoff Insurance” (the “Insurance company”)
Insurance operations
100.00% 100.00% Russia
LLC TCS Services 100.00% 100.00% Russia LLC Microfinance company "T-Finance"
Micro-finance services
100.00% 100.00% Russia
LLC “Phoenix” Collection services 100.00% 100.00% Russia LLC “Tinkoff Software DC” (Russia)
Software development service
100.00% 100.00% Russia
LLC “Tinkoff Software DC” (Belarus)
Software development service
100.00% - Belarus
LLC “Tinkoff Mobile” Telecommunication 100.00% 100.00% Russia ANO “Tinkoff Education” Education services 100.00% 100.00% Russia
LLC “Tinkoff Capital” Asset management company
100.00% 100.00% Russia
LLC “Tinkoff Invest Lab” Investment services 100.00% 100.00% Russia
LLC “CloudPayments” Online payment services
95.00% 95.00% Russia
LLC “Beskontakt” Fintech 85.40% - Russia
Aximetria GmbH Cryptocurrency services
83.20% - Switzerland
LLC “Dzhast Luk” Online payment services
51.00% - Russia
Vivid Money Holdco Limited
Group of fintech start-ups
9.47% 16.32% Ireland
TCS Finance D.A.C. Financing - - Ireland Mortgage agent TB-1 Financing - - Russia
In the fourth quarter 2021 the Group acquired a 51.0% stake in LLC “Dzhast Luk” and a 83.2% stake in Aximetria GmbH for a total amount of RR 0.8 billion. “Dzhast Luk” LLC is a company that operates Jump.Finance, a fintech service that automates payments to individuals and self-employed persons. Aximetria GmbH is a Swiss financial services company providing cryptocurrency services.

TCS Group Holding PLC Notes to the Consolidated Financial Statements – 31 December 2021
7
1 Introduction (Continued)
In April 2021 the Group acquired a 77.4% shareholding in LLC “Beskontakt”. In July 2021 the Group exercised a call option agreement with the founders and remaining stakeholders of LLC “Beskontakt” and acquired an additional 8%. As a result, the Group’s shareholding increased to 85.4%. LLC “Beskontakt” is a fintech company developing the “Koshelek” app, which is a digital wallet and a mobile app aggregating bank and loyalty cards. The acquired entity will assist the expansion of the Group’s customer base through the marketing and cross-selling of its products to the app’s users. Refer to Note 41 for the details of this acquisition.
In August 2020 the Group acquired a 22.15% shareholding in Incantus Holding Limited, which is a group of fintech start-ups launched in 2020 to provide a range of services to retail customers in Europe (excluding CIS) through the mobile banking platform Vivid Money. On 31 May 2021 Incantus was restructured into a new holding, Vivid Money Holdco Limited. As a result of series of new shares issuances related to fresh equity funding, the Company’s share in Vivid Money Holdco Limited has diluted to 9.47% as at 31 December 2021 (2020: 16.32%).
TCS Finance D.A.C. is a structured entity which issued debt securities including subordinated perpetual bonds for the Group. The Group neither owns shares nor has voting rights in this company. However, this entity was consolidated as it was specifically set up for the purposes of the Group, and the Group has exposure to substantially all risks and rewards through outstanding guarantees of the entity’s obligations.
Mortgage agent TB-1 is a special purpose entity which issued bonds secured by a portfolio of home equity loans (Note 16). The Group neither owns shares nor has voting rights in this company. However, this entity was consolidated as it was specifically set up for the purposes of the Group, and the Group has exposure to significant risks and rewards through the retention of a junior tranche in the transaction.
EBT is a special purpose trust which has been specifically created for the long-term incentive program for Management of the Group (MLTIP). The Group neither owns shares nor has voting rights in EBT.
Principal activity. The Group’s principal business activities are retail banking to private individuals, individual entrepreneurs’ (“IE”) and small and medium enterprises’ (“SME”) accounts and banking services, brokerage services and insurance operations within the Russian Federation through the Bank and the Insurance Company. The Bank operates under general banking license No. 2673 issued by the Central Bank of the Russian Federation (“CBRF”) on 8 December 2006. The Insurance Company operates under an insurance license issued by the CBRF.
The Bank participates in the state deposit insurance scheme, which was introduced by Federal Law No. 177-FZ “Deposits insurance in banks of the Russian Federation” dated 23 December 2003. The State Deposit Insurance Agency guarantees repayment of up to RR 1.4 million per individual, individual entrepreneur and small enterprise deposits in case of the withdrawal of a license of a bank or a CBRF-imposed moratorium on payments.
Registered address and place of business. The Company’s registered address is 25 Spyrou Araouzou, Berengaria 25, 5th floor, Limassol, Cyprus, and place of business is Office 403, Lophitis Business Centre I, Corner of 28th October/Emiliou Chourmouziou Streets, Limassol 3035 Cyprus. The Bank’s and the Insurance Company’s registered address is 2-nd Khutorskaya Street, 38A, building 26, 127287, Moscow, Russian Federation.
Presentation currency. These consolidated financial statements are presented in millions of Russian Rubles (RR).

TCS Group Holding PLC Notes to the Consolidated Financial Statements – 31 December 2021
8
2 Operating Environment of the Group
Russian Federation. The Group operates mainly within the Russian Federation. As a result of the pandemic, 2020 has been a ground shaking year across the globe in many industries, but in the Russian credit market the COVID-19 dislocations proved less impactful than during the previous crises of 2008-09 or 2013-2014, in part helped by government support and more disciplined lending practices of the biggest banks. In 2020 the CBR relaxed risk weights for the first time in many years. This coupled with restructuring programs launched by many banks helped the credit card market to still grow by 1.6% in 2020.
In 2021 the recovery in Russian economic activity is becoming more sustainable. However, the sharp decline in economic activity caused by the coronavirus pandemic was accompanied by a rupture of production and supply chains, the formation of a deep imbalance in supply and demand, and a softening of financial conditions as part of anti-crisis government programs. This resulted in worldwide general rise of inflation. By mid-2021, there was a trend towards accelerating consumer inflation. As a result, in October 2021 the CBR decided to raise the key rate by 75 basis points to 7.50% per annum. The growth of the key rate and raising yields of the Russian Federal bonds market led to substantial decline in bond prices denominated in RR.
The CBR also continues to tighten regulatory requirements, in particular, establishing macroprudential limits (quantitative restrictions on the issuance of unsecured loans) on consumer loans for banks and microfinance organizations is being considered.
Some of numerous measures attempting to contain the spreading and impact of COVID-19, such as travel bans and restrictions, quarantines, shelter-in-place orders and limitations on business activity, were subsequently relaxed, however, as of 31 December 2021, the global infection levels remain high, vaccination rate is low, and there is a risk that the Russian authorities may impose additional restrictions in 2022, including in response to new variants of the virus.
According to IFRS 9 “Financial Instruments”, the Group uses forecast information in the expected credit
loss models, including forecasts of macroeconomic indicators. For the purpose of calculating credit loss
allowances as at 31 December 2021, the Group took into account expectations regarding the following
macro-factors and allocated higher weight to the pessimistic macroeconomic scenario:
• Russian stock market index MOEX;
• Moscow Prime Offered Rate;
• Debt load of Russian population based on statistics from bureaus of credit history.
In order to reflect appropriately the uncertainty associated with the COVID-19 pandemic the Group has
made the following changes to their ECL model:
• the macro-adjustment calculation approach was refined to reflect the most recent impact of economic
developments;
• an adjustment to the loss given default was made to address lower expected recoveries during the
upcoming quarters;
• higher probabilities of default were applied to the loans which have been restructured.
More detailed information about the changes and their impact on the results of the Group’s operations for
the year ended 31 December 2021 is disclosed in Note 3.

TCS Group Holding PLC Notes to the Consolidated Financial Statements – 31 December 2021
9
2 Operating Environment of the Group (continued)
The management of the Group considers that the Group has demonstrated over the years and during the current COVID-crisis its ability to withstand shocks and retains its positive long-term outlook in particular due to the following advantages of the Group’s business model:
• using flexible business structure, the Group swiftly shifted some of its resources from businesses
that were needed to run more conservatively to businesses with higher growth prospects;
• the Group has a highly liquid, diversified, foreign exchange hedged, and well-capitalized consolidated
statement of financial position;
• the Group’s digital model is exactly what is needed in the current environment and this can be seen
in the ongoing increased online payment volumes as well as increased take up of its mobile lifestyle
app, current accounts, and brokerage business.
The Group regularly stress tests its business to assess the sustainability of its liquidity and capital positions. These tests demonstrate that Group’s current levels of capital and liquidity are more than sufficient to absorb potential economic and operational impacts related to the new waves of the COVID-19 pandemic.
3 Critical Accounting Estimates and Judgements in Applying Accounting Policies
The Group makes estimates and assumptions that affect the amounts recognized in the consolidated financial statements and the carrying amounts of assets and liabilities within the next financial year. Estimates and judgements are continually evaluated and are based on management’s experience and other factors, including expectations of future events that are believed to be reasonable under the circumstances. Management also makes certain judgements, apart from those involving estimations, in the process of applying the accounting policies. Judgements that have the most significant effect on the amounts recognized in the consolidated financial statements and estimates that can cause a significant adjustment to the carrying amount of assets and liabilities within the next financial year include:
ECL measurement. Calculation and measurement of ECLs is an area of significant judgement and involves methodology, models and data inputs. The following components of ECL calculation have a major impact on credit loss allowance: probability of default (“PD”) (impacted by definition of default, SICR, forward-looking scenarios and theirs weights) and loss given default (“LGD”). Refer to Note 30 for explanation of terms. The Group makes estimates and judgments, which are constantly analysed based on statistical data, actual and forecast information, as well as management experience, including expectations regarding future events that are considered reasonable in the current circumstances. Refer to Note 30 for further information on ECL measurement.
In order to address rising credit risks the Group adjusted the main approaches to assessing the level of expected credit losses that have the most significant effect on the amounts recognised in the consolidated financial statements:
• the macroeconomic model has become more conservative, based on different scenarios: base, optimistic and pessimistic, and higher weight is assigned to the pessimistic scenario (refer to Note 30 for details on distribution of scenarios and sensitivity analysis);
• for loans in default the Group has applied increased coefficients of LGD;
• the Group has estimated the volume of loans to individuals which were restructured despite no evidence of any SICR, as of the reporting date and applied higher PDs to such loans for the purposes of estimation of expected credit losses.
The impact of the changed macroeconomic conditions assessed using the approaches described above was approximately RR 3.5 billion of additional credit loss allowance as at 31 December 2021 (2020: RR 5.6 billion).

TCS Group Holding PLC Notes to the Consolidated Financial Statements – 31 December 2021
10
3 Critical Accounting Estimates and Judgements in Applying Accounting Policies (Continued)
In 2021, the Group implemented a new behavioural model for calculating probabilities of default for retail annuity loans (cash loans, secured loans, POS loans and car loans). The management of the Group believes that the new model results in a more refined assessment of expected credit losses. The impact of this change was accounted for as a change in accounting estimate and was recognized by including in profit or loss RR 78 million of additional credit loss allowance charge. Refer to Note 8 to see impact on each class of loans separately.
An increase or decrease in PDs by 0.5% compared to PDs used in the ECL estimates calculated at 31 December 2021 would result in an increase or decrease in credit loss allowances of RR 2.3 billion (2020: by 2% RR 5.2 billion).
An increase or decrease in LGDs by 1% compared to LGDs used in the ECL estimates calculated at 31 December 2021 would result in an increase or decrease in credit loss allowances of RR 0.8 billion (2020: by 2% RR 1.5 billion).
Credit exposure on revolving credit facilities. For credit card loans, the Group's exposure to credit losses extends beyond the maximum contractual period of the facility. For such facilities the Group measures ECLs over the period that the Group is exposed to credit risk and ECLs are not mitigated by credit risk management actions. Application of this approach requires judgement: determining a period for measuring ECLs ‒ the Group considers historical information and experience about: (a) the length of time for related defaults to occur on similar financial instruments following a SICR and (b) the credit risk management actions that the Group expects to take once the credit risk has increased (e.g. the reduction or removal of undrawn limits). For details of the period over which the Group is exposed to credit risk on revolving facilities and which is used as an approximation of lifetime period for ECL calculation for stage 2 and stage 3 loans and advances to customers, refer to Note 30.
Perpetual subordinated debts. A perpetual subordinated bond issue in June 2017 was initially recognised in the amount of USD 295.8 million (RR 16.9 billion). A perpetual subordinated loan participation notes issue in September 2021 was initially recognised in the amount of USD 600 million (RR 43.5 billion). Both issues represented by the funds received from investors less issuance costs. Subsequent measurement of these instruments is consistent with the accounting policy for debt securities in issue. Interest expense on these instruments is calculated using the effective interest rate method and recognised in profit or loss for the year.
In the event the accrued interest is paid, the payment decreases the balance of the liability. A cancellation of accrued interest for a given period results in its conversion, at the Group's option, into equity and therefore the respective amount of the liability is reclassified to equity. Foreign exchange translation gains and losses on the bond are recognised in profit or loss for the period. Application of this approach requires judgement: the Group has taken into consideration that there are contingent settlement provisions that could genuinely arise and as such has classified the perpetual subordinated debts instrument in its entirety as a liability, rather than equity, on the basis of the terms of issue which stipulate the possible redemption of the instrument in several cases other than liquidation of the issuer.
If the Group had recognized these instruments as equity, then interest expense would only have been recognized when it was paid and treated as a distribution from equity rather than an expense in profit or loss.
The Group also from time to time invests in perpetual subordinated debts issued by third parties. The Group has taken into consideration that there are genuine contingent settlement provisions that could arise and as such has classified the investments in perpetual subordinated debts as investments in debt securities on the basis of terms of issue which stipulate the possible redemption of the instrument in several cases other than liquidation of the issuer.
The investments in these instruments are classified as debt investment securities measured at FVTPL since the analysis of the contractual cash flow characteristics resulted in acquired perpetual bonds not passing SPPI test. If the Group had recognized this instrument as equity instrument, then it could have been measured at FVTPL or FVOCI as the Group does not hold it for trading purposes.

TCS Group Holding PLC Notes to the Consolidated Financial Statements – 31 December 2021
11
3 Critical Accounting Estimates and Judgements in Applying Accounting Policies (Continued)
Interest income recognition. The effective interest method incorporates significant assumptions around expected loan lives as well as judgements of type of fees and costs that are included in interest income. Refer to Note 41.
Unbundling of loans and insurance products. Certain loans issued by the Group are forgivable upon events such as the borrower's death, or the borrower becoming unemployed because the borrower had opted to purchase the Insurance Company's products to cover repayments of the related loan products issued by the Bank in such cases. The Group is able to measure the loans separately. Also the borrowers are able to take a loan without insurance at the time of issuance with no different interest rate and the borrowers can cancel the insurance products at any time, separately from the loan. Accordingly, the Group unbundles the loans from the insurance arrangement.
The portion of the fee attributable to the insurance component (i.e. the amount paid to the Insurance Company to cover the insured risk) is recognised within Insurance premiums earned line (refer to Note 24). The remaining portion of the fee approximates a fee that the Bank would have earned on market terms for selling third party insurance products and it is recognised as a fee for selling credit protection within Fee and commission income line (refer to Note 22). The timing of recognition of the two income streams does not materially vary as the insurance coverage is sold on a monthly basis.
Financial assets sales and securitisations. Group’s securitisation activities involve home equity loans and are predominantly transacted using SPEs. In a typical securitisation, the SPE purchases assets financed by proceeds received from the SPE’s issuance of debt certificates and other notes of indebtedness. These assets and liabilities are recorded on the balance sheet of the SPE and consolidated on the Group’s consolidated statement of financial position, unless the accounting requirements for sale were met. At 31 December 2021 the Group has not made a securitisation transaction that resulted in derecognition of transferred assets. The Group assessed that its secured loan portfolio meets the criteria for held to collect business model and determined that the past securitisation transactions have not resulted in derecognition of the assets and therefore are not inconsistent with the held to collect business model.
The Group may have intention to sell home equity loans under securitisation, in this case the derecognition requirements should be applied. The derecognition test is performed in 2 steps:
1) Pass-through arrangement. All the following conditions have to be met to conclude that pass-through arrangements meet the criteria:
• An entity has no obligation to pay amounts to the eventual recipients, unless it collects equivalent amounts from the original asset. Short-term advances by the entity to the eventual recipients with the right of full recovery of the amount lent plus accrued interest from the amounts eventually payable to the eventual recipients at market rates do not violate this condition.
• An entity is prohibited by the transfer contract’s terms from selling or pledging the original asset other than as security to the eventual recipients for the obligation to pay them cash flows.
• An entity has an obligation to remit any cash flows that it collects on behalf of the eventual recipients without material delay (up to 3 months).
2) Risk-reward assessment. If a transfer meets the pass-through requirements the transferor still needs to assess whether it has transferred sufficient risks and rewards associated with the asset to achieve derecognition. If, as the result of assessment, majority of risks and associated rewards are deemed to be transferred, the asset is derecognized. Otherwise the sale is accounted for as a finance deal.
Investments in securities. As a result of attaining systemically important status, management made a decision to create a portfolio of investments into debt securities managed under a “hold to collect” business model. These securities will be accounted for amortised cost, as opposed to fair value, will be held until full maturity and will not be susceptible to market price fluctuations. Initially this portfolio will be created from the Bank’s existing portfolio of high-grade bonds, consisting of Russian government bonds. In 2021, the Group has already managed designated bonds under the “hold to collect” model with no disposal made for these securities. The purpose of this decision is to create a source of low-risk, long term interest income while minimizing pressure on the Bank’s regulatory capital and capital adequacy position, as well as decreasing overall market risks of the Group.
TCS Group Holding PLC Notes to the Consolidated Financial Statements – 31 December 2021
12
3 Critical Accounting Estimates and Judgements in Applying Accounting Policies (Continued)
The described change in accounting treatment of the securities managed under hold to collect model will be effective starting from 1 January 2022.
Tax legislation. Russian and Cypriot tax, currency and customs legislation are subject to varying interpretations. Refer to Note 32.
4 Segment Analysis
Operating segments are components that engage in business activities that may earn revenues or incur expenses, whose operating results are regularly reviewed by the chief operating decision maker (CODM) and for which discrete financial information is available. The CODM is the person or group of persons who allocates resources and assesses the performance for the Group. The functions of CODM are performed by the Management of the Bank and the Management of the Insurance Company.
Description of products and services from which each reportable segment derives its revenue
Since the business of the Group is expanding certain operating segments became significant enough to be considered as separate reportable segments. This triggered changes in the number and composition of segments to be presented. The Group is organised on the basis of 8 main business segments:
Consumer finance – representing retail loans (credit cards, cash loans, consumer loans, car loans, secured loans), deposits and savings, also lifestyles and travel services to individuals.
Retail debit cards - representing customer current accounts services to individuals with the loyalty programs, co-branded offers, and also lifestyles and travel services to individuals. Assets of the segment are represented by placements of the funds attracted in investments in securities, treasury transactions, other financial and non-financial assets.
InsurTech – representing insurance services provided to individuals, such as personal accident insurance, personal property insurance, travel insurance and vehicle insurance (Note 24).
SME services – representing customer current accounts, savings, deposits services and loans to individual entrepreneurs and small to medium businesses. Assets of the segment are represented by placements of the funds attracted into investments in securities, treasury transactions, other financial and non-financial assets.
Acquiring and payments – providing merchants and businesses the ability to process payments online using internet and offline acquiring services, through direct-to-merchant agreements, aggregators and the Group's own aggregator CloudPayments.
InvestTech - representing online brokerage platform for investing in a range of securities including Russian and international securities (ETFs, stocks, bonds, etc.).
Mobile virtual network operator (MVNO) services - providing full coverage across Russia and international roaming, offering a number of value-added options such as virtual numbers, music and video streaming services, etc.
Other investments represent investments in associated companies and equity instruments. The CODM made a decision to allocate such investments into a separate business segment. Disclosures for comparative periods were amended accordingly.
The Group’s principal activities are mainly undertaken within the Russian Federation. Given the retail nature of business of the segments, the Group does not have any significant revenue stream from any single customer.

TCS Group Holding PLC Notes to the Consolidated Financial Statements – 31 December 2021
13
4 Segment Analysis (Continued)
Factors that management used to identify the reportable segments
The Group’s segments are strategic business units that focus on different services to the customers of the Group. Their performance is analysed separately by the CODM and they are managed separately because each business unit requires different marketing strategies and represents different types of businesses.
Measurement of operating segment profit or loss, assets and liabilities
The CODM reviews financial information prepared based on International financial reporting standards adjusted to meet the requirements of internal reporting. The CODM evaluates performance of each segment based on profit before tax.
Information about reportable segment assets and liabilities, profit or loss
Segment reporting of the Group’s assets and liabilities as at 31 December 2021 is set out below:
In millions of RR
Consu- mer
Finance
Retail Debit
Cards
Insur- Tech
Invest- Tech
Acquiring and Payments
SME Services
MVNO services
Other invest- ments
Elimina- tions
Total
Reportable segment assets 692,859 273,392 21,581 229,653 22,161 72,760 1,207 9,607 (5,475) 1,317,745 Reportable segment liabilities 279,376 592,195 11,457 120,404 1,645 140,287 1,765 - (5,475) 1,141,654
Segment reporting of the Group’s assets and liabilities as at 31 December 2020 is set out below:
In millions of RR
Consu- mer
Finance
Retail Debit
Cards
Insur- Tech
Invest- Tech
Acquiring and Payments
SME Services
MVNO services
Other invest- ments
Elimina- tions
Total
Reportable segment assets 456,195 245,923 12,437 73,773 15,563 55,517 755 2,050 (2,919) 859,294 Reportable segment liabilities 203,723 345,585 6,901 83,428 649 91,412 3,499 - (2,919) 732,278
All jointly used assets, such as fixed assets, rights of use assets and intangible assets were allocated to the segments on the basis of detailed analysis of usage of those assets by segments.

TCS Group Holding PLC Notes to the Consolidated Financial Statements – 31 December 2021
14
4 Segment Analysis (Continued)
Segment reporting of the Group’s capital expenditures for the year ended 31 December 2021 is set out below:
In millions of RR
Consu- mer
Finance
Retail Debit
Cards
Insur- Tech
Invest- Tech
Acquiring and Payments
SME Services
MVNO services
Total
Intangible assets 3,263 5,364 1,116 440 97 988 434 11,702 Tangible fixed assets and right-of-use assets 4,166 1,342 323 116 195 272 54 6,468
Total capital expenditure 7,429 6,706 1,439 556 292 1,260 488 18,170
Segment reporting of the Group’s capital expenditures for the year ended 31 December 2020 is set out below:
In millions of RR
Consu- mer
Finance
Retail Debit
Cards
Insur- Tech
Invest- Tech
Acquiring and Payments
SME Services
MVNO services
Total
Intangible assets 897 1,098 550 251 32 559 282 3,669 Tangible fixed assets and right-of-use assets 1,640 384 120 38 84 109 29 2,404
Total capital expenditure 2,537 1,482 670 289 116 668 311 6,073

TCS Group Holding PLC Notes to the Consolidated Financial Statements – 31 December 2021
15
4 Segment Analysis (Continued)
Segment reporting of the Group’s income and expenses for the year ended 31 December 2021 is set out below:
In millions of RR
Consu- mer
Finance
Retail Debit
Cards
Insur- Tech
Invest- Tech
Acquiring and
Payments
SME Services
MVNO services
Other invest- ments
Elimina- tions
Total
External revenues Interest income 139,123 10,834 511 8,152 - 5,156 13 23 - 163,812 Fee and commission income - Fee and commission income on cards' and current accounts' services 3,011 19,463 - 506 - 13,858 166 - - 37,004 - Fee for selling credit protection 5,639 - - - - - - - - 5,639 - Acquiring commission - 103 - - 24,996 - - - - 25,099 - MVNO and investments services - - - 11,369 - - 2,898 - - 14,267 - Other fees receivable 594 3,294 - - 146 26 - - - 4,060
Timing of fee and commission income recognition: - At point in time 6,838 20,109 - 11,146 25,142 9,470 1,012 - - 73,717 - Over time 2,406 2,751 - 729 - 4,414 2,052 - - 12,352
Total fee and commission income 9,244 22,860 - 11,875 25,142 13,884 3,064 - - 86,069
Insurance premiums earned - - 23,063 - - - - - - 23,063 Other operating income 557 11 327 - 28 - - - - 923
Total external revenues 148,924 33,705 23,901 20,027 25,170 19,040 3,077 23 - 273,867
Revenues from other segments Interest income - 4,746 134 - - 2,214 - - (7,094) - Fee and commission income - Acquiring commission - - - - 324 - - - (324) - - Other fees receivable 6 397 - - - - 601 - (1,004) - Insurance premiums earned - - 209 - - - - - (209) - Other operating income 450 - - - - - - - (450) -
Total revenues from other segments 456 5,143 343 - 324 2,214 601 - (9,081) -
TOTAL REVENUES 149,380 38,848 24,244 20,027 25,494 21,254 3,678 23 (9,081) 273,867
Interest expense (18,863) (17,566) - (265) - (1,644) (10) - 7,094 (31,254) Credit loss allowance charge (21,588) (46) (14) - - (35) - - - (21,683) Fee and commission expense (3,108) (14,018) (160) (2,700) (15,957) (1,214) (1,961) - 339 (38,779) Insurance claims incurred - - (5,008) - - - - - 44 (4,964) Administrative and other operating expenses (25,326) (12,621) (4,619) (4,967) (3,500) (6,940) (1,433) (158) 115 (59,449) Other (losses)/gains (1,476) 519 1 3 - 252 - 7,443 - 6,742
Segment result before acquisition expenses 79,019 (4,884) 14,444 12,098 6,037 11,673 274 7,308 (1,489) 124,480
Customer acquisition expense (19,112) (10,165) (1,989) (7,924) (609) (3,701) (1,431) - 1,489 (43,442)
SEGMENT RESULT 59,907 (15,049) 12,455 4,174 5,428 7,972 (1,157) 7,308 - 81,038

TCS Group Holding PLC Notes to the Consolidated Financial Statements – 31 December 2021
16
4 Segment Analysis (Continued)
Segment reporting of the Group’s income and expenses for the year ended 31 December 2020 is set out below:
In millions of RR
Consu- mer
Finance
Retail Debit
Cards
Insur- Tech
Invest- Tech
Acquiring and
Payments
SME Services
MVNO services
Other invest- ments
Elimina- tions
Total
External revenues Interest income 113,486 9,092 409 2,804 - 2,358 10 8 - 128,167 Fee and commission income - Fee and commission income on cards' and current accounts' services 2,715 11,981 - 261 - 9,147 15 - - 24,119 - Fee for selling credit protection 4,657 - - - - - - - - 4,657 - Acquiring commission - - - - 11,049 - - - - 11,049 - MVNO and investments services - - - 4,998 - - 1,815 - - 6,813 - Other fees receivable 548 346 - - 77 - - - - 971
Timing of fee and commission income recognition: - At point in time 5,906 10,396 - 4,927 11,126 5,346 511 - - 38,212 - Over time 2,205 1,740 - 332 - 3,801 1,319 - - 9,397
Total fee and commission income 7,920 12,327 - 5,259 11,126 9,147 1,830 - - 47,609
Insurance premiums earned - - 18,567 - - - - - - 18,567 Other operating income 1,169 - 250 - 26 - - - - 1,445
Total external revenues 122,575 21,419 19,226 8,063 11,152 11,505 1,840 8 - 195,788
Revenues from other segments Interest income - 2,737 56 - - 1,244 - - (4,037) - Fee and commission income - Acquiring commission - - - - 85 - - - (85) - - Other fees receivable 2 251 - - - - 379 - (632) - Insurance premiums earned - - 72 - - - - - (72) - Other operating income 371 - - - - - - - (371) -
Total revenues from other segments 373 2,988 128 - 85 1,244 379 - (5,197) -
TOTAL REVENUES 122,948 24,407 19,354 8,063 11,237 12,749 2,219 8 (5,197) 195,788
Interest expense (16,965) (9,322) - - - (1,215) - - 4,037 (23,465) Credit loss allowance charge (38,243) (372) - - - (726) - - - (39,341) Fee and commission expense (2,505) (9,266) (88) (1,491) (6,976) (803) (1,214) - 128 (22,215) Insurance claims incurred - - (3,842) - - - - - 28 (3,814) Administrative and other operating expenses (16,518) (5,698) (3,759) (2,027) (1,656) (4,322) (961) (170) 106 (35,005) Other (losses)/gains (1,120) 5,935 219 - - 1,345 - 510 - 6,889
Segment result before acquisition expenses 47,597 5,684 11,884 4,545 2,605 7,028 44 348 (898) 78,837
Customer acquisition expense (12,466) (4,042) (1,143) (3,111) (311) (1,385) (1,028) - 898 (22,588)
SEGMENT RESULT 35,131 1,642 10,741 1,434 2,294 5,643 (984) 348 - 56,249

TCS Group Holding PLC Notes to the Consolidated Financial Statements – 31 December 2021
17
4 Segment Analysis (Continued)
Fee and commission income on cards’ and current accounts' services include SME services commission, SMS fee, interchange fee, foreign currency exchange transactions fee, fee for money transfers, cash withdrawal fee and replenishment fee.
Interest income and interest expense from other segments amounted to RR 7,094 million for the year ended 31 December 2021 (2020: RR 4,037 million) are calculated using the funds transfer pricing curve.
5 Cash and Cash Equivalents
In millions of RR 31 December 2021 31 December 2020
Cash on hand 36,955 21,069 Cash balances with the CBRF (other than mandatory reserve deposits) 51,008
38,646
Placements with other banks with original maturities of less than three months:
- AA- to AA+ rated 19,602 6,404 - A- to A+ rated 696 1,328 - BBB- to BBB+ rated 13,223 1,276 - BB- to BB+ rated 45 646 - B- to B+ rated 142 499 - Unrated 601 - Non-bank credit organizations: - BBB- to BBB+ rated 185,370 53,764 - BB- to BB+ rated 7,640 11,265 - B- to B+ rated 775 190 - Unrated 419 1,264
Total Cash and Cash Equivalents 316,476 136,351
Cash on hand includes cash balances in ATMs and cash balances in transit. Placements with other banks and organizations with original maturities of less than three months include placements under reverse sale and repurchase agreements in the amount of RR 152,331 million as at 31 December 2021 (2020: RR 33,210 million). The Group has a right to sell or repledge securities received under reverse sale and repurchase agreements.
The table below discloses the credit quality of cash and cash equivalents balances based on credit risk grades at 31 December 2021:
In millions of RR
Cash balances with the CBRF
Placements with other banks and non-bank credit
organizations
Total
Excellent (AA- to AA+, A- to A+) 51,008 20,298 71,306 Good (BBB- to BBB+, BB+) - 198,638 198,638 Monitor (BB, B- to B+, unrated) - 9,577 9,577
Total cash and cash equivalents, excluding cash on hand 51,008 228,513 279,521
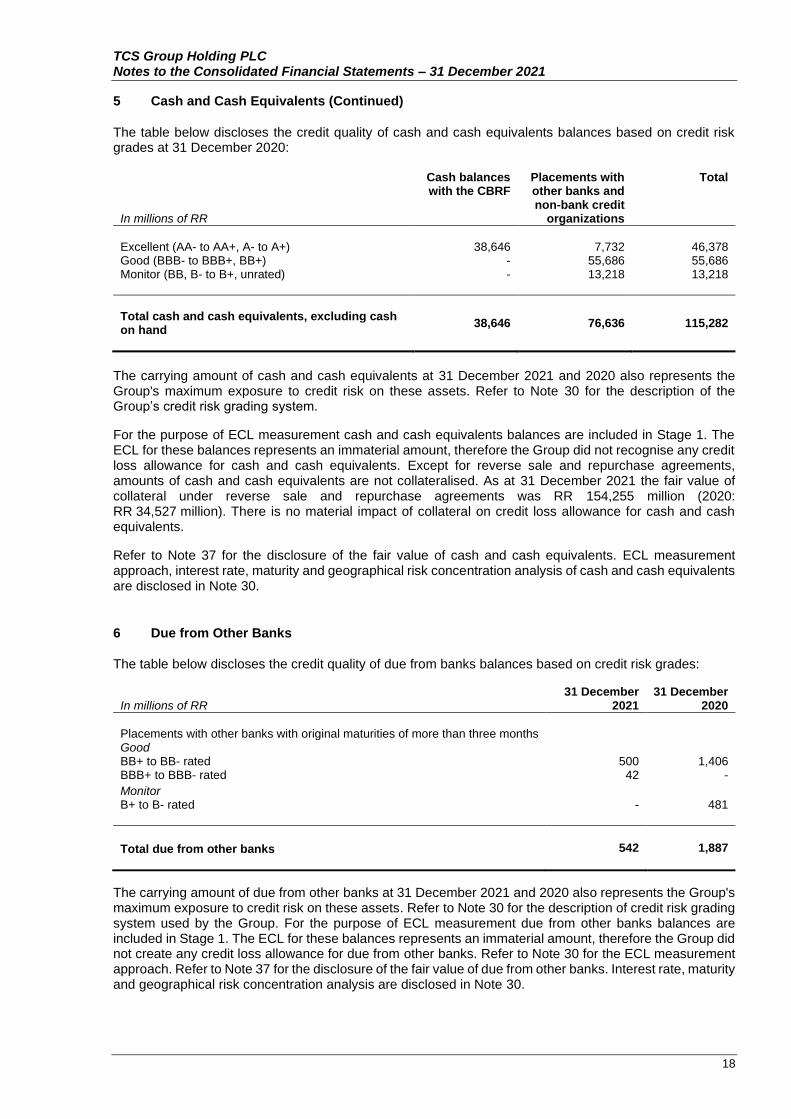
TCS Group Holding PLC Notes to the Consolidated Financial Statements – 31 December 2021
18
5 Cash and Cash Equivalents (Continued)
The table below discloses the credit quality of cash and cash equivalents balances based on credit risk grades at 31 December 2020:
In millions of RR
Cash balances with the CBRF
Placements with other banks and non-bank credit
organizations
Total
Excellent (AA- to AA+, A- to A+) 38,646 7,732 46,378 Good (BBB- to BBB+, BB+) - 55,686 55,686 Monitor (BB, B- to B+, unrated) - 13,218 13,218
Total cash and cash equivalents, excluding cash on hand
38,646 76,636 115,282
The carrying amount of cash and cash equivalents at 31 December 2021 and 2020 also represents the Group's maximum exposure to credit risk on these assets. Refer to Note 30 for the description of the Group’s credit risk grading system.
For the purpose of ECL measurement cash and cash equivalents balances are included in Stage 1. The ECL for these balances represents an immaterial amount, therefore the Group did not recognise any credit loss allowance for cash and cash equivalents. Except for reverse sale and repurchase agreements, amounts of cash and cash equivalents are not collateralised. As at 31 December 2021 the fair value of collateral under reverse sale and repurchase agreements was RR 154,255 million (2020: RR 34,527 million). There is no material impact of collateral on credit loss allowance for cash and cash equivalents.
Refer to Note 37 for the disclosure of the fair value of cash and cash equivalents. ECL measurement approach, interest rate, maturity and geographical risk concentration analysis of cash and cash equivalents are disclosed in Note 30.
6 Due from Other Banks
The table below discloses the credit quality of due from banks balances based on credit risk grades:
In millions of RR 31 December
2021 31 December
2020
Placements with other banks with original maturities of more than three months Good BB+ to BB- rated 500 1,406 BBB+ to BBB- rated 42 -
Monitor B+ to B- rated - 481
Total due from other banks 542 1,887
The carrying amount of due from other banks at 31 December 2021 and 2020 also represents the Group's maximum exposure to credit risk on these assets. Refer to Note 30 for the description of credit risk grading system used by the Group. For the purpose of ECL measurement due from other banks balances are included in Stage 1. The ECL for these balances represents an immaterial amount, therefore the Group did not create any credit loss allowance for due from other banks. Refer to Note 30 for the ECL measurement approach. Refer to Note 37 for the disclosure of the fair value of due from other banks. Interest rate, maturity and geographical risk concentration analysis are disclosed in Note 30.

TCS Group Holding PLC Notes to the Consolidated Financial Statements – 31 December 2021
19
7 Investments in Securities and Repurchase Receivables
In millions of RR 31 December 2021
31 December 2020
Securities measured at fair value through other comprehensive income 207,175 234,189 Securities measured at fair value through profit or loss 8,136 4,265
Total investments in securities 215,311 238,454
Repurchase receivables 5,826 29
Total investments in securities and repurchase receivables 221,137 238,483
Repurchase receivables represent securities sold under sale and repurchase agreements which the counterparty has the right, by contract or custom, to sell or repledge. As at 31 December 2021 the sale and repurchase agreements are short-term and mature in January 2022.
1) Investments in securities and repurchase receivables measured at fair value through other comprehensive income
The table below discloses investments in debt securities and repurchase receivables measured at FVOCI by classes:
In millions of RR 31 December 2021
31 December 2020
Investments in securities Russian government bonds 120,155 123,916 Corporate bonds 76,285 96,200 Municipal bonds 8,367 9,474 Foreign government bonds 2,368 4,599
Repurchase receivables Russian government bonds 5,752 - Corporate bonds 74 29
Total investments in securities and repurchase receivables measured at FVOCI
213,001 234,218
Including credit loss allowance 724 714

TCS Group Holding PLC Notes to the Consolidated Financial Statements – 31 December 2021
20
7 Investments in Securities and Repurchase Receivables (Continued)
1) Investments in securities and repurchase receivables measured at fair value through other comprehensive income (Continued)
The table below contains an analysis of the credit risk exposure of investments in securities and repurchase receivables measured at FVOCI at 31 December 2021, for which an ECL allowance is recognised, based on credit risk grades:
In millions of RR
Stage 1 (12-months ECL)
Stage 2 (lifetime ECL for
SICR)
Total
Russian government bonds
- Excellent 140,678 - 140,678 Total AC gross carrying amount 140,678 - 140,678 Credit loss allowance (291) - (291)
Fair value adjustment from AC to FV (14,480) - (14,480) Carrying value 125,907 - 125,907
Corporate bonds
- Excellent 1,002 - 1,002 - Good 67,380 - 67,380 - Monitor 9,414 465 9,879 - Sub-standard 11 - 11 Total AC gross carrying amount 77,807 465 78,272 Credit loss allowance (333) (15) (348)
Fair value adjustment from AC to FV (1,580) 15 (1,565) Carrying value 75,894 465 76,359 Municipal bonds
- Good 7,304 - 7,304 - Monitor 1,443 - 1,443 Total AC gross carrying amount 8,747 - 8,747 Credit loss allowance (46) - (46)
Fair value adjustment from AC to FV (334) - (334) Carrying value 8,367 - 8,367 Foreign government bonds
- Good 652 - 652 - Monitor 1,419 - 1,419 - Sub-standard 337 - 337 Total AC gross carrying amount 2,408 - 2,408 Credit loss allowance (39) - (39) Fair value adjustment from AC to FV (1) - (1) Carrying value 2,368 - 2,368

TCS Group Holding PLC Notes to the Consolidated Financial Statements – 31 December 2021
21
7 Investments in Securities and Repurchase Receivables (Continued)
1) Investments in securities and repurchase receivables measured at fair value through other comprehensive income (Continued)
The table below contains an analysis of the credit risk exposure of debt securities measured at FVOCI at 31 December 2020, for which an ECL allowance is recognised, based on credit risk grades:
In millions of RR
Stage 1 (12-months ECL)
Stage 2 (lifetime ECL for
SICR)
Total
Russian government bonds - Excellent 125,422 - 125,422 Total AC gross carrying amount 125,422 - 125,422 Credit loss allowance (255) - (255) Fair value adjustment from AC to FV (1,251) - (1,251) Carrying value 123,916 - 123,916
Corporate bonds - Excellent 560 - 560 - Good 85,653 - 85,653 - Monitor 6,726 620 7,346 Total AC gross carrying amount 92,939 620 93,559 Credit loss allowance (334) (14) (348) Fair value adjustment from AC to FV 2,953 36 2,989 Carrying value 95,558 642 96,200
Municipal bonds
- Good 7,750 - 7,750 - Monitor 1,523 - 1,523 Total AC gross carrying amount 9,273 - 9,273 Credit loss allowance (45) - (45) Fair value adjustment from AC to FV 246 - 246 Carrying value 9,474 - 9,474
Foreign government bonds - Good 908 - 908 - Monitor 3,119 - 3,119 - Sub-standard 494 - 494 Total AC gross carrying amount 4,521 - 4,521 Credit loss allowance (66) - (66) Fair value adjustment from AC to FV 144 - 144 Carrying value 4,599 - 4,599
There are no stage 3 investments in securities during the year and as at 31 December 2021 and 2020.
Refer to Note 30 for the description of credit risk grading system used by the Group and the approach to ECL measurement, including the definition of default and SICR as applicable to investments in securities and repurchase receivables at FVOCI. The investments at FVOCI are not collateralised. Refer to Note 37 for the disclosure of the fair value.
Securities at FVOCI reclassified to repurchase receivables continue to be carried at fair value in accordance with accounting policies for these categories of assets. Refer to Note 13 for the related liabilities.

TCS Group Holding PLC Notes to the Consolidated Financial Statements – 31 December 2021
22
7 Investments in Securities and Repurchase Receivables (Continued)
1) Investments in securities and repurchase receivables measured at fair value through other comprehensive income (Continued)
The following table explains the changes in the credit loss allowance (including those pledged under repurchase agreements) and gross carrying amount for debt securities at FVOCI for the year ended 31 December 2021:
Credit loss allowance Gross carrying amount
Stage 1 Stage 2 Total Stage 1 Stage 2 Total
In millions of RR
(12-months
ECL)
(lifetime ECL for
SICR)
(12-months ECL)
(lifetime ECL for
SICR)
Russian government bonds
At 31 December 2020 255 - 255 125,422 - 125,422
Movements with impact on credit loss allowance charge:
New originated or purchased 30 - 30 17,992 - 17,992
Foreign exchange gains - - - (124) - (124) Disposal during the year (3) - (3) (2,001) - (2,001) Interest income accrued 13 - 13 7,334 - 7,334 Interest received (14) - (14) (7,945) - (7,945) Other movements 10 - 10 - - - Total movements with impact on credit loss allowance charge 36 - 36 15,256 - 15,256
At 31 December 2021 291 - 291 140,678 - 140,678
Corporate bonds At 31 December 2020 334 14 348 92,939 620 93,559 Movements with impact on credit loss allowance charge:
New originated or purchased 100 - 100 14,216 - 14,216 Foreign exchange gains - - - (92) - (92)
Redemption during the year (12) (3) (15) (5,119) (150) (5,269) Disposal during the year (88) - (88) (23,650) - (23,650) Interest income accrued 15 1 16 4,665 40 4,705 Interest received (17) (1) (18) (5,152) (45) (5,197) Other movements 1 4 5 - - - Total movements with impact on credit loss allowance charge (1) 1 - (15,132) (155) (15,287) At 31 December 2021 333 15 348 77,807 465 78,272

TCS Group Holding PLC Notes to the Consolidated Financial Statements – 31 December 2021
23
7 Investments in Securities and Repurchase Receivables (Continued)
1) Investments in securities and repurchase receivables measured at fair value through other comprehensive income (Continued)
Credit loss allowance Gross carrying amount
Stage 1 Stage 2 Total Stage 1 Stage 2 Total
In millions of RR
(12-months
ECL)
(lifetime ECL for
SICR)
(12-months ECL)
(lifetime ECL for
SICR)
Municipal bonds At 31 December 2020 45 - 45 9,273 - 9,273 Movements with impact on credit loss allowance charge:
New originated or purchased 1 - 1 137 - 137 Redemption during the year (3) - (3) (552) - (552) Disposal during the year 3 - 3 (68) - (68) Interest income accrued 2 - 2 590 - 590 Interest received (2) - (2) (633) - (633) Other movements - - - - - - Total movements with impact on credit loss allowance charge 1 - 1 (526) - (526) At 31 December 2021 46 - 46 8,747 - 8,747
Foreign government bonds
At 31 December 2020 66 - 66 4,521 - 4,521 Movements with impact on credit loss allowance charge:
New originated or purchased 22 - 22 1,309 - 1,309
Foreign exchange gains 1 - 1 44 - 44 Redemption during the year (7) - (7) (926) - (926) Disposal during the year (39) - (39) (2,472) - (2,472) Interest income accrued 1 - 1 95 - 95 Interest received (2) - (2) (163) - (163) Other movements (3) - (3) - - - Total movements with impact on credit loss allowance charge (27) - (27) (2,113) - (2,113)
At 31 December 2021 39 - 39 2,408 - 2,408

TCS Group Holding PLC Notes to the Consolidated Financial Statements – 31 December 2021
24
7 Investments in Securities and Repurchase Receivables (Continued)
1) Investments in securities and repurchase receivables measured at fair value through other comprehensive income (Continued)
The following table explains the changes in the credit loss allowance (including those pledged under repurchase agreements) and gross carrying amount for debt securities at FVOCI for the year ended 31 December 2020:
Credit loss allowance Gross carrying amount
Stage 1 Stage 2 Total Stage 1 Stage 2 Total
In millions of RR
(12-months
ECL)
(lifetime ECL for
SICR)
(12-months ECL)
(lifetime ECL for
SICR)
Russian government bonds At 31 December 2019 99 - 99 54,471 - 54,471 Movements with impact on credit loss allowance charge:
New originated or purchased 522 - 522 289,955 - 289,955 Foreign exchange gains 1 - 1 767 - 767 Redemption during the year (160) - (160) (89,000) - (89,000) Disposal during the year (233) - (233) (129,350) - (129,350) Interest income accrued 8 - 8 5,318 - 5,318 Interest received (12) - (12) (6,739) - (6,739) Other movements 30 - 30 - - - Total movements with impact on credit loss allowance charge 156 - 156
70,951 - 70,951 At 31 December 2020 255 - 255 125,422 - 125,422 Corporate bonds
At 31 December 2019 225 - 225 69,645 - 69,645 Movements with impact on credit loss allowance charge:
New originated or purchased 198 - 198 70,438 - 70,438 Transfers: - to lifetime (from Stage 1 to Stage 2) (3) 3 -
(620) 620 -
Foreign exchange gains 15 - 15 5,061 - 5,061 Redemption during the year (13) - (13) (4,171) - (4,171) Disposal during the year (117) - (117) (46,924) - (46,924) Interest income accrued 14 - 14 4,587 45 4,632 Interest received (16) (1) (17) (5,077) (45) (5,122) Other movements 31 12 43 - - - Total movements with impact on credit loss allowance charge 109 14 123
23,294 620 23,914
At 31 December 2020 334 14 348 92,939 620 93,559

TCS Group Holding PLC Notes to the Consolidated Financial Statements – 31 December 2021
25
7 Investments in Securities and Repurchase Receivables (Continued)
1) Investments in securities and repurchase receivables measured at fair value through other comprehensive income (Continued)
Credit loss allowance Gross carrying amount
Stage 1 Stage 2 Total Stage 1 Stage 2 Total
In millions of RR
(12-months
ECL)
(lifetime ECL for
SICR)
(12-months ECL)
(lifetime ECL for
SICR)
Municipal bonds At 31 December 2019 21 - 21 6,085 - 6,085 Movements with impact on credit loss allowance charge:
New originated or purchased 25 - 25 7,440 - 7,440 Redemption during the year - - - (91) - (91) Disposal during the year (19) - (19) (4,140) - (4,140) Interest income accrued 3 - 3 474 - 474 Interest received (2) - (2) (495) - (495) Other movements 17 - 17 - - - Total movements with impact on credit loss allowance charge 24 - 24
3,188 - 3,188 At 31 December 2020 45 - 45 9,273 - 9,273
Foreign government bonds At 31 December 2019 - - - - - - Movements with impact on credit loss allowance charge:
New originated or purchased 68 - 68 7,516 - 7,516 Foreign exchange gains 1 - 1 246 - 246 Disposal during the year (11) - (11) (3,224) - (3,224) Interest income accrued 1 - 1 61 - 61 Interest received (1) - (1) (78) - (78) Other movements 8 - 8 - - - Total movements with impact on credit loss allowance charge 66 - 66
4,521 - 4,521 At 31 December 2020 66 - 66 4,521 - 4,521

TCS Group Holding PLC Notes to the Consolidated Financial Statements – 31 December 2021
26
7 Investments in Securities and Repurchase Receivables (Continued)
2) Securities measured at fair value through profit or loss
The table below discloses investments in securities measured at FVTPL by classes:
In millions of RR 31 December
2021 31 December
2020
Investments in securities
Perpetual corporate bonds 2,316 4,265
Corporate shares 5,820 -
Total investments in securities and repurchase receivables measured at FVTPL 8,136 4,265
The table below discloses the movements in securities at FVTPL for the year ended 31 December 2021 and 2020:
In millions of RR 2021 2020
Carrying amount at 1 January 4,265 413 Purchases 562 4,125 Disposal (1,729) (440) Interest income accrued 169 75 Interest received (128) (25) Foreign exchange (loss)/ gain (153) 8 Revaluation through PL 5,150 109
Carrying amount at 31 December 8,136 4,265
Investments in securities measured at FVTPL are carried at fair value, which also reflects any credit risk related write-downs and best represents Group’s maximum exposure to credit risk. The securities measured at FVTPL are not collateralized. Interest rate, maturity and geographical risk concentration analysis of investment in securities are disclosed in Note 30.

TCS Group Holding PLC Notes to the Consolidated Financial Statements – 31 December 2021
27
8 Loans and Advances to Customers
In millions of RR 31 December
2021 31 December
2020
Gross carrying amount of loans and advances to customers at AC 680,152 445,529 Less credit loss allowance (77,815) (70,900)
Total carrying amount of loans and advances to customers at AC 602,337 374,629
Loans and advances to customers at FVTPL 3,971 1,892
Total loans and advances to customers 606,308 376,521
Loans and advances to customers at FVTPL represent a loan that does not meet SPPI requirement and that was issued to related party (refer to Note 39).
Gross carrying amount and credit loss allowance amount for loans and advances to customers at AC by classes at 31 December 2021 and 2020 are disclosed in the table below:
31 December 2021 31 December 2020
In millions of RR
Gross carrying amount
Credit loss
allowance
Carrying amount
Gross carrying amount
Credit loss
allowance
Carrying amount
Credit card loans 333,894 (52,987) 280,907 267,586 (54,242) 213,344 Cash loans 126,295 (14,121) 112,174 68,131 (11,055) 57,076 Secured loans 72,043 (1,986) 70,057 40,232 (1,099) 39,133 Car loans 77,882 (5,342) 72,540 33,991 (2,144) 31,847 POS loans 60,348 (2,605) 57,743 32,690 (1,611) 31,079 Loans to IE and SME 9,690 (774) 8,916 2,899 (749) 2,150
Total loans and advances to customers at AC 680,152 (77,815) 602,337 445,529 (70,900) 374,629
Credit cards are issued to customers for cash withdrawals or payment for goods or services, within the range of limits established by the Bank. These limits may be increased or decreased from time-to-time based on management decision. Credit card loans are not collateralized.
Cash loans represent a product for the borrowers who have a positive credit history and who do not have overdue loans in other banks. Cash loans are loans provided to customers via the Bank’s debit cards. These loans are available for withdrawal without commission.
Secured loans represent loans secured with a real estate (home equity loans) or a car. As at 31 December 2021 home equity loans under securitisation amounted to RR 4,446 million (2020: RR nil). Refer to Note 16 for details of the securitisation of home equity loans.
POS (“Point of sale”) loans represent loans to fund online and offline purchases through internet and offline shops for individual borrowers.
Car loans represent loans for the purchase of a vehicle which is used as collateral under the loan.
Loans to IE and SME represent loans provided by the Bank to individual entrepreneurs and small and medium businesses for the purpose of working capital management.

TCS Group Holding PLC Notes to the Consolidated Financial Statements – 31 December 2021
28
8 Loans and Advances to Customers (Continued)
The credit loss allowance for loans and advances to customers recognised in the period is impacted by a variety of factors. The main movements in the tables presented below are described as follows:
• new originated or purchased category represents the gross carrying amounts and the related ECL of purchased loans and loans issued during the reporting period (and withdrawals of limits of new credit card borrowers) as at the end of the reporting period or as at the date of transfer of loan out of stage 1 (whichever date is earlier);
• transfers between Stage 1, 2 and 3 due to balances experiencing significant increases (or decreases) of credit risk or becoming credit-impaired in the period, and the consequent "step up" (or “step down”) between 12-month and lifetime ECL. Transfers present the amount of credit loss allowance charged or recovered at the moment of transfer of a loan among the respective stages;
• changes to ECL measurement model assumptions and estimates represent movements due to application of a new behavioural model for calculating probabilities of default;
• movements other than transfers and new originated or purchased loans category represent all other movements of ECL in particular related to changes in gross carrying amounts (including drawdowns, repayments, and accrued interest), as well as updates of inputs to ECL model in the period;
• write-offs of allowances are related to assets that were written-off during the period;
• unwinding of discount (for Stage 3) category represents adjustment to credit loss allowance and gross carrying amount for Stage 3 loans to increase it to discounted amount of the expected cash shortfalls to the reporting date using the effective interest rate;
• Modification of original cash flows without derecognition represents adjustment to credit loss allowance and gross carrying amount of Stage 3 loans caused by the modification of terms of those loans which is not substantial.

TCS Group Holding PLC Notes to the Consolidated Financial Statements – 31 December 2021
29
8 Loans and Advances to Customers (Continued)
The following tables disclose the changes in the credit loss allowance and gross carrying amount for loans and advances to customers between the beginning and the end of the reporting and comparative periods:
Credit loss allowance Gross carrying amount
Stage 1 Stage 2 Stage 3 Total Stage 1 Stage 2 Stage 3 Purchased/ Total
In millions of RR
(12-months
ECL)
(lifetime ECL for
SICR)
(lifetime ECL for
credit impaired)
(12-months
ECL)
(lifetime ECL for
SICR)
(lifetime ECL for
credit impaired)
originated credit
impaired
Credit card loans
At 31 December 2020 16,441 7,560 30,241 54,242 210,074 11,758 45,573 181 267,586
Movements with impact on credit loss allowance charge for the year:
New originated or purchased 5,889 - - 5,889 82,751 - - 229 82,980
Transfers: - to lifetime (from Stage 1 to Stage 2) (2,412) 6,542 - 4,130 (11,692) 11,692 - - - - to credit-impaired (from Stage 1 and Stage 2 to Stage 3) (4,278) (6,649) 24,875 13,948 (22,163) (9,220) 31,383 - - - recovered (from Stage 3 to Stage 2 and from Stage 2 to Stage 1) 426 (1,210) (21) (805) 1,813 (1,787) (26) - -
Movements other than transfers and new originated or purchased loans (1,038) 1,319 (5,707) (5,426) 9,330 (457) (6,313) (11) 2,549
Total movements with impact on credit loss allowance charge for the year (1,413) 2 19,147 17,736 60,039 228 25,044 218 85,529
Movements without impact on credit loss allowance charge for the year Unwinding of discount (for Stage 3) - - 4,920 4,920 - - 4,920 - 4,920 Write-offs - - (18,856) (18,856) - - (18,856) - (18,856) Sales - - (2,329) (2,329) - - (2,559) - (2,559) Modification of original cash flows without derecognition - - (2,726) (2,726) - - (2,726) - (2,726)
At 31 December 2021 15,028 7,562 30,397 52,987 270,113 11,986 51,396 399 333,894

TCS Group Holding PLC Notes to the Consolidated Financial Statements – 31 December 2021
30
8 Loans and Advances to Customers (Continued)
Credit loss allowance Gross carrying amount
Stage 1 Stage 2 Stage 3 Total Stage 1 Stage 2 Stage 3 Purchased/ Total
In millions of RR
(12-months
ECL)
(lifetime ECL for
SICR)
(lifetime ECL for
credit impaired)
(12-months ECL)
(lifetime ECL for
SICR)
(lifetime ECL for
credit impaired)
originated credit
impaired
Credit card loans At 31 December 2019 11,704 6,853 25,572 44,129 197,796 11,432 35,373 336 244,937 Movements with impact on credit loss allowance charge for the year: New originated or purchased 4,037 - - 4,037 49,264 - - 130 49,394 Transfers: - to lifetime (from Stage 1 to Stage 2) (2,520) 6,396 - 3,876 (11,557) 11,557 - - - - to credit-impaired (from Stage 1 and Stage 2 to Stage 3) (5,642) (6,697) 29,371 17,032 (27,133) (9,677) 36,810 - - - recovered (from Stage 3 to Stage 2 and from Stage 2 to Stage 1) 328 (784) (23) (479) 1,416 (1,388) (28) - -
Changes to ECL measurement model assumptions and estimates 2,960 633 1,936 5,529 - - - - - Movements other than transfers and new originated or purchased loans 5,574 1,159 (4,307) 2,426 288 (166) (4,089) (285) (4,252)
Total movements with impact on credit loss allowance charge for the year 4,737 707 26,977 32,421 12,278 326 32,693 (155) 45,142
Movements without impact on credit loss allowance charge for the year: Unwinding of discount (for Stage 3) - - 5,713 5,713 - - 5,713 - 5,713 Write-offs - - (14,071) (14,071) - - (14,071) - (14,071) Sales - - (2,134) (2,134) - - (2,319) - (2,319) Modification of original cash flows without derecognition - - (11,816) (11,816) - - (11,816) - (11,816)
At 31 December 2020 16,441 7,560 30,241 54,242 210,074 11,758 45,573 181 267,586

TCS Group Holding PLC Notes to the Consolidated Financial Statements – 31 December 2021
31
8 Loans and Advances to Customers (Continued)
Credit loss allowance Gross carrying amount
Stage 1 Stage 2 Stage 3 Total Stage 1 Stage 2 Stage 3 Purchased/ Total
In millions of RR
(12-months
ECL)
(lifetime ECL for
SICR)
(lifetime ECL for
credit impaired)
(12-months
ECL)
(lifetime ECL for
SICR)
(lifetime ECL for
credit impaired)
originated credit
impaired
Cash loans
At 31 December 2020 4,120 2,041 4,894 11,055 56,186 4,767 6,748 430 68,131 Movements with impact on credit loss allowance charge for the year:
New originated or purchased 4,998 - - 4,998 100,712 - - 464
101,176
Transfers: - to lifetime (from Stage 1 to Stage 2) (1,018) 4,039 - 3,021 (7,276) 7,276 - - - - to credit-impaired (from Stage 1 and Stage 2 to Stage 3) (1,562) (1,577) 5,673 2,534 (4,319) (1,950) 6,269 - - - recovered (from Stage 3 to Stage 2 and from Stage 2 to Stage 1) 63 (285) (4) (226) 940 (936) (4) - - Changes to ECL measurement model assumptions and estimates (338) 180 - (158) - - - - - Movements other than transfers and new originated or purchased loans (1,688) (1,408) (800) (3,896) (36,703) (2,765) (309) 28 (39,749)
Total movements with impact on credit loss allowance charge for the year 455 949 4,869 6,273 53,354 1,625 5,956 492 61,427
Movements without impact on credit loss allowance charge for the year Unwinding of discount (for Stage 3) - - 628 628 - - 628 - 628 Write-offs - - (3,149) (3,149) - - (3,149) - (3,149) Sales - - (604) (604) - - (660) - (660) Modification of original cash flows without derecognition - - (82) (82) - - (82) - (82)
At 31 December 2021 4,575 2,990 6,556 14,121 109,540 6,392 9,441 922 126,295
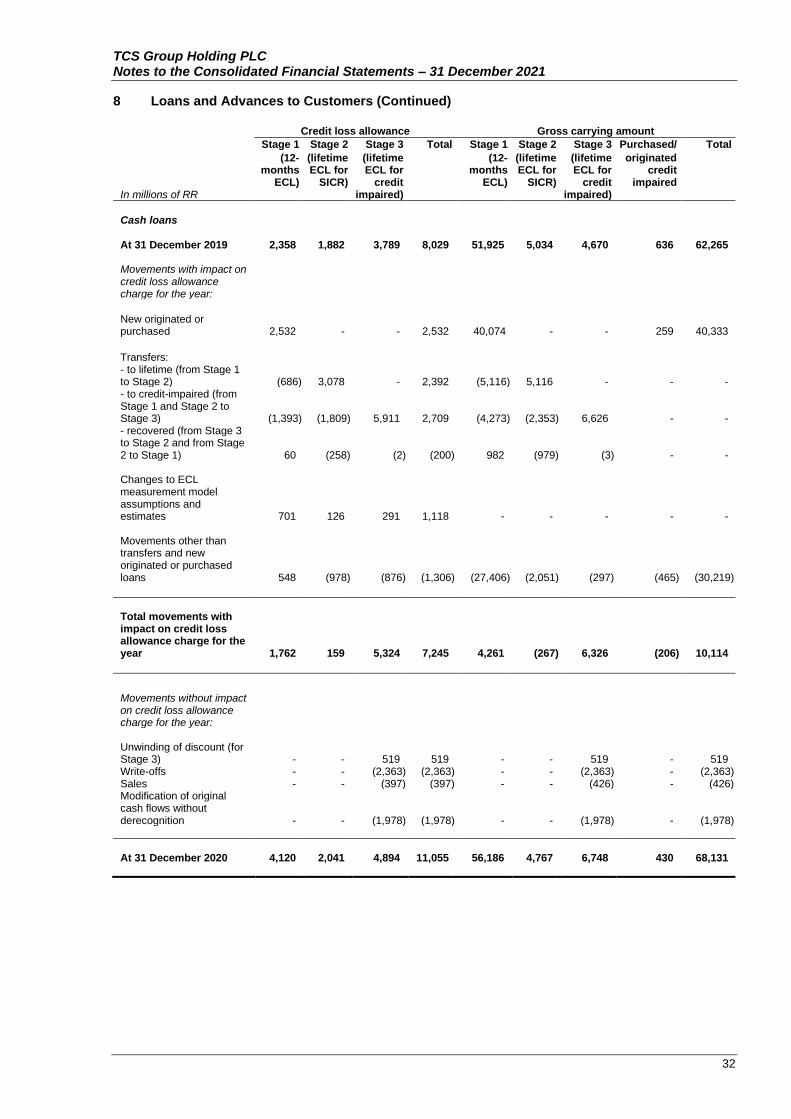
TCS Group Holding PLC Notes to the Consolidated Financial Statements – 31 December 2021
32
8 Loans and Advances to Customers (Continued)
Credit loss allowance Gross carrying amount
Stage 1 Stage 2 Stage 3 Total Stage 1 Stage 2 Stage 3 Purchased/ Total
In millions of RR
(12-months
ECL)
(lifetime ECL for
SICR)
(lifetime ECL for
credit impaired)
(12-months
ECL)
(lifetime ECL for
SICR)
(lifetime ECL for
credit impaired)
originated credit
impaired
Cash loans
At 31 December 2019 2,358 1,882 3,789 8,029 51,925 5,034 4,670 636 62,265 Movements with impact on credit loss allowance charge for the year:
New originated or purchased 2,532 - - 2,532 40,074 - - 259 40,333
Transfers: - to lifetime (from Stage 1 to Stage 2) (686) 3,078 - 2,392 (5,116) 5,116 - - - - to credit-impaired (from Stage 1 and Stage 2 to Stage 3) (1,393) (1,809) 5,911 2,709 (4,273) (2,353) 6,626 - - - recovered (from Stage 3 to Stage 2 and from Stage 2 to Stage 1) 60 (258) (2) (200) 982 (979) (3) - - Changes to ECL measurement model assumptions and estimates 701 126 291 1,118 - - - - - Movements other than transfers and new originated or purchased loans 548 (978) (876) (1,306) (27,406) (2,051) (297) (465) (30,219)
Total movements with impact on credit loss allowance charge for the year 1,762 159 5,324 7,245 4,261 (267) 6,326 (206) 10,114
Movements without impact on credit loss allowance charge for the year: Unwinding of discount (for Stage 3) - - 519 519 - - 519 - 519 Write-offs - - (2,363) (2,363) - - (2,363) - (2,363) Sales - - (397) (397) - - (426) - (426) Modification of original cash flows without derecognition - - (1,978) (1,978) - - (1,978) - (1,978)
At 31 December 2020 4,120 2,041 4,894 11,055 56,186 4,767 6,748 430 68,131
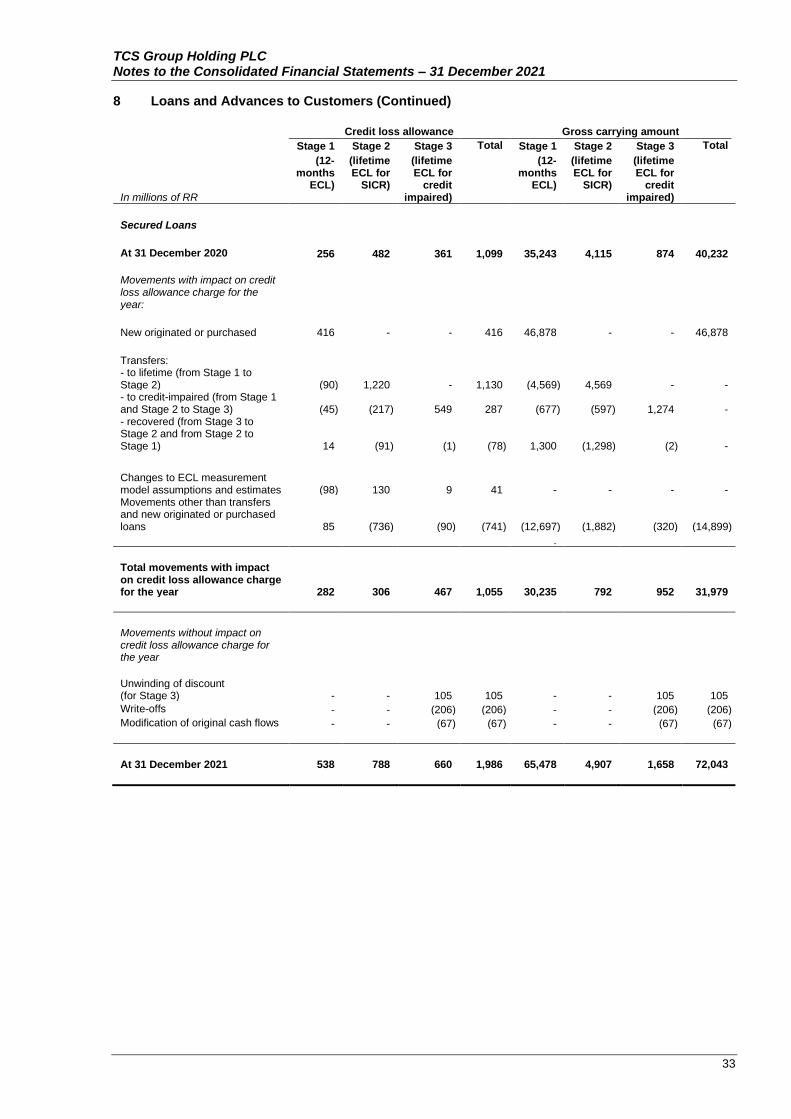
TCS Group Holding PLC Notes to the Consolidated Financial Statements – 31 December 2021
33
8 Loans and Advances to Customers (Continued)
Credit loss allowance Gross carrying amount
Stage 1 Stage 2 Stage 3 Total Stage 1 Stage 2 Stage 3 Total
In millions of RR
(12-months
ECL)
(lifetime ECL for
SICR)
(lifetime ECL for
credit impaired)
(12-months
ECL)
(lifetime ECL for
SICR)
(lifetime ECL for
credit impaired)
Secured Loans
At 31 December 2020 256 482 361 1,099 35,243 4,115 874 40,232
Movements with impact on credit loss allowance charge for the year:
New originated or purchased 416 - - 416 46,878 - - 46,878
Transfers: - to lifetime (from Stage 1 to Stage 2) (90) 1,220 - 1,130 (4,569) 4,569 - - - to credit-impaired (from Stage 1 and Stage 2 to Stage 3) (45) (217) 549 287 (677) (597) 1,274 - - recovered (from Stage 3 to Stage 2 and from Stage 2 to Stage 1) 14 (91) (1) (78) 1,300 (1,298) (2) -
Changes to ECL measurement model assumptions and estimates (98) 130 9 41 - - - - Movements other than transfers and new originated or purchased loans 85 (736) (90) (741) (12,697) (1,882) (320) (14,899)
.
Total movements with impact on credit loss allowance charge for the year 282 306 467 1,055 30,235 792 952 31,979
Movements without impact on credit loss allowance charge for the year
Unwinding of discount (for Stage 3) - - 105 105 - - 105 105
Write-offs - - (206) (206) - - (206) (206)
Modification of original cash flows - - (67) (67) - - (67) (67)
At 31 December 2021 538 788 660 1,986 65,478 4,907 1,658 72,043

TCS Group Holding PLC Notes to the Consolidated Financial Statements – 31 December 2021
34
8 Loans and Advances to Customers (Continued)
Credit loss allowance Gross carrying amount
Stage 1 Stage 2 Stage 3 Total Stage 1 Stage 2 Stage 3 Total
In millions of RR
(12-months
ECL)
(lifetime ECL for
SICR)
(lifetime ECL for
credit impaired)
(12-months
ECL)
(lifetime ECL for
SICR)
(lifetime ECL for
credit impaired)
Secured Loans At 31 December 2019 150 264 82 496 27,366 2,037 198 29,601 Movements with impact on credit loss allowance charge for the year:
New originated or purchased 141 - - 141 21,517 - - 21,517 Transfers: - to lifetime (from Stage 1 to Stage 2) (40) 954 - 914 (4,120) 4,120 - - - to credit-impaired (from Stage 1 and Stage 2 to Stage 3) (15) (135) 371 221 (524) (355) 879 - - recovered (from Stage 3 to Stage 2 and from Stage 2 to Stage 1) 3 (41) (3) (41) 516 (509) (7) - Changes to ECL measurement model assumptions and estimates 67 3 9 79 - - - - Movements other than transfers and new originated or purchased loans (50) (563) (21) (634) (9,512) (1,178) (119) (10,809)
Total movements with impact on credit loss allowance charge for the year 106 218 356 680 7,877 2,078 753 10,708
Movements without impact on credit loss allowance charge for the year: Unwinding of discount (for Stage 3) - - 46 46 - - 46 46 Write-offs - - (16) (16) - - (16) (16) Modification of original cash flows - - (107) (107) - - (107) (107)
At 31 December 2020 256 482 361 1,099 35,243 4,115 874 40,232

TCS Group Holding PLC Notes to the Consolidated Financial Statements – 31 December 2021
35
8 Loans and Advances to Customers (Continued)
Credit loss allowance Gross carrying amount
Stage 1 Stage 2 Stage 3 Total Stage 1 Stage 2 Stage 3 Purchased/ Total
In millions of RR
(12-months
ECL)
(lifetime ECL for
SICR)
(lifetime ECL for
credit impaired)
(12-months
ECL)
(lifetime ECL for
SICR)
(lifetime ECL for
credit impaired)
originated credit
impaired
POS loans
At 31 December 2020 527 227 857 1,611 30,278 1,080 1,045 287 32,690 Movements with impact on credit loss allowance charge for the year:
New originated or purchased 945 - - 945 56,356 - - 113 56,469
Transfers: - to lifetime (from Stage 1 to Stage 2) (137) 922 - 785 (2,888) 2,888 - - - - to credit-impaired (from Stage 1 and Stage 2 to Stage 3) (174) (195) 1,175 806 (1,022) (314) 1,336 - - - recovered (from Stage 3 to Stage 2 and from Stage 2 to Stage 1) 4 (20) - (16) 194 (194) - - -
Changes to ECL measurement model assumptions and estimates 92 42 - 134 - - - - - Movements other than transfers and new originated or purchased loans (406) (439) (149) (994) (26,388) (1,569) (116) (11) (28,084)
Total movements with impact on credit loss allowance charge for the year 324 310 1,026 1,660 26,252 811 1,220 102 28,385
Movements without impact on credit loss allowance charge for the year
Unwinding of discount (for Stage 3) - - 81 81 - - 81 - 81 Write-offs - - (522) (522) - - (522) - (522) Sales - - (216) (216) - - (277) - (277) Modification of original cash flows without derecognition - - (9) (9) - - (9) - (9)
At 31 December 2021 851 537 1,217 2,605 56,530 1,891 1,538 389 60,348

TCS Group Holding PLC Notes to the Consolidated Financial Statements – 31 December 2021
36
8 Loans and Advances to Customers (Continued)
Credit loss allowance Gross carrying amount
Stage 1 Stage 2 Stage 3 Total Stage 1 Stage 2 Stage 3 Purchased/ Total
In millions of RR
(12-months
ECL)
(lifetime ECL for
SICR)
(lifetime ECL for
credit impaired)
(12-months
ECL)
(lifetime ECL for
SICR)
(lifetime ECL for
credit impaired)
originated credit
impaired
POS loans
At 31 December 2019 298 190 569 1,057 24,031 1,053 658 198 25,940 Movements with impact on credit loss allowance charge for the year:
New originated or purchased 525 - - 525 29,695 - - 226 29,921
Transfers: - to lifetime (from Stage 1 to Stage 2) (83) 642 - 559 (1,863) 1,863 - - - - to credit-impaired (from Stage 1 and Stage 2 to Stage 3) (119) (234) 1,023 670 (751) (354) 1,105 - - - recovered (from Stage 3 to Stage 2 and from Stage 2 to Stage 1) 3 (15) - (12) 206 (206) - - -
Changes to ECL measurement model assumptions and estimates 40 3 16 59 - - - - - Movements other than transfers and new originated or purchased loans (137) (359) (209) (705) (21,040) (1,276) (173) (137) (22,626)
Total movements with impact on credit loss allowance charge for the year 229 37 830 1,096 6,247 27 932 89 7,295
Movements without impact on credit loss allowance charge for the year:
Unwinding of discount (for Stage 3) - - 46 46 - - 46 - 46 Write-offs - - (360) (360) - - (360) - (360) Sales - - (50) (50) - - (53) - (53) Modification of original cash flows without derecognition - - (178) (178) - - (178) - (178)
At 31 December 2020 527 227 857 1,611 30,278 1,080 1,045 287 32,690

TCS Group Holding PLC Notes to the Consolidated Financial Statements – 31 December 2021
37
8 Loans and Advances to Customers (Continued)
Credit loss allowance Gross carrying amount
Stage 1 Stage 2 Stage 3 Total Stage 1 Stage 2 Stage 3 Total
In millions of RR
(12-months
ECL)
(lifetime ECL for
SICR)
(lifetime ECL for
credit impaired)
(12-months
ECL)
(lifetime ECL for
SICR)
(lifetime ECL for
credit impaired)
Car Loans At 31 December 2020 664 558 922 2,144 30,716 2,012 1,263 33,991 Movements with impact on credit loss allowance charge for the year: New originated or purchased 1,812 - - 1,812 59,391 - - 59,391 Transfers: - to lifetime (from Stage 1 to Stage 2) (385) 1,796 - 1,411 (3,703) 3,703 - - - to credit-impaired (from Stage 1 and Stage 2 to Stage 3) (382) (375) 1,806 1,049 (1,740) (578) 2,318 - - recovered (from Stage 3 to Stage 2 and from Stage 2 to Stage 1) 19 (103) (3) (87) 622 (617) (5) - Changes to ECL measurement model assumptions and estimates (75) 136 - 61 - - - - Movements other than transfers and new originated or purchased loans 59 (479) (187) (607) (14,112) (751) (196) (15,059)
Total movements with impact on credit loss allowance charge for the year 1,048 975 1,616 3,639 40,458 1,757 2,117 44,332
Movements without impact on credit loss allowance charge for the year Unwinding of discount (for Stage 3) - - 179 179 - - 179 179 Write-offs - - (354) (354) - - (354) (354) Sales - - (1) (1) - - (1) (1) Modification of original cash flows without derecognition - - (265) (265) - - (265) (265)
At 31 December 2021 1,712 1,533 2,097 5,342 71,174 3,769 2,939 77,882

TCS Group Holding PLC Notes to the Consolidated Financial Statements – 31 December 2021
38
8 Loans and Advances to Customers (Continued)
Credit loss allowance Gross carrying amount
Stage 1 Stage 2 Stage 3 Total Stage 1 Stage 2 Stage 3 Total
In millions of RR
(12-months
ECL)
(lifetime ECL for
SICR)
(lifetime ECL for
credit impaired)
(12-months
ECL)
(lifetime ECL for
SICR)
(lifetime ECL for
credit impaired)
Car Loans At 31 December 2019 368 285 260 913 18,725 1,060 371 20,156 Movements with impact on credit loss allowance charge for the year: New originated or purchased 485 - - 485 21,598 - - 21,598 Transfers: - to lifetime (from Stage 1 to Stage 2) (141) 844 - 703 (1,926) 1,926 - - - to credit-impaired (from Stage 1 and Stage 2 to Stage 3) (184) (232) 770 354 (739) (352) 1,091 - - recovered (from Stage 3 to Stage 2 and from Stage 2 to Stage 1) 10 (50) - (40) 308 (307) (1) - Changes to ECL measurement model assumptions and estimates 105 13 32 150 - - - - Movements other than transfers and new originated or purchased loans 21 (302) 38 (243) (7,250) (315) (20) (7,585)
Total movements with impact on credit loss allowance charge for the year 296 273 840 1,409 11,991 952 1,070 14,013
Movements without impact on credit loss allowance charge for the year: Unwinding of discount (for Stage 3) - - 81 81 - - 81 81 Write-offs - - (63) (63) - - (63) (63) Modification of original cash flows - - (196) (196) - - (196) (196)
At 31 December 2020 664 558 922 2,144 30,716 2,012 1,263 33,991
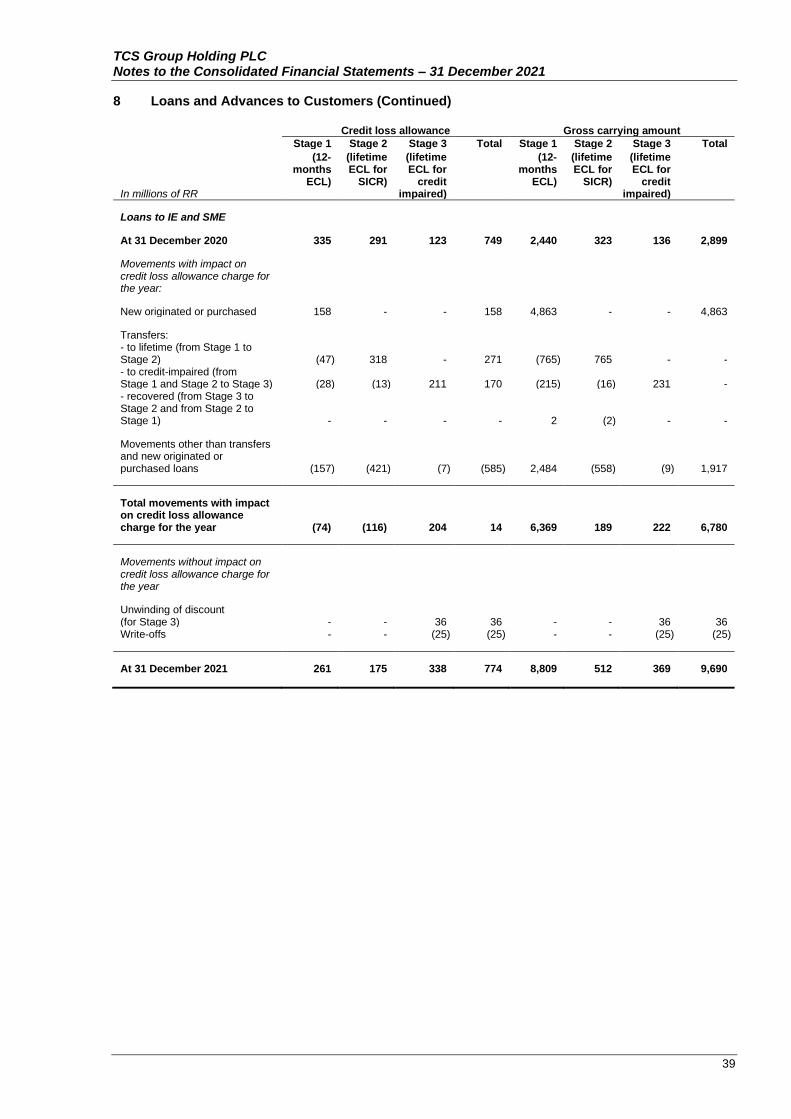
TCS Group Holding PLC Notes to the Consolidated Financial Statements – 31 December 2021
39
8 Loans and Advances to Customers (Continued)
Credit loss allowance Gross carrying amount
Stage 1 Stage 2 Stage 3 Total Stage 1 Stage 2 Stage 3 Total
In millions of RR
(12-months
ECL)
(lifetime ECL for
SICR)
(lifetime ECL for
credit impaired)
(12-months
ECL)
(lifetime ECL for
SICR)
(lifetime ECL for
credit impaired)
Loans to IE and SME At 31 December 2020 335 291 123 749 2,440 323 136 2,899 Movements with impact on credit loss allowance charge for the year:
New originated or purchased 158 - - 158 4,863 - - 4,863 Transfers: - to lifetime (from Stage 1 to Stage 2) (47) 318 - 271 (765) 765 - - - to credit-impaired (from Stage 1 and Stage 2 to Stage 3) (28) (13) 211 170 (215) (16) 231 - - recovered (from Stage 3 to Stage 2 and from Stage 2 to Stage 1) - - - - 2 (2) - - Movements other than transfers and new originated or purchased loans (157) (421) (7) (585) 2,484 (558) (9) 1,917 Total movements with impact on credit loss allowance charge for the year (74) (116) 204 14 6,369 189 222 6,780 Movements without impact on credit loss allowance charge for the year Unwinding of discount (for Stage 3) - - 36 36 - - 36 36 Write-offs - - (25) (25) - - (25) (25) At 31 December 2021 261 175 338 774 8,809 512 369 9,690

TCS Group Holding PLC Notes to the Consolidated Financial Statements – 31 December 2021
40
8 Loans and Advances to Customers (Continued)
Credit loss allowance Gross carrying amount
Stage 1 Stage 2 Stage 3 Total Stage 1 Stage 2 Stage 3 Total
In millions of RR
(12-months ECL)
(lifetime ECL for
SICR)
(lifetime ECL for
credit impaired)
(12-months
ECL)
(lifetime ECL for
SICR)
(lifetime ECL for
credit impaired)
Loans to IE and SME At 31 December 2019 57 10 46 113 940 21 52 1,013 Movements with impact on credit loss allowance charge for the year:
New originated or purchased 28 - - 28 676 - - 676 Transfers: - to lifetime (from Stage 1 to Stage 2) (143) 314 - 171 (375) 375 - - - to credit-impaired (from Stage 1 and Stage 2 to Stage 3) (16) (13) 77 48 (69) (17) 86 - Changes to ECL measurement model assumptions and estimates 10 - 3 13 - - - - Movements other than transfers and new originated or purchased loans 399 (20) - 379 1,268 (56) 1 1,213
Total movements with impact on credit loss allowance charge for the year 278 281 80 639 1,500 302 87 1,889
Movements without impact on credit loss allowance charge for the year: Unwinding of discount (for Stage 3) - - 11 11 - - 11 11 Write-offs - - (14) (14) - - (14) (14)
At 31 December 2020 335 291 123 749 2,440 323 136 2,899
In 2021 the Group implemented a new behavioural model for calculating probabilities of default for retail annuity loans (cash loans, secured loans, POS loans and car loans). Refer to Note 3 for details.
In 2020 the Group implemented following changes to ECL measurement model assumptions:
• Additional credit loss allowance charge due to the impact of the changed macroeconomic conditions.
• For the purposes of LGD estimation the Group has refined the approach to calculation of the rate used for discounting expected cash flows from defaulted loans. The refined approach is that the Group uses more disaggregated and specific discount rates for each credit product in the overall loan portfolio of the Group rather than one generic rate, which makes the estimate more precise.
• Having accumulated additional information the Group has refined its behavioural PD model used for PD estimation for credit card loans. Also the Group has refined PD models for secured loans and car loans using the most recent statistical data.
• The Group has refined its approach to calculation of the impact of modification of original cash flows without derecognition on stage 3 loans credit loss allowance and gross carrying amount.

TCS Group Holding PLC Notes to the Consolidated Financial Statements – 31 December 2021
41
8 Loans and Advances to Customers (Continued)
The credit loss allowance charge during the year ended 31 December 2021 presented in the tables above differs from the amount presented in the consolidated statement of profit or loss and other comprehensive income for the year due to RR 4,510 million (2020: RR 4,063 million) recovery of amounts previously written-off as uncollectible, due to RR 3,991 million (2020: RR 1,750 million) recovery from the purchased loans in excess of their gross carrying amount, and due to RR 203 million recovery of ECL for credit related commitments (2020: RR 1,295 million charge of ECL for credit related commitments, including RR 638 million of charge due to changes to ECL measurement model assumptions and estimates).
The amount of the recovery received from written-off loans and purchased loans during the year was credited directly to the credit loss allowance line in the consolidated statement of profit or loss and other comprehensive income.
The contractual amount outstanding of loans and advances to customers which were written off during the reporting period ended 31 December 2021 and are still subject to enforcement activity is equal to RR 16,519 million (2020: RR 13,966 million).
The amount of the ECL for credit related commitments is accounted separately from ECL for credit cards loans and is included in other financial liabilities in the consolidated statement of financial position.
During the year ended 31 December 2021 the Group sold credit-impaired loans to third parties (external debt collection agencies) by the means of transferring all subsequest risks and rewards without recource to the buyer, which resulted into derecognition of gross amount of RR 3,497 million (2020: RR 2,798 million) and credit loss allowance of RR 3,150 million (2020: RR 2,581 million). The difference between the carrying amount of these loans and the consideration received was recognised as losses in the amount of RR 80 million within credit loss allowance for loans and advances to customers and credit related commitments for the year ended 31 December 2021 (2020: losses in the amount of RR 186 million).
Presented below is an analysis of issued, activated and utilised cards based on their credit card limits as at the end of the reporting period:
In units 31 December
2021 31 December
2020
Credit card limits Up to 20 RR thousand 1,407,747 1,046,228 20-40 RR thousand 723,075 538,746 40-60 RR thousand 631,398 497,940 60-80 RR thousand 612,737 495,431
80-100 RR thousand 596,141 479,786 100-120 RR thousand 442,534 331,606
120-140 RR thousand 480,082 378,547 140-200 RR thousand 1,089,388 870,503 More than 200 RR thousand 337,574 225,417
Total number of cards (in units) 6,320,676 4,864,204
Table above only includes credit cards less than 180 days overdue.
The following table contains an analysis of the credit risk exposure of loans and advances to customers measured at AC and for which an ECL allowance is recognised. The carrying amount of loans and advances to customers below also represents the Group's maximum exposure to credit risk on these loans.

TCS Group Holding PLC Notes to the Consolidated Financial Statements – 31 December 2021
42
8 Loans and Advances to Customers (Continued)
Loans and advances to customers at 31 December 2021 are disclosed as follows:
In millions of RR
Stage 1 (12-months
ECL)
Stage 2 (lifetime ECL
for SICR)
Stage 3 (lifetime ECL
for credit impaired)
Purchased/ originated
credit impaired
Total
Credit card loans
- Excellent 131,944 - - - 131,944
- Good 121,697 1,570 - - 123,267 - Monitor 16,472 3,810 - - 20,282
- Sub-standard - 6,606 8,847 - 15,453 - NPL - - 42,549 399 42,948
Gross carrying amount 270,113 11,986 51,396 399 333,894
Credit loss allowance (15,028) (7,562) (30,397) - (52,987)
Carrying amount 255,085 4,424 20,999 399 280,907
Cash loans
- Excellent 74,885 - - - 74,885
- Good 34,094 3,512 - - 37,606
- Monitor 561 1,134 - - 1,695 - Sub-standard - 1,746 1,167 - 2,913
- NPL - - 8,274 922 9,196
Gross carrying amount 109,540 6,392 9,441 922 126,295
Credit loss allowance (4,575) (2,990) (6,556) - (14,121)
Carrying amount 104,965 3,402 2,885 922 112,174
Secured Loans
- Excellent 53,540 - - - 53,540
- Good 11,355 3,685 - - 15,040 - Monitor 583 668 - - 1,251
- Sub-standard - 554 - - 554 - NPL - - 1,658 - 1,658
Gross carrying amount 65,478 4,907 1,658 - 72,043
Credit loss allowance (538) (788) (660) - (1,986)
Carrying amount 64,940 4,119 998 - 70,057

TCS Group Holding PLC Notes to the Consolidated Financial Statements – 31 December 2021
43
8 Loans and Advances to Customers (Continued)
POS loans - Excellent 44,024 - - - 44,024
- Good 12,223 1,105 - - 13,328 - Monitor 283 310 - - 593 - Sub-standard - 476 28 - 504 - NPL - - 1,510 389 1,899
Gross carrying amount 56,530 1,891 1,538 389 60,348
Credit loss allowance (851) (537) (1,217) - (2,605)
Carrying amount 55,679 1,354 321 389 57,743
Car loans - Excellent 53,275 - - - 53,275
- Good 17,290 2,115 - - 19,405 - Monitor 609 703 - - 1,312 - Sub-standard - 951 - - 951 - NPL - - 2,939 - 2,939
Gross carrying amount 71,174 3,769 2,939 - 77,882
Credit loss allowance (1,712) (1,533) (2,097) - (5,342)
Carrying amount 69,462 2,236 842 - 72,540
Loans to IE and SME - Excellent 5,997 - - - 5,997
- Good 2,731 265 - - 2,996
- Monitor 81 87 - - 168 - Sub-standard - 160 - - 160 - NPL - - 369 - 369
Gross carrying amount 8,809 512 369 - 9,690
Credit loss allowance (261) (175) (338) - (774)
Carrying amount 8,548 337 31 - 8,916

TCS Group Holding PLC Notes to the Consolidated Financial Statements – 31 December 2021
44
8 Loans and Advances to Customers (Continued)
Loans and advances to customers at 31 December 2020 are disclosed as follows:
In millions of RR
Stage 1 (12-months
ECL)
Stage 2 (lifetime ECL
for SICR)
Stage 3 (lifetime ECL
for credit impaired)
Purchased/ originated
credit impaired
Total
Credit card loans
- Excellent 68,398 - - - 68,398 - Good 131,957 1,891 - - 133,848 - Monitor 9,719 3,757 - - 13,476 - Sub-standard - 6,110 9,326 - 15,436 - NPL - - 36,247 181 36,428
Gross carrying amount 210,074 11,758 45,573 181 267,586
Credit loss allowance (16,441) (7,560) (30,241) - (54,242)
Carrying amount 193,633 4,198 15,332 181 213,344
Cash loans
- Excellent 33,877 - - - 33,877
- Good 22,053 3,189 - - 25,242 - Monitor 256 546 - - 802
- Sub-standard - 1,032 989 - 2,021 - NPL - - 5,759 430 6,189
Gross carrying amount 56,186 4,767 6,748 430 68,131
Credit loss allowance (4,120) (2,041) (4,894) - (11,055)
Carrying amount 52,066 2,726 1,854 430 57,076
Secured Loans
- Excellent 21,201 - - - 21,201
- Good 13,937 3,307 - - 17,244
- Monitor 105 442 - - 547 - Sub-standard - 366 - - 366
- NPL - - 874 - 874
Gross carrying amount 35,243 4,115 874 - 40,232
Credit loss allowance (256) (482) (361) - (1,099)
Carrying amount 34,987 3,633 513 - 39,133

TCS Group Holding PLC Notes to the Consolidated Financial Statements – 31 December 2021
45
8 Loans and Advances to Customers (Continued)
In millions of RR
Stage 1 (12-months
ECL)
Stage 2 (lifetime ECL
for SICR)
Stage 3 (lifetime ECL
for credit impaired)
Purchased/ originated
credit impaired
Total
POS loans - Excellent 25,159 - - - 25,159
- Good 4,998 793 - - 5,791 - Monitor 121 121 - - 242 - Sub-standard - 166 28 - 194 - NPL - - 1,017 287 1,304
Gross carrying amount 30,278 1,080 1,045 287 32,690
Credit loss allowance (527) (227) (857) - (1,611)
Carrying amount 29,751 853 188 287 31,079
Car loans - Excellent 21,444 - - - 21,444
- Good 9,136 1,427 - - 10,563 - Monitor 136 263 - - 399 - Sub-standard - 322 - - 322 - NPL - - 1,263 - 1,263
Gross carrying amount 30,716 2,012 1,263 - 33,991
Credit loss allowance (664) (558) (922) - (2,144)
Carrying amount 30,052 1,454 341 - 31,847
Loans to IE and SME - Excellent 1,673 - - - 1,673
- Good 760 295 - - 1,055
- Monitor 7 12 - - 19 - Sub-standard - 16 - - 16 - NPL - - 136 - 136
Gross carrying amount 2,440 323 136 - 2,899
Credit loss allowance (335) (291) (123) - (749)
Carrying amount 2,105 32 13 - 2,150

TCS Group Holding PLC Notes to the Consolidated Financial Statements – 31 December 2021
46
8 Loans and Advances to Customers (Continued)
Stage 3 includes restructured loans that are less than 90 days overdue which are not considered as NPL according to the Group’s credit risk grading master scale. Refer to Note 30 for the description of credit risk grading system used by the Group.
Loans in courts are included in Stage 3 and are loans to delinquent borrowers, against which the Group has filed claims to courts in order to recover outstanding balances. As at 31 December 2021 the gross carrying amount of the loans in courts was RR 39,066 million (2020: RR 31,082 million).
Description of collateral held for loans to individuals carried at amortised cost is as follows at 31 December 2021:
In millions of RR Secured loans Car loans Total
Loans collateralised by: - residential real estate 61,428 - 61,428 - cars 9,344 54,523 63,867
Total collateralised gross carrying amount (representing exposure to credit risk for each class of loans at AC) 70,772 54,523 125,295
Description of collateral held for loans to individuals carried at amortised cost is as follows at 31 December 2020:
In millions of RR Secured loans Car loans Total
Loans collateralised by: - residential real estate 37,896 - 37,896 - cars 2,101 26,515 28,616
Total collateralised gross carrying amount (representing exposure to credit risk for each class of loans at AC) 39,997 26,515 66,512
In the disclosure above the difference between collateralised gross carrying amounts and total gross carrying amount of the respective loans represents unsecured disclosures of RR 24,630 million (2020: RR 7,711 million). Unsecured loans arise as the result of the fact that the borrowers have two months to register their cars as collateral for car loans as well as the application of a conservative discount in determining the carrying value of collateral for secured and car loans applied.
The extent to which collateral and other credit enhancements mitigate credit risk for financial assets carried at amortised cost that are credit impaired, is presented by disclosing collateral values separately for (i) those assets where collateral and other credit enhancements are equal to or exceed carrying value of the asset (“over-collateralised assets”) and (ii) those assets where collateral and other credit enhancements are less than the carrying value of the asset (“under-collateralised assets”).
The effect of collateral on credit impaired assets at 31 December 2021 is as follows.
Over-collateralised assets Under-collateralised assets
In millions of RR
Gross carrying amount of the
assets
Value of collateral
Gross carrying amount of the
assets
Value of collateral
Credit impaired assets: Secured loans 1,625 4,381 33 11 Car loans 843 1,355 2,096 929

TCS Group Holding PLC Notes to the Consolidated Financial Statements – 31 December 2021
47
8 Loans and Advances to Customers (Continued)
The effect of collateral on credit impaired assets at 31 December 2020 is as follows.
Over-collateralised assets Under-collateralised assets
In millions of RR
Gross carrying amount of the
assets
Value of collateral
Gross carrying amount of the
assets
Value of collateral
Credit impaired assets:
Secured loans 855 2,136 19 10 Car loans 200 296 1,063 715
The values of collateral considered in this disclosure are after a valuation haircut of 15% (2020: 15%) for residential real estate and 20% (2020: 20%) for cars applied to consider liquidity and quality of the pledged assets.
All contractual modifications of loans with the lifetime ECL that did not lead to derecognition did not have gains less losses on modification recognised in profit or loss for the year ended 31 December 2021 (2020: same).
Refer to Note 37 for the disclosure of the fair value of loans and advances to customers. Interest rate, maturity and geographical risk concentration analysis are disclosed in Note 30. Information on related party balances is disclosed in Note 39.
9 Guarantee Deposits with Payment Systems
As at 31 December 2021 and 2020 guarantee deposits were placed in favour of MasterCard with Barclays Bank Plc London (A rated), in favour of Visa with United Overseas Bank Ltd Singapore (AA- rated), and in favour of Russia payment card Mir with Russian National payment card system (NSPK).
As at 31 December 2021 the carrying value of guarantee deposits with payment systems was RR 15,171 million (2020: RR 15,475 million).
The table below discloses the credit quality of guarantee deposits with payment systems balances based on credit risk grades:
In millions of RR 31 December
2021 31 December
2020
- Excellent 13,772 14,803 - Good 1,399 672
Total guarantee deposits with payment systems 15,171 15,475
The carrying amount of guarantee deposits with payment systems at 31 December 2021 and 2020 also represents the Group's maximum exposure to credit risk on these assets. Refer to Note 30 for the description of credit risk grading system used by the Group. For the purpose of ECL measurement guarantee deposits with payment systems balances are included in Stage 1. Guarantee deposits with payment systems are unsecured financial assets.
The ECL for these balances represents an immaterial amount, therefore the Group did not create any credit loss allowance for guarantee deposits with payment systems. Refer to Note 30 for the ECL measurement approach. Interest rate, maturity and geographical risk concentration analysis are disclosed in Note 30.

TCS Group Holding PLC Notes to the Consolidated Financial Statements – 31 December 2021
48
10 Brokerage Receivables and Brokerage Payables
In millions of RR 31 December
2021 31 December
2020
Amounts receivable from brokers and clearing organizations 49,138 24,064
Total brokerage receivables 49,138 24,064
Amounts payable to brokers and clearing organizations 9,634 9,206
Total brokerage payables 9,634 9,206
Brokerage receivables represent placements under reverse sale and repurchase agreements made by the Bank with central counterparty to provide customers of the Bank who have brokerage accounts with the Bank with the possibility to acquire securities in case those customers have insufficient own funds to acquire those securities. These balances are fully collateralized by highly liquid securities and have minimal credit risk. As at 31 December 2021 the fair value of collateral of brokerage receivables was RR 46,721 million (2020: RR 24,113 million). For the purpose of ECL measurement brokerage receivables are included in Stage 1. The ECL for these balances represents an immaterial amount, therefore the Group did not recognise any credit loss allowance for brokerage receivables.
Brokerage payables represent funds attracted under sale and repurchase agreements made by the Bank with central counterparty to provide customers of the Bank who have brokerage accounts with the Bank with the possibility to borrow securities and make a short sale.
As at 31 December 2021 the fair value of collateral of brokerage payables was RR 11,123 million (2020: RR 9,696 million).
ECL measurement approach, interest rate, maturity and geographical risk concentration analysis are disclosed in Note 30. Refer to Note 33 for the disclosure of the offsetting assets and liabilities. Refer to Note 37 for the disclosure of the fair value of brokerage receivables and brokerage payables.

TCS Group Holding PLC Notes to the Consolidated Financial Statements – 31 December 2021
49
11 Tangible Fixed Assets, Intangible Assets and Right-of-use Assets
Tangible fixed assets Intangible assets
In millions of RR
Land Buil- ding
Equip-ment
Lease- hold
improve-ments
Vehic- les
Total tangible
fixed assets
Capita- lised
Acqui- red
Total intangible
assets
Cost 31 December 2019 396 4,219 6,070 1,620 88 12,393 1,944 7,173 9,117 Additions - - 2,168 2 - 2,170 1,854 1,815 3,669 Disposals - - (164) (231) - (395) - (73) (73)
31 December 2020 396 4,219 8,074 1,391 88 14,168 3,798 8,915 12,713
Additions - - 5,783 187 1 5,971 4,311 7,391 11,702 Disposals - - (38) (399) (28) (465) - (116) (116)
31 December 2021 396 4,219
13,819 1,179 61 19,674 8,109
16,190 24,299
Depreciation and amortisation
31 December 2019 - (133) (2,594) (673) (41) (3,441) (496) (3,186) (3,682) Charge for the year (Note 25) - (43) (1,421) (149) (4) (1,617) (704) (1,257) (1,961) Disposals - - 103 128 - 231 - 12 12
31 December 2020 - (176) (3,912) (694) (45) (4,827) (1,200) (4,431) (5,631)
Charge for the year (Note 25) - (42) (2,083) (47) (8) (2,180) (1,699) (1,902) (3,601) Disposals - - 23 218 28 269 - 2 2
31 December 2021 - (218) (5,972) (523) (25) (6,738) (2,899) (6,331) (9,230)
Net book value
31 December 2020 396 4,043 4,162 697 43 9,341 2,598 4,484 7,082
31 December 2021 396
4,001 7,847 656 36 12,936 5,210 9,859 15,069

TCS Group Holding PLC Notes to the Consolidated Financial Statements – 31 December 2021
50
11 Tangible Fixed Assets, Intangible Assets and Right-of-use Assets (Continued)
Intangible assets additions in the amount of RR 4,311 million related to capitalised the software developments by Tinkoff Software DC during the year ended 31 December 2021 (2020: RR 1,854 million).
Other intangible assets acquired during the year ended 31 December 2021 and 2020 mainly represent accounting software, retail banking software, insurance software, licenses and development of software.
Right-of-use assets and lease liabilities. Right-of-use-assets relate to the office premises leased by the Group. Rental contracts are typically for fixed periods from 1 to 5 years. The Group does not have extension or termination options of its lease agreements other than lease agreements of low value items.
The right of use assets by class of underlying items is analysed as follows:
In millions of RR Office premises
Carrying amount at 31 December 2019 1,608 Additions 234 Depreciation charge (Note 25) (702)
Carrying amount at 31 December 2020 1,140
Additions 497 Depreciation charge (Note 25) (609)
Carrying amount at 31 December 2021 1,028
Expenses relating to leases of low-value assets and short-term leases in the amount of RR 1,126 million are included in administrative and other operating expenses (2020: RR 548 million). Refer to Note 25. Total cash outflow for long-term rental contract leases during the year ended 31 December 2021 was RR 820
million (2020: RR 758 million).
12 Other Financial and Non-financial Assets
In millions of RR 31 December
2021 31 December
2020
Other Financial Assets Settlement of operations with plastic cards 42,995 23,882 Insurance's financial assets 965 542 Other 9,009 6,646
Total Other Financial Assets 52,969 31,070
Other Non-Financial Assets Prepaid expenses 5,996 1,478 Insurance's non-financial assets 817 509 Other 2,082 1,399
Total Other Non-Financial Assets 8,895 3,386

TCS Group Holding PLC Notes to the Consolidated Financial Statements – 31 December 2021
51
12 Other Financial and Non-financial Assets (Continued)
Settlement of operations with plastic cards represents settlements with payment systems and payment channels on operations of the customers with banking cards due to be settled within 3 working days. This amount also includes prepayment to the payment systems for operations during holiday period.
At 31 December 2021, included in other financial assets are receivables and investments in associates (2020: same).
As at 31 December 2021 and 2020 prepaid expenses consist of prepayments for marketing, IT support, security and ATM-service.
The table below discloses the credit quality of other financial assets based on credit risk grades:
In millions of RR 31 December
2021 31 December
2020
- Excellent 29,850 19,683 - Good 23,119 11,387
Total other financial assets 52,969 31,070
Refer to Note 30 for the description of the Group’s credit risk grading system.
For the purpose of ECL measurement settlement of operations with plastic cards balances and other receivables are included in Stage 1. The ECL for these balances represents an immaterial amount, therefore the Group did not recognise any credit loss allowance. Refer to Note 30 for the ECL measurement approach. Refer to Note 37 for the disclosure of the fair value of other financial assets. The maturity and geographical risk concentration analysis of amounts of other financial assets is disclosed in Note 30.
13 Due to Banks
In millions of RR 31 December
2021 31 December
2020
Correspondent accounts and overnight placements of other banks 5,829 4,795 Sale and repurchase agreements with other banks 5,484 24
Total due to banks 11,313 4,819
At 31 December 2021, included in the amounts due to other banks are collateral for swap contracts of RR 5,829 million (2020: RR 4,789 million) and liabilities of RR 5,484 million (2020: RR 24 million) arising from sale and repurchase agreements with debt securities at FVOCI (Note 7).
Refer to Note 37 for the disclosure of the fair value of amounts due to banks. Interest rate, maturity and geographical risk concentration analysis of due to banks is disclosed in Note 30. Refer to Note 33 and 34 for information on the amounts included in due to banks received under sale and repurchase agreements and fair value of securities pledged.

TCS Group Holding PLC Notes to the Consolidated Financial Statements – 31 December 2021
52
14 Customer Accounts
In millions of RR 31 December
2021 31 December
2020
Individuals - Current/demand accounts 544,561 323,145 - Brokerage accounts 110,277 73,970 - Term deposits 146,548 135,995 IE and SME - Current/demand accounts 140,287 89,199 - Term deposits 3,403 2,213 Other legal entities - Current/demand accounts 647 2,267 - Term deposits - 48
Total customer accounts 945,723 626,837
Refer to Note 37 for the disclosure of the fair value of customer accounts. Interest rate, maturity and geographical risk concentration analysis of customer accounts amounts is disclosed in Note 30. Information on related party balances is disclosed in Note 39.
15 Debt Securities in Issue
In millions of RR Date of maturity 31 December
2021 31 December
2020
RR denominated bonds issued in September 2019 12 September 2029 10,176 10,166 RR denominated bonds issued in April 2019 21 March 2029 10,105 10,134 RR denominated bonds issued in April 2017 22 April 2022 1,113 2,492 Structured debt notes issued in December 2020 5 December 2023 122 119 Structured debt notes issued in October 2020 5 October 2023 91 89 Structured debt notes issued in December 2020 1 December 2023 73 74 RR denominated bonds issued in June 2016 24 June 2021 - 836
Total debt securities in issue 21,680 23,910
On 25 September 2019 the Bank issued RR denominated bonds with a nominal value of RR 10,000 million at 8.25% coupon rate maturing on 12 September 2029.
On 3 April 2019 the Bank issued RR denominated bonds with a nominal value of RR 10,000 million at 9.25% coupon rate maturing on 21 March 2029.
On 28 April 2017 the Bank issued RR denominated bonds with a nominal value of RR 5,000 million at 9.65% coupon rate maturing on 22 April 2022.
During October and December 2020 the Bank issued structured debt notes with the total nominal value of RR 282 million at 0.01% coupon rate maturing in October and December 2023. The structured debt notes are linked to the performance of the underlying assets, such as the gold trust and equity indexes. The derivative instruments embedded in the structured notes were separated and accounted within financial derivatives line in the consolidated statement of financial position.
On 30 June 2016 the Group issued RR denominated bonds with a nominal value of RR 3,000 million at 11.7% coupon rate maturing on 24 June 2021. The Group redeemed all outstanding bonds of this issue at maturity.
All RR denominated bonds and structured debt notes issued by the Bank are traded on the Moscow Exchange. Refer to Note 37 for the disclosure of the fair value of debt securities in issue. Interest rate, maturity and geographical risk concentration analysis of debt securities in issue are disclosed in Note 30.

TCS Group Holding PLC Notes to the Consolidated Financial Statements – 31 December 2021
53
16 Other Borrowed Funds
On 5-6 July 2021 the Group completed the securitisation of home equity loans placed by mortgage agent TB- 1. The placement included Class A and B bonds secured by a portfolio of home equity loans. Class A bonds are represented by senior tranche totaling RR 5,623 million and were placed with private and institutional investors with a coupon of 7.9%. Class B bonds are represented by subordinated junior tranche totaling RR 878 million that was retained by the Bank. This junior tranche absorbs substantially all amount of credit risks related to the portfolio. As a result, the securitised home equity loans amounted to RR 5,638 million failed to meet derecognition criteria set out by IFRS 9 and hence continue to be recognised in the Group’s consolidated financial statement.
As at 31 December 2021 the carrying value of borrowings through securitisation transaction amounted to RR 3,806 million that are represented by Class A bonds. The carrying value of the securitised home equity loans amounted to RR 4,446 million (Note 8). The fair value of the securitised home equity loans does not differ materially from the carrying value as at 31 December 2021. Refer to Note 33 for the resulting net position.
17 Subordinated Debt
In millions of RR 31 December
2021 31 December
2020 Perpetual subordinated loan notes issued in September 2021 41,504 - Perpetual subordinated loan notes issued in June 2017 18,153 20,755
Total subordinated debt 59,657 20,755
On 20 September 2021 the Group issued perpetual subordinated loan participation notes with a nominal value of USD 600 million (RR 43,536 million) with zero premium. The Group has a right to repay the notes at its discretion starting from 20 December 2026 and they are repayable in case of certain events other than liquidation. The notes bear a fixed interest rate of 6.00% p.a. payable quarterly starting from 20 December 2021.
On 15 June 2017 the Group issued perpetual subordinated loan participation notes with a nominal value of USD 300 million (RR 17,109 million) with zero premium. The Group has a right to repay the notes at its discretion starting from 15 September 2022 and they are repayable in case of certain events other than liquidation. The notes bear a fixed interest rate of 9.25% p.a. payable quarterly starting from 15 September 2017.
All perpetual subordinated loan participation notes have no stated maturity, and interest payments may be cancelled by the Group at any time.
The claims of lenders against the Group in respect of the principal and interest on these bonds are subordinated to the claims of other creditors in accordance with the legislation of the Russian Federation.
The perpetual subordinated loan participation notes are traded on the Global Exchange Market. Interest rate, maturity and geographical risk concentration analysis of subordinated debt is disclosed in Note 30. Refer to Note 37 for the disclosure of the fair value of financial instruments.

TCS Group Holding PLC Notes to the Consolidated Financial Statements – 31 December 2021
54
18 Insurance Provisions
In millions of RR 31 December
2021 31 December
2020
Insurance Provisions Provision for unearned premiums 7,281 3,907 Loss provisions 3,084 2,160 Total Insurance Provisions 10,365 6,067
Movements in provision for unearned premiums for the year ended 31 December 2021 and 2020 are as follows:
In millions of RR
2021 2020
Gross provision
Reinsurer’s share of
provision
Provision net of
reinsurance
Gross provision
Reinsurer’s share of
provision
Provision net of
reinsurance
Provision for unearned premiums as at 1 January 3,907 (11) 3,896 3,938 (11) 3,927
Change in provision, gross 3,374 - 3,374 (31) - (31)
Provision for unearned premiums as at 31 December 7,281 (11) 7,270 3,907 (11) 3,896
Movements in loss provisions for the year ended 31 December 2021 and 31 December 2020 are as follows:
In millions of RR Note
OCP and IBNR
URP Provision for claims
handling expenses
Total loss provisions
Loss provisions as at 31 December 2019 1,930 197 215 2,342
Losses incurred in the current reporting period 3,456 - - 3,456 Changes in OCP, IBNR and claims handling provisions related to prior periods (119) - 147 28 Insurance claims paid 24 (3,500) - - (3,500) Claims handling expenses accrued - - 528 528 Claims handling expenses paid 24 - - (497) (497) Unexpired risk provision reversal - (197) - (197)
Loss provisions as at 31 December 2020 1,767 - 393 2,160
Losses incurred in the current reporting period 4,475 - - 4,475 Changes in OCP, IBNR and claims handling provisions related to prior periods (190) - (47) (237) Insurance claims paid 24 (3,594) - - (3,594) Claims handling expenses accrued - - 728 728 Claims handling expenses paid 24 - - (448) (448)
Loss provisions as at 31 December 2021 2,458 - 626 3,084
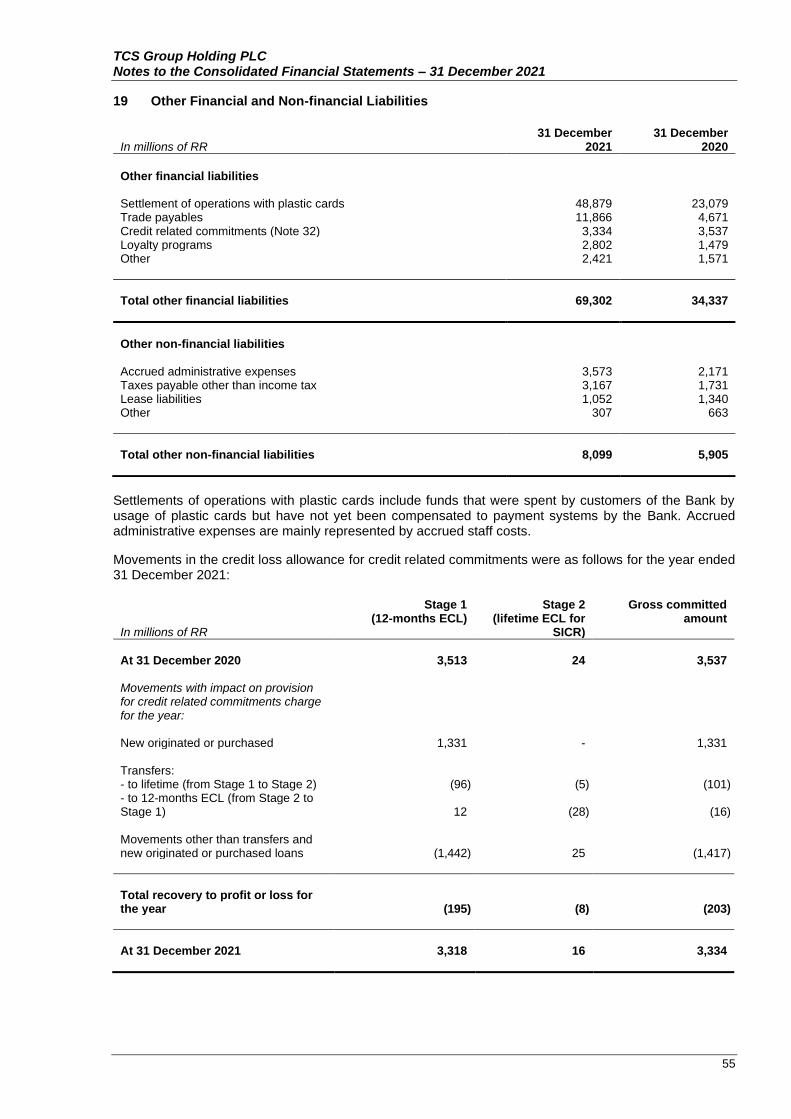
TCS Group Holding PLC Notes to the Consolidated Financial Statements – 31 December 2021
55
19 Other Financial and Non-financial Liabilities
In millions of RR 31 December
2021 31 December
2020
Other financial liabilities Settlement of operations with plastic cards 48,879 23,079 Trade payables 11,866 4,671 Credit related commitments (Note 32) 3,334 3,537 Loyalty programs 2,802 1,479 Other 2,421 1,571
Total other financial liabilities 69,302 34,337
Other non-financial liabilities Accrued administrative expenses 3,573 2,171 Taxes payable other than income tax 3,167 1,731 Lease liabilities 1,052 1,340 Other 307 663
Total other non-financial liabilities 8,099 5,905
Settlements of operations with plastic cards include funds that were spent by customers of the Bank by usage of plastic cards but have not yet been compensated to payment systems by the Bank. Accrued administrative expenses are mainly represented by accrued staff costs.
Movements in the credit loss allowance for credit related commitments were as follows for the year ended 31 December 2021:
In millions of RR
Stage 1 (12-months ECL)
Stage 2 (lifetime ECL for
SICR)
Gross committed amount
At 31 December 2020 3,513 24 3,537 Movements with impact on provision for credit related commitments charge for the year:
New originated or purchased 1,331 - 1,331 Transfers: - to lifetime (from Stage 1 to Stage 2) (96) (5) (101) - to 12-months ECL (from Stage 2 to Stage 1) 12 (28) (16) Movements other than transfers and new originated or purchased loans (1,442) 25 (1,417)
Total recovery to profit or loss for the year (195) (8) (203)
At 31 December 2021 3,318 16 3,334

TCS Group Holding PLC Notes to the Consolidated Financial Statements – 31 December 2021
56
19 Other Financial and Non-financial Liabilities (Continued)
Movements in the credit loss allowance for credit related commitments were as follows for the year ended 31 December 2020:
In millions of RR
Stage 1 (12-months
ECL)
Stage 2 (lifetime ECL
for SICR)
Gross committed
amount
At 31 December 2019 2,228 14 2,242 Movements with impact on provision for credit related commitments charge for the year: New originated or purchased 920 - 920 Transfers: - to lifetime (from Stage 1 to Stage 2) (95) 9 (86) - to 12-months ECL (from Stage 2 to Stage 1) 7 (15) (8) Changes to ECL measurement model assumptions and estimates (637) (1) (638) Movements other than transfers and new originated or purchased loans 1,090 17 1,107 Total charge to profit or loss for the year 1,285 10 1,295
At 31 December 2020 3,513 24 3,537
The main movements in the table presented above are described as follows:
• new originated or purchased category represents the day one 12-month ECL for the undrawn part of the purchased loans and loans to new borrowers (for this particular product) before the first payment became due;
• transfers between Stage 1 and Stage 2 due to undrawn limits experiencing significant increases (or decreases) of credit risk and the consequent “step up” (or “step down”) between 12-month and Lifetime ECL. Transfers present the amount of credit loss allowance for loan commitments charged or recovered at the moment of transfer of a loan commitment among the respective stages;
• movements other than transfers and new originated or purchased loans category represents all other movements of ECL for loan commitments in particular related to changes in gross carrying amounts of associated loans, ECL model assumptions and other.
There are no movements in Stage 3, as in case of becoming credit-impaired, undrawn limits will be blocked.
Interest rate, maturity and geographical risk concentration analysis of other financial liabilities is disclosed in Note 30. Refer to Note 37 for disclosure of fair value of other financial liabilities. Refer to Note 32 for analysis of loan commitments by credit risk grades.

TCS Group Holding PLC Notes to the Consolidated Financial Statements – 31 December 2021
57
20 Share Capital, Share Premium and Treasury Shares
In millions of RR except for the number of shares
Number of authorised
shares
Number of outstanding
shares
Ordinary shares
Share premium
Treasury shares
Total
At 1 January 2020 210,034,648 199,305,492 230 26,998 (3,164)
24,064
GDRs buy-back - - - - (661) (661) GDRs and shares transferred under MLTIP - - - - 587 587
At 31 December 2020 210,034,648 199,305,492 230 26,998 (3,238)
23,990
Increase of number of authorised shares 14,184,030 GDRs buy-back - - - - (1,877) (1,877) GDRs and shares transferred under MLTIP - - - - 2,548 2,548
At 31 December 2021 224,218,678 199,305,492 230 26,998 (2,567) 24,661
In November 2021 the Company’s shareholders approved a resolution to increase authorised share capital to USD 8,968,747.12 by the creation of 14,184,030 new shares of nominal value USD 0.04 each. As at 31 December 2021 the total number of authorised shares is 224,218,678 shares (31 December 2020: 210,034,648 shares) with a par value of USD 0.04 per share.
At 31 December 2021 the total number of outstanding shares is 199,305,492 shares (2020: 199,305,492 shares) with a par value of USD 0.04 per share (2020: USD 0.04 per share).
At 31 December 2021 and 31 December 2020 treasury shares represent GDRs of the Group repurchased from the market for the purposes permitted by Cyprus law including contribution to MLTIP. Refer to Note 39.
At 31 December 2021 the total number of treasury shares is 1,237,583 (2020: 3,013,379).
During the year ended 31 December 2021 the Group repurchased 425,017 GDRs at market price for RR 1,877 million (2020: 650,000 GDRs at market price for RR 661 million).
During the year ended 31 December 2021 the Group transferred 2,200,813 GDRs (2020: 1,809,681 GDRs), representing 1.10% (2020: 0.91%) of the issued shares, upon vesting under the MLTIP. This resulted in a transfer of RR 2,548 million (2020: RR 587 million) out of treasury shares to retained earnings.
Basic earnings per share are calculated by dividing the profit or loss attributable to owners of the Company by the weighted average number of ordinary shares in issue during the year, excluding treasury shares. For the purpose of calculating diluted earnings per share the Group considered the dilutive effect of share options granted under MLTIP.

TCS Group Holding PLC Notes to the Consolidated Financial Statements – 31 December 2021
58
20 Share Capital, Share Premium and Treasury Shares (Continued)
Earnings per share are calculated as follows:
In millions of RR except for the number of shares 2021 2020
Profit for the year attributable to ordinary shareholders of the Company 63,471 44,209
Weighted average number of ordinary shares in issue used for basic earnings per ordinary share calculation (thousands) 197,239 195,962 Weighted average number of ordinary shares in issue used for diluted earnings per ordinary share calculation (thousands) 201,569 197,604
Basic earnings per ordinary share (expressed in RR per share) 321.80 225.60 Diluted earnings per ordinary share (expressed in RR per share) 314.88 223.73
Information on dividends is disclosed in Note 28.
Reconciliation of the number of shares used for basic and diluted EPS:
In thousands Note 2021 2020
Weighted average number of ordinary shares in issue used for basic earnings per ordinary share calculation 197,239 195,962 Number of shares attributable for MLTIP 39 7,019 7,276 Number of shares that would have been issued at fair value (2,689) (5,634)
Weighted average number of ordinary shares in issue used for diluted earnings per ordinary share calculation 201,569 197,604

TCS Group Holding PLC Notes to the Consolidated Financial Statements – 31 December 2021
59
21 Net Margin
In millions of RR 2021 2020
Interest income calculated using the effective interest rate method
Loans and advances to customers, including: Credit card loans 98,585 89,253 Cash loans 17,550 11,439 Car loans 7,987 3,342 Secured loans 7,737 4,950 POS loans 7,666 4,806 Loans to IE and SME 2,631 529 Debt securities and repurchase receivables at FVOCI 12,710 10,510 Brokerage operations 8,059 2,629 Placements with other banks and non-bank credit organizations with original maturities of less than three months 695 626 Total interest income calculated using the effective interest rate method 163,620 128,084 Other similar income Financial assets at FVTPL 192 83 Total interest income 163,812 128,167
Interest expense calculated using the effective interest rate method
Customer accounts, including: Individuals - Current/demand accounts 16,392 9,590 - Term deposits 5,217 6,499 IE and SME 1,317 1,022 Other legal entities 51 24 Subordinated debt 2,692 1,948 RR denominated bonds 1,879 2,027 Due to banks 671 439 Other borrowed funds 211 - Euro-Commercial Paper - 32 Total interest expense calculated using the effective interest rate method 28,430 21,581 Other similar expense
Lease liabilities 80 139 Total interest expense 28,510 21,720 Expenses on deposit insurance programme 2,744 1,745 Net margin 132,558 104,702

TCS Group Holding PLC Notes to the Consolidated Financial Statements – 31 December 2021
60
22 Fee and Commission Income and Expense
In millions of RR 2021 2020
Fee and commission income
Acquiring commission 25,099 11,049 Brokerage fee 11,369 4,998
SME services commission 10,546 7,437 Fee for money transfers 7,123 3,944 Foreign currency exchange transactions fee 6,717 3,943 Interchange fee 6,052 3,963 Fee for selling credit protection 5,639 4,657
SMS fee 5,157 3,945 Income from MVNO services 2,898 1,815
Subscription fee 1,982 - Cash withdrawal fee 1,155 746
Marketing services fee 604 394 Replenishment fee 254 141 Other fees receivable 1,474 577
Total fee and commission income 86,069 47,609
Acquiring commission represents commission for processing card payments from online and offline points of sale. Brokerage fee includes trading fee and brokerage account service fee. SME services commission represents commission for services to individual entrepreneurs and small to medium businesses. Fee for selling credit protection represents fee which the Bank receives for selling voluntary credit insurance to borrowers of the Group. Income from MVNO services represents income from providing mobile services such as full coverage across Russia and international roaming, offering a number of value-added options such as virtual numbers, music and video streaming services, etc. Subscription fee is a payment from a client who has subscribed to receive a discount on card service, more cashback, more income from savings and account balance, special loyalty programs from partners.
The Group has refined the presentation of the Group's revenue structure by reclassifying the sum of provider’s fee from other fees receivable to fee for money transfers. The comparative information was amended accordingly:
In millions of RR As originally
presented Reclassification As reclassified
Fee for money transfers 3,117 827 3,944 Other fees receivable 1,404 (827) 577

TCS Group Holding PLC Notes to the Consolidated Financial Statements – 31 December 2021
61
22 Fee and Commission Income and Expense (Continued)
In millions of RR 2021 2020
Fee and commission expense Payment systems 28,028 14,684 Banking and other fees 3,863 2,361 Service fees 3,437 2,654 Costs of MVNO services 1,922 1,225 Payment channels 1,529 1,291
Total fee and commission expense 38,779 22,215
Payment systems fees represent fees for MasterCard, Visa and other payment systems’ services. Service fees represent fees for statement printing, mailing service, SMS services and others. Payment channels represent fees paid to third parties through whom borrowers make loan repayments. Costs of MVNO services represent expenses for the traffic, telecommunications service and roaming.
Refer to Note 41 that describes the types of revenues recognized on a point in time basis and on the over time basis.
23 Customer Acquisition Expense
In millions of RR 2021 2020
Marketing and advertising 26,286 12,091 Staff costs 10,695 6,689 Cards issuing expenses 2,140 1,064 Partnership expenses 1,818 1,145 Credit bureaux 1,641 1,038 Telecommunication expenses 478 284 Other acquisition 384 277
Total customer acquisition expenses 43,442 22,588
Customer acquisition expenses represent expenses paid by the Group on services related to origination of customers which are not directly attributable to the recognised assets and are not incremental. The Group uses a variety of different channels for the acquisition of new customers.
Staff costs represent salary expenses and related costs of employees directly involved in customer acquisition. Included in staff costs are statutory social contributions to the state non-budgetary funds in the amount of RR 2,124 million for the year ended 31 December 2021 (2020: RR 1,265 million).

TCS Group Holding PLC Notes to the Consolidated Financial Statements – 31 December 2021
62
24 Insurance Premiums Earned and Claims Incurred
In millions of RR 2021 2020
Insurance premiums earned Insurance premiums on insurance, co-insurance and reinsurance operations 26,437 18,536 Change in provision for unearned premiums (3,374) 31
Total Insurance premiums earned 23,063 18,567
Insurance claims incurred Insurance claims on insurance, co-insurance and reinsurance operations (3,594) (3,500) Changes in loss provisions (924) 182 Claims handling expenses (448) (497) Reinsurers' share 2 1
Total Insurance claims incurred (4,964) (3,814)
The Insurance company provides the following types of insurance:
Personal accident insurance and collective insurance against accidents, illnesses or loss of work provides compensation and financial protection in the event of injuries, disability, death or loss of loss of work of the borrower. It is different from life insurance and medical and health insurance. In accordance with the terms of individual insurance contracts, the policyholder and beneficiary is an individual who has entered into an insurance contract. In accordance with the terms of the collective insurance contract, the insurer is the Bank that has concluded the collective insurance contract with the Insurance Company, the beneficiary is the insured individual.
Motor vehicle insurance and property insurance provides compensation for damage to a client’s vehicle or other property.
Compulsory third party liability insurance (CTP) contracts provide the insured with financial protection from the risk of civil liability of vehicle owners, which may occur as a result of harm to life, health or property of others when using vehicles.
Voluntary third party (VTP) risk insurance contracts provide the insured with financial protection in case of insufficiency of insurance payment for compulsory third party liability insurance of motor vehicle owners (CTP) to compensate for harm caused to life, health and / or property.
Travel insurance provides compensation in case of medical or other unforeseen expenses of the client while being away from their place of permanent residence.
Staff and administrative expenses for insurance operations are included in Note 25.

TCS Group Holding PLC Notes to the Consolidated Financial Statements – 31 December 2021
63
25 Administrative and Other Operating Expenses
In millions of RR Note 2021 2020
Staff costs 45,304 24,365 Amortization of intangible assets 11 3,601 1,961 IT and software support 2,319 1,449 Depreciation of fixed assets 11 2,180 1,617 Professional services 1,524 643 Short-term and low-value lease 1,126 788 Office maintenance and office supplies 610 454 Depreciation of right-of-use assets 11 609 702 Communication services 471 505 Collection expenses 454 303 Security expenses 224 198 Other administrative expenses 1,038 814 Other provisions (recovery)/ charge and impairment (reversal)/ loss (11) 1,206
Total administrative and other operating expenses 59,449 35,005
The total fees charged by the Company's statutory auditor for the statutory audit of the annual consolidated and separate financial statements of the Company for the year ended 31 December 2021 amounted to RR 7.5 million (2020: RR 6.9 mln). The total fees charged by the Company's statutory auditor for the year ended 31 December 2020 for other assurance services amounted to RR 3.4 million (2020: RR 0.8 million), for tax advisory services amounted to RR 1.5 million (2020: RR 3.4 million) and for other non-assurance services amounted to RR 0.1 million (2020: RR 0.1 million).
Included in staff costs are statutory social contributions to the non-budget funds and share-based remuneration:
In millions of RR 2021 2020
Statutory social contribution to the non-budget funds 7,505 4,223 Total 7,505 4,223 Share-based remuneration - Management long-term incentive program 5,740 1,092 - Key employees retention plan 248 372 - Warrant compensation 25 - Total 6,013 1,464
The average number of employees employed by the Group during the reporting year, including those who are working under civil contracts, was 43,787 (2020: 25,970).
26 Other Operating Income
In millions of RR 2021 2020
Subrogation fee 318 250 Reimbursement fee 49 190 Other 556 1,005
Total other operating income 923 1,445

TCS Group Holding PLC Notes to the Consolidated Financial Statements – 31 December 2021
64
27 Income Taxes
Income tax expense comprises the following:
In millions of RR 2021 2020
Current tax 11,437 10,612 Deferred tax 6,233 1,424
Total income tax expense 17,670 12,036
The income tax rate applicable to the majority of the Group’s income is 20% (2020: 20%). The operations of the Group are subject to multiple tax jurisdictions. The income tax rate applicable to the Russian subsidiaries of the Company is 20%. The income tax rate applicable to the Company registered in Cyprus is 12.5% (2020: 12.5%).
A reconciliation between the expected and the actual taxation charge is provided below.
In millions of RR 2021 2020
Profit before tax 81,038 56,249
Theoretical tax expense at statutory rate of 20% (2020: 20%) 16,208 11,250 Tax effect of items, which are not deductible or assessable for taxation purposes:
- Non-deductible expenses 2,481 418 - Other expenses including dividend tax (11) 709 - Unrecognised tax losses 62 109 - Non-taxable income (461) -
Effects of different tax rates: - Income on government and corporate securities taxed at different rates (606) (448) - Results of companies of the Group taxed at different statutory rates (3) (2)
Income tax expenses for the year 17,670 12,036
Differences between IFRS and taxation regulations in Russia and other countries give rise to temporary differences between the carrying amount of assets and liabilities for financial reporting purposes and their tax bases. As all of the Group’s temporary differences arise in Russia, the tax effect of the movements in these temporary differences is detailed below and is recorded at the rate of 20% (2020: 20%).
In the context of the Group’s current structure and Russian tax legislation, tax losses and current tax assets of different group companies may not be offset against current tax liabilities and taxable profits of other group companies and, accordingly, taxes may accrue even where there is a consolidated tax loss.

TCS Group Holding PLC Notes to the Consolidated Financial Statements – 31 December 2021
65
27 Income Taxes (Continued)
Therefore, deferred tax assets and liabilities are offset only when they relate to the same taxable entity and the same taxation authority.
The deferred tax assets effect of the movements in temporary differences for the year ended 31 December 2021 is detailed below:
In millions of RR
31 December 2020
(Charged)/ credited to
profit or loss
31 December 2021
Tax effect of deductible and taxable temporary differences Loans and advances to customers 3,673 (3,673) - Tangible fixed assets (506) 506 - Right-of-use assets (186) 186 - Intangible assets (200) 200 - Revaluation of debt investments at FVOCI (1,450) 1,450 - Revaluation of debt investments at FVTPL (34) 34 - Accrued expenses and other temporary differences 521 (521) - Lease liabilities 231 (231) - Customer accounts (53) 53 - Debt securities in issue (58) 58 - Financial derivatives (991) 991 -
Deferred tax assets 947 (947) -
The deferred tax liabilities effect of the movements in temporary differences for the year ended 31 December 2021 is detailed below:
In millions of RR
31 December
2020
(Charged)/ credited to
profit or loss
Credited to OCI
31 December
2021
Tax effect of deductible and taxable temporary differences Loans and advances to customers (123) (62) - (185)
Tangible fixed assets - (764) - (764)
Right-of-use assets - (153) - (153)
Intangible assets (45) (344) - (389)
Revaluation of debt investments at FVOCI (23) (1,878) 3,759 1,858
Revaluation of debt investments at FVTPL - (1,093) - (1,093) Accrued expenses and other temporary differences (144) 106 - (38)
Lease liabilities - 206 - 206 Customer accounts - (73) - (73)
Debt securities in issue - 3 - 3
Financial derivatives - (1,183) - (1,183)
Insurance provisions 2 (51) - (49)
Deferred tax liabilities (333) (5,286) 3,759 (1,860)

TCS Group Holding PLC Notes to the Consolidated Financial Statements – 31 December 2021
66
27 Income Taxes (Continued)
The deferred tax assets effect of the movements in temporary differences for the year ended 31 December 2020 is detailed below:
In millions of RR
31 December
2019
(Charged)/ credited to
profit or loss
Credited to OCI
31 December 2020
Tax effect of deductible and taxable temporary differences Loans and advances to customers 3,576 97 - 3,673 Tangible fixed assets (588) 82 - (506) Right-of-use assets (322) 136 - (186) Intangible assets (195) (5) - (200) Revaluation of debt investments at FVOCI (1,019) (1,094) 663 (1,450) Revaluation of debt investments at FVTPL - (34) - (34) Accrued expenses and other temporary differences (208) 729 - 521 Lease liabilities 339 (108) - 231 Customer accounts (44) (9) - (53) Debt securities in issue (62) 4 - (58) Financial derivatives 40 (1,031) - (991)
Deferred tax assets 1,517 (1,233) 663 947
The deferred tax liabilities effect of the movements in temporary differences for the year ended 31 December 2020 is detailed below:
In millions of RR
31 December 2019
(Charged)/ credited to
profit or loss
31 December 2020
Tax effect of deductible and taxable temporary differences Loans and advances to customers (61) (62) (123) Tangible fixed assets (16) 16 - Intangible assets (76) 31 (45) Revaluation of debt investments at FVOCI - (23) (23) Accrued expenses and other temporary differences 21 (165) (144) Insurance provisions (10) 12 2
Deferred tax liabilities (142) (191) (333)

TCS Group Holding PLC Notes to the Consolidated Financial Statements – 31 December 2021
67
28 Dividends
The movements in dividends during the year ended 31 December 2021 and 2020 are as follows:
In millions of RR 2021 2020
Dividends payable at 1 January 656 582 Dividends declared 3,559 11,563 Dividends paid (3,628) (11,853) Foreign exchange differences and other movements (283) 364
Dividends payable at 31 December 304 656
Dividends per share declared (in USD) 0.24 0.80
On 11 March 2021 the Group announced suspension of dividend payments for the remainder of 2021 to keep the funds inside the Group to provide for organic and/or inorganic growth opportunities.
Dividends declared in the tables above represent dividends declared by the Board of directors are reduced by RR 74 million for the year ended 31 December 2020 due to dividends on GDRs acquired by the Company from the market not for the immediate purposes of the existing MLTIP.
On 10 March 2021 the Board of directors declared an interim dividend of USD 0.24 (RR 17.82) per share/per GDR with a total amount allocated for dividend payment of around USD 47.8 million (RR 3,552 million).
On 11 November 2020 the Board of directors declared an interim dividend in line with the current dividend policy of USD 0.25 (RR 19.10) per share/per GDR with a total amount allocated for dividend payment of around USD 49.8 million (RR 3,807 million). Declared dividends were paid in USD on 30 November 2020.
On 5 August 2020 the Board of directors declared an interim dividend in line with the current dividend policy of USD 0.20 (RR 14.68) per share/per GDR with a total amount allocated for dividend payment of around USD 39.9 million (RR 2,925 million). Declared dividends were paid in USD on 24 August 2020.
On 11 May 2020 the Board of directors declared an interim dividend in line with the current dividend policy of USD 0.14 (RR 10.34) per share/per GDR with a total amount allocated for dividend payment of around USD 28 million (RR 2,061 million). Declared dividends were paid in USD on 1 and 2 June 2020.
On 10 March 2020 the Board of directors declared an interim dividend of USD 0.21 (RR 14.18) per share/per GDR with a total amount allocated for dividend payment of around USD 41.9 million (RR 2,826 million). Declared dividends were paid in USD on 30 March and 1 April 2020.
Dividends were declared and paid in USD throughout the years ended 31 December 2021 and 2020. Dividends payable at 31 December 2021 related to treasury shares acquired under MLTIP amounting to RR 304 million are included in other non-financial liabilities (2020: RR 656 million).

TCS Group Holding PLC Notes to the Consolidated Financial Statements – 31 December 2021
68
29 Reconciliation of Liabilities Arising from Financing Activities
The table below sets out an analysis of the Group’s debt and the movements in the Group’s debt for each of the periods presented. The debt items are those that are reported as financing in the consolidated statement of cash flows.
In millions of RR
Debt securities in
issue
Perpetual subordinated
debts
Lease liabilities
Total
At 31 December 2019 26,078 18,487 1,694 46,259 Cash flows from repayments (2,894) (1,937) (758) (5,589) Cash flows from proceeds 331 710 - 1,041 Foreign exchange adjustments 459 3,609 - 4,068 Other non-cash movements (64) (114) 404 226
At 31 December 2020 23,910 20,755 1,340 46,005
Cash flows from repayments (2,247) (7,745) (820) (10,812) Cash flows from proceeds - 45,362 - 45,362 Foreign exchange adjustments - 999 - 999 Other non-cash movements 17 286 532 835
At 31 December 2021 21,680 59,657 1,052 82,389
30 Financial and Insurance Risk Management
The risk management function within the Group is carried out with respect to financial risks, operational risks and legal risks by the management of the Bank and Insurance Company. Financial risk comprises market risk (including currency risk, interest rate risk and other price risk), credit risk and liquidity risk. The primary function of financial risk management is to establish risk limits and to ensure that any exposure to risk stays within these limits. The operational and legal risk management functions are intended to ensure the proper functioning of internal policies and procedures in order to minimize operational and legal risks.
Credit risk. The Group exposes itself to credit risk, which is the risk that one party to a financial instrument will cause a financial loss for the other party by failing to meet an obligation. Exposure to credit risk arises as a result of the Group’s lending and other transactions with counterparties giving rise to financial assets. The Group grants retail loans and SME loans to customers across all regions of Russia, therefore its credit risk is broadly diversified.
The management of the Group takes special measures to mitigate growing credit risk such as decreasing of credit limits for unreliable clients, diversifying of modes of work with overdue borrowers, toughening of scoring for the new borrowers etc., giving rise to financial assets and off-balance sheet credit-related commitments.
The Group’s maximum exposure to credit risk is reflected in the carrying amounts of financial assets in the consolidated statement of financial position. For financial guarantees issued, commitments to extend credit, undrawn credit lines, the maximum exposure to credit risk is the amount of the commitment (Note 32).
The Bank created a credit committee, which establishes general principles for lending to individual borrowers. According to these principles, the minimum requirements for potential customers are listed below:
• Citizenship of the Russian Federation;
• Age from 18 to 70 y.o., but not older than 70 y.o. at the time of loan repayment;
• Availability of a cell-phone;

TCS Group Holding PLC Notes to the Consolidated Financial Statements – 31 December 2021
69
30 Financial and Insurance Risk Management (Continued)
• Permanent employment;
• Permanent income.
Сredit cards are issued with a limit of up to RR 700 thousand, with monthly debt repayment.
For cash loans, minimum requirements are listed below:
• The requested loan term is from 3 to 36 months;
• Cash loan volumes range between RR 50 thousand and RR 2,000 thousand.
For POS loans minimum requirements are listed below:
• The requested loan amount should exceed RR 3 thousand;
• The requested loan term is from 3 to 36 months;
• The amount of one POS loan does not exceed RR 500 thousand.
For secured loans minimum requirements are listed below:
• The requested loan secured with a car amount should be between RR 100 thousand and RR 3,000 thousand, loan term is from 3 months to 5 years. The requirement for the car is in good condition of driving with an age not more than 15 years, availability of a vehicle registration certificate and vehicle passport;
• The requested loan secured with a real estate amount should be between RR 200 thousand and RR 15,000 thousand, loan term is from 3 months to 15 years. The requirement for the real estate is an apartment in the apartment building within the Russian Federation, which is free from any encumbrances.
For car loans minimum requirements are listed below:
• The requested loan term is from 1 to 5 years;
• Car loan volumes up to RR 3,000 thousand;
• The requirement for the car is with an age not more than 18 years and availability of vehicle passport.
For loans to SME minimum requirements are listed below:
• Working capital loan: loan volumes up to RR 10,000 thousand and loan term to 6 months;
• Credit for individual entrepreneurs for any purpose: loan volumes up to RR 2,000 thousand and loan term to 36 months;
• Investment credit line secured by real estate: loan volumes up to RR 15 million and loan term to 5 years. The requirement for the real estate is an apartment in the apartment building within the Russian Federation, which is free from any encumbrances;
• For SME with a turnover from RR 120 million per year: loan volumes up to RR 60 million and loan term to 5 years.
A credit decision process includes:
• Validation of the application data. The system checks the validity of the data provided (addresses, telephone numbers, age, if the applicant already uses any other products of the Bank);
• Phone verification of the application information about the potential customer, his/her employment, social and property status, etc. This step may be omitted for POS loans;
• Requesting of the previous credit history of the applicant from the three largest credit bureaus in Russia – Equifax, UCB (United Credit Bureau) and NBCH (National Bureau of Credit Histories);
• Based on all available information, the credit score of the applicant is calculated and a final decision is made about the approval of the credit product;

TCS Group Holding PLC Notes to the Consolidated Financial Statements – 31 December 2021
70
30 Financial and Insurance Risk Management (Continued)
• The approved loan amount, loan term and tariff plan are calculated depending on the score and declared income.
Management of the Group manages the credit risk on unused limits on credit cards in the following way:
a) if the credit card loan is overdue for more than 7 days, its account will be blocked till repayment;
b) if the borrower had lost his/her source of income, then borrower account might be blocked till verification of his/her new employment;
c) if borrower’s loan debt burden in other banks is substantially bigger than at the time of loan origination or the credit quality of the borrower decreases significantly then the borrower’s limit for credit might be reduced accordingly.
When a customer experiences serious difficulties with his/her current debt servicing, he/she may be offered loan restructuring. In this case the Bank stops accrual of interest, commissions and fines and the debt amount is restructured according to a fixed instalment payment plan with not more than 36 equal monthly payments. Another way of working with overdue loans is initiation of the state court process. This collection option statistically gives greater recovery than the sale of credit-impaired loans. Defaulted clients that could be subject to the court process are chosen by the Bank’s Collection Department considering the following criteria:
a) the client’s account balance was fixed, accrual of interest stopped;
b) information about the client is considered to be up to date;
c) the client denied restructuring program;
d) term of limitation of court actions has not expired;
e) court process is economically justified.
When loans become unrecoverable or not economically viable to pursue further collection efforts, the Collection Department may decide to sell these loans to a debt collection agency. The Collection Department considers the following criteria for credit-impaired loans qualifying for sale to external debt collection agencies:
a) loans remain unpaid after all collection procedures were performed (no payment during last 4-6 months);
b) the debtor cannot be either reached or found for the previous 4 months;
c) the debtor has no assets and there is no expectation he/she will have any in the future;
d) the debtor has died and there is no known estate or guarantor;
e) it is determined that it is not cost effective to continue collection efforts.

TCS Group Holding PLC Notes to the Consolidated Financial Statements – 31 December 2021
71
30 Financial and Insurance Risk Management (Continued)
Credit risk grading system. For measuring credit risk and grading financial instruments except for loans and advances to customers by the level of credit risk, the Group applies risk grades estimated by external international rating agencies in case these financial instruments have risk grades estimated by external international rating agencies (using Fitch ratings and in case of their absence - Moody’s or Standard & Poor’s ratings adjusting them to Fitch’s categories using a reconciliation table):
Master scale credit risk grade Corresponding ratings of external international rating
agency (Fitch)
Excellent AAA, AA+ to AA-, A+ to A- Good BBB+ to BBB-, BB+ Monitor BB to B+ Sub-standard B, B- Doubtful CCC+ to CC- Default C, D
Each master scale credit risk grade is assigned a specific degree of creditworthiness:
• Excellent – high credit quality with lowest or very low expected credit risk;
• Good - good credit quality with currently low expected credit risk;
• Monitor – adequate credit quality with a moderate credit risk;
• Sub-standard – moderate credit quality with a satisfactory credit risk;
• Doubtful – facilities that require closer monitoring and remedial management; and
• Default – facilities in which a default has occurred.
For measuring credit risk and grading loans and advances to customers, credit related commitments and those financial instruments which do not have risk grades estimated by external international rating agencies, the Group applies risk grades and the corresponding range of probabilities of default (PD):
Master scale credit risk grade Corresponding interval
Excellent For credit cards: non-overdue with PD < 5%;
for other types of loans: non-overdue for the last 12 months with PD < 5% or with early repayments
Good all other non-overdue loans Monitor 1-30 days overdue for all types of loans or without first due date for credit card
loans Sub-standard 31-90 days overdue or restructured loans 0-90 days overdue NPL 90+ days overdue
The condition of early repayments is satisfied, as described in the table above, if cumulative amount of early repayments exceed 5% of the gross carrying amount at the date of recognition of the loan
Each master scale credit risk grade is assigned a specific degree of creditworthiness:
• Excellent – strong credit quality with minimum expected credit risk;
• Good – adequate credit quality with low expected credit risk;
• Monitor – adequate credit quality with a moderate credit risk and credit cards loans before the first due date;
• Sub-standard – low credit quality with a substantial credit risk, includes restructured loans that are less than 90 days overdue;
• NPL – non-performing loans, credit-impaired loans more than 90 days overdue.

TCS Group Holding PLC Notes to the Consolidated Financial Statements – 31 December 2021
72
30 Financial and Insurance Risk Management (Continued)
The rating models are regularly reviewed by the Credit Risk Department, backtested on actual default data and updated if necessary. Despite the method used, the Group regularly validates the accuracy of ratings estimates and appraises the predictive power of the models.
Expected credit loss (ECL) measurement – definitions and description of estimation techniques. ECL is a probability-weighted estimate of the present value of future cash shortfalls (i.e., the weighted average of credit losses, with the respective risks of default occurring in a given time period used as weights). ECL measurement is based on the following components used by the Group:
Default occurs when a financial asset is 90 days past due or less than 90 days overdue but with the final statement issued, i.e. the limit is closed, the balance is fixed, interest and commissions are no longer accrued.
Probability of Default (PD) – an estimate of the likelihood of default to occur over a given time period.
Exposure at Default (EAD) – an estimate of exposure at a future default date, taking into account expected changes in exposure after the reporting date, including repayments of principal and interest, and expected drawdowns on committed facilities.
Loss Given Default (LGD) – an estimate of the loss arising on default as a percentage of the EAD. It is based on the difference between the contractual cash flows due and those that the Group would expect to receive.
Discount Rate – a rate to discount an expected loss to its present value at the reporting date. The discount rate represents the effective interest rate (EIR) for the financial instrument or an approximation thereof.
Lifetime period – the maximum period over which ECL should be measured. For POS loans lifetime period is equal to 24 months, cash loans to 36 months, secured loans to 72 months, car loans to 48 months. For revolving facilities, it is based on statistics of the average period between the moment of the loan falling into the Stage 2 until the write-off or attrition. Currently the Group estimates that this period equals to 4 years, though it is subject to periodical reassessment.
Lifetime ECL – losses that result from all possible default events over the remaining lifetime period of the financial instrument.
12-month ECL – the portion of lifetime ECLs that represent the ECLs resulting from default events on a financial instrument that are possible within 12 months after the reporting date that are limited by the remaining contractual life of the financial instrument.
Forward looking information – the information that includes the key macroeconomic variables impacting credit risk and expected credit losses for each portfolio segment. A pervasive concept in measuring ECL in accordance with IFRS 9 is that it should consider forward-looking information.
Credit Conversion Factor (CCF) – a coefficient that shows that the probability of conversion of an off-balance sheet amount to exposure on the consolidated statement of financial position within a defined period. It can be calculated for a 12-month or lifetime period. Based on the analysis performed, the Group considers that 12-month and lifetime CCFs are the same.
Purchased or originated credit-impaired (POCI) financial assets - financial assets that are credit-impaired upon initial recognition.
Default and credit-impaired assets – assets for which a default event has occurred.
The default definition stated above should be applied to all types of financial assets of the Group.
An instrument is considered to no longer be in default (i.e. to have “cured”) when it no longer meets any of the default criteria.
Significant increase in credit risk (SICR) - the SICR assessment is performed on an individual basis for all financial assets by monitoring the triggers stated below. The criteria used to identify SICR are monitored and reviewed periodically for appropriateness by the Group’s Risk Management Department.

TCS Group Holding PLC Notes to the Consolidated Financial Statements – 31 December 2021
73
30 Financial and Insurance Risk Management (Continued)
The Group considers a financial instrument to have experienced a SICR when one or more of the following quantitative, qualitative or backstop criteria have been met.
For interbank operations, bonds issued by banks and bonds issued by corporates and sovereigns:
• 30 days past due;
• award of risk grade “Doubtful”;
• decrease of assigned external rating by 2 notches, which corresponds to an approximate increase of PD by 2.5 times.
For credit card loans:
• 30 days past due; or
• threshold defined on an individual basis using existing scoring models: increase of the 12-month PD compared to 12-month PD estimated 18 months ago or as of the date of initial recognition (if it occurred less than 18 months ago) by 3 times and PD reaching 50% and above. 18-month period was determined as the weighted average period of the most recent date where the credit limit was revised by at least 25%, which is considered to be a substantial revision.
For all other loans:
• 30 days past due; or
• if number of overdue payments for the last 6 due dates exceeds 2, or if PD exceeds 50%.
If the SICR criteria are no longer met, the instrument will be transferred back to Stage 1.
General principle of techniques applied
For non-POCI financial assets, ECLs are generally measured based on the risk of default over one of two different time periods, depending on whether or not the credit risk of the borrower has increased significantly since initial recognition.
This approach can be summarized in a three-stage model for ECL measurement:
• Stage 1 – a financial instrument that is not credit-impaired on initial recognition and its credit risk has not increased significantly since initial recognition, the loss allowance is based on 12-month ECLs;
• Stage 2 – if since the date, which was assumed to be the date of initial recognition is identified a SICR, the financial instrument is moved to Stage 2 but is not yet deemed to be credit-impaired, the loss allowance is based on lifetime ECLs;
• Stage 3 – if the financial instrument is credit-impaired or restructured, the financial instrument is then moved to Stage 3 and the loss allowance is based on lifetime ECLs.
ECL for POCI financial assets is always measured on a lifetime basis (Stage 3), so at the reporting date, the Group only recognises the cumulative changes in lifetime expected credit losses.
The Group carries out two separate approaches for ECL measurement:
• for loans and advances to customers: assessment on a portfolio basis: internal ratings are estimated on an individual basis but the same credit risk parameters (e.g. PD, LGD) are applied during the process of ECL calculations for the same credit risk ratings and homogeneous segments of the loan portfolio;
• for all other financial assets except FVTPL: assessment based on external ratings.
The Group performs an assessment on a portfolio basis for the retail loans. This approach incorporates aggregating the portfolio into homogeneous segments based on borrower-specific information, such as delinquency, the historical data on losses and other.

TCS Group Holding PLC Notes to the Consolidated Financial Statements – 31 December 2021
74
30 Financial and Insurance Risk Management (Continued)
Principles of assessment on portfolio basis – to assess the staging of exposure and to measure a loss allowance on a collective basis, the Group combines its exposures into segments on the basis of shared credit risk characteristics, such as that exposures to risk within a group are homogeneous.
Examples of shared characteristics include type of customer, product type, credit risk rating, date of initial recognition, overdue level and repayment statistics.
The different segments reflect differences in PD. The appropriateness of groupings is monitored and reviewed on a periodic basis by the Risk Management Department.
In general, ECL is the multiplication of the following credit risk parameters: EAD, PD and LGD (definitions of the parameters are provided above). The general approach used for ECL calculation is stated below.
where:
𝑃𝐷𝑡𝑖 – probability of default in moment 𝑡𝑖 (can’t be higher than 100%);
𝐸𝐴𝐷𝑡𝑖- exposure at default in moment 𝑡𝑖;
𝐿𝐺𝐷𝑡𝑖- loss given default in moment 𝑡𝑖;
𝑡𝑖 – number of months in the loan’s lifetime;
𝐸𝐼𝑅 – effective interest rate;
𝑁 – remaining amount of payments.
The ECL is determined by predicting credit risk parameters (EAD, PD and LGD) for each future month during the lifetime period for each exposure or segment. These three components are multiplied together. This effectively calculates an ECL for each future month, which is then discounted back to the reporting date and summed up. The discount rate used in the ECL calculation is the effective interest rate or an approximation thereof.
The EADs are determined based on the expected payment profile, on an individual basis. For revolving products, the EAD is predicted by taking the current withdrawn balance and adding a “credit conversion factor” that accounts for the expected drawdown of the remaining limit of utilised loans by the time of default. These assumptions vary by product type, current limit utilisation and other borrower-specific behavioural characteristics. For other products EAD is equal to current exposure as there is no credit limit to utilize.
Two types of PDs are used for calculating ECLs: 12-month and lifetime PD:
• 12-month PDs – the estimated probability of a default occurring within the next 12 months. This parameter is used to calculate 12-month ECLs. An assessment of a 12-month PD is based on the latest available historic default data using borrower-specific behavioural characteristics and adjusted for forward-looking information when appropriate. Based on borrower-specific PDs the exposures are allocated to segments to which average PD for the segment is applied.
• Lifetime PDs – the estimated probability of a default occurring over the remaining life of the financial instrument. This parameter is used to calculate lifetime ECLs for Stage 2 and Stage 3 exposures. An assessment of a lifetime PD is based on the latest available historic default data using product specific lifetime periods defined above. To calculate Lifetime PD, the Group developed lifetime PD curves based on the 12-month PD data.

TCS Group Holding PLC Notes to the Consolidated Financial Statements – 31 December 2021
75
30 Financial and Insurance Risk Management (Continued)
LGD represents the Group's expectation of the extent of loss on a defaulted exposure. For credit card loans, cash loans and POS loans LGDs are calculated on portfolio basis based on recovery statistics of defaulted loans over the period of 24 or 36 months. For secured loans, car loans and loans to SME LGDs are calculated using current market data in relation to the expected recoveries.
ECL measurement for loan commitments. The ECL measurement for these instruments includes the same steps as described above for on-balance sheet exposures and differs with respect to EAD calculation. The EAD is a product of credit conversion factor (“CCF”) and amount of the commitment. CCF for undrawn credit limits of credit cards and overdrafts is defined based on statistical analysis of exposures at default.
Principles of assessment based on external ratings – the principles of ECL calculations based on external ratings are the same as for their assessment on a portfolio basis. Credit risk parameters (PD and LGD) are taken from the default and recovery statistics published by international rating agencies (Fitch and in case of their absence - Moody’s or Standard & Poor’s).
Forward-looking information incorporated in the ECL models. The calculation of ECLs incorporates forward-looking information. The Group has performed historical analysis and identified the key economic variables impacting credit risk and ECLs for each portfolio. The list of variables:
• Russian stock market index MOEX;
• Moscow Prime Offered Rate;
• Debt load of Russian population based on statistics from bureaus of credit history.
The impact of these economic variables on the ECL has been determined by performing statistical regression analysis in order to understand the way how changes in these variables historically impacted default rates. Three different scenarios are used: base, optimistic and pessimistic. The scenarios are weighted accordingly with base scenario having the 92.7% (2020: 71.1%) weight, optimistic scenario having the 0.1% (2020: 0.1%) weight and pessimistic scenario having the 7.2% (2020: 28.8%) weight. Scenarios are reviewed monthly.
An increase in pessimistic scenario by 10% to the detriment of the base one would result in increase in credit loss allowances of RR 338 million. An increase in optimistic scenario by 10% to the detriment of the base one would result in decrease in credit loss allowances of RR 57 million.
Backtesting – the Group regularly reviews its methodology and assumptions to reduce any difference between the estimates and the actual loss of credit. Such backtesting is performed on a quarterly basis.
The results of backtesting the ECL measurement methodology are communicated to Group Management and further steps for refining models and assumptions are defined after discussions between authorised persons.
Market risk. The Group takes on exposure to market risks. Market risks of the Group arise from open positions in (a) currency and (b) interest rate, both of which are exposed to general and specific market movements. The priority goal of market risk management is to maintain the risks assumed by the Group at a level determined by the Group in accordance with its own strategic objectives. Management sets limits on the value of risk that may be accepted, which is monitored on a daily basis. However, the use of this approach does not prevent losses outside of these limits in the event of more significant market movements.
Currency risk. In respect of currency risk, the management sets limits on the level of exposure by currency and in total for both overnight and intra-day positions, which are monitored daily.

TCS Group Holding PLC Notes to the Consolidated Financial Statements – 31 December 2021
76
30 Financial and Insurance Risk Management (Continued)
The table below summarizes the Group’s exposure to foreign currency exchange rate risk at the end of the year:
At 31 December 2021 At 31 December 2020
In millions of RR
Non-derivative monetary financial
assets
Non-derivative monetary financial liabilities
Derivatives Net position
Non-derivative monetary financial
assets
Non-derivative monetary financial liabilities
Derivatives Net position
RR 1,002,784 (835,131) (23,351) 144,302 674,171 (545,395) (24,276) 104,500 USD 206,008 (228,623) 29,227 6,612 116,693 (140,851) 29,207 5,049 Euro 55,093 (53,866) (3) 1,224 35,019 (31,909) (5) 3,105 GBP 2,368 (2,360) - 8 1,405 (1,414) - (9) Others 4,077 (4,219) - (142) 1,942 (2,455) - (513)
Total 1,270,330 (1,124,199) 5,873 152,004 829,230 (722,024) 4,926 112,132
Derivatives presented above are monetary financial assets or monetary financial liabilities but are presented separately in order to show the Group’s gross exposure. Amounts disclosed in respect of derivatives represent the fair value, at the end of the reporting period, of the respective currency that the Group agreed to buy (positive amount) or sell (negative amount) before netting of positions and payments with the counterparty. The amounts by currency are presented gross as stated in Note 36.
The net total represents the fair value of the currency derivatives. The above analysis includes only monetary assets and liabilities.
The following table presents sensitivities of profit or loss and equity to reasonably possible changes in exchange rates applied at the end of the reporting period, with all other variables held constant:
At 31 December 2021 At 31 December 2020
In millions of RR
Impact on profit for the
year
Impact on total
equity
Impact on profit for the
year
Impact on total
equity
USD strengthening by 20% (2020: by 20%) 1,322 1,322 794 794 USD weakening by 20% (2020: by 20%) (1,322) (1,322) (794) (794) Euro strengthening by 20% (2020: by 20%) 245 245 488 488 Euro weakening by 20% (2020: by 20%) (245) (245) (488) (488) GBP strengthening by 20% (2020: by 20%) 2 2 1 1 GBP weakening by 20% (2020: by 20%) (2) (2) (1) (1)
The exposure was calculated only for monetary balances denominated in currencies other than the functional currency of the respective entity of the Group.
Interest rate risk. The Group takes on exposure to the effects of fluctuations in the prevailing levels of market interest rates on its financial position and cash flows. Interest margins may increase as a result of such changes but may reduce or create losses in the event that unexpected movements arise. Management monitors on a daily basis and sets limits on the level of mismatch of interest rate repricing that may be undertaken.
The Group is exposed to prepayment risk through providing fixed rate loans, which give the borrower the right to repay the loans early. The Group’s current year profit and equity at the end of the current reporting period would not have been significantly impacted by changes in prepayment rates because such loans are carried at amortised cost and the prepayment right is at or close to the amortised cost of the loans and advances to customers (2020: no material impact).

TCS Group Holding PLC Notes to the Consolidated Financial Statements – 31 December 2021
77
30 Financial and Insurance Risk Management (Continued)
The table below summarizes the Group’s exposure to interest rate risks. The table presents the aggregated amounts of the Group’s financial assets and liabilities at carrying amounts, categorized by the earlier of contractual interest repricing or maturity dates:
In millions of RR
Demand and less than 1 month
From 1 to 6 months
From 6 to 12 months
From 1 to 3 years
More than 3 years
Total
31 December 2021 Total financial assets 504,182 215,387 128,403 245,696 182,625 1,276,293 Total financial liabilities (610,067) (238,762) (119,402) (102,641) (53,417) (1,124,289)
Net interest sensitivity gap at 31 December 2021 (105,885) (23,375) 9,001 143,055 129,208 152,004
31 December 2020 Total financial assets 249,316 149,031 77,988 138,248 219,682 834,265 Total financial liabilities (379,481) (165,961) (75,564) (90,975) (10,152) (722,133)
Net interest sensitivity gap at 31 December 2020 (130,165) (16,930) 2,424 47,273 209,530 112,132
The Group has no significant risk associated with variable interest rates on loans and advances provided to customers or loans received.
The aim of interest rate risk management is to maintain the risks assumed by the Group within the limits determined by the Group in accordance with its own strategic objectives. The interest rate risk is managed by setting caps and floors in relation to interest rates on financial assets and liabilities depending on their types and maturities and balancing the assets and liabilities which are sensitive to changes in interest rates.
The assessment of the magnitude of interest rate risk is carried out by performing a sensitivity analysis which imply assessment of impact on net interest income of a shift in interest rates by 200 basis points. At 31 December 2021, if interest rates at that date had been 200 basis points lower/higher (2020: 200 basis points), with all other variables held constant, profit for the year would have been RR 3,040 million (2020: RR 2,243 million) lower/higher, equity would have been RR 3,040 million (2020: RR 2,243 million) lower/higher.
The Group monitors interest rates for its financial instruments. The table below summarizes interest rates for the years 2021 and 2020 based on reports reviewed by key management personnel.For securities, the interest rates represent yields to maturity based on market quotations at the reporting date:

TCS Group Holding PLC Notes to the Consolidated Financial Statements – 31 December 2021
78
30 Financial and Insurance Risk Management (Continued)
At 31 December 2021 At 31 December 2020
In % p.a. RR USD EURO GPB Other RR USD EURO GPB Other
Assets Cash and cash equivalents 0.0 0.0 0.0 0.0 0.0 0.0 0.0 0.0 0.0 0.0 Loans and advances to customers 28.9 - 1.7 - - 33.5 - 1.7 - - Due from banks 0.0 - - - - 3.2 - - - - Investments in securities 6.9 2.3 1.3 - - 6.9 2.6 1.3 - - Repurchase receivables 5.9 0.0 0.0 0.0 - 6.9 3.3 - - - Brokerage receivables 15.2 15.0 15.2 - - 15.5 15.4 13.5 - -
Liabilities Due to banks 4.8 0.0 - - - 4.4 0.0 - - - Customer accounts 2.7 0.3 0.1 0.0 0.0 3.3 0.5 0.1 0.1 0.0 Other borrowed funds 8.6 - - - - - - - - - Debt securities in issue 4.9 - - - - 8.6 - - - - Brokerage payables 15.2 15.4 - - - 15.6 15.6 - - - Subordinated debt - 8.2 - - - - 10.0 - - -
The sign “-” in the table above means that the Group does not have the respective assets or liabilities in the corresponding currency
Geographical risk concentrations. The geographical concentration of the Group’s financial assets and liabilities at 31 December 2021 is set out below:
In millions of RR Russia OECD Other
Non-OECD Listed Total
Financial assets Cash and cash equivalents 295,864 20,612 - - 316,476 Mandatory cash balances with the CBRF 8,589 - - - 8,589 Due from other banks 542 - - - 542 Loans and advances to customers 602,337 - 3,971 - 606,308 Financial derivatives 5,963 - - - 5,963 Investments in securities 209,477 - 5,834 - 215,311 Repurchase receivables 5,826 - - - 5,826 Brokerage receivables 49,138 - - - 49,138 Guarantee deposits with payment systems 1,399 13,772 - - 15,171 Other financial assets 52,944 - 25 - 52,969 Total financial assets 1,232,079 34,384 9,830 - 1,276,293 Financial liabilities Due to banks 11,313 - - - 11,313 Customer accounts 945,723 - - - 945,723 Debt securities in issue - - - 21,680 21,680 Other borrowed funds 3,806 - - - 3,806 Financial derivatives 90 - - - 90 Brokerage payables 9,634 - - - 9,634 Subordinated debt - - - 59,657 59,657 Insurance provisions 3,084 - - - 3,084 Other financial liabilities 69,170 67 65 - 69,302 Total financial liabilities 1,042,820 67 65 81,337 1,124,289 Credit related commitments (Note 32) 307,806 - - 307,806

TCS Group Holding PLC Notes to the Consolidated Financial Statements – 31 December 2021
79
30 Financial and Insurance Risk Management (Continued)
The geographical concentration of the Group’s financial assets and liabilities at 31 December 2020 is set out below:
In millions of RR Russia OECD Other
Non-OECD Listed Total
Financial assets Cash and cash equivalents 128,536 7,815 - - 136,351 Mandatory cash balances with the CBRF 5,379 - - - 5,379 Due from other banks 1,887 - - - 1,887 Loans and advances to customers 374,629 - 1,892 - 376,521 Financial derivatives 5,035 - - 5,035 Investments in securities 231,872 - 6,582 - 238,454 Repurchase receivables 29 - - - 29 Brokerage receivables 24,064 - - - 24,064 Guarantee deposits with payment systems 672 14,803 - - 15,475 Other financial assets 30,912 - 158 - 31,070 Total financial assets 803,015 22,618 8,632 - 834,265
Financial liabilities Due to banks 4,819 - - - 4,819 Customer accounts 626,837 - - - 626,837 Debt securities in issue - - - 23,910 23,910 Financial derivatives 109 - - - 109 Brokerage payables 9,206 - - - 9,206 Subordinated debt - - - 20,755 20,755 Insurance provisions 2,160 - - - 2,160 Other financial liabilities 34,291 - 46 - 34,337 Total financial liabilities 677,422 - 46 44,665 722,133
Credit related commitments (Note ) 204,868 - - 204,868
Assets, liabilities and credit related commitments have been based on the country in which the counterparty is located. Cash on hand has been allocated based on the country in which they are physically held. Balances with Russian counterparties actually outstanding to/from offshore companies of these Russian counterparties, are allocated to the caption “Russia”.
Other risk concentrations. Management monitors and discloses concentrations of credit risk by obtaining reports listing exposures to borrowers with aggregated loan balances in excess of 10% of net assets. The Group did not have any such significant risk concentrations at 31 December 2021 and 2020.
Liquidity risk. Liquidity risk is the risk that an entity will encounter difficulty in meeting obligations associated with financial liabilities. The Group is exposed to daily calls on its available cash resources from unused limits on issued credit cards, retail deposits from customers, current accounts and due to banks. The Group does not maintain cash resources to meet all of these needs as experience shows that only a certain level of calls will take place and it can be predicted with a high level of certainty. Liquidity risk is managed by the Financial Committee of the Bank. The Group seeks to maintain a stable funding base primarily consisting of amounts due to institutional investors, corporate and retail customer deposits and debt securities. The Group keeps all available cash in diversified portfolios of liquid instruments such as a correspondent account with CBRF and overnight placements in high-rated commercial banks, in order to be able to respond quickly and smoothly to unforeseen liquidity requirements. The available cash at all times exceeds all accrued financing costs falling due within half a year plus two months of regular operating costs.

TCS Group Holding PLC Notes to the Consolidated Financial Statements – 31 December 2021
80
30 Financial and Insurance Risk Management (Continued)
The liquidity management of the Group requires consideration of the level of liquid assets necessary to settle obligations as they fall due; maintaining access to a range of funding sources; maintaining funding contingency plans; and monitoring balance sheet liquidity ratios against regulatory requirements.
The liquidity analysis takes into account the covenant requirements and ability of the Group to waive any potential breaches within the grace period. The Bank calculates liquidity ratios on a daily basis in accordance with the requirements of the CBRF. The Bank has complied with these ratios throughout 2021 and 2020. The CFO receives information about the liquidity profile of the financial assets and liabilities. This includes daily, weekly, monthly and quarterly updates on the level of credit card transactions and repayments, statistics on credit card issuance and credit card limit utilisation, inflow and outflow of retail deposits, changes in the investment securities portfolio, level of expected outflows such as operating costs and financing activities. The CFO then ensures the availability of an adequate portfolio of short-term liquid assets, made up of an amount on the correspondent account with the CBRF and overnight deposits with banks, to ensure that sufficient liquidity is maintained within the Group as a whole. Regular liquidity stress testing under a variety of scenarios covering both normal and more severe market conditions and credit card portfolio behaviour is reviewed by the CFO.
The table below shows liabilities at 31 December 2021 by their remaining contractual maturity. The amounts of liabilities disclosed in the maturity table are the contractual undiscounted cash flows and gross loan commitments. Such undiscounted cash flows differ from the amount included in the consolidated statement of financial position because the consolidated statement of financial position amount is based on discounted cash flows. When the amount payable is not fixed, the amount disclosed is determined by reference to the conditions existing at the reporting date. Foreign currency payments are translated using the spot exchange rate at the end of the reporting period.
The maturity analysis of financial liabilities at 31 December 2021 is as follows:
In millions of RR
Demand and less
than 1 month
From 1 to 3 months
From 3 to 6 months
From 6 to 12 months
More than 1 year
Total
Liabilities Due to banks 5,600 - - 3,993 1,720 11,313 Customer accounts 545,363 117,367 100,511 114,368 73,213 950,822 Debt securities in issue 153 292 1,495 940 31,608 34,488 Other borrowed funds - - - - 3,806 3,806 Financial derivatives 51 198 249 334 6,602 7,434 Brokerage payables 9,634 - - - - 9,634 Subordinated debt 365 698 1,075 18,908 39,707 60,753 Insurance provisions 350 724 724 587 699 3,084 Other financial liabilities 66,683 - - - - 66,683 Lease liabilities 64 92 146 275 109 686 Credit related commitments (Note 32) 307,806 - - - - 307,806
Total potential future payments for financial obligations
936,069 119,371 104,200 139,405 157,464 1,456,509

TCS Group Holding PLC Notes to the Consolidated Financial Statements – 31 December 2021
81
30 Financial and Insurance Risk Management (Continued)
The maturity analysis of financial liabilities at 31 December 2020 is as follows:
In millions of RR
Demand and less
than 1 month
From 1 to 3 months
From 3 to 6 months
From 6 to 12 months
More than 1 year
Total
Liabilities Due to banks - - - - 4,819 4,819 Customer accounts 335,710 84,412 80,149 80,306 49,184 629,761 Debt securities in issue 173 316 515 1,930 23,245 26,179 Financial derivatives 51 198 251 501 25,842 26,843 Brokerage payables 9,206 - - - - 9,206 Subordinated debt 168 322 496 998 22,126 24,110 Insurance provisions 345 207 953 358 297 2,160 Other financial liabilities 34,337 - - - - 34,337 Lease liabilities 64 102 166 330 686 1,348 Credit related commitments (Note 32)
204,868 - - - - 204,868
Total potential future payments for financial obligations
584,922 85,557 82,530 84,423 126,199 963,631
Financial derivatives receivable and payable are disclosed in the Note 36. The tables above present only the gross payables.
Insurance provisions are disclosed in the table above based on their expected maturities.
Customer accounts are classified in the above analysis based on contractual maturities. However, in accordance with the Russian Civil Code, individuals have a right to withdraw their deposits prior to maturity if they forfeit their right to accrued interest.
The Group takes on exposure to liquidity risk, which is the risk of cash surplus in case of assets-liabilities cash-flow profile mismatch. Exposure to liquidity risk arises as a result of the Group’s borrowing and operational activities that assume cash payment obligations. The Group uses daily, short-term and long-term reporting, stress-testing and forecasting practices to monitor and prevent potential liquidity problems. The Group is actively increasing the number of counterparties for interbank lending, looks for new wholesale markets, improves and creates additional debit and credit products to have more instruments over cash-flow management. The recent economic situation has resulted in increased liquidity risk.
In response the management of the Group preserves cash safety cushions for possible cash outflows and has planned Group’s liquidity position for the next year to ensure it can cover all upcoming payment obligations.

TCS Group Holding PLC Notes to the Consolidated Financial Statements – 31 December 2021
82
30 Financial and Insurance Risk Management (Continued)
The expected maturity analysis of financial instruments at carrying amounts as monitored by management at 31 December 2021 is presented in the table below.
In millions of RR
Demand and less
than 1 month
From 1 to 3 months
From 3 to 6 months
From 6 to 12 months
From 1 to 5 years
More than 5 years
Total
Assets Cash and cash equivalents 309,364 7,112 - - - - 316,476 Mandatory cash balances with the CBRF 4,794 901 673 780 1,441 - 8,589 Due from other banks - - - - 542 - 542 Loans and advances to customers 79,485 95,910 100,446 109,658 190,672 30,137 606,308 Financial derivatives 111 - - 4,052 1,800 - 5,963 Investments in securities 209,491 - - - - 5,820 215,311 Repurchase receivables 5,826 - - - - - 5,826 Brokerage receivables 49,138 49,138 Guarantee deposits with payment systems 1,989 2,400 2,513 2,744 4,771 754 15,171 Other financial assets 51,883 53 31 37 965 - 52,969 Total financial assets 712,081 106,376 103,663 117,271 200,191 36,711 1,276,293
Liabilities Due to banks 5,600 - - 3,993 1,720 - 11,313 Customer accounts 527,741 99,159 74,102 85,933 158,788 - 945,723 Debt securities in issue - 872 1,113 873 7,263 11,559 21,680 Other borrowed funds - - - - - 3,806 3,806 Financial derivatives 59 - - - 31 - 90 Brokerage payables 9,634 - - - - - 9,634 Subordinated debt - 1,046 1,046 19,798 37,767 - 59,657 Insurance provisions 350 724 724 587 699 - 3,084 Other financial liabilities 66,683 825 787 698 309 - 69,302 Total financial liabilities 610,067 102,626 77,772 111,882 206,577 15,365 1,124,289
Net liquidity gap at 31 December 2021 102,014 3,750 25,891 5,389 (6,386) 21,346 152,004
Cumulative liquidity gap at 31 December 2021 102,014 105,764 131,655 137,044 130,658 152,004 -
Provision for unearned premiums in the amount of RR 7,281 million is not included in the insurance provisions stated above. Refer to Note 18.

TCS Group Holding PLC Notes to the Consolidated Financial Statements – 31 December 2021
83
30 Financial and Insurance Risk Management (Continued)
The expected maturity analysis of financial instruments at carrying amounts as monitored by management at 31 December 2020 is presented in the table below.
In millions of RR
Demand and less
than 1 month
From 1 to 3 months
From 3 to 6 months
From 6 to 12 months
From 1 to 5 years
More than 5 years
Total
Assets Cash and cash equivalents 136,351 - - - - - 136,351 Mandatory cash balances with the CBRF 2,756 546 454 531 1,092 - 5,379 Due from other banks - - - - 1,887 - 1,887 Loans and advances to customers 52,623 67,843 69,011 72,407 98,002 16,635 376,521 Financial derivatives 82 - - - 4,953 - 5,035 Investments in securities 238,454 - - - - - 238,454 Repurchase receivables 29 - - - - - 29 Brokerage receivables 24,064 24,064 Guarantee deposits with payment systems 2,163 2,788 2,836 2,976 4,028 684 15,475 Other financial assets 30,820 44 21 12 173 - 31,070
Total financial assets 487,342 71,221 72,322 75,926 110,135 17,319 834,265
Liabilities Due to banks - - - - 4,819 - 4,819 Customer accounts 321,104 63,601 52,958 61,899 127,275 - 626,837 Debt securities in issue - 870 944 981 11,281 9,834 23,910 Financial derivatives 76 - - - 33 - 109 Brokerage payables 9,206 - - - - - 9,206 Subordinated debt - 481 481 961 18,832 - 20,755 Insurance provisions 345 207 953 358 297 - 2,160 Other financial liabilities 34,337 - - - - - 34,337
Total financial liabilities 365,068 65,159 55,336 64,199 162,537 9,834 722,133
Net liquidity gap at 31 December 2020 122,274 6,062 16,986 11,727 (52,402) 7,485 112,132
Cumulative liquidity gap at 31 December 2020 122,274 128,336 145,322 157,049 104,647 112,132 -
Provision for unearned premiums in the amount of RR 3,907 million is not included in the insurance provisions stated above. Refer to Note 18.
As at the 31 December 2021 all the investment in debt securities are classified within demand and less than one month as they are easy repoable in CBR or on the open market securities and can provide immediate liquidity to the Group. All current accounts of individuals are classified using outflow curve (2020: the same).
The allocation of deposits of individuals considers the statistics of autoprolongations and top-ups of longer deposits with the funds from shorter deposits after their expiration in case when the customers have more than one active deposit. The matching and/or controlled mismatching of the maturities and interest rates of assets and liabilities is fundamental to the management of the Group. It is unusual for banks ever to be completely matched since business transacted is often of an uncertain term and of different types.

TCS Group Holding PLC Notes to the Consolidated Financial Statements – 31 December 2021
84
30 Financial and Insurance Risk Management (Continued)
An unmatched position potentially enhances profitability but can also increase the risk of losses. The maturities of assets and liabilities and the ability to replace, at an acceptable cost, interest-bearing liabilities as they mature, are important factors in assessing the liquidity of the Group and its exposure to changes in interest and exchange rates.
Management believes that in spite of a substantial portion of customer accounts being on demand, diversification of these deposits by number and type of depositors, and the past experience of the Group would indicate that these customer accounts provide a long-term and stable source of funding for the Group.
Insurance risk. Insurance risk is the risk associated with insurance contracts, consisting in the possibility of the occurrence of an insurance event and the uncertainty of the amount and time of occurrence of the loss associated with it.
The insurance risk management process covers all stages, from the stage of development of insurance rates to the settlement of losses.
The main steps in the insurance risk management process include:
• Underwriting and regulation of tariff policy;
• Efficiency of the loss settlement process;
• Diversification of the insurance portfolio.
Tariff policy. The process of underwriting and regulation of the tariff policy includes the formation of tariffs for certain areas of activity based on the analysis of results for previous periods, existing market conditions and the Insurance Company's strategy.
The insurance tariff is set on the basis of the analysis of the expected loss ratio based on Group’s insurance portfolio and similar products on the market, the commission ratio based on the analysis of product profitability and commission rates for similar products on the market, and the analysis of the average market rate. When developing tariffs, factors such as expected inflation and changes in the legislation of the Russian Federation are also taken into account.
The Insurance Company monitors the correctness of the calculation of the insurance premium under the insurance contract by analysing, on a regular basis, the deviations of the actual received premiums from the estimated premiums.
Loss settlement process. In accordance with the insurance contract, the policyholder is obliged to notify the insurance company of a loss within a certain period of time. Losses are settled by specialized units, other than selling business units. The insurance claims will be paid only after receiving all the necessary documents confirming the fact of the insured event. Also, if necessary, economic security department and legal department are involved in checking documents for settlement of losses. If at the time of payment of the insurance claims the policyholder had outstanding debt of the insurance premium, the unpaid part is deducted from the amount of compensation.
If there is a third party that caused an insurance loss to the insured client, the Group has a right to pursue third parties responsible for loss for payment of some or all costs related to the claims settlement process of the Group.
Diversification of the insurance portfolio. To reduce insurance risk, the Group also uses the diversification of its insurance portfolio - it insures a large number of small risks, which, in particular, is achieved through the remote provision of insurance services almost throughout the Russian Federation. The company does not operate outside the Russian Federation and is exposed to risks associated with the geographical features of the regions of the Russian Federation.

TCS Group Holding PLC Notes to the Consolidated Financial Statements – 31 December 2021
85
30 Financial and Insurance Risk Management (Continued)
Sensitivity analysis. The following analyses the possible changes in the key assumptions used in the calculation of insurance liabilities under contracts other than life insurance, provided that the other assumptions are constant. This analysis reflects the impact on gross and net liabilities, profit before tax and equity of the Group. Effect of changes in the key assumptions as at 31 December 2021:
In millions of RR except for the number of claims
Change in assumptions
Effect on insurance
obligations other than
life insurance
Effect on the reinsurers'
share in insurance
obligations other than life
insurance
Effect on profit
before tax
Effect on equity
The average cost of insurance claims – 10% (256) 1 255 204 + 10% 256 (1) (255) (204)
The average number of claims – 10% (256) 1 255 204 + 10% 256 (1) (255) (204)
Effect of changes in the key assumptions as at 31 December 2020:
In millions of RR except for the number of claims
Change in assumptions
Effect on insurance
obligations other than
life insurance
Effect on the reinsurers'
share in insurance
obligations other than life
insurance
Effect on profit
before tax
Effect on equity
The average cost of insurance claims – 10% (180) 1 179 143 + 10% 180 (1) (179) (143)
The average number of claims – 10% (180) 1 179 143 + 10% 180 (1) (179) (143)
31 Management of Capital
The Group’s objectives when managing capital are (i) for the Bank to comply with the capital requirements set by the Central Bank of Russian Federation (CBRF), (ii) for the Insurance Company to comply with the capital requirements set by the legislation of the Russian Federation, (iii) for the Group to comply with the financial covenants set by the terms of securities issued; (iv) to safeguard the Group’s ability to continue as a going concern.
The Group considers total capital under management to be equity attributable to shareholders of the Company as shown in the consolidated statement of financial position. The amount of capital that the Group managed as of 31 December 2021 was RR 176,091 million (2020: RR 127,016 million).
Compliance with capital adequacy ratios set by the CBRF is monitored daily and submitted to the CBRF monthly with reports outlining their calculation reviewed and signed by the Bank’s Chief Executive Officer and Chief Accountant. Other objectives of capital management are evaluated annually. In accordance with information provided internally to key management personnel, the amount of regulatory capital of the Bank calculated in accordance with the methodology set by CBRF as at 31 December 2021 was RR 206,955 million, and the equity capital adequacy ratio (N1.0) was 15.27% (2020: RR 121,350 million and 13.07%). Minimum required statutory equity capital adequacy ratio (N1.0) was 8% as at 31 December 2021 (2020: 8%).

TCS Group Holding PLC Notes to the Consolidated Financial Statements – 31 December 2021
86
31 Management of Capital (Continued)
In October 2021 the Bank has been added to the Bank of Russia’s list of 13 systemically important banking institutions due to a recognition of the Bank’s growing presence in the financial market and expanding customer base of its ecosystem. As a result, from 1 January 2022 the Bank will be obliged to comply with the additional capital adequacy buffers +1% to the minimum required statutory equity capital adequacy ratio (N1.0).
The Group also monitors capital requirements including capital adequacy ratio under the Basel III methodology of the Basel Committee on Banking Supervision: global regulatory framework for more resilient banks and banking systems (hereinafter “Basel III”). The composition of the Group’s capital calculated in accordance with the methodology set by Basel Committee with capital adjustments as set out in Basel III is as follows:
In millions of RR 31 December
2021 31 December
2020
Share capital 230 230 Share premium 26,998 26,998 Treasury shares (2,567) (3,238) Share-based payment reserve 4,745 1,548 Retained earnings 159,491 99,540 Revaluation reserve for investments in debt securities (13,131) 1,849
Less intangible assets (15,069) (7,082) Non-controlling interest 325 89
Common Equity Tier 1 (CET1) 161,022 119,934
Additional Tier 1 59,657 20,755
Tier 1 capital 220,679 140,689
Total capital 220,679 140,689
Risk weighted assets (RWA) Credit risk 794,241 562,918 Operational risk 261,813 199,184 Market risk 32,484 24,707
Total risk weighted assets (RWA) 1,088,538 786,809
Common equity Tier 1 capital adequacy ratio (CET1 /Total RWA), % 14.79% 15.24%
Tier 1 capital adequacy ratio (Tier 1 capital /Total RWA), % 20.27% 17.88% Total capital adequacy ratio (Total capital /Total RWA), % 20.27% 17.88%
The Group and the Bank have complied with all externally imposed capital requirements throughout the years ended 31 December 2021 and 2020.
The Insurance Company has complied with all capital requirements set by the legislation of the Russian Federation throughout the years ended 31 December 2021 and 2020.

TCS Group Holding PLC Notes to the Consolidated Financial Statements – 31 December 2021
87
32 Contingencies and Commitments
Legal proceedings. From time to time and in the normal course of business, claims against the Group may be received. On the basis of its own estimates and internal professional advice, management is of the opinion that no material unprovided losses will be incurred in respect of claims.
Tax contingencies. Russian tax legislation which was enacted or substantively enacted at the end of the reporting period, is subject to varying interpretations when being applied to the transactions and activities of the Group. Consequently, tax positions taken by management and the formal documentation supporting the tax positions may be challenged tax authorities. Russian tax administration is gradually strengthening, including the fact that there is a higher risk of review of tax transactions without a clear business purpose or with tax incompliant counterparties. Fiscal periods remain open to review by the authorities in respect of taxes for three calendar years preceding the year when decision about review was made. Under certain circumstances reviews may cover longer periods. The Russian transfer pricing legislation is generally aligned with the international transfer pricing principles developed by the Organization for Economic Cooperation and Development (OECD), although it has specific features. This legislation provides for the possibility of additional tax assessment for controlled transactions (transactions between related parties and certain transactions between unrelated parties), if such transactions are not on an arm's length.
Tax liabilities arising from controlled transactions are determined based on their actual transaction prices. It is possible, with the evolution of the interpretation of transfer pricing rules, that such transfer prices could be challenged. The impact of any such challenge cannot be reliably estimated; however, it may be significant to the financial position and/or the overall operations of the Group.
The Group includes companies incorporated outside of Russia. The tax liabilities of the Group are determined on the assumption that these companies are not subject to Russian profits tax, because they do not have a permanent establishment in Russia. The Company is a tax resident of Cyprus only and full beneficial owner of the Bank and Insurance Company. This interpretation of relevant legislation may be challenged but the impact of any such challenge cannot be reliably estimated currently; however, it may be significant to the financial position and/or the overall operations of the Group.
The Controlled Foreign Company (CFC) legislation introduced Russian taxation of profits of foreign companies and non-corporate structures (including trusts) controlled by Russian tax residents (controlling parties). The CFC income is subject to a 20% tax rate if the CFC is controlled by a legal entity and a rate of 13% if it is controlled by an individual. As a result, management reassessed the Group’s tax positions and recognised current tax expense as well as deferred taxes that arose from the expected taxable manner of recovery of the relevant Group’s operations to which the CFC legislation applies to and to the extent that the Group (rather than its owners) is obliged to settle such taxes.
As Russian tax legislation does not provide definitive guidance in certain areas, the Group adopts, from time to time, interpretations of such uncertain areas that reduce the overall tax rate of the Group. While management currently estimates that the tax positions and interpretations that it has taken can probably be sustained, there is a possible risk that outflow of resources will be required should such tax positions and interpretations be challenged by the tax authorities. The impact of any such challenge cannot be reliably estimated; however, it may be significant to the financial position and/or the overall operations of the Group. As at 31 December 2021 and 2020 no material tax risks were identified.
Future lease payments related to leases where leased asset is of low value The future cash outflows to which the Group is exposed and which are not reflected in the lease liabilities amounted to RR 298 million at 31 December 2021 and relate primarily to leases of assets which are of low value (2020: RR 233 million).
Compliance with covenants. The Group is subject to certain covenants related primarily to its subordinated perpetual debt. Non-compliance with such covenants may result in negative consequences for the Group. Management believes that the Group was in compliance with all such covenants as at 31 December 2021 and 2020.

TCS Group Holding PLC Notes to the Consolidated Financial Statements – 31 December 2021
88
32 Contingencies and Commitments (Continued)
Credit related commitments and performance guarantees issued. The primary purpose of these instruments is to ensure that funds are available to a customer as required. Commitments to extend credit represent unused portions of authorisations to extend credit in the form of credit card loans, guarantees. With respect to credit risk on commitments to extend credit, the Group is potentially exposed to loss in an amount equal to the total unused commitments, if the unused amounts were to be drawn down. Most commitments to extend credit are contingent upon customers maintaining specific credit standards. The Group monitors the term to maturity of credit related commitments because longer-term commitments generally have a greater degree of credit risk than shorter-term commitments.
Performance guarantees are contracts that provide compensation if another party fails to perform a contractual obligation. Such contracts do not transfer credit risk. The risk under performance guarantee contracts is the possibility that the insured event (i.e. the failure to perform the contractual obligation by another party) occurs. The key risks the Group faces are significant fluctuations in the frequency and severity of payments incurred on such contracts relative to expectations. The Group uses a scoring model to predict levels of such payments. Claims must be made before the contract matures and most claims are settled within short term. This allows the Group to achieve a high degree of certainty about the estimated payments and therefore future cash flows.
Outstanding credit related commitments and performance guarantees are as follows:
In millions of RR 31 December
2021 31 December
2020
Unused limits on credit card loans 295,233 208,405 Unused limits on SME loans 15,907 7,291 Credit loss allowance (3,334) (3,537)
Total credit related commitments, net of сredit loss allowance 307,806 212,159
Performance guarantees issued 137 498 Provisions (1) (4)
Total performance guarantees issued, net of provisions 136 494
The total outstanding contractual amount of unused limits on contingencies and commitments liability does not necessarily represent future cash requirements, as these financial instruments may expire or terminate without being funded. In accordance with credit card service conditions the Group has a right to refuse the issuance, activation, reissuing or unblocking of a credit card, and is providing a credit card limit at its own discretion and without explaining its reasons.

TCS Group Holding PLC Notes to the Consolidated Financial Statements – 31 December 2021
89
32 Contingencies and Commitments (Continued)
The following table contains an analysis of credit related commitments by credit quality at 31 December 2021 based on credit risk grades.
In millions of RR
Stage 1 Stage 2 Stage 3 Total
(12-months ECL) (lifetime ECL for SICR)
(lifetime ECL for credit impaired)
Credit related commitments - Excellent 270,344 - - 270,344 - Good 13,179 91 - 13,270 - Monitor 27,242 284 - 27,526
Unrecognised gross amount 310,765 375 - 311,140
Credit loss allowance (3,318) (16) - (3,334)
Unrecognised net amount 307,447 359 - 307,806
The following table contains an analysis of credit related commitments by credit quality at 31 December 2020 based on credit risk grades.
In millions of RR
Stage 1 Stage 2 Stage 3 Total
(12-months ECL) (lifetime ECL for SICR)
(lifetime ECL for credit impaired)
Credit related commitments - Excellent 180,619 - - 180,619 - Good 14,905 84 - 14,989 - Monitor 12,546 251 - 12,797
Unrecognised gross amount 208,070 335 - 208,405
Credit loss allowance (3,513) (24) - (3,537)
Unrecognised net amount 204,557 311 - 204,868
Also, the Group may decide to increase or decrease a credit card limit using a scoring model, which is based on the client's behaviour model. Therefore, the fair value of the contractual amount of revocable unused limits on contingencies and commitments is close to zero. Credit related commitments are denominated in RR.

TCS Group Holding PLC Notes to the Consolidated Financial Statements – 31 December 2021
90
32 Contingencies and Commitments (Continued)
The following table contains an analysis of performance guarantees issued by credit quality based on credit risk grades.
31 December
2021 31 December
2020
In millions of RR
Stage 1 Stage 1
(12-months ECL) (12-months ECL)
Performance guarantees issued - Excellent 80 310 - Good 57 188 Unrecognised gross amount 137 498 Provisions (1) (4) Unrecognised net amount 136 494
Mandatory cash balances with the CBRF of RR 8,589 million as at 31 December 2021 (2020: RR 5,379 million) represent mandatory reserve deposits which are not available to finance the Bank's day to day operations.
33 Offsetting Financial Assets and Financial Liabilities
Financial instruments subject to offsetting, enforceable master netting and similar arrangements are as follows at 31 December 2021:
Gross amounts
before offsetting
Gross amounts set
off in the consolidated statement of
financial position
Net amount after offsetting in the
consolidated statement of
financial position
Amounts subject to master netting and
similar arrangements not set off in the
consolidated statement of financial position
Net amount of expo-
sure
In millions of RR Financial
instruments Cash
collateral
ASSETS Reverse repurchase agreements 152,331 - 152,331 154,255 - - Brokerage receivables 49,138 - 49,138 46,721 - 2,417 Financial derivatives 5,820 - 5,820 - 5,829 -
Total assets subject to offsetting, master netting and similar arrangement 207,289 - 207,289 200,976 5,829 2,417
LIABILITIES
Correspondent accounts and overnight placements of other banks 5,829 - 5,829 5,820 - 9 Sale and repurchase agreements with other banks 5,484 - 5,484 5,826 - - Brokerage payables 9,634 - 9,634 11,123 - - Other borrowed funds 3,806 - 3,806 4,446 - -
Total liabilities subject to offsetting, master netting and similar arrangement 24,753 - 24,753 27,215 - 9

TCS Group Holding PLC Notes to the Consolidated Financial Statements – 31 December 2021
91
33 Offsetting Financial Assets and Financial Liabilities (Continued)
Financial instruments subject to offsetting, enforceable master netting and similar arrangements are as follows at 31 December 2020:
Gross amounts
before offsetting
Gross amounts set
off in the consolidated statement of
financial position
Net amount after
offsetting in the
consolidated statement of
financial position
Amounts subject to master netting and similar
arrangements not set off in the consolidated statement
of financial position
Net amount
of expo- sure
In millions of RR Financial
instruments Cash
collateral
ASSETS Reverse repurchase agreements 33,210 - 33,210 34,527 - - Brokerage receivables 24,064 - 24,064 24,113 - - Financial derivatives 4,920 - 4,920 - 4,795 125
Total assets subject to offsetting, master netting and similar arrangement 62,194 - 62,194 58,640 4,795 125
LIABILITIES Due to banks 4,819 - 4,819 4,949 - - Brokerage payables 9,206 - 9,206 9,696 - -
Total liabilities subject to offsetting, master netting and similar arrangement 14,025 - 14,025 14,645 - -
As at 31 December 2021 the Group has master netting arrangements with counterparty banks, which are enforceable in case of default. The Group also made margin deposits with clearing house counterparty as collateral for its outstanding derivative positions. The counterparty may set off the Group’s liabilities with the margin deposit in case of default (2020: same). The disclosure does not apply to loans and advances to customers and related customer deposits.
34 Transfers of Financial Assets
The Group transferred financial assets in transactions that did not qualify for derecognition in the current periods.
The table below shows the amount of operations under sale and repurchase agreements which the Group enters into in the normal course of business:
Notes
31 December 2021 31 December 2020
In millions of RR
Carrying amount of the assets
Carrying amount of
the associated
liabilities
Carrying amount of the assets
Carrying amount of
the associated
liabilities
Debt securities at FVOCI pledged under repurchase agreements 13 5,826 5,484 29 24
Total 5,826 5,484 29 24

TCS Group Holding PLC Notes to the Consolidated Financial Statements – 31 December 2021
92
34 Transfers of Financial Assets (Continued)
In the normal course of business, the Group makes borrowings on interbank market using different financial instruments as collateral to support its everyday operations in terms of liquidity.
The Group also enters into reverse sale and repurchase agreements. The summary of such operations is provided in the table below:
31 December 2021 31 December 2020
In millions of RR Notes
Amounts granted
under repo
agreements
Fair value of securities
received as collateral
Amounts granted
under repo
agreements
Fair value of securities
received as collateral
Cash and cash equivalents 5 152,331 154,255 33,210 34,527 Brokerage receivables 10 49,138 46,721 24,064 24,113
Total 201,469 200,976 57,274 58,640
35 Non-Controlling Interest
The following table provides information about each subsidiary that has non-controlling interest:
In millions of RR
Place of business
(and country of
incorpo-ration if
different)
Proportion of non-
controlling interest
Proportion of non-
controlling interest’s
voting rights held
Profit or loss
attribu-table to
non-controlling
interest
Accumu-lated non-
controlling interest in
the subsidiary
Dividends paid to
non-controlling
interest during the
year
Year ended 31 December 2021
LLC “Cloudpayments” Russia 5.00% 5.00% 41 130 7 LLC “Beskontakt” Russia 14.60% 14.60% (144) 202 - Year ended 31 December 2020
LLC “Cloudpayments” Russia 5.00% 5.00% 4 89 18
The summarized financial information of these subsidiaries was as follows:
In millions of RR
Current assets
Non-current assets
Current liabilities
Non-current
liabilities
Revenue Profit/ (loss)
Total compre-hensive income
Cash flows
Year ended 31 December 2021
LLC “Cloudpayments” 1,182 284 238 - 1,952 898 898 119 LLC “Beskontakt” 284 337 258 1,895 389 (734) (734) 32 Year ended 31 December 2020
LLC “Cloudpayments” 389 277 105 - 1,226 606 606 (13)

TCS Group Holding PLC Notes to the Consolidated Financial Statements – 31 December 2021
93
36 Financial Derivatives
The table below sets out fair values, at the end of the reporting period, of currencies receivable or payable under foreign exchange forwards and swap contracts entered into by the Group. The table reflects gross positions before the netting of any counterparty positions (and payments) and covers the contracts with settlement dates after the end of the respective reporting period.
31 December 2021 31 December 2020
In millions of RR
Contracts with positive
fair value
Contracts with negative
fair value
Contracts with positive
fair value
Contracts with negative fair
value
Foreign exchange forwards and swaps: discounted notional amounts, at the end of the reporting period, of - USD receivable on settlement (+) 29,288 (42) 29,311 - - USD payable on settlement (-) 12 (31) - (104) - RR receivable on settlement (+) - - 75 - - RR payable on settlement (-) (23,341) (10) (24,351) - - EUR receivable on settlement (+) - (7) - - - EUR payable on settlement (-) 4 - - (5)
Fair value of foreign exchange forwards and swaps 5,963 (90) 5,035 (109)
37 Fair Value of Financial Instruments
Fair value measurements are analysed by level in the fair value hierarchy as follows: (i) level one are measurements at quoted prices (unadjusted) in active markets for identical assets or liabilities, (ii) level two measurements are valuation techniques with all material inputs observable for the asset or liability, either directly (that is, as prices) or indirectly (that is, derived from prices), and (iii) level three measurements are valuations not based on observable market data (that is, unobservable inputs).
(a) Recurring fair value measurements
Recurring fair value measurements are those that the accounting standards require or permit in the consolidated statement of financial position at the end of each reporting period. The levels in the fair value hierarchy into which the recurring fair value measurements are categorised are as follows:

TCS Group Holding PLC Notes to the Consolidated Financial Statements – 31 December 2021
94
37 Fair Value of Financial Instruments (Continued)
31 December 2021 31 December 2020
In millions of RR Level 1 Level 2 Level 3 Total Level 1 Level 2 Level 3 Total
ASSETS AT FAIR VALUE
Investments in securities 211,375 3,936 - 215,311
232,198 6,256 -
238,454
Repurchase receivables 5,826 - - 5,826 29 - - 29 Loans and advances to customers - - 3,971 3,971 - - 1,892 1,892
Financial derivatives - 5,963 - 5,963 - 5,035 - 5,035
Total assets recurring fair value measurements 217,201 9,899 3,971 231,071
232,227 11,291 1,892
245,410
LIABILITIES AT FAIR VALUE Financial derivatives - 90 - 90 - 109 - 109
Total liabilities recurring fair value measurements - 90 - 90 - 109 - 109
Investments in securities categorised in level 2 are represented by liquid debt securities classified in “Good” credit risk grade.

TCS Group Holding PLC Notes to the Consolidated Financial Statements – 31 December 2021
95
37 Fair Value of Financial Instruments (Continued)
The description of valuation techniques and the description of the inputs used in the fair value measurement for level 2 and level 3 measurements at 31 December 2021 are as follows:
In millions of RR Fair value Valuation technique Inputs used
ASSETS AT FAIR VALUE
Investments in securities 3,936
Observable quotes for comparable securities adjusted by multiplicator depending on the degree of the market activity
Quotes from the automated fair value system for financial instruments of NSD Price Center*
Foreign exchange swaps and forwards 5,963
Discounted cash flows adjusted for counterparty credit risk
Russian rouble curve. USD Dollar Swaps Curve. EUR Swaps Curve. CDS quotes assessment of counterparty credit risk or reference entities.
Total recurring fair value
measurements at level 2 9,899
Loans and advances to customers 3,971
Revaluation of the convertible loan based on the Vivid Money Holdco Limited share price as per the most recent sale purchase transactions with shares of Vivid Money Holdco Limited (Note 39)
Share price as per the most recent sale purchase transaction
Total recurring fair value
measurements at level 3 3,971
LIABILITIES AT FAIR VALUE
Foreign exchange swaps and forwards 90
Discounted cash flows adjusted for counterparty credit risk
Russian rouble curve. USD Dollar Swaps Curve. EUR Swaps Curve. CDS quotes assessment of counterparty credit risk or reference entities.
Total recurring fair value
measurements at level 2 90

TCS Group Holding PLC Notes to the Consolidated Financial Statements – 31 December 2021
96
37 Fair Value of Financial Instruments (Continued)
The description of valuation techniques and the description of the inputs used in the fair value measurement for level 2 measurements at 31 December 2020 are as follows:
In millions of RR Fair value Valuation technique Inputs used
ASSETS AT FAIR VALUE
Investments in securities 6,256
Observable quotes for comparable securities adjusted by multiplicator depending on the degree of the market activity
Quotes from the automated fair value system for financial instruments of NSD Price Center*
Foreign exchange swaps and forwards 5,035
Discounted cash flows adjusted for counterparty credit risk
Russian rouble curve. USD Dollar Swaps Curve. EUR Swaps Curve. CDS quotes assessment of counterparty credit risk or reference entities.
Total recurring fair value
measurements at level 2 11,291
Loans and advances to customers 1,892
Revaluation of the convertible loan based on the Vivid Money Holdco Limited share price as per its most recent sale purchase transactions with shares of Vivid Money Holdco Limited (Note 38)
Share price as per the most recent sale purchase transaction
Total recurring fair value
measurements at level 3 1,892
LIABILITIES AT FAIR VALUE
Foreign exchange swaps and forwards 109
Discounted cash flows adjusted for counterparty credit risk
Russian rouble curve. USD Dollar Swaps Curve. EUR Swaps Curve. CDS quotes assessment of counterparty credit risk or reference entities.
Total recurring fair value
measurements at level 2 109
* NSD Valuation Center is a fair value measurement service for bonds and other financial instruments, accredited by the CBRF.
There were no changes in the valuation techniques for level 2 recurring fair value measurements during the year ended 31 December 2021 and 2020. Level 2 derivatives comprise foreign exchange forwards and swaps.
The foreign exchange forwards have been fair valued using forward exchange rates that are quoted in an active market. Foreign exchange swaps are fair valued using forward interest rates extracted from observable yield curves. The effects of discounting are generally insignificant for level 2 derivatives.

TCS Group Holding PLC Notes to the Consolidated Financial Statements – 31 December 2021
97
37 Fair Value of Financial Instruments (Continued)
Changes of the fair value measurements at Level 3 for the year ended 31 December 2021 and 2020 are as follows:
In millions of RR Loans and advances to customers
Fair value at the date of recognition 1,374 Other interest income 8 Net gains from foreign exchange translation 16 Net gains from revaluation of convertible loan 494
Fair value as at 31 December 2020 - Level 3 1,892
Other interest income 23
Net losses from foreign exchange translation (317) Net gains from revaluation of convertible loan 2,373
Fair value as at 31 December 2021 - Level 3 3,971
As at 31 December 2021, if the share price had been 10% lower/higher, fair value of loans and advances to customers carried at fair value would have been RR 293 million lower/higher (2020: 64 million).

TCS Group Holding PLC Notes to the Consolidated Financial Statements – 31 December 2021
98
37 Fair Value of Financial Instruments (Continued)
(b) Assets and liabilities not measured at fair value but for which fair value is disclosed
Fair values analysed by level in the fair value hierarchy and carrying value of assets not measured at fair value are as follows:
31 December 2021 31 December 2020
In millions of RR Level 1 Level 2 Level 3 Carrying
value Level 1 Level 2 Level 3 Carrying
value
FINANCIAL ASSETS CARRIED AT AMORTISED COST
Cash and cash equivalents - Cash on hand 36,955 - - 36,955 21,069 - - 21,069 - Cash balances with the CBRF (other than mandatory reserve deposits) - 51,008 - 51,008 - 38,646 - 38,646 - Placements with other banks and non-bank credit organizations with original maturities of less than three months - 228,513 - 228,513 - 76,636 - 76,636 Mandatory cash balances with the CBRF - 8,589 - 8,589 - 5,379 - 5,379 Due from other banks - 542 - 542 - 1,887 - 1,887 Loans and advances to customers - - 602,864 602,337 - - 374,996 374,629 Guarantee deposits with payment systems - - 15,171 15,171 - - 15,475 15,475 Brokerage receivables - 49,138 - 49,138 - 24,064 - 24,064 Other financial assets Settlement of operations with plastic cards receivable - 42,995 - 42,995 - 23,882 - 23,882 Insurance's financial assets - 965 - 965 - 542 - 542 Other receivables - 9,009 - 9,009 - 6,646 - 6,646
Total financial assets carried at amortised cost 36,955 390,759 618,035 1,045,222 21,069 177,682 390,471 588,855

TCS Group Holding PLC Notes to the Consolidated Financial Statements – 31 December 2021
99
37 Fair Value of Financial Instruments (Continued)
Fair values analysed by level in the fair value hierarchy and carrying value of liabilities not measured at fair value are as follows:
31 December 2021 31 December 2020
In millions of RR Level 1 Level 2 Level 3 Carrying
value Level 1 Level 2 Level 3 Carrying
value
FINANCIAL LIABILITIES CARRIED AT AMORTISED COST
Due to banks - 11,313 - 11,313 - 4,819 - 4,819
Brokerage payables - 9,634 - 9,634 - 9,206 - 9,206 Customer accounts Individuals -Current/demand accounts - 544,561 - 544,561 - 323,145 - 323,145 - Brokerage accounts - 110,277 - 110,277 - 73,970 - 73,970
-Term deposits - 149,813 - 146,548 - 138,971 - 135,995 SME -Current/demand accounts - 140,287 - 140,287 - 89,199 - 89,199 -Term deposits - 3,434 - 3,403 - 1,915 - 2,213
Other legal entities -Current/demand accounts - 647 - 647 - 2,267 - 2,267
-Term deposits - - - - - 48 - 48 Debt securities in issue
RR Bonds issued on domestic market 21,794 - - 21,680 24,824 - - 23,910 Other borrowed funds Borrowings through securitisation transaction 3,723 - - 3,806 - - - -
Subordinated debt Perpetual subordinated debts 59,365 - - 59,657 22,174 - - 20,755 Other financial liabilities Settlement of operations with plastic cards - 48,879 - 48,879 - 23,079 - 23,079
Trade payables - 11,866 - 11,866 - 4,671 - 4,671 Credit related commitments - - - 3,334 - - - 3,537
Loyalty programs - 2,802 - 2,802 - 1,479 - 1,479 Other financial liabilities - 2,421 - 2,421 - 1,571 - 1,571
Total financial liabilities carried at amortised cost 84,882 1,035,934 - 1,121,115 46,998 674,340 - 719,864
Fair value is the amount at which a financial instrument could be exchanged in a current transaction between willing parties, other than in a forced sale or liquidation, and is best evidenced by an active quoted market price. Where quoted market prices are not available, the Group used valuation techniques. The fair value of floating rate instruments that are not quoted in an active market was estimated to be equal to their carrying amount. The fair value of unquoted fixed interest rate instruments was estimated based on estimated future cash flows expected to be received discounted at current interest rates for new instruments with similar credit risk and remaining maturity.
As at 31 December 2021 and 2020 the fair value of the debt securities in issue and subordinated debt has been calculated based on quoted prices from the Moscow Exchange MICEX-RTS, St. Petersburg Exchange and Global Exchange Market, where the Group’s debt securities are listed and traded.

TCS Group Holding PLC Notes to the Consolidated Financial Statements – 31 December 2021
100
37 Fair Value of Financial Instruments (Continued)
Weighted average discount rates used in determining fair value as of 31 December 2021 and 2020 are disclosed below:
In % p.a. 31 December
2021 31 December
2020
Assets Cash and cash equivalents 0.0 0.0
Due from other banks 2.4 3.2 Investments in securities 5.6 5.4
Repurchase receivables 4.3 5.1 Loans and advances to customers 28.9 33.5 Brokerage receivables 15.1 15.4
Liabilities
Due to banks 4.8 4.4 Customer accounts 2.7 2.2
Debt securities in issue 9.1 6.1 Other borrowed funds 8.6 - Brokerage payables 15.4 15.6 Subordinated debt 5.9 5.3
38 Presentation of Financial Instruments by Measurement Category
For the purposes of measurement, IFRS 9 “Financial Instruments” classifies financial assets into the following categories: (a) financial assets at FVTPL; (b) financial assets at FVOCI and (c) financial assets at AC. Financial assets at FVTPL have two sub-categories: (i) assets measured at FVTPL mandatorily, and (ii) assets designated as such upon initial recognition.
The following table provides a reconciliation of classes of financial assets with these measurement categories as of 31 December 2021:
In millions of RR AC FVTPL FVOCI Total
Cash and cash equivalents - Cash on hand 36,955 - - 36,955 - Cash balances with the CBRF (other than mandatory reserve deposits) 51,008 - - 51,008 - Placements with other banks and non-bank credit organizations with original maturities of less than three months 228,513 - - 228,513 Mandatory cash balances with the CBRF 8,589 - - 8,589 Due from other banks 542 542 Loans and advances to customers 602,337 3,971 - 606,308 Financial derivatives - 5,963 - 5,963 Guarantee deposits with payment systems 15,171 - - 15,171 Investments in securities - 8,136 207,175 215,311 Repurchase receivables - - 5,826 5,826 Brokerage receivables 49,138 - - 49,138 Other financial assets - Settlement of operations with plastic cards receivable 42,995 - - 42,995 - Insurance's financial assets 965 - - 965 - Other receivables 9,009 - - 9,009
TOTAL FINANCIAL ASSETS 1,045,222 18,070 213,001 1,276,293

TCS Group Holding PLC Notes to the Consolidated Financial Statements – 31 December 2021
101
38 Presentation of Financial Instruments by Measurement Category (Continued)
The following table provides a reconciliation of classes of financial assets with these measurement categories as of 31 December 2020:
In millions of RR AC FVTPL FVOCI Total
Cash and cash equivalents - Cash on hand 21,069 - - 21,069 - Cash balances with the CBRF (other than mandatory reserve deposits) 38,646 - - 38,646 - Placements with other banks and non-bank credit organizations with original maturities of less than three months 76,636 - - 76,636 Mandatory cash balances with the CBRF 5,379 - - 5,379 Due from other banks 1,887 1,887 Loans and advances to customers 374,629 1,892 - 376,521 Financial derivatives - 5,035 - 5,035 Guarantee deposits with payment systems 15,475 - - 15,475 Investments in securities - 4,265 234,189 238,454 Repurchase receivables - - 29 29 Brokerage receivables 24,064 - - 24,064 Other financial assets - Settlement of operations with plastic cards receivable 23,882 - - 23,882 - Insurance's financial assets 542 - - 542 - Other receivables 6,646 - - 6,646
TOTAL FINANCIAL ASSETS 588,855 11,192 234,218 834,265
As of 31 December 2021 and 2020 all of the Group’s financial liabilities except derivatives were carried at amortised cost.

TCS Group Holding PLC Notes to the Consolidated Financial Statements – 31 December 2021
102
39 Related Party Transactions
Parties are generally considered to be related if the parties are under common control or one party has the ability to control the other party or can exercise significant influence over the other party in making financial or operational decisions. In considering each possible related party relationship, attention is directed to the substance of the relationship, not merely the legal form. The outstanding balances with related parties were as follows:
31 December 2021 31 December 2020
In millions of RR
Key management
personnel
Associates and other
related parties
Key management
personnel
Associates and other
related parties
ASSETS Loans and advances to customers (average interest rate: 1.7-11.9% p.a. (31 December 2020: 1.7-13.7% p.a.)): 380 3,971 570 1,855 - Gross carrying amount 413 3,971 607 1,892 - Credit loss allowance (33) - (37) (37) Other financial assets - - - 158
TOTAL ASSETS 380 3,971 570 2,013
Customer accounts, including brokerage accounts (average interest rate: 1.8-11% p.a. (31 December 2020: 0.8-3.7% p.a.)) 7,716 166 6,246 2,086 Other non-financial liabilities 1,741 - 584 -
TOTAL LIABILITIES 9,457 166 6,830 2,086
EQUITY Share-based payment reserve - Management long-term incentive program 4,225 - 1,378 -
TOTAL EQUITY 4,225 - 1,378 -
On 31 August 2020 the Group acquired shareholding in Vivid Money Holdco Limited (Note 1), which is a group of fintech start-ups launched in 2020 to provide a range of services to retail customers in Europe (excluding CIS). The investment in Vivid Money Holdco Limited was classified as an investment in associate and accounted for using the equity method. Also in 2020 the Group issued convertible loan to Vivid Money Holdco Limited (Note 8), which is carried at FV.

TCS Group Holding PLC Notes to the Consolidated Financial Statements – 31 December 2021
103
39 Related Party Transactions (Continued)
The income and expense items with related parties were as follows:
2021 2020
In millions of RR
Key management
personnel
Associates and other
related parties
Key management
personnel
Associates and other
related parties
Interest income calculated using the effective interest rate method 37 186 26 32 Other similar income - 23 - 8 Interest expense calculated using effective interest rate method (103) - (42) (33) Net gains/(losses) from foreign exchange translation - 229 - (40) Net gains from financial assets at FVTPL - 2,373 - 494 Administrative and other operating expenses (7,337) (158) (2,895) (248) Other operating income - - - 447
Key management compensation is presented below:
In millions of RR 2021 2020
Short-term benefits: - Salaries 1,356 1,086 - Short-term bonuses 1,408 921 Long-term benefits: - Management long-term incentive programme 4,520 862 - Key employees retention plan 28 26 - Warrant compensation 25 -
Total 7,337 2,895
Warrant compensation. In the fourth quarter of 2021 the Group issued a new instrument that represents a share-based equity-settled compensation: 5-year warrants with an aggregate value equal to 1.2% of an increase in the market capitalisation of the Company as at 1 January 2027 (calculated as the volume-weighted average GDR price over the preceding six months, which amounted to 89.2 USD at the date of the grant) over a GDR price of USD 92 (the "Warrants"). The Warrants vest on 1 January 2027 and are exercisable at any time on or after that date. The Group has a unilateral right to terminate the Warrants at a one month's notice. When the Warrants are exercised, the Group is required to deliver the Ordinary Shares (GDRs) up to the value of the Warrants determined on 1 January 2027. The weighted-average fair value of the Warrants at the grant date was RR 1.1 bln and it was measured using the Black-Scholes model based on historical market quotes of GDRs. At the date of publication of the Group’s annual results, the share price of the Company was significantly below the strike price of the Warrants.
Key employees retention plan (KERP). On 14 April 2020 the Group launched a new long term incentive program for more than 250 senior and middle management level employees. The purpose of the program is to retain and motivate key employees with high potential. This was a performance-based cash-settled program linked to the market price of GDRs. A new grant has been provided to the current and new participants in April 2021. In 2021 number of employees joined the program increased to more than 400 participants. Later in November 2021 the program has been converted into equity-settled instrument to increase its efficiency for the Group and participants. After the conversion the program has been combined with Management long-term incentive program (MLTIP) due to application of similar approach to the grants.

TCS Group Holding PLC Notes to the Consolidated Financial Statements – 31 December 2021
104
39 Related Party Transactions (Continued)
Participants of the program receive the vested parts of their grants provided that they remain employed by the Group throughout the vesting period. Participants are entitled to the dividends, if any.
Participants who leave the Group lose their right for the unvested parts of the grants. The program provides 3 equal annual vestings after grant date. The expenses related to those participants who are considered to be key management personnel are disclosed in the table above.
Management long-term incentive program. On 31 March 2016 the Group introduced a MLTIP as both a long-term incentive and a retention tool for the management of the Group. Total number of GDRs attributable to the management is 17,241 thousand as at 31 December 2021 (2020: 15,290 thousand).
Participants of the program receive the vested parts of their grants provided that they remain employed by the Group throughout the vesting period. Participants are entitled to the dividends, if any. Participants who leave the Group lose their right for the unvested parts of the grants.
The fair value of the awards as at grant dates (31 March 2016, 8 February 2017, 22 February 2018, 15 January 2019, 5 June 2020, 11 December 2020, 9 February 2021 and 23 November 2021) is determined on the basis of market quotes of GDRs as at those dates. Weighted-average fair value of the awards in 2021 was USD 87 per 1 GDR (2020: USD 24.7 per 1 GDR).
Each grant before 2020 is divided into 4 equal awards. Each award vests over 4 years in equal tranches. The delivery dates as of which the GDRs are allowed to be sold by the participants correspond to the vesting dates 31 March, as well as each subsequent 31 March (with the exception of 2019 when the vesting date for all participants was 31 January 2019) until 2022 for participants joining in 2016, until 2023 for participants joining in 2017, until 2024 for participants joining in 2018, until 2025 for participants joining in 2019.
Each grant provided in 2020 and 2021 is vested over 5 years. The delivery dates as of which the GDRs are allowed to be sold by the participants correspond to the vesting dates 31 August, as well as each subsequent 31 August until 2025 for 2020 grant and until 2026 for 2021 grant.
The following table discloses the changes in the numbers of GDRs attributable to the MLTIP:
In thousands Number of GDRs
attributable to the MLTIP
At 31 December 2019 3,782
Granted 5,350 Vested (1,810) Forfeited (46)
At 31 December 2020 7,276
Granted 1,950 Vested (2,201) Forfeited (6)
At 31 December 2021 7,019

TCS Group Holding PLC Notes to the Consolidated Financial Statements – 31 December 2021
105
40 Events after the End of the Reporting Period
On 1 January 2022 the Group reclassified RR 122,805 million of government bonds, previously accounted under “Hold to collect and sell” business model into “‘Hold to collect” accounted for amortised cost, with subsequent reversal of RR 14,867 million of negative revaluation reserve recognised through other comprehensive income. The Group managed the reclassified assets under “Hold to collect” business model and made no sale of these government bonds throughout 2021.
In February 2022, the economic situation in Russia was negatively affected by the military-political conflict in the region, as well as expanded international sanctions against certain Russian companies, citizens and institutions. These factors led to a significant increase in volatility in the financial markets, frequent and significant price changes, and an increase in trading spreads.
During the period from 18 February to 3 March 2022:
• the exchange rate of the Central Bank of the Russian Federation (the CBR) fluctuated in the range from 75.57 to 103.25 rubles per USD and from 86.13 rubles to 114.55 rubles per Euro;
• RTS stock index fluctuated in the range from 616.7 to 1391.3 points;
• the international sanctions list was expanded, which meant that the access for some companies to international financial markets in order to raise funds was limited;
• the cost of a barrel of oil on international markets is in the range from $92.73 to $113 USD per 1 barrel.
Because of the increased volatility in the financial sector, the CBR introduced a number of support measures, being:
• The ability to report shares and bonds acquired before 18 February 2022 at market value as of 18 February 2022, and acquired from 18 February to 31 December 2022 - at fair value as of the acquisition date. Applicable for the purposes of regulatory reporting. Effective until 31 December 2022.
• The ability to use the values of foreign exchange rates as of 18 February 2022. Applicable for the purposes of regulatory reporting. Effective until 31 December 2022.
• Relaxation of short-term liquidity ratios for systemically important banks and brokers. Effective until 31 December 2022.
• Providing additional liquidity for up to RR 3 trillion to systemically important banks through the mechanism of REPO transactions.
• To improve the ability of banks to manage liquidity, the CBR intends to reduce to zero the additional and increased additional rates of insurance premiums for banks participating in the deposit insurance system for deposits in rubles and foreign currency attracted in the first and second quarters.
• The ability not to decrease the estimates of borrowers’ financial standing and debt service quality for loan loss provisioning purposes if borrowers’ financial standing deteriorated after 18 February 2022 as a result of the sanctions. Applicable for the purposes of regulatory reporting. Effective until 31 December 2022.
• The ability to use the assessments made as of 18 February 2022 for the assets recorded on banks’ balance sheets for loan loss provisioning on loans where security assets are classified under quality category I and II. Applicable for the purposes of regulatory reporting. Effective until 31 December 2022.
• The implementation of the countercyclical macroprudential policy (release of the accumulated macroprudential capital buffer for unsecured consumer loans and mortgage loans in rubles and foreign currency), starting from 28 February 2022. This measure has no time limit. The value of add-ons to risk weights for new claims issued after 1 March 2022 are released or decreased.
The CBR’s Board of Directors decided to increase the key rate to 20% per annum from 28 February 2022 to support financial and price stability and protect the savings of citizens from depreciation.

TCS Group Holding PLC Notes to the Consolidated Financial Statements – 31 December 2021
106
40 Events After the End of the Reporting Period (Continued)
After the official publication of the regulation and until 30 June 2022, the restriction on the effective interest rate of consumer loans for banks will be temporarily suspended. At the same time, the current macroprudential add-on matrix for newly provided unsecured consumer loans remains unchanged (higher add-ons for high EIRs) and will encourage banks to raise interest rates on loans to individuals in a limited manner.
As at 3 March 2022 the Group complied with all the required ratios including capital adequacy and liquidity ratios.
The Group has formed in advance a liquidity reserve, including cash in rubles and foreign currency, to provide stability to the customer service and the stability of the Group. All necessary measures have been taken to ensure uninterrupted non-cash payments and meet the needs of the Group's customers, backing cash desks and ATMs with cash banknotes. Under the different stress scenarios the Group has in place different plans and options all of which are at present available to the management to meet the range of reasonable possible challenges. The plans include a wide range of measures aimed at protecting the funds, assets and interests of customers, as well as ensuring the regular operation of all functions.
The Group maintains adequate capital and liquidity and closely monitors its foreign exchange position and cash flow.
The Group has all the necessary technological capabilities for maintaining its operations without interruptions.
As of 3 March 2022, the Group is not subject to any sanctions. However, further expansion of the sanctions list, the shutdown of the SWIFT system for some Russian banks, the possible introduction of restrictions on the CBR and a number of companies, including customers and counterparties of the Group, may have a significant impact on the activities and financial position of the Group in the future, the consequences of which are difficult to predict. The future economic and regulatory environment and its impact on the Group's operations may differ from management's current expectations.
The Management of the Group is currently assessing the possible impact of the events mentioned above and taking all the necessary measures to ensure the sustainability of the Group's operations.
41 Significant Accounting Policies
Basis of preparation. These consolidated financial statements have been prepared in accordance with International Financial Reporting Standards (“IFRS”) as adopted by the European Union (EU) and the requirements of the Cyprus Companies Law Cap.113.
The consolidated financial statements have been prepared under the historical cost convention, as modified by the initial recognition of financial instruments based on fair value, and by revaluation of financial instruments categorised at fair value through profit or loss (“FVTPL”) and at fair value through other comprehensive income (“FVOCI”). The principal accounting policies applied in the preparation of these consolidated financial statements are set out below. These policies have been consistently applied to all the periods presented, unless otherwise stated. Refer to Note 42. Management prepared these consolidated financial statements on a going concern basis.
Consolidated financial statements. Subsidiaries are those investees, including structured entities, that the Group controls because the Group (i) has power to direct relevant activities of the investees that significantly affect their returns, (ii) has exposure, or rights, to variable returns from its involvement with the investees, and (iii) has the ability to use its power over the investees to affect the amount of investor’s returns. The existence and effect of substantive rights, including substantive potential voting rights, are considered when assessing whether the Group has power over another entity. For a right to be substantive, the holder must have practical ability to exercise that right when decisions about the direction of the relevant activities of the investee need to be made. The Group may have power over an investee even when it holds less than majority of voting power in an investee.

TCS Group Holding PLC Notes to the Consolidated Financial Statements – 31 December 2021
107
41 Significant Accounting Policies (Continued)
In such a case, the Group assesses the size of its voting rights relative to the size and dispersion of holdings of the other vote holders to determine if it has de-facto power over the investee. Protective rights of other investors, such as those that relate to fundamental changes of investee’s activities or apply only in exceptional circumstances, do not prevent the Group from controlling an investee.
Subsidiaries are consolidated from the date on which control is transferred to the Group (acquisition date) and are deconsolidated from the date on which control ceases.
The acquisition method of accounting is used to account for the acquisition of subsidiaries other than those acquired from parties under common control. Identifiable assets acquired and liabilities and contingent liabilities assumed in a business combination are measured at their fair values at the acquisition date, irrespective of the extent of any non-controlling interest.
The Group measures non-controlling interest that represents present ownership interest and entitles the holder to a proportionate share of net assets in the event of liquidation on a transaction by transaction basis, either at: (a) fair value, or (b) the non-controlling interest's proportionate share of net assets of the acquiree. Non-controlling interests that are not present ownership interests are measured at fair value.
Goodwill is measured by deducting the net assets of the acquiree from the aggregate of the consideration transferred for the acquiree, the amount of non-controlling interest in the acquiree and fair value of an interest in the acquiree held immediately before the acquisition date. Any negative amount (“negative goodwill”) is recognised in profit or loss, after management reassesses whether it identified all the assets acquired and all liabilities and contingent liabilities assumed, and reviews appropriateness of their measurement.
The consideration transferred for the acquiree is measured at the fair value of the assets given up, equity instruments issued and liabilities incurred or assumed, including fair value of assets or liabilities from contingent consideration arrangements, but excludes acquisition related costs such as advisory, legal, valuation and similar professional services. Transaction costs incurred for issuing equity instruments are deducted from equity; transaction costs incurred for issuing debt are deducted from its carrying amount and all other transaction costs associated with the acquisition are expensed.
Intercompany transactions, balances and unrealised gains on transactions between group companies are eliminated; unrealised losses are also eliminated unless the cost cannot be recovered. The Company and all of its subsidiaries use uniform accounting policies consistent with the Group’s policies.
Non-controlling interest is that part of the net results and of the equity of a subsidiary attributable to interests which are not owned, directly or indirectly, by the Group. Non-controlling interest forms a separate component of the Group’s equity. When the Group acquires a dormant company with no business operations holding an asset and this asset is the main reason of acquisition of the company such transaction is treated as an asset acquisition. No goodwill is recognized as a result of such acquisition.
Purchases and sales of non-controlling interests. The Group applies the economic entity model to account for transactions with owners of non-controlling interest. Any difference between the purchase consideration and the carrying amount of non-controlling interest acquired is recorded as a capital transaction directly in equity. The Group recognises the difference between sales consideration and carrying amount of non-controlling interest sold as a capital transaction in the consolidated statement of changes in equity.
Associates. Associates are entities over which the Group has significant influence (directly or indirectly), but not control, generally accompanying a shareholding of between 20 and 50 percent of the voting rights. Investments in associates are accounted for using the equity method of accounting and are initially recognised at cost. The carrying amount of associates includes goodwill identified on acquisition less accumulated credit losses, if any. Dividends received from associates reduce the carrying value of the investment in associates. Other post-acquisition changes in Group’s share of net assets of an associate are recognised as follows: (i) the Group’s share of profits or losses of associates is recorded in the consolidated profit or loss for the year as share of result of associates, (ii) the Group’s share of other comprehensive income is recognised in other comprehensive income and presented separately, (iii); all other changes in the Group’s share of the carrying value of net assets of associates are recognised in profit or loss within the share of result of associates.

TCS Group Holding PLC Notes to the Consolidated Financial Statements – 31 December 2021
108
41 Significant Accounting Policies (Continued)
However, when the Group’s share of losses in an associate equals or exceeds its interest in the associate, including any other unsecured receivables, the Group does not recognise further losses, unless it has incurred obligations or made payments on behalf of the associate. Otherwise the Group continue to recognise further losses if it has commitments to fund the associate’s operations.
Unrealised gains on transactions between the Group and its associates are eliminated to the extent of the Group’s interest in the associates; unrealised losses are also eliminated unless the transaction provides evidence of an impairment of the asset transferred.
The Group applies the impairment requirements in IFRS 9 to long-term loans and similar long-term interest that in substance form part of the investment in associate before reducing the carrying value of the investment by a share of a loss of the investee that exceeds the amount of the Group’s interest in the ordinary shares.
Disposals of subsidiaries, associates or joint ventures. When the Group ceases to have control or significant influence, any retained interest in the entity is remeasured to its fair value, with the change in carrying amount recognised in profit or loss. The fair value is the initial carrying amount for the purposes of subsequently accounting for the retained interest as an associate, joint venture or financial asset. In addition, any amounts previously recognised in other comprehensive income in respect of that entity, are accounted for as if the Group had directly disposed of the related assets or liabilities. This may mean that amounts previously recognised in other comprehensive income are recycled to profit or loss.
If the ownership interest in an associate is reduced but significant influence is retained, only a proportionate share of the amounts previously recognised in other comprehensive income are reclassified to profit or loss, where appropriate.
Financial instruments – key measurement terms. Depending on their classification financial instruments are carried at fair value or amortised cost as described below.
Fair value is the price that would be received to sell an asset or paid to transfer a liability in an orderly transaction between market participants at the measurement date. The best evidence of fair value is price in an active market. An active market is one in which transactions for the asset or liability take place with sufficient frequency and volume to provide pricing information on an ongoing basis. Fair value of financial instruments traded in an active market is measured as the product of the quoted price for the individual asset or liability and the quantity held by the entity. This is the case even if a market’s normal daily trading volume is not sufficient to absorb the quantity held and placing orders to sell the position in a single transaction might affect the quoted price.
The price within the bid-ask spread which management considers to be the most representative of fair value for quoted financial assets and liabilities is the last bid price of the business day. A portfolio of financial derivatives or other financial assets and liabilities that are not traded in an active market is measured at the fair value of a group of financial assets and financial liabilities on the basis of the price that would be received to sell a net long position (an asset) for a particular risk exposure or paid to transfer a net short position (a liability) for a particular risk exposure in an orderly transaction between market participants at the measurement date.
This is applicable for assets carried at fair value on a recurring basis if the Group: (a) manages the group of financial assets and financial liabilities on the basis of the entity’s net exposure to a particular market risk (or risks) or to the credit risk of a particular counterparty in accordance with the entity’s documented risk management or investment strategy; (b) it provides information on that basis about the group of assets and liabilities to the entity’s key management personnel; and (c) the market risks, including duration of the entity’s exposure to a particular market risk (or risks) arising from the financial assets and financial liabilities is substantially the same.
Valuation techniques such as discounted cash flow models or models based on recent arm’s length transactions or consideration of financial data of the investees, are used to measure fair value of certain financial instruments for which external market pricing information is not available.

TCS Group Holding PLC Notes to the Consolidated Financial Statements – 31 December 2021
109
41 Significant Accounting Policies (Continued)
Fair value measurements are analysed by level in the fair value hierarchy as follows: (i) level one are measurements at quoted prices (unadjusted) in active markets for identical assets or liabilities, (ii) level two measurements are valuations techniques with all material inputs observable for the asset or liability, either directly (that is, as prices) or indirectly (that is, derived from prices), and (iii) level three measurements are valuations not based on solely observable market data (that is, the measurement requires significant unobservable inputs). Transfers between levels of the fair value hierarchy are deemed to have occurred at the end of the reporting period. Refer to Note 37.
Transaction costs are incremental costs that are directly attributable to the acquisition, issue or disposal of a financial instrument. An incremental cost is one that would not have been incurred if the transaction had not taken place. Transaction costs include fees and commissions paid to agents (including employees acting as selling agents), advisors, brokers and dealers, levies by regulatory agencies and securities exchanges, and transfer taxes and duties. Transaction costs do not include debt premiums or discounts, financing costs or internal administrative or holding costs.
Amortised cost (“AC”) is the amount at which the financial instrument was recognised at initial recognition less any principal repayments, plus accrued interest, and for financial assets less any allowance for expected credit losses. Accrued interest includes amortisation of transaction costs deferred at initial recognition and of any premium or discount to maturity amount using the effective interest method. Accrued interest income and accrued interest expense, including both accrued coupon and amortised discount or premium (including fees deferred at origination, if any), are not presented separately and are included in the carrying values of related items in the consolidated statement of financial position.
The effective interest method is a method of allocating interest income or interest expense over the relevant period, so as to achieve a constant periodic rate of interest (effective interest rate) on the carrying amount. The effective interest rate is the rate that exactly discounts estimated future cash payments or receipts (excluding future credit losses) through the expected life of the financial instrument or a shorter period, if appropriate, to the gross carrying amount of a financial asset or to the amortised cost of a financial liability.
The calculation does not consider expected credit losses and includes transaction costs, premiums or discounts and fees and points paid or secured that are integral to the effective interest rate such as origination fees.
The effective interest rate discounts cash flows of variable interest instruments to the next interest repricing date, except for the premium or discount, which reflects the credit spread over the floating rate specified in the instrument, or other variables that are not reset to market rates. Such premiums or discounts are amortised over the whole expected life of the instrument. The present value calculation includes all fees paid or received between parties to the contract that are an integral part of the effective interest rate.
For assets that are purchased or originated credit impaired (“POCI”) at initial recognition, the effective interest rate is adjusted for credit risk, i.e. it is calculated based on the expected cash flows on initial recognition instead of contractual payments.
Financial instruments – initial recognition. Financial instruments at FVTPL are initially recorded at fair value. All other financial instruments are initially recorded at fair value adjusted for transaction costs that are incremental and directly attributable to the acquisition or the issue of the financial asset or financial liability. Fair value at initial recognition is best evidenced by the transaction price. A gain or loss on initial recognition is only recorded if there is a difference between fair value and transaction price which can be evidenced by other observable current market transactions in the same instrument or by a valuation technique whose inputs include only data from observable markets.
After the initial recognition, an ECL allowance is recognised for financial assets measured at AC and investments in debt instruments measured at FVOCI, resulting in an immediate accounting loss.
All purchases and sales of financial assets that require delivery within the time frame established by regulation or market convention (“regular way” purchases and sales) are recorded at trade date, which is the date on which the Group commits to deliver a financial asset.

TCS Group Holding PLC Notes to the Consolidated Financial Statements – 31 December 2021
110
41 Significant Accounting Policies (Continued)
The Group uses discounted cash flow valuation techniques to determine the fair value of currency swaps, foreign exchange forwards that are not traded in an active market. Differences may arise between the fair value at initial recognition, which is considered to be the transaction price, and the amount determined at initial recognition using a valuation technique. The differences are immediately recognised in profit or loss if the valuation uses only level 1 or level 2 inputs.
Financial assets – classification and subsequent measurement – measurement categories. The Group classifies financial assets in the following measurement categories: FVTPL, FVOCI and AC. The classification and subsequent measurement of debt financial assets depends on:
• the Group’s business model for managing the related assets portfolio and
• the cash flow characteristics of the asset.
Financial assets – classification and subsequent measurement – business model. The business model reflects how the Group manages the assets in order to generate cash flows – whether the Group’s objective is:
• solely to collect the contractual cash flows from the assets (“hold to collect contractual cash flows”); or
• to collect both the contractual cash flows and the cash flows arising from the sale of assets (“hold to collect contractual cash flows and sell”);
• if neither of i) and ii) is applicable, the financial assets are classified as part of “other” business model and measured at FVTPL.
Business model is determined for a group of assets (on a portfolio level) based on all relevant evidence about the activities that the Group undertakes to achieve the objective set out for the portfolio available at the date of the assessment. Factors considered by the Group in determining the business model include the purpose and composition of a portfolio, past experience on how the cash flows for the respective assets were collected, how risks are assessed and managed, how the assets’ performance is assessed and how managers are compensated.
Based on the analysis performed the Group included the following financial instruments in the business model “hold to collect contractual cash flows” since the Group manages these financial instruments solely to collect contractual cash flows: cash and cash equivalents, mandatory cash balances with the CBRF, due from other banks, loans and advances to customers, guarantee deposits with payment systems, brokerage receivables and other financial assets. The Group included debt securities at FVOCI in the business model “hold to collect contractual cash flows and sell” since the Group manages these financial instruments to collect both the contractual cash flows and the cash flows arising from the sale of assets. The Group included debt securities measured at FVTPL and financial derivatives in the business model “other”.
Financial assets – classification and subsequent measurement – cash flow characteristics. Where the business model is to hold assets to collect contractual cash flows or to hold contractual cash flows and sell, the Group assesses whether the cash flows represent solely payments of principal and interest (the SPPI test). Financial assets with embedded derivatives are considered in their entirety when determining whether their cash flows are consistent with the SPPI feature.
In making this assessment, the Group considers whether the contractual cash flows are consistent with a basic lending arrangement, i.e. interest includes only consideration for credit risk, time value of money, other basic lending risks and profit margin.
Where the contractual terms introduce exposure to risk or volatility that is inconsistent with a basic lending arrangement, the financial asset is classified and measured at FVTPL. The SPPI assessment is performed on initial recognition of an asset and it is not subsequently reassessed. However, if the contractual terms of the asset are modified, the Group considers if the contractual cash flows continue to be consistent with a basic lending arrangement in assessing whether the modification is substantial. See below for “Financial assets – modification”.

TCS Group Holding PLC Notes to the Consolidated Financial Statements – 31 December 2021
111
41 Significant Accounting Policies (Continued)
Financial assets – reclassification. Financial instruments are reclassified only when the business model for managing the portfolio as a whole changes. The reclassification has a prospective effect and takes place from the beginning of the first reporting period that follows after the change in the business model. The Group did not change its business model during the current and comparative period and did not make any reclassifications.
Financial assets – impairment – credit loss allowance for ECL. The Group assesses on a forward-looking basis the ECL for debt instruments (including loans) measured at AC and FVOCI and for the exposure arising from loan commitments and financial guarantee contracts. The Group measures ECL and recognises credit loss allowance at each reporting date.
The measurement of ECL reflects:
1) an unbiased and probability weighted amount that is determined by evaluating a range of possible outcomes;
2) the time value of money; and
3) all reasonable and supportable information that is available without undue cost and effort at the end of each reporting period about past events, current conditions and forecasts of future conditions.
Debt instruments measured at AC are presented in the consolidated statement of financial position net of the allowance for ECL.
For loan commitments (where those components can be separated from the loan) and financial guarantees, a separate provision for ECL is recognised as a financial liability in the consolidated statement of financial position. For debt instruments at FVOCI, changes in amortised cost, net of allowance for ECL, are recognised in profit or loss and other changes in carrying value are recognised in OCI as gains less losses on debt instruments at FVOCI.
The Group applies a “three stage” model for impairment in accordance with IFRS 9, based on changes in credit quality since initial recognition:
1) A financial instrument that is not credit-impaired on initial recognition is classified in Stage 1. Financial assets in Stage 1 have their ECL measured at an amount equal to the portion of lifetime ECL that results from default events possible within the next 12 months or until contractual maturity, if shorter (“12 months ECL”).
2) If the Group identifies a significant increase in credit risk (“SICR”) since initial recognition, the asset is transferred to Stage 2 and its ECL is measured based on ECL on a lifetime basis, that is, up until contractual maturity but considering expected prepayments, if any (“lifetime ECL”). Refer to Note 30 for a description of how the Group determines when a SICR has occurred.
3) If the Group determines that a financial asset is credit-impaired, the asset is transferred to Stage 3 and its ECL is measured as a lifetime ECL. Refer to Note 30 for a description of how the Group defines credit-impaired assets and default.
For financial assets that are purchased or originated credit-impaired (“POCI Assets”), the ECL is always measured at a lifetime ECL. Note 30 provides information about inputs, assumptions and estimation techniques used in measuring ECL, including an explanation of how the Group incorporates forward-looking information in the ECL models.
As an exception, for certain financial instruments, such as credit cards, that may include both a loan and an undrawn commitment component, the Group measures expected credit losses over the period that the Group is exposed to credit risk, that is, until the expected credit losses would be mitigated by credit risk management actions, even if that period extends beyond the maximum contractual period. This is because contractual ability to demand repayment and cancel the undrawn commitment does not limit the exposure to credit losses to such contractual notice period. Refer to Note 3 for critical judgements applied by the Group in determining the period for measuring ECL.

TCS Group Holding PLC Notes to the Consolidated Financial Statements – 31 December 2021
112
41 Significant Accounting Policies (Continued)
Financial assets – write-off. Uncollectible assets are partly written-off against the related сredit loss allowance usually after one year since they become overdue. The amount of uncollectible part of loan is estimated on a loan portfolio basis taking into account defaulted loans recovery statistics. The Group writes-off financial assets that are mostly still subject to enforcement activity, however, there is no reasonable expectation of recovery. If credit-impaired loans are sold to third parties, the Group remeasures the amount of ECL prior to sale taking into consideration the expected sales proceeds so that there are no gains or losses on derecognition upon sale.
Repayments of written-off loans. Recovery of amounts previously written-off as uncollectible is credited directly to the credit loss allowance line in the consolidated statement of profit or loss and other comprehensive income. Cash flows related to repayments of written-off loans are separately presented within recoveries from written-off loan in the consolidated statement of cash flows.
Financial assets – derecognition. The Group derecognises financial assets when (a) the assets are redeemed or the rights to cash flows from the assets otherwise expired or (b) the Group has transferred the rights to the cash flows from the financial assets or entered into a qualifying pass-through arrangement while (i) also transferring substantially all risks and rewards of ownership of the assets or (ii) neither transferring nor retaining substantially all risks and rewards of ownership, but not retaining control. Control is retained if the counterparty does not have the practical ability to sell the asset in its entirety to an unrelated third party without needing to impose restrictions on the sale.
Financial assets – modification. The Group sometimes renegotiates or otherwise modifies the contractual terms of the financial assets. The Group assesses whether the modification of contractual cash flows is substantial considering, among other, the following factors: any new contractual terms that substantially affect the risk profile of the asset, significant change in interest rate, change in the currency denomination, new collateral or credit enhancement that significantly affects the credit risk associated with the asset, or a significant extension of a loan when the borrower is not in financial difficulties.
If the modified terms are substantially different, the rights to cash flows from the original asset expire and the Group derecognises the original financial asset and recognises a new asset at its fair value. The date of renegotiation is considered to be the date of initial recognition for subsequent impairment calculation purposes, including determining whether a SICR has occurred.
The Group also assesses whether the new loan or debt instrument meets the SPPI criterion. Any difference between the carrying amount of the original asset derecognised and fair value of the new substantially modified asset is recognised in profit or loss, unless the substance of the difference is attributed to a capital transaction with owners.
In a situation where the renegotiation was driven by financial difficulties of the counterparty and inability to make the originally agreed payments, the Group compares the original and revised expected cash flows to assets whether the risks and rewards of the asset are substantially different as a result of the contractual modification. If the risks and rewards do not change, the modified asset is not substantially different from the original asset and the modification does not result in derecognition.
The Group recalculates the gross carrying amount by discounting the modified contractual cash flows by the original effective interest rate (or credit-adjusted effective interest rate for POCI financial assets) and recognises a modification gain or loss through a credit loss allowance. Usually modifications of stage 3 loans do not result in derecognition since they do not change the expected cash flows substantially and represent the way of collection of past due balances.
Financial liabilities – measurement categories. Financial liabilities are classified as subsequently measured at AC, except for financial liabilities at FVTPL: this classification is applied to derivatives, financial liabilities held for trading (e.g. short positions in securities).
Financial liabilities – derecognition. Financial liabilities are derecognised when they are extinguished (i.e. when the obligation specified in the contract is discharged, cancelled or expires).

TCS Group Holding PLC Notes to the Consolidated Financial Statements – 31 December 2021
113
41 Significant Accounting Policies (Continued)
An exchange between the Group and its original lenders of debt instruments with substantially different terms, as well as substantial modifications of the terms and conditions of existing financial liabilities, are accounted for as an extinguishment of the original financial liability and the recognition of a new financial liability. The terms are substantially different if the discounted present value of the cash flows under the new terms, including any fees paid net of any fees received and discounted using the original effective interest rate, is at least 10% different from the discounted present value of the remaining cash flows of the original financial liability.
In addition, other qualitative factors, such as the currency that the instrument is denominated in, changes in the type of interest rate, new conversion features attached to the instrument and change in loan covenants are also considered. If an exchange of debt instruments or modification of terms is accounted for as an extinguishment, any costs or fees incurred are recognised as part of the gain or loss on the extinguishment. If the exchange or modification is not accounted for as an extinguishment, any costs or fees incurred adjust the carrying amount of the liability and are amortised over the remaining term of the modified liability.
Modifications of liabilities that do not result in extinguishment are accounted for as a change in estimate using a cumulative catch up method, with any gain or loss recognised in profit or loss, unless the economic substance of the difference in carrying values is attributed to a capital transaction with owners.
Cash and cash equivalents. Cash and cash equivalents are short-term, highly liquid investments that are readily convertible to known amounts of cash and which are subject to an insignificant risk of changes in value. Cash and cash equivalents include all interbank placements and reverse sale and repurchase agreements with other banks with original maturities of less than three months. Funds restricted for a period of more than three months on origination are excluded from cash and cash equivalents. Cash and cash equivalents are carried at amortised cost as: (i) they are held for collection of contractual cash flows and those cash flows represent SPPI, and (ii) they are not designated at FVTPL.
The payments or receipts presented in the consolidated statement of cash flows represent transfers of cash and cash equivalents by the Group, including amounts charged or credited to current accounts of the Group’s counterparties held with the Group, such as loan interest income or principal collected by charging the customer’s current account or interest payments or disbursement of loans credited to the customer’s current account, which represents cash or cash equivalent from the customer’s perspective.
Brokerage receivables and brokerage payables. Brokerage receivables represent placements under reverse sale and repurchase agreements made by the Bank with central counterparty to provide customers of the Bank who have brokerage accounts with the Bank with possibility to acquire securities in case those customers have insufficient own funds to acquire those securities. Brokerage payables represent funds attracted under sale and repurchase agreements made by the Bank with central counterparty to provide customers of the Bank who have brokerage accounts with the Bank with the possibility to borrow securities and make a short sale. Brokerage receivables and payables are short-term and accounted at amortised cost.
Mandatory cash balances with the CBRF. Mandatory cash balances with the CBRF are carried at amortised cost and represent non-interest bearing mandatory reserve deposits which are not available to finance the Group’s day to day operations and hence are not considered as part of cash and cash equivalents for the purposes of the consolidated statement of cash flows.
Due from other banks. Amounts due from other banks are recorded when the Group advances money to counterparty banks with no intention of trading the resulting unquoted non-derivative receivable due on fixed or determinable dates. Amounts due from other banks are carried at amortised cost as: (i) they are held for collection of contractual cash flows and those cash flows represent SPPI, and (ii) they are not designated at FVTPL.
Certain bank deposits are subject to the “bail-in” legislation that permits or requires a national resolving authority to impose losses on holders in particular circumstances. Where the bail-in clauses are included in the contractual terms of the instrument and would apply even if legislation subsequently changes, the SPPI test is not met and such instruments are mandatorily measured at FVTPL. The Group did not identify such balances due from other banks.

TCS Group Holding PLC Notes to the Consolidated Financial Statements – 31 December 2021
114
41 Significant Accounting Policies (Continued)
Where such clauses in the contract merely acknowledge the existence of the legislation and do not create any additional rights or obligation for the Group, the SPPI criterion is met and the respective instruments are carried at AC.
Investments in debt securities. Based on the business model and the contractual cash flow characteristics, the Group classifies investments in debt securities as carried at AC, FVOCI or FVTPL.
Debt securities are carried at AC if they are held for collection of contractual cash flows and where those cash flows represent SPPI, and if they are not voluntarily designated at FVTPL in order to significantly reduce an accounting mismatch.
Debt securities are carried at FVOCI if they are held for collection of contractual cash flows and for selling, where those cash flows represent SPPI, and if they are not designated at FVTPL. Interest income from these assets is calculated using the effective interest method and recognised in profit or loss. An impairment allowance estimated using the expected credit loss model is recognised in profit or loss for the year. All other changes in the carrying value are recognised in OCI except for foreign exchange translation gains/(losses) and interest income calculated using the effective interest rate method. When the debt security is derecognised, the cumulative gain or loss previously recognised in OCI is reclassified from OCI to profit or loss.
Investments in debt securities are carried at FVTPL if they do not meet the criteria for AC or FVOCI. The Group may also irrevocably designate investments in debt securities at FVTPL on initial recognition if applying this option significantly reduces an accounting mismatch between financial assets and liabilities being recognised or measured on different accounting bases.
Loans and advances to customers. Loans and advances to customers are recorded when the Group advances money to purchase or originate a loan due from a customer.
Based on the business model and the cash flow characteristics, the Group classifies loans and advances to customers into one of the following measurement categories:
1) AC: loans that are held for collection of contractual cash flows and those cash flows represent SPPI and loans that are not voluntarily designated at FVTPL;
2) FVTPL: loans that do not meet the criteria for AC or FVOCI are measured at FVTPL (mandatory FVTPL).
Impairment allowances of the loans measured at AC are determined based on the forward-looking ECL model. Note 30 provides information about inputs, assumptions and estimation techniques used in measuring ECL, including an explanation of how the Group incorporates forward-looking information in the ECL models.
Credit related commitments. The Group issues commitments to provide loans. Commitments to provide loans are initially recognised at their fair value, which is normally evidenced by the amount of fees received. Such loan commitment fees are deferred and included in the carrying value of the loan on initial recognition. At the end of each reporting period, the commitments are measured at the amount of the loss allowance determined based on the expected credit loss model. For loan commitments (where those components can be separated from the loan), a separate provision for ECL is recognised as a liability in the consolidated statement of financial position.
Performance guarantees. Performance guarantees are contracts that provide compensation if another party fails to perform a contractual obligation. Such contracts transfer non-financial performance risk in addition to credit risk. Performance guarantees are initially recognised at their fair value, which is normally evidenced by the amount of fees received. This amount is amortised on a straight line basis over the life of the contract. At the end of each reporting period, the performance guarantee contracts are measured at the higher of (i) the unamortised balance of the amount at initial recognition and (ii) the best estimate of expenditure required to settle the contract at the end of each reporting period, discounted to present value.

TCS Group Holding PLC Notes to the Consolidated Financial Statements – 31 December 2021
115
41 Significant Accounting Policies (Continued)
Where the Group has the contractual right to revert to its customer for recovering amounts paid to settle the performance guarantee contracts, such amounts will be recognised as an asset upon transfer of the loss compensation to the guarantee’s beneficiary. These fees are recognised within fee and commission income in profit or loss.
Sale and repurchase agreements and lending of securities. Sale and repurchase agreements (“repo agreements”), which effectively provide a lender’s return to the counterparty, are treated as secured financing transactions. Securities sold under such sale and repurchase agreements are not derecognised. The securities are not reclassified in the consolidated statement of financial position unless the transferee has the right by contract or custom to sell or repledge the securities, in which case they are reclassified as repurchase receivables. The corresponding liability is presented within amounts due to other banks or other borrowed funds.
Securities purchased under agreements to resell (“reverse repo agreements”), which effectively provide a lender’s return to the Group, are recorded as due from other banks or loans and advances to customers, as appropriate. The difference between the sale and repurchase price, adjusted by interest and dividend income collected by the counterparty, is treated as interest income and accrued over the life of reverse repo agreements using the effective interest method.
Securities lent to counterparties for a fixed fee are retained in the consolidated financial statements in their original category in the consolidated statement of financial position unless the counterparty has the right by contract or custom to sell or repledge the securities, in which case they are reclassified and presented separately.
Securities borrowed for a fixed fee are not recorded in the consolidated financial statements, unless these are sold to third parties, in which case the purchase and sale are recorded in profit or loss for the year within gains less losses arising from trading securities. The obligation to return the securities is recorded at fair value in other borrowed funds.
Based on classification of securities sold under the sale and repurchase agreements, the Group classifies repurchase receivables into one of the following measurement categories: AC, FVOCI, FVTPL.
Guarantee deposits with payment systems. Amounts of guarantee deposits with payment systems are recorded when the Group advances money to payment systems with no intention of trading the resulting unquoted non-derivative receivable. Amounts of guarantee deposits with payment systems are carried at amortised cost.
Tangible fixed assets. Tangible fixed assets are stated at cost less accumulated depreciation and provision for impairment, where required.
Costs of minor repairs and day-to-day maintenance are expensed when incurred. Costs of replacing major parts or components of premises and equipment items are capitalised, and the replaced part is retired.
At the end of each reporting period management assesses whether there is any indication of impairment of tangible fixed assets. If any such indication exists, management estimates the recoverable amount, which is determined as the higher of an asset’s fair value less costs to sell and its value in use. The carrying amount is reduced to the recoverable amount and the impairment loss is recognised in profit or loss for the year. An impairment loss recognised for an asset in prior years is reversed if there has been a change in the estimates used to determine the asset’s value in use or fair value less costs to sell.
Gains and losses on disposals determined by comparing proceeds with carrying amount are recognised in profit or loss for the year (within other operating income or expenses).
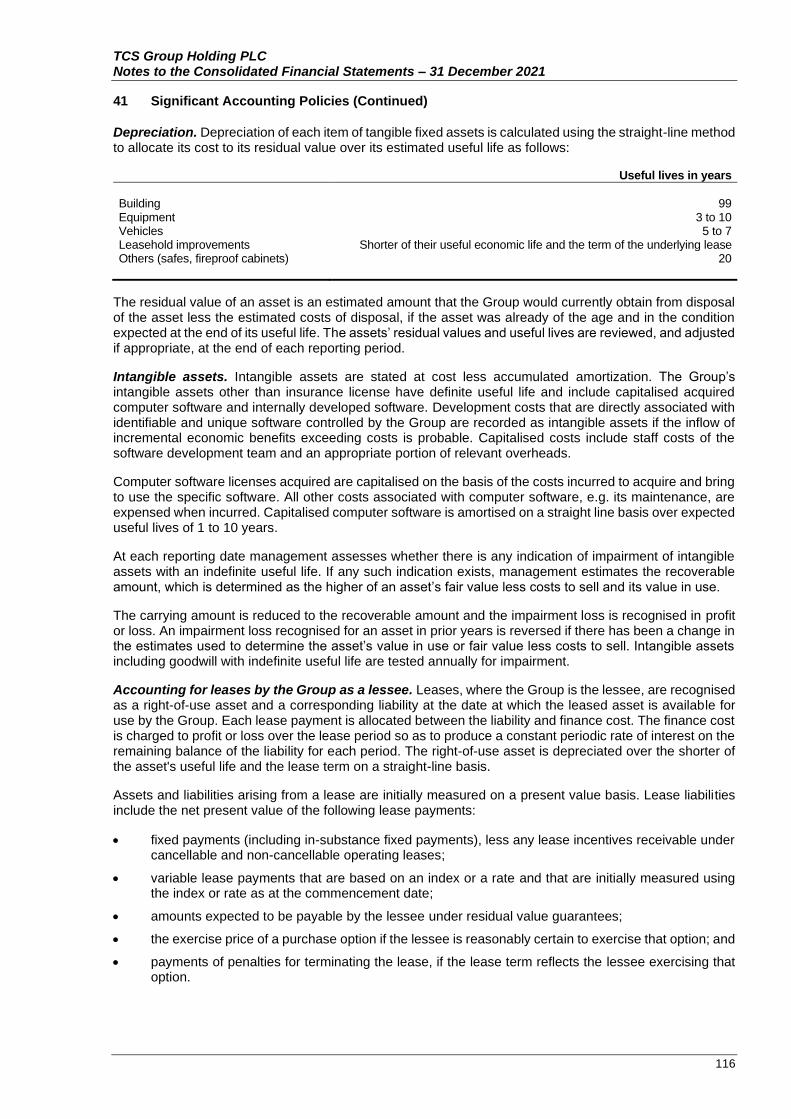
TCS Group Holding PLC Notes to the Consolidated Financial Statements – 31 December 2021
116
41 Significant Accounting Policies (Continued)
Depreciation. Depreciation of each item of tangible fixed assets is calculated using the straight-line method to allocate its cost to its residual value over its estimated useful life as follows:
Useful lives in years
Building 99 Equipment 3 to 10 Vehicles 5 to 7 Leasehold improvements Shorter of their useful economic life and the term of the underlying lease Others (safes, fireproof cabinets) 20
The residual value of an asset is an estimated amount that the Group would currently obtain from disposal of the asset less the estimated costs of disposal, if the asset was already of the age and in the condition expected at the end of its useful life. The assets’ residual values and useful lives are reviewed, and adjusted if appropriate, at the end of each reporting period.
Intangible assets. Intangible assets are stated at cost less accumulated amortization. The Group’s intangible assets other than insurance license have definite useful life and include capitalised acquired computer software and internally developed software. Development costs that are directly associated with identifiable and unique software controlled by the Group are recorded as intangible assets if the inflow of incremental economic benefits exceeding costs is probable. Capitalised costs include staff costs of the software development team and an appropriate portion of relevant overheads.
Computer software licenses acquired are capitalised on the basis of the costs incurred to acquire and bring to use the specific software. All other costs associated with computer software, e.g. its maintenance, are expensed when incurred. Capitalised computer software is amortised on a straight line basis over expected useful lives of 1 to 10 years.
At each reporting date management assesses whether there is any indication of impairment of intangible assets with an indefinite useful life. If any such indication exists, management estimates the recoverable amount, which is determined as the higher of an asset’s fair value less costs to sell and its value in use.
The carrying amount is reduced to the recoverable amount and the impairment loss is recognised in profit or loss. An impairment loss recognised for an asset in prior years is reversed if there has been a change in the estimates used to determine the asset’s value in use or fair value less costs to sell. Intangible assets including goodwill with indefinite useful life are tested annually for impairment.
Accounting for leases by the Group as a lessee. Leases, where the Group is the lessee, are recognised as a right-of-use asset and a corresponding liability at the date at which the leased asset is available for use by the Group. Each lease payment is allocated between the liability and finance cost. The finance cost is charged to profit or loss over the lease period so as to produce a constant periodic rate of interest on the remaining balance of the liability for each period. The right-of-use asset is depreciated over the shorter of the asset's useful life and the lease term on a straight-line basis.
Assets and liabilities arising from a lease are initially measured on a present value basis. Lease liabilities include the net present value of the following lease payments:
• fixed payments (including in-substance fixed payments), less any lease incentives receivable under cancellable and non-cancellable operating leases;
• variable lease payments that are based on an index or a rate and that are initially measured using the index or rate as at the commencement date;
• amounts expected to be payable by the lessee under residual value guarantees;
• the exercise price of a purchase option if the lessee is reasonably certain to exercise that option; and
• payments of penalties for terminating the lease, if the lease term reflects the lessee exercising that option.

TCS Group Holding PLC Notes to the Consolidated Financial Statements – 31 December 2021
117
41 Significant Accounting Policies (Continued)
The lease term includes any non-cancellable and optional extension periods which have been assessed as reasonably certain to be exercised. The lease payments are discounted using the interest rate implicit in the lease. If that rate cannot be determined, the lessee’s incremental borrowing rate is used, being the rate that the lessee would have to pay to borrow the funds necessary to obtain an asset of similar value in a similar economic environment with similar terms and conditions.
Right-of-use assets are measured at cost comprising the following:
• the amount of the initial measurement of lease liability,
• any lease payments made at or before the commencement date less any lease incentives received,
• any initial direct costs, and
• dismantling and restoration costs.
As an exception to the above, the Group accounts for short-term leases and leases of low value assets by recognising the lease payments as an operating expense on a straight line basis. Short-term leases are leases with a lease term of 12 months or less, and the lease does not provide for the possibility of repurchase of the asset at the end of the contract. Low value assets are assets with a value of RR 300,000 or less at the date of conclusion of the contract.
Right-of-use assets are included in tangible fixed assets, lease liabilities are included in other non-financial liabilities in the consolidated statement of financial position. Depreciation of right-of-use assets are recognised in administrative and other operating expenses in the consolidated statement of profit or loss and other comprehensive income. Finance cost is recognised within other similar expense line of the consolidated statement of profit or loss and other comprehensive income. Repayment of principal of lease liabilities is disclosed within cash flows from financing activities of the consolidated statement of cash flows.
Due to other banks. Amounts due to banks are recorded when money or other assets are advanced to the Group by counterparty banks. Non-derivative liability is carried at amortised cost.
Customer accounts. Customer accounts are non-derivative liabilities to corporate entities and individuals and are carried at amortised cost.
Debt securities in issue. Debt securities are stated at amortised cost. If the Group purchases its own debt securities in issue, they are removed from the consolidated statement of financial position and the difference between the carrying amount of the liability and the consideration paid is included in a separate line of consolidated statement of profit or loss and other comprehensive income as gains/losses from repurchase of debt securities in issue.
Subordinated debt. Subordinated debt can only be paid in the event of a liquidation after the claims of other higher priority creditors have been met. Subordinated debt is carried at AC.
Financial derivatives. Financial derivatives represented by forwards and foreign currency swaps are carried at their fair value. Derivatives are carried as assets when fair value is positive and as liabilities when fair value is negative. Changes in the fair value of financial derivatives are recorded in profit or loss within Net (losses)/gains from derivatives revaluation. The Group does not apply hedge accounting.
Income taxes. Income taxes have been provided for in the consolidated financial statements in accordance with Russian legislation and Cyprus legislation enacted or substantively enacted by the end of the reporting period. The income tax charge comprises current tax and deferred tax and is recognised in profit or loss for the year except if it is recognised in other comprehensive income or directly in equity because it relates to transactions that are also recognised, in the same or a different period, in other comprehensive income or directly in equity.
Current tax is the amount expected to be paid to or recovered from the taxation authorities in respect of taxable profits or losses for the current and prior periods. Taxable profits or losses are based on estimates if the consolidated financial statements are authorised prior to filing relevant tax returns. Taxes other than on income are recorded within administrative and other operating expenses.

TCS Group Holding PLC Notes to the Consolidated Financial Statements – 31 December 2021
118
41 Significant Accounting Policies (Continued)
Deferred income tax is provided using the balance sheet liability method for tax loss carry forwards and temporary differences arising between the tax bases of assets and liabilities and their carrying amounts for financial reporting purposes. In accordance with the initial recognition exemption, deferred taxes are not recorded for temporary differences on initial recognition of an asset or a liability in a transaction other than a business combination if the transaction, when initially recorded, affects neither accounting nor taxable profit. Deferred tax balances are measured at tax rates enacted or substantively enacted at the end of reporting period which are expected to apply to the period when the temporary differences will reverse or the tax loss carry forwards will be utilised. Deferred tax assets and liabilities are netted only within the individual companies of the Group. Deferred tax assets for deductible temporary differences and tax loss carry forwards are recorded only to the extent that it is probable that future taxable profit will be available against which the deductions can be utilised.
Deferred income tax is not recognised on post-acquisition retained earnings and other post acquisition movements in reserves of subsidiaries, where the Group controls the subsidiary’s dividend policy and it is probable that the difference will not reverse through dividends or otherwise in the foreseeable future.
Uncertain tax positions. The Group's uncertain tax positions are assessed by management at the end of each reporting period. Liabilities are recorded for income tax positions that are determined by management as more likely than not to result in additional taxes being levied if the positions were to be challenged by the tax authorities. The assessment is based on the interpretation of tax laws that have been enacted or substantively enacted at the end of reporting period and any known court or other rulings on such issues.
Liabilities for penalties, interest and taxes other than on income are recognised based on management’s best estimate of the expenditure required to settle the obligations at the end of the reporting period.
Provisions for liabilities and charges. Provisions for liabilities and charges are non-financial liabilities of uncertain timing or amount. They are accrued when the Group has a present legal or constructive obligation as a result of past events, it is probable that an outflow of resources embodying economic benefits will be required to settle the obligation, and a reliable estimate of the amount of the obligation can be made.
Levies and charges, such as taxes other than income tax or regulatory fees based on information related to a period before the obligation to pay arises, are recognised as liabilities when the obligating event that gives rise to pay a levy occurs, as identified by the legislation that triggers the obligation to pay the levy. If a levy is paid before the obligating event, it is recognised as a prepayment.
Other liabilities. Other liabilities are accrued when the counterparty has performed its obligations under the contract and are carried at amortised cost.
Share capital. Ordinary shares are classified as equity. Incremental costs directly attributable to the issue of new shares are shown in equity as a deduction, net of tax, from the proceeds and debited against share premium.
Share premium. Share premium is the difference between the fair value of the consideration receivable for the issue of shares and the nominal value of the shares. The share premium account can only be resorted to for limited purposes, which do not include the distribution of dividends, and is otherwise subject to the provisions of the Cyprus Companies Law on reduction of share capital.
Treasury shares. Where the Company or its subsidiaries purchase the Company’s equity instruments, the consideration paid, including any directly attributable incremental external costs, net of income taxes, is deducted from equity attributable to the owners of the Company until the equity instruments are reissued, disposed of or cancelled. Where such shares are subsequently disposed of or reissued, any consideration received is included in equity. The value of GDRs transferred out of treasury shares for the purposes of the long-term incentive program for management of the Group are determined based on the weighted average cost.
Dividends. Dividends are recorded in equity in the period in which they are declared. Any dividends declared after the end of the reporting period and before the consolidated financial statements are authorised for issue, are disclosed in the Note 40. The accounting reports of the Group entities are the basis for profit distribution and other appropriations. The separate financial statements of the Company prepared in accordance with IFRS as adopted by the EU and in accordance with Cyprus Companies Law is the basis of available reserves for distribution.

TCS Group Holding PLC Notes to the Consolidated Financial Statements – 31 December 2021
119
41 Significant Accounting Policies (Continued)
Dividend distribution to the Company's shareholders is recognised as a liability in the Company's consolidated financial statements in the year in which the dividends are appropriately authorised and are no longer at the discretion of the Company. More specifically, interim dividends are recognised as a liability in the period in which these are authorised by the Board of directors and in the case of final dividends, these are recognised in the period in which these are approved by the Company's shareholders.
Interest income and expense recognition. Interest income and expense calculated using effective interest method are recorded for all debt instruments, other than those at FVTPL, on an accrual basis using the effective interest method. This method defers, as part of interest income or expense, all fees paid or received between the parties to the contract that are an integral part of the effective interest rate, transaction costs and all other premiums or discounts.
Fees integral to the effective interest rate include origination fees (e.g. interchange fee on credit card loans) received or paid by the entity relating to the creation or acquisition of a financial asset or issuance of a financial liability.
Commitment fees (e.g. annual fee on credit card loans) received by the Group to originate loans at market interest rates are integral to the effective interest rate if it is probable that the Group will enter into a specific lending arrangement and does not expect to sell the resulting loan shortly after origination. The Group does not designate loan commitments as financial liabilities at FVTPL.
For financial assets that are originated or purchased credit-impaired, the effective interest rate is the rate that discounts the expected cash flows (including the initial expected credit losses) to the fair value on initial recognition (normally represented by the purchase price). As a result, the effective interest is credit-adjusted.
Interest income is calculated by applying the effective interest rate to the gross carrying amount of financial assets, except for:
i) financial assets that have become credit-impaired (Stage 3), for which interest revenue is calculated by applying the effective interest rate to their AC (net of the ECL provision); and
ii) financial assets that are purchased or originated credit-impaired, for which the original credit-adjusted effective interest rate is applied to the AC.
Customer acquisition expense recognition. Customer acquisition expenses are represented by the costs incurred by the Group on services related to attraction of the client, mailing of advertising materials, processing of responses etc. Those costs, which can be directly attributed to the acquisition of a particular client, are included in the effective interest rate of the originated financial instruments; the remaining costs are expensed on the basis of the actual services provided.
Other income and expense recognition. All other income is generally recorded on an accrual basis by reference to completion of the specific performance obligation assessed on the basis of measurement of the Group’s progress towards complete satisfaction of that performance obligation.
All other expenses are generally recorded on an accrual basis by reference to completion of the specific transaction assessed on the basis of the actual service provided as a proportion of the total services to be provided.
Other similar income. Other similar income represents interest income recorded for debt instruments measured at fair value through profit or loss (“FVTPL”) and is recognised on an accrual basis using nominal interest rate.
Other similar expense. Other similar expense represents finance cost related to the discounted lease payments using the incremental borrowing rate.
Fee and commission income and expense. Fee and commission income is recognised over time as the services are rendered, when the customer simultaneously receives and consumes the benefits provided by the Group’s performance. Such income includes SMS fee, part of SME services commission, part of brokerage fee and income from MVNO services which represents fixed monthly payments.

TCS Group Holding PLC Notes to the Consolidated Financial Statements – 31 December 2021
120
41 Significant Accounting Policies (Continued)
Variable fees are recognised only to the extent that management determines that it is highly probable that a significant reversal will not occur.
Other fee and commission income is recognised at a point in time when the Group satisfies its performance obligation, usually upon execution of the underlying transaction. The amount of fee or commission received or receivable represents the transaction price for the services identified as distinct performance obligations. Such income includes acquiring commission, part of SME services commission, brokerage fee and income from MVNO services, which represents payments for each transaction, fee for selling credit protection, interchange fee, cash withdrawal fee, foreign currency exchange transactions fee, fee for money transfers and other.
All fee and commission expenses are generally recorded on an accrual basis by reference to completion of the specific transaction assessed on the basis of the actual service provided as a proportion of the total services to be provided.
Customer loyalty program. The group operates loyalty programs where retail clients accumulate points, which entitle them to reimbursement of purchases made with credit and debit cards. A financial liability is recognised for the amount of fair value of points expected to be redeemed until they are actually redeemed or expire with the corresponding entries to interest income calculated using the effective interest rate method or commission expenses depending on whether the points were accumulated by credit card clients or debit card clients respectively.
Insurance contracts. Insurance contracts are those contracts that transfer significant insurance risk. Insurance risk exists when the Group has uncertainty in respect of at least one of the following matters at inception of the contract: occurrence of insurance event, date of occurrence of the insurance event, and the claim value in respect of the occurred insurance event. Such contracts may also transfer financial risk.
Non-life insurance (short-term insurance). The below items from the consolidated statement of financial position of the Group are accounted within Other financial assets and Other financial liabilities lines, the below items from the consolidated statement of profit or loss and other comprehensive income of these consolidated financial statements are accounted within Income from insurance operations and Insurance claims incurred lines.
• Premiums written. Premiums (hereafter – “premiums” or “insurance premiums”) under insurance contracts are recorded as written upon inception of a contract and are earned on a pro-rata basis over the term of the related contract coverage. Reduction of premium written in subsequent periods (under amendments to the signed original contacts, for example) is accounted by debiting of premiums written in current period.
• Claims. Claims are charged to the consolidated statement of profit or loss and other comprehensive income as compensation is paid to policyholders (beneficiaries) or third parties.
• Claims handling expenses. Claims handling expenses are recognised in profit or loss for the period as incurred and include direct expenses related to negotiations and subsequent claims handling, as well as indirect expenses, including expenses of claims handling department and administrative expenses directly related to activities of this department.
• Reinsurance. The Group assumes and cedes reinsurance in the normal course of business. Ceded reinsurance contracts do not relieve the Group from its obligations to the policyholders under insurance contract. Amounts due from reinsurers are measured consistently with the amounts associated with the direct insurance contracts and in accordance with the terms of each reinsurance contract. Reinsurance assets arising from outward reinsurance contracts include reinsurers share in paid claims, including claims handling expenses. Liabilities under outward reinsurance operations are obligations of the Group for payment of premiums to reinsurers. Reinsurance assets include premiums ceded to the Group under inward reinsurance contracts. The Group's liabilities under inward reinsurance contracts are obligations to compensate the Group's share in paid claims, including claims handling expenses to reinsurers. The Group assesses its reinsurance assets for impairment on a regular basis. If there is objective evidence that the reinsurance asset is impaired, the Group reduces the carrying amount of the reinsurance asset to its recoverable amount and recognises that impairment loss in the consolidated statement of profit or loss and other comprehensive income.

TCS Group Holding PLC Notes to the Consolidated Financial Statements – 31 December 2021
121
41 Significant Accounting Policies (Continued)
The Group gathers the evidence that a reinsurance asset is impaired using the same process adopted for financial assets carried at amortised cost. The impairment loss is also calculated following the same method used for the financial assets carried at amortised cost.
• Subrogation income. The Group has a right to pursue third parties responsible for loss for payment of some or all costs related to the claims settlement process of the Group (subrogation). Reimbursements are recognised as income only if the Group is confident in receipt of these amounts from these third parties. Under inward reinsurance contracts, amounts of reimbursement due to the Group as a result of settlement of reinsurer's subrogation claims are treated as the Group's income as at the date of acceptance of the invoice received from the reinsurer and including calculation of the Group's share in the subrogation claim.
• Deferred acquisition costs. Deferred acquisition costs (“DAC”) are calculated (for non-life insurance contracts) separately for each insurance product. Acquisition costs include remuneration to agents for concluding agreements with corporate clients and individuals and brokerage fees for underwriting of assumed reinsurance agreements. They vary with and fully depend on the premium earned under acquired or renewed insurance policies. These acquisition costs are deferred and amortised over the period in which the related written premiums are earned. They are reviewed by line of business at the time of the policy issue and at the end of each accounting period to ensure they are recoverable based on future estimates. For the insurance contracts with duration of less than one month and with automatic prolongation condition amortisation of one-off acquisition costs occurs over the period determined based on statistical assessment of duration of the insurance contract taking into account all of the expected future prolongations.
Insurance provisions
• Provision for unearned premiums. Provision for unearned premiums (“UEPR”) represents the proportion of premiums written that relate to the unexpired term of policies in force as at the reporting date, calculated on a time apportionment basis. UEPR is recognised within liabilities on a gross basis.
• Loss provisions. Loss provisions represent the accumulation of estimates for ultimate losses and include outstanding claims provision (“OCP”) and provision for losses incurred but not yet reported (“IBNR”). Loss provisions are recognised within liabilities on a gross basis. Estimates of claims handling expenses are included in both OCP and IBNR. OCP is provided in respect of claims reported, but not settled as at the reporting date. The estimation is made on the basis of information received by the Group during settlement of the insured event, including information received after the reporting date. IBNR is determined by the Group by line of business using actuarial methods, and includes assumptions based on prior years’ claims and claims handling experience. IBNR is calculated for each occurrence period as the difference between the projected maximum amount of future payments resulting from the events that occurred during the period and the amount of future payments resulting from the event already reported but not settled at the reporting date within the same period. The methods of determining such estimates and establishing the resulting provisions are continually reviewed and updated. Resulting adjustments are reflected in the consolidated statement of profit or loss and other comprehensive income as they arise. Loss provisions are estimated on an undiscounted basis due to relatively quick pattern of claims notification and payment.
• Unexpired risk provision. Unexpired risk provision (“URP”) is recorded when unearned premiums are insufficient to meet claims and expenses, which may be incurred after the end of the financial year. To estimate the unexpired risk provision the Group uses historical experience and forward looking assumptions of ultimate loss ratios (including claims handling expenses) and the level of in-force portfolio maintenance expenses. The expected claims are calculated having regard to events that have occurred prior to the reporting date. For the purposes of final presentation of consolidated financial statements unexpired risk provision is written off against deferred acquisition costs.
• Liability adequacy testing. As at each reporting date the adequacy of the insurance reserves is tested. Testing of insurance reserves for non-life insurance is performed to ensure adequacy of contract liabilities. In performing these tests, current estimates of future contractual cash flows, claims handling and administration expenses are used. As a result of liability adequacy testing for non-life insurance, the Group sets up its URP.

TCS Group Holding PLC Notes to the Consolidated Financial Statements – 31 December 2021
122
41 Significant Accounting Policies (Continued)
Foreign currency translation and operations. The functional currency of the Company and each of the Group’s consolidated entities is the Russian Rouble (“RR”), which is the currency of the primary economic environment in which each entity operates. Monetary assets and liabilities are translated into each entity’s functional currency at the official exchange rate of the CBRF at the end of the respective reporting period.
Foreign exchange gains and losses resulting from the translation of monetary assets and liabilities into each entity’s functional currency at year-end official exchange rates of the CBRF are recognised in profit or loss for the year as Net (losses)/gains from foreign exchange translation.
Foreign exchange gains and losses resulting from the settlement of transactions with foreign currencies are recognised in profit or loss for the year as net (losses)/gains from operations with foreign currencies (except for clients’ foreign currency exchange transactions fee, which is recognised in profit or loss as fee and commission income).
Translation at year-end rates does not apply to non-monetary items that are measured at historical cost.
At 31 December 2021 the rate of exchange used for translating foreign currency balances was USD 1 = RR 74.2926 (2020: USD 1 = RR 73.8757), and the average rate of exchange was USD 1 = RR 73.6541 (2020: USD 1 = RR 72.1464).
Offsetting. Financial assets and liabilities are offset and the net amount reported in the consolidated statement of financial position only when there is a legally enforceable right to offset the recognised amounts, and there is an intention to either settle on a net basis, or to realise the asset and settle the liability simultaneously. Such a right of set off (a) must not be contingent on a future event and (b) must be legally enforceable in all of the following circumstances: (i) in the normal course of business, (ii) the event of default and (iii) the event of insolvency or bankruptcy.
Earnings per share. Earnings per share are determined by dividing the profit or loss attributable to owners of the Company by the weighted average number of participating shares outstanding during the reporting year, excluding treasury shares. For the purpose of diluted earnings per share calculation the Group considers dilutive effects of shares granted under employee share option plans.
Staff costs and related contributions. Wages, salaries, contributions to the Russian Federation state pension and social insurance funds, paid annual leave and sick leave, bonuses, and non-monetary benefits are accrued in the year in which the associated services are rendered by the employees of the Group. The Group has no legal or constructive obligation to make pension or similar benefit payments beyond the payments to the statutory defined contribution scheme.
Segment reporting. Segments are reported in a manner consistent with the internal reporting provided to the Group’s chief operating decision maker. Segments whose revenue, result or assets are ten percent or more of all the segments are reported separately.
Equity-settled share-based payment. The expense is recognized over the vesting period and is measured at the fair value of the award determined at the grant date, which is amortized over the service (vesting) period. The fair value of the equity award is estimated only once at the grant date and is trued up to the estimated number of instruments that are expected to vest. Dividends declared during the vesting period accrue and are paid to the employee together with the sale proceeds of the vested shares upon a liquidity event. Expected dividends (including those expected during the vesting period) are therefore included in the determination of fair value of the share-based payment.
Cash-settled share-based program. The expense is recognized gradually over the vesting period and is measured at the fair value of the liability at each end of the reporting period. The fair value of the liability reflects all vesting conditions, except for the requirement of the employee to stay in service which is reflected through the amortization schedule. The liability is measured, initially and at the end of each reporting period until settled, at fair value, taking into account the terms and conditions on which the instruments were granted and the extent to which the employees have rendered service to date.

TCS Group Holding PLC Notes to the Consolidated Financial Statements – 31 December 2021
123
41 Significant Accounting Policies (Continued)
Beskontakt acquisition. On 29 April 2021 the Group obtained control of LLC “Beskontakt” through acquisition of its 77,4% net assets (refer to Note 1). To account for this acquisition, the Group decided to apply an optional concentration test as allowed under IFRS 3 “Business combination”. The concentration test has demonstrated that approximately 95% of the fair value of gross assets acquired would be concentrated in intangible asset that is represented by the “Koshelek” application and customer database. Therefore, the Group concluded that the acquired set of assets and activities is not a business. For the acquisition of an asset or a group of assets that does not constitute a business, such a transaction or event does not give rise to goodwill.
Amendments of the consolidated financial statements after issue. The Board of directors of the Company has the power to amend the consolidated financial statements after issue.
Changes in presentation. In March 2021 the Group refined its presentation of non-recoverable VAT expenses by including them into the expense items which triggered such VAT expenses. The management considers that such refined presentation results in more relevant presentation of substance of those non-recoverable VAT expenses. As a result, the comparative information was amended accordingly in the notes to the following financial statements line items: Fee and commission expense, Customer acquisition expense and Administrative and other operating expenses (refer to Notes 22, 23 and 25).
The effect of changes described above on the consolidated statement of profit or loss and other comprehensive income for the year ended 31 December 2020 is as follows:
In millions of RR As originally
presented Reclassification As reclassified
Fee and commission expense (21,599) (616) (22,215) Administrative and other operating expenses (35,621) 616 (35,005)
42 Adoption of New or Revised Standards and Interpretations
The following amended standard became effective from 1 January 2021, but did not have any material impact on the Group:
Interest rate benchmark (IBOR) reform – phase 2 amendments to IFRS 9, IAS 39, IFRS 7, IFRS 4 and IFRS 16 (issued on 27 August 2020 and effective for annual periods beginning on or after 1 January 2021). Under these amendments, changes to the basis for determining the contractual cash flows are reflected by adjusting the effective interest rate. No immediate gain or loss is recognised. Reform and replacement of various inter-bank offered rates (‘IBORs’) has become a priority for regulators. Most IBOR rates would stop being published by 31 December 2021, while certain USD LIBOR rates would stop being published by 30 June 2023. During the reporting year and as at 31 December 2021, the Group does not have any transactions and balances based on IBOR or LIBOR rates.
Covid-19-Related Rent Concessions – Amendments to IFRS 16 (issued on 28 May 2020 and effective for annual periods beginning on or after 1 June 2020).
43 New Accounting Pronouncements
Certain new amendments have been issued that are mandatory for the annual periods beginning on or after 1 January 2022, which the Group has not early adopted:
IFRS 17 "Insurance Contracts"(issued on 18 May 2017 and effective for annual periods beginning on or after 1 January 2023). IFRS 17 replaces IFRS 4, which has given companies dispensation to carry on accounting for insurance contracts using existing practices. As a consequence, it was difficult for investors to compare and contrast the financial performance of otherwise similar insurance companies. IFRS 17 is a single principle-based standard to account for all types of insurance contracts, including reinsurance contracts that an insurer holds.

TCS Group Holding PLC Notes to the Consolidated Financial Statements – 31 December 2021
124
43 New Accounting Pronouncements (Continued)
The standard requires recognition and measurement of groups of insurance contracts at: (i) a risk-adjusted present value of the future cash flows (the fulfilment cash flows) that incorporates all of the available information about the fulfilment cash flows in a way that is consistent with observable market information; plus (if this value is a liability) or minus (if this value is an asset) (ii) an amount representing the unearned profit in the group of contracts (the contractual service margin). Insurers will be recognising the profit from a group of insurance contracts over the period they provide insurance coverage, and as they are released from risk. If a group of contracts is or becomes loss-making, an entity will be recognising the loss immediately. The Group is currently assessing the impact of IFRS 17 on the insurance contracts issued by the Insurance Company as well as the impact for credit cards and similar loan products which may include insurance component.
Amendments to IFRS 17 and an amendment to IFRS 4 (issued on 25 June 2020 and effective for annual periods beginning on or after 1 January 2023). The amendments include a number of clarifications intended to ease implementation of IFRS 17, simplify some requirements of the standard and transition. The amendments relate to eight areas of IFRS 17, and they are not intended to change the fundamental principles of the standard.
Amendment to IFRS 4 – deferral of IFRS 9 (issued on 25 June 2020 and effective for annual periods beginning on or after 1 January 2023). The amendments to IFRS 4 addressed the temporary accounting consequences of the different effective dates of IFRS 9 and the forthcoming IFRS 17. The amendments to IFRS 4 extended the expiry date of the temporary exemption from applying IFRS 9 until 2023 in order to align the effective date of IFRS 9 with the new IFRS 17. The fixed expiry date of the temporary exemption from applying IFRS 9 in IFRS 4 has been deferred to annual reporting periods beginning on or after 1 January 2023.
Amendments to IAS 8 Accounting policies, Changes in Accounting Estimates and Errors: Definition of Accounting Estimates (issued on 12 February 2021 and effective for annual periods beginning on or after 1 January 2023)*.
Amendments to IAS 1 Presentation of Financial Statements and IFRS Practice Statement 2: Disclosure of Accounting policies (issued on 12 February 2021 and effective for annual periods beginning on or after 1 January 2023)*.
Deferred tax related to assets and liabilities arising from a single transaction – Amendments to IAS 12 (issued on 7 May 2021 and effective for annual periods beginning on or after 1 January 2023)*. The amendments to IAS 12 specify how to account for deferred tax on transactions such as leases and decommissioning obligations.
The following other new pronouncements are not expected to have any material impact on the Group when adopted:
• IFRS 14, Regulatory Deferral Accounts (issued on 30 January 2014 and effective for annual periods beginning on or after 1 January 2016)*.
• Classification of liabilities as current or non-current – Amendments to IAS 1 (issued on 23 January 2020 and effective for annual periods beginning on or after 1 January 2022)*.
• Proceeds before intended use, Onerous contracts – cost of fulfilling a contract, Reference to the Conceptual Framework – narrow scope amendments to IAS 16, IAS 37 and IFRS 3, and Annual Improvements to IFRSs 2018-2020 – amendments to IFRS 1, IFRS 9, IFRS 16 and IAS 41 (issued on 14 May 2020 and effective for annual periods beginning on or after 1 January 2022)*.
• Classification of liabilities as current or non-current, deferral of effective date – Amendments to IAS 1 (issued on 15 July 2020 and effective for annual periods beginning on or after 1 January 2023)*.
• Covid-19-Related Rent Concessions – Amendments to IFRS 16 (issued on 31 March 2021 and effective for annual periods beginning on or after 1 April 2021).
* Denotes standards, interpretations and amendments which have not yet been endorsed by the European Union.