annual_report_2017.pdf - ALSO Holding AG
194
-
Upload
khangminh22 -
Category
Documents
-
view
0 -
download
0
Transcript of annual_report_2017.pdf - ALSO Holding AG

1


RETURN ON INVESTED CAPITAL
(ROIC)
REVENUE AND NET PROFIT
CASH CONVERSION DEVELOPMENT
RETURN ON CAPITAL EMPLOYED
(ROCE)
EARNINGS BEFORE INTEREST AND
TAXES (EBIT)
EQUITY AND RETURN ON EQUITY
(ROE)
PRICE-EARNINGS RATIO
(P/E RATIO)
NET WORKING CAPITAL
(NWC)
KEY PERFORMANCE INDICATORS
To view the key performance indicators in augmented reality, download the
Discover ALSO app onto your smartphone, available in the App Store and the
Google Play Store.

2
3
AHEADA H E A D
KEY FIGURES
2017 2016 2015 2014 2013
consolidated statement of comprehensive income (IN MIO EUR)
Net sales 8 890.7 7 984.1 7 792.1 7 237.8 6 532.6
Thereof Supply 6 963.8 6 231.6 6 018.1
Thereof as-a-Service 324.5 239.6 211.7
Thereof Solutions 1 602.4 1 512.9 1 562.3
Gross margin 544.3 506.0 507.5 462.8 428.6
EBITDA 157.3 146.0 140.0 123.9 113.5
EBIT 141.0 128.5 109.9 96.0 87.4
Profit before taxes (EBT) 124.2 113.9 90.8 81.9 72.6
Net profit Group 92.5 83.2 62.9 60.9 50.1
consolidated statement of financial position (IN MIO EUR) 12.31.2017 12.31.2016 12.31.2015 12.31.2014 12.31.2013
Cash and cash equivalents 235.6 55.5 40.0 24.2 41.6
Other current assets 1 662.7 1 579.7 1 464.8 1 426.1 1 210.1
Non-current assets 260.2 259.9 255.0 261.5 241.1
total assets 2 158.5 1 895.1 1 759.8 1 711.8 1 492.8
Current liabilities 1 179.3 1 100.4 1 031.2 1 025.4 932.2
Non-current liabilities 355.9 229.5 235.8 232.4 139.3
Equity 623.3 565.2 492.8 454.0 421.3
total liabilities 2 158.5 1 895.1 1 759.8 1 711.8 1 492.8
Equity ratio 28.9 % 29.8 % 28.0 % 26.5 % 28.2 %
consolidated statement of cash flows (IN MIO EUR) 2017 2016 2015 2014 2013
Free cash flow 67.3 70.5 21.3 – 12.8 51.4
Cash flow before changes working capital 97.7 100.1 96.1 88.3 71.3
Investments in property, plant and equipment 11.0 6.8 9.8 6.3 5.6
key figures 2017 2016 2015 2014 2013
Gross margin as % of net sales 6.1 % 6.3 % 6.5 % 6.4 % 6.6 %
Net profit Group as % of net sales 1.0 % 1.0 % 0.8 % 0.8 % 0.8 %
Return on equity (ROE) 14.8 % 14.7 % 12.8 % 13.4 % 11.9 %
Net financial debt/EBITDA 1.10 1.14 1.54 1.44 0.67
Average headcount during the year 1) 3 790 3 524 3 649 3 426 3 155
EBITDA PER EMPLOYEE IN EUR 1 000 41.5 41.4 38.4 36.2 36.0
shares of also holding ag 2017 2016 2015 2014 2013
Number of registered shares, nominal value CHF 1.00 per share 12 848 962 12 848 962 12 848 962 12 848 962 12 848 962
Dividend per registered share (in CHF) 2.75 2) 2.25 1.90 1.60 1.40
Earnings per share EPS (in CHF) 8.03 7.09 5.26 5.82 4.81
Equity per registered share (in CHF) 56.77 47.24 41.56 42.49 40.25
Market capitalization at December 31 (in Mio CHF) 1 721.8 1 155.1 884.0 666.2 636.0
Price-earnings ratio (P/E ratio) 16.7 12.7 13.1 9.0 10.3
1) Basis: full-time equivalent positions excluding temporary employees2) Proposal of the Board of Directors

3
AHEAD
To be not just a leader but a pioneer in an environment as disruptive as the ICT industry, you need openness, determination, and good partners. ALSO acts as this partner for its customers, providers and buyers in the ICT industry. We are constantly expanding our services in the areas of hardware, software, logistics, and consultancy on networks and IT architecture, thereby helping our customers achieve success.
We are also AHEAD when it comes to communications: This year, we enhanced our AR and VR app so that you can quickly and interactively gain an overview of ALSO’s performance, strategy, and services. The core topics for fiscal year 2017 can be accessed in a dialog format whose interface is reminiscent of chat bots.I invite you to discover ALSO as a worthwhile investment for yourselves.
Yours,
Gustavo Möller-Hergt
You can download the app in the App Store or the Google Play Store.Simply enter “Discover ALSO” as a search term in the respective store.
E D I T O R I A L
GUSTAVO MÖLLER-HERGTCEO and Chairman of the Board of Directors
of ALSO HOLDING AG

AL
SO
An
nu
al
Re
po
rt
2
01
7
4
5
AH
EA
D
1

AL
SO
An
nu
al
Re
po
rt
2
01
7
5
AH
EA
D
AH E AD
ALSO is presenting a record result again for 2017. In both net sales and earnings, we achieved further significant improvements compared to the strong results from the previous year.
IN PERFORMANCE
P E R F O R M A N C E
A l l k e y f i g u r e s o n
t h e c o m p a n y ’ s e c o n o m i c
d e v e l o p m e n t o n
p a g e 6 3
The company’s sustainable growth is also reflected in its good market capitalization.

AL
SO
An
nu
al
Re
po
rt
2
01
7
6
7
AH
EA
D
NET SALES2 0 1 7
8 890 688I N T H O U S A N D S
O F E U R O S
EAT2 0 1 7
92 527I N T H O U S A N D S
O F E U R O S
EBT2 0 1 7
124 180I N T H O U S A N D S
O F E U R O S
COMPANY PERFORMANCE
A H E A D I N
The steady expansion of our customer base and the continuous optimization and automation of our processes enable us to sell and replace our inventory around ten times per year. High net sales and efficient use of capital form the basis for profitability and sustainable growth.
FULL CONTROL – EVERY THING AS IT SHOULD BE

AL
SO
An
nu
al
Re
po
rt
2
01
7
7
AH
EA
D
A H E A D I N
During the reporting year, the price of the ALSO share developed very positively. The share price rose from 93.00 Swiss francs per share as at January 1, 2017, to 134.00 Swiss francs as at December 31, 2017, corresponding to an increase of 44.1 percent as against the start of the year. Including the dividend, the total yield on a share that was bought on January 1, 2017, was 46.5 percent.
+ 44.1%
SHARE PRICE PERFORMANCEFULL STRENGTH – STEEP ASCENT

AL
SO
An
nu
al
Re
po
rt
2
01
7
8
9
AH
EA
D
2

AL
SO
An
nu
al
Re
po
rt
2
01
7
9
AH
EA
D
AHE AD
ALSO offers services at all
levels of the ICT value chain.
With the introduction of our
MORE strategy in 2012,
we laid the foundations for
the steady and sustainable
development of the company.
S T R AT E G Y
A d e t a i l e d e x p l a n a t i o n
o f t h e c o m p a n y ’ s
s t r a t e g y c a n b e
f o u n d s t a r t i n g
o n p a g e 4 9
As well as optimizing its tra-
ditional services, ALSO has
also systematically diversified
its services and increasingly
developed new, service-
focused offers in recent years.
IN TRANSFORMING BUSINESS

AL
SO
An
nu
al
Re
po
rt
2
01
7
1 0
1 1
AH
EA
D
A H E A D I N T R A N S F O R M I N G B U S I N E S S
MAINTAIN stands for securing the transactional business model, based on which the company’s as-a-Service and Solutions business will be further expanded to attain the targeted growth and income goals.
MAINTAINTO DISCOVER NEW WORLDS , YOU NEED A SECURE HOME BASE .

AL
SO
An
nu
al
Re
po
rt
2
01
7
1 1
AH
EA
D
OPTIMIZE stands for continuous optimization of processes, particularly in order to increase the profitability of the transactional business model. With the launch of our SAP system and Business Intelligence 2.0 in 2017 in particular, we established an important basis for the company’s continued development.
A H E A D I N T R A N S F O R M I N G B U S I N E S S
OPTIMIZETHERE IS NOTHING THAT CANNOT BE IMPROVED.

AL
SO
An
nu
al
Re
po
rt
2
01
7
1 2
1 3
AH
EA
D
A H E A D I N T R A N S F O R M I N G B U S I N E S S
REINVENT is aimed at the further growth of ALSO. On the basis of the transactional business model, we will also develop solution- and usage-oriented business models and generate additional growth with the resulting offers.
REINVENTIF YOU WANT TO CLIMB HIGH, YOU HAVE TO TAKE UNTRODDEN PATHS .

AL
SO
An
nu
al
Re
po
rt
2
01
7
1 3
AH
EA
D
ENHANCE primarily means expanding our market position by way of acquisitions in line with the REINVENT goal. ALSO aligns its activities to markets with long-term profitability and/or growth potential. The goal of the portfolio policy is to attain or hold the first or second market position in all countries.
A H E A D I N T R A N S F O R M I N G B U S I N E S S
ENHANCEINVESTING IN KNOWLEDGE BRINGS THE HIGHEST RETURN .

AL
SO
An
nu
al
Re
po
rt
2
01
7
1 4
1 5
AH
EA
D
3

AL
SO
An
nu
al
Re
po
rt
2
01
7
1 5
AH
EA
D
AHE AD
We will achieve sustainably
profitable growth only if
we consistently place our
customers and their business
success at the heart of our
work. To this end, ALSO has
divided its offers into three
business models: Supply,
Solutions and as-a-Service.
Our extensive product
portfolio, the optimized
webshop, customized credit
lines, as well as the ALSO
Cloud Marketplace and
our constantly growing
as-a-Service range provide
vendors and buyers in
the ICT industry with all
options in order to operate
successfully on the market.
IN DEVELOPING BUSINESS
B U S I N E S S M O D E L
M o r e a b o u t t h e
c o m p a n y ’ s 3 S b u s i n e s s
m o d e l s s t a r t i n g
o n p a g e 5 4

AL
SO
An
nu
al
Re
po
rt
2
01
7
1 6
1 7
AH
EA
D
This business model, which is based on economies of scale, includes business with optimized trading processes and logistics for the IT, consumer electronics, and telecommunication sectors. The ALSO value proposition for the providers consists of creating a broad range of customers, providing detailed logistics, and managing complexity. For the buyers, it consists of providing a product portfolio, managing detailed logistics, and providing the credit line.
A H E A D I N D E V E L O P I N G B U S I N E S S
SUPPLYA PICTURE IS WORTH A THOUSAND WORDS .

AL
SO
An
nu
al
Re
po
rt
2
01
7
1 7
AH
EA
D
Designing and implementing complex infrastructure and virtualizing networks, servers, and storage opens up new dimensions in IT but also requires a high level of consultancy expertise in the different fields. In Solutions business, ALSO therefore provides project-based support to SMBs in particular on questions of architecture and IT design, rapidly translates requirements into specific configurations, and monitors the status of projects.
A H E A D I N D E V E L O P I N G B U S I N E S S
SOLUTIONSFOR THOSE WHO HAVE AN IDE A OF THE FUTURE, TOMORROW IS ALRE ADY HERE .

AL
SO
An
nu
al
Re
po
rt
2
01
7
1 8
1 9
AH
EA
D
In this area, ALSO acts as a service provider rather than a seller. The services offered are called up as needed and remunerated with variable payments based on usage. The reported net sales include services from the areas of cloud marketplace, outsourcing, and process (re-)engineering, currently in three areas in particular: Logistics-as-a-Service, Marketing-as-a-Service, and IT-as-a-Service.
A H E A D I N D E V E L O P I N G B U S I N E S S
AS-A-SERVICEBROADENING YOUR PERSPECTIVE SHARPENS YOUR FOCUS .
AL
SO
An
nu
al
Re
po
rt
2
01
7
1 9
AH
EA
D
1 91 9

AL
SO
An
nu
al
Re
po
rt
2
01
7
2 0
2 1
AH
EA
D
4

AL
SO
An
nu
al
Re
po
rt
2
01
7
2 1
AH
EA
D
AHE AD
ALSO has defined five factors
that are used to continuously
optimize the company’s income:
Vendor mix. For us, this
means securing an
attractive supplier portfolio.
Product mix. This has the
aim of rapidly providing
innovative products
and services with high
growth potential.
IN DRIVING BUSINESS
I N S T R U M E N T S
M o r e a b o u t t h e f i v e
f a c t o r s f o r o p t i m i z i n g
t h e c o m p a n y ’ s
i n c o m e s t a r t i n g
o n p a g e 5 6
Operational excellence.
This factor is focused on
continuously optimizing
structures and processes to
reduce operating expense.
Business model mix.
This is about systematically
expanding Supply business
and further developing the
Solutions and as-a-Service
business models.
Buyer mix. Here, we focus on
fast-growing buyer groups.

AL
SO
An
nu
al
Re
po
rt
2
01
7
2 2
2 3
AH
EA
D
As a result of intensive work on all five factors in 2017, we optimized the vendor and buyer mix and consequently also expanded our product mix to the current total of 250 000 items. In the area of operational excellence, we further improved the efficiency of our operational processes. We will systematically use the resulting income for the further expansion of our business models.
A H E A D I N D R I V I N G B U S I N E S S
5 INSTRUMENTSDASHBOARD FOR BUSINESS

AL
SO
An
nu
al
Re
po
rt
2
01
7
2 3
AH
EA
D

AL
SO
An
nu
al
Re
po
rt
2
01
7
2 4
2 5
AH
EA
D
Approximately 8 890 700 000
EUROS TOTAL NET SALES
~ 80 000 END CUSTOMERS
> 1 000 000USERS
100 000 BUYERS, INCLUDING
50 000 RESELLERS
525PROVIDERS, INCLUDING
> 80 DIGITAL SERVICE PROVIDERS
ALSO IN BRIEF
> 1 500 CLOUD/ IT SERVICES
250 000 ITEMS
ALSO MARKETPLACE

AL
SO
An
nu
al
Re
po
rt
2
01
7
2 5
AH
EA
D
MARKET PLACE
SUPPLY15 LOGISTICS CENTERS THROUGHOUT EUROPE
UP TO 14 500 000 CONSIGNMENTS SENT P.A.
0.02 % ERROR RATE IN ORDER PICKING
680 000 FINANCIAL TRANSACTIONS
P.A.
SOLUTIONS85 000 STUDIES ON
CONFIGURATION AND ARCHITECTURE
50 000 HOURS OF CONSULTING
2 800 PROOFS OF CONCEPT
ALSO INSIGHTS INTO THE 3 S
AS-A-SERVICEIT-AS-A-SERVICE
MORE THAN 1 500 SERVICES BY OVER 80 SERVICE PROVIDERS
APPROX. 80 000 END CUSTOMERSMORE THAN 1 000 000 USERS
LOGISTICS-AS-A-SERVICEABOUT 50 000 DEVICES PER DAY
SENT TO CUSTOMERS ON BEHALFOF RESELLERS

AL
SO
An
nu
al
Re
po
rt
2
01
7
2 6
2 7
AH
EA
D
MOBILE COMMUNICATIONS
Apple, Motorola, Samsung
SOFTWARE
3D PRINTING
3D Systems,
HP
IOT
Aruba, Avalue,
HP, Microsoft
Adobe, IBM, Kaspersky, Microsoft, Symantec, VMWare
COMPONENTS AND
ACCESSORIES
APC, AVM, Logitech, Intel, Seagate, Sonos, Western Digital
PRINTINGBrother, Canon,
Epson, HP, Kyocera, Lexmark
DISPLAYS
HP, LG, Samsung
SERVER, STORAGE, NETWORKING
Cisco, Lenovo, HP, IBM, Fujitsu
COMPUTING
Acer, Apple, Asus, HP, Lenovo, Toshiba
AL
SO
MA
RK
ET
PL
AC
E
CONSUMABLES
Canon, Epson, HP, Kyocera, Lexmark
SECURITYKaspersky,
Sophos,
Symantec
UCC
Microsoft, Polycom,
Unify
ALSO INSIGHTS PROVIDER

AL
SO
An
nu
al
Re
po
rt
2
01
7
2 7
AH
EA
D
25.5%RETAILERS
13.5%CORPORATE
11.1%OTHERS
16.8%ETAILERS
13.1%VALUE-ADDED
RESELLERS
20.0%SMB-RESELLERSA
LS
O
MA
RK
ET
PL
AC
EALSO INSIGHTS
BUYERS

AL
SO
An
nu
al
Re
po
rt
2
01
7
2 8
2 9
AH
EA
D
ALSO’S «PLATFORM-AS- A-SERVICE» PARTNERS
On top of the 15 ALSO countries in Europe, the ALSO Cloud Marketplace is available in anadditional 56 countries via our “Platform-as-a-Service” partners.
ALSO AND INTCOMEX
BARBADOS
BERMUDA
CAYMAN ISLANDS
CHILE
COLOMBIA
COSTA RICA
CURAÇAO
DOMINICAN REPUBLIC
ECUADOR
EL SALVADOR
GUATEMALA
HONDURAS
JAMAICA
NICARAGUA
PANAMA
PERU
PUERTO RICO
TRINIDAD AND TOBAGO
URUGUAY
USA
ALSO AND WESTCOAST
IRELAND
UNITED KINGDOM
ALSO AND BEZEQ INT
ISRAEL
ALSO AND LOGICOM
ALBANIA
ALGERIA
BAHRAIN
BULGARIA
CROATIA
CYPRUS
EGYPT
GREECE
ITALY
JORDAN
KOSOVO
KUWAIT
LEBANON
LIBYA
MACEDONIA
MALTA
MONTENEGRO
OMAN
QATAR
ROMANIA
SAUDI ARABIA
SERBIA
SOUTH AFRICA
TUNISIA
UNITED ARAB EMIRATES
ALSO AND INNOVIX
CHINA
HONG KONG
INDONESIA
MALAYSIA
PHILIPPINES
SINGAPORE
THAILAND
VIETNAM

AL
SO
An
nu
al
Re
po
rt
2
01
7
2 9
AH
EA
D
6
1
9
2
4
8
7
513
11
10
312
1514
1 BELGIUM ALSO België, Amelia Earhartlaan 17
BE-9051 Gent WWW.ALSO.BE
2 DENMARK ALSO A/S, Helgeshøj Alle 8 –10
DK-2630 Taastrup WWW.ALSO.DK
3 GERMANY ALSO Deutschland GmbH, Lange Wende 43
DE-59494 Soest WWW.ALSO.DE
4 ESTONIA ALSO Eesti OÜ, Liivalao tn 18, Nõmme linnaosa
Harju maakond, EE-11216 Tallinn WWW.ALSO.EE
5 FINLAND ALSO Finland Oy, Kalevantie 2D
FI-33100 Tampere WWW.ALSO.FI
6 FRANCE ALSO France S.A.S., 10 avenue des Louvresses
FR-92230 Gennevilliers WWW.ALSOFRANCE.FR
7 LATVIA ALSO Latvia SIA, Liliju iela 29
LV-2167 MarupeWWW.ALSOLATVIA.LV
8 LITHUANIA UAB «ALSO Lietuva», Verslo g. 6, Kumpiu k.
Kauno rajonas, LT-54311 WWW.ALSO.LT
9 NETHERLANDS
ALSO Nederland B.V., Wijchenseweg 20NL-6537 TL Nijmegen
WWW.ALSO.NL 10 NORWAY
ALSO AS, Tassebekkveien 354NO-3160 Stokke
WWW.ALSO.NO 11 AUSTRIA
ALSO Austria GmbH, Industriestrasse 14AT-2301 Gross-Enzersdorf
WWW.ALSO.AT
12 POLAND ALSO Polska sp. z o.o., ul. Komitetu Obrony Robotników 45A
PL-02-146 Warszawa WWW.ALSOPOLSKA.PL
13 SWEDEN ALSO Sweden AB, Höjdrodergatan 25
SE-212 39 Malmö WWW.ALSO.SE
14 SWITZERLAND ALSO Schweiz AG, Meierhofstrasse 5
CH-6032 Emmen WWW.ALSO.CH
15 SLOVENIA ALSO d.o.o., Koprska ulica 98
SI-1000 Ljubljana WWW.ALSO.SI
HEADQUARTERS ALSO Holding AG, Meierhofstrasse 5
CH-6032 Emmen WWW.ALSO.COM
ALSO IN EUROPE

30
ALSO Annual Report 2017 CONTENTS
CONSOLIDATED FINANCIAL STATEMENTS Consolidated statement of comprehensive income� 109Consolidated statement of financial position� 110Consolidated statement of changes in equity� 112Consolidated statement of cash flows� 113Notes to the consolidated financial statements� 114Report of the statutory auditor to the General Meeting on the consolidated financial statements 2017� 172
FINANCIAL STATEMENTS OF ALSO HOLDING AGProfit and loss statement of ALSO Holding AG� 176Balance sheet of ALSO Holding AG� 177Notes to the financial statements of ALSO Holding AG� 178Report of the statutory auditor to the General Meeting on the financial statements 2017� 184
Imprint� 189Financial calendar� 190
Principles 99Changes in the reporting year 99Compensation system 99Responsibilities and procedures for approving and setting compensation 100Compensation for the reporting year 101Compensation for the prior year 103Compensation paid to former members of governing bodies 105Compensation paid to related parties 105Loans and borrowing facilities 105Report of the statutory auditor to the General Meeting on the compensation report 2017 106
Group structure and shareholders � 81Capital structure� 82Board of Directors� 82Group Management� 92Compensation, shareholdings, and loans 92Shareholders’ rights of participation 93Change of control and defense measures� 95Auditors� 95Information policy� 96Important changes occurring after the balance sheet date� 96
Letter to shareholders� 33ALSO share and shareholder structure� 39The ALSO Group� 43Objectives and strategy� 49Basis for the 3S: Our service range� 54Optimizing income 2017� 56Employees and society� 58Business development of the Group� 63Risk report� 68Outlook 74ALSO Outlook 76
CONTENTS
1 STATUS REPORT
2 CORPORATE
GOVERNANCE
3 COMPENSATION
REPORT
4 FINANCIAL
REPORT

STATUS REPORT
1 STATUSREPORT


33
ALSO Annual Report 2017 STATUS REPORT
2017 was another good fiscal year for the ALSO Group, as we were able to increase net sales and earnings for the seventh time in a row. Our company benefited from a very positive trend in the ICT market in 2017. As we signaled last year in our outlook for 2017, the total net sales of 8 890.7 mil-lion euros that we recorded represents an increase that is significantly higher than the market growth of 1.4 percent forecast by Gartner market research institution at the end of 2016. ALSO has deliv-ered the results we promised and even posted an above-average increase in the Group net profit of 11.2 percent to 92.5 million euros. Consistently implemented, our strategy has gained traction and provides the basis for the sustainable success of the ALSO Group.
We therefore put forward a proposal to the Board of Directors for a dividend of 2.75 Swiss francs on each dividend-bearing share, which once again represents an increase of 22.2 percent on the previous year. In view of the good financial situation and future prospects of the Group as well as the expec-tations of our shareholders, the Board of Directors has approved this proposal and will submit it to the Annual General Meeting for approval.
ALSO ON THE MARKET
With a view to sustainable profitable growth for our company, the focus of our efforts is placed on our customers and their business success. By continuing to develop the company from a traditional ICT distributor to an end-to-end solution provider for the ICT industry, we have created an ecosystem for vendors through which they can distribute their products efficiently, quickly, and in integrated solutions. Using the services offered by ALSO, buyers can in turn decisively expand, optimize and manager their service range. Our extensive product portfolio, the optimized webshop, customized credit lines, as well as the ALSO Cloud Marketplace (ACM) and our extensive as-a-Service range enable our resellers to cover every end customer requirement with great flexibility. And so we make our customers successful.
The MORE strategy lays the foundation for the steady and sustainable development of our company while taking the requirements of all stakeholders into account. As well as optimizing our traditional services, ALSO has also diversified its services and increasingly developed vertical offers. The three business models of Supply, Solutions, and as-a-Service have been defined with a clear focus on our customers and their needs. In addition to customer-oriented activities, we have concentrated inter-nally on the following five factors to optimize income as we have continued the practical develop-ment of these models:
LETTER TO SHAREHOLDERS

34
ALSO Annual Report 2017 StatuS RepoRt
VeNDoR MIX
By integrating new vendors in the existing product categories and intensifying the cooperation with existing vendors, we have substantially expanded both vendor and product diversity. As part of the new as-a-Service business model, we successfully attracted almost 40 additional independent ser-vice providers offering 200 new services on the ACM and thus further enhancing its attractiveness for our partners in 2017.
BuYeR MIX
ALSO continued to boost the increase in the share of wallet (proportion of the total spend of a cus-tomer for a specific product group at ALSO) in the various customer categories in 2017. It thus proved possible to increase the net sales among small and medium-sized businesses (SMBs) by 5.9 percent. With our “as-a-Service”partners, we are represented through the ACM in over 70 countries and have thus been able to attract new buyers, for example in the Near and Middle East as well as in the Asia region.
pRoDuCt MIX
By intensifying and expanding the cooperation with our providers, we have been able to offer new products, such as the A3 and 3D printer product range from HP, in the existing product categories. ALSO has also secured numerous competitive advantages for itself in the establishment of new prod-uct categories; our managed print services and services involving the Internet of Things (IoT) and and in the area of security can be listed here as examples.
opeRatIoNaL eXCeLLeNCe
The successful conclusion of our ERP harmonization means that we now have a uniform system (SAP) in operation in the complete distribution landscape extending across all 15 country companies. The foundation has thus been created for us to standardize and further develop our customer relationship management (CRM) as well as our business intelligence tool (BI). With a view to standardization, best practice processes are being harmonized throughout the Group in order thus to significantly enhance operational excellence by optimizing structures.

35
ALSO Annual Report 2017 STATUS REPORT
BUSINESS MODEL MIX
ORGANIC GROWTH THROUGH THE FURTHER DEVELOPMENT OF OUR BUSINESS MODELS
We have consistently developed the sales shares of our Solutions and as-a-Service business models. Examples here include services in the area of Logistics-as-a-Service for our Swiss customers Media-Markt, Swisscom, and Sunrise as well as the takeover of the entire reverse logistics for Fujitsu in Finland. In the area of IT-as-a-Service, we currently take care of over 1.3 million seats on the basis of a usage-based business model. We will continually expand these service offers in 2018.
NON-ORGANIC GROWTH THROUGH ACQUISITIONS
The non-organic growth as well as the development and consolidation of new business models was intensified through company takeovers in 2017. The Dutch distributor Five 4 U, with its expertise in the graphics field that is relevant for the continued expansion of the business, was acquired for example. Valuable expertise in the area of IT network and IT security infrastructure and IoT was inte-grated in the company through the Finnish IT solutions and sales company Smartsec and also BelP of France. The involvement of BelP in the area of vertical markets will in particular help ALSO to tap the enormous potential of these market segments for the benefit of the whole Group.
TRANSFORMATION
The entire management team is involved in the ongoing process to accelerate the transformation of the company, which is being undertaken in three workstreams. The first stream aims to create the tools for the agile realization of opportunities. We will achieve this through the targeted employment of our Business Intelligence 2.0 and a CRM-based, enhanced customer segmentation. The second stream involves optimizing the company’s structure by accelerating the establishment of compe-tency centers, continuing to develop our e-commerce area, and swiftly rolling out best practices. The objective in the third stream is to consistently develop and market new product categories as well as to identify and leverage different dimensions related to cross-selling potential. In light of the dynamic market trends and the increasing opportunities resulting from them, we have decided together with the Group Management and the Board of Directors to set up a 12-member Transfor-mation Executive Team (TET), which will meet on a quarterly basis to set the direction for the further development of the company.

36
ALSO Annual Report 2017 STATUS REPORT
ALSO ON THE CAPITAL MARKET
The strong and sustained business performance met with a positive response on the capital market. ALSO outperformed the Swiss Performance Index (SPI) by 25.4 percentage points in the fiscal year.
ALSO SHARE
The very good performance of the ALSO share led in May 2017 to the equity interest held by Schindler Holding AG in ALSO Holding AG falling below the threshold of 3 percent as a result of the exchange of the convertible bonds issued by Schindler. Schindler announced on May 29, 2017, that 99.99 percent of the exchangeable bonds had been converted. The ALSO share’s free float increased from 41.10 percent in the previous year to 48.70 percent. The number of institutional investors and small investors increased from the end of the previous year from 1 708 to 2 622.
FINANCING ON THE CAPITAL MARKET
ALSO Holding AG successfully placed a bonded loan in August 2017. The high demand from inves-tors led to a substantial oversubscription, with the result that the volume of 100 million euros that was originally planned was increased to 154 million euros. The total volume is divided into three tranches with terms of five, seven, and ten years with fixed and variable interest rates. Although ALSO Holding AG does not have an official rating from the rating agencies, the funds were taken up on very good terms and conditions.
CAPITAL MARKET COMMUNICATION
We enhanced our capital market communication and held a dialog with the financial community in the reporting year. We conducted eight roadshows across Europe with approximately 40 institu-tional investors.
Since 2014, ALSO has been breaking new ground in its reporting. In the current annual report, we set another benchmark when it comes to using the possibilities offered by digital technologies in communication. The “Discover ALSO” app, which can be downloaded from the app store, allows shareholders, customers, and business partners to view selected business processes as well as key figures in virtual and augmented reality. The core topics for fiscal year 2017 can be accessed very quickly in a dialog format where the interface is reminiscent of a chat bot.

37
ALSO Annual Report 2017 STATUS REPORT
OUTLOOK
In the medium term, the ALSO Group is aiming for net sales of 10 to 14 billion euros and an EBITDA margin of 2.1 to 2.6 percent.
Big data and artificial intelligence, the Internet of Things, or blockchain technology – all of these are grown drivers for the ICT industry. For the ICT market in the countries in which ALSO operates, the Gartner market research institution estimates that end customer spending will increase by a 1.5 percent. A 6.8 percent rise is expected in business software alone. According to Gartner, global ICT spending is likely to grow by 4.5 percent in 2018.
In particular, investments in the development of artificial intelligence will also lead to further significant growth. ALSO expects this trend will also boost the ICT market in the countries in which the company operates.
Given this background, we see potential for further profitable growth in net sales, organically as a result of winning market share, as a result of constantly expanding the product categories in our portfolio, and as a result of further developing our business models. Furthermore, we are looking to grow non-organically through targeted acquisitions. In countries in which ALSO is already present, we will look to strengthen our market position through market consolidation in the traditional dis-tribution business and/or through investments in companies that work in the Solutions and Services business models. We will open up new countries within Europe through acquisitions and partner-ships. These will also play an important role in the international rollout of our as-a-Service platform across Europe and beyond.
We will achieve a further increase in profitability by working intensively on these five factors. The increasing automation of the transactional business is a critical factor for success in the area of opera-tional excellence. The harmonization of our ERP system and the further development of CRM allow us to use state-of-the-art tools to analyze, project, and optimize our business processes. We are planning to expand and invest in our webshop in the coming years with the aim of using the knowledge gained from business intelligence to further increase sales and to develop customized solutions for our cus-tomers. Furthermore, we are dedicated to boosting the expansion of the high-margin Solutions (IT architecture and design) and as-a-Service (logistics, IT and Marketing-as-a-Service) business models.

38
ALSO Annual Report 2017 STATUS REPORT
THANKS
On behalf of the ALSO Group, I would like to thank all our stakeholders, our buyers and providers for the trust they have placed in us and for the opportunity to be their partners. At the same time, we value the flexibility and support of our suppliers. Our performance would not be possible without the great dedication of our employees and their expertise to consistently implement the measures defined in our MORE strategy.
All our activities have been boosted by the valuable discussions that we constantly hold with our customers and by the contributions made by my colleagues on the Board of Directors.
Interested investors and analysts have provided helpful comments, questions, discussions and sug-gestions, which we discussed with our management teams and transformed into specific measures in some cases.
Last but not least, I would like to express my gratitude to you, our valued shareholders. Thank you to those of you who invested in us for the first time in 2017 for the trust you have placed in us, and thank you to the long-standing shareholders amongst you for your continuing strong association
with the ALSO Group.
GUSTAVO MÖLLER-HERGT
CEO AND CHAIRMAN OF THE BOARD OF DIRECTORS

39
ALSO Annual Report 2017 STATUS REPORT
ALSO SHARE AND SHAREHOLDER STRUCTURE
SHARE PRICE DEVELOPMENT IN THE REPORTING YEAR
During the reporting year, the price of the ALSO share developed positively. It started at 93.00 Swiss francs as of January 1, 2017, and closed the fiscal year at 134.00 Swiss francs per share, cor-responding to a rise of 44.1 percent as against the start of the year. Including the dividend, the total yield on a share that was bought on January 1, 2017, was 46.5 percent. The ALSO share thus outperformed the Vontobel Swiss Small Companies Index by 22.4 percentage points and the Swiss Performance Index (SPI) by 25.4 percentage points. The ALSO share also developed very pos-itively in comparison with other important indices. For example, it outperformed the Swiss Market Index (SMI) by 31.3 percentage
points and recorded an increase 32.6 percentage points higher than that of the German Stock Index (DAX). Compared with the shares of all companies in the SMI and the DAX, the 44.1 percent increase in ALSO’s share price was exceeded by only four compa-nies. The ALSO share is thus much higher than many other forms of investment, such as fixed-income securities or demand depos-its at banks. For natural persons subject to tax in Switzerland, its appeal is increased further by the tax exemption of distributions from capital reserves.
As of December 31, 2017, the total market capitalization of ALSO was 1 722 million Swiss francs (previous year: 1 155 million Swiss francs).
KEY FIGURES OF THE ALSO SHARE
2017
Number of registered shares with a nominal value of CHF 1.00 per share 12 848 962
Dividend per share (CHF) 2.75 1)
Equity per registered share (CHF) 56.77
Registered share price high (CHF) 140.00
Registered share price low (CHF) 90.15
Market capitalization as of December 31 (CHF million) 1 722
1) Proposal of the Board of Directors
2017
2012 588
2013 636
2014 666
2015 884
2016 1�155
1�722
MARKET CAPITALIZATION (IN SWISS FRANCS AS OF DECEMBER 31)
40
ALSO Annual Report 2017 STATUS REPORT
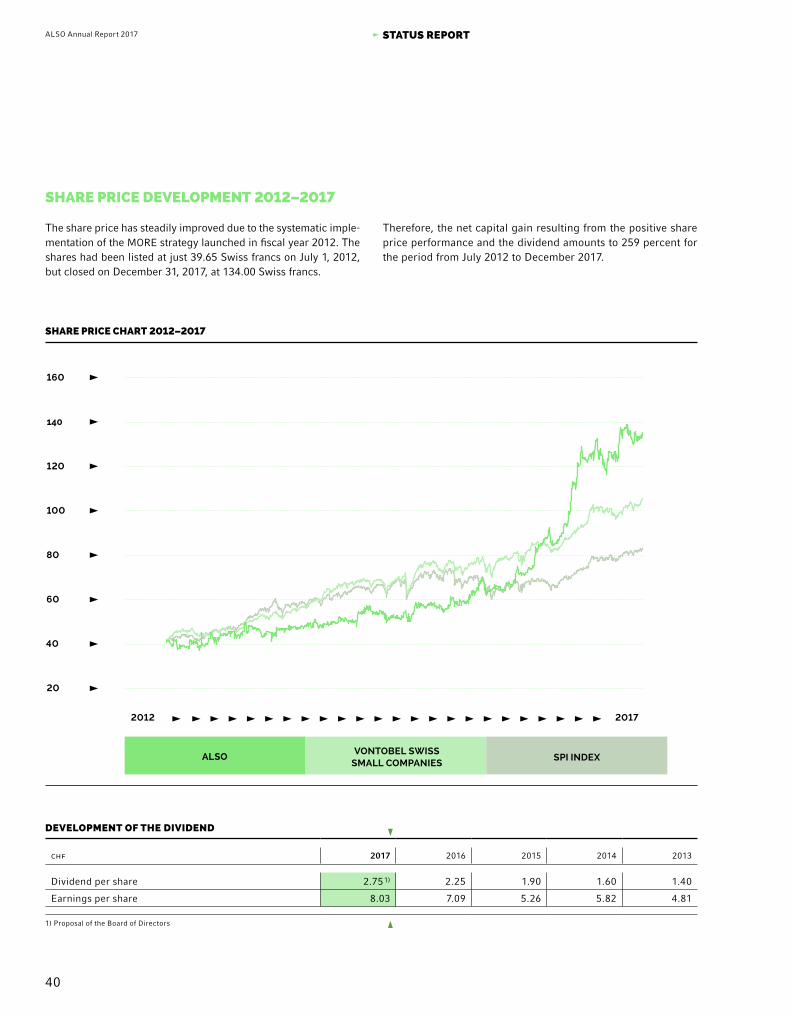
SHARE�PRICE�DEVELOPMENT�2012–2017
The share price has steadily improved due to the systematic imple-mentation of the MORE strategy launched in fiscal year 2012. The shares had been listed at just 39.65 Swiss francs on July 1, 2012, but closed on December 31, 2017, at 134.00 Swiss francs.
DEVELOPMENT OF THE DIVIDEND
chf 2017 2016 2015 2014 2013
Dividend per share 2.75 1) 2.25 1.90 1.60 1.40
Earnings per share 8.03 7.09 5.26 5.82 4.81
1) Proposal of the Board of Directors
Therefore, the net capital gain resulting from the positive share price performance and the dividend amounts to 259 percent for the period from July 2012 to December 2017.
20
2012 2017
140
160
100
80
120
60
40
ALSO SPI INDEXVONTOBEL SWISS
SMALL COMPANIES
SHARE�PRICE�CHART�2012–2017

41
ALSO Annual Report 2017 STATUS REPORT
DIVIDEND POLICY
For 2018, the Board of Directors proposes a distribution to the shareholders from the reserve from contribution in kind of 2.75 Swiss francs per share. This represents a total dividend payment of 35.3 million Swiss francs. The proposal will be submitted to the shareholders for approval at the Annual General Meeting of March 27, 2018.
In the event that the proposal is accepted by the shareholders, the dividend is tax-free for Swiss shareholders, as it is paid from the reserve from contribution in kind.
In the previous year, 32 percent of the Group net profit was distributed.
2017
2015
2014
2013
2016
DIVIDEND PER SHARE (IN SWISS FRANCS)
2.25
1.90
1.60
1.40
2.75�1
1) Proposal of the Board of Directors
SHAREHOLDERS
ALSO has a broadly diversified range of international, long-term shareholders with a clear majority ownership structure. The main shareholder is Special Distribution Holding GmbH (51.30 percent).
Special Distribution Holding GmbH, with its registered office in Düsseldorf, Germany, is a company of the Droege Group. The Droege Group is an independent consultancy and investment com-pany. With its range of services, the group has been operating for over 30 years as a specialist in tailored transformation programs with the aim of increasing enterprise value. The Droege Group combines a family business structure with a strong capital base
NUMBER OF INSTITUTIONAL AND SMALL INVESTORS
2016
855
2�622
1�708
2015
2017
to create a family equity business model. The group carries out direct investments with own equity in corporate subsidiaries and medium-sized companies in “special situations” or acts as a “tem-porary partner” in comprehensive value enhancement projects on the basis of performance-related fees. As an industrial holding company, a diversified portfolio is formed.
Due to the sustainable improvement in the ALSO Group’s earn-ings, which have resulted in a consistently high ALSO share price, the free float has climbed steadily to 48.70 percent. As a result, the ALSO share has become even more attractive for institutional and small investors, and their numbers have practically trebled from 855 in 2015 to 2 622 in 2017.

42
ALSO Annual Report 2017 STATUS REPORT
INVESTOR RELATIONS
ALSO substantially changed its capital market communication in 2013. We worked on two aspects:
Corporate communications with a website and annual report; Investor relations with capital market communication, ana-
lyst meetings and roadshows.
CORPORATE COMMUNICATIONS:
Since December 2013, all of the ALSO Group’s websites have been harmonized in order to achieve uniform presentation of the busi-ness model as well as a shared corporate identity and a shared corporate design.
With the support of Strichpunkt, a renowned design agency that has won multiple awards for its work in the field of annual reports, we completed the first milestone of a new type of reporting with the Annual Report 2014. As well as reporting on the fiscal year, the annual reports are also intended to provide insight into the ALSO Group’s goals, strategy, and fields of activity. This work is being continued on an ongoing basis. With the ALSO Annual Report 2015, we won one of the renowned Red Dots for communica-tion design. With the ALSO Annual Report 2016, we developed a new form of financial communication. The business models are explained using virtual reality as the basis, while key performance indicators are presented virtually thanks to augmented reality. In 2017, we expanded the app by adding a conversation format where the interface resembles a chat bot. Our shareholders, customers, and business partners can thus quickly access the most important facts about the 2017 fiscal year and the company.
INVESTOR RELATIONS:
ALSO commissioned the specialist service provider Brunswick Group to support its corporate communications and investor rela-tions activities. Since then, a road map for communications within the Group has been developed with the aim of harmonizing and managing local notifications. This is not only about showing a uniform image of the Group, but also integrating local news in the Group’s overall strategy. Shareholders can use various dif-ferent channels to obtain information about ALSO and the ALSO share. In addition to online information, the Investor Relations team is also available by telephone or at the central e-mail address
[email protected]. Moreover, the members of the Group Management are available to answer shareholders’ ques-tions at the Annual General Meeting and also in personal meetings during the year.
The ALSO share is monitored and regularly assessed by various banks and analysts. In 2016, the bank Vontobel AG prepared a study on ALSO for the first time. The management of the ALSO Group is available to answer questions from interested analysts and provides information on the Group’s development in line with the legal cir-cumstances. We held eight road shows over the course of the year, starting in Zurich in March, followed by Helsinki, Copenhagen, London, Paris and Zurich in April, and finally Emmen in June and November. Institutional investors and analysts had the chance to obtain in-depth information on the ALSO Group’s strategy and business development. The interim report for the half year and the annual report will be published as part of our communication. Taking account of the legal conditions, ALSO will be available to analysts and journalists to answer questions relating to the quarterly performance.

43
ALSO Annual Report 2017 STATUS REPORT
ALSO IN BRIEF
ALSO was founded in 1984 and is now one of Europe’s leading service providers for the ICT industry. We bring providers and buyers in the ICT industry together and offer them services at all levels of the value chain from a single source. Our goal is to ensure sustainable growth of the company by increasing our cus-tomers’ competitiveness and developing their business sustain-ably and profitably.
ALSO Holding AG has its headquarters in Emmen, Switzerland, and is listed on the Swiss Stock Exchange. Droege Group AG, Germany, holds a majority interest.
ALSO is represented in 15 European countries, with a dominant position in seven of these, and generates total net sales of approx-imately 8.9 billion euros with around 4 000 employees.
The basis of ALSO’s business models are the two customer cate-gories “providers” and “buyers”. The ALSO Group has a portfolio of more than 500 vendors in the ICT product categories of hard-ware, software, and IT services, including all global market leaders.
We offer the vendors access to a broad spectrum of over 100 000 buyers, who can call up further customized services in the logis-tics, finance, IT, and digital services sectors, as well as traditional distribution services. ALSO offers services along the entire value chain from a single source.
On the ALSO Cloud Marketplace (ACM) platform, more than 1 500 services are offered, 7 500 channel partners are connected, and almost 80 000 end customers with over 1 300 000 users are reached. By expanding the offer of the ACM in the form of a plat-form as a service for our distribution partners in various regions, we will be able to reach over 50 additional countries in Europe, the Near and Middle East, Africa, Asia (including China), and North and Latin America.
THE TRADITIONAL TRANSACTIONAL BUSINESS MODEL: SUPPLY
Marketing in the ICT industry is largely a three-step process. In a first step, the providers supply the ALSO companies. In a second step, these supply a very heterogeneous buyer structure, which in turn serves the end customers.
Because of non-existent scaling effects, small and medium-sized buyers are not always served directly by the providers. Here, ALSO takes over aspects such as payment transactions, fine logis-tics, or financing. Larger buyers, who for economic reasons also outsource functions and processes, have the possibility of down-loading these from ALSO as modules.
For the provider, taking over these tasks results in a reduction of complexity, and thereby in easier access to the various channels and regions. Smaller providers, who have no country organization of their own, use ALSO to obtain access to the market.
We offer our customers an extensive range of products and ser-vices in a total of over 1 200 product categories – 49 of which were added in 2017 alone – ranging from 3D printing products to IoT applications for security to data simulation.
On the basis of Europe’s biggest marketplace for the ICT industry, we enable our customers to sustainably shape and develop their businesses. Our webshop has around 400 000 visitors per month and generates annual net sales of 1.2 billion euros.
THE ALSO GROUP

44
ALSO Annual Report 2017 STATUS REPORT
1st tier (40 %)1st tierDirect (15 %)
SMB END CUSTOMERSLARGEORGANISATIONS
B2B
(Corporate/SMB/VAR/ Integrators)
END CUSTOMER BUSINESS
(Retailers/Etailers)
2nd tier (45 %)
SERVICES HARDWARESOFTWARE Providers
Buyers
Resellers
(AND OTHERS)
ICT MARKET MODEL

45
ALSO Annual Report 2017 STATUS REPORT
NEW BUSINESS MODELS: SOLUTIONS AND AS-A-SERVICE
Alongside this traditional, transaction-based business model of Supply, a growing number of solution-oriented business models have also been added in recent years. The Solutions sector com-prises consultancy services with which ALSO supports resellers with architecture and IT design issues, for example by rapidly translating requirements into specific configurations and deliver-ing the corresponding products for implementation.
An important role is played by our “as-a-Service” offers, which range from logistics-as-a-Service to marketing services to com-pletely cloud-based services, for example in the area of platform-as-a-Service, or can be combined with hardware components as in the case of Workplace-as-a-Service and Printing-as-a-Service. Driven by the increasing evolution of IoT, this area, combined under IT as a service, will become considerably more important for the ICT industry and therefore also for ALSO in the future.
OUR GROUP STRUCTURE AND ORGANIZATION
The Board of Directors of ALSO Holding AG is responsible for the highest level of management. It defines the strategic, organiza-tional, and financial goals of the Group. The Board Committee
advises and supervises Group Management. There are also three committees (Compensation and Nomination Committee, Board Committee, and Audit Committee).
The Board of Directors has delegated the management of the day-to-day business of the company to the CEO of the Group. To take account of the rapidly changing requirements in the ICT sector, Group Management has decided to expand its subordinated management committee.
THE TRANSFORMATION EXECUTIVE TEAM
The in 2017 newly formed Transformation Executive Team (TET) with a total of 12 members meets on a quarterly basis to discuss issues relating to the business development and actively advance the transformation of the company. The composition of the team, consisting of digital natives and experienced employees from the distribution business, will be adjusted dynamically as needed.
The matrix organization shown on the following page, which we continuously develop and expand, has proven effective for the efficient management of the company.
Jan Bogdanovich, Chief Transformation Officer, age 32, Riga location / Harald Wojnowski, MD of ALSO Switzerland, age 55, Emmen location / Laurent Mitais, MD of ALSO France, age 55, Paris location / Joachim Streitberg, Chief Information Officer, age 48, Soest location / Thomas Meyerhans, General Counsel, age 37, Düsseldorf location / Michael Gericks, SVP for Consumptional Business Model, age 32, Berlin location / Jorge Gállego Pérez de Larraya, Senior Business Analyst, age 35, Sweden location / Volkan Weissenberg, SVP for Vendor Management, age 39, Soest location / Philipp Koch, Finance Director for Consumptional Business Model, age 31, Berlin location / Hanna Osetek-Pasquet, MD of ALSO Poland, age 33, Warsaw location / Reiner Schwitzki, MD of ALSO Germany, age 50, Soest location / Simone Blome-Schwitzki, Solution MD of ALSO Germany, age 42, Soest location / (all from left to right)
TRANSFORMATION�EXECUTIVE�TEAM�2017
0100101010101010

46
ALSO Annual Report 2017 STATUS REPORT
ORGANIZATION OF ALSO
CENTRALEUROPE
NORTHERN /EASTERNEUROPE
CHIEF VENDORMANAGER
GROUP MANAGEMENT
CHIEF EXECUTIVE OFFICER
EUROPEAN KEY ACCOUNT
SMB DEVELOPMENT
SUPPLY SERVICES
SOLUTIONS SERVICES
CONSUMPTIONAL BUSINESS
LOGISTICS SERVICES
IT PROCESSES
TRANSFORMATION
E-COMMERCE (WEBSHOP)
FINANCIAL SERVICES
SUPPORT FUNCTIONS LEGAL, HR,�INTERNAL�AUDIT�ETC.
The company’s international activities are grouped into two mar-ket segments: the Central Europe market segment (Austria, France, Germany, and Switzerland) and the Northern/Eastern Europe market segment (Belgium, Denmark, Estonia, Finland, Latvia, Lithuania, the Netherlands, Norway, Poland, Slovenia, and Sweden). Together, the 15 country companies, and all other com-panies that are controlled directly or indirectly by ALSO Holding AG, form the ALSO Group.

47
ALSO Annual Report 2017 STATUS REPORT
COMPANY MANAGEMENT
ALSO uses quantitative and qualitative key figures for the short-, medium-, and long-term management of the company. ALSO aims to maintain a balanced relationship between growth, profitability, and the capital structure. Earnings, growth, and capital ratios are therefore used as quantitative key figures. The management focus is on sustainable improvement of these KPIs.
QUALITATIVE KEY FIGURES
Customer loyalty: Scientific studies show that there is a strong correlation between corporate success and the Net Promoter Score. The NPS measures customer loyalty and helps identify areas where action is needed to improve customer satisfaction and loyalty. ALSO uses this key figure because the financial tar-gets set can be achieved only with a loyal and satisfied customer base. The NPS for customers has been measured online continu-ously since mid-2016. In 2017, a total of 5 007 customers from all business areas and all countries with ALSO locations were included in the survey. If a customer reports a problem, he or she is immediately contacted by a team. The Managing Director of the relevant country manages this process. The Net Promoter Score is 40.4 percent.
Employee satisfaction: The ALSO Group’s growth strategy cannot succeed without dedicated employees. For this reason, the Group started systematically measuring employee satisfaction in 2015. In addition to the employees’ personal work environment and team collaboration, aspects such as their assessment of the com-pany’s sustainability and development opportunities within the company are examined. The results provide important insights with regard to the company’s positioning as an attractive employer and the development of targeted HR work. Visible weaknesses in relation to targeted personnel development and communications within the company are countered with specific measures in the countries under the leadership and responsibility of the relevant Managing Directors.
QUANTITATIVE PERFORMANCE INDICATORS
Profitability: Because the different business models show extreme variations in terms of their net sales volumes and margins, ALSO uses earnings before tax (EBT) as the basis for measuring profit-ability. The EBT development compared to the previous year is analyzed. At the same time, comparisons of the individual ALSO companies are performed. In 2017 we generated EBT of 124 mil-lion euros, representing an improvement of 9.0 percent in com-parison to the previous year (114 million euros). The EBT margin came to 1.4 percent.
Sustainable growth: ALSO aims to generate sustainable growth. This is monitored and managed on the basis of the sustainable growth rate (SGR). The SGR represents the maximum possible growth in net sales that can be achieved without a deterioration in the financial structure. It is calculated by multiplying the profit margin 1), the retention rate 2), the capital turnover ratio 3), and the equity ratio 4). When developing new business areas or acquisi-tions, the impact on this Group key figure is considered.
DEVELOPMENT OF THE SGR
2017
2016
2015
2014
2013
2012
10.1
10.0
8.1
9.7
8.4
8.4
Between 2013 and 2017, ALSO grew at slightly below the potential sustainable growth rate on average, also including acquisitions, and achieved the goal of a stable financial structure. In 2018, sus-tainable growth of 10 percent can be achieved without a deterio-ration in the company’s financial structure. For investors, this means that while the dividend yield remains constant (previous year: 2.5 percent) there is no capital dilution, and they can addi-tionally benefit from the increase in value from the targeted growth.
ALSO has defined various KPIs for managing its profitability and capital structure. These are continuously monitored, reported to the management on a regular basis, and can also be called up by the management independently via our IT systems (particularly SAP and BI). The main performance indicator for ALSO is EBT. Its development is evaluated at several different levels.
* 2017 with provisional figures and retention rate at 2016 level.
1) Profit margin: Net profit/net sales2) 1 minus payout ratio3) Net sales/total assets4) Total assets/equity
48
ALSO Annual Report 2017 STATUS REPORT
The focus is on the gross margin component, which is analyzed in great detail. Costs are broken down by type and by cost center. With regard to monitoring the capital structure, the focus is on controlling net working capital. There is a particular focus here on the inventory-related key figures of days inventory outstanding and the age structure of inventories. Other important key figures in our reporting are: full-time equivalent positions, market share by country and vendor, overdue receivables, customer range, net financial debt, share of net sales from e-commerce, shares of cus-tomer channels, and cash flow development.
Capital structure: The Group aims to ensure that it does not gen-erate profit or growth at the expense of changes in the capital structure. One service that ALSO offers its customers is the pro-vision of credit lines. For this reason, the Group’s capital require-ments are managed with strict monitoring of the different country organizations’ liquidity cycles. The country Managing Directors, as well as some Business Unit Managers since last year, have specific targets in this regard.
ALSO’s total assets are influenced by the high availability of our broad product portfolio and by the payment targets granted to buyers, and reflect the value proposition for our customers, pro-viders and buyers in the ICT industry. At the same time, the high net working capital requirements represent a significant barrier to entry for potential new market players. The steady expansion of our customer base and the continuous optimization and auto-mation of our processes enable us to sell and replace our inven-tory around ten times per year. This efficient use of capital forms the basis for profitability and sustainable growth.

49
ALSO Annual Report 2017 STATUS REPORT
OBJECTIVES AND STRATEGYMORE
The primary goal of the company is to achieve sustainable prof-itable growth with reference to the key figures described in the “Company Management” section. This means that ALSO attains growth that takes into account the capital structure and profitabil-ity of the company. These cornerstones define the conflicting pri-orities of our activities, and every decision is made on this basis.
Within this area of tension, we have defined and prioritized four activities:
M for MAINTAIN stands for securing the transactional business model, based on which the as-a-Service and Solutions business will be further expanded to attain the targeted growth and income goals.
O as in OPTIMIZE stands for continuous optimization of pro-cesses, particularly to increase the profitability of the transac-tional business model. The launch of our SAP system and Busi-ness Intelligence 2.0 establishes an important basis for the company’s continued development.
R stands for REINVENT. ALSO aims to continue growing with the transactional business model while also generating additional growth with solution- and usage-oriented business models and resulting offers.
Finally, E stands for ENHANCE. This mainly means expanding our market position by acquisitions in line with the Reinvent goal.
ALSO aligns its activities to markets with long-term profitability and/or growth potential. The goal of the portfolio policy is to attain or hold the first or second market position in all countries. The Group is represented in 15 countries. In countries where ALSO has a dominant market position, the focus is on companies and investments for the rapid expansion of new business models. In other countries, ALSO pursues the dual strategy of achieving a dominant market position by means of further acquisitions within existing business models while also establishing new business models rapidly by acquiring existing providers.
Provided there is sufficient stability and legal certainty, new coun-tries and regions are tapped in line with the following priorities:
Cooperations with existing companies to tap new business models.
Moving into new markets with new business models (green-field).
Acquisition of established market providers.
THE MORE STRATEGY PROGRAM
GROWTH
PROFITABILITY CAPITAL STRUCTURE
REINVENT
OPTIMIZE
MAINTAIN
ENHANCE

50
ALSO Annual Report 2017 STATUS REPORT
OUR�3S�BUSINESS�MODEL:�SUPPLY,�SOLUTIONS AND AS-A-SERVICE
We enable our customers – providers and buyers of hardware, software, and services – to fully exploit their existing potential and implement new business ideas. In order to scale our services, we systematically take advantage of the market opportunities aris-ing from increasing digitalization in particular.
The starting point for our business was and still is the digital workplace or “seat” and the associated infrastructure. The service offered by ALSO in marketing the seat may be transactional – associated with a change in ownership of software and/or hard-ware, expert reports, concepts, etc. – or usage-oriented with flex-ible, needs-based delivery and management of these items.
New developments in the areas of WiFi network infrastructure, edge computing, and IoT are also presenting the IT industry and ALSO with completely new opportunities – specifically, the “dig-ital machine space” – and the possibility to develop and market these. Edge computing can be used as an architecture concept for the IoT that establishes a connection between clearly identi-fiable physical objects and a virtual representation in an Inter-net-like structure. These offers can be marketed in transactions or as-a-Service.
Against the backdrop of the broad customer base, the Solutions and as-a-Service business models will be further expanded in order to generate additional growth with higher margins and compensate for potentially falling margins in traditional business. ALSO consequently has a service portfolio that combines the strong net sales of transactional business with the loyalty arising from consultancy expertise and the profitability of long-term, usage-oriented offers. At the same time, this gives rise to an important strategic differentiating criterion in competition.
client operations business applicationsinfrastructure
HOW MUCH DOES AN IT SEAT IN AN ENTRPRISE TODAY COST?
ALSO IT SEAT STRUCTURE CURRENT MARKET IT SEAT STRUCTURE
50 % 35�%
15�%
50�%
20�%
30�%
cost in euros: 8 000cost in euros: 9 000
EVALUATION OF DISTRIBUTION METHODS
USAGE- ORIENTED
TRANSACTION- BASED
NET SALES
SUSTAINABILITY OF NET SALES
CUSTOMER LOYALTY
WORKING CAPITAL
AUTOMATION LEVEL
BARRIERS TO ENTRY
AUTOMATION LEVEL
high medium low

51
ALSO Annual Report 2017 STATUS REPORT
SOLUTIONS
Addressable ALSO market: 20 billion euros
SUPPLY
Addressable ALSO market: 56 billion euros (o/w 22 billion
euros distribution)
AS-A- SERVICE
Addressable ALSO market: 175 billion euros
EVALUATION�OF�THE�3S
high medium low
NET SALES OPEX MARGINCUSTOMER
LOYALTYWORKING CAPITAL

USE�OF�OFFERS�ALONG�THE�3S�
BUSINESS MODELS
30%
60%
DISTRIBUTION OF NET SALES & MEDIUM-TERM TARGET FOR DISTRIBUTION OF NET SALES
4 %
18 %
78 %
10%
TODAY
SOLUTIONSAS-A-SERVICESUPPLY
FUTURE
52
ALSO Annual Report 2017 STATUS REPORT
SUPPLY
Net sales in the traditional transactional business model (Supply) include business with optimized trading processes and logistics for the IT, consumer electronics, and telecommunication sectors. The business model is characterized by a high number and fre-quency of transactions, high net sales, high scalability, high work-ing capital requirements, low retention rates, and low margins. In short, it is a model based on economies of scale.
The ALSO value proposition for the providers consists of creating a broad range of customers, providing detailed logistics, and managing complexity. For the buyers, it consists of providing a product portfolio, managing detailed logistics, and providing the credit line.
The focus in supply business is the ability to map orders of any size for the reseller rapidly and as simply as possible. ALSO can deliver to its customers – or the customers of these customers – within the same day. Smaller resellers can order products from a broad portfolio in any desired quantity. Buyers have 24/7 access to the information in ALSO’s webshops about our extensive prod-uct offerings and ordering methods. Net sales are recognized at the date when a product is sold.
SOLUTIONS
Designing and implementing complex infrastructure and virtualiz-ing networks, servers, and storage opens up new dimensions in IT but also requires a high level of consultancy expertise in the differ-ent fields. In solutions business, ALSO therefore provides proj-ect-based support to SMBs in particular on questions of architecture and IT design, rapidly translates requirements into specific config-urations, and monitors the status of projects.
The business model, which comprises all net sales from trading business with products that form part of comprehensive solutions, is characterized by consultancy services across all phases of the project.
For the providers, the value proposition includes the broad range of customers and the provision of first-/second-level support. For the buyers, the focus is on configuration, engineering, proof of con-cept, provision of the credit line, and delivery of the entire product range required in the specific case.
Net sales are recognized at the date when a product is sold. Specific types of solutions business include performance tests, optimization of the IT environment, and after-sales support. ALSO offers resellers the opportunity to present products and solutions to their consum-ers live in the demo center.

53
ALSO Annual Report 2017 STATUS REPORT
AS-A-SERVICE
In this area, ALSO acts as a service provider rather than a seller. The services offered are called up as needed and remunerated with variable payments based on usage. The reported net sales include services from the areas of cloud marketplace, outsourc-ing, and process (re-)engineering:
Logistics-as-a-Service: supply chain solutions along the complete value chain for providers and buyers.
Marketing-as-a-Service: traditional and digital marketing for providers, in order to widen their customer base.
IT-as-a-Service: Platform-, Infrastructure-, Workplace-, and Software-as-a-Service. This may include reconditioning used hardware and subsequently marketing it (end-to-end).
IT-AS-A-SERVICE
The value proposition for providers consists of tapping a diverse customer base via the ALSO platforms and significantly reducing complexity in distribution. For our buyers, meanwhile, using the platform offers means that they do not have to operate their own infrastructure in order to offer complex usage-oriented services.
Net sales are recognized either when the service is performed (brokerage commission) or when the processed product is sold (reconditioning of used hardware) or they are distributed over a period of use (managed print services). Specific types of service business include IT services (ICT services in the areas of recruit-ment, 2nd-level support, and telesales), logistics services, train-ing, and marketing.
PLATFORM-AS-A-SERVICE (ALSO CLOUD MARKETPLACE)
SOFTWARE- AS-A-SERVICE
WORKPLACE-AS-A-SERVICE
INFRASTRUCTURE-AS-A-SERVICE
THE SEAT

54
ALSO Annual Report 2017 STATUS REPORT
BASIS FOR THE 3S:OUR SERVICE RANGE
Within our 3S business models, we offer the following services:
FINANCIAL SERVICES
A key function of our financial platform is to support working capi-tal financing. We offer credit lines and payment targets to meet specific needs. In addition, for SMB resellers we develop individ-ual financing solutions for larger projects. The ALSO webshop brokers offerings for leasing, merchandise credit insurance, and creditworthiness information, which can be called up simply and digitally. All payment transactions with buyers and providers for products and services are executed efficiently. In 2017, we had a total of approximately 51 000 active customers with a credit line, and the volume of credit lines granted came to 3.5 billion euros.
Needs-related portfolio, efficient processing of payments, uncomplicated online fulfillment
SUPPLY SERVICES
ALSO can deliver to its customers – or the customers of these customers – within the same day. Smaller resellers can order products from us out of a broad portfolio, at attractive prices, and in any desired quantity. ALSO’s sales and product marketing employees can offer professional support on questions of config-uration and project management. Buyers have 24/7 access to the information in our webshops about our extensive product offer-ings and ordering methods. In 2017, we sold more than 200 000 articles from over 500 providers via the ALSO B2B marketplace.
High availability, uncomplicated credit processing, competitive prices
LOGISTICS SERVICES
In our pan-European logistics network covering 300 000 square meters, we process 14.5 million packages and sets a year of vari-ous sizes, from small USB sticks to large-format printers. We offer B2B and B2C partners access to order tracking. Even com-plete fulfillment is included in the service offering. A pan-Euro-pean track-and-trace system enables constant order tracking irre-spective of the shipper being used. With MyDelivery, ALSO has provided webshop providers from all sectors with a tool that allows their customers to control the place and time window for delivery as they wish. Depending on the delivery service selected, delivery flat rates can also be charged to the end customer directly via state-of-the-art mobile payment. In 2017, we particularly expanded our service range in the area of reverse logistics with new or extended contracts with custom-ers in Switzerland and Finland.
Optimal cut-off times, highly diverse single-item and batch sizes, extensive multi-channel capability
SOLUTIONS SERVICES
ALSO maintains daily contact with its buyers and therefore knows their requirements in relation to software, servers, storage, net-works, security, and other topics. ALSO offers a solutions portfolio that is exactly aligned to customers’ requirements. In projects, ALSO provides support on questions of architecture and design, rapidly translates requirements into concrete configurations, and monitors the status of projects. When managing projects, ALSO draws attention to price and product changes and offers support with proof of concept. In 2017, we prepared a total of 2 800 proofs of concept for customers.
Customized portfolio, short project planning phase, secure project financing

55
ALSO Annual Report 2017 STATUS REPORT
IT SERVICES
The ALSO Cloud Marketplace is based on a redundant data center operated by the company itself, where the most recent security standards are applied. In addition to the latest SAP system with HANA technology, ALSO also uses a modern business intelligence system with predictive analytics to promptly detect developments in the market. Our partners process 2.9 billion euros via Elec-tronic Data Interchange (EDI) and 1.2 billion euros through our webshops. To support our customers even better, we use analyt-ical tools for continuous optimization. Buyers can call up their structure data, for example their order data, online at any time. The shop-in-shop webshop “myStore” established in 2017, with which resellers can quickly and easily set up an individual shop for each of their customers, is one example of the wide range of possible uses of the ALSO Cloud Marketplace.
Individualized provision of data, easy system integra-tion, state-of-the-art security standards
DIGITAL SERVICES
Through the Cloud platform, ALSO connects service providers with resellers and enables them to assemble appropriate cloud solutions for their customers easily and quickly. In its choice of offerings, in addition to well-known cloud services − such as vir-tual servers and mailboxes − ALSO includes independent software and service providers, too. Predefined criteria regulate the inclu-sion of services in the local cloud service catalog. With just a few clicks, resellers create their own marketplace and determine the services for their customers, set their selling prices, and submit an offer. The services are automatically made available to the cus-tomers. The easy-to-use and intuitive standardized interface, as well as support in the respective national language, enable rapid entry into the cloud business. We expect the current number of 1.3 million seats in 71 countries to increase significantly over the coming years.
Qualified service portfolio, automatic readying, sim-ple scaling

56
ALSO Annual Report 2017 StatuS RepoRt
optIMIZING INCoMe 2017
ALSO steers the continual optimization of the income using the following five levers*:
VeNDoR MIX
Securing an attractive supplier portfolio by means of short reaction times to changes in general conditions on the ALSO marketplace.
We strongly boosted our cooperation with famous manu-facturers such as Microsoft, HP, and Lenovo. Being hon-ored with the Distribution Partner of the Year Award 2017 from Microsoft and the Global Distributor of the Year Award 2017 by HPE is testament to the excellent cooperation we enjoy with our vendors.
We have also successfully incorporated into our portfolio a large number of new vendors, including Logitec, Kensing-ton, and ROOMZ, to name just a few.
Just under 40 independent software vendors (ISVs) offered over 200 new services on the ALSO Cloud Marketplace in 2017. Currently, 1 500 vertical cloud services from a total of 80 ISVs can thus be accessed via the ALSO Cloud Marketplace.
BuYeR MIX
Focusing on fast-growing buyer groups with perfectly tailored services and connection to the CRM.
In 2017, we continued consistently to follow the path we set out on in 2016 to develop our international presence through regional partners. After opening up the Anglo-Saxon market together with Westcoast, we teamed up with Intcomex to make the ALSO Cloud Marketplace accessible in 20 coun-tries in North and Latin America, and we worked with Bezeq International to successfully open Israel as an important IT country, while 26 countries in the MEA (Middle East and Africa) region have already been developed with Logicom. It was thus possible in 2017 to open up a further 21 countries for our PaaS offer. But in our core markets, too, we signifi-cantly expanded our service business with existing custom-ers, such as the MediaMarkt Group in Switzerland.
We launched marketing campaigns in some core mar-kets with the aim of expanding the cooperation with SMB resellers and achieved a revenue growth of 5.9 percent.
pRoDuCt MIX
Rapidly providing innovative products and services with high growth potential.
In 2017 alone, we expanded our portfolio with 49 new prod-uct categories. A primary area was the distribution of 3D printing solutions. Furthermore, we entered into a strate-gic partnership for the marketing of A3 printers. Alongside its role as a logistics partner, ALSO here offers additional services such as installation, the supply of consumables, reverse logistics, and project management.
In the course of the year, ALSO restructured and expanded training programs and certification services, especially in the field of security, and bundled the many facets under the umbrella of the “ALSO Security Education Circle.”
ALSO works together with market leading providers of inte-grated storage, server, and virtualization software solutions. One of the objectives of ALSO here is to promote the distri-bution of hyperconvergent solutions in Europe.
ALSO has opened up the possibility for its partners to incor-porate innovations such as IBM Watson (artificial intelli-gence) as part of their own solution. The resulting solu-tions, supplemented by their own end-to-end support, can be marketed to our partners’ customers on a fixed price basis or also in an SaaS model through the cloud.
We have significantly expanded our offer for users of the ALSO Cloud Marketplace in the area of security:
Security and archiving programs for e-mail communi-cations that meet the requirements of the General Data Protection Regulation (GDPR) that will come into force on May 25, 2018,
Blockchain-based secure data exchange for companies working in fields that are particularly sensitive when it comes to data protection,
Cloud security for our SMB customers, Solutions for the secure migration of data to the cloud.
We are developing offers the use of the IoT. A concrete example is the rollout of software services for video surveillance.
57
ALSO Annual Report 2017 STATUS REPORT
OPERATIONAL EXCELLENCE
Continuously optimizing structures and processes to reduce operating expense.
In 2017, we took a decisive step forward in our efforts to create an organization that is even more customer-ori-ented, efficient, and agile. The Group-wide finalization of the SAP harmonization has to be highlighted in particular. As a result, we can perform Group-wide enterprise resource planning (ERP) in order to plan and manage resources in a timely and needs-based way and thus further enhance our operational excellence.
Furthermore, the foundation has thus been laid for inte-grated customer relationship management (CRM), which will enable us to further develop and boost our customer relationships, better exploit any opportunities that arise, and optimize our processes. This will produce a new level of quality in customer care and support especially for our large number of small and medium-sized enterprises.
The webshop has been and will continue to be upgraded. We see great potential here in the future resulting from increasing standardization and automation of the transac-tional business, which will mean that effectiveness will be improved and scalability will be increased.
The launch of our Business Intelligence 2.0 has enabled us to significantly optimize our flexibility and the possibility of analyzing data and to identify and implement Group-wide best practices more quickly.
BUSINESS MODEL MIX
Systematically expanding and developing the Solutions and as-a-Service business models.
The ALSO Group began working on extending its services in the direction of usage-based ICT models back in 2012. The area includes as-a-Service offers for platforms, infra-structure, software, devices and workplaces. Grouped under IT-as-a-Service, ALSO thus provides critical compet-itive advantages to its resellers, which are able to respond with agility and dynamism to the constantly changing requirements of the market thanks to the ALSO Cloud Mar-ketplace. The establishment and development of the offers of seats as a central element of the business model in the context of the PaaS program (Platform-as-a-Service) has to be highlighted in particular. In 2017, ALSO offered a total of 1.3 million seats, over 450 000 of which are PaaS seats for customers.
In the Logistics-as-a-Service business sector, we submit-ted tenders in Switzerland to Sunrise and Swisscom, with which we had already worked before 2017, and successfully
convinced them to continue using the ALSO services in the future, partly in expanded form. In Finland, we took over the complete reverse logistics of Fujitsu in 2017.
Development of service platforms such as WePrintSmarter, with which resellers can optimize customer processes. The first product from WePrintSmarter is for example “SmartSupplies,” which allows ordering and delivering processes for toners and ink cartridges to be fully automated as an Internet-based end-to-end solution.
A team for commercial applications in the area of the IoT was set up in 2017, and it is already working on the first concrete offers.
* All the applications mentioned are given as examples, which should not be regarded as exhaustive, to illustrate the practical work related to the five levers.
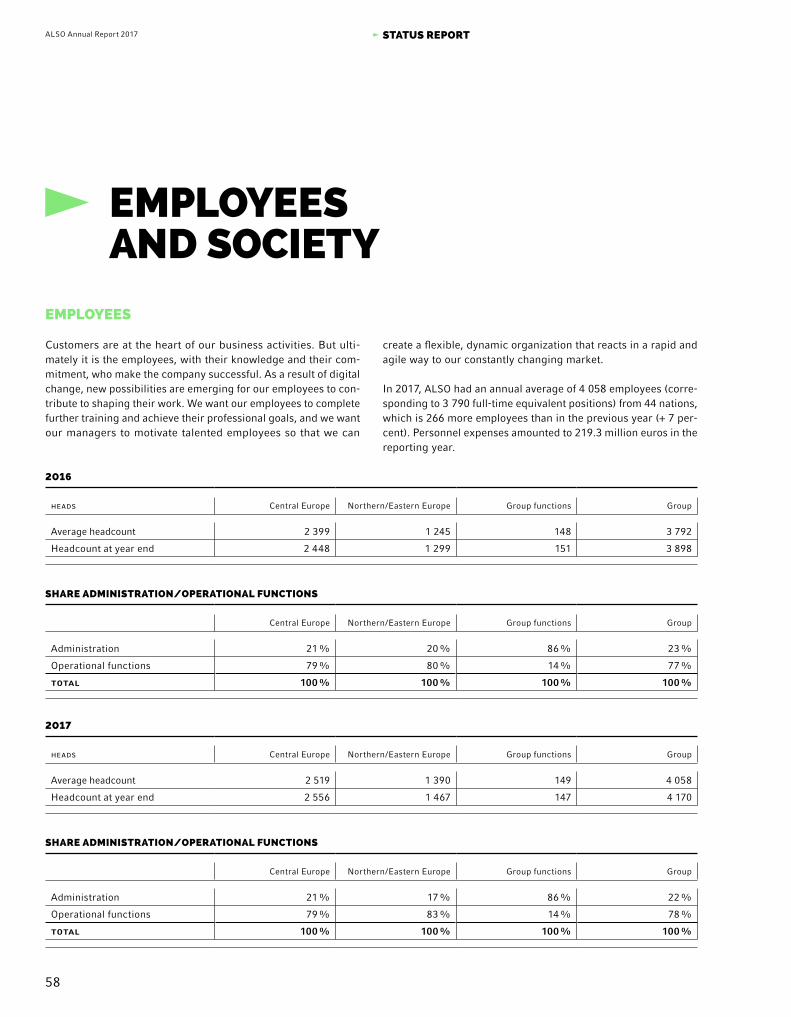
58
ALSO Annual Report 2017 STATUS REPORT
EMPLOYEES AND SOCIETY
EMPLOYEES
Customers are at the heart of our business activities. But ulti-mately it is the employees, with their knowledge and their com-mitment, who make the company successful. As a result of digital change, new possibilities are emerging for our employees to con-tribute to shaping their work. We want our employees to complete further training and achieve their professional goals, and we want our managers to motivate talented employees so that we can
create a flexible, dynamic organization that reacts in a rapid and agile way to our constantly changing market.
In 2017, ALSO had an annual average of 4 058 employees (corre-sponding to 3 790 full-time equivalent positions) from 44 nations, which is 266 more employees than in the previous year (+ 7 per-cent). Personnel expenses amounted to 219.3 million euros in the reporting year.
2016
heads Central Europe Northern/Eastern Europe Group functions Group
Average headcount 2 399 1 245 148 3 792
Headcount at year end 2 448 1 299 151 3 898
SHARE ADMINISTRATION/OPERATIONAL FUNCTIONS
Central Europe Northern/Eastern Europe Group functions Group
Administration 21 % 20 % 86 % 23 %
Operational functions 79 % 80 % 14 % 77 %
total 100 % 100 % 100 % 100 %
2017
heads Central Europe Northern/Eastern Europe Group functions Group
Average headcount 2 519 1 390 149 4 058
Headcount at year end 2 556 1 467 147 4 170
SHARE ADMINISTRATION/OPERATIONAL FUNCTIONS
Central Europe Northern/Eastern Europe Group functions Group
Administration 21 % 17 % 86 % 22 %
Operational functions 79 % 83 % 14 % 78 %
total 100 % 100 % 100 % 100 %

59
ALSO Annual Report 2017 STATUS REPORT
ALSO conducts a group-wide survey of employee satisfaction (NPS) each year. In this way, we obtain valuable results for devel-oping specific improvement measures and integrating them in the organization.
The employee survey this year mainly produced three points for optimization - communication between the management and employees, the development of career plans and, related to that, appreciation of the work that is performed. We will examine these points in more depth in order to understand exactly the views and expectations of the employee and to build on this to develop spe-cific measures for the individual national company.
In addition to the interesting sector in which we work, our employ-ees value in particular the innovative strength of the company. The personal work environment and the tasks assigned to them are also seen in a positive light by employees.
With the web-based Performance Appraisal Tool, the performance of around 200 managers is systematically evaluated twice a year. It also reveals any necessary training measures.
The Design Thinking workshops conducted in the previous year led to a large number of regional initiatives. Construction work was carried out in Finland and other countries to create or optimize social rooms and meeting places for employees.
A project was conducted in Switzerland that reviewed and furtherdeveloped the ALSO culture. Every employee can now find in “ALSO Swiss House” a summary of basic principles, conduct and leadership values and compliance guidelines.
The age structure of our employees is balanced and displays a good mixture between highly qualified employees, internationally experienced managers, and young talents.
COMPLIANCE
ALSO sees part of its corporate responsibility in harmonizing its economic objectives with the social requirements as well as the requirements of its customers, employees, investors and part-ners. For us, this means creating added value while at the same time reducing detrimental effects for people and the environment.
A variety of measures and tools are available to our company that we can use to embed sustainability and drive that process for-ward: Approaches to responsible corporate management and to integrity in our conduct. These include for example our corporate
AGE STRUCTURE*
Central EuropeNorthern/Eastern
Europe Group functions Group Previous year
< 20 2 % 0 % 5 % 2 % 3 %
21 – 30 17 % 15 % 23 % 18 % 17 %
31 – 40 25 % 36 % 27 % 29 % 29 %
41 – 50 31 % 34 % 24 % 31 % 32 %
> 50 25 % 15 % 21 % 20 % 19 %
total 100 % 100 % 100 % 100 % 100 %
* As of December 31, 2017
governance and compliance structures just as much as defining and monitoring key performance indicators in the field of sustain-ability and formulating sustainability targets within our areas of responsibility. All ALSO activities are carried out in compliance with the code of conduct. A focus is placed within the national companies on raising the awareness of all employees concerning ecological and social concerns.
The ALSO compliance program is an important element in our risk management and is applied in all countries. A key component of the program is the training of our employees. New employees are familiarized with the contents of the training online and in on-site courses, while refresher courses are conducted regularly for all employees. The training ratio of all employees required to undergo the compliance online training (excluding employees working purely in logistics and temporary staff) amounted to 98.3 percent in 2017.

60
ALSO Annual Report 2017 STATUS REPORT
ECOLOGY
The responsible use of resources is an element that is firmly inte-grated in our business processes. This involves making it possible to quantify, and thus also to control and manage our environmen-tal efforts. We are currently focusing on three main points throughout the company: Increasing efficiency in the areas of electricity and heating and reducing waste. We also examine our future investments from this perspective.
The following countries currently form the basis for collecting our sustainability figures: Denmark, Germany, Estonia, Finland,
France, Latvia, the Netherlands (ALSO International B.V. and ALSO Nederland B.V.), Norway, Sweden and Switzerland. The surveys have been started in Lithuania and Poland, and the goal is to integrate these countries in the scope by 2018.
IMPROVED EFFICIENCY IN THE USE OF ENERGY
We understand improved efficiency to involve reducing the con-sumption of electricity and fossil fuels by optimizing the heating and lighting concepts of all buildings as well as installing building insulation, which we are also undertaking in some properties that are not actually owned by the company.
TREND IN HEATING COSTS
kWh p.a. CO2/kg CO2/FTE
2015 14 932 546 3 179 660 1 096
2016 14 895 230 3 175 713 1 091
2017 13 706 098 2 942 778 975
change 2017 vs. 2015 – 8.2 % – 7.4 % – 11.0 %
The selection of samples covers > 90 percent of the total net sales of ALSO.
TREND IN ELECTRICITY CONSUMPTION
kWh p.a. CO2/kg CO2/FTE
2015 13 653 601 2 305 394 795
2016 12 916 234 2 125 928 730
2017 11 372 628 1 710 992 567
change 2017 vs. 2015 – 16.6 % – 25.8 % – 28.7%
The selection of samples covers > 90 percent of the total net sales of ALSO.

61
ALSO Annual Report 2017 STATUS REPORT
Despite an absolute increase in the number of employees and in surface area, we succeeded in further reducing our energy con-sumption. The further reduction of our electricity consumption and thus also of CO2 pollution is particularly pleasing. Total CO2 emissions were successfully reduced by 25.8 percent and even by 28.7 percent per FTE from 2015 to 2017.
Individual measures that should be highlighted include for exam-ple a reduction of the temperature in the warehouse facilities in Switzerland by 1 degree Celsius as well as the use of geothermal energy to heat the new warehouse in Finland.
TREND IN WASTE/RECYCLING
The objective here is to record and optimize the material and sub-stance flows, to ensure recycling and appropriate disposal, and to avoid waste while systematically considering the environmental requirements at our suppliers and waste disposal partners.
WASTE/RECYCLING
Total waste/metric tons
Recyclable/ metric tons Total in %
Non-recyclable/metric tons Total in %
Waste per delivery/kg
2015 4 182 3 655 87 % 527 13 % 0.579
2016 3 907 3 485 89 % 422 11 % 0.516
2017 4 120 3 700 90 % 420 10 % 0.493
change 2017 vs. 2015 – 14.8 %
The selection of samples covers > 90 percent of the total net sales of ALSO.
By separating waste consistently and more efficiently, we have been able to increase the proportion of recyclable packaging com-ponents at the warehouse facilities. It has thus proved possible to further reduce the high level of non-recyclable waste throughout the Group. In addition, more detailed separation of the materials has been implemented.
SUSTAINABILITY IN THE SUPPLY CHAIN
In 2016, we carried out a CSR self-assessment using a questionnaire at our suppliers. The aim of the survey was to gain an overview of the commitment of the suppliers to sustainability and to organize exchanges between each other. The questionnaire was sent to the majority of our suppliers with which we generate roughly 97 per cent of our total net sales overall. The response rate was 54.5 per-cent, accounting for a sales volume of 70.8 percent of total net sales. One focal point of our continued work in this area will be to step up our cooperation with suppliers that work sustainably.

62
ALSO Annual Report 2017 STATUS REPORT
TARGETS
The ALSO Group has set itself the target of continually improving its CO2 footprint, and in this process the entire supply chain from manufacturer to customer is investigated to see whether there are any possibilities for improvements. A number of concrete projects are already underway for 2018 that will play a part in further reducing the CO2 emissions of the Group and thus also help to further minimize our CO2 footprint. The fol-lowing individual initiatives are presented by way of example here:
Project 1 Switch from conventional lighting to LED lighting in our ware-house facilities in Braunschweig and Soest in Germany
Braunschweig Soest
Days of use 250 250
Period of use 13 h 13 h
Electricity consumption for lighting, current 373 MWh 484 MWh
Saving in % 60% 60 %
Electricity saving p.a. 224 MWh 290 MWh
CO2 saving p.a. 140 t 181 t
By switching to LED lighting, the energy demand in both ware-houses can be reduced by 60 percent each, which means savings of 140 metric tons of CO2 in Braunschweig and 181 metric tons of CO2 in Soest.
Project 2Significant reduction of the CO2 footprint of our warehouse facility in Pirkkala, Finland, through the use of renewable energy sources
Our Finnish organization successfully underwent ISO 14001 cer-tification in 2017. To this end, a company environmental policy, environmental targets, and an environmental program were defined, while a corresponding management system was set up to implement and achieve the targets. We took a first large step to minimizing our CO2 emissions when we moved into our new warehouse facility in Pirkkala, Finland, in the middle of 2016. Exclusively geothermal energy is used to sup-ply heat for the entire warehouse. In 2017, the conditions were created to guarantee from the beginning of 2018 an electricity supply from our energy suppliers that is generated 100 percent from wind power.
As a result of this measure, the CO2 emissions per kilogram will be reduced by 92 percent in comparison with 2017. Comparing the estimated CO2/kg consumption in 2018 with the value from 2015 (old warehouse), a CO2 saving of 97.5 percent will be gen-erated from 2018 onward.

63
ALSO Annual Report 2017 STATUS REPORT
BUSINESS DEVELOPMENT OF THE GROUP
ICT MARKET OVERVIEW
According to the CONTEXT market research institute, net sales in the entire ICT distribution market in the countries that are rele-vant for ALSO grew by + 4.5 percent compared to the previous year. The main areas driving this development were telecommu-nications (+ 13.3 percent), mobile computing (+ 5.1 percent), dis-plays (+ 8.1 percent), and computing components (+ 7.6 percent). Negative trends were recorded in the areas of software & licences (– 2.4 percent), server computing (– 9.7 percent), data center net-working & security (– 13.2 percent) and printing (– 5.1 percent).
In the comparable reporting year, ALSO gained market share in significant categories: mobile computing + 11.9 percent (Panel + 5.1 percent), printing consumables + 7.8 percent (Panel + 2.2 per-cent), telecommunications + 52.4 percent (Panel + 13.3 percent), and displays + 12.1 percent (Panel 8.1 percent).
There were slight declines in ALSO’s market share in the categories of server computing – 12.8 percent (Panel – 9.7 percent). The decrease in the panel figure for server computing was particularly attributable to the falling volume of HPE (– 4.0 percent) and Lenovo (– 7.0 percent). Due to the panel share of ALSO, the focus in this segment was to optimize the vendor mix and the product categories.
NET SALES, EBT, AND MARGIN BY MARKET SEGMENT (IN MIO EUR)
NORTHERN/EASTERN EUROPE 2)CENTRAL EUROPE 1)
1) Germany, France, Austria, Switzerland2) Belgium, Denmark, Estonia, Finland, Latvia, Lithuania, Netherlands, Norway, Poland, Slovenia, Sweden
EBT EBT
2017 86.7–�4.4�%
2017 34.6+�49.1�%
2017 0.9+�28.6�%
2017 3�878+�16.2�%
EBT MARGIN EBT MARGIN
2017 1.6–�11.1�%
NET SALES NET SALES
2017 5�436+�8.9�%
2016 3�337
2016 90.7
2016 1.8
2016 23.2
2016 0.7
2016 4�992

64
ALSO Annual Report 2017 STATUS REPORT
CENTRAL EUROPE MARKET SEGMENT
According to Context the ICT distribution market in the Central European countries that are relevant for ALSO developed posi-tively (+ 5.6 percent). In the comparable reporting year, ALSO grew by + 7.5 percent. In Germany, ALSO was able to grow impres-sivly by + 8.3 percent and gained additional market share (Panel + 6.7 percent). This applies to France, too, where ALSO was able to grow by + 5.7 percent (Panel + 3.0 percent). In Austria ALSO managed to grow by + 9.3 percent (Panel+ 4.3 percent). In Swit-zerland, ALSO could grow by + 6.2 percent despite the fact that a new ERP was rolled out in 2017 (Panel + 6.7 percent). NORTHERN/EASTERN EUROPE MARKET SEGMENT
According to CONTEXT, the ICT distribution market developed positively in this region (+ 2.0 percent). ALSO even recorded strong growth of + 14.3 percent and thus significantly expanded its market share. ALSO grew in Denmark + 4.1 percent (Panel – 2.7 percent), in Sweden + 7.4 percent (Panel – 4.0 percent), in Finland + 10.5 percent (Panel + 5.7 percent), in Poland + 64.6 per-cent (Panel + 5.2 percent), in the Baltics + 13.8 percent (Panel 8.7 percent). Although ALSO was growing in Norway + 8.0 per-cent, it slightly lost market share (Panel + 14.6 percent).
BUSINESS DEVELOPMENT OF THE GROUP
ALSO is presenting a record result again for fiscal year 2017. Group net profit climbed by 11.2 percent year-on-year to 92.5 million euros. At the same time, the Group’s net sales improved by 11.4 percent to 8.9 billion euros. Profit before taxes (EBT) jumped up by 9.0 percent year-on-year to 124.2 million euros in fiscal year 2017. EBITDA increased by 7.7 percent to 157.3 million euros.
CENTRAL EUROPE AND NORTHERN/ EASTERN EUROPE MARKET SEGMENTS
The company is represented in 15 countries, which are grouped into two market segments: the Central Europe market segment (Austria, France, Germany, and Switzerland) and the Northern/Eastern Europe market segment (Belgium, Denmark, Estonia, Finland, Latvia, Lithuania, Netherlands, Norway, Poland, Slove-nia, and Sweden).
In the Central Europe market segment, ALSO posted a year-on-year increase in net sales of 8.9 percent from 4 992 million euros to 5 436 million euros. EBT declined slightly by 4.4 percent from 90.7 million euros to 86.7 million euros. Earnings were particularly impacted by investments in personnel. The team in France was expanded to gain further market share in the SMB environment, to strengthen the LAFI (Logiciels Application Formation Informa-tion, a subsidiary of ALSO) locations, and due to the acquisition of BEIP. In Germany, the cloud back office was expanded, and reverse logistics capacity was strengthened. As part of the SAP launch in Switzerland, ALSO Switzerland’s best practices were incorporated in the Group SAP to allow other companies to share in the efficiency improvement. In order to further develop the ALSO cloud platform, we have strengthened our central develop-ment team.
In the Northern/Eastern Europe market segment, net sales rose by 16.2 percent compared to the previous year, from 3 337 million euros to 3 878 million euros. EBT rose from 23.2 million euros to 34.6 million euros. Despite necessary investments to improve competitiveness in the area of logistics by reducing excess per-sonnel capacity, earnings were increased, particularly due to the improvement in Poland. The development of the competence cen-ter for supplies in the Netherlands (ALSO International) also increased earnings. Earnings in Finland also improved further. As part of the new service agreement with Fujitsu in the area of reverse logistics, ALSO Finland additionally took on employees of the customer, thus laying the foundations for further improve-ments in earnings in the future.

65
ALSO Annual Report 2017 STATUS REPORT
INVESTMENTS AND ACQUISITIONS
INVESTMENTS
Investments in property, plant and equipment and intangible assets amounted to around 15.5 million euros in 2017 (previous year: 13.4 million euros). These funds were used for the ongoing development of the IT and logistics infrastructure in particular as well as for IT services. The ratio of investments to EBITDA was 9.9 percent (previous year: 9.2 percent). Investments were made in particular in the warehouse facilities in Poland and the Neth-erlands. Furthermore, the IT services in the IaaS segment were expanded. The key investments in intangible assets concern intro-ductions of SAP in Switzerland and the forthcoming integration of Five 4 U in the Netherlands, the updating of the ERP system, and the development of the ALSO Cloud Marketplace.
The investments will make a key contribution to achieving the ambitious growth targets. ALSO will continue its investment pol-icy moving ahead as well. In order to facilitate further growth and generate synergies, investments in installations for a new ware-house facility are planned in 2018 for the merger of the ware-house locations of ALSO Netherlands and Five 4 U.
ACQUISITIONS
The funds used for acquisitions amounted to around 9.7 mil-lion euros in 2017 (previous year 3.7 million euros) and relate primarily to the purchase price payments for three companies. The Dutch special distributor Five 4 U B.V., which operates in the Benelux region, was acquired to generate synergy and cross-sell-ing effects. The company specializes in Apple products. Products from numerous other manufacturers, such as HP and Epson, are also distributed. Moreover, software and IT services are offered to customers. New customer groups will thus be opened up, and we will create an important base for our 3D printing business sector. Furthermore, two value added distributors (VADs) of security and network products were acquired, Internet Smartsec Oy of Finland and BeIP S.A.S. of France. Their expertise and product portfolios in a growing market environment represent for ALSO an optimal addition to its own range of solutions. The focus of BeIP on ver-tical segments, such as the market for telecommunication oper-ators, opens up enormous potential for us.
ALSO is still striving to support the ambitious growth targets with value-adding acquisitions. The focus is on acquisitions of Solution and Service activities that can be scaled up based on the ALSO platform, and on acquisitions on European growth markets to expand the ALSO platform. Options on developed European mar-kets, where ALSO is not represented, are also being considered to expand the platform.
INVESTMENTS AND ACQUISITIONS IN BRIEF
eur 1 000 2017 2016 2015 2014
investments in property, plant and equipment and in intangible assets 15 534 13 351 13 751 11 965
Thereof in land and buildings 148 291 854 2 016
Thereof in warehouse equipment 1 972 3 218 5 432 1 087
Thereof in other property, plant and equipment 9 012 4 014 4 061 3 512
Thereof in intangible assets 4 402 5 828 3 404 5 350
Investments as a percentage of EBITDA 9.9 % 9.2 % 9.8 % 7.9 %
acquisitions 9 734 3 676 11 346 62 308
BeIP S.A.S. 1 225
Internet Smartsec Oy 681
Five 4 U 7 473
Others 355
total investments and acquisitions 25 268 17 027 25 097 74 273

66
ALSO Annual Report 2017 STATUS REPORT
SOLID FINANCING STRUCTURE
The main task of ALSO’s finance division is to provide the neces-sary liquidity for financing the company’s operating business on the condition of securing the capital structure. It aims to finance the required maturities at the best possible conditions. As a result of the transactional business, the majority of financing require-ments are short-term. Owing to seasonal effects, working cap-ital is subject to short-term fluctuations. The necessary cash is obtained mainly by selling existing receivables to factoring com-panies. This is supplemented by bank lines of credit that are avail-able at short notice. In addition, ALSO continuously increased the proportion of long-term financing by placing bonded loans on the capital market. In 2017, new bonded loans totaling 153.5 mil-lion euros were raised with terms of five, seven and 10 years. The positive response from investors is a clear sign of confidence in the business model of ALSO. In order to minimize risk, attention was paid to obtaining a diversified term structure at favorable financing conditions. As a result of this optimization of the financ-ing structure, we will enhance the flexibility of our MORE program and enable the strategic development of the Group also in terms of potential future acquisitions.
The financing structure now offers greater flexibility to cover net working capital financing. The long-term financing displays a bal-anced distribution of the maturity structure over the years 2018 to 2027.
Non-current bank loans Bonded loans
MATURITY PROFILE (IN MIO EUR)
2023 2024 2025 – 2027
17.0
50.550.0
77.060.0
16.517.413.0
2018 2019 2020 2021 2022
16.8 17.81.4 1.4 0.3 0.3 0.8
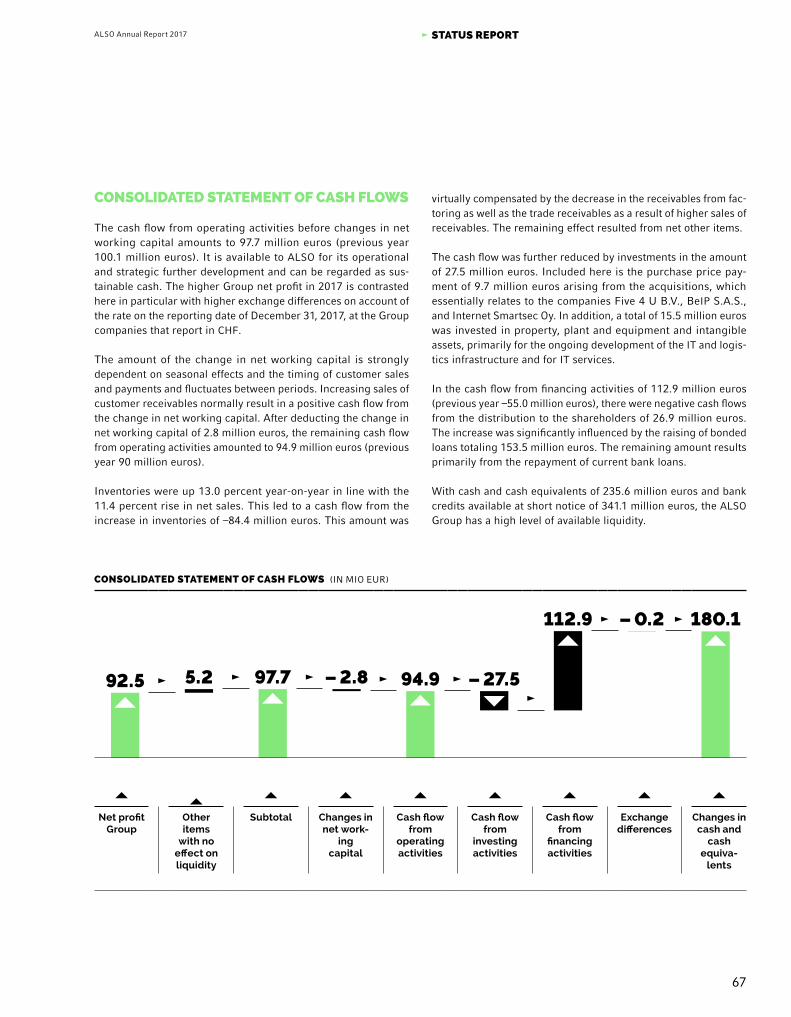
67
ALSO Annual Report 2017 STATUS REPORT
CONSOLIDATED STATEMENT OF CASH FLOWS
The cash flow from operating activities before changes in net working capital amounts to 97.7 million euros (previous year 100.1 million euros). It is available to ALSO for its operational and strategic further development and can be regarded as sus-tainable cash. The higher Group net profit in 2017 is contrasted here in particular with higher exchange differences on account of the rate on the reporting date of December 31, 2017, at the Group companies that report in CHF.
The amount of the change in net working capital is strongly dependent on seasonal effects and the timing of customer sales and payments and fluctuates between periods. Increasing sales of customer receivables normally result in a positive cash flow from the change in net working capital. After deducting the change in net working capital of 2.8 million euros, the remaining cash flow from operating activities amounted to 94.9 million euros (previous year 90 million euros).
Inventories were up 13.0 percent year-on-year in line with the 11.4 percent rise in net sales. This led to a cash flow from the increase in inventories of –84.4 million euros. This amount was
virtually compensated by the decrease in the receivables from fac-toring as well as the trade receivables as a result of higher sales of receivables. The remaining effect resulted from net other items.
The cash flow was further reduced by investments in the amount of 27.5 million euros. Included here is the purchase price pay-ment of 9.7 million euros arising from the acquisitions, which essentially relates to the companies Five 4 U B.V., BeIP S.A.S., and Internet Smartsec Oy. In addition, a total of 15.5 million euros was invested in property, plant and equipment and intangible assets, primarily for the ongoing development of the IT and logis-tics infrastructure and for IT services.
In the cash flow from financing activities of 112.9 million euros (previous year –55.0 million euros), there were negative cash flows from the distribution to the shareholders of 26.9 million euros. The increase was significantly influenced by the raising of bonded loans totaling 153.5 million euros. The remaining amount results primarily from the repayment of current bank loans.
With cash and cash equivalents of 235.6 million euros and bank credits available at short notice of 341.1 million euros, the ALSO Group has a high level of available liquidity.
CONSOLIDATED STATEMENT OF CASH FLOWS (IN MIO EUR)
Net profitGroup
Other items
with noeffect onliquidity
Subtotal Changes innet work-
ingcapital
Cash flowfrom
operatingactivities
Cash flowfrom
investingactivities
Cash flowfrom
financingactivities
Exchange differences
Changes incash and
cashequiva-
lents
180.1112.9
–�27.594.9–�2.897.75.292.5
–�0.2

68
ALSO Annual Report 2017 STATUS REPORT
RISK REPORTOBJECTIVES
The objective of our corporate activities is to use opportunities, minimize risks and, through that, systematically and sustainably increase the value of the company. The main objectives are to make significant risks visible, prevent threats to the existence of the company as a going concern, increase the enterprise value over the long term, ensure that targets are hit and future suc-cesses are achieved, and optimize the risk costs.
ORGANIZATION AND PROCESS
ALSO implements a standardized risk management process that is applicable throughout the Group. This process ensures that risks in all key Group companies are systematically analyzed and a uniform evaluation is made. The risk transparency that has been created allows suitable control actions and countermeasures to be derived. The implementation of these measures generally results in reduced potential for damage. At ALSO, the organization of the risk management is the responsibility of Internal Audit. It col-lects information from the ALSO companies every six months on the risks that have been identified and the countermeasures that have been initiated. To this end, one person is assigned respon-sibility for each issue in the ALSO companies. The respective risk officers or managing directors are responsible for ensuring that
the contents are complete and correct. Group Management and Internal Audit must be informed immediately by the risk officers and additionally in an ad hoc report if new critical risks emerge.
The principles of the risk management system are defined in the risk management manual of the ALSO Group.The risk management process takes all relevant risks of the key Group companies into account. The individual risks are identi-fied, assessed, and consolidated. ALSO classifies the risks into four special risk fields based on the source of the risk (company- related risks, market risks, financial risks, and tax risks).
The individual risks are assessed in terms of their possible effect on profits or liquidity (very low to economically destructive) and their probability of occurrence (low to very high). The classifi-cation of the possible effect is determined as a function of the consolidated net profit of the ALSO Group, and an annual review is carried out to assess whether it is necessary to revise the clas-sification. A revision of the risk categories was carried out in the reporting year on account of the significant increase in the con-solidated net profit over the past years.Based on the possible effect as well as the probability of occur-rence, the risks are broken down into the categories red, orange, yellow, and green.
RISK REPORT
Low High Very highModerateRisk Wighting
PROBABILITY
DESTRUCTIVE
GRAVE
MODERATE
JEOPARDIZING EXISTENCE
AVERAGE
SIGNIFICANT
LOW

69
ALSO Annual Report 2017 STATUS REPORT
GENERAL RISK SITUATION
The business performance of the ALSO Group depends signifi-cantly on the general economic situation, economic develop-ments, and technological progress, especially as a result of digita-lization. In order to prevent a substantial decline in the enterprise value, the ALSO Group is systematically expanding its vendor and buyer structure and investing in the development of the Supply, Solutions, and Services business segments. The following picture emerges in the individual risk fields in 2017. The focus is placed on the company-related risks, followed by the market risks. No risk is currently reported as a red risk. There is an orange risk related to the impairment of the goodwill, which is currently esti-mated to be around 150 million euros. This represents a derived risk, as the impairment of the goodwill depends on the expected future business performance. The risk is countered by the con-sistent development of the ALSO strategy.
NUMBER OF IDENTIFIED RISKS
20�
123�
27�
20�8 1
COMPANY-RELATED RISKS
MARKET RISKS
FINANCIAL RISKS
TAX RISKS
7 1
2016
2016
2016
2017
2017
2017 127�
27�20
18
32
40
2016 8�
2017 8�
g r e e n
y e l l o w
o r a n g e

70
ALSO Annual Report 2017 STATUS REPORT
The basis for the risk management is illustrated in the following graphic on the risks and opportunities of the business, which is constantly monitored, analyzed and further developed by the management.
TOWS
THREATS
WEAKNESSES
Image of Industry
Vendor Concentration
Countries Concentration
Clear Strategy
Analytics
Execution
Speed
High scalability
Barrier of Entry
Channel Shift
National protectionism
Lack of IT Experts
Operative Risks
Cyber Security
Competition
New Business Opportunities
Acquisition Targets
Start-up Mentality
OPPORTUNITIES
STRENGTHS

71
ALSO Annual Report 2017 STATUS REPORT
SPECIFIC RISK FACTORS
COMPANY-RELATED RISKS
INFORMATION TECHNOLOGY
Information security and IT availability and performance are the key prerequisites for successful entrepreneurial activity. The existing systems are constantly optimized. In addition, tests are carried out as part of the internal audit, and measures are appro-priately checked when it comes to implementation. In order to cover possible risks in the event of IT malfunctions, especially the failure to meet contractually guaranteed delivery dates, IT capacity is constantly adapted to meet demand. Differentiated backup and recovery strategies play their part in preventing data losses as a result of cyber attacks for example and in minimizing downtimes.
LOGISTICS AND STORAGE
The business model of ALSO depends to a high degree on the availability of efficient, discrete logistics structures, the security of the stock on hand, and high-performance and cost-effective exter-nal logistics partners. The logistics structures are vulnerable to traditional risks of failure, such as fire, flood and theft, as well as risks that prices for transport and the rent for warehouse facilities will change. In addition, there are risks in the competitiveness of our logistics structures. There is currently a risk here in a ware-house in the Northern/Eastern Europe market segment. A new concept is planned to counter this. The inventory held by ALSO is subject to depreciation risks as a result of the relatively short product lifecyles of IT products. ALSO counters this risk through dedicated, demand-based scheduling of the inventory with the aim of generating higher availability and corresponding inventory turnover times as well as through appropriate rights contained in the agreements with providers (price protection, stock protection, or stock rotation).
HUMAN RESOURCES
The further development of ALSO depends materially on the knowledge and the dedication of its workforce. ALSO concerns itself with personnel risks and works with systematic staff plan-ning and qualification in order to deploy, promote and retain employees in line with their abilities. Furthermore, active moni-toring of employee satisfaction is carried out. The development of our personnel and managers is an important condition for proactively and reliably ensuring our human resources capaci-ties. Despite all our efforts, a shortage of specialists remains a
challenge. The in-house possibilities for continuous professional development will therefore continue to be strengthened in order to train our own personnel optimally in the medium and long term and thus counteract the skills shortage. Bottlenecks in the recruitment of appropriately certified employees exist in partic-ular in the Group companies focusing on the Solutions business field. In the future, recruitment will be concentrated with the help of social media tools in order to address a broader circle of potential new employees.
LEGAL AND COMPLIANCE
As a Group with international operations, ALSO has to comply with numerous legal and fiscal regulations as well as regulations under antitrust and patent law. The large number of relevant provisions at the local and international levels and their increas-ing complexity increase the risk that ALSO may incur significant legal and economic risks, such as fines and claims for compen-sation, in the event that it fails to comply with them. In order to minimize compliance risks, ALSO has set up a compliance man-agement system that is aligned with the usual market standards and accordingly features the key elements. The program stipu-lates that all new hires joining the Group are trained in good time before they take up their job. The training courses are repeated on a regular basis. The use of an e-learning platform addition-ally allows employees to be tested about what they have learned. Current and impending legal disputes are continuously identi-fied, analyzed, and evaluated in terms of their legal and financial effects and taken into appropriate consideration in the ongoing risk management process. ALSO Deutschland GmbH faces a risk in connection with copyright fees here.
MARKET RISKS
GROWTH RISKS
A large increase in delivery volumes at month’s end could lead to volume and shipping capacities becoming critical at certain loca-tions. This would result in constraints on the shipping quality. The significant increase in the scope of delivery with a larger retailer created an increased risk for ALSO Deutschland GmbH as a result of a failure to meet guaranteed delivery times. In addition to a short-term workaround involving the exchange of special orders between locations, a project to optimize inventory turnover times, and external commissioning of and storage at service providers, our logistics strategy is currently undergoing a comprehensive audit and revision.

72
ALSO Annual Report 2017 STATUS REPORT
COMPETITION RISKS
ALSO works to counteract the competition in the ICT industry through its growth strategy. The scaling of the business models and the related increase in volumes result in competitive advan-tages for ALSO and its resellers. Active engagement with provid-ers and the design of the price structure for buyers are crucial levers to this end. Furthermore, ALSO distinguishes itself within the market through unique selling points in the Service and Solu-tions business models.
BUYERS
On the buyer side, risks can arise from the dependence on sev-eral large customers. In 2017, net sales with the largest individual customers totaled 824 million euros. Growth will be promoted and targeted at the fourth- to tenth-largest customers of a mar-ket in order to avoid concentration risks. An SMB initiative was launched in July 2016 in Germany among 500 selected exist-ing and former customers in order to further diversify the buyer structure.
In its operating business, ALSO is exposed to default risks in cus-tomer receivables. A credit check is performed on the customer as early as the quotation phase in order to limit the risk of losses on receivables. Default risks are additionally limited by active receivables management. Active customer monitoring, balance sheet analyses, disclosures, insurance rating, and factoring pro-grams are some of the important measures carried out here. A considerable proportion of the receivables are hedged by com-mercial credit insurance.
PROVIDERS
ALSO works with the major providers of hardware and software especially in the Supply business field. Concentration risks and dependencies on large individual providers result from this. ALSO counters these with active market share management as part of the vendor mix lever (refer to relevant page in the Management Report). On the ICT market, ALSO constantly monitors the product innovations of the providers so that it can get involved in fields with high potential at an early stage. Large receivables from pro-viders regularly arise as a result of various programs designed to support sales promotion activities by providers (including marketing programs, bonuses, sales discounts, price protection, for example). Complete documentation of the basis of claim is required at all times in order to enforce these claims. ALSO count-ers the risk with a permanent and efficient process organization for the relevant business transactions.
FINANCIAL RISKS
LIQUIDITY RISKS
One of the central tasks of ALSO is to guarantee the Group’s sol-vency at all times by providing sufficient funds when necessary as well as by ensuring the profitability through management of the financial risks. The central liquidity risk management sys-tem ensures that the Group is always in a position to fulfill its payment obligations promptly. ALSO continuously monitors its liquidity with a detailed cash flow plan on a daily basis. Extensive planning ensures furthermore that sufficient liquidity is available in the medium and long terms. In the area of financing, ALSO uses a wide variety of financial institutions in order to reduce any dependency on individual banks. ALSO was always able to fulfill all financial obligations also in fiscal year 2017.
RISK RELATED TO DEPOSITS
ALSO is exposed to a default risk arising from its financing activ-ities. In the financial area, ALSO manages the resulting risk posi-tion by the diversification of financial institutions and by verifi-cation of the financial strength of each counterparty based on publicly available ratings as well as on publicly available ad-hoc information about the financial institutions. As a result, ALSO is generally able to keep the credit risks to a minimum. Some larger receivables from financial institutions arise in particular in the factoring area. No losses on receivables have occurred during the long-standing business relationships with the factoring compa-nies. The risk of loss on receivables from factoring partners is not insured with credit insurance. The default risk of loss is minimized by ALSO through regular evaluation of the factoring partners.
INTEREST RATE RISKS
ALSO’s interest rate risks relate mainly to current financial liabil-ities with variable interest rates. Interest rate fluctuations cause changes in the interest income and expense of the interest-bear-ing assets and liabilities. ALSO is particularly exposed to interest rate risks in euros, Swiss francs, Danish kroner and Polish zloty. The interest rate management is handled centrally. Short-term interest rate risks are partially hedged, a material part of inter-est bearing-liabilities hence remaining exposed to interest rate fluctuations. Taking into account the existing and planned debt structure, interest derivatives are used if necessary to meet the bandwidths recommended by central Group treasury and pre-scribed by management. Since ALSO uses fixed as well as variable interest-bearing instruments, interest risks may result from an increase as well as a decrease in market interest rates.
73
ALSO Annual Report 2017 STATUS REPORT
EXCHANGE RATE RISKS
A material part of the cash flows of the operational companies occurs in currencies which are not the functional currencies of those subsidiaries. ALSO is therefore exposed to foreign currency risks. Foreign currency risks are hedged only if they affect the cash flow of the Group. Exchange rate risks that arise in the con-solidated financial statements through the translation of state-ments of comprehensive income and statements of financial posi-tion of subsidiaries are not hedged.
In the purchasing area, a certain amount is conducted in foreign currencies, especially euros (where it is not the functional cur-rency) and in US dollars. To hedge this exchange rate risk, Central Treasury hedges the purchasing volumes of the operating com-panies outside their functional currency.
Group-internal loans between subsidiaries with different func-tional currencies give rise to foreign currency risks. ALSO hedges most of these risks. Speculative borrowing or lending in foreign currencies is not permitted. Transaction-related foreign currency risks are also monitored, and the corresponding net exposures in the various currencies are calculated.
By regular use of forward contracts, ALSO constantly reduces the exchange rate risk. There is therefore no material exchange rate risk for the Group.
TAX RISKS
ALSO’s operations are heavily networked and carried out across different locations. The accompanying service relationships con-tain the risk that the underlying transfer prices will not be rec-ognized for tax purposes. In order to limit this risk, ALSO has worked with specialist tax consultants to design the transfer pric-ing concept and has the underlying transfer pricing documenta-tion audited at regular intervals. ALSO has some tax loss carry-for-wards. There is a risk that these loss carry-forwards will not be used and will lapse as a result of time or other restrictions. ALSO regularly examines whether it is possible to use the loss carry-for-wards through tax planning.
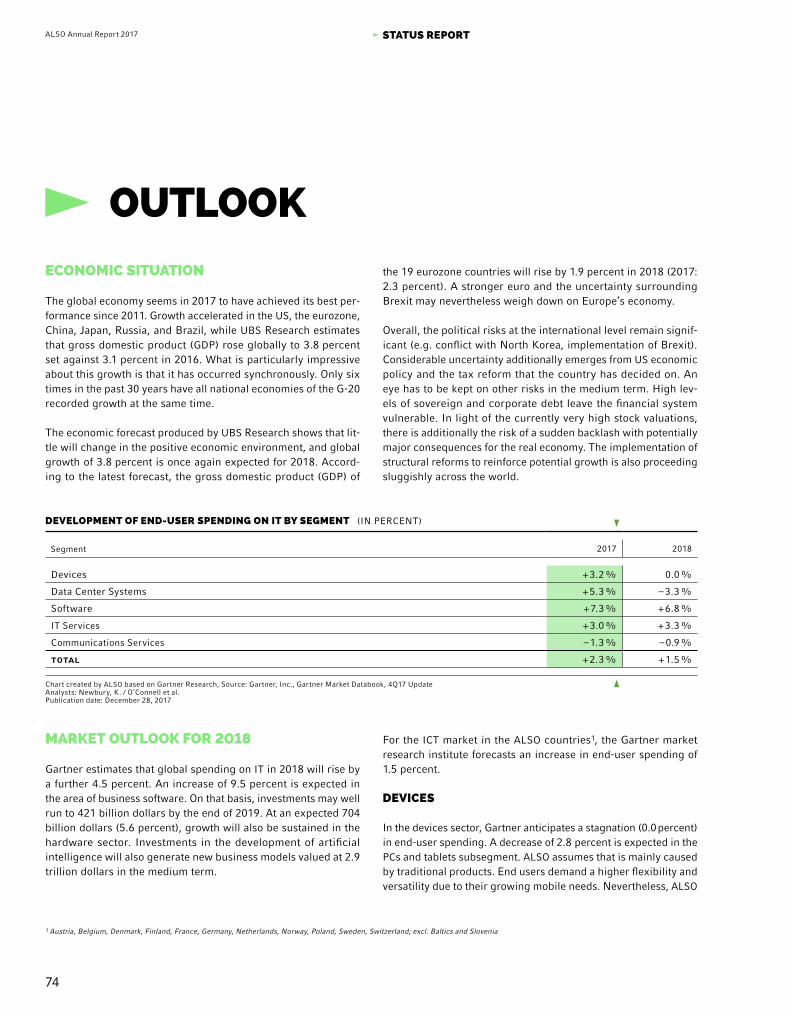
74
ALSO Annual Report 2017 STATUS REPORT
OUTLOOKECONOMIC SITUATION
The global economy seems in 2017 to have achieved its best per-formance since 2011. Growth accelerated in the US, the eurozone, China, Japan, Russia, and Brazil, while UBS Research estimates that gross domestic product (GDP) rose globally to 3.8 percent set against 3.1 percent in 2016. What is particularly impressive about this growth is that it has occurred synchronously. Only six times in the past 30 years have all national economies of the G-20 recorded growth at the same time.
The economic forecast produced by UBS Research shows that lit-tle will change in the positive economic environment, and global growth of 3.8 percent is once again expected for 2018. Accord-ing to the latest forecast, the gross domestic product (GDP) of
the 19 eurozone countries will rise by 1.9 percent in 2018 (2017: 2.3 percent). A stronger euro and the uncertainty surrounding Brexit may nevertheless weigh down on Europe’s economy.
Overall, the political risks at the international level remain signif-icant (e.g. conflict with North Korea, implementation of Brexit). Considerable uncertainty additionally emerges from US economic policy and the tax reform that the country has decided on. An eye has to be kept on other risks in the medium term. High lev-els of sovereign and corporate debt leave the financial system vulnerable. In light of the currently very high stock valuations, there is additionally the risk of a sudden backlash with potentially major consequences for the real economy. The implementation of structural reforms to reinforce potential growth is also proceeding sluggishly across the world.
DEVELOPMENT OF END-USER SPENDING ON IT BY SEGMENT (IN PERCENT)
Segment 2017 2018
Devices + 3.2 % 0.0 %
Data Center Systems + 5.3 % – 3.3 %
Software + 7.3 % + 6.8 %
IT Services + 3.0 % + 3.3 %
Communications Services – 1.3 % – 0.9 %
total + 2.3 % + 1.5 %
Chart created by ALSO based on Gartner Research, Source: Gartner, Inc., Gartner Market Databook, 4Q17 UpdateAnalysts: Newbury, K. / O’Connell et al.Publication date: December 28, 2017
MARKET�OUTLOOK�FOR�2018
Gartner estimates that global spending on IT in 2018 will rise by a further 4.5 percent. An increase of 9.5 percent is expected in the area of business software. On that basis, investments may well run to 421 billion dollars by the end of 2019. At an expected 704 billion dollars (5.6 percent), growth will also be sustained in the hardware sector. Investments in the development of artificial intelligence will also generate new business models valued at 2.9 trillion dollars in the medium term.
For the ICT market in the ALSO countries1, the Gartner market research institute forecasts an increase in end-user spending of 1.5 percent.
DEVICES
In the devices sector, Gartner anticipates a stagnation (0.0 percent) in end-user spending. A decrease of 2.8 percent is expected in the PCs and tablets subsegment. ALSO assumes that is mainly caused by traditional products. End users demand a higher flexibility and versatility due to their growing mobile needs. Nevertheless, ALSO
1 Austria, Belgium, Denmark, Finland, France, Germany, Netherlands, Norway, Poland, Sweden, Switzerland; excl. Baltics and Slovenia

75
ALSO Annual Report 2017 STATUS REPORT
believes in a big opportunity in the gaming sector for traditional formats. Furthermore, ALSO expects stabilization in traditional PC market mainly driven by upgrade to Windows 10.
According to Gartner the spending on mobile phones is fore-casted to increase by 3.6 percent. ALSO expects that new user demands, smartphone life cycles close to two years and devices with larger screens are the main driving forces behind this growth. Furthermore, the average selling price of smartphones is expected to grow because of the release of premium devices like iPhone X.
For the printers subsegment Gartner is forecasting a decrease by 7.2 percent during 2018. ALSO assumes that this is based on the decline in laser printing. Furthermore, Gartner expects that large and mid-size enterprises implement print management solutions and optimize their printer fleets through device consolidation to reduce office print spending by 30 percent. A further reason is the growing trend towards digitalized workflows and electronic sharing of content. SOFTWARE
According to Gartner’s forecasts, the software sector will post a strong growth of 6.8 percent. In the enterprise application soft-ware subsegment (+8.6 percent), ALSO expects customer rela-tionship management (CRM) to endure as growth driver, followed by supply chain management (SCM), open-source application software and enterprise content management. ALSO supposes an acceleration in the adoption of the Software-as-a-Service (SaaS) application model. According to Gartner many enterprises use or plan to use SaaS. They evaluate SaaS as more cost-effective than on-premises solutions and easier and faster to deploy. 2
In the infrastructure software subsegment, Gartner forecasts a growth of 4.8 percent. In ALSO’s opinion this will be leaded by data integration tool and data quality tool (DIDQ). Digital business requires active and dynamic data integration in real time. This will lead to data integration tool suites with additional function-ality and to new cloud-based offerings. In addition, the current good market conditions in Western Europe traditionally lead to more investments in modern technologies, like cloud-related investments, especially SaaS. Enterprises want to integrate quickly new SaaS applications with their existing application port-folio. Therefore, ALSO assumes an expansion in spending in the
areas integration-Platform-as-a-Service (iPaaS), application-Plat-form-as-a-Service (aPaaS) and application programming inter-faces (API) management.
DATA CENTER SYSTEMS
End-user spending on data center systems is expected to decline by 3.3 percent. Gartner forecasts a decrease of 7.0 percent for servers. ALSO believes this is caused by extending life cycles of enterprise servers. Many organizations avoid replacing their servers despite disadvantages like increasing maintenance costs and/or downtime. Based on Gartner reports, DRAM and SSD prices are increasing due to supply shortages. 3 This has a negative impact on enterprise server demand too.
In addition, a shrinkage is expected for the subsegments enter-prise network equipment (–4.0 percent) and external control-ler-based storage (–4.3 percent). While in the latter a destructive competition between internal enterprise infrastructure business units is responsible for the loss of revenue, in the enterprise network equipment subsegment it is a result of disruption of application delivery controllers (ADCs) and WAN optimization controllers (WOCs), along with merger of intrusion prevention system (IPS) and the firewall market.
Based on Gartner´s report, these declines in sales will be partially offset by unified communications (+3.6 percent), whose growth is driven by greater bundling of cloud applications.
IT SERVICES
Gartner forecasts growth of 3.3 percent in the IT services sector. In the subsegments, a 3.8 percent increase in business IT services and a 1.0 percent decrease in IT product support are anticipated. Gartner estimates that Infrastructure-as-a-Service (IaaS) will add the greatest amount of spending growth in business IT services, with hyperscale providers gaining increased dominance. Tradi-tional services like infrastructure outsourcing (e.g. service desk outsourcing, end-user device outsourcing and data center out-sourcing) will decrease. 4
For the subsegment of product support services Gartner expects decline in client device/network systems and data center systems hardware support, while the custom software support will increase. 5
2 Swinehart, H. / Woodward, A. et al. (2017): Forecast Analysis: Enterprise Application Software, Worldwide, 3Q17 Update, Gartner Inc.3 Yamada, K. / O’Connell, A. et al. (2017): Forecast Analysis: Servers, Worldwide, 3Q17 Update, Gartner Inc. 4 Lovelock, J. / O’Connell, A. et al. (2017): Forecast Analysis: IT Spending, Worldwide, 3Q17 Update, Gartner Inc.5 Blackmore, D. / Tornbohm, C. et al. (2018): IT Services, Worldwide, 4Q17 Update, Gartner Inc.
Disclaimer: The Gartner Report(s) described herein, (the “Gartner Report(s)”) represent(s) research opinion or viewpoints published, as part of a syndicated subscription service, by Gartner, Inc. (“Gartner”), and are not representations of fact. Each Gartner Report speaks as of its original publication date (and not as of the date of this Annual Report]) and the opinions expressed in the Gartner Report(s) are subject to change without notice.
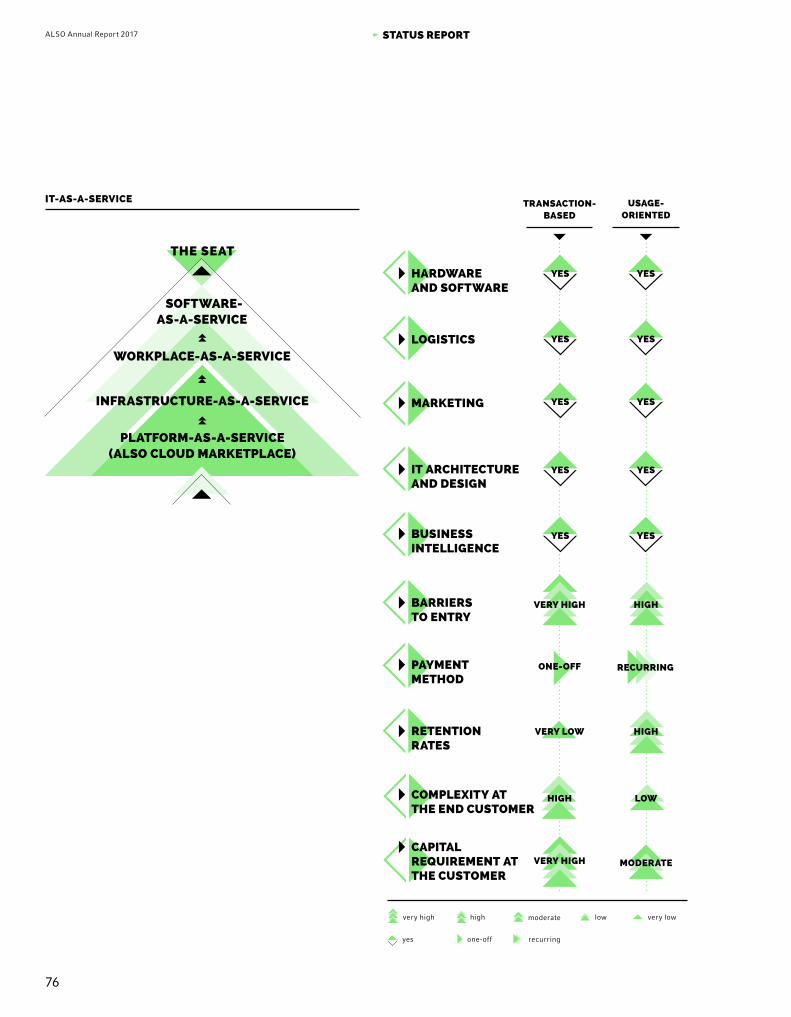
76
ALSO Annual Report 2017 STATUS REPORT
TRANSACTION- BASED
USAGE- ORIENTED
moderate
yes one-off
very low
recurring
very high high low
HARDWARE AND SOFTWARE
YES YES
LOGISTICS YES YES
MARKETING YES YES
IT ARCHITECTURE AND DESIGN
YES YES
BUSINESS INTELLIGENCE
YES YES
PAYMENT METHOD
ONE-OFF RECURRING
BARRIERS TO ENTRY
VERY HIGH HIGH
COMPLEXITY AT THE END CUSTOMER
LOWHIGH
RETENTION RATES
HIGHVERY LOW
CAPITAL REQUIREMENT AT THE CUSTOMER
MODERATEVERY HIGH
IT-AS-A-SERVICE
THE SEAT
PLATFORM-AS-A-SERVICE (ALSO CLOUD MARKETPLACE)
SOFTWARE- AS-A-SERVICE
WORKPLACE-AS-A-SERVICE
INFRASTRUCTURE-AS-A-SERVICE

77
ALSO Annual Report 2017 STATUS REPORT
ALSO OUTLOOKOUTLOOK FOR THE COMPANY
Blockchain, Industry 4.0, smart homes – data are the raw material of the 21st century. A variety of business models are required to handle, use, and process these data. Virtual platforms with com-plex server and network architecture providing the basis for data centers and business intelligence applications will be needed. Hardware will be needed for servers and storage, as will software and devices as interfaces for tapping these data.
ALSO will continue to act as the link in a three-stage distribu-tion process, bringing vendors and buyers together. Usage-based business models are forming part of transactional business to an ever increasing extent. Infrastructure operated by the end cus-tomer, on which clearly defined tasks are executed over a long period of time, is increasingly being replaced precisely by the skills or the operating resources that are needed to complete one task and that are rented for precisely the time it takes to do so. The concept of needs-based usage applies just as much for soft-ware as it does for hardware, as much for digital infrastructure as it does for logistics services. The billing for these services is based on usage.
PROCESS-BASED ECONOMY OF SCALE
ALSO also sees a future focus of its business activity in the further development of the transactional business model, whether this is in the area of Supply or as-a-Service.
The aim is to supply customers with all the products and ser-vices they need as quickly and flexibly as possible. The business model is characterized by a high turnover speed and a low degree of vertical integration, while the processes are automated to the greatest possible extent.
KNOWLEDGE-BASED ECONOMY OF SERVICE
In parallel to this, the second focus will be placed on the devel-opment of the usage-oriented business, which primarily covers the area of IT-as-a-Service in addition to logistics and marketing. The aim here is to take the strain off our customers, to provide them with the flexibility and simplicity they need to be able to concentrate on their core competences.
This business model is characterized by a high degree of con-sultancy and specially tailored solutions, which results in high added value.
STRUCTURAL ANALYSIS AND OPTIMIZATION FOR THE FURTHER DEVELOPMENT OF THE COMPANY
We will conduct a structural analysis to systematically examine all business structures and processes in our organization in order to create the best position for the company in every field and to consistently translate our strategy into operational measures. The examination of the internal business processes will be geared toward the needs of our customers and the requirements and conditions of the market. We are using an upstream best practice comparison to define benchmarks and focal points of the exam-ination. A consistent focus on problems will allows us to identify the factors that will play a part in further increasing effectiveness and efficiency. Divided into the five working groups
Future Foundations, Business Models, E-Commerce, Products|Providers|Customers, Company,
the entire management team is involved in the project. In this way, we will gain insights into how tried-and-trusted methods and strategies for action function and at the same time encourage the entrepreneurial thinking and action of our employees.
Disclaimer: This Annual Report contains forward-looking statements which are based on current assumptions and forecasts of the ALSO management. Known and unknown risks, uncertainties, and other factors could lead to material differences between the forward-looking statements made here and the actual development, in particular the results, financial situation, and performance of the Group. The Group accepts no responsibility for updating these forward-looking statements or adapting them to future events or developments.

78
ALSO Annual Report 2017 STATUS REPORT
FINANCIAL OUTLOOK
Including acquisitions, ALSO is aiming for a net sales volume of 10 to 14 billion euros in the medium term. The share of Solutions is expected to be about 30 percent, while about 10 percent is targeted in the as-a-Service area. These shares will also depend on the weighting of the acquisitions. ALSO expects them to be focused on the areas of Solutions and as-a-Service. In the area of as-a-Service, the focus is on expanding usage-based business models – Platform-, Infrastructure-, Workplace- and Software-as-a-Service. In the area of Supply, the aim is to optimize the provider and buyer composition, product categories, and oper-ating expenses. This, combined with optimization of the pro-portionate weighting of the business models, will result in an increase in profitability. In the medium term, ALSO is aiming for an EBITDA margin in a range of 2.1 percent to 2.6 percent of net sales. Despite continuing uncertainties with regard to the eco-nomic conditions, ALSO is therefore confident that the targeted measures will take full effect and that an attractive return can be generated in the future, too.
In 2018, business opportunities will also arise for ALSO as a result of changes in the structure of the competition. The anticipated sales increase in the year as a whole should therefore be above the market growth of 1.5 percent forecast by Gartner. With regard to the consolidated net profit, the increase is once again expected to be higher than the forecast sales growth.

2 CORPORATEGOVERNANCE
CORPORATE GOVERNANCE


81
ALSO Annual Report 2017 CORPORATE GOVERNANCE
CORPORATE GOVERNANCEThis Corporate Governance Report contains the information that is stipulated by the Directive on Information Relating to Corporate Governance of the SIX Swiss Exchange and follows its structure.
1.GROUP STRUCTURE AND SHAREHOLDERS
1.1GROUP STRUCTURE
ALSO Holding AG is the parent company of the ALSO Group, which directly or indirectly holds all other Group companies and associates. The shares of ALSO Holding AG have been listed on SIX Swiss Exchange since 1986 (symbol: ALSN, valor symbol: 2 459 027, ISIN: CH0024590272). The market capitalization of the ALSO Group amounted to CHF 1 722 million as of December 31, 2017.
Please see page 160 of the annual report for the list of the Group’s subsidiaries and equity investments.
The ALSO Group has streamlined and efficient management struc-tures at all levels. The operational Group structure as of December 31, 2017 is as follows: The Board of Directors of ALSO Holding AG
is responsible for the highest level of management; see also section 3 of this report. It defines the strategic, organizational, and financial goals of the Group. There are also three committees (Compensation and Nomination Committee, Board Committee, and Audit Committee; see also section 3.4.2 of this report).
In addition to the Board of Directors, there is a three-person Group Management consisting of the CEO, CFO and the Corporate Vice President for Northern/Eastern Europe; see also section 4 of this report. The Board of Directors has delegated the management of the day-to-day business of the company to Group Management under the direction of the CEO of the Group. The Board Committee advises and supervises Group Management.
For every country in which ALSO is active, a Managing Director bears the overall operational responsibility. There are also Senior Vice Presidents who are responsible for the Group-wide func-tional areas of European Key Account, SMB Development, Sup-ply-, Solutions-, Logistics- and Financial-Services, IT Processes, Consumptional Business, Transformation as well as of E-Com-merce. The Corporate Vice Presidents have supra-regional responsibility for customers so that they can adapt best practices of the different customer segments.
1.2SIGNIFICANT SHAREHOLDERS
SIGNIFICANT SHAREHOLDERS
12.31.2017 12.31.2016
Special Distribution Holding GmbH, Dusseldorf (Germany)* 51.30 % 51.30 %
Schindler Pars International Ltd., Hergiswil (Switzerland)** *** 7.60 %
Bestinver Gestion, S.G.I.I.C. S.A., Madrid (Spain) 3.17 % 5.96 %
SaraSelect, c/o J. Safra Sarasin Investmentfonds AG, Basel (Switzerland) 3.60 % 4.00 %
LB(Swiss) Investment AG, Zurich (Switzerland) *** 3.93 %
Source: Share register as of December 31 (without nominees)* Controlling shareholder: Walter P.J. Droege through Droege Group AG** Held 100 percent by Schindler Holding AG*** Voting rights below the notifiable threshold value of three percent

82
ALSO Annual Report 2017 CORPORATE GOVERNANCE
Notifications made during the fiscal year in accordance with Art. 120 et seqq. Financial Market Infrastructure Act “FMIA” can be viewed using the following link:
https://www.six-exchange-regulation.com/en/home/publications/significant-shareholders.html
As regards the value of the percentage voting rights shown, it should be noted that any changes in the percentage voting rights between the notifiable threshold values are not subject to disclo-sure requirements.
1.3CROSS-SHAREHOLDINGS
ALSO Holding AG has no cross-shareholdings exceeding 5 per-cent in any company outside the ALSO Group.
2.CAPITAL STRUCTURE
2.1ORDINARY SHARE CAPITAL
The ordinary share capital amounts to CHF 12 848 962 as of December 31, 2017. It consists of 12 848 962 fully paid-up registered shares with a nominal value of CHF 1.00 per share. Subject to Art. 5 of the Articles of Association www.also.com/goto/articlesofassociation, each registered share entitles the shareholder to one vote as well as to a proportionate share of the available earnings and liquidation proceeds.
The company has issued neither participation certificates nor shares with preferential rights.
The company has not issued any profit-sharing certificates.
2.2AUTHORIZED AND CONDITIONAL SHARE CAPITAL
The company has authorized share capital and conditional share capital of CHF 2 500 000 each as of December 31, 2017. Capital increases from authorized and conditional share capital are mutually restrictive, i.e. the total number of new shares resulting from the authorized and conditional share capital together in accordance with Art. 2a and 2b of the Articles of Association may not exceed 2 500 000 shares. The proportion of new shares assigned to each of the two categories is stipulated by the Board of Directors. The amount of CHF 2 500 000 corresponds to roughly 19% of the existing share capital. The newly issued shares are subject to the restrictions set out in Art. 5 of the Articles of Association.
The Articles of Association containing the precise wording of the texts relating to authorized and conditional share capital issue in accordance with Art. 2a and 2b of the Articles of Association, specifically details regarding the beneficiaries and the conditions and forms of, can be downloaded as a .pdf document at
www.also.com/goto/articlesofassociation.
2.3CHANGES IN CAPITAL DURING THE LAST THREE YEARS
There were no changes in share capital in the last three years.
2.4LIMITATIONS ON TRANSFERABILITY AND NOMINEE REGISTRATIONS
The Board of Directors may refuse to register an acquirer of shares as a full shareholder (i.e. as a shareholder with voting rights) unless the acquirer expressly declares that they have acquired the shares in their own name and on their own account.
There are no specific rules regarding the registration of nominees in the share register.
2.5CONVERTIBLE BONDS AND OPTIONS
ALSO Holding AG had not issued any convertible bonds or options as of December 31, 2017.
3.BOARD OF DIRECTORS
3.1MEMBERS OF THE BOARD OF DIRECTORS, ACTIVITIES, AND VESTED INTERESTS
The Board of Directors, which may have a maximum of eight members, currently has seven members. Except for Gustavo Möller-Hergt, who has been a member of Group Management since 2011, and a member and Chairman of the Board of Directors since March 13, 2014, the Board of Directors is composed of non-executive members.

83
ALSO Annual Report 2017 CORPORATE GOVERNANCE
BOARD OF DIRECTORS
Name Nationality Position Since
Gustavo Möller-Hergt DE Chairman 2014
Walter P.J. Droege DE Vice Chairman 2011
Rudolf Marty CH Member 1993
Karl Hofstetter CH Member 1996
Frank Tanski DE Member 2011
Peter Athanas CH Member 2014
Ernest-W. Droege DE Member 2016
As of December 31, 2017
None of the members of the Board of Directors, with the excep-tion of Gustavo Möller-Hergt, has been a member of the Group Management of ALSO Holding AG or a subsidiary of the ALSO Group in the three fiscal years preceding the year under review.
Walter P.J. Droege is the majority shareholder of Droege Group AG (the Droege Group). Please see section 6.6 on page 162 of the annual report for details of the business relationships between the ALSO Group and the Droege Group. There are no other material business relationships between the members of the Board of Directors and ALSO Holding AG.
3.2NUMBER OF PERMISSIBLE ACTIVITIES
A member of the Board of Directors may exercise a maximum of ten additional activities as a member of the highest management or directorial body of other legal entities that are entered in the Commercial Register, or required by Art. 12 of VegüV to be so entered, and are not controlled by the company. The Board of Directors shall ensure that such activities do not conflict with the exercise of duties to the ALSO Group. Functions in various legal entities that are under joint control, or in entities in which this legal entity has a material interest, are counted as one function.
3.3ELECTION AND TERM OF OFFICE
The members of the Board of Directors are elected individually by the Annual General Meeting for a term of office of one year and can be re-elected. The Chairman of the Board of Directors is also elected by the Annual General Meeting for a period of office of one year. There is no limit on the term in office.
The Board of Directors has decided that, as a rule, members should retire at the Annual General Meeting held to approve the Annual Report for the fiscal year in which they reach the age of 70. In exceptional cases, the Board of Directors may decide to waive this rule.
For information on the first election of the members, please refer to Note 3.1.
3.4INTERNAL ORGANIZATION
3.4.1DIVISION OF ROLES WITHIN THE BOARD OF DIRECTORS AND WORKING METHODS
The Board of Directors represents ALSO Holding AG towards third parties. It can delegate the representation powers to one or more of its members or to third parties. The Chairman convenes meet-ings of the Board of Directors as often as the Group’s business requires, but at least four times a year. The Chairman prepares the meetings, chairs them, and draws up their agenda. The Vice Chairman deputies for the Chairman. Any member of the Board can ask for a meeting to be convened and for the inclusion of an item on the agenda.

84
ALSO Annual Report 2017 CORPORATE GOVERNANCE
WALTER�P.�J.�DROEGE
Member and Vice Chairman of the Board of Directors of ALSO Holding AG since 2011 and Chairman of the Board Committee. CAREER MILESTONES
Founder and sole director of Droege International Group AG, Düsseldorf, Germany, which is wholly owned by the Walter P. J. Droege family. EDUCATION
Diploma in Business Management OTHER ACTIVITIES AND VESTED INTERESTS Member of the supervisory boards, CEO, or member of the advisory boards of various subsidiaries within the Droege International Group AG; member of the Advisory Board of Deutsche Bank, Düsseldorf, Germany; member of the Board of HSBC Trinkaus & Burkhardt AG, Düsseldorf, Ger-many; Vice Chairman of the Supervisory Board of Trenkwalder International AG and of Trenkwalder Beteiligungs GmbH, both in Vienna, Austria; member of the Advisory Board of Weltbild Holding GmbH, Augsburg, Germany; mem-ber of the Supervisory Board of the METRIC mobility solutions AG, Hanover, Germany.
0100101010101010
0100101010101010
MEMBERS OF THE BOARD OF DIRECTORSACTIVITIES AND VESTED INTERESTS

85
ALSO Annual Report 2017 CORPORATE GOVERNANCE
ERNEST-W.�DROEGE
Member of the Board of Directors of ALSO Holding AG since 2016. CAREER MILESTONES Member of the management teams of Droege International Group AG, Düsseldorf. Prior to that, in investment banking at Goldman Sachs. EDUCATION Studied industrial engineering in Karlsruhe and Zurich, doc-torate in economics at RWTH Aachen. OTHER ACTIVITIES AND VESTED INTERESTS Member of the supervisory board, CEO, or member of the advisory board of various subsidiaries within the Droege International Group AG, including CEO of Droege Group Unternehmer-Beratung GmbH, Düssel-dorf, Germany; Chairman of the Supervisory Board of Trenkwalder Interna-tional AG and Trenkwalder Beteiligungs GmbH, both in Vienna, Austria.
PETER ATHANAS
Member of the Board of Directors of ALSO Holding AG since 2014 and Chair-man of the Compensation and Nomination Committee. CAREER MILESTONES
CEO of pa impact GmbH, Baden, Switzerland. Previously Senior Executive Vice President Corporate Development of Schindler Holding AG. Member of the Board of Directors and of the Executive Committee of the Board of the Schindler Group. Chairman of the Board of Directors and CEO of Ernst & Young Switzer-land, member of the Global Executive Board and member of the Global Man-agement Group. Partner in the Arthur Andersen organization, CEO of Arthur Andersen Switzerland, and member of the Global Board. EDUCATION Master’s degree in Law and Economics and PhD in Economics from the University of St. Gallen, Switzerland. OTHER ACTIVITIES AND VESTED INTERESTS Member of the Board of Cembra Money Bank Ltd, Zurich, Switzer-land; member of the Board of Directors of Blackrock Asset Management Schweiz AG in Switzerland; member of the Board of Skuani AG, Zurich, Switzer-land; member of the Board of Directors of KONTIVIA AG, Zurich, Switzerland; member of the Board of the Institute of Public Finance and Fiscal Law of the University of St. Gallen, Switzerland, council member of the Foundation for the Promotion of Studies for the Master’s Degree in Law and Economics of the University of St. Gallen, Switzerland, and Curator of the Werner Siemens Foun-dation, Zug, Switzerland. Professor of National and International Tax Law at the University of St. Gallen, Switzerland. Member of the Foundation Board of the Swiss Study Foundation, Zurich, Switzerland. Advisory role at Schindler Holding AG, Hergiswil, Switzerland, until March 2017.
01010101010101010100101010101010
0100101010101010

86
ALSO Annual Report 2017 CORPORATE GOVERNANCE
KARL HOFSTETTER
Member of the Board of Directors of ALSO Holding AG since 1996. CAREER MILESTONES Group General Counsel of the Schindler Group. For many years a member of the Executive Committee of Schindler Holding AG, Her-giswil, Switzerland. EDUCATION Studies in law and economics at the uni-versities of Zurich (Switzerland), Stanford, UCLA, and Harvard (all USA). Licensed attorney in Zurich and New York, professor of private and commer-cial law at the University of Zurich, Switzerland. OTHER ACTIVITIES AND VESTED INTERESTS Member of the Board of Directors and the “Supervisory and Nomination Committee” of Schindler Holding AG, Hergiswil, Switzer-land. Member of the Board of Directors of Venture Incubator AG, Zug, Switzerland, and Chairman of the Board of Trustees of the Kuoni and Hugen-tobler Foundation, Stans, Switzerland. Member of the Board of Trustees of Stichting INPAR, Amsterdam, the Netherlands. Also Chairman of SwissHold-ings (the Federation of Industrial and Service Groups in Switzerland). Mem-ber of the University Council of the University of Lucerne, Switzerland, and of the Commission of Experts on Disclosure of the SIX Swiss Exchange; Chair-man of the Advisory Committee of the “Program on Comparative Corporate Law, Governance, and Finance” at Harvard Law School, Boston, USA.
RUDOLF MARTY
Member of the Board of Directors of ALSO Holding AG since 1993 and Chair-man of the Audit Committee. CAREER MILESTONES Chairman and majority shareholder of Advexo AG, Lucerne, Switzerland. Previously Managing Part-ner of itopia AG – corporate information technology, Zurich, Switzerland. Prior to this Professor for IT at University of Zurich, Switzerland, Head of the IT Research Laboratory and Applications Development of Union Bank of Swit-zerland (UBS), Zurich, Switzerland. EDUCATION MBA and doctorate in Information Technology, Zurich University, Switzerland. OTHER ACTIVITIES AND VESTED INTERESTS Chairman of the Gebert Rüf Foundation, Zurich and Basel, Switzerland.
0100101010101010
0100101010101010
0100101010101010
01010101010101010100101010101010
0101010101010101010010101010101
0100101010101010
01010101010101010100101010101010
010101010101010100101010101010

87
ALSO Annual Report 2017 CORPORATE GOVERNANCE
GUSTAVO MÖLLER-HERGT
Member of the Board of Directors of ALSO Holding AG and Chairman since 2014. Chief Executive Officer of the ALSO Group and since 2011 a member of the Group Management. CAREER MILESTONES BEFORE CURRENT POSITION
Chief Operating Officer of the ALSO Group; previously Chief Representative of the Droege Group. CEO and Chief Representative and previously in various positions with the Warsteiner Group. Member of the Supervisory Board of SIAC in Douala, Cameroon, Chairman of the Supervisory Board of CASA Isen-beck in Buenos Aires, Argentina. EDUCATION Diploma in Engineering from the Technical University, Munich, Germany, and graduate of Harvard Business School, Boston, USA. Doctorate from the Technical University, Berlin, Germany, where he lectures on operations management. OTHER ACTIVITIES AND VESTED INTERESTS Member of the Advisory Board of Deutsche Bank, Düsseldorf, Germany, and of the Board of Trustees of the Bamberg Symphony Orchestra, Bamberg, Germany.
FRANK TANSKI
Member of the Board of Directors of ALSO Holding AG since 2011. CAREER MILESTONES Managing Director of Droege Capital GmbH and of Special Distribution Holding GmbH, Düsseldorf, Germany. Previously he held a managerial position with a large bank in Germany. EDUCATION Diploma in Business Management.
01010101010101010100101010101010
01010101010101010100101010101010
0100101010101010
0100101010101010
88
ALSO Annual Report 2017 CORPORATE GOVERNANCE
3.4.2COMMITTEES
The Board of Directors may delegate the preparation and execu-tion of its decisions to committees or to its individual members. The Board of Directors has appointed three standing committees: the Board Committee (BC), the Audit Committee, and the Com-pensation and Nomination Committee.
For each of the committees, the Board of Directors elects a Chair-man from the members of the Board of Directors. The period of office of all committee members is one year. The Board of Direc-tors can dismiss any member of a committee at any time, except for the members of the Compensation and Nomination Commit-tee, whose election and dismissal lie within the competence of the Annual General Meeting.
3.4.2.1BOARD COMMITTEE (BC)
The Board of Directors appoints a standing BC from among its members. Normally, the BC consists of three members of the Board of Directors who have solid knowledge and extensive experience in the wholesale, financial, corporate governance, and risk control areas.
The BC assists and supports the Board of Directors in the manage-ment of the ALSO Group at senior level and in the supervision of the individuals entrusted with running these companies.
The BC reports to the Board of Directors. The Chairman of the BC informs the Board of Directors about the BC’s work and decisions at each ordinary board meetExceptional events of major signifi-cance are communicated immediately to all members of the Board of Directors.
The BC has among other things the following duties and responsibilities:
Monitoring implementation of the Group strategy by Group Management
Preparation and monitoring of Board of Directors decisions regarding investments, mergers and acquisitions, and oth-er significant projects and transactions carried out by the ALSO Group
Ensuring supervision of the individuals entrusted with the executive management where this function is not per-formed by the Audit Committee
Assessments and proposals to the Board of Directors re-garding potential capital increases or decreases and the issue of bonds by the company
Assessments and proposals to the Board of Directors re-garding notification of the legal authorities in the event of over-indebtedness
Decisions on granting significant guarantees, sureties, col-lateral, and other letters of comfort for the benefit of per-sons or companies outside the Group
Decisions regarding significant legal disputes Reaching decisions on the necessity and the scope of
financial restructuring of ALSO companies Reaching decisions on significant increases or decreases
in the share capital of ALSO companies (except for ALSO Holding AG)
Decisions regarding significant deviations from budget Decisions regarding measures involving all or a substantial
number of employees of ALSO companies or concerning consultations with the works council of individual ALSO companies with regard to such measures
The BC is entitled to delegate certain responsibilities to one of its members, to Group Management, to employees of the ALSO Group who hold an important line and/or staff position, or to third parties.
COMPOSITION OF THE BOARD COMMITTEE
Walter P.J. Droege Chairman
Frank Tanski Member
Peter Athanas Member
As of December 31, 2017
3.4.2.2AUDIT COMMITTEE
The Board of Directors appoints an Audit Committee. The Audit Committee generally consists of three members who possess the necessary financial, legal, and technical expertise.
The Audit Committee reports to the Board of Directors. The Chair-man of the Audit Committee informs the Board of Directors about the Audit Committee’s work and decisions at each ordinary board meeting. The Head of Internal Audit and the Chief Compliance Officer have the right to inform the Chairman of the Audit Com-mittee at any time about situations that are relevant to auditing or compliance. Exceptional events of major significance are com-municated immediately to all members of the Board of Directors by memorandum.
89
ALSO Annual Report 2017 CORPORATE GOVERNANCE
The Audit Committee has the following specific responsibilities: Monitoring and evaluation of the suitability and effective-
ness of internal financial controls; monitoring of adjust-ments following significant changes in the risk profile
Evaluation of the audit strategy adopted by the statutory auditor and verification that shortcomings are corrected and recommendations are implemented
Approval of the annual planning of Internal Audit and dis-cussion of the ensuing reporting with the head of Internal Audit
Evaluation of the performance and remuneration of statu-tory auditor and its independence
Evaluation of the collaboration between statutory auditor and Internal Audit
Evaluation of measures taken by Group Management to ensure appropriate risk management
Evaluation of the measures taken to ensure adherence to legal requirements and internal regulations (compliance) as well as of the associated supervisory measures
Analysis of financial reporting, evaluation of the accounting principles, and assessment of the most important items
Discussion of the year-end closing and annual financial statements with the responsible bodies and submission of a recommendation to the Board of Directors
In the fulfillment of its tasks, the Audit Committee may delegate assignments to other parties, in particular to Group Management, Internal Audit, the Chief Compliance Officer, and the statutory auditor.
COMPOSITION OF THE AUDIT COMMITTEE
Rudolf Marty Chairman
Frank Tanski Member
Peter Athanas Member
As of December 31, 2017
3.4.2.3COMPENSATION AND NOMINATION COMMITTEE
The members of the Compensation and Nomination Committee are elected annually by the Annual General Meeting. The Board of Directors appoints the Chairman.
The Compensation and Nomination Committee prepares all rele-vant decisions of the Board of Directors relating to the compen-sation of the members of the Board of Directors and Group Man-agement, and submits proposals to the Board of Directors regarding the type and amount of the annual compensation of the members of the Board of Directors and Group Management, as well as their fringe benefits and the stipulations of their employ-ment contracts. The Board of Directors has also delegated the following other duties to the Compensation and Nomination Committee:
Preparation of decisions of the Board of Directors regarding nomination of the Vice Chairman of the Board of Directors and pre-selection of potential candidates for the Board of Directors
Preparation of decisions of the Board of Directors regard-ing nomination, promotion, and dismissal of the members of Group Management and Country Managing Directors of the ALSO Group
Preparation of decisions of the Board of Directors regarding the introduction and amendment of employee participation plans
Review of the succession planning and leadership qualifica-tions of the members of the Board of Directors and Group Management, the Country Managing Directors, and other individuals in the ALSO Group who exercise central line and/or staff functions
The Board of Directors may delegate further tasks concerning compensation, human resources, and related areas to the Com-pensation and Nomination Committee. The organization, working methods, and reporting of the Compensation and Nomination Committee are laid down in a set of regulations.
COMPOSITION OF THE COMPENSATION AND NOMINATION
COMMITTEE
Peter Athanas Chairman
Walter P.J. Droege Member
Frank Tanski Member
As of December 31, 2017

90
ALSO Annual Report 2017 CORPORATE GOVERNANCE
3.4.3FREQUENCY OF MEETINGS OF THE BOARD OF DIRECTORS AND ITS COMMITTEES
The Board of Directors convenes for half-day or full-day ordinary meetings, as well as an annual joint strategy meeting with Group Management and Senior Vice Presidents. The task at these meet-ings is to analyze the positioning of the ALSO Group in the light of current macro-economic and company-specific circumstances and to review, and if necessary to redefine, the strategic orienta-tion. The CFO is usually present as a guest at the meetings of the Board of Directors. The representatives of the company’s auditor attended one meeting in the reporting year. In addition, external lawyers attended two meetings in 2017 to provide legal advice.
The Board of Directors met for a total of nine meetings, including one strategy meeting and five conference calls in 2017.
The BC meets as often as its business requires, normally every two months. Five meetings were held in the year under review, including four conference calls.
The Audit Committee meets for half-day or full-day meetings as often as its business requires. The Audit Committee held two meetings concerning the year under review. The CFO, Internal Audit, the compliance officers, and the auditors are usually pres-ent as guests at the meetings of the Audit Committee.
The Compensation and Nomination Committee meets as often as its business requires. The Compensation and Nomination Com-mittee held one conference call relating to the year under review.
The agendas for the meetings are defined by their respective chairman. Minutes of the meetings and decisions are recorded. Other members of Group Management or other individuals may attend meetings of the Board of Directors or its committees at the invitation of the respective chairman.
3.5AREAS OF RESPONSIBILITY
According to the law, the Board of Directors is responsible for the ultimate management and supervision of the Group. It has the inalienable and non-transferable responsibilities in accordance with Art. 716a, Paragraph 1, of the Swiss Code of Obligations. It can also take decisions on all matters that are not allocated to the Annual General Meeting by law or by the Articles of Association
www.also.com/goto/articlesofassociation.
In particular, the Board of Directors is required to approve, or make decisions, concerning:
The Group’s objectives and strategy The list of measures designed to prevent or mitigate poten-
tial loss or damage associated with the main risks Appointing the members of Group Management Defining the organization and appointing those persons
entrusted with the task of representing ALSO Holding AG The proposals to the Annual General Meeting regarding the
compensation of the Board of Directors and Group Man-agement
The drafting of the retirement benefit plan for the members of Group Management
The Group’s budget, plan, and forecast The consolidated annual and interim financial statements
of the Group and the annual financial statements of ALSO Holding AG
The Group’s investment budget Transactions that exceed certain financial amounts Important mergers and acquisitions, joint ventures, and
similar transactions The annual report and the compensation report
In addition, the Board of Directors has delegated operational management of the company to Group Management. Operational management comprises the obligation to implement all necessary measures, particularly with regard to personnel- and product-re-lated issues, market orientation, monitoring the competition, and planning for the future.
Group Management is responsible for ensuring that the Group achieves the targets set by the Board of Directors. In addition to its overall responsibility for operational management, Group Man-agement has the following main tasks in particular:
The pursuit of strategic objectives and enforcement of these objectives using action plans
Defining HR and compensation policy below Group Man-agement level
Defining the product mix as well as the marketing and sales policy
Concluding and canceling agreements with manufacturers at Group level
Defining sourcing policy Defining basic principles of transfer pricing Defining logistical concepts and structures Approving the budgets, financial results, and investments
of the Group companies Defining the operational information and reporting systems Defining communication policy and outward appearance Regulating and performing risk management

91
ALSO Annual Report 2017 CORPORATE GOVERNANCE
The CEO manages the ALSO Group through the members of Group Management, who report to him. He chairs Group Man-agement meetings and supervises the implementation of their decisions. He evaluates the performance and results of the Central Europe and Northern/Eastern Europe market segments. Based on his evaluation, he decides which resources – particularly financial and personnel – should be allocated to the individual business segments. The CEO is responsible for ensuring that the company develops consistently, in accordance with its defined business practices and strategies. It is the duty of the other members of Group Management to ensure that these measures are imple-mented at national level or in the areas for which they are responsible.
3.6INFORMATION AND CONTROL INSTRUMENTS VIS-À-VIS GROUP MANAGEMENT
The Board of Directors supervises Group Management and uses reporting and controlling processes to monitor its operating methods. The ALSO Group has available a comprehensive elec-tronic management information system (MIS). At each of its meet-ings, the Board of Directors is informed by the CEO, or by another member of Group Management, of the current business and sig-nificant events. At these meetings, members of the Board of Directors may ask other members of the Board of Directors or the CEO to provide information about the ALSO Group that they require in order to carry out their duties. All members of the Board of Directors are notified immediately of any exceptional occurrences.
The Internal Audit, compliance officers, and auditing bodies assist the Board of Directors in carrying out its controlling and supervi-sory duties. In addition, the BC and the Audit Committee monitor the performance of Group Management. The scope of this remit is agreed with the Board of Directors of ALSO Holding AG.
The BC, the Audit Committee, and the Compensation Committee periodically receive information in the form of Group reports rel-evant to their needs. These reports are also discussed in depth at regular meetings that take place with the committees involved. The Board of Directors defines and evaluates the Group’s most significant risks on the basis of a coordinated and consistent approach to risk management and control. Based on a list of the most important risks, Group Management establishes a list of measures to prevent and mitigate potential loss and damage. The list is presented for assessment and approval to the Board of Directors, which then ensures that the measures are put into practice.
In addition, the Board of Directors is supported by the ALSO Group Internal Audit. The Internal Audit has an unrestricted right to demand information and examine the records of all Group com-panies and departments. In addition, after consultation with the Audit Committee, Group Management may ask the Internal Audit to carry out special investigations above and beyond its usual remit. The Head of the Internal Audit submits a report to the Audit Committee at half-yearly intervals.
3.7MEASURES IN ACCORDANCE WITH THE SWISS CODE OF BEST PRACTICE FOR CORPORATE GOVERNANCE
At ALSO, the positions of Chairman of the Board of Directors and CEO are held conjointly. The balance of influence between the Board of Directors and Group Management is safeguarded by three committees that have been established, of which the Chair-man of the Board of Directors is not a member, and a clear major-ity situation. In 2015, the Lead Director concept was introduced as part of an amendment of the Organizational Regulations. In particular, the Lead Director is responsible for heading the meet-ings of the Board of Directors – possibly only for single items of the agenda – in the event that the Chairman experiences a conflict of interests. He can convene meetings independently. The Vice Chairman of the Board of Directors, Walter P.J. Droege, serves as the Lead Director.
Currently all members of the Board of Directors are men. Should vacancies occur, the Board of Directors will consider filling them with female members.
The Board of Directors conducts regularly a self-evaluation of its working methods and efficiency.

92
ALSO Annual Report 2017 CORPORATE GOVERNANCE
4.GROUP MANAGEMENT
4.1MEMBERS OF GROUP MANAGEMENT, ACTIVITIES, AND VESTED INTERESTS
The members of the Group Management of ALSO Holding AG are as follows:
MEMBERS OF GROUP MANAGEMENT
Name Nationality Position
Gustavo Möller-Hergt DE Chief Executive Officer (CEO)
Ralf Retzko DE Chief Financial Officer (CFO)
Ole Eklund DK Corporate Vice President Northern/ Eastern Europe
As of December 31, 2017
Changes in Group Management in the reporting year: Stefan Klinglmair, former Corporate Vice President for Central Europe, left the company as at September 1, 2017.
4.2NUMBER OF PERMISSIBLE ACTIVITIES
A member of Group Management may exercise a maximum of ten additional activities as a member of the highest management or directorial body of other legal entities that are entered in the Com-mercial Register according to Art. 12 of VegüV, or would be required to be so entered, and are not controlled by the company. The Board of Directors shall ensure that such activities do not con-flict with the exercise of duties to the company. Functions in various legal entities that are under joint control, or in entities in which this legal entity has a material interest, are counted as one function.
4.3MANAGEMENT AGREEMENTS
ALSO Holding AG has not entered into any management contracts with persons outside the Group for the delegation of executive management. According to Art. 6 of VegüV, delegation of the executive management to legal entities is not permitted.
5.COMPENSATION, SHAREHOLDINGS, AND LOANS
For information on the compensation and shareholdings of members of the Board of Directors and Group Management, and loans to the same, please see the Compensation Report from page 97.

93
ALSO Annual Report 2017 CORPORATE GOVERNANCE
6.SHAREHOLDERS’ RIGHTS OF PARTICIPATION
6.1RESTRICTIONS ON VOTING RIGHTS AND REPRESENTATION
Each share that is entered in the share register entitles the share-holder to one vote.
The rights of shareholders to participate in Annual General Meet-ings comply with legal requirements and the Articles of Associa-tion www.also.com/goto/articlesofassociation. Every shareholder may personally participate in the Annual General Meeting and cast his/her vote(s), or be represented by a proxy appointed in writing, which proxy need not be a shareholder, or be represented by the Independent Proxy. Shareholders may issue their power of attorney and instructions to the Independent Proxy by post or electronically. The Independent Proxy is obliged to exercise the voting rights that are delegated to him by share-holders according to their instructions. Should he have received no instructions, he shall abstain from voting.
On an annual basis, the Annual General Meeting elects the Inde-pendent Proxy with the right of substitution. His term of office terminates at the conclusion of the next Annual General Meeting. Re-election is possible. Should the company have no Independent Proxy, the Board of Directors shall appoint an Independent Proxy for the next Annual General Meeting.
6.2STATUTORY QUORUM REQUIREMENTS
Unless a qualified majority is stipulated by law, the Annual Gen-eral Meeting makes its decisions on the basis of the relative majority of valid votes cast, regardless of the number of share-holders present or shares represented. Abstentions and blank votes do not count as votes. In the case of elections, the first round of voting is decided by the absolute majority and the sec-ond round by the relative majority. The Chairman has the casting vote in the event of a tie.
6.3CONVENING THE ANNUAL GENERAL MEETING
Annual General Meetings are convened by the Board of Directors or, if necessary, by the auditors or other bodies in accordance with Art. 699 and Art. 700 of the Swiss Code of Obligations. Shareholders who collectively represent at least 10 percent of the share capital may convene an Annual General Meeting. When doing so, they must indicate the matters to be discussed and the corresponding proposals.
Annual General Meetings are convened by publication in the Swiss Official Gazette of Commerce at least 20 days prior to the date of the meeting. The shareholders may also be informed in writing (by unregistered letter) or by electronic means.
6.4DEFINITION OF THE AGENDA
The Board of Directors is responsible for specifying the agenda. Shareholders who together own at least five percent of the share capital may request that specific proposals be put on the agenda. The request, including the agenda item and the proposals, must be submitted in writing at least 60 days prior to the date of the Annual General Meeting.
6.5REGISTRATION IN THE SHARE REGISTER
Only shareholders who are registered in the share register as shareholders with voting rights at the closing date are entitled to attend an Annual General Meeting and to exercise their voting rights. The Board of Directors ensures that the closing date is set as close as possible to the date of the Annual General Meeting, i.e. not more than five to ten days prior to it. The closing date is published together with the invitation to the Annual General Meeting in the Swiss Official Gazette of Commerce. There are no exceptions to the rule regarding the closing date.

01010101010101010100101010101010
01010101010101010100101010101010
01010101010101010100101010101010
0100101010101010
01010101010101010100101010101010
01010101010101010100101010101010
01010101010101010100101010101010
01010101010101010100101010101010
94
ALSO Annual Report 2017 CORPORATE GOVERNANCE
MEMBERS OF GROUP MANAGEMENTACTIVITIES AND VESTED INTERESTS
GUSTAVO MÖLLER-HERGT
Member of the Board of Directors of ALSO Holding AG and Chairman since 2014. Chief Executive Officer of the ALSO Group and since 2011 a member of the Group Management. CAREER MILESTONES Chief Operating Officer of the ALSO Group; previously Chief Representative of the Droege Group. CEO and Chief Representative and before in various positions with the Warsteiner Group. Member of the Supervisory Board of SIAC in Douala, Cameroon. Chairman of the Supervisory Board of CASA Isenbeck in Buenos Aires, Argen-tina. EDUCATION Diploma in Engineering from the Technical University, Munich, Germany, and graduate of Harvard Business School, Bos-ton, USA. Doctorate from the Technical University, Berlin, Germany, where he lectures on operations management. OTHER ACTIVITIES AND VESTED INTERESTS Member of the Advisory Board of Deutsche Bank, Dusseldorf, Germany, and of the Board of Trustees of the Bamberg Symphony Orchestra, Bamberg, Germany.
RALF RETZKO
Chief Financial Officer of the ALSO Group and since 2011 a member of the Group Management. CAREER MILESTONES BEFORE CURRENT POSITION
Head of Controlling, Commercial Manager and Chief Financial Officer of the Actebis Group. Previously Central Controlling of Karstadt AG, Essen, Germany, and, following his studies, Scientific Assistant at the Institute of Busi-ness Information Technology, Göttingen University, Germany. EDUCATION
Studied business management, mathematics, and information technology for business in Göttingen, Germany. Subsequently took a doctorate in busi-ness management.
OLE EKLUND
Member of the Group Management of the ALSO Group and responsible as Corporate Vice President for Northern/Eastern Europe since July 2015. CAREER MILESTONES BEFORE CURRENT POSITION Managing Director of ALSO A/S Taastrup, Denmark, Sales Director for Scandinavia at ALSO A/S, Denmark, previously Managing Director with various IT companies in Den-mark, including Ingram Micro A/S, Magirus Nordic A/S and Avnet Technology Solutions. EDUCATION Graduate Diploma in Business Administration and Marketing, Copenhagen Business School, Denmark, and Bachelor’s degree in Education, University College KDAS, Skovlunde, Denmark. OTHER ACTIV-ITIES AND VESTED INTERESTS Chairman of the Board of Directors of PDC A/S, Copenhagen, Denmark, and until March 2017 member of the Board of the Danish IT Industry Association, Copenhagen, Denmark.

95
ALSO Annual Report 2017 CORPORATE GOVERNANCE
7.CHANGE OF CONTROL AND DEFENSE MEASURES
7.1DUTY TO MAKE AN OFFER
The obligation to submit a public take-over offer pursuant to Art. 125 paragraph 3 and paragraph 4 FMIA (formerly Art. 32 and Art. 52 of the Swiss Stock Exchanges and Securities Trading Act “SESTA”) has been waived (“opting out”).
7.2CHANGE OF OWNERSHIP CLAUSES
There are no change-of-control provisions in favor of any member of the Board of Directors and/or Group Management and/or other management personnel.
8.AUDITORS
8.1DURATION OF THE MANDATE AND TERM OF OFFICE OF THE AUDITOR IN CHARGE
The auditors are elected annually at the Annual General Meeting for one year. PricewaterhouseCoopers AG (PwC) have been the statutory auditors of ALSO Holding AG since 2013. The auditor in charge has been responsible for auditing the individual financial statements of ALSO Holding AG as well as the consolidated finan-cial statements of the ALSO Group since fiscal year 2017. The auditor in charge is changed every seven years at the latest as required by law.
The main Group companies are audited by PwC.
8.2FEES
The fees charged by PwC as the auditors of ALSO Holding AG and of the Group companies audited by them, and their fees for additional services, are as follows:
FEES
chf 1 000 2017 2016
Audit 834 806
Audit related services 159 81
Tax and other services 399 366
total 1 392 1 253

96
ALSO Annual Report 2017 CORPORATE GOVERNANCE
8.3INFORMATIONAL INSTRUMENTS PERTAINING TO AN�AUDIT
Prior to the audit, the auditors agree the content of the audit with the Audit Committee of ALSO Holding AG. Special assignments from the Board of Directors are also included in the scope of the audit. The findings of the audit are set out in a comprehensive report which is submitted to the Board of Directors.
Each year, the Audit Committee evaluates the performance, fees, and independence of the auditors, and the audit strategy. The Board of Directors discusses and reviews the scope of the audits and the resulting reports. On this basis, it decides on any changes or improvements to be made. There is regular contact between the auditors and the members of the Board of Directors, Group Management, and the Audit Committee of ALSO Holding AG. There was one meeting between the full Board of Directors and the auditors regarding the financial statements for the fiscal year 2017.
Additional service or consulting assignments are delegated to the auditors only if they are permitted by the auditors’ code of independence.
9.INFORMATION POLICY
Detailed financial statements are published in the form of the half-year and annual reports. The published accounts comply with the requirements of Swiss company law, the listing rules of SIX Swiss Exchange, and the International Financial Reporting Standards (IFRS).
The ALSO Group also presents its financial statements at its annual results media conference and its Annual General Meeting.
The ALSO Group reports in accordance with the disclosure requirements of Art. 124 FMIA and the ad-hoc publication require-ments of Art. 53 of the listing rules of SIX Swiss Exchange. At
www.also.com/goto/subscribe, interested parties can reg-ister for the free ALSO Holding AG e-mail distribution list in order
to receive direct, up-to-date information that may be relevant to the share price (ad-hoc announcements). Ad-hoc announcements may be viewed at www.also.com/goto/mediareleases at the same time as notification to SIX Swiss Exchange and for two years thereafter.
In addition, media releases, presentations, and brochures are pub-lished as necessary. These documents are available to all, both electronically at www.also.com and in printed form.
Announcements to the shareholders are made by way of unregis-tered letters or publication in the Swiss Official Gazette of Commerce (SHAB), unless otherwise stipulated in mandatory legal provisions or in the company’s articles of association. The invi-tation to the Annual General Meeting may also be sent by elec-tronic means.
FINANCIAL CALENDAR
Annual General Meeting March 27, 2018
Publication half-year report July 26, 2018
ALSO Holding AGMeierhofstrasse 5CH-6032 EmmenSwitzerlandTel. +41 41 266 18 00Email: [email protected]
10.IMPORTANT CHANGES OCCURRING AFTER THE BALANCE SHEET DATE
No material changes have occurred since the end of the reporting period.

3 COMPENSATION REPORT
COMPENSATION REPORT
98
ALSO Annual Report 2017 COMPENSATION REPORT

99
ALSO Annual Report 2017 COMPENSATION REPORT
COMPENSATION REPORTThis Compensation Report contains information on the compen-sation of the members of the Board of Directors and Group Man-agement. The report was prepared in accordance with the provi-sions of the Ordinance Against Excessive Compensation in Listed Companies (VegüV). It satisfies the requirements of SIX Swiss Exchange for information on corporate governance and the stan-dards stipulated in the “Swiss Code of Best Practice for Corporate Governance” of economiesuisse.
This Compensation Report will be presented to the next Annual General Meeting of ALSO Holding AG, which will be held on March 27, 2018, for a consultative vote.
1.PRINCIPLES
The success of the ALSO Group depends largely on the qualifica-tions and commitment of its employees. The purpose of the Group’s compensation policy is to attract, motivate, and retain qualified personnel. It is also intended to bring management interests in line with those of ALSO and its shareholders.
The compensation system is designed so that the compensation is performance-based and market-driven, and so that entrepreneurial thinking and action are encouraged. Compensation decisions should be fair, transparent and therefore understandable for the persons concerned.
2.CHANGES IN THE REPORTING YEAR
Stefan Klinglmair, former Corporate Vice President for Central Europe, left the company as at September 1, 2017.
3.COMPENSATION SYSTEM
3.1BOARD OF DIRECTORS
The members of the Board of Directors receive a fixed fee for their activities and no performance-related payment.
The chairmen and members of committees of the Board of Direc-tors receive an additional fixed fee for these functions.
3.2GROUP MANAGEMENT
The members of Group Management receive compensation con-sisting of fixed and performance-related (variable) components.
The fixed components consist of a monthly salary and, from case-by-case, a flat-rate vehicle allowance, a company car, or flat-rate representation expenses. Certain fringe benefits may also be paid.
The variable compensation depends on the business success and is paid in the form of a cash bonus. Variable compensation includes a short-term and a long-term component and breaks down as follows:
Short-term, variable compensation: For the CEO and CFO, it depends entirely on the combined target values of EBT and EBITDA that are defined by the Board of Directors. If the targets are attained, the bonus is calculated accord-ing to a progressively increasing percentage of the attained EBT, which is defined in advance by the Board of Directors.
For the other members of Group Management, the bonus is calculated as a fixed percentage of the attained EBT, which is defined in advance by the Board of Directors.

100
ALSO Annual Report 2017 COMPENSATION REPORT
Long-term, variable compensation: A long-term incentive applies to members of Group Management whose contribution has a material influence on the long-term development of the Group. The long-term incentive was agreed with the members of Group Man-agement at the time in 2011 and was expanded to in-clude the new members of Group Management in 2016. It is designed so that a one-time special premium is paid if long-term financial targets that are defined by the Board of Directors are attained in two successive years. The payment is only made on condition that the recipient is actually employed by the ALSO Group on the date when the payment is made.
In the case of exceptional non-recurring events (e.g. acquisitions) that are not the responsibility of Group Management, the Board of Directors may, at its own discretion, adjust the parameters on which the calculation of variable compensation is based.
For exceptional performance, in addition to the target bonus, the Board of Directors may, at its own discretion, award a special bonus, which is reported under “Cash bonus (gross)” in the Com-pensation Report.
3.3CAPITAL PARTICIPATION PLAN
No participations, conversion rights or options are granted to members of the Board of Directors or Group Management.
4.RESPONSIBILITIES AND PROCEDURES FOR APPROVING AND SETTING COMPENSATION
Responsibilities for compensation-related decisions are governed by the Articles of Association www.also.com/goto/ articlesofassociation, the Organizational Regulations and the Regulations of the Compensation and Nomination Committee of ALSO Holding AG.
4.1COMPENSATION AND NOMINATION COMMITTEE
The Compensation and Nomination Committee prepares all rele-vant decisions of the Board of Directors relating to the compen-sation of the members of the Board of Directors and Group
Management, and submits proposals to the Board of Directors regarding the type and amount of the annual compensation of the members of the Board of Directors and Group Management, as well as their fringe benefits and the stipulations of their employ-ment contracts.
The Compensation and Nomination Committee can also make proposals to the Board of Directors for amendments to the com-pensation system.
4.2BOARD OF DIRECTORS
Under and subject to the approval of the Annual General Meeting, the definitive compensation is determined by the Board of Direc-tors. As a rule, the effective bonus is determined at the proposal of the Compensation and Nomination Committee in the first quar-ter of the following year. The executive members of the Board of Directors are not present when their compensation is determined. No external consultants were called in during the reporting year.
4.3GENERAL MEETING
The Annual General Meeting each year approves the following compensation amounts for the respective ongoing fiscal year with binding effect:
Maximum amount for fixed compensation for members of the Board of Directors
Maximum amount for fixed compensation for members of the Group Management
Maximum amount for variable compensation for members of the Group Management
The Annual General Meeting can subsequently increase the compensation already approved at any time.
If the Annual General Meeting refuses its approval, the Board of Directors can submit new proposals at the same general meeting or a new general meeting yet to be convened.
The additional amount for the hiring of new members of Group Management after approval by the Annual General Meeting is 30 percent of the total compensation approved for the respective period per new member. Approval of this additional compensa-tion by the Annual General Meeting is not required.

101
ALSO Annual Report 2017 COMPENSATION REPORT
5.COMPENSATION FOR THE REPORTING YEAR
5.1GENERAL
The disclosed compensation of the members of the Board of Directors and Group Management includes all compensation paid for the entire reporting year, subject to the following amplifica-tions and restrictions:
The disclosed variable compensation elements comprise the accrued variable compensation elements attributable to the completed fiscal year.
The compensation paid to new members of the Board of Di-rectors and Group Management is reckoned from the date on which they take over the respective function.
If a member resigns from the Board of Directors or Group Management, the compensation up to the resignation date, plus any compensation in the reporting year in connection with these activities, are reported together.
In individual cases, members of Group Management may be entitled to a company car. Such benefits are reported under “Non-cash benefits”.
Members of Group Management may receive certain fringe benefits in the form of discounts. Provided that such ben-efits do not exceed the value of CHF 500 per case, and the total of such benefits does not exceed an aggregate value of CHF 20 000 per fiscal year, they are not reported.
Any contributions to post-employment benefit plans, exec-utive insurance plans, or private insurances are reported as “Pension expenses”.
The compensation of the members of Group Management was in some cases borne directly by ALSO Holding AG and in other cases indirectly by subsidiaries through intercom-pany charging.
5.2AGGREGATE�COMPENSATION�–� BOARD OF DIRECTORS
At the Annual General Meeting on March 21, 2017, shareholders approved maximum fixed total compensation of CHF 0.7 million for fiscal year 2017.
The members of the Board of Directors do not receive any vari-able compensation for their activities.
chf 1 000Fixed, cash
(gross)Pension
expenses Total 2017
Gustavo Möller-Hergt, Chairman/executive member – – –
Walter P.J. Droege, Vice Chairman 1), 3), 4) 140 – 140
Karl Hofstetter 80 5 85
Rudolf Marty 2), 5) 90 4 94
Frank Tanski 1), 2), 3) 95 – 95
Peter Athanas 1), 2), 3), 6) 100 6 106
Ernest-W. Droege 80 – 80
total compensation 585 15 600
Approved at the Annual General Meeting 700
Gustavo Möller-Hergt has been a member of Group Management since 2011 and a member and Chairman of the Board of Directors since March 13, 2014. For his compensation, please refer to the section on compensation of the members of Group Management. All other members of the Board of Directors are non-executive members.1) Member of the Board Committee2) Member of the Audit Committee3) Member of the Compensation and Nomination Committee4) Including compensation as Chairman of the Board Committee5) Including compensation as Chairman of the Audit Committee6) Including compensation as Chairman of the Compensation and Nomination Committee

102
ALSO Annual Report 2017 COMPENSATION REPORT
5.3AGGREGATE�COMPENSATION�–� GROUP MANAGEMENT
At the Annual General Meeting on March 21, 2017, shareholders approved maximum fixed total compensation of EUR 1.5 million and maximum variable total compensation of EUR 3.5 million for fiscal year 2017.
In the reporting period, cash bonus for Gustavo Möller-Hergt was 78 percent (previous year: 74 percent) of his total compensation. For the members of Group Management, the average cash bonus was 69 percent (previous year: 65 percent).
The Annual General Meeting approves the compensation of the members of Group Management in euros, since the compensation is paid out mostly in this currency. This allows for deviations between approved and effective compensation as a result of exchange rate changes to be avoided. For this reason, ALSO pres-ents the compensation in EUR as well as in CHF.
AGGREGATE COMPENSATION IN CHF
Fixed compensation Variable compensation
chf 1 000Cash
(gross)Non-cash benefits/
miscellaneous Pension expensesFixed total
compensationCash bonus
(gross) Total 2017
Group Management
total 1) 1 043 59 352 1 454 3 239 4 693
Highest individual compensation
Gustavo Möller-Hergt 345 16 174 535 1 878 2 413
Translated into CHF using average exchange rates 2017 (EUR/CHF 1.1117)1) Including settlement of all contractual and legal entitlements of one departed member of Group Management
AGGREGATE COMPENSATION IN EUR
Fixed compensation Variable compensation
eur 1 000Cash
(gross)Non-cash benefits/
miscellaneous Pension expensesFixed total
compensationCash bonus
(gross) Total 2017
Group Management
total 1) 938 53 317 1 308 2 914 4 222
Approved at the Annual General Meeting 1 500 3 500 5 000
Highest individual compensation
Gustavo Möller-Hergt 310 14 157 481 1 689 2 170
1) Including settlement of all contractual and legal entitlements of one departed member of Group Management

103
ALSO Annual Report 2017 COMPENSATION REPORT
6.COMPENSATION FOR THE PRIOR YEAR
6.1GENERAL
The disclosed compensation of the members of the Board of Directors and Group Management includes all compensation paid for the entire fiscal year of 2016. The additions and restrictions in 5.1 also apply to compensation for the previous year.
chf 1 000Fixed, cash
(gross)Pension
expenses Total 2016
Gustavo Möller-Hergt, Chairman/executive member – – –
Walter P.J. Droege, Vice Chairman 1), 3), 4) 140 – 140
Karl Hofstetter 80 5 85
Rudolf Marty 2), 5) 90 4 94
Frank Tanski 1), 2), 3) 95 – 95
Peter Athanas 1), 2), 3), 6) 100 6 106
Ernest-W. Droege 7) 60 – 60
Olaf Berlien 8) 20 – 20
total compensation 585 15 600
Approved at the Annual General Meeting 700
Gustavo Möller-Hergt has been a member of Group Management since 2011 and a member and Chairman of the Board of Directors since March 13, 2014. For his compensation, please refer to the section on compensation of the members of Group Management. All other members of the Board of Directors are non-executive members.1) Member of the Board Committee2) Member of the Audit Committee3) Member of the Compensation and Nomination Committee4) Including compensation as Chairman of the Board Committee5) Including compensation as Chairman of the Audit Committee6) Including compensation as Chairman of the Compensation and Nomination Committee7) Ernest-W. Droege was elected to the Board of Directors at the Annual General Meeting held on March 17, 2016. Compensation from the 2016 Annual General Meeting8) Olaf Berlien resigned on the date of the Annual General Meeting (March 17, 2016). Compensation until the 2016 Annual General Meeting
6.2AGGREGATE�COMPENSATION�–� BOARD OF DIRECTORS
At the Annual General Meeting on March 17, 2016, shareholders approved maximum fixed total compensation of CHF 0.7 million for fiscal year 2016.
The members of the Board of Directors did not receive any vari-able compensation for their activities.

104
ALSO Annual Report 2017 COMPENSATION REPORT
6.3AGGREGATE�COMPENSATION�–� GROUP MANAGEMENT
At the Annual General Meeting on March 17, 2016, shareholders approved maximum fixed total compensation of EUR 1.5 million and maximum variable total compensation of EUR 3.3 million for fiscal year 2016.
AGGREGATE COMPENSATION IN CHF
Fixed compensation Variable compensation
chf 1 000Cash
(gross)Non-cash benefits/
miscellaneous Pension expensesFixed total
compensationCash bonus
(gross) Total 2016
Group Management
total 1 104 57 314 1 475 2 715 4 190
Highest individual compensation
Gustavo Möller-Hergt 338 16 171 525 1 510 2 035
Translated into CHF using average exchange rates 2016 (EUR/CHF 1.0902)
The Annual General Meeting approves the compensation of the members of Group Management in euros, since the compensation is paid out mostly in this currency. This allows for deviations between approved and effective compensation as a result of exchange rate changes to be avoided. For this reason, ALSO presents the compensation in EUR as well as in CHF.
AGGREGATE COMPENSATION IN EUR
Fixed compensation Variable compensation
eur 1 000Cash
(gross)Non-cash benefits/
miscellaneous Pension expensesFixed total
compensationCash bonus
(gross) Total 2016
Group Management
total 1 013 52 288 1 353 2 490 3 843
Approved at the Annual General Meeting 1 500 3 300 4 800
Highest individual compensation
Gustavo Möller-Hergt 310 15 157 482 1 385 1 867

105
ALSO Annual Report 2017 COMPENSATION REPORT
7.COMPENSATION PAID TO FORMER MEMBERS OF GOVERNING BODIES
In the reporting year, no compensation was paid to former mem-bers of the Board of Directors. An agreed benefit payment of CHF 81 741 was made to one former member of Group Management.
A benefit payment of CHF 80 160 was made to a former member of Group Management in the previous year.
8.COMPENSATION PAID TO RELATED PARTIES
Neither in the reporting year, nor in the prior year, was any com-pensation paid by ALSO Holding AG, or any other Group company, to any related parties of present or former members of the gov-erning bodies.
9.LOANS AND BORROWING FACILITIES
9.1CURRENT AND FORMER MEMBERS OF THE GOVERNING BODIES
The company does not grant loans or credits to members of the Board of Directors or Group Management. Neither in the report-ing year, nor in the prior year, were any loans or credits granted by ALSO Holding AG, or any other Group company, to any present or former members of the governing bodies, nor were any such loans or credits outstanding at December 31, 2017.
9.2RELATED PARTIES
Neither in the reporting year, nor in the prior year, were any loans or credits granted by ALSO Holding AG, or any other Group com-pany, to any related parties of present or former members of the governing bodies, nor were any such loans or credits outstanding at December 31, 2017.

106
ALSO Annual Report 2017 COMPENSATION REPORT
Report of the statutory auditor to the General Meeting on the compensation report 2017We have audited the compensation report of ALSO Holding AG paragraphs 5. to 9. on pages 101 to 105 for the year ended 31 December 2017.
Board of Directors’ responsibility
The Board of Directors is responsible for the preparation and overall fair presentation of the compensation report in accordance with Swiss law and the Ordinance against Excessive Compensation in Stock Exchange Listed Companies (Ordinance). The Board of Directors is also responsible for designing the compensation system and defining individual compensation packages.
Auditor’s responsibility
Our responsibility is to express an opinion on the accompanying compensation report. We conducted our audit in accordance with Swiss Auditing Standards. Those standards require that we comply with ethical requirements and plan and perform the audit to obtain reason-able assurance about whether the compensation report complies with Swiss law and articles 14–16 of the Ordinance.
An audit involves performing procedures to obtain audit evidence on the disclosures made in the compensation report with regard to compensation, loans and credits in accordance with articles 14–16 of the Ordinance. The procedures selected depend on the auditor’s judgment, including the assessment of the risks of material misstatements in the compensation report, whether due to fraud or error. This audit also includes evaluating the reasonableness of the methods applied to value components of compensation, as well as assessing the overall presentation of the compensation report.
We believe that the audit evidence we have obtained is sufficient and appropriate to provide a basis for our opinion.
Opinion
In our opinion, the compensation report of ALSO Holding AG for the year ended 31 December 2017 complies with Swiss law and articles 14–16 of the Ordinance.
PricewaterhouseCoopers AG
Joanne Burgener Andreas BrunAudit expert Audit expertAuditor in charge
Lucerne, 9 February 2018

4 FINANCIALREPORT
FINANCIAL REPORT

108
ALSO Annual Report 2017 FINANCIAL REPORT

109
ALSO Annual Report 2017 FINANCIAL REPORT
CONSOLIDATED STATEMENT OF COMPREHENSIVE INCOME
eur 1 000 Note 2017 2016
total net sales 4.1 8 890 688 100.0 % 7 984 149 100.0 %
Cost of goods sold and services provided – 8 346 340 – 7 478 161
gross profit 544 348 6.1 % 505 988 6.3 %
Personnel expenses 4.2 – 219 256 – 209 433
Other operating expenses 4.4 – 183 879 – 173 048
Other operating income 4.4 16 067 22 500
ebitda 157 280 1.8 % 146 007 1.8 %
Depreciation and amortization 5.5 / 5.6 – 16 320 – 17 516
operating profit (ebit) 140 960 1.6 % 128 491 1.6 %
Financial income 4.5 1 925 2 553
Financial expenses 4.5 – 18 705 – 17 597
Share of income of associates 5.14 0 445
profit before tax (ebt) 124 180 1.4 % 113 892 1.4 %
Income taxes 4.6 – 31 653 – 30 705
net profit group 92 527 1.0 % 83 187 1.0 %
Items that will not be subsequently reclassified to profit or loss
Remeasurement of defined benefit plans 1 043 6 060
Tax effects 4.6 – 148 – 733
subtotal 895 5 327
Items that may be subsequently reclassified to profit or loss
Exchange differences – 6 619 1 936
Fair value adjustments on cash flow hedges 1 655 1 254
Tax effects 4.6 – 239 – 148
subtotal – 5 203 3 042
other comprehensive income – 4 308 8 369
total comprehensive income 88 219 91 556
Net profit Group attributable to:
Shareholders of ALSO Holding AG 92 630 83 382
Non-controlling interests – 103 – 195
Total comprehensive income attributable to:
Shareholders of ALSO Holding AG 88 322 91 751
Non-controlling interests – 103 – 195
earnings per share in eur *
Basic earnings per share 5.13 7.22 6.50
Diluted earnings per share 5.13 7.22 6.50
* Attributable to the shareholders of ALSO Holding AG
The accompanying notes form an integral part of the consolidated financial statements.

110
ALSO Annual Report 2017 FINANCIAL REPORT
ASSETS
CONSOLIDATED STATEMENT OF FINANCIAL POSITION
eur 1 000 Note 12.31.2017 12.31.2016
current assets
Cash and cash equivalents 5.1 235 561 55 477
Trade receivables 5.2 570 713 583 508
Inventories 5.3 834 123 738 273
Prepaid expenses, accrued income and other receivables 5.4 257 872 257 818
Derivative financial instruments 6.2 70 101
total current assets 1 898 339 88 % 1 635 177 86 %
non-current assets
Property, plant and equipment 5.5 84 169 85 879
Intangible assets 5.6 165 200 164 644
Financial assets 2 280 1 413
Derivative financial instruments 6.2 124 0
Deferred tax assets 4.6 8 392 7 990
total non-current assets 260 165 12 % 259 926 14 %
total assets 2 158 504 100 % 1 895 103 100 %
The accompanying notes form an integral part of the consolidated financial statements.

111
ALSO Annual Report 2017 FINANCIAL REPORT
LIABILITIES AND EQUITY
eur 1 000 Note 12.31.2017 12.31.2016
current liabilities
Financial liabilities 5.8 83 571 28 786
Trade payables 851 090 862 688
Accrued expenses, deferred income and other payables 5.9 228 334 195 981
Derivative financial instruments 6.2 1 077 1 170
Tax liabilities 10 193 7 274
Provisions 5.10 5 050 4 459
total current liabilities 1 179 315 55 % 1 100 358 58 %
non-current liabilities
Financial liabilities 5.8 325 722 192 631
Provisions 5.10 4 592 4 241
Derivative financial instruments 6.2 4 866 4 603
Deferred tax liabilities 4.6 6 637 6 556
Employee benefits 4.3 14 077 21 533
total non-current liabilities 355 894 16 % 229 564 12 %
total liabilities 1 535 209 71 % 1 329 922 70 %
equity
Share capital 9 960 9 960
Capital reserves 134 947 161 896
Treasury shares 5.11 – 1 822 – 1 194
Cash flow hedge reserve – 2 189 – 3 777
Exchange differences – 1 985 4 806
Remeasurement of defined benefit plans – 8 991 – 9 886
Retained earnings 493 187 403 234
equity attributable to also shareholders 623 107 29 % 565 039 30 %
Non-controlling interests 188 142
total equity 623 295 29 % 565 181 30 %
total liabilities and equity 2 158 504 100 % 1 895 103 100 %
The accompanying notes form an integral part of the consolidated financial statements.

112
ALSO Annual Report 2017 FINANCIAL REPORT
CONSOLIDATED STATEMENT OF CHANGES IN EQUITY
eur 1 000 NoteShare
capitalCapital
reservesTreasury
sharesOther
reserves *Retained earnings
Equity attributable
to share-holders
Non- controlling
interests Total
january 1, 2017 9 960 161 896 – 1 194 – 8 857 403 234 565 039 142 565 181
Net profit Group 0 0 0 0 92 630 92 630 – 103 92 527
Other comprehensive income 0 0 0 – 4 308 0 – 4 308 0 – 4 308
total comprehensive income 0 0 0 –4 308 92 630 88 322 – 103 88 219
Distributions to shareholders 5.13 0 – 26 949 0 0 0 – 26 949 0 – 26 949
Acquisition of non-controlling interests 3 0 0 0 0 – 4 388 – 4 388 0 – 4 388
Remeasurement of put options on shares of non-controlling interests 2.7 0 0 0 0 1 711 1 711 149 1 860
Measurement adjustment treasury shares 5.11 0 0 – 628 0 0 – 628 0 – 628
december 31, 2017 9 960 134 947 – 1 822 – 13 165 493 187 623 107 188 623 295
january 1, 2016 9 960 184 231 – 1 194 – 17 226 317 482 493 253 – 439 492 814
Net profit Group 0 0 0 0 83 382 83 382 – 195 83 187
Other comprehensive income 0 0 0 8 369 0 8 369 0 8 369
total comprehensive income 0 0 0 8 369 83 382 91 751 – 195 91 556
Distributions to shareholders 5.13 0 – 22 335 0 0 0 – 22 335 – 22 – 22 357
Acquisition of non-controlling interests 3 0 0 0 0 – 622 – 622 622 0
Remeasurement of put options on shares of non-controlling interests 2.7 0 0 0 0 2 992 2 992 176 3 168
december 31, 2016 9 960 161 896 – 1 194 – 8 857 403 234 565 039 142 565 181
* See Note 5.12
The accompanying notes form an integral part of the consolidated financial statements.

113
ALSO Annual Report 2017 FINANCIAL REPORT
CONSOLIDATED STATEMENT OF CASH FLOWS
eur 1 000 2017 2016
net profit group 92 527 83 187
Depreciation and amortization 16 320 17 516
Change of provisions and employee benefits – 4 482 –2 529
Losses/gains from the sale of non-current assets 37 – 23
Other non-cash items – 6 747 1 951
subtotal 97 655 100 102
Change in trade receivables 72 870 – 46 756
Change in receivables from factoring 11 006 – 52 529
Change in inventories – 84 377 – 22 322
Change in prepaid expenses, accrued income and other receivables – 9 394 1 083
Change in trade payables – 8 426 94 975
Change in accrued expenses, deferred income and other payables 15 547 15 413
cash flow from operating activities 94 881 89 966
Net cash flow from acquisitions of subsidiaries (see Note 3) – 9 734 – 3 676
Payment of contingent consideration from acquisitions of subsidiaries (see Note 3) – 2 763 – 3 348
Dividends from associates 0 455
Additions to property, plant and equipment – 11 002 – 6 801
Additions to intangible assets – 4 402 – 5 828
Disposals of property, plant and equipment 239 79
Disposals / additions of financial assets 120 – 309
cash flow from investing activities – 27 542 – 19 428
Distributions to shareholders – 26 949 – 22 335
Distributions to non-controlling interests 0 – 22
Proceeds from increase of financial liabilities 159 407 23 352
Repayments of financial liabilities – 21 505 – 35 608
Proceeds / repayments of factoring liabilities 1 947 – 20 389
cash flow from financing activities 112 900 – 55 002
Exchange differences – 155 – 59
change in cash and cash equivalents 180 084 15 477
cash and cash equivalents at january 1 55 477 40 000
cash and cash equivalents at december 31 235 561 55 477
Included in cash flow from operating activities
Income taxes paid 28 425 25 965
Interest paid 16 127 14 739
Interest received 273 222
The accompanying notes form an integral part of the consolidated financial statements.

114
ALSO Annual Report 2017 FINANCIAL REPORT
NOTES TO THE CONSOLIDATED FINANCIAL STATEMENTS
1.CORPORATE INFORMATION
The basis of ALSO’s business models are the two customer cate-gories “providers” and “buyers”. The ALSO Group has a portfolio of more than 500 vendors in the various ICT product categories of hardware, software, and IT services, including all global market leaders. We offer the vendors access to a broad spectrum of buy-ers, who can call up further customized services in the logistics, finance, IT, and digital services sectors, as well as traditional dis-tribution services. ALSO offers services along the entire value chain from a single source.
On the basis of a European B2B marketplace, the customers are enabled to sustainably shape and develop their businesses.
2.ACCOUNTING POLICIES
2.1BASIS OF PREPARATION
The ALSO Group’s consolidated financial statements are prepared in accordance with the requirements of the Swiss Code of Obliga-tions and the International Financial Reporting Standards (IFRS), as well as the accounting and measurement principles described below. The consolidated financial statements are prepared on the assumption of a going concern. The consolidated financial state-ments are prepared on a historical cost basis, except for certain financial assets and liabilities which are measured at fair value. The financial statements are available in German and English, of which the German version is binding.
These consolidated financial statements for the fiscal year 2017 of ALSO Holding AG inclusive all of its directly or indirectly con-trolled subsidiaries are presented in EUR (reporting currency), since the majority of revenues are generated in the euro area. For clarity, all values are presented in thousands of euros (TEUR).
2.2SIGNIFICANT CHANGES IN THE ACCOUNTING AND MEASUREMENT PRINCIPLES
The accounting policies adopted are consistent with those of the previous fiscal year except for those new and amended stan-dards and interpretations effective from January 1, 2017, which are listed below. A description of the changes and their impact on the consolidated financial statements is provided below if they materially affect the financial position, performance, or cash flow situation of ALSO:
Recognition of Deferred Tax Assets for Unrealised Losses (Amendments to IAS 12)
Disclosure Initiative (Amendments to IAS 7) Clarification of the scope of the Standard (Amendments to
IFRS 12)
None of the changes have any material effect on the financial position, performance, or cash flow situation of ALSO.
2.3PUBLISHED STANDARDS, INTERPRETATIONS, AND AMENDMENTS NOT YET APPLIED
The following standards, interpretations, and amendments which have been issued but not yet applied by ALSO are being con-stantly analyzed by ALSO for their impact on the consolidated financial statements:
IFRS 9 Financial Instruments – effective January 1, 2018 IFRS 15 Revenue from Contracts with Customers – effective
January 1, 2018 IFRS 16 Leases – effective January 1, 2019 Deletion of short-term exemptions for first-time adopters
(Amendments to IFRS 1) – effective January 1, 2018 Measuring an associate or joint venture at fair value
(Amendments to IAS 28) – effective January 1, 2018 Classification and Measurement of Share-based Payment
Transactions (Amendments to IFRS 2) – effective Janu-ary 1, 2018
Applying IFRS 9 Financial Instruments with IFRS 4 Insur-ance Contracts (Amendments to IFRS 4) – effective Janu-ary 1, 2018
IFRIC 22 Foreign Currency Transactions and Advance Con-sideration – effective January 1, 2018
Transfers of Investment Property (Amendments to IAS 40) – effective January 1, 2018

115
ALSO Annual Report 2017 FINANCIAL REPORT
Sale or Contribution of Assets between an Investor and its Associate or Joint Venture (Proposed amendments to IFRS 10 and IAS 28) – date of initial application unknown
Making Materiality Judgements (IFRS Practice Statement) – effective January 1, 2018
ALSO has analyzed the impact of IFRS 15 on the recognition and disclosure of net sales in detail. The customer contracts underly-ing the main business models are not expected to contain any items that are required to be recorded or disclosed differently under IFRS 15 than under the previous standards and interpreta-tions. Both for the traditional transactional business models and for trading business with products that form part of comprehen-sive solutions, there is only a short interval between concluding the contract and performing the service/recognizing net sales. Services performed for customers on the basis of service con-tracts are of a transactional nature or are provided over short periods that form the basis for billing to customers.
ALSO has also analyzed the impact of IFRS 9 in detail. The classi-fication and measurement of trade receivables and receivables from factoring companies needs to be adjusted, but this will not have any significant financial effects. The classification and mea-surement of other financial instruments remains unchanged.
ALSO therefore does not currently anticipate any significant effects from the initial application of IFRS 15 and IFRS 9.
ALSO will apply IFRS 16 as at January 1, 2019. Based on current knowledge, the following financial consequences are anticipated:
Equity ratio: Decrease due to additional capitalization of assets from rights of use and lease liabilities
Consolidated net profit: No significant consequences, but decrease in other operating expenses along with increase in depreciation/amortization and financial expenses
Consolidated cash flow statement: No effects on cash flow, but repayments of lease liabilities will now be reported un-der financing activities (previously in cash flow from oper-ating activities).
From today’s perspective, the application of other changes will not have any material effects on the capital, financial, income, or cash flow situation of ALSO. ALSO applies the changes for the first time as from the fiscal year following the date stated in the standard.
2.4KEY ASSUMPTIONS AND ESTIMATES
Preparation of the financial statements in accordance with IFRS requires management to make certain assumptions and estimates which influence the figures presented in this report. The neces-sary analyses and assessments are continuously reviewed and modified if necessary. However, the actual results may differ from these estimates. The main items whose amount and presentation materially depend on assumptions and estimates are as follows:
VENDOR BONUSES
The accruals of vendor receivables for bonuses contain estimates which are based on various factors such as sales volumes, quan-tities, stock levels, and other qualitative and quantitative targets. The amount recognized for the bonuses depends mainly on the attainment of the agreed targets. The bonus models vary between the vendors.
IMPAIRMENT OF GOODWILL
ALSO tests the capitalized goodwill at least once per year for impairment. This requires an assessment of the value in use of an underlying cash-generating unit or group of cash-generating units. The estimates of factors such as volumes, sales prices, sales growth, gross margin, operating expenses and investments, market conditions, balance sheet structure, and other economic factors, as well as parameters (e.g. discount rates) derived from external data, are based on assumptions that management considers reasonable ( see Note 5.7).
DEFERRED TAX ASSETS
Deferred tax assets are determined on the basis of estimates. The forecasts that are made for this purpose cover a timeframe of several years and include interpretations of existing tax laws and ordinances as well as changes in tax rates ( see Note 4.6).

116
ALSO Annual Report 2017 FINANCIAL REPORT
SALE OF TRADE RECEIVABLES
In various countries, ALSO sells trade receivables to independent factoring companies. The assessment of whether the contractual arrangements of the factoring programs result in a significant transfer of risk, and the associated derecognition of the receiv-ables, has a significant influence on the balance sheet of ALSO ( see Note 6.8).
EMPLOYEE BENEFITS
In various countries there are defined benefit plans. The defined benefit liability is based partly on long-term actuarial assumptions which may differ from actual future developments. Determination of the discount rate, the future development of salaries and pensions, and life expectancy are important components of the actuarial measurement.
2.5SCOPE OF CONSOLIDATION
These consolidated financial statements include the annual finan-cial statements as at December 31 of ALSO Holding AG, Emmen, Switzerland, and of the companies over which ALSO has control. ALSO controls a subsidiary when ALSO is exposed to the risks of the entity, has rights to variable returns from its involvement in the entity, and can affect these returns through exercise of its power over the entity. By this definition, ALSO controls SINAS Beteiligungs GmbH & Co. Vermietungs-KG, even though less than half of its voting shares are owned by ALSO. With the opening of insolvency proceedings under self-administration, ALSO lost con-trol of ALSO Logistics Services GmbH in 2015. Nevertheless, as a member of the Creditor Committee, ALSO exercises significant influence on ALSO Logistics Services GmbH.
Subsidiaries are fully consolidated from the date on which control is transferred to ALSO and deconsolidated from the date that con-trol ceases. Group companies are listed in Note 6.5.
CHANGES�IN�2017
The following companies were acquired by the ALSO Group in 2017 and were included in the scope of consolidation:
Country Domicile Company name Voting interest
France Paris BeIP S.A.S 51.00 %
Finland Helsinki Internet Smartsec Oy 100.00 %
Netherlands Utrecht All 4 U B.V. 100.00 %
Utrecht Esseko B.V. 100.00 %
Utrecht Five 4 U Nederland B.V. 100.00 %
Belgium Mechelen Five 4 U BVBA 100.00 %
CHANGES�IN�2016
The following companies were acquired by the ALSO Group in 2016 and were included in the scope of consolidation:
Country Domicile Company name Voting interest
Slovenia Ljubljana ALSO d.o.o. 100.00 %
Latvia Riga ALSO Cloud Latvia SIA 100.00 %
Switzerland Stans Bachmann Mobile Kommunikation AG 100.00 %

117
ALSO Annual Report 2017 FINANCIAL REPORT
2.6CONSOLIDATION METHOD
The consolidated financial statements are based on the financial statements of the individual Group companies, which are pre-pared using consistent accounting and measurement policies throughout the Group.
Assets and liabilities, as well as income and expenses, are included at their full amounts, and non-controlling interests in equity and net profit are shown separately.
All intragroup transactions (expenses, income, assets, and liabil-ities), as well as material unrealized gains from intragroup sales of assets which have not yet been sold to third parties, are eliminated.
2.7ACQUISITIONS
Acquisitions are accounted for using the acquisition method. If the consideration transferred for the acquisition of an entity exceeds the underlying fair value of the identifiable net assets that are acquired, the excess represents goodwill. For the purpose of impairment testing, goodwill acquired in a business combination is, from the acquisition date, allocated to the cash-generating units that are expected to benefit, or generate future cash flows, from the combination. The goodwill is recognized in the cash-gen-erating unit’s functional currency.
Acquisition costs are recognized as expense and reported as other operating expenses.
For each business combination, the acquirer measures the non-controlling interests in the acquired entity either at fair value or in proportion to the identifiable net assets of the acquired entity. Contingent liabilities that are acquired through the acquisition, and whose fair value can be reliably determined, are recognized in the acquisition balance sheet as liabilities at their fair value.
The results of the acquired companies are recognized from the date on which the Group obtains control. When an entity leaves the scope of the consolidation, the difference between the
consideration received and the net assets plus accumulated for-eign exchange differences at the date on which the Group loses control of the entity is recognized in the financial result.
If a business combination is achieved in stages, the acquirer’s previously held equity interest in the acquiree is remeasured to fair value at each acquisition date and a resulting gain or loss relating to the previously held equity interest is recognized through profit or loss.
If the Group undertakes a business combination with put options that are held by shareholders of non-controlling interests and does not thereby obtain ownership, the non-controlling interests continue to be allocated a share in the profits. At the end of each reporting period, the allocation is recognized as a financial liabil-ity as if the acquisition had taken place at this date. Any excess over the reclassified amount, and all changes in the present value of the financial liability, are recognized in retained earnings.
A change in the ownership interest in a subsidiary without loss of control is recognized as an equity transaction.
2.8INVESTMENTS IN ASSOCIATES
Entities over which ALSO has significant influence, but not con-trol, are accounted for by the equity method. ALSO is generally considered to have significant influence if it holds an interest of between 20 % and 50 % in an entity. Under the equity method, the investment is initially recognized at cost. In subsequent mea-surements, the carrying amount is increased by the share in prof-its of the entity and reduced by its share in losses and by dividend payments received from the entity. If the share in losses of the entity equal or exceed its carrying amount, ALSO ceases to rec-ognize its share in losses. Provisions are recognized for any fur-ther share in losses if ALSO has a legal or constructive obligation.
The book value of investments in associates consists of the share in net assets and goodwill.
At each reporting date, ALSO tests for objective indications of impairment. Any impairment loss is recognized through profit or loss.

118
ALSO Annual Report 2017 FINANCIAL REPORT
2.9TRANSLATION OF FOREIGN CURRENCY
Each entity of the Group determines its own functional currency. The functional currency of the Group companies is the normal currency of their local economic environment. Transactions in foreign currencies are translated into the respective functional currency at the spot rate that applies at the date of the transaction. All exchange gains and losses arising on transactions in foreign currencies, or on translation of monetary assets, are recognized in profit or loss.
Exchange gains on certain loans with equity-like nature are rec-ognized in other comprehensive income provided that repayment of the loan is not planned or intended in the near future. Such exchange gains are recognized in other comprehensive income and only reclassified to the financial result upon loss of control of the entity or repayment of the loan.
The annual financial statements of the foreign operations that have a functional currency different from the Group reporting currency are translated into the Group reporting currency (EUR) as follows:
statement of financial position at year-end rates; statement of comprehensive income at average annual
rates; statement of cash flows at average annual rates.
Exchange differences arising on the translation of financial state-ments of entities whose functional currency is not the euro are recognized in other comprehensive income and on eventual loss of control of the subsidiary are reclassified to the financial result.
EXCHANGE RATES (TO EURO)
Year-end rate Average rate
2017 2016 2017 2016
USA USD 1.1993 1.0541 1.1297 1.1069
Switzerland CHF 1.1702 1.0739 1.1117 1.0902
Norway NOK 9.8403 9.0863 9.3270 9.2906
Denmark DKK 7.4449 7.4344 7.4386 7.4452
Sweden SEK 9.8438 9.5525 9.6351 9.4689
Poland PLN 4.1770 4.4103 4.2570 4.3632
2.10TOTAL NET SALES
Total net sales comprise invoiced deliveries of goods and services and other sales-related revenue.
Revenue from goods deliveries is only recognized when it is prob-able that the economic benefits associated with the transaction will flow to ALSO and the amount can be reliably measured. The revenue is recognized when the goods are shipped, specifically when the risks and rewards are transferred to the purchaser.
Accruals for discounts and allowances granted to customers are recognized as a reduction in revenue at the time the related revenue is recognized or the incentives are granted. They are calculated on the basis of the specific terms of the individual agreements and the underlying revenues. Service revenue is rec-ognized in the statement of comprehensive income as soon as the service is rendered and it becomes probable that an economic benefit will flow to the Group.

119
ALSO Annual Report 2017 FINANCIAL REPORT
2.11PERSONNEL EXPENSES/EMPLOYEE BENEFIT PLANS
In addition to the actual remuneration for services rendered (wages, salaries, and bonuses), personnel expenses also include ancillary personnel costs and social security contributions. Awards for years of service are also recognized as personnel expenses over the underlying period of service and accrued accordingly.
The companies of the ALSO Group operate various employee ben-efit plans according to the local conditions and practices in the respective countries.
Defined contribution plans are post-employment plans under which the Group pays fixed contributions into a separate fund and is neither legally nor de facto obliged to pay further contributions.
For defined benefit pension plans, the costs of providing benefits as well as the required provisions are defined actuarily using the projected unit credit method. In the case of plans that provide higher benefit growth in later years (backloading), the benefits that can be acquired are assigned on the basis of the net liability excluding future employee-funded benefit components. The lia-bilities are backed with assets which are managed by autonomous separately funded benefit plans or with provisions for employee benefits which are recognized in the financial statements of the relevant entities.
A surplus in a defined benefit plan is only recognized to the amount of the future economic benefits that are available in the form of reductions in contributions or repayments, taking into account the upper limit for the asset (asset ceiling). A defined benefit obligation is fully recognized as a provision.
Pension costs are composed of three elements: Service costs, which are part of personnel expenses, and
consist of current service costs, past service costs, and gains/losses from plan settlements;
Net interest, which is recorded in the financial result, and is determined by applying the discount rate to the net defined benefit liability, or net defined benefit asset, that exists at the beginning of the year;
Gains and losses resulting from actuarial remeasurement, which are immediately recognized in other comprehensive income as remeasurements of employee benefits. Remea-surements of employee benefits are not recycled through the income statement at any later point in time.
2.12CAPITAL PARTICIPATION PLANS
Until February 8, 2011, the ALSO Group granted shares and options of ALSO Holding AG to then members of Group Management.
Under the terms of the share plan, the shares that were granted passed into the ownership of the beneficiaries with all associated rights, but subject to a vesting period of three years during which they may not be sold.
Under the terms of the option plan, the beneficiaries received on an annual basis option rights for the purchase of shares of ALSO Holding AG at a predetermined price. The options could only be exercised after a vesting period of three years. Payment in cash is not permitted.
The fair value of the option premiums from the capital participa-tion plan ( see Note 6.6) as determined according to the Hull-White model was charged to personnel expenses over the vesting period of three years.
2.13FINANCIAL ASSETS
Financial assets mainly comprise trade receivables, prepaid expenses, accrued income, and other receivables as well as finan-cial assets.
Financial assets are categorized as follows: Loans and receivables: Non-derivative financial assets with
fixed or determinable payments which are not quoted on an active market.
At fair value through profit or loss: Comprises financial assets acquired for short-term sale and derivatives. Certain other financial instruments can also be assigned to this cat-egory provided that the respective conditions are fulfilled.
All other financial assets are classified as financial assets available for sale.

120
ALSO Annual Report 2017 FINANCIAL REPORT
The classification of financial assets depends on the purpose for which the respective financial assets were acquired. Management determines the classification of financial assets at their initial rec-ognition and reassesses the classification at each reporting date. Financial assets other than financial assets recognized at fair value through profit or loss are initially recognized at fair value plus transaction costs. All purchases and sales are recognized on the trade date.
After their initial recognition, financial assets are measured depending on their category as follows:
Loans and receivables: At amortized cost using the effective interest method (equal distribution of cashflows during the term resulting in a zero difference of net present value).
At fair value through profit or loss: At fair value. If the fair value is not readily available, it must be calculated using a recognized valuation model. Any changes in fair value are recognized in the statement of comprehensive income under net financial result (financial income or financial ex-pense) or cost of goods sold for the respective reporting period.
Available for sale: At fair value. Any unrealized changes in value are recognized in other comprehensive income, except for interest that was calculated using the effective interest method, and exchange rate fluctuations on borrow-ing instruments. In the case of sale, impairment, or other disposal, the cumulative gains and losses that are recog-nized in equity are reclassified into the net financial result (financial income, financial expense) of the current report-ing period ( see Note 2.14).
At the reporting date, or whenever otherwise impairment is indi-cated, the carrying amounts of all financial assets that are not rec-ognized at fair value through profit or loss are tested for objective substantial indications (e.g. significant financial difficulties of the debtor, etc.) of impairment. Any impairment loss that arises due to a difference between the carrying amount and the fair value is recognized through profit or loss.
2.14HEDGE ACCOUNTING
To hedge its interest and currency risks that result from its oper-ating activities, financial transactions and investments, ALSO uses derivative financial instruments. The method used to recognize the resulting gain or loss on derivative financial instruments depends on whether the instrument is designed to hedge a spe-cific risk and whether the hedge qualifies for hedge accounting.
ALSO uses derivative financial instruments to hedge foreseen transactions or fixed obligations. If the derivative financial instru-ment that is used qualifies as a cash flow hedge when the contract is entered into, changes in value of the effective component of this derivative are recognized in other comprehensive income. The ineffective component is recognized in profit or loss. At the date of initial recognition of the hedged asset or liability, or expense or income, the changes in value that were recognized in other com-prehensive income are included in the respective hedged item.
The purpose of hedge accounting is to offset the changes in the hedged item and the hedging instrument in the statement of com-prehensive income. To qualify as hedge accounting, the hedging relationship must meet the requirements regarding documenta-tion, probability, effectiveness, and reliability of measurement. Both at hedge inception and throughout the lifetime of the hedge, ALSO therefore documents its assessment of whether the hedge is highly effective in offsetting the risks of changes in fair values or cash flows resulting from changes in fair value of the hedging instrument.
Especially forward contracts that provide effective hedging eco-nomically, and in keeping with the Group strategy, do not qualify for hedge accounting. Depending on the economic background, changes in the market values of these derivative financial instru-ments are recognized in the statement of comprehensive income either in the gross margin (currency hedging) or the financial result (interest rate hedging).
2.15CASH AND CASH EQUIVALENTS
In addition to cash on hand and current account balances, cash equivalents also include time deposits with an original term of up to three months.
2.16TRADE RECEIVABLES
Trade receivables are recognized at face value less provision for impairment, when there are indications that the customer will not be able to meet its payment obligations (insolvency, etc.). Default rates based on historical experience are offset against the con-tractually foreseen payment streams.

121
ALSO Annual Report 2017 FINANCIAL REPORT
The impairment of trade receivables takes place indirectly through a separate impairment account. The impairment charged to the statement of comprehensive income in the reporting period is reported under other operating expenses. Should a trade receivable no longer be collectable, the receivable, along with any impairment that has already been charged, is derecognized. Should a payment subsequently be received, it is credited to other operating income.
2.17INVENTORIES
Inventories are recognized at the lower of purchase cost and net realizable value. The purchase costs contain all purchase and overhead costs incurred in bringing each product to its present location and condition. The inventories are valued using the weighted-average purchase price method. Value adjustments are made for slow-moving inventories or inventories with purchase cost higher than market value. Unsaleable inventories are written off in full.
2.18PROPERTY, PLANT AND EQUIPMENT
Property, plant and equipment is valued at acquisition cost minus economically necessary depreciation. Borrowing costs of quali-fied assets (which means project duration greater than 12 months) are additionally capitalized. Maintenance and repair costs with no added value are not capitalized. Significant investments are broken down into their constituent parts if the estimated useful lives of the separate components differ.
Depreciation is calculated using the straight-line method over the estimated useful life of the asset. Impairments are recognized under depreciation and shown separately in the assets analysis. The depreciation method as well as the estimated residual values and useful lives are reviewed annually.
Land Not depreciated Buildings Useful life 25 years Equipment Useful life 2 – 15 years Other property,
plant and equipment Useful life 4 – 10 years
2.19FINANCE LEASES
Leasing agreements that transfer to ALSO substantially all of the risks and benefits that are associated with ownership of the leased item are classified as finance leases. Equipment that is financed by leasing agreements is capitalized in the statement of financial position at the lower of market value or the net present value of the future lease payments. Non-current assets arising from finance leases are depreciated over their estimated useful life or the period of the agreement if shorter. Outstanding liabilities aris-ing from finance leases are recognized as current and non-current financial liabilities.
Leases that do not transfer essentially all of the risks and benefits associated with ownership of the leased asset are classified as operating leases and the payments are recognized in the state-ment of comprehensive income.
2.20INTANGIBLE ASSETS
Intangible assets comprise goodwill and internally created soft-ware, as well as licenses, patents and similar rights, customer lists, brand names, and software, that are acquired from third parties. The amortization of all intangible assets with finite useful lives is calculated by the straight-line method over the expected useful life. Impairment losses are recognized under amortization and disclosed separately in the assets analysis.
Goodwill is not normally amortized but tests for impairment are performed annually as well as whenever there is an indication that the goodwill may be impaired.
Material borrowing costs relating to qualifying assets (project duration greater than 12 months) are additionally capitalized.
With the exception of goodwill, no intangible assets with indefi-nite useful lives are capitalized.
Software Useful life 3 – 7 years Customer lists Useful life 3 – 5 years Other intangible assets Useful life 3 years
122
ALSO Annual Report 2017 FINANCIAL REPORT
2.21IMPAIRMENT
Goodwill is tested for impairment each year ( see Note 5.7). Impairment is determined by assessing the recoverable amount of the cash-generating unit (CGU or group of CGUs) to which the goodwill relates. The recoverable amount of an asset or CGU is the higher of its fair value less costs of disposal and its value in use. To determine the value in use, the cash flows for the next three years are estimated based on detailed budgets; beyond that period, a long-term growth rate is determined to forecast the future cash flows. The cash flows are then discounted at an appro-priate discount rate. If the recoverable amount of the CGU is less than its carrying amount, an impairment loss is recognized. An impairment loss that is recognized against goodwill cannot be reversed in subsequent reporting periods.
Other non-current assets are tested for impairment whenever events or changed circumstances indicate a potential impairment. If there are indications of impairment, the recoverable amount of the asset is calculated. The recoverable amount of the non-current asset or CGU is the higher of its fair value less costs of disposal and its value in use. If the carrying amount exceeds the recover-able amount, the asset is written down to that amount. This spe-cial write-down (impairment) is reported separately in the assets analysis. An impairment reversal is possible if, at a later date, an impairment test shows that the loss in value no longer exists.
2.22FACTORING
The ALSO Group has sold or assigned some of its trade receiv-ables to finance companies (factors). The receivables are only derecognized when substantially all of the risks contained in the receivables have been transferred to the purchaser of the receiv-ables. Based on current legal agreements relating to factoring, all or significant portions of the customer default risk are transferred to the receivables purchaser. The interest risk remains with the ALSO Group until the date at which the receivables are received by the purchaser of the receivables or until the contractually agreed latest date. Securitization reserves are reported under other receivables.
Remaining bad debt, interest, and currency risks are recognized as continuing involvement in trade accounts receivable. This con-tinuing involvement is offset by a corresponding liability, which also takes into account the risk of its utilization.
Payment of the purchase price by the factoring company takes place either when the payment is received by the factoring com-pany or with interest at the request of ALSO. The still outstanding part of the purchase price receivable is reported under other receivables.
Interest expense and administration fees resulting from the sale of receivables are recognized in the financial result.
2.23FINANCIAL LIABILITIES
Financial liabilities particularly include trade payables, liabilities to banks, other liabilities, liabilities from finance leases, and deriv-ative financial liabilities.
Financial liabilities are separated into two categories. They are classified either as “at fair value through profit or loss”, or as “other financial liabilities”:
At fair value through profit or loss: At their initial recogni-tion and subsequently, these financial liabilities are mea-sured at fair value. The transaction costs directly identi-fiable to the purchase of these liabilities are expensed. Derivatives with a negative replacement value are by defi-nition assigned to this category.
Other financial liabilities: Other financial liabilities mainly comprise financial debts. Financial liabilities are measured at amortized cost using the effective interest method. In addition to actual interest payments, interest expense also includes annual compound interest and pro rata transaction costs.
Financial guarantees and pledges are reported as contingent lia-bilities and only recognized as provisions when a cash outflow becomes probable.

123
ALSO Annual Report 2017 FINANCIAL REPORT
2.24PROVISIONS
Provisions are liabilities of uncertain timing or amount. They are recognized if the ALSO Group has a legal or de facto present obli-gation from a past event, which will lead to a probable outflow of resources, and a reliable estimate can be made of the amount of the obligation.
Warranties in respect of products supplied or services rendered by ALSO give rise to legal or de facto obligations. Provisions for warranty-related costs are recognized at the date when the respec-tive product is sold or service rendered. The amount of the neces-sary provision is based on historical experience and expected probabilities of future occurrence. The resulting expenses are normally limited to logistical processes for returning the defective products to the vendor. The cost of repair or replacement is borne by the vendor.
Restructuring provisions are only recognized when a detailed restructuring plan is available and its main features have been announced to all those affected by it.
If the effect of the time-value of money is material, non-current provisions are discounted.
2.25TAXES
Taxes on income are accrued in the same periods as the reve-nue and expenses to which they relate, and are reported as tax liabilities. Deferred taxes include the income tax effects of tem-porary differences between the Group’s internal measurement criteria and the local tax measurement guidelines for assets and liabilities (comprehensive liability method). With this method, deferred taxes are created for temporary taxable differences. Deferred taxes are adjusted annually for any changes in local tax legislation. Tax-loss carry-forwards and deductible temporary differences are reported as deferred tax assets if it is sufficiently probable that future taxable profits will be adequate to utilize the respective deferred tax assets ( see Note 4.6).
Taxes that would have to be paid in the event of a payout of retained earnings in the subsidiaries are not accrued unless this type of payout is expected to be made in the near future.
2.26EQUITY
Equity is composed of share capital, capital reserves, treasury shares, cash flow hedge reserves, exchange differences, remea-surement of defined benefit plans, retained earnings, and non-controlling interests.
The share capital represents the nominal capital of ALSO Holding AG. The capital reserves consist of all contributions to sharehold-ers’ equity received from outside the company other than share capital. Gains or losses resulting from the sale of treasury shares are also recognized in the capital reserves. The cash flow hedge reserve contains changes in the fair value of cash flow hedges. Under remeasurement of defined benefit plans, all actuarial gains and losses on the measurement of defined benefit plans are rec-ognized. Under exchange differences, all exchange differences are recognized that result from translation of the financial state-ments of those Group companies whose functional currency is not the same as the reporting currency. Retained earnings com-prise the gains/losses resulting from the decisions of the consol-idated entities regarding the application of earnings that are car-ried forward to the new account.
The share capital and the capital reserves are translated at histor-ical exchange rates, dividends and other distributions at transac-tional exchange rates.
Dividends and other distributions to shareholders are charged to equity in the period in which they are declared.
3.BUSINESS COMBINATIONS
ACQUISITION�OF�BEIP�S.A.S
On January 6, 2017, the ALSO Group acquired 51 % of the voting shares in BeIP S.A.S BeIP S.A.S, an unlisted company with regis-tered office in Paris, France, offers a wide portfolio of IT technol-ogies and related support services, mainly in the areas of network and security infrastructure. The objective of the acquisition is to strengthen the market position of ALSO in France.

124
ALSO Annual Report 2017 FINANCIAL REPORT
Under the purchase agreement, ALSO has the option to purchase, and the counterparty the option to sell, the remaining 49 % of the voting shares. ALSO has decided to recognize the non-controlling interests in the acquired company at their proportionate share of the fair value of net identifiable assets.
The consideration transferred for 51 % of the voting shares was TEUR 1 531. An additional contingent consideration (earn-out) was agreed, which is due as of 2018. The estimated amount of that contingent consideration at the date of acquisition was TEUR 1 459 and depends on the future operating results of the company.
In the purchase price allocation, a fair value of the net assets of TEUR 232 was identified. The value of the non-controlling inter-ests is TEUR 223. Goodwill of TEUR 2 758 was recognized. The goodwill mainly reflects the expected synergy effects from access-ing vertical markets. Cash for the amount of TEUR 306 was acquired. The fair value of trade receivables amounts to TEUR 632 and consists of gross contractual amounts of TEUR 914 and a pro-vision for bad debts in the amount of TEUR 282. No contingent liabilities were recognized. The goodwill is not tax-deductible.
Since information is still outstanding, the purchase price alloca-tion that was performed on January 6, 2017 and revised at the reporting date is provisional.
For the remaining 49 % of the voting shares, the parties have signed call and put options. Non-controlling interests for BeIP S.A.S were not reported, but the present value of the put option is recognized as a liability in the statement of financial position.
Since the date of acquisition, BeIP S.A.S has contributed TEUR 21 378 to the net sales and TEUR –66 to the net profit of ALSO.
As at December 31, 2017, TEUR 1 531 of the purchase price of TEUR 2 990 had been paid out.
ACQUISITION OF INTERNET SMARTSEC OY
On February 2, 2017, the ALSO Group acquired 100 % of the voting shares in Internet Smartsec Oy, an unlisted company with regis-tered office in Helsinki, Finland, that offers high-standard security and network products and provides consultation and training in data security and data networks. The objective of the acquisition is to strengthen the market position of ALSO in Finland.
The consideration transferred for 100 % of the voting shares was TEUR 685. In the purchase price allocation, a fair value of the net assets of TEUR 351 was identified. Goodwill of TEUR 334 was recognized. The goodwill mainly reflects the expected synergy effects from to expanding the Solution and Service business. Cash for the amount of TEUR 4 was acquired. The fair value of trade receivables amounts to TEUR 933. No contingent liabilities were recognized. The goodwill is not tax-deductible.
Since information is still outstanding, the purchase price alloca-tion that was performed on February 2, 2017 and revised at the reporting date is provisional.
Since the date of acquisition, Internet Smartsec Oy has contrib-uted TEUR 5 753 to the net sales and TEUR 86 to the net profit of ALSO.
At December 31, 2017, the purchase price of TEUR 685 had been fully paid out.
ACQUISITION�OF�FIVE�4�U�B.V.
On July 6, 2017, the ALSO Group acquired 100 % of the voting shares in Five 4 U Group (consisting of Five 4 U B.V., All 4 U B.V., Esseko B.V. and Five 4 U BVBA). Five 4 U, an unlisted company with registered office in Utrecht, the Netherlands, and Mechelen, Belgium, is one of the leading specialized distributors for hard-ware and software in the Benelux with Apple products and with graphic arts expertise. The objective of the acquisition is to open up new customer groups in the Netherlands and Belgium and to expand the product portfolio, foremost in the area of graphics.
The consideration transferred for 100 % of the voting shares was TEUR 10 374. An additional contingent consideration (earn-out) was agreed, which is due as of 2018. The estimated amount of that contingent consideration at the date of acquisition was TEUR 2 500 and set-off with liabilities towards the seller of Five 4 U. The amount of that contingent consideration depends on the future operating results of the company.
In the purchase price allocation, a fair value of the net assets of TEUR 10 080 was identified. Goodwill of TEUR 294 was recog-nized. The goodwill mainly reflects the expected synergy effects from opening up new customer groups in the Netherlands and Belgium. Cash for the amount of TEUR 1 227 was acquired. The fair value of trade receivables amounts to TEUR 44 944 and

125
ALSO Annual Report 2017 FINANCIAL REPORT
consists of gross contractual amounts of TEUR 45 013 and a pro-vision for bad debts in the amount of TEUR 69. No contingent liabilities were recognized. The goodwill is not tax-deductible.
Since information is still outstanding, the purchase price alloca-tion that was performed on July 6, 2017 and revised at the report-ing date is provisional.
Since the date of acquisition, Five 4 U has contributed TEUR 141 181 to the net sales and TEUR 53 to the net profit of ALSO.
As at December 31, 2017, TEUR 8 700 of the purchase price of TEUR 10 374 had been paid out.
OTHER ACQUISITIONS
In 2017, ALSO acquired some assets and liabilities of companies that are active in the printing area and in pre-installation and re-cycling services. In one of these acquisition the net assets acquired exceeded the agreed purchase price by TEUR 398. This negative goodwill was recognized in 2017 in the statement of comprehensive income as financial income and represented a reduction in the purchase price for the amount of operative cost savings for the seller.
Furthermore, ALSO acquired remaining voting shares in ALSO Polska sp. z o.o. for the amount of TEUR 2 763.
CONSEQUENCES OF THE ACQUISITIONS
If the acquisitions had taken place at the beginning of the year, the net sales of ALSO for the period would have been TEUR 8 996 071 and the net profit TEUR 92 357.

126
ALSO Annual Report 2017 FINANCIAL REPORT
ASSETS AND LIABILITIES FROM BUSINESS COMBINATIONS
Fair values at the date of acquisition
eur 1 000 BeIP S.A.S *Internet
Smartsec Oy * Five 4 U *Other
acquisitions * Total
current assets
Cash and cash equivalents 306 4 1 227 – 1 537
Trade receivables 632 933 44 944 – 46 509
Inventories 1 892 607 14 505 – 17 004
Prepaid expenses, accrued income and other receivables 1 701 302 2 373 – 4 376
total current assets 4 531 1 846 63 049 – 69 426
non-current assets
Property, plant and equipment 112 27 129 178 446
Intangible assets 387 119 1 145 643 2 294
Financial assets 24 – 296 – 320
Deferred tax assets 23 46 1 448 – 1 517
total non-current assets 546 192 3 018 821 4 577
total assets 5 077 2 038 66 067 821 74 003
current liabilities
Financial liabilities 18 453 38 189 – 38 660
Trade payables 2 667 818 12 244 – 15 729
Accrued expenses, deferred income and other payables 1 120 162 487 – 1 769
Tax liabilities 5 – 2 227 – 2 232
Provisions 40 – – – 40
total current liabilities 3 850 1 433 53 147 – 58 430
non-current liabilities
Financial liabilities 651 – 2 840 – 3 491
Provisions 20 230 – – 250
Deferred tax liabilities 101 24 – 99 224
total non-current liabilities 772 254 2 840 99 3 965
total liabilities 4 622 1 687 55 987 99 62 395
Total net assets 232 351 10 080 722 11 385
Goodwill 2 758 334 294 31 3 417
Negative goodwill – 398 – 398
consideration transferred 2 990 685 10 374 355 14 404
analysis of cash flows from the acquisitions
Cash acquired 306 4 1 227 – 1 537
Cash paid – 1 531 – 685 – 8 700 – 355 – 11 271
net cash outflow – 1 225 – 681 – 7 473 – 355 – 9 734
* Provisional amounts

127
ALSO Annual Report 2017 FINANCIAL REPORT
BUSINESS�COMBINATIONS�2016
ACQUISITION OF BACHMANN MOBILE KOMMUNIKATION
AG
On August 1, 2016, the ALSO Group acquired 70 % of the voting shares in Bachmann Mobile Kommunikation AG and thus increased its voting share from the previous 30% to 100%. Bachmann Mobile Kommunikation AG, with registered office in Stans, Switzerland, is a leading provider of repair and logistics services in the consumer electronics and mobile communications after-sales service market. The objective of the acquisition is to enhance high-margin range of products and services through end-to-end solutions.
Up until August 1, 2016, the investment in Bachmann Mobile Kommunikation AG was accounted for using the equity method. As a result of the acquisition of the remaining 70% of the voting shares, the carrying amount of the previous 30% of the voting shares of TEUR 1 287 was remeasured. The difference of TEUR 1 471 from the fair value of TEUR 2 758 is recognized in 2016 under financial income.
The provisional purchase price allocation as at December 31, 2016 was completed in 2017. There was no change in the measurement of the acquired assets.
ACQUISITION OF NON-CONTROLLING INTEREST IN
MEDIUM GMBH
On June 8, 2016, ALSO acquired the remaining 20 % of the share capital of MEDIUM GmbH. The transaction resulted in 2016 in income of TEUR 153. Additionally TEUR 622 was reclassified from non-controlling interests to retained earnings.
EARN-OUT NRS
In 2016 earn-out in the amount of TEUR 1 348 was paid for NRS that was acquired in 2012. This purchase price had already been taken into account in the purchase price allocation as of December 31, 2012.
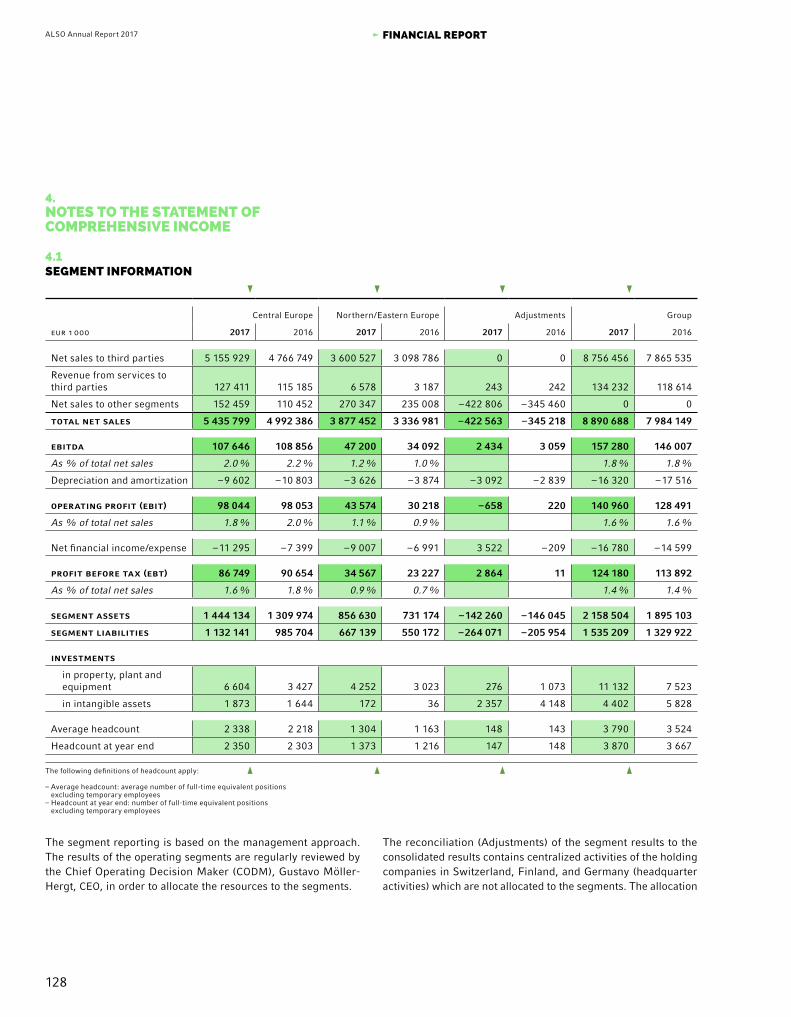
128
ALSO Annual Report 2017 FINANCIAL REPORT
4.NOTES TO THE STATEMENT OF COMPREHENSIVE INCOME
4.1SEGMENT INFORMATION
Central Europe Northern/Eastern Europe Adjustments Group
eur 1 000 2017 2016 2017 2016 2017 2016 2017 2016
Net sales to third parties 5 155 929 4 766 749 3 600 527 3 098 786 0 0 8 756 456 7 865 535
Revenue from services to third parties 127 411 115 185 6 578 3 187 243 242 134 232 118 614
Net sales to other segments 152 459 110 452 270 347 235 008 – 422 806 – 345 460 0 0
total net sales 5 435 799 4 992 386 3 877 452 3 336 981 – 422 563 – 345 218 8 890 688 7 984 149
ebitda 107 646 108 856 47 200 34 092 2 434 3 059 157 280 146 007
As % of total net sales 2.0 % 2.2 % 1.2 % 1.0 % 1.8 % 1.8 %
Depreciation and amortization – 9 602 – 10 803 – 3 626 – 3 874 – 3 092 – 2 839 – 16 320 – 17 516
operating profit (ebit) 98 044 98 053 43 574 30 218 – 658 220 140 960 128 491
As % of total net sales 1.8 % 2.0 % 1.1 % 0.9 % 1.6 % 1.6 %
Net financial income/expense – 11 295 – 7 399 – 9 007 – 6 991 3 522 – 209 – 16 780 – 14 599
profit before tax (ebt) 86 749 90 654 34 567 23 227 2 864 11 124 180 113 892
As % of total net sales 1.6 % 1.8 % 0.9 % 0.7 % 1.4 % 1.4 %
segment assets 1 444 134 1 309 974 856 630 731 174 – 142 260 – 146 045 2 158 504 1 895 103
segment liabilities 1 132 141 985 704 667 139 550 172 – 264 071 – 205 954 1 535 209 1 329 922
investments
in property, plant and equipment 6 604 3 427 4 252 3 023 276 1 073 11 132 7 523
in intangible assets 1 873 1 644 172 36 2 357 4 148 4 402 5 828
Average headcount 2 338 2 218 1 304 1 163 148 143 3 790 3 524
Headcount at year end 2 350 2 303 1 373 1 216 147 148 3 870 3 667
The following definitions of headcount apply: – Average headcount: average number of full-time equivalent positions
excluding temporary employees– Headcount at year end: number of full-time equivalent positions
excluding temporary employees
The segment reporting is based on the management approach. The results of the operating segments are regularly reviewed by the Chief Operating Decision Maker (CODM), Gustavo Möller-Hergt, CEO, in order to allocate the resources to the segments.
The reconciliation (Adjustments) of the segment results to the consolidated results contains centralized activities of the holding companies in Switzerland, Finland, and Germany (headquarter activities) which are not allocated to the segments. The allocation

129
ALSO Annual Report 2017 FINANCIAL REPORT
of the net sales is determined by the place where invoicing occurs. Revenues, as well as assets and liabilities (mainly trade receiv-ables and payables), between the segments are eliminated in the “Adjustments” column. The assets and liabilities contain all bal-ance sheet items that are directly attributable to the segments.
Profit before tax (EBT) contains all income and expenses that are directly attributable to the respective operating segments. It also
includes direct allocations of centrally occurring expenses. EBT is the main performance indicator in the ALSO Group.
A reconciliation of the management reporting to the segment reporting is not required, since internal and external reporting are based on the same accounting principles.
DETAILS OF THE RECONCILIATION
eur 1 000 2017 2016
Costs for shareholders/mark-up for management fees/other centralized costs 2 434 3 059
total at ebitda level 2 434 3 059
Depreciation and amortization – 3 092 – 2 839
Net financial result 3 522 – 209
total at ebt level 2 864 11
The financial result in the “Adjustments” column in 2017 arose from the difference between external financing costs and internal loan conditions.
GEOGRAPHICAL INFORMATION
eur 1 000 Total net sales Non-current
assets *
switzerland
2017 918 354 62 741
2016 851 288 68 427
germany
2017 3 596 786 128 430
2016 3 312 469 130 439
netherlands
2017 1 170 709 6 065
2016 1 040 067 4 362
others
2017 3 204 839 52 133
2016 2 780 325 47 295
group
2017 8 890 688 249 369
2016 7 984 149 250 523
* Without deferred tax assets and financial assets
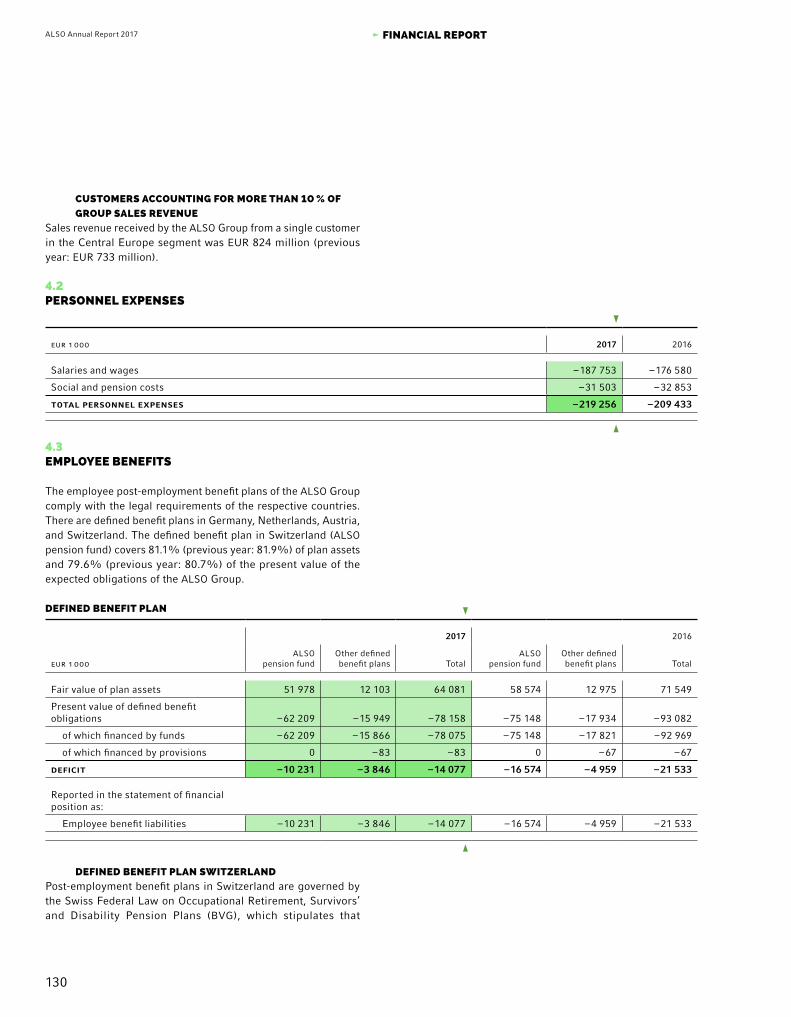
130
ALSO Annual Report 2017 FINANCIAL REPORT
CUSTOMERS�ACCOUNTING�FOR�MORE�THAN�10�%�OF�
GROUP SALES REVENUE
Sales revenue received by the ALSO Group from a single customer in the Central Europe segment was EUR 824 million (previous year: EUR 733 million).
4.2PERSONNEL EXPENSES
eur 1 000 2017 2016
Salaries and wages – 187 753 – 176 580
Social and pension costs – 31 503 – 32 853
total personnel expenses – 219 256 – 209 433
4.3EMPLOYEE BENEFITS
The employee post-employment benefit plans of the ALSO Group comply with the legal requirements of the respective countries. There are defined benefit plans in Germany, Netherlands, Austria, and Switzerland. The defined benefit plan in Switzerland (ALSO pension fund) covers 81.1% (previous year: 81.9%) of plan assets and 79.6% (previous year: 80.7%) of the present value of the expected obligations of the ALSO Group.
DEFINED BENEFIT PLAN
2017 2016
eur 1 000ALSO
pension fundOther defined benefit plans Total
ALSO pension fund
Other defined benefit plans Total
Fair value of plan assets 51 978 12 103 64 081 58 574 12 975 71 549
Present value of defined benefit obligations – 62 209 – 15 949 – 78 158 – 75 148 – 17 934 – 93 082
of which financed by funds – 62 209 – 15 866 – 78 075 – 75 148 – 17 821 – 92 969
of which financed by provisions 0 – 83 – 83 0 – 67 – 67
deficit – 10 231 – 3 846 – 14 077 – 16 574 – 4 959 – 21 533
Reported in the statement of financial position as:
Employee benefit liabilities – 10 231 – 3 846 – 14 077 – 16 574 – 4 959 – 21 533
DEFINED BENEFIT PLAN SWITZERLAND
Post-employment benefit plans in Switzerland are governed by the Swiss Federal Law on Occupational Retirement, Survivors’ and Disability Pension Plans (BVG), which stipulates that

131
ALSO Annual Report 2017 FINANCIAL REPORT
NET POST-EMPLOYMENT BENEFIT EXPENSES
FOR DEFINED BENEFIT PLANS
2017 2016
eur 1 000ALSO
pension fundOther defined benefit plans Total
ALSO pension fund
Other defined benefit plans Total
Current service cost – 3 458 – 817 – 4 275 – 3 821 – 655 – 4 476
Past service cost 6 547 8 6 555 1 645 51 1 696
Net interest employee benefit – 98 – 67 – 165 – 207 – 85 – 292
net post-employment benefit expenses 2 991 – 876 2 115 – 2 383 – 689 – 3 072
In 2017, the number of employees insured at the ALSO pension fund in accordance with the BVG was reduced significantly. Fur-thermore, the ALSO pension fund reduced its conversion rate. This resulted in negative past service cost of TEUR 6 547.
In 2016, the ALSO pension fund reduced its conversion rate. This resulted in negative past service cost of TEUR 1 645.
post-employment benefit plans must be managed by indepen-dent, legally autonomous bodies. Post-employment benefit plans are overseen by a regulator as well as by a state supervisory body. The ultimate governing body of a post-employment benefit plan (Board of Trustees) is composed of equal numbers of employee and employer representatives.
Plan participants are insured against the financial consequences of old age, disability, and death. The various benefits are defined in regulations, with the BVG specifying the minimum benefits that are to be provided. The employer and the employee pay contributions to the post-employment benefit plan. In case of an underfunding, various measures can be taken, such as adjusting the pension commitment by altering the conversion rates or increasing current contributions. Under certain conditions the employer is obliged to make additional restructuring contribu-tions. The BVG prescribes how the employees and the employer jointly fund any restructuring measures.
The Swiss post-employment benefit plan, the ALSO Pension Fund, has the legal form of a foundation. All actuarial risks are borne by the foundation. These risks consist of demographic risks
(primarily life expectancy) and financial risks (primarily the dis-count rate and the return on the plan assets), which are regularly assessed by the Board of Trustees. In addition, a report is pre-pared annually in accordance with IFRS requirements as well as an actuarial report prepared in accordance with the requirements of the BVG.
The Board of Trustees is responsible for the investment of the assets. It defines the investment strategy as often as necessary – especially in the case of significant market developments or changes to the structure of the plan participants – and at least once annually. When defining the investment strategy, the Board of Trustees takes account of the foundation’s objectives, benefit obligations, and risk capacity. The investment strategy is defined in the form of a long-term target asset structure (investment policy).
The Board of Trustees delegates implementation of the invest-ment strategy and management of the plan assets to an external asset manager. The Board of Trustees monitors compliance with the investment strategy and development of the plan assets sev-eral times a year.

132
ALSO Annual Report 2017 FINANCIAL REPORT
REMEASUREMENT OF DEFINED BENEFIT PLANS
2017 2016
eur 1 000ALSO
pension fundOther defined benefit plans Total
ALSO pension fund
Other defined benefit plans Total
Actuarial gains/losses:
Changes in demographic assumptions 0 562 562 5 430 434 5 864
Changes in financial assumptions – 3 581 878 – 2 703 – 1 402 – 1 785 – 3 187
Return on plan assets (excluding interest income) 3 598 – 414 3 184 2 663 720 3 383
Effect of change in asset ceiling 0 0 0 0 0 0
total remeasurement recognized in other comprehensive income 17 1 026 1 043 6 691 – 631 6 060
CHANGE IN FAIR VALUE OF PLAN ASSETS
2017 2016
eur 1 000ALSO
pension fundOther defined benefit plans Total
ALSO pension fund
Other defined benefit plans Total
january 1 58 574 12 975 71 549 53 609 8 054 61 663
Effect of acquisitions 0 0 0 0 2 327 2 327
Interest income 396 147 543 540 160 700
Return on plan assets (excluding interest income) 3 598 – 414 3 184 2 663 720 3 383
Employee contributions 1 635 336 1 971 1 465 180 1 645
Employer contributions 2 233 812 3 045 1 989 699 2 688
Net benefits (paid) received – 9 730 – 1 145 – 10 875 – 2 236 734 – 1 502
Exchange differences – 4 728 – 608 – 5 336 544 101 645
december 31 51 978 12 103 64 081 58 574 12 975 71 549
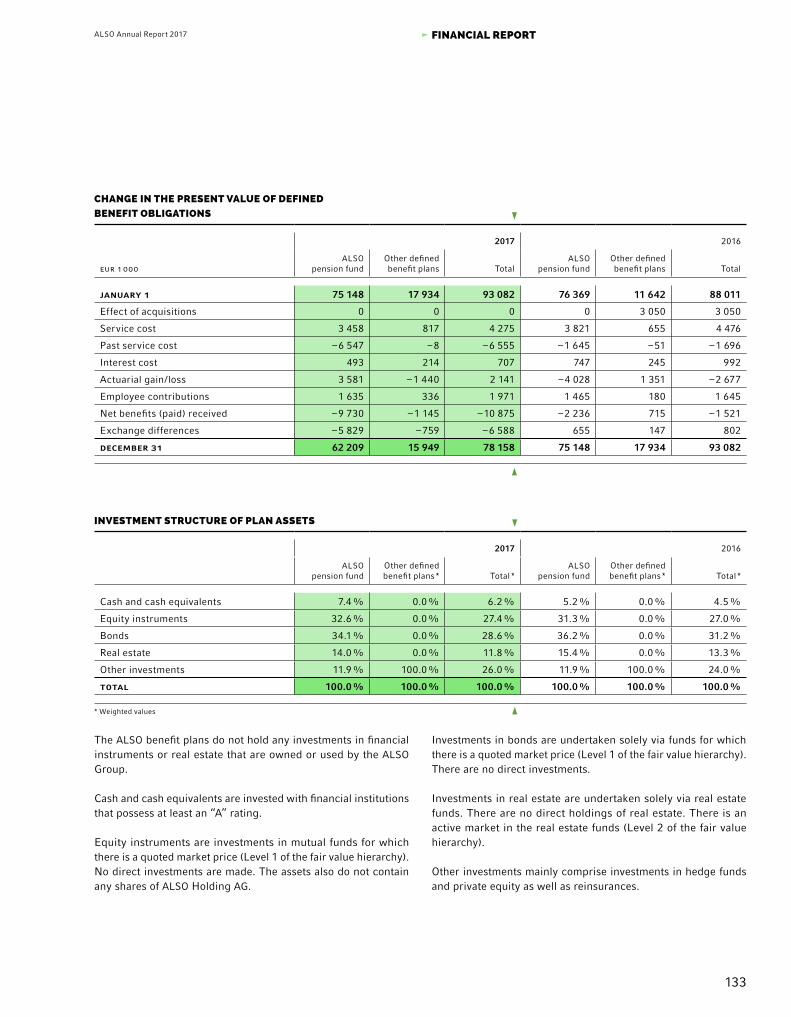
133
ALSO Annual Report 2017 FINANCIAL REPORT
CHANGE IN THE PRESENT VALUE OF DEFINED
BENEFIT OBLIGATIONS
2017 2016
eur 1 000ALSO
pension fundOther defined benefit plans Total
ALSO pension fund
Other defined benefit plans Total
january 1 75 148 17 934 93 082 76 369 11 642 88 011
Effect of acquisitions 0 0 0 0 3 050 3 050
Service cost 3 458 817 4 275 3 821 655 4 476
Past service cost – 6 547 – 8 – 6 555 – 1 645 – 51 – 1 696
Interest cost 493 214 707 747 245 992
Actuarial gain/loss 3 581 – 1 440 2 141 – 4 028 1 351 – 2 677
Employee contributions 1 635 336 1 971 1 465 180 1 645
Net benefits (paid) received – 9 730 – 1 145 – 10 875 – 2 236 715 – 1 521
Exchange differences – 5 829 – 759 – 6 588 655 147 802
december 31 62 209 15 949 78 158 75 148 17 934 93 082
INVESTMENT STRUCTURE OF PLAN ASSETS
2017 2016
ALSO pension fund
Other defined benefit plans * Total *
ALSO pension fund
Other defined benefit plans * Total *
Cash and cash equivalents 7.4 % 0.0 % 6.2 % 5.2 % 0.0 % 4.5 %
Equity instruments 32.6 % 0.0 % 27.4 % 31.3 % 0.0 % 27.0 %
Bonds 34.1 % 0.0 % 28.6 % 36.2 % 0.0 % 31.2 %
Real estate 14.0 % 0.0 % 11.8 % 15.4 % 0.0 % 13.3 %
Other investments 11.9 % 100.0 % 26.0 % 11.9 % 100.0 % 24.0 %
total 100.0 % 100.0 % 100.0 % 100.0 % 100.0 % 100.0 %
* Weighted values
The ALSO benefit plans do not hold any investments in financial instruments or real estate that are owned or used by the ALSO Group.
Cash and cash equivalents are invested with financial institutions that possess at least an “A” rating.
Equity instruments are investments in mutual funds for which there is a quoted market price (Level 1 of the fair value hierarchy). No direct investments are made. The assets also do not contain any shares of ALSO Holding AG.
Investments in bonds are undertaken solely via funds for which there is a quoted market price (Level 1 of the fair value hierarchy). There are no direct investments.
Investments in real estate are undertaken solely via real estate funds. There are no direct holdings of real estate. There is an active market in the real estate funds (Level 2 of the fair value hierarchy).
Other investments mainly comprise investments in hedge funds and private equity as well as reinsurances.

134
ALSO Annual Report 2017 FINANCIAL REPORT
MAIN ACTUARIAL ASSUMPTIONS
2017 2016
ALSO pension fund
Other defined benefit plans * Total *
ALSO pension fund
Other defined benefit plans * Total *
Discount rate 0.8 % 1.3 % 0.9 % 0.7 % 1.0 % 0.7 %
Future salary increases 1.0 % 0.6 % 0.9 % 1.0 % 0.7 % 0.9 %
Future pension increases 0.0 % 0.4 % 0.1 % 0.0 % 0.3 % 0.1 %
Mortality table BVG 2015 n/a BVG 2015 BVG 2015 n/a BVG 2015
* Weighted values
The present value of the defined benefit obligation (DBO) is deter-mined annually by independent actuaries using the projected unit credit method. Actuarial assumptions are required for this purpose.
SENSITIVITIES OF THE MAIN ACTUARIAL ASSUMPTIONS
The main actuarial assumptions were identified to be the discount rate and the future development of salaries and wages. The fol-lowing effects on the DBO can be expected:
An increase/decrease of 0.25 percentage points in the dis-count rate would result in a decrease/increase in the DBO of 5% respectively.
An increase/decrease of 0.25 percentage points in the ex-pected development of salaries and wages would result in an increase/decrease in the DBO of 1% respectively.
The sensitivity analysis is based on realistically possible changes as of the end of the reporting year. Each change in a significant actuarial assumption was analyzed separately as part of the test. Interdependencies were not taken into account.
NET PENSION COST FOR DEFINED CONTRIBUTION PLANS
eur 1 000 2017 2016
Employer contributions 2 019 1 503

135
ALSO Annual Report 2017 FINANCIAL REPORT
4.4OTHER OPERATING EXPENSES/INCOME
OTHER OPERATING EXPENSES
eur 1 000 2017 2016
Leasing expenses – 21 023 – 20 156
Maintenance and repair expenses – 15 257 – 15 395
Marketing and administrative expenses – 101 790 – 98 269
Insurance, consulting and other operating expenses – 45 809 – 39 228
total other operating expenses – 183 879 – 173 048
OTHER OPERATING INCOME
eur 1 000 2017 2016
Gains on sales of property, plant and equipment 27 22
Other operating income 16 040 22 478
total other operating income 16 067 22 500
Other operating income mainly comprises contributions from suppliers, insurance payments, and company-produced assets.
4.5NET FINANCIAL INCOME/EXPENSE
FINANCIAL INCOME
eur 1 000 2017 2016
Interest income 400 549
Exchange gains, net 0 18
Fair value adjustments of contingent considerations (Note 6.2) 838 239
Negative goodwill from acquisitions 398 0
Other financial income 289 1 747
total financial income 1 925 2 553
Concerning negative goodwill in 2017 and other financial income in 2016, please refer to Note 3.

136
ALSO Annual Report 2017 FINANCIAL REPORT
FINANCIAL EXPENSES
eur 1 000 2017 2016
Interest expenses – 14 866 – 12 198
Factoring fees – 2 956 – 2 766
Net interest employee benefits – 165 – 292
Exchange losses, net – 11 0
Other financial expenses – 707 – 2 341
total financial expenses – 18 705 – 17 597
financial result – 16 780 – 15 044
EXCHANGE DIFFERENCES
eur 1 000 2017 2016
Exchange differences recognized in financial result – 11 18
Exchange differences recognized in gross margin 9 968 1 354
total exchange differences 9 957 1 372
4.6INCOME TAXES
The main elements contributing to the difference between the expected tax rate for the Group and the effective tax rate are:
INCOME TAX EXPENSES
eur 1 000 2017 2016
Income taxes in the reporting period – 30 364 – 30 955
Income taxes in prior periods – 646 – 83
total current income tax – 31 010 – 31 038
Reduction in deferred tax rate – 11 – 108
Changes in temporary differences – 632 441
total deferred tax – 643 333
total income tax expense – 31 653 – 30 705

137
ALSO Annual Report 2017 FINANCIAL REPORT
ANALYSIS OF TAX EXPENSE
eur 1 000 2017 2016
profit before tax (ebt) 124 180 113 892
Expected tax rate (weighted) 25.8 % 25.9 %
Expected income tax expense – 31 997 – 29 495
Utilization of previously unrecognized tax losses 2 672 2 366
Income tax losses not recognized – 1 340 – 1 397
Income not subject to tax 538 887
Non-deductible expenses – 2 356 – 2 797
Reduction in deferred tax rate – 11 – 108
Tax effect from prior periods 15 55
Withholding tax on Group dividends 788 – 150
Other factors 38 – 66
effective income tax expense – 31 653 – 30 705
Effective income tax rate 25.5 % 27.0 %
The weighted tax rate is calculated from the income tax rates that are expected to apply for the Group companies in the respective tax jurisdictions. The decrease in the effective tax rate from 27.0% in 2016 to 25.5% in 2017 is primarily due to a retroactive change in the treatment of withholding tax on dividends in France and a reduction of non-deductible expenses.
In 2017, in the tax jurisdictions that are relevant for ALSO, there were no material changes in the applicable income tax rates.
TAX EFFECTS IN OTHER COMPREHENSIVE INCOME
eur 1 000 2017 2016
Tax effects on items that will not subsequently be reclassified to profit or loss
Remeasurement of defined benefit plans – 148 – 733
subtotal – 148 – 733
Tax effects on items that may subsequently be reclassified to profit or loss
Foreign currency adjustments on loans at foreign subsidiaries – 172 – 1
Fair value adjustment on cash flow hedges – 67 – 147
subtotal – 239 – 148
total tax effects in other comprehensive income – 387 – 881

138
ALSO Annual Report 2017 FINANCIAL REPORT
DEFERRED TAXES
Statement of financial position Recognized in income taxes
Deferred tax assets Deferred tax liabilities
eur 1 000 2017 2016 2017 2016 2017 2016
Temporary differences
Current assets 543 633 3 893 4 047 – 31 – 453
Property, plant and equipment 152 223 2 789 3 273 298 316
Intangible assets 882 1 137 1 848 1 915 –291 54
Recognized tax loss carry-forwards 3 677 4 057 0 0 – 213 844
Provisions and employee benefits 3 308 3 923 493 506 – 373 38
Liabilities 3 916 2 166 1 515 964 160 – 466
Other temporary differences 0 0 185 0 – 193 0
total 12 478 12 139 10 723 10 705 – 643 333
Offsetting – 4 086 – 4 149 – 4 086 – 4 149 0 0
total deferred taxes 8 392 7 990 6 637 6 556 – 643 333
CHANGES IN DEFERRED TAXES (NET)
eur 1 000 2017 2016
january 1 1 434 1 834
Effect of acquisitions 1 293 47
Changes in temporary differences – 1 030 – 548
Exchange differences 58 101
december 31 1 755 1 434
TAX LOSS CARRY-FORWARDS
eur 1 000 2017 2016
total tax loss carry-forwards 85 619 99 690
Of which recognized as deferred tax assets – 14 624 – 17 522
total tax loss carry-forwards not recognized 70 995 82 168
Tax effect on unrecognized tax loss carry-forwards 15 613 17 931
Total unrecognized tax loss carry-forwards expiring:
in two to five years (weighted tax rate 2017: 20.0 %; previous year: 19.7 %) 23 019 23 282
in six to ten years (weighted tax rate 2017: 20.9 %; previous year: 20.1 %) 14 696 19 426
No expiry (weighted tax rate 2017: 23.9 %; previous year: 23.9 %) 33 280 39 460

139
ALSO Annual Report 2017 FINANCIAL REPORT
Reduction of recognized tax loss carry-forwards from TEUR 17 522 in 2016 to TEUR 14 624 in 2017 is mainly due to utilization of tax loss carry-forwards in Sweden and Norway.
In 2017, ALSO capitalized a deferred tax asset for the amount of TEUR 1 455 in Germany. This was based on tax losses that had occurred between 2011 and 2016. ALSO regards it as sufficiently probable that in the future taxable profits will occur that are equal to the amount of the deferred tax asset.
In 2016, ALSO capitalized a deferred tax asset for the amount of TEUR 1 148 in Sweden. This was based on tax losses that had occurred before 2011. ALSO regards it as sufficiently probable that in the future taxable profits will occur that are equal to the amount of the deferred tax asset.
The loss carry-forwards existing at December 31, 2017 and 2016 derive mainly from Sweden, Finland, Germany, the Netherlands and Norway.
For tax loss carry-forwards in the amount of TEUR 70 995, no deferred tax assets are recognized since they cannot be offset against other Group profits and it is unlikely that the entities carrying the tax losses forward will have future taxable profits against which to offset the related tax benefit.
As at December 31, 2017, there were no deferred tax liabilities for retained earnings amounting to TEUR 9 814 (previous year: TEUR 37 072) in subsidiaries which are liable to tax in the event of a dividend payment. There are no plans for dividend payment in the foreseeable future from those retained earnings. Since 2017, dividend payments are no longer taxed in France.
5.NOTES TO THE CONSOLIDATED STATEMENT OF�FINANCIAL�POSITION�AS�AT�DECEMBER�31
5.1CASH AND CASH EQUIVALENTS
eur 1 000 2017 2016
Cash at bank and on hand 235 561 55 477
total cash and cash equivalents 235 561 55 477
5.2TRADE RECEIVABLES
eur 1 000 2017 2016
Trade receivables (gross) 527 939 583 057
Effect of acquisitions 46 860 3 962
Provision for bad debts – 4 086 – 3 511
total trade receivables 570 713 583 508

140
ALSO Annual Report 2017 FINANCIAL REPORT
eur 1 000 2017 2016
Trade receivables past due but not impaired
< 90 days 39 154 29 836
90 to 180 days 984 808
> 180 days to 1 year 733 611
> 1 year 136 120
total trade receivables past due but not impaired 41 007 31 375
At the reporting date, trade receivables past due but not impaired contain no indications that the customers will not meet their pay-ment obligations. As at the date of preparation of these consoli-dated financial statements, material portions of those receivables have been paid.
ALSO has sold or assigned trade receivables to independent fac-toring companies. Please refer to Note 6.8.
eur 1 000 2017 2016
status of bad debt provision as at january 1 3 511 2 298
Effect of acquisitions 351 183
Exchange differences 5 – 28
Creation 1 133 2 320
Release – 361 – 772
Utilization – 553 – 490
status of bad debt provision as at december 31 4 086 3 511
Trade receivables write-offs – 1 644 – 1 816
Income from payments for trade receivables previously written-off 244 275

141
ALSO Annual Report 2017 FINANCIAL REPORT
5.3INVENTORIES
eur 1 000 2017 2016
Inventories 846 123 745 716
Downpayments to suppliers 1 027 3 282
Inventory provision – 13 027 – 10 725
total inventories 834 123 738 273
For most inventories, there are limited-duration price-protection guarantees from the vendors/manufacturers. The ALSO companies usually purchase goods in local currency. A recognizable loss of value due to low inventory turnover, ageing, etc. is taken into account through inventory provisions.
In the reporting period, inventory for the amount of TEUR 8 283 064 (previous year: TEUR 7 421 048) was recognized as cost of goods sold in the consolidated statement of comprehensive income. This includes changes in inventory provisions totaling TEUR 1 935 recognized as expenses. In the previous year, TEUR 705 was recognized as income.
5.4PREPAID EXPENSES, ACCRUED INCOME AND OTHER RECEIVABLES
eur 1 000 2017 2016
Miscellaneous tax receivables 11 662 5 007
Receivables from factors 198 162 211 159
Other receivables 40 453 33 446
other receivables 250 277 249 612
Prepaid expenses and accrued income 7 595 8 206
total prepaid expenses, accrued income and other receivables 257 872 257 818
Receivables from factors ( see Note 6.8) consist of dilution reserves of TEUR 138 761 (previous year: TEUR 105 138) from ongoing sales of receivables and within the scope of credit lines callable claims of TEUR 59 401 (previous year: TEUR 106 021).
Other receivables consist mainly of receivables from vendors.

142
ALSO Annual Report 2017 FINANCIAL REPORT
5.5PROPERTY, PLANT AND EQUIPMENT
eur 1 000 Land and buildings EquipmentOther property, plant
and equipment Total
january 1, 2017 62 991 10 624 12 264 85 879
Additions 148 1 972 9 012 11 132
Effect of acquisitions 0 138 308 446
Disposals 0 – 17 – 328 – 345
Reclassifications 361 1 444 – 1 805 0
Depreciation – 2 320 – 2 868 – 4 764 – 9 952
Exchange differences – 2 332 – 193 – 466 – 2 991
december 31, 2017 58 848 11 100 14 221 84 169
overview as at december 31, 2017
Acquisition costs 74 191 34 318 36 648 145 157
Accumulated depreciation /impairment – 15 343 – 23 218 – 22 427 – 60 988
december 31, 2017 58 848 11 100 14 221 84 169
Of which finance leases 0 966 0 966
january 1, 2016 64 982 12 889 11 244 89 115
Additions 291 3 218 4 014 7 523
Effect of acquisitions 0 0 250 250
Disposals 0 – 15 – 180 – 195
Reclassifications – 2 – 681 683 0
Depreciation – 2 420 – 4 219 – 3 793 – 10 432
Exchange differences 140 – 568 46 – 382
31. dezember 2016 62 991 10 624 12 264 85 879
overview as at december 31, 2016
Acquisition costs 76 530 32 800 32 850 142 180
Accumulated depreciation/impairment – 13 539 – 22 176 – 20 586 – 56 301
december 31, 2016 62 991 10 624 12 264 85 879
Of which finance leases 0 1 456 0 1 456
Land and buildings comprises land and buildings used for oper-ational purposes.
In 2017, additions are mainly a result of investments in other prop-erty, plant and equipment and in “Infrastructure-as-a-Service”.
Losses from the sale of property, plant, and equipment are recog-nized in other operating expenses and amount to TEUR 37 (pre-vious year: TEUR 22 income).

143
ALSO Annual Report 2017 FINANCIAL REPORT
5.6INTANGIBLE ASSETS
eur 1 000 Goodwill Customer lists Other intangible assets Total
january 1, 2017 149 658 2 199 12 787 164 644
Additions 0 0 4 402 4 402
Effect of acquisitions 3 417 1 829 465 5 711
Disposals 0 0 – 49 – 49
Amortization 0 – 1 279 – 5 089 – 6 368
Exchange differences – 3 046 – 6 – 88 – 3140
december 31, 2017 150 029 2 743 12 428 165 200
overview as at december 31, 2017
Acquisition costs 150 029 4 850 35 895 190 774
Accumulated amortization/impairment 0 – 2 107 – 23 467 – 25 574
december 31, 2017 150 029 2 743 12 428 165 200
january 1, 2016 140 878 4 351 11 022 156 251
Additions 0 0 5 828 5 828
Effect of acquisitions 7 992 346 0 8 338
Disposals 0 0 0 0
Amortization 0 – 2 474 – 4 610 – 7 084
Exchange differences 788 – 24 547 1 311
december 31, 2016 149 658 2 199 12 787 164 644
overview as at december 31, 2016
Acquisition costs 149 658 5 917 34 059 189 634
Accumulated amortization/impairment 0 – 3 718 – 21 272 – 24 990
december 31, 2016 149 658 2 199 12 787 164 644
In 2017, goodwill was mainly increased by the acquisition of BeIP S.A.S.
With the exception of goodwill, no intangible assets with indefi-nite useful lives are capitalized. The average residual amortization period for the customer lists is two year. Other intangible assets consist mainly of software and licenses.
The carrying amount of the customer list that was identified in the merger of ALSO and Actebis in 2011 was amortized for the last time in January 2016.

144
ALSO Annual Report 2017 FINANCIAL REPORT
5.7IMPAIRMENT TEST
eur 1 000 2017 2016
Carrying amount goodwill Central Europe 133 576 133 018
Carrying amount goodwill Northern/Eastern Europe 16 453 16 640
total goodwill 150 029 149 658
Discount rate (post tax) goodwill Central Europe 6.0 % 6.1 %
Discount rate (post tax) goodwill Northern/Eastern Europe 6.1 % 6.3 %
Growth rate sales revenue for residual value Central Europe 1.0 % 1.0 %
Growth rate sales revenue for residual value Northern/Eastern Europe 1.0 % 1.0 %
Expected average EBITDA margin Central Europe (residual value) 1.7 % 1.7 %
Expected average EBITDA margin Northern/Eastern Europe (residual value) 1.2 % 1.2 %
Goodwill is monitored and tested for impairment by means of value-in-use calculations of two groups of cash-generating units. The value in use is the present value of the discounted cash flows. It is based on planning assumptions over a three-year period, plus residual values which have been approved by Management. The discount rates applied, and the average growth rate in net sales, are set out in the above table.
The value-in-use calculation for the group of cash-generating units is sensitive to assumptions relating to the balance sheet structure, gross margin, and cost structure. The balance sheet structure and gross margin are derived from historical values as well as from strategic and economic changes. The cost structure is adapted to the expected gross margin.
The value in use is substantially higher than the reported net assets. Even a material change in the base data, e.g. a sustained deterioration in the gross margin, or a change in the balance sheet and cost structure, would not cause an impairment of the goodwill.

145
ALSO Annual Report 2017 FINANCIAL REPORT
5.8CURRENT AND NON-CURRENT FINANCIAL LIABILITIES
2017 2016
eur 1 000Carrying
amount Interest rateCarrying
amount Interest rate
current financial liabilities
Bank loans 3 487 0.4 to 1.3 % 20 628 0.4 to 1.3 %
Bonded loan 16 960 2.5 to 2.8 % 0
Finance lease 559 2.0 to 3.0 % 611 2.0 to 3.0 %
Liabilities from factoring 44 021 0.5 to 2.5 % 4 685 0.5 %
Contingent consideration from acquisitions of subsidiaries 2 341 2 763
Third-party loans 16 203 0.0 to 3.0 % 99
total current financial liabilities 83 571 28 786
non-current financial liabilities
Bank loans 54 213 0.7 to 3.0 % 59 613 0.7 to 3.0 %
Bonded loan 266 259 1.1 to 2.8 % 130 222 2.1 to 2.8 %
Finance lease 553 2.0 to 3.0 % 1 003 2.0 to 3.0 %
Contingent consideration from acquisitions of subsidiaries 3 461 0
Third-party loans 1 236 1 793
total non-current financial liabilities 325 722 192 631
total financial liabilities 409 293 221 417
BONDED LOAN
ALSO placed a EUR 154 million bonded loan on August 31, 2017. The total amount is divided into several tranches with terms of five, seven and ten years. ALSO uses interest rates swaps to hedge the variable interest rate.
COVENANTS
Certain financial liabilities are subject to covenant clauses, under which stipulated financial key figures must be attained. As at December 31, 2017, all covenants were met.

146
ALSO Annual Report 2017 FINANCIAL REPORT
RECONCILIATION OF FINANCIAL LIABILITIES
CURRENT FINANCIAL LIABILITIES
eur 1 000 Bank loans Bonded loan Finance lease
Liabilities from factor-
ing
Contingent consideration
from acquisitions
of subsid-iaries
Third-party loans Total
january 1, 2017 20 628 0 611 4 685 2 763 99 28 786
Net cash flow – 20 774 0 – 627 1 947 – 2 763 5 246 – 16 971
Effect of acquisitions 439 0 0 37 523 666 32 38 660
Value adjustments 0 0 0 0 – 712 0 – 712
Other non-cash adjustments 3 245 16 960 581 0 2 387 10 829 34 002
Exchange differences – 51 0 – 6 – 134 0 – 3 – 194
december 31, 2017 3 487 16 960 559 44 021 2 341 16 203 83 571
NON-CURRENT FINANCIAL LIABILITIES
eur 1 000 Bank loans Bonded loan Finance lease
Contingent consideration
from acquisitions of
subsidiariesThird-party
loans Total
january 1, 2017 59 613 130 222 1 003 0 1 793 192 631
Net cash flow 557 153 500 0 0 0 154 057
Effect of acquisitions 651 0 0 2 840 0 3 491
Value adjustments 0 0 0 – 126 0 – 126
Other non-cash adjustments – 3 354 – 17 463 – 451 747 – 519 – 21 040
Exchange differences – 3 254 0 1 0 – 38 – 3 291
december 31, 2017 54 213 266 259 553 3 461 1 236 325 722
Required repayments of bonded loans in 2018 in the amount of TEUR 16 960 are displayed as reclassifications in other non-cash adjustments from long-term to short-term financial liabilities.
Other non-cash adjustments in the amount of TEUR 10 829 in the category third party loans are mainly resulting from reverse fac-toring of trade payables.

147
ALSO Annual Report 2017 FINANCIAL REPORT
5.9ACCRUED EXPENSES, DEFERRED INCOME AND OTHER PAYABLES
eur 1 000 2017 2016
accrued expenses and deferred income 47 775 47 343
Miscellaneous tax payables 99 612 91 951
Liabilities from factoring (continuing involvement) 66 150 47 667
Accrued interest from factoring 1 133 621
Other payables to third parties 13 448 8 201
Other payables to related parties (see Note 6.6) 216 198
other payables 180 559 148 638
total accrued expenses, deferred income and other payables 228 334 195 981
Accrued expenses, deferred income, and other payables are rec-ognized in the statement of financial position at nominal value. They comprise short-term expense accruals and deferred income relating to revenue for subsequent accounting periods already received, as well as accruals for services not yet invoiced. Tax payables include value added and other tax liabilities.
For liabilities from factoring, please refer to Note 6.8.

148
ALSO Annual Report 2017 FINANCIAL REPORT
5.10PROVISIONS
eur 1 000
Guarantees, returned goods,
complaints Litigations Restructuring Other provisions Total
january 1, 2017 3 274 1 069 0 4 357 8 700
Creation 2 612 182 0 570 3 364
Effect of acquisitions 0 0 0 290 290
Utilization – 2 531 0 0 – 226 – 2 757
Release 0 – 32 0 0 – 32
Exchange differences 2 0 0 75 77
december 31, 2017 3 357 1 219 0 5 066 9 642
Current provisions 2 670 1 219 0 1 161 5 050
Non-current provisions 687 0 0 3 905 4 592
total 2017 3 357 1 219 0 5 066 9 642
january 1, 2016 3 399 700 14 7 544 11 657
Creation 2 696 390 0 1 766 4 852
Utilization – 2 823 – 21 – 14 – 4 674 – 7 532
Release 0 0 0 – 231 – 231
Exchange differences 2 0 0 – 48 – 46
december 31, 2016 3 274 1 069 0 4 357 8 700
Current provisions 2 531 1 069 0 859 4 459
Non-current provisions 743 0 0 3 498 4 241
total 2016 3 274 1 069 0 4 357 8 700
There is an existing guarantee provision for the amount of TEUR 3 357 for the risk of expenses that have not yet occurred but which are expected to occur before the end of the guarantee period that was granted. It is expected that the greater part of the provision will be utilized in the next fiscal year, or at the latest within two years.
The provisions for litigation contain claims for damages as well as legal costs for various pending court cases. For significant parts of the litigation, a settlement is expected in the next fiscal year.
Other provisions contain long-service benefits, other employee allowances, and provisions for various risks. Utilization normally takes place within five years.
The creation and the utilization of other provisions in 2016 related mainly to expected costs in relation to ALSO Logistics Services GmbH.
5.11EQUITY
As at December 31, 2017, the number of registered shares each with a nominal value of CHF 1.00 per share totaled 12 848 962. The share capital is unchanged compared to 2016.
Authorized and conditional share capital comprises 2 500 000 shares with a nominal value of CHF 1.00 per share.

149
ALSO Annual Report 2017 FINANCIAL REPORT
TREASURY SHARES
Number
Value eur 1 000
january 1, 2017 28 089 1 194
Additions 0 0
Disposals 0 0
Measurement adjustment 0 628
december 31, 2017 28 089 1 822
january 1, 2016 28 089 1 194
Additions 0 0
Disposals 0 0
december 31, 2016 28 089 1 194
OPTING-OUT
The Articles of Association contain an opting-out clause.
MAJOR SHAREHOLDERS
12.31.17 12.31.16
Special Distribution Holding GmbH, Düsseldorf (Germany) * 51.30 % 51.30 %
Schindler Pars International Ltd., Hergiswil (Switzerland) ** *** 7.60 %
Bestinver Gestion, S.G.I.I.C., S.A. Madrid (Spain) 3.17 % 5.96 %
SaraSelect, c/o J. Safra Sarasin Investmentfonds AG, Basel (Switzerland) 3.60 % 4.00 %
LB(Swiss) Investment AG, Zürich (Switzerland) *** 3.93 %
Share register as of December 31 (without nominees)* Controlling shareholder: Walter P.J. Droege through Droege Group AG ** Held 100 percent by Schindler Holding AG*** Voting rights below the notifiable threshold value of three percent
REGULATIONS REGARDING THE RESTRICTED
TRANSFERABILITY OF SHARES
In accordance with Art. 5 of the Articles of Association, the Board of Directors may refuse to register an acquirer of shares as a full shareholder (i.e. as a shareholder with voting rights) unless the acquirer expressly declares that they have acquired the shares in their own name and on their own account.
RETAINED EARNINGS
The distribution of retained earnings is subject to restrictions: Special reserves of ALSO Holding AG can only be distribut-
ed after a corresponding resolution by the Annual General Meeting.
The reserves of subsidiaries are first distributed to the par-ent company in accordance with local tax regulations and legislation.

150
ALSO Annual Report 2017 FINANCIAL REPORT
5.12OTHER RESERVES
eur 1 000 Cash flow hedge reserve Exchange differencesRemeasurement of
defined benefit plans Total other reserves
january 1, 2017 – 3 777 4 806 – 9 886 – 8 857
Net profit Group 0 0 0 0
Other comprehensive income 1 588 – 6 791 895 – 4 308
total comprehensive income 1 588 – 6 791 895 – 4 308
Distributions to shareholders 0 0 0 0
Acquisition of non-controlling interests 0 0 0 0
Remeasurement of put options on shares of non-controlling interests 0 0 0 0
Measurement adjustment treasury shares 0 0 0 0
december 31, 2017 – 2 189 – 1 985 – 8 991 – 13 165
january 1, 2016 – 4 884 2 871 – 15 213 – 17 226
Net profit Group 0 0 0 0
Other comprehensive income 1 107 1 935 5 327 8 369
total comprehensive income 1 107 1 935 5 327 8 369
Distributions to shareholders 0 0 0 0
Acquisition of non-controlling interests 0 0 0 0
Remeasurement of put options on shares of non-controlling interests 0 0 0 0
december 31, 2016 – 3 777 4 806 – 9 886 – 8 857

151
ALSO Annual Report 2017 FINANCIAL REPORT
5.13EARNINGS PER SHARE/DIVIDEND PER SHARE
2017 2016
net profit group eur 92 630 000 83 382 000
Shares issued (weighted) Number of shares 12 848 962 12 848 962
Less treasury shares (weighted) Number of shares – 28 089 – 28 089
Available shares for calculation (weighted) Number of shares 12 820 873 12 820 873
basic earnings per share eur 7.22 6.50
diluted net profit group eur 92 630 000 83 382 000
Shares issued (weighted) for calculation Number of shares 12 820 873 12 820 873
Adjustment for dilution from options Number of shares 953 590
Diluted shares Number of shares 12 821 826 12 821 463
diluted earnings per share eur 7.22 6.50
The company has 28 089 treasury shares in its portfolio. In the above table, these treasury shares are deducted from the total number of shares outstanding. The diluted figures include the effect of the option program.
The Board of Directors will propose to the Annual General Meet-ing on March 27, 2018, that a distribution to shareholders for the amount of TCHF 35 257 (CHF 2.75 per share) be paid for the finan-cial year 2017. In the prior year, a distribution to shareholders was made for the amount of TCHF 28 847 (CHF 2.25 per share).
5.14INVESTMENTS IN ASSOCIATES
eur 1 000 2017 2016
january 1 0 1 291
Share of income of associates 0 445
Dividends from associates 0 – 455
Disposals 0 – 1 287
Exchange differences 0 6
december 31 0 0
Concerning the disposal of investments in associates in 2016, please refer to Note 3.

152
ALSO Annual Report 2017 FINANCIAL REPORT
6.FURTHER INFORMATION ON THE CONSOLIDATED FINANCIAL STATEMENTS
6.1CONTINGENT LIABILITIES
ALSO Deutschland GmbH has received a written demand for information and payment of copyright fees on external hard disks in connection with a tariff that was published in Germany on November 3, 2011. This was the first time that a tariff was pub-lished for this category of device. The tariff relates to various products and vendors. The tariff has been applied retroactively as of January 1, 2008, and relates to various different types of prod-ucts. The amount of the fees ranges from EUR 5.00 for simple external hard disks to EUR 34.00 for multimedia hard disks. The demand was decided upon by the responsible arbitration body. The settlement proposal provides for considerably lower tariffs for the period from 2008 to 2010. The settlement proposal has not been accepted by any of the parties to the dispute. An appeal has been lodged and the proceedings are now being continued at the Munich Higher Regional Court. The current state of proceedings does not allow for a different assessment from that of the previous year.
According to the majority opinion of the vendors, distributors, Bitkom, and their legal advisors, it is unlikely that the tariff can be applied retrospectively. It is highly probable that the legal con-ditions for a retrospective publication to be effective are not ful-filled. A liability of ALSO Deutschland GmbH for the period from January 1, 2008, to November 3, 2011, has therefore not been rec-ognized in the statement of financial position. Should this opinion prove false, and the tariffs be applied retrospectively, this would have a material effect on the capital, financial and income situa-tion of the ALSO Group.
The amount of the tariffs after publication starting from 2011 is also disputed. ALSO Deutschland GmbH has recognized the pub-lished tariffs in the statement of financial position for this period.
In order to avoid drawn-out legal proceedings, we generally con-sider it possible that like in other comparable cases vendors, dis-tributors, and Bitkom (industry association) may reach an agree-ment with the copyright collecting agencies on tariffs in the sense of an overall solution for the retroactive period and the period after publication. If such an agreement is reached, then based on studies to date and taking account of the amounts already rec-ognized in the statement of financial position its impact on the ALSO Group’s net profit and equity could vary between income of EUR 3 million and expense of EUR 12 million, depending on the assumptions made.

153
ALSO Annual Report 2017 FINANCIAL REPORT
6.2FINANCIAL INSTRUMENTS
HEDGING TRANSACTIONS
Contract value Replacement value Risk Hedging instruments
eur 1 000 Positive Negative
Cash Flow Hedge 351 000 0 2 786 Interest Interest rate swap
total december 31, 2017 351 000 0 2 786
Cash Flow Hedge 243 000 0 4 394 Interest Interest rate swap
total december 31, 2016 243 000 0 4 394
Various cash flow hedges (interest rate swaps) became ineffective or had to be restructured in 2016 and in 2015 due to negative interest rates. As a result of this ineffectiveness or restructuring, measurement changes have therefore been recognized directly in financial result since these cash flow hedges became ineffective or were restructured. In 2017 this resulted in financial income of TEUR 1 716 (previous year: TEUR 1 034). Furthermore, these hedging transactions were reclassified from equity to financial expenses in the amount of TEUR 1 619 (previous year: TEUR 959).
For further information about hedging transactions please see Note 6.7.

154
ALSO Annual Report 2017 FINANCIAL REPORT
CLASSES�OF�FINANCIAL�INSTRUMENTS�2017
eur 1 000Loans and
receivables
At fair value through profit
or lossAmortized
costHedge
accountingNon-financial
instruments
Carrying amount
12.31.2017
financial assets
Trade receivables (Note 5.2) 570 713 570 713
Prepaid expenses, accrued income and other receivables (Note 5.4) 238 615 19 257 257 872
Financial assets 2 280 2 280
Current derivative financial instruments 70 70
Non-current derivative financial instruments 77 47 124
financial liabilities
Financial liabilities (Note 5.8) 621 408 672 409 293
Trade payables 851 090 851 090
Accrued expenses, deferred income and other payables (Note 5.9) 80 947 147 387 228 334
Current derivative financial instruments 360 717 1 077
Non-current derivative financial instruments 2 750 2 116 4 866
In 2017, the net gain from financial instruments measured at fair value through profit or loss (mainly forward exchange contracts, options and contingent considerations from acquisitions) amounted to TEUR 1 154.
The carrying amount of the financial instruments is essentially the fair value.

155
ALSO Annual Report 2017 FINANCIAL REPORT
CLASSES�OF�FINANCIAL�INSTRUMENTS�2016
eur 1 000Loans and
receivables
At fair value through profit
or lossAmortized
costHedge
accountingNon-financial
instruments
Carrying amount
12.31.2016
financial assets
Trade receivables (Note 5.2) 583 508 583 508
Prepaid expenses, accrued income and other receivables (Note 5.4) 244 605 13 213 257 818
Financial assets 1 413 1 413
Current derivative financial instruments 101 101
financial liabilities
Financial liabilities (Note 5.8) 2 763 218 654 221 417
Trade payables 862 688 862 688
Accrued expenses, deferred income and other payables (Note 5.9) 56 687 139 294 195 981
Current derivative financial instruments 822 348 1 170
Non-current derivative financial instruments 557 4 046 4 603
In 2016, the net gain from financial instruments measured at fair value through profit or loss (mainly forward exchange contracts, options and contingent considerations from acquisitions) amounted to TEUR 5 682.
The carrying amount of the financial instruments is essentially the fair value.
FAIR VALUE HIERARCHY
ALSO applies the following measurement hierarchy to determine the fair value of financial instruments:Level 1: Listed, unchanged market price in active markets.Level 2: Measurement methods in which all assumptions that
have a material impact on the fair value are indirectly or directly available.
Level 3: Measurement methods with assumptions that have a material impact on the fair value which are not publicly available.

156
ALSO Annual Report 2017 FINANCIAL REPORT
FAIR�VALUE�OF�THE�FINANCIAL�INSTRUMENTS�2017
eur 1 000 Level 1 Level 2 Level 3Fair value
12.31.2017
financial assets
Current derivative financial instruments 70 70
Forward exchange contracts 70 70
Non-current derivative financial instruments 124 124
Interest rate swaps 124 124
financial liabilities
Contingent consideration from acquisitions of subsidiaries – 621 – 621
Current derivative financial instruments – 1 077 – 1 077
Forward exchange contracts – 360 – 360
Interest rate swaps – 717 – 717
Non-current derivative financial instruments – 2 116 – 2 750 – 4 866
Interest rate swaps – 2 116 – 2 116
Put options on non-controlling interests – 2 750 – 2 750
total financial liabilities level 3 – 3 371
FAIR�VALUE�OF�THE�FINANCIAL�INSTRUMENTS�2016
eur 1 000 Level 1 Level 2 Level 3Fair value
12.31.2016
financial assets
Current derivative financial instruments 101 101
Forward exchange contracts 101 101
financial liabilities
Contingent consideration from acquisitions of subsidiaries – 2 763 – 2 763
Current derivative financial instruments – 1 170 – 1 170
Forward exchange contracts – 822 – 822
Interest rate swaps – 348 – 348
Non-current derivative financial instruments – 4 603 – 4 603
Interest rate swaps – 4 603 – 4 603
total financial liabilities level 3 – 2 763

157
ALSO Annual Report 2017 FINANCIAL REPORT
RECONCILIATION�OF�FINANCIAL�INSTRUMENTS�WITHIN�LEVEL�3
eur 1 000 2017 2016
january 1 – 2 763 – 8 196
Recognition of contingent consideration from the acquisition of subsidiaries – 1 459 0
Fair value adjustments of contingent consideration from the acquisition of subsidiaries recognized in financial result 838 239
Exercise of put options/call options 2 763 – 1 573
Recognition/fair value adjustments of put options recognized in equity – 2 750 3 168
Fair value adjustments of put options recognized in personnel expenses 0 153
Payment of contingent consideration from acquisitions of subsidiaries 0 3 348
Exchange differences 0 98
december 31 – 3 371 – 2 763
In 2017 and 2016 respectively, there were no transfers of financial instruments between Level 1 and Level 2. There were also no transfers into or out of Level 3.
MEASUREMENT TECHNIQUES OF FINANCIAL
INSTRUMENTS�WITHIN�LEVEL�2�
Forward exchange contracts are measured based on observable forward rates and spot rates and are recognized at their positive or negative replacement value. Interest rate swaps are measured based on the net present value of observable forward rates and recognized in the statement of financial position at their positive or negative replacement value respectively.
MEASUREMENT TECHNIQUES OF FINANCIAL
INSTRUMENTS�WITHIN�LEVEL�3
The fair value of contingent considerations from the acquisition of subsidiaries, put options on shares of non-controlling interests and call options is calculated based on contractually agreed mea-surement methods. These calculations are based on the expected future operating profits of subsidiaries and, therefore, depend on assumptions that are neither directly nor indirectly observable in the market. The expected future operating profits are based on medium-term plans which cover a period of three years. Those plans are reviewed by the management of ALSO.

158
ALSO Annual Report 2017 FINANCIAL REPORT
A change in the underlying expected future profits would have the following effect on the fair value:
SENSITIVITY OF FINANCIAL INSTRUMENTS WITHIN LEVEL 3
eur 1 000 2017 2016
5 % increase in the expected future results – 242 0
5 % reduction in the expected future results 242 0
6.3PLEDGED OR ASSIGNED ASSETS SERVING AS COLLATERAL FOR OWN LIABILITIES
eur 1 000 2017 2016
Inventories 20 877 21 003
Property, plant and equipment 19 901 23 861
total assets pledged 40 778 44 864
The property, plant, and equipment shown above has been pledged as collateral against existing mortgages in Switzerland and Austria. The inventories have been pledged as collateral against trade payables in Finland.
6.4RENTAL AND LEASING COMMITMENTS
PAYMENTS FOR FIXED-TERM CONTRACTS (OPERATING LEASE)
eur 1 000 2017 2016
Due in 1st year 24 396 22 828
Due in 2nd – 5th year 65 092 48 203
Due from the 6th year onwards 18 464 22 603
Rental agreements for some buildings of the ALSO Group include options to extend the rental period.

159
ALSO Annual Report 2017 FINANCIAL REPORT
PAYMENTS FOR FIXED-TERM CONTRACTS (FINANCE LEASE)
eur 1 000 2017 2016
Due in 1st year 579 659
Due in 2nd – 5th year 562 1 034
1 141 1 693
Minus interest expense component – 29 – 79
total financial debt from finance lease (note 5.8) 1 112 1 614
Of which current 559 611
Of which non-current 553 1 003
The finance leases mainly comprise IT systems and printers in Germany and Switzerland.
CASH RECEIPTS AS LESSOR
eur 1 000 2017 2016
Due in 1st year 428 477
Due in 2nd – 5th year 860 1 184
Due from the 6th year onwards 180 190
Individual companies of the ALSO Group act as lessor for office and warehouse space for indefinite terms. The leases can be ter-minated at 2 or 15 months’ notice.

160
ALSO Annual Report 2017 FINANCIAL REPORT
6.5SUBSIDIARIES
Country Head office CompanyParticipation *
12.31.17Participation *
12.31.16Share capital
in 1 000 Currency Code
Switzerland Emmen ALSO Holding AG 12 849 CHF S
Emmen ALSO Schweiz AG 100 % 100 % 100 CHF D
Thun NRS Printing Solutions AG 100 % 100 % 100 CHF S
Emmen Quatec AG 100 % 100 % 100 CHF S
Stans Bachmann Mobile Kommunikation AG
100 % 100 % 100 CHF S
Belgium Mechelen Five 4 U BVBA 100 % – 8 331 EUR D
Denmark Tåstrup ALSO A/S 100 % 100 % 39 000 DKK D
Germany Soest ALSO Deutschland GmbH 100 % 100 % 20 000 EUR D
Osnabrück NT plus GmbH 100 % 100 % 12 500 EUR D
Osnabrück SEAMCOM GmbH & Co. KG 100 % 100 % 203 EUR D
Osnabrück SEAMCOM Verwaltungs GmbH 100 % 100 % 26 EUR S
Straubing ALSO MPS GmbH 100 % 100 % 100 EUR S
Berlin druckerfachmann.de GmbH 100 % 100 % 200 EUR S
Berlin LumIT GmbH 100 % 100 % 25 EUR S
Soest ALSO International Services GmbH 100 % 100 % 100 EUR S
Soest ALSO IH GmbH 100 % 100 % 25 EUR S
Soest Impaso Online Services GmbH 100 % 100 % 25 EUR S
Staufenberg Fulfilment Plus GmbH 100 % 100 % 50 EUR S
Pullach i. Isartal SINAS Beteiligungs GmbH & Co. Vermietungs-KG **
0 % 0 % 9 EUR S
Soest MEDIUM GmbH 100 % 100 % 25 EUR D
Frankfurt am Main
Pestinger GmbH 74.8 % 74.8 % 26 EUR D
Stuttgart Beamer & more GmbH 51 % 51 % 25 EUR D
Berlin ALSO Enterprise Services GmbH 100 % 100 % 100 EUR S
Berlin druckerfachmann Verwaltungs GmbH (formerly ALSO bringback GmbH)
100 % 100 % 25 EUR S
Berlin Webinstore AG 99.99 % 99.99 % 500 EUR S
Soest ALSO Mobility Services GmbH 100 % 100 % 25 EUR S
Soest ALSO Logistics Services GmbH i. L. ***
100 % 100 % 25 EUR S
Finland Tampere ALSO Nordic Holding Oy 100 % 100 % 10 000 EUR S
Tampere ALSO Finland Oy 100 % 100 % 841 EUR D
Helsinki ALSO Cloud Oy 100 % 100 % 11 EUR S
Helsinki ALSO Cloud Solutions Oy 100 % 100 % 3 EUR S
Helsinki Internet Smartsec Oy **** – 8 EUR D
France Gennevilliers ALSO France S.A.S. 100 % 100 % 14 500 EUR D

161
ALSO Annual Report 2017 FINANCIAL REPORT
Country Head office CompanyParticipation *
12.31.17Participation *
12.31.16Share capital
in 1 000 Currency Code
Gennevilliers LAFI Logiciels Application Formation Information S.A.S.
100 % 100 % 400 EUR S
Paris BeIP S.A.S. 51 % – 147 EUR D
Morocco Casablanca BeIP International 100 % – 50 MAD D
Netherlands Nieuwegein ALSO Nederland B.V. 100 % 100 % 1 000 EUR D
Nijmegen ALSO Digital Holding B.V. 51 % 51 % 18 EUR S
Nijmegen ALSO Digital B.V. 100 % 100 % 18 EUR S
Nijmegen ALSO International B.V. 100 % 100 % 18 EUR D
Utrecht All 4 U B.V. 100 % – 50 EUR S
Utrecht Esseko B.V. 100 % – 54 EUR D
Utrecht Five 4 U Nederland B.V. 100 % – 10 EUR D
Norway Sandefjord ALSO AS 100 % 100 % 11 063 NOK D
Estonia Tallinn ALSO Eesti OÜ 100 % 100 % 192 EUR D
Tallinn Internet Smartsec OÛ 100 % – 3 EUR D
Latvia Mãrupe SIA “ALSO Latvia” 100 % 100 % 1 210 EUR D
Riga ALSO Cloud Latvia SIA 100 % 100 % 100 EUR S
Lithuania Kaunas UAB “ALSO Lietuva” 100 % 100 % 1 883 EUR D
Austria Gross-Enzersdorf ALSO Austria GmbH 100 % 100 % 100 EUR D
Poland Warsaw ALSO Polska sp. z o.o. 99.99 % 99.99 % 41 705 PLN D
Goleniow MLS sp. z o.o. 100 % 100 % 5 000 PLN D
Goleniow Blue Bridge sp. z o.o. 100 % 100 % 100 PLN S
Szczecin iTerra sp. z o.o. 100 % 100 % 3 250 PLN D
Sweden Malmö ALSO Sweden AB 100 % 100 % 1 000 SEK D
Slovenia Ljubljana ALSO d.o.o. 100 % 100 % 8 EUR S
Codes: D = Distribution; S = Service/Holding company* Participation equals ALSO Holding AG’s direct or indirect voting interest in the
company.** Regarding the consolidation of SINAS Beteiligungs GmbH & Co. Vermietungs-KG,
please refer to Note 2.5*** Regarding the consolidation of ALSO Logistics Services GmbH, please refer to Note 2.5**** As at September 1, 2017, Internet Smartsec Oy and ALSO Finland Oy merged.
The merged company conducts its business under the name of ALSO Finland Oy.

162
ALSO Annual Report 2017 FINANCIAL REPORT
6.6TRANSACTIONS WITH RELATED PARTIES
Existing receivables and payables at the reporting date are unse-cured. In 2017 and 2016 respectively, no impairments of receiv-ables were necessary. There are no guarantees, pledges, or other contingent liabilities in favor of related parties. The following transactions and volumes took place with related parties:
TRANSACTIONS WITH PRINCIPAL SHAREHOLDERS
eur 1 000 2017 2016
Net sales to Droege Group 111 82
Operating expenses Droege Group – 2 595 – 3 197
Trade receivables Droege Group 63 14
Trade payables Droege Group (Note 5.9) – 216 – 198
The distributions of TEUR 13 845 to Droege that were decided at the General Meeting of March 21, 2017 were paid on March 27, 2017.
LIABILITIES TO ALSO PENSION FUND
eur 1 000 2017 2016
ALSO Holding AG 0 – 13
ALSO Schweiz AG – 303 – 233
TRANSACTIONS WITH KEY MANAGEMENT
eur 1 000 2017 2016
Salaries * 4 471 4 132
Contributions to pension plans 304 234
Anniversary bonuses or other special payments 1 0
Retirement bonuses 0 0
Employee shares/options 0 0
total compensation 4 776 4 366
* Fixed compensation (salaries and flat-rate expenses), bonuses, Board of Directors’ fees, employer contributions for social security, and other non-monetary benefits/reductions

163
ALSO Annual Report 2017 FINANCIAL REPORT
OPTION CONDITIONS
Year of issue Right to Exercise period Exercise price in chf *
Market price then applicable in
chf *Open on 12.31.2017
Number
2011 Shares May 1, 2014 to April 30, 2020 45.40 16.88 1 506
total 1 506
* In the interest of comparability, no conversion to euro was made.
In the reporting year, no options were exercised. At Decem-ber 31, 2017, 1 506 options were exercisable. The options are valued according to the Hull-White model, which explicitly takes account of the effects of the restriction period and of an early exercise of the options. The fair value of the options was recog-nized in profit and loss, and one third (vesting period) was charged to personnel expenses, lastly in 2013.
6.7FINANCIAL RISK MANAGEMENT
PRINCIPLES OF RISK MANAGEMENT
In relation to its financial assets and liabilities, ALSO is exposed to special risks arising from changes in exchange rates and inter-est rates. In addition to these market risks, there are also liquidity and credit risks. The objective of financial risk management is to control and limit these market risks by ongoing operational and financial activities. For this purpose, and depending on the esti-mated risk, selected hedging instruments are used. Derivative financial instruments are used exclusively as hedging instru-ments, i.e. they are not used for trading or speculative purposes. To minimize the default risk, the material hedging transactions are only entered into with leading financial institutions.
At regular intervals, the appropriateness of the risk management and the internal control system is reviewed by the Board of Direc-tors and modified if necessary. This ensures that the Board of Directors and the Group Management are completely and promptly informed of material risks. In addition, monthly internal reports on the financial position of the company allow any risks arising from the ongoing business to be recognized as early as possible, and corresponding countermeasures to be initiated. For this purpose, Accounting and Controlling constantly adapt their reporting systems to changing conditions.
For optimal cash management, the management of liquidity not required for ongoing operations and the long-term financing of the Group is centralized. The treasury function also records, mon-itors, and controls financial risks based on information provided by the Board of Directors and Group Management.
CREDIT RISK
Credit risk is the risk of economic loss resulting from a counter-party being unable or unwilling to fulfil its contractual payment obligations. Credit risk thus includes not only the immediate default risk, but also the risk of a worse credit rating along with the risk of concentration of individual risks.
In its operational business, as well as in some of its financing activities, ALSO is exposed to a default risk. In the financial area, ALSO manages the resulting risk position by the diversification of financial institutions and by verification of the financial strength of each counterparty based on publicly available ratings, as well as on publicly available ad-hoc information about the financial institutions.

164
ALSO Annual Report 2017 FINANCIAL REPORT
CREDIT�QUALITY�AS�OF�DECEMBER�31,�2017
eur 1 000Standard & Poor´s AA– A+ A A– BBB+ BBB No rating Total
Moody´s Aa3 A1 A2 A3 Baa1 Baa2
Cash and cash equivalents (Note 5.1) 93 246 4 248 46 728 47 408 37 271 185 6 475 235 561
Receivables from factoring (Note 5.4) 32 747 41 437 88 770 13 409 7 480 14 319 0 198 162
29 % 11 % 32 % 14 % 10 % 3 % 1 % 100 %
Cash and cash equivalents with a rating from Fitch of BB in the amount of TEUR 2 126 are included in the category “no rating”.
CREDIT�QUALITY�AS�OF�DECEMBER�31,�2016
eur 1 000Standard &
Poor´s AA– A+ A BBB+ BBB No rating Total
Moody´s Aa3 A1 A2 Baa1 Baa2
Cash and cash equivalents (Note 5.1) 2 553 739 3 162 37 106 5 717 6 200 55 477
Receivables from factoring (Note 5.4) 34 361 0 139 493 23 078 13 512 715 211 159
13 % 0 % 54 % 23 % 7 % 3 % 100 %
The credit quality of financial institutions is displayed based on public ratings by Standard & Poor’s or Moody’s. The rating code is a letter code that indicates the default risk of a debtor (country, company) and hence allows easy assessment of its creditworthi-ness. An independent, statistically determinable and validatable probability of default can be assigned to each rating code.
AAA / Aaa Risk of default is virtually zero.AA / Aa Safe investment, with slight risk of default.A The investment is safe provided that no unforeseen
eventualities impair the overall economy or the industry.BBB / Baa The investment is sufficient save but more depen-
dent on economic developments than the above categories.<BBB / Baa Mainly investments for which no public rating exists.
Ratings may be modified by the addition of a plus (+) or minus (–) sign or by the numbers 1 to 3 to move the rating up or down within the rating group.
At the reporting date, no value adjustments were necessary on cash and cash equivalents or receivables from factors.
In the operational area, ALSO limits the default risk by constantly monitoring customers’ credit ratings and setting credit limits based thereon. The operational companies of the Group have largely insured their open trade receivables by means of credit insurances. The credit insurances generally cover defaults for 85 to 95% of the insured amounts. The residual credit default risk on trade receivables is therefore considered by ALSO to be lim-ited, particularly since it is further minimized by the large number of customers and their wide geographical distribution. In addi-tion, to further reduce default risks, certain receivables were com-pletely sold.
Resulting from this sale are receivables from factors amounting to TEUR 198 162 (previous year: TEUR 211 159) ( see Note 5.4), which are spread over several factoring partners. The largest receivable from a single factoring partner is for TEUR 47 603 (previous year: TEUR 86 294). During the long-standing business relationships with the factoring compa-nies, no losses on receivables have occurred. The risk of loss on receivables from factoring partners is not insured with credit insurances. The default risk of loss is minimized by ALSO through regular evaluation of the factoring partners.

165
ALSO Annual Report 2017 FINANCIAL REPORT
Receivables which have not been sold, and for which payment is in arrears, are impaired by individual amounts based on recent experience. Experience from the past indicates that this risk can be considered to be low ( see also Note 5.2). The maximum credit risk (including derivative financial instruments with a pos-itive market value) is represented by the carrying amounts of the financial assets. ALSO has not issued any financial guarantees infavor of third parties.
LIQUIDITY RISKS
The central liquidity risk management system ensures that the Group is always in a position to fulfil its payment obligations promptly. ALSO continuously monitors its liquidity with a detailed cash flow plan on a daily basis. Extensive planning ensures fur-thermore that sufficient liquidity is available in the medium and long term.
ALSO’s objective is to obtain liquidity corresponding to the neces-sary timing. Since the main requirement for finance is to cover the operational business activities, which are subject to large seasonal fluctuations, over the year as a whole most of the sources of funds are short-term. The necessary funds are mainly obtained by selling existing receivables to factoring companies and supplemented by bank lines of credit that are available at short notice. At the report-ing date, the unutilized available credit lines with banks amounted to EUR 341 million (previous year: EUR 334 million).
The following table shows the financial liabilities of the Group by expiration date. The information is based on contractually agreed undiscounted interest and amortization payments. Forward pur-chases and sales of foreign currencies are not included in the finan-cial derivatives. Since the forward transactions do not cause any net negative cash flow, they do not present a liquidity risk to ALSO.
FINANCIAL�LIABILITIES�BY�EXPIRATION�DATE�2017
eur 1 000
Carrying amount
12.31.2017 Total cash flow Up to 1 year 1 to 5 yearsMore than
5 years
Trade payables 851 090 851 090 851 090 0 0
Other liabilities 80 947 80 947 80 947 0 0
Loans from banks and third parties and bonded loans 358 358 379 368 41 204 240 207 97 957
Liabilities from factoring 44 021 44 139 44 139 0 0
Contingent consideration from the acquisition of subsidiaries 5 802 5 802 2 341 2 505 956
Finance lease 1 112 1 141 579 562 0
total 1 341 330 1 362 487 1 020 300 243 274 98 913
derivative financial instruments
Put options 2 750 2 984 0 2 984 0
Interest rate swaps (net) 12 685 1 390 6 130 5 165

166
ALSO Annual Report 2017 FINANCIAL REPORT
FINANCIAL�LIABILITIES�BY�EXPIRATION�DATE�2016
eur 1 000
Carrying amount
12.31.2016 Total cash flow Up to 1 year 1 to 5 yearsMore than
5 years
Trade payables 862 688 862 688 862 688 0 0
Other liabilities 56 687 56 687 56 687 0 0
Loans from banks and third parties and bonded loans 212 355 219 711 23 252 194 967 1 492
Liabilities from factoring 4 685 4 688 4 688 0 0
Contingent consideration from the acquisition of subsidiaries 2 763 2 763 2 763 0 0
Finance lease 1 614 1 693 659 1 034 0
total 1 140 792 1 148 230 950 737 196 001 1 492
derivative financial instruments
Interest rate swaps (net) 4 738 2 513 2 225 0
The table includes all instruments held on December 31, 2017 and 2016 respectively, for which payments had already been con-tractually agreed. Plan figures for future new liabilities are not included. Foreign currency amounts were translated at the year-end exchange rate. The variable interest payments from the finan-cial instruments were calculated using the interest rates fixed at December 31, 2017 and 2016, respectively. Financial liabilities that can be repaid at any time are always assigned to the earliest maturity date, irrespective of the fact that the greater part of these financial liabilities is revolving.
INTEREST RATE RISKS
ALSO’s interest rate risks relate mainly to current financial liabil-ities with variable interest rates. Interest rate fluctuations cause changes in the interest income and expense of the interest-bear-ing assets and liabilities. ALSO is particularly exposed to interest rate risks in EUR, CHF, PLN and DKK.
The interest rate management is handled centrally. Short-term interest rate risks are only partially hedged, a material part of interest bearing-liabilities hence remaining exposed to interest rate fluctuations.
Taking into account the existing and planned debt structure, interest derivatives are used if necessary to meet the bandwidths recommended by central Group treasury and prescribed by man-agement. Since ALSO uses fixed as well as variable interest-bear-ing instruments, interest risks may result from an increase as well as a decrease in market interest rates.
SENSITIVITY ANALYSIS
Interest rate risks are evaluated by means of sensitivity analyses. These sensitivity analyses demonstrate the effects of changes in market interest rates on unsecured variable interest expense and income, as well as on equity, when all other variables remain constant.
The change in the market interest rates affects the value and the effectiveness of the hedging instruments and therefore affects equity and the financial result. If the market interest rate on December 31, 2017 and 2016 respectively, had been 100 base points higher/lower, the effect would have been as follows:

167
ALSO Annual Report 2017 FINANCIAL REPORT
SENSITIVITY�OF�INTEREST�RATES�2017
eur 1 000 Effect on the financial result Effect on the equity
Market interest rates +100 bps – 7 956 7 807
Market interest rates –100 bps 2 076 – 6 543
SENSITIVITY�OF�INTEREST�RATES�2016
eur 1 000 Effect on the financial result Effect on the equity
Market interest rates +100 bps – 3 292 2 919
Market interest rates –100 bps – 619 – 2 919
Market interest rates were slightly negative in 2017 and 2016. Because some financing partners do not pass on negative interest rates to ALSO, the financing costs would not be affected to the same extent by a 100 bps decrease as they would be by a 100 bps increase. Hedging instruments that had a negative impact on the financial result in 2016 due to ineffectiveness (according to IFRS) expired in 2017. ALSO concluded new hedging instruments in 2017 that take account of the negative interest rate environment so as to rule out additional negative effects on the financial result. For that purpose, ALSO uses interest rate forwards that in the mid-term hedge ALSO against increasing interest rates. However, those instruments do not have an impact on the financial result in the above disclosed sensitivity of interest rates. The measure-ment of hedging instruments is purely a valuation effect that does not result in any outflow of cash for ALSO.
This analysis is based on the assumption that the amount at the respective reporting date corresponds closely to the average amount utilized during the year.
EXCHANGE RATE RISKS
A material part of the cash flows of the operational companies occurs in currencies which are not the functional currencies of those subsidiaries. ALSO is therefore exposed to foreign currency risks. Foreign currency risks are only hedged if they affect the cash flow of the Group. Exchange rate risks that arise in the con-solidated financial statements through the translation of state-ments of comprehensive income and statements of financial posi-tion of subsidiaries are not hedged.
In the purchasing area, a certain amount is conducted in foreign currencies, especially EUR (where it is not the functional cur-rency) and in USD. To hedge this exchange rate risk, Central Trea-sury hedges the purchasing volumes of the operating companies outside their functional currency.
Group-internal loans between subsidiaries with different func-tional currencies give rise to foreign currency risks. ALSO hedges most of these risks. Speculative borrowing or lending in foreign currencies is not permitted. Transaction-related foreign currency risks are also monitored and the corresponding net exposures in the various currencies are calculated.
By regular use of forward contracts, ALSO constantly reduces the exchange rate risk so that there is no material exchange rate risk to the Group. The table below shows the main unsecured net exposures of the Group at the end of 2017 and 2016 respectively. These usually reflect the open risks over the year.

168
ALSO Annual Report 2017 FINANCIAL REPORT
UNHEDGED NET EXPOSURE
eur 1 000 EUR/USD EUR/CHF EUR/PLN EUR/DKK EUR/NOK EUR/SEK EUR/GBP
December 31, 2017 20 609 12 008 43 506 13 058 10 039 8 519 7 206
December 31, 2016 35 687 10 006 8 502 636 2 096 9 488 4 536
SENSITIVITY ANALYSIS
If, on December 31, 2017 and 2016 respectively, the EUR had been 10% stronger/weaker relative to the reporting date balances in those currencies, and all other variables had remained unchanged, the consolidated statement of comprehensive income and shareholders’ equity (net, after tax) would have been TEUR 8 989 higher/lower (previous year: TEUR 5 136). The dis-closed net exposures are mainly offset by inventories which are held in foreign currencies. Those inventories will be sold within a short period of time and would therefore largely compensate the effects explained above on the statement of comprehensive income.
Exchange differences resulting from the translation of entities whose functional currency is not the euro are not included in the sensitivity analysis.
CAPITAL MANAGEMENT
The overriding objective of capital management at ALSO is to maintain an appropriate equity base in order to preserve the trust of investors, customers, and the market, and to support future developments in the core business. The internal target value for the ratio of equity to total assets has been defined as 25 to 35 %.
The capital management serves to maintain an optimal Group-wide capital structure which not only gives ALSO sufficient finan-cial flexibility, but also maintains a high credit rating.
The equity structure can be maintained or modified by means of the dividend policy, capital repayments, and, if necessary, capital increases.
The capital structure is monitored on the basis of the net financial debt and reported equity. Net financial debt comprises inter-est-bearing financial liabilities less cash and cash equivalents.
eur 1 000 12.31.2017 12.31.2016
Current financial liabilities 83 571 28 786
Non-current financial liabilities 325 722 192 631
total financial liabilities (note 5.8) 409 293 221 417
./. Cash and cash equivalents (Note 5.1) – 235 561 – 55 477
Net financial debt 173 732 8 % 165 940 9 %
Reported equity 623 295 29 % 565 181 30 %
Equity and net financial debt 797 027 37 % 731 121 39 %
total liabilities and equity 2 158 504 100 % 1 895 103 100 %

169
ALSO Annual Report 2017 FINANCIAL REPORT
6.8FACTORING
ALSO has sold or assigned trade receivables to independent fac-toring companies. To the extent that a significant transfer of risk takes place, these transactions reduce the total receivables of the Group.
RECEIVABLES FULLY DERECOGNIZED IN THE
STATEMENT OF FINANCIAL POSITION:
If the sale of trade receivables transfers all material rewards and risks to the factoring company, under IAS 39 these receivables are fully derecognized and a corresponding receivable from the factoring company is recognized see Note 5.4.
Due to the contractual terms of the factoring program, ALSO is exposed to certain residual risks even after the trade receivables are sold. For the time period between maturity and payment of the sold receivables, ALSO is obliged to pay interest to the factor-ing company (interest risk for late payments).
RESIDUAL RISKS OF FULLY DERECOGNIZED RECEIVABLES
eur 1 000Carrying amount/fair value
of loss riskTheoretical maximum
loss risk
Interest risk for late payment 123 1 978
total december 31, 2017 123 1 978
Interest risk for late payment 92 1 367
total december 31, 2016 92 1 367
Taking into account ongoing creditworthiness checks, the large number of customers, and their historical payment behavior, as well as the known time period between maturity and payment of the sold receivables, ALSO expects that interest of TEUR 123 (previous year: TEUR 92) for late payments will be due on sold receivables at December 31, 2016. Corresponding accruals for these amounts were therefore made at December 31, 2017 and 2016, respectively.
Should the theoretical case occur of default on payment of all receivables that have been sold, ALSO would have to pay interest to the factors for the time period between maturity of the sold receivables and a contractually agreed latest date. As at Decem-ber 31, 2017, the theoretical maximum value at risk from this loss was estimated at TEUR 1 978 (previous year: TEUR 1 367).
RECEIVABLES NOT FULLY DERECOGNIZED IN THE
STATEMENT OF FINANCIAL POSITION:
In some agreements, neither complete transfer nor complete retention of the rewards and risks of the receivables can be assumed. Under these agreements, the trade receivables are not fully derecognized, and a residual amount remains recognized in the statement of financial position. Under IAS 39, this residual amount represents a so-called “continuing involvement”.
The trade receivables of TEUR 570 713 (previous year: TEUR 583 508, see Note 5.2) therefore contain a continuing involvement for the amount of TEUR 65 867 (previous year: TEUR 47 453).This is composed of the residual interest risk for late payments of TEUR 4 902 (previous year: TEUR 1 233), the residual credit risk of TEUR 51 647 (previous year: TEUR 37 907), and the residual exchange rate risk of TEUR 9 319 (previous year: TEUR 8 314).

170
ALSO Annual Report 2017 FINANCIAL REPORT
Due to the continuing involvement, there is a corresponding obli-gation for the amount of TEUR 65 867 (previous year: TEUR 47 453), which is recognized in accrued expenses, deferred income and other payables. In addition, there is an accrual for the amount of TEUR 160 (previous year: TEUR 122) for the fair value of the residual risk of the continuing involvement. Only the change in the true uncollectibility and interest risk is recognized through profit and loss.
NET�OBLIGATION�2017
eur 1 000 Carrying amount/fair value
Asset from continuing involvement 65 867
Obligation from continuing involvement 66 027
net obligation at december 31, 2017 – 160
NET�OBLIGATION�2016
eur 1 000 Carrying amount/fair value
Asset from continuing involvement 47 453
Obligation from continuing involvement 47 575
net obligation at december 31, 2016 – 122
At the reporting date, the gross amount of these sold receivables with continuing involvement was TEUR 628 189 (previous year: TEUR 470 548).
LIABILITY�FROM�FACTORING�2017
eur 1 000Fair value
of the remaining riskObligation from continuing
involvementTotal liability
from factoring
Receivables fully derecognized 123 0 123
Receivables not fully derecognized 160 65 867 66 027
december 31, 2017 (note 5.9) 283 65 867 66 150

171
ALSO Annual Report 2017 FINANCIAL REPORT
LIABILITY�FROM�FACTORING�2016
eur 1 000Fair value
of the remaining riskObligation from continuing
involvementTotal liability
from factoring
Receivables fully derecognized 92 0 92
Receivables not fully derecognized 122 47 453 47 575
december 31, 2016 (note 5.9) 214 47 453 47 667
6.9EVENTS AFTER THE REPORTING PERIOD
No material events occurred after the reporting period.
6.10APPROVAL OF THE ALSO GROUP CONSOLIDATED FINANCIAL STATEMENTS
These consolidated financial statements were released for publi-cation by the Board of Directors of ALSO Holding AG on Febru-ary 9, 2018, and will be submitted to the Annual General Meeting of March 27, 2018, for approval.

172
ALSO Annual Report 2017 FINANCIAL REPORT
Report of the statutory auditor to the General Meeting on the consolidated financial statements 2017Report on the audit of the consolidated financial statements
Opinion
We have audited the consolidated financial statements of ALSO Holding AG and its subsidiaries (the Group), which comprise the con-solidated balance sheet as at 31 December 2017 and the consolidated statement of comprehensive income, consolidated statement of changes in equity and consolidated statement of cash flows for the year then ended, and notes to the consolidated financial statements, including a summary of significant accounting policies.
In our opinion, the consolidated financial statements pages 109 to 171 give a true and fair view of the consolidated financial position of the Group as at 31 December 2017 and its consolidated financial performance and its consolidated cash flows for the year then ended in accordance with International Financial Reporting Standards (IFRS) and comply with Swiss law.
Basis for opinionWe conducted our audit in accordance with Swiss law, International Standards on Auditing (ISAs) and Swiss Auditing Standards. Our responsibilities under those provisions and standards are further described in the “Auditor’s responsibilities for the audit of the consol-idated financial statements” section of our report.
We are independent of the Group in accordance with the provisions of Swiss law and the requirements of the Swiss audit profession, as well as the IESBA Code of Ethics for Professional Accountants, and we have fulfilled our other ethical responsibilities in accordance with these requirements. We believe that the audit evidence we have obtained is sufficient and appropriate to provide a basis for our opinion.
Our audit approach
Overview Overall materiality: EUR 6.200.000
We concluded full scope audit work and specified procedures at twelve reporting units in seven countries. Our audit scope including specified procedures addressed 84 % of the Group’s net sales, 82 % of the assets and 85 % of the profit of the Group.
Additionally, we concluded reviews at a further eight reporting units in eight countries, which addressed an additional 13 % of the net sales, 11 % of the assets and 10 % of the profit of the Group.
As a key audit matter, the following area of focus has been identified:
Impairment testing of goodwill
Wesent-lichkeit
Prüfungs-umfang
Besonderswichtige
Prüfungs-sachver-
halte
Materiality
Audit scope
Key audit matters
Caractèresignificatif
Étenduede l’audit
Élémentsclés
de l’audit

173
ALSO Annual Report 2017 FINANCIAL REPORT
Audit scope
We tailored the scope of our audit in order to perform sufficient work to enable us to provide an opinion on the consolidated financial statements as a whole, taking into account the structure of the Group, the accounting processes and controls, and the industry in which the Group operates.
The audit strategy for the audit of the consolidated financial statements was determined taking into account the work performed by the Group auditor and the work performed at Group components by auditors in the PwC network and by third parties. All significant subsid-iaries of the Group were audited by PwC. Where audits were performed by component auditors, we ensured that, as Group auditor, we were adequately involved in the audit in order to assess whether adequate sufficient appropriate audit evidence was obtained from the work of the component auditors to provide a basis for our opinion. The involvement of the Group auditor included telephone conferences with the component auditors and an investigation of the risk assessment.
MaterialityThe scope of our audit was influenced by our application of materiality. Our audit opinion aims to provide reasonable assurance that the consolidated financial statements are free from material misstatement. Misstatements may arise due to fraud or error. They are consid-ered material if individually or in aggregate, they could reasonably be expected to influence the economic decisions of users taken on the basis of the consolidated financial statements.
Based on our professional judgement, we determined certain quantitative thresholds for materiality, including the overall materiality for the consolidated financial statements as a whole as set out in the table below. These, together with qualitative considerations, helped us to determine the scope of our audit and the nature, timing and extent of our audit procedures and to evaluate the effect of misstatements, both individually and in aggregate, on the consolidated financial statements as a whole.
Overall Group materiality EUR 6.200.000
How we determined it 5% of profit before taxRationale for the materiality benchmark applied We chose profit before tax as the benchmark because, in our view,
it is the benchmark against which the performance of the Group is most commonly measured. In addition, profit before tax is a generally accepted benchmark for considerations of materiality.
We agreed with the Audit Committee that we would report to them misstatements above EUR 620.000 identified during our audit as well as any misstatements below that amount which, in our view, warranted reporting for qualitative reasons.

174
ALSO Annual Report 2017 FINANCIAL REPORT
Key audit matters
Key audit matters are those matters that, in our professional judgement, were of most significance in our audit of the consolidated finan-cial statements of the current period. These matters were addressed in the context of our audit of the consolidated financial statements as a whole, and in forming our opinion thereon, and we do not provide a separate opinion on these matters.
IMPAIRMENT TESTING OF GOODWILL
Key audit matter How our audit addressed the key audit matter
Impairment testing of goodwill was deemed a key audit matter for the following two reasons:Goodwill represents a significant amount on the balance sheet. It amounts to a total of EUR 150.0 million, of which EUR 133.5 million relates to the Central Europe cash-generating unit and EUR 16.5 million relates to the North/Eastern Europe cash-generating unit.
In addition, there is significant scope for judgement in determining the assumptions relating to future business results and the discount rate applied to forecasted cash flows.
Please refer to page 115 (key assumptions and estimates), pages 121 to 122 (accounting standards for intangible assets and
impairment) and page 144 (notes to the consolidated financial statements).
We assessed the impairment tests carried out by the Group by performing the following audit procedures:• For the forecasted cash flows, we assessed the budget process,
especially whether Group Management and the Board of Directors monitored this process and challenged the assump-tions made.
• We tested whether the values used for the impairment tests were in line with the budget approved by the Board of Directors.
• We discussed with Group Management how the country- specific assumptions concerning revenue growth and long-term growth rates have been established.
• We compared the assumptions relating to the prior year’s revenues and results with those for the year under review in order to identify, in retrospect, any assumptions that were too optimistic regarding the budgeted revenues and results.
• We assessed the reasonableness of the forecasts relating to investments and to the change in net working capital.
• For each cash-generating unit (CGU), we compared the discount rate used with its cost of capital.
• In addition, using sensitivity analyses, we tested whether a significant change in each of the key assumptions (the discount rate, the EBITDA margin and the long-term growth rate) resulted in the impairment of the goodwill.
• We discussed the results of these tests with Group Management in terms of both the headroom available before the goodwill would be impaired and the probability of such a change in the assumptions occurring.
In performing the audit procedures listed above, we addressed the risk of the impairment of the goodwill. We have no findings to report.
Other information in the annual report
The Board of Directors is responsible for the other information in the annual report. The other information comprises all information included in the annual report, but does not include the consolidated financial statements, the stand-alone financial statements and the compensation report of ALSO Holding AG and our auditor’s reports thereon.
Our opinion on the consolidated financial statements does not cover the other information in the annual report and we do not express any form of assurance conclusion thereon.

175
ALSO Annual Report 2017 FINANCIAL REPORT
In connection with our audit of the consolidated financial statements, our responsibility is to read the other information in the annual report and, in doing so, consider whether the other information is materially inconsistent with the consolidated financial statements or our knowledge obtained in the audit, or otherwise appears to be materially misstated. If, based on the work we have performed, we conclude that there is a material misstatement of this other information, we are required to report that fact. We have nothing to report in this regard.
Responsibilities of the Board of Directors for the consolidated financial statements
The Board of Directors is responsible for the preparation of the consolidated financial statements that give a true and fair view in accor-dance with IFRS and the provisions of Swiss law, and for such internal control as the Board of Directors determines is necessary to enable the preparation of consolidated financial statements that are free from material misstatement, whether due to fraud or error.
In preparing the consolidated financial statements, the Board of Directors is responsible for assessing the Group’s ability to continue as a going concern, disclosing, as applicable, matters related to going concern and using the going concern basis of accounting unless the Board of Directors intends either to liquidate the Group or to cease operations, or has no realistic alternative but to do so.
Auditor’s responsibilities for the audit of the consolidated financial statements
Our objectives are to obtain reasonable assurance about whether the consolidated financial statements as a whole are free from material misstatement, whether due to fraud or error, and to issue an auditor’s report that includes our opinion. Reasonable assurance is a high level of assurance, but is not a guarantee that an audit conducted in accordance with Swiss law, ISAs and Swiss Auditing Standards will always detect a material misstatement when it exists. Misstatements can arise from fraud or error and are considered material if, indi-vidually or in the aggregate, they could reasonably be expected to influence the economic decisions of users taken on the basis of these consolidated financial statements.
A further description of our responsibilities for the audit of the consolidated financial statements is located at the website of EXPERTsuisse http://expertsuisse.ch/en/audit-report-for-public-companies. This description forms part of our auditor’s report.
Report on other legal and regulatory requirements
In accordance with article 728a paragraph 1 item 3 CO and Swiss Auditing Standard 890, we confirm that an internal control system exists which has been designed for the preparation of consolidated financial statements according to the instructions of the Board of Directors.
PricewaterhouseCoopers AG
Joanne Burgener Andreas BrunAudit expert Audit expertAuditor in charge
Lucerne, 9 February 2018

176
ALSO Annual Report 2017 FINANCIAL REPORT
chf 1 000 2017 2016
Service revenue 20 313 19 411
Investment revenue 50 336 50 592
Other operating income 213 1
Service expenses –10 297 –8 981
Personnel expenses –5 951 –6 353
Other operating expenses –7 715 –5 990
Depreciation 0 –1
Financial income 10 088 7 689
Financial expenses –4 692 –5 511
Direct tax expenses –377 –381
net profit 51 918 50 476
PROFIT AND LOSS STATEMENT OF ALSO HOLDING AG

177
ALSO Annual Report 2017 FINANCIAL REPORT
ASSETS
chf 1 000 12.31.2017 12.31.2016
Cash 18 20
Other current receivables
From Group companies 342 622 147 859
Prepaid expenses and accrued income 273 297
total current assets 342 913 148 176
Loans to Group companies 157 665 148 058
Investments 516 587 513 623
total non-current assets 674 252 661 681
total assets 1 017 165 809 857
LIABILITIES AND EQUITY
chf 1 000 12.31.2017 12.31.2016
Liabilities to banks (interest-bearing) 19 847 0
Other current payables
To third parties 21 154
To Group companies (interest-bearing) 43 236 58 590
Accrued expenses and deferred income 22 117 13 973
total current liabilities 85 221 72 717
Liabilities to banks (interest-bearing) 311 578 139 845
total non-current liabilities 311 578 139 845
total liabilities 396 799 212 562
Share capital 12 849 12 849
Legal capital reserves
Capital contribution reserve 230 378 259 225
Share-premium reserve 8 618 8 618
Legal reserves
General reserve 1 100 1 100
Special reserve 90 000 90 000
Retained earnings
Balance brought forward 227 043 176 567
Net profit 51 918 50 476
Treasury shares –1 540 –1 540
total shareholders’ equity 620 366 597 295
total liabilities and equity 1 017 165 809 857
BALANCE SHEET OF ALSO HOLDING AG
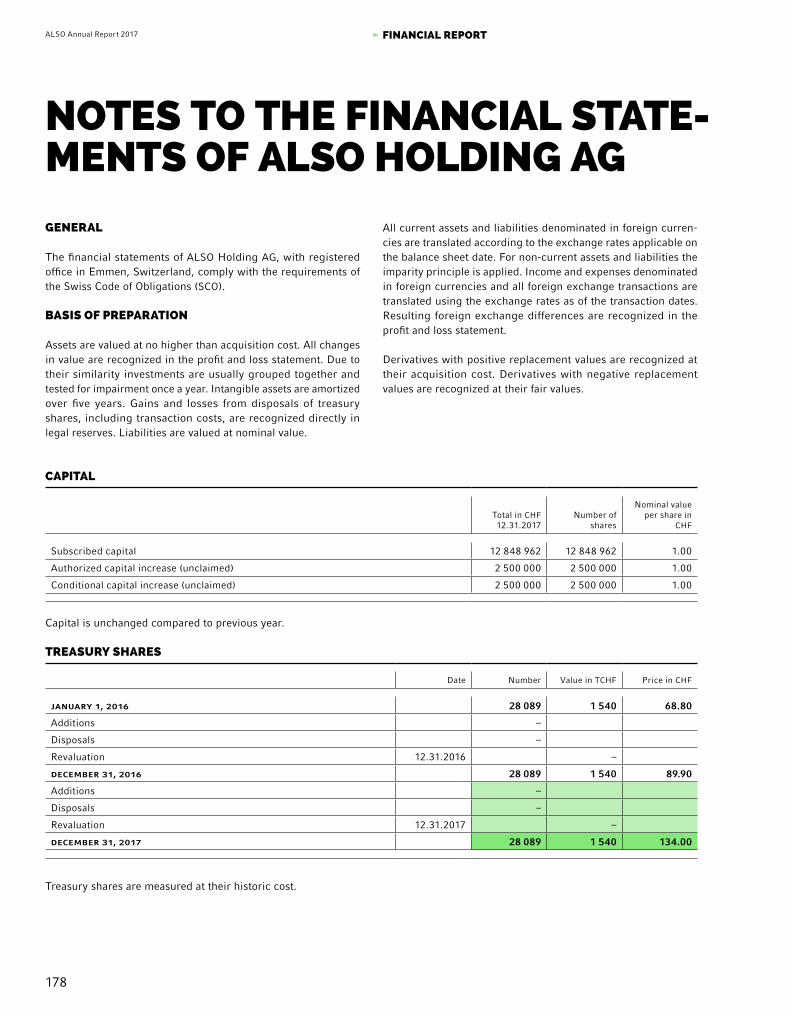
178
ALSO Annual Report 2017 FINANCIAL REPORT
TREASURY SHARES
Date Number Value in TCHF Price in CHF
january 1, 2016 28 089 1 540 68.80
Additions –
Disposals –
Revaluation 12.31.2016 –
december 31, 2016 28 089 1 540 89.90
Additions –
Disposals –
Revaluation 12.31.2017 –
december 31, 2017 28 089 1 540 134.00
GENERAL
The financial statements of ALSO Holding AG, with registered office in Emmen, Switzerland, comply with the requirements of the Swiss Code of Obligations (SCO).
BASIS OF PREPARATION
Assets are valued at no higher than acquisition cost. All changes in value are recognized in the profit and loss statement. Due to their similarity investments are usually grouped together and tested for impairment once a year. Intangible assets are amortized over five years. Gains and losses from disposals of treasury shares, including transaction costs, are recognized directly in legal reserves. Liabilities are valued at nominal value.
All current assets and liabilities denominated in foreign curren-cies are translated according to the exchange rates applicable on the balance sheet date. For non-current assets and liabilities the imparity principle is applied. Income and expenses denominated in foreign currencies and all foreign exchange transactions are translated using the exchange rates as of the transaction dates. Resulting foreign exchange differences are recognized in the profit and loss statement.
Derivatives with positive replacement values are recognized at their acquisition cost. Derivatives with negative replacement values are recognized at their fair values.
NOTES TO THE FINANCIAL STATE-MENTS OF ALSO HOLDING AG
CAPITAL
Total in CHF12.31.2017
Number of shares
Nominal value per share in
CHF
Subscribed capital 12 848 962 12 848 962 1.00
Authorized capital increase (unclaimed) 2 500 000 2 500 000 1.00
Conditional capital increase (unclaimed) 2 500 000 2 500 000 1.00
Capital is unchanged compared to previous year.
Treasury shares are measured at their historic cost.

179
ALSO Annual Report 2017 FINANCIAL REPORT
MAJOR SHAREHOLDERS
12.31.2017 12.31.2016
Special Distribution Holding GmbH, Düsseldorf (Germany) * 51.30 % 51.30 %
Schindler Pars International Ltd., Hergiswil (Switzerland) ** *** 7.60 %
Bestinver Gestion, S.G.I.I.C. S.A., Madrid (Spain) 3.17 % 5.96 %
SaraSelect, c/o Sarasin Investmentfonds AG, Basel (Switzerland) 3.60 % 4.00 %
LB(Swiss) Investment AG, Zürich (Switzerland) *** 3.93 %
Share register as of December 31 (without nominees)* Controlling shareholder: Walter P.J. Droege through Droege Group AG ** Held 100 percent by Schindler Holding AG*** Voting rights below the notifiable threshold value of three percent
CONTINGENT LIABILITIES
chf 1 000 12.31.2017 12.31.2016
Conditional liabilities towards third parties 730 856 575 997
Letters of comfort p.m. p.m.
total 730 856 575 997
LIABILITIES TO DEFINED BENEFIT PLANS
chf 1 000 12.31.2017 12.31.2016
ALSO pension fund – 14
total – 14
NUMBER OF FULL-TIME EQUIVALENT POSITIONS
In 2017, the average number of full-time equivalent positions was 11 (previous year: 12).
The contingent liabilities of ALSO Holding AG cover the condi-tional liabilities for bank guarantees, borrowing arrangements and delivery commitments of the Group companies.

180
ALSO Annual Report 2017 FINANCIAL REPORT
INFORMATION ABOUT DIRECTLY OR INDIRECTLY CONTROLLED INVESTMENTS
Country Head office CompanyParticipation *
12.31.2017Participation *
12.31.2016Share capital
in 1 000 Currency Code
Switzerland Emmen ALSO Holding AG 12 849 CHF S
Emmen ALSO Schweiz AG 100 % 100 % 100 CHF D
Thun NRS Printing Solutions AG 100 % 100 % 100 CHF S
Emmen Quatec AG 100 % 100 % 100 CHF S
Stans Bachmann Mobile Kommunikation AG
100 % 30 % 100 CHF S
Belgium Mechelen Five 4 U BVBA 100 % – 8 331 EUR D
Denmark Tåstrup ALSO A/S 100 % 100 % 39 000 DKK D
Germany Soest ALSO Deutschland GmbH 100 % 100 % 20 000 EUR D
Osnabrück NT plus GmbH 100 % 100 % 12 500 EUR D
Osnabrück SEAMCOM GmbH & Co. KG 100 % 100 % 203 EUR D
Osnabrück SEAMCOM Verwaltungs GmbH 100 % 100 % 26 EUR S
Straubing ALSO MPS GmbH 100 % 100 % 100 EUR S
Berlin druckerfachmann.de GmbH 100 % 100 % 200 EUR S
Berlin LumIT GmbH 100 % 100 % 25 EUR S
Soest ALSO International Services GmbH 100 % 100 % 100 EUR S
Soest ALSO IH GmbH 100 % 100 % 25 EUR S
Soest Impaso Online Services GmbH 100 % 100 % 25 EUR S
Staufenberg Fulfilment Plus GmbH 100 % 100 % 50 EUR S
Pullach i. Isartal SINAS Beteiligungs GmbH & Co. Vermietungs-KG
0 % 0 % 9 EUR S
Soest MEDIUM GmbH 100 % 80 % 25 EUR D
Frankfurt am Main
Pestinger GmbH 74.8 % 74.8 % 26 EUR D
Stuttgart Beamer & more GmbH 51 % 51 % 25 EUR D
Berlin ALSO Enterprise Services GmbH 100 % 100 % 100 EUR S
Berlin druckerfachmann Verwaltungs GmbH (formerly ALSO bringback GmbH)
100 % 100 % 25 EUR S
Berlin Webinstore AG 99.99 % 99.99 % 500 EUR S
Soest ALSO Mobility Services GmbH 100 % 100 % 25 EUR S
Soest ALSO Logistics Services GmbH i. L.
100 % 100 % 25 EUR S
Finland Tampere ALSO Nordic Holding Oy 100 % 100 % 10 000 EUR S
Tampere ALSO Finland Oy 100 % 100 % 841 EUR D
Helsinki ALSO Cloud Oy 100 % 100 % 11 EUR S
Helsinki ALSO Cloud Solutions Oy 100 % 100 % 3 EUR S
Helsinki Internet Smartsec Oy ** – 8 EUR D
France Gennevilliers ALSO France S.A.S. 100 % 100 % 14 500 EUR D
Gennevilliers LAFI Logiciels Application Formation Information S.A.S.
100 % 100 % 400 EUR S

181
ALSO Annual Report 2017 FINANCIAL REPORT
INFORMATION ABOUT DIRECTLY OR INDIRECTLY CONTROLLED INVESTMENTS
Country Head office CompanyParticipation *
12.31.2017Participation *
12.31.2016Share capital
in 1 000 Currency Code
Paris BeIP S.A.S. 51 % – 147 EUR D
Morocco Casablanca BeIP International 100 % – 50 MAD D
Netherlands Nieuwegein ALSO Nederland B.V. 100 % 100 % 1 000 EUR D
Nijmegen ALSO Digital Holding B.V. 51 % 51 % 18 EUR S
Nijmegen ALSO Digital B.V. 100 % 100 % 18 EUR S
Nijmegen ALSO International B.V. 100 % 100 % 18 EUR D
Utrecht All 4 U B.V. 100 % – 50 EUR S
Utrecht Esseko B.V. 100 % – 54 EUR D
Utrecht Five 4 U Nederland B.V. 100 % – 10 EUR D
Norway Sandefjord ALSO AS 100 % 100 % 11 063 NOK D
Estonia Tallinn ALSO Eesti OÛ 100 % 100 % 192 EUR D
Tallinn Internet Smartsec OÛ 100 % – 3 EUR D
Latvia Marupe SIA “ALSO Latvia” 100 % 100 % 1 210 EUR D
Riga ALSO Cloud Latvia SIA 100 % – 100 EUR S
Lithuania Kaunas UAB “ALSO Lietuva” 100 % 100 % 1 883 EUR D
Austria Gross-Enzersdorf ALSO Austria GmbH 100 % 100 % 100 EUR D
Poland Warsaw ALSO Polska sp. z o.o. 99.99 % 99.99 % 41 705 PLN D
Goleniow MLS sp. z o.o. 100 % 100 % 5 000 PLN D
Goleniow Blue Bridge sp. z o.o. 100 % 100 % 100 PLN S
Szczecin iTerra sp. z o.o. 100 % 100 % 3 250 PLN D
Sweden Malmö ALSO Sweden AB 100 % 100 % 1 000 SEK D
Slovenia Ljubljana ALSO d.o.o. 100 % 100 % 8 EUR S
Codes: D = Distribution, S = Service- / Holding company* Participation equals ALSO Holding AG’s direct or indirect voting interest in the company.** As at September 1, 2017, Internet Smartsec Oy and ALSO Finland Oy merged. The merged company conducts its business under the name of ALSO Finland Oy.

182
ALSO Annual Report 2017 FINANCIAL REPORT
PARTICIPATIONS, CONVERSION RIGHTS AND OPTIONS
In accordance with Art. 25 of the Articles of Association, no par-ticipations, conversion rights or options are granted to members of the Board of Directors or Group Management.
The existing participations, conversion rights, and options of the members of the Board of Directors and Group Management and their related parties are as follows:
BOARD�OF�DIRECTORS�2017
12.31.2017
Number of shares Number of options
Gustavo Möller-Hergt, Chairman/Executive Member – –
Walter P. J. Droege, Vice Chairman 6 592 032 –
Karl Hofstetter 2 000 –
Rudolf Marty 10 –
Frank Tanski – –
Peter Athanas – –
Ernest-W. Droege – –
total 6 594 042 –
BOARD�OF�DIRECTORS�2016
12.31.2016
Number of shares Number of options
Gustavo Möller-Hergt, Chairman/Executive Member – –
Walter P. J. Droege, Vice Chairman 6 592 032 –
Karl Hofstetter 2 000 –
Rudolf Marty 10 –
Frank Tanski – –
Peter Athanas – –
Ernest-W. Droege – –
total 6 594 042 –
Gustavo Möller-Hergt has been a member of Group Management since 2011 and a member and Chairman of the Board of Directors since March 13, 2014. All other members of the Board of Directors are non-executive members.

183
ALSO Annual Report 2017 FINANCIAL REPORT
GROUP MANAGEMENT
Neither in the reporting year nor in the prior year did the mem-bers of Group Management receive participations, conversion rights, or options.
ADDITIONAL DISCLOSURES, STATEMENT OF CASH FLOWS AND STATUS REPORT
In accordance with Art. 961d, Paragraph 1, of the Swiss Code of Obligations, additional disclosures, the statement of cash flows and the status report are dispensed with, as the ALSO Holding AG prepares the consolidated financial statements in accordance with a generally accepted financial reporting standard.
EVENTS AFTER THE REPORTING PERIODThese financial statements were released for publication by the Board of Directors of ALSO Holding AG on February 9, 2018, and will be submitted to the Annual General Meeting of March 27, 2018, for approval.
No material events occurred after the reporting period.
There are no further matters requiring disclosure according to the Swiss Code of Obligations (SCO) Art. 959c.
PROPOSAL�OF�THE�BOARD�OF�DIRECTORS�TO�THE�ANNUAL�GENERAL�MEETING�OF�MARCH 27, 2018
chf 1 000 2017 2016
brought forward, january 1 227 043 176 567
Net profit 51 918 50 476
Dissolution of reserve from contribution in kind 35 257 28 847
total available earnings 314 218 255 890
disbursement of reserve from contribution in kind –35 257 –28 847
Balance to be carried forward 278 961 227 043

184
ALSO Annual Report 2017 FINANCIAL REPORT
Report of the statutory auditor to the General Meeting on the financial statements 2017Report on the audit of the financial statements
Opinion
We have audited the financial statements of ALSO Holding AG, which comprise the balance sheet as at 31 December 2017, income state-ment and notes for the year then ended, including a summary of significant accounting policies.
In our opinion, the financial statements pages 176 to 183 as at 31 December 2017 comply with Swiss law and the company’s articles of incorporation.
Basis for opinionWe conducted our audit in accordance with Swiss law and Swiss Auditing Standards. Our responsibilities under those provisions and standards are further described in the “Auditor’s responsibilities for the audit of the financial statements” section of our report.
We are independent of the entity in accordance with the provisions of Swiss law and the requirements of the Swiss audit profession and we have fulfilled our other ethical responsibilities in accordance with these requirements. We believe that the audit evidence we have obtained is sufficient and appropriate to provide a basis for our opinion.
Our audit approach
Overview Overall materiality: CHF 3.100.000
We tailored the scope of our audit in order to perform sufficient work to enable us to provide an opinion on the financial statements as a whole, taking into account the structure of the entity, the accounting processes and controls, and the industry in which the entity operates.
As a key audit matter, the following area of focus has been identified:
Impairment of equity investments
Wesent-lichkeit
Prüfungs-umfang
Besonderswichtige
Prüfungs-sachver-
halte
Materiality
Audit scope
Key audit matters
Caractèresignificatif
Étenduede l’audit
Élémentsclés
de l’audit

185
ALSO Annual Report 2017 FINANCIAL REPORT
Audit scope
We designed our audit by determining materiality and assessing the risks of material misstatement in the financial statements. In par-ticular, we considered where subjective judgements were made; for example, in respect of significant accounting estimates that involved making assumptions and considering future events that are inherently uncertain. As in all of our audits, we also addressed the risk of management override of internal controls, including among other matters consideration of whether there was evidence of bias that rep-resented a risk of material misstatement due to fraud.
Materiality
The scope of our audit was influenced by our application of materiality. Our audit opinion aims to provide reasonable assurance that the financial statements are free from material misstatement. Misstatements may arise due to fraud or error. They are considered material if individually or in aggregate, they could reasonably be expected to influence the economic decisions of users taken on the basis of the financial statements.
Based on our professional judgement, we determined certain quantitative thresholds for materiality, including the overall materiality for the financial statements as a whole as set out in the table below. These, together with qualitative considerations, helped us to determine the scope of our audit and the nature, timing and extent of our audit procedures and to evaluate the effect of misstatements, both indi-vidually and in aggregate on the financial statements as a whole.
Overall materiality CHF 3.100.000
How we determined it 0.5 % of equityRationale for the materiality benchmark applied We chose equity as the benchmark because it is a relevant and
generally accepted benchmark for materiality considerations relating to a holding company.
We agreed with the Audit Committee that we would report to them misstatements above CHF 310.000 identified during our audit as well as any misstatements below that amount which, in our view, warranted reporting for qualitative reasons.

186
ALSO Annual Report 2017 FINANCIAL REPORT
Report on key audit matters based on the Circular 1/2015 of the Federal Audit Oversight Authority
Key audit matters are those matters that, in our professional judgement, were of most significance in our audit of the financial statements of the current period. These matters were addressed in the context of our audit of the financial statements as a whole, and in forming our opinion thereon, and we do not provide a separate opinion on these matters.
IMPAIRMENT OF EQUITY INVESTMENTS
Key audit matter How our audit addressed the key audit matter
Impairment testing of equity investments was deemed a key audit matter for the following two reasons:Equity investments of CHF 516.6 million represent the largest single asset category. A valuation adjustment on this item would have a sig-nificant impact on the equity of the company. Testing for impairment depends on the future results of the each company concerned.
In addition, there is significant scope for judgement in determining the assumptions with regard to future results.
Please refer to page 178 (Accounting policies).
We assessed the impairment test performed by the company on equity investments by performing the following audit procedures:• For the forecasted cash flows, we assessed the budget process,
especially whether Management and the Board of Directors monitored this process and challenged the assumptions made.
• We tested whether the values used for the impairment test were in line with the budget approved by the Board of Directors.
• We discussed with Management how the country-specific assumptions concerning revenue growth and long-term growth rates have been established.
• We compared the assumptions relating to the prior year’s reve-nues and results with those for the year under review in order to identify, in retrospect, any assumptions that were too optimistic regarding the budgeted revenues and results.
• We assessed the adequacy of the forecasts relating to invest-ments and to the change in net working capital.
• We compared the applied discount rate with the respective cost of capital.
• In addition, using sensitivity analyses, we tested whether a sig-nificant change in each of the key assumptions (the discount rate, the EBITDA margin and the long-term growth rate) resulted in the impairment of the equity investments.
• We discussed the results of these tests with Management in terms of both the headroom available before the carrying amount of the equity investments would be impaired and the probability of such a change in the assumptions occurring.
In performing the audit procedures listed above, we addressed the risk of impairment of the equity investments. We have no findings to report.
187
ALSO Annual Report 2017 FINANCIAL REPORT
Responsibilities of the Board of Directors for the financial statements
The Board of Directors is responsible for the preparation of the financial statements in accordance with the provisions of Swiss law and the company’s articles of incorporation, and for such internal control as the Board of Directors determines is necessary to enable the preparation of financial statements that are free from material misstatement, whether due to fraud or error.
In preparing the financial statements, the Board of Directors is responsible for assessing the entity’s ability to continue as a going concern, disclosing, as applicable, matters related to going concern and using the going concern basis of accounting unless the Board of Directors intends either to liquidate the entity or to cease operations, or has no realistic alternative but to do so.
Auditor’s responsibilities for the audit of the financial statements
Our objectives are to obtain reasonable assurance about whether the financial statements as a whole are free from material misstate-ment, whether due to fraud or error, and to issue an auditor’s report that includes our opinion. Reasonable assurance is a high level of assurance, but is not a guarantee that an audit conducted in accordance with Swiss law and Swiss Auditing Standards will always detect a material misstatement when it exists. Misstatements can arise from fraud or error and are considered material if, individually or in the aggregate, they could reasonably be expected to influence the economic decisions of users taken on the basis of these financial statements.
A further description of our responsibilities for the audit of the financial statements is located at the website of EXPERTsuisse http://expertsuisse.ch/en/audit-report-for-public-companies. This description forms part of our auditor’s report.
Report on other legal and regulatory requirements
In accordance with article 728a paragraph 1 item 3 CO and Swiss Auditing Standard 890, we confirm that an internal control system exists which has been designed for the preparation of financial statements according to the instructions of the Board of Directors.We further confirm that the proposed appropriation of available earnings complies with Swiss law and the company’s articles of incor-poration. We recommend that the financial statements submitted to you be approved.
PricewaterhouseCoopers AG
Joanne Burgener Andreas BrunAudit expert Audit expertAuditor in charge
Lucerne, 9 February 2018

188
ALSO Annual Report 2017 FINANCIAL REPORT

189
ALSO Annual Report 2017 FINANCIAL REPORT
IMPRINT
FOR FURTHER INFORMATION PLEASE CONTACT
ALSO Holding AG
Meierhofstrasse 5
CH-6032 Emmen
Tel. +41 41 266 18 00
Fax +41 41 266 18 70
WWW.ALSO.COM
The original German language version is binding.
EDITING/CONCEPT AND TEXT
ALSO Holding AG, Emmen, Switzerland
DESIGN AND REALISATION
Strichpunkt, Stuttgart / Berlin, Germany
Meinders & Elstermann GmbH & Co. KG, Belm

190
ALSO Annual Report 2017 FINANCIAL REPORT
27.MAR
ANNUALGENERAL MEETING
26.JUL
PUBLICATIONHALF-YEAR REPORT
FINAN CIALCALENDAR


ALSO Holding AGMeierhofstrasse 5CH-6032 EmmenTel. +41 41 266 18 00Fax +41 41 266 18 70
FOR FURTHER INFORMATION
WWW.ALSO.COM