EQUITY NOTE: RÁBA Automotive Holding
20
1 EQUITY RESEARCH – RÁBA EQUITY NOTE: RÁBA Automotive Holding Recommendation: HOLD (revised) Target price (12M): HUF 1,280 (revised) 19 February 2021 Highlights We revised up our 12M target price on Rába Automotive Holding (RABA HB; RABA.BU) to 1,280 HUF/share from the previous HUF 1,197. Despite the somewhat better profit outlook, we revise down our previous BUY recommendation to HOLD, due to the strong stock market rally in December 2020 that pushed Rába’s stock price to an elevated level. The new target price is 0.7% lower than the HUF 1,290 closing price on 18 February 2021. Total return is estimated at the same -0.7% on a 12-month forecast period, as no dividend payment is expected for Y2020. Due to the covid-19 pandemic, Rába suffered sharp revenue decline in its key markets in 2020; both EBIT and EBITDA turned negative in Q2. After-tax profit sank into negative territory in the first three quarters of 2020. However, third-quarter earnings figures reflected strong QoQ recovery in the EU and the domestic market. The recovery continued in Q4 2020, QoQ growth characterized Rába's operation in almost every market and segment. As a result of the company's persistent efforts to manage the cost side, EBIT jumped to over HUF 1.1bn and EBITDA climbed to HUF 1.7bn in Q4, both recalling pre-covid times. Fourth-quarter EBIT offset operating losses suffered in Q1-Q3 last year, thus whole-year profitability swung into positive territory. As the second wave of pandemic swept over Europe and a third wave may become imminent, governments are focusing on vaccination in order to reach a minimum level of immunity, and to be able to reopen some parts of the economy. Restrictions in Q4 2020 weighed on the industry, but not as much as in last spring. Recession persisted in the past quarter in most countries in Europe, the latest GDP statistics showed, but with covid vaccines within reach, the outlook for swift economic recovery may drastically change from the second quarter of 2021. Volvo Group, one of Rába's largest peers reported dynamic Q4 expansion of order intakes in Europe, Rába's main export market. This improves the medium-term outlook for Rába as well. Given the stronger-than-expected Q4 profitability and improving medium-term outlook, we revised up our profit forecasts. The current enterprise value reflects the expectations in terms of improving landscape as vaccination progresses, although uncertainty regarding the rebound of the European automotive market has not evaporated. The personnel changes in the Board of Directors of Rába Equity Analyst: Orsolya Rátkai Phone: +36 1 374 7270 Email: [email protected]
-
Upload
khangminh22 -
Category
Documents
-
view
6 -
download
0
Transcript of EQUITY NOTE: RÁBA Automotive Holding

1
EQUITY RESEARCH – RÁBA
EQUITY NOTE: RÁBA Automotive Holding
Recommendation: HOLD (revised)
Target price (12M): HUF 1,280 (revised)
19 February 2021
Highlights
We revised up our 12M target price on Rába Automotive Holding (RABA HB;
RABA.BU) to 1,280 HUF/share from the previous HUF 1,197. Despite the somewhat
better profit outlook, we revise down our previous BUY recommendation to HOLD,
due to the strong stock market rally in December 2020 that pushed Rába’s stock
price to an elevated level. The new target price is 0.7% lower than the HUF 1,290
closing price on 18 February 2021. Total return is estimated at the same -0.7% on a
12-month forecast period, as no dividend payment is expected for Y2020.
Due to the covid-19 pandemic, Rába suffered sharp revenue decline in its key
markets in 2020; both EBIT and EBITDA turned negative in Q2. After-tax profit sank
into negative territory in the first three quarters of 2020. However, third-quarter
earnings figures reflected strong QoQ recovery in the EU and the domestic
market. The recovery continued in Q4 2020, QoQ growth characterized Rába's
operation in almost every market and segment. As a result of the company's
persistent efforts to manage the cost side, EBIT jumped to over HUF 1.1bn and
EBITDA climbed to HUF 1.7bn in Q4, both recalling pre-covid times. Fourth-quarter
EBIT offset operating losses suffered in Q1-Q3 last year, thus whole-year
profitability swung into positive territory.
As the second wave of pandemic swept over Europe and a third wave may become
imminent, governments are focusing on vaccination in order to reach a minimum
level of immunity, and to be able to reopen some parts of the economy.
Restrictions in Q4 2020 weighed on the industry, but not as much as in last spring.
Recession persisted in the past quarter in most countries in Europe, the latest GDP
statistics showed, but with covid vaccines within reach, the outlook for swift
economic recovery may drastically change from the second quarter of 2021.
Volvo Group, one of Rába's largest peers reported dynamic Q4 expansion of order
intakes in Europe, Rába's main export market. This improves the medium-term
outlook for Rába as well.
Given the stronger-than-expected Q4 profitability and improving medium-term
outlook, we revised up our profit forecasts. The current enterprise value reflects
the expectations in terms of improving landscape as vaccination progresses,
although uncertainty regarding the rebound of the European automotive market
has not evaporated. The personnel changes in the Board of Directors of Rába
Equity Analyst:
Orsolya Rátkai
Phone:
+36 1 374 7270
Email:
2
EQUITY RESEARCH – RÁBA
Holding add a new risk factor to the management's undisturbed operation, while
fast-growing raw material prices may endanger the strict cost control the
company lately followed.
The share price of Rába Automotive gained 40% in December but lost 6% in
January. Rába dropped 14.0% YTD while the BUX gained 4.6% this year.
Summary
Rába Automotive Holding's net sales revenues fell 7% YoY in Q4, to HUF 11.0bn,
after 17% decrease in Q3, 43% plunge in Q2, and 19% drop in Q1 2020. Export
revenues declined 12% YoY in HUF terms, with EU sales dropping 2% YoY in EUR
terms (Q3: -16%; Q2: -52% YoY) and US sales shrinking 22% YoY w/o FX effect (Q3:
-35%; Q2: -36% YoY).
Rába's quarterly sales figures were in line with our expectation, and as a new
phenomenon, revenues increased on QoQ basis in almost every market and
segment. In terms of sales revenues denominated in euros, the weakening HUF
also added to the improving performance.
Rába's cost-cutting efforts also contributed to the better-than-expected profit
figures. EBIT jumped to HUF 1.1bn and EBITDA amounted to HUF 1.7bn, recalling
pre-covid profit figures. Q4 EBIT rate improved to 10% and EBITDA rate jumped to
near 16%, margin levels not seen in a decade in Rába's history.
Outstanding fourth-quarter profitability only partly offset losses accumulated in
the less fortunate prior quarters of 2020. As a result, Rába reported HUF 1.1bn
yearly loss and HUF -85 EPS.
The pandemic, with the second wave hitting economies, still makes forecasting
challenging. We revised up our previous forecast to reflect the better-than-
expected profitability improvement in Q4 and improving business environment,
especially if vaccination speeds up. Nevertheless, risks lie on the downside,
regarding the short and medium-term outlook. Personnel changes in the BoD may
add further risk to the company's operation.
3
EQUITY RESEARCH – RÁBA
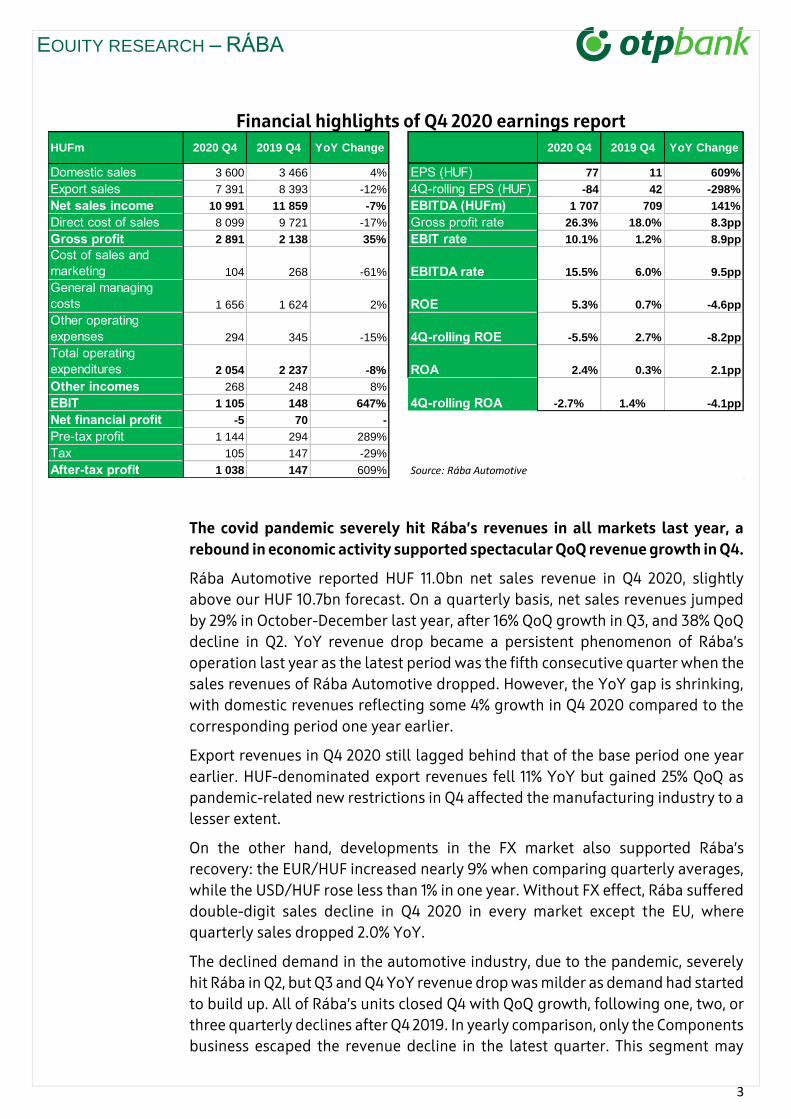
Financial highlights of Q4 2020 earnings report
The covid pandemic severely hit Rába’s revenues in all markets last year, a
rebound in economic activity supported spectacular QoQ revenue growth in Q4.
Rába Automotive reported HUF 11.0bn net sales revenue in Q4 2020, slightly
above our HUF 10.7bn forecast. On a quarterly basis, net sales revenues jumped
by 29% in October-December last year, after 16% QoQ growth in Q3, and 38% QoQ
decline in Q2. YoY revenue drop became a persistent phenomenon of Rába’s
operation last year as the latest period was the fifth consecutive quarter when the
sales revenues of Rába Automotive dropped. However, the YoY gap is shrinking,
with domestic revenues reflecting some 4% growth in Q4 2020 compared to the
corresponding period one year earlier.
Export revenues in Q4 2020 still lagged behind that of the base period one year
earlier. HUF-denominated export revenues fell 11% YoY but gained 25% QoQ as
pandemic-related new restrictions in Q4 affected the manufacturing industry to a
lesser extent.
On the other hand, developments in the FX market also supported Rába’s
recovery: the EUR/HUF increased nearly 9% when comparing quarterly averages,
while the USD/HUF rose less than 1% in one year. Without FX effect, Rába suffered
double-digit sales decline in Q4 2020 in every market except the EU, where
quarterly sales dropped 2.0% YoY.
The declined demand in the automotive industry, due to the pandemic, severely
hit Rába in Q2, but Q3 and Q4 YoY revenue drop was milder as demand had started
to build up. All of Rába’s units closed Q4 with QoQ growth, following one, two, or
three quarterly declines after Q4 2019. In yearly comparison, only the Components
business escaped the revenue decline in the latest quarter. This segment may
Domestic sales 3 600 3 466 4% EPS (HUF) 77 11 609%
Export sales 7 391 8 393 -12% 4Q-rolling EPS (HUF) -84 42 -298%
Net sales income 10 991 11 859 -7% EBITDA (HUFm) 1 707 709 141%
Direct cost of sales 8 099 9 721 -17% Gross profit rate 26.3% 18.0% 8.3pp
Gross profit 2 891 2 138 35% EBIT rate 10.1% 1.2% 8.9pp
Cost of sales and
marketing 104 268 -61% EBITDA rate 15.5% 6.0% 9.5pp
General managing
costs 1 656 1 624 2% ROE 5.3% 0.7% -4.6pp
Other operating
expenses 294 345 -15% 4Q-rolling ROE -5.5% 2.7% -8.2pp
Total operating
expenditures 2 054 2 237 -8% ROA 2.4% 0.3% 2.1pp
Other incomes 268 248 8%
EBIT 1 105 148 647%
Net financial profit -5 70 -
Pre-tax profit 1 144 294 289%
Tax 105 147 -29%
After-tax profit 1 038 147 609% Source: Rába Automotive
2019 Q4 YoY ChangeHUFm 2020 Q4 2019 Q4 YoY Change 2020 Q4
4Q-rolling ROA -2.7% 1.4% -4.1pp
4
EQUITY RESEARCH – RÁBA
have bottomed out in Q3 as the total revenues of this segment already gained 25%
QoQ in HUF terms in Q4, with EU sales adding 15% QoQ and domestic revenues
jumping 34% QoQ. In YoY terms, the Components business' revenue increased by
a tiny 1% in the past quarter.
The Axle business unit, which generates a major part of the revenue, witnessed 9%
YoY decrease in the past quarter, with considerably milder drop than the 17% and
31% YoY declines reported in Q3 and Q2, respectively. In quarterly comparison, the
Vehicle business unit finally left in Q4 2020 the decreasing revenue path it had
taken in the previous couple of quarters. Although last quarter saw 26% YoY
revenues drop, exports increased by 25% QoQ, while domestic sales gained 84%.
Recovery on the domestic market is also palpable as besides QoQ growth, YoY
revenue increase also mostly returned (the Vehicle business is the exception as
the much-awaited military orders were not placed, which still weighs on the unit's
domestic performance).
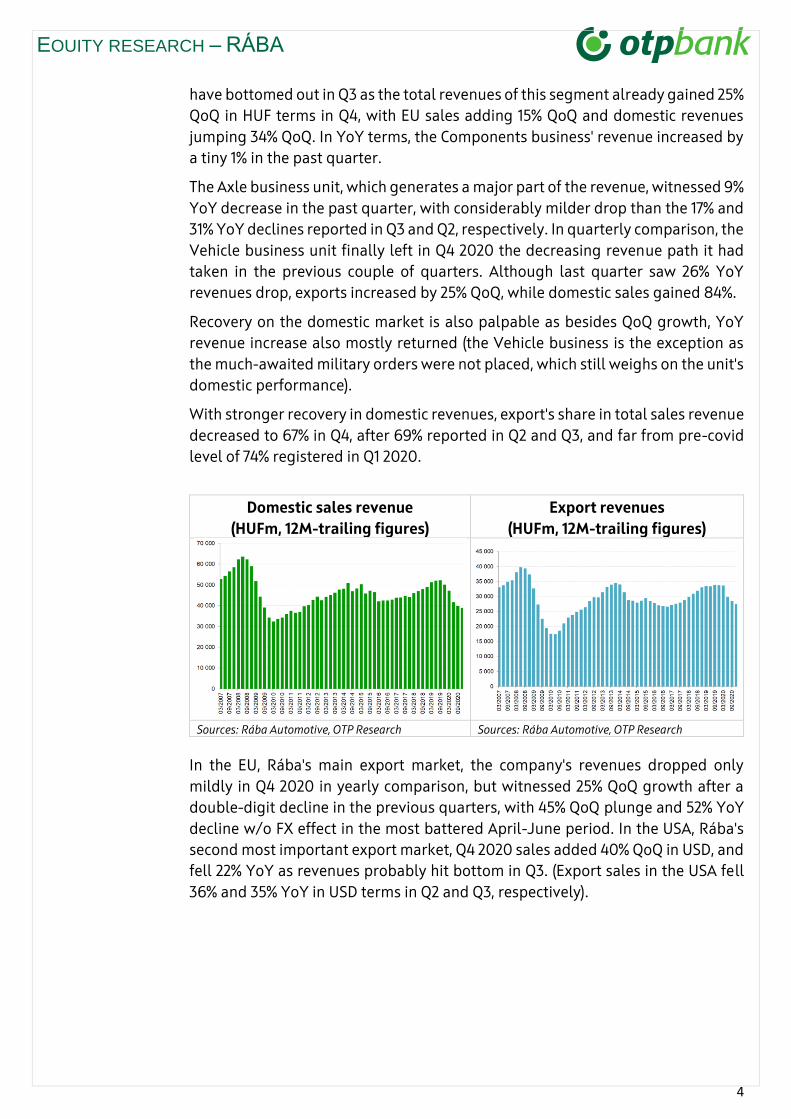
With stronger recovery in domestic revenues, export's share in total sales revenue
decreased to 67% in Q4, after 69% reported in Q2 and Q3, and far from pre-covid
level of 74% registered in Q1 2020.
Domestic sales revenue
(HUFm, 12M-trailing figures)
Export revenues
(HUFm, 12M-trailing figures)
Sources: Rába Automotive, OTP Research Sources: Rába Automotive, OTP Research
In the EU, Rába's main export market, the company's revenues dropped only
mildly in Q4 2020 in yearly comparison, but witnessed 25% QoQ growth after a
double-digit decline in the previous quarters, with 45% QoQ plunge and 52% YoY
decline w/o FX effect in the most battered April-June period. In the USA, Rába's
second most important export market, Q4 2020 sales added 40% QoQ in USD, and
fell 22% YoY as revenues probably hit bottom in Q3. (Export sales in the USA fell
36% and 35% YoY in USD terms in Q2 and Q3, respectively).

5
EQUITY RESEARCH – RÁBA
12M-trailing EU export sales
revenue of Rába Automotive (EURm)
12M-trailing US export sales revenue
of Rába Automotive (USDm)
Sources: Rába Automotive, OTP Research Sources: Rába Automotive, OTP Research
Quarterly revenue growth in the US market also showed recovery as sales
revenues jumped by 40% in Q4 compared to Q3, after 35% QoQ contraction
(without FX effect) in Q3, and 28% decline in Q2. However, the somewhat lower
USD/HUF – when comparing quarterly averages in Q4 and Q3 – slightly pared
down QoQ growth in HUF terms.
Export revenues in CIS and Eastern Europe turned for the worse in the second half
of Y2020 as sales halved in a yearly basis in Q3 and fell 65% YoY in Q4 after the
jump in Q2. On a quarterly basis, CIS export gained 20% in October-December.
Exports to 'other markets' shrank further in Q4 2020, the 64% YoY decline in Q3
was followed by 80% YoY plunge, while QoQ decline was 25% in FX terms in the
last quarter of 2020.
12M-trailing sales revenue of Rába
Automotive in the CIS market
(EURm)
12M-trailing sales revenue of Rába
Automotive in the ‘other markets’
(EURm)
Sources: Rába Automotive, OTP Research Sources: Rába Automotive, OTP Research
Profitability improved further in Q4, delivering outstanding profit rates not
seen in the past several years. Despite the slightly higher raw material prices but
lower energy prices, Rába not only maintained the elevated level of gross margin
reported in Q3 2020 (20.3%) but it also managed to lift it beyond 26%, well above
the long-term average and to a level not seen since the end of Y2012. As a result,
gross profit increased to HUF 2.9bn in Q4 2020, from HUF 1.7bn in Q3 (+66% QoQ)
and HUF 2.1bn in Q4 2019 (+35% YoY).
6
EQUITY RESEARCH – RÁBA
As we wrote earlier, the company implemented measures to control the cost side
when the revenue side faded. Rába announced changes in order to cut general
management and administration costs, including the reorganisation of the
corporate structure, optimising purchasing, and implementing exceptionally
tough cost control.
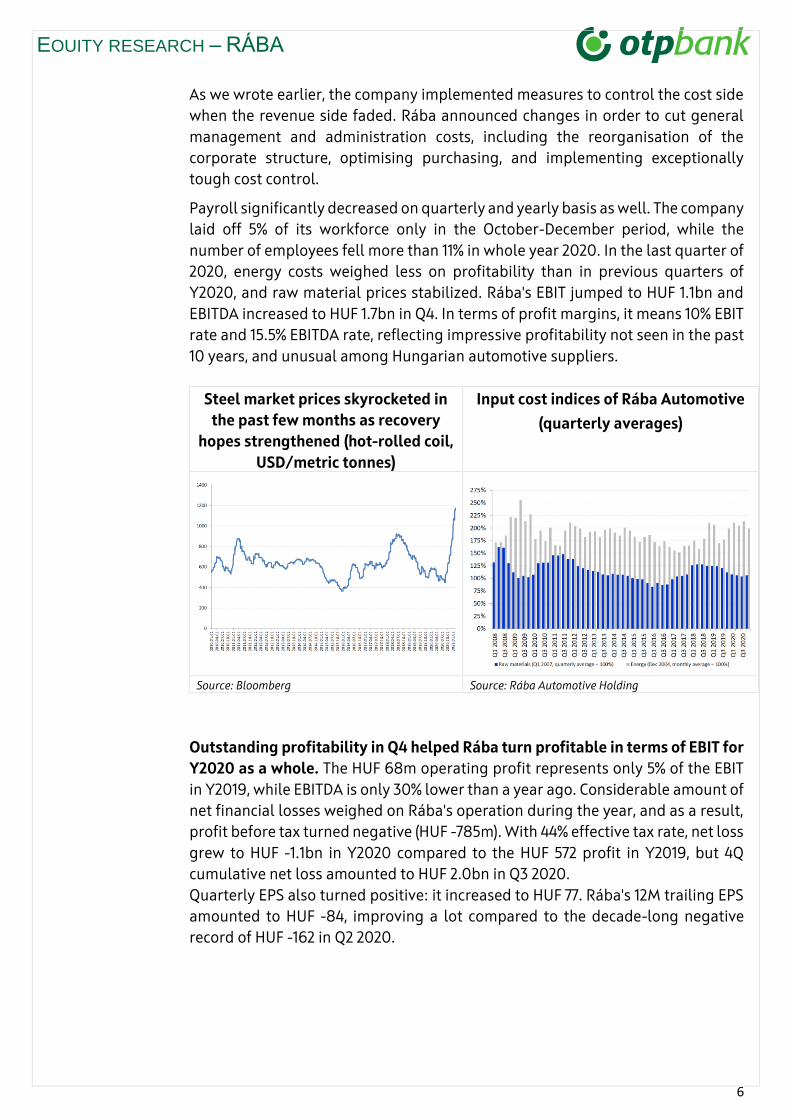
Payroll significantly decreased on quarterly and yearly basis as well. The company
laid off 5% of its workforce only in the October-December period, while the
number of employees fell more than 11% in whole year 2020. In the last quarter of
2020, energy costs weighed less on profitability than in previous quarters of
Y2020, and raw material prices stabilized. Rába's EBIT jumped to HUF 1.1bn and
EBITDA increased to HUF 1.7bn in Q4. In terms of profit margins, it means 10% EBIT
rate and 15.5% EBITDA rate, reflecting impressive profitability not seen in the past
10 years, and unusual among Hungarian automotive suppliers.
Steel market prices skyrocketed in
the past few months as recovery
hopes strengthened (hot-rolled coil,
USD/metric tonnes)
Input cost indices of Rába Automotive
(quarterly averages)
Source: Bloomberg Source: Rába Automotive Holding
Outstanding profitability in Q4 helped Rába turn profitable in terms of EBIT for
Y2020 as a whole. The HUF 68m operating profit represents only 5% of the EBIT
in Y2019, while EBITDA is only 30% lower than a year ago. Considerable amount of
net financial losses weighed on Rába's operation during the year, and as a result,
profit before tax turned negative (HUF -785m). With 44% effective tax rate, net loss
grew to HUF -1.1bn in Y2020 compared to the HUF 572 profit in Y2019, but 4Q
cumulative net loss amounted to HUF 2.0bn in Q3 2020.
Quarterly EPS also turned positive: it increased to HUF 77. Rába's 12M trailing EPS
amounted to HUF -84, improving a lot compared to the decade-long negative
record of HUF -162 in Q2 2020.

7
EQUITY RESEARCH – RÁBA
EBITDA margin at Rába’s business
units
12M-trailing EPS (HUF)
Sources: Rába Automotive, OTP Research Sources: Rába Automotive, OTP Research
Comments
• The covid crisis in Q2 2020 steepened the deteriorating trend in the EU's automotive
market. Q3 and Q4 have brought rising manufacturing PMIs, reflecting an improving
economic environment. The recently published Q4 GDP data also gave evidence that,
even though economic activity had deteriorated in the eurozone with second-wave
restrictions, but not as much as in last spring.
o QoQ growth returned in the euro area in Q3, after the dramatic decline in Q2.
Manufacturing PMIs and business confidence indicators also reflected
somewhat improving economic environment, mainly in the manufacturing
sector. However, as the second wave of the pandemic swept over Europe,
economic sentiment in some parts of Europe deteriorated again by November,
due to renewed restrictions.
o In the second wave, governments implemented more optimised restrictions in
order to avoid the kind of sharp downturn experienced in Q2. These actions
bore some fruits as euro area GDP dropped only (SA) 0.6% QoQ compared to
the 11.7% QoQ decline in Q2, and some member states (namely Germany and
Spain) even achieved mild QoQ growth (0.1% and 0.4%, respectively).
o The YoY decline steepened to 5.0% in Q4 2020 in the euro area, after the 4.3%
YoY drop reported in Q3 2020.
o EU27 GDP fell 4.8% YoY in Q4 2020, after 4.2% contraction in Q3. Compared to
the previous quarter, Q4 GDP dropped in the EU27 country group after 11.4%
quarterly plunge in Q2 and 11.5% QoQ growth in Q3.
o The European Commission's latest forecasts (Winter 2021 Economic Forecast,
issued on 2 February 2021; on the day when the Q4 2020 flash estimate was
published) expect GDP to increase by 3.7% in the EU27, and by 3.8% in the euro
area this year. It was revised down compared to EC's Autumn 2020 Economic
Forecast, and it can be revised further down as the second estimate to Q4
growth came slightly higher than expected. Economic growth is expected to
gain momentum in the EU27 in 2022, with GDP expanding by 3.9% but euro area
growth remaining at 3.8% next year. The EC's growth scenario calculates with
8
EQUITY RESEARCH – RÁBA
one more quarter with QoQ decline (Q1 2021) but the following quarters are
expected to deliver positive real growth both in the EU27 and the eurozone.
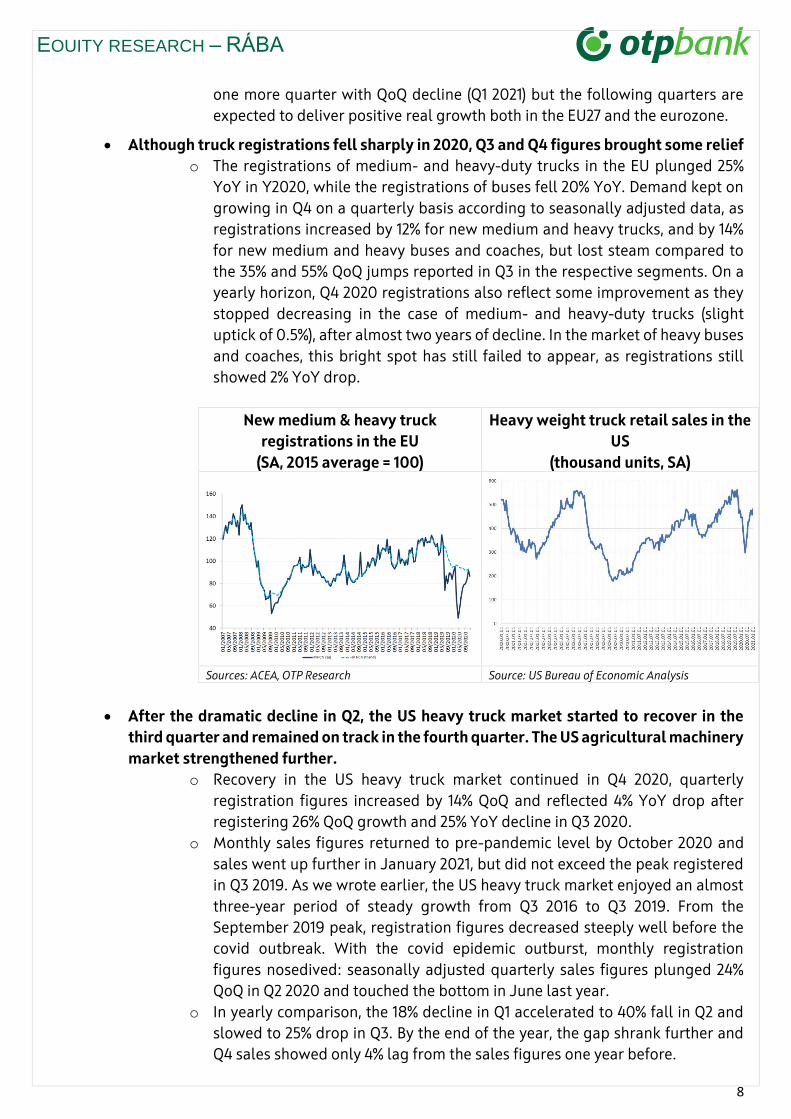
• Although truck registrations fell sharply in 2020, Q3 and Q4 figures brought some relief
o The registrations of medium- and heavy-duty trucks in the EU plunged 25%
YoY in Y2020, while the registrations of buses fell 20% YoY. Demand kept on
growing in Q4 on a quarterly basis according to seasonally adjusted data, as
registrations increased by 12% for new medium and heavy trucks, and by 14%
for new medium and heavy buses and coaches, but lost steam compared to
the 35% and 55% QoQ jumps reported in Q3 in the respective segments. On a
yearly horizon, Q4 2020 registrations also reflect some improvement as they
stopped decreasing in the case of medium- and heavy-duty trucks (slight
uptick of 0.5%), after almost two years of decline. In the market of heavy buses
and coaches, this bright spot has still failed to appear, as registrations still
showed 2% YoY drop.
New medium & heavy truck
registrations in the EU
(SA, 2015 average = 100)
Heavy weight truck retail sales in the
US
(thousand units, SA)
Sources: ACEA, OTP Research Source: US Bureau of Economic Analysis
• After the dramatic decline in Q2, the US heavy truck market started to recover in the
third quarter and remained on track in the fourth quarter. The US agricultural machinery
market strengthened further.
o Recovery in the US heavy truck market continued in Q4 2020, quarterly
registration figures increased by 14% QoQ and reflected 4% YoY drop after
registering 26% QoQ growth and 25% YoY decline in Q3 2020.
o Monthly sales figures returned to pre-pandemic level by October 2020 and
sales went up further in January 2021, but did not exceed the peak registered
in Q3 2019. As we wrote earlier, the US heavy truck market enjoyed an almost
three-year period of steady growth from Q3 2016 to Q3 2019. From the
September 2019 peak, registration figures decreased steeply well before the
covid outbreak. With the covid epidemic outburst, monthly registration
figures nosedived: seasonally adjusted quarterly sales figures plunged 24%
QoQ in Q2 2020 and touched the bottom in June last year.
o In yearly comparison, the 18% decline in Q1 accelerated to 40% fall in Q2 and
slowed to 25% drop in Q3. By the end of the year, the gap shrank further and
Q4 sales showed only 4% lag from the sales figures one year before.

9
EQUITY RESEARCH – RÁBA
o Considering the whole last year, the retail sales of heavy trucks fell 23% in
Y2020 compared to Y2019, in the biggest yearly drop since the global financial
crisis (2008/2009).
o During the pandemic, the agricultural machinery market showed more
resilience than the truck market in 2020 as agriculture itself is more resilient
to cyclical changes. From quarter to quarter, sold units increased in almost
every machinery category and exceeded the long-term average between 2015
and 2019. In the most common category –the segment of two-wheeled farm
tractors with capacity of less than 40HP– retail sales increased by 4% QoQ and
36% YoY in Q4 2020 and other segments also witnessed double-digit growth[1]
in yearly comparison. In 2020 as a whole, the market of two-wheeled farm
tractors expanded by 18%, while the market of four-wheeled farm tractors
gained 4% and self-propelled combine sales increased 6%.
• Sales to the area covering the CIS lost steam, sales dropped in Q3 and Q4
o Weak demand has characterised the heavy truck and bus markets in the CIS
throughout the past year. Statistics showed 7% decline of registrations in the
new heavy truck market in the January-December period, while the bus
market also shrank 7%. The latest available data from January 2021 reflect the
persistence of last year’s downward trend, the new bus market in Russia
declined 11% YoY and while new truck sales fell 16% YoY. We note that Rába’s
performance (tripling revenues) in Q2 2020 was due to very low base, while the
44% YoY decline in Q3 reflected more the real market development.
• The current pandemic situation totally altered the economic landscape and it put
economies and enterprises onto a very different growth path from one expected at the
beginning of 2020. However, with covid vaccination having started, the outlook for a
swift economic recovery is markedly improving.
o The pandemic, with the ongoing second wave, still makes economic outlook
uncertain as governments balance between safety-first approach and winking
at gradual reopening once pandemic statistics show permanent improvement.
With covid vaccination rollout having started, the chances for the economies
to return to their pre-covid growth paths increased a lot. At the same time, the
emersion of newer and newer variants of SARS-Cov2 risks this swift economic
recovery or makes it at least uncertain. Certain degree of recession persisted
in Q4 and is expected to continue in Q1 2021 (even though we do not expect e.g.
supply chain challenges in the industrial sectors), but outlook for a recovery
next year has improved. We expect a growth spike in Q2 and Q3 2021.
Vaccination may alter the economic landscape by providing strong support for
future growth. The revival of investment may add further impetus, as
enterprises catch up on their postponed purchases.
o Only one of Rába’s two European peers has released its Q4 2020 earnings
report so far. Volvo reported positive developments again in the past
quarter, just like in Q3 2020. Net order intake for heavy- and medium-duty
trucks jumped 42% YoY in Q4 2020 in Europe, after 21% YoY expansion in Q3 (in
the number of trucks). Total order intake increased by 61% YoY in the past
quarter. In whole 2020, heavy- and medium-duty truck orders upped a meagre
10
EQUITY RESEARCH – RÁBA
2%, compared to 2019. In terms of deliveries, the fourth quarters did not bring
any growth in Europe or globally, but cumulative four-quarter delivery figures
showed 23% YoY decline in Europe, and 28% decrease for the total market. As
a forward-looking guidance, Volvo, as one of the biggest market players,
raised its forecast for the EU30 market of heavy- and medium-duty trucks for
2021. The company expects 290,000 new registrations in this segment for 2021,
50,000 more than in its earlier forecast, and it is reflecting 25% YoY growth
after 28% decline in 2020.
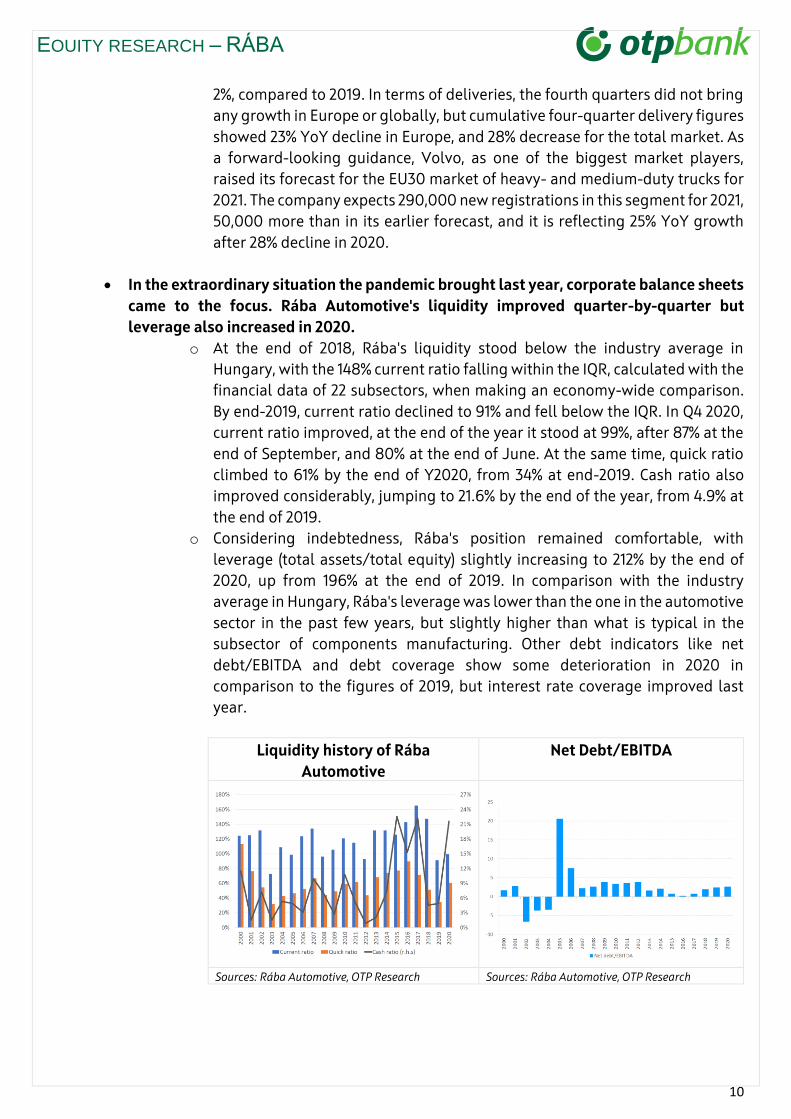
• In the extraordinary situation the pandemic brought last year, corporate balance sheets
came to the focus. Rába Automotive's liquidity improved quarter-by-quarter but
leverage also increased in 2020.
o At the end of 2018, Rába's liquidity stood below the industry average in
Hungary, with the 148% current ratio falling within the IQR, calculated with the
financial data of 22 subsectors, when making an economy-wide comparison.
By end-2019, current ratio declined to 91% and fell below the IQR. In Q4 2020,
current ratio improved, at the end of the year it stood at 99%, after 87% at the
end of September, and 80% at the end of June. At the same time, quick ratio
climbed to 61% by the end of Y2020, from 34% at end-2019. Cash ratio also
improved considerably, jumping to 21.6% by the end of the year, from 4.9% at
the end of 2019.
o Considering indebtedness, Rába's position remained comfortable, with
leverage (total assets/total equity) slightly increasing to 212% by the end of
2020, up from 196% at the end of 2019. In comparison with the industry
average in Hungary, Rába's leverage was lower than the one in the automotive
sector in the past few years, but slightly higher than what is typical in the
subsector of components manufacturing. Other debt indicators like net
debt/EBITDA and debt coverage show some deterioration in 2020 in
comparison to the figures of 2019, but interest rate coverage improved last
year.
Liquidity history of Rába
Automotive
Net Debt/EBITDA
Sources: Rába Automotive, OTP Research Sources: Rába Automotive, OTP Research

11
EQUITY RESEARCH – RÁBA
Valuation
• Considering the developments of the past months, we revised up our top-line and
bottom-line estimates. Although we still have not left behind the pandemic, the start
of vaccination is a big step forward to normalization and the gradual easing of
current restrictions. However, new variants of the covid virus put economic recovery
at considerable risk, growth outlook remains uncertain, particularly in the short run.
• Based on the available data one of Rába's global peers had released, the European
market of heavy- and medium-duty trucks may hold out recovery stronger than
expected a few months ago. With Rába's better-than-expected Q4 figures (mainly on
the cost side), we implemented some modifications in our valuation model. We note
that, in the current circumstances, the position of small companies and those at the
end of the supply chain is less certain. To reflect the higher grade of uncertainty, we
previously increased the illiquidity discount in our valuation model and we still
maintain it.
• Considering Rába's better-than-expected Q4 profitability, the strong cost control
Rába maintains and the better-than-previously-forecast recovery outlook in the
European market of heavy- and medium-duty trucks, we revised up our profit
estimates. We expect this year's EBIT to increase to HUF 1.1bn, after HUF 68m
operating profit in 2020. This year's EBITDA is expected to rise to HUF 3.2bn, from
HUF 2.4bn in 2020. 12M EPS is forecast to climb to HUF 46 in 2021. In 2022, EBIT may
reach HUF 1.4bn and EBITDA is expected to near HUF 3.5bn. Y2022 EPS is expected to
improve further and increase to HUF 59. However, we are aware of the downside and
upside risks to our forecast. It is a question how Rába manages costs when raw
material prices set off, as it happened with steel prices in the past few months, while
slow vaccine rollout in many countries may harm swift economic recovery and delay
the withdrawal of restriction measures.
• Consequently, we revised up our 12M target price to 1,280 HUF/share from the
previous HUF 1197. Our valuation model focuses on the forecast horizon between
2021 and 2025. The new 12M target price is 0.7% lower than the HUF 1,290 closing
price on 18 February, 2021. The new target price offers the same -0.7% TR as Rába is
not expected to pay dividend from Y2020 results.
• The future sale of Rába's real estate is also part of our valuation. Although the
company announced in December 2019 that a possible buyer had made an offer and
the BoD acting on behalf of the shareholders' AGM had entitled the management to
sell the property in question, the transaction may fizzle out, at least no information
has been issued to indicate otherwise.
• However, if the transaction finally concludes with the previously announced
purchase price, it may add 81 HUF/share to the current target price.

12
EQUITY RESEARCH – RÁBA
Deduction of 12M target price
Source: OTP Research
Rába's valuation (HUFm) 2019 2020 2021 2022 2023 2024 2025
FCFF in the
explicit period
FCFF -278 -1 185 298 824 1 161 1 379 196
Discount factor 0,95 0,96 0,95 0,90 0,85 0,79 0,73
DCF -263 -1 134 270 673 803 755 82 2 584
Terminal value (HUFm) 29 626
Net present value (HUFm) of TV 22 552
Enterprise Value (incl. possible future property
sale) HUFm 26 829
Net debt 10 941
Equity value - Dec 31 2021, HUFm 15 888
Number of shares 13 352 765
Expected return on equity 7,6%
12M Target price 1 280
Current price 1 290
Upside/Downside -0,7%
TR Upside/Downside -0,7%
CONSOLIDATED INCOME STATEMENT HUFm
2018 2019 2020 2021E 2022E 2023E
Domestic sales 15 827 16 257 11 560 12 740 13 904 13 643
Export sales 32 805 33 525 27 194 29 749 33 849 35 916
Total sales revenue 48 632 49 782 38 754 42 489 47 753 49 559
Direct cost of sales -38 262 -40 463 -30 722 -33 991 -38 680 -40 143
Gross profit 10 370 9 319 8 032 8 498 9 073 9 416
Indirect costs of sales -8 564 -7 979 -7 964 -7 351 -7 641 -7 830
EBIT 1 807 1 340 68 1 147 1 433 1 586
EBITDA 3 846 3 455 2 409 3 220 3 485 3 618
Net financial profit/loss -109 -411 -909 -300 -300 -300
Profit before tax 1 698 1 004 -785 847 1 133 1 286
Tax -501 -433 -345 -237 -351 -296
After-tax profit 1 197 572 -1 130 610 781 990
Dividend 238 267 0 122 156 198
EPS 90 43 -83 46 59 74
DPS 18 20 0 9 12 15
*Unconfirmed, estimated on the basis of official consolidated total sales and preliminary export sales figures.
13
EQUITY RESEARCH – RÁBA
Sources: Rába Automotive, OTP Research
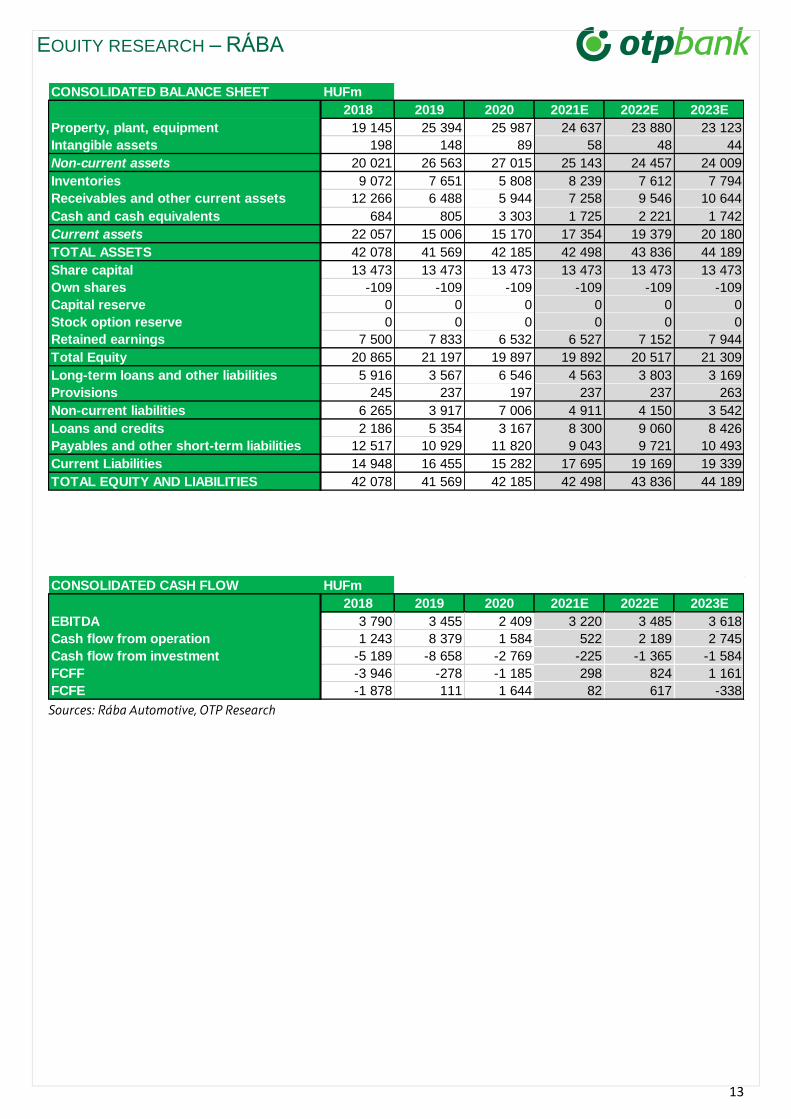
CONSOLIDATED BALANCE SHEET HUFm
2018 2019 2020 2021E 2022E 2023E
Property, plant, equipment 19 145 25 394 25 987 24 637 23 880 23 123
Intangible assets 198 148 89 58 48 44
Non-current assets 20 021 26 563 27 015 25 143 24 457 24 009
Inventories 9 072 7 651 5 808 8 239 7 612 7 794
Receivables and other current assets 12 266 6 488 5 944 7 258 9 546 10 644
Cash and cash equivalents 684 805 3 303 1 725 2 221 1 742
Current assets 22 057 15 006 15 170 17 354 19 379 20 180
TOTAL ASSETS 42 078 41 569 42 185 42 498 43 836 44 189
Share capital 13 473 13 473 13 473 13 473 13 473 13 473
Own shares -109 -109 -109 -109 -109 -109
Capital reserve 0 0 0 0 0 0
Stock option reserve 0 0 0 0 0 0
Retained earnings 7 500 7 833 6 532 6 527 7 152 7 944
Total Equity 20 865 21 197 19 897 19 892 20 517 21 309
Long-term loans and other liabilities 5 916 3 567 6 546 4 563 3 803 3 169
Provisions 245 237 197 237 237 263
Non-current liabilities 6 265 3 917 7 006 4 911 4 150 3 542
Loans and credits 2 186 5 354 3 167 8 300 9 060 8 426
Payables and other short-term liabilities 12 517 10 929 11 820 9 043 9 721 10 493
Current Liabilities 14 948 16 455 15 282 17 695 19 169 19 339
TOTAL EQUITY AND LIABILITIES 42 078 41 569 42 185 42 498 43 836 44 189
CONSOLIDATED CASH FLOW HUFm
2018 2019 2020 2021E 2022E 2023E
EBITDA 3 790 3 455 2 409 3 220 3 485 3 618
Cash flow from operation 1 243 8 379 1 584 522 2 189 2 745
Cash flow from investment -5 189 -8 658 -2 769 -225 -1 365 -1 584
FCFF -3 946 -278 -1 185 298 824 1 161
FCFE -1 878 111 1 644 82 617 -338
14
EQUITY RESEARCH – RÁBA
Risks surrounding Rába’s economic activity
Liquidity risk: In the current covid crisis, liquidity and debt issues came to the fore as
companies must maintain liquidity and solvency at a time when revenues decline in a
better case, or simply vanish for a period in the worst case. In industry comparison, Rába
operates with relatively low liquidity, which further decreases in times of economic
distress (e.g. the financial crisis of 2008/2009). Earlier data prove that Rába's liquidity
position already weakened by end-2019 and remained at the same low level in Q1 2020.
In Q2, liquidity ratios deteriorated, but by end-Q4 2020 current ratio, quick ratio and cash
ratio also improved compared to end-2019. When assessing Rába’s indebtedness, it
stands out that it is lower now than in 2008/2009. However, by end-2020 leverage
increased and net debt/EBITDA climbed to 3.0x from 2.4x at end-2019. Debt/EBITDA ratio
grew from 2.7x at the end-2019 to 5.7 by the end of 2020.
FX risk: As export sales have a dominant share in Rába’s sales performance, the company
is exposed to exchange rate fluctuations. About 60–70% of the total sales revenue is FX-
dominated, which climbed from 65% in 2017 to 67% in 2018 and in 2019, and to 70% in
2020. Export’s weight in sales revenues is expected to remain above 70% in the coming
years. In the present circumstances, with revenues declining due to the covid-19
pandemic, a weaker HUF (in yearly comparison) partly offset sales' drop in FX terms.
Raw material & energy prices: Steel prices on the global commodity market started to
decline in mid-2018. Since the second half of 2018, benchmark steel prices have been
dropping, and by the middle of 2019, prices fell more than 20%, when comparing
quarterly averages. Steel benchmark kept on falling throughout the second half of Y2019
and the first half of 2020 and bottomed out in Q3 2020. Since then hot-rolled coil
benchmark price has skyrocketed: the price in the middle of February was 150% higher
than the lowest price in the middle of August.
At the same time, energy prices seem to be stabilizing at a relatively high level, putting
Rába's profitability under pressure, even though the Q4 energy price reported by Rába is
7% lower than in Q3.
Economic environment: Economic landscape radically changed in Q1 2020 due to the
coronavirus pandemic, and economies went off from the previously expected growth
path. There are a lot of uncertainties considering the economic downturn and the
possible recovery, which also add downside risk to our forecast. And while the Hungarian
monetary and exchange rate policy is also changing, in case of an external shock, like
now, we can see that the monetary policy will be able to accommodate itself to that
situation through exchange rates.
Risks surrounding Rába’s property for sale: According to Rába's announcement on the
resolutions of the BoD on behalf of the shareholders' AGM, the management was
authorized the sell part of the company's property portfolio. It is expected to be fulfilled
in one year's time. When it happens, the sales revenue as a one-off item will add some 81
HUF/share to Rába's enterprise value, calculated based on the disclosed data. However,
in the current environment, companies may postpone their investment plans, while
administrative and regulatory hurdles may also hinder the transaction.
15
EQUITY RESEARCH – RÁBA
Labour supply: Labour market developments, particularly the labour shortage that
prevailed earlier could have arrived at a point when it may harm the companies’ growth
potential, and result in higher labour costs, or extra capex need to substitute labour force
with robotization, or may lead to chronic capacity shortage. Rába is located in Western
Hungary, where unemployment practically vanished, and the local labour market is very
supply-driven. However, covid may change the landscape in this sense as well, but its
effect is hardly palpable at this point, as wage dynamics in the manufacturing industry
remained at an elevated level this year, latest statistics show.
Ownership: Apparently, the state-owned MNV’s 75% ownership in Rába so far made no
palpable changes to the company’s operation or strategy. A significant part of MNV’s
asset portfolio consists of companies linked to public services – from this point of view
Rába, an industrial manufacturer that operates under market conditions, does not seem
to fit the owner’s portfolio. MNV has not published a comprehensive strategy or a clear
view on its goals with Rába, except the declaration at the time of the buyout on
strengthening the state’s presence in strategic sectors like the automotive industry.
Lately, Rába could not benefit from the proximity of this strategic owner, and the
framework contract of 2018 bore no visible fruit for the company.
A further risk is that the directives centrally declared on the operation of state-owned
companies do not differentiate between companies, and do not take into consideration
the sector's characteristics. Although we consider the dominant state ownership a real
risk, this research does not factor it in.
The initiation report, which contains the assumptions of the models used, is available here.
The valuation methodology used in this present equity research note to determine our price targets and
recommendations is available here. (Also available in Hungarian)
This investment recommendation has not used proprietary models.
The risk warning, which includes the adequate explanations of the length of time of the investment to which the
recommendation relates as well as a sensitivity analysis of the assumptions, is indicated in the part of this
recommendation where the length of time and the risks of the investment are presented.
Any information relating to the date and time for the price mentioned in this recommendation is revealed in the
part of the recommendation where the given price is indicated.
16
EQUITY RESEARCH – RÁBA
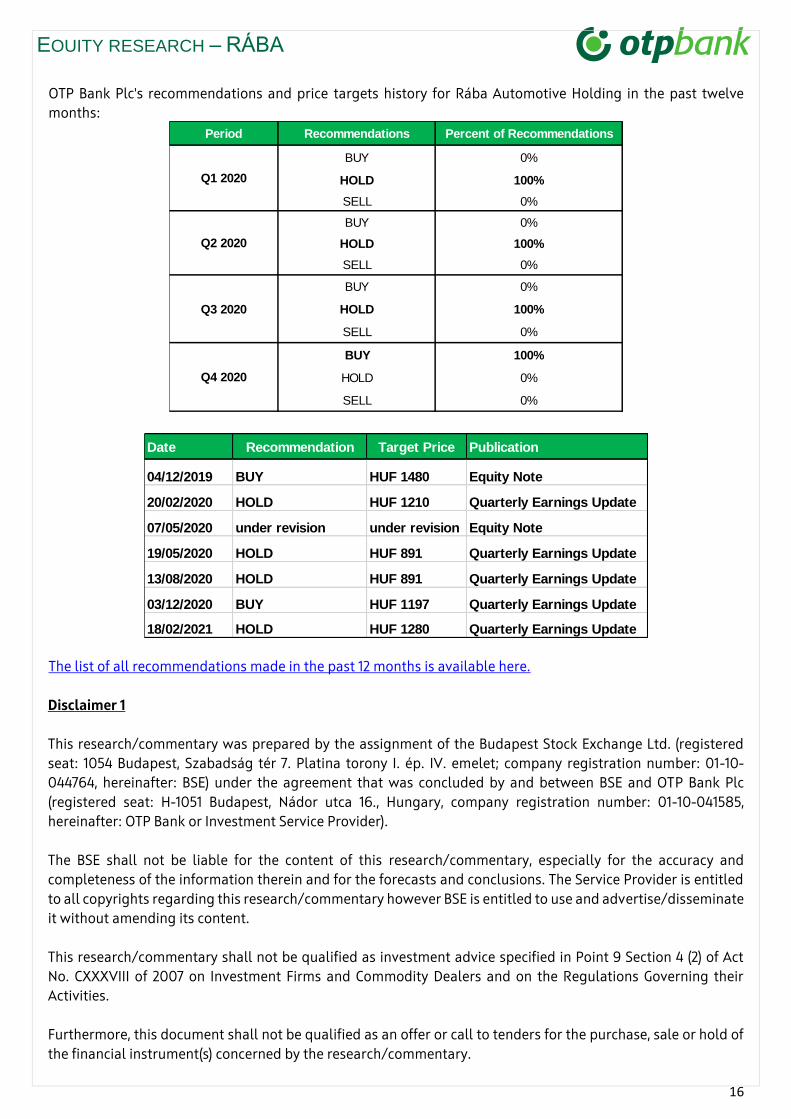
OTP Bank Plc's recommendations and price targets history for Rába Automotive Holding in the past twelve
months:
The list of all recommendations made in the past 12 months is available here.
Disclaimer 1
This research/commentary was prepared by the assignment of the Budapest Stock Exchange Ltd. (registered
seat: 1054 Budapest, Szabadság tér 7. Platina torony I. ép. IV. emelet; company registration number: 01-10-
044764, hereinafter: BSE) under the agreement that was concluded by and between BSE and OTP Bank Plc
(registered seat: H-1051 Budapest, Nádor utca 16., Hungary, company registration number: 01-10-041585,
hereinafter: OTP Bank or Investment Service Provider).
The BSE shall not be liable for the content of this research/commentary, especially for the accuracy and
completeness of the information therein and for the forecasts and conclusions. The Service Provider is entitled
to all copyrights regarding this research/commentary however BSE is entitled to use and advertise/disseminate
it without amending its content.
This research/commentary shall not be qualified as investment advice specified in Point 9 Section 4 (2) of Act
No. CXXXVIII of 2007 on Investment Firms and Commodity Dealers and on the Regulations Governing their
Activities.
Furthermore, this document shall not be qualified as an offer or call to tenders for the purchase, sale or hold of
the financial instrument(s) concerned by the research/commentary.
Period Recommendations Percent of Recommendations
BUY 0%
HOLD 100%
SELL 0%
BUY 0%
HOLD 100%
SELL 0%
BUY 0%
HOLD 100%
SELL 0%
BUY 100%
HOLD 0%
SELL 0%
Q3 2020
Q4 2020
Q2 2020
Q1 2020
Date Recommendation Target Price Publication
04/12/2019 BUY HUF 1480 Equity Note
20/02/2020 HOLD HUF 1210 Quarterly Earnings Update
07/05/2020 under revision under revision Equity Note
19/05/2020 HOLD HUF 891 Quarterly Earnings Update
13/08/2020 HOLD HUF 891 Quarterly Earnings Update
03/12/2020 BUY HUF 1197 Quarterly Earnings Update
18/02/2021 HOLD HUF 1280 Quarterly Earnings Update
17
EQUITY RESEARCH – RÁBA
Disclaimer 2
1. Pursuant to the Commission-delegated regulation 2017/565/EU of the European Parliament, the content
of this document shall be considered as an investment research, which recommends or suggests an
investment strategy, explicitly or implicitly concerning one or more financial instruments or the issuers
of financial instruments, including any opinion as to the present or future value or price of such
instruments. The statements in this investment research contain objective or independent explanation.
Furthermore, pursuant to Directive 2014/65/EU of the European Parliament and of the Council, this
document shall be considered as investment recommendation. This document does not take into
account investors' individual interests, circumstances, or objectives; therefore, in the absence of personal
recommendation, it shall not be considered as an investment advice.
OTP Bank intends to make this document available to its clients or to the public, or to make it accessible
to other persons in a way that allows this document to be disseminated to the public.
2. Information herein reflects the market situation at the time of writing. It provides only momentary
information and may change as market conditions and circumstances develop. Additional information
may be available on request. Where a figure relates to a period on or before the date of communication,
the figure relates to the past and indicates a historic data. Past performance is not a reliable indicator of
future results and shall be not treated as such. OTP Bank makes no representation or warranty, express
or implied, is made regarding future performance of any financial instrument mentioned in this
communication. OTP Bank shall have no liability for the information contained in this for any loss or
damage whether direct, indirect, financial, economic, or consequential, whether or not caused by the
negligent act or omission of OTP Bank, provided that such limitation of liability shall not apply to any
liability which cannot be excluded or limited under the applicable law.
3. The issuer of this report does not claim that the information presented herein is perfectly accurate or
complete. However it is based on sources available to the public and widely believed to be reliable. Also
the opinions and estimates presented herein reflect a professional subjective judgment at the original
date of publication and are therefore subject to change thereafter without notice. Furthermore there can
be no guarantees that any market developments will unfold as forecasted. Opinions and estimates
constitute our judgment and are subject to change without notice.
4. The issuer(s) of the product(s) mentioned in this document do not hold more than 5% of OTP Bank's
registered capital. OTP Bank is a market maker of the financial instrument that is discussed in this
document. Neither was OTP Bank a lead-manager (organizer) or joint lead manager (organizer) of any
public placement of the issuer's financial instruments (e.g. securities) in the previous 12 months.
Regarding investment services defined in Sections A and B of Annex 1 of Directive 2014/65/EU, OTP Bank
is not a party of the agreement with the issuer. OTP Bank maintains a conflict of interest policy and it
keeps such records, and is has requirements that regulate the transmission of bank secrets and securities
secrets, which requirements shall be considered as the effective internal organizational and
management solutions as well as information barriers to prevent or manage conflicts of interest. The
remuneration of the person(s) participating in preparing the recommendation is not directly related to
the transactions carried out as part of the investment services specified in Sections A and B of Annex 1 of
Directive 2014/65/EU, or to transactions carried out by them or by other legal entities of the same group
or to trading fees that they or another legal person of the same group receive. OTP Bank does not hold
net long or short positions that exceed 0.5% threshold of the issuer's total registered capital.
5. OTP Bank has developed appropriate internal procedures for (i) the personal transactions and tradings
of financial analysts and other relevant persons, (ii) the physical separation of the financial analysts
involved in
18
EQUITY RESEARCH – RÁBA
the production of investment research and other relevant persons; moreover, information barriers have
been implemented, (iii) for accepting and managing incentives and remuneration.
6. This communication does not contain a comprehensive analysis of the described issues; it is only for
information purposes. No part, chapter, or the entirety of this information shall be considered as
investment advice, not even if any part of this document contains a description of a certain financial
instrument in terms
of its possible price or yield development, and the related investment options. This information shall not
be considered as legal, tax or accounting advice.
7. This information reflects the market situation at the time when the document was prepared. You may
request more information from OTP Bank. This document was prepared based on publicly accessible
information made available to OTP Bank from one or more sources. This document was prepared using
data, facts and information from the following essential sources: Bloomberg, Reuters, Hungarian Central
Statistical Office, Eurostat, Magyar Nemzeti Bank (Hungary's central bank), and European Central Bank
(ECB). Although the information in this document has been prepared in good faith from sources that OTP
Bank believes to be reliable, we do not represent or warrant its accuracy or completeness. This document
represents the opinion and estimations of analysts at OTP Research, based on publicly available data.
You may receive different recommendation from the staff of OTP Bank, in particular if you are provided
investment advice based on an investment advice agreement. The content of this document is based on
the opinion of OTP Research's analyst at the time when the document was prepared, and they may be
subject to change at any time in the future without further notice.
8. Please be informed that, irrespective of the statements of this investment research, OTP Bank is entitled
to deal or trade as market maker, acting in good faith and in accordance with the usual way of market-
making, with the financial instruments distributed by the issuer(s) specified in this document, as well as
to provide other investment activities or ancillary (investment) services, and/or other financial or
ancillary financial services to the issuer and other persons.
9. This document shall not be a basis for any further analysis in relation to the financial instruments
contained therein. Any reference in this document to the future distribution of a financial instrument
shall be construed as indicative, preliminary and informative, and any analysis of such financial
instrument is exclusively based on publicly available information listed in the respective prospectus or
announcement. The content of this document shall not imply that OTP Bank acts as an agent, a fiduciary,
or an advisor to, or on behalf on, any prospective purchaser of the financial instruments discussed herein.
10. For certain persons, access to the products and/or services discussed in this document may not be
granted, or it may be limited. The act of preparing this document by OTP Bank, its uploading to the
website, its publication may under no circumstances be considered as OTP Bank's intention to make
available product and/or service information in the prospectus to persons whom any country or state
prohibits from having or obtaining the given product and/or service, including the promotion and the
advertisement thereof. This communication and any of the financial instruments and information
contained herein are not intended for the use of private investors in the UK and US. OTP Bank is not
allowed to provide direct investment services to US investors. Any individual decision or investment
made based on this publication is made solely at the risk of the client and OTP Bank shall not be held
responsible for the success of the investment decisions or for attaining the Client's target.
11. This publication contains generic presentation of information and knowledge, thus it does not take into
account the individual clients' unique and special interests, financial condition, or their ability and
willingness to take risks. Therefore please contact our staff or contact your banking consultant for advice

19
EQUITY RESEARCH – RÁBA
before you make an investment decision. The assessment and the consideration of the individual
circumstances is provided by the suitability and compliance tests that assess clients' financial
knowledge, experience, risk-taking abilities, as well as the examination of the target market.
12. Before making an informed decision to invest and to use the services, please carefully read through all
documents, including the documentation, prospectus, regulations, terms and conditions,
announcements and key information documents for that product/service, and carefully consider the
subject, the risk, the fees and costs of your investment, the possibility of any loss, and seek information
about the tax regulations regarding the product and the investment. The prices of financial instruments
and securities are changing, outrights sales are realized at then current market prices, which may involve
losses.
The information and opinions in this document do not substitute or take the place of the issuance
documentation for the given financial assets (e.g. prospectus, fund management rules), or their
brochures or announcements.
13. You assume total responsibility and risk for any specific decision or investment; OTP Bank shall not be
held responsible for the effectiveness of investment decisions or for reaching your purpose, nor for the
individual investment decision made based on this document or any part thereof, or for their
consequences.
Investments in financial instruments carry a certain degree of risk, which may affect the effectiveness of
the investment decision, and investors may not receive the whole amount they had expected the
investment to
yield in their investment targets; they may not preserve even the invested amount, therefore the invested
capital might even decrease, be wholly lost, or even lead to additional payment obligation.
14. Trading with leveraged products (such as foreign exchange contracts, or shares and indices that have
underlying products) carries a considerable amount of risk, and these products are not suitable for all
investors. Trading with leveraged products carries the risk of losing all capital, and it may incur losses
that exceed the amount invested.
15. The figures and information described herein refer to the past, and past performance is not a reliable
indicator of future yields, changes, or performance. The changes on money and capital markets, the
fluctuation of prices, the development of investments and their yields are influenced by the combined
effect of multiple factors; one important factor of them is the change in investors' expectations. The
development of prices, the future yield of financial assets, indices or indicators, the examination of
their changes, trends, and future performance is based on estimations and forecasts, which forecasts
do not allow reliable conclusions to be drawn about the future moves of prices, real future yields,
changes, or performance. For each product and service, please assess their tax accounting implications,
and other tax consequences, taking into account that they cannot be precisely assessed without knowing
the effective tax regulations of the client's individual circumstances; and these legislative provisions as
well as the circumstances may change over time.
16. OTP Bank reserves the right to modify this document in the future, without prior notice. The planned
frequency of updates to the recommendation is quarterly. The initiation report preceding this research
was published on 18 December 2017.
17. OTP Bank (business registration number: 01-10-041-585; registered seat: Nádor utca 16., Budapest H-
1051, Hungary; authorised by Magyar Nemzeti Bank (former supervisory authority: Hungarian Financial
Supervisory Authority, 'PSZÁF'). Supervisory authority: Magyar Nemzeti Bank (National Bank of Hungary
– H-1054 Budapest, Szabadság tér 9); financial customer services: H-1013 Budapest, Krisztina krt. 39. The
20
EQUITY RESEARCH – RÁBA
terms and conditions of this equity research and disclaimer shall be governed by and construed in
accordance with Hungarian law.
18. Please note that the Internet is not a secure environment and OTP Bank does not accept any liability for
any loss caused by the result of using this report in a form altered or delayed by the wilful or accidental
interception, corruption or virus infection.
19. OTP Bank, in compliance with the applicable law, assumes no responsibility, obligation, warranty or
guarantee whatsoever for any direct or indirect damage (including losses arising from investments), or
for the costs or expenses, detrimental legal consequences or other sanctions (including punitive and
consequential damage) sustained by any natural or legal person as a result of the purchase or sale of
financial instruments or engaging investment services described herein, even if OTP Bank was warned
of the possibility of such occurrences.
20. If you received this document from OTP Bank Plc, then it was sent to you with your previous consent. You
may withdraw this permission by sending an e-mail to [email protected] or writing a letter
addressed to 'Research Center', Hungary H-1051, Budapest, Nádor utca 21. Please refer to your name and
e-mail address in both cases.
21. The personal data in this investment research are processed by OTP Bank. The legal basis for processing
the data is the legitimate interest of OTP Bank. The detailed information about the processing of personal
data and the related rights of data subjects is available here.
This document was prepared by:
Orsolya Rátkai
Senior Equity Analyst
OTP Research
This document was finalized at 9:38:13 AM on 19 February 2021