Annual Report and Accounts - Chams Plc
108
Annual Report and Accounts Chams PLC 2013
-
Upload
khangminh22 -
Category
Documents
-
view
8 -
download
0
Transcript of Annual Report and Accounts - Chams Plc

Annual Report and Accounts
Chams PLC
2013

C H A M S P L C 2 0 1 3 A N N U A L R E P O R T 3
TABLE OF CONTENTSSection 1: REPORTS
4 Vision & Mission Statement
6 Directors, Officers & Professional Advisers
8 Notice of Annual General Meeting
9 Chairman’s Statement
13 Managing Director’s Review
16 Corporate Governance
19 Directors’ Report for the Year Ended 31 December 2013
23 Board of Directors’ Profile
27 Projects and Events
32 Corporate Profile & Subsidiary Information
Section 2: FINANCIAL STATEMENTS
35 Report of the Audit Committee
36 Report of the External Auditors
37 Statement of Profit or Loss and Other Comprehensive Income
38 Consolidated Statement of Financial Position
40 Statement of Changes in Equity
42 Consolidated Statement of Cash Flows
44 Notes to the Financial Statements
93 Consolidated Statement of Value-Added
94 Consolidated Financial Summary
96 List of Unclaimed Dividends
102 Corporate Directory

C H A M S P L C 2 0 1 3 A N N U A L R E P O R T4
VISION & MISSION STATE ME NT
C H A M S P L C 2 0 1 3 A N N U A L R E P O R T 5
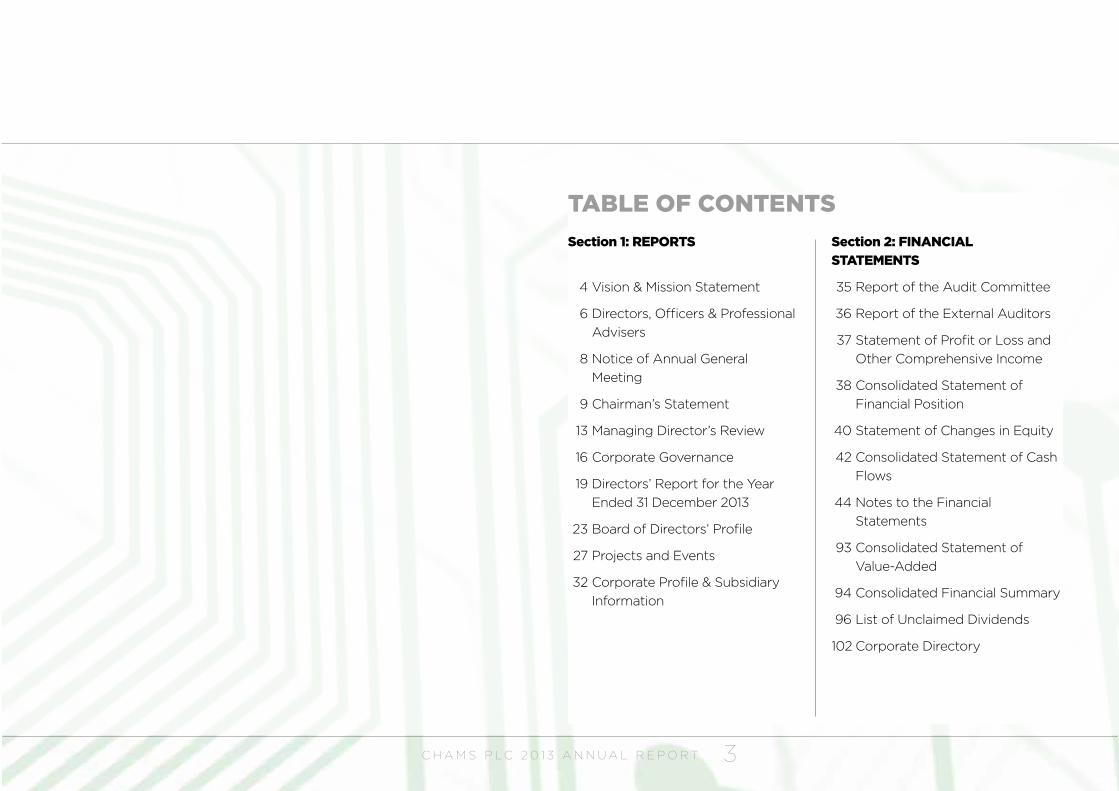
Our Envisioned FutureA company of Nigerian origin, we will be
extremely influential and highly visible in
global technology. Our trusted cutting
edge technology will enhance the quality
of life in a manner that glorifies God. We
would be employer of first choice.
Our VisionTo be the leading provider of innovative
and beneficial technologies that improve
the quality of life.
Our MissionTo design and deploy innovative and
beneficial technologies, while creating
value for all our stakeholders
Our Core Values1. Create a healthy and dynamic work
environment characterized by Z-CASE
• Zero tolerance for excuses
• Candor
• An entrepreneurial spirit,
• Strong bonds between past and
present Chams family
• Excitement
2. It is imperative to delight our customers
by making our technologies available
24/7
3. We commit to giving back to society
through group activities that will
positively impact on our communities.
4. Faith in God
C H A M S P L C 2 0 1 3 A N N U A L R E P O R T6
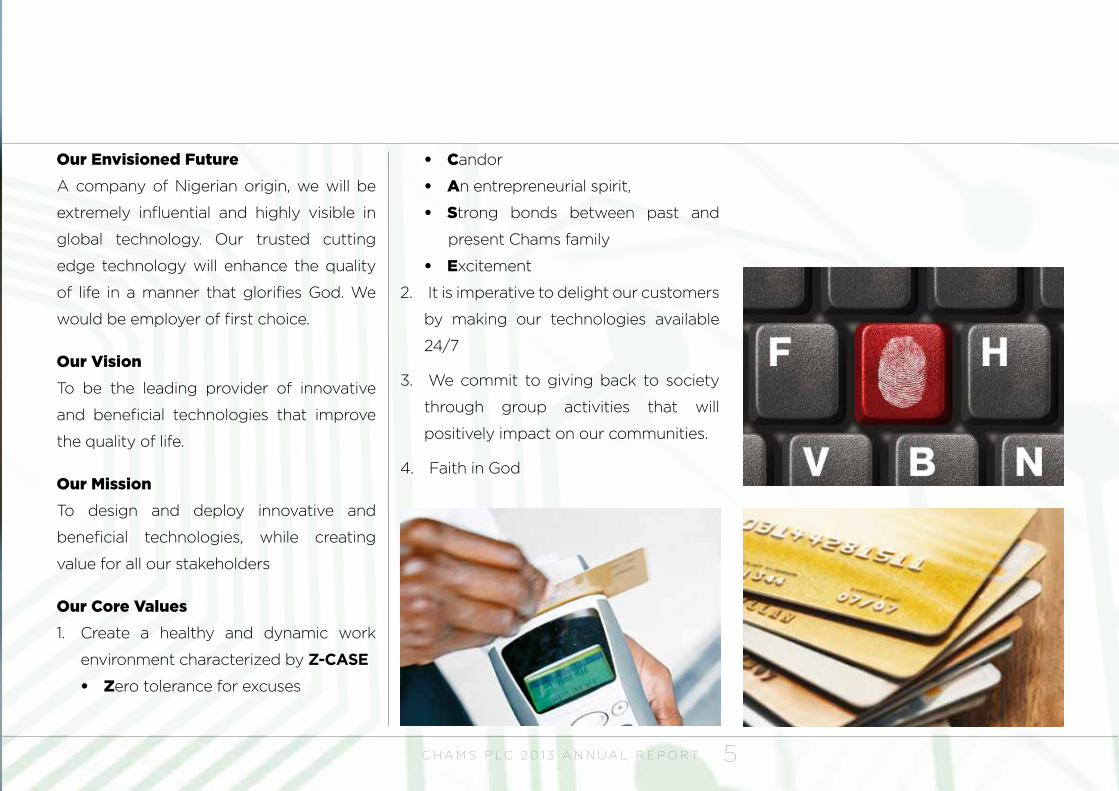
DIRECTORS , OFFICE RS & PROFESSIONAL ADVISE RS
BOARD OF DIRECTORS
• Very Rev. Ayo Richards Chairman
• Sir. Demola Aladekomo Managing Director
• Alhaji Idi Mohammed Farouk MFR Member
• Engr Akin Sawyerr Member
• Prof Oladapo Afolabi OON Member
• Prof Shehu Abdullahi Member
• Dr. Evans Woherem Member
• Mr Olufemi Williams Member
COMPANY SECRETARY
• Fred Ichekwai
LEGAL ADVISERS
• Marriot Solicitors,
No. 91A Lewis Street, Lafiaji,
Lagos Island, Lagos
• Dominion Chambers,
Suite D82, Dolphin Plaza, Corporation Drive,
Dolphin Estate, Ikoyi Lagos
C H A M S P L C 2 0 1 3 A N N U A L R E P O R T 7
• Afe Babalola & Co (Emmanuel Chambers)
Emmanuel House,
24, Madeira Street, Imani Estate, Maitama, Abuja
REGISTERED OFFICE
• 8, Louis Solomon Close,
off Ahmadu Bello Way,
Victoria Island, Lagos
AUDITORS
• BDO Professional Services
ADOL House
15, CIPM Avenue, CBD, Alausa
Ikeja, Lagos
REGISTRARS
• First Registrars
Plot 2 Abebe Village Road
Iganmu
Lagos
BANKERS
• UBA
Plot 226 Idowu Taylor Street
Victoria Island, Lagos
• FIRST BANK
Adeola Odeku Street
Victoria Island, Lagos
• ZENITH
Ajose Adeogun Street
Victoria Island, Lagos
• GTB PLC
Awolowo Road
Ikoyi, Lagos
• SKYE BANK PLC
Adeola Hopewell Street
Victoria Island, Lagos
• ACCESS BANK PLC
Awolowo Road,
Ikoyi, Lagos
• WEMA PLC
Idowu Taylor Street
Victoria Island
Lagos
• KEYSTONE BANK LIMITED
Allen Avenue
Ikeja
Lagos
DIRECTORS , OFFICE RS & PROFESSIONAL ADVISE RS
C H A M S P L C 2 0 1 3 A N N U A L R E P O R T8
Chams PLC
NOTICE OF ANNUAL GE NE R AL ME ETING
NOTICE IS HEREBY GIVEN that the 30th Annual General Meeting
of Chams Plc will hold on Wednesday, 30th April 2014 at the Agip
Recital Hall of the MUSON Centre, Onikan, Lagos at 11.00 a.m.
prompt to transact the following business:
ORDINARY BUSINESS
1. To lay before the members the Audited Financial Statements for the Year ended 31st December
2013 and the Reports of the Directors, Auditors and Audit Committee thereon.
2. To elect/re-elect the Directors
3. To fix the remuneration of the Directors
4. To authorize the Directors to fix the remuneration of the Auditors
5. To appoint the members of the Audit Committee
Dated this 4th day of April 2014.
BY ORDER OF THE BOARD
FREDERICK ICHEKWAI
Company Secretary
NOTESProxy
A member of the Company entitled to attend and vote at an Annual Gen-eral Meeting is entitled to appoint a proxy to attend and vote in his/her stead. The proxy need not be a member of the company. For the appoint-ment to be valid, a completed proxy form must be deposited with the Company’s Secretary not less than 48 hours before the time fixed for the meeting.
Closure of Register
The Register of Members and Transfer book will be closed from 22nd April to 24th April 2014 (both days inclusive) for the purpose of updating the Register of Members.
Audit Committee
In accordance with Section 359(6) of the Companies and Allied Matters Act, Cap C20 LFN 2004, any shareholder may nominate another share-holder for appointment as a member of the Audit Committee by giving notice in writing of such nomination to the Company Secretary at least Twenty-One (21) days before the Annual General Meeting.

C H A M S P L C 2 0 1 3 A N N U A L R E P O R T 9
CHAIRMAN ’S STATE ME NT
Restructured for Improved Corporate PerformanceEsteemed Shareholders,
Distinguished ladies and gentlemen, I am pleased to
welcome you to the 30th Annual General Meeting
(AGM) of your company.
Although I have been on the Board of Directors of
Chams Plc since late 2009, this is the first AGM that
I have the privilege of presiding over as Chairman
since my appointment, which took effect from
1st June 2013. I thank God for this privilege. I thank
my colleagues on Board for the huge confidence re-
posed in me with this new appointment.
I must thank our revered immediate past Chairman,
The Most Reverend Prof. Adebayo Dada Akinde
who had for the last eight years steered the affairs
of our company to the enviable leadership position
we occupy in Identity Management in Nigeria today.
I commend you, fellow shareholders for the support
and co-operation that you have extended to your
company and the Board over the years and partic-
ularly in the 2013 financial year which has enabled
your company not to only sustain the recovery that
was achieved in 2012, but also to improve on that
performance.
Let me share with you some of the economic devel-
opments within and outside Nigeria that impacted
on our operations in the past year.
Review of the Global EconomyGrowth in world economy was not as strong as ex-
pected. The variance between actual and projected
growth rates in most regions and economies attests
to this. This assertion is deduced by comparing ac-
tual GDP growth for selected countries/region with
(forecasts) issued by the IMF. For instance: USA,
2.0% (2.5%); Euro area, -0.3% (0.8%); Germany, 1.3%
(1.4%). The variance is even wider for emerging mar-
kets, where the economy was projected to grow by
6.2%, compared to a run rate of about 4.5%, in 2013.
Emerging markets like China have slowed over
the past year and this could indicate a much lon-
ger weakening in growth than was previously en-
C H A M S P L C 2 0 1 3 A N N U A L R E P O R T10
visaged. Similarly, economies like India and Russia
slowed further in growth, and there was no allow-
ance for any expansionary policies because of infla-
tionary pressures, financial imbalances and waning
market confidence.
Review of Nigerian economyNigeria’s economy fared well in 2013, compared to
most emerging and frontier economies. Gross Do-
mestic Product (GDP) was strong at 7.72% in the
year, in spite of the various tight fiscal and monetary
policy measures that pervade the year. The general
effect of CBN’s tight monetary policy stance was
high interest rates, liquidity squeeze in the system
and some level of price stability.
Inflation rates were single digits for the year, based
on the monthly data released by the National Bu-
reau of Statistics (NBS). As at December 2013, infla-
tion rate was 8.0%. While the apex regulator suc-
cessfully kept inflation rates under 10% in the year,
exchange rates weakened from around N167/US$
for most part of the year to about N172/US$ at the
parallel market as the year came to a close.
Review of industry trends The Information and Communication sector (ICT)
has now become a key driver of economic activ-
ity in Nigeria and other developing markets. It has
become apparent that a myriad of ICT solutions are
now required to support business in various sectors
of the economy, including financial services sector,
telecommunications sector and trade.
The ICT business is so huge and indefinite in many
respects. Our focus therefore will be on the identity
management and payment industries. The structure
and nature of economies in this part of the world
leaves a huge gap to fill, given that there is an ab-
sence of core identity infrastructure, which also
makes it difficult for the payment system to thrive.
In view of this, there has been a rapid growth in the
issuance of identity cards and the registration of
citizens for record-keeping purposes.
There are many government-driven Identity assur-
ance programs going on in Nigeria currently and
they are with biometrics. We have the national ID
program by the NIMC, the KYC biometric registra-
tion program for bank customers and many such
programs by some State governments. As a leading
player in this area, we are proud to inform you that
we are engaged with these government agencies to
provide these identity management products and
services.
We are also aware of the challenges in the industry
and continue to find innovative ways of surmount-
ing them. The complexity of the solutions, cost
implications of tools and platforms, problem with
product and service differentiation, illiteracy, level of
financial inclusion, poor security infrastructure, slow
legal adjudication process and low acceptance by
the general public have been issues the ICT sector
has had to contend with.
Notwithstanding, with more political will and in-
creasing awareness of the general public, these
challenges are being overcome and the opportuni-
ties are opening up for all to partake in.
I will now present our financial results
Review of performanceOur company’s financial results show resilience in
key financial data, as indicated in the following high-
lights:
Total revenue of N3.44 billion, 21.3% higher than the
N2.84 billion we recorded in 2012;
Profit After Tax increased by 115.3% to N188.5 million
compared to N87.5 million the previous year;
Earnings Per Share improved to 7kobo, more than
CHAIRMAN ’S STATE ME NT
C H A M S P L C 2 0 1 3 A N N U A L R E P O R T 11
twice what we posted in 2012;
Shareholders’ funds improved by 5% to N4.7 billion
(N4.5 billion was recorded in 2012); and
Total assets grew by 22.9% to N10.7 billion, com-
pared to N8.7 billion in 2012.
I am pleased to inform you that these set of results
will become even better in the coming years. To
achieve this level of performance in 2013, Chams
embarked on some business initiatives that will be
discussed hereunder.
New projectsChams PLC undertook projects of significant finan-
cial import in the local identity management and
transaction payments space in 2013. Before now,
specifically from 2008, your company started com-
mitting resources to investments in infrastructure
for identity management and transaction payments
to make it the market leader in this emerging indus-
try.
We have implemented and are working on projects
that include:
y Biometric Matching Solution project led by CBN
Banker’s committee
y National Identity project led by NIMC
y Identity Management project for the State of
Osun
y Identity Management project for Anambra
State
y You-WIN biometric data capture project
y PHCN biometric data capture project
y Call Centre project for Telcos and banks in
partnership with Tech Mahindra
y Payroll Automation project for the State of
Osun
y Osun State Residency Card
y Internal Generated Revenue project for Anam-
bra State
y Internally Generated Revenue project for Abia
State
The demand for identity management and transac-
tion payments solutions is likely to continue grow-
ing at a Compound Annual Growth Rate (CAGR)
of 5% until 2018. The likelihood of demand growth
will arise from the ongoing implementation of the
Central Bank of Nigeria’s cashlite policy; increasing
financial inclusion and the digitization of commerce,
presenting opportunities for technology solution
providers in our line of business.
While there are challenges in the short term, your
Directors are confident that the outlook for the
identity management and payments industry in
general and your Company in particular is positive
over the medium to long term.
Board of DirectorsYour company is blessed with a Board of Directors
of high quality and integrity. The varied and bal-
anced skills and experience that members of the
Board bring to bear on the affairs of the company
have contributed immensely to the success we are
witnessing.
To further strengthen the Board, another eminent
Nigerian, Professor Shehu Usman Abdullahi was in-
vited to Board during the year under review.
Professor Shehu Usman Abdullahi is an accom-
plished Academic and Professor. He was a former
Academy Provost, Nigerian Defence Academy, Ka-
duna (1996-2004) and a former Vice Chancellor of
Ahmadu Bello University, Zaria (2004-2009). Your
CHAIRMAN ’S STATE ME NT
C H A M S P L C 2 0 1 3 A N N U A L R E P O R T12
company has been benefitting from his wealth of
experience and vast local and International network.
We have commenced a Board and Directors per-
formance evaluation and the insights derived from
this exercise, which will be done annually, are being
used to improve Board processes and participation
in steering your company on the path of sustainabil-
ity growth and profitability.
Future OutlookIn the 2014 financial year, we are engaged in driving
the implementation of the Bank Verification Num-
ber project initiated by the Central Bank of Nigeria
(CBN) and the Bankers’ Committee. We are imple-
menting the one-year project in partnership with
Dermalog Identification Systems, a leading global
company in the field of bio-payment.
Chams PLC and its technical partner, Dermalog, will
work for five years on the Bank Biometric Matching
Solution Project, which is expected to create 1000
new jobs for young professionals. The Bank Biomet-
ric project and several other projects being imple-
mented nationwide by Chams are pointers to our
future success based on investment and pioneer-
ing efforts in identity management and transaction
payments.
Apart from its benefits to the national economy,
which is bridging the formal and informal economy,
the Bankers Biometric Matching Solution project
and the increasing uptake of identity management
products and services by private and public enter-
prises usher Chams PLC into a new era of strength,
financial stability, improved cash flow and profitabil-
ity beyond the 2014 financial year.
Conclusion:Let me close by congratulating our hardworking
Managing Director Mr. Demola Aladekomo and his
team of committed, competent and versatile staff
for the good results posted.
My appreciation goes to my colleagues on the
Board for their immense contributions to the posi-
tive repositioning being witnessed in our company.
I thank you, our esteemed shareholders for your un-
flinching support that has brought us to this van-
tage position that points to a brighter future.
Thank you all and God bless you all.
Very Revd. Ayodeji RichardsChairman
CHAIRMAN ’S STATE ME NT
C H A M S P L C 2 0 1 3 A N N U A L R E P O R T 13
MANAGING DIRECTOR’S REVIEW
Distinguished Shareholders,
It is my pleasure to present our Company’s per-
formance during the 2013 financial year. Indeed,
adopting the option to rededicate our resources
towards extracting value from our core business
was the appropriate thing to do. I believe so be-
cause the results we are presenting to you to-
day was driven by our Identity Management and
Transaction solutions businesses. The journey to
maintaining our industry leadership has not been
a smooth one, in view of the nature of competition
in our business and the increasing proliferation
of various transaction-based payment solutions
business. In all, we are determined to stay focused,
leveraging off our deep market knowledge and
track record of experience to set the stage for the
attainment of our strategic intent of being an “Au-
thority in Identity Management”.
In the previous financial year, we commenced our
articulated corporate restructuring strategy and
our operations showed resilience in many respects.
In the end, we had a significant improvement in our
corporate performance that year, thereby setting
the tone for what we have recorded for the 2013
financial year. We are delighted to inform you that
our company posted a 21.3% growth in revenue to
reach N3.44 billion in 2013, while profit after tax
accelerated by 115.3% to N188.5 million. Consider-
ing the steps we have taken and the opportunities
we see in our market, we believe that this growth
trajectory will continue in the years ahead.
Strategic Imperatives for 2013Management made a concerted decision to review
our businesses and streamline our operations to-
wards the areas we have demonstrated a high de-
gree of capability. The outcome of this include the
following:
y Focus on identity management, payment and
transaction solutions business;
y Product and service offerings to the private
sector;
y Aggressive retrieval of trade and other receiv-
ables to better manage our cash flow position;
y Attracting and retaining the brightest talents to
drive the initiative;
y A system that allows cross selling of products,
services and resources within the Group;
y Entering into value-adding partnerships and al-
liances; and
C H A M S P L C 2 0 1 3 A N N U A L R E P O R T14
y Continued development and motivation our
workforce, our most cherished assets.
In view of the emergence of e-commerce and e-
government business in the Nigerian market, the
demand for identity management products and
services cannot be overemphasized. This is to fa-
cilitate the ease and security of electronic-based
transactions in the public and private sectors of
the economy. We are taking advantage of our
unique market positioning and prior investments
in this area to lead the identity management solu-
tions market.
We believe that the growth in demand for identity
management and transaction payments solutions
is likely to continue at a CAGR of c.10% until 2018.
This will be driven by the ongoing implementation
of the Central Bank of Nigeria’s cashlite policy;
increasing financial inclusion and the digitization
of commerce, presenting opportunities for tech-
nology solution providers in our line of business.
Although, we anticipate cost pressures and infra-
structure challenge, especially power and distri-
bution, we are largely insulated from the vagaries
of these issues being a fully integrated technol-
ogy solutions provider. I can assure you that your
company will stand up with its head held up high
above the competition.
Overview of 2013 Financial PerformanceOur company’s financial results showed resilience
in key financial data, as indicated in the following
highlights:
y Total revenue of N3.44 billion, 21.3% higher than
the N2.84 billion we recorded in 2012;
y Profit After Tax increased by 115.3% to N188.5
million versus N87.5 million the previous year;
y Earnings Per Share improved to 7kobo, more
than twice what we posted in 2012;
y Shareholders’ funds improved by 5% to N4.7 bil-
lion (N4.5 billion was recorded in 2012); and
y Total assets grew by 22.9% to N10.7 billion, com-
pared to N8.7 billion in 2012.
We are pleased with our financial performance in
the year 2013, as it confirmed that the various ini-
tiatives we are putting in place are bearing fruit.
To consolidate on our performance in the last fi-
nancial year and maintain our profitability is quite
commendable and we are confident that things
can only become better for us. More gratifying is
the fact that we have sustained our topline growth
trajectory, an indication that we have continued
to increase our market share and remain com-
petitive. We have entered into some partnership
agreements that will have positive impact on our
performance in the coming years.
Organization RestructuringBuilding on the success of our business structure re-
modeling, we are investing in far reaching develop-
ment programs, aimed at strengthening the struc-
ture of our Company to enable it cushion any shock
or disruption that may ensue from our competitive
operating environment that is fast becoming more
global than local.
Chams PLC streamlined its business operations by
exiting non-core functions such as sales of payment
card printers, Access Control Terminals and point of
sale terminals, to focus on the core business of iden-
tity management and payment systems solutions.
ChamsAccess Limited, a subsidiary of Chams PLC,
is now positioned as the hardware channels provid-
er in the Chams group. Thus they are engaged in the
provision of related products and after sale services.
MANAGING DIRECTOR’S REVIEW
C H A M S P L C 2 0 1 3 A N N U A L R E P O R T 15
Our PeopleWe continue to invest in our people and processes
to align ourselves properly with the vagaries of
our operating environment and our overall corpo-
rate objectives. These will guarantee our competi-
tiveness and sustain our growth in market share
and profit.
We have recruited seasoned and talented profes-
sionals with proven track records of performance
in various leading blue-chip corporates within
and outside Africa in the 2013 financial year to
strengthen our management team. Your Board of
Directors is wholly committed to growing, engag-
ing and inspiring these great minds to ensure that
they find unrivalled fulfillment in being part of the
Chams family.
We believe that this will translate to improving
business results, excellent corporate performance
and sustainable development of our Company.
ConclusionOur priorities are clear for this year; we are deter-
mined to achieve the following:
y Complete the ongoing restructuring across the
group and dedicate our energy towards deliver-
ing value to all stakeholders;
y Upgrade our Card Personalization Bureau to
EMV Certified Standard;
y Foster strategic alliance with our partners based
in South Africa and Israel;
y Launch new card products and solutions into
the market;
y Sustain our growth in market share
y Achieve a profit growth of 300%; and
y Continue to engage the investment community
and keep you abreast of developments in our
company.
At this juncture, I want to thank everyone, who has
made this moment a memorable one for us all. The
Board of our company has been very support-
ive and we appreciate them for reposing some
much confidence in the management and staff
of Chams. To management and staff of the com-
pany, I say “thank you” for your commitment to
the vision of this great company and your tenacity
through the bumpy road to our journey. We also
thank our esteemed customers and partners for
choosing to do business with us. Finally, we must
express our gratitude to you, our shareholders for
your steadfastness and patience through all these
years. It is our belief that our company will surely
become better and we shall all reap bountifully.
Thank you
Demola AladekomoGroup Managing Director
MANAGING DIRECTOR’S REVIEW
C H A M S P L C 2 0 1 3 A N N U A L R E P O R T16
CORPOR ATE GOVE RNANCE
The companies that make up Chams Group are advocates and practitioners of corporate gover-nance. The practice of corporate governance fos-ters openness, transparency, accountability, hones-ty, selflessness, integrity, leadership, monitoring of performance and leadership. This is visible through the adherence to international best practice in the following areas:
COMPLIANCE WITH THE CODE OF CORPORATE GOVERNANCE
The Board as a whole is comprised of a number of sub-committees amongst which are audit, finance and appointment, promotions and governance committees. The Board is also comprised of high profile non-executive members serving in various capacities at the sub –committees mentioned above and involved in setting the emoluments of the man-aging director and other directors of the company. The non-executive directors are appointed for a fixed period and have to be re-elected by the share-holders at an AGM. The company is committed to full disclosure and transparency in providing infor-mation to all stakeholders because of its belief that this is the most important driving force in any good governance process.
RISK MANAGEMENT FUNCTION:
Across the group, there is an internal audit function that ensures both compliance, operational and fi-nancial controls are in place, in order to minimize
risk. The Internal Audit unit ensures that these func-tions are performed. The Audit Committee also has a risk management oversight function to ensure full compliance.
PUBLISHING OF FINANCIAL STATEMENTS AND AUDITORS REPORT:
The implementation of audit exercises and the pub-lishing of company annual reports as well as group annual reports help to foster transparency and openness .The use of highly qualified external audi-tors from a reputable audit firm helps to minimize external risks as well as ensuring that information contained in financial reports are accurate. Your company is continuously working on improving the free flow of information to all stakeholders and the general public.
COMMUNICATION BETWEEN BOARD OF DIREC-TORS AND SHAREHOLDERS:
Apart from the Annual General Meetings your com-pany has recognized the need to carry the share-holders along through periodic sensitization of de-velopments in the organization. This is to ensure that there is an avenue for continuous flow of infor-mation and to foster better understanding.
CORPORATE SOCIAL RESPONSIBILITY:
Corporate Social Responsibility is an integral part of the activities of the companies in the Chams Group. We believe in giving back to the society and this
is done through activities such as the Chams The-atre Series, a strategic contribution of Chams Plc to the rejuvenation and growth of the Arts in Nigeria and the Soup Kitchen through which we reach the under-privileged and disadvantaged in the society.
In the year under review your company made donations and charitable gifts amounting to =N=6,732,000 in 2013.
GOAL CONGRUENCE AMONG STAKEHOLDER GROUPS:
This has to do with ensuring that there is synergy between directors and shareholders thereby reduc-ing conflict and ensuring that directors fully maxi-mize the wealth of shareholders. Other stakeholders are also taken into consideration such as suppliers, employees and so on, in order to ensure that com-ponents of each organization are working in tan-dem towards the realization of stated objectives.
REMUNERATION:
The remuneration of Directors and all members of staff are performance based. This is to ensure that the company does not reward directors and man-agers for failure and non-compliance.
QUALITY CONTROL:
Revalidation of ISO 9001: 2008
The company in the year under review commenced the process of revalidation of the ISO 9000:2001
C H A M S P L C 2 0 1 3 A N N U A L R E P O R T 17
certification to ensure quality standards are main-tained within the organization and stipulated pro-cesses are strictly adhered to. Other certified com-panies within the group with valid ISO certification are in checks to ensure adherence to stated quality standards.
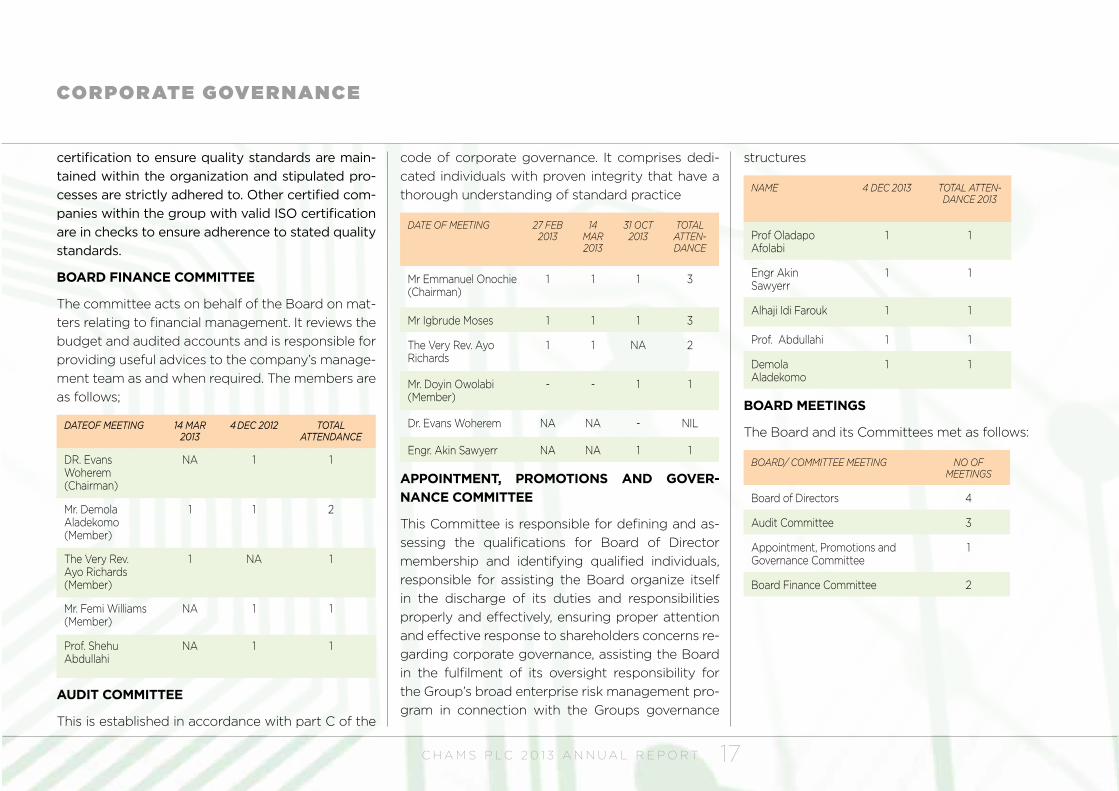
BOARD FINANCE COMMITTEE
The committee acts on behalf of the Board on mat-ters relating to financial management. It reviews the budget and audited accounts and is responsible for providing useful advices to the company’s manage-ment team as and when required. The members are as follows;
DATEOF MEETING 14 MAR 2013
4 DEC 2012 TOTAL ATTENDANCE
DR. Evans Woherem (Chairman)
NA 1 1
Mr. Demola Aladekomo (Member)
1 1 2
The Very Rev. Ayo Richards (Member)
1 NA 1
Mr. Femi Williams (Member)
NA 1 1
Prof. Shehu Abdullahi
NA 1 1
AUDIT COMMITTEE
This is established in accordance with part C of the
code of corporate governance. It comprises dedi-cated individuals with proven integrity that have a thorough understanding of standard practice
DATE OF MEETING 27 FEB 2013
14 MAR 2013
31 OCT 2013
TOTAL ATTEN-DANCE
Mr Emmanuel Onochie (Chairman)
1 1 1 3
Mr Igbrude Moses 1 1 1 3
The Very Rev. Ayo Richards
1 1 NA 2
Mr. Doyin Owolabi (Member)
- - 1 1
Dr. Evans Woherem NA NA - NIL
Engr. Akin Sawyerr NA NA 1 1
APPOINTMENT, PROMOTIONS AND GOVER-NANCE COMMITTEE
This Committee is responsible for defining and as-sessing the qualifications for Board of Director membership and identifying qualified individuals, responsible for assisting the Board organize itself in the discharge of its duties and responsibilities properly and effectively, ensuring proper attention and effective response to shareholders concerns re-garding corporate governance, assisting the Board in the fulfilment of its oversight responsibility for the Group’s broad enterprise risk management pro-gram in connection with the Groups governance
structures
NAME 4 DEC 2013 TOTAL ATTEN-DANCE 2013
Prof Oladapo Afolabi
1 1
Engr Akin Sawyerr
1 1
Alhaji Idi Farouk 1 1
Prof. Abdullahi 1 1
Demola Aladekomo
1 1
BOARD MEETINGS
The Board and its Committees met as follows:
BOARD/ COMMITTEE MEETING NO OF MEETINGS
Board of Directors 4
Audit Committee 3
Appointment, Promotions and Governance Committee
1
Board Finance Committee 2
CORPOR ATE GOVE RNANCE
C H A M S P L C 2 0 1 3 A N N U A L R E P O R T18
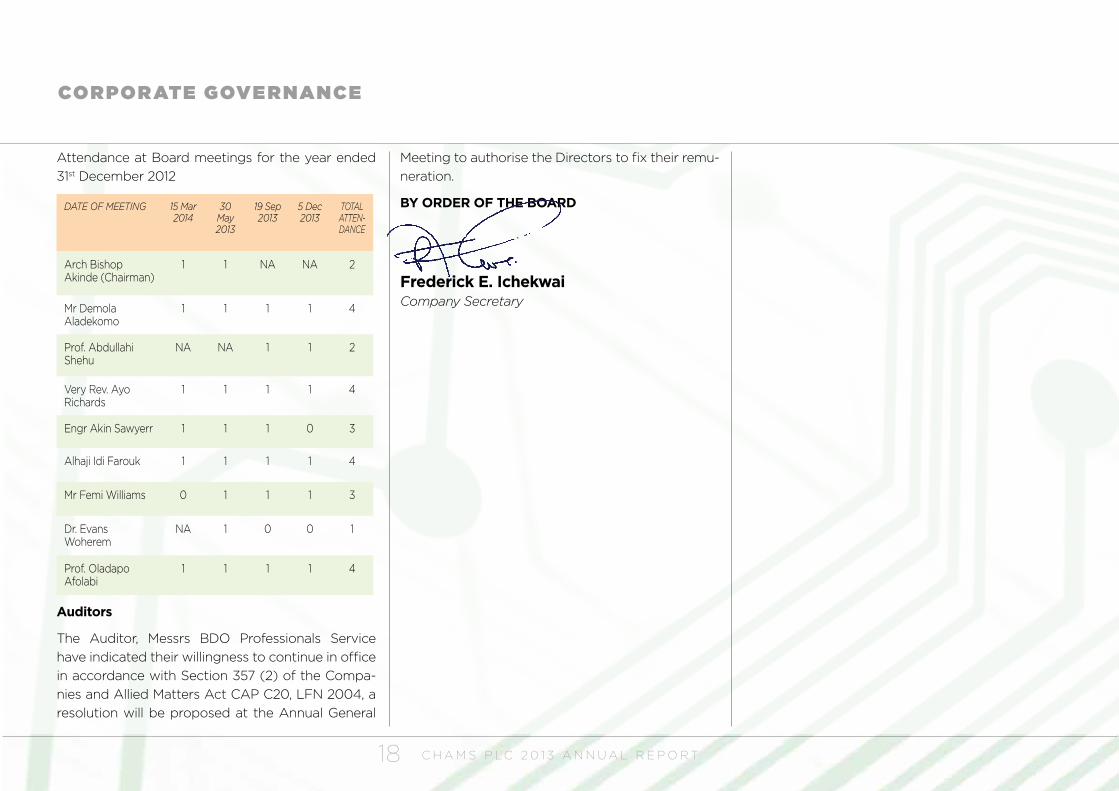
Attendance at Board meetings for the year ended 31st December 2012
DATE OF MEETING 15 Mar 2014
30 May 2013
19 Sep 2013
5 Dec 2013
TOTAL ATTEN-DANCE
Arch Bishop Akinde (Chairman)
1 1 NA NA 2
Mr Demola Aladekomo
1 1 1 1 4
Prof. Abdullahi Shehu
NA NA 1 1 2
Very Rev. Ayo Richards
1 1 1 1 4
Engr Akin Sawyerr 1 1 1 0 3
Alhaji Idi Farouk 1 1 1 1 4
Mr Femi Williams 0 1 1 1 3
Dr. Evans Woherem
NA 1 0 0 1
Prof. Oladapo Afolabi
1 1 1 1 4
Auditors
The Auditor, Messrs BDO Professionals Service have indicated their willingness to continue in office in accordance with Section 357 (2) of the Compa-nies and Allied Matters Act CAP C20, LFN 2004, a resolution will be proposed at the Annual General
Meeting to authorise the Directors to fix their remu-neration.
BY ORDER OF THE BOARD
Frederick E. Ichekwai Company Secretary
CORPOR ATE GOVE RNANCE
C H A M S P L C 2 0 1 3 A N N U A L R E P O R T 19
DIRECTORS’ RE PORTFOR THE YEAR E NDE D 31 DECE MBE R 2013
The Directors present their annual report on the af-fairs of Chams Plc (“the Company”), and subsidiar-ies (“the Group”), together with the group audited financial statements and the auditor’s report for the year ended 31 December 2013.
1. Principal Activities The principal activities of Chams Plc and its sub-sidiaries continue to be provision of identification, transaction and payment solutions. This includes the development, deployment, implementation and maintenance of technology based systems, com-puting and solutions platforms, communication in-frastructure and other services designed to facilitate the operations of all forms of electronic business.
2. Legal FormThe company was incorporated as a private limit-ed company on September 10th 1985 and became a public limited company in 2007. At the 23rd An-nual General Meeting of the Company on 6 June 2008, the shareholders authorized the Directors to change the name Chams Nigeria PLC to CHAMS PLC. Subsequent to the Placements authorized by the shareholders, an application was made to the Council of the Nigeria Stock Exchange for the ad-mission of all the issued and paid up shares of the Company to the Daily Official List of the Exchange through Listing by Introduction.
3. Subsidiaries The company has Four subsidiaries; CardCentre Nigeria Limited, engaged in the production and manufacturing of Cards – Identity, payments, Smart cards etal; PayMaster Limited, engaged in the de-ployment of Point of Transaction and Point of Sales terminals; ChamsAcccess limited, licensed consor-tium for the deployment of ATMs in the country also involved in the deployment of multi application ter-minals; and ChamsSwitch , engaged in provision of the e-payment transaction processing platform for the Nigerian Market.
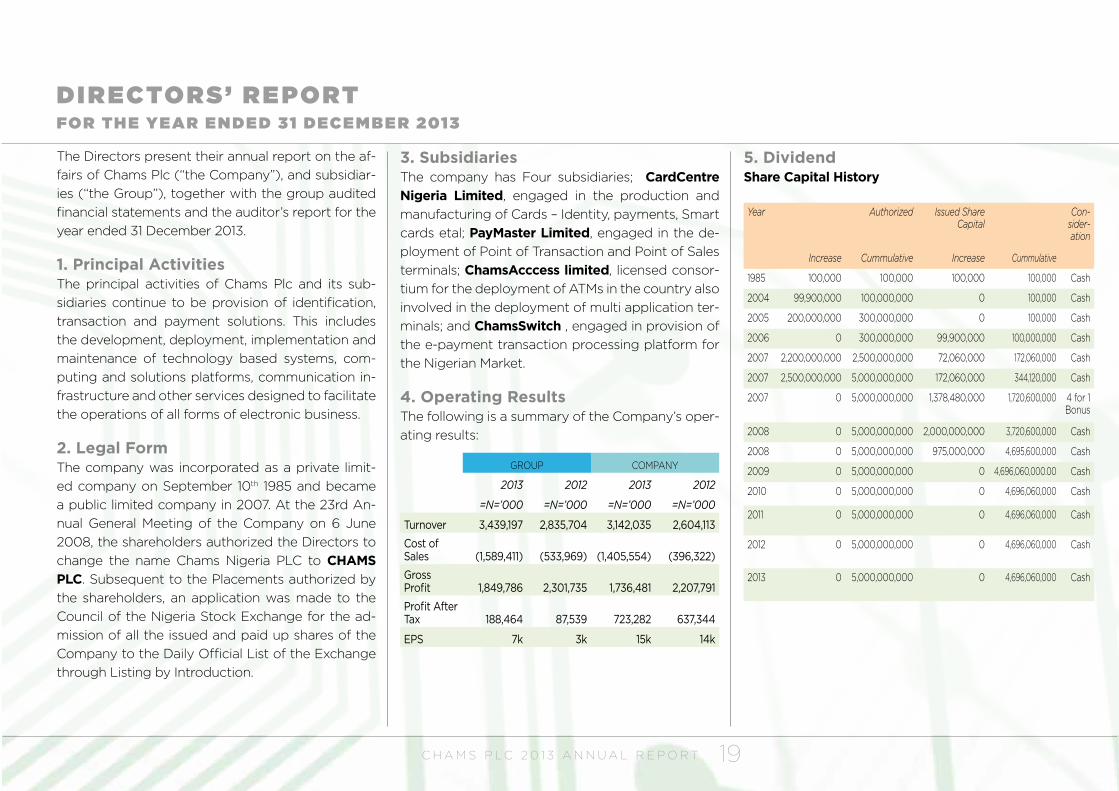
4. Operating ResultsThe following is a summary of the Company’s oper-ating results:
GROUP COMPANY
2013 2012 2013 2012
=N=’000 =N=’000 =N=’000 =N=’000
Turnover 3,439,197 2,835,704 3,142,035 2,604,113
Cost of Sales (1,589,411)
(533,969) (1,405,554) (396,322)
Gross Profit 1,849,786 2,301,735 1,736,481 2,207,791
Profit After Tax 188,464 87,539 723,282 637,344
EPS 7k 3k 15k 14k
5. DividendShare Capital History
Year Authorized Issued Share Capital
Con-sider-ation
Increase Cummulative Increase Cummulative
1985 100,000 100,000 100,000 100,000 Cash
2004 99,900,000 100,000,000 0 100,000 Cash
2005 200,000,000 300,000,000 0 100,000 Cash
2006 0 300,000,000 99,900,000 100,000,000 Cash
2007 2,200,000,000 2,500,000,000 72,060,000 172,060,000 Cash
2007 2,500,000,000 5,000,000,000 172,060,000 344,120,000 Cash
2007 0 5,000,000,000 1,378,480,000 1,720,600,000 4 for 1 Bonus
2008 0 5,000,000,000 2,000,000,000 3,720,600,000 Cash
2008 0 5,000,000,000 975,000,000 4,695,600,000 Cash
2009 0 5,000,000,000 0 4,696,060,000.00 Cash
2010 0 5,000,000,000 0 4,696,060,000 Cash
2011 0 5,000,000,000 0 4,696,060,000 Cash
2012 0 5,000,000,000 0 4,696,060,000 Cash
2013 0 5,000,000,000 0 4,696,060,000 Cash
C H A M S P L C 2 0 1 3 A N N U A L R E P O R T20
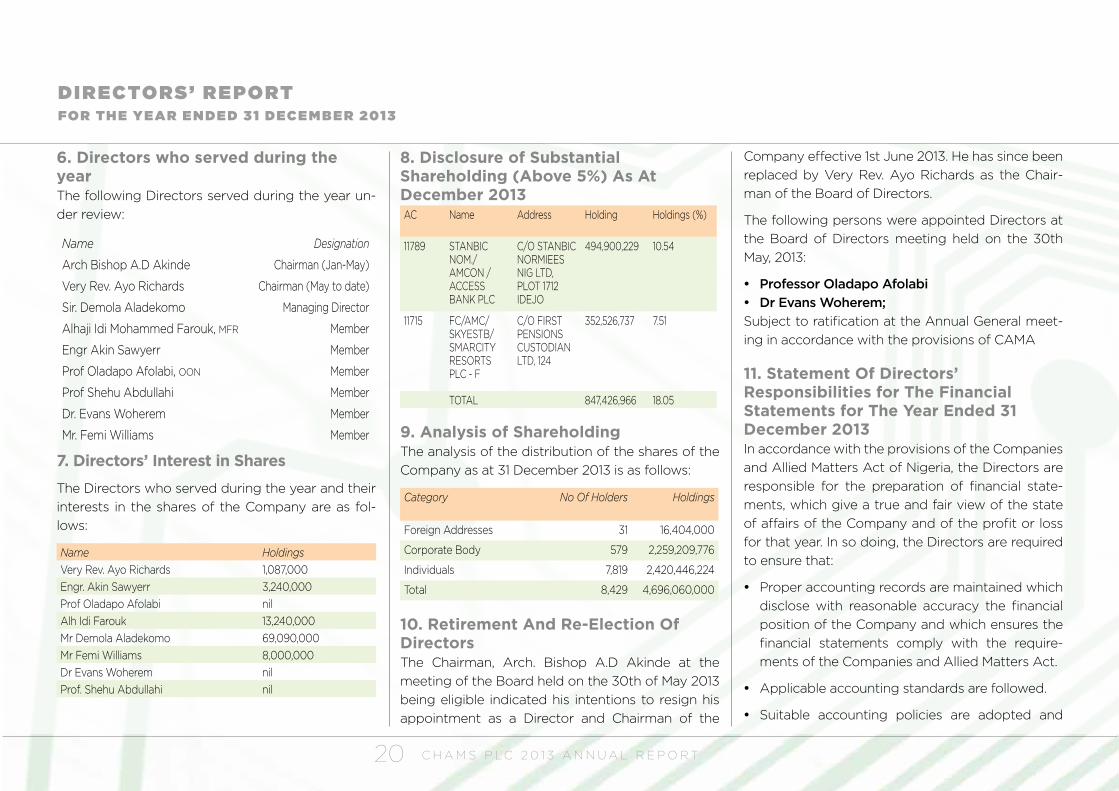
6. Directors who served during the yearThe following Directors served during the year un-der review:
Name Designation
Arch Bishop A.D Akinde Chairman (Jan-May)
Very Rev. Ayo Richards Chairman (May to date)
Sir. Demola Aladekomo Managing Director
Alhaji Idi Mohammed Farouk, MFR Member
Engr Akin Sawyerr Member
Prof Oladapo Afolabi, OON Member
Prof Shehu Abdullahi Member
Dr. Evans Woherem Member
Mr. Femi Williams Member
7. Directors’ Interest in Shares
The Directors who served during the year and their interests in the shares of the Company are as fol-lows:
Name HoldingsVery Rev. Ayo Richards 1,087,000Engr. Akin Sawyerr 3,240,000Prof Oladapo Afolabi nilAlh Idi Farouk 13,240,000Mr Demola Aladekomo 69,090,000Mr Femi Williams 8,000,000Dr Evans Woherem nilProf. Shehu Abdullahi nil
8. Disclosure of Substantial Shareholding (Above 5%) As At December 2013AC Name Address Holding Holdings (%)
11789 STANBIC NOM./ AMCON / ACCESS BANK PLC
C/O STANBIC NORMIEES NIG LTD, PLOT 1712 IDEJO
494,900,229 10.54
11715 FC/AMC/SKYESTB/SMARCITY RESORTS PLC - F
C/O FIRST PENSIONS CUSTODIAN LTD, 124
352,526,737 7.51
TOTAL 847,426,966 18.05
9. Analysis of ShareholdingThe analysis of the distribution of the shares of the Company as at 31 December 2013 is as follows:
Category No Of Holders Holdings
Foreign Addresses 31 16,404,000
Corporate Body 579 2,259,209,776
Individuals 7,819 2,420,446,224
Total 8,429 4,696,060,000
10. Retirement And Re-Election Of DirectorsThe Chairman, Arch. Bishop A.D Akinde at the meeting of the Board held on the 30th of May 2013 being eligible indicated his intentions to resign his appointment as a Director and Chairman of the
Company effective 1st June 2013. He has since been replaced by Very Rev. Ayo Richards as the Chair-man of the Board of Directors.
The following persons were appointed Directors at the Board of Directors meeting held on the 30th May, 2013:
y Professor Oladapo Afolabi y Dr Evans Woherem;
Subject to ratification at the Annual General meet-ing in accordance with the provisions of CAMA
11. Statement Of Directors’ Responsibilities for The Financial Statements for The Year Ended 31 December 2013In accordance with the provisions of the Companies and Allied Matters Act of Nigeria, the Directors are responsible for the preparation of financial state-ments, which give a true and fair view of the state of affairs of the Company and of the profit or loss for that year. In so doing, the Directors are required to ensure that:
y Proper accounting records are maintained which disclose with reasonable accuracy the financial position of the Company and which ensures the financial statements comply with the require-ments of the Companies and Allied Matters Act.
y Applicable accounting standards are followed.
y Suitable accounting policies are adopted and
DIRECTORS’ RE PORTFOR TH E YEAR E N DE D 31 DECE M B E R 2013
C H A M S P L C 2 0 1 3 A N N U A L R E P O R T 21
consistently applied.
y Judgments and estimates made are reasonable and prudent.
y The going concern basis is used, unless it is inap-propriate to presume that the Company will con-tinue in business.
y Internal control procedures are instituted which, as far as is reasonably possible, safeguard the assets of the Company and prevent and detect fraud and other irregularities.
12. Donations and Charitable GiftsThe Company identifies with the aspirations of the community as well as the environment within which it operates and made voluntary donations to vari-ous charitable organizations and other institutions in the country. No donation was made to any politi-cal organization.
The Company during the year donated a total sum of N6,732,000.00 to charitable causes
13. Employment and Employeesa. Employment of physically challenged persons
The Company has a non-discriminatory policy on recruitment. Applications would always be wel-comed from suitably qualified disabled persons and are reviewed strictly on qualification. The Compa-ny’s policy is that the highest qualified and most ex-perienced persons are recruited for appropriate job
levels irrespective of an applicant’s state of origin, ethnicity, religion or physical condition.
b. Health safety and welfare of employees
Health and safety regulations are in force within the Company’s premises and employees are aware of existing regulations. The Company provides subsi-dies to all level of employees for medical expenses, transportation, housing, lunch etc.
c. Employees involvement and training
The Company is committed to keeping employees fully informed as much as possible regarding the Company’s performance and progress and seeking their opinion where practicable on matters, which particularly affect them as employees.
Training is carried out at various levels through both in-house and external courses. Incentive schemes designed to encourage the involvement of employ-ees in the Company’s performance are implement-ed whenever appropriate.
14. Post Balance Sheet EventsThere were no post balance sheet events which could have had a material effect on the state of af-fairs of the Company as at 31 December 2013 or the profit for the year ended on that date, which have not been adequately provided for or disclosed.
15. Compliance With The Code Of Corporate GovernanceChams Plc continuously strives to comply with global standards of corporate governance. The Company has separated the posts of Managing Director and Chairman and the Chairman is not in-volved in the day-to-day running of the Company. This is geared towards avoiding the concentration of too much power in a single individual.
The Board as a whole is comprised of a number of sub-Committees amongst which are Audit, Finance and Appointment, Performance and Governance Committees. The Board is also comprised of high profile non-executive members serving in various capacities at the sub-Committees mentioned above and involved in setting the emoluments of the Man-aging Director and other Directors of the Company. The non-executive directors are appointed for a fixed period and have to be re-elected by the share-holders at an AGM. The Company is committed to full disclosure and transparency in providing infor-mation to all stakeholders because of its belief that this is the most important driving force in any good governance process.
16. Board Finance CommitteeThe Committee acts on behalf of the Board on mat-ters relating to Financial Management. It reviews the Budget and Audited Accounts and is responsible for providing useful advice to the Company’s man-agement team as and when required.
DIRECTORS’ RE PORTFOR TH E YEAR E N DE D 31 DECE M B E R 2013
C H A M S P L C 2 0 1 3 A N N U A L R E P O R T22
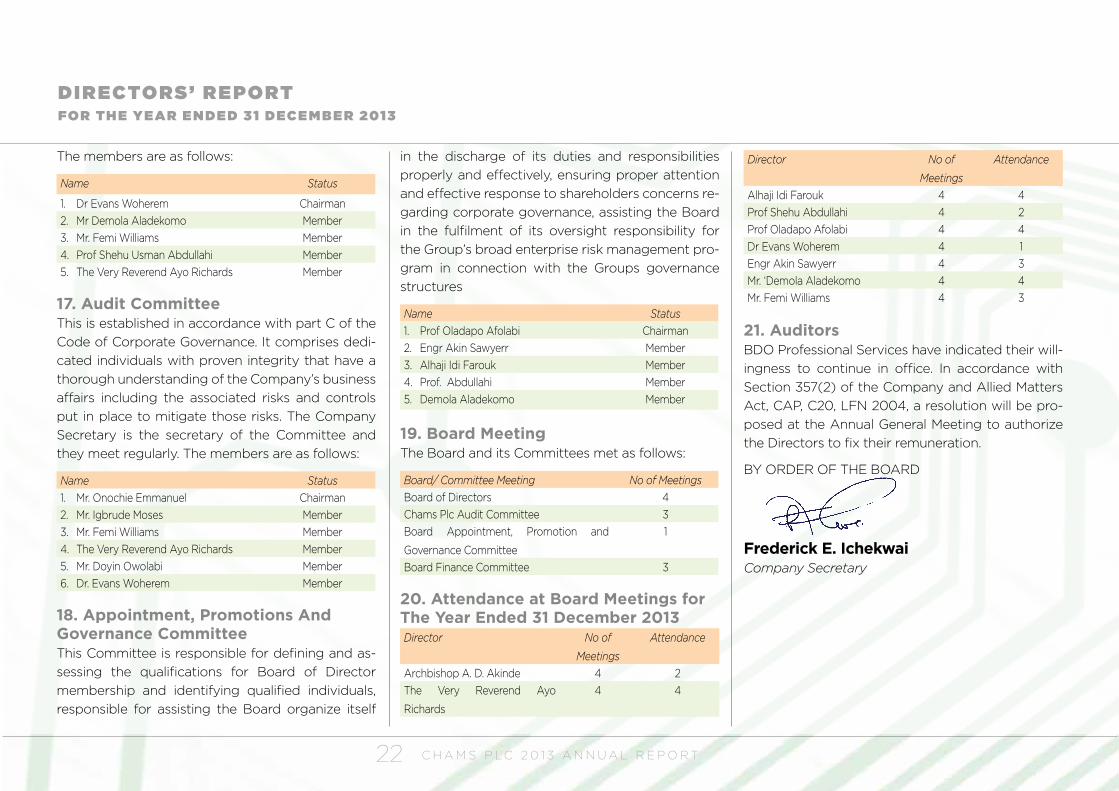
The members are as follows:
Name Status
1. Dr Evans Woherem Chairman2. Mr Demola Aladekomo Member3. Mr. Femi Williams Member4. Prof Shehu Usman Abdullahi Member5. The Very Reverend Ayo Richards Member
17. Audit CommitteeThis is established in accordance with part C of the Code of Corporate Governance. It comprises dedi-cated individuals with proven integrity that have a thorough understanding of the Company’s business affairs including the associated risks and controls put in place to mitigate those risks. The Company Secretary is the secretary of the Committee and they meet regularly. The members are as follows:
Name Status1. Mr. Onochie Emmanuel Chairman2. Mr. Igbrude Moses Member3. Mr. Femi Williams Member4. The Very Reverend Ayo Richards Member5. Mr. Doyin Owolabi Member6. Dr. Evans Woherem Member
18. Appointment, Promotions And Governance CommitteeThis Committee is responsible for defining and as-sessing the qualifications for Board of Director membership and identifying qualified individuals, responsible for assisting the Board organize itself
in the discharge of its duties and responsibilities properly and effectively, ensuring proper attention and effective response to shareholders concerns re-garding corporate governance, assisting the Board in the fulfilment of its oversight responsibility for the Group’s broad enterprise risk management pro-gram in connection with the Groups governance structures
Name Status1. Prof Oladapo Afolabi Chairman2. Engr Akin Sawyerr Member3. Alhaji Idi Farouk Member4. Prof. Abdullahi Member5. Demola Aladekomo Member
19. Board MeetingThe Board and its Committees met as follows:
Board/ Committee Meeting No of MeetingsBoard of Directors 4Chams Plc Audit Committee 3Board Appointment, Promotion and
Governance Committee
1
Board Finance Committee 3
20. Attendance at Board Meetings for The Year Ended 31 December 2013Director No of
Meetings
Attendance
Archbishop A. D. Akinde 4 2The Very Reverend Ayo
Richards
4 4
Director No of
Meetings
Attendance
Alhaji Idi Farouk 4 4Prof Shehu Abdullahi 4 2Prof Oladapo Afolabi 4 4Dr Evans Woherem 4 1Engr Akin Sawyerr 4 3Mr. ‘Demola Aladekomo 4 4Mr. Femi Williams 4 3
21. AuditorsBDO Professional Services have indicated their will-ingness to continue in office. In accordance with Section 357(2) of the Company and Allied Matters Act, CAP, C20, LFN 2004, a resolution will be pro-posed at the Annual General Meeting to authorize the Directors to fix their remuneration.
BY ORDER OF THE BOARD
Frederick E. Ichekwai Company Secretary
DIRECTORS’ RE PORTFOR TH E YEAR E N DE D 31 DECE M B E R 2013

C H A M S P L C 2 0 1 3 A N N U A L R E P O R T 23
Very Rev. Ayo Richards
Very Rev. Ayodeji Richards is the Chairman of the Board of Directors of Chams PLC, a responsibility he assumed on June 2013. The board collectively de-cides the general policy of the company.
Revd. Richards is an associate of the Chartered insti-tute of Bankers of Nigeria and the Institute of Char-
tered Accountants of Nigeria. He has over 20 years of experience in the banking sector and has contributed significantly to the sector, having occupied positions as the one-time managing director of (GTB) Guaran-ty Trust Bank, Gambia; DGM of Access bank, Senior Manager of Stallion Home Savings & Loan Ltd etc.
Presently, he is the Managing Consultant for Shep-herds Consult Limited- a firm that specializes in cor-porate restructuring, tax consultancy and financial training. With an avocation for reading, he has pub-lished Christian literature books such as “The Hand that Gives”, “In his Vineyard”, “Resist the Devil” etc.
Sir. Demola Benjamin AladekomoSir. Aladekomo is the founder and chief visionary of Chams PLC. He pioneered many landmark projects in Nigeria’s ICT landscape and was responsible for the establishment of the first wide area networking on PC in Nigeria. In addition, Chams, under his lead-ership was the first company to venture into card technologies in Nigeria and the acclaimed success story of Valucard is a brainchild of Sir Aladekomo.
He is a Past President and Fellow of the Nigeria Computer Society (NCS), A member of Nigeria So-ciety of Engineers (NSE) and a Fellow of Computer Professional Registration Council (CPN). He holds a B.Sc. Degree in Computer Engineering from the University of Ife and an MBA from the University of Lagos. He was part of the first Chief Executives Pro-gramme at the Lagos Business School in 1992 and
he is the current President of the Lagos Business School Alumni Association (LBSAA).
He is the Chairman, Board of Trustees: Volunteer Corps, a non-governmental organisation commit-ted to professional volunteerism for public school education. He also served as the Vice Chairman of the Board of Trustees of SmartCard Society of Ni-geria.
BOARD OF DIRECTORS’ PROFILE
C H A M S P L C 2 0 1 3 A N N U A L R E P O R T24
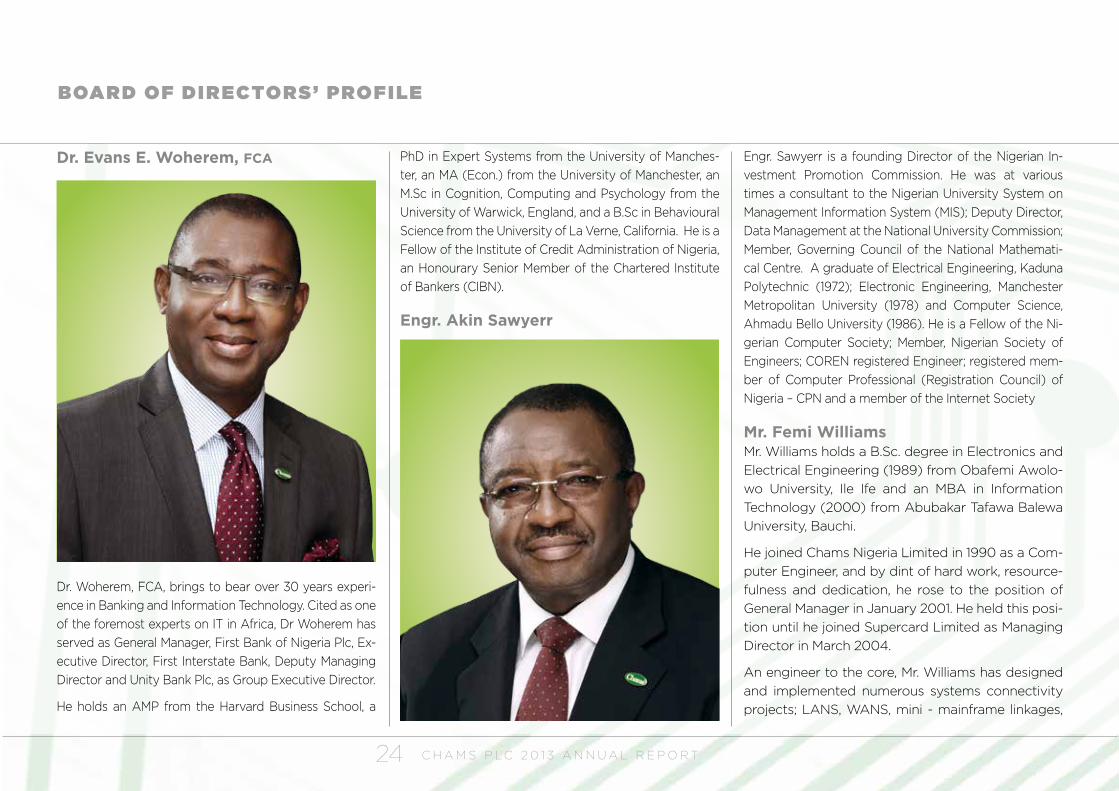
Dr. Evans E. Woherem, FCA
Dr. Woherem, FCA, brings to bear over 30 years experi-ence in Banking and Information Technology. Cited as one of the foremost experts on IT in Africa, Dr Woherem has served as General Manager, First Bank of Nigeria Plc, Ex-ecutive Director, First Interstate Bank, Deputy Managing Director and Unity Bank Plc, as Group Executive Director.
He holds an AMP from the Harvard Business School, a
PhD in Expert Systems from the University of Manches-ter, an MA (Econ.) from the University of Manchester, an M.Sc in Cognition, Computing and Psychology from the University of Warwick, England, and a B.Sc in Behavioural Science from the University of La Verne, California. He is a Fellow of the Institute of Credit Administration of Nigeria, an Honourary Senior Member of the Chartered Institute of Bankers (CIBN).
Engr. Akin Sawyerr
Engr. Sawyerr is a founding Director of the Nigerian In-vestment Promotion Commission. He was at various times a consultant to the Nigerian University System on Management Information System (MIS); Deputy Director, Data Management at the National University Commission; Member, Governing Council of the National Mathemati-cal Centre. A graduate of Electrical Engineering, Kaduna Polytechnic (1972); Electronic Engineering, Manchester Metropolitan University (1978) and Computer Science, Ahmadu Bello University (1986). He is a Fellow of the Ni-gerian Computer Society; Member, Nigerian Society of Engineers; COREN registered Engineer; registered mem-ber of Computer Professional (Registration Council) of Nigeria – CPN and a member of the Internet Society
Mr. Femi Williams Mr. Williams holds a B.Sc. degree in Electronics and Electrical Engineering (1989) from Obafemi Awolo-wo University, Ile Ife and an MBA in Information Technology (2000) from Abubakar Tafawa Balewa University, Bauchi.
He joined Chams Nigeria Limited in 1990 as a Com-puter Engineer, and by dint of hard work, resource-fulness and dedication, he rose to the position of General Manager in January 2001. He held this posi-tion until he joined Supercard Limited as Managing Director in March 2004.
An engineer to the core, Mr. Williams has designed and implemented numerous systems connectivity projects; LANS, WANS, mini - mainframe linkages,
BOARD OF DIRECTORS’ PROFILE

C H A M S P L C 2 0 1 3 A N N U A L R E P O R T 25
structured cabling systems, etc. He was the Chief Operating Officer of Chams for many years leading the sales, marketing and technical teams. He was actively involved in strategic policy formulation and implementation as well as mentoring for the entire company.
He is a member of the Nigerian Computer Society (NCS), Nigerian Society of Engineers and Computer Professional (Registration Council) of Nigeria (CPN).
Alhaji Idi Farouk, MFR
Alhaji Farouk (MFR) is a former Director General, National Orientation Agency, Abuja and has wide experience in both private and Public Sector. The various appointments held by Alhaji Farouk include local government chairman and permanent secre-tary ministry of Information in Kaduna State. He also oversees the activities of Kaduna State Home Af-fairs and Culture. In 1999, he was appointed as Chief
of Staff of government house Kaduna.
Between the Periods of 2000-2005, Alhaji Farouk was a member of the board governing council of the Federal Polytechnic, Ado Ekiti and Peugout Au-tomobile Nigeria Limited.
Professor Oladapo Abraham Afolabi, OON, OFR
Prof. Oladapo Afolabi brings his wealth of experience
BOARD OF DIRECTORS’ PROFILE
C H A M S P L C 2 0 1 3 A N N U A L R E P O R T26
spanning several years in both academic and public ser-vice to bear on the Chams board.
Prof. Afolabi is a specialist in Environmental and Food Nu-tritional Chemistry, Afolabi was Head of Service from No-vember 2010 to September 2011. An alumnus of Obafemi Awolowo University Ile Ife, Osun State, where he earned his B.Sc. in 1975, Afolabi also got his MSc. also in Biochem-istry from the same institution before bagging his Ph.D. in Applied Chemistry in 1981. He has taught in many insti-tutions in Nigeria and outside the country including the Obafemi Awolowo University, Ladoke Akintola University of Technology, Ogbomosho, and the University of Zim-babwe.
For the former HoS, the civil service years started in 1991 when he joined the Federal Environmental Protection Agency (FEPA) from where he rose to the rank of an Act-ing Director. From FEPA, he joined the Ministry of Envi-ronment in 1995. In October 2006, he was appointed a permanent secretary and in June 2007 became the Perm Sec in charge of the Labour ministry.
In November 2007, he was posted to the Ministry of Ag-riculture and Water Resources to lay a solid groundwork for the newly-formed ministry. In 2009 he was redeployed to the Cabinet Secretariat from where in August of same year he was appointed the Perm Sec, Ministry of Educa-tion.
Professor Afolabi is a Fellow of the International Atomic Energy Agency; Institute of Chartered Chemists of Nige-ria; Chartered Institute of Local Government and Public
Administrators of Nigeria, Institute of Public Analysts of Nigeria, Michael Imoudu Institute for Labour Studies, Insti-tute of Chartered Chemists of Nigeria. He was conferred the National honors of OON and CFR in 2009 and 2011 respectively.
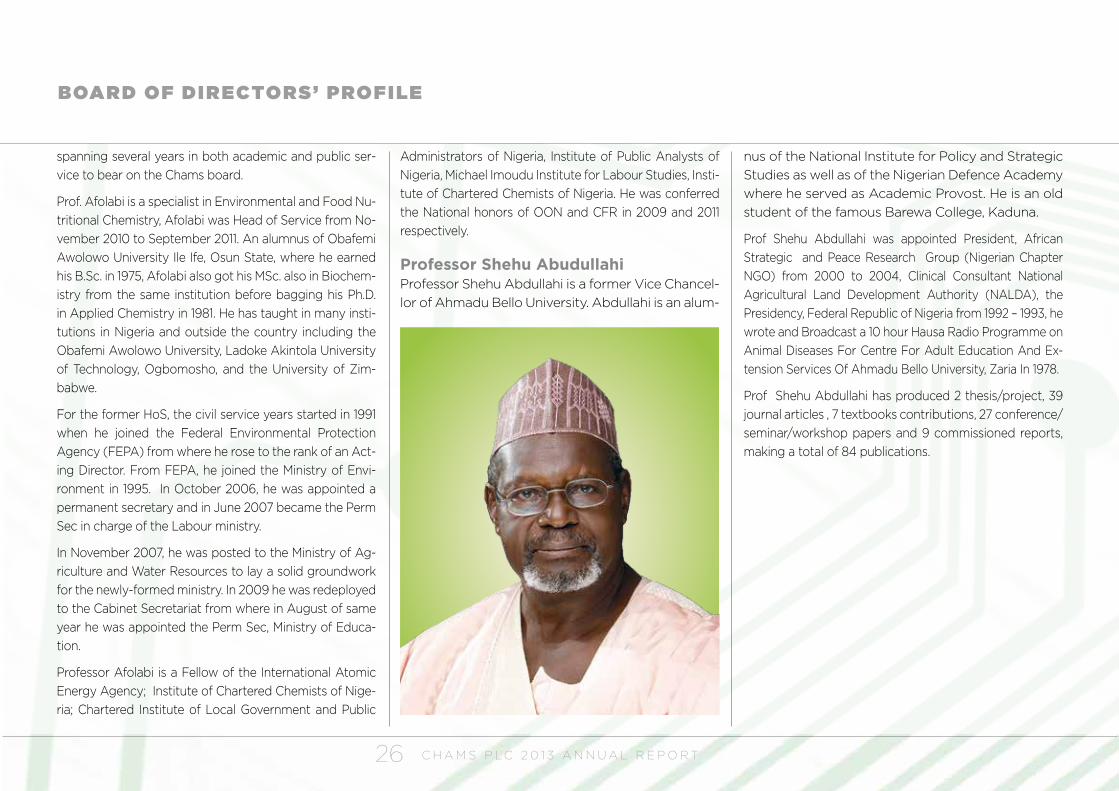
Professor Shehu AbudullahiProfessor Shehu Abdullahi is a former Vice Chancel-lor of Ahmadu Bello University. Abdullahi is an alum-
nus of the National Institute for Policy and Strategic Studies as well as of the Nigerian Defence Academy where he served as Academic Provost. He is an old student of the famous Barewa College, Kaduna.
Prof Shehu Abdullahi was appointed President, African Strategic and Peace Research Group (Nigerian Chapter NGO) from 2000 to 2004, Clinical Consultant National Agricultural Land Development Authority (NALDA), the Presidency, Federal Republic of Nigeria from 1992 – 1993, he wrote and Broadcast a 10 hour Hausa Radio Programme on Animal Diseases For Centre For Adult Education And Ex-tension Services Of Ahmadu Bello University, Zaria In 1978.
Prof Shehu Abdullahi has produced 2 thesis/project, 39 journal articles , 7 textbooks contributions, 27 conference/seminar/workshop papers and 9 commissioned reports, making a total of 84 publications.
BOARD OF DIRECTORS’ PROFILE

C H A M S P L C 2 0 1 3 A N N U A L R E P O R T 27
Osun
The Osun Residency ProjectChams partnered with OSUN state to deliver various e-government solutions which include payroll automation, biometric enrolment of staff of the civil service, pupils and general citizenry. The thrust of the e-government projects embarked upon by the state is to avail the state required data statistics to guide in the implementation of its socio economic and welfare initia-tives for its citizenry and resi-dents. In Osun state today, public school pupils have ac-cess to free education, free feeding, uniforms, and facil-ity upgrade across all public schools, computer education and literacy for all senior high pupils amongst others.
Osun state is also the only state in the country today where all her paymasters are Microsoft certified.
PROJECTS AND EVE NTS

C H A M S P L C 2 0 1 3 A N N U A L R E P O R T28
Anambra StateChams Plc is working with the Anambra State Gov-ernment to register residents and create a central database for planning and resource allocation. Reg-istered residents will a state number and unique identity card in line with the Anambra Integrated Development Scheme of the state government.
The project covers
• Establishment of Identity Management/IGR sys-tem.
• Biometric registration of all residents.
• De-duplication (AFIS) of the database to remove duplicate records.
• Issuance of unique ID/ANIDS number to all resi-dents.
• Establishment of state of the art Data Centre
PROJECTS AND EVE NTS
• Deployment of card personalization plant.
• Deployment of solutions to increase the State’s internally generated revenue.
Integration to other data sources and projects in the state.
C H A M S P L C 2 0 1 3 A N N U A L R E P O R T 29
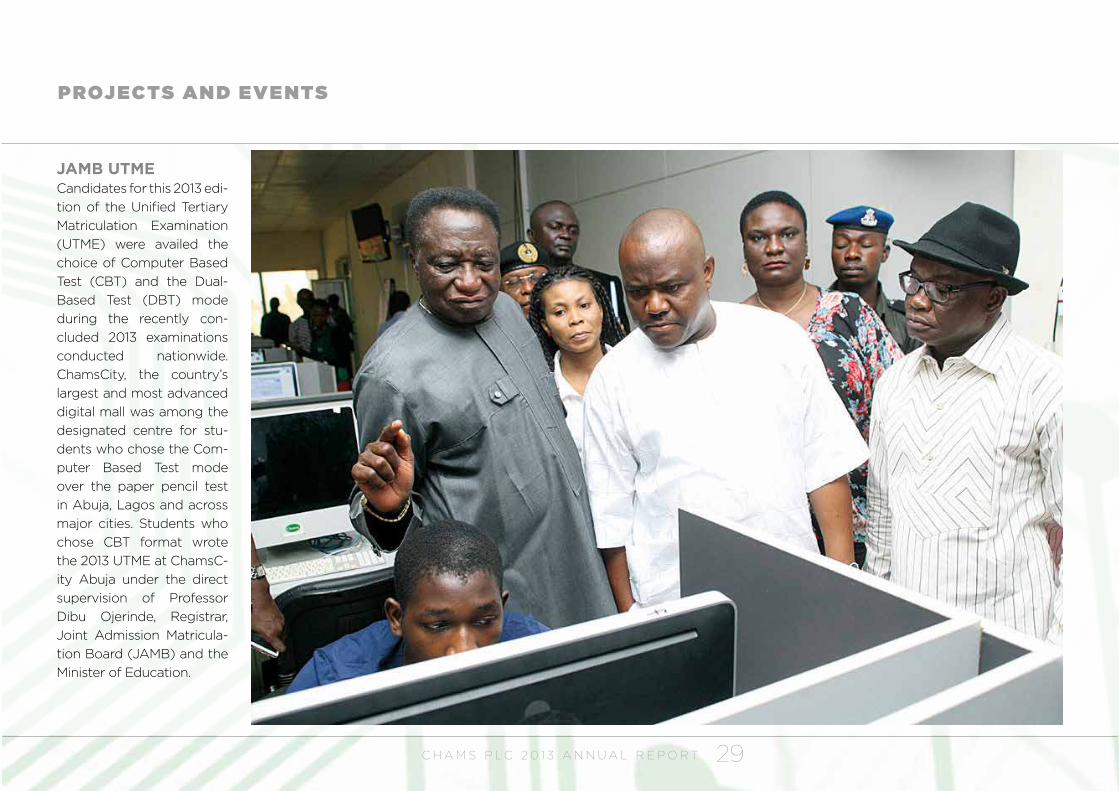
JAMB UTME Candidates for this 2013 edi-tion of the Unified Tertiary Matriculation Examination (UTME) were availed the choice of Computer Based Test (CBT) and the Dual-Based Test (DBT) mode during the recently con-cluded 2013 examinations conducted nationwide. ChamsCity, the country’s largest and most advanced digital mall was among the designated centre for stu-dents who chose the Com-puter Based Test mode over the paper pencil test in Abuja, Lagos and across major cities. Students who chose CBT format wrote the 2013 UTME at ChamsC-ity Abuja under the direct supervision of Professor Dibu Ojerinde, Registrar, Joint Admission Matricula-tion Board (JAMB) and the Minister of Education.
PROJECTS AND EVE NTS
C H A M S P L C 2 0 1 3 A N N U A L R E P O R T30
PROJECTS AND EVE NTS
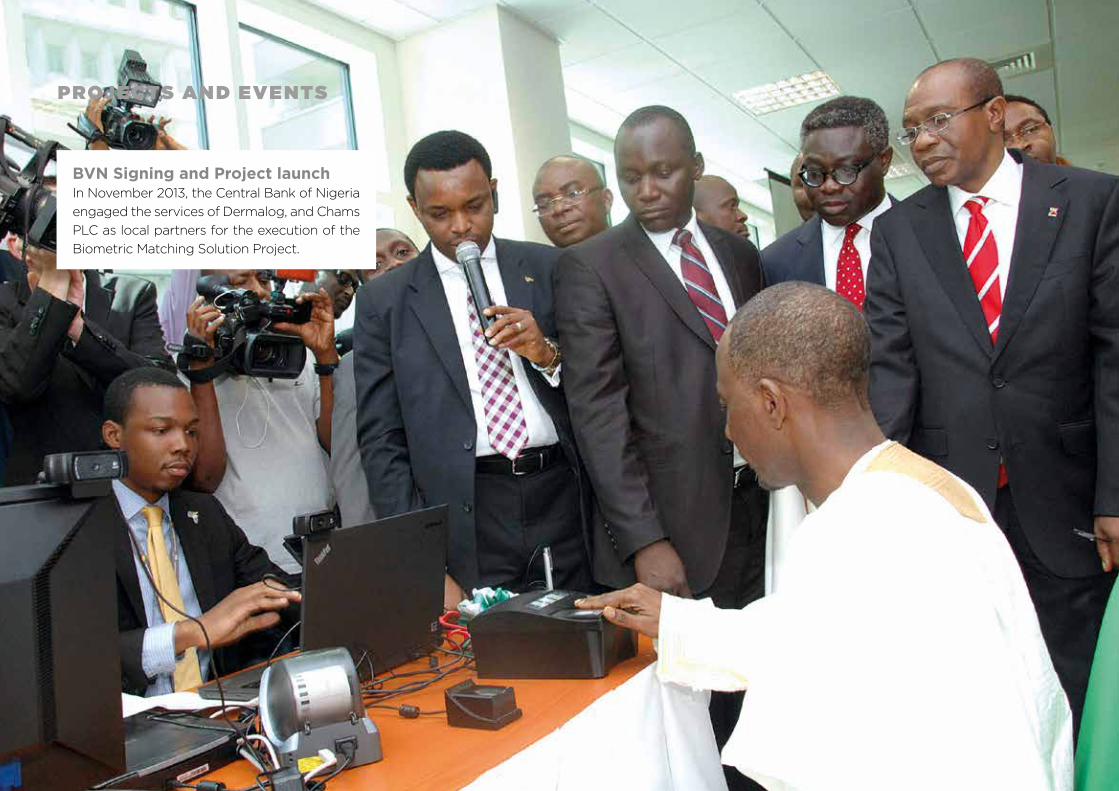
BVN Signing and Project launchIn November 2013, the Central Bank of Nigeria engaged the services of Dermalog, and Chams PLC as local partners for the execution of the Biometric Matching Solution Project.
C H A M S P L C 2 0 1 3 A N N U A L R E P O R T 31
PROJECTS AND EVE NTS
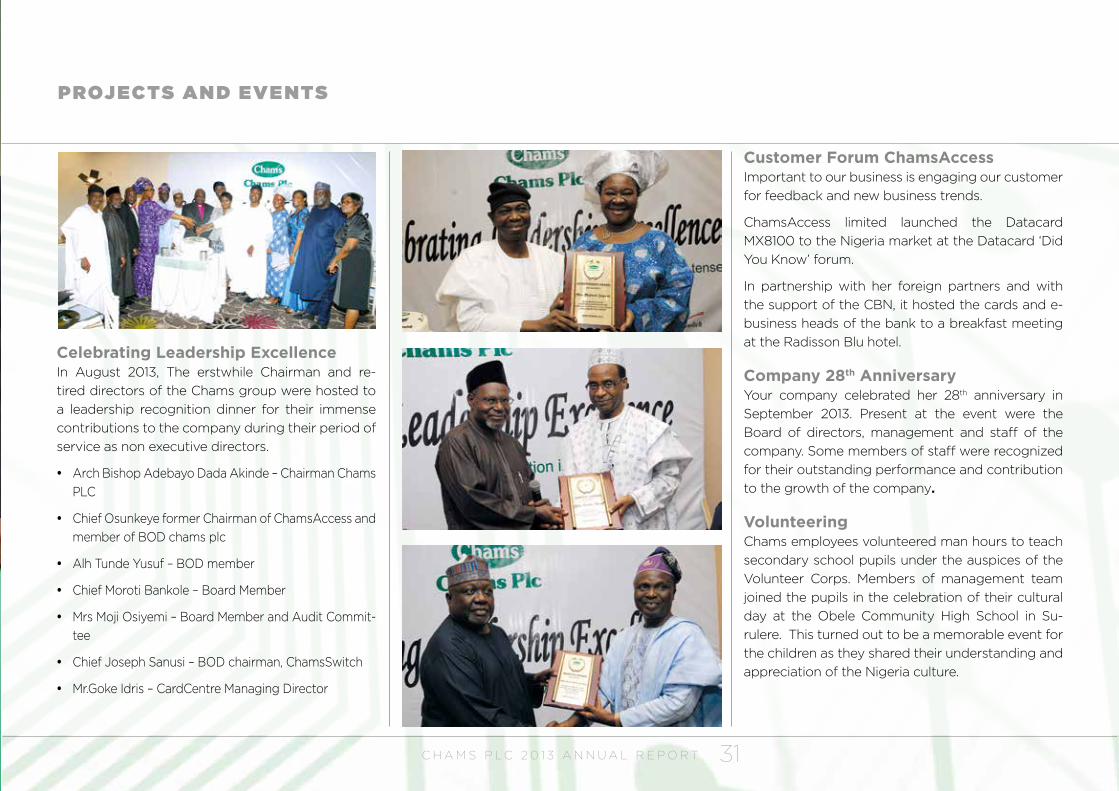
Celebrating Leadership Excellence In August 2013, The erstwhile Chairman and re-tired directors of the Chams group were hosted to a leadership recognition dinner for their immense contributions to the company during their period of service as non executive directors.
y Arch Bishop Adebayo Dada Akinde – Chairman Chams PLC
y Chief Osunkeye former Chairman of ChamsAccess and member of BOD chams plc
y Alh Tunde Yusuf – BOD member
y Chief Moroti Bankole – Board Member
y Mrs Moji Osiyemi – Board Member and Audit Commit-tee
y Chief Joseph Sanusi – BOD chairman, ChamsSwitch
y Mr.Goke Idris – CardCentre Managing Director
Customer Forum ChamsAccess Important to our business is engaging our customer for feedback and new business trends.
ChamsAccess limited launched the Datacard MX8100 to the Nigeria market at the Datacard ‘Did You Know’ forum.
In partnership with her foreign partners and with the support of the CBN, it hosted the cards and e-business heads of the bank to a breakfast meeting at the Radisson Blu hotel.
Company 28th Anniversary Your company celebrated her 28th anniversary in September 2013. Present at the event were the Board of directors, management and staff of the company. Some members of staff were recognized for their outstanding performance and contribution to the growth of the company.
Volunteering Chams employees volunteered man hours to teach secondary school pupils under the auspices of the Volunteer Corps. Members of management team joined the pupils in the celebration of their cultural day at the Obele Community High School in Su-rulere. This turned out to be a memorable event for the children as they shared their understanding and appreciation of the Nigeria culture.
C H A M S P L C 2 0 1 3 A N N U A L R E P O R T32
CHAMS PLC Profile Starting off as a privately owned business in 1985 Chams PLC has successfully migrated from the business of Computer Maintenance to the busi-ness of developing enterprise technology solutions in identity management, transactional card-based services, e-commerce and mobile payment system.
The mission of Chams PLC over the last 26 years has been the “Advancement of Information Technology through the provision of high standard Professional Information Technology Services competitively and profitably.”
Chams Plc remains the leading provider of Informa-tion Technology solutions in Nigeria, providing intel-ligent solutions to a wide range of public and private sector initiatives and pioneering new directions as well. Chams PLC is reputed as the first home-grown company to be listed in Guinness Book of World Record, for setting up the ChamsCity mega Digital Mall and also the first Computer Technology Com-pany listed on the Nigerian Stock Exchange.
The business concern of Chams Plc is the provision of infrastructure to drive e-payment, transaction and identity management and thus the subsidiaries and business units (listed below) of the company are positioned to deliver this.
Strategic Business UnitsChamsCity As a business unit, ChamsCity is posi-tioned as a service provider. It employs technology
as an enabling platform for improved efficiency in business. With over 2000 computer systems and 3 centers in Lagos, Port-Harcout and Abuja, Cham-sCity has facilitated a number of international IT conferences, professional examinations; computer based testing, e-learning and training. Corporate or-ganizations have also signed on to its platform to enhance their recruitment and testing process.
In the last year, ChamsCity facilitated a number of computer based testing and training for corporate multinationals and government institutions. It also has handled biometric staff audit and verification for a number of states and government parastatals. Some of its major clients are Joint Admissions Ma-triculation Board (JAMB), Nigerian Airforce (NAF), Nigerian Customs Services, Osun State, Anambra State, NCC, Amnesty, Bureau of Public Enterprise, Power Holding Company of Nigeria, National Iden-tity Management Commission, Nigerian Computer Society, etc.
Identity Management department is the primary public sector focused and they have successfully executed a number of major government projects which include the State’s identity management projects, Nigerian Communications Commission SIM registration project, Nigerian Air Force, etc.
Naira.com is an information and transactional web portal and it also offers payment infrastructure to web portals in the country. Naira.com is the first ecommerce/payment site and aggregator in Nige-
CORPOR ATE PROFILE & SUBSIDIARY INFORMATION
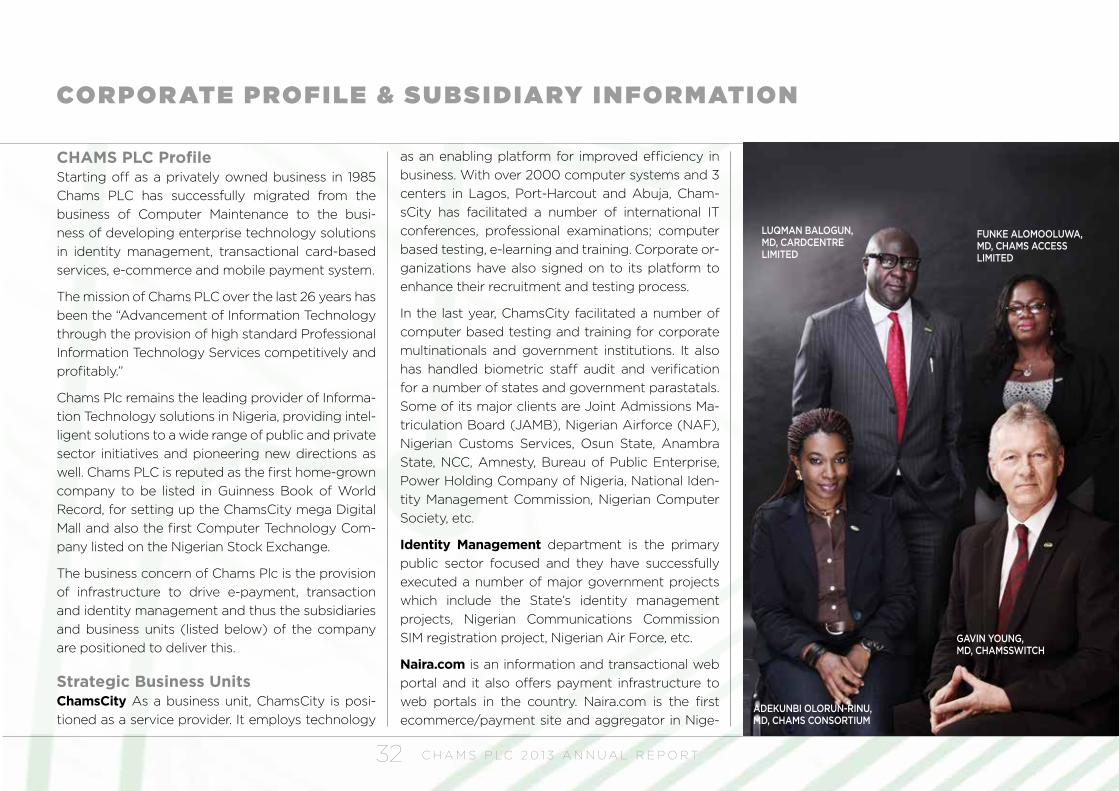
LUQMAN BALOGUN, MD, CARDCENTRE LIMITED
FUNKE ALOMOOLUWA, MD, CHAMS ACCESS LIMITED
GAVIN YOUNG, MD, CHAMSSWITCH
ADEKUNBI OLORUN-RINU, MD, CHAMS CONSORTIUM
C H A M S P L C 2 0 1 3 A N N U A L R E P O R T 33
ria. It paved the way for Nigerians to participate in ecommerce without restrictions that has erstwhile greeted online transactions from Nigeria.
Subsidiary companies within the Chams group are;
ChamsSwitch: is a subsidiary of Chams Plc estab-lished to provide transactional and Identification switching services. ChamsSwitch is committed to providing a platform that would allow e-payment processing i.e. financial transactions and identifica-tion management. ChamsSwitch is built to serve all existing payment platforms.
ChamsMobile offers mobile payment solutions to the vast array of the unbanked in the rural and suburban communities. Services available include cash-in and Cash-out, cash transfer, balance inquiry and mini account statement, phone credit top up, utility payment etc. ChamsMobile is a licensed CBN mobile payment operator and has completed its proof of concept for its mobile payment solution and has commenced deployment. ChamsMobile is owned by Bancore International and Chams PLC.
ChamsAccess: ChamsAccess Limited is a subsid-iary of Chams Plc. Our core focus at ChamsAccess Limited is the sale, deployment and support of Au-tomated Teller Machines, Financial/Identity Card Printers, Time & Attendance/ Access Control Termi-nals. ChamsAccess is the only authorized distributor of the Kingteller ATMs, Datacard range of printers and card solutions, Iguard time and attendance and
Access control terminal, Bitel point of sale terminals and Kings Self service interactive Kiosk.
PayMaster is a CBN licensed POS terminal solutions provider (PTSP) Deploying POS terminals and in-novative solutions on POS terminals are the main thrust of the company. PayMaster is equipped with requisite manpower and skills for the deployment and provision of technical support for POS termi-nals deployed across the country. Its one of the companies driving the cashlite agenda of the CBN.
CardCentre produces smart card solutions for Identity, financial and loyalty purposes in Nigeria, and the first ISO 9000:2001 certified perso- card plant in Nigeria. CARDCENTRE is a smartcard and Solutions service provider with focus on produc-tion, printing, personalization and fulfillment of card products such as EMV Payment cards, co-branded cards, multi-function identity cards and other relat-ed solutions.
ChamsConsortium is set up mainly as an Identity management company. Owned by Chams PLC and Nextzon Business services Limited, ChamsConsor-tium is appointed by the National Identity Manage-ment Commission as a partner on a public private partnership (PPP) concessionaire agreement basis for the New National Identity Management system and database for the federation. The project has since commenced with enrolment and is billed to help curb a lot of security issues and other related matters in the country.
Some of our major achievements include;
Mobile Payment License: Through our Subsidiary (Chams Mobile) Chams owns an operational license from Central Bank of Nigeria (CBN) as a Mobile Money Operator positioned to lead the mobile pay-ment landscape.
Independent ATM Deployment License (IAD): ChamsAccess Limited secured Central Bank of Ni-geria’s License to deploy ATM on behalf of banks and other customers, handle support and issues management. This is in addition to its business of ATM hardware and software sale.
PTSP License: PayMaster limited owns a Central Bank of Nigeria License as a Point of Sale Terminal service provider which allow the company to
y Acquire merchants
y Deploy POS and mobile terminals
y Support issue management
y Maintenance and repair services on behalf of our partner’s organizations
Chams Bitel Partnership: the Chams- Bitel termi-nals is endorsed by the Central Bank of Nigeria as one of the Point of Sales Terminals (POS) for driving the Cashlite Nigeria Project,
Other Major Projects Highlights y Staff /Pensioners Audit and Biometric enrol-
ment for Power Holding Company of Nigeria
CORPOR ATE PROFILE & SUBSIDIARY INFORMATION
C H A M S P L C 2 0 1 3 A N N U A L R E P O R T34
(PHCN) across the Federation
y Staff Audit and Biometric registration for all staff of Access Bank during its merger/ acquisi-tion of Intercontinental bank
y Biometric enrollment of Anambra State resi-dents
y Deployment of time and attendance Applica-tion for Federal Road Safety Commission
y Biometric enrollment for of Nigerian Customs Service (NCS) and production of Smart Identi-fication Cards
y Staff audit for the Ministry of Aviation through biometric registration of all Agencies and Para-statals which include NAMA, NCA, FANN and NCAT
y Biometric enrollment of Anambra Local Gov-ernment Staff and production of Smart Identi-fication Cards
y Staff Audit /Biometric enrollment of all Osun State Civil Servants to fish out Ghost workers and deployed Software Payroll System for Osun State Civil Servants
y Biometric enrollment of all Staff and Students of University of Lagos
y Biometric enrollment of all Staff and Students of Federal University Ndufu-Alike Ikwo (FUNAI)
y Biometric enrollment for NACHO Staff and de-
ployment of Access Control and Time Atten-dance Terminals.
y INEC Voters ID Card: delivered 52 million Inde-pendent National Electoral Commission cards to be used by Nigerian voters.
y Chams-NIMC: The Federal Government of Nige-ria awarded the implementation of the new Na-tional Identity Management Commission (NIMC) to Chams consortium.
y NATIONAL ID: Chams is the first indigenous company to participate in the Nigeria National ID project, which saw live production of the cards. Chams implemented the first successful rollout of the National ID card in 1999.
y VALUCARD: Now UPS (Universal Payment Sys-tems) was conceptualized by CHAMS in partner-ship with some banks in Nigeria to develop the first smart card technology in Nigeria and to date the organization provides technical assistance for effective implementation of payment solutions.
y CASP Consortium for the Administration of Pen-sions and Salaries was developed in response to the many challenges faced by Government in the administration of its Workers’ remuneration and payment of monthly Pensions to its Pensioners.
Our Awards and Recognition y ICT Company of the Year, 2012 - Leadership
Awards, Nigeria
y ICT Company of the Year, 2011 - Leadership Awards, Nigeria
y Partnership Distributor Award, 2012 - Datacard Group, Canada
y Guinness World Record Certification for Cham-sCity as the World’s Largest Internet Centre, La-gos and Abuja. - 2009
y ICT Company of the Year, 2008 - National ICT Merit Awards,
y ICT Company of the Year, 2008 - Leadership Awards, Nigeria
y CICAN Crystal of Excellence Awards, 2009 (In recognition of ChamsCity entry into the Guinness book of World Records).
y TIGA (Technology In Government In Africa), 2008
y Total Solution Company of the Year, 2008 - Na-tional ICT Merit Awards
y Datacard Presidential Awards, Canada, 2008, 2010,2011 - DataCard Group Canada
y ICT Brand of the Year, 2008 - Financial Standard Newspaper
CORPOR ATE PROFILE & SUBSIDIARY INFORMATION
C H A M S P L C 2 0 1 3 A N N U A L R E P O R T 35
TO THE MEMBERS OF CHAMS PLCIn accordance with the provision of section 359(6) of the Companies and Allied Matters Act CAP C20 Laws of the Federation of Nigeria, 2004, we confirm that we have reviewed the audit plan and scope, and the Management Letter on the audit of the accounts of the Company and the response to the said Letter.
In our opinion, the plan and scope of the audit for the year ended December, 2013 were adequate. We have reviewed the Auditors findings and we are satis-fied with the management responses thereon.
We also confirm that the accounting and reporting policies of the Company are in accordance with legal requirements and ethical practices.
Mr Emmanuel Onochie
Chairman Audit Committee
25th March, 2014
MEMBERS OF THE AUDIT COMMITTEE
Mr Emmanuel Onochie – Chairman
Mr Tunde Yusuf – Member
The Very Rev. Ayo Richards – Member
Mr Moses Igbrude – Member
Mr Doyin Owolabi – Member
Mr Femi Williams - Member
RE PORT OF THE AUDIT COMMITTE E
C H A M S P L C 2 0 1 3 A N N U A L R E P O R T36
RE PORT OF INDE PE NDE NT AUDITORS
TO THE MEMBERS OF CHAMS PLC AND ITS SUBSIDIARY COMPANIES
We have audited the accompanying financial statements of Chams Plc and its subsidiary Companies (‘together the Group’) for the financial year ended 31 December 2013, which com-prises the consolidated statement of financial position, consolidated statement of profit or loss and other comprehensive income, consolidated statement of changes in equity, consolidated statement of cash flows for the year then ended, and notes to the consolidated financial state-ments which include the significant accounting policies and other explanatory notes
Directors’ responsibility for the financial statements 2. The directors are responsible for the preparation and fair presentation of these financial statements in accordance with International Financial Reporting Standards issued by the In-ternational Accounting Standards Board, in compliance with relevant provisions of the Finan-cial Reporting Council of Nigeria Act, No 6, 2011 and the Companies and Allied Matters Act, CAP C20 LFN 2004. This responsibility includes: designing, implementing and maintaining internal controls relevant to the preparation and fair presentation of financial statements that are free from material misstatement, whether due to fraud or error, selecting and applying appropriate accounting polices and making accounting estimates that are reasonable in the circumstances.
Auditors’ responsibility3. Our responsibility is to express an independent opinion on the financial statements based on our audit. We conducted our audit in accordance with International Standards on Audit-ing. Those standards require that we comply with ethical requirements and plan and perform our audit to obtain reasonable assurance that the financial statements are free from material misstatement.
An audit involves performing procedures to obtain audit evidence about the amounts of dis-closures in the financial statements. The procedures selected depend on the auditors’ judge-
ment, including the assessment of the risks of material misstatement of the financial state-ments, whether due to fraud or error. In making those risk assessments, the auditors consider internal controls relevant to the entity’s preparation and fair presentation of the financial state-ments in order to design audit procedures that are appropriate in the circumstances, but not for the purpose of expressing an opinion on the effectiveness of the Company’s internal con-trol. An audit also includes evaluating the appropriateness of accounting policies used and the reasonableness of accounting estimates made by the directors, as well as evaluating the overall presentation of the financial statements.
We believe that the audit evidence we have obtained is sufficient and appropriate to provide a basis for our opinion.
Opinion4 In our opinion, the financial statements give a true and fair view of the state of affairs of the Company and the group financial position as at 31 December 2013 and of the financial per-formance and cash flows for the year then ended in accordance with International Financial Reporting Standards and in compliance with the relevant provisions of the Financial Reporting Council of Nigeria Act No 6, 2011 and the Companies and Allied Matters Act, CAP C20 LFN 2004.
Report on other legal requirements5. The Companies and Allied Matters Act, CAP C20 LFN, 2004 requires that in carrying out our audit, we consider and report to you on the following matters. We confirm that:
i. we have obtained all the information and explanations which to the best of our knowledge and belief were necessary for the purpose of our audit;
ii. in our opinion, proper books of account have been kept by the Company; and
iii. the Company’s statement of financial position and profit and loss and other compre-hensive income statement are in agreement with the books of account.
Lagos, Nigeria 31 March 2014
Chartered Accountants
Tel: +234 1 7941667, 7404787www.bdo-ng.com
ADOL House15 CIPM AvenueCentral Business DistrictAlausa, IkejaP. O. Box 4929, GPO, MarinaLagos, Nigeria
C H A M S P L C 2 0 1 3 A N N U A L R E P O R T 37
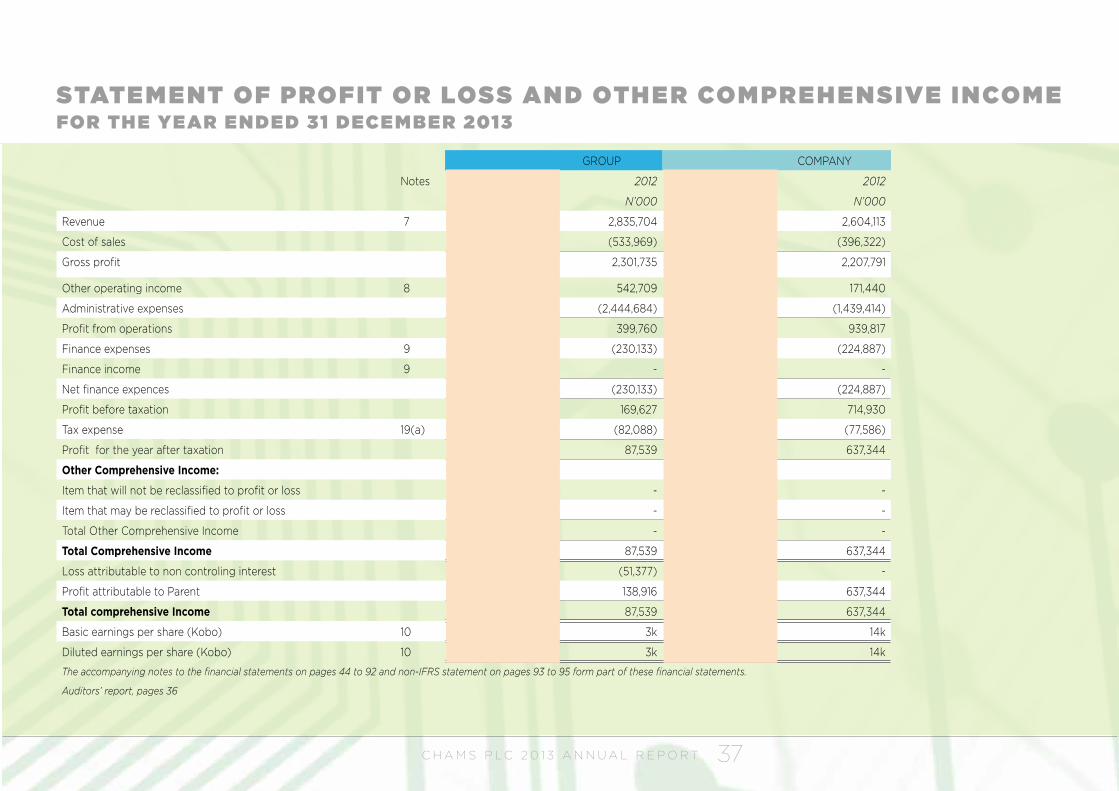
GROUP COMPANY
Notes 2013 2012 2013 2012
N’000 N’000 N’000 N’000
Revenue 7 3,439,197 2,835,704 3,142,035 2,604,113
Cost of sales (1,589,411) (533,969) (1,405,554) (396,322)
Gross profit 1,849,786 2,301,735 1,736,481 2,207,791
Other operating income 8 22,342 542,709 20,042 171,440
Administrative expenses (1,551,931) (2,444,684) (910,405) (1,439,414)
Profit from operations 320,197 399,760 846,118 939,817
Finance expenses 9 (216,472) (230,133) (211,942) (224,887)
Finance income 9 3,198 - - -
Net finance expences (213,274) (230,133) (211,942) (224,887)
Profit before taxation 106,923 169,627 634,176 714,930
Tax expense 19(a) 81,541 (82,088) 89,106 (77,586)
Profit for the year after taxation 188,464 87,539 723,282 637,344
Other Comprehensive Income:
Item that will not be reclassified to profit or loss - - - -
Item that may be reclassified to profit or loss - - - -
Total Other Comprehensive Income - - - -
Total Comprehensive Income 188,464 87,539 723,282 637,344
Loss attributable to non controling interest (132,567) (51,377) - -
Profit attributable to Parent 321,031 138,916 723,282 637,344
Total comprehensive Income 188,464 87,539 723,282 637,344
Basic earnings per share (Kobo) 10 7k 3k 15k 14k
Diluted earnings per share (Kobo) 10 7k 3k 15k 14k
The accompanying notes to the financial statements on pages 44 to 92 and non-IFRS statement on pages 93 to 95 form part of these financial statements.
Auditors’ report, pages 36
STATE ME NT OF PROFIT OR LOSS AND OTHE R COMPRE HE NSIVE INCOMEFOR THE YEAR E NDE D 31 DECE MBE R 2013
C H A M S P L C 2 0 1 3 A N N U A L R E P O R T38
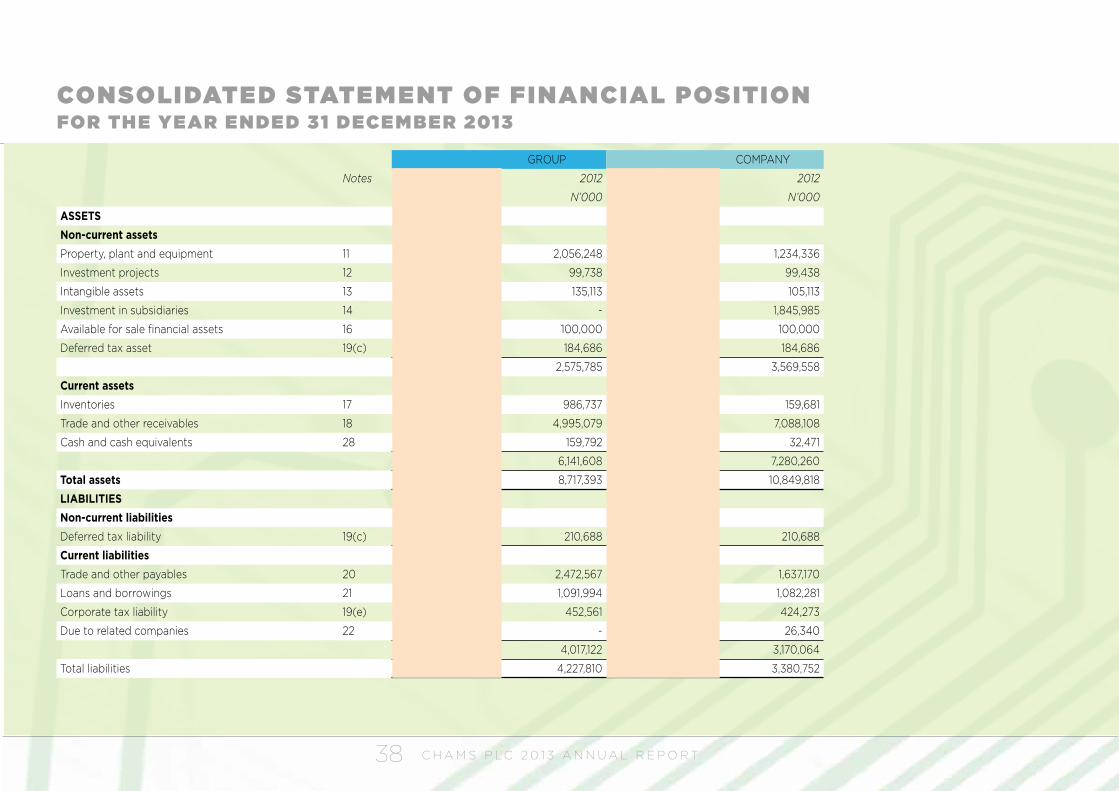
CONSOLIDATE D STATE ME NT OF FINANCIAL POSITIONFOR THE YEAR E NDE D 31 DECE MBE R 2013
GROUP COMPANY
Notes 2013 2012 2013 2012
N’000 N’000 N’000 N’000
ASSETS
Non-current assetsProperty, plant and equipment 11 1,682,203 2,056,248 1,164,419 1,234,336
Investment projects 12 151,236 99,738 150,936 99,438
Intangible assets 13 98,703 135,113 98,703 105,113
Investment in subsidiaries 14 - - 1,845,985 1,845,985
Available for sale financial assets 16 100,000 100,000 100,000 100,000
Deferred tax asset 19(c) 129,126 184,686 129,126 184,686
2,161,268 2,575,785 3,489,169 3,569,558
Current assetsInventories 17 935,909 986,737 240,491 159,681
Trade and other receivables 18 7,484,052 4,995,079 8,506,073 7,088,108
Cash and cash equivalents 28 137,526 159,792 98,645 32,471
8,557,487 6,141,608 8,845,209 7,280,260
Total assets 10,718,755 8,717,393 12,334,378 10,849,818
LIABILITIESNon-current liabilitiesDeferred tax liability 19(c) - 210,688 - 210,688
Current liabilitiesTrade and other payables 20 4,574,337 2,472,567 2,744,125 1,637,170
Loans and borrowings 21 940,523 1,091,994 907,610 1,082,281
Corporate tax liability 19(e) 526,148 452,561 490,295 424,273
Due to related companies 22 - - 26,340
6,041,008 4,017,122 4,142,030 3,170,064
Total liabilities 6,041,008 4,227,810 4,142,030 3,380,752
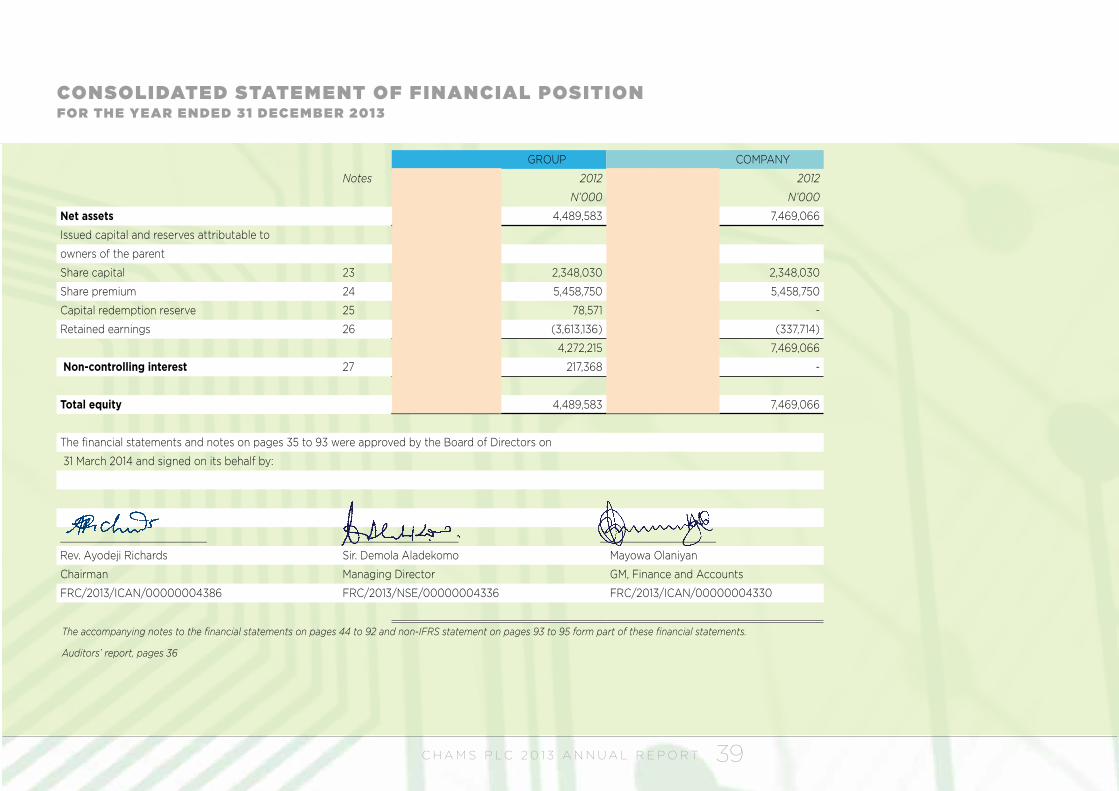
C H A M S P L C 2 0 1 3 A N N U A L R E P O R T 39
CONSOLIDATE D STATE ME NT OF FINANCIAL POSITIONFOR TH E YEAR E N DE D 31 DECE M B E R 2013
GROUP COMPANY
Notes 2013 2012 2013 2012
N’000 N’000 N’000 N’000
Net assets 4,677,747 4,489,583 8,192,348 7,469,066
Issued capital and reserves attributable to
owners of the parent
Share capital 23 2,348,030 2,348,030 2,348,030 2,348,030
Share premium 24 5,458,750 5,458,750 5,458,750 5,458,750
Capital redemption reserve 25 131,094 78,571 - -
Retained earnings 26 (2,892,657) (3,613,136) 385,568 (337,714)
5,045,217 4,272,215 8,192,348 7,469,066
Non-controlling interest 27 (367,470) 217,368 - -
Total equity 4,677,747 4,489,583 8,192,348 7,469,066
The financial statements and notes on pages 35 to 93 were approved by the Board of Directors on
31 March 2014 and signed on its behalf by:
________________________ ___________________ ___________________
Rev. Ayodeji Richards Sir. Demola Aladekomo Mayowa Olaniyan
Chairman Managing Director GM, Finance and Accounts
FRC/2013/ICAN/00000004386 FRC/2013/NSE/00000004336 FRC/2013/ICAN/00000004330
The accompanying notes to the financial statements on pages 44 to 92 and non-IFRS statement on pages 93 to 95 form part of these financial statements.
Auditors’ report, pages 36
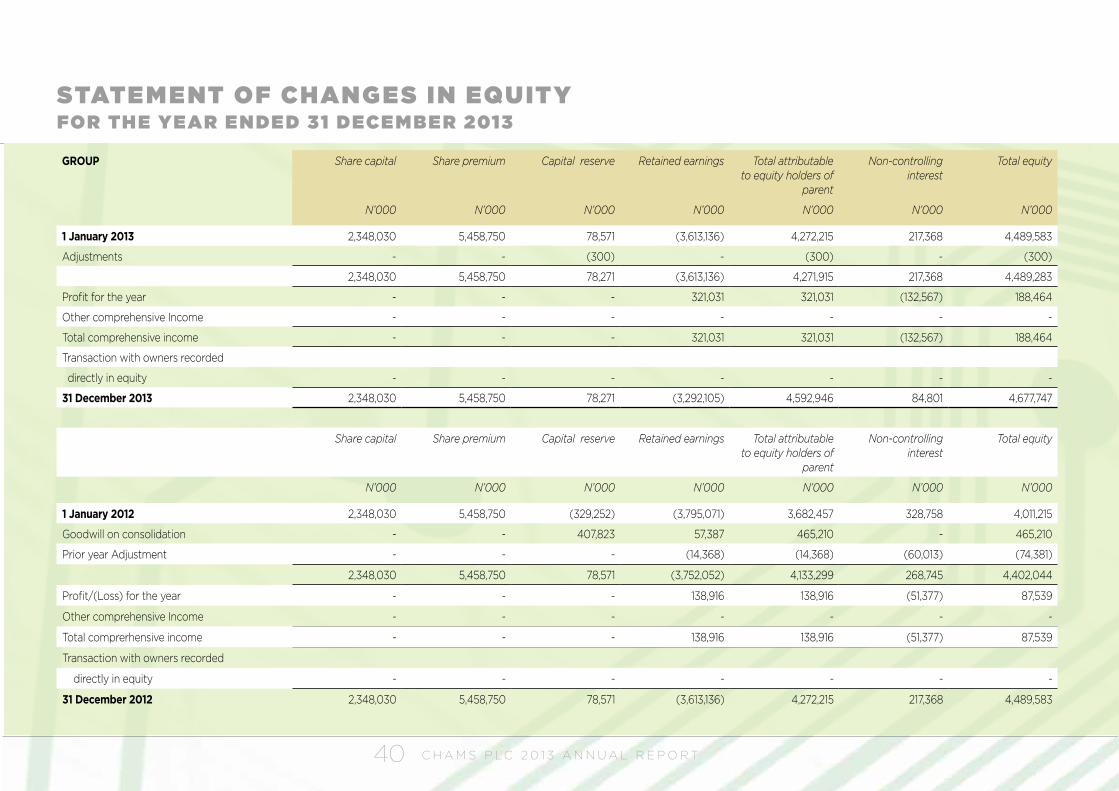
C H A M S P L C 2 0 1 3 A N N U A L R E P O R T40
GROUP Share capital Share premium Capital reserve Retained earnings Total attributable to equity holders of
parent
Non-controlling interest
Total equity
N’000 N’000 N’000 N’000 N’000 N’000 N’000
1 January 2013 2,348,030 5,458,750 78,571 (3,613,136) 4,272,215 217,368 4,489,583
Adjustments - - (300) - (300) - (300)
2,348,030 5,458,750 78,271 (3,613,136) 4,271,915 217,368 4,489,283
Profit for the year - - - 321,031 321,031 (132,567) 188,464
Other comprehensive Income - - - - - - -
Total comprehensive income - - - 321,031 321,031 (132,567) 188,464
Transaction with owners recorded
directly in equity - - - - - - -
31 December 2013 2,348,030 5,458,750 78,271 (3,292,105) 4,592,946 84,801 4,677,747
Share capital Share premium Capital reserve Retained earnings Total attributable to equity holders of
parent
Non-controlling interest
Total equity
N’000 N’000 N’000 N’000 N’000 N’000 N’000
1 January 2012 2,348,030 5,458,750 (329,252) (3,795,071) 3,682,457 328,758 4,011,215
Goodwill on consolidation - - 407,823 57,387 465,210 - 465,210
Prior year Adjustment - - - (14,368) (14,368) (60,013) (74,381)
2,348,030 5,458,750 78,571 (3,752,052) 4,133,299 268,745 4,402,044
Profit/(Loss) for the year - - - 138,916 138,916 (51,377) 87,539
Other comprehensive Income - - - - - - -
Total comprerhensive income - - - 138,916 138,916 (51,377) 87,539
Transaction with owners recorded
directly in equity - - - - - - -
31 December 2012 2,348,030 5,458,750 78,571 (3,613,136) 4,272,215 217,368 4,489,583
STATE ME NT OF CHANGES IN EQUITYFOR THE YEAR E NDE D 31 DECE MBE R 2013
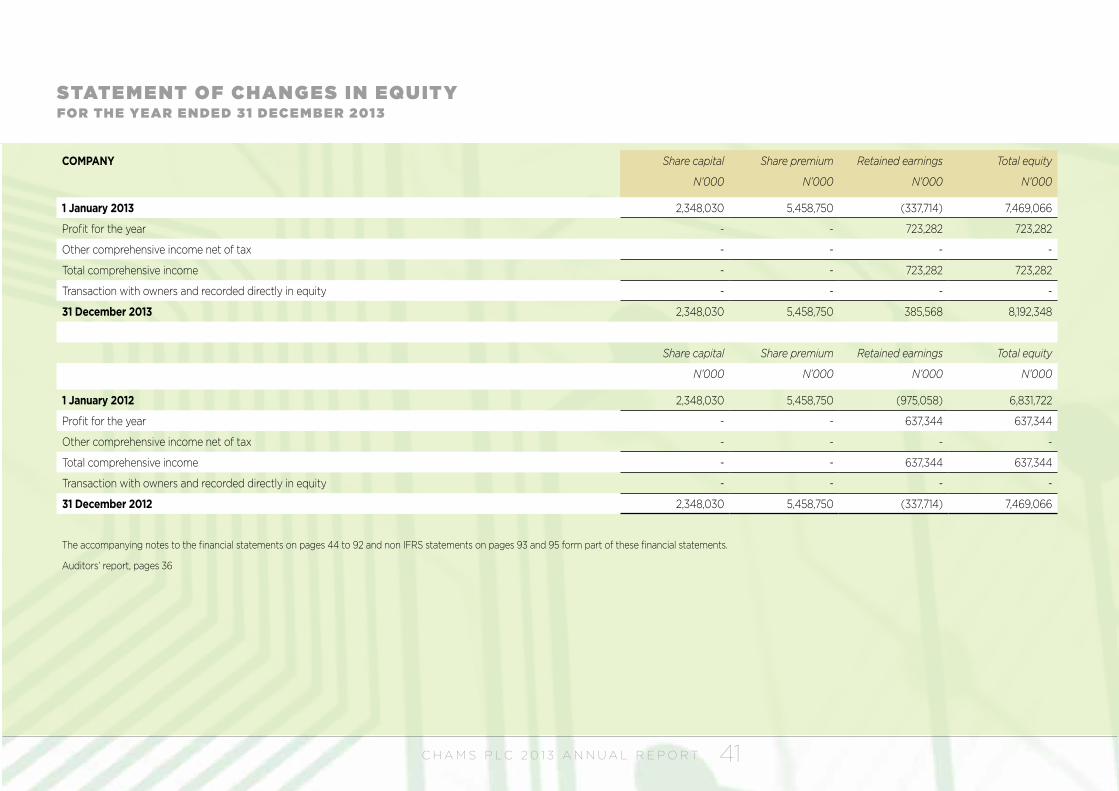
C H A M S P L C 2 0 1 3 A N N U A L R E P O R T 41
COMPANY Share capital Share premium Retained earnings Total equity
N’000 N’000 N’000 N’000
1 January 2013 2,348,030 5,458,750 (337,714) 7,469,066
Profit for the year - - 723,282 723,282
Other comprehensive income net of tax - - - -
Total comprehensive income - - 723,282 723,282
Transaction with owners and recorded directly in equity - - - -
31 December 2013 2,348,030 5,458,750 385,568 8,192,348
Share capital Share premium Retained earnings Total equity
N’000 N’000 N’000 N’000
1 January 2012 2,348,030 5,458,750 (975,058) 6,831,722
Profit for the year - - 637,344 637,344
Other comprehensive income net of tax - - - -
Total comprehensive income - - 637,344 637,344
Transaction with owners and recorded directly in equity - - - -
31 December 2012 2,348,030 5,458,750 (337,714) 7,469,066
The accompanying notes to the financial statements on pages 44 to 92 and non IFRS statements on pages 93 and 95 form part of these financial statements.
Auditors’ report, pages 36
STATE ME NT OF CHANGES IN EQUITYFOR TH E YEAR E N DE D 31 DECE M B E R 2013
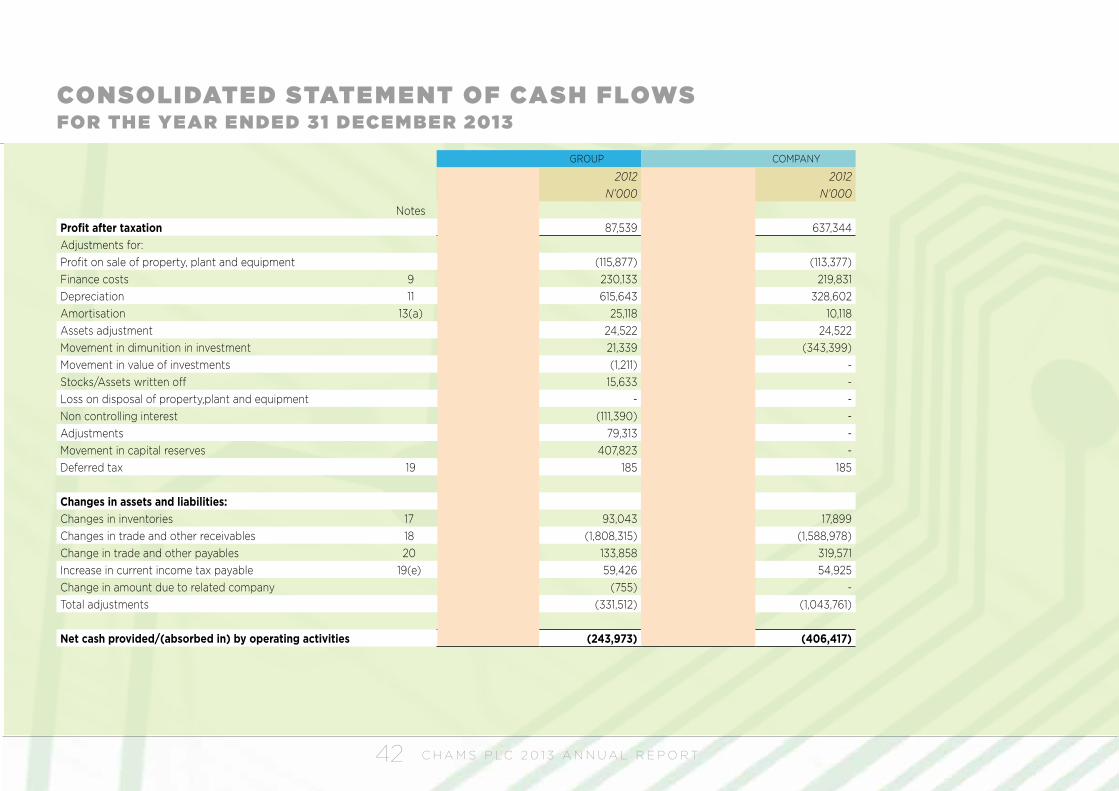
C H A M S P L C 2 0 1 3 A N N U A L R E P O R T42
GROUP COMPANY
2013 2012 2013 2012N’000 N’000 N’000 N’000
Notes Profit after taxation 188,464 87,539 723,282 637,344 Adjustments for:Profit on sale of property, plant and equipment - (115,877) - (113,377)Finance costs 9 216,472 230,133 205,678 219,831 Depreciation 11 322,468 615,643 86,763 328,602 Amortisation 13(a) 36,410 25,118 6,410 10,118 Assets adjustment 40,000 24,522 - 24,522 Movement in dimunition in investment 21,339 - (343,399)Movement in value of investments - (1,211) - - Stocks/Assets written off - 15,633 - - Loss on disposal of property,plant and equipment 32,506 - - - Non controlling interest - (111,390) - - Adjustments - 79,313 - - Movement in capital reserves - 407,823 - - Deferred tax 19 (155,128) 185 (155,128) 185
Changes in assets and liabilities:Changes in inventories 17 50,828 93,043 (80,810) 17,899 Changes in trade and other receivables 18 (2,488,973) (1,808,315) (1,417,965) (1,588,978)Change in trade and other payables 20 2,101,770 133,858 1,106,955 319,571 Increase in current income tax payable 19(e) 73,587 59,426 66,022 54,925 Change in amount due to related company - (755) (26,430) - Total adjustments 229,940 (331,512) (208,416) (1,043,761)
Net cash provided/(absorbed in) by operating activities 418,404 (243,973) 514,866 (406,417)
CONSOLIDATE D STATE ME NT OF CASH FLOWSFOR THE YEAR E NDE D 31 DECE MBE R 2013
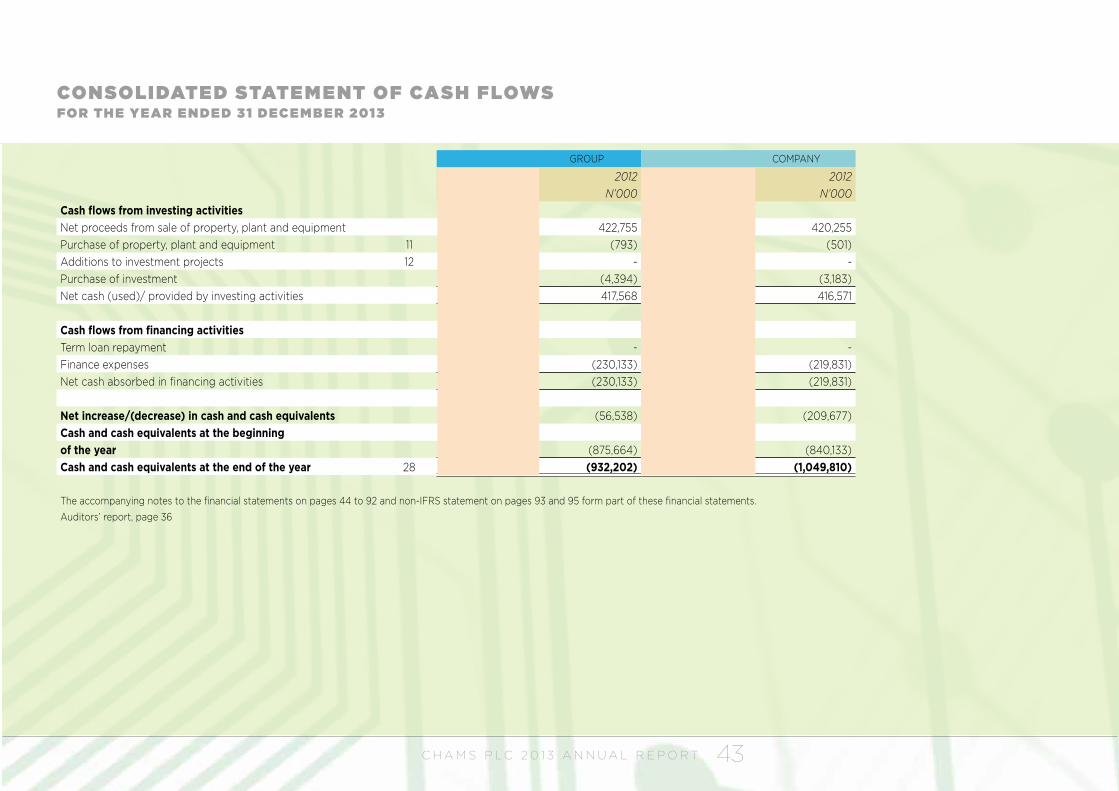
C H A M S P L C 2 0 1 3 A N N U A L R E P O R T 43
GROUP COMPANY
2013 2012 2013 2012N’000 N’000 N’000 N’000
Cash flows from investing activitiesNet proceeds from sale of property, plant and equipment 422,755 - 420,255 Purchase of property, plant and equipment 11 (21,229) (793) (16,846) (501)Additions to investment projects 12 (51,498) - (51,498) - Purchase of investment - (4,394) - (3,183)Net cash (used)/ provided by investing activities (72,727) 417,568 (68,344) 416,571
Cash flows from financing activitiesTerm loan repayment - - - - Finance expenses (216,472) (230,133) (205,678) (219,831)Net cash absorbed in financing activities (216,472) (230,133) (205,678) (219,831)
Net increase/(decrease) in cash and cash equivalents 129,205 (56,538) 240,844 (209,677)Cash and cash equivalents at the beginning of the year (932,202) (875,664) (1,049,809) (840,133)Cash and cash equivalents at the end of the year 28 (802,997) (932,202) (808,965) (1,049,810)
The accompanying notes to the financial statements on pages 44 to 92 and non-IFRS statement on pages 93 and 95 form part of these financial statements.Auditors’ report, page 36
CONSOLIDATE D STATE ME NT OF CASH FLOWSFOR TH E YEAR E N DE D 31 DECE M B E R 2013
C H A M S P L C 2 0 1 3 A N N U A L R E P O R T44
NOTES TO THE FINANCIAL STATE ME NTSFOR THE YEAR E NDE D 31 DECE MBE R 20131. History of the Company and nature of operations
Chams Plc (The Company) was incorporated as a limited liability Company on 10 September 1985 and became a public Company on 4 September 2008. The Company was listed on the floor of the Nigerian Stock Exchange on 8 September 2008. The principal activities of Chams Plc and its subsidiaries (the Group) include identity management, payment collections and transactional systems. The Company’s registered office is located at 8, Louis Solomon Close, Victoria Island, Lagos.
2. Basis of preparationa. The consolidated financial statements have been prepared in accordance with International Financial Reporting Standards (IFRS) as issued by the Interna-
tional Accounting Standards Board (IASB) and interpretations issued by the International Financial Reporting Interpretations Committee (IFRIC) and the requirements of the Companies and Allied Matters Act, CAP C20, LFN, 2004, where the provisions of IFRS are in conflict with the requirements of the com-panies and Allied Matters Act, CAP C20, LFN 2004, IFRS supersedes.
b. The financial statements were authorised for issue by the Board of Directors on 31 March 2014. The consolidated financial statements have been prepared on the historical cost basis.
c. Functional and presentation currency.These financial statements are presented in Naira, which is the Company’s functional currency. Amounts are rounded to the nearest thousand, unless oth-erwise stated
d. The preparation of financial statements in compliance with IFRS requires management to make certain critical accounting estimates. It also requires man-agement to exercise judgement in applying the Group’s accounting policies. Areas where assumptions and estimates are significant to the financial state-ments are disclosed in Note 4
3. New standards, interpretations and amendments effective from 1 January 2013A number of new standards, interpretations and amendments effective for the first time for the year beginning on, or after 1 January 2013, have been adopted in these financial statements. The nature and effect of each new standard, interpretation and amendment adopted by the Company is detailed below. Not all new standards and interpretations effective for the first time for the year beginning on, or after 1 January 2013 affected the Company’s annual financial statements.
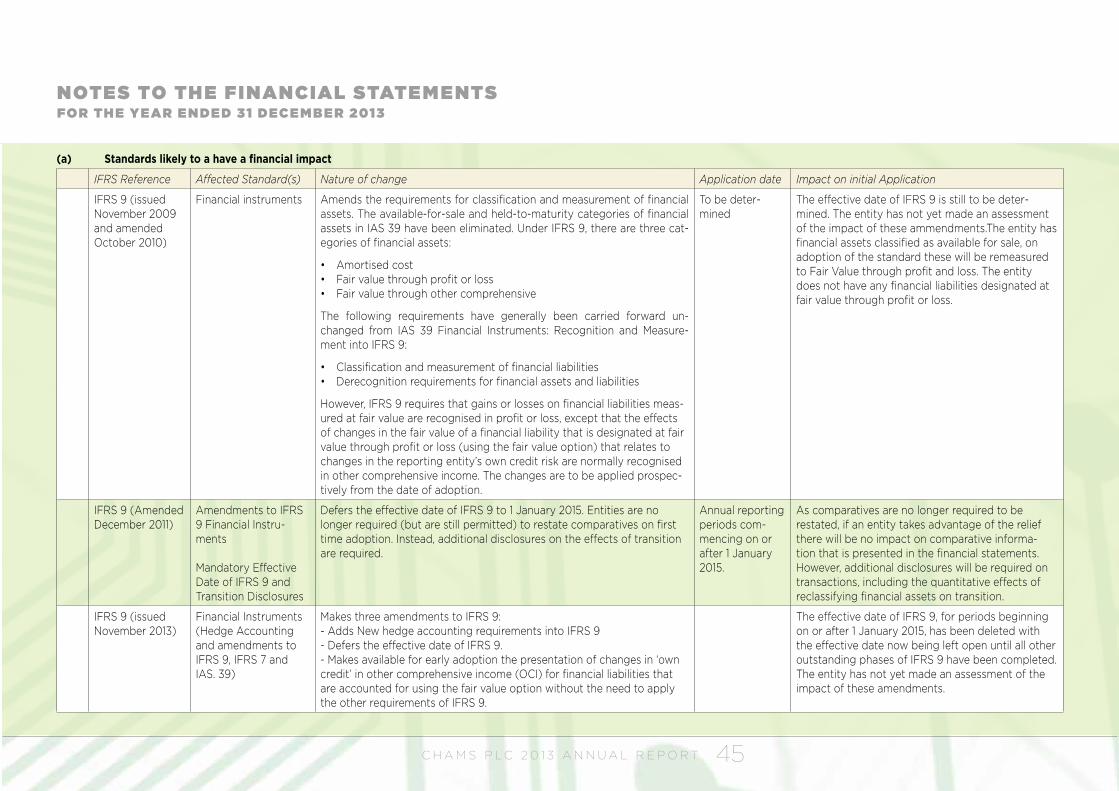
C H A M S P L C 2 0 1 3 A N N U A L R E P O R T 45
NOTES TO THE FINANCIAL STATE ME NTSFOR TH E YEAR E N DE D 31 DECE M B E R 2013
(a) Standards likely to a have a financial impact
IFRS Reference Affected Standard(s) Nature of change Application date Impact on initial Application
IFRS 9 (issued November 2009 and amended October 2010)
Financial instruments Amends the requirements for classification and measurement of financial assets. The available-for-sale and held-to-maturity categories of financial assets in IAS 39 have been eliminated. Under IFRS 9, there are three cat-egories of financial assets:
• Amortised cost • Fair value through profit or loss • Fair value through other comprehensive
The following requirements have generally been carried forward un-changed from IAS 39 Financial Instruments: Recognition and Measure-ment into IFRS 9:
• Classification and measurement of financial liabilities • Derecognition requirements for financial assets and liabilities
However, IFRS 9 requires that gains or losses on financial liabilities meas-ured at fair value are recognised in profit or loss, except that the effects of changes in the fair value of a financial liability that is designated at fair value through profit or loss (using the fair value option) that relates to changes in the reporting entity’s own credit risk are normally recognised in other comprehensive income. The changes are to be applied prospec-tively from the date of adoption.
To be deter-mined
The effective date of IFRS 9 is still to be deter-mined. The entity has not yet made an assessment of the impact of these ammendments.The entity has financial assets classified as available for sale, on adoption of the standard these will be remeasured to Fair Value through profit and loss. The entity does not have any financial liabilities designated at fair value through profit or loss.
IFRS 9 (Amended December 2011)
Amendments to IFRS 9 Financial Instru-ments
Mandatory Effective Date of IFRS 9 and Transition Disclosures
Defers the effective date of IFRS 9 to 1 January 2015. Entities are no longer required (but are still permitted) to restate comparatives on first time adoption. Instead, additional disclosures on the effects of transition are required.
Annual reporting periods com-mencing on or after 1 January 2015.
As comparatives are no longer required to be restated, if an entity takes advantage of the relief there will be no impact on comparative informa-tion that is presented in the financial statements. However, additional disclosures will be required on transactions, including the quantitative effects of reclassifying financial assets on transition.
IFRS 9 (issued November 2013)
Financial Instruments (Hedge Accounting and amendments to IFRS 9, IFRS 7 and IAS. 39)
Makes three amendments to IFRS 9: - Adds New hedge accounting requirements into IFRS 9- Defers the effective date of IFRS 9.- Makes available for early adoption the presentation of changes in ‘own credit’ in other comprehensive income (OCI) for financial liabilities that are accounted for using the fair value option without the need to apply the other requirements of IFRS 9.
The effective date of IFRS 9, for periods beginning on or after 1 January 2015, has been deleted with the effective date now being left open until all other outstanding phases of IFRS 9 have been completed. The entity has not yet made an assessment of the impact of these amendments.
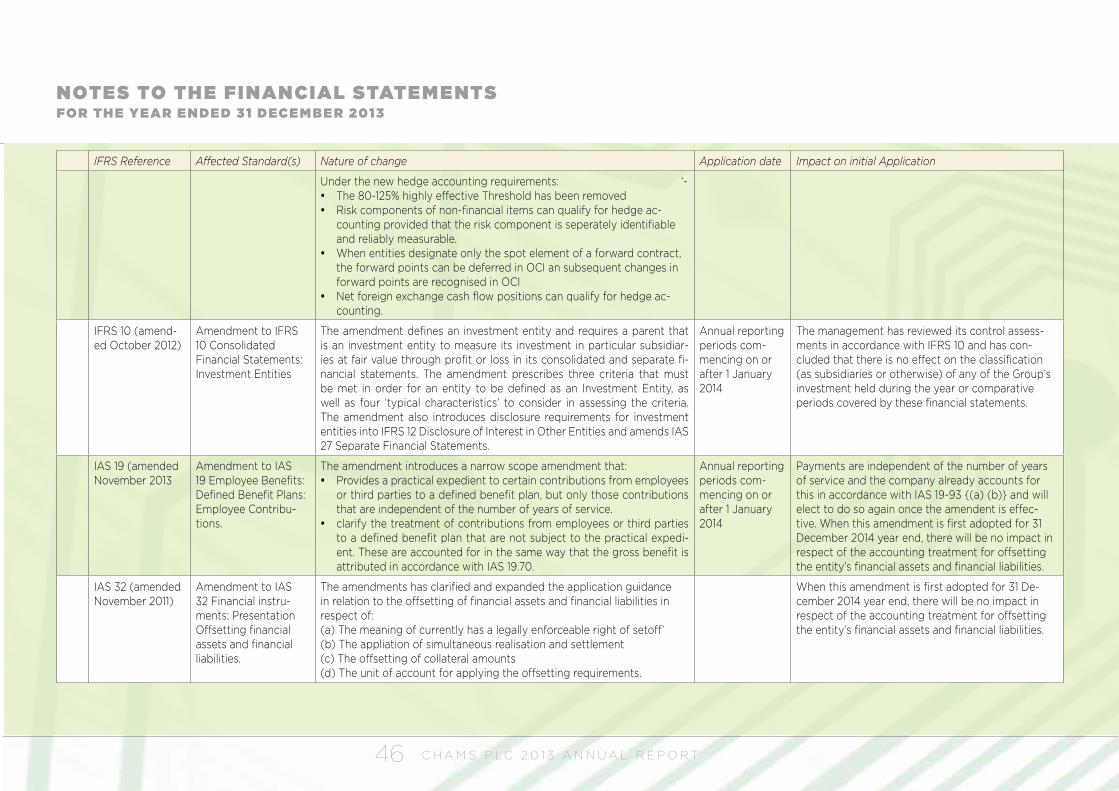
C H A M S P L C 2 0 1 3 A N N U A L R E P O R T46
IFRS Reference Affected Standard(s) Nature of change Application date Impact on initial Application
Under the new hedge accounting requirements: ‘- y The 80-125% highly effective Threshold has been removed y Risk components of non-financial items can qualify for hedge ac-
counting provided that the risk component is seperately identifiable and reliably measurable.
y When entities designate only the spot element of a forward contract, the forward points can be deferred in OCI an subsequent changes in forward points are recognised in OCI
y Net foreign exchange cash flow positions can qualify for hedge ac-counting.
IFRS 10 (amend-ed October 2012)
Amendment to IFRS 10 Consolidated Financial Statements: Investment Entities
The amendment defines an investment entity and requires a parent that is an investment entity to measure its investment in particular subsidiar-ies at fair value through profit or loss in its consolidated and separate fi-nancial statements. The amendment prescribes three criteria that must be met in order for an entity to be defined as an Investment Entity, as well as four ‘typical characteristics’ to consider in assessing the criteria. The amendment also introduces disclosure requirements for investment entities into IFRS 12 Disclosure of Interest in Other Entities and amends IAS 27 Separate Financial Statements.
Annual reporting periods com-mencing on or after 1 January 2014
The management has reviewed its control assess-ments in accordance with IFRS 10 and has con-cluded that there is no effect on the classification (as subsidiaries or otherwise) of any of the Group’s investment held during the year or comparative periods covered by these financial statements.
IAS 19 (amended November 2013
Amendment to IAS 19 Employee Benefits: Defined Benefit Plans: Employee Contribu-tions.
The amendment introduces a narrow scope amendment that: y Provides a practical expedient to certain contributions from employees
or third parties to a defined benefit plan, but only those contributions that are independent of the number of years of service.
y clarify the treatment of contributions from employees or third parties to a defined benefit plan that are not subject to the practical expedi-ent. These are accounted for in the same way that the gross benefit is attributed in accordance with IAS 19.70.
Annual reporting periods com-mencing on or after 1 January 2014
Payments are independent of the number of years of service and the company already accounts for this in accordance with IAS 19-93 {(a) (b)} and will elect to do so again once the amendent is effec-tive. When this amendment is first adopted for 31 December 2014 year end, there will be no impact in respect of the accounting treatment for offsetting the entity’s financial assets and financial liabilities.
IAS 32 (amended November 2011)
Amendment to IAS 32 Financial instru-ments: Presentation Offsetting financial assets and financial liabilities.
The amendments has clarified and expanded the application guidance in relation to the offsetting of financial assets and financial liabilities in respect of:(a) The meaning of currently has a legally enforceable right of setoff’(b) The appliation of simultaneous realisation and settlement (c) The offsetting of collateral amounts(d) The unit of account for applying the offsetting requirements.
When this amendment is first adopted for 31 De-cember 2014 year end, there will be no impact in respect of the accounting treatment for offsetting the entity’s financial assets and financial liabilities.
NOTES TO THE FINANCIAL STATE ME NTSFOR TH E YEAR E N DE D 31 DECE M B E R 2013
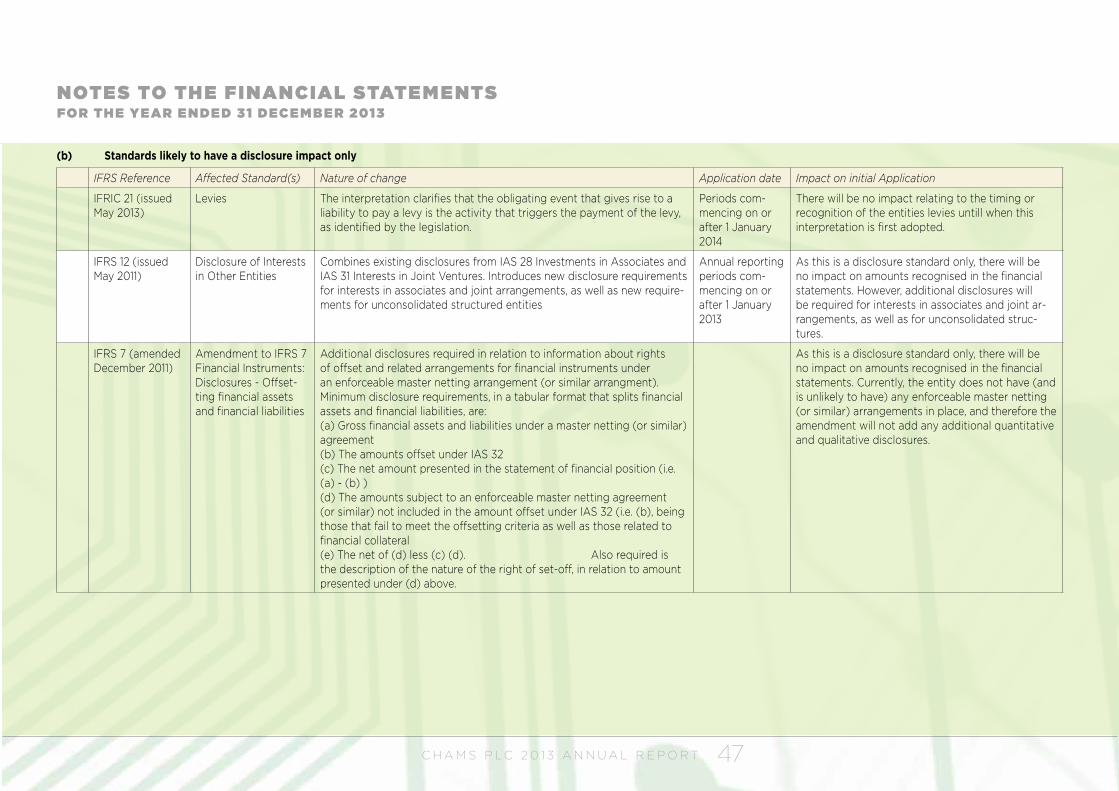
C H A M S P L C 2 0 1 3 A N N U A L R E P O R T 47
IFRS Reference Affected Standard(s) Nature of change Application date Impact on initial Application
IFRIC 21 (issued May 2013)
Levies The interpretation clarifies that the obligating event that gives rise to a liability to pay a levy is the activity that triggers the payment of the levy, as identified by the legislation.
Periods com-mencing on or after 1 January 2014
There will be no impact relating to the timing or recognition of the entities levies untill when this interpretation is first adopted.
IFRS 12 (issued May 2011)
Disclosure of Interests in Other Entities
Combines existing disclosures from IAS 28 Investments in Associates and IAS 31 Interests in Joint Ventures. Introduces new disclosure requirements for interests in associates and joint arrangements, as well as new require-ments for unconsolidated structured entities
Annual reporting periods com-mencing on or after 1 January 2013
As this is a disclosure standard only, there will be no impact on amounts recognised in the financial statements. However, additional disclosures will be required for interests in associates and joint ar-rangements, as well as for unconsolidated struc-tures.
IFRS 7 (amended December 2011)
Amendment to IFRS 7 Financial Instruments: Disclosures - Offset-ting financial assets and financial liabilities
Additional disclosures required in relation to information about rights of offset and related arrangements for financial instruments under an enforceable master netting arrangement (or similar arrangment). Minimum disclosure requirements, in a tabular format that splits financial assets and financial liabilities, are:(a) Gross financial assets and liabilities under a master netting (or similar) agreement(b) The amounts offset under IAS 32(c) The net amount presented in the statement of financial position (i.e. (a) - (b) )(d) The amounts subject to an enforceable master netting agreement (or similar) not included in the amount offset under IAS 32 (i.e. (b), being those that fail to meet the offsetting criteria as well as those related to financial collateral(e) The net of (d) less (c) (d). Also required is the description of the nature of the right of set-off, in relation to amount presented under (d) above.
As this is a disclosure standard only, there will be no impact on amounts recognised in the financial statements. Currently, the entity does not have (and is unlikely to have) any enforceable master netting (or similar) arrangements in place, and therefore the amendment will not add any additional quantitative and qualitative disclosures.
(b) Standards likely to have a disclosure impact only
NOTES TO THE FINANCIAL STATE ME NTSFOR TH E YEAR E N DE D 31 DECE M B E R 2013
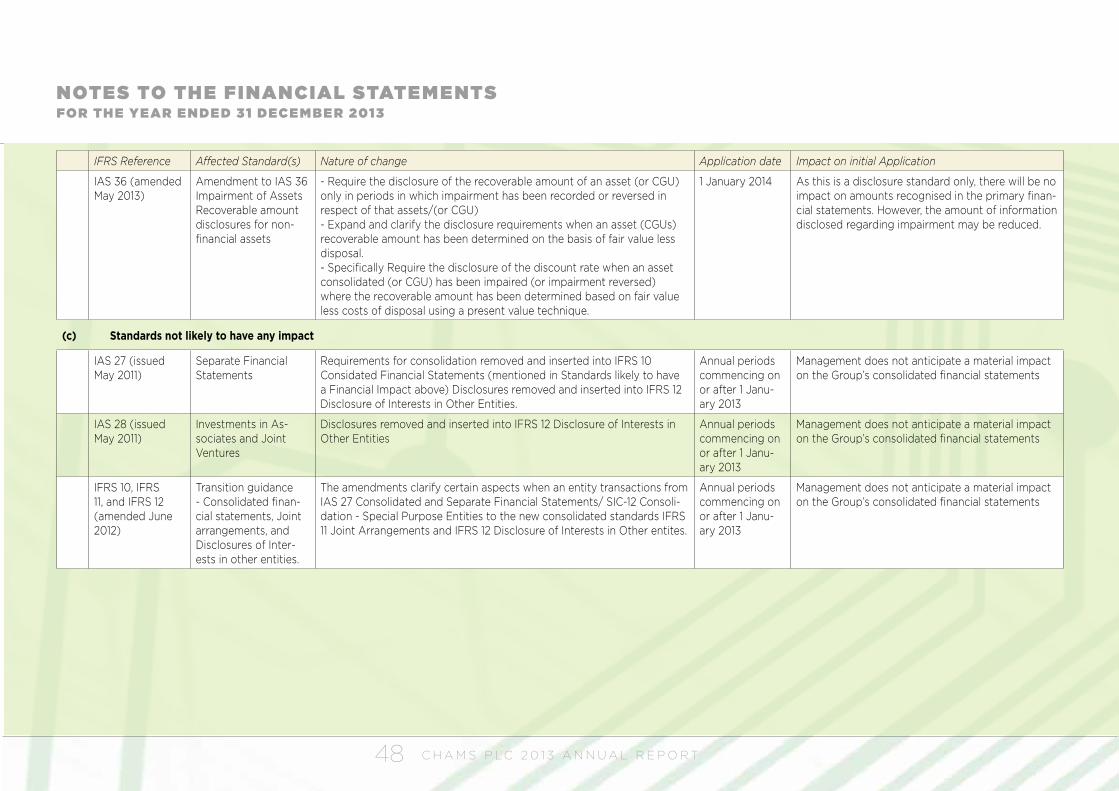
C H A M S P L C 2 0 1 3 A N N U A L R E P O R T48
IFRS Reference Affected Standard(s) Nature of change Application date Impact on initial Application
IAS 36 (amended May 2013)
Amendment to IAS 36 Impairment of Assets Recoverable amount disclosures for non-financial assets
- Require the disclosure of the recoverable amount of an asset (or CGU) only in periods in which impairment has been recorded or reversed in respect of that assets/(or CGU)- Expand and clarify the disclosure requirements when an asset (CGUs) recoverable amount has been determined on the basis of fair value less disposal.- Specifically Require the disclosure of the discount rate when an asset consolidated (or CGU) has been impaired (or impairment reversed) where the recoverable amount has been determined based on fair value less costs of disposal using a present value technique.
1 January 2014 As this is a disclosure standard only, there will be no impact on amounts recognised in the primary finan-cial statements. However, the amount of information disclosed regarding impairment may be reduced.
(c) Standards not likely to have any impact
IAS 27 (issued May 2011)
Separate Financial Statements
Requirements for consolidation removed and inserted into IFRS 10 Considated Financial Statements (mentioned in Standards likely to have a Financial Impact above) Disclosures removed and inserted into IFRS 12 Disclosure of Interests in Other Entities.
Annual periods commencing on or after 1 Janu-ary 2013
Management does not anticipate a material impact on the Group’s consolidated financial statements
IAS 28 (issued May 2011)
Investments in As-sociates and Joint Ventures
Disclosures removed and inserted into IFRS 12 Disclosure of Interests in Other Entities
Annual periods commencing on or after 1 Janu-ary 2013
Management does not anticipate a material impact on the Group’s consolidated financial statements
IFRS 10, IFRS 11, and IFRS 12 (amended June 2012)
Transition guidance - Consolidated finan-cial statements, Joint arrangements, and Disclosures of Inter-ests in other entities.
The amendments clarify certain aspects when an entity transactions from IAS 27 Consolidated and Separate Financial Statements/ SIC-12 Consoli-dation - Special Purpose Entities to the new consolidated standards IFRS 11 Joint Arrangements and IFRS 12 Disclosure of Interests in Other entites.
Annual periods commencing on or after 1 Janu-ary 2013
Management does not anticipate a material impact on the Group’s consolidated financial statements
NOTES TO THE FINANCIAL STATE ME NTSFOR TH E YEAR E N DE D 31 DECE M B E R 2013
C H A M S P L C 2 0 1 3 A N N U A L R E P O R T 49
4. Significant accounting policies(i) Revenue recognition
Revenue is recognised when it is probable that the economic benefits associated with the transaction will flow to the enterprise and the amount of the revenue can be measured reliably. Revenue is the fair value of the consideration received net of taxes and discounts. Revenue from sales of goods is recognised when delivery has taken place and transfer of risks and rewards of ownership has been completed. Revenue from service rendered is recognised immediately the service is completed and a service delivery form is issued. When services are provided in phases, revenue is recognised on completion of each phase of the project. Dividends are recognised when shareholders right to received payment is established.
Contract revenue is recognised in the income statement on percentage of completion method with the stage of completion being measured by reference to the actual work performed to date.
(ii) Basis of consolidation
a. Subsidiaries
Subsidiaries are entities controlled by the Group. Control exists when the group has the power to govern the financial and operating policies of the entity so as to obtain benefits from its activities. In assessing control, potential voting rights that presently are exercisable are taken into account. The financial statements of subsidiaries are included in the consolidated financial statements from the date that control commences until the date that control ceases. The financial statements have been prepared using uniform accounting policies for like transactions and other events in similar circumstances.
b. Accounting method of acquisition
The acquisition method of accounting is used to account for the purchase of subsidiaries. The cost of an acquisition is measured at the fair value of the assets given, equity instruments issued and liabilities incurred or assumed, plus any costs directly related to the acquisition. The excess of the cost of an acquisition over the Group’s share of the fair value of the identifiable net assets acquired is recorded as goodwill.
c. Associates
When the Group has the power to participate in (but not control) the financial and operating policy decisions of another entity, it is classified as an as-sociate. Associates are initially recognised in the consolidated statement of financial position at cost. The Group’s share of post-acquisition profits and losses is recognised in the consolidated statement of comprehensive income except that losses in excess of the Group’s investment in the associate are not recognised unless there is an obligation to make good those losses.
Profit and losses arising on transactions between the Group and its associates are recognised only to the extent of unrelated investor’s interest in the associate. The investor’s share in the associate’s profits and losses resulting from these transactions is eliminated against the carrying value of the as-sociates.
NOTES TO THE FINANCIAL STATE ME NTSFOR TH E YEAR E N DE D 31 DECE M B E R 2013
C H A M S P L C 2 0 1 3 A N N U A L R E P O R T50
Any premium paid for an associate above the fair value of the Group’s share of the identifiable assets, liabilities and contingent liabilities acquired is capi-talised and included in the carrying amount of the associate. Where there is objective evidence that the investment in the associate has been impaired, the carrying amount of the investment is tested for impairment in the same way as other non-financial assets.
d. Joint venture
Jointly controlled entities are included in the financial statements using proportionate consolidation. The share of each of the jointly controlled entity’s assets, liabilities, income and expenses are combined on the line by line basis with those of the Group.
Profits and losses arising on transactions between the Group and jointly controlled entities are recognised only to the extent of unrelated investor’s inter-est in the entity. The investor’s share in the jointly controlled entity’s profits and losses resulting from these transactions is eliminated against the asset or liability of the jointly controlled entity arising on the transaction.
The Group includes the assets its controls, its share of any income and the liabilities and expenses of jointly controlled operations and jointly controlled assets in accordance with the terms of the underlying contractual arrangement.
(iii) Segment reporting
An operating segment is a component of an entity:
(a) That engages in business activities from which it may earn revenues and incur expenses (including inter group transactions).
(b) Whose operating results are regularly reviewed by the entity’s chief operating decision maker to make decisions about resources to be allocated to the segments and assess its performance and
(c) For which discrete financial information is available
The Company has three main business segments:
• Identity Management and solutions
• Payments, Collections and Transactional Systems
• ICT Training
Revenue and cost reporting are directly related to the segments. Operating segments are reported in a manner consistent with the internal reporting provided to the chief operating decision makers. The chief operating decision makers have been identified as the members of the management team including the Group Managing Director.
All reported revenue and related costs of each segments are reconciled.
NOTES TO THE FINANCIAL STATE ME NTSFOR TH E YEAR E N DE D 31 DECE M B E R 2013
C H A M S P L C 2 0 1 3 A N N U A L R E P O R T 51
a. Identity management
Chams is a regional resource centre for identification solutions for clients ranging from corporations, educational bodies to national government.
Our identity management activities will include prometrics, biometrics identification with applications in the financial, healthcare, corporate and other public fields.
• Chamscity: is the major hub for large and nationwide Biometrics, data management, online real-time examinations and conferences etc. It offers a unique infrastructural backbone for the realisation of net national identification schemes and projects.
• Terminal and printers: has expertise in sales, installation and maintenance of Data card Printers in Nigeria and sales of terminals and access control.
Under the Group Operations we provide identity management through our subsidiary companies such as:
Card Centre Limited
This is an operator of one of the world’s largest card manufacturing and personalising factory. It also has Smart and Chip Card expertise engaging efficient and effective technologies for card personalisation, identity card enrolment logistic and access control.
b. Payments, collections and transactional systems
Our payments systems involve building, developing and maintenance of ICT infrastructures across the nation through our companies by helping Nigeria move seamlessly with the world’s trend of cashless economy. Under the Group Operations, we provide payment platforms through our subsidiary compa-nies such as:
ChamsAccess Limited
Deploys across the nation the premium automated teller machines and self-service Chams Access Service Terminals (CAST).
ChamsSwitch Limited
Set up to build an enabling infrastructure to ensure unimpeded expansion of all other E-payment initiatives of Chams Group.
ChamsMobile Limited/Naira.com
Setting up mobile payment platforms that will allow users carry out transactions through their mobile phones. These transactions ranges from funds transfer and airtime top-up to balance equiry etc.
NOTES TO THE FINANCIAL STATE ME NTSFOR TH E YEAR E N DE D 31 DECE M B E R 2013
C H A M S P L C 2 0 1 3 A N N U A L R E P O R T52
Paymaster Limited
Specialises in deployment of POS terminals with e-payment, vouchers, identity, loyalty, and more financing banking applications.
c. ICT Training
Through ChamsVarsity activities, we provide training and knowledge acquisition to bridge the gap in ICT management and education in Nigeria by providing quality ICT education in the sector.
d. All non-current assets under each segment are geographically analysed.
e. Others: Terminal and printers and recharge card aspect of Card Center
Geographical location
Abuja Lagos Port-HarcourtChams Switch Chams Plc Chams City
v. Property, plant and equipment
Item of property, plant and equipment are measured at cost less depreciation and impairment losses
Cost includes expenditures that are directly attributable to the acquisition of the asset.
When an item of property, plant and equipment is replaced, the carrying amount of such item of property, plant and equipment will include the cost of re-placing the part of such an item when the cost is incurred. The carrying amount of those parts that are replaced is derecognised.
Depreciation is recognised in profit and loss on a straight line basis to write down the cost of each asset to its residual value over the estimated useful life of each part of an item of property, plant and equipment.
The expected useful lives of property, plant and equipment are as follows:
Leasehold improvement Over the shorter of the useful life of the itemBuilding 50 years
Computers and other IT equipment 4 years
Furniture and fittings 4 years
Plant and machineries 7 years
NOTES TO THE FINANCIAL STATE ME NTSFOR TH E YEAR E N DE D 31 DECE M B E R 2013
C H A M S P L C 2 0 1 3 A N N U A L R E P O R T 53
Motor vehicles 4 years
IT Software 5 years
Derecognition
An item of property, plant and equipment is derecognised on disposal when no future economic benefits are expected from its use or disposal. Any gain or loss arising on derecognition of the asset is included in profit and loss in the year the asset is derecognised.
At each statement of financial position date, the Group assesses whether there is any indication that an asset may be impaired. If any such exists, the recov-erable amount of the asset is estimated in order to determine the extent of the impairment loss, if any.
When it is not possible to estimate the recoverable amount of an individual asset, the Group estimates the recoverable amount of the smallest generating unit to which the asset belongs.
If there is an indication that an asset is impaired, the carrying amount of the asset is reduced to its recoverable amount. Impairment losses are recognised immediately in the income statement.
vi. Leases
Leases in which substantially all the risks and rewards incidental to the ownership of the leased asset have been transferred to the Group (a finance lease), the asset is treated as if it has been purchased outright. Upon initial recognition, the leased asset is measured at an amount equal to the lower of its fair value and the present value of the minimum lease payments. Subsequent to initial recognition, the asset is accounted for in accordance with the accounting policy applicable to that asset. The interest element of the lease is charged to the consolidated statement of comprehensive income over the period of the lease. Leases order than finance lease are operating lease and are not recognised as assets in the books. lease expenses are charged to the statement of profit or loss and other comprehensive income.
vii. Investment property
An investment property is an investment in land and building held primarily for generating income or capital appreciation and not occupied substantially for use in the operation of the Group.
Initial measurement is at cost, while subsequent recognition is at fair value. Investment property measured at fair value is reassessed every year and changes in carrying value are recognised in the consolidated statement of profit or loss.
viii. Intangible asset
Internally generated intangible assets are primarily comprised of internally developed software. Such software as well as other internally generated assets
NOTES TO THE FINANCIAL STATE ME NTSFOR TH E YEAR E N DE D 31 DECE M B E R 2013
C H A M S P L C 2 0 1 3 A N N U A L R E P O R T54
for internal use are valued at cost and amortised over their useful lives. Impairments are recorded if the carrying amount of the asset exceeds the recover-able amount.
Development costs include, in addition to those costs attributable to the development of the asset, an appropriate proportion of overhead costs. Borrowing costs are capitalised to the extent that they are material and related to the period over which the asset is generated. The estimated useful life of software is 5 years which is assessed for impairment every year.
ix. Goodwill
Goodwill represents an asset representing the future economic benefits arising from other assets acquired in a business combination that are not individually identified and separately re-organised.
Cost comprises of assets given, liabilities assumed and equity instruments issued, plus the amount of any non-controlling interests in the business acquired plus, if the business combination is achieved in stages, the fair value of the existing equity interest in the acquiree. Contingent consideration is included in cost at its acquisition date fair value and, in case of contingent consideration classified as financial liability, measured subsequently through profit and loss.
Goodwill is capitalized as an intangible asset with any impairment (The Company is required to test on annual basis whether goodwill has suffered impair-ment) in carrying value being charged to the consolidated statement of comprehensive income. Where the fair value of identifiable assets, liabilities and contingent liabilities exceed the fair value of consideration paid, the excess is credited in full to the consolidated statement of comprehensive income on the acquisition date.
x. Inventories
Inventories of raw materials are valued at lower of purchase cost (based on weighted average cost, including related costs) and their net realizable value. A write down is recorded if net realizable value is less than the book value.
Write down on inventories of spare parts and consumables are calculated by comparing book value and probable net realizable value after a specific analy-sis of obsolescence of inventory.
xi. Cash and cash equivalents
Cash and cash equivalents include cash in hand, deposits held at call with banks, other short term highly liquid investments with original maturities of three months or less. For the purpose of the statement of cash flows, bank overdrafts are shown within loans and borrowings in current liabilities on the consoli-dated statement of financial position.
xii. Borrowings costs
Borrowing costs are interest and other costs that the entity incurs in connection with the borrowing of funds. Borrowing costs on qualifying capital expen-
NOTES TO THE FINANCIAL STATE ME NTSFOR TH E YEAR E N DE D 31 DECE M B E R 2013
C H A M S P L C 2 0 1 3 A N N U A L R E P O R T 55
diture are capitalized while others are expensed.
xiii. Employee benefits
a) Short - term employee benefits
All short term employee benefits payable within 12 months after service is rendered, the undiscounted amount of the benefits expected to be paid in respect of service rendered by employees in a period should be recognized in that period. All benefits that are due or outstanding as at the end of the year are accrued for.
b) Defined contribution plans
The cost to be recognized in the period is the contributory pension payable by employer (i.e. 7.5% of Basic, Housing and Transport) and the employee contributes in exchange for service rendered by employees during the period (e.g. pension contribution scheme). The cost is recognized as an expense in income statement when they fall due.
c) Termination benefits
Termination benefits would be recognized when and only when, the Group is demonstrably committed to either terminate the employment of an em-ployee or group of employees before the normal retirement date or provide termination benefits as a result of an offer made in order to encourage voluntary redundancy.
The Group shall recognize termination benefits as an expense when the Group is demonstrably committed with a detailed formal plan for the termina-tion without realistic possibility of withdrawal.
xiv. Income tax
Expenses on income tax comprise current and deferred tax. Current tax is the expected tax payable on taxable income or loss for the year, using tax rates en-acted by the Government. Current tax assets and liabilities will be offset on the statement of financial position. Deferred tax is provided using the statement of financial position method, providing for temporary differences between the carrying amounts of assets and liabilities for financial reporting purposes and the amount used for taxation purposes.
A deferred tax asset is recognized only to the extent that it is probable that future taxable profit will be available against which the asset can be utilized.
Additional income taxes that arise from the distribution of dividend by the Group are recognized at the same time as the liability to pay the related dividend is recognized.
NOTES TO THE FINANCIAL STATE ME NTSFOR TH E YEAR E N DE D 31 DECE M B E R 2013
C H A M S P L C 2 0 1 3 A N N U A L R E P O R T56
xv. Share capital
Financial instruments issued by the Group are classified as equity only to extent that they do not meet the definition of a financial liability or financial asset.
The Group’s ordinary shares are classified as equity instruments.
xvi. Foreign currency transactions
Transactions in foreign currencies are translated into the functional currency at the exchange rates at the dates of the transactions. Monetary assets and li-abilities denominated in foreign currencies at each reporting date are retranslated to the functional currency at exchange rates as at the date.
Foreign exchange gains and losses resulting from the settlement of such transactions and from the re-measurement of monetary items denominated in foreign currencies at year end exchange rates are recognised in profit or loss.
Non monetary items are not re-translated at year end and are measured at historical cost (translated using the exchange rates at the transaction dates,) except for non monetary items measured at fair value which are translated using the exchange rates at the date when fair value was determined.
xvii. Provisions, Contingent Assets and Liabilities
Provisions are recognized when the Group has a present legal or constructive obligation as a result of past events, and it is probable that an outflow of economic resources will be required from the group and the amounts can be estimated reliably. Timing or amounts of the outflow may still be uncertain.
Provisions are measured at the estimated amounts required to settle the present obligation, based on the most reliable evidence available at the reporting date, including the risks and uncertainties associated with the present obligation. Where there are a number of obligations, the likelihood that an outflow will be required in settlement is determined by considering the class of obligations as a whole.
Provisions are discounted to their present values when the time value of money is material.
xviii. Financial Instruments
Recognition, Initial measurement and derecognition
Financial assets and financial liabilities are recognised when the Group becomes a party to the contractual provisions of the financial instruments and are measured initially at fair value adjusted by transaction costs, except for those carried at fair value through profit or loss which are measured initially at fair value.
Financial assets are derecognised when the contractual rights to the cash flows from the financial assets expire, or when the financial assets and all substan-tial risks and rewards are transferred. A financial liability is derecognised when it is extinguished, discharged, cancelled or expires.
NOTES TO THE FINANCIAL STATE ME NTSFOR TH E YEAR E N DE D 31 DECE M B E R 2013
C H A M S P L C 2 0 1 3 A N N U A L R E P O R T 57
Classification and subsequent measurement of financial assets
For the purpose of subsequent measurement, financial assets other than those designated and effective as hedging instruments are classified into the fol-lowing categories upon initial recognition:
• Loans and receivables
• Financial assets at fair value through profit or loss (FVTPL)
• Held-to-maturity (HTM) investments
• Available-for-sale (AFS) financial assets
All financial assets except for those at FVTPL are subject to review for impairment at least yearly to identify whether there is any objective evidence that a financial asset or a group of financial assets is impaired.
All income and expenses relating to financial assets that are recognised in the profit or loss are presented within finance costs, finance income or other fi-nancial items, except for impairment of trade receivables which is presented within other expenses.
Loans and receivables
Loans and receivables are non-derivative financial assets with fixed or determinable payments that are not quoted in an active market. After initial recogni-tion, these are measured at amortised cost using the effective interest method, less provision for impairment. Discounting is omitted where the effect of discounting is immaterial. The group’s cash and cash equivalents, trade and other receivables fall into this category of financial instruments.
Individual significant receivables are considered for impairment when they are past due or when objective evidence is received that a specific counterparty will default. Receivables that are not considered to be individually impaired are reviewed for impairment in groups, which are determined by reference to the industry and region of a counterparty and other shared risk characteristics. The impairment loss estimate is then based on recent historical counterparty default rates for each identified group.
Financial assets at FVTPL
Financial assets at FVTPL include financial assets that are either classified as held for trading or that meet certain conditions and are designated at FVTPL upon initial recognition. All derivative financial instruments fall into this category, except for those designated and effective as hedging instruments, for which the hedge accounting requirements apply.
Assets in this category are measured at fair value with gains or losses recognised in profit or loss. The fair values of financial assets in this category are de-termined by reference to active market transactions or using a valuation technique where no active market exists.
NOTES TO THE FINANCIAL STATE ME NTSFOR TH E YEAR E N DE D 31 DECE M B E R 2013
C H A M S P L C 2 0 1 3 A N N U A L R E P O R T58
HTM investments
HTM investments are non-derivative financial assets with fixed or determinable payments and fixed maturity other than loans and receivables. Investments are classified as HTM if the group has the intention and ability to hold them until maturity.
HTM investments are measured subsequently at amortised cost using the effective interest method. If there is objective evidence that the investment is im-paired, determined by reference to external credit ratings, the financial asset is measured at the present value of estimated future cash flows. Any changes to the carrying amount of the investment including impairment losses are recognised in profit or loss.
AFS financial assets
AFS financial assets are non-derivative financial assets that are either designated to this category or do not qualify for inclusion in any of the other categories of financial assets. The group’s AFS financial assets include unquoted equity investment in Joint Komputer Kompany Limited.
The equity investment in Joint Komputer Kompany Limited is measured at cost less any impairment charges, as its fair value cannot currently be estimated reliably. Impairment charges are recognised in profit or loss.
All other AFS financial assets are measured at fair value. Gains and losses are recognised in other comprehensive income and reported within the AFS re-serve within equity, except for impairment losses and foreign exchange differences on monetary assets, which are recognised in profit or loss. When the asset is disposed of or is determined to be impaired, the cumulative gain or loss recognised in other comprehensive income is reclassified from the equity reserve to profit or loss and presented as a reclassification adjustment within other comprehensive income. Interest is calculated using the effective interest rate method and dividends are recognised in profit or loss within finance income.
Reversals and impairment losses are recognised in other comprehensive income, except for financial assets that are debt securities which are recognised in profit or loss only if the reversal can be objectively related to an event occurring after the impairment loss was recognised.
5. CRITICAL ACCOUNTING ESTIMATES AND JUDGEMENTS
The Group makes certain estimates and assumptions regarding the future. Estimates are based on factors including historical experience and expectations of future events that management believes to be reasonable. However, given the judgmental nature of such estimates, actual results could be different from assumptions used. The estimates and assumptions that can have significant risks of causing material adjustments to the carrying amounts of assets and liabilities are set out below:
a. POWER TO EXERCISE SIGNIFICANT INFLUENCE
When the Company holds less than 20% of voting rights in an investment but the Company has the power to exercise significant influence, such an investment is treated as an associate. Where the Company holds over 20% of voting rights (but not over 50%) and the Company does not exercise sig-
NOTES TO THE FINANCIAL STATE ME NTSFOR TH E YEAR E N DE D 31 DECE M B E R 2013
C H A M S P L C 2 0 1 3 A N N U A L R E P O R T 59
nificant influence, the investment is treated as an available – for – sale investment.
b. LEGAL PROCEEDINGS
In accordance with IFRS, the Group recognizes a provision where there is a present obligation from a past event, a transfer of economic benefits is prob-able and the amount of cost of the transfer can be estimated reliably. In instances where the criteria are not met, a contingent liability may be disclosed in thenotes to the financial statements. Application of these accounting principles to legal cases requires the Group’s management to make determinations about various factual and legal matters beyond control. The Company reviews outstanding legal cases following developments in the legal proceedings and at each reporting date in order to assess the need for provisions and disclosures in its financial statements. Among the factors considered in making decisions on provisions are the nature of litigation, claim or assessment, the legal process and potential level of damages in the jurisdiction in which the litigation, claim or assessment has been brought, the progress of the case( including the progress after the date of the financial statements but before those statements are issued), the opinion or views of legal advisers, experience on similar cases and any decision of the Company’s management as to how it will respond to the litigation, claims or assessment.
c. DETERMINATION OF FAIR VALUES OF INTANGIBLE ASSETS IN BUSINESS COMBINATIONS
The fair value of patents and trademarks acquired in a business combination is based on the discounted estimated royalty payments that would have been avoided as a result of the trademark or a patent being owned. The fair value of other intangible assets is based on the discounted cash flows ex-pected to be derived from the use and eventual sales of assets
6 FINANCIAL INSTRUMENTS- RISK MANAGEMENT
The Company is exposed through its operations to the following financial risks:
• Foreign exchange risk
• Interest rate risk
• Liquidity risk
• Credit risk
Foreign Exchange Risk
Most of the Group’s transactions are carried out in Nigerian Naira (N). Exposures to currency exchange rates arise from the Group’s overseas purchases of goods and raw materials, which are primarily denominated in US dollars (USD). To mitigate the Group’s exposure to foreign currency risk, non-Naira cash flows are monitored and forward exchange contracts are entered into in accordance with the Group’s risk management policies.
NOTES TO THE FINANCIAL STATE ME NTSFOR TH E YEAR E N DE D 31 DECE M B E R 2013
C H A M S P L C 2 0 1 3 A N N U A L R E P O R T60
Generally, the Group’s risk management procedures distinguish short term foreign currency cash flows (due within 6 months) from longer term cash flows (due after 6 months). Where the amounts to be paid and received in a specific currency are expected to largely offset one another, no further hedging ac-tivity is undertaken. Forward exchange contracts are mainly entered into for significant long term foreign currency exposures that are not expected to be offset by other currency transactions.
Interest rate risk
The Group’s policy is to minimize interest rate cash flow risk exposures by choosing short term borrowings (mainly overdrafts). At 31 December 2013, the Group is exposed to changes in market interest rates through short term bank borrowings at variable interest rates. There are no borrowings at fixed interest rates. The exposure to interest rates for the Group’s money market funds is considered immaterial.
Liquidity risk
Liquidity risk is that the Group might be unable to meet its obligations. The Group manages its liquidity needs by forecasting cash inflows and outflows due in day-to-day business. Liquidity needs are monitored in various time bands: on a day-to-day and week-to-week basis, as well as on the basis of a roll-ing 30-day projection. Long term liquidity needs for a 180-day and a 360-day lookout period are identified monthly. Net cash requirements are compared to available borrowing facilities in order to determine headroom or any shortfalls. This analysis shows that available borrowing facilities are expected to be sufficient over the lookout period.
The Group’s objective is to maintain cash and marketable securities to meet its liquidity requirements for 30-day periods at a minimum.
The Group considers expected cash flows from financial assets in assessing and managing liquidity risk, in particular its cash resources and trade receivables. Cash flows from trade and other receivables are all contractually due within six months.
Credit risk
Credit risk is the risk that a counterparty fails to discharge an obligation to the Group. The Group is exposed to this risk through creating receivables to cus-tomers, placing deposits etc. The Group’s maximum exposure to credit risk is limited to the carrying amount of financial assets recognised at 31 December, 2013.
The Group continuously monitors defaults of customers and other counterparties, identified either individually or by group, and incorporates this informa-tion into its credit risk controls. Where available at reasonable cost, external credit ratings and/or reports on customers and other counterparties are ob-tained and used. The Group’s policy is to deal only with creditworthy counterparties.
The Group’s management considers that all the reported financial assets that are not impaired or past due for each of the 31 December reporting dates under review are of good credit quality.
NOTES TO THE FINANCIAL STATE ME NTSFOR TH E YEAR E N DE D 31 DECE M B E R 2013
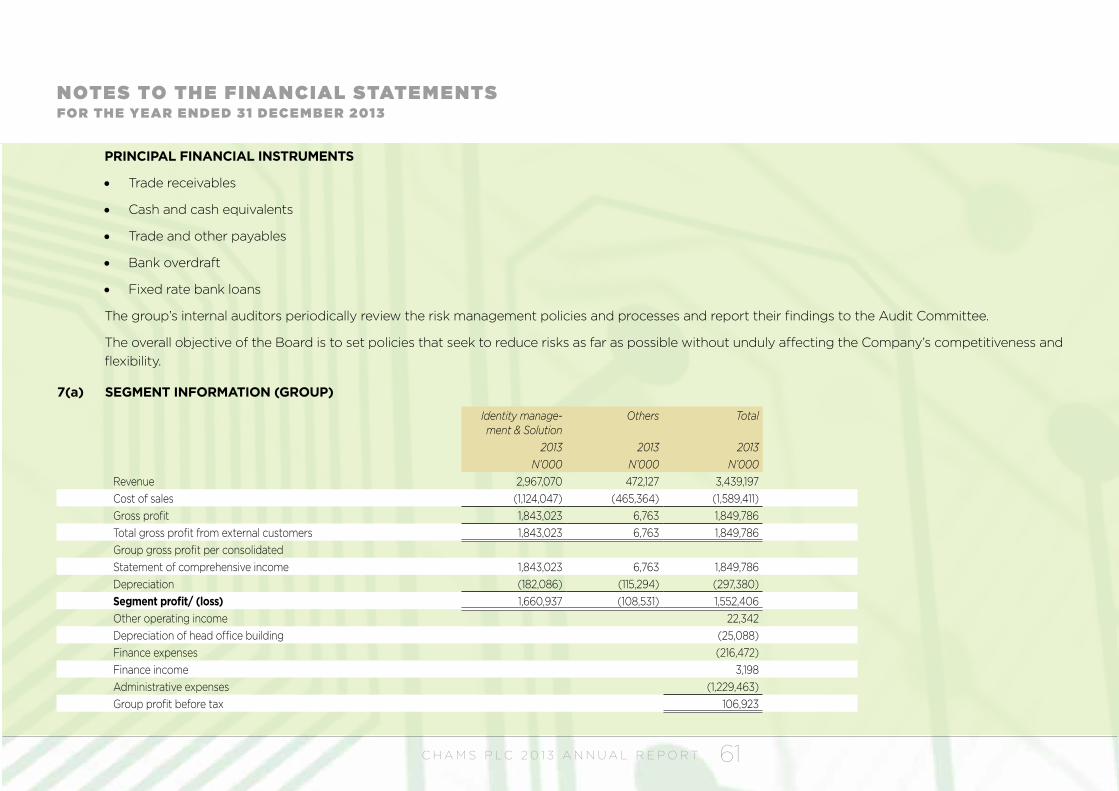
C H A M S P L C 2 0 1 3 A N N U A L R E P O R T 61
PRINCIPAL FINANCIAL INSTRUMENTS
• Trade receivables
• Cash and cash equivalents
• Trade and other payables
• Bank overdraft
• Fixed rate bank loans
The group’s internal auditors periodically review the risk management policies and processes and report their findings to the Audit Committee.
The overall objective of the Board is to set policies that seek to reduce risks as far as possible without unduly affecting the Company’s competitiveness and flexibility.
Identity manage-ment & Solution
Others Total
2013 2013 2013N’000 N’000 N’000
Revenue 2,967,070 472,127 3,439,197 Cost of sales (1,124,047) (465,364) (1,589,411)Gross profit 1,843,023 6,763 1,849,786 Total gross profit from external customers 1,843,023 6,763 1,849,786 Group gross profit per consolidatedStatement of comprehensive income 1,843,023 6,763 1,849,786 Depreciation (182,086) (115,294) (297,380)Segment profit/ (loss) 1,660,937 (108,531) 1,552,406 Other operating income 22,342 Depreciation of head office building (25,088)Finance expenses (216,472)Finance income 3,198 Administrative expenses (1,229,463)Group profit before tax 106,923
NOTES TO THE FINANCIAL STATE ME NTSFOR TH E YEAR E N DE D 31 DECE M B E R 2013
7(a) SEGMENT INFORMATION (GROUP)
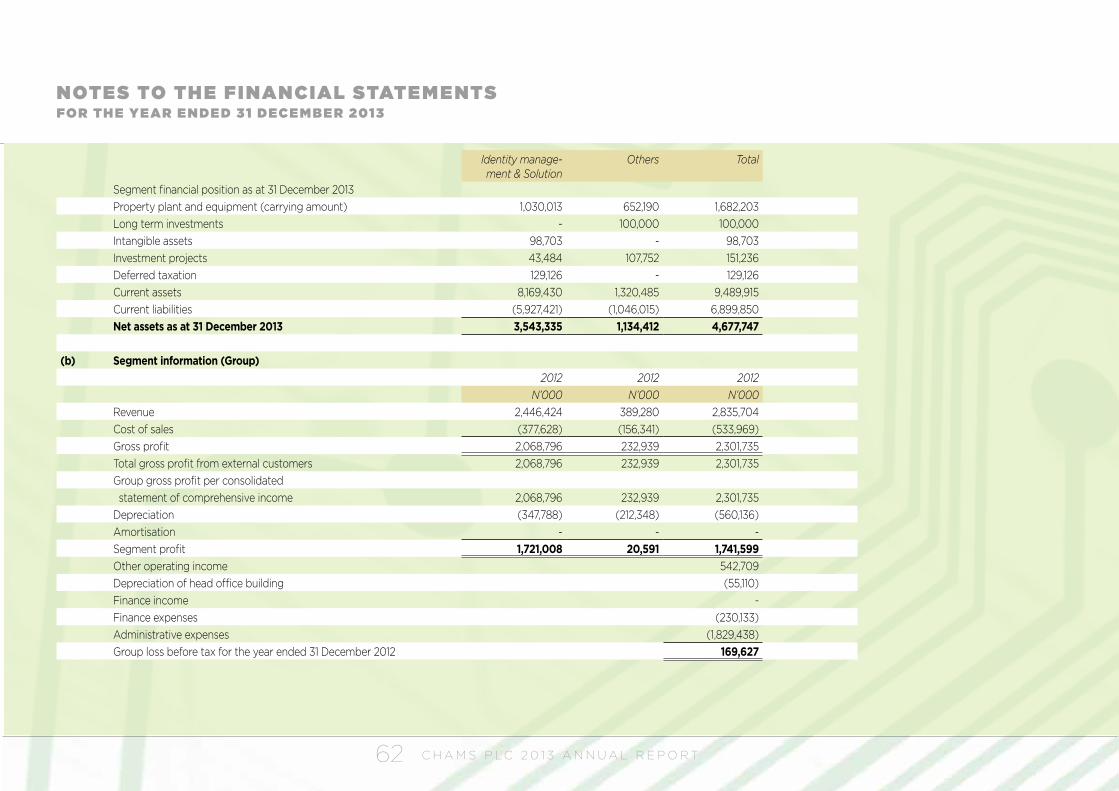
C H A M S P L C 2 0 1 3 A N N U A L R E P O R T62
NOTES TO THE FINANCIAL STATE ME NTSFOR TH E YEAR E N DE D 31 DECE M B E R 2013
Identity manage-ment & Solution
Others Total
Segment financial position as at 31 December 2013Property plant and equipment (carrying amount) 1,030,013 652,190 1,682,203 Long term investments - 100,000 100,000 Intangible assets 98,703 - 98,703 Investment projects 43,484 107,752 151,236 Deferred taxation 129,126 - 129,126 Current assets 8,169,430 1,320,485 9,489,915 Current liabilities (5,927,421) (1,046,015) 6,899,850 Net assets as at 31 December 2013 3,543,335 1,134,412 4,677,747
(b) Segment information (Group)2012 2012 2012
N’000 N’000 N’000Revenue 2,446,424 389,280 2,835,704 Cost of sales (377,628) (156,341) (533,969)Gross profit 2,068,796 232,939 2,301,735 Total gross profit from external customers 2,068,796 232,939 2,301,735 Group gross profit per consolidated statement of comprehensive income 2,068,796 232,939 2,301,735 Depreciation (347,788) (212,348) (560,136)Amortisation - - - Segment profit 1,721,008 20,591 1,741,599 Other operating income 542,709 Depreciation of head office building (55,110)Finance income - Finance expenses (230,133)Administrative expenses (1,829,438)Group loss before tax for the year ended 31 December 2012 169,627
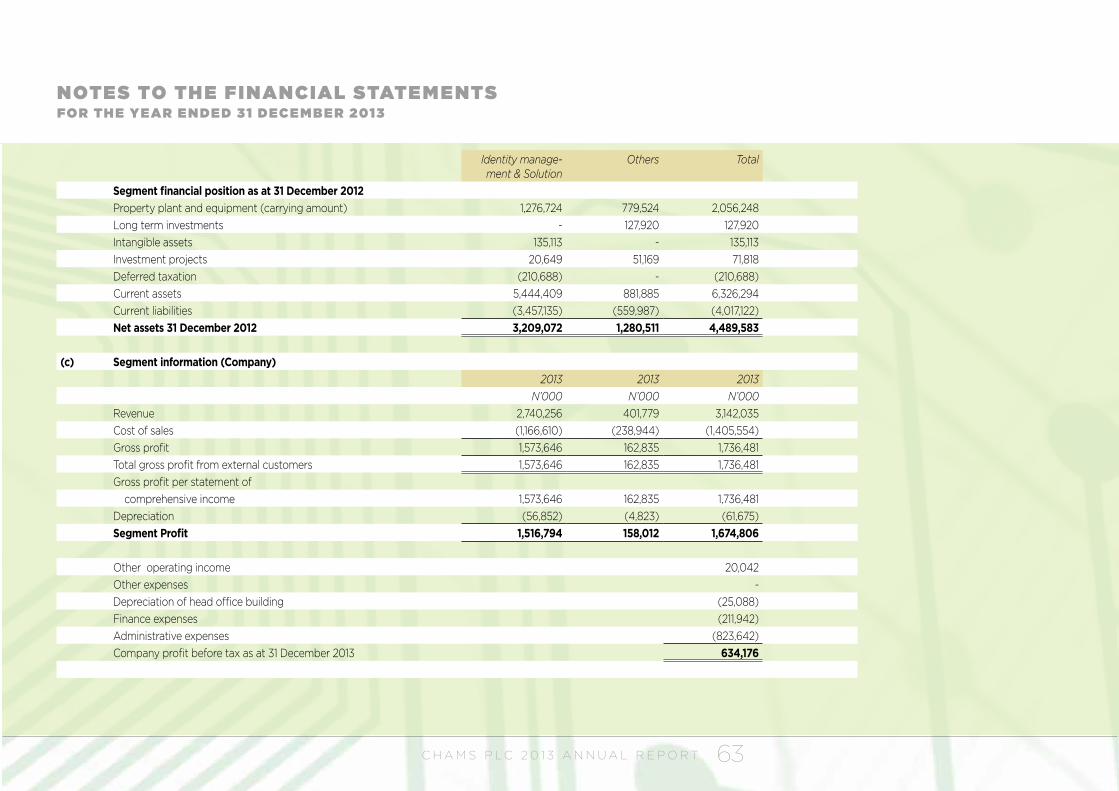
C H A M S P L C 2 0 1 3 A N N U A L R E P O R T 63
NOTES TO THE FINANCIAL STATE ME NTSFOR TH E YEAR E N DE D 31 DECE M B E R 2013
Identity manage-ment & Solution
Others Total
Segment financial position as at 31 December 2012Property plant and equipment (carrying amount) 1,276,724 779,524 2,056,248 Long term investments - 127,920 127,920 Intangible assets 135,113 - 135,113 Investment projects 20,649 51,169 71,818 Deferred taxation (210,688) - (210,688)Current assets 5,444,409 881,885 6,326,294 Current liabilities (3,457,135) (559,987) (4,017,122)Net assets 31 December 2012 3,209,072 1,280,511 4,489,583
(c) Segment information (Company)2013 2013 2013
N’000 N’000 N’000Revenue 2,740,256 401,779 3,142,035 Cost of sales (1,166,610) (238,944) (1,405,554)Gross profit 1,573,646 162,835 1,736,481 Total gross profit from external customers 1,573,646 162,835 1,736,481 Gross profit per statement of comprehensive income 1,573,646 162,835 1,736,481 Depreciation (56,852) (4,823) (61,675)Segment Profit 1,516,794 158,012 1,674,806
Other operating income 20,042 Other expenses - Depreciation of head office building (25,088)Finance expenses (211,942)Administrative expenses (823,642)Company profit before tax as at 31 December 2013 634,176
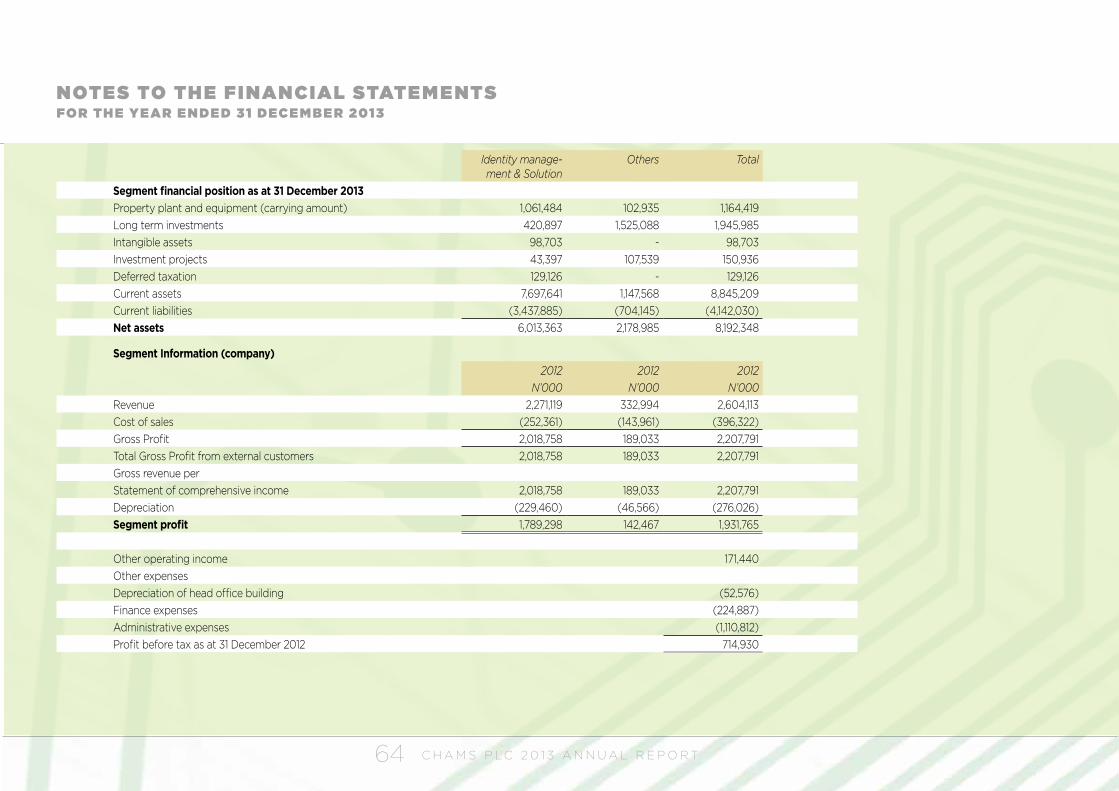
C H A M S P L C 2 0 1 3 A N N U A L R E P O R T64
NOTES TO THE FINANCIAL STATE ME NTSFOR TH E YEAR E N DE D 31 DECE M B E R 2013
Identity manage-ment & Solution
Others Total
Segment financial position as at 31 December 2013Property plant and equipment (carrying amount) 1,061,484 102,935 1,164,419 Long term investments 420,897 1,525,088 1,945,985 Intangible assets 98,703 - 98,703 Investment projects 43,397 107,539 150,936 Deferred taxation 129,126 - 129,126 Current assets 7,697,641 1,147,568 8,845,209 Current liabilities (3,437,885) (704,145) (4,142,030)Net assets 6,013,363 2,178,985 8,192,348
Segment Information (company)2012 2012 2012
N’000 N’000 N’000Revenue 2,271,119 332,994 2,604,113 Cost of sales (252,361) (143,961) (396,322)Gross Profit 2,018,758 189,033 2,207,791 Total Gross Profit from external customers 2,018,758 189,033 2,207,791 Gross revenue perStatement of comprehensive income 2,018,758 189,033 2,207,791 Depreciation (229,460) (46,566) (276,026)Segment profit 1,789,298 142,467 1,931,765
Other operating income 171,440 Other expensesDepreciation of head office building (52,576)Finance expenses (224,887)Administrative expenses (1,110,812)Profit before tax as at 31 December 2012 714,930
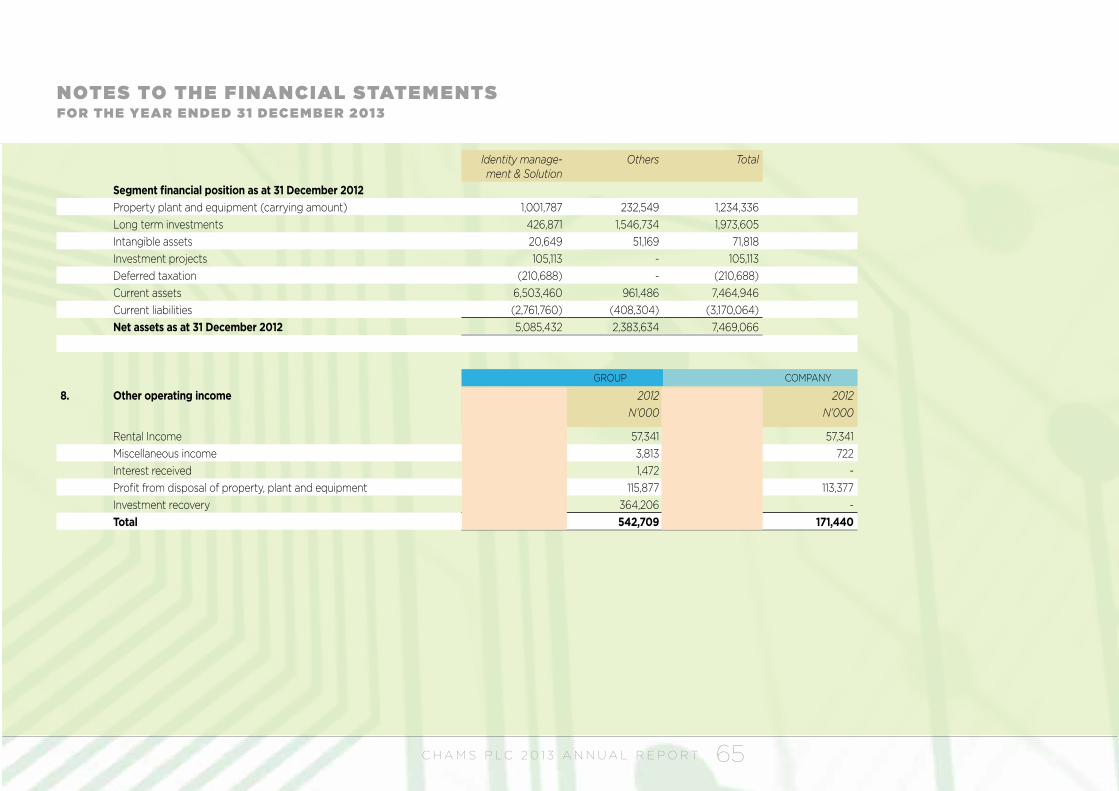
C H A M S P L C 2 0 1 3 A N N U A L R E P O R T 65
NOTES TO THE FINANCIAL STATE ME NTSFOR TH E YEAR E N DE D 31 DECE M B E R 2013
Identity manage-ment & Solution
Others Total
Segment financial position as at 31 December 2012Property plant and equipment (carrying amount) 1,001,787 232,549 1,234,336 Long term investments 426,871 1,546,734 1,973,605 Intangible assets 20,649 51,169 71,818 Investment projects 105,113 - 105,113 Deferred taxation (210,688) - (210,688)Current assets 6,503,460 961,486 7,464,946 Current liabilities (2,761,760) (408,304) (3,170,064)Net assets as at 31 December 2012 5,085,432 2,383,634 7,469,066
GROUP COMPANY
8. Other operating income 2013 2012 2013 2012 N’000 N’000 N’000 N’000
Rental Income 16,355 57,341 16,355 57,341 Miscellaneous income 5,987 3,813 3,687 722 Interest received - 1,472 - - Profit from disposal of property, plant and equipment - 115,877 - 113,377 Investment recovery - 364,206 - - Total 22,342 542,709 20,042 171,440
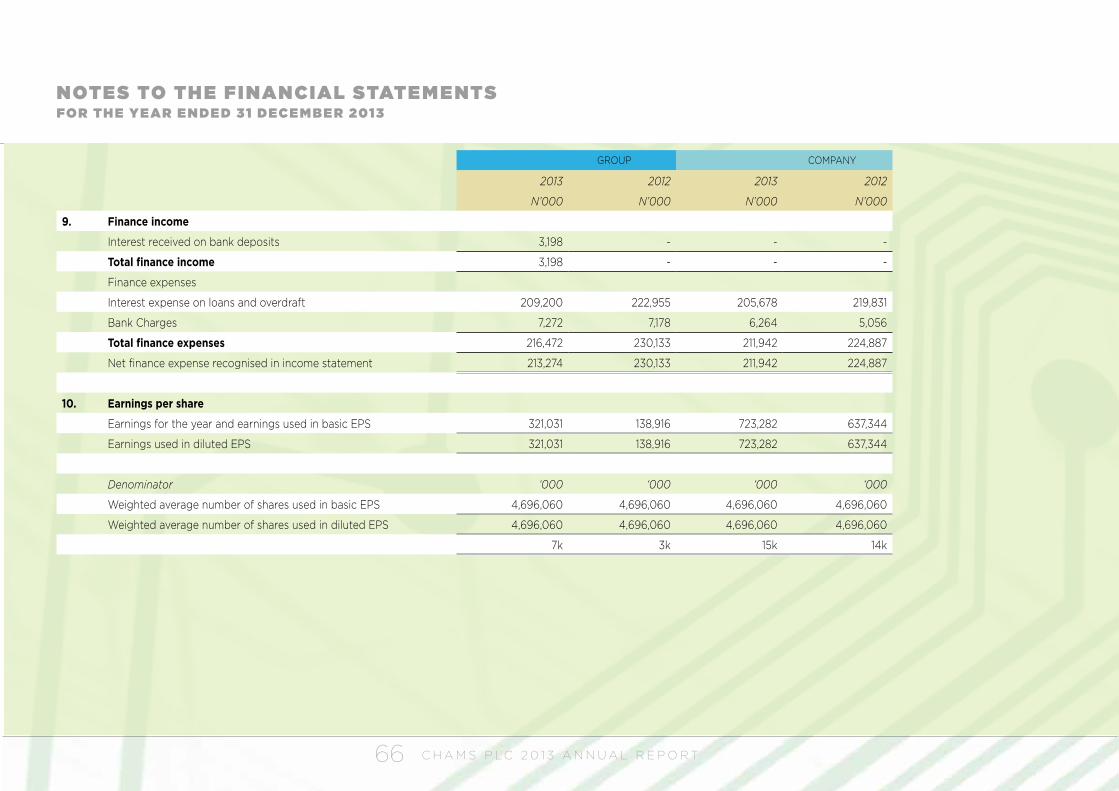
C H A M S P L C 2 0 1 3 A N N U A L R E P O R T66
NOTES TO THE FINANCIAL STATE ME NTSFOR TH E YEAR E N DE D 31 DECE M B E R 2013
GROUP COMPANY
2013 2012 2013 2012
N’000 N’000 N’000 N’000
9. Finance income
Interest received on bank deposits 3,198 - - -
Total finance income 3,198 - - -
Finance expenses
Interest expense on loans and overdraft 209,200 222,955 205,678 219,831
Bank Charges 7,272 7,178 6,264 5,056
Total finance expenses 216,472 230,133 211,942 224,887
Net finance expense recognised in income statement 213,274 230,133 211,942 224,887
10. Earnings per share
Earnings for the year and earnings used in basic EPS 321,031 138,916 723,282 637,344
Earnings used in diluted EPS 321,031 138,916 723,282 637,344
Denominator ‘000 ‘000 ‘000 ‘000
Weighted average number of shares used in basic EPS 4,696,060 4,696,060 4,696,060 4,696,060
Weighted average number of shares used in diluted EPS 4,696,060 4,696,060 4,696,060 4,696,060
7k 3k 15k 14k
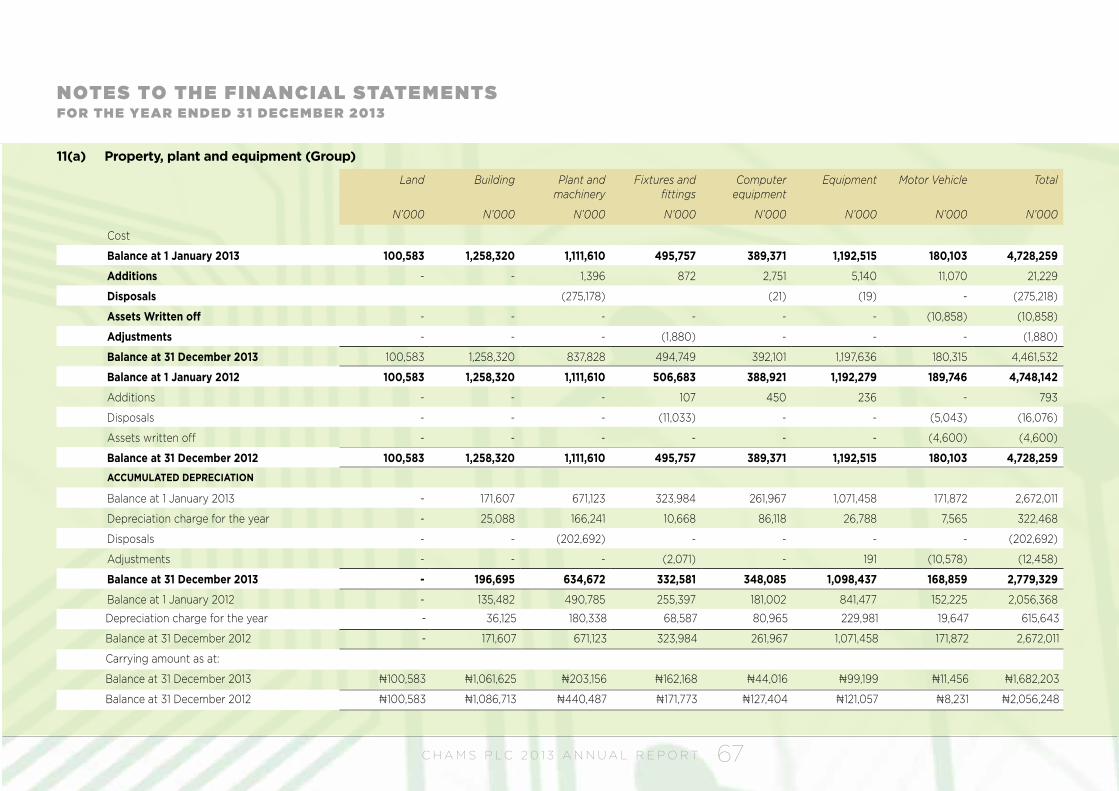
C H A M S P L C 2 0 1 3 A N N U A L R E P O R T 67
NOTES TO THE FINANCIAL STATE ME NTSFOR TH E YEAR E N DE D 31 DECE M B E R 2013
Land Building Plant and machinery
Fixtures and fittings
Computer equipment
Equipment Motor Vehicle Total
N’000 N’000 N’000 N’000 N’000 N’000 N’000 N’000
Cost
Balance at 1 January 2013 100,583 1,258,320 1,111,610 495,757 389,371 1,192,515 180,103 4,728,259
Additions - - 1,396 872 2,751 5,140 11,070 21,229
Disposals (275,178) (21) (19) - (275,218)
Assets Written off - - - - - - (10,858) (10,858)
Adjustments - - - (1,880) - - - (1,880)
Balance at 31 December 2013 100,583 1,258,320 837,828 494,749 392,101 1,197,636 180,315 4,461,532
Balance at 1 January 2012 100,583 1,258,320 1,111,610 506,683 388,921 1,192,279 189,746 4,748,142
Additions - - - 107 450 236 - 793
Disposals - - - (11,033) - - (5,043) (16,076)
Assets written off - - - - - - (4,600) (4,600)
Balance at 31 December 2012 100,583 1,258,320 1,111,610 495,757 389,371 1,192,515 180,103 4,728,259 ACCUMULATED DEPRECIATION
Balance at 1 January 2013 - 171,607 671,123 323,984 261,967 1,071,458 171,872 2,672,011
Depreciation charge for the year - 25,088 166,241 10,668 86,118 26,788 7,565 322,468
Disposals - - (202,692) - - - - (202,692)
Adjustments - - - (2,071) - 191 (10,578) (12,458)
Balance at 31 December 2013 - 196,695 634,672 332,581 348,085 1,098,437 168,859 2,779,329
Balance at 1 January 2012 - 135,482 490,785 255,397 181,002 841,477 152,225 2,056,368
Depreciation charge for the year - 36,125 180,338 68,587 80,965 229,981 19,647 615,643
Balance at 31 December 2012 - 171,607 671,123 323,984 261,967 1,071,458 171,872 2,672,011
Carrying amount as at:
Balance at 31 December 2013 ₦100,583 ₦1,061,625 ₦203,156 ₦162,168 ₦44,016 ₦99,199 ₦11,456 ₦1,682,203
Balance at 31 December 2012 ₦100,583 ₦1,086,713 ₦440,487 ₦171,773 ₦127,404 ₦121,057 ₦8,231 ₦2,056,248
11(a) Property, plant and equipment (Group)
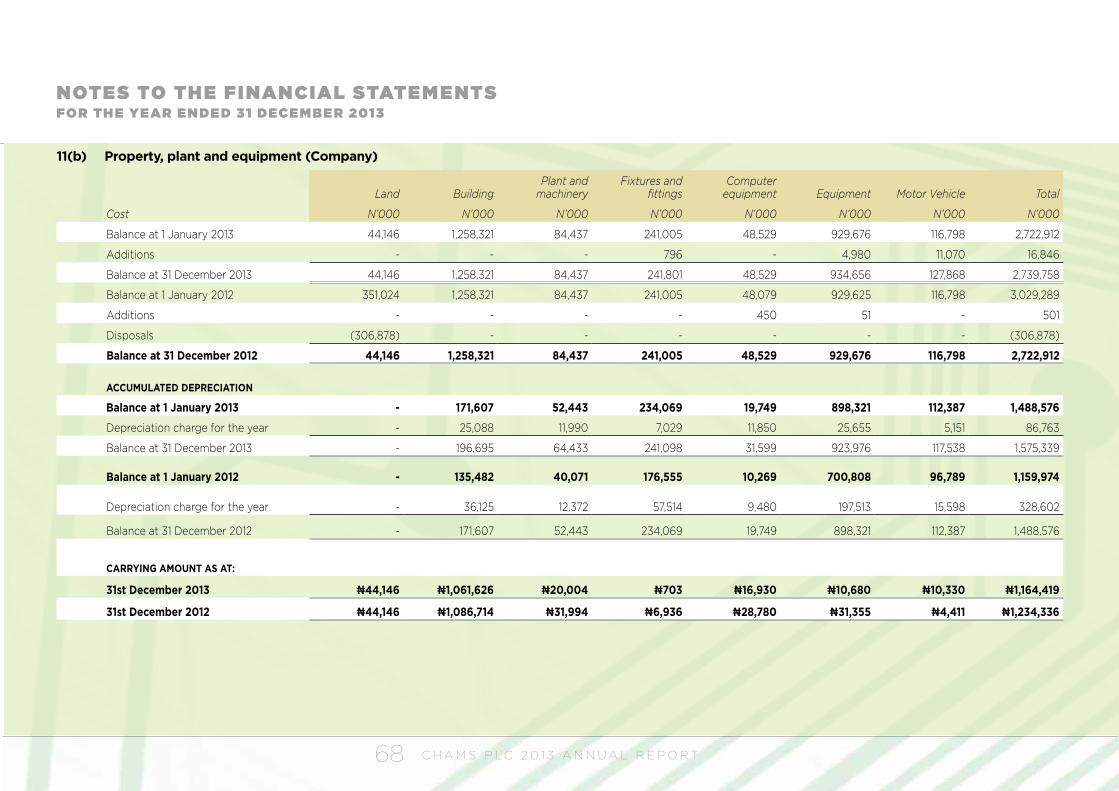
C H A M S P L C 2 0 1 3 A N N U A L R E P O R T68
Land BuildingPlant and
machinery Fixtures and
fittingsComputer
equipment Equipment Motor Vehicle Total
Cost N’000 N’000 N’000 N’000 N’000 N’000 N’000 N’000
Balance at 1 January 2013 44,146 1,258,321 84,437 241,005 48,529 929,676 116,798 2,722,912
Additions - - - 796 - 4,980 11,070 16,846
Balance at 31 December 2013 44,146 1,258,321 84,437 241,801 48,529 934,656 127,868 2,739,758
Balance at 1 January 2012 351,024 1,258,321 84,437 241,005 48,079 929,625 116,798 3,029,289
Additions - - - - 450 51 - 501
Disposals (306,878) - - - - - - (306,878)
Balance at 31 December 2012 44,146 1,258,321 84,437 241,005 48,529 929,676 116,798 2,722,912
ACCUMULATED DEPRECIATION
Balance at 1 January 2013 - 171,607 52,443 234,069 19,749 898,321 112,387 1,488,576
Depreciation charge for the year - 25,088 11,990 7,029 11,850 25,655 5,151 86,763
Balance at 31 December 2013 - 196,695 64,433 241,098 31,599 923,976 117,538 1,575,339
Balance at 1 January 2012 - 135,482 40,071 176,555 10,269 700,808 96,789 1,159,974
Depreciation charge for the year - 36,125 12,372 57,514 9,480 197,513 15,598 328,602
Balance at 31 December 2012 - 171,607 52,443 234,069 19,749 898,321 112,387 1,488,576
CARRYING AMOUNT AS AT:
31st December 2013 ₦44,146 ₦1,061,626 ₦20,004 ₦703 ₦16,930 ₦10,680 ₦10,330 ₦1,164,419
31st December 2012 ₦44,146 ₦1,086,714 ₦31,994 ₦6,936 ₦28,780 ₦31,355 ₦4,411 ₦1,234,336
11(b) Property, plant and equipment (Company)
NOTES TO THE FINANCIAL STATE ME NTSFOR TH E YEAR E N DE D 31 DECE M B E R 2013
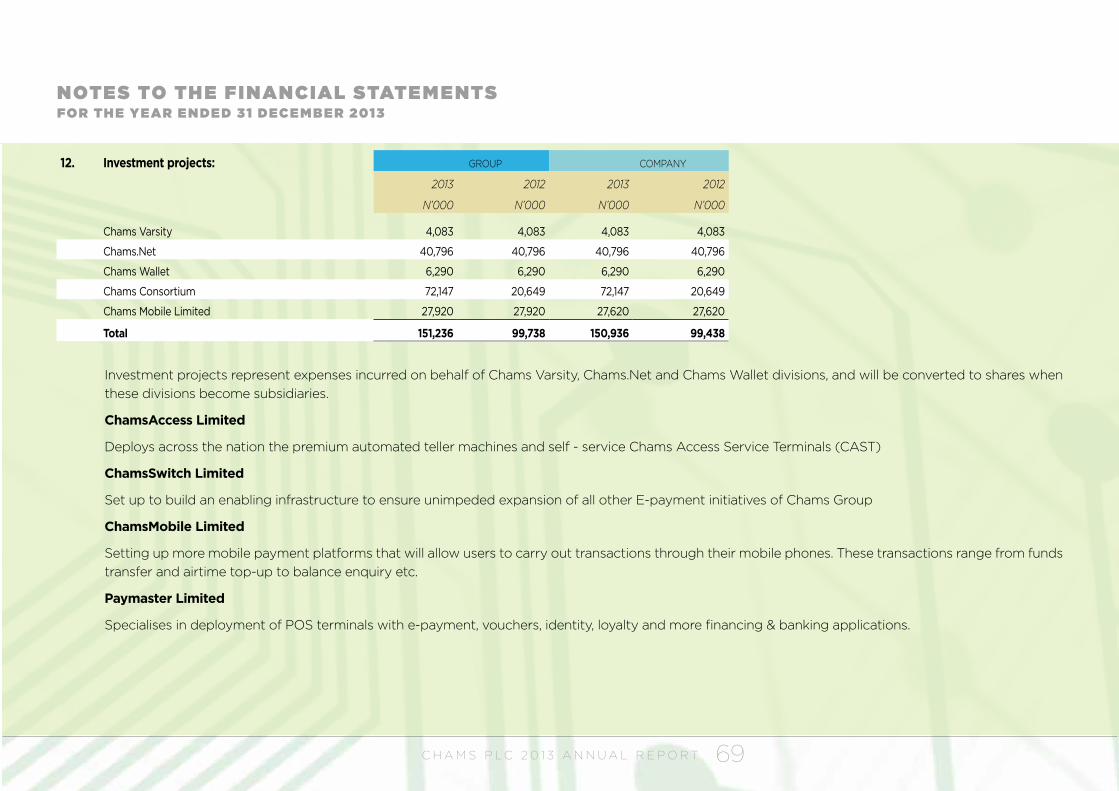
C H A M S P L C 2 0 1 3 A N N U A L R E P O R T 69
12. Investment projects: GROUP COMPANY
2013 2012 2013 2012
N’000 N’000 N’000 N’000
Chams Varsity 4,083 4,083 4,083 4,083
Chams.Net 40,796 40,796 40,796 40,796
Chams Wallet 6,290 6,290 6,290 6,290
Chams Consortium 72,147 20,649 72,147 20,649
Chams Mobile Limited 27,920 27,920 27,620 27,620
Total 151,236 99,738 150,936 99,438
Investment projects represent expenses incurred on behalf of Chams Varsity, Chams.Net and Chams Wallet divisions, and will be converted to shares when these divisions become subsidiaries.
ChamsAccess Limited
Deploys across the nation the premium automated teller machines and self - service Chams Access Service Terminals (CAST)
ChamsSwitch Limited
Set up to build an enabling infrastructure to ensure unimpeded expansion of all other E-payment initiatives of Chams Group
ChamsMobile Limited
Setting up more mobile payment platforms that will allow users to carry out transactions through their mobile phones. These transactions range from funds transfer and airtime top-up to balance enquiry etc.
Paymaster Limited
Specialises in deployment of POS terminals with e-payment, vouchers, identity, loyalty and more financing & banking applications.
NOTES TO THE FINANCIAL STATE ME NTSFOR TH E YEAR E N DE D 31 DECE M B E R 2013
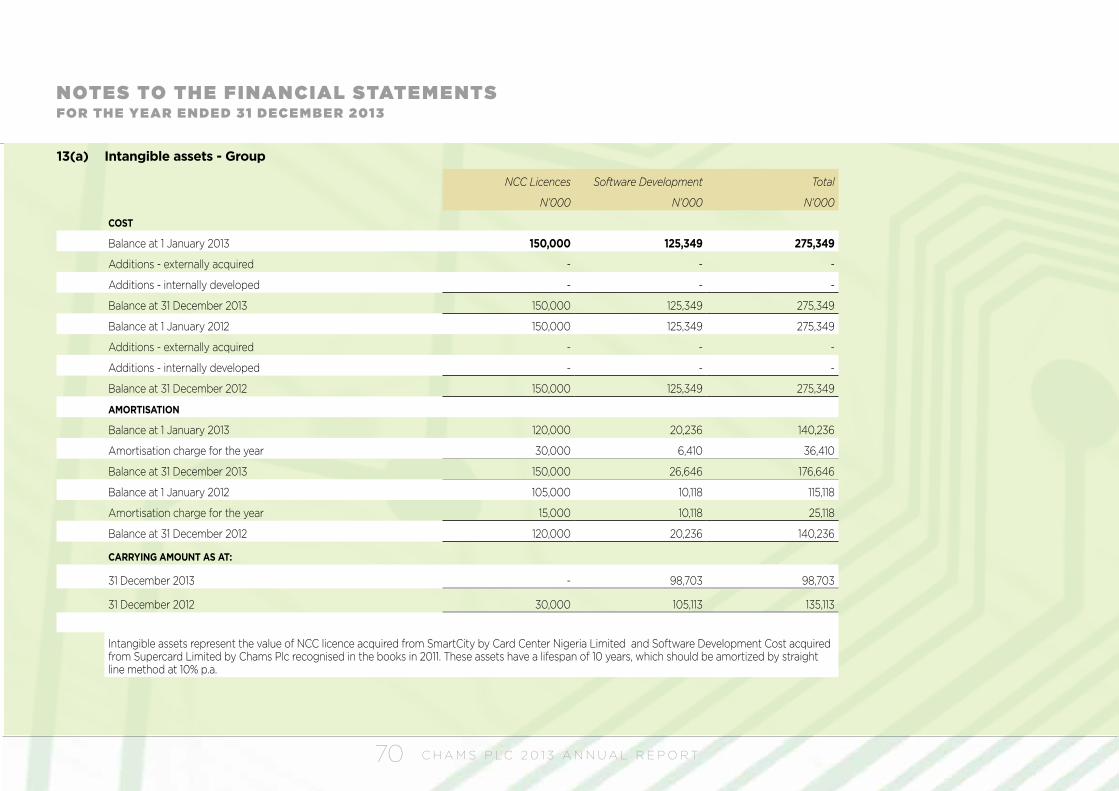
C H A M S P L C 2 0 1 3 A N N U A L R E P O R T70
13(a) Intangible assets - Group
NOTES TO THE FINANCIAL STATE ME NTSFOR TH E YEAR E N DE D 31 DECE M B E R 2013
NCC Licences Software Development Total
N’000 N’000 N’000
COST
Balance at 1 January 2013 150,000 125,349 275,349
Additions - externally acquired - - -
Additions - internally developed - - -
Balance at 31 December 2013 150,000 125,349 275,349
Balance at 1 January 2012 150,000 125,349 275,349
Additions - externally acquired - - -
Additions - internally developed - - -
Balance at 31 December 2012 150,000 125,349 275,349
AMORTISATION
Balance at 1 January 2013 120,000 20,236 140,236
Amortisation charge for the year 30,000 6,410 36,410
Balance at 31 December 2013 150,000 26,646 176,646
Balance at 1 January 2012 105,000 10,118 115,118
Amortisation charge for the year 15,000 10,118 25,118
Balance at 31 December 2012 120,000 20,236 140,236
CARRYING AMOUNT AS AT:
31 December 2013 - 98,703 98,703
31 December 2012 30,000 105,113 135,113
Intangible assets represent the value of NCC licence acquired from SmartCity by Card Center Nigeria Limited and Software Development Cost acquired from Supercard Limited by Chams Plc recognised in the books in 2011. These assets have a lifespan of 10 years, which should be amortized by straight line method at 10% p.a.
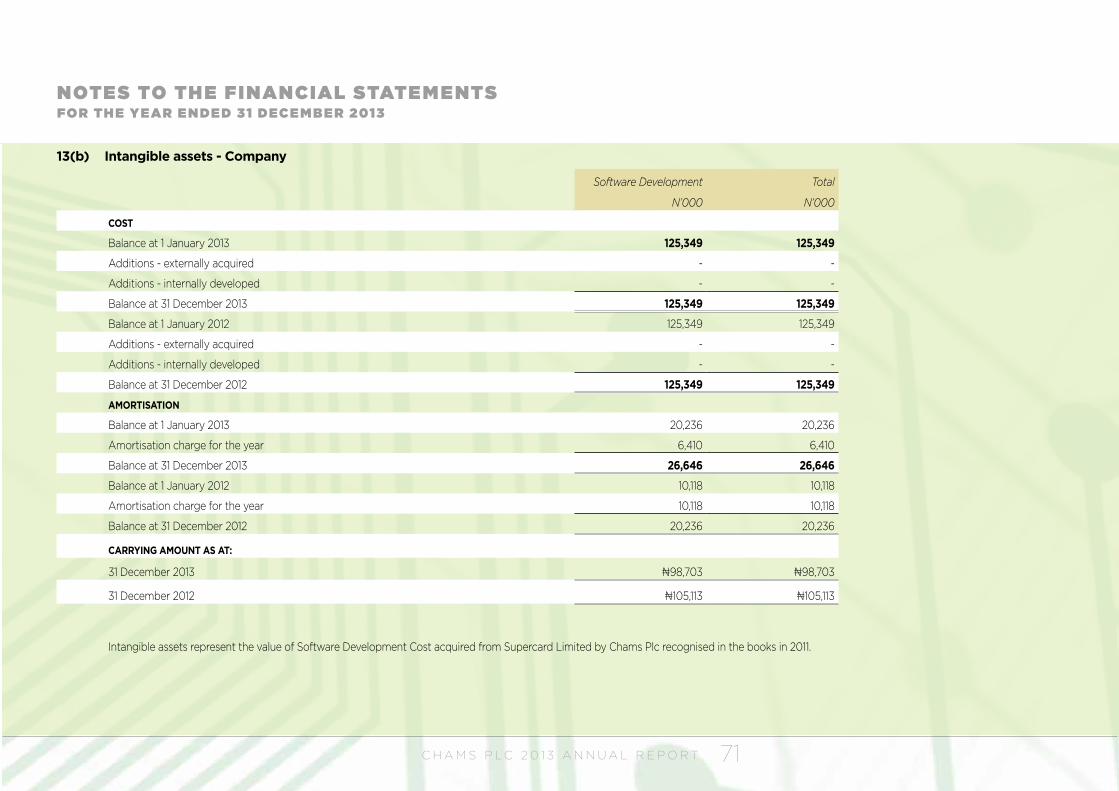
C H A M S P L C 2 0 1 3 A N N U A L R E P O R T 71
Software Development Total
N’000 N’000
COST
Balance at 1 January 2013 125,349 125,349
Additions - externally acquired - -
Additions - internally developed - -
Balance at 31 December 2013 125,349 125,349
Balance at 1 January 2012 125,349 125,349
Additions - externally acquired - -
Additions - internally developed - -
Balance at 31 December 2012 125,349 125,349
AMORTISATION
Balance at 1 January 2013 20,236 20,236
Amortisation charge for the year 6,410 6,410
Balance at 31 December 2013 26,646 26,646
Balance at 1 January 2012 10,118 10,118
Amortisation charge for the year 10,118 10,118
Balance at 31 December 2012 20,236 20,236
CARRYING AMOUNT AS AT:
31 December 2013 ₦98,703 ₦98,703
31 December 2012 ₦105,113 ₦105,113
Intangible assets represent the value of Software Development Cost acquired from Supercard Limited by Chams Plc recognised in the books in 2011.
13(b) Intangible assets - Company
NOTES TO THE FINANCIAL STATE ME NTSFOR TH E YEAR E N DE D 31 DECE M B E R 2013
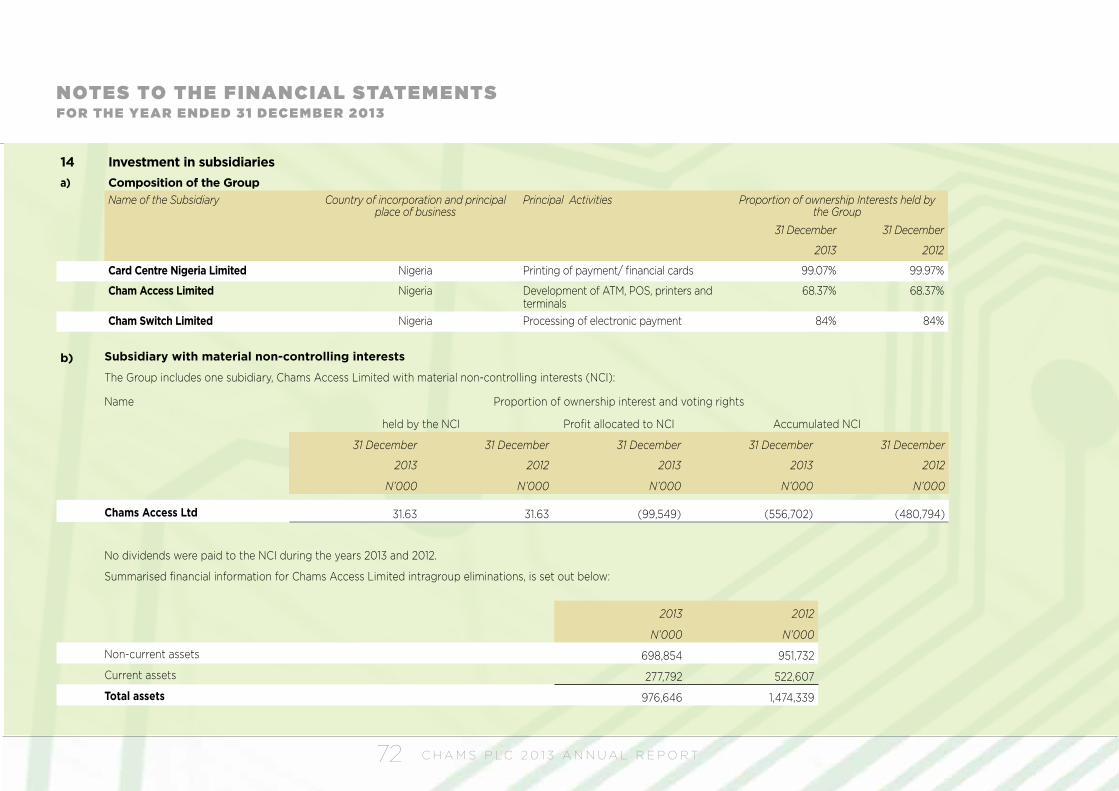
C H A M S P L C 2 0 1 3 A N N U A L R E P O R T72
14 Investment in subsidiariesa) Composition of the Group
Name of the Subsidiary Country of incorporation and principal place of business
Principal Activities Proportion of ownership Interests held by the Group
31 December 31 December
2013 2012
Card Centre Nigeria Limited Nigeria Printing of payment/ financial cards 99.07% 99.97%
Cham Access Limited Nigeria Development of ATM, POS, printers and terminals
68.37% 68.37%
Cham Switch Limited Nigeria Processing of electronic payment 84% 84%
b) Subsidiary with material non-controlling interests
The Group includes one subidiary, Chams Access Limited with material non-controlling interests (NCI):
Name Proportion of ownership interest and voting rights
held by the NCI Profit allocated to NCI Accumulated NCI
31 December 31 December 31 December 31 December 31 December
2013 2012 2013 2013 2012
N’000 N’000 N’000 N’000 N’000
Chams Access Ltd 31.63 31.63 (99,549) (556,702) (480,794)
No dividends were paid to the NCI during the years 2013 and 2012.
Summarised financial information for Chams Access Limited intragroup eliminations, is set out below:
2013 2012
N’000 N’000
Non-current assets 698,854 951,732
Current assets 277,792 522,607
Total assets 976,646 1,474,339
NOTES TO THE FINANCIAL STATE ME NTSFOR TH E YEAR E N DE D 31 DECE M B E R 2013
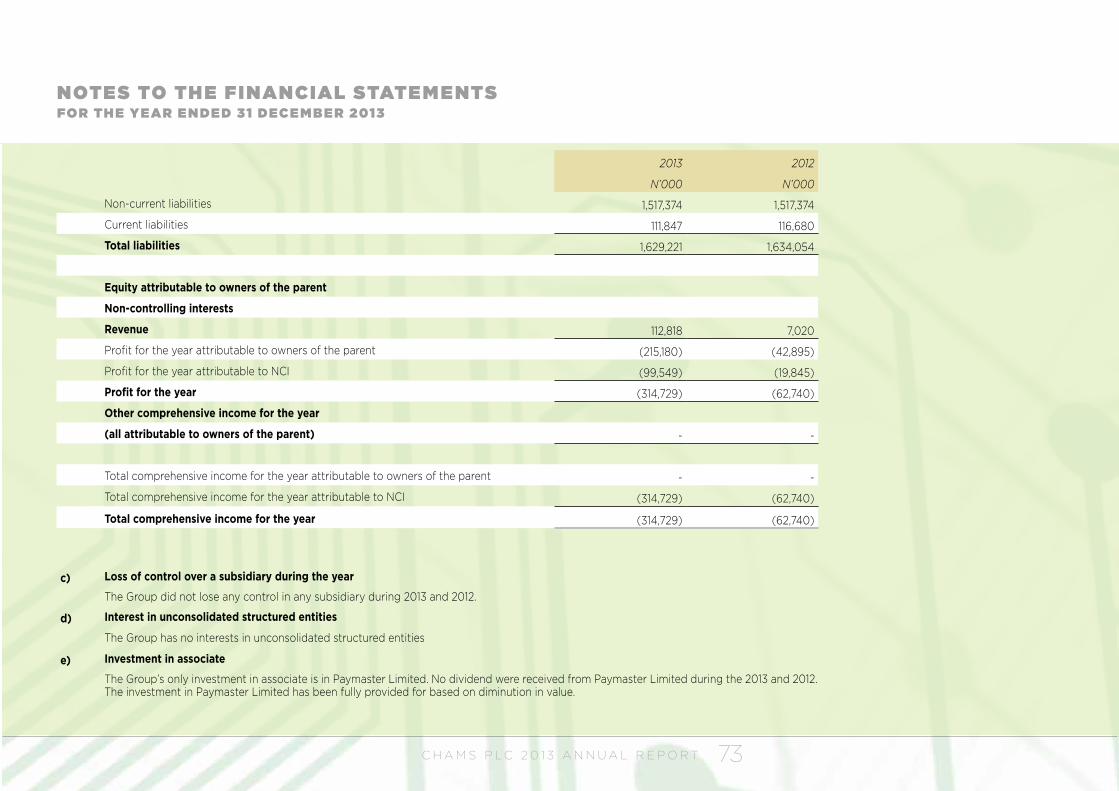
C H A M S P L C 2 0 1 3 A N N U A L R E P O R T 73
2013 2012
N’000 N’000
Non-current liabilities 1,517,374 1,517,374
Current liabilities 111,847 116,680
Total liabilities 1,629,221 1,634,054
Equity attributable to owners of the parent
Non-controlling interests
Revenue 112,818 7,020
Profit for the year attributable to owners of the parent (215,180) (42,895)
Profit for the year attributable to NCI (99,549) (19,845)
Profit for the year (314,729) (62,740)
Other comprehensive income for the year
(all attributable to owners of the parent) - -
Total comprehensive income for the year attributable to owners of the parent - -
Total comprehensive income for the year attributable to NCI (314,729) (62,740)
Total comprehensive income for the year (314,729) (62,740)
c) Loss of control over a subsidiary during the year
The Group did not lose any control in any subsidiary during 2013 and 2012.
d) Interest in unconsolidated structured entities
The Group has no interests in unconsolidated structured entities
e) Investment in associate
The Group’s only investment in associate is in Paymaster Limited. No dividend were received from Paymaster Limited during the 2013 and 2012. The investment in Paymaster Limited has been fully provided for based on diminution in value.
NOTES TO THE FINANCIAL STATE ME NTSFOR TH E YEAR E N DE D 31 DECE M B E R 2013
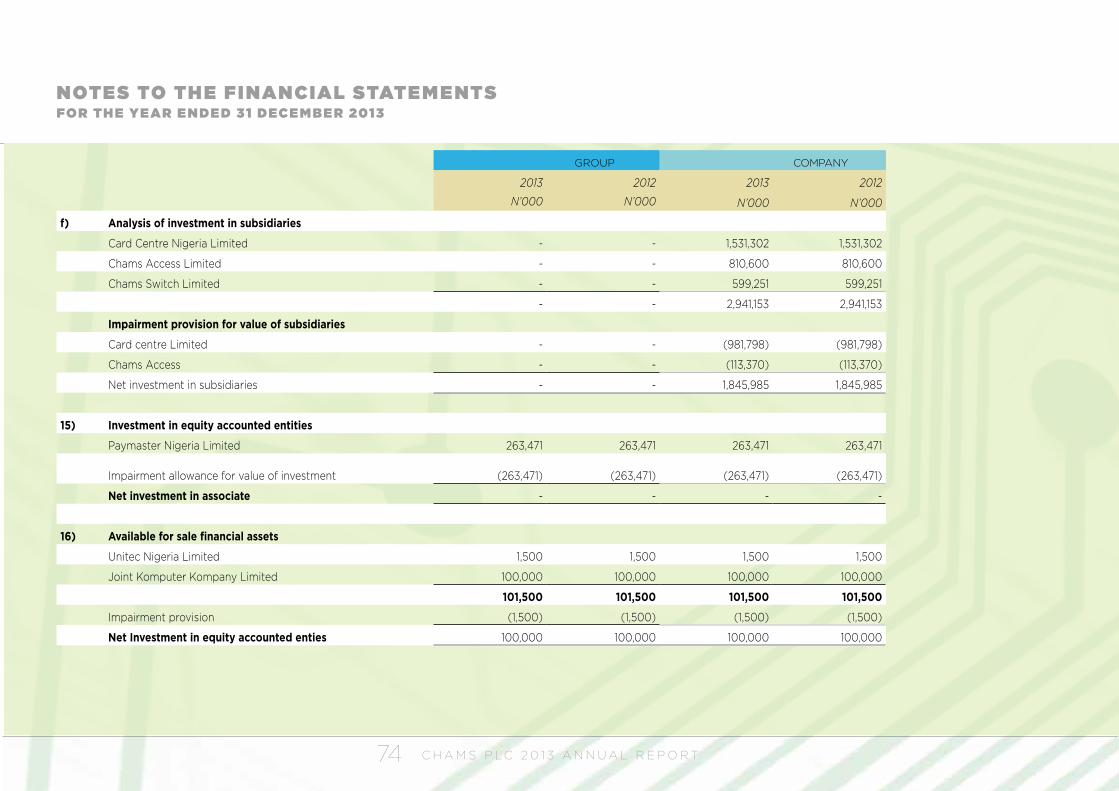
C H A M S P L C 2 0 1 3 A N N U A L R E P O R T74
GROUP COMPANY
2013 2012 2013 2012
N’000 N’000 N’000 N’000
f) Analysis of investment in subsidiaries
Card Centre Nigeria Limited - - 1,531,302 1,531,302
Chams Access Limited - - 810,600 810,600
Chams Switch Limited - - 599,251 599,251
- - 2,941,153 2,941,153
Impairment provision for value of subsidiaries
Card centre Limited - - (981,798) (981,798)
Chams Access - - (113,370) (113,370)
Net investment in subsidiaries - - 1,845,985 1,845,985
15) Investment in equity accounted entities
Paymaster Nigeria Limited 263,471 263,471 263,471 263,471
Impairment allowance for value of investment (263,471) (263,471) (263,471) (263,471)
Net investment in associate - - - -
16) Available for sale financial assets
Unitec Nigeria Limited 1,500 1,500 1,500 1,500
Joint Komputer Kompany Limited 100,000 100,000 100,000 100,000
101,500 101,500 101,500 101,500
Impairment provision (1,500) (1,500) (1,500) (1,500)
Net Investment in equity accounted enties 100,000 100,000 100,000 100,000
NOTES TO THE FINANCIAL STATE ME NTSFOR TH E YEAR E N DE D 31 DECE M B E R 2013
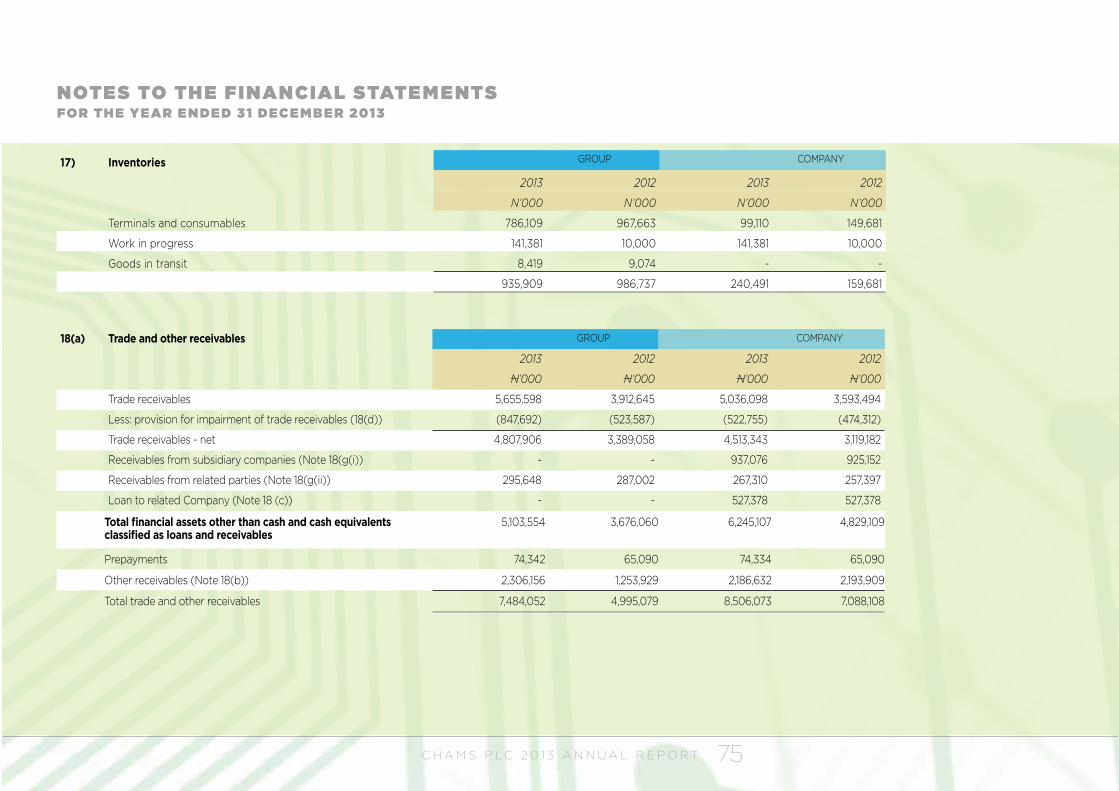
C H A M S P L C 2 0 1 3 A N N U A L R E P O R T 75
17) Inventories GROUP COMPANY
2013 2012 2013 2012
N’000 N’000 N’000 N’000
Terminals and consumables 786,109 967,663 99,110 149,681
Work in progress 141,381 10,000 141,381 10,000
Goods in transit 8,419 9,074 - -
935,909 986,737 240,491 159,681
18(a) Trade and other receivables GROUP COMPANY
2013 2012 2013 2012
N’000 N’000 N’000 N’000
Trade receivables 5,655,598 3,912,645 5,036,098 3,593,494
Less: provision for impairment of trade receivables (18(d)) (847,692) (523,587) (522,755) (474,312)
Trade receivables - net 4,807,906 3,389,058 4,513,343 3,119,182
Receivables from subsidiary companies (Note 18(g(i)) - - 937,076 925,152
Receivables from related parties (Note 18(g(ii)) 295,648 287,002 267,310 257,397
Loan to related Company (Note 18 (c)) - - 527,378 527,378
Total financial assets other than cash and cash equivalents classified as loans and receivables
5,103,554 3,676,060 6,245,107 4,829,109
Prepayments 74,342 65,090 74,334 65,090
Other receivables (Note 18(b)) 2,306,156 1,253,929 2,186,632 2,193,909
Total trade and other receivables 7,484,052 4,995,079 8,506,073 7,088,108
NOTES TO THE FINANCIAL STATE ME NTSFOR TH E YEAR E N DE D 31 DECE M B E R 2013
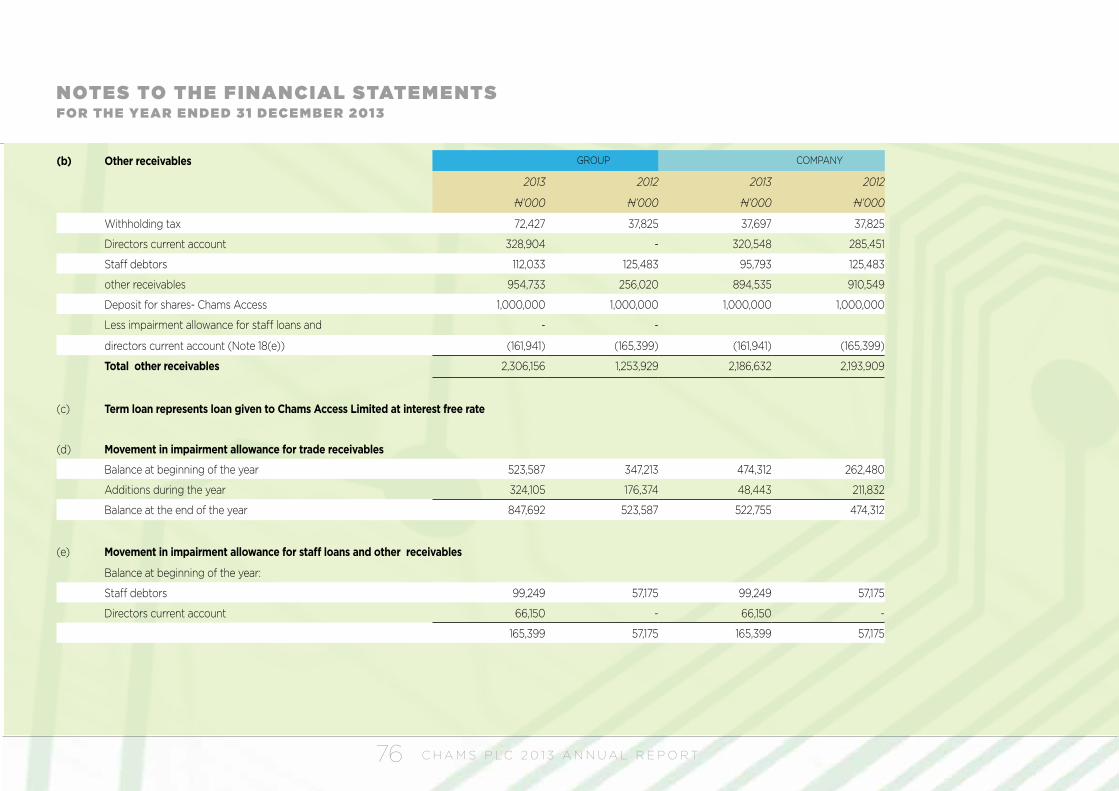
C H A M S P L C 2 0 1 3 A N N U A L R E P O R T76
(b) Other receivables GROUP COMPANY
2013 2012 2013 2012
N’000 N’000 N’000 N’000
Withholding tax 72,427 37,825 37,697 37,825
Directors current account 328,904 - 320,548 285,451
Staff debtors 112,033 125,483 95,793 125,483
other receivables 954,733 256,020 894,535 910,549
Deposit for shares- Chams Access 1,000,000 1,000,000 1,000,000 1,000,000
Less impairment allowance for staff loans and - -
directors current account (Note 18(e)) (161,941) (165,399) (161,941) (165,399)
Total other receivables 2,306,156 1,253,929 2,186,632 2,193,909
(c) Term loan represents loan given to Chams Access Limited at interest free rate
(d) Movement in impairment allowance for trade receivables
Balance at beginning of the year 523,587 347,213 474,312 262,480
Additions during the year 324,105 176,374 48,443 211,832
Balance at the end of the year 847,692 523,587 522,755 474,312
(e) Movement in impairment allowance for staff loans and other receivables
Balance at beginning of the year:
Staff debtors 99,249 57,175 99,249 57,175
Directors current account 66,150 - 66,150 -
165,399 57,175 165,399 57,175
NOTES TO THE FINANCIAL STATE ME NTSFOR TH E YEAR E N DE D 31 DECE M B E R 2013
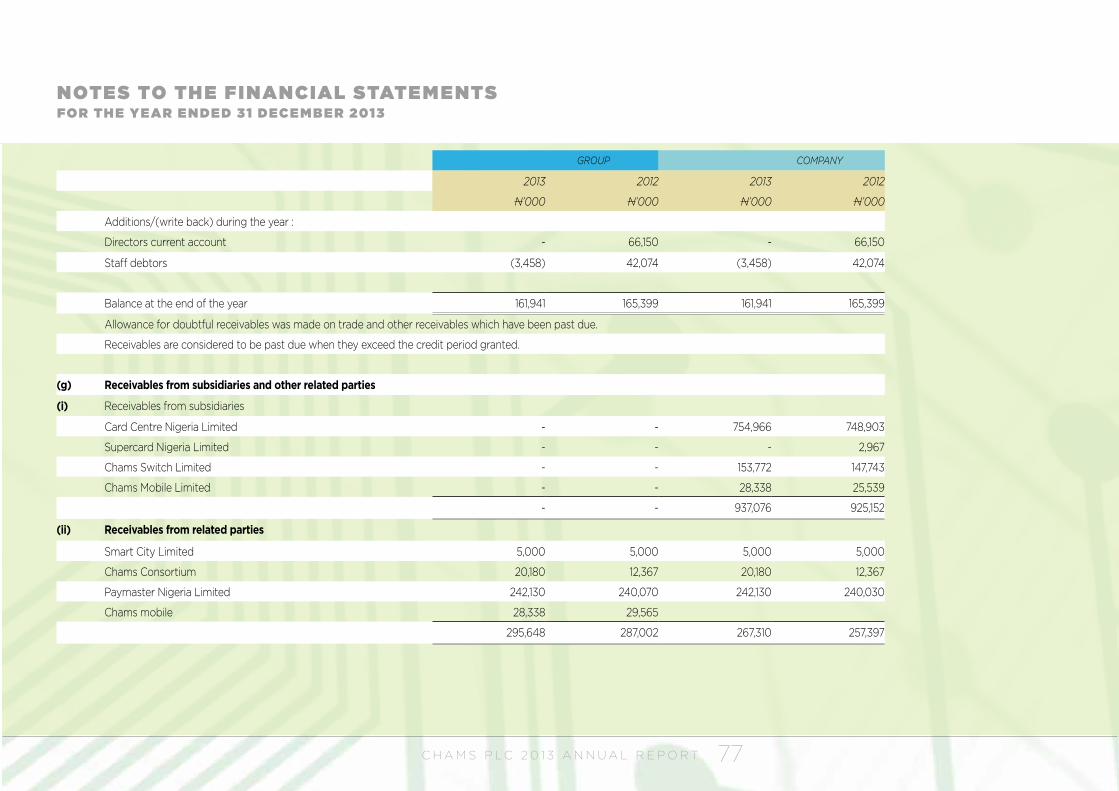
C H A M S P L C 2 0 1 3 A N N U A L R E P O R T 77
GROUP COMPANY
2013 2012 2013 2012
N’000 N’000 N’000 N’000
Additions/(write back) during the year :
Directors current account - 66,150 - 66,150
Staff debtors (3,458) 42,074 (3,458) 42,074
Balance at the end of the year 161,941 165,399 161,941 165,399
Allowance for doubtful receivables was made on trade and other receivables which have been past due.
Receivables are considered to be past due when they exceed the credit period granted.
(g) Receivables from subsidiaries and other related parties
(i) Receivables from subsidiaries
Card Centre Nigeria Limited - - 754,966 748,903
Supercard Nigeria Limited - - - 2,967
Chams Switch Limited - - 153,772 147,743
Chams Mobile Limited - - 28,338 25,539
- - 937,076 925,152
(ii) Receivables from related parties
Smart City Limited 5,000 5,000 5,000 5,000
Chams Consortium 20,180 12,367 20,180 12,367
Paymaster Nigeria Limited 242,130 240,070 242,130 240,030
Chams mobile 28,338 29,565
295,648 287,002 267,310 257,397
NOTES TO THE FINANCIAL STATE ME NTSFOR TH E YEAR E N DE D 31 DECE M B E R 2013
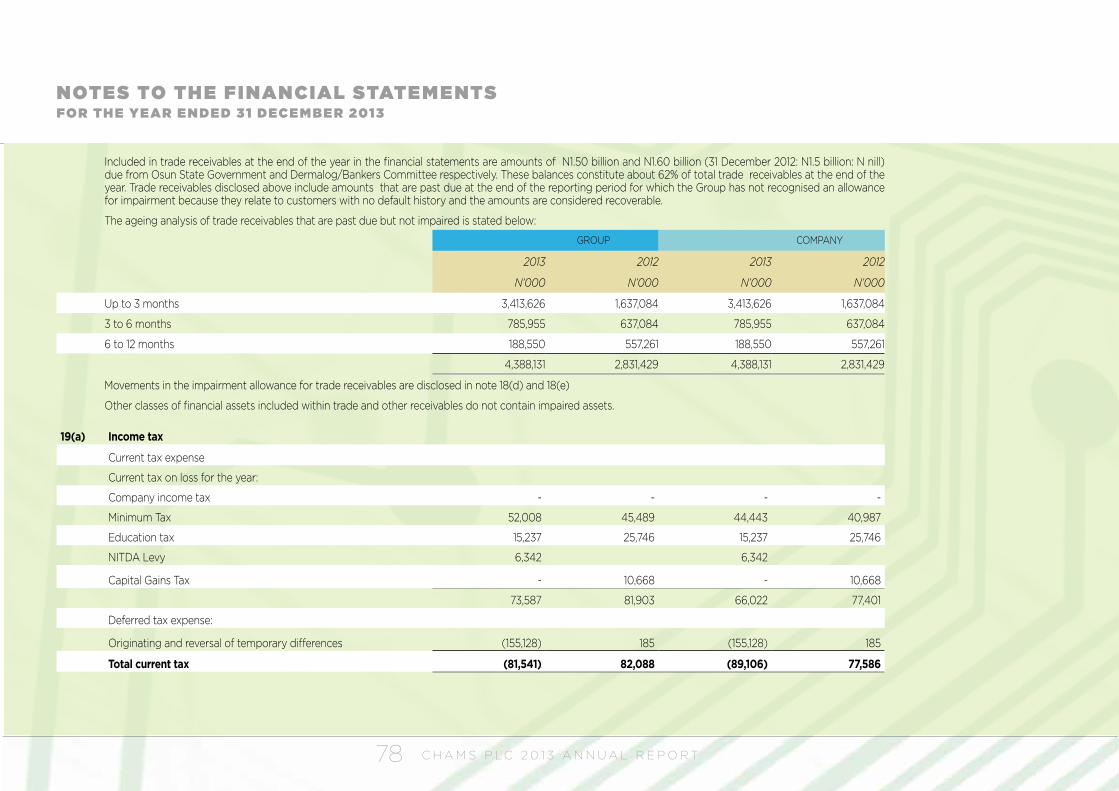
C H A M S P L C 2 0 1 3 A N N U A L R E P O R T78
Included in trade receivables at the end of the year in the financial statements are amounts of N1.50 billion and N1.60 billion (31 December 2012: N1.5 billion: N nill) due from Osun State Government and Dermalog/Bankers Committee respectively. These balances constitute about 62% of total trade receivables at the end of the year. Trade receivables disclosed above include amounts that are past due at the end of the reporting period for which the Group has not recognised an allowance for impairment because they relate to customers with no default history and the amounts are considered recoverable.
The ageing analysis of trade receivables that are past due but not impaired is stated below:
GROUP COMPANY
2013 2012 2013 2012
N’000 N’000 N’000 N’000
Up to 3 months 3,413,626 1,637,084 3,413,626 1,637,084
3 to 6 months 785,955 637,084 785,955 637,084
6 to 12 months 188,550 557,261 188,550 557,261
4,388,131 2,831,429 4,388,131 2,831,429
Movements in the impairment allowance for trade receivables are disclosed in note 18(d) and 18(e)
Other classes of financial assets included within trade and other receivables do not contain impaired assets.
19(a) Income tax
Current tax expense
Current tax on loss for the year:
Company income tax - - - -
Minimum Tax 52,008 45,489 44,443 40,987
Education tax 15,237 25,746 15,237 25,746
NITDA Levy 6,342 6,342
Capital Gains Tax - 10,668 - 10,668
73,587 81,903 66,022 77,401
Deferred tax expense:
Originating and reversal of temporary differences (155,128) 185 (155,128) 185
Total current tax (81,541) 82,088 (89,106) 77,586
NOTES TO THE FINANCIAL STATE ME NTSFOR TH E YEAR E N DE D 31 DECE M B E R 2013
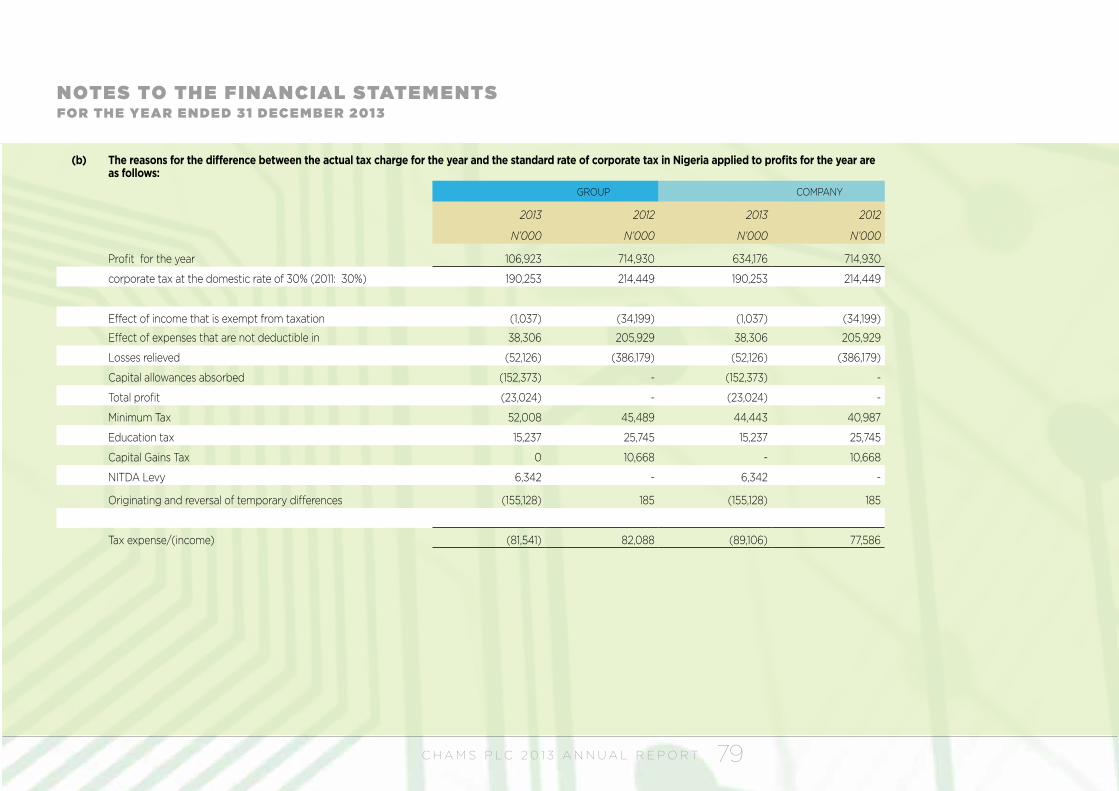
C H A M S P L C 2 0 1 3 A N N U A L R E P O R T 79
(b) The reasons for the difference between the actual tax charge for the year and the standard rate of corporate tax in Nigeria applied to profits for the year are as follows:
GROUP COMPANY
2013 2012 2013 2012
N’000 N’000 N’000 N’000
Profit for the year 106,923 714,930 634,176 714,930
corporate tax at the domestic rate of 30% (2011: 30%) 190,253 214,449 190,253 214,449
Effect of income that is exempt from taxation (1,037) (34,199) (1,037) (34,199)
Effect of expenses that are not deductible in 38,306 205,929 38,306 205,929
Losses relieved (52,126) (386,179) (52,126) (386,179)
Capital allowances absorbed (152,373) - (152,373) -
Total profit (23,024) - (23,024) -
Minimum Tax 52,008 45,489 44,443 40,987
Education tax 15,237 25,745 15,237 25,745
Capital Gains Tax 0 10,668 - 10,668
NITDA Levy 6,342 - 6,342 -
Originating and reversal of temporary differences (155,128) 185 (155,128) 185
Tax expense/(income) (81,541) 82,088 (89,106) 77,586
NOTES TO THE FINANCIAL STATE ME NTSFOR TH E YEAR E N DE D 31 DECE M B E R 2013
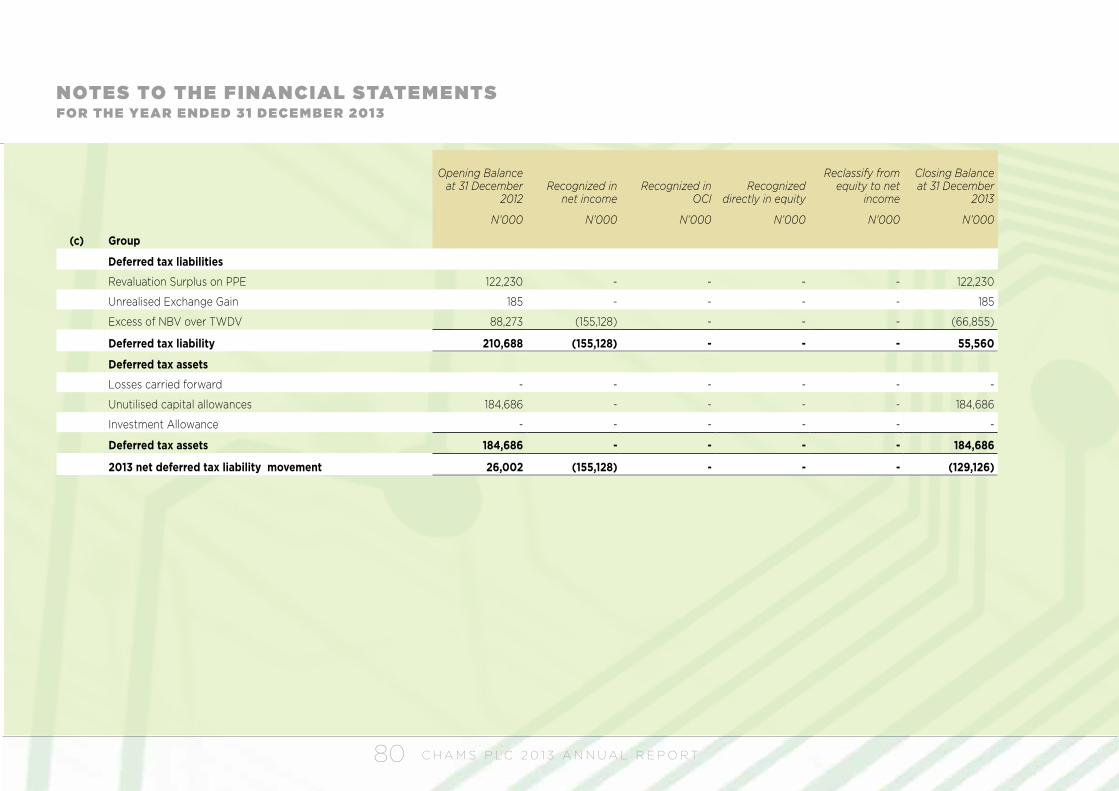
C H A M S P L C 2 0 1 3 A N N U A L R E P O R T80
Opening Balance at 31 December
2012Recognized in
net incomeRecognized in
OCIRecognized
directly in equity
Reclassify from equity to net
income
Closing Balance at 31 December
2013
N’000 N’000 N’000 N’000 N’000 N’000
(c) Group
Deferred tax liabilities
Revaluation Surplus on PPE 122,230 - - - - 122,230
Unrealised Exchange Gain 185 - - - - 185
Excess of NBV over TWDV 88,273 (155,128) - - - (66,855)
Deferred tax liability 210,688 (155,128) - - - 55,560
Deferred tax assets
Losses carried forward - - - - - -
Unutilised capital allowances 184,686 - - - - 184,686
Investment Allowance - - - - - -
Deferred tax assets 184,686 - - - - 184,686
2013 net deferred tax liability movement 26,002 (155,128) - - - (129,126)
NOTES TO THE FINANCIAL STATE ME NTSFOR TH E YEAR E N DE D 31 DECE M B E R 2013
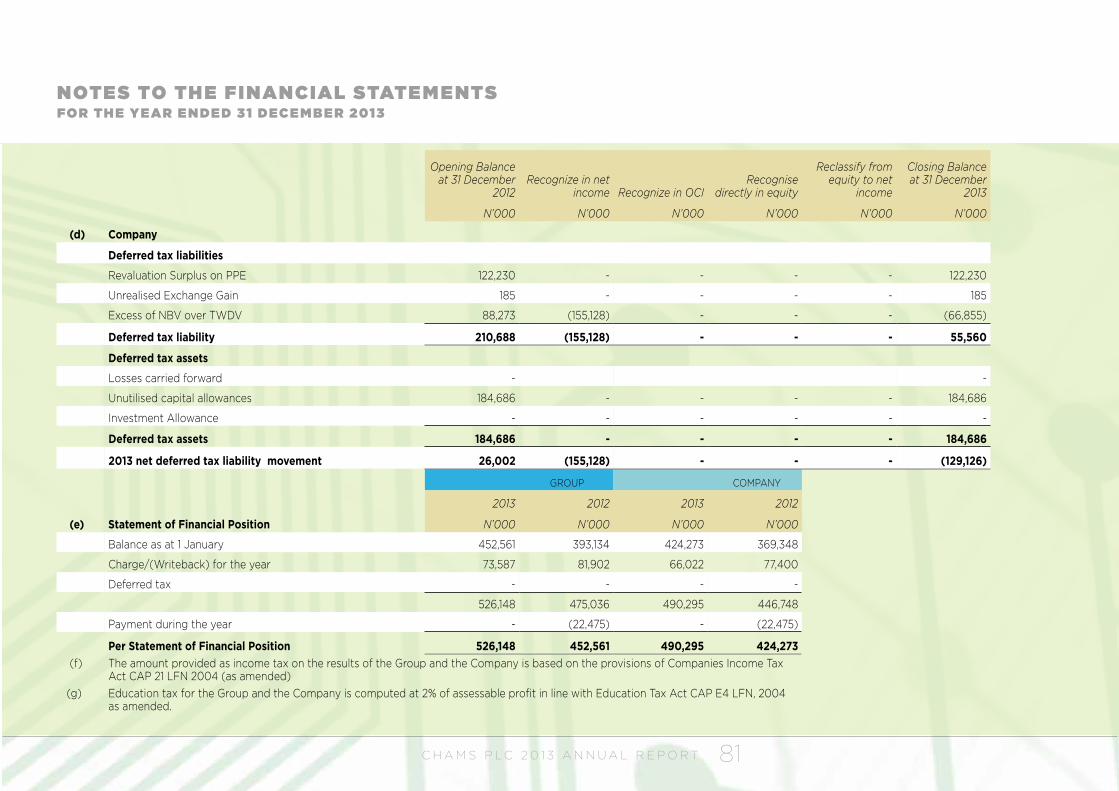
C H A M S P L C 2 0 1 3 A N N U A L R E P O R T 81
GROUP COMPANY
2013 2012 2013 2012
(e) Statement of Financial Position N’000 N’000 N’000 N’000
Balance as at 1 January 452,561 393,134 424,273 369,348
Charge/(Writeback) for the year 73,587 81,902 66,022 77,400
Deferred tax - - - -
526,148 475,036 490,295 446,748
Payment during the year - (22,475) - (22,475)
Per Statement of Financial Position 526,148 452,561 490,295 424,273 (f) The amount provided as income tax on the results of the Group and the Company is based on the provisions of Companies Income Tax
Act CAP 21 LFN 2004 (as amended) (g) Education tax for the Group and the Company is computed at 2% of assessable profit in line with Education Tax Act CAP E4 LFN, 2004
as amended.
NOTES TO THE FINANCIAL STATE ME NTSFOR TH E YEAR E N DE D 31 DECE M B E R 2013
Opening Balance at 31 December
2012Recognize in net
income Recognize in OCIRecognise
directly in equity
Reclassify from equity to net
income
Closing Balance at 31 December
2013
N’000 N’000 N’000 N’000 N’000 N’000
(d) Company
Deferred tax liabilities
Revaluation Surplus on PPE 122,230 - - - - 122,230
Unrealised Exchange Gain 185 - - - - 185
Excess of NBV over TWDV 88,273 (155,128) - - - (66,855)
Deferred tax liability 210,688 (155,128) - - - 55,560
Deferred tax assets
Losses carried forward - -
Unutilised capital allowances 184,686 - - - - 184,686
Investment Allowance - - - - - -
Deferred tax assets 184,686 - - - - 184,686
2013 net deferred tax liability movement 26,002 (155,128) - - - (129,126)
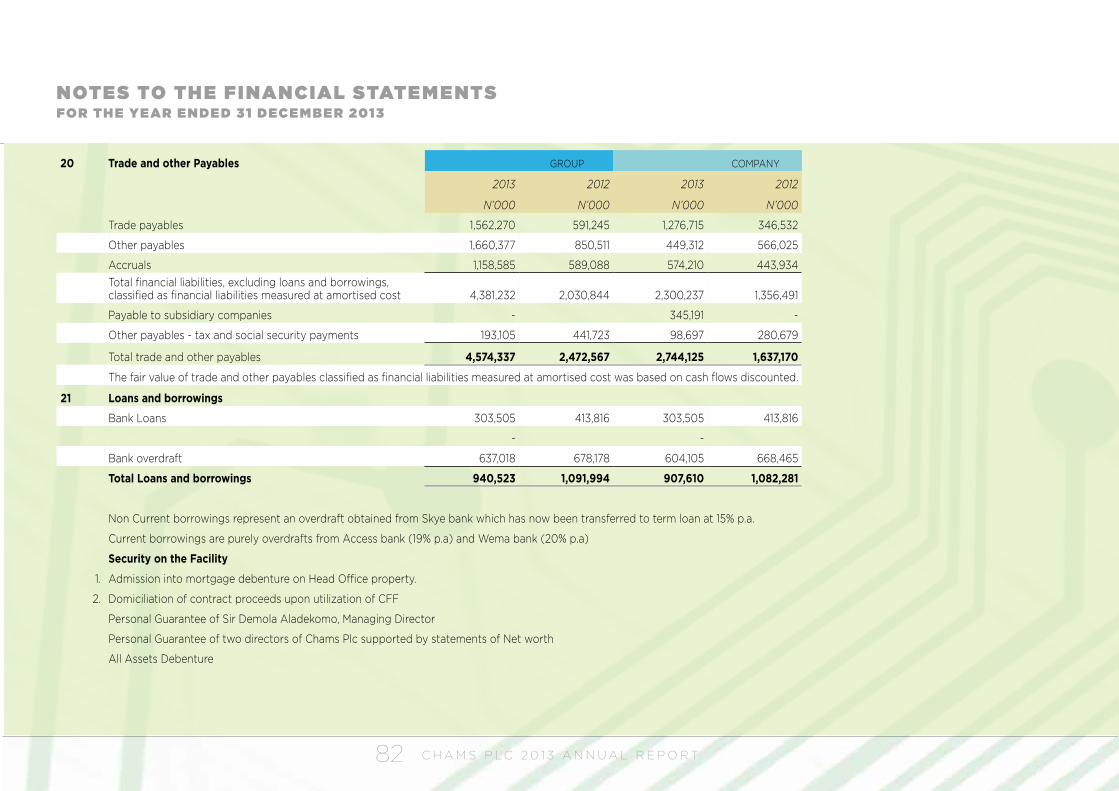
C H A M S P L C 2 0 1 3 A N N U A L R E P O R T82
20 Trade and other Payables GROUP COMPANY
2013 2012 2013 2012
N’000 N’000 N’000 N’000
Trade payables 1,562,270 591,245 1,276,715 346,532
Other payables 1,660,377 850,511 449,312 566,025
Accruals 1,158,585 589,088 574,210 443,934 Total financial liabilities, excluding loans and borrowings, classified as financial liabilities measured at amortised cost 4,381,232 2,030,844 2,300,237 1,356,491
Payable to subsidiary companies - 345,191 -
Other payables - tax and social security payments 193,105 441,723 98,697 280,679
Total trade and other payables 4,574,337 2,472,567 2,744,125 1,637,170
The fair value of trade and other payables classified as financial liabilities measured at amortised cost was based on cash flows discounted.
21 Loans and borrowings
Bank Loans 303,505 413,816 303,505 413,816
- -
Bank overdraft 637,018 678,178 604,105 668,465
Total Loans and borrowings 940,523 1,091,994 907,610 1,082,281
Non Current borrowings represent an overdraft obtained from Skye bank which has now been transferred to term loan at 15% p.a.
Current borrowings are purely overdrafts from Access bank (19% p.a) and Wema bank (20% p.a)
Security on the Facility
1. Admission into mortgage debenture on Head Office property.
2. Domiciliation of contract proceeds upon utilization of CFF
Personal Guarantee of Sir Demola Aladekomo, Managing Director
Personal Guarantee of two directors of Chams Plc supported by statements of Net worth
All Assets Debenture
NOTES TO THE FINANCIAL STATE ME NTSFOR TH E YEAR E N DE D 31 DECE M B E R 2013
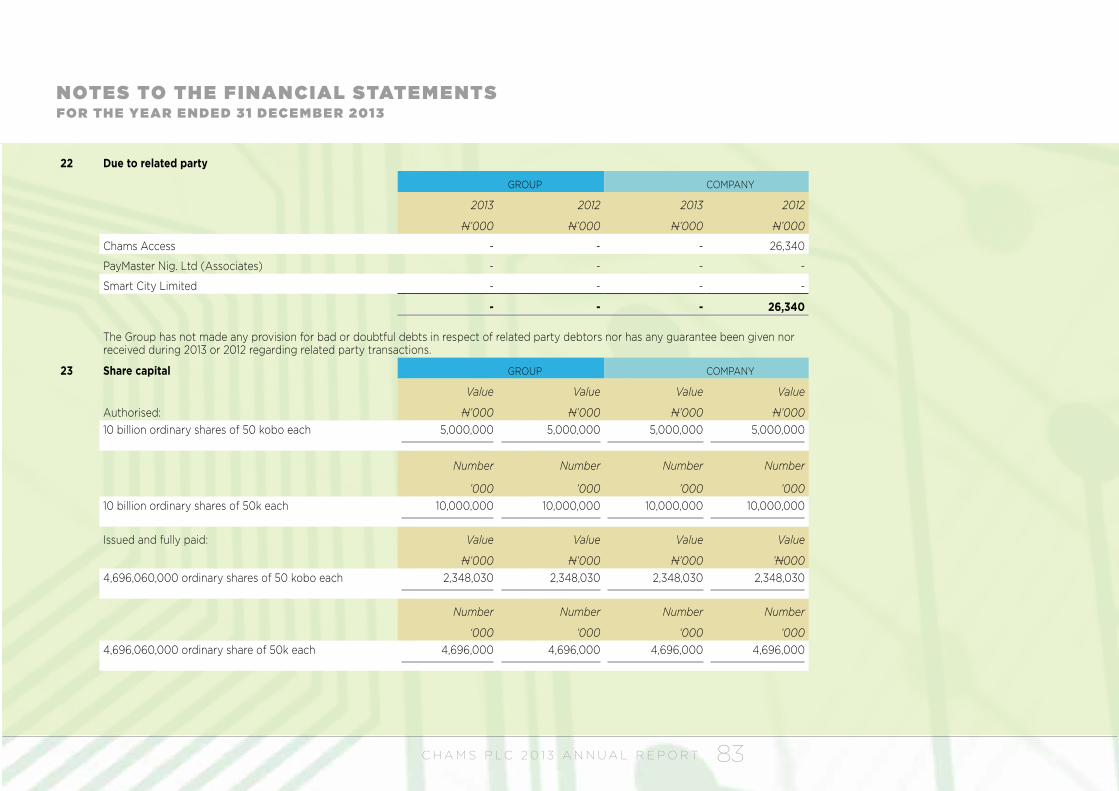
C H A M S P L C 2 0 1 3 A N N U A L R E P O R T 83
22 Due to related party
GROUP COMPANY
2013 2012 2013 2012
N’000 N’000 N’000 N’000
Chams Access - - - 26,340
PayMaster Nig. Ltd (Associates) - - - -
Smart City Limited - - - -
- - - 26,340
The Group has not made any provision for bad or doubtful debts in respect of related party debtors nor has any guarantee been given nor received during 2013 or 2012 regarding related party transactions.
23 Share capital GROUP COMPANY
Value Value Value Value
Authorised: N’000 N’000 N’000 N’00010 billion ordinary shares of 50 kobo each 5,000,000 5,000,000 5,000,000 5,000,000
Number Number Number Number
’000 ’000 ’000 ’00010 billion ordinary shares of 50k each 10,000,000 10,000,000 10,000,000 10,000,000
Issued and fully paid: Value Value Value Value
N’000 N’000 N’000 ’N0004,696,060,000 ordinary shares of 50 kobo each 2,348,030 2,348,030 2,348,030 2,348,030
Number Number Number Number
‘000 ‘000 ‘000 ‘0004,696,060,000 ordinary share of 50k each 4,696,000 4,696,000 4,696,000 4,696,000
NOTES TO THE FINANCIAL STATE ME NTSFOR TH E YEAR E N DE D 31 DECE M B E R 2013
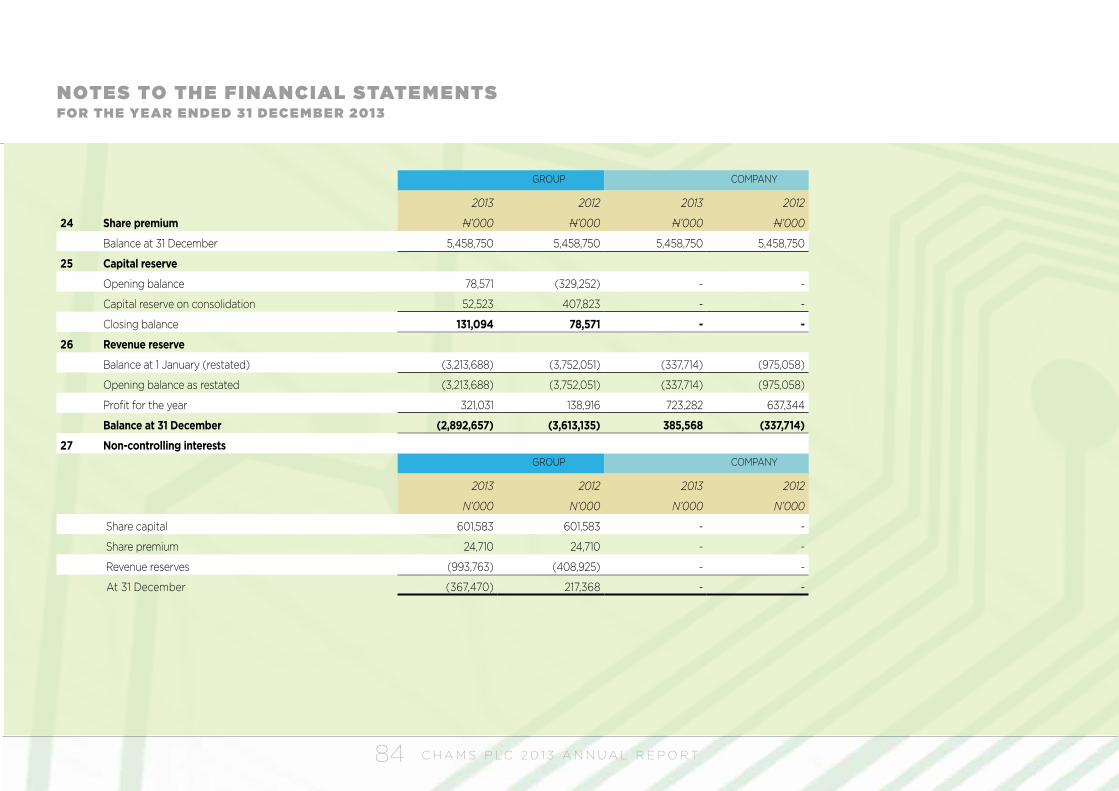
C H A M S P L C 2 0 1 3 A N N U A L R E P O R T84
GROUP COMPANY
2013 2012 2013 2012
24 Share premium N’000 N’000 N’000 N’000
Balance at 31 December 5,458,750 5,458,750 5,458,750 5,458,750
25 Capital reserve
Opening balance 78,571 (329,252) - -
Capital reserve on consolidation 52,523 407,823 - -
Closing balance 131,094 78,571 - -
26 Revenue reserve
Balance at 1 January (restated) (3,213,688) (3,752,051) (337,714) (975,058)
Opening balance as restated (3,213,688) (3,752,051) (337,714) (975,058)
Profit for the year 321,031 138,916 723,282 637,344
Balance at 31 December (2,892,657) (3,613,135) 385,568 (337,714)
27 Non-controlling interests GROUP COMPANY
2013 2012 2013 2012
N’000 N’000 N’000 N’000
Share capital 601,583 601,583 - -
Share premium 24,710 24,710 - -
Revenue reserves (993,763) (408,925) - -
At 31 December (367,470) 217,368 - -
NOTES TO THE FINANCIAL STATE ME NTSFOR TH E YEAR E N DE D 31 DECE M B E R 2013
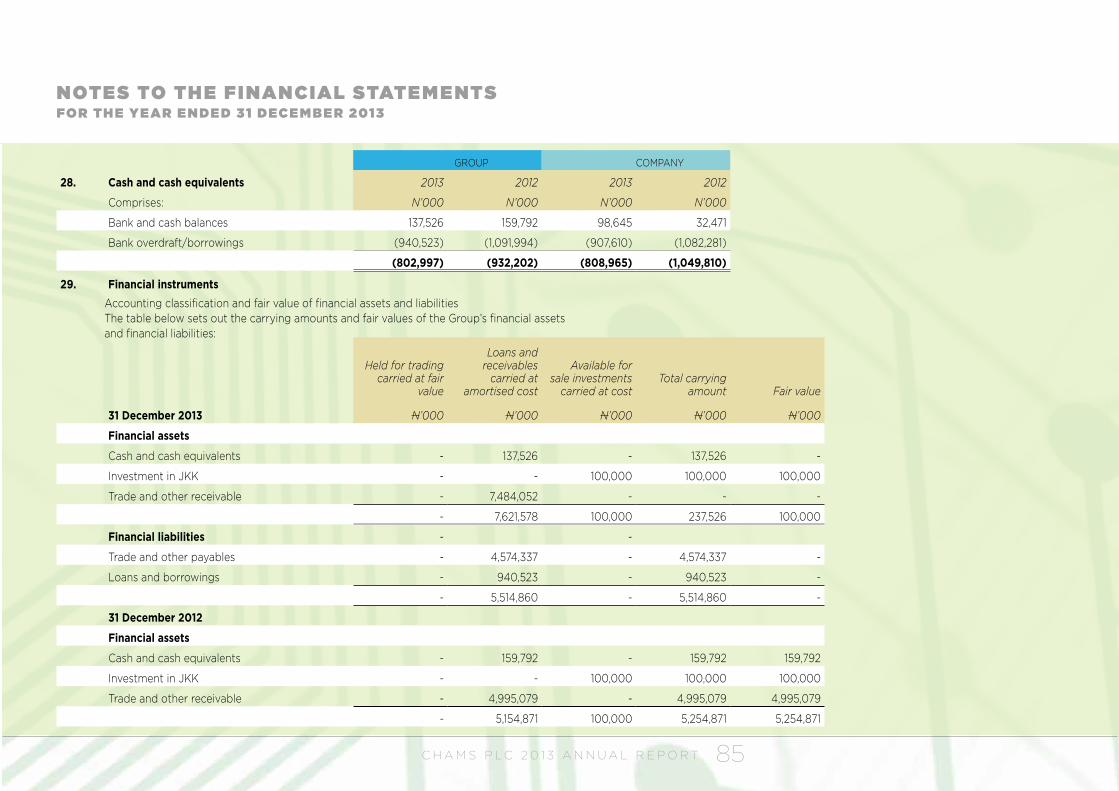
C H A M S P L C 2 0 1 3 A N N U A L R E P O R T 85
29. Financial instrumentsAccounting classification and fair value of financial assets and liabilitiesThe table below sets out the carrying amounts and fair values of the Group’s financial assetsand financial liabilities:
Held for trading carried at fair
value
Loans and receivables
carried at amortised cost
Available for sale investments
carried at costTotal carrying
amount Fair value
31 December 2013 N’000 N’000 N’000 N’000 N’000
Financial assets
Cash and cash equivalents - 137,526 - 137,526 -
Investment in JKK - - 100,000 100,000 100,000
Trade and other receivable - 7,484,052 - - -
- 7,621,578 100,000 237,526 100,000
Financial liabilities - -
Trade and other payables - 4,574,337 - 4,574,337 -
Loans and borrowings - 940,523 - 940,523 -
- 5,514,860 - 5,514,860 -
31 December 2012
Financial assets
Cash and cash equivalents - 159,792 - 159,792 159,792
Investment in JKK - - 100,000 100,000 100,000
Trade and other receivable - 4,995,079 - 4,995,079 4,995,079
- 5,154,871 100,000 5,254,871 5,254,871
NOTES TO THE FINANCIAL STATE ME NTSFOR TH E YEAR E N DE D 31 DECE M B E R 2013
GROUP COMPANY
28. Cash and cash equivalents 2013 2012 2013 2012
Comprises: N’000 N’000 N’000 N’000
Bank and cash balances 137,526 159,792 98,645 32,471
Bank overdraft/borrowings (940,523) (1,091,994) (907,610) (1,082,281)
(802,997) (932,202) (808,965) (1,049,810)
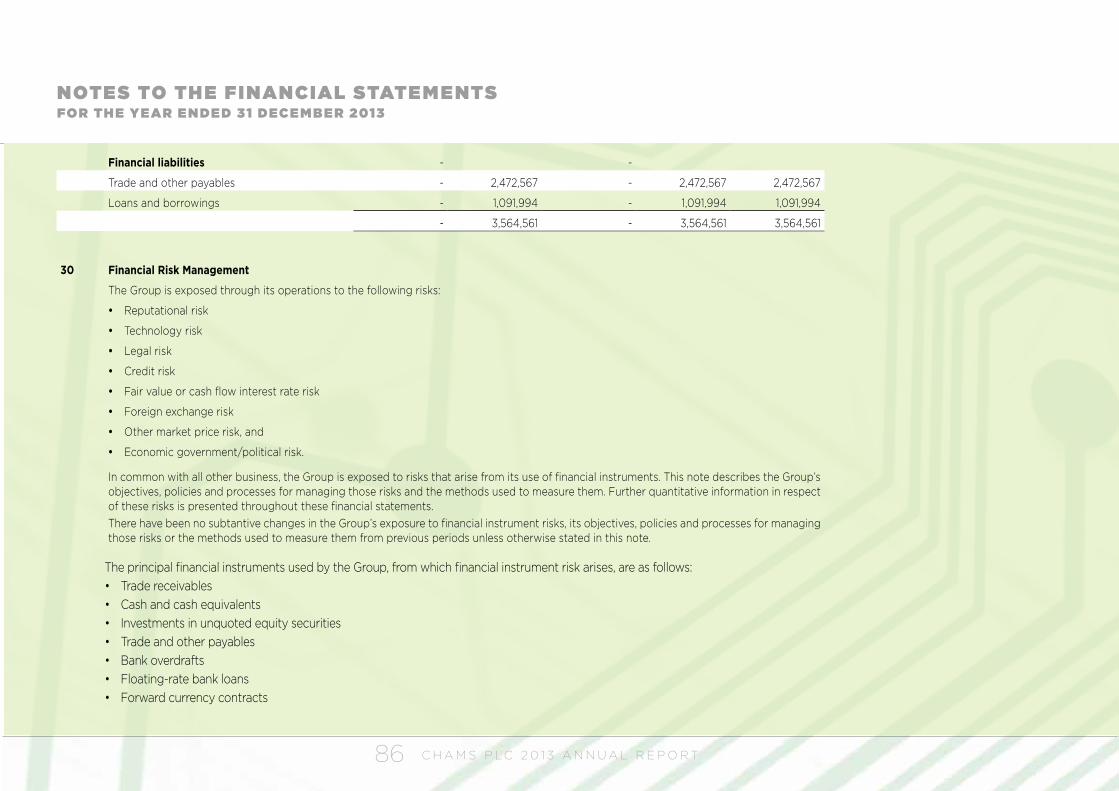
C H A M S P L C 2 0 1 3 A N N U A L R E P O R T86
Financial liabilities - -
Trade and other payables - 2,472,567 - 2,472,567 2,472,567
Loans and borrowings - 1,091,994 - 1,091,994 1,091,994
- 3,564,561 - 3,564,561 3,564,561
30 Financial Risk Management
The Group is exposed through its operations to the following risks:
y Reputational risk
y Technology risk
y Legal risk
y Credit risk
y Fair value or cash flow interest rate risk
y Foreign exchange risk
y Other market price risk, and
y Economic government/political risk.
In common with all other business, the Group is exposed to risks that arise from its use of financial instruments. This note describes the Group’s objectives, policies and processes for managing those risks and the methods used to measure them. Further quantitative information in respect of these risks is presented throughout these financial statements. There have been no subtantive changes in the Group’s exposure to financial instrument risks, its objectives, policies and processes for managing those risks or the methods used to measure them from previous periods unless otherwise stated in this note.
NOTES TO THE FINANCIAL STATE ME NTSFOR TH E YEAR E N DE D 31 DECE M B E R 2013
The principal financial instruments used by the Group, from which financial instrument risk arises, are as follows: • Trade receivables • Cash and cash equivalents• Investments in unquoted equity securities • Trade and other payables • Bank overdrafts • Floating-rate bank loans • Forward currency contracts
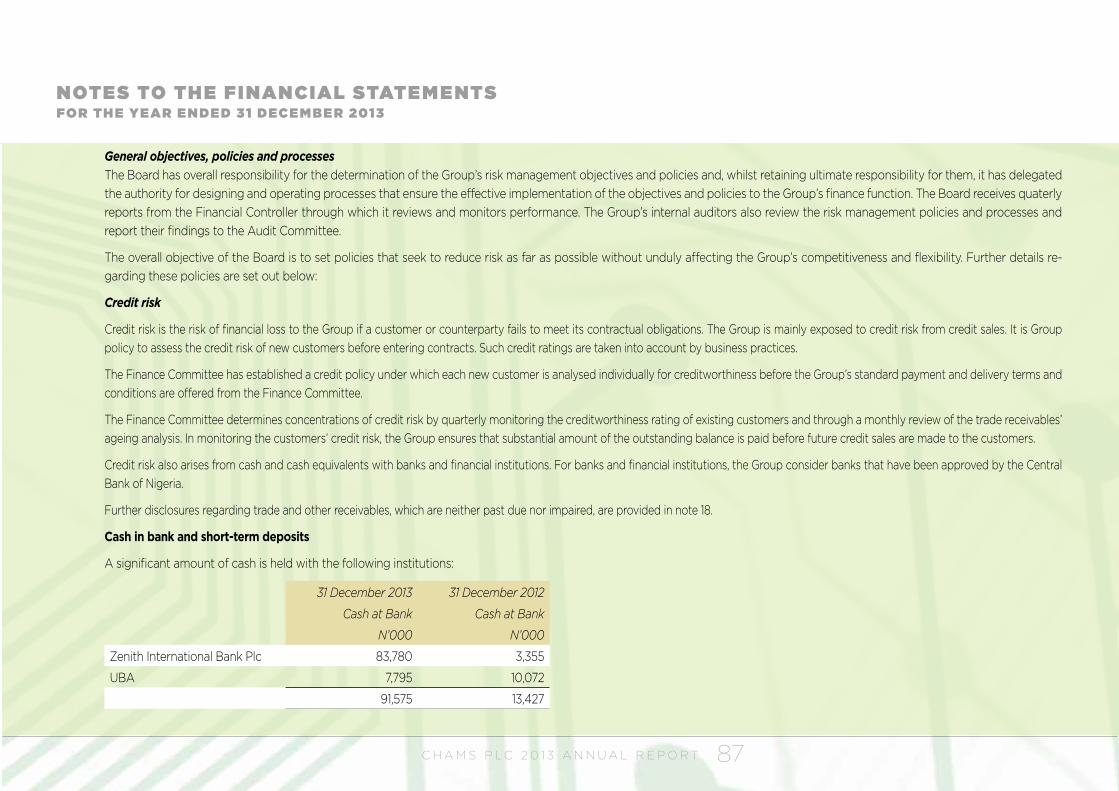
C H A M S P L C 2 0 1 3 A N N U A L R E P O R T 87
NOTES TO THE FINANCIAL STATE ME NTSFOR TH E YEAR E N DE D 31 DECE M B E R 2013
General objectives, policies and processes The Board has overall responsibility for the determination of the Group’s risk management objectives and policies and, whilst retaining ultimate responsibility for them, it has delegated the authority for designing and operating processes that ensure the effective implementation of the objectives and policies to the Group’s finance function. The Board receives quaterly reports from the Financial Controller through which it reviews and monitors performance. The Group’s internal auditors also review the risk management policies and processes and report their findings to the Audit Committee.
The overall objective of the Board is to set policies that seek to reduce risk as far as possible without unduly affecting the Group’s competitiveness and flexibility. Further details re-garding these policies are set out below:
Credit risk
Credit risk is the risk of financial loss to the Group if a customer or counterparty fails to meet its contractual obligations. The Group is mainly exposed to credit risk from credit sales. It is Group policy to assess the credit risk of new customers before entering contracts. Such credit ratings are taken into account by business practices.
The Finance Committee has established a credit policy under which each new customer is analysed individually for creditworthiness before the Group’s standard payment and delivery terms and conditions are offered from the Finance Committee.
The Finance Committee determines concentrations of credit risk by quarterly monitoring the creditworthiness rating of existing customers and through a monthly review of the trade receivables’ ageing analysis. In monitoring the customers’ credit risk, the Group ensures that substantial amount of the outstanding balance is paid before future credit sales are made to the customers.
Credit risk also arises from cash and cash equivalents with banks and financial institutions. For banks and financial institutions, the Group consider banks that have been approved by the Central Bank of Nigeria.
Further disclosures regarding trade and other receivables, which are neither past due nor impaired, are provided in note 18.
Cash in bank and short-term deposits
A significant amount of cash is held with the following institutions:
31 December 2013 31 December 2012
Cash at Bank Cash at Bank
N’000 N’000
Zenith International Bank Plc 83,780 3,355
UBA 7,795 10,072
91,575 13,427
C H A M S P L C 2 0 1 3 A N N U A L R E P O R T88
NOTES TO THE FINANCIAL STATE ME NTSFOR TH E YEAR E N DE D 31 DECE M B E R 2013
The Finance Committee monitors the utilisation of the credit limits regularly and at the reporting date does not expect any losses from non-performance by the counterparties.
Market risk
Market risk arises from the Group’s use of tradable and foreign currency financial instruments. It is the risk that the fair value or future cash flows of a financial instrument will fluctuate because of changes in foreign exchange rates (currency risk) or other market factors (other price risk)
Fair value and cash flow interest rate risk
The Group is exposed to cash flow interest rate from borrowings at floating rate. It is currently Group policy that all existing floating rate borrowings are restructured to fixed rates in order to mitigate against frequent fluctuation in interest rate.This policy is managed across the Group by individual treasury units. Although the board accepts that this policy neither protects the Group entirely from the risk of paying rates in excess of current market rates nor eliminates fully cash flow risk associated with variability in interest payments, it considers that it achieves an apropriate balance of exposure to these risks.
During 2013 and 2012, the Group’s borrowings at variable rate were denominated in Naira
The Group analysis the interest rate exposure on a quarterly basis. A sensitivity analysis is performed by applying a simulation technique to the liabilities that represent major interest bearing positions.
Based on the various scenarios the Group then manages its cash-flow interest rate risk by changing from using floating-to-fixed interest rate. The Group has adopted a No borrowing policy in order to eliminate expsosure to interest rate.
At 31 December 2013, if interest rates on Naira - denominated borrowings had been 5% basis points higher/lower with all other variables held constant, profit before tax for the year would have been N117,746 (2012: N96,100) mainly as a result of higher/lower interest expenses on floating rate borrowing. The directors consider that 5% is the maximum likely change in Naira interest rates over the next year, being the period up to the next point at which the Group expects to make these disclosures.
Foreign exchange risk
Foreign exchange risk arises when individual Group entities enter into transactions denominated in a currency other than their functional currency. The Group’s policy is, where pos-sible, to allow group entities to settle liabilities denominated in their functional currency with the cash generated from their own operations in that currency. Where group entities have liabilities denominated in a currency other than their functional currency (and have insufficient reserves of that currency to settle them), cash already denominated in that currency will, where possible, be transferred from elsewhere within the Group.
In order to monitor the continuing effectiveness of this policy, the Board receives a monthly forcast, analysed by the major currencies held by the Group, of liabilities due for settlement and expected cash reserves.
The Group is currently not exposed to foreign exchange risk as it does not have any liabiity to be settled in foreign currency.
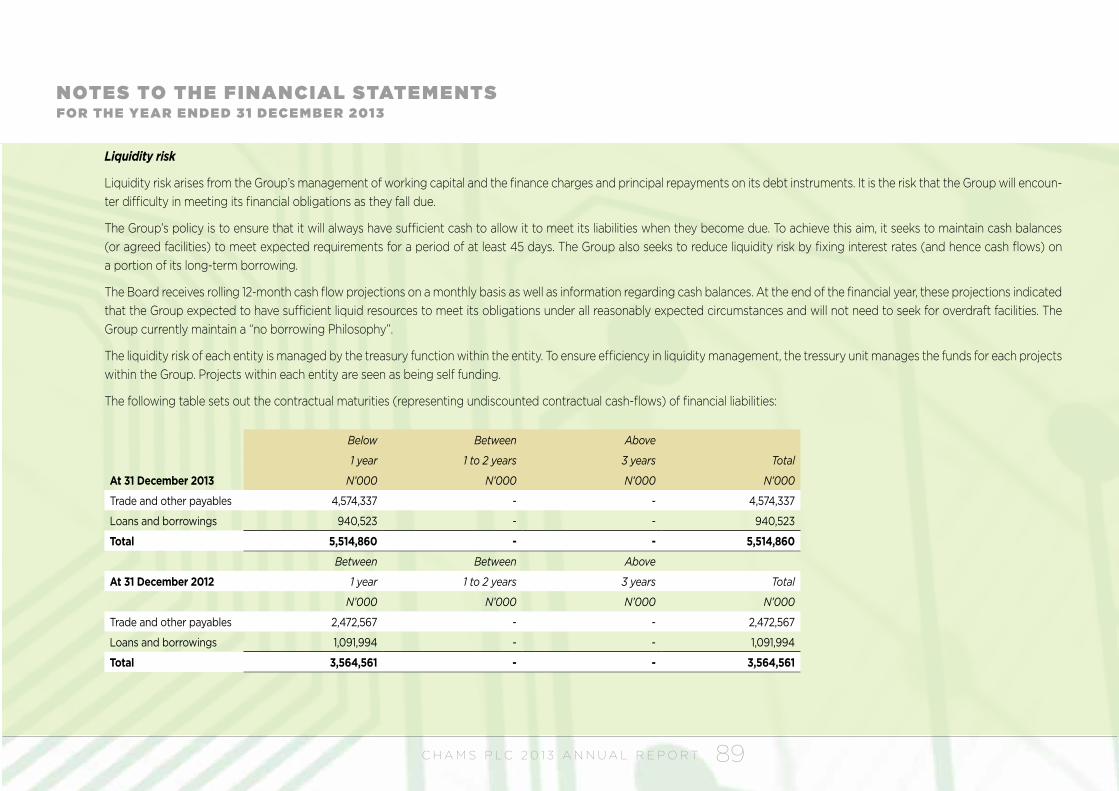
C H A M S P L C 2 0 1 3 A N N U A L R E P O R T 89
NOTES TO THE FINANCIAL STATE ME NTSFOR TH E YEAR E N DE D 31 DECE M B E R 2013
Liquidity risk
Liquidity risk arises from the Group’s management of working capital and the finance charges and principal repayments on its debt instruments. It is the risk that the Group will encoun-ter difficulty in meeting its financial obligations as they fall due.
The Group’s policy is to ensure that it will always have sufficient cash to allow it to meet its liabilities when they become due. To achieve this aim, it seeks to maintain cash balances (or agreed facilities) to meet expected requirements for a period of at least 45 days. The Group also seeks to reduce liquidity risk by fixing interest rates (and hence cash flows) on a portion of its long-term borrowing.
The Board receives rolling 12-month cash flow projections on a monthly basis as well as information regarding cash balances. At the end of the financial year, these projections indicated that the Group expected to have sufficient liquid resources to meet its obligations under all reasonably expected circumstances and will not need to seek for overdraft facilities. The Group currently maintain a “no borrowing Philosophy”.
The liquidity risk of each entity is managed by the treasury function within the entity. To ensure efficiency in liquidity management, the tressury unit manages the funds for each projects within the Group. Projects within each entity are seen as being self funding.
The following table sets out the contractual maturities (representing undiscounted contractual cash-flows) of financial liabilities:
Below Between Above
1 year 1 to 2 years 3 years Total
At 31 December 2013 N’000 N’000 N’000 N’000
Trade and other payables 4,574,337 - - 4,574,337
Loans and borrowings 940,523 - - 940,523
Total 5,514,860 - - 5,514,860
Between Between Above
At 31 December 2012 1 year 1 to 2 years 3 years Total
N’000 N’000 N’000 N’000
Trade and other payables 2,472,567 - - 2,472,567
Loans and borrowings 1,091,994 - - 1,091,994
Total 3,564,561 - - 3,564,561
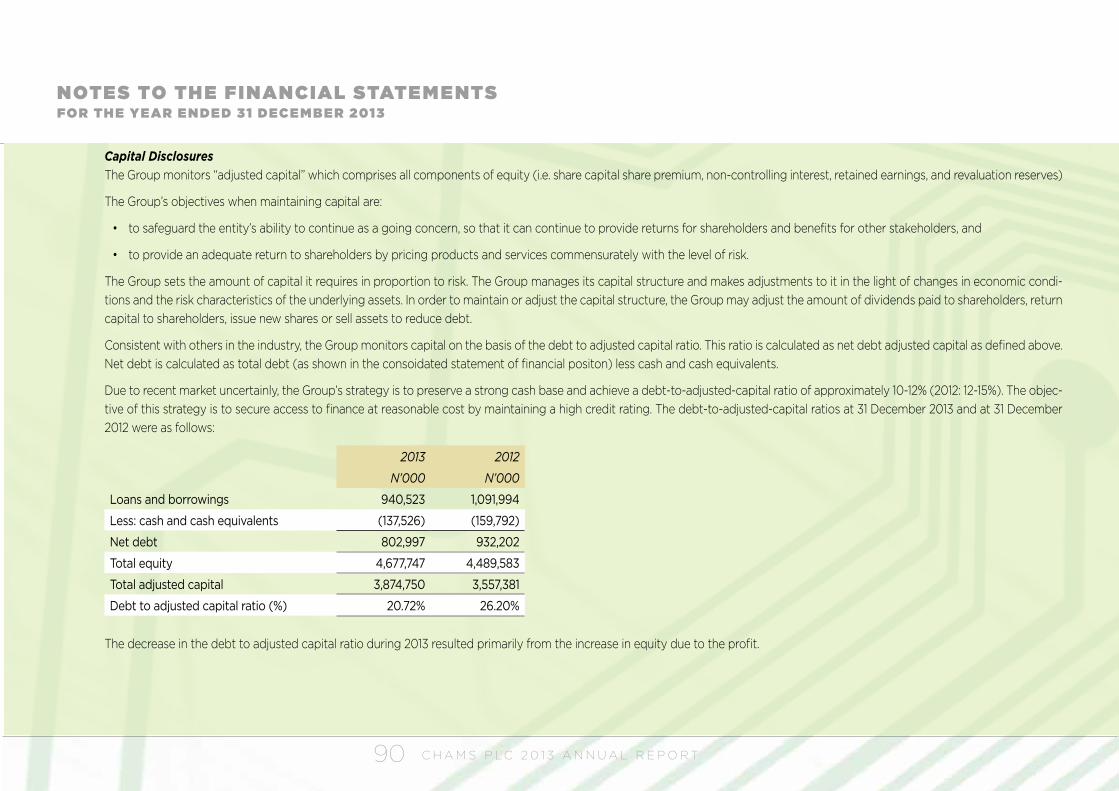
C H A M S P L C 2 0 1 3 A N N U A L R E P O R T90
NOTES TO THE FINANCIAL STATE ME NTSFOR TH E YEAR E N DE D 31 DECE M B E R 2013
Capital Disclosures The Group monitors “adjusted capital” which comprises all components of equity (i.e. share capital share premium, non-controlling interest, retained earnings, and revaluation reserves)
The Group’s objectives when maintaining capital are:
• to safeguard the entity’s ability to continue as a going concern, so that it can continue to provide returns for shareholders and benefits for other stakeholders, and
• to provide an adequate return to shareholders by pricing products and services commensurately with the level of risk.
The Group sets the amount of capital it requires in proportion to risk. The Group manages its capital structure and makes adjustments to it in the light of changes in economic condi-tions and the risk characteristics of the underlying assets. In order to maintain or adjust the capital structure, the Group may adjust the amount of dividends paid to shareholders, return capital to shareholders, issue new shares or sell assets to reduce debt.
Consistent with others in the industry, the Group monitors capital on the basis of the debt to adjusted capital ratio. This ratio is calculated as net debt adjusted capital as defined above. Net debt is calculated as total debt (as shown in the consoidated statement of financial positon) less cash and cash equivalents.
Due to recent market uncertainly, the Group’s strategy is to preserve a strong cash base and achieve a debt-to-adjusted-capital ratio of approximately 10-12% (2012: 12-15%). The objec-tive of this strategy is to secure access to finance at reasonable cost by maintaining a high credit rating. The debt-to-adjusted-capital ratios at 31 December 2013 and at 31 December 2012 were as follows:
2013 2012
N’000 N’000
Loans and borrowings 940,523 1,091,994
Less: cash and cash equivalents (137,526) (159,792)
Net debt 802,997 932,202
Total equity 4,677,747 4,489,583
Total adjusted capital 3,874,750 3,557,381
Debt to adjusted capital ratio (%) 20.72% 26.20%
The decrease in the debt to adjusted capital ratio during 2013 resulted primarily from the increase in equity due to the profit.
C H A M S P L C 2 0 1 3 A N N U A L R E P O R T 91
NOTES TO THE FINANCIAL STATE ME NTSFOR TH E YEAR E N DE D 31 DECE M B E R 2013
31. Guarantees and other financial commitments
Capital commitments
There were no capital commitments authorised by the Directors as at 31 December, 2013 (2012 - Nil).
Contingent liabilities
The Directors are of the opinion that there were no contingent liabilities in respect of actions against the company, accordingly no provision has been made in these consolidated finan-cial statements as at 31 December 2013 (2012 - Nil).
32. Subsequent events review
In the opinion of the Directors, there were no significant post balance sheet events that could have material effect on the state of affairs of the Company and its subsidiaries as at 31 December 2013 and on the loss for the year ended on that date, which have not been adequately provided for or disclosed in these consolidated financial statements.
33. Related party transactions
Related parties include the Board of Directors, the Group Executive Board, the Group Managing Director, close family members and companies which are controlled by these individu-als.
During the year, the Company transacted business to/from its subsidiaries and associated companies These transactions were conducted on an arms length basis in the ordinary course of business.
Transactions with Subsidiaries
• Rent and service charges to Chams Access is N8,329,779
• Rent and service charges to CardCentre Nigeria Limited is N22,946,392.73
Transactions with Associates
• Rent and service charges to PayMaster is N7,789,779
• Working capital loan to Paymaster from Chams Plc is N13,597,597
Other related parties
• Working capital loan to Chams Consortium from Chams Plc is N6,500,000
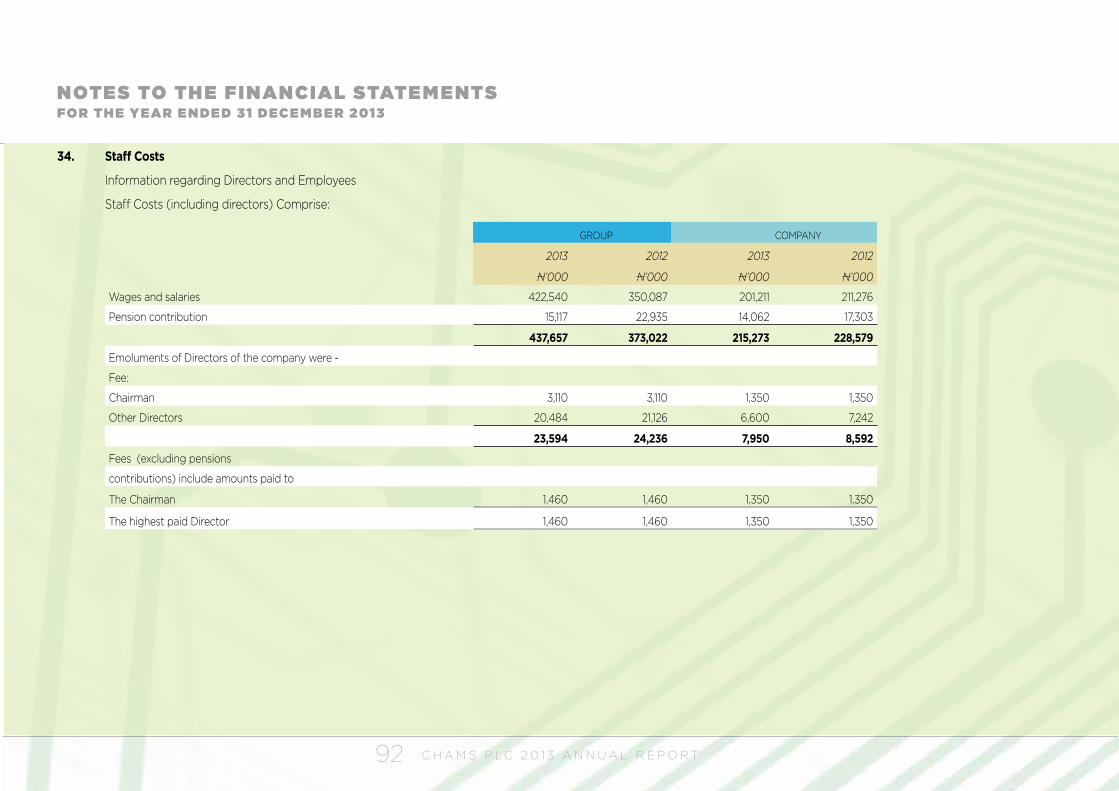
C H A M S P L C 2 0 1 3 A N N U A L R E P O R T92
NOTES TO THE FINANCIAL STATE ME NTSFOR TH E YEAR E N DE D 31 DECE M B E R 2013
34. Staff Costs
Information regarding Directors and Employees
Staff Costs (including directors) Comprise:
GROUP COMPANY
2013 2012 2013 2012
N’000 N’000 N’000 N’000
Wages and salaries 422,540 350,087 201,211 211,276
Pension contribution 15,117 22,935 14,062 17,303
437,657 373,022 215,273 228,579
Emoluments of Directors of the company were -
Fee:
Chairman 3,110 3,110 1,350 1,350
Other Directors 20,484 21,126 6,600 7,242
23,594 24,236 7,950 8,592
Fees (excluding pensions
contributions) include amounts paid to
The Chairman 1,460 1,460 1,350 1,350
The highest paid Director 1,460 1,460 1,350 1,350
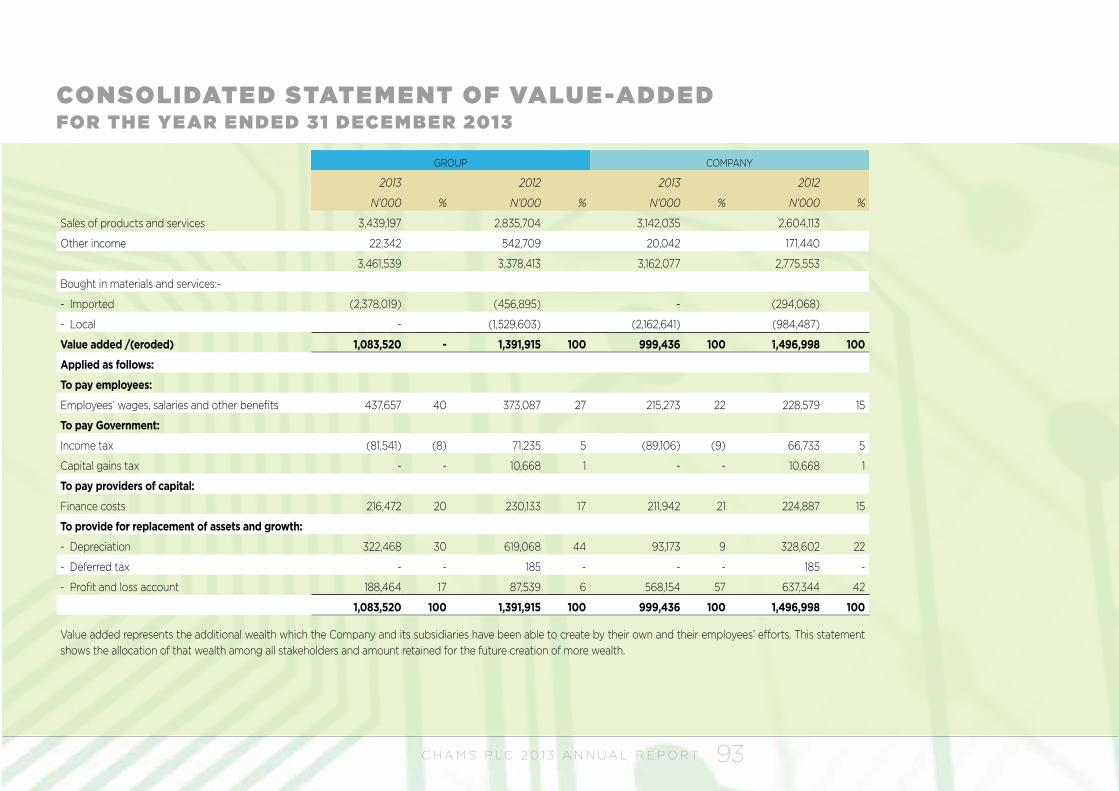
C H A M S P L C 2 0 1 3 A N N U A L R E P O R T 93
GROUP COMPANY
2013 2012 2013 2012
N’000 % N’000 % N’000 % N’000 %
Sales of products and services 3,439,197 2,835,704 3,142,035 2,604,113
Other income 22,342 542,709 20,042 171,440
3,461,539 3,378,413 3,162,077 2,775,553
Bought in materials and services:-
- Imported (2,378,019) (456,895) - (294,068)
- Local - (1,529,603) (2,162,641) (984,487)
Value added /(eroded) 1,083,520 - 1,391,915 100 999,436 100 1,496,998 100
Applied as follows:
To pay employees:
Employees’ wages, salaries and other benefits 437,657 40 373,087 27 215,273 22 228,579 15
To pay Government:
Income tax (81,541) (8) 71,235 5 (89,106) (9) 66,733 5
Capital gains tax - - 10,668 1 - - 10,668 1
To pay providers of capital:
Finance costs 216,472 20 230,133 17 211,942 21 224,887 15
To provide for replacement of assets and growth:
- Depreciation 322,468 30 619,068 44 93,173 9 328,602 22
- Deferred tax - - 185 - - - 185 -
- Profit and loss account 188,464 17 87,539 6 568,154 57 637,344 42
1,083,520 100 1,391,915 100 999,436 100 1,496,998 100
Value added represents the additional wealth which the Company and its subsidiaries have been able to create by their own and their employees’ efforts. This statement shows the allocation of that wealth among all stakeholders and amount retained for the future creation of more wealth.
CONSOLIDATE D STATE ME NT OF VALUE-ADDE DFOR THE YEAR E NDE D 31 DECE MBE R 2013
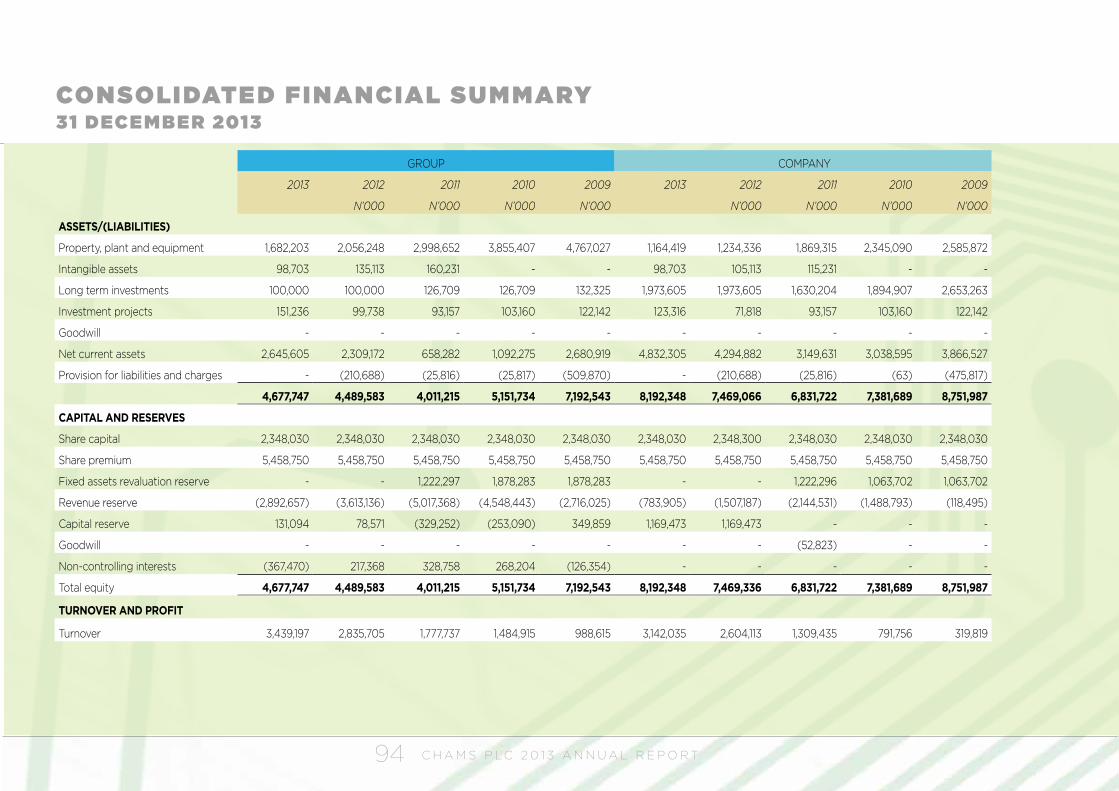
C H A M S P L C 2 0 1 3 A N N U A L R E P O R T94
GROUP COMPANY
2013 2012 2011 2010 2009 2013 2012 2011 2010 2009
N’000 N’000 N’000 N’000 N’000 N’000 N’000 N’000
ASSETS/(LIABILITIES)
Property, plant and equipment 1,682,203 2,056,248 2,998,652 3,855,407 4,767,027 1,164,419 1,234,336 1,869,315 2,345,090 2,585,872
Intangible assets 98,703 135,113 160,231 - - 98,703 105,113 115,231 - -
Long term investments 100,000 100,000 126,709 126,709 132,325 1,973,605 1,973,605 1,630,204 1,894,907 2,653,263
Investment projects 151,236 99,738 93,157 103,160 122,142 123,316 71,818 93,157 103,160 122,142
Goodwill - - - - - - - - - -
Net current assets 2,645,605 2,309,172 658,282 1,092,275 2,680,919 4,832,305 4,294,882 3,149,631 3,038,595 3,866,527
Provision for liabilities and charges - (210,688) (25,816) (25,817) (509,870) - (210,688) (25,816) (63) (475,817)
4,677,747 4,489,583 4,011,215 5,151,734 7,192,543 8,192,348 7,469,066 6,831,722 7,381,689 8,751,987
CAPITAL AND RESERVES
Share capital 2,348,030 2,348,030 2,348,030 2,348,030 2,348,030 2,348,030 2,348,300 2,348,030 2,348,030 2,348,030
Share premium 5,458,750 5,458,750 5,458,750 5,458,750 5,458,750 5,458,750 5,458,750 5,458,750 5,458,750 5,458,750
Fixed assets revaluation reserve - - 1,222,297 1,878,283 1,878,283 - - 1,222,296 1,063,702 1,063,702
Revenue reserve (2,892,657) (3,613,136) (5,017,368) (4,548,443) (2,716,025) (783,905) (1,507,187) (2,144,531) (1,488,793) (118,495)
Capital reserve 131,094 78,571 (329,252) (253,090) 349,859 1,169,473 1,169,473 - - -
Goodwill - - - - - - - (52,823) - -
Non-controlling interests (367,470) 217,368 328,758 268,204 (126,354) - - - - -
Total equity 4,677,747 4,489,583 4,011,215 5,151,734 7,192,543 8,192,348 7,469,336 6,831,722 7,381,689 8,751,987
TURNOVER AND PROFIT
Turnover 3,439,197 2,835,705 1,777,737 1,484,915 988,615 3,142,035 2,604,113 1,309,435 791,756 319,819
CONSOLIDATE D FINANCIAL SUMMARY31 DECE MBE R 2013
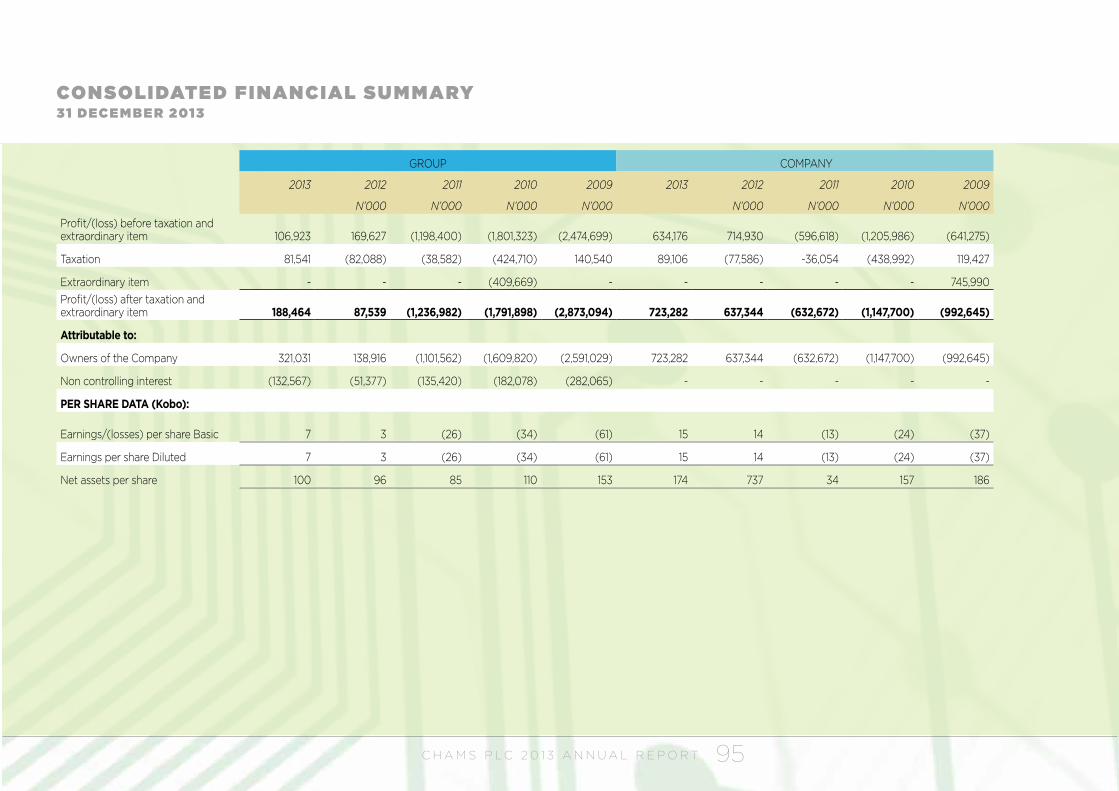
C H A M S P L C 2 0 1 3 A N N U A L R E P O R T 95
GROUP COMPANY
2013 2012 2011 2010 2009 2013 2012 2011 2010 2009
N’000 N’000 N’000 N’000 N’000 N’000 N’000 N’000Profit/(loss) before taxation and extraordinary item 106,923 169,627 (1,198,400) (1,801,323) (2,474,699) 634,176 714,930 (596,618) (1,205,986) (641,275)
Taxation 81,541 (82,088) (38,582) (424,710) 140,540 89,106 (77,586) -36,054 (438,992) 119,427
Extraordinary item - - - (409,669) - - - - - 745,990 Profit/(loss) after taxation and extraordinary item 188,464 87,539 (1,236,982) (1,791,898) (2,873,094) 723,282 637,344 (632,672) (1,147,700) (992,645)
Attributable to:
Owners of the Company 321,031 138,916 (1,101,562) (1,609,820) (2,591,029) 723,282 637,344 (632,672) (1,147,700) (992,645)
Non controlling interest (132,567) (51,377) (135,420) (182,078) (282,065) - - - - -
PER SHARE DATA (Kobo):
Earnings/(losses) per share Basic 7 3 (26) (34) (61) 15 14 (13) (24) (37)
Earnings per share Diluted 7 3 (26) (34) (61) 15 14 (13) (24) (37)
Net assets per share 100 96 85 110 153 174 737 34 157 186
CONSOLIDATE D FINANCIAL SUMMARY31 DECE M B E R 2013
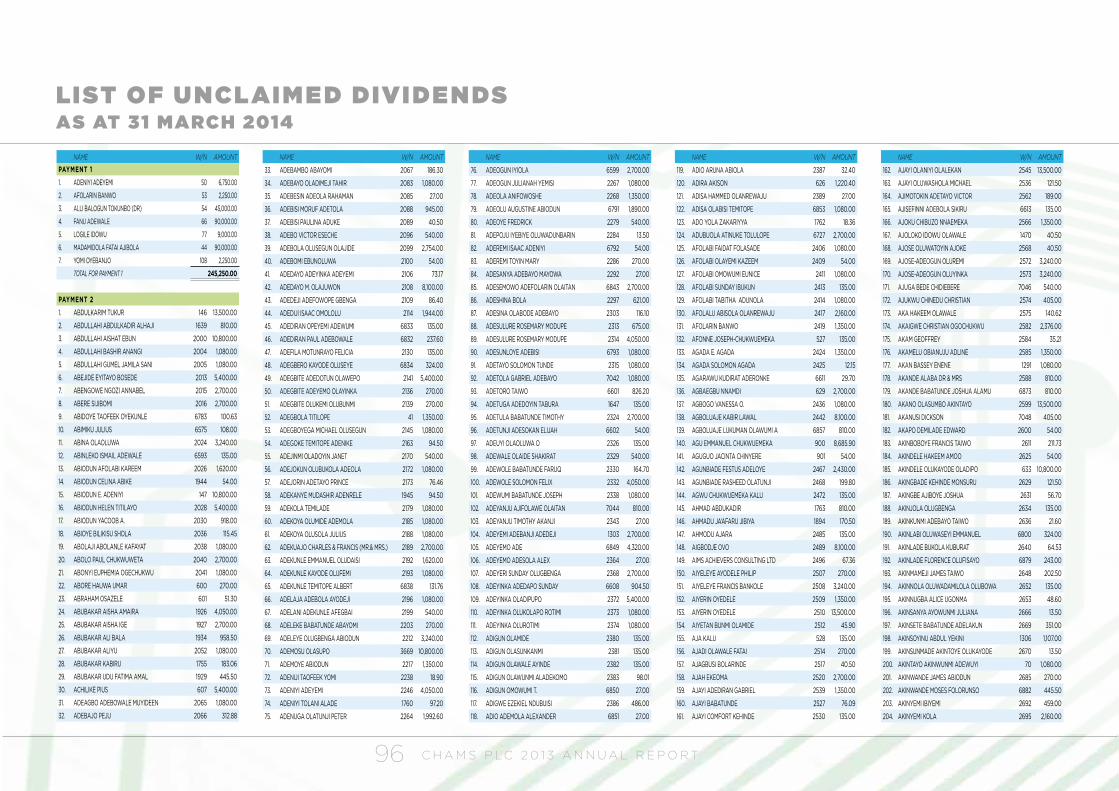
C H A M S P L C 2 0 1 3 A N N U A L R E P O R T96
NAME W/N AMOUNT
PAYMENT 11. ADENIYI ADEYEMI 50 6,750.00
2. AFOLARIN BANWO 53 2,250.00
3. ALLI BALOGUN TOKUNBO (DR) 54 45,000.00
4. FANU ADEWALE 66 90,000.00
5. LOGILE IDOWU 77 9,000.00
6. MADAMIDOLA FATAI AJIBOLA 44 90,000.00
7. YOMI OYEBANJO 108 2,250.00
TOTAL FOR PAYMENT 1 245,250.00
PAYMENT 21. ABDULKARIM TUKUR 146 13,500.00
2. ABDULLAHI ABDULKADIR ALHAJI 1639 810.00
3. ABDULLAHI AISHAT EBUN 2000 10,800.00
4. ABDULLAHI BASHIR ANANGI 2004 1,080.00
5. ABDULLAHI GUMEL JAMILA SANI 2005 1,080.00
6. ABEJIDE EYITAYO BOSEDE 2013 5,400.00
7. ABENGOWE NGOZI ANNABEL 2015 2,700.00
8. ABERE SIJIBOMI 2016 2,700.00
9. ABIDOYE TAOFEEK OYEKUNLE 6783 100.63
10. ABIMIKU JULIUS 6575 108.00
11. ABINA OLAOLUWA 2024 3,240.00
12. ABINLEKO ISMAIL ADEWALE 6593 135.00
13. ABIODUN AFOLABI KAREEM 2026 1,620.00
14. ABIODUN CELINA ABIKE 1944 54.00
15. ABIODUN E. ADENIYI 147 10,800.00
16. ABIODUN HELEN TITILAYO 2028 5,400.00
17. ABIODUN YACOOB A. 2030 918.00
18. ABIOYE BILIKISU SHOLA 2036 115.45
19. ABOLAJI ABOLANLE KAFAYAT 2038 1,080.00
20. ABOLO PAUL CHUKWUWETA 2040 2,700.00
21. ABONYI EUPHEMIA OGECHUKWU 2041 1,080.00
22. ABORE HAUWA UMAR 600 270.00
23. ABRAHAM OSAZELE 601 51.30
24. ABUBAKAR AISHA AMAIRA 1926 4,050.00
25. ABUBAKAR AISHA IGE 1927 2,700.00
26. ABUBAKAR ALI BALA 1934 958.50
27. ABUBAKAR ALIYU 2052 1,080.00
28. ABUBAKAR KABIRU 1755 183.06
29. ABUBAKAR UDU FATIMA AMAL 1929 445.50
30. ACHILIKE PIUS 607 5,400.00
31. ADEAGBO ADEBOWALE MUYIDEEN 2065 1,080.00
32. ADEBAJO PEJU 2066 312.88
NAME W/N AMOUNT
33. ADEBAMBO ABAYOMI 2067 186.30
34. ADEBAYO OLADIMEJI TAHIR 2083 1,080.00
35. ADEBESIN ADEOLA RAHAMAN 2085 27.00
36. ADEBISI MORUF ADETOLA 2088 945.00
37. ADEBISI PAULINA ADUKE 2089 40.50
38. ADEBO VICTOR ESECHE 2096 540.00
39. ADEBOLA OLUSEGUN OLAJIDE 2099 2,754.00
40. ADEBOMI EBUNOLUWA 2100 54.00
41. ADEDAYO ADEYINKA ADEYEMI 2106 73.17
42. ADEDAYO M. OLAJUWON 2108 8,100.00
43. ADEDEJI ADEFOWOPE GBENGA 2109 86.40
44. ADEDIJI ISAAC OMOLOLU 2114 1,944.00
45. ADEDIRAN OPEYEMI ADEWUMI 6833 135.00
46. ADEDIRAN PAUL ADEBOWALE 6832 237.60
47. ADEFILA MOTUNRAYO FELICIA 2130 135.00
48. ADEGBERO KAYODE OLUSEYE 6834 324.00
49. ADEGBITE ADEDOTUN OLAWEPO 2141 5,400.00
50. ADEGBITE ADEYEMO OLAYINKA 2136 270.00
51. ADEGBITE OLUKEMI OLUBUNMI 2139 270.00
52. ADEGBOLA TITILOPE 41 1,350.00
53. ADEGBOYEGA MICHAEL OLUSEGUN 2145 1,080.00
54. ADEGOKE TEMITOPE ADENIKE 2163 94.50
55. ADEJINMI OLADOYIN JANET 2170 540.00
56. ADEJOKUN OLUBUKOLA ADEOLA 2172 1,080.00
57. ADEJORIN ADETAYO PRINCE 2173 76.46
58. ADEKANYE MUDASHIR ADENRELE 1945 94.50
59. ADEKOLA TEMILADE 2179 1,080.00
60. ADEKOYA OLUMIDE ADEMOLA 2185 1,080.00
61. ADEKOYA OLUSOLA JULIUS 2188 1,080.00
62. ADEKUAJO CHARLES & FRANCIS (MR.& MRS.) 2189 2,700.00
63. ADEKUNLE EMMANUEL OLUDAISI 2192 1,620.00
64. ADEKUNLE KAYODE OLUFEMI 2193 1,080.00
65. ADEKUNLE TEMITOPE ALBERT 6838 131.76
66. ADELAJA ADEBOLA AYODEJI 2196 1,080.00
67. ADELANI ADEKUNLE AFEGBAI 2199 540.00
68. ADELEKE BABATUNDE ABAYOMI 2203 270.00
69. ADELEYE OLUGBENGA ABIODUN 2212 3,240.00
70. ADEMOSU OLASUPO 3669 10,800.00
71. ADEMOYE ABIODUN 2217 1,350.00
72. ADENIJI TAOFEEK YOMI 2238 18.90
73. ADENIYI ADEYEMI 2246 4,050.00
74. ADENIYI TOLANI ALADE 1760 97.20
75. ADENUGA OLATUNJI PETER 2264 1,992.60
NAME W/N AMOUNT
76. ADEOGUN IYIOLA 6599 2,700.00
77. ADEOGUN JULIANAH YEMISI 2267 1,080.00
78. ADEOLA ANIFOWOSHE 2268 1,350.00
79. ADEOLU AUGUSTINE ABIODUN 6791 1,890.00
80. ADEOYE FREDRICK 2279 540.00
81. ADEPOJU IYEBIYE OLUWADUNBARIN 2284 13.50
82. ADEREMI ISAAC ADENIYI 6792 54.00
83. ADEREMI TOYIN MARY 2286 270.00
84. ADESANYA ADEBAYO MAYOWA 2292 27.00
85. ADESEMOWO ADEFOLARIN OLAITAN 6843 2,700.00
86. ADESHINA BOLA 2297 621.00
87. ADESINA OLABODE ADEBAYO 2303 116.10
88. ADESULURE ROSEMARY MODUPE 2313 675.00
89. ADESULURE ROSEMARY MODUPE 2314 4,050.00
90. ADESUNLOYE ADEBISI 6793 1,080.00
91. ADETAYO SOLOMON TUNDE 2315 1,080.00
92. ADETOLA GABRIEL ADEBAYO 7042 1,080.00
93. ADETORO TAIWO 6601 826.20
94. ADETUGA ADEDOYIN TABURA 1647 135.00
95. ADETULA BABATUNDE TIMOTHY 2324 2,700.00
96. ADETUNJI ADESOKAN ELIJAH 6602 54.00
97. ADEUYI OLAOLUWA O 2326 135.00
98. ADEWALE OLAIDE SHAKIRAT 2329 540.00
99. ADEWOLE BABATUNDE FARUQ 2330 164.70
100. ADEWOLE SOLOMON FELIX 2332 4,050.00
101. ADEWUMI BABATUNDE JOSEPH 2338 1,080.00
102. ADEYANJU AJIFOLAWE OLAITAN 7044 810.00
103. ADEYANJU TIMOTHY AKANJI 2343 27.00
104. ADEYEMI ADEBANJI ADEDEJI 1303 2,700.00
105. ADEYEMO ADE 6849 4,320.00
106. ADEYEMO ADESOLA ALEX 2364 27.00
107. ADEYERI SUNDAY OLUGBENGA 2368 2,700.00
108. ADEYINKA ADEDAPO SUNDAY 6608 904.50
109. ADEYINKA OLADIPUPO 2372 5,400.00
110. ADEYINKA OLUKOLAPO ROTIMI 2373 1,080.00
111. ADEYINKA OLUROTIMI 2374 1,080.00
112. ADIGUN OLAMIDE 2380 135.00
113. ADIGUN OLASUNKANMI 2381 135.00
114. ADIGUN OLAWALE AYINDE 2382 135.00
115. ADIGUN OLAWUNMI ALADEKOMO 2383 98.01
116. ADIGUN OMOWUMI T. 6850 27.00
117. ADIGWE EZEKIEL NDUBUISI 2386 486.00
118. ADIO ADEMOLA ALEXANDER 6851 27.00
NAME W/N AMOUNT
119. ADIO ARUNA ABIOLA 2387 32.40
120. ADIRA AKISON 626 1,220.40
121. ADISA HAMMED OLANREWAJU 2389 27.00
122. ADISA OLABISI TEMITOPE 6853 1,080.00
123. ADO YOLA ZAKARIYYA 1762 18.36
124. ADUBUOLA ATINUKE TOLULOPE 6727 2,700.00
125. AFOLABI FAIDAT FOLASADE 2406 1,080.00
126. AFOLABI OLAYEMI KAZEEM 2409 54.00
127. AFOLABI OMOWUMI EUNICE 2411 1,080.00
128. AFOLABI SUNDAY IBUKUN 2413 135.00
129. AFOLABI TABITHA ADUNOLA 2414 1,080.00
130. AFOLALU ABISOLA OLANREWAJU 2417 2,160.00
131. AFOLARIN BANWO 2419 1,350.00
132. AFONNE JOSEPH-CHUKWUEMEKA 527 135.00
133. AGADA E. AGADA 2424 1,350.00
134. AGADA SOLOMON AGADA 2425 12.15
135. AGARAWU KUDIRAT ADERONKE 6611 29.70
136. AGBAEGBU NNAMDI 629 2,700.00
137. AGBOGO VANESSA O. 2436 1,080.00
138. AGBOLUAJE KABIR LAWAL 2442 8,100.00
139. AGBOLUAJE LUKUMAN OLAWUMI A 6857 810.00
140. AGU EMMANUEL CHUKWUEMEKA 900 8,685.90
141. AGUGUO JACINTA CHINYERE 901 54.00
142. AGUNBIADE FESTUS ADELOYE 2467 2,430.00
143. AGUNBIADE RASHEED OLATUNJI 2468 199.80
144. AGWU CHUKWUEMEKA KALU 2472 135.00
145. AHMAD ABDUKADIR 1763 810.00
146. AHMADU JA’AFARU JIBIYA 1894 170.50
147. AHMODU AJARA 2485 135.00
148. AIGBODJE OVO 2489 8,100.00
149. AIMS ACHIEVERS CONSULTING LTD 2496 67.36
150. AIYELEYE AYODELE PHILIP 2507 270.00
151. AIYELEYE FRANCIS BANKOLE 2508 3,240.00
152. AIYERIN OYEDELE 2509 1,350.00
153. AIYERIN OYEDELE 2510 13,500.00
154. AIYETAN BUNMI OLAMIDE 2512 45.90
155. AJA KALU 528 135.00
156. AJADI OLAWALE FATAI 2514 270.00
157. AJAGBUSI BOLARINDE 2517 40.50
158. AJAH EKEOMA 2520 2,700.00
159. AJAYI ADEDIRAN GABRIEL 2539 1,350.00
160. AJAYI BABATUNDE 2527 76.09
161. AJAYI COMFORT KEHINDE 2530 135.00
NAME W/N AMOUNT
162. AJAYI OLANIYI OLALEKAN 2545 13,500.00
163. AJAYI OLUWASHOLA MICHAEL 2536 121.50
164. AJIMOTOKIN ADETAYO VICTOR 2562 189.00
165. AJISEFINNI ADEBOLA SIKIRU 6613 135.00
166. AJOKU CHIBUZO NNAEMEKA 2566 1,350.00
167. AJOLOKO IDOWU OLAWALE 1470 40.50
168. AJOSE OLUWATOYIN AJOKE 2568 40.50
169. AJOSE-ADEOGUN OLUREMI 2572 3,240.00
170. AJOSE-ADEOGUN OLUYINKA 2573 3,240.00
171. AJUGA BEDE CHIDIEBERE 7046 540.00
172. AJUKWU CHINEDU CHRISTIAN 2574 405.00
173. AKA HAKEEM OLAWALE 2575 140.62
174. AKAIGWE CHRISTIAN OGOCHUKWU 2582 2,376.00
175. AKAM GEOFFREY 2584 35.21
176. AKAMELU OBIANUJU ADLINE 2585 1,350.00
177. AKAN BASSEY ENENE 1291 1,080.00
178. AKANDE ALABA DR & MRS 2588 810.00
179. AKANDE BABATUNDE JOSHUA ALAMU 6873 810.00
180. AKANO OLASUMBO AKINTAYO 2599 13,500.00
181. AKANUSI DICKSON 7048 405.00
182. AKAPO DEMILADE EDWARD 2600 54.00
183. AKINBOBOYE FRANCIS TAIWO 2611 211.73
184. AKINDELE HAKEEM AMOO 2625 54.00
185. AKINDELE OLUKAYODE OLADIPO 633 10,800.00
186. AKINGBADE KEHINDE MONSURU 2629 121.50
187. AKINGBE AJIBOYE JOSHUA 2631 56.70
188. AKINJOLA OLUGBENGA 2634 135.00
189. AKINKUNMI ADEBAYO TAIWO 2636 21.60
190. AKINLABI OLUWASEYI EMMANUEL 6800 324.00
191. AKINLADE BUKOLA KUBURAT 2640 64.53
192. AKINLADE FLORENCE OLUFISAYO 6879 243.00
193. AKINMAMEJI JAMES TAIWO 2648 202.50
194. AKINNOLA OLUWADAMILOLA OLUBOWA 2652 135.00
195. AKINNUGBA ALICE UGONMA 2653 48.60
196. AKINSANYA AYOWUNMI JULIANA 2666 13.50
197. AKINSETE BABATUNDE ADELAKUN 2669 351.00
198. AKINSOYINU ABDUL YEKINI 1306 1,107.00
199. AKINSUNMADE AKINTOYE OLUKAYODE 2670 13.50
200. AKINTAYO AKINWUNMI ADEWUYI 70 1,080.00
201. AKINWANDE JAMES ABIODUN 2685 270.00
202. AKINWANDE MOSES FOLORUNSO 6882 445.50
203. AKINYEMI IBIYEMI 2692 459.00
204. AKINYEMI KOLA 2695 2,160.00
LIST OF UNCLAIME D DIVIDE NDSAS AT 31 MARCH 2014
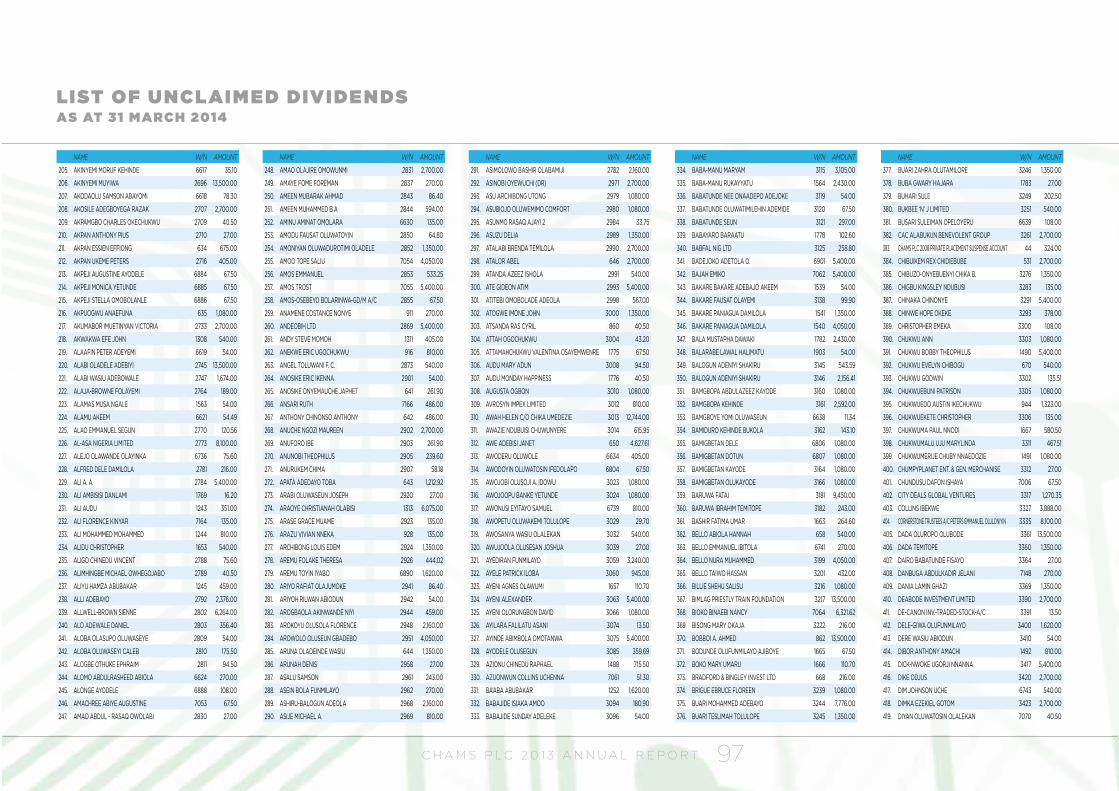
C H A M S P L C 2 0 1 3 A N N U A L R E P O R T 97
NAME W/N AMOUNT
205. AKINYEMI MORUF KEHINDE 6617 35.10
206. AKINYEMI MUYIWA 2696 13,500.00
207. AKODAOLU SAMSON ABAYOMI 6618 78.30
208. AKOSILE ADEGBOYEGA RAZAK 2707 2,700.00
209. AKPAMGBO CHARLES OKECHUKWU 2709 40.50
210. AKPAN ANTHONY PIUS 2710 27.00
211. AKPAN ESSIEN EFFIONG 634 675.00
212. AKPAN UKEME PETERS 2716 405.00
213. AKPEJI AUGUSTINE AYODELE 6884 67.50
214. AKPEJI MONICA YETUNDE 6885 67.50
215. AKPEJI STELLA OMOBOLANLE 6886 67.50
216. AKPUOGWU ANAEFUNA 635 1,080.00
217. AKUMABOR IMUETINYAN VICTORIA 2733 2,700.00
218. AKWAKWA EFE JOHN 1308 540.00
219. ALAAFIN PETER ADEYEMI 6619 54.00
220. ALABI OLADELE ADEBIYI 2745 13,500.00
221. ALABI WASIU ADEBOWALE 2747 1,674.00
222. ALAJA-BROWNE FOLAYEMI 2764 189.00
223. ALAMAS MUSA NGALE 1563 54.00
224. ALAMU AKEEM 6621 54.49
225. ALAO EMMANUEL SEGUN 2770 120.56
226. AL-ASA NIGERIA LIMITED 2773 8,100.00
227. ALEJO OLAWANDE OLAYINKA 6736 75.60
228. ALFRED DELE DAMILOLA 2781 216.00
229. ALI A. A. 2784 5,400.00
230. ALI AMBISISI DANLAMI 1769 16.20
231. ALI AUDU 1243 351.00
232. ALI FLORENCE KINYAR 7164 135.00
233. ALI MOHAMMED MOHAMMED 1244 810.00
234. ALIDU CHRISTOPHER 1653 540.00
235. ALIGO CHINEDU VINCENT 2788 75.60
236. ALIMHINGBE MICHAEL OWHEGOJABO 2789 40.50
237. ALIYU HAMZA ABUBAKAR 1245 459.00
238. ALLI ADEBAYO 2792 2,376.00
239. ALLWELL-BROWN SIENNE 2802 6,264.00
240. ALO ADEWALE DANIEL 2803 356.40
241. ALOBA OLASUPO OLUWASEYE 2809 54.00
242. ALOBA OLUWASEYI CALEB 2810 175.50
243. ALOGBE OTHUKE EPHRAIM 2811 94.50
244. ALOMO ABDULRASHEED ABIOLA 6624 270.00
245. ALONGE AYODELE 6888 108.00
246. AMACHREE ABIYE AUGUSTINE 7053 67.50
247. AMAO ABDUL - RASAQ OWOLABI 2830 27.00
NAME W/N AMOUNT
248. AMAO OLAJIRE OMOWUNMI 2831 2,700.00
249. AMAYE FOME FOREMAN 2837 270.00
250. AMEEN MUBARAK AHMAD 2843 86.40
251. AMEEN MUHAMMED B A 2844 594.00
252. AMINU AMINAT OMOLARA 6630 135.00
253. AMODU FAUSAT OLUWATOYIN 2850 64.80
254. AMONIYAN OLUWADUROTIMI OLADELE 2852 1,350.00
255. AMOO TOPE SALIU 7054 4,050.00
256. AMOS EMMANUEL 2853 533.25
257. AMOS TROST 7055 5,400.00
258. AMOS-OSEBEYO BOLARINWA-GD/M A/C 2855 67.50
259. ANAMENE COSTANCE NONYE 911 270.00
260. ANDEOBIH LTD 2869 5,400.00
261. ANDY STEVE MOMOH 1311 405.00
262. ANEKWE ERIC UGOCHUKWU 916 810.00
263. ANGEL TOLUWANI F. C. 2873 540.00
264. ANOSIKE ERIC IKENNA 2901 54.00
265. ANOSIKE ONYEMAUCHE JAPHET 641 261.90
266. ANSARI RUTH 7166 486.00
267. ANTHONY CHINONSO ANTHONY 642 486.00
268. ANUCHE NGOZI MAUREEN 2902 2,700.00
269. ANUFORO IBE 2903 261.90
270. ANUNOBI THEOPHILUS 2905 239.60
271. ANURUKEM CHIMA 2907 58.18
272. APATA ADEDAYO TOBA 643 1,212.92
273. ARABI OLUWASEUN JOSEPH 2920 27.00
274. ARAOYE CHRISTIANAH OLABISI 1313 6,075.00
275. ARASE GRACE MUAME 2923 135.00
276. ARAZU VIVIAN NNEKA 928 135.00
277. ARCHIBONG LOUIS EDEM 2924 1,350.00
278. AREMU FOLAKE THERESA 2926 444.02
279. AREMU TOYIN IYABO 6890 1,620.00
280. ARIYO RAFIAT OLAJUMOKE 2941 86.40
281. ARIYOH RILWAN ABIODUN 2942 54.00
282. AROGBAOLA AKINWANDE NIYI 2944 459.00
283. AROKOYU OLUSOLA FLORENCE 2948 2,160.00
284. AROWOLO OLUSEUN GBADEBO 2951 4,050.00
285. ARUNA OLADEINDE WASIU 644 1,350.00
286. ARUNAH DENIS 2958 27.00
287. ASALU SAMSON 2961 243.00
288. ASEIN BOLA FUNMILAYO 2962 270.00
289. ASHIRU-BALOGUN ADEOLA 2968 2,160.00
290. ASIJE MICHAEL A. 2969 810.00
NAME W/N AMOUNT
291. ASIMOLOWO BASHIR OLABAMIJI 2782 2,160.00
292. ASINOBI OYEWUCHI (DR) 2971 2,700.00
293. ASU ARCHIBONG UTONG 2979 1,080.00
294. ASUBIOJO OLUWEMIMO COMFORT 2980 1,080.00
295. ASUNMO RASAQ AJAYI 2 2984 33.75
296. ASUZU DELIA 2989 1,350.00
297. ATALABI BRENDA TEMILOLA 2990 2,700.00
298. ATALOR ABEL 646 2,700.00
299. ATANDA AZEEZ ISHOLA 2991 540.00
300. ATE GIDEON ATIM 2993 5,400.00
301. ATITEBI OMOBOLADE ADEOLA 2998 567.00
302. ATOGWE IMONE JOHN 3000 1,350.00
303. ATSANDA RAS CYRIL 860 40.50
304. ATTAH OGOCHUKWU 3004 43.20
305. ATTAMAHCHUKWU VALENTINA OSAYEMWENRE 1775 67.50
306. AUDU MARY ADUN 3008 94.50
307. AUDU MONDAY HAPPINESS 1776 40.50
308. AUGUSTA OGBON 3010 1,080.00
309. AVROSYN IMPEX LIMITED 3012 810.00
310. AWAH HELEN C/O CHIKA UMEDEZIE 3013 12,744.00
311. AWAZIE NDUBUISI CHUWUNYERE 3014 615.95
312. AWE ADEBISI JANET 650 4,627.61
313. AWODERU OLUWOLE 6634 405.00
314. AWODOYIN OLUWATOSIN IFEDOLAPO 6804 67.50
315. AWOJOBI OLUSOJI A. IDOWU 3023 1,080.00
316. AWOJOOPU BANKE YETUNDE 3024 1,080.00
317. AWONUSI EYITAYO SAMUEL 6739 810.00
318. AWOPETU OLUWAKEMI TOLULOPE 3029 29.70
319. AWOSANYA WASIU OLALEKAN 3032 540.00
320. AWUJOOLA OLUSESAN JOSHUA 3039 27.00
321. AYEDIRAN FUNMILAYO 3059 3,240.00
322. AYELE PATRICK ILOBA 3060 945.00
323. AYENI AGNES OLAWUMI 1657 110.70
324. AYENI ALEXANDER 3063 5,400.00
325. AYENI OLORUNGBON DAVID 3066 1,080.00
326. AYILARA FALILATU ASANI 3074 13.50
327. AYINDE ABIMBOLA OMOTANWA 3075 5,400.00
328. AYODELE OLUSEGUN 3085 359.69
329. AZIONU CHINEDU RAPHAEL 1488 715.50
330. AZUONWUN COLLINS UCHENNA 7061 51.30
331. BA’ABA ABUBAKAR 1252 1,620.00
332. BABAJIDE ISIAKA AMOO 3094 180.90
333. BABAJIDE SUNDAY ADELEKE 3096 54.00
NAME W/N AMOUNT
334. BABA-MANU MARYAM 3115 3,105.00
335. BABA-MANU RUKAYYATU 1564 2,430.00
336. BABATUNDE NEE ONAADEPO ADEJOKE 3119 54.00
337. BABATUNDE OLUWATIMILEHIN ADEMIDE 3120 67.50
338. BABATUNDE SEUN 3121 297.00
339. BABAYARO BARAATU 1778 102.60
340. BABFAL NIG LTD 3125 258.80
341. BADEJOKO ADETOLA O. 6901 5,400.00
342. BAJAH EMIKO 7062 5,400.00
343. BAKARE BAKARE ADEBAJO AKEEM 1539 54.00
344. BAKARE FAUSAT OLAYEMI 3138 99.90
345. BAKARE PANIAGUA DAMILOLA 1541 1,350.00
346. BAKARE PANIAGUA DAMILOLA 1540 4,050.00
347. BALA MUSTAPHA DAWAKI 1782 2,430.00
348. BALARABE LAWAL HALIMATU 1903 54.00
349. BALOGUN ADENIYI SHAKIRU 3145 543.59
350. BALOGUN ADENIYI SHAKIRU 3146 2,156.41
351. BAMGBOPA ABDULAZEEZ KAYODE 3160 1,080.00
352. BAMGBOPA KEHINDE 3161 2,592.00
353. BAMGBOYE YOMI OLUWASEUN 6638 11.34
354. BAMIDURO KEHINDE BUKOLA 3162 143.10
355. BAMIGBETAN DELE 6806 1,080.00
356. BAMIGBETAN DOTUN 6807 1,080.00
357. BAMIGBETAN KAYODE 3164 1,080.00
358. BAMIGBETAN OLUKAYODE 3166 1,080.00
359. BARUWA FATAI 3181 9,450.00
360. BARUWA IBRAHIM TEMITOPE 3182 243.00
361. BASHIR FATIMA UMAR 1663 264.60
362. BELLO ABIOLA HANNAH 658 540.00
363. BELLO EMMANUEL IBITOLA 6741 270.00
364. BELLO NURA MUHAMMED 3199 4,050.00
365. BELLO TAIWO HASSAN 3201 432.00
366. BILLIE SHEHU SALISU 3216 1,080.00
367. BIMLAG PRIESTLY TRAIN FOUNDATION 3217 13,500.00
368. BIOKO BINAEBI NANCY 7064 6,321.62
369. BISONG MARY OKAJA 3222 216.00
370. BOBBOI A. AHMED 862 13,500.00
371. BODUNDE OLUFUNMILAYO AJIBOYE 1665 67.50
372. BOKO MARY UMARU 1666 110.70
373. BRADFORD & BINGLEY INVEST LTD 668 216.00
374. BRIGUE EBRUCE FLOREEN 3239 1,080.00
375. BUARI MOHAMMED ADEBAYO 3244 7,776.00
376. BUARI TESLIMAH TOLULOPE 3245 1,350.00
NAME W/N AMOUNT
377. BUARI ZAHRA OLUTAMILORE 3246 1,350.00
378. BUBA GWARY HAJARA 1783 27.00
379. BUHARI SULE 3249 202.50
380. BUKBEE ‘N’ J LIMITED 3251 540.00
381. BUSARI SULEIMAN OPELOYERU 6639 108.00
382. CAC ALABUKUN BENEVOLENT GROUP 3261 2,700.00
383. CHAMS PLC 2008 PRIVATE PLACEMENT SUSPENSE ACCOUNT 44 324.00
384. CHIBUIKEM REX CHIDIEBUBE 531 2,700.00
385. CHIBUZO-ONYEBUENYI CHIKA B. 3276 1,350.00
386. CHIGBU KINGSLEY NDUBUSI 3283 135.00
387. CHINAKA CHINONYE 3291 5,400.00
388. CHINWE HOPE OKEKE 3293 378.00
389. CHRISTOPHER EMEKA 3300 108.00
390. CHUKWU ANN 3303 1,080.00
391. CHUKWU BOBBY THEOPHILUS 1490 5,400.00
392. CHUKWU EVELYN CHIBOGU 670 540.00
393. CHUKWU GODWIN 3302 135.51
394. CHUKWUEBUNI PATRISON 3305 1,080.00
395. CHUKWUEDO AUSTIN IKECHUKWU 944 1,323.00
396. CHUKWUEKETE CHRISTOPHER 3306 135.00
397. CHUKWUMA PAUL NNODI 1667 580.50
398. CHUKWUMALU UJU MARYLINDA 3311 467.51
399. CHUKWUMERIJE CHUBY NNAEDOZIE 1491 1,080.00
400. CHUMPYPLANET ENT. & GEN. MERCHANISE 3312 27.00
401. CHUNDUSU DAFON ISHAYA 7006 67.50
402. CITY DEALS GLOBAL VENTURES 3317 1,270.35
403. COLLINS IBEKWE 3327 3,888.00
404. CORNERSTONE TRUSTEES A/C PETERS EMMANUEL OLULONIYIN 3335 8,100.00
405. DADA OLUROPO OLUBODE 3361 13,500.00
406. DADA TEMITOPE 3360 1,350.00
407. DAIRO BABATUNDE FISAYO 3364 27.00
408. DANBUGA ABDULKADIR JELANI 7148 270.00
409. DANIA LAMIN GHAZI 3369 1,350.00
410. DEABODE INVESTMENT LIMITED 3390 2,700.00
411. DE-CANON INV.-TRADED-STOCK-A/C 3391 13.50
412. DELE-GIWA OLUFUNMILAYO 3400 1,620.00
413. DERE WASIU ABIODUN 3410 54.00
414. DIBOR ANTHONY AMACHI 1492 810.00
415. DICK-NWOKE UGORJI NNANNA 3417 5,400.00
416. DIKE ODJUS 3420 2,700.00
417. DIM JOHNSON UCHE 6743 540.00
418. DIMKA EZEKIEL GOTOM 3423 2,700.00
419. DIYAN OLUWATOSIN OLALEKAN 7070 40.50
LIST OF UNCLAIME D DIVIDE NDSAS AT 31 MARCH 2014
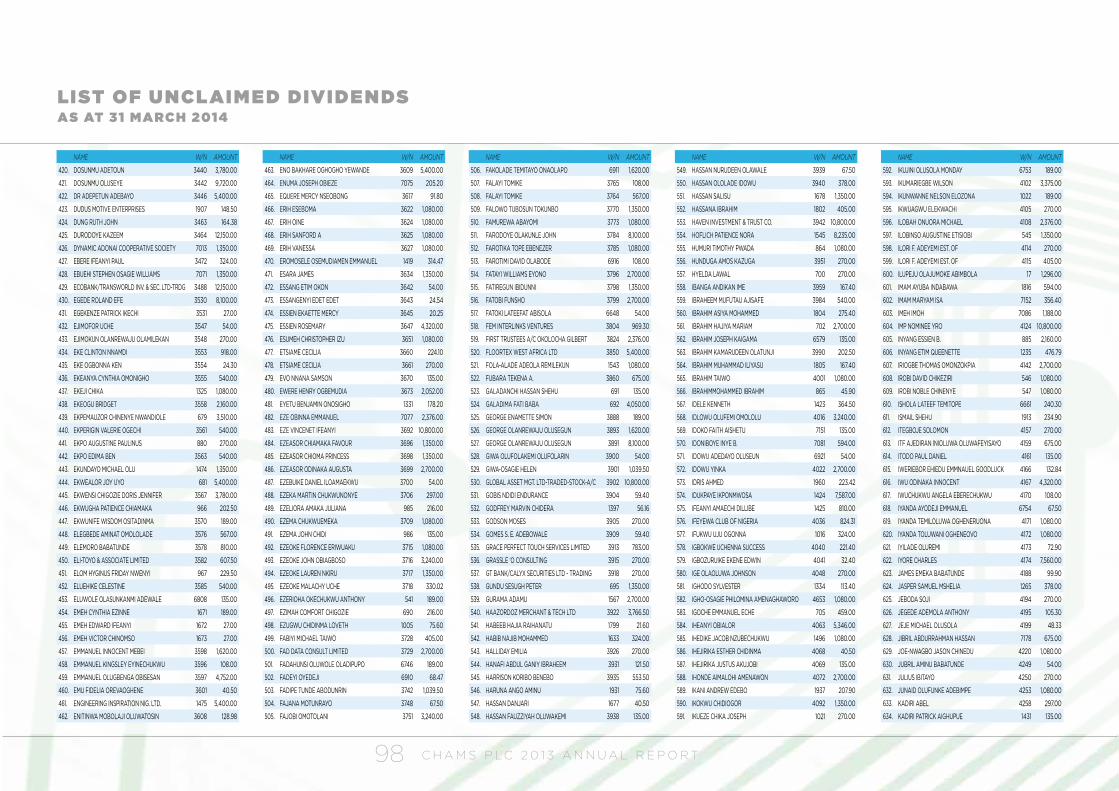
C H A M S P L C 2 0 1 3 A N N U A L R E P O R T98
NAME W/N AMOUNT
420. DOSUNMU ADETOUN 3440 3,780.00
421. DOSUNMU OLUSEYE 3442 9,720.00
422. DR ADEPETUN ADEBAYO 3446 5,400.00
423. DUDUS MOTIVE ENTERPRISES 1907 148.50
424. DUNG RUTH JOHN 3463 164.38
425. DURODOYE KAZEEM 3464 12,150.00
426. DYNAMIC ADONAI COOPERATIVE SOCIETY 7013 1,350.00
427. EBERE IFEANYI PAUL 3472 324.00
428. EBUEHI STEPHEN OSAGIE WILLIAMS 7071 1,350.00
429. ECOBANK/TRANSWORLD INV. & SEC. LTD-TRDG 3488 12,150.00
430. EGEDE ROLAND EFE 3530 8,100.00
431. EGEKENZE PATRICK IKECHI 3531 27.00
432. EJIMOFOR UCHE 3547 54.00
433. EJIMOKUN OLANREWAJU OLAMILEKAN 3548 270.00
434. EKE CLINTON NNAMDI 3553 918.00
435. EKE OGBONNA KEN 3554 24.30
436. EKEANYA CYNTHIA OMONIGHO 3555 540.00
437. EKEJI CHIKA 1325 1,080.00
438. EKEOGU BRIDGET 3558 2,160.00
439. EKPEMAUZOR CHINENYE NWANDIOLE 679 3,510.00
440. EKPERIGIN VALERIE OGECHI 3561 540.00
441. EKPO AUGUSTINE PAULINUS 880 270.00
442. EKPO EDIMA BEN 3563 540.00
443. EKUNDAYO MICHAEL OLU 1474 1,350.00
444. EKWEALOR JOY UYO 681 5,400.00
445. EKWENSI CHIGOZIE DORIS JENNIFER 3567 3,780.00
446. EKWUGHA PATIENCE CHIAMAKA 966 202.50
447. EKWUNIFE WISDOM OSITADINMA 3570 189.00
448. ELEGBEDE AMINAT OMOLOLADE 3576 567.00
449. ELEMORO BABATUNDE 3578 810.00
450. ELI-TOYO & ASSOCIATE LIMITED 3582 607.50
451. ELOM HYGINUS FRIDAY NWENYI 967 229.50
452. ELUEHIKE CELESTINE 3585 540.00
453. ELUWOLE OLASUNKANMI ADEWALE 6808 135.00
454. EMEH CYNTHIA EZINNE 1671 189.00
455. EMEH EDWARD IFEANYI 1672 27.00
456. EMEH VICTOR CHINOMSO 1673 27.00
457. EMMANUEL INNOCENT MEBEI 3598 1,620.00
458. EMMANUEL KINGSLEY EYINECHUKWU 3596 108.00
459. EMMANUEL OLUGBENGA OBISESAN 3597 4,752.00
460. EMU FIDELIA OREVAOGHENE 3601 40.50
461. ENGINEERING INSPIRATION NIG. LTD. 1475 5,400.00
462. ENITINWA MOBOLAJI OLUWATOSIN 3608 128.98
NAME W/N AMOUNT
463. ENO BAKHARE OGHOGHO YEWANDE 3609 5,400.00
464. ENUMA JOSEPH OBIEZE 7075 205.20
465. EQUERE MERCY NSEOBONG 3617 91.80
466. ERIH ESEBOMA 3622 1,080.00
467. ERIH OINE 3624 1,080.00
468. ERIH SANFORD A 3625 1,080.00
469. ERIH VANESSA 3627 1,080.00
470. EROMOSELE OSEMUDIAMEN EMMANUEL 1419 314.47
471. ESARA JAMES 3634 1,350.00
472. ESSANG ETIM OKON 3642 54.00
473. ESSANGENYI EDET EDET 3643 24.54
474. ESSIEN EKAETTE MERCY 3645 20.25
475. ESSIEN ROSEMARY 3647 4,320.00
476. ESUMEH CHRISTOPHER IZU 3651 1,080.00
477. ETSIAME CECILIA 3660 224.10
478. ETSIAME CECILIA 3661 270.00
479. EVO NNANA SAMSON 3670 135.00
480. EWERE HENRY OGBEMUDIA 3673 2,052.00
481. EYETU BENJAMIN ONOSIGHO 1331 178.20
482. EZE OBINNA EMMANUEL 7077 2,376.00
483. EZE VINCENET IFEANYI 3692 10,800.00
484. EZEASOR CHIAMAKA FAVOUR 3696 1,350.00
485. EZEASOR CHIOMA PRINCESS 3698 1,350.00
486. EZEASOR ODINAKA AUGUSTA 3699 2,700.00
487. EZEBUIKE DANIEL ILOAMAEKWU 3700 54.00
488. EZEKA MARTIN CHUKWUNONYE 3706 297.00
489. EZELIORA AMAKA JULIANA 985 216.00
490. EZEMA CHUKWUEMEKA 3709 1,080.00
491. EZEMA JOHN CHIDI 986 135.00
492. EZEOKE FLORENCE ERIWUAKU 3715 1,080.00
493. EZEOKE JOHN OBIAGBOSO 3716 3,240.00
494. EZEOKE LAUREN NKIRU 3717 1,350.00
495. EZEOKE MALACHY UCHE 3718 330.02
496. EZERIOHA OKECHUKWU ANTHONY 541 189.00
497. EZIMAH COMFORT CHIGOZIE 690 216.00
498. EZUGWU CHIDINMA LOVETH 1005 75.60
499. FABIYI MICHAEL TAIWO 3728 405.00
500. FAD DATA CONSULT LIMITED 3729 2,700.00
501. FADAHUNSI OLUWOLE OLADIPUPO 6746 189.00
502. FADEYI OYEDEJI 6910 68.47
503. FADIPE TUNDE ABODUNRIN 3742 1,039.50
504. FAJANA MOTUNRAYO 3748 67.50
505. FAJOBI OMOTOLANI 3751 3,240.00
NAME W/N AMOUNT
506. FAKOLADE TEMITAYO ONAOLAPO 6911 1,620.00
507. FALAYI TOMIKE 3765 108.00
508. FALAYI TOMIKE 3764 567.00
509. FALOWO TUBOSUN TOKUNBO 3770 1,350.00
510. FAMUREWA ABAYOMI 3773 1,080.00
511. FARODOYE OLAKUNLE JOHN 3784 8,100.00
512. FAROTIKA TOPE EBENEZER 3785 1,080.00
513. FAROTIMI DAVID OLABODE 6916 108.00
514. FATAYI WILLIAMS EYONO 3796 2,700.00
515. FATIREGUN IBIDUNNI 3798 1,350.00
516. FATOBI FUNSHO 3799 2,700.00
517. FATOKI LATEEFAT ABISOLA 6648 54.00
518. FEM INTERLINKS VENTURES 3804 969.30
519. FIRST TRUSTEES A/C OKOLOCHA GILBERT 3824 2,376.00
520. FLOORTEX WEST AFRICA LTD 3850 5,400.00
521. FOLA-ALADE ADEOLA REMILEKUN 1543 1,080.00
522. FUBARA TEKENA A. 3860 675.00
523. GALADANCHI HASSAN SHEHU 691 135.00
524. GALADIMA FATI BABA 692 4,050.00
525. GEORGE ENAMETTE SIMON 3888 189.00
526. GEORGE OLANREWAJU OLUSEGUN 3893 1,620.00
527. GEORGE OLANREWAJU OLUSEGUN 3891 8,100.00
528. GIWA OLUFOLAKEMI OLUFOLARIN 3900 54.00
529. GIWA-OSAGIE HELEN 3901 1,039.50
530. GLOBAL ASSET MGT. LTD-TRADED-STOCK-A/C 3902 10,800.00
531. GOBIS NDIDI ENDURANCE 3904 59.40
532. GODFREY MARVIN CHIDERA 1397 56.16
533. GODSON MOSES 3905 270.00
534. GOMES S. E. ADEBOWALE 3909 59.40
535. GRACE PERFECT TOUCH SERVICES LIMITED 3913 783.00
536. GRASSLE ‘O CONSULTING 3915 270.00
537. GT BANK/CALYX SECURITIES LTD - TRADING 3918 270.00
538. GUNDU SESUGH PETER 695 1,350.00
539. GURAMA ADAMU 1567 2,700.00
540. HAAZORDOZ MERCHANT & TECH LTD 3922 3,766.50
541. HABEEB HAJIA RAIHANATU 1799 21.60
542. HABIB NAJIB MOHAMMED 1633 324.00
543. HALLIDAY EMILIA 3926 270.00
544. HANAFI ABDUL GANIY IBRAHEEM 3931 121.50
545. HARRISON KORIBO BENEBO 3935 553.50
546. HARUNA ANGO AMINU 1931 75.60
547. HASSAN DANJARI 1677 40.50
548. HASSAN FAUZZIYAH OLUWAKEMI 3938 135.00
NAME W/N AMOUNT
549. HASSAN NURUDEEN OLAWALE 3939 67.50
550. HASSAN OLOLADE IDOWU 3940 378.00
551. HASSAN SALISU 1678 1,350.00
552. HASSANA IBRAHIM 1802 405.00
553. HAVEN INVESTMENT & TRUST CO. 3942 10,800.00
554. HOFLICH PATIENCE NORA 1545 8,235.00
555. HUMURI TIMOTHY PWADA 864 1,080.00
556. HUNDUGA AMOS KAZUGA 3951 270.00
557. HYELDA LAWAL 700 270.00
558. IBANGA ANDIKAN IME 3959 167.40
559. IBRAHEEM MUFUTAU AJISAFE 3984 540.00
560. IBRAHIM ASIYA MOHAMMED 1804 275.40
561. IBRAHIM HAJIYA MARIAM 702 2,700.00
562. IBRAHIM JOSEPH KAIGAMA 6579 135.00
563. IBRAHIM KAMARUDEEN OLATUNJI 3990 202.50
564. IBRAHIM MUHAMMAD ILIYASU 1805 167.40
565. IBRAHIM TAIWO 4001 1,080.00
566. IBRAHIMMOHAMMED IBRAHIM 865 45.90
567. IDELE KENNETH 1423 364.50
568. IDLOWU OLUFEMI OMOLOLU 4016 3,240.00
569. IDOKO FAITH AISHETU 7151 135.00
570. IDONIBOYE INYE B. 7081 594.00
571. IDOWU ADEDAYO OLUSEUN 6921 54.00
572. IDOWU YINKA 4022 2,700.00
573. IDRIS AHMED 1960 223.42
574. IDUKPAYE IKPONMWOSA 1424 7,587.00
575. IFEANYI AMAECHI DILLIBE 1425 810.00
576. IFEYEWA CLUB OF NIGERIA 4036 824.31
577. IFUKWU UJU OGONNA 1016 324.00
578. IGBOKWE UCHENNA SUCCESS 4040 221.40
579. IGBOZURUIKE EKENE EDWIN 4041 32.40
580. IGE OLAOLUWA JOHNSON 4048 270.00
581. IGHODO SYLVESTER 1334 113.40
582. IGHO-OSAGIE PHILOMINA AMENAGHAWORO 4653 1,080.00
583. IGOCHE EMMANUEL ECHE 705 459.00
584. IHEANYI OBIALOR 4063 5,346.00
585. IHEDIKE JACOB NZUBECHUKWU 1496 1,080.00
586. IHEJIRIKA ESTHER CHIDINMA 4068 40.50
587. IHEJIRIKA JUSTUS AKUJOBI 4069 135.00
588. IHONDE AIMALOHI AMENAWON 4072 2,700.00
589. IKANI ANDREW EDEBO 1937 207.90
590. IKOKWU CHIDIOGOR 4092 1,350.00
591. IKUEZE CHIKA JOSEPH 1021 270.00
NAME W/N AMOUNT
592. IKUJINI OLUSOLA MONDAY 6753 189.00
593. IKUMARIEGBE WILSON 4102 3,375.00
594. IKUNWANNE NELSON ELOZONA 1022 189.00
595. IKWUAGWU ELEKWACHI 4105 270.00
596. ILOBAH ONUORA MICHAEL 4108 2,376.00
597. ILOBINSO AUGUSTINE ETISIOBI 545 1,350.00
598. ILORI F. ADEYEMI EST. OF 4114 270.00
599. ILORI F. ADEYEMI EST. OF 4115 405.00
600. ILUPEJU OLAJUMOKE ABIMBOLA 17 1,296.00
601. IMAM AYUBA INDABAWA 1816 594.00
602. IMAM MARYAM ISA 7152 356.40
603. IMEH IMOH 7086 1,188.00
604. IMP NOMINEE YRO 4124 10,800.00
605. INYANG ESSIEN B. 885 2,160.00
606. INYANG ETIM QUEENETTE 1235 476.79
607. IRIOGBE THOMAS OMONZOKPIA 4142 2,700.00
608. IROBI DAVID CHIKEZIRI 546 1,080.00
609. IROBI NOBLE CHINENYE 547 1,080.00
610. ISHOLA LATEEF TEMITOPE 6661 240.30
611. ISMAIL SHEHU 1913 234.90
612. ITEGBOJE SOLOMON 4157 270.00
613. ITF AJEDIRAN INIOLUWA OLUWAFEYISAYO 4159 675.00
614. ITODO PAUL DANIEL 4161 135.00
615. IWERIEBOR EHIEDU EMMNAUEL GOODLUCK 4166 132.84
616. IWU ODINAKA INNOCENT 4167 4,320.00
617. IWUCHUKWU ANGELA EBERECHUKWU 4170 108.00
618. IYANDA AYODEJI EMMANUEL 6754 67.50
619. IYANDA TEMILOLUWA OGHENERUONA 4171 1,080.00
620. IYANDA TOLUWANI OGHENEOVO 4172 1,080.00
621. IYILADE OLUREMI 4173 72.90
622. IYORE CHARLES 4174 7,560.00
623. JAMES EMEKA BABATUNDE 4188 99.90
624. JASPER SAMUEL MSHELIA 1265 378.00
625. JEBODA SOJI 4194 270.00
626. JEGEDE ADEMOLA ANTHONY 4195 105.30
627. JEJE MICHAEL OLUSOLA 4199 48.33
628. JIBRIL ABDURRAHMAN HASSAN 7178 675.00
629. JOE-NWAGBO JASON CHINEDU 4220 1,080.00
630. JUBRIL AMINU BABATUNDE 4249 54.00
631. JULIUS IBITAYO 4250 270.00
632. JUNAID OLUFUNKE ADEBIMPE 4253 1,080.00
633. KADIRI ABEL 4258 297.00
634. KADIRI PATRICK AIGHUPUE 1431 135.00
LIST OF UNCLAIME D DIVIDE NDSAS AT 31 MARCH 2014
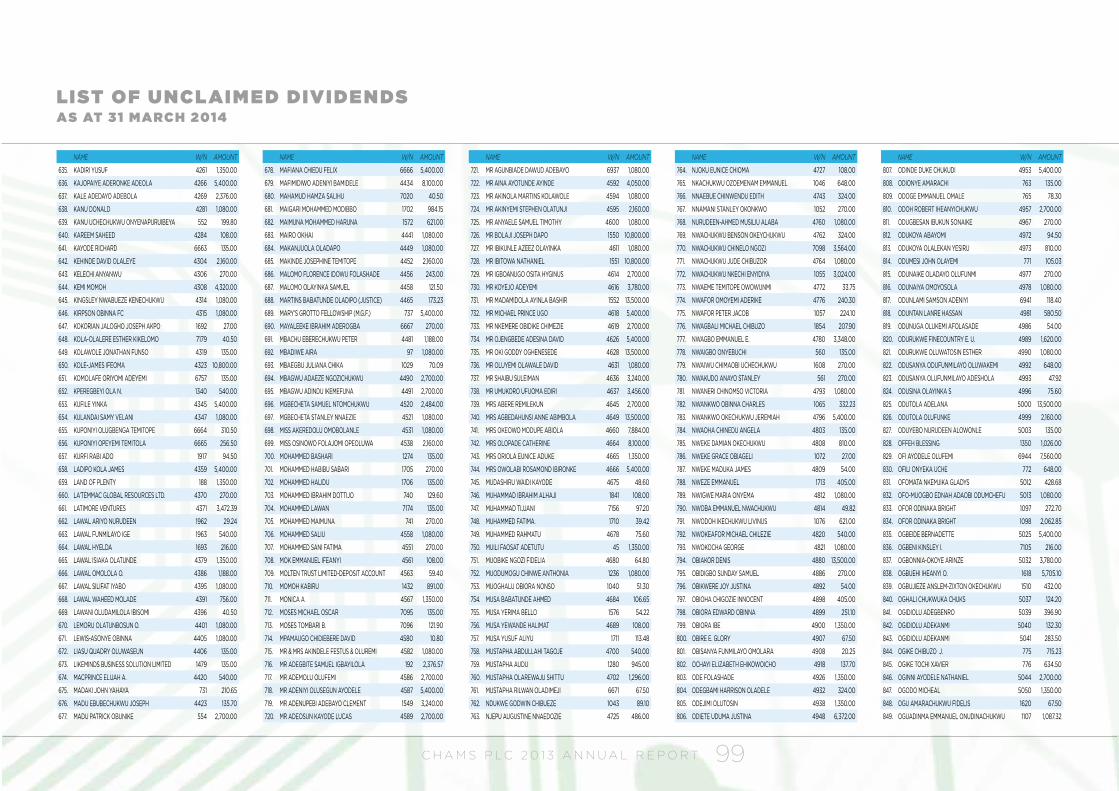
C H A M S P L C 2 0 1 3 A N N U A L R E P O R T 99
NAME W/N AMOUNT
635. KADIRI YUSUF 4261 1,350.00
636. KAJOPAIYE ADERONKE ADEOLA 4266 5,400.00
637. KALE ADEDAYO ADEBOLA 4269 2,376.00
638. KANU DONALD 4281 1,080.00
639. KANU UCHECHUKWU ONYENAPURUIBEYA 552 199.80
640. KAREEM SAHEED 4284 108.00
641. KAYODE RICHARD 6663 135.00
642. KEHINDE DAVID OLALEYE 4304 2,160.00
643. KELECHI ANYANWU 4306 270.00
644. KEMI MOMOH 4308 4,320.00
645. KINGSLEY NWABUEZE KENECHUKWU 4314 1,080.00
646. KIRPSON OBINNA FC 4315 1,080.00
647. KOKORIAN JALOGHO JOSEPH AKPO 1692 27.00
648. KOLA-OLALERE ESTHER KIKELOMO 7179 40.50
649. KOLAWOLE JONATHAN FUNSO 4319 135.00
650. KOLE-JAMES IFEOMA 4323 10,800.00
651. KOMOLAFE ORIYOMI ADEYEMI 6757 135.00
652. KPEREGBEYI OLA N. 1340 540.00
653. KUFILE YINKA 4345 5,400.00
654. KULANDAI SAMY VELANI 4347 1,080.00
655. KUPONIYI OLUGBENGA TEMITOPE 6664 310.50
656. KUPONIYI OPEYEMI TEMITOLA 6665 256.50
657. KURFI RABI ADO 1917 94.50
658. LADIPO KOLA JAMES 4359 5,400.00
659. LAND OF PLENTY 188 1,350.00
660. LA’TEMMAC GLOBAL RESOURCES LTD. 4370 270.00
661. LATIMORE VENTURES 4371 3,472.39
662. LAWAL ARIYO NURUDEEN 1962 29.24
663. LAWAL FUNMILAYO IGE 1963 540.00
664. LAWAL HYELDA 1693 216.00
665. LAWAL ISIAKA OLATUNDE 4379 1,350.00
666. LAWAL OMOLOLA O. 4386 1,188.00
667. LAWAL SILIFAT IYABO 4395 1,080.00
668. LAWAL WAHEED MOLADE 4391 756.00
669. LAWANI OLUDAMILOLA IBISOMI 4396 40.50
670. LEMORU OLATUNBOSUN O. 4401 1,080.00
671. LEWIS-ASONYE OBINNA 4405 1,080.00
672. LIASU QUADRY OLUWASEUN 4406 135.00
673. LIKEMINDS BUSINESS SOLUTION LIMITED 1479 135.00
674. MACPRINCE ELIJAH A. 4420 540.00
675. MADAKI JOHN YAHAYA 731 210.65
676. MADU EBUBECHUKWU JOSEPH 4423 135.70
677. MADU PATRICK OBUNIKE 554 2,700.00
NAME W/N AMOUNT
678. MAFIANA CHIEDU FELIX 6666 5,400.00
679. MAFIMIDIWO ADENIYI BAMIDELE 4434 8,100.00
680. MAHAMUD HAMZA SALIHU 7020 40.50
681. MAIGARI MOHAMMED MODIBBO 1702 984.15
682. MAIMUNA MOHAMMED HARUNA 1572 621.00
683. MAIRO OKHAI 4441 1,080.00
684. MAKANJUOLA OLADAPO 4449 1,080.00
685. MAKINDE JOSEPHINE TEMITOPE 4452 2,160.00
686. MALOMO FLORENCE IDOWU FOLASHADE 4456 243.00
687. MALOMO OLAYINKA SAMUEL 4458 121.50
688. MARTINS BABATUNDE OLADIPO (JUSTICE) 4465 173.23
689. MARY’S GROTTO FELLOWSHIP (M.G.F.) 737 5,400.00
690. MAYALEEKE IBRAHIM ADEROGBA 6667 270.00
691. MBACHU EBERECHUKWU PETER 4481 1,188.00
692. MBADIWE AIRA 97 1,080.00
693. MBAEGBU JULIANA CHIKA 1029 70.09
694. MBAGWU ADAEZE NGOZICHUKWU 4490 2,700.00
695. MBAGWU ADINDU IKEMEFUNA 4491 2,700.00
696. MGBECHETA SAMUEL NTOMCHUKWU 4520 2,484.00
697. MGBECHETA STANLEY NNAEZIE 4521 1,080.00
698. MISS AKEREDOLU OMOBOLANLE 4531 1,080.00
699. MISS OSINOWO FOLAJOMI OPEOLUWA 4538 2,160.00
700. MOHAMMED BASHARI 1274 135.00
701. MOHAMMED HABIBU SABARI 1705 270.00
702. MOHAMMED HALIDU 1706 135.00
703. MOHAMMED IBRAHIM DOTTIJO 740 129.60
704. MOHAMMED LAWAN 7174 135.00
705. MOHAMMED MAIMUNA 741 270.00
706. MOHAMMED SALIU 4558 1,080.00
707. MOHAMMED SANI FATIMA 4551 270.00
708. MOK EMMANUEL IFEANYI 4561 108.00
709. MOLTEN TRUST LIMITED-DEPOSIT ACCOUNT 4563 59.40
710. MOMOH KABIRU 1432 891.00
711. MONICA A 4567 1,350.00
712. MOSES MICHAEL OSCAR 7095 135.00
713. MOSES TOMBARI B. 7096 121.90
714. MPAMAUGO CHIDIEBERE DAVID 4580 10.80
715. MR & MRS AKINDELE FESTUS & OLUREMI 4582 1,080.00
716. MR ADEGBITE SAMUEL IGBAYILOLA 192 2,376.57
717. MR ADEMOLU OLUFEMI 4586 2,700.00
718. MR ADENIYI OLUSEGUN AYODELE 4587 5,400.00
719. MR ADENUPEBI ADEBAYO CLEMENT 1549 3,240.00
720. MR ADEOSUN KAYODE LUCAS 4589 2,700.00
NAME W/N AMOUNT
721. MR AGUNBIADE DAWUD ADEBAYO 6937 1,080.00
722. MR AINA AYOTUNDE AYINDE 4592 4,050.00
723. MR AKINOLA MARTINS KOLAWOLE 4594 1,080.00
724. MR AKINYEMI STEPHEN OLATUNJI 4595 2,160.00
725. MR ANYAELE SAMUEL TIMOTHY 4600 1,080.00
726. MR BOLAJI JOSEPH DAPO 1550 10,800.00
727. MR IBIKUNLE AZEEZ OLAYINKA 4611 1,080.00
728. MR IBITOWA NATHANIEL 1551 10,800.00
729. MR IGBOANUGO OSITA HYGINUS 4614 2,700.00
730. MR KOYEJO ADEYEMI 4616 3,780.00
731. MR MADAMIDOLA AYINLA BASHIR 1552 13,500.00
732. MR MICHAEL PRINCE UGO 4618 5,400.00
733. MR NKEMERE OBIDIKE CHIMEZIE 4619 2,700.00
734. MR OJENGBEDE ADESINA DAVID 4626 5,400.00
735. MR OKI GODDY OGHENESEDE 4628 13,500.00
736. MR OLUYEMI OLAWALE DAVID 4631 1,080.00
737. MR SHAIBU SULEIMAN 4636 3,240.00
738. MR UMUKORO UFUOMA EDIRI 4637 3,456.00
739. MRS ABERE REMILEKUN 4645 2,700.00
740. MRS AGBEDAHUNSI ANNE ABIMBOLA 4649 13,500.00
741. MRS OKEOWO MODUPE ABIOLA 4660 7,884.00
742. MRS OLOPADE CATHERINE 4664 8,100.00
743. MRS ORIOLA EUNICE ADUKE 4665 1,350.00
744. MRS OWOLABI ROSAMOND IBIRONKE 4666 5,400.00
745. MUDASHIRU WAIDI KAYODE 4675 48.60
746. MUHAMMAD IBRAHIM ALHAJI 1841 108.00
747. MUHAMMAD TIJJANI 7156 97.20
748. MUHAMMED FATIMA. 1710 39.42
749. MUHAMMED RAHMATU 4678 75.60
750. MUILI FAOSAT ADETUTU 45 1,350.00
751. MUOBIKE NGOZI FIDELIA 4680 64.80
752. MUODUMOGU CHINWE ANTHONIA 1236 1,080.00
753. MUOGHALU OBIORA NONSO 1040 51.30
754. MUSA BABATUNDE AHMED 4684 106.65
755. MUSA YERIMA BELLO 1576 54.22
756. MUSA YEWANDE HALIMAT 4689 108.00
757. MUSA YUSUF ALIYU 1711 113.48
758. MUSTAPHA ABDULLAHI TAGOJE 4700 540.00
759. MUSTAPHA AUDU 1280 945.00
760. MUSTAPHA OLAREWAJU SHITTU 4702 1,296.00
761. MUSTAPHA RILWAN OLADIMEJI 6671 67.50
762. NDUKWE GODWIN CHIBUEZE 1043 89.10
763. NJEPU AUGUSTINE NNAEDOZIE 4725 486.00
NAME W/N AMOUNT
764. NJOKU EUNICE CHIOMA 4727 108.00
765. NKACHUKWU OZOEMENAM EMMANUEL 1046 648.00
766. NNAEBUE CHINWENDU EDITH 4743 324.00
767. NNAMANI STANLEY OKONKWO 1052 270.00
768. NURUDEEN-AHMED MUSILIU ALABA 4760 1,080.00
769. NWACHUKWU BENSON OKEYCHUKWU 4762 324.00
770. NWACHUKWU CHINELO NGOZI 7098 3,564.00
771. NWACHUKWU JUDE CHIBUZOR 4764 1,080.00
772. NWACHUKWU NKECHI ENYIDIYA 1055 3,024.00
773. NWAEME TEMITOPE OWOWUNMI 4772 33.75
774. NWAFOR OMOYEMI ADERIKE 4776 240.30
775. NWAFOR PETER JACOB 1057 224.10
776. NWAGBALI MICHAEL CHIBUZO 1854 207.90
777. NWAGBO EMMANUEL E. 4780 3,348.00
778. NWAIGBO ONYEBUCHI 560 135.00
779. NWAIWU CHIMAOBI UCHECHUKWU 1608 270.00
780. NWAKUDO ANAYO STANLEY 561 270.00
781. NWANERI CHINOMSO VICTORIA 4793 1,080.00
782. NWANKWO OBINNA CHARLES 1065 332.23
783. NWANKWO OKECHUKWU JEREMIAH 4796 5,400.00
784. NWAOHA CHINEDU ANGELA 4803 135.00
785. NWEKE DAMIAN OKECHUKWU 4808 810.00
786. NWEKE GRACE OBIAGELI 1072 27.00
787. NWEKE MADUKA JAMES 4809 54.00
788. NWEZE EMMANUEL 1713 405.00
789. NWIGWE MARIA ONYEMA 4812 1,080.00
790. NWOBA EMMANUEL NWACHUKWU 4814 49.82
791. NWODOH IKECHUKWU LIVINUS 1076 621.00
792. NWOKEAFOR MICHAEL CHILEZIE 4820 540.00
793. NWOKOCHA GEORGE 4821 1,080.00
794. OBIAKOR DENIS 4880 13,500.00
795. OBIDIGBO SUNDAY SAMUEL 4886 270.00
796. OBIKWERE JOY JUSTINA 4892 54.00
797. OBIOHA CHIGOZIE INNOCENT 4898 405.00
798. OBIORA EDWARD OBINNA 4899 251.10
799. OBIORA IBE 4900 1,350.00
800. OBIRE E. GLORY 4907 67.50
801. OBISANYA FUNMILAYO OMOLARA 4908 20.25
802. OCHAYI ELIZABETH EHIKOWOICHO 4918 137.70
803. ODE FOLASHADE 4926 1,350.00
804. ODEGBAMI HARRISON OLADELE 4932 324.00
805. ODEJIMI OLUTOSIN 4938 1,350.00
806. ODIETE UDUMA JUSTINA 4948 6,372.00
NAME W/N AMOUNT
807. ODINDE DUKE CHUKUDI 4953 5,400.00
808. ODIONYE AMARACHI 763 135.00
809. ODOGE EMMANUEL OMALE 765 78.30
810. ODOH ROBERT IHEANYICHUKWU 4957 2,700.00
811. ODUGBESAN IBUKUN SONAIKE 4967 270.00
812. ODUKOYA ABAYOMI 4972 94.50
813. ODUKOYA OLALEKAN YESIRU 4973 810.00
814. ODUMESI JOHN OLAYEMI 771 105.03
815. ODUNAIKE OLADAYO OLUFUNMI 4977 270.00
816. ODUNAIYA OMOYOSOLA 4978 1,080.00
817. ODUNLAMI SAMSON ADENIYI 6941 118.40
818. ODUNTAN LANRE HASSAN 4981 580.50
819. ODUNUGA OLUKEMI AFOLASADE 4986 54.00
820. ODURUKWE FINECOUNTRY E. U. 4989 1,620.00
821. ODURUKWE OLUWATOSIN ESTHER 4990 1,080.00
822. ODUSANYA ODUFUNMILAYO OLUWAKEMI 4992 648.00
823. ODUSANYA OLUFUNMILAYO ADESHOLA 4993 47.92
824. ODUSINA OLAYINKA S 4996 75.60
825. ODUTOLA ADELANA 5000 13,500.00
826. ODUTOLA OLUFUNKE 4999 2,160.00
827. ODUYEBO NURUDEEN ALOWONLE 5003 135.00
828. OFFEH BLESSING 1350 1,026.00
829. OFI AYODELE OLUFEMI 6944 7,560.00
830. OFILI ONYEKA UCHE 772 648.00
831. OFOMATA NKEMJIKA GLADYS 5012 428.68
832. OFO-MUOGBO EDNAH ADAOBI ODUMCHEFU 5013 1,080.00
833. OFOR ODINAKA BRIGHT 1097 272.70
834. OFOR ODINAKA BRIGHT 1098 2,062.85
835. OGBEIDE BERNADETTE 5025 5,400.00
836. OGBENI KINSLEY I. 7105 216.00
837. OGBONNIA-OKOYE ARINZE 5032 3,780.00
838. OGBUEHI IHEANYI O. 1618 5,705.10
839. OGBUJIEZE ANSLEM-ZIXTON OKECHUKWU 1510 432.00
840. OGHALI CHUKWUKA CHUKS 5037 124.20
841. OGIDIOLU ADEGBENRO 5039 396.90
842. OGIDIOLU ADEKANMI 5040 132.30
843. OGIDIOLU ADEKANMI 5041 283.50
844. OGIKE CHIBUZO J. 775 715.23
845. OGIKE TOCHI XAVIER 776 634.50
846. OGINNI AYODELE NATHANIEL 5044 2,700.00
847. OGODO MICHEAL 5050 1,350.00
848. OGU AMARACHUKWU FIDELIS 1620 67.50
849. OGUADINMA EMMANUEL ONUDINACHUKWU 1107 1,087.32
LIST OF UNCLAIME D DIVIDE NDSAS AT 31 MARCH 2014
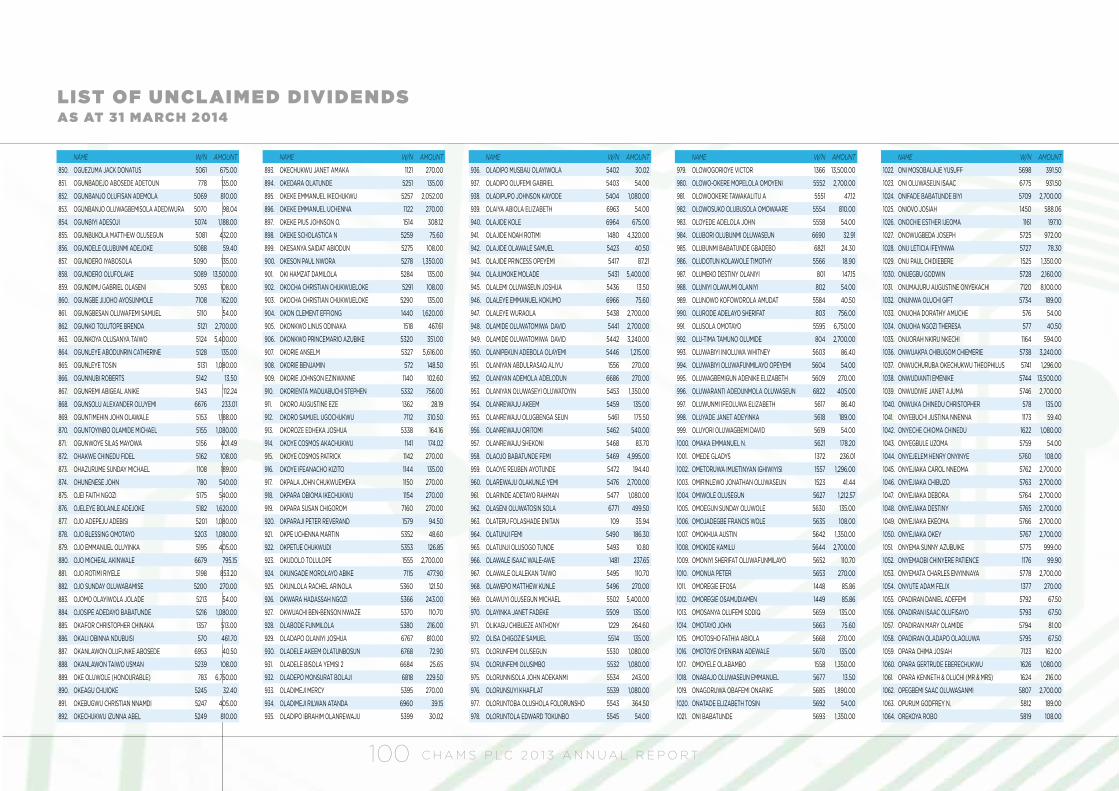
C H A M S P L C 2 0 1 3 A N N U A L R E P O R T100
NAME W/N AMOUNT
850. OGUEZUMA JACK DONATUS 5061 675.00
851. OGUNBADEJO ABOSEDE ADETOUN 778 135.00
852. OGUNBANJO OLUFISAN ADEMOLA 5069 810.00
853. OGUNBANJO OLUWAGBEMISOLA ADEDIWURA 5070 98.04
854. OGUNBIYI ADESOJI 5074 1,188.00
855. OGUNBUKOLA MATTHEW OLUSEGUN 5081 432.00
856. OGUNDELE OLUBUNMI ADEJOKE 5088 59.40
857. OGUNDERO IYABOSOLA 5090 135.00
858. OGUNDERO OLUFOLAKE 5089 13,500.00
859. OGUNDIMU GABRIEL OLASENI 5093 108.00
860. OGUNGBE JIJOHO AYOSUNMOLE 7108 162.00
861. OGUNGBESAN OLUWAFEMI SAMUEL 5110 54.00
862. OGUNKO TOLUTOPE BRENDA 5121 2,700.00
863. OGUNKOYA OLUSANYA TAIWO 5124 5,400.00
864. OGUNLEYE ABODUNRIN CATHERINE 5128 135.00
865. OGUNLEYE TOSIN 5131 1,080.00
866. OGUNNUBI ROBERTS 5142 13.50
867. OGUNREMI ABIGEAL ANIKE 5143 112.24
868. OGUNSOLU ALEXANDER OLUYEMI 6676 233.01
869. OGUNTIMEHIN JOHN OLAWALE 5153 1,188.00
870. OGUNTOYINBO OLAMIDE MICHAEL 5155 1,080.00
871. OGUNWOYE SILAS MAYOWA 5156 401.49
872. OHAKWE CHINEDU FIDEL 5162 108.00
873. OHAZURUME SUNDAY MICHAEL 1108 189.00
874. OHUNENESE JOHN 780 540.00
875. OJEI FAITH NGOZI 5175 540.00
876. OJELEYE BOLANLE ADEJOKE 5182 1,620.00
877. OJO ADEPEJU ADEBISI 5201 1,080.00
878. OJO BLESSING OMOTAYO 5203 1,080.00
879. OJO EMMANUEL OLUYINKA 5195 405.00
880. OJO MICHEAL AKINWALE 6679 795.15
881. OJO ROTIMI RIYELE 5198 853.20
882. OJO SUNDAY OLUWABAMISE 5200 270.00
883. OJOMO OLAYIWOLA JOLADE 5213 54.00
884. OJOSIPE ADEDAYO BABATUNDE 5216 1,080.00
885. OKAFOR CHRISTOPHER CHINAKA 1357 513.00
886. OKALI OBINNA NDUBUISI 570 461.70
887. OKANLAWON OLUFUNKE ABOSEDE 6953 40.50
888. OKANLAWON TAIWO USMAN 5239 108.00
889. OKE OLUWOLE (HONOURABLE) 783 6,750.00
890. OKEAGU CHIJIOKE 5245 32.40
891. OKEBUGWU CHRISTIAN NNAMDI 5247 405.00
892. OKECHUKWU IZUNNA ABEL 5249 810.00
NAME W/N AMOUNT
893. OKECHUKWU JANET AMAKA 1121 270.00
894. OKEDARA OLATUNDE 5251 135.00
895. OKEKE EMMANUEL IKECHUKWU 5257 2,052.00
896. OKEKE EMMANUEL UCHENNA 1122 270.00
897. OKEKE PIUS JOHNSON O. 1514 308.12
898. OKEKE SCHOLASTICA N 5259 75.60
899. OKESANYA SAIDAT ABIODUN 5275 108.00
900. OKESON PAUL NWORA 5278 1,350.00
901. OKI HAMZAT DAMILOLA 5284 135.00
902. OKOCHA CHRISTIAN CHUKWUELOKE 5291 108.00
903. OKOCHA CHRISTIAN CHUKWUELOKE 5290 135.00
904. OKON CLEMENT EFFIONG 1440 1,620.00
905. OKONKWO LINUS ODINAKA 1518 467.61
906. OKONKWO PRINCEMARIO AZUBIKE 5320 351.00
907. OKORIE ANSELM 5327 5,616.00
908. OKORIE BENJAMIN 572 148.50
909. OKORIE JOHNSON EZINWANNE 1140 102.60
910. OKORIENTA MADUABUCHI STEPHEN 5332 756.00
911. OKORO AUGUSTINE EZE 1362 28.19
912. OKORO SAMUEL UGOCHUKWU 7112 310.50
913. OKOROZE EDHEKA JOSHUA 5338 164.16
914. OKOYE COSMOS AKACHUKWU 1141 174.02
915. OKOYE COSMOS PATRICK 1142 270.00
916. OKOYE IFEANACHO KIZITO 1144 135.00
917. OKPALA JOHN CHUKWUEMEKA 1150 270.00
918. OKPARA OBIOMA IKECHUKWU 1154 270.00
919. OKPARA SUSAN CHIGOROM 7160 270.00
920. OKPARAJI PETER REVERAND 1579 94.50
921. OKPE UCHENNA MARTIN 5352 48.60
922. OKPETUE CHUKWUDI 5353 126.85
923. OKUDOLO TOLULOPE 1555 2,700.00
924. OKUNGADE MOROLAYO ABIKE 7115 477.90
925. OKUNLOLA RACHEL ARINOLA 5360 121.50
926. OKWARA HADASSAH NGOZI 5366 243.00
927. OKWUACHI BEN-BENSON NWAZE 5370 110.70
928. OLABODE FUNMILOLA 5380 216.00
929. OLADAPO OLANIYI JOSHUA 6767 810.00
930. OLADELE AKEEM OLATUNBOSUN 6768 72.90
931. OLADELE BISOLA YEMISI 2 6684 25.65
932. OLADEPO MONSURAT BOLAJI 6818 229.50
933. OLADIMEJI MERCY 5395 270.00
934. OLADIMEJI RILWAN ATANDA 6960 39.15
935. OLADIPO IBRAHIM OLANREWAJU 5399 30.02
NAME W/N AMOUNT
936. OLADIPO MUSBAU OLAYIWOLA 5402 30.02
937. OLADIPO OLUFEMI GABRIEL 5403 54.00
938. OLADIPUPO JOHNSON KAYODE 5404 1,080.00
939. OLAIYA ABIOLA ELIZABETH 6963 54.00
940. OLAJIDE KOLE 6964 675.00
941. OLAJIDE NOAH ROTIMI 1480 4,320.00
942. OLAJIDE OLAWALE SAMUEL 5423 40.50
943. OLAJIDE PRINCESS OPEYEMI 5417 87.21
944. OLAJUMOKE MOLADE 5431 5,400.00
945. OLALEMI OLUWASEUN JOSHUA 5436 13.50
946. OLALEYE EMMANUEL KOKUMO 6966 75.60
947. OLALEYE WURAOLA 5438 2,700.00
948. OLAMIDE OLUWATOMIWA DAVID 5441 2,700.00
949. OLAMIDE OLUWATOMIWA DAVID 5442 3,240.00
950. OLANIPEKUN ADEBOLA OLAYEMI 5446 1,215.00
951. OLANIYAN ABDULRASAQ ALIYU 1556 270.00
952. OLANIYAN ADEMOLA ADELODUN 6686 270.00
953. OLANIYAN OLUWASEYI OLUWATOYIN 5453 1,350.00
954. OLANREWAJU AKEEM 5459 135.00
955. OLANREWAJU OLUGBENGA SEUN 5461 175.50
956. OLANREWAJU ORITOMI 5462 540.00
957. OLANREWAJU SHEKONI 5468 83.70
958. OLAOJO BABATUNDE FEMI 5469 4,995.00
959. OLAOYE REUBEN AYOTUNDE 5472 194.40
960. OLAREWAJU OLAKUNLE YEMI 5476 2,700.00
961. OLARINDE ADETAYO RAHMAN 5477 1,080.00
962. OLASENI OLUWATOSIN SOLA 6771 499.50
963. OLATERU FOLASHADE ENITAN 109 35.94
964. OLATUNJI FEMI 5490 186.30
965. OLATUNJI OLUSOGO TUNDE 5493 10.80
966. OLAWALE ISAAC WALE-AWE 1481 237.65
967. OLAWALE OLALEKAN TAIWO 5495 110.70
968. OLAWEPO MATTHEW KUNLE 5496 270.00
969. OLAWUYI OLUSEGUN MICHAEL 5502 5,400.00
970. OLAYINKA JANET FADEKE 5509 135.00
971. OLIKAGU CHIBUEZE ANTHONY 1229 264.60
972. OLISA CHIGOZIE SAMUEL 5514 135.00
973. OLORUNFEMI OLUSEGUN 5530 1,080.00
974. OLORUNFEMI OLUSIMBO 5532 1,080.00
975. OLORUNNISOLA JOHN ADEKANMI 5534 243.00
976. OLORUNSUYI KHAFILAT 5539 1,080.00
977. OLORUNTOBA OLUSHOLA FOLORUNSHO 5543 364.50
978. OLORUNTOLA EDWARD TOKUNBO 5545 54.00
NAME W/N AMOUNT
979. OLOWOGORIOYE VICTOR 1366 13,500.00
980. OLOWO-OKERE MOPELOLA OMOYENI 5552 2,700.00
981. OLOWOOKERE TAWAKALITU A 5551 47.12
982. OLOWOSUKO OLUBUSOLA OMOWAARE 5554 810.00
983. OLOYEDE ADELOLA JOHN 5558 54.00
984. OLUBORI OLUBUNMI OLUWASEUN 6690 32.91
985. OLUBUNMI BABATUNDE GBADEBO 6821 24.30
986. OLUDOTUN KOLAWOLE TIMOTHY 5566 18.90
987. OLUMEKO DESTINY OLANIYI 801 147.15
988. OLUNIYI OLAWUMI OLANIYI 802 54.00
989. OLUNOWO KOFOWOROLA AMUDAT 5584 40.50
990. OLURODE ADELAYO SHERIFAT 803 756.00
991. OLUSOLA OMOTAYO 5595 6,750.00
992. OLU-TIMA TAMUNO OLUMIDE 804 2,700.00
993. OLUWABIYI INIOLUWA WHITNEY 5603 86.40
994. OLUWABIYI OLUWAFUNMILAYO OPEYEMI 5604 54.00
995. OLUWAGBEMIGUN ADENIKE ELIZABETH 5609 270.00
996. OLUWARANTI ADEDUNMOLA OLUWASEUN 6822 405.00
997. OLUWUNMI IFEOLUWA ELIZABETH 5617 86.40
998. OLUYADE JANET ADEYINKA 5618 189.00
999. OLUYORI OLUWAGBEMI DAVID 5619 54.00
1000. OMAKA EMMANUEL N. 5621 178.20
1001. OMEDE GLADYS 1372 236.01
1002. OMETORUWA IMUETINYAN IGHIWIYISI 1557 1,296.00
1003. OMIRINLEWO JONATHAN OLUWASEUN 1523 41.44
1004. OMIWOLE OLUSEGUN 5627 1,212.57
1005. OMOEGUN SUNDAY OLUWOLE 5630 135.00
1006. OMOJADEGBE FRANCIS WOLE 5635 108.00
1007. OMOKHUA AUSTIN 5642 1,350.00
1008. OMOKIDE KAMILU 5644 2,700.00
1009. OMONIYI SHERIFAT OLUWAFUNMILAYO 5652 110.70
1010. OMONUA PETER 5653 270.00
1011. OMOREGIE EFOSA 1448 85.86
1012. OMOREGIE OSAMUDIAMEN 1449 85.86
1013. OMOSANYA OLUFEMI SODIQ 5659 135.00
1014. OMOTAYO JOHN 5663 75.60
1015. OMOTOSHO FATHIA ABIOLA 5668 270.00
1016. OMOTOYE OYENIRAN ADEWALE 5670 135.00
1017. OMOYELE OLABAMBO 1558 1,350.00
1018. ONABAJO OLUWASEUN EMMANUEL 5677 13.50
1019. ONAGORUWA OBAFEMI ONARIKE 5685 1,890.00
1020. ONATADE ELIZABETH TOSIN 5692 54.00
1021. ONI BABATUNDE 5693 1,350.00
NAME W/N AMOUNT
1022. ONI MOSOBALAJE YUSUFF 5698 391.50
1023. ONI OLUWASEUN ISAAC 6775 931.50
1024. ONIFADE BABATUNDE BIYI 5709 2,700.00
1025. ONIOVO JOSIAH 1450 588.06
1026. ONOCHIE ESTHER IJEOMA 1161 197.10
1027. ONOWUGBEDA JOSEPH 5725 972.00
1028. ONU LETICIA IFEYINWA 5727 78.30
1029. ONU PAUL CHIDIEBERE 1525 1,350.00
1030. ONUEGBU GODWIN 5728 2,160.00
1031. ONUMAJURU AUGUSTINE ONYEKACHI 7120 8,100.00
1032. ONUNWA OLUCHI GIFT 5734 189.00
1033. ONUOHA DORATHY AMUCHE 576 54.00
1034. ONUOHA NGOZI THERESA 577 40.50
1035. ONUORAH NKIRU NKECHI 1164 594.00
1036. ONWUAKPA CHIBUGOM CHIEMERIE 5738 3,240.00
1037. ONWUCHURUBA OKECHUKWU THEOPHILUS 5741 1,296.00
1038. ONWUDIANTI EMENIKE 5744 13,500.00
1039. ONWUDIWE JANET AJUMA 5746 2,700.00
1040. ONWUKA CHINEDU CHRISTOPHER 578 135.00
1041. ONYEBUCHI JUSTINA NNENNA 1173 59.40
1042. ONYECHE CHIOMA CHINEDU 1622 1,080.00
1043. ONYEGBULE UZOMA 5759 54.00
1044. ONYEJELEM HENRY ONYINYE 5760 108.00
1045. ONYEJIAKA CAROL NNEOMA 5762 2,700.00
1046. ONYEJIAKA CHIBUZO 5763 2,700.00
1047. ONYEJIAKA DEBORA 5764 2,700.00
1048. ONYEJIAKA DESTINY 5765 2,700.00
1049. ONYEJIAKA EKEOMA 5766 2,700.00
1050. ONYEJIAKA OKEY 5767 2,700.00
1051. ONYEMA SUNNY AZUBUIKE 5775 999.00
1052. ONYEMAOBI CHINYERE PATIENCE 1176 99.90
1053. ONYEMATA CHARLES ENYINNAYA 5778 2,700.00
1054. ONYUTE ADAM FELIX 1377 270.00
1055. OPADIRAN DANIEL ADEFEMI 5792 67.50
1056. OPADIRAN ISAAC OLUFISAYO 5793 67.50
1057. OPADIRAN MARY OLAMIDE 5794 81.00
1058. OPADIRAN OLADAPO OLAOLUWA 5795 67.50
1059. OPARA CHIMA JOSIAH 7123 162.00
1060. OPARA GERTRUDE EBERECHUKWU 1626 1,080.00
1061. OPARA KENNETH & OLUCHI (MR & MRS) 1624 216.00
1062. OPEGBEMI SAAC OLUWASANMI 5807 2,700.00
1063. OPURUM GODFREY N. 5812 189.00
1064. OREKOYA ROBO 5819 108.00
LIST OF UNCLAIME D DIVIDE NDSAS AT 31 MARCH 2014
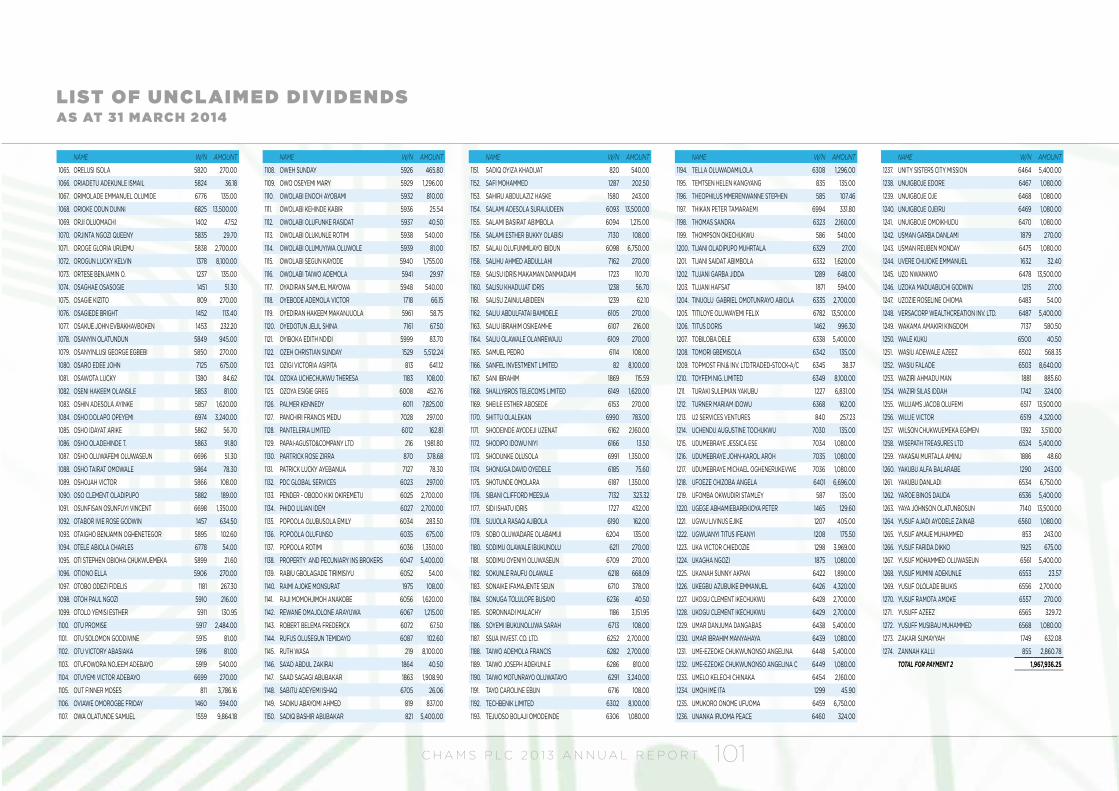
C H A M S P L C 2 0 1 3 A N N U A L R E P O R T 101
NAME W/N AMOUNT
1065. ORELUSI ISOLA 5820 270.00
1066. ORIADETU ADEKUNLE ISMAIL 5824 36.18
1067. ORIMOLADE EMMANUEL OLUMIDE 6776 135.00
1068. ORIOKE ODUN DUNNI 6825 13,500.00
1069. ORJI OLUOMACHI 1402 47.52
1070. ORJINTA NGOZI QUEENY 5835 29.70
1071. OROGE GLORIA URUEMU 5838 2,700.00
1072. OROGUN LUCKY KELVIN 1378 8,100.00
1073. ORTESE BENJAMIN O. 1237 135.00
1074. OSAGHAE OSASOGIE 1451 51.30
1075. OSAGIE KIZITO 809 270.00
1076. OSAGIEDE BRIGHT 1452 113.40
1077. OSAKUE JOHN EVBAKHAVBOKEN 1453 232.20
1078. OSANYIN OLATUNDUN 5849 945.00
1079. OSANYINLUSI GEORGE EGBEBI 5850 270.00
1080. OSARO EDEE JOHN 7125 675.00
1081. OSAWOTA LUCKY 1380 84.62
1082. OSENI HAKEEM OLANSILE 5853 81.00
1083. OSHIN ADESOLA AYINKE 5857 1,620.00
1084. OSHO DOLAPO OPEYEMI 6974 3,240.00
1085. OSHO IDAYAT ARIKE 5862 56.70
1086. OSHO OLADEHINDE T. 5863 91.80
1087. OSHO OLUWAFEMI OLUWASEUN 6696 51.30
1088. OSHO TAIRAT OMOWALE 5864 78.30
1089. OSHOJAH VICTOR 5866 108.00
1090. OSO CLEMENT OLADIPUPO 5882 189.00
1091. OSUNFISAN OSUNFUYI VINCENT 6698 1,350.00
1092. OTABOR IVIE ROSE GODWIN 1457 634.50
1093. OTAIGHO BENJAMIN OGHENETEGOR 5895 102.60
1094. OTELE ABIOLA CHARLES 6778 54.00
1095. OTI STEPHEN OBIOHA CHUKWUEMEKA 5899 21.60
1096. OTIONO ELLA 5906 270.00
1097. OTOBO ODEZI FIDELIS 1181 267.30
1098. OTOH PAUL NGOZI 5910 216.00
1099. OTOLO YEMISI ESTHER 5911 130.95
1100. OTU PROMISE 5917 2,484.00
1101. OTU SOLOMON GODDIVINE 5915 81.00
1102. OTU VICTORY ABASIAKA 5916 81.00
1103. OTUFOWORA NOJEEM ADEBAYO 5919 540.00
1104. OTUYEMI VICTOR ADEBAYO 6699 270.00
1105. OUT FINNER MOSES 811 3,786.16
1106. OVIAWE OMOROGBE FRIDAY 1460 594.00
1107. OWA OLATUNDE SAMUEL 1559 9,864.18
NAME W/N AMOUNT
1108. OWEH SUNDAY 5926 465.80
1109. OWO OSEYEMI MARY 5929 1,296.00
1110. OWOLABI ENOCH AYOBAMI 5932 810.00
1111. OWOLABI KEHINDE KABIR 5936 25.54
1112. OWOLABI OLUFUNKE RASIDAT 5937 40.50
1113. OWOLABI OLUKUNLE ROTIMI 5938 540.00
1114. OWOLABI OLUMUYIWA OLUWOLE 5939 81.00
1115. OWOLABI SEGUN KAYODE 5940 1,755.00
1116. OWOLABI TAIWO ADEMOLA 5941 29.97
1117. OYADIRAN SAMUEL MAYOWA 5948 540.00
1118. OYEBODE ADEMOLA VICTOR 1718 66.15
1119. OYEDIRAN HAKEEM MAKANJUOLA 5961 58.75
1120. OYEDOTUN JELIL SHINA 7161 67.50
1121. OYIBOKA EDITH NDIDI 5999 83.70
1122. OZEH CHRISTIAN SUNDAY 1529 5,512.24
1123. OZIGI VICTORIA ASIPITA 813 641.12
1124. OZOKA UCHECHUKWU THERESA 1183 108.00
1125. OZOYA ESIGIE GREG 6008 452.76
1126. PALMER KENNEDY 6011 7,825.00
1127. PANCHIRI FRANCIS MEDU 7028 297.00
1128. PANTELERIA LIMITED 6012 162.81
1129. PAPAI-AGUSTO&COMPANY LTD 216 1,981.80
1130. PARTRICK ROSE ZIRRA 870 378.68
1131. PATRICK LUCKY AYEBANUA 7127 78.30
1132. PDC GLOBAL SERVICES 6023 297.00
1133. PENDER - OBODO KIKI OKIREMETU 6025 2,700.00
1134. PHIDO LILIAN IDEM 6027 2,700.00
1135. POPOOLA OLUBUSOLA EMILY 6034 283.50
1136. POPOOLA OLUFUNSO 6035 675.00
1137. POPOOLA ROTIMI 6036 1,350.00
1138. PROPERTY AND PECUNIARY INS BROKERS 6047 5,400.00
1139. RABIU GBOLAGADE TIRIMISIYU 6052 54.00
1140. RAIMI AJOKE MONSURAT 1975 108.00
1141. RAJI MOMOHJIMOH ANAKOBE 6056 1,620.00
1142. REWANE OMAJOLONE ARAYUWA 6067 1,215.00
1143. ROBERT BELEMA FREDERICK 6072 67.50
1144. RUFUS OLUSEGUN TEMIDAYO 6087 102.60
1145. RUTH WASA 219 8,100.00
1146. SA’AD ABDUL ZAKIRAI 1864 40.50
1147. SAAD SAGAGI ABUBAKAR 1863 1,908.90
1148. SABITU ADEYEMI ISHAQ 6705 26.06
1149. SADIKU ABAYOMI AHMED 819 837.00
1150. SADIQ BASHIR ABUBAKAR 821 5,400.00
NAME W/N AMOUNT
1151. SADIQ OYIZA KHADIJAT 820 540.00
1152. SAFI MOHAMMED 1287 202.50
1153. SAHIRU ABDULAZIZ HASKE 1580 243.00
1154. SALAMI ADESOLA SURAJUDEEN 6093 13,500.00
1155. SALAMI BASIRAT ABIMBOLA 6094 1,215.00
1156. SALAMI ESTHER BUKKY OLABISI 7130 108.00
1157. SALAU OLUFUNMILAYO IBIDUN 6098 6,750.00
1158. SALIHU AHMED ABDULLAHI 7162 270.00
1159. SALISU IDRIS MAKAMAN DANMADAMI 1723 110.70
1160. SALISU KHADUJAT IDRIS 1238 56.70
1161. SALISU ZAINULABIDEEN 1239 62.10
1162. SALIU ABDULFATAI BAMIDELE 6105 270.00
1163. SALIU IBRAHIM OSIKEAMHE 6107 216.00
1164. SALIU OLAWALE OLANREWAJU 6109 270.00
1165. SAMUEL PEDRO 6114 108.00
1166. SANFEL INVESTMENT LIMITED 82 8,100.00
1167. SANI IBRAHIM 1869 115.59
1168. SHALLYBROS TELECOMS LIMITED 6149 1,620.00
1169. SHEILE ESTHER ABOSEDE 6153 270.00
1170. SHITTU OLALEKAN 6990 783.00
1171. SHODEINDE AYODEJI UZENAT 6162 2,160.00
1172. SHODIPO IDOWU NIYI 6166 13.50
1173. SHODUNKE OLUSOLA 6991 1,350.00
1174. SHONUGA DAVID OYEDELE 6185 75.60
1175. SHOTUNDE OMOLARA 6187 1,350.00
1176. SIBANI CLIFFORD MEESUA 7132 323.32
1177. SIDI ISHATU IDRIS 1727 432.00
1178. SIJUOLA RASAQ AJIBOLA 6190 162.00
1179. SOBO OLUWADARE OLABAMIJI 6204 135.00
1180. SODIMU OLAWALE IBUKUNOLU 6211 270.00
1181. SODIMU OYENIYI OLUWASEUN 6709 270.00
1182. SOKUNLE RAUFU OLAWALE 6218 668.09
1183. SONAIKE IFAMAJENTE SEUN 6710 378.00
1184. SONUGA TOLULOPE BUSAYO 6236 40.50
1185. SORONNADI MALACHY 1186 3,151.95
1186. SOYEMI IBUKUNOLUWA SARAH 6713 108.00
1187. SSUA INVEST. CO. LTD. 6252 2,700.00
1188. TAIWO ADEMOLA FRANCIS 6282 2,700.00
1189. TAIWO JOSEPH ADEKUNLE 6286 810.00
1190. TAIWO MOTUNRAYO OLUWATAYO 6291 3,240.00
1191. TAYO CAROLINE EBUN 6716 108.00
1192. TECHBENIK LIMITED 6302 8,100.00
1193. TEJUOSO BOLAJI OMODEINDE 6306 1,080.00
NAME W/N AMOUNT
1194. TELLA OLUWADAMILOLA 6308 1,296.00
1195. TEMTSEN HELEN KANGYANG 835 135.00
1196. THEOPHILUS MMERENWANNE STEPHEN 585 107.46
1197. THIKAN PETER TAMARAEMI 6994 331.80
1198. THOMAS SANDRA 6323 2,160.00
1199. THOMPSON OKECHUKWU 586 540.00
1200. TIJANI OLADIPUPO MUHRTALA 6329 27.00
1201. TIJANI SAIDAT ABIMBOLA 6332 1,620.00
1202. TIJJANI GARBA JIDDA 1289 648.00
1203. TIJJANI HAFSAT 1871 594.00
1204. TINUOLU GABRIEL OMOTUNRAYO ABIOLA 6335 2,700.00
1205. TITILOYE OLUWAYEMI FELIX 6782 13,500.00
1206. TITUS DORIS 1462 996.30
1207. TOBILOBA DELE 6338 5,400.00
1208. TOMORI GBEMISOLA 6342 135.00
1209. TOPMOST FIN.& INV. LTD.TRADED-STOCK-A/C 6345 38.37
1210. TOYFEM NIG. LIMITED 6349 8,100.00
1211. TURAKI SULEIMAN YAKUBU 1227 6,831.00
1212. TURNER MARIAM IDOWU 6368 162.00
1213. U2 SERVICES VENTURES 840 257.23
1214. UCHENDU AUGUSTINE TOCHUKWU 7030 135.00
1215. UDUMEBRAYE JESSICA ESE 7034 1,080.00
1216. UDUMEBRAYE JOHN-KAROL AROH 7035 1,080.00
1217. UDUMEBRAYE MICHAEL OGHENERUKEVWE 7036 1,080.00
1218. UFOEZE CHIZOBA ANGELA 6401 6,696.00
1219. UFOMBA OKWUDIRI STAMLEY 587 135.00
1220. UGEGE ABHAMIEBAREKIOYA PETER 1465 129.60
1221. UGWU LIVINUS EJIKE 1207 405.00
1222. UGWUANYI TITUS IFEANYI 1208 175.50
1223. UKA VICTOR CHIEDOZIE 1298 3,969.00
1224. UKAGHA NGOZI 1875 1,080.00
1225. UKANAH SUNNY AKPAN 6422 1,890.00
1226. UKEGBU AZUBUIKE EMMANUEL 6426 4,320.00
1227. UKOGU CLEMENT IKECHUKWU 6428 2,700.00
1228. UKOGU CLEMENT IKECHUKWU 6429 2,700.00
1229. UMAR DANJUMA DANGABAS 6438 5,400.00
1230. UMAR IBRAHIM MANYAHAYA 6439 1,080.00
1231. UME-EZEOKE CHUKWUNONSO ANGELINA 6448 5,400.00
1232. UME-EZEOKE CHUKWUNONSO ANGELINA C 6449 1,080.00
1233. UMELO KELECHI CHINAKA 6454 2,160.00
1234. UMOH IME ITA 1299 45.90
1235. UMUKORO ONOME UFUOMA 6459 6,750.00
1236. UNANKA IRUOMA PEACE 6460 324.00
NAME W/N AMOUNT
1237. UNITY SISTERS CITY MISSION 6464 5,400.00
1238. UNUIGBOJE EDORE 6467 1,080.00
1239. UNUIGBOJE OJE 6468 1,080.00
1240. UNUIGBOJE OJEIRU 6469 1,080.00
1241. UNUIGBOJE OMOIKHUDU 6470 1,080.00
1242. USMAN GARBA DANLAMI 1879 270.00
1243. USMAN REUBEN MONDAY 6475 1,080.00
1244. UVERE CHIJIOKE EMMANUEL 1632 32.40
1245. UZO NWANKWO 6478 13,500.00
1246. UZOKA MADUABUCHI GODWIN 1215 27.00
1247. UZOZIE ROSELINE CHIOMA 6483 54.00
1248. VERSACORP WEALTHCREATION INV. LTD. 6487 5,400.00
1249. WAKAMA AMAKIRI KINGDOM 7137 580.50
1250. WALE KUKU 6500 40.50
1251. WASIU ADEWALE AZEEZ 6502 568.35
1252. WASIU FALADE 6503 8,640.00
1253. WAZIRI AHMADU MAN 1881 885.60
1254. WAZIRI SILAS IDDAH 1742 324.00
1255. WILLIAMS JACOB OLUFEMI 6517 13,500.00
1256. WILLIE VICTOR 6519 4,320.00
1257. WILSON CHUKWUEMEKA EGIMEN 1392 3,510.00
1258. WISEPATH TREASURES LTD 6524 5,400.00
1259. YAKASAI MURTALA AMINU 1886 48.60
1260. YAKUBU ALFA BALARABE 1290 243.00
1261. YAKUBU DANLADI 6534 6,750.00
1262. YAROE BINOS DAUDA 6536 5,400.00
1263. YAYA JOHNSON OLATUNBOSUN 7140 13,500.00
1264. YUSUF AJADI AYODELE ZAINAB 6560 1,080.00
1265. YUSUF AMAJE MUHAMMED 853 243.00
1266. YUSUF FARIDA DIKKO 1925 675.00
1267. YUSUF MOHAMMED OLUWASEUN 6561 5,400.00
1268. YUSUF MUMINI ADEKUNLE 6553 23.57
1269. YUSUF OLOLADE BILIKIS 6556 2,700.00
1270. YUSUF RAMOTA AMOKE 6557 270.00
1271. YUSUFF AZEEZ 6565 329.72
1272. YUSUFF MUSIBAU MUHAMMED 6568 1,080.00
1273. ZAKARI SUMAYYAH 1749 632.08
1274. ZANNAH KALLI 855 2,860.78
TOTAL FOR PAYMENT 2 1,967,936.25
LIST OF UNCLAIME D DIVIDE NDSAS AT 31 MARCH 2014
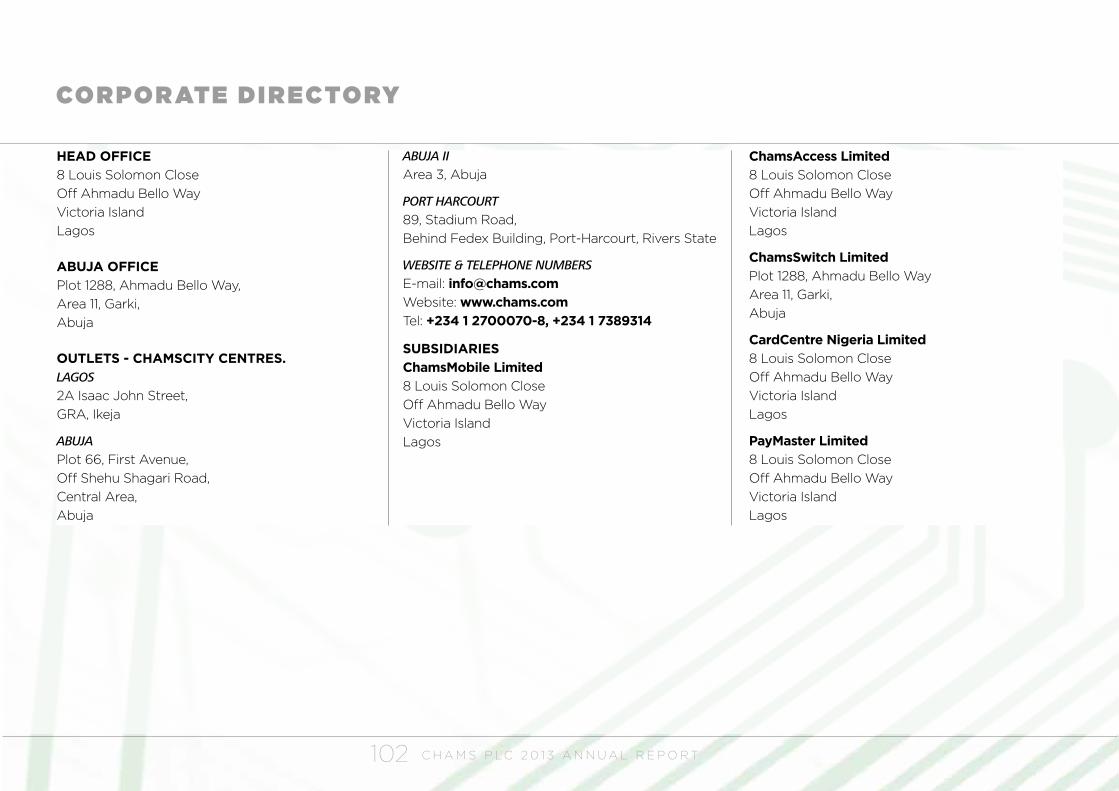
C H A M S P L C 2 0 1 3 A N N U A L R E P O R T102
HEAD OFFICE 8 Louis Solomon Close Off Ahmadu Bello Way Victoria Island Lagos
ABUJA OFFICE Plot 1288, Ahmadu Bello Way, Area 11, Garki, Abuja
OUTLETS - CHAMSCITY CENTRES. LAGOS 2A Isaac John Street, GRA, Ikeja
ABUJA Plot 66, First Avenue, Off Shehu Shagari Road, Central Area, Abuja
ABUJA II
Area 3, Abuja
PORT HARCOURT
89, Stadium Road, Behind Fedex Building, Port-Harcourt, Rivers State
WEBSITE & TELEPHONE NUMBERS E-mail: [email protected]: www.chams.comTel: +234 1 2700070-8, +234 1 7389314
SUBSIDIARIES ChamsMobile Limited 8 Louis Solomon Close Off Ahmadu Bello Way Victoria Island Lagos
ChamsAccess Limited 8 Louis Solomon Close Off Ahmadu Bello Way Victoria Island Lagos
ChamsSwitch Limited Plot 1288, Ahmadu Bello Way Area 11, Garki, Abuja
CardCentre Nigeria Limited 8 Louis Solomon Close Off Ahmadu Bello Way Victoria Island Lagos
PayMaster Limited 8 Louis Solomon Close Off Ahmadu Bello Way Victoria Island Lagos
CORPOR ATE DIRECTORY
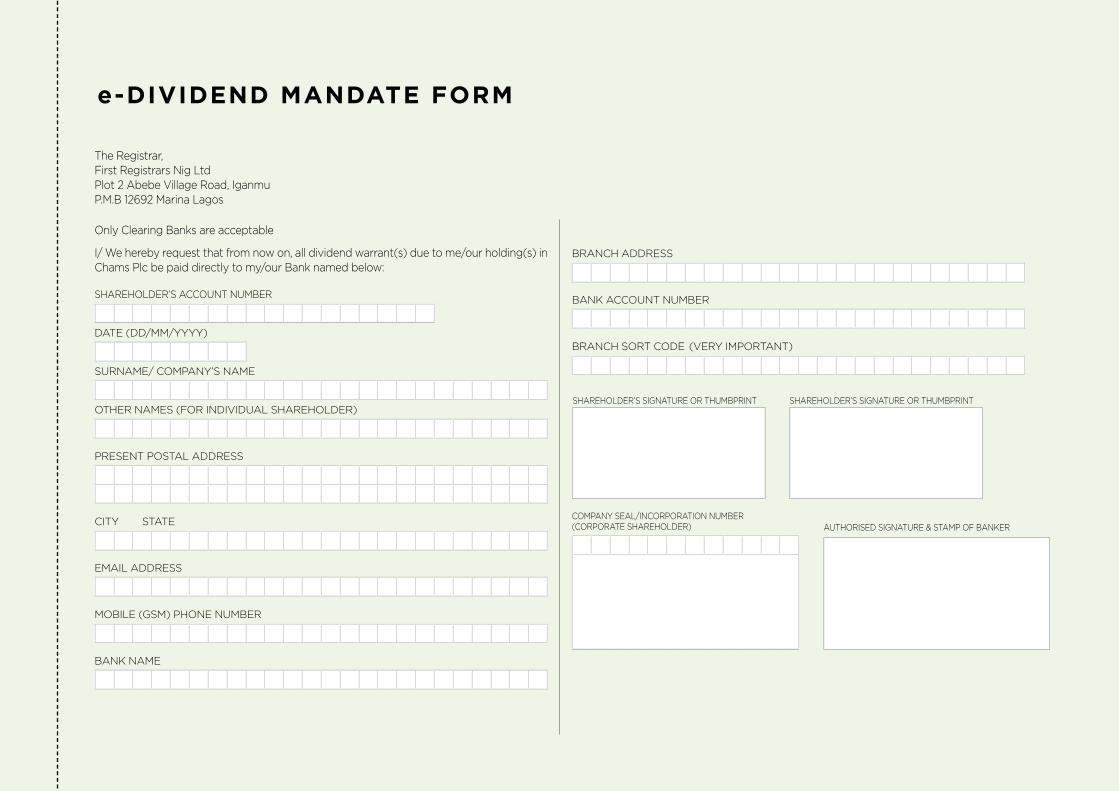
BRANCH ADDRESS
BANK ACCOUNT NUMBER
BRANCH SORT CODE (VERY IMPORTANT)
The Registrar,First Registrars Nig LtdPlot 2 Abebe Village Road, IganmuP.M.B 12692 Marina Lagos
Only Clearing Banks are acceptable
I/ We hereby request that from now on, all dividend warrant(s) due to me/our holding(s) in Chams Plc be paid directly to my/our Bank named below:
SHAREHOLDER’S ACCOUNT NUMBER
DATE (DD/MM/YYYY)
SURNAME/ COMPANY’S NAME
OTHER NAMES (FOR INDIVIDUAL SHAREHOLDER)
PRESENT POSTAL ADDRESS
CITY STATE
EMAIL ADDRESS
MOBILE (GSM) PHONE NUMBER
BANK NAME
e-DIVIDEND MANDATE FORM
SHAREHOLDER’S SIGNATURE OR THUMBPRINT SHAREHOLDER’S SIGNATURE OR THUMBPRINT
AUTHORISED SIGNATURE & STAMP OF BANKERCOMPANY SEAL/INCORPORATION NUMBER (CORPORATE SHAREHOLDER)


30th Annual General Meeting to be held at Agip Recital Hall, Muson Centre, Onikan, Lagos on Wednesday, 30th April, 2014.
I/We_______________________________________________________________being a member/members
of CHAMS Plc hereby appoint _________________________________________________________________
______________ ___________________________________________________________________________
or failing him ______________________________________________________or failing him______________
______________________ as my proxy to attend and vote for me/us and on my behalf at the Annual General
Meeting of the company to be held on Thursday, 30th May, 2014 and at any adjournment thereof.
Dated this_______________________________________________day of __________________________2014
Shareholder’s name ________________________________________________________________________
Shareholder’s Signature _____________________________________________________________________
S/N RESOLUTION FOR AGAINST
1 To receive the audited Financial Statement for the year ended 31 December, 2013 and
the Reports of the Directors, Auditors and Audit Committee thereon
2
3
4
Please indicate with an ‘X’ in the appropriate square how you wish your votes to be cast on the resolutions set above.
Unless otherwise instructed, the proxy will vote or abstain from voting at his or her discretion.
Before posting the above form please tear off this part and
return it for admission to the meeting
A D M I S S I O N C A R D
Please admit the Shareholder named on this Card or
his duly appointed proxy to the Annual General Meet-
ing to be held on Wednesday, 30th April, 2014 at Agip
Recital Hall, Muson Centre, Onikan, Lagos.
The admission card must be produced by the Proxy in
order to gain entrance into the Annual General Meeting.
NAME OF SHAREHOLDER
NAME OF PROXY
SIGNATURE (SHAREHOLDER)
NUMBER OF SHARES HELD
PROXY FORM


www.chamsplc.com