IMI plc Annual Report and Accounts 2017
175
IMI plc Annual Report and Accounts 2017
-
Upload
khangminh22 -
Category
Documents
-
view
1 -
download
0
Transcript of IMI plc Annual Report and Accounts 2017

IMI p
lc Annual R
eport and Accounts 2017

IMI plcAnnual Report & Accounts 2017
Engineering GREAT the IMI Way

Our purpose is to deliver great solutions that tackle the most demanding engineering challenges. We help some of the world’s biggest industrial companies operate their processes safely, cleanly, efficiently and cost effectively. We operate through three divisions – IMI Critical Engineering, IMI Precision Engineering and IMI Hydronic Engineering – and employ approximately 11,000 people in over 50 countries around the world.
02 Chairman’s statement
04 Group overview
05 IMI eco-system
Introduction 02-09
Strategic Review†
12 Chief Executive’s review
16 Our strategic model
18 Strategic growth priorities
28 Operational review
34 Corporate responsibility
44 Measurements and targets
46 How we manage risk
Our Chief Executive reviews 2017 and outlines our strategy and the progress we are making.
10-49
50-85Corporate Governance
52 The Board
54 Letter from the Chairman
55 Corporate Governance Report
60 Audit Committee Report
64 Nominations Committee Report
66 Directors’ Remuneration Report
We introduce our Board, and explain our governance structure and how it operates.
86-170Financial Statements
88 Finance Director’s introduction
90 Primary statements
98 Section 1 - Basis of preparation
99 Section 2 - Results for the year
110 Section 3 - Operating assets and liabilities
116 Section 4 - Capital structure and financing costs
140 Section 5 - Other notes
146 Directors’ Report
168 Five year summary
170 Shareholder and general information
Our financial statements for the year presented in a user-friendly format.
Contents
† The Strategic Report on pages 10 to 49, 91, 92 to 93, 95 and 97 has been approved by the Board of Directors and signed on their behalf by Mark Selway, Chief Executive, on 1 March 2018.
Annual Report and Accounts 2017IMI plc

» Results in-line with market expectations
» Continued good progress on strategic initiatives
» Good operating cash flow of £218m supported debt reduction
» Adjusted Basic EPS increased 9%
» Continued de-risking of global pension liabilities
» 2% increase in the full year dividend recommended
» Announced acquisition of Bimba Manufacturing
Adjusted revenue*
Segmental operating margin*
Adjusted profit before tax*
Adjusted basic earnings per share*
Statutory revenue
Adjusted operating cash flow*
Statutory profit before tax
Total dividend for year
Up 6% Up 6%
Up 0 bps
Up 8% Up 9%
Up 9%
Down 11%
Up 2%
2017 highlights
IMI eco-systemTurn to page 05
£1,751m £1,751m
£181m£224m
13.8% £218m
65.3p 39.4p
* These figures are non statutory alternative performance measures. See pages 98 and 99 for explanations and rationale for using these and the associated definitions and reconciliations to statutory measures.
Throughout this Report, unless otherwise stated, references to revenue and profit before tax are on an adjusted basis. References to operating profit, unless otherwise stated, relate to adjusted segmental operating profit.
01Introduction
Strategic R
eviewC
orporate Governance
Financial Statem
entsIntro
ductio
n

Well positioned for growthIn 2014 our strategic direction was reset. Since then we have reshaped our business to harness the greatest growth opportunities, significantly improved our operational performance and created a pipeline of innovative, market leading products. As a result, both our customer offering and our ability to compete in the market place have been significantly enhanced.
In 2017 momentum increased. As detailed in the Chief Executive’s review on page 12, and in the operational reviews on pages 28 to 33, each of our divisions have well-defined plans which are driving real ambition in our operational performance. In addition, each has a developing, refreshed product portfolio which improves competitiveness in our existing markets and provides access to new growth opportunities. As repositioning continues, some of our key markets have also delivered improvement, leaving the Group increasingly confident of the long-term growth potential.
Towards the close of the year, we announced our acquisition of Bimba Manufacturing Company. Based in Chicago, Illinois, Bimba is a key player in the US Industrial Automation market, with a very strong cylinder product line (which includes North America’s leading actuator brand), excellent technology and an extensive distributor network. Through the acquisition, we will nearly double the size of our US Industrial Automation business and our combined businesses will provide an even stronger platform from which we can further develop. I am very pleased to welcome Bimba to our Group.
Our people and cultureDue to the hard work of our employees across every area of the Group, we now have a competitive growth platform. On behalf of the Board I would like to thank each and every one of our employees for their commitment to make IMI a truly great company.
Our core values and behaviours, which are key to the delivery of our strategy, are well embedded in everything we do. During the several site visits I made this year, including to China, Mexico and the
US, collaborative working practices, continuous improvement and a commitment to doing business the IMI Way were clearly evident. In October, we held our Board meeting at Critical Engineering’s IMI Orton plant in Italy where we saw a much improved factory. I was delighted also to have travelled with Roy Twite to visit our new world-class manufacturing operation in South Korea; the visit fully re-inforced just how successful the local management team has been, particularly at accessing IMI’s global capabilities and deploying them in the region. The plant is absolutely deserving of IMI Critical Engineering’s accolade as a top performer in the application of Lean. Furthermore, its new IT system is delivering dramatic improvements in its financial controls and operational efficiencies. These factors, when combined with the passion exhibited in Value Engineering, place our South Korean plant at the forefront of the global Critical Engineering valve market.
During the year I also visited our IMI Precision Engineering operations in America and Mexico with Massimo Grassi. I was impressed with the passion for continuous improvement across every part of our operations and am confident that the improving Commercial Vehicle and Industrial Automation markets in the region will accelerate our progress in 2018.
Board and GovernanceIn early December, we announced the sad death of Bob Stack. Bob joined IMI as a non-executive director in 2008 and was the senior independent director and chair of the Remuneration Committee. Bob has been a wise counsel to IMI and a major contributor to the Board for nine years. He excelled in his roles as senior independent director and chair of the Remuneration Committee. Consequently, Carl-Peter Forster, who has been a member of our Board since 2012, was appointed senior independent director and Birgit Nørgaard, who has also been a member of our Board since 2012, became Chair of the Remuneration Committee.
Our focus remains resolute on building both competitive advantage and shareholder value by delivering great products and continuously improving our customer offering.
Chairman’s statement
Fixed, focused and ready to grow
Lord Smith of KelvinChairman
Annual Report and Accounts 2017IMI plc02

During this year Ross McInnes stepped down from our Board to concentrate on his other activities. We are grateful for the contribution Ross made as Chair of the Audit Committee and as a member of our Board, and wish him well for the future. Isobel Sharp succeeded Ross as Chair of the Audit Committee. Isobel joined our Board and the Audit Committee in September 2015 and has extensive audit, accounting and corporate governance experience.
A search for new non-executive directors was commenced in 2017 and resulted in the appointment of Thomas Thune Andersen with effect from 1 July 2018. The search for an additional non-executive director is continuing.
I’m also pleased to report that, in accordance with best practice recommendations, the Board undertook an independent review of Board effectiveness which was carried out by Egon Zehnder in the latter part of 2017. The review identified the significant progress which has been made in building the core skill-sets on the Board, as required by a global engineering business such as ours. Alignment of the non-executive
and Executive members of IMI’s Board was also recognised. Some areas for improvement were identified and those will be addressed as we progress with our plans for 2018.
DividendReflecting our continued confidence in the Group’s prospects the Board is recommending that the final dividend be increased by 2% to 25.2p (2016:24.7p). This makes a total dividend for the year of 39.4p, an increase of 1.8% over last year’s 38.7p.
Looking aheadSince 2014 we have focused diligently on executing our strategy, despite tougher than expected market conditions. While there is still much to do, the market environment in some of our businesses is improving and the hard work and significant progress which continues to be achieved across all areas of our business keeps us firmly on track to deliver a much improved business and enhanced shareholder value.
Lord Smith presents at a town hall meeting to the employees of IMI CCI Korea, Paju during a visit with Roy Twite, Divisional Managing Director in November 2017.
Introd
uction
Financial Statem
entsC
orporate Governance
Strategic R
eview03

IMI Hydronic Engineering operational review Turn to page 32
IMI Hydronic Engineering is the leadingglobal supplier of products for hydronic distribution systems which deliver optimal and energy efficient heating and cooling systems to the residential and commercial building sectors.
IMI Precision Engineering operational review Turn to page 30
IMI Precision Engineering specialises in developing motion and fluid controltechnologies for applications whereprecision, speed and reliabilityare essential.
IMI Critical Engineering operational reviewTurn to page 28
IMI Critical Engineering is a world-leadingprovider of critical flow control solutionsthat enable vital energy and processindustries to operate safely, cleanly,reliably and more efficiently.
Adjusted revenue by geography
RoW1% UK
2% Western Europe
72%
North America6%
Emerging Markets19%
IMI plc is a specialist engineering company that designs, manufactures and services highly engineered products that control the precise movement of fluids.
Group overview
Number of employees
3,500
Adjusted revenue
Adjusted operating profit
£648m
£84m
Number of employees
5,300
Adjusted revenue
Adjusted operating profit
£791m
£134m
Number of employees
1,800
Adjusted revenue
Adjusted operating profit
£312m
£50m
IMI eco-system inside
Adjusted revenue by geography
RoW4%
UK6%
North America
26%
Western Europe
43%
Emerging Markets21%
Adjusted revenue by geography
RoW8% UK
3%
North America
18%
Western Europe
13%
Emerging Markets58%
Annual Report and Accounts 2017IMI plc04

IMI’s global footprinthttp://www.imiplc.com/about-imi/our-divisions/imi-at-a-glance.aspx
RoW5% UK
4%
North America
19%
Western Europe38%
Emerging Markets34%
IMI Hydronic Engineering
18%
IMI Precision Engineering
45%
IMI Critical Engineering37%
09
Balancing & Control Thermostatic Control Pressurisation Water Quality
Key brands IMI Bopp & Reuther, IMI CCI, IMI Fluid Kinetics, IMI InterAtiva, IMI NH, IMI Orton, IMI Remosa, IMI STI, IMI TH Jansen, IMI Truflo Marine, IMI Truflo Rona, IMI Truflo Italy, IMI Z&J, IMI Zikesch
Main markets Oil & Gas, Fossil Power, Nuclear Power, Petrochemical, Iron & Steel, Desalination and Process Industries
Major operational locations Brazil, China, Czech Republic, Germany, India, Italy, Japan, South Korea, Sweden, Switzerland, UK and USA
Power Oil & Gas Petrochemical Actuation
Adjusted Group revenue by geography Adjusted Group revenue by division
We are the world leading supplier of engineered to order turbine bypass valves for critical applications in conventional and nuclear power plants – helping to provide the safest, most reliable and efficient power generation.
2017 adjusted revenue: £278m
We supply anti-surge valve and actuator systems to the world’s largest LNG compression facilities. Our systems are capable of ultra-fast response to maximise LNG production while protecting the compressor.
2017 adjusted revenue: £203m
We design and manufacture integrated flow control systemsfor critical applications in Fluid Catalytic Cracking. We also supply bespoke valves into the ethylene, polypropylene and delayed cokingproduction processes.
2017 adjusted revenue: £95m
We focus on the design and production of complete actuation systems to operate industrial valves for the most demanding applications and processes in terms of forces, speed and accuracy and harsh environments.
2017 adjusted revenue: £27m
Key brands IMI Norgren, IMI Buschjost, IMI FAS,IMI Herion, IMI Maxseal
Main markets Industrial Automation, Commercial Vehicle, Life Sciences, Energy, Food and Beverage, and Rail
Major operational locations Brazil, China, Czech Republic, Germany, India, Mexico, Switzerland, UK and USA
Key brands IMI Heimeier, IMI Pneumatex, IMI TA, IMI Flow Design
Main markets Water based heating and cooling systems for commercial buildings, and temperature control for residential buildings
Major operational locations Germany, Poland, Slovenia, Sweden,Switzerland and USA
Our hydronic balancing and control solutions enable buildings to keep comfort at the right level and lift HVAC efficiency by up to 30%. Our expertise covers constant and variable flow and both static and dynamic balancing.
2017 adjusted revenue: £157m
We design and manufacture thermostatic control systems which guarantee direct orautomatic control of radiators and underfloor heating systems to perfectly control individualroom temperatures.
2017 adjusted revenue: £111m
The single most important component in any hydronic system is the water itself. Whencompromised, the effects can be felt throughout the system. Our dirt and air separators and pressure step degassers protect the installation by keeping water free of microbubbles and sludge.
2017 adjusted revenue: £12m
Industrial Automation Commercial Vehicle Oil & Gas Life Sciences
We supply high performance products including valves, valve islands, proportional and pressure monitoring controls and air preparation products, as well as a comprehensive range of pneumatic actuators.
2017 adjusted revenue: £440m
We design and manufacture a range of cab chassis andpowertrain solutions which deliver fuel efficiency, emissions reduction and faster assembly times for the world’s leading commercial vehiclemanufacturers.
2017 adjusted revenue: £183m
We offer a comprehensive range of products which deliver precision control in even the harshest environments, including stainless steel valves and regulators, nuclear class valves and emergency shutdown controls.
2017 adjusted revenue: £67m
We supply precision flow control solutions used in medical devices,diagnostic equipment and biotech and analytical instruments. Our products help to reduce the sizeof equipment, while enhancing accuracy, throughput and fluidcontrol performance.
2017 adjusted revenue: £64m
Reliable pressurisation is a basic requirement for a trouble-free operation of heating, cooling andsolar systems. Our robust range of pressure maintenance systemswith compressors or pumps and expansion vessels maintains the right pressure in the system at all times.
2017 adjusted revenue: £32m
Introd
uction
Financial Statem
entsC
orporate Governance
Strategic R
eview

Ecosystem Multipurpose commercial buildingOur balancing & control solutions combine highly precise mechanical valves and digital actuation allowing complete electronic integration and greater efficiency in complex heating & cooling systems.
Commercial VehicleOur range of cab, chassis and powertrain solutions deliver fuel efficiency, emissions reduction and faster assembly times.
Manual transmission controls
Digital actuation
Combined control & balancing
Pressure independent modulating control
Valve arrays
Engine control multi-valve block
Combined cycle power plantProducts designed to cope with high pressure and temperature differences in the most critical applications ensures power is available when needed.
Turbine bypass valves
Desuperheaters

Ecosystem Our role in the world
RailWe offer customised solutions for all types of rail applications.
Family houseWe provide a comprehensive range of thermostatic control products, ensuring optimal temperature control and energy efficiency.
LNGWe provide the control and safety systems to ensure safe delivery of liquefied natural gas to power cities across the world.
AMT compressed air dryer
Pantograph control systems Door control
valve systems
Thermostatic controls
Automatic flow control
Isolation cryogenic ball valves
Triple eccentric butterfly valves
Anti-surge valves
Underfloor heating manifolds
Engine control multi-valve block

Our products and technologies are used in a wide range of applications to help processes across many sectors operate safely, cleanly, efficiently and cost effectively.
Data centresWe ensure stable pressure and clean water for high cooling intensity applications, preventing premature equipment failure and costly downtime.
RefineryWe keep the world moving from petrol to diesel and jet fuel, our specialist valves refine crude oil to provide a wide range of products.
Industrial AutomationWe develop solutions for our customers in the machinery, food & beverage, printing and factory automation industries.
Medical devices and instrumentationWe help OEMs increase performance of their systems, enabling cutting edge devices that improve health and the environment.Goggle
valves
Conventional control valves
VM10 valve island with Industrial Ethernet
Dirt separation
Excelon® Plus air preparation
Specialist triple eccentric butterfly valves
ISOLine™ actuator
Pressurisation

HospitalsOur products help to deliver quality, energy-efficient HVAC systems, which ensure optimal patient comfort.
Offshore platformWe design and provide valves for the most critical applications including offshore.
Medical devices and instrumentationWe help OEMs increase performance of their systems, enabling cutting edge devices that improve health and the environment.
FLATPROP proportional valve
Balancing valves
Thermosatic controls
Specialist ball valves
Control valves
Differential pressure controls
MICROSOL solenoid valve
FLEXISOL solenoid valve
100DMT choke valve
Engineering GREAT the IMI Way

Strategic Review
Engineering GREAT the IMI Way
12 Chief Executive’s review
16 Our strategic model
18 Strategic growth priorities
28 Operational review
34 Corporate responsibility
44Measurements and targets
46How we manage risk
10 IMI plc Annual Report and Accounts 2017

IMI Critical Engineering manufactures the largest valves in the world and are renowned for specialist products and engineering know-how.
11Introduction
Strategic R
eviewC
orporate Governance
Financial Statem
entsS
trategic R
eview

Overview2017 was another year of important progress for IMI. The combination of a growing pipeline of great new products and the continued drive to improve our operational performance is enhancing our competitiveness, the results from which will become increasingly evident as markets continue to recover.
Acquisition of Bimba Manufacturing Company (‘Bimba’) The previously announced acquisition of Bimba for a total consideration of £148m (US$198m) was completed on 31 January 2018. The transaction is fully aligned with our strategy and fulfils our stated objective of increasing our US revenues while extending IMI Precision Engineering’s presence in its core Industrial Automation segment. In particular, the acquisition provides the platform to accelerate IMI Precision Engineering’s North American growth objectives by leveraging both Bimba’s strong brand and its market leading US distributor network. The combination will also materially improve Bimba’s profitability with margins expected to progressively move closer to those of IMI Precision Engineering as it adopts IMI’s operational excellence programme.
Trading environmentTrading conditions across our three divisions were mixed throughout 2017 with a return to strong growth in IMI Precision Engineering’s end markets offsetting ongoing softness in the Energy market in IMI Critical Engineering.
The Oil & Gas market, which represents almost a third of IMI Critical Engineering’s revenues, stabilised in the latter half of the year while the Power generation sector continued to be impacted by lower investment due to power demand lagging the installed supply base.
In IMI Precision Engineering, the core Industrial Automation and Commercial Vehicle markets,
which represent almost 80% of the division’s revenue, showed good progress in the year across all of our key geographies.
In IMI Hydronic Engineering, the European construction markets, which represent over 80% of the division’s revenues, were marginally stronger and in North America and China construction markets continued to grow.
Cost reduction initiatives In response to the protracted deterioration in several of our most important markets, we continued to undertake a number of restructuring activities. These actions have now included the sale or closure of twelve lower growth, higher cost IMI Critical Engineering sites and the reduction of operating costs across the entire Group.
In IMI Precision Engineering we continued to deliver Project Janus on-time and on-budget, including a structured programme of cost reductions, insourcing to increase machining capacity utilisation, simplification of the organisational structure, and further leveraging of our low-cost manufacturing operations.
In IMI Hydronic Engineering, a programme to reduce operating costs in targeted locations was completed in 2017.
Results overviewAdjusted Group revenues were 6% higher at £1,751m (2016: £1,649m). Excluding favourable exchange rate movements and disposals, Group revenues on an organic basis were flat when compared to the prior year and reflected the mix of end markets across our three divisions. Adjusted segmental operating profit was 6% higher at £241m (2016: £228m). Excluding the impact of favourable exchange rate movements and disposals, segmental operating profit was flat on an organic basis. The Group’s operating margin was 13.8% against 13.8% in 2016 and adjusted
2017 was a year of good progress for the Group with results in-line with market expectations. Our various initiatives have further improved operational performance, and on-going investment in great new products and customer solutions has enhanced our market competitiveness.
Chief Executive’s review
Well positioned for growth
Mark SelwayChief Executive
Annual Report and Accounts 2017IMI plc12

earnings per share were 9% higher at 65.3p (2016: 59.8p). Good operating cash flow of £218m (2016: £246m) followed a strong comparative last year and reflected an increase in working capital to support growing markets. Overall, inventory days showed a modest improvement.
Net Debt of £265m (2016: £283m) reflected good cash delivery and resulted in a Net Debt to EBITDA ratio of 0.9x against 1.0x at the end of 2016.
IMI has continued its proactive risk management of pensions liabilities. The UK schemes remain in surplus following our continued de-risking programme. In early 2017 the Group successfully
completed the transfer of £429m of liabilities to insurance partners. Building on that success, a second phase is underway which is expected to transfer in excess of £400m to insurers in 2018. The overseas deficit has reduced by £24m in the year.
Good strategic progressIt is pleasing to report a further year of successful execution of our strategy, which is making a real difference to our competitive positioning. Key achievements, driven by a passion for continuous improvement, included enhanced operational performance and the addition of high quality
products across all three divisions. We are confident that we will achieve world-class operational performance by 2019, as envisaged in our original 2014 plan.
Improving our operational performanceImproving operational performance is fundamental to our objective of creating competitive advantage and remains a key part of our strategic plan.
Strategic timeline
Supported by value enhancing acquisitions
Year 3:
Nearly firing on all cylinders
2017
Ambition:
Double operating profits
Year 0:
The hard work begins
2014
Year 1:
Increased investment
2015
Year 2:
Benefits starting to show
2016
Year 4:
Up to full speed
2018
IMI’s Executive at IMI Z&J in Düren, Germany, looking at a slide gate valve designed to handle temperatures of 1,600˚C.
13Introduction
Strategic R
eviewC
orporate Governance
Financial Statem
entsS
trategic R
eview

Chief Executive’s review
1 Members of IMI’s Executive are shown a goggle valve in assembly at IMI Z&J Germany. The valves can weigh over 100 tonnes.
2 IMI’s Executive toured the newly refurbished manufacturing halls, which have been upgraded to provide world-class facilities for petrochemical valve production.
3 Chief Executive, Mark Selway, checks out planning in IMI Z&J’s Obeya room.
12 3
Annual Report and Accounts 2017IMI plc14

During 2017 each of our divisions continued to enhance their operational performance. The Group’s average Lean score advanced to 71% at the year-end and compared to 66% at the same point in 2016. Scrap rates, on-time-delivery and inventory management all improved and the benefits were evident in the Group’s working capital in the year. This enhanced productivity and operational performance provides an important foundation to underpin our increased competitiveness and responsiveness to customers.
Positioning our businesses for growthIn the past three years, we have invested heavily in new systems and processes which are essential to the Group’s sustainable competitive advantage. During 2017 new integrated IT systems, that make day-to-day operations more cost and time efficient, were successfully installed on-time and on-budget in IMI Critical Engineering’s plants in China and the USA. IMI Precision Engineering’s new JD Edwards system was successfully installed in three US sites and the division is now focused on fully integrating all elements of the system before extending its deployment elsewhere. IMI Hydronic Engineering’s JD Edwards ERP system was successfully deployed at its Slovenia manufacturing plant and at nine country sales facilities during 2017.
Today, disciplined and efficient processes, including New Product Development, competitor product tear-downs and the application of Value Engineering, are embedded across all our operations. These processes underpin the sustainability of continuous improvement and ensure that investment ultimately delivers an earlier and greater return. Much has also been achieved to simplify the way our businesses operate.
New product portfoliosOur focus on New Product Development gained significant momentum during the year and as a result we have expanded our portfolio of great new products which enhance the competitiveness of the Group. Our advanced product quality planning process (APQP) and competitor product tear-downs have resulted in the development of industry-leading ranges of platform products in IMI Precision Engineering which increased the division’s new product vitality index to 10% in the year.
IMI Hydronic Engineering maintained its development pipeline and in 2017 launched 13 new products while IMI Critical Engineering also introduced further enhanced products through the year. All three divisions have ambitious plans to continue their product development strategies in 2018 and beyond.
Furthermore, by combining New Product Development with Value Engineering processes, IMI Critical Engineering has expanded its addressable markets and is competing in segments that were not previously accessible. In particular, following the development of a range of semi-severe valves, the division is now competing effectively in larger adjacent markets without compromising its divisional margins.
Business developmentAlongside our organic growth initiatives, targeted acquisitions that meet our clearly defined and disciplined criteria remain a core part of our strategy. In the year, we were pleased to confirm the successful negotiation to acquire Bimba Manufacturing, a market leading supplier of pneumatic, hydraulic and electric motion products to the North American Industrial Automation market and on 1 February this year, we confirmed that the transaction had successfully completed
on the terms outlined in our 14 December announcement. We continue to evaluate and refine our targets, enhance our integration process and make our underlying businesses stronger, all of which will facilitate the success of any future developments.
Our people Our people are key to our success and the progress we have made during 2017 is down to their continued hard work. Across all our businesses there is a passion for continuous improvement, and a focus on delivering the best products and services to our customers in a way consistent with our values and culture.
I would like to thank all IMI employees for their hard work and their on-going drive to deliver our strategic ambitions. I would also like to extend a very warm welcome to our new colleagues from Bimba.
OutlookIn the first half of 2018 we expect organic revenues to be higher than for the same period in 2017, with margins reflecting a modest improvement, supported by both rationalisation savings and improved market conditions in IMI Precision Engineering. Results for the full year will also reflect our normal second-half bias.
Executive Committee
Mark SelwayChief Executive
Daniel ShookFinance Director
Phil CliftonInterim Managing Director, IMI Hydronic Engineering
Massimo GrassiDivisional Managing Director, IMI Precision Engineering
Paul RobertsGroup Business Development Director
Geoff TranfieldGroup Human Resources Director
John O’SheaGroup Legal Director and Company Secretary
Roy TwiteDivisional Managing Director, IMI Critical Engineering
15Introduction
Strategic R
eviewC
orporate Governance
Financial Statem
entsS
trategic R
eview

Capitalising on significant organic growth opportunities
Improving operational performance
Expanding our addressable markets through targeted
acquisitions
Increasing investment in New Product Development
Man
ufac
turin
g a
nd se
lling innovative products and services to our chosen markets
Capturing aftermarket opportunities for spares, support a
nd se
rvice
How we generate our revenue
Strategic growthpriorities
Strategic enablers
Work together as one
Maint
ain fin
ancia
l disc
ipline
Invest in Group-wide IT and infrastructure
Our business model is built around our core strategic priorities: capitalising on growth opportunities, improving operational performance, investing in product development and targeted acquisitions. Our continued focus on these areas is driving operational excellence across the Group and delivering improved, more innovative products and services to our customers. As a result we are enhancing our competitive advantage. By continuing to meet our customers’ needs and investing in our leading market positions, we are well placed to grow profitably to the benefit of all stakeholders including our shareholders.
Our strategic model
Annual Report and Accounts 2017IMI plc16

Strategic growth enablers
Our key strategic enablers help us deliver our strategic growth objectives while capitalising on the geographic and operational capabilities of the Group. We have outlined the following key strategic enablers.
Maintaining financial disciplineAs we execute our strategy to deliver accelerated growth, we continue to maintain financial discipline. Capital is allocated to drive organic growth, maintain a progressive dividend policy and fund acquisitions. Whilst retaining flexibility to develop IMI’s full potential, we continue to focus on maintaining an efficient balance sheet and, in the event of us having cash in excess of the Group’s needs, we would return any excess capital to shareholders. Through the life of our five year plan we will work to maintain net debt to EBITDA of around two times through the cycle.
Net debt to adjusted EBITDA
2016 1.0x 2017 0.9x
Working together as one simplified IMI To harness the Group’s full potential we remain determined to channel and maximise our scale and act wherever possible as one IMI. Establishing core processes has provided a strong platform that underpins a framework for creating consistent Group–wide standards and behaviours.
The IMI Global Intranet launched in 2014, has undergone a refresh this year. It is now more organised, more extensive and more engaging. Enhanced navigation across all sections and
more extensive cross-linking of relevant content means that employees have easy and quick access to important and valuable information that helps them to run their business in a more efficient, productive and Lean way.
Investing in Group-wide IT and infrastructure During 2017, our programme of investment in customer relationship management and IT security systems has continued across all three of our divisions. While the heavy lifting in terms of system architecture and operating procedure are fully established, the roll-out across our major operations will continue for some period into the future.
In all our divisions, there has been significant progress with the delivery of ERP programmes during the course of the year. In IMI Critical Engineering, implementations have taken place in Singapore, Malaysia and the US. IMI Precision Engineering have completed installations at their core US locations of Littleton, Louisville and Queretaro, and IMI Hydronic Engineering have rolled-out to their factory in Slovenia and sales offices in Hungary, Slovenia, Romania, Croatia, Belgium, France, Luxembourg, Serbia and Lithuania.
123
45
1 IMI Pneumatex’s iconic Statico pressurisation vessel exiting the paint oven in Füllinsdorf, Switzerland
2 IMI Truflo Marine’s specialist ball valves for critical applications require talent for continuous development
3 Visual shop floor management is a key daily activity at IMI Critical Engineering China
4 A key part of the production process of IMI Hydronic Engineering’s small dimension Statico vessel, the stamping press.
5 IMI Critical Engineering’s expertise provides world-leading solutions, helping major energy companies to reduce emissions and improve safety.
17Introduction
Strategic R
eviewC
orporate Governance
Financial Statem
entsS
trategic R
eview

Strategic growth priorities
Improving operational performance
Capitalising on significant organic growth opportunities
Our self-help Lean journey is underpinned by the engagement of management and employees at all levels.
Our priority is to capitalise on end-markets where we already are, or have the potential to be, in a leading position.
Our strategic plan to accelerate growth is focused on four key growth priorities.
Turn to page 20 Turn to page 22
Annual Report and Accounts 2017IMI plc18

Expanding our addressable markets through targeted acquisitions
Increasing investment in New Product Development
Beyond our existing business portfolio, we have the potential to expand through the careful execution of value enhancing acquisitions.
All three divisions are increasingly delivering on our promise to introduce great new products and solutions for our customers, more quickly and more effectively than ever before.
IMI Hydronic Engineering’s new Zeparo G-Force dirt separator during the automated quality test in Füllinsdorf, Switzerland.
Turn to page 24 Turn to page 26
19Introduction
Strategic R
eviewC
orporate Governance
Financial Statem
entsS
trategic R
eview

Enhancing our e-commerce offeringIMI Precision Engineering’s focus on maximising its potential from digital communications continued in 2017 with the launch of a new website, which went live in January in 34 countries and 20 languages, and which was designed to work consistently across all devices. Newly developed online product configurators have been developed for 10 key industrial automation product ranges and the continued expansion of this capability is a key ingredient in our continued focus on digital excellence.
The new IMI Norgren Express App, which went live in November 2016, has now been rolled-out to more than 20 countries with more than 40 distributor stock locations available to make it even easier for customers to find local stock quickly.
The Group operates in a number of attractive end-markets and to achieve our ambitions we must focus on those that offer the greatest potential in terms of delivering top and bottom line growth. Our priority is to capitalise on those end-markets where we already are, or have the potential to be, in a leading position – markets where we can grow and where there are significant aftermarket opportunities.
Capitalising on significant organic growth opportunities
Strategic growth priorities
Expanding our addressable marketsIMI Hydronic Engineering has significantly expanded its market offerings with over 56 new products launched since 2014.
Included in these new products is TA-Slider, an actuator range targeted at the fast growing HVAC hydronic control market – a market IMI Hydronic Engineering previously did not address. Complementing the division’s market leading balancing and control valves, the addition of TA-Slider has created a product portfolio that provides customers will all their balancing, control and actuation products from a single source.
To support the introduction of the new actuator products, the IMI Hydronic College conducted a series of intensive training programmes which have helped to build confidence in the division’s expertise and deep knowledge in this growing market. An innovative marketing campaign, entitled ‘Products Like Me’, was launched in the year and was successful at positioning Hydronic Engineering as the preferred partner for control contractors and system integrators.
Annual Report and Accounts 2017IMI plc20

2
3
4
Annual Report and Accounts 2016
61 IMI CCI Korea’s world-class facility produces critical valves for extreme applications.
2 IMI CCI choke valves for the Middle East in local, final acceptance test and inspection.
3 Lord Smith of Kelvin recognising IMI CCI Korea as the Doosan Supplier of the Year award.
4 IMI CCI pressure test valves in Saudi Arabia.
5 In 2017, IMI Critical Engineering opened a new facility in Qinpu, China, to further support the Energy and Petrochemical industries.
5
Positioning our business for growth Having a coherent strategy that strengthens our market position and capitalises on available growth opportunities is as important when markets are difficult, as when they are strong. Markets do not always behave in the way they are expected to – but they will always offer the greatest opportunities to those who are properly positioned to capitalise on them.
In IMI Critical Engineering, there has been a carefully planned re-positioning on several levels. Whether it relates to geographic footprint, product innovation or value engineering - supporting our customers remains at the centre of our plans.
Following a period of restructuring and investment in new facilities, IMI Critical Engineering has re-aligned its global footprint with world-class manufacturing facilities in the heart of important and high growth markets of the future, including China, India and South Korea. As testament to the continuing success of our South Korean site, in March IMI CCI Korea was named Doosan Heavy Industries & Constructions ‘Supplier of the Year 2017’.
The division’s competitive advantage has also been strengthened through the wide adoption of Value Engineering.
The core processes that have been successfully embedded in our business over recent years, the drive for Lean and operational excellence, and the significantly upgraded IT infrastructure have all improved the division’s competitiveness and its sustainable growth prospects. IMI Critical Engineering has long been an industry leader and we are confident that the actions taken by the division have improved quality of the business enormously.
1
21Introduction
Strategic R
eviewC
orporate Governance
Financial Statem
entsS
trategic R
eview

As we improve how our businesses operate we will better utilise capacity, enhance our competitiveness, reduce working capital and generate cost savings by operating more efficiently. By doing this, we are also improving service to our customers. We are progressively self-funding our organic growth initiatives using the benefits generated from our operational improvements. Our self-help Lean journey is underpinned by the engagement of management and employees at all levels and we remain absolutely confident that embedding Lean across the whole of IMI is an essential enabler to deliver and sustain our achievements.
Strategic growth priorities
Improving operational performance
% Lean score
80
70
60
50
40
30
20
10
FirstAssessment
2014 year end
2015 year end
2016 year end
2017 year end
70%Lean score up 46% from first assessment
70%Lean score up 37% from first assessment
Success factors in Lean & HSE in 2017Cross-functional teams using a visual project management tool known as Obeya have continued to be rolled-out across our engineering-to-order businesses in IMI Critical Engineering. Obeya provides end-to-end visualisation of both product and information flow which has reduced lead times by 15% whilst also improving working capital and on time delivery to the customer.
A major focus on inventory reduction within our long-cycle businesses, with the use of the IMI practical problem solving tools, has resulted in a reduction of inventory of over 20% for our actuator business at IMI STI and at our specialist valve business IMI Remosa in Italy.
The division is now working to implement Lean projects in the back office with a primary aim to further improve customer service. Early successes include a 20% reduction in the time to produce a customer quote.
Lean manufacturing driving a range of sustainable operational benefitsOur operational performance has improved significantly in recent years and the resulting benefits are apparent across all our divisions. In IMI Precision Engineering the level of product quality defects is now at its lowest level ever and in terms of safety, the division has seen an 80% reduction in its accident rate over the course of the last three years.
The drive towards sustainable progress remains a key focus as we develop and support our people to apply Lean manufacturing to continually improve our businesses and customer offering. Eliminating non-value added activities using Lean tools has resulted in faster delivery and reduced inventory. For example, in our Alpen factory in Germany, orders for our customised actuators received by 11.00 am are now manufactured and shipped on the same day. A new manufacturing line at our plant in Fradley, UK can produce any combination of 700 different finished parts on demand, rather than in batches, which results in increased productivity and reduced lead times.
1. Cultural Awareness
2. Visual Management & Housekeeping
3. Standardised Work
4. Flexible Operations
5. Continuous Improvement
6. Error Proofing
7. Quick Changeover
8. Total Productive Maintenance
9. Material Control
10. Level Production
31%
46%
59%
66%
71%
Annual Report and Accounts 2017IMI plc22

1
1 Preparing the Universal A valve for its first visual inspection.
2 One-piece flow process in operation at IMI Hydronic Engineering’s site in Dallas, USA.
3 Measuring points assembly on IMI Flow Design’s Unibody valve.
4 An engineer gives the product a final quality check before shipment.
World-class operational performance enhancing market competitiveness Improving plants to make them operate more efficiently is fundamental to improving financial returns but it also generates a range of other benefits. The focus on Lean has helped drive greater operational flexibility while increasing responsiveness to our customers.
Since launching our new strategic direction in 2014 we have greatly improved operational performance across the Group and IMI Hydronic Engineering has been at the forefront of those improvements. As a result, our attractiveness as a supplier continues to be enhanced.
IMI Hydronic Engineering’s Olkusz plant in Poland and its Slovenian plant in Brežice were two of the first in the Group to achieve world-class operational performance. Since then Erwitte, Germany – one of IMI Hydronic Engineering’s largest plants – has more than doubled its Lean score from 33% in its first audit to 77% at the end of 2017. Through the application of Lean, the plant has achieved the lowest scrap rate in its history. The division’s Dallas plant in the USA now makes all products to order having installed one-piece flow production, which allows faster response to customer demands.
In addition to improving operational performance, we have overhauled our IT infrastructure. During 2017 the division successfully rolled-out on time and on budget new ERP systems in its Slovenian plant and across sales offices in 9 countries. Today IT systems across half of the division have been replaced by the new IMI Hydronic Engineering JD Edwards standard. This robust IT platform is crucial to the business and it has already enabled IMI Hydronic Engineering to access the large European retail market via the strategic partnerships it has developed with Saint-Gobain, Ferguson and GC Group, three of the four top European wholesalers.
34
78%Lean score up 41% from first assessment
2
23Introduction
Strategic R
eviewC
orporate Governance
Financial Statem
entsS
trategic R
eview

Increasing investment in New Product Development
Strategic growth priorities
New Product Development driving growth in key Middle East marketsThe development and launch of a number of new products has resulted in IMI Critical Engineering almost doubling its installed base of choke valves in the Middle East during the year.
Using the New Product Development processes that are now embedded across all of our businesses, IMI CCI developed and launched a new choke-valve product line, 100DMT (Drag Multi-Trim), specifically for the Middle Eastern oil and gas market. This new product range offers a multi-trim solution for high-flow environments and advanced noise abatement. As the energy industry faces the potential challenges of ‘lower-for-longer’ oil price and rising costs, the 100DMT provides customers with an innovative and cost-effective solution. The valve range allows customers to use one valve for the entire lifetime of the oil well. This is far better than the current situation which forces customers to undertake expensive maintenance and change-out valves as well pressures drop. With the 100DMT the total life costs of operation are dramatically reduced.
Having successfully established the new systems and disciplines essential to effective New Product Development – including advanced product quality planning (APQP), rigorous competitor product tear-downs and Value Engineering – all three divisions are increasingly delivering on our promise to introduce great new products and solutions for our customers, more quickly and more effectively than ever before.
Creating innovative products that deliver significant customer benefitsOf the 13 new products IMI Hydronic Engineering launched in 2017, the Simply Compresso – the smallest, lightest and easiest to install connected compressor-controlled pressurisation device on the market – was the highlight of the year.
Developed and launched in a little over 12 months, Simply Compresso maintains the pressure of HVAC systems and provides remote troubleshooting via the internet, while enabling optimum performance to be delivered regardless of space constraints.
IMI Hydronic Engineering also extended its range of TA-Slider digital actuators by adding communication options and additional features to increase its potential in the market.
In addition, the division’s 2015 launch of its eclipse automatic flow product range was extended into underfloor heating manifolds providing customers with the same control and comfort as in their radiators.
Annual Report and Accounts 2017IMI plc24

New platform products – the first of many to enhance competitiveness The early phase of the IMI Precision Engineering strategy concentrated on significantly improving the operations while conducting a detailed review of the markets we serve and their relative attractiveness. The results of that review have informed, among other things, our product development strategy. Using what are now standard New Product Development protocols across the Group, we have recently launched 13 important platform products which are changing our competitive positioning in our markets and with our customers.
In addition to enhancing our core product offerings, where appropriate our platform developments have included sensing configurations to enhance performance and inter connectivity. Our Industry 4.0 strategy is well developed and focused on delivering the maximum commercial benefits by addressing current customer demand while monitoring changes in customer and market requirements. Many of the products we have already launched have connectability with our customers Industry 4.0 solutions.
Industrial Automation – In April 2017 at Hannover Messe, the world-leading industrial technology trade fair, IMI Precision Engineering launched its first new major platform products in over 10 years. These new products include ISOLine™ a ‘fit and forget’ pneumatic actuator range, Excelon Plus, the next generation air preparation unit and upgraded valve islands which now incorporate Ethernet/IP and provide increased connectivity. These products form part of our core offering and are found at the heart of factory automation systems.
Commercial Vehicle – a valve array that controls most chassis air-controlled accessories was brought to market in September 2017. The product, which takes a signal from the dash valve using an integrated electronic circuit with
CAN-BUS interface control, offers a number of significant customer benefits.
Life Sciences – the IMI Norgren CadentTM 3, launched at the AACC San Diego Fair in August, is a highly flexible and programmable syringe pump capable of moving fluids as slowly as 0.008 microlitres/min. This new generation pump provides greater precision and accuracy for complex imaging and laser applications in analytical, biotechnology and diagnostic instrumentation.
Energy - ICO4-PST is the first-ever smart solenoid valve partial stroke testing system with the ability to diagnose the condition of every element in the final control loop. In November, this market leading product won the Energy Industries Council’s Technology Award.
Rail – The Integrated Twin AMT dryer was developed using our enhanced product development process and successfully launched in November 2016. Since the initial launch, IMI Precision Engineering has won a number of new contracts for the supply of the new dryer to train fleets across the rail industry including new metro trains in China and the Sydney Trains Outer Suburban Car fleet.
New Product Development continues at pace with an expanding pipeline of further new developments including 30 major product platforms, which are planned for launch over the next few years. This significant extension and upgrade of our product portfolio is already improving our competitiveness.
1 IMI Precision Engineering’s Energy team receiving the Energy Industries Council Technology Award for the IC04-PST smart solenoid valve.
2 The new M/50 IO-Link switch sensor enables connectivity and condition monitoring of actuators, including IMI Precision Engineering’s new ISOLine.
3 Manufacturing of the AMT dryer at IMI Precision Engineering’s facility in Leeds.
1
23
25Introduction
Strategic R
eviewC
orporate Governance
Financial Statem
entsS
trategic R
eview

We will supplement our organic growth with targeted acquisitions capable of producing returns in excess of the Group’s weighted average cost of capital within three years. Each of the Group’s three divisions has a well developed list of acquisition targets and our business development team has the experience, policies and structure to deliver high quality deals. The acquisition of Bimba Manufacturing in December 2017 was a highlight of the year.
Expanding our addressable markets through targeted acquisitions
Strategic growth priorities
Extending market reach Within IMI Critical Engineering, bolt-on acquisitions to extend both our product range of semi-severe and configured products and our geographic footprint in both our existing and adjacent markets remain our focus. Opportunities with attractive aftermarkets are particularly favoured.
Our acquisition strategies for the divisions are:
Fewer but better targets Our product strategy is well developed in IMI Hydronic Engineering, and increasingly focuses on high quality well run European acquisition candidates. The division developed a well-defined pipeline of bolt-on opportunities, many of which are family owned which would fit well with IMI’s culture, whilst enabling us to leverage their strong brands and management capabilities.
Annual Report and Accounts 2017IMI plc26
2
3
Annual Report and Accounts 2016
64
1
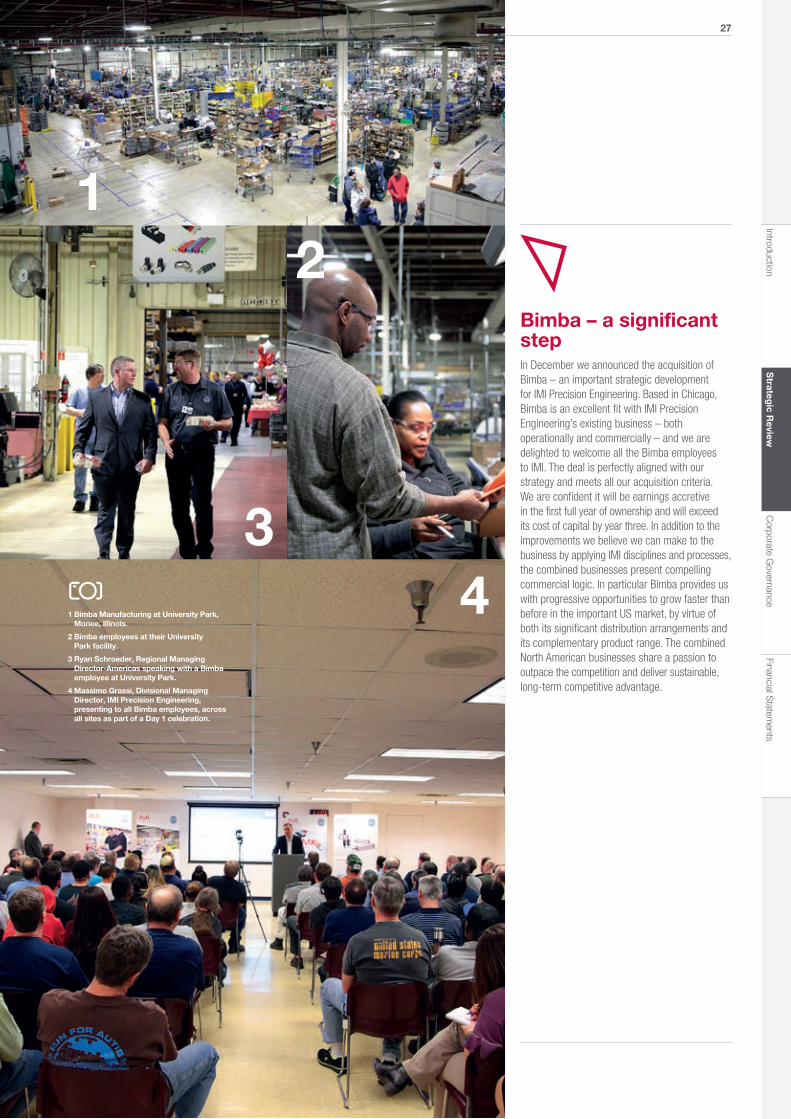
Bimba – a significant step In December we announced the acquisition of Bimba – an important strategic development for IMI Precision Engineering. Based in Chicago, Bimba is an excellent fit with IMI Precision Engineering’s existing business – both operationally and commercially – and we are delighted to welcome all the Bimba employees to IMI. The deal is perfectly aligned with our strategy and meets all our acquisition criteria. We are confident it will be earnings accretive in the first full year of ownership and will exceed its cost of capital by year three. In addition to the improvements we believe we can make to the business by applying IMI disciplines and processes, the combined businesses present compelling commercial logic. In particular Bimba provides us with progressive opportunities to grow faster than before in the important US market, by virtue of both its significant distribution arrangements and its complementary product range. The combined North American businesses share a passion to outpace the competition and deliver sustainable, long-term competitive advantage.
1 Bimba Manufacturing at University Park, Monee, Illinois.
2 Bimba employees at their University Park facility.
3 Ryan Schroeder, Regional Managing Director-Americas speaking with a Bimba employee at University Park.
4 Massimo Grassi, Divisional Managing Director, IMI Precision Engineering, presenting to all Bimba employees, across all sites as part of a Day 1 celebration.
27Introduction
Strategic R
eviewC
orporate Governance
Financial Statem
entsS
trategic R
eview

Performance
While we continue to expect a tough trading environment in our Oil & Gas and Power markets, it is important to recognise the great progress that has been made to realign the cost base and geographic footprint of the division. The reorganisation programme has been delivered on-time and on-budget and significantly enhances the division’s competitive position.
Full year order intake at £658m (2016: £614m) was 2% higher on an organic basis. The Value Engineering process delivered £139 million of new orders, which would otherwise have been lost or resulted in unacceptable margins. Furthermore, Value Engineering has enabled us to outrun existing competitors and access new and adjacent markets.
As expected, New Construction Oil & Gas order intake was 11% lower due largely to Middle East HIPPs orders which were secured in the prior year. While New Construction Fossil Power orders were 11% lower due to reduced activity levels, Petrochemical order input was 53% higher, reflecting good orders for Gas Processing and Refinery projects in China and North America in the first half. Nuclear New Construction orders increased substantially from the low base in 2016, and included contract awards for the UK nuclear project at Hinkley Point.
Aftermarket orders were 1% higher when compared to 2016 reflecting a significant increase in LNG aftermarket in the first half, which offset lower Downstream parts orders in the second half of the year. Fossil Power Aftermarket strengthened in the second half resulting in a 5% increase for the full year. Nuclear Aftermarket reduced 8%, whilst Petrochemical Aftermarket grew by 18%.
Revenues of £648m (2016: £651m) were flat on an adjusted basis and, after excluding £40m of exchange rate benefit and £2m from disposals, 6% lower on an organic basis. Segmental operating profit of £84m (2016: £82m) was
3% higher on an adjusted basis and 5% lower on an organic basis. Margins improved to 13.0% against 12.6% in 2016, reflecting the benefits of restructuring and Value Engineering.
Value Engineering and improved project management activities helped deliver a year-end order book of £515m at equivalent margins to the prior year. The division’s Lean scores improved significantly from 62% to 70% in the year and the core customer metrics showed good progress.
IMI Critical Engineering continued its longer-term footprint reorganisation which resulted in the closure of a number of lower growth sites and delivered £23m of profit benefit in the year. These projects place the division in a stronger competitive position, while realigning our manufacturing footprint to be closer to customers in higher growth markets.
In addition to the product and operational investments, the division continued its programme of IFS ERP roll-outs with further successful launches in Singapore, Malaysia, California and Kansas. IFS is now fully embedded in ten of IMI Critical Engineering’s CCI sites and we have now agreed to extend the roll-outs to include our Petrochemical businesses, progressively from 2018.
Outlook
Based on the current order book and market outlook, we expect first half organic revenues to reflect a slight improvement with broadly flat margins when compared to 2017. Results for the full year are expected to include the benefits of restructuring and the normal second half bias.
IMI Critical Engineering is a world-leading provider of flow control solutions that enable vital energy and process industries to operate safely, cleanly, reliably and more efficiently. Our products control the flow of steam, gas and liquids in harsh environments and are designed to withstand temperature and pressure extremes as well as intensely abrasive or corrosive cyclical operations.
Operational review
Adjusted revenue
Adjusted operating profit
Find out more: www.imi-critical.com
£648m
£84.0m
Flat
Up 3%
Key achievements» Value Engineering helped secure
£139m of new orders and enhanced competitiveness
» Increased margins despite lower sales
» Rationalisation programme delivered with £23m profit benefit, on-time and on-budget
» On-time and on-budget ERP programme implementation now completed at ten sites
» Increased average Lean score to 70%
» Sale of loss-making UK fasteners business
Annual Report and Accounts 2017IMI plc28

“The substantial change in our geographic positioning and cost base, when combined with our Value Engineering successes, leave us ideally placed to capitalise in a recovering market.”
Roy Twite Divisional Managing Director
Creating competitive advantage Despite challenging end market conditions IMI Critical Engineering has continued to win new orders by significantly enhancing the competitiveness of its product offering. Orders totalling £139m were secured during the year through the application of Value Engineering processes and tools which have been embedded in the division as part of our move toward best in class operational and engineering practices. The Value Engineering philosophy, which examines every aspect of the design, procurement and manufacturing process, enables the division to improve product competitiveness and deliver great value to the customer, while still protecting margins to acceptable levels.
In line with this strategy, Value Engineering has enabled the division to organically expand its addressable market and participate in market segments that were not previously accessible. In particular, we have a developed a semi-severe valve product range and are now competitive in this larger market. Where Value Engineering has been combined with New Product Development, it has also opened-up new market adjacencies, enabling us to offer industry leading engineering at optimised value for new applications and customers.
Contract wins during the year included:
• A gas processing contract worth £12m for the largest propane dehydrogenation unit in China
• A major turnaround contract worth over £10m for the second largest US refinery
• A US LNG project worth £8m
• New Nuclear contracts worth £23m, including for Hinkley Point C
IMI CCI Korea has become a world-leading manufacturing site for critical valves.
29Introduction
Strategic R
eviewC
orporate Governance
Financial Statem
entsS
trategic R
eview

IMI Precision Engineering specialises in the design and manufacture of motion and fluid control technologies where precision, speed and reliability are essential to the processes in which they are involved.
Performance
IMI Precision Engineering’s core markets have experienced a strong rebound with double digit growth in Asia and solid progress in the Americas and European regions. Industrial Automation sales have now delivered five consecutive quarters of growth globally while our Commercial Vehicle related sales experienced strong growth in North America and Asia and continued good markets in Europe.
Revenues of £791m (2016: £708m) were 12% higher on an adjusted basis and, after excluding £42m of exchange rate benefit, 5% higher on an organic basis. Industrial Automation revenues of £440m were 5% higher with good growth across all regions.
Commercial Vehicle sales of £183m were 7% higher, despite contract completions in the year, and reflect stronger than anticipated markets. European Commercial Vehicle revenues were slightly higher whilst North America grew by 9%. Energy sales were 1% lower than 2016 while Life Sciences and Rail were 6% and 15% higher, respectively.
Segmental operating profit of £134m (2016: £119m) was 13% higher on an adjusted basis and, after excluding £7m of exchange rate benefit, 7% higher on an organic basis. Operating margins of 16.9% compared to 16.7% in 2016, or 16.2% if property disposal gains are excluded.
Operationally, the division has also made great progress. The combination of Lean, New Product Development and the benefits of project Janus all contributed to a much improved performance in the year. In 2018 we have further ambitious improvement targets which include the completion and relocation of our Indian operation to a new and larger factory in New Delhi. Our customer facing operational metrics will also be a key focus with the new regional organisations working to streamline our supply chains.
The successful implementation of Lean throughout the division has continued to make excellent progress with the score increasing to 70% against 66% at the end of 2016. The impact of Lean was evident in the
results with improved productivity and a four-day improvement in inventory days in the year.
Our focus on New Product Development gained significant momentum during the year and as a result we have expanded our portfolio of great new products which enhance the competitiveness of the Group. Our advanced product quality planning process (APQP) and competitor product tear-downs have resulted in the development of industry-leading ranges of platform products. In 2017, new product launches were introduced across the entire range and represented over £75m, or 10% of sales.
Project Janus progressed to plan and to budget and contributed £7.4m of benefit in the year. This successful first phase will be extended to include further actions which will add to the £12m of cost savings we initially targeted. The in-sourcing actions and improved market conditions helped increase utilisation in the year to almost 70%. The localisation and low cost manufacturing transfers are already reducing lead times and will accelerate as local tooling comes into service in 2018.
In addition to product and operational investments, the division has continued to strengthen its new JD Edwards ERP system in its core Norgren North American operations. Once completed, the division will have a world-class, fully integrated IT system which will be progressively rolled-out to the other parts of the business.
Outlook
The global industrial outlook remains positive with leading indicators pointing to an improved Industrial Automation market in the year ahead. We also expect North American Class 8 volumes in 2018 to largely offset an expected £10m of contract completions in the year ahead.
Based on current market conditions, we expect first half organic revenues and profits to show good improvement when compared to the first half of 2017. The benefits of new product launches and improved market conditions are expected to deliver improved results for the full year.
Operational review
£791m
£133.5m
Adjusted revenue
Adjusted operating profit
Up 12%
Up 13%
Find out more: www.imi-precision.com
Key achievements» Successfully launched first new
platform products in over a decade
» Won significant Commercial Vehicle contracts
» IMI Norgren Express App supporting Industrial Automation growth
» Lean initiatives delivered improvement in inventory days
» Increased average Lean score to 70%
» Delivered Janus restructuring benefits
Annual Report and Accounts 2017IMI plc30
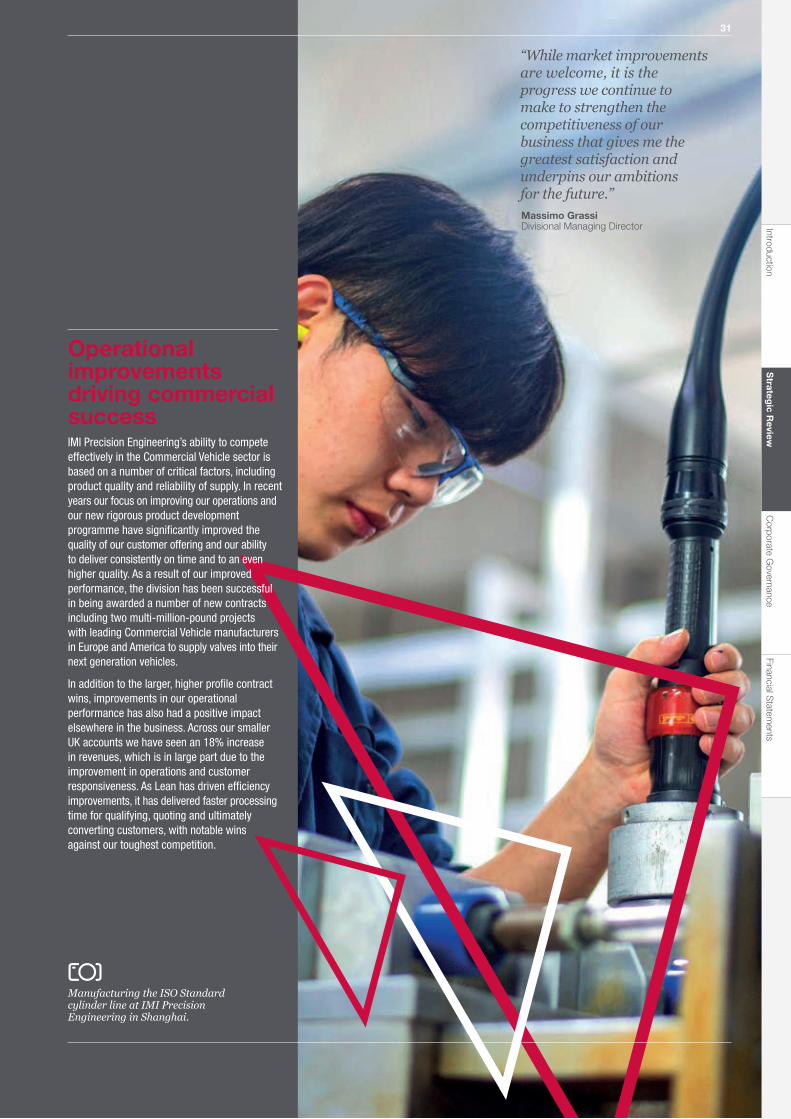
Manufacturing the ISO Standard cylinder line at IMI Precision Engineering in Shanghai.
“While market improvements are welcome, it is the progress we continue to make to strengthen the competitiveness of our business that gives me the greatest satisfaction and underpins our ambitions for the future.”Massimo Grassi Divisional Managing Director
Operational improvements driving commercial success IMI Precision Engineering’s ability to compete effectively in the Commercial Vehicle sector is based on a number of critical factors, including product quality and reliability of supply. In recent years our focus on improving our operations and our new rigorous product development programme have significantly improved the quality of our customer offering and our ability to deliver consistently on time and to an even higher quality. As a result of our improved performance, the division has been successful in being awarded a number of new contracts including two multi-million-pound projects with leading Commercial Vehicle manufacturers in Europe and America to supply valves into their next generation vehicles.
In addition to the larger, higher profile contract wins, improvements in our operational performance has also had a positive impact elsewhere in the business. Across our smaller UK accounts we have seen an 18% increase in revenues, which is in large part due to the improvement in operations and customer responsiveness. As Lean has driven efficiency improvements, it has delivered faster processing time for qualifying, quoting and ultimately converting customers, with notable wins against our toughest competition.
31Introduction
Strategic R
eviewC
orporate Governance
Financial Statem
entsS
trategic R
eview
Performance
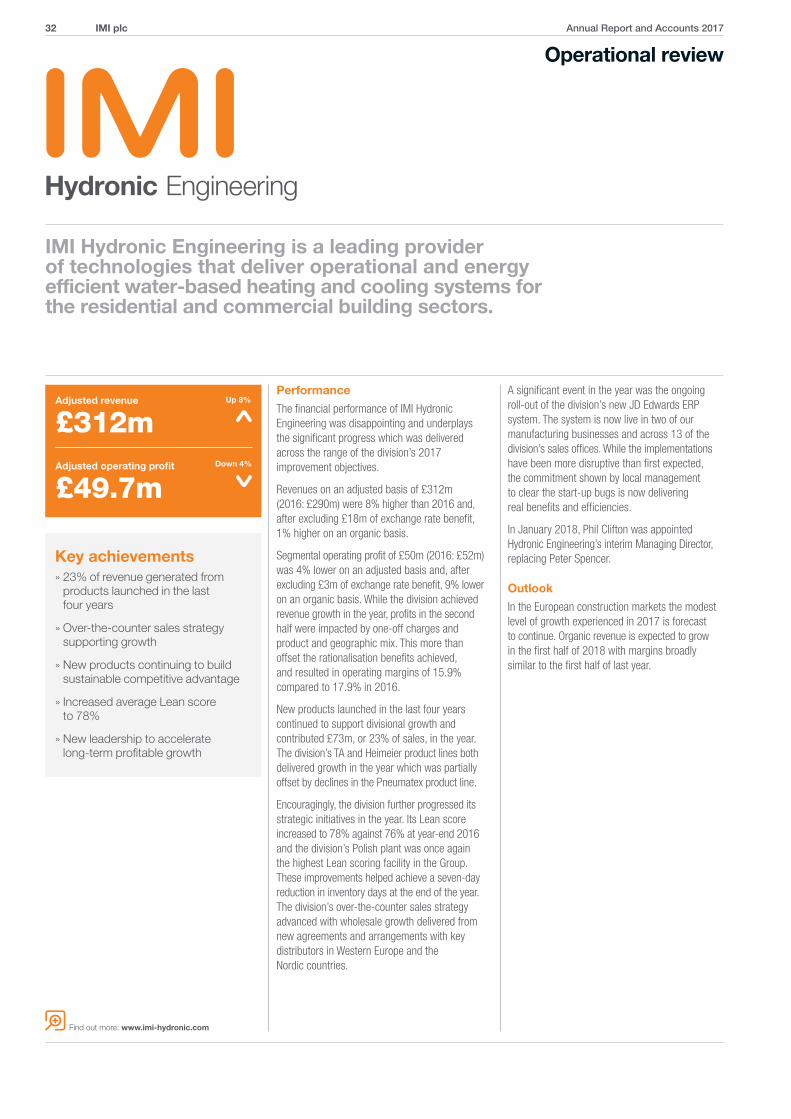
The financial performance of IMI Hydronic Engineering was disappointing and underplays the significant progress which was delivered across the range of the division’s 2017 improvement objectives.
Revenues on an adjusted basis of £312m (2016: £290m) were 8% higher than 2016 and, after excluding £18m of exchange rate benefit, 1% higher on an organic basis.
Segmental operating profit of £50m (2016: £52m) was 4% lower on an adjusted basis and, after excluding £3m of exchange rate benefit, 9% lower on an organic basis. While the division achieved revenue growth in the year, profits in the second half were impacted by one-off charges and product and geographic mix. This more than offset the rationalisation benefits achieved, and resulted in operating margins of 15.9% compared to 17.9% in 2016.
New products launched in the last four years continued to support divisional growth and contributed £73m, or 23% of sales, in the year. The division’s TA and Heimeier product lines both delivered growth in the year which was partially offset by declines in the Pneumatex product line.
Encouragingly, the division further progressed its strategic initiatives in the year. Its Lean score increased to 78% against 76% at year-end 2016 and the division’s Polish plant was once again the highest Lean scoring facility in the Group. These improvements helped achieve a seven-day reduction in inventory days at the end of the year. The division’s over-the-counter sales strategy advanced with wholesale growth delivered from new agreements and arrangements with key distributors in Western Europe and the Nordic countries.
A significant event in the year was the ongoing roll-out of the division’s new JD Edwards ERP system. The system is now live in two of our manufacturing businesses and across 13 of the division’s sales offices. While the implementations have been more disruptive than first expected, the commitment shown by local management to clear the start-up bugs is now delivering real benefits and efficiencies.
In January 2018, Phil Clifton was appointed Hydronic Engineering’s interim Managing Director, replacing Peter Spencer.
Outlook
In the European construction markets the modest level of growth experienced in 2017 is forecast to continue. Organic revenue is expected to grow in the first half of 2018 with margins broadly similar to the first half of last year.
Operational review
Adjusted revenue
Adjusted operating profit
Find out more: www.imi-hydronic.com
IMI Hydronic Engineering is a leading provider of technologies that deliver operational and energy efficient water-based heating and cooling systems for the residential and commercial building sectors.
£312m
£49.7m
Up 8%
Down 4%
Key achievements» 23% of revenue generated from
products launched in the last four years
» Over-the-counter sales strategy supporting growth
» New products continuing to build sustainable competitive advantage
» Increased average Lean score to 78%
» New leadership to accelerate long-term profitable growth
Annual Report and Accounts 2017IMI plc32

Phil Clifton Interim Managing Director
“IMI Hydronic Engineering is an attractive business that has made tremendous progress in the quality of its factories and in its customer offering. The time is now right to translate the hard work and improvements into tangible financial benefits.”
Capitalising on our core strengths IMI Hydronic Engineering is recognised for its market leading technical HVAC system expertise and the support it provides to customers across a range of large commercial projects. Our core strengths and differentiated approach have enabled us to build this reputation. In particular:
• our dedicated sales team supports every stage of each project, from planning and design, through to installation and commissioning and, subsequently, maintenance;
• our New Product Development processes are underpinned by deep technical knowledge, centred on delivering innovative solutions that meet customers’ exact requirements; and
• our Hydronic College provides industry leading training programmes that cover the latest HVAC developments.
During 2017 this differentiated approach contributed to a number of significant iconic project wins. In May, our technical capabilities and customer focused sales management process helped us secure the Iconova development project. Iconova is a luxury city centre residential and commercial development in Gazlantep, Turkey and is the largest luxury residential development in the region. The project uses the division’s recently developed control valve range, TA-Modulator, a small valve that delivers a high performance in a compact form which enables both space and budget constraints to be effectively managed.
In the year IMI Hydronic Engineering was also awarded The Trèfle, Campus de la Santé project, a building in Geneva, Switzerland that will house the headquarters of a number of institutions in the health sector, including the Global Fund to Fight AIDS, Tuberculosis and Malaria. Our ability to offer technical training via our Hydronic College and the fact that our product, which incorporates smart digital settings, could be installed and commissioned in a very short period of time were instrumental in securing this key contract.
The Eclipse insert is added to its thermostatic radiator valve body at IMI Hydronic Engineering Germany
33Introduction
Strategic R
eviewC
orporate Governance
Financial Statem
entsS
trategic R
eview

Corporate responsibility
Attracting the best people and developing and engaging with our employeesOur performance is dependent on developing, retaining and recruiting the best people with the most relevant skills and experience who are aligned with our values and behaviours and who can contribute to delivering our strategic ambitions.
Our ambition is for IMI to become a world-class business – a truly great company that leads its marketplace, that thinks long-term, that delivers sustainable value to all stakeholders and operates all aspects of its business in a responsible way.
Turn to page 38
Creating a positive and collaborative place to work
We are committed to creating a positive and collaborative workplace where our culture is underpinned by core values and behaviours which promote fair and ethical working practices.
To help ensure we achieve this ambition we focus on:
Turn to page 36
Annual Report and Accounts 2017IMI plc34

Ensuring that we minimise our environmental impact
Prioritising health and safety
We have a responsibility to minimise the environmental impact of our day-to-day operations. Our products help our customers operate their systems and processes safely, cleanly and cost effectively.
The health and safety of our employees, contractors and visitors is a primary priority for the Group. Our combined Lean and Health and Safety audits underpin Group-wide rigour and continuous improvement throughout our operations.
Engineers at IMI CCI in Florence are world experts in control system logic for high integrity pressure protection systems.
Turn to page 40 Turn to page 42
35Introduction
Strategic R
eviewC
orporate Governance
Financial Statem
entsS
trategic R
eview

CultureOur values and behaviours help shape our culture and outline the standards and conduct with which everyone in the Group should comply. They are embedded in all our internal processes and procedures, including our Code of Conduct, and they are integral to the ‘The IMI Way’, which defines how we do business.
Human rights, equality, diversity and inclusionWe remain a signatory to the UN Global Compact which establishes standards for human rights, labour practices and anti-corruption. We also have our own policies and procedures, including our Code of Conduct, which set out how people should be treated and how we should conduct our business.
We have a Group-wide Diversity and Inclusion Policy. We ensure that our work place is inclusive and that all employees and workers are treated fairly in an environment which is free from any form of discrimination including the nine protected characteristics outlined in the Equality Act 2010, (age, religion, race, sex, disability, gender reassignment, marriage/civil partnership, pregnancy and maternity and sexual orientation) and other similarities and differences including social background, nationality and family or care responsibilities.
We believe it is essential that across all parts of our business we employ people from different backgrounds and cultures to serve our global footprint and our diverse customer base. Our Diversity and Inclusion Policy and principles are embedded in all our human resource processes and procedures, and we run diversity awareness training programmes, including an E-learning module (translated into core languages) which employees can access via our global intranet. In 2017 key hiring Managers and all HR contacts participated in the on-line module.
When creating shortlists for internal and external vacancies, we insist that external recruiters take account of our policy and, as part of our internal management performance process, each Divisional Managing Director is set objectives aimed at improving diversity in their division. We are committed to employing and developing local employees in our geographies to align with our customers and the communities in which we work and consequently have a very small and focused expatriate population. We have developed metrics which are used to measure our success locally in creating and sustaining diverse and inclusive teams. Diversity of thought is, we believe, key to innovation and we have piloted workshops to develop this further.
UK Gender Pay GapLegislation has been introduced which requires us to disclose information about our UK gender pay gap by April 2018. This legislation affects all employers with 250 or more UK employees.
We are a global business with a workforce of over 10,000 people. In the UK we have 1,021 employees. The table below summarises our gender pay gap for our UK employees for the year ending 5 April 2017. Full details, and an explanation of how these figures were calculated, is provided on our website at www.imiplc.com
We are committed to creating a diverse and inclusive working environment and fair treatment, including equal pay. This commitment is reinforced by the clear and robust recruitment policies and pay structures we operate. Our remuneration policy is designed to support gender diversity and is reviewed regularly to align with best practice; as an example, a new family friendly benefits policy was launched in 2017, providing enhanced maternity and paternity benefits for all UK employees.
Ethical behaviour It is essential that we run our business in an ethical way with the highest standards of integrity. As part of their induction, every employee who joins the Group receives training in relation to our Code of Conduct (the ‘Code’) which covers, amongst other things, anti-bribery, anti-corruption and competing fairly. Refresher training on the Code is provided regularly, as appropriate, and is reinforced through the IMI Way and face-to-face and on-line training sessions.
In addition, we have a series of policies and procedures in place which are designed to help instil the highest ethical standards and regulatory compliance. These are embedded in our risk assessment processes, further details of which are provided on page 46.
We are committed to creating a positive and collaborative workplace where the culture is underpinned by core values and behaviours which promote fair and ethical working practices. This is the right thing to do. It also enables us to operate more effectively, attract and retain great people and is key to the delivery of our strategy.
Creating a positive and collaborative place to work
Corporate responsibility
Our mindset
“Engineering GREAT together”Behaviours:
Learn Improve
ConnectLeadDeliver
UK Gender Pay Gap 2017
Mean Pay Gap 36.5%
Median Pay Gap 25.1%
Gender mix across the Group
Female Female % Male Male %
All employees
3,068 27% 8,462 73%
Managers 198 18% 909 82%
Senior managers
94 16% 510 84%
Board directors
2 29% 5 71%
Annual Report and Accounts 2017IMI plc36

6
We conduct advanced due diligence on our business partners including agents and distributors that support us in obtaining sales. This is carried out using software from leading providers and covers a range of areas including initial and ongoing background checks, screening against sanctions lists, a compliance certification process and the signing of a formal agreement.
In addition, all our businesses conduct basic checks to understand who a potential customer is and to identify risks that may be involved in supplying to them.
We encourage all employees to report to their manager any incident that is not in keeping with the IMI values and behaviours and we operate a confidential independent compliance hotline in 12 languages, which allows anonymous reporting. Hotline activity is reviewed each month by the Group’s Ethics and Compliance Committee, and all reports are investigated thoroughly and, where required, appropriate action is taken to resolve issues fully and quickly. During 2017 52 cases were reported via the hotline which compared to 48 in 2016 and 97 in 2015.
Managing our supply chainOur commitment to human rights extends across our supply chain. We conduct regular audits to make sure that child or forced labour is not used in our supply chain and that suppliers’ workplaces are safe. If suppliers are unable to comply with our strict responsible business requirements we terminate our relationship with them.
We believe that all companies must take their role seriously in preventing modern day slavery and human trafficking and we use a combination of general corporate responsibility policies and specific supply chain compliance actions to combat modern slavery in our supply chain. Our full statement on the Modern Slavery Act and detail about the steps we take to ensure that slavery and human trafficking do not take place within our supply chain or any part of our business is available on our website at www.imiplc.com.
Community activities We have a responsibility to the communities around the world in which we operate. In addition to creating jobs and investing in our local communities, each year employees across the Group participate in what has become known as ‘The IMI Way Day’ during which they receive face to-face refresher training on both The IMI Way and the Code and spend time supporting a local community charity or project. These initiatives contribute to the local community, help build trust and reinforce our team building and collaborative approach.
Some of the activities undertaken during the IMI Way Day 2017
» Development of a garden at a school in the West Midlands, UK where children have limited access to the outdoors
» Supporting the Little Sisters of the Poor care home in Chennai, India including making donations which were used to provide groceries, ceiling fans and lights for the facility
» Providing books for the children in an orphanage in Delhi, India which is home to over 40 children
» Donating clothes and other items to an orphanage in Selangor, Malaysia
» Donating blood in Bangalore, India
» Leading games and activities at a sensory garden in Shanghai, China used by children with autism
» Clearing up waterways in Singapore
» Collecting litter in Thailand
» Organising supplies for a food bank in Dallas, USA
We also support a range of local charities in the places where we operate and contribute funding to support local communities affected by natural disasters such as Hurricane Irma and more broadly to organisations who provide emergency support for crisis situations around the world.
1
2
341 Employees at IMI Precision
Engineering’s HQ in Birmingham, UK.
2 Getting a fresh perspective on Lean practices during a cross-functional workshop in IMI Hydronic Engineering’s Dallas, USA factory.
3 At IMI Orton in Piacenza, Italy, employees show their commitment to the IMI Way.
4 IMI Precision Engineering engineers working with train-builders in China.
37Introduction
Strategic R
eviewC
orporate Governance
Financial Statem
entsS
trategic R
eview

RecruitmentOur performance and our ability to execute our strategy is dependent on recruiting the best people with the most relevant skills and experience who are aligned with our values and behaviours and our strategic ambition. We operate a robust process when selecting new employees following the principles embedded in our Recruitment Policy which aims to ensure our process is fair, transparent and consistent. This is designed to complement our focus on developing our own talent and leaders for the future.
Development and succession planningTo ensure that we have a strong talent pipeline and to enable our people to enhance their skills and progress their careers, we operate a number of training and development programmes.
In 2017 a further 75 senior managers participated in our ‘Leading the Way to Engineering GREAT’ programme, bringing the total number of participants in the programme to 170 since its launch in 2015. Focused on ensuring we have leadership skills across the Group capable of supporting our strategy and growth, ‘Leading the Way to Engineering GREAT’ underpins our succession planning process. By the end of 2018, 250 members of our senior management team will have participated in the programme.
During the year 400 newly promoted and existing managers participated in our ‘Being a GREAT IMI Manager’ programme which was rolled-out in Italy, Poland, Singapore and India, alongside Germany, China, the Czech Republic, the UK and the US, where it was already embedded. Since its launch in 2015 over 600 IMI managers have attended the two and half day course and by the end of 2018 that number will have increased to 1,000.
To support our significant New Product Development activity, new product training sessions have been made available to relevant employees via IMI Learn, our e-learning platform, which is hosted on our global intranet. Across all divisions sales teams have undertaken bespoke training which has covered pricing, margins and selling skills development.
In addition to our training and development programmes, all employees are provided with on-the-job training and personal mentoring. We also have a Performance Management Policy which is rigorously implemented to ensure all employees are appraised in a fair and consistent way. The policy also establishes a process which provides employees with regular opportunities to discuss their objectives and personal development plans during the year.
Engaging our peopleOur objective is to involve all our employees, keep them informed and get their feedback on matters affecting them as employees and on the various factors affecting the performance of the Group. This is achieved through formal and informal meetings, internal communications and regular divisional updates.
Our global intranet connects our employees across the Group. It serves as a training platform and over 10,000 employees are registered to use it to access our IMI Lean programme. We also use the intranet to share Group news and developments, including our results and important initiatives in areas such as health and safety, and to facilitate cross business collaboration and the sharing of best practice. During the year our intranet was enhanced. The presentation of data on the site was made more impactful to facilitate further engagement and collaboration across the Group.
This year we combined our Group and divisional conferences into a single event. 300 employees gathered together and subsequently were tasked with sharing the key messages and information arising from the conference with their teams. We also conduct regular town hall meetings and work with our European Works Council, covering 11 countries across Europe, to further encourage effective employee communication and engagement.
Annually we undertake an employee survey which is completed at the end of our IMI Way Day. The 2017 survey indicated improvements year-on-year in a number of areas including better understanding of the Group’s strategy and priorities and the number of employees who would recommend IMI as a good employer. Where local issues are identified these are followed-up often using pulse surveys (a quick and effective real-time survey that gathers further detail) to elicit more specific data where useful.
Attracting, developing and engaging the best people
Corporate responsibility
Our improving performance has been achieved through the commitment, excellence, innovation and collaboration of our people. To ensure that we maintain this progress we must continue to attract and retain great people, provide them with opportunities to make a difference and enable their personal and professional development.
Our cross divisional magazine, the IMI eye, which features news stories generated by our businesses around the world, is published twice a year and distributed in multiple languages to all employees and key stakeholders.
Annual Report and Accounts 2017IMI plc38

Giuseppe BuscemiManaging Director, IMI Remosa
In 1999 I began my career at Remosa (which was acquired by IMI in 2012) after graduating with a Magna cum Laude Master Degree in Mechanical Engineering. Since then I have had the opportunity to gain significant experience and an extensive and practical knowledge of both engineering and manufacturing by covering different roles, including Project Engineer and Operations & Engineering Director. In 2017 I was delighted to be appointed to my current position.
In 2015, I participated in the IMI Leadership Programme ‘Leading the Way to Engineering GREAT’. Throughout the programme I was given insight into finance, strategy, marketing as well as my own leadership style. Through working directly with a coach in a small learning group, I was able to grow and develop as a leader, recognising the importance of having a growth mind set. I believe this really helped me to get my promotion to my current role.
Today I am responsible for the IMI Remosa business and the 250 employees in the organisation. We operate in a global market which makes the demands of the job very interesting, in terms of the products, markets and the people I work with. The IMI Way helps us to deliver in the right way and my team and all the employees of IMI Remosa are key to our success.
Natalie Zeranksa Head of Marketing Communications, IMI Hydronic Engineering
When I started my job hunt fresh out of university IMI was offering one of the best graduate programmes on the market – a competitive package and, more importantly, the chance to experience different business areas. For me this was an opportunity to find out more about the business I was joining and discover what I was really passionate about. It was also a special feeling to be accepted into an engineering world without an engineering background, which reflects our Company’s commitment to diversity and expanding talent across all areas of the business.
Since I joined IMI I have had the opportunity to experience a number of different roles within different parts of the Group. I moved into a marketing role with IMI Hydronic Engineering seven years ago and since then my responsibilities have grown and I have been able to develop my management skills.
IMI’s wide range of tailored development programmes, which offer practical tools and support, have helped me be more effective at managing myself, my team and also my day-to-day business activities. The programmes, which draw participants from across the Group, have also enabled me to build a support network beyond my division’s business and there is always someone who has faced a similar challenge who is willing to share their experience. The programmes also allowed me to take time out of the ‘daily rush’ to re-examine how I work and make changes for the better.
Martin MaasManaging Director, IMI FAS
I joined IMI’s Graduate Development programme in 2006 and my first role was with the (then new) Life Sciences sector within IMI Precision Engineering.
At the time, I was looking for a job in an international company ‘that actually made stuff’, and the high levels of technology behind IMI’s products were very appealing to me, as was IMI’s Graduate Scheme. I was hoping to learn about business, experience new cultures, grow as a professional and progress in my career.
Now, 11 years later, I am Managing Director of IMI FAS, and lead IMI’s Life Sciences initiative in Europe, having progressed through increasingly senior sales and marketing roles in the Group, each stretching me that bit further out of my comfort zone.
Looking back on the numerous development programmes I have participated in over the years, they have helped hone my management skills, my strategic thinking and my soft skills. As importantly, the interactions with colleagues, and now friends, across the business have been invaluable particularly when I have faced challenging situations and needed help and support. Overall I feel well prepared for my current responsibilities and when I take the next step in my career, I am confident that I will continue to have the support I need.
39
Here some of our people explain how their careers have developed:
Giuseppe Buscemi Natalie Zeranksa Martin Maas
39Introduction
Strategic R
eviewC
orporate Governance
Financial Statem
entsS
trategic R
eview

Our proactive approach Our proactive approach to health and safety starts with awareness and prevention training. Every employee, as part of their induction, receives health and safety training relevant to their role in line with our Health, Safety and Environmental compliance principles. Employees engaged in manufacturing operations participate in further on-site training which focuses on hazard identification, risk assessment and action planning. In addition, their individual personal development programmes focus on enhancing their skills and capabilities in order to mitigate health and safety risks.
Some 2017 health & safety initiatives» Following the consolidation of our European
manufacturing footprint, we invested in IMI Z&J’s German plant in Düren, to create a centre of excellence. As part of the plant’s renovation, the working environment has been made safer, infrastructure has been improved and employee welfare facilities have been enhanced. There have been no lost time accidents at the site for two years.
» We strive to make our operations as safe as possible for our people and this was recognised during an independent survey undertaken by
Zurich insurance at our IMI Precision Engineering Farmington site. The survey confirmed that our operation achieved an excellent ‘A’ grade result.
» At our IMI Hydronic Engineering site in Switzerland, following the installation of noise reduction panels, noise levels were reduced between 17% and 47%.
» In each of our operations health and safety performance is continuously monitored. In all IMI plants IMI management regularly undertake ‘Gemba Walks’ (a Lean manufacturing term used to describe the personal observation of work) which involves a detailed physical review of operations to observe and identify real time potential hazards and risks. Furthermore, each and every incident requiring first aid, or any other medical intervention, is reported and recorded. Any incident requiring more than first aid treatment is reported to divisional management and a remediation plan is agreed and implemented. Where appropriate, safety alerts are provided to other Group sites to share lessons learned and create greater safety awareness across the Group.
» In addition, health and safety performance is regularly tracked, reviewed and analysed at multiple levels across the Group. The review process is detailed in the adjacent column.
The health and safety of our employees, contractors and visitors to our facilities is paramount.
Our ambition is to become a world-class business with a world-class health and safety record. To achieve this we take a proactive approach and strive to continuously improve our performance.
Prioritising health & safety
Corporate responsibility
The production team meets for the daily factory meeting at IMI Hydronic Engineering in Olkusz, Poland
Our bi-annual review process
Rigorous local assessment of ten key operational and safety areas. Undertaken by specialist health and safety experts and combined with our semi-annual Lean benchmarking reviews
Independent review of local assessment by Group or Divisional Health and Safety champion
Creation of combined Lean-HSE report covering progress since last assessment, potential hazard identification, remedial action recommendations and targets for further improvement
Publication of report on Group-wide intranet to facilitate the sharing of best practice
Analysis to identify commonly recurring Group-wide hazards which require specific remedial action
Annual Report and Accounts 2017IMI plc40

2
1
1 Half way through the year, IMI CCI Korea employees celebrated the great achievement of 2,500 days with no Lost Time Accidents. Their seven year achievement includes the period of building and relocation to their new site.
2 Throughout our sites, visual safety boards ensure all employees are safe and informed.
3 Achieving world-class standards requires the highest calibre of employees and equipment, which ensures safe working & quality.
4 Assembly of the AMT dryers at IMI Precision Engineering’s facility in Leeds.
43
Our progress during the yearDuring the year we continued to improve our health and safety processes.
» Our Gemba observation walks are helping improve our site safety performance. In 2017 our HSE Lean assessment score saw a 7% improvement on 2016.
» While the number of Lost Time Accidents (‘LTAs’) in 2017 increased to 23 (2016:15), as a result of IMI Critical Engineering’s safety performance, total lost time and non-lost time injuries have fallen by 13% during the year. In addition, the accident frequency rate has declined and on average there is only 1.1 lost time accident for every million hours worked. We are committed to eradicating the incidence of accidents in our workplaces and we will continue to rigorously embed robust safety procedures across all our operations.
» 83% of our sites have not had a lost time accident in 2017 compared to 78% in 2016 and a number of our facilities have recorded significant periods of zero LTAs. IMI Critical Engineering Korea has recorded no LTAs for seven years and both IMI Buschjost in IMI Precision Engineering and IMI Hydronic Engineering Slovenia have recorded no LTAs for over three years.
» We continue to run our hand safety campaign following its launch at the end of 2016. As a result the number of hand injuries, the most common cause of injuries to IMI employees, has reduced. For example, IMI Critical Engineering has seen a 56% reduction in such injuries since the start of the campaign.
41Introduction
Strategic R
eviewC
orporate Governance
Financial Statem
entsS
trategic R
eview

Our productsOur products help our customers operate their systems and processes safely, cleanly and cost effectively. They also help tackle some of the biggest issues facing the world today including global warming and resource scarcity. Below are some of our products that help reduce emissions and energy consumption.
» IMI CCI VLB high pressure Combined Cycle Power Plant turbine bypass valves Produce more power for the same fuel consumption by operating at higher temperatures allowing plants to operate more efficiently, with lower emissions.
» IMI CCI’s fugitive emissions packing technology (patent pending) Prevents leakage of hydrocarbons and reduces emissions from valves in refineries, the largest source of global CO
2 emissions.
» IMI Precision Engineering’s valve systems Help manage vehicle emissions and aid reduced fuel consumption by optimising engine performance.
» IMI Precision Engineering’s standard range of pneumatic products Reduce air consumption and, as a result, generate energy cost savings.
» IMI Hydronic Engineering’s thermostatic radiator valves Reduce energy consumption by as much as 28% compared with manual radiator valves by automatically adjusting flows dependant on the ambient temperature.
» IMI Hydronic Engineering’s TA Modulator automatic balancing and control valves Save up to 18% of annual energy consumption when compared to on-off control solutions, by ensuring only the required flow is delivered to terminal units.
Our operationsWe have a responsibility to minimise the environmental impact of our day-to-day operations. Our strategy, which focuses on continuous operational improvement and operating as efficiently as possible, underpins our commitment to do that.
We have invested in over 50 video conference meeting rooms globally. This, together with new software available to employees for video conferencing from mobile devices and laptops, has enabled meetings to be held throughout the Group as though attendees were in the same location. Our conferencing technology, which is regularly used for operational meetings and Executive and Board meetings, has driven a reduction in air travel across the Group.
Our operations maintain environmental policies which are reviewed and updated annually by management to ensure that we are driving environmental improvements across our plants and facilities.
As a Group we support the Carbon Disclosure Project (‘CDP’) climate change initiative and submit annual CDP reports which cover our risk management approach to climate change and our emissions performance.
Given the nature of our production processes, our main focus is energy efficiency. We operate a Group-wide energy efficiency programme which during the year delivered a number of efficiency improvements.
In 2014 we relocated IMI Precision Engineering’s UK manufacturing operations to a new modern facility at Fradley. The building’s more efficient heating system has had a significant impact on our energy usage and over the course of the last three years gas consumption has reduced by 87%, on a like-for-like basis and overall energy usage has reduced by 39%.
Since 2015 we have reduced our CO2 emissions by
over 4%. In line with our continuous improvement culture and investment in our operations, we will look to further reduce our emissions in the future.
Through our focus on Lean and efficiency, our operations across the Group have reduced their production process generated scrap and waste including:
» In the last 12 months, our IMI Critical Engineering site, IMI CCI RSM, has introduced a number of initiatives to reduce scrap and waste, including providing training to employees to identify errors early in the production process, changing material handling practices and investing in new machinery to improve welding quality. Year-on-year this has resulted in a 30% scrap reduction.
» IMI Precision Engineering’s Fellbach plant has reduced its scrap levels by 51% since 2015 by implementing Lean manufacturing techniques which analyse different stages of the production process and implement corrective actions as required; and
» IMI Hydronic Engineering’s foundry in Germany has reduced scrap by more than 50% since 2015 by changing raw materials. A rebuild of the foundry with low emission equipment contributed to the result.
Ensuring that we minimise our environmental impact
Corporate responsibility
We have a responsibility to minimise the environmental impact of our day-to-day operations. Our products are designed and manufactured to help our customers operate their systems and processes safely, cleanly and cost effectively. Together, both our operations and products are helping to tackle some of the biggest issues facing the world today including global warming and resource scarcity.
CO2 emissions
62
61
60
59
58
57 2015
‘000 tonnes
2015-16 2016-17 2017
Annual Report and Accounts 2017IMI plc42

43
1
2
3
4 5
6
1 Testing of solenoid valves for commercial vehicles at IMI Precision Engineering in Seattle, USA.
2 IMI Norgren Excelon Plus has tamper-proof features that stop the pressure in air systems being increased, and therefore keep energy usage to a minimum.
3 IMI Precision Engineering’s Alpen, Germany site has decreased annual CO2 emissions by the equivalent of 175,000kg following the installation of solar panels in combination with heat pumps.
4 IMI Critical Engineering’s newly redesigned turbine bypass valves allow plants to operate more efficiently and safely.
5 Highly precise production of TA-Modulator.
6 A new industry standard: Eclipse thermostatic radiator insert.
43Introduction
Strategic R
eviewC
orporate Governance
Financial Statem
entsS
trategic R
eview

Measurements and targetsBusiness performance is measured through Group-wide targets and improvement measures. Each IMI business participates in an annual round of planning meetings with the Executive Committee, during which performance and future plans for that business are reviewed and updated. These business plans have all been aligned with the Group’s strategy. The Key Performance Indicators (‘KPIs’) set out below represent the financial and non-financial targets which are integral to the delivery of our strategy.
Organic revenue growth excludes the impact of acquisitions, disposals and foreign exchange movements. In 2017, the Group’s continuing businesses organic revenue was equal to the prior year.
In 2017, Group segmental operating profit was £241m compared to £228m in the prior year representing an increase of 6% on an adjusted basis. On an organic basis, after adjusting for the adverse impact of exchange rates and disposals, segmental operating profit was 1% lower than the prior year.
Segmental operating profit
£227.7m£239.4m £240.9m
400
300
200
100
2015
Millions
2016 2017
Organic revenue growth
+0%
6
0
5
-1
4
-2
3
-3
2
-4
1
-5
-6 2015
%
2016 2017
-5%-5%
Annual Report and Accounts 2017IMI plc44

During the year we continued to improve our operational performance and Lean scores toward world-class. Our six-monthly benchmarking process is well embedded, and scores continue to reflect the improvement which is being achieved across all Group operations. Our highest scoring site is 94% and the average has increased from 31% when we first benchmarked the business in 2014 to 71% at the 2017 year end.
The health and safety of all our employees remains paramount. We measure our progress in this area by tracking our >1 day lost time accident frequency rate (‘LTA rate’). Although still low, in 2017 our LTA rate increased to 0.11. Management continues to work across the organisation to identify and reduce workplace hazards.
Health & Safety lost time accident rate
0.14 0.07 0.11
0.3
0.25
0.2
0.15
0.1
0.05
2015 2016 2017
Return on capital employed (‘ROCE’) is defined as segmental operating profit after tax divided by capital employed. In 2017, ROCE was 12.4% which compares to 12.5% in 2016 and reflectsthe Group’s ability to continue to deliver solid results in mixed market conditions.
Return on capital employed
14.3%59% 12.5%66% 12.4%71%
20
15
10
5
2015
%
2016Year-end 2016
Year-end 2015
2017Year-end 2017
Lean assessment
100
75
50
25
%
Inventory checks as part of Lean practices in IMI Hydronic Engineering’s world-class factory in Poland
45Introduction
Strategic R
eviewC
orporate Governance
Financial Statem
entsS
trategic R
eview

How we manage riskOur risk management processes are embedded in all our businesses. These processes identify, evaluate and manage the risks which could impact our performance, our reputation or our ability to successfully execute our growth strategy.
Risk appetite
Prudent Balanced Receptive
Strategic risk
Compliance risk
Financial risk
Operational risk
The Board determines our risk appetite monitors and reviews the risk management processes we operate. Responsibility for implementing and monitoring internal controls and other elements of risk management is delegated to the Chief Executive and the Executive Committee. The Executive Committee operates alongside the Audit Committee, which has primary responsibility for oversight of financial controls, the Nominations Committee, which has primary responsibility for succession risk, and the Remuneration Committee which has primary responsibility for remuneration and incentive structure risk.
Risk appetiteThe Board is responsible for determining the nature and extent of risks which it feels are acceptable and appropriate for us to achieve our strategic objectives. Specific risk exposures and appetites vary according to the nature of the risk, including our ability to mitigate their impact.
Risk management We adopt a common, Group-wide approach to the identification, assessment and quantification of risks and the way they are managed, mitigated and monitored. We operate a bottom-up risk management framework, which is described below. This approach ensures that the Board and the senior leadership team are able to actively assess risks and monitor the measures used to mitigate, transfer or avoid such risks. It also ensures that risks are managed at multiple levels throughout the Group and that feedback is communicated to our operations to incorporate in their local risk management processes.
Group strategic risk management process
Operational risk management process
Strategic review of the Group’s principal risks and constructive challenge in relation to the monitors and measures implemented to manage such risks.
Board The Executive Committee’s review, which includes a detailed analysis of the Group risk profile, the supporting divisional summaries and actions undertaken to ensure compliance with the UK Corporate Governance Code, is submitted to the Board twice a year. The Board also undertakes an annual review to assess the effectiveness of internal controls used to manage risk across the Group.
Delivery of Group-wide strategic actions and monitoring of risks and key performance indicators.
Divisional and Group Executive
Bi-annually each manufacturing operation uploads its risk profile to the Group intranet. Our three divisions review and consolidate their most significant site level and commercial risks and mitigation strategies into a divisional risk profile, which includes any additional divisional level risks as appropriate. The divisional risk profiles are then consolidated into a single Group risk profile and the divisional and Group risk profiles are presented and reviewed by the Executive Committee twice a year.
Feedback and communications provided to operating companies and manufacturing operations on Group and Divisional strategic actions.
Operating companies
All manufacturing operations maintain an up-to-date risk profile which identifies the key risks facing the business, assesses the mitigating processes and controls in place to manage the risk and monitors and measures the effectiveness of those controls. The risk profile enables management to identify issues and areas that require improvement and efficiently develop remediation action plans. The risk profile is incorporated into each business’ monthly management reporting procedures which increases management ownership and accountability, both of which are crucial to ensuring an effective risk management framework.
Identify existing mitigating actions and controls
Identify monitors to confirm controls are operating effectively
Assess if further controls are required and initiate improvement actions
Monitor improvement actions and report
Identify and assess the risks
Annual Report and Accounts 2017IMI plc46

The key strategic, operational, financial and compliance risks facing the Group, in order of priority, are shown in the table on the following pages. This analysis includes why we think the risk is important, how we are managing the risk, and the main changes during 2017.
In addition to strategic, operational and compliance risks, the Group is also exposed to broader financial market risks, in particular, currency exchange rate volatility following the Brexit referendum. A description of these risks and our centralised approach to managing them is described in Section 4.4 of the financial statements.
RISK
IMPACT ON OUR STRATEGIC GROWTH PRIORITIES
WHY WE THINK THIS IS IMPORTANT
HOW WE ARE MITIGATING THE RISK
GLOBAL ECONOMIC OR POLITICAL INSTABILITYIMPACTING THE GROUP’S ABILITY TO ACHIEVE FORECAST AND MARKETEXPECTATIONS
RISK MOVEMENT
The Group operates in global markets and demand for our products is dependent on economic and market conditions. A downturn in the economy or political instability could impact demand and the Group’s ability to achieve market expectations. The Group needs to be responsive to market conditions whether weak or buoyant.
» Maintain a balanced business portfolio operating across a range of markets.
» Monitor key customers and respond quickly to changes in customer demand.
» Utilise core forecasting processes that ensure operational output can be right-sized appropriately.
» Undertake enhanced stress testing and sensitivity analysis of business plans and regularly review key market and sector metrics.
» Focus on enhancing competitiveness by increasing investment in New Product Development, Value Engineering and improving operational performance.
» Develop robust contingency plans to ensure agility if realignment of cost base is required.
CHANGES DURING 2017 While IMI Critical Engineering has continued to face challenges in many of its key markets, Value Engineering has enabled the division to win new orders in adjacent segments. Both IMI Precision Engineering and IMI Hydronic Engineering have experienced a stable or improving trading environment. We have continued to execute our strategy and our competitiveness is improving. Further information about our strategic progress during the year is detailed in the Chief Executive’s review and Operational review – see pages 12 & 28 respectively.
FAILURE TO DELIVER MAJORTRANSFORMATIONAL PROJECTS ON TIME AND ON BUDGET
RISK MOVEMENT
The Group is continually evolving and changing, both to respond to external pressures and conditions but also to ensure that we are in a strong position to achieve our strategic goals. Change projects include business reorganisations and implementation of new IT systems which are complex and long-term. Failure to deliver the desired objectives on time and on budget and failure to react quickly enough to changing market conditions, could have an adverse financial impact on the Group.
» Detailed plans with clear and measurable milestones reviewed by Divisional Managing Directors.
» Regular review of major project progress by Executive Committee.
» Enhanced risk assessment process including full mitigation action plans.
» Specialist IT and Group Assurance reviews of major IT projects.
» Detailed contingency plans.» Monthly operational meetings which rigorously
review progress of all projects.» ERP steering committee meetings and post go-live
audits to review progress on implementation plans.
CHANGES DURING 2017 As outlined in the Operational review on page 28 each division has robust systems and procedures to manage and monitor business critical projects. In addition, our ERP investment programme continued to be delivered on schedule and on budget. While the risk of failed ERP implementations remains pertinent due to more of our operations introducing new systems, the risk is mitigated by greater experience from prior implementation, proficient system implementation teams and a proven control environment. There have been no major post-implementation ERP issues in the year and this has contributed to a net reduction in the risk for the Group.
QUALITY ISSUES LEADING TO PRODUCT FAILURE, RECALL, WARRANTY ISSUES, INJURY, DAMAGE OR DISRUPTION TO CUSTOMERS’ BUSINESS
RISK MOVEMENT
Developing innovative and technically advanced products is at the heart of what we do. The quality and safety of our products is of the highest importance and failure to deliver the quality required would result in negative financial and reputational damage.
» Adherence to Group-wide standard for Advanced Product Quality Planning process (APQP).
» Weekly and monthly reporting on APQP process to identify improvements in the early phases of the development process.
» Continued focus on quality management systems and audits.
» Testing of finished product and customer sign-off on the most critical products.
» Targeted Lean events to improve quality, including implementation of Obeya reviews for projects work.
» Upgrade of talent with a focus on both quality and product development excellence.
CHANGES DURING 2017 During the year our operational performance continued to improve. Details of key developments are detailed on page 22. New Product Development momentum increased during the year and further details are included on page 24. Despite increased investment and a significant number of new product launches the level of risk has remained the same year-on-year due to improved processes and controls and proven success in this New Product Development area.
Improving operational performance
Capitalising on significant organic growth opportunities
Expanding our addressable markets through targeted acquisitions
Increasing investment in New Product Development
Strategic growth priorities key
47Introduction
Strategic R
eviewC
orporate Governance
Financial Statem
entsS
trategic R
eview

How we manage risk
RISK
IMPACT ON OUR STRATEGIC GROWTH PRIORITIES
WHY WE THINK THIS IS IMPORTANT
HOW WE ARE MITIGATING THE RISK
FAILURE TO INTEGRATEACQUISITIONS SUCCESSFULLYAND DELIVER THE REQUIREDSYNERGIES
RISK MOVEMENT
An integral part of the Group’s strategy is to make value enhancing acquisitions that have the potential to broaden our addressable markets, leverage our position in existing attractive end markets. Failure to deliver the post-acquisition strategy would reduce the value of acquired businesses.
» Annual Strategic review process to identify potential target acquisitions that align with the Group Strategy
» Central M&A function, suitably resourced, working with divisions to identify hard and soft synergies within targeted acquisition opportunities.
» Formalised acquisition approval, due diligence and post-acquisition integration processes.
» Documented process and toolkit to monitor and effectively manage 100 days post-acquisition integration.
CHANGES DURING 2017 Our post acquisition integration process, which deploys a mix of divisional and Group resources, ensures that the right people across all disciplines are available to successfully project manage acquisition integration. Following a review of our M&A resource, we strengthened certain functions and areas. These resources are in place and already being deployed to support the integration of Bimba Manufacturing.
FAILURE TO COMPLY WITH LEGISLATION OR A BREACH OF OUR OWN HIGH STANDARDS OF ETHICAL BEHAVIOUR
RISK MOVEMENT
The Group has an established framework which instigates the highest ethical standards and regulatory compliance across our business. As we expand our operations it is important that we maintain these standards. Legislative requirements around tax, anti-bribery, fraud and competition law require rigorous monitoring and training to avoid financial and reputational damage.
» Commitment to good governance practices as embodied in the IMI Way.
» Continued enhancement of the internal controls declaration process and continued, rigorous audits by our Group Assurance team.
» Policies, manuals, guidelines and standard operating procedures are available to all employees under the legal, compliance and financial sections of the IMI global intranet.
» Group, division and local resources dedicated to compliance.
» Employee training focused on how to apply the IMI Way in everyday situations and key risk areas such as competition law, fraud and antibribery and corruption.
» Confidential IMI hotline to report concerns.» Divisional risk assessed compliance plans.» Third party agent due diligence and approval procedures
and termination of non-compliant agents.» Extensive control framework for dealings with higher
risk territories, including formal training for relevant employees.
CHANGES DURING 2017 The challenging market and regulatory environment demands the very highest standards of conduct and further details of the processes and procedures we operate to help ensure this are detailed on page 36. We have stringent procedures and processes that allow us to operate in high risk territories. Since the lifting of non-US Iranian sanctions in 2016, we have significantly enhanced our compliance procedures within IMI Critical Engineering to ringfence our business development activities in Iran to ensure no breach of trade sanctions. Despite the more challenging territories, we believe the enhancements made to our compliance framework are sufficient to mitigate this increased risk.
FAILURE TO MANAGE THE SUPPLY CHAIN
RISK MOVEMENT
The Group has a significant number of contracts with a broad base of suppliers. Failure to meet customers’ requirements in respect of quality or delivery, could have a material impact on the Group’s results.
» Monitoring of risks and development of contingency plans to mitigate the impact of a supplier failure or increased prices.
» Preferred supplier lists for all major materials and components in each of the divisions.
» Escalation process and regular review meetings with key suppliers.
» Adequate safety stock and/or dual supply for critical components.
CHANGES DURING 2017 Following the initial introduction in 2016 of a supply scorecard, preferred supplier lists, a supplier risk assessment selection tool and commodity experts, we have focused on embedding these processes within our businesses. During the year we have implemented procedures to ensure compliance with the Modern Slavery Act including training for over 300 procurement employees to spot, monitor and deal with any concerns relating to forced labour in our supply chain. We have a zero-risk appetite to engage with suppliers who are not aligned with our own code of conduct and strong ethical standards. Each of our three divisions assesses supplier code of conduct risks and audits any high-risk suppliers for all aspects of supply chain risk. As such, we believe our risk profile remained unchanged in 2017.
Annual Report and Accounts 2017IMI plc48

RISK
IMPACT ON OUR STRATEGIC GROWTH PRIORITIES
WHY WE THINK THIS IS IMPORTANT
HOW WE ARE MITIGATING THE RISK
UNAUTHORISED ACCESS TO OUR IT SYSTEMS
RISK MOVEMENT
Unapproved access to IT systems could result in loss of intellectual property, fraudulent activity, theft and business interruption.
» IT Security Improvement programme underway across the Group.
» IT security steering group comprising representatives from all divisions with corporate sponsorship and oversight.
» Regular communication with employees to raise awareness of cyber security.
» Disaster recovery plans instigated on all critical IT assets.
» 24/7 monitoring from security operations centre.
CHANGES DURING 2017 Recognising the increased threat to both our IT systems and data, we have strengthened our Group-wide Security Improvement programme. Phase 1 of that programme was completed in September and included deployment of security software to all laptops and factory control devices at 147 locations in 44 countries together with 24/7 monitoring by our dedicated Security Operations Centre. Phase 2 of the programme is well underway to deploy robust server protection. In addition, we have also strengthened the data back-up and re-installation testing procedures at our business units. We continue to communicate regularly with all our employees to raise awareness of cyber risks and mitigating procedures and behaviours.
INCREASINGLY COMPETITIVEMARKETS LEADING TO PRICING PRESSURES ORLOSS OF CUSTOMERS
RISK MOVEMENT
Increased volatility and slowdown in major economies could result in increased competition leading to loss of customers and/or pricing pressures leading to lost sales and reduced profits.
» Competitor tear-down and Value Engineering procedures.
» Review of site capacity as part of the Lean benchmarking to better utilise facilities and improve productivity.
» Standard costings to ensure thorough understanding of product cost.
» Lean implementation to increase operational performance, quality delivery and service standards.
» Customer feedback surveys on performance and actions tracked to improve performance.
CHANGES DURING 2017 Improvements in operational capabilities, routine tear-down testing and competitive benchmarking of competitor products continue to underpin New Product Development across all our divisions. Value Engineering processes enabled IMI Critical Engineering to win a number of new orders, further details of which are provided on page 26. 2017 has also seen greater volatility in input costs, particularly around commodities. Internal reporting has been adapted to track and ensure these cost increases are managed appropriately.
NEW PRODUCT DEVELOPMENT
RISK MOVEMENT
The Group’s strategy for sustainable long-term growth will be achieved in part by delivering a pipeline of innovative new products. Failure to deliver market leading products will impact our ability to grow.
» Five-year technology and product roadmaps included in divisional strategies.
» Continued investment in research and development to ensure we target the most profitable opportunities.
» Centres of design and technological excellence established with dedicated teams to monitor progress.
» Detailed project plans to track new product introduction actions on both a weekly and monthly basis.
» Tracking of key performance metrics including sales from new products and research and development spend against sales.
CHANGES DURING 2017 New product development is an integral component of the five-year strategic planning cycle and establishes commercial priorities and development roadmaps for all the Group’s principal markets. Our end to end Advanced Product Quality Planning (APQP) and New Product Development processes cover design, prototyping, testing, costing and launch to market and has successfully delivered competitively priced new products to market. Further information about our New Product Development activities are detailed on page 24.
49Introduction
Strategic R
eviewC
orporate Governance
Financial Statem
entsS
trategic R
eview

Corporate Governance
52 The Board
54 Letter from the Chairman
55Corporate Governance Report
60 Audit Committee Report
64 Nominations Committee Report
66Directors’ Remuneration Report
Engineering GREAT the IMI Way
Annual Report and Accounts 2017IMI plc50

Custom made pneumatic panel being manufactured for a customer at IMI Precision Engineering’s Indian manufacturing facility in Noida, New Delhi.
51Introduction
Strategic R
eviewC
orporate Governance
Financial Statem
entsC
orp
orate G
overnance

Board of Directors
Find out more: www.imiplc.com/about-imi/leadership-and-governance/board.aspx
Committee membership
Nominations Committee – Chair Executive Committee Executive Committee
Nationality
Lord Smith of KelvinChairman
Mark SelwayChief Executive
Daniel ShookFinance Director
Roy TwiteExecutive Director
Nominations Committee Remuneration Committee – Chair
Executive Committee
Australian British AmericanAmerican British
Bob StackFormer senior independent non-executive director; who sadly died on 7 December 2017
British
Key external appointments
Non-executive Chairman of Alliance Trust plc
Non-executive Chairman of the British Business Bank plc
Non-executive director of Halma plc
Formerly non-executive director of the Earthwatch Institute and Signet Jewellers Limited
Date of appointment
2015 2013 2007 2008 until 7 December 20172015
Expertise
Significant UK and international board experience
Extensive knowledge of both engineering and manufacturing
Strong track record in private equity, mergers and acquisitions
Specialist capability in finance
Experienced and proven Chief Executive
Proven track record running international engineering businesses
In-depth knowledge of relevant end-markets including oil & gas, energy and automotive
Proven organisational and engineering expertise
Management capability having run all of IMI’s divisions
Extensive knowledge of end- markets and customer base
Experienced non-executive director at public company level
Significant international business experience
Specialist capability in human resources, organisational change and corporate affairs
Extensive financial management experience
Extensive knowledge of complex process manufacturing across a range of industrial sectors
Strong international perspective, having worked in a number of key geographies during his time with two leading global businesses
Annual Report and Accounts 2017IMI plc52

Nationality
Committee membership
Audit CommitteeNominations Committee Remuneration Committee
Audit Committee – ChairNominations Committee
Remuneration Committee – ChairAudit CommitteeNominations Committee
Carl-Peter ForsterSenior independent non-executive director
Isobel SharpNon-executive director
Birgit NørgaardNon-executive director
BritishDanishGerman
Key external appointments
Non-executive director of Geely Automobile Holdings, Hong Kong
Chairman of London Taxi Company
Non-executive director of Volvo Cars Corporation
Chairman of Chemring Group plc
Non-executive director and Audit Committee Chair of The Bankers Investment Trust PLC
Non-executive director and Audit Committee Chair of Winton Group Limited
Honorary Professor at Edinburgh University Business School
Non-executive director of DSV A/S and NCC AB
Non-executive director of WSP Global Inc. and Chair of the Governance, Ethics and Compliance Committee
Non-executive director of Cobham plc
Date of appointment
2012 20152012
Expertise
Experienced international business leader
In-depth knowledge of the automotive sector
Expert in operational excellence and Lean manufacturing
Significant experience in technology management
Experienced non-executive
Held senior executive positions in engineering consultancy
Wide ranging sectoral experience including energy, water, infrastructure and building industries
Experience in strategy as well as finance and accounting
Considerable accounting, audit, governance and transactions experience including time as the Senior Technical Partner at Deloitte in London, President of the Institute of Chartered Accountants of Scotland and membership of the UK Accounting Standards Board and the Financial Reporting Review Panel
Board experience
International business responsibility
Engineering
Public company board
Finance
Regulatory & legal
86%
71%
71%
57%
86%Mergers & acquisitions
86%
53Introduction
Strategic R
eviewC
orporate Governance
Financial Statem
entsC
orp
orate G
overnance

Chairman’s Governance letter
Corporate Governance introduction
Dear Shareholder
As Chairman, my key areas of focus are on ensuring that the Board provides effective leadership and maintains strong governance at all times. In the Corporate Governance Report on pages 55 to 85, we describe our governance arrangements and the practical workings of the Board and its committees.
LeadershipI am now in my third year as Chairman and have been pleased with the evolution of the Board, particularly as regards the constructive dynamic in the Boardroom. The quality of discussion at meetings is high and all of our non-executive directors are making an important contribution.
I enjoy a strong working relationship with the Chief Executive and we keep in close contact on a weekly and more frequent basis as necessary. Our thinking on key decisions is well aligned as a result of our supportive but suitably challenging debates.
CultureThe Board sets the tone at the top and has established clear leadership values and behaviours which are underpinned by a comprehensive governance framework. These values and behaviours are built into our leadership development programmes and performance assessment processes. Excellent leadership behaviours are a pre-requisite for advancement. We have also embedded policies and processes to underpin compliance and doing business in the right way.
Governance highlights» A new chair of the Audit Committee was selected from among the
continuing non-executive directors.
» Board succession plans put into action to cover Bob Stack’s roles as senior independent director and chair of the Remuneration Committee after his sad death on 7 December 2017.
» Following a wide ranging search process Thomas Thune Andersen was appointed to the Board with effect from 1 July 2018. The search for a further non-executive director continues.
» A review of the Directors’ Remuneration Policy was completed by the Remuneration Committee following stakeholder consultation and the resulting proposals were approved by the Board for submission to this year’s Annual General Meeting.
» We reaffirmed the strategy for the Group and continued to refine the detailed plans and implementation of the strategy at a business level.
» Approval was given for the significant, complementary acquisition of Bimba Manufacturing Company for an enterprise value of approximately £148m.
» An audit tender process was initiated by the Audit Committee which will result in a decision on the auditor to be proposed for appointment at next year’s AGM in May 2019.
Board evaluationIn keeping with our Group-wide focus on continuous improvement, in 2017 we completed a comprehensive evaluation of Board performance facilitated by Egon Zehnder. The overall assessment was highly complimentary of the Board’s function and effectiveness and details of the areas for development are outlined on page 57.
Compliance with the 2016 UK Corporate Code
I am pleased to report that IMI complied with the 2016 UK Corporate Governance Code throughout the year. Further details of our compliance with that Code are provided in the following Corporate Governance and Committee Reports.
Yours faithfully
Lord Smith of Kelvin Chairman
1 March 2018
Annual Report and Accounts 2017IMI plc54

Corporate Governance Report
UK Corporate Governance Code - Compliance statementThe Board is committed to maintaining high standards of corporate governance and confirms that throughout the year-ending 31 December 2017 the Company has applied the principles of good governance contained in the 2016 UK Corporate Governance Code (the ‘Code’) and complied with its best practice provisions. Further details appear below, and in the Directors’ Report and other cross-referenced sections of this Annual Report, all of which are incorporated by reference into this report. There are no provisions in respect of which an explanation is needed under the ‘comply or explain’ requirement. A description of the main features of the Company’s internal control system and disclosures on other regulatory matters including statements on going concern and viability can be found on pages 146 to 149 in the Directors’ Report. A summary of our risk management systems and information about the risks and uncertainties that relate to our business is detailed within the ‘How we manage risk’ section on pages 46 to 49. Information on corporate responsibility can be found in the Corporate Responsibility section on pages 36 to 43.
Board compositionSeven directors served on the Board throughout 2017: the Chairman; the Chief Executive; three independent non-executive directors; the Finance Director and one operational executive director. In addition, Ross McInnes was a non-executive director until 30 September 2017 and Bob Stack was a non-executive director until 7 December 2017. Thomas Thune Andersen was appointed as a non-executive director with effect from 1 July 2018. The Board now comprises seven directors. In line with the Code, all continuing directors stand for re-election at each Annual General Meeting.
Independence of non-executive directorsThe Board considers that all of the non-executive directors are free from any business or other relationship which could materially interfere with the exercise of their independent judgement and all meet the criteria for independence under the Code. All of the non-executive directors are regarded by the Board as independent. The Chairman was also regarded as independent at the date of his appointment to the Board.
Board diversityThe non-executive directors are a diverse group from different backgrounds and nationalities and bring with them a wide range of skills and experience in commerce, finance and industry in various parts of the world. There are five different nationalities on the Board and two of the seven serving directors are female (i.e. 29%). Our approach to diversity is set out in more detail in the Corporate Responsibility section on pages 36 to 43 and in the Nominations Committee Report on page 64.
Dates of appointment
Meetings and use of Board timeThe Board met on seven occasions during the year including two results reporting meetings, a day dedicated to strategy discussions and regular review meetings at which updates are provided as appropriate to include safety, operational and financial matters, investor relations, risk and legal affairs. One special meeting was convened to approve the acquisition of Bimba Manufacturing Company. In addition, there were several days spent on Board site visits and attendance at the Group Management Conference.
Set out below is the Board’s formal report on corporate governance and separate reports from the Audit, Nominations and Remuneration Committees.
* Under the Code, the Chairman is excluded when considering the independent non-executive composition of the Board.
3 53 2 4 3
3 Independent non-executive directors
3 Executive directors
2 Female
5 Male
3 British
4 Other
Non-executive / executive directors*
Gender Nationality
Name Date of appointment Date of current letter of appointment
Anticipated expiry of current term
Carl-Peter Forster 1 October 2012 12 December 2017 30 September 2018
Birgit Nørgaard 6 November 2012 12 December 2017 5 November 2018
Isobel Sharp 1 September 2015 12 December 2017 31 August 2018
Lord Robert Smith 7 May 2015 12 December 2017 6 May 2018
55Introduction
Strategic R
eviewC
orporate Governance
Financial Statem
entsC
orp
orate G
overnance

February
Approval of the preliminary results and Annual Report
Approval of the final dividend recommendation
Approval of notice of Annual General Meeting including for 2018 the remuneration policy
May
Review of trading and other updates
Approval of the interim management statement
Preparation for the Annual General Meeting
July
Approval of the interim results
Approval of interim dividend
Interim risk review
September
Strategy meeting
Five year business plan review
October
Site visit
Review of trading and other updates
November
Acquisition proposal
December
Budget for 2018
Updates for review
Annual risk review
Board evaluation
Corporate Governance Report
2017 Board cycle
Board attendance
1 Ross McInnes did not participate in one meeting due to family bereavement and stepped down from the Board on 30 September 2017.
2 Bob Stack ceased to be a director due to his sad death on 7 December 2017.
In 2018 to date the Board has met once with all members in attendance.
Board roles and reserved mattersA description of Board roles and reserved matters is included in the IMI Corporate Governance Framework (which can be found on the Company website) and is summarised in the Directors’ Report on pages 146 to 149.
Induction and continuing development programmeA formal induction process for new non-executive directors is well established and is the responsibility of the Chairman with support from the Chief Executive and Company Secretary.
Business familiarisation is at the core of induction and continuing development for non-executive directors at IMI and is centred around gaining an understanding of the business and getting to know the wider management team. In addition, all non-executive directors attend a corporate induction day for senior managers held at head office. There is also a committee induction process designed to brief new committee members on the relevant committee’s activity and the issues it faces.
Non-executive directors are required to visit business units around the Group and to meet face-to-face with senior operating management and key corporate staff. There is regular contact between management and non-executive directors during site visits, formal meetings and other company events.
During 2017 all of the non-executive directors made site visits and the whole Board spent two days in Italy, where they visited the IMI Orton business in IMI Critical Engineering. Feedback on individual site visits is given to the Board.
Appropriate training and other continuing professional development is available to all non-executive directors and regular updates are given during the year where relevant to the business arising at Board and committee meetings. Non-executive directors are encouraged to undertake training at company expense and several did attend external training during the year.
Board visit to IMI Orton, ItalyIMI has a substantial presence in Italy which is home to business units in all three divisions. In particular, IMI Critical Engineering has five business units in the country including, IMI Orton in Piacenza near Milan. IMI Orton is a key brand for IMI Critical Engineering and offers a range of isolation valves for LNG and other severe service applications. In October the Board visited IMI Orton where it held meetings and toured the manufacturing site.
The Board commended the investment in the IMI Orton facility and the high standards of operational management. IMI’s core processes were seen to be well embedded and the business has made excellent progress with its Value Engineering programme. Site visits are an important, regular feature of the Board calendar. Each visit provides an excellent opportunity for the Board to meet a wider group of employees and gain a more in-depth understanding of the business.
During the factory tour, management and staff had the opportunity to showcase a wide range of improvements and local management made business presentations. Senior managers from IMI Orton and other Critical Engineering businesses in Italy joined the Board for discussions over dinner.
Director Board meetings % attended where eligible
Carl-Peter Forster 7/7 100
Ross McInnes1 2/4 50
Birgit Nørgaard 7/7 100
Isobel Sharp 7/7 100
Lord Smith 7/7 100
Bob Stack2 6/7 100
Mark Selway 7/7 100
Daniel Shook 7/7 100
Roy Twite 7/7 100
Annual Report and Accounts 2017IMI plc56

Board evaluationIn line with the Code, the Board has agreed that the Chairman should arrange an externally facilitated evaluation process, normally once every three years. The last such evaluation was conducted in 2014. In 2017 an externally-facilitated evaluation exercise was carried out with Egon Zehnder, an independent consultancy that has no other business connection with the Company.
A comprehensive brief was given to the assessment team by the Chairman and the Chief Executive. The evaluation also observed Board and committee meetings in July 2017 and subsequently detailed interviews were conducted with every director. In addition, representatives of Egon Zehnder interviewed members of the senior management team and selected advisers. All participants completed questionnaires and were interviewed on an individual basis. Draft conclusions were discussed with the Chairman and subsequently reviewed with the whole Board at its meeting in December 2017 with Egon Zehnder present. Carl-Peter Forster as the senior independent director received the report on the Chairman which he discussed with him, and the Chairman received a report with feedback on individual directors which was discussed with them. The chairs of the three non-executive committees each received a report from the external evaluation exercise and reviewed that with their committee. Based on their review Egon Zehnder’s overriding conclusion was that the Board is run in an effective manner and the Board was pleased with the highly positive outcome. Following discussion of the report by Egon Zehnder the Board noted some areas for development over the coming year including routine feedback on site visits, continuing development of strong relationships among Board members and regular M&A updates for the Board to be expanded.
The directors are satisfied that the Board is fulfilling its responsibilities appropriately and that the Board and its committees were effective and that each continuing director demonstrated a valuable contribution and a commitment to their role.
As senior independent director, Carl-Peter Forster conducted a review of the Chairman with the other non-executive directors and shared the results with the Chairman. During the year the Chairman also met with the non-executive directors to review the performance of the Chief Executive. The Chairman passed on to the Chief Executive appropriate feedback from the review of his performance.
Standing committees of the BoardThe standing committees of the Board are the Audit Committee, the Nominations Committee and the Remuneration Committee. Each of these committees operates under written terms of reference which clearly set out their respective delegated responsibilities and authorities. The full terms of reference of these committees are part of the IMI Corporate Governance Framework. The committees report to the Board on their work, normally through their respective chair, following each meeting.
Separate reports from the committees appear in this Annual Report as follows: Audit Committee Report on pages 60 to 63; Nominations Committee Report on pages 64 to 65 and Remuneration Committee Report on pages 66 to 85.
1 Raoul Gatti, Managing Director of IMI Orton explains the benefits of new machine tool fixings designed using SMED technologies (Single Minute Exchange of Dies).
2 Andrea Forzi (R), Head of Petrochemical & Isolation, explains IMI Orton products to IMI’s Chairman, Lord Smith.
12
57Introduction
Strategic R
eviewC
orporate Governance
Financial Statem
entsC
orp
orate G
overnance

Corporate Governance Report
Isobel SharpChair
Lord Smith of KelvinChair
Birgit NørgaardChair
Audit Committee Nominations Committee Remuneration Committee
Membership
Carl-Peter Forster
Birgit Nørgaard
Main responsibilities
Financial reporting
» Oversight role in relation to financial statements
» Reviewing significant areas of judgement and accounting policies
» Reviewing the proposed statements on going concern and viability to appear in the Annual Report
» Advising the Board on whether the draft Annual Report is fair, balanced and understandable
» Monitoring announcements in respect of financial performance
Financial control and risk
» Monitoring the effectiveness of internal financial controls
» Reviewing financial risk including fraud risk
» Oversight of internal audit and other key processes for monitoring internal financial control
» Overseeing the external audit process, its objectivity, effectiveness and cost with responsibility for setting the audit fee
» Making recommendations to the Board for the appointment of the auditor including oversight of the audit tender process
» Reviewing the system for confidential whistleblowing and the treatment of reports received
Membership
Carl-Peter Forster
Birgit Nørgaard
Isobel Sharp
Main responsibilities
» Board and committee composition
» Oversight of succession plans for the Board and for senior management and corporate roles
» Search for and recommendation of candidates for appointment as non-executive directors, Chief Executive and other executive director positions
» Diversity policy and monitoring of progress
» Review and recommendation of proposals for the assignment of major executive responsibilities and the appointment and removal of divisional business leaders
Main responsibilities
» Define and recommend the remuneration policy
» Determine the individual remuneration packages for the most senior executives and the Chairman within the policy approved by shareholders
» Set annual and long-term incentive metrics and awards and determine the outcomes
» Report on remuneration matters and constructively engage with shareholders
» Assess risk in respect of remuneration and incentive structures in particular
Membership
Carl-Peter Forster
Annual Report and Accounts 2017IMI plc58
Executive CommitteeThe Executive Committee is chaired by the Chief Executive and the other members are shown on page 15. The Committee meets monthly and more often as may be required. Regular attendees at its meetings include the Group Financial Controller, Director of Risk and Compliance, and the Head of Investor Relations.
The Executive Committee is the senior management body and as part of the broad remit set by the Chief Executive it monitors and manages business performance, reviews progress against strategic objectives and considers divisional management issues. It also formulates budgets and proposals on strategy, policy and resource allocation for consideration by the Board. The Executive Committee is a management committee which takes its authority from the Chief Executive and is not a committee of the Board.
The Executive Committee plays a key part in risk assessment, risk management and monitoring processes and receives regular reports on human resources, health and safety, compliance, legal and other corporate affairs.
Investor relationsThe Board seeks to maintain a balanced understanding of the issues and concerns of major shareholders and to assist them in the stewardship of their investments. The Chief Executive and Finance Director have primary responsibility at Board level for investor relations and they, and the Head of Investor Relations, report to the Board on shareholder issues at every Board meeting during the year. Financial analysts’ notes are circulated to the directors and the Board receives regular feedback reports from the Company’s brokers and public relations advisers as well as from management. Dialogue is maintained with the principal shareholders and the executive directors meet regularly with institutional investors. During 2017 there were over 130 such meetings with institutional shareholders. The Chairman and the senior independent director also are available to shareholders as needed and both have had contact with investors during the year.
The 2017 Annual General Meeting was presided over by the Chairman and attended by all of the directors other than Ross McInnes, who gave his apologies for absence due to a family bereavement. The Chairman encouraged debate and questions at the formal meeting and the directors met shareholders informally afterwards. Each substantively separate issue was put to the Annual General Meeting as an individual motion. Notice of the Annual General Meeting was issued more than twenty working days in advance of the meeting and the level of votes lodged for and against each resolution, together with details of abstentions, are shown on the IMI website. The Board values the support of shareholders and the poll results for all resolutions proposed at the Annual General Meeting were above 90% in favour in each case.
In addition to the Annual Report, the Company issues preliminary results and interim results announcements, as well as two interim management statements between results announcements. The IMI website includes recordings of results presentations made by senior management, recent annual and interim reports, interim management statements, other corporate announcements and links to the websites of the Group’s businesses.
The Company has arranged a dealing service for the convenience of shareholders with Equiniti (details are shown on page 170). A sponsored Level 1 American Depositary Receipt programme has been established for which Citibank, N.A. acts as depositary (details can be found on page 170).
By order of the Board
John O’Shea Group Legal Director and Company Secretary
1 March 2018
59Introduction
Strategic R
eviewC
orporate Governance
Financial Statem
entsC
orp
orate G
overnance

Audit Committee Report
Dear Shareholder
I am pleased to present my first report as Chair of the Audit Committee which outlines the Committee’s composition, main responsibilities and key areas of focus.
The core responsibilities of the Committee are oversight in relation to financial reporting, internal financial controls and assurance processes. The full terms of reference of the Committee can be found in the IMI Corporate Governance Framework on the Company’s website.
Composition of the Audit CommitteeBirgit Nørgaard, Carl-Peter Forster and I were members of the Audit Committee throughout the year. Ross McInnes was Chair of the Committee until 30 September 2017. All of the Committee members are regarded by the Board as independent non-executive directors. I have chaired the Audit Committee since 1 October 2017 and became a member on 1 September 2015. I spent my earlier career in the accounting and audit profession and I have significant recent and relevant financial experience. I also currently chair the audit committee at The Bankers Investment Trust PLC and Winton Group Limited. My colleagues on the Committee also have experience at audit committee level and collectively the Committee has the skills, experience and objectivity to be an effective Audit Committee and to challenge constructively.
The Committee generally asks the following to join its meetings: the Chairman, the Chief Executive, the Finance Director, the Group Financial Controller, the Director of Risk and Compliance, the Group Assurance Director and the external auditor, EY. I consult with the Finance Director, the Company Secretary and other key staff and with the external auditor ahead of meetings to ensure issues are well understood and meeting papers are appropriate.
The Committee holds at least part of several meetings each year alone with the external auditor and with the Director of Risk and Compliance and the Group Assurance Director. The Committee has the power to call on any employee to come before it. The Secretary to the Committee is the Company Secretary, who is also the Group Legal Director.
Main areas of activityThe Audit Committee met four times in 2017, including two results reporting meetings and two planning and review meetings.
The Committee reviewed the effectiveness of internal financial controls and assurance processes. Financial controls continued to be a key focus area for the Committee and during the year management has made further progress in strengthening internal financial controls and risk management processes. Based on its review of selected key controls, EY agreed with management’s assessment that the level of control effectiveness at the locations assessed in the audit remains high at 95% although there was a slight drop from last year’s 98% due to transition issues arising from personnel changes at a few locations. Management and the Committee reviewed this result and
Annual Report and Accounts 2017IMI plc60

the Committee was pleased to note the action taken to mitigate personnel transition issues going forward. The IT investment and infrastructure programme is bolstering the control environment, and as the implementation progresses, it facilitates increasing efficiency improvements in the audit.
The Committee has received and challenged reports on the six-monthly Internal Control Declarations which are submitted by each business unit and cover internal controls on financial affairs, IT, human resources and other key areas. The process is managed by Group Assurance, which follows up declarations to review scores and appropriate improvement actions.
The Committee reviewed and approved for submission to the Board the statements on going concern and viability, which appear in the Directors’ Report on pages 146 to 149. The Committee advises the Board on the fair, balanced and understandable requirements in respect of the Annual Report and the Committee has made a positive report to the Board in this connection. This is also an area for review by the external auditor in relation to which it did not report any exceptions. The statement of Directors’ responsibilities on page 150 includes confirmation by the Board that it considers the Annual Report, taken as a whole, to be fair, balanced and understandable. During the year, Committee members received updates covering changes in accounting standards and other key topics.
Attendance
1 Ross McInnes stepped down from the Board on 30 September 2017.
Oversight of financial reportingThe Committee acts in an oversight role in respect of the Annual Report and other announcements with financial content all of which are prepared by management. The Committee received reports on the annual and interim financial statements from management and the external auditor. The auditor’s report including a summary of key audit matters is set out on pages 151 to 157.
Significant judgements related to the financial statementsIn preparing the accounts, there are a number of areas requiring the exercise by management of judgement and estimation. The Committee reviews the most significant accounting areas involving such judgements and estimates and these are described below.
Impairment of goodwill and intangibles arising from acquisitionsWe considered the level of goodwill held on the Group’s balance sheet in respect of a number of past acquisitions and whether, given the future prospects of these businesses, the value of goodwill in each case remains appropriate.
The Committee reviewed the assumptions and calculations used by management in the assessment of any impairment of goodwill and intangible assets and agreed that no impairment charges were required. Impairment was also a key audit matter for EY which reported its findings to the Committee. Section 3.2 to the financial statements on page 111 provides details regarding the Group’s intangible assets and goodwill.
Revenue and profit recognitionThe Committee discussed the timing of revenue and profit recognition on some of the Group’s larger contracts. In addition, this is a key audit matter for which EY reported to the Committee.
Having reviewed management’s process and EY’s report, the Committee concluded that revenues and profits were appropriately reflected in the financial statements. Section 5.4 note C to the financial statements on pages 141 to 142 provides further information.
The Committee also reviewed management’s assessment of the impact of IFRS 15 ‘Revenue from Contracts with Customers’ which comes into effect from January 2018 and is discussed further in Section 1 on page 98.
Inventory valuationThe Committee reviewed the judgements applied to standard costing valuations and provisions against excess and obsolete inventory and concurred with management’s assessment. This was a key audit matter for EY, in respect of which it reported to the Committee that inventory valuation across the Group is considered appropriate. Note 3.1.1 to the financial statements on page 110 provides details of inventory valuation.
Other judgement areasThe Committee reviewed the appropriateness of the accounting treatment in respect of pension scheme liabilities, including the actuarial assumptions used and the impact of one-off special pension events. The Committee also reviewed reporting from the external auditor, which concurred with the accounting for pensions proposed by management. The Committee supported management’s on-going efforts to de-risk the Group’s pension obligations which in 2017 included the buy-out by an insurance company of £429m of UK defined benefit obligations. Further details can be found in Section 4.9 on page 128.
In addition the Committee reviewed the appropriateness of restructuring costs disclosed as adjusting items, property sales, leasing arrangements and the adequacy of taxation provisions. Further details on these matters can be found in Sections 2.2 and 2.4, respectively on pages 104 and 106.
The Financial Reporting Review Team of the Financial Reporting Council (‘FRC’) reviewed specific disclosures relating to alternative performance measures in IMI’s 2016 Annual Report as part of its thematic review on this topic. The FRC provided its comments to the Group and the changes proposed by the Group in response have been welcomed by the FRC. In particular, in its reporting the Group has now replaced the term ‘reported’ with ‘adjusted’ as the way of referencing the alternative performance measures used by the Group and has renamed the ‘exceptional items’ category as ‘adjusting items’. These two changes have been made in this Annual Report and are explained further in notes 1.1 and 2.2 to the Financial Statements, respectively on pages 98 and 104.
Director Audit Committee meetings
% attended where eligible
Carl-Peter Forster 4/4 100
Ross McInnes1 3/4 100
Birgit Nørgaard 4/4 100
Isobel Sharp 4/4 100
61Introduction
Strategic R
eviewC
orporate Governance
Financial Statem
entsC
orp
orate G
overnance

Audit Committee Report
External audit independence and performance reviewThe Committee approved the proposed external audit approach and its scope based on the size and level of risk of the entities concerned. The Group and EY take a risk based approach to audit and other assurance activity. The key audit matters identified by EY are set out in its report on pages 152 and 153 and were reviewed by the Committee in approving the audit scope and plan.
The Committee considered the independence and objectivity of the external auditor to be satisfactory. In assessing auditor independence the Committee had regard to the Financial Reporting Council’s latest best practice guidance for audit committees. In addition, the external auditor confirmed that its ethics and independence policies complied with the requirements of the Institute of Chartered Accountants in England and Wales.
The policy on the use of the auditor for non-audit work was reviewed and updated by the Committee in 2016 to take account of developments in regulatory requirements and ethical guidelines for the audit profession. The policy requires approval by the Committee for any non-audit engagement which is more than trivial. The Finance Director monitors any proposed non-audit engagement of EY and refers to the Committee for approval as appropriate. The policy does not allow work to be placed with the auditor if it could compromise auditor independence, such as, functioning in the role of management or auditing its own work. Non-audit fees paid to the auditor were £0.1m (2016: £0.2m), which represents 4% of the audit fee and demonstrates the tight control which is maintained in this area. No non-audit engagements involved fees above £30,000 and the main area of activity was the interim results review. The Committee considers that the level and nature of non-audit work does not compromise the independence of the external auditor. Benchmarking of the audit fee was conducted to ensure that it is appropriate and competitive and the Committee approved the proposed audit fee payable to EY.
We formally reviewed the effectiveness of the external audit process. A questionnaire was used to review the external auditor and was completed by each member of the Committee and by the Finance Director, with the Group Financial Controller, who coordinated the review. Feedback was also received from the Chief Executive, the Head of Group Finance, Group and Divisional Management. The output from this process was considered by the Committee and was provided to the external auditor. As a result of this exercise the Committee believes the external auditor’s performance has been satisfactory and the external auditor is considered to be effective. To enhance further the external audit process, certain improvement actions were identified in the effectiveness review and plans have been put in place by EY to address these. These included improved processes for monitoring the completion of the statutory accounts of the subsidiaries and sufficient training to support any EY staff transitions.
Auditor choice, tenure and tenderingThe Committee recommended and the Board approved the proposal to seek approval to re-appoint EY as the external auditor at the forthcoming Annual General Meeting. EY was first appointed as auditor for the year-ending 31 December 2009, following a competitive tendering process, after which it replaced the previous external auditor. The term of appointment is annual and there are no contractual restrictions on the Committee’s choice of external auditor.
To maintain the objectivity of the audit process, the external audit partner responsible for the Group is rotated within the audit firm at least every five years and the current Senior Statutory Auditor, Andrew Walton, has now been in place for four years and will change following completion of the 2017 audit. Succession planning has been carried out and a new audit partner designate, Simon O’Neill, has been approved by the Committee.
Pursuant to the statutory requirement for audit tendering after ten years (i.e. in time for the 31 December 2019 audit), the Committee initiated an audit tender process in 2017, considered and, after amendment, approved the list of firms invited to tender. The Committee will make a recommendation to the Board in the summer of 2018 to allow adequate time for transition if there is to be a change of external audit firm.
Internal auditThe Committee also receives reports from and monitors the work of the internal audit function, known as Group Assurance. Group Assurance reports through the Director of Risk and Compliance to the Chief Executive. Group Assurance also has a direct reporting line to the Committee. Assurance work is primarily directed towards financial control audits but has been broadened into other areas including project planning and implementation for major business changes and internal control declarations. The principal projects reviewed in 2017 were major computer systems implementations in each of three divisions and a factory relocation.
Group Assurance works closely with the divisions to implement improved monitoring and review processes to complement the internal and external audit coverage. The annual plan and resourcing for internal audit were approved by the Committee and take account of the enhanced monitoring and review activity planned within the divisions. In 2017 the scope of internal audits has been extended to cover certain other operational and commercial risks. To achieve this, experienced financial managers in the divisions have worked with the Group Assurance team on combined reviews covering financial, operational and commercial matters. Group Assurance has also trained divisional finance managers in financial control auditing skills and provided a toolkit to enable them to take a wider role in supporting internal audit activity from 2018.
The Committee reviewed the effectiveness of Group Assurance with Management and received input from the external auditor. The Committee was pleased to note that Group Assurance had provided the training, tools and process required for the divisions to assume more responsibility for monitoring and assurance around internal financial controls, and that involving experienced financial managers from the divisions is enhancing both the effectiveness of Group Assurance and the skills of those managers.
Annual Report and Accounts 2017IMI plc62

Compliance hotlineThe Committee reviews the operation of the independent compliance hotline for reporting concerns, oversees the more significant reports received and considers how these are investigated and followed up. The Committee believes that the hotline process and investigations are effective and that proportionate action is taken by management in response.
Committee effectivenessThe Committee reviewed its own performance and terms of reference and received positive feedback from the evaluation exercise carried out in relation to the Board and each of its standing committees by Egon Zehnder.
The Committee approved this report on its work.
Yours faithfully
Isobel Sharp Chair of the Audit Committee
1 March 2018
63Introduction
Strategic R
eviewC
orporate Governance
Financial Statem
entsC
orp
orate G
overnance

Nominations Committee Report
Dear Shareholder
I am pleased to make my report as Chair of the Nominations Committee. This report is intended to give an account of the Committee and its activity in support of the Board. The core responsibilities of the Committee are for succession planning and appointments at Board level and oversight of the same at Executive level. The full terms of reference of the Committee can be found in the IMI Corporate Governance Framework on the Company’s website.
Composition of the Nominations CommitteeCarl-Peter Forster, Birgit Nørgaard, Isobel Sharp and I were members of the Committee throughout the year. Ross McInnes was a member until 30 September 2017 and Bob Stack was a member until his sad death 7 December 2017. For the purposes of the UK Corporate Governance Code, all of the non-executive directors on the Committee are regarded as independent non-executive directors.
Attendance
1 Ross McInnes stepped down from the Board on 30 September 2017.2 Bob Stack ceased to be a director on 7 December 2017.
Main areas of activity Board changes and recommendations for election and re-electionThe Committee played a full part in the internal appointments among the non-executive directors and recommended to the Board the senior independent director appointee and the Audit and Remuneration Committee chair appointees. A new non-executive director, Thomas Thune Andersen, has been appointed following a full search process overseen by the Committee. All of the directors standing are recommended for re-election at the Annual General Meeting. The Board approved all of the recommendations made by the Committee for the renewals of appointment for continuing directors.
Director Nominations Committee meetings
% attended where eligible
Carl-Peter Forster 3/3 100
Ross McInnes1 2/3 100
Birgit Nørgaard 3/3 100
Isobel Sharp 3/3 100
Lord Smith 3/3 100
Bob Stack2 2/3 100
Annual Report and Accounts 2017IMI plc64
Succession planningThe Committee reviews Board composition and has formulated a structured, medium-term plan for Board succession. Following Bob Stack’s sad death on 7 December 2017, Carl-Peter Forster was appointed as senior independent director and Birgit Nørgaard became chair of the Remuneration Committee. These appointments were in line with the pre-existing succession plans of the Committee.
Ross McInnes stepped down from the Board on 30 September 2017 and Isobel Sharp was appointed to succeed him as chair of the Audit Committee following a recommendation by the Committee. This appointment was in line with the succession planning put in place by the Committee.
To strengthen the remaining non-executive element on the Board, a wide-ranging search for two new non-executive directors was conducted using Zygos Partnership Limited as search consultants and resulted in the appointment of Thomas Thune Andersen with effect from 1 July. A further non-executive director appointment is planned and the search and selection process continues.
During the year we reviewed talent development and succession planning for the top 220 roles in the Group with the support of the Chief Executive and Group Human Resources Director. We were encouraged to see that significant progress continues to be made in terms of cultivating a stronger pipeline of high-calibre talent. Further details of our leadership development and succession planning processes are set out in the Corporate Responsibility section on pages 36 to 39.
Review of time commitments and contributionsThe appointments of the Chairman and non-executive directors are made on the basis of a formal letter of appointment including a stated minimum time commitment judged appropriate by the Committee. The Committee considers that the time given to IMI by each non-executive director is sufficient. The Board is satisfied that I have the necessary time to devote to my role as Chairman.
DiversityThe Board recognises the benefits a diverse pool of talent can bring to a boardroom and remains committed to increasing diversity in the businesses by voluntary measures. We will continue to review the composition of our management teams and the Board to ensure that we have the right mix of skills and experience while maintaining our effectiveness and execution capabilities.
At Board level, there are five nationalities, two of the four non-executive directors are female and there is a broad mix of backgrounds and experience. Currently 29% of directors are female. We are supportive of the need to improve gender diverse representation at Board and senior executive levels and are working hard to this end. Further information on workforce diversity matters is given in the Corporate Responsibility section on pages 36 to 39.
Committee effectivenessThe Nominations Committee reviewed its own performance and terms of reference and received positive feedback from the evaluation exercise carried out in respect of the Board and each of its committees which was facilitated by Egon Zehnder.
The Committee approved this report on its work.
Yours faithfully
Lord Smith of Kelvin Chair of the Nominations Committee
1 March 2018
65Introduction
Strategic R
eviewC
orporate Governance
Financial Statem
entsC
orp
orate G
overnance

Annual Statement from the Chair of the Committee
Dear Shareholder
It was with great sadness we announced that the Chair of the Committee, Bob Stack passed away in December 2017. After serving on the Committee for 5 years I assumed the role of Chair, and on behalf of the Committee I would like to take the opportunity to acknowledge Bob Stack’s contribution in the 8 years he served as Chair during which time he received strong shareholder support for our remuneration policy and its implementation.
It is testament to my former colleague’s character that despite his illness he did during 2017 lead the Committee in its review of IMI’s executive remuneration policy, with the objective of ensuring that it continues to support the delivery of our strategic growth plan and that there remains a strong pay for performance relationship. Following this review, we are proposing no major changes, but some adaptations to the existing executive remuneration arrangements to further align executive and shareholder long-term interests. We will be seeking your approval of this new remuneration policy at the upcoming Annual General Meeting.
As part of the policy review process, both Bob Stack and I had the opportunity to consult with a number of our shareholders and shareholder representative bodies who have helped shape our policy decisions.
Changes to remuneration policyThe review of the remuneration policy was principally focused on how the business and the environment in which it operates has progressed since our current policy was approved by shareholders in 2015. The review focused on the following areas:
» The alignment of remuneration with IMI’s strategic objectives;
» The relationship between pay and performance;
» Pay design trends, governance developments and investor views; and
» The market competitiveness of the current policy compared to peers.
Consensus amongst the Committee was that as IMI is in the midst of a five-year strategic plan, radical change to the existing policy is not desired, nor necessary. Further, our current policy has maintained a strong pay-for-performance relationship during its period of implementation and provides executives with a competitive but not excessive opportunity for reward.
That said, the Committee is mindful of the current developments surrounding executive pay and alignment with pay of the wider workforce. The new policy will therefore:
» Reduce the pension allowance for new hires
Reduce the current maximum pension allowance for new hires from 30% to 25% of base salary for a Chief Executive and 20% for any other executive director. The Committee considers this to be a more equitable ratio with the wider employee pension provision (at management level) whilst balancing legacy commitments to incumbents. This follows a previous reduction in the maximum from 35% to 30% when the current policy was introduced in 2015.
» Adopt a two year post-vesting holding period for shares arising from long-term incentive awards
The Committee discussed at length the appropriateness of introducing other new features into the new remuneration policy. Having given due regard to the feedback from our shareholders on proposals put to them, it concluded that it is appropriate to adopt a two year post-vesting holding period for any awards made after the new policy is approved. This new feature is in addition to the existing share ownership guidelines, which require executive directors to build
Directors’ Remuneration ReportAnnual Report and Accounts 2017IMI plc66
and then maintain a shareholding in IMI worth at least 250% of salary for the Chief Executive, Mark Selway, 150% of salary for the Finance Director, Dan Shook and 200% of salary for Executive Director, Roy Twite.
» Continue to enforce mandatory annual bonus deferral under current share ownership guidelines
The new policy will continue to require retention in shares of 50% of any annual bonus earned and of any vested long-term incentive until the minimum share ownership guideline is achieved.
» Enhance disclosures
In addition to the policy revisions disclosed above, the Committee has made further disclosure enhancements to the Annual Remuneration Report in areas including:
» Long-term incentive award performance conditions;
» Annual incentive targets in respect of IMI Critical Engineering as they relate to Roy Twite;
» Personal objectives element of annual bonus performance measures; and
» Share ownership guidelines.
The Committee strongly believes that these new policy features, together with the enhancements to annual disclosures, will further strengthen shareholder alignment and transparency.
Pay for performance in 2017Our focus this year has been twofold: to ensure consistent application of our outgoing policy and to ensure remuneration arrangements remain appropriate in light of the continuing tough economic and market conditions.
2017 has been a year of good progress for IMI even against continued mixed economic and market conditions. Group adjusted profit before tax has increased by 7.7% to £224.1m while organic revenue growth remained flat with revenue at £1,751m on a constant currency basis. Cash conversion remained strong at 92% in 2017 and shareholders will receive a dividend of 39.4p – an increase of 2% from last year assuming the final dividend recommendation is approved at the forthcoming Annual General Meeting.
Our various initiatives to harness the Group’s potential continue to progress well. We remain committed to investment in new product development to fuel growth, improving operational performance to enhance our competitiveness and investing to modernise our IT infrastructure. The business continues to successfully implement cost-reduction activities on time and on budget that support near term financial results, and also through acquisitions including Bimba Manufacturing which support our long-term strategic agenda. The Committee monitors and takes into account the financial and strategic benefits of such initiatives when making pay decisions.
How were pay outcomes linked to performance in 2017?Remuneration for the executive directors is closely tied to business performance with a high proportion of total remuneration delivered through variable pay linked to our strategic plan and budget.
Annual incentives paid to executive directors in respect of performance in 2017 continued to be based on a combination of Group adjusted profit before tax, organic revenue growth, cash conversion and strategic and personal objectives. 2017 saw strong financial performance with high achievement against targets set 12 months ago and in the context of the continued challenging environment in which the business operates, targets set in respect of financial metrics for the annual incentive scheme and in terms of the strategic and personal objectives. The Committee is confident that the annual incentive outcomes ranging between 77.9% and 96.8% of maximum for the executive directors represent a fair reflection of the business and individual performance in the context of the continued challenging environment in which the business has been operating.
2018 marks the first year of potential vesting under the IMI Incentive Plan (‘IIP’), approved by shareholders in 2015. Mark Selway, Roy Twite and Dan Shook were granted a performance share award under the IIP in 2015 and the awards will vest at 6.55% in May 2018.
Base salaries in 2018The Committee reviewed the base salary levels for the Chief Executive, Mark Selway and Executive Director, Roy Twite in light of the 2017 business performance and concluded that an increase of 2.6% effective 1 January 2018, was appropriate and in line with the wider employee workforce. The Committee agreed to increase the base salary level for Daniel Shook, Finance Director by 5% to reflect the excellent progress made during his three year tenure with the Company and taking into account he was appointed on a base salary lower than his predecessor and his remuneration when compared to Chief Financial Officers in similar size businesses.
The fees of the Chairman and non-executive directors were also reviewed and were increased by 2.6%, effective 1 January 2018, in line with the executive directors and the wider employee workforce, for which the average increase awarded for 2018 is around 3%.
Looking forwardMy predecessor and the Committee have devoted a considerable amount of time to reviewing the executive remuneration framework over the year. Subject to shareholder approval, it is our intention that the new policy will operate for the next three years, as the Executive team continues to focus on delivering long-term value to you, our shareholders. On behalf of Bob Stack and myself I would like to personally thank those investors that took the time to participate in our consultation exercise and engage with us in developing our proposed policy. We hope that the new policy will meet with your support at the upcoming 2018 Annual General Meeting.
Birgit Nørgaard Chair of the Remuneration Committee on behalf of the Board
1 March 2018
67Introduction
Strategic R
eviewC
orporate Governance
Financial Statem
entsC
orp
orate G
overnance

Directors’ Remuneration Policy
Directors’ Remuneration Report
The Remuneration Committee (the ‘Committee’) presents the Directors’ Remuneration Policy Report, which will be put to shareholders for a binding vote at the Annual General Meeting (‘AGM’) to be held on 3 May 2018. Subject to shareholder approval, the effective date of this policy will be 3 May 2018. The intention of the Committee is that the policy will normally remain in place for three years.
Illustrations of the application of IMI’s remuneration policyTo illustrate the opportunity available to our executive directors, and the sensitivity of pay to performance, the graphs on this page set out pay outcomes under three performance scenarios:
» minimum, where pay is limited to fixed, non-performance components (based on 2018 salaries, the corresponding pension allowance and other benefits);
» ‘on-target’, where annual bonus and long-term incentives vest at on-target levels; and;
» maximum, where all variable pay components vest in full.
The charts are based on proposed IMI Incentive Plan awards for 2018. No share price growth or dividend assumptions are made and all-employee share plans are excluded.
4,831
M W Selway
R M TwiteD J Shook
Salary 822 822 822
Pension 30% 30% 30%
Benefits 63 63 63
Annual Incentive Bonus 0% 100% 200%
IIP 0% 62.5% 250%
Salary 439 439 439
Pension 20% 20% 20%
Benefits 39 39 39
Annual Incentive Bonus 0% 62.5% 125%
IIP 0% 37.5% 150%
Salary 475 475 475
Pension 35% 35% 35%
Benefits 27 27 27
Annual Incentive Bonus 0% 75% 150%
IIP 0% 50% 200%
Long-term incentivesBonusFixed pay
100%
100%100%
46% 23%
53%
5,000
3,0003,000
2,5002,500
4,000
2,0002,000
3,000
1,5001,500
2,000
1,0001,000
1,000
500500
Minimum
MinimumMinimum
£000
£000£000
On-target
On-targetOn-target Maximum
Maximum
Maximum
33%34%
43%
28%27%
31%
21%
19%17%
37%
1,132
668566
2,467
1,262
1,005
1,773
2,331
29%
30%
41%
Long-term incentivesBonusFixed pay
Long-term incentivesBonusFixed pay
56% 32%
Percentages in the above tables are percentages of salary.
Annual Report and Accounts 2017IMI plc68

Future policy table – executive directors
Fixed elements of executive remuneration
Component & purpose Operation Annual opportunity Performance
Salary
Reflects individual performance and personal contribution to delivering strategy. Set in the context of total pay levels.
Reviewed annually with changes normally effective from January.
The Committee takes into account the level of increase for the wider executive population, market data, business performance, external economic factors, the complexity of the business and the role, cost, and the incumbent’s experience and performance.
Normally any salary increase for an executive director will be in line with those of the wider workforce. Increases beyond this may be awarded in certain circumstances, such as a change in responsibility or development in role, after taking into account the factors noted opposite.
N/A
Pension
Provides for retirement and supports succession planning.
A cash allowance in lieu of pension is paid monthly. To the extent required by law, part of this allowance will be paid into a defined contribution pension arrangement. With the Committee’s approval the executive directors may redirect all or part of the balance of this allowance into a defined contribution pension arrangement.
Up to 25% of salary for any new hire who becomes Chief Executive and 20% of salary for any other new executive director.
This represents a reduction in maximum contributions compared to the current policy.
Legacy obligations will continue to be honoured in respect of serving executive directors (Chief Executive 30% and Roy Twite 35%).
N/A
Benefits
Protects the well-being of executives and provides fair and reasonable market competitive benefits.
The policy provides a normal range of benefits to executive directors. These include but are not limited to:
Non-cash: private healthcare for themselves and their family, life insurance, and other ancillary benefits including the use of a company driver.
Cash and taxable allowances: car and fuel allowance, personal tax advice and four annual round trips for the Chief Executive or his family between work and home locations.
Relocation costs: where it is in IMI’s interests to request that executives work in a different country or region then we may pay relocation and provide benefits and allowances in line with IMI’s Global Mobility Policy.
Expenses: expenses that are incurred by an executive director in undertaking their role are reimbursed together with any tax arising on such benefits where the Company considers it fair and reasonable to do so. Typically these might include business travel, meals and client entertainment, and are provided in the form of an allowance or reimbursement.
The value of benefits vary year-on-year depending on the age and health of the individual, the cost of providing them and the geography in which the executive is based. However, the range of benefits is not expected to change from year to year.
Should it be appropriate to relocate an executive director or to recruit an executive director from overseas, flexibility is reserved to provide benefits that ensure that the individual and IMI can both achieve the commercial purpose of this relocation.
N/A
69Introduction
Strategic R
eviewC
orporate Governance
Financial Statem
entsC
orp
orate G
overnance

Variable components of executive remuneration
Component & purpose Operation Annual opportunity Performance
Annual Incentive Bonus
Drives and rewards performance against annual financial, strategic and operational goals, which are consistent with the medium to long-term strategic goals of IMI. Takes into account individual behaviours and contributions.
Based on annual performance relative to set targets.
If the executive has not achieved their share ownership guideline, up to half of any bonus must be invested into IMI shares for at least three years. Once the share ownership guidelines is met, an executive can elect to receive their bonus in cash and/or shares. Dividends (or equivalent value payments) accrue and are payable in cash or shares when shares are released.
Recovery provisions are included in the plan rules allowing for malus and clawback.
Up to a maximum of 200% of salary
Percentage of award payable (straight-line between points):
Threshold 0%
Target 50%
Maximum 100%
In 20181 the performance measures will be Group adjusted profit before tax (40%), organic revenue growth (20%), cash conversion (20%), strategic and personal objectives (20%) with a health and safety underpin.
The Committee has the discretion to determine the appropriate measures and targets annually to ensure alignment with strategy. Normally these will be a combination of measures linked to the financial and non-financial performance of IMI.
IMI Incentive Plan (‘IIP’)
Incentivises long-term value creation, aligning the interests of executives and shareholders through share awards. Performance metrics support the long-term strategy of IMI and the vehicle and time horizon provides a retention tool for key executives.
The Committee can make annual share-based awards. Dividends (or equivalent value payments) accrue and are payable in cash or shares in respect of vested awards.
If the executive has not achieved their share ownership guideline, 50% of vested share awards must be retained. Notwithstanding this requirement, any vested share awards will be subject to a sale restriction for a period of 2 years from the date of vesting, subject to the executive being permitted to sell such number of shares as may be required to settle tax liabilities as they may arise.
Recovery provisions are included in the plan rules allowing for malus and clawback.
Normal award: Up to 250% of salary
Maximum award: 400% of salary (to be used in exceptional circumstances only e.g. upon recruitment2)
If an award above the normal maximum is made, full details will be provided in the following year’s Annual Report on remuneration.
Percentage of award payable (straight-line between points):
Threshold 25%
Maximum 100%
In 2018 the performance measures will be Group adjusted profit before tax growth (50%), ROCE (25%) and relative TSR (25%).
The Committee has discretion to determine appropriate measures, targets and ranges in respect of each award when made.
Other executive director remuneration policies
Share Ownership Guidelines
It is a requirement of the remuneration policy that executive directors are subject to guidelines which require them to build a shareholding in IMI worth at least 250% of salary for M W Selway, 150% of salary for D J Shook and 200% of salary for R M Twite. Policy permits the Committee to determine that 50% of any annual bonus earned is deferred into shares until the share ownership guideline is achieved together with 50% of any vested share awards. Each executive is then required to maintain at least this share ownership guideline level (subject to allowances for share price fluctuations and changes in base salary thereafter). When assessing compliance with this guideline the Committee reviews both the level of beneficial share ownership and vested but unexercised share incentive awards on a post-tax basis.
Directors’ Remuneration ReportDirectors’ Remuneration Policy
1 These are the same performance measures as 2017.2 Refer to page 72 for further details.
Annual Report and Accounts 2017IMI plc70

Additional notes to the future policy tableSetting of performance measures and targetsThe Committee reviews and selects performance measures, targets and ranges annually, which take account of the economic conditions and the priorities of IMI at the time. Details of the performance measures are included in the Annual Report each year. At the time of selecting performance measures, the Committee determines the performance targets that will apply in respect of each measure. Factors that the Committee may consider include the strategic plan, the annual budget, analysts’ forecasts, economic conditions, individuals’ areas of responsibilities and the Committee’s expectations over the relevant period. Depending on the nature of the measure e.g. health and safety, the Committee may exercise judgement in assessing performance and determining the level of vesting.
Principles for the impact of corporate transactions The Committee has established principles that determine the way in which corporate transactions will impact remuneration. It is clear that any corporate transaction, which is in the best interests of IMI and its shareholders, should not have an adverse impact on remuneration. The principles include the need for management to be treated in a manner consistent with shareholders in respect to the rights to equity, that performance should be measured on a like-for-like basis, that there should be no compensation for adverse or favourable tax consequences and that any changes to performance computations will be reviewed by the Company’s auditors.
Recovery provisionsThe Committee has the power to operate malus and/or clawback provisions in the event that the Company misstated financial results and if there was an error or miscalculation in determining the size of the award and/or gross misconduct. The provisions enable the Committee to reduce future annual bonus payments, reduce the number of shares under any form of share award, and/or require the individual to make a payment to the Company on terms deemed to be fair and reasonable by the Committee.
All-Employee Share PlansIMI operates an HMRC approved Savings Related Share Option Scheme which is open to all of the Group’s UK employees, including the UK-based executive directors. The scheme seeks to encourage share ownership amongst the broader employee population in a tax efficient manner and operates subject to statutory requirements including a limit on the level of savings that can be used to acquire shares. The Group also has a global share plan, the operation of which varies by geography, which executive directors can participate in on the same terms as other employees.
Differences in the remuneration policy for executives relative to the broader employee populationThe remuneration framework in place for the executive directors is informed by the remuneration structure that applies to the broader employee population. While absolute levels and the provision of certain components, benefits and allowances vary by geography and level, the overarching themes are consistent:
» we aim to offer competitive remuneration at all levels of the organisation to attract and retain highly qualified employees;
» salaries are reviewed annually with any increases made on a discretionary basis and informed by factors such as those set out in the policy table;
» consistent with executive directors, the leadership group participates in annual bonus plans with measures linked to corporate, divisional and/or local performance depending on seniority;
» a wider executive population can be considered for awards under the IIP. At lower levels, employees can also be considered for discretionary share awards with a pre-grant performance test. IMI’s share plans are intended to encourage share ownership at all levels of the Group. The all-employee plans described above are offered on consistent terms to all employees in the geographies where the plans operate; and
» eligibility for and provision of benefits and allowances varies by level and local market practice. For senior managers, it is standard to receive a company car allowance. Pension contributions below the Board are set at a lower rate, and can take the form of a cash allowance.
71Introduction
Strategic R
eviewC
orporate Governance
Financial Statem
entsC
orp
orate G
overnance

Directors’ Remuneration ReportDirectors’ Remuneration Policy
Other executive director remuneration policiesAppointments to the Board Base salary will be set taking into account factors including market levels, experience, internal relativities and cost. The Committee may determine that an initial positioning below market is appropriate and in those circumstances, realign base salary in the years following appointment, which may result in an exceptional rate of increase in the short-term. Any reliance on this principle will be noted at the time of appointment. The theoretical maximum variable pay opportunity that can be awarded in one year will be up to 200% in annual bonus and up to 400% in an IIP award.
As part of the appointments policy the Committee may also:
» continue with the provision of existing legacy remuneration components relating to pension, benefits and allowances for internal appointments;
» provide benefits, allowances and/or payments related to relocation; and/or
» make a long-term incentive award on appointment, outside of the annual cycle, under the existing shareholder approved share plan to provide an immediate interest in company performance. The Committee will determine the level of any award, performance conditions and time horizon informed by the business circumstances at the time. The maximum value of such an award will be 400% of salary and will only be used in exceptional circumstances e.g. upon recruitment.
The Committee may consider ‘buying–out’ incentive awards, up to an equivalent value, that an individual forfeits in accepting the appointment. To achieve this, the Committee will use the shareholder approved plan. When making their decision, the Committee will be informed by the vehicles, time horizons, value and performance targets associated with any forfeited awards.
Service contracts will be entered into on terms summarised in the service contract policy (see adjacent table).
Service contracts
From September 2013
Notice period 12 months’ notice by either party
Payment in lieu of notice
As determined by the Committee, but restricted to salary, benefits and pension. Directors have a duty to mitigate
Prior to September 2013 (Roy Twite)
Notice period 12 months’ notice by either party
Payment in lieu of notice
At the Committee’s discretion
Annual Report and Accounts 2017IMI plc72

Termination and loss of office The primary principle underpinning the determination of any payments on loss of office is that payments for failure will not be made. Service contracts and plan rules have been drafted in such a way that the Committee has the necessary powers to ensure this. On departure, the Committee will take into account factors including the reason for the executive leaving, performance during the time served in the year and contractual obligations when approving any payments. When an executive is terminated for cause there is no entitlement to salary, pension, benefits or an annual bonus and unvested share awards lapse.
The following table provides a summary of the treatment of each component of pay applicable for the current executive directors. It should be noted that the Committee applies judgement in determining whether an individual is classed as a good leaver or otherwise under the share plans and is authorised to reach compromise agreements with departing executives. Agreed departure can include death, ill health, redundancy or retirement.
Payment Agreed departure Differences in a change in control situation
Salary, pension and benefits
The Committee may make payment in lieu of notice. None.
Annual bonus Individuals can be considered for a bonus; factors such as time served during the performance period and performance can be taken into account.
Deferred bonuses vest.
Performance to the date of the event taking place will be considered in determining whether any bonus should be payable, subject to the overall maximum applicable to the relevant individual.
For directors appointed prior to September 2013, there remains a bonus entitlement if a change in control has taken place within the 24 months prior to termination. In this scenario, the director is entitled to bonus, or compensation in lieu of bonus, in respect of the relevant calendar year.
IIP performance share awards and legacy Performance Share Plan (PSP)
Performance measured at the end of the performance period, or at the date of cessation of employment.
Pro-rating for time elapsed at cessation of employment will be considered by the Committee.
The Committee can reduce or increase the exercise period for unvested and vested but unexercised awards (legacy PSP only).
Vested awards which are subject to a holding period will not normally be forfeited on a termination and the holding period will continue to apply to such awards (although the Committee may release awards early from the holding period in appropriate cases). If the reason for termination is misconduct, vested awards which are subject to a holding period may be forfeited in whole or in part.
Similar to agreed departure with the following differences:
A reduction in the exercise period for vested but unexercised awards.
Performance and time elapsed will be taken into account, but the Committee may enable awards to vest in full.
In certain situations (as defined in the plan rules) rollover awards of a broadly equivalent nature can be offered.
Other The Committee may approve other limited payments which may include legal fees connected to the departure, untaken holiday, out-placement and repatriation.
Similar to agreed departure.
73Introduction
Strategic R
eviewC
orporate Governance
Financial Statem
entsC
orp
orate G
overnance

Directors’ Remuneration ReportDirectors’ Remuneration Policy
Considerations taken into account when setting our directors’ remuneration policyEmployment conditions at IMIWhen setting the salaries for executive directors the Committee takes into account a number of factors (as noted in the future policy table on pages 69 to 70) and these include the broader employment conditions within IMI. More specifically:
» the Committee reviews budgeted salary increases across the Group on a country-by-country basis when assessing the appropriateness of any increases for the executive directors; and
» in making decisions the Committee also takes account of the internal relativities against the reference group and within the wider leadership group and general employee population.
Details of these comparison metrics will be included every year in the Annual Remuneration Report.
Shareholder viewsThe Committee has a standard annual agenda item whereby the feedback from shareholders and investor advisory bodies is presented and discussed following the Annual General Meeting. The feedback that the Committee receives informs discussions for the formulation of future policy and subsequent remuneration decisions. A formal shareholder consultation process was undertaken in the Autumn of 2017 to gather investor feedback on the proposed remuneration policy as set out herein. Shareholders were generally supportive of the proposals and their feedback has been taken into account during the development of the new remuneration policy set out here.
Chairman and non-executive directorsLetters of appointment The letters of appointment set out key duties, including appropriate time commitments, provisions for induction and familiarisation with the businesses and wider senior management team and require approval for other directorships and potential conflicts of interest.
There are no provisions for the Company to give notice, but the Chairman is required to give three months’ notice to the Company and non-executives one month. Subject to annual re-election at the Annual General Meeting, the initial period to first renewal is three years. After six years, renewal is considered on an annual basis.
The letters of appointment are available for inspection at the Annual General Meeting and the Company’s registered office. Details of the dates and unexpired terms are included in the Corporate Governance report on page 55.
Appointments to the board Any contractual terms will be consistent with those currently adopted for existing non-executive directors updated as necessary for legal reasons and to reflect best practice. The Chairman and non-executive directors are not eligible to receive any variable pay. On appointment, fees for non-executive directors will be consistent with the policy in place at the time of appointment. If necessary, to secure the appointment of a new Chairman who is not based in the UK, payments relating to relocation and/or housing may be provided.
Chairman and non-executive directorsThe table over the page summarises the policy with respect to the remuneration of the Chairman and non-executive directors. No component of remuneration is linked to performance, there are no provisions for the recovery of sums paid or the withholding of any payments and there are no provisions for the Company to pay compensation on early termination.
Annual Report and Accounts 2017IMI plc74

Component Purpose Operation Annual Opportunity
Base Fees To attract and retain high-calibre individuals by offering market-competitive fees, commensurate to the time commitment and experience that is required.
Fees are reviewed annually and can be paid in cash and/or shares.
Benchmarked against companies of a similar size and complexity.
When setting fees, factors considered include the level of increase for employees more generally, market data, business performance, external economic factors, the skills required, time requirements and cost.
In respect of the Chairman, IMI also considers the individual’s profile and experience.
As of 1 January 2017, the Chairman’s fee was £312,000 paid in cash. Fees can be paid in a combination of cash and/or IMI shares.
At 31 December 2017 base fees for the non-executive directors were £62,424 paid in cash.
The fees were reviewed at the end of 2017 and increased by 2.6% with effect 1 January 2018.
Additional Fees
To reflect the additional time required when an individual chairs a committee, is appointed as senior independent director, or is otherwise required to assume additional duties.
Fees are reviewed annually and can be paid in cash and/or shares.
The Chairman is not eligible to receive additional fees for his chairmanship of the Nominations Committee.
Fees are benchmarked where appropriate and set in a manner consistent with base fees (see above).
Fee levels in place at 31 December 2017:
Committee Chairman: £15,606
Senior independent director: £10,404
The above fees were reviewed at the end of 2017 and increased by 2.6% with effect 1 January 2018.
Benefits To reimburse reasonable business expenses. Reimbursement in cash on production of receipts or other proof of payment of business expense.
All reasonable travel and other expenses incurred by the Chairman and non-executive directors in carrying out their duties together with any tax arising on such benefits, are reimbursed where the Company considers it fair and reasonable to do so. Typically these might include business travel, meals and entertainment, and are provided in the form of an allowance or reimbursement.
Future policy table – Chairman and non-executive directors
75Introduction
Strategic R
eviewC
orporate Governance
Financial Statem
entsC
orp
orate G
overnance

Directors’ Remuneration Report
Annual Remuneration Report
The CommitteeCompositionThe members of the Committee throughout the year were Bob Stack (Chair until his sad death on 7 December 2017), Carl-Peter Forster and Birgit Nørgaard (Chair from 11 December 2017). In accordance with the 2016 UK Corporate Governance Code, all of the non-executive directors were regarded by the Board as independent.
ResponsibilityThe Committee determines the remuneration policy and rewards for the executive directors and, in his absence, the Chairman. The Committee also reviews the remuneration packages of those at the next most senior level of management and has considered the levels of pay across the Group. A copy of the Committee’s terms of reference, which are reviewed annually, is included in the IMI Corporate Governance Framework and available in the Corporate Governance section of the IMI website.
Internal advisers to the CommitteeDuring the year, the Committee consulted the Chief Executive, regarding the packages of the other executive directors and senior managers. It also received support from the Finance Director, the Group Human Resources Director, the Head of Group Reward and the Company Secretary, who is also secretary to the Committee. None of these individuals were involved in determining their own remuneration.
External advisers to the CommitteeIndependent remuneration consultant, Willis Towers Watson, is formally appointed by the Committee and provided advice on executive directors’ remuneration to the Committee in 2017. The Committee noted that the firm are actuaries and administrators for the IMI Pension Fund. The Committee is comfortable that these activities do not represent a conflict of interest and that objective and independent advice continues to be received by the Committee from the dedicated team servicing it at Willis Towers Watson.
During 2017, Willis Towers Watson has also supported management on some broader reward and human resource matters. The fees charged by Willis Towers Watson in respect of advice and services to the Committee totalled £141,725 in 2017. Willis Towers Watson are signatories to the Remuneration Consultants’ Code of Conduct in the UK.
A summary of the Committee’s activities during 2017The Committee had three formal meetings during the year; attendance can be viewed in the table below. The principal agenda items were as follows:
» a review of IMI’s executive remuneration practices and subsequent preparation of the proposed new Directors’ Remuneration Policy to be presented for shareholder approval at the Annual General Meeting in May 2018;
» a review of total compensation packages of the executive directors and the most senior management of the Group to ensure alignment with IMI’s strategic growth plan;
» approval of achievements and outcomes under the incentive plans;
» consideration of the fees for the Chairman;
» setting the framework and target levels for the 2017 incentive cycle including review of the performance targets attaching to the 2018 long-term incentive plan awards;
» approval of the granting of share awards to executive directors and certain other levels of management including a review of the Total Shareholder Return comparator group to ensure it remains appropriate;
» a review of IMI’s gender pay gap results for the year ended 5 April 2017;
» a review of the UK corporate governance environment relative to remuneration;
» a review of the engagement of the independent remuneration consultants to the Committee; and
» a review of the Committee’s own performance, constitution and terms of reference, including an externally facilitated evaluation with Egon Zehnder which was extremely positive.
Attendance
The Remuneration Committee (the Committee) presents the Annual Remuneration Report, which will be put to shareholders for an advisory (non-binding) vote at the Annual General Meeting to be held on 3 May 2018. The report includes details of the Committee, the pay received during the year in accordance with our current remuneration policy (approved on 7 May 2015) and comparative internal and external data.
Director Remuneration Committee meetings
% attended where eligible
R J Stack 2 100
C P Forster 3 100
B Nørgaard 3 100
Annual Report and Accounts 2017IMI plc76

Annual General Meeting voting outcomesThe following table summarises the details of votes cast for and against the 2015 Directors’ Remuneration Policy, and the 2016 Annual Remuneration Report resolution along with the number of votes withheld. The Committee was pleased with the level of support from shareholders and will continue to consider the views of, and feedback from, shareholders when determining and reporting on remuneration arrangements.
Executive single figure table (audited)
Voting outcome Votes for Votes against Votes withheld
Directors Remuneration Policy 2015
96.55% 3.45% 3,352,149
Annual Remuneration Report 2016
95.52% 4.48% 2,201,997
These figures have been calculated as follows:
Base salary: the actual salary receivable for the year.
Pension: the cash allowance paid in lieu of pension.
Taxable benefits: the gross value of all taxable benefits (or benefits that would be taxable for a person tax resident in the UK) received in the year.
Annual incentive bonus: the value of the annual incentive payable for performance in respect of the relevant financial year (half of this is automatically delivered in the form of deferred bonus share awards when the executive does not meet the share ownership requirement).
IMI Incentive Plan (IIP): the value on vesting of the nil cost options that were subject to performance over the three-year period ending on 31 December in the relevant financial year (see share price assumptions below).
Performance on appointment (1 October 2013) M W Selway was Share Plan (PSP): made an award under the PSP which vested on
30 September 2016. Full details are included in the 2016 Directors Remuneration Report. No other such awards to directors are outstanding.
Share price assumptions: for shares vesting in 2018, that related to performance in the three years to 31 December 2017, the average share price over the final three months of 2017 (1,257.05 pence) is used to estimate the value of shares on vesting.
All-employee share plans: the value of free shares at award and dividends under the Employee Share Ownership Plan in the relevant financial year and the intrinsic value of Save As You Earn share options on the date of grant in the relevant financial year (applying a 10% discount as permitted under the Save As You Earn Share Plan).
Dividend equivalent for the IIP an additional number of shares payments: proportional to the dividends paid between the date
of the award and the date of vesting are delivered on the vesting date (no further dividends are accrued after the vesting date). This applies to both the performance share awards and deferred bonus share awards under the IIP. Under the legacy PSP dividend equivalent payments are made on vested but unexercised share awards, which take the form of nil-cost options. Dividend equivalents, while notionally tracked by IMI from grant to exercise, are not paid or transferred to the participant until the point of exercise. These have been included in the single figure based on the number of dividend equivalents notionally accrued in the financial year, valued at the price on the dividend payment date. Any residual cash is rolled over and applied to the subsequent dividend equivalent purchase.
Director
Fixed pay (£000)
Annual variable pay
(£000)Long-term variable pay
(£000)
Other items in the nature of remuneration
(£000)
Total(£000)Base salary Pension
Taxable benefits1
Annual incentive
bonus
IMI Incentive Plan (IIP)
Performance Share
Plan (PSP)
Subtotallong-term
variable pay
All- employee
share plans
Dividend equivalent payments
See page Page 78 Page 78 Page 78Pages
78 to 80 Page 81 Page 82
M W Selway2017 801 240 63 1,525 138 - 138 5 1 2,773
2016 785 236 57 781 - 38 38 4 - 1,901
R M Twite2017 463 162 27 541 64 - 64 4 - 1,261
2016 454 159 27 311 - - - 4 - 955
D J Shook2017 418 84 39 506 43 - 43 3 - 1,093
2016 410 82 45 252 - - - 4 - 793
1 An adjustment has been made to the 2016 reported taxable benefits for M W Selway, R M Twite and D J Shook. This relates to non-cash benefits including the personal use of company drivers and company entertainment, plus associated tax costs.
R M Twite served on the Board of Halma plc during the year and received fees of £52,000 in respect of this appointment which he retained.
77Introduction
Strategic R
eviewC
orporate Governance
Financial Statem
entsC
orp
orate G
overnance

Directors’ Remuneration ReportAnnual Remuneration Report
Executive remuneration received in respect of 2017Base salarySalaries effective January 2017 were agreed taking into account a range of factors including the prevailing economic conditions, the financial performance of the Group and salary increases for other employees. The average increase for employees was 2.6%, compared to 2.0% for the executive directors. M W Selway’s, R M Twite’s and D J Shook’s salaries were increased by 2.0% to £801,000, £463,000 and £418,000 respectively.
PensionExecutive directors received a taxable cash allowance instead of pension benefits. M W Selway receives a cash allowance of 30% of salary and D J Shook receives a cash allowance of 20% of salary. R M Twite receives a cash allowance of 35% of salary as a legacy obligation from his appointment as an executive director in 2007 which continues to be honoured.
Pension benefits for past serviceR M Twite was previously an active member of the defined benefit IMI Pension Fund. He opted out with effect from 1 February 2007, before he became an executive director and as a result, he retains past pensionable service up to that date in the IMI 2014 Deferred Fund (the Fund).
The key elements of the benefits in the Fund are summarised below:
» the normal retirement age under the Fund is 62 and R M Twite may retire from employment with IMI any time after age 60 without actuarial discount.
» on death after retirement, a dependant’s pension is provided equal to 50% of the member’s pension.
» should he die within the first five years of retirement, the dependant’s pension is increased to 100% of the member’s pension for the remainder of the five-year period.
» pensions in payment, in excess of any guaranteed minimum pension, are increased each year in line with price inflation up to a maximum of 5% in respect of pension built up before 1 January 2006, and 2.5% in respect of pension built up after 1 January 2006.
Benefits During the year the executive directors received a number of benefits. These are summarised below and amounts less than £10,000 p.a. are combined.
1 An adjustment has been made to the 2016 reported taxable benefits for M W Selway, R M Twite and D J Shook. This relates to non-cash benefits including the personal use of company drivers and company entertainment, plus associated tax costs.
In addition to the above benefits and allowances that are included in the single figure table (refer to table on page 77), the executive directors are also beneficiaries of company policies that have no taxable value, including directors’ and officers’ insurance, death in service cover, travel insurance and personal accident cover.
Annual incentive bonusThe 2017 bonus plan focused on the financial performance of IMI during the year, including Group adjusted profit before tax (40%), organic revenue growth (20%), cash conversion (20%) and strategic and personal objectives (20%). There was a health and safety underpin to ensure bonuses are only paid out when minimum standards are achieved.
2017 has been a year of good progress for IMI even against continued mixed economic and market conditions:
» Group adjusted profit before tax increased to £224.1m in 2017 from £208m in 2016, representing a 7.7% increase;
» Group revenue remained flat with revenue at £1,751m compared to 2016;
» cash conversion remained strong at 92% in 2017, compared with 95% in 2016;
» the total dividend for the year increased by 2% compared to 2016; and
» good health and safety performance and delivery of measurable benefits from Lean and other health, safety and environmental initiatives.
Accrued pension in the Fund as at
31 December 2017
£000pa
Accrued pension in the Fund as at
31 December 2016
£000pa
R M Twite 71 70
M W Selway R M Twite D J Shook
2017 20161 2017 20161 2017 20161
Non-cash benefits (£000)
14 16 10 10 21 26
Company car and fuel allowance (£000)
20 20 17 17 14 14
Allowances and reimbursement (£000)
29 21 - - 4 5
Total 63 57 27 27 39 45
Annual Report and Accounts 2017IMI plc78

Summarised in the table below is the achievement against Group targets for M W Selway and D J Shook and a combination of Group profit before tax and Divisional targets for R M Twite.
Director Measure Maximum opportunity (%
of salary)
Performance Targets Actual performance1
Actual performance
(as % of salary)Threshold Target Maximum
M W Selway Group profit before tax2 80% £151.6m £178.3m £196.1m £201.8m 80.0%
Group organic revenue growth3 40% £1,428m £1,487m £1,546m £1,608m 40.0%
Group cash conversion4 40% 69% 81% 89% 92% 40.0%
Strategic personal objectives 40% See table on page 80 76% 30.4%
200% 190.4%
D J Shook Group profit before tax2 50% £151.6m £178.3m £196.1m £201.8m 50.0%
Group organic revenue growth3 25% £1,428m £1,487m £1,546m £1,608m 25.0%
Group cash conversion4 25% 69% 81% 89% 92% 25.0%
Strategic personal objectives 25% See table on page 80 84% 21.0%
125% 121.0%
R M Twite Group profit before tax2 52.5% £151.6m £178.3m £196.1m £201.8m 52.5%
Divisional operating profit5 22.5% £69.2m £81.4m £89.5m £75.0m 5.4%
Divisional organic revenue6 22.5% £547.2m £572.4m £597.8m £596.0m 21.7%
Divisional cash conversion4 22.5% 82% 97% 107% 90% 11.4%
Strategic personal objectives 30.0% See table on page 80 86% 25.8%
150% 116.8%
¹ Actual performance is stated at the exchange rates used in the targets. ² Adjusted Group profit before tax, as set out in Section 2.1.1 page 99, adjusted for the impact of foreign exchange and disposals. ³ Growth of organic revenue, as set out in Section 2.1.1 page 99, adjusted for the impact of foreign exchange and disposals.4 This is calculated as management operating cash flow divided by management operating profit. 5 Management divisional operating profit adjusted for the impact of foreign exchange and disposals. 6 This is as set out in Section 2.1.1 page 99, adjusted for the impact of foreign exchange and disposals.
79Introduction
Strategic R
eviewC
orporate Governance
Financial Statem
entsC
orp
orate G
overnance

Strategic personal objectivesAs part of the strategic growth plan, the Committee sets each executive director a number of strategic personal objectives each year. Performance against these objectives is assessed using a combination of quantitative and qualitative reference points to ensure a robust assessment process. Mid-way through the year the executive is reviewed against their progress towards achieving the strategic personal objectives with a full review taking place by the Committee at the end of the performance period. As well as performance against strategic personal objectives, the Committee considers the wider performance of the Group. A summary of the strategic personal objectives set for 2017 and the performance commentary against them is provided in the table below.
Based on the performance described above, the annual incentive bonus outcomes for 2017 are set out below:
Director Strategic personal objectives Performance commentary
M W Selway Strengthen organisation: complete the final phases of restructuring across the divisions; continue to improve operational performance through Lean; and actively sponsor and support the Group’s diversity agenda.
Excellent progress achieved in the Lean and customer performance metrics; and increased diversity through hires to senior roles.
Strategic growth: refine acquisition targets against clearly defined and disciplined criteria whilst enhancing integration process readiness; build strong relationships with acquisition targets; continue to build strong relationships with investors; and ensure successful execution of 2017 divisional growth strategies.
Acquisition of Bimba Manufacturing which supports our long-term strategic agenda. Good progress with defining and building relationships with key targets in all three divisions. Organic growth outstrips key peers in IMI Critical Engineering and IMI Precision Engineering divisions.
Deliver projects: strengthen IMI capabilities through enhanced IT improvement plans; revised go-to-market strategies; new product portfolios; and compelling customer solutions.
New IT systems now live in all three divisions on time and on budget. New products and Value Engineering success totalled £139m in IMI Critical Engineering, new platform products in IMI Precision Engineering and further extensions to IMI Hydronic Engineering.
D J Shook Strengthen finance organisation: execute the plan to broaden the finance organisations’ skill set and bench strength during the year; apply Lean principles to back office process; deliver robust training to new divisional audit teams; and deliver agreed outcomes for Group Control, Treasury and Tax.
New Group Controller, employees and graduates added to expand finance team opportunities. Tax, Treasury and IT personnel are strengthened. Procure to pay program launched in IMI Precision Engineering and results exceeded expectations. Divisional audit process fully developed and delivering benefits.
Deliver projects: strengthen IMI capabilities through enhanced IT improvement plans e.g. ERP; disruptive technologies analysis; desktop collaboration standards; and security enhancement program.
ERP successfully rolled-out across all three divisions with security firewalls and monitoring now in place across the whole of IMI.
R M Twite Strengthen division: deliver rationalisation projects in line with the approved business cases; further enhance team diversity when opportunities arise; improve Lean scores by the end of the year; collaborate with other Divisional Managing Directors to drive growth and technology agenda; build strong relationships with acquisition targets; and reposition IMI Critical Engineering geographic footprint into higher growth markets.
All rationalisation delivered on-time and on-budget with 2017 savings exceeding plan. Numerous executive and management positions filled with diverse range of individuals. IMI Critical Engineering Lean scores achieve year-end target of 70% with customer facing KPIs progressing. Technology reviews undertaken and future plans defined. Work continues with acquisition targets. Geographic footprint realigned, 16% increase in employee population in Asia with equivalent reduction in Europe.
Deliver projects: continue to improve the efficiency of IMI’s New Product Development process; deliver 2017 ERP milestones; and implement policy deployment through an Obeya room.
New products delivered in 2017 and Value Engineering has secured £139m in new orders. Six new ERP installations on-time and on-budget. Obeya room fully deployed and delivering results.
Directors’ Remuneration ReportAnnual Remuneration Report
2017 maximum bonus opportunity
(% of salary)
Total bonus awarded (£000)
Total bonus awarded
(% of salary)
Achievement of share ownership guidelines
at 31 Dec 20171
Bonus delivered in form of cash
(£000)
Bonus delivered in form of share
awards (£000)
M W Selway 200% 1,525 190.4% 37% 762.5 762.5
R M Twite 150% 541 116.8% 176% 541 -
D J Shook 125% 506 121.0% 31% 253 253
1 Details of the share ownership guidelines for M W Selway, R M Twite and D J Shook can be found on page 81.
Annual Report and Accounts 2017IMI plc80

Initial award Value on date of award¹ (£000)
Number of initial shares vesting
Additional dividend equivalent shares
Total shares vesting²
Value of shares on vesting³ (£000)
M W Selway 154,041 1,925 10,089 897 10,986 138
R M Twite 71,218 890 4,664 415 5,079 64
D J Shook 48,012 600 3,144 279 3,423 43
¹ The three day average mid-market price on the date of award was 1,249.67 pence. ² Owing to the vesting date occurring in May 2018, this award will attract an additional dividend, the value of which is unknown at this time and hence has been excluded from this table.³ The price on vesting is unknown at this time and so the total number of shares vesting is valued at the average price over the last quarter of 2017 (1,257.05 pence).
Return on capital employed (ROCE)25% of the award was subject to the achievement of ROCE. This measure is defined as segmental operating profit as a percentage of the capital employed excluding goodwill and acquired intangibles during the financial year ended 31 December 2017. It compares the earnings of the Company with the capital invested. ROCE was chosen as a measure as it represents how well the Company has used its investment made by shareholders and capital from creditors to generate a profit.
The portion of the share award that will vest related to ROCE depends on ROCE in the final year of the performance period. For ROCE of less than 40% no award under this element will vest. 25% of the award will vest for ROCE of 40%, rising on a straight-line basis to full vesting for ROCE of 50%. At the end of the performance period return on capital employed was 40.16% resulting in this element vesting at 6.55%.
Total Shareholder Return (TSR)25% of the award was subject to the achievement of a relative TSR performance measure against a defined group of companies (as disclosed in the Notice of Annual General Meeting 2015) adjusted during the performance period to take account of merger and acquisition activity during the performance period in line with the Committee’s established guidelines. TSR is defined as the movement in share price during the performance period, measured in local currency, with adjustment to take account of changes in capital structure and dividends, which are assumed to be reinvested in shares on the ex-dividend date. TSR was chosen as a measure as it is an external, relative benchmark for performance that aligns executives’ rewards with the creation of shareholder value.
The portion of the award that will vest related to TSR depends on where IMI ranks in the comparator group. For a TSR rank that is below median, no award under this element will vest. 25% of the award will vest for median TSR, rising on a straight-line basis to full vesting for upper quartile TSR. At the end of the three-year performance period, the Company ranked 20th out of 28 companies in the peer group. The resultant vesting outcome for this element of the award is nil. The Committee agreed that the outcome under the TSR measure was reflective of the general underlying financial performance of the Company.
Group adjusted profit before tax growthHalf of each award was subject to the achievement of the Group adjusted profit before tax growth measure. This measure is defined as the profit before tax before adjusted items as shown in the audited accounts of the Group, adjusted to reflect changes in the Company’s capital structure and any adjusted items, at the Remuneration Committee’s discretion.
Adjusted profit before tax growth is a key measure for IMI as it gives an indication of the strength of the Company’s financial performance and shows the amount available to reinvest into the business, and pay a return to shareholders through dividends. For growth of less than 2.5% per annum, no award under this element will vest. 25% of the award will vest for growth of 2.5% per annum rising on a straight-line basis to full vesting for growth of 7.5% per annum.
Over the three-year performance period ending 31 December 2017 IMI delivered Group profit before tax growth of -6.9%. The resultant vesting outcome for this element of the award is nil.
Deferred bonus share awardsIn May 2015, deferred bonus share awards were also made under the IIP which vest in May 2018. These are the form of share award used for mandatory bonus deferral into shares of up to 50% of annual bonus payable where the executive director is yet to reach their shareholding guideline.
Share ownership guidelineIt is a requirement of the remuneration policy that executive directors are subject to guidelines which require them to build a shareholding in IMI worth at least 250% of salary for M W Selway, 150% of salary for D J Shook and 200% of salary for R M Twite. The Policy permits the Committee discretion to determine that 50% of any annual bonus earned is deferred into shares until the share ownership guideline is achieved together with 50% of any vested share awards. Each executive is then required to maintain this share ownership guideline (subject to allowances for share price fluctuations and changes in base salary thereafter). When assessing compliance with this guideline the Committee reviews both the level of beneficial share ownership and vested but unexercised share incentive awards on a post-tax basis. Although M W Selway and D J Shook continue to make progress towards this guideline, and have a material interest in the Company’s shares, the Committee has determined that half of the annual bonus payable to M W Selway and D J Shook as outlined above will be delivered in the form of deferred bonus share awards which must be held for a period of at least three years and until the share ownership guideline has been met. Further, the Committee has determined that half of the performance share awards made to M W Selway and D J Shook in May 2015 and due to vest in May 2018 must also be retained until such time as the share ownership requirement is met. At the end of the year R M Twite significantly exceeded the share ownership guideline.
Awards vesting under the IIPIn May 2015, performance share awards were made to the executive directors under the IIP. The vesting of the awards was subject to the achievement of three independent performance conditions as described below, measured over the three-years ending 31 December 2017. The 2015 IIP award will vest at 6.55% in May 2018.
81Introduction
Strategic R
eviewC
orporate Governance
Financial Statem
entsC
orp
orate G
overnance

Grants made under the IIP
Performance share award grants under the IIP were made on 9 March 2017 in the form of nil-cost options. Awards are due to vest on 9 March 2020, subject to performance in three core areas aligned to our longer-term strategic priorities: ROCE (25%), relative TSR (25%) and Group adjusted profit before tax (50%).
The performance targets and vesting scale that apply to the 2017 IIP awards are as follows:
Further details of the above performance targets can be found in the awards vesting under the IIP section on page 81.
The following performance share award grants were approved and made in 2017:
The IIP is also used to grant deferred bonus awards exercisable after three years to satisfy bonuses delivered in the form of shares. Details of these additional IIP awards made in 2017 are shown in the table on page 83 under the ‘without performance conditions’ column. No performance conditions apply to these awards.
For share awards granted in 2017 the TSR group was reduced from 27 to 18 peers to ensure complete alignment with our peers and comparison to companies with similar products, customers and global spread. The 2017 peer group includes the following companies and these will be adjusted to take into account merger and acquisition activity during the performance period in line with the Committe’s guidelines:
All-employee share plansExecutive directors are eligible to participate in the all-employee share plans on the same terms as other eligible employees at IMI. In 2017, M W Selway, R M Twite and D J Shook received free share awards under the All Employee Share Ownership Plan. M W Selway received Save As You Earn (SAYE) awards in 2017 of 813 shares.
Directors’ Remuneration ReportAnnual Remuneration Report
ROCE Relative TSR Group adjusted
profit before tax growth
Level of vesting
Threshold 40% Median 2.5% 25%
Maximum 50% Upper quartile 7.5% 100%
Weighting 25% 25% 50% -
Share interests granted to executive directors during 2017 (audited)
IIP shares awarded
Value on date of award1
(£000)
Award as a percentage of
salary
M W Selway 156,323 2,003 250%
R M Twite 72,287 926 200%
D J Shook 48,946 627 150%
1 The three day average mid-market price on the date of award was 1,281.00 pence.
TSR comparator group companies
1. AirTAC 7. GKN 13. Rotork
2. Belimo 8. Ingersoll-Rand 14. Spectris
3. Curtiss-Wright 9. ITT 15. SMC
4. Eaton 10. Morgan Advanced Materials 16. Smiths Group
5. Emerson Electric 11. Parker-Hannifin 17. SPX
6. Flowserve 12. Rockwell Automation 18. Weir
All Employee Share Ownership Plan SAYE
Dividends(£000)
Total value under the all-employee share
plans (£000)
Number of shares awarded
Value of free share award1
(£000)
Number of options awarded
Value of SAYE options2
(£000)
M W Selway2017 278 4 813 1 - 5
2016 363 4 - - - 4
R M Twite2017 278 4 - - - 4
2016 363 4 - - - 4
D J Shook2017 235 3 - - - 3
2016 242 2 2,129 2 - 4
1 In 2017 free shares were awarded at a share price of 1,292.00 pence (990.71 pence in 2016).2 In 2017 SAYE awards were made at a 10% discount and the value shown is the intrinsic gain at the date of the grant, calculated in accordance with the single figure requirements
(on page 77). See Section 4.11.1 on page 136.
Annual Report and Accounts 2017IMI plc82

Payments to past directors (audited)It is the Committee’s intention to disclose any payments to past directors, including the vesting of share-based awards post departure on a basis consistent with the executive directors.
There were no payments to past directors during the year. Dividend equivalent payments for vested but unexercised nil option awards will continue to be made to past directors under the terms of the original grant.
Chairman’s and non-executive directors’ single figure table (audited) The following table summarises the total fees and benefits paid to the Chairman and non-executive directors in respect of the financial years ending 31 December 2017 and 31 December 2016.
Director 2017 (£000) 2016 (£000)
Base fees Additional fees
Taxable benefits
Total Base fees Additional fees
Taxable benefits6
Total
Lord Smith of Kelvin 312 - 5 317 306 - 5 311
C P Forster 62 14 3 66 61 - 3 64
B Nørgaard 62 15 8 71 61 - 5 66
R J Stack 62 26 3 91 61 261 10 97
R McInnes3 47 12 5 64 61 162 7 84
I Sharp 62 4 2 68 61 - 2 63
1 Includes fees for being Chair of the Remuneration Committee and senior independent director.2 Includes fees for being Chair of the Audit Committee. 3 Resigned as director effective September 2017. 4 Includes fee for senior independent director effective from 11 December 2017. 5 Includes fee for being Chair of the Remuneration Committee effective from 11 December 2017.6 The table includes benefits for non-executive directors in 2016 that were not previously reported. This includes travel and hotel expenses plus tax costs associated
with board meetings held at IMI HQ.
Directors’ shareholdings and share interests (audited) The following table summarises the share interests of any director who served during the year as at 31 December 2017 or at the date of leaving from the Board.
During the period 31 December 2017 to 23 February 2018 there were no changes in the interests of any current director from those shown save for purchases within the IMI All Employee Share Ownership Plan on 9 January of 9 shares on behalf of each of M W Selway, R M Twite and D J Shook at 1,398.00 pence per share and 13 February 2018 of 10 shares on behalf of each of M W Selway, R M Twite and D J Shook at 1,249.00 pence per share.
1 Resigned as director, as at 30 September 2017. 2 Vesting dates of share awards are shown on page 81.
Director Total interests
Beneficial interests
Scheme interests
Nil-cost options All-employee share plans
With performance conditions Without performance conditions
Unvested2 Vested but unexercised
Unvested Vested but unexercised
M W Selway 664,143 9,612 558,183 3,880 90,874 - 1,594
R M Twite 385,734 120,354 258,158 - - - 7,222
D J Shook 200,877 4,000 174,592 - 21,428 - 857
Lord Smith of Kelvin 8,300 8,300 - - - - -
C P Forster 2,625 2,625 - - - - -
B Nørgaard 2,625 2,625 - - - - -
R J Stack 13,125 13,125 - - - - -
R McInnes1 3,000 3,000 - - - - -
I Sharp 3,000 3,000 - - - - -
83Introduction
Strategic R
eviewC
orporate Governance
Financial Statem
entsC
orp
orate G
overnance

Relative importance of spend on pay The following information is intended to provide additional context regarding the total remuneration for executive directors.
In 2017, the total dividend for the year of 39.4 pence represented an increase of 2% over last year’s 38.7 pence.
Relative percentage change in remuneration for Chief ExecutiveThe Committee actively considers any increases in base pay for the Chief Executive relative to the broader IMI employee population. However, benefits and bonus payments are not typically compared given they are driven by a far broader range of factors, such as local practices, eligibility, individual circumstances and role.
Historical performance and remunerationIn addition to considering executive remuneration in the context of internal comparisons, the Committee reviews historical outcomes under the variable pay plans.
The graph below compares IMI’s total shareholder return (TSR) to the FTSE100 and FTSE250 over the last nine years. We compare performance to the FTSE100 as IMI has been included in the index in the past and it is a position where IMI aspires to be. TSR measures the returns that a company has provided for its shareholders, reflecting share price movements and assuming reinvestment of dividends (source: DataStream), with data averaged over the final 30 days of each financial year. As the graph below illustrates, IMI’s absolute and relative TSR performance has been strong over the last nine years.
2017(£m)
2016 (£m)
Change
Dividends 105.5 104.2 1%
Total employment costs for Group (see Section 2.1.3.1 on page 103)
578.7 566.6 2%
Chief Executive Employees1
Base salary 2% 4%
Benefits 11% 1%
Annual bonus 95% 114%
1 All UK head office employees. This comparison excludes our international workforce which we believe would not provide a true comparison given differing local market factors.
Value of a hypothetical £100 investment£800
£700
£600
£500
£400
£300
£200
£100
£02008 2009 2010 2011 2012 2013 2014 2015 2016 2017
IMI FTSE100 FTSE250
Financial year-ended 31 December 20091 20101 20111 20121 20131 20142 20152 20162 20172
Total remuneration (single figure, £000) 2,547 4,439 12,289 7,954 6,688 1,567 1,667 1,9013 2,773
Annual variable pay (% of maximum) 91% 95% 85% 47% 62% 36% 40% 50% 95%
Long-term variable pay (% of maximum) - Share Matching Plan
64% 97% 95% 100% 100% - - - -
Long-term variable pay (% of maximum) - Performance Share Plan
45% 100% 100% 100% 82.6% - - 3.5% -
Long-term variable pay (% of maximum) - IMI Incentive Plan
- - - - - - - - 6.55%
The following table summarises the total remuneration for the Chief Executive over the last nine years, and the outcomes of short and long-term incentive plans as a % of maximum.
1 Represents remuneration for M J Lamb who was Chief Executive from before 2009 until 31 December 2013.2 Represents remuneration for M W Selway who was appointed Chief Executive on 1 January 2014. ³ Adjusted for revised taxable benefits figure for M W Selway (see page 78).
Directors’ Remuneration ReportAnnual Remuneration Report
Annual Report and Accounts 2017IMI plc84

Application of the IMI Directors’ Remuneration Policy in 2018 Executive director fixed paySalaries effective January 2018 were agreed taking into account a range of factors including the prevailing economic conditions, the financial performance of the Group and salary increases for other employees.
The average increase for 2018 awarded to employees was 3.0%, compared to 2.6% for the Chief Executive and Executive Director R M Twite. Their base salaries were increased by 2.6% to £822,000 and £475,000 respectively. The Committee agreed to increase the base salary level for D J Shook, Finance Director by 5% to reflect the excellent progress made during his three year tenure with the Company and taking into account he was appointed on a base salary lower than his predecessor and his remuneration when compared to Chief Financial Officers in similar size businesses. The base salary for D J Shook for 2018 is £439,000.
Other elements of fixed pay (benefits and pension) will remain unchanged, although pension allowances are a fixed percentage of salary.
Incentive pay
Annual bonusIn accordance with the current and proposed new remuneration policy, the annual bonus plan will be operated as follows in 2018:
» As in 2017, the 2018 maximum bonus opportunity is set at 200% of salary for M W Selway, 150% for R M Twite and 125% for D J Shook.
» As in 2017, the annual bonus for M W Selway and D J Shook will be subject to performance in Group adjusted profit before tax (40%), organic revenue growth (20%), cash conversion (20%) and strategic and personal objectives (20%). Health and safety will serve as an underpin to ensure bonuses are only paid out when minimum standards are achieved.
» As in 2017, the annual bonus for R M Twite in 2018 will be subject to performance in Group adjusted profit before tax (35%), IMI Critical Engineering operating profit (15%), IMI Critical Engineering organic revenue growth (15%), IMI Critical Engineering cash conversion (15%) and strategic and personal objectives (20%).
» The Committee has determined that the targets associated with the performance measures will be disclosed retrospectively on the same basis and to the same extent as for 2017 targets (see annual bonus metrics table on page 79).
Performance share awards under the IIPIn accordance with the current and proposed new remuneration policy, the IIP will be operated as follows in 2018:
» 2018 awards are set at 250% of salary for M W Selway, 200% for R M Twite and 150% for D J Shook.
» Awards will vest subject to performance in three core areas aligned to our longer-term strategic priorities: ROCE (25%), relative TSR (25%) and Group adjusted profit before tax growth (50%).
» The performance targets that will apply to the 2018 IIP awards are as follows:
However, in line with the proposed new policy if approved at the Annual General Meeting on 3 May 2018, awards to be made after that date to executive directors will be subject to a two year post-vesting holding period.
Service contractsThe unexpired terms of the non-executive directors’ service contracts can be reviewed in the Board’s Corporate Governance Report on page 55.
Fees for the Chairman and non-executive directorsThe Chairman and non-executive directors’ remuneration increased by 2.6%, with effect from 1 January 2018. This is in line with the executive directors and the wider employee workforce.
Share ownership for the Chairman and non-executive directorsThe Chairman and non-executive directors are encouraged to hold some shares in IMI within a reasonable period after their appointment. As at 31 December 2017, the Chairman and non-executive directors hold IMI shares as set out in the table on page 83.
Birgit NørgaardChair of the Remuneration Committeefor and on behalf of the Board
1 March 2018
ROCE Relative TSR
Group adjusted
profit before tax growth
Level of vesting
Threshold 40% Median 2.5% 25%
Maximum 50% Upper quartile
7.5% 100%
Weighting 25% 25% 50% -
85Introduction
Strategic R
eviewC
orporate Governance
Financial Statem
entsC
orp
orate G
overnance

Financial Statements
88 Finance Director’s introduction
90Primary statements
99Results for the year
110 Operating assets
146 Directors’ report
168Five year summary
Engineering GREAT the IMI Way
Annual Report and Accounts 2017IMI plc86

The production test rig in IMI Hydronic Engineering’s factory in Dallas, USA.
IntroductionS
trategic Review
Corporate G
overnance87
Financial Statem
ents

88 IMI plc Annual Report and Accounts 2017
Notes to the financial statements provide additional information required by statute, accounting standards or the Listing Rules to explain a particular feature of the financial statements. The notes that follow will also provide explanations and additional disclosure to assist readers’ understanding and interpretation of the Annual Report and the financial statements.
Financial StatementsFinance Director’s Introduction
Introduction from Daniel Shook
Dear Shareholder
Welcome to the financial statements section of our Annual Report.
My financial review commentary is set out in this section alongside the primary statements. These financial statements are presented with the primary statements first, followed by five sections: ‘Basis of preparation’, ‘Results for the year’, ‘Operating assets and liabilities’, ‘Capital structure and financing costs’ and ‘Other notes’.
IMI continues to improve its overall control environment and risk management procedures. The Company has further mitigated the risks associated with the defined benefit pension schemes during the year and has proactively managed working capital as the Group has grown during 2017.
Although market conditions remain mixed, IMI continues to invest in the foundations of the business which will deliver long-term benefits.
Daniel ShookFinance Director

89
Primary statementsConsolidated income statement and commentary ......................................................... 90Consolidated statement of comprehensive income and commentary ............................ 92Consolidated statement of changes in equity and commentary .................................... 93Consolidated balance sheet and commentary ............................................................... 94 Consolidated statement of cash flows and commentary ................................................ 96
Section 1 – Basis of preparation .............................................................................. 98
Section 2 – Results for the year2.1 Segmental information and alternative performance measures ................................ 992.2 Adjusting items ..................................................................................................... 1042.3 Earnings per ordinary share .................................................................................. 1052.4 Taxation ................................................................................................................ 1062.5 Discontinued operations ....................................................................................... 109
Section 3 – Operating assets and liabilities3.1 Working capital ..................................................................................................... 1103.2 Intangible assets ................................................................................................... 1113.3 Property, plant and equipment .............................................................................. 1133.4 Acquisitions .......................................................................................................... 1143.5 Disposals .............................................................................................................. 1143.6 Provisions ............................................................................................................. 115
Section 4 – Capital structure and financing costs4.1 Net debt ............................................................................................................... 1164.2 Interest-bearing loans and borrowings .................................................................. 1174.3 Net financing costs ............................................................................................... 1184.4 Financial risk management ................................................................................... 1194.5 Capital management ............................................................................................ 1224.6 Debt and credit facilities ........................................................................................ 1234.7 Fair value .............................................................................................................. 1254.8 Market risk sensitivity analysis on financial instruments ......................................... 1274.9 Retirement benefits ............................................................................................... 128 4.10 Share capital ...................................................................................................... 1344.11 Share-based payments ...................................................................................... 1364.12 Non-controlling interests ..................................................................................... 139
Section 5 – Other notes5.1 Contingent liabilities .............................................................................................. 1405.2 Related party transactions .................................................................................... 1405.3 Subsequent events ............................................................................................... 1405.4 Significant accounting policies .............................................................................. 140
Directors’ Report ..................................................................................................... 146
Statement of Directors’ Responsibilities ............................................................... 150
Independent Auditor’s Report to the Members of IMI plc .................................... 151
IMI plc Company financial statements .................................................................. 158
Subsidiary undertakings ......................................................................................... 163
Five year summary ................................................................................................... 168
Shareholder and general information ..................................................................... 170
Financial statementsTable of contents

90 IMI plc Annual Report and Accounts 2017
2017 2016
Adjusting Adjusting Adjusted items Statutory Adjusted items Statutory Notes £m £m £m £m £m £m
Revenue 2.1 1,751 1,751 1,649 8 1,657
Segmental operating profit 2.1 240.9 240.9 227.7 227.7Reversal of net economic hedge contract (gains)/losses 2.2.5 (0.9) (0.9) 5.6 5.6Restructuring costs 2.2.1 (1.7) (34.6) (36.3) (3.5) (18.8) (22.3)Gains on special pension events 2.2.2 10.8 10.8 2.8 2.8Impairment losses 2.2.4 - (5.0) (5.0)Acquired intangible amortisation and acquisition costs 2.2.6 (19.5) (19.5) (20.5) (20.5)Loss on disposal of subsidiaries 2.2.3 (2.3) (2.3) - -
Operating profit 239.2 (46.5) 192.7 224.2 (35.9) 188.3Financial income 4.3 5.5 12.5 18.0 4.5 12.6 17.1Financial expense 4.3 (19.8) (9.2) (29.0) (21.8) (19.4) (41.2)Net financial (expense)/income relating to defined benefit pension schemes 4.9.3.3 (0.8) (0.8) 1.1 1.1Net financial expense (15.1) 3.3 (11.8) (16.2) (6.8) (23.0)
Profit before tax 224.1 (43.2) 180.9 208.0 (42.7) 165.3Taxation 2.4.5 (47.1) 11.5 (35.6) (43.7) 11.6 (32.1)
Profit from continuing operations after tax 177.0 (31.7) 145.3 164.3 (31.1) 133.2Profit from discontinued operations after tax 2.5 16.9 16.9 - -
Total profit for the year 177.0 (14.8) 162.2 164.3 (31.1) 133.2
Attributable to: Owners of the parent 176.9 162.1 161.9 130.8 Non-controlling interests 4.12 0.1 0.1 2.4 2.4
Profit for the year 177.0 162.2 164.3 133.2
Earnings per share 2.3 Basic - from profit for the year 65.3p 59.8p 59.8p 48.3p Diluted - from profit for the year 65.1p 59.7p 59.4p 48.0p Basic - from continuing operations 65.3p 53.6p 59.8p 48.3p Diluted - from continuing operations 65.1p 53.5p 59.4p 48.0p
Consolidated income statementFor the year ended 31 December 2017

91
Results summaryAdjusted revenue increased by 6% to £1,751m (2016: £1,649m). After reflecting the favourable exchange rate impact of £100m and the contribution from disposals, organic revenue remained constant reflecting mixed market conditions, particularly in Critical Engineering which continues to be impacted by weak oil and gas and power demand. Statutory revenue increased by 6% to £1,751m (2016: £1,657m).
Segmental operating profit of £241m (2016: £228m) rose by 6% and on an adjusted basis decreased by 1% at constant exchange rates and excluding disposals. The segmental operating margin was 13.8% (2016: 13.8%). Further information on the each of the division’s segmental results is included within the performance review section on pages 28 to 33. Statutory operating profit was £193m (2016: £188m). We consider that the presentation of adjusted results allows for improved insight to the trading performance of the Group (see Section 1.1).
Adjusted net interest costs on net borrowings were £14m (2016: £17m), reflecting the full year impact of the repayment of US$75m of borrowings in July 2016. Adjusted net interest costs were covered 20 times (2016: 16 times) by continuing adjusted earnings before interest, tax, depreciation, amortisation, impairment and adjusting items of £288m (2016: £273m). The net pension financing expense under IAS 19 was £0.8m (2016: £1.1m income).
Adjusted profit before taxation was £224m (2016: £208m), an increase on the previous year of 8%.
The adjusted effective tax rate for the Group remained constant at 21% (2016: 21%). The total adjusted tax charge for the year on continuing operations was £47m (2016: £44m) and continuing adjusted profit after tax was £177m (2016: £164m). The Group seeks to manage its tax affairs within its core tax principles of compliance, fairness, value and transparency, in accordance with the Group’s Tax Policy which is explained further in Section 2.4.
Adjusting itemsStatutory operating profit was £193m (2016: £188m). Adjusting items are discussed below:
Restructuring costs Restructuring costs presented as adjusting items in 2017 of £35m (2016: £19m) are as a result of a number of significant restructuring projects across the Group, in particular within Critical Engineering and Precision Engineering. This restructuring is explained in more detail in Section 2.2.1 on page 104. Restructuring costs of £2m (2016: £4m) that arose from normal recurring cost reduction exercises are included in the adjusted financial performance of the Group.
Pensions During 2017, a number of further de-risking exercises, including the conversion of certain pensions to non-inflation linked, occurred in the UK which resulted in net gains of £2m. The termination and final settlement of a Senior Retirement Plan in the US resulted in a net gain of £2m. Restructuring exercises in Switzerland resulted in a curtailment gain of £5m which was offset by a loss of £1m, relating to the distribution of pension assets to members from our previously overfunded Swiss schemes. The completion of the transfer of £429m of liabilities covered by insurance policies to the insurance companies through a formal buy-out transaction resulted in a net gain of £3m.
Loss on disposal of subsidiaries The Group disposed of Stainless Steel Fasteners in H2 resulting in a loss of £2m which is presented in the income statement as an adjusting item. The loss on disposal is not disclosed within discontinued operations because it did not represent a major line of business at the time of disposal.
Impairment losses The Group recorded no impairment charges during the year (2016: £5m).
Reversal of net economic hedge contract (gains)/losses For segmental reporting purposes, changes in the fair value of economic hedges which are not designated as hedges for accounting purposes, together with the gains and losses on their settlements, are included in the adjusted revenues and operating profit of the relevant business segment. The adjusting item at the operating level reverses this treatment with the gain of £1m (2016: loss of £6m) and records a charge within interest (see Section 2.2.5).
Financing costs A net gain arose on the revaluation of financial instruments and derivatives under IAS 39 of £3m (2016: £7m loss) principally reflecting movements in exchange rates during the year on forward foreign exchange contracts.
Acquired intangible amortisation and acquisition costs For segmental purposes, acquired intangible amortisation is excluded from adjusted profits, to allow for better comparability of the performance across divisions. This allows users of the financial statements to gain a clearer understanding of the performance of the business, with the impact of amortisation identified separately in line with internal reporting to management. Acquired intangible amortisation decreased to £18m (2016: £21m) following the full amortisation of the acquired customer relationships arising on the Remosa acquisition. An analysis by segment of acquired intangible amortisation is included in Section 2.1. Acquisition costs of £2m were incurred during the year relating to the acquisition of Bimba Manufacturing Company which completed on 31 January 2018 (see Section 5.3).
Taxation A tax credit of £12m (2016: £12m) arose in connection with the above adjusting items.
Statutory profit from continuing operations after tax Statutory profit after taxation was £145m (2016: £133m).
Statutory profit from discontinued operations after tax A pre-tax gain of £2m and post-tax gain of £17m was recognised in the current year as a result of the finalisation of a number of matters relating to historical discontinued operations.
Earnings per share (EPS) The Board considers that a more meaningful indication of the performance of the Group is provided by adjusted earnings per share. Details of this calculation are given in Section 2.3 to the Group financial statements on page 105. Adjusted EPS was 65.3p, an increase of 9% on last year’s 59.8p. Statutory basic EPS increased by 11% to 53.6p (2016: 48.3p) and statutory diluted EPS increased by 24% to 59.7p (2016: 48.0p).
Exchange rates The most important foreign currencies for the Group remain the Euro and the US dollar and the relevant average rates of exchange for the consolidated income statement were:
2017 2016
Euro 1.14 1.22
US dollar 1.29 1.36
The movement in average exchange rates between 2016 and 2017 resulted in our adjusted 2017 revenue being 6% higher and segmental operating profit being 7% higher as the average Euro and US dollar rates against sterling were 7% and 5% stronger, respectively.
If the average exchange rates for January 2018 of US$1.38 and e1.13 were projected for the full year and applied to our 2017 results, it is estimated that adjusted revenue would have been 2% lower and segmental operating profit would have been approximately 3% lower.
Finance Director’s commentary on the consolidated income statement

92 IMI plc Annual Report and Accounts 2017
2017 2016
£m £m £m £m
Profit for the year 162.2 133.2
Items reclassified to profit and loss in the year Foreign exchange loss reclassified to income statement
Items that may be reclassified to profit and loss Change in fair value of effective net investment hedge derivatives 3.4 (2.8) Exchange differences on translation of foreign operations net of hedge settlements and funding revaluations (11.0) 39.4 Fair value loss on available for sale financial assets (0.2) - Related tax effect on items that may subsequently be reclassified to profit and loss (0.6) 0.6 (8.4) 37.2
Items that will not subsequently be reclassified to profit and loss Re-measurement loss on defined benefit plans (12.3) (78.2) Related taxation effect 1.7 15.3 Effect of taxation rate change on previously recognised items (0.3) (2.5) (10.9) (65.4)
Other comprehensive expense for the year, net of taxation (19.3) (28.2)
Total comprehensive income for the year, net of taxation 142.9 105.0
Attributable to: Owners of the parent 142.8 102.6 Non-controlling interests 0.1 2.4
Total comprehensive income for the year, net of taxation 142.9 105.0
Finance Director’s commentary on the consolidated statement of comprehensive income and the consolidated statement of changes in equity
Movements in shareholders’ equityShareholders’ equity at the end of 2017 was £607m (2016: £543m). Movements in shareholders’ equity can be split into three categories:
• the profit for the year attributable to the equity shareholders of £162m (2016: £131m). This is discussed on the page opposite the income statement.
• other comprehensive income movements in the year decreased shareholders’ equity by £19m (2016: £28m decrease). These are discussed below.
• movements taken directly to equity in the year reduced shareholders’ equity by £79m (2016: £106m). These are discussed overleaf.
Other comprehensive incomeWhen the Group makes unrealised gains or losses on assets and liabilities, instead of being recorded in the income statement, they are credited or charged to reserves and recorded in the statement of comprehensive income. In accordance with the amendment to IAS 1, these items are allocated between those items that have been reclassified to the income statement, those that may be reclassified to the income statement and those items that will not subsequently be reclassified to the income statement.
Any net investment hedge derivatives which have not settled by the year-end are marked to market on the balance sheet at the year-end and the movements are recorded in the hedging reserve. This movement is also included in other comprehensive income and in 2017, amounted to a gain of £3m (2016: £2m loss) including the related taxation effect.
The Group’s foreign denominated net assets are translated into sterling using exchange rates prevailing at the year-end. To the extent that these differ from the rates used at the previous year-end to translate net assets at that date and from the average exchange rate used to translate foreign denominated income during the year, a difference on reserves arises, which is included in other comprehensive income, along with the settlement of net investment hedge derivatives and revaluations of foreign debt, which are used to protect the group from this exposure. These items (including the related taxation effect) amounted to a loss of £11m in 2017 (2016: £39m gain).
Actuarial movements in the Group’s defined benefit pension obligations are also recorded in other comprehensive income. The Group completed a bulk insurance buy-in exercise in relation to certain members of the UK Funds during the year and the difference between the value of the liabilities insured and the cost of the premium to insure them has been recognised in other comprehensive income.
Consolidated statement of comprehensive income For the year ended 31 December 2017

93
Share Capital Total Non- Share premium redemption Hedging Translation Retained parent controlling Total capital account reserve reserve reserve earnings equity interests equity £m £m £m £m £m £m £m £m £m
As at 1 January 2016 81.8 11.8 174.4 0.6 1.4 276.1 546.1 42.8 588.9Profit for the year 130.8 130.8 2.4 133.2Other comprehensive income/(expense) (2.2) 39.4 (65.4) (28.2) - (28.2)
Total comprehensive income/(expense) (2.2) 39.4 65.4 102.6 2.4 105.0Issue of share capital - 0.3 0.3 0.3Dividends paid (104.2) (104.2) (0.8) (105.0)Share-based payments (net of tax) 5.8 5.8 5.8Shares acquired for: employee share scheme trust (7.4) (7.4) (7.4)Income earned by partnership - (4.4) (4.4)As at 31 December 2016 81.8 12.1 174.4 (1.6) 40.8 235.7 543.2 40.0 583.2Changes in equity in 2017 Profit for the year 162.1 162.1 0.1 162.2Other comprehensive income/(expense) 2.6 (11.0) (10.9) (19.3) (19.3)
Total comprehensive income/(expense) 2.6 (11.0) 151.2 142.8 0.1 142.9Issue of share capital - 0.6 0.6 0.6Dividends paid (105.5) (105.5) (105.5)Share-based payments (net of tax) 8.0 8.0 8.0Shares acquired for: employee share scheme trust (2.7) (2.7) (2.7)Derecognition of interest in IMI Scottish Limited Partnership 21.3 21.3 (39.3) (18.0)Derecognition of interest in IMI CCI SPEC (0.3) (0.3) (0.8) (1.1)As at 31 December 2017 81.8 12.7 174.4 1.0 29.8 307.7 607.4 - 607.4
These movements are explained in detail in Section 4.9 on page 128. Together with the taxation effect, the loss in the year was £11m (2016: £63m loss).
Items recognised directly in equityMovements in reserves which represent transactions with the shareholders of the Group are recognised directly in equity rather than in the income statement or through other comprehensive income.
0.1m (2016: 0.1m) shares were issued during the year, realising £0.6m (2016: £0.3m) in the share capital and share premium account.
The 2016 final dividend of 24.7p per share and the 2017 interim dividend of 14.2p per share were paid during the year (2016: 2015 final dividend of 24.5p and 2016 interim dividend of 14.0p), which reduced equity by £106m (2016: £104m).
The credit for share-based payments, which reverses the £8m (2016: £6m) charged through the income statement in the year, thereby deferring the reduction in reserves until such time as the options are exercised, is also recognised here, together with the reversal of the associated nil tax credit (2016: nil).
The charge to reserves relating to the purchase of shares by the employee trust to satisfy share options, net of amounts received from employees representing the price on exercise for those options was £3m (2016: £7m charge), refer to Section 4.11 for more information.
Derecognition of minority interestOn 31 January 2017, the terms of the conditional entitlement for the IMI 2014 Deferred and Pensioner Funds to receive income of £4.4m per annum from the Group was altered. This resulted in the Scottish Limited Partnership and its associated non-controlling interest being derecognised from the Group’s balance sheet from this date.
On 23 November 2017, the Group acquired the remaining 30% of shareholding in Shanghai CCI Power Control Equipment Co Limited for £1.1m. Following this transaction the associated minority interest was derecognised from the Group’s balance sheet from this date.
Consolidated statement of changes in equityFor the year ended 31 December 2017

94 IMI plc Annual Report and Accounts 2017
2017 2016 Notes £m £m
Assets Intangible assets 3.2 509.0 521.2Property, plant and equipment 3.3 270.4 266.2Employee benefit assets 4.9 5.7 57.8Deferred tax assets 2.4.7 20.9 22.8Other receivables 4.2 5.7Total non-current assets 810.2 873.7
Inventories 3.1.1 251.3 255.2Trade and other receivables 3.1.2 418.8 400.5Other current financial assets 4.7 4.1 2.9Current tax 8.3 7.1Investments 4.7 13.8 29.9Cash and cash equivalents 4.1 98.6 79.7Total current assets 794.9 775.3Total assets 1,605.1 1,649.0
Liabilities Bank overdraft 4.1 (31.0) (12.2)Interest-bearing loans and borrowings 4.2 (113.8) (6.8)Provisions 3.6 (19.2) (19.9)Current tax (61.0) (62.8)Trade and other payables 3.1.3 (416.5) (407.9)Other current financial liabilities 4.7 (3.9) (13.5)Total current liabilities (645.4) (523.1)
Interest-bearing loans and borrowings 4.2 (219.0) (343.3)Employee benefit obligations 4.9 (83.6) (137.6)Provisions 3.6 (15.4) (19.1)Deferred tax liabilities 2.4.7 (27.7) (32.0)Other payables 3.1.3 (6.6) (10.7)Total non-current liabilities (352.3) (542.7)Total liabilities (997.7) (1,065.8)Net assets 607.4 583.2
Equity Share capital 4.10.1 81.8 81.8Share premium 12.7 12.1Other reserves 205.2 213.6Retained earnings 307.7 235.7
Equity attributable to owners of the parent 607.4 543.2Non-controlling interests 4.12 - 40.0Total equity 607.4 583.2
Approved by the Board of Directors on 1 March 2018 and signed on its behalf by:
Lord Smith of Kelvin Chairman
Consolidated balance sheetAt 31 December 2017

95
Net debtNet debt at the year-end was £265m compared to £283m at the end of the previous year, reflecting business cash flows. The net debt is composed of a cash balance of £99m (2016: £80m), a bank overdraft of £31m (2016: £12m) and interest-bearing loans and borrowings of £333m (2016: £350m).
The year-end net debt to EBITDA ratio was 0.9 times (2016: 1.0 times) based on continuing adjusted EBITDA. At the end of 2017 the loan notes totalled £329m (2016: £343m), with a weighted average maturity of 3.5 years (2016: 4.3 years) and other loans including bank overdrafts totalled £35m (2016: £20m). Total committed bank loan facilities available to the Group at the year-end were £302m (2016: £301m), of which £nil (2016: £nil) was drawn.
Intangible assetsThe value of the Group’s intangible assets decreased to £509m at 31 December 2017 (2016: £521m). This decrease was due to the amortisation charge for the year of £27m (2016: £29m), impairment of £nil (2016: £6m) and exchange movements of £7m (2016: £75m gain) partially offset by additions to intangible assets of £22m (2016: £24m).
Property, plant and equipment (PPE)The net book value of the Group’s PPE at 31 December 2017 was £270m (2016: £266m). Capital expenditure on PPE amounted to £47m (2016: £47m), with capital expenditure focused on the continuous improvement of the Precision Engineering factories in the Czech Republic and Germany and investment in new plant and machinery at the Critical Engineering sites in Italy, China and Austria. Including capitalised intangible assets, total capital expenditure was £70m (2016: £71m) and was 1.5 times (2016: 1.5 times) the depreciation and amortisation charge (excluding acquired intangible amortisation) for the year of £47m (2016: £46m).
Working capital The increase in the Group’s trade and other receivables of £18m is due to foreign exchange movements of £8m offset by unfavourable cash movements of £26m.
The Group’s inventory decreased by £4m during the year due to favourable cash movements.
The Group’s trade and other payables increased by £9m due to foreign exchange movements of £13m offset by favourable cash movements of £22m.
The working capital cash movements during the year are discussed in more detail in the narrative opposite the consolidated cash flow statement.
TaxationThe current tax asset increased to £8m (2016: £7m) due to business restructuring in the year resulting in additional tax refunds due. The current tax liability reduced slightly to £61m (2016: £63m).
Deferred tax assets decreased by £2m to £21m (2016: £23m) and deferred tax liabilities decreased by £4m during the year to £28m (2016: £32m). The significant movements, net of the effect of foreign exchange movements, relate to the deferred tax recognised in respect of pension funds, the effects of the amortisation of intangible assets and the reduction in the rate of US tax. More analysis of the deferred tax movement in the year is shown in Section 2.4.
PensionsThe Group has 69 (2016: 63) defined benefit obligations in existence as at 31 December 2017. The Group recognises there is a funding and investment risk inherent within defined benefit arrangements and seeks to continue its programme of closing overseas defined benefit plans where possible and providing in their place appropriate defined contribution arrangements.
The net deficit for defined benefit obligations at 31 December 2017 was £78m (2016: £80m deficit). The UK funds surplus was £2m as at 31 December 2017 (2016: £24m surplus) and constituted 85% (2016: 88%) of the total defined benefit liabilities and 92% (2016: 94%) of the total defined benefit assets. The reduction in the UK surplus in 2017 principally arose from the activities undertaken during the year to further de-risk the position.
The deficit in the overseas funds as at 31 December 2017 was £80m (2016: £103m). The decrease in the overseas deficit is predominantly as a result of favourable exchange movements and the settlement of a US scheme during the year.
Details of movements in actuarial assumptions are discussed in Section 4.9.
Foreign exchange and interest rate riskFurther information on how the Group manages its exposure to these financial risks is shown in Section 4.4 of the financial statements on page 119. The most important foreign currencies for the Group remain the Euro and the US dollar and the relevant closing rates of exchange for the balance sheet were:
As at 31 December
2017 2016
Euro 1.13 1.17
US dollar 1.35 1.23
Return on capital employed Post tax return on capital employed (ROCE) from continuing operations was 12.4% compared to 12.5% in 2016. Continued investment in the business in the year and the Group’s ability to continue to deliver solid results in mixed market conditions has resulted in the ROCE metric remaining constant.
DividendThe Board has recommended a final dividend in respect of 2017 of 25.2p (2016: 24.7p) per share, an increase of 2% over the 2016 final dividend. This makes the total dividend for 2017 of 39.4p (2016: 38.7p). The cost of the final dividend is expected to be £68m (2016: £67m), leading to a total dividend cost of £107m (2016: £105m) in respect of the year ended 31 December 2017. Dividend cover based on adjusted earnings for the continuing businesses is 1.7 times (2016: 1.5 times). As detailed in the Company financial statements on page 159, all of the retained earnings at both 31 December 2017 and 31 December 2016 are considered to be distributable reserves.
Whilst the Group does not have a formal dividend policy or payout ratio, the Group’s aim is to continue with progressive dividends, which typically increase at a steady rate for both the interim and final dividend payments, with an aim that the dividend should, through the cycle, be covered by at least two times adjusted earnings. In making its dividend recommendations, the Board considers the levels of cash and debt within the Group, forecasted operating and capital cash flow requirements and the availability of distributable reserves. The Board also monitors the Group’s dividend cover based on adjusted earnings for the continuing business. For more details refer to Section 4.5.
Share price and shareholder returnThe share price at 31 December 2017 was £13.33 (2016: £10.40) and the average for the year was £12.19 (2016: £9.69) representing an increase of 28% and increase of 26% respectively. Based on the 2017 average share price, the proposed total dividend of 39.4p represents a yield of 3.2%.
Finance Director’s commentary on the consolidated balance sheet

96 IMI plc Annual Report and Accounts 2017
2017 2016 £m £m
Cash flows from operating activitiesOperating profit for the year from continuing operations 192.7 188.3Operating profit for the year from discontinued operations 2.2 -Adjustments for: Depreciation and amortisation 65.8 66.3 Impairment of property, plant and equipment and intangible assets 3.3 8.0 Loss on disposal of subsidiaries 1.7 - Gain on special pension events (10.8) (2.8)Loss/(Profit) on sale of property, plant and equipment 1.5 (1.6)Equity-settled share-based payment expense 8.0 5.8Decrease in inventories 3.9 17.5(Increase)/decrease in trade and other receivables (26.5) 6.8Increase in trade and other payables 22.4 5.5Decrease in provisions and employee benefits (7.0) (8.6)
Cash generated from the operations 257.2 285.2Income taxes paid (39.8) (31.7)
Cash generated from the operations after tax 217.4 253.5Additional pension scheme funding - UK and overseas (3.3) (1.9)Net cash from operating activities 214.1 251.6
Cash flows from investing activitiesInterest received 5.5 4.5Proceeds from sale of property, plant and equipment 0.5 6.8Net sale/(purchase) of investments 0.8 (0.4)Settlement of transactional derivatives (0.9) (2.4)Settlement of currency derivatives hedging balance sheet (18.3) (41.8)Acquisition of property, plant and equipment and non-acquired intangibles (69.8) (70.9)Net cash from investing activities (82.2) (104.2)
Cash flows from financing activities Interest paid (19.8) (21.8)Payment to non-controlling interest (2.2) (4.4)Shares acquired for employee share scheme trust (2.7) (7.4)Proceeds from the issue of share capital for employee share schemes 0.6 0.3Net drawdown of borrowings (2.1) (54.6)Dividends paid to equity shareholders and non-controlling interest (105.5) (105.0)Net cash from financing activities (131.7) (192.9)
Net increase/(decrease) in cash and cash equivalents 0.2 (45.5)Cash and cash equivalents at the start of the year 67.5 107.8Effect of exchange rate fluctuations on cash held (0.1) 5.2Cash and cash equivalents at the end of the year* 67.6 67.5
* Net of bank overdrafts of £31.0m (2016: £12.2m).
Notes to the cash flow appear in Section 4.1.
Consolidated statement of cash flows For the year ended 31 December 2017

97
Movement in net debt2017
£m2016
£m
EBITDA* from continuing operations 287.5 273.0
Working capital movements (0.2) 29.8
Capital and development expenditure (69.8) (70.9)
Provisions and employee benefit movements** (10.4) (2.2)
Other 10.8 16.2
Adjusted operating cash flow*** 217.9 245.9
Adjusting items**** (29.2) (25.2)
Operating cash flow 188.7 220.7
Tax paid (39.8) (31.7)
Interest and derivatives (33.5) (61.5)
Cash generation 115.4 127.5
Additional pension scheme funding (3.3) (1.9)
Free cash flow before corporate activity 112.1 125.6
Dividends paid to equity shareholders and non-controlling interest
(105.5) (105.0)
Proceeds from disposal of subsidiaries - -
Payment to non-controlling interest (2.2) (4.4)
Net purchase of own shares (2.1) (7.1)
Net cash flow (excluding debt movements) 2.3 9.1
Opening net debt (282.6) (236.9)
Net cash disposed - -
Foreign exchange translation 15.1 (54.8)
Closing net debt (265.2) (282.6)
* Adjusted profit after tax (£177.0m) before interest (£15.1m), tax (£47.1m), depreciation (£38.6m) and amortisation (£9.7m).
** Movement in provisions and employee benefits as per the statement of cash flows (£7.0m) adjusted for the increase in restructuring provisions (£3.4m).
*** Adjusted operating cash flow is the cash generated from the operations shown in the statement of cash flows less cash spent acquiring property, plant and equipment, non-acquired intangible assets and investments; plus cash received from the sale of property, plant and equipment and the sale of investments, excluding the cash impact of adjusting items. This measure best reflects the operating cash flows of the Group.
**** Cash impact of adjusting items.
Reconciliation of EBITDA to movement in net debtThe Group’s consolidated statement of cash flows is shown on the opposite page, which reconciles the operating profit for the year to the change in cash and overdrafts in the balance sheet as required for financial reporting purposes.
However, because the Group’s debt financing also includes other interest-bearing liabilities, to aid understanding, an analysis of the effect of the transactions in the year on net debt has been provided. Accordingly, a reconciliation between adjusted EBITDA and net debt is shown in the table above, upon which this section provides commentary.
Operating cash flowAdjusted operating cash flow was £218m (2016: £246m). After the £29m (2016: £25m) cash outflow from adjusting items, the operating cash flow was £189m (2016: £221m). This represents a conversion rate of total Group segmental operating profit after restructuring costs into operating cash flow of 92% (2016: 107%).
Net working capital balances were equal to the prior year (2016: £30m decrease). Inventory decreased by £4m (2016: £18m decrease) due to decreases in inventory within Critical Engineering and Hydronic Engineering. The Group’s receivables increased by £26m (2016: £7m decrease) as a result of an increase in revenue. Payables increased by £22m (2016: £6m increase) due to higher trading activity and proactive supplier management.
Cash spent on property, plant and equipment and other non-acquired intangibles in the year was £70m (2016: £71m) which was equivalent to 1.5 times (2016: 1.5 times) depreciation and amortisation thereon. Research and development spend including capitalised intangible development costs of £9m (2016: £8m) totalled £50m (2016: £57m).
In 2017 the Group paid tax of £40m (2016: £32m) which was 84% (2016: 73%) of the adjusted tax charge for the year. This reflects the timing of estimated tax payments on account and is discussed in more detail in Section 2.4.
In 2017 there was a £34m cash outflow (2016: £62m outflow) from interest and derivatives, including a £18m outflow (2016: £42m outflow) from the settlement of currency derivatives hedging the balance sheet.
After payment of interest and tax, the cash flow generated from operations was £115m (2016: £128m).
Free cash flow before corporate activityAs noted in Section 4.12, following the derecognition of the minority interest relating to the Scottish Limited Partnership, £3.3m of additional pension contributions were made. Free cash flow before corporate activity was £112m (2016: £126m).
Net cash outflow (excluding debt movements)Dividends paid to shareholders totalled £106m (2016: £104m) and there was a cash outflow of £2m (2016: £7m outflow) for net share purchases to satisfy employee share options.
The total net cash inflow (excluding debt movements) was £2m (2016: inflow of £9m).
Closing net debtThe opening net debt was £283m (2016: £237m). There were exchange rate gains of £15m (2016: £55m loss), principally on US dollar and Euro denominated borrowings. After the net cash inflow in the year of £2m (2016: £9m inflow), closing net debt was £265m (2016: £283m).
Finance Director’s commentary on the consolidated cash flow statement

98 IMI plc Annual Report and Accounts 2017
1.1 IntroductionIMI plc (the ‘Company’) is a company domiciled in the United Kingdom. The consolidated financial statements of the Company comprise the Company and its subsidiaries (together referred to as the ‘Group’). The Company financial statements present information about the company as a separate entity and not about the Group. The consolidated financial statements have been prepared in accordance with International Financial Reporting Standards as adopted by the EU and applicable law (IFRSs). The Company has elected to prepare its Parent Company Financial Statements in accordance with FRS 101 and these are presented on pages 158 to 166. The financial statements were approved by the Board of Directors on 22 February 2018.
Alternative Performance Measures (APMs) are used in discussions with the investment analyst community and by the Board and management to monitor the trading performance of the Group. We consider that the presentation of APMs allows for improved insight to the trading performance of the Group. We have reviewed the APMs presented as part of the continuous improvement of our external reporting and consider that the term Adjusted, together with an adjusting items category, best reflects the trading performance of the Group. The APMs presented in the Annual Report and Accounts to 31 December 2017 are defined in Section 2.
1.2 Basis of accountingThe financial statements are presented in Pounds Sterling (which is the Company’s functional currency), rounded to the nearest hundred thousand, except revenues, which are rounded to the nearest whole million. They are prepared on the historical cost basis except that the following assets and liabilities are stated at their fair value: derivative financial instruments; available-for-sale financial assets; financial assets and liabilities identified as hedged items; and assets and liabilities acquired through business combinations. Non-current assets and liabilities held for sale are stated at the lower of their carrying amounts and their fair values less costs to sell.
The policies described in this section and in the accompanying sections have been applied consistently throughout the Group for the purposes of these consolidated financial statements except as discussed below. Refer to Section 5.4 for the Group’s significant accounting policies.
i) New or amended EU Endorsed Accounting Standards adopted by the Group during 2017
The following amended standards were adopted in these financial statements during 2017, none of which had any impact.
• IFRS 12 ‘Disclosure of Interests in Other Entities’
• IAS 7 ‘Statement of Cash Flows’
• IAS 12 ‘Income Taxes’
ii) Issued Accounting Standards which are not effective for the year ended 31 December 2017
The IASB and IFRIC have issued a number of new accounting standards and amendments with an effective date after the date of these financial statements.
• IFRS 9 ‘Financial Instruments’ (2014)
A finalised version of IFRS 9 was issued in July 2014, incorporating requirements for classification and measurement, impairment, general hedge accounting and de-recognition. The Group has completed an impact assessment of IFRS 9 and noted that certain of the Group’s equity investments, currently held at historic cost, will need to be recognised at fair value under IFRS 9. An election will be made to recognise movements in the fair value of each investment, currently held at amortised cost, in other comprehensive income. This will have an immaterial impact on the financial statements. The standard will be adopted from 1 January 2018.
• IFRS 15 ‘Revenue from Contracts with Customers’ (2015)
The Group has updated its assessment of the impact that IFRS 15 ‘Revenue from Contracts with Customers’ will have on the financial statements at the effective date of 1 January 2018. It is considered that the adoption of this standard will not have significant impact on the financial statements.
• IFRS 16 ‘Leases’ (2015)
IFRS 16 provides a single lessee accounting model, requiring lessees to recognise assets and liabilities for all leases unless the original lease term is 12 months or less or the leased asset has a low value. The Group has completed an impact assessment of IFRS 16 on all Group property and non-property leases. The impact of the new standard, as at 2017, is outlined in the table below. The estimate range reflects the spread of sensitivities applied to the key assumptions adopted to complete the impact assessment. The standard will be adopted from 1 January 2019.
Financial Statement ItemIncrease/(Decrease)£m
Balance sheet Property, plant and equipment 95 – 106
Balance sheet Liabilities 94 – 105
Income statement Operating profit 2 – (1)
Income statement Finance costs 4 – nil
Section 1 – basis of preparation

99
What you will find in this section
This section focuses on the results and performance of the Group. On the following pages you will find disclosures explaining the Group’s results for the year, including segmental information, adjusting items, taxation and earnings per share. You will also find a summary of the Group’s alternative performance measures, including the definition of each and the rationale for their use.
2.1 Segmental information and alternative performance measures
Organic revenue growth and operating profit are the two short-term key performance indicators or measures that reflect the way the performance of the Group is managed and monitored by the Executive Committee. In this section the key constituents of these two KPI’s, being the Group’s adjusted revenues and segmental operating profits, are analysed by reference to the performance and activities of the Group’s segments and their operating costs.
2.1.1 Segmental informationSegmental information is presented in the consolidated financial statements for each of the Group’s operating segments. The operating segment reporting format reflects the Group’s management and internal reporting structures and represents the information that was presented to the chief operating decision-maker, being the Executive Committee. As described on page 09, each of the Group’s three divisions has a number of key brands across its main markets and operational locations. For the purposes of reportable segmental information, operating segments are aggregated into the Group’s three divisions, as the nature of the products, production processes and types of customer are similar within each division. Inter-segment revenue is insignificant.
IMI Critical EngineeringIMI Critical Engineering is a world-leading provider of critical flow control solutions that enable vital energy and process industries to operate safely, cleanly, reliably and more efficiently.
IMI Precision EngineeringIMI Precision Engineering specialises in developing motion and fluid control technologies for applications where precision, speed and reliability are essential.
IMI Hydronic EngineeringIMI Hydronic Engineering designs and manufactures technologies which deliver optimal and energy efficient heating and cooling systems to the residential and commercial building sectors.
Performance is measured based on adjusted segmental operating profit which is defined in the table below.
Businesses enter into forward currency and metal contracts to provide economic hedges against the impact on profitability of swings in rates and values in accordance with the Group’s policy to minimise the risk of volatility in revenues, costs and margins. Segmental operating profits are therefore charged/credited with the impact of these contracts. In accordance with IAS 39, these contracts do not meet the requirements for hedge accounting and gains and losses are reversed out of adjusted revenue and operating profit and are recorded in net financial income and expense for the purposes of the consolidated income statement.
Alternative Performance MeasuresTo facilitate a more meaningful review of performance, certain alternative performance measures have been included within this Annual Report. These APMs are used by the Executive Committee to monitor and manage the performance of the Group, in order to ensure that decisions taken align with its long-term interests. Movements in adjusted revenue and segmental operating profit are given on an organic basis (see definition opposite) so that performance is not distorted by acquisitions, disposals and movements in exchange rates. The table below details the definition of each APM and a reference to where it can be reconciled to the equivalent statutory measure.
APM DefinitionReconciliation to statutory measure
Adjusted revenue
Adjusted profit before tax
Adjusted earnings per share
These measures are as reported to management and do not reflect the impact of the items such as in Section 2.2.
See income statement on page 90.
Adjusted segmental operating profit and margin
These measures are as reported to management and do not reflect the impact of the items such as in Section 2.2 and gains and losses on disposal of subsidiaries.
See income statement on page 90 and segmental reporting note in Section 2.1.1.
Organic growth
This measure removes the impact of adjusting items, disposals and movements in exchange rates.
See segmental reporting note in Section 2.1.1.
Adjusted operating cash flow
This measure reflects cash generated from operations as shown in the statement of cash flows less cash spent acquiring property, plant and equipment, non-acquired intangible assets and investments; plus cash received from the sale of property, plant and equipment and the sale of investments, excluding the cash impact of adjusting items.
See cash flow commentary on page 97.
Section 2 – results for the year

100 IMI plc Annual Report and Accounts 2017
The following table illustrates how the results for the segments reconcile to the overall results reported in the income statement.
Revenue Operating profit Operating margin
2017 2016 2017 2016 2017 2016 £m £m £m £m % %
Continuing operations IMI Critical Engineering 648 651 84.0 81.8 13.0% 12.6% IMI Precision Engineering 791 708 133.5 118.5 16.9% 16.7% IMI Hydronic Engineering 312 290 49.7 51.9 15.9% 17.9% Corporate costs (26.3) (24.5)
Total adjusted revenue/segmental operating profit and margin 1,751 1,649 240.9 227.7 13.8% 13.8%
Restructuring costs (non-adjusting) (1.7) (3.5)Total adjusted revenue/operating profit and margin 1,751 1,649 239.2 224.2 13.7% 13.6%
Reversal of net economic hedge contract losses - 8.0 (0.9) 5.6Restructuring costs (34.6) (18.8)Gains on special pension events 10.8 2.8Impairment losses (5.0)Acquired intangible amortisation (19.5) (20.5)Loss on disposal of subsidiaries (2.3) -
Statutory revenue/operating profit 1,751 1,657 192.7 188.3
Net financial expense (11.8) (23.0)Statutory profit before tax from continuing operations 180.9 165.3
The following table illustrates how revenue and operating profit have been impacted by movements in foreign exchange, acquisitions and disposals.
Year ended 31 December 2016 Year ended 31 December 2017
Movement As in foreign As Adjusted Organic adjusted exchange Disposals Organic adjusted Disposals Organic growth (%) growth (%)
Adjusted revenue IMI Critical Engineering 651 40 (5) 686 648 (3) 645 0% -6% IMI Precision Engineering 708 42 750 791 791 12% 5% IMI Hydronic Engineering 290 18 308 312 312 8% 1%Total 1,649 100 (5) 1,744 1,751 (3) 1,748 6% 0%
Segmental operating profit IMI Critical Engineering 81.8 6.3 0.5 88.6 84.0 0.6 84.6 3% -5% IMI Precision Engineering 118.5 6.7 125.2 133.5 133.5 13% 7% IMI Hydronic Engineering 51.9 2.7 54.6 49.7 49.7 -4% -9% Corporate costs (24.5) (24.5) (26.3) (26.3) Total 227.7 15.7 0.5 243.9 240.9 0.6 241.5 6% -1%
Segmental operating profit margin (%) 13.8% 14.0% 13.8% 13.8%
Section 2 – results for the year (continued)
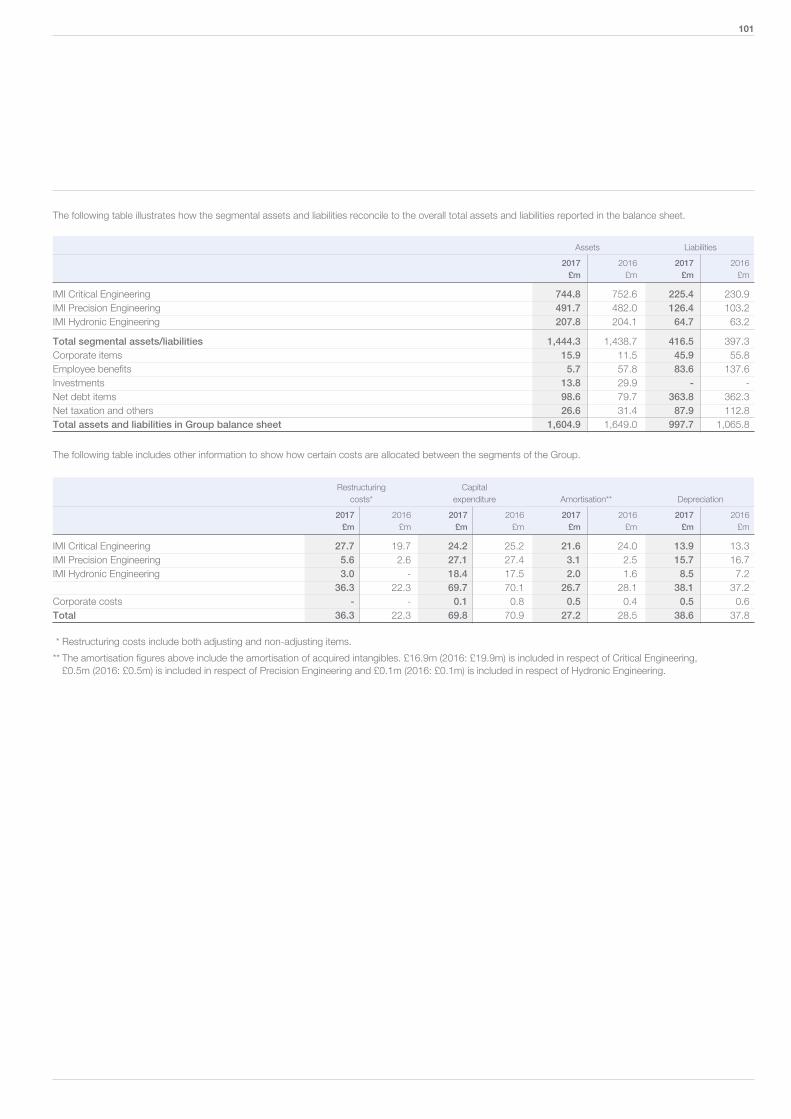
101
The following table illustrates how the segmental assets and liabilities reconcile to the overall total assets and liabilities reported in the balance sheet.
Assets Liabilities
2017 2016 2017 2016 £m £m £m £m
IMI Critical Engineering 744.8 752.6 225.4 230.9IMI Precision Engineering 491.7 482.0 126.4 103.2IMI Hydronic Engineering 207.8 204.1 64.7 63.2
Total segmental assets/liabilities 1,444.3 1,438.7 416.5 397.3Corporate items 15.9 11.5 45.9 55.8Employee benefits 5.7 57.8 83.6 137.6Investments 13.8 29.9 - -Net debt items 98.6 79.7 363.8 362.3Net taxation and others 26.6 31.4 87.9 112.8Total assets and liabilities in Group balance sheet 1,604.9 1,649.0 997.7 1,065.8
The following table includes other information to show how certain costs are allocated between the segments of the Group.
Restructuring Capital costs* expenditure Amortisation** Depreciation
2017 2016 2017 2016 2017 2016 2017 2016 £m £m £m £m £m £m £m £m
IMI Critical Engineering 27.7 19.7 24.2 25.2 21.6 24.0 13.9 13.3IMI Precision Engineering 5.6 2.6 27.1 27.4 3.1 2.5 15.7 16.7IMI Hydronic Engineering 3.0 - 18.4 17.5 2.0 1.6 8.5 7.2 36.3 22.3 69.7 70.1 26.7 28.1 38.1 37.2Corporate costs - - 0.1 0.8 0.5 0.4 0.5 0.6Total 36.3 22.3 69.8 70.9 27.2 28.5 38.6 37.8
* Restructuring costs include both adjusting and non-adjusting items.
** The amortisation figures above include the amortisation of acquired intangibles. £16.9m (2016: £19.9m) is included in respect of Critical Engineering, £0.5m (2016: £0.5m) is included in respect of Precision Engineering and £0.1m (2016: £0.1m) is included in respect of Hydronic Engineering.

102 IMI plc Annual Report and Accounts 2017
Emerging Markets31%
North America21%
Western Europe38%
Rest of theWorld5%
UK5%
Emerging Markets34%
North America19%
Western Europe38%
Rest of theWorld5%
UK4%
The following table shows a geographical analysis of the location of the Group’s property, plant and equipment and intangible assets.
2017 2016 £m £m
UK 81.8 77.7Germany 252.9 251.5Rest of Europe 240.6 238.2USA 140.7 152.1Asia Pacific 46.8 51.1Rest of World 16.4 16.8Total 779.2 787.4
Adjusted revenue by destination (2016)Adjusted revenue by destination (2017)
The following table shows a geographical analysis of how the Group’s revenue is derived by destination.
2017 2016 Revenue Revenue £m £m
UK 79 75Germany 260 240Other Western Europe 393 390Western Europe 653 630USA 318 327Canada 20 17 North America 338 344Emerging Markets 595 520Rest of World 86 80 Total adjusted revenue 1,751 1,649Reversal of economic hedge contract losses - 8Total statutory revenue 1,751 1,657
Section 2 – results for the year (continued)

103
2.1.2 Operating costs by function
The following table is included to show how much of the operating costs deducted from revenue to arrive at the Group’s statutory operating profit, relate to cost of sales, selling and distribution costs, administrative expenses and adjusting items.
2017 £m
2016 £m
Adjusted revenue 1,751.0 1,649.0
Cost of sales (980.1) (923.8)
Segmental gross profit 770.9 725.2
Selling and distribution costs (243.2) (223.6)
Administrative expenses (286.8) (273.9)
Restructuring costs (1.7) (3.5)
Adjusted operating profit 239.2 224.2
Adjusted items* (46.5) (35.9)
Statutory operating profit 192.7 188.3
* The adjusting items are analysed in detail in Section 2.2.
2.1.3 Specific elements of operating costs
Certain specific items of operating expenses are disclosed to provide the reader of financial statements with more information regarding these costs. This section provides this analysis.
2.1.3.1 Employee information
The average number of people employed by the Group during the year was:
2017 2016
IMI Critical Engineering 3,473 3,836
IMI Precision Engineering 5,272 5,284
IMI Hydronic Engineering 1,820 1,843
Corporate 105 118
Total Group 10,670 11,081
The aggregate employment cost charged to operating profit for the year was:
2017 £m
2016 £m
Wages and salaries 487.0 465.9
Share based payments 8.0 5.8
Social security costs 83.5 82.6
Pension costs* 0.2 12.3
Total 578.7 566.6
* Pension costs include the £10.8m gain (2016: £2.8m gain) on special pension events which are disclosed as adjusting items, see Section 4.9.3.3.
The aggregate gains made by directors on the exercise of share options was £nil (2016: £0.2m). The remuneration, as defined in the Companies Act 2006 Schedule 5, for the executive directors comprises fixed and annual variable pay as set out in the table on page 77 of the Remuneration Report. For details of the non-executive directors’ remuneration please refer to page 83 of the Remuneration Report.
2.1.3.2 Operating lease charges and operating lease commitments
The Group enters into leases for property, plant and equipment assets when doing so represents a more cost-effective or lower risk option than purchasing them. This leads to an income statement charge for the year and future commitments for the Group in respect of these leases.
Continuing operating costs include a charge of £15.2m (2016: £14.7m) relating to the lease of properties and a charge of £8.8m (2016: £7.6m) relating to the lease of plant and machinery. The continuing commitments in respect of non-cancellable operating leases in place are shown in the following table by time period:
2017 2016 Land and Land and buildings Others buildings Others £m £m £m £m
Within one year 18.2 10.9 15.9 7.1In the second to fifth year 38.6 8.6 39.3 10.0After five years 15.6 - 17.5 - 72.4 19.5 72.7 17.1
2.1.3.3 Research and development expenditure
The continuing cost of research and development expenditure charged directly to the income statement was £48.0m (2016: £48.4m). In addition, amortisation of capitalised intangible development costs amounted to £3.4m (2016: £3.1m) and across the Group a further £9.0m (2016: £8.1m) was capitalised.
2.1.3.4 Exchange on operating activities net of hedging arrangements
The transactional foreign exchange gains in the Group were £3.5m (2016: losses of £1.5m).
2.1.3.5 Audit fees
The Group engages its auditor, EY, to perform assignments in addition to their statutory audit duties where their expertise, experience and knowledge of the Group should enable them to perform these assignments more efficiently than other similar service providers.
The Group’s policy on such assignments is set out in the Audit Committee Report on page 62. Fees earned by EY and its associates during the year are set out below:
2017 £m
2016 £m
Fees earned by the Company’s auditor for the audit of the Company’s annual accounts 0.2 0.2
The audit of the Company’s subsidiaries, pursuant to legislation 2.5 2.4
Tax compliance services - 0.1
Other assurance services 0.1 0.1
Total 2.8 2.8

104 IMI plc Annual Report and Accounts 2017
2.2 Adjusting items
The adjusting items category in the income statement includes those items which are removed from statutory measures to provide insight as to the performance of the Group. They include restructuring costs, special pension events, losses on disposals of subsidiaries, impairment losses, the reversal of gains/losses on economic hedges, acquisition costs and acquired intangible amortisation.
2.2.1 Restructuring costs
The restructuring costs treated as adjusting items total £34.6m (2016: £18.8m) are as a result of a number of significant restructuring projects across the Group. This includes the restructure of the Critical Belgian business (£12.4m) the Switzerland Controls & Nuclear business in Critical Engineering (£8.3m), the restructure of our European business in Precision Engineering (£4.1m) and a Global Restructuring Programme within Hydronic Engineering (£3.0m). A further £6.8m was incurred within Critical Engineering due to right sizing (£4.9m) and the finalisation of 2016 production transfers and closures (£1.9m).
Adjusting restructuring costs in 2016 included £7.6m relating to the closure of one our Critical Engineering sites in Germany, £1.7m from the closure of one of our Critical Engineering sites in Italy, £3.2m for the continuing European restructuring exercise commenced in 2015 and £5.6m from the restructuring of our Swedish business.
Other restructuring costs of £1.7m (2016: £3.5m) are not included in the measure of segment operating profit reported to the Executive Committee. These costs have been charged below segmental operating profit and included in adjusted operating profit as, based on their quantum, they do not meet our definition of adjusting items.
2.2.2 Gains on special pension events
During 2017, a number of further de-risking exercises, including the conversion of certain pensions to non-inflation linked, occurred in the UK which resulted in net gains of £1.7m. The termination and final settlement of an historical Senior Retirement Plan in the US resulted in a net gain of £2.2m and, following further restructuring exercises in Switzerland, a curtailment gain of £5.3m was recognised. These gains were partially offset by a loss of £1.8m in adjusting items, relating to the distribution of pension assets to members from our previously overfunded Swiss schemes. The completion of the transfer of £429m of liabilities covered by insurance policies to the insurance companies through a formal buy-out transaction resulted in a net gain of £3.4m.
Gains on special pension events in the UK and Switzerland of £2.8m were recognised in 2016.
2.2.3 Losses on disposal of subsidiaries
The loss on the disposal of Stainless Steel Fasteners (SSF) is disclosed in Section 3.5. No subsidiaries were disposed in 2016.
2.2.4 Impairment losses
As reported on page 112, following completion of the Group’s annual impairment review, no impairment charges on intangible assets were recognised. In 2016 an impairment charge of £5m was recorded against the goodwill associated with the Stainless Steel Fasteners (SSF) CGU in the IMI Critical Engineering division. As described in 2.2.1, an impairment charge of £3.3m (2016: £2.2m) was recognised against property, plant and equipment directly resulting from a number of significant restructuring projects as detailed in Section 2.2.1.
2.2.5 Reversal of net economic hedge contract losses/gains
For segmental reporting purposes, changes in the fair value of economic hedges which are not designated as hedges for accounting purposes, together with the gains and losses on their settlement, are included in the adjusted revenues and operating profit of the relevant business segment. The adjusting items at the operating level reverse this treatment. The financing adjusting items reflect the change in value or settlement of these contracts with the financial institutions with whom they were transacted. The former comprised a reversal of a gain of £0.9m (2016: reversal of a loss of £5.6m) and the latter amounted to a gain of £3.3m (2016: loss of £6.8m).
2.2.6 Acquired intangible amortisation and acquisition costs
For segmental purposes, acquired intangible amortisation is excluded from adjusted profits, to allow for better comparability of the performance across divisions. This allows users of the financial statements to gain a clearer understanding of the performance of the business, with the impact of amortisation identified separately in line with internal reporting to management. Acquired intangible amortisation decreased to £17.5m (2016: £20.5m) following the full amortisation of the acquired customer relationships arising on the Remosa acquisition. Acquisition costs of £2.0m were incurred during the year arising from the acquisition of Bimba Manufacturing Company which completed on 31 January 2018 (see Section 5.3).
2.2.7 Taxation
The tax effects of the above items are included in the adjusting items column of the income statement.
Section 2 – results for the year (continued)

105
2017 2016 Key million million
Weighted average number of shares for the purpose of basic earnings per share A 271.1 270.8Dilutive effect of employee share options 0.5 1.8Weighted average number of shares for the purpose of diluted earnings per share B 271.6 272.6
Key £m £m
Statutory profit for the year 162.2 133.2Non-controlling interests (0.1) (2.4)
Statutory profit for the year attributable to owners of the parent C 162.1 130.8Statutory profit from discontinued operations, net of tax (16.9) -
Continuing statutory profit for the year attributable to owners of the parent D 145.2 130.8Total adjusting items charges included in profit before tax 43.2 42.7Total adjusting items credits included in taxation (11.5) (11.6)
Earnings for adjusted EPS E 176.9 161.9
Key 2017 2016
Statutory EPS measures
Statutory basic EPS C/A 59.8p 48.3pStatutory diluted EPS C/B 59.7p 48.0pStatutory basic continuing EPS D/A 53.6p 48.3pStatutory diluted continuing EPS D/B 53.5p 48.0p
Adjusted EPS measures Adjusted basic EPS E/A 65.3p 59.8pAdjusted diluted EPS E/B 65.1p 59.4p
Discontinued earnings per share
Statutory basic discontinued earnings per share were 6.2p (2016: nil). Statutory diluted discontinued earnings per share were 6.2p (2016: nil).
2.3 Earnings per ordinary share
Earnings per share (EPS) is the amount of post-tax profit attributable to each share (excluding those held in the Employee Benefit Trust or by the Company). Basic EPS measures are calculated as the Group profit for the year attributable to equity shareholders divided by the weighted average number of shares in issue during the year. Diluted EPS takes into account the dilutive effect of all outstanding share options priced below the market price, in arriving at the number of shares used in its calculation.
Both of these measures are also presented on an adjusted basis, to assist the reader of the financial statements to get a better understanding of the performance of the Group. The note below demonstrates how this calculation has been performed.
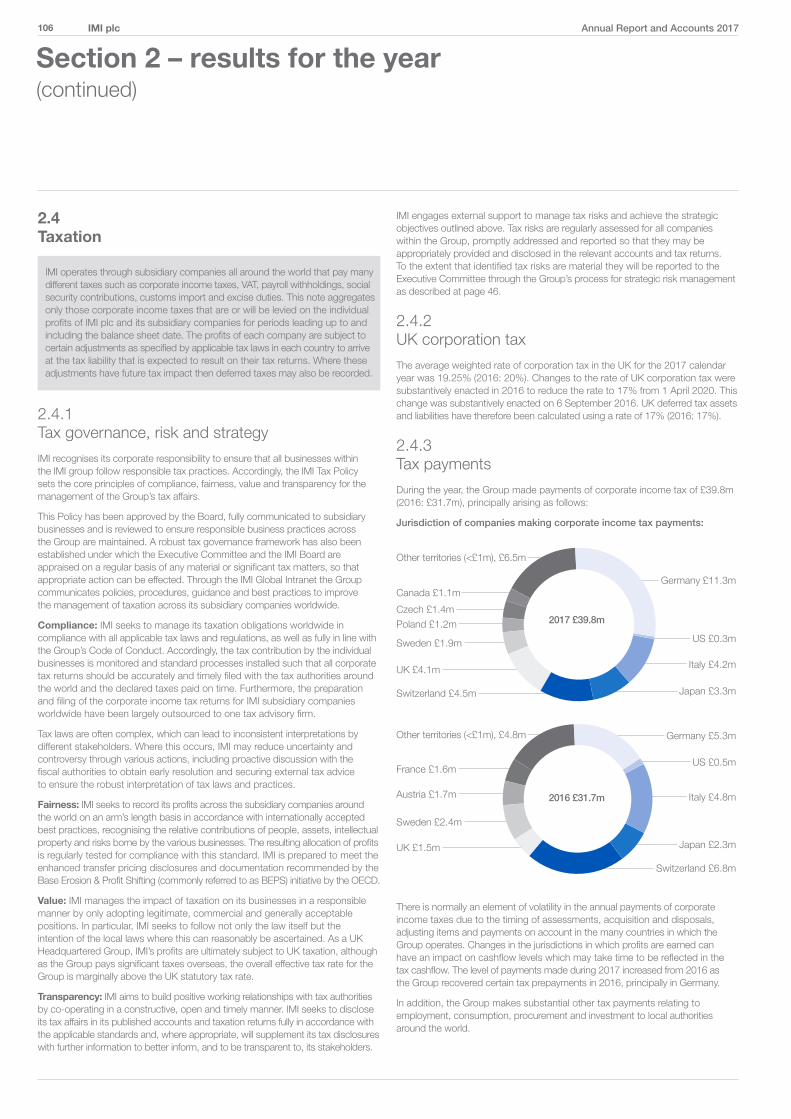
106 IMI plc Annual Report and Accounts 2017
2.4 Taxation
IMI operates through subsidiary companies all around the world that pay many different taxes such as corporate income taxes, VAT, payroll withholdings, social security contributions, customs import and excise duties. This note aggregates only those corporate income taxes that are or will be levied on the individual profits of IMI plc and its subsidiary companies for periods leading up to and including the balance sheet date. The profits of each company are subject to certain adjustments as specified by applicable tax laws in each country to arrive at the tax liability that is expected to result on their tax returns. Where these adjustments have future tax impact then deferred taxes may also be recorded.
2.4.1 Tax governance, risk and strategy
IMI recognises its corporate responsibility to ensure that all businesses within the IMI group follow responsible tax practices. Accordingly, the IMI Tax Policy sets the core principles of compliance, fairness, value and transparency for the management of the Group’s tax affairs.
This Policy has been approved by the Board, fully communicated to subsidiary businesses and is reviewed to ensure responsible business practices across the Group are maintained. A robust tax governance framework has also been established under which the Executive Committee and the IMI Board are appraised on a regular basis of any material or significant tax matters, so that appropriate action can be effected. Through the IMI Global Intranet the Group communicates policies, procedures, guidance and best practices to improve the management of taxation across its subsidiary companies worldwide.
Compliance: IMI seeks to manage its taxation obligations worldwide in compliance with all applicable tax laws and regulations, as well as fully in line with the Group’s Code of Conduct. Accordingly, the tax contribution by the individual businesses is monitored and standard processes installed such that all corporate tax returns should be accurately and timely filed with the tax authorities around the world and the declared taxes paid on time. Furthermore, the preparation and filing of the corporate income tax returns for IMI subsidiary companies worldwide have been largely outsourced to one tax advisory firm.
Tax laws are often complex, which can lead to inconsistent interpretations by different stakeholders. Where this occurs, IMI may reduce uncertainty and controversy through various actions, including proactive discussion with the fiscal authorities to obtain early resolution and securing external tax advice to ensure the robust interpretation of tax laws and practices.
Fairness: IMI seeks to record its profits across the subsidiary companies around the world on an arm’s length basis in accordance with internationally accepted best practices, recognising the relative contributions of people, assets, intellectual property and risks borne by the various businesses. The resulting allocation of profits is regularly tested for compliance with this standard. IMI is prepared to meet the enhanced transfer pricing disclosures and documentation recommended by the Base Erosion & Profit Shifting (commonly referred to as BEPS) initiative by the OECD.
Value: IMI manages the impact of taxation on its businesses in a responsible manner by only adopting legitimate, commercial and generally acceptable positions. In particular, IMI seeks to follow not only the law itself but the intention of the local laws where this can reasonably be ascertained. As a UK Headquartered Group, IMI’s profits are ultimately subject to UK taxation, although as the Group pays significant taxes overseas, the overall effective tax rate for the Group is marginally above the UK statutory tax rate.
Transparency: IMI aims to build positive working relationships with tax authorities by co-operating in a constructive, open and timely manner. IMI seeks to disclose its tax affairs in its published accounts and taxation returns fully in accordance with the applicable standards and, where appropriate, will supplement its tax disclosures with further information to better inform, and to be transparent to, its stakeholders.
IMI engages external support to manage tax risks and achieve the strategic objectives outlined above. Tax risks are regularly assessed for all companies within the Group, promptly addressed and reported so that they may be appropriately provided and disclosed in the relevant accounts and tax returns. To the extent that identified tax risks are material they will be reported to the Executive Committee through the Group’s process for strategic risk management as described at page 46.
2.4.2 UK corporation tax
The average weighted rate of corporation tax in the UK for the 2017 calendar year was 19.25% (2016: 20%). Changes to the rate of UK corporation tax were substantively enacted in 2016 to reduce the rate to 17% from 1 April 2020. This change was substantively enacted on 6 September 2016. UK deferred tax assets and liabilities have therefore been calculated using a rate of 17% (2016: 17%).
2.4.3 Tax payments
During the year, the Group made payments of corporate income tax of £39.8m (2016: £31.7m), principally arising as follows:
Jurisdiction of companies making corporate income tax payments:
There is normally an element of volatility in the annual payments of corporate income taxes due to the timing of assessments, acquisition and disposals, adjusting items and payments on account in the many countries in which the Group operates. Changes in the jurisdictions in which profits are earned can have an impact on cashflow levels which may take time to be reflected in the tax cashflow. The level of payments made during 2017 increased from 2016 as the Group recovered certain tax prepayments in 2016, principally in Germany.
In addition, the Group makes substantial other tax payments relating to employment, consumption, procurement and investment to local authorities around the world.
US £0.3m
Germany £11.3m
Other territories (<£1m), £6.5m
UK £4.1m
Sweden £1.9m
Poland £1.2m
Czech £1.4m
Canada £1.1m
Japan £3.3m
Italy £4.2m
Switzerland £4.5m
2017 £39.8m
Section 2 – results for the year (continued)
US £0.5m
Germany £5.3mOther territories (<£1m), £4.8m
UK £1.5m
Sweden £2.4m
Austria £1.7m
France £1.6m
Japan £2.3m
Italy £4.8m
Switzerland £6.8m
2016 £31.7m

107
2.4.5 Reconciliation of effective tax rate
As IMI’s head office and parent company is domiciled in the UK, the Group references its effective tax rate to the UK corporation tax rate, despite only a small portion of the Group’s business being in the UK. Therefore, the following tax reconciliation applies the UK corporation tax rate for the year to profit before tax, both before and after adjusting items. The resulting tax charge is reconciled to the actual tax charge for the Group, by taking account of specific tax adjustments as follows:
2017 2016
Adjusted Adjustments Statutory Adjusted Adjustments Statutory Section £m £m £m £m £m £m
Profit before tax from continuing operations 224.1 (43.2) 180.9 208.0 (42.7) 165.3Profit before tax from discontinued operations 2.5 2.2 2.2 - -Profit before tax 224.1 (41.0) 183.1 208.0 (42.7) 165.3
Income tax using the Company’s domestic rate of tax of 19.25% (2016: 20%) 43.1 (7.9) 35.2 41.6 (8.5) 33.1Effects of: Non-deductible items 1.8 3.7 5.5 3.2 0.6 3.8 Non-taxable loss on disposal of businesses - 0.4 0.4 - - Utilisation of losses on which no deferred tax had been recognised (2.6) (2.6) (1.0) (1.0) Current year losses for which no deferred tax asset has been recognised 6.5 0.4 6.9 3.5 3.5 Change in future tax rate on deferred tax (5.0) (5.0) (3.0) (3.0) Differing tax rates 5.5 (4.4) 1.1 (2.8) (3.7) (6.5) (Over)/Under provided in prior years (2.2) (18.4) (20.6) 2.2 2.2Total tax in income statement 47.1 (26.2) 20.9 43.7 (11.6) 32.1Income tax expense reported in the consolidated income statement 47.1 (11.5) 35.6 43.7 (11.6) 32.1Effective rate of tax - continuing operations: 21.0% 19.5% 21.0% 19.4%Income tax attributable to discontinued operations 2.5 (14.7) (14.7) - -Effective rate of tax - discontinued operations: Total tax in income statement 47.1 (26.2) 20.9 43.7 (11.6) 32.1Effective rate of tax - total Group: 21.0% 11.5% 21.0% 19.4%
The US Tax Cuts and Jobs Act became law on 22 December 2017. The Act lowers the rate of Federal Corporate Income tax from 35% to 21% from 1 January 2018, which will benefit IMI in future years. Given that the rate change was substantively enacted by the balance sheet date, US deferred tax balances have been measured at a rate of 23% (2016: 37%), reflecting the combined Federal and State Corporate Income tax rates at which they are expected to reverse. This has resulted in a one off credit in 2017 to the Income Statement of £5m and a charge to the Consolidated Statement of Comprehensive Income of £0.3m.
As a result of the OECDs Base Erosion & Profit Shifting (BEPS) initiative the effective rate of tax on certain intra-group lending has increased in 2017. With regard to the Group’s US businesses this has a broadly equal but opposite effect to the benefits from the US Tax Cuts and Jobs Act. As a result, the Group’s overall adjusted effective rate of tax remains stable.
2.4.4 Recognised in the income statement
This section sets out the current and deferred tax charges, which together comprise the total tax charge in the income statement.
2017 £m
2016 £m
Current tax charge
Current tax charge 40.6 42.5
Adjustments in respect of prior years (20.1) 5.5
20.5 48.0
Deferred taxation
Origination and reversal of temporary differences 0.4 (15.9)
Total income tax charge 20.9 32.1
The income tax charge is apportioned between continuing and discontinued operations in the income statement as follows:
2017 £m
2016 £m
Current tax charge
Continuing operations 35.2 48.0
Discontinued operations (14.7) -
20.5 48.0
Deferred tax charge
Continuing operations 0.4 (15.9)
0.4 (15.9)
2017 £m
2016 £m
Total income tax charge
Continuing operations 35.6 32.1
Discontinued operations (14.7) -
20.9 32.1

108 IMI plc Annual Report and Accounts 2017
2.4.6 Recognised outside of the income statement
In addition to amounts charged to the income statement, some current tax and deferred tax is (credited)/charged directly to equity or through other comprehensive income, which can be analysed as follows:
2017 2016 £m £m
Deferred tax: On equity-settled transactions (0.3) - On re-measurement gains and on defined benefit plans (1.5) (12.8) (1.8) (12.8)
Current tax: On change in value of effective net investment hedge derivatives 0.7 (0.6) (1.1) (13.4)
Of which the following amounts are (credited)/charged: to the statement of comprehensive income (0.8) (13.4) to the statement of changes in equity (0.3) - (1.1) (13.4)
2.4.7 Recognised deferred tax assets and liabilities
Deferred taxes record the tax consequences of temporary differences between the accounting and taxation recognition of certain items, as explained below:
Assets Liabilities Net
2017 2016 2017 2016 2017 2016 £m £m £m £m £m £m
Non-current assets 1.1 1.1 (34.1) (46.9) (33.0) (45.8)Inventories 4.2 4.2 (3.5) (5.1) 0.7 (0.9)On revaluation of derivatives 0.5 0.8 (3.6) (2.0) (3.1) (1.2)Employee benefits and provisions 30.3 42.1 (3.7) (3.9) 26.6 38.2Other tax assets 2.0 0.5 - - 2.0 0.5
38.1 48.7 (44.9) (57.9) (6.8) (9.2)Offsetting within tax jurisdictions (17.2) (25.9) 17.2 25.9 - -Total deferred tax assets and liabilities 20.9 22.8 (27.7) (32.0) (6.8) (9.2)
Section 2 – results for the year (continued)

109
The movement in the net deferred tax balances has been recognised in the financial statements as analysed below:
Recognised Recognised in the outside the Balance at income income Balance at 1 Jan 17 statement statement Exchange 31 Dec 17 £m £m £m £m £m
Non-current assets (45.8) 11.2 - 1.6 (33.0)Inventories (0.9) 1.2 - 0.4 0.7On revaluation of derivatives (1.2) (1.9) - - (3.1)Employee benefits and provisions 38.2 (12.5) 1.8 (0.9) 26.6Other tax assets 0.5 1.6 - (0.1) 2.0Net deferred tax liability (9.2) (0.4) 1.8 1.0 (6.8)
Recognised Recognised in the outside the Balance at income income Balance at 1 Jan 16 statement statement Exchange 31 Dec 16 £m £m £m £m £m
Non-current assets (46.2) 7.9 - (7.5) (45.8)Inventories (1.0) 0.7 - (0.6) (0.9)On revaluation of derivatives (1.5) 0.3 - - (1.2)Employee benefits and provisions 14.1 7.4 12.8 3.9 38.2Other tax assets 0.9 (0.4) - - 0.5Net deferred tax liability (33.7) 15.9 12.8 (4.2) (9.2)
All exchange movements are taken through the translation reserve.
2.4.8 Unrecognised deferred tax assets and liabilities
Deferred tax assets of £49.1m (2016: 56.2m) have not been recognised in respect of tax losses of £65.2m (2016: £47.9m), interest of £33.6m (2016: £61.3m) and capital losses of £118.4m (2016: £119.1m). The majority of the tax losses have no expiry date. No deferred tax asset has been recognised for these temporary differences due to the uncertainty over their offset against future taxable profits and therefore their recoverability. In some instances, these balances are also yet to be accepted by the tax authorities and so could be challenged in the event of an audit.
It is likely that the majority of unremitted earnings of overseas subsidiaries would qualify for the UK dividend exemption. However £30.5m (2016: £48.9m) of those earnings may still result in a tax liability principally as a result of withholding taxes levied by the overseas jurisdictions in which those subsidiaries operate. These tax liabilities are not expected to exceed £2.5m (2016: £2.9m) of which £2.5m (2016: £2.7m) has been provided on the basis that the group expects to remit these amounts.
2.5 Discontinued operations
When the Group has assets and liabilities that have been sold in the year or are likely to be sold rather than being held for continuing use, these assets and liabilities are included in current assets and liabilities and denoted ‘held for sale’ rather than in their usual categories.
If they represent a significant enough proportion of the Group, they are also treated as discontinued operations. This means that their trading performance, i.e. their revenues, costs and other items of income and expense, are no longer reported within the headline figures in the income statement and are instead reported in a separate line, net of tax, called ‘discontinued operations’. These amounts no longer form part of continuing earnings per share. Comparative figures are restated to be shown on the same basis.
This enables the income statement for the current and prior year to be presented on a consistent basis and to convey a more forward-looking version of the results for the year.
A pre-tax gain of £2.2m and post-tax gain of £16.9m was recognised in the current year as a result of the finalisation of a number of matters relating to historical discontinued operations.
There was no profit or loss from discontinued operations in 2016.

110 IMI plc Annual Report and Accounts 2017
What you will find in this section
This section shows the assets used to generate the Group’s trading performance and the liabilities incurred as a result. Liabilities relating to the Group’s financing activities are addressed in Section 4. Deferred tax assets and liabilities are shown in Section 2.4.7. On the following pages there are sections covering working capital, non-current assets, acquisitions, other payables due after more than one year, provisions and pensions.
3.1 Working capital
Working capital represents the assets and liabilities the Group generates through its trading activities. The Group therefore defines working capital as trade and other receivables, inventory and trade and other payables. Working capital is managed very carefully to ensure that the Group can meet its trading and financing obligations within its ordinary operating cycle.
To provide the Executive Committee with insight into the management of working capital, an important measure monitored is cash conversion. Cash conversion is defined as the operating cash flow (as defined in the commentary on the cash flow statement) divided by the segmental operating profit which therefore represents the proportion of segmental operating profit generated during the year that has been converted into cash.
3.1.1 Inventories
2017 2016 £m £m
Raw materials and consumables 79.5 77.0Work in progress 113.6 113.9Finished goods 58.2 64.3 251.3 255.2
Inventories are stated after: Allowance for impairment 38.2 41.8
In 2017 the cost of inventories recognised as an expense (being segmental cost of sales) amounted to £980.1m (2016: £923.8m). The Group’s inventory decreased by £3.9m due to decreases in inventory held in IMI Critical Engineering and IMI Hydronic Engineering.
In 2017 the write-down of inventories to net realisable value amounted to £13.4m (2016: £10.6m). The reversal of write-downs amounted to £6.6m (2016: £2.3m). Write-downs and reversals in both years relate to on-going assessments of inventory obsolescence, excess inventory holding and inventory resale values across all of the Group’s businesses.
3.1.2 Trade and other receivables
2017 2016 £m £m
Current Trade receivables 339.9 337.0Other receivables 52.2 42.6Prepayments and accrued income 26.7 20.9 418.8 400.5
Receivables are stated after: Allowance for impairment 12.5 11.5
The increase in the Group’s trade and other receivables of £18.3m is due to foreign exchange movements of £8.2m offset by unfavourable cash movements of £26.5m.
The Group’s exposure to credit and market risks related to trade and other receivables is disclosed in Section 4.4.
3.1.3 Trade and other payables
2017 2016 £m £m
Current Trade payables 222.0 214.2Social security and other taxation 26.8 22.3Other payables 7.8 23.0Accruals and deferred income 159.9 148.4 416.5 407.9
Non-current Other payables 6.6 10.7 423.1 418.6
The Group’s trade and other payables increased by £4.5m due to foreign exchange movements of £17.9m, offset by favourable cash movements of £22.4m.
Section 3 – operating assets and liabilities

111
3.2 Intangible assets
The following section shows the non-physical assets used by the Group to generate revenues and profits. These assets include goodwill, customer relationships, order books, patents, development costs and software development costs. The cost of these assets is the amount that the Group has paid for them or, when they have arisen due to a business combination, the fair value of the specific intangible assets that could be sold separately or which arise from legal rights.
In the case of goodwill, its cost is the amount the Group has paid in acquiring a business over and above the fair value of the individual assets net of the liabilities acquired. The value of the goodwill can arise from a number of sources, but in relation to our more recent acquisitions, it has been represented by post-acquisition synergies and the skills and knowledge of the workforce. The value of the Group’s intangible assets, with the exception of goodwill, reduces over the number of years over which the Group expects to use the asset, the useful life, via an annual amortisation charge to the income statement.
The Group splits its intangible assets between those arising on acquisitions and those which do not, because the amortisation of acquired intangibles is recognised as an adjusting item in the income statement.
Where there are indications that the value of intangible assets is no longer representative of their value to the Group, for example where there is a customer relationship recognised but revenues from that customer are reducing, or where goodwill was recognised on an acquisition but the performance of the business acquired is below expectations, the directors review the value of the assets to ensure they have not fallen below their amortised values. If this has happened, a one-off impairment charge is recognised. This section explains the overall carrying values of the intangible assets within the Group and the specific judgements and estimates made by the directors in arriving at these values.
3.2.1 Analysis of intangible assets
Non-acquired Acquired Other Total Other non- intangibles customer acquired acquired acquired under Goodwill relationships intangibles intangibles intangibles construction Total £m £m £m £m £m £m £m
CostAs at 1 January 2016 366.3 166.4 86.0 618.7 64.8 18.7 702.2Exchange adjustments 60.6 27.0 13.9 101.5 10.8 2.7 115.0Additions - - - - 11.2 12.7 23.9Transfers from assets in the course of construction - - - - 9.9 (9.9) -Disposals - - - - (0.8) (0.1) (0.9)
As at 31 December 2016 426.9 193.4 99.9 720.2 95.9 24.1 840.2Exchange adjustments (6.5) 2.0 (0.1) (4.4) 0.2 (0.5) (4.7)Disposals of subsidiaries - - (0.1) (0.1) (0.1) - (0.2)Additions - - - - 7.6 14.6 22.2Transfers from assets in the course of construction - - - - 13.0 (13.0) -Disposals - - - - (5.2) (0.1) (5.3)As at 31 December 2017 420.4 195.4 99.9 715.7 111.4 25.1 852.2
Amortisation As at 1 January 2016 25.6 109.0 73.0 207.6 37.4 - 245.0Exchange adjustments 4.1 18.1 12.3 34.5 5.9 - 40.4Disposals - - - - (0.7) - (0.7)Impairment 5.0 - - 5.0 0.8 - 5.8Amortisation for year - 18.0 2.5 20.5 8.0 - 28.5
As at 31 December 2016 34.7 145.1 87.8 267.6 51.4 - 319.0Exchange adjustments 1.4 0.9 (0.3) 2.0 0.3 - 2.3Disposals of subsidiaries - - (0.1) (0.1) (0.1) - (0.2)Disposals - - - - (5.1) - (5.1)Amortisation for year - 15.0 2.5 17.5 9.7 - 27.2As at 31 December 2017 36.1 161.0 89.9 287.0 56.2 - 343.2Net book value at 31 December 2016 392.2 48.3 12.1 452.6 44.5 24.1 521.2Net book value at 31 December 2017 384.3 34.4 10.0 428.7 55.2 25.1 509.0

112 IMI plc Annual Report and Accounts 2017
3.2.2Goodwill impairment testing
Goodwill is not subject to an annual amortisation charge. Instead, its carrying value is assessed annually by comparison to the future cash flows of the business to which it relates (the cash generating unit, or CGU). These cash flows are discounted to reflect the time value of money and this discount rate, together with the growth rates assumed in the cash flow forecasts, are the key assumptions in this impairment testing process.
Goodwill is allocated to CGUs based on the synergies expected to be derived from the acquisition upon which the goodwill arose. The Group has 19 (2016: 20) cash generating units to which goodwill is allocated. The composition of CGUs reflects both the way in which cash inflows are generated and the internal reporting structure. Where our businesses operate closely with each other we will continue to review whether they should be treated as a single or combined CGU.
Goodwill is tested annually for impairment as part of the overall assessment of assets against their recoverable amounts. The recoverable amount of a CGU is the higher of its fair value less costs to sell and its value in use. Value in use is determined using cash flow projections from financial budgets, forecasts and plans approved by the Board covering a five-year period and include a terminal value multiple. The projected cash flows reflect the latest expectation of demand for products and services.
The key assumptions in these calculations are the long-term growth rates and the discount rates applied to forecast cash flows in addition to the achievement of the forecasts themselves. Long-term growth rates are based on long-term economic forecasts for growth in the manufacturing sector in the geographical regions in which the cash generating unit operates. Pre-tax discount rates specific to each cash generating unit are calculated by adjusting the Group post-tax weighted average cost of capital (WACC) of 7% (2016: 8%) for the tax rate relevant to the jurisdiction before adding risk premia for the size of the unit, the characteristics of the segment in which it resides, and the geographical regions from which the cash flows are derived.
This exercise resulted in the use of the following ranges of values for the key assumptions:
2017 2016 % %
Pre-tax discount rate 8.4 - 14.4 9.0 – 14.9Long-term growth rate 0.8 - 2.1 0.9 – 2.1
For the purpose of assessing the significance of CGUs, the Group uses a threshold of 20% of the total goodwill balance. Goodwill of £93.1m (2016: £85.1m) associated with the Control Valves CGU in Critical Engineering is considered to be significant. The recoverable amount of the CGU is determined from a value in use calculation. The key assumptions for the value in use valuation are the discount rate, growth rate and operating cashflows. These estimates are determined using the methodology discussed above.
The discount rate applied for Control Valves is 10.1% (2016: 10.9%) and a growth rate of 2.1% (2016: 2.1%) is applied into perpetuity.
No other CGUs have goodwill that is considered significant in the context of the Group’s total goodwill balance, nor do any CGUs use the same key assumptions for the purposes of impairment testing in either this year or the last.
The aggregate amount of goodwill arising from acquisitions prior to 1 January 2004 which had been deducted from the profit and loss reserves and incorporated into the IFRS transitional balance sheet as at 1 January 2004, amounted to £364m. The cumulative impairment recognised in relation to goodwill is £39m (2016: £39m).
Section 3 – operating assets and liabilities (continued)

113
3.3 Property, plant and equipment
The following section concerns the physical assets used by the Group to generate revenues and profits. These assets include manufacturing, distribution and office sites, as well as equipment used in the manufacture of the Group’s products. The cost of these assets represents the amount initially paid for them.
With the exception of the Group’s land and assets under construction which have not yet been brought into use, a depreciation expense is charged to the income statement to reflect the annual wear and tear and the reduction in the value of the asset over time. For details on the periods over which assets are depreciated, see Section 5. Depreciation is calculated by reference to the assets’ useful lives, by estimating the number of years over which the Group expects the asset to be used. As we do for our intangible assets (see Section 3.2), if there has been a technological change or decline in business performance the directors review the value of the assets to ensure they have not fallen below their depreciated value. If an asset’s value falls below its depreciated value, a one-off impairment charge is made against profit.
Assets in the Land & Plant & course of buildings equipment construction Total £m £m £m £m
Cost As at 1 January 2016 159.5 524.6 21.7 705.8Exchange adjustments 27.1 81.7 2.0 110.8Additions 1.8 20.9 24.3 47.0Transfers from assets in the course of construction 2.3 22.4 (24.7) -Disposals (8.3) (24.2) (0.4) (32.9)As at 31 December 2016 182.4 625.4 22.9 830.7
Exchange adjustments 0.5 1.1 (0.1) 1.5Disposals of subsidiaries (0.4) (2.1) (0.1) (2.6)Additions 1.7 18.2 27.7 47.6Transfers from assets in the course of construction 3.3 25.6 (28.9) -Disposals (2.6) (35.7) (0.4) (38.7)As at 31 December 2017 184.9 632.5 21.1 838.5
Depreciation As at 1 January 2016 81.3 393.7 - 475.0Exchange adjustments 14.5 62.9 - 77.4Disposals (5.3) (22.6) - (27.9)Impairment charge 1.4 0.8 - 2.2Depreciation 3.9 33.9 - 37.8As at 31 December 2016 95.8 468.7 - 564.5
Exchange adjustments - 0.2 - 0.2Disposals of subsidiaries (0.2) (1.4) - (1.6)Disposals (3.4) (33.5) - (36.9)Impairment charge 0.4 2.9 - 3.3Depreciation 3.6 35.0 - 38.6As at 31 December 2017 96.2 471.9 - 568.1NBV at 31 December 2016 86.6 156.7 22.9 266.2NBV at 31 December 2017 88.7 160.6 21.1 270.4
A net impairment charge of £3.3m relating to continuing operations occurred during the year (2016: £2.2m) as described in Section 2.2. The recoverable amount of these assets has been determined using their fair value less costs to sell, estimated by both internal and external valuation specialists.
Group contracts in respect of future capital expenditure which had been placed at the balance sheet date relating to the continuing business amounted to £4.9m (2016: £7.4m).
Included in the total net book value of plant and equipment is £0.4m (2016: £0.6m) in respect of assets acquired under finance leases. Depreciation for the year on these assets was £0.2m (2016: £0.2m).

114 IMI plc Annual Report and Accounts 2017
3.4 Acquisitions
The following section discusses businesses acquired by the Group, which have given rise to the additions to the acquired intangible assets (including goodwill) reported in Section 3.2 and which contributed to the Group’s profits, working capital and other balance sheet asset and liabilities.
3.4.1 Acquisitions in the current year
There were no acquisitions during 2017. The Group acquired Bimba Manufacturing Company and its subsidiaries on 31 January 2018 (see Section 5.3).
3.4.2 Acquisitions in the prior year
There were no acquisitions during 2016.
3.5 Disposals
3.5.1 Disposals in the current year
On 1 September 2017, the Group disposed of Stainless Steel Fasteners (SSF) resulting in a loss of £2.3m which is presented in the income statement as an adjusting item. The loss on disposal is not disclosed within discontinued operations as SSF did not represent a separate major line of business.
A summary of the proceeds received, assets disposed and resulting loss on disposal is included in the table below:
SSF 1 September 2017 £m
Sale consideration 0.1Net assets disposed (1.1)Costs of disposal (1.3)Loss on disposal (2.3)
Net cash flow arising on disposal Cash disposed of -Cash costs of disposal (0.6)Net cash flow arising on disposal of operations (0.6)
3.5.2 Disposals in the prior year
There were no disposals of subsidiaries during 2016.
Section 3 – operating assets and liabilities (continued)

115
3.6 Provisions
A provision is recorded instead of a payable (see Section 3.1.3) when there is less certainty over how much cash will be paid and when the payment might be made. When the Group has an obligation relating to previous events and when it is probable that cash will be paid to settle it, a provision rather than a payable is recorded. In this situation, an estimate is required.
The principal estimates made in respect of the Group’s provisions concern the timing and amount of payments required to:
• cover the costs of known restructuring projects;
• reimburse customers for potential product warranty claims;
• ensure that current and former manufacturing sites meet relevant environmental standards;
• reflect the estimated outcome of ongoing legal disputes; and
• provide against indemnities following the disposal of subsidiaries.
Analysis of the Group’s provisions:
Environmental, Trade legal & Restructuring warranties indemnity Total £m £m £m £m
Current 11.1 8.0 0.8 19.9Non-current 1.0 9.4 8.7 19.1At 1 January 2017 12.1 17.4 9.5 39.0
Arising during the year 26.7 (0.1) 0.4 27.0Utilised during the year (24.8) (4.4) (2.7) (31.9)Exchange adjustment 0.5 (0.1) 0.1 0.5At 31 December 2017 14.5 12.8 7.3 34.6
Current 13.0 6.2 - 19.2Non-current 1.5 6.6 7.3 15.4 14.5 12.8 7.3 34.6
The restructuring provision reflects residual amounts committed but not spent in relation to a number of specific projects and the majority is expected to be utilised within the next 12 months.
Trade warranties are given in the normal course of business and cover a range of periods, typically one to two years, with the expected amounts falling due in less than and greater than one year separately analysed above. Amounts set aside represent the directors’ best estimate regarding the amount of the settlements and the timing of resolution with customers.
Environmental and legal provisions recognise the Group’s obligation to remediate contaminated land at a number of current and former sites, together with current legal cases for which a settlement is considered probable. Because of the long-term nature of the liabilities, the timescales are uncertain and the provisions represent the directors’ best estimates of these costs.
Provisions for indemnities included in the agreed terms of disposals of subsidiaries are provided for based on the expected probability of indemnified losses that may be suffered by the purchaser.

116 IMI plc Annual Report and Accounts 2017
What you will find in this section
This section outlines how the Group manages its capital and related financing costs. The directors determine the appropriate capital structure for the Group, specifically, how much cash is raised from shareholders (equity) and how much is borrowed from financial institutions (debt) in order to finance the Group’s activities both now and in the future. The directors consider the Group’s capital structure and dividend policy at least twice a year ahead of announcing results in the context of its ability to continue as a going concern and deliver its business plan.
The Board is mindful that equity capital cannot be easily flexed and in particular raising new equity would normally be likely only in the context of an acquisition. Debt can be issued and repurchased more easily but frequent changes lead to high transaction costs and debt holders are under no obligation to accept repurchase offers.
4.1 Net debt
Net debt is the Group’s key measure used to evaluate total outstanding debt, net of the current cash resources. Some of the Group’s borrowings (and cash) are held in foreign currencies. Movements in foreign exchange rates affect the sterling value of the net debt.
a) Reconciliation of cash and cash equivalents
2017 2016 £m £m
Cash and cash equivalents in current assets 98.6 79.7Bank overdraft in current liabilities (31.0) (12.2)Cash and cash equivalents 67.6 67.5
b) Reconciliation of net cash to movement in net borrowings
2017 2016 £m £m
Net increase/(decrease) in cash and cash equivalents excluding foreign exchange and net cash disposed/acquired 0.2 (45.5)Net repayment of borrowings 2.1 54.6
Decrease/(increase) in net debt before acquisitions, disposals and foreign exchange 2.3 9.1Currency translation differences 15.1 (54.8)
Movement in net borrowings in the year 17.4 (45.7)Net borrowings at the start of the year (282.6) (236.9)Net borrowings at the end of the year (265.2) (282.6)
Section 4 – capital structure and financing costs

117
c) Analysis of net debt
Borrowings and finance leases due
Cash and cash within after more Total equivalents one year than one year net debt £m £m £m £m
At 1 January 2017 67.5 (6.8) (343.3) (282.6)Cash flow excluding settlement of currency derivatives hedging balance sheet and net cash disposed of/acquired 18.3 (118.4) 120.7 20.6Settlement of currency derivatives hedging balance sheet (18.3) - - (18.3)Currency translation differences 0.1 11.4 3.6 15.1At 31 December 2017 67.6 (113.8) (219.0) (265.2)
4.2 Interest-bearing loans and borrowings
The Group borrows money from financial institutions in the form of bonds and other financial instruments. These generally have fixed interest rates and are for a fixed term or are drawn from committed borrowing facilities that generally have floating interest rates.
This section provides information about the terms of the Group’s interest-bearing loans and borrowings. For more information about the Group’s exposure to interest rate and foreign currency risk, see Section 4.4.3.
2017 2016 £m £m
Current liabilities Unsecured loan notes and other loans 113.8 6.3Finance lease liabilities - 0.5 113.8 6.8
Non-current liabilities Unsecured loan notes and other loans 218.6 342.8Finance lease liabilities 0.4 0.5 219.0 343.3
The Group will repay £111.1m of the unsecured loan notes on 21 February 2018.

118 IMI plc Annual Report and Accounts 2017
4.3 Net financing costs
This section details the income generated on the Group’s financial assets and the expense incurred on borrowings and other financial assets and liabilities. The finance income and expense taken into account in arriving at adjusted earnings only includes the income and expense arising on cash balances, borrowings and retirement benefit obligations. The finance income or expense on mark-to-market movements on interest and foreign exchange derivatives and other financing costs are excluded from adjusted earnings per share.
Recognised in the income statement
2017 2016
Financial Financial Interest instruments Total Interest instruments Total £m £m £m £m £m £m
Interest income on bank deposits 5.5 5.5 4.5 4.5Financial instruments at fair value through profit or loss: Other economic hedges - current year trading 6.9 6.9 5.6 5.6 - future year transactions 5.6 5.6 7.0 7.0Financial income 5.5 12.5 18.0 4.5 12.6 17.1
Interest expense on interest-bearing loans and borrowings (19.8) (19.8) (21.8) (21.8)Financial instruments at fair value through profit or loss: Other economic hedges - current year trading (6.8) (6.8) (7.5) (7.5) - future year transactions (2.4) (2.4) (11.9) (11.9)Financial expense (19.8) (9.2) (29.0) (21.8) (19.4) (41.2)Net financial income relating to defined benefit pension schemes (0.8) (0.8) 1.1 1.1Net financial expense (15.1) 3.3 (11.8) (16.2) (6.8) (23.0)
Included in financial instruments are current year trading gains and losses on economically effective transactions which for management reporting purposes are included in adjusted revenue and operating profit (see Section 2.1). For statutory purposes these are required to be shown within net financial income and expense above. Gains or losses for future year transactions are in respect of financial instruments held by the Group to provide stability of future trading cash flows.
Recognised in other comprehensive income
2017 2016 £m £m
Change in fair value of effective portion of net investment hedges 3.4 (2.8)Foreign currency translation differences (11.0) 39.4Change in fair value of other financial assets (0.2) -Income tax on items recognised in other comprehensive income (0.6) 0.6Total items recognised in other comprehensive income (net of tax) (8.4) 37.2
Recognised in: Hedging reserve 2.6 (2.2) Translation reserve (11.0) 39.4 Retained earnings - - (8.4) 37.2
Section 4 – capital structure and financing costs(continued)

119
4.4 Financial risk management
The Group’s activities expose it to a variety of financial risks: interest rate, foreign exchange and base metal price movements in addition to funding and liquidity risks. The financial instruments used to manage these risks themselves introduce exposure to credit risk, market risk and liquidity risk.
This section presents information about the Group’s exposure to each of these risks; the Group’s objectives, policies and processes for measuring and managing risks, including each of the above risks, and the Group’s management of capital.
4.4.1 Overview
The Board has overall responsibility for the establishment and oversight of the Group’s risk management framework. As described in the Corporate Governance Report on page 50 the Executive Committee monitors risk and internal controls and the Audit Committee monitors financial risk, while the other Board committees also play a part in contributing to the oversight of risk.
The Audit Committee oversees how management monitors compliance with the Group’s financial risk management policies and procedures and reviews the adequacy of the risk management framework in relation to the financial risks faced by the Group. The Group Assurance department undertakes both regular and ad-hoc reviews of risk management controls and procedures, the results of which are reported to the Audit Committee.
The following sections discuss the management of specific financial risk factors in detail, including credit risk, foreign exchange risk, cash flow interest rate risk, commodity risk and liquidity risk.
4.4.2 Credit risk
Credit risk is the risk of financial loss to the Group if a customer or counterparty to a financial instrument fails to meet its contractual obligations, and arises principally from the Group’s receivables from customers, cash and cash equivalents held by the Group’s banks and other financial assets. At the end of 2017 these totalled £442.5m (2016: £437.9m).
4.4.2.1 Managing credit risk arising from customers
The Group’s exposure to credit risk is influenced mainly by the individual characteristics of each customer. The demographics of the Group’s customer base, including the default risk of the industry and country in which customers operate, have less of an influence on credit risk. Our largest single customer accounted for 2% of our 2017 revenues (2016: 2%).
Geographically there is no unusual concentration of credit risk. The Group’s contract approval procedure ensures that large contracts are signed off at executive director level at which time the risk profile of the contract, including potential credit and foreign exchange risks, is reviewed. Credit risk is minimised through due diligence on potential customers, appropriate credit limits, cash flow management and the use of documentary credits where appropriate.
4.4.2.2 Exposure to credit risk in respect of financial assets
The maximum exposure to credit risk for financial assets is represented by their carrying value and is analysed below:
Carrying amount
2017 2016 £m £m
Cash and cash equivalents 98.6 79.7 Investments 4.0 21.2 102.6 100.9
4.4.2.3 Exposure to credit risk in respect of trade receivables
Carrying amount
2017 2016 £m £m
UK 14.5 17.3Germany 27.2 29.6Rest of Europe 99.1 106.0USA 54.0 49.6Asia Pacific 81.6 83.6Rest of World 63.5 50.9 339.9 337.0
The maximum exposure to credit risk for trade receivables at the reporting date by segment was as follows:
Carrying amount
2017 2016 £m £m
IMI Critical Engineering 178.4 180.6IMI Precision Engineering 115.3 109.5IMI Hydronic Engineering 46.2 46.9 339.9 337.0

120 IMI plc Annual Report and Accounts 2017
4.4.2.4 Impairment provisions for trade receivables
The ageing of trade receivables at the reporting date was:
2017 2016
Gross Impairment Gross Impairment £m £m £m £m
Not past due 292.6 (0.6) 287.6 (0.5)Past due 1-30 days 26.4 (0.5) 28.2 (0.5)Past due 31-90 days 12.6 (0.8) 11.9 (0.5)Past due over 90 days 20.8 (10.6) 20.7 (9.9)Total 352.4 (12.5) 348.4 (11.4)
The net movement in the allowance for impairment in respect of trade receivables during the year was as follows:
2017 2016 £m £m
Net balance at 1 January 11.4 8.9Utilised during the year (1.3) (1.1)Charged to the income statement 3.0 3.8Released (0.3) (1.6)Exchange (0.3) 1.4Net balance at 31 December 12.5 11.4
The net impairment charge recognised of £2.7m (2016: charge of £2.2m) relates to the movement in the Group’s assessment of the risk of non-recovery from a range of customers across all of its businesses.
4.4.2.5 Managing credit risk arising from counterparties
A group of relationship banks provides the bulk of the banking services, with pre-approved credit limits set for each institution. Financial derivatives are entered into with these core banks and the credit exposure to these instruments is included when considering the credit exposure to the counterparties. At the end of 2017 credit exposure including cash deposited did not exceed £18.0m with any single institution (2016: £14.0m).
4.4.3 Market risk
Market risk is the risk that changes in market prices, such as foreign exchange rates, interest rates and commodity prices will affect the Group’s income and cash flows or the value of its financial instruments. The objective of market risk management is to manage and control market risk exposures within acceptable parameters.
Under the management of the central treasury function, the Group enters into derivatives in the ordinary course of business and also manages financial liabilities in order to mitigate market risks. All such transactions are carried out within the guidelines set by the Board and are undertaken only if they relate to underlying exposures.
4.4.3.1 Foreign exchange risk
The Group publishes consolidated accounts in sterling but conducts much of its global business in other currencies. As a result it is subject to the risks associated with foreign exchange movements affecting transaction costs (transactional risk), translation of foreign profits (profit translation risk) and translation of the underlying net assets of foreign operations (asset translation risk).
a) Management of transactional risk
The Group’s wide geographical spread both in terms of cost base and customer locations helps to reduce the impact on profitability of swings in exchange rates as well as creating opportunities for central netting of exposures. It is the Group’s policy to minimise risk to exchange rate movements affecting sales and purchases by economically hedging or netting currency exposures at the time of commitment, or when there is a high probability of future commitment, using currency instruments (primarily forward exchange contracts). A proportion of forecast exposures are hedged depending on the level of confidence and hedging is periodically adjusted following regular reviews. On this basis over 50% of the Group’s annual exposures to transactional risk are likely to be hedged at any point in time and the Group’s net transactional exposure to different currencies varies from time to time.
b) Management of profit translation risk
The Group is exposed to the translation of profits denominated in foreign currencies into the sterling-based income statement. The interest cost related to the currency liabilities hedging the asset base provides a partial hedge to this exposure. Short-term currency option contracts may be used to provide limited protection against sterling strength on an opportunistic basis. The translation of US dollar and Euro-based profits represent the most significant translation exposures for the Group.
c) Management of asset translation risk
The Group hedges its net investments in its major overseas operations by way of external currency loans and forward currency contracts. The intention is to manage the Group’s exposure to gains and losses in Group equity resulting from retranslation of currency net assets at balance sheet dates.
To the extent that an instrument used to hedge a net investment in a foreign operation is determined to be an effective hedge, the gain or loss arising is recognised directly in reserves. Any ineffective portion is recognised immediately in the income statement.
Section 4 – capital structure and financing costs(continued)

121
d) Currency profile of assets and liabilities
Assets subject Exchange to interest Other Total Total Cash* Debt contracts rate risk net assets net assets net assets 2017 2017 2017 2017 2017 2017 2016 £m £m £m £m £m £m £m
Sterling 30 - 492 522 - 522 437US dollar 3 (217) 33 (181) 141 (40) 15Euro 9 (116) (320) (427) 417 (10) 11Other 26 - (205) (179) 314 135 120Total 68 (333) - (265) 872 607 583
* Cash is stated net of overdrafts.
Exchange contracts and non-sterling debt are financial instruments used as currency hedges of overseas net assets.
4.4.3.2 Interest rate risk
The Group is exposed to a number of global interest rates through assets and liabilities denominated in jurisdictions to which these rates are applied, most notably US, Eurozone and UK rates. The Group is exposed to these because market movements in these rates will increase or decrease the interest charge recognised in the Group income statement.
a) Management of interest rate risk
The Group adopts a policy of maintaining a portion of its liabilities at fixed interest rates and reviewing the balance of the floating rate exposure to ensure that if interest rates rise globally the effect on the Group’s income statement is manageable.
Interest rates are managed using fixed and floating rate debt and financial instruments including interest rate swaps. Floating rate liabilities comprise short-term debt which bears interest at short-term bank rates and the liability side of exchange contracts where the interest element is based primarily on three month inter-bank rates.
All cash surpluses are invested for short periods and are treated as floating rate investments.
Non-interest bearing financial assets and liabilities including short-term trade receivables and payables have been excluded from the following analysis.

122 IMI plc Annual Report and Accounts 2017
4.4.3.3 Commodity risk
The commodity inputs to the Group’s production process typically consist of base metals. Commodity risk for the Group is the risk that the prices of these inputs could rise, thus reducing Group profits.
The Group’s operating companies purchase metal and metal components and are therefore exposed to changes in commodity prices.
Management of commodity risk
The Group manages this exposure through a centralised process hedging copper, zinc and aluminium using a combination of financial contracts and local supply agreements designed to minimise the volatility of short-term margins.
4.4.4 Liquidity risk
Liquidity risk is the risk that the Group will not be able to meet its financial obligations as they fall due.
a) Management of liquidity risk
The Group’s approach to managing liquidity is to ensure, as far as possible, that it will always have adequate resources to meet its liabilities when they fall due, with sufficient headroom to cope with abnormal market conditions. This position is reviewed on a quarterly basis.
Funding for the Group is co-ordinated centrally by the treasury function and comprises committed bilateral facilities with a core group of banks, and a series of US loan note issues. The level of facilities is maintained such that facilities and term loans exceed the forecast peak gross debt of the Group over a rolling 12 month view by an appropriate amount taking into account market conditions and corporate activity, including acquisitions, organic growth plans and share buybacks. In addition, we undertake regular covenant compliance reviews to ensure that we remain fully within those covenant limits. At the end of 2017 the Group had undrawn committed facilities totaling £302m (2016: £301m) and was holding cash and cash equivalents of £99m (2016: £80m). There are no significant seasonal funding requirements or capital intensive investment areas for the Group.
4.5 Capital management
Capital management concerns the decision as to how the Group’s activities are financed and specifically, how much of the Group capital is provided by borrowings (or debt) and how much of it is financed with equity raised from the issue of share capital.
The Board’s policy is to maintain a balance sheet with a broad capital base and the strength to sustain the future development of the business including acquisitions. This section discusses how the Board views the capital base of the Group and the impact on leverage, distribution policy and investment policy.
b) Interest rate risk profile
The following table shows how much of our cash, interest-bearing liabilities and exchange contracts attract both fixed and floating rate interest charges, and how this is analysed between currencies:
Assets Weighted Debt and Cash and subject Weighted average exchange exchange to interest Floating Fixed average period contracts contracts rate risk rate rate fixed for which 2017 2017 2017 2017 2017 interest rate rate is fixed £m £m £m £m £m % years
Sterling - 522 522 522 US dollar (217) 36 (181) 15 (196) 6.7 1.0Euro (436) 9 (427) (294) (133) 1.4 7.3Other (205) 26 (179) (179) Total (858) 593 (265) 64 (329)
Assets Weighted Debt and Cash and subject Weighted average exchange exchange to interest Floating Fixed average period contracts contracts rate risk rate rate fixed for which 2016 2016 2016 2016 2016 interest rate rate is fixed £m £m £m £m £m % years
Sterling - 412 412 412 US dollar (215) 65 (150) 65 (215) 6.7 2.0Euro (414) 4 (410) (282) (128) 1.4 8.3Other (169) 34 (135) (135) Total (798) 515 (283) 60 (343)
Section 4 – capital structure and financing costs(continued)

123
4.5.1 Overview
The Board monitors the geographical spread of its shareholders and employees are encouraged to hold shares in the Company. The capital base of the Group includes total equity and reserves and net debt. Employee benefit obligations net of deferred tax form part of the extended capital base. Management of this element of the capital base is discussed further in Section 4.9 of the financial statements. Undrawn committed funding facilities are maintained as described in Section 4.6.1 to provide additional capital for growth (including acquisitions and organic investments) and liquidity requirements as discussed above.
4.5.2 Capital base
2017 2016 £m £m
Total equity 607 583Gross debt including overdrafts 364 363Gross cash (99) (80)Capital base 872 866Employee benefits and deferred tax assets 27 57Extended capital base 899 923Undrawn funding facilities 302 301Available capital base 1,201 1,224
Part of the capital base is held in currencies to broadly match the currency base of the assets being funded as described in the asset translation risk section.
4.5.3 Debt or equity
The balance between debt and equity in the capital base of the Group is considered regularly by the Board in light of market conditions, business forecasts, growth opportunities and the ratio of net debt to continuing adjusted EBITDA. Funding covenants currently limit net debt to a maximum of 3.0 times EBITDA. The net debt to EBITDA ratio at the end of 2017 was 0.9 times (2016: 1.0 times). Through the life of our five year plan, the Board would consider appropriate acquisitions that could take net debt up to 2.5 times EBITDA on acquisition, provided that a clear plan exists to reduce this ratio back to under 2.0 times. It is expected that at these levels our debt would continue to be perceived as investment grade. The potential benefits to equity shareholders of greater leverage are offset by higher risk and the cost and availability of funding. The Board will consider raising additional equity in the event that it is required to support the capital base of the Group.
4.5.4 Dividend policy and share buy-backs
As part of the capital management process, the Group ensures that adequate reserves are available in IMI plc in order to meet proposed shareholder dividends, the purchase of shares for employee share scheme incentives and any on-market share buyback programme.
Whilst the Group does not have a formal dividend policy or payout ratio, the Group’s aim is to continue with progressive dividends, which typically increase at a steady rate for both the interim and final dividend payments, with an aim that the dividend should, through the cycle, be covered by at least two times adjusted earnings. In the event that the Board cannot identify sufficient investment opportunities through capital expenditure, organic growth initiatives and acquisitions, the return of funds to shareholders through share buybacks or special dividends will be considered. It should be noted that a number of shares are regularly bought in the market by an employee benefit trust in order to hedge the exposure under certain management incentive plans. Details of these purchases are shown in Section 4.10.2 to the financial statements.
4.5.5 Weighted average cost of capital
The Group currently uses a post-tax weighted average cost of capital (WACC) of 7% (2016: 8%) as a benchmark for investment returns. This is reviewed regularly in the light of changes in market rates. The Board tracks the Group’s return on invested capital and seeks to ensure that it consistently delivers returns in excess of the WACC.
4.6 Debt and credit facilities
This section provides details regarding the specific borrowings that the Group has in place to satisfy the debt elements of the capital management policy discussed above.
4.6.1 Undrawn committed facilitiesThe Group has various undrawn committed borrowing facilities. The facilities available at 31 December in respect of which all conditions precedent had been met were as follows:
2017 2016 £m £m
Expiring within one year 51.5 50.6Expiring between one and two years 50.0 50.0Expiring after more than two years 200.0 200.0 301.5 300.6
The weighted average life of these facilities is 2.0 years (2016: 2.5 years).

124 IMI plc Annual Report and Accounts 2017
4.6.2 Terms and debt repayment schedule
The terms and conditions of cash and cash equivalents and outstanding loans were as follows:
Effective Carrying Contractual 0 to 1 to 2 to 3 to 4 to 5 years interest rate value cash flows <1 year <2 years <3 years <4 years <5 years and over % £m £m £m £m £m £m £m £m
2017Cash and cash equivalents Floating 98.6 98.6 98.6 US loan notes 2018 5.98% (111.1) (112.1) (112.1) US loan notes 2019 7.61% (74.1) (82.9) (5.6) (77.3) US loan notes 2022 7.17% (11.1) (15.0) (0.8) (0.8) (0.8) (0.8) (11.8) US loan notes 2025 1.39% (132.7) (145.9) (1.8) (1.8) (1.8) (1.8) (1.8) (136.9)Finance leases Various (0.4) (0.4) - (0.4) Bank overdrafts Floating (31.0) (31.0) (31.0) Unsecured bank loans Floating (3.4) (3.4) (2.7) (0.7) Total (265.2) (292.1) (55.4) (80.9) (2.6) (2.6) (13.6) (136.9)
2016Cash and cash equivalents Floating 79.7 79.7 79.7 US loan notes 2018 5.98% (121.6) (129.9) (7.3) (122.6) US loan notes 2019 7.61% (81.0) (96.9) (6.2) (6.2) (84.5) US loan notes 2022 7.17% (12.2) (17.5) (0.9) (0.9) (0.9) (0.9) (0.9) (13.0)US loan notes 2025 1.39% (128.0) (142.8) (1.8) (1.8) (1.8) (1.8) (1.8) (133.8)Finance leases Various (1.0) (1.0) (0.5) (0.2) (0.1) (0.1) (0.1) Bank overdrafts Floating (12.2) (12.2) (12.2) Unsecured bank loans Floating (6.3) (6.6) (6.5) (0.1) Total (282.6) (327.2) 44.3 (131.8) (87.3) (2.8) (2.8) (146.8)
Contractual cash flows include undiscounted committed interest cash flows and, where the amount payable is not fixed, the amount disclosed is determined by reference to the conditions existing at the reporting date.
Section 4 – capital structure and financing costs(continued)

125
4.7 Fair value
Financial instruments included in the financial statements are measured at either fair value or amortised cost. The measurement of this fair value can in some cases be subjective, and can depend on the inputs used in the calculations. The Group generally calculates its own fair values using comparable observed market prices and a valuation model using the respective and relevant market data for the instrument being valued.
4.7.1 Total financial assets and liabilities
The table below sets out the Group’s accounting classification of each class of financial assets and liabilities, and their fair values at 31 December 2017 and 31 December 2016. Under IAS 39, all derivative financial instruments not in a hedge relationship are classified as derivatives at fair value through the income statement. The Group does not use derivatives for speculative purposes and transacts all derivatives with suitable investment grade counterparties. All transactions in derivative financial instruments are undertaken to manage the risks arising from the Group’s business activities.
Fair value
Other Available for At Total Designated derivatives sale assets amortised carrying Fair value at fair value at fair value at fair value cost value if different £m £m £m £m £m £m
2017Cash and cash equivalents 98.6 98.6 Bank overdrafts (31.0) (31.0) Borrowings due within one year (113.8) (113.8) (111.6)Borrowings due after one year (219.0) (219.0) (225.0)Trade and other payables* (423.1) (423.1) Trade receivables 339.9 339.9 Investments 3.2 10.6 13.8 Other current financial assets/(liabilities) Derivative assets** 4.1 4.1 Derivative liabilities*** (2.3) (1.6) (3.9) Total (2.3) 2.5 101.8 436.4 (334.4)
2016 Cash and cash equivalents 79.7 79.7Bank overdrafts (12.2) (12.2)Borrowings due within one year (6.8) (6.8)Borrowings due after one year (343.4) (343.4) (360.7)Trade and other payables* (402.3) (402.3)Trade receivables 337.0 337.0Investments 21.2 8.7 29.9Derivative assets** 2.9 2.9Derivative liabilities*** (5.7) (7.8) (13.5)Total (5.7) (4.9) 100.9 (419.0) (328.7)
* Trade and other payables exclude corporation tax and other tax liabilities and include liabilities of £6.6m (2016: £10.7m) falling due after more than one year.
** Includes £0.1m (2016: nil) falling due after more than one year.
*** Derivative liabilities include liabilities of £0.1m (2016: £0.7m) falling due after more than one year: £0.1m in 1-2 years and £nil in 2-3 years (2016: £0.7m in 1-2 yrs and nil in 2-3 yrs). Derivative liabilities designated at fair value represent the fair value of net investment hedge derivatives. The increase in value of net investment hedge derivative liabilities in the year of £3.4m is shown in the consolidated statement of comprehensive income (net of tax).
There are no other financial liabilities included within payables disclosed above and finance leases disclosed in Section 4.6.2.

126 IMI plc Annual Report and Accounts 2017
The following table shows the Group’s financial instruments held at fair value.
Quoted prices in active markets Significant for identical other assets and observable Unobservable liabilities inputs inputs Level 1 Level 2 Level 3 Total £m £m £m £m
As at 31 December 2017 Financial assets measured at fair valueEquity instruments* 3.2 3.2Cash and cash equivalents 98.6 98.6Foreign currency forward contracts 4.1 4.1 101.8 4.1 - 105.9
Financial liabilities measured at fair valueForeign currency forward contracts (3.9) (3.9) - (3.9) - (3.9)
As at 31 December 2016Financial assets measured at fair valueEquity instruments* 21.2 21.2Cash and cash equivalents 79.7 79.7Foreign currency forward contracts 2.9 2.9 100.9 2.9 - 103.8
Financial liabilities measured at fair value Foreign currency forward contracts (13.5) (13.5) - (13.5) - (13.5)
* Equity instruments relate to investments in funds in order to satisfy long-term benefit arrangements.
Valuation techniques for level 2 inputs
Derivative assets and liabilities of £4.1m and £3.9m respectively are valued by level 2 techniques. The valuations are derived from discounted contractual cash flows using observable, and directly relevant, market interest rates and foreign exchange rates from market data providers.
Valuation techniques for level 3 inputs
The Group has no financial assets or financial liabilities measured at fair value using significant unobservable (level 3) inputs.
4.7.2 Valuation methodology
Cash and cash equivalents, bank overdrafts, trade payables and trade receivables are carried at their book values as this approximates to their fair value due to the short-term nature of the instruments.
Long-term and short-term borrowings, apart from any which are subject to hedging arrangements, are carried at amortised cost as it is the intention that they will not be repaid prior to maturity, where this option exists. The fair values are evaluated by the Group based on parameters such as interest rates and relevant credit spreads.
Long-term borrowings which are subject to hedging arrangements are valued using appropriate discount rates to value the relevant hedged cash flows.
Derivative assets and liabilities, including foreign exchange forward contracts, interest rate swaps and metal hedges, are valued using comparable observed market prices and a valuation model using foreign exchange spot and forward rates, interest rate curves and forward rate curves for the underlying commodities.
Section 4 – capital structure and financing costs(continued)

127
4.7.3Fair value hierarchy
The Group uses the following hierarchy for determining and disclosing the fair value of financial instruments by valuation technique:
Level 1: quoted (unadjusted) prices in active markets for identical assets or liabilities.Level 2: other techniques for which all inputs which have a significant effect on the recorded fair value are observable, either directly or indirectly.Level 3: techniques which use inputs which have a significant effect on the recorded fair value that are not based on observable market data.
4.8 Market risk sensitivity analysis on financial instruments
This section shows how the fair value of financial instruments presented can change for a given change in market rates.
The values shown in the table below are estimates of the impact on financial instruments only. The risks that these financial instruments have been acquired to hedge will move in an opposite direction.
4.8.1 Overview
In estimating the sensitivity of the financial instruments all other variables are held constant to determine the impact on profit before tax and equity. The analysis is for illustrative purposes only, as in practice market rates rarely change in isolation.
Actual results in the future may differ materially from these estimates due to the movements in the underlying transactions, actions taken to mitigate any potential losses, the interaction of more than one sensitivity occurring, and further developments in global financial markets. As such this table should not be considered as a projection of likely future gains and losses in these financial instruments.
4.8.2 Financial derivatives sensitivity table
The outputs from the sensitivity analysis are estimates of the impact of market risk assuming that the specified changes occur only to the financial derivatives and do not reflect the opposite movement from the impact of the specific change on the underlying business that they are designed to hedge.
1% 1% 10% 10% decrease increase 10% 10% decrease in increase in in interest in interest weakening strengthening base metal base metal rates rates in sterling in sterling costs costs £m £m £m £m £m £m
At 31 December 2017 Impact on income statement: (loss)/gain - - (5.8) 5.8 (0.5) 0.5Impact on equity: (loss)/gain - - (77.9) 77.9 - -
At 31 December 2016 Impact on income statement: (loss)/gain - - (2.4) 2.4 (0.3) 0.3Impact on equity: (loss)/gain - - (67.4) 67.4 - -

128 IMI plc Annual Report and Accounts 2017
4.9 Retirement Benefits
IMI offers a number of defined benefit arrangements to employees that will not be paid until more than a year after the period in which they are earned, for example pension benefits, jubilee plans, post-employment and other long-term employee benefit arrangements.
There is a significant degree of estimation involved in predicting the ultimate benefits payable under these defined benefit arrangements in respect of which the Group holds net liabilities on its balance sheet. This section explains how the value of these benefits payable and any assets funding the arrangements are accounted for in the Group financial statements and gives details of the key assumptions upon which the estimations are based.
Assets and liabilities for defined contribution arrangements are minimal as they relate solely to short-term timing differences between the period during which benefits have accrued and when contributions are paid into schemes.
Defined contribution (DC): Arrangements where the employer pays fixed contributions into an external fund on behalf of the employee (who is responsible for making the investment decision and therefore assumes the risks and rewards of fund performance). Contributions to these arrangements are recognised in the income statement as incurred.
Defined benefit (DB): A defined benefit pension plan is a pension arrangement in which the employer promises a specified annual benefit on retirement that is predetermined by a formula based on the employee’s earnings history, tenure of service and age, rather than depending directly on individual investment returns. In some cases, this benefit is paid as a lump sum on leaving the Company or while in the service of the Company rather than as a pension. The Group underwrites one or more risks in meeting these obligations and therefore any net liability or surplus in these arrangements is shown on the Group balance sheet.
4.9.1 Summary information Net pension deficit: £77.9m (2016: deficit of £79.8m)
The net pension deficit or ‘net liability for defined benefit obligations’ (DBO) at 31 December 2017 was £77.9m (2016: deficit of £79.8m). The assets and liabilities of the schemes are aggregated, recognised in the consolidated balance sheet and shown within non-current liabilities or in non-current assets if a scheme is in surplus and it is recoverable.
Number of defined benefit arrangements: 69 (2016: 63)
The number of defined benefit arrangements increased following the recognition of six schemes in Mexico and a scheme in the United Arab Emirates (UAE), offset by the wind-up of a pension scheme in the US.
The following table shows a summary of the geographical profile of the Group’s DBOs:
Surplus/ Quantity Quantity Assets DBO (deficit) 2017 2016 £m £m £m
Australia 2 2 - (0.4) (0.4)Austria 6 6 - (3.1) (3.1)France 3 3 0.2 (1.1) (0.9)Germany 28 28 6.3 (55.2) (48.9)India 6 6 - (0.7) (0.7)Italy 5 5 - (2.8) (2.8)Mexico 6 - - (0.6) (0.6)Spain 2 2 - (0.1) (0.1)Switzerland 5 5 77.3 (92.1) (14.8)UAE 1 - - (1.1) (1.1)US* 2 3 - (6.1) (6.1)UK 3 3 918.1 (916.5) 1.6 69 63 1,001.9 (1,079.8) (77.9)
* The US deficit above excludes £0.4m of assets relating to unqualified plans classified as investments (see Section 4.7).
Section 4 – capital structure and financing costs(continued)

129
% % of total of total Qty Assets assets DBO liabilities Type of scheme No. £m % £m %
2017Final salary* 27 918.3 92% 964.2 89%Cash balance** 10 77.3 8% 94.9 9%Jubilee*** 14 - 0% 3.0 0%Other 18 6.5 0% 17.7 2%Total 69 1,002.1 100% 1,079.8 100%Asset ceiling (0.2) Revised assets 1,001.9
2016Final salary* 21 1,424.0 94% 1,459.6 92%Cash balance** 10 80.2 6% 106.1 7%Jubilee*** 14 - 0% 2.8 0%Other 18 6.0 0% 21.5 1%Total 63 1,510.2 100% 1,590.0 100%
* Final salary scheme: The pension available to a member in a final salary arrangement will be a proportion of the member’s salary at or around their retirement date. This proportion will be determined by the member’s length of pensionable service, their accrual rate and any particular circumstances under which the member retires (for example early ill-health retirement).
** Cash balance: A cash balance scheme is a form of defined benefit pension under which the member has the right to a defined lump sum on retirement rather than a defined amount of pension receivable. For example, a cash balance plan may have minimum or guaranteed rates of return on pension contributions. The amount of pension to which that lump sum may be converted is determined by the annuity rates prevailing at the time of conversion.
*** Jubilee: Jubilee plans provide for cash award payments which are based on completed lengths of service. These payments are often made on cessation of service with the company, subject to a minimum period of service.
The Group provides pension benefits through a mixture of funded and unfunded defined benefit and defined contribution DC arrangements, although its strategy is to move away from defined benefit arrangements towards defined contribution arrangements wherever possible to minimise the liability of the Group. Assessments of the obligations of the defined benefit plans are carried out by independent actuaries, based on the projected unit credit method. A historical split of the types of defined benefit schemes in operation is as follows:
Asset profile of schemes
The following table sets out the profile of the overall assets of the schemes (to give an indication of their risk profile), the comparative amounts of the funded and unfunded DBO and a split of the balance sheet impact between schemes with a net pension surplus and a net pension deficit.
2017 2016 £m £m
Quoted equities 33.7 34.4Quoted bonds 326.9 688.3Total quoted assets 360.6 722.7
Private equities 111.1 114.4Insurance policies* 431.9 525.4IMI Scottish Limited Partnership - 18.0Hedge funds 1.4 14.1Property 20.6 29.8Other** 76.5 85.8Total unquoted assets 641.5 787.5
Fair value of assets 1,002.1 1,510.2Restriction due to asset ceiling (0.2) -DBOs for funded schemes (1,017.6) (1,512.5)DBOs for unfunded schemes (62.2) (77.5)Net surplus/ (deficit) for DBOs (77.9) (79.8)
Schemes in net pension deficit (83.6) (137.6)Schemes in net pension surplus 5.7 57.8
* The values assigned to the insurance policies are established by an independent third party actuary having regard to the liabilities insured and in particular the IAS 19 discount rate, the expected pension increases and the assumed life expectancy of the members covered.
** ‘Other’ assets include the market value of interest, inflation, equity and currency swaps relating to UK scheme assets and liabilities.
The overseas assets of £84.0m (2016: £86.3m) comprise equities of £33.7m (2016: £34.4m), bonds of £24.9m (2016: £25.2m), insurance of £4.7m (2016: £7.6m), property of £15.5m (2016: £15.1m) and other assets of £5.2m (2016: £4.0m).
Funded: The majority of the Group defined benefit and other post-employment benefit arrangements are funded, which means they are linked to specific plan assets that have been segregated in a trust or foundation.
Unfunded: Plans that are not funded are those that are not backed by segregated assets. These include some pension plans but also a number of other long-term arrangements for the benefit of our employees, with benefits payable while they are employed by the Group but more than 12 months after the related service is rendered. Actuarial gains and losses on other long-term arrangements are recognised in the income statement in the period in which they arise.
Average duration by geographyThe following table shows the weighted average number of years (or duration) over which pension benefits are expected to be paid:
Location Years
UK 18.7Switzerland 18.3US 6.9Eurozone 15.8

130 IMI plc Annual Report and Accounts 2017
4.9.2 The UK and overseas pension funds
4.9.2.1 The UK Funds
The United Kingdom constitutes 85% (2016: 88%) of total defined benefit liabilities and 92% (2016: 94%) of total defined benefit assets. Historically the IMI Pension Fund offered final salary benefits to UK employees until it closed to new entrants in 2005 and to future accrual on 31 December 2010. In December 2014 winding-up procedures commenced and those members who were not eligible or did not take up the offer of a single cash lump sum transferred to one of two new Funds (IMI 2014 Pensioner Fund or the IMI 2014 Deferred Fund – ‘the UK Funds’). Ongoing pension benefits in the UK are provided via the Trustee’s defined contribution plan - The IMI Retirement Savings Plan. All UK pension assets are run on behalf of the Trustee by the Board of the IMI Common Investment Fund.
The Trustee has determined an investment objective to achieve, over time, a position of self-sufficiency, defined using a discount rate of gilts + 0.25%.
Asset allocationThe Trustee has, over recent valuations, continued to reduce asset volatility and sensitivity to UK interest rates, inflation and foreign currencies. This work continued in December 2017, when a further buy-in policy with the pension insurance company (PIC) was executed which covered the remaining benefits within the Pensioner Fund and approximately £50m of recent retirees in the Deferred Fund. £100m of assets were transferred by the Trustee to PIC in consideration of the final true-up of the July 2017 annuity and initial payment for the December policy. On 31 January 2017 £429m of liabilities covered by insurance policies were permanently transferred to the insurance companies through a formal buy-out transaction. This resulted in the pension asset and corresponding DBO being removed from the balance sheet. Following the deduction of associated fees of £2.3m, these activities yielded gains of £3.4m which are classified as adjusting items (see Section 2.2.2).
Liability managementThe Trustee has continued to undertake, where practicable liability management programs. In December 2017 a Pension Increase Exchange and Flexible Retirement Option exercises were carried out which allowed pensioners to increase their current monthly income in return for removing part or all of their annual inflationary increases. Following the deduction of associated fees of £2.0m, the exercises resulted in settlement gains of £1.7m which are classified as adjusting items (see Section 2.2.2).
ContributionsThe recovery plan from the 2011 valuation agreed annual contributions of £16.8m until 2016. The Trustee agreed, as part of the 2015 valuation, the payments for 2015 and 2016 were not to be paid and instead a contingent contribution plan was agreed for the IMI 2014 Pensioner Fund. The amount of contributions due, if any, will depend on asset performance over the next three triennial valuations with contributions payable where asset returns are less than 1.5% over gilts. The maximum amounts payable, where asset returns are less than or equal to 0.7% over gilts would be:
£13m due 30 June 2019£12m due 30 June 2022£12m due 30 June 2025
4.9.2.2 Overseas pension funds
On 31 March 2017, the Group settled its remaining liabilities in relation to one of its pension plans in the USA. This resulted in a gain of £2.2m being recognised. Following a restructuring exercise relating to one of the schemes in Switzerland, the Group realised a curtailment gain of £5.3m. This gain was partially offset by a loss of £1.8m relating to the distribution of pension assets to members from our previously overfunded Swiss schemes.
These events led to the special pension events which are classified as adjusting items (see Section 2.2.2).
4.9.3 Specific effect on financial statements
The corresponding entries for increases and decreases in the net pension deficit reported in the balance sheet are reflected as follows:
• Cash flow statement: When the Group makes cash contributions to fund the deficit they are reflected in the cash flow statement and reduce the net deficit/increase the net surplus.
• Income statement: Movements in the overall net pension deficit are recognised in the income statement when they relate to changes in the overall pension promise, due to either an additional period of service (known as ‘current service cost’), changes to pension terms in the scheme rules (known as ‘past service cost’), or closure of all or part of a scheme (known as settlements and curtailments). The interest charge/income on the net deficit/surplus position is also recognised in the income statement.
• Other comprehensive income (OCI): Movements in the overall net pension deficit are recognised through OCI when they relate to changes in actuarial assumptions or the difference (experience gain or loss) between previous assumptions and actual results.
The table below reconciles the movement in the UK and overseas defined benefit obligation between 1 January 2017 and 31 December 2017.
UK Overseas Total £m £m £m
Net defined benefit surplus/(obligation) at 1 January 2017 23.6 (103.4) (79.8)Movement recognised in: Income statement 10.4 (1.9) 8.5 OCI (35.7) 5.7 (30.0) Cash flow statement 3.3 21.5 24.8Other movements - (1.4) (1.4)Net defined benefit surplus/(obligation) at 31 December 2017 1.6 (79.5) (77.9)
Section 4 – capital structure and financing costs(continued)

131
4.9.3.1 Cash flow impacts
2017 2016
UK Overseas Total UK Overseas Total £m £m £m £m £m £m
Amounts from employees - 2.5 2.5 - 2.5 2.5Amounts from employers 3.3 3.3 6.6 0.1 4.9 5.0Benefits and settlements paid directly by the Group - 18.2 18.2 - 5.3 5.3Total 3.3 24.0 27.3 0.1 12.7 12.8
The expected contributions to the defined benefit arrangements in 2018 are £2.0m of normal employer contributions and £2.1m of normal employee contributions, both in relation to overseas pension funds.
4.9.3.2 Other comprehensive incomeMovements in pension assets and liabilities that arise during the year from changes in actuarial assumptions, or because actual experience is different from the actuarial assumptions, are recognised in equity via other comprehensive income. These movements are analysed below:
2017 2016
Overseas Overseas Overseas Overseas post non-post post non-post UK employment employment Total UK employment employment Total £m £m £m £m £m £m £m £m
Change in discount rate (31.9) 1.7 - (30.2) (203.2) (8.8) - (212.0)Change in inflation 6.2 - - 6.2 (43.0) 2.4 - (40.6)Change in other assumptions 21.8 1.8 - 23.6 (4.3) 0.9 - (3.4)Actuarial experience 10.1 0.6 - 10.7 6.5 1.2 - 7.7Asset experience (41.8) 1.4 - (40.4) 167.9 2.0 - 169.9Actuarial gains/(losses) in the year (35.6) 5.5 - (30.1) (76.1) (2.3) - (78.4)Change in the asset ceiling - (0.2) - (0.2) - 0.2 - 0.2Exchange gains/(losses) - - 0.3 0.3 - (13.0) (1.8) (14.8)Gains/(losses) recognised through equity (35.6) 5.3 0.3 (30.0) (76.1) (15.1) (1.8) (93.0)
IMI takes advice from independent actuaries regarding the appropriateness of the assumptions used to determine the present value of the defined benefit obligations. These assumptions include the discount rate applied to the assets and liabilities, the life expectancy of the members, their expected salary and pension increases and inflation. The assumptions used for this purpose in these financial statements are summarised below:
Weighted Averages
31 Dec 2017 31 Dec 2016 31 Dec 2015
UK Overseas UK Overseas UK Overseas % pa % pa % pa % pa % pa % pa
Inflation - RPI 3.3 n/a 3.4 n/a 3.1 n/aInflation - CPI 2.3 1.3 2.4 1.2 2.1 1.5Discount rate 2.4 1.3 2.6 1.4 3.7 1.7Expected salary increases n/a 1.4 2.2 1.4 2.5 1.7Rate of pension increases 3.3 0.5 3.4 0.4 3.1 0.4

132 IMI plc Annual Report and Accounts 2017
2017 2016 2015 Years Years Years
Life expectancy at age 65 (UK Funds only) Current male pensioners 20.9 21.2 21.1Current female pensioners 23.6 24.1 24.0Future male pensioners 22.6 23.3 23.2Future female pensioners 25.5 26.4 26.3
The mortality assumptions used for the UK Funds above reflect its scheme specific experience, together with an allowance for improvements over time. The experience was reviewed as part of the formal triennial actuarial valuation carried out as at 31 March 2015, and the assumptions used as at 31 December 2017 and 31 December 2016 reflect the results of this review.
4.9.3.3 Income statementIn accordance with IAS 19, pension costs recorded through the income statement primarily represent the increase in the defined benefit obligation based on employee service during the year and the interest on the net liability or surplus for defined benefit obligations in respect of employee service in previous years. The table below shows the total cost reported in the income statement in respect of pension obligations and therefore also includes the cost of the defined contribution schemes.
2017 2016
Overseas Overseas Overseas Overseas post non-post post non-post UK employment employment Total UK employment employment Total £m £m £m £m £m £m £m £m
Current service cost - 5.1 1.0 6.1 - 5.1 1.5 6.6Past service cost/(credit) (0.8) 1.7 0.1 1.0 (7.6) 4.7 - (2.9)Settlement/curtailment gain (8.7) (7.8) - (16.5) - (1.5) - (1.5)Recognition of losses - - 0.2 0.2 - - 0.4 0.4DC employer contributions - - - - - - - -Pension (income)/expense - operating costs (9.5) (1.0) 1.3 (9.2) (7.6) 8.3 1.9 2.6
Interest on DBO 25.3 2.0 0.3 27.6 42.7 2.7 0.4 45.8Interest on assets (26.2) (0.6) - (26.8) (46.0) (0.9) - (46.9)Interest (income)/expense - financing costs (0.9) 1.4 0.3 0.8 (3.3) 1.8 0.4 (1.1)
The table below illustrates how the UK Funds’ net pension surplus would decrease (excluding the impact of inflation rate and interest rate hedging), as at 31 December 2017, in the event of the following reasonable changes in the key assumptions above.
UK
Discount rate 0.1% pa lower £10.5mInflation-linked pension increases 0.1% pa higher* £8.3mIncrease of one year in life expectancy from age 65 £15.2m10% fall in non-bond-like assets** £11.2m
* This is an in-payment pension increase sensitivity.
** Fund assets excluding cash, bonds, insurance policies and the Funds’ interest in the IMI Scottish Limited Partnership.
The table below shows how the net pension deficit for IMI’s non-UK plans would increase, in the event of the following reasonable changes in the key assumptions above.
Non-UK
Discount rate 0.1% pa lower £2.5mSalary increases 0.1% higher £0.4mIncrease of one year in life expectancy at age 65 £3.9m
In each case all other assumptions are unchanged.
Section 4 – capital structure and financing costs(continued)

133
4.9.4 Overall reconciliation of changes in the net surplus/(liability) for defined benefit obligations
2017 2016
Net defined Net defined Defined benefit Defined benefit benefit Asset asset/ benefit Asset asset/ obligation Assets ceiling (liability) obligation Assets ceiling (liability) £m £m £m £m £m £m £m £m
Brought forward at start of year (1,590.0) 1,510.2 - (79.8) (1,341.7) 1,346.3 (0.2) 4.4Current service cost (6.1) - - (6.1) (6.6) - - (6.6)Past service cost (1.0) - - (1.0) 2.9 - - 2.9Settlement/curtailment 468.2 (451.7) - 16.5 5.0 (3.5) - 1.5Net interest (cost)/income on net defined benefit (liability)/asset (27.6) 26.9 - (0.7) (45.8) 46.9 - 1.1Immediate recognition of gains/(losses) (0.2) - - (0.2) (0.4) - - (0.4)Total credited/(charged) to income statement 433.3 (424.8) - 8.5 (44.9) 43.4 - (1.5)
Actuarial gain due to experience 10.7 - - 10.7 7.7 - - 7.7Actuarial (loss)/gain due to financial assumption changes (24.0) - - (24.0) (252.6) - - (252.6)Actuarial (loss)/gain due to demographic assumption changes 23.6 - - 23.6 (3.4) - - (3.4)Return on plan assets* greater/(lower) than discount rate - (22.4) - (22.4) - 169.9 - 169.9Change in effect of asset ceiling - - (0.2) (0.2) - - 0.2 0.2Total remeasurements recognised in other comprehensive income 10.3 (22.4) (0.2) (12.3) (248.3) 169.9 0.2 (78.2)
Derecognition of Scottish Limited Partnership - (18.0) - (18.0) - - - -Total recognised directly in equity - (18.0) - (18.0) - - - -
Employer contributions - 6.6 - 6.6 - 5.0 - 5.0Employee contributions (2.5) 2.5 - - (2.5) 2.5 - -Benefits and settlements paid directly by the Group 18.2 - - 18.2 5.3 - - 5.3Benefits paid from plan assets 47.8 (47.8) - - 70.3 (70.3) - -Net cash outflow/(inflow) 63.5 (38.7) - 24.8 73.1 (62.8) - 10.3
New material plans (1.4) - - (1.4) - - - -Changes in exchange rates 4.5 (4.2) - 0.3 (28.2) 13.4 - (14.8)Total other movements 3.1 (4.2) - (1.1) (28.2) 13.4 - (14.8)Carried forward at end of year (1,079.8) 1,002.1 (0.2) (77.9) (1,590.0) 1,510.2 - (79.8)
* Net of asset management costs

134 IMI plc Annual Report and Accounts 2017
4.10 Share capital
The ordinary shareholders of the Group own the Company. This section shows how the total number of ordinary shares in issue has changed during the year and how many of these ordinary shares are held as treasury shares or in Employee Benefit Trusts, to be used to satisfy share options and awards to directors and employees of the Company, as part of employee share ownership programmes. This section also sets out the dividends paid or proposed to be paid to shareholders.
4.10.1 Number and value of shares
2017 2016
Ordinary Ordinary Shares Shares 28 4/7p per 28 4/7p per share share Number (m) Value (£m) Number (m) Value (£m)
In issue at the start of the year 286.2 81.8 286.2 81.8Issued to satisfy employee share schemes - - - -In issue at the end of the year 286.2 81.8 286.2 81.8
All issued share capital at 31 December 2017 is fully paid and conveys the same rights.
4.10.2 Share movements in the year
Movements in shares due to share issues and purchases during the year were as follows:
Number of ordinary shares of 28 4/7p each (million)
Employee Benefit Trust Treasury Other Total
In issue at 31 December 2016 0.9 14.3 271.0 286.2New issues to satisfy employee share scheme awards - - - -Market purchases 0.3 - (0.3) -Shares allocated under employee share schemes (0.2) - 0.2 -At 31 December 2017 1.0 14.3 270.9 286.2
During the year nil (2016: nil) shares were issued under employee share schemes realising nil (2016: nil).
Employee Benefit Trust
The Employee Benefit Trust made market purchases of a total of 0.3m (2016: 0.8m) shares with an aggregate market value of £4.0m (2016: £8.0m) and a nominal value of £0.1m (2016: £0.2m). Associated transaction costs amounted to nil (2016: nil).
Share options exercised in 2017 were settled using the shares in the Group’s Employee Benefit Trust. In 2017 0.2m (2016: 0.8m) shares were issued for cash of £1.3m (2016: £0.6m).
Of the 15.3m (2016: 15.2m) shares held within retained earnings, 1.0m (2016: 0.9m) shares with an aggregate market value of £13.0m (2016: £9.4m) are held in trust to satisfy employee share scheme vesting.
Section 4 – capital structure and financing costs(continued)

135
4.10.3 Dividends
After the balance sheet date the following dividends were proposed by the directors. The dividends have not been provided for and there are no income tax consequences.
2017 2016 £m £m
Current year final dividend - 25.2p per qualifying ordinary share (2016: 24.7p) 68.3 67.0
The following dividends were declared and paid by the Group during the year:
2017 2016 £m £m
Prior year final dividend paid - 24.7p per qualifying ordinary share (2015 final year dividend: 24.5p) 67.0 66.3Current year interim dividend paid - 14.2p per qualifying ordinary share (2016: 14.0p) 38.5 37.9 105.5 104.2

136 IMI plc Annual Report and Accounts 2017
4.11 Share-based payments
The Group uses share option schemes to reward and retain its employees. The estimated cost of awarding these share options is charged to the income statement over the period that the Group benefits from the employees’ services. This cost is then added back to retained earnings, to reflect that there is no overall impact on the Group’s balance sheet until the shares are issued to the employees when the options are exercised.
The individual share option schemes, the number of options outstanding under each of them, the estimated cost of these options recognised in the income statement and the assumptions used in arriving at this estimated cost are described in this section.
4.11.1 Outstanding share options
At 31 December 2017, options to purchase ordinary shares had been granted to, but not yet exercised by, participants of IMI share option schemes as follows:
Date of Number grant of shares Price Dates from which exercisable
IMI Sharesave Scheme 10.04.12 5,020 890.01p 01.08.17 05.04.13 8,895 1196.50p 01.08.16 or 01.08.18 06.05.14 19,012 1384.02p 01.08.17 or 01.08.19 05.06.15 71,149 1075.32p 01.08.18 or 01.08.20 29.04.16 188,632 845.10p 01.08.19 or 01.08.21 21.04.17 47,062 1106.00p 01.08.20 or 01.08.22 339,770 Global Employee Share Purchase Plans 15.08.16 25,954 948.60p 15.08.18 14.08.17 30,481 1067.04p 14.08.19 56,435 IMI Incentive Plan 07.05.15 678,539 - 07.05.17 or 07.05.18 09.03.16 1,139,157 - 09.03.18 or 09.03.19 09.03.17 933,716 - 09.03.19 or 09.03.20 2,751,412 IMI Share Option Plan 03.09.09 2,989 440.93p 03.09.12 22.03.10 19,500 645.00p 22.03.13 23.03.11 194,000 971.83p 23.03.14 04.05.12 334,600 980.67p 04.05.15 27.11.12 12,200 1007.33p 27.11.15 12.03.13 348,250 1322.70p 12.03.16 22.10.13 74,000 1518.33p 22.10.16 11.03.14 336,550 1467.00p 11.03.17 1,322,089 Incentive Plan (also known as Performance Share Plan) 04.04.08 1,000 - 04.04.11 22.10.13 3,418 - 22.10.16 4,418 Share Matching Plan 28.03.11 3,154 - 28.03.14 10.05.12 40,647 - 10.05.15 09.04.13 2,647 - 09.04.16 46,448Total 4,520,572
Section 4 – capital structure and financing costs(continued)

137
4.11.2 Schemes under which options are outstanding
The options in the above table relate to the following share-based payment schemes:
IMI Sharesave Scheme (SAYE)
This scheme is open to the majority of the Group’s UK employees, including the executive directors, and allows the grant of options to all participants at a discount of up to 20% below the market price. Such schemes are not subject to performance conditions and offer tax incentives to encourage employees to use their own money to purchase IMI shares. SAYE options may be exercised within six months of the date they first become exercisable.
Global Employee Share Purchase Plans (GESPP)
These plans were introduced in 2011 for the US and Germany. The German and US GESPP’s offer the opportunity to buy shares in IMI at a fixed price at a future date. The German GESPP mirrors the UK Sharesave scheme, with a minimum/maximum savings limit per month and contract duration of three to five years. The US GESPP also operates in a similar way to the UK Sharesave Scheme, with a minimum/maximum savings limit per month, but the contract duration is for a fixed period of two years and different taxation conditions apply for the exercise period. No further awards are intended to be granted under the German GESPP.
IMI Share Option Plan (SOP)
Share option awards were made from 2009 to selected senior managers and certain other employees under the SOP. These awards are not subject to performance conditions, but are subject to a three year vesting period. The purpose of the SOP is to give selected IMI employees (who are not executive directors of the Company) the opportunity to share in the benefits of share price growth and to increase their IMI shareholding.
IMI 2005 Long-term Incentive Plan (also known as Performance Share Plan (PSP))
Awards have been granted to the Company’s executive directors and selected senior managers within the Group. Awards have been granted subject to stretching performance targets, the nature of which differs depending upon the year in which the award was granted. No further awards can be granted under the PSP. The outstanding PSP awards will expire in 2023.
4.11.3 Other share-based payment arrangements
The Group also operates the following employee share plans:
Share Matching Plan (SMP)
The delivery of the executive directors’ and selected senior managers’ annual bonuses is governed by the individual’s achievement of a Share Ownership Guideline (SOG). The SOG is a requirement to hold a percentage of salary as IMI shares and, if achieved, any bonus is paid in cash. The SMP has been operated on the basis that if the SOG is not achieved a proportion of any annual bonus will be mandatorily deferred for three years and delivered in IMI shares under the SMP. This mandated investment (if the SOG is not achieved) has been matched from 75% up to a maximum of 200%. These matching shares can be earned if performance conditions over the three year vesting period are met.
Qualifying employees have also been able to elect voluntarily to defer all or part of the remainder of their bonus, and invest personal funds, up to a maximum of 100% of their annual bonus opportunity. Additional shares, in the form of a matching award, may be earned (up to a maximum of 200% of the ‘gross equivalent’ number of shares invested in the SMP) if performance conditions over the three year vesting period are met.
The performance measures for SMP matching awards differ depending upon the year in which the award was granted. No further awards can be granted under the SMP.
Share Incentive Plan (SIP)
The SIP is open to the majority of the Group’s UK employees, including the executive directors. This scheme covers two separate opportunities for employees to share in IMI’s success as follows:
• Partnership shares – allow employees to invest up to the statutory maximum from pre-tax pay, which is used to buy IMI shares.
• Free shares – allows a grant of shares to employees each year, up to the statutory maximum.
Shares acquired or awarded under the SIP are not subject to performance conditions and offer tax incentives to encourage employees to build up their shareholdings with the Company.
The IMI Incentive Plan (IIP)
In light of the expiry in 2015 of both the PSP and SMP, the IIP was introduced to act as the Company’s sole senior executive long-term incentive plan. The IIP acts as an umbrella plan which allows the Company to grant different types of award to different employee groups in an efficient way. The IIP is to be used annually to grant ‘Performance Share Awards’ in respect of ordinary shares to the executive directors and other members of senior management subject to performance conditions. The IIP will also be used annually to grant ‘Bonus Share Awards’ below board level. The IIP also gives the Company the ability to grant ‘Restricted Stock Unit Awards’ and ‘Share Options’. It is currently intended that Restricted Stock Unit Awards and share options will only be granted in response to specific business requirements.

138 IMI plc Annual Report and Accounts 2017
4.11.4 Options granted during the year Number of Weighted options average Normal granted option exercisable (thousand) price date
SAYE 2016 227 845p 2019-2021 2017 51 1106p 2020-2022
GESPP 2016 36 949p 2018 2017 30 1067p 2019
IIP 2016 1,238 - 2018-2019 2017 942 - 2019-2020
4.11.5 Movement in outstanding options in the year
Options granted at Options not granted at nil cost 1 nil cost 2 Total
Number of Weighted Number of Number of options Range of average options options (thousand) option prices option price (thousand) (thousand)
Outstanding at 1 January 2016 2,308 441-1518p 1180p 2,592 4,900Exercisable at 1 January 2016 814 441-1007p 961p 653 1,467Granted 263 845-949p 859p 1,238 1,501Exercised 109 511-1197p 899p 641 750Lapsed 363 845-1467p 1177p 727 1,090Outstanding at 31 December 2016 2,099 441-1518p 1156p 2,462 4,561Exercisable at 31 December 2016 1,236 441-1518p 1128p 105 1,341
Granted 81 1067-1106p 1091p 942 1,023Exercised 195 645-1384p 955p 82 277Lapsed 267 845-1467p 1242p 520 787Outstanding at 31 December 2017 1,718 441-1518p 1162p 2,802 4,520Exercisable at 31 December 2017 1,340 441-1518p 1218p 118 1458 1 Options not granted at nil cost include options granted under the following schemes: IMI Sharesave Scheme, Global Employee Share Purchase Plans and
IMI Share Option Plan.2 Options granted at nil cost are those granted under the Performance Share Plan, Share Matching Plan and IMI Incentive Plan.
Section 4 – capital structure and financing costs(continued)
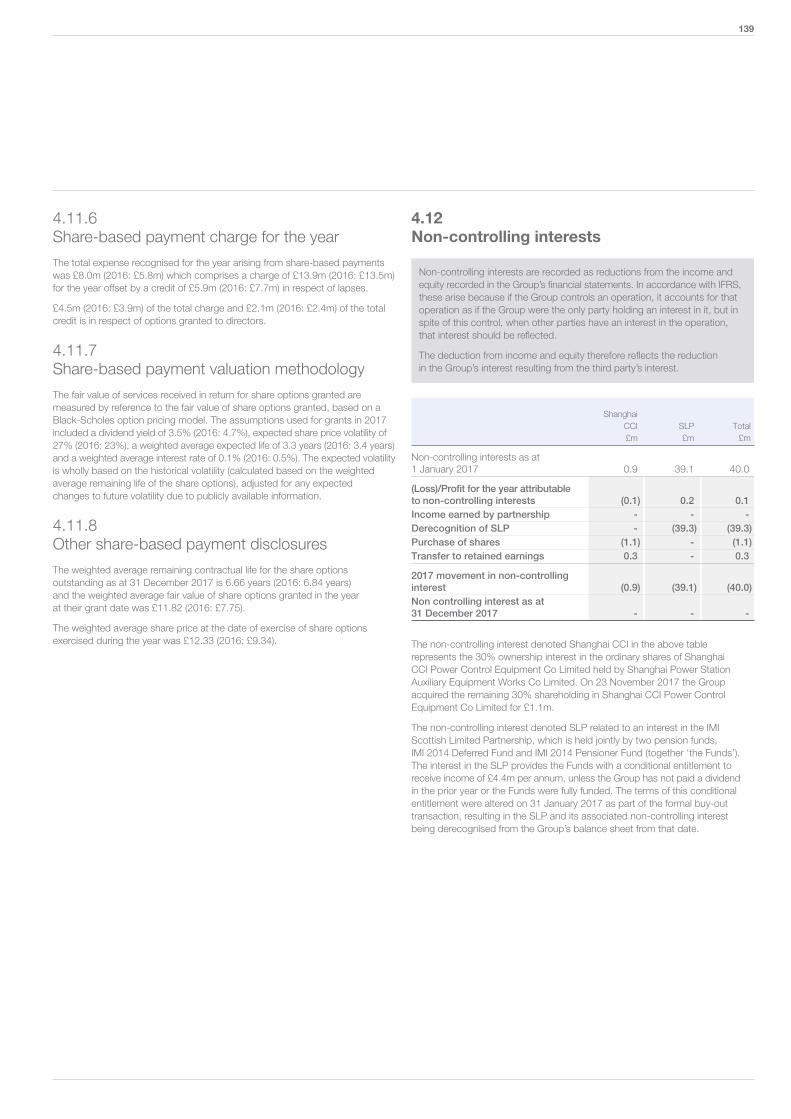
139
4.11.6 Share-based payment charge for the year
The total expense recognised for the year arising from share-based payments was £8.0m (2016: £5.8m) which comprises a charge of £13.9m (2016: £13.5m) for the year offset by a credit of £5.9m (2016: £7.7m) in respect of lapses.
£4.5m (2016: £3.9m) of the total charge and £2.1m (2016: £2.4m) of the total credit is in respect of options granted to directors.
4.11.7 Share-based payment valuation methodology
The fair value of services received in return for share options granted are measured by reference to the fair value of share options granted, based on a Black-Scholes option pricing model. The assumptions used for grants in 2017 included a dividend yield of 3.5% (2016: 4.7%), expected share price volatility of 27% (2016: 23%), a weighted average expected life of 3.3 years (2016: 3.4 years) and a weighted average interest rate of 0.1% (2016: 0.5%). The expected volatility is wholly based on the historical volatility (calculated based on the weighted average remaining life of the share options), adjusted for any expected changes to future volatility due to publicly available information.
4.11.8 Other share-based payment disclosures
The weighted average remaining contractual life for the share options outstanding as at 31 December 2017 is 6.66 years (2016: 6.84 years) and the weighted average fair value of share options granted in the year at their grant date was £11.82 (2016: £7.75).
The weighted average share price at the date of exercise of share options exercised during the year was £12.33 (2016: £9.34).
4.12 Non-controlling interests
Non-controlling interests are recorded as reductions from the income and equity recorded in the Group’s financial statements. In accordance with IFRS, these arise because if the Group controls an operation, it accounts for that operation as if the Group were the only party holding an interest in it, but in spite of this control, when other parties have an interest in the operation, that interest should be reflected.
The deduction from income and equity therefore reflects the reduction in the Group’s interest resulting from the third party’s interest.
Shanghai CCI SLP Total £m £m £m
Non-controlling interests as at 1 January 2017 0.9 39.1 40.0
(Loss)/Profit for the year attributable to non-controlling interests (0.1) 0.2 0.1Income earned by partnership - - -Derecognition of SLP - (39.3) (39.3)Purchase of shares (1.1) - (1.1)Transfer to retained earnings 0.3 - 0.3
2017 movement in non-controlling interest (0.9) (39.1) (40.0)Non controlling interest as at 31 December 2017 - - -
The non-controlling interest denoted Shanghai CCI in the above table represents the 30% ownership interest in the ordinary shares of Shanghai CCI Power Control Equipment Co Limited held by Shanghai Power Station Auxiliary Equipment Works Co Limited. On 23 November 2017 the Group acquired the remaining 30% shareholding in Shanghai CCI Power Control Equipment Co Limited for £1.1m.
The non-controlling interest denoted SLP related to an interest in the IMI Scottish Limited Partnership, which is held jointly by two pension funds, IMI 2014 Deferred Fund and IMI 2014 Pensioner Fund (together ‘the Funds’). The interest in the SLP provides the Funds with a conditional entitlement to receive income of £4.4m per annum, unless the Group has not paid a dividend in the prior year or the Funds were fully funded. The terms of this conditional entitlement were altered on 31 January 2017 as part of the formal buy-out transaction, resulting in the SLP and its associated non-controlling interest being derecognised from the Group’s balance sheet from that date.

140 IMI plc Annual Report and Accounts 2017
5.1 Contingent liabilities
A contingent liability is a liability that is not sufficiently certain to qualify for recognition as a provision because significant subjectivity exists regarding its outcome.
Group contingent liabilities relating to guarantees in the normal course of business and other items amounted to £197m (2016: £208m).
5.2 Related party transactions
Related parties are solely the key management personnel. The Board is considered to be the key management personnel of the Group.
2017 2016 £m £m
Short-term employee benefits* 6.2 4.7 Share-based payments** 2.4 1.6 Total 8.6 6.3
* Short-term employee benefits comprise salary, including employers’ social contributions, benefits earned during the year and bonuses awarded for the year.
** For details of the shared based payment charge for key management personnel, see Section 4.11.6.
There are no other related party transactions.
5.3 Subsequent events
Events that occur in the period between 31 December and the date of approval of the annual report can be categorised as adjusting or non-adjusting depending on whether the condition existed at 31 December. If the event is an adjusting event, then an adjustment to the results is made. If a non-adjusting event after the year-end is material, non-disclosure could influence decisions that readers of the financial statements make. Accordingly, for each material non-adjusting event after the reporting period we disclose the nature of the event and an estimate of its financial effect, or a statement that such an estimate cannot be made.
On 31 January 2018, the Group acquired Bimba Manufacturing Company (Bimba) and its subsidiaries for $198m. Bimba is a market leading manufacturer of pneumatic, hydronic and electric motion solutions based in North America.
On 28 February 2018, the Group served notice of its intention to wind up the IMI 2014 Pensioner Fund. As a result of this transaction, in excess of £400m of pension assets and the corresponding DBO will be removed from the balance sheet. This impact is expected to be included in the 2018 results.
5.4 Significant accounting policies
A. Subsidiaries and non-controlling interests
The Group financial statements consolidate the financial statements of IMI plc and the entities it controls (its subsidiaries) for the year to 31 December. The Group has no significant interests which are accounted for as associates or joint ventures as at 31 December 2017.
Subsidiaries are consolidated from the date of their acquisition, being the date on which the Group obtains control, and continue to be consolidated until the date that such control ceases. Control comprises the power to govern the financial and operating policies of the investee so as to obtain benefit from its activities and is achieved through direct or indirect ownership of voting rights; currently exercisable or convertible potential voting rights; or by way of contractual agreement. The financial statements of subsidiaries used in the preparation of the consolidated financial statements are prepared for the same reporting year as the parent company and are based on consistent accounting policies. All intragroup balances and transactions, including unrealised profits arising from them, are eliminated in full.
A change in the ownership interest of a subsidiary, without loss of control, is accounted for as an equity transaction. If the Group loses control over a subsidiary, it:
• derecognises the assets (including any goodwill relating to the subsidiary) and liabilities of the subsidiary;
• derecognises the carrying amount of any non-controlling interest;
• derecognises the cumulative translation differences recorded in equity;
• recognises the fair value of the consideration received;
• recognises the fair value of any investment retained;
• recognises any surplus or deficit in profit or loss; and
• reclassifies the parent’s share of components previously recognised in other comprehensive income to profit or loss or retained earnings, as appropriate.
Taxation on the above accounting entries would also be recognised where applicable.
Non-controlling interests include the equity in a subsidiary not attributable, directly or indirectly, to the parent company and the UK Funds’ interest in the IMI Scottish Limited Partnership (the Partnership). Non-controlling interests are presented within equity in the consolidated balance sheet, separately from equity attributable to owners of the parent. Losses within a subsidiary are proportionally attributed to the non-controlling interest even if that results in a deficit balance.
B. Use of judgements and estimates
The preparation of financial statements requires management to make judgements, estimates and assumptions that affect the application of accounting policies and the reported amounts of assets, liabilities, income and expenses. Actual results may differ from these estimates.
i. Key judgements
Classification of adjusting items
Management has applied judgement in the selection of the Alternative Performance Measures (APMs) used in the Annual Report and Accounts. The APMs presented are used in discussions with the investment analyst community and by the Board and management to monitor the trading performance of the Group. We consider that the presentation of APMs allows for improved insight to the trading performance of the Group. The adjusting items in the income statement include restructuring costs, special pension events, losses on disposals of subsidiaries, impairment losses, the reversal of gains/losses on economic hedges, acquisition costs and acquired intangible amortisation. See Section 2.2 for further details of the items that are classified as adjusting items.
Section 5 – other notes

141
ii. Key estimates and assumptions
The key estimates and assumptions concerning the future and other sources of estimation uncertainty at the reporting date are described below. The Group bases its assumptions and estimates on information available when the consolidated financial statements are prepared. Market changes or circumstances arising beyond the control of the Group are reflected in the assumptions and estimates when they occur. Revisions to accounting estimates are recognised in the period in which the estimate is revised and in any future periods affected.
Impairment of non-financial assets
Impairment exists when the carrying value of an asset or cash generating unit exceeds its recoverable amount, which is the higher of its fair value less costs to sell and its value in use. The value in use is based on a discounted cash flow model. Cash flows are derived from the Group’s long-term forecasts for the next three to five years. The principal key estimate reflects the assumptions in these calculations are the long-term growth rates and the discount rate applied to forecast cash flows in addition to the achievement of the forecasts themselves. Further information on the assumptions adopted for material cash generating units and the assets affected is included in Section 3.2.
Trading provisions
The Group sells a wide range of highly technical products and whilst they are designed and engineered to a high degree of precision and to customer specifications, there is a risk of products requiring modification, which can lead to warranty claims, excess or obsolete inventory and collection risk regarding receivables. Management makes estimates based on:
• past experience of warranty claims and the associated costs of similar claims;
• historical sales trends and management’s view of future sales forecasts;
• forecast costs to complete; and
• the identification of customers and territories for which there is a heightened collection risk.
The degree of dependence on future events makes these estimates inherently subjective. The amounts of the trading provisions recognised for inventory, trade receivables and other provisions are disclosed in Section 3.1.1, Section 3.1.2 and Section 3.6 respectively.
Employee benefits
The present value of the Group’s defined benefit pension plans and other post-employment benefits are determined using actuarial valuations. An actuarial valuation involves making various assumptions that may differ from actual developments in the future. These include the determination of the discount rate, inflation, future salary increases, mortality rates and future pension increases. The assumption used and analysis of their sensitivity is included in Section 4.9. Due to the complexity of the valuation and its long-term nature, a defined benefit obligation is highly sensitive to changes in these assumptions.
iii. Changes in judgements, estimates and assumptions
In light of the FRC’s recent guidance on the disclosure of key judgements and estimates, management reassessed those presented in the 2016 Annual Report and Accounts and concluded that, in the current year, the follow items are no longer significant judgements and estimates.
Development costs
Management has reviewed the judgements applied in determining whether development costs should be capitalised in line with the criteria detailed in IAS 38: Intangible Assets and concluded that they do not have a significant effect on the amounts recognised.
Disposed businesses
Management has reviewed the estimates used to recognise warranty and indemnity provisions arising from historical disposed businesses and concluded that the associated estimation uncertainty is immaterial.
Taxes
Management has reviewed the following estimates and concluded that the associated estimation uncertainty is not material:
• Uncertainties facing the Group from the interpretation of complex tax regulations, changes in tax laws and the timing of future taxable income; and
• The estimates used to establish provisions for the possible consequences of audits by the tax authorities in the countries that the Group operates.
Share-based payments
Management has reviewed each element of the share based payment charge and concluded that the charge is not materially sensitive to the assumptions used.
C. Revenue Recognition
Revenue is recognised to the extent that it is probable that the economic benefits will flow to the Group and that the revenue can be reliably measured. The nature of the equipment, valve and other contracts into which the Group enters means that:
• the contracts usually contain discrete elements, each of which transfers risks and rewards to the customer. Where such discrete elements are present, revenue is recognised on each element in accordance with the policy on the sale of goods.
• the service element of the contract is usually insignificant in relation to the total contract value and is often provided on a short-term or one-off basis. Where this is the case, revenue is recognised when the service is complete.
As a result of the above, the significant majority of the Group’s revenue is recognised on a sale of goods basis.
The specific methods used to recognise the different forms of revenue earned by the Group are set out below:
i. Sale of goods
Revenue from the sale of goods is recognised in the income statement net of returns, trade discounts and volume rebates when the significant risks and rewards of ownership have been transferred to the buyer and reliable measurement is possible. No revenue is recognised where recovery of the consideration is not probable or there are significant uncertainties regarding associated costs, or the possible return of goods.
Transfers of risks and rewards vary depending on the nature of the products sold and the individual terms of the contract of sale. Sales made under internationally accepted trade terms, Incoterms 2010, are recognised as revenue when the Group has completed the primary duties required to transfer risks as defined by the International Chamber of Commerce Official Rules for the Interpretation of Trade Terms. Sales made outside Incoterms 2010 are generally recognised on delivery to the customer. In limited instances, a customer may request that the Group retains physical possession of an asset for a period after the significant risk and rewards of ownership have transferred to the customer. In these circumstances, the Group provides this storage as a service to the customer and therefore revenue is recognised prior to delivery of the asset.
ii. Rendering of services
As noted above, because revenue from the rendering of services is usually insignificant in relation to the total contract value and is generally provided on a short-term or one-off basis, revenue is usually recognised when the service is complete.

142 IMI plc Annual Report and Accounts 2017
Where this is not the case, revenue from services rendered is recognised in proportion to the stage of completion of the service at the balance sheet date.
The stage of completion is assessed by reference to the contractual agreement with each separate customer and the costs incurred on the contract to date in comparison to the total forecast costs of the contract. Revenue recognition commences only when the outcome of the contract can be reliably measured. Installation fees are similarly recognised by reference to the stage of completion on the installation unless they are incidental to the sale of the goods, in which case they are recognised when the goods are sold.
When a transaction combines a supply of goods with the provision of a significant service, revenue from the provision of the service is recognised separately from the revenue from the sale of goods by reference to the stage of completion of the service unless the service is essential to the functionality of the goods supplied, in which case the whole transaction is treated as a construction contract. Revenue from a service that is incidental to the supply of goods is recognised at the same time as the revenue from the supply of goods.
iii. Construction contracts
As noted above, customer contracts usually contain discrete elements separately transferring risks and rewards to the customer. However, where such discrete elements are not in place, revenue from significant contracts is recognised in proportion to the stage of completion of the contract by reference to the specific contract terms and the costs incurred on the contract to date in comparison to the total forecast costs of the contract.
Variations in contract work, claims and incentive payments are included in revenue from construction contracts when certain criteria are met. Variations are included when the customer has agreed to the variation or acknowledged liability for the variation in principle. Claims are included when negotiations with the customer have reached an advanced stage such that the customer is certain to accept the claim. Incentive payments are included when a contract is sufficiently advanced that it is probable that the performance standards triggering the incentive will be achieved.
Profit attributable to contract activity is recognised if the final outcome of such contracts can be reliably assessed. On all contracts, full provision is made for any losses in the year in which they are first foreseen.
D. Adjusting items
Adjusting items are disclosed separately in Section 2.2 and are included in a separate column on the face of the income statement. They are excluded in arriving at adjusted results where the inclusion of these items would otherwise distort the trading performance of the Group.
E. Goodwill
Goodwill is initially measured at cost being the excess of the aggregate of the acquisition-date fair value of the consideration transferred and the amount recognised for the non-controlling interest (and where the business combination is achieved in stages, the acquisition-date fair value of the acquirer’s previously held equity interest in the acquiree) over the net identifiable amounts of the assets acquired and the liabilities assumed for the business combination.
After initial recognition, goodwill is measured at cost less any accumulated impairment losses. For the purpose of impairment testing, goodwill acquired in a business combination is, from the acquisition date, allocated to each of the Group’s cash-generating units (or groups of cash generating units) that are expected to benefit from the combination, irrespective of whether other assets or liabilities of the acquiree are assigned to those units. Each unit or group of units to which goodwill is allocated shall represent the lowest level within the entity at which the goodwill is monitored for internal management purposes and shall not be larger than an operating segment before aggregation.
Where goodwill forms part of a cash-generating unit and part of the operation within that unit is disposed of, the goodwill associated with the operation disposed of is included in the carrying amount of the operation when determining the gain or loss on disposal of the operation. Goodwill disposed of in this circumstance is measured based on the relative values of the operation disposed of and the portion of the cash-generating unit retained.
F. Financial income and expense
Financial income comprises interest receivable on funds invested, income from investments and gains on hedging instruments that are recognised in the income statement. Interest income is recognised in the income statement as it accrues, taking into account the effective yield on the asset. Dividend income is recognised in the income statement on the date that the dividend is declared.
Financial expense comprises interest payable on borrowings calculated using the effective interest rate method, the interest related element of derivatives and losses on financial instruments that are recognised in the income statement. The interest expense component of finance lease payments is recognised in the income statement using the effective interest rate method.
Net finance expense relating to defined benefit pension schemes represents the assumed interest on the difference between employee benefit plan liabilities and the employee benefit plan assets.
Borrowing costs directly attributable to the acquisition, construction or production of an asset that necessarily takes a substantial period of time to get ready for its intended use or sale are capitalised as part of the cost of the respective assets. All other borrowing costs are expensed in the period they occur. Borrowing costs consist of interest and other costs that an entity incurs in connection with the borrowing of funds.
G. Income tax
Current tax payable/receivable represents the expected tax payable/receivable on the taxable income for the year, using tax rates enacted or substantively enacted at the balance sheet date and taking into account any adjustments in respect of prior years.
Deferred tax is provided, using the balance sheet method, on temporary differences between the carrying amounts of assets and liabilities for financial reporting purposes and the amounts used for taxation purposes. Deferred tax is not recognised for the following temporary differences: the initial recognition of goodwill, the initial recognition of assets or liabilities in a transaction that is not a business combination and that affects neither accounting nor taxable profit, and differences relating to investments in subsidiaries to the extent that the timing of the reversal of the differences can be controlled and it is probable that the differences will not reverse in the foreseeable future. Deferred tax is measured at the tax rates that are expected to apply when the temporary differences reverse, based on the tax laws that have been enacted or substantively enacted by the balance sheet date.
A deferred tax asset is recognised to the extent that it is probable that future taxable profit will be available against which the temporary difference can be utilised.
H. Non-current assets held for sale and discontinued operations
Where applicable, on initial classification as ‘held for sale’, non-current disposal groups are recognised at the lower of carrying amount and fair value less costs to sell. Impairment losses on the initial classification of assets as held for sale are included in profit or loss, even for assets measured at fair value, as are impairment losses on subsequent remeasurement and any reversal thereof. Once classified as held for sale, assets are no longer depreciated or amortised.
A discontinued operation is a component of the Group’s business that represents a separate major line of business that has been disposed of, is held for sale or is a subsidiary acquired exclusively with a view to re-sale.
Section 5 – other notes(continued)

143
I. Foreign currencies
i. Foreign currency transactions
Monetary assets and liabilities denominated in foreign currencies have been translated into sterling at the rates of exchange ruling at the balance sheet date. Foreign exchange differences arising on translating transactions at the exchange rate ruling on the transaction date are reflected in the income statement. Non-monetary assets and liabilities that are measured at historical cost in a foreign currency are translated using the exchange rate at the date of the transaction. Non-monetary assets and liabilities denominated in foreign currencies that are stated at fair value are translated into sterling at foreign exchange rates ruling at the balance sheet date.
ii. Foreign operations
The income statements of overseas subsidiary undertakings are translated at the appropriate average rate of exchange for the year and the adjustment to year-end rates is taken directly to reserves.
The assets and liabilities of foreign operations, including goodwill and fair value adjustments arising on acquisition, are translated at foreign exchange rates ruling at the balance sheet date.
Foreign exchange differences arising on retranslation are recognised directly as a separate component of equity. Since 1 January 2004, the Group’s date of transition to IFRSs, such differences have been recognised in the translation reserve. When a foreign operation is disposed of, in part or in full, the relevant amount in the translation reserve is transferred to profit or loss.
J. Financial instruments and fair value hedging
Financial instruments are initially recorded at fair value plus directly attributable transaction costs unless the instrument is a derivative not designated as a hedge (see below). Subsequent measurement depends on the designation of the instrument, which follows the categories in IAS 39:
• Fixed deposits, principally comprising funds held with banks and other financial institutions are classified as ‘available for sale assets’ under IAS 39, and held at fair value. Short term borrowings and overdrafts are classified as financial liabilities at amortised cost.
• Derivatives, comprising interest rate swaps, foreign exchange contracts and options, metals futures contracts and any embedded derivatives, are classified as ‘fair value through profit or loss’ under IAS 39, unless designated as hedges. Derivatives not designated as hedges are initially recognised at fair value; attributable transaction costs are recognised in profit or loss when incurred. Subsequent to initial recognition, changes in fair value of such derivatives and gains or losses on their settlement are recognised in net financial income or expense.
• Long-term loans and other interest bearing borrowings are generally held at amortised cost using the effective interest rate method. Where the long-term loan is hedged, generally by an interest rate swap, and the hedge is regarded as effective, the carrying value of the long-term loan is adjusted for changes in fair value of the hedge.
• Trade receivables are stated at cost as reduced by appropriate impairment allowances for estimated irrecoverable amounts.
• Trade payables are stated at cost.
• Financial assets and liabilities are recognised on the balance sheet only when the Group becomes a party to the contractual provisions of the instrument.
• Available for sale financial assets are carried at fair value with gains and losses being recognised in equity, except for impairment losses which are recognised in the income statement.
K. Other hedging
i. Hedge of monetary assets and liabilities, financial commitments or forecast transactions
Where a derivative financial instrument is used as an economic hedge of the foreign exchange or metals commodity price exposure of a recognised monetary asset or liability, financial commitment or forecast transaction, but does not meet the criteria to qualify for hedge accounting under IAS 39 no hedge accounting is applied and any gain or loss resulting from changes in fair value of the hedging instrument is recognised in net financial income or expense.
Where such a derivative is a formally designated hedge of a forecast transaction for accounting purposes, movements in the value of the derivative are recognised directly in other comprehensive income to the extent the hedge is effective. The Company assesses the effectiveness of the hedge based on the expected fair value of the amount to be received and the movement in the fair value of the derivative designated as the hedge.
For segmental reporting purposes, changes in the fair value of economic hedges that are not designated hedges, which relate to current year trading, together with the gains and losses on their settlement, are allocated to the segmental revenues and operating profit of the relevant business segment.
ii. Hedge of net investment in foreign operation
Where a foreign currency liability or derivative financial instrument is a formally designated hedge of a net investment in a foreign operation, foreign exchange differences arising on translation of the foreign currency liability or changes in the fair value of the financial instrument are recognised directly in equity via other comprehensive income to the extent the hedge is effective. The Group assesses the effectiveness of its net investment hedges based on fair value changes of its net assets, including relevant goodwill designated as foreign currency assets, and the fair value changes of both the debt designated as a hedge and the relevant financial instrument.
L. Intangible assets
Intangible assets are further sub-divided in the notes to these accounts between acquired intangible assets and non-acquired intangible assets. Amortisation of acquired intangible assets is treated as an adjusting item as described in Section 2.2 of these accounting policies, because of its inherent volatility. The accounting policy for goodwill is described in accounting policy E.
i. Research and development
Expenditure on research activities, undertaken with the prospect of gaining new scientific or technical knowledge and understanding, is recognised in the income statement as an expense as incurred.
Expenditure on development activities, whereby research findings are applied to a plan or design for the production of new or substantially improved products and processes, is capitalised provided benefits are probable, cost can be reliably measured and if, and only if, the product or process is technically and commercially feasible and the Group has sufficient resources and intention to complete development. The expenditure capitalised includes the cost of materials, direct labour and directly attributable overheads. Other development expenditure is recognised in the income statement as an expense as incurred. Capitalised development expenditure is stated at cost less accumulated amortisation (see below) and impairment losses (see accounting policy ‘Impairment’) and is included in the other acquired or other non-acquired category of intangible assets depending on its origin.

144 IMI plc Annual Report and Accounts 2017
ii. Software development costs
Software applications and systems that are not an integral part of their host computer equipment are capitalised on initial recognition as intangible assets at cost. Cost comprises the purchase price plus directly attributable costs incurred on development of the asset to bring it into use. Following initial recognition, software development costs are carried at cost less any accumulated amortisation (see below) and accumulated impairment losses (see accounting policy ‘Impairment’) and are included in the other acquired or other non-acquired category of intangible assets depending on their origin.
iii. Customer relationships and other acquired intangible assets
Customer relationships and other intangible assets that are acquired by the Group as part of a business combination are stated at their fair value calculated by reference to the net present value of future benefits accruing to the Group from utilisation of the asset, discounted at an appropriate discount rate. Expenditure on other internally generated intangible assets is recognised in the income statement as an expense as incurred.
iv. Amortisation of intangible assets other than goodwill
Amortisation is charged to the income statement on a straight-line basis (other than for customer relationships and order book, which are charged on a sum of digits basis) over the estimated useful lives of the intangible assets. Amortisation commences from the date the intangible asset becomes available for use. The estimated useful lives for:
• Capitalised development costs are the life of the intangible asset (usually a maximum of 10 years)
• Software development costs are the life of the intangible asset (up to 10 years)
• Customer relationships are the life of the intangible asset (up to 10 years)
• Other intangible assets (including order books, brands and software) are the life of the intangible asset (up to 10 years)
M. Property, plant and equipment
Freehold land and assets in the course of construction are not depreciated.
Items of property, plant and equipment are stated at cost less accumulated depreciation (see below) and impairment losses (see accounting policy ‘Impairment’).
Where an item of property, plant and equipment comprises major components having different useful lives, they are accounted for as separate items of property, plant and equipment. Costs in respect of tooling owned by the Group for clearly identifiable new products are capitalised net of any contribution received from customers and are included in plant and equipment.
Depreciation is charged to the income statement on a straight-line basis (unless such a basis is not aligned with the anticipated benefit) so as to write down the cost of assets to residual values over the period of their estimated useful lives within the following ranges:
• Freehold buildings - 25 to 50 years
• Plant and equipment - 3 to 20 years
N. Leased assets
Leases where the Group assumes substantially all the risks and rewards of ownership are classified as finance leases.
Plant and equipment acquired by way of finance lease is stated at an amount equal to the lower of its fair value and the present value of the minimum lease payments at inception of the lease, less accumulated depreciation (see above) and impairment losses (see accounting policy ‘Impairment’).
Payments made under operating leases are recognised in the income statement on a straight-line basis over the term of the lease.
Lease incentives received are recognised in the income statement over the period of the lease unless a different systematic method is more appropriate under the terms of the lease. The majority of leasing transactions entered into by the Group are operating leases.
O. Inventories
Inventories are valued at the lower of cost and net realisable value. Due to the varying nature of the Group’s operations, both first in, first out (FIFO) and weighted average methodologies are employed. In respect of work in progress and finished goods, cost includes all direct costs of production and the appropriate proportion of production overheads.
P. Cash and cash equivalents
Cash and cash equivalents comprise cash balances and call deposits. Bank overdrafts that are repayable on demand and form an integral part of the Group’s cash management are included as a component of cash and cash equivalents for the purpose of the statement of cash flows.
Q. Impairment
The carrying values of the Group’s non-financial assets other than inventories (see accounting policy ‘Inventories’) and deferred tax assets (see accounting policy ‘Income tax’), are reviewed at each balance sheet date to determine whether there is any indication of impairment.
If any such indication exists, the recoverable amount of the asset or all assets within its cash generating unit is estimated. An impairment loss is recognised whenever the carrying amount of an asset or its cash generating unit exceeds its recoverable amount. Impairment losses are recognised in the income statement.
For goodwill and assets that are not yet available for use, the recoverable amount is evaluated at each balance sheet date.
i. Calculation of recoverable amount
The recoverable amount of the Group’s receivables other than financial assets held at fair value is calculated as the present value of expected future cash flows, discounted at the original effective interest rate inherent in the asset. Receivables with a short duration of less than one year are not discounted.
The recoverable amount of other assets is the greater of their fair value less costs to sell and value in use. In assessing value in use an individual assessment is made of the estimated future cash flows generated for each cash generating unit (based upon the latest Group forecast and extrapolated using an appropriate long-term growth rate for each cash generating unit in perpetuity, consistent with an estimate of the relevant geographic long-term GDP growth). These are discounted to their present value using a pre-tax discount rate that reflects current market assessments of the time value of money and the risks specific to the asset. Management believe that this approach, including the use of the indefinite cash flow projection, is appropriate based upon both historical experience and because it is one of the bases management utilise to evaluate the fair value of investment opportunities. For an asset that does not generate largely independent cash inflows, the recoverable amount is determined for the smallest cash generating unit to which the asset belongs.
ii. Reversals of impairment
As required by IAS 36 ‘Impairment of Assets’, any impairment of goodwill or available for sale financial assets is non-reversible. In respect of other assets, an impairment loss is reversed if at the balance sheet date there are indications that the loss has decreased or no longer exists following a change in the estimates used to determine the recoverable amount.
An impairment loss is reversed only to the extent that the asset’s carrying amount does not exceed the carrying amount that would have been determined, net of depreciation or amortisation, if no impairment loss had been recognised.
R. Dividends
Final dividends payable are recognised as a liability at the date at which they are approved by the Company’s shareholders or by the subsidiary’s shareholders in respect of dividends to non-controlling interests. Interim dividends payable are recognised on the date they are declared.
Section 5 – other notes(continued)

145
S. Employee benefits
i. Defined contribution pension plans
Contributions to defined contribution pension plans are recognised as an expense in the income statement as incurred.
ii. Defined benefit pension plans
The Group’s net obligation in respect of defined benefit pension plans is calculated separately for each plan by estimating the amount of future benefit that employees have earned in return for their service in the current and prior periods; that benefit is discounted to determine its present value, and the fair value of any plan assets are deducted. Past service costs are recognised in profit or loss on the earlier of the date of the plan amendment or curtailment, and the date that the Group recognises restructuring-related costs. The discount rate is the yield at the balance sheet date on high quality corporate bonds of the appropriate currency that have durations approximating those of the Group’s obligations. The calculation is performed by a qualified actuary using the projected unit credit method. When the calculation results in a net asset to the Group, the recognised asset is limited to the present value of any future refunds from the plan or reductions in future contributions to the plan and restricted by any relevant asset ceiling. Any deduction made by the tax authorities in the event of a refund of a surplus would be regarded by the Group as an income tax.
When the benefits of a plan are improved, the expense is recognised immediately in the income statement. Re-measurement gains and losses are recognised immediately in equity and disclosed in the statement of comprehensive income.
iii. Long-term service and other post-employment benefits
The Group’s net obligation in respect of long-term service and other post-employment benefits, other than pension plans, is the amount of future benefit that employees have earned in return for their service in the current and prior periods. The obligation is calculated using the projected unit credit method and is discounted to its present value and the fair value of any related assets is deducted. The discount rate is the yield at the balance sheet date on high quality bonds of the appropriate currency that have durations approximating those of the Group’s obligations.
iv. Equity and equity-related compensation benefits
The Group operates a number of equity and equity- related compensation benefits as set out in Section 4.11. The fair value of the employee services received in exchange for the grant of the options is recognised as an expense each year. The total amount to be expensed over the vesting period is determined by reference to the fair value of the options granted, excluding the impact of any non-market vesting conditions (for example, profitability and sales growth targets). Non-market vesting conditions are included in assumptions about the number of options that are expected to become exercisable. The fair value of the options is determined based on the Black-Scholes option-pricing model.
At each balance sheet date, the Group revises its estimates of the number of options that are expected to vest. It recognises the impact of the revision of original estimates, if any, in the income statement.
For newly issued shares, the proceeds received net of any directly attributable transaction costs are credited to share capital (nominal value) and share premium when the options are exercised.
T. Provisions
Provisions are recognised when: the Group has a present legal or constructive obligation as a result of past events; it is probable that an outflow of resources will be required to settle the obligation; and the amount can be reliably estimated. Provisions are valued at management’s best estimate of the amount required to settle the present obligation at the balance sheet date.
A provision for restructuring is recognised when the Group has approved a detailed and formal restructuring plan, and the restructuring has either commenced or has been announced publicly.

146 IMI plc Annual Report and Accounts 2017
Strategic report
The strategic report is incorporated by reference and includes the following content:
Results and dividend
The Group consolidated income statement is shown on page 90. Segmental operating profit amounted to £240.9m (2016: £227.7m) and profit before taxation and discontinued operations amounted to £180.9m (2016: £165.3m).
The directors recommend a final dividend of 25.2p per share (2016: 24.7p per share) on the ordinary share capital payable, subject to shareholder approval at the Annual General Meeting to be held on 3 May 2018, on 18 May 2018 to shareholders on the register at the close of business on 6 April 2018. Together with the interim dividend of 14.2p per share paid on 15 September 2017, this final dividend will bring the total distribution for the year to 39.4p per share (2016: 38.7p per share).
Research and development
See Section 2.1.3.3 to the financial statements on page 103.
Shareholders’ funds
Shareholders’ funds increased from £543.2m at the end of 2016 to £607.4m at 31 December 2017.
Share capital
As at 31 December 2017, the Company’s share capital comprised a single class of share capital which was divided into ordinary shares of 28 4/7p each. Details of the share capital of the Company are set out in Section 4.10 to the financial statements on page 134. The Company’s ordinary shares are listed on the London Stock Exchange.
The Company has a Level 1 American Depositary Receipt (ADR) programme for which Citibank, N.A. acts as depositary. See page 170 for further details.
As at 31 December 2017, 972,257 shares were held in an employee trust for use in relation to certain executive incentive plans representing 0.4% of the issued share capital (excluding treasury shares) at that time. The independent trustee of the trust has the same rights as any other shareholder other than as specifically restricted in the governing trust deed. The EBT has agreed to waive any right to all dividend payments now and in the future. Participants in option schemes do not hold any voting rights on the shares until the date of exercise.
During 2017, 63,793 new ordinary shares were issued under employee share schemes: 63,793 under save as you earn plans and nil under executive share plans. Shares acquired through Company share schemes and plans rank equally with the shares in issue and have no special rights.
The rights and obligations attaching to the Company’s ordinary shares are set out in the Company’s articles of association, copies of which can be obtained from Companies House in the UK, from the Company’s website or by writing to the Company Secretary. Changes to the articles of association must be
approved by a special resolution of the shareholders (75% majority required) in accordance with the legislation in force at the time. Subject to applicable statutes, shares may be issued with such rights and restrictions as the Company may by ordinary resolution decide or (if there is no such resolution or so far as it does not make specific provision) as the Board may decide.
Holders of ordinary shares are entitled to receive the Company’s report and accounts, to attend, speak and vote at general meetings of the Company, and to appoint proxies to exercise their rights. Holders of ordinary shares may receive a dividend and on a liquidation, may share in the assets of the Company.
Subject to meeting certain thresholds, holders of ordinary shares may requisition a general meeting of the Company or propose resolutions at Annual General Meetings. Voting rights for ordinary shares held in treasury are suspended and the treasury shares carry no rights to receive dividends or other distributions of assets.
There are no restrictions on the transfer of ordinary shares in the Company other than:
• certain restrictions as may from time to time be imposed by laws and regulations (for example insider trading laws); and
• pursuant to the Company’s share dealing code whereby the directors and certain employees of the Company require approval to deal in the Company’s shares.
The Company is not aware of any arrangements between shareholders that may result in restrictions on the transfer of ordinary shares or on voting rights. None of the ordinary shares carry any special rights with regard to control of the Company. The only restrictions on voting rights are those that apply to the ordinary shares held in treasury. Electronic and paper proxy appointments and voting instructions must be received by the Company’s registrars not later than 48 hours (excluding any non-working days) before a general meeting, or (subject to the Company’s articles of association) any adjournment thereof.
Treasury shares
The Company was granted authority at the Annual General Meeting held on 4 May 2017 to purchase up to 27,197,561 of its ordinary shares of 28 4/7p each. This authority will expire at the conclusion of the next Annual General Meeting to be held on 3 May 2018, where shareholders will be asked to give a similar authority, details of which will be given in the Notice of Annual General Meeting.
As at 31 December 2017, 14,248,836 ordinary shares (nominal value £4,071,096) were held in treasury representing 5.2% of the issued share capital (excluding treasury shares) at that time. The maximum number of shares held in treasury during the year ended 31 December 2017 was 14,248,836.
Substantial shareholdings
Information provided to the Company pursuant to the Disclosure Guidance and Transparency Rules is published on a regulatory information service and on the Company’s website. As at 31 December 2017, the following voting interests in the ordinary share capital of the Company, disclosable under the Disclosure Guidance and Transparency Rules, had been notified to the Company:
1 As of the date in the notification to the Company.
The directors present their report, together with the audited financial statements, for the year ended 31 December 2017.
% Held 1
MFS Investment Management 13.01%
Ameriprise Financial Inc 5.93%
Blackrock Inc 5.50%
Standard Life Investments (Holdings) 4.97%
Legal & General Group plc 3.03%
Strategic Review Pages 10 to 49
Commentary provided on the consolidated income statement
Page 91
Commentary provided on the consolidated statement of comprehensive income
Pages 92 to 93
Commentary provided on the consolidated statement of changes in equity
Pages 92 to 93
Commentary provided on the consolidated balance sheet and the consolidated statement of cash flows
Pages 95 and 97
Directors’ Report

147
Subsequent to 31 December 2017 and up to the date of this Report, no changes in the voting interests have been notified to the Company in accordance with the Disclosure Guidance and Transparency Rules.
As far as the Company is aware, there are no persons with substantial holdings in the Company other than those noted above.
Statement on corporate governance
The required disclosures are contained in the Corporate Governance Report on pages 55 to 59 and are incorporated into this Directors’ Report by reference.
Employee engagement and diversity
Every effort is made to ensure that applications for employment from disabled employees are fully and fairly considered and that disabled employees have equal opportunity in training, succession planning and promotion. Further disclosures relating to employee diversity, employee engagement and policies are set out on pages 36 and 39.
Details of employee share schemes are set out in the Remuneration Report on page 71 and in Sections 4.11.2 and 4.11.3 of the financial statements on page 137.
Health, safety and the environment
It is Group policy to continuously improve healthy and safe working conditions and to always operate in an environmentally responsible manner.
Our carbon reporting statistics demonstrate that our recent performance in gross tonnes of CO2 emissions has continued to improve: 2015 - 61,250, 2016 – 60,000, 2017 – 58,500. As such, we achieved our target to keep emissions at or below 2015 levels for 2017. Of the 2017 total, our direct (scope 1) emissions of CO2, essentially gas, diesel and fuel oil consumed, amounted to 16,500 tonnes. Our indirect (scope 2) emissions of CO2 emissions, essentially the emissions generated on our behalf to provide our electricity, amounted to 42,000 tonnes.
In addition to gross tonnes of CO2 emissions, we report CO2 emissions intensity relative to £million sales; Our result for 2017 is 33.4 which is an improvement relative to the 34.4 we achieved in 2016 when restated on a constant currency basis, (2016 reported figure of 36.3). We plan to drive further savings in our CO2 emissions by continuously improving the condition of our sites and ensuring our processes are Lean and sustainable.
Our CO2 emissions accounting methodology follows DEFRA guidelines and includes all material emissions across IMI. See page 42 for further CO2 emissions and energy efficiency details.
Political donations
No political donations were made during the year.
Directors
The membership of the Board and biographical details of the directors are given on pages 52 and 53 and are incorporated into this report by reference.
The rules for the appointment and replacement of directors are set out in the Company’s articles of association. The Company’s articles of association require each director to stand for re-election at each Annual General Meeting.
Qualifying indemnity provisions and liability insurance
The Company maintains directors’ and officers’ liability insurance and all directors of the Company benefit from qualifying third party indemnity provisions which were in place during the financial year. At the date of this Annual Report there are such indemnity arrangements with each director in respect of the costs of defending civil, criminal and regulatory proceedings brought against them, as a director or employee, subject always to the limitations set by the Companies Act 2006.
The Group operates pension schemes in the UK which provide retirement and death benefits for employees and former employees of the Group. The corporate trustee of the pension schemes is IMI Pensions Trust Limited, a subsidiary of the Company. Qualifying pension scheme indemnity provisions, as defined in section 235 of the Companies Act 2006, were in force for the financial year ended 31 December 2017 and remain in force for the benefit of each of the directors of the corporate trustee of the pension schemes. These indemnity provisions cover, to the extent permitted by law, certain losses or liabilities incurred as a director or officer of the corporate trustee of the pension schemes.
The Group also has in place third party qualifying indemnity provisions, as defined in section 234 of the Companies Act 2006, in favour of certain employees who discharge responsibilities for various wholly-owned subsidiary companies and these indemnities are given on a similar basis to the above.
Role of the Board
The role of the Board is:
• to promote the success of the Company;
• be guardians of stakeholders’ interests;
• to set/monitor leadership behaviour and culture;
• to select and appoint the Executive Committee;
• to provide supportive challenge to the Executive Committee;
• to approve business plans and strategy;
• to oversee governance, risk and the control environment; and
• to monitor and oversee the businesses and management.
The Board provides leadership, direction and governance for the Company and oversees business and management performance. The Board has adopted a Corporate Governance Framework which defines Board roles and includes the list of matters reserved to it and written delegations of authority for its committees and the Executive Committee. Board reserved matters include strategy and key areas of policy, major operational and strategic risks, significant investment decisions and material changes in the organisation of the Group.
In the IMI Corporate Governance Framework, the Board has clearly defined in writing those matters which are reserved to it and the respective delegated authorities of its committees and it has also set written limits of authority for the Chief Executive. The Group has a clear organisational structure and well-established reporting and control disciplines. Managers of operating units assume responsibility for and exercise a high degree of autonomy in running day-to-day trading activities. They do this within a framework of clear rules, policies and delegated authorities regarding business conduct, approval of proposals for investment and material changes in operations and are subject to regular senior management reviews of performance.
Division of responsibilities amongst directors
Chairman:
• building a well-balanced Board
• chairing meetings, setting the agenda and ensuring the best use of time
• ensuring effectiveness of the Board including the quality of debate and decisions
• promoting the right environment and relations for effective engagement and challenge around the boardroom table
• setting the tone and high standards of governance practice
• getting the right executive leadership and succession plans in place
There is a clear division of responsibility between the Chairman and Chief Executive, which is reflected in the IMI Corporate Governance Framework approved by the Board. In summary, the Chairman is responsible for the leadership and effectiveness of the Board but does not have any executive powers or responsibilities. The Chief Executive leads the Executive Committee in running the businesses and implementing operational and strategic plans under authority delegated by the Board.

148 IMI plc Annual Report and Accounts 2017
The Chairman is responsible for ensuring that the Board meetings operate to an appropriate agenda, and that adequate information is provided sufficiently in advance of meetings to allow proper consideration. He is supported by the Company Secretary, who also assists in ensuring that the Board operates in accordance with good corporate governance under the Code and relevant regulatory requirements. The Company Secretary acts as secretary to all of the standing committees of the Board. The Board has a recognised procedure for any director to obtain independent professional advice at the Company’s expense and all directors have access to the Company Secretary who is a solicitor.
Chief Executive:
• leadership of the Executive Committee
• formulating strategy, business plans and budgets
• ensuring the highest compliance and internal control standards are maintained
• developing organisation structure
• resourcing, talent development and succession plans
Directors’ powers
The powers of the directors are determined by UK legislation and the articles of association of the Company in force from time to time. The directors were authorised to allot and issue ordinary shares and to make market purchases of the Company’s ordinary shares by resolutions of the Company passed at its Annual General Meeting held on 4 May 2017 by the passing of new resolutions, in respect of the new ordinary shares of 28 4/7p each. The current authorities will expire at the conclusion of the next Annual General Meeting to be held on 3 May 2018, at which new authorities will be sought.
Further details of authorities the Company is seeking for the allotment, issue and purchase of its ordinary shares will be set out in the separate Notice of Annual General Meeting.
Directors’ interests
The interests of the persons (including the interests of any connected persons) who were directors at the end of the year, in the share capital of the Company, and their interests under share option and incentive schemes, are shown on pages 77 to 83.
Management of conflicts of interest
The Company’s articles of association include certain provisions relevant to the activity of the Board and its committees and can be viewed on the IMI website. These provisions include requirements for disclosure and approval by the Board of potential conflicts of interest. These procedures apply, inter alia, to external directorships and it is the Board’s view that they operated effectively during 2017.
Each director has a duty under the Companies Act 2006 to avoid a situation in which they have or may have a direct or indirect interest that conflicts or possibly may conflict with the interests of the Company. This duty is in addition to the duty that they owe to the Company to disclose to the Board any interest in any transaction or arrangement under consideration by the Company. If any director becomes aware of any situation which may give rise to a conflict of interest, that director informs the rest of the Board and the Board is then permitted under the articles of association to decide to authorise such conflict. The information is recorded in the Company’s register of conflicts and a conflicts authorisation letter is issued to the relevant director.
Change of control
The Company and its subsidiaries are party to a number of agreements that may allow the counterparties to alter or terminate the arrangements on a change of control of the Company following a takeover bid, such as commercial contracts and employee share plans. Other than as referred to in the next paragraph, none of these is considered by the Company to be significant in terms of its likely impact on the Group as a whole.
In the event of a change of control of the Company, the Group’s main funding agreements allow the lenders to renegotiate terms or give notice of repayment for all outstanding amounts under the relevant facilities.
The Company does not have agreements with any director or employee that would provide compensation for loss of office or employment specifically resulting from a takeover, although the provisions of the Company’s share schemes include a discretion to allow awards granted to directors and employees under such schemes to vest in those circumstances.
Information to be disclosed under Listing Rules 9.8.4R
Internal control
The Board has responsibility for oversight of the Group’s system of internal control and confirms that the system of internal control takes into account the Code and relevant best practice guidance including the Financial Reporting Council’s September 2014 publication, ‘Guidance on Risk Management, Internal Control and Related Financial and Business Reporting’.
All operating units prepare forward plans and forecasts which are reviewed in detail by the Executive Committee and consolidated for review by the Board. Performance against forecast is continuously monitored at monthly meetings of the Executive Committee and, on a quarterly basis, by the Board. Minimum standards for accounting systems and controls, which are documented and monitored, are promulgated throughout the Group. Certified annual reports are required from senior executives of operating units, confirming compliance with Group financial reporting requirements. The internal audit function, Group Assurance, operates a rolling programme of internal assurance on site reviews at selected operating units. During the year, internal audits have been in conjunction with finance experts from each division through the audit transition project. This has enabled us to review a wider range of business risks and facilitated a greater sharing of best practice across the businesses. Additionally, visits to operations are carried out by senior Group finance personnel. These internal assurance processes are co-ordinated with the activity of the Company’s external auditor.
Capital investments are subject to a clear process for investment appraisal, authorisation and post-investment review, with major investment proposals referred for consideration by the Executive Committee and, according to their materiality, to the Board. In addition, the Executive Committee regularly reviews the operation of corporate policies and controls including those relating to ethics and compliance matters, treasury activities, environmental issues, health and safety, human resources, taxation, insurance and pensions. Compliance and internal audit reports summaries are made available to the Board, the Audit Committee and the Executive Committee, to enable control issues and developments to be monitored.
Control processes are dynamic and continuous improvements are made to adapt them to the changing risk profile of operations and to implement proportionate measures to address any identified weakness in the internal control system. More information in relation to risk is given on page 46 under the heading ‘How we manage risk’. The internal control declaration process is fully embedded and enables improvement in control through bi-annual self- assessments from all operating units. Action plans to improve controls as a result of these assessments are being tracked and reported to the Audit Committee.
Through the procedures outlined here, the Board has considered the effectiveness of all significant aspects of internal control for the year 2017 and up to the date of this Annual Report. The Board believes that the Group’s system of internal control, which is designed to manage rather than eliminate risk, provides reasonable but not absolute assurance against material misstatement or loss.
Listing Rule Detail Section reference of financial statement
9.8.4R (1-2)(5-14) Not applicable -
9.8.4R (4) Long-term incentive 4.11
Directors’ Report(continued)

149
Financial reporting processes
The use of the Group’s accounting manual and prescribed reporting requirements by finance teams throughout the Group are important in ensuring that the Group’s accounting policies are clearly established and that information is appropriately reviewed and reconciled as part of the reporting process. The use of a standard reporting package by all entities in the Group ensures that information is presented in a consistent way that facilitates the production of the consolidated financial statements.
Viability statement
In accordance with the UK Corporate Governance Code, the directors have assessed the viability of the Company over a relevant period, taking into account the Group’s financial and trading position as summarised in this Annual Report, the principal risks and uncertainties set out on pages 46 to 49 and the five-year business plans reviewed by the Board in September 2017. Based on this assessment, and other matters considered and reviewed by the Board, the directors confirm that they have a reasonable expectation that the Company will be able to continue in operation and meet its liabilities as they fall due over the period from the date of this Annual Report to 31 December 2022.
The directors have determined that the period to 31 December 2022 constitutes an appropriate period over which to make its assessment of viability. Whilst the directors have no reason to believe the Company will not be viable over a longer timing horizon, the five-year period to 31 December 2022 was chosen as it aligns with the Company’s business and strategic planning timing horizon and is a sensible period for such an assessment. It is believed this period provides readers of the Annual Report with an appropriately long-term view with which to assess the Company’s prospects although future outcomes cannot be predicted with certainty.
In making its assessment, the Board recognised the principal risks facing the Company, including those that would threaten its business model, future performance, solvency or liquidity. A summary of these risks can be found on pages 46 to 49.
The five-year business plan was used to assess the headroom on the Company’s facilities and to stress test ongoing covenant compliance under scenarios where its principal risks materialise. The analysis considered both ‘running business’ risks, such as reducing revenues and margins, as well as one-off ‘event’ risks such as product recalls. The Board also considered the Company’s ability to raise capital in the future, as well as both the ongoing actions undertaken to prevent occurrence and the potential actions to mitigate the impact of any particular risk.
The directors also recognised a number of key features of the Company’s operations. The Company’s wide geographical and sector diversification, and the lack of a single major production site, help minimise the risk of serious business interruption. Furthermore, our business model is structured so that the Company is not overly reliant on a few large customers. Our largest customer constitutes only 2% of Group revenue and our top 20 customers account for just over 16% of Group revenue. In addition, our ability to flex our cost base reduces our exposure to sudden adverse economic conditions.
Going concern
Accounting standards require that directors satisfy themselves that it is reasonable for them to conclude whether it is appropriate to prepare financial statements on a going concern basis. The Group’s business activities, together with the factors likely to affect its future development, performance and position are set out in the strategic report on pages 10 to 49. Principal risks are detailed on pages 46 to 49. The financial position of the Group, its cash flows, liquidity position and borrowing facilities are described in the financial statements. In addition, Section 4.4 to the financial statements includes the Group’s objectives, policies and processes for managing its capital; its financial risk management objectives; details of its financial instruments and hedging activities; and its exposures to credit risk and liquidity risk. Section 4.9 to the financial statements addresses the management of the funding risks of the Group’s employee benefit obligations.
The Group has considerable financial resources together with long-standing relationships with a number of customers, suppliers and funding providers across different geographic areas and industries. The Group’s forecasts and projections, taking account of potential and realistic changes in trading performance, indicate that the Group is able to operate within the level of facilities either in place on 31 December 2017, or renewed since, without the need to renew any further facilities before 1 March 2018. As a consequence, the directors believe that the Group is well- placed to manage its business risks successfully despite the uncertainties inherent in the current economic outlook. Such uncertainties as have been identified are not regarded as material uncertainties for the purpose of the going concern assessment.
After making due enquiry, the directors have a reasonable expectation that the Group has adequate resources to continue in operational existence for the foreseeable future. Accordingly, they continue to adopt the going concern basis in preparing the financial statements.
Disclosure of information to the auditor
Each director confirms that, so far as they are each aware, there is no relevant audit information of which the Company’s auditor is unaware; and each director has taken all the steps that he or she ought to have taken as a director to make himself or herself aware of any relevant audit information and to establish that the Company’s auditor is aware of that information.
Annual General Meeting
The Annual General Meeting will be held at the Hilton Birmingham Metropole Hotel, National Exhibition Centre, Birmingham on 3 May 2018 at 10am. Notice of the Annual General Meeting will be published on the Company’s website.
By order of the Board
John O’SheaCompany Secretary
1 March 2018
IMI plc is registered in England No. 714275
150 IMI plc Annual Report and Accounts 2017
Statement of directors’ responsibilities in respect of the Annual Report and the financial statements
The directors are responsible for preparing the Annual Report, which includes the Directors’ Report, the Strategic Report, Remuneration Report and Corporate Governance Statement, and the Group and parent company financial statements in accordance with applicable law and regulations.
Company law requires the directors to prepare financial statements for each financial year. Under that law the directors are required to prepare the Group financial statements in accordance with those International Financial Reporting Standards as adopted by the European Union and the parent company financial statements in accordance with United Kingdom Generally Accepted Accounting Practice (United Kingdom Accounting Standards and applicable law). Under company law the directors must not approve the financial statements unless they are satisfied that they present fairly the financial position, financial performance and cash flows for that period. In preparing those financial statements, the directors are required to:
• select suitable accounting policies and then apply them consistently;
• make judgements and estimates that are reasonable;
• present information, including accounting policies, in a manner that provides relevant, reliable, comparable and understandable information;
• state that the Group financial statements have complied with IFRSs as adopted by the European Union, subject to any material departures disclosed and explained in the financial statements; and
• state for the parent company financial statements whether applicable United Kingdom Accounting Standards have been followed, subject to any material departures disclosed and explained in the financial statements.
The directors are responsible for keeping adequate accounting records that are sufficient to show and explain the Company’s transactions and disclose with reasonable accuracy at any time the financial position of the Group and the parent company and enable them to ensure that the Group and parent company financial statements comply with the Companies Act 2006 and Article 4 of the IAS Regulation as appropriate. They are also responsible for safeguarding the assets of the Group and the parent company and hence for taking reasonable steps for the prevention and detection of fraud and other irregularities.
The directors are responsible for the maintenance and integrity of the corporate and financial information included on the Company’s website. Legislation in the United Kingdom governing the preparation and dissemination of financial statements may differ from legislation in other jurisdictions.
Directors’ responsibility statement under the Disclosure and Transparency Rules
Each of the directors, as at the date of this report, confirms that:
• the Group and parent company financial statements in this Annual Report, which have been prepared in accordance with applicable UK law and with the applicable set of accounting standards, give a true and fair view of the assets, liabilities, financial position and profit of the Group; and
• the Annual Report (which includes the Directors’ Report and the Strategic Report) includes a fair review of the development and performance of the business and the position of the Company and the Group taken as a whole, together with a description of the principal risks and uncertainties that they face.
The directors are responsible for preparing the Annual Report in accordance with applicable laws and regulations. Having taken advice from the Audit Committee, the Board considers the report and accounts, taken as a whole, are fair, balanced and understandable and provide the information necessary for shareholders to assess the Group’s performance, business model and strategy.
By order of the Board
John O’SheaCompany Secretary
1 March 2018
Statement of Directors’ Responsibilities

151
Independent Auditor’s Report to the Members of IMI plc
In our opinion:
• IMI plc’s Group financial statements and Parent Company financial statements (the ‘financial statements’) give a true and fair view of the state of the Group’s and of the Parent Company’s affairs as at 31 December 2017 and of the Group’s profit for the year then ended;
• the Group financial statements have been properly prepared in accordance with IFRSs as adopted by the European Union;
• the Parent Company financial statements have been properly prepared in accordance with United Kingdom Generally Accepted Accounting Practice including FRS 101 ‘Reduced Disclosure Framework’; and
• the financial statements have been prepared in accordance with the requirements of the Companies Act 2006 and as regards to the Group financial statements, Article 4 of the IAS Regulation.
We have audited the Group and Parent Company financial statements of IMI plc for the year ended 31 December 2017 which comprise:
Group Parent Company
Consolidated income statement for the year then ended Balance sheet as at 31 December 2017Consolidated statement of comprehensive income for the year then ended Statement of changes in equity for the year then endedConsolidated statement of changes in equity for the year then ended Related notes C1 to C10 to the financial statements including a summary of significant accounting policies Consolidated balance sheet as at 31 December 2017 Consolidated cash flow statement for the year then ended Related notes 1 to 5 to the financial statements, including a summary of significant accounting policies
The financial reporting framework that has been applied in the preparation of the Group financial statements is applicable law and International Financial Reporting Standards (IFRSs) as adopted by the European Union. The financial reporting framework that has been applied in the preparation of the Parent Company financial statements is applicable law and United Kingdom Accounting Standards (United Kingdom Generally Accepted Accounting Practice), including FRS 101 ‘Reduced Disclosure Framework’.
Basis for opinion
We conducted our audit in accordance with International Standards on Auditing (UK) (ISAs (UK)) and applicable law. Our responsibilities under those standards are further described in the Auditor’s responsibilities for the audit of the financial statements section of our report below. We are independent of the Group and Parent Company in accordance with the ethical requirements that are relevant to our audit of the financial statements in the UK, including the FRC’s Ethical Standard as applied to listed public interest entities, and we have fulfilled our other ethical responsibilities in accordance with these requirements.
We believe that the audit evidence we have obtained is sufficient and appropriate to provide a basis for our opinion.
Use of our report
This report is made solely to the company’s members, as a body, in accordance with Chapter 3 of Part 16 of the Companies Act 2006. Our audit work has been undertaken so that we might state to the company’s members those matters we are required to state to them in an auditor’s report and for no other purpose. To the fullest extent permitted by law, we do not accept or assume responsibility to anyone other than the company and the company’s members as a body, for our audit work, for this report, or for the opinions we have formed.
Conclusions relating to principal risks, going concern and viability statement
We have nothing to report in respect of the following information in the annual report, in relation to which the ISAs (UK) require us to report to you whether we have anything material to add or draw attention to:
• the disclosures in the annual report set out on pages 46 to 49 that describe the principal risks and explain how they are being managed or mitigated;
• the directors’ confirmation set out on page 149 in the annual report that they have carried out a robust assessment of the principal risks facing the entity, including those that would threaten its business model, future performance, solvency or liquidity;
• the directors’ statement set out on page 149 in the financial statements about whether they considered it appropriate to adopt the going concern basis of accounting in preparing them, and their identification of any material uncertainties to the entity’s ability to continue to do so over a period of at least twelve months from the date of approval of the financial statements;
• whether the directors’ statement in relation to going concern required under the Listing Rules in accordance with Listing Rule 9.8.6R(3) is materially inconsistent with our knowledge obtained in the audit; or
• the directors’ explanation set out on page 149 in the annual report as to how they have assessed the prospects of the entity, over what period they have done so and why they consider that period to be appropriate, and their statement as to whether they have a reasonable expectation that the entity will be able to continue in operation and meet its liabilities as they fall due over the period of their assessment, including any related disclosures drawing attention to any necessary qualifications or assumptions.

152 IMI plc Annual Report and Accounts 2017
Overview of our audit approach
Key audit matters - Revenue and profit recognition - Inventory valuation - Carrying value of goodwill and acquired intangible assetsAudit scope - We performed an audit of the complete financial information of 13 components and audit procedures on specific balances for
a further 25 components. - The components where we performed full or specific audit procedures accounted for 87% of profit before tax adjusted for
non-recurring items, 58% of revenue and 74% of total assets.Materiality - Overall Group materiality of £10.0m which represents 5% of profit before tax adjusted for non-recurring items.What has changed - In the prior year, our auditor’s report included a key audit matter in relation to the valuation of the overall pension scheme
liabilities. Following a number of transactions to de-risk the pension scheme over recent years, we now conclude that the likelihood of material misstatement has reduced.
Key audit matters
Key audit matters are those matters that, in our professional judgment, were of most significance in our audit of the financial statements of the current period and include the most significant assessed risks of material misstatement (whether or not due to fraud) that we identified. These matters included those which had the greatest effect on: the overall audit strategy, the allocation of resources in the audit; and directing the efforts of the engagement team. These matters were addressed in the context of our audit of the financial statements as a whole, and in our opinion thereon, and we do not provide a separate opinion on these matters.
Risk Our response to the risk
Revenue and profit recognition (£1,751m, PY comparative £1,649m)
Refer to the Audit Committee Report (page 61); Accounting policies (page 141); and Note 2.1 of the Consolidated Financial Statements (page 99)
Revenue and profit recognition is a significant audit risk across all divisions within the Group.
There is a risk of inappropriate revenue recognition if deliveries are recorded within the wrong accounting period or revenue is not accounted for in line with contractual terms. The cyclical nature of deliveries within the Critical Engineering division results in significant shipments near the December period end which increases the risk of a cut-off error.
There is a risk of inappropriate profit recognition if management override causes contract loss provisions in the Critical Engineering division to be misstated.
RISK MOVEMENT
We performed the below audit procedures at full and specific scope entities over this risk area in 28 locations where revenue is in scope, which represents 58% of the total revenue balance.
We carried out testing of controls over revenue recognition with a focus on those related to the timing of revenue recognition.
We performed analytical procedures to compare revenue recognised with our expectations from past experience, management’s forecasts and, where possible, external market data.
We obtained support for individually unusual and/or material revenue journals.
We performed tests of detail for a sample of revenue transactions to confirm the transactions had been appropriately recorded in the income statement and verified that the risks and rewards of ownership of the products had been transferred to the customer by:
• analysing the contract and terms of the sale to determine that the Group had fulfilled the requirements of the contract;
• confirming revenue could be reliably measured by reference to underlying documentation; and
• confirming collectability of the revenue was reasonably assured by agreeing to collection history.
We performed cut-off testing by tracing a sample of transactions around the period end to third party delivery note documentation and customer acceptance.
We also performed specific procedures over £327m of revenue recognised in the 48 Precision and Hydronic divisions’ marketing companies. These companies purchase IMI manufactured products, either directly from the manufacturing IMI entity or through the Group’s centralised warehousing, and sell into local markets. The specific procedures performed included verifying the occurrence and completeness of a sample of sales transactions recognised by the marketing companies through to goods despatch documentation. We tested a sample of transactions recognised in these companies to determine the measurement of revenue recognised is consistent with the Group’s transfer pricing policies and the inter-company transactions eliminate on consolidation.
In respect of new construction contracts in the Critical Engineering division we tested a sample of management’s assessment of forecast costs to complete, corroborating the underlying assumptions against historic experience and future production plans to determine any contract losses are appropriately recognised. These procedures focused on loss making and low margin contracts in order to assess the completeness of contract loss provisions.
Key observations communicated to the Audit Committee:
Our audit procedures did not identify evidence of material misstatements regarding revenue or profit recognition in the Group.
Independent Auditor’s Report to the Members of IMI plc(continued)

153
Risk Our response to the risk
Inventory valuation (£251m, PY comparative £255m)
Refer to the Audit Committee Report (page 61); Accounting policies (page 144); and Note 3.1.1 of the consolidated financial statements (page 110).
The valuation of inventory across the Group is dependent on establishing appropriate valuation processes. This includes reliance on controls. Management judgement is applied to formulaic calculations for standard costing and excess and obsolete inventory provisions. If these judgements are not appropriate then this increases the risk that inventory is overstated.
RISK MOVEMENT
We performed the below audit procedures at full and specific scope entities over this risk area in 28 locations where inventory is in scope, which represents 72% of the total inventory balance.
We carried out testing on controls over inventory valuation to verify the Group values inventory appropriately.
We tested the accumulation of cost within inventory, confirming the valuation reflected the products’ stage of completion including agreement to the physical inventory counts which we attended.
We obtained evidence to support the standard costs used and performed procedures to ensure only normal production variances had been capitalised in the year-end inventory balance and material abnormal inefficiencies had been appropriately expensed including comparing actual production rates to budget.
We obtained evidence to support inventory is held at the lower of cost and net realisable value by auditing the adequacy of excess and obsolete provisions held against inventory. This included comparing forecast product usage to customer orders, considering historical usage, historical accuracy of provisioning and understanding management’s future plans to utilise the inventory.
We performed clerical procedures on the formulaic calculations to confirm the accuracy of the inventory provisioning.
Key observations communicated to the Audit Committee:
Inventory valuation across the Group is considered appropriate including the adequacy of the excess and obsolete provision. Our audit procedures confirmed that variances between standard and actual costs and the overheads absorbed in the inventory valuation had been correctly calculated.
Risk Our response to the risk
Carrying value of goodwill and acquired intangible assets (£429m, PY comparative £453m)
Refer to the Audit Committee Report (page 61); Accounting policies (page 143); and Note 3.2 of the consolidated financial statements (page 111).
As a consequence of the Group’s growth strategy a significant value of goodwill and intangible assets has arisen from acquisitions. There is a risk that cash generating units (CGUs) may not achieve the anticipated business performance to support the carrying value of these assets leading to an impairment charge that has not been recognised by management. Significant judgement is required in assessing the future cash flows of the CGUs, together with the rate at which they are discounted.
RISK MOVEMENT
We examined management’s methodology as detailed in Section 3.2 of the consolidated financial statements, the models for assessing the valuation of significant goodwill balances to understand the composition of management’s future cash flow forecasts, and the process undertaken to prepare them. This included confirming the underlying cash flows were consistent with the Board approved budgets. We also re-performed the calculations in the model to test the mechanical integrity.
For all CGUs we calculated the degree to which the key assumptions would need to fluctuate before an impairment conclusion was triggered and considered the likelihood of this occurring, in order to assess the adequacy of the company’s disclosures in this area.
In respect of the CGUs identified as having impairment indicators or lower levels of headroom we performed detailed testing with support from our valuation specialists to critically assess and corroborate the key inputs of the forecast cash flows including:
• Corroborating the discount rate used by obtaining the underlying data used in the calculation and benchmarking it against comparable organisations and market data;
• Validating the growth rate assumed by comparing them to economic and industry forecasts; and
• Analysing the historical accuracy of budgets to actual results to determine whether forecast cash flows are reliable based on past experience.
We audited the disclosures in respect of goodwill and intangibles with reference to the requirements of IAS 36 and confirmed their consistency with the audited impairment models.
The audit procedures performed to address this risk have been performed by the Group audit team.
Key observations communicated to the Audit Committee:
Our year-end audit procedures did not identify evidence of material misstatement regarding the carrying value of goodwill and acquired intangible assets in the Group.

154 IMI plc Annual Report and Accounts 2017
13% (9%)Other procedures
In the prior year, our auditor’s report included a key audit matter in relation to the accounting for the valuation of the overall pension scheme liabilities. Following a number of transactions to de-risk the pension scheme over recent years we now conclude that the likelihood of material misstatement has reduced.
The scope of our audit
Tailoring the scope
Our assessment of audit risk, our evaluation of materiality and our allocation of performance materiality determine our audit scope for each entity within the Group. Taken together, this enables us to form an opinion on the consolidated financial statements. We take into account the contribution to Group revenue and operating profit, risk profile (including country risk, risk determined to be associated based on the grading of internal audit findings, controls findings, historical knowledge and risk arising from change in the period including changes to IT systems and key management personnel), the number of significant accounts based on performance materiality and any other known factors when assessing the level of work to be performed at each entity.
In assessing the risk of material misstatement to the Group financial statements, and to ensure we had adequate quantitative coverage of significant accounts in the financial statements, of the 136 reporting components of the Group, we selected 38 components which represent the principal and higher risk business units within the Group.
Of the 38 components selected, we performed an audit of the complete financial information of 13 components (‘full scope components’) which were selected based on their size or risk characteristics. For the remaining 25 components (‘specific scope components’), we performed audit procedures on specific accounts within that component that we considered had the potential for the greatest impact on the significant accounts in the financial statements either because of the size of these accounts or their risk profile.
The reporting components where we performed audit procedures accounted for 87% (2016: 91%) of the Group’s profit before tax adjusted for non-recurring items used to calculate materiality, 58% (2016: 62%) of the Group’s Revenue and 74% (2016: 76%) of the Group’s total assets.
For the current year, the full scope components contributed 35% (2016: 29%) of the Group’s profit before tax adjusted for non-recurring items used to calculate materiality, 38% (2016: 39%) of the Group’s Revenue and 57% (2016: 58%) of the Group’s Total assets. The specific scope component contributed 52% (2016: 62%) of the Group’s profit before tax adjusted for non-recurring items used to calculate materiality, 20% (2016: 23%) of the Group’s Revenue and 17% (2016: 18%) of the Group’s Total assets. The audit scope of these components may not have included testing of all significant accounts of the component but will have contributed to the coverage of significant tested for the Group.
We also performed procedures over the revenue recognised in the Precision and Hydronic divisions’ marketing companies, which provided additional coverage of 19% (2016: 18%) in respect of the Group’s revenue.
Excluding full and specific scope entities, there are a further 98 reporting entities with average revenues of £7.4m and average profit before tax adjusted for non-recurring items of £0.3m. For these components, we performed other procedures, including analytical review, testing of consolidation journals, intercompany eliminations, foreign currency translation recalculations and enquiries of management to respond to any potential risks of material misstatement to the Group financial statements.
The following charts illustrate the coverage obtained from the work performed by our audit teams.
Changes from the prior year
The number of full scope entities has remained consistent between periods at 13 (2016: 13) and the number of specific scope entities has reduced to 25 (2016: 27). These changes predominantly reflect restructuring undertaken by the Group which has resulted in a reduction of the size and risk profile of certain entities previously in scope.
Profit before tax adjusted for non-recurring items - CY / (PY)
52% (62%) Specific scope entities
35% (29%) Full scope entities
Total assets - CY / (PY)
17% (18%) Specific scope entities
26% (24%)Other procedures
57% (58%) Full scope entities
Revenue - CY / (PY)
20% (23%)Specific scope entities
23% (20%)Other procedures
19% (18%)Procedures on
marketing companies
38% (39%)Full scope entities
Independent Auditor’s Report to the Members of IMI plc(continued)

155
Starting basis
Adjustments
Materiality
Involvement with component teams
In establishing our overall approach to the Group audit, we determined the type of work that needed to be undertaken at each of the components by us, as the primary audit engagement team, or by component auditors from other EY global network firms operating under our instruction. Of the 13 full scope components, one component which operates as the Parent Company was audited directly by the Group audit team. For the 25 specific scope components, where the work was performed by component auditors, we determined the appropriate level of involvement to enable us to determine that sufficient audit evidence had been obtained as a basis for our opinion on the Group as a whole.
The Group audit team continued to follow a programme of planned visits that has been designed to ensure that the Senior Statutory Auditor or his delegate visits the vast majority of full and specific scope locations once every three years. During the current year’s audit cycle, visits were undertaken by the Group audit team to the entity teams in Austria, Brazil, China, Czech Republic, Germany, Switzerland, US, and the United Kingdom. These visits involved meeting with our entity team to discuss and direct their audit approach, reviewing and understanding the significant audit findings in response to the key audit maters including revenue, profit recognition and inventory valuation, holding meetings with local management, undertaking factory tours and obtaining updates on local regulatory matters including tax, pensions and legal. The Group audit team interacted regularly with the entity teams during various stages of the audit. We discussed the results of component team reporting with each full and specific scope location at both the period 9 and 12 reporting dates. Where appropriate, we reviewed key working papers and were responsible for the scope and direction of the audit process. This, together with the additional procedures performed at Group level, gave us appropriate evidence for our opinion on the Group financial statements.
Our application of materiality
We apply the concept of materiality in planning and performing the audit, in evaluating the effect of identified misstatements on the audit and in forming our audit opinion.
Materiality
The magnitude of an omission or misstatement that, individually or in the aggregate, could reasonably be expected to influence the economic decisions of the users of the financial statements. Materiality provides a basis for determining the nature and extent of our audit procedures.
We determined materiality for the Group to be £10.0 million (2016: £9.2 million), which is 5% (2016: 5%) of profit before tax adjusted for non-recurring items. We believe that profit before tax adjusted for the items described in the chart below provides us with a consistent year on year basis for determining materiality and is the most relevant performance measure to the stakeholders of the entity.
• Profit before tax - £180.9m for the year ended 31 December 2017
• Gain on special pension events - (£10.8m) (Note 2.2.2 to the Financial Statements)
• Restructuring - £34.6m (Note 2.2.1 to the Financial Statements)
• Loss on disposal of Stainless Steel Fasteners (SSF) - £2.3m (Note 2.2.3 to the Financial Statements)
• Profit before tax adjusted for non-recurring items - £207.0m (basis for materiality)
• Materiality of £10.0m (approximately 5% of materaiality basis)
We determined materiality for the Parent Company to be £9.2 million (2016: £10.8 million), which is 2% (2016: 2%) of equity shareholders’ funds.
Performance materiality
The application of materiality at the individual account or balance level. It is set at an amount to reduce to an appropriately low level the probability that the aggregate of uncorrected and undetected misstatements exceeds materiality.
On the basis of our risk assessments, together with our assessment of the Group’s overall control environment, our judgement was that performance materiality was 75% (2016: 75%) of our planning materiality, namely £7.5m (2016: £6.9m). Audit work at component locations for the purpose of obtaining audit coverage over significant financial statement accounts is undertaken based on a percentage of total performance materiality. The performance materiality set for each entity is based on the relative scale and risk of the entity to the Group as a whole and our assessment of the risk of misstatement at that entity. In the current year, the range of performance materiality allocated to entities was £0.45m to £1.55m (2016: £0.45m to £1.50m).
Reporting threshold
An amount below which identified misstatements are considered as being clearly trivial.
We agreed with the Audit Committee that we would report to them all uncorrected audit differences in excess of £0.5m (2016: £0.5m), which is set at 5% of planning materiality, as well as differences below that threshold that, in our view, warranted reporting on qualitative grounds.
We evaluate any uncorrected misstatements against both the quantitative measures of materiality discussed above and in light of other relevant qualitative considerations in forming our opinion.
Other information
The other information comprises the information included in the annual report and accounts set out on pages 1 to 89, other than the financial statements and our auditor’s report thereon. The directors are responsible for the other information.
Our opinion on the financial statements does not cover the other information and, except to the extent otherwise explicitly stated in this report, we do not express any form of assurance conclusion thereon.
In connection with our audit of the financial statements, our responsibility is to read the other information and, in doing so, consider whether the other information is materially inconsistent with the financial statements or our knowledge obtained in the audit or otherwise appears to be materially misstated. If we identify such material inconsistencies or apparent material misstatements, we are required to determine whether there is a material misstatement in the financial statements or a material misstatement of the other information. If, based on the work we have performed, we conclude that there is a material misstatement of the other information, we are required to report that fact.
We have nothing to report in this regard.

156 IMI plc Annual Report and Accounts 2017
In this context, we also have nothing to report in regard to our responsibility to specifically address the following items in the other information and to report as uncorrected material misstatements of the other information where we conclude that those items meet the following conditions:
• Fair, balanced and understandable set out on page 150 – the statement given by the directors that they consider the annual report and financial statements taken as a whole is fair, balanced and understandable and provides the information necessary for shareholders to assess the Group’s performance, business model and strategy, is materially inconsistent with our knowledge obtained in the audit; or
• Audit committee reporting set out on page 60 to 63 – the section describing the work of the Audit Committee does not appropriately address matters communicated by us to the Audit Committee; or
• Directors’ statement of compliance with the UK Corporate Governance Code set out on page 55 – the parts of the directors’ statement required under the Listing Rules relating to the Company’s compliance with the UK Corporate Governance Code containing provisions specified for review by the auditor in accordance with Listing Rule 9.8.10R(2) do not properly disclose a departure from a relevant provision of the UK Corporate Governance Code.
Opinions on other matters prescribed by the Companies Act 2006
In our opinion, the part of the directors’ remuneration report to be audited has been properly prepared in accordance with the Companies Act 2006.
In our opinion, based on the work undertaken in the course of the audit:
• the information given in the strategic report and the directors’ report for the financial year for which the financial statements are prepared is consistent with the financial statements; and
• the strategic report and the directors’ report have been prepared in accordance with applicable legal requirements.
Matters on which we are required to report by exception
In light of the knowledge and understanding of the Group and the parent company and its environment obtained in the course of the audit, we have not identified material misstatements in the strategic report or the directors’ report.
We have nothing to report in respect of the following matters in relation to which the Companies Act 2006 requires us to report to you if, in our opinion:
• adequate accounting records have not been kept by the parent company, or returns adequate for our audit have not been received from branches not visited by us; or
• the parent company financial statements and the part of the Directors’ Remuneration Report to be audited are not in agreement with the accounting records and returns; or
• certain disclosures of directors’ remuneration specified by law are not made; or
• we have not received all the information and explanations we require for our audit.
Responsibilities of directors
As explained more fully in the directors’ responsibilities statement set out on page 150, the directors are responsible for the preparation of the financial statements and for being satisfied that they give a true and fair view, and for such internal control as the directors determine is necessary to enable the preparation of financial statements that are free from material misstatement, whether due to fraud or error.
In preparing the financial statements, the directors are responsible for assessing the Group and parent company’s ability to continue as a going concern, disclosing, as applicable, matters related to going concern and using the going concern basis of accounting unless the directors either intend to liquidate the Group or the parent company or to cease operations, or have no realistic alternative but to do so.
Auditor’s responsibilities for the audit of the financial statements
Our objectives are to obtain reasonable assurance about whether the financial statements as a whole are free from material misstatement, whether due to fraud or error, and to issue an auditor’s report that includes our opinion. Reasonable assurance is a high level of assurance, but is not a guarantee that an audit conducted in accordance with ISAs (UK) will always detect a material misstatement when it exists. Misstatements can arise from fraud or error and are considered material if, individually or in aggregate, they could reasonably be expected to influence the economic decisions of users taken on the basis of these financial statements.
Explanation as to what extent the audit was considered capable of detecting irregularities, including fraud
The objectives of our audit, in respect to fraud, are; to identify and assess the risks of material misstatement of the financial statements due to fraud; to obtain sufficient appropriate audit evidence regarding the assessed risks of material misstatement due to fraud, through designing and implementing appropriate responses; and to respond appropriately to fraud or suspected fraud identified during the audit. However, the primary responsibility for the prevention and detection of fraud rests with both those charged with governance of the entity and management.
Our approach was as follows:
• We obtained an understanding of the legal and regulatory frameworks that are applicable to the Group and determined that the most significant frameworks which are directly relevant to specific assertions in the financial statements are those that relate to the reporting framework (IFRS, FRS 101, the Companies Act 2006 and UK Corporate Governance Code). In addition, we concluded that there are certain significant laws and regulations which may have an effect on the determination of the amount and disclosure in the financial statements being the Listing Rules of the UK Listing Authority, and those laws and regulations relating to health and safety and employee matters.
• We understood how the Group is complying with those frameworks by making enquiries of management, internal audit, those responsible for legal and compliance procedures and the Company Secretary. We corroborated our enquiries through our review of board minutes, papers provided to the Audit Committee and correspondence received from regulatory bodies.
• We assessed the susceptibility of the Group’s financial statements to material misstatement, including how fraud might occur, by meeting with management from various parts of the business to understand where it considered there was susceptibility to fraud. We also considered performance targets and their influence on efforts made by management to manage earnings or influence the perceptions of analysts. We considered the programmes and controls that the Group has established to address risks identified, or that otherwise prevent, deter and detect fraud; and how senior management monitors those programmes and controls. Where the risk was considered to be higher, we performed audit procedures to address each identified fraud risk. These procedures included testing manual journals and were designed to provide reasonable assurance that the financial statements were free from fraud or error.
• Based on this understanding we designed our audit procedures to identify non-compliance with such laws and regulations identified in the paragraphs above. Our procedures involved: journal entry testing, with a focus on manual consolidation journals and journals indicating large or unusual transactions based on our understanding of the business; enquiries of legal counsel, group management, internal audit, divisional management and full and specific scope management; and focused testing, as referred to in the key audit matters section above.
A further description of our responsibilities for the audit of the financial statements is located on the
Financial Reporting Council’s website at https://www.frc.org.uk/auditorsresponsibilities This description forms part of our auditor’s report.
Independent Auditor’s Report to the Members of IMI plc(continued)

157
Other matters we are required to address
• Following the recommendation of the Audit Committee, we were appointed as auditor by the shareholders and signed an engagement letter on 27 July 2017. We were appointed by the Company at the AGM on 4 May 2017 to audit the financial statements for the year ended 31 December 2017 and the subsequent financial year. The period of total uninterrupted engagement including previous renewals and reappointments is nine years, covering the years ending 31 December 2009 to 31 December 2017.
• The non-audit services prohibited by the FRC’s Ethical Standard were not provided to the Group or the parent company and we remain independent of the Group and the parent company in conducting the audit.
• The audit opinion is consistent with the additional report to the Audit Committee.
Andrew Walton (Senior Statutory Auditor) for and on behalf of Ernst & Young LLP, Statutory Auditor Birmingham 1 March 2018
Notes:
1. The maintenance and integrity of the IMI plc website is the responsibility of the directors; the work carried out by the auditors does not involve consideration of these matters and, accordingly, the auditors accept no responsibility for any changes that may have occurred to the financial statements since they were initially presented on the website.
2. Legislation in the United Kingdom governing the preparation and dissemination of financial statements may differ from legislation in other jurisdictions.

158 IMI plc Annual Report and Accounts 2017
2017 2016 Note £m £m
Fixed assetsInvestments C5 173.2 173.2
Current assetsDebtors C6 282.9 364.4Deferred tax assets C7 2.7 1.1Cash at bank and in hand 3.8 4.8 289.4 370.3
Creditors: amounts falling due within one yearOther creditors C8 (4.3) (3.0)Net current assets 285.1 367.3Total assets less current liabilities 458.3 540.5Net assets 458.3 540.5
Capital and reservesCalled up share capital C9 81.8 81.8Share premium account 12.7 12.1Capital redemption reserve 174.4 174.4Profit and loss account 189.4 272.2Equity shareholders’ funds 458.3 540.5
Approved by the Board of Directors on 1 March 2018 and signed on its behalf by:
Lord Smith of Kelvin
Chairman
Company balance sheetat 31 December 2017

159
Company statement of changes in equity for the year ended 31 December 2017
Share Share Redemption Retained Parent capital premium reserve earnings equity £m £m £m £m £m
At 1 January 2016 81.8 11.8 174.4 312.8 580.8Retained profit for the year 65.2 65.2Dividends paid on ordinary shares (104.2) (104.2)Shares issued in the year 0.3 0.3Share-based payments 5.8 5.8Shares issued by: employee share scheme trust (7.4) (7.4)At 31 December 2016 81.8 12.1 174.4 272.2 540.5
Retained profit for the year 17.4 17.4Dividends paid on ordinary shares* (105.5) (105.5)Shares issued in the year - 0.6 0.6Share-based payments 8.0 8.0Shares acquired for*: employee share scheme trust (2.7) (2.7)At 31 December 2017 81.8 12.7 174.4 189.4 458.3
* Details of treasury and employee trust share scheme movements are contained in Section 4.10 of the Group financial statements and details of dividends paid and proposed in the year are shown in note C4.
All of the retained earnings held at both 31 December 2017 and 31 December 2016 are considered to be distributable reserves.

160 IMI plc Annual Report and Accounts 2017
C1. Significant accounting policies
The following accounting policies have been applied consistently in dealing with items considered material in relation to the financial statements, except where otherwise noted below:
Basis of accounting
The financial statements were prepared in accordance with Financial Reporting Standard 101 ‘Reduced Disclosure Framework’ (FRS 101).
The Company has not presented a separate profit and loss account as permitted by Section 408 of the Companies Act 2006. The Company has taken advantage of the following disclosure exemptions under FRS 101:
a) the requirements of paragraphs 45 (b) and 46-52 of IFRS 2 ‘Share based Payment’;
b) the requirements of IFRS 7 ‘Financial Instruments’;
c) the requirements of paragraphs 91-99 of IFRS 13 ‘Fair Value Measurement’;
d) the requirement in paragraph 38 of IAS 1 ‘Presentation of Financial Statements’ to present comparative information in respect of paragraph 79(a)(iv) of IAS 1;
e) the requirements of paragraphs 10(d), 10(f) and 134-136 of IAS 1;
f) the requirements of IAS 7 ‘Statement of Cash Flows’;
g) the requirements of paragraphs 30 and 31 of IAS 8 ‘Accounting Policies, Changes in Accounting Estimates and Errors’;
h) the requirements of paragraph 17 of IAS 24 ‘Related Party Disclosures’; and
i) the requirements in IAS 24 ‘Related Party Disclosures’ to disclose related party transactions entered into between two or more members of the Group, provided that any subsidiary which is party to the transaction is wholly owned by such a member. Related party transactions with the Company’s key management personnel are disclosed in the Remuneration Report on pages 66 to 85 and in Section 5.2 on page 140 of the Group financial statements.
Judgements and key sources of estimation uncertainty
The preparation of financial statements requires management to make judgements, estimates and assumptions that affect the amounts reported for assets and liabilities as at the balance sheet date and the amounts reported for income and expenses during the year. However, the nature of estimation means that actual outcomes could differ from those estimates.
Foreign currencies
The Company’s functional currency and presentation currency is sterling. Transactions in foreign currencies are recorded using the rate of exchange ruling at the date of transaction.
Monetary assets and liabilities denominated in foreign currencies have been translated into sterling at the rates of exchange ruling at the balance sheet date and the gains or losses on translation are included in the profit and loss account.
Investments
Investments in subsidiaries are accounted for at cost less any provision for impairment. The Company’s cost of investments in subsidiary undertakings is stated at the aggregate of (a) the cash consideration and either (b) the nominal value of the shares issued as consideration when Section 612 of the Companies Act 2006 applies or (c) in all other cases the market value of the Company’s shares on the date they were issued as consideration.
Taxation
The charge for taxation is based on the profit for the year and takes into account taxation deferred because of temporary differences between the treatment of certain items for taxation and accounting purposes.
Deferred tax is recognised in respect of all temporary differences between the treatment of certain items for taxation and accounting purposes which have arisen but not reversed by the balance sheet date, except as otherwise required by IAS 12 ‘Income Taxes’. Deferred tax is measured at the tax rates that are expected to apply when the temporary differences reverse, based on the tax laws that have been enacted or substantively enacted by the balance sheet date. A deferred tax asset is recognised to the extent that it is probable that future taxable profit will be available against which the temporary difference can be utilised.
Equity and equity-related compensation benefits
The Company operates a number of equity and equity-related compensation benefits as set out in Section 4.11 to the Group financial statements. The fair value of the employee services received in exchange for the grant of the options is recharged in full to the principal employing company and accordingly, there is no net charge recorded in the Company’s financial statements. The recharged amount is recognised as a debtor falling due for payment within one year.
The total amount recharged over the vesting period is determined by reference to the fair value of the options granted, excluding the impact of any non-market vesting conditions (for example, profitability and sales growth targets). Non-market vesting conditions are included in assumptions about the number of options that are expected to become exercisable. The fair value of the options at the date of grant is determined based on the Black-Scholes option-pricing model.
At each balance sheet date, the Company revises its estimate of the number of options that are expected to vest. It recognises the impact of the revision of original estimates, if any, in the amount recharged to subsidiary undertakings.
For newly issued shares, the proceeds received, net of any directly attributable transaction costs are credited to share capital (nominal value) and share premium when the options are exercised.
Treasury shares
The consideration paid by the Company on the acquisition of treasury shares is charged directly to retained earnings in the year of purchase. Consideration received for the sale of such shares is also recognised in equity, with any difference between the proceeds from sale and the original cost taken to share premium. If treasury shares are subsequently cancelled the nominal value of the cancelled shares is transferred from share capital to the capital redemption reserve. No gain or loss is recognised on the purchase, sale or cancellation of treasury shares.
Dividends
Dividends unpaid at the balance sheet date are only recognised as a liability at that date to the extent that they are authorised and are no longer at the discretion of the Company. Unpaid dividends that do not meet these criteria are disclosed in the notes to the financial statements.
C2. Remuneration of directors
The detailed information concerning directors’ emoluments, shareholdings and options are shown in the audited section of the Remuneration Report on pages 66 to 85 and Section 2.1.3 of the Group financial statements.
C3. Staff numbers and costs
The number of people employed by the Company, including directors, during the year was 26 (2016: 29) all of whom were employed in administrative roles. The costs associated with them were borne by a subsidiary undertaking.
The Company participates in the IMI UK Funds, which are defined benefit schemes in which the assets are held independently. The total net defined benefit costs of these Funds are borne by a subsidiary undertaking and therefore in accordance with IAS 19, no net defined benefit costs are recognised in the Company’s financial statements. Section 4.9 to the Group financial statements provides further details regarding the defined benefit schemes.
Company notes to the financial statements

161
C4. Dividends
The aggregate amount of dividends comprises:
2017 2016 £m £m
Prior year final dividend paid - 24.7p per qualifying ordinary share (2016: 24.5p) 67.0 66.3Current year interim dividend paid - 14.2p per qualifying ordinary share (2016: 14.0p) 38.5 37.9Aggregate amount of dividends paid in the financial year 105.5 104.2
Dividends paid in the year of £105.5m represent 39.4p per share (2016: 37.9p).
After the balance sheet date the following dividends were proposed by the directors. The dividends have not been provided for and there are no income tax consequences.
2017 2016 £m £m
Current year final dividend - 25.2p per qualifying ordinary share (2016: 24.7p) 68.3 67.0
Dividends proposed after the balance sheet date may differ from the final dividend paid. This is a result of the final number of qualifying shares entitled to dividends differing from those in issue at the balance sheet date.
C5. Fixed assets - investments
Subsidiary undertakings
2017 2016 £m £m
At 1 January 2017 and 31 December 2017 cost and net book value 173.2 173.2
Details of subsidiary undertakings as at 31 December 2017 are shown on pages 163 to 166.
C6. Debtors
2017 2016 £m £m
Falling due for payment after more than one year: Amounts owed by subsidiary undertakings 170.5 278.2
Falling due for payment within one year: Amounts owed by subsidiary undertakings 112.4 86.2 282.9 364.4
C7. Deferred tax
2017 2016 £m £m
The deferred tax included in the balance sheet is as follows: Employee benefits and share based payments 2.7 1.1 Deferred tax asset included in the balance sheet 2.7 1.1
Reconciliation of movement in deferred tax asset: At 1 January 2017 1.1 1.1Deferred tax credit in the profit and loss account 1.3 -Deferred tax credit in equity 0.3 - At 31 December 2017 2.7 1.1
Changes to the rate of UK corporation tax were substantively enacted in 2016 to reduce the rate to 19% from 1 April 2017 and to 17% from 1 April 2020. The deferred tax balance has been calculated based on the rates applicable when the balances are expected to reverse, which is mainly 17% (2016: 17%).

162 IMI plc Annual Report and Accounts 2017
C8. Other creditors falling due within one year
2017 2016 £m £m
Amounts owed to subsidiary undertakings 3.2 1.7Other payables 1.1 1.3 4.3 3.0
C9. Share capital
2017 2016 £m £m
Issued and fully paid 286.2m (2016: 286.2m) ordinary shares of 28 4/7p each 81.8 81.8
C10. Contingencies
Contingent liabilities relating to guarantees in the normal course of business and other items amounted to £100.5m (2016: £82.4m).
There is a right of set-off with three of the Company’s bankers relating to the balances of the Company and a number of its wholly-owned UK subsidiaries.
Where the Company enters into financial guarantee contracts to guarantee the indebtedness of other companies within its Group, the Company considers these to be insurance arrangements, and accounts for them as such. In this respect, the Company treats the guarantee contract as a contingent liability until such time as it becomes probable that the Company will be required to make a payment under the guarantee.
Company notes to the financial statements(continued)

163
Subsidiary undertakings
A full list of the Group’s subsidiary undertakings and registered/principal offices as at 31 December 2017 is included below. Except where indicated, the share capital consists of ordinary shares only. The principal country in which each subsidiary operates and has its registered/principal office is the country of incorporation. IMI plc’s effective interest in the undertakings listed is 100%, except where indicated, and is held in each case by a subsidiary undertaking, except for IMI Group Ltd, IMI Deutschland Verwaltungs GmbH, IMI Lakeside Australia Pty Ltd and Liquick 200 Limited which are held directly by IMI plc.
The Group has an interest in a partnership, the IMI Scottish Limited Partnership, which is fully consolidated into these Group accounts. The Group has taken advantage of the exemption conferred by regulation 7 of the Partnerships (Accounts) Regulations 2008 and has, therefore, not appended the accounts of this qualifying partnership to these accounts. Separate accounts for the partnership are not required to be and have not been filed at Companies House.
Anson Cast Products Limited, Charles Baynes Netherlands BV Netherlands, FCX North America Limited, FCX Pension Trustees Limited, Holford Estates Limited, IMI CIF Trustee Limited, IMI Deutschland Limited, IMI Euro Finance Limited, IMI Fluid Controls (Finance) Limited, IMI Germany Limited, IMI Group Limited, IMI Kynoch Limited, IMI Lakeside Five Limited, IMI Marston Limited, IMI Overseas Investments Limited, IMI Pensions Trust Limited, IMI plc, IMI Property Investments Limited, IMI Refiners Limited, IMI Retirement Savings Trust Limited, IMI Sweden Finance Limited, IMI Vision Limited, Liquick 211 Limited, Premier Profiles Limited, Truflo Group Limited, Truflo International Limited, Truflo Investments Limited
Lakeside, Solihull Parkway, Birmingham Business Park, Birmingham, West Midlands B37 7XZ, United Kingdom
Commtech Limited, The Commtech Group Limited, Engineering Appliances Limited, IMI Group Services Limited, IMI Lakeside One Limited, Liquick 200 Limited, Martonair International Limited
1020 Eskdale Road, Winnersh, Wokingham, RG41 5TS, United Kingdom
IMI Critical Engineering Holding GmbH, IMI Deutschland II GmbH & Co KG, IMI Deutschland Verwaltungs GmbH, IMI Germany Holding Limited & Co. KG, Norgren GmbH
Bruckstrasse 93, 46519 Alpen, Germany
IMI Fluid Controls Holdings Inc, IMI Holdings LLC, Norgren Automation Solutions LLC, Norgren Inc, Norgren Kloehn, Inc
CSC, Corporation Trust Centre, 1209 Orange Street, Wilmington DE 19801, United States
IMI Australia Pty Ltd, IMI Lakeside Australia Pty Ltd, Tube Fittings Sales Pty Limited
33 South Corporate Avenue, Rowville VIC 3178, Australia
IMI Lakeside Ireland Limited, Lakeside Finance Unlimited Company, Lakeside Treasury Unlimited Company
1 Stokes Place, St Stephens Green, Dublin 2, Republic of Ireland
CCI AG, CCI Switzerland AG, Norgren AG
Itaslenstrasse 9, 8362 Balterswil, Switzerland

164 IMI plc Annual Report and Accounts 2017
IMI Holding Italy S.r.l., Orton S.R.L., Truflo Rona S.r.l.
Via Stendhal, 65, 20144 Milano, Italy
IMI Hydronic Engineering AB, IMI Indoor Climate AB, IMI Sweden AB
Annelund, SE-524 80, Ljung, Sweden
B & R Holding GmbH, Bopp & Reuther Sicherheits- und Regelarmaturen GmbH
Carl-Reuther Str. 1, 68305 Mannheim, Germany
Heimeier GmbH, IMI Hydronic Engineering Deutschland GmbH
Voellinghauser Weg 2, 59597 Erwitte, Germany
IMI Aero-Dynamiek BVBA, IMI Hydronic Engineering NV
Boomsesteenweg 28, B 2627 Schelle, Belgium
IMI Components Limited, Truflo Marine Limited
Westwood Road, Birmingham, B6 7JF, United Kingdom
IMI Group Inc, IMI Interamerica Inc
Corporate Service Company, 2711 Centerville Road, Wilmington DE 19808, United States
IMI Hydronic Engineering A/S Norgren A/S
Vesterlundvej 18, DK-2730 Herlev, Denmark
IMI Hydronic Engineering BV, IMI Netherlands Holdings BV
Röntgenweg 20, Alphen aan den Rijn, NL-2408 AB, Netherlands
IMI Hydronic Engineering Switzerland AG, TA Hydronics Holding AG
Mühlerainstrasse 26, 4414, Füllinsdorf, Switzerland
IMI Scotland Limited, The IMI Scottish Limited Partnership
15 Atholl Crescent, Edinburgh EH3 8HA, United Kingdom
Norgren Co Limited China, Norgren Manufacturing Co Ltd
Building 3, No. 1885, Duhui Road, Minhang District, Shanghai, China
Norgren Manufacturing De Mexico SA DE CV, Norgren SA de CV
AV De la Montana 120, Parque Industrial Queretaro, Santiago de Queretaro, Queretaro, CP 76220, Mexico
Valves Holding GmbH, Z & J Technologies GmbH
Bertramsweg 6, 52355 Düren, Germany
Brookvale International Insurance Limited Clarendon House, Church Street, Hamilton, HM11, Bermuda
Buschjost GmbH Detmolder Strasse 256, 32545 Bad Oeynhausen, Germany
C.H. Zikesch Armaturen GmbH Mercatorstr. 16-18, 46485 Wesel, Germany
CCI (Asia Pacific) Pte Ltd 29 International Business Park, ACER Building, Tower A, #04-01, Singapore, 609923, Singapore
CCI America do Sul Comercio de Equipamentos Industriais Ltda Rua Itapeva, 286 cjs 95/96/97, Sao Paulo, 01332-000, Brazil
CCI Czech Republic s.r.o. K Letišti 1804/3, Šlapanice, 62700, Czech Republic
CCI Flow Control (Shanghai) Co Ltd Room 108, Unit 15, 159 Tian Zhou Road, Cao He Jing Development Zone, Shanghai, 200233, China
CCI International Limited Unit A3 Brookside Business Park, Greengate, Middleton, Manchester, M24 1GS, United Kingdom
CCI Italy Srl Via Leopardi 26, 20123, Milan, Italy
CCI Limited 14 Dangdong 2-ro, Munsan-eup, Paju-si, Gyeonggi-do, 10816, Republic of Korea
CCI Valve Technology AB Industrigatan 1-3, Box 603, 661 29 Säffle, Sweden
CCI Valve Technology GmbH Lemböckgasse 63/1, 1230 Wien, Austria
Control Component India Pvt Limited Ground, 1st & 2nd Floor, Tower 4, SJR i park, Plot # 13 14&15, EPIP Zone Phase 1, Whitefield Road, Bangalore 560066, India
Control Components Inc 22591 Avenida Empresa, Rancho Santa Margarita CA 92688, United States
FAS Medic SA Route de Bossonnens 2, 1607, Palezieux, Switzerland
Fluid Automation Systems GmbH Stuttgarter Straße 120, 70736 Fellbach, Germany
Fluid Automation Systems SA 126 Route de l'Etraz, 1290, Versoix, Switzerland
Herion Systemtechnik GmbH Untere Talstrasse 65, 71263 Weil der Stadt, Germany
IMI Aero-Dynamiek BV Havenstraat 9, VS 3861, Nijkerk, Netherlands
IMI Americas Inc 5400 South Delaware Street, Littleton, CO 80120, United States
Subsidiary undertakings(continued)

165
IMI CCI South Africa (Pty) Ltd 18 Van Rensburg North Avenue, Ext 66, Witbank, 1035, South Africa
IMI Consulting (Shanghai) Co Limited Units 03,06 9 Floor, No. 500 Fushan Road, Pudong New Area, Shanghai, 200122, China
IMI Critical Engineering (Shanghai) Company Limited B3-2, No. 303, Xinke Road, Qingpu District, Shanghai, China
IMI Critical FZE Office No. FZJOA1308, FZJ0A1310, FZJ0A1307A, Jebel Ali Free Zone, Dubai, United Arab Emirates
IMI Energi & VVS Utveckling AB Annedalsvägen 9, 22764, Lund, Sweden
IMI Engineering Sdn. Bhd. K-7-5 & K-7-6, Solaris Mont Kiara, Soho, Jalan Solaris Mont Kiara, 50480 Kuala Lumpa, Malaysia
IMI France SARL 52 Boulevard de Sébastopol, 75003 Paris, France
IMI Hidronik Muhendislik Iklimlendirme Sistemleri Ltd Sti Atasehir Bulvari Ata Carsi no. 50-59, Atasehir, Istanbul, Turkey
IMI Hydronic Engineering AS Glynitveien 7, Ski, N-1400, Norway
IMI Hydronic Engineering China Room 306, Xin Mao Building, No 2 Tai Zhong Nan Road, Shanghai, 200131 Pilot Free Trade Zone, China
IMI Hydronic Engineering France S.A. 13, rue de la Perdrix - Les Flamants 8, Paris Nord II BP84004, Tremblay-en-France, 95931, France
IMI Hydronic Engineering FZE Office 2107 (PO Box 262611), Jafza View 19, Jafza, Dubai, United Arab Emirates
IMI Hydronic Engineering GesmbH Industriestrasse 9, Objekt 5, 2353, Guntramsdorf, Austria
IMI Hydronic Engineering Inc 8908 Governors Row, Dallas TX 75247, United States
IMI Hydronic Engineering International SA Route de Crassier 19, Lake Geneva Business Park, 1262, Eysins, Switzerland
IMI Hydronic Engineering Limited Unit 3 Nimbus Park, Porz Avenue, Dunstable, Bedfordshire, LU5 5WZ, United Kingdom
IMI Hydronic Engineering Ltda Av Fagundes Filho, 134 cj 43, S. Judas, Sao Paulo, 04304-010, Brazil
IMI Hydronic Engineering OY Robert Huberin tie 7, Vantaa FI-01510, Finland
IMI Hydronic Engineering Pte Ltd 223 Mountbatten Road #03-01, Singapore 398008, Singapore
IMI Hydronic Engineering S.A. 9, rue des 3 Cantons, Windhof, L-8399, Luxembourg
IMI Hydronic Engineering (Spain) SAU Complejo Europa Empresarial, C/Rozabella, 6, Las Rozas, 28290, Madrid, Spain
IMI Hydronic Engineering s.r.l. Via dei Martinit 3 cap, 20146, Milan, Italy
IMI Hydronic Engineering UAB A.Juozapaviciaus 27-5, Kaunas, LT – 45258, Lithuania
IMI International Co Srl Str. Aristide Pascal nr.36, Sector 3, Bucuresti, 031445, Romania
IMI International d.o.o Alpska cesta 37b, Lesce, 4248, Slovenia
IMI International d.o.o. Slavonska avenija 17, Zagreb, 10040, Croatia
IMI International d.o.o. Beograd Milutina Milankovica 1b, Novi Beograd, 11070, Serbia
IMI International Kft. Kunigunda Útja 60, Budapest, HU-1037, Hungary
IMI International LLC Leninskaya Street 19 b2, 115280, Moscow, Russian Federation
IMI International s.r.o. Central Trade Park D1, c.p.1573, Humpolec, 396 01, Czech Republic
IMI International Sp. z.o.o. Olewin 50 A, PL-32300 , Olkusz, Poland
IMI Japan KK 6-2-2 Takatsukadai, Nishi-ku, Kobe 651-2271, Japan
IMI Norgren Herion PVT Limited A-62, Sector - 63, Noida, Uttar Pradesh 201301, India
IMI Norgren Limited 137a Slaney Close, Dublin Industrial Estate, Glasnevin, Dublin 11, Ireland
IMI Norgren Pneumatics (Shanghai) Co Limited 1st Floor , No 71 Building, 1066 Quinzhou North Road, Chaohejing Hi-Tech Park, Shanghai, 200233, China
IMI Norgren SA (Sociedad Unipersonal) Calle Colom, 391, 2 Edif. Tecno, 08223, Terrassa, Spain
IMI Watson Smith Limited One Snowhill, Snowhill Queensway, Birmingham, West Midlands, B4 6GH, United Kingdom
IMI Webber Limited City Business Park, Easton Road, Easton, Bristol, BS5 0SP, United Kingdom
Industrie Mecanique Pour Les Fluides SA 15 Avenue des Cures, 95580, Andilly, France
Interativa Indústria, Av. Eng. Alberto de Zagottis, 696-B, Sao Paulo SP, Brazil
Comércio e Representações Ltda Avenida Garabed Gananian, 386 Bairro Aparecidinha, Sorocaba, São Paulo, 18.087-340, Brazil
Kynoch Sweden Holding AB c/o IMI Hydronic Engineering AB, 52 480 Ljung, Sweden
Liquick 213 Limited 2 Cornwall Street, Birmingham, West Midlands, B3 2DL, United Kingdom
Newman Hattersley Limited 151 Superior Blvd, Mississauga ON L5T 2L1, Canada

166 IMI plc Annual Report and Accounts 2017
Norgren AS Karihaugveien 89, Oslo, 1086, Norway
Norgren BV Transistorstraat 2, 1322, Almere, Netherlands
Norgren Co Limited 120/34 M.12, Rachedewa, Bangplee, Samutprakarn, 10540, Thailand
Norgren European Logistics Company Limited 4060 Lakeside, Solihull Parkway, Birmingham Business Park, Birmingham, B37 7XZ, United Kingdom
Norgren Finland OY Huopalahdentie 24, A-talo FI-00350 Helsinki, Finland
Norgren Ges.m.b.H Industriezentrum No Sud, Strasse 2, Wiener Neudorf, 2355, Austria
Norgren GT Development Corporation CT Corporation System, 508 Union Ave SE, Suite 120, Olympia WA 98501, United States
Norgren Limited 6/F Benson Tower, 74 Hung To Road, Kwun Tong, Kowloon, Hong Kong
Norgren Limited 15A Vestey Drive, Auckland, 1060, New Zealand
Norgren Limited Blenheim Way, Fradley Park, Lichfield, Staffordshire, WS13 8SY, United Kingdom
Norgren Ltda Av. Eng. Alberto de Zagottis, 696-B, Sao Paulo SP, Brazil
Norgren NV F Walravensstraat 84, B.1651 Lot, Belgium
Norgren Pte. Limited 16 Tuas Street, Singapore 638453, Singapore
Norgren SAS 4 Boulevard Michael Faraday, 77700 Serris, France
Norgren SpA Via trieste 16, Vimercate, 20871, Milan, Italy
Norgren Sweden AB Box 14001, Ventilgatan 6, S-200 24 Malmo, Sweden
Norgren Taiwan Co Limited 3F, No. 540 Sec. 1, Minsheng N. Rd., Guishan Dist., Taoyuan City, 333, Taiwan
Pneumatex GmbH Planiger Str 34, 55543 Bad Kreuznach, Germany
Quanta Dialysis Technologies Limited (25%)* Tything Road, Alcester, Warwickshire, B49 6EU, United Kingdom
Remosa Srl Viale Pula 37, 09123 sede e stabilimento stradario, 03608, Cagliari, Sardinia, Italy
SAIC CCI Valve Co Ltd (44%)* Block B, 123 Chongming Xiushan Road, Chongming County, Shanghai, China
Shanghai CCI Power Control Equipment Co Ltd 2200 Yang Shu Pu Road, Yangpu District, Shanghai, 200090, China
STI s.r.l. Via dei Caravaggi 15, 24040, Levate (BG), Italy
TA Regulator d.o.o. Orliska Ulica13, Brezice, SI-8250, Slovenia
TH Jansen Armaturen GmbH Otto-Kaiser Str. 6, 66386 Sankt Ingbert, Germany
Thompson Valves Limited 17 Balena Close, Creekmoor, Poole, Dorset, BH17 7EF, United Kingdom
Truflo Rona S.A. 3e avenue, 16, Parc Industrial des Hauts Sarts, 4040 Herstal, Belgium
Z & J High Temperature Equipment (Shanghai) Co Ltd 819 Yinchun Road, Minhang District, Shanghai, 201109, China
Zimmermann & Jansen Inc 4525 Kennedy Commerce Drive, Houston, TX 77036, United States
* Treated as external investments
Subsidiary audit exemptions
IMI plc has issued guarantees over the liabilities over the following companies at 31 December 2017 under Section 479C of Companies Act 2006 and these entities are exempt from the requirements of the Act relating to the audit of individual accounts by virtue of Section 479A of the Act:
Company name Company number
FCX North America Limited 03430451
Holford Estates Limited 01181406
IMI Deutschland Limited 07843551
IMI Euro Finance Limited 07929408
IMI Fluid Controls (Finance) Limited 08528502
IMI Germany Limited 07843576
IMI Lakeside One Limited 00616526
Company name Company number
IMI Marston Limited 00155987
IMI Refiners Limited 00148305
IMI Vision Limited 04421176
IMI Scotland Limited SC378424
IMI Sweden Finance Limited 07272731
Premier Profiles Limited 02547749
Subsidiary undertakings(continued)

167
The following table shows the geographic distribution of employees as at 31 December 2017 and is not required to be audited.
United Kingdom 1,265Continental Europe 5,872Americas 2,100Asia Pacific 1,193Rest of World 217Total 10,647
Geographic distribution of employees

168 IMI plc Annual Report and Accounts 2017
Five year summary
2015
Adjusted revenue £m Adjusted profit before tax* £m
* On an adjusted basis.
Adjusted Group revenue by geography 2017
Rest of theWorld5%
Emerging Markets34%
North America19%
Westen Europe38%
UK4%
2013
2017
1,75
1
1,55
7
2013
2014
2015
1,74
4
2016
2017
2014
2016
Income statement
2013 2014 2015 2016 2017 £m £m £m £m £m
Statutory revenue 1,743 1,692 1,567 1,657 1,751Adjusted revenue* 1,744 1,686 1,557 1,649 1,751Operating profit* 321.6 295.5 236.9 224.2 239.2
Adjusted profit before tax* 297.7 278.1 218.7 208.0 224.1Special pension events - 7.0 9.1 2.8 10.8Restructuring costs (14.2) (8.6) (27.1) (18.8) (34.6)Acquired intangible amortisation and impairment (21.9) (60.4) (32.2) (25.5) (17.5)Acquisition and disposal costs (9.9) (1.8) - - (2.0)(Loss)/gain on disposal of subsidiaries - 34.2 (8.4) - (2.3)Financial instruments excluding economic hedge contract gains/losses (2.4) (2.8) 2.6 (1.2) 2.4Profit before tax from continuing operations 249.3 245.7 162.7 165.3 180.9EBITDA† 332 371 263 273 288
* On an adjusted basis.† Earnings before interest, tax, depreciation, amortisation and impairment.
Group revenue by geography
2013 2014 2015 2016 2017 £m £m £m £m £m
UK 104 98 90 75 79Western Europe* 686 644 563 630 653North America 338 318 334 344 338Emerging Markets 504 544 505 520 595Rest of World 112 82 65 80 86Adjusted Revenue 1,744 1,686 1,557 1,649 1,751Reversal of net economic hedge contract losses/(gains) (1) 6 10 8 -Statutory Revenue 1,743 1,692 1,567 1,657 1,751
* Defined as Germany, France, Holland, Italy, Spain, Denmark, Greece, Belgium, Republic of Ireland, Portugal, Luxemburg, Sweden, Finland, Austria, Cyprus, Switzerland and Norway.
224
1,68
6
1,64
9
298
278
219
208

169
Earnings and dividends
2013 2014 2015 2016 2017
Adjusted basic earnings per share 72.6p 78.0p 62.2p 59.8p 65.3pStatutory basic earnings per share (continuing) 60.4p 69.2p 44.7p 48.3p 53.6pOrdinary dividend per share 35.3p 37.6p 38.4p 38.7p 39.4p
Balance sheet
2013 2014 2015 2016 2017 £m £m £m £m £m
Segmental net assets Continuing 897 849 926 1,041 1,027 Discontinued 196 - - - -Other net non-operating liabilities excluding borrowings (gross) (246) (95) (100) (175) (155)Net debt Continuing (226) (200) (237) (283) (265)Discontinued 27 - - - -Net assets 648 554 589 583 607
Statistics
2013 2014 2015 2016 2017
Segmental operating profit as a percentage of segmental revenue 18.4% 17.5% 15.4% 13.8% 13.8%Segmental operating profit as a percentage of segmental net assets 35.9% 34.8% 25.9% 21.9% 23.4%Effective tax rate on adjusted profit before tax 22.0% 22.0% 22.0% 21.0% 21.0%Net assets per share (excluding treasury and EBT shares) 210.0p 218.4p 217.3p 215.1p 224.0pNet debt as a percentage of shareholders’ funds 34.9% 36.1% 40.2% 48.5% 43.7%Net debt: EBITDA* 0.7 0.6 0.9 1.0 0.9EBITDA*: Interest 21 23 15 16 20
* On an adjusted basis.

170 IMI plc Annual Report and Accounts 2017
Shareholder and general information
Announcement of trading results
The trading results for the Group for the first half of 2018 will be announced on 31 July 2018. The trading results for the full year ending 31 December 2018 will be announced in early 2019. Interim management statements will be issued in May and November 2018.
Dividend payments in 2018
Final: 18 May 2018
Interim: September 2018
Share prices and capital gains tax
The closing price of the Company’s ordinary shares on the London Stock Exchange on 31 December 2017 was 1,333.00p (2016: 1,040.00p). The market value of the Company’s ordinary shares on 31 March 1982, as calculated for capital gains tax purposes, was 53.5p per share.
The Company’s SEAQ number is 514433.
Enquiries about shareholdings
For enquiries concerning shareholders’ personal holdings, please contact the Company’s Registrar: Equiniti (contact details appear to the right).
Please remember to tell Equiniti if you move house, change bank details or if there is any other change to your account information.
Managing your shares on-line
Shareholders can manage their holdings on-line by registering with Shareview, the internet based platform provided by Equiniti. Registration is a straightforward process and allows shareholders to:
• help us to reduce print, paper and postage costs and the associated environmental impact of these;
• cast your AGM vote electronically;
• receive an email alert when important shareholder documents are available on-line such as Annual Reports and Notices of General Meetings;
• access details of your individual shareholding quickly and securely;
• set up a dividend mandate on-line; and
• change your registered postal address or your dividend mandate details.
To find out more information about the services offered by Shareview and to register, please visit www.shareview.co.uk.
Corporate website
The IMI plc website provides a wealth of useful information for shareholders and should be your first port of call for general queries relating to the Company and your shares. As well as providing share price data and financial history, the site also provides background information about the Company.
Shareholders are also encouraged to sign up to receive news alerts by email in the Investors section of the website. These include all of the financial news releases from throughout the year that are not sent to shareholders by post. You can access the corporate website at www.imiplc.com.
Annual General Meeting 2018
This year’s AGM will be held at the Hilton Birmingham Metropole, National Exhibition Centre, Birmingham B40 1PP on Thursday 3 May 2018 at 10am. For further information, please refer to the Notice of Meeting which is on the corporate website.
Individual Savings Account (ISA)
IMI‘s ordinary shares can be held in an ISA. For information about the ISA operated by our Registrar, Equiniti, please call the Equiniti ISA helpline on 0345 300 0430. Lines are open from 8.30am to 5.30pm, Monday to Friday, excluding public holidays in England and Wales.
Share dealing service
Managed by Equiniti, the Company’s registrar, the IMI plc Share dealing service provides shareholders with a simple way of buying and selling IMI ordinary shares. Telephone: 0345 603 7037. Full written details can be obtained from Equiniti (contact details appear to the right).
Share fraud
Share fraud includes scams where investors are called out of the blue and offered shares that often turn out to be worthless or non-existent, or an inflated price for shares they own. These calls come from fraudsters operating in ‘boiler rooms’ that are mostly based abroad. Further information on how to spot share fraud or report a scam can be found on our corporate website.
American Depository Receipts
IMI plc has an American Depositary Receipt (ADR) programme that trades on the Over-The-Counter market in the USA, using the symbol IMIAY. ADR enquiries should be directed to Citibank Shareholder Services, PO Box 43077, Providence, RI 02940- 3077, USA. Toll-free number in the USA is 1-877-CITI-ADR (877-248-4237) and from outside the USA is 1-781-575-4555. You can also email [email protected].
Headquarters and registered office
LakesideSolihull ParkwayBirmingham Business ParkBirminghamB37 7XZ
Telephone: +44 121 717 3700
IMI plc is registered in England No.714275
Registrars
EquinitiAspect HouseSpencer RoadLancingWest SussexBN99 6DA
Telephone: 0371 384 2916 or from overseas +44 121 415 7047
Lines are open 8.30am to 5.30pm, Monday to Friday (excluding public holidays in England and Wales)
Stockbrokers
JPMorgan CazenoveBank of America Merrill Lynch
Auditor
Ernst & Young LLP
Cautionary statement
This Annual Report may contain forward-looking statements that may or may not prove accurate. For example, statements regarding expected revenue growth and operating margins, market trends and our product pipeline are forward-looking statements. It is believed that the expectations reflected in these statements are reasonable but they may be affected by a number of risks and uncertainties that are inherent in any forward-looking statement which could cause actual results to differ materially from those currently anticipated. Any forward-looking statement is made in good faith and based on information available to IMI plc as of the date of the preparation of this Annual Report. All written or oral forward-looking statements attributable to IMI plc are qualified by this caution. IMI plc does not undertake any obligation to update or revise any forward- looking statement to reflect any change in circumstances or in IMI plc’s expectations.

Designed and produced by Design Motive Ltd
Printed and bound in the UK by CPI Colour Ltd

IMI plcLakesideSolihull ParkwayBirmingham Business ParkBirmingham B37 7XZUnited Kingdom
www.imiplc.com