Vodafone Group Plc Annual Report for the year ended 31 March 2017
Upload
khangminh22Category
view
1download
0
3i Group plcAnnual report and accounts 2021
For definitions of our financial terms used throughout this report, please see our Glossary on pages 192 and 193.
DisclaimerThe Annual report and accounts have been prepared solely to provide information to shareholders. They should not be relied on by any other party or for any other purpose.
The Strategic report on pages 1 to 79, the Directors’ report on pages 81 to 106 and 118 to 124, and the Directors’ remuneration report on pages 107 to 117 have been drawn up and presented in accordance with and in reliance upon English company law and the liabilities of the Directors in connection with those reports shall be subject to the limitations and restrictions provided by that law. This Annual report may contain statements about the future, including certain statements about the future outlook for 3i Group plc and its subsidiaries (“3i” or “the Group”). These are not guarantees of future performance and will not be updated. Although we believe our expectations are based on reasonable assumptions, any statements about the future outlook may be influenced by factors that could cause actual outcomes and results to be materially different.
+ www.3i.comFor more information and regular updates
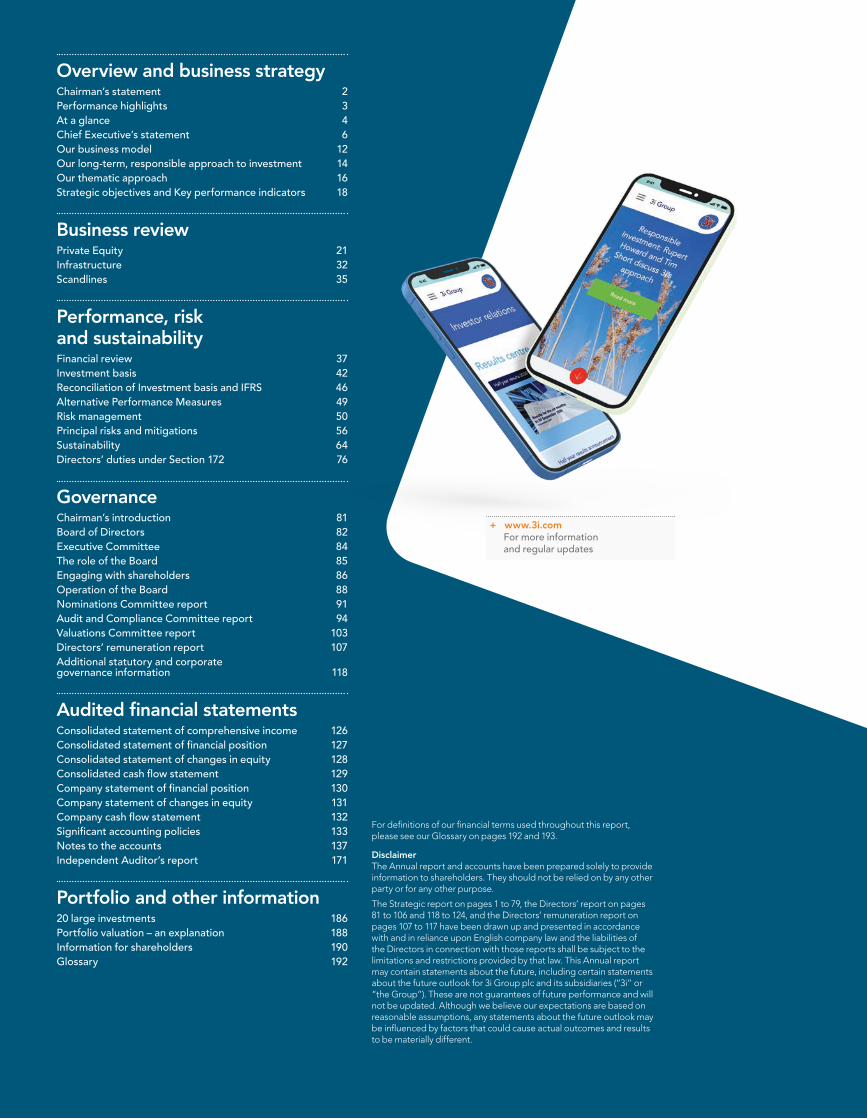
Overview and business strategyChairman’s statement 2Performance highlights 3At a glance 4Chief Executive’s statement 6Our business model 12Our long-term, responsible approach to investment 14Our thematic approach 16Strategic objectives and Key performance indicators 18
Business reviewPrivate Equity 21Infrastructure 32Scandlines 35
Performance, risk and sustainabilityFinancial review 37Investment basis 42Reconciliation of Investment basis and IFRS 46Alternative Performance Measures 49Risk management 50Principal risks and mitigations 56Sustainability 64Directors’ duties under Section 172 76
GovernanceChairman’s introduction 81Board of Directors 82Executive Committee 84The role of the Board 85Engaging with shareholders 86Operation of the Board 88Nominations Committee report 91Audit and Compliance Committee report 94Valuations Committee report 103Directors’ remuneration report 107Additional statutory and corporate governance information 118
Audited financial statementsConsolidated statement of comprehensive income 126Consolidated statement of financial position 127Consolidated statement of changes in equity 128Consolidated cash flow statement 129Company statement of financial position 130Company statement of changes in equity 131Company cash flow statement 132Significant accounting policies 133Notes to the accounts 137Independent Auditor’s report 171
Portfolio and other information20 large investments 186Portfolio valuation – an explanation 188Information for shareholders 190Glossary 192
We generate attractive returns for our shareholders and co-investors by investing in private equity and infrastructure assets.
As proprietary capital investors we have a long-term, responsible approach.
We create value through thoughtful origination, disciplined investment and active management of our assets, driving sustainable growth in our investee companies.
Our purpose
3i Group plc Annual report and accounts 2021Overview and business strategy
1

Chairman’s statement
In challenging circumstances, 3i delivered a strong result in our financial year to 31 March 2021 (“FY2021”). Our Private Equity and Infrastructure portfolios have demonstrated resilience and adaptability and have continued to generate attractive returns for shareholders.
Market environment and performanceWe began our financial year at a time of unprecedented uncertainty as Covid-19 spread across the world. Since then, extraordinary public health measures have been put in place to mitigate the impact of the pandemic and record levels of fiscal and monetary stimulus have been deployed by governments and central banks in our major markets to support business and protect the economy. Following the initial sharp fall towards the end of March 2020, global markets have rallied significantly but remain susceptible to volatility as the situation develops. As we move into our financial year to 31 March 2022 (“FY2022”), the successful global deployment of vaccines and other health measures are critical to restoring confidence and stability.
In the midst of the pandemic, the transition period for Britain’s departure from the EU ended on 31 December 2020. Our portfolio was not exposed to significant Brexit risks and the end of the transition period brought no major disruption to our business or portfolio.
The pandemic has accelerated a number of existing economic and social trends. These have been reflected in the good performance of many of our portfolio companies, which have demonstrated resilience and delivered strong performance in the year to 31 March 2021. This includes our investments in the consumer goods, e-commerce, healthcare and business and technology services sectors and our infrastructure assets. There were weaker performances in the smaller proportion of our portfolio operating in more challenged sectors, including travel and automotive. The Group’s total return for the year was £1,726 million (2020: £253 million). Net asset value (“NAV”) increased to 947 pence per share (31 March 2020: 804 pence) and our total return on opening shareholders’ funds was 22% (2020: 3%).
DividendOur dividend policy is to maintain or grow the dividend year-on-year, subject to balance sheet strength and the outlook for investment and realisation levels. 3i has not received any government support, furloughed any employees, nor made any employees redundant as a result of the pandemic. Even though we have not been using some
of our offices for the past 12 months, we have maintained our third-party outsourced support, including office cleaning, maintenance and reception services. We provided liquidity support for two of our portfolio companies and have capacity to support other portfolio companies, if required.
Recognising the importance of our dividend to institutional and private shareholders, we maintained shareholder dividends during FY2021, paying a first dividend of 17.5 pence per share in January 2021. In line with the Group’s policy and in recognition of the Group’s financial performance, the Board recommends a second FY2021 dividend of 21.0 pence (2020: 17.5 pence), subject to shareholder approval, which will take the total dividend to 38.5 pence (2020: 35.0 pence).
BoardDuring the year to 31 March 2021, Jonathan Asquith, Deputy Chairman and Senior Independent Director, and Peter Grosch retired from the Board. I would like to thank both for their valuable contribution to 3i. David Hutchison was appointed Senior Independent Director to succeed Jonathan with effect from 25 June 2020. Peter McKellar will join the Board as a non-executive Director with effect from 1 June 2021. As set out in his biography on page 83, Peter McKellar brings highly relevant experience of asset management and private markets. As part of the long-term succession planning for the Board, I will not seek re-election at the AGM in 2022. The Nominations Committee will conduct a search process to identify my successor as chair and I will step down after an appropriate handover has been completed.
Our peopleThe health and wellbeing of our employees and contractors has been a key priority since the pandemic broke out. For the vast majority of FY2021, the 3i team has worked remotely and I have been impressed with how well our colleagues have adapted, while maintaining their normal high standards of performance. I would like to thank everyone at 3i and our portfolio companies for their outstanding contribution during a very challenging year.
OutlookFY2022 is likely to be another year of social and economic uncertainty, as many countries continue to face high levels of Covid-19 infection. Both the Group and our underlying portfolio have demonstrated strength and resilience over the past 12 months and, with a strong balance sheet and our experienced investment teams, we are confident that we are well positioned for FY2022.
Simon ThompsonChairman
12 May 2021
We are disciplined investors, focused on creating value for shareholders by driving sustainable growth in our portfolio companies.
3i Group plc Annual report and accounts 2021Overview and business strategy
2
Performance highlights
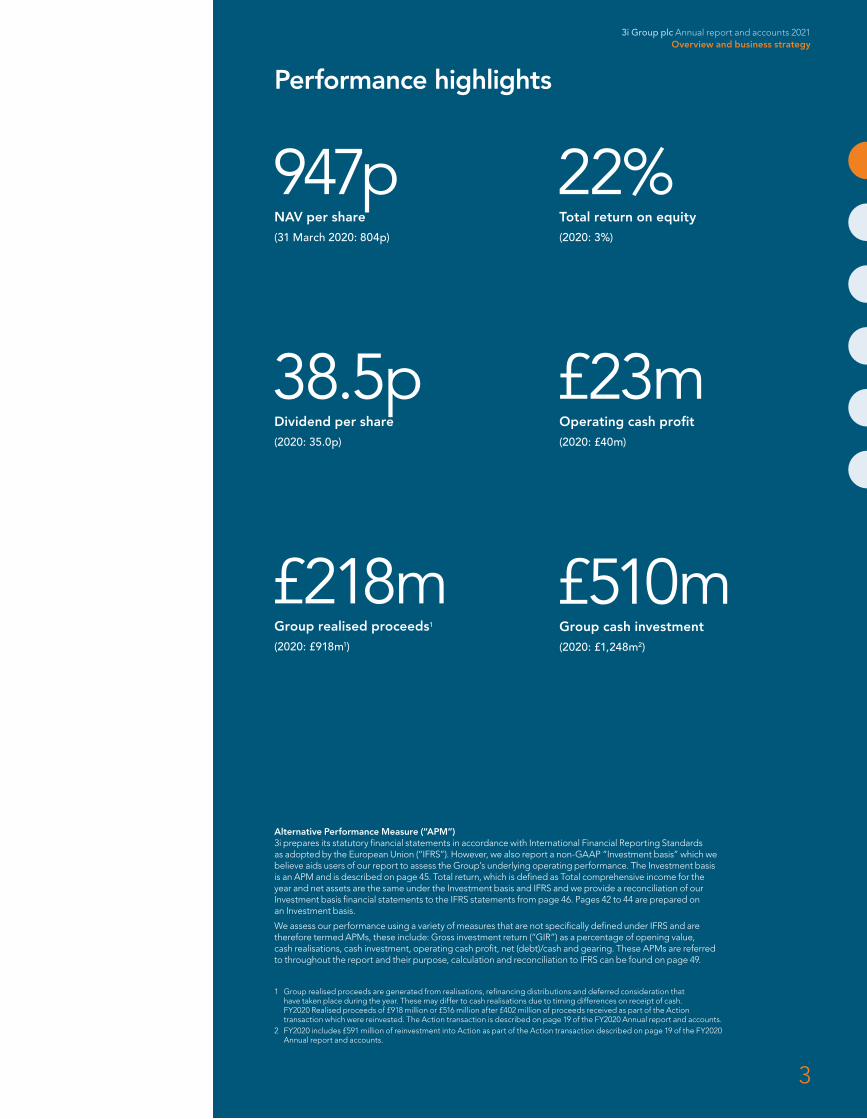
947pNAV per share(31 March 2020: 804p)
22%Total return on equity(2020: 3%)
£510mGroup cash investment(2020: £1,248m2)
£218mGroup realised proceeds1
(2020: £918m1)
38.5pDividend per share(2020: 35.0p)
£23mOperating cash profit(2020: £40m)
1 Group realised proceeds are generated from realisations, refinancing distributions and deferred consideration that have taken place during the year. These may differ to cash realisations due to timing differences on receipt of cash. FY2020 Realised proceeds of £918 million or £516 million after £402 million of proceeds received as part of the Action transaction which were reinvested. The Action transaction is described on page 19 of the FY2020 Annual report and accounts.
2 FY2020 includes £591 million of reinvestment into Action as part of the Action transaction described on page 19 of the FY2020 Annual report and accounts.
Alternative Performance Measure (“APM”)3i prepares its statutory financial statements in accordance with International Financial Reporting Standards as adopted by the European Union (“IFRS”). However, we also report a non-GAAP “Investment basis” which we believe aids users of our report to assess the Group’s underlying operating performance. The Investment basis is an APM and is described on page 45. Total return, which is defined as Total comprehensive income for the year and net assets are the same under the Investment basis and IFRS and we provide a reconciliation of our Investment basis financial statements to the IFRS statements from page 46. Pages 42 to 44 are prepared on an Investment basis.
We assess our performance using a variety of measures that are not specifically defined under IFRS and are therefore termed APMs, these include: Gross investment return (“GIR”) as a percentage of opening value, cash realisations, cash investment, operating cash profit, net (debt)/cash and gearing. These APMs are referred to throughout the report and their purpose, calculation and reconciliation to IFRS can be found on page 49.
3
3i Group plc Annual report and accounts 2021Overview and business strategy
At a glance
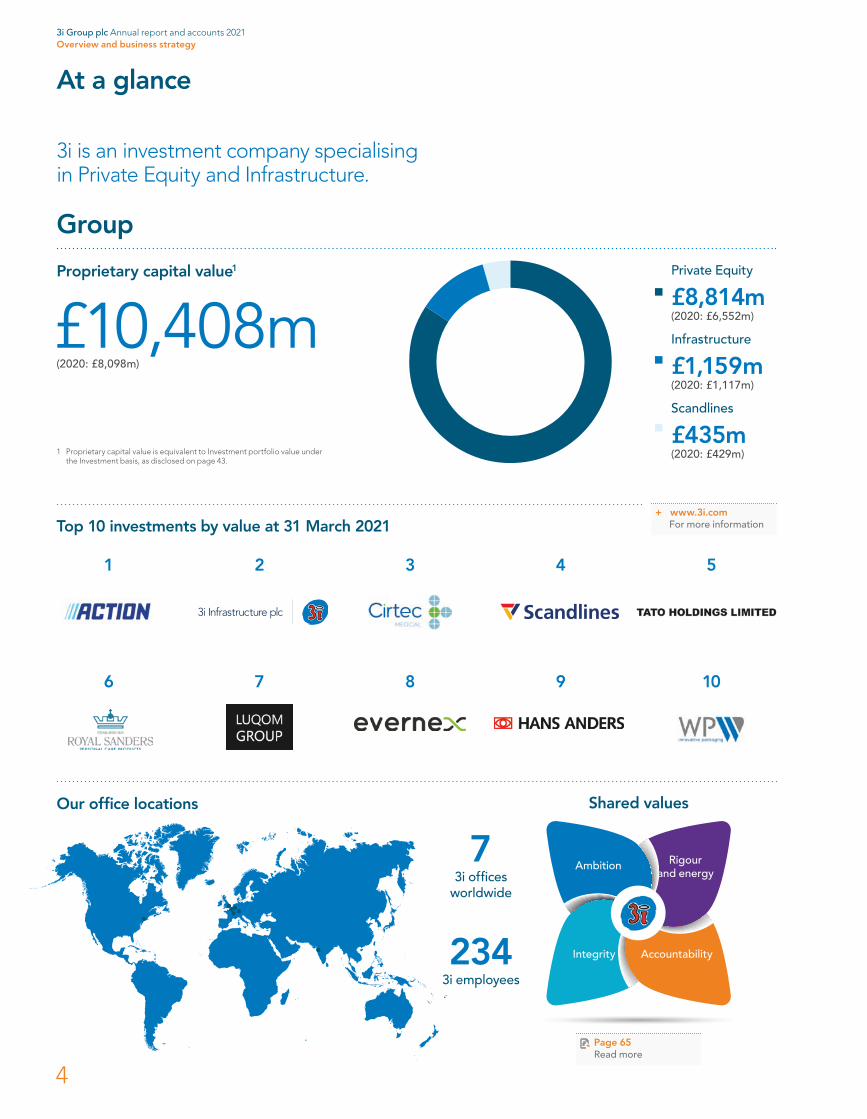
3i is an investment company specialising in Private Equity and Infrastructure.
Group
Proprietary capital value1
£10,408m(2020: £8,098m)
Top 10 investments by value at 31 March 2021
1 2 3 4 5
6 7 8 9 10
Private Equity
£8,814m(2020: £6,552m)
Infrastructure
£1,159m(2020: £1,117m)
Scandlines
£435m(2020: £429m)
+ www.3i.comFor more information
1 Proprietary capital value is equivalent to Investment portfolio value under the Investment basis, as disclosed on page 43.
Ambition
Integrity Accountability
Rigour and energy
2343i employees
73i offices
worldwide
Page 65 Read more
Our office locations Shared values
3i Group plc Annual report and accounts 2021Overview and business strategy
4
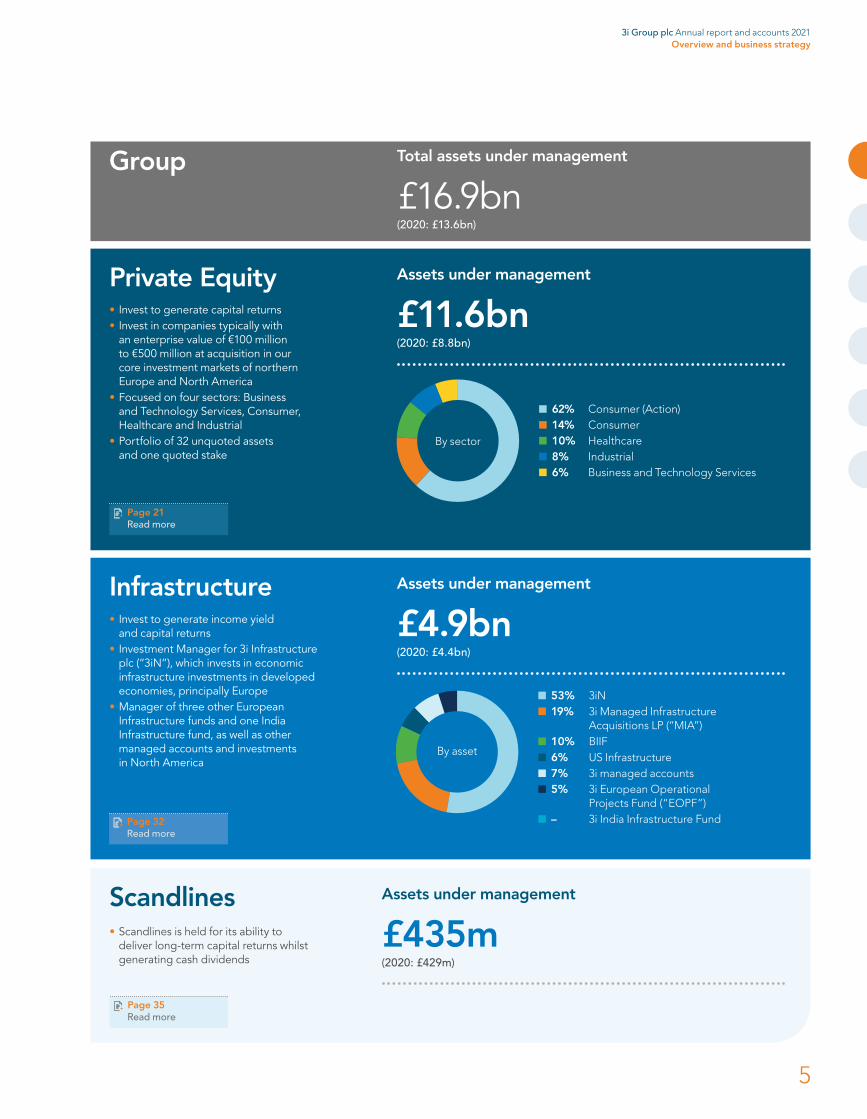
• Scandlines is held for its ability to deliver long-term capital returns whilst generating cash dividends
Scandlines Assets under management
£435m(2020: £429m)
Group Total assets under management
£16.9bn(2020: £13.6bn)
Page 35Read more
• Invest to generate capital returns• Invest in companies typically with
an enterprise value of €100 million to €500 million at acquisition in our core investment markets of northern Europe and North America
• Focused on four sectors: Business and Technology Services, Consumer, Healthcare and Industrial
• Portfolio of 32 unquoted assets and one quoted stake
Private Equity Assets under management
£11.6bn(2020: £8.8bn)
14% Consumer10% Healthcare
62% Consumer (Action)
8% Industrial6% Business and Technology Services
By sector
Page 21Read more
• Invest to generate income yield and capital returns
• Investment Manager for 3i Infrastructure plc (“3iN”), which invests in economic infrastructure investments in developed economies, principally Europe
• Manager of three other European Infrastructure funds and one India Infrastructure fund, as well as other managed accounts and investments in North America
Infrastructure Assets under management
£4.9bn(2020: £4.4bn)
53% 3iN19% 3i Managed Infrastructure Acquisitions LP (“MIA”)10% BIIF6% US Infrastructure7% 3i managed accounts5% 3i European Operational Projects Fund (“EOPF”)– 3i India Infrastructure Fund
By asset
Page 32Read more
3i Group plc Annual report and accounts 2021Overview and business strategy
5

Chief Executive’s statement
The Group delivered a strong result in FY2021 during a period of unprecedented uncertainty and disruption caused by the Covid-19 pandemic. This outcome was supported by the resilient performance of our Private Equity and Infrastructure portfolios, our strong balance sheet and the capabilities of our experienced team. Our investment markets remain awash with uninvested capital, but our strong networks and patient approach meant we completed three new Private Equity investments at attractive prices, whilst continuing our focus on enhancing the value of both portfolios through buy-and-build opportunities. We start our new financial year with a well-positioned balance sheet and a portfolio of assets that have good momentum and are strategically positioned to continue to drive attractive returns for our shareholders.
The start of FY2021 coincided with lockdowns across many of the geographies in which we and our portfolio companies operate. Our primary focus was to protect the wellbeing of our own employees, those of our portfolio companies and of the communities in which we collectively operate. Our rigorous portfolio management processes allowed us to identify and respond quickly and effectively to the challenges that arose as a result of the spring 2020 lockdowns. As we moved into the summer, our portfolio companies quickly recovered momentum even though their operations continued to be interrupted throughout the year by varying degrees of restrictions.
Our investment strategy over the last 10 years has been focused on assets that are exposed to secular growth trends, including the growth of value-for-money retail and e-commerce. The pandemic has resulted in an acceleration of these trends, as well as an increased focus on health and hygiene, from which our portfolio continues to benefit. As a result, the Group generated a total return on shareholders’ funds of £1,726 million, or 22% (2020: £253 million, or 3%), ending the year with a NAV per share of 947 pence (31 March 2020: 804 pence). Our results include the significant negative impact of currency translation; 84% of the Group’s assets are denominated in euros or US dollars and we recorded a net foreign exchange loss of £396 million from the strength of sterling in the latter part of the year. Our total return was also reduced by an accounting loss of £122 million as we reflected the commercial outcome of the Trustees’ decision to enter into a final buy-in of the UK pension plan’s liabilities, meaning we are no longer exposed to longevity, interest or inflation risk on the pension plan, and without making any further cash contribution. Together, the foreign exchange translation loss and revaluation of the pension plan resulted in a 54 pence reduction to our FY2021 NAV per share.
Record levels of dry powder, robust credit markets and pent-up demand following a period of limited global activity in the initial phases of the Covid-19 pandemic have led to aggressive pricing and competition in both the Private Equity and Infrastructure asset classes. We have remained focused and selective in our origination efforts despite this environment, deploying £275 million in three new Private Equity investments, whilst also financing our Private Equity portfolio companies with £124 million to fund portfolio M&A activity.
Private Equity performanceIn the 12 months to 31 March 2021, the Private Equity portfolio delivered a gross investment return (“GIR”) of 30% (2020: 6%). Many of our portfolio companies have either excelled in this challenging environment or adapted to the changing circumstances very quickly and, as a result, 87% of our portfolio by value grew their LTM adjusted earnings to December 2020.
I have been very impressed by how the 3i team has adapted to getting things done remotely and how well our investment portfolio has performed during this highly unusual period.
Simon Borrows, Chief Executive
3i Group plc Annual report and accounts 2021Overview and business strategy
6
Action is the leading general merchandise discount retailer in Europe and our largest investment. In the year to December 2020, which included a 53rd week, Action delivered revenue growth of 10% and finished the year with operating EBITDA of €616 million, a 14% increase on 2019, despite the Covid-19 pandemic. The strength of this result re-emphasises the power of Action’s unique customer proposition, its ability to quickly adapt to changing circumstances and the strength of its financial model and cash generation capabilities.
Action’s performance in 2020 alternated between periods of robust performance leading up to and after the initial 2020 lockdowns and subsequent periods of disrupted performance due to restrictions on trading. In the first 11 weeks of 2020, Action recorded very strong performance with like-for-like (“LFL”) sales growth of over 7% and strong cash generation. As the pandemic took hold across Europe in March 2020 through to early May 2020, Action faced government-enforced temporary closures or assortment restrictions across all markets except the Netherlands. As a result of the temporary store closures, its supply chain was scaled down, and this led to some availability issues when all stores reopened selling the full range between mid-May and the end of October 2020. However, despite availability challenges, Action delivered double digit LFL sales growth in every month of that period, reflecting a combination of pent-up demand, customer loyalty and increased brand awareness and penetration in markets such as Germany, Austria and Poland. At the end of 2020, as the second wave of the pandemic took hold across Europe, renewed restrictions in November and December 2020 resulted in the business being limited to selling essentials only in Austria, Belgium, France and Germany and shops being closed entirely in the Netherlands. Action finished 2020 with LFL at (1.4)%, or 10.4% on a normalised basis excluding the impact of lockdowns, which was a remarkable result considering the two major periods of disruption.
A key value driver of Action’s business model is its international expansion strategy. Despite the disruption caused by the pandemic, the business continued its international store roll-out with 164 new stores opened across eight countries in 2020. Action’s most recently established market, Poland, performed well and exceeded expectations. The five pilot stores opened in the Czech Republic also delivered encouraging results, supporting the decision to roll-out further in that market in 2021. There is still plenty of expansion potential in existing and new countries and Action opened two new pilot stores in Italy in April 2021 and plans to open new stores in Spain in 2022. Essential to supporting this store roll-out and store growth is ensuring sufficient supply chain infrastructure is in place and, in the year, Action opened its ninth distribution centre (“DC”) in Verrières in France. In 2021, it will open a new DC in Bratislava, Slovakia and a second in Bierun, Poland.
Action has been nimble in its response to government-enforced restrictions, leading to the accelerated implementation of Click & Collect facilities across multiple markets in the first quarter of 2021, after pilots were carried out in France and Belgium in 2020. Additionally, in the Netherlands, Action implemented a shopping by appointment system, operating in line with Dutch restrictions, building on its investment in its digital capabilities. Both measures underpinned a resilient sales performance in the first quarter of 2021 and are helping to mitigate the impact of continued trading restrictions across Europe.
Although Action faced more widespread store closures and store restrictions in the first quarter of 2021 than it did last year, it finished the quarter with very strong trading in March 2021 and run-rate EBITDA for the quarter just ahead of the same period last year. Action’s cash and liquidity remains above €500 million. Lockdown restrictions are now easing across most countries in Europe and the company saw strong year-on-year trading in April 2021. Action has set a target of opening 300 new stores this year and is on track to do that after the first four months.
In FY2021, we saw strong momentum in earnings growth and cash generation for our portfolio companies operating in the consumer goods, e-commerce, healthcare and business and technology services sectors. Since our investment in April 2018, Royal Sanders has doubled both its revenue and EBITDA, driven by continued organic growth, value-accretive add-on acquisitions and a continuous focus on operational improvements. Operating in the private label and contract manufacturing personal care space and with customers numbering among the largest and most successful retailers and brand owners across Europe, Royal Sanders has benefited from the non-cyclical, defensive nature of the industry and has captured a substantial share of the increase in demand for handwash and hand gels during the Covid-19 pandemic. Growth of its key customer base and a number of new customer wins have generated significant earnings growth in the year, whilst the recent buy-and-build acquisitions of Royal Herkel and Tunap Cosmetics, both funded from its balance sheet, have added additional diversification to its offering. As a result of such strong performance and cash flow generation, the company made a dividend distribution to 3i of £38 million in July 2020.
As an investment institution, our business model is to allocate, invest and manage risk capital. We do this from a platform that has good and responsible values, a grounded team culture, a prudent financial approach and a wide international reach and diversity through our well-established office network. Our investment executives are able to use the power of broader portfolio experience and learnings to grow and improve each specific investment. This only works with rigorous processes, robust central control and an uncompromising attitude to the resilience of the investment portfolio, all of which is governed by the Investment Committee.
3i Group plc Annual report and accounts 2021Overview and business strategy
7
Luqom, our speciality online lighting retail platform, has seen favourable tailwinds from the accelerated shift towards e-commerce and increased consumer discretionary spend on home and living products. The business has also focused on further internationalisation, launching web shops in 10 new countries, taking the number of country websites it operates to 27. Its acquisition of QLF in 2019 provided the business with a platform for additional rapid expansion across Europe. As a result, Luqom doubled its EBITDA in the year and is well positioned to continue to capitalise on the structural market shift towards e-commerce. At the end of March 2021, Luqom signed the acquisition of Lampemesteren, the online market leader for premium lighting products in the Nordics. The acquisition completed in April 2021 and was funded by Luqom.
Cirtec Medical delivered significant year-on-year growth supporting key customers during a challenging macro environment and it continued to demonstrate itself as an ‘acquirer of choice’ in the fragmented medical device outsourcing (“MDO”) market, with its bolt-on acquisition of NovelCath, a fast-growing catheter-based delivery systems manufacturer based in Minnesota. NovelCath, a highly strategic acquisition that will enable both deeper vertical integration and broader exposure to fast-growing market, is Cirtec Medical’s seventh acquisition since 3i’s original investment. Cirtec Medical continues to be positioned as among the most differentiated assets in the MDO market, with an attractive mix of end-market exposure, capabilities and financial profile.
Havea has remained resilient throughout the pandemic, benefiting from the focus on health and wellness. Its omni-channel strategy has enabled e-commerce and mail-order sales to mitigate a drop in footfall in pharmacies and other outlets for its products. The business also continued to build on its existing platform with the acquisition of Laudavie, the French specialist in children’s food supplements.
The medical side of Q Holding’s business saw resilient demand for non-discretionary medical products in 2020, offsetting the effects of reduced elective surgeries that were impacted by reduced capacity and fewer patient visits due to the pandemic.
Our minority stakes in Tato and AES have performed well and we recognised dividend income in the year from both assets. Tato, the manufacturer of speciality chemicals, has benefited from increased demand for biocidal, disinfectant and hygiene products which is driving strong earnings growth and cash generation. The business returned £14 million of dividends to 3i in the year. AES responded well during the pandemic and outperformed our expectations for sales and profitability, reaffirming its strategic position in the valuable mechanical seal market.
Our retail businesses have demonstrated their resilience to restrictions imposed across Europe during the course of 2020 and into 2021. Following our £20 million equity investment into Hans Anders in April 2020, the performance of the business recovered since stores reopened in June 2020 through a combination of strong trading and cost savings. The business enjoys a strong market position as a value-for-money optical retailer and benefits from previous investments in digitisation. Increasing online sales and high conversion rates through shopping by appointment mitigated trading restrictions imposed across its markets. BoConcept also experienced a very good recovery in trading after the easing of the first wave of lockdown measures in H1 2020. The business is benefiting from a number of operational initiatives taken to optimise its international franchise model and from the accelerated omni-channel development with more online interaction with customers and an improved omni-customer journey.
Our portfolio companies exposed to the travel and automotive sectors continue to operate in more challenging conditions. arrivia’s core markets have been significantly impacted, with no cruise sailings since February 2020 and limited resort vacations. Despite these headwinds, arrivia’s business model has proven resilient relative to other travel businesses, benefiting from stable cash revenues from membership subscriptions and from management initiatives taken to streamline the business. As expected, the current trading conditions remain challenging for arrivia, with low booking levels anticipated in the first half of 2021 across cruise and vacation ownership until there is greater vaccine deployment across the US. However, hotel and air bookings have shown improvements in recent months with greater vaccine roll-out in the US, suggesting pent-up travel demand for when cruise and resort travel can safely resume.
Similarly, and as expected, Audley Travel’s revenues have been under significant pressure, with departures severely restricted since April 2020. In November 2020, we invested a further £46 million of capital to support the business. The bookings trajectory since our further investment has been positive, driven by improving sentiment following the progress with vaccines, confirming that there is clear intent and pent-up demand for travel later in 2021 and beyond amongst the Audley Travel client base. However, despite these positive developments, we continue to remain cautious about the recovery in the travel sector.
Formel D’s performance in the 12 months to 31 March 2021 was severely impacted by a combination of prolonged Covid-19 restrictions, a semi-conductor shortage affecting automotive production and operational challenges in France and US. Whilst we expect the business to improve in the medium term, the 12-month outlook remains challenging. Market conditions also impacted the connector seals and insulators business of Q Holding in the first half of 2020 due to soft light vehicle and other industrial production and corresponding supply chain management and plant shutdowns. Encouragingly, the business began to rebound towards the end of 2020 and has continued strong year over year growth into 2021 due to end customer volume recovery and supply chain restocking. Basic-Fit is well positioned to benefit from an increased focus on health and wellbeing post Covid-19 and, despite the significant disruption caused by enforced club closures and having declined to a share price low point for the year of €13.4 on 3 April 2020, its share price increased by 116% in the 12 months to 31 March 2021, closing at €32.85 (31 March 2020: €15.20).
Chief Executive’s statement continued
Page 30For more information on MPM
3i Group plc Annual report and accounts 2021Overview and business strategy
8

Private Equity investmentWe invested £275 million in three new companies, maintaining our disciplined approach to pricing and originating away from aggressively competitive processes. In September 2020, we completed the £61 million investment in GartenHaus, an online retailer of garden buildings, sheds, saunas, and related products in Germany, Austria, Switzerland and the Netherlands. Shortly thereafter, we supported GartenHaus in the bolt-on acquisition of Polhus, an online retailer of garden houses and related products based in Sweden. Since acquisition, both businesses have been outperforming our trading expectations.
In December 2020, we completed the £124 million investment in MPM, an international branded, premium and natural pet food company. MPM has an established presence in the UK, EMEA and APAC with a fast-growing operation in North America, where expansion is a focus of our investment thesis. In March 2021, we completed the £90 million investment in WilsonHCG, a global provider of total talent solutions, with a focus on recruitment process outsourcing. In addition to these new investments, we invested £115 million in two transformational buy-and-build opportunities for two of our portfolio companies. In July 2020, we supported Evernex’s acquisition of Technogroup, a third-party data centre maintenance provider in Germany, Austria and Switzerland. Having established a Bioprocessing platform last year, we achieved a significant milestone in the growth and internationalisation of this platform through the acquisition of Sani-Tech West Inc in July 2020. The combined business was renamed SaniSure and the total 3i investment in this platform over the last two years is £135 million. In August 2020, SaniSure completed the acquisition of Biofluidfocus, which was self-funded. Both Evernex and SaniSure have performed in line with our expectations.
Private Equity realisationsAs a proprietary capital investor, and with the benefit of a strong balance sheet, we are not under pressure to exit investments when we believe a longer-term hold may yield greater returns for shareholders. Given the significant market uncertainty as a result of Covid-19, we had always expected a lower level of realisation proceeds in FY2021 compared to prior years. In the year, we completed one material realisation, the disposal of Kinolt, receiving total proceeds of £91 million, including £5 million of income. As we look ahead to FY2022, the resilience of the majority of our portfolio companies and their ability to remain cash generative means we have a much more active pipeline of refinancings and realisations.
Infrastructure performance 3iN’s well diversified portfolio proved resilient to the challenges of the Covid-19 pandemic. In the 12 months to 31 March 2021, 3iN generated a total return on opening NAV of 9.2% and delivered its dividend target of 9.8p, a 6.5% increase on last year. The Infrastructure asset class remains very competitive and, in our role as 3iN’s Investment Manager, we focused on building value through the existing platform investments, with Infinis completing the acquisition of the development rights for a 6MW PV project and Tampnet purchasing a 1,200km offshore fibre cable system in the Gulf of Mexico. 3iN committed additional capital to ESVAGT to fund further growth in its offshore wind servicing segment and completed the acquisition of further stakes in its existing Dutch PPP projects. In April 2021, 3iN announced a new c.€182m investment to acquire a 60% stake in DNS:NET, a leading independent telecommunications provider in Germany.
The Group’s 30% stake in 3iN was valued at £797 million at 31 March 2021, reflecting a strong rebound in the share price, which closed at 296 pence (31 March 2020: 247 pence). In addition, we recognised £26 million of dividend income from 3iN.
Regional Rail demonstrated its strategic importance to the transportation of products by rail across the eastern United States, as it was deemed an essential service throughout the Covid-19 pandemic. The business benefited from better than expected operational efficiency at its Carolina Coastal Railway line, offsetting some freight softness in the winter months across Northeast America. In March 2021, following strong cash generation, Regional Rail completed a long-term financing package, returning £74 million of cash to 3i. Smarte Carte has remained cash generative despite the reduction in air travel across the US. The business has benefited from its diverse offering and from a better than expected rebound in US domestic travel over the last six months, offsetting softness from international travel. The long-term outlook for the business remains positive.
Over the last year, we established a new 3i-managed vehicle that will co-invest alongside 3iN in certain transactions, with a commitment of €400 million from Industriens Pension of Denmark. This fund platform broadens our capabilities and complements our mandate as Investment Manager to 3iN. Our 3i European Operational Projects Fund completed the acquisition of a portfolio of eight operational projects in France from DIF Infrastructure III and has now deployed c.60% of its total commitments at 31 March 2021. We expect this to increase to c.62% of its total commitments upon completion of new acquisitions agreed at the end of March 2021.
Page 31For more information on GartenHaus
Page 31For more information on WilsonHCG
3i Group plc Annual report and accounts 2021Overview and business strategy
9
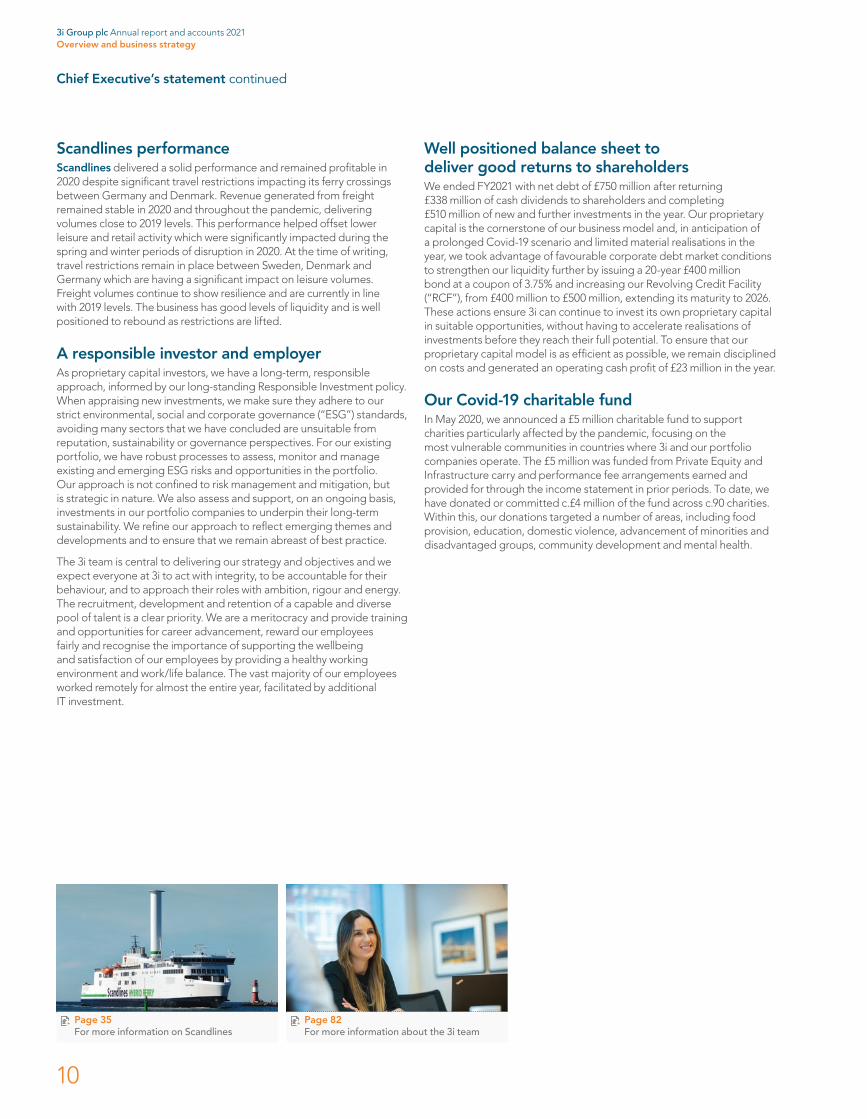
Scandlines performanceScandlines delivered a solid performance and remained profitable in 2020 despite significant travel restrictions impacting its ferry crossings between Germany and Denmark. Revenue generated from freight remained stable in 2020 and throughout the pandemic, delivering volumes close to 2019 levels. This performance helped offset lower leisure and retail activity which were significantly impacted during the spring and winter periods of disruption in 2020. At the time of writing, travel restrictions remain in place between Sweden, Denmark and Germany which are having a significant impact on leisure volumes. Freight volumes continue to show resilience and are currently in line with 2019 levels. The business has good levels of liquidity and is well positioned to rebound as restrictions are lifted.
A responsible investor and employerAs proprietary capital investors, we have a long-term, responsible approach, informed by our long-standing Responsible Investment policy. When appraising new investments, we make sure they adhere to our strict environmental, social and corporate governance (“ESG”) standards, avoiding many sectors that we have concluded are unsuitable from reputation, sustainability or governance perspectives. For our existing portfolio, we have robust processes to assess, monitor and manage existing and emerging ESG risks and opportunities in the portfolio. Our approach is not confined to risk management and mitigation, but is strategic in nature. We also assess and support, on an ongoing basis, investments in our portfolio companies to underpin their long-term sustainability. We refine our approach to reflect emerging themes and developments and to ensure that we remain abreast of best practice.
The 3i team is central to delivering our strategy and objectives and we expect everyone at 3i to act with integrity, to be accountable for their behaviour, and to approach their roles with ambition, rigour and energy. The recruitment, development and retention of a capable and diverse pool of talent is a clear priority. We are a meritocracy and provide training and opportunities for career advancement, reward our employees fairly and recognise the importance of supporting the wellbeing and satisfaction of our employees by providing a healthy working environment and work/life balance. The vast majority of our employees worked remotely for almost the entire year, facilitated by additional IT investment.
Well positioned balance sheet to deliver good returns to shareholdersWe ended FY2021 with net debt of £750 million after returning £338 million of cash dividends to shareholders and completing £510 million of new and further investments in the year. Our proprietary capital is the cornerstone of our business model and, in anticipation of a prolonged Covid-19 scenario and limited material realisations in the year, we took advantage of favourable corporate debt market conditions to strengthen our liquidity further by issuing a 20-year £400 million bond at a coupon of 3.75% and increasing our Revolving Credit Facility (“RCF”), from £400 million to £500 million, extending its maturity to 2026. These actions ensure 3i can continue to invest its own proprietary capital in suitable opportunities, without having to accelerate realisations of investments before they reach their full potential. To ensure that our proprietary capital model is as efficient as possible, we remain disciplined on costs and generated an operating cash profit of £23 million in the year.
Our Covid-19 charitable fundIn May 2020, we announced a £5 million charitable fund to support charities particularly affected by the pandemic, focusing on the most vulnerable communities in countries where 3i and our portfolio companies operate. The £5 million was funded from Private Equity and Infrastructure carry and performance fee arrangements earned and provided for through the income statement in prior periods. To date, we have donated or committed c.£4 million of the fund across c.90 charities. Within this, our donations targeted a number of areas, including food provision, education, domestic violence, advancement of minorities and disadvantaged groups, community development and mental health.
Chief Executive’s statement continued
Page 35For more information on Scandlines
Page 82For more information about the 3i team
3i Group plc Annual report and accounts 2021Overview and business strategy
10
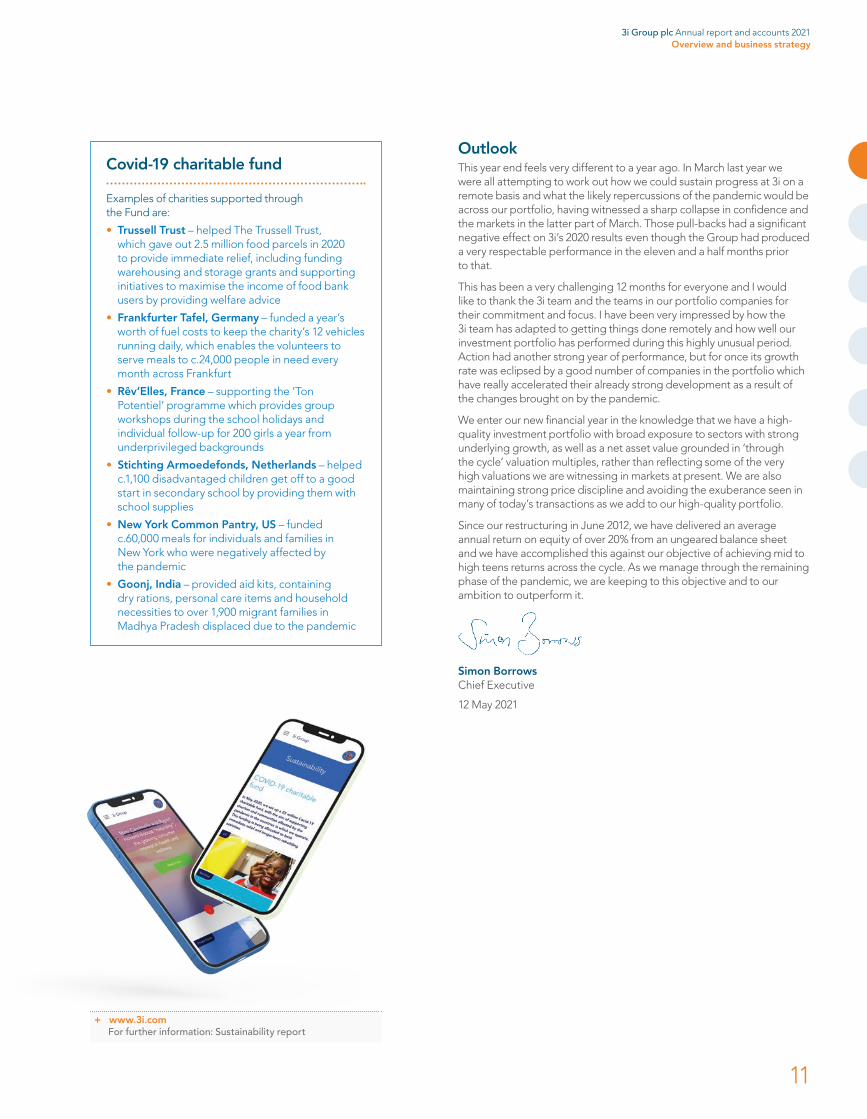
Covid-19 charitable fund
Examples of charities supported through the Fund are:
• Trussell Trust – helped The Trussell Trust, which gave out 2.5 million food parcels in 2020 to provide immediate relief, including funding warehousing and storage grants and supporting initiatives to maximise the income of food bank users by providing welfare advice
• Frankfurter Tafel, Germany – funded a year’s worth of fuel costs to keep the charity’s 12 vehicles running daily, which enables the volunteers to serve meals to c.24,000 people in need every month across Frankfurt
• Rêv’Elles, France – supporting the ‘Ton Potentiel’ programme which provides group workshops during the school holidays and individual follow-up for 200 girls a year from underprivileged backgrounds
• Stichting Armoedefonds, Netherlands – helped c.1,100 disadvantaged children get off to a good start in secondary school by providing them with school supplies
• New York Common Pantry, US – funded c.60,000 meals for individuals and families in New York who were negatively affected by the pandemic
• Goonj, India – provided aid kits, containing dry rations, personal care items and household necessities to over 1,900 migrant families in Madhya Pradesh displaced due to the pandemic
OutlookThis year end feels very different to a year ago. In March last year we were all attempting to work out how we could sustain progress at 3i on a remote basis and what the likely repercussions of the pandemic would be across our portfolio, having witnessed a sharp collapse in confidence and the markets in the latter part of March. Those pull-backs had a significant negative effect on 3i’s 2020 results even though the Group had produced a very respectable performance in the eleven and a half months prior to that.
This has been a very challenging 12 months for everyone and I would like to thank the 3i team and the teams in our portfolio companies for their commitment and focus. I have been very impressed by how the 3i team has adapted to getting things done remotely and how well our investment portfolio has performed during this highly unusual period. Action had another strong year of performance, but for once its growth rate was eclipsed by a good number of companies in the portfolio which have really accelerated their already strong development as a result of the changes brought on by the pandemic.
We enter our new financial year in the knowledge that we have a high-quality investment portfolio with broad exposure to sectors with strong underlying growth, as well as a net asset value grounded in ‘through the cycle’ valuation multiples, rather than reflecting some of the very high valuations we are witnessing in markets at present. We are also maintaining strong price discipline and avoiding the exuberance seen in many of today’s transactions as we add to our high-quality portfolio.
Since our restructuring in June 2012, we have delivered an average annual return on equity of over 20% from an ungeared balance sheet and we have accomplished this against our objective of achieving mid to high teens returns across the cycle. As we manage through the remaining phase of the pandemic, we are keeping to this objective and to our ambition to outperform it.
Simon BorrowsChief Executive
12 May 2021
+ www.3i.comFor further information: Sustainability report
3i Group plc Annual report and accounts 2021Overview and business strategy
11
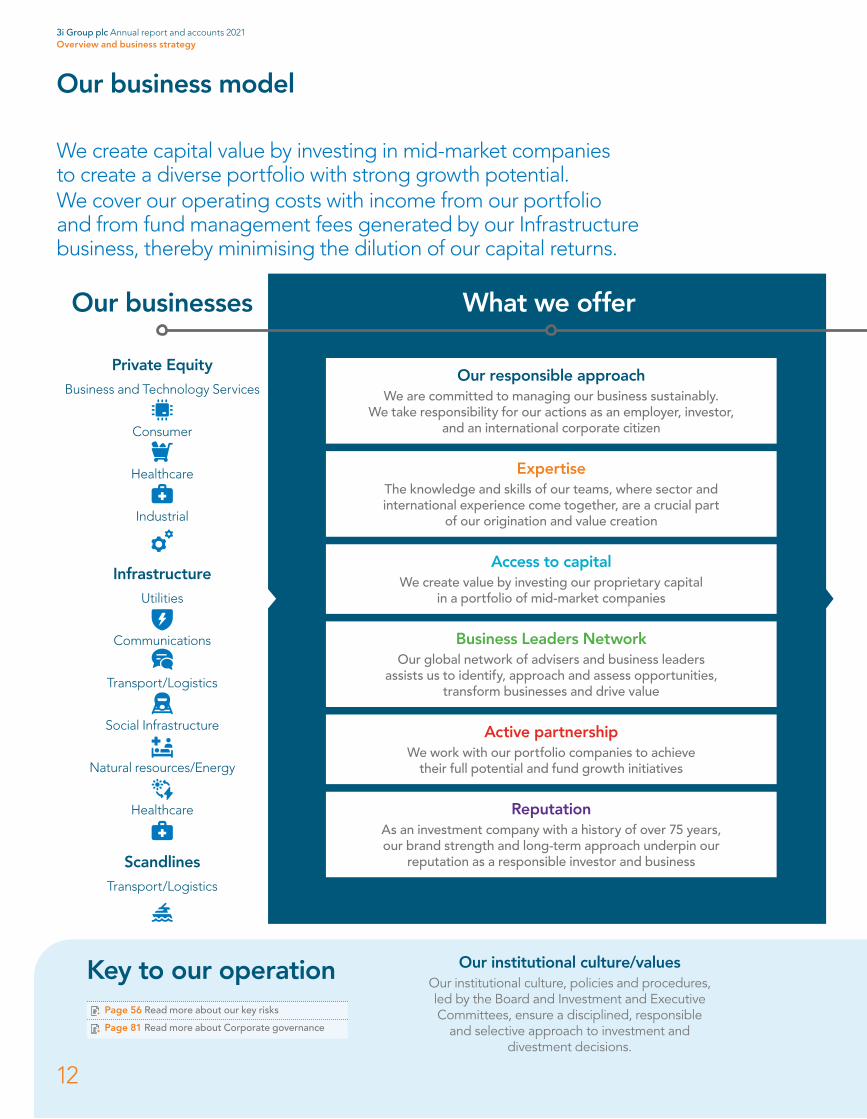
We create capital value by investing in mid-market companies to create a diverse portfolio with strong growth potential.We cover our operating costs with income from our portfolio and from fund management fees generated by our Infrastructure business, thereby minimising the dilution of our capital returns.
Our business model
Our businesses
Private EquityBusiness and Technology Services
Consumer
Healthcare
Industrial
Infrastructure Utilities
Communications
Transport/Logistics
Social Infrastructure
Natural resources/Energy
Healthcare
ScandlinesTransport/Logistics
What we offer
ExpertiseThe knowledge and skills of our teams, where sector and international experience come together, are a crucial part
of our origination and value creation
Access to capitalWe create value by investing our proprietary capital
in a portfolio of mid-market companies
Business Leaders NetworkOur global network of advisers and business leaders
assists us to identify, approach and assess opportunities, transform businesses and drive value
Active partnershipWe work with our portfolio companies to achieve
their full potential and fund growth initiatives
ReputationAs an investment company with a history of over 75 years, our brand strength and long-term approach underpin our
reputation as a responsible investor and business
Our responsible approachWe are committed to managing our business sustainably.
We take responsibility for our actions as an employer, investor, and an international corporate citizen
Key to our operation Our institutional culture/valuesOur institutional culture, policies and procedures, led by the Board and Investment and Executive Committees, ensure a disciplined, responsible
and selective approach to investment and divestment decisions.
Page 56 Read more about our key risks
Page 81 Read more about Corporate governance
3i Group plc Annual report and accounts 2021Overview and business strategy
12
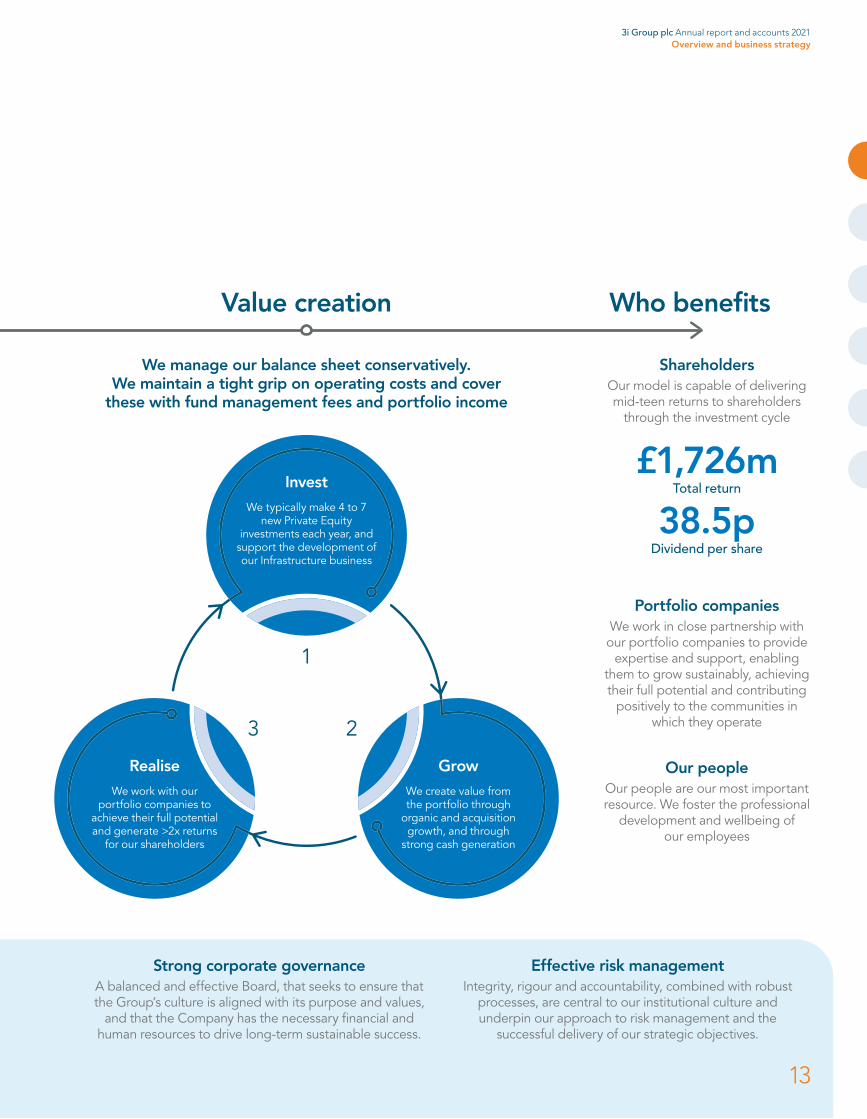
Who benefitsValue creation
We manage our balance sheet conservatively. We maintain a tight grip on operating costs and cover
these with fund management fees and portfolio income
Strong corporate governanceA balanced and effective Board, that seeks to ensure that the Group’s culture is aligned with its purpose and values,
and that the Company has the necessary financial and human resources to drive long-term sustainable success.
Effective risk managementIntegrity, rigour and accountability, combined with robust
processes, are central to our institutional culture and underpin our approach to risk management and the
successful delivery of our strategic objectives.
Portfolio companiesWe work in close partnership with our portfolio companies to provide
expertise and support, enabling them to grow sustainably, achieving their full potential and contributing
positively to the communities in which they operate
Our peopleOur people are our most important resource. We foster the professional
development and wellbeing of our employees
ShareholdersOur model is capable of delivering mid-teen returns to shareholders
through the investment cycle
£1,726mTotal return
38.5pDividend per share
1
23
InvestWe typically make 4 to 7
new Private Equity investments each year, and
support the development of our Infrastructure business
GrowWe create value from the portfolio through
organic and acquisition growth, and through
strong cash generation
RealiseWe work with our
portfolio companies to achieve their full potential and generate >2x returns
for our shareholders
3i Group plc Annual report and accounts 2021Overview and business strategy
13

Our long-term, responsible approach to investment
As proprietary capital investors we have a long-term, responsible approach. We create value through thoughtful origination, disciplined investment and active management of our portfolio, driving sustainable growth in our investee companies.
The recruitment, development and retention of a capable and diverse team is key to our success. We provide training and opportunities for career advancement, reward our employees fairly and recognise the importance of supporting the wellbeing and satisfaction of our employees by providing a healthy working environment and work/life balance.
We value diversity and our employees are recruited, promoted and rewarded on the basis of merit, ability and performance. We are an equal opportunities employer and prohibit all forms of unfair discrimination.
Our people and relationships are our priority
We benefit from a flat organisational structure, which supports an open communication culture. Direct feedback to senior managers is actively encouraged.
234employees
7%unplanned turnover rate
Responsible approach to investment and portfolio managementFor many years, we have carried out our investment activities under our Responsible Investment policy, which is embedded in our investment and portfolio management processes. This policy applies to all of our investments, irrespective of country or sector. We have also been signatories of the UN Principles for Responsible Investment since 2011.
We are well positioned to have a positive impact through the decisions we make across our portfolio. We have a medium to long-term
horizon, typically buying majority or significant minority holdings in our portfolio companies, and, since 2012, are always represented on their boards. We make a limited number of new investments every year, allowing us to be selective and screen out companies whose impact on the environment and society is inconsistent with our policies. We have robust processes to assess, monitor, and manage ESG and reputational risks in the portfolio and to identify attractive opportunities from the developments of mitigations and adaptations to these risks.
We believe that a responsible approach to investment is a material lever for value creation in our portfolio.
+ unpri.org to read more
3i Group plc Annual report and accounts 2021Overview and business strategy
14

We invest in businesses that we believe will benefit from structural trends likely to support long-term sustainable growth.
Careful origination and portfolio constructionWe approach investment origination and portfolio construction with great care. We have a clear focus on a limited number of sectors and geographies where we have built a strong track record, in-house expertise and comprehensive networks.
We adopt a thematic approach to investment, backing companies which benefit from long-term secular growth trends. We have the flexibility to adapt our investment approach to take into account market developments and regulatory policy and societal or environmental changes.
Our proprietary capital approach and well positioned balance sheet allows us the flexibility to back our strongest investments over the long term, ensuring we deliver sustainable returns for all stakeholders.
Strong values and institutional culture3i was founded in 1945 with the objective of providing growth capital to post-war Britain. The responsibility which came with that purpose still guides our behaviour today.
We strive to embed responsible business practices throughout our organisation. We do this by having robust policies and processes in place and by promoting the right culture among our staff. We expect all employees to act with integrity, to be accountable and act with a careful ownership mindset and to approach their roles with ambition, rigour and energy. Our executive team is driven by the principle of “doing the right thing, at the right time” for all stakeholders. Our capable, experienced and diverse Board provides effective oversight and challenge.
Ambition
Integrity Accountability
Rigour and energy
Our shared values
Page 65 read more about our values
Page 81 read more about governance
Pages 16-17 read more in Our thematic approach
3i Group plc Annual report and accounts 2021Overview and business strategy
15
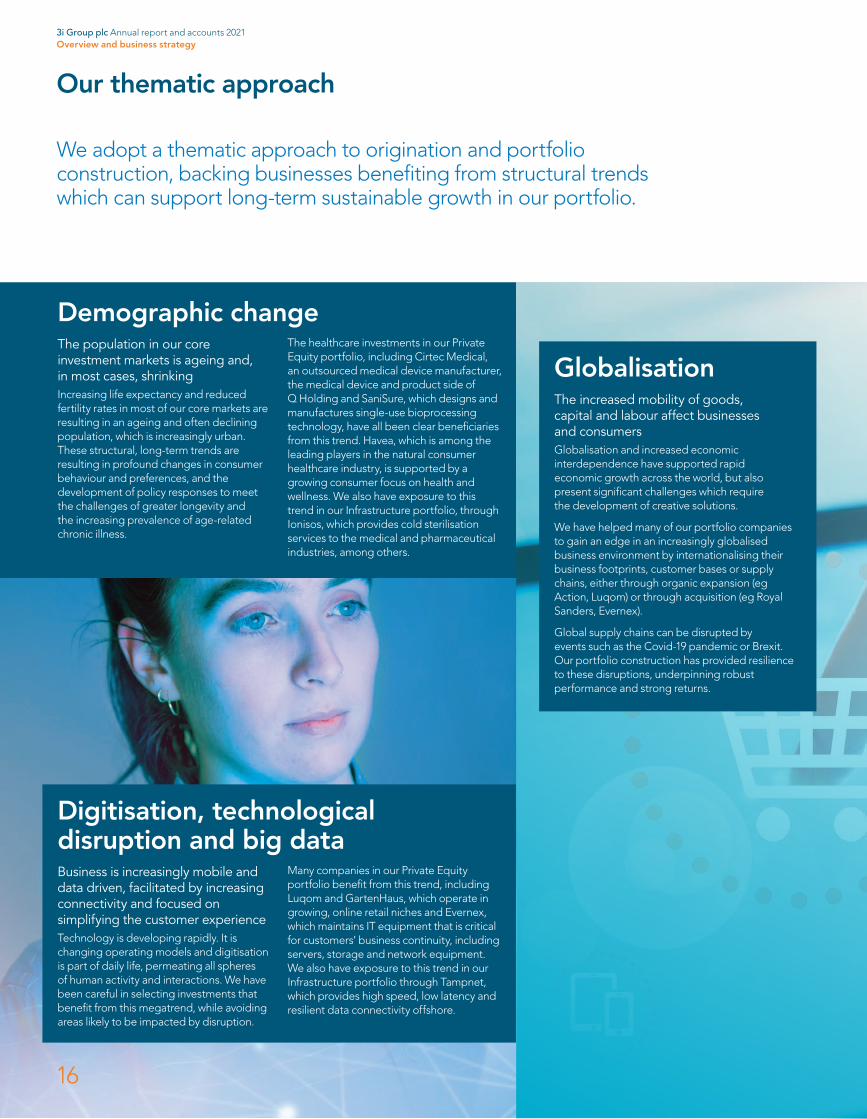
Demographic changeThe population in our core investment markets is ageing and, in most cases, shrinkingIncreasing life expectancy and reduced fertility rates in most of our core markets are resulting in an ageing and often declining population, which is increasingly urban. These structural, long-term trends are resulting in profound changes in consumer behaviour and preferences, and the development of policy responses to meet the challenges of greater longevity and the increasing prevalence of age-related chronic illness.
The healthcare investments in our Private Equity portfolio, including Cirtec Medical, an outsourced medical device manufacturer, the medical device and product side of Q Holding and SaniSure, which designs and manufactures single-use bioprocessing technology, have all been clear beneficiaries from this trend. Havea, which is among the leading players in the natural consumer healthcare industry, is supported by a growing consumer focus on health and wellness. We also have exposure to this trend in our Infrastructure portfolio, through Ionisos, which provides cold sterilisation services to the medical and pharmaceutical industries, among others.
Digitisation, technological disruption and big dataBusiness is increasingly mobile and data driven, facilitated by increasing connectivity and focused on simplifying the customer experienceTechnology is developing rapidly. It is changing operating models and digitisation is part of daily life, permeating all spheres of human activity and interactions. We have been careful in selecting investments that benefit from this megatrend, while avoiding areas likely to be impacted by disruption.
Many companies in our Private Equity portfolio benefit from this trend, including Luqom and GartenHaus, which operate in growing, online retail niches and Evernex, which maintains IT equipment that is critical for customers’ business continuity, including servers, storage and network equipment. We also have exposure to this trend in our Infrastructure portfolio through Tampnet, which provides high speed, low latency and resilient data connectivity offshore.
GlobalisationThe increased mobility of goods, capital and labour affect businesses and consumers Globalisation and increased economic interdependence have supported rapid economic growth across the world, but also present significant challenges which require the development of creative solutions.
We have helped many of our portfolio companies to gain an edge in an increasingly globalised business environment by internationalising their business footprints, customer bases or supply chains, either through organic expansion (eg Action, Luqom) or through acquisition (eg Royal Sanders, Evernex).
Global supply chains can be disrupted by events such as the Covid-19 pandemic or Brexit. Our portfolio construction has provided resilience to these disruptions, underpinning robust performance and strong returns.
Our thematic approach
We adopt a thematic approach to origination and portfolio construction, backing businesses benefiting from structural trends which can support long-term sustainable growth in our portfolio.
3i Group plc Annual report and accounts 2021Overview and business strategy
16

Low carbon and circular economyThe response to the climate and environmental emergencies will be among the defining themes of our timeThe transition to a more sustainable consumption model and the development of solutions to tackle global warming and climate change, either through regulatory “push” or changes in consumer preferences, are going to provide attractive investment opportunities for many decades.
We have significant exposure to the renewable energy and waste management sectors through our Infrastructure division, with investments in companies such as Infinis and Valorem, which generate renewable energy, and Attero and HERAmbiente, which sort and recycle waste and generate power from waste that cannot be recycled. Our Infrastructure business is also invested in ESVAGT, the market leader in the fast growing segment of service operation vessels for the offshore wind industry.
Our Private Equity portfolio also has exposure to this trend. For example, WP, a manufacturer of innovative packaging systems for the FMCG industry, is investing in the development of packaging that is easily recyclable and made with greater use of recycled materials. A core pillar of Evernex’s customer proposition is to repair, reuse and recycle IT equipment, reducing waste and emissions.
Value-for-moneyConsumers want convenience, excitement, relevance and authenticity at good valueWe expect consumers’ focus on value to increase as a result of the economic uncertainty created by the Covid-19 pandemic, even as the public health emergency recedes.
Value-for-money has been one of the winning themes in our Private Equity portfolio for many years and we expect it will remain an enduring trend. Action, our largest investment, has grown revenues and EBITDA by 817% and 758% respectively since we first invested in 2011,
by providing a good quality, surprising and sustainably sourced assortment at very low prices. Hans Anders, a value-for-money optical retailer, is winning market share across its markets by offering private label and branded products at average price points significantly below its major competitors. Basic-Fit, the European market leader in the value-for-money fitness market is growing its market share. Royal Sanders, a leading European private label and contract manufacturing producer of personal care products, is growing strongly thanks to its strong product offering in the value-for-money segment as well as relationships with the largest value-for-money retailers.
3i Group plc Annual report and accounts 2021Overview and business strategy
17

Key performance indicatorsGross investment return (“GIR”)1,2 as % of opening portfolio valueThe performance of the proprietary investment portfolio expressed as a percentage of the opening portfolio value.
Link to strategic objectives
Cash realisations
Proceeds from the sale of Debt Management/residual Debt Management assets
Scandlines reinvestment
Action reinvestment
Cash realisations1,2
Support our returns to shareholders, as well as our ability to invest in new opportunities.
Link to strategic objectives
2017 2018 2019 2020 2021
£1,308m £1,277m £1,261m
£801m
£319m
£270m £152m £529m
£402m
£399m
£1,038m£1,125m
£732m
NAV per share2
The measure of the fair value per share of our proprietary investments and other assets after the net cost of operating the business and dividends paid in the year.
Link to strategic objectives
2017 2018 2019 2020 2021
604p
724p815p 804p
947p
Cash investments
Scandlines reinvestment
Action reinvestment
Cash investment1,2,3
Identifying and investing in new and further investments is the primary driver of the Group’s ability to deliver attractive returns.
Link to strategic objectives
2017 2018 2019 2020 2021
£638m£827m £859m
£1,248m
£510m
£591m
£657m
£529m
£330m
Operating cash profit1,2,4
By covering the cash operating cost of running our business with cash income, we reduce the potential dilution of capital returns.
Link to strategic objectives
2017 2018 2019 2020 2021
£5m
£11m
£46m
£40m
£23m
Dividends
Share price
Total shareholder return2
The return to our shareholders through the movement in the share price and dividends paid during the year.
Link to strategic objectives
2017 2018 2019 2020 2021
71%
18%3%
19%4% (17)%
3%
7%64%
15% 15%
51%5%
46%
(20)%
Strategic objectives
Realise investments with good cash‑ to‑cash returns
Grow investment portfolio earnings
2017 2018 2019 2020 2021
40%
27%
21%
4%
26%
3i Group plc Annual report and accounts 2021Overview and business strategy
18
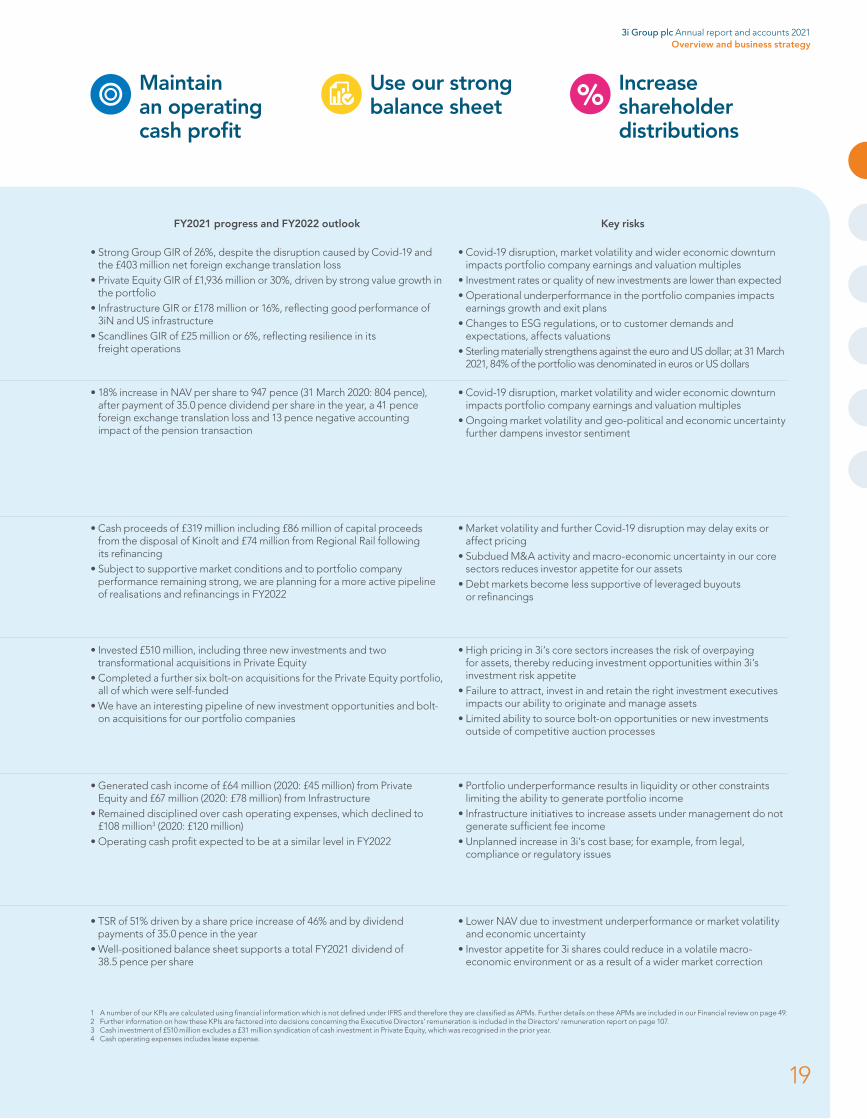
FY2021 progress and FY2022 outlook Key risks
• Covid-19 disruption, market volatility and wider economic downturn impacts portfolio company earnings and valuation multiples
• Ongoing market volatility and geo-political and economic uncertainty further dampens investor sentiment
• Strong Group GIR of 26%, despite the disruption caused by Covid-19 and the £403 million net foreign exchange translation loss
• Private Equity GIR of £1,936 million or 30%, driven by strong value growth in the portfolio
• Infrastructure GIR or £178 million or 16%, reflecting good performance of 3iN and US infrastructure
• Scandlines GIR of £25 million or 6%, reflecting resilience in its freight operations
• Covid-19 disruption, market volatility and wider economic downturn impacts portfolio company earnings and valuation multiples
• Investment rates or quality of new investments are lower than expected• Operational underperformance in the portfolio companies impacts
earnings growth and exit plans• Changes to ESG regulations, or to customer demands and
expectations, affects valuations• Sterling materially strengthens against the euro and US dollar; at 31 March
2021, 84% of the portfolio was denominated in euros or US dollars
• 18% increase in NAV per share to 947 pence (31 March 2020: 804 pence), after payment of 35.0 pence dividend per share in the year, a 41 pence foreign exchange translation loss and 13 pence negative accounting impact of the pension transaction
• Generated cash income of £64 million (2020: £45 million) from Private Equity and £67 million (2020: £78 million) from Infrastructure
• Remained disciplined over cash operating expenses, which declined to £108 million3 (2020: £120 million)
• Operating cash profit expected to be at a similar level in FY2022
• Portfolio underperformance results in liquidity or other constraints limiting the ability to generate portfolio income
• Infrastructure initiatives to increase assets under management do not generate sufficient fee income
• Unplanned increase in 3i’s cost base; for example, from legal, compliance or regulatory issues
• Cash proceeds of £319 million including £86 million of capital proceeds from the disposal of Kinolt and £74 million from Regional Rail following its refinancing
• Subject to supportive market conditions and to portfolio company performance remaining strong, we are planning for a more active pipeline of realisations and refinancings in FY2022
• Market volatility and further Covid-19 disruption may delay exits or affect pricing
• Subdued M&A activity and macro-economic uncertainty in our core sectors reduces investor appetite for our assets
• Debt markets become less supportive of leveraged buyouts or refinancings
• High pricing in 3i’s core sectors increases the risk of overpaying for assets, thereby reducing investment opportunities within 3i’s investment risk appetite
• Failure to attract, invest in and retain the right investment executives impacts our ability to originate and manage assets
• Limited ability to source bolt-on opportunities or new investments outside of competitive auction processes
• Invested £510 million, including three new investments and two transformational acquisitions in Private Equity
• Completed a further six bolt-on acquisitions for the Private Equity portfolio, all of which were self-funded
• We have an interesting pipeline of new investment opportunities and bolt-on acquisitions for our portfolio companies
• TSR of 51% driven by a share price increase of 46% and by dividend payments of 35.0 pence in the year
• Well-positioned balance sheet supports a total FY2021 dividend of 38.5 pence per share
• Lower NAV due to investment underperformance or market volatility and economic uncertainty
• Investor appetite for 3i shares could reduce in a volatile macro-economic environment or as a result of a wider market correction
Use our strong balance sheet
Increase shareholder distributions
Maintain an operating cash profit
1 A number of our KPIs are calculated using financial information which is not defined under IFRS and therefore they are classified as APMs. Further details on these APMs are included in our Financial review on page 49.2 Further information on how these KPIs are factored into decisions concerning the Executive Directors’ remuneration is included in the Directors’ remuneration report on page 107.3 Cash investment of £510 million excludes a £31 million syndication of cash investment in Private Equity, which was recognised in the prior year.4 Cash operating expenses includes lease expense.
3i Group plc Annual report and accounts 2021Overview and business strategy
19
Business reviewWhat’s in this sectionPrivate Equity 21
Infrastructure 32
Scandlines 35

We invest in mid-market businesses headquartered in northern Europe and North America with potential for international growth. Once invested, we work closely with our portfolio companies to achieve their full potential, realising our investments at the appropriate time to deliver strong cash-to-cash returns for 3i shareholders and other investors.
Our Private Equity portfolio delivered a GIR of £1,936 million or 30% on the opening portfolio value (2020: £352 million or 6%) in FY2021, after a £371 million foreign exchange translation loss. This result is underpinned by continued good earnings growth and cash flow despite the disruptions caused by the Covid-19 pandemic. In the 12 months to 31 March 2021, the Private Equity portfolio value increased to £8,814 million (31 March 2020: £6,552 million) driven by organic growth and value accretive acquisitions in our existing portfolio and new investments. As we enter the next financial year, the portfolio has good momentum and is strategically well positioned to continue to benefit from an acceleration in consumer trends towards value-for-money retail, e-commerce and health, wellbeing and hygiene.
The contribution of Action to the Private Equity performance is detailed in Note 1 of the financial statements.
Table 1: Gross investment return for the year to 31 March
Investment basis 2021
£m 2020
£m
Realised profits over value on the disposal of investments 29 90Unrealised profits/(losses) on the revaluation of investments 2,161 (34)Dividends 53 5Interest income from investment portfolio 55 106Fees receivable 9 9Foreign exchange on investments (371) 176Gross investment return 1,936 352Gross investment return as a % of opening portfolio value 30% 6%
Private Equity
At a glanceGross investment return
£1,936m or 30%(2020: £352m or 6%)
Investment
£508m(2020: £1,062m1)
Realised proceeds
£114m(2020: £848m2)
Portfolio growing earnings
87%3(2020: 93%)
Portfolio value
£8,814m(2020: £6,552m)
Number of companies
33(2020: 32)
1 FY2020 investment includes £591 million of reinvestment in Action as part of the Action transaction described on page 19 of the FY2020 Annual report and accounts.
2 FY2020 realised proceeds includes £402 million of realised proceeds from Action as part of the Action transaction described on page 19 of the FY2020 Annual report and accounts.
3 LTM adjusted earnings to 31 December 2020. Includes 25 portfolio companies.
3i Group plc Annual report and accounts 2021Business review
21

Action has a simple, efficient and scalable operating model offering c.6,000 different products across 14 categories in its stores. One-third of these products are part of a standard range, while the other two-thirds change constantly. Every week, Action introduces more than 150 new articles. Action offers a broad range of products including well-known branded products, private labels and supplier-branded items and the average sales price of its products is below €2.
Throughout the Covid-19 pandemic, Action’s key focus was on the wellbeing of all staff and customers and, in keeping with government guidelines, it implemented limits on the number of people in stores at any one time, increased the frequency of cleaning and established strict procedures around safety screens, the use of face masks and disinfectants. Beyond this, Action donated over 15 million medical gloves to organisations distributing medical supplies and food to hospitals, food banks and care providers. Following restrictions in the Netherlands, an independent survey of 4,500 consumers suggested Action as the most missed retailer in the Netherlands.
Despite the temporary pause in the store roll-out plan as a result of Covid-19, in 2020 Action opened 164 new stores in eight different countries, including five pilot stores in the Czech Republic, which have started well. The Polish market has continued to perform well and Action added a further 44 stores there, taking the total to over 100 stores only three years since first entering the country. The expansion in France continued with 42 new stores, including one store that is a larger and more efficient store size in Paris. The store offers the same products as other stores in larger quantities and has a focus on the sustainable product range and provides charging stations for electric cars.
Action’s supply chain and organisational capabilities are key to its international expansion strategy and growth. The company has continued to invest in its infrastructure by opening a ninth DC in Verrières in France, supporting 120 stores, and a second distribution hub in Wrocław, Poland, adding to the first hub opened in France in 2019. These hubs improve product availability and reduce supply chain risk by receiving large, direct shipments from Asia and supplying the DCs. The use of the hubs and DCs allows for the more efficient transportation of goods, therefore reducing carbon emissions per product.
As a result of Covid-19 restrictions, Action has had to quickly adapt to a rapidly changing environment and its digital strategy has become an increasing area of importance. The investment in its digital customer interface allowed Action to engage with customers via social media during the periods of closure and the launch of Click & Collect in France and Belgium saw encouraging results after being developed in only six weeks. Click & Collect has been available over the last six months in the Netherlands, France, Belgium, Germany and Austria and has contributed to a significant increase in online engagement, with 10 million weekly web visits in the eight weeks to early May 2021.
In 2020, Action strengthened its Social Responsibility Strategy covering four key pillars of safe and responsibly sourced products, being a responsible employer, minimising the impact on the environment across its business and supply chain and good citizenship. In 2020, 76% of cotton products sold by Action were certified by the Better Cotton initiative and 60% of paper and wooden products were produced from sustainable timber. Further information is available on Action’s website, www.action.com.
Action is an award-winning, general merchandise, discount retailer in Europe, with more than 1,750 stores in nine countries. Action’s unique customer value proposition of quality products, surprise assortment and low prices attracted more than nine million customers into the stores and over five million website visits every week in 2020.
* 2020 includes a 53rd week.
Key financial figuresat 31 December
164stores added
2019
1,552
2020
1,716
Investing in good businesses to make them great
Store figuresnumber of stores
SalesEBITDA
€2,675m€310m
2016 2017
€3,418m€387m
2018
€4,216m€450m
2019
€5,114m€541m
2020*
€5,637m€616m
22
3i Group plc Annual report and accounts 2021Business review
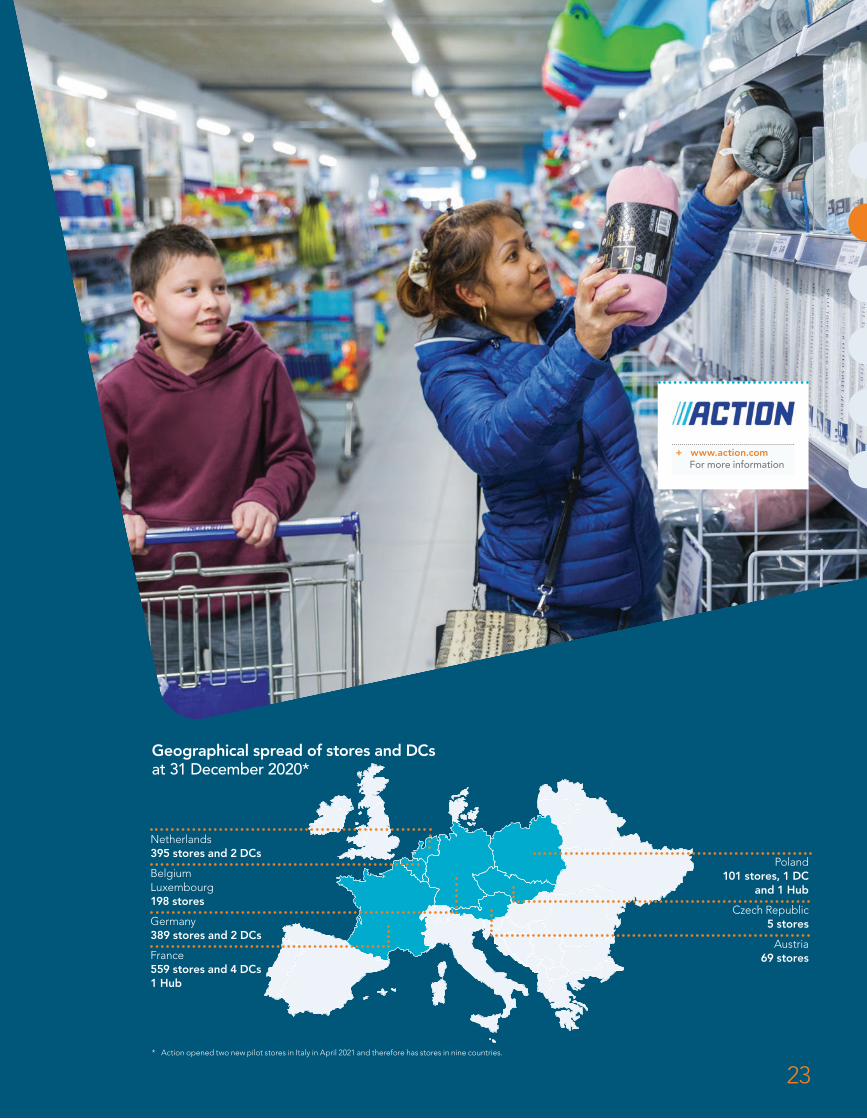
* Action opened two new pilot stores in Italy in April 2021 and therefore has stores in nine countries.
Netherlands395 stores and 2 DCs
France559 stores and 4 DCs 1 Hub
Germany389 stores and 2 DCs
BelgiumLuxembourg198 stores
Poland101 stores, 1 DC
and 1 Hub
Czech Republic 5 stores
Austria 69 stores
Geographical spread of stores and DCs at 31 December 2020*
+ www.action.comFor more information
23
Private Equity continued
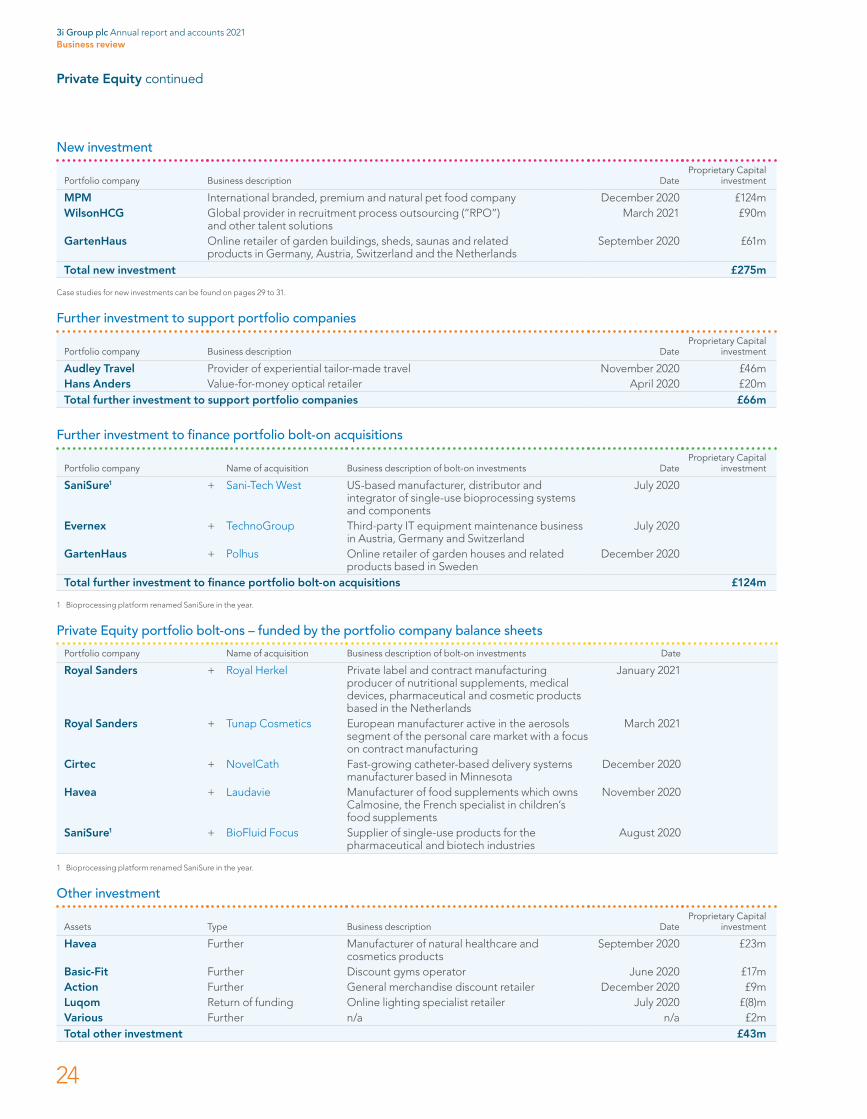
New investment
Portfolio company Business description DateProprietary Capital
investment
MPM International branded, premium and natural pet food company December 2020 £124mWilsonHCG Global provider in recruitment process outsourcing (“RPO”)
and other talent solutionsMarch 2021 £90m
GartenHaus Online retailer of garden buildings, sheds, saunas and related products in Germany, Austria, Switzerland and the Netherlands
September 2020 £61m
Total new investment £275m
Case studies for new investments can be found on pages 29 to 31.
Further investment to support portfolio companies
Portfolio company Business description DateProprietary Capital
investment
Audley Travel Provider of experiential tailor-made travel November 2020 £46mHans Anders Value-for-money optical retailer April 2020 £20mTotal further investment to support portfolio companies £66m
Further investment to finance portfolio bolt-on acquisitions
Portfolio company Name of acquisition Business description of bolt-on investments DateProprietary Capital
investment
SaniSure1 + Sani-Tech West US-based manufacturer, distributor and integrator of single-use bioprocessing systems and components
July 2020
Evernex + TechnoGroup Third-party IT equipment maintenance business in Austria, Germany and Switzerland
July 2020
GartenHaus + Polhus Online retailer of garden houses and related products based in Sweden
December 2020
Total further investment to finance portfolio bolt-on acquisitions £124m
1 Bioprocessing platform renamed SaniSure in the year.
Private Equity portfolio bolt-ons – funded by the portfolio company balance sheets
Portfolio company Name of acquisition Business description of bolt-on investments Date
Royal Sanders + Royal Herkel Private label and contract manufacturing producer of nutritional supplements, medical devices, pharmaceutical and cosmetic products based in the Netherlands
January 2021
Royal Sanders + Tunap Cosmetics European manufacturer active in the aerosols segment of the personal care market with a focus on contract manufacturing
March 2021
Cirtec + NovelCath Fast-growing catheter-based delivery systems manufacturer based in Minnesota
December 2020
Havea + Laudavie Manufacturer of food supplements which owns Calmosine, the French specialist in children’s food supplements
November 2020
SaniSure1 + BioFluid Focus Supplier of single-use products for the pharmaceutical and biotech industries
August 2020
1 Bioprocessing platform renamed SaniSure in the year.
Other investment
Assets Type Business description DateProprietary Capital
investment
Havea Further Manufacturer of natural healthcare and cosmetics products
September 2020 £23m
Basic-Fit Further Discount gyms operator June 2020 £17mAction Further General merchandise discount retailer December 2020 £9mLuqom Return of funding Online lighting specialist retailer July 2020 £(8)mVarious Further n/a n/a £2mTotal other investment £43m
3i Group plc Annual report and accounts 2021Business review
24
Investment activityFollowing a period of limited activity in the initial phases of the Covid-19 pandemic, global investment volumes rebounded through the second half of 2020. Pent-up demand coupled with record levels of dry powder and robust credit markets have fuelled very high investment multiples in the US and Europe. We have remained selective and price disciplined, investing £275 million in three new assets at attractive prices.
We have continued to enhance the value of our portfolio through buy-and-build investments for our platform assets. We completed two transformational bolt-on acquisitions, Evernex’s acquisition of TechnoGroup and, having established a Bioprocessing platform last year, we achieved a significant milestone in the growth and internationalisation of this platform, through the acquisition of Sani-Tech West. The combined platform has now been renamed SaniSure. In addition to these two transformational acquisitions, we completed a further six bolt-on acquisitions, with only the GartenHaus acquisition of Polhus requiring funding from 3i.
We also used our capital to support the existing portfolio through the Covid-19 pandemic, completing a £20 million equity investment in Hans Anders in April 2020 and investing a further £46 million in Audley Travel in November 2020. Other noteworthy investment includes £17 million in Basic-Fit to provide expansion capital in June 2020, and the repurchase of equity stakes in Havea and Action. Luqom returned £8 million of over funding that we had provided for the bolt-on acquisition of QLF in FY2020 and this has been treated as return of investment.
In total, in the 12 months to 31 March 2021, our Private Equity team invested a total of £508 million across new and further investments.
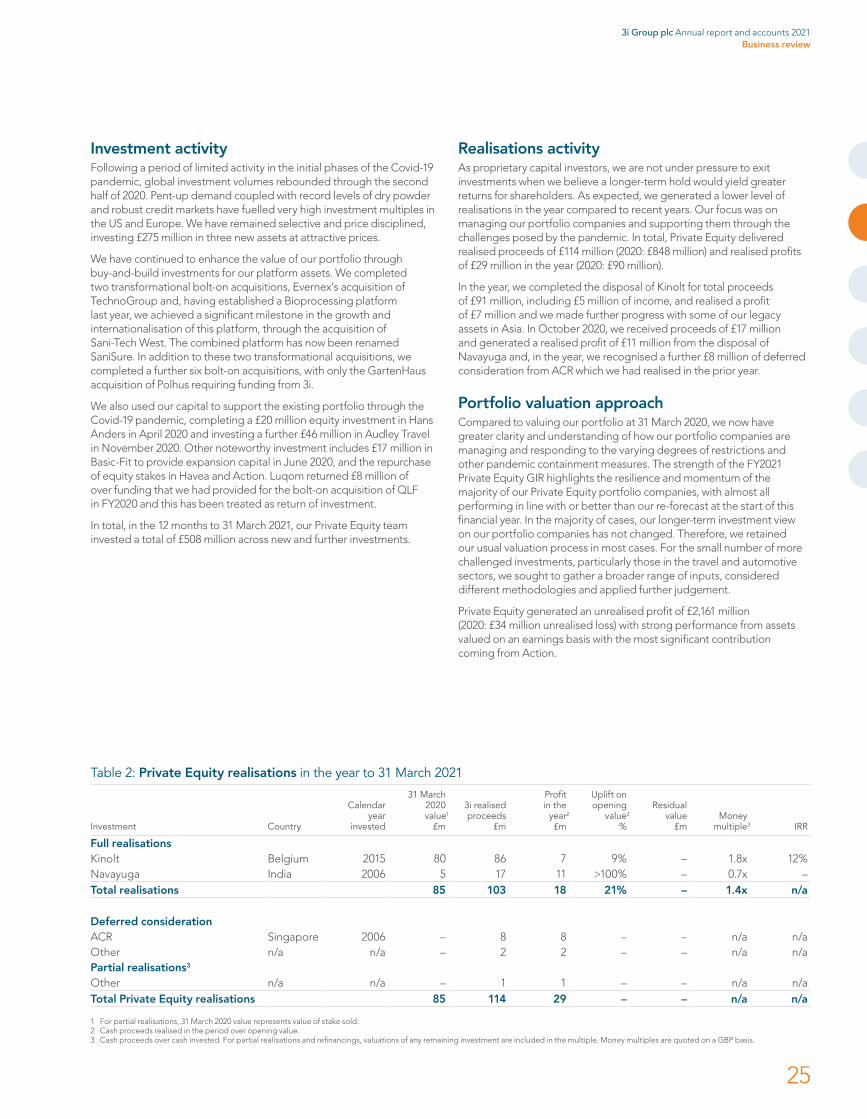
Realisations activityAs proprietary capital investors, we are not under pressure to exit investments when we believe a longer-term hold would yield greater returns for shareholders. As expected, we generated a lower level of realisations in the year compared to recent years. Our focus was on managing our portfolio companies and supporting them through the challenges posed by the pandemic. In total, Private Equity delivered realised proceeds of £114 million (2020: £848 million) and realised profits of £29 million in the year (2020: £90 million).
In the year, we completed the disposal of Kinolt for total proceeds of £91 million, including £5 million of income, and realised a profit of £7 million and we made further progress with some of our legacy assets in Asia. In October 2020, we received proceeds of £17 million and generated a realised profit of £11 million from the disposal of Navayuga and, in the year, we recognised a further £8 million of deferred consideration from ACR which we had realised in the prior year.
Portfolio valuation approachCompared to valuing our portfolio at 31 March 2020, we now have greater clarity and understanding of how our portfolio companies are managing and responding to the varying degrees of restrictions and other pandemic containment measures. The strength of the FY2021 Private Equity GIR highlights the resilience and momentum of the majority of our Private Equity portfolio companies, with almost all performing in line with or better than our re-forecast at the start of this financial year. In the majority of cases, our longer-term investment view on our portfolio companies has not changed. Therefore, we retained our usual valuation process in most cases. For the small number of more challenged investments, particularly those in the travel and automotive sectors, we sought to gather a broader range of inputs, considered different methodologies and applied further judgement.
Private Equity generated an unrealised profit of £2,161 million (2020: £34 million unrealised loss) with strong performance from assets valued on an earnings basis with the most significant contribution coming from Action.
Table 2: Private Equity realisations in the year to 31 March 2021
Investment Country
Calendar year
invested
31 March 2020value1
£m
3i realised proceeds
£m
Profit in the
year2
£m
Uplift on opening
value2
%
Residual value
£mMoney
multiple3 IRR
Full realisationsKinolt Belgium 2015 80 86 7 9% – 1.8x 12%Navayuga India 2006 5 17 11 >100% – 0.7x –Total realisations 85 103 18 21% – 1.4x n/a
Deferred considerationACR Singapore 2006 – 8 8 – – n/a n/aOther n/a n/a – 2 2 – – n/a n/aPartial realisations3
Other n/a n/a – 1 1 – – n/a n/aTotal Private Equity realisations 85 114 29 – – n/a n/a
1 For partial realisations, 31 March 2020 value represents value of stake sold.2 Cash proceeds realised in the period over opening value.3 Cash proceeds over cash invested. For partial realisations and refinancings, valuations of any remaining investment are included in the multiple. Money multiples are quoted on a GBP basis.
3i Group plc Annual report and accounts 2021Business review
25

Private Equity continued
Action valuation and performanceAction’s run-rate earnings proved to be resilient in the 12 months to 31 March 2021, despite the two periods of major disruption due to significant trading restrictions, and the business remained highly cash generative throughout this time. This trend continued into April and early May 2021. With the benefit of this 12 months of experience we made an adjustment to the earnings used for valuation purposes, adding back the EBITDA losses that were incurred in the month of April 2020 as being unrepresentative of the normal earnings of the business. This effectively means we are using 11 months of run-rate earnings to 31 March 2021 (1 May 2020-31 March 2021). The run-rate earnings used include our normal adjustment to reflect stores opened in the year, as well as the add-back of €10 million exceptional Covid-19 related costs incurred in Action’s first quarter of 2021. The valuation at 31 March 2021 includes the net debt and capital structure as at that date. Further details on Action’s performance can be found in the CEO statement on page 6 and in the Action case study on page 22.
We increased Action’s post discount run-rate multiple to 18.5x (31 December 2020: 18.0x) and applied this to the run-rate earnings described above. Further details on the Action multiple can be found on page 27. At 31 March 2021, Action was valued at £4,566 million (31 March 2020: £3,536 million) and, as the largest Private Equity investment by value, it represented 52% of the Private Equity portfolio (31 March 2020: 54%).
Performance (excluding Action)Excluding Action, the performance of investments valued on an earnings basis resulted in unrealised profits of £536 million (March 2020: £61 million unrealised loss), as we continue to see strong momentum in earnings growth and cash generation for portfolio companies operating in the consumer goods, e-commerce, healthcare and business and technology services sectors, offsetting underperformance from companies exposed to the travel and automotive industries.
Royal Sanders has performed strongly, generating significant earnings growth and cash flow, which allowed it to return a dividend to 3i of £38 million in July 2020. The business continued its organic growth and captured a share of the increase in demand for handwash and hand gels whilst building on its existing platform with two bolt-on acquisitions. As part of our valuation process, we estimated the proportion of profits which may not be maintainable as sales of handwash and hand gels normalise, and therefore excluded €9 million of these profits from the valuation earnings. The valuation increased to £364 million at 31 March 2021 (31 March 2020: £198 million).
The accelerated shift towards e-commerce and increased consumer discretionary spending on home and living products has generated positive tailwinds for Luqom. The business has grown its international footprint, launching web shops in 10 new countries and is well positioned to expand its reach further across Europe. The business doubled its earnings in the year and was valued at £307 million at 31 March 2021 (31 March 2020: £144 million).
Cirtec Medical has benefited from platform-specific tailwinds, with a number of customers ramping up their orders. Additionally, it has continued its buy and build strategy with the acquisition of NovelCath and has completed several margin optimisation initiatives, all of which delivered strong year-on-year earnings growth. At 31 March 2021, Cirtec Medical was valued at £444 million (31 March 2020: £302 million).
The increased focus on health and wellness benefited Havea in the year. The business mitigated a drop in footfall as a result of the pandemic with an increased online presence and continued to build on its existing platform with the acquisition of Laudavie. Tato has seen increased demand for speciality chemicals used in biocidal, disinfectant and hygiene products driving strong earnings growth and cash generation and returned £14 million of dividends to 3i in FY2021. We are now working more closely with management and the family owners of this minority investment and so reduced the liquidity discount on our holding.
Measures and initiatives put in place to mitigate the disruption caused by Covid-19 restrictions have enabled both Hans Anders and BoConcept to deliver a resilient performance in a challenging retail environment.
Table 3: Unrealised profits/(losses) on the revaluation of Private Equity investments1 in the year to 31 March
2021 £m
2020 £m
Earnings based valuationsPerformance (excluding Action) 536 (61)Multiple movements (excluding Action) 408 (231)Action performance2 1,067 461Action multiple 135 –
Other basesUplift to imminent sale – 1Write-off – (103)Discounted cash flow (101) (9)Other movements on unquoted investments 3 –Quoted portfolio 113 (92)
Total 2,161 (34)
1 Further information on our valuation methodology, including definitions and rationale, is included in the Portfolio valuation – an explanation on pages 188 and 189.
2 Action performance in FY2020 includes £272 million unrealised loss which is the adjustment made at 31 March 2020 to align the fair value to the Action transaction as described on page 19 of the FY2020 Annual report and accounts.
3i Group plc Annual report and accounts 2021Business review
26
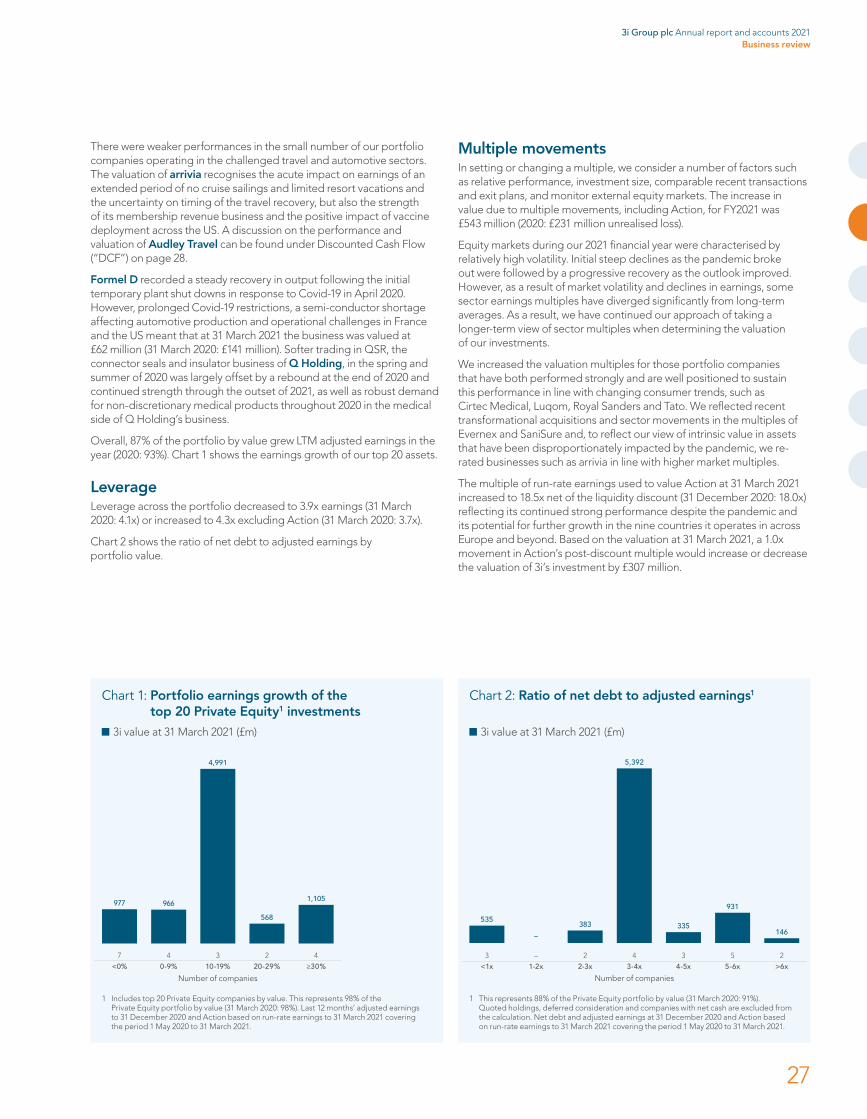
There were weaker performances in the small number of our portfolio companies operating in the challenged travel and automotive sectors. The valuation of arrivia recognises the acute impact on earnings of an extended period of no cruise sailings and limited resort vacations and the uncertainty on timing of the travel recovery, but also the strength of its membership revenue business and the positive impact of vaccine deployment across the US. A discussion on the performance and valuation of Audley Travel can be found under Discounted Cash Flow (“DCF”) on page 28.
Formel D recorded a steady recovery in output following the initial temporary plant shut downs in response to Covid-19 in April 2020. However, prolonged Covid-19 restrictions, a semi-conductor shortage affecting automotive production and operational challenges in France and the US meant that at 31 March 2021 the business was valued at £62 million (31 March 2020: £141 million). Softer trading in QSR, the connector seals and insulator business of Q Holding, in the spring and summer of 2020 was largely offset by a rebound at the end of 2020 and continued strength through the outset of 2021, as well as robust demand for non-discretionary medical products throughout 2020 in the medical side of Q Holding’s business.
Overall, 87% of the portfolio by value grew LTM adjusted earnings in the year (2020: 93%). Chart 1 shows the earnings growth of our top 20 assets.
LeverageLeverage across the portfolio decreased to 3.9x earnings (31 March 2020: 4.1x) or increased to 4.3x excluding Action (31 March 2020: 3.7x).
Chart 2 shows the ratio of net debt to adjusted earnings by portfolio value.
Multiple movements In setting or changing a multiple, we consider a number of factors such as relative performance, investment size, comparable recent transactions and exit plans, and monitor external equity markets. The increase in value due to multiple movements, including Action, for FY2021 was £543 million (2020: £231 million unrealised loss).
Equity markets during our 2021 financial year were characterised by relatively high volatility. Initial steep declines as the pandemic broke out were followed by a progressive recovery as the outlook improved. However, as a result of market volatility and declines in earnings, some sector earnings multiples have diverged significantly from long-term averages. As a result, we have continued our approach of taking a longer-term view of sector multiples when determining the valuation of our investments.
We increased the valuation multiples for those portfolio companies that have both performed strongly and are well positioned to sustain this performance in line with changing consumer trends, such as Cirtec Medical, Luqom, Royal Sanders and Tato. We reflected recent transformational acquisitions and sector movements in the multiples of Evernex and SaniSure and, to reflect our view of intrinsic value in assets that have been disproportionately impacted by the pandemic, we re-rated businesses such as arrivia in line with higher market multiples.
The multiple of run-rate earnings used to value Action at 31 March 2021 increased to 18.5x net of the liquidity discount (31 December 2020: 18.0x) reflecting its continued strong performance despite the pandemic and its potential for further growth in the nine countries it operates in across Europe and beyond. Based on the valuation at 31 March 2021, a 1.0x movement in Action’s post-discount multiple would increase or decrease the valuation of 3i’s investment by £307 million.
Number of companies
<0%7 4 3 2
977 966
4,991
568
1,105
0-9% 10-19% 20-29%4
≥30%
Number of companies<1x
3 – 2 34 5 2
535
–
383 335
5,392
931
146
1-2x 2-3x 4-5x3-4x 5-6x >6x
1 Includes top 20 Private Equity companies by value. This represents 98% of the Private Equity portfolio by value (31 March 2020: 98%). Last 12 months’ adjusted earnings to 31 December 2020 and Action based on run-rate earnings to 31 March 2021 covering the period 1 May 2020 to 31 March 2021.
1 This represents 88% of the Private Equity portfolio by value (31 March 2020: 91%). Quoted holdings, deferred consideration and companies with net cash are excluded from the calculation. Net debt and adjusted earnings at 31 December 2020 and Action based on run-rate earnings to 31 March 2021 covering the period 1 May 2020 to 31 March 2021.
Chart 1: Portfolio earnings growth of the top 20 Private Equity1 investments
3i value at 31 March 2021 (£m)
Chart 2: Ratio of net debt to adjusted earnings1
3i value at 31 March 2021 (£m)
3i Group plc Annual report and accounts 2021Business review
27
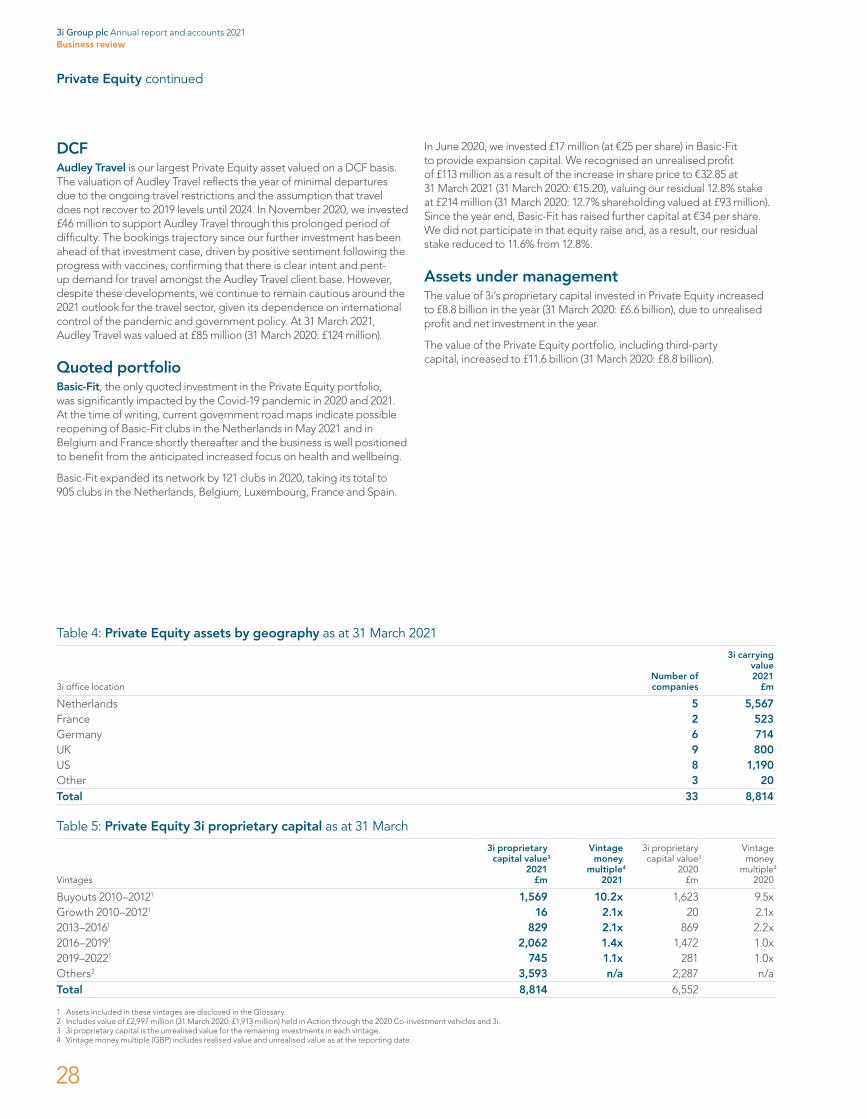
Private Equity continued
DCFAudley Travel is our largest Private Equity asset valued on a DCF basis. The valuation of Audley Travel reflects the year of minimal departures due to the ongoing travel restrictions and the assumption that travel does not recover to 2019 levels until 2024. In November 2020, we invested £46 million to support Audley Travel through this prolonged period of difficulty. The bookings trajectory since our further investment has been ahead of that investment case, driven by positive sentiment following the progress with vaccines, confirming that there is clear intent and pent-up demand for travel amongst the Audley Travel client base. However, despite these developments, we continue to remain cautious around the 2021 outlook for the travel sector, given its dependence on international control of the pandemic and government policy. At 31 March 2021, Audley Travel was valued at £85 million (31 March 2020: £124 million).
Quoted portfolioBasic-Fit, the only quoted investment in the Private Equity portfolio, was significantly impacted by the Covid-19 pandemic in 2020 and 2021. At the time of writing, current government road maps indicate possible reopening of Basic-Fit clubs in the Netherlands in May 2021 and in Belgium and France shortly thereafter and the business is well positioned to benefit from the anticipated increased focus on health and wellbeing.
Basic-Fit expanded its network by 121 clubs in 2020, taking its total to 905 clubs in the Netherlands, Belgium, Luxembourg, France and Spain.
In June 2020, we invested £17 million (at €25 per share) in Basic-Fit to provide expansion capital. We recognised an unrealised profit of £113 million as a result of the increase in share price to €32.85 at 31 March 2021 (31 March 2020: €15.20), valuing our residual 12.8% stake at £214 million (31 March 2020: 12.7% shareholding valued at £93 million). Since the year end, Basic-Fit has raised further capital at €34 per share. We did not participate in that equity raise and, as a result, our residual stake reduced to 11.6% from 12.8%.
Assets under management The value of 3i’s proprietary capital invested in Private Equity increased to £8.8 billion in the year (31 March 2020: £6.6 billion), due to unrealised profit and net investment in the year.
The value of the Private Equity portfolio, including third-party capital, increased to £11.6 billion (31 March 2020: £8.8 billion).
Table 5: Private Equity 3i proprietary capital as at 31 March
Vintages
3i proprietary capital value3
2021 £m
Vintage money
multiple4
2021
3i proprietary capital value3
2020 £m
Vintage money
multiple4
2020
Buyouts 2010–20121 1,569 10.2x 1,623 9.5xGrowth 2010–20121 16 2.1x 20 2.1x2013–20161 829 2.1x 869 2.2x2016–20191 2,062 1.4x 1,472 1.0x2019–20221 745 1.1x 281 1.0xOthers2 3,593 n/a 2,287 n/aTotal 8,814 6,552
1 Assets included in these vintages are disclosed in the Glossary.2 Includes value of £2,997 million (31 March 2020: £1,913 million) held in Action through the 2020 Co-investment vehicles and 3i. 3 3i proprietary capital is the unrealised value for the remaining investments in each vintage. 4 Vintage money multiple (GBP) includes realised value and unrealised value as at the reporting date.
Table 4: Private Equity assets by geography as at 31 March 2021
3i office locationNumber of companies
3i carrying value 2021
£m
Netherlands 5 5,567France 2 523Germany 6 714UK 9 800US 8 1,190Other 3 20Total 33 8,814
3i Group plc Annual report and accounts 2021Business review
28

£135m3i total investment in FY2020 and FY2021
+ www.sanisure.comFor more information
SaniSure (formerly Bioprocessing platform), is a global, pure-play platform in the bioprocessing market bringing together Sani-Tech West, Cellon, TBL Performance Plastics (“TBL”) and Silicone Altimex. By combining these companies, we have created a vertically-integrated platform in the high-growth bioprocessing space. The combined business is a manufacturer of single-use technology (“SUT”) bioprocessing components, systems, and assemblies serving the vaccine and biologics manufacturing value chain.
Having initially established the Bioprocessing platform in 2019 through the acquisitions of Cellon, TBL and Silicone Altimex, 3i acquired Sani-Tech West, Inc. (Sani-Tech West and subsidiaries SaniSure® and SureTech), a US-based manufacturer, distributor and integrator of single-use bioprocessing systems and components, in July 2020. The platform was subsequently rebranded as SaniSure. The transformative bolt-on of Sani-Tech West significantly expands the combined group’s global footprint and market-leading product portfolio. In August 2020, SaniSure completed the balance sheet funded acquisition of BioFluid Focus, which specialises in supplying single-use products for the pharmaceutical and biotech industries.
The combined platform has a strong footprint across North America and Europe, offering enhanced supply chain assurance, and the business is well positioned to benefit from strong market tailwinds.
Healthcare
SaniSure
29
3i Group plc Annual report and accounts 2021Business review

MPM (“making pet food matters”) is an international branded, premium, natural pet food company.MPM, headquartered in the UK, is the owner of leading pet food brands including Applaws, Encore and Reveal, which are sold in 49 markets across the UK, EMEA and APAC with a fast-growing business in North America. MPM differentiates itself through high quality, human-grade products, natural, clean-label ingredients and its “cat first” proposition.
The company is highly cash generative and has organically grown sales at a 20% CAGR since 2015, with international sales accounting for more than 60% of revenues. The premium wet cat food market is large and is forecast to continue to grow at c.7% per annum. There is significant potential for further international growth as MPM aims to accelerate its expansion in North America.
MPM is accredited by the Ethical Company Organisation and its high-quality ingredients are sourced sustainably. Making a positive impact on both society and the environment is at the heart of MPM’s objectives.
Consumer
MPM
£124m3i new investment in FY2021
+ www.mpmproducts.co.ukFor more information
30
3i Group plc Annual report and accounts 2021Business review

Wilson Human Capital Group (“WilsonHCG”) is a global provider of talent solutions. WilsonHCG, headquartered in Tampa, Florida, is a global company with offices throughout North America, Europe and Asia. With clients served in more than 65 countries and six continents, WilsonHCG provides a full suite of configurable talent services including recruitment process outsourcing (“RPO”), executive search, contingent talent solutions and HR technology advisory. Its primary focus is in the RPO space, where it has been the fastest growing provider over the last few years with a double-digit growth rate due to continued outsourcing adoption by new clients and further penetration with existing clients.
The business is continuing its international expansion journey, following the recent acquisition of Profile in Asia, where there will be an opportunity for WilsonHCG to serve its clients across all talent acquisition solutions and grow its RPO presence in the region. Post the Covid-19 pandemic, the market is expected to return to historical levels of growth as companies increasingly value the superior outcomes, flexibility and efficiency that RPO providers such as WilsonHCG offer.
Business and Technology Services
WilsonHCG
£90m3i new investment in FY2021 + www.wilsonhcg.com
For more information
GartenHaus is an online retailer of garden buildings, sheds, saunas, and related products in the DACH region.GartenHaus, founded in 2002 and head-quartered in Germany, launched its first online shop in 2009 and now has over 100,000 customers and more than one million monthly visits. The company has around 100 employees and combines specialist trade product know-how with digital competence and offers a one-stop shop for customers, from planning to realisation and maintenance of garden and home projects. It offers the largest product assortment in Europe from 100 third-party and seven private label brands, such as Alpholz, CARLSSON, FinnTherm and Terrando.
Driven by the increasing popularity of gardening and leisure trends, the relevant home and garden market is expected to grow
by more than 10% per annum going forward, while online penetration is expected to double by 2025. The key focus is to expand the product range into adjacent categories, as well as to internationalise the business by expanding into neighbouring countries such as the UK, France, Scandinavia and the Netherlands which have fragmented markets and similar product trends.
In December 2020, we invested a further £9 million to support GartenHaus’s acquisition of Polhus, an online retailer of garden houses and related products based in Sweden. Combined, GartenHaus and Polhus will be the pure-play, online market leader in both the German-speaking and Scandinavian regions.
Sustainability is a key focus for GartenHaus and the wood used for its products is from sustainably managed forest areas in northern Europe. 95% of its suppliers are FSC (Forest Stewardship Council) certified and many products have PEFC (Programme for the Endorsement of Forest Certification) labels.
£70m3i new and further investment in FY2021
+ www.gartenhaus-gmbh.deFor more information
Consumer
GartenHaus
31
3i Group plc Annual report and accounts 2021Business review
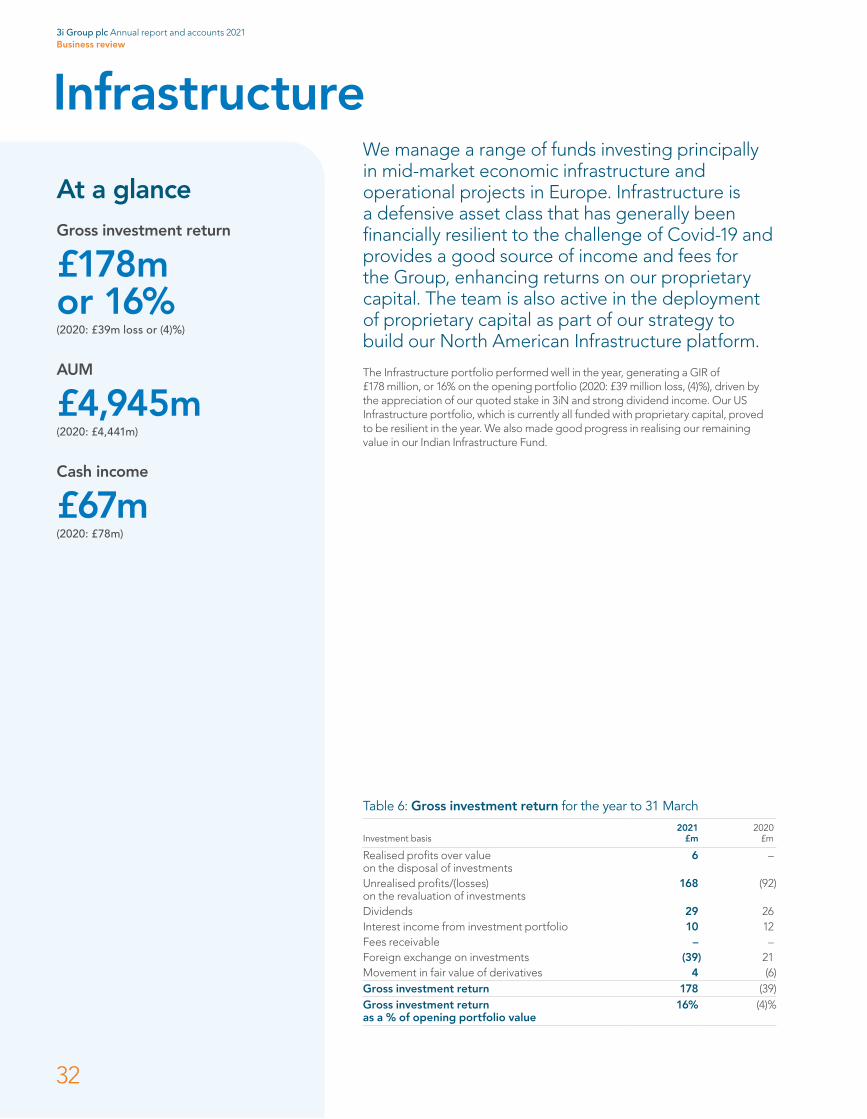
At a glanceGross investment return
£178m or 16%(2020: £39m loss or (4)%)
AUM
£4,945m(2020: £4,441m)
Cash income
£67m(2020: £78m)
We manage a range of funds investing principally in mid-market economic infrastructure and operational projects in Europe. Infrastructure is a defensive asset class that has generally been financially resilient to the challenge of Covid-19 and provides a good source of income and fees for the Group, enhancing returns on our proprietary capital. The team is also active in the deployment of proprietary capital as part of our strategy to build our North American Infrastructure platform.
The Infrastructure portfolio performed well in the year, generating a GIR of £178 million, or 16% on the opening portfolio (2020: £39 million loss, (4)%), driven by the appreciation of our quoted stake in 3iN and strong dividend income. Our US Infrastructure portfolio, which is currently all funded with proprietary capital, proved to be resilient in the year. We also made good progress in realising our remaining value in our Indian Infrastructure Fund.
Infrastructure
Table 6: Gross investment return for the year to 31 March
Investment basis 2021
£m2020
£m
Realised profits over value on the disposal of investments
6 –
Unrealised profits/(losses) on the revaluation of investments
168 (92)
Dividends 29 26Interest income from investment portfolio 10 12Fees receivable – –Foreign exchange on investments (39) 21Movement in fair value of derivatives 4 (6)Gross investment return 178 (39)Gross investment return as a % of opening portfolio value
16% (4)%
3i Group plc Annual report and accounts 2021Business review
32
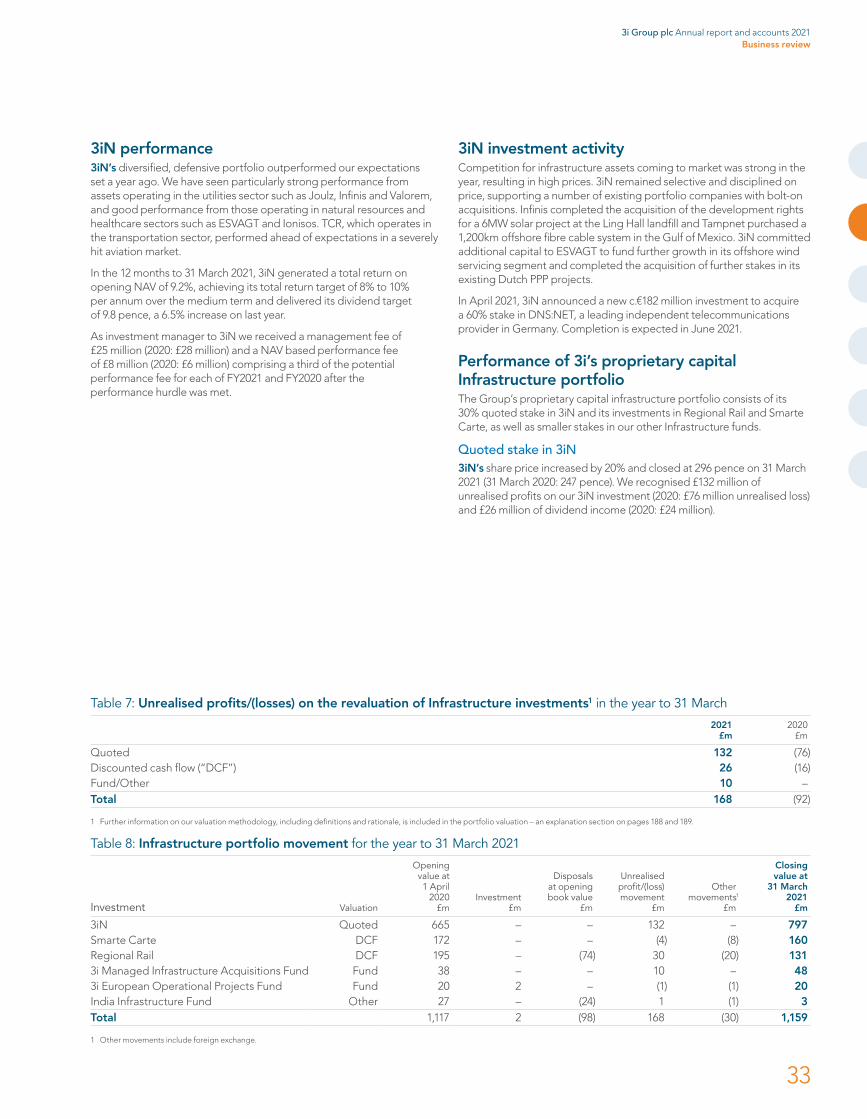
3iN performance 3iN’s diversified, defensive portfolio outperformed our expectations set a year ago. We have seen particularly strong performance from assets operating in the utilities sector such as Joulz, Infinis and Valorem, and good performance from those operating in natural resources and healthcare sectors such as ESVAGT and Ionisos. TCR, which operates in the transportation sector, performed ahead of expectations in a severely hit aviation market.
In the 12 months to 31 March 2021, 3iN generated a total return on opening NAV of 9.2%, achieving its total return target of 8% to 10% per annum over the medium term and delivered its dividend target of 9.8 pence, a 6.5% increase on last year.
As investment manager to 3iN we received a management fee of £25 million (2020: £28 million) and a NAV based performance fee of £8 million (2020: £6 million) comprising a third of the potential performance fee for each of FY2021 and FY2020 after the performance hurdle was met.
3iN investment activityCompetition for infrastructure assets coming to market was strong in the year, resulting in high prices. 3iN remained selective and disciplined on price, supporting a number of existing portfolio companies with bolt-on acquisitions. Infinis completed the acquisition of the development rights for a 6MW solar project at the Ling Hall landfill and Tampnet purchased a 1,200km offshore fibre cable system in the Gulf of Mexico. 3iN committed additional capital to ESVAGT to fund further growth in its offshore wind servicing segment and completed the acquisition of further stakes in its existing Dutch PPP projects.
In April 2021, 3iN announced a new c.€182 million investment to acquire a 60% stake in DNS:NET, a leading independent telecommunications provider in Germany. Completion is expected in June 2021.
Performance of 3i’s proprietary capital Infrastructure portfolioThe Group’s proprietary capital infrastructure portfolio consists of its 30% quoted stake in 3iN and its investments in Regional Rail and Smarte Carte, as well as smaller stakes in our other Infrastructure funds.
Quoted stake in 3iN3iN’s share price increased by 20% and closed at 296 pence on 31 March 2021 (31 March 2020: 247 pence). We recognised £132 million of unrealised profits on our 3iN investment (2020: £76 million unrealised loss) and £26 million of dividend income (2020: £24 million).
Table 7: Unrealised profits/(losses) on the revaluation of Infrastructure investments1 in the year to 31 March
2021 £m
2020 £m
Quoted 132 (76)Discounted cash flow (“DCF”) 26 (16)Fund/Other 10 –Total 168 (92)
1 Further information on our valuation methodology, including definitions and rationale, is included in the portfolio valuation – an explanation section on pages 188 and 189.
Table 8: Infrastructure portfolio movement for the year to 31 March 2021
Investment Valuation
Opening value at 1 April
2020 £m
Investment £m
Disposals at opening book value
£m
Unrealised profit/(loss) movement
£m
Othermovements1
£m
Closing value at
31 March 2021
£m
3iN Quoted 665 – – 132 – 797Smarte Carte DCF 172 – – (4) (8) 160Regional Rail DCF 195 – (74) 30 (20) 1313i Managed Infrastructure Acquisitions Fund Fund 38 – – 10 – 483i European Operational Projects Fund Fund 20 2 – (1) (1) 20India Infrastructure Fund Other 27 – (24) 1 (1) 3Total 1,117 2 (98) 168 (30) 1,159
1 Other movements include foreign exchange.
3i Group plc Annual report and accounts 2021Business review
33
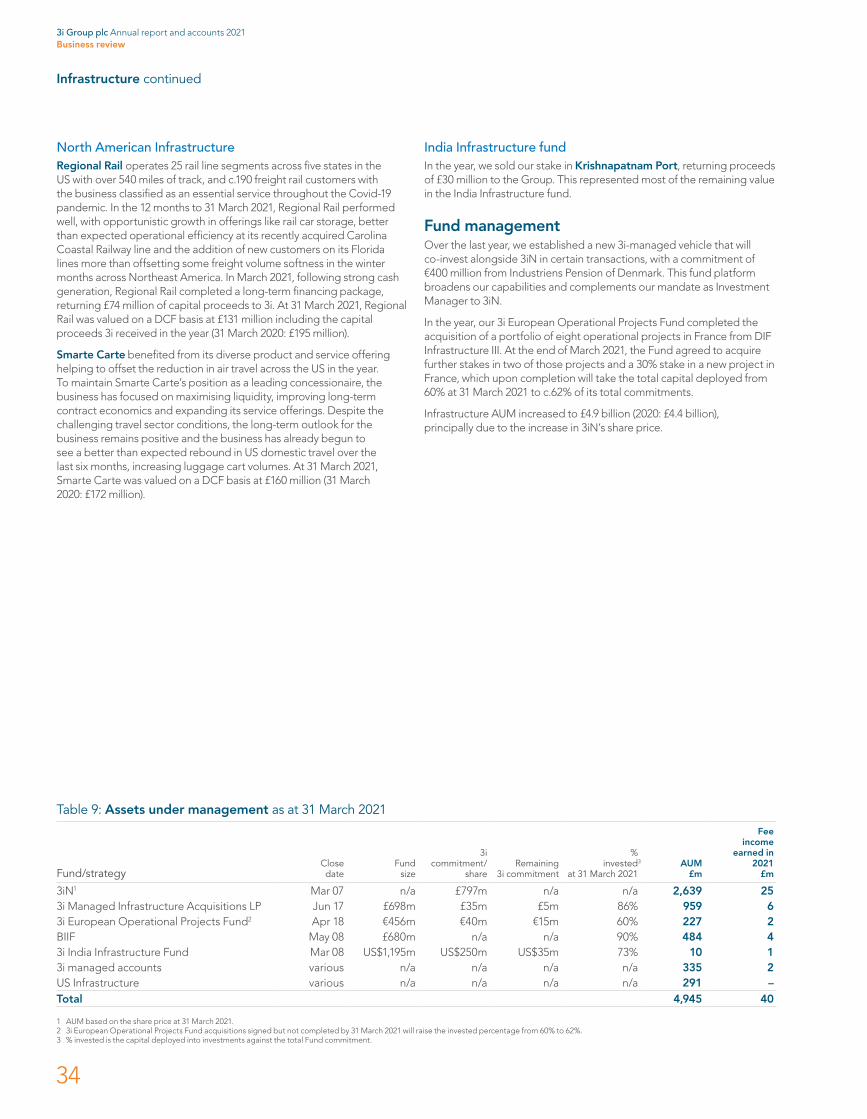
North American InfrastructureRegional Rail operates 25 rail line segments across five states in the US with over 540 miles of track, and c.190 freight rail customers with the business classified as an essential service throughout the Covid-19 pandemic. In the 12 months to 31 March 2021, Regional Rail performed well, with opportunistic growth in offerings like rail car storage, better than expected operational efficiency at its recently acquired Carolina Coastal Railway line and the addition of new customers on its Florida lines more than offsetting some freight volume softness in the winter months across Northeast America. In March 2021, following strong cash generation, Regional Rail completed a long-term financing package, returning £74 million of capital proceeds to 3i. At 31 March 2021, Regional Rail was valued on a DCF basis at £131 million including the capital proceeds 3i received in the year (31 March 2020: £195 million).
Smarte Carte benefited from its diverse product and service offering helping to offset the reduction in air travel across the US in the year. To maintain Smarte Carte’s position as a leading concessionaire, the business has focused on maximising liquidity, improving long-term contract economics and expanding its service offerings. Despite the challenging travel sector conditions, the long-term outlook for the business remains positive and the business has already begun to see a better than expected rebound in US domestic travel over the last six months, increasing luggage cart volumes. At 31 March 2021, Smarte Carte was valued on a DCF basis at £160 million (31 March 2020: £172 million).
India Infrastructure fundIn the year, we sold our stake in Krishnapatnam Port, returning proceeds of £30 million to the Group. This represented most of the remaining value in the India Infrastructure fund.
Fund managementOver the last year, we established a new 3i-managed vehicle that will co-invest alongside 3iN in certain transactions, with a commitment of €400 million from Industriens Pension of Denmark. This fund platform broadens our capabilities and complements our mandate as Investment Manager to 3iN.
In the year, our 3i European Operational Projects Fund completed the acquisition of a portfolio of eight operational projects in France from DIF Infrastructure III. At the end of March 2021, the Fund agreed to acquire further stakes in two of those projects and a 30% stake in a new project in France, which upon completion will take the total capital deployed from 60% at 31 March 2021 to c.62% of its total commitments.
Infrastructure AUM increased to £4.9 billion (2020: £4.4 billion), principally due to the increase in 3iN’s share price.
Infrastructure continued
Table 9: Assets under management as at 31 March 2021
Fund/strategyClose date
Fund size
3i commitment/
shareRemaining
3i commitment
% invested3
at 31 March 2021AUM
£m
Fee income
earned in 2021
£m
3iN1 Mar 07 n/a £797m n/a n/a 2,639 253i Managed Infrastructure Acquisitions LP Jun 17 £698m £35m £5m 86% 959 63i European Operational Projects Fund2 Apr 18 €456m €40m €15m 60% 227 2BIIF May 08 £680m n/a n/a 90% 484 43i India Infrastructure Fund Mar 08 US$1,195m US$250m US$35m 73% 10 13i managed accounts various n/a n/a n/a n/a 335 2US Infrastructure various n/a n/a n/a n/a 291 –Total 4,945 40
1 AUM based on the share price at 31 March 2021.2 3i European Operational Projects Fund acquisitions signed but not completed by 31 March 2021 will raise the invested percentage from 60% to 62%.3 % invested is the capital deployed into investments against the total Fund commitment.
3i Group plc Annual report and accounts 2021Business review
34
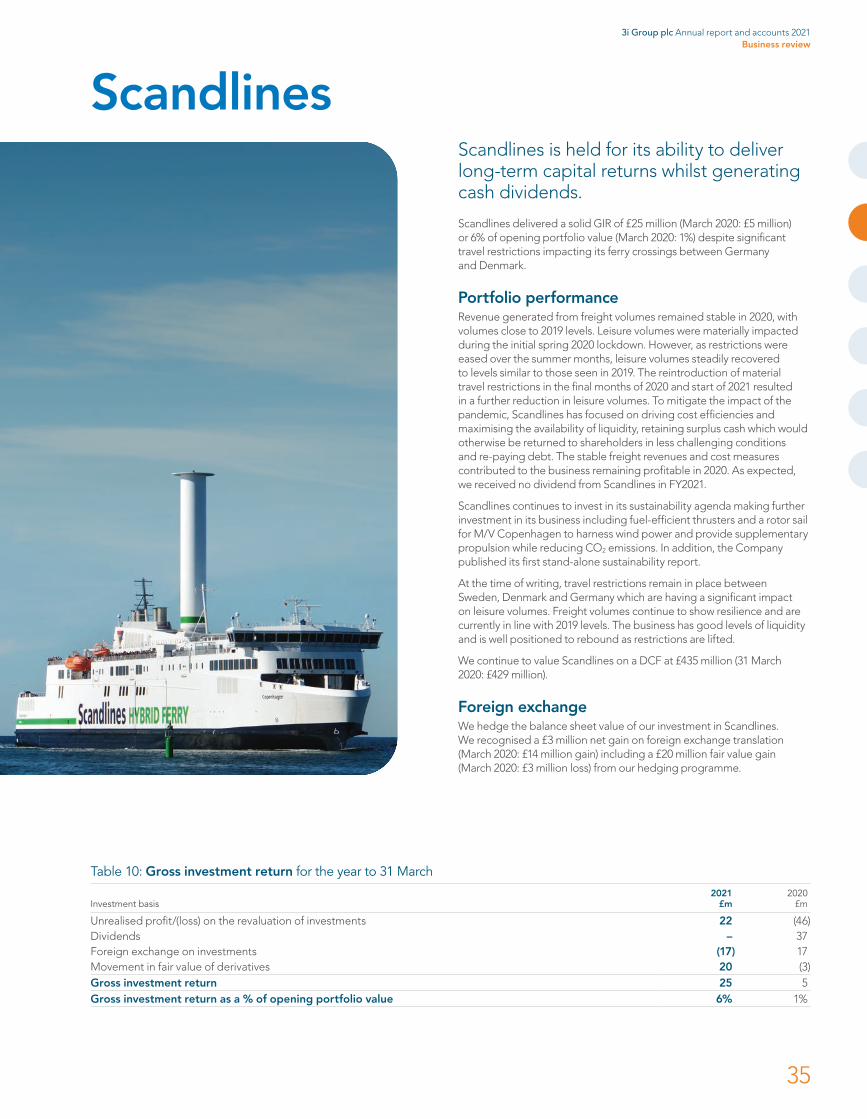
ScandlinesScandlines is held for its ability to deliver long-term capital returns whilst generating cash dividends.
Scandlines delivered a solid GIR of £25 million (March 2020: £5 million) or 6% of opening portfolio value (March 2020: 1%) despite significant travel restrictions impacting its ferry crossings between Germany and Denmark.
Portfolio performance Revenue generated from freight volumes remained stable in 2020, with volumes close to 2019 levels. Leisure volumes were materially impacted during the initial spring 2020 lockdown. However, as restrictions were eased over the summer months, leisure volumes steadily recovered to levels similar to those seen in 2019. The reintroduction of material travel restrictions in the final months of 2020 and start of 2021 resulted in a further reduction in leisure volumes. To mitigate the impact of the pandemic, Scandlines has focused on driving cost efficiencies and maximising the availability of liquidity, retaining surplus cash which would otherwise be returned to shareholders in less challenging conditions and re-paying debt. The stable freight revenues and cost measures contributed to the business remaining profitable in 2020. As expected, we received no dividend from Scandlines in FY2021.
Scandlines continues to invest in its sustainability agenda making further investment in its business including fuel-efficient thrusters and a rotor sail for M/V Copenhagen to harness wind power and provide supplementary propulsion while reducing CO2 emissions. In addition, the Company published its first stand-alone sustainability report.
At the time of writing, travel restrictions remain in place between Sweden, Denmark and Germany which are having a significant impact on leisure volumes. Freight volumes continue to show resilience and are currently in line with 2019 levels. The business has good levels of liquidity and is well positioned to rebound as restrictions are lifted.
We continue to value Scandlines on a DCF at £435 million (31 March 2020: £429 million).
Foreign exchangeWe hedge the balance sheet value of our investment in Scandlines. We recognised a £3 million net gain on foreign exchange translation (March 2020: £14 million gain) including a £20 million fair value gain (March 2020: £3 million loss) from our hedging programme.
Table 10: Gross investment return for the year to 31 March
Investment basis 2021
£m 2020
£m
Unrealised profit/(loss) on the revaluation of investments 22 (46)Dividends – 37Foreign exchange on investments (17) 17Movement in fair value of derivatives 20 (3)Gross investment return 25 5Gross investment return as a % of opening portfolio value 6% 1%
3i Group plc Annual report and accounts 2021Business review
35
Performance, risk and sustainabilityWhat’s in this sectionFinancial review 37
Investment basis 42
Reconciliation of Investment basis and IFRS 46
Alternative Performance Measures 49
Risk management 50
Principal risks and mitigations 56
Sustainability 64
Directors’ duties under Section 172 76

Financial review
Strong financial performanceWe generated a GIR of £2,139 million in FY2021 (2020: £318 million) and operating profit before carried interest of £2,031 million (2020: £215 million).
The total return was £1,726 million, representing a profit on opening shareholders’ funds of 22% (2020: £253 million or 3%). The diluted NAV per share at 31 March 2021 increased by 18% to 947 pence (31 March 2020: 804 pence) after paying dividends totalling 35 pence per share during the year. This result was after a net foreign exchange translation loss of 41 pence and the 13 pence negative accounting re-measurement loss from a fundamental de-risking of the UK defined benefit pension plan.
Investment basis and alternative performance measures (“APMs”)In our Strategic report we report our financial performance using our Investment basis. We do not consolidate our portfolio companies; as private equity and infrastructure investments they are not operating subsidiaries. IFRS 10 provides an exception from consolidation but also requires us to fair value other companies in the Group (primarily intermediate holding companies and partnerships), which results in a loss of transparency. As explained in the Investment basis and Reconciliation of investment basis and IFRS sections below, the total comprehensive income and net assets are the same under our audited IFRS financial statements and our Investment basis. The Investment basis is simply a “look through” of IFRS 10 to present the underlying performance and we believe it is more transparent to readers of our Annual report and accounts.
In October 2015, the European Securities and Markets Authority (“ESMA”) published guidelines about the use of APMs. These are financial measures such as KPIs that are not defined under IFRS. Our Investment basis is itself an APM, and we use a number of other measures which, on account of being derived from the Investment basis, are also APMs.
Further information about our use of APMs, including the applicable reconciliations to the IFRS equivalent where appropriate, is provided at the end of the Financial review and should be read alongside the Investment basis to IFRS reconciliation. Our APMs are gross investment return as a percentage of the opening investment portfolio value, cash realisations, cash investment, operating cash profit, net cash/(debt) and gearing.
Table 11: Total return for the year to 31 March
Investment basis2021
£m2020
£m
Realised profits over value on the disposal of investments 35 90Unrealised profits/(losses) on the revaluation of investments 2,351 (172)Portfolio incomeDividends 82 68Interest income from investment portfolio 65 118Fees receivable 9 9
Foreign exchange on investments (427) 214Movement in the fair value of derivatives 24 (9)Gross investment return 2,139 318Fees receivable from external funds 44 44Operating expenses (112) (116)Interest received (1) 1Interest paid (47) (38)Exchange movements 7 1Other income 1 5Operating profit before carried interest 2,031 215Carried interestCarried interest and performance fees receivable 5 85Carried interest and performance fees payable (184) (84)
Operating profit before tax 1,852 216Tax charge – (1)Profit for the year 1,852 215Re-measurements of defined benefit plans (126) 38Total comprehensive income for the year (“Total return”) 1,726 253Total return on opening shareholders’ funds 22% 3%
3i Group plc Annual report and accounts 2021Performance, risk and sustainability
37
Financial review continued
Realised profitsWe generated total realised proceeds of £218 million (2020: £918 million) and realised profits of £35 million (2020: £90 million) in the year, including realised proceeds of £114 million and profit of £29 million from Private Equity (2020: £848 million, £90 million) and realised proceeds of £104 million and profit of £6 million from Infrastructure (2020: nil, nil).
Unrealised value movementsWe recognised an unrealised profit of £2,351 million (2020: £172 million unrealised loss). Our portfolios performed strongly in FY2021 despite the uncertainty and disruption caused by Covid-19. Action continued to deliver robust performance contributing £1,202 million of unrealised profits and we also saw strong performance from our Private Equity investments in Royal Sanders, Luqom, Cirtec Medical, Tato, SaniSure, Magnitude Software and AES. The share prices of our quoted investments, 3iN and Basic-Fit, recovered well in the year.
Further information on the Private Equity, Infrastructure and Scandlines valuations is included in the business reviews.
Portfolio incomePortfolio income decreased to £156 million during the year (2020: £195 million). Interest income from portfolio companies, the majority of which is non-cash, reduced to £65 million (2020: £118 million) as we provided against interest income on the assets most impacted by the Covid-19 pandemic. Partially offsetting this was strong dividend income of £82 million (2020: £68 million), the majority of which was cash, following distributions from Royal Sanders, 3iN and Tato. Fee income remained stable in the year at £9 million (2020: £9 million).
Fees receivable from external fundsFees received from external funds were £44 million (2020: £44 million). 3i receives a fund management fee from 3iN, which amounted to £25 million in FY2021 (2020: £28 million). 3i also received fee income of £6 million (2020: £6 million) from MIA through advisory and management fees and continued to generate fee income from other 3i managed accounts and other funds. In Private Equity, we recognised a £4 million administration fee for our management of the 3i 2020 Co-investment vehicles related to Action.
Operating expensesOperating expenses of £112 million (2020: £116 million), decreased in the year due to lower overhead spend and lower travel cost due to global restrictions on travel. 3i continues to focus on controlling its operating expenses to achieve an operating cash profit.
Operating cash profit We generated an operating cash profit of £23 million in the year (2020: £40 million). Cash income decreased to £131 million (2020: £160 million), principally due to lower cash interest following the receipt of non-recurring cash interest in FY2020, Scandlines’ decision not to pay a dividend in 2020, and the decision to defer the collection of some portfolio income as a result of prudent portfolio liquidity management during the pandemic. This was offset by good dividend income from the stronger performers in the portfolio. Cash operating expenses decreased to £108 million (2020: £120 million) driven principally by lower variable compensation costs and a reduction in travel.
Table 12: Unrealised value movements on the revaluation of investments for the year to 31 March
2021 £m
2020 £m
Private Equity 2,161 (34)Infrastructure 168 (92)Scandlines 22 (46)Total 2,351 (172)
Table 13: Operating cash profit for the year to 31 March
2021 £m
2020 £m
Cash fees from external funds 39 44Cash portfolio fees 7 12Cash portfolio dividends and interest 85 104Cash income 131 160Cash operating expenses1 (108) (120)Operating cash profit 23 40
1 Cash operating expenses include operating expenses paid and lease payments.
3i Group plc Annual report and accounts 2021Performance, risk and sustainability
38

Carried interest and performance feesWe receive carried interest and performance fees from third-party funds and 3iN. We also pay carried interest and performance fees to participants in plans relating to returns from investments. These are received and/or paid subject to meeting certain performance conditions. In Private Equity, we typically accrue net carried interest payable between 10% and 13% of GIR, based on the assumption that all investments are realised at their balance sheet value. Carried interest is paid to participants when cash proceeds have actually been received following a realisation, refinancing event or other cash distribution and performance hurdles are passed in cash terms. Due to the length of time between investment and realisation, the schemes are usually active for a number of years and their participants include both current and previous employees of 3i.
We generated a strong GIR of £596 million in the Private Equity 2016-19 vintage (2020: £(145) million). As a result, the performance hurdle for this vintage has now been met on an accruals basis and we are now accruing carried interest payable for this vintage. As this was a first time accrual, it includes an element of “catch up” leading to a higher than usual carried interest charge this year. The effect of the catch up is £54 million. The continued robust performance of Action in the Buyouts 2010-12 vintage led to a £117 million increase in carried interest payable in FY2021.
During the year, £506 million (2020: £35 million) was paid to participants in Private Equity, of which £496 million was paid to participants in the Private Equity Buyouts 2010-12 carry plan, which includes a residual Action stake. The amount paid includes £111 million which became due following the decision to acquire 25% of the outstanding carry liability in August 2020. The economic result of this transaction is the increase in 3i’s investment in Action, net of carry, from 46.2% to 47.7%; the gross investment is 52.7% (31 March 2020: 52.6%) following purchase of a further small equity stake in Action as described on page 25.
Overall, the effect of the income statement charge, cash payments, as well as currency translation meant that the balance sheet carried interest and performance fees payable was £560 million (31 March 2020: £1,038 million).
3iN pays a performance fee based on its NAV on an annual basis, subject to a hurdle rate of return and partly deferred, subject to further hurdles. The continued strong performance of the assets held by 3iN resulted in the recognition of £8 million (2020: £6 million) of performance fees receivable. The Infrastructure team receives a share of the fee received from 3iN, with the majority of payments deferred and expensed over a number of years. £11 million (2020: £21 million) was recognised as an expense during the year, relating to performance fees from both the current and previous years. During the year, £10 million was paid to the Infrastructure team. The total potential payable relating to the FY2021 performance fee was £7 million, which together with the prior periods’ performance fee, results in remaining cumulative total potential payable for performance fees of £55 million.
Table 14: Carried interest and performance fees for the year to 31 March
Statement of comprehensive income2021
£m2020
£m
Carried interest and performance fees receivablePrivate Equity (3) 79Infrastructure 8 6Total 5 85Carried interest and performance fees payablePrivate Equity (173) (63)Infrastructure (11) (21)Total (184) (84)Net carried interest payable (179) 1
Table 15: Carried interest and performance fees at 31 March
Statement of financial position2021
£m2020
£m
Carried interest and performance fees receivablePrivate Equity 8 11Infrastructure 8 6Total 16 17Carried interest and performance fees payablePrivate Equity (533) (998)Infrastructure (27) (40)Total (560) (1,038)
3i Group plc Annual report and accounts 2021Performance, risk and sustainability
39
Financial review continued
Net foreign exchange movementsAt 31 March 2021, 84% of the Group’s net assets were denominated in euros or US dollars (31 March 2020: 78%). As sterling strengthened against both of these currencies, the Group recorded a total net foreign exchange translation loss of £420 million in the year (2020: £215 million gain), before the £24 million (2020: £9 million loss) translation gain from the movement in the fair value of hedging derivatives. The net foreign exchange loss also reflects the translation of non-portfolio net assets, including non-sterling cash held at the balance sheet date.
The Group’s general policy is not to hedge its foreign currency denominated portfolio. Where possible, flows from currency realisations are matched with currency investments. Short-term derivative contracts are used occasionally to manage transaction cash flows. We do hedge the foreign exchange translation risk associated with our investment in Scandlines, which is considered a longer-term hold with relatively predictable cash flows. As at 31 March 2021, the notional amount of the forward foreign exchange contracts held by the Group was €500 million, all relating to Scandlines.
PensionDuring the year, the 3i Group Pension Plan’s Trustees̀ completed a £650 million buy-in transaction with Legal & General. This transaction was completed without additional contributions from 3i. This insurance policy, alongside previous buy-in policies entered into with Pension Insurance Corporation and Legal & General in March 2017 and February 2019 respectively, means that the Plan benefits of all members are now insured. This is an excellent outcome, as it provides long-term security for the Plan members and 3i is no longer exposed to any material longevity, interest or inflation risk in the Plan or any financing requirements.
The last triennial funding valuation was based on the Plan’s position at 30 June 2019 and, on an IAS 19 accounting basis, the Plan remains in surplus. We reduced the IAS 19 Plan surplus to reflect the commercial outcome of the buy-in transaction from £173 million at 31 March 2020 to £55 million at 31 March 2021, which included a £122 million re-measurement loss, but no impact on cash.
TaxThe Group’s parent company continues to operate in the UK as an approved investment trust company. An approved investment trust is a UK investment company which is required to meet certain conditions set out in the UK tax rules to obtain and maintain its tax status. This approval allows certain investment profits of the Company, broadly its capital profits, to be exempt from tax in the UK. The Group’s tax charge for the year was nil (2020: £1 million). The Group’s overall UK tax position for the financial year is dependent on the finalisation of tax returns of the various corporate and partnership entities in the UK group.
Balance sheet and liquidityWe have run a conservative balance sheet strategy as a fundamental part of our business model since 2012. The validity of that choice was demonstrated throughout FY2021, enabling us to continue to invest without needing to accelerate any realisations. We had provided guidance that, in a normal economic environment, we were comfortable operating between £500 million of net cash and £500 million of net debt. We have now taken the opportunity to review this range, having had the benefit of testing our strategy under the stress of the pandemic and recognising the significant increase in the quality and value of our net assets since 2012. We have concluded that our guidance of a £500 million net cash tolerance remains appropriate but that we should extend the net debt tolerance to £750 million and include a gearing tolerance of up to 15%. Delivery of our mid to high-teens returns is not dependent on having a geared balance sheet. Any such, gearing would therefore be short term and tactical, rather than structural. The £750 million net debt tolerance is not a limit, and we would be prepared to exceed it provided gearing remains below 15%, and there is good visibility on realisations and refinancings occurring within the next 12 months.
Table 16: Net assets and sensitivity by currency at 31 March
FX rate £m %
1% sensitivity
£m
Sterling n/a 1,254 14% n/aEuro1 1.1741 6,237 68% 62US dollar 1.3803 1,489 16% 15Danish krone 8.7315 162 2% 2Other n/a 22 – n/a
1 Sensitivity impact is net of derivatives.
3i Group plc Annual report and accounts 2021Performance, risk and sustainability
40
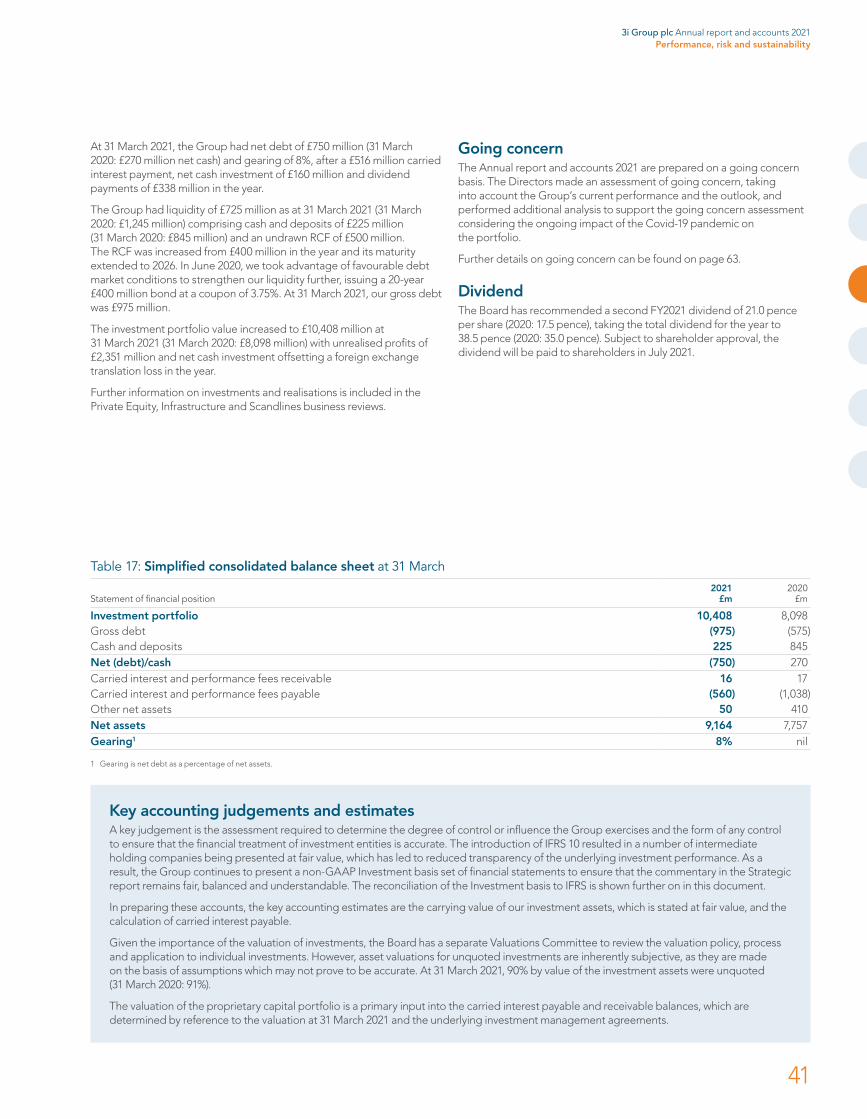
At 31 March 2021, the Group had net debt of £750 million (31 March 2020: £270 million net cash) and gearing of 8%, after a £516 million carried interest payment, net cash investment of £160 million and dividend payments of £338 million in the year.
The Group had liquidity of £725 million as at 31 March 2021 (31 March 2020: £1,245 million) comprising cash and deposits of £225 million (31 March 2020: £845 million) and an undrawn RCF of £500 million. The RCF was increased from £400 million in the year and its maturity extended to 2026. In June 2020, we took advantage of favourable debt market conditions to strengthen our liquidity further, issuing a 20-year £400 million bond at a coupon of 3.75%. At 31 March 2021, our gross debt was £975 million.
The investment portfolio value increased to £10,408 million at 31 March 2021 (31 March 2020: £8,098 million) with unrealised profits of £2,351 million and net cash investment offsetting a foreign exchange translation loss in the year.
Further information on investments and realisations is included in the Private Equity, Infrastructure and Scandlines business reviews.
Going concern The Annual report and accounts 2021 are prepared on a going concern basis. The Directors made an assessment of going concern, taking into account the Group’s current performance and the outlook, and performed additional analysis to support the going concern assessment considering the ongoing impact of the Covid-19 pandemic on the portfolio.
Further details on going concern can be found on page 63.
DividendThe Board has recommended a second FY2021 dividend of 21.0 pence per share (2020: 17.5 pence), taking the total dividend for the year to 38.5 pence (2020: 35.0 pence). Subject to shareholder approval, the dividend will be paid to shareholders in July 2021.
Table 17: Simplified consolidated balance sheet at 31 March
Statement of financial position2021
£m2020
£m
Investment portfolio 10,408 8,098Gross debt (975) (575)Cash and deposits 225 845Net (debt)/cash (750) 270Carried interest and performance fees receivable 16 17Carried interest and performance fees payable (560) (1,038)Other net assets 50 410Net assets 9,164 7,757Gearing1 8% nil
1 Gearing is net debt as a percentage of net assets.
Key accounting judgements and estimatesA key judgement is the assessment required to determine the degree of control or influence the Group exercises and the form of any control to ensure that the financial treatment of investment entities is accurate. The introduction of IFRS 10 resulted in a number of intermediate holding companies being presented at fair value, which has led to reduced transparency of the underlying investment performance. As a result, the Group continues to present a non-GAAP Investment basis set of financial statements to ensure that the commentary in the Strategic report remains fair, balanced and understandable. The reconciliation of the Investment basis to IFRS is shown further on in this document.
In preparing these accounts, the key accounting estimates are the carrying value of our investment assets, which is stated at fair value, and the calculation of carried interest payable.
Given the importance of the valuation of investments, the Board has a separate Valuations Committee to review the valuation policy, process and application to individual investments. However, asset valuations for unquoted investments are inherently subjective, as they are made on the basis of assumptions which may not prove to be accurate. At 31 March 2021, 90% by value of the investment assets were unquoted (31 March 2020: 91%).
The valuation of the proprietary capital portfolio is a primary input into the carried interest payable and receivable balances, which are determined by reference to the valuation at 31 March 2021 and the underlying investment management agreements.
3i Group plc Annual report and accounts 2021Performance, risk and sustainability
41

Investment basis
Consolidated statement of comprehensive incomefor the year to 31 March
2021 £m
2020 £m
Realised profits over value on the disposal of investments 35 90Unrealised profits/(losses) on the revaluation of investments 2,351 (172)Portfolio incomeDividends 82 68Interest income from investment portfolio 65 118Fees receivable 9 9
Foreign exchange on investments (427) 214Movement in the fair value of derivatives 24 (9)Gross investment return 2,139 318Fees receivable from external funds 44 44Operating expenses (112) (116)Interest received (1) 1Interest paid (47) (38)Exchange movements 7 1Other income 1 5Operating profit before carried interest 2,031 215Carried interestCarried interest and performance fees receivable 5 85Carried interest and performance fees payable (184) (84)
Operating profit before tax 1,852 216Tax charge – (1)Profit for the year 1,852 215Other comprehensive incomeRe-measurements of defined benefit plans (126) 38
Total comprehensive income for the year (“Total return”) 1,726 253
3i Group plc Annual report and accounts 2021Performance, risk and sustainability
42

Consolidated statement of financial positionas at 31 March
2021 £m
2020 £m
AssetsNon-current assetsInvestmentsQuoted investments 1,011 758Unquoted investments 9,397 7,340
Investment portfolio 10,408 8,098Carried interest and performance fees receivable 8 11Other non-current assets 54 26Intangible assets 8 9Retirement benefit surplus 55 173Property, plant and equipment 5 5Right of use asset 16 19Derivative financial instruments 16 7Deferred income taxes 1 –Total non-current assets 10,571 8,348Current assetsCarried interest and performance fees receivable 8 6Other current assets 21 296Current income taxes 2 2Derivative financial instruments 10 6Cash and cash equivalents 225 845Total current assets 266 1,155Total assets 10,837 9,503LiabilitiesNon-current liabilitiesTrade and other payables (24) (5)Carried interest and performance fees payable (543) (505)Loans and borrowings (975) (575)Retirement benefit deficit (29) (25)Lease liability (13) (16)Derivative financial instruments – (2)Deferred income taxes (1) (1)Provisions (2) (3)Total non-current liabilities (1,587) (1,132)Current liabilitiesTrade and other payables (64) (73)Carried interest and performance fees payable (17) (533)Lease liability (4) (4)Derivative financial instruments – (2)Current income taxes (1) (2)Total current liabilities (86) (614)Total liabilities (1,673) (1,746)Net assets 9,164 7,757EquityIssued capital 719 719Share premium 788 788Other reserves 7,721 6,328Own shares (64) (78)Total equity 9,164 7,757
3i Group plc Annual report and accounts 2021Performance, risk and sustainability
43
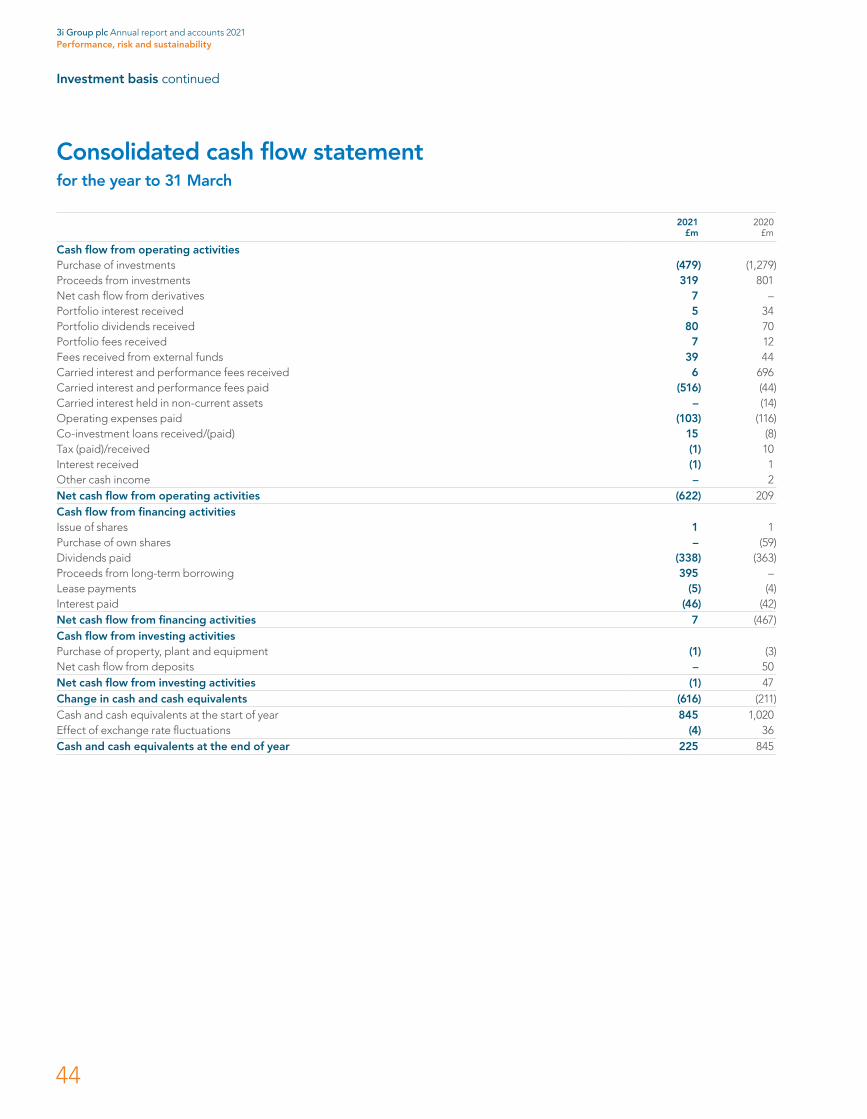
Consolidated cash flow statementfor the year to 31 March
2021 £m
2020 £m
Cash flow from operating activitiesPurchase of investments (479) (1,279)Proceeds from investments 319 801Net cash flow from derivatives 7 –Portfolio interest received 5 34Portfolio dividends received 80 70Portfolio fees received 7 12Fees received from external funds 39 44Carried interest and performance fees received 6 696Carried interest and performance fees paid (516) (44)Carried interest held in non-current assets – (14)Operating expenses paid (103) (116)Co-investment loans received/(paid) 15 (8)Tax (paid)/received (1) 10Interest received (1) 1Other cash income – 2Net cash flow from operating activities (622) 209Cash flow from financing activitiesIssue of shares 1 1Purchase of own shares – (59)Dividends paid (338) (363)Proceeds from long-term borrowing 395 –Lease payments (5) (4)Interest paid (46) (42)Net cash flow from financing activities 7 (467)Cash flow from investing activitiesPurchase of property, plant and equipment (1) (3)Net cash flow from deposits – 50Net cash flow from investing activities (1) 47Change in cash and cash equivalents (616) (211)Cash and cash equivalents at the start of year 845 1,020Effect of exchange rate fluctuations (4) 36Cash and cash equivalents at the end of year 225 845
Investment basis continued
3i Group plc Annual report and accounts 2021Performance, risk and sustainability
44
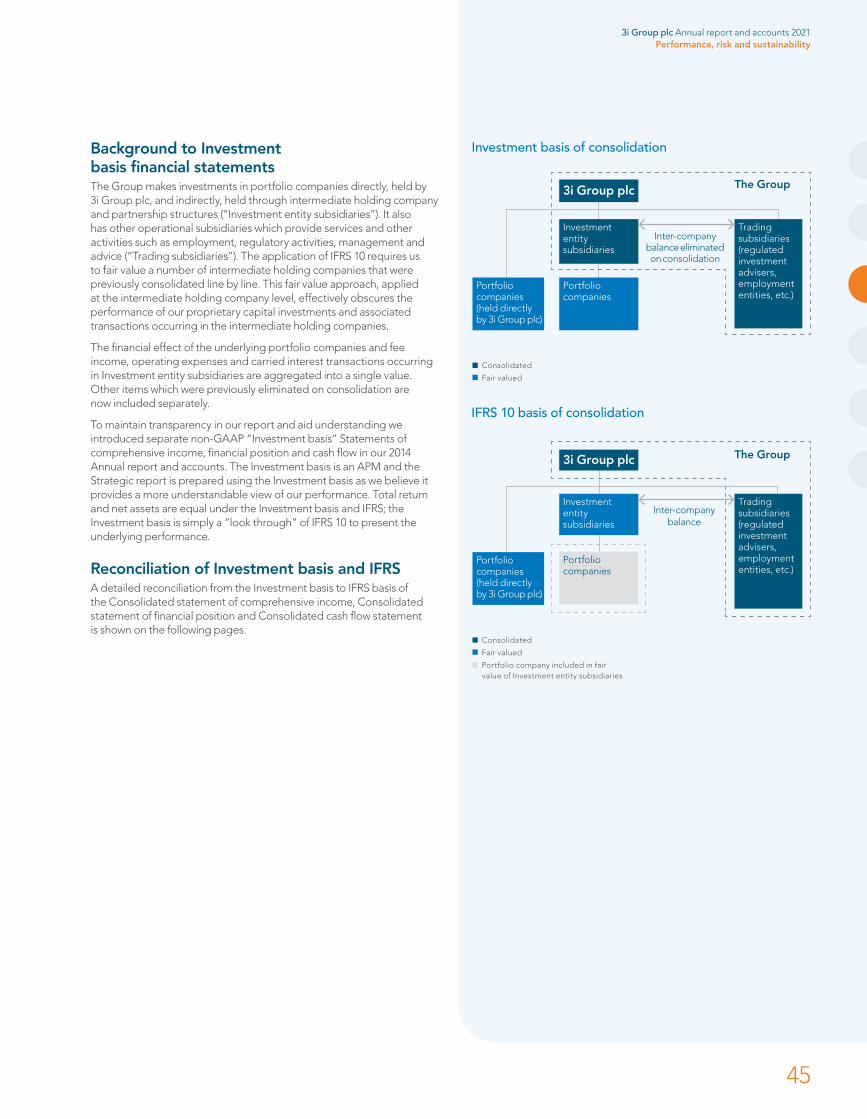
Background to Investment basis financial statementsThe Group makes investments in portfolio companies directly, held by 3i Group plc, and indirectly, held through intermediate holding company and partnership structures (“Investment entity subsidiaries”). It also has other operational subsidiaries which provide services and other activities such as employment, regulatory activities, management and advice (“Trading subsidiaries”). The application of IFRS 10 requires us to fair value a number of intermediate holding companies that were previously consolidated line by line. This fair value approach, applied at the intermediate holding company level, effectively obscures the performance of our proprietary capital investments and associated transactions occurring in the intermediate holding companies.
The financial effect of the underlying portfolio companies and fee income, operating expenses and carried interest transactions occurring in Investment entity subsidiaries are aggregated into a single value. Other items which were previously eliminated on consolidation are now included separately.
To maintain transparency in our report and aid understanding we introduced separate non-GAAP “Investment basis” Statements of comprehensive income, financial position and cash flow in our 2014 Annual report and accounts. The Investment basis is an APM and the Strategic report is prepared using the Investment basis as we believe it provides a more understandable view of our performance. Total return and net assets are equal under the Investment basis and IFRS; the Investment basis is simply a “look through” of IFRS 10 to present the underlying performance.
Reconciliation of Investment basis and IFRS A detailed reconciliation from the Investment basis to IFRS basis of the Consolidated statement of comprehensive income, Consolidated statement of financial position and Consolidated cash flow statement is shown on the following pages.
Investment basis of consolidation
IFRS 10 basis of consolidation
Trading subsidiaries (regulated investment advisers, employment entities, etc.)
3i Group plc
Portfolio companies (held directly by 3i Group plc)
Portfolio companies
Investment entity subsidiaries
The Group
Inter-company balance
Trading subsidiaries (regulated investment advisers, employment entities, etc.)
Portfolio companies (held directly by 3i Group plc)
Portfolio companies
Investment entity subsidiaries
The Group
Inter-company balance eliminated on consolidation
3i Group plc
Consolidated
Fair valued
Portfolio company included in fair value of Investment entity subsidiaries
Consolidated
Fair valued
3i Group plc Annual report and accounts 2021Performance, risk and sustainability
45

Reconciliation of Investment basis and IFRS
Reconciliation of consolidated statement of comprehensive incomefor the year to 31 March
Notes
Investment basis 2021
£m
IFRS adjustments
2021 £m
IFRS basis 2021
£m
Investment basis 2020
£m
IFRS adjustments
2020 £m
IFRS basis 2020
£m
Realised profits/(losses) over value on the disposal of investments
1,2 35 (26) 9 90 (119) (29)
Unrealised profits/(losses) on the revaluation of investments
1,2 2,351 (1,134) 1,217 (172) 144 (28)
Fair value movements on investment entity subsidiaries
1 – 792 792 – 191 191
Portfolio incomeDividends 1,2 82 (33) 49 68 (46) 22Interest income from investment portfolio 1,2 65 (43) 22 118 (81) 37Fees receivable 1,2 9 4 13 9 2 11
Foreign exchange on investments 1,3 (427) 232 (195) 214 (178) 36Movement in the fair value of derivatives 24 – 24 (9) – (9)Gross investment return 2,139 (208) 1,931 318 (87) 231Fees receivable from external funds 44 – 44 44 – 44Operating expenses 4 (112) 1 (111) (116) – (116)Interest received 1 (1) – (1) 1 1 2Interest paid (47) – (47) (38) – (38)Exchange movements 1,3 7 10 17 1 25 26Income from investment entity subsidiaries 1 – 22 22 – 19 19Other income/(expense) 1 – 1 5 (2) 3Operating profit before carried interest 2,031 (175) 1,856 215 (44) 171Carried interestCarried interest and performance fees receivable 5 – 5 85 (18) 67Carried interest and performance fees payable (184) 178 (6) (84) 61 (23)
Operating profit before tax 1,852 3 1,855 216 (1) 215Tax charge 1,4 – – – (1) – (1)Profit for the year 1,852 3 1,855 215 (1) 214Other comprehensive income/(expense)Exchange differences on translation of foreign operations
1,3 – (3) (3) – 1 1
Re-measurements of defined benefit plans (126) – (126) 38 – 38Other comprehensive income for the year (126) (3) (129) 38 1 39Total comprehensive income for the year (“Total return”)
1,726 – 1,726 253 – 253
The IFRS basis is audited and the Investment basis is unaudited.
Notes:1 Applying IFRS 10 to the Consolidated statement of comprehensive income consolidates the line items of a number of previously consolidated subsidiaries into a single line item “Fair value movements
on investment entity subsidiaries”. In the “Investment basis” accounts we have disaggregated these line items to analyse our total return as if these Investment entity subsidiaries were fully consolidated, consistent with prior years. The adjustments simply reclassify the Consolidated statement of comprehensive income of the Group, and the total return is equal under the Investment basis and the IFRS basis.
2 Realised profits/(losses), unrealised profits/(losses), and portfolio income shown in the IFRS accounts only relate to portfolio companies that are held directly by 3i Group plc and not those portfolio companies held through Investment entity subsidiaries. Realised profits, unrealised profits, and portfolio income in relation to portfolio companies held through Investment entity subsidiaries are aggregated into the single “Fair value movement on investment entity subsidiaries” line. This is the most significant reduction of information in our IFRS accounts.
3 Foreign exchange movements have been reclassified under the Investment basis as foreign currency asset and liability movements. Movements within the Investment entity subsidiaries are included within “Fair value movements on investment entities”.
4 Other items also aggregated into the “Fair value movements on investment entity subsidiaries” line include fees receivable from external funds, audit fees, administration expenses, carried interest and tax.
The IFRS basis is audited and the Investment basis is unaudited.
Notes to Reconciliation of consolidated statement of financial position on page 47:1 Applying IFRS 10 to the Consolidated statement of financial position aggregates the line items into the single line item “Investments in investment entity subsidiaries”. In the Investment basis we have
disaggregated these items to analyse our net assets as if the Investment entity subsidiaries were consolidated. The adjustment reclassifies items in the Consolidated statement of financial position. There is no change to the net assets, although for reasons explained below, gross assets and gross liabilities are different. The disclosure relating to portfolio companies is significantly reduced by the aggregation, as the fair value of all investments held by Investment entity subsidiaries is aggregated into the “Investments in investment entity subsidiaries” line. We have disaggregated this fair value and disclosed the underlying portfolio holding in the relevant line item, ie, quoted investments or unquoted investments. Other items which may be aggregated include carried interest, other assets and other payables, and the Investment basis presentation again disaggregates these items.
2 Intercompany balances between Investment entity subsidiaries and trading subsidiaries also impact the transparency of our results under the IFRS basis. If an Investment entity subsidiary has an intercompany balance with a consolidated trading subsidiary of the Group, then the asset or liability of the Investment entity subsidiary will be aggregated into its fair value, while the asset or liability of the consolidated trading subsidiary will be disclosed as an asset or liability in the Consolidated statement of financial position for the Group.
3 Investment basis financial statements are prepared for performance measurement and therefore reserves are not analysed separately under this basis.
3i Group plc Annual report and accounts 2021Performance, risk and sustainability
46
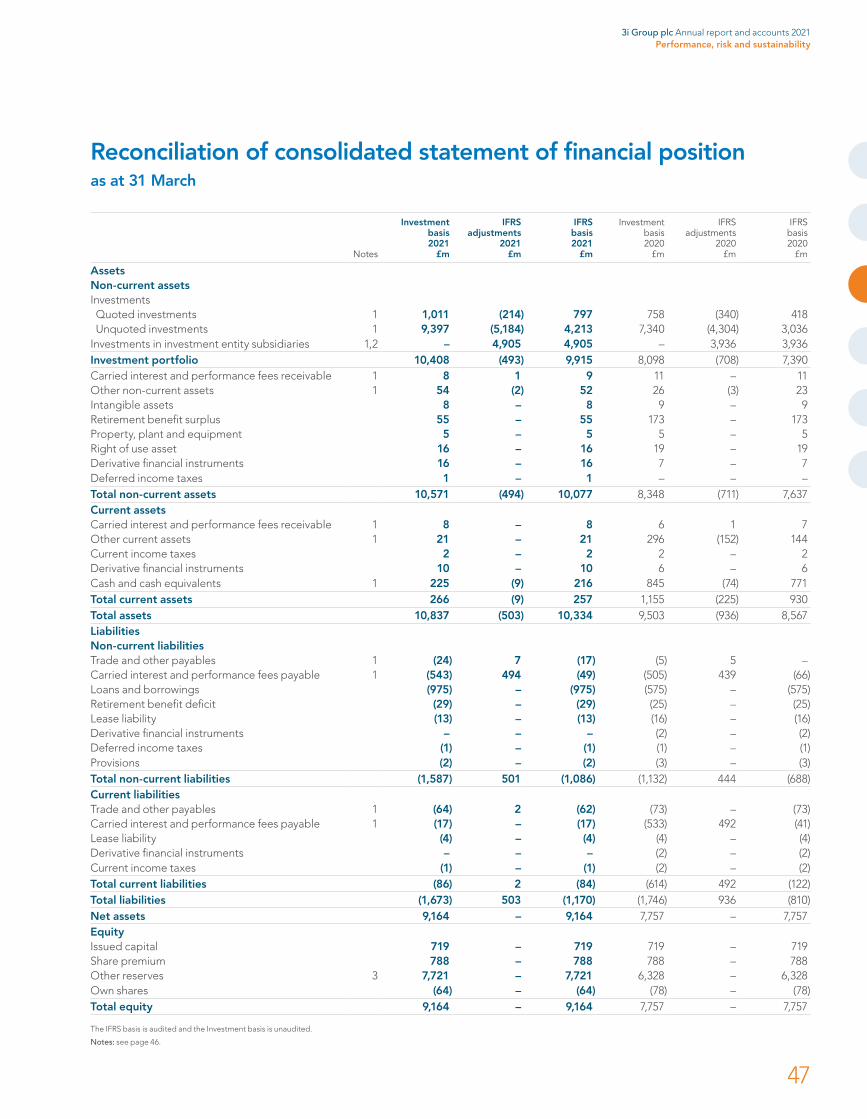
Reconciliation of consolidated statement of financial positionas at 31 March
Notes
Investment basis 2021
£m
IFRS adjustments
2021 £m
IFRS basis 2021
£m
Investment basis 2020
£m
IFRS adjustments
2020 £m
IFRS basis 2020
£m
Assets Non-current assetsInvestmentsQuoted investments 1 1,011 (214) 797 758 (340) 418Unquoted investments 1 9,397 (5,184) 4,213 7,340 (4,304) 3,036
Investments in investment entity subsidiaries 1,2 – 4,905 4,905 – 3,936 3,936Investment portfolio 10,408 (493) 9,915 8,098 (708) 7,390Carried interest and performance fees receivable 1 8 1 9 11 – 11Other non-current assets 1 54 (2) 52 26 (3) 23Intangible assets 8 – 8 9 – 9Retirement benefit surplus 55 – 55 173 – 173Property, plant and equipment 5 – 5 5 – 5Right of use asset 16 – 16 19 – 19Derivative financial instruments 16 – 16 7 – 7Deferred income taxes 1 – 1 – – –Total non-current assets 10,571 (494) 10,077 8,348 (711) 7,637Current assetsCarried interest and performance fees receivable 1 8 – 8 6 1 7Other current assets 1 21 – 21 296 (152) 144Current income taxes 2 – 2 2 – 2Derivative financial instruments 10 – 10 6 – 6Cash and cash equivalents 1 225 (9) 216 845 (74) 771Total current assets 266 (9) 257 1,155 (225) 930Total assets 10,837 (503) 10,334 9,503 (936) 8,567Liabilities Non-current liabilitiesTrade and other payables 1 (24) 7 (17) (5) 5 –Carried interest and performance fees payable 1 (543) 494 (49) (505) 439 (66)Loans and borrowings (975) – (975) (575) – (575)Retirement benefit deficit (29) – (29) (25) – (25)Lease liability (13) – (13) (16) – (16)Derivative financial instruments – – – (2) – (2)Deferred income taxes (1) – (1) (1) – (1)Provisions (2) – (2) (3) – (3)Total non-current liabilities (1,587) 501 (1,086) (1,132) 444 (688)Current liabilitiesTrade and other payables 1 (64) 2 (62) (73) – (73)Carried interest and performance fees payable 1 (17) – (17) (533) 492 (41)Lease liability (4) – (4) (4) – (4)Derivative financial instruments – – – (2) – (2)Current income taxes (1) – (1) (2) – (2)Total current liabilities (86) 2 (84) (614) 492 (122)Total liabilities (1,673) 503 (1,170) (1,746) 936 (810)Net assets 9,164 – 9,164 7,757 – 7,757EquityIssued capital 719 – 719 719 – 719Share premium 788 – 788 788 – 788Other reserves 3 7,721 – 7,721 6,328 – 6,328Own shares (64) – (64) (78) – (78)Total equity 9,164 – 9,164 7,757 – 7,757
The IFRS basis is audited and the Investment basis is unaudited.
Notes: see page 46.
3i Group plc Annual report and accounts 2021Performance, risk and sustainability
47
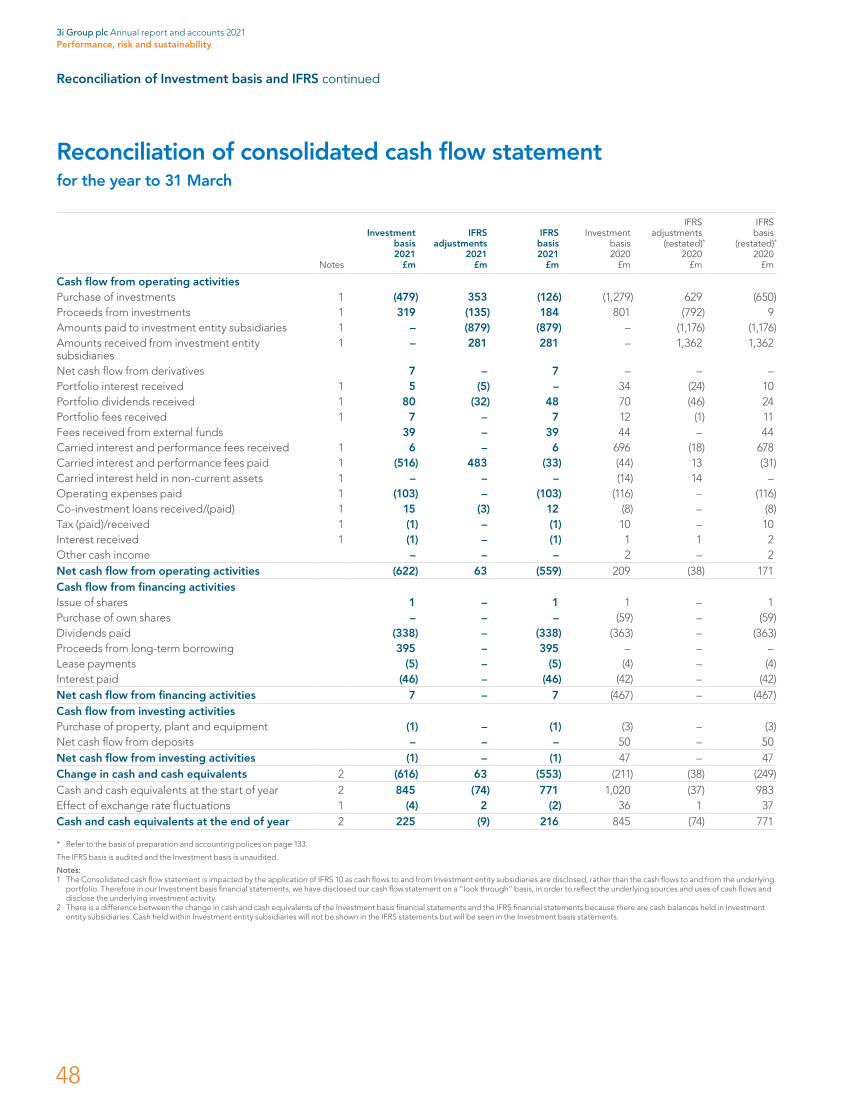
Reconciliation of consolidated cash flow statement for the year to 31 March
Notes
Investment basis 2021
£m
IFRS adjustments
2021 £m
IFRS basis 2021
£m
Investment basis 2020
£m
IFRS adjustments
(restated)*2020
£m
IFRS basis
(restated)*2020
£m
Cash flow from operating activitiesPurchase of investments 1 (479) 353 (126) (1,279) 629 (650)Proceeds from investments 1 319 (135) 184 801 (792) 9Amounts paid to investment entity subsidiaries 1 – (879) (879) – (1,176) (1,176)Amounts received from investment entity subsidiaries
1 – 281 281 – 1,362 1,362
Net cash flow from derivatives 7 – 7 – – –Portfolio interest received 1 5 (5) – 34 (24) 10Portfolio dividends received 1 80 (32) 48 70 (46) 24Portfolio fees received 1 7 – 7 12 (1) 11Fees received from external funds 39 – 39 44 – 44Carried interest and performance fees received 1 6 – 6 696 (18) 678Carried interest and performance fees paid 1 (516) 483 (33) (44) 13 (31)Carried interest held in non-current assets 1 – – – (14) 14 –Operating expenses paid 1 (103) – (103) (116) – (116)Co-investment loans received/(paid) 1 15 (3) 12 (8) – (8)Tax (paid)/received 1 (1) – (1) 10 – 10Interest received 1 (1) – (1) 1 1 2Other cash income – – – 2 – 2Net cash flow from operating activities (622) 63 (559) 209 (38) 171Cash flow from financing activitiesIssue of shares 1 – 1 1 – 1Purchase of own shares – – – (59) – (59)Dividends paid (338) – (338) (363) – (363)Proceeds from long-term borrowing 395 – 395 – – –Lease payments (5) – (5) (4) – (4)Interest paid (46) – (46) (42) – (42)Net cash flow from financing activities 7 – 7 (467) – (467)Cash flow from investing activitiesPurchase of property, plant and equipment (1) – (1) (3) – (3)Net cash flow from deposits – – – 50 – 50Net cash flow from investing activities (1) – (1) 47 – 47Change in cash and cash equivalents 2 (616) 63 (553) (211) (38) (249)Cash and cash equivalents at the start of year 2 845 (74) 771 1,020 (37) 983Effect of exchange rate fluctuations 1 (4) 2 (2) 36 1 37Cash and cash equivalents at the end of year 2 225 (9) 216 845 (74) 771
* Refer to the basis of preparation and accounting polices on page 133.
The IFRS basis is audited and the Investment basis is unaudited.
Notes:1 The Consolidated cash flow statement is impacted by the application of IFRS 10 as cash flows to and from Investment entity subsidiaries are disclosed, rather than the cash flows to and from the underlying
portfolio. Therefore in our Investment basis financial statements, we have disclosed our cash flow statement on a “look through” basis, in order to reflect the underlying sources and uses of cash flows and disclose the underlying investment activity.
2 There is a difference between the change in cash and cash equivalents of the Investment basis financial statements and the IFRS financial statements because there are cash balances held in Investment entity subsidiaries. Cash held within Investment entity subsidiaries will not be shown in the IFRS statements but will be seen in the Investment basis statements.
Reconciliation of Investment basis and IFRS continued
3i Group plc Annual report and accounts 2021Performance, risk and sustainability
48

We assess our performance using a variety of measures that are not specifically defined under IFRS and are therefore termed APMs. The APMs that we use may not be directly comparable with those used by other companies. Our Investment basis is itself an APM. The explanation of and rationale for the Investment basis and its reconciliation to IFRS is provided above. The table below defines our additional APMs.
Gross investment return as a percentage of opening portfolio valuePurpose Calculation Reconciliation to IFRSA measure of the performance of our proprietary investment portfolio.
Page 18For further information see the Group KPIs
It is calculated as the gross investment return, as shown in the Investment basis Consolidated statement of comprehensive income, as a % of the opening portfolio value.
The equivalent balances under IFRS and the reconciliation to the Investment basis are shown in the Reconciliation of the consolidated statement of comprehensive income and the Reconciliation of the consolidated statement of financial position respectively.
Cash realisationsPurpose Calculation Reconciliation to IFRSCash proceeds from our investments support our returns to shareholders, as well as our ability to invest in new opportunities.
Page 18For further information see the Group KPIs
The cash received from the disposal of investments in the year as shown in the Investment basis Consolidated cash flow statement.
The equivalent balance under IFRS and the reconciliation to the Investment basis is shown in the Reconciliation of the consolidated cash flow statement.
Cash investmentPurpose Calculation Reconciliation to IFRSIdentifying new opportunities in which to invest proprietary capital is the primary driver of the Group’s ability to deliver attractive returns.
Page 18For further information see the Group KPIs
The cash paid to acquire investments in the year as shown on the Investment basis Consolidated cash flow statement.
The equivalent balance under IFRS and the reconciliation to the Investment basis is shown in the Reconciliation of the consolidated cash flow statement.
Operating cash profitPurpose Calculation Reconciliation to IFRSBy covering the cash cost of running the business with cash income, we reduce the potential dilution of capital returns.
The cash income from the portfolio (interest, dividends and fees) together with fees received from external funds less cash operating expenses and leases payments as shown on the Investment basis Consolidated cash flow statement. The calculation is shown in Table 13 of the Financial review.
The equivalent balance under IFRS and the reconciliation to the Investment basis is shown in the Reconciliation of the consolidated cash flow statement.
Net (debt)/cashPurpose Calculation Reconciliation to IFRSA measure of the available cash to invest in the business and an indicator of the financial risk in the Group’s balance sheet.
Cash and cash equivalents plus deposits less loans and borrowings as shown on the Investment basis Consolidated statement of financial position.
The equivalent balance under IFRS and the reconciliation to the Investment basis is shown in the Reconciliation of the consolidated statement of financial position.
GearingPurpose Calculation Reconciliation to IFRSA measure of the financial risk in the Group’s balance sheet.
Net debt (as defined above) as a % of the Group’s net assets under the Investment basis. It cannot be less than zero.
The equivalent balance under IFRS and the reconciliation to the Investment basis is shown in the Reconciliation of the consolidated statement of financial position.
Alternative Performance Measures (“APMs”)
3i Group plc Annual report and accounts 2021Performance, risk and sustainability
49

Risk management
Effective risk management underpins the successful delivery of our strategy and longer-term sustainability of the business. Integrity, rigour and accountability are central to our values and culture at 3i and are embedded in our approach to risk management.
Understanding our risk appetite and cultureAs both an investor and asset manager, 3i is in the business of taking risks in order to seek to achieve its targeted returns for fund investors and shareholders. The Board approves the strategic objectives that determine the level and types of risk that 3i is prepared to accept. The Board reviews 3i’s strategic objectives and risk appetite at least annually. The Group’s risk management framework is designed to support the delivery of the Group’s strategic objectives and the longer-term sustainability of the business and its investment portfolio.
3i’s risk appetite policy, which is consistent with previous years, is built on rigorous and comprehensive investment procedures and conservative capital management.
CultureIntegrity, rigour and accountability are central to our values and culture and are embedded in our approach to risk management. Our Investment Committee, which has oversight of the investment pipeline development and approves new investments, significant portfolio changes and divestments, is integral to ensuring a consistent approach across the business. This includes compliance with 3i’s financial and strategic requirements, cultural values and appropriate investment behaviours. Members of the Executive Committee have responsibility for their own business or functional areas and the Group expects individual behaviours to meet its high standards of conduct. All employees share the responsibility for upholding 3i’s strong control culture and supporting effective risk management. Senior managers, typically those who report to Executive Committee members, are required to confirm their individual and business area compliance annually. In addition, all staff are required to comply with regulatory conduct rules and are assessed on how they demonstrate 3i’s values as part of their annual appraisal. Finally, our Remuneration Committee is responsible for ensuring the Group’s remuneration policy is aligned with the Group’s culture and values, weighted towards variable compensation dependent on performance, and does not encourage inappropriate risk taking.
The following sections explain how we control and manage the risks in our business. They outline the key risks, our assessment of their potential impact on our business in the context of the current environment and how we seek to mitigate them. It is important to note that under the current working from home conditions, which have been in place for the past year, the Group has continued to maintain a strong control environment. Our people have successfully adapted to remote working, demonstrating positive engagement and the ability to use technology in effective ways. We will continue to enhance our existing processes based on what we have learnt from the last year.
Approach to risk governanceThe Board is responsible for risk assessment, the risk management process and for the protection of the Group’s reputation, brand integrity and longer-term sustainability. It considers the most significant risks facing the Group and uses quantitative analyses, such as vintage controls which consider the portfolio concentration by geography and sector, periodic reporting of financial and non-financial KPIs from the portfolio, including ESG indicators, and liquidity reporting, where appropriate.
Non-executive oversight is also exercised through the Audit and Compliance Committee which focuses on upholding standards of integrity, financial reporting, risk management, going concern and internal control. The Audit and Compliance Committee’s activities are discussed further in this document in the Audit and Compliance Committee report.
The Board has delegated the responsibility for risk oversight to the Chief Executive. He is assisted by the Group Risk Committee (“GRC”) in managing this responsibility, and guided by the Board’s appetite for risk and any specific limits set. The GRC maintains the Group risk review, which summarises the Group’s principal risks, associated mitigating actions and key risk indicators, and identifies any changes to the Group’s risk profile. The review also incorporates a watch list of new and emerging risks for monitoring purposes. The risk review takes place four times a year, with the last review in April 2021, and the Chief Executive provides updates to each Audit and Compliance Committee meeting. The Investment Committee has principal responsibility for managing the Group’s investment portfolio and monitoring its most material risks. It ensures a consistent approach to investment and portfolio management processes across the business.
In addition to the above, a number of other Board and Executive Committee members contribute to the Group’s overall risk governance structure. Please refer to page 52 for further details on the Risk governance structure.
3i Group plc Annual report and accounts 2021Performance, risk and sustainability
50

Risk appetiteOur risk appetite is defined by our strategic objectives. We invest capital in businesses to deliver capital returns and portfolio and fund management cash income to cover our costs, and increase returns to our investors.
Investment risk The substantial majority of the Group’s capital is invested in Private Equity. Before the Group commits to an investment, we assess the Private Equity opportunity using the following criteria:
• return objective: individually assessed and subject to a minimum target of a 2x money multiple over four to five years;
• geographic focus: operate within our core markets of northern Europe and North America;
• sector expertise: focus on Business and Technology Services, Consumer, Industrial and Healthcare;
• responsible investment: focus on the overall long-term sustainability of each business and ESG risk profile in line with the criteria and exclusions set out in our Responsible Investment policy; and
• vintage: invest up to £750 million per annum in four to seven new investments in companies with an enterprise value range of €100 million to €500 million at investment.
Investments made by 3iN need to be consistent with 3iN’s overall return target of 8% to 10% over the medium term and generate a mix of capital and income returns. Other Infrastructure investments made by the Group should be capable of delivering capital growth and fund management fees which together generate mid-teen returns. All Infrastructure investments are also made subject to the criteria set out in the Group’s Responsible Investment policy.
On occasion, the Group may conclude that it is in the interest of shareholders, and consistent with our strategic objectives, to hold a Private Equity investment for a longer period. Such an investment may be managed outside the Private Equity or Infrastructure businesses. The only investment currently so managed is Scandlines.
Capital management3i adopts a conservative approach to managing its capital resources as follows:
• the Group aims to operate within a range of £500 million net cash to £750 million net debt, with tolerance to operate outside of this range on a short-term basis and up to a gearing level of 15% dependent on investment and realisation flows. However, the Group may raise long-term debt, or use other financing from time to time, to manage investment and realisation flows. The Group has no appetite for structural gearing which means that achievement of its returns objectives is not reliant on gearing;
• the Group generally does not hedge its currency exposure for its Private Equity and Infrastructure assets, but it does match currency realisations with investments, where possible, and may take out short-term hedges occasionally to hedge investments and realisations between signing and completion;
• if appropriate, with due consideration of any associated liquidity risk, the Group will hedge a portion of its currency exposure on its longer-term investments, such as Scandlines; and
• we have limited appetite for the dilution of capital returns as a result of operating and interest expenses. All our business lines generate cash income to mitigate this risk.
+ www.3i.comFor more information on 3i Group’s Pillar 3 document
3i Group plc Annual report and accounts 2021Performance, risk and sustainability
51

Audit and Compliance Committee
• Responsible for reviewing financial reporting risk and internal control and the relationship with the External auditor
• Reviews and challenges reports from Group Finance, Tax, Internal Audit and Compliance
• Chief Executive updates the Committee at each meeting on the output of the latest GRC meeting
• Oversees the assessment and management of ESG issues and risks, including those related to environmental legislation and regulation, climate change, governance and compliance regulation
Remuneration Committee
• Responsible for ensuring a remuneration culture which is weighted towards variable reward and strictly dependent on performance whilst not encouraging inappropriate risk taking
• Approves carried interest and asset performance linked schemes for our investment professionals that are in line with market practice and enable the Group to attract and retain the best talent
• By excluding Executive Directors from carried interest or performance fee profit schemes, the Committee ensures that their remuneration is closely aligned with shareholder returns
Nominations Committee
• Responsible for ensuring that the Board has the necessary skills, experience and knowledge to enable the Group to deliver its strategic objectives
• Responsible for appointing a diverse Board
Valuations Committee
• Specific and primary responsibility for the valuation policy and valuation of the Group’s investment portfolio including the impact of sustainability related matters
• Provides oversight and challenge of underlying assumptions on the valuation of the unquoted investment portfolio (103% of net assets at 31 March 2021)
• Direct engagement with the External auditor, including its specialist valuations team
Investment Committee• Principal committee for managing the Group’s
investment portfolio and monitoring its most material risks. Meets as often as required
• Chaired by the Chief Executive• Strict oversight of each step of the investment
lifecycle• Approves all investment, divestment and
material portfolio decisions• Monitors investments against original
investment case• Ensures investments are in line with the Group’s
investment policy and risk appetite• Responsible for the implementation of the
Responsible Investment policy, as well as for the assessment of the overall long-term sustainability of portfolio companies, ESG risks and opportunities in the portfolio
Chief Executive• Delegated responsibility for management of the Group • Delegated responsibility for investment decisions• Delegated responsibility for risk management
Group Risk Committee • Assists the Chief Executive with the oversight
of risk management across the Group• Implements the Group’s risk appetite policy
and monitors performance• Maintains the Group risk review which details
its principal risk exposure and appropriate mitigations and controls, and an overview of new and emerging risks
• Two members of the GRC, the Group Finance Director and General Counsel, form the Risk Management Function as required under the AIFMD Regulations and the FCA’s Investment Funds Sourcebook
• Maintains oversight of the management of the Responsible Investment policy and of key ESG and sustainability risks across the Group and portfolio
Conflicts Committee• Deals with potential conflicts as required
Treasury Transactions Committee• Considers specific treasury transactions
as required
Executive Committee• Monitors divisional performance• Facilitates information sharing between divisions• Meets monthly
Market Abuse Regulation Committee
• Considers potential disclosure matters as required
Board• Approves the Group’s risk appetite and strategy• Responsible for ensuring an effective risk management and oversight process across
the Group and for the longer-term investment strategy and sustainability of the business • Assisted by four Board Committees with specific responsibility for key risk management areas• Delegates management of the Group to the Chief Executive
Risk management continued
Risk governance structure
3i Group plc Annual report and accounts 2021Performance, risk and sustainability
52

Risk frameworkThe risk framework is augmented by a separate Risk Management Function which has specific responsibilities under the FCA’s Investment Funds Sourcebook. It meets ahead of the GRC meetings to consider the key risks impacting the Group, and any changes in the relevant period where appropriate. It also considers the separate risk reports for each Alternative Investment Fund (“AIF”) managed by the Group, including areas such as portfolio composition, portfolio valuation, operational updates and team changes, which are then considered by the GRC.
The Group operates a “three lines of defence” framework for managing and identifying risk:
1. The first line of defence against outcomes outside our risk appetite is constituted by our business functions themselves.
2. Line management is supported by oversight and control functions, specifically Compliance, Group Finance, Human Resources and Legal.
3. Internal Audit provides independent assurance over the operation of controls and is the third line of defence.
The internal audit programme includes the review of the effectiveness of risk management processes and recommendations to improve the internal control environment.
Role of Group Risk Committee in risk managementThe quarterly Group risk review process includes an analysis of external developments, emerging risks, and the monitoring of key strategic and financial metrics (such as KPIs) considered to be indicators of potential changes in the Group’s risk profile. The GRC uses this information to identify its principal risks. It then evaluates the impact and likelihood of each risk, with reference to associated measures and KPIs. The adequacy of the mitigation plans is then assessed and, if necessary, additional actions are agreed and reviewed at the subsequent meeting. A report summarising the key conclusions of each GRC meeting and a copy of the risk review report is provided to the Audit and Compliance Committee.
A number of focus topics are also agreed in advance of each meeting. In FY2021, the GRC covered the following:
• a review of the Group’s IT framework including cyber security, systems developments and IT resilience;
• an update on the Group’s business continuity and resilience planning and testing;
• updates on the risk implications of Covid-19 and on contingency planning, including people management, systems performance, key supplier performance and office management;
• a review of the Group’s stress tests to support its Internal Capital Adequacy Assessment Process (“ICAAP”) and Viability statement;
• semi-annual updates on ESG and sustainability issues and themes with respect to the Group’s portfolio companies;
• an update on the Taskforce for Climate-related Financial Disclosures; and
• the proposed risk disclosures in the 2021 Annual report and accounts.
There were no significant changes to the GRC’s overall approach to risk governance or its operation in FY2021, but we continued to refine our framework for risk management where appropriate.
3i Group plc Annual report and accounts 2021Performance, risk and sustainability
53
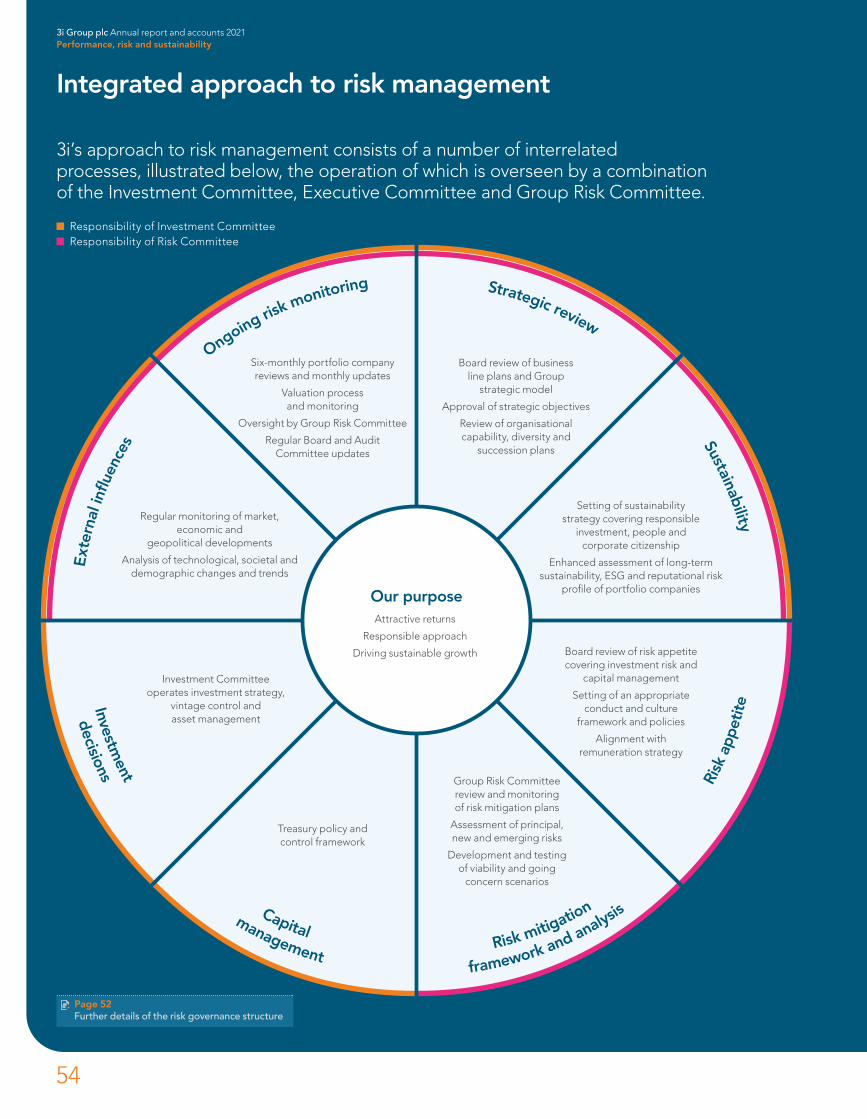
Responsibility of Investment Committee Responsibility of Risk Committee
3i’s approach to risk management consists of a number of interrelated processes, illustrated below, the operation of which is overseen by a combination of the Investment Committee, Executive Committee and Group Risk Committee.
Page 52Further details of the risk governance structure
Strategic review
Sustainability
Ext
erna
l infl
uen
ces
Ongoing risk monitoring
Investment
Capital Risk mitigation
Risk
app
etite
decisions
management framework and analysis
Board review of business line plans and Group
strategic model
Approval of strategic objectives
Review of organisational capability, diversity and
succession plans
Six-monthly portfolio company reviews and monthly updates
Valuation process and monitoring
Oversight by Group Risk Committee
Regular Board and Audit Committee updates
Setting of sustainability strategy covering responsible
investment, people and corporate citizenship
Enhanced assessment of long-term sustainability, ESG and reputational risk
profile of portfolio companies
Regular monitoring of market, economic and
geopolitical developments
Analysis of technological, societal and demographic changes and trends
Board review of risk appetite covering investment risk and
capital management
Setting of an appropriate conduct and culture
framework and policies
Alignment with remuneration strategy
Investment Committee operates investment strategy,
vintage control and asset management
Treasury policy and control framework
Group Risk Committee review and monitoring of risk mitigation plans
Assessment of principal, new and emerging risks
Development and testing of viability and going
concern scenarios
Our purposeAttractive returns
Responsible approach
Driving sustainable growth
Integrated approach to risk management
54
3i Group plc Annual report and accounts 2021Performance, risk and sustainability
Role of Investment Committee in risk managementOur Investment Committee is fundamental to the management of investment risk. The Investment Committee is involved in and approves every material step of the investment, portfolio management and realisation process.
We carry out our investment activities under our Responsible Investment policy, which is embedded in our processes and informs the Investment Committee’s assessment of each investment opportunity.The investment case presented at the outset of our investment consideration process includes the expected benefit of operational improvements, growth initiatives, opportunities arising from initiatives to mitigate the impact of sustainability-related challenges, and M&A activity that will be driven by our investment professionals together with the portfolio company’s management team. It will also include a view on the likely exit strategy and timing. In evaluating new and existing investments, the Investment Committee also takes account of reputational and sustainability-related risks and opportunities, including the impact of environmental factors on the markets each company serves and demand for its products, the resilience of each company’s assets and supply chain and the feasibility and cost of initiatives to reduce the company’s environmental footprint. This evaluation takes into account broader ESG and sustainability developments and trends.
After an investment is made, each investment case is closely monitored:
• our monthly portfolio monitoring reviews assess current performance against budget, prior year and a set of traffic light indicators and bespoke, forward looking financial and non-financial KPIs; and
• we hold semi-annual reviews of all our assets. We focus on the longer-term performance and plan for the investment compared to the original investment case, together with any strategic developments, a detailed assessment of ESG and sustainability risks and opportunities, and market outlook.
Our monitoring processes also include consideration of instances where individual portfolio company underperformance could have adverse reputational consequences for the Group, even though the value impact may not be material. The monthly portfolio monitoring reviews and the semi-annual reviews are attended by the Investment Committee and the senior members of the investment teams. Non-executive Directors are invited to attend the semi-annual reviews.
Finally, we recognise the need to plan and execute a successful exit at the optimum time for the portfolio company’s development, taking consideration of market conditions. This risk is closely linked to the external economic environment. Exit plans are refreshed where appropriate in the semi-annual portfolio reviews and the divestment process is clearly defined and overseen by the Investment Committee.
We review our internal processes and investment decisions in light of actual outcomes on an ongoing basis.
+ www.3i.com3i’s approach as a responsible investor and a summary of our Responsible Investment policy
3i Group plc Annual report and accounts 2021Performance, risk and sustainability
55

Business and risk environment in FY2021The impact of the Covid-19 pandemic has been at the forefront of our risk assessment and mitigation planning processes throughout the year. Our focus has been first and foremost on protecting the wellbeing of our own employees, as well as those of our portfolio companies and the communities in which we collectively operate. We have taken steps to minimise any operational disruption to the Group by activating our contingency plans and putting in place a comprehensive range of measures. We have worked with our portfolio companies to do likewise. We have performed an assessment of a medium and long-term recovery for the economy which considers rolling lockdowns amid virus mutations and vaccine deployment delays.
The Directors have considered a robust assessment of the principal risks facing the Group, including those that would threaten its business model, future performance, solvency or liquidity. We define our principal risks as those that have the potential to impact the delivery of our strategic objectives materially. We also maintain a “watch list” of risks which includes new and emerging risks which may have the potential to become principal risks but are not yet considered to be so. Likewise, principal risks may be moved to the watch list where this risk has reduced but still requires close monitoring. These risks are regularly reviewed to determine if they have the potential to impact the delivery of our strategy. In the year, we have updated our watch list to include the need to monitor developments in reporting of diversity and other social issues. A further addition was the potential use of government support and furlough payments and impact of any significant planned operational changes by portfolio companies to address Covid-19 disruption for those assets most exposed, which is overseen by the Investment Committee. The matter of ESG risks and reporting requirements, previously on the watch list, was incorporated into a new principal risk, and the risk in relation to the UK/EU trading relationship was moved from the principal risks to the watch list.
ExternalExternal risks are the risks to our business which are usually outside of our direct control such as political, economic, environmental, social, regulatory and competitor risks.
The impact of Covid-19 on global economic growth and market volatility has been closely monitored over the year. Extensive travel restrictions, quarantines and other social distancing measures have had a significant and adverse economic impact, with some sectors being particularly hard hit in the short term by the resultant falls in consumer and business demand. Some of our portfolio companies operate in the automotive and travel sectors which have been directly affected by lockdown and travel restrictions. Measures and initiatives put in place to mitigate the disruption caused by Covid-19 restrictions have generally enabled these portfolio companies to stabilise their performance. The repercussions of the global pandemic will be widespread and long-lasting. This includes, for example, the impact on government finances and changes in consumer and investor behaviours. Accordingly, we have added this as a separate principal risk.
Our environmental impact is a matter of significant importance to us and our investors, and we support behavioural change that reduces any adverse impact and enhances our ESG and sustainability agenda more broadly. We aim to achieve our strategic objectives as a responsible investor. Our Investment Committee plays a significant role in ensuring that each investment is assessed for its ESG and sustainability risks and opportunities, and in overseeing key developments and initiatives both at the portfolio company level and more broadly. Further details can be found on page 59.
Consideration of geo-political developments forms part of our overall risk assessment and our investment decisions with respect to specific markets or economies. For example, the EU and UK reached a trade agreement in December 2020 which came into effect from 1 January 2021. Although this did not include financial services, we have a degree of clarity which has enabled the Group to review and identify simplifications to its existing regulatory and operational structures in the EU. Currently 70% of our portfolio is invested in northern Europe and these structures are designed to enable the continued smooth operation of 3i’s investment activities in the region.
InvestmentOur overarching objective is to source attractive investment opportunities at the right price and execute our investment plans successfully.
As part of our portfolio monitoring, all of our new investments in the year are subject to rigorous review, including performance against a 180-day plan. We continued to monitor the portfolio actively and held additional reviews for the small number of Private Equity assets where operational improvements and reorganisation were particularly intense.
Our investment and portfolio monitoring semi-annual reviews include an enhanced ESG and sustainability assessment, which enables current and emerging risks and opportunities to be tracked on a systematic basis.
Investment teams are responsible for origination and asset management and are rewarded with performance-based remuneration.
OperationalThe potential operational disruption of the Covid-19 pandemic to the Group was classified as a principal risk towards the end of FY2020 and remains an ongoing risk for FY2021 and beyond. From the onset, we were able to activate our existing incident management and business continuity plans supplemented by a comprehensive contingency plan. 3i’s employees have fulfilled their roles effectively since the start of the pandemic, having continued to work on a remote basis. This has been underpinned by robust and secure IT systems and the reliable performance of 3i’s key third-party service providers.
Principal risks and mitigations – aligning risk to our strategic objectives
3i Group plc Annual report and accounts 2021Performance, risk and sustainability
56

Attracting and retaining key people remains a significant potential operational risk. The recruitment and induction of new staff has continued during the past year on a fully or partially remote basis. Additional steps have been taken to maintain good levels of staff engagement and provide additional support where needed in the current remote working environment. Our Remuneration Committee ensures that our variable compensation schemes are in line with market practice. This includes carried interest, an important long-term incentive, which rewards cash-to-cash returns.
In addition, detailed succession plans are in place for each business area. The Board completed its last formal annual review of the Group’s organisational capability and succession plans in September 2020. The success of the Group since the 2012 restructuring has led to modest levels of voluntary staff turnover, 7% in FY2021.
Fraud risk is considered on a regular basis. The Group has a robust fraud risk assessment and anti-fraud programme in place. The latter includes fraud prevention work by Internal Audit, awareness training and provision of an independent reporting service or “hotline” accessible by all staff. The Group’s cyber security programme also aims to identify and mitigate the risks of third-party frauds, for example ransomware and phishing attacks, through the use of IT security tools and regular staff training.
New and emerging risksThe GRC maintains a watch list of risks which are deemed of sufficient importance to require active monitoring by the GRC but are not currently regarded as principal risks to the achievement of the Group’s strategic objectives. Risks on the watch list may be reclassified as principal risks and vice versa based on the GRC’s assessment. Details of changes in the year are summarised on page 56.
The current watch list includes some portfolio related risks, such as concentration and specific sector exposures; tax risks in relation to changing rules; the UK/EU trading relationship; cyber security; and the increased importance of diversity and other social issues.
We recognise the increasing impact that environmental and climate-related risks are having on businesses and communities across the world. The Group is not directly exposed to material environmental or climate-related risks. We monitor and manage any direct environmental and climate-related risks through our comprehensive risk governance framework and compliance processes and procedures, which also ensure that 3i is compliant with all applicable environmental legislation and reporting requirements.
We are, however, potentially exposed to environmental and climate-related risks through the portfolio. Our investment strategy is to make a limited number of new investments each year, selected within our target sectors and geographies on the basis of their compatibility with our return targets. We carry out our investment activities under a rigorous Responsible Investment policy and have the flexibility to screen out businesses at an early stage which have unsustainable environmental practices, or which are exposed to excessive risks. Once invested, we monitor environmental and climate-related risks closely and use our influence to ensure that our portfolio companies are compliant with emerging regulations and legislation in this field to encourage the development of more environmentally sustainable behaviours in our portfolio companies, as well as investments to mitigate the impact of our portfolio companies’ environmental impact.
In view of the increasing importance of ESG and sustainability risks, outlined above, we moved this topic from our watch list and incorporated it into a new principal risk.
Our annual stress test scenario planning, which underpins our Viability statement, also models a range of environmental impacts on our portfolio, including an increase in physical risks relating to climate change, loss of key personnel and different shaped recoveries from the pandemic. In practice, such risk is limited as our investment strategy can be adapted to changing risks and regulations.
OutlookCovid-19 continues to have a significant impact on the global economy and livelihoods; however, the current outlook is more encouraging, with vaccine programmes beginning to have a positive effect, particularly in the UK and US. Progress, however, is dependent on more effective global vaccine deployment ahead of potential new virus mutations, against which existing vaccines may not be as effective.
3i continues to operate with limited disruption to its day-to-day operations and has worked closely with portfolio management teams to support their respective contingency plans. Enhanced portfolio monitoring and reporting processes remain in place to identify any short-term liquidity or covenant test issues and other actions needed to support portfolio companies through this unprecedented period of uncertainty. The impact of Covid-19 on the longer-term plans of the portfolio companies is subject to regular updates and assessments as part of this enhanced monitoring.
We made three new investments in the last six months and have continued to grow portfolio value through our buy-and-build strategy. Our diverse portfolio has demonstrated a resilient performance, despite the significant disruption caused by lockdowns and other Covid-19 related restrictions, and is well positioned to maintain this momentum going forward.
We have a clear and consistent strategy and a disciplined approach to investment whilst looking to put more capital behind those portfolio companies we already know well. We expect competition for the best assets in our sectors to remain intense and prices high. Accordingly, our focus remains on bilateral or complex processes and our buy-and-build platforms where we continue to build an attractive pipeline of new and further investment opportunities.
3i Group plc Annual report and accounts 2021Performance, risk and sustainability
57

Principal risks and mitigations – aligning risk to our strategic objectives continued
The disclosures on the following pages are not an exhaustive list of risks and uncertainties faced by the Group, but rather a summary of the principal risks which are regularly reviewed by the GRC and the Board, and have the potential to affect materially the achievement of the Group’s strategic objectives and impact its financial performance, reputation and brand integrity.
Investment
Potential impact• Impacts longer-term returns and capital management
and therefore ability to deliver strategic plan
• May impact progress with specific strategic initiatives
• May reduce staff morale and confidence
• Cost base may not be sustainable
Risk management and mitigation• Regular monitoring of investment and divestment pipeline
• Early involvement of Investment Committee as new investment ideas are identified
• Disciplined approach to sourcing investment opportunities and pricing
• Regular review of asset allocation
• Focus on bolt-on acquisition opportunities, which can be more attractively priced and offer synergy benefits
FY2021 outcome• Invested in three new Private Equity companies and
completed eight bolt-on acquisitions, with three requiring 3i proprietary capital investment
• Investment Committee maintained a cautious stance, declining a number of investment proposals where price and risk and reward failed to meet Group requirements
Movement in risk status in FY2021
Link to strategic objectives
Key risk
Lower investment rates
Key risk
Exposure of specific portfolio assets to Covid-19 disruption
Potential impact• Health and safety of employees and customers
• Impact on NAV through the contraction of Private Equity portfolio earnings or changes in valuation multiples
• Reduces realisation potential, impacting shareholder returns
• Potential impact and profile of specific cases of underperformance, including reputational risks to 3i as an investor
• Increases the need to provide liquidity support to portfolio companies
• Assets in the transportation and travel sectors more exposed and more likely to underperform in the current market
Risk management and mitigation• Detailed scenario and contingency planning at the
portfolio company level
• Steps taken by portfolio companies to monitor and manage the health and safety of their employees and customers
• Steps taken by portfolio companies, particularly in the retail sector, to adapt to changing social distancing and other restrictions
• Steps taken by portfolio companies to manage and fund operating and financing costs through an extended period of disruption
FY2021 outcome• We provided liquidity support for two of our portfolio
companies and have capacity to support our other portfolio companies if required
• Close monitoring of portfolio performance and future forecasts with regular updates provided to 3i Investment Committee and then to 3i Group Board
Movement in risk status in FY2021
Link to strategic objectives
3i Group plc Annual report and accounts 2021Performance, risk and sustainability
58
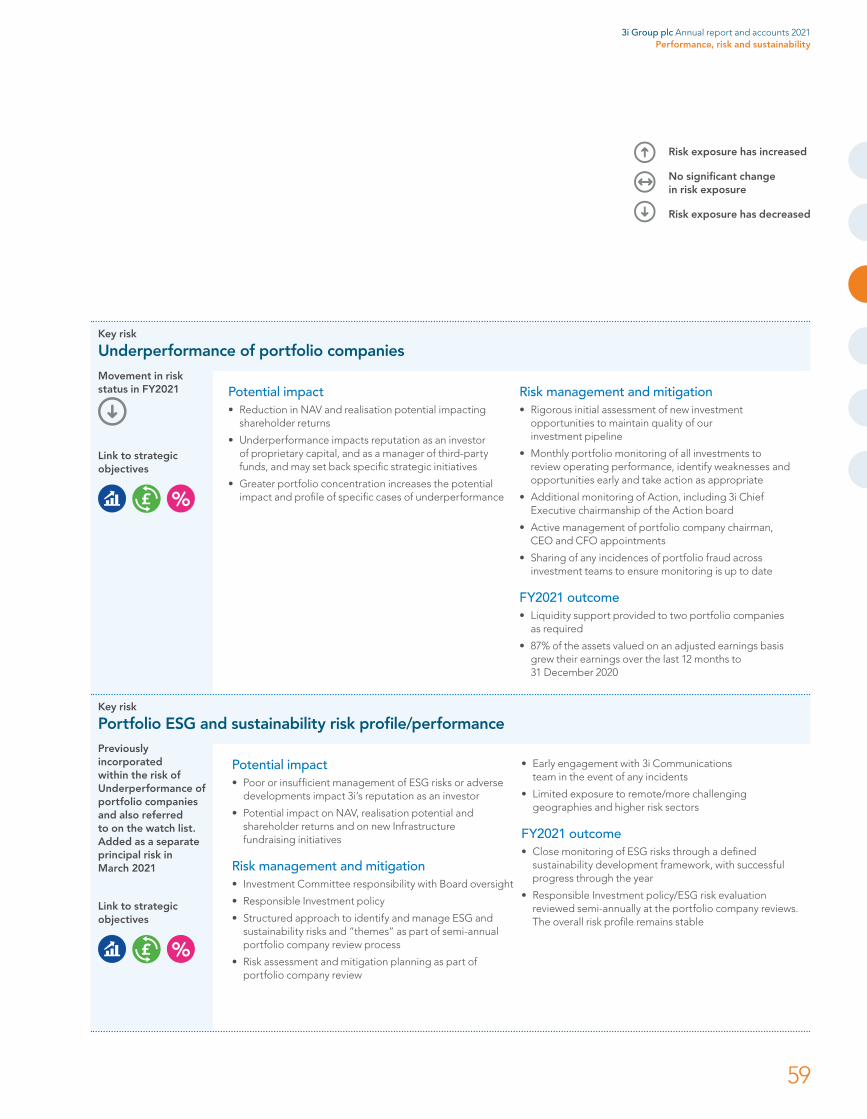
Risk exposure has increased
No significant change in risk exposure
Risk exposure has decreased
Potential impact• Poor or insufficient management of ESG risks or adverse
developments impact 3i’s reputation as an investor
• Potential impact on NAV, realisation potential and shareholder returns and on new Infrastructure fundraising initiatives
Risk management and mitigation• Investment Committee responsibility with Board oversight
• Responsible Investment policy
• Structured approach to identify and manage ESG and sustainability risks and “themes” as part of semi-annual portfolio company review process
• Risk assessment and mitigation planning as part of portfolio company review
• Early engagement with 3i Communications team in the event of any incidents
• Limited exposure to remote/more challenging geographies and higher risk sectors
FY2021 outcome• Close monitoring of ESG risks through a defined
sustainability development framework, with successful progress through the year
• Responsible Investment policy/ESG risk evaluation reviewed semi-annually at the portfolio company reviews. The overall risk profile remains stable
Previously incorporated within the risk of Underperformance of portfolio companies and also referred to on the watch list. Added as a separate principal risk in March 2021
Link to strategic objectives
Key risk
Portfolio ESG and sustainability risk profile/performance
Key risk
Underperformance of portfolio companies
Potential impact• Reduction in NAV and realisation potential impacting
shareholder returns
• Underperformance impacts reputation as an investor of proprietary capital, and as a manager of third-party funds, and may set back specific strategic initiatives
• Greater portfolio concentration increases the potential impact and profile of specific cases of underperformance
Risk management and mitigation• Rigorous initial assessment of new investment
opportunities to maintain quality of our investment pipeline
• Monthly portfolio monitoring of all investments to review operating performance, identify weaknesses and opportunities early and take action as appropriate
• Additional monitoring of Action, including 3i Chief Executive chairmanship of the Action board
• Active management of portfolio company chairman, CEO and CFO appointments
• Sharing of any incidences of portfolio fraud across investment teams to ensure monitoring is up to date
FY2021 outcome• Liquidity support provided to two portfolio companies
as required
• 87% of the assets valued on an adjusted earnings basis grew their earnings over the last 12 months to 31 December 2020
Movement in risk status in FY2021
Link to strategic objectives
3i Group plc Annual report and accounts 2021Performance, risk and sustainability
59

Risk exposure has increased
No significant change in risk exposure
Risk exposure has decreased
Principal risks and mitigations – aligning risk to our strategic objectives continued
External
Potential impact• Influences the shape and speed of economic recovery
• Impact on specific sectors most exposed to Covid-19 related disruption (eg travel sector)
• Likely to lead to tax increases to fund the cost of support and stimulus programmes
• May result in shifts in consumer behaviours and use of technology
Risk management and mitigation• Enhanced portfolio monitoring and reporting to address
Covid-19 related risks
FY2021 outcome• The impact of the Covid-19 pandemic remains uncertain
• Assets exposed to the travel sector are constrained by ongoing restrictions
• Overall, 3i’s portfolio has performed well, displaying resilience throughout the pandemic, and adapting to manage the ongoing regional lockdowns
This risk was previously considered within the wider global economy, but has now been separated out as a standalone principal risk
Link to strategic objectives
Key risk
Longer term repercussions of Covid-19 pandemic
Key risk
Global economic growth and investor and market confidence is vulnerable to ongoing uncertainties, including geo-political developments
Potential impact• Limits earnings growth or reduces NAV owing to
contraction of earnings in our investments and/or changes in multiples and discount rates used for their valuation
• Increases liquidity or covenant risks across the portfolio or limits ability to refinance our investments
• Impacts general market confidence and risk appetite
• Leads to reduced M&A volumes in 3i’s core markets, economic instability and lower growth, which impacts realisation levels
Risk management and mitigation• Regular portfolio company reviews as well as Investment
Committee focus on investment strategy, exit processes and refinancing strategies
• Monthly portfolio monitoring to identify and address portfolio issues promptly
• Monitoring of valuations and application of policy by the Valuations Committee
• Regular liquidity and currency monitoring and strategic reviews of the balance sheet
• Regular review of resourcing and key man exposures as part of business line reviews and the portfolio company review process
FY2021 outcome• Resilient portfolio, with the majority of portfolio
companies adapting to the changing environment and demonstrating good earnings growth
• Overall increase in portfolio valuation particularly in e-commerce, health and hygiene and value for money retail
• Group GIR of 26%
• Group gearing of 8% and liquidity of £725 million. Recently increased our RCF to £500 million and extended its maturity to 2026
Movement in risk status in FY2021
Link to strategic objectives
3i Group plc Annual report and accounts 2021Performance, risk and sustainability
60

Key risk
Volatility in capital markets and foreign exchange
Potential impact• May impact portfolio valuations and realisation processes
• Increases risks with IPO exit route and bank financing
• Potential for large equity market fall to impact asset valuations
• Unhedged foreign exchange rate movements impact total return and NAV
Risk management and mitigation• Portfolio company reviews focus on investment strategy,
exit plans and refinancing strategies
• Active management of exit strategies by Investment Committee to enable us to adapt to market conditions
• Regular liquidity and currency monitoring and strategic reviews of the Group’s balance sheet
• Matching of investment and realisation currency flows and use of short-term hedging on a case-by-case basis
• Scandlines FX hedging programme
FY2021 outcome• At 31 March 2021, 84% of the portfolio was denominated
in euros or US dollars. As sterling strengthened, we generated a net foreign exchange translation loss of £396 million (2020: £206 million gain)
• Foreign exchange exposures at the portfolio company level monitored and hedged where appropriate
• Strong portfolio performance, demonstrating resilience, leading to an increase in portfolio value in the year
Movement in risk status in FY2021
Link to strategic objectives
Potential impact• Reduced investment rates in Private Equity
and Infrastructure
• Increased risk of overpaying for investments impacting potential returns
• Potential for higher cash realisations on exits in due course
Risk management and mitigation• Central oversight and disciplined approach to investment
pipeline
• Active management of investments and exit strategies by Investment Committee
• Our local teams and networks facilitate the origination of off-market transactions
FY2021 outcome• Invested in three new Private Equity companies and
completed eight bolt-on acquisitions to support buy-and-build strategies
• Realisation of two assets in the year and refinancing proceeds received from our US infrastructure portfolio
Movement in risk status in FY2021
Link to strategic objectives
Key risk
High pricing in 3i’s core sectors
3i Group plc Annual report and accounts 2021Performance, risk and sustainability
61
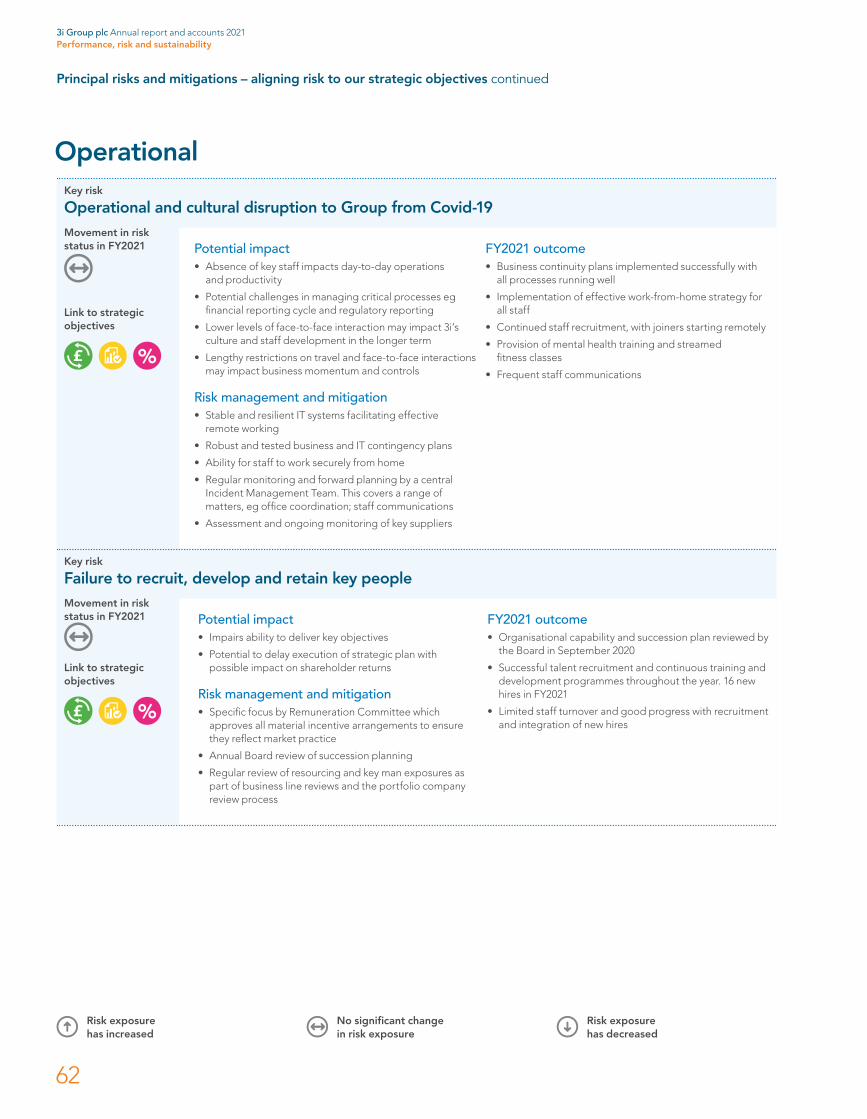
Principal risks and mitigations – aligning risk to our strategic objectives continued
Operational
Potential impact• Impairs ability to deliver key objectives
• Potential to delay execution of strategic plan with possible impact on shareholder returns
Risk management and mitigation• Specific focus by Remuneration Committee which
approves all material incentive arrangements to ensure they reflect market practice
• Annual Board review of succession planning
• Regular review of resourcing and key man exposures as part of business line reviews and the portfolio company review process
FY2021 outcome• Organisational capability and succession plan reviewed by
the Board in September 2020
• Successful talent recruitment and continuous training and development programmes throughout the year. 16 new hires in FY2021
• Limited staff turnover and good progress with recruitment and integration of new hires
Movement in risk status in FY2021
Link to strategic objectives
Key risk
Failure to recruit, develop and retain key people
Key risk
Operational and cultural disruption to Group from Covid-19
Potential impact• Absence of key staff impacts day-to-day operations
and productivity
• Potential challenges in managing critical processes eg financial reporting cycle and regulatory reporting
• Lower levels of face-to-face interaction may impact 3i’s culture and staff development in the longer term
• Lengthy restrictions on travel and face-to-face interactions may impact business momentum and controls
Risk management and mitigation• Stable and resilient IT systems facilitating effective
remote working
• Robust and tested business and IT contingency plans
• Ability for staff to work securely from home
• Regular monitoring and forward planning by a central Incident Management Team. This covers a range of matters, eg office coordination; staff communications
• Assessment and ongoing monitoring of key suppliers
FY2021 outcome• Business continuity plans implemented successfully with
all processes running well
• Implementation of effective work-from-home strategy for all staff
• Continued staff recruitment, with joiners starting remotely
• Provision of mental health training and streamed fitness classes
• Frequent staff communications
Movement in risk status in FY2021
Link to strategic objectives
Risk exposure has increased
No significant change in risk exposure
Risk exposure has decreased
3i Group plc Annual report and accounts 2021Performance, risk and sustainability
62
Going concern statementGoing concern is assessed for a period of at least 12 months from the date that the Annual report is approved. The Directors are required to evaluate that the Group has adequate resources to continue in operational existence for at least the next 12 months. The Directors have made an assessment of going concern, taking into account both the Group’s current performance and outlook, which considered the impact of the Covid-19 pandemic, using the information available up to the date of issue of these financial statements.
In carrying out their assessment on going concern, the Directors considered a wide range of information, including:
• details of the Group’s business and operating models and strategy;
• details of the approach to managing risk;
• a summary of the financial position considering performance;
• the risk appetite profile; and
• the impact on the Group due to the Covid-19 pandemic.
The Group monitors its funding position and its liquidity risk throughout the year to ensure it has access to sufficient funds to meet forecast cash requirements.
At 31 March 2021, the Group remained well funded with a liquidity of £725 million (31 March 2020: £1,245 million). Liquidity comprised cash and deposits of £225 million (31 March 2020: £845 million) and undrawn facilities of £500 million (31 March 2020: £400 million). During the year, the Group took steps to strengthen liquidity by successfully issuing a £400 million bond with a maturity date of 2040. The Group also increased its RCF to £500 million and extended the maturity to 2026. The RCF has no financial covenants. To preserve liquidity, the Group monitors liquidity regularly, ensuring it is adequate and sufficient and is underpinned by its monitoring of investments, realisations, operating expenses and receipt of portfolio cash income.
The Directors have acknowledged their responsibilities in relation to the financial statements for the year to 31 March 2021. After making the assessment on going concern, the Directors considered it appropriate to prepare the financial statements of the Company and the Group on a going concern basis, having considered the impact of Covid-19 on their operations and portfolio. The Group has sufficient financial resources and liquidity and is well positioned to manage business risks in the current economic environment and can continue operations for a period of at least 12 months from the date of this report. The Directors have also considered key dependencies set out within the Risk Management section including investment and operational requirements.
Viability statementThe Directors have assessed 3i’s viability over a three-year period to March 2024. 3i conducts its strategic planning over a five-year period; this statement is based on the first three years, which provides more certainty over the forecasting assumptions used. 3i’s strategic plan, ICAAP and associated principal risks as set out on pages 58 to 62 are the foundation of the Directors’ assessment.
The assessment is overseen by the Group Finance Director and is subject to challenge by the GRC, review by the Audit and Compliance Committee and approval by the Board.
The Group’s strategic plan projects the performance, net asset value and liquidity of 3i over a five-year period and is presented at the Directors’ annual strategy meeting in December and updated throughout the year as appropriate. At the strategy meeting, the Directors consider the strategy and opportunities for, and threats to, each business line and
the Group as a whole. The outcome of those discussions is included in the next iteration of the strategic plan which is then used to support the viability assessment. The current iteration of the Plan reflects the effect of the Covid-19 pandemic.
The Group’s ICAAP and viability testing considers multiple severe, yet plausible, individual and combined stress scenarios. These scenarios include a range of estimated impacts, primarily based on providing additional support to portfolio companies as a result of the downturn and delaying the Group’s ability to realise and make new investments. A key judgement applied is the extent of a continued Covid-19 related impact on trading activity and restrictions alongside the likely recovery profile of portfolio companies. The scenarios tested are as follows:
• K-shape recovery – considers the impact of a K-shaped recovery which sees a marked divergence in the recovery profile of assets in different sectors;
• U-shape recovery – considers the impact of additional or prolonged lockdown periods which result in an extended economic downturn;
• Concentration risk – considers a material event in a single large asset in the investment portfolio;
• Combined scenario with a U-shape recovery and concentration risk – considers both scenarios occurring at the same time;
• Loss of key personnel – considers the impact of the loss of key Private Equity and Infrastructure personnel;
• Impact of a significant event – considers the impact of certain portfolio companies not being able to withstand the impact of the event, leading to a permanent loss in value following operational underperformance, covenant breaches, fraud, or a cyber security breach or other ESG issues; and
• Climate change – considers the impact of climate change on 3i’s portfolio, driven by changes in consumer behaviour, regulations, and other physical and business risks.
The assessment projects the amount of capital the Group needs in the business to cover its risks, including financial and operational risks, under such stress scenarios. The results of each of the stress test scenarios indicate that the Group is able to meet its obligations as they fall due for the viability period over three years from the date of approval of these financial statements by, in certain cases, making use of controllable management actions. In all these scenarios the Directors expect the Group to be able to recover without a permanent long term impact on its solvency or capital requirements. Mitigating actions within management control include reduced new investment levels and drawing on the existing RCF. The analysis shows that, while there may be a significant impact on the Group’s reported performance in the short term under a number of these scenarios, the resilience and quality of the balance sheet is such that solvency is maintained, and the business remains viable.
Taking the inputs from the strategic planning process, the ICAAP and its stress scenarios, the Directors reviewed an assessment of the potential effects of 3i’s principal risks on its current portfolio and forecast investment and realisation activity, and the consequent impact on 3i’s capital and liquidity.
Based on this assessment, the Directors have a reasonable expectation that the Company and the Group will be able to continue in operation and meet all their liabilities as they fall due up to at least March 2024.
Going concern and Viability statement
3i Group plc Annual report and accounts 2021Performance, risk and sustainability
63

We run our business sustainably with regard to the interests of all the stakeholders that we serve. We are committed to achieving our strategic and investment objectives while behaving responsibly as an investor, an employer and as an international corporate citizen.
Over the years, we have built a strong reputation and track record by investing and managing our portfolio responsibly and by operating according to high standards of conduct and behaviour. We take responsibility for our actions, carefully consider how our choices will affect the societies and environment in which our portfolio companies operate and ensure that our values and ethics are integrated into our formal business policies, practices and plans. We believe that encouraging this approach in our portfolio companies is a driver of long-term outperformance.
This section aims to provide a brief summary of our approach to sustainability. For the full picture, please read it in conjunction with our Sustainability report, available on our website. Further information on our approach to sustainability, including summaries of relevant policies, can also be found on our website.
We are committed to communicating both financial and non-financial performance in a clear, open and comprehensive manner and to maintaining an open dialogue with stakeholders. To that end, we presented our approach to sustainability and responsible investment in our capital markets seminar, which was webcast for the benefit of all stakeholders in September 2020.
For the fourth year since the Recommendations of the Taskforce on Climate-Related Financial Disclosures (“TCFD”) were first published we are making partial disclosures under that framework. We are taking steps to prepare for fuller disclosure in due course.
Pages 73-75Read more about our TCFD disclosures
Sustainability
Our sustainability strategy is defined by three key priorities:
1. A responsible investor We believe that a responsible approach to investment adds value to our portfolio. Our Responsible Investment policy is embedded within our investment and portfolio management processes. It informs our investment decisions and our behaviours as a responsible manager of our assets. We are rigorous in assessing and managing ESG risks in our portfolio. Equally, we are keen to invest in opportunities that contribute to the development of solutions to global sustainability challenges. We make a limited number of investments each year, allowing us to be very selective in our approach to new investment.
2. A responsible employerOur people are our main asset and recruiting, retaining and developing our talent is one of our most important priorities. We promote an open communication culture and provide an inclusive and supportive working environment with opportunities for training and career development. We value diversity and our employees are recruited, promoted and rewarded on the basis of merit, ability and performance. We are an equal opportunities employer and prohibit all forms of unfair discrimination.
3. A good corporate citizenWe strive to embed responsible business practices throughout our organisation. We do this by having robust policies and processes in place and by promoting the right culture among our staff. We expect our employees to act with integrity, to be accountable for their behaviour, and to approach their roles with ambition, rigour and energy. All employees are formally evaluated against our values as part of our appraisal process every year.
+ www.3i.com/sustainabilityFor more information
3i Group plc Annual report and accounts 2021Performance, risk and sustainability
64
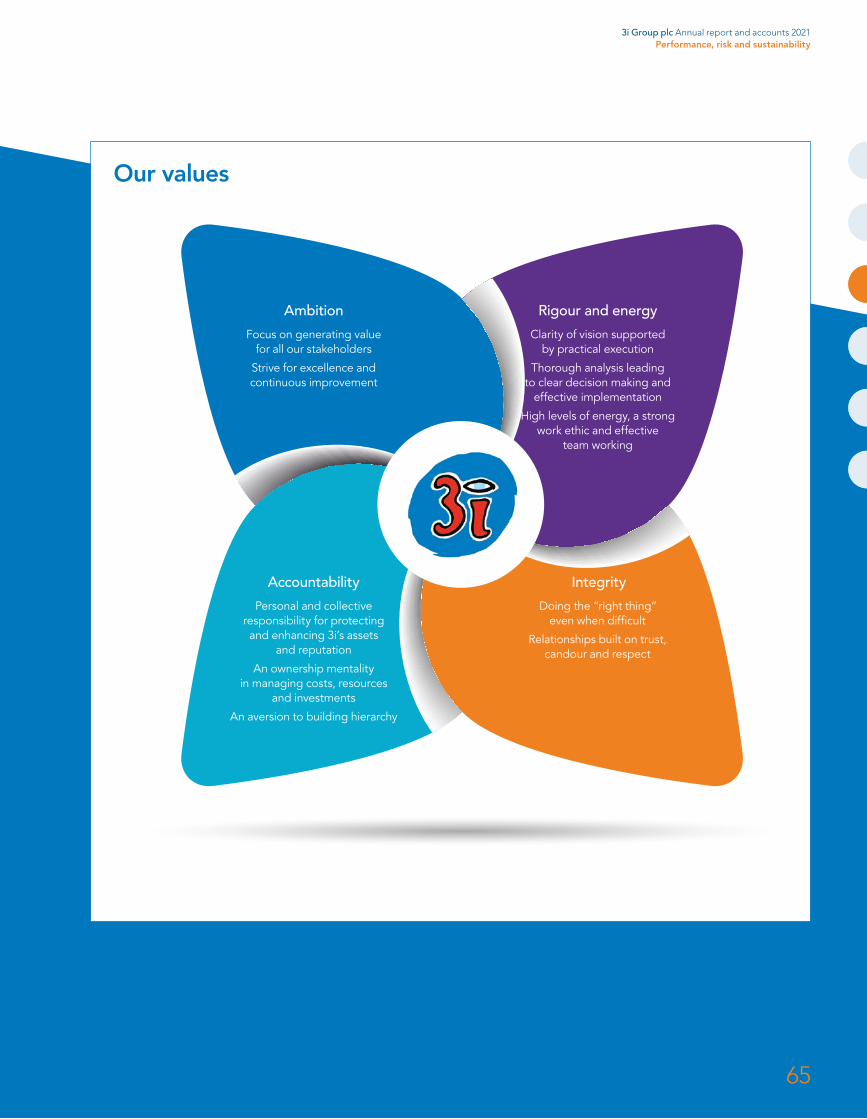
Our values
Ambition
Focus on generating value for all our stakeholders
Strive for excellence and continuous improvement
Integrity
Doing the “right thing” even when difficult
Relationships built on trust, candour and respect
Accountability
Personal and collective responsibility for protecting and enhancing 3i’s assets
and reputation
An ownership mentality in managing costs, resources
and investments
An aversion to building hierarchy
Rigour and energy
Clarity of vision supported by practical execution
Thorough analysis leading to clear decision making and
effective implementation
High levels of energy, a strong work ethic and effective
team working
3i Group plc Annual report and accounts 2021Performance, risk and sustainability
65
Sustainability continued
A responsible investor
With fewer than 240 employees globally, 3i has a relatively small direct impact in terms of the environment and other sustainability issues. However, with assets under management of £16.9 billion, we have the influence and opportunity to have a greater positive impact through the decisions we make across our portfolio.We believe that a responsible approach to investment is a material lever for value creation in our portfolio.
We are well positioned to have a positive impact through the decisions we make across our portfolio:
• we carry out our investment activity according to our Responsible Investment policy which is embedded in our processes. We have also been signatories to the UN Principles of Responsible Investment since 2011;
• thanks to our proprietary capital we have a medium to long-term investment horizon. We typically have majority or significant minority stakes in our portfolio companies and, since 2012, have always been represented on their boards. We are therefore well placed to drive long-term, sustainable growth in our portfolio. This involves the continuous assessment, monitoring and management of the long-term sustainability factors relevant to our portfolio investments, and the associated risks and opportunities; and
• we make a limited number of new investments each year, allowing us to be very selective and to screen out opportunities that have an unsustainable impact on the environment and societies in which they operate, inconsistent with generating long-term value.
We are committed to evolving our approach to responsible investment continuously, and have an interdisciplinary sustainability project team devoted to that task.
Our Responsible Investment policy and ESG monitoring processWe have a clear and comprehensive Responsible Investment (“RI”) policy which is embedded into our investment and portfolio monitoring processes. In our experience, companies with high ESG standards are typically better run, better at identifying and managing their business risks and opportunities for growth and generate higher quality earnings growth. This policy sets out the businesses in which 3i will not invest, as well as minimum standards in relation to ESG matters which we expect new portfolio companies to meet, or to commit to meeting over a reasonable time period. The policy applies to all our investments, irrespective of their country or sector.
The Board of Directors is responsible for the RI policy, including regular reviews and the approval of any material changes. The Investment Committee is responsible for the implementation of the RI policy, and for ensuring that it is executed in a meaningful way by 3i’s investment teams in all investment and portfolio management processes.
The management of ESG and broader sustainability risks and opportunities is key to driving value from our investments. It is also key to safeguarding our reputation as a responsible investor. We therefore have robust processes in place to ensure that these are considered before making an investment and during our period of ownership. These are described in our Sustainability report.
3i’s objectives as set out in the RI policy are to invest only in businesses which are committed to:
The environmentA cautious and responsible approach to the environmental management of their business operations by making efficient use of natural resources and mitigating environmental risks and damage.
Business integrityUpholding high standards of business integrity, avoiding corruption in all its forms, ensuring strong data management and cyber security and compliance with applicable anti-bribery, anti-fraud, anti-money laundering and data protection laws and regulations.
Fair and safe working conditionsRespecting the human rights of their workers; maintaining safe and healthy working conditions for their employees, contractors and suppliers; treating their employees fairly; upholding the right to freedom of association and collective bargaining; and respecting the health, safety and wellbeing of those affected by their business activities.
Good governanceClear accountability with defined responsibilities, procedures and controls and appropriate checks and balances in company management structures.
3i Group plc Annual report and accounts 2021Performance, risk and sustainability
66

Our RI policy and the UN’s Sustainable Development GoalsOur RI policy pre-dates the publication of the United Nation’s Sustainable Development Goals (“SDGs”) and was therefore not designed to align with that framework. In practice, however, we believe our approach supports the achievement of the goals through:
• the systematic pre-investment screening of opportunities, which ensures that we only invest in companies that commit to adopting a responsible approach to the environment, to respecting the rights of their workers and to engaging fairly with all stakeholders;
• our emphasis on generating returns by driving long-term, sustainable growth in our portfolio companies, creating value through investment in innovation, international expansion and buy-and-build acquisitions, while considering the interests of all stakeholders; and
• our engaged management of portfolio companies through active participation on their boards, setting strategy and encouraging the development of more sustainable business practices. This is supported by our influence as majority or significant minority shareholders, combined with our emphasis on upholding the highest levels of governance at 3i itself and in the companies that we invest in.
Sustainable growth opportunities in our portfolioWe believe that the systematic assessment of the sustainability profile of investments can help us not only to manage risks, but importantly can also bring about opportunities for value growth and new or further investment in our portfolio.
Many of the businesses we invest in stand to benefit from sustainable growth trends and a number of our portfolio companies already make a positive impact on the environment and societies in which they operate, including on some of the themes highlighted by the UN SDGs.
For example, several of our portfolio companies across our Private Equity and Infrastructure business contribute to:
• Improving health and wellbeing – investments that contribute to this theme include Cirtec Medical, SaniSure, Ionisos and Havea.
• The transition to a lower carbon economy – Infinis, Valorem and ESVAGT.
• The achievement of a more sustainable consumption model through a circular economy – Weener Plastics, Evernex, Attero.
In addition, many of our portfolio companies have made public statements on how their business activities align with the UN SDGs. These include, for example, Action, Hans Anders, Audley Travel, AES Seal, Scandlines, Attero, ESVAGT, Infinis, Ionisos, Joulz, Tampnet, TCR and Valorem.
These opportunities are described in our Sustainability report.
Sustainability risks in our portfolioWe have very strong portfolio risk management processes:
• we undertake ESG due diligence before making new investments and monitor all relevant ESG and reputational risks through our rigorous portfolio monitoring processes;
• we make majority or significant minority investments and are represented on the boards of our portfolio companies, where we ensure that ESG risks are assessed and that adequate mitigation plans are put in place;
• we ensure that there is board-level responsibility at each of our portfolio companies for the continuous assessment and mitigation of ESG risks and work with portfolio company management teams to ensure that ESG risks and long-term sustainability are addressed in their strategy; and
• our Investment Committee has responsibility for portfolio risk management, with oversight from the GRC and Board of Directors.
The key risks our portfolio was exposed to during the year were Covid-19, cyber security and occupational health and safety. While our portfolio is generally not immediately vulnerable to the risks posed by climate change, we do recognise that climate change has the potential to affect many of our investments through changes in regulation, changes in consumer preferences or stakeholder pressure to reduce their carbon and broader environmental footprint. To mitigate this risk, we ensure that our portfolio companies understand their own environmental impacts and stay abreast of regulatory and market developments, and develop their commercial offering to ensure that it remains attractive to their customers and that it meets stakeholder expectations.
These opportunities and risks are described in our Sustainability report.
+ www.3i.comFor more information on our approach to responsible investing and sustainability opportunities and risks please see our Sustainability report.
+ www.3i.comFor a summary of our Responsible Investment policy
3i Group plc Annual report and accounts 2021Performance, risk and sustainability
67

92 Female142 Male
4 Female4 Male
8 Female31 Male
The recruitment, development and retention of a capable and diverse pool of talent is key to our success. We provide training and opportunities for career advancement, reward our employees fairly and recognise the importance of supporting the wellbeing and satisfaction of our employees by providing a healthy working environment and work/life balance. With fewer than 240 employees, we benefit from a flat organisational structure, which facilitates a culture of open communication. Direct feedback to senior managers is actively encouraged. We are a meritocracy and, as such, our employees are recruited, promoted and rewarded based on merit.We have a suite of human resources policies and procedures covering areas including recruitment, vetting and performance management, equal opportunities and diversity, family-friendly policies, medical insurance and health checks, health and safety and flexible working, and appropriate processes to monitor their application. 3i takes the health and wellbeing of its employees and contractors seriously, and has taken a precautionary approach in its response to the Covid-19 pandemic, adhering strictly to the advice given and restrictions imposed by governmental and health authorities in the countries in which we operate. Further details of our human resources policies and procedures are available in our Sustainability report, and summaries of a number of these policies can be found on our website.
Human rightsWhilst 3i does not have, nor need, a formal human rights policy, our policies are consistent with internationally recognised human rights principles such as the UN Global Compact. We comply fully with applicable human rights legislation in the countries in which we operate, for example covering areas such as freedom of association and the right to collective bargaining, equal remuneration and protection against discrimination. We also encourage our business partners and suppliers to adopt the same standards with respect to human rights.
Page 71Read more about our commitments on modern slavery
Gender diversity
3i employees
1 Includes non-executive Directors who are not 3i employees.2 Senior managers excludes Simon Borrows and Julia Wilson, our Chief Executive
and Group Finance Director, who are included as Board members. The measure includes those who have responsibility for planning, directing or controlling the activities of the Company or of a strategically significant part of the Company, or are Directors of the undertakings included in the consolidation.
Senior managers2
We are making reasonable progress towards the achievement of better gender diversity in our organisation. At 31 March 2021, 3i’s total of 234 employees was broken down as follows:
Sustainability continued
A responsible employer
+ www.3i.com/sustainability/modern-slavery/
3i Group plc Directors1
3i Group plc Annual report and accounts 2021Performance, risk and sustainability
68

Equal opportunity and diversity3i is fully committed to being an equal opportunities employer, and prohibits unfair discrimination. We do not set specific diversity targets given the small number of employees but we seek to ensure that our corporate culture and policies create an inclusive work environment that helps to bring out the best in our employees. Our Equal Opportunities and Diversity policy establishes that all 3i employees (temporary and permanent), contract workers and job applicants are treated fairly and are offered equal opportunity in selection, training, career development, promotion and remuneration. During the year, no incidents of discrimination were reported.
We have made progress in achieving greater diversity within our organisation but recognise that we can do better. However, we are a small company with relatively low turnover and recruitment volumes, which means that achieving better diversity will be a gradual process. We consider diversity in all recruitment processes and explore initiatives to address the perceived barriers to entry into our sector. In particular, we are focusing on three areas:
• Gender diversity: we contribute to industry-wide work and advocacy on gender parity through a number of industry associations and by being an official sponsor of Level 20, a not for profit organisation whose key ambition is for women to hold 20% of senior positions in the European private equity industry. It seeks to achieve this ambition through mentoring programmes, networking opportunities and broader advocacy and research.
• Ethnic diversity: we recently joined the #10000BlackInterns initiative, which aims to help transform the horizons and prospects of young black people in the UK by offering paid work experience in the investment management industry. Two interns will join us through that scheme in the Summer of 2021.
• Social diversity: we have partnered with Bright Network to help us source more diverse candidates at graduate level. Bright Network partners with over 250 leading employers to connect its members from all backgrounds with employers across all sectors. In 2018, we also began a partnership with Career Ready, a social mobility charity based across the UK, that connects employers with schools and colleges to provide disadvantaged students with mentors, internships, masterclasses and employer-led activities that prepare them for the world of work. A number of our employees act as mentors in Career Ready’s mentoring programme.
In line with our objective of promoting equality and diversity, our policy is to support employees before and after the birth or adoption of a child. Maternity, adoption, paternity and shared parental leave is available to all eligible full and part-time employees and our policies meet at least the statutory minimum requirements.
Graduate training schemeOur graduate recruitment scheme was launched in 2015. It involves formal classroom-based training and a programme of rotations over a period of 30 months. The top performers on the programme are offered the opportunity to be fast-tracked directly into our business. Several of the participants have joined 3i permanently and are now integral members of our investment team. Three new graduate trainees joined us in September 2020 and a further two are due to join us in September 2021.
Grievance procedures and reporting a concern3i has clear grievance and disciplinary procedures, an employee assistance programme and an independent, external “whistle blowing” hotline service which allows employees to report concerns anonymously.
as at 31 March 2021
234Employees
21Nationalities
3i Group plc Annual report and accounts 2021Performance, risk and sustainability
69
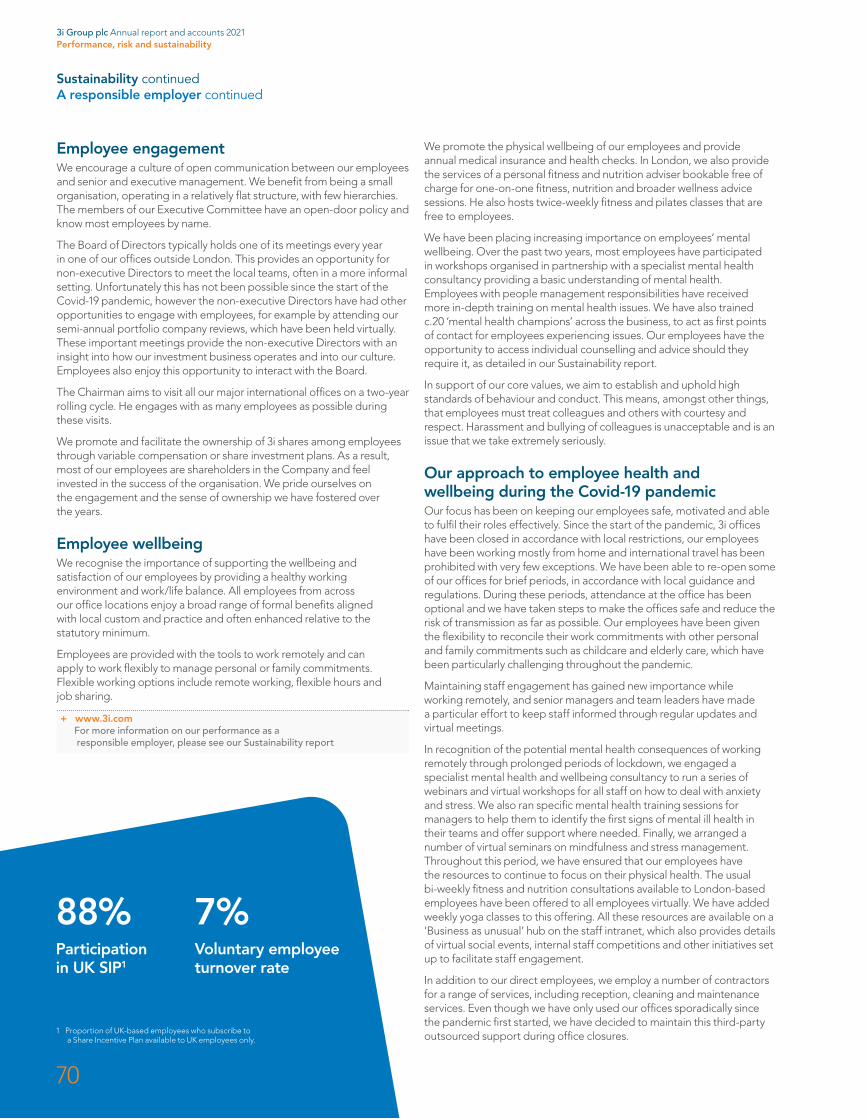
Sustainability continuedA responsible employer continued
Employee engagementWe encourage a culture of open communication between our employees and senior and executive management. We benefit from being a small organisation, operating in a relatively flat structure, with few hierarchies. The members of our Executive Committee have an open-door policy and know most employees by name.
The Board of Directors typically holds one of its meetings every year in one of our offices outside London. This provides an opportunity for non-executive Directors to meet the local teams, often in a more informal setting. Unfortunately this has not been possible since the start of the Covid-19 pandemic, however the non-executive Directors have had other opportunities to engage with employees, for example by attending our semi-annual portfolio company reviews, which have been held virtually. These important meetings provide the non-executive Directors with an insight into how our investment business operates and into our culture. Employees also enjoy this opportunity to interact with the Board.
The Chairman aims to visit all our major international offices on a two-year rolling cycle. He engages with as many employees as possible during these visits.
We promote and facilitate the ownership of 3i shares among employees through variable compensation or share investment plans. As a result, most of our employees are shareholders in the Company and feel invested in the success of the organisation. We pride ourselves on the engagement and the sense of ownership we have fostered over the years.
Employee wellbeingWe recognise the importance of supporting the wellbeing and satisfaction of our employees by providing a healthy working environment and work/life balance. All employees from across our office locations enjoy a broad range of formal benefits aligned with local custom and practice and often enhanced relative to the statutory minimum.
Employees are provided with the tools to work remotely and can apply to work flexibly to manage personal or family commitments. Flexible working options include remote working, flexible hours and job sharing.
+ www.3i.comFor more information on our performance as a responsible employer, please see our Sustainability report
We promote the physical wellbeing of our employees and provide annual medical insurance and health checks. In London, we also provide the services of a personal fitness and nutrition adviser bookable free of charge for one-on-one fitness, nutrition and broader wellness advice sessions. He also hosts twice-weekly fitness and pilates classes that are free to employees.
We have been placing increasing importance on employees’ mental wellbeing. Over the past two years, most employees have participated in workshops organised in partnership with a specialist mental health consultancy providing a basic understanding of mental health. Employees with people management responsibilities have received more in-depth training on mental health issues. We have also trained c.20 ‘mental health champions’ across the business, to act as first points of contact for employees experiencing issues. Our employees have the opportunity to access individual counselling and advice should they require it, as detailed in our Sustainability report.
In support of our core values, we aim to establish and uphold high standards of behaviour and conduct. This means, amongst other things, that employees must treat colleagues and others with courtesy and respect. Harassment and bullying of colleagues is unacceptable and is an issue that we take extremely seriously.
Our approach to employee health and wellbeing during the Covid-19 pandemicOur focus has been on keeping our employees safe, motivated and able to fulfil their roles effectively. Since the start of the pandemic, 3i offices have been closed in accordance with local restrictions, our employees have been working mostly from home and international travel has been prohibited with very few exceptions. We have been able to re-open some of our offices for brief periods, in accordance with local guidance and regulations. During these periods, attendance at the office has been optional and we have taken steps to make the offices safe and reduce the risk of transmission as far as possible. Our employees have been given the flexibility to reconcile their work commitments with other personal and family commitments such as childcare and elderly care, which have been particularly challenging throughout the pandemic.
Maintaining staff engagement has gained new importance while working remotely, and senior managers and team leaders have made a particular effort to keep staff informed through regular updates and virtual meetings.
In recognition of the potential mental health consequences of working remotely through prolonged periods of lockdown, we engaged a specialist mental health and wellbeing consultancy to run a series of webinars and virtual workshops for all staff on how to deal with anxiety and stress. We also ran specific mental health training sessions for managers to help them to identify the first signs of mental ill health in their teams and offer support where needed. Finally, we arranged a number of virtual seminars on mindfulness and stress management. Throughout this period, we have ensured that our employees have the resources to continue to focus on their physical health. The usual bi-weekly fitness and nutrition consultations available to London-based employees have been offered to all employees virtually. We have added weekly yoga classes to this offering. All these resources are available on a ‘Business as unusual’ hub on the staff intranet, which also provides details of virtual social events, internal staff competitions and other initiatives set up to facilitate staff engagement.
In addition to our direct employees, we employ a number of contractors for a range of services, including reception, cleaning and maintenance services. Even though we have only used our offices sporadically since the pandemic first started, we have decided to maintain this third-party outsourced support during office closures. 1 Proportion of UK-based employees who subscribe to
a Share Incentive Plan available to UK employees only.
88%Participation in UK SIP1
7%Voluntary employee turnover rate
3i Group plc Annual report and accounts 2021Performance, risk and sustainability
70

We strive to embed responsible business practices throughout the organisation. We have robust policies and processes in place and actively promote the right values and culture within our business. All employees are assessed annually against our corporate values and have a responsibility to be aware of, and abide by, 3i’s compliance, behaviour, environmental, ethical and social policies and procedures.
GovernanceGood corporate governance is fundamental to 3i and its activities and is critical to the delivery of value to our stakeholders. For full details of our governance structure and processes, please see the Corporate Governance section of this report.
Anti-bribery and corruption3i does not offer, pay or accept bribes and we only work with third parties whose standards of business integrity are substantively consistent with ours. 3i is not aware of any breaches of its Anti-bribery policy by its employees.
We expect the businesses we invest in to operate in compliance with all applicable laws and regulations and, where appropriate, work towards meeting relevant international standards where these are more stringent. This includes, in particular, upholding high standards of business integrity, avoiding corruption in all its forms and complying with applicable anti-bribery, anti-fraud and anti-money laundering laws and regulations.
Modern slaveryWe published our statement on modern slavery for the financial year ending 31 March 2020 on our website in September 2020, and will update this statement in September 2021. 3i is committed to ensuring that:
• there is no slavery or human trafficking in any part of its business or supply chains; and
• the companies in which it invests are also committed to ensuring that there is no slavery or human trafficking in any part of their businesses or supply chains.
+ www.3i.com/sustainability/modern-slaveryFor more information on our latest Modern Slavery disclosure
Data protection3i’s data protection policy reflects the requirements of the general European data protection legislation, supplemented or adapted as necessary for local regulatory requirements. 3i is committed to protecting the data of its staff, customers and contacts and using it in an appropriate manner. We recognise the rights afforded to individuals by data protection legislation and that we must notify data subjects of the fact that we process their personal data and the specific purposes for which we do so. During the last year we did not receive any substantiated complaints from third parties or complaints by regulatory bodies regarding the use and disclosure of personal data.
Cyber resilienceWe focus on cyber resilience both in terms of 3i’s own systems and those of its portfolio companies. We run a periodic cyber resilience e-learning course for all staff and a continuous “phishing” email programme to test and monitor 3i staff’s “click-rate” and to promote increased practical awareness of the risks associated with phishing emails. 3i also tested its Cyber Security Incident Response Plan and updated its overall business resilience strategy and governance framework. The 3i Cyber Security Review Board continues to meet monthly to discuss cyber security issues and to review the cyber risk register and dashboard of relevant cyber key performance indicators.
In relation to our portfolio companies, we continue actively to promote cyber resilience as a key component of the corporate governance programme through our representatives on their boards. We use an external firm of cyber security specialists to conduct non-intrusive reviews of the cyber resilience of our key portfolio companies’ systems. Cyber resilience is one of the governance topics reviewed at the six-monthly business reviews of 3i’s portfolio companies which are conducted as part of 3i’s regular asset management and portfolio monitoring programme.
Environmental impact Page 73-75
Please refer to our TCFD disclosures
A good corporate citizen
3i Group plc Annual report and accounts 2021Performance, risk and sustainability
71
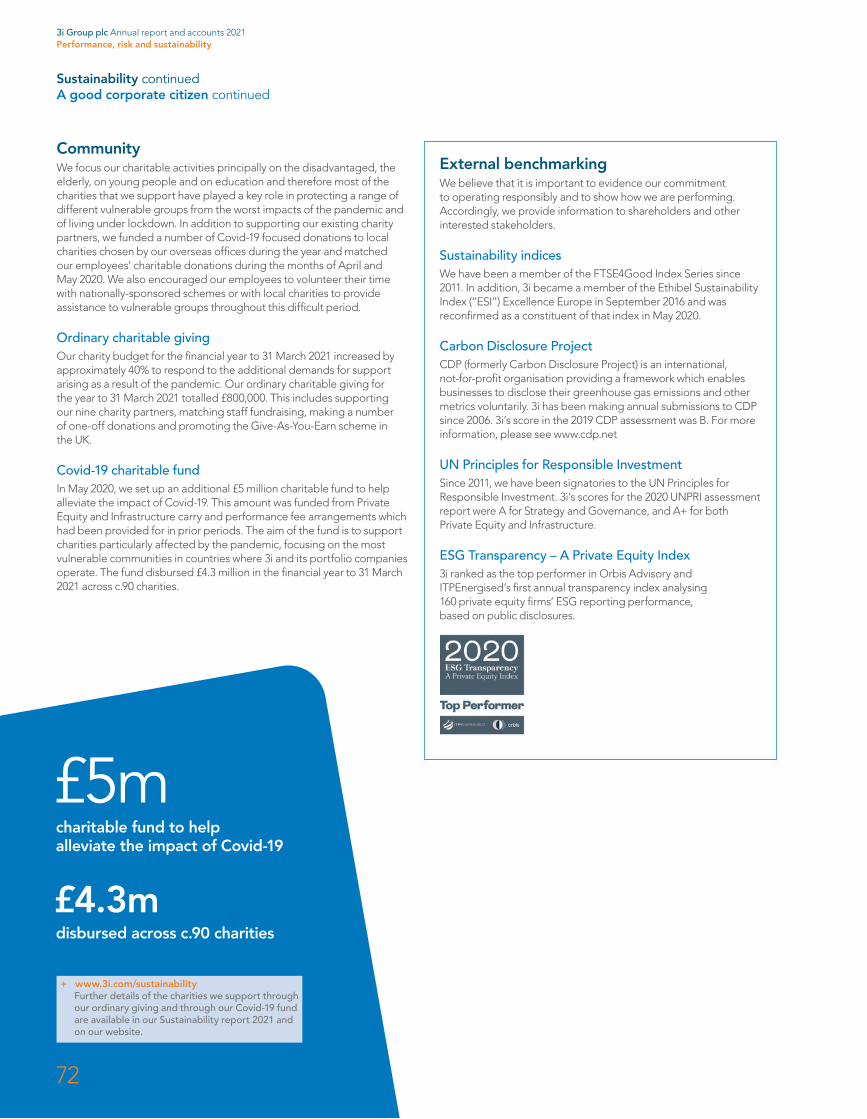
CommunityWe focus our charitable activities principally on the disadvantaged, the elderly, on young people and on education and therefore most of the charities that we support have played a key role in protecting a range of different vulnerable groups from the worst impacts of the pandemic and of living under lockdown. In addition to supporting our existing charity partners, we funded a number of Covid-19 focused donations to local charities chosen by our overseas offices during the year and matched our employees’ charitable donations during the months of April and May 2020. We also encouraged our employees to volunteer their time with nationally-sponsored schemes or with local charities to provide assistance to vulnerable groups throughout this difficult period.
Ordinary charitable givingOur charity budget for the financial year to 31 March 2021 increased by approximately 40% to respond to the additional demands for support arising as a result of the pandemic. Our ordinary charitable giving for the year to 31 March 2021 totalled £800,000. This includes supporting our nine charity partners, matching staff fundraising, making a number of one-off donations and promoting the Give-As-You-Earn scheme in the UK.
Covid-19 charitable fundIn May 2020, we set up an additional £5 million charitable fund to help alleviate the impact of Covid-19. This amount was funded from Private Equity and Infrastructure carry and performance fee arrangements which had been provided for in prior periods. The aim of the fund is to support charities particularly affected by the pandemic, focusing on the most vulnerable communities in countries where 3i and its portfolio companies operate. The fund disbursed £4.3 million in the financial year to 31 March 2021 across c.90 charities.
£4.3mdisbursed across c.90 charities
£5mcharitable fund to help alleviate the impact of Covid-19
+ www.3i.com/sustainabilityFurther details of the charities we support through our ordinary giving and through our Covid-19 fund are available in our Sustainability report 2021 and on our website.
Sustainability continuedA good corporate citizen continued
External benchmarking We believe that it is important to evidence our commitment to operating responsibly and to show how we are performing. Accordingly, we provide information to shareholders and other interested stakeholders.
Sustainability indicesWe have been a member of the FTSE4Good Index Series since 2011. In addition, 3i became a member of the Ethibel Sustainability Index (“ESI”) Excellence Europe in September 2016 and was reconfirmed as a constituent of that index in May 2020.
Carbon Disclosure ProjectCDP (formerly Carbon Disclosure Project) is an international, not-for-profit organisation providing a framework which enables businesses to disclose their greenhouse gas emissions and other metrics voluntarily. 3i has been making annual submissions to CDP since 2006. 3i’s score in the 2019 CDP assessment was B. For more information, please see www.cdp.net
UN Principles for Responsible Investment Since 2011, we have been signatories to the UN Principles for Responsible Investment. 3i’s scores for the 2020 UNPRI assessment report were A for Strategy and Governance, and A+ for both Private Equity and Infrastructure.
ESG Transparency – A Private Equity Index3i ranked as the top performer in Orbis Advisory and ITPEnergised’s first annual transparency index analysing 160 private equity firms’ ESG reporting performance, based on public disclosures.
3i Group plc Annual report and accounts 2021Performance, risk and sustainability
72
These disclosures reflect 3i’s response to the recommendations of the TCFD. They set out how we incorporate climate-related risks and opportunities for our business and portfolio into our governance, strategy and risk management. They also include disclosures on our direct GHG emissions metrics. These disclosures are only partially aligned to the TCFD framework. We are taking steps to prepare for fuller disclosure in due course.
What follows should be read in conjunction with the rest of the Annual report and with our Sustainability report and specific references are provided where applicable.
GovernanceThe Board as a whole reviews our approach to sustainability, corporate responsibility and related policies and addresses specific issues if they arise. It is also accountable for our Responsible Investment policy, for monitoring its implementation and for approving material changes to it. It has established a committee structure to assist it in the discharge of its responsibilities. Of particular relevance to the assessment and monitoring of climate-related and broader environmental risks and opportunities are:
• the Audit and Compliance Committee, which, among other areas, is also responsible for internal controls and risk management, including the assessment and management of ESG risks and opportunities, and for ensuring compliance with environmental legislation and regulation. The Audit and Compliance Committee is also responsible for reviewing and approving our disclosures under the TCFD framework; and
• the Valuations Committee, which considers the valuation impact of climate change-related and other ESG risks and opportunities on our portfolio.
Day-to-day accountability for sustainability, including climate change-related issues, rests with executive management and, in particular, the Chief Executive. The Chief Executive has also established a number of committees to support him in overseeing and monitoring policies and procedures and to address issues if they arise. These include the Investment Committee and the Group Risk Committee.
The Investment Committee is responsible for overseeing the implementation of the Responsible Investment policy, and for making decisions concerning the acquisition, management, ongoing monitoring and disposal of investments, as well as making decisions concerning major investments made by our portfolio companies. In evaluating new and existing investments, the Investment Committee takes account of climate-related risks, including the impact of climate change on the markets each company serves and demand for its products; the climate change resilience of each company’s assets and supply chain; and, in the case of energy-intensive industries, the feasibility and potential cost of GHG emissions abatement.
The Group Risk Committee oversees the Group’s risk management framework. It maintains the Group’s risk review, which identifies the principal risks and new and emerging risks facing 3i as well as the associated mitigating actions and key risk indicators. The risk review is updated quarterly.
Pages 81-124 Governance framework: Annual report
Page 9 Governance framework: Sustainability report
Pages 11-29 Our approach to responsible investment: Sustainability report
StrategyOur objective is to generate attractive returns for our shareholders and other investors, by investing in and managing private equity and infrastructure assets. We create value through disciplined investment and the responsible management of our assets, driving sustainable growth in our investee companies. We believe that the careful assessment and management of ESG-related risks and opportunities, including climate-related risks and opportunities, is a material lever for value creation in our portfolio.
Portfolio Our investment strategy is to make a small number of new investments each year in our Private Equity and Infrastructure businesses, selected within our target sectors and geographies on the basis of their compatibility with our return objectives. We do not manage any sustainability-driven investment strategies, nor is it our intention to do so, but we have long believed that good ESG performance is an integral part of good investment performance.
As set out earlier in this section and in our Sustainability report, for many years we have carried out our investment activities under our Responsible Investment policy, which is embedded in our investment and portfolio management processes. The long-term sustainability factors relevant to our portfolio, and related risks and opportunities, are continuously assessed, monitored and managed. We have the flexibility to screen out businesses which have unsustainable environmental practices. Once invested, we use our influence to encourage the development of more environmentally sustainable behaviours in our portfolio companies, as well as investments to mitigate our portfolio companies’ environmental impact, including the emission of greenhouse gases.
We are committed to improve our role as a responsible investor on an ongoing basis. We will continue to develop and refine our Responsible Investment policy and ensure it is implemented through our investment and asset management activities.
Pages 1-79 Strategic report: Annual report
Pages 11-29 Our approach to responsible investment: Sustainability report
+ www.3i.com/sustainabilityMore information on our Responsible Investment policy
3i Group 3i has a very limited direct impact on the environment and is not a significant producer of greenhouse gas emissions. We do, however, try to minimise our direct impact on the environment and have implemented initiatives across the organisation to try to achieve that objective. Our London and Luxembourg offices, which accounted for approximately two-thirds of our overall electricity consumption in FY2021, already purchase electricity from 100% renewable sources.
Pages 49-52 Environment: Sustainability report
Our TCFD disclosures
3i Group plc Annual report and accounts 2021Performance, risk and sustainability
73

Risk managementPortfolio We make a limited number of new investments every year and have the flexibility to screen out investment opportunities which are overly exposed to climate-related or other risks. Our portfolio composition changes over time as we buy and sell investments. We are able to sell investments that become or have potential to become exposed to certain risks, including climate-related risks that our Investment Committee considers are unacceptable, and we are not obliged to continue to invest in any particular sector or sub-sector.
We monitor all relevant portfolio risks, including climate-related risks and changing consumer preferences in response to climate change, through our rigorous investment assessment and portfolio monitoring processes. This is critical to protecting and enhancing the value of our assets and is at the core of what we do. We undertake ESG due diligence, including environmental due diligence, before making new investments, and monitor ESG risks throughout the life of our investments.
We are represented on the boards of all our portfolio companies (with the exception of a small number in India), where we ensure that all climate-related risks are assessed, discussed and mitigated with the necessary rigour. We also aim to ensure that there is board-level responsibility at each of our portfolio companies for the continuous assessment and mitigation of climate-related risks.
While our portfolio is generally not immediately vulnerable to the risks posed by climate change, we do recognise that climate change has the potential to affect many of our investments through changes in regulation, changes in consumer preferences or stakeholder pressure to reduce their carbon and broader environmental footprint. To mitigate this risk, we ensure that our portfolio companies understand their own environmental impacts and stay abreast of regulatory and market developments, and that they develop their commercial offering to ensure that it remains attractive to their customers and that it meets stakeholder expectations.
For the purpose of preparing our annual Viability statement, we have carried out a number of tests which consider the impact on the Group of multiple severe, yet plausible individual and combined stress scenarios, including the impact that climate change might have on a number of our more vulnerable assets through changes in regulation, in consumer preferences, an increase in physical risks and other business risks. Because of the composition of our current portfolio and the flexibility we have in its construction, our analysis showed that a climate change-related stress scenario should not impact the viability of the Group over the medium term.
This year we added a specific portfolio ESG underperformance risk to our risk review to reflect the increasing importance of these themes. Previously this risk had been considered under a generic portfolio underperformance risk. We will continue to develop our governance and risk management framework to ensure that sustainability-related risks in our portfolio remain an important part of our agenda and are treated as a priority by our portfolio company management teams.
3i Group As a business, we are not exposed to material environmental risks. We employ fewer than 240 employees globally and our offices are leased. We have a comprehensive risk governance framework and compliance processes and procedures to ensure that all risks, including climate-related risks, are monitored and managed with due care and diligence and that 3i is fully compliant with all applicable environmental legislation.
Pages 50-63 Risk: Annual report
Page 27 ESG risks: Sustainability report
Metrics and targetsPortfolio Due to the diverse nature of our portfolio, we have not carried out systematic portfolio-wide scenario analyses (other than the limited analysis performed for the preparation of the Group’s Viability statement) nor published aggregated GHG emissions intensity data. As a manager of a portfolio of investments, we consider climate risk on an individual company and overall portfolio basis. Changes in our portfolio composition mean that a year-on-year comparison of metrics may not be representative of the longer-term improvement in our portfolio as a whole. We are, however, working to align our disclosures with the TCFD framework. Where appropriate and relevant, we carry out scenario analyses on an asset-by-asset basis, both before making an investment and subsequently as part of our ongoing portfolio monitoring and asset management.
While we have not published aggregated data, we monitor the individual environmental performance of our investee companies and use our influence as an investor to promote a commitment in our investee companies to minimise harmful emissions and waste, invest in the mitigation of their environmental impact and implement energy efficiency measures. This is an important part not only of our portfolio risk management procedures, but also of the value creation plan for each of our investments.
Sustainability continuedOur TCFD disclosures continued
3i Group plc Annual report and accounts 2021Performance, risk and sustainability
74
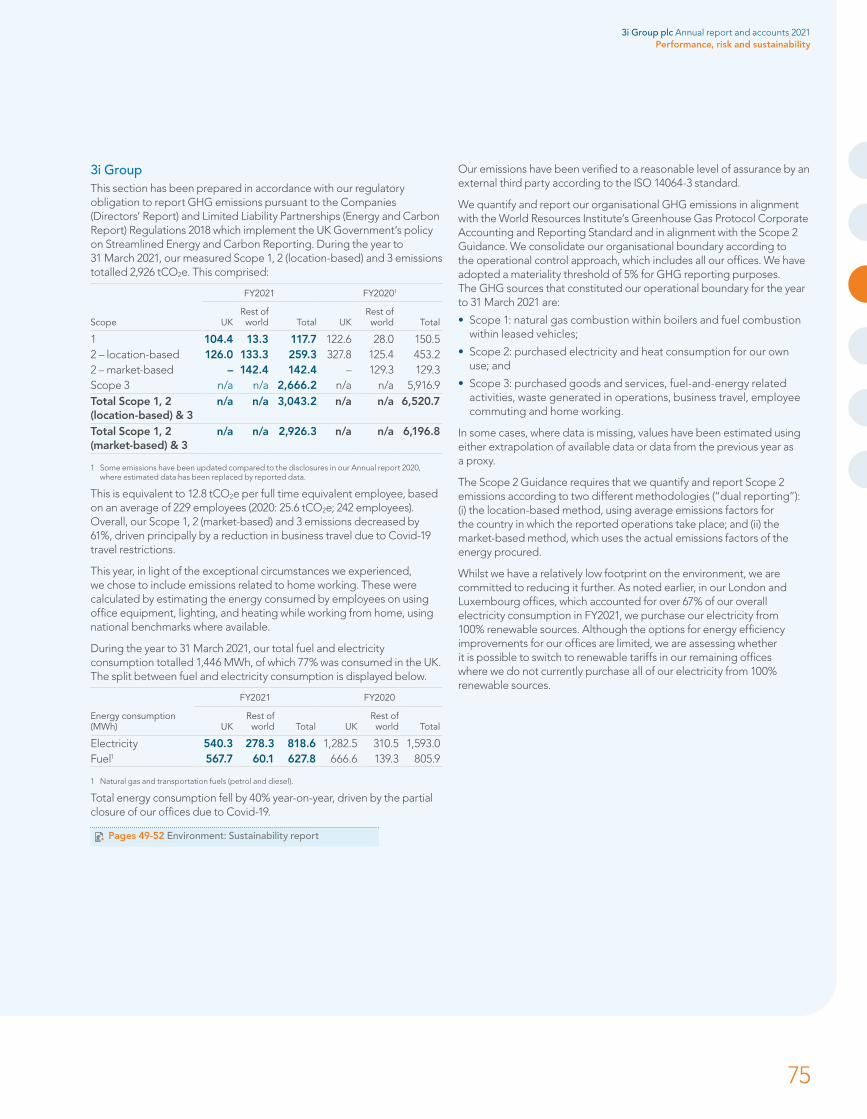
3i Group This section has been prepared in accordance with our regulatory obligation to report GHG emissions pursuant to the Companies (Directors’ Report) and Limited Liability Partnerships (Energy and Carbon Report) Regulations 2018 which implement the UK Government’s policy on Streamlined Energy and Carbon Reporting. During the year to 31 March 2021, our measured Scope 1, 2 (location-based) and 3 emissions totalled 2,926 tCO2e. This comprised:
Scope
FY2021 FY20201
UKRest of world Total UK
Rest of world Total
1 104.4 13.3 117.7 122.6 28.0 150.52 – location-based 126.0 133.3 259.3 327.8 125.4 453.22 – market-based – 142.4 142.4 – 129.3 129.3Scope 3 n/a n/a 2,666.2 n/a n/a 5,916.9Total Scope 1, 2 (location-based) & 3
n/a n/a 3,043.2 n/a n/a 6,520.7
Total Scope 1, 2 (market-based) & 3
n/a n/a 2,926.3 n/a n/a 6,196.8
1 Some emissions have been updated compared to the disclosures in our Annual report 2020, where estimated data has been replaced by reported data.
This is equivalent to 12.8 tCO2e per full time equivalent employee, based on an average of 229 employees (2020: 25.6 tCO2e; 242 employees). Overall, our Scope 1, 2 (market-based) and 3 emissions decreased by 61%, driven principally by a reduction in business travel due to Covid-19 travel restrictions.
This year, in light of the exceptional circumstances we experienced, we chose to include emissions related to home working. These were calculated by estimating the energy consumed by employees on using office equipment, lighting, and heating while working from home, using national benchmarks where available.
During the year to 31 March 2021, our total fuel and electricity consumption totalled 1,446 MWh, of which 77% was consumed in the UK. The split between fuel and electricity consumption is displayed below.
Energy consumption(MWh)
FY2021 FY2020
UKRest of world Total UK
Rest of world Total
Electricity 540.3 278.3 818.6 1,282.5 310.5 1,593.0Fuel1 567.7 60.1 627.8 666.6 139.3 805.9
1 Natural gas and transportation fuels (petrol and diesel).
Total energy consumption fell by 40% year-on-year, driven by the partial closure of our offices due to Covid-19.
Pages 49-52 Environment: Sustainability report
Our emissions have been verified to a reasonable level of assurance by an external third party according to the ISO 14064-3 standard.
We quantify and report our organisational GHG emissions in alignment with the World Resources Institute’s Greenhouse Gas Protocol Corporate Accounting and Reporting Standard and in alignment with the Scope 2 Guidance. We consolidate our organisational boundary according to the operational control approach, which includes all our offices. We have adopted a materiality threshold of 5% for GHG reporting purposes. The GHG sources that constituted our operational boundary for the year to 31 March 2021 are:
• Scope 1: natural gas combustion within boilers and fuel combustion within leased vehicles;
• Scope 2: purchased electricity and heat consumption for our own use; and
• Scope 3: purchased goods and services, fuel-and-energy related activities, waste generated in operations, business travel, employee commuting and home working.
In some cases, where data is missing, values have been estimated using either extrapolation of available data or data from the previous year as a proxy.
The Scope 2 Guidance requires that we quantify and report Scope 2 emissions according to two different methodologies (“dual reporting”): (i) the location-based method, using average emissions factors for the country in which the reported operations take place; and (ii) the market-based method, which uses the actual emissions factors of the energy procured.
Whilst we have a relatively low footprint on the environment, we are committed to reducing it further. As noted earlier, in our London and Luxembourg offices, which accounted for over 67% of our overall electricity consumption in FY2021, we purchase our electricity from 100% renewable sources. Although the options for energy efficiency improvements for our offices are limited, we are assessing whether it is possible to switch to renewable tariffs in our remaining offices where we do not currently purchase all of our electricity from 100% renewable sources.
3i Group plc Annual report and accounts 2021Performance, risk and sustainability
75
Directors’ duties under Section 172
Board decisions: the Company’s purpose and strategy, and engaging with stakeholdersDirectors have a duty to promote the success of the Company for the benefit of its members. Board decisions are guided by the Company’s purpose (as set out on page 1) namely to generate attractive returns for our shareholders and co-investors by investing in private equity and infrastructure assets. The Board’s strategy for doing this is described in “Our business model” on page 12 and the Board’s strategic objectives and key performance indicators are set out on pages 18 and 19.
In addition to the above considerations, the Board also has regard to the interests of its stakeholders and the wider community.
Board decisions often involve complex interactions of factors and require Directors to understand and have regard to a wide range of stakeholder interests and concerns.
This statement (and other sections of this Annual report cross-referenced in it) contains an explanation of how during the year the Directors had regard to the matters set out in section 172(1) (a) to (f) of the Companies Act 2006 when performing their duty under section 172; a description of how the interests of the Company’s key stakeholders as well as the matters set out in section 172 were considered in Board discussions and decision making in the year; and a statement summarising how during the year the Directors have had regard to the need to foster the Company’s business relationships with suppliers, customers and others, and the effect of that regard, including on the principal decisions taken by the Company during the year.
The Board is committed to effective engagement with the Company’s stakeholders and adopted a Stakeholder Engagement Strategy in March 2019. Effective communication is integral to building stakeholder relationships. Understanding the Company’s stakeholders and how they and their interests will impact on the success of the Company over the long term is a key part of the Board’s decision making. See pages 77 and 78 for how we identified our stakeholders and how we communicate with them and see pages 79 and 88 which provide details of key Board decisions in the year and how the Board had regard to stakeholders’ interests and the matters set out in section 172 in the Board’s decision making.
The duties of the directors – section 172
Under section 172 of the Companies Act 2006 a director of a company must act in the way he considers, in good faith, would be most likely to promote the success of the company for the benefit of its members as a whole, and in doing so have regard (amongst other matters) to:
• The likely consequences of any decision in the long term The interests of the company’s employees
• The need to foster the company’s business relationships with suppliers, customers and others
• The impact of the company’s operations on the community and the environment
• The desirability of the company maintaining a reputation for high standards of business conduct
• The need to act fairly towards all members of the Company
Directors’ duties under Section 172
3i Group plc Annual report and accounts 2021Performance, risk and sustainability
76

Engaging with our stakeholders
As an investment company whose purpose is to generate attractive investment returns, our stakeholders are different from those of many other companies such as consumer or manufacturing companies who make and/or sell products to others. Our key stakeholders are instead those with whom we have relationships in seeking to fulfil our purpose.
Our key stakeholders are described below together with why they are important to us and how we engage with them and foster business relationships with them. The way in which the Directors have had regard to the need to foster these relationships can be seen in the description of decision making on pages 79 and 88.
Shareholders
Why are they important?
A strong relationship with shareholders is essential for the long-term success of the business. They provide our permanent capital and it is for their benefit that the Directors are required to promote the success of the Company.
How do we engage with them and foster business relationships? The Company has an extensive shareholder engagement programme.
Pages 86-87Engaging with shareholders
Employees and contractors
Why are they important?
3i is a people business as our people are critical to the success of the Company in investing capital successfully.
How do we engage with them and foster business relationships?Our approach as a responsible employer is described in the Sustainability report on pages 68 to 70. The Directors’ report on page 122 includes details on their engagement with our people. Engagement has been all the more challenging over the past year because of Covid-19. Steps which have been taken to maintain engagement and foster relationships with employees during the Covid-19 pandemic are described on page 70.
Fund investors
Why are they important?
Fund Investors provide capital which we invest as part of our investment management activities and are customers to whom we owe regulatory duties.
How do we engage with them and foster business relationships?The Company has a Fund Investor Relations team which coordinates and maintains relationships with fund investors, and potential investors. There is extensive engagement through regular and ad hoc meetings with fund investors and Co-Investors, supported by comprehensive reporting and access to a web-based Investor portal for fund investors.
The Chief Executive and relevant investment professionals participate in some of these meetings, as appropriate.
Who are our stakeholders?
Investee companies
Why are they important?
The companies in which we invest are the source of returns to our shareholders and fund investors.
How do we engage with them and foster business relationships?We take a long-term responsible approach to investment, working with the management teams of investee companies to create value. Our business model is described on pages 12 and 13. The SaniSure case study on page 29, and details of new investments made in the year on page 24 provide examples of this business model in practice.
The principal engagement with portfolio companies is through the Company’s investment teams. One or more of our investment professionals are usually appointed as directors of each investee company. Engagement with investee companies takes place both formally at board level and informally by the Private Equity and Infrastructure investment teams on an ongoing basis. In addition, regular Chairman, CEO and CFO forums share best practice and experience.
Bondholders and lenders
Why are they important?
Access to bank borrowing and the ability to issue bonds and other debt provides important flexibility and resilience to the Company’s financial structure.
How do we engage with them and foster business relationships?Together with the Group Finance Director, the Group Treasurer manages engagement with the holders of the Company’s bonds and the lenders in the Company’s revolving credit facility. This includes the maintenance of a dedicated section on 3i.com. Lending banks are regularly invited to the Group’s results presentation.
Pages 60-62 Transparency and stakeholder engagement: Sustainability report
+ www.3i.com/sustainabilityFor more information on Transparency and stakeholder engagement
3i Group plc Annual report and accounts 2021Performance, risk and sustainability
77

Government and regulatory bodies
Why are they important?
The Company works in a regulated environment and can only continue to operate in compliance with relevant regulation.
How do we engage with them and foster business relationships?Our Group Compliance team and local professionals lead our relationships with regulators in the UK, Luxembourg and elsewhere.
The Company actively participates in policy forums, engages on regulatory matters and is a member of a number of industry consultative bodies, including, for example, the British Venture Capital Association and Invest Europe.
Professional advisers and consultants (including due diligence providers, search and recruitment firms, BLN, business consultants and law firms)
Why are they important?
The Company relies on its extensive network of consultants and advisers to help it to originate, analyse and execute new investments, to assist with portfolio management and other projects.
How do we engage with them and foster business relationships?The investment teams, Executive Directors and functional teams lead these relationships and maintain close and regular dialogue with our advisers and consultants.
Rating agencies
Why are they important?
A credit rating is important for the Company to be able to borrow from banks and to issue bonds or other debt.
How do we engage with them and foster business relationships?The Group Treasurer manages engagement with credit rating agencies through regular reviews and updates on the Company’s activities, performance and annual meetings with the Group Finance Director and the Treasury team, and senior management from the business lines if necessary.
Communities
Why are they important?
The Company is committed to contributing positively to the communities in which it operates.
How do we engage with them and foster business relationships?For details of the Company’s contribution to communities see the Sustainability report on page 64.
Pages 55-59Communities: Sustainability report
+ www.3i.com/sustainabilityFor more information on Communities
Members of the 3i Group Pension Plan
Why are they important?
Members of the 3i Group Pension Plan are former and current employees to whom the Group has provided commitments regarding their pension provision.
How do we engage with them and foster business relationships?The Group Finance Director meets regularly with the Trustees of the 3i Group Pension Plan and also updates the Trustees on the Group’s strategy and financial performance. The Group provides support to the Trustees through the provision of a pension manager and company secretarial services, and practical support through the provision of facilities to meet and communicate. As set out in Note 26 to the financial statements the Trustees executed a third and final buy-in transaction in the year as a result of which substantially all of the Plan benefits of all members are now insured.
Directors’ duties under Section 172 continuedEngaging with stakeholders continued
3i Group plc Annual report and accounts 2021Performance, risk and sustainability
78
Response to the Covid-19 pandemicDecision making in relation to the Covid-19 pandemic started at the end of the previous financial year and continued throughout the financial year. We have continued to focus on ensuring the safety and wellbeing of the Company’s employees and contractors. Our investment teams worked with investee companies to assist them in managing operational and financial issues which arose due to the pandemic and the Group provided financial support where required. In addition to our regular charitable giving, during the year our employees supported charities particularly affected by the pandemic, focusing on the most vulnerable communities in countries where 3i and its portfolio companies operate, through a £5 million Covid-19 charitable fund established from Private Equity and Infrastructure carry and performance fee arrangements. The fund has now been almost fully disbursed.
Further detail on the response to the pandemic can be seen on page 88 and causes supported can be found on page 11 and in the Sustainability report on page 72 and on the 3i website.
How stakeholder interests have influenced decision makingThe Board takes account of the interests of stakeholders as well as the other factors mentioned in section 172 of the Companies Act 2006 in deciding on actions that would likely promote the success of the Company for the benefit of its members as a whole. Each Board meeting receives a reminder of the Directors’ duties under section 172. Examples of key decisions taken by the Board in the year together with brief details of how the interests of stakeholders were taken into account are given below. Further detail on Board decision making is given on pages 88 and 89.
Key decisions in the year
For the purposes of the UK Companies Act 2006, the Strategic report of 3i Group plc comprises pages 1 to 79.
By order of the Board
Simon BorrowsChief Executive
12 May 2021
FY2020 second dividend and FY2021 first dividendIn May 2020, when the outlook was uncertain and many other companies were reducing or postponing dividends, the Directors took account of the shareholders’ desire for income distributions and balanced this against the need to maintain liquidity for new investment and operating expenses. After considering these factors and detailed liquidity forecasts which showed that the Group maintained a very strong balance sheet, the Directors recommended that the total dividend for FY2020 be maintained at the same level as the previous
year and later recommended a maintained FY2021 first dividend. The fact that the Company had taken no Government support under the various support schemes established to support businesses through the Covid-19 pandemic was also a relevant consideration in deciding to pay dividends.
£400 million bond issueIn June 2020, the Company issued a £400 million 3.75% sterling bond repayable in 2040. The Board saw it as in shareholders’ interests to take advantage of historically low interest rates to issue long-term debt as additional liquidity would increase the Group’s flexibility, should the pandemic be prolonged, to provide financial support to the portfolio if required, to make further investments where attractive opportunities
presented themselves and to avoid any pressure to sell investments at sub-optimal pricing. The bond issue required appropriate consideration of credit rating agencies as well as bond investors.
+ www.3i.com/sustainabilityfor the Sustainability report
3i Group plc Annual report and accounts 2021Performance, risk and sustainability
79

Governance
What’s in this sectionChairman’s introduction 81
Board of Directors 82
Executive Committee 84
The role of the Board 85
Engaging with our shareholders 86
Operation of the Board 88
Nominations Committee report 91
Audit and Compliance Committee report 94
Valuations Committee report 103
Directors’ remuneration report 107
Additional statutory and corporate governance information 118
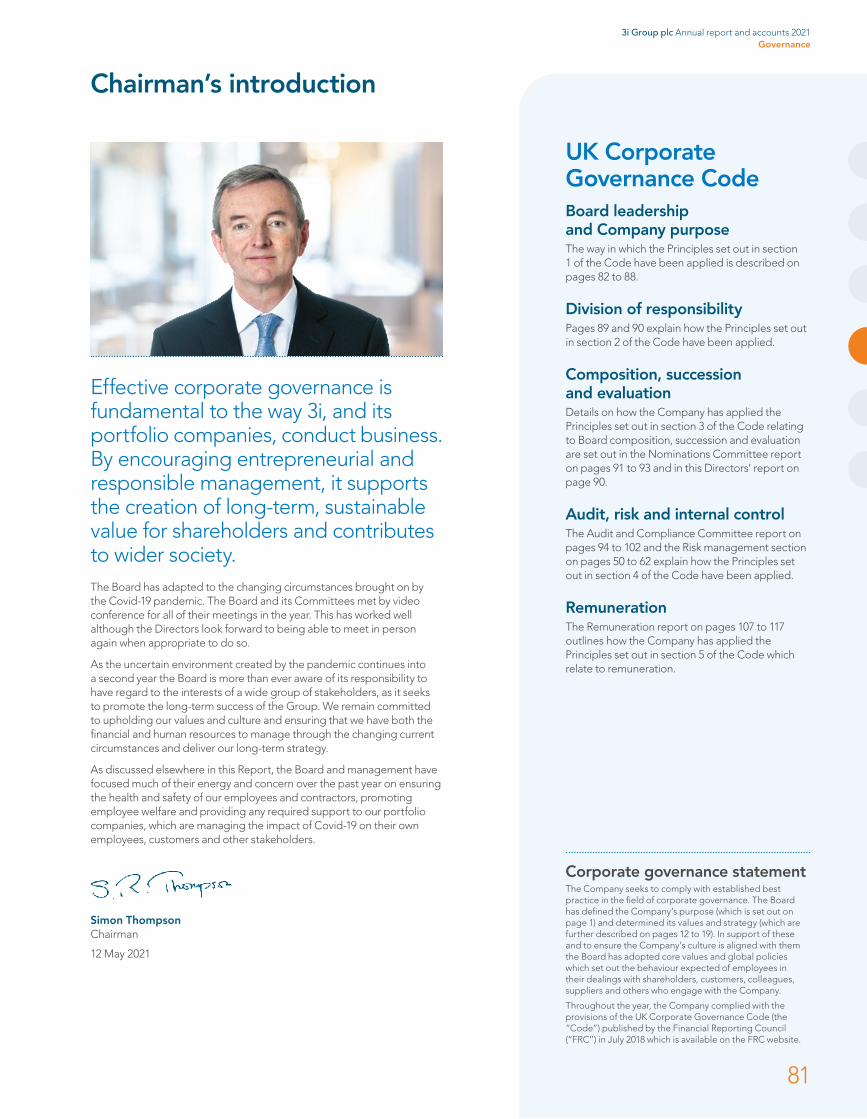
Chairman’s introduction
Corporate governance statementThe Company seeks to comply with established best practice in the field of corporate governance. The Board has defined the Company’s purpose (which is set out on page 1) and determined its values and strategy (which are further described on pages 12 to 19). In support of these and to ensure the Company’s culture is aligned with them the Board has adopted core values and global policies which set out the behaviour expected of employees in their dealings with shareholders, customers, colleagues, suppliers and others who engage with the Company.
Throughout the year, the Company complied with the provisions of the UK Corporate Governance Code (the “Code”) published by the Financial Reporting Council (“FRC”) in July 2018 which is available on the FRC website.
UK Corporate Governance CodeBoard leadership and Company purposeThe way in which the Principles set out in section 1 of the Code have been applied is described on pages 82 to 88.
Division of responsibilityPages 89 and 90 explain how the Principles set out in section 2 of the Code have been applied.
Composition, succession and evaluationDetails on how the Company has applied the Principles set out in section 3 of the Code relating to Board composition, succession and evaluation are set out in the Nominations Committee report on pages 91 to 93 and in this Directors’ report on page 90.
Audit, risk and internal controlThe Audit and Compliance Committee report on pages 94 to 102 and the Risk management section on pages 50 to 62 explain how the Principles set out in section 4 of the Code have been applied.
RemunerationThe Remuneration report on pages 107 to 117 outlines how the Company has applied the Principles set out in section 5 of the Code which relate to remuneration.
Effective corporate governance is fundamental to the way 3i, and its portfolio companies, conduct business. By encouraging entrepreneurial and responsible management, it supports the creation of long-term, sustainable value for shareholders and contributes to wider society.The Board has adapted to the changing circumstances brought on by the Covid-19 pandemic. The Board and its Committees met by video conference for all of their meetings in the year. This has worked well although the Directors look forward to being able to meet in person again when appropriate to do so.
As the uncertain environment created by the pandemic continues into a second year the Board is more than ever aware of its responsibility to have regard to the interests of a wide group of stakeholders, as it seeks to promote the long-term success of the Group. We remain committed to upholding our values and culture and ensuring that we have both the financial and human resources to manage through the changing current circumstances and deliver our long-term strategy.
As discussed elsewhere in this Report, the Board and management have focused much of their energy and concern over the past year on ensuring the health and safety of our employees and contractors, promoting employee welfare and providing any required support to our portfolio companies, which are managing the impact of Covid-19 on their own employees, customers and other stakeholders.
Simon ThompsonChairman
12 May 2021
3i Group plc Annual report and accounts 2021Governance
81

The Board promotes a culture of strong governance across the business and adheres to the Principles set out in the UK Corporate Governance Code.
Simon BorrowsChief ExecutiveChief Executive since 2012, and an Executive Director since he joined 3i in 2011. Chairman of the Group’s Risk Committee, Executive Committee and Investment Committee. Chairman of the Supervisory Board of Peer Holding I B.V., the Dutch holding company for the Group’s investment in Action.
Previous experienceFormerly Chairman of Greenhill & Co International LLP, having previously been Co-Chief Executive Officer of Greenhill & Co, Inc. Before founding the European operations of Greenhill & Co in 1998 he was the Managing Director of Baring Brothers International Limited. Formerly a non-executive Director of the British Land Company PLC and Inchcape plc.
Simon ThompsonChairmanNon-executive Director since 2015 and appointed non-executive Chairman with effect from close of the 2015 AGM. Chairman of Rio Tinto plc.
Simon’s significant and varied experience of listed company chairmanships together with his investment banking background supports his effective chairmanship of the Board.
Previous experienceNon-executive Chairman of Tullow Oil plc. Formerly an executive director of Anglo American plc and Chairman of the Tarmac Group. Non-executive director of AngloGold Ashanti Ltd, Newmont Mining Corporation and Sandvik AB. Senior Independent Director of Amec Foster Wheeler plc. Previous career in investment banking with N M Rothschild and S.G. Warburg.
Julia WilsonGroup Finance DirectorGroup Finance Director and member of the Executive Committee since 2008. A member of the Investment Committee since 2012. Joined 3i in 2006 as Deputy Finance Director. Also a non-executive director of Barclays PLC, and Chairman of the 100 Group.
Previous experienceFormerly a non-executive director of Legal & General Group plc, and formerly Group Director of Corporate Finance at Cable & Wireless plc, having previously held a variety of tax and finance roles at Cable & Wireless plc, Hanson plc and Tomkins plc.
Board leadership and Company purposeBoard of Directors
Page 85Read more about our the role of the Board
Page 89Read more about how the Board operates
3i Group plc Annual report and accounts 2021Governance
82

Coline McConville Independent non-executive DirectorNon-executive Director since 2018. Also Senior Independent Director of Fevertree Drinks plc, a non-executive Director of Travis Perkins plc and a member of the Supervisory Board of Tui AG.
Coline has a diverse commercial background, having worked in a range of sectors and also brings to the Board significant listed board experience including chairing several remuneration committees and acting as Senior Independent Director at Fevertree. This enables her to make valuable contributions to the Board’s discussions and to those of the Remuneration Committee, which she now chairs.
Previous experienceFormerly a non-executive Director of Tui Travel plc, UTV Media plc, Wembley National Stadium Limited, Shed Media plc, HBOS plc and Inchcape plc. Prior to that was Chief Operating Officer and Chief Executive Officer Europe of Clear Channel International Limited and had previously worked for McKinsey and LEK.
Alexandra SchaapveldIndependent non-executive DirectorNon-executive Director since January 2020. Non-executive director of Société Générale, France and non-executive director of Bumi Armada Berhad, Malaysia.
Alexandra brings extensive financial services expertise in a number of important markets for 3i as well as considerable board experience in a variety of sectors. These help provide an international perspective to the Board’s decision making process.
Previous experienceFormerly on the boards of Vallourec S.A., FMO N.V., Stage Entertainment N.V., Holland Casino N.V., VU University and VU Medical Center and Duin & Kruidberg. Prior to that many years of corporate and investment banking at RBS and ABN AMRO.
Peter McKellarIndependent non-executive DirectorPeter McKellar will join the Board on 1 June 2021 and will stand for election at the 2021 Annual General Meeting.
Deputy Chairman of AssetCo plc and a Board Member of Scottish Enterprise, Scotland’s national economic development agency.
Peter will bring to the Board significant experience and understanding of financial services and asset management, with a particular expertise in private equity and infrastructure.
Previous experienceUntil September 2020 was Global Head of Private Markets at Standard Life Aberdeen plc and had previously led Standard Life Investments’ private equity and infrastructure business and been their Chief Investment Officer. He joined Standard Life Investments in 1999. Prior to that he held a variety of finance posts in industry and corporate finance positions.
Caroline BanszkyIndependent non-executive DirectorNon-executive Director since 2014. Also a non-executive Director of Gore Street Energy Storage Fund plc and IntegraFin Holdings plc.
Caroline brings to the Board extensive banking, investment and operating experience across a range of businesses. This as well as her accountancy background contributes to her effective chairmanship of Audit and Compliance Committee.
Previous experienceFormerly the Chief Executive of the Law Debenture Corporation p.l.c. from 2002 to 2016. Chief Operating Officer of SVB Holdings PLC, a Lloyd’s listed integrated vehicle, from 1997 to 2002. Previously, Finance Director of N M Rothschild & Sons Limited from 1995 to 1997, having joined the bank in 1981. She originally trained at what is now KPMG.
David HutchisonSenior Independent DirectorNon-executive Director since 2013 and Senior Independent Director since June 2020. Chief Executive of Social Finance Limited.
David has considerable investment and banking experience across a range of asset classes which he brings to bear on his contribution to Board discussions and in particular in his chairmanship of Valuations Committee.
Previous experienceUntil 2009 Head of UK Investment Banking at Dresdner Kleinwort Limited and a member of its Global Banking Operating Committee. From 2012 to 2017, a non-executive director of the Start-Up Loans Company.
Stephen DaintithIndependent non-executive DirectorNon-executive Director since 2016. Chief Financial Officer and an executive director of Ocado Group plc.
Stephen contributes directly relevant financial and operating experience, drawn from a range of consumer, digital, engineering and other international businesses, to the Board’s decision making.
Previous experienceFormerly an executive director of Rolls-Royce Holdings plc from 2017 to March 2021 and Finance Director of Daily Mail and General Trust plc (“DMGT”) from 2011 to 2017. Non-executive director of ZPG Plc. Prior to joining DMGT he was Chief Operating Officer and Chief Financial Officer of Dow Jones and prior to that Chief Financial Officer of News International. He originally qualified as a chartered accountant with Price Waterhouse (now part of PwC).
3i Group plc Annual report and accounts 2021Governance
83

Rob Collins Managing Partner, Head of North American Infrastructure Joined 3i in 2017 as the Managing Partner for North American Infrastructure. A member of the Executive Committee since 2018. Also a non-executive director of Smarte Carte and Regional Rail.
Previous experiencePrior to joining 3i, led Hastings’ infrastructure investment team in North America and Europe. Founded the infrastructure M&A practice at Morgan Stanley and Greenhill where he was a Managing Director at both firms. Started his infrastructure career at Goldman Sachs after serving as a nuclear-power officer in the US Navy.
Pieter de JongCo-Head Private EquityJoined 3i in 2004, served as Managing Director of 3i Benelux between 2011 and 2019. A member of the Executive Committee, Investment Committee and Group Risk Committee since 2019. Also a non-executive director of Basic-Fit and Royal Sanders and a board observer at WP.
Previous experienceStarted his career at Stork in the USA, before joining Van Den Boom Group, a corporate finance consulting firm in Benelux, where he became partner/owner responsible for M&A. After selling the firm to NIBC in 2000, he headed the M&A department until 2003.
Peter WirtzCo-Head Private EquityJoined 3i in 1998. Served as 3i Germany Co-Head between 2009 and 2019. A member of the Executive Committee, Investment Committee and Group Risk Committee since 2019. Also non-executive director of Christ, Scandlines, GartenHaus, MPM and Luqom.
Previous experiencePrior to joining 3i, worked for Deutsche Bank and spent four years with Procter & Gamble in various finance functions.
Phil WhiteManaging Partner, Head of InfrastructureJoined 3i in 2007. A member of the Executive Committee, Investment Committee and Group Risk Committee since 2014. Also a non-executive director of Ionisos.
Previous experiencePrior to joining 3i, experience in infrastructure investment, advisory and financing, including roles at Macquarie, WestLB and Barclays.
Kevin DunnGeneral Counsel and Company SecretaryResponsible for 3i’s legal, compliance, internal audit, human resources and company secretarial functions. A member of the Executive Committee since joining 3i in 2007.
Previous experiencePrior to joining 3i, was a Senior Managing Director, running GE’s European Leveraged Finance business after serving as European General Counsel for GE. Prior to GE, was a partner at the law firms Travers Smith and Latham & Watkins.
Simon BorrowsChief Executive
Julia WilsonGroup Finance Director
Page 82See profile
Page 82See profile
Board leadership and Company purpose continued
Executive Committee
3i Group plc Annual report and accounts 2021Governance
84

The role of the Board
Attendance at Board and Committee meetings1
Independence Board
Audit and Compliance Committee
Nominations Committee
Remuneration Committee
Valuations Committee
Total meetings held1 7 6 5 5 4Number attended:S R Thompson Independent on appointment 7(7) – 5(5) 5(5) 4(4)S A Borrows Executive Director 7(7) – – – 4(4)J S Wilson Executive Director 7(7) – – – 4(4)J P Asquith Independent2 5(5) 4(4) 3(3) 4(4) –C J Banszky Independent 7(7) 6(6) 5(5) 5(5) –S W Daintith Independent 7(7) 6(6) 5(5) – 4(4)P Grosch Not independent2,3 5(5) – 2(3) – 3(3)D A M Hutchison Independent 7(7) – 5(5) 5(5) 4(4)C McConville Independent 7(7) 6(6) 4(5) 5(5) –A Schaapveld Independent 7(7) 6(6) 5(5) – 4(4)
1 This table shows the number of scheduled meetings of the Board and its Committees attended by each Director in the year, together with (in brackets) the number of meetings they were eligible to attend. 2 Mr Asquith and Mr Grosch retired from the Board on 31 December 2020.3 Mr P Grosch was not considered independent because of his links with the Group’s Private Equity business including his position as chairman of Kinolt (formerly Euro-Diesel), a company in which the Group
was invested prior to its disposal in July 2020. Mr P Grosch received directors’ fees from and was a shareholder in Kinolt.
Non-executive Directors also attended a number of other Company meetings to increase their understanding of the principal risks in the business and the strength and depth of our people.
The role of the Board is to lead the Company in promoting the long-term sustainable success of the Company, generating value for shareholders and contributing to wider society. The Board has established the Company’s purpose, values and strategy and satisfies itself that these and its culture are aligned. The Company’s purpose is set out on page 1. The values are described on page 15. The Board satisfies itself that these are aligned. All Directors are required to act with integrity, lead by example, and promote the Company’s culture and values.
The Board approves the Group’s strategic objectives which are set out on pages 18 and 19. It ensures the necessary resources are in place for the Company to meet these objectives through a Board approved planning and budgeting process. The Board measures performance against those objectives using the KPIs set out on page 18 which are reported to the Board in the monthly Board report.
The framework of controls established by the Board to enable risk to be assessed and managed is described in the Risk management section on pages 50 to 62.
Page 52Risk governance framework
The Board ensures that employee policies and practices are consistent with the Company’s values and supports the Company’s long-term sustainable success during its annual review of the Group Succession Planning and Strategic Capability Review. The Remuneration Committee reviews workforce remuneration and the alignment of incentives and rewards with culture. The Board, through its Audit and Compliance Committee, assesses and monitors behaviours and its adherence to the Company’s values. Regular reports from the Internal Audit and Group Compliance teams consider and comment on culture within the business and their consistency with the Company’s culture. Arrangements to enable employees to raise any matters of concern are described on page 69.
3i Group plc Annual report and accounts 2021Governance
85

Approach to investor relations and Board oversightThe Board recognises the importance of maintaining an engaged and purposeful relationship with existing and potential shareholders. Shareholders provide our permanent capital and it is for their benefit that the Directors are required to promote the success of the Group. 3i has a comprehensive Investor Relations programme to help investors to understand its performance.
The Chief Executive, the Group Finance Director and the Group Investor Relations Director meet with the Company’s principal shareholders and with potential shareholders on a regular basis to discuss the Group’s activities, strategy and financial performance.
The Chairman offers to meet major shareholders on corporate governance, strategy and management in July after the AGM and is available more often as required. Non-executive Directors are also available to meet shareholders, as required.
The Executive Directors brief the Board on a regular basis on the implementation of the Investor Relations programme and on feedback received from analysts and investors. Any significant concern raised by shareholders in relation to the Group is communicated to the Board.
Investor Relations programmeWe engage our market audiences through a full programme of events. Our FY2021 Investor Relations programme is set out below. As a result of travel and meeting restrictions imposed globally to manage the Covid-19 pandemic, all investor meetings and other events were held virtually.
Our FY2021 Investor Relations programme
May• Annual results
and international investor roadshow
June• International investor
roadshow (continued)
• Annual General Meeting and virtual shareholder presentation
July• Q1 performance update
• Group investor call
• Chairman’s meetings with major shareholders, if required
August• Group investor call
September• Private Equity capital
markets seminar
• Barclays financial services conference
• Bank of America financial services conference
November• Half-yearly results
• International investor roadshow
December• International investor
roadshow (continued)
January• Q3 performance update
• Group investor call
February• Crédit Suisse financial
services conference
March• Action capital
markets seminar
• Morgan Stanley financial services conference
5
11
9 6
12
7
1
8
2 3
FY2021
Board leadership and Company purpose continued
Engaging with shareholders
Website3i’s website provides a brief description of 3i’s history, current operations and strategy, as well as an archive of over 10 years of news and historical financial information on the Group and details of forthcoming events for shareholders and analysts.
+ www.3i.com/investor-relationsFor more information about 3i and regular updates
3i Group plc Annual report and accounts 2021Governance
86
Institutional investorsThe Executive Directors and Investor Relations Director meet with the Group’s principal shareholders on a twice-yearly basis, generally following the publication of annual and half-yearly results, but also as required during the year. They also host large group investor calls after the publication of quarterly performance updates, to target both existing and potential shareholders.
The Chairman and Senior Independent Director are also available to meet with shareholders as required.
The Executive Directors and Group Investor Relations Director also meet with smaller shareholders and potential investors on a regular basis throughout the year, as part of arranged UK and international roadshows and as required.
Throughout the year, the Executive Directors and Group Investor Relations Director also participated in conferences for institutional investors organised by Bank of America, Barclays, Crédit Suisse and Morgan Stanley.
Annual and half-yearly results presentationsThe Executive Directors present the annual and half-yearly results to institutional investors and financial analysts. These presentations are webcast live on 3i’s website, and the on-demand webcast remains available on the website for a period of 12 months.
As a result of the Covid-19 pandemic and social distancing measures imposed by the UK Government, the annual results presentation for FY2021 will be held virtually via a webcast. The presentation materials and webcast will be made available on 3i’s website.
Individual investorsIndividual investors are encouraged to engage with the Group and provide feedback through the Group Investor Relations Director and the Company Secretary, whose contact details are available on the website.
Capital markets seminars3i held two capital markets seminars in FY2021, including one in September 2020 and one in March 2021.
During our September 2020 capital markets seminar, which was held virtually via a webcast, our Chief Executive discussed 3i’s approach to sustainability and responsible investment. We also presented on two of our most recent Private Equity investments, Evernex and SaniSure. These two presentations were delivered by the Private Equity investment partners responsible for those investments.
The presentation materials used during the seminar were made available on 3i’s website.
The Action capital markets seminar in March 2021 was also held virtually via a webcast. The event consisted of presentations by the 3i Chief Executive and the management team of Action. This event focused on Action’s business model and strategy, its approach to sustainability and on its financial performance. An on-demand webcast of this event is available on our website.
Annual General MeetingThe Group uses its AGM as an important opportunity to communicate with its retail shareholders, who are encouraged to ask questions during the meeting, and have an opportunity to meet Directors before and after the formal proceedings.
At the Meeting, business presentations are generally made by the Chairman and the Chief Executive. The Chairmen of the Remuneration, Audit and Compliance and Nominations Committees are generally available to answer shareholders’ questions. Business to be discussed at the Meeting is notified to shareholders in advance through the Notice of Meeting and covers matters such as the annual election of Directors, the appointment of the External auditor and the dividend declaration. During the Meeting, shareholders are also asked to approve the financial statements and reports of the Directors and the External auditor. In addition, shareholders are asked to approve the Directors’ remuneration report.
The 2020 AGM was held privately, due to restrictions on large meetings imposed by the UK Government to manage the Covid-19 pandemic. A shareholder presentation was held immediately after the AGM via a webcast. During the webcast, shareholders had the opportunity to listen to presentations from the Chairman and Chief Executive and to ask questions. Shareholders also had the opportunity to email their questions to the Group Investor Relations Director ahead of the webcast, as set out in the Notice of AGM.
The 2020 Notice of AGM was dispatched to shareholders not less than 20 working days before the Meeting. At that Meeting, voting on each resolution was taken on a poll and the poll results were made available on the Company’s website. At the 2020 AGM, all resolutions were passed with at least 90% of the votes in favour.
3i Group plc Annual report and accounts 2021Governance
87

Review of Balance sheet policyIn December 2020 the Board reviewed its balance sheet strategy, which had been unchanged since 2012 when the Board adopted conservative financial constraints to mitigate the risks arising from a structurally geared balance sheet in times of stress. The outcome of the Board’s review is described on page 40. Whilst primarily a matter
of engaging the interest of shareholders, it also required appropriate communication to credit agencies and the Group’s lenders.
The Board met for seven scheduled meetings during FY2021, together with two additional ad hoc meetings relating to specific matters which arose at short notice. The Board also held a strategy day in December 2020. A table of individual Board member attendance at the scheduled Board and Committee meetings is provided on page 85.
The Board’s agenda is set by the Chairman. Board members and, as appropriate, executives from the relevant business areas are invited to present on key items allowing the Board the opportunity to debate and challenge initiatives directly with the senior management team.
As described on page 76, the Board in its decision making has regard to the interests of stakeholders as well as the other factors mentioned in section 172 of the Companies Act 2006 when determining steps that
would likely promote the success of the Company for the benefit of its members as a whole. Details of decisions taken by the Board in the year together with details of how, where relevant, the Board had regard to the interests of relevant stakeholders are set out on page 79 and below. Our key stakeholders are discussed on pages 77 and 78.
In addition, the Board also dealt with its regular annual cycle of business including: the Group’s strategic plan; related KPIs and annual budget; regular reports from the Chief Executive and the Board’s Committees; updates on the Group’s Private Equity and Infrastructure businesses; the recommendations of the Valuations Committee on valuations of investments; the Annual report and accounts, Half-yearly report and quarterly performance updates; and the Group’s organisational capability and succession plans.
Board leadership and Company purpose continued
What the Board did in FY2021
Response to the Covid-19 pandemic An outline of Board decision making on Covid-19 is set out on page 79, and further details are set out below.
Employees and third-party outsource staff Decisions focused on ensuring the safety and wellbeing of our employees and third-party outsource colleagues. The vast majority of our employees worked remotely for almost the entire year. Additional IT investment facilitated this. Management also focused on protecting mental health and wellbeing, ensuring communication and providing individual support where needed.
Some offices were able to reopen in a Covid-secure way in the financial year when allowed by regulation and best practice in the relevant locations following appropriate risk assessments. All such attendance during the year was voluntary and employees had the option to continue working remotely.
Investee companies The Company’s investment teams worked with investee companies to assist them in managing operational and financial issues which arose. In cases where further financial support was needed, the Company considered the needs of the portfolio company and the interests of the Company’s shareholders, taking into consideration the longer-term prospects of the portfolio company.
Shareholders Whilst having regard to the interests of employees, third-party outsource staff and portfolio companies, as described above, the Directors were always conscious of their duty to shareholders to promote the success of the Company. For example, as described on page 79, decisions concerning dividends became more complex as a result of the Covid-19 pandemic, and the immediate regulatory and political response to it.
ActionWe completed the Action transaction (described on page 19 of the 2020 Annual report) in March 2020. As a consequence of this, during FY2021 we also completed arrangements which facilitated the payment of carried interest to participating employees and former employees in respect of the Action transaction, and in addition agreed to pay approximately 25% of the outstanding carried interest in respect of 3i’s own investment in Action.
The combined effect of these transactions was to increase 3i’s net economic interest in Action to 47.7%. In its decision making, the Board had regard to the investment merits of increasing the Company’s effective investment in Action whilst taking account of the Company’s liquidity position and having regard to the interest of participating former and current 3i employees.
3i Group plc Annual report and accounts 2021Governance
88

The Board ensures that it has the policies, processes, information, time and resources it needs in order to function effectively and efficiently.The Board meets formally on a regular basis and, at each meeting, considers business performance. There is a clear division of responsibilities between the Chairman and Chief Executive. There is a clearly defined schedule of matters reserved for the Board. In line with Government regulations and guidance, meetings in the year were largely held remotely. When circumstances permit, and in-person meetings resume, these will again usually be held in London as was the case before the Covid-19 pandemic, except for one meeting a year which is generally held in or near one of our other offices, providing a chance for non-executive Directors to meet our local teams and visit or meet the management of some of our portfolio companies.
The Board is assisted by various Principal Committees of the Board, which report to it regularly and details of their activity in the year are provided on pages 91 to 117.
Matters delegated by the Board to the Chief Executive include implementation of the Board approved strategy, most investment decisions, day-to-day management and operation of the business, the appointment and most remuneration of employees below the Executive Committee, and risk management. The Board receives regular reports on potential conflicts of interests involving Directors and any actual conflicts of interest identified are managed appropriately. This may involve excluding the Director concerned from relevant information and discussions.
Day-to-day management of the Group is the responsibility of the Chief Executive. To assist him in this role, the Chief Executive has established a number of additional management committees, including the Investment Committee, which are outlined in the description of our governance framework on page 52.
Responsibilities of the Chairman• Leads the Board and is responsible for its overall effectiveness in
directing the Company.
• Leads the Board in establishing the purpose, values and culture of the Company.
• Leads the Board in setting its agenda, approving strategy, monitoring financial and operational performance, and establishing the Group’s risk appetite.
• Organises the business of the Board, ensuring its effectiveness, and maintains an effective system of internal controls.
• Ensures that Directors receive accurate, timely and clear information. This includes ensuring that the non-executive Directors receive regular reports on shareholders’ views on the Group.
• Responsible for the composition of the Board, facilitates constructive Board relations and the effective contribution of all non-executive Directors.
Responsibilities of the Chief Executive• Direct charge of the Group on a day-to-day basis and is
accountable to the Board for the financial and operational performance of the Group.
• Chairs the Investment Committee to review the acquisition, management and disposal of investments.
• Leads the Executive management team to develop and implement the Group’s strategy and manage the risk and internal control framework.
• Reports to the Board on financial and operational performance, risk management and progress in delivering the strategic objectives.
• Regularly engages with shareholders and other key stakeholders on the Group’s activities and progress.
Role of non-executive Directors• Provide constructive challenge, strategic guidance and hold
management to account.
• Scrutinise the performance of management and individual Executive Directors in meeting agreed objectives and monitor the reporting of performance.
• Seek assurance on the integrity of the financial information and that financial controls and systems of risk management are robust and defensible.
• Determine appropriate levels of remuneration for Executive Directors and Executive Committee and together with the Chairman, have a prime role in appointing Directors and in succession planning for the Board.
• Constructively challenge and help develop proposals on strategy; this occurs at meetings of the Board, and in particular at the annual review meeting to discuss ongoing strategy, the most recent of which took place in December 2020.
• Ensure that they have sufficient time to meet their Board responsibilities.
Role of the Senior Independent Director• The Senior Independent Director provides a sounding board
for the Chairman and serves as an intermediary for the other Directors and the shareholders, and has a prime role in succession planning for the Chair.
Division of responsibilities How the Board operates
89
3i Group plc Annual report and accounts 2021Governance

Composition, succession and evaluationSkills and experienceTraining and adviceThe Company has a training policy which provides a framework within which training for Directors is planned with the objective of ensuring Directors understand the duties and responsibilities of being a director of a listed company. All Directors are required to keep their skills up-to-date and maintain their familiarity with the Company and its business.
On appointment, all non-executive Directors have discussions with the Chairman and the Chief Executive following which appropriate briefings on the responsibilities of Directors, the Company’s business and the Company’s procedures are arranged. The Company provides opportunities for non-executive Directors to obtain a thorough understanding of the Company’s business by meeting members of the senior management team who in turn arrange, as required, visits to investment or support teams.
All non-executive Directors have access to the Company’s Compliance e-training modules which are used to train the Company’s employees on regulatory compliance matters. In the year, Directors received an update on special Valuation Guidelines issued by IPEV in the context of Covid-19; refresher training on IFRS 10 and consolidated financial statements; training on the background to the use of alternative performance measures in the context of investment basis accounts; and refresher training on the regulatory regimes to which companies in the Group are subject.
The Company has procedures for Directors to take independent legal or other professional advice in relation to the performance of their duties. In addition, Directors have access to the advice and services of the General Counsel and Company Secretary, who advises the Board, through the Chairman, on governance matters.
Performance and evaluationDuring the year, the Board conducted its annual evaluation of its own performance and that of its committees and individual Directors. On this occasion the process was conducted internally by the Chairman with support from Lintstock Limited in the form of a questionnaire and results report. The Chairman then held one-to-one interviews with Directors informed by the results of the questionnaire which had been completed by all Board members and the Company Secretary. The Chairman reported the results of the evaluation to the Board.
Overall, the evaluation found that the Board had maintained a high level of performance in the last year. In particular, adjustment of the Board’s focus and priorities in response to Covid-19 was very highly rated by Board members. 3i’s risk management arrangements were seen to have coped exceptionally well with the challenges associated with Covid-19, and the performance of the portfolio reflected the rigour of 3i’s investment and asset management processes.
The evaluation identified a number of actions and questions for further review:
• The need for additional asset management experience following the retirement of Mr Asquith was recognised and the appointment of Mr McKellar has now been announced. The Board also identified potential objectives for future non-executive Director recruitment as including further increasing diversity and candidates with corporate finance, investment, digital or retail experience, or experience in the United States.
• The Board identified topics for additional Director training including refresher training on the Group’s regulatory framework, its investment trust status and a teach-in on carried interest and remuneration arrangements. This training has now been either delivered or has been scheduled for the coming year.
• Priorities for the conduct of future Board meetings were identified including resuming in-person meetings, non-UK visits and visits to portfolio companies as soon as circumstances permitted.
• Key issues for Board discussion in the coming year were identified including:
– people, culture and succession planning, within the business lines, professional services functions and at Board level;
– investment portfolio management and composition;
– monitoring risk management;
– strategy and disclosure of ESG and Sustainability, including climate change;
– reviewing lessons from, and long-term impact of, the pandemic on 3i work practices and investment policy;
– an annual update on technology risks/opportunities in the investment portfolio; and
– other longer-term strategic issues.
In his role as Senior Independent Director, David Hutchison led a review by the Directors of the performance of the Chairman, which was also facilitated with a questionnaire and results report prepared by Lintstock Limited. Mr Hutchison subsequently reported back to the Board and provided feedback to the Chairman.
The topics covered by the annual Board evaluation included:
• Board composition and expertise;
• management succession planning and people development;
• Board dynamics;
• Board support;
• the performance of the Board’s Committees;
• management and focus of Board meetings;
• the Board’s response to Covid-19;
• the Board’s strategic and operational oversight;
• risk management and internal control; and
• priorities for change.
3i Group plc Annual report and accounts 2021Governance
90
Dear Shareholder I am pleased to present the Nominations Committee report for the year ended 31 March 2021. My report explains the role of the Committee as well as its work this year.
Role of the CommitteeThe Committee’s principal role is to ensure that the Board has the necessary skills and experience to enable the Group to deliver its current and future strategic objectives. The Committee regularly reviews the balance and composition of the Board, and develops appropriate succession plans, including contingency plans. The Committee’s discussions are complemented by discussions at meetings of the full Board where appropriate.
DirectorsDirectors’ biographical details are set out on pages 82 and 83.
All Directors are subject to re-appointment every year. Accordingly, at the AGM to be held on 1 July 2021, all the Directors will retire from office and, being eligible, will seek re-appointment. The Board’s recommendation for the re-appointment of Directors is set out in the 2020 Notice of AGM.
Peter Grosch, a non-independent non-executive Director, retired from the Board on 31 December 2020, but continues as a consultant to the Group. Jonathan Asquith, who served as Senior Independent Director (“SID”) and Chairman of the Remuneration Committee until 25 June 2020, also retired from the Board on 31 December 2020. David Hutchison succeeded Jonathan as SID, in which capacity he provides support to me, acts as an intermediary with the other Directors, if necessary, and oversees my appraisal by the other Directors. David is also available to the Company’s shareholders to address any concerns that they have not been able to resolve through me, Simon Borrows or Julia Wilson, or where they consider these channels to be inappropriate. Coline McConville succeeded Jonathan as Chairman of Remuneration Committee.
Simon ThompsonCommittee Chair
Nominations Committee report
Membership during the year
Name Membership status Meetings
Simon Thompson Member since April 2015 and Chairman since June 2015
5(5)
Jonathan Asquith Member until 31 December 2020
3(3)
Caroline Banszky Member since July 2014 5(5)
Stephen Daintith Member since October 2016
5(5)
Peter Grosch Member until 31 December 2020
2(3)
David Hutchison Member since November 2013
5(5)
Coline McConville Member since November 2018
4(5)
Alexandra Schaapveld Member since January 2020
5(5)
The column above headed “Meetings” shows the number of meetings of the Committee attended by each member during the year, together with, in parentheses, the number of meetings they were entitled to attend.
Read more about the Composition of the Board on pages 82 and 83. Further information on the Nominations Committee’s terms of reference can be found on www.3i.com
Pages 82-83Read more about the Composition of the Board
+ www.3i.comFor more information on the Nominations Committee’s terms of reference
3i Group plc Annual report and accounts 2021Governance
91

Composition, succession and evaluation continuedNominations Committee report continued
The work of the CommitteeAppointments and appointment processWe have a formal, rigorous and transparent process to identify the skills and experience required, appraise suitable candidates and appoint new Directors. In the case of non-executive Directors, the appraisal includes an assessment of whether potential candidates have sufficient time available to fulfil their roles. Recommendations for appointment are put to the full Board for approval. Specialist recruitment consultants assist the Committee with the appointment process. During the year the Committee worked with external search consultants Egon Zehnder in relation to the Board appointment referred to below. Egon Zehnder performed no other services for 3i in the year although it did perform work for certain of 3i’s portfolio companies. During the year, the Committee reviewed its appointment process. It agreed the process remained appropriate.
Following the retirements of Jonathan Asquith and Peter Grosch, the Board reviewed the skills and experience required by the Board and concluded that a candidate with significant asset management and private markets experience would best support the Board’s decision-making. The Committee worked with Egon Zehnder in a recruitment process which led to the decision to appoint Peter McKellar as a non-executive Director with effect from 1 June 2021. As set out in his biography on page 83, Peter will bring to the Board significant experience and understanding of financial services and asset management, with a particular expertise in private equity and infrastructure.
Board evaluationIn advance of the Board evaluation conducted during the year, the Committee considered and agreed the proposed evaluation process. The evaluation was conducted internally but with some support from Lintstock Limited. The next externally facilitated Board evaluation will take place during the financial year ending March 2022. Lintstock Limited performed no other services for 3i in the year.
Further details on the outcome of the Board evaluation are set out on page 90. The evaluation process informs the development of the Board’s rolling agenda for the subsequent year and succession planning, by confirming the Board’s key strategic priorities and objectives.
Succession planningWith a relatively small Board (during the year comprising the Chairman, the Chief Executive, the Group Finance Director and just five or six other non-executive Directors), few Board vacancies arise in most years. Nonetheless, the Committee and the Board regularly consider succession planning. The Committee’s approach to succession planning at Board level seeks to ensure that retirements are planned for and take place in a coordinated manner to minimise risk to the Company’s strategic objectives through gaps in key skills on the Board or a lack of continuity. Contingency plans to cater for unexpected events are also considered. During the year the Committee reviewed and agreed the contingency arrangements in the event that either of the Executive Directors becomes unavailable at short notice. It also reviewed longer-term succession proposals and potential timescales in relation to the Chairman, the Executive Directors and the non-executive Directors.
As mentioned in my Chairman’s statement on page 2, I will not seek re-election at the AGM in 2022 and will step down when my successor is appointed and an appropriate handover has been completed. The Nominations Committee has commenced a process to find my successor including instructing an external search consultancy to assist it with the process. In line with the UK Corporate Governance Code, I will not chair the Committee while it is dealing with my succession nor play any other part in that process.
In relation to succession planning below Board level, and as part of the Board’s work to support the development of a diverse pipeline of talent, the Committee and the Board considered and discussed the 2020 Group Succession Planning and Strategic Capability Review which was presented to the Directors by the Executive Committee members and the HR Director. This annual review identifies development and succession plans for key staff including all members of Executive Committee and their direct reports with details of short-term contingency arrangements in case of a sudden vacancy, planned successors and identification of those who with further experience could be potential longer-term successors.
Diversity and inclusionThe Board strongly supports the principle of boardroom diversity. The Board’s aim is to have a diverse Board in terms of skills, experience, gender, social and ethnic backgrounds, and cognitive and personal strengths. The external search consultancies we engage are instructed to put forward a diversity of candidates for all Board positions and the Board makes appointments on merit and against objective criteria.
With four female Directors out of a total of eight, the Board exceeds the gender diversity targets set by the Hampton-Alexander review. However, the Committee recognises that the Board does not yet meet the recommendations of the Parker review in relation to ethnic diversity. The Committee and the Board are committed to ensuring that the Board composition will satisfy these requirements in the short to medium term.
3i Group plc Annual report and accounts 2021Governance
92

25% >9 years37% 6–9 years13% 3–6 years25% 1–3 years– 0–1 years
63% Financial services
37% Other
50% Female50% Male
Composition of the Board
Sector experience
Tenure
Gender diversity
Below Board level, the Committee reviews and monitors initiatives aimed at developing a diverse pipeline of talent within the Company through the succession planning process referred to above and the appointments process. As a business with fewer than 240 employees globally, 3i makes relatively few new hires each year but, when hiring, we proactively seek to recruit from a diverse pool of candidates. As importantly, we take a long-term, sustainable approach to improving the diversity of our workforce and are committed to creating an inclusive culture in which both existing and newly-recruited staff can reach their potential, regardless of their gender, social or ethnic backgrounds.
The gender balance of our employees and our senior managers is reported in more detail in the Sustainability section on page 68. At 31 March 2021 our employees were 61% male and 39% female. The under-representation of females in senior management and investment roles continues to be an area of focus. As at 31 March 2021 21% of our senior managers (as defined on page 66, which excludes the Executive Directors) were female. We will continue to address this issue and specifically will explore how to leverage our partnership with Level 20 (a not for profit organisation dedicated to improving gender diversity in the European private equity industry), which we joined as an official sponsor in 2020.
As at 31 March 2021, more than one in eight of 3i’s total UK employees were from BAME backgrounds. The proportion of our employees with a BAME background in mid to higher salary brackets also exceeded one in eight. We have continued our partnership with the Bright Network, who have helped us to source more diverse candidates at graduate level via targeted email campaigns. 3i is a member of the #10000BlackInterns programme, an initiative to offer a practical way to give more black applicants access to a career path in the financial services sector. We also continue to support Career Ready, a mentoring programme that supports young people aged 16 to 18 who lack the opportunities, professional networks and confidence to develop their talents and fulfil their potential. See the Sustainability section on page 69.
Simon ThompsonChair, Nominations Committee
12 May 2021
3i Group plc Annual report and accounts 2021Governance
93

Caroline BanszkyCommittee Chair
Audit, risk and controlAudit and Compliance Committee report
Membership during the year
Name Membership status Meetings
Caroline Banszky Member since July 2014 and Chairman since January 2015
6(6)
Jonathan Asquith Member since March 2011. Retired in December 2020
4(4)
Stephen Daintith Member since October 2016
6(6)
Coline McConville Member since November 2018
6(6)
Alexandra Schaapveld Member since January 2020
6(6)
The column above headed “Meetings” shows the number of meetings of the Committee attended by each member during the year, together with, in parentheses, the number of meetings they were entitled to attend.
Other regular attendees at the Committee meetings include the following: Group Chair; Chief Executive; Group Finance Director; Group General Counsel; Group Financial Controller; the Head of Internal Audit; the Head of Compliance; and the External auditor, KPMG LLP.
+ www.3i.comFurther information on the Audit and Compliance Committee’s terms of reference
Dear Shareholder I am pleased to present the Audit and Compliance Committee report for the year ended 31 March 2021. My report explains the Committee’s work this year.We held six regular scheduled meetings this year, four of which were coordinated with 3i’s external reporting timetable.
This year more than ever, given the extent of home and virtual working, particular effort was made to keep everyone involved in the Annual report and accounts informed and engaged through regular updates from management and team leaders. In addition we have been working closely with KPMG LLP (“KPMG”) in their first year of audit, to ensure the transition has been as smooth as possible.
In response to the Report of the Independent Review into the Quality and Effectiveness of Audit, better known as the Brydon Review, which was published in December 2019, we have published an Audit and Assurance policy which can be found on pages 99 to 102. Although we are not required to publish this policy until FY2022 we welcome this initiative, hence the early publication. However, we will not ask shareholders to approve it until the Annual General Meeting in 2022.
At the 2020 AGM, KPMG was formally appointed as the Group’s new External auditor for the year ending 31 March 2021. Throughout the year the Committee received regular updates from management and KPMG to ensure a smooth transition from our previous auditor Ernst & Young LLP (“EY”) and to retain a high level of audit quality. I have welcomed and encouraged the new challenges, perspectives and discussions KPMG has brought to the audit of our Annual report and accounts 2021 and am pleased with the efficient and professional delivery of the first year of audit.
In advance of each Committee meeting, I met the Group Finance Director, the Group Financial Controller and the Heads of Compliance and Internal Audit to discuss their reports as well as any relevant issues. I also met privately with KPMG as part of my ongoing review of their effectiveness and, periodically, with other members of the 3i senior management team.
I have continued to have regular discussions and planning meetings with management and KPMG on delivering the Annual report and accounts. 3i has a detailed business continuity plan for the whole organisation. Remote working has allowed 3i to continue to operate with no material disruption to deliverables throughout the year and there has been limited impact on 3i’s continued ability to facilitate discussion and to enable informed decision making.
The rest of the report sets out in detail the Committee’s activities in the year. It is structured into four parts:
• Governance • Internal audit• Report on the year • External audit
I look forward to engaging with you on the work of the Committee.
Caroline BanszkyChair, Audit and Compliance Committee
12 May 2021
3i Group plc Annual report and accounts 2021Governance
94
GovernanceAll members of the Committee are independent non-executive Directors. The Board believes members have the necessary range of financial, risk, control and commercial experience required to provide effective challenge to management. In particular, the Board is satisfied that Caroline Banszky and Stephen Daintith have the recent and relevant financial experience as outlined in the FRC’s Corporate Governance Code. The attendance of members at meetings is shown in the table on page 85.
The Committee meets privately for part of its meetings and also has regular private meetings with the External auditor, the Group Finance Director, the Head of Internal Audit and the Head of Compliance in the absence of other members of the management team.
Report on the yearIn addition to assessing and evaluating the areas of significant accounting judgement and monitoring the effectiveness of 3i’s risk management framework, the Committee particularly focused on a number of topics, which are set out below.
What the Committee reviewed in FY2021
Financial reporting• Annual and half-year reports
• Quarterly performance updates
• Key accounting judgements and estimates
• Update on the relevant thematic reviews from the FRC
• Accounting treatment of the buy-in transaction of the UK defined benefit pension scheme
• Application of APMs
• Reviewed the Annual report to ensure that it is fair, balanced and understandable
External audit• Transition planning for the change in External auditor
to KPMG
• Confirmation of the External auditor independence
• Policy and approval for non-audit fees
• FY2021 audit plan, including significant audit risks (being the valuation of the unquoted investment portfolio and the calculation of carried interest)
• Audit results report, including the results from testing Key Audit Matters
• External auditor performance and effectiveness
Internal control, compliance and risk management• Review of 3i’s system of control and risk management
• External and internal audit reports
• Review of the Viability statement and the supporting stress test scenarios
• Update on cyber security and penetration tests
• IT resilience and disaster recovery
• Staff annual verification exercise
• Update on compliance with HMRC’s Senior Accounting Officer Regime
• Audit and Assurance policy
Risk review• Valuation reports and recommending the investment
portfolio valuation to the Board
• Review of investment themes from portfolio company review process and portfolio performance including ESG issues and risks
• Regular reviews of compliance with regulatory rules and compliance monitoring findings
• Annual tax update
• Reports on approach to tax policy and strategy
• Litigation
• Liquidity and going concern
3i Group plc Annual report and accounts 2021Governance
95
Audit, risk and control continuedAudit and Compliance Committee report continued
Accounting policies and practices The Committee reviewed the reporting and accounting treatment of the buy-in transaction of the UK defined benefit pension scheme, which took place during the year. In addition, the Committee discussed and responded to the IASB’s post implementation review of IFRS 10, 11 and 12. The Committee also reviewed the current application of APMs.
Financial reporting regulatorsThe Committee considered comment letters and papers from the FRC, including their Year End Advice Letter to Audit Committee Chairs and Finance Directors in November 2020 as well as their annual review of corporate reporting and their published thematic reviews. The Committee reviewed a paper prepared by management, which detailed how it had taken due account of the matters raised and the enhancements it proposed to relevant disclosures in the Half-yearly accounts 2020 and Annual report and accounts 2021. The Committee considered and incorporated the recent guidance on the financial reporting effects of Covid-19 following the publication by the FRC on going concern, viability and cash resources. The Committee also considered a paper prepared by management, which detailed 3i’s attendance to FRC workshops on Section 172 and corporate disclosures on risk providing both insight and challenge.
The Group’s internal control and risk management systems including those in relation to the financial reporting process include:
• a comprehensive system of key control and oversight processes, including regular reconciliations, line manager reviews and systems’ access controls;
• updates for the Committee on accounting developments, including draft and new accounting standards and legislation;
• a separate Valuations Committee which considers the Group’s investment valuation policies, application and outcome;
• approval of the Group’s budget by the Board and a comprehensive system of financial reporting to the Board, based on the annual budget with monthly reporting of actual results, analysis of variances, scrutiny of key performance indicators and regular re-forecasting;
• reports from Internal Audit on matters relevant to the financial reporting process, including periodic assessments of internal controls, processes and fraud risk;
• independent updates and reports from the External auditor on accounting developments, application of accounting standards, key accounting judgements and observations on systems and controls;
• appointment of experienced and professional staff, both by recruitment and promotion, of the necessary calibre to fulfil their allotted responsibilities; and
• appropriate Board oversight of external reporting.
TaxationThe Committee received updates from the Group Tax Director on the Group’s taxation status. These reports covered an update on the Group’s transfer pricing policy, upcoming legislative and regulatory changes, Covid-19 considerations and the Directive on Administration Cooperation.
Going concern and viabilityThe Directors are required to make a statement in the Annual report as to 3i’s long-term viability. The Committee provides advice to the Board on the form and content of the statement, including the underlying assumptions. In advance of the year end the Committee reviewed the Group’s proposed stress test scenarios to support the Going concern and Viability statement. At the year end, the Committee evaluated a report from management setting out its view of 3i’s long-term viability and content of the proposed Viability statement. This report was based on the Group’s five-year strategic plan and covered forecasts for investments and realisations, liquidity and gearing, including forecast outcomes of the stress test of the plan and forecast capital and liquidity performance against an assessment of the Group’s risk profile. It incorporated the 31 March 2021 valuations, and consideration of a range of economic outcomes. The Committee discussed whether the choice of the three-year period remained appropriate. It concluded that it remained the most appropriate period and provided more certainty on the Group’s performance due to the nature of the Group’s business and its risk appetite to invest in Private Equity and Infrastructure investments for a period of four to five years.
Taking into account the assessment of the Group’s stress testing results and its risk appetite statement (as disclosed on page 51), the Committee agreed to recommend the Viability statement and three-year viability period to the Board for approval.
The Directors believe the Group has sufficient financial resources and liquidity and is well placed to manage business risks in the current economic environment, and can continue operations for the foreseeable future based on a range of economic outcomes. The Directors have also considered key dependencies set out within the Risk management section including investment and operational requirements.
Areas of accounting judgement and control focusThe Committee pays particular attention to matters it considers to be important by virtue of their complexity, level of judgement and potential impact on the financial statements and wider business model. Significant areas of focus considered by the Committee are detailed in the table below, alongside the actions taken by the Committee (with appropriate challenge from the External auditor) to address them.
3i Group plc Annual report and accounts 2021Governance
96
Areas of accounting judgement and control focus
Valuation of the proprietary capital investment portfolioArea of significant attentionThe most material area of judgement and estimation in the financial statements, and noted as a significant risk and Key Audit Matter by the External auditor, relates to the valuation of the unquoted proprietary capital investment portfolio, which at 31 March 2021 was £9,397 million, or 103% of net assets, under the Investment basis.
In recognition of the importance of this area, the Board has a Valuations Committee to review the valuations policy, process and application to individual investments. The Valuations Committee provides quarterly oral reports to the Audit and Compliance Committee and the Board.
What the Committee reviewed and concludedOn behalf of the Board, the Committee received and evaluated quarterly reports from the Chairman of the Valuations Committee and the External auditor, with particular focus on the assumptions supporting the valuation of unquoted asset investments, any valuation uncertainties and the proposed disclosure in the financial statements. Members of the Committee also attend the Valuations Committee meetings.
The detail on the key valuation considerations and the review and challenge undertaken in the year is included in the Valuations Committee report on pages 103 to 106.
Carried interest payableArea of significant attentionThe valuation of the proprietary capital portfolio is a primary input into the carried interest payable and receivable balances, which are determined by reference to the valuation at 31 March 2021.
Following the Action transaction in FY2020, previously accrued carried interest was paid in the year to participants in the Buyouts 2010-2012 carry scheme.
What the Committee reviewed and concludedInternal Audit reviews the carried interest balances and carry plan distributions made to plan participants before the payments are made. Summaries of the work done are included in updates to the Committee.
The Committee reviewed the carried interest payable as part of the overall summary prepared by management to support the Annual report and accounts 2021.
Retirement benefitsArea of significant attentionDuring the year the 3i Group Pension Plan completed a £650 million buy-in transaction of the UK defined benefit pension scheme with Legal & General.
Under IAS 19 the buy-in transaction is not considered to be a settlement, the purpose of this further insurance policy is treated as an investment decision by management.
The valuation is supported by input from an independent actuary at 31 March 2021.
What the Committee reviewed and concludedThe Committee reviewed the accounting treatment for the buy-in of the UK defined benefit pension scheme with Legal & General.
The Committee challenged management on the risk and accounting impact of the proposal and agreed with management’s recommendations, concluding that they are appropriate.
Going concern and Viability statementArea of significant attentionThe Covid-19 pandemic has caused a significant market disruption and uncertainty in the global economy. At a portfolio level, management have continued to monitor developments closely and, where necessary, implement mitigating actions.
At a Group level management have performed a detailed review at both the half-year and full-year testing against the Group’s liquidity and viability to determine if adopting a going concern basis is appropriate. The Company also increased the strength of our balance sheet by issuing a new £400 million bond in 2020 and increased the RCF from £400 million to £500 million, extending its maturity to 2026.
What the Committee reviewed and concludedThe Committee reviewed and challenged the analysis to support going concern and the Viability statement. The financial information presented within the Consolidated financial statements has been prepared on a going concern basis. The Committee reviewed the assessment of going concern, taking into account both the Group’s current performance and the Group’s outlook, which considered the continued impacts of the Covid-19 pandemic, using information available to the date of issue of the Consolidated financial statements.
Details of the assessment are included on page 63.
Fair, balanced and understandable and the presentation of 3i’s reports and accountsArea of significant attentionUnder the UK Corporate Governance Code, the Board should establish arrangements to ensure the Annual report presents a fair, balanced and understandable assessment of the Group’s position and prospects.
The Group prepares the non-GAAP Investment basis financial statements to provide an disaggregated view of the underlying portfolio alongside the IFRS basis to aid in the understanding of the results and performance of the underlying portfolio.
What the Committee reviewed and concludedThe Committee reviewed the Half-yearly and Annual financial statements as well as the Quarterly performance updates with management, focusing on the integrity and clarity of disclosure and enabling the Board to provide the fair, balanced and understandable confirmation to shareholders in the Annual report and accounts 2021.
A report summarising the considerations for the Annual report and accounts 2021 was reviewed by the Committee in advance of the year end and a summary of the detailed procedures undertaken was prepared alongside the Annual report and accounts 2021. Given the continued focus on APMs, the Committee reviewed the Group’s current APMs and concluded that they meet the fair, balanced and understandable principles.
3i Group plc Annual report and accounts 2021Governance
97
Audit, risk and control continuedAudit and Compliance Committee report continued
Internal audit The Committee continued to monitor the scope, activity, and resources of the Group’s Internal Audit function, including approving the internal audit plan and assessing whether its operating model remained effective. The Committee monitors Internal Audit activity quarterly, which includes the results of its reviews of 3i’s investment offices and updates on outstanding agreed actions from previous reports, as well as other areas of identified higher risk. The Committee concluded that the Internal Audit function remained appropriate.
Risk and internal control reviewsThe Committee is responsible on behalf of the Board for overseeing the effectiveness of the Group’s risk management and internal control systems. It monitors the activities of the Group Risk Committee (“GRC”), the risk management processes in place and Internal Audit’s assessment of the effectiveness of controls, the use of the Group’s whistleblowing facility and compliance with the UK Bribery Act.
As highlighted on page 53 in the Risk management section, a report summarising each quarterly GRC meeting, along with the risk report considered, is provided to the Committee for review and discussion. This includes a twice yearly update on key ESG and sustainability risks and developments across the portfolio. In addition, the Head of Internal Audit prepares an annual report providing an independent assessment of the effectiveness of 3i’s risk management and internal control systems for presentation to the Committee.
The overall risk management and internal control process is regularly reviewed by the Committee as well as the Board and complies with the Guidance on Risk Management, Internal Control and Related Financial and Business Reporting issued by the FRC. The Committee performed its annual review of the system’s effectiveness and reported its conclusions to the Board. The process has been in place for the year under review and up to the date of approval of this Annual report and accounts 2021.
External auditThe Committee has responsibility for making recommendations to the Board on the appointment of the External auditor, determining its independence from the Group and its management and agreeing the scope and fee for the audit.
Auditor transitionThe Committee had regular discussions and updates from management and KPMG on the transition progress, including audit planning, internal control and audit fees, with the External auditor attending all of this year’s Committee meetings.
In order to ensure a smooth transition process while operating remotely, KPMG has attended a number of meetings with the Directors, key members of the management team and teams who are responsible for day-to-day running of key financial reporting processes and controls. These meetings have enabled KPMG to better understand our governance framework, business structure, investment portfolios and key control environment. In addition KPMG also shadowed the process for the FY2020 year end audit and undertook a review of EY’s audit files. Following the appointment of KPMG, it has not identified any significant changes to our accounting policies or presentation.
Auditor independenceThe Group has a policy for setting out what non-audit services can be purchased from the firm appointed as External auditor. The aim of the policy is to support and safeguard the objectivity and independence of the External auditor and to comply with the FRC’s Ethical Standards for auditors. It also ensures that where fees for approved non-audit
services are greater than a pre-determined limit, they are subject to the Committee Chair’s prior approval. The policy permits certain non-audit services to be procured, following approval, when the Committee continues to see benefits for the Group in engaging KPMG. Examples of this include work:
• that is closely related to the external audit;
• where a detailed understanding of the Group is required; and
• where KPMG is able to provide a higher quality and/or better value service than other potential providers.
The key principle of our policy is that permission to engage the External auditor will always be refused when a threat to independence and/or objectivity is present or perceived. In line with KPMG’s publicly announced policy, 3i will not generally use KPMG for any non-audit services that are not closely related to KPMG’s role as 3i’s External auditor. This includes investment-related services such as due diligence.
All proposals for services with KPMG must be forwarded to the Group Financial Controller in the first instance and will require approval by the Chairman of the Audit and Compliance Committee above a defined limit and provided the work is not closely related to KPMG’s role of 3i’s External auditor. Examples of services that require additional approval include:
• the fee exceeds £100,000; or
• the service is work other than services closely related to KPMG’s role as 3i’s External auditor.
KPMG has reviewed its own independence in line with these criteria and its own ethical guideline standards. This includes the review of due diligence processes undertaken within the Group’s investment activities. KPMG has confirmed to the Committee that following its review it is satisfied that it has acted in accordance with relevant regulatory and professional requirements.
Audit and non-audit fees The fees for the year to 31 March 2021 represent fees paid to KPMG, while the fees for the year to 31 March 2020 represent fees to the previous auditor, EY.
The total audit fee for the year was £2.5 million (2020: £1.9 million). Non-audit fees paid to the External auditor were £0.3 million (2020: £0.6 million). The Committee concluded that these fees fell within its criteria for engaging KPMG and do not believe they pose a threat to the External auditor’s independence or objectivity.
In order to safeguard independence, the Committee maintains a policy on the engagement of the External auditor for non-audit services. KPMG, the Group’s new External auditor, has been subject to the policy since before its appointment from 23 December 2019 to ensure there were no engagements that would restrict its appointment.
Assessing external audit effectivenessThe Committee reviews the effectiveness of KPMG through the use of questionnaires completed by management, by considering the extent of its contribution at Committee meetings throughout the course of the year, and in one-to-one meetings.
FY2021 was KPMG’s first year as the Group’s External auditor. The Committee ensured that it was satisfied with the effectiveness and timeliness of the audit planning, scope and completion and that KPMG had sufficient resources to understand the business, its controls and key risks.
The FY2021 evaluation also reviewed the quality of the audit process, the use of KPMG’s valuation specialists to support the audit of the portfolio valuations and the technical knowledge of the team. The Committee concluded that the audit was effective.
3i Group plc Annual report and accounts 2021Governance
98
As an investment institution, our business model is to allocate, invest and manage risk capital. We do this from a platform that has good and responsible values, a grounded team culture, a prudent financial approach and a wide international reach and diversity through our well-established office network. Our investment executives are able to use the power of broader portfolio experience and learnings to grow and improve each specific investment. This only works with rigorous processes, robust central control and an uncompromising attitude to the resilience of the investment portfolio, all of which is governed by the Investment Committee.Through a comprehensive and consistent process, we apply a high degree of judgement in setting the investment valuations which underpin our periodic reported financial performance and are the most material area of judgement in the financial statements. The Valuations Committee sets policy and provides oversight of the integrity of this valuation process. On behalf of the Board, the Audit and Compliance Committee receives quarterly reports from the Chairman of the Valuations Committee and the External auditor, with a focus on key assumptions, valuation uncertainties and disclosure in the financial statements. As a FTSE100 company, transparency and integrity of our reporting of investment outcomes and valuations is fundamental.
Purpose and scope This Audit and Assurance policy (“Policy”) sets out how the Board ensures that our investment, valuation and reporting processes and controls (in the broadest sense) are adhered to, and that the employee culture is aligned with our strategic delivery, providing appropriate mitigation of the risk and judgement inherent in our business model. The Policy covers external and internal audit activities and other sources of assurance available to the Board.
The scope and nature of the Group’s audit and assurance activities are influenced by the Group’s legal, regulatory, governance and operating structures. As a listed company, the Group is subject to the Listing Rules of the UK Listing Authority and the provisions of the UK Corporate Governance Code. In headcount terms, 3i is a relatively small organisation with a flat operating structure.
The Group provides investment management and other services for which regulatory authorisation is required. It does not, however, have permission to deal with retail clients. 3i is regulated in a number of jurisdictions; primarily in the UK by the Financial Conduct Authority. The contracts for 3i’s investment services and its regulatory authorisations carry a wide range of obligations which are incorporated into the Group’s systems and controls and apply to all staff. These requirements include the need to maintain minimum levels of regulated capital which are monitored by way of an Internal Capital Adequacy Assessment Process (“ICAAP”). The assessment involves the use of stress testing scenarios which also link into the Group’s viability assessment work.
DevelopmentThis Policy is owned by the Board and developed based on a range of inputs including the views of Executive Committee and assurance providers, and benchmarking against emerging good practice. The Policy is reviewed at least annually and its operation overseen by the Audit and Compliance Committee.
Risk and assuranceThe Group Risk Committee, Executive Committee and senior managers are required to provide the Audit and Compliance Committee with regular updates on a range of topics to enable the Committee to form a view on the adequacy of the planned assurance work in relation to the Group’s principal risks, risk mitigation plans and any significant new risks, themes or developments.
Both the External and Internal auditors are expected to form an independent view on the principal risks and the controls to mitigate these, taking into account the risk profile and strategy of the business and the assessment performed by the Group Risk Committee. This in turn provides the basis for making informed risk-based decisions regarding the scope and focus of assurance work. The auditors are required to present details of their respective risk assessments, areas of focus and audit approach to the Audit and Compliance Committee for its consideration and input.
In addition to scheduled updates from Finance, Group Compliance, IT and Tax, the Audit and Compliance Committee may seek assurance work in other areas from time to time, either from internal sources or externally commissioned work. The oversight work of the other Board Committees, notably the Valuations and Remuneration Committees, is also taken into consideration.
Viability and going concernThere is an established process for preparing the Group’s Viability statement, co-ordinated by Group Finance. This involves engagement with 3i’s Group Strategy team and Private Equity and Infrastructure business lines to develop a range of plausible and relevant stress test scenarios, which are also linked back to the Group’s principal risks.
The views of the Group Risk Committee are sought on the test scenarios, results and proposed disclosures. This is then presented to the Audit and Compliance Committee for consideration and input. The External auditor also provides independent assurance on the reasonableness of the inputs, key assumptions and stress test scenario analysis, in the context of its work on viability and going concern.
Key internal controls and assuranceThe design of the Group’s key control framework is directly linked to the Group’s risk mitigation plans, and is summarised in the table opposite.
The Audit and Compliance Committee requisitions assurance work which focuses on the design and effectiveness of the internal control framework. The adequacy of assurance coverage is considered as part of the presentation of the respective External and Internal audit assurance plans described above. Use is also made of external benchmarking and frameworks to provide additional assurance in specific areas. For example, the NIST Cybersecurity Framework is deployed to assess and improve 3i’s ability to prevent, detect and respond to cyber attacks. Assurance work is expected to adapt to changes to the Group’s risk and operating profile, illustrated by the case study on page 101.
Audit and Assurance policy
3i Group plc Annual report and accounts 2021Governance
99
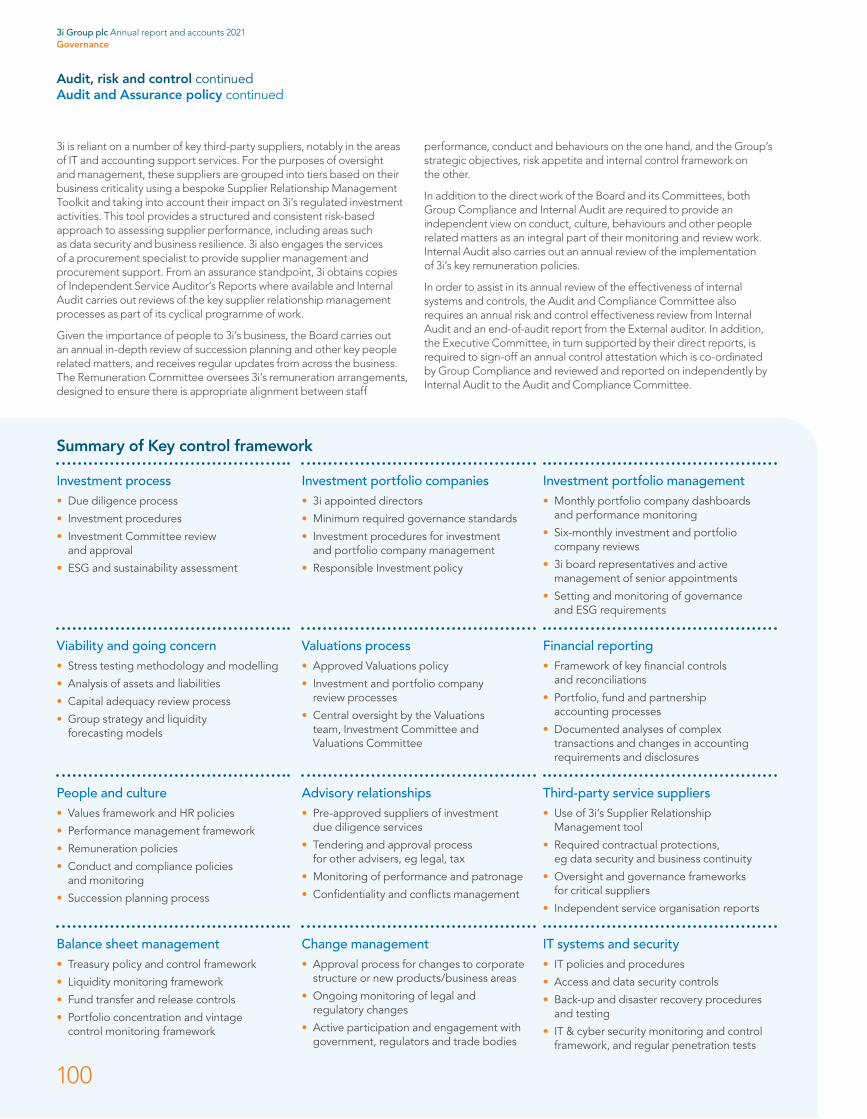
Audit, risk and control continuedAudit and Assurance policy continued
3i is reliant on a number of key third-party suppliers, notably in the areas of IT and accounting support services. For the purposes of oversight and management, these suppliers are grouped into tiers based on their business criticality using a bespoke Supplier Relationship Management Toolkit and taking into account their impact on 3i’s regulated investment activities. This tool provides a structured and consistent risk-based approach to assessing supplier performance, including areas such as data security and business resilience. 3i also engages the services of a procurement specialist to provide supplier management and procurement support. From an assurance standpoint, 3i obtains copies of Independent Service Auditor’s Reports where available and Internal Audit carries out reviews of the key supplier relationship management processes as part of its cyclical programme of work.
Given the importance of people to 3i’s business, the Board carries out an annual in-depth review of succession planning and other key people related matters, and receives regular updates from across the business. The Remuneration Committee oversees 3i’s remuneration arrangements, designed to ensure there is appropriate alignment between staff
performance, conduct and behaviours on the one hand, and the Group’s strategic objectives, risk appetite and internal control framework on the other.
In addition to the direct work of the Board and its Committees, both Group Compliance and Internal Audit are required to provide an independent view on conduct, culture, behaviours and other people related matters as an integral part of their monitoring and review work. Internal Audit also carries out an annual review of the implementation of 3i’s key remuneration policies.
In order to assist in its annual review of the effectiveness of internal systems and controls, the Audit and Compliance Committee also requires an annual risk and control effectiveness review from Internal Audit and an end-of-audit report from the External auditor. In addition, the Executive Committee, in turn supported by their direct reports, is required to sign-off an annual control attestation which is co-ordinated by Group Compliance and reviewed and reported on independently by Internal Audit to the Audit and Compliance Committee.
Summary of Key control framework
Investment process Investment portfolio companies Investment portfolio management• Due diligence process
• Investment procedures
• Investment Committee review and approval
• ESG and sustainability assessment
• 3i appointed directors
• Minimum required governance standards
• Investment procedures for investment and portfolio company management
• Responsible Investment policy
• Monthly portfolio company dashboards and performance monitoring
• Six-monthly investment and portfolio company reviews
• 3i board representatives and active management of senior appointments
• Setting and monitoring of governance and ESG requirements
Viability and going concern Valuations process Financial reporting• Stress testing methodology and modelling
• Analysis of assets and liabilities
• Capital adequacy review process
• Group strategy and liquidity forecasting models
• Approved Valuations policy
• Investment and portfolio company review processes
• Central oversight by the Valuations team, Investment Committee and Valuations Committee
• Framework of key financial controls and reconciliations
• Portfolio, fund and partnership accounting processes
• Documented analyses of complex transactions and changes in accounting requirements and disclosures
People and culture Advisory relationships Third-party service suppliers• Values framework and HR policies
• Performance management framework
• Remuneration policies
• Conduct and compliance policies and monitoring
• Succession planning process
• Pre-approved suppliers of investment due diligence services
• Tendering and approval process for other advisers, eg legal, tax
• Monitoring of performance and patronage
• Confidentiality and conflicts management
• Use of 3i’s Supplier Relationship Management tool
• Required contractual protections, eg data security and business continuity
• Oversight and governance frameworks for critical suppliers
• Independent service organisation reports
Balance sheet management Change management IT systems and security• Treasury policy and control framework
• Liquidity monitoring framework
• Fund transfer and release controls
• Portfolio concentration and vintage control monitoring framework
• Approval process for changes to corporate structure or new products/business areas
• Ongoing monitoring of legal and regulatory changes
• Active participation and engagement with government, regulators and trade bodies
• IT policies and procedures
• Access and data security controls
• Back-up and disaster recovery procedures and testing
• IT & cyber security monitoring and control framework, and regular penetration tests
3i Group plc Annual report and accounts 2021Governance
100
Reporting of control findingsFor monitoring and reporting purposes, a significant control failure or weakness is defined as one resulting in or with potential to result in a material misstatement in the financial statements or loss to the business, or significant reputational damage, penalties or sanctions.
Both the External and Internal Auditors are required to provide the Audit and Compliance Committee with details of their respective reporting frameworks including, for example, materiality limits, risk ratings and reporting thresholds. This is to ensure there is a degree of consistency and understanding of the definitions applied. It further assists in understanding the nature and severity of any control findings reported; the appropriateness of proposed remedial actions, timelines and ownership; and the need for disclosure.
The Board and Executive Committee have a very limited tolerance for operational risk events and errors. Accordingly, a relatively low reporting threshold is applied by both Group Compliance and Internal Audit with respect to any findings. This involves both a qualitative and quantitative impact assessment. A similarly low threshold is set for the Group’s risk log reporting process, under which any financial losses or exposures greater than £20,000 must be reported.
Assurance over company reportingThe Group’s approach to assurance over company reporting is grounded in a culture of transparency and openness. The External auditor, for example, holds regular catch-up meetings with senior managers across the business, the Audit and Compliance Committee chairman and Internal Audit throughout the year, not only during the reporting cycle.
The Group aims to identify changes in reporting requirements and potential technical accounting or disclosure issues at an early stage and to engage fully with the External auditor, Audit and Compliance Committee and external advisers as appropriate. Areas of greater complexity or judgement are documented to facilitate the overall process and regular updates are provided to the Audit and Compliance Committee.
The External auditor’s report in the Annual report and accounts provides a comprehensive overview of key audit matters, audit scope and materiality. This includes details of the main audit risks and the approach taken to information in the Annual report other than the audited financial statements. The other information in the Annual report includes the presentation of the financial results on a separate non-GAAP Investment basis, in the interest of transparency and understanding, which are reconciled to the audited accounts prepared using the IFRS basis of consolidation. The Group’s half-yearly financial report is subject to a review in accordance with the relevant auditing standards on the review of interim financial statements. Details are set out in the External auditor’s report in the full-year and half-year reports.
The preparation of 3i’s external reporting is subject to a well-established input, review and verification process, covering the financial statements and other information in the Annual report; the Half-yearly report; and other reporting by the Company. The process involves close engagement with 3i’s investment and professional service teams and Internal Audit to ensure that the reporting is fair, balanced and understandable, as well as complete and accurate. The Audit and Compliance Committee is briefed and consulted at each stage of the process.
Approach to investment portfolio companiesThe companies in 3i’s proprietary capital and managed investment portfolios operate independently of 3i, with their own boards. 3i’s oversight is exercised through the appointment of 3i investment executives to serve as directors on the boards. Each board is responsible for its own audit and assurance arrangements including the appointment of their external auditors and, where appropriate, internal auditors.
3i sets minimum governance standards for its investment portfolios overseen by the 3i appointed directors. The standards cover the overall governance structure; independent financial review; internal controls; IT systems and cyber security; legal and regulatory compliance; critical incident management; and financial reporting.
Assurance case study
The need for the majority of 3i staff and staff at 3i’s key service providers to work remotely for most of FY2021 required a number of adjustments to the Group’s audit and assurance approach. Specific examples included:
• additional steps to ensure the proper on-boarding and full engagement with the Group’s newly appointed External auditor, KPMG;
• specific focus on changes to 3i’s IT operating environment, including new and emerging cyber security risks, and additional management updates and assurance work in relation to: (i) operating performance KPIs, such as remote log-in and help desk enquiry data; (ii) protective and detective cyber controls; (iii) results of penetration and other tests; and (iv) cyber and IT security staff training and awareness;
• additional assurance provided in relation to Treasury operations; specifically, the ability to transfer funds safely and securely on a remote basis;
• additional processes put in place to support the integrity of the investment portfolio company valuations in the context of operational and market uncertainties (and subject to additional assurance work by both the External and Internal Auditors);
• assurance work focused on the maintenance of key controls and processes to ensure these were not being modified or by-passed, intentionally or unintentionally, as a result of remote working (this included, for example, authorisation controls and timely performance of key reconciliations);
• additional assurance with respect to the oversight and performance of key service providers, including business continuity arrangements; and
• independent views sought from Group Compliance and Internal Audit on people related matters; for example, staff morale, conduct, culture and behaviours.
3i Group plc Annual report and accounts 2021Governance
101
Investment basis
Page 45Background to Investment basis financial statements
Principal risks and mitigations
Pages 50-57Risk governance and oversight arrangements
Pages 58-62Summary of principal risks and risk mitigation
Page 63Going concern and viability
Audit and Compliance Committee report
Page 96Going concern and viability
Pages 96-97 Areas of accounting judgement and control focus
Page 98Internal audit
Page 98External auditor independence
Page 98Audit and non-audit fees
Page 98Appointment of auditors
Accounting policies
Page 133Basis of preparation – going concern
Notes to the accounts
Page 142Details of fees for audit and non-audit services
Independent Auditor’s report
Pages 172-176Overview of audit
Page 175Going concern risk and response
Page 176Key audit risks and response
Page 181Materiality
Page 182Audit scope
Page 183Audit work on other information
Further informationThese governance standards form part of a broader range of ESG and sustainability measures applied by 3i to each investment portfolio company, benchmarked against industry standards for the relevant sector. Reporting against these standards and the development of specific action plans is an integral part of 3i’s semi-annual investment portfolio company review process.
3i’s Internal Auditors provide an independent assessment of the completeness and accuracy of the investment portfolio company review reports as part of their work on 3i’s investment business units.
Approach to fraud riskThe assessment of fraud risk forms part of the assurance planning presented to the Audit and Compliance Committee. Internal Audit, for example, undertakes a detailed fraud risk assessment and carries out a cyclical programme of anti-fraud assurance work, the results of which are reported to the Audit and Compliance Committee.
3i investment executives are required to report any significant fraud incidents occurring at the investment portfolio company level. This includes details of the root cause and remedial actions. This reporting enables both the Group Risk and Audit and Compliance Committees to assess any potential reputational risks to 3i and possible reporting or notification requirements.
Auditor independence and effectivenessThe Audit and Compliance Committee assesses the independence and effectiveness of both the External and Internal Auditors at least annually and in accordance with the relevant professional standards and FRC Guidance. In addition, the Committee Chairman meets regularly with the external audit team and Head of Internal Audit. Internal Audit also reports against a small number of agreed key performance indicators.
Assurance resourcingThere are a number of different categories of assurance activities. The Audit and Compliance Committee’s involvement in the review of assurance budgets and resourcing is based on the profile, risk and nature of those activities. The overall objective is to ensure that resourcing is adequate to meet assurance needs of the Board in a way which is operationally efficient and reflects any relevant external developments.
The audit scoping and fees for the External auditor is reviewed and approved in detail by the Audit and Compliance Committee on an annual basis. The Committee also reviews any fees paid for non-audit services and fees paid by 3i’s investment portfolio companies, as part of its assessment of the External auditor’s objectivity and independence.
Resourcing for Internal Audit, including any co-sourcing needs, is reviewed annually and confirmed on a regular basis directly with the Head of Internal Audit, to ensure that this is sufficient to support the requirements of the agreed assurance plan. The Head of Internal Audit is responsible for the associated budgeting and management of costs.
There are a range of “2nd line” functions and roles which are also an important source of assurance. These include, for example, Group Compliance, the Chief Information Security Officer, and Health and Safety officer. Assurance work may also be requisitioned from external providers in specialist areas, such as the measurement of greenhouse gas emissions, or in the form of expert advice on specific matters. The review of resourcing for these areas forms an integral part of the Group’s budgeting process and is the responsibility of the relevant Executive Committee member. The Group’s operating costs budget is subject to Board approval.
Audit, risk and control continuedAudit and Assurance policy continued
3i Group plc Annual report and accounts 2021Governance
102

Dear Shareholder I am pleased to present the Valuations Committee report for the year ended 31 March 2021. My report explains the role of the Committee as well as the work we reviewed this year. The Valuations Committee plays a key role in providing the Board with assurance that the valuation process is robust and independently challenged. During the year, we met four times as part of the Group’s external reporting timetable. We reviewed and challenged the assumptions behind management’s proposed asset valuations and reported to the Audit and Compliance Committee and the Board.
Our principal focus was the Group’s unquoted investments in Private Equity, as well as Scandlines, Smarte Carte and Regional Rail, as a high level of judgement is required to value this portfolio of assets. This portfolio accounts for 90% of 3i’s proprietary capital invested.
The valuation of the Group’s principal Infrastructure investment, its quoted holding in 3iN which represents 8% of 3i’s proprietary capital, requires less judgement given that it is based on the share price of the listed company.
At each meeting we received a detailed report from the Group Finance Director recommending the proposed valuation of the Group’s investment portfolio. This report highlights the main drivers of value movement analysed between performance (movement in earnings and net debt), multiple movements and other factors. At each meeting, we also reviewed selected assets for detailed discussion; examples of such assets covered during the year included Action, Audley Travel, Arrivia, Formel D, Q Holding, Hans Anders, Royal Sanders and Luqom.
I met the Group Finance Director and the Group Financial Controller in advance of each meeting to discuss the key valuation assumptions and review management’s paper before circulation. I also met the External auditor, KPMG, effective from 1 April 2020, privately to discuss the results of its quarterly reviews. These reviews challenged management’s approach to valuations, the selection of comparable companies and the relevance of earnings adjustments. Additionally, the Auditor selected a sample of 5-9 assets each quarter for an in-depth review by its specialist valuations team helping to derive an independent valuation range. Over the course of the year substantially all of the portfolio was reviewed in depth by KPMG as part of their transition. In February 2021, the External auditor and I discussed their approach to the year-end audit.
In advance of the full-year and half-year reporting, management hold individual portfolio company reviews with the respective investment teams. Non-executive Directors, including members of the Committee, attended a significant proportion of the meetings held in September 2020 and March 2021 and were represented at the reviews of the five largest Private Equity portfolio company investments as well as Scandlines.
David HutchisonCommittee Chair
Membership during the year
Name Membership status Meetings
David Hutchison Chairman and Member since December 2013
4(4)
Simon Thompson Member since June 2015 4(4)
Stephen Daintith Member since October 2016
4(4)
Peter Grosch Member since January 2016. Retired in December 2020
3(3)
Simon Borrows Member since May 2012 4(4)
Julia Wilson Member since December 2008
4(4)
Alexandra Schaapveld Member since January 2020
4(4)
The column above headed “Meetings” shows the number of meetings of the Committee attended by each member during the year, together with, in parentheses, the number of meetings they were entitled to attend.
Other regular attendees at the Committee meetings include the following: Audit and Compliance Committee Chair; Deputy Chair; Group Financial Controller; Group General Counsel; Managing Partners of Private Equity; the External auditor, KPMG.
+ www.3i.comFurther information on the Valuations Committee’s terms of reference
Valuations Committee report
3i Group plc Annual report and accounts 2021Governance
103
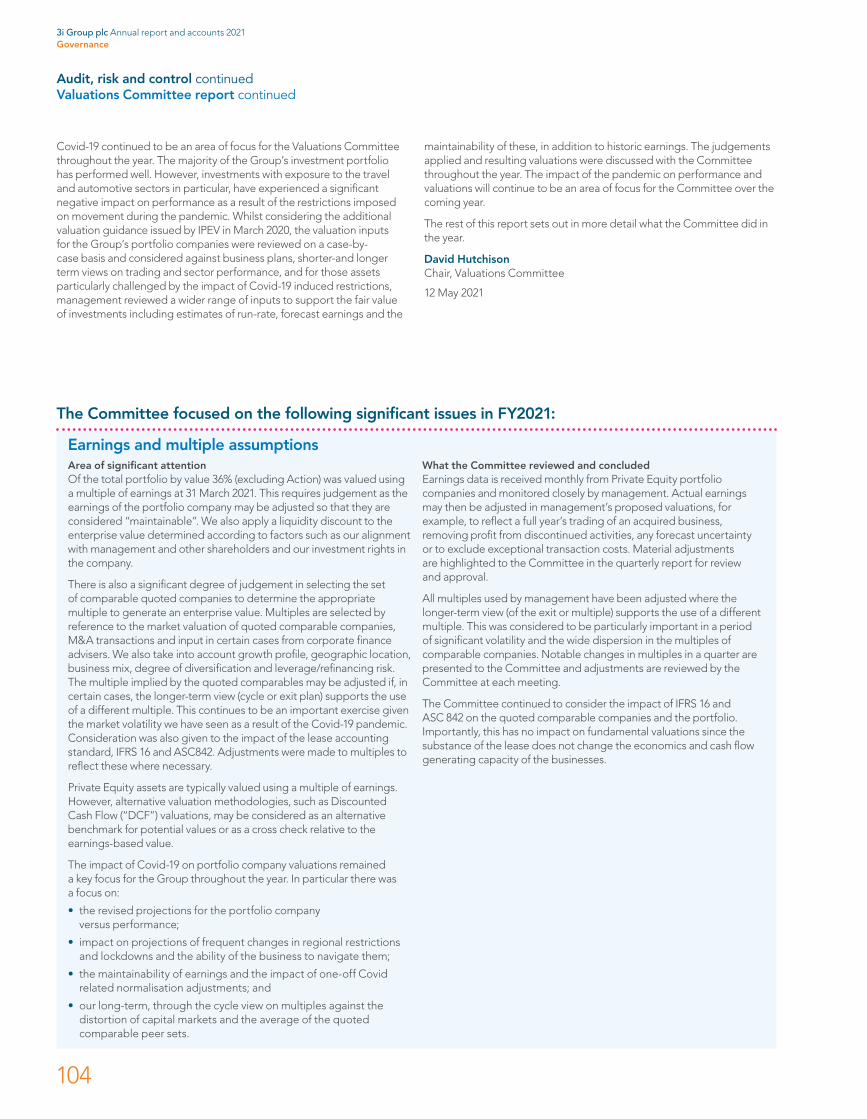
Audit, risk and control continuedValuations Committee report continued
Covid-19 continued to be an area of focus for the Valuations Committee throughout the year. The majority of the Group’s investment portfolio has performed well. However, investments with exposure to the travel and automotive sectors in particular, have experienced a significant negative impact on performance as a result of the restrictions imposed on movement during the pandemic. Whilst considering the additional valuation guidance issued by IPEV in March 2020, the valuation inputs for the Group’s portfolio companies were reviewed on a case-by-case basis and considered against business plans, shorter-and longer term views on trading and sector performance, and for those assets particularly challenged by the impact of Covid-19 induced restrictions, management reviewed a wider range of inputs to support the fair value of investments including estimates of run-rate, forecast earnings and the
maintainability of these, in addition to historic earnings. The judgements applied and resulting valuations were discussed with the Committee throughout the year. The impact of the pandemic on performance and valuations will continue to be an area of focus for the Committee over the coming year.
The rest of this report sets out in more detail what the Committee did in the year.
David HutchisonChair, Valuations Committee
12 May 2021
Earnings and multiple assumptionsArea of significant attentionOf the total portfolio by value 36% (excluding Action) was valued using a multiple of earnings at 31 March 2021. This requires judgement as the earnings of the portfolio company may be adjusted so that they are considered “maintainable”. We also apply a liquidity discount to the enterprise value determined according to factors such as our alignment with management and other shareholders and our investment rights in the company.
There is also a significant degree of judgement in selecting the set of comparable quoted companies to determine the appropriate multiple to generate an enterprise value. Multiples are selected by reference to the market valuation of quoted comparable companies, M&A transactions and input in certain cases from corporate finance advisers. We also take into account growth profile, geographic location, business mix, degree of diversification and leverage/refinancing risk. The multiple implied by the quoted comparables may be adjusted if, in certain cases, the longer-term view (cycle or exit plan) supports the use of a different multiple. This continues to be an important exercise given the market volatility we have seen as a result of the Covid-19 pandemic. Consideration was also given to the impact of the lease accounting standard, IFRS 16 and ASC842. Adjustments were made to multiples to reflect these where necessary.
Private Equity assets are typically valued using a multiple of earnings. However, alternative valuation methodologies, such as Discounted Cash Flow (“DCF”) valuations, may be considered as an alternative benchmark for potential values or as a cross check relative to the earnings-based value.
The impact of Covid-19 on portfolio company valuations remained a key focus for the Group throughout the year. In particular there was a focus on:
• the revised projections for the portfolio company versus performance;
• impact on projections of frequent changes in regional restrictions and lockdowns and the ability of the business to navigate them;
• the maintainability of earnings and the impact of one-off Covid related normalisation adjustments; and
• our long-term, through the cycle view on multiples against the distortion of capital markets and the average of the quoted comparable peer sets.
What the Committee reviewed and concludedEarnings data is received monthly from Private Equity portfolio companies and monitored closely by management. Actual earnings may then be adjusted in management’s proposed valuations, for example, to reflect a full year’s trading of an acquired business, removing profit from discontinued activities, any forecast uncertainty or to exclude exceptional transaction costs. Material adjustments are highlighted to the Committee in the quarterly report for review and approval.
All multiples used by management have been adjusted where the longer-term view (of the exit or multiple) supports the use of a different multiple. This was considered to be particularly important in a period of significant volatility and the wide dispersion in the multiples of comparable companies. Notable changes in multiples in a quarter are presented to the Committee and adjustments are reviewed by the Committee at each meeting.
The Committee continued to consider the impact of IFRS 16 and ASC 842 on the quoted comparable companies and the portfolio. Importantly, this has no impact on fundamental valuations since the substance of the lease does not change the economics and cash flow generating capacity of the businesses.
The Committee focused on the following significant issues in FY2021:
3i Group plc Annual report and accounts 2021Governance
104
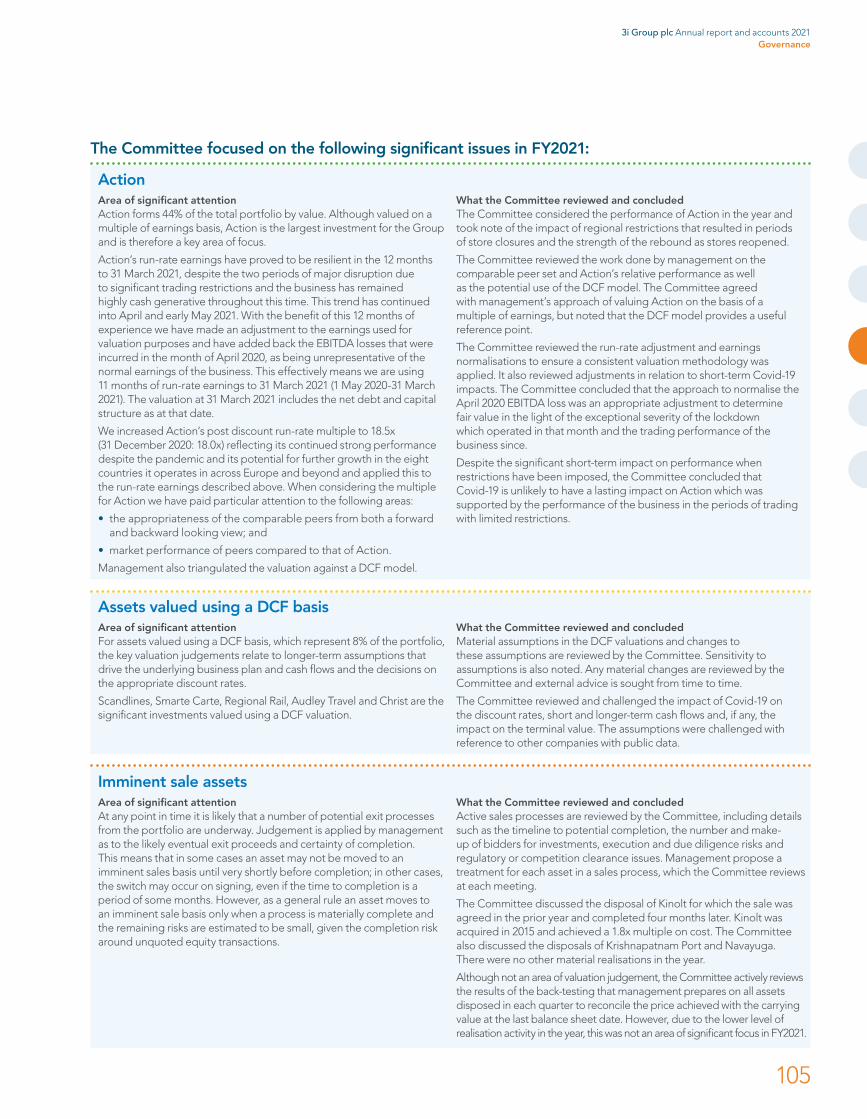
ActionArea of significant attentionAction forms 44% of the total portfolio by value. Although valued on a multiple of earnings basis, Action is the largest investment for the Group and is therefore a key area of focus.
Action’s run-rate earnings have proved to be resilient in the 12 months to 31 March 2021, despite the two periods of major disruption due to significant trading restrictions and the business has remained highly cash generative throughout this time. This trend has continued into April and early May 2021. With the benefit of this 12 months of experience we have made an adjustment to the earnings used for valuation purposes and have added back the EBITDA losses that were incurred in the month of April 2020, as being unrepresentative of the normal earnings of the business. This effectively means we are using 11 months of run-rate earnings to 31 March 2021 (1 May 2020-31 March 2021). The valuation at 31 March 2021 includes the net debt and capital structure as at that date.
We increased Action’s post discount run-rate multiple to 18.5x (31 December 2020: 18.0x) reflecting its continued strong performance despite the pandemic and its potential for further growth in the eight countries it operates in across Europe and beyond and applied this to the run-rate earnings described above. When considering the multiple for Action we have paid particular attention to the following areas:
• the appropriateness of the comparable peers from both a forward and backward looking view; and
• market performance of peers compared to that of Action.
Management also triangulated the valuation against a DCF model.
What the Committee reviewed and concludedThe Committee considered the performance of Action in the year and took note of the impact of regional restrictions that resulted in periods of store closures and the strength of the rebound as stores reopened.
The Committee reviewed the work done by management on the comparable peer set and Action’s relative performance as well as the potential use of the DCF model. The Committee agreed with management’s approach of valuing Action on the basis of a multiple of earnings, but noted that the DCF model provides a useful reference point.
The Committee reviewed the run-rate adjustment and earnings normalisations to ensure a consistent valuation methodology was applied. It also reviewed adjustments in relation to short-term Covid-19 impacts. The Committee concluded that the approach to normalise the April 2020 EBITDA loss was an appropriate adjustment to determine fair value in the light of the exceptional severity of the lockdown which operated in that month and the trading performance of the business since.
Despite the significant short-term impact on performance when restrictions have been imposed, the Committee concluded that Covid-19 is unlikely to have a lasting impact on Action which was supported by the performance of the business in the periods of trading with limited restrictions.
Assets valued using a DCF basisArea of significant attentionFor assets valued using a DCF basis, which represent 8% of the portfolio, the key valuation judgements relate to longer-term assumptions that drive the underlying business plan and cash flows and the decisions on the appropriate discount rates.
Scandlines, Smarte Carte, Regional Rail, Audley Travel and Christ are the significant investments valued using a DCF valuation.
What the Committee reviewed and concludedMaterial assumptions in the DCF valuations and changes to these assumptions are reviewed by the Committee. Sensitivity to assumptions is also noted. Any material changes are reviewed by the Committee and external advice is sought from time to time.
The Committee reviewed and challenged the impact of Covid-19 on the discount rates, short and longer-term cash flows and, if any, the impact on the terminal value. The assumptions were challenged with reference to other companies with public data.
Imminent sale assetsArea of significant attentionAt any point in time it is likely that a number of potential exit processes from the portfolio are underway. Judgement is applied by management as to the likely eventual exit proceeds and certainty of completion. This means that in some cases an asset may not be moved to an imminent sales basis until very shortly before completion; in other cases, the switch may occur on signing, even if the time to completion is a period of some months. However, as a general rule an asset moves to an imminent sale basis only when a process is materially complete and the remaining risks are estimated to be small, given the completion risk around unquoted equity transactions.
What the Committee reviewed and concludedActive sales processes are reviewed by the Committee, including details such as the timeline to potential completion, the number and make-up of bidders for investments, execution and due diligence risks and regulatory or competition clearance issues. Management propose a treatment for each asset in a sales process, which the Committee reviews at each meeting.
The Committee discussed the disposal of Kinolt for which the sale was agreed in the prior year and completed four months later. Kinolt was acquired in 2015 and achieved a 1.8x multiple on cost. The Committee also discussed the disposals of Krishnapatnam Port and Navayuga. There were no other material realisations in the year.
Although not an area of valuation judgement, the Committee actively reviews the results of the back-testing that management prepares on all assets disposed in each quarter to reconcile the price achieved with the carrying value at the last balance sheet date. However, due to the lower level of realisation activity in the year, this was not an area of significant focus in FY2021.
The Committee focused on the following significant issues in FY2021:
3i Group plc Annual report and accounts 2021Governance
105

Review processAs part of its challenge and review process, the Committee:
• considered the management information provided to support the Committee’s review of the valuations, including management’s responses to any challenges raised by the Committee members or the External auditor;
• sought assurance from the External auditor as to whether and how they had considered the appropriateness of valuations and the underlying assumptions made;
• reviewed the consistency of the views of management and the External auditor and their valuation specialists; and
• reviewed and challenged the differential between carrying values and those implied by the floating multiple of comparable quoted companies.
The Committee was satisfied that the application of the policy and process was appropriate during the period under review, and recommended the portfolio valuation to the Audit and Compliance Committee and the Board at each quarter end for approval by the Board.
In addition, the Committee is responsible for keeping the Group’s valuation policy under review and recommending any changes to the policy to the Audit and Compliance Committee and the Board. The policy is reviewed at least annually, with the last update in January 2021 incorporating considerations from the additional IPEV guidelines issued in March 2020 in response to the Covid-19 pandemic.
More information on our valuation methodology, including definitions and rationale, is included in the Portfolio valuation – an explanation section on pages 188 and 189.
External auditAs part of its external audit, KPMG reviews the proposed investment portfolio valuation to determine that the valuation policy is being complied with and that there is consistent application and support for the underlying assumptions. As part of its year-end audit, and to support its opinion on the Financial statements as a whole, KPMG’s specialist valuations team reviews a selection of investments to provide assurance on its overall audit conclusion on the appropriateness of 3i’s portfolio valuation as a separate report to the Valuations Committee.
Audit, risk and control continuedValuations Committee report continued
3i Group plc Annual report and accounts 2021Governance
106
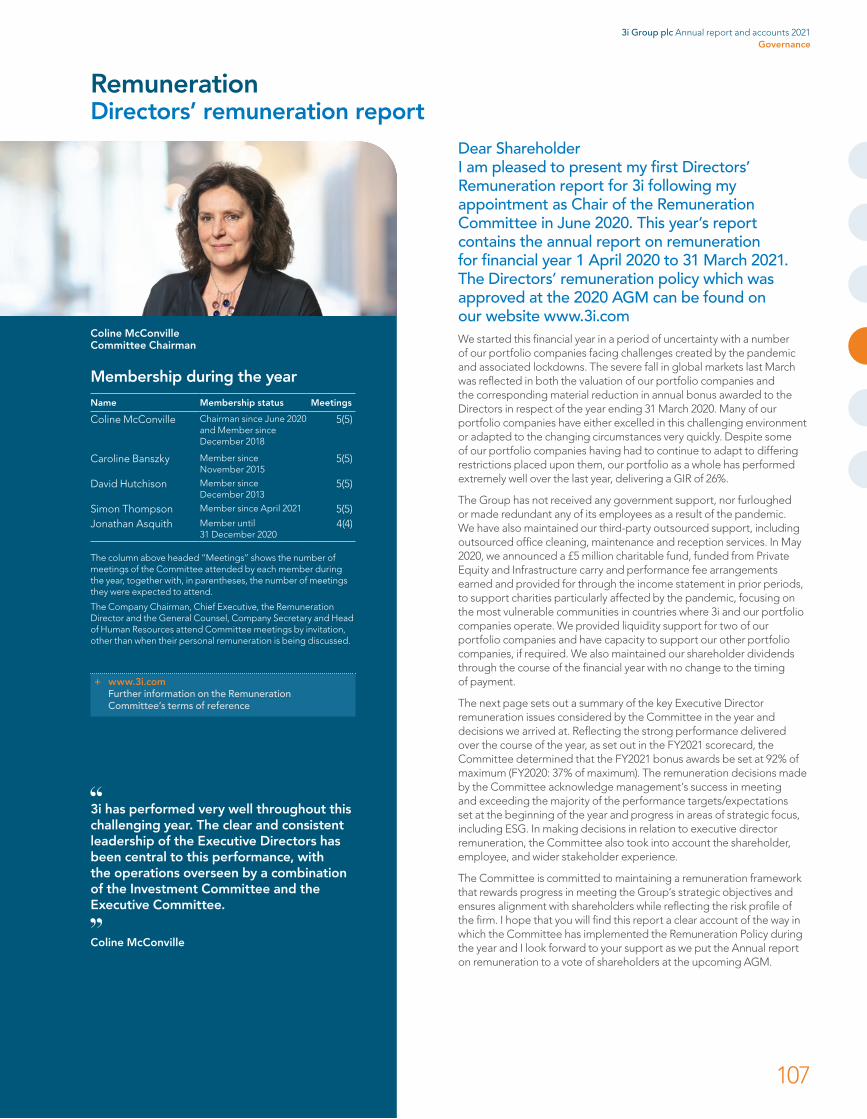
RemunerationDirectors’ remuneration report
Dear Shareholder I am pleased to present my first Directors’ Remuneration report for 3i following my appointment as Chair of the Remuneration Committee in June 2020. This year’s report contains the annual report on remuneration for financial year 1 April 2020 to 31 March 2021. The Directors’ remuneration policy which was approved at the 2020 AGM can be found on our website www.3i.comWe started this financial year in a period of uncertainty with a number of our portfolio companies facing challenges created by the pandemic and associated lockdowns. The severe fall in global markets last March was reflected in both the valuation of our portfolio companies and the corresponding material reduction in annual bonus awarded to the Directors in respect of the year ending 31 March 2020. Many of our portfolio companies have either excelled in this challenging environment or adapted to the changing circumstances very quickly. Despite some of our portfolio companies having had to continue to adapt to differing restrictions placed upon them, our portfolio as a whole has performed extremely well over the last year, delivering a GIR of 26%.
The Group has not received any government support, nor furloughed or made redundant any of its employees as a result of the pandemic. We have also maintained our third-party outsourced support, including outsourced office cleaning, maintenance and reception services. In May 2020, we announced a £5 million charitable fund, funded from Private Equity and Infrastructure carry and performance fee arrangements earned and provided for through the income statement in prior periods, to support charities particularly affected by the pandemic, focusing on the most vulnerable communities in countries where 3i and our portfolio companies operate. We provided liquidity support for two of our portfolio companies and have capacity to support our other portfolio companies, if required. We also maintained our shareholder dividends through the course of the financial year with no change to the timing of payment.
The next page sets out a summary of the key Executive Director remuneration issues considered by the Committee in the year and decisions we arrived at. Reflecting the strong performance delivered over the course of the year, as set out in the FY2021 scorecard, the Committee determined that the FY2021 bonus awards be set at 92% of maximum (FY2020: 37% of maximum). The remuneration decisions made by the Committee acknowledge management’s success in meeting and exceeding the majority of the performance targets/expectations set at the beginning of the year and progress in areas of strategic focus, including ESG. In making decisions in relation to executive director remuneration, the Committee also took into account the shareholder, employee, and wider stakeholder experience.
The Committee is committed to maintaining a remuneration framework that rewards progress in meeting the Group’s strategic objectives and ensures alignment with shareholders while reflecting the risk profile of the firm. I hope that you will find this report a clear account of the way in which the Committee has implemented the Remuneration Policy during the year and I look forward to your support as we put the Annual report on remuneration to a vote of shareholders at the upcoming AGM.
Coline McConvilleCommittee Chairman
Coline McConville
Membership during the year
Name Membership status Meetings
Coline McConville Chairman since June 2020 and Member since December 2018
5(5)
Caroline Banszky Member since November 2015
5(5)
David Hutchison Member since December 2013
5(5)
Simon Thompson Member since April 2021 5(5)Jonathan Asquith Member until
31 December 20204(4)
The column above headed “Meetings” shows the number of meetings of the Committee attended by each member during the year, together with, in parentheses, the number of meetings they were expected to attend.
The Company Chairman, Chief Executive, the Remuneration Director and the General Counsel, Company Secretary and Head of Human Resources attend Committee meetings by invitation, other than when their personal remuneration is being discussed.
+ www.3i.comFurther information on the Remuneration Committee’s terms of reference
3i has performed very well throughout this challenging year. The clear and consistent leadership of the Executive Directors has been central to this performance, with the operations overseen by a combination of the Investment Committee and the Executive Committee.
3i Group plc Annual report and accounts 2021Governance
107

FY2021 Annual bonus
Quantitative measures Qualitative measures
Portfolio returns (excl Action):
30.3%
Portfolio returns (Action):
28.9%
Portfolio returns (3iN):
9.2%
Portfolio returns (Scandlines):
6.0%
Operating cash Profit:
£23m
See page 110 for further details of the qualitative
metrics and the performance against each.
OutcomeReflecting the strong performance delivered over the course of the year, which resulted in the majority of the performance targets/expectations set at the beginning of the year being exceeded, as well as progress in other areas of strategic focus, all illustrated through the FY2021 scorecard (set out on page 109), the Committee determined that the bonuses for the two Executive Directors would be 92% of maximum bonus opportunity (FY2020: 37% of maximum). The Committee considered performance in the round, taking into account the performance criteria set out above, and determined that the pay-out is fair and justified and therefore no discretion has been applied.
2018 Long-term incentive award vesting in FY2021Our Long-term incentive plan is designed to align our Executive Directors with our primary target of growing shareholder returns. Given the importance of long-term shareholder returns, our LTIP awards have and continue to contain both a relative and absolute total shareholder return target measured over three years (relative TSR being measured against the FTSE 350).
Threshold Maximum Actual performance
Vesting Overall vesting
Relative TSR(50% weighting)
Median Upper quartile Above upper quartile 100%
70.63%
Absolute TSR(50% weighting)
10% p.a. growth 18% p.a. growth 12.1% p.a. growth 41.26%
The Committee considered performance in the round when assessing the LTIP vesting and determined that the pay-out is a fair reflection of overall performance, the shareholder experience, the employee experience, and the wider stakeholder experience over the three-year performance period, and therefore no discretion has been applied.
Alignment through significant personal shareholdings of the executives The Executive Directors are also aligned with shareholders through their material shareholdings (Mr Borrows 29,973% of base salary; Mrs Wilson 4,315% of base salary), which are significantly above the shareholding requirements set for them. Further, Executive Directors are expected to maintain a shareholding in the Company for two years post-employment at the lower of their shareholding at the time they leave employment and the amount of their shareholding requirement.
Looking forwardA Group-wide 3% increase to salaries will take place in FY2022 which will also be applied to Executive Director salaries. This follows a salary freeze last year.
The Committee continues to be of the view that the current remuneration framework remains fit-for-purpose, rewards progress in meeting the Group’s strategic objectives and ensures alignment with shareholders while reflecting the risk profile of the firm. Therefore, there are no proposed changes to the annual bonus and LTIP schemes for FY2022. Further details on how the remuneration policy will be implemented in respect of FY2022 are set out on page 115.
Coline McConvilleChairman, Remuneration Committee
12 May 2021
Directors’ remuneration report continued
3i Group plc Annual report and accounts 2021Governance
108
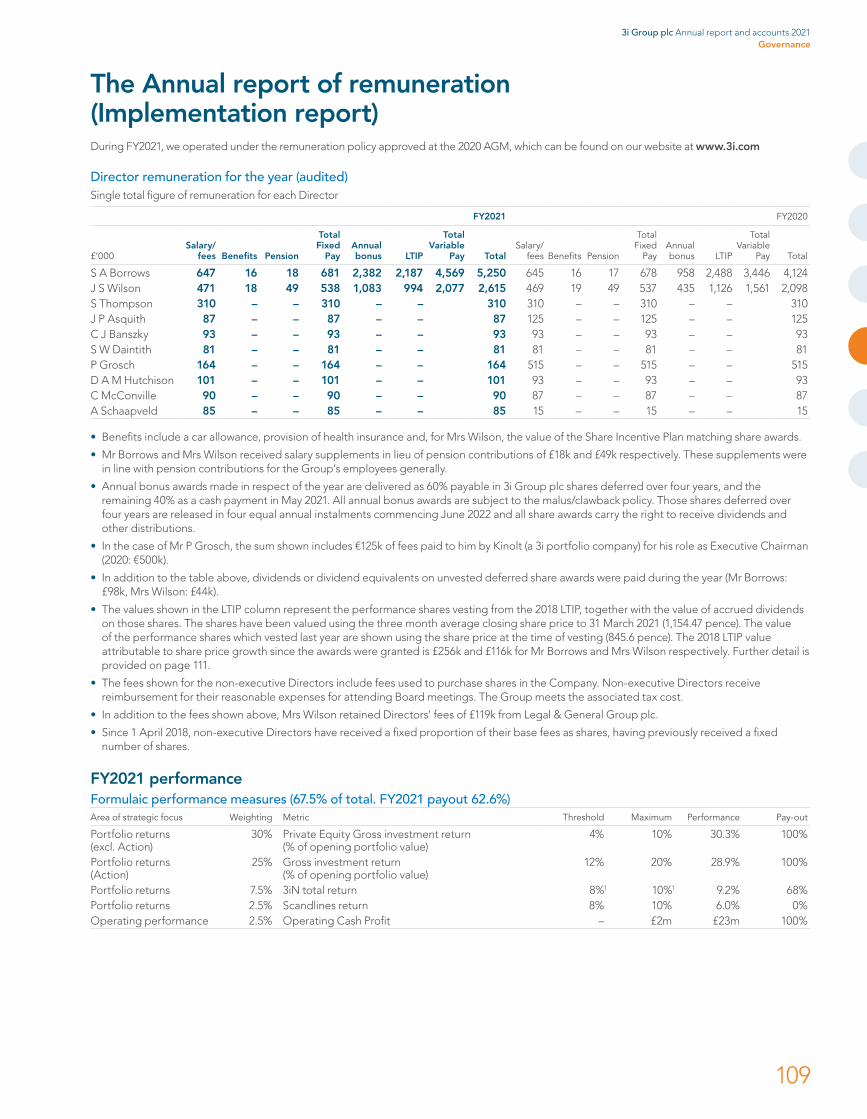
The Annual report of remuneration (Implementation report)During FY2021, we operated under the remuneration policy approved at the 2020 AGM, which can be found on our website at www.3i.com
Director remuneration for the year (audited)Single total figure of remuneration for each Director
FY2021 FY2020
£’000Salary/
fees Benefits Pension
Total Fixed
PayAnnual bonus LTIP
Total Variable
Pay TotalSalary/
fees Benefits Pension
Total Fixed
PayAnnual bonus LTIP
Total Variable
Pay Total
S A Borrows 647 16 18 681 2,382 2,187 4,569 5,250 645 16 17 678 958 2,488 3,446 4,124J S Wilson 471 18 49 538 1,083 994 2,077 2,615 469 19 49 537 435 1,126 1,561 2,098S Thompson 310 – – 310 – – 310 310 – – 310 – – 310J P Asquith 87 – – 87 – – 87 125 – – 125 – – 125C J Banszky 93 – – 93 – – 93 93 – – 93 – – 93S W Daintith 81 – – 81 – – 81 81 – – 81 – – 81P Grosch 164 – – 164 – – 164 515 – – 515 – – 515D A M Hutchison 101 – – 101 – – 101 93 – – 93 – – 93C McConville 90 – – 90 – – 90 87 – – 87 – – 87A Schaapveld 85 – – 85 – – 85 15 – – 15 – – 15
• Benefits include a car allowance, provision of health insurance and, for Mrs Wilson, the value of the Share Incentive Plan matching share awards.
• Mr Borrows and Mrs Wilson received salary supplements in lieu of pension contributions of £18k and £49k respectively. These supplements were in line with pension contributions for the Group’s employees generally.
• Annual bonus awards made in respect of the year are delivered as 60% payable in 3i Group plc shares deferred over four years, and the remaining 40% as a cash payment in May 2021. All annual bonus awards are subject to the malus/clawback policy. Those shares deferred over four years are released in four equal annual instalments commencing June 2022 and all share awards carry the right to receive dividends and other distributions.
• In the case of Mr P Grosch, the sum shown includes €125k of fees paid to him by Kinolt (a 3i portfolio company) for his role as Executive Chairman (2020: €500k).
• In addition to the table above, dividends or dividend equivalents on unvested deferred share awards were paid during the year (Mr Borrows: £98k, Mrs Wilson: £44k).
• The values shown in the LTIP column represent the performance shares vesting from the 2018 LTIP, together with the value of accrued dividends on those shares. The shares have been valued using the three month average closing share price to 31 March 2021 (1,154.47 pence). The value of the performance shares which vested last year are shown using the share price at the time of vesting (845.6 pence). The 2018 LTIP value attributable to share price growth since the awards were granted is £256k and £116k for Mr Borrows and Mrs Wilson respectively. Further detail is provided on page 111.
• The fees shown for the non-executive Directors include fees used to purchase shares in the Company. Non-executive Directors receive reimbursement for their reasonable expenses for attending Board meetings. The Group meets the associated tax cost.
• In addition to the fees shown above, Mrs Wilson retained Directors’ fees of £119k from Legal & General Group plc.
• Since 1 April 2018, non-executive Directors have received a fixed proportion of their base fees as shares, having previously received a fixed number of shares.
FY2021 performanceFormulaic performance measures (67.5% of total. FY2021 payout 62.6%) Area of strategic focus Weighting Metric Threshold Maximum Performance Pay-out
Portfolio returns (excl. Action)
30% Private Equity Gross investment return (% of opening portfolio value)
4% 10% 30.3% 100%
Portfolio returns (Action)
25% Gross investment return (% of opening portfolio value)
12% 20% 28.9% 100%
Portfolio returns 7.5% 3iN total return 8%1 10%1 9.2% 68%Portfolio returns 2.5% Scandlines return 8% 10% 6.0% 0%Operating performance 2.5% Operating Cash Profit – £2m £23m 100%
3i Group plc Annual report and accounts 2021Governance
109

The Annual report of remuneration continued
Qualitative performance measures (32.5% of total. FY2021 payout 29.4%)Area of strategic focus Weighting Metric Expectation Performance Comments
Portfolio returns 5% Private Equity portfolio earnings growth
>10% 31% Many of our portfolio companies have either excelled in this challenging environment or adapted to the changing circumstances very quickly and, as a result, 87% of our portfolio by value grew their annual adjusted earnings to December 2020.
Investment management 15% New capital invested in Private Equity
Up to €450m €483m The Company continues to make selective investment decisions and avoids opportunities it considers to be overpriced. Three new investments were completed in the year (MPM, Wilson and Gartenhaus), together with three larger and strategic bolt-on acquisitions.
New 3iN capital committed in Core/PPP
£300m £23m In the face of extreme price competition, and despite generating a good level of potential investment opportunities, our teams maintained a disciplined approach and, as a result, no new investments were made in the year. The acquisition of further stakes in our existing Dutch PPP projects was completed in the year.
Environmental, social and governance targets across the portfolio and 3i Group
ESG assessments form part of the regular portfolio company review process within our Private Equity and Infrastructure businesses.Successful Carbon roundtable held in March 2021 for 23 portfolio companies (across Private Equity, Infrastructure and Scandlines).3i continues to perform well against external sustainability ratings and benchmarks, including being ranked first in ITPEnergised/Orbis Advisory’s first ranking on ESG transparency in the UK Private Equity industry.
Strategy 7.5% Development of the strategic vision of the Group and progress of corporate projects
The Company has supported its portfolio companies through the pandemic, including the injection of cash to support specific businesses. A further €125m of Action carry liability was crystallised during the year which increased the net value of 3i’s stake in Action.The pension plan’s Trustees successfully completed a buy-in transaction with Legal & General with no further contributions required from 3i. The Plan benefits are now fully insured meaning 3i is no longer exposed to any material longevity, interest or inflation risk and any financing requirements.
People 5% Development of the quality and strength of the Group’s staff
The Group immediately and effectively transitioned to remote working on announcement of lockdown restrictions, with minimal disruption to business operations. The company offered all staff mental health sessions to specifically address the additional challenges faced whilst remote working during lockdowns.The Board reviewed and approved the succession plan during the year and good progress has been made in recruiting key hires, particularly within the investment teams.
1 The threshold and maximum return targets are set in line with 3iN’s public return objectives.
Consistent with last year, the Board did not set a threshold and maximum for all metrics and set expectations rather than targets for some. This is because the timing of investments and realisations is highly sensitive to market conditions, and a more prescriptive approach would run the risk of creating perverse incentives for executives. For example, setting a target level of realisations may result in the earlier sale of assets than would otherwise be appropriate, and setting a target level of investments may result in investing at inflated prices. This was emphasised this year, with the decision with respect to 3iN, where no new investments were made due to the extreme price competition in the market albeit one significant investment completing a day after the financial year ended. In relation to operating performance, the continued tight focus on managing operating costs is emphasised by specifying a narrow range of acceptable outcomes rather than a single numerical target. Operating costs as a percentage of assets under management compares favourably with other investment groups.
3i Group plc Annual report and accounts 2021Governance
110

Chief Executive and Group Finance Director Annual bonus outcomesIn the light of the performance detailed above, and following an assessment taking into account the shareholder, employee, and wider stakeholder experience, the Committee awarded Mr Borrows a bonus in respect of FY2021 of £2,382k (being 92% of his maximum bonus opportunity), and awarded Mrs Wilson a bonus in respect of FY2021 of £1,083k (being 92% of her maximum bonus opportunity). In each case, 40% of the award will be paid in cash immediately and 60% will be deferred into the Company’s shares vesting in equal instalments over four years. Annual bonus awards are subject to the malus/clawback policy.
Share awards vesting in FY2021 subject to performance conditions2018 Long-term incentive award (audited)The Long-term incentive awards granted in June 2018 to Mr Borrows and Mrs Wilson were subject to performance conditions based on absolute and relative Total Shareholder Return over the three financial years to 31 March 2021. The table below shows the achievement against these conditions and the resulting proportion of the awards which will vest in June 2021.
Weighting Threshold Maximum Actual Total
Total Shareholder Return Measure % Performance % vesting Performance % vesting Performance % vesting % vesting
Absolute Total Shareholder Return 50% 10% pa 20% 18% pa 100% 12.13% 41.26% 70.63%Relative Total Shareholder Return (as measured against the FTSE 350 Index)
50% Median 25% Upper quartile
100% Above Upper
quartile
100%
The table below shows the grants made to each Executive Director on 28 June 2018 at a share price of 1,007.08 pence and the resulting number of shares that will vest due to the achievement against the performance targets as set out above. The value of the shares vesting has been included in the single figure table using the three month average closing share price to 31 March 2021 of 1,154.47 pence.
Basis of award at grantFace value
at grant
Number of shares awarded
at 1,007.08 per share % vesting
Number of shares vesting
Value of shares vesting
at 1,154.47p per share
S A Borrows Face value award of 4 times base salary of £619k £2,476k 245,871 70.63% 173,658 £2,005kJ S Wilson Face value award of 2.5 times base salary of £451k £1,127k 111,759 70.63% 78,935 £911k
The proportion of the award vesting will be released 50% in June 2021, 25% in June 2022 and 25% in June 2023 together with the value of dividends that would have been received during the period from grant to the release date.
Change in the remuneration of the Directors compared to other employeesThe table below shows the percentage change in remuneration paid to each Director and employees as a whole between the year to 31 March 2020 and the year to 31 March 2021.
Salary/Fees Benefits Bonus
S A Borrows 0% 0% 149%J S Wilson 0% (5)% 149%S Thompson 0% – –J P Asquith1 (30)% – –C J Banszky 0% – –S W Daintith 0% – –P Grosch2 (68)% – –D A M Hutchison3 9% – –C McConville3 3% – –A Schaapveld1 467% – –
All other employees 2% 2% 76%
1 J P Asquith stepped down from the Board in December 2020; A Schaapveld joined the board in January 2020. The changes in the fees shown above is due to part year payments.2 P Grosch fees include fees paid to him by Kinolt (a 3i portfolio company). He stepped down from Kinolt’s Board in June 2020.3 D A M Hutchison was appointed Senior Independent Director in June 2020. C McConville was appointed Remuneration Committee Chair in June 2020.
3i Group plc Annual report and accounts 2021Governance
111
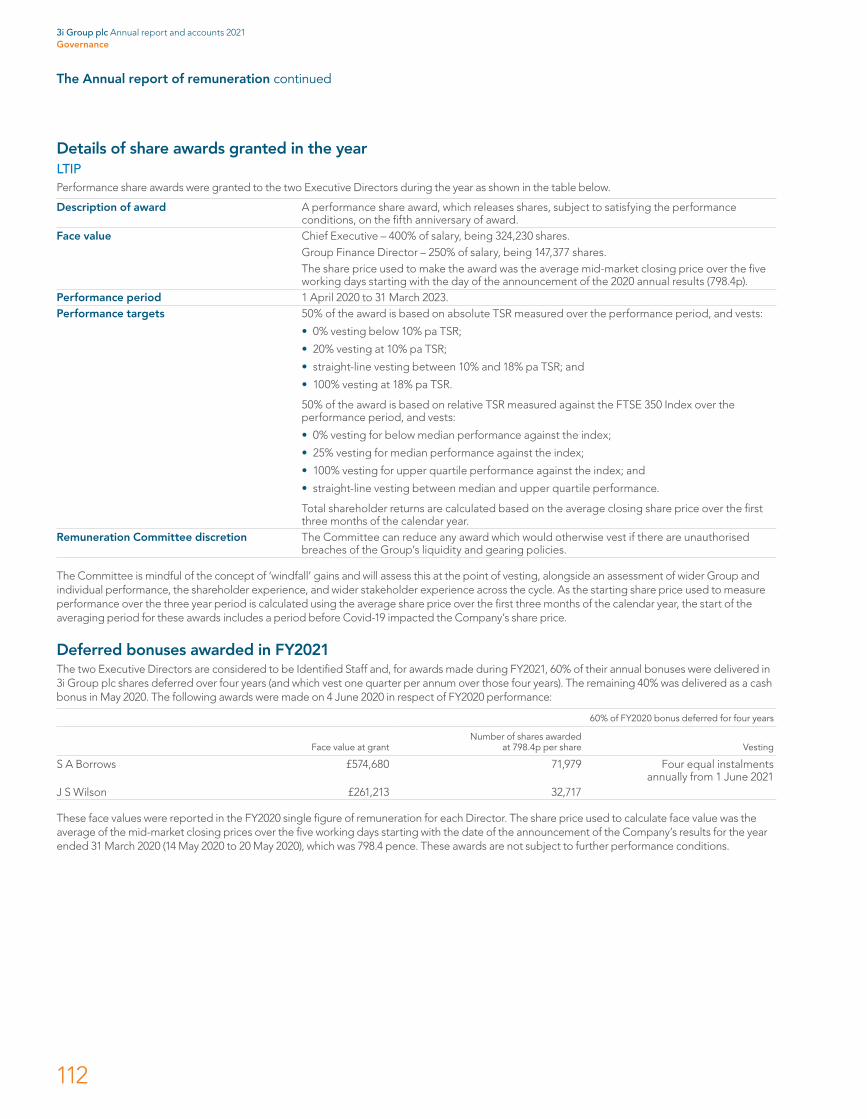
The Annual report of remuneration continued
Details of share awards granted in the yearLTIPPerformance share awards were granted to the two Executive Directors during the year as shown in the table below.
Description of award A performance share award, which releases shares, subject to satisfying the performance conditions, on the fifth anniversary of award.
Face value Chief Executive – 400% of salary, being 324,230 shares.Group Finance Director – 250% of salary, being 147,377 shares.The share price used to make the award was the average mid-market closing price over the five working days starting with the day of the announcement of the 2020 annual results (798.4p).
Performance period 1 April 2020 to 31 March 2023.Performance targets 50% of the award is based on absolute TSR measured over the performance period, and vests:
• 0% vesting below 10% pa TSR;
• 20% vesting at 10% pa TSR;
• straight-line vesting between 10% and 18% pa TSR; and
• 100% vesting at 18% pa TSR.
50% of the award is based on relative TSR measured against the FTSE 350 Index over the performance period, and vests:
• 0% vesting for below median performance against the index;
• 25% vesting for median performance against the index;
• 100% vesting for upper quartile performance against the index; and
• straight-line vesting between median and upper quartile performance.
Total shareholder returns are calculated based on the average closing share price over the first three months of the calendar year.
Remuneration Committee discretion The Committee can reduce any award which would otherwise vest if there are unauthorised breaches of the Group’s liquidity and gearing policies.
The Committee is mindful of the concept of ‘windfall’ gains and will assess this at the point of vesting, alongside an assessment of wider Group and individual performance, the shareholder experience, and wider stakeholder experience across the cycle. As the starting share price used to measure performance over the three year period is calculated using the average share price over the first three months of the calendar year, the start of the averaging period for these awards includes a period before Covid-19 impacted the Company’s share price.
Deferred bonuses awarded in FY2021The two Executive Directors are considered to be Identified Staff and, for awards made during FY2021, 60% of their annual bonuses were delivered in 3i Group plc shares deferred over four years (and which vest one quarter per annum over those four years). The remaining 40% was delivered as a cash bonus in May 2020. The following awards were made on 4 June 2020 in respect of FY2020 performance:
60% of FY2020 bonus deferred for four years
Face value at grantNumber of shares awarded
at 798.4p per share Vesting
S A Borrows £574,680 71,979 Four equal instalments annually from 1 June 2021
J S Wilson £261,213 32,717
These face values were reported in the FY2020 single figure of remuneration for each Director. The share price used to calculate face value was the average of the mid-market closing prices over the five working days starting with the date of the announcement of the Company’s results for the year ended 31 March 2020 (14 May 2020 to 20 May 2020), which was 798.4 pence. These awards are not subject to further performance conditions.
3i Group plc Annual report and accounts 2021Governance
112

Share Incentive PlanDuring the year, Mrs Wilson participated in the HMRC approved Share Incentive Plan which allowed employees to invest up to £150 per month from pre-tax salary in ordinary shares (“partnership shares”). For each partnership share, the Company grants two free ordinary shares (“matching shares”) which are forfeited if the participant resigns within three years of grant. Dividends are reinvested in further ordinary shares (“dividend shares”).
During the year, Mrs Wilson purchased 184 partnership shares, and received 368 matching shares and 707 dividend shares at prices ranging between 797.6p and 1,165.83p per share, with an average price of 991.75p.
Hedging of share awardsAs a matter of policy the Group ensures that it holds the maximum potential number of shares granted under the LTIP and Deferred Share Plan from the date of grant. Shares are purchased by the Employee Benefit Trust in the market as and when required to ensure that coverage is maintained.
Pension arrangements (audited)Mr Borrows and Mrs Wilson receive pension benefits on the same percentage basis of their pensionable salaries as other employees of the Company. During the year, they received salary supplements in lieu of pension of £18k and £49k respectively.
Payments to past Directors (audited)No payments to past Directors were made in the year.
Payments for loss of office (audited)No payments to Directors for loss of office were made in the year.
Statement of Directors’ shareholding and share interests (audited)The Company’s share ownership and retention policy requires Executive Directors to build up over time and thereafter maintain a shareholding in the Company’s shares equivalent to at least 3.0 times gross salary in the case of the Chief Executive and 2.0 times gross salary for the Group Finance Director. In addition, shareholding targets have been introduced for other members of the Executive Committee at 1.5 times their gross salaries and for partners in the Group’s businesses at 1.0 times their gross salaries. Since 2018 non-executive Directors and the Chairman are required to build up over time and thereafter maintain a shareholding in the Company’s shares equivalent to at least 1 times their respective annual base fees (cash and shares).
From this year, Executive Directors will be expected to maintain a shareholding in the Company for two years post employment at the lower of their shareholding at the time they leave employment and the levels set out above.
Details of Directors’ interests (including interests of their connected persons) in the Company’s shares as at 31 March 2021 are shown in the table below. The closing share price on 31 March 2021 was 1,153.50p.
Owned outright1 Deferred shares2Subject to
performanceShareholding requirement
Current shareholding
(% salary)
S A Borrows3 15,557,074 697,794 561,498 300% 29,973%J S Wilson3,4 1,178,084 327,209 255,226 200% 4,315%
Shares owned outright
Shareholding requirement
Current shareholding (% base fee)
S Thompson3 82,362 100% 306%C Banszky3 23,585 100% 418%S Daintith3 8,831 100% 157%D Hutchison3 80,756 100% 1,433%C McConville3 6,665 100% 118%A Schaapveld3 2,083 100% 37%
1 The share interests shown for Mrs Wilson include shares held in the 3i Group Share Incentive Plan. The owned outright column includes partnership and dividend shares under the SIP. The deferred shares column includes matching shares under the SIP.
2 The number of shares shown includes the 2018 Performance Share award. The performance against the performance targets results in 70.63% of the shares being released as described on page 111.3 Directors are restricted from hedging their exposure to the 3i share price.4 From 1 April 2021 to 1 May 2021, Mrs Wilson became interested in a further 12 shares overall outright (SIP Partnership Shares) and a further 24 deferred shares (SIP Matching Shares). There were no other
changes to Directors’ share interests in that period.
3i Group plc Annual report and accounts 2021Governance
113
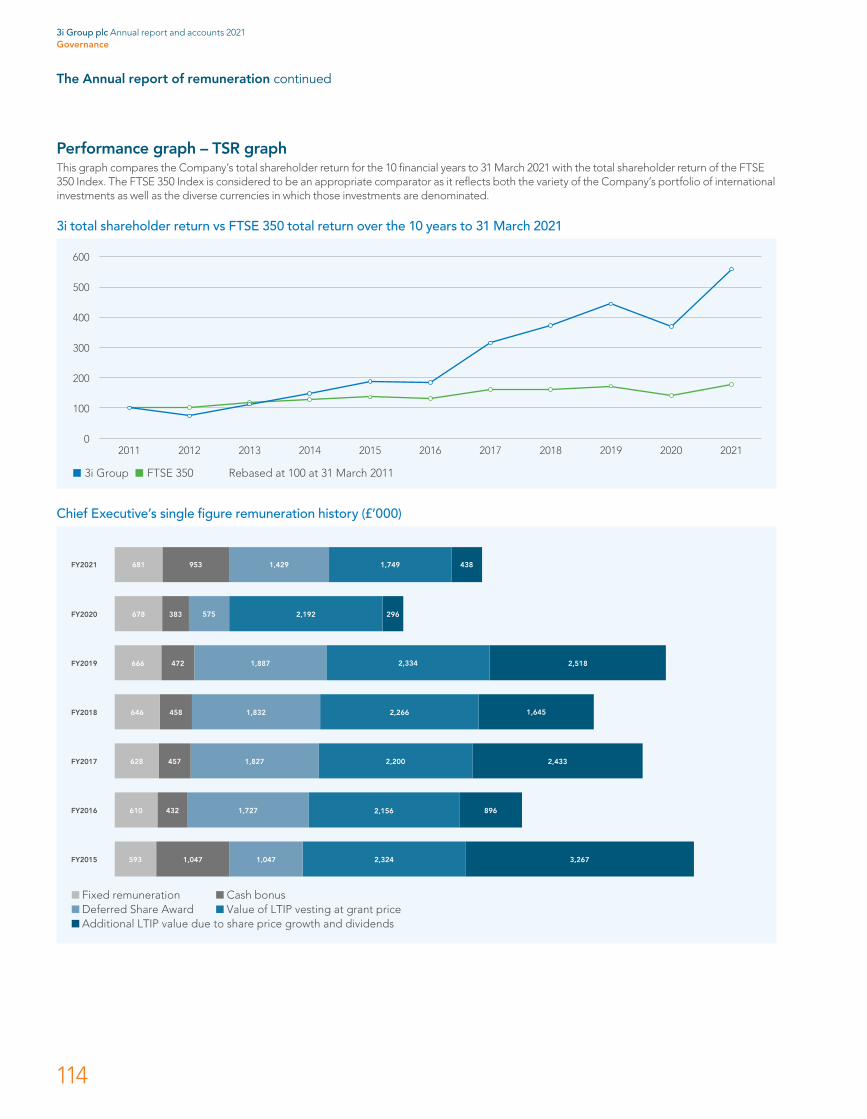
The Annual report of remuneration continued
Performance graph – TSR graphThis graph compares the Company’s total shareholder return for the 10 financial years to 31 March 2021 with the total shareholder return of the FTSE 350 Index. The FTSE 350 Index is considered to be an appropriate comparator as it reflects both the variety of the Company’s portfolio of international investments as well as the diverse currencies in which those investments are denominated.
3i total shareholder return vs FTSE 350 total return over the 10 years to 31 March 2021
600
500
400
300
200
100
02014201320122011 2015 2016 2017 202120202018
Rebased at 100 at 31 March 20113i Group FTSE 350
2019
Chief Executive’s single figure remuneration history (£’000)
1,6452,2661,832458646
628 457 1,827 2,200 2,433
610 432 1,727 2,156 896
3,2672,3241,0471,047593
1,887 2,334 2,518472666
FY2015
FY2016
FY2020
FY2021
FY2019
2,192 296575383678
1,749 4381,429953681
FY2018
FY2017
Fixed remuneration Deferred Share Award Additional LTIP value due to share price growth and dividends
Cash bonus Value of LTIP vesting at grant price
3i Group plc Annual report and accounts 2021Governance
114
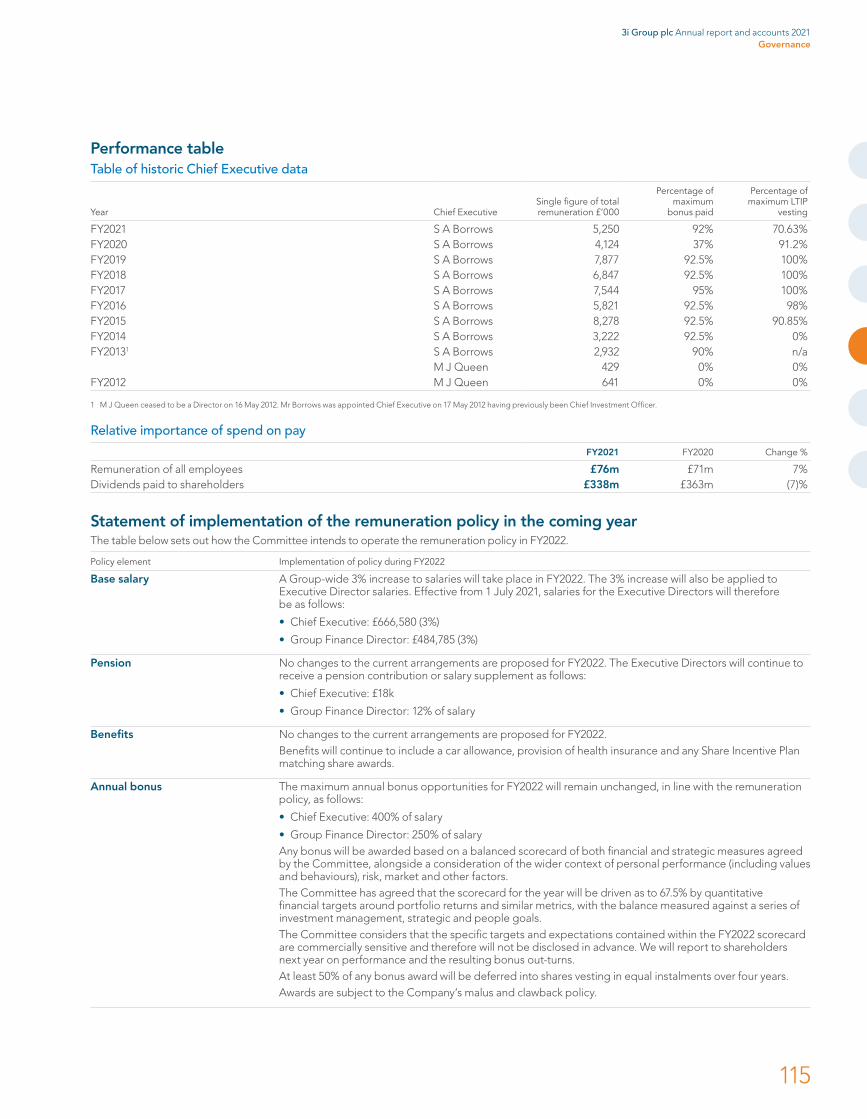
Performance tableTable of historic Chief Executive data
Year Chief ExecutiveSingle figure of total remuneration £’000
Percentage of maximum
bonus paid
Percentage of maximum LTIP
vesting
FY2021 S A Borrows 5,250 92% 70.63%FY2020 S A Borrows 4,124 37% 91.2%FY2019 S A Borrows 7,877 92.5% 100%FY2018 S A Borrows 6,847 92.5% 100%FY2017 S A Borrows 7,544 95% 100%FY2016 S A Borrows 5,821 92.5% 98%FY2015 S A Borrows 8,278 92.5% 90.85%FY2014 S A Borrows 3,222 92.5% 0%FY20131 S A Borrows 2,932 90% n/a
M J Queen 429 0% 0%FY2012 M J Queen 641 0% 0%
1 M J Queen ceased to be a Director on 16 May 2012. Mr Borrows was appointed Chief Executive on 17 May 2012 having previously been Chief Investment Officer.
Relative importance of spend on pay
FY2021 FY2020 Change %
Remuneration of all employees £76m £71m 7%Dividends paid to shareholders £338m £363m (7)%
Statement of implementation of the remuneration policy in the coming yearThe table below sets out how the Committee intends to operate the remuneration policy in FY2022.
Policy element Implementation of policy during FY2022
Base salary A Group-wide 3% increase to salaries will take place in FY2022. The 3% increase will also be applied to Executive Director salaries. Effective from 1 July 2021, salaries for the Executive Directors will therefore be as follows:
• Chief Executive: £666,580 (3%)
• Group Finance Director: £484,785 (3%)
Pension No changes to the current arrangements are proposed for FY2022. The Executive Directors will continue to receive a pension contribution or salary supplement as follows:
• Chief Executive: £18k
• Group Finance Director: 12% of salary
Benefits No changes to the current arrangements are proposed for FY2022.Benefits will continue to include a car allowance, provision of health insurance and any Share Incentive Plan matching share awards.
Annual bonus The maximum annual bonus opportunities for FY2022 will remain unchanged, in line with the remuneration policy, as follows:
• Chief Executive: 400% of salary
• Group Finance Director: 250% of salaryAny bonus will be awarded based on a balanced scorecard of both financial and strategic measures agreed by the Committee, alongside a consideration of the wider context of personal performance (including values and behaviours), risk, market and other factors.The Committee has agreed that the scorecard for the year will be driven as to 67.5% by quantitative financial targets around portfolio returns and similar metrics, with the balance measured against a series of investment management, strategic and people goals.The Committee considers that the specific targets and expectations contained within the FY2022 scorecard are commercially sensitive and therefore will not be disclosed in advance. We will report to shareholders next year on performance and the resulting bonus out-turns.At least 50% of any bonus award will be deferred into shares vesting in equal instalments over four years.Awards are subject to the Company’s malus and clawback policy.
3i Group plc Annual report and accounts 2021Governance
115

The Annual report of remuneration continued
Policy element Implementation of policy during FY2022
Long-term Incentive Plan Awards under the Long-term Incentive Plan in FY2022 will remain unchanged and be made as follows:
• Chief Executive: 400% of salary
• Group Finance Director: 250% of salaryPerformance will be measured over a three-year period and will be determined by the Remuneration Committee. Performance measures remain unchanged from the previous year and will be as follows:50% of the award is based on absolute TSR measured over the performance period, and vests:
• 0% vesting below 10% pa TSR;
• 20% vesting at 10% pa TSR;
• straight-line vesting between 10% and 18% pa TSR; and
• 100% vesting at 18% pa TSR.50% of the award is based on relative TSR measured against the FTSE 350 Index over the performance period, and vests:
• 0% for below median performance against the index;
• 25% for median performance against the index;
• 100% for upper quartile performance against the index; and
• straight-line vesting between median and upper quartile performance.Total shareholder returns are calculated based on the average closing share price over the first three months of the calendar year. Awards are subject to the Company’s malus and clawback policy.To the extent that shares vest, awards are subject to a holding period whereby they are released on or around (but not earlier than) fifth anniversaries of grant.The Chief Executive and Group Finance Director are not permitted to participate in carried interest plans and similar arrangements.
Shareholding requirements Shareholding requirements will be as follows:
• Chief Executive: 300% of salary
• Group Finance Director: 200% of salary
• Non-executive Directors (including the Company Chairman): 100% of base fee (cash and shares)
• Executive Directors will be expected to maintain a shareholding in the Company for two years post employment at the lower of their shareholding at the time they leave employment and of the levels set out above. Deferred bonus awards and shares to be released under the Long Term Incentive Plan may be reduced or withheld if the post-employment shareholding targets for the Executive Directors are not met.
Non-executive Director fees The fees for the non-executive Directors remain unchanged in FY2022, and will be:Chairman fee: £240,000 plus £70,000 in 3i sharesNon-executive Directors: Board membership base fee: £50,000 plus £15,000 in 3i sharesSenior Independent Director fee: £10,000Committee Chairman: £20,000Committee member: £8,000Committee fees are payable in respect of the Audit and Compliance Committee, Remuneration Committee and Valuations Committee.
3i Group plc Annual report and accounts 2021Governance
116
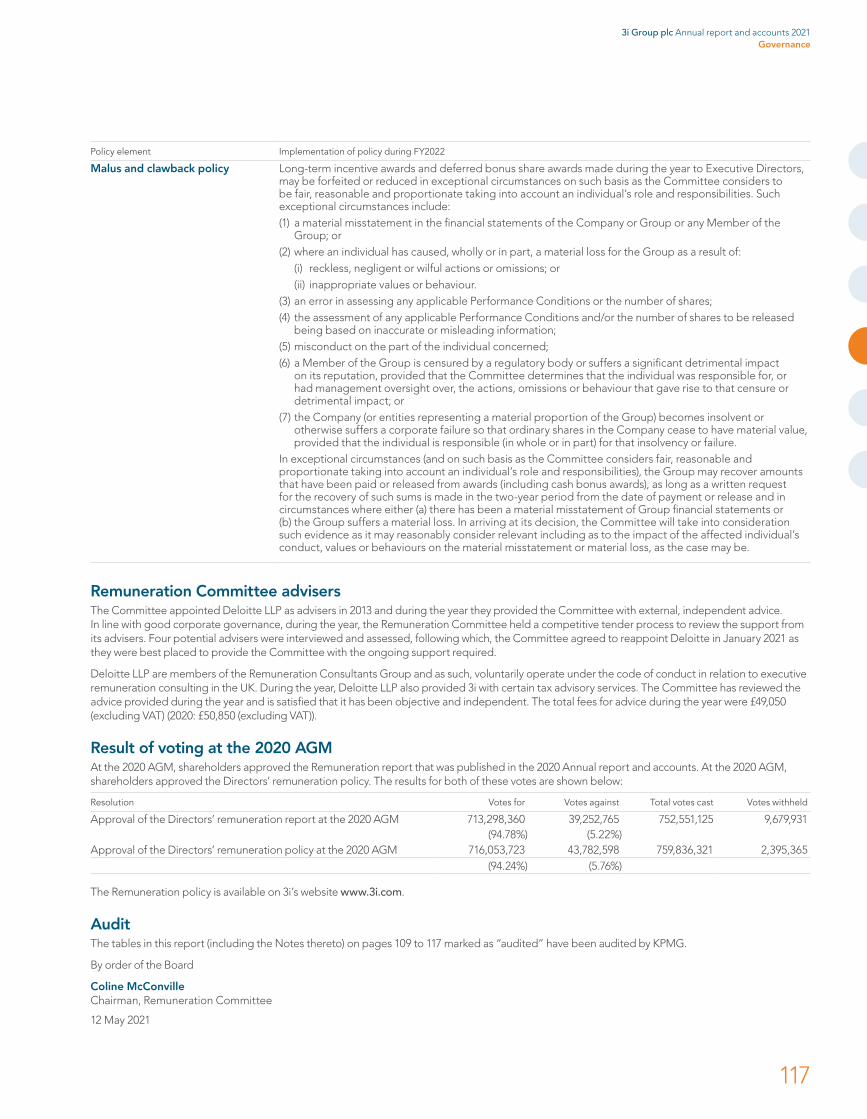
Policy element Implementation of policy during FY2022
Malus and clawback policy Long-term incentive awards and deferred bonus share awards made during the year to Executive Directors, may be forfeited or reduced in exceptional circumstances on such basis as the Committee considers to be fair, reasonable and proportionate taking into account an individual’s role and responsibilities. Such exceptional circumstances include:(1) a material misstatement in the financial statements of the Company or Group or any Member of the
Group; or(2) where an individual has caused, wholly or in part, a material loss for the Group as a result of:
(i) reckless, negligent or wilful actions or omissions; or(ii) inappropriate values or behaviour.
(3) an error in assessing any applicable Performance Conditions or the number of shares;(4) the assessment of any applicable Performance Conditions and/or the number of shares to be released
being based on inaccurate or misleading information; (5) misconduct on the part of the individual concerned; (6) a Member of the Group is censured by a regulatory body or suffers a significant detrimental impact
on its reputation, provided that the Committee determines that the individual was responsible for, or had management oversight over, the actions, omissions or behaviour that gave rise to that censure or detrimental impact; or
(7) the Company (or entities representing a material proportion of the Group) becomes insolvent or otherwise suffers a corporate failure so that ordinary shares in the Company cease to have material value, provided that the individual is responsible (in whole or in part) for that insolvency or failure.
In exceptional circumstances (and on such basis as the Committee considers fair, reasonable and proportionate taking into account an individual’s role and responsibilities), the Group may recover amounts that have been paid or released from awards (including cash bonus awards), as long as a written request for the recovery of such sums is made in the two-year period from the date of payment or release and in circumstances where either (a) there has been a material misstatement of Group financial statements or (b) the Group suffers a material loss. In arriving at its decision, the Committee will take into consideration such evidence as it may reasonably consider relevant including as to the impact of the affected individual’s conduct, values or behaviours on the material misstatement or material loss, as the case may be.
Remuneration Committee advisersThe Committee appointed Deloitte LLP as advisers in 2013 and during the year they provided the Committee with external, independent advice. In line with good corporate governance, during the year, the Remuneration Committee held a competitive tender process to review the support from its advisers. Four potential advisers were interviewed and assessed, following which, the Committee agreed to reappoint Deloitte in January 2021 as they were best placed to provide the Committee with the ongoing support required.
Deloitte LLP are members of the Remuneration Consultants Group and as such, voluntarily operate under the code of conduct in relation to executive remuneration consulting in the UK. During the year, Deloitte LLP also provided 3i with certain tax advisory services. The Committee has reviewed the advice provided during the year and is satisfied that it has been objective and independent. The total fees for advice during the year were £49,050 (excluding VAT) (2020: £50,850 (excluding VAT)).
Result of voting at the 2020 AGMAt the 2020 AGM, shareholders approved the Remuneration report that was published in the 2020 Annual report and accounts. At the 2020 AGM, shareholders approved the Directors’ remuneration policy. The results for both of these votes are shown below:
Resolution Votes for Votes against Total votes cast Votes withheld
Approval of the Directors’ remuneration report at the 2020 AGM 713,298,360 39,252,765 752,551,125 9,679,931(94.78%) (5.22%)
Approval of the Directors’ remuneration policy at the 2020 AGM 716,053,723 43,782,598 759,836,321 2,395,365(94.24%) (5.76%)
The Remuneration policy is available on 3i’s website www.3i.com.
AuditThe tables in this report (including the Notes thereto) on pages 109 to 117 marked as “audited” have been audited by KPMG.
By order of the Board
Coline McConvilleChairman, Remuneration Committee
12 May 2021
3i Group plc Annual report and accounts 2021Governance
117
This section of the Directors’ report contains the corporate governance statement required by FCA Disclosure Guidance and Transparency Rule 7.2.
Corporate governance Throughout the year, the Company complied with the provisions of the UK Corporate Governance Code (the “Code”) published by the FRC in July 2018 and which is available on the FRC website.
The Group’s internal control and risk management systems, including those in relation to the financial reporting process, are described on page 98.
Directors and independenceDirectors’ biographical details are set out on pages 82 and 83. The Board currently comprises the Chairman, five non-executive Directors and two Executive Directors. Mr S R Thompson, Ms C J Banszky, Mr S A Borrows, Mr S W Daintith, Mr D A M Hutchison, Ms C L McConville, Ms A Schaapveld and Mrs J S Wilson served as Directors throughout the year under review. Mr J P Asquith and Mr P Grosch served as a Director throughout the year until their retirements from the Board on 31 December 2020. Following the year end Mr P McKellar was appointed as an additional non-executive Director with effect from 1 June 2021.
The Board regularly considers the independence of non-executive Directors. The Board considers all of the Company’s non-executive Directors to be independent. The Chairman was independent on appointment.
Additional statutory and corporate governance information
1 Where 3i makes an investment in an existing portfolio business as part of a restructuring or reorganisation of its investment in that existing portfolio business (which restructuring or reorganisation may involve, without limitation, 3i disposing of all or part of its existing investment in the relevant portfolio business and reinvesting all or part of the proceeds into a different entity which acquires or holds the relevant portfolio business or a substantial part thereof), the cost of that investment, for the purposes of determining the maximum exposure limit under this policy, shall, to the extent that the investment does not increase 3i’s exposure to the relevant portfolio business, be deemed to be the cost of 3i’s existing investment in the relevant portfolio business (or, in the case of a partial reinvestment, the pro-rated cost of 3i’s existing investment in the relevant portfolio business) immediately prior to the restructuring or reorganisation. If 3i’s investment includes a further investment, such that 3i increases its overall exposure to the relevant portfolio business as part of the restructuring or reorganisation, the cost of any such further investment at the date of such investment shall be added to the cost of the investment in the existing portfolio business as determined pursuant to the previous sentence.
Investment policy
The UK Listing Authority’s Listing Rules require 3i, as a closed-ended investment fund, to publish an investment policy. Shareholder approval is required for material changes to this policy. Non-material changes can be made by the Board. The current policy is set out below. No changes have been made to the policy since it was published in the Company’s 2018 Report and Accounts.
• 3i is an investment company which aims to provide its shareholders with quoted access to private equity and infrastructure returns. Currently, its main focus is on making quoted and unquoted equity and/or debt investments in businesses and funds in Europe, Asia and the Americas. The geographies, economic sectors, funds and asset classes in which 3i invests continue to evolve as opportunities are identified. Proposed investments are assessed individually and all significant investments require approval from the Group’s Investment Committee. Overall investment targets are subject to periodic reviews and the investment portfolio is also reviewed to monitor exposure to specific geographies, economic sectors and asset classes.
• 3i seeks to diversify risk through significant dispersion of investments by geography, economic sector, asset class and size as well as through the maturity profile of its investment portfolio.
• Although 3i does not set maximum exposure limits for asset allocations, it does have a maximum exposure limit that, save as mentioned below, no investment will be made unless its cost1 does not exceed 15% of the investment portfolio value as shown in the last published valuation. A further investment may be made in an existing portfolio business provided the aggregate cost of that investment and of all other unrealised investments in that portfolio business does not exceed 15% of the investment portfolio value as shown in the last published valuation. A higher limit of 30% will apply to the Company’s investment in 3i Infrastructure plc. For the avoidance of doubt, 3i may retain an investment, even if its carrying value is greater than 15% or 30% (as the case may be) of the portfolio value at the time of an updated valuation.
• Investments are generally funded with a mixture of debt and shareholders’ funds with a view to maximising returns to shareholders, whilst maintaining a strong capital base. 3i’s gearing depends not only on its level of debt, but also on the impact of market movements and other factors on the value of its investments. The Board takes this into account when, as required, it sets a precise maximum level of gearing. The Board has therefore set the maximum level of gearing at 150% and has set no minimum level of gearing. If the gearing ratio should exceed the 150% maximum limit, the Board will take steps to reduce the gearing ratio to below that limit as soon as practicable thereafter. 3i is committed to achieving balance sheet efficiency.
3i Group plc Annual report and accounts 2021Governance
118
Appointment and re-election of DirectorsSubject to the Company’s Articles of Association, the Companies Acts and satisfactory performance evaluation, non-executive Directors are appointed for an initial three-year term. Before the third and sixth anniversaries of first appointment, the Director discusses with the Board whether it is appropriate for a further three-year term to be served.
Under the Company’s Articles of Association, the minimum number of Directors is two and the maximum is 20, unless otherwise determined by the Company by ordinary resolution. Directors are appointed by ordinary resolution of shareholders or by the Board. The Company’s Articles of Association provide for Directors to retire by rotation at an AGM if they were appointed by the Board since the preceding AGM, they held office during the two preceding AGMs but did not retire at either of them, they held non-executive office for a continuous period of nine years or more at the date of that AGM, or they choose to retire from office.
Shareholders can remove any Director by special resolution and appoint another person to be a Director in their place by ordinary resolution. Shareholders can also remove any Director by ordinary resolution of which special notice has been given.
Subject to the Company’s Articles of Association, retiring Directors are eligible for re-appointment. The office of Director is vacated if the Director resigns, becomes bankrupt or is prohibited by law from being a Director or where the Board so resolves following the Director suffering from ill health or being absent from Board meetings for 12 months without the Board’s permission.
The Board’s responsibilities and processes The composition of the Board and its Committees as well as the Board’s key responsibilities and the way in which it and its Committees work are described on pages 82 to 117. The Board is responsible to shareholders for the overall management of the Group and may exercise all the powers of the Company subject to the provisions of relevant statutes, the Company’s Articles of Association and any directions given by special resolution of the shareholders. The Articles of Association empower the Board to offer, allot, grant options over or otherwise deal with or dispose of the Company’s shares as the Board may decide.
The Companies Act 2006 authorises the Company to make market purchases of its own shares if the purchase has first been authorised by a resolution of the Company.
The Board’s diversity policies in relation to Directors are described in the Nominations Committee report on page 92 and such policies in relation to employees are described on page 69.
At the AGM in June 2020, shareholders renewed the Board’s authority to allot ordinary shares and to repurchase ordinary shares on behalf of the Company subject to certain limits. Details of the authorities which the Board will be seeking at the 2021 AGM are set out in the 2021 Notice of AGM.
Matters reserved for the Board The Board has approved a formal schedule of matters reserved to it and its duly authorised Committees for decision. These include matters such as the Group’s overall strategy, strategic plan and annual operating budget; approval of the Company’s financial statements and changes to accounting policies or practices; changes to the capital structure or regulated status of the Company; major capital projects or changes to business operations; investments and divestments above certain limits; policy on borrowing, gearing, hedging and treasury matters; and adequacy of internal control systems.
Rights and restrictions attaching to sharesA summary of the rights and restrictions attaching to shares as at 31 March 2021 is set out below.
The Company’s Articles of Association may be amended by special resolution of the shareholders in a general meeting. Holders of ordinary shares enjoy the rights set out in the Articles of Association of the Company and under the laws of England and Wales. Any share may be issued with or have attached to it such rights and restrictions as the Company by ordinary resolution or, failing such resolution, the Board may decide.
Holders of ordinary shares are entitled to attend, speak and vote at general meetings and to appoint proxies and, in the case of corporations, corporate representatives to attend, speak and vote at such meetings on their behalf. To attend and vote at a general meeting a shareholder must be entered on the register of members at such time (not being earlier than 48 hours before the meeting) as stated in the Notice of general meeting. On a poll, holders of ordinary shares are entitled to one vote for each share held.
Holders of ordinary shares are entitled to receive the Company’s Annual report and accounts, to receive such dividends and other distributions as may lawfully be paid or declared on such shares and, on any liquidation of the Company, to share in the surplus assets of the Company after satisfaction of the entitlements of the holders of any shares with preferred rights as may then be in issue.
There are no restrictions on the transfer of fully paid shares in the Company, save as follows. The Board may decline to register: a transfer of uncertificated shares in the circumstances set out in the Uncertificated Securities Regulations 2001; a transfer to more than four joint holders; a transfer of certificated shares which is not in respect of only one class of share; a transfer which is not accompanied by the certificate for the shares to which it relates; a transfer which is not duly stamped in circumstances where a duly stamped instrument is required; or a transfer where in accordance with section 794 of the Companies Act 2006 a notice (under section 793 of that Act) has been served by the Company on a shareholder who has then failed to give the information required within the specified time.
In the latter circumstances the Company may make the relevant shares subject to certain restrictions (including in respect of the ability to exercise voting rights, to transfer the shares validly and, except in the case of a liquidation, to receive the payment of sums due from the Company).
3i Group plc Annual report and accounts 2021Governance
119
Additional statutory and corporate governance information continued
There are no shares carrying special rights with regard to control of the Company. There are no restrictions placed on voting rights of fully paid shares, save where in accordance with Article 12 of the Company’s Articles of Association a restriction notice has been served by the Company in respect of shares for failure to comply with statutory notices or where a transfer notice (as described below) has been served in respect of shares and has not yet been complied with. Where shares are held on behalf of former or current employees under employee share schemes, those participants can give instructions to the holder of such shares as to how votes attached to such shares should be exercised.
In the circumstances specified in Article 38 of the Company’s Articles of Association the Company may serve a transfer notice on holders of shares. The relevant circumstances relate to: (a) potential tax disadvantage to the Company, (b) the number of “United States Residents” who own or hold shares being 75 or more, or (c) the Company being required to be registered as an investment company under relevant US legislation. The notice would require the transfer of relevant shares and, pending such transfer, the rights and privileges attaching to those shares would be suspended.
The Company is not aware of any agreements between holders of its securities that may restrict the transfer of shares or exercise of voting rights.
Share capital and debenturesThe issued ordinary share capital of the Company as at 1 April 2020 was 973,074,585 ordinary shares and at 31 March 2021 was 973,166,947 ordinary shares of 7319/22 pence each. It increased over the year by 92,362 ordinary shares on the issue of shares to the Trustee of the 3i Group Share Incentive Plan.
At the Annual General Meeting (“AGM”) on 25 June 2020, the Directors were authorised to repurchase up to 97,000,000 ordinary shares in the Company (representing approximately 10% of the Company’s issued ordinary share capital as at 11 May 2020) until the Company’s AGM in 2021 or 30 September 2021, if earlier. This authority was not exercised in the year. Details of the authorities which the Board will be seeking at the 2021 AGM are set out in the 2021 Notice of AGM.
As at 31 March 2021 the Company had sterling fixed rate notes in issue as detailed in Note 17 to the accounts.
The Articles of Association also specifically empower the Board to exercise the Company’s powers to borrow money and to mortgage or charge the Company’s assets and any uncalled capital and to issue debentures and other securities.
Portfolio management and voting policy In relation to unquoted investments, the Group’s approach is to seek to add value to the businesses in which the Group invests through the Group’s extensive experience, resources and contacts and through active engagement with the Boards of those companies. In relation to quoted investments, the Group’s policy is to exercise voting rights on all matters affecting its interests.
Tax and investment company statusThe Company is an investment company under section 833 of the Companies Act 2006. HM Revenue & Customs has approved the Company as an Investment Trust under section 1158 of the Corporation Tax Act 2010 and the Company directs its affairs to enable it to continue to remain so approved.
Where appropriate, the Company looks to the provisions included within the Association of Investment Companies SORP.
Major interests in ordinary sharesThe table below shows notifications of major voting interests in the Company’s ordinary share capital (notifiable in accordance with Chapter 5 of the FCA’s Disclosure Guidance and Transparency Rules or section 793 Companies Act 2006) which had been received by the Company as at 31 March 2021 and 30 April 2021.
As at 31 March 2021
% of issued share
capitalAs at 30 April
2021
% of issued share
capital
Artemis Investment Management LLP
51,646,471 5.31% 50,490,781 5.19%
BlackRock, Inc 91,649,726 9.42% 93,278,945 9.59%Legal & General Investment Management Limited
34,109,877 3.51% 34,517,567 3.55%
Threadneedle Asset Management Limited
36,007,663 3.70% 35,969,706 3.70%
UBS AG 40,630,213 4.18% 36,701,937 3.77%Vanguard Group Inc 37,885,255 3.89% 38,327,511 3.94%
3i Investments plc3i Investments plc is authorised by the FCA to, among other things, manage Alternative Investment Funds (“AIFs”). It is currently the Alternative Investment Fund Manager (“AIFM”) of five AIFs, including the Company and 3iN. In compliance with regulatory requirements, 3i Investments plc has ensured that a depository has been appointed for each AIF. This is Citibank Europe plc, UK Branch.
3i Group plc Annual report and accounts 2021Governance
120
The Annual report and accounts meet certain investor disclosure requirements as set out in FUND 3.2.2R, 3.2.3R, 3.2.5R and 3.2.6R of the FCA’s Investment Funds sourcebook (“FUND Disclosures”) for the Company as a standalone entity. The Company’s profit for the year is stated in its Statement of changes in equity and its Financial position is shown on page 130. The Company performs substantially all of its investment related activities through its subsidiaries and therefore the Group’s Consolidated statement of comprehensive income is considered to be more useful to investors than a Company statement.
Furthermore, in some instances the relevant FUND Disclosures have been made in relation to the Group on a consolidated basis rather than in respect of the Company on a solo basis. This is because the Company operates through its group subsidiaries and therefore reporting on the Group’s activities provides more relevant information on the Company and its position. There have been no material changes to the disclosures required to be made under FUND 3.2.2R in the past year.
Although certain FUND Disclosures are made in this Annual report, full disclosures are summarised on the 3i website at www.3i.com. This will be updated as required and changes noted in future Annual reports.
For the purposes of the FUND Disclosures set out in FUND 3.3.5(R) (5) and (6), the total amount of remuneration paid by AIFM to its staff for the year to 31 March 2021 was £163 million, of which £42 million was fixed remuneration and £121 million was variable remuneration. The total number of beneficiaries is 235. The aggregate total remuneration paid to AIFM Identified Staff for the year to 31 March 2021 was £40 million, of which £35 million was paid to Senior Management and £5 million was paid to other AIFM Identified Staff. A summary of the remuneration policy of 3i can be found on the Company’s website.
DividendsA first FY2021 dividend of 17.5 pence per ordinary share in respect of the year to 31 March 2021 was paid on 13 January 2021. The Directors recommend a second FY2021 dividend of 21.0 pence per ordinary share be paid in respect of the year to 31 March 2021 to shareholders on the Register at the close of business on 18 June 2021.
The trustee of The 3i Group Employee Trust and the trustee of the 2010 Carry Trust have each waived (subject to certain minor exceptions) dividends declared on shares in the Company held by those trusts and the Trustee of The 3i Group Share Incentive Plan has waived dividends on unallocated shares in the Company held by it.
Directors’ conflicts of interests, external appointments and indemnities Directors have a statutory duty to avoid conflicts of interest with the Company. The Company’s Articles of Association enable Directors to approve conflicts of interest and include other conflict of interest provisions. The Company has implemented processes to identify potential and actual conflicts of interest. Such conflicts are then considered for approval by the Board, subject, if necessary, to appropriate conditions.
The Board has adopted a policy on Directors’ other appointments under which additional external appointments should not be undertaken without prior approval of the Board. Executive Directors should not take on more than one non-executive directorship in a FTSE 100 company or other significant appointment.
As permitted by the Company’s Articles of Association during the year and as at the date of this Directors’ report, there were in place Qualifying Third-Party Indemnity Provisions (as defined under relevant legislation) for the benefit of the Company’s Directors and Qualifying Pension Scheme Indemnity Provisions for the benefit of the directors of one associated company, Gardens Pension Trustees Limited.
Directors’ employment contractsMr S A Borrows and Mrs J S Wilson each have employment contracts with the Group with notice periods of 12 months where notice is given by the Group and six months where notice is given by the Director. Save for these notice periods their employment contracts have no unexpired terms. None of the other Directors has a service contract with the Company.
Employment The employment policy of the Group is one of equal opportunity in the selection, training, career development and promotion of employees, regardless of age, gender, sexual orientation, ethnic origin, religion and whether disabled or otherwise. Further details on equal opportunities and diversity are included in the Strategic report on page 69 and in the Nominations Committee report on page 92.
3i treats applicants and employees with disabilities fairly and provides facilities, equipment and training to assist disabled employees to do their jobs. Arrangements are made as necessary to ensure support to job applicants who happen to be disabled and who respond to requests to inform the Company of any requirements. Should an employee become disabled during their employment, efforts would be made to retain them in their current employment or to explore the opportunities for their retraining or redeployment within 3i. Financial support is also provided by 3i to support disabled employees who are unable to work, as appropriate to local market conditions.
3i’s principal means of keeping in touch with the views of its employees is through employee appraisals, informal consultations, team briefings and employee conferences. Managers throughout 3i have a continuing responsibility to keep their staff informed of developments and to communicate financial results and other matters of interest. This is achieved by structured communication including regular meetings of employees. Members of the Board have regular formal and informal interaction with a significant number of 3i employees, including through office visits and one-to-one meetings.
3i Group plc Annual report and accounts 2021Governance
121

Additional statutory and corporate governance information continued
3i is an equal opportunities employer and has clear grievance and disciplinary procedures in place. 3i also has an employee assistance programme which provides a confidential, free and independent counselling service and is available to all UK employees and their families in the UK.
3i’s employment policies are designed to provide a competitive reward package which will attract and retain high-quality staff, whilst ensuring that the relevant costs remain at an appropriate level.
3i’s remuneration policy is influenced by 3i’s financial and other performance conditions and market practices in the countries in which it operates. All employees receive a base salary and are also eligible to be considered for a performance-related annual variable incentive award. For those members of staff receiving higher levels of annual variable incentive awards, a proportion of such awards is delivered in 3i shares, vesting over a number of years. Remuneration policy is reviewed by the 3i Group plc Remuneration Committee, comprising 3i Group plc non-executive Directors.
Where appropriate, employees are eligible to participate in 3i share schemes to encourage employees’ involvement in 3i’s performance. Investment executives in the Private Equity business line may also participate in carried interest schemes, which allow executives to share directly in future profits on investments. Similarly, investment executives in the Infrastructure business line may participate in asset-linked and/or fee-linked incentive arrangements. Employees participate in local state or company pension schemes as appropriate to local market conditions.
Employees are able to raise in confidence with the Company any matters of concern. Issues can be raised with line management, the Internal Audit team and the Human Resources team as appropriate. Employees can also raise matters with an externally run confidential telephone reporting line, and can do so anonymously if they wish. Matters raised are investigated and followed up as appropriate. The Board monitors any matters reported to the externally run telephone reporting line through an annual report to Audit and Compliance Committee from Internal Audit.
Workforce engagementThe Company has a Staff Engagement Strategy which has been adopted by the Board as the most appropriate way for the Company to comply with the relevant requirements of the UK Corporate Governance Code. This is in preference to adopting one of the three workforce engagement examples specifically mentioned in the UK Corporate Governance Code. The Board believes this Strategy is appropriate and proportionate in the context of an office based workforce of fewer than 240 people worldwide, all of whom engage regularly with members of senior management. Before the Covid-19 pandemic prevented such contact, senior management and members of the Board would meet in person formally and informally with staff in a variety of contexts including office visits, investment reviews, Board and Committee presentations and Board dinners with investment teams. A general “open door” policy (whether physically or virtually) adopted by senior management encourages interaction with staff. The Human Resources team are a point of contact for all members of staff and they as well as line managers report issues requiring management attention to senior management as they occur. The Internal Audit and Group Compliance teams consider employee matters including culture, compliance with the Company’s values and staff turnover in their reports to senior management. For the coming year, this will be supplemented by an annual report to the Board by the Human Resources Director. The formal annual appraisal process provides a further opportunity for engagement.
During the year, the Covid-19 pandemic did interfere with the normal mechanisms of staff engagement. The vast majority of our employees worked remotely for almost the entire year. During this period of remote working, managers arranged regular virtual team meetings. Senior managers attended these meetings periodically to keep in touch with the teams for which they were responsible. Whilst in person Board meetings moved to virtual or hybrid ones, Directors continued to receive updates on employee matters in presentations from the business line heads as well as from the HR Director in the annual Board consideration of the Group Succession Planning and Strategic Capability Review. Non-executive Directors continued to meet with a wide range of members of the investment teams at the twice yearly Portfolio Company Review meetings, albeit that these were held virtually.
In addition, the Board’s regular visit to one of the investment offices was this year replaced by interactive virtual presentations from UK-based investment and professional services staff in the Private Equity and Infrastructure business lines.
Political donations In line with Group policy, during the year to 31 March 2021 no donations were made to political parties or organisations, or independent election candidates, and no political expenditure was incurred.
Significant agreements As at 31 March 2021, the Company was party to one agreement subject to a renegotiation period on a change of control of the Company following a takeover bid. This agreement is a £500 million multi-currency Revolving Credit Facility Agreement dated 13 March 2020, between the Company, Barclays Bank PLC and a number of other banks. The Company is required to promptly notify Barclays Bank PLC, as agent bank, of a change of control. This opens a 20-day negotiation period to determine if each Lender is willing to continue participating in the facility. For any Lender with whom no agreement is reached, amounts outstanding to that Lender would be repayable and their Commitment cancelled, with no less than 10 business days’ notice after the end of the negotiation period.
Internal control and risk management systemsA description of the Group’s internal control and risk management systems in relation to the financial reporting process is set out in the Audit and Compliance Committee report on page 98.
Going concernThe Directors have acknowledged their responsibilities in relation to the financial statements for the year to 31 March 2021.
After making enquiries, the Directors considered it appropriate to prepare the financial statements of the Company, and the Group, on a going concern basis. The Viability statement is included on page 63.
3i Group plc Annual report and accounts 2021Governance
122
Audit informationPursuant to section 418(2) of the Companies Act 2006, each of the Directors confirms that:
• so far as they are aware, there is no relevant audit information of which the Company’s Auditor is unaware; and
• they have taken all steps they ought to have taken to make themselves aware of any relevant audit information and to establish that the Company’s Auditor is aware of such information.
Appointment of AuditorIn accordance with section 489 of the Companies Act 2006, a resolution proposing the reappointment of KPMG LLP as the Company’s Auditor will be put to members at the forthcoming AGM.
Information required by Listing Rule 9.8.4Information required by Listing Rule 9.8.4 not included in this section of the Directors’ report may be found as set out below:
Topic Location
Capitalised interest Portfolio income on page 38Share allotments Note 20 on page 154
Information included in Strategic reportIn accordance with section 414 C (11) of the Companies Act 2006, the following information otherwise required to be set out in the Directors’ report has been included in the Strategic report: risk management objectives and policies; post-balance sheet events; likely future developments in the business; engagement with suppliers, customers and others; employee involvement; and greenhouse gas emissions. The Directors’ Viability statement is also shown in the Strategic report on page 63.
Statement of Directors’ responsibilitiesThe Directors are responsible for preparing the Annual report and the Group and parent Company financial statements for each financial year in accordance with applicable United Kingdom law and regulations. They are required to prepare the Group financial statements in accordance with international accounting standards in conformity with the requirements of the Companies Act 2006 and applicable law and have elected to prepare the parent Company financial statements on the same basis.
Under company law, the Directors must not approve the financial statements unless they are satisfied that they give a true and fair view of the state of affairs of the Group and parent Company and of their profit or loss for that period. In preparing each of the Group and parent Company financial statements, the Directors are required to:
• select suitable accounting policies and then apply them consistently;
• make judgements and estimates that are reasonable, relevant and reliable;
• state whether they have been prepared in accordance with international accounting standards in conformity with the requirements of the Companies Act 2006;
• assess the Group and parent Company’s ability to continue as a going concern, disclosing, as applicable, matters related to going concern; and
• use the going concern basis of accounting unless they either intend to liquidate the Group or the parent Company or to cease operations, or have no realistic alternative but to do so.
The Directors are responsible for keeping adequate accounting records that are sufficient to show and explain the parent Company’s transactions and disclose with reasonable accuracy at any time the financial position of the parent Company and enable them to ensure that its financial statements comply with the Companies Act 2006. They are responsible for such internal control as they determine is necessary to enable the preparation of financial statements that are free from material misstatement, whether due to fraud or error, and have general responsibility for taking such steps as are reasonably open to them to safeguard the assets of the Group and to prevent and detect fraud and other irregularities.
Under applicable law and regulations, the Directors are also responsible for preparing a Strategic report, Directors’ report, Directors’ remuneration report and Corporate governance statement that complies with that law and those regulations.
The Directors are responsible for the maintenance and integrity of the corporate and financial information included on the Company’s website. Legislation in the UK governing the preparation and dissemination of financial statements may differ from legislation in other jurisdictions.
3i Group plc Annual report and accounts 2021Governance
123

Responsibility statement of the Directors in respect of the Annual financial report The Directors confirm that to the best of their knowledge:
• the financial statements, prepared in accordance with the applicable set of accounting standards, give a true and fair view of the assets, liabilities, financial position and profit or loss of the Company and the undertakings included in the consolidation taken as a whole; and
• the Strategic report includes a fair review of the development and performance of the business and the position of the Company and the undertakings included in the consolidation taken as a whole, together with a description of the principal risks and uncertainties that they face.
The Directors consider this Annual report and accounts, taken as a whole, is fair, balanced and understandable and provides the information necessary for shareholders to assess the Group’s position and performance, business model and strategy.
The Directors of the Company and their functions are listed on pages 82 and 83.
3i Group plc is registered in England with company number 1142830.
Directors’ reportFor the purposes of the UK Companies Act 2006, the Directors’ report of 3i Group plc comprises the Governance section on pages 80 to 124 other than the Directors’ remuneration report on pages 107 to 117.
The Strategic report, Directors’ report and Directors’ remuneration report have been drawn up and presented in accordance with and in reliance upon English company law and the liabilities of the Directors in connection with those reports shall be subject to the limitations and restrictions provided by that law.
By order of the Board
K J DunnCompany Secretary
12 May 2021
Registered office: 16 Palace Street London SW1E 5JD
Additional statutory and corporate governance information continued
3i Group plc Annual report and accounts 2021Governance
124
Audited financial statementsWhat’s in this sectionConsolidated statement of comprehensive income 126
Consolidated statement of financial position 127
Consolidated statement of changes in equity 128
Consolidated cash flow statement 129
Company statement of financial position 130
Company statement of changes in equity 131
Company cash flow statement 132
Significant accounting policies 133
Notes to the accounts 137
Independent Auditor’s report 171
125
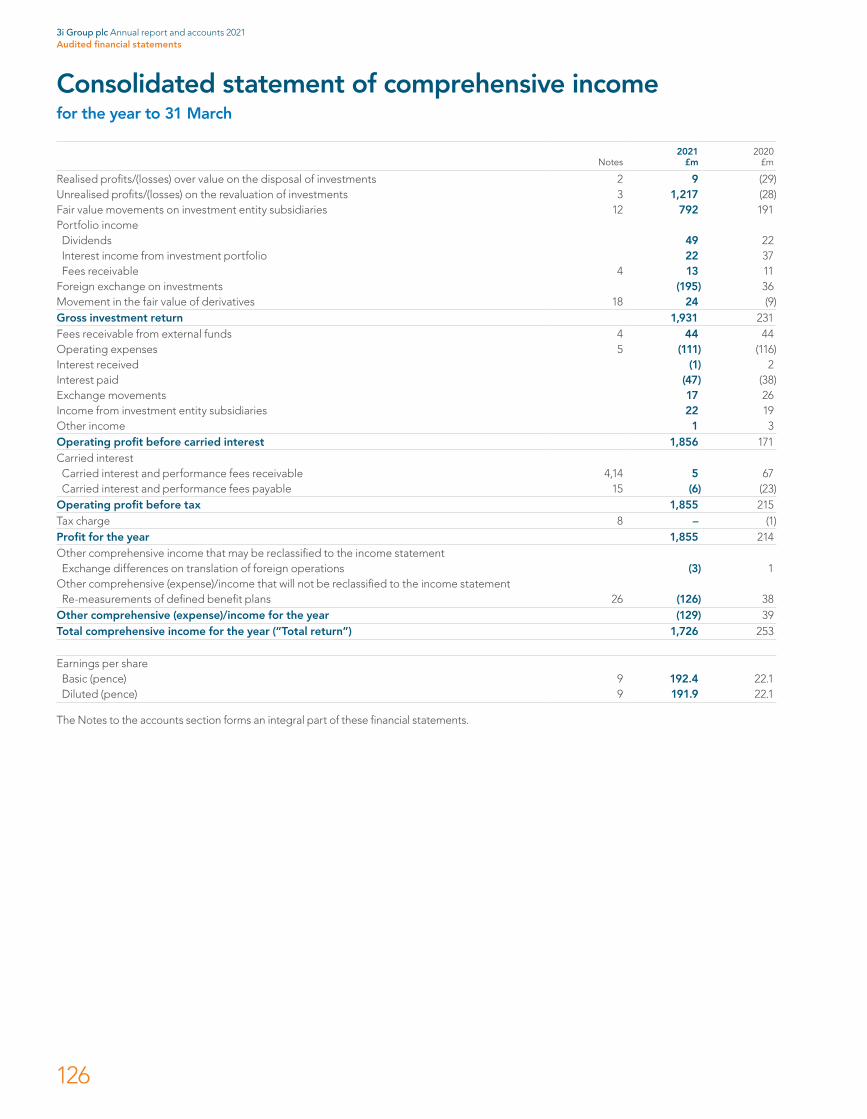
Notes2021
£m2020
£m
Realised profits/(losses) over value on the disposal of investments 2 9 (29)Unrealised profits/(losses) on the revaluation of investments 3 1,217 (28)Fair value movements on investment entity subsidiaries 12 792 191Portfolio incomeDividends 49 22Interest income from investment portfolio 22 37Fees receivable 4 13 11
Foreign exchange on investments (195) 36Movement in the fair value of derivatives 18 24 (9)Gross investment return 1,931 231Fees receivable from external funds 4 44 44Operating expenses 5 (111) (116)Interest received (1) 2Interest paid (47) (38)Exchange movements 17 26Income from investment entity subsidiaries 22 19Other income 1 3Operating profit before carried interest 1,856 171Carried interestCarried interest and performance fees receivable 4,14 5 67Carried interest and performance fees payable 15 (6) (23)
Operating profit before tax 1,855 215Tax charge 8 – (1)Profit for the year 1,855 214Other comprehensive income that may be reclassified to the income statementExchange differences on translation of foreign operations (3) 1
Other comprehensive (expense)/income that will not be reclassified to the income statementRe-measurements of defined benefit plans 26 (126) 38
Other comprehensive (expense)/income for the year (129) 39Total comprehensive income for the year (“Total return”) 1,726 253
Earnings per shareBasic (pence) 9 192.4 22.1Diluted (pence) 9 191.9 22.1
The Notes to the accounts section forms an integral part of these financial statements.
Consolidated statement of comprehensive incomefor the year to 31 March
3i Group plc Annual report and accounts 2021Audited financial statements
126

Notes2021
£m2020
£m
AssetsNon-current assetsInvestmentsQuoted investments 11 797 418Unquoted investments 11 4,213 3,036
Investments in investment entity subsidiaries 12 4,905 3,936Investment portfolio 9,915 7,390Carried interest and performance fees receivable 14 9 11Other non-current assets 16 52 23Intangible assets 8 9Retirement benefit surplus 26 55 173Property, plant and equipment 5 5Right of use asset 16 19Derivative financial instruments 18 16 7Deferred income taxes 8 1 –Total non-current assets 10,077 7,637Current assetsCarried interest and performance fees receivable 14 8 7Other current assets 16 21 144Current income taxes 2 2Derivative financial instruments 18 10 6Cash and cash equivalents 216 771Total current assets 257 930Total assets 10,334 8,567LiabilitiesNon-current liabilitiesTrade and other payables 19 (17) –Carried interest and performance fees payable 15 (49) (66)Loans and borrowings 17 (975) (575)Retirement benefit deficit 26 (29) (25)Lease liability (13) (16)Derivative financial instruments 18 – (2)Deferred income taxes 8 (1) (1)Provisions (2) (3)Total non-current liabilities (1,086) (688)Current liabilitiesTrade and other payables 19 (62) (73)Carried interest and performance fees payable 15 (17) (41)Lease liability (4) (4)Derivative financial instruments 18 – (2)Current income taxes (1) (2)Total current liabilities (84) (122)Total liabilities (1,170) (810)Net assets 9,164 7,757EquityIssued capital 20 719 719Share premium 788 788Capital redemption reserve 43 43Share-based payment reserve 27 34 33Translation reserve (5) (2)Capital reserve 6,733 5,432Revenue reserve 916 822Own shares 21 (64) (78)Total equity 9,164 7,757
The Notes to the accounts section forms an integral part of these financial statements.
Simon ThompsonChairman
12 May 2021
Consolidated statement of financial positionas at 31 March
3i Group plc Annual report and accounts 2021Audited financial statements
127
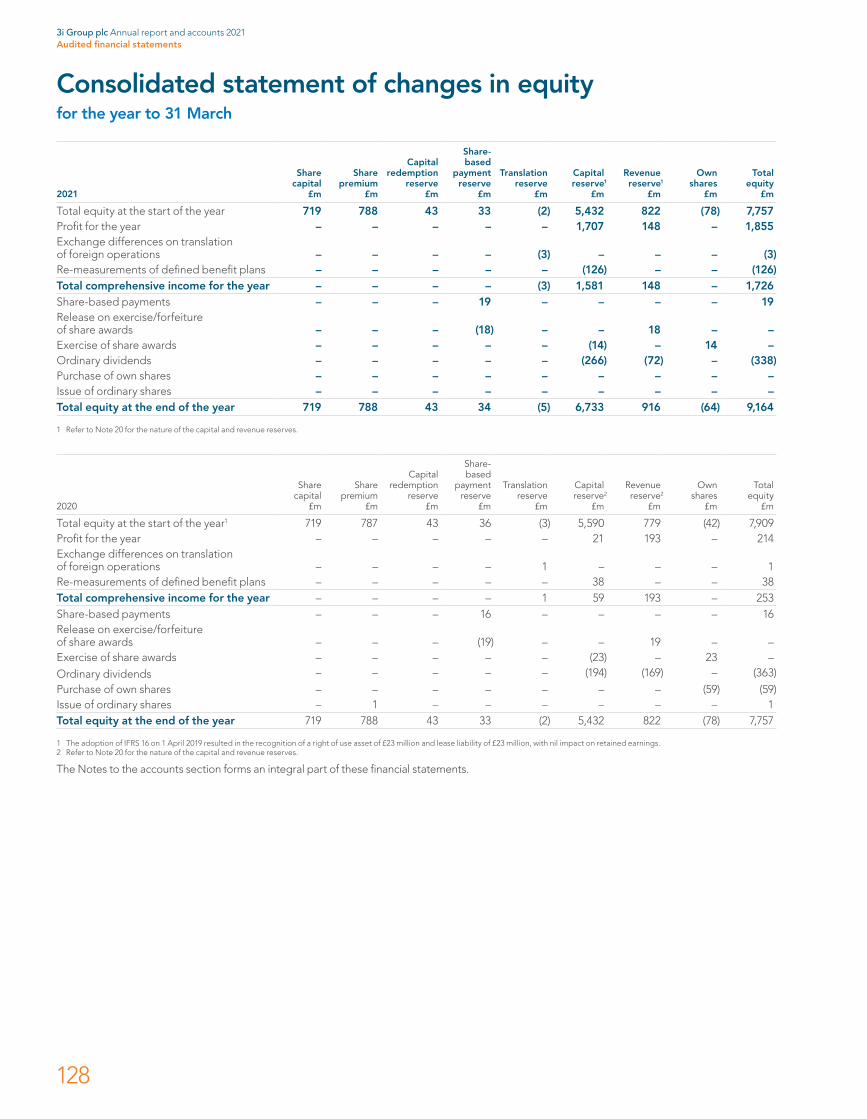
2021
Share capital
£m
Share premium
£m
Capital redemption
reserve £m
Share- based
payment reserve
£m
Translation reserve
£m
Capitalreserve1
£m
Revenuereserve1
£m
Own shares
£m
Total equity
£m
Total equity at the start of the year 719 788 43 33 (2) 5,432 822 (78) 7,757Profit for the year – – – – – 1,707 148 – 1,855Exchange differences on translation of foreign operations – – – – (3) – – – (3)Re-measurements of defined benefit plans – – – – – (126) – – (126)Total comprehensive income for the year – – – – (3) 1,581 148 – 1,726Share-based payments – – – 19 – – – – 19Release on exercise/forfeiture of share awards – – – (18) – – 18 – –Exercise of share awards – – – – – (14) – 14 –Ordinary dividends – – – – – (266) (72) – (338)Purchase of own shares – – – – – – – – –Issue of ordinary shares – – – – – – – – –Total equity at the end of the year 719 788 43 34 (5) 6,733 916 (64) 9,164
1 Refer to Note 20 for the nature of the capital and revenue reserves.
2020
Share capital
£m
Share premium
£m
Capital redemption
reserve £m
Share- based
payment reserve
£m
Translation reserve
£m
Capitalreserve2
£m
Revenuereserve2
£m
Own shares
£m
Total equity
£m
Total equity at the start of the year1 719 787 43 36 (3) 5,590 779 (42) 7,909Profit for the year – – – – – 21 193 – 214Exchange differences on translation of foreign operations – – – – 1 – – – 1Re-measurements of defined benefit plans – – – – – 38 – – 38Total comprehensive income for the year – – – – 1 59 193 – 253Share-based payments – – – 16 – – – – 16Release on exercise/forfeiture of share awards
–
–
–
(19)
–
–
19
–
–
Exercise of share awards – – – – – (23) – 23 –Ordinary dividends – – – – – (194) (169) – (363)Purchase of own shares – – – – – – – (59) (59)Issue of ordinary shares – 1 – – – – – – 1Total equity at the end of the year 719 788 43 33 (2) 5,432 822 (78) 7,757
1 The adoption of IFRS 16 on 1 April 2019 resulted in the recognition of a right of use asset of £23 million and lease liability of £23 million, with nil impact on retained earnings.2 Refer to Note 20 for the nature of the capital and revenue reserves.
The Notes to the accounts section forms an integral part of these financial statements.
Consolidated statement of changes in equityfor the year to 31 March
3i Group plc Annual report and accounts 2021Audited financial statements
128
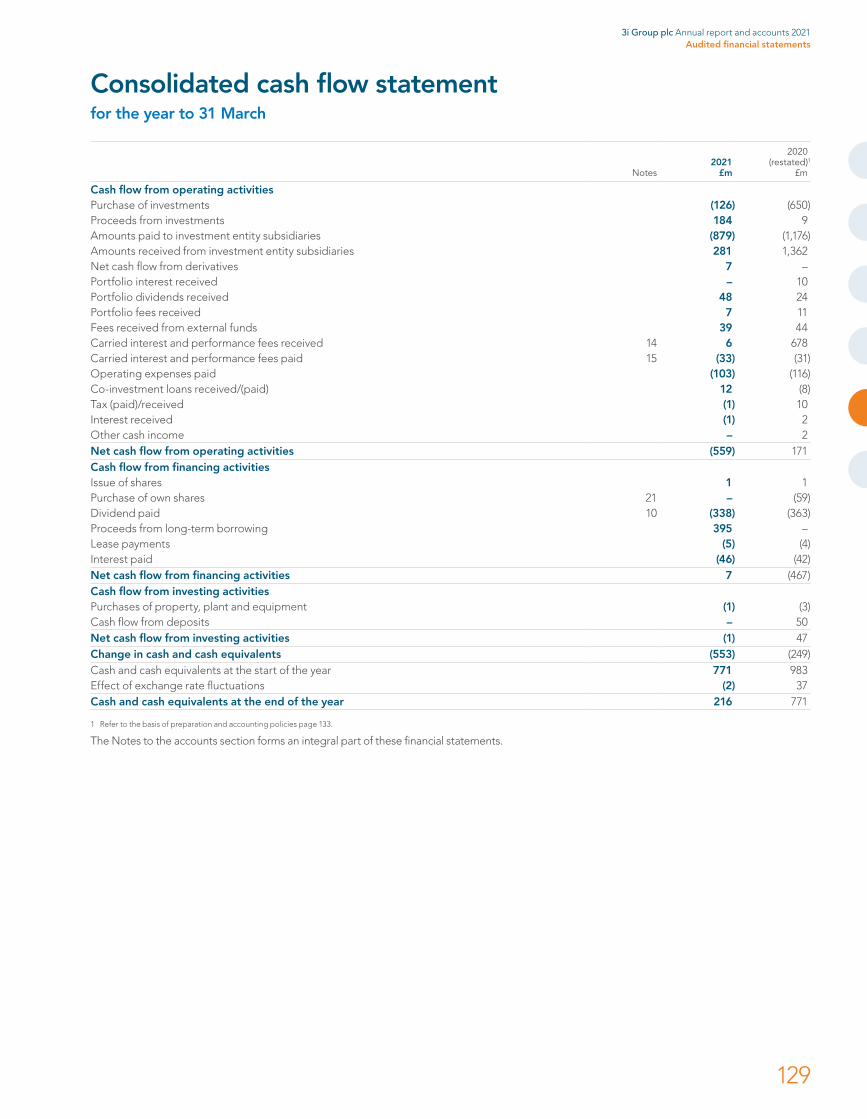
Notes2021
£m
2020 (restated)1
£m
Cash flow from operating activitiesPurchase of investments (126) (650)Proceeds from investments 184 9Amounts paid to investment entity subsidiaries (879) (1,176)Amounts received from investment entity subsidiaries 281 1,362Net cash flow from derivatives 7 –Portfolio interest received – 10Portfolio dividends received 48 24Portfolio fees received 7 11Fees received from external funds 39 44Carried interest and performance fees received 14 6 678Carried interest and performance fees paid 15 (33) (31)Operating expenses paid (103) (116)Co-investment loans received/(paid) 12 (8)Tax (paid)/received (1) 10Interest received (1) 2Other cash income – 2Net cash flow from operating activities (559) 171Cash flow from financing activitiesIssue of shares 1 1Purchase of own shares 21 – (59)Dividend paid 10 (338) (363)Proceeds from long-term borrowing 395 –Lease payments (5) (4)Interest paid (46) (42)Net cash flow from financing activities 7 (467)Cash flow from investing activitiesPurchases of property, plant and equipment (1) (3)Cash flow from deposits – 50Net cash flow from investing activities (1) 47Change in cash and cash equivalents (553) (249)Cash and cash equivalents at the start of the year 771 983Effect of exchange rate fluctuations (2) 37Cash and cash equivalents at the end of the year 216 771
1 Refer to the basis of preparation and accounting policies page 133.
The Notes to the accounts section forms an integral part of these financial statements.
Consolidated cash flow statement for the year to 31 March
3i Group plc Annual report and accounts 2021Audited financial statements
129
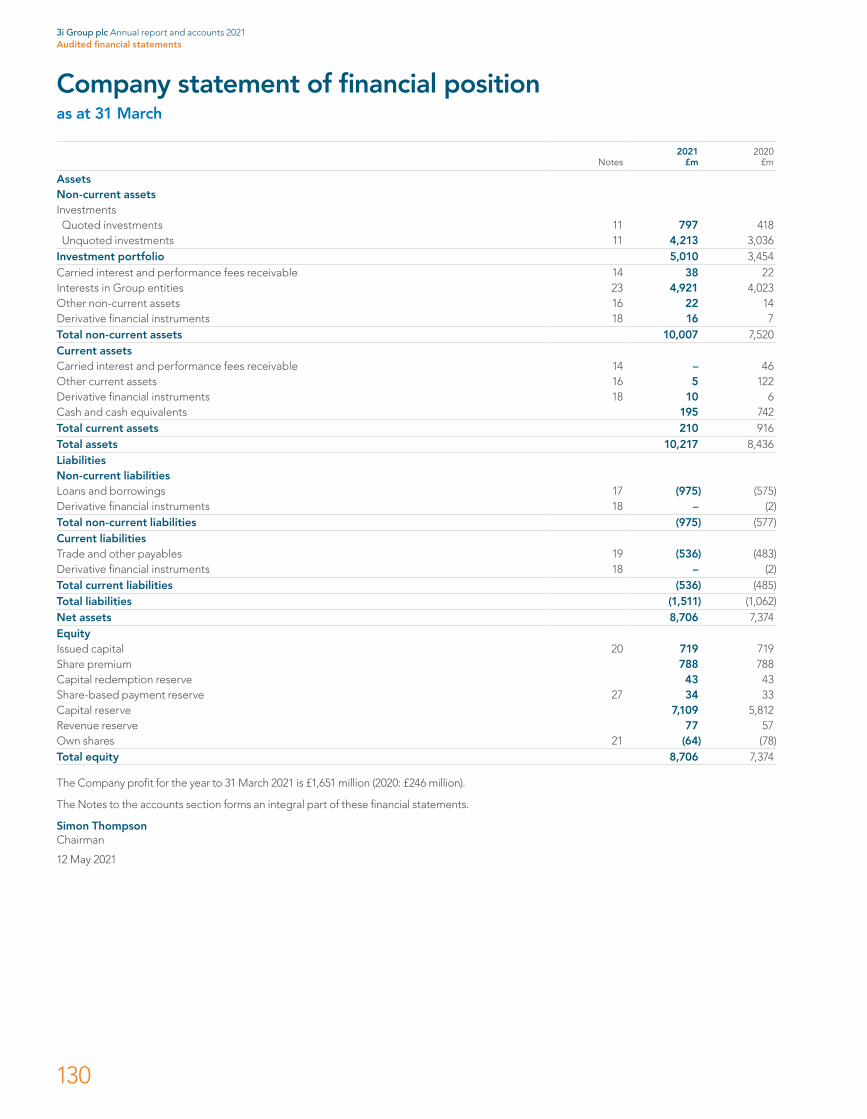
Notes2021
£m2020
£m
AssetsNon-current assetsInvestmentsQuoted investments 11 797 418Unquoted investments 11 4,213 3,036
Investment portfolio 5,010 3,454Carried interest and performance fees receivable 14 38 22Interests in Group entities 23 4,921 4,023Other non-current assets 16 22 14Derivative financial instruments 18 16 7Total non-current assets 10,007 7,520Current assetsCarried interest and performance fees receivable 14 – 46Other current assets 16 5 122Derivative financial instruments 18 10 6Cash and cash equivalents 195 742Total current assets 210 916Total assets 10,217 8,436LiabilitiesNon-current liabilitiesLoans and borrowings 17 (975) (575)Derivative financial instruments 18 – (2)Total non-current liabilities (975) (577)Current liabilitiesTrade and other payables 19 (536) (483)Derivative financial instruments 18 – (2)Total current liabilities (536) (485)Total liabilities (1,511) (1,062)Net assets 8,706 7,374EquityIssued capital 20 719 719Share premium 788 788Capital redemption reserve 43 43Share-based payment reserve 27 34 33Capital reserve 7,109 5,812Revenue reserve 77 57Own shares 21 (64) (78)Total equity 8,706 7,374
The Company profit for the year to 31 March 2021 is £1,651 million (2020: £246 million).
The Notes to the accounts section forms an integral part of these financial statements.
Simon ThompsonChairman
12 May 2021
Company statement of financial positionas at 31 March
3i Group plc Annual report and accounts 2021Audited financial statements
130
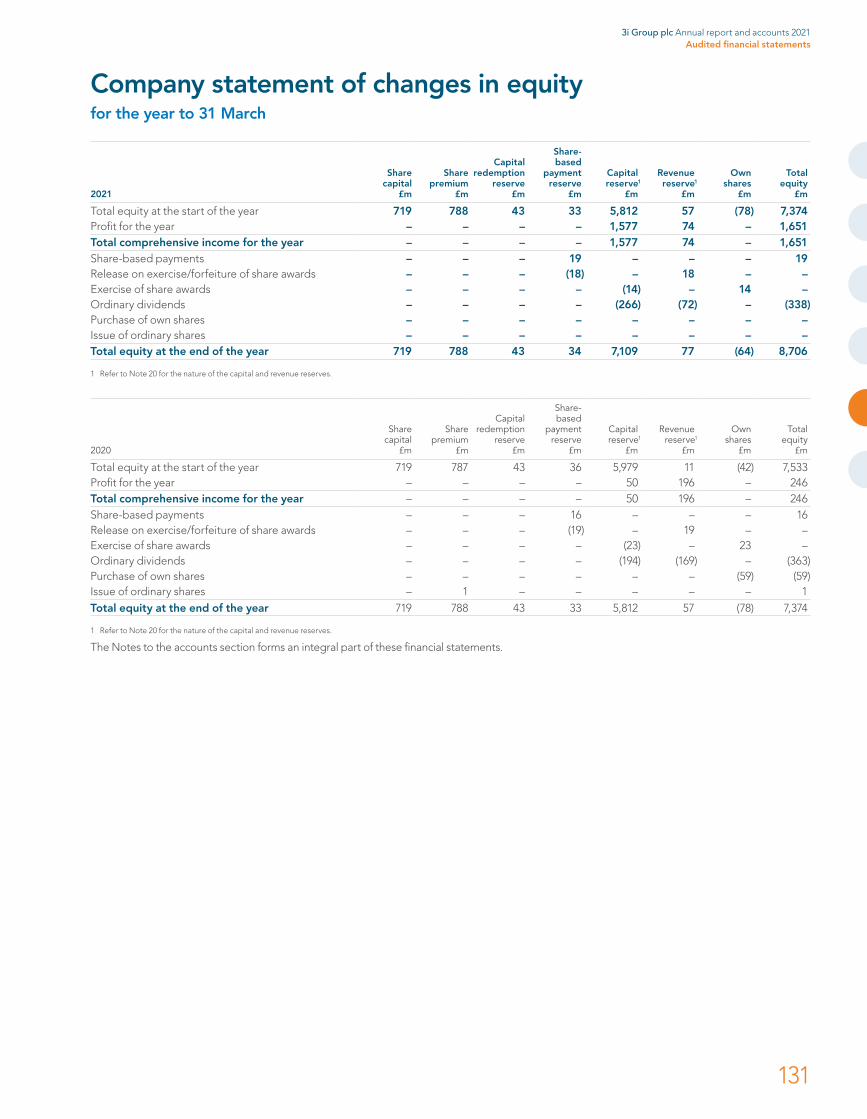
2021
Share capital
£m
Share premium
£m
Capital redemption
reserve £m
Share- based
payment reserve
£m
Capitalreserve1
£m
Revenuereserve1
£m
Own shares
£m
Total equity
£m
Total equity at the start of the year 719 788 43 33 5,812 57 (78) 7,374Profit for the year – – – – 1,577 74 – 1,651Total comprehensive income for the year – – – – 1,577 74 – 1,651Share-based payments – – – 19 – – – 19Release on exercise/forfeiture of share awards – – – (18) – 18 – –Exercise of share awards – – – – (14) – 14 –Ordinary dividends – – – – (266) (72) – (338)Purchase of own shares – – – – – – – –Issue of ordinary shares – – – – – – – –Total equity at the end of the year 719 788 43 34 7,109 77 (64) 8,706
1 Refer to Note 20 for the nature of the capital and revenue reserves.
2020
Share capital
£m
Share premium
£m
Capital redemption
reserve £m
Share- based
payment reserve
£m
Capitalreserve1
£m
Revenuereserve1
£m
Own shares
£m
Total equity
£m
Total equity at the start of the year 719 787 43 36 5,979 11 (42) 7,533Profit for the year – – – – 50 196 – 246Total comprehensive income for the year – – – – 50 196 – 246Share-based payments – – – 16 – – – 16Release on exercise/forfeiture of share awards – – – (19) – 19 – –Exercise of share awards – – – – (23) – 23 –Ordinary dividends – – – – (194) (169) – (363)Purchase of own shares – – – – – – (59) (59)Issue of ordinary shares – 1 – – – – – 1Total equity at the end of the year 719 788 43 33 5,812 57 (78) 7,374
1 Refer to Note 20 for the nature of the capital and revenue reserves.
The Notes to the accounts section forms an integral part of these financial statements.
Company statement of changes in equity for the year to 31 March
3i Group plc Annual report and accounts 2021Audited financial statements
131
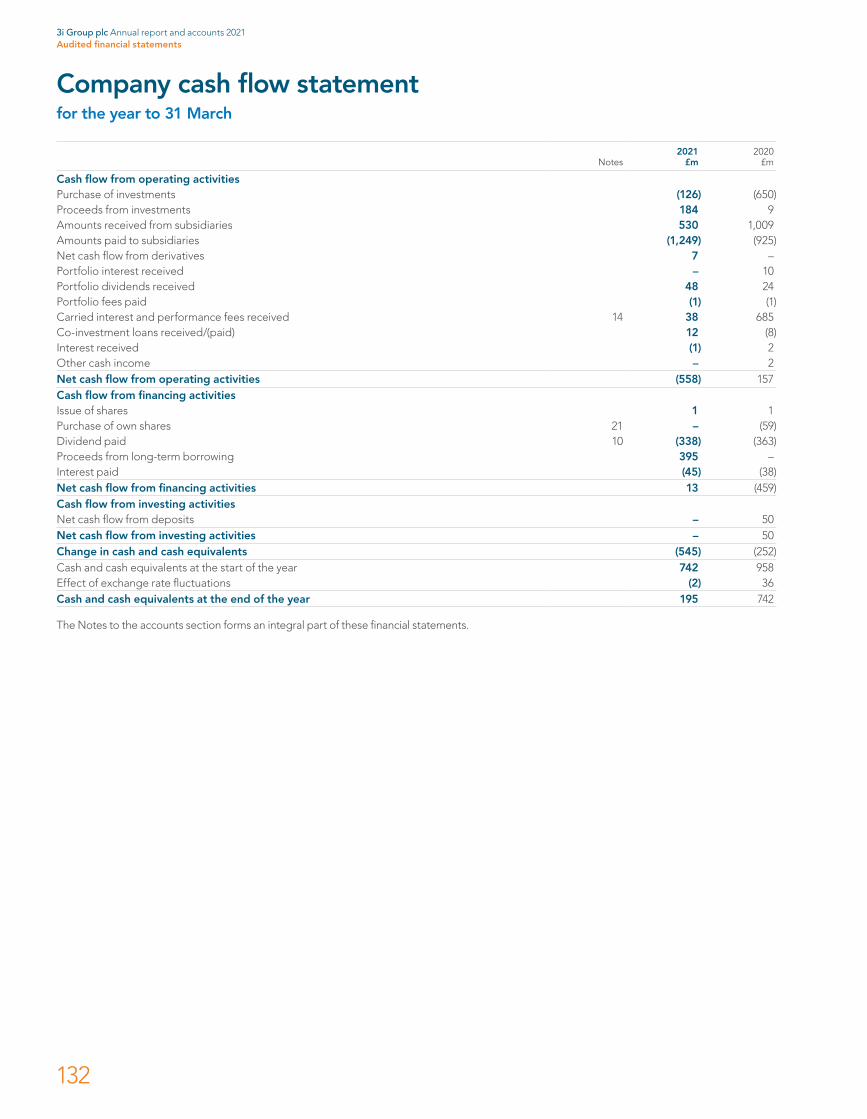
Notes2021
£m2020
£m
Cash flow from operating activitiesPurchase of investments (126) (650)Proceeds from investments 184 9Amounts received from subsidiaries 530 1,009Amounts paid to subsidiaries (1,249) (925)Net cash flow from derivatives 7 –Portfolio interest received – 10Portfolio dividends received 48 24Portfolio fees paid (1) (1)Carried interest and performance fees received 14 38 685Co-investment loans received/(paid) 12 (8)Interest received (1) 2Other cash income – 2Net cash flow from operating activities (558) 157Cash flow from financing activitiesIssue of shares 1 1Purchase of own shares 21 – (59)Dividend paid 10 (338) (363)Proceeds from long-term borrowing 395 –Interest paid (45) (38)Net cash flow from financing activities 13 (459)Cash flow from investing activitiesNet cash flow from deposits – 50Net cash flow from investing activities – 50Change in cash and cash equivalents (545) (252)Cash and cash equivalents at the start of the year 742 958Effect of exchange rate fluctuations (2) 36Cash and cash equivalents at the end of the year 195 742
The Notes to the accounts section forms an integral part of these financial statements.
Company cash flow statementfor the year to 31 March
3i Group plc Annual report and accounts 2021Audited financial statements
132
Reporting entity3i Group plc (the “Company”) is a public limited company incorporated and domiciled in England and Wales. The consolidated financial statements (“the Group accounts”) for the year to 31 March 2021 comprise the financial statements of the Company and its consolidated subsidiaries (collectively, “the Group”).
The Group accounts have been prepared and approved by the Directors in accordance with section 395 of the Companies Act 2006 and the Large and Medium-Sized Companies and Groups (Accounts and Reports) Regulations 2008. The Company has taken advantage of the exemption in section 408 of the Companies Act 2006 not to present its Company statement of comprehensive income and related Notes.
A Basis of preparationThe Group and Company accounts have been prepared and approved by the Directors in accordance with international accounting standards in conformity with the requirements of the Companies Act 2006 and in accordance with international financial reporting standards adopted pursuant to Regulation (EC) No 1606/2002 as it applies in the European Union. The financial statements are presented to the nearest million sterling (£m), the functional currency of the Company.
The Group did not implement the requirements of any other standards or interpretations that were in issue; these were not required to be adopted by the Group for the year ended 31 March 2021. No other standards or interpretations have been issued that are expected to have a material impact on the Group’s financial statements.
The Group adopts the direct method for the cash flow statements, which requires major classes of gross cash receipts and gross cash payments to be disclosed separately. As such, the Group has changed the consolidated cash flow statement to present net cash flows from investment entity subsidiaries on a gross basis in two line items: Amounts paid to investment entity subsidiaries and Amounts received from investment entity subsidiaries. Comparatives for the year to 31 March 2020 have been restated.
The principal accounting policies applied in the preparation of the Group accounts are disclosed below, but where possible, they have been shown as part of the Note to which they specifically relate in order to assist the reader’s understanding. These policies have been consistently applied and apply to all years presented, except for in relation to the adoption of new accounting standards.
Going concernThese financial statements have been prepared on a going concern basis as disclosed in the Directors’ report. The Directors have made an assessment of going concern for a period of at least 12 months from the date of approval of the accounts, taking into account the Group’s current performance, financial position and the principal and emerging risks facing the business, including the impact of Covid-19 on global markets and potential implications for the Group’s financial performance.
The Group, its investments and its critical functions have been operating well throughout the financial year against a backdrop of the pandemic, and the challenges posed by the various government-imposed lockdowns and restrictions implemented in response. As discussed in detail in the Strategic report (see pages 1 to 79), the majority of the portfolio has been resilient, with those portfolio companies operating in the consumer, e-commerce, healthcare and business services sectors continuing to deliver very strong performances. The assets exposed to travel and automotive sectors continue to be more negatively impacted by the pandemic. As we enter the next financial year, our portfolio of assets should be well positioned to continue to generate good returns for shareholders.
With the experience of FY2021 at a portfolio and operational level, the Directors considered the impact of the current Covid-19 environment on the business for at least the next 12 months. Underpinning the Group’s business model is its proprietary capital. This enables the Group to operate without third-party obligations regarding the timing of realisations and deployment of capital. The Group covers its cash operating costs, £108 million at 31 March 2021, with cash income generated by our Infrastructure business and some income from our Private Equity portfolio and Scandlines, £131 million at 31 March 2021. The Directors’ assessment of going concern, which takes into account this business model and the Group’s existing liquidity of £725 million, indicates that the Group and parent company will have sufficient funds to continue as a going concern, for at least the next 12 months. Liquidity comprised of cash and deposits of £225 million (31 March 2020: £845 million) and undrawn facilities of £500 million (31 March 2020: £400 million). During the year the Group successfully issued a £400 million bond with a maturity date of 2040. The Group also increased its RCF to £500 million and extended the maturity to 2026. The Group manages liquidity with the aim of ensuring it is adequate and sufficient, by regular monitoring of investments, realisations, operating expenses and portfolio cash income.
Significant accounting policies
3i Group plc Annual report and accounts 2021Audited financial statements
133

Significant accounting policies continued
In addition, the Directors have modelled a number of severe stress test scenarios, including the consideration of the potential impact of continued Covid-19 restrictions and the anticipated recovery profile for each portfolio company, as well as the impact of a significant downturn event specifically on the Group’s largest asset, Action. These scenarios include a range of estimated impacts, primarily based on providing additional support to portfolio companies as a result of the downturn and delaying the Group’s ability to realise and make new investments. The scenarios are most sensitive to a delay in realisations which contribute to liquidity of the Group. A key judgement applied is the extent of a continued Covid-19 related impact on trading activity and restrictions alongside the likely recovery profile of portfolio companies. The severe scenarios include assumptions modelling a “K-shaped” recovery (which sees a greater divergence in the recovery profile of assets in different sectors) and a “U-shaped” recovery (which considers a more extended and drawn-out recovery in which the economy is impacted by rolling lockdowns and much reduced economic activity).
The results of each of the stress test scenarios indicate that the Group is able to meet its obligations as they fall due for a period of at least 12 months from the date of approval of these financial statements by, in certain cases, making use of controllable management actions. In all these scenarios the Directors expect the Group to be able to recover without a permanent long-term impact on its solvency or capital requirements. Mitigating actions within management control include reduced new investment levels and drawing on the existing RCF.
Having performed the assessment on going concern, the Directors considered it appropriate to prepare the financial statements of the Company and Group on a going concern basis, and have concluded that the Group has sufficient financial resources, is well placed to manage business risks in the current economic environment, and can continue operations for a period of at least 12 months from the date of issue of these financial statements.
B Basis of consolidationIn accordance with IFRS 10 the Company meets the criteria as an investment entity and therefore is required to recognise subsidiaries that also qualify as investment entities at fair value through profit or loss. It does not consolidate the investment entities it controls. Subsidiaries that provide investment related services, such as advisory, management or employment services, are not accounted for at fair value through profit and loss and continue to be consolidated unless those subsidiaries qualify as investment entities, in which case they are recognised at fair value. Subsidiaries are entities controlled by the Group. Control, as defined by IFRS 10, is achieved when the Group has all of the following:
• power over the relevant activities of the investee;
• exposure, or rights, to variable returns from its involvement with the investee; and
• the ability to affect those returns through its power over the investee.
The Group is required to determine the degree of control or influence the Group exercises and the form of any control to ensure that the financial treatment is accurate.
Subsidiaries are fully consolidated from the date on which the Group effectively obtains control. All intragroup balances and transactions with subsidiaries are eliminated upon consolidation. Subsidiaries are de-consolidated from the date that control ceases.
The Group comprises several different types of subsidiaries. For a new subsidiary, the Group assesses whether it qualifies as an investment entity under IFRS 10, based on the function the entity performs within the Group. For existing subsidiaries, the Group annually reassesses the function performed by each type of subsidiary to determine if the treatment under IFRS 10 exception from consolidation is still appropriate. The types of subsidiaries and their treatment under IFRS 10 are as follows:
General Partners (“GPs”) – ConsolidatedGeneral Partners provide investment management services and do not hold any direct investments in portfolio assets. These entities are not investment entities.
Investment managers/advisers – ConsolidatedThese entities provide investment related services through the provision of investment management or advice. They do not hold any direct investments in portfolio assets. These entities are not investment entities.
Holding companies of investment managers/advisers – ConsolidatedThese entities provide investment related services through their subsidiaries. Typically they do not hold any direct investment in portfolio assets and these entities are not investment entities.
3i Group plc Annual report and accounts 2021Audited financial statements
134
Limited Partnerships and other intermediate investment holding structures – Fair valuedThe Group makes investments in portfolio assets through its ultimate parent company as well as through other limited partnerships and corporate subsidiaries which the Group has created to align the interests of the investment teams with the performance of the assets through the use of various carried interest schemes. The purpose of these limited partnerships and corporate holding vehicles, many of which also provide investment related services, is to invest for investment income and capital appreciation. These partnerships and corporate subsidiaries meet the definition of an investment entity and are accounted for at fair value through profit and loss.
Portfolio investments – Fair valuedUnder IFRS 10, the test for accounting subsidiaries takes wider factors of control as well as actual equity ownership into account. In accordance with the investment entity exception, these entities have been held at fair value with movements in fair value being recognised in profit or loss.
Associates – Fair valuedAssociates are those entities in which the Group has significant influence, but not control, over the financial and operating policies. Investments that are held as part of the Group’s investment portfolio are carried in the Consolidated statement of financial position at fair value even though the Group may have significant influence over those companies.
Further detail on our application of IFRS 10 can be found in the Reconciliation of Investment basis to IFRS section.
C Critical accounting judgements and estimatesThe reported results of the Group are sensitive to the accounting policies, assumptions and estimates that underpin the preparation of its financial statements. UK company law and IFRS require the Directors, in preparing the Group’s financial statements, to select suitable accounting policies, apply them consistently and make judgements and estimates that are reasonable and prudent. The Group’s estimates and assumptions are based on historical experience and expectation of future events and are reviewed periodically. The actual outcome may be materially different from that anticipated.
(a) Critical judgementsIn the course of preparing the financial statements, one judgement has been made in the process of applying the Group’s accounting policies, other than those involving estimations, that has had a significant effect on the amounts recognised in the financial statements as follows:
I. Assessment as an investment entityThe Board has concluded that the Company continues to meet the definition of an investment entity, as its strategic objective of investing in portfolio investments and providing investment management services to investors for the purpose of generating returns in the form of investment income and capital appreciation remains unchanged.
(b) Critical estimatesIn addition to these significant judgements the Directors have made two estimates, which they deem to have a significant risk of resulting in a material adjustment to the amounts recognised in the financial statements within the next financial year. The details of these estimates are as follows:
I. Fair valuation of the investment portfolioThe investment portfolio, a material asset of the Group, is held at fair value. Details of valuation methodologies used and the associated sensitivities are disclosed in Note 13 Fair values of assets and liabilities. Further information can be found in Portfolio valuation – an explanation on pages 188 and 189. Given the importance of this area, the Board has a separate Valuations Committee to review the valuations policies, process and application to individual investments. A report on the activities of the Valuations Committee (including a review of the assumptions made) is included in the Valuations Committee Report on pages 103 and 106.
II. Carried interest payableCarried interest payable is calculated based on the underlying agreements, and assuming all portfolio investments are sold at their fair values at the balance sheet date. The actual amounts of carried interest paid will depend on the cash realisations of these portfolio investments and valuations may change significantly in the next financial year. The fair valuation of the investment portfolio is itself a critical estimate, as detailed above. The sensitivity of carried interest payable to movements in the investment portfolio is disclosed in Note 15.
3i Group plc Annual report and accounts 2021Audited financial statements
135
D Other accounting policies(a) Gross investment returnGross investment return is equivalent to “revenue” for the purposes of IAS 1. It represents the overall increase in net assets from the investment portfolio net of deal-related costs and includes foreign exchange movements in respect of the investment portfolio. The substantial majority is investment income and outside the scope of IFRS 15. It is analysed into the following components with the relevant standard shown where appropriate:
i. Realised profits or losses over value on the disposal of investments are the difference between the fair value of the consideration received in accordance with IFRS 13 less any directly attributable costs, on the sale of equity and the repayment of interest income from the investment portfolio, and its carrying value at the start of the accounting period, converted into sterling using the exchange rates in force at the date of disposal.
ii. Unrealised profits or losses on the revaluation of investments are the movement in the fair value of investments in accordance with IFRS 13 between the start and end of the accounting period converted into sterling using the exchange rates in force at the date of fair value assessment.
iii. Fair value movements on investment entity subsidiaries are the movements in the fair value of Group subsidiaries which are classified as investment entities under IFRS 10. The Group makes investments in portfolio assets through these entities which are usually limited partnerships or corporate subsidiaries.
iv. Portfolio income is that portion of income that is directly related to the return from individual investments. It is recognised to the extent that it is probable that there will be economic benefit and the income can be reliably measured. The following specific recognition criteria must be met before the income is recognised:
• Dividends from equity investments are recognised in profit or loss when the shareholders’ rights to receive payment have been established.
• Interest income from the investment portfolio is recognised as it accrues. When the fair value of an investment is assessed to be below the principal value of a loan, the Group recognises a provision against any interest accrued from the date of the assessment going forward until the investment is assessed to have recovered in value.
• The accounting policy for fee income is included in Note 4.
v. Foreign exchange on investments arises on investments made in currencies that are different from the functional currency of the Company being sterling. Investments are translated at the exchange rate ruling at the date of the transaction in accordance with IAS 21. At each subsequent reporting date, investments are translated to sterling at the exchange rate ruling at that date.
vi. Movement in the fair value of derivatives relates to the change in fair value of forward foreign exchange contracts which have been used to minimise foreign currency risk in the investment portfolio. See Note 18 for more details.
(b) Foreign currency translationFor the Company and those subsidiaries whose balance sheets are denominated in sterling, which is the Company’s functional and presentational currency, monetary assets and liabilities and non-monetary assets held at fair value denominated in foreign currencies are translated into sterling at the closing rates of exchange at the balance sheet date. Foreign currency transactions are translated into sterling at the average rates of exchange over the year and exchange differences arising are taken to profit or loss.
The statements of financial position of subsidiaries and associates, which are not held at fair value, denominated in foreign currencies are translated into sterling at the closing rates. The statements of comprehensive income for these subsidiaries and associates are translated at the average rates and exchange differences arising are taken to other comprehensive income. Such exchange differences are reclassified to profit or loss in the period in which the subsidiary or associate is disposed of.
(c) Treasury assets and liabilitiesShort-term treasury assets, and short and long-term treasury liabilities are used in order to manage cash flows.
Cash and cash equivalents comprise cash at bank and amounts held in money market funds which are readily convertible into cash and there is an insignificant risk of changes in value. Financial assets and liabilities are recognised in the balance sheet when the relevant Group entity becomes a party to the contractual provisions of the instrument. De-recognition occurs when rights to cash flows from a financial asset expire, or when a liability is extinguished.
Significant accounting policies continued
3i Group plc Annual report and accounts 2021Audited financial statements
136

1 Segmental analysisOperating segments are the components of the Group whose results are regularly reviewed by the Group’s chief operating decision maker to make decisions about resources to be allocated to the segment and assess its performance.
The Chief Executive, who is considered to be the chief operating decision maker, managed the Group on the basis of business divisions determined with reference to market focus, geographic focus, investment funding model and the Group’s management hierarchy. A description of the activities, including returns generated by these divisions and the allocation of resources, is given in the Strategic report. For the geographical segmental split, revenue information is based on the locations of the assets held. To aid the readers’ understanding we have split out Action, Private Equity’s largest asset, into a separate column. Action is not regarded as a reported segment as the chief operating decision maker reviews performance, makes decisions and allocates resources to the Private Equity segment, which includes Action.
The segmental information that follows is presented on the basis used by the Chief Executive to monitor the performance of the Group. The reported segments are Private Equity, Infrastructure and Scandlines.
The segmental analysis is prepared on the Investment basis. The Investment basis is an APM and we believe it provides a more understandable view of performance. For more information on the Investment basis and a reconciliation between the Investment basis and IFRS see pages 45 to 48.
Investment basis Year to 31 March 2021
Private Equity
£m
Of which Action
£m
Infrastructure
£mScandlines
£mTotal4
£m
Realised profits over value on the disposal of investments 29 – 6 – 35Unrealised profits on the revaluation of investments 2,161 1,202 168 22 2,351Portfolio incomeDividends 53 – 29 – 82Interest income from investment portfolio 55 – 10 – 65Fees receivable 9 1 – – 9
Foreign exchange on investments (371) (181) (39) (17) (427)Movement in the fair value of derivatives – – 4 20 24Gross investment return 1,936 1,022 178 25 2,139Fees receivable from external funds 4 – 40 – 44Operating expenses (70) – (40) (2) (112)Interest received (1)Interest paid (47)Exchange movements 7Other income 1Operating profit before carried interest 2,031Carried interestCarried interest and performance fees receivable (3) – 8 – 5Carried interest and performance fees payable (173) – (11) – (184)
Operating profit before tax 1,852Tax charge –Profit for the year 1,852Other comprehensive expenseRe-measurements of defined benefit plans (126)
Total return 1,726Realisations1 114 – 104 – 218Cash investment2 (508) (9) (2) – (510)Net (investment)/divestment (394) (9) 102 – (292)Balance sheetOpening portfolio value at 1 April 2020 6,552 3,536 1,117 429 8,098Investment3 633 9 2 – 635Value disposed (85) – (98) – (183)Unrealised value movement 2,161 1,202 168 22 2,351Other movement (including foreign exchange) (447) (181) (30) (16) (493)Closing portfolio value at 31 March 2021 8,814 4,566 1,159 435 10,408
1 Realised proceeds may differ from cash proceeds due to timing of cash receipts. During the year Private Equity received £105 million of cash proceeds which were recognised as realised proceeds in FY2020 and recognised £4 million of realised proceeds in Private Equity which are to be received in FY2022.
2 Cash investment per the segmental analysis is different to cash investment per the cash flow due to £31 million of syndication in Private Equity which was recognised in FY2020 and received in FY2021. 3 Includes capitalised interest and other non-cash investment.4 The total is the sum of Private Equity, Infrastructure and Scandlines, “Of which Action” is part of Private Equity.
A number of items are not managed by segment by the chief operating decision maker and therefore have not been allocated to a specific segment.
Notes to the accounts
3i Group plc Annual report and accounts 2021Audited financial statements
137
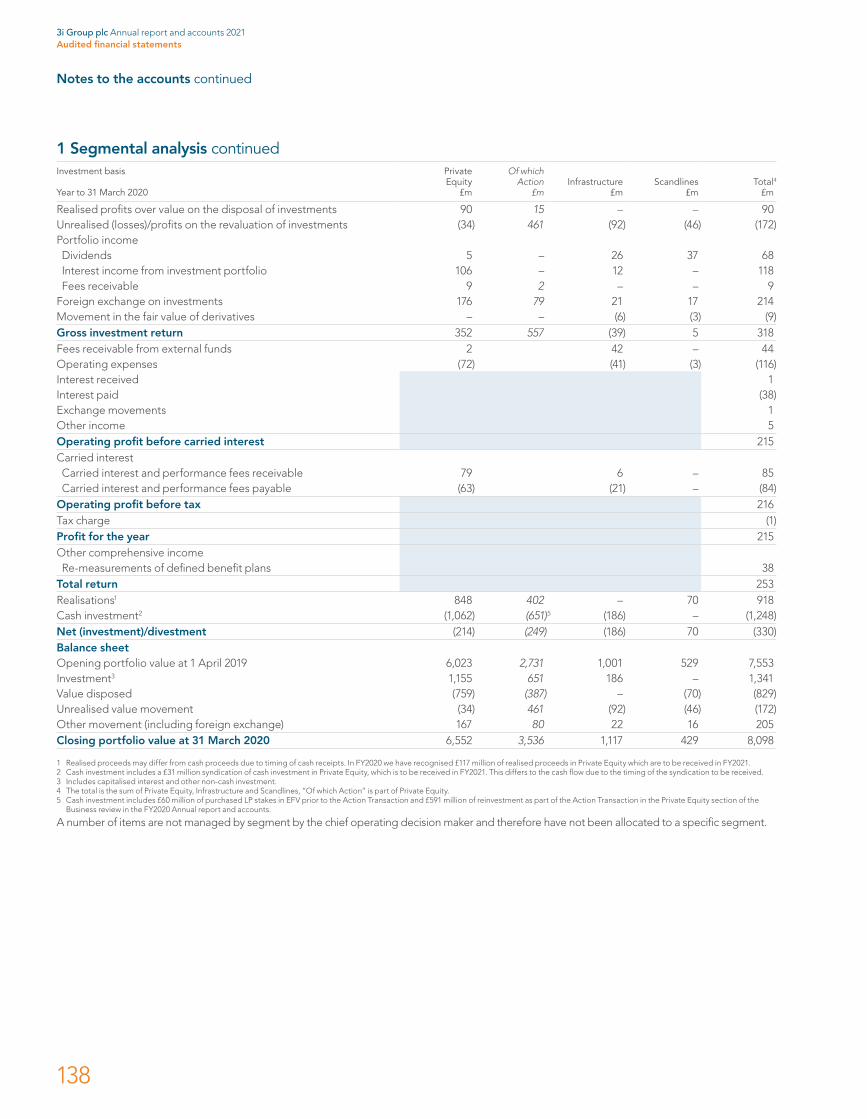
Notes to the accounts continued
1 Segmental analysis continuedInvestment basis Year to 31 March 2020
Private Equity
£m
Of which Action
£m
Infrastructure
£mScandlines
£mTotal4
£m
Realised profits over value on the disposal of investments 90 15 – – 90Unrealised (losses)/profits on the revaluation of investments (34) 461 (92) (46) (172)Portfolio incomeDividends 5 – 26 37 68Interest income from investment portfolio 106 – 12 – 118Fees receivable 9 2 – – 9
Foreign exchange on investments 176 79 21 17 214Movement in the fair value of derivatives – – (6) (3) (9)Gross investment return 352 557 (39) 5 318Fees receivable from external funds 2 42 – 44Operating expenses (72) (41) (3) (116)Interest received 1Interest paid (38)Exchange movements 1Other income 5Operating profit before carried interest 215Carried interestCarried interest and performance fees receivable 79 6 – 85Carried interest and performance fees payable (63) (21) – (84)
Operating profit before tax 216Tax charge (1)Profit for the year 215Other comprehensive incomeRe-measurements of defined benefit plans 38
Total return 253Realisations1 848 402 – 70 918Cash investment2 (1,062) (651)5 (186) – (1,248)Net (investment)/divestment (214) (249) (186) 70 (330)Balance sheetOpening portfolio value at 1 April 2019 6,023 2,731 1,001 529 7,553Investment3 1,155 651 186 – 1,341Value disposed (759) (387) – (70) (829)Unrealised value movement (34) 461 (92) (46) (172)Other movement (including foreign exchange) 167 80 22 16 205Closing portfolio value at 31 March 2020 6,552 3,536 1,117 429 8,098
1 Realised proceeds may differ from cash proceeds due to timing of cash receipts. In FY2020 we have recognised £117 million of realised proceeds in Private Equity which are to be received in FY2021.2 Cash investment includes a £31 million syndication of cash investment in Private Equity, which is to be received in FY2021. This differs to the cash flow due to the timing of the syndication to be received. 3 Includes capitalised interest and other non-cash investment.4 The total is the sum of Private Equity, Infrastructure and Scandlines, “Of which Action” is part of Private Equity.5 Cash investment includes £60 million of purchased LP stakes in EFV prior to the Action Transaction and £591 million of reinvestment as part of the Action Transaction in the Private Equity section of the
Business review in the FY2020 Annual report and accounts.
A number of items are not managed by segment by the chief operating decision maker and therefore have not been allocated to a specific segment.
3i Group plc Annual report and accounts 2021Audited financial statements
138
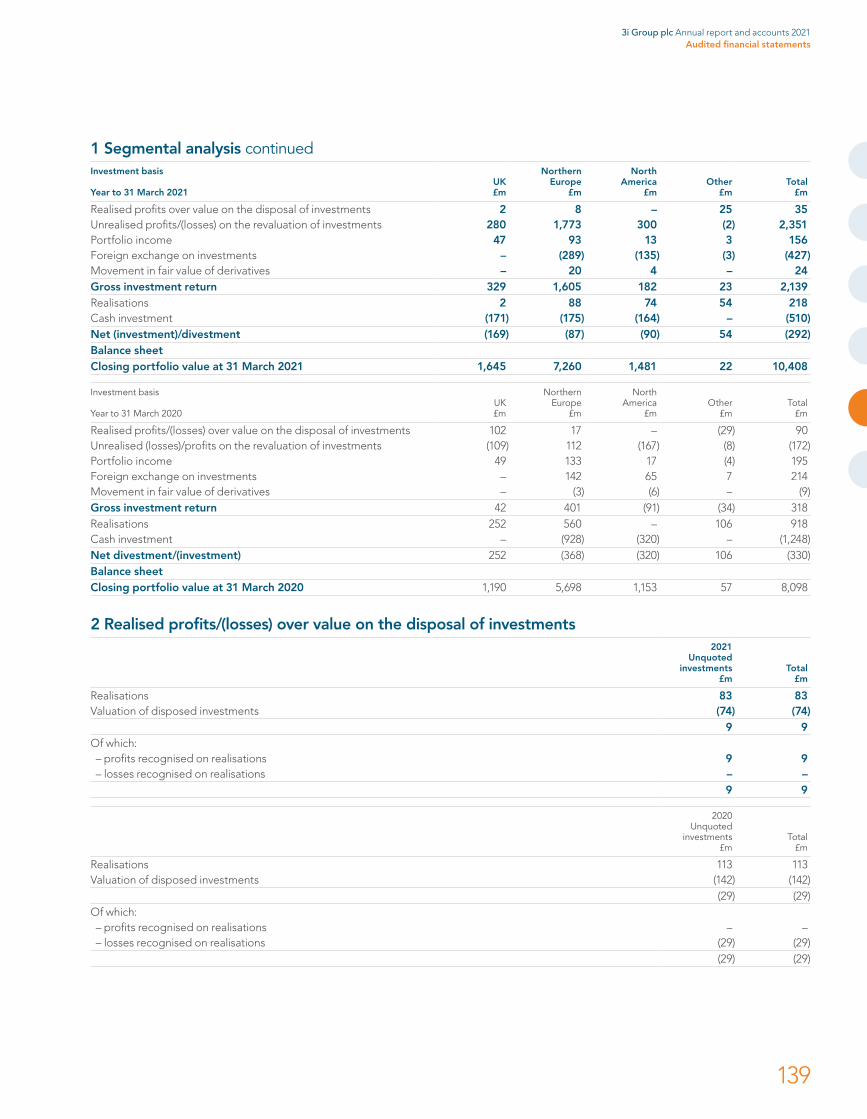
1 Segmental analysis continuedInvestment basis Year to 31 March 2021
UK £m
Northern Europe
£m
North America
£m
Other
£m
Total
£m
Realised profits over value on the disposal of investments 2 8 – 25 35Unrealised profits/(losses) on the revaluation of investments 280 1,773 300 (2) 2,351Portfolio income 47 93 13 3 156Foreign exchange on investments – (289) (135) (3) (427)Movement in fair value of derivatives – 20 4 – 24Gross investment return 329 1,605 182 23 2,139Realisations 2 88 74 54 218Cash investment (171) (175) (164) – (510)Net (investment)/divestment (169) (87) (90) 54 (292)Balance sheetClosing portfolio value at 31 March 2021 1,645 7,260 1,481 22 10,408
Investment basis Year to 31 March 2020
UK £m
Northern Europe
£m
North America
£m
Other
£m
Total
£m
Realised profits/(losses) over value on the disposal of investments 102 17 – (29) 90Unrealised (losses)/profits on the revaluation of investments (109) 112 (167) (8) (172)Portfolio income 49 133 17 (4) 195Foreign exchange on investments – 142 65 7 214Movement in fair value of derivatives – (3) (6) – (9)Gross investment return 42 401 (91) (34) 318Realisations 252 560 – 106 918Cash investment – (928) (320) – (1,248)Net divestment/(investment) 252 (368) (320) 106 (330)Balance sheetClosing portfolio value at 31 March 2020 1,190 5,698 1,153 57 8,098
2 Realised profits/(losses) over value on the disposal of investments 2021
Unquoted investments
£mTotal
£m
Realisations 83 83Valuation of disposed investments (74) (74)
9 9Of which: – profits recognised on realisations 9 9– losses recognised on realisations – –
9 9
2020Unquoted
investments£m
Total£m
Realisations 113 113Valuation of disposed investments (142) (142)
(29) (29)Of which: – profits recognised on realisations – –– losses recognised on realisations (29) (29)
(29) (29)
3i Group plc Annual report and accounts 2021Audited financial statements
139
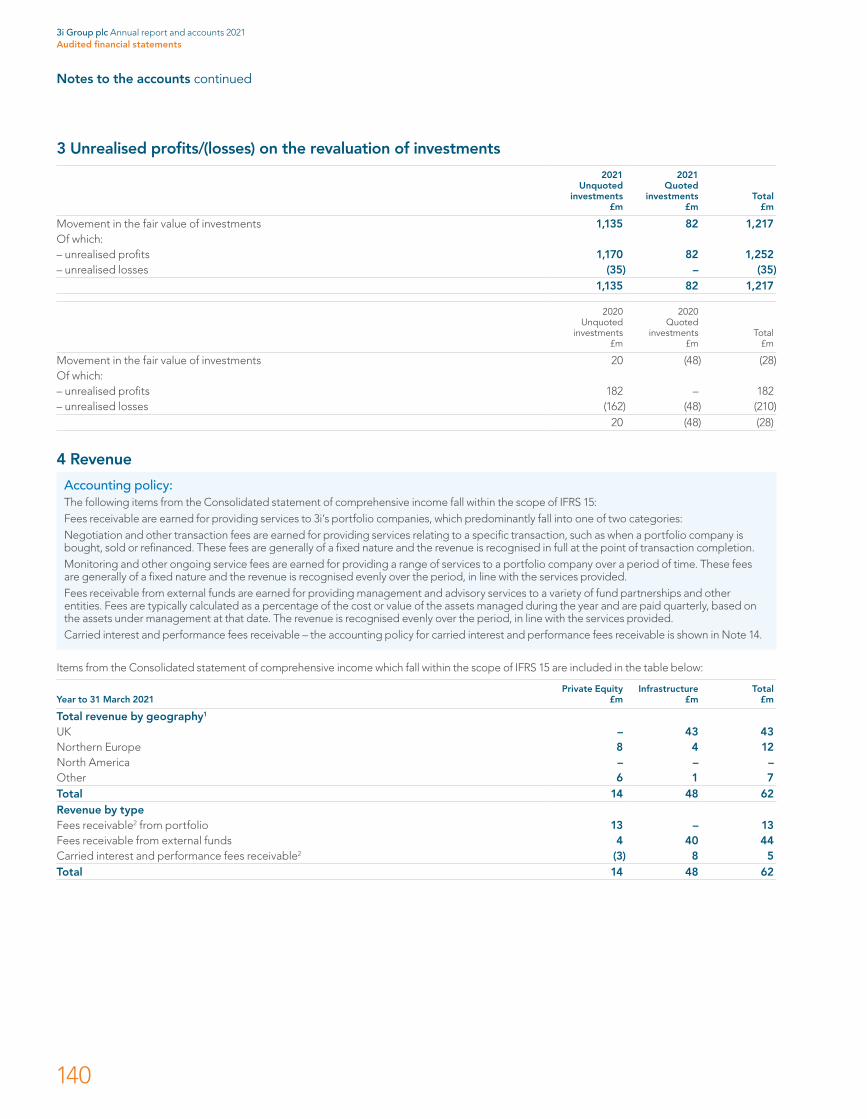
Notes to the accounts continued
3 Unrealised profits/(losses) on the revaluation of investments
2021Unquoted
investments£m
2021Quoted
investments£m
Total£m
Movement in the fair value of investments 1,135 82 1,217Of which: – unrealised profits 1,170 82 1,252– unrealised losses (35) – (35)
1,135 82 1,217
2020 Unquoted
investments£m
2020Quoted
investments£m
Total£m
Movement in the fair value of investments 20 (48) (28)Of which: – unrealised profits 182 – 182– unrealised losses (162) (48) (210)
20 (48) (28)
4 Revenue
Accounting policy:The following items from the Consolidated statement of comprehensive income fall within the scope of IFRS 15:Fees receivable are earned for providing services to 3i’s portfolio companies, which predominantly fall into one of two categories:Negotiation and other transaction fees are earned for providing services relating to a specific transaction, such as when a portfolio company is bought, sold or refinanced. These fees are generally of a fixed nature and the revenue is recognised in full at the point of transaction completion.Monitoring and other ongoing service fees are earned for providing a range of services to a portfolio company over a period of time. These fees are generally of a fixed nature and the revenue is recognised evenly over the period, in line with the services provided.Fees receivable from external funds are earned for providing management and advisory services to a variety of fund partnerships and other entities. Fees are typically calculated as a percentage of the cost or value of the assets managed during the year and are paid quarterly, based on the assets under management at that date. The revenue is recognised evenly over the period, in line with the services provided.Carried interest and performance fees receivable – the accounting policy for carried interest and performance fees receivable is shown in Note 14.
Items from the Consolidated statement of comprehensive income which fall within the scope of IFRS 15 are included in the table below:
Year to 31 March 2021Private Equity
£mInfrastructure
£mTotal
£m
Total revenue by geography1
UK – 43 43Northern Europe 8 4 12North America – – –Other 6 1 7Total 14 48 62Revenue by typeFees receivable2 from portfolio 13 – 13Fees receivable from external funds 4 40 44Carried interest and performance fees receivable2 (3) 8 5Total 14 48 62
3i Group plc Annual report and accounts 2021Audited financial statements
140

4 Revenue continued
Year to 31 March 2020Private Equity
£mInfrastructure
£mTotal
£m
Total revenue by geography1
UK 63 44 107Northern Europe 9 3 12North America 5 – 5Other (3) 1 (2)Total 74 48 122Revenue by typeFees receivable2 from portfolio 11 – 11Fees receivable from external funds 2 42 44Carried interest and performance fees receivable2 61 6 67Total 74 48 122
1 For fees receivable from external funds and carried interest and performance fees receivable the geography is based on the domicile of the fund.2 Fees receivable and carried interest receivable above are different to the Investment basis figures included in Note 1. This is due to the fact that Note 1 is disclosed on the Investment basis and the table
above is shown on the IFRS basis. For an explanation of the Investment basis and a reconciliation between Investment basis and IFRS basis see pages 45 to 48.
Consolidated statement of financial positionAs at 31 March 2021, other current assets in the Consolidated statement of financial position include balances relating to fees receivable from portfolio and fees receivable from external funds of £1 million and £2 million respectively (31 March 2020: £2 million and £1 million respectively). As at 31 March 2021, other non-current assets in the Consolidated statement of financial position includes balances relating to fees receivable from external funds of £7 million (31 March 2020: £1 million). Details of the carried interest and performance fees receivable included in the Consolidated statement of financial position are shown in Note 14. These are different to the balances included in the Investment basis Consolidated statement of financial position. For an explanation of the Investment basis and a reconciliation between Investment basis and IFRS basis see pages 45 to 48.
5 Operating expensesOperating expenses of £111 million (2020: £116 million) recognised in the IFRS Consolidated statement of comprehensive income, include the following amounts:
2021 £m
2020 £m
Depreciation of property, plant and equipment 2 2Depreciation of right of use assets 4 4Amortisation of intangible assets 1 1Audit fees (Note 7) 3 2Staff costs (Note 6) 76 71Redundancy costs – 1
Including expenses incurred in the entities accounted for as investment entity subsidiaries of £1 million (2020: nil), the Group’s total operating expenses on the Investment basis for the year were £112 million (2020: £116 million).
6 Staff costsThe table below is prepared in accordance with Companies Act requirements, which is consistent with both the IFRS and the Investment basis.
2021 £m
2020 £m
Wages and salaries 58 52Social security costs 9 7Share-based payment costs (Note 27) 6 8Pension costs 3 4Total staff costs 76 71
The average number of employees during the year was 234 (2020: 242), of which 152 (2020: 156) were employed in the UK.
3i Group plc Annual report and accounts 2021Audited financial statements
141
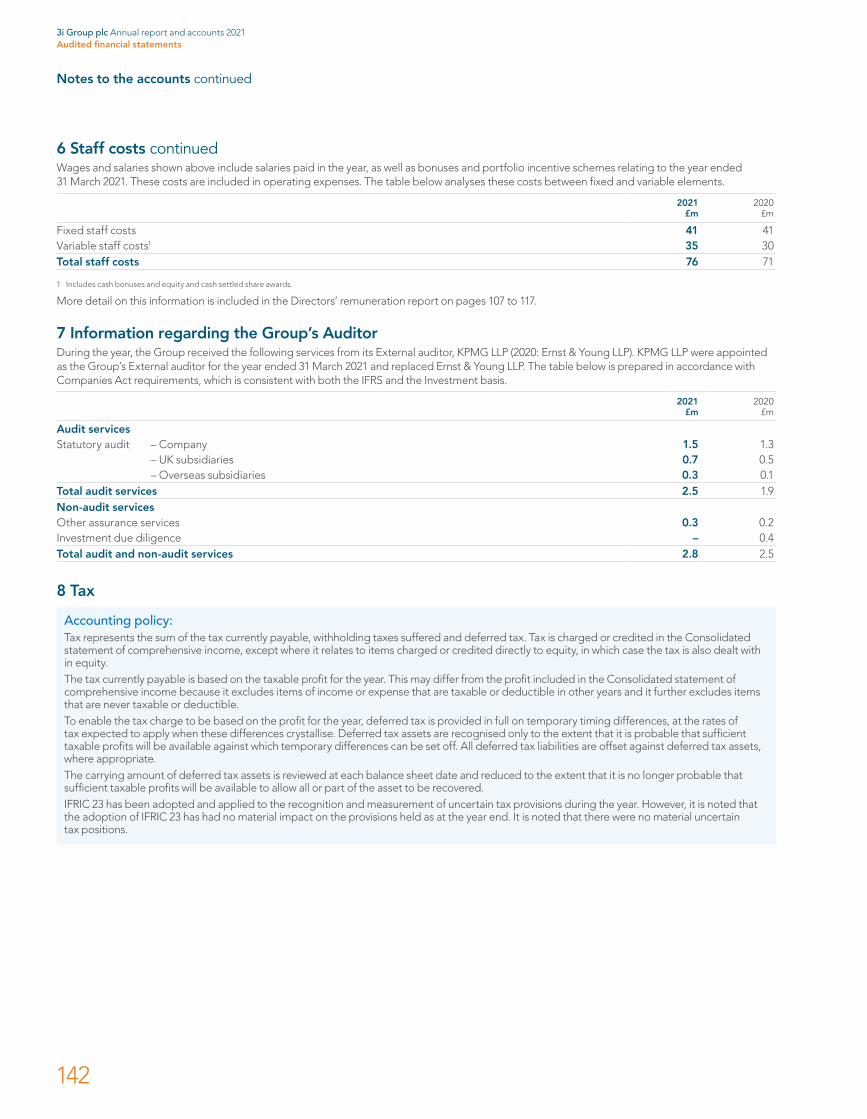
Notes to the accounts continued
6 Staff costs continuedWages and salaries shown above include salaries paid in the year, as well as bonuses and portfolio incentive schemes relating to the year ended 31 March 2021. These costs are included in operating expenses. The table below analyses these costs between fixed and variable elements.
2021 £m
2020 £m
Fixed staff costs 41 41Variable staff costs1 35 30Total staff costs 76 71
1 Includes cash bonuses and equity and cash settled share awards.
More detail on this information is included in the Directors’ remuneration report on pages 107 to 117.
7 Information regarding the Group’s AuditorDuring the year, the Group received the following services from its External auditor, KPMG LLP (2020: Ernst & Young LLP). KPMG LLP were appointed as the Group’s External auditor for the year ended 31 March 2021 and replaced Ernst & Young LLP. The table below is prepared in accordance with Companies Act requirements, which is consistent with both the IFRS and the Investment basis.
2021 £m
2020 £m
Audit services Statutory audit – Company 1.5 1.3 – UK subsidiaries 0.7 0.5 – Overseas subsidiaries 0.3 0.1Total audit services 2.5 1.9Non-audit servicesOther assurance services 0.3 0.2Investment due diligence – 0.4Total audit and non-audit services 2.8 2.5
8 Tax
Accounting policy: Tax represents the sum of the tax currently payable, withholding taxes suffered and deferred tax. Tax is charged or credited in the Consolidated statement of comprehensive income, except where it relates to items charged or credited directly to equity, in which case the tax is also dealt with in equity.The tax currently payable is based on the taxable profit for the year. This may differ from the profit included in the Consolidated statement of comprehensive income because it excludes items of income or expense that are taxable or deductible in other years and it further excludes items that are never taxable or deductible.To enable the tax charge to be based on the profit for the year, deferred tax is provided in full on temporary timing differences, at the rates of tax expected to apply when these differences crystallise. Deferred tax assets are recognised only to the extent that it is probable that sufficient taxable profits will be available against which temporary differences can be set off. All deferred tax liabilities are offset against deferred tax assets, where appropriate.The carrying amount of deferred tax assets is reviewed at each balance sheet date and reduced to the extent that it is no longer probable that sufficient taxable profits will be available to allow all or part of the asset to be recovered.IFRIC 23 has been adopted and applied to the recognition and measurement of uncertain tax provisions during the year. However, it is noted that the adoption of IFRIC 23 has had no material impact on the provisions held as at the year end. It is noted that there were no material uncertain tax positions.
3i Group plc Annual report and accounts 2021Audited financial statements
142
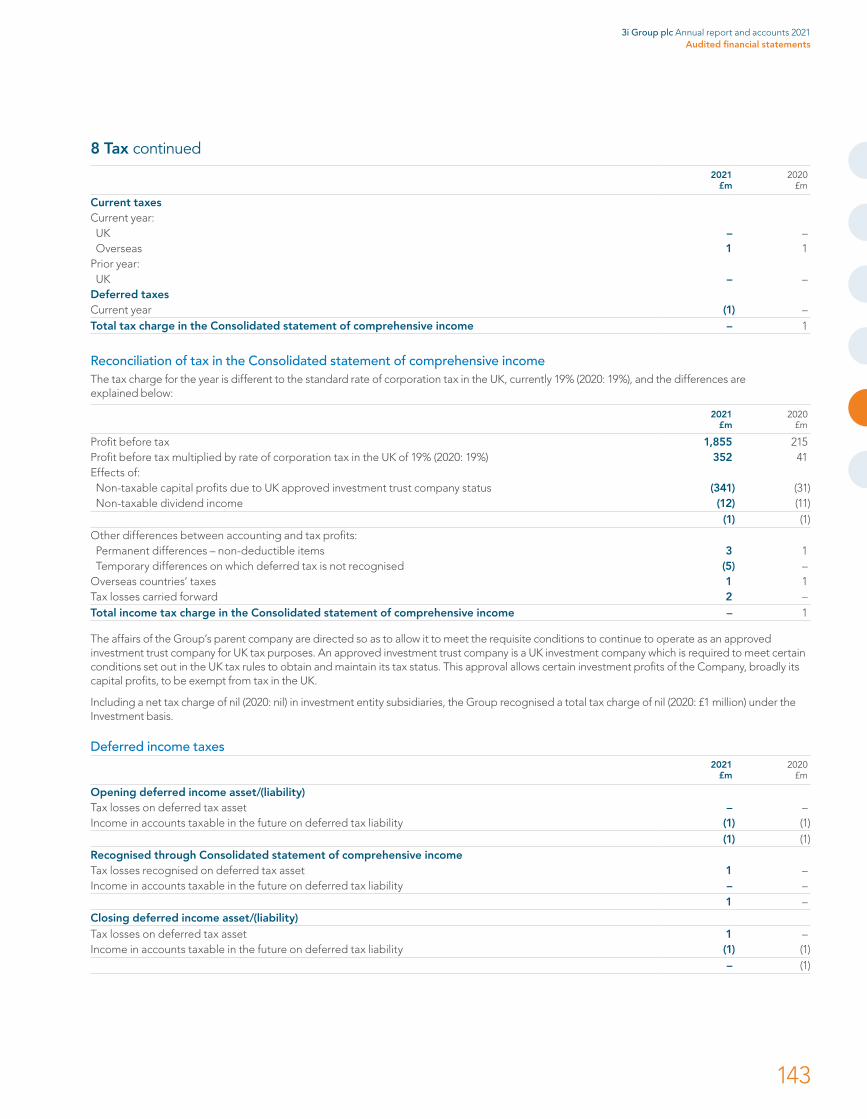
8 Tax continued
2021 £m
2020 £m
Current taxesCurrent year:UK – –Overseas 1 1
Prior year:UK – –
Deferred taxesCurrent year (1) –Total tax charge in the Consolidated statement of comprehensive income – 1
Reconciliation of tax in the Consolidated statement of comprehensive incomeThe tax charge for the year is different to the standard rate of corporation tax in the UK, currently 19% (2020: 19%), and the differences are explained below:
2021 £m
2020 £m
Profit before tax 1,855 215Profit before tax multiplied by rate of corporation tax in the UK of 19% (2020: 19%) 352 41Effects of:Non-taxable capital profits due to UK approved investment trust company status (341) (31)Non-taxable dividend income (12) (11)
(1) (1)Other differences between accounting and tax profits:Permanent differences – non-deductible items 3 1Temporary differences on which deferred tax is not recognised (5) –
Overseas countries’ taxes 1 1Tax losses carried forward 2 –Total income tax charge in the Consolidated statement of comprehensive income – 1
The affairs of the Group’s parent company are directed so as to allow it to meet the requisite conditions to continue to operate as an approved investment trust company for UK tax purposes. An approved investment trust company is a UK investment company which is required to meet certain conditions set out in the UK tax rules to obtain and maintain its tax status. This approval allows certain investment profits of the Company, broadly its capital profits, to be exempt from tax in the UK.
Including a net tax charge of nil (2020: nil) in investment entity subsidiaries, the Group recognised a total tax charge of nil (2020: £1 million) under the Investment basis.
Deferred income taxes2021
£m2020
£m
Opening deferred income asset/(liability)Tax losses on deferred tax asset – –Income in accounts taxable in the future on deferred tax liability (1) (1)
(1) (1)Recognised through Consolidated statement of comprehensive incomeTax losses recognised on deferred tax asset 1 –Income in accounts taxable in the future on deferred tax liability – –
1 –Closing deferred income asset/(liability)Tax losses on deferred tax asset 1 –Income in accounts taxable in the future on deferred tax liability (1) (1)
– (1)
3i Group plc Annual report and accounts 2021Audited financial statements
143

Notes to the accounts continued
8 Tax continued
At 31 March 2021, the Group had carried forward tax losses of £1,388 million (31 March 2020: £1,358 million), capital losses of £87 million (31 March 2020: £87 million) and other deductible temporary differences of £53 million (31 March 2020: £44 million). With the additional restrictions on utilising brought forward losses introduced from 1 April 2017, and the uncertainty that the Group will generate sufficient or relevant taxable profits not covered by the Investment Trust exception in the foreseeable future to utilise these amounts, no deferred tax asset has been recognised in respect of these losses. In the Spring Budget 2021, the Government announced that from 1 April 2023 the corporation tax rate will increase to 25% for large companies. This new law has not yet been substantively enacted and therefore the deferred tax assets and liabilities have been calculated using the existing rate of corporation tax in the UK of 19% (2020: 19%).
9 Per share informationThe calculation of basic net assets per share is based on the net assets and the number of shares in issue at the year end. When calculating the diluted net assets per share, the number of shares in issue is adjusted for the effect of all dilutive share awards.
2021 2020
Net assets per share (£)Basic 9.50 8.06Diluted 9.47 8.04Net assets (£m)Net assets attributable to equity holders of the Company 9,164 7,757
2021 2020
Number of shares in issueOrdinary shares 973,166,947 973,074,585Own shares (8,530,634) (10,398,032)
964,636,313 962,676,553Effect of dilutive potential ordinary sharesShare awards 2,656,230 1,649,348Diluted shares 967,292,543 964,325,901
The calculation of basic earnings per share is based on the profit attributable to shareholders and the weighted average number of shares in issue. The weighted average shares in issue for the year to 31 March 2021 are 964,217,242 (2020: 968,001,540). When calculating the diluted earnings per share, the weighted average number of shares in issue is adjusted for the effect of all dilutive share awards. The diluted weighted average shares in issue for the year to 31 March 2021 are 966,547,522 (2020: 969,674,941).
2021 2020
Earnings per share (pence)Basic 192.4 22.1Diluted 191.9 22.1Earnings (£m)Profit for the year attributable to equity holders of the Company 1,855 214
10 Dividends2021
pence per share2021
£m2020
pence per share2020
£m
Declared and paid during the yearOrdinary sharesSecond dividend 17.5 169 20.0 194First dividend 17.5 169 17.5 169
35.0 338 37.5 363Proposed dividend 21.0 203 17.5 168
The Group introduced a simplified dividend policy in May 2018. In accordance with this policy, subject to maintaining a conservative balance sheet approach, the Group aims to maintain or grow the dividend each year. The first dividend has been set at 50% of the prior year’s total dividend.
The dividend can be paid out of either the capital reserve or the revenue reserve subject to the investment trust rules.
The distributable reserves of the parent company are £3,811 million (31 March 2020: £3,863 million) and the Board reviews the distributable reserves bi-annually, including consideration of any material changes since the most recent audited accounts, ahead of proposing any dividend. The Board also reviews the proposed dividends in the context of the requirements of being an approved investment trust. Shareholders are given the opportunity to approve the total dividend for the year at the Company’s Annual General Meeting. Details of the Group’s continuing viability and going concern can be found in the Risk management section.
3i Group plc Annual report and accounts 2021Audited financial statements
144
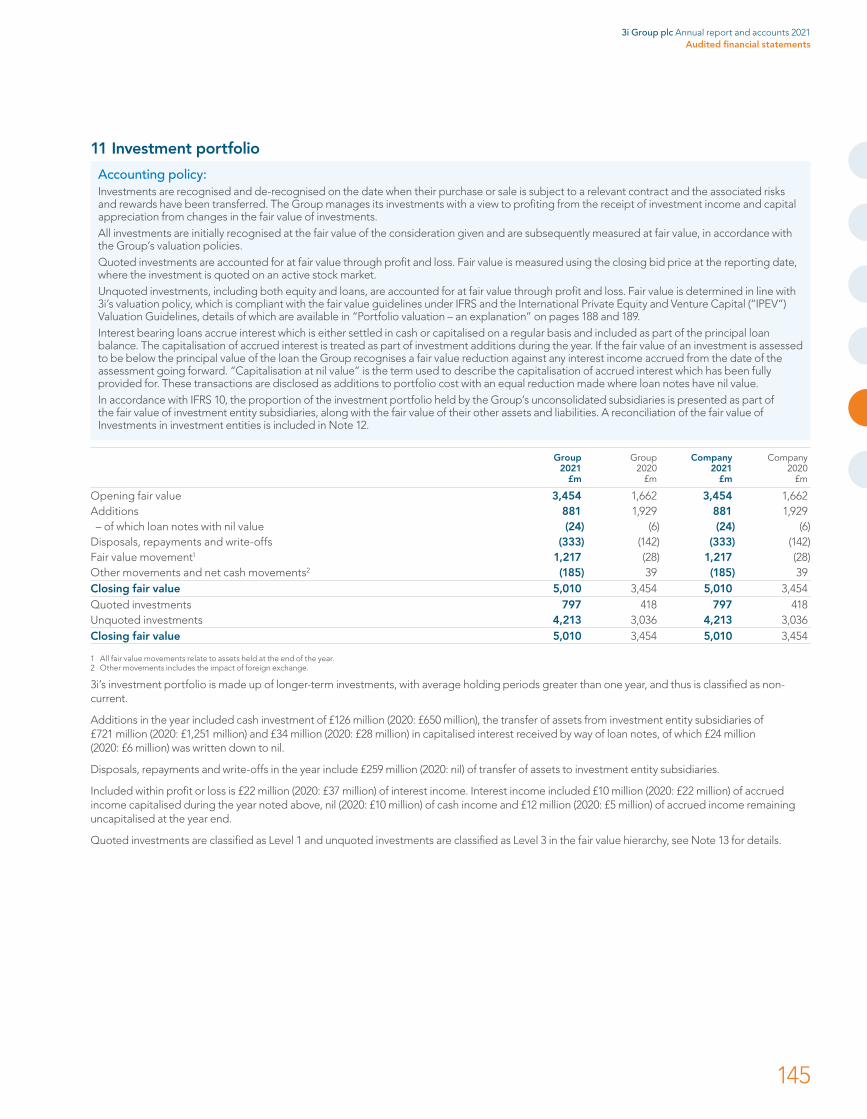
11 Investment portfolio
Accounting policy:Investments are recognised and de-recognised on the date when their purchase or sale is subject to a relevant contract and the associated risks and rewards have been transferred. The Group manages its investments with a view to profiting from the receipt of investment income and capital appreciation from changes in the fair value of investments.All investments are initially recognised at the fair value of the consideration given and are subsequently measured at fair value, in accordance with the Group’s valuation policies.Quoted investments are accounted for at fair value through profit and loss. Fair value is measured using the closing bid price at the reporting date, where the investment is quoted on an active stock market.Unquoted investments, including both equity and loans, are accounted for at fair value through profit and loss. Fair value is determined in line with 3i’s valuation policy, which is compliant with the fair value guidelines under IFRS and the International Private Equity and Venture Capital (“IPEV”) Valuation Guidelines, details of which are available in “Portfolio valuation – an explanation” on pages 188 and 189.Interest bearing loans accrue interest which is either settled in cash or capitalised on a regular basis and included as part of the principal loan balance. The capitalisation of accrued interest is treated as part of investment additions during the year. If the fair value of an investment is assessed to be below the principal value of the loan the Group recognises a fair value reduction against any interest income accrued from the date of the assessment going forward. “Capitalisation at nil value” is the term used to describe the capitalisation of accrued interest which has been fully provided for. These transactions are disclosed as additions to portfolio cost with an equal reduction made where loan notes have nil value.In accordance with IFRS 10, the proportion of the investment portfolio held by the Group’s unconsolidated subsidiaries is presented as part of the fair value of investment entity subsidiaries, along with the fair value of their other assets and liabilities. A reconciliation of the fair value of Investments in investment entities is included in Note 12.
Group 2021
£m
Group 2020
£m
Company 2021
£m
Company 2020
£m
Opening fair value 3,454 1,662 3,454 1,662Additions 881 1,929 881 1,929– of which loan notes with nil value (24) (6) (24) (6)
Disposals, repayments and write-offs (333) (142) (333) (142)Fair value movement1 1,217 (28) 1,217 (28)Other movements and net cash movements2 (185) 39 (185) 39Closing fair value 5,010 3,454 5,010 3,454Quoted investments 797 418 797 418Unquoted investments 4,213 3,036 4,213 3,036Closing fair value 5,010 3,454 5,010 3,454
1 All fair value movements relate to assets held at the end of the year.2 Other movements includes the impact of foreign exchange.
3i’s investment portfolio is made up of longer-term investments, with average holding periods greater than one year, and thus is classified as non-current.
Additions in the year included cash investment of £126 million (2020: £650 million), the transfer of assets from investment entity subsidiaries of £721 million (2020: £1,251 million) and £34 million (2020: £28 million) in capitalised interest received by way of loan notes, of which £24 million (2020: £6 million) was written down to nil.
Disposals, repayments and write-offs in the year include £259 million (2020: nil) of transfer of assets to investment entity subsidiaries.
Included within profit or loss is £22 million (2020: £37 million) of interest income. Interest income included £10 million (2020: £22 million) of accrued income capitalised during the year noted above, nil (2020: £10 million) of cash income and £12 million (2020: £5 million) of accrued income remaining uncapitalised at the year end.
Quoted investments are classified as Level 1 and unquoted investments are classified as Level 3 in the fair value hierarchy, see Note 13 for details.
3i Group plc Annual report and accounts 2021Audited financial statements
145

Notes to the accounts continued
12 Investments in investment entity subsidiaries
Accounting policy:Investments in investment entity subsidiaries are accounted for as financial instruments at fair value through profit and loss in accordance with IFRS 9.These entities are typically limited partnerships and other intermediate investment holding structures which hold the Group’s interests in investments in portfolio companies. The fair value can increase or decrease from either amounts paid to or received from the investment entity subsidiaries or valuation movements in line with the Group’s valuation policy.Substantially all of these entities meet the definition of a Fund under the IPEV guidelines and the fair value of these entities is their net asset value.We determine that, in the ordinary course of business, the net asset value of investment entity subsidiaries is considered to be the most appropriate to determine fair value. At each reporting period, we consider whether any additional fair value adjustments need to be made to the net asset value of the investment entity subsidiaries. These adjustments may be required to reflect market participants’ considerations about fair value that may include, but are not limited to, liquidity and the portfolio effect of holding multiple investments within the investment entity subsidiary. There was no particular circumstance to indicate that a fair value adjustment was required (31 March 2020: no adjustment required) and, after due consideration, we concluded that the net asset values were the most appropriate reflection of fair value at 31 March 2021.
Level 3 fair value reconciliation – investments in investment entity subsidiaries
Non-current
Group 2021
£m
Group 2020
£m
Opening fair value 3,936 5,159Amounts paid to investment entity subsidiaries 879 1,176Amounts received from investment entity subsidiaries (281) (1,362)Fair value movements on investment entity subsidiaries 792 191Transfer of portfolio investments from investment entity subsidiaries (462) (1,251)Transfer of assets to investment entity subsidiaries 41 23Closing fair value 4,905 3,936
Transfer of portfolio investments from investment entity subsidiaries includes the transfer of investment portfolio between investment entity subsidiaries and the Company at fair value. The consideration for these transfers can either be cash or intra-group receivables.
Restrictions3i Group plc, the ultimate parent company, receives dividend income from its subsidiaries. There are no restrictions on the ability to transfer funds from these subsidiaries to the Group at 31 March 2021. At 31 March 2020 a cash balance of £109 million was held in escrow in investment entity subsidiaries for carried interest payable paid in June 2020.
Support3i Group plc continues to provide, where necessary, ongoing support to its investment entity subsidiaries for the purchase of portfolio investments. The Group’s current commitments are disclosed in Note 24.
3i Group plc Annual report and accounts 2021Audited financial statements
146
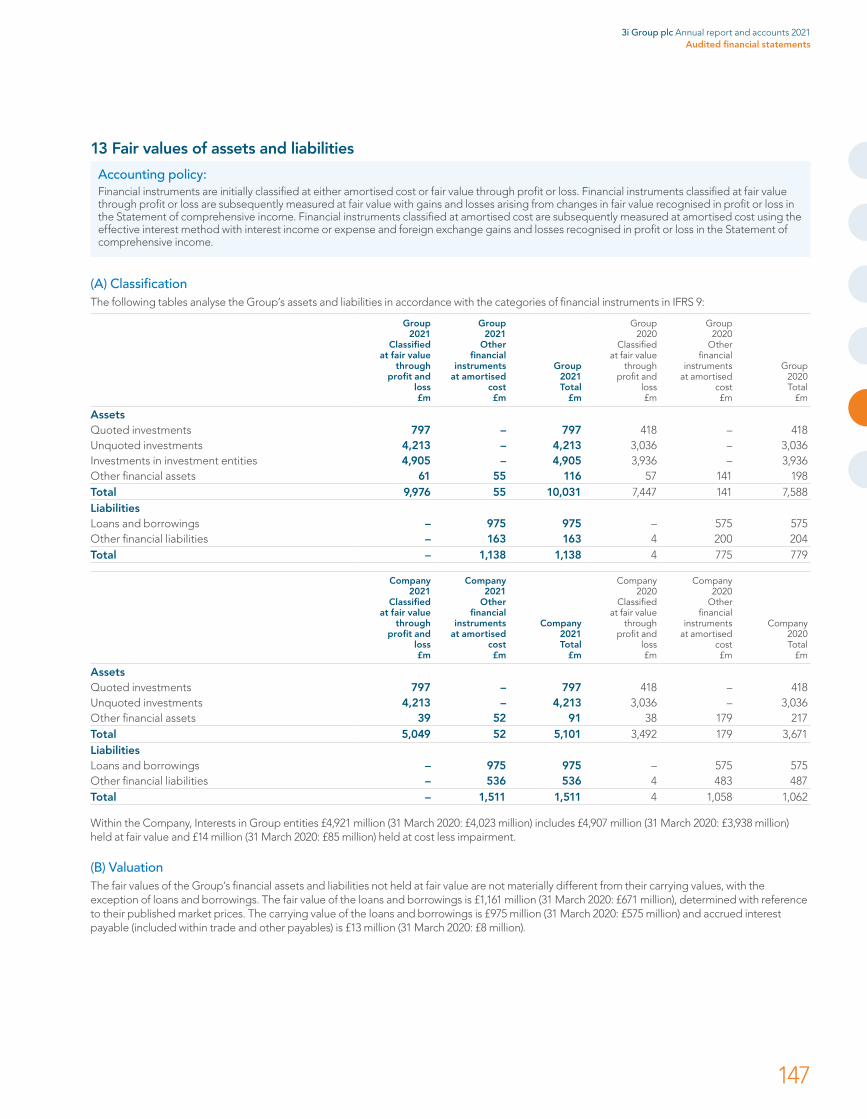
13 Fair values of assets and liabilities
Accounting policy:Financial instruments are initially classified at either amortised cost or fair value through profit or loss. Financial instruments classified at fair value through profit or loss are subsequently measured at fair value with gains and losses arising from changes in fair value recognised in profit or loss in the Statement of comprehensive income. Financial instruments classified at amortised cost are subsequently measured at amortised cost using the effective interest method with interest income or expense and foreign exchange gains and losses recognised in profit or loss in the Statement of comprehensive income.
(A) ClassificationThe following tables analyse the Group’s assets and liabilities in accordance with the categories of financial instruments in IFRS 9:
Group2021
Classifiedat fair value
throughprofit and
loss£m
Group2021
Otherfinancial
instrumentsat amortised
cost£m
Group2021Total
£m
Group2020
Classifiedat fair value
throughprofit and
loss£m
Group2020
Otherfinancial
instrumentsat amortised
cost£m
Group2020Total
£m
AssetsQuoted investments 797 – 797 418 – 418Unquoted investments 4,213 – 4,213 3,036 – 3,036Investments in investment entities 4,905 – 4,905 3,936 – 3,936Other financial assets 61 55 116 57 141 198Total 9,976 55 10,031 7,447 141 7,588Liabilities Loans and borrowings – 975 975 – 575 575Other financial liabilities – 163 163 4 200 204Total – 1,138 1,138 4 775 779
Company2021
Classifiedat fair value
throughprofit and
loss£m
Company2021
Otherfinancial
instrumentsat amortised
cost£m
Company2021Total
£m
Company2020
Classifiedat fair value
throughprofit and
loss£m
Company2020
Otherfinancial
instrumentsat amortised
cost£m
Company2020Total
£m
AssetsQuoted investments 797 – 797 418 – 418Unquoted investments 4,213 – 4,213 3,036 – 3,036Other financial assets 39 52 91 38 179 217Total 5,049 52 5,101 3,492 179 3,671Liabilities Loans and borrowings – 975 975 – 575 575Other financial liabilities – 536 536 4 483 487Total – 1,511 1,511 4 1,058 1,062
Within the Company, Interests in Group entities £4,921 million (31 March 2020: £4,023 million) includes £4,907 million (31 March 2020: £3,938 million) held at fair value and £14 million (31 March 2020: £85 million) held at cost less impairment.
(B) ValuationThe fair values of the Group’s financial assets and liabilities not held at fair value are not materially different from their carrying values, with the exception of loans and borrowings. The fair value of the loans and borrowings is £1,161 million (31 March 2020: £671 million), determined with reference to their published market prices. The carrying value of the loans and borrowings is £975 million (31 March 2020: £575 million) and accrued interest payable (included within trade and other payables) is £13 million (31 March 2020: £8 million).
3i Group plc Annual report and accounts 2021Audited financial statements
147
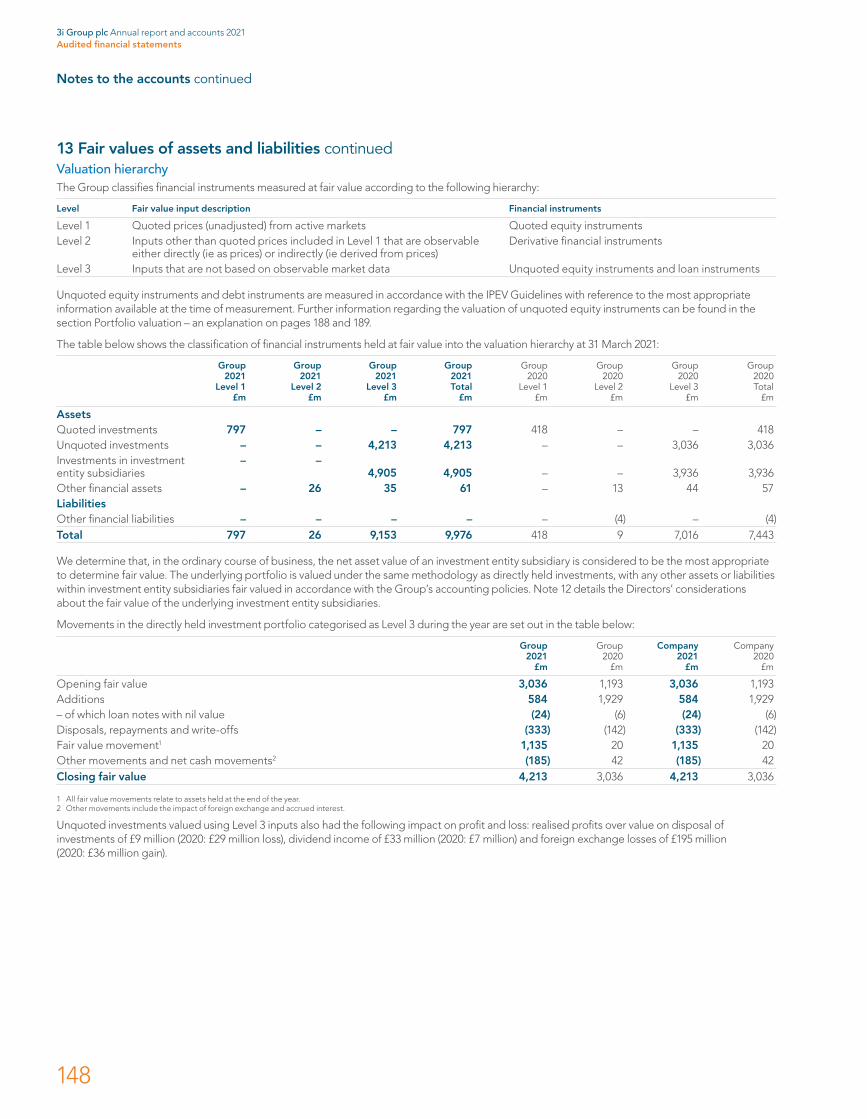
Notes to the accounts continued
13 Fair values of assets and liabilities continuedValuation hierarchyThe Group classifies financial instruments measured at fair value according to the following hierarchy:
Level Fair value input description Financial instruments
Level 1 Quoted prices (unadjusted) from active markets Quoted equity instrumentsLevel 2 Inputs other than quoted prices included in Level 1 that are observable
either directly (ie as prices) or indirectly (ie derived from prices)Derivative financial instruments
Level 3 Inputs that are not based on observable market data Unquoted equity instruments and loan instruments
Unquoted equity instruments and debt instruments are measured in accordance with the IPEV Guidelines with reference to the most appropriate information available at the time of measurement. Further information regarding the valuation of unquoted equity instruments can be found in the section Portfolio valuation – an explanation on pages 188 and 189.
The table below shows the classification of financial instruments held at fair value into the valuation hierarchy at 31 March 2021:
Group 2021
Level 1 £m
Group 2021
Level 2 £m
Group 2021
Level 3 £m
Group 2021 Total
£m
Group 2020
Level 1 £m
Group 2020
Level 2 £m
Group 2020
Level 3 £m
Group 2020 Total
£m
Assets Quoted investments 797 – – 797 418 – – 418Unquoted investments – – 4,213 4,213 – – 3,036 3,036Investments in investment entity subsidiaries
– –4,905 4,905 – – 3,936 3,936
Other financial assets – 26 35 61 – 13 44 57LiabilitiesOther financial liabilities – – – – – (4) – (4)Total 797 26 9,153 9,976 418 9 7,016 7,443
We determine that, in the ordinary course of business, the net asset value of an investment entity subsidiary is considered to be the most appropriate to determine fair value. The underlying portfolio is valued under the same methodology as directly held investments, with any other assets or liabilities within investment entity subsidiaries fair valued in accordance with the Group’s accounting policies. Note 12 details the Directors’ considerations about the fair value of the underlying investment entity subsidiaries.
Movements in the directly held investment portfolio categorised as Level 3 during the year are set out in the table below:
Group 2021
£m
Group 2020
£m
Company 2021
£m
Company 2020
£m
Opening fair value 3,036 1,193 3,036 1,193Additions 584 1,929 584 1,929– of which loan notes with nil value (24) (6) (24) (6)Disposals, repayments and write-offs (333) (142) (333) (142)Fair value movement1 1,135 20 1,135 20Other movements and net cash movements2 (185) 42 (185) 42Closing fair value 4,213 3,036 4,213 3,036
1 All fair value movements relate to assets held at the end of the year.2 Other movements include the impact of foreign exchange and accrued interest.
Unquoted investments valued using Level 3 inputs also had the following impact on profit and loss: realised profits over value on disposal of investments of £9 million (2020: £29 million loss), dividend income of £33 million (2020: £7 million) and foreign exchange losses of £195 million (2020: £36 million gain).
3i Group plc Annual report and accounts 2021Audited financial statements
148

13 Fair values of assets and liabilities continuedAssets move between Level 1 and Level 3 when an unquoted equity investment lists on a quoted market exchange. There were no transfers in or out of Level 3 during the year. In the 12 months to 31 March 2021, two assets changed valuation basis within Level 3, one moving from an earnings-based valuation to a DCF and Action moving from Transaction value which was used as a basis to determine fair value at 31 March 2020 to an earnings-based valuation. The changes in valuation methodology in the period reflect our view of the most appropriate method to determine the fair value of the two assets at 31 March 2021. Further information can be found in the Private Equity and Infrastructure sections of the Business and Financial review starting on page 21.
The following table summarises the various valuation methodologies used by the Group to fair value Level 3 instruments, the inputs and the sensitivities applied and the impact of those sensitivities to the unobservable inputs. We have maintained a 5% sensitivity which is underpinned by the resilient performance of our portfolio. For the small number of companies in our portfolio that are exposed to more challenged sectors such as travel and automotive sectors, our fair value at 31 March 2021, reflects the impact this has had on performance. All numbers in the table below are on an Investment basis.
Level 3 unquoted investments
Methodology Description InputsFair value at
31 March (£m)
Sensitivity on key unobservable
input
Fair value impact of
sensitivities (£m) +5%/-5%
Earnings (Private Equity)
Most commonly used Private Equity valuation methodology.Used for investments which are typically profitable and for which we can determine a set of listed companies and precedent transactions, where relevant, with similar characteristics.
Earnings multiples are applied to the earnings of the Company to determine the enterprise value.Earnings multiplesWhen selecting earnings multiples, we consider:1. Comparable listed companies’ current
performance and through-the-cycle averages2. Relevant market transaction multiples3. Exit expectations and other company specific
factors For point 1 and 2 of the above we select companies in the same industry and, where possible, with a similar business model and profile in terms of size, products, services and customers, growth rates and geographic focus.The pre-discount multiple ranges from 8.5x – 19.5x (2020: 8.0x – 14.5x).Other inputs:EarningsReported earnings are adjusted for non-recurring items, such as restructuring expenses, for significant corporate actions and, in exceptional cases, run-rate adjustments to arrive at maintainable earnings.The most common measure is earnings before interest, tax, depreciation and amortisation (“EBITDA”).Earnings are usually obtained from portfolio company management accounts to the preceding quarter end, with reference also to forecast earnings and the maintainable view of earnings. Action, our largest asset, we value using run-rate earnings.
8,393(2020: 6,328
of which 3,536 is Action
based on Transaction value at 31
March 2020)
For the assets valued on an
earnings basis, we have
applied a 5% sensitivity to the earnings
multiple
Action is our largest asset, and we have
included a 5% sensitivity on
Action’s earnings
multiple of 19.5x
(equivalent to 18.5x net). On a
stand-alone basis, this is
equal to
528(20201: 216)
(539)(20201: (216))
283(2020: n/a)
(284)(2020: n/a)
Discounted cash flow (Private Equity/Infrastructure/ Scandlines)
Appropriate for businesses with long-term stable cash flows, typically in Infrastructure or, alternatively, businesses where DCF is more appropriate in the short term.
Long-term cash flows are discounted at a rate which is benchmarked against market data, where possible, or adjusted from the rate at the initial investment based on changes in the risk profile of the investment.
831(2020: 832)
For the assets valued on a
DCF basis, we have applied a
5% sensitivity to the discount
rate
(38)(2020: (35))
40(2020: 37)
NAV (Private Equity/Infrastructure)
Used for investments in unlisted funds.
Net asset value reported by the fund manager. The valuation of the underlying portfolio is consistent with IFRS.
69(2020: 58)
A 5% increase on closing NAV
3(2020: 3)
Other (Private Equity/Infrastructure)
Used where elements of a business are valued on different bases.
Values of separate elements prepared on one of the methodologies listed above.
104(2020: 122)
A 5% increase in the closing
value
5(2020: 6)
1 2020 excludes Action which was valued on Transaction value which was used as a basis to determine fair value at 31 March 2020.
3i Group plc Annual report and accounts 2021Audited financial statements
149
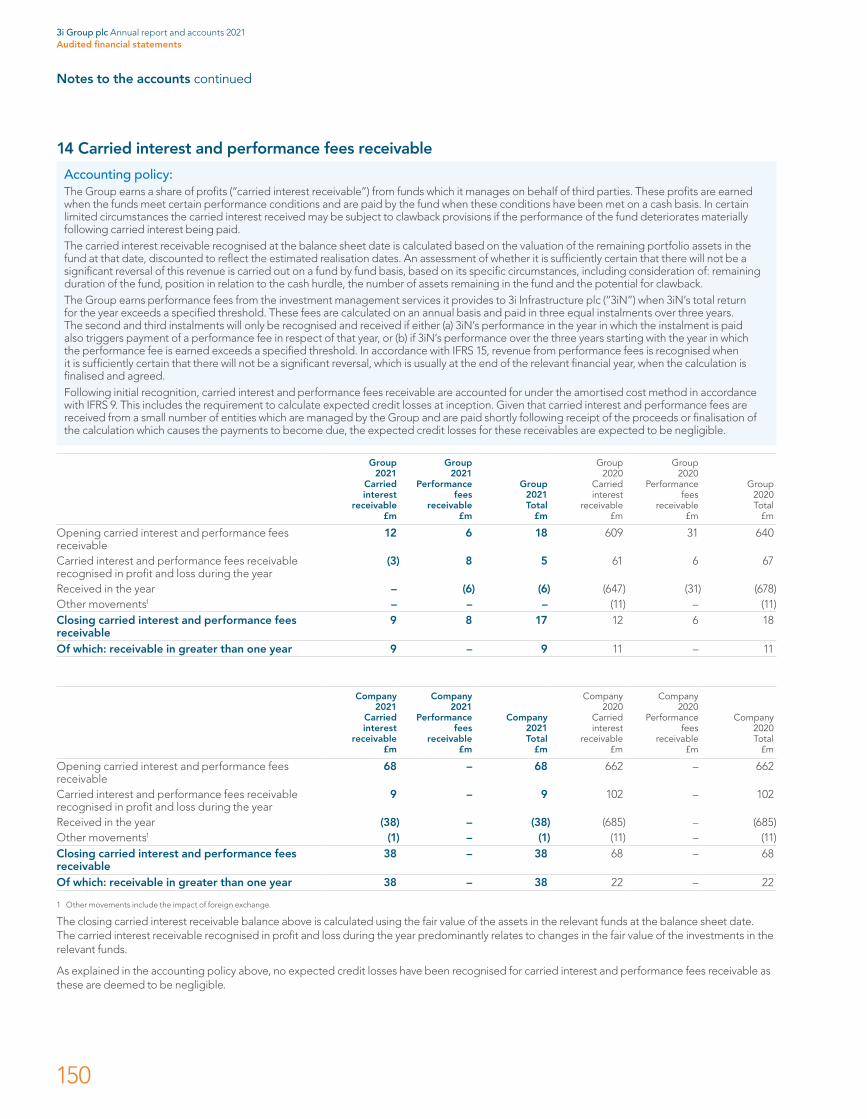
Notes to the accounts continued
14 Carried interest and performance fees receivable
Accounting policy:The Group earns a share of profits (“carried interest receivable”) from funds which it manages on behalf of third parties. These profits are earned when the funds meet certain performance conditions and are paid by the fund when these conditions have been met on a cash basis. In certain limited circumstances the carried interest received may be subject to clawback provisions if the performance of the fund deteriorates materially following carried interest being paid.The carried interest receivable recognised at the balance sheet date is calculated based on the valuation of the remaining portfolio assets in the fund at that date, discounted to reflect the estimated realisation dates. An assessment of whether it is sufficiently certain that there will not be a significant reversal of this revenue is carried out on a fund by fund basis, based on its specific circumstances, including consideration of: remaining duration of the fund, position in relation to the cash hurdle, the number of assets remaining in the fund and the potential for clawback.The Group earns performance fees from the investment management services it provides to 3i Infrastructure plc (“3iN”) when 3iN’s total return for the year exceeds a specified threshold. These fees are calculated on an annual basis and paid in three equal instalments over three years. The second and third instalments will only be recognised and received if either (a) 3iN’s performance in the year in which the instalment is paid also triggers payment of a performance fee in respect of that year, or (b) if 3iN’s performance over the three years starting with the year in which the performance fee is earned exceeds a specified threshold. In accordance with IFRS 15, revenue from performance fees is recognised when it is sufficiently certain that there will not be a significant reversal, which is usually at the end of the relevant financial year, when the calculation is finalised and agreed.Following initial recognition, carried interest and performance fees receivable are accounted for under the amortised cost method in accordance with IFRS 9. This includes the requirement to calculate expected credit losses at inception. Given that carried interest and performance fees are received from a small number of entities which are managed by the Group and are paid shortly following receipt of the proceeds or finalisation of the calculation which causes the payments to become due, the expected credit losses for these receivables are expected to be negligible.
Group2021
Carriedinterest
receivable£m
Group2021
Performancefees
receivable£m
Group2021Total
£m
Group2020
Carriedinterest
receivable£m
Group2020
Performancefees
receivable£m
Group2020Total
£m
Opening carried interest and performance fees receivable
12 6 18 609 31 640
Carried interest and performance fees receivable recognised in profit and loss during the year
(3) 8 5 61 6 67
Received in the year – (6) (6) (647) (31) (678)Other movements1 – – – (11) – (11)Closing carried interest and performance fees receivable
9 8 17 12 6 18
Of which: receivable in greater than one year 9 – 9 11 – 11
Company2021
Carriedinterest
receivable£m
Company2021
Performancefees
receivable£m
Company2021Total
£m
Company2020
Carriedinterest
receivable£m
Company2020
Performancefees
receivable£m
Company2020Total
£m
Opening carried interest and performance fees receivable
68 – 68 662 – 662
Carried interest and performance fees receivable recognised in profit and loss during the year
9 – 9 102 – 102
Received in the year (38) – (38) (685) – (685)Other movements1 (1) – (1) (11) – (11)Closing carried interest and performance fees receivable
38 – 38 68 – 68
Of which: receivable in greater than one year 38 – 38 22 – 22
1 Other movements include the impact of foreign exchange.
The closing carried interest receivable balance above is calculated using the fair value of the assets in the relevant funds at the balance sheet date. The carried interest receivable recognised in profit and loss during the year predominantly relates to changes in the fair value of the investments in the relevant funds.
As explained in the accounting policy above, no expected credit losses have been recognised for carried interest and performance fees receivable as these are deemed to be negligible.
3i Group plc Annual report and accounts 2021Audited financial statements
150
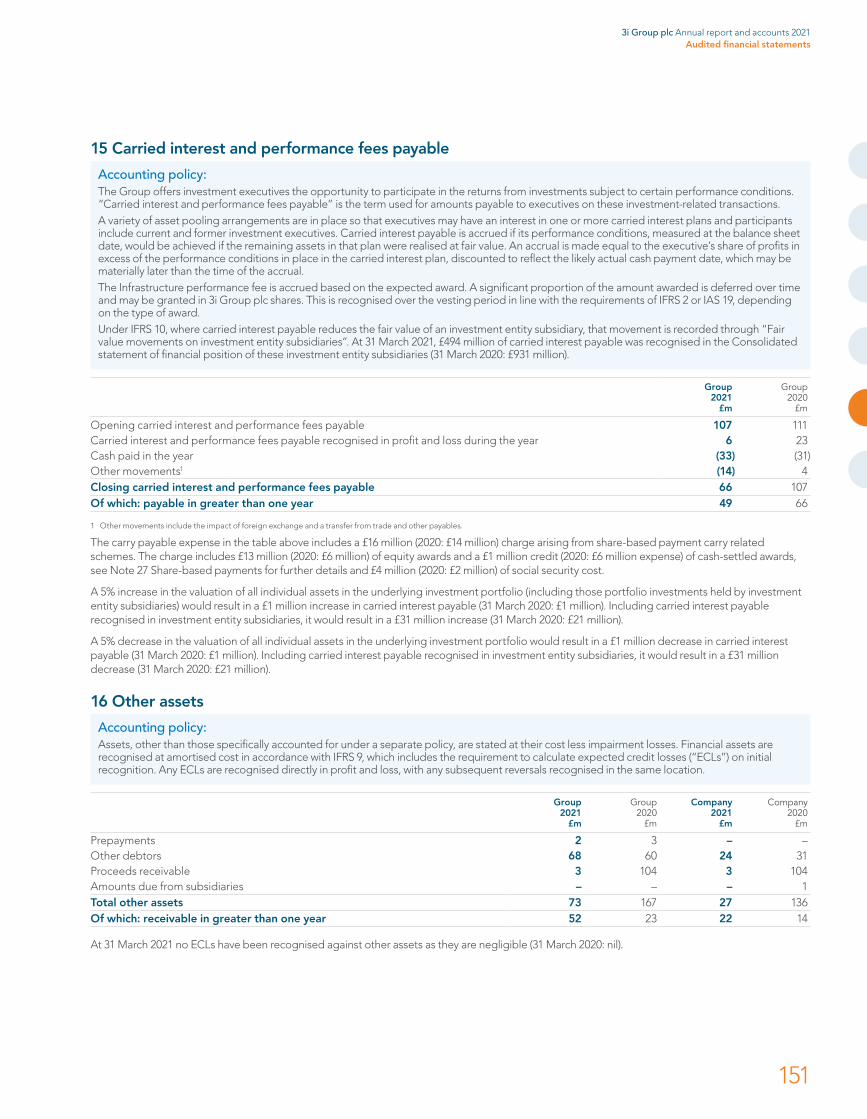
15 Carried interest and performance fees payable
Accounting policy:The Group offers investment executives the opportunity to participate in the returns from investments subject to certain performance conditions. “Carried interest and performance fees payable” is the term used for amounts payable to executives on these investment-related transactions.A variety of asset pooling arrangements are in place so that executives may have an interest in one or more carried interest plans and participants include current and former investment executives. Carried interest payable is accrued if its performance conditions, measured at the balance sheet date, would be achieved if the remaining assets in that plan were realised at fair value. An accrual is made equal to the executive’s share of profits in excess of the performance conditions in place in the carried interest plan, discounted to reflect the likely actual cash payment date, which may be materially later than the time of the accrual.The Infrastructure performance fee is accrued based on the expected award. A significant proportion of the amount awarded is deferred over time and may be granted in 3i Group plc shares. This is recognised over the vesting period in line with the requirements of IFRS 2 or IAS 19, depending on the type of award.Under IFRS 10, where carried interest payable reduces the fair value of an investment entity subsidiary, that movement is recorded through “Fair value movements on investment entity subsidiaries”. At 31 March 2021, £494 million of carried interest payable was recognised in the Consolidated statement of financial position of these investment entity subsidiaries (31 March 2020: £931 million).
Group 2021
£m
Group2020
£m
Opening carried interest and performance fees payable 107 111Carried interest and performance fees payable recognised in profit and loss during the year 6 23Cash paid in the year (33) (31)Other movements1 (14) 4Closing carried interest and performance fees payable 66 107Of which: payable in greater than one year 49 66
1 Other movements include the impact of foreign exchange and a transfer from trade and other payables.
The carry payable expense in the table above includes a £16 million (2020: £14 million) charge arising from share-based payment carry related schemes. The charge includes £13 million (2020: £6 million) of equity awards and a £1 million credit (2020: £6 million expense) of cash-settled awards, see Note 27 Share-based payments for further details and £4 million (2020: £2 million) of social security cost.
A 5% increase in the valuation of all individual assets in the underlying investment portfolio (including those portfolio investments held by investment entity subsidiaries) would result in a £1 million increase in carried interest payable (31 March 2020: £1 million). Including carried interest payable recognised in investment entity subsidiaries, it would result in a £31 million increase (31 March 2020: £21 million).
A 5% decrease in the valuation of all individual assets in the underlying investment portfolio would result in a £1 million decrease in carried interest payable (31 March 2020: £1 million). Including carried interest payable recognised in investment entity subsidiaries, it would result in a £31 million decrease (31 March 2020: £21 million).
16 Other assets
Accounting policy:Assets, other than those specifically accounted for under a separate policy, are stated at their cost less impairment losses. Financial assets are recognised at amortised cost in accordance with IFRS 9, which includes the requirement to calculate expected credit losses (“ECLs”) on initial recognition. Any ECLs are recognised directly in profit and loss, with any subsequent reversals recognised in the same location.
Group2021
£m
Group2020
£m
Company2021
£m
Company2020
£m
Prepayments 2 3 – –Other debtors 68 60 24 31Proceeds receivable 3 104 3 104Amounts due from subsidiaries – – – 1Total other assets 73 167 27 136Of which: receivable in greater than one year 52 23 22 14
At 31 March 2021 no ECLs have been recognised against other assets as they are negligible (31 March 2020: nil).
3i Group plc Annual report and accounts 2021Audited financial statements
151

Notes to the accounts continued
17 Loans and borrowings
Accounting policy: All loans and borrowings are initially recognised at the fair value of the consideration received. After initial recognition, these are subsequently measured at amortised cost using the effective interest method, which is the rate that exactly discounts the estimated future cash flows through the expected life of the liabilities. Financial liabilities are derecognised when they are extinguished.
Group 2021
£m
Group 2020
£m
Loans and borrowings are repayable as follows:Within one year – –Between the second and fifth year 200 200After five years 775 375
975 575
Principal borrowings include:
Rate Maturity
Group 2021
£m
Group 2020
£m
Company 2021
£m
Company 2020
£m
Fixed rate £200 million notes (public issue) 6.875% 2023 200 200 200 200£375 million notes (public issue) 5.750% 2032 375 375 375 375£400 million notes (public issue) 3.750% 2040 400 – 400 –
975 575 975 575Committed multi-currency facilities £500 million LIBOR+0.50% 2026 – – – –
– – – –Total loans and borrowings 975 575 975 575
During the year the Company extended its syndicated multi-currency facility to March 2026 (2020: March 2025); and increased the size to £500 million (31 March 2020: £400 million). The £500 million facility has no financial covenants. The RCF has a one year extension option subject to certain requirements which if successfully exercised would extend the maturity date to March 2027.
All of the Group’s borrowings are repayable in one instalment on the respective maturity dates. None of the Group’s interest-bearing loans and borrowings are secured on the assets of the Group. The fair value of the loans and borrowings is £1,161 million (31 March 2020: £671 million), determined with reference to their published market prices. The loans and borrowings are included in Level 2 of the fair value hierarchy. The interest expense for loans and borrowings recognised within profit and loss is £50 million (2020: £37 million) and the interest paid for loans and borrowings recognised within the Consolidated cash flow statement is £45 million (2020: £38 million).
In accordance with the FCA’s Investment Funds sourcebook (FUNDS 3.2.2R and Fund 3.2.6R), 3i Investments plc, as AIFM of the Company, is required to calculate leverage in accordance with a set formula and disclose this to investors. In line with this formula, leverage at 31 March 2021 for the Group is 131% (31 March 2020: 115%) and the Company is 130% (31 March 2020: 104%) under both the gross method and the commitment method. The leverage for 3i Investments plc at 31 March 2021 is 100% (31 March 2020: 100%) under both the gross method and the commitment method.
Under the Securities Financing Transactions Regulation and the FCA’s Investment Funds sourcebook (FUNDS 3.2.4A), 3i is required to disclose certain information relating to the use of securities financing transactions (“SFTs”) and total return swaps. At 31 March 2021, 3i was not party to any transactions involving SFTs or total return swaps.
Reconciliation of liabilities arising from financing activitiesThe changes in the Group’s liabilities arising from financing activities are classified as follows:
Loans and borrowings
2021 £m
Lease liability
2021 £m
Loans and borrowings
2020 £m
Lease liability
2020 £m
Opening liability 575 20 575 –Adoption of IFRS 16 – Leases – – – 23Additions 400 2 – 1Repayments – (5) – (4)Closing liability 975 17 575 20
3i Group plc Annual report and accounts 2021Audited financial statements
152

18 Derivatives
Accounting policy:Derivative financial instruments are accounted for at fair value through profit and loss in accordance with IFRS 9. They are revalued at the balance sheet date based on market prices, with any change in fair value being recorded in profit and loss. Derivatives are recognised in the Consolidated statement of financial position as a financial asset when their fair value is positive and as a financial liability when their fair value is negative. The Group’s derivative financial instruments are not designated as hedging instruments.
Statement of comprehensive income
Group 2021
£m
Group 2020
£m
Company 2021
£m
Company 2020
£m
Movement in the fair value of derivatives 24 (9) 24 (9)
Statement of financial position
Group 2021
£m
Group 2020
£m
Company 2021
£m
Company 2020
£m
Non-current assetsForward foreign exchange contracts 16 7 16 7Current assetsForward foreign exchange contracts 10 6 10 6Non-current liabilitiesForward foreign exchange contracts – (2) – (2)Current liabilitiesForward foreign exchange contracts – (2) – (2)
The Company entered into forward foreign exchange contracts to minimise the effect of fluctuations arising from movements in exchange rates in the value of the Group’s investment in Scandlines and Regional Rail. During the year the Company closed out its forward foreign exchange contracts for Regional Rail.
As at 31 March 2021 the notional amount of the forward foreign exchange contracts held by the Company was €500 million (31 March 2020: €500 million) for Scandlines and nil (31 March 2020: $112 million) for Regional Rail.
19 Trade and other payables
Accounting policy:Liabilities, other than those specifically accounted for under a separate policy, are stated based on the amounts which are considered to be payable in respect of goods or services received up to the balance sheet date. Financial liabilities are recognised at amortised cost in accordance with IFRS 9.
Group 2021
£m
Group 2020
£m
Company 2021
£m
Company 2020
£m
Trade and other payables 79 73 12 11Amounts due to subsidiaries – – 524 472Total trade and other payables 79 73 536 483Of which: payable in greater than one year 17 – – –
3i Group plc Annual report and accounts 2021Audited financial statements
153
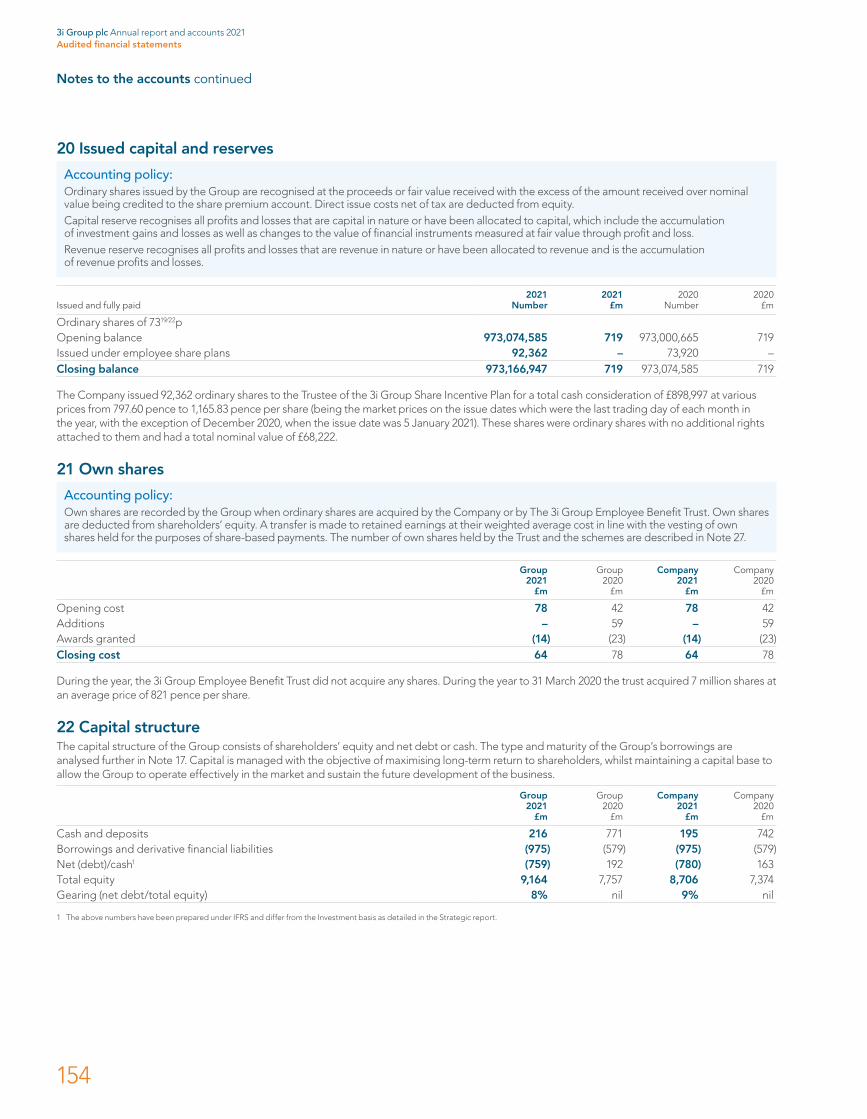
Notes to the accounts continued
20 Issued capital and reserves
Accounting policy:Ordinary shares issued by the Group are recognised at the proceeds or fair value received with the excess of the amount received over nominal value being credited to the share premium account. Direct issue costs net of tax are deducted from equity.Capital reserve recognises all profits and losses that are capital in nature or have been allocated to capital, which include the accumulation of investment gains and losses as well as changes to the value of financial instruments measured at fair value through profit and loss.Revenue reserve recognises all profits and losses that are revenue in nature or have been allocated to revenue and is the accumulation of revenue profits and losses.
Issued and fully paid2021
Number2021
£m2020
Number2020
£m
Ordinary shares of 7319⁄22pOpening balance 973,074,585 719 973,000,665 719Issued under employee share plans 92,362 – 73,920 –Closing balance 973,166,947 719 973,074,585 719
The Company issued 92,362 ordinary shares to the Trustee of the 3i Group Share Incentive Plan for a total cash consideration of £898,997 at various prices from 797.60 pence to 1,165.83 pence per share (being the market prices on the issue dates which were the last trading day of each month in the year, with the exception of December 2020, when the issue date was 5 January 2021). These shares were ordinary shares with no additional rights attached to them and had a total nominal value of £68,222.
21 Own shares
Accounting policy:Own shares are recorded by the Group when ordinary shares are acquired by the Company or by The 3i Group Employee Benefit Trust. Own shares are deducted from shareholders’ equity. A transfer is made to retained earnings at their weighted average cost in line with the vesting of own shares held for the purposes of share-based payments. The number of own shares held by the Trust and the schemes are described in Note 27.
Group 2021
£m
Group 2020
£m
Company 2021
£m
Company 2020
£m
Opening cost 78 42 78 42Additions – 59 – 59Awards granted (14) (23) (14) (23)Closing cost 64 78 64 78
During the year, the 3i Group Employee Benefit Trust did not acquire any shares. During the year to 31 March 2020 the trust acquired 7 million shares at an average price of 821 pence per share.
22 Capital structureThe capital structure of the Group consists of shareholders’ equity and net debt or cash. The type and maturity of the Group’s borrowings are analysed further in Note 17. Capital is managed with the objective of maximising long-term return to shareholders, whilst maintaining a capital base to allow the Group to operate effectively in the market and sustain the future development of the business.
Group 2021
£m
Group 2020
£m
Company 2021
£m
Company 2020
£m
Cash and deposits 216 771 195 742Borrowings and derivative financial liabilities (975) (579) (975) (579)Net (debt)/cash1 (759) 192 (780) 163Total equity 9,164 7,757 8,706 7,374Gearing (net debt/total equity) 8% nil 9% nil
1 The above numbers have been prepared under IFRS and differ from the Investment basis as detailed in the Strategic report.
3i Group plc Annual report and accounts 2021Audited financial statements
154

22 Capital structure continuedCapital constraintsThe Group is generally free to transfer capital from subsidiary undertakings to the parent company, subject to maintaining each subsidiary with sufficient reserves to meet local statutory/regulatory obligations. No significant constraints (apart from those shown in Note 12) have been identified and the Group has been able to distribute profits as appropriate.
The Group’s regulated capital requirement is reviewed regularly by the Board of 3i Investments plc, an investment firm regulated by the FCA, and the Group’s Audit and Compliance Committee. In addition, the Group’s Internal Capital Adequacy Assessment Process (“ICAAP”) report is updated as appropriate and reviewed by the Board of 3i Investments plc and the Audit and Compliance Committee. The Group complies with the Individual Capital Guidance as agreed with the FCA and operates with a significant consolidated regulatory capital surplus, significantly in excess of the FCA’s prudential rules. The Group’s Pillar 3 disclosure document can be found on www.3i.com.
23 Interests in Group entities
Accounting policy:The Company has controlling equity interests in, and makes loans to, both consolidated and fair valued Group entities. Equity investments in, and loans to, investment entities are held at fair value in the Company’s accounts. The net assets of these entities are deemed to represent fair value. Equity investments in other subsidiaries are held at cost less impairment and any loans to these subsidiaries are held at amortised cost in accordance with IFRS 9, which includes the requirement to calculate expected credit losses on initial recognition.
Company 2021
Equity investments
£m
Company 2021
Loans £m
Company 2021 Total
£m
Opening book value 2,318 1,705 4,023Additions 19 880 899Share of profits from partnership entities – 231 231Disposals and repayments (214) (681) (895)Fair value movements 264 414 678Exchange movements – (15) (15)Closing book value 2,387 2,534 4,921
Company 2020
Equity investments
£m
Company 2020
Loans £m
Company 2020 Total
£m
Opening book value 3,577 1,644 5,221Additions 25 1,200 1,225Share of profits from partnership entities – 1,470 1,470Disposals and repayments (14) (2,265) (2,279)Fair value movements (1,270) (377) (1,647)Exchange movements – 33 33Closing book value 2,318 1,705 4,023
Equity investments in, and loans to investment entities are held at fair value, equity investments in other subsidiaries are held at cost less impairment. The measurements at fair value and cost less impairment are assessed against the Company’s equity and loan instruments into these subsidiaries, which are eliminated on consolidation for the Group. For this reason equity investments and loans into investments entities do not form part of the investment portfolio for the Company and instead are included within interests in Group entities. Details of significant Group entities are given in Note 30.
3i Group plc Annual report and accounts 2021Audited financial statements
155
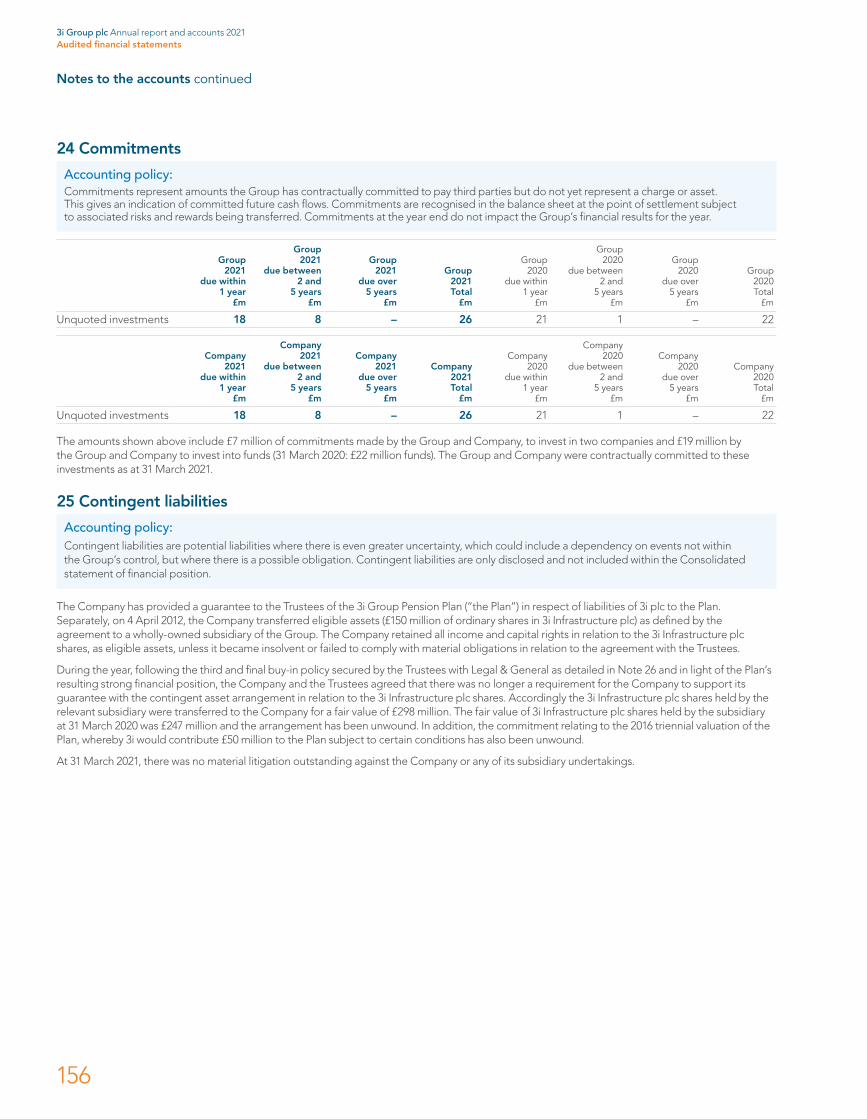
Notes to the accounts continued
24 Commitments
Accounting policy:Commitments represent amounts the Group has contractually committed to pay third parties but do not yet represent a charge or asset. This gives an indication of committed future cash flows. Commitments are recognised in the balance sheet at the point of settlement subject to associated risks and rewards being transferred. Commitments at the year end do not impact the Group’s financial results for the year.
Group 2021
due within 1 year
£m
Group 2021
due between 2 and
5 years £m
Group 2021
due over 5 years
£m
Group 2021 Total
£m
Group 2020
due within 1 year
£m
Group 2020
due between 2 and
5 years £m
Group 2020
due over 5 years
£m
Group 2020 Total
£m
Unquoted investments 18 8 – 26 21 1 – 22
Company 2021
due within 1 year
£m
Company 2021
due between 2 and
5 years £m
Company 2021
due over 5 years
£m
Company 2021 Total
£m
Company 2020
due within 1 year
£m
Company 2020
due between 2 and
5 years £m
Company 2020
due over 5 years
£m
Company 2020 Total
£m
Unquoted investments 18 8 – 26 21 1 – 22
The amounts shown above include £7 million of commitments made by the Group and Company, to invest in two companies and £19 million by the Group and Company to invest into funds (31 March 2020: £22 million funds). The Group and Company were contractually committed to these investments as at 31 March 2021.
25 Contingent liabilities
Accounting policy:Contingent liabilities are potential liabilities where there is even greater uncertainty, which could include a dependency on events not within the Group’s control, but where there is a possible obligation. Contingent liabilities are only disclosed and not included within the Consolidated statement of financial position.
The Company has provided a guarantee to the Trustees of the 3i Group Pension Plan (“the Plan”) in respect of liabilities of 3i plc to the Plan. Separately, on 4 April 2012, the Company transferred eligible assets (£150 million of ordinary shares in 3i Infrastructure plc) as defined by the agreement to a wholly-owned subsidiary of the Group. The Company retained all income and capital rights in relation to the 3i Infrastructure plc shares, as eligible assets, unless it became insolvent or failed to comply with material obligations in relation to the agreement with the Trustees.
During the year, following the third and final buy-in policy secured by the Trustees with Legal & General as detailed in Note 26 and in light of the Plan’s resulting strong financial position, the Company and the Trustees agreed that there was no longer a requirement for the Company to support its guarantee with the contingent asset arrangement in relation to the 3i Infrastructure plc shares. Accordingly the 3i Infrastructure plc shares held by the relevant subsidiary were transferred to the Company for a fair value of £298 million. The fair value of 3i Infrastructure plc shares held by the subsidiary at 31 March 2020 was £247 million and the arrangement has been unwound. In addition, the commitment relating to the 2016 triennial valuation of the Plan, whereby 3i would contribute £50 million to the Plan subject to certain conditions has also been unwound.
At 31 March 2021, there was no material litigation outstanding against the Company or any of its subsidiary undertakings.
3i Group plc Annual report and accounts 2021Audited financial statements
156
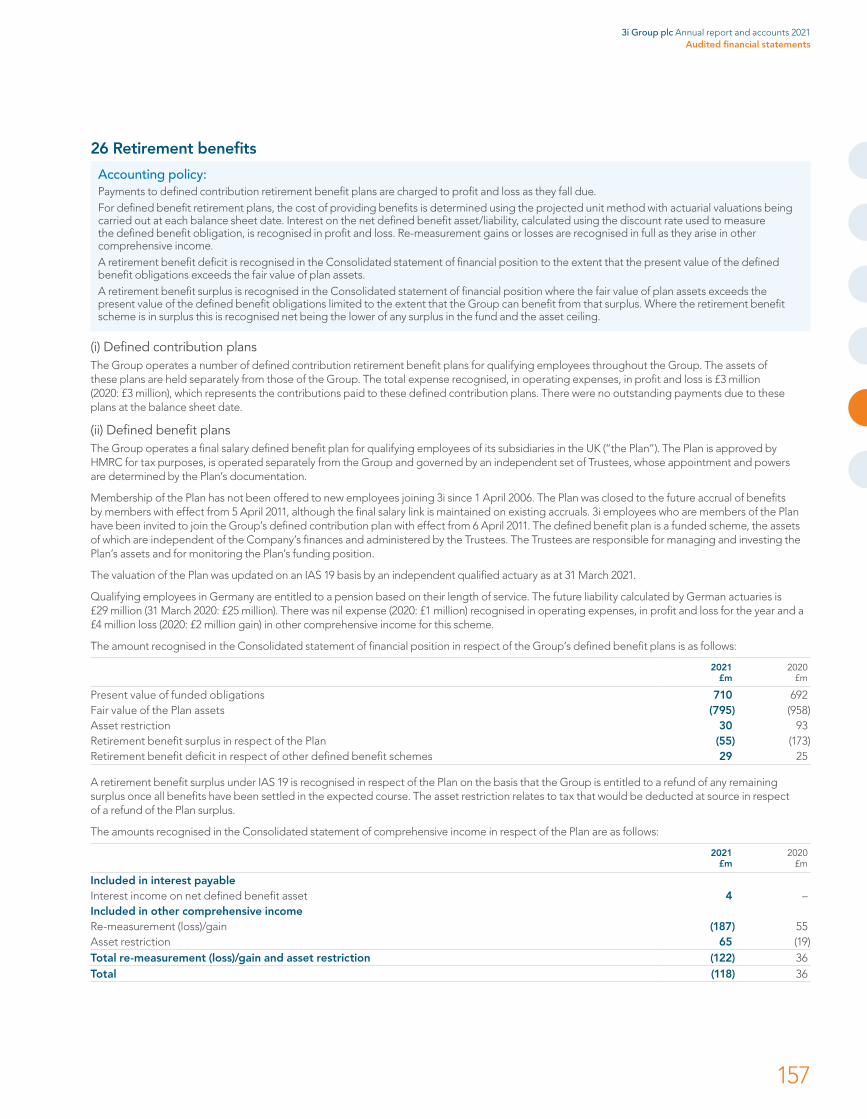
26 Retirement benefits
Accounting policy:Payments to defined contribution retirement benefit plans are charged to profit and loss as they fall due.For defined benefit retirement plans, the cost of providing benefits is determined using the projected unit method with actuarial valuations being carried out at each balance sheet date. Interest on the net defined benefit asset/liability, calculated using the discount rate used to measure the defined benefit obligation, is recognised in profit and loss. Re-measurement gains or losses are recognised in full as they arise in other comprehensive income.A retirement benefit deficit is recognised in the Consolidated statement of financial position to the extent that the present value of the defined benefit obligations exceeds the fair value of plan assets.A retirement benefit surplus is recognised in the Consolidated statement of financial position where the fair value of plan assets exceeds the present value of the defined benefit obligations limited to the extent that the Group can benefit from that surplus. Where the retirement benefit scheme is in surplus this is recognised net being the lower of any surplus in the fund and the asset ceiling.
(i) Defined contribution plansThe Group operates a number of defined contribution retirement benefit plans for qualifying employees throughout the Group. The assets of these plans are held separately from those of the Group. The total expense recognised, in operating expenses, in profit and loss is £3 million (2020: £3 million), which represents the contributions paid to these defined contribution plans. There were no outstanding payments due to these plans at the balance sheet date.
(ii) Defined benefit plansThe Group operates a final salary defined benefit plan for qualifying employees of its subsidiaries in the UK (“the Plan”). The Plan is approved by HMRC for tax purposes, is operated separately from the Group and governed by an independent set of Trustees, whose appointment and powers are determined by the Plan’s documentation.
Membership of the Plan has not been offered to new employees joining 3i since 1 April 2006. The Plan was closed to the future accrual of benefits by members with effect from 5 April 2011, although the final salary link is maintained on existing accruals. 3i employees who are members of the Plan have been invited to join the Group’s defined contribution plan with effect from 6 April 2011. The defined benefit plan is a funded scheme, the assets of which are independent of the Company’s finances and administered by the Trustees. The Trustees are responsible for managing and investing the Plan’s assets and for monitoring the Plan’s funding position.
The valuation of the Plan was updated on an IAS 19 basis by an independent qualified actuary as at 31 March 2021.
Qualifying employees in Germany are entitled to a pension based on their length of service. The future liability calculated by German actuaries is £29 million (31 March 2020: £25 million). There was nil expense (2020: £1 million) recognised in operating expenses, in profit and loss for the year and a £4 million loss (2020: £2 million gain) in other comprehensive income for this scheme.
The amount recognised in the Consolidated statement of financial position in respect of the Group’s defined benefit plans is as follows:
2021 £m
2020 £m
Present value of funded obligations 710 692Fair value of the Plan assets (795) (958)Asset restriction 30 93Retirement benefit surplus in respect of the Plan (55) (173)Retirement benefit deficit in respect of other defined benefit schemes 29 25
A retirement benefit surplus under IAS 19 is recognised in respect of the Plan on the basis that the Group is entitled to a refund of any remaining surplus once all benefits have been settled in the expected course. The asset restriction relates to tax that would be deducted at source in respect of a refund of the Plan surplus.
The amounts recognised in the Consolidated statement of comprehensive income in respect of the Plan are as follows:
2021 £m
2020 £m
Included in interest payable Interest income on net defined benefit asset 4 –Included in other comprehensive incomeRe-measurement (loss)/gain (187) 55Asset restriction 65 (19)Total re-measurement (loss)/gain and asset restriction (122) 36Total (118) 36
3i Group plc Annual report and accounts 2021Audited financial statements
157
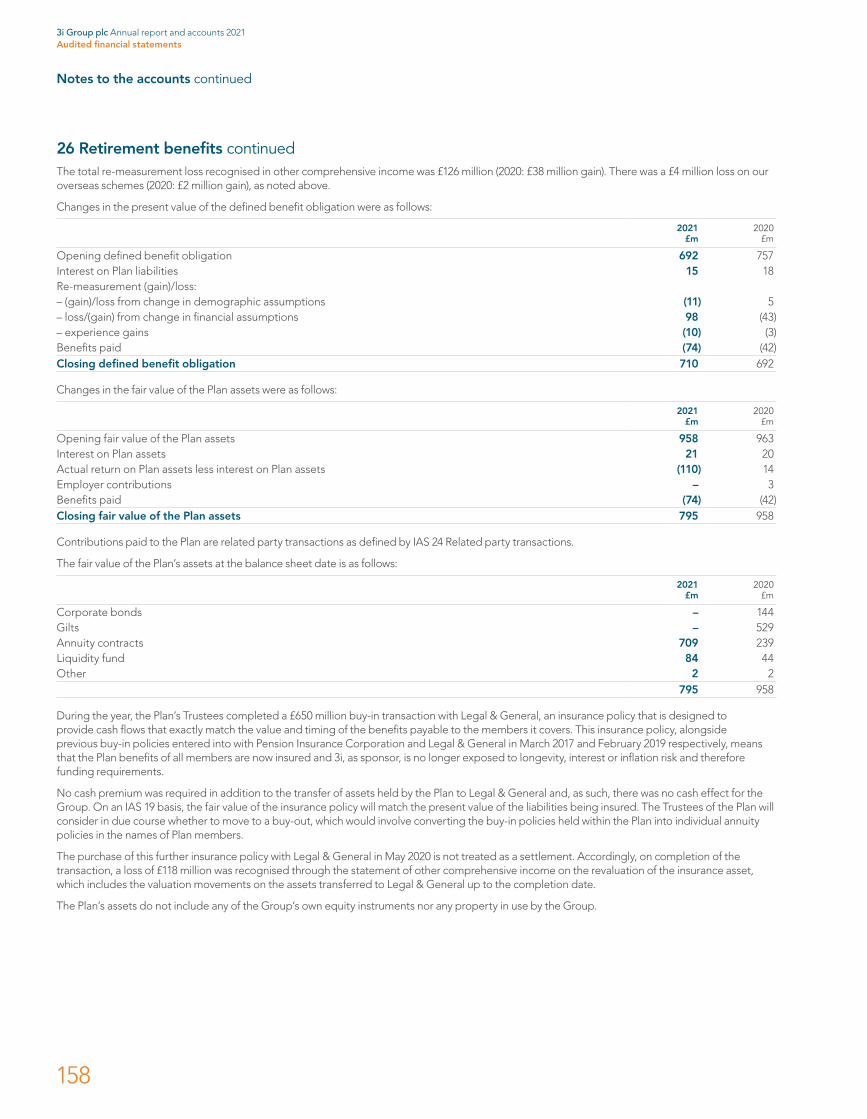
Notes to the accounts continued
26 Retirement benefits continuedThe total re-measurement loss recognised in other comprehensive income was £126 million (2020: £38 million gain). There was a £4 million loss on our overseas schemes (2020: £2 million gain), as noted above.
Changes in the present value of the defined benefit obligation were as follows:
2021 £m
2020 £m
Opening defined benefit obligation 692 757Interest on Plan liabilities 15 18Re-measurement (gain)/loss:– (gain)/loss from change in demographic assumptions (11) 5– loss/(gain) from change in financial assumptions 98 (43)– experience gains (10) (3)Benefits paid (74) (42)Closing defined benefit obligation 710 692
Changes in the fair value of the Plan assets were as follows:
2021 £m
2020 £m
Opening fair value of the Plan assets 958 963Interest on Plan assets 21 20Actual return on Plan assets less interest on Plan assets (110) 14Employer contributions – 3Benefits paid (74) (42)Closing fair value of the Plan assets 795 958
Contributions paid to the Plan are related party transactions as defined by IAS 24 Related party transactions.
The fair value of the Plan’s assets at the balance sheet date is as follows:
2021 £m
2020 £m
Corporate bonds – 144Gilts – 529Annuity contracts 709 239Liquidity fund 84 44Other 2 2
795 958
During the year, the Plan’s Trustees completed a £650 million buy-in transaction with Legal & General, an insurance policy that is designed to provide cash flows that exactly match the value and timing of the benefits payable to the members it covers. This insurance policy, alongside previous buy-in policies entered into with Pension Insurance Corporation and Legal & General in March 2017 and February 2019 respectively, means that the Plan benefits of all members are now insured and 3i, as sponsor, is no longer exposed to longevity, interest or inflation risk and therefore funding requirements.
No cash premium was required in addition to the transfer of assets held by the Plan to Legal & General and, as such, there was no cash effect for the Group. On an IAS 19 basis, the fair value of the insurance policy will match the present value of the liabilities being insured. The Trustees of the Plan will consider in due course whether to move to a buy-out, which would involve converting the buy-in policies held within the Plan into individual annuity policies in the names of Plan members.
The purchase of this further insurance policy with Legal & General in May 2020 is not treated as a settlement. Accordingly, on completion of the transaction, a loss of £118 million was recognised through the statement of other comprehensive income on the revaluation of the insurance asset, which includes the valuation movements on the assets transferred to Legal & General up to the completion date.
The Plan’s assets do not include any of the Group’s own equity instruments nor any property in use by the Group.
3i Group plc Annual report and accounts 2021Audited financial statements
158
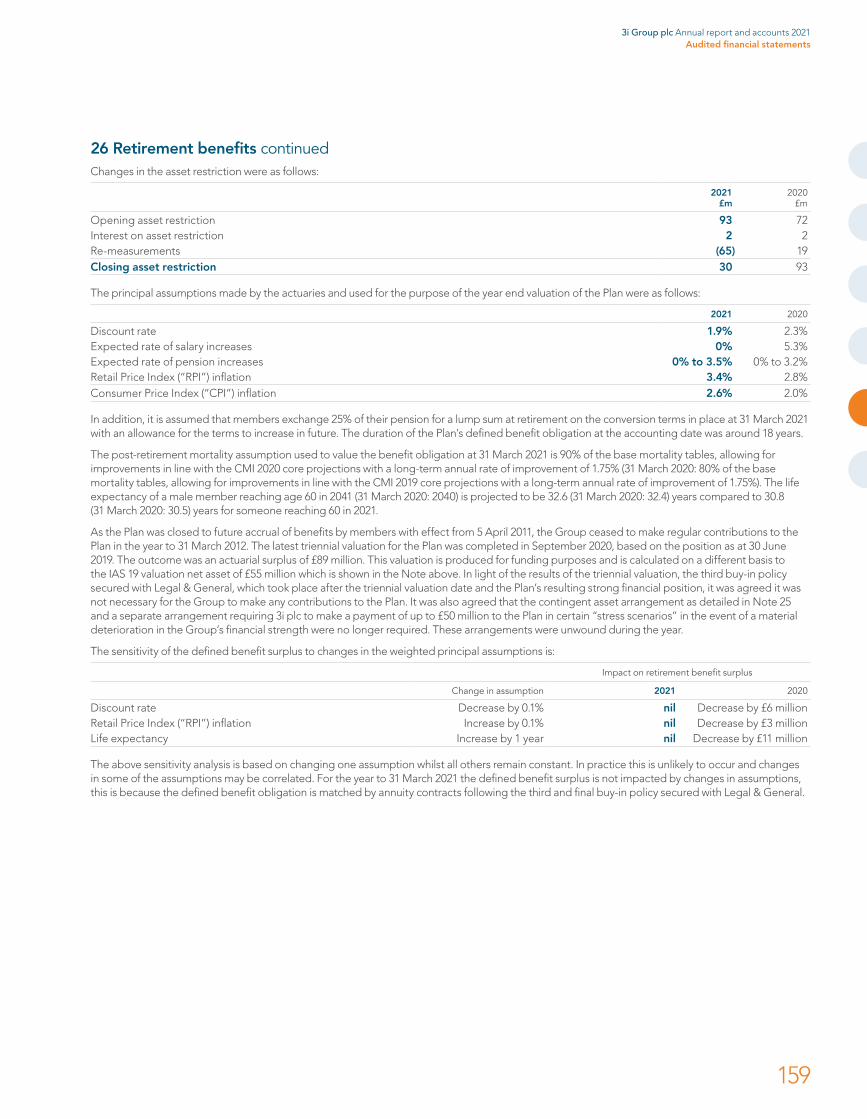
26 Retirement benefits continuedChanges in the asset restriction were as follows:
2021 £m
2020 £m
Opening asset restriction 93 72Interest on asset restriction 2 2Re-measurements (65) 19Closing asset restriction 30 93
The principal assumptions made by the actuaries and used for the purpose of the year end valuation of the Plan were as follows:
2021 2020
Discount rate 1.9% 2.3%Expected rate of salary increases 0% 5.3%Expected rate of pension increases 0% to 3.5% 0% to 3.2%Retail Price Index (“RPI”) inflation 3.4% 2.8%Consumer Price Index (“CPI”) inflation 2.6% 2.0%
In addition, it is assumed that members exchange 25% of their pension for a lump sum at retirement on the conversion terms in place at 31 March 2021 with an allowance for the terms to increase in future. The duration of the Plan’s defined benefit obligation at the accounting date was around 18 years.
The post-retirement mortality assumption used to value the benefit obligation at 31 March 2021 is 90% of the base mortality tables, allowing for improvements in line with the CMI 2020 core projections with a long-term annual rate of improvement of 1.75% (31 March 2020: 80% of the base mortality tables, allowing for improvements in line with the CMI 2019 core projections with a long-term annual rate of improvement of 1.75%). The life expectancy of a male member reaching age 60 in 2041 (31 March 2020: 2040) is projected to be 32.6 (31 March 2020: 32.4) years compared to 30.8 (31 March 2020: 30.5) years for someone reaching 60 in 2021.
As the Plan was closed to future accrual of benefits by members with effect from 5 April 2011, the Group ceased to make regular contributions to the Plan in the year to 31 March 2012. The latest triennial valuation for the Plan was completed in September 2020, based on the position as at 30 June 2019. The outcome was an actuarial surplus of £89 million. This valuation is produced for funding purposes and is calculated on a different basis to the IAS 19 valuation net asset of £55 million which is shown in the Note above. In light of the results of the triennial valuation, the third buy-in policy secured with Legal & General, which took place after the triennial valuation date and the Plan’s resulting strong financial position, it was agreed it was not necessary for the Group to make any contributions to the Plan. It was also agreed that the contingent asset arrangement as detailed in Note 25 and a separate arrangement requiring 3i plc to make a payment of up to £50 million to the Plan in certain “stress scenarios” in the event of a material deterioration in the Group’s financial strength were no longer required. These arrangements were unwound during the year.
The sensitivity of the defined benefit surplus to changes in the weighted principal assumptions is:
Impact on retirement benefit surplus
Change in assumption 2021 2020
Discount rate Decrease by 0.1% nil Decrease by £6 millionRetail Price Index (“RPI”) inflation Increase by 0.1% nil Decrease by £3 millionLife expectancy Increase by 1 year nil Decrease by £11 million
The above sensitivity analysis is based on changing one assumption whilst all others remain constant. In practice this is unlikely to occur and changes in some of the assumptions may be correlated. For the year to 31 March 2021 the defined benefit surplus is not impacted by changes in assumptions, this is because the defined benefit obligation is matched by annuity contracts following the third and final buy-in policy secured with Legal & General.
3i Group plc Annual report and accounts 2021Audited financial statements
159
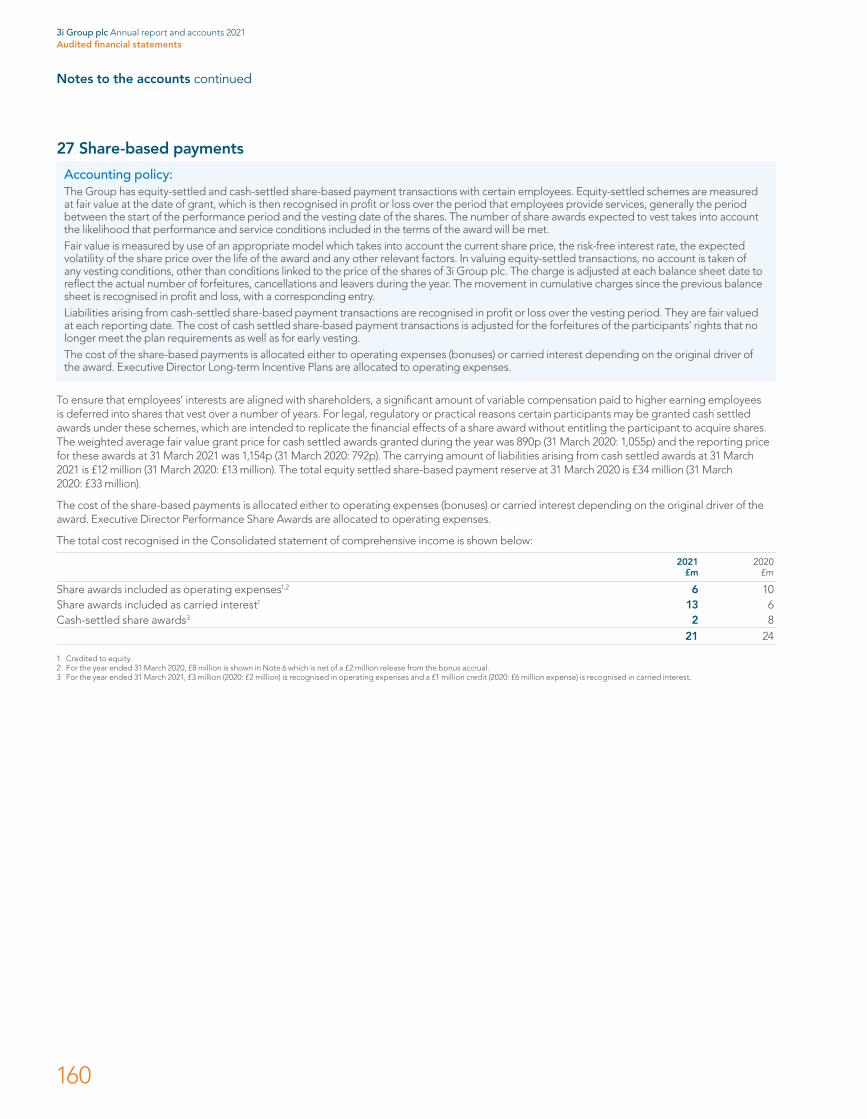
Notes to the accounts continued
27 Share-based payments
Accounting policy:The Group has equity-settled and cash-settled share-based payment transactions with certain employees. Equity-settled schemes are measured at fair value at the date of grant, which is then recognised in profit or loss over the period that employees provide services, generally the period between the start of the performance period and the vesting date of the shares. The number of share awards expected to vest takes into account the likelihood that performance and service conditions included in the terms of the award will be met.Fair value is measured by use of an appropriate model which takes into account the current share price, the risk-free interest rate, the expected volatility of the share price over the life of the award and any other relevant factors. In valuing equity-settled transactions, no account is taken of any vesting conditions, other than conditions linked to the price of the shares of 3i Group plc. The charge is adjusted at each balance sheet date to reflect the actual number of forfeitures, cancellations and leavers during the year. The movement in cumulative charges since the previous balance sheet is recognised in profit and loss, with a corresponding entry.Liabilities arising from cash-settled share-based payment transactions are recognised in profit or loss over the vesting period. They are fair valued at each reporting date. The cost of cash settled share-based payment transactions is adjusted for the forfeitures of the participants’ rights that no longer meet the plan requirements as well as for early vesting.The cost of the share-based payments is allocated either to operating expenses (bonuses) or carried interest depending on the original driver of the award. Executive Director Long-term Incentive Plans are allocated to operating expenses.
To ensure that employees’ interests are aligned with shareholders, a significant amount of variable compensation paid to higher earning employees is deferred into shares that vest over a number of years. For legal, regulatory or practical reasons certain participants may be granted cash settled awards under these schemes, which are intended to replicate the financial effects of a share award without entitling the participant to acquire shares. The weighted average fair value grant price for cash settled awards granted during the year was 890p (31 March 2020: 1,055p) and the reporting price for these awards at 31 March 2021 was 1,154p (31 March 2020: 792p). The carrying amount of liabilities arising from cash settled awards at 31 March 2021 is £12 million (31 March 2020: £13 million). The total equity settled share-based payment reserve at 31 March 2020 is £34 million (31 March 2020: £33 million).
The cost of the share-based payments is allocated either to operating expenses (bonuses) or carried interest depending on the original driver of the award. Executive Director Performance Share Awards are allocated to operating expenses.
The total cost recognised in the Consolidated statement of comprehensive income is shown below:
2021 £m
2020 £m
Share awards included as operating expenses1,2 6 10Share awards included as carried interest1 13 6Cash-settled share awards3 2 8
21 24
1 Credited to equity.2 For the year ended 31 March 2020, £8 million is shown in Note 6 which is net of a £2 million release from the bonus accrual.3 For the year ended 31 March 2021, £3 million (2020: £2 million) is recognised in operating expenses and a £1 million credit (2020: £6 million expense) is recognised in carried interest.
3i Group plc Annual report and accounts 2021Audited financial statements
160
27 Share-based payments continuedMovements in share awardsThe number of equity and cash settled share-based awards outstanding as at 31 March is as follows:
2021 Number
2020 Number
Outstanding at the start of the year 6,772,722 8,987,604Granted 6,480,993 2,686,985Exercised (2,810,733) (4,733,314)Forfeited (302,414) (168,553)Lapsed (58,970) –Outstanding at the end of year 10,081,598 6,772,722Weighted average remaining contractual life of awards outstanding in years 2.5 1.8Weighted average fair value of awards granted (pence) 766 896Weighted average market price at date of exercise (pence) 843 1,068Exercisable at the end of the year 15,381 21,200
Details of the different types of awards are as follows:
Performance Share AwardPerformance Share Awards are granted to employees and Executive Directors under the 3i Group Discretionary Share Plan 2020 (and predecessor rules).
EmployeesPerformance Share Awards granted to employees (other than Executive Directors) after the financial year end are subject to performance conditions based on absolute and relative Total Shareholder Return over three financial years. Awards performance vest, to the extent they satisfy the performance conditions, following the three-year performance period and are then released in the third year from the date of grant together with a payment equal to the dividends that would have been paid on the released shares during the period from grant to release. The method of settlement can be both equity and cash depending on the type of award. The equity awards are measured using the Monte Carlo model. The model simulates the Total Shareholder Return which has been incorporated into the fair value at grant date by applying a discount to the valuation obtained.
Executive DirectorsPerformance Share Awards granted to Executive Directors after the financial year are subject to performance conditions based on absolute and relative Total Shareholder Return over three financial years. Awards performance vest, to the extent they satisfy the performance conditions, following the three-year performance period. Outstanding Executive Director awards granted up to and including 2019 are released, to the extent they have performance vested, together with a payment equal to the value of the dividends that would have been paid on the released shares during the period from grant to release as to 50% in year three and 25% in each of years four and five. Executive Director performance share awards granted from 2020 onwards are released, to the extent they have performance vested, in the fifth year from the date of grant together with a payment equal to the value of the dividends that would have been paid on the released shares during the period from grant to release. The method of settlement is equity. These awards are measured using the Monte Carlo model. The model simulates the Total Shareholder Return which has been incorporated into the fair value at grant date by applying a discount to the valuation obtained. The features of the Group’s share schemes for Executive Directors are described in the Directors’ remuneration report on pages 107 to 117.
Restricted Share AwardRestricted Share Awards are granted under the 3i Group Deferred Bonus Plan 2020 (and predecessor rules) and are granted to employees and Executive Directors after the financial year and are subject to continued service conditions. The shares subject to the awards are transferred to the participants on grant subject to forfeiture if the service condition is not fulfilled and cease to be subject to forfeiture in equal proportions over the three years following grant or over four years in the case of certain such awards granted to members of the Executive Committee. Cash dividends are received by participants on the shares during the period in which they remain subject to forfeiture. The method of settlement can be both equity and cash depending on the type of award. The equity awards are measured using the Black Scholes model.
Deferred Share AwardDeferred Share Awards were granted under the 3i Group Deferred Bonus Plan and were subject to continued service conditions. Subject to fulfilment of the service conditions awards vested in the third year following grant and were exercisable in the third to tenth years following grant. Deferred Share Awards are no longer being made and all outstanding awards have vested.
3i Group plc Annual report and accounts 2021Audited financial statements
161
Notes to the accounts continued
27 Share-based payments continuedInfrastructure Performance Fee AwardInfrastructure Performance Fee Share awards are granted to employees in the Infrastructure team under the 3i Special Share Award Plan. Awards are granted to employees after the financial year and are subject to performance conditions based on receipt by 3i plc of certain instalments of performance fees payable by 3i Infrastructure plc under the terms of its Investment Management Agreement with 3i. The shares vest and are released, subject to satisfying the performance conditions, in equal instalments in the first and second years after grant together with payments equal to the value of the dividends that would have been paid on the released shares during the period from grant to release. If the performance condition is not met in year one, the award does not lapse but is retested in year two when some or all of the shares may vest. The method of settlement can be both equity and cash depending on the type of award. The equity awards are measured using the Black Scholes model.
Measurement of fair valuesThe fair value of the plans have been measured using both the Monte Carlo model and Black Scholes model for equity share awards. The inputs used in the measurement of the grants are based on the following assumptions:
Monte Carlo model Black Scholes model
2021 2020 2021 2020
Share price at grant date (pence)1 849 1,082 870 1,056Fair value at grant date (pence)1 250 619 777 969Exercise price (pence) – – – –Expected volatility (weighted average) 26.0% 22.9% 30.9% 24.6%Expected life (weighted average) 4 years 3 years 3 years 3 yearsDividend yield – – 4.0% 3.3%Risk free interest rate 0.02% 0.57% 0.01% 0.58%
1 Where share awards are granted on multiple dates the average price is disclosed.
Expected volatility was determined by reviewing share price volatility for the expected life of each award up to the date of grant.
Holdings of 3i Group plc sharesThe Group has established an employee benefit trust and the total number of 3i Group plc shares held in this trust at 31 March 2021 was 9 million (31 March 2020: 10 million). Dividend rights have been waived on these shares. During the year, the trust did not acquire any shares. During the year to 31 March 2020 the trust acquired 7 million shares at an average price of 821 pence per share. The total market value of the shares held in trust based on the year end share price of 1,154 pence (31 March 2020: 792 pence) was £98 million (31 March 2020: £82 million).
28 Financial risk managementIntroductionA review of the Group’s objectives, policies and processes for managing and monitoring risk is set out in the Risk management section on pages 50 to 62. This Note provides further detail on financial risk management, cross-referring to the Risk management section where applicable, and includes quantitative data on specific financial risks.
The Group is a highly selective investor and each investment is subject to an individual risk assessment through an investment approval process. The Group’s Investment Committee is part of the overall risk management framework set out in the Risk section. The risk management processes of the Company are aligned with those of the Group and both the Group and the Company share the same financial risks.
Financial risksConcentration risk3i seeks to diversify risk through significant dispersion of investments by geography, economic sector, asset class and size as well as through the maturity profile of its investment portfolio. Although 3i does not set maximum limits for asset allocation, it does have a maximum exposure limit for the cost of new investments. This is detailed in the Investment policy on page 118 in the Governance section. Quantitative data regarding the concentration risk of the portfolio across geographies can be found in the Segmental analysis in Note 1 and in the 20 large investments table on pages 186 and 187.
Action is the largest asset in the Group’s investment portfolio and a 5% increase or decrease in value would result in £228 million or £(228) million impact on the overall Group portfolio value.
Credit riskThe Group is subject to credit risk on its unquoted investments, derivatives, cash and deposits. The maximum exposure is the balance sheet amount. The Group’s cash is held with a variety of counterparties with 90% of the Group’s surplus cash held on demand in AAA rated money market funds (31 March 2020: 97%).
The credit quality of unquoted investments, which are held at fair value and include debt and equity elements, is based on the financial performance of the individual portfolio companies. The credit risk relating to these assets is based on their enterprise value and is reflected through fair value movements. Further detail can be found in the Price risk – market fluctuations disclosure in this Note and the sensitivity disclosure to changes in the valuation assumptions is provided in the valuation section of Note 13.
3i Group plc Annual report and accounts 2021Audited financial statements
162

28 Financial risk management continuedLiquidity riskThe liquidity outlook is monitored at least monthly by management and regularly by the Board in the context of periodic strategic reviews of the balance sheet. The new investment pipeline and forecast realisations are closely monitored and assessed against our vintage control policy, as described on page 50 of the Risk management section. The table below analyses the maturity of the Group’s gross contractual liabilities.
Financial liabilities
As at 31 March 2021
Due within 1 year
£m
Due between 1 and 2 years
£m
Due between 2 and 5 years
£m
Due more than 5 years
£m
£m Total
£m
Gross commitments:Fixed loan notes 50 250 110 1,143 1,553Committed multi-currency facility 1 1 2 – 4Carried interest and performance fees payable within one year 17 – – – 17Trade and other payables 63 – – 17 80Lease liabilities 4 4 9 – 17Total 135 255 121 1,160 1,671
Gross commitments include principal amounts and interest and fees where relevant. Carried interest and performance fees payable within non-current liabilities of £49 million (31 March 2020: £66 million) has no stated maturity as it results from investment related transactions and it is not possible to identify with certainty the timing of when the investments will be sold. Carried interest and performance fees payable within non-current liabilities is shown after discounting, which has an impact of £1 million (31 March 2020: £2 million).
As at 31 March 2020
Due within1 year
£m
Due between1 and 2 years
£m
Due between2 and 5 years
£m
Due morethan 5 years
£m
£mTotal
£m
Gross commitments:Fixed loan notes 35 35 278 547 895Committed multi-currency facility 1 1 2 – 4Carried interest and performance fees payable within one year 41 – – – 41Trade and other payables 73 – – – 73Lease liabilities 4 4 12 – 20Total 154 40 292 547 1,033
The Company disclosures are the same as those for the Group with the following exceptions: carried interest and performance fees payable due within one year is nil (31 March 2020: nil), trade and other payables due within one year is £536 million (31 March 2020: £483 million), trade and other payables due more than five years nil (31 March 2020: nil) and lease liabilities due within one year nil (31 March 2020: nil), lease liabilities due between one and two years nil (31 March 2020: nil) and lease liabilities due between two and five years nil (31 March 2020: nil).
Market riskThe valuation of the Group’s investment portfolio is largely dependent on the underlying trading performance of the companies within the portfolio but the valuation and other items in the financial statements can also be affected by interest rate, currency and quoted market fluctuations. The Group’s sensitivity to these items is set out below. During the year market price risk impacted the valuations of the Group’s investments due to increased volatility within capital markets caused by the global economic impact of Covid-19, this is further detailed on pages 60 and 61 in the Risk management section.
(i) Interest rate riskOn the liability side, the direct impact of a movement in interest rates is limited to any drawings under the committed multi-currency facility as the Group’s outstanding debt is fixed rate. The sensitivities below arise principally from changes in interest receivable on cash and deposits.
An increase of 100 basis points, based on the closing balance sheet position over a 12-month period, would lead to an approximate increase in total comprehensive income of £2 million (2020: £8 million) for the Group and £2 million (2020: £7 million) for the Company. In addition, the Group and Company have indirect exposure to interest rates through changes to the financial performance and the valuation of portfolio companies caused by interest rate fluctuations.
(ii) Currency riskThe Group’s net assets in euro, US dollar, Danish krone and all other currencies combined are shown in the table below. This sensitivity analysis is performed based on the sensitivity of the Group’s net assets to movements in foreign currency exchange rates assuming a 10% movement in exchange rates against sterling. The sensitivity of the Company to foreign exchange risk is not materially different from the Group.
3i Group plc Annual report and accounts 2021Audited financial statements
163
Notes to the accounts continued
28 Financial risk management continuedThe Group considers currency risk on specific investment and realisation transactions. Further information on how currency risk is managed is provided on page 61.
As at 31 March 2021Sterling
£mEuro
£mUS dollar
£mDanish krone
£mOther
£mTotal
£m
Net assets 1,254 6,237 1,489 162 22 9,164Sensitivity analysisAssuming a 10% movement in exchange rates against sterling:Impact on net assets n/a 622 149 16 2 789
As at 31 March 2020Sterling
£mEuro
£mUS dollar
£mDanish krone
£mOther
£mTotal
£m
Net assets 1,511 4,904 1,191 119 32 7,757Sensitivity analysisAssuming a 10% movement in exchange rates against sterling:Impact on net assets n/a 489 119 12 3 623
(iii) Price risk – market fluctuationsThe Group’s management of price risk, which arises primarily from quoted and unquoted equity instruments, is through the careful consideration of the investment, asset management and divestment decisions at the Investment Committee. The Investment Committee’s role in risk management is detailed on page 55 in the Risk management section. A 5% change in the fair value of those investments would have the following direct impact in profit or loss:
Group
Quoted investment
£m
Unquoted investment
£m
Investment in Investment
entity subsidiaries
£mTotal
£m
At 31 March 2021 40 211 245 496At 31 March 20201 21 152 197 370
Company
Quoted investment
£m
Unquoted investment
£mTotal
£m
At 31 March 2021 40 211 251At 31 March 20201 21 152 173
1 Comparatives as at 31 March 2020 are based on a 5% change in fair value.
29 Related parties and interests in other entitiesThe Group has various related parties stemming from relationships with limited partnerships managed by the Group, its investment portfolio (including unconsolidated subsidiaries), its advisory arrangements and its key management personnel. In addition, the Company has related parties in respect of its subsidiaries. Some of these subsidiaries are held at fair value (unconsolidated subsidiaries) due to the treatment prescribed in IFRS 10.
Related partiesLimited partnershipsThe Group manages a number of external funds which invest through limited partnerships. Group companies act as the general partners of these limited partnerships and exert significant influence over them. The following amounts have been included in respect of these limited partnerships:
Statement of comprehensive income
Group 2021
£m
Group 2020
£m
Company 2021
£m
Company 2020
£m
Carried interest receivable (3) 61 9 102Fees receivable from external funds 17 14 – –
Statement of financial position
Group 2021
£m
Group 2020
£m
Company 2021
£m
Company 2020
£m
Carried interest receivable 9 12 38 68
3i Group plc Annual report and accounts 2021Audited financial statements
164

29 Related parties and interests in other entities continuedInvestmentsThe Group makes investments in the equity of unquoted and quoted investments where it does not have control but may be able to participate in the financial and operating policies of that company. IFRS presumes that it is possible to exert significant influence when the equity holding is greater than 20%. The Group has taken the investment entity exception as permitted by IFRS 10 and has not equity accounted for these investments, in accordance with IAS 28, but they are related parties. The total amounts included for investments where the Group has significant influence but not control are as follows:
Statement of comprehensive income
Group 2021
£m
Group 2020
£m
Company 2021
£m
Company 2020
£m
Realised profits/(losses) over value on the disposal of investments 8 (29) 8 (29)Unrealised profits on the revaluation of investments 225 66 225 66Portfolio income 19 3 18 3
Statement of financial position
Group 2021
£m
Group 2020
£m
Company 2021
£m
Company 2020
£m
Unquoted investments 578 354 578 354
Advisory and management arrangementsThe Group acted as Investment Manager to 3i Infrastructure plc (“3iN”), which is listed on the London Stock Exchange, for the year to 31 March 2021. The following amounts have been recognised in respect of the management relationship:
Statement of comprehensive income
Group 2021
£m
Group 2020
£m
Company 2021
£m
Company 2020
£m
Unrealised profits/(losses) on the revaluation of investments 82 (48) 82 (48)Fees receivable from external funds 25 29 – –Performance fees receivable 8 6 – –Dividends 16 15 16 15
Statement of financial position
Group 2021
£m
Group 2020
£m
Company 2021
£m
Company 2020
£m
Quoted equity investments 797 418 797 418Performance fees receivable 8 6 – –
SubsidiariesTransactions between the Company and its fully consolidated subsidiaries, which are related parties of the Company, are eliminated on consolidation. Details of related party transactions between the Company and its subsidiaries are detailed below.
Management, administrative and secretarial arrangementsThe Company has appointed 3i Investments plc, a wholly-owned subsidiary of the Company incorporated in England and Wales, as its investment manager. 3i Investments plc received a fee of £8 million (2020: £13 million) from 3i plc, a fellow subsidiary, for this service.
The Company has appointed 3i plc, a wholly-owned subsidiary of the Company incorporated in England and Wales, to provide the Company with a range of administrative and secretarial services. 3i plc received a fee of £107 million (2020: £93 million) for this service.
Key management personnelThe Group’s key management personnel comprise the members of the Executive Committee and the Board’s non-executive Directors. The following amounts have been included in respect of these individuals:
Statement of comprehensive income
Group 2021
£m
Group 2020
£m
Salaries, fees, supplements and benefits in kind 4 4Cash bonuses 2 2Carried interest and performance fees payable 16 9Share-based payments 9 10Termination payments – –
3i Group plc Annual report and accounts 2021Audited financial statements
165
Notes to the accounts continued
29 Related parties and interests in other entities continued
Statement of financial position
Group 2021
£m
Group 2020
£m
Bonuses and share-based payments 15 22Carried interest and performance fees payable within one year 1 41Carried interest and performance fees payable after one year 42 32
No carried interest was paid or accrued for the Executive or non-executive Directors (2020: nil). Carried interest paid in the year to other key management personnel was £48 million (2020: £2 million).
Unconsolidated structured entitiesThe application of IFRS 12 requires additional disclosure on the Group’s exposure to unconsolidated structured entities.
The Group has exposure to a number of unconsolidated structured entities as a result of its investment activities across its Private Equity and Infrastructure business lines. The nature, purpose and activities of these entities are detailed below along with the nature of risks associated with these entities and the maximum exposure to loss.
Closed-end limited partnershipsThe Group manages a number of closed-end limited partnerships, which are either Private Equity or Infrastructure focused, in return for a management fee. The purpose of these partnerships is to invest in Private Equity or Infrastructure investments for capital appreciation. Limited Partners, which in some cases may include the Group, finance these entities by committing capital to them and cash is drawn down or distributed for financing investment activity.
The Group’s attributable stakes in these entities are held at fair value, fees receivable are recognised on an accruals basis and carried interest is accrued when relevant performance hurdles are met.
The risk and maximum exposure to loss arising from the Group’s involvement with these entities are summarised below:
Balance sheet line item of asset or liability
Carrying amountMaximum loss
exposure£m
Assets£m
Liabilities£m
Net£m
Unquoted investments 69 – 69 69Carried interest receivable 9 – 9 9Total 78 – 78 78
At 31 March 2020, the carrying amount of assets and maximum loss exposure of unquoted investments and carried interest receivable was £58 million and £12 million respectively. The carrying amount of liabilities was nil.
At 31 March 2021, the total assets under management relating to these entities was £4.4 billion (31 March 2020: £4.3 billion). The Group earned fee income of £17 million (2020: £14 million) and a carried interest credit of £3 million (2020: £61 million expense) in the year.
Regulatory information relating to fees3i Investments plc acts as the AIFM of 3i Group plc. In performing the activities and functions of the AIFM, the AIFM or another 3i company may pay or receive fees, commissions or non-monetary benefits to or from third parties of the following nature:
Transaction fees3i companies receive monitoring and directors’ fees from portfolio companies. The amount is agreed with the portfolio company at the time of the investment but may be re-negotiated. Where applicable, 3i may also receive fees on the completion of transactions such as acquisitions, refinancings or syndications either from the portfolio company or a co-investor. Transaction fees paid to 3i are included in portfolio income.
Payments for third-party services3i companies may retain the services of third-party consultants; for example, for an independent director or other investment management specialist expertise. The amount paid varies in accordance with the nature of the service and the length of the service period and is usually, but not always, paid/reimbursed by the portfolio companies. The payment may involve a flat fee, retainer or success fee. Such payments, where borne by 3i companies, are usually included in portfolio income.
Payments for services from 3i companiesOne 3i company may provide investment advisory services to another 3i company and receive payment for such services.
3i Group plc Annual report and accounts 2021Audited financial statements
166

30 Subsidiaries and related undertakingsIFRS 10 deems control, as opposed to equity ownership, as the key factor when determining what meets the definition of a subsidiary. If a group is exposed to, or has rights to, variable returns from its involvement with the investee, then under IFRS 10 it has control. This is inconsistent with the UK’s Companies Act 2006, where voting rights being greater than 50% is the key factor when identifying subsidiaries.
Under IFRS 10, 26 of the Group’s portfolio company investments are considered to be accounting subsidiaries. As the Group applies the investment entity exception available under IFRS 10, these investee companies are classified as investment entity subsidiaries.
The Companies Act 2006 requires disclosure of certain information about the Group’s related undertakings. Related undertakings are subsidiaries, joint ventures, associates and other significant holdings. In this context, significant means either a shareholding greater than or equal to 20% of the nominal value of any class of shares or a book value greater than 20% of the Group’s assets.
The Company’s related undertakings at 31 March 2021 are listed below:
Description Holding/share class Footnote
Subsidiaries3i Holdings plc 100% ordinary shares 13i Investments plc 100% ordinary shares 13i plc 100% ordinary shares 13i International Holdings 100% ordinary shares 1Investors in Industry plc 100% ordinary shares/cumulative preference shares 1Mayflower GP Limited 100% ordinary shares 363i Assets LLP 100% partnership interest 13i General Partner No 1 Limited 100% ordinary shares 13i Corporation 100% ordinary shares 23i Deutschland Gesellschaft für Industriebeteiligungen mbH 100% ordinary shares 4Gardens Nominees Limited 100% ordinary shares 1Gardens Pension Trustees Limited 100% ordinary shares 13i Europe plc 100% ordinary shares 13i Nominees Limited 100% ordinary shares 13i Osprey GP Limited 100% ordinary shares 13i Investments GP Limited 100% ordinary shares 13i Nordic plc 100% ordinary shares 13i GP 2004 Limited 100% ordinary shares 33i Ademas LP 100% partnership interest 3The 3i Group Employee Trust n/a 63i International Services plc 100% ordinary shares 13i EFV Nominees A Limited 100% ordinary shares 13i EFV Nominees B Limited 100% ordinary shares 13i India Private Limited 100% ordinary shares 73i Sports Media (Mauritius) Limited 100% ordinary shares 83i Asia Limited 100% ordinary shares 83i EFV GP Limited 100% ordinary shares 13i Infraprojects (Mauritius) Limited 100% ordinary shares 83i Research (Mauritius) Limited 100% ordinary shares 8IIF SLP GP Limited 100% ordinary shares 33i Buyouts 2010 A LP 83% partnership interest 13i Buyouts 2010 B LP 79% partnership interest 1GP CCC 2010 Limited 100% ordinary shares 33i GC GP Limited 100% ordinary shares 13i GP 2010 Limited 100% ordinary shares 13i Growth Capital A LP 100% partnership interest 13i Growth Capital G LP 100% partnership interest 13i Growth 2010 LP 85% partnership interest 1Strategic Investments FM (Mauritius) Alpha Limited 70% ordinary shares 83i GC Nominees A Limited 100% ordinary shares 13i GC Nominees B Limited 100% ordinary shares 13i India Infrastructure B LP 99% partnership interest 193i Asia Pacific 2004-06 LP 100% partnership interest 1
3i Group plc Annual report and accounts 2021Audited financial statements
167

Notes to the accounts continued
Description Holding/share class Footnote
3i 2004 GmbH & Co KG 100% partnership interest 43i General Partner 2004 GmbH 100% ordinary shares 4Pan European Buyouts Co-invest 2006-08 LP 100% partnership interest 1Pan Euro Buyouts (Dutch) A Co-invest 2006-08 LP 100% partnership interest 13i US Growth Corporation 100% ordinary shares 34Global Growth Co-invest 2006-08 LP 100% partnership interest 17Pan European Growth Co-invest 2006-08 LP 100% partnership interest 1Pan European Growth (Dutch)A Co-invest 2006-08 LP 100% partnership interest 1Asia Growth Co-invest 2006-08 LP 100% partnership interest 13i GP 2006-08 Limited 100% ordinary shares 1Pan European Buyouts (Nordic) Co-invest 2006-08 LP 100% partnership interest 1Pan European Growth (Nordic) Co-invest 2006-08 LP 100% partnership interest 1GP CCC 08-10 Limited 100% ordinary shares 33i GP 08-10 Limited 100% ordinary shares 13i PE 2013-16A LP 100% partnership interest 13i PE 2013-16C LP 100% partnership interest 13i GP 2013 Ltd 100% ordinary shares 1GP 2013 Ltd 100% ordinary shares 33i BIFM Investments Limited 100% ordinary shares 1BIIF GP Limited 100% ordinary shares 1BAM General Partner Limited 100% ordinary shares 1BEIF Management Limited 100% ordinary shares 13i BIIF GP LLP 100% partnership interest 13i PE 2016-19 A LP 100% partnership interest 13i Managed Infrastructure Acquisitions GP (2017) LLP 100% partnership interest 13i Managed Infrastructure Acquisitions GP Limited 100% ordinary shares 13i 2016 Gmbh & Co. KG 100% partnership interest 43i European Operational Projects GmbH & Co. KG 100% partnership interest 4GP 2016 Limited 100% ordinary shares 33i GP 2016 Limited 100% ordinary shares 13i European Operational Projects GP s.a.r.l 100% ordinary shares 103i SCI Holdings Limited 100% ordinary shares 13i North American Infrastructure Partners, LLC 80% ordinary shares 183i Abaco ApS 100% ordinary shares 253i Investments (Luxembourg) S.A. 100% ordinary shares 103i 2019-22 DLP SCSp 100% partnership interest 103i PE 2019-22 A LP 100% partnership interest 13i PE 2019-22 B LP 100% partnership interest 13i PE 2019-22 Warehouse LP 100% partnership interest 33i 2020 Co-investment LP 100% partnership interest 33i GP 2019 Limited 100% ordinary shares 13i GP 2020 Limited 100% ordinary shares 33i GP 2019 s.a.r.l 100% ordinary shares 103i GP 2019 (Scots) Limited 100% ordinary shares 33i 2020 Co-investment GP s.a.r.l 100% ordinary shares 103i France SAS 100% ordinary shares 163i IP Acquisitions Limited 100% ordinary shares 13i IP Acquisitions GP LLP 100% partnership interest 12020 Co-Investment 1 LP 88% partnership interest 12020 Co-Investment 2 LP 94% partnership interest 13i IIF GP 2020 Limited 100% ordinary shares 13i IIF GP LLP 100% partnership interest 13i IP Acquisitions LP 100% partnership interest 1
30 Subsidiaries and related undertakings continued
3i Group plc Annual report and accounts 2021Audited financial statements
168

Description Holding/share class Footnote
Coral LP 50% carried interest units 33i Netherlands B.V. 100% ordinary shares 12Associates3i Growth Carry A LP 25% partnership interest 33i Growth Carry B LP 25% partnership interest 33i Growth Capital B LP 36% partnership interest 13i Buyouts 2010 C LP 49% partnership interest 1Moon Topco GmbH 49% ordinary shares 13Layout Holdco A/S 49% ordinary shares 14Fuel Holdco SA 43% ordinary shares 10Boketto Holdco Limited 47% ordinary shares 15Klara HoldCo S.A. 43% ordinary shares 10Shield Holdco LLC 49% ordinary shares 34Q Holdco Ltd 42% ordinary shares 203i Infrastructure plc 30% ordinary shares 19Peer Holding 1 BV 49% ordinary shares 21AES Engineering Ltd 43% ordinary shares 22Chrysanthes 1 s.a.r.l 49% ordinary shares 10Carter Thermal Industries Limited 34% ordinary shares 23Harper Topco Limited 42% ordinary shares 24Orange County Fundo de Investmento EM Particpacoes 39% equity units 27Permali Gloucester Limited 32% ordinary shares 28Tato Holdings Limited 27% ordinary shares 30Lilas 1 SAS 49% ordinary shares 31Nimbus Communications Ltd 30% ordinary shares 32Asia Strategic MedTech Holdings (Mauritius) Limited 36% ordinary shares 8Aurela TopCo Gmbh 43% ordinary shares 5Retina Holdco BV 49% ordinary shares 29C Medical Holdco, LLC 49% ordinary shares 2Crown Holdco BV 49% ordinary shares 123i India Infrastructure Holdings Ltd 21% ordinary shares 8Racing Topco GmbH 49% ordinary shares 26Panda Holdco LLC 49% ordinary shares 2Scandlines Infrastructure ApS 35% ordinary shares 33Alinghi 1 S.A.S 49% ordinary shares 11CTS BP Holdings GP LLC 49% ordinary shares 2Strategic Investments FM ( Mauritius) B Limited 36% ordinary shares 8New Amsterdam Software GP LLC 49% ordinary shares 34Garden & House International GmbH 49% ordinary shares 35T&J Holdco Limited 49% ordinary shares 9WHCG GP LLC 49% ordinary shares 36
30 Subsidiaries and related undertakings continued
3i Group plc Annual report and accounts 2021Audited financial statements
169

There are no joint ventures or other significant holdings. The 20 large portfolio companies by fair value are detailed on pages 186 and 187. The combination of the table above and that on pages 186 and 187 is deemed by the Directors to fulfil the requirements under IFRS 12 on the disclosure of material subsidiaries.
Footnote Address
1 16 Palace Street, London, SW1E 5JD, UK2 1 Grand Central Place, East 42nd Street, Suite 4100 New York, NY 10165, USA3 50 Lothian Road, Festival Square, Edinburgh, EH3 9WJ, UK4 OpernTurm, Bockenheimer Landstresse 2-4, 60306 Frankfurt am Main, Germany5 Seelbüde 13, 36110 Schlitz, Germany6 Computershare, Queensway House, Hilgrove Street, St Helier, JE1 1ES, Jersey7 Level 7, The Capital B-Wing, Bandra Kurla Complex, Bandra East, Mumbai, 400051, India8 5th Floor, Ebene Esplanade, 24 Bank Street, Cybercity, Ebene, Mauritius9 Floor 2, Trident 3, Trident Business Park, Styal Road, Manchester, M22 5XB, UK10 9 Rue Sainte Zithe, L-2763 Luxembourg, Grand Duchy of Luxembourg11 16 place de l’Iris, 92 400 Courbevoie, France12 Cornelis Schuytstraat 72, 1071JL Amsterdam, Netherlands13 Gruber Str. 48, 85586 Poing, Germany14 Mørupvej 16 Mørup 7400 Herning, Denmark15 New Mill, New Mill Lane, Witney, Oxfordshire, OX29 9SX, UK16 29-31, rue de Berri, 75008 Paris, France17 2nd Floor, Gaspe House, 66-72 Esplanade, St Helier, JE1 1GH, Jersey18 1209 Orange Street, Wilmington, Delaware 19801, USA19 12 Castle Street, St Helier, JE2 3RT, Jersey20 1 Bartholomew Lane, London, EC2N 2AX, UK21 Perenmarkt 15, Zwaagdijk East, 1681PG, Netherlands22 Bradmarsh Business Park, Mill Close, Rotherham, South Yorkshire, S60 1BZ, UK23 90 Lea Ford Road, Birmingham B33 9TX24 Building 5 First Floor, 566 Chiswick High Road, Chiswick Park, London W4 5YF, UK 25 Holbergsgade 14, 2tv, 1057, Copenhagen, Denmark26 Hunsrückstr. 1 53842, Troisdorf, Nordrhein-Westfalen Germany27 Avenida Brigadeiro Faria Lima, 2055, 19 andar, 01452-001 – Sao Paulo, SP, Brazil28 Bristol Road, Gloucester, GL1 5TT, UK29 Papland 21, 4206CK Gorinchem, Netherlands30 Thor Group Ltd, Bramling House, Bramling, Canterbury, Kent, CT3 1NB, UK31 Park a Eco Vendee Sud Loire, 85600, Bouffere, France 32 44 Oberoi Complex, Andthei (West), Mumbai, India 33 Havneholmen 29, 6 sal Kobenhavn, 1561, Denmark34 251 Little Falls Drive, Wilmington, DE 19808, New Castle, US35 Bahrenfelder Chaussee 49, 22761, Hamburg, Germany36 400 N Ashley Dr. Suite 3000, Tampa, FL 33602, USA
30 Subsidiaries and related undertakings continued
Notes to the accounts continued
3i Group plc Annual report and accounts 2021Audited financial statements
170
1. Our opinion is unmodifiedIn our opinion:
• the financial statements of 3i Group plc give a true and fair view of the state of the Group’s and of the Parent Company’s affairs as at 31 March 2021, and of the Group’s profit for the year then ended;
• the Group and Parent Company financial statements have been properly prepared in accordance with international accounting standards in conformity with the requirements of the Companies Act 2006; and
• the Group and Parent Company financial statements have been prepared in accordance with the requirements of, and as applied in accordance with the provisions of, the Companies Act 2006 and, as regards the Group financial statements, Article 4 of the IAS Regulation to the extent applicable.
What our opinion coversWe have audited the consolidated and parent company financial statements of 3i Group plc for the year ended 31 March 2021 (FY20/21) included in the Annual Report and Accounts, which comprise:
Group (3i Group plc and its subsidiaries) Parent Company (3i Group plc)
Consolidated statement of comprehensive income
Consolidated statement of financial position
Consolidated statement of changes in equity
Consolidated cash flow statement
Notes 1 to 30 to the Consolidated Financial Statements, and the summary of significant accounting policies
Company statement of financial position
Company statement of changes in equity
Company cash flow statement
Notes to the Parent Company Financial Statements, and the summary of significant accounting policies
Basis for opinion We conducted our audit in accordance with International Standards on Auditing (UK) (“ISAs (UK)”) and applicable law. Our responsibilities are described below. We believe that the audit evidence we have obtained is a sufficient and appropriate basis for our opinion. Our audit opinion and matters included in this report are consistent with those discussed and included in our reports to the Audit and Compliance Committee (“ACC”).
We have fulfilled our ethical responsibilities under, and we remain independent of the Group in accordance with, UK ethical requirements including the FRC Ethical Standard as applied to listed public interest entities.
KPMG LLP’s independent auditor’s report to the members of 3i Group plc
3i Group plc Annual report and accounts 2021Audited financial statements
171

KPMG LLP’s independent auditor’s report to the members of 3i Group plc continued
2. Overview of our audit
Factors driving our view of risks
The year ended 31 March 2021 is our first year as the Group’s auditor. We have formulated our risk assessment based on our industry knowledge, discussions with the Board of Directors, consideration of the development of the Group’s business and consideration of the audit conducted by our predecessor.
During FY20/21, the Group’s investment portfolio has been impacted by COVID-19. The impact on individual portfolio companies varies. However, those investments with exposure to the travel and automotive sectors have experienced a significant negative impact on performance as a result of the restrictions imposed on movement during the pandemic. This has increased the level of judgment required to be exercised by the Group and the Parent Company, in particular as a result of volatility in earnings (including earnings adjustments), comparable company multiples, projected cash flow, discount factors and terminal value for discounted cashflow valuations.
Carried interest payable, by virtue of the relationship between the accrual of carried interest payable and the valuation of the unquoted investment portfolio inherent in the calculation, has been similarly impacted.
We have considered the impact of COVID-19, (including the FRC guidance for auditors and additional valuation guidance issued by IPEV) in our risk assessment and have designed our audit procedures accordingly. This has included specific focus on adjustments to maintainable earnings for multiples-based valuations and on key assumptions in discounted cash flow models. We have further considered the impact of COVID-19 on respective portfolio companies and selected specific companies for additional review by our valuation specialists by considering each portfolio company against a set criteria including materiality, impact of adjustments to maintainable earnings and any specific impact of COVID-19 on the underlying portfolio company.
We have assessed whether COVID-19 has had any impact on the financial reporting controls. Where this is the case, we have adapted our audit testing.
Key Audit Matters Item
Valuation of Unquoted Investment Portfolio
4.1
Completeness and Accuracy of Carried Interest payable
4.2
Audit and Compliance Committee (“ACC”) interaction
During the year, the ACC met 6 times. KPMG are invited to attend all ACC meetings and are provided with an opportunity to meet with the ACC in private sessions without the Executive Directors being present. For each Key Audit Matter, we have set out communications with the ACC in section 4, including matters that required particular judgement for each.
The matters included in the Audit and Compliance Committee Chair’s report on page 97 are consistent with our observations of those meetings.
3i Group plc Annual report and accounts 2021Audited financial statements
172
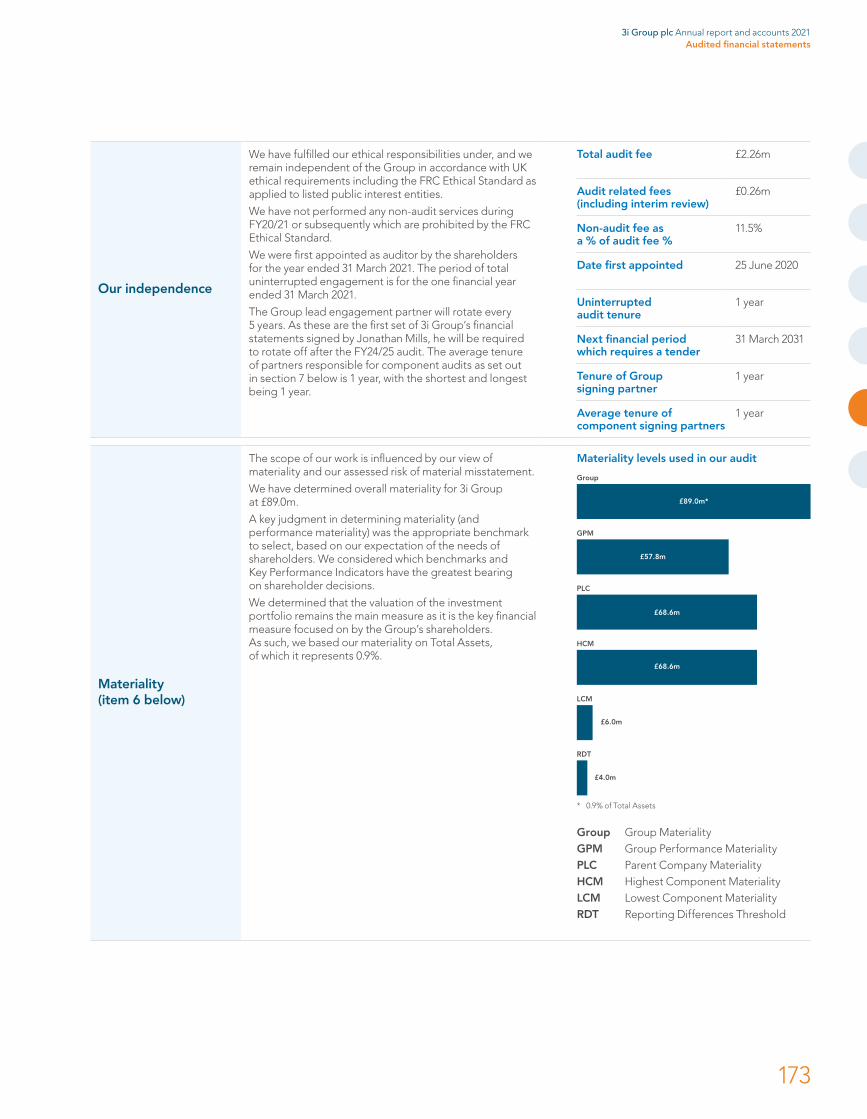
Our independence
We have fulfilled our ethical responsibilities under, and we remain independent of the Group in accordance with UK ethical requirements including the FRC Ethical Standard as applied to listed public interest entities.
We have not performed any non-audit services during FY20/21 or subsequently which are prohibited by the FRC Ethical Standard.
We were first appointed as auditor by the shareholders for the year ended 31 March 2021. The period of total uninterrupted engagement is for the one financial year ended 31 March 2021.
The Group lead engagement partner will rotate every 5 years. As these are the first set of 3i Group’s financial statements signed by Jonathan Mills, he will be required to rotate off after the FY24/25 audit. The average tenure of partners responsible for component audits as set out in section 7 below is 1 year, with the shortest and longest being 1 year.
Total audit fee £2.26m
Audit related fees (including interim review)
£0.26m
Non-audit fee as a % of audit fee %
11.5%
Date first appointed 25 June 2020
Uninterrupted audit tenure
1 year
Next financial period which requires a tender
31 March 2031
Tenure of Group signing partner
1 year
Average tenure of component signing partners
1 year
Materiality (item 6 below)
The scope of our work is influenced by our view of materiality and our assessed risk of material misstatement.
We have determined overall materiality for 3i Group at £89.0m.
A key judgment in determining materiality (and performance materiality) was the appropriate benchmark to select, based on our expectation of the needs of shareholders. We considered which benchmarks and Key Performance Indicators have the greatest bearing on shareholder decisions.
We determined that the valuation of the investment portfolio remains the main measure as it is the key financial measure focused on by the Group’s shareholders. As such, we based our materiality on Total Assets, of which it represents 0.9%.
Materiality levels used in our audit
Group
GPM
PLC
HCM
LCM
RDT
£89.0m*
£57.8m
£68.6m
£68.6m
£6.0m
£4.0m
* 0.9% of Total Assets
Group Group MaterialityGPM Group Performance MaterialityPLC Parent Company MaterialityHCM Highest Component MaterialityLCM Lowest Component MaterialityRDT Reporting Differences Threshold
3i Group plc Annual report and accounts 2021Audited financial statements
173

KPMG LLP’s independent auditor’s report to the members of 3i Group plc continued
Group scope (item 7 below)
We have performed risk assessment and planning procedures and determined the Group’s components that require involvement from component auditors. We have scoped 2 components for full scope audits of financial information for consolidation purposes.
We have performed audit procedures centrally across the Group, set out in more detail in item 7. In addition, we have performed group level analysis on the remaining components to determine whether further risks of material misstatement exist in those components.
We consider the scope of our audit, as agreed with the Audit and Compliance Committee, to be an appropriate basis for our audit opinion.
Full scope audit
Remaining components
Coverage of group financial statementsTotal assets
99%1%
Revenue
96%4%
Profit before tax
88%12%
The impact of climate change on our audit
In planning our audit we have considered the potential impacts of climate change on the Group’s business and its financial statements.
Climate change impacts the Group in a variety of ways including the impact of climate risk on investment valuations, potential reputational risk associated with the Group’s delivery of its climate related initiatives, and greater emphasis on climate related narrative and disclosure in the annual report. The Group’s exposure to climate change is primarily through the portfolio companies, as the key valuation assumptions and estimates may be impacted by climate risks.
As part of our audit we have made enquiries of management to understand the extent of the potential impact of climate change risk on the Group’s financial statements and the Group’s preparedness for this. We have performed a risk assessment of how the impact of climate change may affect the financial statements and our audit, in particular over the valuation of unquoted investment portfolio. We have conducted internal consultations to challenge our risk assessment including with our own climate change and sustainability professionals. There was no significant impact of this on our key audit matters.
We have also read the Group’s and the Parent Company’s disclosure of climate related information in the front half of the annual report as set out on pages 73 to 75. We have not been engaged to provide assurance over the accuracy of these disclosures.
3i Group plc Annual report and accounts 2021Audited financial statements
174
3. Going concern, viability and principal risks and uncertaintiesThe Directors have prepared the financial statements on a going concern basis as they do not intend to liquidate the Parent Company or the Group or to cease their operations, and as they have concluded that the Parent Company’s and the Group’s financial position means that this is realistic. They have also concluded that there are no material uncertainties that could have cast significant doubt over their ability to continue as a going concern for at least a year from the date of approval of the financial statements (“the going concern period”).
Going concern
We used our knowledge of the Group and Parent Company, its industry, and the general economic environment to identify the inherent risks to its business model and analysed how those risks might affect the Group’s and Parent Company’s financial resources or ability to continue operations over the going concern period. The risks that we considered most likely to adversely affect the Group’s and Parent Company’s available financial resources over this period are:
• the continued impact of the COVID-19 pandemic on severely impacted portfolio companies and the expected recovery of these entities impacting liquidity through the choice to provide further financial support to the portfolio;
• A material downturn in performance of the Group’s largest asset, Action; and
• The impact of the COVID-19 pandemic on the Group’s ability to realise investments and the timing of such realisations.
We critically assessed the assumptions in the Directors’ downside scenarios relevant to liquidity metrics, in particular, in relation to the continued impact of COVID-19 on the severely impacted portfolio companies, the expected recovery for these companies, and the potential financial support required. We assessed whether the scenarios applied take into account all reasonably possible downsides.
Our procedures also included an assessment of whether the going concern disclosure Accounting policy A to the financial statements gives a complete and accurate description of the Directors’ assessment of going concern.
Accordingly, we found the use of the going concern basis of preparation without any material uncertainty for the Group and Parent Company to be acceptable. However, as we cannot predict all future events or conditions and as subsequent events may result in outcomes that are inconsistent with judgements that were reasonable at the time they were made, the above conclusions are not a guarantee that the Group or the Parent Company will continue in operation.
Our reporting
• We consider that the Directors’ use of the going concern basis of accounting in the preparation of the Group’s and Company’s financial statements is appropriate.
• We have not identified, and concur with the Directors’ assessment that there is not, a material uncertainty related to events or conditions that, individually or collectively, may cast significant doubt on the Group’s or Parent Company’s ability to continue as a going concern for the going concern period.
• We have nothing material to add or draw attention to in relation to the Directors’ statement in Accounting Policy A to the financial statements on the use of the going concern basis of accounting with no material uncertainties that may cast significant doubt over the Group’s and Parent Company’s use of that basis for a period of at least twelve months from the date of approval of the financial statements, and we found the going concern disclosure in Accounting policy A to be acceptable.
• The related statement under the Listing Rules set out on page 63 is materially consistent with the financial statements and our audit knowledge.
3i Group plc Annual report and accounts 2021Audited financial statements
175

KPMG LLP’s independent auditor’s report to the members of 3i Group plc continued
Disclosures of emerging and principal risks and longer-term viability
Our responsibility
We are required to perform procedures to identify whether there is a material inconsistency between the Directors’ disclosures in respect of emerging and principal risks and the viability statement, and the financial statements and our audit knowledge.
Based on the knowledge we acquired during our financial statements audit, we have nothing further to add or draw attention to in relation to:
• the Directors’ confirmation within the viability statement that they have carried out a robust assessment of the emerging and principal risks facing the Group, including those that would threaten its business model, future performance, solvency and liquidity;
• the Principal risks and mitigations disclosures describing these risks and explaining how they are being managed and mitigated; and
• the Directors’ explanation in the viability statement of how they have assessed the prospects of the Group, over what period they have done so and why they considered that period to be appropriate, and their statement as to whether they have a reasonable expectation that the Group will be able to continue in operation and meet its liabilities as they fall due over the period of their assessment, including any related disclosures drawing attention to any necessary qualifications or assumptions.
Under the Listing Rules we are also required to review the Viability Statement.
Our work is limited to assessing these matters in the context of only the knowledge acquired during our financial statements audit. As we cannot predict all future events or conditions and as subsequent events may result in outcomes that are inconsistent with judgments that were reasonable at the time they were made, the absence of anything to report on these statements is not a guarantee as to the Group’s and Parent Company’s longer-term viability.
Our reporting
We have nothing material to add or draw attention to in relation to these disclosures.
We have concluded that these disclosures are materially consistent with the financial statements and our audit knowledge.
4. Key audit matters
What we mean
Key audit matters are those matters that, in our professional judgment, were of most significance in the audit of the financial statements and include the most significant assessed risks of material misstatement (whether or not due to fraud) identified by us, including those which had the greatest effect on:
• the overall audit strategy;
• the allocation of resources in the audit; and
• directing the efforts of the engagement team.
We include below the key audit matters in decreasing order of audit significance together with our key audit procedures to address those matters and our results from those procedures. These matters were addressed, and our results are based on procedures undertaken for the purpose of our audit of the financial statements as a whole. We do not provide a separate opinion on these matters.
4.1 Valuation of unquoted investment portfolio (GROUP AND PARENT COMPANY)
Financial Statement Elements Our results
FY20/21 FY19/20
FY20/21: AcceptableUnquoted investments – Group (Note 11) £4,213m £3,036mUnquoted investments – Parent Company (Note 11) £4,213m £3,036mInvestments in investment entity subsidiaries – Group (Note 12) £4,905m £3,936mInterest in Group entities – Parent Company (Note 23) £4,921m £ 4,023m
3i Group plc Annual report and accounts 2021Audited financial statements
176

Description of the Key Audit Matter Our response to the risk
Subjective valuation
The proprietary investment portfolio comprises a number of unquoted investments. These are held by the Group and the Parent company, both directly and indirectly within unconsolidated investment entities whose fair value consists primarily of the valuation of the unquoted investments it holds.
As these investments are unquoted and illiquid, the fair value is determined through the application of valuation techniques. The application of valuation techniques involves the exercise of significant judgement by the Group and Parent company in relation to the choice of valuation technique employed and assumptions into the respective models (e.g. earnings multiple, discount rate).
During the year, the Group and Parent Company’s investment portfolio has been impacted by COVID-19. The impact on individual portfolio companies varies. However, those investments with exposure to the travel and automotive sectors have experienced a significant negative impact on performance as a result of the restrictions imposed on movement during the pandemic. This has increased the level of judgment required to be exercised by the Group and the Parent Company, in particular as a result of the volatility in earnings (including earnings adjustments), comparable company multiples, projected cash flow, discount factors and terminal value for discounted cash flow valuations.
We have considered the impact of COVID-19, (including the FRC guidance for auditors and additional valuation guidance issued by IPEV) in our risk assessment and have designed our audit procedures accordingly. This has included specific focus on adjustments to maintainable earnings for multiples-based valuations and on key assumptions in discounted cash flow models. We have further considered the impact of COVID-19 on respective portfolio companies and selected specific companies for additional review by our valuation specialists by considering each portfolio company against a set criteria including materiality, impact of adjustments on maintainable earnings and impact of COVID-19 on the underlying portfolio company.
The effect of these matters is that, as part of our risk assessment, we determined that the subjective estimates in fair value measurement of certain unquoted investments, as detailed above, have a high degree of estimation uncertainty, with a potential range of reasonable outcomes greater than our materiality for the financial statements as a whole, and possibly many times that amount.
Our procedures to address the risk included:
Control design: We obtained an understanding of the Group and Parent Company’s processes to determine the fair value of unquoted investments. We documented and assessed the design and implementation of the investment valuation processes and controls. We performed the tests below rather than seeking to rely on any of the Group and Parent Company’s controls because the nature of the balance is such that we would expect to obtain audit evidence primarily through the detailed procedures described.
Methodology choice: In the context of observed industry best practice and the provisions of the International Private Equity and Venture Capital Valuation Guidelines, we challenged the appropriateness of the valuation basis selected.
Benchmarking assumptions: We challenged the Group and Parent Company on key judgments affecting investee company valuations, such as the maintainability of the earnings used in valuations, the choice of benchmark for earnings multiples, projected cash flows, discount factors and terminal value for discounted cash flow valuations. We compared key underlying financial data inputs to external sources such as financial information of comparable businesses, the investee company audited financial statements and management information as applicable. We challenged the assumptions around maintainability of earnings based on the plans of investee companies and whether these are achievable. Our work included consideration of events which occurred subsequent to the year end up until the date of this audit report.
Historical comparisons: We assessed investment realisations in the period and compared actual investment sales proceeds to prior valuations to understand the reasons for any significant variances and determined whether they are indicative of bias and error in the Group and Parent Company’s approach to valuations.
Our valuations expertise: For a sample of investments, selected based on audit materiality and risk profile of each investment, we used our own valuations specialists to assist us in assessing the principles and appropriateness of the valuation methodology, critically reviewing the key assumptions and independently providing a reasonable range for earnings multiples, discount rates and terminal value multiples.
Assessing transparency: We considered the appropriateness, in accordance with relevant accounting standards, of the disclosures in respect of unquoted investments and the effect of changing one or more assumptions to reasonably possible alternative valuation assumptions.
Communications with the 3i Group plc Audit and Compliance Committee and Valuations committee
We discussed with and reported to the Audit and Compliance Committee and the Valuations Committee:
• Our approach to the audit of the valuation of the unquoted investment portfolio including details of our planned substantive procedures and the extent of our control reliance.
• Our conclusions on the appropriateness of 3i’s valuation methodology and policy.
• Our conclusions on the appropriateness of the valuation selected for individual portfolio companies and, for our sample of investments subject to corporate finance review, an indication of where the Group’s valuation assumptions lay within our reasonable range.
• The adequacy of the disclosures, particularly as it relates to the sensitivity of the valuation inputs.
Areas of particular auditor judgementWe identified the following as the areas of particular auditor judgement:
• the appropriateness of the valuation of unquoted investment portfolio and in particular, the selection of key assumptions into the valuation models.
Based on the risk identified and our procedures performed, we consider the valuation of the unquoted investment portfolio to be acceptable.
Further information in the Annual Report and Accounts: See the Audit and Compliance Committee Report on page 97 and the Valuations Committee report on pages 103 to 106 for details on how the committees considered valuation of unquoted investment portfolio as an area of significant attention, page 145 for the accounting policy and page 149 for the sensitivity disclosure on unquoted investments, and page 146 on the accounting policy for unquoted investment entities.
3i Group plc Annual report and accounts 2021Audited financial statements
177
KPMG LLP’s independent auditor’s report to the members of 3i Group plc continued
4.2 Completeness and accuracy of carried interest payable (GROUP AND PARENT COMPANY)
Financial Statement Elements Our results
FY20/21 FY19/20
FY20/21: AcceptableCarried interest and performance fees payable(Note 15)
£494m £931m
Description of the Key Audit Matter Our response to the risk
Subjective estimates
Carried interest payable predominantly impacts the valuation of investment entity subsidiaries due to the relationship of the payable balance on the Net Asset Value (‘NAV’) of the investment entity subsidiaries. Carried interest payable is calculated as a function of the investment returns that would be achieved, if the investments within each fund or scheme were realised at fair value at the year-end date, subject to the relevant hurdle rates or performance conditions being met.
Carried interest is calculated assuming all portfolio investments are sold at their fair values at the balance sheet date. The actual amounts of carried interest paid will depend on the cash realisations of these investments and valuations may change significantly in the next financial year. The valuation of the unquoted investment portfolio is itself a critical estimate which is discussed further in section 4.1.
The effect of these matters is that, as part of our risk assessment, we determined that the subjective estimates in carried interest payable, as detailed above, has a high degree of estimation uncertainty, with a potential range of reasonable outcomes greater than our materiality for the financial statements as a whole, and possibly many times that amount. The financial statements (note 15) disclose the sensitivity estimated by the Group and the Parent Company.
Calculation error
Due to the number of bespoke, complex agreements and the manual nature of the calculation and recognition process, there is an increased risk of error in relation to the carried interest payable.
Our procedures included:
The key input to the estimate of carried interest payable is the valuation of unquoted investment portfolio. Our approach to the valuation of investments is outlined in section 4.1.
Control design: We obtained an understanding of the Group and Parent Company’s processes to determine the carried interest payable. We documented and assessed the design and implementation of the processes and controls. We performed the tests below rather than seeking to rely on any of the Group’s and Parent Company’s controls because the nature of the balance is such that we would expect to obtain audit evidence primarily through the detailed procedures described.
Test of details: We selected a sample of carried interest payable calculations and agreed amounts accrued and/or paid back to management calculations and, where relevant, to bank statements.
Methodology implementation: For the sample selected, we obtained the relevant agreements and agreed the methodology used in management’s calculations to the relevant agreements.
Reperformance: For the sample selected, we agreed key inputs, including estimated valuations, relevant hurdles and performance obligations, to supporting documentation. We independently reperformed calculations and compared our reperformance to management’s calculations.
Completeness: To assess the completeness of carried interest payable recorded, we selected a sample of agreements for which no carry was recorded. We obtained the agreements and related calculations, agreed inputs to supporting documentation and reperformed calculations to evaluate the completeness of carried interest payable.
Communications with the 3i Group plc Audit and Compliance Committee
We discussed with and reported to the Audit and Compliance Committee:
• Our approach to the audit of carried interest payable.
• Our conclusions on the carried interest payable balance held within investment entity subsidiaries.
Areas of particular auditor judgementWe identified the following as the areas of particular auditor judgement:
• Valuation of unquoted investment portfolio as an input to the carried interest payable calculation.
Based on the risk identified, our procedures performed, we found the carried interest payable balance to be acceptable.
Further information in the Annual Report and Accounts: See the Audit and Compliance Committee Report on page 97 for details on how the Audit and Compliance Committee considered carried interest payable as an area of significant attention and what the Audit and Compliance Committee reviewed and concluded on this area, page 151 for the accounting policy and the sensitivity disclosure on Carried Interest payable, and page 146 for accounting policy for investment in investment entity subsidiaries.
3i Group plc Annual report and accounts 2021Audited financial statements
178
5. Our ability to detect irregularities, and our response
Fraud – identifying and responding to risks of material misstatement due to fraud
Fraud risk assessment
To identify risks of material misstatement due to fraud (“fraud risks”) we assessed events or conditions that could indicate an incentive or pressure to commit fraud or provide an opportunity to commit fraud. In this risk assessment we considered the following:
• Our meetings throughout the year with the Head of Internal Audit, Group General Counsel and Head of Compliance including obtaining and reviewing supporting documentation such as:
– Board and Audit and Compliance Committee minutes;
– Internal audit reports;
– Internal risk registers; and
– Breaches registers
• Enquiries of the finance team, the General Counsel, the Head of Compliance, the Head of Internal Audit, and the Audit and Compliance Committee as to whether they have knowledge of any actual, suspected or alleged fraud.
• Considering the Group’s remuneration policies, key drivers for remuneration and bonus levels; and
• Discussions among the engagement team regarding how and where fraud might occur in the financial statements and any potential indicators of fraud. The engagement team includes audit partners and staff who have extensive experience of working with companies in the same sectors as 3i operates, and this experience was relevant to the discussion about where fraud risks may arise. To assist us in identifying fraud risks, the discussions also involved our own forensic specialists who advised the engagement team of fraud schemes that had arisen in similar sectors and industries; our own forensic specialists participated in the initial fraud risk assessment discussions.
Risk communications We communicated identified fraud risks throughout the audit team and remained alert to any indications of fraud throughout the audit. This included communications from the Group to component audit teams of relevant fraud risks identified at the group level.
Fraud risks As required by auditing standards, and taking into account possible pressures to meet performance targets, we perform procedures to address the risk of management override of controls, in particular the risk that Group management may be in a position to make inappropriate accounting entries and the risk of bias in accounting estimates and judgements such as the valuation of unquoted investment portfolio.
On this audit we assessed there to be no fraud risk related to revenue recognition because the Group has a relatively simple revenue model with no material estimation or judgement; the highly formulaic nature and low volume of individual revenue transactions means there is a remote risk of material misstatement from fraudulent manipulation; and opportunities for a material misstatement due to fraudulent revenue recognition are limited by the control environment.
We identified additional fraud risks relating to the valuation of unquoted investment portfolio held on balance sheet and within investment entity subsidiaries. As these investments are unquoted and illiquid, they are valued using valuation techniques. Such techniques are subjective and involve the exercise of judgement by the Group and Parent Company over areas such as the maintainability of the earnings used in valuations, the choice of benchmark for earnings multiples, projected cash flows, discount factors and terminal value for discounted cash flow valuations. In addition, the valuation of unquoted investments drives the remuneration of the Executive Directors, and is a key indicator for their performance. Due to the highly judgemental nature of these valuations, the reliance on unobservable inputs, and the linkage to Executive Directors’ remuneration, we consider there to be increased risk of fraud in relation to the valuation of unquoted investment portfolio. The impact of the COVID-19 pandemic has increased the risk due to the economic disturbance arising from lockdowns and uncertainty relating to the recovery and future performance of certain industries.
Procedures to address fraud risks
Our audit procedures included evaluating the design, implementation and operating effectiveness of internal controls relevant to mitigate these risks.
We also performed substantive audit procedures including:
• Comparing journal entries to supporting documentation for a selection based on risk, for example, post-close journals, those posted by senior finance management, those posted to unusual accounts or those containing unusual journal descriptions; and
• Assessing significant accounting estimates, including valuation of unquoted investments, for any indicators of management bias.
Link to KAMs Further detail in respect of fraud risks identified over the valuation of unquoted investment portfolio is contained within the key audit matter disclosures in section 4.1 of this report.
3i Group plc Annual report and accounts 2021Audited financial statements
179
KPMG LLP’s independent auditor’s report to the members of 3i Group plc continued
Laws and regulations – identifying and responding to risks of material misstatement due to non-compliance with laws and regulations
Risk assessment We identified areas of laws and regulations that could reasonably be expected to have a material effect on the financial statements. For this risk assessment, matters considered included the following:
• our general commercial and sector experience;
• discussions with the Directors and other management (as required by auditing standards);
• inspection of the Group’s regulatory and legal correspondence;
• inspection of the policies and procedures regarding compliance with laws and regulations; and
• relevant discussions with the Group’s General Counsel.
As the Group operates in a highly regulated environment, our assessment of risks of material misstatement also took into account the control environment including the entity’s higher level procedures for complying with regulatory requirements. Our assessment included inspection of key frameworks, policies and standards in place, understanding and evaluating the role of the compliance function in establishing these and monitoring compliance and testing of related controls around whistleblowing and complaints.
Risk communications Our communication of identified laws and regulations risks was made throughout our team and we remained alert to any indications of non-compliance throughout the audit. This included communication from the group to component audit teams of relevant laws and regulations identified at group level.
Direct laws context and link to audit
The potential effect of these laws and regulations on the financial statements varies considerably.
Firstly, the Group is subject to laws and regulations that directly affect the financial statements including:
• Financial reporting legislation (including related companies legislation);
• Taxation legislation (direct tax and indirect tax); and
• Distributable profits legislation.
We assessed the extent of compliance with these laws and regulations as part of our procedures on the related financial statement items.
Most significant indirect law/ regulation areas
Secondly, the Group is subject to many other laws and regulations where the consequences of non-compliance could have a material effect on amounts or disclosures in the financial statements, for instance through the imposition of fines or litigation or the loss of the Group’s license to operate in countries where the non-adherence to laws could prevent trading in such countries.
We identified the following areas as those most likely to have such an effect:
• Anti-bribery and corruption;
• Competition legislation;
• Pensions legislation;
• Market abuse regulations; and
• Certain aspects of company legislation recognising the financial and regulated nature of the Group’s activities and its legal form.
Auditing standards limit the required audit procedures to identify non-compliance with these laws and regulations to enquiry of the Directors and other management and inspection of regulatory and legal correspondence, if any. Therefore if a breach of operational regulations is not disclosed to us or evident from relevant correspondence, an audit will not detect that breach.
Context of the ability of the audit to detect fraud or breaches of law or regulation
Owing to the inherent limitations of an audit, there is an unavoidable risk that we may not have detected some material misstatements in the financial statements, even though we have properly planned and performed our audit in accordance with auditing standards. For example, the further removed non-compliance with laws and regulations (irregularities) is from the events and transactions reflected in the financial statements, the less likely the inherently limited procedures required by auditing standards would identify it.
In addition, as with any audit, there remained a higher risk of non-detection of irregularities, as these may involve collusion, forgery, intentional omissions, misrepresentations, or the override of internal controls. Our audit procedures are designed to detect material misstatement. We are not responsible for preventing non-compliance and cannot be expected to detect non-compliance with all laws and regulations.
3i Group plc Annual report and accounts 2021Audited financial statements
180

6. Our determination of materialityThe scope of our audit was influenced by our application of materiality. We set quantitative thresholds and overlay qualitative considerations to help us determine the scope of our audit and the nature, timing and extent of our procedures, and in evaluating the effect of misstatements, both individually and in the aggregate, on the financial statements as a whole.
£89.0mMateriality for the financial statements as a whole
What we meanThis is the amount representing the total magnitude of misstatements that we expect to influence the economic decisions of the users of these financial statements.
Basis for determining materiality and judgements appliedOur assessment of overall group materiality was £89.0m. This was determined with reference to a benchmark of total assets.
In our view, the use of total assets is consistent with the view that shareholders look to the financial health and valuation of the unquoted investment portfolio as the primary financial indicator to understand the Group’s performance. In determining the materiality benchmark, we had regard to shareholder commentary on the Group.
The £89.0m was determined by applying a percentage to the total assets. When using an asset-related measure to determine overall materiality, KPMG’s approach is to apply a percentage between 0.5% – 1% to the measure. In setting overall materiality, we applied a rate of 0.9%, which is lower than the top end of the allowable percentage range.
Materiality for the Parent Company financial statements as a whole was set at £68.6m, determined with reference to a benchmark of company total assets (of which it represents 0.67%).
£57.8mPerformance materiality
What we meanOur procedures on individual account balances and disclosures were performed to performance materiality, so as to reduce to an acceptable level the risk that individually immaterial misstatements in individual account balances add up to a material amount across the financial statements as a whole.
Basis for determining performance materiality and judgements appliedWe have considered performance materiality at a level of 65% of materiality for 3i Group’s financial statements as a whole to be appropriate. We applied this percentage in our determination of performance materiality because we did not identify any factors indicating an elevated level of risk.
The Parent Company performance materiality was set at £44.6m.
£4.0mAudit misstatement posting threshold
What we meanThis is the amount below which identified misstatements are considered to be clearly trivial from a quantitative point of view. We may become aware of differences below this threshold which could alter the nature, timing and scope of our audit procedures, for example if we identify smaller differences which are indicators of fraud.
This is also the amount above which all differences identified are communicated to 3i Group plc’s Audit and Compliance Committee.
Basis for determining the audit misstatement reporting threshold and judgements appliedWe set our audit misstatement posting threshold at 5% of our materiality, rounded down to the nearest £m. We will also report to the Audit and Compliance Committee any items that warrant reporting on qualitative grounds.
The overall materiality for the Group at £89.0m compares as follows to the main Financial Statement captions amounts.
Net assets Gross investment income Profit for the year
31 March 2021
For the year ended
31 March 2021
For the year ended
31 March 2021
Financial Statement Caption £9,164m £1,931m £1,855m
Group Materiality as % of caption 1.0% 4.6% 4.8%
3i Group plc Annual report and accounts 2021Audited financial statements
181
KPMG LLP’s independent auditor’s report to the members of 3i Group plc continued
7. The scope of our audit
Group scope
What we meanHow the Group audit team determined the procedures to be performed across the Group by component audit teams.
We have performed risk assessment and planning procedures and determined the Group’s components that require involvement from component auditors. We have scoped two components for audits of financial information for consolidation purposes.
Scope Number of components Range of materiality applied
Full scope audit 2 £6m – £68m
Audit of account balance 0 n/a
Specified audit procedures 0 n/a
We have also performed audit procedures centrally across the Group, and beyond the components scope set out above, in the following areas:
• Consolidation of the financial information;
• Journal entry analysis, to identify journals with higher risks such as those posted by Group management into component books, and manual entries into accounts where these are not expected (e.g. Revenue);
• Share based payments; and
• Defined Benefit Pension.
In addition, we have performed Group level analysis on the remaining components to determine whether further risks of material misstatement exist in those components.
Group audit team oversight
What we meanThe extent of the Group audit team’s involvement in component audits.
Individually financially significant components scoped in for the group audit are performed by the component audit team, Jonathan Mills, the Group audit partner inspected the component team’s key work papers related to the significant risks and assessed the appropriateness of conclusions and the consistency between reported findings and work performed.
3i Group plc Annual report and accounts 2021Audited financial statements
182
8. Other information in the annual reportThe Directors are responsible for the other information presented in the Annual Report together with the financial statements. Our opinion on the financial statements does not cover the other information and, accordingly, we do not express an audit opinion or, except as explicitly stated below, any form of assurance conclusion thereon.
All other information
Our responsibility Our responsibility is to read the other information and, in doing so, consider whether, based on our financial statements audit work, the information therein is materially misstated or inconsistent with the financial statements or our audit knowledge.
Our reportingBased solely on that work we have not identified material misstatements or inconsistencies in the other information.
Strategic report and Directors’ report
Our responsibility and reportingBased solely on our work on the other information described above we are required to report to you as follows:
• we have not identified material misstatements in the strategic report and the Directors’ report;
• in our opinion the information given in those reports for the financial year is consistent with the financial statements; and
• in our opinion those reports have been prepared in accordance with the Companies Act 2006.
Directors’ remuneration report
Our responsibility We are required to form an opinion as to whether the part of the Directors’ remuneration report to be audited has been properly prepared in accordance with the Companies Act 2006.
Our reportingIn our opinion the part of the Directors’ remuneration report to be audited has been properly prepared in accordance with the Companies Act 2006.
Corporate governance disclosures
Our responsibility We are required to perform procedures to identify whether there is a material inconsistency between the financial statements and our audit knowledge, and:
• the Directors’ statement that they consider that the annual report and financial statements taken as a whole is fair, balanced and understandable, and provides the information necessary for shareholders to assess the Group’s position and performance, business model and strategy;
• the section of the annual report describing the work of the Audit and Compliance Committee, including the significant issues that the Audit and Compliance Committee considered in relation to the financial statements, and how these issues were addressed; and
• the section of the annual report that describes the review of the effectiveness of the Group’s risk management and internal control systems.
Our reportingBased on those procedures, we have concluded that each of these disclosures is materially consistent with the financial statements and our audit knowledge.
We are also required to review the part of Corporate Governance Statement relating to the Group’s compliance with the provisions of the UK Corporate Governance Code specified by the Listing Rules for our review.
We have nothing to report in this regard.
Other matters on which we are required to report by exception
Our responsibility Under the Companies Act 2006, we are required to report to you if, in our opinion:
• adequate accounting records have not been kept by the Parent Company, or returns adequate for our audit have not been received from branches not visited by us; or
• the Parent Company financial statements and the part of the Directors’ remuneration report to be audited are not in agreement with the accounting records and returns; or
• certain disclosures of Directors’ remuneration specified by law are not made; or
• we have not received all the information and explanations we require for our audit.
Our reportingWe have nothing to report in these respects.
3i Group plc Annual report and accounts 2021Audited financial statements
183

9. Respective responsibilities Directors’ responsibilities As explained more fully in their statement set out on page 123, the Directors are responsible for: the preparation of the financial statements including being satisfied that they give a true and fair view; such internal control as they determine is necessary to enable the preparation of financial statements that are free from material misstatement, whether due to fraud or error; assessing the Group’s and Parent Company’s ability to continue as a going concern, disclosing, as applicable, matters related to going concern; and using the going concern basis of accounting unless they either intend to liquidate the Group or the Parent Company or to cease operations, or have no realistic alternative but to do so.
Auditor’s responsibilities Our objectives are to obtain reasonable assurance about whether the financial statements as a whole are free from material misstatement, whether due to fraud or error, and to issue our opinion in an auditor’s report. Reasonable assurance is a high level of assurance, but does not guarantee that an audit conducted in accordance with ISAs (UK) will always detect a material misstatement when it exists. Misstatements can arise from fraud, other irregularities or error and are considered material if, individually or in aggregate, they could reasonably be expected to influence the economic decisions of users taken on the basis of the financial statements.
A fuller description of our responsibilities is provided on the FRC’s website at www.frc.org.uk/auditorsresponsibilities.
10. The purpose of our audit work and to whom we owe our responsibilitiesThis report is made solely to the Company’s members, as a body, in accordance with Chapter 3 of Part 16 of the Companies Act 2006. Our audit work has been undertaken so that we might state to the Company’s members those matters we are required to state to them in an auditor’s report and for no other purpose. To the fullest extent permitted by law, we do not accept or assume responsibility to anyone other than the Company and the Company’s members, as a body, for our audit work, for this report, or for the opinions we have formed.
Jonathan Mills (Senior Statutory Auditor) for and on behalf of KPMG LLP, Statutory Auditor Chartered Accountants 15 Canada Square Canary Wharf London E14 5GL 12 May 2021
KPMG LLP’s independent auditor’s report to the members of 3i Group plc continued
3i Group plc Annual report and accounts 2021Audited financial statements
184
Portfolio and other informationWhat’s in this section20 large investments 186
Portfolio valuation – an explanation 188
Information for shareholders 190
Glossary 192
185
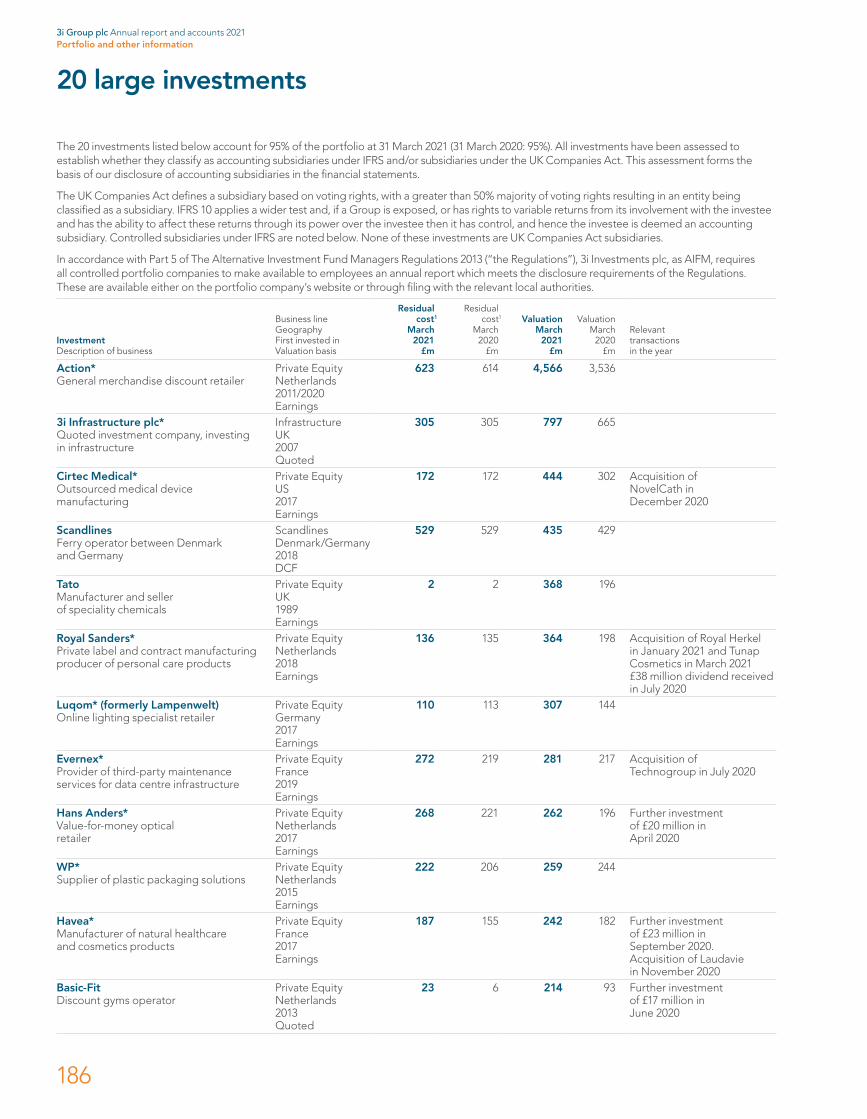
The 20 investments listed below account for 95% of the portfolio at 31 March 2021 (31 March 2020: 95%). All investments have been assessed to establish whether they classify as accounting subsidiaries under IFRS and/or subsidiaries under the UK Companies Act. This assessment forms the basis of our disclosure of accounting subsidiaries in the financial statements.
The UK Companies Act defines a subsidiary based on voting rights, with a greater than 50% majority of voting rights resulting in an entity being classified as a subsidiary. IFRS 10 applies a wider test and, if a Group is exposed, or has rights to variable returns from its involvement with the investee and has the ability to affect these returns through its power over the investee then it has control, and hence the investee is deemed an accounting subsidiary. Controlled subsidiaries under IFRS are noted below. None of these investments are UK Companies Act subsidiaries.
In accordance with Part 5 of The Alternative Investment Fund Managers Regulations 2013 (“the Regulations”), 3i Investments plc, as AIFM, requires all controlled portfolio companies to make available to employees an annual report which meets the disclosure requirements of the Regulations. These are available either on the portfolio company’s website or through filing with the relevant local authorities.
InvestmentDescription of business
Business line Geography First invested in Valuation basis
Residualcost1
March 2021
£m
Residualcost1
March 2020
£m
Valuation March
2021 £m
Valuation March
2020 £m
Relevant transactions in the year
Action*General merchandise discount retailer
Private Equity Netherlands 2011/2020 Earnings
623 614 4,566 3,536
3i Infrastructure plc*Quoted investment company, investing in infrastructure
Infrastructure UK 2007 Quoted
305 305 797 665
Cirtec Medical*Outsourced medical device manufacturing
Private Equity US 2017 Earnings
172 172 444 302 Acquisition of NovelCath in December 2020
ScandlinesFerry operator between Denmark and Germany
Scandlines Denmark/Germany 2018 DCF
529 529 435 429
TatoManufacturer and seller of speciality chemicals
Private Equity UK 1989 Earnings
2 2 368 196
Royal Sanders*Private label and contract manufacturing producer of personal care products
Private Equity Netherlands 2018 Earnings
136 135 364 198 Acquisition of Royal Herkel in January 2021 and Tunap Cosmetics in March 2021 £38 million dividend received in July 2020
Luqom* (formerly Lampenwelt)Online lighting specialist retailer
Private Equity Germany 2017 Earnings
110 113 307 144
Evernex*Provider of third-party maintenance services for data centre infrastructure
Private Equity France 2019 Earnings
272 219 281 217 Acquisition of Technogroup in July 2020
Hans Anders*Value-for-money optical retailer
Private Equity Netherlands 2017 Earnings
268 221 262 196 Further investment of £20 million in April 2020
WP*Supplier of plastic packaging solutions
Private Equity Netherlands 2015 Earnings
222 206 259 244
Havea*Manufacturer of natural healthcare and cosmetics products
Private Equity France 2017 Earnings
187 155 242 182 Further investment of £23 million in September 2020. Acquisition of Laudavie in November 2020
Basic-FitDiscount gyms operator
Private Equity Netherlands 2013 Quoted
23 6 214 93 Further investment of £17 million in June 2020
20 large investments
3i Group plc Annual report and accounts 2021Portfolio and other information
186

InvestmentDescription of business
Business line Geography First invested in Valuation basis
Residualcost1
March 2021
£m
Residualcost1
March 2020
£m
Valuation March
2021 £m
Valuation March
2020 £m
Relevant transactions in the year
AES EngineeringManufacturer of mechanical seals and support systems
Private Equity UK 1996 Earnings
30 30 212 158
Q Holding*Manufacturer of precision engineered elastomeric components
Private Equity US 2014 Earnings
162 162 187 222
SaniSure* (formerly Bioprocessing platform) Manufacturer, distributor and integrator of single-use bioprocessing systems and components
Private Equity US 2019 Earnings
135 60 183 64 Acquisition of Biofluidfocus in August 2020 and Sani-Tech West in July 2020
Magnitude Software*Leading provider of unified application data management solutions
Private Equity US 2019 Earnings
139 139 165 121
BoConcept*Urban living designer
Private Equity Denmark 2016 Earnings
165 149 161 119
Smarte Carte*Provider of self-serve vended luggage carts, electronic lockers and concession carts
Infrastructure US 2017 DCF
176 167 160 172
Regional Rail*Owns and operates short-line freight railroads and rail-related businesses
Infrastructure US 2019 DCF
175 175 131 195 Distributed £74 million to 3i
MPM*An international branded, premium and natural pet food company
Private Equity UK 2020 Earnings
128 – 124 – New investment
3,959 3,559 9,862 7,453
* Controlled in accordance with IFRS.1 Residual cost includes cash investment and interest net of cost disposed.
3i Group plc Annual report and accounts 2021Portfolio and other information
187

PolicyThe valuation policy is the responsibility of the Board, with additional oversight and annual review from the Valuations Committee. The policy is reviewed at least annually, with the last update in January 2021. Our policy is to value 3i’s investment portfolio at fair value and we achieve this by valuing investments on an appropriate basis, applying a consistent approach across the portfolio. The policy ensures that the portfolio valuation is compliant with the fair value guidelines under IFRS and, in so doing, is also compliant with the IPEV guidelines. The policy ensures valuation methodologies are selected and applied consistently or where methodologies change year on year this is supported. The policy covers the Group’s Private Equity, Infrastructure and Scandlines investment valuations. Valuations of the investment portfolio of the Group and its subsidiaries are performed at each quarter end.
Fair value is the underlying principle and is defined as “the price that would be received to sell an asset in an orderly transaction between market participants at the measurement date” (IPEV guidelines, December 2018). We have continued to consider the additional IPEV guidelines issued in March 2020 in light of the Covid-19 outbreak. Fair value is an estimate and, as such, determining fair value requires the use of judgement.
The quoted assets in our portfolio are valued at their closing bid price at the balance sheet date. The majority of the portfolio, however, is represented by unquoted investments.
Private Equity unquoted valuationTo arrive at the fair value of the Group’s unquoted Private Equity investments, we first estimate the entire value of the company we have invested in – the enterprise value. We then apportion that enterprise value between 3i, other shareholders and lenders.
Determining enterprise valueThe enterprise value is determined using one of a selection of methodologies depending on the nature, facts and circumstances of the investment.
Where possible, we use methodologies which draw heavily on observable market prices, whether listed equity markets or reported merger and acquisition transactions, and trading updates from our portfolio.
As unquoted investments are not traded on an active market, the Group adjusts the estimated enterprise value by a liquidity discount. The liquidity discount is applied to the total enterprise value and we apply a higher discount rate for investments where there are material restrictions on our ability to sell at a time of our choosing. A small number of our private equity investments are valued using a discounted cash flow (“DCF”), and for these assets we do not apply a liquidity discount.
The table on the next page outlines in more detail the range of valuation methodologies available to us, as well as the inputs and adjustments necessary for each. The impact of Covid-19 has resulted in a level of uncertainty and in determining the fair value of our investments, we have again considered a broader range of inputs including historical, current and forward-looking data. Where forward looking data forms the base of a valuation, the accuracy, reliability and maintainability of these forecasts has been considered.
Apportioning the enterprise value between 3i, other shareholders and lendersOnce we have estimated the enterprise value, the following steps are taken:
1. We subtract the value of any claims, net of free cash balances that are more senior to the most senior of our investments.
2. The resulting attributable enterprise value is apportioned to the Group’s investment, and equal ranking investments by other parties, according to contractual terms and conditions, to arrive at a fair value of the entirety of the investment. The value is then distributed amongst the different loan, equity and other financial instruments accordingly.
3. If the value attributed to a specific shareholder loan investment in a company is less than its carrying value, a shortfall is implied, which is recognised in our valuation. In exceptional cases, we may judge that the shortfall is temporary; to recognise the shortfall in such a scenario would lead to unrepresentative volatility and hence we may choose not to recognise the shortfall.
Other factorsIn applying this framework, there are additional considerations that are factored into the valuation of some assets.
Impacts from structuringStructural rights are instruments convertible into equity or cash at specific points in time or linked to specific events. For example, where a majority shareholder chooses to sell, and we have a minority interest, we may have the right to a minimum return on our investment.
Debt instruments, in particular, may have structural rights. In the valuation, it is assumed third parties, such as lenders or holders of convertible instruments, fully exercise any structural rights they might have if they are “in the money”, and that the value to the Group may therefore be reduced by such rights held by third parties. The Group’s own structural rights are valued on the basis they are exercisable on the reporting date.
Assets classified as “terminal”If we believe an investment has more than a 50% probability of failing in the 12 months following the valuation date, we value the investment on the basis of its expected recoverable amount in the event of failure. It is important to distinguish between our investment failing and the business failing; the failure of our investment does not always mean that the business has failed, just that our recoverable value has dropped significantly. This would generally result in the equity and loan components of our investment being valued at nil. Value movements in the period relating to investments classified as terminal are classified as provisions in our value movement analysis.
Infrastructure unquoted valuationThe primary valuation methodology used for unquoted Infrastructure investments is the discounted cash flow method. Fair value is estimated by deriving the present value of the investment using reasonable assumptions of expected future cash flows and the terminal value and date, and the appropriate risk-adjusted discount rate that quantifies the risk inherent to the investment. The discount rate is estimated with reference to the market risk-free rate, a risk-adjusted premium and information specific to the investment or market sector.
Scandlines unquoted valuationScandlines is valued on a DCF basis. This is consistent with the Infrastructure methodology.
Portfolio valuation – an explanation
3i Group plc Annual report and accounts 2021Portfolio and other information
188

Methodology Description Inputs Adjustments
% of investment basis portfolio
valued on this basis
Earnings (Private Equity)
Most commonly used Private Equity valuation methodologyUsed for investments which are typically profitable and for which we can determine a set of listed companies and precedent transactions, where relevant, with similar characteristics
Earnings multiples are applied to the earnings of the Company to determine the enterprise valueEarnings multiplesWhen selecting earnings multiple, we consider:1. Comparable listed companies current
performance and through the cycle averages2. Relevant market transaction multiples3. Exit expectations and other company specific
factors For point 1 and 2 of the above we select companies in the same industry and, where possible, with a similar business model and profile in terms of size, products, services and customers, growth rates and geographic focusEarningsReported earnings are adjusted for non-recurring items, such as restructuring expenses, for significant corporate actions and, in exceptional cases, run-rate adjustments to arrive at maintainable earningsThe most common measure is earnings before interest, tax, depreciation and amortisation (“EBITDA”)Earnings are usually obtained from portfolio company management accounts to the preceding quarter end, with reference also to forecast earnings and the maintainable view of earnings Action, our largest asset, we value using run-rate earnings
A liquidity discount is applied to the enterprise value, typically between 5% and 15%, using factors such as our alignment with management and other investors and our investment rights in the deal structure
80%
Discounted cash flow (Private Equity/Infrastructure/ Scandlines)
Appropriate for businesses with long-term stable cash flows, typically in Infrastructure or alternatively businesses where DCF is more appropriate in the short term
Long-term cash flows are discounted at a rate which is benchmarked against market data, where possible, or adjusted from the rate at the initial investment based on changes in the risk profile of the investment
Discount already implicit in the discount rate applied to long-term cash flows – no further discounts applied
8%
Quoted (Infrastructure/Private Equity)
Used for investments in listed companies
Closing bid price at balance sheet date No adjustments or discounts applied
10%
NAV (Private Equity/Infrastructure)
Used for investments in unlisted funds
Net asset value reported by the fund manager Typically no further discount applied in addition to that applied by the fund manager
1%
Other (Private Equity/Infrastructure)
Used where elements of a business are valued on different bases
Values of separate elements prepared on one of the methodologies listed above
Discounts applied to separate elements as above
1%
Consistent with IPEV guidelines, all equity investments are held at fair value using the most appropriate methodology and no investments are held at historical cost.
3i Group plc Annual report and accounts 2021Portfolio and other information
189
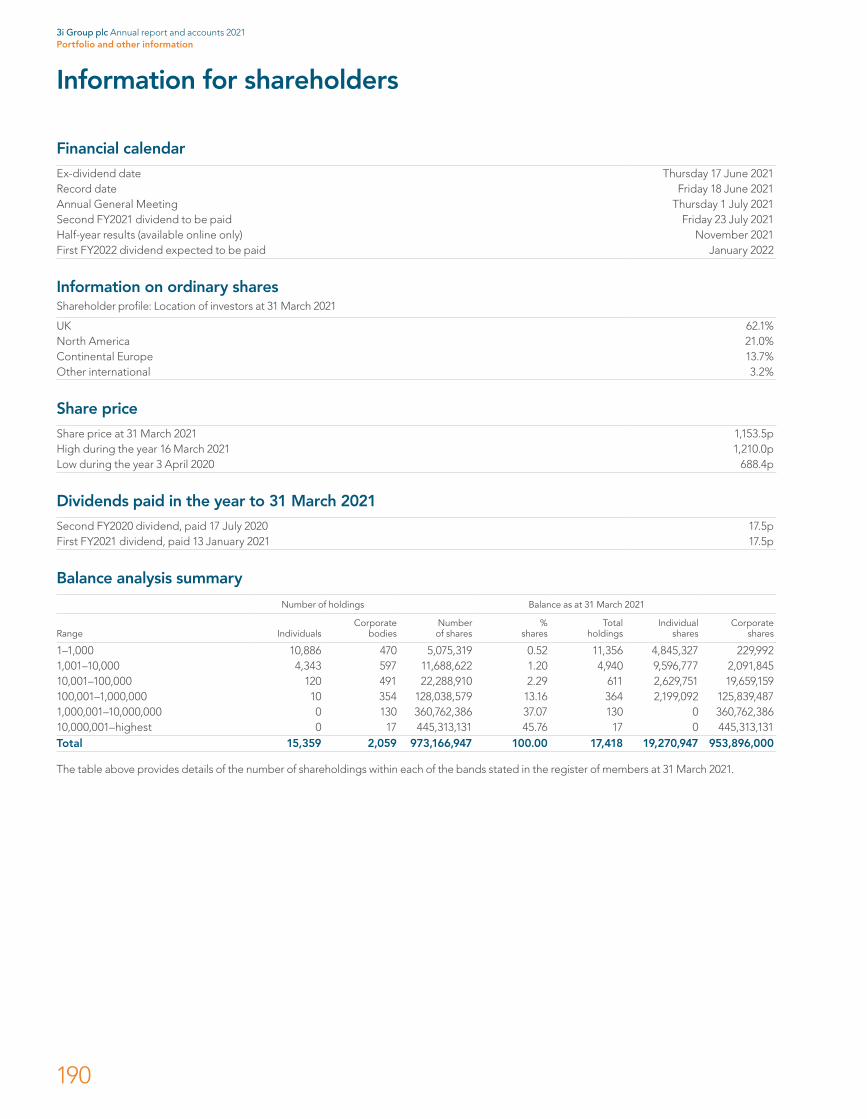
Financial calendarEx-dividend date Thursday 17 June 2021Record date Friday 18 June 2021Annual General Meeting Thursday 1 July 2021Second FY2021 dividend to be paid Friday 23 July 2021Half-year results (available online only) November 2021First FY2022 dividend expected to be paid January 2022
Information on ordinary sharesShareholder profile: Location of investors at 31 March 2021
UK 62.1%North America 21.0%Continental Europe 13.7%Other international 3.2%
Share priceShare price at 31 March 2021 1,153.5pHigh during the year 16 March 2021 1,210.0pLow during the year 3 April 2020 688.4p
Dividends paid in the year to 31 March 2021Second FY2020 dividend, paid 17 July 2020 17.5pFirst FY2021 dividend, paid 13 January 2021 17.5p
Balance analysis summary
Number of holdings Balance as at 31 March 2021
Range IndividualsCorporate
bodiesNumber of shares
% shares
Total holdings
Individual shares
Corporate shares
1–1,000 10,886 470 5,075,319 0.52 11,356 4,845,327 229,9921,001–10,000 4,343 597 11,688,622 1.20 4,940 9,596,777 2,091,84510,001–100,000 120 491 22,288,910 2.29 611 2,629,751 19,659,159100,001–1,000,000 10 354 128,038,579 13.16 364 2,199,092 125,839,4871,000,001–10,000,000 0 130 360,762,386 37.07 130 0 360,762,38610,000,001–highest 0 17 445,313,131 45.76 17 0 445,313,131Total 15,359 2,059 973,166,947 100.00 17,418 19,270,947 953,896,000
The table above provides details of the number of shareholdings within each of the bands stated in the register of members at 31 March 2021.
Information for shareholders
3i Group plc Annual report and accounts 2021Portfolio and other information
190
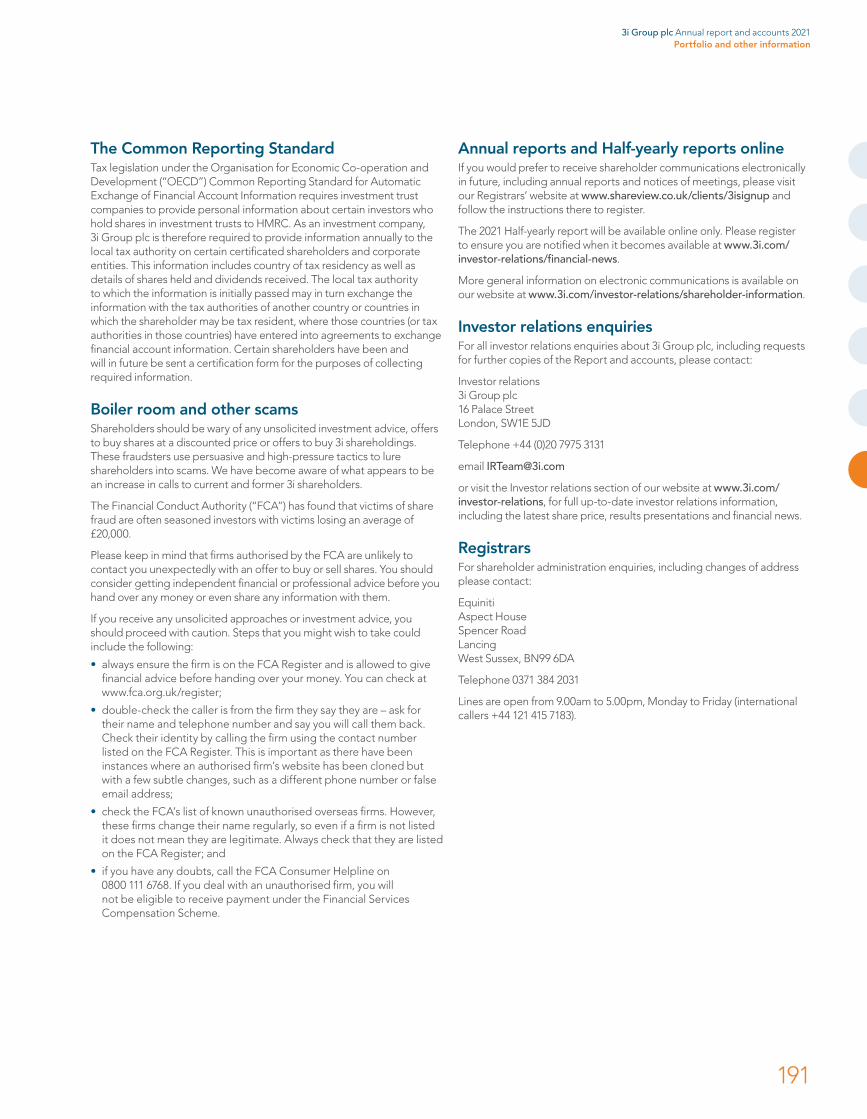
The Common Reporting StandardTax legislation under the Organisation for Economic Co-operation and Development (“OECD”) Common Reporting Standard for Automatic Exchange of Financial Account Information requires investment trust companies to provide personal information about certain investors who hold shares in investment trusts to HMRC. As an investment company, 3i Group plc is therefore required to provide information annually to the local tax authority on certain certificated shareholders and corporate entities. This information includes country of tax residency as well as details of shares held and dividends received. The local tax authority to which the information is initially passed may in turn exchange the information with the tax authorities of another country or countries in which the shareholder may be tax resident, where those countries (or tax authorities in those countries) have entered into agreements to exchange financial account information. Certain shareholders have been and will in future be sent a certification form for the purposes of collecting required information.
Boiler room and other scamsShareholders should be wary of any unsolicited investment advice, offers to buy shares at a discounted price or offers to buy 3i shareholdings. These fraudsters use persuasive and high-pressure tactics to lure shareholders into scams. We have become aware of what appears to be an increase in calls to current and former 3i shareholders.
The Financial Conduct Authority (“FCA”) has found that victims of share fraud are often seasoned investors with victims losing an average of £20,000.
Please keep in mind that firms authorised by the FCA are unlikely to contact you unexpectedly with an offer to buy or sell shares. You should consider getting independent financial or professional advice before you hand over any money or even share any information with them.
If you receive any unsolicited approaches or investment advice, you should proceed with caution. Steps that you might wish to take could include the following:
• always ensure the firm is on the FCA Register and is allowed to give financial advice before handing over your money. You can check at www.fca.org.uk/register;
• double-check the caller is from the firm they say they are – ask for their name and telephone number and say you will call them back. Check their identity by calling the firm using the contact number listed on the FCA Register. This is important as there have been instances where an authorised firm’s website has been cloned but with a few subtle changes, such as a different phone number or false email address;
• check the FCA’s list of known unauthorised overseas firms. However, these firms change their name regularly, so even if a firm is not listed it does not mean they are legitimate. Always check that they are listed on the FCA Register; and
• if you have any doubts, call the FCA Consumer Helpline on 0800 111 6768. If you deal with an unauthorised firm, you will not be eligible to receive payment under the Financial Services Compensation Scheme.
Annual reports and Half-yearly reports onlineIf you would prefer to receive shareholder communications electronically in future, including annual reports and notices of meetings, please visit our Registrars’ website at www.shareview.co.uk/clients/3isignup and follow the instructions there to register.
The 2021 Half-yearly report will be available online only. Please register to ensure you are notified when it becomes available at www.3i.com/investor-relations/financial-news.
More general information on electronic communications is available on our website at www.3i.com/investor-relations/shareholder-information.
Investor relations enquiriesFor all investor relations enquiries about 3i Group plc, including requests for further copies of the Report and accounts, please contact:
Investor relations 3i Group plc 16 Palace Street London, SW1E 5JD
Telephone +44 (0)20 7975 3131
email [email protected]
or visit the Investor relations section of our website at www.3i.com/investor-relations, for full up-to-date investor relations information, including the latest share price, results presentations and financial news.
RegistrarsFor shareholder administration enquiries, including changes of address please contact:
Equiniti Aspect House Spencer Road Lancing West Sussex, BN99 6DA
Telephone 0371 384 2031
Lines are open from 9.00am to 5.00pm, Monday to Friday (international callers +44 121 415 7183).
3i Group plc Annual report and accounts 2021Portfolio and other information
191
2013-2016 vintage includes Aspen Pumps, Audley Travel, Basic-Fit, Dynatect, Kinolt, ATESTEO, JMJ, Q Holding, WP, Scandlines further (completed in December 2013), Christ, Geka, Óticas Carol and Blue Interactive.
2016-2019 vintage includes BoConcept, Cirtec Medical, Formel D, Hans Anders, arriva, Luqom, Havea, Royal Sanders, Magnitude Software and Schlemmer.
2019-2022 vintage includes Evernex, SaniSure, GartenHaus, MPM and WilsonHCG.
AIFMD Regulations are the Alternative Investment Fund Managers Regulations 2013.
Alternative Investment Funds (“AIFs”) At 31 March 2021, 3i Investments plc as AIFM, managed five AIFs. These were 3i Group plc, 3i Growth Capital Fund, 3i Eurofund V, 3i Managed Infrastructure Acquisitions LP and 3i Infrastructure plc. 3i Investments (Luxembourg) SA as AIFM, managed one AIF, 3i European Operational Projects Fund.
Alternative Investment Fund Manager (“AIFM”) is the regulated manager of AIFs. Within 3i, these are 3i Investments plc and 3i Investments (Luxembourg) SA.
APAC The Asia Pacific region.
Approved Investment Trust Company This is a particular UK tax status maintained by 3i Group plc, the parent company of 3i Group. An approved Investment Trust company is a UK company which meets certain conditions set out in the UK tax rules which include a requirement for the company to undertake portfolio investment activity that aims to spread investment risk and for the company’s shares to be listed on an approved exchange. The “approved” status for an investment trust must be agreed by the UK tax authorities and its benefit is that certain profits of the company, principally its capital profits, are not taxable in the UK.
Assets under management (“AUM”) A measure of the total assets that 3i has to invest or manages on behalf of shareholders and third-party investors for which it receives a fee. AUM is measured at fair value. In the absence of a third-party fund in Private Equity, it is not a measure of fee generating capability.
Automatic Exchange of Information (“AEOI”) regulation covers the combined legislative requirements of Common Reporting Standards (“CRS”) and the Foreign Account Tax Compliance Act (“FATCA”). Both sets of rules require financial groups to identify investors and report details to their local authority who will then exchange the information with other relevant tax authorities.
B2B Business-to-business.
Board The Board of Directors of the Company.
Buyouts 2010-2012 vintage includes Action, Amor, Element, Etanco, Hilite, OneMed and Trescal.
CAGR is the compound annual growth rate.
Capital redemption reserve is established in respect of the redemption of the Company’s ordinary shares.
Capital reserve recognises all profits and losses that are capital in nature or have been allocated to capital. Following changes to the Companies Act, the Company amended its Articles of Association at the 2012 Annual General Meeting to allow these profits to be distributable by way of a dividend.
Carried interest payable is accrued on the realised and unrealised profits generated taking relevant performance hurdles into consideration, assuming all investments were realised at the prevailing book value. Carried interest is only actually paid when the relevant performance hurdles are met and the accrual is discounted to reflect expected payment periods.
Carried interest receivable The Group earns a share of profits from funds which it manages on behalf of third parties. These profits are earned when the funds meet certain performance conditions and are paid by the fund once these conditions have been met on a cash basis. The carried interest receivable may be subject to clawback provisions if the performance of the fund deteriorates following carried interest being paid.
Company 3i Group plc.
Country-by-Country reporting (“CbC Reporting”) refers to a requirement for large multinational groups, operating in different countries, to file an annual report with their head office tax authority. This provides information about the activities of the entities in the Group, on a country-by-country basis, across the countries in which the Group operates.
DACH The region covering Austria, Germany and Switzerland.
Discounting The reduction in present value at a given date of a future cash transaction at an assumed rate, using a discount factor reflecting the time value of money.
EBITDA is defined as earnings before interest, taxation, depreciation and amortisation and is used as the typical measure of portfolio company performance.
EBITDA multiple Calculated as the enterprise value over EBITDA, it is used to determine the value of a company.
EMEA The region covering Europe, the Middle East and Africa.
Executive Committee The Executive Committee is responsible for the day-to-day running of the Group and comprises: the Chief Executive; Group Finance Director; the Managing Partners of the Private Equity and Infrastructure businesses; and the Group’s General Counsel.
Fair value movements on investment entity subsidiaries The movement in the carrying value of Group subsidiaries, classified as investment entities under IFRS 10, between the start and end of the accounting period converted into sterling using the exchange rates at the date of the movement.
Fair value through profit or loss (“FVTPL”) is an IFRS measurement basis permitted for assets and liabilities which meet certain criteria. Gains and losses on assets and liabilities measured as FVTPL are recognised directly in the Statement of comprehensive income.
Fee income (or Fees receivable) is earned for providing services to 3i’s portfolio companies and predominantly falls into one of two categories. Negotiation and other transaction fees are earned for providing transaction related services. Monitoring and other ongoing service fees are earned for providing a range of services over a period of time.
Fees receivable from external funds are earned for providing management and advisory services to a variety of fund partnerships and other entities. Fees are typically calculated as a percentage of the cost or value of the assets managed during the year and are paid quarterly, based on the assets under management to date.
Glossary
3i Group plc Annual report and accounts 2021Portfolio and other information
192
Foreign exchange on investments arises on investments made in currencies that are different from the functional currency of the Company. Investments are translated at the exchange rate ruling at the date of the transaction. At each subsequent reporting date investments are translated to sterling at the exchange rate ruling at that date.
Gross investment return (“GIR”) includes profit and loss on realisations, increases and decreases in the value of the investments we hold at the end of a period, any income received from the investments such as interest, dividends and fee income, movements in the fair value of derivatives and foreign exchange movements. GIR is measured as a percentage of the opening portfolio value.
Growth 2010-2012 vintage includes Element, Hilite, BVG, Go Outdoors, Loxam, Touchtunes and WFCI.
Interest income from investment portfolio is recognised as it accrues. When the fair value of an investment is assessed to be below the principal value of a loan, the Group recognises a provision against any interest accrued from the date of the assessment going forward until the investment is assessed to have recovered in value.
International Financial Reporting Standards (“IFRS”) are accounting standards issued by the International Accounting Standards Board (“IASB”). The Group’s consolidated financial statements are required to be prepared in accordance with IFRS, as endorsed by the EU.
Investment basis Accounts prepared assuming that IFRS 10 had not been introduced. Under this basis, we fair value portfolio companies at the level we believe provides useful comprehensive financial information. The commentary in the Strategic report refers to this basis as we believe it provides a more understandable view of our performance.
IRR Internal Rate of Return.
Key Performance Indicator (“KPI”) is a measure by reference to which the development, performance or position of the Group can be measured effectively.
Like-for-like compare financial results in one period with those for the previous period.
Money multiple is calculated as the cumulative distributions plus any residual value divided by paid-in capital.
Net asset value (“NAV”) is a measure of the fair value of our proprietary investments and the net costs of operating the business.
Operating cash profit is the difference between our cash income (consisting of portfolio interest received, portfolio dividends received, portfolio fees received and fees received from external funds as per the Investment basis Consolidated cash flow statement) and our operating expenses and lease payments (as per the Investment basis Consolidated cash flow statement).
Operating profit Includes gross investment return, management fee income generated from managing external funds, the costs of running our business, net interest payable, other losses and carried interest.
Organic growth is the growth a company achieves by increasing output and enhancing sales internally.
Performance fee receivable The Group earns a performance fee from the investment management services it provides to 3i Infrastructure plc (“3iN”) when 3iN’s total return for the year exceeds a specified threshold. This fee is calculated on an annual basis and paid in cash early in the next financial year.
Portfolio effect is the level of risk based on the diversity of the investment portfolio.
Portfolio income is that which is directly related to the return from individual investments. It is comprised of dividend income, income from loans and receivables and fee income.
Proprietary Capital Shareholders’ capital which is available to invest to generate profits.
Public Private Partnership (“PPP”) is a government service or private business venture which is funded and operated through a partnership of government and one or more private sector companies.
Realised profits or losses over value on the disposal of investments The difference between the fair value of the consideration received, less any directly attributable costs, on the sale of equity and the repayment of loans and receivables and its carrying value at the start of the accounting period, converted into sterling using the exchange rates at the date of disposal.
Revenue reserve recognises all profits and losses that are revenue in nature or have been allocated to revenue.
Segmental reporting Operating segments are reported in a manner consistent with the internal reporting provided to the Chief Executive who is considered to be the Group’s chief operating decision maker. All transactions between business segments are conducted on an arm’s length basis, with intrasegment revenue and costs being eliminated on consolidation. Income and expenses directly associated with each segment are included in determining business segment performance.
Share-based payment reserve is a reserve to recognise those amounts in retained earnings in respect of share-based payments.
SORP means the Statement of Recommended Practice: Financial Statements of Investment Trust Companies and Venture Capital Trusts.
SPAC Special Purpose Acquisition Company.
Syndication The sale of part of our investment in a portfolio company to a third party, usually within 12 months of our initial investment and for the purposes of facilitating investment by a co-investor or portfolio company management in line with our original investment plan. A syndication is treated as a negative investment rather than a realisation.
Total return Comprises operating profit less tax charge less movement in actuarial valuation of the historic defined benefit pension scheme.
Total shareholder return (“TSR”) is the measure of the overall return to shareholders and includes the movement in the share price and any dividends paid, assuming that all dividends are reinvested on their ex-dividend date.
Translation reserve comprises all exchange differences arising from the translation of the financial statements of international operations.
Unrealised profits or losses on the revaluation of investments The movement in the carrying value of investments between the start and end of the accounting period converted into sterling using the exchange rates at the date of the movement.
3i Group plc Annual report and accounts 2021Portfolio and other information
193

Notes
194
3i Group plc Annual report and accounts 2021

Designed and produced by Radley Yeldar www.ry.com
3i Group plcRegistered office: 16 Palace Street, London, SW1E 5JD, UK
Registered in England No. 1142830 An investment company as defined by section 833 of the Companies Act 2006
This report was printed by Pureprint Group using their environmental print technology which minimises the negative environmental impacts of the printing process. Vegetable-based inks were used throughout and 99% of the dry waste and 95% of the cleaning solvents associated with this production were recycled. This report is printed on Revive 100, made from 100% FSC® Recycled certified fibre sourced from de-inked post-consumer waste. The printer and the manufacturing mill are both credited with ISO 14001 Environmental Management Systems Standard and both are FSC® certified. The mill also holds EMAS, the EU Eco-label. Revive 100 is a Carbon balanced paper which means that the carbon emissions associated with its manufacture have been measured and offset using the World Land Trust’s Carbon Balanced scheme.
FSC® – Forest Stewardship Council®
This ensures that there is an audited chain of custody from the tree in the well-managed forest through to the finished document in the printing factory.
ISO 14001A pattern of control for an environmental management system against which an organisation can be accredited by a third party.
Artist: David Ridley
www.3i.com
3i Group plc
16 Palace Street, London, SW1E 5JD, UK Telephone +44 (0)20 7975 3131
THR27385
Register onlineTo receive shareholder communications electronically, including reports and notices of meetings, please register at
+ www.3i.com/investor-relations
Sign up for 3i newsTo be kept up-to-date with 3i’s latest financial news and press releases, sign up for alerts at
+ www.3i.com/investor-relations
Copyright © 2022 FDOKUMEN