Grafton Group plc Annual Report 2014 - AnnualReports.com
168
Annual Report 2014
-
Upload
khangminh22 -
Category
Documents
-
view
0 -
download
0
Transcript of Grafton Group plc Annual Report 2014 - AnnualReports.com

Annual Report 2014


Grafton Group plc Annual Report 2014
01
About Grafton Group plc 02
Business & Strategy ReviewFinancial Highlights 04Financial Summary 05Operating Highlights 05Segment Trading Locations 06Trading Locations 07Principal Brands and Market Position 08Board of Directors and Secretary 10Strategy 12Chairman’s Statement 16Chief Executive Officer’s Review 18Group Financial Review 24Executive Committee 26Grafton Group plc Financial History - 1993 to 2014 28Report of the Directors 30Corporate Social Responsibility 33
Corporate Governance Directors’ Report on Corporate Governance 38Audit and Risk Committee Report 43Principal Risks and Uncertainties 48 Report of the Remuneration Committee on Directors’ Remuneration 51- Chairman’s Annual Statement 51- Remuneration Policy Report 53- Annual Report on Remuneration 61Statement of Directors’ Responsibilities 70
Financial Statements Independent Auditor’s Report 72Group Income Statement 77Group Statement of Comprehensive Income 78Group Balance Sheet 79Group Cash Flow Statement 80Group Statement of Changes in Equity 81Accounting Policies 83Notes to the Group Financial Statements 93Company Balance Sheet 150Company Cash Flow Statement 151Company Statement of Changes in Equity 152Notes to the Company Financial Statements 153
Shareholder InformationCorporate Information 164Financial Calendar 164Location of Annual General Meeting 165
Grafton Group plc Annual Report 2014
01
Contents

Grafton Group plc Annual Report 2014
02
About Grafton Group plc
Grafton Group plc (“Grafton” or “the Group”) is primarily a distributor of building materials in the UK, Ireland and Belgium. The Group is also the market leader in DIY retailing in Ireland and is the largest manufacturer of dry mortar in Britain.
Grafton has 10,000 employees and operates from over 600 locations.
Grafton Group plc is headquartered in Ireland and its units (shares) are quoted on the London Stock Exchange where it is a member of the FTSE 250 Index.
Grafton has strong national or regional positions in the merchanting, retailing and mortar manufacturing markets.
Grafton’s strategy is to be an international trade supplier of construction products and related activities, built on service, supported by a strong financial base and operated within a framework of high business ethics and integrity.
Merchanting The Merchanting segment distributes building materials from 578 branches in the UK, Ireland and Belgium.
Retailing The Group is the largest DIY retailer in Ireland trading nationally from 37 stores and also operates a kitchens business from seven stores.
Manufacturing The Manufacturing segment operates the leading dry mortar business in Britain.

Business& Strategy
ReviewFinancial Highlights 04Financial Summary 05Operating Highlights 05Segment Trading Locations 06Trading Locations 07Principal Brands and Market Position 08Board of Directors and Secretary 10Strategy 12Chairman’s Statement 16Chief Executive Officer’s Review 18Group Financial Review 24Executive Committee 26Grafton Group plc Financial History - 1993 to 2014 28Report of the Directors 30Corporate Social Responsibility 33
Business & Strategy Review Corporate Governance Financial Statements Shareholder Information
Grafton Group plc Annual Report 2014
03

Grafton Group plc Annual Report 2014
04
Financial Highlights
Revenue
UP 9.6%
£2.1bn13
Underlying operating profit*
UP 43%
£110.1m13
Underlying Group operating profit margin*
increased by 120 basis points
5.3%13
Underlying profit before taxation*
UP 56%
£101.2m13
Adjusted basic earnings per share*
UP 54%
34.4p13
Dividend
UP 26%
10.75p13
Cash generation from operations
UP 68% and year-end gearing of 8%
£160.0m
Return on capital employed
increased by 330 basis points
11.1%13
14
14
14
14
14
14
13 14
14
* The comparative performance for 2013 excludes a non-recurring pension credit of £30.0 million and a property impairment charge of £27.2 million.

Business & Strategy Review Corporate Governance Financial Statements Shareholder Information
Grafton Group plc Annual Report 2014
05
Financial Summary
Operating Highlights
Strong UK merchanting performance driven by growth in the housing repair, maintenance and improvement (RMI) and new-build markets
Significant profit growth in Irish merchanting business as market recovery accelerated
DIY business in Ireland improved its performance in a stable market
Five bolt-on acquisitions completed during the year – three in the UK and two in Belgium
“2014 was a year of significant progress for Grafton which recorded its fifth successive year of strong profit growth and met the Board’s ‘first base’ financial targets of an operating profit margin exceeding 5% and a double digit return on capital employed. Given that 2014 was also the first full year of recovery in its major businesses, the overall outlook for the Group is positive.” Gavin Slark, Chief Executive Officer
2014 2013*
£’m £’m % change
Revenue 2,082 1,900 +10%
Underlying*Operating profit 110.1 77.2 +43%
Profit before tax 101.2 64.9 +56%
Profit after tax 80.0 51.7 +55%Adjusted earnings per share – basic 34.4p 22.3p +54%
StatutoryOperating profit 110.1 80.0 +38%
Profit before tax 101.2 67.7 +50%
Profit after tax 80.0 62.1 +29%
Earnings per share – basic 34.4p 26.8p +28%
Dividend 10.75p 8.5p +26%
Net debt 75.3 133.7 -44%
Total equity 906.3 874.3 +4%Return on capital employed 11.1% 7.8% +3.3% pts
* The comparative performance for 2013 excludes a non-recurring pension credit of £30.0 million and a property impairment charge of £27.2 million.

Grafton Group plc Annual Report 2014
06
Builders Merchanting
Plumbers Merchanting
Manufacturing
Retailing
Merchanting
Retailing
Manufacturing
Segment Revenue
UK
Ireland
Belgium
Geographic Revenue
90%
75%
20% 5%
8% 2%
2013
£1.90bn
89%
9% 2%
75%
22% 3%
2014
£2.08bn
20132014
Segment Trading Locations
UK Ireland Belgium Total
Builders Merchanting 287 39 17 343
Plumbers Merchanting 232 3 - 235
Merchanting 519 42 17 578
Retailing - 44 - 44
Manufacturing 9 1 - 10
Total 528 87 17 632

Business & Strategy Review Corporate Governance Financial Statements Shareholder Information
Grafton Group plc Annual Report 2014
07
Builders Merchanting
Plumbers Merchanting
Manufacturing
Retailing
Merchanting
Retailing
Manufacturing
Segment Revenue
UK
Ireland
Belgium
Geographic Revenue
90%
75%
20% 5%
8% 2%
2013
£1.90bn
89%
9% 2%
75%
22% 3%
2014
£2.08bn
20132014
Trading Locations

Grafton Group plc Annual Report 2014
08
Principal Brands and Market Position
Merchanting
The Merchanting segment trades from 578 branches, principally under the Selco, Buildbase and Plumbase brands in the South East, Midlands and North of England, under the Chadwicks and Heiton Buckley brands in the Republic of Ireland and under the Macnaughton Blair brand in Northern Ireland. Grafton trades under the YouBuild and MPRO brands in Belgium.
Retailing
The Group is the largest DIY retailer in Ireland trading from 37 stores nationally under the Woodie’s brand and also operates a kitchens business that trades from seven stores under the In-House brand.
Manufacturing
EuroMix, the largest manufacturer in Britain of silo-based mortar for use in new build residential and commercial construction projects, trades from nine plants that provide regional market coverage in England and Scotland. MFP is a manufacturer of plastic pipe systems in Dublin.
Market PositionBuilders Merchanting
UK No. 3 Ireland No. 1 Belgium No. 1
Plumbers Merchanting UK No. 4 Ireland No. 1
Market PositionDIY Retailing
Ireland No. 1
Market PositionMortar Manufacturing
UK No. 1

Business & Strategy Review Corporate Governance Financial Statements Shareholder Information
Grafton Group plc Annual Report 2014
09

Grafton Group plc Annual Report 2014
10
Board of Directors and Secretary
Michael Chadwick, (IRL), BA, MScNON-EXECUTIVE CHAIRMANMichael Chadwick joined the Group in 1975, was appointed to the Board on 4 December 1979 and became Executive Chairman in 1985. He retired as Executive Chairman on 1 July 2011 and continued to serve on the Board from that date as non-executive Chairman. He is a Director of other companies in which he has invested.
Gavin Slark, (UK)CHIEF EXECUTIVE OFFICERGavin Slark joined the Group and the Board as Chief Executive Designate on 1 April 2011 and was appointed Chief Executive Officer on 1 July 2011. He was previously Group Chief Executive of BSS Group plc, a leading UK distributor to specialist trades including the plumbing, heating and construction sectors.
David Arnold, (UK), BSc, FCMA, FCTCHIEF FINANCIAL OFFICERDavid Arnold joined the Board and the Group as Group Chief Financial Officer on 9 September 2013. He was Group Finance Director of Enterprise plc, the UK Maintenance and Support Services business, from 2010 to 2013 and Finance Director of Redrow plc, the house builder, from 2003 to 2010. He previously held senior financial positions with Six Continents plc, the hotels group and Tarmac plc, the building materials company.
Roderick Ryan, (IRL), B.Comm, FCA, AITINON-EXECUTIVE DIRECTORRoderick Ryan joined the Board on 15 March 2006 and was appointed Senior Independent Director in May 2010. He is a Non-Executive Director of Glen Dimplex having previously served as an executive director of the company. Mr. Ryan is a former Managing Partner of Arthur Andersen in Ireland. He is a member of the Chartered Accountants Regulatory Board.

Business & Strategy Review Corporate Governance Financial Statements Shareholder Information
Grafton Group plc Annual Report 2014
11
Charles M. Fisher, (UK), MANON-EXECUTIVE DIRECTORCharles Fisher was appointed to the Board on 1 May 2009. He is currently Chairman of Garden Centre Property Development Trading plc. He was Chairman and Chief Executive of Sharpe & Fisher plc, the UK builders merchanting company, from 1989 to 1999. He was formerly Chairman of Mowlem plc and previously served as a director of a number of other public companies including Travis Perkins plc, Baggeridge Brick plc, South Western Electricity plc and Delta plc.
Annette Flynn, (IRL), B.Comm, FCCA, C.DirNON-EXECUTIVE DIRECTORAnnette Flynn was appointed to the Board on 15 March 2011. She is currently a Non-Executive Director of Aryzta AG, a global food business with a leadership position in speciality bakery, and Canada Life International Assurance Limited. She was formerly a non-executive director of Irish Life Group, a life and pensions company and of UDG Healthcare plc, the international healthcare services group where she previously served as an executive director for seven years. She also held senior positions with Kerry Group plc, the international food ingredients business.
Frank van Zanten, (NL), MBANON-EXECUTIVE DIRECTORFrank van Zanten was appointed to the Board on 13 May 2013. He is Managing Director of the Continental Europe business area of Bunzl plc, the FTSE 100 UK international distribution and outsourcing Group with operations across the Americas, Europe and Australasia. He was previously Chief Executive of PontMeyer N.V., the Dutch Builders Merchants.
Charles Rinn, MBA, FCCA,GROUP FINANCIAL CONTROLLER & SECRETARY
Board ServiceDirector Length of Service
M. Chadwick 35.3 yearsG. Slark 4.0 yearsD. Arnold 1.5 yearsR. Ryan 9.0 yearsC. M. Fisher 5.9 yearsA. Flynn 4.0 yearsF. van Zanten 1.8 years
Board Committee Membership and Length of Service
Audit and Risk
MembershipLength of
Service
R. Ryan (Chairman) 8.5 years
A. Flynn 4.0 years
F. van Zanten 1.6 years
Remuneration
MembershipLength of
Service
C. M. Fisher (Chairman) 4.8 years
A. Flynn 3.4 years
R. Ryan 4.8 years
Nomination
MembershipLength of
Service
R. Ryan (Chairman) 4.8 years
M. Chadwick 21.3 years
C. M. Fisher 4.8 years
Finance
MembershipLength of
Service
G. Slark (Chairman) 4.0 years
D. Arnold 1.5 years
C. Rinn 11.0 years

Grafton Group plc Annual Report 2014
12
• Maximising long term returns for shareholders supported by the three strategic financial pillars of Revenue growth in existing and new markets, Operating Profit Margin growth and increasing Capital Turn.
• Developing an innovative and efficient multi-specialist and multi-channel business.
• Being a focused supplier of construction materials to all segments of the industry.
• Deploying mature acquisition and integration skills to complete transactions and realise synergies.
• Operating a decentralised organisation structure that confers significant autonomy on local management teams within a tight Group accounting, risk management and control environment.
• Employing high calibre management teams comprised of individuals that have a mix of:
- Through-the-cycle Merchanting, DIY Retailing and Mortar Manufacturing experience;
- Broadly based operational management experience; and
- Suitably qualified professionals with expertise covering a range of management disciplines appropriate to the scale and diversity of individual group businesses.
• Utilising the Board and the Group Headquarters based in Ireland to implement the strategy of the Group;
- To allocate capital for replacement and development projects using a rigorous approach to project evaluation;
- To critically review business performance using key metrics that are applied across the Group;
- To facilitate the transfer of best practice initiatives; and
- To coordinate the realisation of Group synergy benefits including procurement gains.
• Conducting business to a high standard of integrity for the benefit of all stakeholders and in a responsible way that involves a commitment to achieving the highest practical standards of health and safety for employees, customers and visitors to Group locations.
Strategy
The Group’s overall strategy is to be an international distributor of building materials and related activities. This strategy is executed by building market leadership positions in national or regional markets through organic growth and acquisitions.
Implementing this strategy is based on:

Business & Strategy Review Corporate Governance Financial Statements Shareholder Information
Grafton Group plc Annual Report 2014
13
MarketsDemand in the Group’s markets is influenced by a range of macro-economic factors including GDP growth, construction growth, construction output as a percentage of GDP, interest rates and the availability of credit. Other relevant measures are demographic trends, sustainable housing demand and employment trends. Demand in individual markets is also a function of the size of the construction, merchanting, RMI and housing markets. The age of the housing stock influences demand in the merchanting market as increased expenditure on housing RMI is required as the housing stock ages and where the replacement rate of housing is low.
The Group’s merchanting customers are primarily trade professionals covering a range of skills required for the construction and repair of houses including general house building, civils and groundworks contractors and trade specialists covering the plumbing and heating, joinery, roofing, insulation, landscaping and electrical trades.
Merchanting SegmentThe overall merchanting segment strategy is based on developing and maintaining national or regional market positions in the distribution of building materials and related markets through a combination of organic growth, greenfield developments and acquisitions.
Merchanting Brands in the UK
• Primary business focus on RMI sector which has attractive market dynamics including greater through the cycle resilience.
• Focus on three financial pillars of revenue growth, improving the operating profit margin and increasing returns on capital employed by utilising spare capacity and creating greater efficiency in the existing branch network.
• Continue to extract efficiencies and synergies from current market leading positions.
• Development of Buildbase, Selco and Plumbase brands in areas of the market where they currently do not have a presence or are under-represented.
• Selectively participate in consolidation of UK merchanting market as a buyer of choice.
• Develop sustainable position in electrical distribution through the use of a low cost implant route to market model that leverages off existing merchanting assets and infrastructure.
• Continued development of hire centres in builders merchanting branches.
• Expand selectively in complementary product markets such as the Plumbase Industrial format that supplies pipeline and mechanical engineering products.
Merchanting Brands in Ireland
• Strengthen market leadership position.
• Utilise bottom of the cycle spare capacity in the branch network, as market conditions improve, to increase revenue, operating margin and return on capital employed.
• Develop complementary presence in adjacent product categories.
• In-fill geographic coverage through greenfield development.
Merchanting Brands in Belgium
• Expand current market position through acquisitions.
• Extract scale related synergies as market position develops.
• Leverage off best practice and know-how in merchanting businesses in the UK and Ireland.
Retailing Segment• Maintain clear market leadership position and strong brand
recognition.
• Focus on core strengths in DIY, Home and Garden product categories.
• Utilise spare capacity in branch network, as market conditions improve, to increase revenue, operating margin and return on capital employed.
Manufacturing Segment• Maintain clear market leadership position in the UK Mortar
market.
• Leveraging scale and expertise in the UK Mortar market to expand into related products and markets.
“Demand in the Group’s markets is influenced by a range of macro-economic factors including GDP growth, construction growth, construction output as a percentage of GDP, interest rates and the availability of credit.”

Grafton Group plc Annual Report 2014
14
Strategy(continued)
Strategic Financial Pillars
Revenue Growth
Economic growth from recovery in the UK and Irish economies.
Organic growth from implants, new formats and greenfield developments.
Acquisitions in the UK and other overseas markets to play a role in market consolidation.
Margin Growth
Operating leverage in the Group’s brands as volumes recover.
Pricing initiatives through consistency, customer insights and benchmarking.
More favourable customer and product mix.
Self-help measures focused on branch implants, cost efficiencies and purchasing synergies.
Increasing Capital Turn
Benefits from economic and organic growth and operating leverage.
Property development and disposal opportunities.
Working capital reduction from increasing stock turn.
Cash and collect retail style proposition for trade customers.

Business & Strategy Review Corporate Governance Financial Statements Shareholder Information
Grafton Group plc Annual Report 2014
15
Business Model OverviewGrafton is an international trade focused multi-channel supplier of construction products and related activities.
The business is built on the quality of products and service supported by a strong financial base.
The Group aims to build on leading market positions in the UK, Ireland and Belgium and to grow further internationally in businesses with which it is familiar.
The Group has Three Operating Segments:
Merchanting in the UK, Ireland and Belgium which accounts for 90 per cent of Group revenue;
DIY Retailing in Ireland that generates 8 per cent of Group revenue; and
Dry Mortar Manufacturing in the UK which accounts for 2 per cent of Group revenue.
The Group is developing scalable specialist implant models to maximise returns from the existing merchanting estate in the UK and Ireland. These include tool hire, electrical, plumbing & heating and kitchen & bathroom implants.
Key ObjectivesThe Group’s key objectives are:
• To generate above average long term shareholder returns.
• To be the first choice supplier of its customers.
• To improve cash generation and operating margins.
• To maximise returns on capital employed from the existing branch network.
• To increase market coverage where the Group is currently under represented.
• To refine and develop the range of products and services offered.
• To increase multi-channel supply capabilities.
• To develop beyond the UK, Ireland and Belgium in merchanting and related markets where opportunities exist to:
- Achieve good returns on capital invested;
- Achieve leading market positions in chosen national and regional markets; and
- Add value to familiar business models operating in unconsolidated markets.
Key StrengthsThe Group’s strategy is underpinned by key strengths that include:
• A profit orientated growth philosophy.
• A history of successful investment in acquisitions and organic developments.
• Leading market positions and brands in each of the countries in which the Group operates.
• Unique market positioning with scope to significantly develop the UK and Belgian merchanting business through acquisition.
• Experienced acquisition and integration skills.
• A portfolio of highly cash generative and profitable businesses.
• Strong, capable and highly motivated management teams.
• Innovative business development program.
• Sound financial metrics that incorporate cash generation, low debt and a strong balance sheet and financial capacity.
Grafton Core ValuesThe Group operates on a highly decentralised basis, united around five core values:
• Being Brilliant for our Customers
• Valuing our People
• Entrepreneurial and Empowering
• Ambitious
• Trustworthy

Grafton Group plc Annual Report 2014
16
Chairman’s Statement
Results The Group reported a strong set of results for 2014 and demonstrated its capacity to increase profitability in response to improved trading conditions in its markets. Group revenue increased by 9.6 per cent to £2.08 billion (2013: £1.90 billion) and underlying profit before tax rose by £36.3 million or 56 per cent to £101.2 million (2013: £64.9 million). Adjusted earnings per share increased by 54 per cent to 34.4p (2013: 22.3p). The increase in revenue and profitability was primarily driven by the recovery in the merchanting markets in the UK and Ireland against the background of an improvement in activity in both economies.
DividendA second interim dividend of 7.0p (2013: 5.5p) was approved to give a total dividend for the year of 10.75p. This represents an increase of 26.5 per cent on total interim dividends of 8.5p paid for 2013. The increase is in line with the Board’s policy of increasing dividends as earnings recover and reflects both the strong cashflow from operations and low level of year-end net debt. The dividend cover increased to 3.2 times from 2.6 times.
StrategyThe Board continued to refine its medium term strategy for the Group. The Group has grown and will continue to develop its portfolio of businesses that have market leading positions in the merchanting markets in the UK, Ireland and Belgium and in the DIY market in Ireland and the mortar market in Britain. The Board’s strategy is also based on developing scalable positions in the merchanting market and in complementary segments of the building materials distribution market by extending the Group’s geographic coverage into other Western European countries and regions that offer attractive consolidation opportunities. The Group is at an advanced stage in a review of specific markets that fit with its strategic priorities and which may provide attractive market entry points at the current stage of the economic cycle. The medium term strategy is also focused on identifying innovative opportunities including new routes to market that could provide the Group with new platforms for its future profitable growth.
BoardAn evaluation of the Board, its Committees and individual Directors was conducted by the Senior Independent Director in line with the requirements of The UK Corporate Governance Code 2012. This involved each Director completing a questionnaire that covered a range of factors that fall within the remit of the Board including the effectiveness of the Board and its Committee structure, strategy and value creation. The review concluded that the Board and its Committees are operating effectively and to a high standard of governance and in compliance with best practice. An externally facilitated board evaluation process was conducted at the end of 2012 and the Board plans to engage an external facilitator to conduct the 2015 evaluation.

Business & Strategy Review Corporate Governance Financial Statements Shareholder Information
Grafton Group plc Annual Report 2014
17
There was continuity of Board membership during 2014 following five appointments at Executive and Non-Executive Director level in 2009, 2011 and 2013 as part of the ongoing process of board refreshment and renewal. The Board currently comprises two Executive Directors, four independent Non-Executive Directors and myself as Non-Executive Chairman. The two Executive Directors, Mr. Gavin Slark and Mr. David Arnold joined the Board in 2011 and 2013 respectively. Three Independent Non-Executive Directors, Mr. Charles Fisher, Ms. Annette Flynn and Mr. Frank van Zanten were appointed to the Board in 2009, 2011 and 2013 respectively. Mr. Roderick Ryan, the fourth independent Non-Executive Director, joined the Board in March 2006 and was formally elected to the Board in May 2006. The company intends to put its audit out to tender this year and Mr. Ryan has agreed to stand for re-election and to remain as Chairman of the Audit and Risk Committee during this process.
In line with the policy adopted in recent years, the Board has decided that all Directors will retire and seek re-election at the 2015 AGM. This is not required legally or by the Company’s Articles of Association but is in line with best practice and the provisions of The UK Corporate Governance Code 2012. The internal evaluation confirmed that each Director continued to perform effectively and to demonstrate a strong commitment to the role. I recommend that each of the Directors going forward be re-elected at the Annual General Meeting.
Management and StaffOn behalf of the Board, I thank Gavin Slark, Grafton management and employees for their commitment and contribution to the strong profit improvement reported for 2014.
Conclusion The Board expects the Group to achieve further progress in 2015 and to increase revenue, profitability, cash flow and returns on invested capital as its markets recover and to benefit from the development initiatives undertaken in recent years. Michael Chadwick,Chairman
“ The Group has grown and will continue to develop its portfolio of businesses that have market leading positions in the merchanting markets in the UK, Ireland and Belgium and in the DIY market in Ireland and the mortar market in Britain.”

Grafton Group plc Annual Report 2014
18
Chief Executive Officer’s Review
Group ResultsThe results for 2014 demonstrate the significant progress made by the Group in what was the first full year of recovery in its major markets. Overall trading conditions were favourable as the recovery in the UK and Irish economies was sustained and contributed to strong growth in revenue and operating profit.
The merchanting business in the UK, which generated 73 per cent of Group revenue, benefited from improved economic and market conditions and produced record revenue and operating profit. The overall business performed strongly on the back of increased spending on housing repair, maintenance and improvement (RMI) projects and significant growth in housebuilding.
The merchanting business in Ireland delivered a strong performance as the revival in the housing market gathered pace and spending on housing RMI projects increased strongly from a low base. During the year the recovery broadened into the new housing market which experienced a pick-up in activity from historically low levels.
Revenue was flat in the Irish Retailing business despite improvements in the wider economy and sentiment as consumers continued to prioritise debt reduction.
The mortar manufacturing business continued to benefit from an increase in housebuilding and performed strongly.
The Group’s businesses were strongly cash generative leading to a reduction in net debt by £58.4 million to £75.3 million and a fall in gearing to eight per cent, its lowest level for almost two decades. This outcome was achieved after funding a significant programme of development expenditure to support the medium term development of the Group and increased spending on essential capital expenditure and dividends.
OutlookThe pace of UK growth moderately eased in the fourth quarter but the economy remained firmly on the path of what is expected to be a sustained recovery. Record levels of employment, falling oil prices and low inflation should translate into growth in consumer spending. Growth in housing RMI is expected to be supported by good underlying demand following a long period of under investment and the improvement in the wider economy and secondary housing market. The rate of growth in activity in the new housing market slowed since the middle of last year but the market is forecast to remain strong as it approaches a sustainable level of output. Continued weakness in the Eurozone and political uncertainty around the outcome of the general election are among the risks that could weigh on the strength of the recovery.
In Ireland, the overall outlook is for the recovery to continue with solid economic growth forecast for 2015. An increase in housing transactions and house prices should support continued investment in residential RMI projects. It is anticipated that the recovery in house building from very low levels should continue but that it will take some time for supply to match potential demand of 25,000 units per annum based on demographic factors. Consumer spending is forecast to grow in 2015 as real disposable income rises due to an increase in employment and pick-up in earnings. Despite this favourable backdrop, growth in retail spending including DIY is likely to be modest as households continue to gradually reduce high levels of debt.
Average daily like-for-like revenue grew by 4.7 per cent in January and February 2015 in a competitive UK Merchanting market and by 18.1 per cent in the Irish Merchanting market. Like-for-like revenue growth was 3.0 per cent in the Retailing business in Ireland.
While as always risks remain, the overall outlook is favourable and the Group continues to be well positioned to benefit from growth in its markets and from the development initiatives undertaken over recent years.

Business & Strategy Review Corporate Governance Financial Statements Shareholder Information
Grafton Group plc Annual Report 2014
19
“ UK Merchanting revenue increased by 9.5 per cent to £1.53 billion (2013: £1.39 billion) and operating profit grew by 22.2 per cent to £92.8 million (2013: £75.9 million).”
90%
90% of Group
Revenue
8%
8% of Group
Revenue
2%
2% of Group
Revenue
Operating ReviewMerchanting SegmentGroup merchanting revenue increased by 10.6 per cent to £1.87 billion (2013: £1.69 billion). Operating profit was up by 34.6 per cent to £110.0 million (2013: £81.8 million) and the operating profit margin increased by 1.1 percentage points to 5.9 per cent.
UK Merchanting revenue increased by 9.5 per cent to £1.53 billion (2013: £1.39 billion) and operating profit grew by 22.2 per cent to £92.8 million (2013: £75.9 million).
The UK Merchanting business benefited from more positive market conditions and reported solid growth in volumes which together with a continued focus on margins and costs resulted in a substantial improvement in operating profit. The business continued to expand its market position through bolt-on acquisitions, new branches and branch implants.
Like-for-like revenue growth of 6.5 per cent was driven by the recovery in the residential RMI and new build markets. Volumes grew by 4.0 per cent and materials price inflation is estimated at 2.5 per cent. New branches, implants and acquisitions accounted for 3.0 per cent of the increase in revenue for the year of 9.5 per cent.
The gross margin increased by 0.5 percentage points due to supply chain gains and favourable changes in mix.
The operating profit margin increased by 0.6 percentage points to 6.1 per cent comprising growth of 1.1 percentage points in the first half to 6.1 per cent and 0.2 percentage points in the second half to 6.1 per cent.
Selco Builders Warehouse, the Group’s trade and business only builders merchants that operates a retail style self-select format, had an excellent year achieving a significant increase in revenue, operating profit and margins. The business experienced a strong increase in like-for-like revenue through the year due to increased activity in the residential

Grafton Group plc Annual Report 2014
20
Chief Executive Officer’s Review(continued)
RMI market that was underpinned by the recovery in the wider economy. Growth in revenue was particularly strong in the London region but also extended across all regions. The four London branches that were opened in 2012 and 2013 performed ahead of expectations and made a significant contribution to operating profit. Selco continued to implement its strategy of consolidating its market position and driving growth through branch openings and enhanced customer propositions. Market coverage was extended with the opening of a branch in Isleworth, West London and Hire implants were opened in the London branches. Selco recently opened its 36th branch in Redhill, Surrey and a new branch in Coventry is scheduled to open in July 2015.
Buildbase increased revenue and operating profit supported by the continued strength of the residential RMI and new build markets together with acquisition and development activity. Growth of 15 per cent in housing transactions, rising house prices and good availability of credit at historically low rates of interest combined to provide a positive trading backdrop in the builders merchanting market. Development activity picked up in 2014 with the completion of three acquisitions trading from ten branches in the Greater London Area and Kent with combined annual revenue of £28 million. The Hirebase division had another good year with record revenue and operating profit. It expanded its position in the tool, plant and equipment hire market with the opening of 22 implants increasing to 115 the number of Buildbase branches with a hire offering. Revenue growth in the branch network was also driven by the opening of 39 Electricbase implants taking the total number to 59 by the year-end.
Kate Tinsley was appointed Managing Director of Buildbase with effect from 1 January 2015. Prior to her appointment she was Finance Director of Grafton Merchanting GB. She succeeded Stephen Thompstone who the Board thanks for his significant contribution to the development of Buildbase over a period of 16 years.
Buildbase Civils & Lintels branches realised a strong improvement in revenue and operating profit due to increased volumes driven by the continuing recovery in the new housing market.
Plumbase experienced difficult trading conditions leading to a small decline in revenue for the year as unseasonably mild weather conditions in September and October delayed the start of the heating season and weaker volumes in the domestic installation market following on from the Government’s ECO funded boiler scheme. Tighter operational control and a focus on costs in a weaker market contributed to a marginal improvement in operating profit from a low base. The specialist bathroom products distribution business had another year of good progress with a significant improvement in revenue and operating profit due to improved market conditions and the benefit of profit improvement measures implemented in recent years.
Plumbase Industrial, a distributor of pipeline and mechanical engineering products for use in commercial buildings, residential apartment schemes and industrial processes opened nine branches in the South East following a successful trial of the concept with the opening of a branch in 2013. The business was significantly enlarged by the recently announced acquisition of TG Lynes, a long established player in the sector with a leading market position in London and the South East. This is a significant step forward in the development of the business and complements existing market coverage.
Macnaughton Blair, the Northern Ireland merchanting business, reported good progress for the year increasing revenue and operating profit. The local economy improved in what was the first year since 2007 that business activity, employment and exports all expanded. There was evidence of a recovery in the secondary housing market, a key driver of demand in the RMI sector, as prices increased by 7 per cent and transactions were up by a quarter but remained at less than half the level at the peak of the market in 2007. Housing registrations, a lead indicator of housing starts, were up by 17 per cent from a very low base in a weak house building market. Increased revenue across the branch network, including outperformance in a number of local markets, and realignment of cost in the specialist ironmongery division contributed to the improved results.
Irish Merchanting revenue increased by 6.0 per cent to £257.5 million (2013: £243.0 million). The increase in constant currency was 11.7 per cent. Operating profit increased by 217 per cent to £16.4 million (2013: £5.2 million) and by 234 per cent from €6.1 million to €20.4 million in constant currency. The operating profit margin increased by 4.3 percentage points to 6.4 per cent.
All brands performed strongly in a recovering market that saw a significant increase in profit due to the benefit of a sharp increase in volumes, supply chain gains and tight control of costs. The business improved its market position during 2014

Business & Strategy Review Corporate Governance Financial Statements Shareholder Information
Grafton Group plc Annual Report 2014
21
and, with significant spare capacity in its branch network, was well placed to benefit from the restructuring measures implemented during the downturn.
The market recovery that started in the second half of 2013 in the Greater Dublin area and provincial cities continued into the first quarter of 2014. The pace of growth accelerated sharply in the second quarter as the recovery extended across the branch network and the economy moved onto a firmer growth path. Overall like-for-like revenue growth for the year of 13.9 per cent reflected strong growth in the residential RMI segment of the market and the early stages of a recovery in house building from depressed levels and competitive gains.
Activity in the Irish housing market improved over the course of the year. The number of housing transactions is estimated to have increased from 30,000 to 40,000 but, at two per cent of the housing stock, remained at a low level. The total stock of properties for sale fell to its lowest level since 2007 as properties sold more quickly. There was also evidence that a recovery in non-residential construction was starting to take hold.
House price growth of 16 per cent was concentrated in Dublin, the provincial cities and larger towns. The increase in prices and a shortfall in supply over recent years stimulated growth in house building from historically low levels for the first time since 2006.
The primary focus of management was on growing revenue organically in a recovering market. Growth was fairly evenly spread across all regions and the business also implemented a number of development initiatives including the opening of a further branch in Cork City and expanding its presence in the groundworks and infrastructure market with the opening of Civils implants in ten branches.
Belgium Merchanting revenue increased by 55.6 per cent to £91.6 million (2013: £58.8 million) and by 63.8 per cent in constant currency. Operating profit of £0.8 million was 31.8 per cent ahead of the prior year (2013: £0.6 million) and up by 38.8 per cent in constant currency to €1.1 million (2013: €0.8 million).
Trading conditions were impacted by weak economic growth and a decline in consumer confidence due to concerns over the impact on disposable incomes of the Government’s austerity programme.
Revenue in the like-for-like business increased strongly in the first quarter as trading recovered from a weather related decline in the prior year. Revenue declined in the second and third quarters due to the combination of a softening in the general merchanting market and a competitive readymix concrete market. The rate of decline in like-for-like revenue eased considerably in the fourth quarter and was down by 2.1 per cent for the year.
The Group established a strong initial presence in the Brussels market through the acquisition in February 2014 of Mpro which also trades from four branches in the Walloon region. The two Mpro branches in Brussels were consolidated onto a single site and in October the acquisition of Ginion, which trades from a strategically located and complementary site in the city, was completed.
Catherine de Miribel was appointed CEO of Grafton Belgium and a number of other senior external appointments were made to the management team whose focus is on implementing performance improvement measures and delivering on the synergy opportunities which these acquisitions and the 11 YouBuild branches that are mainly located in the Flanders region offer.

Grafton Group plc Annual Report 2014
22
Chief Executive Officer’s Review(continued)
Retail Segment Revenue fell by 5.7 per cent to £158.2 million (2013: £167.9 million) and was down by 0.6 per cent in constant currency. Revenue in the like-for-like business was up by 0.2 per cent.
Operating profit increased to £2.4 million from £1.2 million in 2013 and to €3.0 million from €1.4 million in constant currency. The prior year result included a property credit of £0.9 million (€1.1 million).
There was a resumption of growth in consumer spending in Ireland for the first time since 2010 supported by increased employment. The return to growth lagged the recovery in the wider economy due to the decline in disposable incomes and increase in savings as consumers reduced high levels of personal debt. Despite consumer sentiment improving to its highest level in eight years, trading conditions in the DIY market were subdued.
Like-for-like revenue growth in the Woodie’s DIY business, which trades nationally from 37 stores, was marginally stronger for the year. Growth in the first half was largely offset by a decline in the second half due to the discontinuance of non-core lines in the prior year as the business refocused on its core strengths of DIY, Home and Garden. There had also been strong demand for seasonal products in the second half of 2013.
2014 was a year of transition for the Woodie’s business under a new Chief Executive who broadened the management team with key internal and external appointments to the supply chain, operations, merchandising, marketing and human resource teams. Improving the shopping experience for the 150,000 customers who shop in Woodie’s each week was a priority in 2014. The look of the stores was enhanced through a new store layout and new ways were introduced to display and merchandise products. The streamlining of brands to reduce product overlap freed up space to launch kitchens
and bathrooms in a number of stores while also generating significant cash flow for the second successive year.
The procurement team was focused on utilising the scale of Woodie’s to source quality product ranges that enabled the business to offer competitive prices and to also increase its gross profit margin for the year. Woodie’s increased profitability and was cash generative in 2014. The operational changes made during the year are expected to put the business in a stronger competitive position to grow revenue as consumer spending increases.
The seven store In-House kitchens business benefited from an improvement in consumer spending on durable household goods and increased volumes of kitchens sold through the Selco and Woodie’s branches.
90%
90% of Group
Revenue
8%
8% of Group
Revenue
2%
2% of Group
Revenue

Business & Strategy Review Corporate Governance Financial Statements Shareholder Information
Grafton Group plc Annual Report 2014
23
Manufacturing Segment Revenue increased by 31.7 per cent to £48.7 million (2013: £37.0 million) and operating profit more than doubled to £7.9 million (2013: £3.9 million). The segment operating profit margin increased by 5.5 percentage points to 16.2 per cent.
CPI EuroMix, the market leader in the supply of silo based mortar from eight manufacturing plants in England and one in Scotland, increased revenue by 33.5 per cent to £45.2 million (2013: £33.9 million). The business benefited from the recovery in the new housing market which extended to all regions. Strong demand for new housing was supported by the economic recovery, the increased availability of mortgages at the lowest level of interest rates seen for some time and the Help-to-Buy scheme which gave first-time buyers greater access to the market.
Growth in revenue moderated as anticipated from 40.3 per cent in the first half to 27.9 per cent in the second half which was measured against growth of 35.0 per cent in the second half of 2013. Housing registrations, a lead indicator of housing starts, increased by 9 per cent in 2014 to over 145,000 units including growth of 17 per cent in the last quarter.
Strong volume growth in a positive pricing environment and good control over input costs and overheads accounted for the increase in operating profit and strong margin progression.
MFP, the PVC drainage and roofline products business based in Dublin, increased revenue and reported a strong recovery in profitability. The business benefited from increased spending on residential RMI and good demand in the utilities market.
Gavin Slark, Chief Executive Officer
90%
90% of Group
Revenue
8%
8% of Group
Revenue
2%
2% of Group
Revenue
“ Revenue increased by 31.7 per cent to £48.7 million (2013: £37.0 million) and operating profit more than doubled to £7.9 million (2013: £3.9 million).”

Grafton Group plc Annual Report 2014
24
Group Financial Review
The Group delivered very good revenue and operating profit growth and outperformed operating margin expectations in recovering markets.
Average daily like-for-like revenue growth of 7.1 per cent increased Group revenue by £133.1 million. Operating profit in the like-for-like business increased by £31.1 million including an incremental property profit of £1.9 million, a drop through rate of 22 per cent that incorporated an improvement of 0.5 per cent in the gross margin and an increase in like-for-like overheads of 3.8 per cent.
The Group continued to be strongly cash generative in 2014 and used its cash flow from operations of £160.0 million (2013: £95.3 million) to fund expenditure on both organic growth and development opportunities and to increase dividends and reduce net debt.
Return on capital employed increased to 11.1 per cent from 7.8 per cent and capital turn increased to 2.1 times from 1.9 times.
PensionEmployee retirement benefits are principally provided under defined contribution style funding arrangements. Defined benefit pension schemes comprise 1,700 deferred members and pensioners and 800 active members, equivalent to eight per cent of the Group’s employees.
Pension liabilities in the Group’s defined benefit pension schemes exceeded scheme assets at the year-end by £33.0 million compared with last year’s deficit of £7.1 million. This was mainly as a result of the decline in bond yields to historically low levels in response to concerns over the outlook for global growth and the risk of deflation in Europe. The rate used to discount liabilities in the UK scheme fell to 3.60 per cent from 4.65 per cent and the Irish rate declined to 2.10 per cent from 3.65 per cent.
Scheme assets of £189.2 million (31 December 2013: £180.7 million) showed an investment return of 8.2 per cent for the year.
PropertyThe Group owns a significant property portfolio, the majority of which is used for trading purposes. It has historically had an active programme of releasing cash and realising value from its property interests and it continues to manage its portfolio with a view to maximising value in the most appropriate way for the overall business. The sale of property realised a profit on disposal of £2.2 million and generated cash flow of £4.4 million in 2014. At the year end, the carrying value of properties held for resale and being actively marketed and properties held pending a recovery in the property market or with a view to enhancing their development potential was £30.1 million.
Net Finance Income and ExpenseThe net finance charge for the year of £8.9 million (2013: £12.3 million) reflected a reduction of £2.5 million in net bank and loan note interest to £7.3 million due principally to the benefit of the debt refinancing completed in May 2014, declining money market interest rates and lower net debt.
The net finance charge element that related to the defined benefit pension scheme obligations fell to £0.3 million (2013: £1.4 million) and the charge due to movements on hedges and foreign exchange increased to £1.3 million (2013: £1.1 million).

Business & Strategy Review Corporate Governance Financial Statements Shareholder Information
Grafton Group plc Annual Report 2014
25
TaxationThe tax charge for the year of £21.2 million represents an effective rate of 21.0 per cent (2013: 20.4 per cent on underlying profit). This reflects the mix of profits that attract different rates of tax in the UK, Ireland and Belgium, the benefit of a reduction in the UK corporation tax rate to 21.5 per cent from 23.25 per cent in 2013 and the disallowance of a tax deduction for certain overheads charged in arriving at profit before tax including depreciation on buildings. A further reduction in the UK rate to 20 per cent is due to take effect on 1 April 2015. The effective rate of 20.4 per cent in 2013 included the benefit of a decline in deferred tax liabilities due to the reduction announced in the rate of UK corporation tax to 20 per cent over the period to 2015.
Capital and Development ExpenditureNet capital and development expenditure for the year was £41.7 million (2013: £22.5 million). The Group continued to invest in the profitable growth of its business with development expenditure of £26.8 million incurred on new Selco stores in Isleworth and Redhill, development of Plumbase Industrial, Electricbase and Hirebase implants and branch upgrades. This also included expenditure of £5.9 million on upgrading the IT systems and infrastructure that supports a number of the UK businesses principally Buildbase and Plumbase as part of a multi-year programme of investment.
Investment of £20.1 million in replacement of assets included distribution vehicles to support ongoing trading in the established branches.
AcquisitionsAcquisition expenditure of £33.1 million (net of cash acquired) was incurred on two acquisitions in Belgium and three in the UK.
FinancingIn May 2014, the Group entered into five year revolving credit facilities with its five principal relationship banks for £460 million. These bilateral multi-currency facilities, which mature in May 2019, replaced existing facilities of £360 million that were mainly due to mature in 2016. The refinancing was brought forward to take advantage of more favourable pricing terms on drawn and undrawn facilities and will lead to annual interest savings of circa £3.0 million based on current drawings.
The new facilities, which were oversubscribed, extended the maturity of the Group’s debt and provided certainty of finance over a longer period. The refinancing also gave the Group increased funding headroom and flexibility with the level of undrawn facilities at the year-end increasing to £207.5 million (31 December 2013: £111.6 million).
Net DebtNet debt declined by £58.4 million to £75.3 million (31 December 2013: £133.7 million), its lowest level since 1999 and the gearing ratio fell to 8 per cent (31 December 2013: 15 per cent), its lowest level for almost two decades. Cash on deposit and held in current accounts was £182.4 million at the year-end (31 December 2013: £151.1 million).
The Group continues to target an efficient and prudent capital structure based on debt ratios that are consistent with investment grade credit metrics while also retaining the flexibility to take advantage of development opportunities in its markets.
Underlying EBITDA interest cover was 19.4 times (2013: 11.0 times) and year-end debt was 0.53 times EBITDA (2013: 1.23 times).
Shareholders’ EquityShareholders’ equity increased to £902.3 million at 31 December 2014 (31 December 2013: £870.3 million). Profit after tax increased equity by £80.0 million. Shareholders’ equity was reduced by the increase in the defined benefit pension scheme deficit after tax of £23.3 million and by dividend payments of £21.5 million. There was a currency loss of £8.3 million on conversion of Euro assets, net of related euro debt, into sterling at the year-end Euro/Sterling rate of exchange of 77.89p (31 December 2013: 83.37p).
David Arnold, Chief Financial Officer
“ The Group continued to be strongly cash generative in 2014 and used its cash flow from operations of £160.0 million (2013: £95.3 million) to fund expenditure on both organic growth and development opportunities and to increase dividends and reduce net debt.”

Grafton Group plc Annual Report 2014
26
Executive Committee
1. Gavin Slark, Chief Executive Officer
2. David Arnold, Chief Financial Officer
3. Charles Rinn, Group Financial Controller & Company Secretary(Absent from photograph)
4. Chris Cunliffe, Chief Executive, Selco Builders Warehouse
5. Jolyon Ingham, Group IT Director
6. Jonathan Jennings, Group Property Director
7. Peter Kearney, Chief Executive, Grafton Merchanting Northern Ireland
8. Eddie Kelly, Chief Executive, Grafton Merchanting Republic of Ireland
9. Mark Kelly, Chief Executive, Grafton Merchanting Great Britain
10. Catherine de Miribel, Chief Executive, Grafton Belgium
11. Declan Ronayne, Chief Executive, Woodie’s DIY
12. Jonathon Sowton, Group Strategic Development Director
The Executive Committee constitutes the Group’s most senior executives who are responsible for implementing Board strategy and for the day-to-day operational management and performance of the Group.
The Committee met four times during the year under the Chairmanship of the Chief Executive Officer and dealt with the following matters:
• Updates on the performance of the Group and business environment.
• Chief Executive updates on the merchanting and retailing businesses.
• Updates from Group function heads on Finance, Property, Information Technology and Acquisitions.
• Significant business development projects.
• Improving operating standards and optimising procurement arrangements.
• Health and safety.
• Succession planning, training and professional development.
The Board has not delegated any of its powers to the Executive Committee.
1.11. 10. 7. 5.4
2.12. 9. 6. 8.

Business & Strategy Review Corporate Governance Financial Statements Shareholder Information
Grafton Group plc Annual Report 2014
27

Grafton Group plc Annual Report 2014
28
Grafton Group plc Financial History - 1993 to 2014
IFRS
Group Income Statements2014
£’m2013 £’m
2012‡ £’m
2011 £’m
2010 £’m
2009 £’m
2008 £’m
2007 £’m
2006 £’m
2005 £’m
2004 £’m
Revenue 2,081.7 1,899.8 1,760.8 1,782.5 1,719.4 1,763.8 2,128.5 2,193.3 2,000.0 1,798.1 1,270.5
Operating profit 110.1 77.2 59.1 47.5 41.5 21.3 92.7 180.4 165.4 146.2 109.3
Operating margin % 5.3% 4.1% 3.4% 2.7% 2.4% 1.2% 4.4% 8.2% 8.3% 8.1% 8.6%
Restructuring (costs)/credit - 2.8 (21.2) (27.8) (13.2) (17.0) (13.7) - - - -
Property profit - - - - - - - 5.0 25.9 6.6 5.1
Finance (expense)/income (net) (8.9) (12.3) (12.9) (10.8) (6.4) 7.8 (28.0) (24.0) (21.4) (21.4) (15.5)
Profit before taxation 101.2 67.7 25.0 8.9 21.9 12.1 51.0 161.4 169.9 131.4 98.9
Taxation (21.2) (5.6) 6.6 (6.7) 33.0 (0.2) (5.1) (21.0) (22.0) (17.8) (13.5)
Profit after taxation 80.0 62.1 31.6 2.2 54.9 11.9 45.9 140.4 147.9 113.6 85.4
Group Balance Sheets2014
£’m2013 £’m
2012£’m
2011 £’m
2010 £’m
2009 £’m
2008 £’m
2007 £’m
2006 £’m
2005 £’m
2004 £’m
Capital employed
Goodwill and intangibles 485.9 481.0 476.2 474.9 479.7 489.3 516.0 448.7 400.3 375.4 174.2
Property, plant and equipment 423.4 413.4 458.3 471.9 489.6 537.1 603.2 516.1 460.8 427.1 286.4
Financial assets 0.1 0.1 0.2 0.1 3.4 3.5 0.2 0.6 0.3 0.2 33.2
Net current assets* 112.8 136.5 133.7 121.2 122.2 122.6 193.0 256.9 225.4 207.8 137.6
Other net non-current liabilities (40.6) (23.0) (85.9) (58.4) (22.8) (56.4) (69.9) (35.7) (35.8) (52.4) (35.8)
981.6 1,008.0 982.5 1,009.7 1,072.1 1,096.1 1,242.5 1,186.6 1,051.0 958.1 595.6
Financed as follows:
Shareholders’ equity 902.3 870.3 813.5 821.0 852.5 809.7 827.6 783.0 681.1 557.7 349.4
Non-controlling interest 4.0 4.0 4.1 - - - - - - - -
Net debt/(cash) 75.3 133.7 164.9 188.7 219.6 286.4 414.9 403.6 369.9 400.4 246.2
981.6 1,008.0 982.5 1,009.7 1,072.1 1,096.1 1,242.5 1,186.6 1,051.0 958.1 595.6
Other Information
Acquisitions & investments 33.1 5.9 17.6 11.1 2.1 6.1 22.4 61.0 59.4 326.7 60.2
Purchase of fixed assets / investment in intangible assets 46.9 24.7 23.0 30.6 8.2 11.0 62.6 71.7 84.8 68.8 60.3
80.0 30.6 40.6 41.7 10.3 17.1 85.0 132.7 144.2 395.5 120.5
Depreciation and intangible amortisation 32.5 31.5 33.9 37.1 40.1 44.7 45.0 40.4 37.8 34.5 23.5
Financial Highlights 2014 2013 2012‡ 2011 2010 2009 2008 2007 2006 2005 2004
Adjusted EPS** (pence) 34.4 22.3 15.1 13.4 15.9 4.8 25.6 57.7 53.2 46.4 38.1
Dividend/share purchase per share (pence) 10.75 8.5 7.0 6.5 6.0 4.5 11.9 15.1 12.8 10.8 8.8
Cashflow per share (pence)# 48.4 39.5 29.9 24.9 44.8 26.6 39.6 74.1 68.4 60.4 49.1
Net assets per share (pence) 387.9 374.4 350.6 354.1 368.5 351.0 359.5 341.2 284.7 234.9 163.7
Underlying EBITDA interest cover (times) 19.4 11.0 8.6 6.4 10.0 5.6 4.5 8.2 10.2 9.4 9.9
Dividend/share purchase cover 3.2 2.6 2.2 2.1 2.6 1.1 2.1 3.8 4.2 4.3 4.3
Net debt to shareholders’ funds 8% 15% 20% 23% 26% 35% 50% 52% 54% 72% 70%
ROCE 11.1% 7.8% 6.1% 4.6% 3.8% 1.8% 7.6% 16.1% 16.5% 18.8% 19.3%
The summary financial information is stated under IFRS for 2004 to 2014 and under Irish GAAP for all years from 1993 to 2003.* Excluding net debt/(cash)** Before pension credit and property impairment in 2013 and before restructuring costs and intangible amortisation in 2012 and taxation credits in both years. In previous years before intangible amortisation, onerous lease provision and impairment, restructuring costs (net), taxation credit in 2010 and investment profit in 2009 and excluding material property profits in previous years

Business & Strategy Review Corporate Governance Financial Statements Shareholder Information
Grafton Group plc Annual Report 2014
29
Irish GAAP
Group Income Statements2003
£’m2002
£’m2001
£’m2000
£’m1999
£’m1998
£’m1997 £’m
1996 £’m
1995 £’m
1994 £’m
1993 £’m
Revenue 1,035.2 724.6 614.9 506.2 408.6 289.7 239.1 197.1 156.7 130.1 102.4
Operating profit 80.1 56.4 48.1 39.4 30.5 22.4 18.7 15.4 11.4 8.7 4.7
Operating margin % 7.7% 7.8% 7.8% 7.8% 7.5% 7.7% 7.8% 7.8% 7.3% 6.7% 4.6%
Restructuring (costs)/credit - - - - - - - - - - -
Property profit 2.4 2.3 1.4 - - - - 1.5 0.6 - -
Finance (expense)/income (net) (11.9) (8.3) (7.7) (7.2) (5.4) (3.3) (1.8) (1.1) (0.9) (0.9) (0.7)
Profit before taxation 70.6 50.4 41.8 32.2 25.1 19.1 16.9 15.8 11.1 7.8 4.0
Taxation (10.6) (7.5) (5.4) (4.2) (3.0) (2.7) (2.5) (2.3) (2.0) (1.6) (0.8)
Profit after taxation 60.0 42.9 36.4 28.0 22.1 16.4 14.4 13.5 9.1 6.2 3.2
Group Balance Sheets2003 £’m
2002 £’m
2001 £’m
2000 £’m
1999 £’m
1998 £’m
1997£’m
1996 £’m
1995£’m
1994 £’m
1993 £’m
Capital employed
Goodwill and intangibles 148.6 65.3 38.0 32.3 19.7 6.9 - - - - -
Property, plant and equipment 244.4 196.6 153.0 130.8 109.4 99.2 42.1 37.8 35.1 31.3 26.9
Financial assets 23.7 21.9 20.5 11.7 11.8 0.1 8.5 0.1 - 0.9 2.6
Net current assets* 139.9 93.9 78.8 66.5 47.4 42.5 20.1 16.7 17.5 14.2 13.4
Other net non-current liabilities (19.9) (11.7) (10.8) (10.0) (8.8) (8.7) (0.8) (0.9) (0.9) (0.9) (0.8)
536.7 366.0 279.5 231.3 179.5 140.0 69.9 53.7 51.7 45.5 42.1
Financed as follows:
Shareholders’ equity 317.0 209.5 160.9 135.1 112.7 98.6 53.6 55.0 46.9 38.9 34.3
Non-controlling interest - - - - - - - - - - -
Net debt/(cash) 219.7 156.5 118.6 96.2 66.8 41.4 16.3 (1.3) 4.8 6.6 7.8
536.7 366.0 279.5 231.3 179.5 140.0 69.9 53.7 51.7 45.5 42.1
Other Information
Acquisitions & investments 152.3 55.8 38.4 34.5 41.9 36.2 21.7 6.5 1.1 4.5 2.1
Purchase of fixed assets / investment in intangible assets 48.0 42.8 26.1 26.3 19.4 14.0 10.7 6.1 6.2 4.4 4.0
200.3 98.6 64.5 60.8 61.3 50.2 32.4 12.6 7.3 8.9 6.1
Depreciation and intangible amortisation 26.0 16.7 13.6 10.1 8.3 4.9 3.9 3.4 2.9 2.3 2.0
Financial Highlights 2003 2002 2001 2000 1999 1998 1997 1996 1995 1994 1993
Adjusted EPS** (pence) 31.2 23.3 20.0 15.8 12.8 9.6 8.5 7.3 5.2 3.7 1.9
Dividend/share purchase per share (pence) 7.3 5.3 4.7 3.7 3.0 2.2 2.0 1.7 1.2 0.8 0.7
Cashflow per share (pence)# 40.6 32.7 27.9 22.1 18.1 13.1 11.5 9.9 7.2 5.4 3.3
Net assets per share (pence) 149.1 118.1 91.4 77.6 65.2 59.9 33.3 34.4 29.8 24.7 22.0
Underlying EBITDA interest cover (times) 9.1 9.1 8.2 6.9 7.2 8.3 12.9 20.2 17.1 12.4 9.9
Dividend/share purchase cover 4.3 4.4 4.3 4.3 4.3 4.3 4.3 4.3 4.3 4.8 2.8
Net debt to shareholders’ funds 69% 75% 74% 71% 59% 42% 30% - 10% 17% 23%
ROCE 17.1% 16.5% 17.4% 17.4% 16.9% 18.2% 23.1% 22.2% 17.6% 14.4% 7.8%
# Based on profit after tax before depreciation, 2013 pension credit, intangible amortisation, onerous lease provision, impairment and excluding material property profits in previous years‡ IAS 19 (Revised) ‘Employee Benefits’ has been adopted as required by IFRS from the year ended 31 December 2013. The comparatives for the year ended 31 December 2012 have been restated.

Grafton Group plc Annual Report 2014
30
Report of the Directors
The Directors present their report to the shareholders together with the audited financial statements for the year ended 31 December 2014.
Group ResultsGroup revenue of £2.08 billion was 9.6 per cent higher than Group revenue of £1.90 billion in 2013. Operating profit increased 43 per cent to £110.1 million compared to £77.2 million in 2013 (before a non-recurring pension credit of £30.0 million and property impairment charge of £27.2 million in 2013).
The net finance expense was £8.9 million (2013: £12.3 million). Group statutory profit before taxation amounted to £101.2 million compared with £67.7 million in the previous year.
The effective rate of tax on profit was 21.0 per cent for the year (2013: underlying rate 20.4 per cent which excludes the non-recurring pension scheme credit and the property impairment charge and was before recognition of a deferred tax asset of £8.5 million for trading losses carried forward in the Irish businesses). The 2014 tax rate of 21.0 per cent reflects the mix of profits between the UK, Ireland and Belgium and the disallowance of a tax deduction for certain items of expenditure including depreciation on buildings. The tax charge of £21.2 million for 2014 also incorporates the unwinding of deferred tax assets and provisions recognised in prior years.
Basic earnings per share were 34.4 pence compared with 26.8 pence in the previous year. Adjusted earnings per share increased by 54 per cent to 34.4 pence from 22.3 pence in 2013 (before pension credit and property impairment charge and recognition of a deferred tax asset for trading losses carried forward in the Irish businesses).
The Group and Company Financial Statements for the year ended 31 December 2014 are set out in detail on pages 77 to 162.
Dividends The payment in 2014 of a second interim dividend for 2013 of 5.5 pence on the ‘C’ Ordinary shares in Grafton Group (UK) plc from UK-sourced income amounted to £12.78 million. A 2014 interim dividend of 3.75 pence per share was paid on 3 October 2014 on the ‘C’ Ordinary shares in Grafton Group (UK) plc from UK-sourced income and amounted to £8.72 million.
A second interim dividend for 2014 of 7.0 pence per share will be paid on the ‘C’ Ordinary shares in Grafton Group (UK) plc from UK-sourced income to all holders of Grafton Units on the Company’s Register of Members at the close of business on 20 March 2015 (the ‘Record Date’). The second interim dividend
will be paid on 17 April 2015. A liability in respect of this interim dividend was not recognised at 31 December 2014 as there was no present obligation to pay the dividend at the year-end.
Review of the BusinessShareholders are referred to the Chairman’s Statement, Chief Executive Officer’s Review and Group Financial Review which contain a review of operations and the financial performance of the Group for 2014, the outlook for 2015 and the key performance indicators used to assess the performance of the Group. These are deemed to be incorporated in the Report of the Directors.
Cautionary StatementCertain statements made in this Annual Report are forward looking statements. Such statements are based on current expectations and are subject to a number of risks and uncertainties that could cause actual events or results to differ materially from those expressed or implied by these forward-looking statements. They appear in a number of places throughout this Annual Report and include statements regarding the intentions, beliefs or current expectations of Directors and senior management concerning, amongst other things, the results of operations, financial condition, liquidity, prospects, growth rate and potential growth opportunities, potential operating performance improvements, the effects of competition and the strategy of the overall Group and its individual businesses. The Directors do not undertake any obligation to update or revise any forward-looking statements, whether as a result of new information, future developments or otherwise, except as required by law.
The risk factors included at pages 48 to 50 of this Annual Report could cause the Group’s results to differ materially from those expressed in forward-looking statements. There may be other risks and uncertainties that the Group is unable to predict at this time or that the Group currently does not expect to have a material adverse effect on its business. These forward-looking statements are made as of the date of this Annual Report.
The forward-looking statements in this Annual Report do not constitute reports or statements published in compliance with any of Regulations 4 to 9 and 26 of the Transparency (Directive 2004/109/EC) Regulations 2007.
Board of DirectorsIn line with the provisions contained in the 2012 UK Corporate Governance Code, all Directors retired at the Annual General Meeting of the Company on 9 May 2014 and being eligible offered themselves for re-election and all were re-elected to the Board on the same day.
Under the Company’s Articles of Association, Directors are required to submit themselves to shareholders for election at the Annual General Meeting following their appointment

Business & Strategy Review Corporate Governance Financial Statements Shareholder Information
Grafton Group plc Annual Report 2014
31
and all the Directors are required to submit themselves for re-election at intervals of not more than three years. However, in accordance with the provisions contained in the 2012 UK Corporate Governance Code, the Board has decided that all Directors seeking re-election should retire at the 2015 Annual General Meeting and offer themselves for re-election.
Share CapitalAt 31 December 2014, a Grafton Unit comprised one ordinary share of 5 cent and seventeen ‘A’ ordinary shares of 0.001 cent each in Grafton Group plc and one ‘C’ ordinary share of Stg0.0001p in Grafton Group (UK) plc. The composition of the Company’s share capital including a summary of the rights and obligations attaching to the three components of a Grafton Unit is set out in Note 17 to the Group Financial Statements.
The Group has in place a number of employee share schemes, the details of which are set out in the Report of the Remuneration Committee on Directors’ Remuneration and in Note 32 to the Group Financial Statements.
Annual General MeetingThe Annual General Meeting of the Company will be held at the IMI Conference Centre, Sandyford Road, Dublin 16 on 12 May 2015 at 10.30am. Your attention is drawn to the circular on the Company’s website, www.graftonplc.com which sets out details of resolutions to be considered at the Annual General Meeting, including the following:
Authority to Allot SharesShareholders are being asked to renew the Directors authority to allot and issue any unissued ordinary share capital of the Company. The total number of shares which the Directors’ may issue under this authority will be limited to approximately 29 per cent of the issued share capital of the Company at 9 March 2015. The Directors have no present intention to make a share issue other than in respect of employee share schemes.
Disapplication of Pre-emption RightsAt each Annual General Meeting, the Directors seek authority to disapply statutory pre-emption rights in relation to allotments of shares for cash up to an aggregate nominal value for all allotments and all treasury shares of €600,000, which is approximately 5 per cent of the nominal value of the issued share capital of the Company. Under the Articles of Association, shareholders are required to renew this power at each year’s Annual General Meeting.
Purchase and Re-issue of Own SharesAt the 2014 Annual General Meeting, shareholders gave the Company and/or any of its subsidiaries authority to make market purchases of up to 10 per cent of the Company’s own shares. Shareholders will be asked to renew this authority at
the Annual General Meeting. Shareholders will also be asked to sanction the price range at which any treasury share may be re-issued other than on the Stock Exchange.
The minimum price which may be paid for shares purchased by the Company shall not be less than the nominal value of the shares and the maximum price will be 105 per cent of the average market price of such shares over the preceding five days. The Directors do not have any current intention of exercising the power to purchase the Company’s own shares and will only do so if they consider it to be in the best interests of the Company and its shareholders.
The authorities which will be sought at the forthcoming AGM to allot shares, disapply pre-emption rights and purchase the Company’s Units will, if granted, expire on the earlier of the date of the Annual General Meeting in 2016 or 15 months after the passing of these resolutions.
Report of the Remuneration Committee on Directors’ RemunerationA resolution to be proposed at the Annual General Meeting deals with the Chairman’s Annual Statement and the Report of the Remuneration Committee on Directors’ Remuneration and the Remuneration Policy Report which the Board has decided, in line with best practice, to present to shareholders as non-binding resolutions.
Notice Period for Extraordinary General MeetingsIf adopted a resolution to be proposed at the Annual General Meeting will maintain the existing authority in the Articles of Association which permits the Company to convene an extraordinary general meeting on 14 days notice in writing where the purpose of the meeting is to consider an ordinary resolution. As a matter of policy, the 14 days’ notice will only be utilised where the Directors believe that it is merited by the business of the meeting and the circumstances surrounding the business.
Amendment of the Memorandum and Articles of Association in response to the Companies Act 2014Resolutions are being proposed in response to the new Companies Act 2014 which is expected to become law on 1 June 2015. The purpose of these resolutions is to amend the Memorandum and Articles of Association of the Company in order to bring them into line with the provisions of the Companies Act 2014 and make some consequential and housekeeping changes.
Substantial HoldingsSo far as the Company is aware, in addition to the Chairman, Mr. Michael Chadwick, whose holding of 19,436,079 Grafton Units represents 8.36 per cent of the Units in issue (excluding treasury shares), the following held shares representing 3 per

Grafton Group plc Annual Report 2014
32
Report of the Directors(continued)
cent or more of its ordinary share capital (excluding treasury shares) at 31 December 2014 and 9 March 2015:
Name 31 December 2014 9 March 2015
Holding % Holding %
EdgePoint Investment Group Inc. 9,398,327 4.04% 9,853,651 4.24%Investec Asset Management Limited* 29,579,194 12.72% 28,896,990 12.42%Franklin Templeton Institutional, LLC* 23,262,430 10.00% 22,186,730 9.54%The Capital Group Companies* 22,903,000 9.85% 22,903,000 9.85%BlackRock, Inc.* 10,763,694 4.63% 12,895,366 5.54%Ameriprise Financial Inc.* - - 7,136,116 3.07%
* The Company has been advised that these units are not beneficially owned.
Apart from these holdings, the Company has not been notified at 9 March 2015 or at 31 December 2014 of any interest of 3 per cent or more in its ordinary share capital.
Director’s and Secretary’s interests in the share capital of the Company are set out in the Report of the Remuneration Committee on Directors’ Remuneration.
Accounting RecordsThe Directors are responsible for ensuring that proper books and accounting records are kept by the Company as required by Section 202 of the Companies Act, 1990. The Directors believe that they have complied with this requirement by providing adequate resources to maintain proper books and accounting records throughout the Group including the appointment of personnel with appropriate qualifications, experience and expertise. The books and accounting records of the Company are maintained at Heron House, Corrig Road, Sandyford Industrial Estate, Dublin 18.
Takeover Regulations 2006The capital structure of the Company is detailed in Note 17 to the Group Financial Statements. Details of employee share schemes are set out in Note 32. In the event of a change of control, the vesting/conversion/exercise of share entitlements/options may be accelerated. The Group’s borrowing facilities may require repayment in the event of a change of control. The Company’s Articles of Association provide that the business of the Company shall be managed by the Directors, who may exercise all such powers of the Company subject to the Companies Acts and the Articles of Association. Details of the powers of the Directors in relation to the issuing or buying back by the Company of its shares are set out above. The company’s Memorandum and Articles of Association, which are available on the Company’s website, www.graftonplc.com, are deemed to be incorporated in this part of the Report of the Directors.
Corporate Governance Regulations 2009As required by company law, the Directors have prepared a Report on Corporate Governance which is set out on pages 38 to 42 and which, for the purposes of Statutory Instrument 450/2009 European Communities (Directive 2006/46) Regulations 2009, is deemed to be incorporated in this part of the Report of the Directors. Details of the capital structure and employee share schemes are included in Notes 17 and 32 respectively.
Principal Risks and UncertaintiesThe Company is required under Irish company law to give a description of the principal risks and uncertainties. These principal risks and uncertainties are set out on pages 48 to 50 and are deemed to be incorporated in this section of the Report of the Directors.
Transparency Regulations 2007The report on Corporate Social Responsibility set out on pages 33 to 36, is deemed to be incorporated in this part of the Report of the Directors together with details of earnings per share in Note 10 to the Group Financial Statements, employment details in Note 5 and details of financial instruments in Note 20.
SubsidiariesThe Group’s principal operating subsidiary undertakings are set out on page 161.
Political ContributionsThere were no political contributions which require disclosure under the Electoral Act, 1997.
Post Balance Sheet EventsThere have been no material events subsequent to 31 December 2014 that would require adjustment to or disclosure in this report except for the acquisition of TG Lynes Ltd. as described in Note 35 to the Group Financial Statements.
AuditorIn accordance with Section 160 (2) of the Companies Act, 1963, the Auditor shall automatically be re-appointed at the company’s Annual General Meeting unless the Auditor does not wish to be re-appointed or a resolution has been passed appointing someone else as Auditor. The Auditor, KPMG, Chartered Accountants, are willing to continue in office and a resolution authorising the Directors to fix their remuneration will be submitted to the Annual General Meeting.
On behalf of the Board
G. Slark, D. Arnold, Directors
9 March 2015

Business & Strategy Review Corporate Governance Financial Statements Shareholder Information
Grafton Group plc Annual Report 2014
33
Corporate Social Responsibility
The Group recognises the importance of conducting its business in a socially responsible manner. This is demonstrated in the way it deals with its employees, customers, suppliers and the communities in which it trades. The Group considers that corporate social responsibility is an integral element of good business management and is committed to taking a balanced view on economic, social and environmental issues when making business decisions.
The EnvironmentThe Group supplies a range of environmental and sustainable products to customers. The Group also promotes the conservation and sustainable use of natural resources to minimise environmental pollution from its activities.
Waste ManagementAs a supplier of building materials and related products, the Group strives to reduce waste going to landfill by increasing levels of recycling. The Group’s Irish businesses are members of Repak and the UK businesses are members of Biffpack.
The average recycling rate for the Group’s UK businesses was 78% in 2014. This was achieved by working closely with its principal waste contractors to segregate non-hazardous waste streams.
Hazardous waste management procedures were strengthened with improved collection facilities installed across UK builders merchanting locations.
Carbon Reduction CommitmentAs part of its commitment to environmental issues, the UK merchanting business is registered as a stakeholder in the UK government’s Carbon Reduction Commitment. The Group is striving to reduce its carbon footprint and to improve performance in other environmentally sensitive areas.
CO2e Emissions by the UK Business
Tonnes in 2014 - 79,998
Emissions were calculated from the following:
• Buildings – electricity, gas and fuel oil
• Transport – petrol, diesel and red diesel
• Processing – fuel oil
Recycling
General waste
Average Recycling Rate UK Business 2014
78%
22%
Emissions by Fuel TypeUK Manufacturing 2014
Monthly Recycling RatesUK Business 2014
59% 23%
18%0%
Diesel
Red Diesel
Electricity
Gas
Petrol
Greenhouse Gas Emissions by Fuel SourceUK Business 2014
28%5% 1%
46%
20%
Diesel
Red Diesel
Electricity
Petrol
Diesel
Red Diesel
Kerosene
Electricity
Gas
Petrol
Emissions by Fuel TypeUK Merchanting 2014
31%
7% 1%
54%7%0%
Tonnes Jan Feb Mar Apr May Jun Jul Aug Sep Oct Nov Dec
Recycling General wasteRecycling General waste
0
200
400
600
800
1000
1200
1400
1600

Grafton Group plc Annual Report 2014
34
Corporate Social Responsibility(continued)
The charts below shows the split of fuel sources:
Approximately 55 per cent of UK merchanting emissions are derived from the use of transport. The continued purchase of more fuel efficient vehicles and better control of vehicles through fitted tracking systems should have a positive effect on emissions.
The Group has established a working group with responsibility to identify strategies for reducing overall electrical energy usage. This group is currently focusing on three key areas:
• Energy awareness
• Lighting
• Energy management systems
Trials have identified the potential for energy savings on lighting through the installation of LED lights. An energy awareness campaign is being launched in 2015.
Online Home Retail, an online retailer of bathroom products, continued its carbon offset scheme. This scheme uses contributions from customers concerned about the environment to purchase and plant traditional broadleaf woodland trees, such as oak, elm and ash in conjunction with The Heart of England Forest Project, the Woodland Trust and local village schemes. Since 2011 Online Home Retail has raised over £150,000, which has been used to plant trees in local communities in the UK. There were more than 20,000 trees across 24 varieties planted in the “Online Home Retail Woods” by the end of 2014, absorbing thousands of tonnes of carbon dioxide and providing much needed habitats for wildlife species native to the UK.
Sustainable ProductsThe Group recognises the increasing importance of supplying renewable and sustainable products. Product ranges designed to provide sustainable building solutions have been introduced. These ranges include Solar Thermal and Solar PV, air source heat pumps, ground source heat pumps, biomass heating, rainwater harvesting and heat recovery ventilation systems.
The Woodie’s DIY business offers a range of environmentally friendly products including energy-saving lamps, solar garden lights and composters for recycling garden and household waste. The merchanting branches sell condensing boilers which reduce demand for fossil fuels, energy-saving insulation materials and controlled ventilation systems.
Grafton Merchanting GB is a Green Deal Provider. Sponsored by the Department of Energy and Climate Change (DECC), The Green Deal is an initiative to encourage home and business owners to improve the energy efficiency of their properties. It provides a platform to enable customers to engage in this initiative which provides finance to property owners for the installation of energy efficient products.
Buildbase has adopted the Timber Trades Federation ‘Responsible Purchasing Policy’. This demonstrates that the business is committed to sourcing timber and timber products from legal and well-managed forests and supports the UK/EU global objective to stop illegal logging. Buildbase holds an internationally recognised environmental certificate for the PEFC (Programme for the Endorsement of Forest Certification) scheme. It is Buildbase policy that its natural timber products are FSC/PEFC accredited. The entire operation is independently audited to guarantee that timber is legally harvested and originates from a sustainable source.
The UK merchanting and manufacturing operations continued to maintain accreditation to the ISO 14001 environmental management standard. This accreditation is seen as vital in helping to focus on environmental risk management initiatives.
In 2014 CPI Mortars achieved accreditation to the sustainability standard BES 6001 which was a significant development for the business and demonstrated the controls that it has in place over the environmental aspects of the mortar manufacturing supply chain.
Health and SafetyThe Group is committed to achieving the best practicable standard of health and safety for its employees, customers and visitors to trading locations. It considers health and safety to be an important element in the overall management of the businesses. Effective health and safety management is driven by Directors and senior managers. Management across the businesses continued to demonstrate their commitment, involvement and leadership through active monitoring of performance, challenging unacceptable standards and promoting effective safety management as a priority.
Specialist health and safety teams were strengthened during the year, both in number and professional capability reflecting the increased focus and activity across the Group. 2014 saw an increased focus on ensuring that the Group’s health and safety specialists work closely with management teams to promote
Recycling
General waste
Average Recycling Rate UK Business 2014
78%
22%
Emissions by Fuel TypeUK Manufacturing 2014
Monthly Recycling RatesUK Business 2014
59% 23%
18%0%
Diesel
Red Diesel
Electricity
Gas
Petrol
Greenhouse Gas Emissions by Fuel SourceUK Business 2014
28%5% 1%
46%
20%
Diesel
Red Diesel
Electricity
Petrol
Diesel
Red Diesel
Kerosene
Electricity
Gas
Petrol
Emissions by Fuel TypeUK Merchanting 2014
31%
7% 1%
54%7%0%
Tonnes Jan Feb Mar Apr May Jun Jul Aug Sep Oct Nov Dec
Recycling General wasteRecycling General waste
0
200
400
600
800
1000
1200
1400
1600

Business & Strategy Review Corporate Governance Financial Statements Shareholder Information
Grafton Group plc Annual Report 2014
35
responsibility for health and safety and implement improved practices.
There was significant activity in a number of businesses to improve the quality, clarity and standard of safety management systems and procedures and to drive effective implementation of change. The ongoing objective is to ensure that all colleagues are aware of the Group’s health and safety standards and understand their roles in observing these standards.
The Group’s training programmes develop knowledge, understanding, capability and commitment among colleagues. Programmes of practical and specialist training continued with the objective of ensuring that colleagues have the requisite skills and competence to operate in areas that give rise to particular health and safety considerations. New E-Learning programmes were introduced to provide safety-critical information to colleagues in an easily accessible format. This medium will be used more extensively through 2015 to deliver training. Manager health and safety training courses were further developed and also formed part of broader management training programmes.
2014 saw a move to a more coordinated strategy for health and safety management across the whole of the Group with the aim of facilitating the transfer of best practice and the development of common standards. A feature of this strategy was the development of more effective communication and enabling key safety information and messages to be delivered in a clear, coordinated and structured way.
Performance monitoring continued to increase across the Group with an improved capacity to capture and analyse data. This allowed the Group to utilise past experience to inform its strategy and to drive further improvements.
The contribution of all colleagues across the Group is critical in preventing accidents and protecting staff, customers and visitors to Group locations.
Human ResourcesThe success of the Group is dependent on the contribution and commitment of its management and staff. The Group’s decentralised culture, which is appropriately supported at Group level, gives management and staff the autonomy to use their experience, expertise and skills both for their own career development and for the success of the Group.
The Group and its businesses are committed to high standards of employment practice and are recognised as good employers in the UK, Ireland and Belgium. The Group aims to reward management and staff fairly by reference to skills, performance, peers and market conditions. The Group, where appropriate, provides incentives to management and staff
through remuneration policies that promote commitment and reward achievement.
It is Group policy that all employees receive fair and equal treatment regardless of gender, age, ethnic origin, nationality, religion or disability.
The Group is committed to offering equal opportunities to all individuals in their recruitment, training and career development having regard to their particular aptitudes and abilities. Training and development programmes are important to the business. Significant attention and resources are devoted to this area. Training programmes are organised internally by Group businesses and also in conjunction with external bodies, including the Builders Merchant Federation in the UK. The programmes cover a range of areas including sales development, customer service, product training, health and safety and leadership skills. These programmes help to ensure that the Group can develop, retain and attract the best individuals at all levels in the business. The Group aims to fill vacancies through internal promotions and to complement internal appointments with recruitment from outside of the organisation.
The Group operates a Revenue approved Save As You Earn Scheme (SAYE) that is intended to enable its eligible UK employees to share in the success of the overall Group. Eligible employees were invited to participate in the 2014 scheme. A very good level of participation was achieved through the 2014 and 2012 SAYE schemes.
The UK merchanting businesses launched a new Apprenticeship Scheme to provide training opportunities for new and current employees. Grafton Merchanting GB recruited 32 apprentices and Selco recruited 15 apprentices on 12 month training programmes.
The Group’s UK businesses and the Irish retail business introduced Employee assistance programmes that give employees access to counselling, support and advice on a wide range of personal and financial matters.
During 2014 Grafton introduced “Speak-Up”, a group wide confidential reporting service run by an independent company. It allows employees to report any concerns they may have regarding certain practices or conduct in their businesses including possible instances of fraud, theft, serious health and safety issues and other risks. While Group policy encourages employees to raise any concerns with their manager in the first instance, this service provides an alternative reporting route if required.
All reports, received by either email or telephone, are logged by the third party and passed to the Group Internal Audit team who then arrange for cases to be fully investigated. The

Grafton Group plc Annual Report 2014
36
Corporate Social Responsibility(continued)
individual making the report is kept appropriately informed of the progress of the investigation and its outcome through the reporting service. All concerns raised through this channel and the outcomes of investigations are reported to the Audit and Risk Committee.
CommunityThe Group recognises its responsibility as a member of the communities where its branches/plants are located and where it conducts business. It is committed to developing links to those communities through local management and staff supporting a range of initiatives covering health, welfare, sport, education and community projects. The Group also supports a range of charitable causes, mainly at local level, by giving donations.
Buildbase is a patron of CRASH the construction and property industry’s charity for homeless people. This charity focuses on improvements to buildings used by homeless people throughout the UK.
GM Distribution works closely with a local Milton Keynes charity called MK Snap that offers education, life skills, work preparation and opportunities for work to individuals with learning difficulties.
The Irish merchanting business partnered with the Hand on Heart’s (“HOH’s”) enterprise initiative which provides employment opportunities for people with disabilities. HOH’s vending machines were installed in all branches. Using a new ‘Social Enterprise’ model, HOH helps to develop self-sustaining enterprises that create jobs for people with disabilities.
Staff in the Irish merchanting business purchased gifts for children and families and donated them to Barnardos, the Society of St. Vincent de Paul and Crumlin Children’s Hospital in Dublin. In August 2014, the Irish merchanting business organised a 208 kilometre Charity Cycle from Dublin to Galway with 26 cyclists taking part and raised £10,000 to support the Laura Lynn charity which provides palliative care and support for children with life-limiting conditions.
Woodie’s DIY continued to act as the main sponsor of Grow-It-Yourself Ireland, which promotes growing vegetables, with a donation of £16,000. Woodie’s stores also continued to provide donations to local community projects and charity appeals in the form of products worth £12,000 in 2014.
In June 2014 Grafton Group plc sponsored its third Cycle Challenge. The four day challenge covered over 384 kilometres in Italy. A team of senior executives completed the challenge and raised £19,000 for the Foundation of Light, the registered charity of Sunderland AFC. The Foundation uses the power of football to inspire, involve and educate children, families and adults across the North East of England and engages with more than 40,000 people every year.
Selco continued to support MacMillan Cancer Support throughout 2014 and has raised £174,000 for the Charity in the last three years.
YouBuild is a partner of “Techniekclubs”, a project for children which encourages them to be creative and technically active.

CorporateGovernance
Directors’ Report on Corporate Governance 38Audit and Risk Committee Report 43Principal Risks and Uncertainties 48 Report of the Remuneration Committee on Directors’ Remuneration 51- Chairman’s Annual Statement 51- Remuneration Policy Report 53- Annual Report on Remuneration 61Statement of Directors’ Responsibilities 70
Business & Strategy Review Corporate Governance Financial Statements Shareholder Information
Grafton Group plc Annual Report 2014
37

Grafton Group plc Annual Report 2014
38
Directors’ Report on Corporate Governance
Compliance with the Combined CodeGrafton Group plc is incorporated in Ireland and subject to Irish company law. It’s Units (shares) are listed on the London Stock Exchange and the 2012 UK Corporate Governance Code (the 2012 Code) sets out the standards for corporate governance to be applied by companies with a listing on the London Stock Exchange. This report describes how the Company has applied the main and supporting principles of the 2012 Code.
Compliance Statement The Board believes that the Company has, throughout the accounting period, complied with all relevant provisions set out in the 2012 Code except that the external audit contract was not put out to tender as explained in the Report of the Audit and Risk Committee.
Board CompositionIt is the Company’s policy that the Board comprises a majority of Non-Executive Directors. At 31 December 2014, the Board of Directors was made up of seven members comprising the Non-Executive Chairman, two Executive Directors and four independent Non-Executive Directors. Mr. Roderick Ryan is the Senior Independent Director. Directors’ biographical details are set out on pages 10 to 11. The Board considers that its current size and structure is appropriate to the scale, complexity and geographic spread of its operations.
The number of Non-Executive Directors is considered sufficient to enable the Board and its Committees to operate effectively without excessive reliance on any individual Non-Executive Director. The Board believes that Executive and Non-Executive Directors between them have the necessary skills, knowledge and experience, gained from a diverse range of industries and backgrounds required to manage the Group. The skills, expertise and experience of the Board is used to review strategy, allocate capital, monitor financial performance and consider executive managements’ response to market developments and operational matters.
Role of the Board and Division of ResponsibilitiesThe Board routinely meets seven times a year and additionally as required by time critical business needs. There is also contact with the Board between meetings as required in order to progress the Group’s business. The Board takes the major decisions while allowing management sufficient scope to run the business within a centralised reporting framework. The Board has a formal schedule of matters specifically reserved for its decision. The matters reserved by the Board for its decision cover all strategic decisions, risk management, acquisitions, approval of interim and final dividends and share purchases, changes to the capital structure, tax and treasury management, major items of capital expenditure, approval of half-yearly and annual financial statements, budgets and material matters currently or prospectively affecting the Group and its performance. The Board’s responsibilities also include ensuring that appropriate management, development and succession plans are in place; reviewing the environmental and health and safety performance of the Group; approving the appointment of Directors and the Company Secretary; approving policies relating to Directors’ remuneration and severance and ensuring that satisfactory dialogue takes place with shareholders.
It is Board policy that no individual or small group of individuals can dominate its decision making.
The roles of Chairman and Chief Executive Officer are split. There is a clear division of responsibility between the Chairman and the Chief Executive Officer. The Chief Executive Officer is responsible for day-to-day management of the Group and is accountable to the Board as Chief Executive Officer for all authority delegated to executive management. The Chairman is responsible for leading the Board and ensuring its effectiveness in all aspects of its role.
Non-Executive Directors act constructively to challenge management proposals and review the performance of the business and management. The Board has delegated some of its responsibilities to the Audit and Risk, Remuneration, Nomination and Finance Committees.
Information and SupportDirectors have full and timely access to all relevant information in a form appropriate to enable them to discharge their duties. Reports and papers are circulated to Directors in preparation for Board and Committee meetings. All Directors receive monthly management accounts and board reports covering the Group’s performance, its strategy and other matters to enable them to review and oversee the performance of the Group on an ongoing basis.

Business & Strategy Review Corporate Governance Financial Statements Shareholder Information
Grafton Group plc Annual Report 2014
39
All Directors have access to independent professional advice at the Group’s expense where they consider that advice is necessary to enable them to discharge their responsibilities as Directors.
The Board periodically holds meetings at Group locations and meets senior management in order to help Directors gain a deeper understanding of the Group’s operations and markets.
Company SecretaryThe Directors have access to the advice and services of the Company Secretary who advises the Board on governance matters. The Company’s Articles of Association and Schedule of Matters reserved for the Board provide that the appointment or removal of the Company Secretary is a matter for the full Board.
Directors’ Independence and Board BalanceFour Non-Executive Directors, Mr. Roderick Ryan, Mr. Charles M. Fisher, Ms. Annette Flynn and Mr. Frank van Zanten are considered by the Board to be independent in character and free from any business or other relationship which could materially interfere with the exercise of independent judgement. The Board has determined that each of the Non-Executive Directors fulfilled this requirement and is independent. In reaching that conclusion, the Board considered the principles relating to independence contained in the 2012 Code.
The Company’s Articles of Association provide that one third of the Directors retire by rotation each year and that each Director seek re-election at the Annual General Meeting every three years. New Directors are subject to election by shareholders at the next Annual General Meeting following their appointment. However, in accordance with the provisions in the 2012 Code, the Board has decided that all Directors should retire at the 2015 Annual General Meeting and offer themselves for re-election. It is Board Policy that Non-Executive Directors are normally appointed for an initial period of three years, which is then reviewed. As noted in the Chairman’s Statement, Mr. Roderick Ryan, who is Chairman of the Audit Committee, was appointed to the Board in March 2006. The company intends to put its audit out to tender this year and Mr. Ryan has agreed to stand for re-election and to remain as Chairman of the Audit and Risk Committee during this process. Mr. Charles Fisher has been reappointed for a third term of three years, Ms. Annette Flynn has two years of her second term of three years to serve and Mr. Frank van Zanten has one year of his first term of three years to serve.
The Board undertakes a formal annual evaluation of its Directors and is satisfied that all Directors who are proposed for re-election continue to discharge their obligations as Directors and contribute effectively to the work of the Board and its Committees.
The overall composition and balance of the Board is kept under review as detailed below in the programme of work undertaken by the Nomination Committee. The Board will continue to manage the orderly succession of Non-Executive Directors.
Induction and TrainingIt is the policy of the Board that formal induction is offered to all Directors appointed to the Board. This includes on-site visits and meetings with Senior Management in the Group’s businesses and briefings from the Chairman, Executive Directors and the Company Secretary. Induction covers matters such as the operations of the Group, the role of the Board and matters reserved for its decision, powers delegated to Board Committees, corporate governance policies and the performance of the Group. Directors are advised on appointment of their legal and other duties and of their obligations as Directors of a listed company.
Evaluation of BoardA formal review of the performance of the Board, Board Committees and individual Directors is undertaken each year including an external evaluation every three years. The process is designed to ensure that the effectiveness of the Board is maintained and improved where possible.
An externally facilitated evaluation of the Board was conducted during 2012 by the Institute of Directors in Ireland which has extensive experience as a facilitator of board evaluations for listed companies. The use of an external facilitator to conduct Board evaluations at least once every three years complements evaluations conducted by the Chairman and/or the Senior Independent Director. The review in 2012 by the Institute of Directors concluded that the Board and its Committees are operating effectively and to a high standard of governance and in compliance with best practice. It also found that there was no concentration of power on the Board and that the Board operated in an open and transparent manner with a high level of engagement from Directors. The Board plans to engage an external facilitator to conduct the 2015 evaluation.

Grafton Group plc Annual Report 2014
40
Directors’ Report on Corporate Governance(continued)
An internal evaluation was conducted by the Senior Independent Director. This involved each Director completing a self-assessment questionnaire independently that covered the running of an effective board, relationships with management, oversight of strategy and development, monitoring financial and operating performance and shareholder value creation. The Senior Independent Director collated the responses to the questionnaire and reported the results of the evaluation to the Board which had a discussion on the areas that required increased focus during 2015. The overall result of the evaluation was very positive with a high level of satisfaction among Directors concerning the matters covered by the evaluation.
The Board confirms that each Non-Executive and Executive Director continues to perform effectively and demonstrate a strong commitment to the role.
Succession PlanningThe Boards’ general policy is to keep the overall composition and balance of the Board under review and to manage the orderly succession of Non-Executive Directors without compromising the effectiveness and continuity of the Board and its Committees.
The Board plans for succession with the assistance of the Nomination Committee. The Board believes that it is necessary to have appropriate Executive Director and Non-Executive Director representation to provide Board balance and also to provide the Board with the breadth of experience required by the scale, geographic spread and complexity of the Group’s operations.
The Nomination Committee takes account of the skills, knowledge and experience required by the Board, international business experience and diversity, including nationality and gender, in considering suitable candidates to serve as Non-Executive Directors as part of the ongoing process of Board renewal.
The Board considers senior management succession planning on a regular basis with a view to developing over the coming years a robust succession pipeline for key positions up to Executive-Director level.
Communication with ShareholdersThe Company recognises the importance of communication with shareholders. Presentations are made to both existing and prospective institutional shareholders principally after the release of half-yearly and annual results. Interim Management Statements are issued in compliance with the EU Transparency (Directive 2004/109/EC Regulations 2007). The Group also issues trading updates in January and July.
It is planned to hold a presentation for analysts in London on 10 March 2015 following the announcement of the Final Results for 2014. The presentation by the Chief Executive Officer and the Chief Financial Officer will be broadcast live on www.graftonplc.com/webcast and can be viewed/downloaded at www.graftonplc.com.
Any significant or noteworthy acquisitions are announced to the market and the Company’s website www.graftonplc.com provides the full text of all announcements including the half-yearly and annual results and investor presentations.
The Group periodically holds a capital markets day for institutional investors and research analysts which provides an opportunity to update the market on the Group’s performance and strategy and for Executive Directors and members of the Executive Committee to engage with the investment community and to hear the views of investors on the Group.
The Board receives reports on feedback from investors and also receives analysts’ reports on the Group. Non-Executive Directors are offered an opportunity to attend meetings with major shareholders. The Chairman is available to meet with shareholders if they have concerns which have not been resolved through the normal channels of Chief Executive Officer and Chief Financial Officer or where such contacts are not appropriate.
General MeetingsThe Company’s Annual General Meeting (AGM), which is held in Ireland, affords individual shareholders the opportunity to question the Chairman and the Board. The Notice of the AGM, which specifies the time, date, place and the business to be transacted, is sent to shareholders at least 20 working days before the meeting. The AGM is normally attended by all Directors. Resolutions are voted on by either a show of hands of those shareholders attending, in person or by proxy, or, if validly requested, by way of a poll. In a poll, the votes of shareholders present and voting at the meeting are added to the proxy votes received in advance and the total number of votes for, against and withheld for each resolution are announced. This information is made available on the Company’s website following the meeting.

Business & Strategy Review Corporate Governance Financial Statements Shareholder Information
Grafton Group plc Annual Report 2014
41
All other general meetings are called Extraordinary General Meetings (EGMs). An EGM called for the passing of a special resolution must be called by at least 21 clear days’ notice. Provided shareholders have passed a special resolution at the immediately preceding AGM and the Company allows shareholders to vote by electronic means, an EGM to consider an ordinary resolution may, if the Directors deem it appropriate, be called at 14 clear days’ notice.
A quorum for a general meeting of the Company is constituted by four or more shareholders present in person and entitled to vote. The passing of resolutions at a meeting of the Company, other than special resolutions, requires a simple majority. A special resolution requires a majority of at least 75 per cent of the votes cast to be passed.
Shareholders have the right to attend, speak, ask questions and vote at general meetings. In accordance with Irish company law, the Company specifies record dates for general meetings, by which date shareholders must be registered in the Register of Members of the Company to be entitled to attend. Record dates are specified in the notice of a general meeting. Shareholders may exercise their right to vote by appointing a proxy/proxies, by electronic means or in writing, to vote some or all of their shares. The requirements for the receipt of valid proxy forms are set out in the Notice convening the meeting. A shareholder, or a group of shareholders, holding at least 5 per cent of the issued share capital of the Company, has the right to requisition a general meeting. A shareholder, or a group of shareholders, holding at least 3 per cent of the issued share capital of the Company, has the right to put an item on the agenda of an AGM or to table a draft resolution for inclusion on the agenda of a general meeting, subject to any contrary provision in Irish company law.
Memorandum and Articles of AssociationThe Company’s Memorandum and Articles of Association set out the objects and purposes of the Company. The Articles detail the rights attaching to each share class; the method by which the Company’s shares can be purchased or re-issued; the provisions which apply to the holding of and voting at general meetings; and the rules relating to the Directors, including their appointment, retirement, re-election, duties and powers.
A copy of the Memorandum and Articles of Association can be obtained from the Group’s website, www.graftonplc.com.
Board CommitteesThe number of board meetings and committee meetings held during the year and attended by each Director was as follows:
BoardAudit and Risk
CommitteeFinance
CommitteeRemuneration
CommitteeNomination Committee
Number of Meetings A B A B A B A B A B
M. Chadwick 7 7 - - - - - - 3 3G. Slark 7 7 - - 4 4 - - - -D. Arnold 7 7 - - 4 4 - - - -F. van Zanten 7 7 4 4 - - - - - -R. Ryan 7 7 4 4 - - 7 7 3 3C. M. Fisher 7 7 - - - - 7 7 3 3A. Flynn 7 7 4 4 - - 7 7 - -
Column AColumn A refers to the number of meetings held during the period the Director was a member of the Board and/or Committee
Column BColumn B refers to the number of meetings attended by the Director during the period the Director was a member of the Board and/or Committee
The Board is assisted by Committees of Board members that focus on specific aspects of its responsibilities. The terms of reference of the Audit and Risk Committee, Remuneration Committee and Nomination Committee, which were approved by the Board and comply with the 2012 Code, are available from the Company and can also be found on the Group’s website at www.graftonplc.com. Membership of Board Committees is shown on page 11. The Company Secretary is secretary to the Audit and Risk Committee and the Remuneration Committee.

Grafton Group plc Annual Report 2014
42
Directors’ Report on Corporate Governance(continued)
Nomination CommitteeThe Nomination Committee comprises Mr. Roderick Ryan, Chairman of the Committee, Mr. Michael Chadwick and Mr. Charles M. Fisher. The Board is actively engaged in orderly succession planning and is assisted in this function by the Nomination Committee. The Committee keeps the composition, skills and diversity of the Board under review to ensure that it has the range of skills required for the Board to meet the demands of the business and fulfil its obligations to shareholders.
The Nomination Committee met formally on three occasions during the year and had interaction between meetings as necessary.
As part of that process of appointing a new Non-Executive Director to replace Mr. Roderick Ryan, the Committee evaluated the Board to ensure that it has the right balance of experience, skills and diversity, including both nationality and gender, to support the future development of the Group. In the light of this evaluation, the Committee prepared a specification of the capabilities required of prospective candidates and an assessment of the anticipated time commitment. An external search consultancy, that has no connection with the Group, was appointed to facilitate the search for a suitable candidate for nomination to the Board. In addition, Committee members were also aware, from their own research and enquiries of potential candidates with the appropriate skills and experience. The Committee will make its recommendation to the Board in due course following a rigorous interview and selection process.
The Nomination Committee’s terms of reference are available from the Company and can also be found on the Group’s website at www.graftonplc.com.
Finance CommitteeThe Finance Committee comprises Mr. Gavin Slark, Chairman, Mr. David Arnold, Chief Financial Officer and Mr. Charles Rinn, Secretary and Group Financial Controller. The Committee deals with acquisition opportunities up to the Board approval stage of the process, capital expenditure under the limit reserved from time to time for the Board and Group management and finance issues.
Going ConcernThe Directors, having made appropriate enquiries, believe that the Company and the Group as a whole has adequate resources to continue in operational existence for the foreseeable future and, for this reason, they continue to adopt the going concern basis in preparing the financial statements.

Business & Strategy Review Corporate Governance Financial Statements Shareholder Information
Grafton Group plc Annual Report 2014
43
Audit and Risk Committee Report
MembershipThe Audit and Risk Committee (“the Committee”) comprises three Non-Executive Directors:
Mr. Roderick Ryan, Chairman; Ms. Annette Flynn; and Mr. Frank van Zanten.
All members of the Committee are determined by the Board to be independent Non-Executive Directors in accordance with provision B1.1 of the 2012 UK Corporate Governance Code. In accordance with the requirements of provision C.3.1 of the UK Corporate Governance Code, Mr. Roderick Ryan is designated as the Committee member with recent and relevant financial experience. The biographical details on pages 10 to 11 demonstrate that members of the Committee have a wide range of financial, taxation, commercial and business experience.
DutiesUnder its terms of reference, which were reviewed and revised during 2013 and reflect best practice, the Committee:
• Monitors the integrity of the Group’s financial statements and announcements relating to the Group’s performance;
• Advises the Board on whether the Annual Report and accounts, taken as a whole, is fair, balanced and understandable, and whether it provides the information necessary for shareholders to assess the Group’s performance, business model and strategy;
• Monitors the effectiveness of the external audit process and makes recommendations to the Board in relation to the appointment, reappointment and remuneration of the External Auditor;
• Oversees the relationship between the Group and the External Auditor including the terms of engagement and scope of audit;
• Reviews the effectiveness of the company’s internal controls;
• Reviews the scope, resourcing, findings and effectiveness of the Internal Audit function;
• Oversees the effectiveness of the risk management procedures in place and the steps taken to mitigate the Group’s risks; and
• Reports to the Board on how it has discharged its responsibilities.
The Committee is satisfied that its role and authority include those matters envisaged by the 2012 UK Corporate Governance Code that should fall within its jurisdiction and that the Board has delegated authority to the Committee to address those tasks for which it has responsibility. The Committee’s terms of reference are available from the Company and are displayed on the Group’s website www.graftonplc.com.
MeetingsThe Committee met four times during the year. The Chairman of the Committee reports to the Board on the work of the Audit and Risk Committee and on its findings and recommendations. Meetings are attended by the members of the Committee and others being principally the Chief Financial Officer and the Group Internal Audit and Business Risk Director attend by invitation. Other members of executive management may be invited to attend to provide a deeper level of insight or expertise in relation to certain issues or developments. The KPMG Audit Partner and Audit Director are invited to attend certain Audit and Risk Committee meetings. The Committee also meets privately with the External Auditor and the Group Internal Audit and Business Risk Director without executive management present. The Chairman of the Committee reports the outcome of the Audit and Risk Committee meetings to the Board.
Activities of the Committee During 2014Financial ReportingThe Committee reviewed the draft financial statements and draft half-yearly results before recommending their approval to the Board. As part of this review, the Committee considered significant accounting policies, estimates and significant judgements. The Committee also reviewed the significant management letter points on internal controls in the Group’s individual businesses prepared by KPMG as part of the audit process.
The significant issues in relation to the financial statements considered by the Committee and how these were addressed are summarised as follows:

Grafton Group plc Annual Report 2014
44
Audit and Risk Committee Report(continued)
Property ImpairmentThe Group continues to hold a number of properties that are currently not in use but which are being actively marketed and categorised as held for resale. A number of other properties have become vacant and are being held as investment properties pending a recovery in the property market or with a view to enhancing their development potential by securing alternative use planning. The Committee reviewed the property valuation report prepared by management and considered the key assumptions supporting the valuations including third party market data and advice received by management concerning local market conditions where there was limited or no precedent transaction data available. The Committee concluded as a result of its review that the net impairment charge for the year recognised in the income statement was appropriate and that investment properties and properties held for resale were recorded on the balance sheet in accordance with the Group’s accounting policies. The Committee also considered the outcome of the audit work undertaken by KPMG in relation to the assessment of fair value.
GoodwillThe Committee considered the goodwill impairment analysis provided by management and agreed with the conclusion reached that no impairment charge should be recognised in the year. In arriving at its decision, the Committee considered the impairment review conducted by management which involved comparing the recoverable amount and carrying amount of the cash generating units. The review by management involved discounting the forecasted cash flows of each cash generating unit (group of units) based on the Group’s weighted average cost of capital and carrying out sensitivity analysis on the key assumptions used in the calculations including the revenue growth rate, the discount rate and the growth rate in perpetuity. The Committee also considered reports on the medium term macro-economic environment, analysts’ forecasts for the Group, the budget for 2015 and forecasts for 2016 to 2019 inclusive prepared by management.
The Committee noted the significant level of headroom in the value in use model prepared by management and considered the impact on the headroom of sensitivity analysis on the key assumptions used in the model. The Committee also noted the year-end market capitalisation of the Group compared to its net asset position. The Committee considered the review of the impairment model carried out by KPMG during the audit and its conclusion that goodwill was appropriately valued.
Rebate IncomeSupplier rebates represent a significant source of income in the merchanting industry and is an area of risk due to the number, complexity and materiality of rebate arrangements. The Committee reviewed the basis used by management for calculating rebate income for the year and rebates receivable at the year end and was satisfied that the accounting treatment adopted was appropriate and that rebates receivable at the year end were recoverable. In reaching its conclusion, the Committee reviewed information and reports prepared by the internal audit function which completed half year and full year reviews across all significant business units with the primary objective of providing independent assurance on the adequacy of the design and operating effectiveness of the controls in place over supplier rebate management. These reviews included re-performing calculations on a sample of rebate income for 2014 and rebate receivable at year end by reference to agreements with individual suppliers and reports of purchases made from suppliers. The Committee also considered the work undertaken by KPMG on the completeness and accuracy of rebate income and rebates receivable at the year end and its conclusion that rebate income recognised in the year and receivable at the year end was materially correct.
Valuation of InventoryThe Group carries significant levels of inventory and key judgements are made by management in estimating the level of provisioning required for slow moving inventory. In arriving at its conclusion that the level inventory provisioning was appropriate, the Committee received regular updates from management on stock ageing and provisioning at business unit level and also sought the views of the Auditors who had considered the appropriateness of the level of inventory provisioning at the year-end on the basis of a review of stock aging and stock turn analysis using computer aided audit techniques.
Internal AuditThe Committee considered reports and updates from the internal audit function which summarised the findings, recommendations and management responses to audits conducted during the year. These reports covered the work undertaken, findings, actions recommended and the response of executive management of the Group’s businesses to recommendations made. The Committee considered and approved the programme of work to be undertaken by the Group’s internal audit function in 2015. The Group Internal Audit and Business Risk Director reports to the Chief Financial Officer and also has direct access to the Audit and Risk Committee. The Committee met with the Group Internal Audit and Business Risk Director on three occasions during the year where he presented internal audit report findings and recommendations and updated the Committee on the actions taken to implement recommendations. The scope, authority and responsibility of the Internal Audit function are set out in the Internal Audit Charter which has been approved by the Committee.

Business & Strategy Review Corporate Governance Financial Statements Shareholder Information
Grafton Group plc Annual Report 2014
45
IT Systems As part of its review of principal risks, the Committee considered the adequacy of the governance structures, and IT policies and procedures to support a programme of investment in systems and infrastructure planned over a number of years that will result in the upgrading and consolidation of systems that support a number of businesses.
Whistleblowing and FraudAs noted on page 35, the Group introduced “Speak-Up”, a group wide confidential reporting service run by an independent company. It allows employees to report any concerns they may have regarding certain practices or conduct in their businesses including possible instances of fraud and theft. All concerns raised through this channel and the outcomes of investigations are reported to the Committee. The Committee also received reports of losses during the year related to fraud and the outcome of investigations.
Anti-Bribery and Corruption The Group’s Code of Conduct and its policies on anti-bribery and corruption require that employees and others working on behalf of the Group do not engage in any form of bribery or corruption.
External AuditorThe Committee reviewed the External Auditor’s overall audit plan for the 2014 audit of the Group and approved the remuneration and terms of engagement. The Committee reviewed the quality and effectiveness of the external audit process and the independence and objectivity of the Auditor.
In order to ensure the independence of the external Auditor, the Committee received confirmation from the Auditors that they are independent of the Group under the requirements of the Auditing Practices Board’s Ethical Standards for Auditors. The Auditors also confirmed that they were not aware of any relationships between the firm and the Group or between the firm and persons in financial reporting oversight roles in the Group that may affect its independence. The Committee considered and was satisfied that the relationships between the Auditor and the Group including those relating to the provision of non-audit services did not impair the Auditors judgement or independence. A new Group Audit Partner is appointed at least every five years and senior audit staff are periodically rotated.
KPMG have been the Group’s Auditors since 1993. Under Irish company law an auditor is automatically re-appointed at a company’s annual general meeting unless the incumbent auditor has given notice in writing that they do not wish to be re-appointed or a resolution has been passed appointing someone else or providing expressly that the incumbent firm shall not be re-appointed. KPMG’s audit partner rotation rules require the lead audit partner responsible for the audit to be rotated every five years. The Group has not formally tendered the Audit since 1993 but the Committee has kept the effectiveness and independence of the audit process under regular review. The terms of engagement do not include any contractual obligations that would prevent the Board from appointing another firm as auditor were it considered to be in the best interests of the Group. The current lead audit partner was first appointed to the role for the year ended 31 December 2011 and 2015 will be the fifth and final year as lead audit partner. In October 2012 the UK Corporate Governance Code introduced a new provision, on a comply or explain basis, requiring FTSE 350 companies to put their audit out to tender every ten years. The Committee deferred a decision in 2013 to put the audit out to tender pending finalisation in 2014 of new regulations by the European Parliament on audit reforms and audit tendering. The new rules require public interest entities to tender their audit after a period of 10 years, rotate the auditor after a maximum period of 20 years and prohibits the external auditor from providing certain non-audit services. In view of the new regulations which impose an obligation on listed companies to rotate their auditor periodically and the rotation of the lead audit partner by KPMG following the 2015 audit of the Group, the Audit Committee have agreed to put the external audit out to tender during the second half of 2015 and to appoint a new firm to conduct the audit of the Group for the year ended 31 December 2016. There are no contractual obligations that restrict the Group’s choice of external auditor.
Non-Audit ServicesThe External Auditor is not prohibited from undertaking non-audit services that do not conflict with auditor independence provided the provision of the services does not impair the auditors objectivity or conflict with the their role as auditor and subject to having the required skills and competence to provide the services. The auditor is precluded from providing non-audit services that could compromise its independence or judgement.

Grafton Group plc Annual Report 2014
46
Audit and Risk Committee Report(continued)
The Committee monitors and reviews the nature of non-audit services provided by the Auditors. An analysis of non-audit services provided by KPMG for 2014 and 2013 is disclosed in Note 2 on page 98. The Committee has undertaken a review of non-audit services provided during 2014 and is satisfied that these services were efficiently provided by the External Auditor with the benefit of their knowledge of the business and did not prejudice their independence and objectivity. The non-audit services mainly included the provision of tax compliance services and submission of tax returns to the Revenue authorities in the UK, Ireland and Europe and advice on tax matters. KPMG is the Group Auditor and a substantial part of the non-audit services were provided by KPMG network firms in the UK and Europe.
Internal Control and Risk ManagementThe Directors acknowledge that they have overall responsibility for the Group’s system of internal control and for reviewing its effectiveness. The Directors recognise that such a system is designed to manage rather than eliminate the risk of failure to achieve business objectives and can only provide reasonable but not absolute assurance against material misstatement or loss.
A process for identifying, evaluating and managing significant risks faced by the Group, in accordance with the Guidance for Directors in the 2012 Code and the Turnbull guidance, has been in place throughout the accounting period and up to the date the financial statements were approved. These risks are reviewed by the Committee and the Board. Executive management is responsible for implementing strategy and for the continued development of the Group’s businesses within parameters set down by the Board. Similarly, day to day management of the Group’s businesses is devolved to operational management within clearly defined authority limits and subject to very tight reporting of financial performance. Group and operating company management are responsible for internal control including the identification and evaluation of significant risks and for implementation of appropriate internal controls to manage such risks. Group management reports to the Board on key risks and internal control issues including the way in which these issues are managed.
The preparation and issue of financial reports, including the consolidated annual and interim accounts is managed by Group Finance with oversight from the Audit Committee. The Group’s financial reporting process is controlled using accounting policies and reporting formats issued by Group Finance to all reporting entities (including subsidiaries) in advance of each reporting period end. Group Finance supports all reporting entities with guidance in the preparation of financial information. The process is supported by a network of finance professionals throughout the Group who have responsibility and accountability to provide information in keeping with agreed policies and procedures. The financial information for each entity is reviewed by the Group’s senior management.
The key features of the Group’s system of internal control and risk management include:
• Review, discussion and approval of the Group’s strategy by the Board.
• Defined structures and authority limits for the operational and financial management of the Group and its businesses.
• A comprehensive system of reporting on trading including a comparison of actual results with budget and the prior year on a monthly and cumulative basis, on operational issues and on financial performance incorporating results and cash flows, working capital management, return on capital employed and other relevant measures of performance.
• Written reports from the Chief Executive Officer and the Chief Financial Officer that form part of papers considered by the Board at every board meeting.
• Review and approval by the Board of budgets incorporating operating performance and cash flows.
• Board approval of major capital expenditure proposals and all acquisition proposals. Capital expenditure proposals below Board level are approved by the Finance Committee.
• Review by senior management and the Audit and Risk Committee of the Internal Audit Report findings, recommendations and follow up actions.
The internal audit function focuses on areas of greatest risk to the Group. It monitors compliance and considers the effectiveness of internal control throughout the Group. The Audit and Risk Committee reviews Internal Audit Reports and meets with the Group Internal Audit and Business Risk Director in order to satisfy itself on the adequacy of the Group’s risk management and internal control systems. In addition, the Audit and Risk Committee reviews KPMG Management Letter reports and meets with the KPMG Audit Partner to discuss the nature of the points raised. The Chairman of the Audit and Risk Committee reports to the Board on all significant matters considered by the Committee.

Business & Strategy Review Corporate Governance Financial Statements Shareholder Information
Grafton Group plc Annual Report 2014
47
In the Board’s view, the ongoing information it receives is sufficient to enable it to review the effectiveness of the Company’s system of internal control. The Directors confirm that they have reviewed the effectiveness of internal control. In particular, they have during the year considered the significant risks affecting the business and the way in which these risks are managed, controlled and monitored.
The principal risks and uncertainties facing the Group have been considered by the Committee and by the Board. It is not practical to document every risk that could affect the Group in this report. The risks identified on pages 48 to 50 are those that could have a material adverse effect on the Group’s prospects, its financial condition and the results of its operations. The actions taken to mitigate the risks described in the Principal Risks and Uncertainties section on pages 48 to 50, cannot provide assurance that other risks will not materialise and/or adversely affect the operating results and financial position of the Group.
The Group has a framework in place to ensure the development, maintenance, operation and review of risk management controls that fulfil the Boards corporate governance obligations and support the Group’s strategic objectives. The Board is responsible for establishing and maintaining risk management controls and for evaluating their effectiveness. The Audit and Risk Committee oversees the effectiveness of the risk management procedures in place and the steps being taken to mitigate the Group’s risks. The Group’s Risk Management Committee, whose membership reflects a range of executive functions, skills, expertise, experience and levels, is responsible for the identification, reporting, mitigation and management of risk. The Risk Management Committee prepares an annual report of its activities and identifies areas for improvement and changes in the risk profile of the Group and presents it to the Audit and Risk Committee.
The risk management process is closely aligned with the overall strategic development of the Group which is influenced by economic growth, organic growth through implants, new formats and greenfield expansion and acquisition related growth in the UK and Belgium. Strategic projects are risk-assessed in conjunction with the commercial, financial and legal appraisal.
Roderick Ryan,Chairman of the Audit and Risk Committee
9 March 2015

Grafton Group plc Annual Report 2014
48
Principal Risks and Uncertainties
Macro-Economic Conditions in the UK, Ireland and BelgiumRiskTrading in the Group’s businesses is influenced by macro-economic conditions in the UK, Ireland and Belgium. The Group’s markets are cyclical in nature and a proportion of revenue is dependent on the willingness of households to incur discretionary expenditure on home improvement projects. Investments of this nature closely correlate with general economic conditions. A deterioration in economic conditions in the UK, Ireland and Belgium could result in lower demand in the Group’s businesses.
The Group’s products are distributed to mainly professional trades people engaged in residential, commercial and industrial maintenance and new-build projects. These markets are affected by trends in improvements, remodelling and maintenance and construction. Demand in these markets is also influenced by factors that include interest rates, the availability of credit, inflation, changes in property values, demographic trends, tax policy, employment levels and gross domestic product. Any negative movement in one or more of these factors could adversely affect demand in the Group’s business.
MitigationThe Group took significant action in previous years in response to the downturn in its markets to increase the operating efficiency of its business which should leave it well positioned to benefit from a recovery. Exposure to the more resilient and less cyclical repair, maintenance and improvement (RMI) market has increased through expansion of the network of Selco stores particularly in the Greater London Area.
The merchanting branches in Ireland have been refocused on the RMI market. Branch showrooms have been upgraded and the product portfolio expanded to meet the needs of customers engaged in residential RMI projects which now account for a higher proportion of revenue.
A highly cost efficient branch implant route to market model has been used to increase revenues through the existing branch network supported by an enhanced service to customers. Buildbase provides a plant, tool and equipment hire service to its customers from 115 Hirebase implants. Electricbase implants which supply a range of electrical products were trialled in 10 Buildbase branches during 2013 and extended into 59 branches by the end of 2014. SelcoHire now trades from 22 Selco branches following a successful trial of the concept in two branches in 2013. Plumb Centre implants provide a full range of plumbing and heating products in the Chadwicks and Heiton Buckley branches in Ireland.
The mitigation strategy also incorporates proactive cost control in response to changes in market conditions. An assessment of macro-economic, construction and residential market conditions informs the allocation of capital resources to new projects.
Competition in Merchanting, DIY and Mortar MarketsRiskThe Group faces volume and price competition in its markets. The Group competes with builders merchants and retailers of varying sizes, and faces competition from existing general and specialist merchants including the national builders merchanting chains in the UK together with retailers, regional merchants and independents. The Group also faces the risk of new entrants to its markets. Actions taken by the Group’s competitors, as well as actions taken by the Group to maintain its own competitiveness and reputation for value for money, may exert pressure on product pricing, margins and profitability. Some of the Group’s competitors may have access to greater financial resources, greater purchasing economies and a lower cost base, any of which may confer a competitive advantage that could adversely impact the Group’s revenues, profits and margins.
MitigationThe Group’s businesses monitor gross margins and, where possible, develop appropriate tactical and trading responses to changes in the competitive and pricing environment. Mitigation of this risk is achieved through ensuring a value proposition for customers through the review of customer pricing metrics, monitoring pricing developments in the market place and the active management of pricing. Promotional and marketing activity is also a feature of revenue and margin management. Procurement strategies are focused on reducing costs through supplier consolidation and sourcing from overseas markets. The Group maintains an open dialogue with suppliers in order to mitigate the impact on customers and Group profitability from commodity related cost pressures. The Group’s businesses conduct surveys and review feedback from customers in order to improve the quality of the overall product and service proposition and to ensure that customer expectations are met.
Employee and Management Engagement, Retention and SkillsRiskThe Group has over 10,000 employees engaged in the operations and management of its portfolio of businesses. Employees are fundamental to the long term success and development of the business. Attracting and retaining employees with the relevant

Business & Strategy Review Corporate Governance Financial Statements Shareholder Information
Grafton Group plc Annual Report 2014
49
skills and experience and investing in training and development is essential to sustaining the existing operations and providing a platform for the longer term development of the Group. The Group is dependent on the successful recruitment, development and retention of talented executives to run the overall Group and its businesses. In addition, the Group’s ability to continue to identify and develop opportunities is influenced by management’s knowledge of and expertise in its markets.
MitigationThe Group and its individual businesses are committed to high standards of employment practice and are recognised as good employers in the UK, Ireland and Belgium. Remuneration and benefits are regularly reviewed and are designed to be competitive with other companies in the sectors that the Group operates in and with market practice generally.
Significant resources and time are devoted to training and development. This includes programmes that are organised internally by Group businesses and also in conjunction with external bodies. Employee turnover is closely monitored and processes are in place to provide career development opportunities and actively manage succession planning throughout the business. The Group made a number of appointments in recent years in planning for the succession of key executives and to support its longer term development.
IT Systems and InfrastructureRiskThe Group’s businesses are dependent on IT systems and supporting infrastructure to trade. The failure of key systems could have a serious impact on the business and result in the loss of revenue and reduced profitability.
The rate and scale of IT change is increasing as the Group undertakes a programme to replace a number of heritage systems. These changes have the potential to disrupt operations.
MitigationBack-up facilities and business continuity plans are in place and tested regularly to ensure that interruptions to the business are prevented or minimised and that data is protected from unauthorised access.
The replacement and updating of systems and technologies is supported by a full strategy and business case analysis and planning and risk analysis for each project. A Programme Board has been established to review progress at significant project milestones and to control costs. The Programme Board is supported by subject matter experts to ensure that projects are managed to deliver technical, functional and business solutions within an appropriate cost and timeframe.
Health and SafetyRiskThe prevention of injury or loss of life to employees, customers and third parties is an absolute priority for the Board and executive management. Health and safety risks in branch locations concern the manual handling of products, slips, trips and falls and incidents involving fork lift trucks and delivery vehicles. Outside of the branch locations the main health and safety risks relate to vehicles engaged in transferring building materials from branch locations to customers’ sites.
MitigationHealth and safety forms part of the agenda at all board meetings and statistics covering accident frequency rates, lost time, management of risks and the cost of accidents and incidents are reviewed by the Board on a regular basis.
The individual businesses invest significant resources in health and safety management and actively work to minimise health and safety risks. Accidents are monitored and corrective action taken when appropriate to reduce or eliminate the risk of recurrence. The Group has recruited additional health and safety expertise to facilitate an improvement in the management of health and safety risks.
Acquisition and Integration of New BusinessesRiskGrowth through acquisition was historically a key element to the Group’s development strategy. The Group may not be able to continue to grow if it is unable to identify attractive targets, execute full and proper due diligence, raise funds on acceptable terms, complete acquisition transactions, integrate the operations of the acquired businesses and realise the anticipated levels of profitability, cash flows and return on invested capital.

Grafton Group plc Annual Report 2014
50
MitigationAcquisitions are made in the context of the Group’s overall strategy. The Group has a long established, experienced and skilled acquisition capability that has significant relevant experience in all aspects of acquisition transactions and in managing post acquisition integration. This process is underpinned by strategic and financial acquisition criteria and the close monitoring of performance post acquisition.
Defined Benefit Pension SchemesRiskRetirement benefits are principally provided under defined contribution style pension arrangements. The Group also operates a number of defined benefit pension schemes in the UK and Ireland. The assets and liabilities of these schemes may exhibit significant volatility attributable primarily to changes in asset valuations, changes in bond yields and longevity of scheme members. In addition to future service contributions, significant cash contributions may be required to eliminate past service deficits.
MitigationAn investment strategy is in place under the stewardship of the pension scheme trustees, in consultation with the Group to protect scheme assets and optimise returns.
The Group’s defined benefit pension schemes were restructured on a more sustainable long-term basis during 2013 following consultations between the Group, the Trustees and active members. The arrangements agreed were based on sharing the cost of funding the scheme deficits and providing for more sustainable future benefits at an affordable cost while also materially reducing the financial risks of the schemes to the businesses.
TaxRiskThe Group’s businesses are subject to tax in a number of jurisdictions and it seeks to organise its affairs in a tax efficient manner. The income statement charge for taxation requires estimates to be made in relation to certain tax matters where the ultimate outcome may not be certain and when such matters may not be determined for an extended period of time. The final determination of these matters could be materially different to the estimate included in the financial statements.
MitigationThe amounts provided for tax are based on management’s estimate having taken appropriate professional advice. The Group maintains an open dialogue with tax authorities as required and is vigilant in ensuring that it complies with tax legislation by also taking appropriate professional advice.
The Availability and Cost of Debt FinanceRiskThe Group’s ability to access liquidity to fund its business in the longer term may be affected during periods of tight credit conditions or the absence of funds at a reasonable cost. The availability and cost of debt finance could limit the Group’s flexibility in planning for and reacting to, competitive pressures and changes in its business and limit its ability to undertake organic developments, make strategic acquisitions and capitalise on business opportunities.
MitigationDebt facilities are managed to provide security of funding and take account of the strong cash generation of the business and the uncertain timing and nature of any acquisition spend. The Group completed a refinancing during 2014 and maintains significant undrawn bank facilities and cash resources to fund its ongoing requirements.
Credit Risk Relating to Customers RiskThe Group is exposed to the risk of default by customers who purchase products on credit. One of the key features of customer service in merchanting is the provision of short-term credit to customers with the Group carrying the associated credit risk.
MitigationThe Group’s exposure to customer credit risk is diversified over a large customer base and the incidence of default by customers is tightly managed by business unit credit control teams. Past-due receivables are monitored and actively managed on an on-going basis and bad debt provisions are made as required.
Principal Risks and Uncertainties(continued)

Business & Strategy Review Corporate Governance Financial Statements Shareholder Information
Grafton Group plc Annual Report 2014
51
Chairman’s Annual Statement
Dear Shareholder,
On behalf of the Board, I am pleased to present the Report of the Remuneration Committee (the Committee) on Directors’ Remuneration.
Although not required under the Irish Companies Acts, the Committee has continued to prepare the Remuneration Report in accordance with the revised UK regulations governing the disclosure and approval of remuneration of the Directors that came into force last year. Accordingly, this remuneration report has been split into three parts – (i) this Annual Statement, (ii) the Remuneration Policy Report which sets out the Group’s policy for remunerating Executive Directors, and (iii) the Annual Report on Remuneration which sets out how Directors were remunerated in 2014 and how it is proposed to apply the policy in 2015. This Annual Statement and the Annual Report on Remuneration will be subject to a single advisory vote and a slightly revised Remuneration Policy will be subject to a second advisory vote at the 2015 AGM.
The remuneration policy adopted by the Board is to reward its Executive Directors competitively having regard to comparable companies. In setting the remuneration policy for the Executive Directors, the Committee takes into account the need to attract, retain and motivate executives of high calibre and ensure that executive management is provided with appropriate incentives to encourage enhanced long-term performance with the objective of aligning the interests of Executive Directors and shareholders. In determining such policy, the Remuneration Committee takes into account all factors which it considers necessary, including market practice, the changing nature of the business and markets in which it operates, the performance of the Group, the experience, responsibility and performance of the individuals concerned and remuneration practices elsewhere in the Group.
Performance Outcome for 2014The key features of what was a very strong performance by the Group are summarised as follows:
• Revenue up 9.6% to £2.1 billion
• Underlying operating profit up 43% to £110.1 million from £77.2 million
• Underlying Group operating profit margin increased by 120 basis points to 5.3% from 4.1%
• Underlying profit before taxation up 56% to £101.2 million from £64.9 million
• Adjusted basic earnings per share up 54% to 34.4p
• 26% dividend increase reflects strong improvement in profitability
• Strong cash generation from operations of £160.0 million and year-end gearing of 8%
• Return on capital employed increased by 330 basis points to 11.1%
Remuneration for 2014The Committee agreed in January 2014 not to award any basic salary increase to Executive Directors for 2014 having taken account of both external market developments and internal Group considerations at that time.
The annual bonus for 2014 was based on demanding financial performance targets and personal objectives. Financial performance targets accounted for three quarters of the overall bonus opportunity. Reflecting the strong performance as set out above, a bonus of 117.18 per cent of basic salary, out of a maximum possible award of 120 per cent of basic salary, was made to the Chief Executive Officer. The bonus award made to the Chief Financial Officer was 97.65 per cent of basic salary out of a potential bonus opportunity of 100 per cent of basic salary.
The performance conditions for Long Term Incentive Plan (LTIP) awards made in April 2012 were based on growth in Earnings Per Share (EPS) and Total Shareholder Return (TSR). Half of the award to the Chief Executive Officer was based on the relative TSR performance versus a peer group. As the Group’s TSR was in the top quartile relative to the peer group, 100 per cent of this half of the award will vest. The other half of the award was based on the Group’s EPS for the financial year ended 31 December 2014 being in the range of 22.57 pence to 28.21 pence (28 cents to 35 cents). As the adjusted earnings per share of 34.4 pence (42.67 cents) for 2014 exceeded the upper end of the range, this performance condition was met and the award to the Chief Executive Officer will also fully vest.
The Remuneration Committee is satisfied that the short and long-term elements of remuneration reflect the strong performance of the Group both in 2014 and over the three years to the end of 2014.
Report of the Remuneration Committee on Directors’ Remuneration

Grafton Group plc Annual Report 2014
52
Report of the Remuneration Committee on Directors’ Remuneration (continued)
Chairman’s Annual Statement (continued)
Remuneration Policy for 2015The Remuneration Policy is set out on pages 53 to 60.
The salaries of Executive Directors are reviewed annually in January. When conducting its review in January 2015, the Committee considered a range of factors including the performance of the Group, market conditions, the prevailing market rates for similar positions in comparable companies, the responsibilities, performance and experience of each executive Director, the level of salary increases across the Group and the balance between the fixed and variable elements of the overall remuneration packages.
No basic salary increases have been awarded to the Chief Executive Officer since his appointment to the position in April 2011 and the Committee agreed to award a salary increase of 2.5 per cent with effect from 1 January 2015. The Chief Financial Officer was appointed to the role in September 2013 and he was also awarded a salary increase of 2.5 per cent with effect from 1 January 2015.
The maximum potential annual performance related pay award for 2014 was 120 per cent of basic pay for the Chief Executive Officer and 100 per cent of basic salary for the Chief Financial Officer and these limits will also apply for 2015.
It is intended that LTIP awards will be granted in 2015 equivalent to 150 per cent of salary to Mr. Slark which is in line with the award made for 2014. Mr. Arnold will be granted an award equivalent to 125 per cent of salary which is consistent with the award made for 2014, his first full year of employment with the Group. The remuneration policy adopted in 2014 set a limit of 100 per cent of basic salary on awards made to the Chief Financial Officer and other Executive Directors except for the first year of employment when a limit of 125 per cent applied. The Committee reconsidered this matter and, having taken account of performance, agreed that the limit of 125 per cent of basic salary on the total value of awards that may be granted under long term incentives should be capable of applying in any year and not limited to the first year of employment. The revised award level is within the LTIP’s overall individual limit of 150 per cent of salary. While benchmarking data has not been the primary reason for the proposed increase, the Committee, having taken advice from New Bridge Street (a trading name of Aon Corporation), is satisfied that a 125 per cent salary LTIP limit will be more in line with typical award levels made by FTSE 250 companies of comparable scale. The revised limit will require a revision to the Remuneration Policy. The revised policy will therefore be subject to an advisory vote at the 2015 AGM. There are no other changes to the Remuneration Policy approved by shareholders last year.
The Remuneration Committee encourages open and constructive dialogue with its shareholders and it pledges to consult with major shareholders ahead of any major future changes to the remuneration policy.
I recommend your support for the advisory resolutions on Directors Remuneration at this year’s Annual General Meeting.
Yours sincerely,
C. M. Fisher Chairman of the Remuneration Committee

Business & Strategy Review Corporate Governance Financial Statements Shareholder Information
Grafton Group plc Annual Report 2014
53
Remuneration Policy Report
This part of the Directors’ Remuneration Report sets out the remuneration policy for the Company and has been prepared in accordance with Schedule 8 to the Large and Medium-sized Companies and Groups (Accounts and Reports) Regulations 2008 (as amended) and the disclosure requirements set out in the Listing Rules of the Financial Conduct Authority. The policy has been developed taking into account the principles of the UK Corporate Governance Code 2012 and describes the policy to be applied from 2015 onwards. The Policy Report will be put to an advisory non-binding shareholder vote at the 2015 AGM and the policy will take formal effect from that date. The only significant change made to the Policy Report adopted in 2014 relates to increasing the limit on the total value of long-term incentives that may be awarded to the Chief Financial Officer and Executive Directors (other than the Chief Executive Officer) to 125 per cent of basic salary. The limit of 125 per cent previously applied to the first year of employment only and reverted to 100 per cent thereafter.
Policy OverviewThe objective of the remuneration policy is to provide remuneration packages for each Executive Director that will:
• attract, retain and motivate executives of high calibre;
• ensure that executive management is provided with appropriate incentives to encourage enhanced long-term performance;
• ensure that the overall package for each director is linked to the short and long term strategic objectives of the Group; and
• have a significant proportion of the potential remuneration package that is paid in equity, which is designed to ensure that executives have a strong alignment with shareholders.
When setting the levels of short-term and long-term variable remuneration and the balance of equity and cash within the package, consideration is given to discouraging unnecessary risk-taking whilst ensuring that performance hurdles are suitably challenging.
In determining such policy, the Remuneration Committee takes into account all factors which it considers necessary, including market practice, the changing nature of the business and markets in which it operates, the performance of the Group, the experience, responsibility and performance of the individuals concerned and remuneration practices elsewhere in the Group.
How the Views of Shareholders are Taken into AccountThe Remuneration Committee considers the guidelines issued by bodies representing institutional shareholders and feedback from shareholders on the Group’s remuneration policies and practices. The Committee also takes on board any shareholder feedback received at the AGM each year. This feedback, plus any additional feedback received during meetings with shareholders from time to time, is then considered as part of the Group’s annual review of remuneration policy.
When any significant changes are made to the remuneration policy, the Remuneration Committee Chairman will inform major shareholders of these in advance and will offer a meeting to discuss these changes. The Remuneration Committee will engage with shareholders and give serious consideration to their views.
Details of votes cast for and against the resolution to approve last year’s remuneration report and any matters discussed with shareholders during the year will be referred to in the Annual Report on Remuneration.
How the Views of Employees are Taken into AccountWhen setting the remuneration policy for Executive Directors the Remuneration Committee takes into account the pay and employment conditions of other employees in the Group although it does not directly consult with employees on directors’ remuneration.

Grafton Group plc Annual Report 2014
54
Report of the Remuneration Committee on Directors’ Remuneration (continued)
Remuneration Policy Report (continued)
The Remuneration Policy for Directors The table below summarises the key aspects of the Group’s future remuneration policy for Executive Directors.
Element, purpose and link to strategy
Operation Maximum opportunity/limit
Performance targets
Base salaryTo recruit, retain and reward executives of a suitable calibre for the roles and duties required
Salaries of Executive Directors are reviewed annually in January and any changes made are effective from 1 January.
When conducting this review and the level of increase, the Committee considers a range of factors including:
• the performance of the Group;
• market conditions;
• the prevailing market rates for similar positions in UK and Irish companies of broadly comparable size and a number of industry specific peers;
• the responsibilities, performance and experience of each Executive Director; and
• the level of salary increases implemented across the Group.
Details of the outcome of the most recent salary review are provided in the Annual Remuneration Report.
Generally, annual increases will be in line with employee increases but higher increases may be awarded on occasion where an individual is promoted or has been recruited on a below market rate or where there have been changes to individual responsibilities or in the size or complexity of the business.
Not applicable
BenefitsTo provide market competitive benefits to ensure the well-being of directors
Benefits may include company car, mobile telephone, life assurance, private medical cover and permanent health insurance.
Relocation or other related expenses may be offered, as required.
The value of other benefits is based on the cost to the company and is not pre-determined.
Relocation expenses must be reasonable and necessary.
Not applicable
PensionTo provide market competitive benefits
A company contribution to a money purchase pension scheme or provision of a cash allowance in lieu of pension.
A company pension contribution or payment in lieu of pension made through the payroll of up to 25% of basic salary.
Not applicable

Business & Strategy Review Corporate Governance Financial Statements Shareholder Information
Grafton Group plc Annual Report 2014
55
Element, purpose and link to strategy
Operation Maximum opportunity/limit
Performance targets
Annual bonusTo encourage and reward delivery of the Group’s annual financial and/or strategic objectives
Bonus payments are determined by the Committee after the year end, based on performance against the targets set. Targets are reviewed annually.
The bonus is payable in cash. An Executive Director is required to apply 30% of the annual bonus after statutory deductions for the purchase of shares in the Group until the shareholding is equivalent to at least 100 per cent of basic salary.
Claw-back may be applied, at the discretion of the Committee, in the event of material misconduct, material misstatement of results, a calculation error and /or the use of incorrect or inaccurate information when calculating the bonus award.
The maximum award under the annual bonus plan is 120% of basic salary for the CEO and 100% of salary for the CFO and any Executive Directors appointed in the future (other than a CEO).
The bonus will be based on the achievement of an appropriate mix of mainly financial objectives but may also include an element for personal objectives.
Financial measures which account for the majority of the bonus opportunity may include measures such as earnings per share, return on capital employed, free cash flow and such other measures as determined from time to time by the Committee. Personal objectives that are relevant to an individual’s specific areas of responsibility may be used. The metrics chosen and their weightings will be set out in the Annual Report on Remuneration.
For financial measures, a sliding scale is set by the Committee. No bonus is payable if performance is below a minimum threshold and the bonus payable increases on a straight line basis thereafter with full bonus payable for achieving the upper point on the scale.

Grafton Group plc Annual Report 2014
56
Report of the Remuneration Committee on Directors’ Remuneration (continued)
Remuneration Policy Report (continued)
Element, purpose and link to strategy
Operation Maximum opportunity/limit
Performance targets
Long-Term Incentives (‘LTIP’)To encourage and reward delivery of the Group’s strategic objectives and provide alignment with shareholders through the use of shares
The 2011 LTIP is an incentive plan that is designed to reward Executive Directors and senior executives in a manner that aligns their interests with those of shareholders. An Executive Director nominated to participate in the plan is granted an award over “free shares” which vest subject to the achievement of performance conditions measured over three financial years and the Executive Director remaining employed in the Group.
There is a claw-back provision under which the Remuneration Committee has the discretion to require the reduction of the vesting of awards or require the repayment of vested awards (within two years of the vesting of awards) in circumstances where the vesting arose as a result of information which has subsequently proved to be inaccurate or misleading in a material respect.
The total value of awards which may be granted under the LTIP rules in any financial year is 150% of basic salary. This may be increased to 200% of salary in exceptional circumstances.
The Company’s current policy is to award 150% of basic salary in the case of the CEO and 125% of basic salary in the case of the CFO and any Executive Directors (other than a CEO) appointed in the future.
The vesting of LTIP awards made to Executive Directors is currently subject to EPS (earnings per share) and TSR (total shareholder return) performance conditions.
The EPS (as defined in the scheme rules) condition will be subject to achieving EPS within a target range. 25% of this part of the award will vest if the lower target in the range is achieved. Where the EPS is between the lower and higher targets in the range, then between 25% and 100% of this part of the award will vest on a straight line basis.
If the Group’s TSR equals the median TSR of the peer group 25% of this part of the award will vest, with full vesting for upper quartile performance or better. Awards vest on a straight line basis for performance between the median and upper quartile.
Notwithstanding the achievement of the TSR performance condition, no shares will vest unless the Committee considers that overall financial results have been satisfactory in the circumstances over the performance period.
The Remuneration Committee has the authority to set appropriate metrics (which may include metrics other than EPS and TSR) for each future award. The Committee believes that the share scheme should align management and shareholder interests and assist the Group in the recruitment and retention of senior executives.

Business & Strategy Review Corporate Governance Financial Statements Shareholder Information
Grafton Group plc Annual Report 2014
57
Element, purpose and link to strategy
Operation Maximum opportunity/limit
Performance targets
All-employee share plansTo encourage share ownership and align the interests of employees with shareholders
Executive Directors are entitled to participate in employee share schemes on the same basis as other employees. The Group currently operates the 2011 Approved SAYE Plan for UK employees and in Ireland the Group has in the past operated a Share Participation Scheme for its Irish employees.
The limits are set by the UK tax authorities from time to time. Currently this limit is £500 per month.
Not applicable
Share ownership guidelinesTo increase the alignment of interests between Executive Directors and shareholders
An Executive Director is required to apply 30% of the annual bonus after statutory deductions for the purchase of shares in the Group until his/her shareholding is equivalent to at least 100 per cent of basic salary.
Minimum 100% of basic salary built up over time.
Not applicable
Chairman and Non-Executive Director feesTo attract and retain a high-calibre Chairman and Non-Executive Directors by offering a market competitive fee level
On the recommendation of the Chairman, the Board sets the level of remuneration of all Non-Executive Directors within an aggregate limit approved from time to time by shareholders. The Chairman’s fee is set based on a recommendation from the Remuneration Committee. The level of fees paid seeks to recognise the time commitment, responsibility and skills required to contribute to the effectiveness of the Board.
Details of the outcome of the most recent fee review are provided in the Annual Remuneration Report.
Not applicable
Notes1. For the annual bonus scheme, earnings per share is a measure of the Group’s overall financial performance, return on capital employed ensures earnings are derived from the efficient use of capital and free cash flow ensures earnings are readily converted into cash.2. EPS and TSR are measures of the return to shareholders in terms of the value of their investment in the Group, dividends paid and the Group’s performance.

Grafton Group plc Annual Report 2014
58
Report of the Remuneration Committee on Directors’ Remuneration (continued)
Remuneration Policy Report (continued)
Annual Bonus and LTIP DiscretionsThe Committee will operate the annual bonus and LTIP according to their respective rules and in accordance with the Listing Rules and applicable tax rules. A copy of the LTIP rules is available on request from the Company Secretary. The Committee, consistent with market practice, retains discretion over a number of areas relating to the operation and administration of these plans. These include (but are not limited to) the following (albeit with the level of award restricted as set out in the policy table above):
• Who participates in the plans;
• The timing of grant of awards;
• The size of awards;
• The choice of performance measures and performance target conditions in respect of each annual award (including the setting of EPS targets and the treatment of delisted companies for the purposes of the TSR comparator group);
• Discretion relating to the measurement of performance in the event of a change of control or reconstruction;
• Determination of a good leaver (in addition to any specified categories) for incentive plan purposes based on the rules of the plan and the appropriate treatment chosen;
• Adjustments required in certain circumstances (e.g. in the event of a de-merger, special dividend or an alteration to the capital structure of the Company including a capitalisation of reserves or rights issue); and
• The ability to adjust existing performance conditions for exceptional events so that they can still fulfil their original purpose.
Legacy ArrangementsFor the avoidance of doubt, in approving this Remuneration Policy Report which forms part of the non-binding advisory vote at the 2015 AGM, it is noted that the Group will honour any commitments entered into with current or former directors that have been disclosed previously to shareholders.
Differences in Remuneration Policy for Executive Directors Compared to Other EmployeesThe Committee is made aware of pay structures across the wider Group when setting the remuneration policy for Executive Directors. The Committee considers the general basic salary increase for the broader employee population when determining the annual salary review for the Executive Directors.
Overall, the remuneration policy for the Executive Directors is more heavily weighted towards variable pay than for other employees. This ensures that there is a clear link between the value created for shareholders and the remuneration received by the Executive Directors and recognises that Executive Directors should have the greatest potential to influence the Group’s value creation for shareholders.
Approach to Recruitment and PromotionsThe remuneration package for a new Director will be set in accordance with and subject to the limits set out in the Group’s approved policy as set out earlier in this report, subject to such modifications as are set out below.
Salary levels for Executive Directors will be set in accordance with the Group’s remuneration policy, taking into account the experience and calibre of the individual and his/her existing remuneration package. Where it is appropriate to offer a lower salary initially, a series of increases to the desired salary positioning may be made over subsequent years subject to individual performance and development in the role. Benefits will generally be provided in line with the approved policy, with relocation or other expenses provided if necessary. A pension contribution of up to 25 per cent of salary may be provided.
The structure of the variable pay element will be in accordance with and subject to the limits set out in the Group’s approved policy detailed above. Different performance measures may be set initially for the annual bonus in the year an Executive Director joins the Group taking into account the responsibilities of the individual and the point in the financial year that he or she joins the Board.

Business & Strategy Review Corporate Governance Financial Statements Shareholder Information
Grafton Group plc Annual Report 2014
59
If it is necessary to buy-out incentive pay or benefit arrangements (which would be forfeited on leaving the previous employer) in the case of an external appointment, this would be provided for taking into account the form (cash or shares), timing and expected value (i.e. likelihood of meeting any existing performance criteria) of the remuneration being forfeited. Share awards may be used to the extent permitted under the Group’s existing share plans and provisions under the Listing Rules where necessary.
In the case of an internal hire, any outstanding variable pay awarded in relation to the previous role will be allowed to pay out according to its terms of grant or adjusted as considered desirable to reflect the new role.
Fees for a new Chairman or Non-Executive Director will be set in line with the approved policy.
Service Contracts & Payments for Loss of OfficeThe Remuneration Committee determines the contractual terms for new Executive Directors, subject to appropriate professional advice to ensure that these reflect best practice.
The Group’s policy is that the period of notice for Executive Directors will not exceed 12 months. The employment contracts of the CEO and the CFO may be terminated on six months’ notice by either side. In the event of a director’s departure, the Group’s policy on termination is as follows:
• The Group will pay any amounts it is required to make in accordance with or in settlement of a director’s statutory employment rights;
• The Group will seek to ensure that no more is paid than is warranted in each individual case;
• There is no entitlement to bonus paid following notice of termination unless expressly provided for in an Executive Director’s employment contract but the Group reserves the right to pay a bonus for the notice period subject to performance conditions;
• Following service of notice to terminate employment, the Company may place the executive on garden leave. During this time, the executive will continue to receive salary and benefits (or a sum equivalent to) until the termination of employment.
A director’s service contract may be terminated without notice and without any further payment or compensation, except for sums accrued up to the date of termination, on the occurrence of certain events such as gross misconduct. If the Group terminates employment in lieu of notice in other circumstances, compensation payable is as provided for in employment contracts which is as follows:
• Gavin Slark - basic salary due for any unexpired notice period;
• David Arnold - basic salary together with benefits and bonus which would have been payable during the notice period or any unexpired balance thereof. Any bonus payable is subject to performance conditions.
Payments may be made in monthly instalments.
The Group may pay salary, benefits and pension in lieu of notice for a new director.
The treatment of unvested awards previously granted under the LTIP upon termination will be determined in accordance with the plan rules. As a general rule, LTIP awards will lapse upon a participant giving or receiving notice of his/her cessation of employment. However for certain good leaver reasons including death, ill health, injury, disability, redundancy, agreed retirement, their employing company or business being sold out of the Group, or any other reason at the Committee’s discretion after taking into account the circumstances prevailing at the time, awards will vest on the normal vesting date subject to the satisfaction of performance conditions and pro-rating the award to reflect the reduced period of time between the commencement of the performance period and the Executive Director’s cessation of employment as a proportion of the total performance period. Alternatively, the Committee can decide that the award will vest on the date of cessation, subject to the extent to which the performance conditions have been satisfied by reference to the date of cessation and pro-rated by reference to the date of cessation of employment.

Grafton Group plc Annual Report 2014
60
Remuneration Policy Report (continued)
Non-Executive DirectorsAll Non-Executive Directors have letters of appointment with the Company for an initial period of three years, unless otherwise terminated earlier by and at the discretion of either party upon one month’s written notice or otherwise in accordance with the Group’s Articles of Association and subject to annual re-appointment at the AGM.
The appointment letters for Non-Executive Directors provide that no compensation is payable on termination other than accrued fees and expenses.
Remuneration Scenarios for Executive DirectorsThe Group’s normal policy results in a significant portion of remuneration received by Executive Directors being dependent on performance. The chart below shows how the total pay opportunities for 2015 for Executive Directors vary under three performance scenarios – Minimum, In line with Expectation and Maximum.
Assumptions: Minimum = fixed pay only (salary + benefits + pension) In line with expectation (which is not target) = 50% vesting of the annual bonus and LTIP awards Maximum = 100% vesting of the annual bonus and LTIP awards No account has been taken of any share price increase.
Report of the Remuneration Committee on Directors’ Remuneration (continued)
0
500
Chart labels show proportion of the total package comprised of each element
1,000
1,500
2,000
2,500
Minimum
£745
£1,513
£2,280
£505
£944
£1,382
Chief Executive Officer Chief Financial Officer
In line with expectation
Maximum In line with expectation
Minimum Maximum
£’00
0
100% 49% 33% 100% 53% 37%
23% 30%
28%
37%
26%35%
21% 28%
Long-Term Share Awards
Annual Bonus
Fixed

Business & Strategy Review Corporate Governance Financial Statements Shareholder Information
Grafton Group plc Annual Report 2014
61
Annual Report on Remuneration
Although not required under the Irish Companies Acts, this report also includes the disclosures required by UK legislation contained in Part 3 of Schedule 8 to The Large and Medium-sized Companies and Groups (Accounts and Reports) (Amendment) Regulations 2013, and the disclosures required by 9.8.6R of the Listing Rules.
Membership of the Remuneration CommitteeThe Committee comprises Mr. Charles M. Fisher, who chairs the Committee, Mr. Roderick Ryan and Ms. Annette Flynn all of whom are Non-Executive Directors that are determined by the Board to be independent. The Committee members have no personal financial interest, other than as shareholders, in matters to be decided, no potential conflicts of interests arising from cross directorships and no day-to-day involvement in running the business. The Non-Executive Directors are not eligible for pensions and do not participate in the Group’s bonus or share schemes. The Committee’s terms of reference can be found on the company website.
The Chairman of the Board attends meetings of the Committee by invitation and participates in the deliberations of the Committee. The Committee also consults the CEO as appropriate. The Committee is also assisted in its work by the Company Secretary who also acts as secretary to the Committee. The Executive Directors and Company Secretary take no part in discussions relating to their own remuneration and benefits. New Bridge Street is the Committee’s executive remuneration advisor and is a signatory to the Remuneration Consultants Group’s Code of Conduct. During 2014 New Bridge Street were appointed by the Remuneration Committee to carry out a review of the remuneration packages of Executive Directors and the Company Secretary, the fees paid to Non-Executive Directors and other remuneration related work. New Bridge Street also advised on the UK regulations governing disclosure and approval of directors’ remuneration. The fees charged for the provision of these services were £20,000 and were charged on a time spent basis.
The Committee met seven times during 2014 and its schedule of work covered the following matters that fall within the scope of its duties and responsibilities:
• Considered and determined bonus awards under the 2013 bonus scheme for the Executive Directors and Company Secretary.
• Approval of 2014 LTIP awards and determined the earnings per share performance condition.
• Reviewed and determined that 90.67 per cent of the TSR component of the 2011 LTIP award was met. The Committee also determined that the EPS performance condition under the 2011 LTIP award was not met and that the awards should lapse.
• Commissioned an independent review by New Bridge Street of the remuneration packages of Executive Directors and the Company Secretary and of the fees paid to Non-Executive Directors and considered the findings of this review.

Grafton Group plc Annual Report 2014
62
Report of the Remuneration Committee on Directors’ Remuneration (continued)
Annual Report on Remuneration (continued)
Single Total Remuneration Figure of Directors’ RemunerationThe following table sets out the total remuneration for directors for the year ending 31 December 2014 and the prior year.
Salary/Fees (a) Bonus (b) Pension (c)Other
Benefits (d)
Long term Incentive Plan (e)
Termination Payment Total
2014 £’000
2013 £’000
2014 £’000
2013 £’000
2014 £’000
2013 £’000
2014 £’000
2013 £’000
2014 £’000
2013 £’000
2014 £’000
2013 £’000
2014 £’000
2013 £’000
Executive Directors
G. Slark 555 555 650 273 128 128 48 48 1,321 520 - - 2,702 1,524
D. Arnold (i) 380 119 371 119 76 24 38 11 - - - - 865 273C. Ó Nualláin (ii) - 293 - 184 - 198 - 18 - 226 - 248 - 1,167
935 967 1,021 576 204 350 86 77 1,321 746 - 248 3,567 2,964
Non-Executive Directors
M. Chadwick 121 127 - - - - - - - - - - 121 127
C. M. Fisher 56 59 - - - - - - - - - - 56 59
A. Flynn 56 59 - - - - - - - - - - 56 59
R. M. Jewson (iii) - 22 - - - - - - - - - - - 22
R. Ryan 56 59 - - - - - - - - - - 56 59F. van Zanten (iv) 56 38 - - - - - - - - - - 56 38
345 364 - - - - - - - - - - 345 364Total Remuneration 1,280 1,331 1,021 576 204 350 86 77 1,321 746 - 248 3,912 3,328
(i) Mr. D. Arnold joined the Board and the Group on 9 September 2013.(ii) Mr. C. Ó Nualláin retired from the Board on 9 September 2013. (iii) Mr. R. W. Jewson retired from the Board at the conclusion of the Annual General Meeting on 14 May 2013.(iv) Mr. F. van Zanten joined the Board as a Non-Executive Director on 13 May 2013.(v) Comparative figures included in the table above have been presented on a consistent basis with the current year. Further details
on the valuation methodologies applied are set out in notes (a) to (f) below. These valuation methodologies are as required by the Regulations and are different from those applied within the financial statements which have been prepared in accordance with International Financial Reporting Standards (“IFRS”). The total expense relating to the directors recognised within the income statement is £584,000 (2013: £490,000) in respect of the long-term incentive plan (LTIP).
Notes to the Directors’ Remuneration Table:(a) This is the amount of salaries and fees earned in respect of the financial year.(b) This is the amount of bonus earned in respect of the financial year.(c) This is the amount of contribution payable in respect of the financial year by way of a company contribution to a pension
scheme or a payment in lieu of pension made through the payroll.(d) Benefits comprise permanent health and medical insurance and the provision of a company car (car allowance).(e) For the year ended 31 December 2014, this is the value of LTIP awards that will vest in April 2015. The value of the awards
is based on the average share price for the three months to 31 December 2014. The vesting of these awards was subject to performance conditions over the period 1 January 2012 to 31 December 2014. For the year ended 31 December 2013, this is the value of LTIP awards that vested in May 2014. The vesting of these awards was subject to performance conditions over the period 1 January 2011 to 31 December 2013.
(f) The Non-Executive Directors and Mr. Ó Nualláin were paid in euros. Fees paid to Non-Executive Directors during 2014 were at the same rate in constant currency (euros) that applied in 2013.

Business & Strategy Review Corporate Governance Financial Statements Shareholder Information
Grafton Group plc Annual Report 2014
63
Salary and FeesThe Committee agreed in January 2014 not to award any basic salary increases to Executive Directors for 2014 having taken account of both external market developments and internal Group considerations at that time. Mr. Slark continued to be paid the same salary since his appointment to the Board on 1 April 2011. Mr. Arnold’s salary was paid at the rate of £380,000 per annum for 2014 and was pro-rated at the same rate in 2013 for the period from 9 September 2013, the date his employment commenced, to 31 December 2013.
Non-Executive Directors fees were paid at the rate of £56,000 per annum, the same level in constant currency since 2005. No additional fees were paid for Chairing Board Committees. The fee paid to the Chairman was £121,000, the same level in constant currency since his appointment as Non-Executive Chairman on 1 July 2011.
Annual BonusThe maximum bonus opportunity for Mr. G. Slark and Mr. D. Arnold was 120 per cent and 100 per cent of salary respectively. The maximum bonus opportunity was divided equally between three financial measures and personal objectives.
The table below analyses the composition of the bonus awards for the year:
Percentage of Basic Salary
Adjusted EPS Cash flow Return on Capital Personal Objectives Bonus Payable
G. Slark 30.00% 27.18% 30.00% 30.00% 117.18%D. Arnold 25.00% 22.65% 25.00% 25.00% 97.65%
The maximum bonus opportunity for each of the four components was 30 per cent of gross pay for Mr. Slark and 25 per cent of gross pay for Mr. Arnold.
The financial targets were set at the beginning of the year by reference to the Group’s budget for 2014. No bonus was payable if the performance achieved was below 90 per cent of target and the bonus payable increased on a straight line basis thereafter with the full bonus opportunity payable on achieving 125 per cent of target for each financial performance measure. The actual targets have not been disclosed as they are considered by the Board to be commercially sensitive information.
As highlighted earlier in this report, the Group performed strongly in 2014 with significant progress made in what was the first full year of recovery in its major markets. Adjusted earnings per share increased by 54 per cent to 34.4 pence (2013: 22.3 pence), cash generated from operations increased by 68 per cent to £160.0 million (2013: £95.3 million) and return on capital employed increased by 3.3 percentage points to 11.1 per cent from 7.8 per cent.
Mr. Slark and Mr. Arnold were each given a number of personal and strategic objectives related to their personal areas of responsibility and the priorities of the overall Group. The nature of these objectives are considered by the Board to be commercially sensitive but included strategic planning to support the international development of the Group, succession planning and personal development covering the senior management of the Group and the refinancing of Group debt. The Committee considered the extent to which these objectives were achieved and agreed a payment of 30 per cent of salary for Mr. Slark and 25 per cent of salary for Mr. Arnold out of a maximum bonus opportunity of 30 per cent and 25 per cent of salary respectively.
PensionPension benefits comprise either a company contribution to an executive’s personal pension plan, a company contribution to the Group defined contribution pension scheme or an allowance paid through the payroll in lieu of pension benefit.
Mr. Slark’s pension benefit comprised a payment made to a defined contribution scheme and a taxable non-pensionable cash allowance. The total pension benefit was £128,000. The pension benefit for Mr. Arnold was based on an annual contribution rate of 20 per cent of his salary.

Grafton Group plc Annual Report 2014
64
Annual Report on Remuneration (continued)
Long Term Incentive Plan (LTIP)The Remuneration Committee has the authority to set appropriate criteria for each award. The Committee believes that the LTIP should align management and shareholder interests and assist the Group in the recruitment and retention of senior executives.
Awards Granted with a Performance Period Covering the Three Years to 31 December 2014The performance conditions for LTIP awards made in April 2012 were based on growth in earnings per share EPS (as defined in the scheme) and total shareholder return (TSR). Half of the awards to Executive Directors were based on relative TSR versus a peer group. The other half was based on the Group’s EPS for the financial year ended 31 December 2014.
The relative TSR performance over the three year period was notionally at the 83rd percentile i.e. in the upper quartile performance. The proportion of this part of the award that will vest is therefore 100 per cent as independently confirmed to the Remuneration Committee by New Bridge Street.
The other half of the awards were based on the Group’s EPS for the financial year ended 31 December 2014 being in the range of 22.57p to 28.21p (28.0 cents to 35.0 cents). The EPS for 2014 of 34.4p (42.67 cents) exceeded the upper limit of the range. As this performance condition was met, 100 per cent of this part of the award will vest. In aggregate 100 per cent of the 2012 LTIP awards will vest as both the EPS and TSR performance conditions were fully met. The number of Grafton Units granted to Mr. Slark on 18 April 2012 and due to vest in 2015 is 211,000. The value of this award is £1.32 million on the basis of the average price of a Grafton Unit of £6.26 over the three months to 31 December 2014.
LTIP Awards Granted During the Year Ended 31 December 2014The following award was made during the year ended 31 December 2014:
Number of Units
Share Price at Grant Date
Value of Award at Grant Date
Mr. G. Slark 134,181 £6.2025 £832,258Mr. D. Arnold 76,582 £6.2025 £475,000
Mr. Slark was granted an award on 16 April 2014 valued at 150 per cent of his base salary in the form of nil cost Grafton Units. Mr. Arnold was granted an award on 16 April 2014 valued at 125 per cent of his base salary in the form of nil cost Grafton Units.
The 2014 award to Mr. Slark and Mr. Arnold will be subject to the achievement performance conditions. Half of these awards will vest depending on the company’s TSR performance over a three-year period commencing on 1 January 2014, with no opportunity to re-test. TSR will be compared to a peer group of 18 companies. Notwithstanding the achievement of the TSR performance condition, no shares will vest unless the Committee considers that the overall financial results have been satisfactory in the circumstances over the performance period.
Where the Company’s TSR performance equals the median TSR performance of the peer group, then 25 per cent of the shares which are subject to the TSR Performance Condition shall vest. 100 per cent of the shares which are subject to the TSR Performance Condition shall vest if the Company’s TSR performance is equal to or greater than the 75th percentile in the peer group. For TSR performance between the 50th and the 75th percentiles, between 25 per cent and 100 per cent of the shares which are subject to the TSR Performance Condition shall vest on a straight-line basis based on the Company’s notional ranking compared against the Comparator Group.
Under the EPS Performance Condition for the other half of awards granted on 16 April 2014, the Company’s EPS for the financial year ending 31 December 2016 must be equal to 38 pence per share if the award is to vest. If this target is achieved, then 25 per cent of the shares which are subject to the EPS Performance Condition shall vest. Where the Company’s EPS for the financial year ending 31 December 2016 is equal to or greater than 45 pence per share, then 100 per cent of the shares which are subject to the EPS Performance Condition shall vest. Where the Company’s EPS for the financial year ending 31 December 2016 is between the thresholds of 38 pence and 45 pence per share, then between 25 per cent and 100 per cent of the shares which are subject to the EPS Performance Condition shall vest on a straight-line basis.
Claw back provisions will apply.
Report of the Remuneration Committee on Directors’ Remuneration (continued)

Business & Strategy Review Corporate Governance Financial Statements Shareholder Information
Grafton Group plc Annual Report 2014
65
LTIP Awards that Vested During the Year Ended 31 December 2014The performance conditions for LTIP awards made in May 2011 were based on growth in EPS (as defined in the scheme) and TSR. Half of the awards to Executive Directors were based on relative TSR versus a peer group. The other half was based on the Group’s EPS for the financial year ended 31 December 2013.
The relative TSR performance over the three year period was at the 68th percentile i.e. between the median and upper quartile performance. The proportion of this part of the award that vested in May 2014 was 90.67 per cent.
The other half of the awards were based on the Group’s EPS for the financial year ended 31 December 2013 being in the range of 37 cent to 45 cent (31.4 pence to 38.2 pence). The EPS for 2013 of 26.3 cent (22.3 pence) did not fall within this range and as the performance condition was not met the awards did not vest and lapsed.
In aggregate 45.33 per cent of the 2011 LTIP awards vested. Mr. Slark received 83,416 Grafton Units under the 2011 LTIP valued at £520,000 on the basis of the average price of a Grafton Unit of £6.23 for the three months to 31 December 2013.
Non-Executive Directors RemunerationNon-Executive Directors receive fees for their roles and are precluded from participating in performance related share or other incentive schemes.
Additional InformationPayments and Shares Vesting to Former Directors An amount of £403,000 was paid/payable to Mr. Ó Nualláin for the provision of consultancy services to the Group during the year. As noted at the time of the announcement of his retirement in September 2013, Mr. Ó Nualláin agreed to be available to provide consultancy services to the Group for a period following his retirement. This arrangement has now concluded and no further amounts are payable to Mr. Ó Nualláin. In addition, 36,268 Grafton Units vested to Mr. Ó Nualláin in May 2014. This represented 90.67 per cent of the LTIP award over 40,000 Grafton Units granted to Mr. Ó Nualláin in May 2011 in his capacity as Finance Director. This award was subject to the TSR performance condition described above. The number of Grafton units granted to Mr. Ó Nualláin on 18 April 2012 and due to vest in 2015 is 54,891. The original LTIP award of 80,000 was pro-rated by reference to Mr. Ó Nualláin’s period of employment with the Group.
A payment of £57,000 was made to Mr. Leo Martin for the provision of consultancy services to the Group during the year.
Application of Remuneration Policy in 2015SalariesThe salaries of Executive Directors were reviewed in January 2015. When conducting this review, the Committee considered a range of factors including the performance of the Group, market conditions, the prevailing market rates for similar positions in comparable companies, the responsibilities, performance and experience of each executive Director, the level of salary increases across the Group and the balance between the fixed and variable elements of the overall remuneration packages. No basic salary increases have been awarded to the Chief Executive Officer since his appointment to the position in April 2011. The Committee agreed to award a salary increase of 2.5 per cent to £568,711. The Chief Financial Officer’s salary was also increased by 2.5 per cent to £389,500. The new salary arrangements were effective from 1 January 2015.
Chairman and Non-Executive Directors’ FeesFees are payable in euro and will remain unchanged in euro from the 2014 levels being the euro equivalent of £121,000 for the Chairman and £56,000 for Non-Executive Directors.
Pension and BenefitsMr. Slark and Mr. Arnold will receive pension contributions/salary supplements in lieu of pension of £128,040 and 20 per cent of salary respectively which is consistent with the arrangements in place for 2014.
Annual BonusThe maximum potential performance related bonus pay award for the Chief Executive Officer for 2015 is 120 per cent of basic salary and the maximum bonus opportunity for 2015 for Mr. Arnold is 100 per cent of salary. These limits also applied in respect of 2014.

Grafton Group plc Annual Report 2014
66
Annual Report on Remuneration (continued)
The financial targets for 2015 are return on capital employed, free cash flow and adjusted earnings per share for the year. The targets were set out by reference to the Group’s budget for 2015. The fourth component is a set of different personal objectives for Mr. Slark and Mr. Arnold. An equal weighting applies for each component. The maximum bonus opportunity for Mr. Slark is 30 per cent of gross pay for each component and 25 per cent of gross pay for Mr. Arnold. For financial measures, a sliding scale is set by the Committee. No bonus is payable if performance is below a minimum threshold. The bonus payable increases on a straight line basis thereafter with full bonus payable for achieving the upper point on the scale. The financial targets and personal objectives are deemed to be commercially sensitive and have not been disclosed.
The annual bonus is payable in cash subject to part investment in shares in accordance with the Group’s share ownership guidelines as set out in the Policy Table.
Clawback provisions will operate as set out in the Policy Report.
Long-term IncentivesThe maximum current annual award limit under the LTIP is 150 per cent of salary and it is intended that awards will be granted in 2015 at 150 per cent of salary to Mr. Slark and 125 per cent of salary to Mr. Arnold. The remuneration policy adopted in 2014 set a limit of 100 per cent of basic salary on awards made to the Chief Financial Officer and other Executive Directors (other than the CEO) except for the first year of employment when a limit of 125 per cent applied. The Committee reconsidered this matter and, having taken account of performance, agreed that the limit of 125 per cent of basic salary on the total value of awards that may be granted under long term incentives should be capable of applying in any year and not limited to the first year of employment. The revised award level is within the LTIP’s overall individual limit of 150 per cent of salary. While benchmarking data has not been the primary reason for the proposed increase, the Committee, having taken advice from New Bridge Street, is satisfied that a 125 per cent salary LTIP limit will be more in line with typical award levels made by FTSE 250 companies of comparable scale.
Clawback provisions will operate as set out in the Policy Report.
Consistent with the conditions applying to the 2014 awards, half of the 2015 awards will be subject to a relative TSR measure against a bespoke peer group of UK and Irish companies. The companies will be selected on the basis that their activities are similar to Grafton or that they operate in sectors that are related to the Group’s activities. The other half will be subject to EPS growth targets within a range which will be determined by the Committee following the announcement of full year results for 2014. The Committee will set EPS targets in respect of this award that are sufficiently challenging following a review of brokers forecasts including any updated forecasts following the release of full year results for 2014, internal forecasts and other relevant information. The performance period for both tranches will cover the three financial years 1 January 2015 to 31 December 2017.
• TSR – No part of this award vests if performance is below median, 25% vests for achieving median, with 100 per cent vesting for upper quartile performance with straight line vesting in between. Notwithstanding the achievement of the TSR performance condition, no shares will vest unless the Committee considers that overall financial results have been satisfactory in the circumstances over the performance period.
• EPS – The extent to which the proposed award vests will depend on the EPS outcome in 2017. The performance condition will be between two thresholds. No part of this award will vest if adjusted EPS is less than the lower threshold, 25 per cent will vest at the lower threshold, with full vesting if the higher threshold or better is achieved. Vesting will be on a straight line basis between both thresholds.
Loss of Office Payments No loss of office payments were made during the year.
Report of the Remuneration Committee on Directors’ Remuneration (continued)

Business & Strategy Review Corporate Governance Financial Statements Shareholder Information
Grafton Group plc Annual Report 2014
67
Relative Importance of Spend on PayThe following table sets out the percentage change in dividends and overall spend on employee pay in the 2014 financial year compared with the prior year.
2014 £’000
2013 £’000
Percentage change
Dividends 24,999 19,643 +27.3%Employee remuneration costs 295,795 268,633 +10.1%
Percentage Change in CEO Pay 2014
£’0002013
£’000Percentage
change
Chief Executive Officer
- Salary 555 555 -
- Benefits 48 48 -- Bonus 650 273 +138.1%
Average employee - Salary, Benefits and Bonus (£) 26,657 25,962 +2.7%
The table above shows the percentage year-on-year change in the value of salary, benefits and annual bonus for the Chief Executive Officer between the current and previous year compared to that of the average employee.
Performance Graph and Single Figure TableTotal Shareholder Return
Source: Datastream (Thompson Reuters)
This graph compares the TSR performance of Grafton Group plc, assuming dividends are re-invested, with the TSR performance of the FTSE 250 over the period 31 December 2008 to 31 December 2014.
The table below shows the total remuneration figure for the CEO position over the five years to 2014.
2010 2011 2012 2013 2014
CEO single total figure of remuneration (£’000) 570 1,151 1,001 1,524 2,702Annual bonus payout relative to maximum 0% 16% 49% 49% 98%LTIP vesting N/A N/A N/A 45% 100%
0
50
100
150
200
250
300
350
Dec 08
Grafton Group
Dec 09 Dec 10 Dec 11 Dec 12 Dec 13 Dec 14Tota
l Sha
reho
lder
Ret
urn
(Reb
ased
)
FTSE 250 Index

Grafton Group plc Annual Report 2014
68
Annual Report on Remuneration (continued)
Statement of Shareholder Voting at the AGM At the 2014 AGM, the Directors’ Remuneration Report received the following votes from shareholders:
Total Number of Votes % of Votes Cast
For 173,006,113 99.90Against 172,114 0.10Total 173,178,227 100.00
The number of votes withheld was 1,348,978. A vote withheld is not a vote under Irish law and is not counted in the calculation of the percentage votes for and against a resolution.
Directors’ and Secretary’s InterestsThe beneficial interests of the Directors in the share capital of the Company were as follows:
Director31 December 2014
Grafton Units*31 December 2013
Grafton Units*
M. Chadwick 19,436,079 19,436,079G. Slark 88,716 47,000D. Arnold 8,000 4,000R. Ryan 35,000 25,000C. M. Fisher 30,000 20,000A. Flynn 11,700 11,700F. van Zanten 3,000 N/A
* At 31 December 2014 and at 31 December 2013, a Grafton Unit comprised one ordinary share of 5 cents each and seventeen ‘A’ ordinary shares of 0.001 cent each in Grafton Group plc and one ‘C’ ordinary share of Stg0.0001p in Grafton Group (UK) plc.
On 31 December 2014 Mr. M. Chadwick held a non-beneficial interest in 2,490,330 (31 December 2013: 2,490,330) Grafton Units in his capacity as an executor of an estate.
Mr. C. Rinn, Secretary, had a beneficial interest in 321,530 Grafton Units at 31 December 2014 (31 December 2013: 303,396).
There have been no changes in the interests of the Directors between 31 December 2014 and the date of this report.
To further align the interests of senior management with those of shareholders, Executive Directors are subject to share ownership guidelines. Executive Directors are required to accumulate a holding of ordinary shares in the Company to a minimum value of 100 per cent of their salary. Directors are required to apply 30 per cent of their annual bonus after statutory deductions for the purchase of shares in the Group until this share ownership requirement is fulfilled.
Directors’ and Secretary’s Interests under the Grafton Group Share SchemesThe interests of the Directors and the Secretary to acquire Grafton Units in accordance with the Grafton Group Share Schemes are shown below:
Mr. C. Rinn had an interest to acquire 316,500 (31 December 2013: 396,500) Grafton Units at 31 December 2014 at prices ranging between €1.66 and €11.50 subject to the rules of the 1999 Grafton Group Share Scheme.
The closing price of a Grafton Unit on 31 December 2014 was 638p (31 December 2013: 647p) and the price range during the year was between 538p and 679.5p (2013: 320p and 655p).
Under the terms of the 1999 Grafton Group Share Scheme, shares were subject to the performance conditions set out below:
Basic shares which cannot be converted before the expiration of five years, unless the Remuneration Committee agrees to a shorter period which shall not be less than three years, and may be converted any time after that to the end of their contractual life provided the Company’s earnings per share has grown at not less than the rate of growth in the Consumer Price Index plus 5 per cent compounded during that period. Basic shares granted after 8 May 2008 cannot be converted before the expiration of three years.
Report of the Remuneration Committee on Directors’ Remuneration (continued)

Business & Strategy Review Corporate Governance Financial Statements Shareholder Information
Grafton Group plc Annual Report 2014
69
Second tier shares which cannot be converted before the expiration of five years and at any time thereafter up to the end of their contractual life, only if over a period of at least five years, the growth in the Group’s earnings per share would place it in the top 25 per cent of the companies listed on the Irish Stock Exchange Index over the same period and also provided that such shares shall be acquired only if the Company’s earnings per share growth over the relevant period is greater, by not less than 10 per cent on an annualised basis, than the increase in the Consumer Price Index over that period.
The share scheme had a ten year life for the award of entitlements. This period expired in 2009 and was replaced in 2011 by the Long Term Incentive Plan (LTIP).
There has not been any contract or arrangement with the Company or any subsidiary undertaking during the year in which an Officer of the Company was materially interested and which was significant in relation to the Company’s business except for remuneration arrangements.
Directors’ and Secretary’s Interests under the 2011 Long Term Incentive Plan (LTIP)The grant of awards over Grafton Units to the Directors and Secretary under the LTIP are shown below:
Number of Units
Grant Date1 January
2014 Granted LapsedTSR Shares
Received 31 Dec 2014 EPS ConditionTSR
Condition Vesting Date*
G. Slark 25 May 2011 184,000 - (100,584) (83,416) - - - 25 May 2014
18 April 2012 211,000 - - - 211,000 105,500 105,500 18 April 2015
16 April 2013 196,792 - - - 196,792 98,396 98,396 16 April 2016
16 April 2014 - 134,181 - - 134,181 67,091 67,090 16 April 2017
591,792 134,181 (100,584) (83,416) 541,973 270,987 270,986
D. Arnold 16 April 2014 - 76,582 - - 76,582 38,291 38,291 16 April 2017
C. Rinn 25 May 2011 40,000 - (21,866) (18,134) - - - 25 May 2014
18 April 2012 50,000 - - - 50,000 25,000 25,000 18 April 2015
16 April 2013 33,000 - - - 33,000 16,500 16,500 16 April 2016
16 April 2014 - 21,616 - - 21,616 10,808 10,808 16 April 2017
123,000 21,616 (21,866) (18,134) 104,616 52,308 52,308
* This is the earliest date for vesting. The actual date is subject to approval by the Remuneration Committee.
The Group’s long-term incentive share scheme expired in April 2009. Consequently, no long-term incentive awards were made during 2010. Shareholder approval was granted at the 2011 Annual General Meeting (AGM) held on 4 May 2011 for the introduction of a new Long-Term Incentive Plan (LTIP) and the first awards under the plan were made on 25 May 2011. Subsequent awards under the LTIP were made on 18 April 2012, 16 April 2013 and 16 April 2014.
In the case of awards that were issued in 2011, 2012, 2013 and 2014 to the Company’s Executive Directors and the Secretary, the Performance Conditions are dependent on the growth in the Company’s EPS (earnings per share) and the Company’s TSR (total shareholder return) performance (the “EPS Performance Condition” and the “TSR Performance Condition”, respectively). The vesting of 50 per cent of the share awards granted to the Company’s Executive Directors and Secretary are subject to the EPS Performance Condition and the remaining 50 per cent are subject to the TSR Performance Condition. EPS is the adjusted earnings per share figure shown in the Company’s Annual Report. TSR represents the change in share price of a listed/quoted company over a period, plus dividends, expressed as a plus or minus percentage of the opening value. For this reason, both EPS and TSR are recognised as good measures of shareholder returns on the value of their investment in the Group when account is taken of the Group’s share price, dividends paid and the Group’s performance.
On behalf of the Board
C.M. Fisher,Chairman of the Remuneration Committee9 March 2015

Grafton Group plc Annual Report 2014
70
The directors are responsible for preparing the Annual Report and the Group and Parent Company Financial Statements, in accordance with applicable law and regulations.
Company law in the Republic of Ireland requires the directors to prepare Group and Parent Company Financial statements each year. Under that law, the directors are required to prepare the Group Financial Statements in accordance with International Financial Reporting Standards (IFRSs) as adopted by the European Union (EU) and have elected to prepare the Company Financial Statements in accordance with IFRSs as adopted by the European Union, and as applied in accordance with the Companies Acts, 1963 to 2013.
Under company law the Directors must not approve the financial statements unless they are satisfied that they give a true and fair view of the state of affairs of the Group and Parent Company and of their profit and loss for that period.
In preparing each of the Group and Parent Company Financial Statements, the Directors are required to:
• Select suitable accounting policies and then apply them consistently;
• Make judgements and estimates that are reasonable and prudent;
• State that the Group Financial Statements comply with IFRS as adopted by the European Union as applied in accordance with the Companies Acts, 1963 to 2013; and
• Prepare the financial statements on the going concern basis unless it is inappropriate to presume that the Group and the Parent Company will continue in business.
The Directors are also required by the Transparency (Directive 2004/109/EC) Regulations 2007 and the Interim Transparency Rules of the Irish Financial Services Regulatory Authority to include a management report containing a fair review of the business and a description of the principal risks and uncertainties facing the Group.
The Directors are responsible for keeping proper books of account which disclose with reasonable accuracy at any time the financial position of the Company, and which enable them to ensure that the Financial Statements of the Group are prepared in accordance with applicable IFRS as adopted by the European Union and comply with the provisions of the Companies Acts, 1963 to 2013, and as regards to the Group Financial Statements Article 4 of IAS Regulation. They are also responsible for safeguarding the assets of the Company and the Group, and hence for taking reasonable steps for the prevention and detection of fraud and other irregularities.
The Directors are responsible for the maintenance and integrity of the website (www.graftonplc.com). Legislation in Ireland concerning the preparation and dissemination of financial statements may differ from legislation in other jurisdictions.
Responsibility Statement as required by the Transparency Directive and the 2012 UK Corporate Governance CodeEach of the directors, whose names and functions are listed on pages 10 to 11 of this Annual Report, confirm that, to the best of each person’s knowledge and belief:
• The Group Financial Statements, prepared in accordance with IFRSs as adopted by the European Union and the Parent Company Financial Statements prepared in accordance with IFRSs as adopted by the European Union, give a true and fair view of the assets, liabilities, financial position of the Group and Parent Company at 31 December 2014 and of the profit of the Group and the profit of the Parent Company for the year then ended;
• The Report of the Directors contained in the Annual Report includes a fair review of the development and performance of the business and the position of the Group and Parent Company and that a fair description of the principal risks and uncertainties faced by the Group and Parent Company is provided on pages 48 to 50; and
• The Annual Report and financial statements, taken as a whole, provides the information necessary to assess the Group’s performance, business model and strategy and is fair, balanced and understandable.
On behalf of the Board
G. Slark D. Arnold
Statement of Directors’ Responsibilities

Financial Statements
Independent Auditor’s Report 72Group Income Statement 77Group Statement of Comprehensive Income 78Group Balance Sheet 79Group Cash Flow Statement 80Group Statement of Changes in Equity 81Accounting Policies 83Notes to the Group Financial Statements 93Company Balance Sheet 150Company Cash Flow Statement 151Company Statement of Changes in Equity 152Notes to the Company Financial Statements 153
Business & Strategy Review Corporate Governance Financial Statements Shareholder Information
Grafton Group plc Annual Report 2014
71

Grafton Group plc Annual Report 2014
72
Independent Auditor’s Reportto the Members of Grafton Group plc
Opinions and conclusions arising from our auditOur opinion on the financial statements is unmodifiedWe have audited the financial statements of Grafton Group plc for the year ended 31 December 2014 as set out on pages 77 to 162, which comprise the Group Income Statement, the Group Statement of Comprehensive Income, the Group and Company Balance Sheets, the Group and Company Cashflow Statements, the Group and Company Statements of Changes in Equity, the Group and Company accounting policies and the related notes. Our audit was conducted in accordance with International Standards on Auditing (ISAs) (UK and Ireland).
In our opinion:
• the Group financial statements give a true and fair view, in accordance with International Financial Reporting Standards (IFRSs) as adopted by the EU, of the state of the Group’s affairs as at 31 December 2014 and of its profit for the year then ended;
• the Company balance sheet gives a true and fair view, in accordance with IFRSs as adopted by the EU as applied in accordance with the provisions of the Companies Acts 1963 to 2013, of the state of the company’s affairs as at 31 December 2014; and
• the financial statements have been properly prepared in accordance with the Companies Acts 1963 to 2013 and, as regards the Group financial statements, Article 4 of the IAS Regulation.
Our assessment of risks of material misstatementThe risks of material misstatement detailed in this section of this report are those risks that we have deemed, in our professional judgement, to have had the greatest effect on: the overall audit strategy; the allocation of resources in our audit; and directing the efforts of the engagement team. Our audit procedures relating to these risks were designed in the context of our audit of the financial statements as a whole. Our opinion on the financial statements is not modified with respect to any of these risks, and we do not express an opinion on these individual risks.
In arriving at our audit opinion above on the Group financial statements, the risks of material misstatement that had the greatest effect on our Group audit were as follows:
Valuation of inventory – 31 December 2014: £249.9 million (31 December 2013: £246.2 million)Refer to page 44 (Audit and Risk Committee Report), page 89 (accounting policy) and page 113 (financial disclosures).
The riskThe Group has a significant investment in inventory at 31 December 2014. There is judgement involved in assessing the level of inventory provision required in respect of slow moving inventory, therefore there is a risk that slow moving inventory has not been adequately provided for.
Our responseIn this area, our audit procedures included, amongst others, Computer Assisted Audit Techniques to analyse the level of stock turns in key business units by reference to historical sales data and comparing that analysis with provisions made by the Group in respect of slow moving inventory at 31 December 2014. We also tested the accuracy of the ageing of inventory based on system generated reports when available and when we had confirmed through other audit procedures that these reports were reliable.

Business & Strategy Review Corporate Governance Financial Statements Shareholder Information
Grafton Group plc Annual Report 2014
73
Valuation of goodwill – 31 December 2014: £480.2 million (31 December 2013: £481.0 million)Refer to page 44 (Audit and Risk Committee Report), page 86 (accounting policy) and pages 105 to 106 (financial disclosures).
The riskThere is a risk that the carrying value of the Group’s goodwill balance may not be recovered from future cash flows. As detailed in the summary of significant accounting policies on page 86, an impairment review of goodwill is performed annually by the Group. In the current year, this review has indicated that an impairment of goodwill is not required. There is inherent uncertainty involved in preparing forecasts and discounted future cash flow projections for this purpose and significant judgement is involved in relation to the assumptions used in the Group’s goodwill impairment model as set out in the goodwill note on pages 105 to 106.
Our responseIn this area, our audit procedures included, among others, interrogating the Group’s goodwill impairment model, evaluating the assumptions and methodologies used by the Group, in particular those relating to revenue growth, gross profit margins, overhead growth, the discount rate and the terminal growth rate applied to the forecasted cash flows in the model. We compared the Group’s assumptions to externally derived data as well as our own assessment in relation to key inputs into the model. We examined the sensitivity analysis performed by Group Finance management and performed our own sensitivity analysis around the key assumptions. We also assessed whether the disclosures in note 11 presented the Group’s assumptions in relation to goodwill impairment and the sensitivities of the outcome of the impairment assessment appropriately reflected the risks inherent in the valuation of goodwill. We compared the market capitalisation of the Group and the book value of the Group’s net assets which indicated that the market capitalisation exceeded the book value by £582m at 31 December 2014.
Completeness and accuracy of rebate income and valuation of rebate receivables Refer to page 44 (Audit and Risk Committee Report) and page 149 (financial disclosures).
The riskRebates are received from suppliers and included in operating costs as a significant adjustment to the price paid for goods purchased by the Group. The nature of the arrangements in place means that a large proportion of the rebates earned during the year by the Group are not received until after the year end. As the calculation of rebate income in the year and the rebate receivable at year end involves the use of assumptions and estimates and is based on complex rebate arrangements, there is a risk that operating costs and the rebate receivable balance at year end may be misstated.
Our responseOur audit procedures included, among others, examining management’s rebate income and rebate receivable calculations, recalculating the rebate income and rebate receivable on a sample basis by reference to purchase reports and supplier rebate agreements. Our procedures also included assessing the reasonableness of any assumptions and estimates made by management in the calculation of rebate income and rebate receivables. In addition, we obtained third party confirmations of rebate income and rebate receivable for key suppliers in certain business units. We tested, on a sample basis, the receipt of cash or rebate credit notes from suppliers during the year and post year end.
We also inspected the work performed by Internal Audit in relation to rebate income and receivable balances at year end.

Grafton Group plc Annual Report 2014
74
Independent Auditor’s Reportto the Members of Grafton Group plc (continued)
Valuation of investment properties - 31 December 2014: £20.5 million (31 December 2013: £19.9 million) and properties held for sale – 31 December 2014: £9.6 million (31 December 2013: £11.4 million)Refer to page 44 (Audit and Risk Committee Report), page 88 (accounting policy) and pages 108 to 112 (financial disclosures).
The riskThe Group has a number of vacant properties where there is a risk that the carrying value may be higher than their market value due to the lack of demand for such properties and lack of liquidity in the commercial property market, particularly in Ireland. The fair value of the Group’s vacant properties is largely determined based on internal valuations performed by the Group’s Property Team.
Our responseOur audit procedures in this area included, among others, an assessment of the Group’s strategy in relation to vacant properties and the Group’s process for the valuation of such properties. We discussed and challenged the valuation process, significant assumptions and critical judgements with the Group Property Team. We also benchmarked the key assumptions made by the Group in relation to commercial property valuations and rental yields to external market data, when available. We performed audit procedures to assess the integrity and reliability of information provided to us by the Group in relation to rental income, comparable property transactions and offers from third parties.
We also considered the adequacy of the fair value disclosures relating to the Group’s investment properties and properties held for sale carried at fair value in note 12.
Our application of materiality and an overview of the scope of our auditThe materiality for the Group financial statements as a whole was set at £5 million (2013: £3.0 million). This has been calculated using a benchmark of Group profit before taxation, which we considered to be one of the principal considerations for members of the Company in assessing the financial performance of the Group.
We report to the Audit Committee all corrected and uncorrected misstatements we identified through our audit in excess of £150,000, in addition to other audit misstatements below that threshold that we believe warranted reporting on qualitative grounds.
The components within the scope of our work accounted for the following percentages of the Group’s results: 99.6% of Group revenue, 99.2% of Group profit before tax and 99.9% of total Group assets (year ended 31 December 2013: 99.9% of Group revenue, 99.8% of Group profit before tax and 99.8% of total Group assets).
The Group audit team instructed component auditors as to the significant areas to be covered, including the relevant risks detailed above and the information to be reported to the Group audit team. The Group audit team approved the component materialities, which ranged from £164,000 to £4.2 million, having regard to the mix of size and risk profile of the Group across the components. With the exception of four components, all of the audit work was performed by KPMG Ireland.
Video and telephone conference meetings were held with these component auditors in order to assess the audit risk and strategy and work undertaken. In addition, a member of the Group audit team attended each component audit closing meeting. At these meetings, the findings reported to the Group audit team were discussed in more detail, and any further work required by the Group audit team was then performed by the component auditor.

Business & Strategy Review Corporate Governance Financial Statements Shareholder Information
Grafton Group plc Annual Report 2014
75
We have nothing to report in respect of matters on which we are required to report by exception ISAs (UK and Ireland) require that we report to you if, based on the knowledge we acquired during our audit, we have identified information in the Annual Report that contains a material inconsistency with either that knowledge or the financial statements, a material misstatement of fact, or that is otherwise misleading.
In particular, we are required to report to you if:
• we have identified any inconsistencies between the knowledge we acquired during our audit and the directors’ statement that they consider the Annual Report is fair, balanced and understandable and provides information necessary for shareholders to assess the entity’s performance, business model and strategy; or
• the Audit and Risk Committee Report does not appropriately disclose those matters that we communicated to the Audit Committee.
The Listing Rules of the UK Listing Authority require us to review:
• the Directors’ Statement, set out on page 42, in relation to going concern;
• the part of the Directors’ Report on Corporate Governance on page 38 relating to the company’s compliance with the ten provisions of the UK Corporate Governance Code specified for our review; and
• certain elements of disclosures in the report to shareholders by the Board of directors’ remuneration committee.
In addition, the Companies Acts require us to report to you if, in our opinion, the disclosures of directors’ remuneration and transactions specified by law are not made.
Our conclusions on other matters on which we are required to report by the Companies Acts 1963 to 2013 are set out belowWe have obtained all the information and explanations which we consider necessary for the purposes of our audit.
The Company balance sheet is in agreement with the books of account and, in our opinion, proper books of account have been kept by the Company.
In our opinion the information given in the Directors’ Report is consistent with the financial statements and the description in the Audit and Risk Committee Report of the main features of the internal control and risk management systems in relation to the process for preparing the Group financial statements is consistent with the Group financial statements.
The net assets of the Company, as stated in the Company balance sheet, are more than half of the amount of its called-up share capital and, in our opinion, on that basis there did not exist at 31 December 2014 a financial situation which, under Section 40 (1) of the Companies (Amendment) Act, 1983, would require the convening of an extraordinary general meeting of the Company.

Grafton Group plc Annual Report 2014
76
Independent Auditor’s Reportto the Members of Grafton Group plc (continued)
Basis of our report, responsibilities and restrictions on useAs explained more fully in the Statement of Directors’ Responsibilities set out on page 70, the Directors are responsible for the preparation of the financial statements and for being satisfied that they give a true and fair view. Our responsibility is to audit and express an opinion on the Group and Company financial statements in accordance with applicable law and International Standards on Auditing (ISAs) (UK and Ireland). Those standards require us to comply with the Financial Reporting Council’s Ethical Standards for Auditors.
An audit undertaken in accordance with ISAs (UK and Ireland) involves obtaining evidence about the amounts and disclosures in the financial statements sufficient to give reasonable assurance that the financial statements are free from material misstatement, whether caused by fraud or error. This includes an assessment of: whether the accounting policies are appropriate to the Group’s circumstances and have been consistently applied and adequately disclosed; the reasonableness of significant accounting estimates made by the Directors; and the overall presentation of the financial statements.
In addition, we read all the financial and non-financial information in the Annual Report to identify material inconsistencies with the audited financial statements and to identify any information that is apparently materially incorrect based on, or materially inconsistent with, the knowledge acquired by us in the course of performing the audit. If we become aware of any apparent material misstatements or inconsistencies we consider the implications for our report.
Whilst an audit conducted in accordance with ISAs (UK and Ireland) is designed to provide reasonable assurance of identifying material misstatements or omissions it is not guaranteed to do so. Rather the auditor plans the audit to determine the extent of testing needed to reduce to an appropriately low level the probability that the aggregate of uncorrected and undetected misstatements does not exceed materiality for the financial statements as a whole. This testing requires us to conduct significant audit work on a broad range of assets, liabilities, income and expense as well as devoting significant time of the most experienced members of the audit team, in particular the engagement partner responsible for the audit, to subjective areas of the accounting and reporting.
Our report is made solely to the Company’s members, as a body, in accordance with section 193 of the Companies Act 1990. Our audit work has been undertaken so that we might state to the Company’s members those matters we are required to state to them in an auditor’s report and for no other purpose. To the fullest extent permitted by law, we do not accept or assume responsibility to anyone other than the Company and the Company’s members as a body, for our audit work, for this report, or for the opinions we have formed.
Cliona Mullen, for and on behalf of
Chartered Accountants, Statutory Audit Firm1 Stokes PlaceSt. Stephen’s GreenDublin 2Ireland
9 March 2015

Business & Strategy Review Corporate Governance Financial Statements Shareholder Information
Grafton Group plc Annual Report 2014
77
Group Income StatementFor the year ended 31 December 2014
2014 2013
Notes £’000 £’000
Revenue 1 2,081,686 1,899,768
Operating costs 2 (1,971,581) (1,849,717)Operating income 2 - 29,964
Operating profit 110,105 80,015
Finance expense 6 (9,857) (13,660)Finance income 6 997 1,366
Profit before tax 101,245 67,721Income tax charge 8 (21,223) (5,622)
Profit after tax for the financial year 80,022 62,099
Profit attributable to:
Owners of the Company 80,046 62,179
Non-controlling interests (24) (80)
Profit after tax for the financial year 80,022 62,099
Earnings per ordinary share - basic 10 34.42p 26.79p
Earnings per ordinary share - diluted 10 33.99p 26.67p
On behalf of the Board
G. SlarkD. ArnoldDirectors
9 March 2015

Grafton Group plc Annual Report 2014
78
Group Statement of Comprehensive IncomeFor the year ended 31 December 2014
2014 2013
Notes £’000 £’000
Profit after tax for the financial year 80,022 62,099
Other comprehensive income
Items that may be reclassified subsequently to the income statement
Currency translation effects:
- on foreign currency net investments (6,707) 1,176
- on foreign currency borrowings designated as net investment hedges (1,634) 908
Fair value movement on cash flow hedges:
- Effective portion of changes in fair value of cash flow hedges (241) (66)
- Net change in fair value of cash flow hedges transferred from equity 109 577Deferred tax on cash flow hedges 25 (2) (63)
(8,475) 2,532
Items that will not be reclassified to the income statementRemeasurement (loss)/gain on Group defined benefit pension schemes 31 (28,054) 7,442Deferred tax on Group defined benefit pension schemes 25 4,728 (1,032)
(23,326) 6,410
Total other comprehensive income (31,801) 8,942
Total comprehensive income for the financial year 48,221 71,041
Total comprehensive income attributable to:
Owners of the Company 48,245 71,121
Non-controlling interests (24) (80)
Total comprehensive income for the financial year 48,221 71,041
On behalf of the Board
G. SlarkD. ArnoldDirectors
9 March 2015

Business & Strategy Review Corporate Governance Financial Statements Shareholder Information
Grafton Group plc Annual Report 2014
79
Group Balance SheetAs at 31 December 2014
2014 2013ASSETS Notes £’000 £’000
Non-current assetsGoodwill 11 480,157 481,020Intangible assets 14 5,757 -Property, plant and equipment 12 423,411 413,401Investment properties 12 20,473 19,861Deferred tax assets 25 23,452 17,666Retirement benefit assets 31 125 718Derivative financial instruments 21 - 835Other financial assets 13 123 124Total non-current assets 953,498 933,625
Current assetsProperties held for sale 12 9,581 11,352Inventories 15 249,906 246,220Trade and other receivables 16 302,871 307,822Derivative financial instruments 21 1,095 835Cash and cash equivalents 19 182,360 151,099Total current assets 745,813 717,328Total assets 1,699,311 1,650,953
EQUITYEquity share capital 17 8,309 8,302Share premium account 17 206,597 206,554Capital redemption reserve 18 621 621Revaluation reserve 18 13,822 13,978Shares to be issued reserve 18 7,834 2,875Cash flow hedge reserve 18 (36) 98Foreign currency translation reserve 18 58,005 66,346Retained earnings 610,998 575,419Treasury shares held 17 (3,897) (3,897)Equity attributable to owners of the Company 902,253 870,296Non-controlling interests 18 4,027 4,051Total equity 906,280 874,347
LIABILITIESNon-current liabilitiesInterest-bearing loans and borrowings 19 244,305 272,610Provisions 22 20,855 22,663Retirement benefit obligations 31 33,085 7,840Derivative financial instruments 21 44 -Deferred tax liabilities 25 30,758 30,746Total non-current liabilities 329,047 333,859
Current liabilitiesInterest-bearing loans and borrowings 19 14,422 13,863Trade and other payables 23 425,696 410,011Current income tax liabilities 17,334 8,201Derivative financial instruments 21 - 33Provisions 22 6,532 10,639Total current liabilities 463,984 442,747Total liabilities 793,031 776,606Total equity and liabilities 1,699,311 1,650,953
On behalf of the Board
G. SlarkD. ArnoldDirectors
9 March 2015

Grafton Group plc Annual Report 2014
80
Group Cash Flow StatementFor the year ended 31 December 2014
Notes 2014 2013
£’000 £’000
Profit before taxation 101,245 67,721Finance income 6 (997) (1,366)Finance expense 6 9,857 13,660Operating profit 110,105 80,015
Depreciation 12 32,392 31,463Amortisation of intangible assets 14 124 -Share-based payments charge 3,679 1,396Non-cash movement in operating provisions 22 2,670 1,717Claims paid on insurance and other provisions 22 (6,774) (4,875)Non-cash movement on asset impairment/revaluation 12 246 27,160Profit on sale of property, plant and equipment (2,345) (718)Non-cash decrease in pension liabilities (net of pension provision) - (29,964)Contributions to pension schemes in excess of IAS 19 charge (1,862) (4,320)Decrease/(increase) in working capital 26 21,804 (6,607)Cash generated from operations 160,039 95,267Interest paid (8,963) (12,025)Income taxes paid (10,445) (6,321)Cash flows from operating activities 140,631 76,921
Investing activitiesInflowsProceeds from sale of property, plant and equipment 5,155 2,184Interest received 699 753Sale of financial assets 13 - 20
5,854 2,957Outflows Acquisition of subsidiary undertakings and businesses 27 (34,835) (4,032)Net cash acquired with subsidiary undertakings 27 1,728 -Deferred acquisition consideration paid 22 - (1,889)Investment in intangible assets – computer software 14 (5,881) -Purchase of property, plant and equipment 12 (40,974) (24,670)
(79,962) (30,591)Cash flows from investing activities (74,108) (27,634)
Financing activitiesInflowsProceeds from the issue of share capital 50 1,959Proceeds from borrowings 56,454 34,407
56,504 36,366Outflows Repayments of borrowings (57,316) (34,282)Dividends paid 9 (21,501) (17,684)Movement on finance lease liabilities (721) (570)Redemption of loan notes payable net of derivatives (11,408) (11,124)
(90,946) (63,660)Cash flows from financing activities (34,442) (27,294)
Net increase in cash and cash equivalents 32,081 21,993
Cash and cash equivalents at 1 January 151,099 128,027Effect of exchange rate fluctuations on cash held (820) 1,079
Cash and cash equivalents at 31 December 182,360 151,099
Cash and cash equivalents are broken down as follows:Cash at bank and short-term deposits 182,360 151,099

Business & Strategy Review Corporate Governance Financial Statements Shareholder Information
Grafton Group plc Annual Report 2014
81G
roup
Sta
tem
ent o
f Cha
nges
in E
quity
Equi
ty
shar
e ca
pita
l
Sha
re
prem
ium
ac
coun
t
Cap
ital
re
dem
ptio
n re
serv
eR
eval
uati
on
rese
rve
Shar
es t
o be
issu
ed
rese
rve
Cas
h fl
ow
hedg
e re
serv
e
Fore
ign
curr
ency
tr
ansl
atio
n re
serv
eR
etai
ned
earn
ings
Trea
sury
sh
ares
To
tal
Non
-co
ntro
lling
in
tere
sts
Tota
l eq
uity
£’0
00
£’0
00
£’0
00
£’0
00
£’
00
0£’
00
0£’
00
0£’
00
0£’
00
0£’
00
0£’
00
0£’
00
0
Year
to
31 D
ecem
ber
2014
At
1 Ja
nuar
y 20
148
,30
220
6,55
46
2113
,978
2,8
759
86
6,34
657
5,41
9(3
,897
)8
70,2
96
4,0
518
74,3
47Pr
ofit
aft
er ta
x fo
r the
fina
ncia
l yea
r -
- -
- -
- -
80,
046
-
80,
046
(2
4)
80,
022
To
tal o
ther
com
preh
ensi
ve
inco
me
Rem
easu
rem
ent g
ain
on p
ensi
ons
(net
of t
ax)
--
--
--
-(2
3,32
6)
-(2
3,32
6)
-(2
3,32
6)
Mov
emen
t in
cash
flow
hed
ge
rese
rve
(net
of t
ax)
--
--
-(1
34)
--
-(1
34)
-(1
34)
Cur
renc
y tr
ansl
atio
n ef
fect
on
fore
ign
curr
ency
net
inve
stm
ents
--
--
--
(6,7
07)
--
(6,7
07)
-(6
,707
)C
urre
ncy
tran
slat
ion
effe
ct o
n fo
reig
n cu
rren
cy b
orro
win
gs
desi
gnat
ed a
s ne
t inv
estm
ent
hedg
es-
--
--
-(1
,634
)-
-(1
,634
)-
(1,6
34)
Tota
l oth
er c
ompr
ehen
sive
in
com
e -
- -
--
(134
)(8
,341
) (2
3,32
6)
- (3
1,8
01)
-
(31,
80
1)
Tota
l com
preh
ensi
ve in
com
e-
--
--
(134
) (8
,341
) 56
,720
-
48,2
45
(24)
48
,221
Tr
ansa
ctio
ns w
ith
owne
rs o
f th
e C
ompa
ny r
ecog
nise
d di
rect
ly in
eq
uity
Div
iden
ds p
aid
(Not
e 9)
--
--
--
-(2
1,50
1)-
(21,
501)
-(2
1,50
1)Is
sue
of G
raft
on U
nits
(net
of i
ssue
ex
pens
es)
743
--
--
--
-50
-50
Shar
e ba
sed
paym
ents
cha
rge
--
--
3,6
79-
--
-3,
679
-3,
679
Def
erre
d ta
x on
sha
re b
ased
pa
ymen
ts-
--
-1,
484
--
--
1,48
4-
1,48
4Tr
ansf
er fr
om s
hare
s to
be
issu
ed
rese
rve
--
--
(20
4)-
-20
4-
--
-Tr
ansf
er fr
om re
valu
atio
n re
serv
e-
--
(156
)-
--
156
--
--
7
43
-(1
56)
4,9
59
--
(21,
141)
-
(16,
288
) -
(16,
288
) A
t 31
Dec
embe
r 20
148
,30
9
206,
597
621
13
,822
7,
834
(3
6)
58,0
05
610
,99
8
(3,8
97)
90
2,25
3 4
,027
9
06,
280

Grafton Group plc Annual Report 2014
82G
roup
Sta
tem
ent o
f Cha
nges
in E
quity
(con
tinu
ed)
Equi
ty s
hare
ca
pita
l
Shar
e pr
emiu
m
acco
unt
Cap
ital
re
dem
ptio
n re
serv
eRe
valu
atio
n re
serv
e
Shar
es to
be
issu
ed
rese
rve
Cas
h fl
ow
hedg
e re
serv
e
Fore
ign
curr
ency
tr
ansl
atio
n re
serv
eRe
tain
ed
earn
ings
Trea
sury
sh
ares
To
tal
Non
-co
ntro
lling
in
tere
sts
Tota
l eq
uity
£’00
0£’
000
£’00
0£’
000
£’00
0£’
000
£’00
0£’
000
£’00
0£’
000
£’00
0£’
000
Year
to
31 D
ecem
ber
2013
At
1 Ja
nuar
y 20
138,
283
204,
614
621
20,6
602,
072
(350
)64
,262
517,
239
(3,8
97)
813,
504
4,13
181
7,63
5
Prof
it a
fter
tax
for t
he fi
nanc
ial y
ear
--
--
--
-62
,179
-62
,179
(80)
62,0
99
Tota
l oth
er c
ompr
ehen
sive
in
com
eRe
mea
sure
men
t gai
n on
pen
sion
s (n
et o
f tax
)-
--
--
--
6,41
0-
6,41
0-
6,41
0
Mov
emen
t in
cash
flow
hed
ge
rese
rve
(net
of t
ax)
--
--
-44
8-
--
448
-44
8
Cur
renc
y tr
ansl
atio
n ef
fect
on
fore
ign
curr
ency
net
inve
stm
ents
--
--
--
1,176
--
1,176
-1,1
76
Cur
renc
y tr
ansl
atio
n ef
fect
on
fore
ign
curr
ency
bor
row
ings
de
sign
ated
as
net i
nves
tmen
t he
dges
--
--
--
908
--
908
-90
8To
tal o
ther
com
preh
ensi
ve
inco
me
--
--
-44
82,
084
6,41
0-
8,94
2-
8,94
2To
tal c
ompr
ehen
sive
inco
me
--
--
-44
82,
084
68,5
89-
71,12
1(8
0)71
,041
Tran
sact
ions
wit
h ow
ners
of
the
Com
pany
rec
ogni
sed
dire
ctly
in
equi
tyD
ivid
ends
pai
d (N
ote
9)-
--
--
--
(17,
684)
-(1
7,68
4)-
(17,
684)
Issu
e of
Gra
fton
Uni
ts (n
et o
f iss
ue
expe
nses
)19
1,94
0-
--
--
--
1,95
9-
1,95
9
Shar
e ba
sed
paym
ents
cha
rge
--
--
1,39
6-
--
-1,
396
-1,
396
Tran
sfer
from
sha
res
to b
e is
sued
re
serv
e-
--
-(5
93)
--
593
--
--
Tran
sfer
from
reva
luat
ion
rese
rve
--
-(6
,682
)-
--
6,68
2-
--
-
19
1,94
0-
(6,6
82)
803
--
(10,
409)
-(1
4,32
9)-
(14,
329)
At
31 D
ecem
ber
2013
8,30
220
6,55
462
113
,978
2,87
598
66,3
4657
5,41
9(3
,897
)87
0,29
64,
051
874,
347

Business & Strategy Review Corporate Governance Financial Statements Shareholder Information
Grafton Group plc Annual Report 2014
83
Accounting Policies
Equi
ty s
hare
ca
pita
l
Shar
e pr
emiu
m
acco
unt
Cap
ital
re
dem
ptio
n re
serv
eRe
valu
atio
n re
serv
e
Shar
es to
be
issu
ed
rese
rve
Cas
h fl
ow
hedg
e re
serv
e
Fore
ign
curr
ency
tr
ansl
atio
n re
serv
eRe
tain
ed
earn
ings
Trea
sury
sh
ares
To
tal
Non
-co
ntro
lling
in
tere
sts
Tota
l eq
uity
£’00
0£’
000
£’00
0£’
000
£’00
0£’
000
£’00
0£’
000
£’00
0£’
000
£’00
0£’
000
Year
to
31 D
ecem
ber
2013
At
1 Ja
nuar
y 20
138,
283
204,
614
621
20,6
602,
072
(350
)64
,262
517,
239
(3,8
97)
813,
504
4,13
181
7,63
5
Prof
it a
fter
tax
for t
he fi
nanc
ial y
ear
--
--
--
-62
,179
-62
,179
(80)
62,0
99
Tota
l oth
er c
ompr
ehen
sive
in
com
eRe
mea
sure
men
t gai
n on
pen
sion
s (n
et o
f tax
)-
--
--
--
6,41
0-
6,41
0-
6,41
0
Mov
emen
t in
cash
flow
hed
ge
rese
rve
(net
of t
ax)
--
--
-44
8-
--
448
-44
8
Cur
renc
y tr
ansl
atio
n ef
fect
on
fore
ign
curr
ency
net
inve
stm
ents
--
--
--
1,176
--
1,176
-1,1
76
Cur
renc
y tr
ansl
atio
n ef
fect
on
fore
ign
curr
ency
bor
row
ings
de
sign
ated
as
net i
nves
tmen
t he
dges
--
--
--
908
--
908
-90
8To
tal o
ther
com
preh
ensi
ve
inco
me
--
--
-44
82,
084
6,41
0-
8,94
2-
8,94
2To
tal c
ompr
ehen
sive
inco
me
--
--
-44
82,
084
68,5
89-
71,12
1(8
0)71
,041
Tran
sact
ions
wit
h ow
ners
of
the
Com
pany
rec
ogni
sed
dire
ctly
in
equi
tyD
ivid
ends
pai
d (N
ote
9)-
--
--
--
(17,
684)
-(1
7,68
4)-
(17,
684)
Issu
e of
Gra
fton
Uni
ts (n
et o
f iss
ue
expe
nses
)19
1,94
0-
--
--
--
1,95
9-
1,95
9
Shar
e ba
sed
paym
ents
cha
rge
--
--
1,39
6-
--
-1,
396
-1,
396
Tran
sfer
from
sha
res
to b
e is
sued
re
serv
e-
--
-(5
93)
--
593
--
--
Tran
sfer
from
reva
luat
ion
rese
rve
--
-(6
,682
)-
--
6,68
2-
--
-
19
1,94
0-
(6,6
82)
803
--
(10,
409)
-(1
4,32
9)-
(14,
329)
At
31 D
ecem
ber
2013
8,30
220
6,55
462
113
,978
2,87
598
66,3
4657
5,41
9(3
,897
)87
0,29
64,
051
874,
347
Statement of ComplianceThe consolidated and Company Financial Statements of Grafton Group plc have been prepared in accordance with International Financial Reporting Standards (IFRSs) as adopted by the European Union (EU).
The Company Financial Statements have been prepared in accordance with IFRSs as adopted by the European Union (EU) and as applied in accordance with the Companies Acts, 1963 to 2013. The Company has taken advantage of the exemption in Section 148(8) of the Companies Act 1963 from presenting to its members the Company Statement of Comprehensive Income and related notes as the Company publishes Company and Group Financial Statements together.
The IFRSs applied in these financial statements were those effective for accounting periods ending on 31 December 2014 and the early adoption of the amendment to IAS 36 Impairment of Assets (Amended).
The accounting policies adopted are consistent with those of the previous year except for (i) a new accounting policy on Intangible Assets (Computer Software) set out in these Accounting Policies and (ii) the following new and amended IFRSs and International Financial Reporting Interpretations Committee (IFRIC) interpretations adopted by the Group as of 1 January 2014 that are effective for the Group’s financial year ending on 31 December 2014 and that had no significant impact on the results or financial position of the Group for the year ended 31 December 2014 other than as set out below:
IFRS 10 – Consolidated Financial Statements. (Effective date: financial year beginning 1 January 2014)
IFRS 10 replaces all of the guidance on control and consolidation in IAS 27 and SIC 12. IFRS 10 changes the definition of control so that the same criteria are applied to all entities to determine control. The core principle that a consolidated entity presents a parent and its subsidiaries as a single entity remains the same, as does the mechanics for consolidation. The definition of control is defined as when the Group is exposed to, or has rights to, variable returns from its involvement with the entity and has the ability to affect these returns through its power over the entity. This standard has not had any significant impact on the Group’s financial statements.
IFRS 11 - Joint Arrangements. (Effective date: financial year beginning 1 January 2014)
IFRS 11 removes the existing accounting policy choice of proportionate consolidation for jointly controlled entities. IFRS 11 makes equity accounting mandatory for participants in joint ventures. The Group previously had adopted an accounting policy of proportionate consolidation for jointly controlled entities but on adoption of IFRS 11 the Group is now required to equity account for its interest in jointly controlled entities. The change in accounting policy has not had any significant impact on the Group’s financial statements.
IFRS 12 - Disclosure of Interest in Other Entities. (Effective date: financial year beginning 1 January 2014)
IFRS 12 requires entities to disclose information about the nature, risks and financial effects associated with the entity’s interest in subsidiaries, associates, joint arrangements and unconsolidated structured entities. This standard has not had a significant impact on the Group’s financial statements.
Amendment to IAS 32 - Offsetting financial assets and financial liabilities (Effective date: financial year beginning 1 January 2014)
This amendment clarifies some of the requirements for offsetting financial assets and financial liabilities on the balance sheet. This amendment has not had a significant impact on the Group’s financial statements.
The adoption of other new standards, interpretations and amendments that become effective for the year ended 31 December 2014 did not have any significant impact on the results or financial position of the Group.
The IASB and IFRIC have issued the following Standards and Interpretations that are not yet effective for the Group:
• IFRS 9 - Financial Instruments: Recognition and Measurement. (Effective date: financial year beginning 1 January 2015). IFRS 9 is the first step in the process to replace IAS 39 Financial Instruments: recognition and measurement. IFRS 9 introduces new requirements for classifying and measuring financial assets. The impact of the standard on the Group’s financial statements has not yet been determined.

Grafton Group plc Annual Report 2014
84
Accounting Policies(continued)
There are no other IFRS or IFRIC interpretations that are effective subsequent to the Grafton 2014 financial year-end that would have a material impact on the Group.
Basis of PreparationThe consolidated Financial Statements, which are presented in sterling and rounded to the nearest thousand are prepared on a going concern basis. The Company Financial Statements continue to be presented in euro and rounded to the nearest thousand and are prepared on a going concern basis. The Statements have been prepared under the historical cost convention, as modified by the previous revaluation of land and buildings, the measurement at fair value of share-based payments at initial date of award and the measurement at fair value of all derivative financial instruments. The carrying values of recognised assets and liabilities that are fair value hedged are adjusted to record changes in the fair values attributable to the risks that are being hedged.
The preparation of consolidated financial statements in accordance with IFRS as adopted by the EU requires management to make certain estimates and assumptions that affect the application of accounting policies and the reported amount of assets, liabilities, income and expense. Management believes that the estimates and assumptions made are reasonable based on the information available to it at the time that those estimates and assumptions are made. The areas involving a high degree of judgement or complexity, or areas where assumptions and estimates are significant in relation to the consolidated financial statements are set out in Note 33 and relate primarily to provisions for liabilities including onerous lease provisions, accounting for defined benefit pension schemes, asset impairment provisions, goodwill impairment, fair value of investment properties, rebate income and current taxation.
Basis of ConsolidationThe consolidated financial statements include the financial statements of the Company and all subsidiaries drawn up to 31 December each year together with the Group’s interest in joint ventures.
The financial year-end of the Group’s subsidiaries and joint venture are coterminous.
SubsidiariesThe financial statements of subsidiaries are included in the consolidated financial statements from the date on which control is obtained and they cease to be consolidated from the date on which the Group loses control. The definition of control is defined as when the Group is exposed to, or has rights to, variable returns from its involvement with the entity and has the ability to affect these returns through its power over the entity.
Joint VenturesJoint ventures are included in the financial statements using the equity method of accounting.
Investment in AssociatesAssociates are those entities in which the Group has a participating interest and over which the Group has significant influence, but not control, of the financial and operating policies. The equity method is used to account for associates. This is a method of accounting whereby the investment is initially recognised at cost and adjusted for post-acquisition changes in the Group’s share of net assets, less any impairment in value. The Group’s share of its associates’ post-acquisition profits or losses is recognised in the income statement. When the Group’s share of losses in an associate equals or exceeds its interest in the associate, the carrying amount is reduced to nil and the Group does not recognise further losses, except to the extent that the Group has incurred obligations in respect of its associates.
Transactions Eliminated on ConsolidationIntra-group balances and transactions, and any unrealised gains and income and expenses arising from such transactions, are eliminated in preparing the consolidated financial statements. Transactions with joint ventures and associates are similarly eliminated to the extent of the Group’s interest in the equity. Unrealised losses are eliminated in the same way as unrealised gains, but only to the extent that there is no evidence of impairment.
Revenue RecognitionRevenue comprises the fair value of consideration receivable for goods and services supplied to external customers in the ordinary course of the Group’s activities and excludes inter-company revenue and value added tax.
In general, revenue is recognised to the extent that it is subject to reliable measurement, that it is probable that economic benefits

Business & Strategy Review Corporate Governance Financial Statements Shareholder Information
Grafton Group plc Annual Report 2014
85
will flow to the Group and that the significant risks and rewards of ownership have passed to the buyer. In the case of sales of goods, this generally arises when products have either been delivered to or collected by a customer and there is no unfulfilled obligation that could affect the acceptance of the products. Revenues are recorded based on the price specified in the sales invoices/contracts net of actual and estimated returns and any discounts granted.
Segment ReportingAn operating segment is a component of the Group that engages in business activities from which it may earn revenues and incur expenses for which discrete financial information is available, including revenues and expenses that relate to transactions with any of the Group’s other components. All operating segments’ operating results are reviewed regularly by the Group’s Chief Operating Decision Maker, being the Board, who is responsible for allocating resources and assessing performance.
Foreign Currency TranslationFunctional and Presentation CurrencyThe consolidated financial statements are presented in sterling. Items included in the financial statements of each of the Group’s entities are measured using its functional currency, being the currency of the primary economic environment in which the entity operates which is primarily euro and sterling.
Transactions and BalancesTransactions in foreign currencies are recorded at the rate of exchange ruling at the date of the transaction. Monetary assets and liabilities denominated in foreign currencies are retranslated to the relevant functional currency at the rate of exchange ruling at the balance sheet date. All currency translation differences on monetary assets and liabilities are taken to the income statement except for the effective portion designated as a hedge of a net investment in a foreign operation which is recognised in other comprehensive income.
Foreign OperationsThe assets and liabilities of foreign operations, including goodwill and any fair value adjustments arising on consolidation, are translated to sterling at the foreign exchange rates ruling at the balance sheet date. Results and cash flows of subsidiaries which do not have sterling as their functional currency are translated into sterling at average exchange rates for the year and the related balance sheets are translated at the rates of exchange ruling at the balance sheet date. Foreign exchange movements arising on translation of the net investment in a foreign operation, including those arising on long term intra-Group loans deemed to be quasi equity in nature, are recognised directly in other comprehensive income, in the currency translation reserve. The portion of exchange gains or losses on foreign currency borrowings or derivatives used to provide a hedge against a net investment in a foreign operation that is designated as a hedge of those investments is recognised directly in other comprehensive income to the extent that they are determined to be effective. The ineffective portion is recognised immediately in the income statement.
Movements since 1 January 2004, the date of transition to IFRS, are recognised in the currency translation reserve and are reclassified to the income statement on disposal of the related business.
Share Capital and Share PremiumThe company’s share capital and share premium has been translated from euro into sterling at historic rates of exchange at the dates of transactions.
Exceptional ItemsThe Group has adopted a policy in relation to its income statement which seeks to highlight significant items within the Group’s results. Such items may include significant restructuring and onerous lease provisions, profit or loss on disposal or termination of operations, litigation costs and settlements and impairment of assets. Judgement is used by the Group in assessing the particular items which, by virtue of their scale and nature, should be disclosed in the income statement or related notes.
Property profit is not disclosed as a separate line item on the face of the Income Statement. Where a material profit arises on the disposal of property, this will be identified in the financial statements.
Finance ExpenseFinance expense comprises interest payable on borrowings calculated using the effective interest rate method, net foreign exchange losses on monetary items and gains and losses on hedging instruments that are recognised in the income statement. The net finance cost of pension scheme obligations is recognised as a finance expense in the income statement. The interest

Grafton Group plc Annual Report 2014
86
Accounting Policies(continued)
expense component of finance lease payments is recognised in the income statement using the effective interest rate method. Where appropriate the fair value adjustment to hedged items that are the subject of a fair value hedge is included as a finance expense or finance income. Borrowing costs that are not directly attributable to the acquisition, construction or production of a qualifying asset are recognised in the income statement as incurred using the effective interest rate method.
Finance IncomeFinance income comprises interest income on funds invested (including available-for-sale financial assets), dividend income, gains on the disposal of available-for-sale financial assets, and gains on hedging instruments that are recognised in profit or loss. The net expected return on defined benefit pension scheme plan assets is recognised as finance income in the income statement. Interest income is recognised in the income statement as it accrues using the effective interest rate method.
Business CombinationsBusiness combinations are accounted for using the acquisition method as at the acquisition date, which is the date on which control is transferred to the Group. Control is defined as when the Group is exposed to, or has rights to, variable returns from its involvement with the entity and has the ability to affect these returns through its power over the entity.
For acquisitions made on or after 1 January 2010, the Group measures goodwill at the acquisition date as:
• the fair value of the consideration transferred; plus
• the recognised amount of any non-controlling interests in the acquiree; plus
• if the business combination is achieved in stages, the fair value of the existing equity interest in the acquiree; less
• the net recognised amount (generally fair value) of the identifiable assets acquired and liabilities assumed.
When the excess is negative, a bargain purchase gain is recognised immediately in the income statement.
The consideration transferred does not include amounts related to the settlement of the pre-existing relationships. Such amounts are generally recognised in the income statement.
Costs related to the acquisition, other than those associated with the issue of debt or equity securities, that the Group incurs in connection with a business combination are expensed as incurred.
Any contingent consideration payable is recognised at fair value at the acquisition date. If the contingent consideration is classified as equity, it is not re-measured and settlement is accounted for within equity. Otherwise, subsequent changes to the fair value of the contingent consideration are recognised in the income statement.
GoodwillGoodwill is the excess of the consideration paid over the fair value of the identifiable assets, liabilities and contingent liabilities in a business combination and relates to assets which are not capable of being individually identified and separately recognised.
Goodwill acquired is allocated, at acquisition date, to the cash generating units expected to benefit from synergies related to the acquisition. Goodwill is measured at cost less accumulated impairment losses. The cash generating units represent the lowest level within the Group at which goodwill is monitored for internal management purposes. These units are no larger than the operating segments determined in accordance with IFRS 8: Operating Segments.
Goodwill is subject to impairment testing on an annual basis and at any time during the year if an indicator of impairment exists.
Where the recoverable amount of a cash generating unit is less than the carrying amount, an impairment loss is recognised. Impairment losses arising in respect of goodwill are not reversed once recognised.
Where a subsidiary is sold, any goodwill arising on acquisition, net of any impairments, is included in determining the profit or loss arising on disposal.
Intangible Assets (Computer Software)Computer software, including computer software which is not an integrated part of an item of computer hardware, is stated at

Business & Strategy Review Corporate Governance Financial Statements Shareholder Information
Grafton Group plc Annual Report 2014
87
cost less any accumulated amortisation and any accumulated impairment losses. Cost comprises purchase price and any other directly attributable costs.
Computer software is recognised if it meets the following criteria:
1. an asset can be separately identified;
2. it is probable that the asset created will generate future economic benefits;
3. the development cost of the asset can be measured reliably;
4. it is probable that the expected future economic benefits that are attributable to the asset will flow to the entity; and
5. the cost of the asset can be measured reliably.
Costs relating to the development of computer software for internal use are capitalised once the recognition criteria outlined above are met. Computer software is amortised over its expected useful life, which ranges from 4 to 8 years, by charging equal instalments to the income statement from the date the assets are ready for use.
Intangible Assets (Other than Goodwill and Computer Software)An intangible asset, other than goodwill and computer software, is recognised to the extent that it is probable that the expected future economic benefits attributable to the asset will flow to the Group and that its fair value can be measured. The asset is deemed to be identifiable when it is separable (i.e. capable of being divided from the entity and sold, transferred, licensed, rented or exchanged, either individually or together with a related contract, asset or liability) or when it arises from contractual or other legal rights, regardless of whether those rights are transferable or separable from the Group or from other rights and obligations.
Intangible assets acquired as part of a business combination are capitalised separately from goodwill at fair value on the date of acquisition if the intangible asset meets the definition of an asset and the fair value can be reliably measured.
Intangible assets are carried at cost less any accumulated amortisation and any accumulated impairment losses. The carrying value of intangible assets is reviewed for impairment at each reporting date and is also subject to impairment testing when events or changes in circumstances indicate that the carrying values may not be recoverable.
The amortisation of intangible assets is calculated to write-off the book value over their useful lives which is currently eight years on a straight-line basis on the assumption of zero residual value.
Property, Plant and EquipmentProperty, plant and equipment are stated at cost or deemed cost less accumulated depreciation and impairment losses. The Group’s freehold properties in Ireland were revalued to fair value in 1998 and are measured on the basis of deemed cost being the revalued amount at the date of that revaluation less accumulated depreciation. The valuations were deemed to be cost for the purposes of transition to IFRS as adopted by the EU. Freehold property acquired is subject to a fair value adjustment at the date of acquisition.
Property, plant and equipment are depreciated over their useful economic life on a straight line basis at the following rates:
Freehold buildings 50-100 years
Freehold land Not depreciated
Leasehold buildings Lease term or up to 100 years
Plant and machinery 5-20 years
Motor vehicles 5 years
Plant hire equipment 4-8 years
The residual value and useful lives of property, plant and equipment are reviewed and adjusted if appropriate at each balance sheet date.

Grafton Group plc Annual Report 2014
88
Accounting Policies(continued)
On disposal of property, plant and equipment, the cost and related accumulated depreciation and impairments are removed from the balance sheet and the net amount, less any proceeds, is taken to the income statement.
The carrying amounts of the Group’s property, plant and equipment are reviewed at each balance sheet date to determine whether there is any indication of impairment. An impairment loss is recognised whenever the carrying amount of an asset or its cash generation unit exceeds its recoverable amount. Impairment losses are recognised in the income statement unless the asset is recorded at a revalued amount in which case it is firstly dealt with through the revaluation reserve relating to that asset with any residual amount being transferred to the income statement.
Cost includes expenditure that is directly attributable to the acquisition of the asset. Subsequent costs are included in an asset’s carrying amount or recognised as a separate asset, as appropriate, only when it is probable that future economic benefits associated with the item will flow to the Group and the cost of the replaced item can be measured reliably. All other repair and maintenance costs are charged to the income statement during the financial period in which they are incurred.
Investment PropertiesInvestment property is initially measured at cost and subsequently at fair value with any change therein recognised in profit or loss.
Any gain or loss on disposal of investment property (calculated as the difference between the net proceeds from disposal and the carrying amount of the item) is recognised in profit or loss. When investment property that was previously classified as property, plant and equipment is sold, any related amount included in the revaluation reserve is transferred to retained earnings.
When the use of a property changes from owner occupied or held for sale to investment property, the property is remeasured to fair value and reclassified accordingly. Any gain on this remeasurement is recognised in profit or loss to the extent that it reverses a previous impairment loss on the specific property, with any remaining gain recognised in Other Comprehensive Income and presented in the revaluation reserve. Any loss is recognised in profit or loss.
Assets Held for SaleNon-current assets that are expected to be recovered principally through sale rather than continuing use and meet the IFRS 5 criteria are classified as held for sale. These assets are shown in the balance sheet at the lower of their carrying amount and fair value less any costs to sell. Impairment losses on initial classification as non-current assets held for sale and subsequent gains or losses on re-measurement are recognised in the income statement.
InvestmentsInvestments, other than investments in joint ventures and associates, are stated in the balance sheet at fair value. All other investments are classified as available for sale with changes in fair value recognised directly in other comprehensive income until the investment is disposed of or is determined to be impaired, at which time the cumulative gain or loss previously recognised in other comprehensive income is brought into the income statement for the period. All items recognised in the income statement relating to investments, other than investments in joint ventures and associates, are reported as non-operating items.
Where investments are actively traded in organised financial markets, fair value is determined by reference to Stock Exchange quoted market bid prices at the close of business on the balance sheet date. Where it is impracticable to determine fair value in accordance with IFRS 13, unquoted equity investments are recorded at historical cost and are included within financial assets on this basis in the Group balance sheet. They are assessed for impairment annually.
Leases Assets held under finance leases, which are leases where substantially all the risks and rewards of ownership of the asset have transferred to the Group and hire purchase contracts are capitalised in the balance sheet and are depreciated over the shorter of useful life and lease term with any impairment being recognised in accumulated depreciation. Leased assets are recorded at an amount equal to the lower of its fair value and the present value of the minimum lease payments at the inception of finance leases. The capital elements of future obligations under leases and hire purchase contracts are included in liabilities in the balance sheet and analysed between current and non-current amounts. The interest elements of the obligations are charged to the income statement over the periods of the leases and hire purchase contracts so as to produce a constant periodic rate of interest on the remaining balance of the liability.

Business & Strategy Review Corporate Governance Financial Statements Shareholder Information
Grafton Group plc Annual Report 2014
89
Leases where the lessor retains substantially all the risks and rewards of ownership are classified as operating leases. Operating lease rentals are charged to the income statement on a straight-line basis over the lease term. Lease incentives are recognised over the lease term on a straight line basis.
InventoriesInventories are stated at the lower of cost and net realisable value. Cost is based on the first-in, first-out principle and includes all expenditure incurred in acquiring the inventories and bringing them to their present location and condition. Raw materials are valued on the basis of purchase cost on a first-in, first-out basis. In the case of finished goods and work-in-progress, cost includes direct materials, direct labour and attributable overheads based on normal operating capacity and excludes borrowing costs. Net realisable value is the estimated proceeds of sale less all further costs to completion and less all costs to be incurred in marketing, selling and distribution.
Trade and Other Receivables and PayablesTrade and other receivables and payables are stated at amortised cost (less any impairment losses), which approximates to fair value given the short-term nature of these assets and liabilities.
Trade receivables are carried at original invoice amount less an allowance for potentially uncollectable debts. Provision is made when there is objective evidence that the Group will not be in a position to collect all of its receivables when they fall due. Bad debts are written-off in the income statement on identification.
Cash and Cash EquivalentsCash and cash equivalents comprise cash balances held for the purposes of meeting short-term cash commitments and money market instruments which are readily convertible to a known amount of cash. Where money market instruments are categorised as cash equivalents, the related balances have an original maturity of three months or less. In addition, for the purposes of the Group cash flow statement, bank overdrafts are netted against cash and cash equivalents where the overdrafts are repayable on demand and form an integral part of cash management. Bank overdrafts are included within current interest-bearing loans and borrowings in the Group balance sheet.
Derivative Financial Instruments and Hedging ActivitiesDerivative financial instruments, principally interest rate and currency swaps, are used in certain circumstances to hedge the Group’s exposure to foreign exchange and interest rate risks arising from its financing activities.
Derivative financial instruments are recognised initially at fair value and thereafter are subsequently re-measured at their fair value. Fair value is the amount for which an asset could be exchanged, or a liability settled, between knowledgeable willing parties in an arm’s length transaction. The fair value of interest rate and currency swaps is the estimated amount that the Group would receive or pay to terminate the swap at the balance sheet date, taking into account current interest and currency exchange rates and the current creditworthiness of the swap counterparties.
The method of recognising the resulting gain or loss on re-measurement to fair value depends on whether the derivative is designated as a hedging instrument. Where derivatives are not designated or do not fulfil the criteria for hedge accounting, changes in fair values are reported in the income statement. Where derivatives qualify for hedge accounting, recognition of the resulting gains or losses depends on the nature of the item being hedged. The Group designates certain derivatives for various purposes in hedge relationships in one or more of the following types of relationships:
(i) Fair value hedge: Hedges of the fair value of recognised liabilities;
(ii) Cash flow hedge: Hedges of a particular risk associated with a highly probable forecast transaction; or
(iii) Net investment hedge: Hedges of a net investment in a foreign operation.
The Group documents at the inception of the transaction the relationship between hedging instruments and hedged items, as well as its risk management objectives and strategy for undertaking various hedging transactions. The Group also documents its assessment, both at hedge inception and on an ongoing basis, of whether the derivatives that are used in hedging transactions are highly effective in offsetting changes in fair values or cash flows of hedged items.

Grafton Group plc Annual Report 2014
90
Accounting Policies(continued)
(i) Fair Value HedgeAny gain or loss stemming from the re-measurement of the hedging instrument to fair value is reported in the income statement. In addition, any gain or loss on the hedged item which is attributable to the fair value movement in the hedged risk is adjusted against the carrying amount of the hedged item and reflected in the income statement.
Where a derivative financial instrument is used to economically hedge the foreign exchange exposure of a recognised monetary asset or liability, hedge accounting is not applied and any gain or loss accruing on the hedging instrument is recognised as finance income or expense in the income statement.
If the hedge no longer meets the criteria for hedge accounting, hedge accounting ceases and the adjustment to the carrying amount of a hedged item for which the effective interest method is used is amortised to profit or loss over the period to maturity.
(ii) Cash Flow HedgesThe effective part of any gain or loss on the derivative financial instrument is recognised in other comprehensive income and presented in the cash flow hedge reserve in equity with the ineffective portion being reported as finance expense or income in the income statement. If a hedge of a forecasted transaction subsequently results in the recognition of a financial asset or a financial liability, the associated gains and losses that were recognised in other comprehensive income are reclassified into profit or loss in the same period or periods during which the asset acquired or liability assumed affects profit or loss. For cash flow hedges, other than those covered by the preceding statements, the associated cumulative gain or loss is removed from other comprehensive income and recognised in the income statement in the same period or periods during which the hedged forecast transaction affects profit or loss. The ineffective part of any gain or loss is recognised immediately in the income statement.
Hedge accounting is discontinued when a hedging instrument expires or is sold, terminated or exercised, or no longer qualifies for hedge accounting. The cumulative gain or loss at that point remains in equity and is recognised in accordance with the above policy when the transaction occurs. If a hedged transaction is no longer expected to occur, the net cumulative gain or loss recognised in other comprehensive income is transferred to the income statement in the period.
(iii) Hedge of Net Investment in Foreign OperationAny gain or loss on the hedging instrument relating to the effective portion of the hedge is recognised in other comprehensive income and presented in the foreign currency translation reserve in equity. The gain or loss relating to the ineffective portion is recognised immediately in the income statement within finance income or finance expense. Cumulative gains and losses remain in equity until disposal or partial disposal of the net investment in the foreign operation at which point the related differences are reclassified to the income statement as part of the overall gain or loss on sale.
Interest-Bearing Loans and BorrowingsAll loans and borrowings are initially recorded at fair value, net of related transaction costs. After initial recognition, current and non-current interest-bearing loans and borrowings are measured at amortised cost. Any difference between the proceeds (net of transaction costs) and the redemption value is recognised in the income statement over the period of the borrowings using the effective interest rate method. Amortised cost includes any issue costs and any discount or premium on settlement. Borrowings are classified as current liabilities unless the Group has an unconditional right to defer settlement of the liability for at least twelve months after the balance sheet date.
Fees paid on the establishment of loan facilities are recognised as transaction costs of the loan to the extent that it is probable that some or all of the facility will be drawn down. In this case, the fee is deferred until the draw-down occurs. To the extent there is no evidence that it is probable that some or all of the facility will be drawn down, the fee is capitalised as a pre-payment for liquidity services and amortised over the period of the facility to which it relates.
ProvisionsA provision is recognised on a discounted basis when the Group has a present (either legal or constructive) obligation as a result of a past event and it is probable that a transfer of economic benefits will be required to settle the obligations and a reliable estimate can be made of the amount required to settle the obligation. A provision for restructuring is recognised when the Group has approved a restructuring plan and the restructuring has commenced. A provision for onerous contracts is recognised when the expected benefits to be derived by the Group from a contract are lower than the unavoidable costs of meeting its obligations under the contract. The provision is measured at the present value of the lower of the expected cost of terminating the contract and the expected net cost of continuing with the contract.

Business & Strategy Review Corporate Governance Financial Statements Shareholder Information
Grafton Group plc Annual Report 2014
91
Retirement Benefit ObligationsObligations to the defined contribution pension plans are recognised as an expense in the income statement as service is received from the relevant employees. The Group has no legal or constructive obligation to pay further contributions in the event that these plans do not hold sufficient assets to provide retirement benefits.
The Group operates a number of defined benefit pension schemes which require contributions to be made to separately administered funds. The Group’s net obligation in respect of defined benefit pension schemes is calculated separately for each plan by estimating the amount of future benefits that employees have earned in return for their service in the current and prior periods. That benefit is discounted to determine its present value, and the fair value of any plan asset is deducted. The discount rate employed in determining the present value of the schemes’ liabilities is determined by reference to market yields at the balance sheet date on high quality corporate bonds for a term consistent with the currency and term of the associated post-employment benefit obligations.
The net surplus or deficit arising in the Group’s defined benefit pension schemes are shown within either non-current assets or liabilities on the face of the Group Balance Sheet. The deferred tax impact of pension scheme surpluses and deficits is disclosed separately within deferred tax assets or liabilities as appropriate. The Group recognises actuarial gains and losses immediately in other comprehensive income.
Any increase in the present value of the plans’ liabilities expected to arise from employee service during the period is charged to operating profit. The Group determines net interest expense/(income) on the net defined benefit liability/(asset) for the period by applying the discount rate used to measure the defined benefit obligation at the beginning of the period. Differences between the income recognised based on the discount rate and the actual return on plan assets, together with the effect of changes in the current or prior assumptions underlying the liabilities are recognised in other comprehensive income. When the benefits of a defined benefit plan are improved, the portion of the increased benefit relating to past service by employees is recognised as an expense in the income statement over the remaining average period until the benefits vest. To the extent that the benefits vest immediately, the expense is recognised immediately in the income statement.
Share-Based Payment TransactionsThe 2011 Long-Term Incentive Plan (LTIP), the 1999 Grafton Group Share Scheme for Senior Executives and the SAYE Scheme for UK employees should enable employees to acquire shares in the Company subject to the conditions of these schemes. New units are issued to satisfy obligations under the 1999 Grafton Group Share Scheme and the SAYE scheme. Entitlements under the LTIP may be satisfied by the issue of units or by a market purchase of units. The fair value of share entitlements at the grant date is recognised as an employee expense in the income statement over the vesting period with a corresponding increase in equity. The fair value is determined by an external valuer using a binomial model. Share entitlements granted by the Company are subject to certain non-market based vesting conditions. Non-market vesting conditions are not taken into account when estimating the fair value of entitlements as at the grant date. The expense for share entitlements shown in the income statement is adjusted to reflect the number of awards for which the related non-market based vesting conditions are expected to be met, such that the amount ultimately recognised as an expense is based on the number of awards that meet the related non-market based vesting conditions at the vesting date.
The proceeds received by the Company on the vesting of share entitlements are credited to share capital and share premium when the share entitlements are converted or issued.
Income TaxIncome tax in the income statement represents the sum of current tax and deferred tax.
Income tax is recognised in the income statement except to the extent that it relates to items recognised directly in other comprehensive income.
Current tax is based on taxable profit and represents the expected tax payable for the year. Taxable profit differs from net profit as reported in the income statement because it excludes items of income or expense that are taxable or deductible in other years and it further excludes certain items that are not tax deductible including property depreciation. The Group’s liability for current tax is calculated using rates that have been enacted or substantially enacted at the balance sheet date. The Group’s income tax charge reflects various allowances and reliefs and planning opportunities available in the tax jurisdictions in which the Group operates. The determination of the Group’s charge for income tax in the income statement requires estimates to be made, on the

Grafton Group plc Annual Report 2014
92
Accounting Policies(continued)
basis of professional advice, in relation to certain matters where the ultimate outcome may not be certain and where an extended period may be required before such matters are determined. The estimates for income tax included in the financial statements are considered appropriate but no assurance can be given that the final determination of these matters will not be materially different to the estimates included in the financial statements.
Deferred tax is provided, using the liability method, on all temporary differences between the carrying amounts of assets and liabilities for financial reporting purposes and the amounts used for taxation purposes. Deferred tax assets and liabilities are measured at the tax rates that are expected to apply in the year when the asset is realised or the liability is settled based on rates that have been enacted or substantially enacted at the balance sheet date.
Deferred tax assets and liabilities are not recognised for the following temporary differences;
• Goodwill that is not deductible for tax purposes;
• Temporary differences arising from the initial recognition of an asset or liability in a transaction that is not a business combination and, at the time of the transaction, affects neither the accounting profit or taxable profit or loss; and
• Temporary differences associated with investments in subsidiaries in which case deferred tax is only recognised to the extent that it is probable that the temporary differences will reverse in the foreseeable future.
The carrying amount of deferred tax assets is reviewed at each balance sheet date and reduced to the extent that it is no longer probable that sufficient taxable profit would be available to allow all or part of the deferred tax asset to be utilised.
Share CapitalOrdinary SharesOrdinary shares are classified as equity. Incremental costs directly attributable to the issue of ordinary shares are recognised as a deduction from equity, net of any tax effects.
Repurchase of Share CapitalWhen share capital recognised as equity is purchased, the amount of the consideration paid, including directly attributable costs, is recognised as a change in equity.
DividendsDividends on ordinary shares are recognised as a liability in the Group’s financial statements in the period in which they are declared by the Company. In the case of interim dividends, these are considered to be declared when they are paid and in the case of final dividends these are declared when authorised by the shareholders in General Meeting.
Earnings per ShareThe Group presents basic and diluted earnings per share (EPS) data for its ordinary shares. Basic EPS is calculated by dividing the profit or loss attributable to ordinary shareholders of the Company by the weighted average number of ordinary shares outstanding during the period, adjusted for treasury shares held. Diluted EPS is calculated by dividing the profit or loss attributable to ordinary shareholders by the weighted average number of ordinary shares outstanding adjusted for treasury shares held and for the effects of all dilutive potential ordinary shares related to employee share schemes.

Business & Strategy Review Corporate Governance Financial Statements Shareholder Information
Grafton Group plc Annual Report 2014
93
Notes to the Group Financial Statements
1. Segment InformationIFRS 8 Operating Segments requires operating segments to be identified on the basis of internal reports that are regularly reviewed by the Chief Operating Decision Maker, being the Board, in order to allocate resources to the segments and to assess their performance. Three operating segments have been identified, Merchanting, Retailing and Manufacturing.
The Merchanting segment is engaged in the distribution of building and plumbing materials primarily to professional trades people engaged in residential repair, maintenance and improvement projects and also in residential and other new build construction from a network of 578 branches in Britain, Ireland and Belgium.
The Retailing segment operates Ireland’s largest DIY and home improvement business from a network of 37 stores that supply mainly retail customers with a wide range of products for the home and garden, and a kitchen retail business that trades from seven stores.
The Manufacturing segment comprises the largest manufacturer of dry mortar in Britain operating from nine plants and a plastics manufacturing business in Ireland.
Information regarding the results of each reportable segment is included in this note. Performance is measured based on segment operating profit/(loss) as included in the internal management reports that are reviewed by the Group’s Chief Operating Decision Maker. Segment operating profit is used to measure performance, as such information is the most relevant in evaluating the results of the Group’s segments.
Segment results, assets and liabilities include all items directly attributable to a segment.
Segment capital expenditure is the total amount incurred during the period to acquire segment assets that are expected to be used for more than one accounting period.

Grafton Group plc Annual Report 2014
94
Notes to the Group Financial Statements(continued)
1. Segment Information (continued)Group Income Statement
Continuing operations – year ended 31 December
Merchanting Retailing Manufacturing Group
2014 2013 2014 2013 2014 2013 2014 2013
£’000 £’000 £’000 £’000 £’000 £’000 £’000 £’000
Segment revenue 1,874,739 1,694,881 158,238 167,889 58,119 44,698 2,091,096 1,907,468
Less: Inter-segment revenue-manufacturing - - - - (9,410) (7,700) (9,410) (7,700)
1,874,739 1,694,881 158,238 167,889 48,709 36,998 2,081,686 1,899,768
Segment operating profit 110,041 81,750 2,383 1,165 7,906 3,945 120,330 86,860
Pension credit - 29,964 - - - - - 29,964
Property impairment - (24,749) - - - (2,411) - (27,160)
Segment operating profit after exceptional items 110,041 86,965 2,383 1,165 7,906 1,534 120,330 89,664
Group
2014 2013
£’000 £’000
Reconciliation to consolidated operating profitSegment operating profit after non-recurring items 120,330 89,664
Central activities (10,225) (9,649)
Operating profit 110,105 80,015
Finance expense (9,857) (13,660)
Finance income 997 1,366
Profit before tax 101,245 67,721
Income tax (21,223) (5,622)
Profit after tax for the financial year 80,022 62,099

Business & Strategy Review Corporate Governance Financial Statements Shareholder Information
Grafton Group plc Annual Report 2014
95
1. Segment Information (continued)Group Balance Sheet
Continuing operations – as at 31 December
Merchanting Retailing Manufacturing Group
2014 2013 2014 2013 2014 2013 2014 2013
£’000 £’000 £’000 £’000 £’000 £’000 £’000 £’000
Segment assets 1,399,331 1,375,099 52,882 64,545 39,943 40,032 1,492,156 1,479,676
Reconciliation of total assets
Deferred tax assets 23,452 17,666
Retirement benefit assets 125 718
Other financial assets 123 124
Derivative financial instruments 1,095 1,670
Cash and cash equivalents 182,360 151,099Total assets in the Group balance sheet 1,699,311 1,650,953
Segment liabilities 404,381 392,757 38,854 40,399 9,848 10,157 453,083 443,313
Reconciliation of total liabilitiesInterest bearing loans and borrowings (current and non-current) 258,727 286,473
Retirement benefit obligations 33,085 7,840
Deferred tax liabilities 30,758 30,746
Current tax liabilities 17,334 8,201
Derivative financial instruments (current and non-current) 44 33
Total liabilities in the Group balance sheet 793,031 776,606

Grafton Group plc Annual Report 2014
96
Notes to the Group Financial Statements(continued)
1. Segment Information (continued)Other Segment Information
Continuing operations – year ended 31 December
Merchanting Retailing Manufacturing Total Group
2014 2013 2014 2013 2014 2013 2014 2013
£’00 0 £’000 £’000 £’000 £’000 £’000 £’000 £’000
Capital expenditure 39,210 23,833 971 283 793 554 40,974 24,670
Investment in intangible assets 5,881 - - - - - 5,881 -
Depreciation 26,827 25,261 3,239 3,771 2,326 2,431 32,392 31,463
Impairment/revaluation of property, plant and equipment 246 24,749 - - - 2,411 246 27,160
Intangible amortisation 124 - - - - - 124 -
Geographic AnalysisThe following is a geographic analysis of the information presented above. The analysis of geographic revenue below is the same whether it is based on location of assets or customers.
Belgium Ireland* UK Group
2014 2013 2014 2013 2014 2013 2014 2013
£’000 £’000 £’000 £’000 £’000 £’000 £’000 £’000
Segment revenue (continuing operations) 91,564 58,849 419,247 414,031 1,570,875 1,426,888 2,081,686 1,899,768
Capital expenditure 730 1,305 3,172 1,871 37,072 21,494 40,974 24,670
Investment in intangible assets - - - - 5,881 - 5,881 -
Segment assets 46,944 39,210 226,047 234,716 739,008 724,730 1,011,999 998,656
Goodwill 480,157 481,020
1,492,156 1,479,676
Segment liabilities 16,539 7,237 138,910 142,993 297,634 293,083 453,083 443,313
*Includes Poland which is immaterial

Business & Strategy Review Corporate Governance Financial Statements Shareholder Information
Grafton Group plc Annual Report 2014
97
2. Operating Costs and Income The following have been charged/(credited) in arriving at operating profit:
Non-recurring items (Note 3): 2014 2013
£’000 £’000
Pension schemePension scheme credit - (29,964)
Property impairmentProperty impairment - UK and Ireland - 27,160
Total non-recurring items (Note 3) - (2,804)
(Increase)/decrease in inventories (857) 5,231
Purchases and consumables 1,416,927 1,293,863
Staff costs before non-recurring items (Note 5) 295,795 268,633
Auditor’s remuneration - Group and subsidiaries 725 734
Depreciation 32,392 31,463
Lease rentals and other hire charges 54,784 53,244
Intangible amortisation 124 -
Profit on disposal of property, plant and equipment (2,345) (718)
Asset impairment/revaluation 246 -
Selling, distribution and administrative expenses 173,790 170,107
1,971,581 1,819,753

Grafton Group plc Annual Report 2014
98
Notes to the Group Financial Statements(continued)
2. Operating Costs and Income (continued)The following services were provided by KPMG, the Group’s Auditor:
2014 2013
£’000 £’000
Audit services (i)
- Group Auditor - KPMG Ireland 417 418
- Other network firm - KPMG 125 119
542 537
Other assurance services (ii)
- Group Auditor - KPMG Ireland 149 166
- Other network firm - KPMG 34 31
183 197
Auditor’s remuneration - Group and subsidiaries (i) & (ii) 725 734
Other non-audit services
- Group Auditor - KPMG Ireland - 16- Other network firm - KPMG 114 24
114 40
Tax advisory services
- Group Auditor - KPMG Ireland 174 165
- Other network firm - KPMG 297 327
471 492
Total- Group Auditor - KPMG Ireland 740 765
- Other network firm - KPMG 570 501
1,310 1,266
Other assurance services relate to the statutory audits of subsidiary companies in the UK, Ireland and Europe except for £16,000 in 2014 (2013: £21,000) that relates to the audit of pension funds.

Business & Strategy Review Corporate Governance Financial Statements Shareholder Information
Grafton Group plc Annual Report 2014
99
3. Non-Recurring Operating Income and Operating Costs
2014 2013
£’000 £’000
Pension schemePension service credit - (18,534)
Settlement gain - (16,932)
Settlement contribution liability - 5,014
Net settlement gain - (11,918)
Professional fees - 488
Pension scheme credit - (29,964)
Property impairment- Irish properties - 23,180
- UK properties - 3,980
- 27,160
Total - (2,804)
Pension scheme creditThe 2013 past service credit of £18.5 million arose due to the implementation of a permanent pensionable salary freeze in the United Kingdom and a pensionable salary freeze in Ireland for five years, together with an alignment of the normal retirement age and the State pension age in Ireland. The net settlement gain of £11.9 million arose due to the settlement of transfer values in respect of deferred members.
Property impairment In 2013 a strategic review of freehold properties gave rise to a non-cash impairment charge of £27.2 million to the Income Statement. The impairment charge related mainly to properties located in the Republic of Ireland.
4. Directors’ Remuneration, Pension Entitlements and InterestsDirectors’ remuneration, pension entitlements and interests in shares and share entitlements are presented in the Report of the Remuneration Committee on Directors’ Remuneration on pages 51 to 69.

Grafton Group plc Annual Report 2014
100
Notes to the Group Financial Statements(continued)
5. EmploymentThe average number of persons employed during the year by segment was as follows:
2014 2013
Merchanting 8,388 7,746
Retailing 1,152 1,216
Manufacturing 163 144
Holding company 24 21
9,727 9,127
The aggregate remuneration costs of employees were: £’000 £’000
Wages and salaries 259,291 236,952
Social welfare 27,104 23,564
Share based payments charge 3,679 1,396
Defined benefit pension (Note 31) 1,161 1,709
Defined contribution pension and related costs 4,560 5,012
Staff costs before non-recurring items 295,795 268,633
Past service credit and settlement gain - non-recurring (Note 31) - (35,466)
Settlement contribution liability (Note 3) - 5,014
Professional fees (Note 3) - 488
Charged to operating profit 295,795 238,669
Net finance cost on pension scheme obligations (Note 31) 244 1,403
Charged to income statement 296,039 240,072
Remeasurement loss/(gain) on pension schemes (Note 31) 28,054 (7,442)
Total employee benefit cost 324,093 232,630
The share-based payments charge was derived on the basis of the Group’s expectation of the number of shares likely to vest having regard to the service and non-market performance vesting conditions, the historic performance of the Group over the period since the share entitlements were granted and the forecast performance over the remaining life of share awards.
Key ManagementThe cost of key management including Directors is set out in the table below:
2014 2013
Number of Individuals 8 8
2014 £’000
2013 £’000
Short-term employee benefits 2,871 2,396
Share-based payment charge 678 552
Termination benefits - 248
Retirement benefits expense 260 409
Charged to operating profit 3,809 3,605

Business & Strategy Review Corporate Governance Financial Statements Shareholder Information
Grafton Group plc Annual Report 2014
101
6. Finance Expense and Finance Income
2014 2013
£’000 £’000
Finance expense:Interest on bank loans and overdrafts 7,809* 10,256*
Interest on loan notes 239* 413*
Net change in fair value of cash flow hedges transferred from equity 109 577
Interest on finance leases 246 278
Net finance cost on pension scheme obligations 244 1,403
Fair value movement on derivatives (cross-currency interest rate swaps not in hedging relationship) - 1
Ineffective portion of changes in fair value of cash flow hedges - 10
Foreign exchange loss 1,210 722
9,857 13,660
Finance income:Foreign exchange gain - (537)
Fair value movement on derivatives (cross-currency interest rate swaps not in hedging relationship) (298) -
Interest income on bank deposits (699)* (829)*
(997) (1,366)
Net finance expense recognised in income statement 8,860 12,294
*Net bank/loan note interest of £7.3 million (2013: £9.8 million)
Amounts relating to items not at fair value through income statement
- Total finance expense on financial liabilities 9,748 13,072
- Total finance income on financial assets (699) (1,366)
Recognised directly in other comprehensive incomeCurrency translation effects on foreign currency net investments (6,707) 1,176
Currency translation effects on foreign currency borrowings designated
as net investment hedges (1,634) 908
Effective portion of changes in fair value of cash flow hedges (241) (66)
Net change in fair value of cash flow hedges transferred to income statement 109 577
(8,473) 2,595

Grafton Group plc Annual Report 2014
102
Notes to the Group Financial Statements(continued)
7. Foreign CurrenciesThe results and cash flows of the subsidiaries with euro functional currencies have been translated into sterling using the average exchange rate for the year. The balance sheets of subsidiaries with euro functional currencies have been translated into sterling at the rate of exchange ruling at the balance sheet date.
The average sterling/euro rate of exchange for the year ended 31 December 2014 was Stg80.61p (Year ended 31 December 2013: Stg84.93p). The sterling/euro exchange rate at 31 December 2014 was Stg77.89p (31 December 2013: Stg83.37p).
8. Income Tax
2014 2013
(a) Income tax recognised in income statement £’000 £’000
Current tax expense/(credit)Irish corporation tax 669 (1,899)
UK and other corporation tax 19,009 5,239
19,678 3,340
Deferred tax expenseIrish deferred tax expense relating to the origination and reversal of temporary differences 1,049 (1,294)
Recognition of previously unrecognised tax losses (357) (8,546)
Deferred tax resulting from change in tax rates - (833)
UK deferred tax expense relating to the origination and reversal of temporary differences 853 12,955
1,545 2,282
Total income tax expense in income statement 21,223 5,622
TaxationThe effective rate of tax on profit was 21.0 per cent (2013: 20.4 per cent excluding a taxation charge of £4.7 million which arose on the non-recurring pension scheme credit and a taxation credit of £3.8 million which arose on the property impairment charge and a once-off credit of £8.5 million due to the recognition of a deferred tax asset for trading losses carried forward in the Irish business). This reflects the mix of profits between the UK, Ireland and Belgium and the disallowance of a tax deduction for certain items of expenditure including depreciation on buildings.
Taxation paid in 2014 of £10.4 million (2013: £6.3 million) reflected the availability of tax allowances and various reliefs carried forward from prior years.
The amount shown for current taxation includes a liability for tax uncertainties and is based on the Directors’ best probability weighted estimate of the probable outflow of economic resources that will be required. As with all estimates, the actual outcome may be different to the current estimate.

Business & Strategy Review Corporate Governance Financial Statements Shareholder Information
Grafton Group plc Annual Report 2014
103
8. Income Tax (continued)
2014 2013
(b) Reconciliation of effective tax rate £’000 £’000
Profit before tax 101,245 67,721
Profit before tax multiplied by the standard rate of tax of 12.5% (2013: 12.5%) 12,656 8,465
Effects of:
Expenses not deductible for tax purposes 2,078 2,809
Differences in effective tax rates on overseas earnings 6,977 4,030
Losses for which no deferred tax asset was recognised - 2,262
Effect of change in tax rates - (833)
Deferred tax recognised on prior year benefits/losses (357) (8,546)
Benefit of prior year items not recognised for deferred tax (1,088) -
Other differences 957 (2,565)
Total income tax expense in income statement 21,223 5,622
2014 2013
(c) Deferred tax recognised in other comprehensive income £’000 £’000
Actuarial movement on pension schemes (4,728) 1,032
Employee share schemes (1,484) -
Financing – cash flow hedge 2 63
(6,210) 1,095
At 31 December 2014 the Group recognised deferred tax assets on tax losses of £8.9 million (2013: £8.5 million). The tax losses arose in the Irish and Belgium tax jurisdiction and their utilisation is dependent on future profits. The Directors have concluded that a forecast period of 5 years is the appropriate timescale over which to consider whether it is more likely than not that the Irish and Belgian sub-groups will earn sufficient future profits to utilise the losses carried forward.
Deferred income tax liabilities have not been recognised for any taxes that would be payable on the unremitted earnings of certain subsidiaries as it is probable that any temporary differences will not reverse in the foreseeable future.
9. Dividends
2014 2013
£’000 £’000
GroupInterim dividend of 5.5p per Grafton Unit – paid 11 April 2014 12,784 -
Interim dividend of 3.75p per Grafton Unit – paid 3 October 2014 8,717 -
Interim dividend of 4.5p (5.5 cent) per Grafton Unit – paid 12 April 2013 - 10,825
Interim dividend of 3.0p (3.5 cent) per Grafton Unit – paid 4 October 2013 - 6,859
21,501 17,684
The payment in 2014 of a second interim dividend for 2013 of 5.5 pence on the ‘C’ Ordinary shares in Grafton Group (UK) plc from UK-sourced income amounted to £12.78 million. A 2014 interim dividend of 3.75 pence per share was paid on 3 October 2014 on the ‘C’ Ordinary shares in Grafton Group (UK) plc from UK-sourced income and amounted to £8.72 million.

Grafton Group plc Annual Report 2014
104
Notes to the Group Financial Statements(continued)
9. Dividends (continued)The Board has agreed to pay a second interim dividend of 7.0 pence on the ‘C’ Ordinary shares in Grafton Group (UK) plc from UK-sourced income to all holders of Grafton Units on the Company’s Register of Members at the close of business on 20 March 2015 (the ‘Record Date’) and the cash consideration will be paid on 17 April 2015. A liability in respect of this second interim dividend has not been recognised at 31 December 2014, as there was no present obligation to pay the dividend at the year-end. The dividend payable on 17 April 2015 will be recognised in 2015.
10. Earnings per Share - GroupThe computation of basic, diluted and adjusted earnings per share is set out below:
2014 2013
£’000 £’000
Numerator for basic, adjusted and diluted earnings per share:Profit after tax for the financial year 80,022 62,099
Non-controlling interest 24 80
Numerator for basic and diluted earnings per share 80,046 62,179
Non-recurring pension credit - (29,964)
Tax relating to non-recurring pension credit - 4,729
Property impairment - 27,160
Deferred tax relating to property impairment - (3,774)
Recognition of a deferred tax asset - (8,546)
Numerator for adjusted earnings per share 80,046 51,784
Denominator for basic and adjusted earnings per share:Number of
Grafton UnitsNumber of
Grafton Units
Weighted average number of Grafton Units in issue 232,522,970 232,112,552
Effect of potential dilutive Grafton Units 2,973,005 987,480
Denominator for diluted earnings per share 235,495,975 233,100,032
Earnings per share (pence) - Basic 34.42 26.79
- Diluted 33.99 26.67
Adjusted earnings per share (pence) - Basic 34.42 22.31
- Diluted 33.99 22.22
The weighted average potential employee share entitlements over 3,369,310 Grafton Units (2013: 4,927,300) which are currently anti-dilutive are not included in the above calculation for diluted earnings per share and adjusted diluted earnings per share.

Business & Strategy Review Corporate Governance Financial Statements Shareholder Information
Grafton Group plc Annual Report 2014
105
11. Goodwill
2014 2013
£’000 £’000
CostAt 1 January 481,020 476,166
Arising on acquisitions (Note 27) 14,695 1
Translation adjustment (15,558) 4,853
At 31 December 480,157 481,020
Goodwill Acquired During the YearGoodwill acquired during the year in the amount of £14.7 million (2013: £1,000) was allocated to the Merchanting segment. Goodwill on these acquisitions reflects the anticipated purchasing and operational synergies to be realised as part of the enlarged Group. No intangible assets formed part of the acquisition consideration.
Cash-Generating UnitsThe Board has determined, for the purposes of IFRS 8 Operating Segments, that three operating segments exist, Merchanting, Retailing and Manufacturing. Goodwill is allocated to cash generating units, or groups of cash generating units, that represent the lowest level within the entity that goodwill is monitored for internal management purposes, which is at Operating Segment level.
2014 2013
£’000 £’000
Merchanting 476,808 477,435
Retailing 3,349 3,585
480,157 481,020
Impairment TestingGoodwill is subject to impairment testing on an annual basis at 31 December and additionally during the year if an indicator of impairment is considered to exist. No impairment charge was recognised by the Group in 2014 (2013: £Nil).
Impairment Testing MethodologyThe recoverable amount of each cash generating unit (group of units) is determined based on value in use calculations. The carrying value of each cash generating unit was compared to its estimated value in use. Value in use is calculated on the basis of estimated future cash flows discounted to present value.
Estimated future cashflows were determined by reference to the budget for 2015 and management reviewed forecasts for each of the following years from 2016 to 2019 inclusive. A long-term perpetuity growth rate was applied in respect of the years after 2019. The estimates of future cash flows were based on consideration of past experience together with an assessment of the future prospects for the Group’s Merchanting and Retailing businesses. This involved making assumptions concerning revenue trends, gross profit margins, overheads and operating profit margins.
The key assumptions used in the value in use calculations are the revenue growth rate, the discount rate and the perpetuity growth rate. The discount rate used was based on the Group’s weighted average cost of capital adjusted to reflect a risk premium. The weighted average cost of capital reflects an assumed equity return, based on the risk free rate for ten year Government bonds adjusted for an equity risk premium and the after-tax cost of debt. The discount rate applied was 8.75 per cent (2013: 8.75 per cent).
In determining a terminal value, it was assumed that cash flows after the first five years will increase at a nominal growth rate in perpetuity of 3 per cent (2013: 3 per cent). The rate assumed was based on an assessment of the likely long term growth prospects for the Merchanting and Retailing segments.
Significant Goodwill AmountsThe most significant cash generating unit (group of units) accounting for the majority of the carrying amount of goodwill is Merchanting.

Grafton Group plc Annual Report 2014
106
Notes to the Group Financial Statements(continued)
11. Goodwill (continued)
2014 2013
£’000 £’000
Carrying amount of goodwill 476,808 477,435
Basis on which recoverable amount assessed Value in use Value in use
Discount rate 8.75% 8.75%
Sensitivity AnalysisThe value in use calculations are sensitive to changes in assumptions, particularly relating to revenue growth, the discount rate and the nominal growth rate in perpetuity. Sensitivity analysis was performed based on changes in each of these factors. A reduction in the revenue growth rate by 2 percentage points would not give rise to impairment. Similarly, an increase in the discount rate from 8.75 per cent to 10 per cent would not give rise to impairment. A reduction in the nominal growth rate in perpetuity from 3 per cent to 2 per cent would not give rise to impairment.
Expected future cash flows are subject to known and unknown risks, uncertainties and other factors and are not a guarantee of future performance. Actual cash flows may therefore differ materially from estimated future cash flows. Similarly, if lower estimates of projected future cash flows were made, a higher discount rate was used, or a lower nominal growth rate in perpetuity was used, these changes would materially alter the present value of future cash flows.
Management identified the discount rate as a key assumption that could cause the carrying amount to exceed the recoverable amount. If the discount rate was changed to 24.0 per cent, the estimated recoverable amount would be equal to the carrying amount.
Allowing for reasonable possible change in any of the other key assumptions would not give rise to an impairment.

Business & Strategy Review Corporate Governance Financial Statements Shareholder Information
Grafton Group plc Annual Report 2014
107
12. Property, Plant and Equipment, Properties Held for Sale and Investment Properties12. (a) Property, Plant and Equipment
Freehold land and buildings
£’000
Leasehold buildings
£’000
Plant machinery and motor vehicles
£’000Total
£’000
Cost At 1 January 2013 371,388 78,263 247,192 696,843
Additions 706 269 23,695 24,670
Acquisitions (Note 27) 2,711 500 449 3,660
Disposals (410) (430) (8,416) (9,256)
Reclassification to properties held for sale (7,569) (155) - (7,724)
Reclassification to investment properties (43,145) - - (43,145)
Exchange adjustment 3,161 526 2,720 6,407
At 1 January 2014 326,842 78,973 265,640 671,455Additions 1,679 2,474 36,821 40,974Acquisitions (Note 27) 9,197 1,755 1,430 12,382Disposals (507) (243) (10,810) (11,560)Reclassifications (12,740) 352 12,388 -Reclassification to properties held for sale (982) - - (982)Reclassification to investment properties (3,683) - - (3,683)Reclassification from properties held for sale 850 - - 850Reclassification from investment properties 2,191 - - 2,191Exchange adjustment (10,073) (1,945) (8,978) (20,996)At 31 December 2014 312,774 81,366 296,491 690,631
DepreciationAt 1 January 2013 43,841 30,742 163,925 238,508
Charge for year 5,001 3,840 22,622 31,463
Impairment charge (Note 3) 25,448 - - 25,448
Disposals (66) (270) (7,930) (8,266)
Reclassification to properties held for sale (3,411) (64) - (3,475)
Reclassification to investment properties (28,496) - - (28,496)
Exchange adjustment 341 193 2,338 2,872
At 1 January 2014 42,658 34,441 180,955 258,054Charge for year 4,510 3,079 24,803 32,392Disposals (93) (70) (10,207) (10,370)Reclassifications (10,217) 55 10,162 -Reclassification to properties held for sale (230) - - (230)Reclassification to investment properties (714) - - (714)Reclassification from properties held for sale 501 - - 501Reclassification from investment properties 710 - - 710Exchange adjustment (3,917) (1,006) (8,200) (13,123)At 31 December 2014 33,208 36,499 197,513 267,220
Net book amountAt 31 December 2014 279,566 44,867 98,978 423,411At 31 December 2013 284,184 44,532 84,685 413,401

Grafton Group plc Annual Report 2014
108
Notes to the Group Financial Statements(continued)
12. Property, Plant and Equipment, Properties Held for Sale and Investment Properties (continued)12. (a) Property, Plant and Equipment (continued)The Group’s freehold and long leasehold properties located in the Republic of Ireland were professionally valued as at December 1998 by professional valuers in accordance with the Appraisal and Valuation Manual of the Society of Chartered Surveyors. Property acquired/purchased after December 1998 is stated at fair value or cost. The valuations which were made on an open market for existing use basis were deemed to be cost for the purpose of the transition to IFRS as adopted by the EU. The remaining properties, which are located in the United Kingdom and Belgium, are included at cost less depreciation.
Property, plant and equipment included leased assets as follows:Plant, machinery & motor vehicles Leasehold properties
2014 £’000
2013 £’000
2014 £’000
2013 £’000
Cost 180 193 6,117 6,382
Accumulated depreciation (116) (87) (2,914) (2,656)
Net book amount 64 106 3,203 3,726
Depreciation charge for year 37 45 272 276
The Group repaid finance leases amounting to £0.7 million (2013: £0.6 million) and entered new leases during the year of £Nil (2013: £Nil).
12. (b) Properties Held for Sale
Cost £’000
Accumulated Depreciation
£’000Net Book Value
£’000
At 1 January 2013 15,288 (836) 14,452
Transfers from property, plant and equipment 7,724 (3,475) 4,249
Impairment Charge - (1,712) (1,712)
Transfers to investment property (5,798) 586 (5,212)
Disposals (553) 77 (476)
Translation adjustment 97 (46) 51
At 31 December 2013 16,758 (5,406) 11,352Transfers from property, plant and equipment 982 (230) 752Transfers to property, plant and equipment (850) 501 (349)Impairment Charge - (666) (666)Transfers to investment property (616) 191 (425)Disposals (1,226) 338 (888)Translation adjustment (216) 21 (195)At 31 December 2014 14,832 (5,251) 9,581
During the year there were five disposals of United Kingdom (UK) properties held for sale, two UK transfers out to investment properties and one UK transfer out to property, plant and equipment. There were 4 transfers in of properties from property, plant and equipment during the year leaving 23 (2013: 27) properties of which 22 (2013: 26) are located in the United Kingdom and 1 (2013: 1) in Ireland. These properties are shown in the balance sheet at the lower of their carrying amount and fair value less any disposal costs. Eight properties are included at a fair value of £3.2 million.
Properties held for sale are not used in the course of business and are available for immediate sale in their present condition subject to terms that are usual and customary for properties of this nature. The individual properties were being actively marketed at the year end and the Group is committed to its plan to sell these properties.

Business & Strategy Review Corporate Governance Financial Statements Shareholder Information
Grafton Group plc Annual Report 2014
109
12. Property, Plant and Equipment, Properties Held for Sale and Investment Properties (continued)12. (c) Investment Properties
Cost £’000
Accumulated Depreciation
£’000Net Book Value
£’000
At 1 January 2013 - - -
Transfers from property, plant and equipment 43,145 (28,496) 14,649
Transfers from assets held for resale 5,798 (586) 5,212
At 31 December 2013 48,943 (29,082) 19,861Transfers from property, plant and equipment 3,683 (714) 2,969Transfers to property, plant and equipment (2,191) 710 (1,481)Transfers from assets held for resale 616 (191) 425Disposals (5,290) 4,558 (732)Revaluations - 420 420Translation adjustment (2,887) 1,898 (989)At 31 December 2014 42,874 (22,401) 20,473
Following completion of a review of its estate in 2014, an additional four United Kingdom properties and an additional two Irish properties were transferred into investment properties. There were two disposals (2013: Nil) of Irish investment properties during the year. One property in the United Kingdom was also transferred out of investment properties during 2014. The total number of investment properties at 31 December 2014 is 22 (2013: 19) of which 6 (2013: 3) are located in the United Kingdom and 16 (2013: 16) are located in Ireland. These properties are being held pending a recovery in the property market or with a view to enhancing their development potential by securing alternative use planning.
Investment properties of £20.5 million which are separately classified in non-current assets are carried at fair value in the financial statements. An internal review undertaken by the Group Property Director was used to determine fair values. The valuation techniques used were the market value of comparable transactions recently completed or on the market. In cases where there are no recent precedent transactions, valuations were based on estimated rental yields and consultations with external agents who have knowledge of local property markets.
12. (d) Fair Value Hierarchy – Properties Held for Sale Carried at fair Value and Investment PropertiesAs noted in the Group’s accounting policies on page 88, properties held for sale are held at the lower of cost and fair value and investment properties are carried at fair value. Fair value is defined as the price that would be received if the asset was sold in an orderly transaction between market participants based on the asset’s highest and best use. Valuations are reviewed each year by the Directors with movements in fair value recognised in the income statement.
The Group undertook an exercise to review its property portfolio during the year. Properties held for sale comprise land and buildings in a number of locations across Ireland and the UK. Investment property, comprising land and buildings located in Ireland and the UK, is held for capital appreciation and or rental income and is not occupied by the Group. This also includes parts of properties owned by the Group which are sublet to third parties. Properties held for sale comprise properties that are held at a cost of £6.4 million (2013: £6.5 million) and properties held at a fair value of £3.2 million (2013: £4.8 million). Included within investment properties are properties that are held at a fair value of £20.5 million.
In general, valuations have been undertaken having regard to comparable market transactions between informed market participants. Due to the reduced or very limited activity levels for transactions for properties of a similar nature in Ireland and the UK the valuations of a number of properties were determined internally with reference to local knowledge, valuation techniques and the exercise of judgement following consultation with property advisers with recent experience of the location and nature of the properties being valued.
The property valuations are derived from data which is not widely publicly available and involves a degree of judgement. For these reasons, the valuations of the Group’s property portfolio are classified as level 3 as defined by IFRS 13.

Grafton Group plc Annual Report 2014
110
Notes to the Group Financial Statements(continued)
12. Property, Plant and Equipment, Properties Held for Sale and Investment Properties (continued)The following is a summary of valuation methods used in relation to the Group’s properties held for sale and investment properties which are carried at fair value:
At 31 December 2014Comparable
market transactions
£’000
Offers from third parties
£’000Total 2014
£’000
Properties Held for SaleMerchanting segment 2,123 1,070 3,193
Comparable market
transactions £’000
Other methods
£’000Total 2014
£’000
Investment PropertiesMerchanting segment 16,672 - 16,672Manufacturing segment 2,715 1,086 3,801Total 19,387 1,086 20,473
At 31 December 2013Comparable
market transactions
£’000
Offers from third parties
£’000Total 2013
£’000
Properties Held for SaleMerchanting segment 4,137 709 4,846
Comparable market
transactions £’000
Other methods
£’000Total 2013
£’000
Investment PropertiesMerchanting segment 14,722 2,013 16,735
Manufacturing segment 3,126 - 3,126
Total 17,848 2,013 19,861

Business & Strategy Review Corporate Governance Financial Statements Shareholder Information
Grafton Group plc Annual Report 2014
111
12. Property, Plant and Equipment, Properties Held for Sale and Investment Properties (continued)The following table shows a reconciliation from the opening balance to the closing balance for level 3 fair values:
Properties held for sale
2014 £’000
Investment properties 2014
£’000
Balance at beginning of year 11,352 19,861
Transfers from property, plant and equipment 752 2,969
Transfers to property, plant and equipment (349) (1,481)
Transfers to investment property (425) -
Transfers from properties held for sale - 425
Disposals in year (888) (732)
Revaluations - 420
Impairment charge (666) -
Foreign exchange movement (195) (989)
Balance at end of year 9,581 20,473
Recorded at fair value 3,193 20,473
Recorded at cost 6,388 -
Total 9,581 20,473
The estimated fair value of certain properties in Ireland fell below cost resulting in an impairment charge of £0.7 million (2013: £1.7 million) relating to properties held for sale. These properties impaired during the year remain in properties held for sale at the year end. A gain of £0.4 million was recognised in investment properties in Ireland during the year. In 2013 an impairment charge of £25.5 million was incurred in respect of property transferred from property, plant and equipment to properties held for sale or investment properties at their fair value. The 2013 total impairment charge relating to properties at fair value in the year was £27.2 million as disclosed in Note 3.
Valuation Techniques and Significant Unobservable Inputs The following tables show the valuation techniques used in measuring the fair value of properties held for sale and investment properties and the significant unobservable inputs used. Where market transactions are present, the comparable market transaction method is used for land and buildings held for sale or capital appreciation.

Grafton Group plc Annual Report 2014
112
Notes to the Group Financial Statements(continued)
12. Property, Plant and Equipment, Properties Held for Sale and Investment Properties (continued)Properties Held for SaleValuation technique Significant unobservable inputs Inter-relationship between key unobservable
inputs and fair value measurement
Comparable market transactions - price per square metre: The value is based on comparable market transactions after discussion with independent agents and/or other information sources.
UK - Regional (excluding major cities)
• Comparable warehouse market prices of £259 - £363 per square metre.
• Comparable industrial development land prices of £50,000 - £600,000 per acre.
The estimated fair value would increase/(decrease) if:
• Comparable market prices per square metre were higher/(lower)
Offers from third parties:This valuation is used for properties that have formal offer documentation received by the Group from third parties intending to purchase with a reasonable possibility of a sale being concluded.
Ireland – UrbanConditional offer price for single redevelopment site £2.287m per acre.
UK - Regional (excluding major cities)
• Single offer figure for warehouse property of £105 per square metre.
• Single offer figure for office property at £1,025 per square metre.
• Offer price range for land and sites of between £72,000 and £651,000 per acre.
The estimated fair value would increase/(decrease) if:
• Final offer price increased/ (decreased)
Investment PropertiesValuation technique Significant unobservable inputs Inter-relationship between key unobservable
inputs and fair value measurement
Comparable market transactions - price per square metre: The value is based on comparable market transactions after discussion with independent registered property appraisers and/or other information sources.
Ireland - Urban
• Comparable minimum office market prices of £419 per square metre.
• Comparable minimum warehouse market prices of £203 per square metre.
• Comparable agricultural land market prices of £11,700 per acre.
• Comparable industrial or development land prices of £78,000 - £242,000 per acre.
Ireland - Regional
• Comparable warehouse market prices of £43 - £512 per square metre.
• Comparable market prices of development land £39,000 - £390,000 per acre.
UK - Regional (excluding major cities)
• Comparable warehouse market price of £251 - £336 per square metre.
• Comparable development sites priced at £325,000 - £1m per acre.
UK - Urban (major cities)
• A single redevelopment site with an industrial development land value of £1.125m per acre.
The estimated fair value would increase/(decrease) if:
• Comparable market prices per square metre were higher/(lower)

Business & Strategy Review Corporate Governance Financial Statements Shareholder Information
Grafton Group plc Annual Report 2014
113
13. Other Financial AssetsOther
Investments £’000
At 1 January 2013 144Disposals (20)
At 31 December 2013 124Translation adjustment (1)At 31 December 2014 123
Other investments represent sundry equity investments at cost which approximates fair value.
14. Intangible AssetsComputer Software
£’000
At 1 January 2014 -Additions 5,881Amortisation (124)At 31 December 2014 5,757
The intangible asset of £5.8 million at 31 December 2014 reflects the cost of the Group’s investment on upgrading the IT systems and infrastructure that supports a number of UK businesses as part of a multi-year programme of investment.
15. Inventories
2014 2013
£’000 £’000
Raw materials 1,183 1,046
Finished goods 14,248 7,446
Goods purchased for resale 234,475 237,728
249,906 246,220
The inventory provision at 31 December 2014 was £15.1 million (31 December 2013: £20.9 million).

Grafton Group plc Annual Report 2014
114
Notes to the Group Financial Statements(continued)
16. Trade and Other Receivables
2014 2013
£’000 £’000
Amounts falling due within one year:Trade receivables 215,903 200,411
Other receivables 86,968 107,411
302,871 307,822
The carrying amount of trade and other receivables represents the maximum credit exposure.
The maximum exposure to credit risk for trade debtors and other receivables at the reporting date by geographic region was as follows:
Carrying Amount
2014 2013
£’000 £’000
Ireland 49,529 49,449
Belgium 17,435 10,592
United Kingdom 235,907 247,781
302,871 307,822
Credit risk is well diversified over a broad customer base with only a small number of accounts with balances in excess of £100,000 that collectively account for a small proportion of total trade receivables.
The ageing of trade and other receivables at 31 December was:
Gross Value Impairment Carrying Amount Gross Value Impairment
Carrying Amount
2014 2014 2014 2013 2013 2013
£’000 £’000 £’000 £’000 £’000 £’000
Not Past Due 241,997 - 241,997 252,015 - 252,015
Past Due0-30 days 41,320 (877) 40,443 38,276 (691) 37,585
30-60 days 24,578 (5,026) 19,552 24,326 (6,330) 17,996
+60 days 4,331 (3,452) 879 3,459 (3,233) 226
70,229 (9,355) 60,874 66,061 (10,254) 55,807
312,226 (9,355) 302,871 318,076 (10,254) 307,822
Movement in Impairment Provision
2014 2013
£’000 £’000
At 1 January 10,254 12,417
Written-off during year (2,375) (3,720)
Additional provision 1,810 1,391
Translation adjustment (334) 166
At 31 December 9,355 10,254

Business & Strategy Review Corporate Governance Financial Statements Shareholder Information
Grafton Group plc Annual Report 2014
115
17. Share Capital and Share Premium
Group and Company 2014 2013
€’000 €’000
Authorised:
Equity shares300 million ordinary shares of 5c each 15,000 15,000
30 billion ‘A’ ordinary shares of 0.001c each 300 300
15,300 15,300
Issue Price Number of Shares
2014 Nominal Value
£’000
2013 Nominal Value
£’000
Issued and fully paid:
Ordinary shares
At 1 January 232,933,607 8,280 8,261
Issued under UK SAYE scheme 19,213 1 1
Grafton Group Share Scheme
Date options and entitlements to acquire shares granted
May 2011 LTIP Nil 137,818 6 -
November 2003 €5.45 - - 18
At 31 December 233,090,638 8,287 8,280
‘A’ ordinary shares
At 1 January 3,959,871,319 22 22
‘A’ ordinary shares issued in year 2,669,527 - -
At 31 December 3,962,540,846 22 22
Total nominal share capital issued 8,309 8,302
Share Premium
2014 2013
Group £’000 £’000
At 1 January 206,554 204,614
Premium on issue of shares under UK SAYE scheme 43 21
Premium on issue of shares under Grafton Group Share Scheme - 1,944
Cost of share issues - (25)
At 31 December 206,597 206,554
Grafton Units Issued During 2014The number of Grafton Units issued during the year under the Group’s Executive Share Schemes and the UK SAYE scheme was 157,031 (2013: 434,994) and the total consideration received amounted to £50,000 (2013: £1,984,000). Costs relating to the issues were £Nil (2013: £25,000).
Grafton UnitsAt 31 December 2014 and at 31 December 2013, a Grafton Unit comprised one ordinary share of 5 cent and seventeen ‘A’ ordinary shares of 0.001 cent each in Grafton Group plc and one ‘C’ ordinary share of Stg0.0001p in Grafton Group (UK) plc.

Grafton Group plc Annual Report 2014
116
Notes to the Group Financial Statements(continued)
17. Share Capital and Share Premium (continued)Ordinary SharesThe holders of ordinary shares are entitled to attend, speak and vote at all General Meetings of the Company.
‘A’ Ordinary SharesAt 31 December 2014, there were seventeen ‘A’ Ordinary shares per Grafton Unit.
All ‘A’ ordinary shares purchased from 2004 to 2009 were cancelled.
The ‘A’ ordinary shares rank pari passu with ordinary shares regarding any dividends declared. On a return of capital on a winding up or otherwise (other than on conversion, redemption or purchase of shares), the holders of ‘A’ ordinary shares are entitled, pari passu with the holders of the ordinary shares, to the repayment of their nominal value of 0.001 cent per share, with no right to participate any further. The holders of the ‘A’ ordinary shares are not entitled to receive notice of any general meeting of Grafton or to attend, speak or vote at any such general meeting, unless the business of the meeting includes a resolution varying or abrogating any of the special rights attaching to such shares.
‘C’ Ordinary Shares (in Grafton Group (UK) plc)The ‘C’ ordinary shares do not entitle their holders to receive notice of, attend or vote at any general meeting of Grafton Group (UK) plc unless the business of the meeting includes a resolution varying or abrogating any of the special rights attaching to such shares. If dividends are declared on ‘C’ ordinary shares, the holder of a Grafton Unit shall be entitled to be paid dividends in respect of the ‘C’ ordinary shares comprised in such Grafton Unit. On a return of capital on a winding up or otherwise (other than on conversion, redemption or purchase of shares) the holders of ‘C’ ordinary shares are entitled, pari passu with the holders of the ‘A’ ordinary shares and ‘B’ ordinary shares in Grafton Group (UK) plc, to the repayment of their nominal value of Stg0.0001p per share, with no right to participate any further. Any holder of a ‘C’ ordinary share, with the prior approval of an extraordinary resolution of the holders of the ‘C’ ordinary shares or with the prior consent in writing of the holders of at least three quarters in nominal value of the issued ‘C’ ordinary shares, is entitled to call for all the holders of the ‘A’ ordinary shares and/or ‘B’ ordinary shares to acquire all the ‘C’ ordinary shares at their nominal value.
Treasury SharesThe Group holds 500,000 (2013: 500,000) Grafton Units at a cost of £3,897,000 (2013: £3,897,000) as treasury shares.
18. Group Statement of Changes in EquityThe capital redemption reserve is a legal reserve which arose from the purchase of ‘A’ ordinary shares, the redemption of redeemable shares in prior years and the buy-back and cancellation of shares.
The revaluation reserve was created as a result of a revaluation of Irish properties in 1998.
The shares to be issued reserve comprises amounts expensed in the income statement in connection with share-based payments, net of transfers to retained earnings on the exercise of share entitlements and the lapsing of such entitlements.
The cash flow hedge reserve comprises the effective portion of the cumulative net change in the fair value of cash flow hedging instruments related to hedged transactions that have not yet occurred.
The foreign currency translation reserve arises from the currency effect on translation of the investment in subsidiaries with euro functional currencies as adjusted for foreign currency borrowings and derivatives designated as net investment hedges.
Non-Controlling InterestsThe Group acquired a controlling interest in YouBuild NV (formerly BMC Groep NV), a Belgian builders merchanting business on 31 October 2012. This company is accounted for as a subsidiary undertaking with a non-controlling interest.

Business & Strategy Review Corporate Governance Financial Statements Shareholder Information
Grafton Group plc Annual Report 2014
117
19. Interest-Bearing Loans and Borrowings
2014 2013
£’000 £’000
Non-current liabilitiesSterling bank loans 26,469 40,456
Euro bank loans 214,739 215,879
2005 unsecured senior US dollar loan notes - 6,668
2005 unsecured senior US dollar loan notes (Stg) - 5,878
Finance leases 3,097 3,729
244,305 272,610
Current liabilitiesSterling bank loans 181 181
Euro bank loans 1,009 631
2005 unsecured senior US dollar loan notes 6,982 6,735
2005 unsecured senior US dollar loan notes (Stg) 5,879 5,880
Finance leases 371 436
14,422 13,863
The decrease in non-current interest bearing loans and borrowings and the increase in current interest bearing loans and borrowings reflects changes in the maturity profile of the Group’s debt at 31 December 2014; debt repaid and drawn during the year including a partial repayment of 2005 unsecured senior US dollar loan notes and the retranslation of euro debt into sterling at the closing year end exchange rate.
2005 Unsecured Senior US Dollar Loan NotesIn June 2005, the Group completed a US$325.0 million debt financing at fixed interest rates ranging from 4.68 per cent to 4.88 per cent in the US Private Placement Market and issued unsecured senior loan notes maturing between 2008 and 2015. US$250.0 million of the US dollar proceeds were swapped into sterling using a cross currency interest rate derivative which also changed the interest rate payable on the loan notes to sterling rates based on six month LIBOR rates plus a margin. The balance of US$75.0 million was received in sterling and the interest rate payable on the amount outstanding is currently variable by reference to three month LIBOR rates.

Grafton Group plc Annual Report 2014
118
Notes to the Group Financial Statements(continued)
19. Interest-Bearing Loans and Borrowings (continued)Maturity of Financial LiabilitiesThe maturity profile of the Group’s interest bearing financial liabilities (bank debt, loan notes and finance leases) can be summarised as follows:
Bank loans Loan notesFinance
leases Total Bank loans Loan notesFinance
leases Total
2014 2014 2014 2014 2013 2013 2013 2013
£’000 £’000 £’000 £’000 £’000 £’000 £’000 £’000
Due within one year 1,190 12,861 371 14,422 812 12,615 436 13,863Between one and two years 715 - 371 1,086 777 12,546 389 13,712Between two and three years 531 - 371 902 254,870 - 389 255,259Between three and four years 227 - 371 598 515 - 389 904Between four and five years 239,735 - 371 240,106 173 - 389 562After five years - - 1,613 1,613 - - 2,173 2,173
242,398 12,861 3,468 258,727 257,147 25,161 4,165 286,473Derivatives (1,051) (1,637)Gross Debt 257,676 284,836Cash and short term deposits (182,360) (151,099)Net debt 75,316 133,737
Shareholders’ equity 902,253 870,296
Gearing 8% 15%
The following table indicates the effective interest rates at 31 December 2014 in respect of interest bearing financial assets and financial liabilities and the periods during which they re-price. The effective interest rate and timing of re-pricing were adjusted for the effect of derivatives.
Effective Interest Rate Total
6 months or less
6 to 12 months 1-2 years 2-5 years
More than 5 years
£’000 £’000 £’000 £’000 £’000 £’000
Sterling deposits 0.50% 18,622 18,622 - - - -Euro deposits 0.25% 17,877 17,877 - - - -Cash at bank 0-0.7% 145,861 145,861 - - - -Cash and cash equivalents 182,360 182,360 - - - -
Floating rate debt:Euro loans 1.62% (200,170) (200,170) - - - -Sterling loans 2.10% (26,650) (26,650) - - - -Total floating rate debt (226,820) (226,820) - - - -
Fixed rate debt:Euro loans 2.00% (15,578) (15,578) - - - -Finance leases 6.00% (3,468) (186) (185) (371) (1,113) (1,613)Total fixed rate debt (19,046) (15,764) (185) (371) (1,113) (1,613)Floating rate loan notes:US dollar loan notes 2005 1.24% (6,982) (6,982) - - - -US dollar loan notes 2005 (Stg) 1.11% (5,879) (5,879) - - - -Total loan notes (12,861) (12,861) - - - -Derivatives 1,051 1,051 - - - -Total Net Debt (75,316) (72,034) (185) (371) (1,113) (1,613)

Business & Strategy Review Corporate Governance Financial Statements Shareholder Information
Grafton Group plc Annual Report 2014
119
19. Interest-Bearing Loans and Borrowings (continued)Borrowing FacilitiesThe Group had an undrawn committed borrowing facility at 31 December 2014 of £207.5 million (2013: £111.6 million) in respect of which all conditions precedent were met and which expires in May 2019 following the refinancing which was completed in May 2014 (2013: £30.0 million was due to expire in 2014 and £81.6 million was due to expire in 2016).
The following table indicates the effective interest rates at 31 December 2013 in respect of interest bearing financial assets and financial liabilities and the periods in which they re-price. The effective interest rate and timing of re-pricing were adjusted for the effect of derivatives.
Effective Interest Rate Total
6 monthsor less
6 to 12 months 1-2 years 2-5 years
More than 5 years
£’000 £’000 £’000 £’000 £’000 £’000
Sterling deposits 0.35% 40,106 40,106 - - - -
Euro deposits 0.36% 19,246 19,246 - - - -
US dollar deposits 0.10% 993 993 - - - -
Cash at bank 0-0.5% 90,754 90,754 - - - -
Cash and cash equivalents 151,099 151,099 - - - -
Floating rate debt:Euro loans 2.90% (199,836) (199,836) - - - -
Sterling loans 3.30% (40,637) (40,637) - - - -
Total floating rate debt (240,473) (240,473) - - - -
Fixed rate debt:Euro loans 5.65% (16,674) (16,674) - - - -
Finance leases 6.00% (4,165) (218) (218) (389) (1,167) (2,173)
Total fixed rate debt (20,839) (16,892) (218) (389) (1,167) (2,173)
Floating rate loan notes:US dollar loan notes 2005 1.15% (13,403) (13,403) - - - -
US dollar loan notes 2005 (Stg) 1.06% (11,758) (11,758) - - - -
Total loan notes (25,161) (25,161) - - - -
Derivatives 1,637 1,637 - - - -
Total Net Debt (133,737) (129,790) (218) (389) (1,167) (2,173)

Grafton Group plc Annual Report 2014
120
Notes to the Group Financial Statements(continued)
20. Financial Instruments and Financial RiskThe fair values of financial assets and liabilities together with the carrying amounts shown in the balance sheet are as follows:
At 31 December 2014Available
for saleCashflow
hedge
Fair value through profit
and lossLoans and
receivablesLiabilities at
amortised cost
Total carrying
value Fair value
£’000 £’000 £’000 £’000 £’000 £’000 £’000
Other financial assets* 123 - - - - 123 -Trade and other receivables* - - - 302,871 - 302,871 -Cash and cash equivalents* - - - 182,360 - 182,360 -Cross-currency interest rate swaps - - 1,095 - - 1,095 1,095
123 - 1,095 485,231 - 486,449 1,095 Interest rate swaps - (44) - - - (44) (44)Euro bank loans - - - - (215,748) (215,748) (215,748)Sterling bank loans - - - - (26,650) (26,650) (26,650)Finance leases - - - - (3,468) (3,468) (3,468)Trade and other payables* - - - - (425,696) (425,696) -2005 unsecured senior US dollar loan notes - - - - (12,861) (12,861) (12,714)
- (44) - - (684,423) (684,467) (258,624)
At 31 December 2013Available
for saleCashflow
hedge
Fair value through profit
and lossLoans and
receivablesLiabilities at
amortised cost
Total carrying
value Fair value
£’000 £’000 £’000 £’000 £’000 £’000 £’000
Other financial assets* 124 - - - - 124 -
Trade and other receivables* - - - 307,822 - 307,822 -
Cash and cash equivalents* - - - 151,099 - 151,099 -
Cross-currency interest rate swaps - - 1,670 - - 1,670 1,670
124 - 1,670 458,921 - 460,715 1,670
Interest rate swaps - (33) - - - (33) (33)
Euro bank loans - - - - (216,510) (216,510) (216,510)
Sterling bank loans - - - - (40,637) (40,637) (40,637)
Finance leases - - - - (4,165) (4,165) (4,165)
Trade and other payables* - - - - (410,011) (410,011) -
2005 unsecured senior US dollar loan notes - - - - (25,161) (25,161) (24,761)
- (33) - - (696,484) (696,517) (286,106)
*The Group has not disclosed the fair values of financial instruments such as short term receivables and payables because their carrying value closely approximates fair value.

Business & Strategy Review Corporate Governance Financial Statements Shareholder Information
Grafton Group plc Annual Report 2014
121
20. Financial Instruments and Financial Risk (continued)Fair ValueA number of the Group’s accounting policies and disclosures require the determination of fair value, for both financial and non-financial assets and liabilities. Set out below is an analysis of financial instruments carried at fair value, by valuation method. The different levels in the fair value hierarchy have been defined as follows:
Level 1: quoted (unadjusted) prices in active markets for identical assets or liabilities.Level 2: inputs other than quoted prices included within level 1 that are observable, either directly or indirectly.Level 3: inputs that are not based on observable market data.
Fair values have been determined for measurement and/or disclosure purposes based on the following methods.
• Trade and other receivables/trade and other payables For receivables and payables with a remaining life of less than six months or demand balances, fair value is the amount that is payable contractually less an impairment provision where appropriate.
• Cash and cash equivalents, including short-term bank depositsFor short term bank deposits and cash and cash equivalents, all of which have a remaining maturity of less than three months, the carrying amount is a reasonable approximation of fair value.
• Other financial assetsCertain of the Group’s financial assets are comprised of investments that do not have a quoted market price in an active market and whose fair value cannot be reliably measured. Such investments are measured at cost less provision for impairment where appropriate and applicable.
• Derivative instruments (Cross currency interest rate swaps and interest rate swaps)The fair values of cross currency interest rate swaps and interest rate swaps are calculated as the present value of the estimated future cash flows based on the terms and maturity of each contract and using forward currency rates and market interest rates as applicable for a similar instrument at the measurement date. Fair values reflect the credit risk of the instrument and include adjustments to take account of the credit risk of the Group entity and counterparty where appropriate.
• Interest bearing loans and borrowingsFor floating rate interest bearing loans and borrowings with a contractual repricing date of less than six months, the nominal amount is deemed to reflect fair value. For loans with repricing dates of greater than six months, the fair value is calculated based on the present value of the expected future principal and interest cash flows discounted at interest rates effective at the balance sheet date and adjusted for credit spread.
• Finance lease liabilitiesFair value is based on the present value of future cash flows discounted at market rates and credit spread.

Grafton Group plc Annual Report 2014
122
Notes to the Group Financial Statements(continued)
20. Financial Instruments and Financial Risk (continued)Fair Value (continued)The following table shows the fair values of financial assets and liabilities including their level in the fair value hierarchy. It does not include fair value information for financial assets and financial liabilities not measured at fair value if the carrying amount is a reasonable approximation of fair value.
2014 2014 2014 2014
Total Level 1 Level 2 Level 3
£’000 £’000 £’000 £’000
Assets measured at fair value
At fair value through profit or lossCross currency interest rate swaps 1,095 - 1,095 -
Liabilities measured at fair value
Designated as hedging instrumentsInterest rate swaps (44) - (44) -
Liabilities not measured at fair value
Liabilities at amortised costEuro bank loans (215,748) - (215,748) -Sterling bank loans (26,650) - (26,650) -Finance leases (3,468) - (3,468) -2005 unsecured senior US dollar Loan Notes (12,714) - (12,714) -
(258,580) - (258,580) -
2013 2013 2013 2013
Total Level 1 Level 2 Level 3
£’000 £’000 £’000 £’000
Assets measured at fair value
At fair value through profit or lossCross currency interest rate swaps 1,670 - 1,670 -
Liabilities measured at fair value
Designated as hedging instrumentsInterest rate swaps (33) - (33) -
Liabilities not measured at fair value
Liabilities at amortised costEuro bank loans (216,510) - (216,510) -
Sterling bank loans (40,637) - (40,637) -
Finance leases (4,165) - (4,165) -
2005 unsecured senior US dollar Loan Notes (24,761) - (24,761) -
(286,073) - (286,073) -

Business & Strategy Review Corporate Governance Financial Statements Shareholder Information
Grafton Group plc Annual Report 2014
123
20. Financial Instruments and Financial Risk (continued)Fair Value (continued) Level 2 Fair Values
Type Valuation technique Significant unobservable inputs
Inter-relationship between key unobservable inputs and fair value measurement
Financial assets and liabilities measured at fair value
Cross currency interest swaps and interest rate swaps
The fair values are based on broker quotes. Similar contracts are traded in an active market and the quotes reflect the actual transactions in similar instruments
Not applicable Not applicable
Financial assets and liabilities not Held at fair value
Other financial liabilities* Discounted cash flows Not applicable Not applicable
*Other financial liabilities include Euro bank loans, Sterling bank loans, finance leases and 2005 unsecured senior US dollar loan notes
Risk Exposures and Group Treasury PolicyThe Group’s operations expose it to various financial risks that include credit risk, liquidity risk, currency risk and interest rate risk. The Group’s treasury policies, which are regularly reviewed, are designed to reduce financial risk in a cost efficient way. A limited number of foreign exchange swaps, spot foreign currency contracts and interest rate swaps are undertaken periodically to hedge underlying interest rate, fair value and currency exposures and it is Board policy to manage these risks in a non-speculative manner.
The Group has exposure to the following risks from its use of financial instruments:
• credit risk
• liquidity risk
• currency risk
• interest rate risk
The manner in which the Group is exposed to each of these risks and the risk management policies applied are discussed below.
The Board of Directors has the overall responsibility for the establishment and oversight of the Group’s risk management framework. The Board is responsible for developing and monitoring the Group’s risk management policies.
The Board and the Audit and Risk Committee have reviewed the process for identifying, evaluating and managing the significant risks affecting the business.

Grafton Group plc Annual Report 2014
124
Notes to the Group Financial Statements(continued)
20. Financial Instruments and Financial Risk (continued)Credit RiskCredit risk arises from credit granted to customers. Credit risk also arises on cash and cash equivalents, derivative financial instruments and cash and deposits with banks and financial institutions.
Exposure to credit risk is monitored on an ongoing basis. Credit evaluations are performed regularly. New customers are subject to initial credit checks that include trade and bank references. New customers are generally subject to restricted credit limits prior to developing a credit history. Due to the established nature of the businesses a high proportion of customers have long-standing trading relationships with Group companies. These established customers are reviewed regularly for financial strength and the appropriateness of their credit limit.
The Group establishes a provision for impairment that represents its estimate of losses in respect of trade and other receivables. The main components of this provision are a specific loss component that relates to individually significant exposures and a collective loss component established for groups of similar assets in respect of losses that have been incurred but not yet identified.
Cash and short term bank deposits are invested with a range of banks, all with original maturities of less than 3 months at 31 December 2014.
The maximum exposure to credit risk is represented by the carrying amount of each financial asset, including derivative financial instruments, in the balance sheet.
The maximum exposure to credit risk at 31 December 2014 and 31 December 2013 was:
2014 2013
£’000 £’000
Trade and other receivables 302,871 307,822
Cash and cash equivalents 182,360 151,099
Cross currency interest rate swaps 1,095 1,670
486,326 460,591
Additional disclosures in relation to the Group’s exposure to credit risk arising from trade and other receivables is set out in Note 16.
The maximum exposure to credit risk for cash and cash equivalents at the reporting date was:
Carrying Amount
2014 2013
£’000 £’000
Domestic banks 46,792 59,903
United Kingdom banks 131,730 89,481
Belgian banks 3,838 1,715
182,360 151,099
The cash on deposit is primarily held with Bank of Ireland, HSBC, Ulster Bank, Barclays and Lloyds Bank. The Group has netting arrangements in place with Bank of Ireland and Lloyds Bank plc with cash balances and overdrawn positions being netted as a legal right of set-off exists with each bank. At 31 December 2014 total overdrawn positions of £20.6 million are offset against cash balances.

Business & Strategy Review Corporate Governance Financial Statements Shareholder Information
Grafton Group plc Annual Report 2014
125
20. Financial Instruments and Financial Risk (continued)Foreign Currency Risk ManagementTransactional foreign exchange risk arises from foreign currency transactions, assets and liabilities. Group operations manage foreign exchange trading risks against the functional currency. The majority of trade conducted by the Group’s Irish and Belgian businesses is in euro. Sterling is the principal currency for the Group’s UK businesses. Currency risks are regularly monitored and managed by utilising spot and forward foreign currency contracts as appropriate for settling liabilities arising from the purchase of goods for resale in non-functional currencies. The majority of transactions entered into by Group entities are denominated in functional currencies and no significant level of hedging is required.
A portion of the Group’s net worth is denominated in euro reflecting profit after tax reserves retained in euro denominated trading and finance companies which gives rise to translation differences on conversion to sterling.
Borrowings made in a non-functional currency are swapped into a functional currency.
As referred to later in this note under hedging, part of the dollar borrowings under the Group’s 2005 US notes are exposed to spot foreign exchange movements at the balance sheet date. The impact of the movement in the spot rate is taken to the income statement.
Sensitivity AnalysisA ten per cent strengthening of the sterling exchange rate against the euro exchange rate at the balance sheet date would have decreased equity and profit after tax by the amount shown below. This assumes that all variables, in particular the results and financial position of each euro functional currency entity and interest rates, remained constant. A ten per cent weakening of the sterling exchange rate against the euro exchange rate would have an equal and opposite effect on the amounts shown below on the basis that all variables remain constant.
Equity Profit after tax
£’000 £’000
31 December 201410% strengthening of sterling currency against the euro (11,400) (500)
31 December 2013
10% strengthening of sterling currency against the euro (11,600) 1,800
HedgingThe Group has exposure to changes in interest rates on certain debt instruments and has hedged an element of this risk by entering into interest rate swaps. The nominal value of contracts outstanding is £15,578,000 (2013: £16,674,000) and the period hedged was from December 2014 to May 2019 (2013: January 2009 to January 2014).
The Group classified interest rate swaps as cash flow hedges and stated them at their fair value. The fair value of these swaps at 31 December 2014 was a liability of £0.04 million (31 December 2013: a liability of £0.03 million). A net charge of £132,000 (31 December 2013: a credit of £511,000) was recorded in the cash flow hedge reserve in other comprehensive income and a balance of £Nil (31 December 2013: £10,000), being the ineffective portion of the hedge, was taken to the Group Income Statement (Note 6).
The Group has exposure to fair value risk and US dollar fluctuations through its fixed rate US dollar Private Placement loan notes. The Group’s policy is to hedge this exposure to currency and fair value movements. This was initially achieved by entering into a number of cross currency interest rate swaps that swapped the debt into floating rate sterling.
The Group originally designated its cross currency interest rate swaps (CCIRS) as both a hedge of its fair value exposure to interest rate fair value and currency risk associated with its fixed rate firm commitment in its US$ Senior Notes and a hedge of the Group’s exposure to foreign currency risk arising on its net investment hedge in operations in the UK. Certain CCIRS fell out of hedge accounting at 30 June 2011 as noted below. The fair value of these swaps at 31 December 2014 was an asset of £1,095,000 (31 December 2013: £1,670,000) and was reflected in current assets of £1,095,000 (2013: £835,000) and non-current assets of £Nil (2013: £835,000).

Grafton Group plc Annual Report 2014
126
Notes to the Group Financial Statements(continued)
20. Financial Instruments and Financial Risk (continued)Hedging (continued)Movements in fair value have been recognised in the income statement as set out in Note 6.
Effectiveness testing performed on the Group’s hedging relationships at 31 December 2011 revealed that two of the Group’s cross currency interest rate swaps were ineffective. As a result, hedge accounting ceased with effect from 30 June 2011, the last reporting date on which the hedges were proven to be effective.
The effect of ceasing to hedge account in respect of these two cross currency interest rate swaps is that all fair value movements on the two swaps from 30 June 2011 were reflected in the income statement while the associated US dollar loans are now accounted for at spot rate on the balance sheet with the impact of the movement in the spot rate taken to the income statement. The cumulative fair value adjustment recognised on the loans at 30 June 2011 is amortised to the income statement over the remaining term of the borrowings. The net income statement impact in the current year, being the difference between the amounts recorded and the amounts that would have been recorded had the hedge remained effective, was a charge of £0.7 million (2013: credit of £0.4 million) to finance income and expense.
Interest Rate RiskThe majority of the Group’s ongoing operations are financed from a mixture of cash generated from operations and borrowings. Other than the US dollar borrowings which were secured at fixed interest rates, borrowings are initially secured at floating interest rates and interest rate risk is monitored on an ongoing basis. Interest rate swaps are used to manage interest rate risk when considered appropriate having regard to the interest rate environment.
Cash Flow Sensitivity Analysis for Variable Rate InstrumentsA reduction of 100 basis points in interest rates at the reporting date would have increased profit before tax and equity by £0.8 million (2013: £1.3 million) on the basis of the Group’s net debt of £75.3 million. An increase of 100 basis points, on the same basis, would have an equal and opposite effect.
Capital ManagementThe capital structure of the Group comprises share capital, reserves and net debt.
The overall approach is to optimise shareholder value by leveraging the balance sheet to an appropriate level having regard to economic and trading conditions in the Group’s markets, the level of internal cash generation, credit conditions generally and interest rates payable.
The Group’s capital structure is kept under ongoing review and the debt component is actively managed with a view to maintaining diversified sources of funding, significant undrawn facilities and cash deposits.
The Directors monitor the Company’s share price and may from time to time exercise their powers to make market purchases of the Company’s own shares, at price levels which they consider to be in the best interests of the shareholders generally, after taking account of the Company’s overall financial position.
The principal bank covenants are a net debt to equity ratio limit of 85 per cent, EBITDA interest cover of 4 times and a minimum shareholders’ equity of £0.64 billion at 31 December 2014.
At 31 December 2014 the net debt to equity ratio was 8 per cent and shareholders’ equity was £0.9 billion. EBITDA for the year was £142.6 million and underlying EBITDA interest cover for 2014 was 19.4 times.

Business & Strategy Review Corporate Governance Financial Statements Shareholder Information
Grafton Group plc Annual Report 2014
127
20. Financial Instruments and Financial Risk (continued)Funding and LiquidityThe Group has cash resources at its disposal through the holding at the year-end of deposits and cash balances of £182.4 million (31 December 2013: £151.1 million) which together with undrawn bank facilities of £207.5 million and cash-flow from operations should provide flexibility in financing its operations.
The following are the undiscounted contractual maturities of financial liabilities, including interest payments.
31 December 2014Carrying Amount
Contractual Cash Flow*
Within 1 Year
Between 1 and 2 Years
Between 2 and 5 Years
Greater Than 5 Years
£’000 £’000 £’000 £’000 £’000 £’000
Non-Derivative Financial
LiabilitiesBank loans 242,398 263,725 5,468 4,811 253,446 -US dollar loan notes 12,861 12,946 12,946 - - -Finance lease liabilities 3,468 11,609 631 631 1,896 8,451Trade and other payables 425,696 425,696 425,696 - - -
Derivative Financial Instruments
Cross-currency swaps not in
hedge relationship
- Outflow - 5,936 5,936 - - -- Inflow (1,095) (7,036) (7,036) - - -Interest rate swaps used for hedging 44 44 28 28 (12) -
683,372 712,920 443,669 5,470 255,330 8,451
*Includes interest based on the rates in place at 31 December 2014.
31 December 2013Carrying Amount
Contractual Cash Flow*
Within 1 Year
Between 1 and 2 Years
Between 2 and 5 Years
Greater Than 5 Years
£’000 £’000 £’000 £’000 £’000 £’000
Non-Derivative Financial
LiabilitiesBank loans 257,147 281,982 9,022 8,855 264,065 40
US dollar loan notes 25,161 25,467 12,922 12,545 - -
Finance lease liabilities 4,165 12,981 865 663 1,928 9,525
Trade and other payables 410,011 410,011 410,011 - - -
Derivative Financial Instruments
Cross-currency swaps not in
hedge relationship
- Outflow - 11,953 6,006 5,947 - -
- Inflow (1,670) (13,586) (6,951) (6,635) - -
Interest rate swaps used for hedging 33 135 135 - - -
694,847 728,943 432,010 21,375 265,993 9,565
*Includes interest based on the rates in place at 31 December 2013.

Grafton Group plc Annual Report 2014
128
Notes to the Group Financial Statements(continued)
20. Financial Instruments and Financial Risk (continued)The following table indicates the periods in which cash flows associated with derivatives that are cash flow hedges are expected to occur.
31 December 2014Carrying Amount
Expected Cash Flow
6 Months or Less
6 to 12 Months
1 to 2 Years
2 to 3 Years
3 to 4 Years
4 to 5 Years
£’000 £’000 £’000 £’000 £’000 £’000 £’000 £’000
Interest rate swaps (44) (44) (13) (15) (28) (13) 12 13
31 December 2013Carrying Amount
Expected Cash Flow
6 Months or Less
6 to 12 Months
1 to 2 Years
2 to 3 Years
3 to 4 Years
4 to 5 Years
£’000 £’000 £’000 £’000 £’000 £’000 £’000 £’000
Interest rate swaps (33) (135) (135) - - - - -
21. Derivatives
2014 2013
£’000 £’000
Included in non-current liabilities:Fair value of interest rate swaps (44) -
Included in current liabilities:Fair value of interest rate swaps - (33)
(44) (33)
Included in non-current assets:Fair value of cross currency swaps - 835
Included in current assets:Fair value of cross currency swaps 1,095 835
1,095 1,670
The decrease in derivatives (current and non-current) at 31 December 2014 is mainly due to movements in the fair values of the remaining cross-currency and interest rate swaps.

Business & Strategy Review Corporate Governance Financial Statements Shareholder Information
Grafton Group plc Annual Report 2014
129
21. Derivatives (continued)Nature of derivative instruments as at 31 December 2014
Contract Period Nature of instrument
Notional payableamount of contracts
outstanding
Notional receivable amount of contracts
outstanding
Fair value asset£’000
Fair value liability
£’000
Cross Currency Swap*
June 2005 to June 2015
Fixed Rate USD $ to floating
Stg £
USD$10,714,289 STG£5,899,937 1,095 -
Hedge Period
Nature of hedging instrument
Notional payable amount of contracts
outstanding
Notional receivable amount of contracts
outstanding
Fair value Asset£’000
Fair value liability
£’000
Interest Rate Swap
Dec 2014 to May 2019
Floating interest
rate to fixed interest rate
€20,000,000 €20,000,000 - (44)
*Not in hedge relationship
Nature of derivative instruments as at 31 December 2013
Contract Period Nature of instrument
Notional payableamount of contracts
outstanding
Notional receivable amount of contracts
outstanding
Fair value asset£’000
Fair value liability
£’000
Cross currency Swap*
June 2005 to June 2015
Fixed Rate USD $ to floating
Stg £
USD$21,428,574 STG£11,799,874 1,670 -
Hedge Period
Nature of hedging instrument
Notional payable amount of contracts
outstanding
Notional receivable amount of contracts
outstanding
Fair value Asset£’000
Fair value liability
£’000
Interest Rate Swap
Jan 2009 to Jan 2014
Floating interest rate to fixed interest rate
€20,000,000 €20,000,000 - (33)
*Not in hedge relationship

Grafton Group plc Annual Report 2014
130
Notes to the Group Financial Statements(continued)
22. Provisions
2014 2013
£’000 £’000
Non-current liabilitiesInsurance provision 7,582 7,412
Onerous lease provision 8,819 9,614
Dilapidations provision 4,454 4,370
Pension settlement contributions - 1,267
Other provisions - -
20,855 22,663
Current liabilitiesInsurance provision 3,931 3,374
Onerous lease provision 562 1,562
Pension settlement contributions 1,272 3,735
Deferred acquisition consideration 572 1,760
WEEE provision 195 208
6,532 10,639
Insurance Onerous leases DilapidationsPension settlement
contribution
2014 2013 2014 2013 2014 2013 2014 2013
Provisions £’000 £’000 £’000 £’000 £’000 £’000 £’000 £’000
At 1 January 10,786 10,986 11,176 12,181 4,370 3,561 5,002 -
Exceptional charge - - - - - - - 5,502
Charge in year 7,111 5,506 373 535 302 1,051 - -
Utilised (2,266) (2,881) (1,545) (1,799) (138) (244) - -
Paid during the year (3,362) (3,015) - - - - (3,412) (401)
Foreign exchange (756) 190 (623) 259 (80) 2 (318) (99)
At 31 December 11,513 10,786 9,381 11,176 4,454 4,370 1,272 5,002
Non-current 7,582 7,412 8,819 9,614 4,454 4,370 - 1,267
Current 3,931 3,374 562 1,562 - - 1,272 3,735

Business & Strategy Review Corporate Governance Financial Statements Shareholder Information
Grafton Group plc Annual Report 2014
131
22. Provisions (continued)Deferred
Consideration WEEE Other Total
2014 2013 2014 2013 2014 2013 2014 2013
Provisions £’000 £’000 £’000 £’000 £’000 £’000 £’000 £’000
At 1 January 1,760 3,077 208 204 - 2,418 33,302 32,427
Arising on prior year acquisitions (Note 27) - 713 - - - - - 713
Exceptional charge - - - - - - - 5,502
Charge in year - - - - - - 7,786 7,092
Utilised (1,167) (153) - - - (1,011) (5,116) (6,088)
Paid during the year - (1,889) - - - (1,459) (6,774) (6,764)
Foreign exchange (21) 12 (13) 4 - 52 (1,811) 420
At 31 December 572 1,760 195 208 - - 27,387 33,302
Non-current - - - - - - 20,855 22,663
Current 572 1,760 195 208 - - 6,532 10,639
Insurance ProvisionThe insurance provision relates to actual obligations under the self-insurance elements of the Group’s overall insurance arrangements which are subject to limits in respect of individual claims. This provision was based on an independent actuarial valuation. The provision principally covers the combined public and employer liability claims for the Group’s businesses. The Group has third party insurance cover above specific limits for individual claims and has an overall maximum aggregate payable for all claims for any one year. Given the nature of personal injury claims the timing of cash outflows can vary significantly. The outflow arising from the payment of claims in the next year is expected to be at a similar level to the previous year. Based on historical experience, it is the Directors best estimate that the balance of claims which are provided for at 31 December 2014 will be paid over a two to six year period.
The incurred but not reported (IBNR) element of the insurance provision is classified as non-current as the normal cycle for settlement of such claims is likely to be more that 12 months from the year end.
For specific claims if a claim is no longer being challenged by the Group, such claims are classified as current liabilities at year end. The Group no longer has an unconditional right to defer payment and it is only the timing of the payment that is uncertain.
On-going claims in legal process are classified as non-current liabilities at year end as the Group still has an unconditional right to defer settlement since it can generally determine the extent and duration of the legal process unless the company expects to settle it within 12 months.
Onerous Lease ProvisionThe onerous lease provision covers the expected cost to the Group of onerous property leases based on the net present value of the relevant branch’s budgeted and forecast cashflows. These branches are unable to derive economic benefit from the leased property. The timing of outflows is over the remaining life of the relevant lease. Changes in trading patterns from year to year may impact forecast cashflows and alter the amount and timing of outflows.
Expected reimbursements in the form of sub-lease rental income are taken into account in respect of certain properties which can be sublet.

Grafton Group plc Annual Report 2014
132
Notes to the Group Financial Statements(continued)
22. Provisions (continued)Dilapidations ProvisionThe dilapidations provision covers the cost of returning certain Group properties back to the landlord at the end of the lease term based on the terms of the lease which sets out the conditions and work required to be undertaken on the return of the property. The timing of the outflows will match the ending of the relevant leases which ranges from 2 to 20 years.
Pension Settlement ContributionAn amount of £1.3 million will be payable in 2015 as a result of the settlement of transfer values with the deferred members of the Chadwicks and Heiton Buckley defined benefit pension schemes which were closed in 2013.
Deferred ConsiderationThe deferred acquisition consideration is payable over the period from January to December 2015.
WEEEThe WEEE provision covers the estimated cost of disposing of the Group’s computer and electronic equipment at the end of their useful life.
OtherIn 2013 £1.0 million and £0.5 million of the opening other provision at 1 January 2013 was utilised on the settlement of an outstanding claim relating to a property lease and another separate legal case. The balance of the provision not required was released back to the income statement in 2013.
23. Trade and Other Payables
2014 2013
£’000 £’000
Trade payables 331,051 318,254
Accruals 67,640 68,908
Social welfare 2,966 3,091
Employee income tax 5,007 3,404
Value added tax 19,032 16,354
425,696 410,011
24. Obligations under Finance Leases
2014 2013
Minimum lease payments Interest Principal
Minimum lease payments Interest Principal
£’000 £’000 £’000 £’000 £’000 £’000
Committed finance lease obligations:
Within one year 631 260 371 690 254 436
Between one and five years 2,527 1,043 1,484 2,571 1,015 1,556
Later than five years 8,451 6,838 1,613 9,720 7,547 2,173
11,609 8,141 3,468 12,981 8,816 4,165
Under the terms of the leases, no contingent rents are payable.

Business & Strategy Review Corporate Governance Financial Statements Shareholder Information
Grafton Group plc Annual Report 2014
133
25. Deferred Taxation
Recognised deferred tax assets and liabilities Assets Liabilities
Net (assets)/ liabilities Assets Liabilities
Net (assets)/ liabilities
2014 2014 2014 2013 2013 2013
£’000 £’000 £’000 £’000 £’000 £’000
Property, plant and equipment (5,797) 28,767 22,970 (7,316) 29,255 21,939
Employee share schemes (2,317) - (2,317) - - -
Financing (6) - (6) (6) - (6)
Other items (1,065) 1,991 926 (745) 1,491 746
Tax value of losses forward (8,922) - (8,922) (8,763) - (8,763)
Pension (5,345) - (5,345) (836) - (836)
(Assets)/liabilities (23,452) 30,758 7,306 (17,666) 30,746 13,080
The increase in the deferred tax asset reflects the utilisation of tax allowances and reliefs for which deferred tax assets were previously recognised, the recognition of deferred tax assets in respect of employee share schemes and an increase in the deferred tax asset on the increased pension schemes deficit.
At 31 December 2014, there were unrecognised deferred tax assets in relation to capital losses of £3.4 million (31 December 2013: £4.7 million), trading losses of £1.1 million (31 December 2013: £0.9 million) and deductible temporary differences of £4.5 million (31 December 2013: £5.0 million). Deferred tax assets were not recognised in respect of capital losses as they can only be recovered against certain classes of taxable profits and the Directors cannot foresee such profits arising in the foreseeable future. Deferred tax assets were not recognised in respect of certain trading losses and deductible temporary differences as these arose in entities that have incurred losses in recent years where the Directors have no certainty as to when there will be sufficient taxable profits in the relevant entities against which they can be utilised.
Analysis of Net Deferred Tax (asset)/liability
Balance 1 Jan 14
Recognised in profit or loss
Recognised in other
comprehensive income
Foreign exchange
retranslationArising on
acquisitionsBalance
31 Dec 14
£’000 £’000 £’000 £’000 £’000 £’000
Property, plant and equipment 21,939 1,182 - (1,610) 1,459 22,970Employee share schemes - (833) (1,484) - - (2,317)Financing (6) - 2 (2) - (6)Other items 746 45 - 135 - 926Tax value of losses carried forward (8,763) 1,036 - 653 (1,848) (8,922)Pension (836) 115 (4,728) 104 - (5,345)
13,080 1,545 (6,210) (720) (389) 7,306

Grafton Group plc Annual Report 2014
134
Notes to the Group Financial Statements(continued)
25. Deferred Taxation (continued)Analysis of Net Deferred Tax (asset)/liability (continued)
Balance 1 Jan 13
Recognised in profit or loss
Recognised in other
comprehensive income
Foreign exchange
retranslationArising on
acquisitionsBalance
31 Dec 13
£’000 £’000 £’000 £’000 £’000 £’000
Property, plant and equipment 15,252 6,141 - 546 - 21,939
Financing (64) - 63 (5) - (6)
Other items 1,413 (696) - 27 2 746
Tax value of losses carried forward - (8,927) - 164 - (8,763)
Pension (7,422) 5,764 1,032 (210) - (836)
9,179 2,282 1,095 522 2 13,080
26. Movement in Working Capital
InventoryTrade and other
receivablesTrade and other
payables Total
£’000 £’000 £’000 £’000
At 1 January 2013 249,332 271,303 (383,160) 137,475
Translation adjustment 1,746 1,289 (2,629) 406
Interest accruals and other movements - (195) (635) (830)
Acquisitions (Note 27) 373 - - 373
Movement in 2013 (5,231) 35,425 (23,587) 6,607
At 1 January 2014 246,220 307,822 (410,011) 144,031Translation adjustment (5,129) (4,322) 8,859 (592)Interest accruals and other movements - (328) (489) (817)Acquisitions (Note 27) 7,958 9,285 (10,980) 6,263Movement in 2014 857 (9,586) (13,075) (21,804)At 31 December 2014 249,906 302,871 (425,696) 127,081

Business & Strategy Review Corporate Governance Financial Statements Shareholder Information
Grafton Group plc Annual Report 2014
135
27. Acquisition of Subsidiary Undertakings and BusinessesIn 2014 the Group completed a number of strategic acquisitions. On 4 February 2014 the Group acquired Binje Ackermans S.A. (MPRO), a six branch merchanting business based in Brussels. On 30 June 2014 the Group acquired Beaumont Forest Products, a specialist timber merchant trading from three branches in the Greater London Area. The Group completed the acquisition of Direct Builders Merchants Limited a general merchanting business trading from three branches located in Sittingbourne, Whitstable and Ashford in Kent on 29 August 2014. On 29 September 2014 the Group acquired Gedimat-Ginion S.A., a single branch merchanting business located in Brussels. On 1 December 2014 the Group completed the acquisition of Crescent Building Supplies (Ruislip) Limited, a general merchanting business trading from three branches in West London and one in Berkshire.
In 2013 the Group acquired the trade and selected assets of Thompson Building Centres and Thompson Associated Plumbing Supplies (acquired: 27 March 2013) and the trade and assets of a single branch merchanting business in Oban, Scotland (acquired: 29 November 2013).
Acquisitions would have contributed £70.0 million and £12.1 million to revenue in the years ended 31 December 2014 and 31 December 2013 respectively on the assumption that they had been acquired on 1 January in both years.
Acquisitions would have contributed an operating profit of £2.9 million and £0.2 million in the years ended 31 December 2014 and 31 December 2013 respectively if they had been acquired on 1 January in both years.
Acquisitions completed in 2014 contributed revenues of £44.5 million (2013 acquisitions: £8.0 million) and a profit of £0.8 million (2013 acquisitions: profit of £0.2 million) for the period from the date of acquisition until the year end.
2014 2013
£’000 £’000
The fair values of assets and liabilities acquired are set out below:Property, plant and equipment (Note 12) 12,382 3,660
Inventories (Note 26) 7,958 373
Trade and other receivables (Note 26) 9,285 -
Trade and other payables (Note 26) (10,980) -
Retirement benefit obligations (Note 31) (267) -
Corporation tax (355) -
Deferred tax asset (Note 25) 1,848 -
Deferred tax liability (Note 25) (1,459) (2)
Cash acquired 1,728 -
Net assets acquired 20,140 4,031
Goodwill (Note 11) 14,695 1
Consideration 34,835 4,032
Satisfied by:
Cash paid 34,835 4,032
Net cash outflow 34,835 4,032
As noted in Note 22, an amount of £0.7 million was recognised as a measurement period adjustment in 2013 relating to a 2012 acquisition.

Grafton Group plc Annual Report 2014
136
Notes to the Group Financial Statements(continued)
27. Acquisition of Subsidiary Undertakings and Businesses (continued)The fair value of identifiable net assets acquired in 2014 was £20.1 million.
Fair Value Consideration Goodwill
£’000 £’000 £’000
Total acquisitions 20,140 34,835 14,695
The fair values were calculated as follows: Book ValuesFair Value
Adjustment Fair Values
£’000 £’000 £’000
Property, plant and equipment 12,382 - 12,382Working capital 6,178 85 6,263Retirement benefit obligations (267) - (267)Corporation tax (355) - (355)Deferred tax asset 1,848 - 1,848Deferred tax liability (Note 25) (35) (1,424) (1,459)Cash acquired 1,728 - 1,728
21,479 (1,339) 20,140
The provisional fair value adjustments noted above have arisen under IFRS 3 Business Combinations. Inventories have been valued at selling price adjusted for the cost of disposal and a reasonable profit allowance to cover selling costs. Deferred tax has also arisen on the difference between the fair value of the properties acquired and their tax base.
No intangible assets were acquired.
The fair value of identifiable net assets acquired in 2013 was £4.0 million.
Fair Value Consideration Goodwill
£’000 £’000 £’000
Total acquisitions 4,031 4,032 1
The fair values were calculated as follows: Book Values Fair Value
Adjustment Fair Values
£’000 £’000 £’000
Property, plant and equipment 3,660 - 3,660
Inventories (Note 26) 369 4 373
Deferred tax - (2) (2)
4,029 2 4,031
The provisional fair value adjustments noted above have arisen under IFRS 3 Business Combinations. Inventories have been valued at selling price adjusted for the cost of disposal and a reasonable profit allowance to cover selling costs.
No intangible assets were acquired.

Business & Strategy Review Corporate Governance Financial Statements Shareholder Information
Grafton Group plc Annual Report 2014
137
28. Reconciliation of Net Cash Flow to Movement in Net Debt
2014 2013
£’000 £’000
Net increase in cash and cash equivalents 32,081 21,993
Net movement in derivative financial instruments 309 1,091
Cash flow from movement in debt and lease financing 12,991 11,569
Change in net debt resulting from cash flows 45,381 34,653
Translation adjustment 13,040 (3,506)
Movement in net debt in the year 58,421 31,147
Net debt at 1 January (133,737) (164,884)
Net debt at 31 December (75,316) (133,737)
29. Capital Expenditure CommitmentsAt the year end the following commitments authorised by the Board had not been provided for in the financial statements:
2014 2013
£’000 £’000
Contracted for 500 5,099
Not contracted for 49,890 36,912
50,390 42,011
Capital commitments in the UK, Ireland and Belgium amounted to £47.5 million (2013: £39.8 million), £2.7 million (2013: £2.2 million) and £0.2 million (2013: £Nil) respectively and relate mainly to replacement of the distribution fleet and store development projects. Included in the not contracted for balance of £49.9 million (2013: £36.9 million) is £17.8 million (2013: £3.8 million) relating to investment in intangible assets - computer software.
30. Operating LeasesTotal commitments payable under non-cancellable operating leases are as follows:
Land and buildings Other
Land and buildings Other
2014 2014 2013 2013
£’000 £’000 £’000 £’000
Operating lease payments due:Within one year 49,839 4,312 48,596 4,465
Between two and five years 179,511 5,267 171,492 4,925
Over five years 393,024 11 425,299 11
622,374 9,590 645,387 9,401
The Group leases a number of properties under operating leases. The leases typically run for a period of 15 to 25 years. Rents are generally reviewed every five years.
During the year ended 31 December 2014 £54.8 million (2013: £53.2 million) was recognised as an expense in the income statement in respect of operating leases.

Grafton Group plc Annual Report 2014
138
Notes to the Group Financial Statements(continued)
31. Pension CommitmentsA number of defined benefit and defined contribution pension schemes are operated by the Group and the assets of the schemes are held in separate trustee administered funds.
The actuarial reports are not available for public inspection.
IAS 19 – Employee BenefitsThe company operates four defined benefit schemes in Ireland, two defined benefit schemes in the UK and a newly acquired scheme in Belgium for qualifying employees (the “DB Schemes”). All schemes except one are closed to new entrants. The DB Schemes are administered by trusts that are legally separated from the company. The trustees of the DB Schemes are required by law to act in the interest of the members of the DB Schemes. The trustees of the DB Schemes are responsible for the investment policy with regard to the assets of the DB Schemes.
Under the DB Schemes, the employees are entitled to receive an annual payment on attainment of normal retirement age which in Ireland, is in line with the State pension age (i.e. age 66, 67 or 68 depending on year of birth) and in the UK is age 65 for the majority of benefits. The level of benefit payable depends on length of service. It also depends, in the case of Ireland, on a member’s final pensionable salary near retirement (excluding salary increases up to and including 1st January 2019) and in the case of the UK, on a member’s 2013 pensionable salary. Salary for pension purposes is integrated with the State Pension. The DB Schemes provide post retirement pension increases in the UK only and spouse’s death in retirement pensions in both Ireland and the UK. No other post-retirement benefits are provided to employees.
Defined Benefit Pension Schemes – Principal RisksThrough its defined benefit pension schemes the Group is exposed to a number of risks the most significant of which are detailed below:
Asset volatility: Under IFRS the assets of the Group’s defined benefit pension schemes are reported at fair value. The majority of the schemes’ assets comprise of equities, bonds and property all of which may fluctuate significantly from one reporting period to the next.
Discount rates: the discount rates used in calculating the present value of scheme liabilities are determined by reference to market yields at the balance sheet date of high quality corporate bonds consistent with the currency and term of the retirement benefit obligations. Changes to the discount rates can have a significant impact on the liability amount.
Salary/price inflation: Some of the Group’s pension obligations are salary and inflation linked. Higher salary and price inflation will lead to higher liabilities. In 2013 the Group agreed new arrangements on the pensioning of salary increases which reduced this risk as noted in the financial assumptions. The exposure to inflation risk relates to the granting of inflation linked pension increases in the UK and to revaluation of deferred benefits in both the UK and Ireland.
Longevity risk: In the majority of cases the Group’s defined benefit pension schemes provide benefits for life. Increases in life expectancy will therefore give rise to higher liabilities.
The nature of these risks is not materially different across all schemes with the exception of salary and price inflation risks which differ between the UK and Ireland.

Business & Strategy Review Corporate Governance Financial Statements Shareholder Information
Grafton Group plc Annual Report 2014
139
31. Pension Commitments (continued)Financial AssumptionsThe financial assumptions used to calculate the retirement benefit liabilities under IAS 19 were as follows:
At 31 Dec 2014
Irish schemes
At 31 Dec 2014 UK schemes
At 31 Dec 2013
Irish schemes
At 31 Dec 2013 UK schemes
Valuation method Projected Unit Projected Unit Projected Unit Projected Unit
Rate of increase in salaries 2.50%* 0.0% 3.00%* 0.0%
Rate of increase of pensions in payment - 3.30% - 3.70%
Discount rate 2.10% 3.60% 3.65% 4.65%
Inflation rate increase 1.30% 3.30%** 2.00% 3.70%**
*2.5% applies from 2 January 2019 (31 December 2013: 3.0% from 2 January 2019).**The inflation assumption shown for the UK is based on the Retail Price Index (RPI).
The future life expectancy at age 65 for males and females (currently aged 55 and 65), inherent in the mortality tables used for the 2014 and 2013 year end IAS 19 disclosures are as follows:
2014 Mortality (years) Ireland UK 2013 Mortality (years) Ireland UK
Future Pensioner aged 65: Male 22.2 22.5 Future Pensioner aged 65: Male 23.9 22.3
Female 24.5 25.2 Female 25.0 25.0Current Pensioner aged 65: Male 20.8 21.7 Current Pensioner aged 65: Male 22.5 21.5
Female 23.4 24.2 Female 23.9 24.0
In 2013 new arrangements were agreed following consultations with the trustees and active members of the defined benefit pension schemes in Ireland and the UK. The changes are based on sharing the costs of funding the deficit and provide for more sustainable future benefits at an affordable cost while reducing the financial risks of the schemes to the Group.
In 2013 the Group agreed to make additional cash contributions over a period of eleven years as part of the arrangements agreed. In addition, payments totalling £5.0 million are be made over the three years to 2015 to the Group’s Irish defined contribution scheme in respect of deferred members who transferred out of the Group’s Irish defined benefit schemes. A non-cash reduction in pension liabilities of £30.0 million related to the new arrangements was recognised in the income statement in 2013 (Note 3).
The 2013 non-recurring past service credit of £18.5 million arose due to the implementation of a permanent pensionable salary freeze in the United Kingdom and a pensionable salary freeze in Ireland for five years, together with an alignment of the normal retirement age and the State pension age in Ireland. There are no changes to arrangements for existing pensioners. The non-recurring net settlement gain of £11.9 million (settlement gain of £16.9 million less agreed future contributions of £5.0 million) arose due to the settlement of transfer values with the deferred members.

Grafton Group plc Annual Report 2014
140
Notes to the Group Financial Statements(continued)
31. Pension Commitments (continued)Scheme AssetsThe assets in these schemes are analysed below:
2014 2013
% £’000 % £’000
UK equities 32 59,706 31 55,393
Overseas (non- UK) equities 39 73,119 41 73,534
Government bonds 6 12,521 6 11,615
Corporate bonds 10 18,639 8 14,515
Property 6 12,400 7 12,272
Other 1 1,566 1 2,449
Alternatives - - 2 3,452
Cash 6 11,252 3 5,349
Net current asset - - 1 2,084
100 189,203 100 180,663
Actuarial value of liabilities (222,163) (187,785)
Deficit in the schemes (32,960) (7,122)
Represented by:
Retirement benefit assets 125 718
Retirement benefit obligations (33,085) (7,840)
(32,960) (7,122)
Some of the investment funds in which the schemes invest, held shares in Grafton Group plc. The total amount held in Grafton Group plc shares was £34,000 at 31 December 2014 (31 December 2013: £117,000).
The net pension deficit of £32,960,000 (2013: £7,122,000) is shown in the Group balance sheet as retirement benefit obligations (non-current liabilities) of £33,085,000 of which £18,113,000 is related to the Euro schemes and £14,972,000 to one UK scheme (2013: £7,840,000 relating to the Irish schemes) and retirement benefit assets (non-current assets) of £125,000 relating to a second UK scheme (2013: £718,000 relating to the two UK schemes). Changes in the rates used to discount liabilities, in line with changes in corporate bond rates, increased scheme liabilities by £48.8 million.
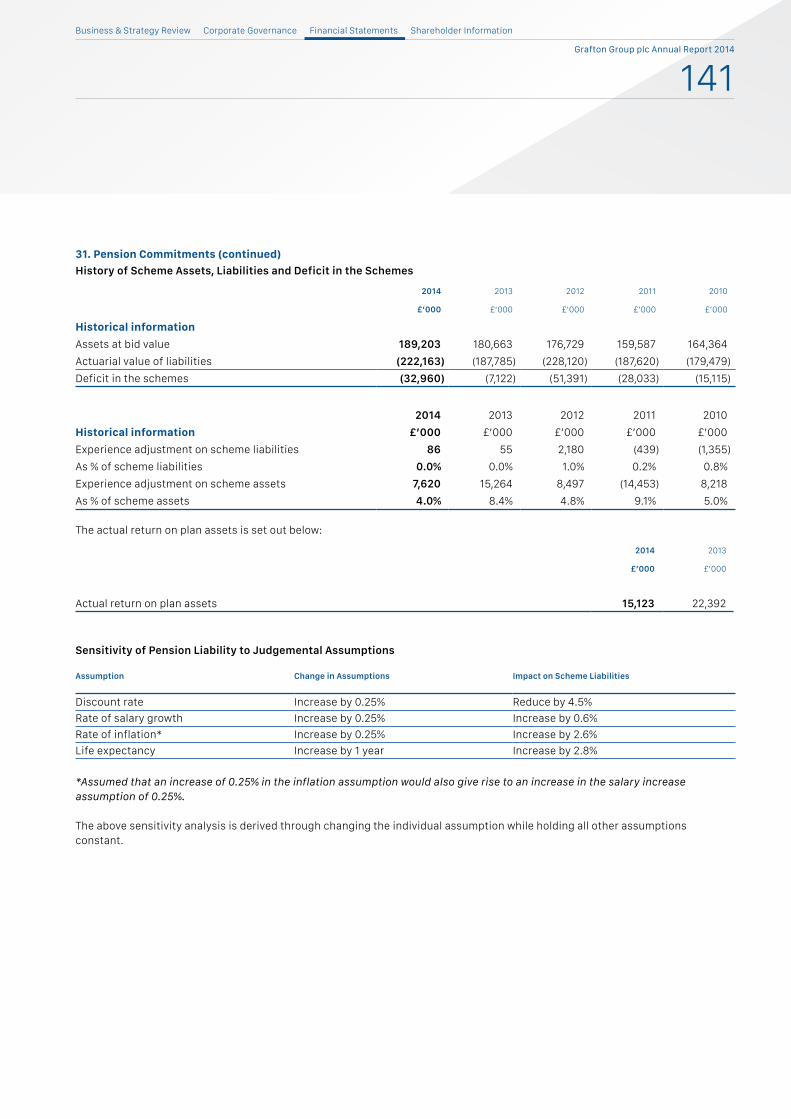
Business & Strategy Review Corporate Governance Financial Statements Shareholder Information
Grafton Group plc Annual Report 2014
141
31. Pension Commitments (continued)History of Scheme Assets, Liabilities and Deficit in the Schemes
2014 2013 2012 2011 2010
£’000 £’000 £’000 £’000 £’000
Historical informationAssets at bid value 189,203 180,663 176,729 159,587 164,364
Actuarial value of liabilities (222,163) (187,785) (228,120) (187,620) (179,479)
Deficit in the schemes (32,960) (7,122) (51,391) (28,033) (15,115)
2014 2013 2012 2011 2010
Historical information £’000 £’000 £’000 £’000 £’000
Experience adjustment on scheme liabilities 86 55 2,180 (439) (1,355)
As % of scheme liabilities 0.0% 0.0% 1.0% 0.2% 0.8%
Experience adjustment on scheme assets 7,620 15,264 8,497 (14,453) 8,218
As % of scheme assets 4.0% 8.4% 4.8% 9.1% 5.0%
The actual return on plan assets is set out below:
2014 2013
£’000 £’000
Actual return on plan assets 15,123 22,392
Sensitivity of Pension Liability to Judgemental Assumptions
Assumption Change in Assumptions Impact on Scheme Liabilities
Discount rate Increase by 0.25% Reduce by 4.5% Rate of salary growth Increase by 0.25% Increase by 0.6% Rate of inflation* Increase by 0.25% Increase by 2.6% Life expectancy Increase by 1 year Increase by 2.8%
*Assumed that an increase of 0.25% in the inflation assumption would also give rise to an increase in the salary increase assumption of 0.25%.
The above sensitivity analysis is derived through changing the individual assumption while holding all other assumptions constant.

Grafton Group plc Annual Report 2014
142
Notes to the Group Financial Statements(continued)
31. Pension Commitments (continued)
The following table provides a reconciliation of the scheme assets (at bid value) and the actuarial value of scheme liabilities:
Year ended 31 December
Assets Liabilities Net asset/(deficit)
2014 2013 2014 2013 2014 2013
£’000 £’000 £’000 £’000 £’000 £’000
At 1 January 180,663 176,729 (187,785) (228,120) (7,122) (51,391)
Acquired in year (Note 27) 223 - (490) - (267) -
Interest income on plan assets 7,503 7,128 - - 7,503 7,128
Contributions by employer 3,023 6,029 - - 3,023 6,029
Contributions by members 1,199 1,329 (1,199) (1,329) - -
Benefit payments (5,549) (27,852) 5,549 27,852 - -
Current service cost - - (1,703) (2,253) (1,703) (2,253)
Past service credit – non-recurring - - - 18,534 - 18,534
Past service credit - - 542 552 542 552
Settlement gain – non-recurring - - - 16,932 - 16,932
Settlement gain – other - - - 84 - 84
Curtailment loss - - - (92) - (92)
Interest cost on scheme liabilities - - (7,747) (8,531) (7,747) (8,531)
Remeasurements
Actuarial gain/(loss) arising from:
- experience variations - - (86) (55) (86) (55)
- financial assumptions - - (38,859) (8,821) (38,859) (8,821)
- demographic assumptions - - 3,271 1,054 3,271 1,054
Return on plan assets excluding interest income 7,620 15,264 - - 7,620 15,264
Translation adjustment (5,479) 2,036 6,344 (3,592) 865 (1,556)
At 31 December 189,203 180,663 (222,163) (187,785) (32,960) (7,122)
Related deferred tax asset (net) 5,345 836
Net pension liability (27,615) (6,286)

Business & Strategy Review Corporate Governance Financial Statements Shareholder Information
Grafton Group plc Annual Report 2014
143
31. Pension Commitments (continued)Expense Recognised in Operating Costs
2014 2013
£’000 £’000
Past service credit - non-recurring (Note 3) - (18,534)
Settlement gain - non-recurring (Note 3) - (16,932)
- (35,466)
Current service cost 1,703 2,253
Past service credit (i) (542) (552)
Settlement gain - other (ii) - (84)
Curtailment loss (iii) - 92
Total operating charge / (credit) 1,161 (33,757)
In 2013 the past service credit of £18.5 million arose due to the implementation of a permanent pensionable salary freeze in the United Kingdom and a pensionable salary freeze in Ireland for five years, together with an alignment of the normal retirement age and the State pension age in Ireland. The settlement gain of £16.9 million arose due to the settlement of transfer values with the deferred members.
(i) The past service credit of £542,000 (2013: £552,000) arose from the 0.6% pension levy imposed by the Irish Government on the Group’s Irish plan assets.
(ii) The settlement gain in 2013 arose due to a member leaving the scheme which gave rise to a transfer payment by the scheme.
(iii) The curtailment loss in 2013 arose in respect of individuals who ceased to be employed by the Group during the year.
Recognised Directly in Other Comprehensive Income
2014 2013
£’000 £’000
Remeasurement (loss)/gain on pensions (28,054) 7,442
Deferred tax on pensions 4,728 (1,032)
(23,326) 6,410
The expense/(credit) is recognised in the following lines in the income statement:
2014 2013
£’000 £’000
Operating costs 1,161 1,709
Operating income - (35,466)
1,161 (33,757)
Net finance costs on pension scheme obligations 244 1,403
Total operating charge 1,405 (32,354)
Cumulative net actuarial losses reported in the Group statement of comprehensive income since 1 January 2004, the transition date to IFRS, to 31 December 2014 is £93.4 million (2013: £65.3 million).

Grafton Group plc Annual Report 2014
144
Notes to the Group Financial Statements(continued)
31. Pension Commitments (continued)Actuarial Valuations – Funding RequirementsEmployees pay contributions equal to a certain percentage of pensionable salary. The percentage payable varies by scheme. Triennial actuarial valuations are carried out to determine the company’s contribution rate required under the schemes.
In Ireland, the DB Schemes are also assessed annually against the Funding Standard (the statutory minimum funding requirement). As most of the DB Schemes did not satisfy the Funding Standard, funding proposals are in place or are currently being put in place to address any Funding Standard deficits. The funding proposals are agreed between the company and the trustees of the relevant schemes and are designed to restore the Funding Standard positions by 2023.
In the UK, the DB Schemes are subject to the Statutory Funding Objective under the Pensions Act 2004. Valuations of the DB Schemes are carried out at least once every three years to determine whether or not the Statutory Funding Objectives are met. As part of the process, the company must agree with the Trustees of the DB Schemes the contributions to be paid to address any shortfalls against the Statutory Funding Objectives and contributions to pay for future accrual of benefits.
The contributions expected to be paid to the Group’s defined benefit schemes in 2015 total approximately £2.9 million (2014: £3.0 million).
Average duration and scheme composition
Ireland UK
2014 2013 2014 2013
Average duration of defined benefit obligation (years) 18.50 17.50 19.00 18.75
Allocation of total defined benefit obligation by participant
2014 2013
Active plan participants 40% 37%
Deferred plan participants 26% 25%
Retirees 34% 38%
100% 100%
32. Share Based PaymentsThe Group’s employee share schemes are equity settled share based payments as defined in IFRS 2 Share Based Payments. The total share based payments expense for the year charged to the income statement was £3,679,000 (2013: £1,396,000), analysed as follows;
2014 2013
£’000 £’000
LTIP 3,183 2,026
1999 Grafton Share Scheme - (1,167)
UK SAYE Scheme 496 537
3,679 1,396

Business & Strategy Review Corporate Governance Financial Statements Shareholder Information
Grafton Group plc Annual Report 2014
145
32. Share Based Payments (continued)Details of the schemes operated by the Group are set out below:
Long Term Incentive Plan (LTIP)A Long Term Incentive Plan (LTIP) was introduced in 2011. Details of the plan are set out in the Report of the Remuneration Committee on Directors’ Remuneration on pages 51 to 69. Awards over 869,027 Grafton Units were granted under the plan on 16 April 2014 (2013: 986,542).
A summary of the award granted on 16 April 2014 is set out below:Grafton Group
LTIPGrafton Group
LTIP
2014 2013
Grant date 16 April 2014 16 April 2013
Share price at date of award (2013 quoted in euro) £6.20 €4.96
Exercise price N/A N/A
Number of employees 188 149
Number of share awards 869,027 986,542
Vesting period 3 years 3 years
Expected volatility 36.2% 35.5%
Award life 3 years 3 years
Expected life 3 years 3 years
Risk free rate 1.12% 0.22%
Expected dividends expressed as dividend yield 2.13% 2.37%
Possibility of ceasing employment before vesting 0% 0%
Valuation model Binomial model Binomial model
Fair value of share award – EPS component £5.82 €4.62
Fair value of share award – TSR component £3.23 €3.20
This expected volatility is based on historic volatility over the last 3 years. The expected life is equal to the vesting period. The risk free rate of return is the yield on bonds from the European Central Bank of a term consistent with the life of the award at the grant date.
A reconciliation of all share awards granted under the LTIP is as follows:
2014 2013
Number Number
Outstanding at 1 January 3,325,842 2,339,300
Granted in year 869,027 986,542
Expired (1,021,182) -
Exercised (137,818) -
Outstanding at 31 December 3,035,869 3,325,842
At 31 December 2014 and 31 December 2013 none of the LTIP’s were exercisable.

Grafton Group plc Annual Report 2014
146
Notes to the Group Financial Statements(continued)
32. Share Based Payments (continued)Share SchemesUp to April 2009 key executives could acquire shares in the Group so as to provide an incentive to perform strongly over an extended period and to align their interests with those of shareholders. Under the terms of the 1999 Grafton Group Share Scheme, two types of share were available subject to the conditions set out below:
(i) Basic shares which cannot be converted before the expiration of five years, unless the Remuneration Committee agrees to a shorter period which shall not be less than three years, and may be converted any time after that to the end of their contractual life provided the Company’s earnings per share has grown at not less than the rate of growth in the Consumer Price Index plus 5 per cent compounded during that period. Basic shares granted after 8 May 2008 cannot be converted before the expiration of three years.
(ii) Second tier shares which cannot be converted before the expiration of five years and at any time thereafter up to the end of their contractual life, only if over a period of at least five years the growth in the Group’s earnings per share would place it in the top 25 per cent of the companies listed on the Irish Stock Exchange Index over the same period and provided that such shares shall be acquired only if the Company’s earnings per share growth over the relevant period is greater, by not less than 10 per cent on an annualised basis, than the increase in the Consumer Price Index over that period.
The share scheme had a ten year life for the award of entitlements and this period expired in 2009. The percentage of share capital which may be issued under the scheme and individual grant limits complied with Institutional Guidelines.
The number of Grafton Units issued during the year under the Company’s Executive Share Schemes was nil (2013: 426,300) and the total consideration received amounted to £Nil (2013: £1,944,000). Costs relating to the issues were £Nil (2013: £25,000). Entitlements outstanding at 31 December 2014 amounted to 5,082,501 (2013: 7,099,301). Grafton Units may be acquired, in accordance with the terms of the scheme, at prices ranging between €1.66 and €11.50 during the period to 2019.
A reconciliation of share entitlements under the Grafton Group Share Option Scheme and the 1999 Grafton Group Share Scheme is as follows:
2014 2013
Number
Weighted average
exercise price € Number
Weighted average
exercise price €
Outstanding at 1 January 7,099,301 6.57 9,143,801 6.40
Forfeited# (1,057,500) 7.24 (1,193,250) 6.10
Expired* (959,300) 6.20 (424,950) 5.45
Exercised - - (426,300) 5.45
Outstanding at 31 December 5,082,501 6.50 7,099,301 6.57
#Share entitlements forfeited by employees who have left the Group and have no further entitlements under the scheme.
*Performance conditions not met.
The weighted average share price at the date of exercise was €Nil (2013: €6.93).
Share entitlements are exercisable within six months upon a change of control of the Company. The weighted average remaining life of the share entitlements is 2.7 years (2013: 3.2 years).
At 31 December 2014 none of the share entitlements were exercisable as the conditions for exercise were not fulfilled before the year-end.

Business & Strategy Review Corporate Governance Financial Statements Shareholder Information
Grafton Group plc Annual Report 2014
147
32. Share Based Payments (continued)UK SAYE SchemeOptions over 2,643,630 (2013: 1,998,060) Grafton Units were outstanding at 31 December 2014, pursuant to a new 2014 and existing 2012 three year saving contracts under the Grafton Group (UK) plc Savings Related Share Option Scheme at a price of £5.97 and €2.85 respectively (2013: €2.85 under 2012 SAYE Scheme). These options are normally exercisable within a period of six months after the third anniversary of the savings contract, being April 2018 for the 2014 SAYE scheme and March 2016 for the 2012 SAYE scheme. The number of Grafton Units issued during the year under the Company’s 2012 SAYE Scheme to good leavers was 19,213 (2013: 8,694) and the total consideration received amounted to £44,000 (2013: £21,000). Options forfeited in the year were 146,782 (2013: 130,046).
A summary of the new 2014 SAYE grant on 16 October 2014 and the previous 2012 SAYE grant on 25 September 2012 is set out below:
UK SAYE Scheme 2014
UK SAYE Scheme 2012
Grant Date16 October
201425 September
2012
Share price at date of grant £6.63 €3.17
Exercise price £5.97 €2.85
Number of employees 1,132 1,161
Share under option 811,565 2,154,235
Vesting period 3 years 3 years
Expected volatility 32.90% 38.70%
Option life 3.5 years 3.5 years
Expected life 3.5 years 3.5 years
Risk free rate 1.11% 0.32%
Expected dividends expressed as dividend yield 1.99% 2.62%
Possibility of ceasing employment before vesting 5% 5%
Valuation model Binomial model Binomial model
Fair value of option £1.25 €0.97
The expected volatility is based on historic volatility over the last 3 years. The expected life is the average expected period to exercise. The risk free rate of return is the yield on bonds from the European Central Bank of a term consistent with the life of the option.
A reconciliation of options granted under the 2012 Grafton Group (UK) plc Savings Related Share Option Scheme is as follows:
Number2014
Option price € Number2013
Option price €
Outstanding at 1 January 1,998,060 2.85 2,136,800 2.85Forfeited (141,147) 2.85 (130,046) 2.85Exercised (19,213) 2.85 (8,694) 2.85
Outstanding at 31 December 1,837,700 1,998,060

Grafton Group plc Annual Report 2014
148
Notes to the Group Financial Statements(continued)
32. Share Based Payments (continued)UK SAYE Scheme A reconciliation of options granted under the 2014 Grafton Group (UK) plc Savings Related Share Option Scheme is as follows:
Number2014
Option price £ Number2013
Option price £
Outstanding at 1 January - - - -
Granted 811,565 5.97 - -
Forfeited (5,635) 5.97 - -
Outstanding at 31 December 805,930 -
At 31 December 2014 and 31 December 2013 none of the UK SAYE shares were exercisable.
33. Accounting Estimates and JudgementsThe Group’s main accounting policies affecting its results and financial condition are set out on pages 83 to 92. Judgements and assumptions have been made by management by applying the Group’s accounting policies in certain areas. Actual results may differ from estimates calculated using these judgements and assumptions. Key sources of estimation uncertainty and critical accounting judgements are as follows:
GoodwillThe Group has capitalised goodwill of £480.2 million at 31 December 2014 (2013: £481.0 million) as detailed in Note 11. Goodwill is required to be tested for impairment at least annually or more frequently if changes in circumstances or the occurrence of events indicate potential impairment exists. The Group uses value in use calculations to determine the recoverable amount of cash generating units containing goodwill. Value in use is calculated as the present value of future cash flows. In calculating value in use, management judgement is required in forecasting cash flows of the segments and in selecting an appropriate discount rate and nominal growth rate in perpetuity. No goodwill impairment charge was recognised by the Group in 2014 (2013: £Nil).
Retirement Benefit ObligationsThe Group operates a number of defined benefit retirement plans which are as set out in Note 31. The Group’s total obligation in respect of defined benefit plans is calculated by independent, qualified actuaries and updated at least annually and totals £222.2 million at 31 December 2014 (2013: £187.8 million). Plan assets at 31 December 2014 amounted to £189.2 million (2013: £180.7 million) giving a net scheme deficit of £33.0 million (2013: £7.1 million). The size of the obligation is sensitive to actuarial assumptions. The key assumptions are the discount rate, the rate of inflation, life expectancy, pension benefits and rate of salary increases. Plan assets are also sensitive to asset returns and the level of contributions made by the Group.
Insurance ProvisionsInsurance provisions of £11.5 million (2013: £10.8 million) shown in Note 22 were based on a review of self-insured claims undertaken by an independent firm of actuaries and consultants. Claims in excess of specified limits are covered by external insurers.
Onerous Lease ProvisionsOnerous lease provisions of £9.4 million (2013: £11.2 million) shown in Note 22 relate to the expected cost to the Group of onerous property leases and are based on the net present value of the relevant branch’s budgeted and forecast cashflows. Changes in trading patterns from year to year may impact on forecast cashflows and alter the amount and timing of outflows.
TaxationManagement is required to make judgements and estimates in relation to taxation provisions and exposures. In the ordinary course of business, the Group is party to transactions for which the ultimate tax determination may be uncertain. As the Group is subject to taxation in a number of jurisdictions, an open dialogue is maintained with Revenue Authorities with a view to the timely agreement of tax returns. The amounts provided/recognised for tax are based on management’s estimate having taken appropriate professional advice. If the final determination of these matters is different from the amounts that were initially recorded such differences will impact the income tax and deferred tax provisions and assets in the period in which the determination was made.

Business & Strategy Review Corporate Governance Financial Statements Shareholder Information
Grafton Group plc Annual Report 2014
149
33. Accounting Estimates and Judgements (continued)Taxation (continued)The amount shown for current taxation includes a liability for tax uncertainties and is based on the Directors’ best probability weighted estimate of the probable outflow of economic resources that will be required. As with all estimates, the actual outcome may be different to the current estimate.
Investment Properties and Properties Held for Sale The Group holds investment properties of £20.5 million (2013: £19.9 million) and properties held for sale of £9.6 million (2013: £11.4 million). Details on the fair value of the investment properties and a number of the properties held for sale is set out and explained in Note 12.
Rebate Income Rebates from suppliers represent a significant source of income for the Group each year. The nature of the arrangements in place means that a large proportion of the rebates due to the Group are not collected until after the year end. The calculation of rebate income in the year and the rebate receivable at year end is based on the agreements in place with suppliers. Rebate is accrued in the year as it is earned. Due to the supplier specific nature of each arrangement the calculations can be complex and requires management to make estimates in the absence of supplier confirmations.
34. Related Party TransactionsThe principal related party transactions that require disclosure under IAS 24: Related Party Disclosures relate to subsidiaries, key management personnel and post employment benefit plans.
SubsidiariesThe consolidated accounts of the Company and its subsidiaries include the following transactions that have been eliminated on consolidation:
• Management charges made by the Company to the subsidiaries of £10.8 million (2013: £13.1 million) for the year ended 31 December 2014;
• No dividend income was received by the Company from subsidiaries during the year (2013: £Nil);
• Loans were granted to and by the Company to its subsidiaries.
Key Management PersonnelThe term key management personnel for 2014 comprise the Board of Grafton Group plc and the Company Secretary/Group Financial Controller. The cost of key management personnel is analysed in Note 5 to the Group Financial Statements. The Report of the Remuneration Committee on Directors’ Remuneration on pages 51 to 69 provides detailed disclosure for 2014 and 2013 of salaries, fees, performance-related pay, pension allowance, other benefits and entitlements to acquire Grafton Units in accordance with the rules of the 1999 Grafton Group Share Scheme and awards granted under the LTIP.
Post-Employment Benefit PlansPension commitments to existing and former employees under defined benefit pension scheme arrangements are disclosed in Note 31 to the Group Financial Statements.
35. Events after the Balance Sheet DateThere have been no material events subsequent to 31 December 2014 that require adjustment to or disclosure in this report except that the Group completed the acquisition of TG Lynes Ltd. on 27 February 2015. The consideration which was payable in cash on completion amounted to £23.0 million. TG Lynes Ltd. reported revenue of £18.3 million and operating profit of £2.1 million for the year ended 30 June 2014.
36. Approval of Financial StatementsThe Board of Directors approved the Group Financial Statements on pages 77 to 149 on 9 March 2015.

Grafton Group plc Annual Report 2014
150
Company Balance SheetAs at 31 December 2014
2014 2013
Notes €’000 €’000
ASSETSNon-current assetsProperty, plant and equipment 3 839 62
Deferred tax asset 9 639 2
Investments in subsidiary undertakings 4 369,145 365,726
Financial assets 4 13 13
Receivables from Group companies 5 25,202 22,700Total non-current assets 395,838 388,503
Current assetsReceivables from Group companies 5 593,356 576,007
Other receivables 5 4,660 8,352
Cash and cash equivalents 3,923 20,405
Total current assets 601,939 604,764
Total assets 997,777 993,267
EQUITYCapital and reserves Equity share capital 6 11,694 11,686
Share premium account 6 295,360 295,306
Capital redemption reserve 905 905
Shares to be issued reserve 9,846 5,283
Retained earnings 334,514 319,881
Treasury shares held (5,746) (5,746)Total equity 646,573 627,315
LIABILITIESCurrent liabilitiesPayables to Group companies 8 340,759 351,675
Other payables 8 10,441 14,276
Current income tax liabilities 4 1
Total current liabilities 351,204 365,952
Total liabilities 351,204 365,952
Total equity and liabilities 997,777 993,267
On behalf of the Board
G. SlarkD. ArnoldDirectors
9 March 2015

Business & Strategy Review Corporate Governance Financial Statements Shareholder Information
Grafton Group plc Annual Report 2014
151
Company Cash Flow StatementFor the year ended 31 December 2014
2014 2013
Notes €’000 €’000
Profit / (loss) before tax 14,012 (6,919)
Finance income (114) (258)
Finance expense 164 150
Operating profit / (loss) 14,062 (7,027)
Depreciation 3 104 139
Share-based payments charge 1,144 604
Contributions to pension schemes in excess of IAS 19 charge 13 (10) (8)
(Decrease) / increase in working capital 10 (143) 3,086
Cash generated / (used) from operations 15,157 (3,206)
Interest paid (164) (150)
Income taxes paid (3) (3)
Cash flows from operating activities 14,990 (3,359)
Investing activities
Inflows
Interest received 114 258
OutflowsInvestment in subsidiary undertakings 4 - (2,324)
Purchase of property, plant and equipment 3 (881) (21)
(881) (2,345)
Cash flows from investing activities (767) (2,087)
Financing activities
Inflows
Proceeds from the issue of share capital 62 2,319
Movement on Group payables - 9,474
62 11,793
Outflows
Movement on Group payables (10,916) -
Movement on Group receivables (19,851) (9,744)
(30,767) (9,744)
Cash flows from financing activities (30,705) 2,049
Net (decrease) in cash and cash equivalents (16,482) (3,397)
Cash and cash equivalents at 1 January 20,405 23,802
Cash and cash equivalents at 31 December 3,923 20,405
Cash and cash equivalents are broken down as follows:
Cash at bank and short-term deposits 3,923 20,405

Grafton Group plc Annual Report 2014
152Co
mpa
ny S
tate
men
t of C
hang
es in
Equ
ity
Equi
ty s
hare
ca
pita
lSh
are
prem
ium
ac
coun
t
Cap
ital
re
dem
ptio
n re
serv
eSh
ares
to
be
issu
ed r
eser
veR
etai
ned
earn
ings
Trea
sury
sh
ares
Tota
l equ
ity
€’0
00
€’0
00
€’0
00
€’0
00
€’0
00
€’0
00
€’0
00
Year
to
31 D
ecem
ber
2014
At 1
Jan
uary
201
411
,68
629
5,30
69
05
5,28
331
9,8
81
(5,7
46)
627
,315
Prof
it a
fter
tax
for t
he fi
nanc
ial y
ear
--
--
14,6
43-
14,6
43
Tota
l oth
er c
ompr
ehen
sive
inco
me
Rem
easu
rem
ent l
oss
on p
ensi
ons
(net
of t
ax)
--
--
(10
)-
(10
)To
tal c
ompr
ehen
sive
inco
me
--
--
14,6
33-
14,6
33Tr
ansa
ctio
ns w
ith
owne
rs o
f th
e C
ompa
ny r
ecog
nise
d di
rect
ly in
equ
ity
Issu
e of
Gra
fton
Uni
ts (n
et o
f iss
ue e
xpen
ses)
854
--
--
62
Shar
e ba
sed
paym
ents
cha
rge
--
-4
,56
3-
-4
,56
3
854
-4
,56
3-
-4
,625
At
31 D
ecem
ber
2014
11,6
94
295,
360
90
59,
846
334
,514
(5,7
46)
646
,573
Year
to
31 D
ecem
ber
2013
At 1
Jan
uary
201
311
,664
293,
009
905
4,33
732
6,11
2(5
,746
)63
0,28
1
Loss
aft
er ta
x fo
r the
fina
ncia
l yea
r-
--
-(6
,921
)-
(6,9
21)
Tota
l oth
er c
ompr
ehen
sive
inco
me
Rem
easu
rem
ent l
oss
on p
ensi
ons
(net
of t
ax)
--
--
(8)
-(8
)
Tota
l com
preh
ensi
ve (e
xpen
se)
--
--
(6,9
29)
-(6
,929
)
Tran
sact
ions
wit
h ow
ners
of
the
Com
pany
rec
ogni
sed
dire
ctly
in e
quit
yIs
sue
of G
raft
on U
nits
(net
of i
ssue
exp
ense
s)22
2,29
7-
--
-2,
319
Tran
sfer
from
oth
er re
serv
e-sh
ares
to b
e is
sued
--
-(6
98)
698
--
Shar
e ba
sed
paym
ents
cha
rge
--
-1,
644
--
1,64
4
22
2,29
7-
946
698
-3,
963
At
31 D
ecem
ber
2013
11,6
8629
5,30
690
55,
283
319,
881
(5,7
46)
627,
315

Business & Strategy Review Corporate Governance Financial Statements Shareholder Information
Grafton Group plc Annual Report 2014
153
Notes to the Company Financial Statements
1. Income StatementIn accordance with Section 148(8) of the Companies Act, 1963, the income statement and related notes of the parent undertaking have not been presented separately in these financial statements. There was a profit after tax of €14.6 million (2013: loss of €6.9 million) attributable to the parent undertaking for the financial year.
2. Statutory and Other InformationThe following items have been charged to the company income statement:
2014 2013
€’000 €’000
Statutory audit (refer to Note 2 of Group Financial Statements) 60 60
Depreciation 104 139
Operating lease costs 114 114
Directors’ remuneration 3,939 3,617
The Directors’ remuneration is set out in detail in the Report of the Remuneration Committee on Directors’ Remuneration on pages 51 to 69.
The average number of persons employed by the Company during the year was 24 (2013: 21).
2014 2013
€’000 €’000
The aggregate remuneration costs of employees were:
Wages and salaries 4,157 4,287
Social welfare 323 335
Share-based payments charge 1,144 604
Defined contribution and pension related costs 761 195
Charged to operating profit 6,385 5,421
Net finance cost on pension scheme obligations - -
Charged to Income Statement 6,385 5,421
Actuarial loss on pension scheme 10 8
Total employee benefit cost 6,395 5,429
Key ManagementThe cost of key management including Directors is set out in the table below:
2014 2013
Number of Individuals 8 8
2014 2013
€’000 €’000
Short-term employee benefits 3,561 2,821
Share-based payment charge 841 650
Termination benefits - 292
Retirement benefits expense 322 482
Charged to operating profit 4,724 4,245

Grafton Group plc Annual Report 2014
154
Notes to the Company Financial Statements(continued)
3. Property, Plant and EquipmentPlant and equipment in the Company is stated as follows:
Plant and equipment
2014 2013
€’000 €’000
Company
CostAt 1 January 1,998 1,977
Additions 881 21
At 31 December 2,879 1,998
DepreciationAt 1 January 1,936 1,797
Charge for year 104 139
At 31 December 2,040 1,936
Net book amountAt 31 December 839 62
At 1 January 62 180
4. Financial Assets
Other investments
Investments in subsidiary undertakings Total
€’000 €’000 €’000
At 1 January 2013 13 362,362 362,375
Acquisitions - 2,324 2,324
Capital contribution – share-based payments - 1,040 1,040
At 31 December 2013 13 365,726 365,739Capital contribution – share-based payments - 3,419 3,419At 31 December 2014 13 369,145 369,158
Other investments represent sundry equity investments at fair value.

Business & Strategy Review Corporate Governance Financial Statements Shareholder Information
Grafton Group plc Annual Report 2014
155
5. Trade and Other Receivables
2014 2013
€’000 €’000
Amounts falling due within one year:Amounts owed by subsidiary undertakings 593,356 576,007
Other receivables 4,660 8,352
598,016 584,359
Amounts falling due after one year:Amounts owed by subsidiary undertakings 25,202 22,700
None of the amounts owed from subsidiary undertakings of €618.6 million (2013: €598.7 million) is considered overdue for payment or is believed not to be recoverable.
6. Share Capital and Share PremiumDetails of equity share capital and share premium are set out below and in Note 17 to the Group Financial Statements.
Issue Price Number of Shares
2014 Nominal Value
€’000
2013 Nominal Value
€’000
Issued and fully paid:
Ordinary shares
At 1 January 232,933,607 11,647 11,625
Issued under UK SAYE scheme 19,213 1 1
Grafton Group Share Schemes
Date options and entitlements to acquire shares granted
May 2011 LTIP Nil 137,818 7 -November 2003 €5.45 - - 21
At 31 December 233,090,638 11,655 11,647
‘A’ ordinary shares
At 1 January 3,959,871,319 39 39
‘A’ ordinary shares issued in year 2,669,527 - -
At 31 December 3,962,540,846 39 39
Total nominal share capital issued 11,694 11,686
Share Premium
2014 2013
Company €’000 €’000
At 1 January 295,306 293,009
Premium on issue of shares under UK SAYE scheme 54 24
Premium on issue of shares under Grafton Group Share Scheme - 2,302
Cost of share issues - (29)
At 31 December 295,360 295,306

Grafton Group plc Annual Report 2014
156
Notes to the Company Financial Statements(continued)
7. Financial Instruments and Financial RiskThere is no difference between the fair value and carrying value of the financial assets and financial liabilities for the Company.
The maximum credit risk is represented by the carrying amount of the asset. The cash on deposit at the year end is primarily held with Bank of Ireland.
The majority of foreign exchange exposure in the Company relates to inter-group balances and transactions.
There is no significant cashflow sensitivity for variable rate instruments in the Company.Carrying amount
Contractual cash flow Within 1 Year
31 December 2014 €’000 €’000 €’000
Non-Derivative Financial LiabilitiesPayable to Group companies 340,759 340,759 340,759
340,759 340,759 340,759
Carrying amount
Contractual cash flow Within 1 Year
31 December 2013 €’000 €’000 €’000
Non-Derivative Financial LiabilitiesPayable to Group companies 351,675 351,675 351,675
351,675 351,675 351,675
8. Trade and Other Payables
2014 2013
€’000 €’000
Trade and other payablesAccruals 10,441 14,276
Amounts owed to subsidiary undertakings 340,759 351,675
351,200 365,951

Business & Strategy Review Corporate Governance Financial Statements Shareholder Information
Grafton Group plc Annual Report 2014
157
9. Deferred Taxation
Recognised deferred tax (assets) and liabilities Assets Liabilities
Net (assets)/ liabilities Assets Liabilities
Net (assets)/ liabilities
2014 2014 2014 2013 2013 2013
€’000 €’000 €’000 €’000 €’000 €’000
Other items (639) - (639) (2) - (2)
2014Balance 1 Jan 14
Recognised in income
Recognised in other
comprehensive income
Foreign exchange
retranslationArising on
acquisitions Balance
31 Dec 14
€’000 €’000 €’000 €’000 €’000 €’000
Other items (2) (637) - - - (639)
2013Balance 1 Jan 13
Recognised in income
Recognised in other
comprehensive income
Foreign exchange
retranslationArising on
acquisitions Balance
31 Dec 13
€’000 €’000 €’000 €’000 €’000 €’000
Other items (2) - - - - (2)
10. Movement in Working CapitalTrade and other
receivables Trade and other
payables Total
€’000 €’000 €’000
At 1 January 2013 6,185 (9,023) (2,838)
Movement in 2013 2,167 (5,253) (3,086)
At 1 January 2014 8,352 (14,276) (5,924)Movement in 2014 (3,692) 3,835 143At 31 December 2014 4,660 (10,441) (5,781)

Grafton Group plc Annual Report 2014
158
Notes to the Company Financial Statements(continued)
11. Reconciliation of Net Cash Flow to Movement in Net Debt
2014 2013
€’000 €’000
Net (decrease) in cash and cash equivalents (16,482) (3,397)
Cash flow from movement in debt and lease financing - -
Change in net debt resulting from cash flows (16,482) (3,397)
Net cash at 1 January 20,405 23,802
Net cash at 31 December 3,923 20,405
12. Operating LeasesTotal commitments payable under non-cancellable operating leases are as follows:
Land and Buildings
2014
Land and Buildings
2013
€’000 €’000
Operating lease payments due:
Within one year 114 114
Between two and five years 342 446
Over five years - -
456 560
13. Pension CommitmentsA defined benefit scheme and defined contribution pension schemes are operated by the Company and the assets of the schemes are held in separate trustee administered funds.
The actuarial reports are not available for public inspection.
IAS 19 – Employee BenefitsAn actuarial valuation was updated to 31 December 2014 by a qualified independent actuary.
Financial AssumptionsThe financial assumptions used to calculate the retirement benefit liabilities under IAS 19 were as follows:
At 31 Dec 2014 At 31 Dec 2013
Company scheme
Company scheme
Valuation Method Projected Unit Projected Unit
Rate of increase of pensions in payment - -
Discount rate 2.10% 3.65%
Inflation rate increase 1.30% 2.00%
The Company’s obligations to the scheme at the end of 2014 and 2013 were limited to providing a pension to an executive who retired in 2009 on a fixed pension.

Business & Strategy Review Corporate Governance Financial Statements Shareholder Information
Grafton Group plc Annual Report 2014
159
13. Pension Commitments (continued)
Year ended 31 December
Assets Liabilities Net asset/(deficit)
2014 €’000
2013 €’000
2014 €’000
2013 €’000
2014 €’000
2013 €’000
At 1 January 1,232 1,286 (1,232) (1,286) - -
Interest income on plan assets 44 47 - - 44 47
Contributions by employer - - - - - -
Contributions by members - - - - - -
Benefit payments (76) (77) 76 77 - -
Current service cost - - - - - -
Past service credit - - 10 8 10 8
Settlement loss - - - - - -
Interest cost on scheme liabilities - - (44) (47) (44) (47)
Remeasurement (losses)/gains 182 (24) (192) 16 (10) (8)
At 31 December 1,382 1,232 (1,382) (1,232) - -
Related deferred tax asset (net) - -
Net pension liability - -
Expense recognised in operating costs
2014 2013
€’000 €’000
Past service credit 10 8
Total operating credit 10 8
Recognised directly in other comprehensive income
2014 2013
€’000 €’000
Remeasurement loss on pensions (10) (8)
(10) (8)
The credit is recognised in the following lines in the income statement:
2014 2013
€’000 €’000
Operating credit (10) (8)
Net finance cost on pensions scheme obligations - -
Total operating credit (10) (8)
No contributions are expected to be paid to the Company’s defined benefit scheme in 2015 (2014: €Nil).

Grafton Group plc Annual Report 2014
160
Notes to the Company Financial Statements(continued)
14. Share-Based PaymentsPlease refer to the Group Share-Based Payments Note (Note 32) set out on pages 144 to 148.
15. Related Party TransactionsThe principal related party transactions that require disclosure under IAS 24: Related Party Disclosures relate to subsidiaries, key management personnel and post employment benefit plans.
SubsidiariesThe consolidated accounts of the Company and its subsidiaries include the following transactions that have been eliminated on consolidation:
• Management charges made by the Company to the subsidiaries of €13.5 million (2013: €15.4 million) for the year ended 31 December 2014;
• No dividend income was received by the Company from subsidiaries during the year (2013: €Nil);
• Loans were granted to and by the Company to its subsidiaries.
Key Management PersonnelThe term key management personnel comprise the Board of Grafton Group plc and the Company Secretary/Group Financial Controller. The cost of key management personnel is analysed in Note 2 to the Company Financial Statements and in Note 5 to the Group Financial Statements. The Report of the Remuneration Committee on Directors’ Remuneration on pages 51 to 69 provides detailed disclosure for 2014 and 2013 salaries, fees, performance-related pay, pension allowance, other benefits and entitlements to acquire Grafton Units in accordance with the rules of the Grafton Group Share Scheme, and awards granted under the 2011 LTIP.
Post Employment Benefit PlansPension commitments to existing and former employees under defined benefit pension scheme arrangements are disclosed in Note 13 to the Company Financial Statements.

Business & Strategy Review Corporate Governance Financial Statements Shareholder Information
Grafton Group plc Annual Report 2014
161
16. Principal Operating SubsidiariesThe principal operating subsidiaries operating in Ireland are:
Name of Company Nature of Business
Grafton Merchanting ROI Limited Builders merchants
Chadwicks Limited Builders merchants
Woodie’s DIY Limited DIY superstores
Panelling Centre Limited Kitchen/Bedroom Panel Products
The Company owns 100 per cent of the ordinary shares, the only class of shares in issue, of its principal operating subsidiary undertakings. The registered office of principal subsidiary undertakings operating in Ireland is c/o Grafton Group plc, Heron House, Corrig Road, Sandyford Industrial Estate, Dublin 18.
The principal operating subsidiaries operating in the United Kingdom are:
Name of Company Nature of Business
Grafton Merchanting GB Limited Builders merchants
Macnaughton Blair Limited Builders merchants
Selco Trade Centres Limited Builders merchants
CPI Mortars Limited Mortar manufacturers
The Company owns 100 per cent of the share capital of its principal subsidiary undertakings operating in the UK. The registered office of Grafton Merchanting GB Limited is PO Box 1586, Gemini One, John Smith Drive, Oxford Business Park South, Oxford, OX4 9JF. The registered office of Selco Trade Centres Limited is First Floor, Boundary House, 2 Wythall Green Way, Wythall, Birmingham, B47 6LW. The registered office of CPI Mortars Limited is Oak Green House, 250-256 High Street, Dorking, Surrey, RH4 1QT. The registered office of Macnaughton Blair Limited is 10 Falcon Road, Belfast, BT12 6RD, Northern Ireland.
The principal operating subsidiaries in Belgium are YouBuild NV (formerly BMC Groep NV) (Builders merchants) and Binje Ackermans S.A. (trading as MPRO). The registered office of YouBuild NV is Ropswalle 26, 8930 Menen, Belgium. The Company owns 65 per cent of the share capital of YouBuild NV. The registered office of Binje Ackermans S.A. is Avenue du Port 25, 1000 Brussels, Belgium.

Grafton Group plc Annual Report 2014
162
Notes to the Company Financial Statements(continued)
17. Section 17 GuaranteesPursuant to the provisions of Section 17, Companies (Amendment) Act, 1986, the Company has guaranteed the liabilities of certain wholly owned subsidiaries in the Republic of Ireland for the financial year ended 31 December 2014 and, as a result, such subsidiary undertakings have been exempted from the filing provisions of Section 7, Companies (Amendment) Act, 1986 and Regulation 20 of the European Communities (Accounts Regulations), 1993.
This guarantee applies to the following wholly owned subsidiaries, whose registered office is c/o Grafton Group plc, Heron House, Corrig Road, Sandyford Industrial Estate, Dublin 18: Absolute Bathrooms Limited, Athina Limited, Atlantic Home and Garden Centre Limited, Barretts of Ballinasloe Limited, Beralt Developments Limited, Bluebell Sawmills Limited, Cardston Properties Limited, Chadwicks Limited, Chadwicks Holdings Limited, Cheshunt Limited, Cork Builders Providers Limited, CPI Limited, Davies Limited, Denningco Limited, Doorplan Ireland Limited, Drainage Systems Dublin Limited, Dunmore Holdings Limited, Eddie’s Hardware Limited, F&T Buckley (Holdings) Limited, F & T Buckley Limited, Frank Barrett & Sons Limited, Garvey Builders Providers Limited, Gillespie Building Supplies (Carlow) Limited, Grafton Group Holdings Limited, Grafton Group Investments Limited, Grafton Group Investment Holdings Limited (formally Grafton Financial Services Limited), Grafton Group Management Services Limited, Grafton Group Secretarial Services Limited, Grafton Group Finance plc (formerly Grafton NPI 2005 plc), Grafton Merchanting ROI Limited, Heatovent Ireland Limited, Heiton Buckley Limited, Heiton Group plc, Heiton McCowen Limited, Heiton McFerran Limited, House of Woods Limited, J.E. Telford Limited, Jarkin Properties Limited, Kenn Truss Limited, Knottingley Limited, Lacombe Properties Limited, Leeway Properties Limited, Leo Wright Holdings Limited, Market Hardware Limited, MB Doorplan Limited, MFP Plastics Limited, MFP Sales Limited, Mooney & O’Dea Limited, Morgan McMahon & Co. Limited, Multy Products (Ireland) Limited, Paddy Power (Kilbarry) Limited, Panelling Centre Limited, Payless D.I.Y. Limited, Perchura Limited, Plumbing Distributors Limited, Plumbland Limited, Pouladuff Developments Limited, Pouladuff Manufacturing Limited, Powlett Properties Limited, Raftor Limited, Resadale Properties Limited, Sam Hire Holdings Limited, Sam Hire Limited, Sandtex Ireland Limited, Stettler Properties Limited, Telford Group Limited, Telfords (Athy) Limited, Telfords (Portlaoise) Limited, Timber Frame Limited, Tiska Limited, Titanium Limited, Topez Limited, Tribiani Limited, Tullamore Hardware Limited, Universal Providers Limited, W&S Timber Components Limited, Weeksbury Limited, Woodies DIY (Irl) Limited, and Woodie’s DIY Limited.
18. Other Guarantees The Company has given guarantees in respect of the bank borrowings of subsidiary undertakings which amounted to €329.1 million at the balance sheet date. The Company has also guaranteed certain property lease obligations of subsidiary undertakings.
19. Approval of Financial StatementsThe Board of Directors approved the Company Financial Statements in respect of the year ended 31 December 2014 on 9 March 2015.

Shareholder Information
Corporate Information 164Financial Calendar 164Location of Annual General Meeting 165
Business & Strategy Review Corporate Governance Financial Statements Shareholder Information
Grafton Group plc Annual Report 2014
163

Grafton Group plc Annual Report 2014
164
Corporate Information
Auditor KPMG
Bankers Bank of Ireland
HSBC Bank plc
Ulster Bank
Barclays Bank plc
Lloyds Bank plc
Solicitors Arthur Cox, Dublin
A&L Goodbody, Dublin
Squire Patton Boggs, London
Norton Rose, London
Lyons Davidson, Bristol
Stockbrokers Goodbody Stockbrokers, Dublin
Numis Securities Limited, London
Corporate & Heron House
Registered Office Corrig Road
Sandyford Industrial Estate, Dublin 18
Phone: 00-353-1-216 0600
Fax: 00-353-1-295 4470
Email: [email protected]
Registrars Capita Asset Services
Shareholders Solutions (Ireland)
2 Grand Canal Square, Dublin 2
Phone; 00-353-1-5530050
Email: [email protected]
www.capitaassetservices.com
Financial CalendarResultsHalf-yearly results 27 August 2014
Full year results 10 March 2015
Annual general meeting 12 May 2015
2015 half-yearly results 27 August 2015
Interim DividendsRecord date 5 September 2014
Record date 20 March 2015

Business & Strategy Review Corporate Governance Financial Statements Shareholder Information
Grafton Group plc Annual Report 2014
165
Location of Annual General Meeting
The Annual General Meeting of the Company will be held on 12 May 2015 at 10.30 am in theIMI Conference Centre, Sandyford Road, Dublin 16. Telephone: (01) 207 8400
Should you require assistance, or have any queries on the day of the AGM, please call 087 971 0851.
182 Grafton Group plc Annual Report 2013
Location of Annual General Meeting
The Annual General Meeting of the Company will be held on 9 May 2014 at 10.30 am in the
IMI Conference Centre, Sandyford Road, Dublin 16. Telephone: (01) 207 8400
Should you require assistance, or have any queries on the day of the AGM, please call 087 971 0851.
BY CAR
From the North, West and South
Using the M50 going south, take Exit 13
(Sandyford/Dundrum/R113), then take the Green
Route to Sandyford Industrial Estate. Turn left onto
Blackthorn Drive at Beacon Court.
At the next T-junction, turn right onto Sandyford Road.
IMI is the next turn left, 100 yards away.
From the East and South East
Travelling north on the N11, take the M50 at
Loughlinstown. Take Exit 13 to Sandyford Industrial
Estate.
Turn left onto Blackthorn Drive at Beacon Court.
At the next T-junction, turn right onto Sandyford Road.
IMI is the next turn left, 100 yards away.
IMI
SANDYFO
RDRO
AD
Tr clights
SOUTHBOUND
N11TOCITY
STILLORGAN
DUALCARRIA
GEW
AY
Exit 14
Tr clights
AVIDTechnology
CLONARD
ROAD
SandyfordIndustrialEstate
LUAS Recommendedroutes to IMI
IMI Conference Centre, Sandyford Road, Dublin 16.Tel: (01) 207 8400
Enniskerry Wexford
BY LUAS
For shareholders’ convenience, courtesy buses will depart from the Sandyford LUAS plaza (last stop) at 9.50am,10.00am and 10.10am. Buses will return to the Sandyford LUAS plaza following the meeting.
Should you have any queries on the day of the AGM, please call 087 971 0851.
The Annual General Meeting of the Company will be held on 29 April 2009 at 10.30am in the
Location of Annual General Meeting

Heron House
Corrig Road
Sandyford Industrial Estate, Dublin 18
Phone: 00-353-1-216 0600
Fax: 00-353-1-295 4470
Email: [email protected]: www.graftonplc.com