OPG Power Ventures Plc - AnnualReports.com
92
Positioned for post COVID-19 recovery Deleveraging world class assets with sustained profitability OPG Power Ventures Plc FY2020 Annual Report & Accounts
-
Upload
khangminh22 -
Category
Documents
-
view
0 -
download
0
Transcript of OPG Power Ventures Plc - AnnualReports.com

Positioned for post COVID-19 recovery
Deleveraging world class assets with sustained profitability
OPG Power Ventures Plc
FY2020 Annual Report & Accounts

2
Contents
Page Number
Strategic Report 3 Highlights
4-6 Chairman’s Statement
7-12 Financial review
13-15 COO operational review
16 Business model
17 Group Objectives and strategies
18-22 Market review
23-36 Sustainability report
Corporate Governance 37-38 Principal risks
39-40 Board of Directors
41-45 Corporate Governance
46-47 Directors’ report
48-51 Directors’ remuneration report
52 Statement of Directors’ responsibilities
Financial Statements 53-57 Auditor’s report
58-62 Financial Statements 63-89 Notes to the Financial Statements 90 Corporate directory 91-92 Definitions & glossary

3
Highlights
Revenue
(£m)
FY16 128.4
FY17 136.2
FY18 140.1
FY19 140.6
FY20 154.0
Operating profit before impairments
(£m)
FY16 44.5
FY17 45.6
FY18 17.5
FY19 29.2
FY20 24.0
Adjusted EBITDA**
(£m)
FY16 50.7
FY17 52.1
FY18 24.7
FY19 35.3
FY20 31.2
EPS
(£ Pence)
FY16 5.29
FY17 8.4
FY18 -24.68
FY19 3.81
FY20 2.11
Profit Before tax
(£m) before impairments and tax
FY16 28.6
FY17 31.8
FY18 6.2
FY19 16.8
FY20 14.5
Net Debt/ Adjusted EBITDA
(£m)
FY16 5
FY17 5.9
FY18 3.8
FY19 2.2
FY20 1.7
• Revenue up 9.5% to £154.0m from £140.6m
in FY19
• Total generation (including deemed) of 2.72
billion units (2.71 billion units in FY19)
• Adjusted EBITDA** of £31.2 million (20.3%
margin) compared with £35.3 million (25.1%
margin) in FY19
• Profit before tax from continued operations
was £14.5 million compared with £16.9
million in FY19
• Term loans principal debt repayment £18.0m
• Borrowings reduced with gross debt of
£56.8m*, compared to £80.4m at 31 March
2019 * Gross Debt of 56.8 million consists of long term loan
of 49.9 million and working capital of 6.9 million
** See definition of Adjusted EBITDA on page 8

4
Chairman’s Statement
Strong operational performance and
profitability
As we have seen, the year was challenging
amidst a turbulent macro environment. The
Company has emerged stronger at the end,
paving pathways for accelerated future growth.
In spite of all the challenges during the year, the
Company’s strong operational performance and
operating profitability in FY20 demonstrates that
focusing on the existing operations and
deleveraging remains the right strategy. The
Company today is poised to be amongst the
most successful and least leveraged power
companies in India with world class assets and
sustained profitability.
The Chennai plants’ generation, including
deemed generation, during FY20 was 2.7 billion
units which is in line with the level achieved in
FY19, with average Plant Load Factor (“PLF”) at
75 per cent (FY19: 75 per cent). During FY20
average realised tariff was Rs5.67 (FY19: Rs5.41)
4.8 per cent higher than in FY19.
In FY20, the Group’s revenue was £154.0 million
(FY19: £140.6 million) and Adjusted EBITDA was
£31.2 million (FY19: £35.3 million). Profit from
continuing operations was £10.2 million (FY19:
£15.0 million) and profit for the year was £8.0
million (£14.0 million).
This was the second year of operations of the
Group’s Karnataka solar projects (62MW)
situated north of Bengaluru. A capacity
utilisation factor of 18.5 per cent was achieved in
FY20 (17 per cent in FY19).
Continued deleveraging
In 2018, the Board took the decision to focus on
our profitable, long-life assets in Chennai, and to
prioritise deleveraging as a method to grow
shareholders’ equity. Total borrowings during
FY20 were reduced from £80.4 million to £56.8
million, comprising term loans of £49.9 million
and working capital loans of £6.9 million.
Since the adoption of this strategy, additional
shareholders’ value of 15.6p per share was
accrued during last three years on account of
term loan repayments.
We will continue to use the cash generation of
our existing operations to repay our debt and
based on the revised term loans’ repayments
schedule we aim to be term loans free in
calendar year 2024.
Indian economy
Being one of the most populous countries in the
world, COVID-19 and the subsequent
countrywide lockdown have caused severe
disruption to the Indian economy. The economy
continued to witness slowdown in growth due to
successive lockdowns, movement restrictions,
lower consumption and slow credit growth.
Amid projections of a sharp contraction in the
global economy, the International Monetary
Fund (“IMF”) projects the Indian GDP to contract
by 10.3 per cent in fiscal year 2020 and projects
the Indian economy to rebound in fiscal year
2021 with GDP growth of 8.8 per cent.
The Reserve Bank of India, the country’s central
bank and banking regulator, has taken several
steps to reduce the negative impact of the
lockdown on the economy through various
monetary policy measures, including reduction
in repo and reverse repo rates, moratorium on
loan repayment, 90 days freeze on non-
performing assets declaration, helping MSMEs
through stimulus packages and credit line for
incentivizing industries. These measures coupled

5
with the easing of lockdown restrictions in a
phased manner, will help economic activity to
resume fully.
Power sector
During the initial lockdown the total power
consumption reduced by approximately 25 per
cent primarily due to a decrease in industrial
demand for electricity on account of COVID-19
restrictions. As the restrictions were eased,
power consumption gradually increased and in
September 2020 country wide consumption
grew by 5.6 per cent after a six month slump.
Following the gradual recovery of the Indian
economy, the power demand in the country is
expected to grow driven by rising industrial
demand. Further, demand revival will be driven
by various reforms undertaken by the
Government of India, viz., the UDAY scheme,
24*7 Power for All initiative and the Saubhagya
scheme. On the energy generation front, coal is
expected to remain a significant fuel source in
the country’s quest to provide power to every
citizen.
Outlook
The Company delivered a robust operational
performance and continued its scheduled
repayment of term loans during FY20.
After the year end, in June 2020, the Group
raised approximately £21.0 million (Rs.2 billion)
through a non-convertible debentures (“NCDs”)
issue with a three years bullet repayment term
and coupon rate of 9.85 per cent. The NCDs
proceeds were used to repay the FY21 and FY22
(i.e. up to March 2022) principal term loans
obligations. Total receivables from TANGEDCO
for principal payment up to 31 March 2020
amounting to £16.4 million (Rs.1.5 billion) has
been fully collected and there are no overdue
monthly invoices from TANGEDCO. Collections
from TANGEDCO were partly used to further
prepay the term loans and partly for working
capital requirements. Following these
transactions, as at 30 September 2020 the
Company’s debt amounts to £42.5 million,
comprised of £21.0 million of NCDs, £21.5
million of existing term loans, with scheduled
repayments spread from June 2022 to June
2024, and working capital loans of £1.3 million.
These two developments strengthened the
Group's financial position and liquidity at this
uncertain times caused by the COVID-19
pandemic.
COVID-19 has posed unprecedented and global
challenges for all countries and the Indian
economy is expected to contract during FY21,
resulting in lower GDP and less demand for
electricity. We have been working tirelessly to
implement plans to limit the human, financial
and commercial consequences of COVID-19. We
have initiated significant cash conservation
initiatives across the Group, whilst ensuring the
health and safety of all our employees to secure
our long term sustainability. These initiatives
have improved the liquidity position of the
Company which, together with support from our
lending institutions, put the Group in a stronger
position to manage the difficult market
conditions.
During the six month period to 30 September
2020, Company operated at average PLF (incl.
deemed), of 46 per cent which in September
2020 increased to 63 per cent. We expect that
the Company’s FY21 generation and average
realised tariff will reduce in comparison with
FY20. However, the Company is likely to benefit
from the projected lower coal prices and freight
rates and remains profitable. We expect that
medium-term and long-term fundamentals
remain unchanged and post-COVID-19 recovery,

6
the Company expects to prosper as management
seeks to deliver its long term, profitable and
sustainable business model.
I would like to thank, all of our employees,
vendors, banks and all stakeholders for the
incredible support we have received during
these unprecedented and extraordinary times.
Arvind Gupta
Chairman
22 October 2020

7
FINANCIAL REVIEW The following is a commentary on the Group’s financial performance for the year.
Income statement 2020 % of
revenue 2019 % of
revenue Year ended 31 March £m £m
Revenue 154.0 140.6
Cost of revenue (excluding depreciation) (90.0) (91.7)
Gross profit 64.0 41.5 48.9 34.8 Other income 0.7 2.6
Distribution, general and administrative
Expenses, expected credit loss (excluding depreciation and share-based compensation) (33.5) (16.2)
Adjusted EBITDA (see definition on page 8) 31.2 20.3 35.3 25.1 Share-based compensation (0.8) Depreciation and amortization (6.3) (6.1)
Net finance costs (9.5) (12.4)
Profit before tax from continuing operations 14.5 9.4 16.8 11.9 Taxation (4.3) (1.8)
Profit after tax from continuing operations 10.2 6.6 15.0 10.7
Loss from discontinued operations, incl. Non-Controlling Interest (2.1) (1.0) Profit for the year 8.0 14.0
Note: Due to rounding, numbers presented throughout this document may not add up precisely to the totals provided and percentages may not precisely reflect the absolute figures.
Revenue
The Group’s revenue has increased by £13.4 million, reflecting a 9.5% growth year on year as a result
of full year impact of increase in tariff during FY19. Average tariff realised during FY20 increased to
Rs5.86 per kWh, as a result of full year impact of tariff increases during October 2018 for captive users
and additional contractual claims to TANGEDCO. Generation exported to customers and billed for
revenue, including deemed generation, was in the same range of 2.72 billion units during FY20 in
comparison with FY19 generation.
Production and output levels from the Group’s operating power plant in Chennai compared to the prior
year were as follows:
Particulars FY20 FY19
Total generation, incl. “deemed” generation (million units) 2,716 2,705
Plant Load Factor (PLF) (%)1 75 75
Average tariff (INR/unit) 2 5.86 5.56
1 Chennai Unit 3: “Deemed” PLF (%) has been included
2 Average tariff includes effect of deemed offtake tariff for Chennai Unit 3. Average FY20 tariff
excluding effect of deemed offtake was Rs5.67 (FY19: Rs5.41).

8
Gross profit and Adjusted EBITDA
Gross profit (‘GP’) in FY20 was 41.5% of revenue (FY19: 34.8%). The increase in GP is primarily on
account of the full year impact of the increase in tariff during FY19, additional contractual claims to
TANGEDCO and reduction of cost of coal.
Adjusted earnings before interest, taxation, depreciation and amortisation (‘Adjusted EBITDA’) is a
measure of a business’ cash generation from operations before depreciation, interest and exceptional
and non-standard or non-operational charges, e.g. share based compensation, etc. Adjusted EBITDA is
useful to analyse and compare profitability among periods and companies, as it eliminates the effects
of financing and capital expenditures.
Adjusted EBITDA was £31.2 million in FY20 a decrease from £35.3 million in FY19. The Adjusted EBITDA
margin was lower at 20.3% in FY20 against 25.1% in FY19 primarily on account of increase in expected
credit loss on trade receivables with respect to contractual claim made on a customer towards change
in law as per the Power Purchase Agreement of £6.4 million, tariff discount dispute of £7.5 million and
change in credit risk of customers of £3.1 million.
Profit from continuing operations before tax was £14.5 million compared with a profit from continuing
operations before tax of £16.8 million in FY19.
Profit before tax reconciliation (‘PBT’) (£m) FY 20
PBT 2019-20 14.5
PBT 2018-19 16.8
Decrease in PBT (2.3)
Increase in GP 15.1
Decrease in Other Income (2.0)
Increase in Expected Credit Loss, Distribution, General & Administrative Expenses (18.0)
Decrease in Net Finance Costs 2.8
Increase in Depreciation and Amortisation (0.2)
Decrease in PBT (2.3)
Taxation
The Company’s operating subsidiaries are under a tax holiday period, but are subject to Minimum
Alternate Tax (‘MAT’) on their accounting profits. Any tax paid under MAT can be offset against future
tax liabilities arising after the tax holiday period.
The tax expense during the year was £4.3 million comprised of current tax expense of £0.8 million and
deferred tax expense of £3.5 million.
9
Profits after tax from continuing operations
Profits after tax from continuing operations have decreased by 32.0% in FY20 to £10.2 million due to
increased provision for expected credit loss.
Assets Held for Sale and Loss from discontinued operations
62MW Karnataka solar projects
In FY18 four Karnataka solar projects (62MW) were commissioned. The Group has a 31% equity interest
in these projects. During FY19, the Company obtained a right to buy an additional 30% equity interest in
the solar projects following the achievement of the conditions precedent under the terms of the
agreement. This right, in combination with other rights, provided substantive potential voting rights and
investments in the underlying solar projects and were re-classified from associates to subsidiaries. Given
the long term returns from solar projects and the level of capital investment required, the Board has
decided to focus on the core thermal power plants business and announced its intention to dispose of the
Karnataka solar projects. The Company initiated the process of disposal of the solar projects in the
previous year which met all conditions of IFRS 5 for classification of the solar business as Assets held for
sale at 31 March 2020. Accordingly, assets of £46.4 million and liabilities of £32.9 million were classified
as assets and liabilities held for sale in the Consolidated Statement of Financial Position as at 31 March
2020 and their loss from operations of £0.3 million was also included in loss from discontinued operations
in the Consolidated Statement of Comprehensive Income.
Impairment provision of investments in joint venture Padma Shipping
In 2014 the Company entered into a Joint Venture agreement with Noble Chartering Ltd (“Noble”), to
secure competitive long term rates for international freight for its imported coal requirements. Under
the arrangement, the company and Noble agreed to jointly purchase and operate two 64,000 MT cargo
vessels through a Joint venture company Padma Shipping Ltd, Hong Kong (‘Padma’).
During FY18, the Joint Venture partner, due to a change in their group strategy, requested for the Joint
Venture to be terminated and as the vessels were still under construction and OPG agreed with this
proposal. During FY19 one of the vessels was sold by the shipping yard and during FY20 the second vessel
has been sold. The Padma joint venture will be terminated and dissolved in due course.
OPG has invested approximately £3.5 million in equity and £1.7 million to date as advance to Padma and
the joint venture has been reported using equity method as per the requirements of IFRS 11. The Company
recognised an impairment provision in FY20 financial statements of £0.9 million (FY19: £1.0 million)
against its investment to date, including its advance to Padma Shipping, resulting in impairment of the
entire investment of £5.2 million on account of the impending dissolution of the joint venture.
Earnings per Share (EPS)
The Company’s total reported EPS decreased to 2.11 pence from 3.81 pence primarily due to higher
provision for expected credit loss on trade receivables and loss from discontinued operations in FY20.

10
Dividend
The Company has issued 12,823,311 (2019: 31,601,503) shares during FY19 with respect to a scrip
dividend at par value of £0.000147 (2018: £0.000147) per share amounting to £1,885 (2019: £4,646). The
difference between fair value of shares issued above par value of £2,325,567 (2019: £3,558,442) with
respect to the scrip dividend was credited to share premium.
Foreign exchange loss on translation
The British Pound-to-Indian Rupee exchange rate has moved higher to a closing rate on 31 March 2020
of £1= INR 93.07 as against £1= INR 90.28 on 31 March 2019 thereby resulting in exchange loss of £4.6
million on translating foreign operations.
Property, plant and equipment
The decrease in net book value of our property, plant and equipment of £11.6 million principally relates
to depreciation and foreign exchange impact on account of translation during the year offset by additions.
Other non‐current assets
Other non-current assets (excluding Property, plant and equipment & Intangible assets) have decreased
by £0.5 million primarily due to decrease in non-current portion of restricted cash.
Current assets
Current assets have decreased by £36.4 million from £139.7 million to £103.3 million year on year
primarily as a result of the following:
• Increase in inventory holdings by £4.3 million.
• Decrease in Assets held for sale by £4.1 million.
• Decrease in trade and other receivables by £22.3 million.
• Decrease in cash and bank balances (including restricted cash) by £14.3 million.
Liabilities
Current liabilities have decreased by £10.8 million from £109.7 million to £98.9 million year on year
primarily due to trade payable and assets held of sales.
Non-current liabilities have decreased by £41.7 million from £80.7 million to £39.0 million year on year
primarily on account of repayment of borrowings and reduction in provision for pledged deposit, offset
with restricted cash.
Gross debt, gearing and finance costs
As of 31 March 2020, total borrowings were £56.8 million (31 March 2019: £80.4 million). The gearing
ratio, net borrowings (i.e. total borrowings minus cash)/(equity plus borrowings), was 25% (31 March
2019: 34%). Gearing ratio is a useful measure of financial risk of the Company.

11
Total borrowings (current and non-current portions) decreased by £23.6 million due to the repayment of term
loans of £18.0 million, the decrease in working capital loans of £3.5 million and foreign exchange impact of
depreciation of INR against GBP.
The Company achieved a major milestone with respect to Unit 1 of Chennai plant (77 MW out of 414 MW) as
the term loans were fully repaid in December 2018. Based on the revised term loans repayments schedule the
Chennai plant is expected to be debt free in calendar 2024.
Finance costs have decreased by £3.1 million from £14.6 million in FY19 to £11.5 million in FY20 primarily
due to the impact of the decrease in foreign exchange losses and reduction in interest expense following
scheduled repayments of term loans. Finance income decreased from £2.2 million in FY19 to £2.0
million in FY20 and therefore net finance costs in FY20 amounted to £9.5 million (FY19: £12.4 million).
The restricted cash balances totaling £7.5 million at 31 March 2020 (31 March 2019: £23.5 million) is
comprised of financial deposits that have been pledged as security for Letters of Credit. Reduction in
restricted cash is primarily due to an offset of financial deposits, pledged as a security for BVP’s
borrowings, against an impairment provision made in previous years.
Cash flow
Cash flow from continuing operations before and after changes in working capital were £48.2 million
(FY19: £35.7 million) and £30.6 million (FY19: £28.1million) respectively. Net cash flow from operating
activities has increased from £28.1 million in FY19 to £30.6 million in FY20, an increase of £2.5 million,
primarily due to increase in gross profit.
Movements (£m) FY20 FY19
Operating cash flows from continuing operations before
changes in working capital 48.2 35.7
Tax paid (0.8) (0.6)
Change in working capital assets and liabilities (16.8) (7.0)
Net cash generated by operating activities from
continuing operations 30.6 28.1
Purchase of property, plant and equipment (net of
disposals) (0.6) (1.5)
Investments sold/(purchased), incl. in solar projects,
market securities, movement in restricted cash and
interest received 3.5 1.2
Net cash from/(used in) continuing investing activities 2.9 (0.3)
Finance costs paid (9.9) (14.8)
Total cash change from continuing operations before net
borrowings 23.6 13.0
Post - reporting date events
The Group raised approximately £21.0 million (Rs2 billion) during June 2020 through non-convertible

12
debentures (NCDs) issue with a three years term and coupon rate of 9.85%. The NCDs proceeds was used
to repay the FY21 and FY22 (i.e. to March 2022) principal term loans obligations.
Post year end operations update and COVID-19 impact
Since the start of FY21, there has been a reduction in generation due to COVID-19 induced country wide
lockdown which resulted in disruption in the economic activities and subsequent decrease in power
demand from captive users. For the six months to 30 September 2020:
• Average Plant Load Factor (“PLF”) was 46% (H1 FY19: 79%); in September 2020 PLF increased to 63%
• Average tariff was Rs5.60 (FY20: Rs5.67)
• At 30 September 2020 the Company’s gross debt amounted to £43.8 million, comprised of £21.0
million of NCDs, £21.5 million of existing term loans, with scheduled repayments spread from June
2022 to June 2024, and working capital loans of £1.3 million
• Various cost reduction, efficiency improvement and liquidity improvement measures have been
implemented to ensure sustainable operations
The Government of India with Reserve Bank of India (RBI) have announced various regulatory measures
to help the industry. Subsequent to the year end, the RBI announced various regulatory measures (RBI
COVID-19 Regulatory package which, inter alia, provides for rescheduling of payments towards term loans
and working capital facilities for principal and interest) to mitigate the burden of debt servicing brought
by disruptions on account of the COVID-19 pandemic and to ensure the continuity of viable businesses.
The Group has opted for such measures for the deferment of payment of principal and interest on term
loans and also interest on working capital loans.
In June 2020, the Group repaid the principal term loan obligation for FY 21 and FY 22 from NCDs proceeds
and during the first few months of FY21 it collected total receivables outstanding at 31 March 2020 of
approximately £16.4 million from its principle customer TANGEDCO and there are no overdue monthly
invoices from TANGEDCO. These two developments strengthened the Group's financial position at this
time of economic slowdown.
Dmitri Tsvetkov
Chief Financial Officer
22 October 2020
13
COO OPERATIONAL REVIEW
The following is a review of operations for the year.
Plant availability and generation
Our operational performance is affected by our revenue generation model, plant availability, plant load
factors and auxiliary power consumption.
Both coal availability and water consumption are two factors that have disrupted the availability and load
factors of other thermal power plants in India in recent years. OPG’s plants are designed to be able to use a
wide range of fuels, both domestic and international, and the Company further has the capability to
maintain adequate reserves of coal. This has been integral to coal availability and we haven’t faced any
interruptions on account of coal since commissioning each unit. In addition, the plants are designed to limit
the consumption of water as they are built with air cooled condenser technology rather than being water
cooled with the result that OPG’s plants use around significantly lesser water than a typical water cooled
thermal power plant that is commonly installed around India and globally. This is a key feature as our units
operate in a region that is naturally water scarce.
Our load factors take account of plant availability as reduced by external factors like normal seasonal
demand adjustments to their offtake under the Long Term Variable Tariff Agreement (LTVT) (though the
customer still pays us as discussed further below), enforced system back downs and one-off disruptions
to demand such as due to adverse weather conditions.
Total generation at our 414 MW Chennai plant in FY20, including ‘deemed’ offtake, was 2.7 bn units
which is same as last year’s generation. The Chennai plant load factor (‘PLF’) including ‘deemed’ offtake,
in FY20 was 75% versus a national average for thermal plants of slightly less than 56%. In FY 21, the
Company expects load factors to be lower than FY20 primarily as a result of lockdowns implemented by
the Indian government due to COVID-19 pandemic and the resultant contraction of industrial activity
across the country.
Auxiliary consumption levels are also a key measure of plant efficiency, and are typically between 7.5 –
8.5% for our Chennai units. In FY 21 plant efficiency is likely to be lower due to the units operating at
significantly lower load factors. The Company has instituted several measures and technical
improvements to mitigate this efficiency loss.
Sales contracts
During FY20, the Company continued supplying directly to industrial customers under short-term and
multi-year contracts in Chennai. The tenure of the sales contracts entered into with industrial customers
at Chennai was between one year and three years. This has accelerated cash collections and improved
visibility of earnings. The capacity allocated to industrial customers under such contracts was 334 MW,
or 81% of the plant’s installed capacity. 74 MW of Chennai capacity has remained available for supply on
the LTVT to the Tamil Nadu State.
For FY21, the Chennai plant expects to continue with its diversified sales mix, contracting the majority of

14
its generation to captive customers and the balance 74 MW to the Tamil Nadu State under the LTVT. As
explained above, due to the slowdown in industrial and commercial activity as a result of the COVID-19
Pandemic, the actual offtake from customers is expected to be lesser than FY 20.
The Chennai plant realised an average tariff of Rs 5.67 in FY20 (FY19: Rs 5.41) and a ‘deemed’ offtake
charge of Rs 1.50 per unit for ‘deemed’ generation. The difference between tariff and cost of coal on a
per unit basis (‘the Clean Dark Spread’), was Rs 2.35 at Chennai for FY20 (FY19: Rs 1.82), which we believe
continues to be amongst the best in the sector. The increase in Clean Dark Spread is primarily due to
reduced coal price during FY20 and full year benefit from the increase in tariff in Oct 18.
For FY21, the Company expects lower realised tariff in comparison with FY20 average realised tariff of
Rs 5.67, largely due to a reduced tariff slab being implemented by the Company in keeping with market
requirements post the slide in power demand during the COVID-19 pandemic. This reduced tariff is
partially offset by the significant decrease in coal price caused by the COVID-19 lockdowns and
subsequent drop in global coal demand.
Coal supply and prices
The Company has consistently been able to import low sulphur coal from a small number of high class
Indonesian coal producers and traders with whom we have developed long-standing relationships. The
Company has purchased coal primarily on short and medium-term contracts in FY20 and as such the
Company benefited as prices softened during the year.
The average coal price was Rs 4,305 per tonne in FY20 which is lower than the average price for FY 19 of
Rs 4,517 per tonne. Independent forecasts predict the international coal prices to reduce further in FY 21
due to COVID-19 pandemic lockdown causing decline in coal demand.
In FY20, the Company contracted a fixed price coal purchase contract for procurement of 1 million tonnes
of coal in FY20, which represented approximately 60% of our annual requirement. The delivery of coal
under this contract took place from June 2019 to March 2020. This created a hedge against volatility in
the coal price due to seasonal fluctuations and any major policy decisions of China.
The Company also executed a small quantity of financial swaps in FY 19 in order to hedge our coal cost.
The impact of this remains nominal as these trades reflect a very small percentage of our annual
consumption. The liquidity in the swaps market had remained low in FY20 but it is expected to increase.
With this trend the Company expects to be able to continue to further hedge our cost by undertaking
larger positions on the financial coal markets.
Following the COVID-19 lockdown, the coal price and freight rates decreased significantly and
international coal prices and freight rates are expected to remain at these lower levels till the end of CY
2020.
The Company will continue to actively review its procurement and hedging practices to establish ways in
which to mitigate the volatility of the coal price and will report any material developments in this regard.

15
Safety and environmental compliance
The Company made good progress with its safety programme, recording no fatalities and an industry
leading Total Recordable Incident Report (TRIR) in FY20 for Chennai.
The Company continues to minimise its consumption of water through air cooling and we operate with a
philosophy of continual improvement with regards to any effluent. The Indian Government has notified
revised compliance standards for emission norms for all thermal power plants across the country to be
effective in a staged manned from June 2020 to 2022. The Company is well placed to comply with the new
standards applicable for Sox, Nox and SPM by doing some capital expenditure. The Company is evaluating
various technologies with a view to be fully compliant to the revised emission norms.
Solar projects - 62 MW Karnataka
In FY17, the Company had signed long-term 25 year PPAs for 62 MW with Karnataka State at an average
tariff of Rs.5.00 across the 4 sites. All the four plants are now operating at their maximum optimal PLF and
have achieved an annual average PLF of 18.5% in FY20 (17% in FY19). Currently the projects are being paid
a tariff of Rs 4.36 per kWh but following favourable interim court orders we expect that Karnataka Discoms
will be paying us the tariffs specified in the PPA, i.e. average tariff of Rs.5.00 across the 4 sites.
Avantika Gupta
Chief Operating Officer
22 October 2020

16
Business Model
17
Group objectives and strategies
The Group’s objective is to build shareholder value through profitable growth by becoming the first choice
provider of reliable and uninterrupted power at competitive rates to its customers
In addition, the Group’s aim is to be a sector leader by
reference to the quality of its earnings, the profitable growth it
delivers and its performance against its own stringent safety
and environment management standards.
To meet these objectives, the Group’s strategy includes:
(i) maximising the performance of its existing power generation assets;
(ii) reducing its cost of capital and paying dividends;
(iii) pursuing responsible growth; and
(iv) delivering accretive growth projects within its areas of
expertise.
Maximising performance of existing power plants
Customers The Group is committed to maximising the performance of its existing power generation assets through plant availability and providing a reliable and uninterrupted supply of electricity directly to its customers. The flexible design of our plants allows us to procure a variety of international and domestic coal and maintain an uninterrupted supply of coal. Further, the Group seeks to achieve competitive prices that are negotiated directly with customers. The Group’s use of the group captive model means that it is well positioned to respond to fluctuations in fuel costs through short- and medium-term sales contracts.
Profitability The Group’s strategy involves developing and operating its power plants under the group captive model enabling it to set its own tariffs with captive users and thereby providing the Group with the flexibility to optimise tariffs and profitability. The Group continuously seeks to improve its operational performance and so implements strategies for the optimisation of its power generation assets.
Reducing cost of capital and paying dividends
The Group aims to maximise cash generation at its existing power plants in order to provide liquidity support for its operations and to repay debt, pay dividends and generate equity for use in potential projects. The Group continues to prioritise projects that can be funded through a combination of debt financing and internal resources, and that can be expected to generate revenues which meet its target return levels without any direct subsidies being made available. Furthermore, the Group seeks to maintain manageable gearing levels and regular open dialogue with its shareholders and financing partners.
Dividends The Group seeks returns for shareholders and has adopted a dividend policy that will, initially, seek to pay out 15% of full year net earnings, subject to the level of free cash flow generated, (calculated after scheduled debt repayments and expected capital expenditure) and progress to a long-term dividend strategy that pays out a third of the Company’s net earnings in any year.
Deleveraging
As of 31 March 2020, total borrowings were £56.8m. The gearing ratio (net borrowings/(equity plus net borrowings) was 25% (31 March 2019: 34%). Total borrowings (current and non-current portions) decreased by £23.5m due to repayment of term loans and working capital loans, through operations of the Chennai plant. The Company achieved a major milestone this year as the term loans with respect to Unit 1 of Chennai plant (77 MW out of 414 MW) were fully repaid in December 2018. Based on term loans repayment schedule Chennai plant will be debt free by the middle of 2024.

18
MARKET REVIEW
Global Economy:
As per World Bank, Global Economic Prospects in CY2019, global GDP growth slowed down to 2.5%,
from 3% a year earlier. This slowdown was caused by weakness in global trade and investment, and
affected both developed economies, such as the Euro area, and developing economies. The global
trade in goods contracted during most of the year and manufacturing activity slowed down
noticeably. The trade tensions between the two largest economies, which dominated global
economic concerns for some time, have caused heightened policy uncertainty and prompted many
countries across the world to adopt protectionist measures.
The COVID-19 pandemic has had a more negative impact on the global economic activity in the first
half of 2020 than anticipated. As per IMF World Economic Outlook October 2020, the recovery is
projected to be more gradual and global decline is projected at 4.4 percent in CY2020 an outcome far
worse than during the 2009 global financial crisis. In CY2021 global growth is projected at 5.2 percent.
Source: Central Statistics Office and World Bank
Indian Economy
Key macroeconomic indicators:
Gross Domestic Product (‘GDP’)
India’s GDP increased from around Rs.92 trillion in fiscal year 2013 to about Rs.146 trillion in fiscal
year 2020, which represented a compound annual growth rate (‘CAGR’) of approximately 6.8%. The
Indian economy was negatively impacted during the last three fiscal years. Declining growth of private
19
4.34.8
1.71.3 1.1 0.6
1.8 2.1
0.90.0
1.0
2.0
3.0
4.0
5.0
6.0
FY 12 FY 13 FY 14 FY 15 FY 16 FY 17 FY 18 FY 19 FY 20
CAD as a % of GDP
consumption, weak increase in fixed investment, muted exports and stress in the financial sector are
some reasons for the slowdown.
As per IMF data, after several years of robust growth, during FY20 Indian GDP growth was slumped
to 4.2 percentage compared with FY19 GDP growth of 6.1%. Decrease in growth was primarily due to
reduced slowdown in industrial production during the year.
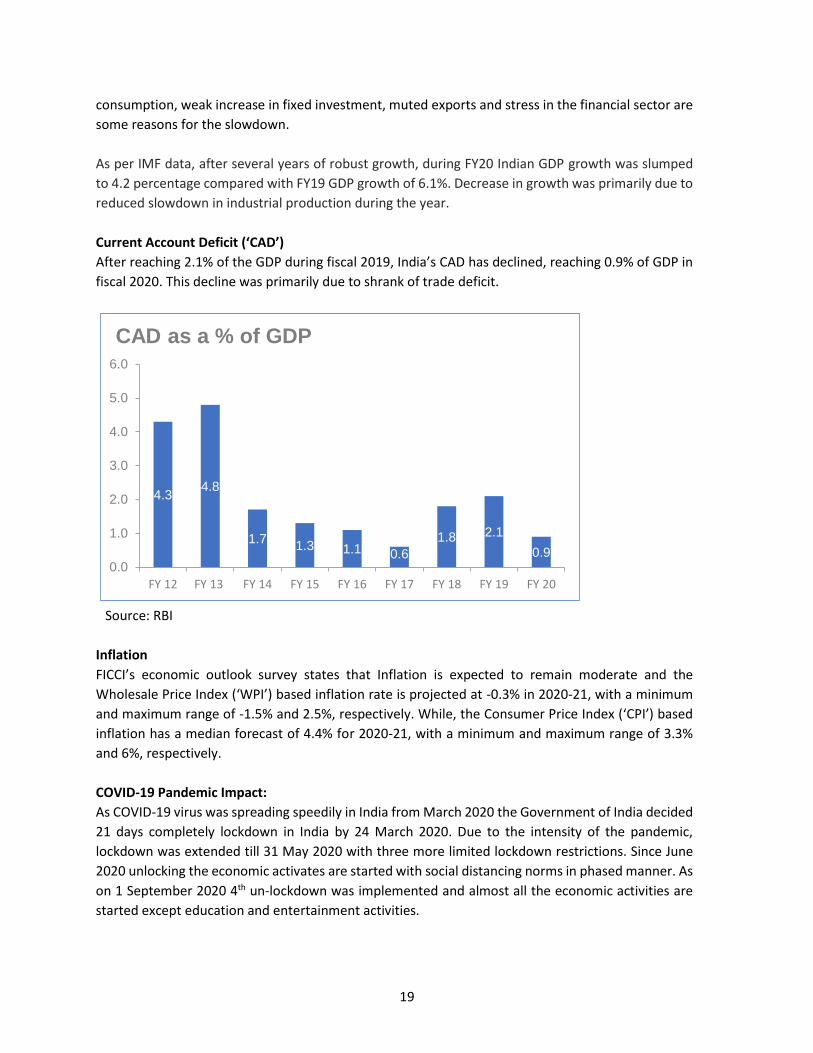
Current Account Deficit (‘CAD’)
After reaching 2.1% of the GDP during fiscal 2019, India’s CAD has declined, reaching 0.9% of GDP in
fiscal 2020. This decline was primarily due to shrank of trade deficit.
Source: RBI
Inflation
FICCI’s economic outlook survey states that Inflation is expected to remain moderate and the
Wholesale Price Index (‘WPI’) based inflation rate is projected at -0.3% in 2020-21, with a minimum
and maximum range of -1.5% and 2.5%, respectively. While, the Consumer Price Index (‘CPI’) based
inflation has a median forecast of 4.4% for 2020-21, with a minimum and maximum range of 3.3%
and 6%, respectively.
COVID-19 Pandemic Impact:
As COVID-19 virus was spreading speedily in India from March 2020 the Government of India decided
21 days completely lockdown in India by 24 March 2020. Due to the intensity of the pandemic,
lockdown was extended till 31 May 2020 with three more limited lockdown restrictions. Since June
2020 unlocking the economic activates are started with social distancing norms in phased manner. As
on 1 September 2020 4th un-lockdown was implemented and almost all the economic activities are
started except education and entertainment activities.
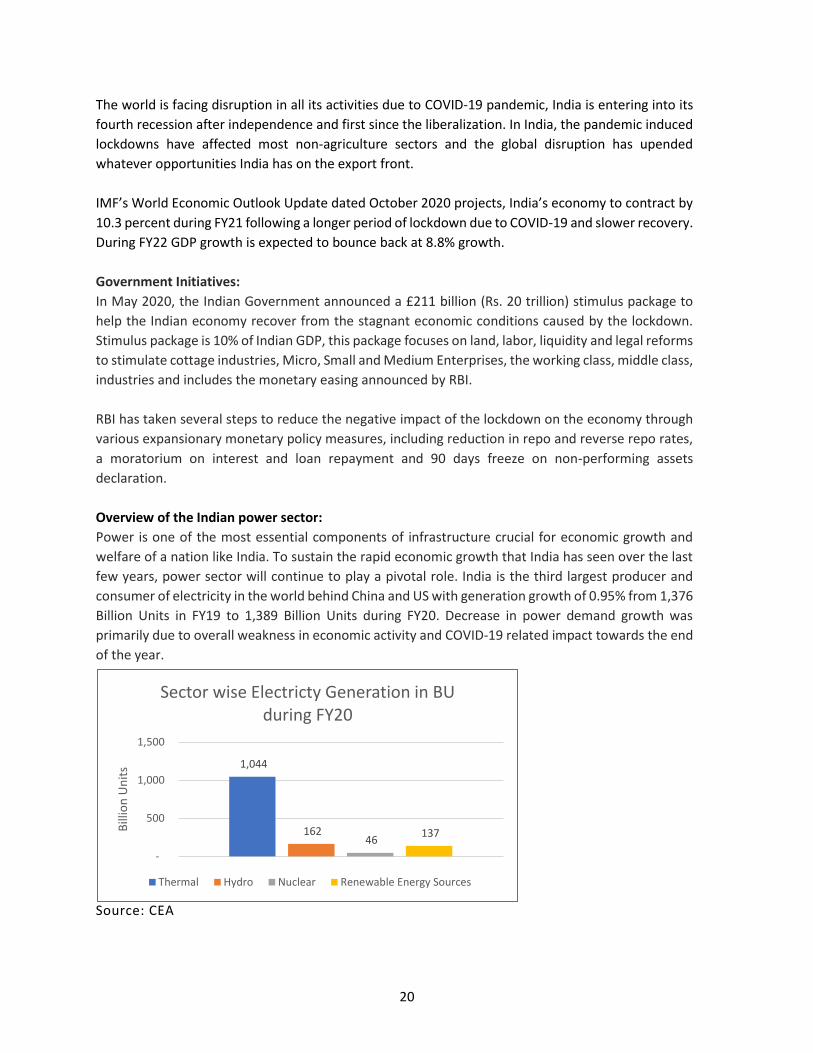
20
1,044
162 46
137
-
500
1,000
1,500
Bill
ion
Un
its
Sector wise Electricty Generation in BU during FY20
Thermal Hydro Nuclear Renewable Energy Sources
The world is facing disruption in all its activities due to COVID-19 pandemic, India is entering into its
fourth recession after independence and first since the liberalization. In India, the pandemic induced
lockdowns have affected most non-agriculture sectors and the global disruption has upended
whatever opportunities India has on the export front.
IMF’s World Economic Outlook Update dated October 2020 projects, India’s economy to contract by
10.3 percent during FY21 following a longer period of lockdown due to COVID-19 and slower recovery.
During FY22 GDP growth is expected to bounce back at 8.8% growth.
Government Initiatives:
In May 2020, the Indian Government announced a £211 billion (Rs. 20 trillion) stimulus package to
help the Indian economy recover from the stagnant economic conditions caused by the lockdown.
Stimulus package is 10% of Indian GDP, this package focuses on land, labor, liquidity and legal reforms
to stimulate cottage industries, Micro, Small and Medium Enterprises, the working class, middle class,
industries and includes the monetary easing announced by RBI.
RBI has taken several steps to reduce the negative impact of the lockdown on the economy through
various expansionary monetary policy measures, including reduction in repo and reverse repo rates,
a moratorium on interest and loan repayment and 90 days freeze on non-performing assets
declaration.
Overview of the Indian power sector:
Power is one of the most essential components of infrastructure crucial for economic growth and
welfare of a nation like India. To sustain the rapid economic growth that India has seen over the last
few years, power sector will continue to play a pivotal role. India is the third largest producer and
consumer of electricity in the world behind China and US with generation growth of 0.95% from 1,376
Billion Units in FY19 to 1,389 Billion Units during FY20. Decrease in power demand growth was
primarily due to overall weakness in economic activity and COVID-19 related impact towards the end
of the year.
Source: CEA

21
India’s per capita consumption however stands at about one-third of the world’s average
per capita electricity consumption. The per capita consumption in the UK is more than five
times that of India. Electricity being a critical enabler for the economic growth of the
country, Government of India is committed to growth in power generation.
As per BP’s energy outlook 2020, much of the increase in the energy demand is
concentrated in developing Asia (India, China and other Asia) where rising prosperity and
improving living standards support increasing energy consumption per head.
As on 31 March 2020, all India overall installed capacity was 370 GW. India’s power sector
is dominated by fossil fuels particularly coal producing almost two -third of the electricity
(231 GW). Electricity demand in the country has increased rapidly and is expected to rise
further in the years to come. In order to meet the increasing demand for electricity in the
country, massive addition to the installed generation capacity has been done in the past.
On Energy generation front, coal is expected to remain a significant fuel source in the country’s quest
to provide power to every citizen but this segment will experience limited growth. As per CEA data,
against the target to add 10,296 MW of thermal power in 2019-20, the actual addition was only 6,765
MW.
Renewable energy is fast emerging as a major source of power in India. As on 31st March 2020 total
installed Renewable Energy Source (RES) except large hydropower was 87 GW. New capacity addition
during the year was 8.7 GM against the target of 11.8 GW. The Government of India has set a target
to achieve 175 GW installed capacity of renewable energy by FY22. Wind energy is estimated to
contribute 60 GW, followed by 100 GW from solar power and 15 GW from biomass and hydropower
by 2022.
Source: CEA
62.4%12.3%
1.8%
23.4%
Sector wise All India Installed Capacity as on 31st Mar 2020
Thermal
Hydro
Nuclear
Renewable Energy Sources
22
Over the next 3 to 5 years, we expect power demand to grow steadily considering the expected pick-up
in the GDP growth and the various macroeconomic and reforms and measures taken by the Government
– steady operational improvement for DISCOMS under Ujwal DISCOM Assurance Yojana (UDAY) scheme
and electrification in the country is increasing with the help of schemes like The Pradhan Mantri Sahaj Bijli
Har Ghar Yojana (SAUBHAGYA) scheme, ‘Power for all’ initiatives, Deen Dayal Upadhyay Gram Jyoti Yojana
(DDUGJY) scheme and Integrated Power Development Scheme (IPDS).
With limited capacity addition in the sector, PLF for the electricity generator is likely to improve over the
medium to long term. This may also provide more visibility on execution of new power purchase
agreements. We are also likely to see some consolidation happening in the power sector.
Coal
India’s non-coking coal import increased by 7.3% in FY 20 to 196.7 Million tons compared to 183.4 Million
tons in FY 19. Government of India has taken many initiatives to increase domestic production and reduce
the dependency on imported coal.
As per Argus Coal Outlook, coal prices are forecasted to soften for the current year due to reduced
demand caused by COVID-19 destruction in the manufacturing activities across the globe.

23
SUSTAINABILITY REPORT

24
About OPG
OPG operates and develops power generation
assets in leading industrialised states of India
with 414 MW in Tamil Nadu and 62 MW in
Karnataka. The Group’s flagship 414 MW coal
fired thermal plant is in the industrial state Tamil
Nadu close to the ports of Ennore and Chennai.
The plant comprises four units on the same site.
The first 77 MW unit commenced operations in
the year 2010 followed by 77 MW Chennai II in
2011, 80 MW Chennai III in 2013 and 180 MW
Chennai IV in June 2015. All units are
technologically enabled to use imported coal
(typically Indonesian) or domestic (Indian) coal.
We commissioned our 62 MW solar projects in
Karnataka in FY 2018, as part of our renewable
strategy. The projects are across four sites
comprising three sites of 20 MW and one site of
2 MW.
Our objective
OPG’s overall objective is to build shareholder
value and be a first-choice provider of power to
its customers. We have pursued this objective
by focusing on:
• Providing reliable and uninterrupted
power to its customers at competitive
rates
• Profitable growth
• Deleveraging
We believe we have an opportunity to become a
leader in the energy sector – leadership in terms
of the quality of our earnings and the delivery of
profitable, sustainable growth. Our objectives,
our long-term focus and our desire to become a
sector leader translates into a short to medium
term focus that involves:
• Maximising the performance of our
existing assets
• Continually seeking ways to reduce our
overall cost of capital
• Delivering accretive growth projects and
expanding further in the renewable
power sector
• Being responsible towards our key
stakeholders as we grow
*Deconsolidation of 300MW Gujarat Project

25
Sustainability at OPG
As a responsible organization our goal is to meet
stakeholder expectations while contributing
towards the well-being of the society. At OPG, we
believe in efficient, sustainable, responsible and
inclusive growth. Our objective is to continuously
improve and comply with the emission standards,
as well as to maintain technological leadership by
utilising new technologies and collaborating with
our key stakeholder groups. In line with our
vision, we continually invest in supporting and
developing local communities through initiatives
that create a positive impact on their lives. The
COVID-19 pandemic has also sparked a renewed
awareness and preparedness to respond to
societal challenges.
Integrating sustainability in
operations
Sustainability has been on top of our corporate
agenda even before the pandemic, but in the
current scenario the 2030 Agenda for Sustainable
Development put forth by the United Nations is
more relevant than ever before.
The success of our business, requires a more
focused and determined approach to all
sustainability considerations, including our
participation in the United Nations Sustainable
Development Goals (SDGs), to address these
issues in an inclusive way.
We are working towards revisiting our present
sustainability agenda, to make it more
comprehensive and aligned to the global targets.
We believe the UN SDGs provide a tangible
framework for us to align and prioritise our
business activities. The energy sector, and in
particular, the private sector, has a pivotal role to
play in the achievement of the sustainable
development goals. Our approach is to employ
the expertise we carry this supports in maximising
the positive impact of the identified opportunities.
We monitor and report our key
sustainability performance indicators, in line with
some of the global reporting frameworks like
Global Reporting Initiative (GRI), Sustainability
Accounting Standards Board (SASB) and
Financial Times Stock Exchange (FTSE).
We endeavour to partner with our key
stakeholders to build a more resilient and
sustainable world.
26
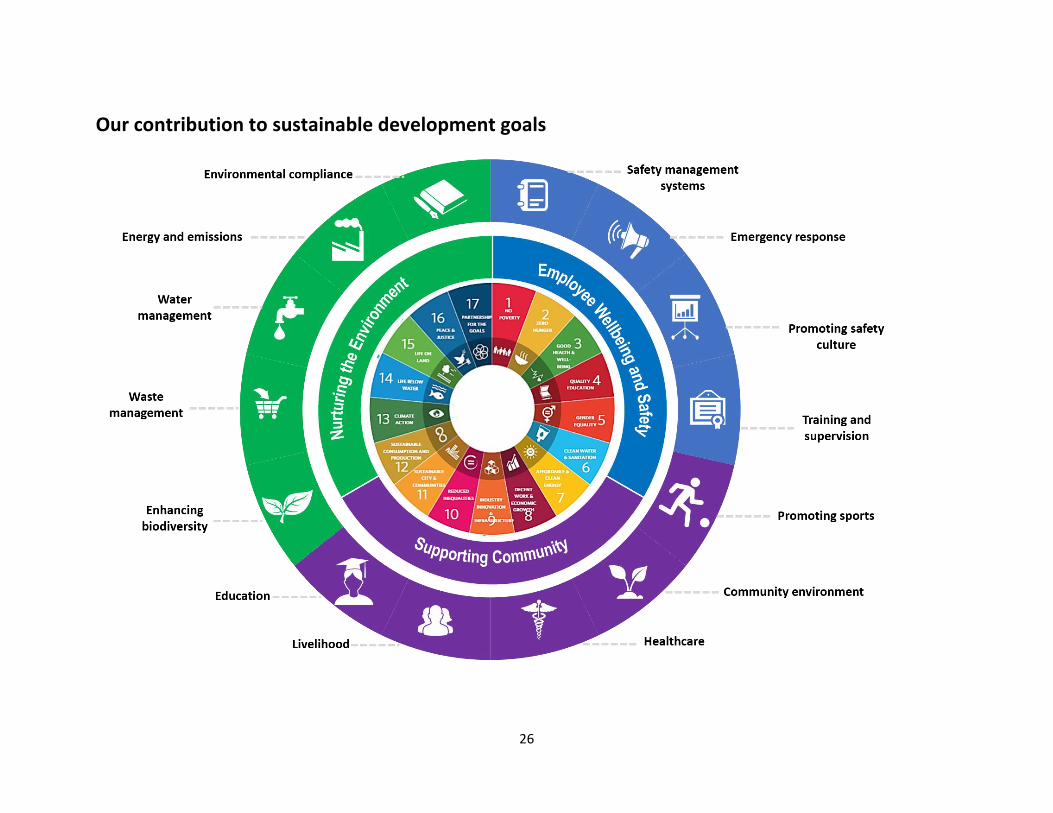
Our contribution to sustainable development goals

27
Sustainability Highlights 2020

28
Sustainability Governance
OPG’s Board bears the overall responsibility for
adopting and implementing sustainability
measures covering the entire company. The
Health, Safety and Environment (HSE)
committee develops, implements and oversees
the HSE performance in the Company and
assists the management in driving industry-
leading practices. The committee keeps track of
strategic and operational issues and periodically
reports to the Board. The committee is also
responsible for setting of wide targets and key
performance indicators and identifying the
sustainability related risks and emerging issues
that could affect our company.
Every plant at OPG has a dedicated Steering
Committee reporting to the HSE Committee on
site specific HSE performance and challenges if
any. The responsibilities of the Steering
Committee include adhering to the HSE
compliance, planning, training and managing
incidents. At the plant level these Committees
monitor all the necessary actions on ground such
as incident and accident data reporting,
corrective and preventive measures implemented
and adopting best practices.
We believe that our employees’ involvement is
critical in achieving a robust sustainability culture.
We encourage their participation by constantly
strengthening their awareness on the importance
of sustainability for our company, and
communities where we operate, and for
themselves as an individual.
Identifying risks and unlocking
opportunities
Our risk management includes assessing the
external and internal environmental, social and
operational risks that could arise from our
operations, the likelihood of these risks, and their
severity. We are in the process of integrating the
sustainability risk management with our overall
enterprise-wide risk management processes.
The extra-financial risks are gradually becoming
evident to various stakeholders. We constantly
identify our risks and opportunities to ensure our
business strategy is aligned to the internal and
external environment. Some of the key risks
identified at company level include:
➢ Water: Water scarcity is one of the key
challenges the world is facing. Growing
exploitation of water resources globally,
has led to degradation of ecosystems. As
organisations try to uphold competitive
advantage and brand differentiation,
increasing water scarcity leads to physical,
financial, regulatory and reputational risks.
➢ Extreme weather events: The world has
become vulnerable to the impacts of
natural disasters like floods and
earthquakes, especially because of
reasons like population growth,
environmental degradation and climate
change.
➢ Regulatory norms: Emission regulations
may become more stringent for thermal
power plants which can potentially make
them uneconomic or/and not competitive.
➢ Investor interest: Thermal power plants
are known to produce greenhouse gases
and ash as a result of burning of fossil fuels.
A lot of investors are now excluding thermal
power plants from their portfolios thereby
creating a downward pressure of stock
price and impeding the ability of the
Company to raise funding for future growth
projects.
➢ Market fluctuation: Thermal power plants
are exposed to fluctuations in the market
prices of coal while renewable energy has
no significant input costs which potentially
makes renewable energy less volatile and
more competitive in terms of attractiveness
as investment opportunity.

29
Some of the strategic objectives towards addressing the risks is highlighted in the table below.
Risk Strategic objective Description
Water Plant design As our units operate in a region that is naturally water scarce, our plants are designed
to limit the consumption of water. They are built with air cooled condenser technology
rather than being water cooled. Our plants use around 99% less water than a typical
water-cooled thermal power plant that is commonly installed around India and globally.
Regulatory
norms
Compliant to emission
norms
We continuously monitor and review changes in the regulatory environment and are
compliant with our commitments under licenses and permits previously granted.
We are also identifying most suitable emission reduction technologies or business
processes to implement and meet compliance in most efficient way.
Investor
interest
Develop and implement of
Renewable/ Energy
transition diversification
strategy to reduce carbon
footprint of thermal power
plants
We are working towards identifying renewable / energy transition projects and
technologies that is most complimentary and suitable to OPG’s current operations and
implement those projects.
This also complements our commitment towards achieving UN SDG 7 – Affordable and
Clean Energy and contributing to the Government of India’s target of installing 175 GW
of renewable energy capacity by the year 2022.
The target is to achieve significant part of the revenue from renewable/Green sources
in the long term.
Market
fluctuation
Fuel supply and cost We realise that the dependence on third parties for coal exposes us to vulnerabilities
such as non-supply, price increase in the international market, foreign exchange
fluctuations and increases in shipping costs and any changes in applicable taxes and
duties. This impacts our operations and profitability.
We are therefore maintaining adequate storage facilities to keep appropriate levels of
surplus stocks and seeking long-term supplies, while maintaining a long-term and
healthy relationship with our suppliers .

30
Sustainable Value Creation
Nurturing the environment
Being a private power sector company, we are conscious of the impact of our operations on the environment. All our
plants are committed to function in a manner that ensures utmost energy efficiency. We have been proactively working
towards improving the efficiency of our operations and processes to ensure optimal utilization of natural resources. OPG
is committed to achieving continuous improvements in environmental performance and seeks to prevent, mitigate and
reduce the environmental impact of the operations.
Our focus on adherence to the highest standards of environmental management is applicable across all our sites. Towards
this, we have adopted various environmental protocols and adhere to leading certifications ensuring compliance with
applicable environmental legislations. Our EHS policy endorses our commitment to improving our performance on various
environmental aspects that go beyond regulatory compliances. We adhere to the requirements of ISO 14001 –
Environmental Management System.
1. Environmental compliance
It is embedded in our group strategy to ensure compliance with standards set forth by the relevant authorities and seek
to exceed the regulatory standards in practice where possible.
A legal compliance review of all the project sites is done in a systematic manner. Our plant specific steering committee
assesses the compliance of the project site against the obtained permits and licenses, on periodic basis. The steering
committee of the plant submits the disclosure on legal compliance to the Board-level HSE committee.
2. Energy and emissions
As a responsible corporate operating in an emission-intensive sector, we are actively creating mitigation plans for
managing energy and emissions related risks. In the reporting period, we utilised 7,295,662.56 Million Kcal of energy and
generated 2,716 million KWh of electricity, while in the previous fiscal year we generated 2,705 million KWh of electricity,
against the consumption of 7,240,844.57 Million Kcal of energy.
We have been proactively taking steps towards installing energy efficient equipment within our processes. We are also
investing in processes and technologies that promote sustainable growth – enhancing energy efficiency and developing
low-carbon technologies. Some of the energy conservation initiatives that we undertook are as below:

31
Our energy conservation projects led to a reduction in Auxiliary Power Consumption (APC) by 0.12% and heat rate
reduction by 89 kcal/kWh. We are also working towards implementing Energy Management System – ISO 50001.
We also recognize that one of the key impacts our processes have on the environment include stack emissions. Some of
the major emissions from these stacks include Particulate Matter (PM), Oxides of Sulphur (SOx) and Oxides of Nitrogen
(NOx). In addition, CO2 is also emitted due to the use of fossil fuels. The average emissions of PM, NOx and SOx in the
reporting year were well within the prescribed limits.
We regularly calculate and monitor emissions generated from our process. At OPG, we are committed to reduce our
emissions in the long term and within the relevant regulatory framework relating to carbon management and climate
change.
3. Water management
We acknowledge the fact that water is a critical shared resource. To protect this valuable resource, we have undertaken
initiatives to reduce, reuse, recycle and regenerate water in our operations to the maximum possible extent thereby
reducing our dependency on fresh water. We also organize awareness sessions that build a habit of consuming less water,
diligently.
OPG plants are designed to limit the consumption of water as they are built with air cooled condenser technology rather
than being water cooled with the result that OPG’s plants use around 99% less water than a typical water cooled thermal
power plant that is commonly installed around India and globally.
Towards better measurement, monitoring and managing, we have installed water meters at our project sites. Our efforts
have paid off, as we have been able to consistently curtail the amount of water consumption.
At OPG, water cycle is a closed loop system and water recovered during the process is diverted to an effluent treatment
plant. The water used for domestic consumption at the plant is treated in Sewage Treatment Plant (STP) and the treated
water from STP is used green belt development. As a zero-discharge plant, there is no effluent released outside our plant
premises.
As an organisation, we are committed to using water responsibly and ensuring conservation. We do this by complying
with all the applicable laws, regulations, and permit conditions, and by implementing water conservation techniques
designed to minimize water-related risks. Some of the initiatives undertaken in the reporting period are:

32
4. Waste management
Waste management is one of the important aspects of our operations as it affects our license to operate and overall
operational costs. The utilisation and disposal of these wastes are governed by regulations. The only hazardous wastes in
our operations are waste oil and oil-soaked cotton waste. We have tie-ups with state pollution control board authorised
agencies for responsible handling and disposal of these hazardous wastes. We do not engage in import or export of any
hazardous waste or materials under the Basel Convention.
Fly ash is a solid waste generated in a coal-based power generation process. As its disposal in landfills presents a significant
challenge the central government is focusing on utilising this fly ash. We work with cement and brick manufacturers to
recycle this Coal Combustion Residue (CCR) generated. In the reporting period, we recycled 100% CCR, 96,640MT of CCR
was sent to the cement and brick kilns, where the residue is used as a raw material.
5. Enhancing biodiversity
We are taking every step to make our premises an eco-friendly workplace. We recognise that our operations have a
potential to impact biodiversity, both directly and indirectly. We plant saplings annually across our project sites to protect
and restore natural habitats while sequestering carbon. We annually plant around 2,000 saplings at our project sites. With
an aim to increase the overall green cover of our sites, we have dedicated 30% of the area at our premises as green belt
to promote local biodiversity.
Employee wellbeing and safety
We view health and safety as an important management task that requires a culture of continual improvement. Our Board
level HSE committee supports our operations and employees in integrating health and safety standards into their
operational planning, business decisions, and daily process activities.
Based on each project site’s health and safety performance, the site-specific steering committee design their own annual
improvement plans, which include targets and improvement measures. The progress made towards the established
targets is monitored periodically by the steering committee.
1. Safety Management System
Given the nature of our operations, safety and health is always our top priority. We have established and implemented
integrated health and safety management system aligned to the international standards OHSAS 18001, and we plan to
transition to ISO 45001 in the next financial year. As part of system implementation, we carry out safety inspection and
management activities at all our project sites. Our health and safety management system guidelines apply to all the
employees working at OPG, this includes employees on our payrolls as well as those on contract.
Our employee strength

33
We have developed a robust Health, Safety and Environment (HSE) strategic plan considering all the elements to achieve
our goal of Zero Harm. Our EHS policy articulates our commitment towards excellence and achieving HSE related targets.
Our project site personnel are trained to identify, alleviate and control risks specific to their operation. Any condition that
is observed unsafe is brought to the notice of the site head, a responsibility is fixed for mitigating the risk in a time bound
manner and is monitored periodically. For each incident, a formal report is prepared with incident type and root cause.
This report is also integrated in the monthly safety report and presented in the safety committee meetings.
During the year, we worked upon key strategic initiatives to enhance & improve our HSE practices. With a total of
1,325,792 man-hours worked in the reporting year, we continue to retain Zero Fatality status.
2. Emergency response
Our emergency response management framework ensures responsiveness in case of crises, consistency across safety
concepts & strategies adopted at project sites and function through its approach to preparation, response and escalation.
The framework also provides guidance on preventing or mitigating significant negative occupational health and safety
impacts that are directly linked to our operations.
We deploy critical controls, subject to ongoing review and verification, to effectively manage our risks. Based on our
emergency response plan, we conduct periodic mock drills. Our project sites also have an onsite well-equipped medical
facility with a visiting doctor and nurse to attend to any medical emergency.
3. Promoting safety culture
We have established a proactive safety culture, by defining HSE objectives & goals while ensuring continual improvement.
Recognizing that leadership is the key driver of safe operations, our management leaders drive a cultural change and help
us achieve our goal of everyone’s safety and well-being. It involves leaders monitoring and spending time at project site

34
engaging with employees and contractors on how we can enhance our safety processes. This leadership engagement also
focuses on improving on-field verification of fatal risks.
To encourage our employees and inculcate proactive safety culture, we have institutionalised an internal safety reward
and recognition scheme. We appreciate the employees for their outstanding performance, that significantly contributes
to achieving operational excellence.
4. Training and supervision
We prioritise development, re-skilling and upskilling of our employees to be the driving force behind their own safety and
well-being and being proactive in identifying and addressing the health and safety needs, allowing them to maximise
learning opportunities most relevant to their work. Our learning and development team along with steering committee
develops safety related training modules. The safety trainings are imparted to both our employees and those on contract
roles. Some of the key areas of training are:
As a good practice, we have implemented “Permit- To-Work” (PTW) system, Hazard Identification and Risk Assessment
(HIRA) and ensure adherence to all other safety operations procedures developed by the steering committee. Our safety
performance and compliance are supervised through our safety dashboards.
Supporting community
OPG is committed to the communities in which it operates and recognises the importance of community engagement. As
an organisation we try and address the existing issues in society, focusing on areas where we can bring our competencies
to achieve tangible, measurable improvements. Through our efforts, we demonstrate our sense of responsibility and seek
to build trust with stakeholders.

35
Our goal is to identify critical areas of development that require investment and intervention, followed by active support
to ensure meaningful socio-economic development that reaches a broader demography. We believe that in doing so, we
will be able to bring in larger participation of community and benefit from socio-economic progress.
1. Education
Education plays a central role in the development and growth of every community and society. We are of the belief that
education prepares children for better prospects and is the stepping stone to lead a life with dignity and quality. We have
adopted a holistic approach towards improving school education and have contributed at multiple levels reaching out
directly to schools and children. We annually provide school uniforms, supplies, notebooks, books, shoes etc., to children
in the communities surrounding our premises. This provides economic assistance to families who otherwise are unable
to support ongoing education for all their children.
As part of promoting girl’s education program, we provide scholarships to deserving girl students; this supports in
completing their college education.
To improve infrastructure facilities of schools we provide the required furniture. We have also taken responsibility of
bearing the expenses towards maintaining the infrastructure of two schools in the neighbourhood.
As part of infrastructure improvement, we have constructed an entire toilet block in a Girls Higher Secondary School, that
is expected to benefit 1200 students.
We are also providing economic assistance to schools, through payment of teachers’ salaries to ensure employment of
skilled and dedicated teachers. This also helps improve the teacher – student ratio which will enable quality education.

36
2. Promoting sports
With an aim to promote sports amongst youth in the nearby communities. We regularly sponsor sports competitions and
have been recognising the winning individual/ teams.
3. Livelihood
In our effort to enhance skills and empower the people in the surrounding community, we conduct various training
programs. To provide women new opportunities to earn, we conduct vocational courses on tailoring. This helps women
learn and develop skills in tailoring, embroidery and other associated skills. We also provide sewing machines to the
trainees.
The skills acquired from the training program, provide women the ability to work from their homes and become financially
independent.
4. Healthcare
We believe access to quality healthcare for all is one of the basic necessities. However, a lot of people still lack access to
basic services. Our intervention to improve healthcare include renovating primary healthcare centres. During the
reporting year, we have assisted a primary healthcare centre in revamping their infrastructure and have provided beds,
medicines etc. We also provide economic assistance to these healthcare centres by way of payment of salaries to
paramedical staffs.
Our work on primary health care directly touches the lives of people in our nearby communities.
5. Community environment
A clean and pollution free environment is necessary to live a healthy life. To promote environmental conservation and
contribute to achieve Goal 6: Ensure access to water and sanitation for all, we have taken initiatives to protect natural
resources by desilting nearby ponds, regeneration of water bodies by constructing borewells in nearby communities and
allied activities.
We also provide safe drinking water to the nearby communities who do not have direct access to potable water.
As part of these initiatives, we aim to make our local communities self-reliant and self-sufficient, especially on water
resources.
Our support to the community during COVID-19
The current COVID-19 pandemic is alarming. While the nation was under lock down, we not only ensured uninterrupted
transmission of power to our customers but also proactively undertook relief activities to help our nearby communities,
especially those impacted by the pandemic.
We continue to provide face masks, gloves, soaps, sodium hypo-chloride solutions, bleaching powder etc., to the nearby
communities in 5 villages. We also provided groceries to nearly 3300 families. We provided food to volunteers who were
engaged in controlling pandemic.
We helped in providing PPE kits to the doctors and medical volunteers who were engaged in controlling pandemic.
We also provided basic necessities and groceries for children and special adults in need, who are in orphanages and adult-
care homes.
37
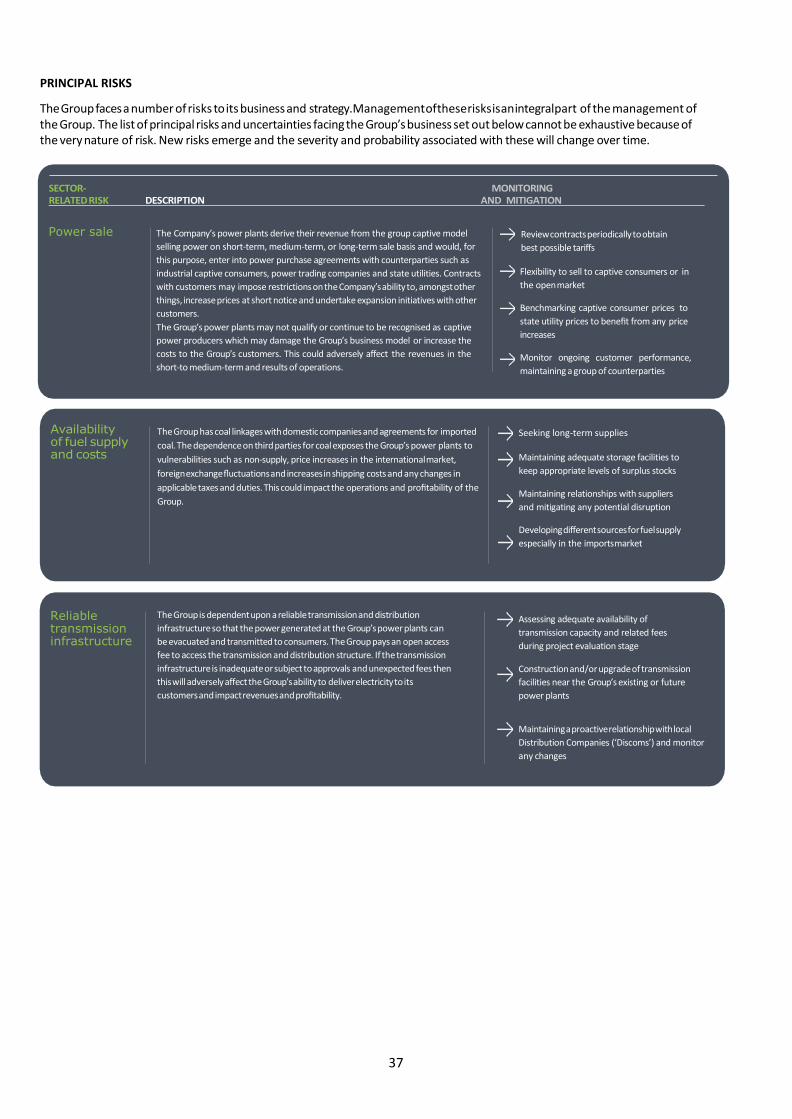
PRINCIPAL RISKS
The Group faces a number of risks to its business and strategy. Management of these risks is an integral part of the management of the Group. The list of principal risks and uncertainties facing the Group’s business set out below cannot be exhaustive because of the very nature of risk. New risks emerge and the severity and probability associated with these will change over time.
Power sale The Company’s power plants derive their revenue from the group captive model
selling power on short-term, medium-term, or long-term sale basis and would, for
this purpose, enter into power purchase agreements with counterparties such as
industrial captive consumers, power trading companies and state utilities. Contracts
with customers may impose restrictions on the Company’s ability to, amongst other
things, increase prices at short notice and undertake expansion initiatives with other
customers.
The Group’s power plants may not qualify or continue to be recognised as captive
power producers which may damage the Group’s business model or increase the
costs to the Group’s customers. This could adversely affect the revenues in the
short-to medium-term and results of operations.
Review contracts periodically to obtain
best possible tariffs
Flexibility to sell to captive consumers or in
the open market
Benchmarking captive consumer prices to
state utility prices to benefit from any price
increases
Monitor ongoing customer performance,
maintaining a group of counterparties
The Group has coal linkages with domestic companies and agreements for imported
coal. The dependence on third parties for coal exposes the Group’s power plants to
vulnerabilities such as non-supply, price increases in the international market,
foreign exchange fluctuations and increases in shipping costs and any changes in
applicable taxes and duties. This could impact the operations and profitability of the
Group.
Seeking long-term supplies
Maintaining adequate storage facilities to
keep appropriate levels of surplus stocks
Maintaining relationships with suppliers
and mitigating any potential disruption
Developing different sources for fuel supply
especially in the imports market
Reliable transmission infrastructure
The Group is dependent upon a reliable transmission and distribution
infrastructure so that the power generated at the Group’s power plants can
be evacuated and transmitted to consumers. The Group pays an open access
fee to access the transmission and distribution structure. If the transmission
infrastructure is inadequate or subject to approvals and unexpected fees then
this will adversely affect the Group’s ability to deliver electricity to its
customers and impact revenues and profitability.
Assessing adequate availability of
transmission capacity and related fees
during project evaluation stage
Construction and/or upgrade of transmission
facilities near the Group’s existing or future
power plants
Maintaining a proactive relationship with local
Distribution Companies (‘Discoms’) and monitor
any changes

38
Global financial instability
The Indian market and Indian economy are influenced by global economic and
market conditions, particularly emerging market countries in Asia.
Financial instability in recent years has inevitably affected the Indian economy.
Continuing uncertainty and concerns about contagion in the wake of the financial
crises could have a negative impact on the availability of funding.
The Group continues to monitor changes and
developments in the global markets to assess the
impact on its financing plans
COVID-19 pandemic
The spread of COVID-19 across the world has impacted businesses globally.
The pandemic has posed risks to human life, resulted in low power demand
due to national lockdown and disrupted supply chain.
The Group had adequate stock of coal and oil
for plant startup and critical spares at the time
of the COVID-19 lockdown. This has helped in
ensuring the functioning of the plant during the
lockdown.
Government policy and regulations
The Group’s operations are subject to complex national and state laws and
regulations with respect to numerous matters, including
the following:
disposal, storage and handling);
health and safety; and planning
and development.
The Group is required to obtain approvals, licences and permits issued by the
Indian government and other regulators and failure to obtain, comply with the terms
of or renew such approvals, licences and permits may restrict the Group’s operations
or development plans, or require their amendment, and may adversely affect the
Group’s profitability, or result in it being subject to fines, sanctions, revocation of
licences or other limitations.
Group’s business model of GCPPs is subject to rules and regulations, which can be
potentially interpreted by the authorities in a way different from Group’s
interpretations. The profitability of the Group will be in part dependent upon the
continuation of a favourable regulatory regime with respect to its projects.
Group monitors and reviews changes in the
regulatory environment and its commitments
under licences previously granted
It continually ensures compliance with the
conditions contained within individual licences
and is mindful of the importance of complying
with national and local legislation and
standards
The Group maintains an open and proactive
relationship with the Indian government and its
various agencies
The Group is consulting with industry and legal
experts as required and, if necessary, is prepared
to defend its position in the courts.
Ability to retain The Group’s existing and planned power plants benefit from various fiscal
fiscal and tax and tax incentives that are available to the Company from the federal and
incentives state governments.
A change in policy or the adoption of tax policies and incentives can have an
adverse impact on the profitability of the Group.
The Group continues to monitor changes and
developments in respect of incentives
provided by the Indian federal and
state authorities
Project investment returns are evaluated
based on the expected incentives available to
the Company and are revised based on the
most up-to-date guidance available
Exchange rate fluctuations
As a consequence of the international nature of its business, the Company is exposed
to risks associated with changes in foreign currency exchange rates. The Group’s
operations are based in India and its functional currency is the Indian Rupee
although the presentational currency is Great Britain Pound.
Imported coal is purchased in US Dollars.
The Group’s financial results may be affected by appreciation or depreciation of the
value of the foreign exchange rates relative to the Indian Rupee.
Putting in place, where appropriate, forward
contracts or hedging mechanisms
Monitoring our risk on a regular basis where no
hedging mechanism is in place and taking steps
to minimise potential losses

39
Member, Audit, Nomination &
Remuneration Committees
Member, Nomination
Committee
BOARD OF DIRECTORS

40
Member, Audit, Nomination &
Remuneration Committees

41
CORPORATE GOVERNANCE REPORT
FINANCIAL YEAR ENDED 31 MARCH 2020
Compliance with the Code
Since admission to AIM, the Group has grown substantially against a background of difficult trading conditions within
the Indian electricity generation sector. The Company completed its development programme, paid dividend with
respect to years ended 31 March 2017, 2018 and 2019 and is poised for the next phase of its development. The key
objective is to build on these achievements and the Board has therefore adopted an approach to governance that is
proportionate with and appropriate to the current size and complexity of the Group.
The Company is committed to high standards of corporate governance and places good governance at the heart of
the business. In March 2020, the Board of the Company formally adopted the Quoted Companies Alliance’s (“QCA”)
code of corporate governance (“the Code”) in line with requirements of the London Stock Exchange’s AIM Rules. The
Board believes that the QCA Code provides the Company with a rigorous corporate governance framework to support
the business and its success in the long-term. The Code sets out ten corporate governance principles. The ways in
which the Company meets the following principles which are described on our website at www.opgpower.com:
1. Establish a strategy and business model which promotes long-term value for shareholders 2. Seek to understand and meet shareholder needs and expectations 3. Take into account wider stakeholder and social responsibilities and other implications for long-term success 4. Embed effective risk management, considering both opportunities and threats, throughout the organisation 5. Maintain the board as a well-functioning, balanced team led by the chair 6. Ensure that between them the directors have the necessary up-to-date experience, skills and capabilities 7. Evaluate board performance based on clear and relevant objectives, seeking continuous improvement 8. Promote a corporate culture that is based on ethical values and behaviour 9. Maintain governance structures and processes that are fit for purpose and support good decision making by
the board 10. Communicate how the Group is governed and is performing by maintaining a dialogue with shareholders and
other relevant stakeholders.
The Board of Directors
The Board comprises the following individuals:
Executive
1. Arvind Gupta (Chairman);
2. Dmitri Tsvetkov (Chief Financial Officer); and
3. Avantika Gupta (Chief Operating Officer) (joined on 27 November 2018).
Non-executive
1. Jeremy Warner Allen (Deputy Chairman);
2. N Kumar (joined on 25 November 2019)
3. Michael Grasby (resigned on 25 November 2019); and
4. Jeremy Beeton (resigned on 16 March 2020).
The Board considers that, as at the date of this report, it complies with Code provision, which requires that, there
should be a at least two independent Non-executive Directors. Mr Allen and Mr Kumar are considered to be
independent under the Code. Biographical details of all the Directors at the date of this report are set out on pages
39 and 40 together with details of their membership, as appropriate, of the Board Committees. The Board is
responsible for setting the Company’s objectives and policies and providing effective leadership and the controls
required for a publicly listed company. Directors receive papers for their consideration in advance of each Board
meeting, including reports on the Group’s operations to ensure that they remain briefed on the latest developments
and are able to make fully informed decisions. The Board met four times during the year under review. In addition to
that the Board had a strategy meeting of the board and five monthly conference calls.
The Executive Committee (‘ExCo’) comprises of the three Executive Directors and four members of senior
management.

42
All Directors have access to the advice and services of the Company Secretary, who is responsible for ensuring that
Board procedures are followed and that applicable rules and regulations are complied with.
Directors have the right to request that any concerns they have are recorded in the appropriate Committee or Board
minutes. Informal procedures are in place for Directors to take independent professional advice at the Company’s
expense although these are not currently set down in writing.
The Company maintains Directors’ and officers’ liability insurance and indemnity cover, the level of which is reviewed
annually.
Division of Responsibilities
Mr Arvind Gupta, Company’s Chairman is responsible for the overall business, strategic decision and heads the
Executive Committee.
On 27 November 2018, Ms Gupta, Chief Operating Officer, was appointed to the Board. She is responsible for the
day-to-day running of the operations. Jeremy Warner Allen joined the Board as Deputy Chairman on 8 November
2017.
In the Board’s view, these changes together ensure an appropriately clear division of responsibilities between the
running of the Board and the executive responsibility for the running of the Company’s business.
Chairman and Deputy Chairman
The Chairman’s key responsibilities were the effective running of the Board, proposing and developing the Group’s
strategy and ensuring that the Board plays a full and constructive part in the development and determination of the
Group’s strategy and overseeing the Board’s decision-making process. In addition to that, the Chairman, as leader
of the executive team, is responsible for implementing the decisions of the Board and its Committees.
Jeremy Warner Allen, the Deputy Chairman, is available to shareholders who have concerns that cannot be resolved
through discussion with the Chairman. The role of the Deputy Chairman is to support and tender advice to the
Chairman on all governance matters.
Re-election of Directors
At every AGM, one-third of the Directors for the time being (excluding any Director appointed since the previous
AGM) or, if their number is not divisible by three, the number nearest to one-third, shall retire from office by rotation.
Pursuant to the Company’s Articles, the Board shall have power at any time to appoint Directors to fill a vacancy and
any Directors so appointed shall hold office only until the annual general meeting of the Company and shall be eligible
for re-election. On this basis, Messrs N Kumar (appointed on 25 November 2019) and Dmitri Tsvetkov, will offer
themselves for re-election at the forthcoming AGM.
Information and professional development
Prior to the Company’s admission to AIM in May 2008, all Directors received a briefing from the Company’s nominated
adviser of their duties, responsibilities and liabilities as a Director of an AIM company. Also all Directors received a
briefing on the Market Abuse Regime (MAR) regulation from the Company’s Nominated Advisor. Directors are
encouraged to keep abreast of developments and attend training courses to assist them with their duties.
In addition to the formal meetings of the Board, the Chairman is available to the other Non-executive Directors to
discuss any issues of concern they may have relating to the Group or as regards to their area of responsibility and to
keep them fully briefed on ongoing matters relating to the Group’s operations.
Board performance and evaluation The Chairman, as part of his responsibilities, informally assesses the performance of the Board and its Directors on
an ongoing basis and brings to the Board’s attention any areas for improvement. For the time being, the Board will
continue to evaluate in this way the balance of skills, experience, independence and knowledge required to ensure
that its composition is appropriate to the Group’s size and complexity. In 2019 the Board introduced a process of self-

43
evaluation of its performance and completed its first self-evaluation. It is still to institute process of periodic evaluation
of its principal committees and the individual Directors.
Meetings of the Board and its Committees The following table sets out the number of meetings of the Board and its Committees during the year under review and individual attendance by the relevant members at these meetings:
Board meetings Board Committee meetings
Audit
Remuneration Nomination
Number Attended Number Attended Number Attended Number Attended
Arvind Gupta 4 4 2 2 NA NA 1 1
Dmitri Tsvetkov 4 4 2 2 NA NA NA NA
Avantika Gupta 4 4 2 2 NA NA NA NA
Jeremy Warner Allen 4 4 2 2 NA NA NA NA
N Kumar 4 1 NA NA NA NA NA NA
Michael Grasby 4 3 2 2 2 2 1 1
Jeremy Beeton 4 4 2 2 2 2 1 1
Number of meetings held during the year 4 2 2 1
In the event that Directors are unable to attend a meeting, their comments on the business to be considered at the meeting are discussed in advance with the Chairman so that their contribution can be included in the wider Board discussions. Board Committees
Audit Committee The members of the Audit Committee are Jeremy Warner Allen, N Kumar (Michael Grasby and Jeremy Beeton were members of the Audit Committee until their resignations in November 2019 and March 2020 respectively). Jeremy Warner Allen is considered to have continuing, relevant financial experience. The Chairman, Chief Financial Officer and Chief Operating Officer and also, as necessary, a representative of the auditors are normally invited to attend meetings of the Committee. The primary duty of the Audit Committee is to oversee the accounting and financial reporting process of the Group, the external audit arrangements, the internal accounting standards and practices, the independence of the external auditor, the integrity of the Group’s external financial reports and the effectiveness of the Group’s risk management and internal control system. The Audit Committee met twice during the year and considered the following matters during the year under review:
• the Annual Report and Accounts for the year ended 31 March 2019; and
• the unaudited results for the half-year FY20 to 30 September 2019. The Audit Committee considered relevant significant issues in relation to the financial statements taking into account business developments during the year and risks and matters raised in the external auditors’ FY19 final and FY20 planning reports to the Audit Committee. These issues were addressed as part of preparation of the FY20 financial statements. Remuneration Committee The Remuneration Committee currently consists of N Kumar, Jeremy Warner Allen, Michael Grasby (was a member of the Remuneration Committee until his resignations in November 2019) and Jeremy Beeton (was a member of the Remuneration Committee until his resignations in March 2020). The primary duty of the Remuneration Committee is to determine and agree with the Board the framework or broad policy for the remuneration of the Executive Directors and such other members of the executive management team of the Group as is deemed appropriate. The remuneration of the Non-executive Directors is a matter for the executive members of the Board. No Director may be involved in any decisions as to his own remuneration.

44
Full details of the role and composition of the Remuneration Committee, the remuneration policy of the Company and its compliance with the Code provisions relating to remuneration are set out in the Directors’ Remuneration Report on pages 48 to 51. Nomination Committee The members of the Nomination Committee are Arvind Gupta, Jeremy Warner Allen, N Kumar, Michael Grasby (was a member of the Nomination Committee until his resignations in November 2019) and Jeremy Beeton (was a member of the Nomination Committee until his resignations in March 2020). The primary duty of the Nomination Committee is to lead the process for Board appointments and make recommendations to the Board. The Nomination Committee regularly reviews the composition of the Board to ensure that the Board has an appropriate and diverse mix of skills experience, independence and knowledge of the Group. We recognise the benefits of gender diversity and in the FY19 we have appointed our first female Executive Director, Ms Avantika Gupta, COO, to the Board. Accountability and Audit Risk management and internal control The Board has overall responsibility for the Group’s system of internal control, which includes risk management. The Board has delegated the responsibility for reviewing the effectiveness of its internal control systems to the Audit Committee. The Audit Committee reviews these systems, policies and processes for tendering, authorisation of expenditure, fraud and the internal audit plan. The system of internal control is designed to manage, rather than eliminate, the risk of failure to achieve business objectives and can only provide reasonable and not absolute assurance against material misstatement or loss. The Board has instructed the ExCo to be a leading part of its process to identify, evaluate and manage the significant risks the Group faces, which is in accordance with the current guidance on internal control. The Audit Committee will assist the Board in discharging its review responsibilities. The Board has carried out a robust assessment of the principal risks faced by the Group, including those that would threaten its business model, future performance, solvency or liquidity. A summary of the key risks facing the Group and mitigating actions is described on pages 37 and 38. Assurance BDO LLP was appointed as auditor for the Group for the financial years ended 31 March 2018 and 31 March 2019 following a tender process. The Audit Committee reviewed the effectiveness of the external auditor and BDO LLP was reappointed in for the financial year ended 31 March 2020. The Audit Committee’s assessment was based on inputs obtained in the course of monitoring the integrity of the financial statements and the significant financial reporting issues and judgements underlying the financial statements, and on its direct interactions with the external auditors. The Audit Committee’s principal interactions with the auditors were its discussions of the audit work performed on areas of higher audit risk and the basis for the auditors’ conclusions on those areas. These interactions were supplemented by others that enabled them, for example, to gauge the depth of the auditors’ understanding of the Company’s business. The Audit Committee’s review focused on the level of experience and expertise of the audit team, their objectivity and professional scepticism, and their preparedness to challenge management in a knowledgeable, informed and constructive manner. The Committee’s review also took account of feedback from management on the effectiveness of the audit process. The Audit Committee considers that, at this stage in the Group’s development, it is more efficient to use a single audit firm to provide certain non-audit services for transactions and tax matters. However, to regulate the position, the Committee will at the appropriate time establish a policy on the provision of non-audit services by the external auditor. That policy will set out the external auditor’s permitted and prohibited non-audit services and a fee threshold requiring prior approval by the Audit Committee for any new engagement. The external auditor did not provide any non-audit services during the year. Having considered the effectiveness and independence of the external auditor as described above, the Audit Committee agreed to recommend to the Board that a resolution to reappoint BDO LLP as the Group’s external auditor should be put to shareholders at the AGM in November 2020.

45
Viability statement A statement on the Directors’ position regarding the Company as going concern is contained in the Directors’ Report on pages 46 and 47. As part of annual strategy session, the directors have assessed the prospects of the Group over a period significantly longer than the 12 months required by the going concern. In this assessment, the Board has considered the principal risks faced by the Group, relevant financial forecasts and the availability of adequate funding. The Board conducted this assessment over a period to the end of calendar year 2023, primarily because this is a primary remaining period of repayment of term loans. Based on its review, the Board is satisfied the viability of the Group would be preserved and have a reasonable expectation that the Group will be able to continue in operation and meet its liabilities as they fall due over the four-year period of their assessment. Shareholder Relations and the Annual General Meeting The Board is committed to maintaining an ongoing dialogue with its shareholders. The Directors are keen to build a mutual understanding of objectives with its principal shareholders. To this end, the Chairman and Chief Financial Officer together with the Deputy Chairman met with a number of institutional shareholders during the year. The Directors also encourage communications with private shareholders and encourages their participation in the AGM. Arvind Gupta is primarily responsible for ensuring the effective communication of shareholders’ views to the Board as a whole and updates the Board accordingly. Board members keep abreast of shareholder opinion and to discuss strategy and governance issues with them as appropriate. Notice of the AGM will be sent to shareholders at least 21 clear days before the meeting. The voting results will be made available on the Company’s website following the meeting. The Company uses its corporate website (www.opgpower.com) to communicate with its institutional shareholders and private investors and posts the latest announcements, press releases and published financial information together with updates on current projects and other information about the Group.

46
DIRECTORS’ REPORT
The Directors present their report, together with the audited financial statements of the Group, for the year ended 31 March 2020. Principal activity OPG Power Ventures Plc (‘the Company’ or ‘OPGPV’) is a public limited company incorporated in the Isle of Man, registered number 002198V, which is listed on the Alternative Investment Market (‘AIM’) of the London Stock Exchange. The Company and its subsidiaries (collectively referred to as ‘the Group’) are primarily engaged in the development, owning, operation and maintenance of private sector power projects in India. The electricity generated from the Group’s plants is sold principally to public sector undertakings and heavy industrial companies in India or in the short-term market. The business objective of the Group is to focus on the power generation business within India and thereby provide reliable, cost-effective power to the industrial consumers and other users under the ‘Group Captive’ provisions mandated by the Government of India.
Results and dividends The Group’s results for the year ended 31 March 2020 are set out in the Consolidated Statement of Comprehensive Income. The Group profit for the year after tax was £8.0m (2019: £14.0m). A review of the Group’s activities is set out in the Chairman’s statement.
A scrip dividend for the year ended 31 March 2019 in amount of 0.6 pence per share was paid. Directors The Directors of the Company during the year and up to the date of this report were as follows:
Arvind Gupta Chairman Dmitri Tsvetkov Chief Financial Officer, Executive Director Avantika Gupta Chief Operating Officer, Executive Director (joined on 27 November 2018) Jeremy Warner Allen Deputy Chairman, Non-Executive Director and Audit and Nomination Committees Chairman N Kumar Non-Executive Director, Remuneration Committee Chairman (joined on 25 November 2019) Michael Grasby Non-Executive Director (resigned on 25 November 2019) Jeremy Beeton Non-Executive Director (resigned on 16 March 2020) Directors’ liability insurance and indemnities The Company maintains liability insurance for the Directors and officers of OPG. Indemnities are in force under which the Company has agreed to indemnify the Directors to the extent permitted by applicable law and the Company’s Articles of Association in respect of all losses arising out of, or in connection with, the execution of their powers, duties and responsibilities as Directors of the Company. Neither the Group’s liability insurance nor indemnities provides cover in the event that a Director or officer is proved to have acted fraudulently or dishonestly. Share capital The issued share capital of the Company at 31 March 2020 was £58,909 comprising 400,733,511 ordinary shares of £0.000147 each, of which there are no designated treasury shares. Political donations The Group has made no political donations during the year under review.
Going concern As highlighted in the Consolidated Statement of Cash Flows and notes 5 (a) and 23 to the financial statements, the Group meets its day-to-day working capital requirements through cash from operations and bank facilities. COVID-19 virus, a global pandemic has affected the world economy leading to significant decline and volatility in financial markets and decline in economic activities. The Group has considered the possible effects that may result from the pandemic on the carrying amounts of receivables and other financial assets and carried out a Reverse Stress Test (“RST”). Based on the RST analysis, we can conclude that the Group is in strong position to go through the current situation caused by COVID-19 pandemic and going concern is not an issue.

47
Further information on the financial position of the Group, its cash flows, liquidity position and borrowing facilities are described in the Financial Review. In addition, note 29 to the financial statements details the Group’s objectives, policies and processes for managing its capital and its exposures to credit risk and liquidity risk. The management’s forecasts and projections, taking account of possible changes in trading performance, show that the Group should be able to operate within the level of its current facility. After making enquiries, the Board has a reasonable expectation that the Company and the Group have adequate resources to continue in operational existence over a period of at least 12 months form the date of approval of the financial statements. Accordingly, the Board considers it appropriate to adopt the going concern basis of accounting in preparing the financial statements. Substantial shareholdings Details of substantial shareholdings are set out on the Company’s website at www.opgpower.com. The Company has been notified, in accordance with the Disclosure and Transparency Rules of the Financial Conduct Authority, of the following interests (whether directly or indirectly held) in 3% or more of the Company’s total voting rights at 31 March 2020:
Percentage of voting rights and issued share capital
Number of ordinary shares
Gita Investments Limited and related parties1 and Directors 52.1% 208,743,537
M&G Investment Management Limited 13.0% 52,051,647
Premier Asset Management Limited 3.8% 15,075,204
British Steel Pension Scheme 3.6% 14,227,222 1 Beneficial interest in these shareholdings vests with Gupta’s family. Registered agent The registered agent of the Company at 31 March 2020 was FIM Capital Limited who served throughout the year and has continued to date. Financial instruments Information on the Group’s financial risk management objectives and policies and its exposure to credit risk, liquidity risk, interest rate risk and foreign currency risk can be found in note 29. Auditor BDO LLP have expressed their willingness to continue in office as auditors and a resolution proposing their re-appointment will be proposed at the forthcoming AGM. Disclosure of information to the auditor The Directors serving at the date of approval of the financial statements confirm that: 1. to the best of their knowledge and belief, there is no information relevant to the preparation of their report of which
the Company’s auditors are unaware; and 2. each Director has taken all the steps a Director might reasonably be expected to have taken to be aware of
relevant audit information and to establish that the Company’s auditors are aware of that information. This report was approved by the Board of Directors on 22 October 2020 and signed on its behalf by: Philip Scales Company Secretary OPG Power Ventures Plc 55 Athol Street Douglas Isle of Man IM1 1LA 22 October 2020
48
DIRECTORS’ REMUNERATION REPORT 2020
Introduction This report sets out information about the remuneration of the Directors of the Company for the year ended 31 March 2020. As a company admitted to AIM, OPG is not required to prepare a directors’ remuneration report. However, the Board follows the principle of transparency and has prepared this report in order to provide information to shareholders on executive remuneration arrangements. This report has been substantially prepared in accordance with the Schedule 8 of the Large and Medium Sized Companies and Groups (Accounts and Reports) (2008) (the ‘Regulations’). Remuneration Committee The members of the Remuneration Committee are N Kumar, Jeremy Warner Allen, Jeremy Beeton (was a Chairman of the Remuneration Committee until March 2020), and Michael Grasby (was a member of the Remuneration Committee until November 2019) who are all independent Non-Executive Directors. Terms of reference have been approved for the Remuneration Committee the primary duty of which is to determine and agree with the Board the framework or broad policy for the remuneration of the Executive Directors, senior managers and such other members of the executive management team of the Group as is deemed appropriate. The remuneration of the Non-Executive Directors is a matter for the executive members of the Board. The principal responsibilities of the Committee include:
• assessing and setting compensation levels for Directors and senior managers;
• reviewing the ongoing appropriateness and relevance of the remuneration policy at regular intervals to ensure that members of the executive team are provided with incentives that encourage enhanced performance;
• reviewing the design of share incentive plans for the approval of the Board or shareholders, as appropriate; and
• ensuring that contractual terms on termination are such that failure is not rewarded and that the duty to mitigate losses is fully recognised in the drafting of Directors’ service agreements and letters of appointment.
In fulfilling these duties, the Committee shall be cognisant of remuneration trends across the Group and within the sector in which the Group operates. The Executive Directors and external advisers may be invited to attend meetings of the Remuneration Committee but do not take part in the decision making. Attendance at meetings of the Remuneration Committee by individual members is detailed in the Corporate Governance Report on page 43. Remuneration policy The Remuneration Committee seeks to maintain a remuneration policy to ensure that the Company is able to attract, retain and motivate its Executive Directors and senior management. The retention of key management and the alignment of management incentives with the creation of shareholder value are key objectives of this policy. The Group therefore sets out to provide competitive remuneration for all its management and employees appropriate to the business environment in the market in which it operates and in recognition of their contribution to Group performance. To achieve this, the remuneration package is based upon the following principles:
• total rewards should be set to provide a fair and attractive remuneration package;
• appropriate elements of the remuneration package should be designed to reinforce the link between performance and contribution to the Group’s success and reward; and
• Executive Directors’ incentives should be aligned with the interests of shareholders. The remuneration strategy is designed to be in line with the Group’s fundamental values of fairness, competitiveness and equity, and also to support the Group’s corporate strategy. The Group seeks increasingly to align the interests of shareholders with those of Directors and senior employees by giving the latter opportunities and encouragement to build up a shareholding interest in the Company.
Long-term incentives The Remuneration Committee believes that it is appropriate to operate share incentive schemes to encourage Executive Directors and senior employees to meet the Group’s long-term strategic and financial objectives set by the Board.

49
Long Term Incentive Plan (‘LTIP’) In April 2019, the Remuneration Committee of the Board of Directors has approved the introduction of an LTIP, which was subsequently revised in July 2019, for a performance-related award of 14.0 million new ordinary shares (representing approximately 3.6 per cent of the Company’s issued share capital) in order to incentivise further the executives and senior management to deliver its planned strategy. The LTIP Shares will be awarded as Nominal Cost Share and will vest in three tranches subject to continued service with OPG until vesting and meeting the following share price performance targets, plant load factor and term loan repayments of the Chennai thermal plant.
- 20% of the LTIP Shares shall vest upon meeting the target share price of 25.16p before the first anniversary for the first tranche, i.e. 24 April 2020, achievement of PLF during the period April 2019 to March 2020 of at least 70% at the Chennai thermal plant and repayment of all scheduled term loans;
- 40% of the LTIP Shares shall vest upon meeting the target share price of 30.07p before the second anniversary for the second tranche, i.e. 24 April 2021, achievement of PLF during the period April 2020 to March 2021 of at least 70% at the Chennai thermal plant and repayment of all scheduled term loans;
- 40% of the LTIP Shares shall vest upon meeting the target share price of 35.00p before the third anniversary for the third tranche, i.e. 24 April 2022, achievement of PLF of at least 70% at the Chennai thermal plant during the period April 2021 to March 2022 and repayment of all scheduled term loans.
The share price performance metric will be deemed achieved if the average share price over a fifteen day period exceeds the applicable target price. In the event that the share price or other performance targets do not meet the applicable target, the number of vesting shares would be reduced pro-rata, for that particular year. However, no LTIP Shares will vest if actual performance is less than 80 per cent of any of the performance targets in any particular year. The terms of the LTIP provide that the Company may elect to pay a cash award of an equivalent value of the vesting LTIP Shares.
None of the LTIP Shares, once vested, can be sold until the third anniversary of the award, unless required to meet personal taxation obligations in relation to the LTIP award. Annual bonus The Remuneration Committee considered bonuses for Executive Directors who were entitled performance bonuses with respect to FY20. In light of COVID-19 it was decided that no bonuses will be awarded to Executive Directors in FY20. In FY19 Arvind Gupta, Chairman, voluntarily waived his FY19 bonus (GBP250K (50% of Base salary)) and Dmitri Tsvetkov, CFO, and Avantika Gupta, COO, voluntarily agreed to reduce their FY19 bonuses from 30% to 20% of Base salary. Therefore Dmitri Tsvetkov was awarded a bonus of £48,000 and Avantika Gupta was awarded a bonus of £24,000 for FY19.
Non-Executive Directors
The remuneration of the Non-executive Directors consists of fees that are paid quarterly in arrears. The Non-executive Directors do not have a contract of employment with the Company. Each has instead entered into a contract for services with the Company.
External appointments It is the Board’s policy to allow the Executive Directors to accept directorships of other companies provided that they have obtained the consent of the Board. Any such directorships must be formally notified to the Board.

50
Directors’ interests in ordinary shares The interests of Directors in the ordinary share capital of the Company during the year were as follows:
31 March 2020
31 March 2019
Gita Investments Limited and related parties1 206,492,166 199,884,417
Michael Grasby (resigned on 25 November 2020) n/a 11,233
Jeremy Warner Allen 1,124,680 1,088,691
Dmitri Tsvetkov 1,126,691 1,090,637
N Kumar (joined on 25 November 2019) - n/a
Jeremy Beeton (resigned on 16 March 2020) n/a 50,000
Michael Grasby (resigned on 25 November 2020) n/a 11,233
Total 208,743,537 202,124,978
1 Beneficial interest in these shareholdings vests with Gupta’s family. There were no changes to Directors’ interests between 31 March 2020 and the date of this report. No Director had any interest in any contract of significance with the Group during the year ended 31 March 2020 other than their service contracts. Directors’ remuneration for the period 31 March 2019 to 31 March 2020.
Salary, annual bonus and benefits
Salary/fees
£
Annual bonus
£
Total
FY20
£
Total
FY19
£
Chairman
Arvind Gupta (paid in INR equivalent) 500,000* – 500,000 500,000
Executive Director
Dmitri Tsvetkov 240,000 – 240,000 288,000
Avantika Gupta (joined on 27 November 2018) 120,000 – 120,000 64,691**
Non-executive Directors
Jeremy Warner Allen 50,000 – 50,000 50,000
N Kumar (joined on 25 November 2019) 15,000 – 15,000 n/a
Michael Grasby (until on 25 November 2019) 33,750 – 33,750 45,000
Jeremy Beeton (until 16 March 2020) 43,270 – 45,000 45,000
Total 1,002,020 – 1,002,020 992,691
No consideration was paid or received by third parties for making available the services of any Executive or Non-
Executive Director. * Arvind Gupta's INR equivalent of FY20 salary: INR 45.8m (FY19: INR 45.8m). In FY19 Arvind Gupta voluntarily
agreed to reduce his base salary to £500,000 and to waive his FY19 bonus. ** Avantika Gupta’s INR equivalent of FY19 salary: INR 11m prorated from 27 November 2019 which is the date of
her Board appointment. As part of COVID-19 response, the Company has implemented various cost reduction and efficiency improvement measures to conserve cash and improve liquidity, including 100 per cent salary reduction for Chairman, 50 per cent salary reductions for Executive and Non-Executive Directors for FY21.

51
Under their service agreements, Mr Arvind Gupta, Mr. Dmitri Tsvetkov and Ms. Avantika Gupta (from 27 Nov 2018) are entitled to medical, insurance and other allowances and received £662,923 (FY19: £57,938), £ 21,000 (FY19: £19,095) and £ 1,316 (FY19: 521) respectively.
Directors’ LTIP
Options as at 1 April 2019
Movements during the period Options outstanding
LTIP granted Granted
Expired/
Cancelled Exercised 31 March 2020
Latest vesting date
Arvind Gupta 24 April 2019 Nil 7,407,407 Nil Nil 7,407,407 24 April 2022
Avantika Gupta 24 April 2019 Nil 1,777,778 Nil Nil 1,777,778 24 April 2022
Dmitri Tsvetkov 24 April 2019 Nil 3,555,556 Nil Nil 3,555,556 24 April 2022
Subsequent to year end, in April 2020, and upon meeting relevant performance targets, 80% of 1st tranche of LTIP
shares vested, 1,185,185 to Arvind Gupta, Chairman, 568,889 to Dmitri Tsvetkov, CFO and 284,444 to Avantika
Gupta, COO.
At 31 March 2020, the closing mid-market price of the Company’s shares was 11.38 pence. During the year under review, the Company’s closing mid-market share price ranged between a low of 10.86 pence and a high of 22.85 pence. This report has been approved by the Board of Directors of the Company. N Kumar Chairman, Remuneration Committee 22 October 2020
52
STATEMENT OF DIRECTORS’ RESPONSIBILITIES Directors’ responsibilities
The Directors are responsible for preparing the Annual Report, the Directors’ Remuneration Report and the Group financial statements. The Directors are required to prepare financial statements for the Group in accordance with International Financial Reporting Standards (‘IFRS’) as adopted for use in the European Union and have also elected to prepare financial statements for the Company in accordance with IFRS as adopted for use in the European Union. Company law requires the Directors to prepare such financial statements in accordance with IFRS and the Companies Act 2006. International Accounting Standard 1 requires that financial statements present fairly for each financial year the Group’s and
Company’s financial position, financial performance and cash flows. This requires the fair presentation of the effects of
transactions, other events and conditions in accordance with the definitions and recognition criteria for assets, liabilities, income
and expenses set out in the International Accounting Standards Board’s ‘Framework for the Preparation and Presentation of
Financial Statements’. In virtually all circumstances, a fair presentation will be achieved by compliance with all applicable
International Financial Reporting Standards. In preparing these financial statements, the directors are required to:
• select suitable accounting policies and then apply them consistently;
• make judgements and accounting estimates that are reasonable and prudent;
• state whether they have been prepared in accordance with IFRSs as adopted by the European Union, subject to any material departures disclosed and explained in the financial statements;
• prepare the financial statements on the going concern basis unless it is inappropriate to presume that the company will continue in business.
The directors are responsible for keeping adequate accounting records that are sufficient to show and explain the company’s
transactions and disclose with reasonable accuracy at any time the financial position of the company and enable them to ensure
that the financial statements comply with the requirements of the Companies Act 2006. They are also responsible for safeguarding
the assets of the company and hence for taking reasonable steps for the prevention and detection of fraud and other irregularities.
Responsibility statement of the directors in respect of the annual financial report
We confirm that to the best of our knowledge:
– the financial statements, prepared in accordance with the applicable set of accounting standards, give a true and fair view of the
assets, liabilities, financial position and profit or loss of the company and the undertakings included in the consolidation taken as
a whole; and
– the strategic report includes a fair review of the development and performance of the business and the position of the issuer and
the undertakings included in the consolidation taken as a whole, together with a description of the principal risks and uncertainties
that they face.
We consider the annual report and accounts, taken as a whole, is fair, balanced and understandable and provides the information
necessary for shareholders to assess the Group’s position and performance, business model and strategy.
Website publication
The directors are responsible for ensuring the annual report and the financial statements are made available on a website. Financial statements are published on the company's website in accordance with legislation in the Isle of Man governing the preparation and dissemination of financial statements, which may vary from legislation in other jurisdictions. The maintenance and integrity of the company's website is the responsibility of the directors. The directors' responsibility also extends to the ongoing integrity of the financial statements contained therein. On behalf of the Board by:
Philip Scales Company Secretary OPG Power Ventures Plc 55 Athol Street Douglas Isle of Man IM1 1LA 22 October 2020
53
Independent auditor’s report to the members of OPG Power Ventures plc
Opinion
We have audited the financial statements of OPG Power Ventures plc (the ‘Parent Company’) and its
subsidiaries (the ‘Group’) for the year ended 30 April 2020 which comprise the Consolidated
statement of comprehensive income, the Consolidated statement of financial position, the
Consolidated statement of cash flows, the Consolidated statement of changes in equity and notes to
the financial statements, including a summary of significant accounting policies.
The financial reporting framework that has been applied in the preparation of the financial statements
is applicable law and International Financial Reporting Standards (IFRSs) as adopted by the European
Union.
In our opinion the financial statements:
• give a true and fair view of the state of the Group’s affairs as at 31 March 2020 and of the Group’s profit for the year then ended;
• have been properly prepared in accordance with IFRSs as adopted by the European Union.
Basis for opinion
We conducted our audit in accordance with International Standards on Auditing (UK) (ISAs (UK)) and
applicable law. Our responsibilities under those standards are further described in the Auditor’s
responsibilities for the audit of the financial statements section of our report. We are independent of
the Group in accordance with the ethical requirements that are relevant to our audit of the financial
statements in the UK, including the FRC’s Ethical Standard as applied to listed entities, and we have
fulfilled our other ethical responsibilities in accordance with these requirements. We believe that the
audit evidence we have obtained is sufficient and appropriate to provide a basis for our opinion.
Conclusions relating to going concern
We have nothing to report in respect of the following matters in relation to which the ISAs (UK) require
us to report to you where:
• the Directors’ use of the going concern basis of accounting in the preparation of the financial statements is not appropriate; or
• the Directors have not disclosed in the financial statements any identified material uncertainties that may cast significant doubt about the Group’s ability to continue to adopt the going concern basis of accounting for a period of at least twelve months from the date when the financial statements are authorised for issue.
Key audit matters
Key audit matters are those matters that, in our professional judgment, were of most significance in
our audit of the financial statements of the current period and include the most significant assessed
risks of material misstatement (whether or not due to fraud) we identified, including those which had
the greatest effect on: the overall audit strategy, the allocation of resources in the audit; and directing
the efforts of the engagement team. These matters were addressed in the context of our audit of the

54
financial statements as a whole, and in forming our opinion thereon, and we do not provide a separate
opinion on these matters.
Key audit matter How this matter was addressed in our audit
Carrying value of thermal power station The Group’s thermal power station represents its most significant asset and totals £193 million as at 31 March 2020. Management is required to assess whether they consider there are any indications that the Group’s assets may be impaired as at 31 March 2020. This assessment is undertaken in line with IAS 36 Impairment of Assets. The future viability and recoverability of the power station is underpinned by the results achieved to date and the prediction of future value based on the future cash inflows generated from the assets. Management determined that the low market capitalisation of the Group when compared to the carrying value of the power station is an indicator of impairment. Management therefore performed an impairment assessment on the cash-generating unit which comprises the thermal power station. This review determined that there was no impairment. As detailed in note 6, the assessment of the recoverable amount of the thermal power required significant judgement and estimates by management. The carrying value of the thermal power represented a significant risk for our audit given the significant judgement and estimates required regarding future operating results, coal prices and discount rates.
We reviewed management’s assessment of indicators of impairment and evaluated management’s impairment models for the thermal power assets against historical performance and our understanding of the operations. We critically challenged the key estimates and assumptions used by management as set out below. Our testing included comparison of the tariffs used in the models to underlying contracts, recalculation of discount rates and critical review of the forecast production and cost profiles against empirical performance and forward coal price data. We have also compared the discount rate used to that included in the previous year and also previous recalculations made by our valuations experts. We sensitised the models for reasonable movements in key judgement areas to ascertain whether there remained a reasonable expectation that there would remain adequate headroom in excess of the carrying values. Key observations Based on the procedures above, we found the Group’s assessment that its impairment model supports the carrying value of the thermal power station to be appropriate.
Going concern In light of the COVID-19 pandemic and the resultant economic uncertainty, as described in the going concern accounting policy, we
Our procedures included reviewing management’s assessment of going concern through analysis of the Group’s cash flow
55
considered the ability of the Group to operate with its current recourses and continue as a going concern in this environment to be a Key Audit Matter. Management have prepared forecasts for a period in excess of 12 months from the date of approval of these financial statements signing which show that the Group can continue to operate within its existing cash resources. Management have also performed reverse stress testing on these forecasts in respect of the key assumptions to determine the changes needed to result in a net cash outflow or breaches of any covenants over the Group’s borrowings. This demonstrated that significant changes in assumptions were required for an uncertainty to exist in the going concern status of the Group. The forecasts accounted for the additional funds raised since the year end through significant receivables collections and the raising of non-convertible debentures. These amounts were used to repay in advance the principal on the bank borrowings for the next two years. These forecasts include the anticipated impact of COVID-19. Further information is included in the going concern accounting policy in note 5 of the financial statements.
forecast through to October 2021 and beyond, including assessing and challenging the assumptions underlying the forecasts through corroboration of key assumptions to external information and a consideration of the key sensitivities as noted below. We also obtained an understanding of the Group’s financing facilities, including the nature of facilities, repayment terms and covenants. We then assessed the facility headroom calculations on both a base case scenario, and management’s downside scenarios as a result of the ongoing COVID-19 pandemic. As part of this process, and taking account of the COVID-19 pandemic, we have reviewed the reverse stress testing of the forecasts as prepared by management and considered the results in the context of the covenants and future cash flows. We have confirmed the funds raised since the year end and corroborated the repayment of the principal on the bank borrowings. We agreed the inclusion of these transactions was correctly reflected in the management forecasts. We considered the adequacy of the disclosures in the financial statements. Key observations Our key observations are set out in the conclusions relating to going concern of our report.
Our application of materiality
Group materiality: £1,077,000 (2019: £850,000).
We apply the concept of materiality both in planning and performing our audit, and in evaluating the
effect of misstatements. We consider materiality to be the magnitude by which misstatements,
including omissions, could influence the economic decisions of reasonable users that are taken on the
basis of the financial statements.
Our Group materiality, for both the current and prior year, has been based upon 5% of the profit
before tax. We have determined a profit based measure is appropriate as the Group are generating

56
stable profits. The use of profit before tax is also in line with other similar companies in the market
and falls in line with FRC guidance.
The two (2019: three) significant components were audited to a level of materiality of £960,000 and
£650,000 (2019: £850,000 to £350,000). Such materialities were used to determine the financial
statement areas that are included within the scope of our audit and the extent of sample sizes tested
during the audit.
We determined the Group performance materiality to be 75% (2019: 75%) of the Group materiality
due to the low value of brought forward adjustments from the prior year, only one primary operating
location, and low value of historic adjustments.
We agreed with the Audit Committee that we would report to the Committee all individual audit
differences identified during the course of our audit in excess of £21,540 (2019: £17,000).
An overview of the scope of our audit
Our Group audit was scoped by obtaining an understanding of the Group and its environment,
including the Group’s system of internal control, and assessing the risks of material misstatement in
the financial statements at the Group level.
In approaching the audit, we considered how the Group is organised and managed. We completed a
full scope audit on the Group’s financial information and the two components we deemed significant,
being OPG Power Ventures plc and OPG Power Generation Private Limited. BDO India completed the
component audits for the significant component located in India with BDO UK reviewing all audit work.
This involved the issuance of group audit instructions from BDO UK to the team in BDO India. BDO UK
completed the audit of the Group’s Parent Company. The 10 non-significant components were subject
to analytical review procedures undertaken by BDO India (and reviewed by the Group audit team) and
the BDO UK team with additional testing carried out on specific significant balances where required
for the purpose of issuing the opinion on the Group financial statements.
Other information
The Directors are responsible for the other information. The other information comprises the
information included in the annual report, other than the financial statements and our auditor’s report
thereon. Our opinion on the financial statements does not cover the other information and, except to
the extent otherwise explicitly stated in our report, we do not express any form of assurance
conclusion thereon.
In connection with our audit of the financial statements, our responsibility is to read the other
information and, in doing so, consider whether the other information is materially inconsistent with
the financial statements or our knowledge obtained in the audit or otherwise appears to be materially
misstated. If we identify such material inconsistencies or apparent material misstatements, we are
required to determine whether there is a material misstatement in the financial statements or a
material misstatement of the other information. If, based on the work we have performed, we
conclude that there is a material misstatement of this other information, we are required to report
that fact.

57
We have nothing to report in this regard.
Responsibilities of directors
As explained more fully in the Statement of Directors’ responsibilities, the Directors are responsible
for the preparation of the financial statements and for being satisfied that they give a true and fair
view, and for such internal control as the Directors determine is necessary to enable the preparation
of financial statements that are free from material misstatement, whether due to fraud or error.
In preparing the financial statements, the Directors are responsible for assessing the Group’s ability
to continue as a going concern, disclosing, as applicable, matters related to going concern and using
the going concern basis of accounting unless the Directors either intend to liquidate the Group or to
cease operations, or have no realistic alternative but to do so.
Auditor’s responsibilities for the audit of the financial statements
Our objectives are to obtain reasonable assurance about whether the financial statements as a whole
are free from material misstatement, whether due to fraud or error, and to issue an auditor’s report
that includes our opinion. Reasonable assurance is a high level of assurance, but is not a guarantee
that an audit conducted in accordance with ISAs (UK) will always detect a material misstatement when
it exists. Misstatements can arise from fraud or error and are considered material if, individually or in
the aggregate, they could reasonably be expected to influence the economic decisions of users taken
on the basis of these financial statements.
A further description of our responsibilities for the audit of the financial statements is located on the
Financial Reporting Council’s website at: www.frc.org.uk/auditorsresponsibilities. This description
forms part of our auditor’s report.
Use of our report
This report is made solely to the Parent Company’s members, as a body, in accordance with our
engagement letter dated 2 September 2020. Our audit work has been undertaken so that we might
state to the Parent Company’s members those matters we are required to state to them in an auditor’s
report and for no other purpose. To the fullest extent permitted by law, we do not accept or assume
responsibility to anyone other than the Parent Company and the Parent Company’s members as a
body, for our audit work, for this report, or for the opinions we have formed.
BDO LLP
Chartered Accountants
Southampton
United Kingdom
Date: 22 October 2020
BDO LLP is a limited liability partnership registered in England and Wales (with registered number
OC305127).

58
Consolidated statement of financial position As at 31 March 2020 (All amount in £, unless otherwise stated) As at As at Notes 31 March 2020 31 March 2019 Assets
Non-current assets
Intangible assets 14 9,045 23,603
Property, plant and equipment 15 192,469,395 204,102,891
Other long-term assets 17 509,628 518,553
Restricted cash 20 26,645 517,271
193,014,713 205,162,318
Current assets
Inventories 19 11,480,099 7,151,366
Trade and other receivables 18 26,901,986 49,198,105
Other short-term assets 17 6,316,735 6,329,354
Current tax assets (net) 1,330,684 1,337,316
Restricted cash 20(b) 7,497,967 23,030,599
Cash and cash equivalents 20(a) 3,438,830 2,118,960
Assets held for sale 7(a), 7(b)
46,356,680 50,497,664
103, 322,981 139,663,364
Total assets 296, 337,694 344,825,682
Equity and liabilities
Equity
Share capital 21 58,909 57,024
Share premium 21 131,451,482 129,125,915
Other components of equity (1,322,987) 2,401,287
Retained earnings 27,818,474 21,916,422
Equity attributable to owners of the Company 158,005,878 153,500,648 Non-controlling interests 497,955 882,759
Total equity 158,503,833 154,383,407
Liabilities
Non-current liabilities
Borrowings 23 33,081,456 51,495,208
Trade and other payables 24 169,373 14,235,485
Provision for pledged deposits 20(b) - 12,627,381
Deferred tax liabilities (net) 13 5,723,791 2,380,115
38,974,620 80,738,189
Current liabilities
Borrowings 23 23,746,229 28,869,722
Trade and other payables 24 41,663,989 45,474,814
Other liabilities 582,241 91,764
Liabilities classified as held for sale 7(b) 32,866,783 35,267,786
98,859,241 109,704,086
Total liabilities 137,833,861 190,442,275
Total equity and liabilities 296, 337,694 344,825,682
The notes are an integral part of these consolidated financial statements The financial statements were authorised for issue by the board of directors on 22 October 2020 and were signed on its behalf by Arvind Gupta, Chairman Dmitri Tsvetkov, Chief Financial Officer

59
Consolidated statement of Comprehensive Income For the Year ended 31 March 2020 (All amount in £, unless otherwise stated)
Year ended Year ended 31 March
2020 31 March
2019 Notes
Revenue 8 154,040,283 140,632,328
Cost of revenue 9 (90,060,252) (91,753,763)
Gross profit 63,980,031 48,878,565
Other income 10 668,037 2,645,332
Distribution cost (9,209,987) (8,476,933)
General and administrative expenses (8,061,622) (6,955,960)
Expected credit loss on trade receivables 29 (17,046,480) (790,437)
Depreciation and amortisation (6,293,034) (6,064,374)
Operating profit 24,036,945 29,236,193
Finance costs 11 (11,495,136) (14,586,917)
Finance income 12 1,962,692 2,207,480
Profit before tax 14,504,501 16,856,756
Tax expense 13 (4,321,124) (1,819,387)
Profit for the year from continued operations 10,183,377 15,037,369
Loss from discontinued operations, including Non-Controlling Interest
7(a)(b)(c) (2,146,275) (989,493)
Profit for the year 8,037,102 14,047,876
Profit for the year attributable to:
Owners of the Company 8,229,504 14,020,364 Non – controlling interests (192,402) 27,512
8,037,102 14,047,876
Earnings per share from continued operations
Basic earnings per share (in pence) 26 2.60 4.09
Diluted earnings per share (in pence) 2.59 4.09
Loss per share from discontinued operations
Basic earnings per share (in pence) 26 (0.50) (0.23)
Diluted earnings per share (in pence) (0.50) (0.23)
Earnings per share -Basic (in pence) 26 2.11 3.81
-Diluted (in pence) 2.09 3.81
Other comprehensive income / (loss) Items that will be reclassified subsequently to profit or loss
Exchange differences on translating foreign operations (4,560,097) 1,207,292
Items that will be not reclassified subsequently to profit or loss
Exchange differences on translating foreign operations, relating to non-controlling interests
(192,401) 961
Total other comprehensive income / (loss) (4,752,498) 1,208,253
Total comprehensive income 3,284,604 15,256,129
Total comprehensive income / (loss) attributable to:
Owners of the Company 3,669,407 15,227,656
Non-controlling interest (384,803) 28,473
3,284,604 15,256,129
The notes are an integral part of these consolidated financial statements

60
Consolidated statement of changes in equity For the Year ended 31 March 2020 (All amount in £, unless otherwise stated)
Issued capital (No.
of shares) Ordinary
shares Share
premium Other
reserves
Foreign currency
translation reserve
Retained earnings
Total attributable
to owners of parent
Non-controlling
interests Total equity At 1 April 2018 356,308,697 52,378 125,567,473 6,650,305 (5,456,310) 11,461,826 138,275,672 854,752 139,130,424
Additions on consolidation of new subsidiary (2,680) (2,680) (466) (3,146) Dividends (Note 21) 31,601,503 4,646 3,558,442 - - (3,563,088) - - -
Transaction with owners 31,601,503 4,646 3,558,442 - - (3,565,768) (2,680) (466) (3,146)
Profit for the year - - - - - 14,020,364 14,020,364 27,512 14,047,876 Other comprehensive income - - - - 1,207,292 - 1,207,292 961 1,208,253
Total comprehensive income - - - - 1,207,292 14,020,364 15,227,656 28,473 15,256,129
At 31 March 2019 387,910,200 57,024 129,125,915 6,650,305 (4,249,018) 21,916,422 153,500,648 882,759 154,383,407
At 1 April 2019 387,910,200 57,024 129,125,915 6,650,305 (4,249,018) 21,916,422 153,500,648 882,759 154,383,407 Employee Share based payment LTIP (Note 22) 835,822 - 835,822 - 835,822 Dividends (Note 21) 12,823,311 1,885 2,325,567 - - (2,327,452) - - -
Transaction with owners 12,823,311 1,885 2,325,567 835,822 - (2,327,452) 835,822 - 835,822
Profit for the year - - - - - 8,229,504 8,229,504 (192,402) 8,037,101 Other comprehensive income - - - - (4,560,096) - (4,560,096) (192,402) (4,752,497)
Total comprehensive income - - - - (4,560,096) 8,229,503 3,669,408 (384,804) 3,284,604
At 31 March 2020 400,733,511 58,909 131,451,482 7,486,127 (8,809,114) 27,818,474 158,005,878 497,955 158,503,833
During the year, the Company paid a scrip dividend of 12,823,311 shares (2019:31,601,503 shares)
The notes are an integral part of these consolidated financial statements.

61
Consolidated statement of cash flows For the Year ended 31 March 2020
(All amount in £, unless otherwise stated)
Year ended Year ended
Notes 31 March 2020 31 March 2019
Cash flows from operating activities
Profit before income tax including discontinued operations 11,365,000 15,867,263
Adjustments for:
Loss from discontinued operations, net 7 3,139,501 989,493
Unrealised foreign exchange loss / (gain) 9(d) 1,568,333 (416,338)
Financial costs 11 9,926,804 14,586,917
Financial income 12 (1,962,692) (2,207,480)
Share based compensation costs 22 835,822 -
Depreciation and amortisation 6,293,034 6,064,374
Expected credit loss on Trade receivables 29 17,046,480 790,437
Changes in working capital
Trade and other receivables 4,406,823 (16,021,881)
Inventories (4,699,650) 2,564,914
Other assets 1,945,750 4,752,087
Trade and other payables (18,245,141) 2,384,828
Other liabilities (217,194) (669,762)
Cash generated from continuing operations 31,402,869 28,684,851
Taxes paid (767,865) (584,390)
Cash provided by operating activities of continuing operations 30,635,004 28,100,461
Cash provided by (used for) operating activities of discontinued operations (2,062,318) (8,256,479)
Net cash provided by operating activities 28,572,687 19,843,983
Cash flows from investing activities
Purchase of property, plant and equipment (including capital advances) (573,668) (1,515,742)
Interest received 1,962,692 2,207,480
Movement in restricted cash 2,240,335 (1,737,255)
Sale/(purchase) of investments (725,418) 785,222
Cash from / (used in) investing activities of continuing operations 2,903,941 (260,295)
Cash from / (used in) investing activities of discontinued operations 426,425 (4,346,681)
Net cash from / (used in) investing activities 3,330,366 (4,606,976)
Cash flows from financing activities
Proceeds from borrowings (net of costs) - 7,535,858
Repayment of borrowings (21,620,516) (20,636,875)
Finance costs paid (9,927,750) (14,835,536)
Cash used in financing activities of continuing operations (31,548,266) (27,936,553)
Cash used in financing activities of discontinued operations 689,255 12,717,446
Net cash used in financing activities (30,859,011) (15,219,107)
Net Increase / (decrease) in cash and cash equivalents from continuing
operations 1,990,679 (96,387)
Net Increase / (decrease) in cash and cash equivalents from discontinued
operations (946,638) 114,286
Net increase in cash and cash equivalents 1,044,042 17,899
Cash and cash equivalents at the beginning of the year 2,118,960 2,185,570
Cash and cash equivalents - solar business 24,545 231,953
Exchange differences on cash and cash equivalents 19,330 29,769
Cash and cash equivalents of the discontinued operations 231,953 (346,231)
Cash and cash equivalents at the end of the year 3,438,830 2,118,960

62
Consolidated statement of cash flows For the Year ended 31 March 2020 (continued) (All amount in £, unless otherwise stated)
Disclosure of Changes in financing liabilities:
Analysis of changes in Net debt 1 April 2019 Cash flows Forex rate
impact 31 March 2020
Working Capital loan 10,433,893 (3,317,490) (202,281) 6,914,122
Secured loan due within one year 18,435,829 (1,087,278) (516,444) 16,832,107
Borrowings grouped under Current liabilities 28,869,722 (4,404,768) (718,725) 23,746,229
Secured loan due after one year 51,495,208 (17,215,748) (1,198,004) 33,081,456
Borrowings grouped under Non-current liabilities 51,495,208 (17,215,748) (1,198,004) 33,081,456
Analysis of changes in Net debt 1 April 2018 Cash flows Other Changes 31 March 2019
Working Capital loan 3,426,622 7,535,858 (528,587) 10,433,893
Secured loan due within one year 20,402,793 (1,966,964) - 18,435,829
Borrowings grouped under Current liabilities 23,829,415 5,568,894 (528,587) 28,869,722
Secured loan due after one year 69,636,532 (18,669,911) 528,587 51,495,208
Borrowings grouped under Non-current liabilities 69,636,532 (18,669,911) 528,587 51,495,208

63
Notes to the Consolidated Financial Statements (All amounts are in £, unless otherwise stated) 1. Nature of operations OPG Power Ventures Plc (‘the Company’ or ‘OPGPV’), and its subsidiaries (collectively referred to as ‘the Group’) are primarily engaged in the development, owning, operation and maintenance of private sector power projects in India. The electricity generated from the Group’s plants is sold principally to public sector undertakings and heavy industrial companies in India or in the short term market. The business objective of the group is to focus on the power generation business within India and thereby provide reliable, cost effective power to the industrial consumers and other users under the ‘open access’ provisions mandated by the Government of India. 2. Statement of compliance The consolidated financial statements of the Group have been prepared in accordance with International Financial Reporting Standards (IFRS) and their interpretations as adopted by the European Union (EU) and the provisions of the Isle of Man, Companies Act 2006 applicable to companies reporting under IFRS. 3. General information OPG Power Ventures Plc, a limited liability corporation, is the Group’s ultimate parent Company and is incorporated and domiciled in the Isle of Man. The address of the Company’s registered Office, which is also the principal place of business, is 55 Athol street, Douglas, Isle of Man IM1 1LA. The Company’s equity shares are listed on the Alternative Investment Market (AIM) of the London Stock Exchange. The Consolidated Financial statements for the year ended 31 March 2020 were approved and authorised for issue by the Board of Directors on 22 October 2020. 4. Recent accounting pronouncements a. Standards, amendments and interpretations to existing standards that are not yet effective and have not been adopted
early by the Group At the date of authorisation of these financial statements, certain new standards, and amendments to existing standards have been published by the IASB that are not yet effective, and have not been adopted early by the Group. Information on those expected to be relevant to the Group’s financial statements is provided below. Management anticipates that all relevant pronouncements will be adopted in the Group’s accounting policies for the first period beginning after the effective date of the pronouncement. New standards, interpretations and amendments not either adopted or listed below are not expected to have a material impact on the Group’s financial statements. Amendments to IAS 1 and IAS 8, “Definition of Material,” published in October 2018. An entity shall apply those amendments prospectively for annual periods beginning on or after 1 January 2020. Amendments to IFRS 3, “Definition of a business,” published in October 2018. Acquisitions that occur on or after first annual reporting period beginning on or after 1 January 2020. Early application is permitted. Amendments to IFRS 9, IAS 39 and IFRS 7, “Interest rate benchmark reform,” published in September 2019. An entity shall apply those amendments prospectively for annual periods beginning on or after 1 January 2020. Currently, these adjustments are not expected to have a material impact on the consolidated financial statements of Group. b. Changes in accounting Standards i) IFRS 16 ‘Leases’ Effective April 1, 2019, the Group applied the accounting standard IFRS 16 ‟Leases” for the first time. IFRS 16 ‟Leases” replaces IAS 17 ‟Leases” and the corresponding interpretations. IFRS 16 introduces a uniform lessee accounting model that requires lessees to recognize all leases in the consolidated balance sheet. This model mandates that right-of-use assets be recognized for identified assets and lease liabilities recognized for entered payment obligations. In accordance with IFRS 16, lease liabilities to be recognized for leases with the Group as a lessee are to be measured at the present value of the future lease payments. In accordance with IFRS 16, right-of-use assets are recognized within property, plant and equipment under the same line item that would have been used if the underlying asset had been purchased. In contrast to the previous approach of fully recognizing expenses from operating leases in the respective functional costs, interest expenses from the unwinding of the discount on lease liabilities will in future be recognized in the financial result. Currently there are no material leases and rentals are charged to the income statement. The new lease accounting regulations have no material impact on the consolidated financial statement of the Group.

64
5. Summary of significant accounting policies a) Basis of preparation The consolidated financial statements of the Group have been prepared on a historical cost basis, except for financial assets and liabilities at fair value through profit or loss and financial assets measured at FVPL. The consolidated financial statements are presented in accordance with IAS 1 Presentation of Financial Statements and have been presented in Great Britain Pounds (‘₤’), the functional and presentation currency of the Company. During FY2019, the Company obtained a right to exercise an option to buy additional 30% equity interest in solar companies. This right, in combination with other rights, provided substantive potential voting rights and investments in solar companies were re-classified from associates to subsidiaries. During FY2019, results of operations of associates Avanti Solar Energy Private Limited, Mayfair Renewable Energy Private Limited, Avanti Renewable Energy Private Limited and Brics Renewable Energy Private Limited were reclassified to discontinued operations. After evaluation of all options, the Company decided that the most efficient way to maximise shareholders’ value from solar operations is to dispose solar companies and it initiated process of disposition of solar companies which met all conditions of IFRS 5 for classification of solar business as Assets held for sale at 31 March 2020 (Note 7(b)). Going concern As at 31 March 2020 the Group had £3.4m in cash and net current assets of £4.4m. The directors and management have prepared a cash flow forecast to October 2021, 12 months from the date this report has been approved. The Group experiences sensitivity in its cash flow forecasts due to the exposure to potential increase in USD denominated coal prices and a decrease in the value of the Indian Rupee. The Directors and management are confident that the Group will be trading in line with its forecast and that any exposure to a fluctuation in coal prices or the exchange rate INR/USD has been taken into consideration and therefore prepared the financial statements on a going concern basis. COVID-19 virus, a global pandemic has affected the world economy leading to significant decline and volatility in financial markets and decline in economic activities. The Group has considered the possible effects that may result from the pandemic on the carrying amounts of receivables and other financial assets and carried out a Reverse Stress Test (RST). In developing the assumptions relating to the possible future uncertainties in the global economic conditions because of this pandemic, the Group, as at the date of approval of these financial statements has used internal and external sources of information. The Group has performed sensitivity analysis on the assumptions used for business projections and based on current estimates expects the carrying amount of these assets will be recovered and no material impact on the financial results inter-alia including the carrying value of various current and non-current assets are expected to arise for the year ended 31 March 2020. The Group will continue to closely monitor any variation due to the changes in situation and these changes will be taken into consideration, if necessary, as and when they crystalise. However, electricity being an essential commodity the impact on industry has been comparatively lower. The operating assets of the Group primarily are located in India. The Government of India with Reserve Bank of India (RBI) have announced various regulatory measures to help the industry. Subsequent to year end, RBI announced various regulatory measures (RBI COVID-19 Regulatory package which, inter alia, provides for rescheduling of payments towards Term Loans and Working Capital facilities for principal and interest) to mitigate the burden of debt servicing brought by disruptions on account of COVID-19 pandemic and to ensure the continuity of viable businesses. The Group has opted for such measures for deferment of payment of principal and interest on term loans and also interest on working capital loans. Please refer to events after year end detailed below that have substantially eased the cash flow burden on account of the Group having repaid the principal term loan obligation for FY 21 and FY 22 and major recoveries of overdues towards power supply from our principle customer TANGEDCO. Based on the RST analysis, we can conclude that the Group is in strong position to go through the current situation caused by COVID-19 pandemic and going concern is not an issue. Developments after the year end Group raised approximately GBP 21.0 million (Rs.2000 million) during June 2020 through non-convertible debentures (NCDs) issue with a three years term and coupon rate of 9.85%. NCD’s proceeds was used to repay the FY21 and FY22 (i.e. to March 2022) principal term loans obligations. This will substantially release the cash flow burden for the next two financial years on account of loan repayment obligations. Subsequent to 31 March 2020, the Group collected the full amount of receivables from its principle customer TANGEDCO of approximately £16.4 m. These two developments strengthened the Group's financial position at this time of economic slowdown.

65
b) Basis of consolidation The consolidated financial statements include the assets, liabilities and results of the operation of the Company and all of its subsidiaries as of 31 March 2020. All subsidiaries have a reporting date of 31 March. A subsidiary is defined as an entity controlled by the Company. The parent controls a subsidiary if it is exposed, or has rights, to variable returns from its involvement with the subsidiary and has the ability to affect those returns through its power over the subsidiary. Subsidiaries are fully consolidated from the date of acquisition, being the date on which effective control is acquired by the Group, and continue to be consolidated until the date that such control ceases. All transactions and balances between Group companies are eliminated on consolidation, including unrealised gains and losses on transactions between Group companies. Where unrealised losses on intra-group asset sales are reversed on consolidation, the underlying asset is also tested for impairment from a group perspective. Amounts reported in the financial statements of subsidiaries have been adjusted where necessary to ensure consistency with the accounting policies adopted by the Group. Non-controlling interest represents the portion of profit or loss and net assets that is not held by the Group and is presented separately in the consolidated statement of comprehensive income and within equity in the consolidated statement of financial position, separately from parent shareholders’ equity. Acquisitions of additional stake or dilution of stake from/ to non-controlling interests/ other venturer in the Group where there is no loss of control are accounted for as an equity transaction, whereby, the difference between the consideration paid to or received from and the book value of the share of the net assets is recognised in ‘other reserve’ within statement of changes in equity. c) Investments in associates and joint ventures Investments in associates and joint ventures are accounted for using the equity method. The carrying amount of the investment in associates and joint ventures is increased or decreased to recognise the Group’s share of the profit or loss and other comprehensive income of the associate and joint venture, adjusted where necessary to ensure consistency with the accounting policies of the Group. Unrealised gains and losses on transactions between the Group and its associates and joint ventures are eliminated to the extent of the Group’s interest in those entities. Where unrealised losses are eliminated, the underlying asset is also tested for impairment. d) List of subsidiaries, joint ventures, and associates Details of the Group’s subsidiaries and joint ventures, which are consolidated into the Group’s consolidated financial statements, are as follows:
i) Subsidiaries
Subsidiaries Immediate
parent Country of
incorporation
% Voting Right % Economic interest
March 2020 March 2019 March 2020 March 2019
Caromia Holdings limited (‘CHL’) OPGPV Cyprus 100 100 100 100 Gita Power and Infrastructure Private Limited, (‘GPIPL’) CHL India 100 100 100 100 OPG Power Generation Private Limited (‘OPGPG’) GPIPL India 73.16 73.49 99.91 99.91 Samriddhi Solar Power LLP(*) OPGPG India 73.16 73.49 99.91 99.90 Samriddhi Surya Vidyut Private Limited OPGPG India 73.16 73.49 99.91 99.90 OPG Surya Vidyut LLP(*) OPGPG India 73.16 73.49 99.91 99.90 Powergen Resources Pte Ltd OPGPV Singapore 98.66 98.67 100.00 100.00 Avanti Solar Energy Private Limited(**) OPGPG India 31 31% 31 31% Mayfair Renewable Energy Private Limited(**) OPGPG India 31 31% 31 31% Avanti Renewable Energy Private Limited(**) OPGPG India 31 31% 31 31% Brics Renewable Energy Private Limited(**) OPGPG India 31 31% 31 31%
(*) During FY20 the companies were converted into LLP.

66
(**) During FY19, the Group obtained a right 'to exercise an option to buy additional equity interest in solar companies. This right, in combination with other rights, provided substantive potential voting rights and investments in solar companies were re-classified from associates to subsidiaries.
ii) Financial assets measured at FVPL (Assets Held for sale) - Joint ventures (Note 7(a))
Joint ventures Venturer Country of incorporation % Voting right % Economic interest
March 2019 March 2018 March 2019 March 2018
Padma Shipping Limited ("PSL")
OPGPV / OPGPG Hong Kong 50 50 50 50
e) Foreign currency translation The functional currency of the Company is the Great Britain Pound Sterling (£). The Cyprus entity is an extension of the parent and pass through investment entity. Accordingly, the functional currency of the subsidiary in Cyprus is the Great Britain Pound Sterling. The functional currency of the Company’s subsidiaries operating in India, determined based on evaluation of the individual and collective economic factors is Indian Rupees (‘₹’ or 'INR'). The presentation currency of the Group is the Great Britain Pound (£) as submitted to the AIM counter of the London Stock Exchange where the shares of the Company are listed. At the reporting date the assets and liabilities of the Group are translated into the presentation currency at the rate of exchange prevailing at the reporting date and the income and expense for each statement of profit or loss are translated at the average exchange rate (unless this average rate is not a reasonable approximation of the cumulative effect of the rates prevailing on the transaction dates, in which case income and expense are translated at the rate on the date of the transactions). Exchange differences are charged/ credited to other comprehensive income and recognized in the currency translation reserve in equity. Transactions in foreign currencies are translated at the foreign exchange rate prevailing at the date of the transaction. Monetary assets and liabilities denominated in foreign currencies at the Statement of financial position date are translated into functional currency at the foreign exchange rate ruling at that date. Aggregate gains and losses resulting from foreign currencies are included in finance income or costs within the profit or loss. INR exchange rates used to translate the INR financial information into the presentation currency of Great Britain Pound (£) are the closing rate as at 31 March 2020: 93.07 (2019: 90.28) and the average rate for the year ended 31 March 2020: 89.97 (2019: 91.60). f) Revenue recognition
In accordance with IFRS 15 - Revenue from contracts with customers, the group recognises revenue to the extent that it reflects the expected consideration for goods or services provided to the customer under contract, over the performance obligations they are being provided. For each separable performance obligation identified, the Group determines whether it is satisfied at a “point in time” or “over time” based upon an evaluation of the receipt and consumption of benefits, control of assets and enforceable payment rights associated with that obligation. If the criteria required for “over time” recognition are not met, the performance obligation is deemed to be satisfied at a “point in time”. Revenue principally arises as a result of the Group’s activities in electricity generation and distribution. Supply of power and billing satisfies performance obligations. The supply of power is invoiced in arrears on a monthly basis and generally the payment terms within the Group are 30 days. Sale of electricity Revenue from the sale of electricity is recognised on the basis of billing cycle under the contractual arrangement with the customers and reflects the value of units of power supplied and the applicable customer tariff after deductions or discounts. Revenue is earned at a point in time of joint meter reading by both buyer and seller for each billing month. Interest and dividend Revenue from interest is recognised as interest accrued (using the effective interest rate method). Revenue from dividends is recognised when the right to receive the payment is established. g) Operating expenses Operating expenses are recognised in the statement of profit or loss upon utilisation of the service or as incurred. h) Taxes Tax expense recognised in profit or loss comprises the sum of deferred tax and current tax not recognised in other comprehensive income or directly in equity.
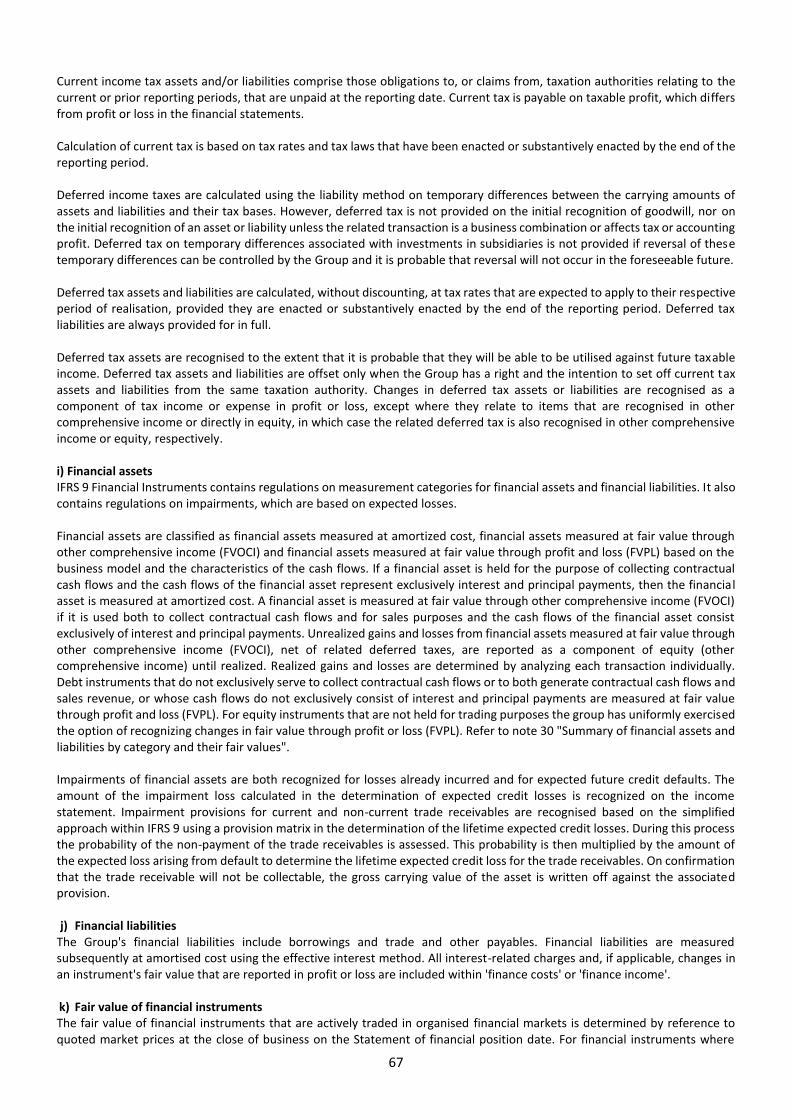
67
Current income tax assets and/or liabilities comprise those obligations to, or claims from, taxation authorities relating to the current or prior reporting periods, that are unpaid at the reporting date. Current tax is payable on taxable profit, which differs from profit or loss in the financial statements. Calculation of current tax is based on tax rates and tax laws that have been enacted or substantively enacted by the end of the reporting period. Deferred income taxes are calculated using the liability method on temporary differences between the carrying amounts of assets and liabilities and their tax bases. However, deferred tax is not provided on the initial recognition of goodwill, nor on the initial recognition of an asset or liability unless the related transaction is a business combination or affects tax or accounting profit. Deferred tax on temporary differences associated with investments in subsidiaries is not provided if reversal of these temporary differences can be controlled by the Group and it is probable that reversal will not occur in the foreseeable future. Deferred tax assets and liabilities are calculated, without discounting, at tax rates that are expected to apply to their respective period of realisation, provided they are enacted or substantively enacted by the end of the reporting period. Deferred tax liabilities are always provided for in full. Deferred tax assets are recognised to the extent that it is probable that they will be able to be utilised against future taxable income. Deferred tax assets and liabilities are offset only when the Group has a right and the intention to set off current tax assets and liabilities from the same taxation authority. Changes in deferred tax assets or liabilities are recognised as a component of tax income or expense in profit or loss, except where they relate to items that are recognised in other comprehensive income or directly in equity, in which case the related deferred tax is also recognised in other comprehensive income or equity, respectively. i) Financial assets IFRS 9 Financial Instruments contains regulations on measurement categories for financial assets and financial liabilities. It also contains regulations on impairments, which are based on expected losses. Financial assets are classified as financial assets measured at amortized cost, financial assets measured at fair value through other comprehensive income (FVOCI) and financial assets measured at fair value through profit and loss (FVPL) based on the business model and the characteristics of the cash flows. If a financial asset is held for the purpose of collecting contractual cash flows and the cash flows of the financial asset represent exclusively interest and principal payments, then the financial asset is measured at amortized cost. A financial asset is measured at fair value through other comprehensive income (FVOCI) if it is used both to collect contractual cash flows and for sales purposes and the cash flows of the financial asset consist exclusively of interest and principal payments. Unrealized gains and losses from financial assets measured at fair value through other comprehensive income (FVOCI), net of related deferred taxes, are reported as a component of equity (other comprehensive income) until realized. Realized gains and losses are determined by analyzing each transaction individually. Debt instruments that do not exclusively serve to collect contractual cash flows or to both generate contractual cash flows and sales revenue, or whose cash flows do not exclusively consist of interest and principal payments are measured at fair value through profit and loss (FVPL). For equity instruments that are not held for trading purposes the group has uniformly exercised the option of recognizing changes in fair value through profit or loss (FVPL). Refer to note 30 "Summary of financial assets and liabilities by category and their fair values". Impairments of financial assets are both recognized for losses already incurred and for expected future credit defaults. The amount of the impairment loss calculated in the determination of expected credit losses is recognized on the income statement. Impairment provisions for current and non-current trade receivables are recognised based on the simplified approach within IFRS 9 using a provision matrix in the determination of the lifetime expected credit losses. During this process the probability of the non-payment of the trade receivables is assessed. This probability is then multiplied by the amount of the expected loss arising from default to determine the lifetime expected credit loss for the trade receivables. On confirmation that the trade receivable will not be collectable, the gross carrying value of the asset is written off against the associated provision. j) Financial liabilities
The Group's financial liabilities include borrowings and trade and other payables. Financial liabilities are measured subsequently at amortised cost using the effective interest method. All interest-related charges and, if applicable, changes in an instrument's fair value that are reported in profit or loss are included within 'finance costs' or 'finance income'. k) Fair value of financial instruments The fair value of financial instruments that are actively traded in organised financial markets is determined by reference to quoted market prices at the close of business on the Statement of financial position date. For financial instruments where

68
there is no active market, fair value is determined using valuation techniques. Such techniques may include using recent arm’s length market transactions; reference to the current fair value of another instrument that is substantially the same; discounted cash flow analysis or other valuation models. l) Property, plant and equipment
Property, plant and equipment are stated at historical cost, less accumulated depreciation and any impairment in value. Historical cost includes expenditure that is directly attributable to property plant & equipment such as employee cost, borrowing costs for long-term construction projects etc., if recognition criteria are met. Likewise, when a major inspection is performed, its costs are recognised in the carrying amount of the plant and equipment as a replacement if the recognition criteria are satisfied. All other repairs and maintenance costs are recognised in the profit or loss as incurred. Land is not depreciated. Depreciation on all other assets is computed on straight-line basis over the useful life of the asset based on management’s estimate as follows:
Nature of asset Useful life (years)
Buildings 40
Power stations 40
Other plant and equipment 3-10
Vehicles 5-11
Assets in the course of construction are stated at cost and not depreciated until commissioned. An item of property, plant and equipment is derecognised upon disposal or when no future economic benefits are expected from its use or disposal. Any gain or loss arising on derecognition of the asset (calculated as the difference between the net disposal proceeds and the carrying amount of the asset) is included in the profit or loss in the year the asset is derecognised. The assets residual values, useful lives and methods of depreciation of the assets are reviewed at each financial year end, and adjusted prospectively if appropriate. m) Intangible assets Acquired software Acquired computer software licences are capitalised on the basis of the costs incurred to acquire and install the specific software. Subsequent measurement All intangible assets, including software are accounted for using the cost model whereby capitalised costs are amortised on a straight-line basis over their estimated useful lives, as these assets are considered finite. Residual values and useful lives are reviewed at each reporting date. The useful life of software is estimated as 4 years. n) Leases All leases are accounted for by recognising a right-of-use asset and a lease liability except for: Leases of low value assets; and • Leases with a duration of 12 months or less. IFRS 16 was adopted effective from 1 April 2019 without restatement of comparative figures. The following policies apply subsequent to the date of initial application, 1 April 2019. Lease liabilities are measured at the present value of the contractual payments due to the lessor over the lease term, with the discount rate determined by reference to the rate inherent in the lease unless (as is typically the case) this is not readily determinable, in which case the group’s incremental borrowing rate on commencement of the lease is used. Variable lease payments are only included in the measurement of the lease liability if they depend on an index or rate. In such cases, the initial measurement of the lease liability assumes the variable element will remain unchanged throughout the lease term. Other variable lease payments are expensed in the period to which they relate. On initial recognition, the carrying value of the lease liability also includes: • amounts expected to be payable under any residual value guarantee; • the exercise price of any purchase option granted in favour of the group if it is reasonable certain to assess that option;

69
• any penalties payable for terminating the lease, if the term of the lease has been estimated in the basis of termination option being exercised. Right of use assets are initially measured at the amount of the lease liability, reduced for any lease incentives received, and increased for: • lease payments made at or before commencement of the lease; • initial direct costs incurred; and • the amount of any provision recognised where the group is contractually required to dismantle, remove or restore the leased asset (typically leasehold dilapidations)
o) Borrowing costs Borrowing costs directly attributable to the acquisition, construction or production of qualifying assets, that necessarily take a substantial period of time to get ready for their intended use or sale, are added to the cost of those assets. Interest income earned on the temporary investment of specific borrowing pending its expenditure on qualifying assets is deducted from the costs of these assets. Gains and losses on extinguishment of liability, including those arising from substantial modification from terms of loans are not treated as borrowing costs and are charged to profit or loss. All other borrowing costs including transaction costs are recognized in the statement of profit or loss in the period in which they are incurred, the amount being determined using the effective interest rate method. p) Impairment of non-financial assets The Group assesses at each reporting date whether there is an indication that an asset may be impaired. If any such indication exists, or when annual impairment testing for an asset is required, the Group estimates the asset’s recoverable amount. An asset’s recoverable amount is the higher of an asset’s or cash-generating unit’s (CGU) fair value less costs to sell and its value in use and is determined for an individual asset, unless the asset does not generate cash inflows that are largely independent of those from other assets or Groups of assets. Where the carrying amount of an asset or CGU exceeds its recoverable amount, the asset is considered impaired and is written down to its recoverable amount. In assessing value in use, the estimated future cash flows are discounted to their present value using a pre-tax discount rate that reflects current market assessments of the time value of money and the risks specific to the asset. In determining fair value less costs to sell, an appropriate valuation model is used. These calculations are corroborated by valuation multiples, quoted share prices for publicly traded subsidiaries or other available fair value indicators. For assets excluding goodwill, an assessment is made at each reporting date as to whether there is any indication that previously recognised impairment losses may no longer exist or may have decreased. If such indication exists, the Group estimates the asset’s or cash-generating unit’s recoverable amount. A previously recognised impairment loss is reversed only if there has been a change in the assumptions used to determine the asset’s recoverable amount since the last impairment loss was recognised. The reversal is limited so that the carrying amount of the asset does not exceed its recoverable amount, nor exceed the carrying amount that would have been determined, net of depreciation, had no impairment loss been recognised for the asset in prior years. Such reversal is recognised in the profit or loss. q) Non-current assets Held for Sale and Discontinued Operations Non-current assets and any corresponding liabilities held for sale and any directly attributable liabilities are recognized separately from other assets and liabilities in the balance sheet in the line items “Assets held for sale” and “Liabilities associated with assets held for sale” if they can be disposed of in their current condition and if there is sufficient probability of their disposal actually taking place. Discontinued operations are components of an entity that are either held for sale or have already been sold and can be clearly distinguished from other corporate operations, both operationally and for financial reporting purposes. Additionally, the component classified as a discontinued operation must represent a major business line or a specific geographic business segment of the Group. Non-current assets that are held for sale either individually or collectively as part of a disposal group, or that belong to a discontinued operation, are no longer depreciated. They are instead accounted for at the lower of the carrying amount and the fair value less any remaining costs to sell. If this value is less than the carrying amount, an impairment loss is recognized. The income and losses resulting from the measurement of components held for sale as well as the gains and losses arising from the disposal of discontinued operations, are reported separately on the face of the income statement under income/loss from discontinued operations, net, as is the income from the ordinary operating activities of these divisions. Prior-year income statement figures are adjusted accordingly. However, there is no reclassification of prior-year balance sheet line items attributable to discontinued operations.

70
r) Cash and cash equivalents Cash and cash equivalents in the Statement of financial position includes cash in hand and at bank and short-term deposits with original maturity period of 3 months or less. For the purpose of the consolidated cash flow statement, cash and cash equivalents consist of cash in hand and at bank and short-term deposits. Restricted cash represents deposits which are subject to a fixed charge and held as security for specific borrowings and are not included in cash and cash equivalents. s) Inventories Inventories are stated at the lower of cost and net realisable value. Costs incurred in bringing each product to its present location and condition is accounted based on weighted average price. Net realisable value is the estimated selling price in the ordinary course of business, less estimated selling expenses. t) Earnings per share
The earnings considered in ascertaining the Group’s earnings per share (EPS) comprise the net profit for the year attributable to ordinary equity holders of the parent. The number of shares used for computing the basic EPS is the weighted average number of shares outstanding during the year. For the purpose of calculating diluted earnings per share the net profit or loss for the period attributable to equity shareholders and the weighted average number of shares outstanding during the period are adjusted for the effects of all dilutive potential equity share. u) Other provisions and contingent liabilities Provisions are recognised when present obligations as a result of a past event will probably lead to an outflow of economic resources from the Group and amounts can be estimated reliably. Timing or amount of the outflow may still be uncertain. A present obligation arises from the presence of a legal or constructive obligation that has resulted from past events. Restructuring provisions are recognised only if a detailed formal plan for the restructuring has been developed and implemented, or management has at least announced the plan's main features to those affected by it. Provisions are not recognised for future operating losses. Provisions are measured at the estimated expenditure required to settle the present obligation, based on the most reliable evidence available at the reporting date, including the risks and uncertainties associated with the present obligation. Where there are a number of similar obligations, the likelihood that an outflow will be required in settlement is determined by considering the class of obligations as a whole. Provisions are discounted to their present values, where the time value of money is material. Any reimbursement that the Group can be virtually certain to collect from a third party with respect to the obligation is recognised as a separate asset. However, this asset may not exceed the amount of the related provision. All provisions are reviewed at each reporting date and adjusted to reflect the current best estimate. In those cases where the possible outflow of economic resources as a result of present obligations is considered improbable or remote, no liability is recognised, unless it was assumed in the course of a business combination. In a business combination, contingent liabilities are recognised on the acquisition date when there is a present obligation that arises from past events and the fair value can be measured reliably, even if the outflow of economic resources is not probable. They are subsequently measured at the higher amount of a comparable provision as described above and the amount recognised on the acquisition date, less any amortisation. v) Share based payments The Group operates equity-settled share-based remuneration plans for its employees. None of the Group's plans feature any options for a cash settlement. All goods and services received in exchange for the grant of any share-based payment are measured at their fair values. Where employees are rewarded using share-based payments, the fair values of employees' services is determined indirectly by reference to the fair value of the equity instruments granted. This fair value is appraised at the grant date and excludes the impact of non-market vesting conditions (for example profitability and sales growth targets and performance conditions). All share-based remuneration is ultimately recognised as an expense in profit or loss with a corresponding credit to 'Other Reserves'. If vesting periods or other vesting conditions apply, the expense is allocated over the vesting period, based on the best available estimate of the number of share options expected to vest. Non-market vesting conditions are included in assumptions about the number of options that are expected to become exercisable. Estimates are subsequently revised if there is any indication

71
that the number of share options expected to vest differs from previous estimates. Any cumulative adjustment prior to vesting is recognised in the current period. No adjustment is made to any expense recognised in prior periods if share options ultimately exercised are different to that estimated on vesting. Upon exercise of share options, the proceeds received net of any directly attributable transaction costs up to the nominal value of the shares issued are allocated to share capital with any excess being recorded as share premium. w) Employee benefits Gratuity In accordance with applicable Indian laws, the Group provides for gratuity, a defined benefit retirement plan (“the Gratuity Plan”) covering eligible employees. The Gratuity Plan provides a lump-sum payment to vested employees at retirement, death, incapacitation or termination of employment, of an amount based on the respective employee's salary and the tenure of employment. Liabilities with regard to the gratuity plan are determined by actuarial valuation, performed by an independent actuary, at each Statement of financial position date using the projected unit credit method. The Group recognises the net obligation of a defined benefit plan in its statement of financial position as an asset or liability, respectively in accordance with IAS 19, Employee benefits. The discount rate is based on the Government securities yield. Actuarial gains and losses arising from experience adjustments and changes in actuarial assumptions are charged or credited to profit or loss in the statement of comprehensive income in the period in which they arise. x) Business combinations Business combinations arising from transfers of interests in entities that are under the control of the shareholder that controls the Group are accounted for as if the acquisition had occurred at the beginning of the earliest comparative period presented or, if later, at the date that common control was established using pooling of interest method. The assets and liabilities acquired are recognised at the carrying amounts recognised previously in the Group controlling shareholder’s consolidated financial statements. The components of equity of the acquired entities are added to the same components within Group equity. Any excess consideration paid is directly recognised in equity. y) Segment Reporting The Group is primarily involved in business of power generation. Considering the nature of Group’s business, as well as based on reviews by the chief operating decision maker to make decisions about resource allocation and performance measurement, there are only two reportable segments in accordance with the requirements of IFRS 8. 6. Significant accounting judgements, estimates and assumptions The preparation of financial statements in conformity with IFRS requires management to make certain critical accounting estimates and assumptions that affect the reported amounts of assets and liabilities and the disclosure of contingent assets and liabilities at the date of the financial statements and the reported amounts of revenues and expenses during the reporting period. The principal accounting policies adopted by the Group in the consolidated financial statements are as set out above. The application of a number of these policies requires the Group to use a variety of estimation techniques and apply judgment to best reflect the substance of underlying transactions. The Group has determined that a number of its accounting policies can be considered significant, in terms of the management judgment that has been required to determine the various assumptions underpinning their application in the consolidated financial statements presented which, under different conditions, could lead to material differences in these statements. The actual results may differ from the judgments, estimates and assumptions made by the management and will seldom equal the estimated results. a. Judgements The following are significant management judgments in applying the accounting policies of the Group that have the most significant effect on the financial statements. Assessing control of subsidiaries, associates, joint ventures During FY19, the Company obtained a right to exercise an option to buy additional 30% equity interest in the solar companies. This right, in combination with other rights, provided substantive potential voting rights and the investments in the solar companies were re-classified from associates to subsidiaries. Subsequently, the results of operations of Avanti Solar Energy

72
Private Limited, Mayfair Renewable Energy Private Limited, Avanti Renewable Energy Private Limited and Brics Renewable Energy Private Limited were reclassified to discontinued operations. Non-current assets held for sale and discontinued operations The Group exercises judgement in whether assets are held for sale. After evaluation of all options, the Company decided that the most efficient way to maximise shareholders’ value from solar operations is to dispose of the solar companies and it initiated the process of disposition of the solar companies. Under IFRS 5, such a transaction meets the 'Asset held for sale' when the transaction is considered sufficiently probable and other relevant criteria are met. Management consider that all the conditions under IFRS 5 for classification of the solar business as held for sale have been met as at 31 March 2020 and expects the interest in the solar companies to be sold within the next 12 months. The investment in the joint venture Padma Shipping Limited and associated advance has been presented as asset held for sale following the process of sale of the second vessel as mentioned in note 7(a). Recoverability of deferred tax assets: The recognition of deferred tax assets requires assessment of future taxable profit (see note 5(h)). b. Estimates and uncertainties The key assumptions concerning the future and other key sources of estimation uncertainty at the Statement of financial position date, that have a significant risk of causing material adjustments to the carrying amounts of assets and liabilities within the next financial year are discussed below: i. Estimation of fair value of financial assets and financial liabilities: While preparing the financial statements the Group makes
estimates and assumptions that affect the reported amount of financial assets and financial liabilities. Trade Receivables The Group ascertains the expected credit losses (ECL) for all receivables and adequate impairment provision are made. At the end of each reporting period a review of the allowance for impairment of trade receivables is performed. Trade receivables do not contain a significant financing element, and therefore expected credit losses are measured using the simplified approach permitted by IFRS 9, which requires lifetime expected credit losses to be recognised on initial recognition. A provision matrix is utilised to estimate the lifetime expected credit losses based on the age, status and risk of each class of receivable, which is periodically updated to include changes to both forward-looking and historical inputs. Assets held for sale - Financial assets measured at FVPL Valuation of Investment in joint venture Padma Shipping is based on estimates and subject to uncertainties (Note 7(a)). Financial assets measured at FVPL Management applies valuation techniques to determine the fair value of financial assets measured at FVPL where active market quotes are not available. This requires management to develop estimates and assumptions based on market inputs, using observable data that market participants would use in pricing the asset. Where such data is not observable, management uses its best estimate. Estimated fair values of the asset may vary from the actual prices that would be achieved in an arm’s length transaction at the reporting date. Other financial liabilities Borrowings held by the Group are measured at amortised cost (Note 5(j) and note 29). ii. Impairment tests: In assessing impairment, management estimates the recoverable amount of each asset or cash-generating
units based on expected future cash flows and use an interest rate for discounting them. Estimation uncertainty relates to assumptions about future operating results including fuel prices, foreign currency exchange rates etc. and the determination of a suitable discount rate;
iii. Useful life of depreciable assets: Management reviews its estimate of the useful lives of depreciable assets at each reporting date, based on the expected utility of the assets.

73
7. Non-current assets held for sale and discontinued operation
Non-current assets held for sale and discontinued operations consists of:
Assets held for sale Liabilities classified as held
for sale Loss from discontinued
operations
At 31 March 2020
At 31 March 2019
At 31 March 2020
At 31 March 2019 For FY 20 For FY 19
i Impairment of investments in joint venture - 918,432 - - (918,432) (1,010,200)
ii Solar subsidiaries (7(b)) 46,356,680 49,579,232 32,866,783 35,267,786 (293,942) 20,708
iii Impairment of deposits pledged for lenders of BVP Note7(c ) - - - - (933,901) -
Total 46,356,680 50,497,664 32,866,783 35,267,786 (2,146,275) (989,493)
a) Investment in joint venture Padma Shipping Limited - classified as held for sale In 2014 the Company entered into a Joint Venture agreement with Noble Chartering Ltd (“Noble”), to secure competitive long term rates for international freight for its imported coal requirements. Under the Arrangement, the company and Noble agreed to jointly purchase and operate two 64,000 MT cargo vessels through a Joint venture company Padma Shipping Ltd, Hong Kong (‘Padma’).
During FY18, the Joint Venture partner due to a change in their group strategy requested for the Joint Venture to be terminated and as the vessels were still under construction, OPG agreed with this proposal. During FY19 one of the vessels was sold by the shipping yard and the second vessel was sold during FY20. The Padma joint venture will be terminated and dissolved. As at 31 March 2020, the investment was therefore reclassified to assets held for sale.
OPG has invested approximately £3,484,178 in equity and £1,727,418 to date as advance and accordingly the joint venture has been reported using equity method as per the requirements of IFRS 11. During the year the Company recognised an impairment provision of £918,432 (2019 £1,000,000) resulting in impairment of entire investment of £5,211,596 in joint venture (note 16) on account of the impending dissolution of the JV. b) Assets held for sale and discontinued operations of solar subsidiaries During FY19, the results of the operations of solar subsidiaries Avanti Solar Energy Private Limited, Mayfair Renewable Energy Private Limited, Avanti Renewable Energy Private Limited and Brics Renewable Energy Private Limited were classified as Assets held for sale. After evaluation of all the options, the Company decided that the most efficient way to maximise shareholders’ value from the solar operations is to dispose of the solar companies and the process of disposition of the solar companies was initiated. The process of sale could not be implemented during FY20 due to pandemic COVID-19 and expectation of comparatively better valuation for sale. However the Management expects the interest in the solar companies to be sold within the next 12 months and continues to locate a buyer.
Non-current Assets held-for-sale and discontinued operations
(a) Assets of disposal group classified as held-for-sale
As at 31 March 2020 As at 31 March 2019
Property, plant and equipment 42,098,498 46,442,294
Trade and other receivables 3,489,633 578,721
Other short-term assets 256,209 499,527
Restricted cash 487,795 1,712,450
Cash and cash equivalents 24,545 346,240
Investment in Joint venture classified as held for sale - 918,432
Total 46,356,680 50,497,664

74
(b) Liabilities of disposal group classified as held-for-sale
As at 31 March 2020 As at 31 March 2019
Non Current liabilities
Borrowings 28,262,288 17,194,745
Trade and other payables - 7,710,956
Deferrred tax liability 1,014,031 1,666,495
Current liabilities
Trade and other payables 901,474 3,958,192
Other liabilities 2,688,990 4,737,398
Total 32,866,783 35,267,786
(c) Analysis of the results of discontinued operations is as follows: For FY 20 For FY 19
Revenue 5,884,401 5,007,509
Operating profit before impairments 2,160,974 4,009,485
Finance income 92,096 311,744
Finance cost (3,540,239) (2,294,669)
Current Tax - (363,372)
Deferred tax 993,226 (1,642,480)
Profit/(Loss) from Solar operations (293,942) 20,708
c) Loss from discontinued operations of BVP As reported in the FY18 financial statements, the Group had pledged deposits with lenders of BVP for overdraft facility availed by BVP. During the year the lenders of BVP have appropriated the entire deposits towards the overdraft loan availed by BVP. The Group has already impaired £12,627,381 during FY18 and the balance deposits of £933,901 has been impaired during the year. 8 Segment Reporting
The Group has adopted the “management approach” in identifying the operating segments as outlined in IFRS 8 - Operating segments. Segments are reported in a manner consistent with the internal reporting provided to the chief operating decision maker. The Board of Directors being the chief operating decision maker evaluate the Group’s performance and allocates resources based on an analysis of various performance indicators at operating segment level. Accordingly, there are two operating segments, thermal power and solar power following the reclassification of the interest in the solar companies as subsidiaries as detailed in note 7(b). The solar power business was classified as held for sale subsequently. There are no geographical segments as all revenues arise from India. All the non-current assets are located in India.
Revenue on account of sale of power to one customer exceeding 10% of total sales revenue amounts to £27,152,241 (2019: £24,117,088).
Segmental information disclosure
Continuing operations Discontinued operations
Thermal Solar
Segment Revenue FY20 FY19 FY20 FY19
Sales 154,040,283 140,632,328 5,884,401 5,007,509
Total 154,040,283 140,632,328 5,884,401 5,007,509
Depreciation, impairment (6,293,034) (6,064,374) (3,516,527) - Profit / (loss) from operation Finance Cost 24,036,945 29,236,193 2,160,974 4,009,485 Tax expenses 1,962,692 2,207,480 92,096 311,744
Profit / (loss) for the year (11,495,136) (14,586,917) (3,540,239) (2,294,669)
Loss from discontinued operations relating to shipping JV and past subsidiary BVP aggregating to £1,887,629 not included above.
Assets 294,328,018 304,743,440 49,579,232 -
Liabilities 155,174,489 165,613,016 35,267,786 -

75
9 Costs of inventories and employee benefit expenses included in the consolidated statements of comprehensive income
a) Cost of fuel
31 March 2020 31 March 2019 Included in cost of revenue:
Cost of fuel consumed 83,133,530 88,754,095
Other direct costs 6,926,722 2,999,668
Total 90,060,252 91,753,763
b) Employee benefit expenses forming part of general and administrative expenses are as follows:
31 March 2020 31 March 2019 Salaries and wages 2,756,438 3,302,162 Employee benefit costs * 760,914 251,520
Long Term Incentive Plan (Note 22) 835,822 -
Total 4,353,174 3,553,682
* includes £21,860 (2019: NIL) being expenses towards gratuity which is a defined benefit plan (Note 5(w))
c) Auditor’s remuneration for audit services amounting to £65,000 (2019: £80,000) is included in general and administrative expenses.
d) Foreign exchange movements (realised and unrealised) included in the Finance costs is as follows:
31 March 2020 31 March 2019 Foreign exchange realised – (gain)/loss (420,842) 3,543,163
Foreign exchange unrealised- (gain) / loss 1,568,333 (416,338)
Total 1,147,491 3,126,825
10 Other income and expenses
Other income
31 March 20209 31 March 2019
Sale of coal 462,718 887,815
Sale of fly ash 26,611 48,910
Power trading commission and other services 161,053 1,217,369
Others 17,655 491,238
Total 668,037 2,645,332
11 Finance costs
Finance costs are comprised of:
31 March 2020 31 March 2019
Interest expenses on borrowings 9,289,625 10,210,464
Net foreign exchange loss (Note 9) 1,147,491 3,126,825
Other finance costs 1,058,020 1,249,628
Total 11,495,136 14,586,917
Other finance costs include charges and cost related to LC's for import of coal and other charges levied by banks on transactions
12 Finance income
Finance income is comprised of:
31 March 2020 31 March 2019
Interest income on bank deposits and advances 1,943,132 2,192,555 Profit on disposal of financial instruments* 19,560 14,925
Total 1,962,692 2,207,480
*Financial instruments represent the mutual funds held during the year.

76
13 Tax expense Tax Reconciliation Reconciliation between tax expense and the product of accounting profit multiplied by India’s domestic tax rate for the years ended 31 March 2019 and 2018 is as follows:
31 March 2020 31 March 2019
Accounting profit / (loss) before taxes 14,504,501 16,856,756
Enacted tax rates 34.94% 34.94%
Tax expense / (benefit) on profit / (loss) at enacted tax rate 5,068,453 5,890,425
Exempt Income due to tax holiday (22,896) (685,895)
Foreign tax rate differential (327,343) 303,096
Unused tax losses brought forward and carried forward (993,226) (1,216,052)
Non-taxable items - (275,769)
MAT credit entitlement (397,088) (190,567)
Actual tax for the period 3,327,899 3,825,239
31 March 2020 31 March 2019
Current tax 788,430 1,281,584
Deferred tax 3,532,694 537,803
Total tax expenses on income from continued operations 4,321,124 1,819,387
Add: tax on income from discontinuing operations (993,226) 2,005,852
Tax reported in the statement of comprehensive income 3,327,899 3,825,239
The Company is subject to Isle of Man corporate tax at the standard rate of zero percent. As such, the Company’s tax liability is zero. Additionally, Isle of Man does not levy tax on capital gains. However, considering that the group’s operations are primarily based in India, the effective tax rate of the Group has been computed based on the current tax rates prevailing in India. Further, a substantial portion of the profits of the Group’s India operations are exempt from Indian income taxes being profits attributable to generation of power in India. Under the tax holiday the taxpayer can utilize an exemption from income taxes for a period of any ten consecutive years out of a total of fifteen consecutive years from the date of commencement of the operations. However, the entities in India are still liable for Minimum Alternate Tax (MAT) which is calculated on the book profits of the respective entities currently at a rate of 17.47% (31 March 2019: 21.55%). The Group has carried forward credit in respect of MAT tax liability paid to the extent it is probable that future taxable profit will be available against which such tax credit can be utilised. Deferred income tax for the Group at 31 March 2020 and 2019 relates to the following:
31 March 2020 31 March 2019
Deferred income tax assets
Unused tax losses brought forward and carried forward 1,216,052 1,216,052
MAT credit entitlement 11,962,515 11,565,427
13,178,567 12,781,479
Deferred income tax liabilities
Property, plant and equipment 18,902,358 15,161,594
18,902,358 15,161,594
Deferred income tax liabilities, net 5,723,791 2,380,115
77
Movement in temporary differences during the year
Particulars As at 01 April 2019
Deferred tax Asset/(Liability) for
the year
Classified as (Asset) / Liability
held for sale Translation adjustment
As at 31 Mar 2020
Property, plant and equipment (15,161,594) (2,936,557) (993,226) 189,018 (18,902,358) Unused tax losses brought forward and carried forward 1,216,052 - 1,216,052 MAT credit entitlement 11,565,427 397,088 - - 11,962,515
Deferred income tax (liabilities) / assets, net (2,380,115) (2,539,468) (993,226) 189,018 (5,723,791)
Particulars As at 01 April 2018
Deferred tax Asset/(Liability) for
the year
Classified as (Asset) / (Liability)
held for sale Translation adjustment
As at 31 Mar 2019
Property, plant and equipment (12,853,799) (4,754,829) 2,447,034 - (15,161,594) Unused tax losses brought forward and carried forward - 2,020,606 (804,554) - 1,216,052 MAT credit entitlement 11,396,590 190,567 - (21,730) 11,565,427
Deferred income tax (liabilities) / assets, net (1,457,209) (2,543,656) 1,642,480 (21,730) (2,380,115)
In assessing the recoverability of deferred income tax assets, management considers whether it is more likely than not that some portion or all of the deferred income tax assets will be realized. The ultimate realization of deferred income tax assets is dependent upon the generation of future taxable income during the periods in which the temporary differences become deductible. The amount of the deferred income tax assets considered realizable, however, could be reduced in the near term if estimates of future taxable income during the carry forward period are reduced. There are no unrecognised deferred tax assets and liabilities. As at 31 March 2020 and 2019, there was no recognised deferred tax liability for taxes that would be payable on the unremitted earnings of certain of the Group's subsidiaries, as the Group has determined that undistributed profits of its subsidiaries will not be distributed in the foreseeable future.
14 Intangible assets Acquired software licences
Cost
At 31 March 2018 847,648
Additions -
Exchange adjustments 4,976
At 31 March 2019 852,624
At 31 March 2019 852,624 Additions -
Exchange adjustments (25,559)
At 31 March 2020 827,065
Accumulated depreciation and impairment
At 31 March 2018 783,478
Charge for the year 40,354
Exchange adjustments 5,190
At 31 March 2019 829,021
At 31 March 2019 829,021
Charge for the year 14,327
Exchange adjustments (25,329)
At 31 March 2020 818,020
Net book value
At 31 March 2020 9,045
At 31 March 2019 23,603

78
15 Property, plant and equipment The property, plant and equipment comprises of:
Land & Buildings
Power stations
Other plant &
equipment Vehicles Solar assets Asset under
construction Total
Cost
At 1 April 2018 4,744,093 221,066,874 614,925 2,394,639 - 4,530,760 233,351,291
Additions 236,830 316,648 1,154,749 8,751 - 18,803 1,735,781 Additions – Solar assets (note 7(b)) 46,635,849 - 46,635,849 Deletions - (11,054) - - - - (11,054) Solar assets classified as Asset Held for Sale (note 7(b)) - - - - (46,635,849) - (46,635,849) Transfer on capitalisation - 290,658 - - - (290,658) - Exchange adjustments 26,978 1,297,928 3,595 14,023 - 26,959 1,369,483
At 31 March 2019 5,007,901 222,961,054 1,773,269 2,417,413 - 4,285,864 236,445,501
At 1st April 2019 5,007,901 222,961,054 1,773,269 2,417,413 - 4,285,864 236,445,501
Additions - 294,954 165,831 10,958 - 82,815 554,559 Transfers on capitalisation 3,903,256 56,168 - - - (3,959,424) - Exchange adjustments (145,667) (6,689,809) (52,848) (72,290) - (128,479) (7,089,093)
At 31 March 2020 8,765,490 216,622,367 1,886,252 2,356,081 - 280,776 229,910,967
Accumulated depreciation and impairment
At 1 April 2018 32,174 24,456,188 526,100 1,065,694 - - 26,080,156
Charge for the year * 12,363 5,494,384 103,316 413,957 - - 6,024,020 Additions - Solar assets (note 7(b)) - - - - 4,417 - 4,417 Exchange adjustments 493 221,076 4,595 12,270 - - 238,434 Solar assets classified as Asset Held for Sale (note 7(b)) - - - - (4,417) - (4,417)
At 31 March 2019 45,030 30,171,648 634,011 1,491,921 - - 32,342,610
At 1 April 2019 45,030 30,171,648 634,011 1,491,921 - - 32,342,610
Charge for the year * 12,981 5,603,791 272,110 389,825 - 6,278,707
Exchange adjustments (2,410) (1,091,777) (28,050) (57,509) - - (1,179,746)
At 31 March 2020 55,601 34,683,662 878,072 1,824,237 - - 37,441,572
Net book value
At 31 March 2020 8,709,889 181,938,705 1,008,180 531,845 - 280,776 192,469,395
At 31 March 2019 4,962,871 192,789,406 1,139,258 925,492 - 4,285,864 204,102,891
The net book value of land and buildings block comprises of:
31 March 2020 31 March 2019
Freehold land
8,134,867 4,514,642
Buildings
405,387 448,229
8,540,254 4,962,871
Property, plant and equipment with a carrying amount of £187,757,094 (2019: £197,184,156) is subject to security restrictions (refer note 23).

79
16 Investments accounted for using the equity method
The carrying amount of investments accounted for using the equity method is as follows:
31 March 2020 31 March 2019
Investments in joint venture 3,448,882 3,448,882
Impairment provision for investments in joint venture (Note 7(a)) (3,448,882) (3,247,668)
Balance value of Investments in joint venture classified as Assets held for sale - (201,214)
Investments accounted for using the equity method - -
The Group’s share of loss from equity accounted investments is as follows:
31 March 2020 31 March 2019
Investment in joint venture
- (34,638)
Investments in associates
- (658)
- (35,296)
a) Investment in joint venture (Note 5(d) and Note 7(a)) The investment in Padma Shipping Limited ("PSL") is accounted for using the equity method in accordance with IAS 28. The financial statements of PSL are as of 31 December 2019 which is the financial year followed by PSL. As no additional information was available as such the 31st December 2019 balances have been used below. At the end of the year the investment in PSL net of impairment provision is classified as Asset held for sale. Summarised financial information for Padma Shipping Limited ("PSL") is set out below:
31 March 2020 31 March 2019
Non-current assets 11,652,330 11,652,330 Current assets (a) 29,970 29,970
Total assets 11,682,300 11,682,300 Current liabilities (b) 11,682,300 4,784,535
Total liabilities 11,682,300 4,784,535 Net assets - 6,897,765
a) Includes cash and cash equivalents b) Includes financial liabilities
31 March 2020 31 March 2019
Total net assets of PSL
- 6,897,765
Proportion of ownership interests held by the Group 50% 50%
Group's share of the investment in PSL - 3,448,882
17 Other Assets
31 March 2020 31 March 2019
A. Short-term
Capital advances
114,084 280,494
Equity instruments measured at fair value through P&L 741,425 40,453 Advances and other receivables
6,587,261 6,008,407
Total
7,442,440 6,329,354
B. Long-term
Lease deposits
492,973 502,869
Other advances
16,655 15,684
Total 509,628 518,553
Financial instruments measured at fair value through P&L are comprised of: Fair value of retained investment in former subsidiary BVP £40,453 (Note 7(c)). Fair Valuation of retained investments in BVP is on the basis of the last transaction.
The fair value of the mutual fund instruments of £700,972 are determined by reference to published data. 18 Trade and other receivables

80
31 March 2020 31 March 2019
Current
Trade receivables 26,901,986 49,079,582 Other receivables - 118,523
26,901,986 49,198,105
The Group’s trade receivables are classified at amortised cost unless stated otherwise and are measured after allowances for future expected credit losses, see “Credit risk analysis” in note 29 “Financial risk management objectives and policies” for more information on credit risk. The carrying amounts of trade and other receivables, which are measured at amortised cost, approximate their fair value and are predominantly non-interest bearing.
19 Inventories
31 March 2020 31 March 2019
Coal and fuel 10,505,138 6,038,267 Stores and spares 974,961 1,113,099
Total 11,480,099 7,151,366
The entire amount of above inventories has been pledged as security for borrowings (refer note 23)
20 Cash and cash equivalents and Restricted cash a. Cash and short term deposits comprise of the following:
31 March 2020 31 March 2019
Cash at banks and on hand 3,438,830 2,118,960
Total 3,438,830 2,118,960
Short-term deposits are placed for varying periods, depending on the immediate cash requirements of the Group. They are recoverable on demand.
b. Restricted cash Restricted cash represents deposits maturing between three to twelve months amounting to £7,497,967 (2019: £23,030,599) and maturing after twelve months amounting to £26,645 (2019: £517,271) which have been pledged by the Group in order to secure borrowing limits with banks. In FY19, restricted cash of £23,030,599 includes £12,627,381 pledged during the previous year in favour of lenders of BVP (Note 7(c)). In FY20, the Group has made impairment provision of £933,901 of securities provided to lenders of BVP. 21 Issued share capital Share Capital The Company presently has only one class of ordinary shares. For all matters submitted to vote in the shareholders meeting, every holder of ordinary shares, as reflected in the records of the Group on the date of the shareholders’ meeting, has one vote in respect of each share held. All shares are equally eligible to receive dividends and the repayment of capital in the event of liquidation of the Group. The Company has issued 12,823,311 (2019: 31,601,503) shares during the year with respect to scrip dividend at par value of £0.000147 (2019: £0.000147) per share amounting to £1,885 (2019: £4,646). The difference between fair value of shares issued above par value of £2,325,567 (2019: £3,558,442) with respect to scrip dividend was credited to share premium. As at 31 March 2020, the Company has an authorised and issued share capital of 400,733,511 (2019: 387,910,200) equity shares at par value of £ 0.000147 (2019: £ 0.000147) per share amounting to £58,909 (2019: £57,024) in total. Reserves Share premium represents the amount received by the Group over and above the par value of shares issued. Any transaction costs associated with the issuing of shares are deducted from share premium, net of any related income tax benefits. Foreign currency translation reserve is used to record the exchange differences arising from the translation of the financial statements of the foreign subsidiaries. Other reserve represents the difference between the consideration paid and the adjustment to net assets on change of controlling interest, without change in control, other reserves also includes any costs related with share options granted and gain/losses on re-measurement of financial assets measured at fair value through other comprehensive income. Retained earnings include all current and prior period results as disclosed in the consolidated statement of comprehensive income less dividend distribution.
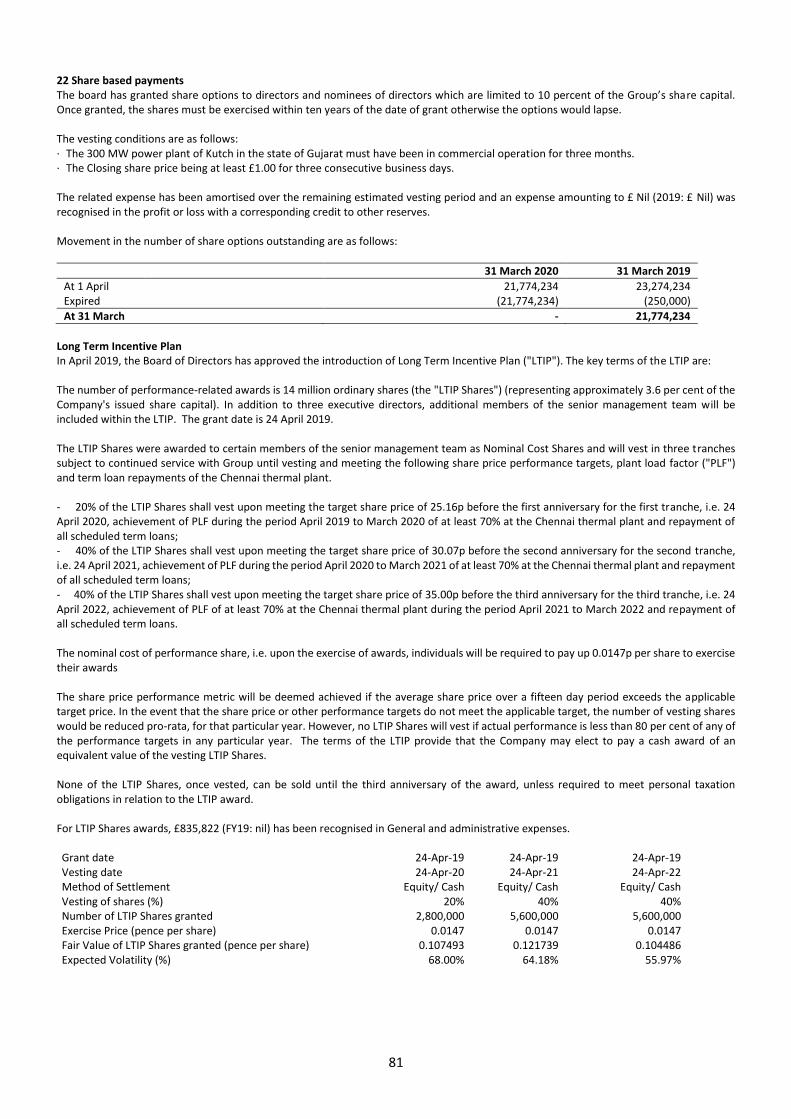
81
22 Share based payments The board has granted share options to directors and nominees of directors which are limited to 10 percent of the Group’s share capital. Once granted, the shares must be exercised within ten years of the date of grant otherwise the options would lapse. The vesting conditions are as follows: · The 300 MW power plant of Kutch in the state of Gujarat must have been in commercial operation for three months. · The Closing share price being at least £1.00 for three consecutive business days. The related expense has been amortised over the remaining estimated vesting period and an expense amounting to £ Nil (2019: £ Nil) was recognised in the profit or loss with a corresponding credit to other reserves. Movement in the number of share options outstanding are as follows:
31 March 2020 31 March 2019
At 1 April
21,774,234 23,274,234 Expired (21,774,234) (250,000)
At 31 March - 21,774,234
Long Term Incentive Plan In April 2019, the Board of Directors has approved the introduction of Long Term Incentive Plan ("LTIP"). The key terms of the LTIP are: The number of performance-related awards is 14 million ordinary shares (the "LTIP Shares") (representing approximately 3.6 per cent of the Company's issued share capital). In addition to three executive directors, additional members of the senior management team will be included within the LTIP. The grant date is 24 April 2019. The LTIP Shares were awarded to certain members of the senior management team as Nominal Cost Shares and will vest in three tranches subject to continued service with Group until vesting and meeting the following share price performance targets, plant load factor ("PLF") and term loan repayments of the Chennai thermal plant. - 20% of the LTIP Shares shall vest upon meeting the target share price of 25.16p before the first anniversary for the first tranche, i.e. 24 April 2020, achievement of PLF during the period April 2019 to March 2020 of at least 70% at the Chennai thermal plant and repayment of all scheduled term loans; - 40% of the LTIP Shares shall vest upon meeting the target share price of 30.07p before the second anniversary for the second tranche, i.e. 24 April 2021, achievement of PLF during the period April 2020 to March 2021 of at least 70% at the Chennai thermal plant and repayment of all scheduled term loans; - 40% of the LTIP Shares shall vest upon meeting the target share price of 35.00p before the third anniversary for the third tranche, i.e. 24 April 2022, achievement of PLF of at least 70% at the Chennai thermal plant during the period April 2021 to March 2022 and repayment of all scheduled term loans. The nominal cost of performance share, i.e. upon the exercise of awards, individuals will be required to pay up 0.0147p per share to exercise their awards The share price performance metric will be deemed achieved if the average share price over a fifteen day period exceeds the applicable target price. In the event that the share price or other performance targets do not meet the applicable target, the number of vesting shares would be reduced pro-rata, for that particular year. However, no LTIP Shares will vest if actual performance is less than 80 per cent of any of the performance targets in any particular year. The terms of the LTIP provide that the Company may elect to pay a cash award of an equivalent value of the vesting LTIP Shares. None of the LTIP Shares, once vested, can be sold until the third anniversary of the award, unless required to meet personal taxation obligations in relation to the LTIP award. For LTIP Shares awards, £835,822 (FY19: nil) has been recognised in General and administrative expenses. Grant date 24-Apr-19 24-Apr-19 24-Apr-19 Vesting date 24-Apr-20 24-Apr-21 24-Apr-22 Method of Settlement Equity/ Cash Equity/ Cash Equity/ Cash Vesting of shares (%) 20% 40% 40% Number of LTIP Shares granted 2,800,000 5,600,000 5,600,000 Exercise Price (pence per share) 0.0147 0.0147 0.0147 Fair Value of LTIP Shares granted (pence per share) 0.107493 0.121739 0.104486 Expected Volatility (%) 68.00% 64.18% 55.97%

82
23 Borrowings The borrowings comprise of the following:
Interest rate (range %) Final maturity 31 March 2020 31 March 2019
Borrowings at amortised cost 10.35-11.40 June 2024 56,827,685 80,364,930
Total
56,827,685 80,364,930
The term loans of £49.9m and working capital loans of £6.9m taken by the Group are fully secured by the property, plant, assets under construction and other current assets of subsidiaries which have availed such loans. All Loans are personally guaranteed by a director. Term loans contain certain covenants stipulated by the facility providers and primarily require the Group to maintain specified levels of certain financial metrics and operating results. As of 31 March 2020, the Group has met all the relevant covenants. Further, the Group raised approximately GBP 21.0 million (Rs.2000 million) during June 2020 through non-convertible debentures (NCDs) issue with a three years term and coupon rate of 9.85%. NCD’s proceeds was used to repay the FY21 and FY22 (i.e. to March 2022) principal term loans obligations. This will substantially release the cash flow burden for next two financial years on account of loan repayment obligations note 5(a). The fair value of borrowings at 31 March 2020 was £56,827,685 (2019: £80,364,930). The fair values have been calculated by discounting cash flows at prevailing interest rates. The borrowings are reconciled to the statement of financial position as follows:
31 March 2020 31 March 2019
Current liabilities
Amounts falling due within one year
23,746,229 28,869,722
Non-current liabilities
Amounts falling due after 1 year but not more than 5 years 33,081,456 51,495,208
Total 56,827,685 80,364,930
24 Trade and other payables
31 March 2020 31 March 2019
Current
Trade payables
45,300,370 45,300,370 Creditors for capital goods
174,444 174,444
Total
45,474,814 45,474,814 Non-current
Security deposit from customers
- 14,085,854
Other payables
169,373 180,746
Total 169,373 14,235,485
Trade payables include credit availed from banks under letters of credit for payments in USD to suppliers for coal purchased by the Group. Other trade payables are normally settled on 45 days terms credit. The arrangements are interest bearing and are payable within one year. With the exception of certain other trade payables, all amounts are short term. Creditors for capital goods are non-interest bearing and are usually settled within a year. Other payables include accruals for gratuity and other accruals for expenses. 25 Related party transactions
Key Management Personnel:
Name of the party Nature of relationship
Arvind Gupta Chairman Avantika Gupta (from November 2018) Chief Operating Officer & Director Dmitri Tsvetkov Chief Financial Officer & Director Jeremy Warner Allen Deputy Chairman Mike Grasby (resigned in November 2019) Director Ravi Gupta (resigned in May 2018) Director Jeremy Beeton (resigned in March 2020) Director N Kumar (from November 2019) Director

83
Related parties with whom the Group had transactions during the period Name of the party Nature of relationship
Padma Shipping Limited The company has joint control of the entity Avanti Solar Energy Private Limited Entity in which Key Management personnel has Control/Significant Influence
(subsdiary from FY 19 note 7(b)) Mayfair Renewable Energy Private Limited Entity in which Key Management personnel has Control/Significant Influence
(subsdiary from FY 19 note 7(b)) Avanti Renewable Energy Private Limited Entity in which Key Management personnel has Control/Significant Influence
(subsdiary from FY 19 note 7(b)) Brics Renewable Energy Private Limited Entity in which Key Management personnel has Control/Significant Influence
(subsdiary from FY 19 note 7(b)) Avantika Gupta Ravi Gupta
Relative of Key Management Personnel (became Director on 27 November 2018) Relative of Key Management Personnel
Summary of transactions with related parties
Name of the party 31 March 2020 31 March 2019
Avantika Gupta
a) Remuneration (up to 27 November 2018) 120,000 79,084
Summary of balance with related parties
Name of the party Nature of balance 31 March 2020 31 March 2019
Padma Shipping Limited
Investment 3,438,682 3,485,837
Padma Shipping Limited
Advances 1,727,418 1,727,418
Padma Shipping Limited
Impairment provision (5,176,300) (4,257,868)
Ravi Gupta
Land Lease Deposit 492,973 502,869
Outstanding balances at the year-end are unsecured. Related party transaction are on arms length basis. There have been no guarantees provided or received for any related party receivables or payables except for corporate guarantees issued to lenders of its subsidiaries classified as Asset Held for Sale of £28,261,524 (2019: £32,132,255). For the year ended 31 March 2020, the Group has not recorded any impairment of receivables relating to amounts owed by related parties £Nil (2019: £Nil). However, the Group has made impairment provision for investments in joint venture £918,432 (2019: £1,000,000) (Note 7(a)). This assessment is undertaken each financial year through examining the financial position of the related party and the market in which the related party operates. A director personally guaranteed loans of a solar subsidiary (loan outstanding £9,372,074 (2019: £10,360,066)) which is classified as Asset Held for Sale. All Loans are personally guaranteed by a director. 26 Earnings per share Both the basic and diluted earnings per share have been calculated using the profit attributable to shareholders of the parent company as the numerator (no adjustments to profit were necessary for the year ended March 2020 or 2019). The Company has issued options and LTIP over ordinary shares which could potentially dilute basic loss per share in the future. There is no difference between basic loss per share and diluted loss per share as the potential ordinary shares are anti-dilutive. The weighted average number of shares for the purposes of diluted earnings per share can be reconciled to the weighted average number of ordinary shares used in the calculation of basic earnings per share (for the Group and the Company) as follows:
Particulars 31 March 2020 31 March 2019
Weighted average number of shares used in basic earnings per share
390,923,328 367,650,606
Shares deemed to be issued for no consideration in respect of share based payments 2,190,519 -
Weighted average number of shares used in diluted earnings per share
393,113,847 367,650,606
84
27 Directors remuneration 31 March 2020 31 March 2019
Arvind Gupta 500,000 500,000 Avantika Gupta (became Director on 27 November 2018) 120,000 64,691 Dmitri Tsvetkov 240,000 288,000 Jeremy Warner Allen 50,000 50,000 N Kumar (from November 2019) 15,000 -
Mike Grasby (resigned in November 2019) 33,750 45,000
Jeremy Beeton (resigned in March 2020) 43,270 45,000
Total 1,002,020 992,691
The above remuneration is in the nature of short-term employee benefits. As the future liability for gratuity and compensated absences is provided on actuarial basis for the companies in the group, the amount pertaining to the directors is not individually ascertainable and therefore not included above. 28 Commitments and contingencies Operating lease commitments The Group leases office premises under operating leases. The leases typically run for a period up to 5 years, with an option to renew the lease after that date. None of the leases includes contingent rentals. Non-cancellable operating lease rentals are payable as follows:
31 March 2019
Not later than one year
46,095
Later than one year and not later than five years 64,254
Total 110,349
Recognition of a right of use asset and a lease liability is not material and instead charge of £55,292 (2019: £41,301) has been recognised as an expense for leases. Contingent liabilities Disputed income tax demand £1,021,210 (2019: £1,056,154). Future cash flows in respect of the above matters are determinable only on receipt of judgements / decisions pending at various forums / authorities. Guarantees and Letter of credit The Group has provided bank guarantees and letter of credits (LC) to customers and vendors in the normal course of business. The LC provided as at 31 March 2020: £30,912,751(2019: £32,373,664) and Bank Guarantee (BG) as at 31 March 2020: £3,167,066 (2019: £6,457,430). LC are supporting accounts payables already recognised in statement of financial position. There have been no guarantees provided or received for any related party receivables or payables except for corporate guarantees issued to lenders of its subsidiaries classified as Asset Held for Sale of £28,261,524 (2019: £32,132,255). BG are treated as contingent liabilities until such time it becomes probable that the Company will be required to make a payment under the guarantee. 29 Financial risk management objectives and policies The Group's principal financial liabilities, comprises of loans and borrowings, trade and other payables, and other current liabilities. The main purpose of these financial liabilities is to raise finance for the Group's operations. The Group has loans and receivables, trade and other receivables, and cash and short-term deposits that arise directly from its operations. The Group also hold investments designated financial assets measured at FVPL categories. The Group is exposed to market risk, credit risk and liquidity risk. The Group's senior management oversees the management of these risks. The Group's senior management advises on financial risks and the appropriate financial risk governance framework for the Group. The Board of Directors reviews and agrees policies for managing each of these risks which are summarised below: Market risk Market risk is the risk that the fair values of future cash flows of a financial instrument will fluctuate because of changes in market prices. Market prices comprise three types of risk: interest rate risk, currency risk and other price risk, such as equity risk. Financial instruments affected by market risk include loans and borrowings, deposits, financial assets measured at FVPL. The sensitivity analyses in the following sections relate to the position as at 31 March 2020 and 31 March 2019 The following assumptions have been made in calculating the sensitivity analyses:

85
(i) The sensitivity of the statement of comprehensive income is the effect of the assumed changes in interest rates on the net interest income for one year, based on the average rate of borrowings held during the year ended 31 March 2020, all other variables being held constant. These changes are considered to be reasonably possible based on observation of current market conditions. Interest rate risk Interest rate risk is the risk that the fair value or future cash flows of a financial instrument will fluctuate because of changes in market interest rates. The Group's exposure to the risk of changes in market interest rates relates primarily to the Group's long-term debt obligations with average interest rates. At 31 March 2020 and 31 March 2019, the Group had no interest rate derivatives. The calculations are based on a change in the average market interest rate for each period, and the financial instruments held at each reporting date that are sensitive to changes in interest rates. All other variables are held constant. If interest rates increase or decrease by 100 basis points with all other variables being constant, the Group’s profit after tax for the year ended 31 March 2020 would decrease or increase by £568,277 (2019: £803,649). Foreign currency risk Foreign currency risk is the risk that the fair value or future cash flows of a financial instrument will fluctuate because of changes in foreign exchange rate. The Group’s presentation currency is the Great Britain £. A majority of our assets are located in India where the Indian rupee is the functional currency for our subsidiaries. Currency exposures also exist in the nature of capital expenditure and services denominated in currencies other than the Indian rupee. The Group’s exposure to foreign currency arises where a Group company holds monetary assets and liabilities denominated in a currency different to the functional currency of that entity:
As at 31 March 2020 As at 31 March 2019
Currency Financial assets Financial liabilities Financial assets Financial liabilities
United States Dollar (USD) 4,275,436 30,575,559 8,242,631 39,040,874
Set out below is the impact of a 10% change in the US dollar on profit arising as a result of the revaluation of the Group’s foreign currency financial instruments:
As at 31 March 2020 As at 31 March 2019
Currency
Closing Rate (INR/USD)
Effect of 10% strengthening in USD
against INR – Translated to GBP
Closing Rate (INR/USD)
Effect of 10% strengthening in USD
against INR – Translated to GBP
United States Dollar (USD) 75.10 2,122,208 69.32 2,681,169
The impact on total equity is the same as the impact on net earnings as disclosed above. Credit risk analysis Credit risk is the risk that counterparty will not meet its obligations under a financial instrument or customer contract, leading to a financial loss. The Group is exposed to credit risk from its operating activities (primarily for trade and other receivables) and from its financing activities, including short-term deposits with banks and financial institutions, and other financial assets. Further, the global economy has been severely impacted by the global pandemic COVID-19 (Note 5(a)). The maximum exposure for credit risk at the reporting date is the carrying value of each class of financial assets amounting to £33,986,093 (2019: £49,388,558) and corporate guarantees issued to lenders of its subsidiaries classified as Asset Held for Sale of £28,261,524 (2019: £32,132,255). The Group has exposure to credit risk from accounts receivable balances on sale of electricity. The operating entities of the group has entered into power purchase agreements with distribution companies incorporated by the Indian state government (TANGEDCO) to sell the electricity generated therefore the group is committed to sell power to these customers and the potential risk of default is considered low. For other customers, the Group ensures concentration of credit does not significantly impair the financial assets since the customers to whom the exposure of credit is taken are well established and reputed industries engaged in their respective field of business. It is Group policy to assess the credit risk of new customers before entering contracts and to obtain credit information during the power purchase agreement to highlight potential credit risks. The Group have established a credit policy under which customers are analysed for credit worthiness before power purchase agreement is signed. The Group’s review includes external ratings, when available, and in some cases bank references. The

86
credit worthiness of customers to which the Group grants credit in the normal course of the business is monitored regularly and incorporates forward looking information and data available. The receivables outstanding at the year end are reviewed till the date of signing the financial statements in terms of recoveries made and ascertain if any credit risk has increased for balance dues. Further, the macro economic factors and specific customer industry status are also reviewed and if required the search and credit worthiness reports, financial statements are evaluated. The credit risk for liquid funds is considered negligible, since the counterparties are reputable banks with high quality external credit ratings. To measure expected credit losses, trade and other receivables have been grouped together based on shared credit risk characteristics and the days past due. The Group determined that some trade receivables were credit impaired as these were long past their due date and there was an uncertainty about the recovery of such receivables. The expected loss rates are based on an ageing analysis performed on the receivables as well as historical loss rates. The historical loss rates are adjusted to reflect current and forward looking information that would impact the ability of the customer to pay. Trade and other receivables are written off when there is no reasonable expectation of recovery. Indicators that there is no reasonable expectation of recovery include, amongst others, the failure of the debtor to engage in a repayment plan, the debtor is not operating anymore and a failure to make contractual payments for a period of greater than 180 days.
31 March 2020 Within Credit
period
Days past due
More than 30 days More than 60 days
More than 180 days
Total
Expected loss rate 0% 0% 0% 17.23%
Gross carrying amount - Trade Receivables -TANGEDCO
2,378,240 3,953,961 5,310,071 18,734,652 30,376,924
Gross carrying amount - Trade Receivables -Others
7,824,720 608,495 889,434 5,286,795 14,609,444
General loss allowance1
4,138,025 4,138,025
Specific loss allowance1 13,970,007 13,970,007
Total loss allowance - - - 18,108,033 18,108,033
1 There has been significant increase in loss allowance in FY20 £17 million (FY19 £0.8 million) primarily on account of contractual claim made on customer towards change in law as per Power Purchase Agreement of £6.4 million, tariff discount dispute of £7.5 million and change in credit risk of customer constituting general loss allowance of £3.1 million.
31 March 2019 Within Credit
period
Days past due
More than 30 days More than 60 days
More than 180 days
Total
Expected loss rate 0% 0% 0% 19.07%
Gross carrying amount - Trade Receivables -TANGEDCO
4,616,792 2,120,998 6,657,543 2,633,639 16,028,972
Gross carrying amount - Trade Receivables -Others
22,093,386 2,169,134 7,034,955 2,933,211 34,230,686
Loss allowance - - - 1,061,553 1,061,553
The closing loss allowances for trade receivables as at 31 March 2020 reconcile to the opening loss allowances as follows:
31 March 2020 31 March 2019
Opening loss allowance as at 1 April (1,061,553) (271,116)
Increase in loss allowance recognised in profit or (loss) during the yearfor new receivables recognised
(17,046,480) (790,437)
Total (18,108,033) (1,061,553)
The Group’s management believes that all the financial assets, except as mentioned above are not impaired for each of the reporting dates under review and are of good credit quality. Liquidity risk analysis The Group’s main source of liquidity is its operating businesses. The treasury department uses regular forecasts of operational cash flow, investment and trading collateral requirements to ensure that sufficient liquid cash balances are available to service on-going business requirements. The Group manages its liquidity needs by carefully monitoring scheduled debt servicing payments for long-term financial liabilities as well as cash outflows due in day-to-day business. Liquidity needs are monitored in various time bands, on a day-to-day and week-to-week basis, as well as on the basis of a rolling 90 day projection. Long-term liquidity needs for a 90 day and a 30 day lookout period are identified monthly.

87
The Group maintains cash and marketable securities to meet its liquidity requirements for up to 60 day periods. Funding for long-term liquidity needs is additionally secured by an adequate amount of committed credit facilities and the ability to sell long-term financial assets. The following is an analysis of the group contractual undiscounted cash flows payable under financial liabilities at 31 March 2020 and 31 March 2019:
As at 31 March 2020
Current Non-Current Total
Within 12 months 1-5 years
Later than 5 years
Borrowings 23,746,229 33,081,456
- 56,827,685
Interest on borrowings 6,595,187 10,464,236
- 17,059,422
Trade and other payables 42,790,023 169,373
- 42,959,396
Liabilities held for sale 32,866,783 - 32,866,783
Other current liabilities 582,241 - 582,241
Total 106,580,463 43,715,065
- 150,295,527
As at 31 March 2019
Current Non-Current Total
Within 12 months 1-5 years
Later than 5 years
Borrowings 28,869,722 51,495,208
- 80,364,930
Interest on borrowings 8,507,484 17,059,422
- 25,566,906
Trade and other payables 45,474,814 14,235,485
- 59,710,299
Provision for pledged deposits Liabilities held for sale Other current liabilities
- 33,601,291
91,764
12,627,381 - -
- -
12,627,381 33,601,291
91,764
Total 116,545,075 95,417,496
- 211,962,571
Capital management Capital includes equity attributable to the equity holders of the parent and debt less cash and cash equivalents. The Group's capital management objectives include, among others:
• Ensure that it maintains a strong credit rating and healthy capital ratios in order to support its business and maximise shareholder value
• Ensure Group’s ability to meet both its long-term and short-term capital needs as a going concern;
• To provide an adequate return to shareholders by pricing products and services commensurately with the level of risk. The Group manages its capital structure and makes adjustments to it, in light of changes in economic conditions. To maintain or adjust the capital structure, the Group may adjust the dividend payment to shareholders, return capital to shareholders or issue new shares. No changes were made in the objectives, policies or processes during the years end 31 March 2020 and 31 March 2019. The Group maintains a mixture of cash and cash equivalents, long-term debt and short-term committed facilities that are designed to ensure the Group has sufficient available funds for business requirements. There are no imposed capital requirements on Group or entities, whether statutory or otherwise.

88
The Capital for the reporting periods under review is summarised as follows:
31 March 2020 31 March 2019
Total equity 158,503,833 154,383,407
Less: Cash and cash equivalents (3,438,830) (2,185,570)
Capital 155,065,003 152,264,447
Total equity
154,383,407
Add: Borrowings (including buyer’s credit) 158,503,833 80,364,930
Overall financing 215,331,518 234,748,337
Capital to overall financing ratio 0.72 0.65
30 Summary of financial assets and liabilities by category and their fair values
Carrying amount Fair value
March 2020 March 2019 March 2020 March 2019
Financial assets
Debt instruments measured at amortised cost
· Cash and cash equivalents 1 3,438,830 2,118,960 3,438,830 2,118,960
· Restricted cash 1 7,524,612 23,547,870 7,524,612 23,547,870
· Current trade receivables 1 26,901,986 49,198,105 26,901,986 49,198,105
· Other long-term assets 509,628 518,553 509,628 518,553
· Other short-term assets 6,701,345 6,288,901 6,701,345 6,288,901 Financial instruments measured at fair value through profit or loss
· Other short term assets - (Note (7)(c)) 741,425 40,453 741,425 40,453
45,817,826 81,712,842 45,817,826 81,712,842
Financial liabilities Term loans 56,827,685 80,364,930 56,827,685 80,364,930
Current trade and other payables 1 42,790,023 45,474,814 42,790,023 45,474,814
Provision for pledged deposits - 12,627,381 - 12,627,381
Non-current trade and other payables 2 169,373 14,235,485 169,373 14,235,485
99,787,081 152,702,610 99,787,081 152,702,610
The fair value of the financial assets and liabilities are included at the price that would be received to sell an asset or paid to transfer a liability (i.e. a exit price) in an ordinary transaction between market participants at the measurement date. The following methods and assumptions were used to estimate the fair values: 1. Cash and short-term deposits, trade receivables, trade payables, and other borrowings like short-term loans, current liabilities approximate their carrying amounts largely due to the short-term maturities of these instruments. 2. The fair value of loans from banks and other financial indebtedness, obligations under finance leases, financial liabilities at fair value through profit or loss as well as other non-current financial liabilities is estimated by discounting future cash flows using rates currently available for debt or similar terms and remaining maturities. 3. Fair value of financial assets measured at FVPL held for trading purposes are derived from quoted market prices in active markets. Fair value of financial assets measured at FVPL of unquoted equity instruments are derived from valuation performed at the year end. Fair Valuation of retained investments in PS and BVP is on basis of the last transaction. Fair value measurements recognised in the statement of financial position The following table provides an analysis of financial instruments that are measured subsequent to initial recognition at fair value, grouped into Levels 1 to 3 based on the degree to which the fair value is observable. • Level 1 fair value measurements are those derived from quoted prices (unadjusted) in active markets for identical assets or liabilities. • Level 2 fair value measurements are those derived from inputs other than quoted prices included within Level 1 that are observable for
the asset or liability, either directly (i.e. as prices) or indirectly (i.e. derived from prices). • Level 3 fair value measurements are those derived from valuation techniques that include inputs for the asset or liability that are not
based on observable market data (unobservable inputs).

89
Financial instruments measured at fair value through profit or loss Level 1 Level 2 Level 3 Total
2020
Unquoted securities - 700,972 40,453
Total - 700,972 40,453
2019
Unquoted securities - - 40,453
Total - - 40,453
There were no transfers between Level 1 and 2 in the period. Investments in mutual funds are valued at closing net asset value (NAV). The Group’s finance team performs valuations of financial items for financial reporting purposes, including Level 3 fair values. Valuation techniques are selected based on the characteristics of each instrument, with the overall objective of maximising the use of market-based information. The finance team reports directly to the chief financial officer (CFO). Valuation processes and fair value changes are discussed by the Board of Directors at least every year, in line with the Group’s reporting dates. 31 Post - reporting date events The Group raised approximately £21.0 million INR₹2000 million) during June 2020 through non-convertible debentures (NCDs) issue with a three years term and coupon rate of 9.85%. The proceeds from the NCDs were used to repay the FY21 and FY22 (i.e. to March 2023) principal term loans obligations.

90
Corporate Directory Nominated Adviser and Broker Cenkos Securities Plc 6-7-8 Tokenhouse Yard London EC2R 7AS Financial PR
Tavistock Communications 1 Cornhill London EC3V 3ND
Administrators and Company Secretary FIM Capital Limited (Formerly IOMA Fund and Investment Management Limited) 55 Athol Street Douglas Isle of Man IM1 1LA
Auditors BDO LLP Arcadia House Maritime Walk Ocean Village Southampton SO143TL
Registrars Link Market Services (Isle of Man) Limited Clinch's House Lord Street Douglas Isle of Man IM99 1R
Legal advisers Dougherty Quinn The Chambers
5 Mount Pleasant
Douglas
Isle of Man
IM1 2PU

91
Definitions & Glossary
Act: Isle of Man Companies Act 2006
Adjusted EBITDA: is a measure of a business’ cash
generation from operations before depreciation,
interest and exceptional and non-standard or non-
operational charges, e.g. share based compensation,
etc.
AGM: Annual General Meeting
AIM: Alternative Investment Market of the London
Stock Exchange
APC: Auxiliary Power Consumption
BG: Bank Guarantee
Board: Board of Directors of OPG Power Ventures
Plc
bps: Basis points
BRICS: Brazil, Russia, India, China and South Africa
CAD: Current Account Deficit
CAGR: Compound Average Growth Rate
CCR: Coal Combustion Residue
CEA: Central Electricity Authority
CFO: Chief Financial Officer
CO: Carbon Monoxide
COO: Chief Operating Officer
Company or OPG or OPGPV or parent: OPG
Power Ventures Plc
CY: Calendar Year
DDUGJY: Deen Dayal Upadhyay Gram Jyoti Yojana
scheme
Discom: Distribution Company (of the State
Electricity Utility)
EHS: Environment, Health and Safety
Electricity Act: Indian Electricity Act 2003 as
amended
EPS: Earnings per share
ESOP: Employee Stock Options Plan
FRC: Financial Reporting Council
FTSE: Financial Times Stock Exchange
ExCo: Executive Committee
FDI: Foreign Direct Investment
FVPL: Fair Value through Profit or Loss
FY: Financial year from 1 April to 31 March
GCPP: Group Captive Power Plant
GDP: Gross Domestic Product
GHG: Green House Gas
Government or GOI: Government of India
GP: Gross Profit
Great Britain Pound Sterling or £/pence: Pounds
sterling or pence, the lawful currency of the UK
GRI: Global Reporting Initiative
Group Captive: Group Captive power plant as
defined under Electricity Act 2003, India
Group or OPG: the Company and its subsidiaries
GW: Gigawatt is 1,000 megawatts
HIRA: Hazard Identification and Risk Assessment
HSE: Health, Safety and Envoronment
IAS: International Accounting Standards
IEA: International Energy Agency
IFRS: International Financial Reporting Standards
Indian Companies Act: the Companies Act, 1956
and amendments thereto
IPDS: Integrated Power Development Scheme
ISAs (UK): International Standards on Auditing (UK)
JV: Joint Venture
kWh: Kilowatt hour is one unit of electricity
LC: Letter of Credits
LOI: Letter of Intent
LSE: London Stock Exchange plc
LTIP: Long Term Incentive Plan
LTOA: Long Term Open Access
LTVT: Long Term Variable Tariff
MAR: Market Abuse Regime regulation
MAT: Minimum Alternative Tax
MoU: Memorandum of Understanding
MSME: Micro, Small and Medium Enterprises
mt: Million tonnes
MW: Megawatt is 1,000 kilowatts
MWh: Megawatt hour
NCDs: Non-convertible debentures
Net Borrowings: Total Borrowings minus
unrestricted cash
NITI Aayog: National Institution for Transforming
India
Nox: Nitrogen Oxides
O&M: Operating and Management

92
PAT: Profit After Tax
PBT: Profit Before Tax
PLF: Plant Load Factor
PPA: Power Purchase Agreement
PSA: Power Supply Agreement
PTW: “Permit- To-Work” system
QCA: Quoted Companies Alliance
RES: Renewable Energy Source
RBI: Reserve Bank of India
ROE: Return on Equity
RST: Reverse Stress Test
Rupees/INR or Rs: Indian Rupee, the lawful
currency of India
SASB: Sustainability Accounting Standards Board
SAUBHAGYA: The Pradhan Mantri Sahaj Bijli Har
Ghar Yojana scheme
SEB: State Electricity Board
SEBI: Securities Exchange Board of India
Sox: Sulphur Oxides
SPM: Suspended Particulate Matter
SPV: Special Purpose Vehicle
State: State of India
STP: Sewage Treatment Plant
TANGEDCO: Tamil Nadu Generation and
Distribution Corporation Limited
The Code: Quoted Companies Alliance’s code of
corporate governance
TRIR: Total Recordable Incident Report
UDAY: Ujwal DISCOM Assurance Yojana, the
financial turnaround and revival package for
DISCOMs initiated by the Government of India
UN SDGs: the United Nations Sustainable
Development Goals
UK/United Kingdom: United Kingdom of Great
Britain and Northern Ireland
US$/USD or $: US Dollars, the lawful currency of the
US
WPI: Wholesale Price Index