
Organizational Resource Assembly in Technology Ventures
179
University of Pennsylvania University of Pennsylvania ScholarlyCommons ScholarlyCommons Publicly Accessible Penn Dissertations 2016 Organizational Resource Assembly in Technology Ventures Organizational Resource Assembly in Technology Ventures Andy Wu University of Pennsylvania, [email protected] Follow this and additional works at: https://repository.upenn.edu/edissertations Part of the Business Administration, Management, and Operations Commons, Economics Commons, Finance and Financial Management Commons, and the Management Sciences and Quantitative Methods Commons Recommended Citation Recommended Citation Wu, Andy, "Organizational Resource Assembly in Technology Ventures" (2016). Publicly Accessible Penn Dissertations. 2105. https://repository.upenn.edu/edissertations/2105 This paper is posted at ScholarlyCommons. https://repository.upenn.edu/edissertations/2105 For more information, please contact [email protected].
-
Upload
khangminh22 -
Category
Documents
-
view
0 -
download
0
Transcript of Organizational Resource Assembly in Technology Ventures

University of Pennsylvania University of Pennsylvania
ScholarlyCommons ScholarlyCommons
Publicly Accessible Penn Dissertations
2016
Organizational Resource Assembly in Technology Ventures Organizational Resource Assembly in Technology Ventures
Andy Wu University of Pennsylvania, [email protected]
Follow this and additional works at: https://repository.upenn.edu/edissertations
Part of the Business Administration, Management, and Operations Commons, Economics Commons,
Finance and Financial Management Commons, and the Management Sciences and Quantitative Methods
Commons
Recommended Citation Recommended Citation Wu, Andy, "Organizational Resource Assembly in Technology Ventures" (2016). Publicly Accessible Penn Dissertations. 2105. https://repository.upenn.edu/edissertations/2105
This paper is posted at ScholarlyCommons. https://repository.upenn.edu/edissertations/2105 For more information, please contact [email protected].

Organizational Resource Assembly in Technology Ventures Organizational Resource Assembly in Technology Ventures
Abstract Abstract This dissertation addresses the assembly of organizational resources by technology ventures. We study how innovative firms acquire human and financial capital and then organize those resources, and how public policy affects that capability.
In the first chapter, we study the role of information in organizational decision-making for the financing of entrepreneurial ventures. We formally model a decentralized set of agents who vote strategically to allocate resources to a project with unknown outcome; they can each acquire costly information to improve their decision quality. We test our predictions in the setting of venture capital, where partners make their own angel investments outside of their employer. We find that the venture capital partners, acting independently, make riskier investments into younger firms with less educated and younger founding teams, but these investments perform better on some metrics even when controlling for investment size and stage. Geographic distance and liquidity constraints increase the probability the investment is taken up by a partner and not the VC.
In the second chapter, we evaluate the impact of skilled immigration on U.S. innovation by exploiting a random lottery in the H-1B visa program. Proponents argue that immigration allows firms to access technical skills and promote innovation, while opponents argue that firms substitute domestic labor for cheaper but equally or less skilled foreign labor. We find that winning an H-1B immigrant does not significantly increase patent applications or grants at the firm level, and there is pervasive use of the program in industries where patenting is not the main value-appropriation strategy.
In the third chapter, we study how a firm should organize the diversity of technical experience, contained within its pool of inventive human capital, for firm-level innovation. Using a sample of biotechnology start-ups, we examine the implications of alternate firm-level design regimes, drawing on both a firm-year panel structure and an inventor-year difference-in-differences empirical approach. Organizing a firm's human capital with greater across-team diversity yields increased firm-level innovation benefits as compared to organizing with greater within-team diversity. The benefits of across-team diversity stem mainly from the influence of that regime on team stability.
Degree Type Degree Type Dissertation
Degree Name Degree Name Doctor of Philosophy (PhD)
Graduate Group Graduate Group Applied Economics
First Advisor First Advisor Joseph E. Harrington
Second Advisor Second Advisor David H. Hsu
Keywords Keywords Angel Investor, Decision-Making, Immigration, Innovation, Teams, Venture Capital

Subject Categories Subject Categories Business Administration, Management, and Operations | Economics | Finance and Financial Management | Management Sciences and Quantitative Methods
This dissertation is available at ScholarlyCommons: https://repository.upenn.edu/edissertations/2105

ORGANIZATIONAL RESOURCE ASSEMBLY IN TECHNOLOGY VENTURES
Andy Wu
A DISSERTATION
m
Applied Economics
For the Graduate Group in Managerial Science and Applied Economics
Presented to the Faculties of the University of Pennsylvania
in
Partial Fulfillment of the Requirements for the Degree of Doctor of Philosophy
2016
Supervisor of Dissertation
~E~~ Patrick T. Harker Professor
Professor of Business Economics and Public Policy
Graduate Group Chairperson
~C- 7,!$z~~ Eric Bradlow
K.P. Chao Professor Professor of Marketing, Statistics, and Education
Dissertation Committee:
David H. Hsu, Richard A. Sapp Professor, Professor of Management (Chair) Vikas A. Aggarwal, Assistant Professor of Entrepreneurshi and Family Enterprise, INSEAD Laura Huang, Assisant Professor of Management Harbir Singh, Mack Professor, Professor of Management

ORGANIZATIONAL RESOURCE ASSEMBLY IN TECHNOLOGY VENTURES
c© COPYRIGHT
2016
Andy Wu
This work is licensed under the
Creative Commons Attribution
NonCommercial-ShareAlike 3.0
License
To view a copy of this license, visit
http://creativecommons.org/licenses/by-nc-sa/3.0/

Being deeply loved by someone gives you strength,
while loving someone deeply gives you courage.
— Laozi
This dissertation is dedicated to
Sail away from the safe harbor.
Catch the trade winds in your sails.
Explore. Dream. Discover.
— Mark Twain
my mother,
The important thing in life
is not the triumph,
but the struggle;
the essential thing is
not to have conquered,
but to have fought well.
— Pierre de Coubertin
my father,
If everything seems under control,
you’re just not going fast enough.
—- Mario Andretti
and my sister.
iii

Acknowledgement
This dissertation is a combination of the ideas and spirit of the people around me.
I cannot overstate the amount of good luck I have had in my life to be surrounded
by such phenomenal mentors, friends, and students.
David H. Hsu took me under his wing in the first year of my graduate studies
and guided me the entire way. I owe my greatest intellectual debt to him. My entire
research agenda and career path in academia was and continues to be inspired by
him.
Joseph H. Harrington, Jr. instilled in me an appreciation for the role of good
theory in our work. He put countless hours into helping me develop my research.
His leadership of the Applied Economics Ph.D. program has nurtured a generation
of young scholars, who benefited from his theoretical insights and compassion.
Vikas A. Aggarwal continues to serve as my closest mentor for my professional
and personal development. He jumped through windows to support me. The oppor-
tunity to work intimately with him on research and follow him around at conferences
shaped my graduate career.
Laura Huang provided the energy and enthusiasm to motivate me in the toughest
moments. Her passion and understanding of entrepreneurship is unmatched. Being
her teaching assistant for MGMT 801 Entrepreneurship inspired me to keep fighting
for my dream of becoming a teacher. She showed me the importance of organizational
iv

behavior and psychology for understanding social phenomenon.
Harbir Singh serves as the role model for my career dreams. Harbir was the
first person to teach me what strategy is. I hope to integrate the theory and practice
of management in my research, business, and academic administration duties just as
he has.
My peers at Penn and other school made countless contributions to this disser-
tation. I also had the pleasure with working with outstanding research assistants
through my years at Penn. Arthur Halim—an undergraduate research assistant
who worked with me over the summer of 2013—continues to inspire me to live every
day to the fullest with his strength and grace. Thank you Arthur.
The University of Pennsylvania had a tremendous impact on me and my
family. My sister and I both got access to an unbelievable set of intellectual and
career resources, and we had the thrill of being part of the best social community at
any university. The Graduate and Professional Student Assembly (GAPSA)
defined my social experience during graduate school, and I made many best friends
over the five years I served as a General Assembly member. I will remember all those
moments—5+ hour meetings, late night emails, snowed-in happy hours, boat parties,
and much more—forever. #GAPSA4LYF
The city of Philadelphia has a special place in my heart. Biking down the
Schuylkill River and seeing the sunset. Sitting by the water at the Spruce Street
Harbor Park at night with all the lights sparkling. Walking across the Walnut Street
bridge late at night and seeing the buildings all lit up. And sitting on my balcony at
International House while the summer wind blew past. There is no feeling like it.
v
Abstract
ORGANIZATIONAL RESOURCE ASSEMBLY IN TECHNOLOGY VENTURES
Andy Wu
Joseph E. Harrington, Jr.
David H. Hsu
This dissertation addresses the assembly of organizational resources by technology
ventures. We study how innovative firms acquire human and financial capital and
then organize those resources, and how public policy affects that capability.
In the first chapter, we study the role of information in organizational decision-
making for the financing of entrepreneurial ventures. We formally model a decen-
tralized set of agents who vote strategically to allocate resources to a project with
unknown outcome; they can each acquire costly information to improve their deci-
sion quality. We test our predictions in the setting of venture capital, where partners
make their own angel investments outside of their employer. We find that the venture
capital partners, acting independently, make riskier investments into younger firms
with less educated and younger founding teams, but these investments perform bet-
ter on some metrics even when controlling for investment size and stage. Geographic
distance and liquidity constraints increase the probability the investment is taken up
by a partner and not the VC.
In the second chapter, we evaluate the impact of skilled immigration on U.S.
vi

innovation by exploiting a random lottery in the H-1B visa program. Proponents
argue that immigration allows firms to access technical skills and promote innovation,
while opponents argue that firms substitute domestic labor for cheaper but equally
or less skilled foreign labor. We find that winning an H-1B immigrant does not
significantly increase patent applications or grants at the firm level, and there is
pervasive use of the program in industries where patenting is not the main value-
appropriation strategy.
In the third chapter, we study how a firm should organize the diversity of technical
experience, contained within its pool of inventive human capital, for firm-level inno-
vation. Using a sample of biotechnology start-ups, we examine the implications of
alternate firm-level design regimes, drawing on both a firm-year panel structure and
an inventor-year difference-in-differences empirical approach. Organizing a firm’s hu-
man capital with greater across-team diversity yields increased firm-level innovation
benefits as compared to organizing with greater within-team diversity. The bene-
fits of across-team diversity stem mainly from the influence of that regime on team
stability.
vii

Table of Contents
Copyright ii
Dedication iii
Acknowledgement iv
Abstract vi
Table of Contents viii
List of Tables xii
List of Illustrations xiv
1 Organizational Decision-Making and Information: Angel In-
vestments by Venture Capital Partners 1
1.1 Introduction . . . . . . . . . . . . . . . . . . . . . . . . . . . . . . . . 1
1.2 Stylized Model . . . . . . . . . . . . . . . . . . . . . . . . . . . . . . 6
1.2.1 Model Setup . . . . . . . . . . . . . . . . . . . . . . . . . . . . 9
1.2.2 Information: Public and Private . . . . . . . . . . . . . . . . . 11
1.2.3 Expected Utility Conditions . . . . . . . . . . . . . . . . . . . 14
1.2.4 Equilibrium for the Information Acquisition Game . . . . . . . 18
1.2.5 Theorems . . . . . . . . . . . . . . . . . . . . . . . . . . . . . 21
viii

1.2.6 Empirical Hypotheses . . . . . . . . . . . . . . . . . . . . . . . 22
1.3 Organizational Forms in Entrepreneurial Finance . . . . . . . . . . . 25
1.3.1 Venture Capital Firms . . . . . . . . . . . . . . . . . . . . . . 25
1.3.2 Angel Investors . . . . . . . . . . . . . . . . . . . . . . . . . . 29
1.4 Empirical Setting: Angel Investments by Venture Capital Partners . . 32
1.4.1 Conditions on Angel Investments by Partners . . . . . . . . . 33
1.4.2 Alternative Scenarios . . . . . . . . . . . . . . . . . . . . . . . 34
1.5 Data . . . . . . . . . . . . . . . . . . . . . . . . . . . . . . . . . . . . 37
1.5.1 Sample Construction . . . . . . . . . . . . . . . . . . . . . . . 37
1.5.2 Entrepreneurial Venture: Observable Characteristics . . . . . . 39
1.5.3 Entrepreneurial Venture: Financial Performance . . . . . . . . 40
1.5.4 Controls . . . . . . . . . . . . . . . . . . . . . . . . . . . . . . 40
1.5.5 Information Acquisition Cost: Geographic Distance . . . . . . 41
1.5.6 Tacit Information: VC Experience . . . . . . . . . . . . . . . . 42
1.5.7 Descriptive Statistics . . . . . . . . . . . . . . . . . . . . . . . 43
1.6 Empirical Strategy . . . . . . . . . . . . . . . . . . . . . . . . . . . . 44
1.6.1 Main Model . . . . . . . . . . . . . . . . . . . . . . . . . . . . 44
1.6.2 Matching Model . . . . . . . . . . . . . . . . . . . . . . . . . . 45
1.6.3 Geography Model . . . . . . . . . . . . . . . . . . . . . . . . . 47
1.6.4 Category Experience Model . . . . . . . . . . . . . . . . . . . 48
1.7 Results . . . . . . . . . . . . . . . . . . . . . . . . . . . . . . . . . . . 48
1.7.1 Hypothesis 1: Explicit Information . . . . . . . . . . . . . . . 48
1.7.2 Hypothesis 2: Cost of Tacit Information Acquisition . . . . . . 49
1.7.3 Hypothesis 3: Tacit Information . . . . . . . . . . . . . . . . . 50
1.7.4 Venture Financial Performance . . . . . . . . . . . . . . . . . 51
1.8 Conclusion . . . . . . . . . . . . . . . . . . . . . . . . . . . . . . . . . 53
ix

1.A Appendix: Stylized Model . . . . . . . . . . . . . . . . . . . . . . . . 73
1.A.1 Parameter Restrictions . . . . . . . . . . . . . . . . . . . . . . 73
1.A.2 No Equilibrium with Both Agents Acquiring a Signal . . . . . 74
1.A.3 Equilibrium with One Agent or No Agents Acquiring a Signal 78
1.A.4 Optimality of Voting Rule . . . . . . . . . . . . . . . . . . . . 79
1.A.5 Empirical Hypotheses . . . . . . . . . . . . . . . . . . . . . . . 82
1.B Appendix: Organizational Forms in Entrepreneurial Finance . . . . . 83
1.B.1 Interviews with Venture Capital Firms . . . . . . . . . . . . . 83
1.C Appendix: Data . . . . . . . . . . . . . . . . . . . . . . . . . . . . . . 84
1.C.1 Testing Org. Structure Assumptions . . . . . . . . . . . . . . 84
1.C.2 Missing Data . . . . . . . . . . . . . . . . . . . . . . . . . . . 86
2 Skilled Immigration and Firm-Level Innovation: Evidence from
the H-1B Lottery 87
2.1 Introduction . . . . . . . . . . . . . . . . . . . . . . . . . . . . . . . . 87
2.2 H-1B Program . . . . . . . . . . . . . . . . . . . . . . . . . . . . . . . 91
2.3 H-1B Lottery . . . . . . . . . . . . . . . . . . . . . . . . . . . . . . . 92
2.4 Empirical Design . . . . . . . . . . . . . . . . . . . . . . . . . . . . . 93
2.5 Data . . . . . . . . . . . . . . . . . . . . . . . . . . . . . . . . . . . . 97
2.6 Results . . . . . . . . . . . . . . . . . . . . . . . . . . . . . . . . . . . 100
2.7 Why Don’t H-1B Immigrants (in the Lottery) Produce Patents? . . . 103
2.7.1 What is Different about the Prior Research? . . . . . . . . . . 103
2.7.2 Why Zero Estimates? . . . . . . . . . . . . . . . . . . . . . . . 104
2.8 Conclusion . . . . . . . . . . . . . . . . . . . . . . . . . . . . . . . . . 107
3 R&D Production Team Organization and Firm-Level Innovation 121
3.1 Introduction . . . . . . . . . . . . . . . . . . . . . . . . . . . . . . . . 121
x

3.2 Theoretical Motivation . . . . . . . . . . . . . . . . . . . . . . . . . . 124
3.3 Methods . . . . . . . . . . . . . . . . . . . . . . . . . . . . . . . . . . 127
3.3.1 Data and Sample . . . . . . . . . . . . . . . . . . . . . . . . . 129
3.3.2 Firm-Year Level Variables . . . . . . . . . . . . . . . . . . . . 131
3.3.3 Inventor-Year Level Variables . . . . . . . . . . . . . . . . . . 135
3.3.4 Model Specifications . . . . . . . . . . . . . . . . . . . . . . . 136
3.4 Results . . . . . . . . . . . . . . . . . . . . . . . . . . . . . . . . . . . 137
3.4.1 Firm-Year Level Analysis . . . . . . . . . . . . . . . . . . . . . 138
3.4.2 Inventor-Year Level Analysis . . . . . . . . . . . . . . . . . . . 139
3.5 Discussion . . . . . . . . . . . . . . . . . . . . . . . . . . . . . . . . . 141
Bibliography 153
xi

List of Tables
1.1 Summary Statistics . . . . . . . . . . . . . . . . . . . . . . . . . . . . 63
1.2 Main Model: Venture Characteristics . . . . . . . . . . . . . . . . . . 64
1.3 Summary Statistics: Matching Model . . . . . . . . . . . . . . . . . . 65
1.4 Matching Model: Venture Characteristics . . . . . . . . . . . . . . . . 66
1.5 Geography Model . . . . . . . . . . . . . . . . . . . . . . . . . . . . . 67
1.6 Category Experience Model . . . . . . . . . . . . . . . . . . . . . . . 68
1.7 Main Model: Venture Financial Performance . . . . . . . . . . . . . . 69
1.8 Matching Model: Venture Financial Performance . . . . . . . . . . . 70
1.9 Fund Availability Model . . . . . . . . . . . . . . . . . . . . . . . . . 71
1.10 Missing Data . . . . . . . . . . . . . . . . . . . . . . . . . . . . . . . 72
2.1 Summary Statistics . . . . . . . . . . . . . . . . . . . . . . . . . . . . 114
2.2 Lottery Placebo Test . . . . . . . . . . . . . . . . . . . . . . . . . . . 115
2.3 Petition Bin Model (Patent Grants) . . . . . . . . . . . . . . . . . . . 116
2.4 Petition Bin Model (Patent Applications) . . . . . . . . . . . . . . . . 117
2.5 Differences-in-Differences (Patent Grants) . . . . . . . . . . . . . . . 118
2.6 Differences-in-Differences (Patent Applications) . . . . . . . . . . . . 119
2.7 Firm Behavior . . . . . . . . . . . . . . . . . . . . . . . . . . . . . . . 120
3.1 Summary Statistics for Firm-Year Analysis . . . . . . . . . . . . . . . 148
3.2 Correlation Matrix for Firm-Year Analysis . . . . . . . . . . . . . . . 149
xii

3.3 Average Effects for Firm-Year Analysis . . . . . . . . . . . . . . . . . 150
3.4 Summary Statistics for Inventor-Year Level of Analysis . . . . . . . . 151
3.5 Average Effects for Inventor-Year Level of Analysis . . . . . . . . . . 152
xiii

List of Illustrations
1.1 Extensive Form Game . . . . . . . . . . . . . . . . . . . . . . . . . . 57
1.2 VC vs. Angel Investment as Function of the Public Signal and Cost
of Information . . . . . . . . . . . . . . . . . . . . . . . . . . . . . . . 58
1.3 VC Partner vs. Non-VC Affiliated Angels . . . . . . . . . . . . . . . . 59
1.4 Geographic Distance Between Venture and VC Offices . . . . . . . . . 60
1.5 VC Experience in Category . . . . . . . . . . . . . . . . . . . . . . . 61
1.6 VC Fund Availability . . . . . . . . . . . . . . . . . . . . . . . . . . . 62
2.1 Firm Industries . . . . . . . . . . . . . . . . . . . . . . . . . . . . . . 109
2.2 Occupation Types . . . . . . . . . . . . . . . . . . . . . . . . . . . . . 110
2.3 Top Patent Classes . . . . . . . . . . . . . . . . . . . . . . . . . . . . 111
2.4 Country of Origin . . . . . . . . . . . . . . . . . . . . . . . . . . . . . 112
2.5 Top H-1B Petitioners . . . . . . . . . . . . . . . . . . . . . . . . . . . 113
3.1 Across-Team and Within-Team Diversity . . . . . . . . . . . . . . . . 146
3.2 Calculation of Diversity Measures . . . . . . . . . . . . . . . . . . . . 147
xiv

Chapter 1
Organizational Decision-Making
and Information:
Angel Investments by Venture
Capital Partners
Andy Wu
1.1 Introduction
Why do we trust groups to make some of our most important decisions? US crim-
inal cases are determined by the unanimous vote of a jury, and a board of directors
has the power to hire and fire the CEO by a majority vote. Why not one juror or one
director? When preferences are aligned, groups can deliver superior decision quality
relative to that of a single agent (de Condorcet, 1785) because of their ability to ag-
1

gregate information across agents. Information aggregation represents an important
differentiating capability for organizations (Cyert and March, 1963; Gavetti et al.,
2007), and it is thus relevant to understand the optimal organizational structures
that enable this capability and their associated boundary conditions (Csaszar, 2012).
In the setting of entrepreneurial finance, optimally aggregating information is espe-
cially crucial for financial intermediaries because information is low and at a premium.
Entrepreneurial ventures lack any of the capital assets or organizational infrastruc-
ture present in larger incumbent firms, and thus they are difficult to value using
straightforward explicit information: these ventures may have unproven manage-
ment teams, enter new and undefined market segments, and develop cutting edge but
untested technology products (Aldrich and Fiol, 1994). The lack of explicit informa-
tion is further exacerbated by information asymmetry that results from entrepreneurs
having greater access to information about their firm than outside parties (Dessein,
2005). As a result, non-traditional tacit information, such as “gut feel” about an
entrepreneur or industry, play a large and pivotal role in the decision-making pro-
cess in entrepreneurial finance (Huang and Knight, 2015; Huang and Pearce, 2015).
To facilitate capital investments into these entrepreneurial firms, we have dedicated
financial institutions, such as venture capital firms, angel investors, crowdfunding
platforms, and accelerators, which seek to address these information problems and
invest in high risk, high reward ventures. These institutions specialize in identifying
investment opportunities from a vague choice set, acquiring and aggregating external
information to evaluate and execute investments, and monitoring their investments
ex post.
We study two particular organizational forms in entrepreneurial finance, venture
capital firms and angel investors, which differ starkly in their decision-making struc-
tures. Venture capital firms are administrated by a general partnership. The partners
2

individually source investments and collect intimate information about those invest-
ments through due diligence, which they then bring to the whole partnership for
consideration. The venture capital partnership then makes decisions by committee
through a formal or informal vote on the deals brought in. Angel investors also in-
dividually source investments and collect information, but unlike a venture capital
firm, they make the investment decisions by themselves. Basic voting theory suggests
that committees can more effectively aggregate information among informed parties
than the parties acting individually (de Condorcet, 1785), so all else equal, we might
expect a group decision-making process to outperform an individual decision-making
process.
We examine a particular phenomenon where the information aggregation advan-
tage of the venture capital organization may break down: individual angel investments
by partners of venture capital firms. Partners of some venture capital firms make their
own angel investments into ventures their firm ultimately chooses not to invest in.
As a requirement of employment with the venture capital firm, the partners have a
fiduciary duty, a duty of loyalty, to the venture capital firm. As such, the venture
capital firm must always have the right of first refusal on any possible deal, and the
partners can only invest in deals that the firm would not do. Thus, we observe an-
gel investments made by the venture capital partners that were necessarily rejected
or “passed over” by the firm decision-making criterion while meeting the partner’s
personal criterion for an investment. Between 2005 and 2013, over 500 US venture
capital firms have partners who made such angel investments on the side. We ask why
an individual partner would still pursue a deal when her colleagues, whose opinion
she presumably respects, voted against it. It is a paradox and open question as to
why a partner would take on substantially more personal financial risk to pursue her
own investment.
3

To explain this phenomenon, we argue that there is a tradeoff in group decision-
making between the benefits of information aggregation and the cost from the par-
ticipation of uninformed agents, driven by a disincentive to acquire costly tacit in-
formation about the venture among the individual agents. This tension presents a
fundamental boundary condition for group decision-making, namely that in some
cases of heterogeneous information, the group decision underperforms an individual
decision.
We offer a stylized formal model to explain the observed phenomenon. A com-
mittee of agents with homogenous utility functions must make a dichotomous choice
about whether to invest in a particular project that can turn out to be good or bad.
A sourcing agent receives a costless private signal, representing tacit information,
which is costly to the other members of a committee. The agents all share a public
signal component representing explicit information. The other agents have the option
to acquire the private signal at cost; this decision is endogenous to the model. The
committee then engages in a voting process with a pre-determined threshold. For the
model, we find there is no pure strategy equilibrium where all agents acquire the costly
private signal, but we find there is an equilibrium where some or no agents acquire
the costly private signal. The comparative statics of the model generate a number of
empirical hypotheses to test. First, projects funded by an angel investor will exhibit
weaker explicit characteristics than those funded by the VC. Second, projects funded
by the angel investor will have a higher associated cost to acquire the necessary tacit
information. Third, projects funded by the angel investor will have less informative
tacit information.
We test our theory on a large sample of investments made by venture capital
partners, in the form of individual angel investments, and their employing firms, in
the form of traditional venture capital investments. We find that the venture capital
4

partners, acting independently, make investments into younger firms with less edu-
cated, less experienced, and younger founding teams, but these investments perform
similarly or better on some financial metrics even when controlling for investment
size, stage, and industry. Geographic distance and VC inexperience in an industry
category increase the probability the investment is taken up by a partner and not the
VC.
This project makes a number of contributions across the strategy and finance lit-
erature. This work is the first to document the investment patterns of venture capital
affiliated angel investors, and it also contributes to the still relatively small literature
on angel investors, who normally represent a heterogeneous and difficult group to
study. Second, we are among the first large sample empirical studies of committee
decision-making and one of the only to make some inroads into the micro-structure
of the organization itself. Most of the prior work has been conducted in lab experi-
ments (Kotha et al., 2015) and simulations (Csaszar, 2012). Third, we contribute to
an emerging stream of work studying specialized decision-making structures as part
of a “behaviorally plausible, decision-centered perspective on organizations” (Gavetti
et al., 2007). Finally, the particular empirical setting at hand in this study is the-
matically related to work on spin-outs, companies founded by former employees of
incumbent firms (e.g. Klepper, 2001), which we will discuss in the conclusion.
This paper proceeds as follows. In Section 1.2, we begin by presenting a stylized
model for organizational decision-making with costly tacit information acquisition,
and we derive empirical hypotheses from this model. In Section 1.3, we review in-
stitutional details about the organizational forms of venture capital firms and angel
investors. In Section 1.4, we explain our particular empirical setting of venture capital
partners who make angel investments. In Section 1.5, we detail the data and variable
construction. In Section 1.6 and Section 1.7, we explain the empirical methodology
5

and discuss the empirical findings. In Section 1.8, we conclude and link our work to
related literatures.
1.2 Stylized Model
A primary purpose of the firm is to acquire, integrate, and then apply information
for its productive use in the form of knowledge (Grant, 1996).1 In the setting of
venture capital, nearly all venture capital firms have a formal or informal mechanism,
usually a vote, held for aggregating information from its partners when evaluating
a possible deal. This information aggregation structure has direct implications for
the ability of the organization to receive knowledge, in other words, its absorptive
capacity (Cohen and Levinthal, 1990).
A key challenge for the organizational use of information is the transferability
of said information. Explicit information is easily and credibly transferable, func-
tioning as a public good. Explicit information can be costlessly aggregated by the
organization since it is easily transferable. Examples of explicit knowledge relevant
to the venture investor include educational characteristics and work experience of
the founding team and the prior financial performance of the startup and its chosen
market (e.g. Bernstein et al., 2016), facts that would be easy to record and communi-
cate. Entrepreneurs create business plans and financial statements for the purposes
of communicating this explicit knowledge to investors, and investors can share these
documents amongst themselves to communicate this explicit knowledge with each
other.
On the other hand, tacit information2 (Polanyi, 1966) cannot be codified and is
1Information is often thought of as the antecedent to knowledge (“all that is known”), whereknowledge is information in a useful cognitive representational form, such as a mental model, schema,rules, constraints, etc.
2Tacit information is also known as implicit information. We use tacit information as an umbrella
6

only revealed by its application, and thus its transfer between people is costly (Kogut
and Zander, 1992). Tacit information plays a key role in the decision process for
venture investors (Huang and Knight, 2015). Examples of tacit information include
the investor’s trust in the entrepreneur’s character and intuition about future market
trends, which are acquired through direct interaction with the entrepreneur or long-
term personal experience respectively. The social psychology literature has focused on
intuition, affectively charged judgements that arise through rapid and non-conscious
associations between different ideas, as a major component of decision-making at
the individual level. For example, Huang and Pearce (2015) show that “gut feel”, a
blend of analysis and intuition derived from the interpersonal relationship between the
individual investor and the entrepreneur, has a real effect on investor decision-making.
Indeed, the investor’s intuitive assessment of the entrepreneur and other informal
channels of information often make up the most important component of the investor’s
decision-making process, more so than the formal business plan (Huang and Pearce,
2015; Kirsch et al., 2009). Furthermore, symbolic actions, such as professionalism,
and other factors gleaned through personal interaction play a deep role in venture
investor decision processes (Zott and Huy, 2007). Thus, an important component of
the information used by investors to evaluate early stage ventures is captured in this
tacit information, and the ability to utilize this tacit information is a key source of
competitive advantage for venture investors who are able to optimally utilize it.
This distinction in transferability of information presents a key inefficiency in
simple group decision-making processes like voting. When all information is explicit,
information can be shared among all participants and thus participants will be in-
formed when they vote. When there is tacit information, some of the agents in a
construct spanning both cognitive and affective domains. Polanyi (1966) argues for the existence oftacit information by noting that “individuals know more than they can explain”.
7

group may not acquire that information because the information acquisition process
is individual costly to each agent. In a standard voting mechanism with no absten-
tions, agents who have not acquired the costly tacit information will still vote but
vote in an uninformed fashion, making their vote worse than useless as they dilute the
quality of the group decision that would have occurred without them. We henceforth
refer to the explicit information as being public, since it is shared by all agents, and
we refer to the tacit information as being private, since it is private to each agent and
not shared. This choice of terminology is made to better align with norms in game
theoretic formal modeling.
We propose a formal model to elucidate on the boundary conditions of group
decision-making through a voting mechanism when some information is heterogeneous
or costly to individual agents. For a committee voting by majority rule, where the
voters are equally informed (all information is public), the Condorcet jury theorem
says that adding more voters asymptotically increases the probability the decision
will be correct (de Condorcet, 1785). However, we consider the case where there is
heterogeneity in information available to the members of the committee by modeling
the tacit component of information as an endogenous outcome of the model (Persico,
2004). We represent shared explicit information through a public signal, and the
non-sharable tacit information is represented by a private signal.3 The committee
decision then notably deviates from efficiency and optimality. The primary channel
by which agents can credibly express their opinion in a voting environment is through
their vote. In most settings, every agent’s opinion counts equally, but not every agent
voting may be informed. This challenge sets up the primary theoretical tension at
the heart of our theory: the benefit of aggregating information across the agents of
3The term signal has a different meaning here than in the labor market literature such as inSpence’s 1973 work. The information content of the signal is only known to the focal agent.
8
the group versus the cost of participation of uninformed agents. We propose that
this tension, driven by the introduction of costly private (tacit) information into the
model, results in the VC partner angel investing phenomenon. We proceed with our
model to show the existence of equilibria demonstrating this trade-off and to derive
a set of comparative statics for the purposes of empirical testing.
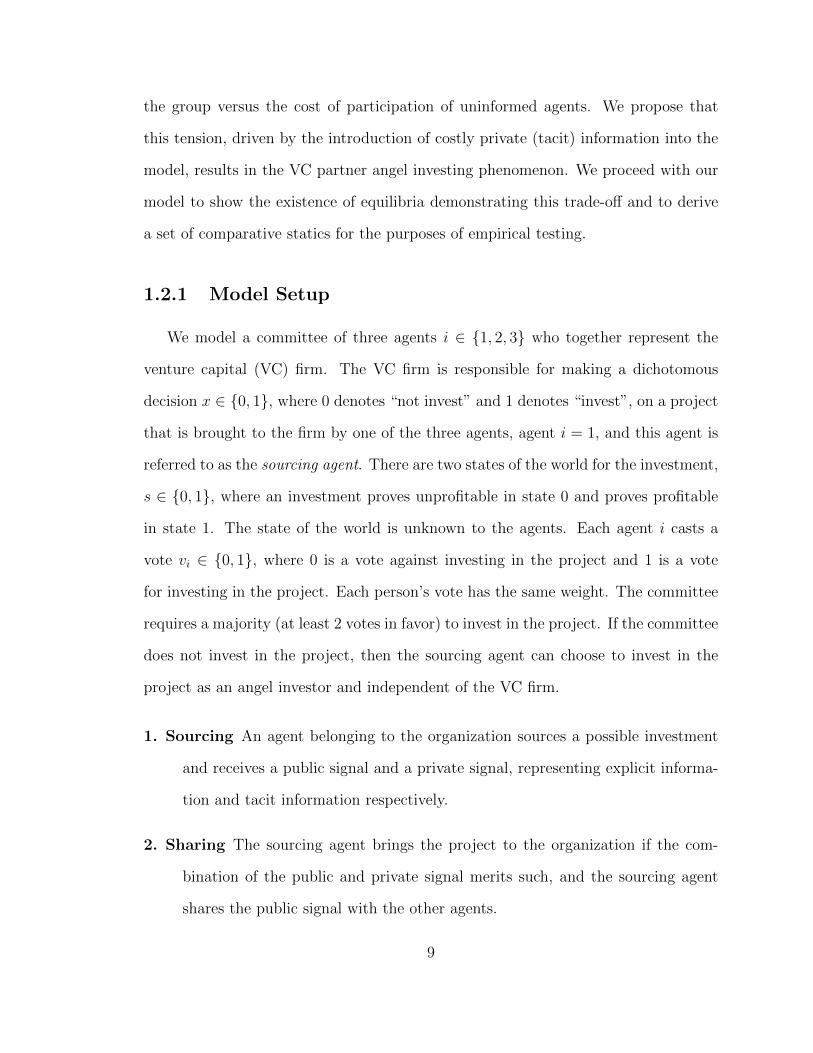
1.2.1 Model Setup
We model a committee of three agents i ∈ {1, 2, 3} who together represent the
venture capital (VC) firm. The VC firm is responsible for making a dichotomous
decision x ∈ {0, 1}, where 0 denotes “not invest” and 1 denotes “invest”, on a project
that is brought to the firm by one of the three agents, agent i = 1, and this agent is
referred to as the sourcing agent. There are two states of the world for the investment,
s ∈ {0, 1}, where an investment proves unprofitable in state 0 and proves profitable
in state 1. The state of the world is unknown to the agents. Each agent i casts a
vote vi ∈ {0, 1}, where 0 is a vote against investing in the project and 1 is a vote
for investing in the project. Each person’s vote has the same weight. The committee
requires a majority (at least 2 votes in favor) to invest in the project. If the committee
does not invest in the project, then the sourcing agent can choose to invest in the
project as an angel investor and independent of the VC firm.
1. Sourcing An agent belonging to the organization sources a possible investment
and receives a public signal and a private signal, representing explicit informa-
tion and tacit information respectively.
2. Sharing The sourcing agent brings the project to the organization if the com-
bination of the public and private signal merits such, and the sourcing agent
shares the public signal with the other agents.
9

3. Acquiring Costly Information Each of the other non-sourcing agents in the
organization decides whether to acquire a private signal at a cost to them. This
decision is conditional on the public signal brought by the sourcing agent.
4. Voting The agents vote. If the vote passes the predetermined majority voting
rule, the organization invests in the project.
5. Individual Decision If the organization does not vote to approve the project,
then the sourcing agent decides whether to individually invest in the project as
an independent angel investor.
In evaluating a project and casting their votes, all agents have identical prefer-
ences, reflected by voting for the project if and only if their information is favorable.
If the project is not funded, then each agent’s payoff is 0, independent of state.4 If
the project is funded and the state is s, each agent receives a payoff of U(s) where
U(0) < 0 < U(1). These payoffs are prior to subtracting any cost of acquiring infor-
mation. For notational simplicity, we assume the payoff for the sourcing agent is also
U(s) when she makes an individual investment.5
Our model follows the setup and many assumptions of the jury voting literature
(e.g. de Condorcet, 1785), and we use the notation as set out in Gerling et al. (2005).
As is common in voting model literature and for all practical considerations, we
only consider pure strategy Nash equilibrium and not probabilistic mixed strategy
equilibrium.
4We assume there is no regret or loss aversion (Kahneman and Tversky, 1979) if the non-fundedproject is eventually funded by some other investor and proves successful. Relaxing this assumptionmay prove to be an interesting avenue for future work.
5If the VC firm does not fund the project but the sourcing agent does, then the latter’s payoffis ωU(s) for some ω > 0. 1
ω can be interpreted as the proportion of the carry that is paid out toan investment partner at a VC firm for deals conducted through the firm. Given that theoreticalresults are robust to ω if utility is invariant to linear transformations, we can set ω = 1 for the sakeof reducing the amount of notation.
10

1.2.2 Information: Public and Private
Agents have two sources of information, explicit and tacit, represented in the
model by a public signal and a private signal respectively. By definition, a public
signal encompasses information that can be shared among the members of the VC
firm, while the private signal contains information that cannot be shared. The public
signal that the sourcing agent brings to the VC firm is embodied in the prior proba-
bility that the project will prove profitable: π = Pr(s = 1). If agent i has a private
signal, it is denoted σi ∈ {B,G, T}, which represent bad, good, and terrific signals re-
spectively. To deliver the main hypotheses for the empirical analysis, the information
space needs to more rich than the voting space; in other words, there must be more
information than can be fully expressed by the voting mechanism. Since an agent has
only two choices in voting vi ∈ {0, 1}, it is sufficient to have three possible private
signals. We define two of those signals as “favorable”, where a signal is “favorable”
if it increases the likelihood attached to s = 1 (investment in the project will prove
profitable) and is “unfavorable” if it decreases the likelihood that s = 1. Signal B
is unfavorable and both signals G and T are favorable. What distinguishes signals
G and T is that G is not a sufficiently positive signal that, by itself, an agent would
believe the project is worthy, while signal T is sufficient by itself for an agent to draw
that conclusion. We will discuss this further in the next section when we define the
conditions on expected utility.
The private signal σi has the following properties captured by the parameters q, θ,
and β, which together with π define the information environment. q is the probability
that the signal is favorable, σi ∈ {G, T}, when in the profitable state s = 1; q is also
the probability that the signal is unfavorable, σi = B, when the state is unprofitable
s = 0. Conditional on s = 1, θ is the probability that the signal is terrific σi = T
given the signal is favorable, σi ∈ {G, T}; analogously, conditional on s = 0, β is the
11

probability that σi = T given σi ∈ {G, T}.
Pr(σ = T |s = 1) = θq Pr(σ = T |s = 0) = β(1− q)
Pr(σ = G|s = 1) = (1− θ)q Pr(σ = G|s = 0) = (1− β)(1− q)
Pr(σ = B|s = 1) = 1− q Pr(σ = B|s = 0) = q
In order for signals G and T to be favorable and B to be unfavorable, it is assumed
that the favorable signals G, T are more likely when s = 1 than when s = 0 and the
reverse is true for the unfavorable signal B:6
Pr(σ = G|s = 1) > Pr(σ = G|s = 0)⇔ (1− θ)q > (1− β)(1− q)
⇔ 1− θ1− β
>1− qq
Pr(σ = T |s = 1) > Pr(σ = T |s = 0)⇔ θq > β(1− q)
⇔ θ
β>
1− qq
Pr(σ = B|s = 1) < Pr(σ = B|s = 0)⇔ 0 < 1− q < q < 1
⇔ 1/2 < q < 1
It is assumed that 0 < β < θ < 1: conditional on a favorable signal, the signal is
more likely σi = T when the state is 1 than when it is 0. We have assumed symmetry
in the signal, Pr(σ ∈ {G, T}|s = 1) = Pr(σ = B|s = 0) = q, so the signal provides
the same information content about the state of the world in the profitable state and
the unprofitable state. Finally, conditional on the state, agents’ signals are assumed
to be independent of each other.
The sourcing agent, denoted as agent 1, is assumed to already have the public and
private signal and brings the project to the VC firm if and only if the private signal is
favorable σ1 ∈ {G, T}. If agent 1 brings the project to the VC firm, then the other two
6This assumption is equivalent to the monotone likelihood ratio property if the private signalwere continuous.
12

agents will infer σ1 ∈ {G, T}. Our model makes this assumption about the sourcing
agent’s signal to better reflect the realities of the deal flow process in a venture capital
firm. In a venture capital firm, the partners of the firm are themselves responsible
for sourcing deal flow for consideration by the firm. Beyond just the search process
for possible investments, the partner conducts a due diligence process to assess the
quality of the process, i.e. acquire the costly private signal. If a partner brought a
project of poor quality, that would hurt the partner’s reputation and waste the time
and resources of the whole firm.
The initial information of agents 2 and 3 is just the public signal, represented by
the prior probability π = Pr(s = 1), and the knowledge that the sourcing agent has
a favorable signal σ1 ∈ {G, T}, although they do not know whether that favorable
private signal is good or terrific. They will independently decide whether to acquire
a private signal at a cost c which is born by the agent and not the VC firm. If agent
2 (or 3) acquires a signal and the project is not funded then her payoff is −c, and if
it is funded and the state is s then her payoff is U(s) − c.7 This costly information
acquisition setup follows from Persico (2004).
After acquiring any private signals, the three agents simultaneously vote. The
agents are not allowed to abstain.8 It is assumed that agent i ∈ {1, 2, 3} votes in
favor of funding the project if and only if:
1. she acquired a signal and the signal is favorable σi ∈ {G, T};9
7Presumably, agent 1 also faces the information acquisition cost, but it is assumed to be a sunkcost outside of this model.
8Allowing for abstentions would be an interesting extension on the model, but we do not believethat allowing for abstentions would change the general findings nor would it be a realistic assumptionfor the setting being studied.
9For this voting rule, an agent may vote for a project even if her current information does notindicate the project is profitable, merely that it has met the rule for being favorable. This action isperfectly reasonable given that the purpose of voting is to aggregate information, so there are caseswhere the group will find a project to be profitable even when the individual agent did not. Thispossibility is only feasible if those with favorable signals vote in support of the project.
13

2. she did not acquire a signal and based on her current beliefs she expects the
project to be profitable.10
After outlining the expected utility conditions, we will characterizing the equilib-
rium for the information acquisition phase. we will show that this voting rule is opti-
mal for those equilibria. We show that the voting rule is optimal in Appendix 1.A.4.
The extensive form representation of the model is shown in Figure 1.1.
——————–Insert Figure 1.1——————–
1.2.3 Expected Utility Conditions
To ensure the existence of an equilibrium, we make the following assumptions
with regards to the expected utility for the individual agents of the VC firm. The
following assumptions ensure that the sourcing agent 1 brings projects to the com-
mittee for which she receives a signal σ1 ∈ {G, T}, because they have a non-zero
probabilities of being approved by the group, and that she would still pursue the
project independently when she receives a signal of σ1 = T .
1. E[U] < 0 Without a private signal, the expected value of a project is negative:
E[U ] = πU(1) + (1− π)U(0) < 0⇔ π <−U(0)
U(1)− U(0),
and recall that U(1) > 0 > U(0). Hence, the prior probability that the project is
worthy of funding is sufficiently small. Given that the vast majority of ideas that
come to a VC firm are not funded, this is a descriptively realistic assumption.
For example, Andreessen Horowitz, a well-known venture capital firm, reviews
over three thousand startups a year, and ultimates invests in fifteen.11
10We assume that the project is never profitable in expectation without having acquired theprivate signal.
11The New Yorker May 18, 2015 issue.
14

2. E[U|σ = B] < E[U] Signal B reduces the expected utility from funding the
project:
E[U |σ = B] < E[U ]⇔π(1− q)U(1) + (1− π)qU(0)
π(1− q) + (1− π)q
< πU(1) + (1− π)U(0)
⇔q > 1
2
This assumption will justify voting against the project if an agent receives signal
B. This parametric assumption has already been made in the model setup to
ensure the private signal has informational value.
3. E[U|σ = G] > E[U] Signal G is favorable in that the expected utility is higher
after having received this signal:
E[U |σ = G] > E[U ]⇔πq(1− θ)U(1) + (1− π)(1− q)(1− β)U(0)
πq(1− θ) + (1− π)(1− q)(1− β)
> πU(1) + (1− π)U(0)
⇔q(1− θ) > (1− q)(1− β)
This assumption will justify voting in support of the project if an agent receives
signal G. Note that this parametric assumption has already been made.
4. E[U|σ = T] > 0 Signal T is sufficiently positive that the expected utility of the
project is positive:
E[U |σ = T ] > 0⇔ πqθU(1) + (1− π)(1− q)βU(0)
πqθ + (1− π)(1− q)β> 0.
This assumption will justify the sourcing agent funding the project if her only
15

information is signal T .
5. E[U|σ ∈ {G,T}] < 0 If an agent only knows a signal is favorable, but not
whether it is G or T , then she will believe the project is not worthy of funding:
E[U |σ ∈ {G, T}] < 0⇔ πqU(1) + (1− π)(1− q)U(0)
πq + (1− π)(1− q)< 0.
Prior to deciding whether to acquire a signal, agents 2 and 3 have their prior
beliefs and the knowledge that agent 1 received a favorable signal by virtue
of having brought the project to the VC firm. At that moment, agents 2 and
3 have expected utility of E[U |σ ∈ {G, T}] from funding the project. This
assumption then implies that if they do not acquire the signal, they vote no.
6. E[U|σ = G] < 0 < E[U|σi = G, σj = G] By this condition, one good signal is
insufficient to conclude the expected utility from the project is positive but two
good signals are sufficient to reach that conclusion. Note that E[U |σ = G] < 0
(Assumption 6a) is implied by the preceding two assumptions: E[U |σ = T ] >
0 > E[U |σ ∈ {G, T}]. To ensure E[U |σi = G, σj = G] > 0 (Assumption 6b), it
is assumed:
E[U |σ1 = G, σ2 = G] > 0⇔
πq2(1− θ)2U(1) + (1− π)(1− q)2(1− β)2U(0)
πq2(1− θ)2 + (1− π)(1− q)2(1− β)2> 0
This condition provides motivation for the existence of the decision-making
organization and the use of a voting rule to aggregate information. If a single
G signal was sufficient to conclude the project is worthy then there would be no
need to bring it to a committee for a vote and no need for agents to make their
decisions as part of the organization in the first place. Thus, the organization
16

would not need to exist.
Assumptions 1 through 6 are sufficient to characterize the equilibrium. We can
further add an additional assumption for E[U |σi = T, σj = B] < 0 to cover all cases of
voting by the organization and to cover the scenario where agent 1 receives a signal of
σ1 = T and agent 2 acquires signal but receives σ2 = B. This additional assumption
implies that agent 1 would not pursue the deal on her own, but this assumption is
not necessary for the model or its empirical predictions.
Parameter Restrictions
The original assumptions on the parameters are: π ∈ (0, 1), q ∈ (12, 1), 0 < β <
θ < 1, and q(1−θ) > (1− q)(1−β). Augmenting these original assumptions with the
additional restrictions from the six conditions just derived from our expected utility
assumptions, we can identify the parameter space for which the model holds. The
derivation is presented in Appendix 1.A.1.
Given that π ∈ (0, 1), U(0) < 0 < U(1), and q ∈ (12, 1), let φπ = π
1−π ∈ (0,∞),
φU = −U(1)U(0)∈ (0,∞), and φq = 1−q
q∈ (0, 1). Our expected utility conditions require
the following parameter restriction:12
φπφU < φq <
1− θ1− βθ
βφπφU√φπφU
The conditions containing θ, β are then satisfied when θ, β −→ 0 and θβ−→ +∞ .
In other words, the probability of receiving a terrific signal (under either state of the
12To cover the case of E[U |σi = T, σj = B] < 0, we can add the additional optional constraint
that φπφU < βθ .
17

world) needs to be small, but the probability of terrific signal needs to be far greater
in the profitable state than in the unprofitable state.13
1.2.4 Equilibrium for the Information Acquisition Game
Agents 2 and 3 simultaneously decide whether to acquire a private signal at cost
c. Once any signals have been acquired, the three agents vote. It was assumed that
agent i ∈ {1, 2, 3} votes in favor of funding the project if and only if:
1. she acquired a signal and the signal is favorable, σi ∈ {G, T};
2. she did not acquire a signal and based on her current beliefs she expects the
project to be profitable.
We refer to an agent who has acquired the private signal as being informed and
an agent who has not as being uninformed. While it is not directly revealed whether
agent 2 and/or 3 are informed, the sourcing agent does knows whether the other
non-sourcing agents are informed, because she is aware of the parameters forming the
cost of information acquisition.
After characterizing the Nash equilibria for the information acquisition game,
we will show that this voting rule forms a symmetric Bayes-Nash equilibrium. For
this equilibrium, the voting rule is optimal and the agents vote sincerely (Austen-
Smith and Banks, 1996; Persico, 2004), and the proof of the voting rule optimality is
presented in Appendix 1.A.4.
First, we show that there does not exist an equilibrium with both agents 2 and 3
acquiring the costly private signal.
13A computational simulation finds a broad set of parameters for which the identified equilibriawill hold.
18

No Equilibrium with Both Agents Acquiring a Signal
There is no Nash equilibrium in which both agents 2 and 3 acquire the costly
private signal. The full proof is presented in Appendix 1.A.2, but the intuition for it
is as follows.
We show that it is not optimal for agent 3 to also acquire a signal if agent 3
anticipates agent 2 acquiring a signal. By the specified voting rule, agent 3 anticipates
agent 1 voting for the project (as agent 1 would not have brought the project to the
VC firm unless σ1 ∈ {G, T} and by the voting rule, an agent with a favorable private
signal votes in support of the project) and anticipates agent 2 voting for the project
if and only if σ2 ∈ {G, T}. If it turns out agent 2 has a favorable signal, both agents
1 and 2 will vote in support in which case the project will be funded irrespective of
agent 3’s vote. If instead σ2 = B, then agent 1 will vote for and agent 2 will vote
against and, in that situation, agent 3 is the pivotal vote.
Given agents 1 and 2 acquire signals, agent 3’s vote is pivotal only when the
other two agents split their votes, i.e. one received a favorable signal and the other
an unfavorable signal. Given that signals are independent and the symmetry in the
model, the beliefs of agent 3, conditional on agents 1 and 2 splitting their votes, are
just her beliefs prior to any information acquisition. Given that it is assumed a single
favorable signal is insufficient to find the project worthy of funding, for agent 3 to
acquire a signal and then voting in favor when the signal is favorable could only result
in funding a project that is not worthy. We conclude there are no equilibria where
both agent 2 and agent 3 acquire the private signal.14
14Consequently, a larger group does not necessarily translate into a more efficient decision, becausewhen the voting rule is a number less than the group size, the remaining agents beyond the votingrule threshold may choose to remain uninformed.
19

Equilibrium with One Agent or No Agents Acquiring a Signal
Consider a strategy pair in which agent 2 acquires a signal and agent 3 does not
acquire a signal. For agent 3, we know from the preceding analysis that she will prefer
not to acquire a signal, so her strategy is optimal. By the voting rule, she will vote
against the project because she has expected utility of E3[U |σ1 ∈ {G, T}] which is
assumed to be negative.
Agent 2 expects agent 1 to vote for the project—agent 1 brought the project to
the firm so he can assume that σ1 ∈ {G, T}—and agent 3 to vote against it. Thus,
agent 2 is the pivotal voter. If he does not acquire a signal then, like agent 3, he will
vote against the project and, therefore, his payoff is zero. If he acquires a signal, his
expected utility is
Pr(σ2 ∈ {G, T}|σ1 ∈ {G, T})E[U |σ1 ∈ {G, T}, σ2 ∈ {G, T}]
+ Pr(σ2 = B|σ1 ∈ {G, T})× 0
= Pr(σ2 ∈ {G, T}|σ1 ∈ {G, T})E[U |σ1 ∈ {G, T}, σ2 ∈ {G, T}].
Thus, acquisition of the signal is optimal if and only if the cost of information acqui-
sition c is less than a critical threshold c equivalent to the above expression, which is
derived in full in Appendix 1.A.3.
Pr(σ2 ∈ {G, T}|σ1 ∈ {G, T})E[U |σ1 ∈ {G, T}, σ2 ∈ {G, T}] ≥ c
⇔ c ≡ πq2U(1) + (1− π)(1− q)2U(0)
πq + (1− π)(1− q)≥ c
If c ≤ c, then it is optimal for agent 2 to acquire a signal given agent 3 does not.
We already showed that for all values of c, it is optimal for agent 3 not to acquire a
signal given agent 2 does. In summary, if c < c, then it is a unique Nash equilibrium
20

for one of those two agents to acquire a signal and the other not to acquire a signal.
If instead c > c, then it is optimal for agent 2 to not acquire a signal given agent 3
does not. By symmetry, we conclude that if c > c, it is the unique Nash equilibrium
for both agents not to acquire signals.
For this equilibrium, the voting rule is optimal and the agents vote sincerely
(Austen-Smith and Banks, 1996; Persico, 2004), and the proof of the voting rule
optimality is presented in Appendix 1.A.4.
1.2.5 Theorems
This stylized model shows that the information aggregation benefits of voting
in a committee can be offset by including endogenous individual costly information
acquisition since uninformed agents continue to vote. We conclude the following:
Theorem 1
∃c > 0 s.t.
(a) If c > c, the Nash equilibrium has agents 2 and 3 not
acquire
(b) If c < c, the Nash equilibrium has agent 2 (or 3)
acquire the signal.
When the cost of individual information acquisition is high, then the other agents
without the endowed private signal are not incentivized to acquire the private in-
formation. When the cost of individual information acquisition is low, then one of
the other agents will acquire the tacit information. Under Theorem 1a, the VC does
not fund the investment, and the angel investor will fund it when σ1 = T . Under
Theorem 1b, the VC funds it when σ2 ∈ {G, T}, and the angel investor does not fund
it.
21

Theorem 2 @ an equilibrium in which both agents 2 and 3 acquire the private signal.
Informally, there is no equilibrium where both agents 2 and 3 acquire the private
signal because you only need as many informed agents as there are votes needed to
reach the predetermined voting threshold. This particular theorem has no implica-
tions for our empirical study, but it is a matter of theoretical interest.
1.2.6 Empirical Hypotheses
Focusing on the critical threshold c for the cost of acquiring information, we
produce three testable empirical hypotheses.
First, we look at how c changes relative to different levels of the public information
π. We analytically show in Appendix 1.A.5 that the comparative statics of c imply
dc
dπ> 0
For larger π, there is a higher acceptable cost threshold c. In other words, the
acceptable cost of acquiring the private signal is increasing in the public information,
or the baseline probability of a profitable investment. It is thus more likely that
agents 2 or 3 will acquire the private signal and thus make it more probable that they
would vote for the possible project. If we take the public signal representing explicit
information to be characteristics observable to the econometrician, this result leads
to the following hypothesis.
Hypothesis 1 Projects funded by an angel investor will have lower π than projects
funded by the VC. They will on average appear worse on observable characteristics.
Observable characteristics include types of information that can easily and cred-
22

ibly transferred between parties.15 In our setting, we will interpret that as easily
observable characteristics of the firm and its founding team, such as the pedigree of
the founders and the age of the firm.
Second, consider the relationship between c and c. Recall that if the cost c exceeds
c, then none of the non-sourcing agents engage in costly information acquisition. In
that case, the organization is certain to reject the project. When instead the cost of
a signal is less than c, then it is still possible that the project may be funded.
Hypothesis 2 Projects funded by an angel investor will have higher c than projects
funded by the VC. They will on average have a higher cost of information acquisition.
As noted before, tacit information is more costly (harder) to acquire than ex-
plicit information since it requires experiential contact between the investor and en-
trepreneur. We will use geographic distance between the investor and the entrepreneur
as a proxy for the cost of information acquisition, as in Sorenson and Stuart (2001),
who argue that information about potential investment opportunities generally cir-
culates more within proximate geographic spaces. There is extensive work in both
the teams (e.g. Clark and Wheelwright, 1992) and multinational (e.g. Ahearne et al.,
2004) literature showing that distance increases the cost of information exchange. In
our setting, the other partners of the VC organization will be less likely to acquire
costly tacit information since it is more costly for the non-sourcing agents to visit the
physical office and meet the full team of the venture, which only the sourcing agent
would have already. Thus, they would be less likely to be informed and then less
likely to invest as suggested by the model.16
15In the finance literature, this might be thought of as “hard” information, which is generallytaken to mean quantitative type information (Petersen, 2004).
16There are also a number of cognitive and behavioral measures that may drive up the cost ofinformation acquisition, but we omit discussion on that in this work.
23

Figure 1.2 presents the the implication of the public signal content and information
cost for investment vehicle outcome as discussed in Hypothesis 1 and Hypothesis 2.
For c(π) where dcdπ> 0, there is an equivalent relation π−1(c). If π > π−1 then the
VC invests. If π < π−1, then the angel investor invests.
——————–Insert Figure 1.2——————–
Third, the comparative statics presented in Appendix 1.A.5 also produce the result
that
dc
dq> 0
For larger q, there is a higher acceptable cost threshold c. In other words, the ac-
ceptable cost of acquiring the private signal is increasing in the information content
of the private signal. It is thus more likely that agents 2 or 3 will acquire the private
signal if the private signal is more informative.
Hypothesis 3 Projects funded by an angel investor will have lower q than projects
funded by the VC. There will be less information content in the private signal in
investments done by the angel relative to those done by the VC.
This result should be fairly intuitive, but unfortunately it is difficult to test in
the data, since there is no clear empirical measure for a private signal, which is pre-
sumably private to to the researcher.17 We empirically proxy for this by looking at
the employing VC firm’s experience in a given category (business model, technology
method, or technology platform). Since tacit knowledge, represented by the private
signal, is developed through experience (e.g. Lam, 2000), then it will be more infor-
mative for the other non-sourcing agents of the firm to evaluate the deal if they are
already experienced in that category. For example, imagine an investor evaluating
17Tacit to the partners is still tacit to the econometrician!
24

a deal in the business model category of Software as a Service (SaaS). There are
specialized aspects to evaluating that type of business that are developed experien-
tially, such as predicting the product-market fit, knowing the optimal management
style, and understanding key performance indicators18 (e.g. annual recurring revenue,
bookings, churn). These are all things that would be developed and honed through
practical experience working with and investing in SaaS businesses, and thus tacit
information would be more informative when an agent evaluates a future deal in the
space.19
These are the three main hypothesises we will test empirically. We make no predic-
tions about the distribution of financial performance between the angel investor and
their employing VC, but we document performance metrics as a matter of empirical
interest.
1.3 Organizational Forms
in Entrepreneurial Finance
We focus our study on two organizational forms tailored to entrepreneurial finance,
venture capital and individual angel investors.
1.3.1 Venture Capital Firms
Venture capital (VC) is a subset of private equity that originated in the 20th
century designed to provide financing, usually equity financing, to early stage, high
18The reason that the key performance indicators for SaaS would not necessarily fall into costlessinformation in the public signal is that the metrics are not actually true financial metrics (revenue,profit), but are meant to be taken as a whole and interpreted qualitatively.
19A primary endogeneity issue with this proxy is that if a VC firm is experienced in a givencategory, then they would also be more prepared to add value to the investment ex post via mentoringand advising. This effect would bias the results towards more venture capital investments and awayfrom angel investments.
25

potential startup businesses. There is an extensive literature on the subject spanning
the last three decades (e.g. MacMillan et al., 1986; Sahlman, 1990; Bygrave and
Timmons, 1992; Hsu, 2004). Much like the broader category of private equity, which
includes leveraged buyout and mezzanine type investments, venture capital firms in
the United States are a financial intermediary, most commonly structured as a general
partnership20 composed of general partners who manage and invest the funds put up
by limited partners,21 which include public pension funds, family offices, and others.
The venture capital firm raises money from limited partners in discrete funds that
have around a 10 year lifespan before the money is returned to the outside investors,
due to the illiquidity of the market for private equity in startup businesses. The
general partners of the firm are paid through a management fee, a set proportion
of the funds under management, and the carry, a percent of the profits, which are
conventionally set at 2% and 20% respectively. In addition, the general partners have
their own capital invested in the fund, usually representing around 1% of the fund.
The general partners have complete control over the day to day management of the
limited partner fund.22 Some subset of the partners, if not all of them, are investment
professionals dedicated to sourcing, conducting due diligence (collecting information),
decision-making, and executing investments into startups; after the investment, the
venture capital firm works to add value to their investments through official channels
20The general partnership structure of venture capital firms provides tax advantages and is flexiblewith respect to allocation of losses and profits and management of the partnership. The partnersare theoretically personally responsible for the liabilities of the general partnership, which does notinclude liability incurred by the fund itself, so liability risk is functionally irrelevant.
21The first venture capital limited partnership was established in 1958, because they were exemptfrom various securities regulations requiring disclosure. They soon supplanted the closed-end fundstructure, which was publically traded and sensitive to the whims of finicky unsophisticated investors(Gompers and Lerner, 2004).
22Interestingly, venture capital firms have “virtually no general legal obligation to behave in thebest interest of their investors” (Rosenberg, 2002). It is presumed that they act in the best interestof their investors, as acting otherwise may hurt their individual and group reputation and thus hurttheir ability to raise future funds and accrue future profits.
26

such as board membership or unofficially through mentorship and advice, with the
eventual goal of bringing the investment to an exit opportunity, namely an acquisition
(M&A) or initial public offering (IPO) event. When we refer to partners in this paper,
we specifically mean investment partners; other non-investment focused employees of
the firm may carry the title of partner, but they are not included in the study. The
composition of the general partners is of utmost important to the performance of the
VC firm: Ewens and Rhodes-Kropf (2015) argue that the partners’ human capital is
two to five times more important than the VC firm’s organizational capital.
By the time of the internet boom of the 2000s, nearly all domestic venture capital
firms were structured as general partnerships, and the consequence is that venture
capital firms have taken a less hierarchical structure to their operations than other
kinds of businesses. The firms are small, with small numbers of partners and support
staff. The partnership model has become so dominant that even in cases where the
firm may not have to be legally structured as a general partnership, such as the case of
corporate venture capital or non-U.S. venture firms, they often take the implicit non-
hierarchical if not legally codified structure of a partnership, and will refer to members
of their management team by the title of partner. Regardless of the legal structure,23
the standard decision making process in this industry is non-hierarchal and jointly
made by the de facto if not de jure investment partners in the context of a committee.
We confirm and document the existence and role of this group decision-making stage
through semi-structured interviews conducted with employees of 19 venture capital
firms; a limited discussion of these interviews is presented in Appendix 1.B.1.
The relatively flat hierarchal structure has consequences for the deal sourcing
23As the Limited Liability Company (LLC) entity form has grown more popular across all typesof businesses in the United States, many venture capital firms have taken this legal structure whilestill maintaining the partnership organizational form; the LLC entity has grown more popular sincethe firm can elect to implement the pass-through taxation of a partnership with the limited liabilityof a corporation.
27

process. Each investment partner is responsible for contributing to the deal flow
by finding and bringing in possible investment opportunities. The potential deals
are sourced by the partners themselves; the partners are assisted by more junior
associates in larger firms, but a deal coming into the firm is generally associated
with a particular partner. The partners source potential deals in a variety of ways,
including introductions from their personal networks, solicitations from entrepreneurs
with no prior connection to the partner, and public news (Hoyt et al., 2012; Shane
and Cable, 2002). From the set of all investment opportunities she sees, the partner
then pre-screens for the highest quality investments to select the set she would like
to bring up for consideration by the full partnership.
Once it reaches the full partnership, the partners jointly make a decision on
whether or not to act on the investment opportunity. The entrepreneur will be invited
to present to the firm at the regularly occurring partnership meeting, which custom-
arily occurs on Mondays. The sourcing partner will share her information with the
rest of the firm and argue in favor of the investment. Since the perceived quality of
the deal has career and financial implications for the sourcing partner, the sourcing
partner will normally speak in favor of the potential deal as she will get pecuniary
and reputational credit for it if the investment turns out to be a good one. Often,
the sourcing partner will end up taking a board seat or advisory role in the startup
if they invest. Since the other partners know that the individual partner will benefit
from having her own deals executed, there may be some discounting of the partner’s
information, and the other partners will have to acquire their own information to
make a fully informed judgment.
There are many reasons the firm may not invest. Other partners may decide the
investment is of poor quality, for example if they were to believe it has too small
a potential market size, has a weak management team, or lacks product-market fit.
28

This belief is likely in contrast with the belief of the sponsoring partner, who clearly
believed the deal had merit. The other partners may have acquired their own private
information on which to judge the investment, or they may not believe the information
provided by the sourcing partner and also fail to acquire their own.
Some VC firms have an investment thesis, a formal or informal statement that
jointly represents the firm’s ex ante plan about the types of businesses they want to
invest in. This investment thesis is based upon what the partners believe to be the
best path towards reaching the ideal level of risk and return for their portfolio, based
upon the information known to them when the thesis is written. The investment
thesis may proscribe a number of target specifications on investment size, investment
stage, industry, geography, and management team profiles.
An investment thesis is generally not legally binding, either to the general part-
nership entity or to any of its limited partnership funds. Thus, the VC firm can freely
invest outside of the bounds of the thesis, and the majority of firms will do so. For
example, Union Square Ventures’s investment thesis states that they seek to invest
in “large networks of engaged users, differentiated through user experience, and de-
fensible through network effects.”24 They have invested in a number of startups that
are only peripherally related or unrelated to that thesis, including enterprise drones
and financial technology. The investment thesis represents an aspirational goal–and
indeed the majority of the portfolio is related to the stated thesis–but it is by no
means a requirement for venture capital firms.
1.3.2 Angel Investors
At the other end of the spectrum of organizational sophistication in entrepreneurial
finance, there are individual investors, known as angels. There is a growing but rela-
24As described on the Union Square Ventures company page.
29

tively limited academic literature focusing on this form of financing.25 Angel investors
take on all the roles of the venture capitalist, including deal sourcing, pre-screening,
evaluation, and then the final decision, all rolled up into one person. These angel
investors are generally affluent, as they must be accredited by the securities commis-
sion of their home country: in the United States, an accredited investor must have a
net worth of at least $1 million, not including the value of their primary residence,
or they can have an income over $200,000 each year for the last two years (in other
words, they have to have enough money such that they can afford to lose their money
on their risky investments). Angels generally make equity or convertible debt invest-
ments, just like venture capitalists. Angel investors come from various backgrounds:
many are current and former executives and entrepreneurs, while a smaller subset
are pure full-time angel investors. Since angel investors use their own funds to make
investments, they have less access to capital than a venture capital firm and make
smaller investments; smaller investments happen earlier in a startup’s lifecycle, so
they often invest earlier than VCs.26
There is a small existing literature on angel investment that mostly focuses on the
differences and conflict between angel investors and venture capitalists. On average,
angel investors occupy a different niche in entrepreneurial finance, serving younger,
less capital intensive startups (Lerner, 1998). Hellmann and Thiele (2014) study the
interaction between angel and venture capital markets. Goldfarb et al. (2013) argue
that angel objectives align more with entrepreneurs than VCs, and that outcomes may
be linked to conflicts of interest; they find that deals with more angel investors have
25For example, Kerr et al. (2014) find in a discontinuity analysis that ventures backed by angelsin syndicates have improved survival, exits, employment, patenting, Web traffic, and financing thanthose not backed.
26The term “angel round” has entered the parlance and is used to mean what might also bereferred to as a seed round, which happens before a series A round. However, this terminology doesnot mean that angel investors do not participate in venture rounds, and they may also make venturesized investments.
30

weaker cash flow and control rights, and experience longer times to resolution. Larger
deals financed by VCs alone are most likely to experience successful liquidation.
Angel investors have also been used as a setting to study individual decision mak-
ing. Maxwell et al. (2011) find that angels use a shortcut decision making heuristic
which they refer to as elimination-by-aspects to reduce the available investment op-
portunities to a manageable size. Huang and Pearce (2015) study the role of gut feel
in angel investor decision making.
In this paper, we focus on a particular kind of angel investor: partners of venture
capital firms. We refer to these individual investors as angel partners. By focusing
on this subset of angel investors, we get around one of the empirical challenges with
studying angel investors: they are by no means a homogenous group, and they vary
heavily by skill, background, and personal motivation. As expected, there are sub-
stantial differences between the partners of venture capital firms and angel investors
with other backgrounds. First, angel partners presumably still have access to the
skills and professional network that they use while employed as a full-time venture
capitalist. These skills can include deal evaluation (e.g. more experience looking at
startups), deal execution (e.g. familiarity and access to the legal documents used by
their employing firm), and post-deal value add (e.g. hiring support). Second, they
see a lot more possible deals than a part-time angel investor, as they are compensated
to look at deals full time. Thus, they have a larger pool of deals to choose from, even
conditional on some of those deals going to their employer. Third, given their full-
time employment in financial services, many of these angel partners are of ultra-high
net worth and can make larger angel investments approximating a smaller venture
investment in the seed, series A, or series B rounds.27
27Since an angel partner is likely wealthier than the average angel, she is also more capable ofdefending her fractional ownership share of the startup by using a contractual pro rata right toinvest more funds in the next round of financing to maintain her original proportion of ownership.
31
The partners of venture capital firms are more sophisticated than the average an-
gel investor on nearly all dimensions and comparable in process and performance to a
venture capital firm. In Figure 1.3, we provide basic descriptive information generated
from the Crunchbase data about that difference. VC affiliated angels, as compared
to non-VC affiliated angels, make more investments, make larger investments, and
participate in later funding rounds, but participate in similarly sized investment syn-
dicates. In other words, angel partners make investments closer to and in the territory
of venture capital firms.
1.4 Empirical Setting: Angel Investments
by Venture Capital Partners
The particular empirical setting we study is perhaps best illustrated by an anec-
dote. C. Richard “Dick” Kramlich was a founding partner at New Enterprise Asso-
ciates (NEA), which he founded in 1978 after leaving Arthur Rock and Co., where
he began his career. An entrepreneur named Rob Campbell was seeking additional
venture funds for his computer software company Forethought, Inc. He was working
on a new program called Presenter, which generated text and graphics for overhead
transparencies. The company was mired in a variety of logistical, engineering, and
financial issues: the engineering on the product was delayed, their largest distributor
went into Chapter 7 bankruptcy, and they were running out of investment money
fast. They approached New Enterprise Associates for additional funds. The partners
of NEA disagreed on whether to invest in Forethought—they were unsure about the
company and they did not like Campbell either—and they ultimately decided not
to invest. Dick wasn’t ready to let it go so easily. He believed there was something
special about the firm and its product, beyond what the current observable state of
32

the firm would suggest. He asked his partners if he could pursue the investment on
his own, with his own money. Since the investment was not in conflict with anything
in the existing portfolio, they gave him the go ahead. He called his wife to tell her
“Pam, stop work on the house. I’m going to fund this company myself”. The com-
pany survived, and in early 1987 they renamed their main product “PowerPoint”.
In August of the same year, just four months later, Microsoft acquired ForeThought
for $14m USD cash (1987 value), a lucrative exit for everyone involved. Microsoft
eventually integrated PowerPoint into its Office suite of desktop applications, and the
rest is history (Goldfine and Geller, 2011).
1.4.1 Conditions on Angel Investments by Partners
The identification of individual vs. group investment decisions comes from the
phenomenon of venture capital firm partners and other employees who also make
angel investments on the side with their own funds. As a requirement of employment
with the venture capital firm, the partners have a fiduciary duty to the venture capital
firm first. In legal terms, the partners owe a duty of loyalty to the partnership, and this
duty requires all partners to disclose any potential opportunity that the partnership
entity would potentially be interested in taking. They then have to wait until the
partnership passes on the opportunity before they can personally engage on it.
Accordingly, the venture capital firm must always have right of first refusal on
any possible deal, and the employee can only invest in deals that the firm would not
do. In addition, the deal cannot be in conflict (i.e. in competition with) with any
current investments already in the venture capital firm’s portfolio and any probably
future investments the firm expects to make. We should also note that not all venture
capital firms allow their partners to make outside investments of their own,28 so we do
28 Bill Bowes at US Venture Partners has stated that they do not allow this (Goldfine and Geller,
33

not include the universe of venture capital firms. We only study venture capital firms
that have partners who make angel investments, which is still represents a substantial
proportion of venture capital firms.
We can observe investments made by the venture capital firm and those rejected by
the venture capital firm and invested in by its partners through an angel investment.
This empirical strategy partially addresses the risk set problem facing empirical work
in venture capital: we normally cannot know what investments were rejected by
the venture capital firm, and now we can observe at least a portion of them. As
noted before, since there is so much heterogeneity among the general category angel
investors, the sample gives us a better composed set of angel investors, who are
skilled and have access to the same information and resources as VCs, and can be
then directly compared to venture capital firms.
Our study still faces the two-sided matching challenges in much of the literature:
we cannot officially discern whether the entrepreneur had any choice in whether to
take the partner’s personal angel investment or the VC firm’s, but it is assumed that
the entrepreneur would have to take the venture capital investment if offered, because
the partner is not allowed to make a competing angel investment cross-bid.
1.4.2 Alternative Scenarios
There are plausible alternative stories for the partner angel investments we ob-
serve. In the most extreme case, the partner may withhold and hide potential invest-
ments from their employing firm or in a lesser form, she may intentionally undersell
the quality of a deal if there is a certain “home run” investment opportunity and the
partner wants to fully capitalize on the gains.
If the investment opportunity is withheld, the venture capital firm does not have
2011).
34

a chance to consider the investment, but our interviews with venture capital partners
suggest this is highly unlikely. A partner acting otherwise would face the consequences
of legal action by the firm and its limited partners (outside investors). Beyond di-
rect legal consequences, there would be significant reputational costs that translate
directly into future financial costs in an industry based heavily on network connec-
tions and syndication activity. The network of investors and entrepreneurs is fairly
small and geographically concentrated, and secrecy would be difficult to maintain;
additionally, the sample we study is only of publicly known investment events. While
there is a possibility of incentive compatibility issues, both the formal legal barriers
and reputational costs of hiding possible investments suggest it is highly unlikely and
would not be a dominating factor driving the observed phenomenon.
In a related but weaker version of the withholding story, a partner may disclose
but intestinally undersell the quality of an investment so that the VC firm will then
pass it up and so the partner can capture it for herself. We cannot empirically rule
out this possibility, but this story is still consistent with the theory we have proposed
in Section 1.2. A partner that is underselling the quality of a deal does so by making
the available public signal π artificially low by failing to disclose relevant explicit
information to her partners. Hypothesis 1 states that a potential investment with
lower π are more likely to be passed on by the VC firm and then be taken up by an
angel partner.
Our model is agnostic to return proportionality: if a partner takes a deal on
their own, then they stand to have more exposure to both the upside and downside
of a potential deal since they capitalized on all the returns and not just the carry
compensation from their VC firm. This proportionality does not change the sign
of the risk-adjusted net present value of a possible investment. One could make an
argument about the differential need for risk-return levels in a VC vs. an individual.
35

For example, perhaps the partners know that the VC needs high-risk high-return type
investments, while angels can live with low-risk low-return type investments. While
this is plausible true, the empirical results presented in Section 1.7 are not consistent
with this story, as the angel partners invest in deals that are observable weaker, and
presumably riskier.
In another case, the partner may fail to bring a potential investment to their em-
ploying firm if she does not believe that the firm will act on the potential investment.
The partner may have prior information that suggests to her that the venture partners
will likely vote no regardless and that bringing the investment up to a vote would be
a waste of time and reflect poorly on her sourcing skills. For example, the potential
investment may be in a sector that does not fit the traditional investment pattern of
the venture capital firm, often codified as an investment thesis discussed in the prior
section.29 Let us assume that the partner is correct, and that the venture capital firm
would indeed not act on the investment. Again, similarly to the extreme case, we in-
terpret this again as the extreme case of where the partners share a low public signal,
and therefore do not bother expending the cost to acquire private information. As
another example, deals that are “too small,” i.e. need only a small amount of capital,
may not merit a full discussion by the firm and would be passed upon immediately
because it would be perceived as not capital efficient by the firm. This possibility
would still fit into the model, as there is likely a fixed cost to conducting due diligence
on a deal (acquiring the private signal), and the possible profit from the deal would
not be perceived as justifying the financial and cognitive costs of evaluating it.
29There is an interesting philosophical question here: if an investment is considered good enoughthat a partner would invest in it, is it really outside of the purview of the venture capital firm tomake the investment? The investment ability of the firm is captured by the aggregate ability ofthe partners themselves, and the venture capital firm could simply structure its decision-makingprocess to capture these deals by allowing the partners to make individual independent decisions oninvestments without the group decision stage.
36

Regardless, we agree that it would be more empirically interesting to compare
deals that are clearly within the purview of the venture capital firm and the angel
investor. We introduce a number of industry, investment size, and round characteris-
tics to control for this, and we also estimate a matching model that directly addresses
this issue.
1.5 Data
1.5.1 Sample Construction
The main dataset is constructed from the universe of venture capital and an-
gel investment rounds from January 1st, 2005 to December 31st, 2013, as identified
in CrunchBase. This set contains firms founded before and during the observation
window, as long as they raised a round in our observation window. CrunchBase
is a database of startup firms and affiliated people (employees, board members,
etc.), financial organizations, and service providers. The database is operated by
TechCrunch, a news website and AOL Inc. subsidiary focused on firms in the infor-
mation technology sector; accordingly, the data oversamples firms in the IT sector
relative to biotechnology and other industries. Much of the data, particularly on in-
vestment events, is entered by TechCrunch staff based upon their own reporting and
SEC Form D filings. A large component of the data is crowdsourced : registered mem-
bers of the public may make submissions to the database which are then reviewed
individually by moderators working for TechCrunch. CrunchBase is also synced up
with AngelList, a website for matching between startups and angel investors, giving
us additional coverage of angel investments.
CrunchBase has superior coverage of angel investment events relative to the more
traditional venture capital database of VentureXpert/Venture Economics (now part
37

of ThomsonOne) used in much of the earlier venture capital literature (Bygrave, 1988;
Gompers and Lerner, 2004). To check the coverage of CrunchBase data, Block and
Sandner (2009) compared a sample of CrunchBase data with statistics published by
the National Venture Capital Association (NVCA), and they find that the number of
investment events in the CrunchBase data accounts for about 97% of the Internet-
related deals as reported by NVCA (amounting to about 21% of all VC deals).
We identified all individual angel investors whose primary occupation is in a fi-
nancial organization that has made an investment into a startup in our sample. We
include investors even if they were employed at their financial organization for only a
portion of our observation period, but this represents only a minimal portion of the
sample. We only retain firms that were identified as either a venture capital, private
equity, or angel stage investment firm, but we refer to these collectively as venture
capital.30 The final full sample consists of 879 unique individuals making investments
out of 726 venture capital organizations into 8342 different startups. We construct
the data at the investment-level, so each observation represents an investment by
either the VC or the angel partner.31
30We classified each of these financial organizations into venture capital, private equity, corporateventure capital, angel investment firm, seed accelerator/business incubator, or a family office. Theclassification was made using information from the website of the respective firm. Venture capitalfirms were defined as those who have the stated strategy of investing in early-stage, growth startupsand who manage money on behalf of outside investors (limited partners). Private equity firmswere distinguished from venture capital firms as those that also made leveraged buyout, mezzaninecapital, distressed, and secondary investments, although they could have also made traditionalventure capital investments in our time period. Corporate venture capital is a venture capital firmmaking investments on behalf of a corporation that is not primarily engaged in investment. Angelinvestment firms specialize in making seed stage investments, either with funds directly held bythe firm or by an outside limited partnership as in traditional venture capital. Seed acceleratorsand business incubators make fixed size investments and also offer participation in a fixed-termcohort-based program which may include office space and mentorship (in almost all cases). Familyinvestment firms are those firms that primarily make investments on behalf of a single individual orfamily and are also managed by that individual or family.
31We also constructed a dataset that restricts the set of investments made by venture capitalfirms to those that are confirmed to be “approved” by the individual investors in our data. Weidentified “individually approved” investments by identifying investments where the focal investor“led” the investment into the venture and thus holds a board or executive position in the startup.
38

1.5.2 Entrepreneurial Venture: Observable Characteristics
To study the distribution of observable characteristics that make up the public
signal in our theoretical model and thus test Hypothesis 1, we construct a number
of entrepreneurial firm characteristics at the time of the investment event, primarily
based upon characteristics of the founding team. The age of the startup at the funding
round is taken as the number of days between the founding date and the investment
round; a younger age is considered riskier because there is less of an explicit financial
track record to evaluate the startup on. To identify the founding team, we identify
individuals formally associated with the startup and who have listed themselves as a
founder in their job title. Firms in about half our sample, for both venture capital
investments and partner investments, disclose this information. For each founding
team member, we build educational characteristics using CrunchBase profiles sup-
plemented with public LinkedIn information to identify whether they have an MBA,
a PhD, a regular masters degree, and if they attended an “elite” institution,32 and
whether or not they studied engineering. We then aggregate this to the firm level
by identifying whether or not the founding team has at least one founder with a
given educational characteristic and averaging the number of founders with a given
education characteristic. We construct a measure of founder age by averaging over
the imputed age of the founders, which we determine by making assumptions about
their age given their graduation year.33 We also study whether any of the founders
Unfortunately, this sample was omitted from the paper because a large amount of data was missingin a systemic way as to introduce bias: we cannot observe cases where the focal investor led theinvestment for the venture capital firm but did not take a position in the startup or did not publiclydisclose it. We suspect that the public disclosure of the board member is a non-random choice bythe investors.
32We identify “elite” educational institutions as those in the top 25 US national universities andthe remaining top 25 non-US universities that were not in the US list, as defined by US News &World Report in 2015.
33Ages are assigned by assuming the founder is a certain age at the graduation year of thelowest degree they list. We assume a founder is the following age at graduation: high school is 18,bachelors degree is 22, master degree is 24, JD is 25, MD is 26, PhD is 27, and MBA is 30. All
39

have prior entrepreneurial experience and measure the count of previous startups the
founding team established that received any equity financing.
1.5.3 Entrepreneurial Venture: Financial Performance
While we make no predictions about financial performance, differences in financial
performance of investments by angel investors vs. venture capital firms is certainly of
empirical interest and included for such reason. We construct a number of outcome
variables to evaluate investment performance as commonly used in the entrepreneurial
finance literature. We use future funding rounds as a proxy for firm survival, with
measures of whether or not the firm achieves any future funding rounds and the
count of future funding rounds. We gauge financial performance with dichotomous
variables on the achievement of a merger and acquisition (M&A) event or an initial
public offering (IPO). We also have exit valuations for all firms which underwent an
IPO and for some of the firms undergoing an acquisition, i.e. for any case where the
final exit valuation was publicly reported.
1.5.4 Controls
There are a number of controls and matching criteria that need to be implemented.
First, angel investors tend to make smaller investments than venture capital firms,
due primarily to liquidity constraints (the individual partner has less access to capital
than his employing venture capital firm which has raised money from outside limited
partners) but also due to both risk aversion (an individual angel investor faces full
exposure to the loss). For a given amount of funds raised, a round composed of only
angels tends to have more participants in the syndicate than a round composed only
ages are calculated for the year 2010, which is acceptable because we include year fixed effects in allempirical models.
40

of venture capital investors. Thus, we need to control for the size of the investment
being made and the number of participants in the round. Unfortunately, the size of
the investment of each participant in a syndicate is not available for most observations:
we accordingly control for the size of the total round as a proxy for the size of the
individual investment. Second, angel investors traditionally make investments into
earlier stages of the venture lifecycle, so we introduce round fixed effects controlling
for the particular stage of financing (seed, series A, series B, etc.). Third, we would
like to broadly control for across-industry heterogeneity, so we classify each firm into
a two digit North American Industry Classification System (NAICS) and introduce
industry fixed effects. Fourth, venture capital activity tends to follow the business
cycle (e.g. Gompers et al., 2008), so we introduce year fixed effects.
1.5.5 Information Acquisition Cost: Geographic Distance
To proxy for the cost of information acquisition and test Hypothesis 2, we look at
the geographic distance between investments and their investors. We calculate geo-
graphic distance between venture capital firms and their investments by calculating
the geodesic distance in kilometers between the two, i.e. the length of the shortest
curve between two points along the surface of a mathematical model of the earth
(Vincenty, 1975). Addresses of the venture capital firms and startups were collected
from CrunchBase and their public facing websites. For the majority of firms, we only
have either their zip code or their city, state, and country available: we assume they
are located at the geographic center of the most specific address we have. Since at
the within city level, our locations are only approximate, we left censor our data for
any geodesic distance less than 1 km and round that to 1 km. In the case of firms
that have multiple offices, we took the distance between the two closest offices, on the
assumption that the closest offices are likely the ones interacting. In our analysis, we
41

take the natural logarithm of the distance since the baseline distance measures are
heavily skewed, and the resulting logged distance distribution is substantially closer
to normal.
1.5.6 Tacit Information: VC Experience
To proxy for the information content of the private signal and test Hypothesis 3,
we look at the experience of the venture capital firm in specific categories. On Crunch-
Base, each startup can self-designate itself into a number of keywords. We then focus
on keywords placed into broad two digit NAICS codes which contain software, in-
ternet, and information technology firms.34 Each of these self-descriptive keywords
were classified into categories by business model, technology method, and technology
platform. The business models are business-to-business (B2B), business-to-consumer
(B2C), crowdsourcing, freemium, infrastructure as a service (IAAS), lead generation,
licensing, machine-to-machine (M2M), open source, peer to peer (P2P), platform
as a service (PAAS), and software as a service (SAAS). The technology methods
are advertising, information aggregation, data analytics, artificial intelligence, big
data, content management, crowdfunding, cyber security, e-commerce, gamification,
gaming, local, media streaming, modeling, operating system, payment, productivity,
sharing, and social media. The technology platforms are application, browser, cloud,
mobile, package, and website. The categorizations are not mutually exclusive: a firm
can fit into multiple categories if they list keywords that fit into multiple categories,
but each keyword is filled into an exclusive category.
For a given VC-venture or angel partner-venture investment round, an experience
measure is constructed for the investing or employing VC by taking the count of
34The main NAICS codes containing software, internet, and information technology firms are 33Manufacturing, 42 Wholesale Trade, 44 45 Retail Trade, 51 Information, 54 Professional, Scientific,and Technical Services, and 61 Educational services.
42

investments executed by the VC prior to the date of the focal investment round in
the category of the startup that is receiving investment. For ventures that fall into
more than one category, we take the value of the category for which the VC has the
most experience.35
1.5.7 Descriptive Statistics
Descriptive statistics for investment level data are presented in Table 1.1. We have
a much larger sample of investments by the venture capital firms than we do for angel
investments by their partners. Not unexpectedly, venture capital firms are on average
making larger investments in older firms, at an average round size of $13.17 million
and firm age of 1193 days while the angel partners invest at an average round size of
$4.04 million and firm age of 569 days. However, the different in the round number is
not as large as one might expect, where angel partners invest in an average round of
1.40 and the VC firms invest at an average round of 1.53. This difference is not very
large for a couple reasons. First, the nature of the startup firm lifecycle is that there
is a high death rate from round to round, so there are compositionally many more
early round investments than later round investments by the VCs. Second, there are
many venture capital firms that only do early stage investments, and these are usually
the smaller VC firms which actually represent most of the sample of VCs. Thus, the
high average round size and later firm age for the VC investments is driven by the
presence of relatively few outlier large and late stage investments made by the VCs,
which the angel partners cannot execute because they lack the financial capital to do
so. We have limited data on the founding team characteristics, with data for about
half the sample. A test of missing data on founding team characteristics is presented
35Empirical results are robust to taking the average experience over multiple categories for whenthe venture falls into multiple categories, instead of the maximum.
43

in Appendix 1.C.2.
——————–Insert Table 1.1——————–
1.6 Empirical Strategy
We propose empirical strategies to document the compositional differences be-
tween angel investments by VC partners and investments by their employing VC
firm and provide evidence in support of the empirical hypotheses suggested by our
theoretical model.
1.6.1 Main Model
To test Hypothesis 1 and to document differences in financial performance, we run
an ordinary least squares (OLS) model with organization fixed effects and year fixed
effects on the sample of investments we study. The organization fixed effects control
for time-invariant effects common to the members of the venture capital organization
and to the venture capital organization itself; the identification assumption being
made here is that the angel investor and their parent organization share the same
mean investment preferences and performance.36 We can conceptualize that prefer-
ence as skill to select investments that is now being controlled. We cluster standard
errors by organizational affiliation. This full sample is where we choose to test our
moderators.
For investment i by the firm or affiliated partner j at time t, we regress the
dependent variable of interest on Angelijt, an indicator for whether the investment
was taken by the partner (1) or the firm (0). Xijt represents a vector of controls,
36This assumption may not universally hold if we believe that there is persistent heterogeneity ininformation access or skill by the partners, such as documented in Ewens and Rhodes-Kropf (2015).
44

including the size of the funding round and the count of the investors in the syndicate.
αj represents a fixed effect for the affiliated VC organization of the investment. δt
represents a year fixed effect to control for the business cycle. ρi represents a round
number fixed effect. τi represents an industry fixed effect, where industry is defined by
the 2 digit NAICS code. β then is the coefficient of interest, and it shows the average
compositional difference in the dependent variable DVijt between investments by a
given VC and its angel partners, controlling for year, round, industry, round size, and
syndicate size.
DVijt = βAngelijt + γXijt + αj + δt + ρi + τi + εijt (Main Model)
We begin with the full set of angel investments by individual investors whose
primary occupation is in a financial organization and the set of venture capital in-
vestments by the venture capital firms that employ these individuals.
1.6.2 Matching Model
To address the issues of confounding compositional differences between the angel
partner and VC investments, such as differences in stage and industry, we introduce
a matching model where we match each angel investment one-to-one with a venture
capital investment made by their parent firm to further explore Hypothesis 1 and
financial performance. The primary issue with the first specification is that financial
constraints and investment theses limit the types of investments that can be made by
individual investors with respect to venture capital firms. The venture capital firms
have greater access to capital from their limited partners and thus can make larger
investments, which often happen at later stages. Angel investments are usually limited
to the earlier stages where the investors make smaller investments. The investment
45

thesis of a firm may place an cultural and implicit–but not legally or officially binding–
bound on the investments allowed within the venture capital firm. There are also
numerically many more venture capital investments than angel investments in our
sample. Starting with the full sample of angel partner investments, we match each
angel investment with the venture capital investment that is in the same 2 digit
NAICS class and closest in total round size and then round date, with a maximum
of $1 million different in round size. We drop angel investments that do not have a
match: these are cases where the venture capital firm makes very large investments
relative to the size of the angel investments made by their employees, which are general
venture capital firms making mezzanine or growth equity investments, which are closer
to what is generally classified as private equity. We run a similar investment-level
OLS regression as the full sample, and we use robust standard errors.
For investment i by matched pair p ∈ P and at time t, we regress the dependent
variable of interest on Angelipt as defined before, controls Xipt for round size and
syndicate size, year fixed effect δt, and round fixed effect ρi.37
DVipt = βAngelipt + γXipt + δt + ρi + εipt (Matching Model)
The summary statistics for the matching model are presented in Table 1.3.
——————–Insert Table 1.3——————–
Both the Main Model and the Matching Model analysis are meant to be descriptive
and intended only to describe the compositional differences in characteristics and
performance between venture capital investments and angel investments made their
partners. By construction, the main independent variable of Angel is not causal in
nature.37Matched pair fixed effects can also be included, but it is unnecessary since the sample is bal-
anced. Results are similar with the inclusion of matched pair fixed effects.
46

1.6.3 Geography Model
To test Hypothesis 2, we present a variation of the Main Model where the depen-
dent variable is now whether the investment goes to the angel partner or stays within
the VC, defined before as Angelijt. ln (Dij) represents the log distance (km) between
the VC firm and the venture, and it is logged because the distances are heavily skewed
and the log transformation makes it more appropriate for use in an OLS model. After
preliminary tests, the non-monotonicity of the effect of geographic distance became
obvious (see Figure 1.4 for a visual presentation), and accordingly a piecewise anal-
ysis of distance was deemed more informative. D[L,R)ij is an indicator variable for
whether the investment is between L kilometers and R kilometers away from the VC;
indicators are created for the bounds [100, 1000), [1000, 10000), and [10000, 100000).
This model is still estimated in OLS clustered at the organizational level, but it is
robust to other functional forms (probit and logit). These indicators are interacted
with ln (Dij) to illustrate the effect of distance for each range of distance. The same
vector of controls γXijt, organization fixed effects αj, year fixed effects δt, round fixed
effects ρi, and industry fixed effects τi are included as in the Main Model.
Angelijt =β1 ln (Dij)
+ β2D[100,1000)ij + β3 ln (Dij)D
[100,1000)ij
+ β4D[1000,10000)ij + β5 ln (Dij)D
[1000,10000)ij
+ β6D[10000,100000)ij + β7 ln (Dij)D
[1000,100000)ij
+ γXijt + αj + δt + ρi + τi + εijt (Geography Model)
47

1.6.4 Category Experience Model
To test Hypothesis 3, we present a model similar to the Geography Model. The
variables BusModelijt, TechMethodijt, and TechP latformijt represent the experi-
ence of the parent VC in the category of the investment as described in the data
section. The other controls and fixed effects are the same as in Geography Model,
with the exclusion of the industry fixed effects ρi.38
Angelijt =β1BusModelijt + β2TechMethodijt + β2TechP latformijt
+ γXijt + αj + δt + ρi + εijt (Category Model)
We test this model with both the full sample and a sample only containing in-
vestments for which the affiliated venture capital firm has non-zero experience in the
respective category, to address concerns about the bounds of an investment thesis.
1.7 Results
1.7.1 Hypothesis 1: Explicit Information
We find evidence in favor of Hypothesis 1. Table 1.2 and Table 1.4 present the
results on the analysis on observable venture characteristics with the Main Model and
Matching Model respectively. We focus here on the discussion of the results of the
main specification, but similar results follow in all samples. Coefficient signs generally
hold throughout the models, but statistical significance suffers as we lose power in
some of the subsample based models (round 1 and 2, matching).
38The model is robust to the inclusion of industry fixed effects. We choose not to include themhere, because we only analyze the sample of software, internet, and information technology firms forwhich we can define categories.
48

——————–Insert Table 1.2——————–
——————–Insert Table 1.4——————–
We find that individual partners invest in firms at a younger firm age controlling for
round stage, ranging from 348 days younger than their parent VC firm in specification
(2-1) and 129 days younger in specification (4-1). They invest in founding teams that
are statistically indistinguishable in size, which we made no prior prediction about.
The individual partners invest in founding teams that are significantly younger, 1.07
years younger in specification (2-4) to .90 years younger in specification (2-5); we do
not find a significant coefficient in (4-2). The founders have less prior entrepreneurial
experience, with .24 less firms founded that received venture investment in their
history in specification (2-1); the results on entrepreneurial experience are robust
across all specifications. Across the education metrics, the founding teams that the
individual partners choose to invest in have less formal education: fewer founding
teams have founders with graduate degrees, MBAs, PhDs, and training in engineering,
although statistical significance varies across specifications. For example, the angel
partners invest in founding teams that are 5.8 percentage points less likely to have any
graduate degree in specification (2-13). We find no significant results on the analysis
of graduation from elite ranked institutions. We find broad support for Hypothesis 1.
1.7.2 Hypothesis 2: Cost of Tacit Information Acquisition
Table 1.5 and Figure 1.4 show the results of our analysis of the effect of geo-
graphic distance on investment uptake between the partner and the firm, as a test of
Hypothesis 2. Table 1.5 is estimated using the Geography Model. There is a stark
non-linearity in the results. Up to about 1000km,39 greater distance is associated with
391000 kilometers is about 621 miles. The distance between San Francisco, CA and Seattle, WAis 1095km (681 miles). The distance between Boston, MA and San Francisco, CA is 4350km (2703
49

a higher probability of the investment being taken by the partner than the firm. After
1000km, more distance has a statistically insignificant effect. While further work has
to be done to explore the consequences of this, one possibility is related to the limits
of forms of transportation. Up to 1000km, it is feasible that the partner would make a
land-based trip via car or train to visit the potential investment, and as that distance
increases and approaches 1000km, it is less likely that non-sourcing partners would
come to visit that investment opportunity to acquire their own private signal. After
1000km, we would imagine that the partners would predominately fly to visit their
investments, minimizing the cost in effort to acquire information. Moreover, beyond
we might think that VC firms have a particular advantage over individual investors in
structuring geographically disparate investments: for example, international invest-
ments face alternative legal and coordination barriers that the VC firm may have the
resources to tackle.
——————–Insert Table 1.5——————–
——————–Insert Figure 1.4——————–
1.7.3 Hypothesis 3: Tacit Information
Table 1.6 and Figure 1.5 show the results of our analysis of VC experience, mea-
sured by a count of prior investments, in a particular business model, technology
method, or technology platform as implemented by the startup, as a test of Hypoth-
esis 3. Table 1.6 is estimated with the Category Model. Across all categorizations
and specifications, the increased experience by the VC is associated with a greater
likelihood that the investment would be picked up by the VC and not by the partner
on her own. VCs with greater experience in a particular category likely have a more
miles).
50

informative private signal across the partners to understand a new investment in the
same category since they have already done so before. Specification (6-1) includes the
full sample of firms that were categorized. One concern with the first specification
is that the firm might have a pre-specified investment thesis stated to the limited
partner outside investors that is contractually or implicitly binding and limits the
scope of investments able to be executed by the firm. Specification (6-2) only looks
at investments for which the VC has any experience in the category, and thus it is
within the scope of any possible investment thesis.
——————–Insert Table 1.6——————–
——————–Insert Figure 1.5——————–
1.7.4 Venture Financial Performance
As a matter of empirical interest, we present the results of the descriptive analysis
of venture financial performance in Table 1.7 and Table 1.8 estimated with the Main
Model and Matching Model respectively. We caution the reader to not over interpret
these results as causal, as there are a number of endogeneity issues that we have not
controlled for: for example, we would expect the venture capital firm and the individ-
ual partner to have different capacities to add value to the entrepreneurial ventures.
Nevertheless, we find inconclusive results regarding the financial performance differ-
ences. In all specifications about future funding rounds (7-1 through 7-6, 8-1 through
8-2), we do not find evidence of statistically significant difference. In specifications
(7-7) through (7-9), investments backed by the angel partner are around 3 percentage
points more likely to reach an acquisition exit, but this effect does not appear in
the matching model (8-3). In the main model, they are around .5 percentage points
less likely to reach an IPO exit in specifications 7-10 through 7-12), but this effect
51

does not appear in the matching model (8-4). It is difficult to directly compare the
aggregate financial value of the acquisitions and IPOs together, and the limited data
available on the exit valuations40 creates some doubt around the specifications (7-16)
through (7-18) and (8-6).
We caution the reader into not over-interpreting the outcome variables in our anal-
ysis of venture financial performance. We don’t observe the level to which the investor
can add value to the investment ex-post (Hsu, 2004; Sørensen, 2007), constituting a
substantive omitted variable. It is plausible the individual angel investors may add
a different amount of value to their investments than the VC organizations, many of
whom have formal structures for helping their startups. Our prior is that the venture
capital firm should have more capacity to advise and monitor the investment since
many VC firms maintain a number of resources, including formal contact lists (the
“Rolodex”), executive and technology recruiting staff, legal support, as well as known
reputations that signal the quality of the venture. For example, First Round Capital,
based in Philadelphia, maintains an internal database of advisers and potential execu-
tive and technical hires for use by its portfolio companies. However, we posit that the
individual partners of the venture capital firm would have access to many of the same
resources that the firm itself would have, because they are employed by the venture
capital firm and familiar with its resources. We cannot make any very generalizable
conclusions about the financial performance differences between individual vs. VC
investments. However, if the venture capital investments do not clearly outperform
the angel partner investments, then on the assumption that the VC organization has
more ability to add value to the investment and an individual angel partner, then
we would suspect that the angel partner investments reflect compositionally ex ante
40There are small sample sizes on the exit valuation, because most M&A transactions do notdisclose it and M&A transactions are by far the most common exit outcome.
52

stronger investments in the presence of analysis suggesting they are similar. However,
there is limited theory to support this suspicion.
——————–Insert Table 1.7——————–
——————–Insert Table 1.8——————–
1.8 Conclusion
We study the role of information in organizational decision making for financing
of entrepreneurial ventures. We formally model an organization of one or more agents
who must make a dichotomous choice about whether or not to allocate resources to a
particular project with an unknown outcome. The agents vote strategically and decide
whether to acquire costly external information to improve their decision quality. We
test our theoretical predictions in the setting of venture capital partnerships, where
venture capital partners invest on their own outside of their employing firms. We
find that the venture capital partners, acting independently, exhibit a number of
different investment behaviors than their employing venture capital firm. They make
investments into younger firms with less educated and younger founding teams, but
these investments perform better on some metrics (future funding rounds, exit events)
even when controlling for investment size and stage.
Our findings link to the broader literature of organization design, especially the
core concepts of incentive alignment (e.g. Jensen and Meckling, 1976) and the pro-
vision of information (e.g. Schelling, 1980). In particular, it contributes to a grow-
ing literature on committee decision-making and information aggregation, which has
long been overlooked by the organization design literature Csaszar and Eggers (2013),
despite being one of the original but “forgotten pillars” (Gavetti et al., 2007) of the
Carnegie tradition (Cyert and March, 1963). In a notable related work, Csaszar (2012)
53

tests the predictions of the Sah and Stiglitz (1991) model of committee decision-
making in a related setting, mutual fund managers, and he finds the organizational
structure has significant effects on the rate of omission and commission errors in the
setting of mutual fund stock picking.
Beyond decision-making and information, our work also fits thematically into the
discussion on resource allocation in organizations. Leaders of organizations, whether
they be a singular manager or a team of managers, must allocate resources to the most
productive activities to maximize organizational performance (Baldwin and Clark,
1994; Bower, 1986; Cyert and March, 1963). This complex process involves the divi-
sion, allocation, incentive alignment, and knowledge questions core to organizational
design. An organization with a singular manager allocating resources can be thought
of as centralized, while an organization with managers jointly allocating resources
can be thought of as decentralized (Sah and Stiglitz, 1991). The venture capital
partnership engages in a centralized decision-making process, while the angel part-
ners acting independently could be thought of as engaging in a decentralized form of
decision-making. The design choice between centralized and decentralized structures
has tradeoffs for the organizations productivity, because they lead to different choices
of resource allocation and thus different aggregate organizational performance.
Our theoretical model and empirical strategy can also lend itself to addressing
the phenomenon of spin-outs, entrepreneurial ventures of ex-employees of large firms.
There are competing theories explaining their origins. On one hand, agency models
suggest an intrinsic conflict of interest between the employees and the firm as valuable
discoveries arise that can be brought to market (e.g. Wiggins, 1995; Anton and Yao,
1995). On the other hand, incumbent firms may lack the organizational capabilities to
recognize and take advantage of new opportunities (e.g. Christensen, 1993). Applying
our findings to the setting of spin-outs, our work suggests that spin-outs can emerge
54

even when incentives are aligned between the employee and the firm, as a consequence
of the organizational form limiting access to information in the incumbent firm. In
more recent work, Agarwal et al. (2004) find that spin-outs occur when incumbent
firms lack both technological and market know-how. In other words, the organization
is not structured to take advantage of new opportunities sourced by its employees.
The resource allocation process may be set up such that the firm leaders lack the
information or decision-making structure to recognize the opportunities in the first
place. Any hierarchy involving teams must ultimately involve a decision-making
process, leading to the age-old tension between individual vs. group decision-making
which we study in a very specific setting.
There are several opportunities for research beyond present study. First, we do
not have information on the exact voting behavior of the participants, a traditional
advantage of lab experiments. Future work should use real life voting data, which
we would like to see particularly in the venture capital setting. Second, we do not
observe the risk set of investments rejected by both the venture capital firm and its
angel partners, which could introduce some bias to the empirical estimates. Third,
there are a number of other theoretical models that could explain a similar pattern
of results. For example, the results could also be explained by heterogeneous utility
function or heterogeneous signal quality (skill) across different participants. We do not
strictly rule out other models, but the information based model we propose represents
a parsimonious case that still explains our full slate of results.
Future work should consider the role of organizational decision-making and re-
source allocation in a variety of organizational forms. A simple extension would be
to general private equity or hedge funds. In our model, we made the simplifying
assumption that the agents made a dichotomous decision to invest or not. In the
hedge fund industry, it is almost certainly a portfolio decision, so the model would
55

have to be quite different. In addition, we are currently exploring other aspects of the
implications of the partnership structure in venture capital firms. In particular, the
substantial heterogeneity in voting mechanisms, hierarchical systems, and compensa-
tion structures used by venture capital partnerships merits additional exploration.
56

Agent 1: Private Signal
T G B
Bring to VC
No Investment
Bring to VC
Agent 2 (or 3): Acquire Signal
Possible Investment
Acquire Not Not Acquire
Angel Investment
Agent 2 (or 3): Private Signal
Evaluate Signal
Evaluate Signal
No Investment
T G B
VC Investment
VC Investment
No Investment
T G B
VC Investment
No Investment
VC Investment
Figure 1.1: Extensive Form Game. This figure is the extensive form representationof the model in Section 1.2. T (terrific), G (good), B (bad) represent the informationcontent of the private signal known to the respective agent but not directly known tothe other agents. The dashed line shows that the other agents would not be able todistinguish between whether Agent 1 had a T or G private signal. Angel Investmentmeans that the agent would take the investment herself. VC Investment means theinvestment is retained by the firm. No Investment means both the VC firm and theindividual agent reject the investment. For the case of Agent 1 receiving a privatesignal T, Agent 2 acquiring the signal, and then Agent 2 receiving a private signalB, we make the optional assumption that E[U |σi = T, σj = B] < 0, resulting in noinvestment.
57

c
π
Angel Invest
VC Invest
c(π)
Angel VCFigure 1.2: VC vs. Angel Investment as Function of the Public Signal andCost of Information. This figure presents the implication of public signal π andinformation cost c on the investment vehicle outcome for the model in Section 1.2.π presents the information content of the public signal, c represents the cost of in-formation acquisition, and c(π) represents the threshold cost function for an agentto acquire the private signal. An investment with π and c placing it above the solidline representing c(π) would be taken up by the individual angel investor if she hasa private signal of T, and if it is below the line then it would be taken up by the VCif another agent has a favorable signal G or T. The horizontal dotted line shows theoutcomes for a given level of c.
58

1 6Number of Angel Investments
VC Partner
Non-VC Partner
0 10,000Round Size
VC Partner
Non-VC Partner
0 2,000Investment Size
VC Partner
Non-VC Partner
0 20Count of Investors in Syndicate
VC Partner
Non-VC Partner
1 2 3Round Number
VC Partner
Non-VC Partner
0 2,000Investment Age (Days)
VC Partner
Non-VC Partner
Figure 1.3: VC Partner vs. Non-VC Affiliated Angels. These box plots illus-trate the compositional differences between angels who are full-time venture capitalpartners and angels who are not (e.g. former entrepreneurs, executives, etc.). Thebox itself represents the 25th and 75th percentile, the white line in the box representsthe median, and the adjacent lines represent the bounds given by 3
2times the inter-
quartile range. Outliners beyond the adjacent lines were omitted from the graph forpresentational purposes. Round Size and Investment Size are in units of thousands ofdollars USD. The Investment Size was imputed dividing the total size of the invest-ment round for which an angel participated in, divided by the number of investors inthe syndicate. Only Number of Angel Investments, Round Size, and Investment Sizehave a statistically significant difference (at beyond the 0.1% level) and the others donot have a significant difference. Source: Crunchbase 2005 to 2013.
59

.16
.18
.2.2
2.2
4Pr
obab
ility
of
Part
ner
Inve
stm
ent
050
010
0015
0020
00
Cou
nt o
f In
vest
men
ts
1 10 100 1000 10000Distance Between Startup and VC (km)
Prob. of Partner Investment
Count of Investments
Figure 1.4: Geographic Distance Between Venture and VC Offices. This figurepresents the relationship between geographic distance between the new venture andthe offices of the venture capitalist and the investment vehicle outcome, in supportof Hypothesis 2. The X-axis represents geodesic distance in kilometers between themain office of a startup and the closest office of the the VC making the investment orthe employing VC of the angel partner who made the investment. Note that the X-axis is presented in a logarithmic scale. The left Y-axis and black line represents theprobability that the investment is taken by an angel partner and not the employingVC. The right Y-axis and grey area represent a frequency histogram of investmentsat each distance. The figure was constructed with local linear smoothing (Cleveland,1979). Source: Crunchbase 2005 to 2013.
60

0.1
.2.3
.4
Prob
abili
ty o
f Pa
rtne
r In
vest
men
t
0 20 40 60 80VC Experience in Category
Business Model
Technology Method
Technology Platform
Figure 1.5: VC Experience in Category. This figure presents the relationshipbetween a venture capital firm’s experience in a category and the investment vehicleoutcome, in support of Hypothesis 3. The X-axis represents the number of invest-ments executed by the VC or the VC who employs the angel partner prior to thedate of the investment in a given Business Model, Technology Method, or TechnologyPlatform category. The Y-axis represents the probability that the investment is takenby an angel partner and not the employing VC. The figure was constructed with locallinear smoothing (Cleveland, 1979). Source: Crunchbase 2005 to 2013.
61

.15
.2.2
5.3
.35
Prob
abili
ty o
f Pa
rtne
r In
vest
men
t
1 10 100 1000 100001 10 100 1000 10000 100000Funds Available to VC (USD)
Figure 1.6: VC Fund Availability. The X-axis represents the imputed value ofavailable limited partner (LP) funds to the VC firm, at the time of the investment:starting from the fund vintage year, where we assign the full value of the size ofthe fund, we discount the value of the fund by 10% of the starting value until it isfully exhausted in 10 years, summed across multiple funds. Note that the X-axisis presented in a logarithmic scale. The Y-axis represents the probability that theinvestment is taken by an angel partner and not the employing VC. The figure wasconstructed with local linear smoothing (Cleveland, 1979). Source: Crunchbase 2005to 2013 and ThomsonOne VentureXpert.
62

Table 1.1: Summary Statistics. Summary statistics are presented for the partnerangel investments and VC firm investments composing the full sample. Section 1 is thedependent variables for observable venture characteristics. Section 2 is the dependentvariables for venture financial performance. Section 3 is the control variables. Section4 the is the industry composition of the sample. Section 5 is the independent variablesused to measure geographic distance and category experience.
Partner Angel VC Firm
Investments Investments Full Sample
Mean Std. Dev. Mean Std. Dev. Min Max Obs.
Age at Funding Round (in Days) 569.35 2302.72 1192.96 1920.45 0 62212 15766
Size of Founding Team 2.70 1.54 2.63 1.70 1 18 13254
Average Age of Founders 33.25 7.38 35.86 8.32 20 75 6583
Max Prior Number of Firms Founded 0.94 1.45 1.13 1.57 0 14 7754
At Least One Founder with Graduate Degree 0.61 0.49 0.66 0.47 0 1 8487
At Least One Founder with MBA 0.38 0.48 0.41 0.49 0 1 8487
At Least One Founder with Ph.D. 0.08 0.26 0.11 0.31 0 1 8487
At Least One Founder with Elite Institution 0.59 0.49 0.59 0.49 0 1 8487
At Least One Founder with Engineering 0.18 0.38 0.22 0.42 0 1 8487
Future Funding Round 0.48 0.50 0.48 0.50 0 1 18227
Number of Future Funding Rounds 0.85 1.17 0.87 1.22 0 9 18227
Acquisition Exit 0.21 0.41 0.18 0.38 0 1 18227
Exit (IPO/M&A) 0.22 0.41 0.20 0.40 0 1 18227
Exit Valuation (MM USD) 657 6,086 1,505 10,210 0 104,200 1360
IPO Exit 0.00 0.07 0.02 0.13 0 1 18227
Round Size (MM USD) 4.04 13.70 13.17 35.55 0.01 1500 16467
Syndicate Size 6.84 4.95 3.91 3.06 1 27 18073
Round Number 1.40 0.74 1.53 0.95 1 11 18227
Round Year 2010.08 2.10 2009.40 2.49 2005 2013 20993
Agriculture, Forestry, etc. (NAICS 11) 0.00 0.06 0.00 0.04 0 1 17410
Utilities (NAICS 22) 0.00 0.00 0.00 0.02 0 1 17410
Construction (NAICS 23) 0.01 0.09 0.03 0.18 0 1 17410
Manufacturing (NAICS 31) 0.00 0.02 0.00 0.01 0 1 17410
Manufacturing (NAICS 32) 0.00 0.07 0.00 0.06 0 1 17410
Manufacturing (NAICS 33) 0.06 0.24 0.15 0.35 0 1 17410
Wholesale Trade (NAICS 42) 0.01 0.09 0.00 0.06 0 1 17410
Retail Trade (NAICS 45) 0.05 0.22 0.05 0.22 0 1 17410
Transportation and Warehousing (NAICS 48) 0.00 0.02 0.00 0.02 0 1 17410
Transportation and Warehousing (NAICS 49) 0.00 0.00 0.00 0.04 0 1 17410
Information (NAICS 51) 0.44 0.50 0.36 0.48 0 1 17410
Finance and Insurance (NAICS 52) 0.04 0.20 0.03 0.18 0 1 17410
Real Estate (NAICS 53) 0.00 0.07 0.00 0.06 0 1 17410
Prof., Sci., Tech. Services (NAICS 54) 0.23 0.42 0.24 0.43 0 1 17410
Administrative and Support (NAICS 56) 0.02 0.15 0.01 0.11 0 1 17410
Educational Services (NAICS 61) 0.03 0.16 0.02 0.14 0 1 17410
Health Care & Social Assistance (NAICS 62) 0.01 0.11 0.02 0.16 0 1 17410
Arts, Entertainment & Recreation (NAICS 71) 0.02 0.16 0.01 0.12 0 1 17410
Accommodation & Food Services (NAICS 72) 0.01 0.08 0.00 0.04 0 1 17410
Other Services (NAICS 81) 0.00 0.06 0.00 0.04 0 1 17410
Public Administration (NAICS 92) 0.00 0.05 0.00 0.04 0 1 17410
Distance (km) 2344.34 3231.57 2196.08 3208.96 0 18106.05 13662
VC Exp. in Business Model 0.32 1.76 0.79 2.86 0 40 17318
VC Exp. in Technology Method 1.31 3.61 2.41 4.94 0 71 17318
VC Exp. in Technology Platform 1.03 3.74 1.68 5.01 0 66 17318
Observations 5107 15897
63

Table 1.2: Main Model: Venture Characteristics. This table presents a de-scriptive multivariate analysis for Hypothesis 1 with various dependent variables forfavorable observable venture characteristics. The first two models for each dependentvariable are estimated with the full sample, and the third is estimated with the sub-sample of the first and second rounds of investment. The Main Model is estimatedwith OLS. Statistical significance is represented by ∗ p < 0.10, ∗ ∗ p < 0.05, and∗ ∗ ∗ p < 0.01. Robust standard errors clustered at the organizational level are shownin parentheses.
Firm Age Founder Age Team Size
(2-1) (2-2) (2-3) (2-4) (2-5) (2-6) (2-7) (2-8) (2-9)
Angel Investor -347.776*** -279.923*** -228.309*** -1.072*** -0.900*** -0.980*** -0.048 -0.076 -0.056
(70.27) (74.49) (83.75) (0.29) (0.29) (0.32) (0.05) (0.05) (0.05)
Round Size 4.562*** 4.033*** 15.426*** 0.047*** 0.043*** 0.070*** -0.002*** -0.001*** -0.002
(1.08) (1.01) (1.99) (0.01) (0.01) (0.01) (0.00) (0.00) (0.00)
Syndicate Size -3.332 -4.968 -3.027 -0.241*** -0.218*** -0.207*** 0.028*** 0.029*** 0.032***
(4.80) (4.81) (5.11) (0.03) (0.03) (0.03) (0.00) (0.00) (0.01)
Observations 14179 13129 11310 5195 4879 4137 10332 9708 8311
Prior Entrepreneurial Exp. Education: Graduate Degree Education: MBA
(2-10) (2-11) (2-12) (2-13) (2-14) (2-15) (2-16) (2-17) (2-18)
Angel Investor -0.235** -0.246** -0.192* -0.058*** -0.058*** -0.027 -0.029* -0.021 0.00
(0.10) (0.10) (0.11) (0.02) (0.02) (0.02) (0.02) (0.02) (0.02)
Round Size -0.001* 0.00 0.004** 0.00 0.00 0.002*** 0.00 0.00 0.00
(0.00) (0.00) (0.00) (0.00) (0.00) (0.00) (0.00) (0.00) (0.00)
Syndicate Size 0.016* 0.020** 0.016* -0.002 -0.001 -0.002 0.005*** 0.005*** 0.003*
(0.01) (0.01) (0.01) (0.00) (0.00) (0.00) (0.00) (0.00) (0.00)
Observations 6147 5807 4844 6688 6305 5315 6688 6305 5315
Education: PhD Education: Elite Institution Education: Engineering
(2-19) (2-20) (2-21) (2-22) (2-23) (2-24) (2-25) (2-26) (2-27)
Angel Investor -0.034*** -0.030*** -0.019* 0.007 0.001 -0.01 -0.040** -0.032** -0.027
(0.01) (0.01) (0.01) (0.02) (0.02) (0.02) (0.02) (0.02) (0.02)
Round Size 0.00 0.00 0.002*** -0.000* 0.00 0.001 0.00 0.00 0.001
(0.00) (0.00) (0.00) (0.00) (0.00) (0.00) (0.00) (0.00) (0.00)
Syndicate Size -0.002** -0.002* -0.001 0.001 0.003 0.002 0.001 0.001 0.001
(0.00) (0.00) (0.00) (0.00) (0.00) (0.00) (0.00) (0.00) (0.00)
Observations 6688 6305 5315 6688 6305 5315 6688 6305 5315
Sample Full Full Rnd 1&2 Full Full Rnd 1&2 Full Full Rnd 1&2
Org. FE Yes Yes Yes Yes Yes Yes Yes Yes Yes
Year FE Yes Yes Yes Yes Yes Yes Yes Yes Yes
Round FE Yes Yes Yes Yes Yes Yes Yes Yes Yes
Industry FE No Yes Yes No Yes Yes No Yes Yes
64

Table 1.3: Summary Statistics: Matching Model. This table presents the dataused for the Matching Model. Starting with the full sample of angel partner invest-ments, we match each angel investment with the venture capital investment that isin the same 2 digit NAICS class and closest in total round size and then round date,with a maximum of $1 million different in round size. We drop angel investmentsthat do not have a match.
Partner Angel VC Firm
Investment Investment
Mean SD Mean SD
Age at Funding Round (in Days) 510.58 1943.77 678.93 1564.45
Size of Founding Team 2.71 1.47 2.75 1.61
Average Age of Founders 33.40 7.29 33.16 7.65
Max Prior Number of Firms Founded 0.94 1.30 1.01 1.49
At Least One Founder with Graduate Degree 0.58 0.49 0.62 0.49
At Least One Founder with MBA 0.37 0.48 0.39 0.49
At Least One Founder with Ph.D. 0.07 0.25 0.08 0.27
At Least One Founder with Elite Institution 0.59 0.49 0.63 0.48
At Least One Founder with Engineering 0.17 0.38 0.20 0.40
Future Funding Round 0.48 0.50 0.45 0.50
Number of Future Funding Rounds 0.83 1.11 0.73 1.06
Acquisition Exit 0.20 0.40 0.17 0.37
Exit (IPO/M&A) 0.20 0.40 0.17 0.38
Exit Valuation (MM USD) 393.22 1757.44 137.03 228.27
IPO Exit 0.00 0.05 0.00 0.05
Round Size (MM USD) 2.41 3.61 2.43 3.59
Syndicate Size 7.29 4.95 4.67 3.86
Round Number 1.41 0.74 1.43 0.70
Round Year 2009.89 1.94 2010.00 1.98
Observations 2458 2458
65

Table 1.4: Matching Model: Venture Characteristics. This table presentsthe results of the Matching Model analysis for Hypothesis 1 with various dependentvariables for favorable observable venture characteristics. The Matching Model isestimated with OLS. Statistical significance is represented by ∗ p < 0.10, ∗∗ p < 0.05,and ∗ ∗ ∗ p < 0.01. Robust standard errors are shown in parentheses.
Firm Founder Team Prior Education:
Age Age Size Entrep. Graduate MBA PhD Elite Eng.
(4-1) (4-2) (4-3) (4-4) (4-5) (4-6) (4-7) (4-8) (4-9)
Angel Investor -128.659** 0.279 -0.122** -0.200* -0.043** -0.034* -0.017 -0.032 -0.050***
(56.65) (0.34) (0.05) (0.10) (0.02) (0.02) (0.01) (0.02) (0.02)
Round Size 110.311*** 0.336*** 0.042*** 0.065*** 0.015*** 0.011*** 0.001 0.012*** 0.004
(8.71) (0.05) (0.01) (0.02) (0.00) (0.00) (0.00) (0.00) (0.00)
Syndicate Size -12.629* -0.265*** 0.042*** 0.029** -0.004* -0.002 -0.001 0.003 0.005***
(6.67) (0.04) (0.01) (0.01) (0.00) (0.00) (0.00) (0.00) (0.00)
Organization FE Yes Yes Yes Yes Yes Yes Yes Yes Yes
Year FE Yes Yes Yes Yes Yes Yes Yes Yes Yes
Round FE Yes Yes Yes Yes Yes Yes Yes Yes Yes
Observations 4298 2065 3735 2332 2538 2538 2538 2538 2538
66

Table 1.5: Geography Model. This table presents the results of the GeographyModel analysis for Hypothesis 2. The Geography Model is estimated with OLS.Statistical significance is represented by ∗ p < 0.10, ∗ ∗ p < 0.05, and ∗ ∗ ∗ p < 0.01.Robust standard errors are shown in parentheses.
Angel Investor
(5-1)
L Distance 0.002
(0.005)
Distance (100 to 1000km) -0.172**
(0.084)
L Distance × Distance (100 to 1000km) 0.028*
(0.014)
Distance (1000 to 10000km) -0.011
(0.085)
L Distance × Distance (1000 to 10000km) 0.001
(0.011)
Distance (10000 to 100000km) 1.843
(1.419)
L Distance × Distance (10000 to 100000km) -0.196
(0.150)
Round Size -0.001***
(0.000)
Syndicate Size 0.028***
(0.002)
Organization FE Yes
Year FE Yes
Round FE Yes
Industry FE Yes
Observations 11719
67

Table 1.6: Category Experience Model. This table presents the results of theCategory Model analysis for Hypothesis 3. The Full sample contains all firms forwhich we were able to categorize. One concern with the first specification is thatthe firm might have a pre-specified investment thesis stated to the limited partneroutside investors that is contractually or implicitly binding and limits the scope ofinvestments able to be executed by the firm. The Experience sample limits the angelinvestments to those contain for which the VC has any experience in the category, andthus it is within the scope of any possible investment thesis. The Category Model isestimated with OLS. Statistical significance is represented by ∗ p < 0.10, ∗∗ p < 0.05,and ∗ ∗ ∗ p < 0.01. Robust standard errors are shown in parentheses.
Angel Investor
(6-1) (6-2)
VC Exp. in Business Model -0.008*** -0.007***
(0.00) (0.00)
VC Exp. in Technology Method -0.008*** -0.007***
(0.00) (0.00)
VC Exp. in Technology Platform -0.004*** -0.004***
(0.00) (0.00)
Round Size -0.001*** -0.001***
(0.00) (0.00)
Syndicate Size 0.026*** 0.027***
(0.00) (0.00)
Sample Full Experience
Organization FE Yes Yes
Year FE Yes Yes
Round FE Yes Yes
Observations 10620 9201
68

Table 1.7: Main Model: Venture Financial Performance. This table presentsthe results of the analysis of financial performance with various dependent variablesfor venture financial performance. The Main Model is estimated with OLS. Statisticalsignificance is represented by ∗ p < 0.10, ∗ ∗ p < 0.05, and ∗ ∗ ∗ p < 0.01. Robuststandard errors clustered at the organizational level are shown in parentheses.
Future Funding Round Number of Future Rounds
(7-1) (7-2) (7-3) (7-4) (7-5) (7-6)
Angel Investor 0.011 -0.007 -0.005 0.043 0.005 0.003
(0.01) (0.01) (0.01) (0.03) (0.03) (0.03)
Round Size 0.00 0.00 -0.001*** 0.00 0.00 -0.003***
(0.00) (0.00) (0.00) (0.00) (0.00) (0.00)
Syndicate Size 0.005*** 0.006*** 0.006*** 0.008** 0.010*** 0.010***
(0.00) (0.00) (0.00) (0.00) (0.00) (0.00)
Observations 16339 15059 13174 16339 15059 13174
Acquisition Exit IPO Exit
(7-7) (7-8) (7-9) (7-10) (7-11) (7-12)
Angel Investor 0.038*** 0.031*** 0.028** -0.004* -0.005** -0.005**
(0.01) (0.01) (0.01) (0.00) (0.00) (0.00)
Round Size 0.000** 0.000*** 0.00 0.001*** 0.001*** 0.001***
(0.00) (0.00) (0.00) (0.00) (0.00) (0.00)
Syndicate Size 0.006*** 0.006*** 0.006*** 0.001 0.001* 0.001**
(0.00) (0.00) (0.00) (0.00) (0.00) (0.00)
Observations 16339 15059 13174 16339 15059 13174
Exit (IPO/M&A) Exit Valuation
(7-13) (7-14) (7-15) (7-16) (7-17) (7-18)
Angel Investor 0.030*** 0.023** 0.022** -657.098 -236.653 -77.885
(0.01) (0.01) (0.01) (552) (278) (69)
Round Size 0.001*** 0.001*** 0.001** 12.307*** 11.764*** -3.242
(0.00) (0.00) (0.00) (1.75) (1.10) (3.68)
Syndicate Size 0.007*** 0.007*** 0.007*** -35.40 29.18 2.84
(0.00) (0.00) (0.00) (39.23) (38.12) (20.34)
Observations 16339 15059 13174 1229 1150 943
Sample Full Full Rnd. 1 & 2 Full Full Rnd. 1 & 2
Org. FE Yes Yes Yes Yes Yes Yes
Year FE Yes Yes Yes Yes Yes Yes
Round FE Yes Yes Yes Yes Yes Yes
Industry FE No Yes Yes No Yes Yes
69

Table 1.8: Matching Model: Venture Financial Performance. This tablepresents the results of the Matching Model analysis of financial performance with var-ious dependent variables for venture financial performance. The Matching Model isestimated with OLS. Statistical significance is represented by ∗ p < 0.10, ∗∗ p < 0.05,and ∗ ∗ ∗ p < 0.01. Robust standard errors are shown in parentheses.
Future # Future Acq. IPO Exit
Round Rounds Exit Exit Exit Valuation
(8-1) (8-2) (8-3) (8-4) (8-5) (8-6)
Angel Investor -0.008 0.024 0.004 0.000 0.003 44.76
(0.01) (0.03) (0.01) (0.00) (0.01) (39.96)
Round Size -0.004** -0.001 0.001 0.001*** 0.001 16.327***
(0.00) (0.00) (0.00) (0.00) (0.00) (2.93)
Syndicate Size 0.009*** 0.016*** 0.006*** 0.00 0.007*** -20.096***
(0.00) (0.00) (0.00) (0.00) (0.00) (6.01)
Organization FE Yes Yes Yes Yes Yes Yes
Year FE Yes Yes Yes Yes Yes Yes
Round FE Yes Yes Yes Yes Yes Yes
Observations 4862 4862 4862 4862 4862 287
70

Table 1.9: Fund Availability Model. This tables presents the results of the analysisof VC fund access. The model is estimated with OLS. Statistical significance isrepresented by ∗ p < 0.10, ∗ ∗ p < 0.05, and ∗ ∗ ∗ p < 0.01. Robust standard errorsclustered at the organizational level are shown in parentheses.
Angel Investor
(8-1)
L Funds Available -0.018
(0.01)
Round Size -0.001***
(0.00)
Syndicate Size 0.030***
(0.00)
Organization FE Yes
Year FE Yes
Round FE Yes
Industry FE Yes
Observations 10359
71

Table 1.10: Missing Data. This table presents the correlations between an indicatorfor missing founding team data and various variables that we have for the full sample.
Correlation with Missing Data Indicator
Angel Investor -0.20
Age at Funding Round (in Days) 0.15
Future Funding Round -0.09
Number of Future Funding Rounds -0.09
Acquisition Exit -0.03
Exit (IPO/M&A) -0.03
Exit Valuation (IPO/M&A) -0.07
IPO Exit 0.00
Funding Round Amount 0.06
Count of Investors in Syndicate -0.19
Round Number -0.12
Round Year -0.16
72

1.A Appendix: Stylized Model
1.A.1 Parameter Restrictions
Assumption 2 and Assumption 3 are satisfied automatically from the original
assumptions.41
E[U |σ = B] < E[U ]︸ ︷︷ ︸Assumption 2
⇔ q >1
2
E[U |σ = G] > E[U ]︸ ︷︷ ︸Assumption 3
⇔ q(1− θ) > (1− q)(1− β)
⇔ 1− qq
<1− θ1− β
Assumption 4, Assumption 6, and Assumption 6b hold if and only if the following
conditions are met42:
E[U |σ = T ] > 0︸ ︷︷ ︸Assumption 4
⇔ πqθU(1) + (1− π)(1− q)βU(0) > 0
⇔ 1− qq
<
(θ
β
)(π
1− π
)(−U(1)
U(0)
)E[U |σ ∈ {G, T}] < 0︸ ︷︷ ︸
Assumption 5
⇔ πqU(1) + (1− π)(1− q)U(0) < 0
⇔ 1− qq
>
(π
1− π
)(−U(1)
U(0)
)E[U |σi = G, σj = G] > 0︸ ︷︷ ︸
Assumption 6b
⇔ πq2(1− θ)2U(1) + (1− π)(1− q)2(1− β)2U(0) > 0
⇔ 1− qq
<
√(π
1− π
)(−U(1)
U(0)
)41Assumption 3 holds as long as θ is not that much larger than β, given q ∈ ( 1
2 , 1).42Assumption 4 is sure to be satisfied as θ/β → +∞. When θ/β is large, the terrific signal,
σ = T , is far more likely for the profitable state (s = 1) than for the unprofitable state (s = 0),conditional on receiving a favorable signal (i.e., σ ∈ {G,T}).
73

Given Assumption 5, the original parameter restrictions imply Assumption 1 and
Assumption 6a.
E[U |σ ∈ {G, T}] < 0︸ ︷︷ ︸Assumption 5
⇒ E[U |σ = G] < 0︸ ︷︷ ︸Assumption 6a
⇒ E[U ] < 0︸ ︷︷ ︸Assumption 1
.
Assumptions 1 through 6 are sufficient to characterize the equilibrium. We can
further add an additional assumption for E[U |σi = T, σj = B] to cover all cases of
voting by the organization. This case would represent the scenario where agent 1
receives a signal of σ1 = T and agent 2 acquires signal but receives σ2 = B. We
assume that agent 1 would not pursue the deal on her own, but this assumption is
not necessary for the model or its empirical predictions.
E[U |σi = T, σj = B] < 0⇔ πqθ(1− q)U(1) + (1− π)(1− q)πθ(1− q) + (1− π)(1− q)βq
< 0
⇔(
π
1− π
)(−U(1)
U(0)
)<β
θ
⇔ φπφU <β
θ
1.A.2 No Equilibrium with Both Agents Acquiring a Signal
If agent 3 does not acquire a signal, given her current expectation E[U |σ1 ∈
{G, T}] < 0, then she will vote against the project, giving her expected utility of
Pr(σ2 ∈ {G, T} |σ1 ∈ {G, T})E[U |σ1 ∈ {G, T}, σ2 ∈ {G, T}]︸ ︷︷ ︸Agent 2 Favorable Signal
+ Pr(σ2 = B |σ1 ∈ {G, T})× 0︸ ︷︷ ︸Agent 2 Unfavorable Signal
.
74

If agent 3 instead acquires a signal, she will vote for the project when σ3 ∈ {G, T}–in
which case it will be funded as there will be at least two votes in support–and vote
against it when σ3 = B–in which case it will be funded if and only if σ2 ∈ {G, T}.
The associated expected utility to agent 3 (after netting out the cost of the signal) is:
Pr(σ2 ∈ {G, T} |σ1 ∈ {G, T})
×E[U |σ1 ∈ {G, T}, σ2 ∈ {G, T}]
︸ ︷︷ ︸
Agent 2 Favorable Signal
+
Pr(σ2 = B |σ1 ∈ {G, T}) Pr(σ3 ∈ {G, T} |σ1 ∈ {G, T}, σ2 = B )
×E[U |σ1 ∈ {G, T}, σ2 = B, σ3 ∈ {G, T}]
︸ ︷︷ ︸
Agent 2 Unfavorable Signal, Agent 3 Favorable Signal
+ [Pr(σ2 = B |σ1 ∈ {G, T}) Pr(σ3 = B |σ1 ∈ {G, T}, σ2 = B )× 0]︸ ︷︷ ︸Agents 2 & 3 Unfavorable Signal
−c
The expected utility of agent 3 acquiring the signal exceeds the expected utility
of agent 3 not acquiring the signal when:
Pr(σ2 = B |σ1 ∈ {G, T}) Pr(σ3 ∈ {G, T} |σ1 ∈ {G, T}, σ2 = B )
×E[U |σ1 ∈ {G, T}, σ2 = B, σ3 ∈ {G, T}] > c.
If this condition could be met, then agent 3 would acquire the signal. We will show
that this condition cannot hold because E[U |σ1 ∈ {G, T}, σ2 = B, σ3 ∈ {G, T}] < 0.
When agent 3’s vote is pivotal and she receives a favorable signal (and votes for it),
75

the expected utility of funding the project is negative.
E[U |σ1 ∈ {G, T}, σ2 = B, σ3 ∈ {G, T}]
= Pr(s = 1 |σ1 ∈ {G, T}, σ2 = B, σ3 ∈ {G, T})U(1)
+ Pr(s = 0 |σ1 ∈ {G, T}, σ2 = B, σ3 ∈ {G, T})U(0).
To solve for this, we solve to the probabilities in the expected utility expression.
Pr(s = 0 |σ1 ∈ {G, T}, σ2 = B, σ3 ∈ {G, T}) follows similarly.
Pr(s = 1 |σ1 ∈ {G, T}, σ2 = B, σ3 ∈ {G, T})
=Pr(s = 1, σ1 ∈ {G, T}, σ2 = B, σ3 ∈ {G, T})
Pr(σ1 ∈ {G, T}, σ2 = B, σ3 ∈ {G, T})
=Pr(s = 1, σ1 ∈ {G, T}, σ2 = B, σ3 ∈ {G, T})∑s∈0,1
Pr(s, σ1 ∈ {G, T}, σ2 = B, σ3 ∈ {G, T})
By the conditional independence of agents’ signals,
Pr(s = 1, σ1 ∈ {G, T}, σ2 = B, σ3 ∈ {G, T})
= Pr(s = 1) Pr(σ1 ∈ {G, T} |s = 1) Pr(σ2 = B |s = 1) Pr(σ3 ∈ {G, T} |s = 1)
= πq(1− q)q = πq2(1− q)
Pr(s = 0, σ1 ∈ {G, T}, σ2 = B, σ3 ∈ {G, T})
= Pr(s = 0) Pr(σ1 ∈ {G, T} |s = 0) Pr(σ2 = B |s = 0) Pr(σ3 ∈ {G, T} |s = 0)
= (1− π)(1− q)q(1− q) = (1− π)q(1− q)2
Combining these expressions, we find an equivalence between the condition proba-
bility of the state with only one favorable signal and two favorable signals and an
76

unfavorable signal.
Pr(s = 1 |σ1 ∈ {G, T}, σ2 = B, σ3 ∈ {G, T})
=πq2(1− q)
πq2(1− q) + (1− π)q(1− q)2
=πq
πq + (1− π)(1− q)
= Pr(s = 1 |σ1 ∈ {G, T})
Pr(s = 1 |σ1 ∈ {G, T}, σ2 = B, σ3 ∈ {G, T}) = Pr(s = 1 |σ1 ∈ {G, T}) follows simi-
larly.
Putting this back into our original expression for E[U |σ1 ∈ {G, T}, σ2 = B, σ3 ∈
{G, T}], we find
E[U |σ1 ∈ {G, T}, σ2 = B, σ3 ∈ {G, T}] = E[U |σ1 ∈ {G, T}]
which is assumed to be negative from Assumption 5.
Since E[U(σ1, σ2, σ3)|σ1 ∈ {G, T}, σ2 = B] < 0, then the condition
E[U(σ1, σ2, σ3)|σ1 ∈ {G, T}, σ2 = B] > 0 cannot hold, which means it cannot be
optimal for agent 3 to acquire a signal given agent 2 does acquire the signal. 43
43The lack of an equilibrium with both agents 2 and 3 acquiring signals is predicated upon avoting rule in which an agent votes yes if and only if her signal is G or T. However, that votingrule need not be optimal when both agents acquire signals. This raises the question of whether anequilibrium exists in which both agents 2 and 3 acquire signals and agents vote yes if and only ifher signal is T.
77

1.A.3 Equilibrium with One Agent or No Agents Acquiring
a Signal
The acquisition of the signal is optimal if and only if
Pr(σ2 ∈ {G, T}|σ1 ∈ {G, T})E[U |σ1 ∈ {G, T}, σ2 ∈ {G, T}] ≥ c
Expanding the left-hand side expression,
Pr(σ2 ∈ {G, T}|σ1 ∈ {G, T})E[U |σ1 ∈ {G, T}, σ2 ∈ {G, T}]
= Pr(σ2 ∈ {G, T}|σ1 ∈ {G, T})
×
[∑s∈0,1
Pr(s |σ1 ∈ {G, T}, σ2 ∈ {G, T})U(s)
]
=
(Pr(σ1 ∈ {G, T}, σ2 ∈ {G, T})
Pr(σ1 ∈ {G, T})
)×
[∑s∈0,1
(Pr(s, σ1 ∈ {G, T}, σ2 ∈ {G, T})Pr(σ1 ∈ {G, T}, σ2 ∈ {G, T})
)U(s)
]
=
(Pr(s = 1, σ1 ∈ {G, T}, σ2 ∈ {G, T})
Pr(σ1 ∈ {G, T})
)U(1)
+
(Pr(s = 0, σ1 ∈ {G, T}, σ2 ∈ {G, T})
Pr(σ1 ∈ {G, T})
)U(0)
78

The probabilities in the expression are
Pr(s = 1, σ1 ∈ {G, T}, σ2 ∈ {G, T})Pr(σ1 ∈ {G, T})
=Pr(s = 1) Pr(σ1 ∈ {G, T} |s = 1) Pr(σ2 ∈ {G, T} |s = 1)
Pr(s = 1) Pr(σ1 ∈ {G, T} |s = 1) + Pr(s = 0) Pr(σ1 ∈ {G, T} |s = 0)
=πq2
πq + (1− π)(1− q)Pr(s = 0, σ1 ∈ {G, T}, σ2 ∈ {G, T})
Pr(σ1 ∈ {G, T})
=Pr(s = 0) Pr(σ1 ∈ {G, T} |s = 0) Pr(σ2 ∈ {G, T} |s = 0)
Pr(s = 1) Pr(σ1 ∈ {G, T} |s = 1) + Pr(s = 0) Pr(σ1 ∈ {G, T} |s = 0)
=(1− π)(1− q)2
πq + (1− π)(1− q)
Hence,
Pr(σ2 ∈ {G, T}|σ1 ∈ {G, T})E[U |σ1 ∈ {G, T}, σ2 ∈ {G, T}] ≥ c
⇔ c ≡ πq2U(1) + (1− π)(1− q)2U(0)
πq + (1− π)(1− q)≥ c
1.A.4 Optimality of Voting Rule
We assumed that an agent’s voting rule has her vote in support of the project if
and only if:
1. she acquired a signal and the signal is favorable, σi ∈ {G, T};
2. she did not acquire a signal and based on her current beliefs she expects the
project to be profitable.
For the equilibria characterized above, we will now show that this voting rule is
optimal and the agents vote sincerely (Austen-Smith and Banks, 1996; Persico, 2004).
79

Consider the equilibrium in which agents 2 and 3 do not acquire signals. As both
of those agents will vote against the project, agent 1 is not pivotal in which case
voting for the project (as prescribed by agent 1’s voting rule) is trivially optimal.
Turning to agent 2, she expects agent 1 to vote for the project and agent 3 to vote
against it (because agent 2 expects agent 3 not to acquire a signal). As agent 2 is
pivotal, the project is not funded if agent 2 votes against it, in which case her payoff
is zero, and the project is funded if she votes for it and that yields expected utility of
E[U |σ1 ∈ {G, T}] which is negative. Hence, it is optimal for agent 2 not to vote for
the project. By symmetry, the same argument applies to agent 3. We conclude that
the voting rule is optimal for the equilibrium in which agents 2 and 3 do not acquire
signals.
Next consider the equilibrium in which agent 2 acquires a signals and agent 3 does
not. Beginning with agent 1, he is pivotal if and only if agent 2 receives a favorable
signal, σ2 ∈ {G, T}, and thus votes in favor of funding to project and that offsets
agent 3’s vote in opposition. It is optimal for agent 1 to vote for the project when
σ1 ∈ {G, T} if E[U |σ1, σ2 ∈ {G, T}] for σ1 ∈ {G, T}. This expected utility is assumed
to be positive by Assumption 6 on the expected utility, and thus agent 1’s voting
rule is optimal. Given agent 1 is expected to vote for and agent 3 against, agent 2 is
pivotal in which case voting for the project if and only if agent 2’s signal is favorable
is optimal when
E[U |σ1 ∈ {G, T}, σ2] > 0 > E[U |σ1 ∈ {G, T}, σ2 = B], σ2 ∈ {G, T}
or
E[U |σ1 ∈ {G, T}, σ2 = G] > 0 > E[U |σ1 ∈ {G, T}, σ2 = B].
80

This condition follow from prior assumptions that
E[U |σ1 = G, σ2 = G] > 0 > E[U |σ1 ∈ {G, T}].
Agent 2’s voting rule is then optimal. Finally, agent 3’s vote is pivotal only when
σ2 = B in which case the expected utility of the project is E[U |σ1 ∈ {G, T}, σ2 =
B] < 0; given that it is negative, it is optimal for agent 3 to vote against it. We
conclude that the symmetric voting rule forms an equilibrium.
81

1.A.5 Empirical Hypotheses
We explore the comparative statics of c with respect to π and q.
dc
dπ=[πq(1− π)(1− q)][2πqU(1)− 2(1− π)(1− q)U(0)]
− [πq2U(1) + (1− π)(1− q)2U(0)][π − 1 + π]
=2π2q2U(1)− 2(1− π)(1− q)U(0)πq
+ 2π(1− π)(1− q)qU(1)− 2(1− π)2(1− q)2U(0)
+ πq2U(1) + (1− π)(1− q)2U(0)
− 2π2q2U(1)− 2π(1− π)(1− q)2U(0)
=2π(1− π)(1− q)q(U(1)− U(0)) + πq2U(1)
+ (1− π)(1− q)2U(0)[−2(1− π) + 1− 2π]
=2π(1− π)(1− q)q(U(1)− U(0)) + πq2U(1)− (1− π)(1− q)2U(0) > 0
dc
dq=[2πqu1 − 2(1− π)(1− q)u0][πq + (1− π)(1− q)]
− [πq2u1 + (1− π)(1− q)2u0](2π − 1)
=2π2q2u1 + 2π(1− π)q(1− q)u1 − 2π(1− π)q(1− q)u0 − 2(1− π)2(1− q)2u0
− 2π2q2u1 + πq2u1 − 2π(1− π)(1− q)2u0 + (1− π)(1− q)2u0
=2π(1− π)q(1− q)(u1 − u0)− 2(1− π)(1− q)2u0 + πq2u1 + (1− π)(1− q)2u0
=2π(1− π)q(1− q)(u1 − u0)− (1− π)(1− q)2u0 + πq2u1 > 0
82

1.B Appendix: Organizational Forms
in Entrepreneurial Finance
1.B.1 Interviews with Venture Capital Firms
We conducted semi-structured interviews with current and former investment
team members at 19 venture capital firms. The purpose of these interviews was to
better understand the functional nature of the organizational decision-making process
within venture capital firms. We contacted 113 alumni of a mid-Atlantic university,
predominantly graduates of its highly ranked business and engineering programs, and
we were able to set up interviews with 22 individuals. The individuals spanned all
levels of seniority within their organizations, ranging from associate up to senior gen-
eral partner. Some individuals had worked at more than one venture capital firm
during the course of their career, and they were thus able to speak about more than
one firm. In some cases, we interviewed multiple employees of the same firm.
Interviews took place over June and July 2014, and each interview was approxi-
mately 30 minutes long. Informants were ensured anonymity of themselves and their
firms. The interview data was supplemented with data available from CrunchBase,
the Investment Advisor Public Disclosure (IAPD) database, Thomson ONE, and
company websites.
The main finding of the interviews is that all venture capital firms have an or-
ganizational routine for integrating information from its employees and evaluating
deals sourced by those employees. There is unanimously a group stage that requires
some or all of the other partners to vote and confirm the deal before it is executed.
However, there is tremendous heterogeneity about how the information is integrated
and how group voting processes work, particularly in the degree of formality used.
83

Firms ranged from allowing partners to individually execute investments with relative
little oversight by the other partners besides a brief discussion at the partner meeting,
to having a formal and tracked voting process requiring a specific number, majority,
or unanimous vote of the partners. There is also heterogeneity in who is allowed to
vote: some firms allow all people with the title of partner to vote, and other firms
have a specialized investment committee involving a subset of the partners to vote.
At the extreme, one firm requires all deals proposed by partners to be voted upon
by only one specific partner. Formal reporting of the results of the interviews are
forthcoming.
1.C Appendix: Data
1.C.1 Testing Org. Structure Assumptions
Finally, to further test the validity of our assumptions on organizational struc-
ture, and in particular the voting mechanisms, we introduce two moderators, power
concentration and venture fund availability.
Fund Availability
To test for implications of variation in the voting structure, we build a measure
of fund availability to the venture capital firm. When funds in the venture capital
firm are tight, we would expect the firm to act on a stricter voting rule if the deal
flow remains constant. We exploit the venture capital fundraising cycle to develop a
measure of fund availability. Using fund data from Thomson One, we assigned a value
of available funds to the venture capital firm. Starting from the fund vintage year, the
year a fund is finalized and makes its first investments, we assign the full value of the
size of the fund, and then every year after that we take off 10% of the starting value
84

of the fund, such that it is fully exhausted in 10 years. For firms with multiple funds,
we take the same method, but sum across the proportionally exhausted fund values
each year. This variable is based on the fairly strong assumption that all funds last 10
years and that the funds are disbursed evenly across those 10 years. Unfortunately,
we do not have data on fund closing years or on exact investment sizes. As with the
geographic distance, the venture capital fund size is also heavily skewed, and we used
the log of venture capital fund size in our analysis.
The results of this analysis are presented in Table 1.9 and Figure 1.6. These
results document the impact of fund availability by the venture capital firm on the
probability the firm would pass over investments and leave it to their partners. The
smaller the funds available to the venture capital firm, the more likely it is to be
passed to the partners for consideration, but this result is insignificant.
——————–Insert Table 1.9——————–
——————–Insert Figure 1.6——————–
Power Concentration
A counter story to the information story we argue is one of incentive misalignment:
perhaps the partners are withholding possible deals from their firm. If this were
true, we would expect to find that partners who hold little to no ownership in their
employing VC firm, to have stronger financial performance in their angel investments
than their employer. To study power concentration, we collect data to identify the
“true” partners of the venture capital firm are. Venture capital firms use the title
of partner for many more employees than those that have significant ownership in
the firm. For example, First Round Capital, a Philadelphia based seed stage venture
capital firm, has 7 employees with the title of partner, but only one, Joshua Kopelman,
85

holds any significant ownership stake in the firm itself. We utilize records from the
Investment Advisor Public Disclosure (IAPD) database from the US Securities and
Exchange Commission. They collect state and federal filings made by investment
advisor firms, e.g. hedge funds and private equity fund management firms. As part of
the filing, they must disclose who their direct owners, indirect owners, and executive
officers are. All firms must disclose any c-suite officers (CEO, CFO, etc.). Those
firms organized as a corporation must disclose any owner of 5% or more of the voting
securities. Firms organized as a partnership must disclose all general partners and
those limited and special partners that have the right to receive upon dissolution,
or have contributed, 5% or more of your capital. We define “true” partner as any
partners named in the IAPD disclosure. This study is omitted from the current paper.
1.C.2 Missing Data
To test whether we should be concerned about the missing data on founding
teams, we conduct a basic test of missing data. There is a weak, mostly insignificant
correlation between the team data missing, and the variables that we do have for the
full sample (round age, future rounds, exit events), exhibiting a pattern consistent
with data that is missing at random (MAR).
——————–Insert Table 1.10——————–
86

Chapter 2
Skilled Immigration
and Firm-Level Innovation:
Evidence from the H-1B Lottery
Andy Wu
2.1 Introduction
Does skilled immigration have a positive impact on domestic innovation at the
firm level? There are two schools of thought on the subject. On the one hand, pro-
ponents of expanding skilled immigration claim that there is a shortage of domestic
technically skilled labor and that skilled immigration increases technological innova-
tion; innovation is a key driver of economic growth (e.g. Solow, 1956; Swan, 1956).
Laszlo Bock, the Senior Vice President of People Operations at Google argues that
“talented foreign-born individuals have played and will continue to play a vital role
87

at Google and throughout our economy” and that restrictions on “our immigration
policies are stifling innovation” (Bock, 2013). Indeed, the observational evidence is
striking: some 42 percent of Fortune 500 firms were started by immigrants or their
children; these 211 firms produce over $5 trillion in revenue annually (Ballmer et al.,
2011). On the other hand, opponents of skilled immigration expansion, particularly
from organized labor, argue that the H-1B program crowds out domestic employees
and suppresses domestic wages. Richard Trumka, President of the AFL-CIO wrote
that “High-tech companies say there are ‘too few’ American high-tech workers, but
that’s not true. . . They want a massive expansion of H-1B visa holders because they
can pay them less. . . This is not about innovation and job creation. It is about dol-
lars and cents” (Trumka, 2013). If we cannot find that the skilled immigrants are
productively superior to domestic labor, such as in generating technological innova-
tion, it becomes harder to justify the H-1B program, particularly if foreign labor is
just a direct substitute for domestic labor and thus depressing domestic wages (e.g.
Samuelson, 1964).
Further empirical understanding of skilled immigration is necessary to guide US
public policy as immigration grows in importance to employers. Many developed
countries explicitly recruit highly skilled immigrants without placing limits on the
number of skilled immigrants that may come, while the United States allows only a
limited number, primarily through the H-1B program.1 In 2014, more than half of
H-1B applications were denied to satisfy the statutory caps, representing the rejection
of a substantial number of mutually beneficial transactions between foreign workers
and domestic employers. Demand for highly skilled immigrants has steadily risen,
possibly reflecting a dwindling technical capacity of U.S. domestic graduates (Bound
1Australia, Canada, Japan, South Korea, the United Kingdom, France, the Netherlands andGermany place no cap on their high-skills immigration (Ochel, 2000).
88

et al., 2009).
The literature on skilled immigration and technological innovation (as measured
by patent counts) has consistently found a positive relationship between the two.
Hunt and Gauthier-Loiselle (2010) find a 1 percentage point increase in immigrant
college graduates’ population share increases patents per capita by 9-18 percent. Hunt
(2011) finds that immigrants entering on a student/trainee or temporary work visa
have higher patent productivity, publishing productivity and company founding rates
than American-born workers. Kerr and Lincoln (2010) find that higher aggregate
H-1B admissions increase immigrant employment and patenting in their study of
city-year variation in H-1B dependence. Chellaraj et al. (2008) study variation in
enrollment in U.S. graduate programs by international versus domestic students and
find that a 10% increase in foreign graduate students leads to 6.8% more patent grants
to universities and 5.0% more to non-universities. The prior literature is dominated
by empirical work using data at the regional level, instead of at the level of individ-
ual firms. This type of regional analysis may be susceptible to various confounding
factors, such as macroeconomic shocks.
In this study, we address these limitations by focusing on the firm-level effects of
skilled immigration. Specifically, we evaluate the impact of skilled immigration on
U.S. innovation by exploiting a random lottery in the H-1B visa program. We compare
firms that applied for the same number of lottery-subject applicants but won different
numbers of immigrants because of the lottery. We then compare patents across these
firms to identify the impact of these immigrants.
We find that winning an H-1B immigrant does not significantly increase patent
applications or grants at the firm level. Our results suggest the existing literature,
which shows a positive correlation between the spatial distributions of skilled immi-
grants and patents, cannot be associated with a direct firm-level effect. We argue
89

that our results are justified and should be expected, given the pervasive use of the
program in industries where patenting is not the main value-appropriation strategy.
Thus, empirical patent measures are not a true measure of innovation for this setting.
In parallel to our study, Doran et al. (2015) also implement the H-1B lottery
for identification of firm-level impact of skilled immigration, but they use a different
econometric strategy involving instrumental variables and focus on patent grants and
the lottery years of 2006 and 2007. We also include the 2008 lottery, the largest of
the 3 years. Beyond just patent grants, we also examine patent applications, giving
us a longer time window for analysis: because of a significant lag between patent
application and patent grants, patent grants may be insufficient to observe immigrant
effects on patents in the relatively recent time period of 2006–2008, making the patent
application data useful for enlarging the sample and ruling out patent approval lags as
an explanation for the null effects. Similar to our findings, they report an insignificant
correlation between H-1B lottery wins and patenting using a different identification
strategy. Across various specifications, we also find insignificant and near negative
effects of H-1B immigration on firm-level patent grants and patent applications.
This paper contributes to a small but growing literature on the impact of skilled
immigration on innovation and firm productivity. Our paper is the first to use ad-
ministrative patent application records in conjunction with H-1B administrative data
to estimate the causal impact of an H-1B immigrant on firm-level innovative produc-
tivity. We also provide information about the behavior and strategies of firms and
immigrants participating in the H-1B program and provide policy recommendations
surrounding the program.
Our paper proceeds as follows. In Section 2.2, we describe the institutional details
of the H-1B visa program. In Section 2.3 and Section 2.4, we elaborate more on the H-
1B lottery, which forms the basis of our empirical design, and explain the associated
90

econometrics. In Section 2.5, we detail our data collection and construction. In
Section 2.6, we present our main results. In Section 2.7, we discuss institutional
details that may have driven other positive findings and argue for tempered optimism
regarding the innovative benefits of the H-1B program. In Section 2.8, we conclude.
2.2 H-1B Program
Firms apply for H-1B visas on behalf of skilled foreign workers they would like
to hire domestically. The H-1B visa program—administered by the United States
Citizenship and Immigration Services (USCIS)—enables U.S. employers to seek tem-
porary foreign workers in a specialty occupation, an occupation that “requires theo-
retical and practical application of a body of highly specialized knowledge in fields of
human endeavor.”2 The visa application fees are paid for by the employer, and the
fee and accompanying legal services generally cost several thousand dollars per visa
petition filed. The visa lasts for three years but can be extended to six years by the
employer. It is officially classified as a non-immigrant visa—i.e., for those not seek-
ing long-term permanent residency—but it works as a “dual intent” visa, meaning
it enables its holder to seek lawful permanent resident status through a green card.
Administratively and throughout this paper, the H-1B sponsoring firm is referred to
as the petitioner, while the foreign worker is known as the beneficiary. A visa applica-
tion is referred to as a petition. The visa ties workers’ legal status to their continued
employment at the firm; if the worker quits or is fired, the worker must secure another
visa or may be required to leave the country. The H-1B program contains a number of
measures designed to protect the employment and wages of domestic workers, codified
2As stated in the U.S. Code of Federal Regulations “Special requirements for admission, exten-sion, and maintenance of status” in 8 CFR§214.2(h).
91

in the Labor Condition Application (LCA), which is self-attested by the petitioners.3
2.3 H-1B Lottery
Our empirical design exploits an idiosyncratic property of the H-1B program that
led to randomization of visa issuance. The Immigration Act of 1990 established a cap
on the number of new H-1B visas that can be issued each year. Congress sets the cap
for each year, which normally exists at 65,000 visas with a separate cap, known as
the “advanced-degree cap exemption,” for 20,000 immigrants with a master’s degree
or higher. In this paper, we focus on only the 65,000 non-advanced degree visas
that are subject to the regular cap. At the beginning of the 1990s, the number of
available visas exceeded the number of petitions, but the number of petitions rose
until the mid-1990s, and the cap became binding. The cap was raised in 1998 and
2000, reaching a high of 195,000 visas and becoming non-binding again in many years.
However, this high cap was not renewed, and by 2004, the cap returned to the original
65,000 and became binding again for non-advanced degree holders.
The program operates on a first-come, first-serve basis, so the petitions that arrive
earlier in the mail take priority. USCIS begins accepting petitions for H-1B visas for
the next year on the first business day of April in the current year. As expected,
firms began to apply earlier as demand for visas increased. In 2005, the available
cap-subject visas ran out in 132 days. By 2006, the visas ran out in 56 days, and in
2007 and 2008, the entire supply of H-1B ran out within days of the application cycle
3The Labor Condition Application (LCA) requires that employers attest to the following con-ditions. First, the immigrant’s wage must meet or exceed the prevailing wage for the majority ofemployees in their area of employment. Second, the hiring of the immigrant must not adverselyaffect working conditions of workers similarly employed. Third, the immigrant cannot be employedin an occupation and place of employment where there is currently a strike, lockout or work stop-page. The American Recovery and Reinvestment Act of 2009 added a number of other restrictions,including that employers must take good-faith steps to recruit U.S. workers for the open positionand that they must not have laid-off and will not lay-off any U.S. worker in an equivalent job.
92

opening. In 2006, 2007, and 2008, they received far more petitions than they had
available visas in those initial days. Because USCIS cannot distinguish which petitions
had arrived in the mail earlier, they subjected H-1B petitions received after the
application cycle opened but before the “final receipt date” to a “computer generated
random selection process” to determine which petitions were approved and which
were not. We refer to the random selection process as the lottery.
In 2007, the quota was exceeded, almost twice over, in the first two days of
the application cycleby the second day, 123,480 applications for H-1B visas were
submitted to USCIS. A lottery was used to randomly allocate 65,000 visas among
the many petitions. In 2008, the quota was exceeded by April 7, and winners were
randomly drawn from the application pool of those who filed for H-1B visas from
April 1 to April 7. We exploit the use of these lotteries for our empirical design.
2.4 Empirical Design
The empirical design leverages the H-1B lottery to address selection bias that may
have impacted previous estimates of the effect of skilled immigration on patenting.
We base our main regression model on Black et al. (2003), who leverage random
assignment in the unemployment insurance system, and Angrist et al. (2012), who
study charter school lotteries in Boston. To isolate random variation from the lottery,
Angrist et al. (2012) condition on “risk set” indicators designating the combination
of schools each student applied to. Conditional on the risk set, winning in the lottery
is random.
In the simplest analysis, we could compare the patent outcomes of firms who
petitioned for the same number of H-1B immigrants but won different number of
H-1B visas because of the lottery. This approach has limited statistical power due
93

to the small number of firms that applied for the exact same number of immigrants.
Instead we pool these regressions using a fixed effect for each observed number of
applications for a firm, thus making comparisons only among firms that applied for
the same number of visas.
Firms petition for multiple H-1B visas for foreign workers. The number of H-1B
visas a firm wins in the lottery is not unconditionally random. The number of H-1Bs
a firm wins, however, is random conditional on how many applications they submit.
Thus we specify the statistical model to compare the mean patenting of firms winning
more lotteries within a group of firms who petitioned for the same number of H-1B
visas. In all our analysis, we study three separate lottery events, in 2006, 2007, and
2008. For firm s, year t, petition count j, lottery year Y , and patent lag k, we
estimate:
ys,t+k = α + βθYst +∑j
δjdYsj + εst
We refer to this model as the “Petition Bin” model. ys,t+k represents the number of
patents a firm applies for or is granted for the k years after the lottery, θYst represents
the number of H-1B immigrants an employer won in year Y , and dYsj represents a
dummy that equals 1 for firms with petition count j and 0 otherwise for firms in the
Y lottery. β captures the average effect of one additional H-1B immigrant on a firm’s
patenting behavior in one year. This model represents the most parsimonious use
of the risk set, which pools data across firms with different numbers of petitions to
increase statistical power. The Petition Bin model is estimated using ordinary least
squares (OLS).
Conditional on the number of petitions a firm submits, θYst approximates a binomial
random variable. The proportion of available visas relative to the total number of
petitions defines the probability p that a particular petition will be successful and be
94

awarded a visa. The number of petitions a particular firm files is denoted as n. A
firm with full information and competent paperwork ability will expect np successes
with variance np(1− p).
To check robustness, we compare the results of this petition bin specification to
those of a generalized differences-in-differences with firm fixed effects to controls for
pre-existing differences in firms and absorb more residual variation to improve effi-
ciency and account for pre-existing differences between lottery winners and losers. If
the lottery is not truly random or our designation does not isolate lottery-induced re-
jections, the generalized differences-in-differences model controls for a baseline patent
rate and addresses that issue. This model controls for underlying time-invariant firm
quality. For firm s, year t, and lottery Y , we estimate:
yst = α + βωYst + ζπYst + γs + λt + εst
We refer to this as the “Diff-in-Diff with Firm FE” model. The variable yst represents
the patent count of firm s at time t. The variable ωYst represents the number of lottery
wins the firm won in Y if t ≥ Y ; for all t < Y , ωYst is equal to 0. πYst represents the
number of H-1B petitions made by the firm in Y if t ≥ Y . For all t < Y , πYst is equal
to zero. The variables γs and λt represent firm and year fixed effects respectively. The
firm fixed effects still function as risk sets, but they are a more generalized control
than the risk sets based upon petition bins.
Finally, we implement another model that replaces the firm effects with petition
bins (which would otherwise be collinear with the firm fixed effects). For firm s, year
t, petition count j, and lottery Y , we estimate:
yst = α + βωYst +∑j
δdYsj + λt + εst
95

We refer to this as the “Diff-in-Diff with Petition Bins” model. dYsj represents a dummy
that equals 1 for firms with petition count j and 0 otherwise. As before, the variable
yst represents the count of patents for firm s at time t. The variable ωYst represents
the number of lottery wins the firm won in Y if t ≥ Y ; for all t < Y , ωYst is equal to
0. This model is less general than the firm FE model—and it may underperform if
the lottery is not truly random—but it would control for non-randomness of lottery
if the non-randomness is predicted by the number of petitions made, which can be
thought of as a proxy for firm size.
We estimate our differences-in-differences models with ordinary least squares
(OLS), OLS with a logged dependent variable (e.g. ln (Patent Count + 1)), and neg-
ative binomial (NBR) with conditional firm fixed effects. First, the OLS model is the
most transparent and best linear unbiased estimator, but inference on the parameters
requires a normality assumption, and the patent count dependent variables are clearly
non-negative and heavily skewed with long right tail: this non-normal distribution
causes inefficiency in the basic OLS model. Second, logging the dependent variable
of patent count is a rough improvement to the performance of OLS as it makes the
dependent variable more normal.4 Third, the negative binomial distribution allows
for count data with different means and variances, and it is commonly used to analyze
patent data (Hausman et al., 1984; Allison and Waterman, 2002). We provide robust
standard errors for all our regression models.
4We add 1 to the patent count before we take the ln to address values of 0 in the dependent vari-able that would otherwise be undefined when logged. This modification makes ex-post interpretationof the coefficient slightly more nuanced, as it doesn’t easily fit the percentage change interpretationof logged regression variables that is traditionally used.
96

2.5 Data
We construct our dataset from U.S. Citizenship and Immigration Services (US-
CIS) administrative records and U.S. Patent and Trademark Office (USPTO) patent
records. The administrative records were obtained through five Freedom of Informa-
tion Act (FOIA) requests made from 2012 to 2014. Our original dataset contains
the universe of H-1B petitions from 1999 to 2012 (3.6 million petitions) with infor-
mation on the final decision regarding each petition. We manually check firm names
to correct for errors and to aggregate petitions made by clear subsidiaries of larger
entities.
We replicate the lottery sample for the years of 2006, 2007, and 2008 from the full
set of petitions. First, we limit the sample to the set of petitions with receipt dates
before or on the “final receipt date” as announced by the USCIS in their press releases.
Second, we eliminate petitions from non-profit entities. Third, we drop beneficiaries
with technical masters and Ph.D. degrees as they would be exempt from the regular
cap and thus would not be subject to the lottery. Fourth, we retain regular filings
(not changing status, extending stay, or amending stay) made for new employment.
Finally, we keep only petitions on behalf of beneficiaries not currently in the U.S. to
create the strictest sample possible. While this sample largely represents the full H-
1B lottery, one drawback of this method of data construction is that we cannot fully
distinguish between petitions declined because of bureaucratic issues (such as failing
to correctly fill out an employer identification number) and those declined because
they were not chosen in the lottery. The number of these bureaucratically declined
applications is small relative to the lottery and as the petition is usually completed
by expert legal help, rejections should be stochastic and not reflect the intrinsic
quality of the petitioning firm. As a robustness check, we implement a generalized
97

differences-in-differences model to control for underlying time-invariant firm quality.
Our patent grant data is from the IQSS Patent Network database (Li et al.,
2014) and our patent application data is from the USPTO/Google Patent Application
Publication dataset, available from 2001. The IQSS Patent Network database extends
until the end of 2013. We fuzzy match petitioning firm names with patent assignees
using the Microsoft Research and Microsoft Business Intelligence algorithm at a 0.85
level (Arasu et al., 2011),5 which we then manually check. We do so separately for
the IQSS and Google Patent data. We were unable to use citation-weighted patent
counts (Trajtenberg, 1990), commonly considered to be a better measure of innovation
impact, because there is not enough of a time window after the lotteries. Another
limitation is that we only see patents granted up to 2013, and we can only observe
patents up to those granted in late 2010, although that is not a complete sample
either as many patents applied for in 2010 have not been granted yet if the process
took longer than three years.
We also include patent applications in our study to give us a longer time window
after the lottery event. Patent grants may understate the effect of H-1B immigration
on innovative productivity as a long review period truncates what we can observe.
Between 1976 and 1996, patent applications took anywhere from 1 to 1,143 months
to be granted, with a mean of 28.4 months (Popp et al., 2004), with variation driven
mostly by idiosyncratic factors, although there is systematic variation in patent grant
lag across technological classes. Assuming the lottery is uncorrelated with the patent
grant lag across technological classes, our results are not biased by different lag lengths
in different technological classes. Given that our patent grant data only extended until
the end of 2013, based upon a two to three year patent grant lag, we have a four year
5Arasu, Chaudhuri, Chen, Ganjam, Kasushik, and Narasayya at Microsoft developed the fuzzymatching technology that made this project possible. We leave it to the reader to recognize theirony of this.
98

window of observation for our 2006 lottery (2007–2010) and a three year window of
observation for our 2007 lottery (2008–2010), with many patent grants missing at the
tail end of the observation window as some patent applications have not been granted
yet. We do not use the 2008 lottery in our study of patent grants because of the short
post-lottery observation window, but we do study the impact of the 2008 lottery
on patent applications. We introduce patent applications to give a larger observation
window up until 2012. Patent applications of course do not fully translate into patent
grants, and some applications are rejected in the process. The grant rate is fairly high
though, as 72.3% of patent applications filed in January 2001 were published before
April 2006 (Lemley and Sampat, 2012).
The descriptive statistics are presented in Table 2.1. The data summarized here
is structured as a balanced firm-year panel from 2005 to 2012. Patent grant data
are available only up until 2010, and patent application data are available up until
2012. To gain a sense of patent productivity of the average firm and the average
interaction with the lottery, in 2008 the average firm in the lottery submitted 1.7
patent applications and received 1.3 patent grants. In the same year, the average
firm submitted petitions for 6.3 and won 4.4 visas in the lottery.
——————–Insert Table 2.1——————–
To assess whether the lottery was random, we implement a placebo test in which
we regress lagged patents granted on the lottery win share; results of this test are
in Table 2.2. The regression demonstrates that there is a precise zero correlation
between the firm’s pre-lottery patent rate and the share of applications the firm won
in the lottery. The consistent zero-results suggest a random lottery.
——————–Insert Table 2.2——————–
99
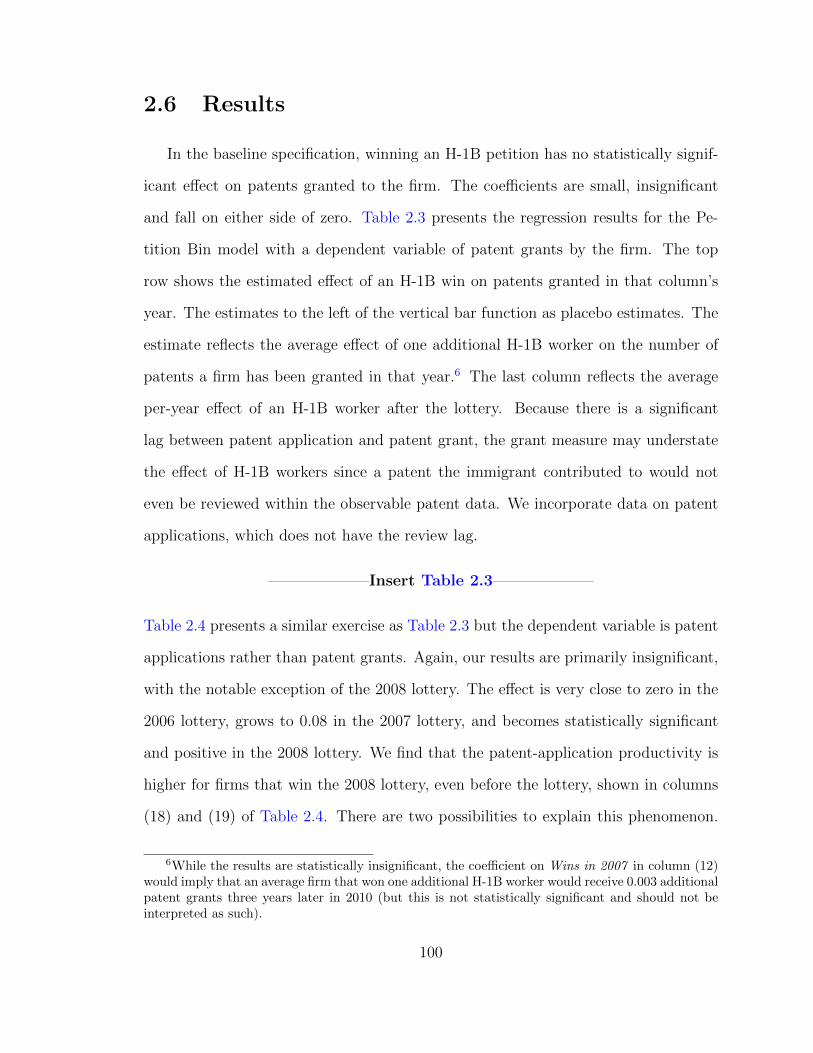
2.6 Results
In the baseline specification, winning an H-1B petition has no statistically signif-
icant effect on patents granted to the firm. The coefficients are small, insignificant
and fall on either side of zero. Table 2.3 presents the regression results for the Pe-
tition Bin model with a dependent variable of patent grants by the firm. The top
row shows the estimated effect of an H-1B win on patents granted in that column’s
year. The estimates to the left of the vertical bar function as placebo estimates. The
estimate reflects the average effect of one additional H-1B worker on the number of
patents a firm has been granted in that year.6 The last column reflects the average
per-year effect of an H-1B worker after the lottery. Because there is a significant
lag between patent application and patent grant, the grant measure may understate
the effect of H-1B workers since a patent the immigrant contributed to would not
even be reviewed within the observable patent data. We incorporate data on patent
applications, which does not have the review lag.
——————–Insert Table 2.3——————–
Table 2.4 presents a similar exercise as Table 2.3 but the dependent variable is patent
applications rather than patent grants. Again, our results are primarily insignificant,
with the notable exception of the 2008 lottery. The effect is very close to zero in the
2006 lottery, grows to 0.08 in the 2007 lottery, and becomes statistically significant
and positive in the 2008 lottery. We find that the patent-application productivity is
higher for firms that win the 2008 lottery, even before the lottery, shown in columns
(18) and (19) of Table 2.4. There are two possibilities to explain this phenomenon.
6While the results are statistically insignificant, the coefficient on Wins in 2007 in column (12)would imply that an average firm that won one additional H-1B worker would receive 0.003 additionalpatent grants three years later in 2010 (but this is not statistically significant and should not beinterpreted as such).
100

First, the lottery could have randomly selected higher productivity firms; the differ-
ences are consistently significant at least the 10% level; it is possible that the lottery
randomly selected firms with a higher pre-lottery patent-application productivity and
indeed would happen in one of ten draws. A second possibility is that the lottery
was not random in 2008. A possible but untested explanation could involve the com-
petitive political environment of the 2008 general election, where USCIS may have
incorporated political pressures to accommodate influential firms.
——————–Insert Table 2.4——————–
Given our results for 2008, our main concern for identification is that either the lottery
is not truly random, or our method of identifying lottery-rejected firms sometimes
includes firms that were rejected because of incomplete paperwork. To control for this,
we implement a generalized differences-in-differences design with firm fixed effects
and with petition bins that would yield unbiased results even if the lottery were non-
random (if some firms are better at winning the lottery than others). The results
from this specification are largely the same, but the coefficient estimates are even
smaller, usually insignificant, and sometimes negative and significant, as presented
in Table 2.5, with a dependent variable of patent grants, and Table 2.6, with a
dependent variable of patent applications. We find some significant results on our
OLS Log DV models. The coefficient on the logged dependent variable represents
the approximate percentage change in patents, so Table 2.5 model (2) is interpreted
as showing a 2% reduction in patenting for an additional H-1B visa won, significant
to the 5% level. The 2008 results shift downward in the differences-in-differences
framework, suggesting that: the lottery randomly chose more productive firms in
2008; the lottery is not truly random; or our classification of lottery rejections is
inaccurate in some cases.
101

——————–Insert Table 2.5——————–
——————–Insert Table 2.6——————–
Another avenue for exploration is that of firm behavior: firms may adjust their H-
1B petition filing strategy based upon the previous year’s success or failure. Our
estimated effects would be understated if, for instance, firms that lose the lottery
apply for more visas the next year; in this case, the firm is only without the productive
capital of an H-1B worker for a single year. Randomly winning (losing) a visa in 2007
would decrease (increase) the number of applications submitted in the next year 2008.
On the other hand, our estimates may be overstated if there were returns to scale
in hiring skilled immigrants; in this case, randomly winning a visa in 2007 would be
positively correlated with the number of petitions a firm submits in 2008, or in other
words, winning (losing) one visa in 2007 increases (reduces) the firm’s H-1B petition
filings in 2008. We find that an additional H-1B visa received in 2007 causes firms to
petition for more visas in 2008, as shown in Table 2.7; one additional H-1B visa won
in the 2007 lottery causes the average firm to apply for about 0.2 more H-1B visas
the following year 2008, significant to a 5% level.
——————–Insert Table 2.7——————–
The null results are striking in the context of the existing literature, the majority
of which demonstrates a robust positive relationship between the H-1B program and
patenting. Some caution is needed in interpreting our particular results. The esti-
mates reflect the average effect of a non-master’s degree H-1B immigrant on patent
applications and grants. The results do not, for instance, speak directly to the impact
of the subset of skilled immigrants educated at elite American universities, as many
of the immigrants were educated at foreign universities of variable quality. More im-
portantly, our study focuses only on the effect of H-1B visas subject to the lottery,
102

i.e. those without a relevant master’s or doctorate degree; petitions for immigrants
with that higher level of education beyond the bachelor’s degree are considered in a
different pool of visas, and thus not subject to the lottery.
2.7 Why Don’t H-1B Immigrants (in the Lottery)
Produce Patents?
The results prompt two questions: Why have previous studies demonstrated large
positive associations? And why would an H-1B win have no effect on patent produc-
tivity?
2.7.1 What is Different about the Prior Research?
First, we proffer that a number of other factors besides the direct effect of an im-
migrant being placed into a firm may be driving prior results. Our leading hypothesis
is that results from studies without a credible control group were unable to control
for significant determinants of patenting productivity. Perhaps the most persuasive
paper, Kerr and Lincoln (2010) show that there were large increases in the rate of
Indian and Chinese patenting in cities and firms that depend on H-1B visas when
H-1B visa availability expanded. The lottery results suggest that these effects may be
driven by an omitted variable, like productivity shocks, which increase both a firm’s
patenting and a firm’s interest in H-1B workers. As an example, imagine that prolific
scientists enter some firms, which increases the firm’s patent rate and the firm’s de-
mand for technical labor, creating a spurious correlation between H-1B workers and
patent creation.
It is also possible that the patenting effects may exist in neighboring firms via
103

spillovers. Regional data on H-1Bs and patenting behavior would be able to capture
spill-over effects, which we would not observe here, but it would be captured in prior
studies that study the regional impacts of H-1B immigration. However, it seems
unlikely to be the case that an immigrant would have no effect on her own firm but
have substantial effects on surrounding firms she has even less to do with, in a time
span of a couple years. A more probable story for possible spillovers comes from
when immigrants employed by one firm are then contracted out to other firms. Thus
the additional lottery wins would not be observed as having an impact on patents at
the firm that won the visa. Later in this section, in Figure 2.5, we address this issue
further.
2.7.2 Why Zero Estimates?
We use our detailed data on petitions to shed light on why the effects are plausibly
zero. The following figures contain data from our sample of petitions from 1999 to
2012, including both lottery and non-lottery petitions.
Figure 2.1 shows the distribution of firm types participating in H-1B program.
48.8% of petitions originate from computer-related firms. The next largest categories
are Architecture & Engineering (12.2%), Education (9.6%) and Administrative Spe-
cializations (8.4%). Life Science firms account for 2.71% of the petitions. Typically
we do not expect any impact on firm-level patenting from educational or administra-
tive firms because they are not traditionally heavy in research and development that
would lead to patents.
——————–Insert Figure 2.1——————–
Figure 2.2 shows the distribution of occupation types (as defined in the Dictionary
of Occupational Types by the US Department of Labor) in H-1B petitions. Diving
104

further into the occupations that beneficiaries are being placed into, we find that
42.9% of the occupations are in “Systems Analysis and Programming,” which rep-
resents information technology support roles, which is clearly unlikely to generate
intellectual property, and software engineers, which as we will also discuss, are also
unlikely to generate substantial intellectual property.
——————–Insert Figure 2.2——————–
Patenting varies heavily by industry because a patent’s ability to internalize the
social benefits of innovation varies widely. Software has been known to have histor-
ically weak patent protection (Bessen and Maskin, 2009). In industries such as life
sciences, chemicals, and semiconductors, patents have been more effective at protect-
ing intellectual property arising from R&D, generating a greater value to patenting
(Arora et al., 2008a).
Moreover, software patents are not predominantly generated by software firms.
Bessen and Hunt (2007) construct a dataset of software patents and find that software
patents tend to be assigned to firms in industries known to accumulate large patent
portfolios and to pursue patents for strategic reasons (computers, electrical equip-
ment, and instruments), particularly in manufacturing and not to actual software
publishers, who only hold 5% of their sample of software patents. The manufacturing
sector acquires 75% of software patents but employs only 11% of programmers and
analysts. These patent portfolios are often part of “patent thickets,” a set of over-
lapping patents for defense purposes by firms and for offensive purposes by patent
assortment entities.
We also run our main analyses (Petition Bin Model & Diff-in-Diff) for the set of
petitions by firms applying for immigrants specializing in life sciences occupations,
where patenting is more common and a more effective measure of value capture. We
find no significant effects. This result may be due to a lack of statistical power given
105

the small sample size. But another possibility is that the set of cap-subject immigrants
in life sciences may indeed have low patenting productivity. As legally defined, the
set of cap-subject immigrants we are studying are those without master’s degrees
and doctorates (otherwise they wouldn’t be cap-subject). It is hard to imagine that
a life science employee with just an undergraduate degree would be very effective
at generating patents in a field where a Ph.D. is so common and necessary training
to conduct independent research. The more likely reality is that the cap-subject
life science occupation immigrants are taking support roles in laboratories and not
leading independent research.
We find that the patent classes represented by the firms participating in the H-1B
program do not reflect the full distribution of patent classes. Figure 2.3 shows the 10
most popular patent classes among patents by H-1B firms and there is a clear lean
toward software and information technology patents, which are less common in the
full set of all USPTO patents.
——————–Insert Figure 2.3——————–
The distribution of H-1B immigrants is heavily skewed towards India, which has been
historically known to produce a large amount of engineers, particularly in software
(Banerjee, 2008). This distribution of H-1B beneficiary country of origin is shown in
Figure 2.4. While not captured in our data, it has been noted that H-1B immigrants
are younger than domestic employees who might otherwise take the occupation (Kerr
et al., 2015). Greater age is found to be beneficial to innovative impact (Jones, 2010).
——————–Insert Figure 2.4——————–
Finally, we reflect on the distribution of visas that would occur in an expansion of
the program. Figure 2.5 shows the top 10 largest filers of H-1B petitions in 2007. With
the exception of Microsoft Corporation, the other nine companies are all what would
106

be classified as information technology consulting firms, best known for outsourcing
services. These firms provide services from foreign labor based located in a foreign
country, which for these firms is usually India, and they are experts in navigating
immigration procedures. Once they obtain a visa for these workers, the firms place
the worker with a client. Because these firms are functionally working for another firm,
the visa-sponsoring firm likely does not own patents resulting from the immigrant.
We have no way of ascertaining the identity of their clients and placement of the
immigrants.
——————–Insert Figure 2.5——————–
To summarize, we believe the academic literature has misinterpreted the practical
use of H-1B program. The majority of firms do not hire H-1B immigrants to gen-
erate patents. The average H-1B immigrant is a young Indian software engineer or
information technology support specialist and not a patent-generating researcher or
scientist, and many of these immigrants are not even employed by their hosting firm.
2.8 Conclusion
We estimate the causal impact of H-1B workers on the patent production of Amer-
ican firms by exploiting a lottery that randomly issues visa to petitioning firms. We
find that traditional H-1B immigrants (no relevant master’s or Ph.D.) have no observ-
able impact on a firm’s patent applications or patent grants. Using a rich dataset on
the universe of H-1B petitions, we demonstrate that the H-1B program is primarily
employed in firms and occupations that do not contribute to innovation as captured
by patents. Our results provide new evidence on the impact and role of skilled im-
migration. Our result is surprising given a substantial prior literature demonstrating
a robust positive correlation between H-1B visa use and patent production. These
107

results are particularly important in light of an on-going debate surrounding the use
of immigration to meet domestic labor demand.
The present work leaves much to be explored in the context of understanding the
H-1B program and skilled immigration more generally. Our analysis focuses on the
impact of H-1B immigrants without a relevant education beyond a bachelor’s degree,
and our results do not speak directly to the innovative value-add of highly skilled
immigrants trained in prestigious American universities or the H-1B visas offered
to immigrants with a master’s degree. The role of the program for master’s and
Ph.D. educated immigrations needs to be further studied as the upper cap on that
portion of the H-1B program is also reached. There are also other categories of the
skilled immigration that have yet to be well studied, including the specialized H-1B1
program for Chile and Singapore, the H-1B2 program related to U.S. Department of
Defense R&D, O-1 visa for individuals with “extraordinary ability or achievement.”
This paper should therefore be viewed as an intermediate step toward characterizing
the impact of high-skilled immigration on American innovation and labor.
108

Computer-Related48.3%
Administrative Specializations Arch. & Engineering Art
Computer-Related Education Entertainment and Recreation
Fashion Law and Jurisprudence Life Sciences
Managers and Officials Math & Physical Science Medicine and Health
Misc. Technical Museum & Library Religion and Theology
Social Sciences Writing
Figure 2.1: Firm Industries. This figure depicts distribution of firm industries whofiled petitions in the H-1B program. The data is from United States Citizenship andImmigration Services (USCIS) and represents the full sample of H-1B petitions filedfrom 1999 to 2012.
109

Systems Analysisand Programming
42.9%
Accountants and Auditors Biological Sciences College and University Education
Electrical/Electronics Eng. Other Other Computer Related
Other Engineering Physicians and Surgeons Systems Analysis and Programming
Figure 2.2: Occupation Types. This figure depicts distribution of beneficiary (im-migrant) occupation types for petitions filed in the H-1B program. The occupationtypes are defined in the Dictionary of Occupational Types by the U.S. Department ofLabor. The largest category, ”Systems Analysis and Programming”, represents infor-mation technology support roles, such as software developers and technical support.The data is from United States Citizenship and Immigration Services (USCIS) andrepresents the full sample of H-1B petitions filed from 1999 to 2012.
110

Class Class Title H-1B USPTO705 Data Processing: Financial, Business Practice,
Management, or Cost/Price Determination4.2% 0.7%
707 Data Processing: Database and File Managementor Data Structures
3.1% 1.2%
514 Drug, Bio-Affecting, and Body Treating Compo-sitions
2.4% 1.3%
435 Chemistry: Molecular Biology and Microbiology 2.4% 1.8%
370 Multiplex Communications 2.4% 1.7%
709 Electrical Computers and Digital Processing Sys-tems: Multicomputer Data Transferring
2.1% 1.5%
455 Telecommunications 2.0% 1.7%
424 Drug, Bio-Affecting, and Body Treating Compo-sitions
1.8% 1.0%
73 Measuring and Testing 1.5% 0.9%
340 Communications: Electrical 1.5% 1.0%
Figure 2.3: Top Patent Classes. This figure shows the top 10 most popular classesfor patents filed by firms who filed at least one petition in the H-1B program from 1999and 2012. The columns Class and Class Title are the official class number and nameas defined by the United States Patent and Trademark Office (USPTO). is the Thecolumn H-1B represents the percentage of all the patents filed by H-1B participatingfirms in that patent class. The column USPTO represents the percentage of allpatents in that patent class in patents applied for in the year 2007. The data is fromUnited States Citizenship and Immigration Services (USCIS) and the United StatesPatent and Trademark Office (USPTO).
111

India49.7%
China (PRC)8.5%
Canada China (PRC) India Japan
Mexico Other Pakistan Philippines
South Korea Taiwan United Kingdom
Figure 2.4: Country of Origin. This figure depicts country of origin of beneficiaries(immigrants) who had H-1B petitions filed on their behalf. The data is from UnitedStates Citizenship and Immigration Services (USCIS) and represents the full sampleof H-1B petitions filed from 1999 to 2012.
112

Firm PetitionsInfosys Technologies Limited 4175
Wipro Limited 2253
Satyam Computer Service Limited 1131
Cognizant Technology Solutions Corporation 979
Tata Consultancy Services Limited 576
Patni Computer Systems Limited 435
Microsoft Corporation 331
US Technology Resources, LLC 322
Accenture PLC 320
Larsen & Toubro Infotech Limited 257
Figure 2.5: Top H-1B Petitioners. This figure shows the top ten largest filers ofH-1B petitions in 2007. With the exception of Microsoft Corporation, the other nineof top ten are information technology consulting firms, commonly associated withoutsourcing services. The data is from United States Citizenship and ImmigrationServices (USCIS) and represents the full sample of H-1B petitions filed in 2007.
113

Table 2.1: Summary Statistics. This table presents summary statistics for our firm-year data composed of firms filing H-1B petitions in the 2006, 2007, and 2008 lotteries.H-1B petition data is from U.S. Citizenship and Immigration Services (USCIS), drawnfrom the compete set of H-1B petitions from 1999 to 2012 obtained via FOIA request.Patent grant data is from the IQSS Patent Network database (Li et al., 2014), and itis only available up until 2010. Patent application data is from the USPTO/GooglePatent Application Publication system, and it is only available up until 2012.
2006 Mean Std. Dev. Min Max Obs.
Patent Grants 3.40 71.93 0 3152 6024
Patent Applications 5.79 107.39 0 3085 8032
Wins 2.26 5.40 0 90 10040
Petitions 2.88 6.27 1 96 10040
Share Won 0.77 0.37 0 1 10040
2007 Mean Std. Dev. Min Max Obs.
Patent Grants 1.45 32.39 0 3152 45720
Patent Applications 1.93 45.63 0 3085 60960
Wins 3.83 38.97 0 2242 76200
Petitions 6.02 58.96 1 4175 76200
Share Won 0.69 0.40 0 1 76200
2008 Mean Std. Dev. Min Max Obs.
Patent Grants 1.27 28.50 0 3152 42150
Patent Applications 1.74 38.50 0 3085 56200
Wins 4.36 50.93 0 2735 70250
Petitions 6.30 74.18 1 4778 70250
Share Won 0.73 0.39 0 1 70250
114

Table 2.2: Lottery Placebo Test. This table presents the results of the lotteryplacebo test. We regress patent grants filed by a firm in the year before the lottery onits share of wins for a given lottery in 2006, 2007, or 2008. This model is estimatedusing ordinary least squares (OLS). Statistical significance is represented by ∗ p <0.10, ∗∗ p < 0.05, and ∗∗∗ p < 0.01. Robust standard errors are shown in parentheses.
(1) (2) (3)
Petition Win Share 2006 2007 2008
Patents 0.000 0.000 0.001
(0.000) (0.000) (0.000)
Constant 0.766*** 0.691*** 0.730***
(0.012) (0.005) (0.005)
Observations 1004 7620 7025
115

Table 2.3: Petition Bin Model (Patent Grants). This table presents the resultsof the Petition Bin model with the dependent variable of Patent Grants. All Yearscontains all available post-treatment (post-lottery) years. This model is estimatedusing ordinary least squares (OLS). Statistical significance is represented by ∗ p <0.10, ∗∗ p < 0.05, and ∗∗∗ p < 0.01. Robust standard errors are shown in parentheses.
(1) (2) (3) (4) (5) (6) (7)
Patent Grants 2005 2006 2007 2008 2009 2010 All Years
Wins in 2006 0.808 0.440 -0.037 0.036 -0.050 -0.005 -0.014
(1.246) (0.841) (0.501) (0.247) (0.151) (0.024) (0.225)
Petition Bins Yes Yes Yes Yes Yes Yes Yes
Observations 1004 1004 1004 1004 1004 1004 4016
(8) (9) (10) (11) (12) (13)
Patent Grants 2006 2007 2008 2009 2010 All Years
Wins in 2007 0.149 0.090 0.039 0.016 0.003* 0.019
(0.112) (0.067) (0.026) (0.010) (0.002) (0.012)
Petition Bins Yes Yes Yes Yes Yes Yes
Observations 7864 7864 7864 7864 7864 23592
116

Table 2.4: Petition Bin Model (Patent Applications). This table presents theresults of the Petition Bin model with the dependent variable of Patent Applications.All Years contains all available post-treatment (post-lottery) years. This model isestimated using ordinary least squares (OLS). Statistical significance is representedby ∗ p < 0.10, ∗ ∗ p < 0.05, and ∗ ∗ ∗ p < 0.01. Robust standard errors are shown inparentheses.
(1) (2) (3) (4) (5) (6) (7) (8) (9)
Patent Applications 2005 2006 2007 2008 2009 2010 2011 2012 All Years
Wins in 2006 0.359 0.500 0.096 -0.053 -0.071 0.164 0.022 -0.096 0.010
(0.493) (0.927) (1.278) (1.349) (1.003) (1.367) (0.952) (0.343) (1.008)
Petition Bins Yes Yes Yes Yes Yes Yes Yes Yes Yes
Observations 1004 1004 1004 1004 1004 1004 1004 1004 6024
(10) (11) (12) (13) (14) (15) (16) (17)
Patent Applications 2006 2007 2008 2009 2010 2011 2012 All Years
Wins in 2007 -0.001 0.046 0.045 0.055 0.088 0.138 0.062 0.078
(0.048) (0.070) (0.079) (0.076) (0.096) (0.110) (0.040) (0.076)
Petition Bins Yes Yes Yes Yes Yes Yes Yes Yes
Observations 7864 7864 7864 7864 7864 7864 7864 39320
(18) (19) (20) (21) (22) (23) (24)
Patent Applications 2007 2008 2009 2010 2011 2012 All Years
Wins in 2008 0.156* 0.192** 0.174** 0.203** 0.190** 0.059** 0.157**
(0.083) (0.091) (0.084) (0.096) (0.085) (0.030) (0.071)
Petition Bins Yes Yes Yes Yes Yes Yes Yes
Observations 7525 7525 7525 7525 7525 7525 30100
117

Table 2.5: Differences-in-Differences (Patent Grants). This table presentsthe results of the Diff-in-Diff with Firm FE model—in the first 3 columns un-der the header Firm FE—and the Diff-in-Diff with Petition Bins model—in thelast 2 columns under the header Petition Bins—with the dependent variable ofPatent Grants. The Diff-in-Diff with Firm FE model is estimated with ordinaryleast squares (OLS) with firm fixed effects, OLS with a logged dependent variableln(Patent Count + 1) and firm fixed effects, and negative bionomial (NBR) with con-ditional firm fixed effects. The Diff-in-Diff with Petitions Bins model is estimatedwith ordinary least squares (OLS) with firm fixed effects and OLS with a logged de-pendent variable ln(Patent Count + 1) and firm fixed effects. Statistical significanceis represented by ∗ p < 0.10, ∗ ∗ p < 0.05, and ∗ ∗ ∗ p < 0.01. Robust standard errorsare shown in parentheses.
Firm FE Petition Bins
OLS OLS Log DV NBR OLS OLS Log DV
Patent Grants (1) (2) (3) (4) (5)
Wins * Post (2006) -7.181 -0.020** -0.055 -2.114 -0.007**
(6.518) (0.009) (0.090) (2.328) (0.003)
Petitions * Post (2006) 4.346 0.011* 0.042
(3.712) (0.007) (0.083)
Observations (2004 to 2010) 6024 6024 498 6024 6024
Patent Grants (6) (7) (8) (9) (10)
Wins * Post (2007) -0.167 -0.001* 0.017 -0.040 -0.001***
(0.214) (0.000) (0.013) (0.046) (0.000)
Petitions * Post (2007) 0.087 0.000 -0.017
(0.112) (0.000) (0.012)
Observations (2005 to 2010) 47184 47184 4500 47184 47184
Patent Grants (11) (12) (13) (14) (15)
Wins * Post (All) -0.089 -0.000 0.014 -0.019 -0.000***
(0.112) (0.000) (0.011) (0.021) (0.000)
Petitions * Post (All) 0.049 0.000 -0.014
(0.062) (0.000) (0.010)
Observations (2004 to 2010) 77592 77592 6846 77592 77592
Firm FE Yes Yes Yes No No
Petition Bins No No No Yes Yes
Year FE Yes Yes Yes Yes Yes
118

Table 2.6: Differences-in-Differences (Patent Applications). This tablepresents the results of the Diff-in-Diff with Firm FE model—in the first 3 columnsunder the header Firm FE—and the Diff-in-Diff with Petition Bins model—in thelast 2 columns under the header Petition Bins—with the dependent variable ofPatent Applications. The Diff-in-Diff with Firm FE model is estimated with or-dinary least squares (OLS) with firm fixed effects, OLS with a logged dependentvariable ln(Patent Count + 1) and firm fixed effects, and negative bionomial (NBR)with conditional firm fixed effects. The Diff-in-Diff with Petitions Bins model isestimated with ordinary least squares (OLS) with firm fixed effects and OLS witha logged dependent variable ln(Patent Count + 1) and firm fixed effects. Statisticalsignificance is represented by ∗ p < 0.10, ∗ ∗ p < 0.05, and ∗ ∗ ∗ p < 0.01. Robuststandard errors are shown in parentheses.
Firm FE Petition Bins
OLS OLS Log DV NBR OLS OLS Log DV
Patent Applications (1) (2) (3) (4) (5)
Wins * Post (2006) 0.823 0.006 -0.064 0.338 0.003
(1.021) (0.006) (0.100) (0.352) (0.002)
Petitions * Post (2006) -0.414 -0.002 0.056
(0.612) (0.004) (0.092)
Observations (2004 to 2012) 8032 8032 568 8032 8032
Patent Applications (6) (7) (8) (9) (10)
Wins * Post (2007) -0.036 -0.000 -0.000 0.002 0.000**
(0.026) (0.000) (0.001) (0.008) (0.000)
Petitions * Post (2007) 0.026* 0.000*** 0.000
(0.014) (0.000) (0.001)
Observations (2005 to 2012) 62912 62912 4960 62912 62912
Patent Applications (11) (12) (13) (14) (15)
Wins * Post (2008) -0.092 -0.001 -0.001 -0.010 0.000
(0.094) (0.000) (0.001) (0.018) (0.000)
Petitions * Post (2008) 0.058 0.000* 0.001
(0.053) (0.000) (0.001)
Observations (2006 to 2012) 52675 52675 3976 52675 52675
Patent Applications (16) (17) (18) (19) (20)
Wins * Post (All) -0.031 -0.000 -0.001 -0.000 0.000
(0.026) (0.000) (0.000) (0.006) (0.000)
Petitions * Post (All) 0.021 0.000** 0.000
(0.015) (0.000) (0.000)
Observations (2004 to 2012) 103456 103456 7688 103456 103456
Firm FE Yes Yes Yes No No
Petition Bins No No No Yes Yes
Year FE Yes Yes Yes Yes Yes
119

Table 2.7: Firm Behavior. This table presents the results of an ordinary leastsquares (OLS) regression with a dependent variable of Petition Bins, the number ofH-1B petitions filed by a firm in 2008, and an independent variable of Wins in 2007,H-1B petitions awarded to the firm in 2007. Petition Bins fixed effects, representingpetitions filed in 2007, are included. Statistical significance is represented by ∗ p <0.10, ∗∗ p < 0.05, and ∗∗∗ p < 0.01. Robust standard errors are shown in parentheses.
(1)
Petition Bins
Wins in 2007 0.197**
(0.091)
Petition Bins Yes
Observations 2805
120

Chapter 3
R&D Production Team
Organization
and Firm-Level Innovation
Vikas A. Aggarwal
David H. Hsu
Andy Wu
3.1 Introduction
The expertise embodied in the stock of inventive human capital of a firm is criti-
cal to its innovation output, particularly in fast-moving entrepreneurial environments
(Campbell et al., 2012; Hatch and Dyer, 2004; Eesley et al., 2014). Recent studies
suggest that ongoing innovation in such settings is very often predicated on collabo-
rative (rather than solo) production of knowledge by multiple individuals inside the
firm (Wuchty et al., 2007; Jones, 2009), and that such team-based approaches are
121

more likely to lead to breakthrough” innovations (Singh and Fleming, 2010). Team
approaches, furthermore, resonate with popular accounts of the processes leading to
innovation over the course of modern business history (Isaacson, 2014). Yet despite
the importance of teams to the process of innovation in entrepreneurial settings, the
strategy literature offers relatively little guidance as to how firms should organize their
overall stock of human capital into teams in situations where firm-level innovation
output is a desired outcome.
There are two key dimensions along which the prior literature has been limited
in exploring the link between the organization of human capital into teams and firm-
level innovation. First, while a rich body of work in the organizations literature
has addressed issues such as the link between diversity (generally demographic) and
team performance (e.g. Ancona and Caldwell, 1992; Williams and O’Reilly, 1998),
it has typically done so by taking the team itself as the focal unit of analysis. Yet
teams do not exist in isolation from one another; a focus on teams, if these teams
are conceptualized solely as atomistic entities disembodied from an organizational
context, may obscure the effects of interactions that occur across teams, with these
interactions possibly shaping firm-level outcomes. Second, while a significant body of
work in the strategy literature has examined the link between teams and performance,
the focus on teams has been largely confined to addressing top management team
(TMT) issues (e.g. Bantel and Jackson, 1989; Eesley et al., 2014), to the exclusion of
issues that reside at the level of the firm’s inventive output (i.e., production teams).
In this paper we focus on the firm-level implications of organizing inventor human
capital (Cohen and Levinthal, 1990; Grant, 1996; Coff, 1997; Katila and Ahuja, 2002)
into production teams with varied configurations. We ask the question: how do
alternate approaches to organizing the diversity of technical experience contained in
a firm’s pool of inventors influence innovation outcomes at the firm-level? We argue
122

that taking a firm-level perspective allows us to conceptualize technical experience
diversity not only in the context of a given team (what we call “within-team” technical
experience diversity), but more importantly in what we refer to as the dimension of
“across-team” technical experience diversity.
To further elaborate on what we mean by these two forms of diversity, we illustrate
in Figure 3.1 the point that a firm’s total stock of technical experience diversity can
be organized in alternate (though not mutually exclusive) ways. First, variation
in the extent of diversity may exist within a team: inventors on a particular team
may be more diverse or more uniform with respect to other inventors on that team.
Second, such variation can be distributed across teams: the teams themselves can be
conceptualized as being more diverse or more uniform as compared to the other teams.
While studies on team design have examined diversity at the level of an individual
team (e.g. Williams and O’Reilly, 1998), the within-firm, across-team perspective has
received little attention. In addition, both dimensions of diversity have generally not
been considered in light of the broader firm-level context and the associated design
choices faced by managers. Our primary goal in this paper is to understand the
relative net benefits to firm-level innovation output of these two diversity regimes.1
——————–Insert Figure 3.1——————–
In the next section we briefly discuss the background literature that motivates our
empirical exercise, focusing in particular on why the concept of across-team technical
experience diversity might be informative in the strategy literature, together with the
key mechanisms—knowledge recombination and coordination costs—that we believe
are likely to shape its effects. Our analysis draws on a sample of 476 venture capital-
1We consider across-team diversity and within-team diversity to be theoretically independentconstructs. While we illustrate the “joint” condition (high on one dimension, low on the other) inFigure 3.1 for ease of exposition, for the purpose of our theory development we are focused on theirindependent effects.
123

backed biotechnology firms which we observe from their date of founding onwards, and
for which we collect information on their inventors’ full invention career experience.
We begin by assembling a firm-year panel dataset that allows us to examine the
effects of the two alternate technical experience diversity regimes with respect to
firm-level innovation. To understand the mechanisms underlying our results we then
reassemble our dataset to explore the effect of the alternate diversity regimes on
inventor productivity using a difference-in-differences empirical specification at the
inventor-year level.
Our results point to two key conclusions: (a) organizing teams with higher levels
of across-team technical experience diversity results in greater benefits to firm-level
innovation output than within-team technical experience diversity; and (b) the across-
team effect operates via the lever of team stability, a measure of coordination costs. In
a final section we discuss our results in the context of the broader strategy literature,
focusing in particular on how the construct of across-team diversity might inform
work in the domains of organization design, strategic human capital, and teams.
3.2 Theoretical Motivation
From the perspective of a manager concerned with firm-level innovation output,
the task of organizing human capital into teams brings to light the dimension of
across-team diversity. This concept has been relatively neglected in the literature on
teams, where the focus has generally been on the team itself (versus the firm) as a unit
of analysis (with a focus on the implications of within-team diversity consequently
being paramount). Our development of the across-team diversity construct is an
inherently firm-level one, which we argue will hold a host of theoretical implications
at the intersection of work on strategy, innovation, and organization design. Puranam
124

et al. (2014) for example argue that all forms of organizing consist of unique solutions
to the universal problems of task division, task allocation, provision of rewards, and
provision of information. Taking these universal problems into account, organizing
a firm’s pool of human capital in a setting where across-team diversity is a desired
attribute would necessitate attention to the host of governance and incentive levers
that influence how team boundaries are set, how knowledge flows within and across
these boundaries, and how structures for knowledge integration might influence the
extent of interactions across teams.
Our primary aim in this paper is thus to be generative with respect to the implica-
tions of the across-team diversity concept, and in so doing to demonstrate that it is a
relevant dimension of interest for managers concerned with effectively employing the
firm’s inventive human capital. Yet our theoretical objectives go beyond this; we aim
as well to identify the possible mechanisms through which the effects of across team
diversity operate. Our starting point for doing so is a stylized fact emerging from the
literature on teams (e.g. Bantel and Jackson, 1989; Ancona and Caldwell, 1992; Mil-
liken and Martins, 1996; Williams and O’Reilly, 1998): teams that are diverse face a
tension between the learning benefits of different perspectives, and the frictions that
must be overcome for these benefits to be realized (Reagans and Zuckerman, 2001).
In the context of firm-level innovation, with the firm’s inventive human capital
as the key resource, we can reframe this tension as one in which the firm-level man-
ager must balance the innovation benefits of knowledge recombination arising from
the diversity of inventors’ technical experience with the costs of coordination stem-
ming from the particular ways in which these inventors are configured into teams. A
firm’s ability to innovate is predicated on the technical experience embodied in its
productive human capital (e.g. Grant, 1996; Coff, 1997), with the experience of any
individual inventor consisting of that gained over her entire career (i.e., not just at
125

the focal firm). This diversity in inventor technical experience benefits the firm’s in-
novation output because recombination of prior knowledge is a key component of the
innovation process (Kogut and Zander, 1992; Hargadon and Sutton, 1997; Fleming,
2001; Katila and Ahuja, 2002; Karim and Kaul, 2015). At the same time, how-
ever, coordination costs, arising from interdependencies among inventors, serve as a
countervailing force (Thompson, 1967; Lawrence and Lorsch, 1967; Kretschmer and
Puranam, 2008; Puranam et al., 2012; Kotha et al., 2013), thereby mitigating the
innovative benefits that might arise from such diversity.
Understanding the innovation implications of alternate firm-level diversity regimes
then involves weighing the relative impact of knowledge recombination and coordi-
nation costs at each organization design level (across- and within-teams). With re-
spect to knowledge recombination, the prior literature points to substantial innovation
benefits of spanning boundaries (Rosenkopf and Nerkar, 2001). These benefits arise
because spanning (e.g., in our case, team) boundaries helps overcome core rigidities
(Leonard-Barton, 1992) and competency traps (Levitt and March, 1988), and enables
inventor teams to avoid an inward focus that can reduce innovative output (Stuart
and Podolny, 1996). Thus, the productivity of a particular inventor is likely to be
shaped by the diversity regime in which she is surrounded. “Boundary spanning”
in the context of production teams can involve for example a particular inventor
team gaining deeper insight (as a result of its exposure to a diverse set of specialized
teams) into how its own knowledge may be applied in alternate settings. Although
this might suggest benefits to an across-team diversity regime, since in such a setting
the “diverse knowledge” to be recombined is more likely to span team boundaries, it
is necessary to weigh this against any associated costs of coordination stemming from
such a diversity regime.
The counter-balancing effects of coordination costs arise at two levels. First,
126

there is the need to coordinate among inventors within the team itself; in such a
case the inventive process itself necessitates some degree of common ground and joint
predictive knowledge that can smooth the ongoing interactions among inventors on
a team in order for the team itself to be productive. Second, there is the need to
coordinate across multiple teams when knowledge sharing is desirable (e.g., when a
given team might benefit from its specialized knowledge being applied in new ways),
or when inventions represent modular pieces of a larger effort that must then be
reintegrated at a higher level (Kretschmer and Puranam, 2008). Effects at both levels
are likely to influence inventor productivity, with the relative ease of coordinating
interdependencies within versus across team boundaries a function of factors such
as the nature of the knowledge effort being pursued, the extent of the benefits that
might arise from sharing information on the use of that knowledge, and the degree of
integration necessary at the firm-level.
This discussion suggests that the relative benefits of knowledge recombination as
compared to the coordination costs necessary to achieve these benefits under each of
the two organizational team design regimes (across- versus within-team diversity) is
a question that needs to be adjudicated empirically. Accordingly, in the analyses that
follow we examine the average main effects of the two team organization regimes; and
then further investigate the possible mechanisms driving these effects, with particular
emphasis on how each diversity regime shapes inventor productivity.
3.3 Methods
Our empirical strategy begins by documenting firm-level patterns with respect
to the impact of across- and within-team diversity on innovation. In line with our
theoretical discussion about the trade-off between knowledge recombination and coor-
127

dination costs when implementing diversity, we conjecture that many of these effects
may arise as a consequence of firm-level diversity regimes affecting the productiv-
ity of human capital. First, the firm-level diversity regimes may affect collaboration
patterns (team stability) through different coordination costs. Second, the regime
may affect the knowledge base that an individual inventor draws upon. To test these
explanations for our firm-level results, we reconstruct the data at the inventor-level,
and examine the effect of alternative firm-level diversity regimes on the inventors’
team stability and breadth of knowledge used.
To study the consequences of team composition for firm-level innovation, we
sought an industry with a prevalent use of multiple teams within a firm, where in-
novation is a key performance metric. The human biotechnology industry fits these
requirements well and has several other favorable characteristics for the purpose of
this study. First, entrepreneurial firms in an R&D-intensive environment provide a
setting in which knowledge-based resources are an important driver of competitive
advantage, consistent with our objective of understanding knowledge-based human
capital. Scientists and engineers are organized into teams for the purposes of knowl-
edge production, and we can observe this team structure through patent records.
Smaller firms with one or few locations also represent a context with managerial flex-
ibility with respect to team design and one in which knowledge sharing across teams
may be more feasible (as compared to a multiproduct, multinational setting).2
2In this study, we primarily document the outcomes of the choice of team structure, althoughthere are a number of remaining questions about the determinants of the team structure itself. Webriefly address this in our inventor-level analysis, but further work is needed. The main endogeneityconcern is the possibility of an omitted variable that is correlated with both the choice of teamstructure (the independent variable) and innovation performance (the dependent variable). Forexample, a superior management team may choose a certain team structure and also be better atgenerating innovation performance, independent of the team structure. Here, the biotechnologyR&D context is also useful since the inventive process is not formulaic, and so managers themselvesare unlikely to have a strong ex-ante mapping between team organization and innovation outcomes.We conducted a series of 10 qualitative interviews in the biotechnology industry to understand thisphenomenon in more detail. These interviews suggest that there is considerable dispersion of beliefs
128

In addition, since patenting is key to value appropriation in the biotechnology
industry (e.g. Levin et al., 1987), we can be more confident in our reliance on patent
data to measure individual- and team-level characteristics within firms (and in par-
ticular, team composition structures). While patent data may give rise to issues of
generalizability, as we discuss in our final section, it has the benefit of allowing us to
observe staffing decisions in a large sample panel set-up, a task that would otherwise
be quite difficult.
Finally, we desire as homogeneous a sample as possible, apart from the dimension
of team organization, so that we can construct comparable and meaningful measures
of innovation. Confining our sample to a single industry setting provides some unifor-
mity in interpreting firm-level objectives; moreover, restricting the sample to venture
capital-backed firms further increases the commonality of the likely objectives and
time horizon issues facing our sample of firms (thereby reducing the potential for
unobserved differences across firms).
3.3.1 Data and Sample
We sample the universe of 476 venture capital-backed human biotechnology (SIC
codes 2833—2836) firms founded between 1980 and 2000, as identified using the
VentureXpert database. Our primary dataset is an unbalanced firm-year panel in
which firms are observed from their year of founding through either 2009 or their
year of dissolution. In order to facilitate within-firm inferences (as discussed later, in
part through employing specifications with firm fixed effects) a longer time window of
observation is desirable. In addition to including all years in which the firm is privately
held, we also include in our observation window years post-IPO and post-acquisition of
in staffing production teams, but due to the uncertain nature of the R&D process, there is quite adisconnect between team organization decisions and inventive productivity.
129

the focal firm by another entity (together with controls for these alternate ownership
regimes).3 We utilize several sources to construct our variables. The IQSS Patent
Network database (Li et al., 2014) includes all U.S. Patent and Trademark Office
data on patents applied for since 1975 and allows us to uniquely identify inventors
associated with patents, and to construct various team measures. Firm-year level
attributes come from Deloitte Recap RDNA, Pharmaprojects, Inteleos, ThomsonOne,
Zephyr, and various SEC filings.
The inventor-year data are constructed from the same patent data used for the
firm-year data. A key empirical design choice for the inventor-level analysis is the
assignment of inventor-years to firms, which determines what firm an inventor is
employed at in a given year. We consider the first year that an inventor patents at
a focal firm to be their first year of employment. An inventor is considered to have
left the firm when he patents at a firm that is not the focal firm. We limit that
observation window to 5 years after the inventor’s first patent at the firm. If we did
not have a restricted window, then in cases where the inventor never patents again
she would be listed as employed at the focal firm until the end of time, even though
she may have departed the focal firm somewhere in that time period. In years where
she patents at multiple firms, we attribute her employment to the firm where she has
the most patent applications (if there is a tie, we assume she remains at the focal
firm). For each inventor identified as employed at a focal firm, we study the five-year
window before and the five-year window after the initial time the inventor patents at
the focal firm; we interpret this time horizon as the period right before and during her
employment at the firm. We also run our analysis on datasets constructed from three
and one year pre- and post-employment windows, and find that our main results are
3In order to collect patent data on a firm’s post-M&A years we follow the procedure outlined inAggarwal and Hsu (2014), which relies on identifying a firm’s pre-acquisition inventors, and matchingthese to patenting activity by the same inventors in the acquiring firm post-acquisition.
130

robust to those time window choices.
3.3.2 Firm-Year Level Variables
Dependent Variable
Our main dependent variable is the number of forward citations received within a
4-year post-application window to the firm’s patents in the focal firm-year. Forward
citations are an accepted measure both of economic value (Trajtenberg, 1990) and of
innovative impact (Jaffe and Trajtenberg, 2002). Maintaining a fixed citation window
allows us to make meaningful comparisons across observation years; without such a
window older patents would be artificially biased upwards in citation count. We also
include total (non-citation weighted) patent count as a dependent variable to measure
innovation output in order to help us understand whether our results are driven by
an effect on innovation impact (forward citations) versus innovation output (patent
count).
Independent Variables
Our primary independent variables of theoretical interest are across-team and
within-team technical experience diversity. Within-team diversity is designed to mea-
sure dyadic diversity (in technical experience) among different inventors on a given
patent team. We measure the angular distance between the functional experience of
every pair of inventors on a team (as described in more detail below), and then aver-
age over all pairs of inventors on a team. To aggregate this measure to the firm-level,
we then average over all teams in a firm-year (our unit of analysis). Across-team
diversity is designed to measure how patent teams differ from one another (in terms
of technical experience) on a pairwise (dyadic) basis. To construct this variable we
131

first measure the distance between the functional experience of every pair of patent
teams, and then average over all such pairs.4
We measure the diversity between any pair of inventors using a cosine similarity
measure, also known as angular distance, or angular separation (Jaffe, 1986). For each
inventor at each year of her career, we define a class experience vector representing
the total experience the inventor has had patenting in each technology class, both
in her current firm and in all prior firms; each entry of the vector represents a stock
count of the inventor’s patents in that particular technological class up to the focal
year, and the dimension of the vector is the total number of primary patent classes
used by the USPTO. Cosine similarity is defined as the angular separation between
these class experience vectors of the two inventors (Jaffe, 1986), while cosine diversity
is defined as 1 minus the cosine similarity of the two inventors. The diversity measure
thus ranges from 0 to 1, where 1 is completely diverse (no technological overlap) and
0 is completely homogeneous (full technological overlap).
To construct the within-team diversity measure, for a given team of inventors
on a patent—referred to as a patent team—we form all possible dyads between the
inventors, and then calculate the cosine diversity for each dyad. For each patent, we
average cosine diversity over the set of all inventor dyads, forming a diversity measure
for each patent. We then average over all patents in a firm-year to form a firm-year
measure.
To construct the across-team diversity measure, we sum the class experience vec-
tors of the inventors on a patent team (i.e., the set of inventors on a given patent)
and create a single class experience vector for the entire patent team. We then take
4We organize our empirical analyses with these two forms of diversity treated as independentconstructs. In unreported results we find that our theoretical predictions are robust to the inclusionof the interaction effect among the two constructs. We also find that the interaction is not significantin our model specifications; we thus choose to report the more concise model specification (i.e.,without the interaction), as this specification concords more closely to our theoretical framework.
132

the set of patents in a firm-year and form all possible dyads between each patent. For
each dyad, we calculate the cosine diversity measure as before, but instead using class
experience vectors for the entire patent team with the final measure then constructed
as an average over all dyads of patent teams in a firm-year. Figure 3.2 gives a detailed
example of how we calculate the across-team and within-team diversity measures.
——————–Insert Figure 3.2——————–
Control Variables
We employ a set of time-varying controls, each measured at the firm-year level, in
order to account for any residual unobserved heterogeneity beyond the time invariant
firm-level characteristics we control for with firm fixed effects (which are included in
all specifications). There are three categories of controls: inventor team controls; firm
patenting controls; and corporate (firm-level) controls. We discuss the rationale for
each category of controls in turn.
The “inventor team controls” account for the technological experience embodied
in the firm’s inventors, measured as an aggregate total at the individual team level,
and then averaged across teams in the firm-year. Inventor experience includes not
only that gained by inventors within the context of the firm itself, but also that which
the firms’ inventors have gained over the course of their entire careers. We include the
following variables: team patenting experience, which measures the collective number
of patents held by inventors on the firm’s patent teams; team forward citation ex-
perience, which similarly measures the collective number of forward citations of the
inventors on a team; and team class experience, which measures the unique number of
patent classes represented by inventors on a team. All measures are averaged across
the firm’s patent teams in a given firm-year. Employing this set of controls thus
broadly accounts for the overall experience level of the firm’s inventors.
133

The “firm patenting controls” measure characteristics of the firm’s overall portfolio
of inventors and experience. In conjunction with the slate of “corporate controls”
described next, this set of variables accounts for various time-varying dimensions of
firm scale, scope, and quality, all of which may be correlated with both team design
characteristics and innovation output. The firm patenting controls include patent
count, which is the total number of patents applied for by the firm in the firm-year;
inventor count, which is the unique number of inventors in the firm-year; and class
span, which is the unique number of classes in which the firm patents in the firm-year.
Finally, the “corporate controls” further account for a set of time-varying char-
acteristics that could correlate with team design and innovation. Collectively these
variables measure various characteristics of firm quality and development stage that
are relevant in our industry setting of early-stage venture capital-backed biotech-
nology firms. These controls include the age of the firm; VC inflows stock, which
measures cumulative venture capital investment into the firm (from VentureXpert);
strategic alliance stock, which measures the cumulative stock of the alliances in which
the firm has been involved to date (from Deloitte Recap RDNA); and active prod-
uct (all stages), which is an indicator for whether the firm has at least one active
product in the Food and Drug Administration (FDA) pipeline (from PharmaPro-
jects and Inteleos). We also control for the firm’s ownership using the post-IPO and
post-M&A variables (privately-held is the baseline), as the ownership regime of the
firm is likely to influence both team organization and innovation (these variables are
hand-collected using archival news sources). Post-IPO indicates that the firm has
undergone an initial public offering (IPO) in or before the focal year, and post-M&A
is an indicator that the firm has undergone a merger or been acquired in or before
the focal year. Table 3.1 provides definitions and summary statistics, while Table 3.2
provides pair-wise correlations of our independent variables.
134

——————–Insert Table 3.1——————–
——————–Insert Table 3.2——————–
3.3.3 Inventor-Year Level Variables
We construct a number of patent-based measures to test the effect of diverse
across-team and within-team regimes on an inventor’s collaboration patterns. The
variables in the difference-in-differences design are derived from the previously de-
scribed firm-level measures of across-team diversity and within-team diversity, which
represent two distinct effects. We define the “treatment” groups as inventors who
in their observed five year employment window at a focal firm ever enter an above-
median level (relative to the full sample of observed values) of across-team or within-
team diversity. If they do, then high across-team diversity or high within-team di-
versity take a value of 1 respectively (and it would remain 0 if they never enter the
respective regime). The main variables of interest, high across-team diversity * post
across-team entry and high within-team diversity * post within-team entry take a
value of 1 in the years after and including the first year that the inventor is employed
at the focal firm and the focal firm is in an above median diversity regime, and 0
otherwise.
The “treatment” groups are defined as whether or not the inventor crosses the
threshold for the median level of across-team or within-team diversity observed in our
sample. Across-team and within-team diversity are considered separate “treatments”.
The post period is thus the period after they cross into the above median level of
(either form of) diversity.
We construct a set of dependent variables to measure both the collaboration pat-
terns (team stability) and breadth of knowledge drawn upon by the inventor. Col-
135

laboration patterns are measured through the focal inventor’s co-patenting history.
Inventor existing collaborators is a count of unique inventors patenting with the focal
inventor in the focal year with whom the focal inventor had patented in the past. A
stable pattern of collaborations, where existing collaborators are preserved, can be
thought of as evidence of team stability. Inventor new collaborators is the count of
inventors that the focal inventor patented with in the focal year that the inventor
had never patented with before. We measure the breadth of knowledge used by the
inventor by looking at her backward citation history. Inventor originality is the aver-
age originality over the of the inventor’s set of patents in the focal year. Originality
is a patent-level Herfindahl-based measure of the breadth of the technological origins
of the patent (Trajtenberg et al., 1997): an originality value of 0 means the patent
only cites one technological class, while an originality value approaching 1 means that
the patent cites many technological classes. Inventor firm self citations is a count
of backward citations which are assigned to the employing firm, but where the focal
inventor was not an inventor.
For controls, we include inventor patent count, the total count of the inventor’s
patents up to the focal year, inventor forward citations (4Y), the forward citations
made to the inventor’s stock of patents within a 4-year window following the appli-
cation date of the respective patents, inventor class experience, the count of classes
spanned by the stock of the inventor’s patents up to the focal year, and inventor
career length, the time in years between the inventor’s first patent and the focal year.
Table 3.4 provides summary statistics for the inventor-year level data.
3.3.4 Model Specifications
We employ conditional fixed effects Poisson models with robust standard errors
in our main analyses at the firm-year level. This estimation technique is appropriate
136

because our dependent variables, forward citations (4Y) and patent count, are non-
negative counts (Hausman et al., 1984; Hall and Ziedonis, 2001). We employ firm and
year fixed effects throughout in order to control for time-invariant firm qualities and
year-to-year changes that might correlate with both production team organization and
firm innovation. Together with the set of controls described above, the conditional
firm fixed effects specification facilitates the interpretation of our results as estimating
within firm, across time effects.
We implement a difference-in-differences design for the analysis of our inventor-
year data. We run ordinary least squares (OLS) regressions with robust standard
errors instead of a non-linear model to simplify the interpretation of the coefficients
in the empirical specification. Since we have two “treatments,” we define two different
treatment groups, included simultaneously in the models. We include firm dummies
to control for both firm average effects, as well as to control for the pure act of entry
into a firm. These are distinct from firm fixed effects since they take a value of 0
in the years before an inventor joins a focal firm. The inclusion of year fixed effects
eliminates the need to include variables indicating the post time period after the
inventor has entered either regime, since they are collinear. A statistical and visual
check of the inventor-level outcomes before they enter either regime finds that the pre-
trend is statistically indistinguishable, and suggests that the difference-in-differences
analysis is valid.
3.4 Results
Table 3.3 reports the specifications we use to test our main effects. The reported
coefficients are incidence rate ratios—i.e., the exponentiated Poisson regression co-
efficients. The interpretation of these coefficients is as follows: for a unit increase
137

in an independent variable, the incidence rate of the dependent variable would be
expected to be scaled (multiplied) by the value of the coefficient on that independent
variable. Thus, a coefficient value less than one should be interpreted as a negative
effect, while a coefficient value greater than one should be interpreted as a positive
effect. In both the written description and the tables we present p-values in lieu of
standard errors, and omit the usual presentation of “stars” indicating thresholds of
statistical significance per the new guidance proposed by Bettis et al. (2015).5
3.4.1 Firm-Year Level Analysis
We report the results of the across-team and within-team diversity effects in Ta-
ble 3.3; the first three specifications have a dependent variable of forward citations
within a four-year window on patents applied for in the focal year, and the last spec-
ification (3-4) has the count of patents applied for in the focal year as the dependent
variable. Specification (3-1) reports just the across-team and within-team results,
(3-2) adds team patenting controls, and (3-3) includes the remainder of our firm-level
controls.6 We use Poisson specifications with both firm and year fixed effects (and
robust standard errors) in all models, and run the analyses at the firm-year level.
We see that there is a positive effect on across-team diversity and a negative effect
on within-team diversity (recall that the coefficients are incidence rate ratios), results
which are consistent across the three specifications, and all of which are significant
at a p-value of 0.1%. The results suggest that shifting the across-team structure
of a firm from complete functional experience homogeneity (0) to fully diverse (1)
yields 103.3% more forward citations in the most parsimonious specification (3-1) to
5Following Bettis et al. (2015), we choose to report p-values in the table, which are based onrobust standard errors. Tables with the associated robust standard errors reported (instead ofp-values) are available upon request.
6We also find (in unreported regressions) that our results are robust to including various com-binations of the firm patenting controls of patent count, inventor count, and class span.
138

70.6% more forward citations in the full specification (3-3). Going from complete
within-team functional homogeneity (0) to full within-team diversity (1) results in
approximately 50% fewer forward citations in specifications (3-1), (3-2), and (3-3),
with significant p-values of 6%, 0.7%, and 3.5% respectively. We perform a Wald
test on the equality of the coefficients for across-team and within-team diversity in
each of the three specifications and can reject the null that the coefficients are equal
with a p-value of less than 0.1%. In the analysis where patent count is the dependent
variable, specification (3-4), and we find that the across-team diversity coefficient has
less statistical significance, with a p-value of 16.5%, but the within-team diversity
coefficient is negative with a p-value of less than 0.1%; going from complete within-
team functional homogeneity (0) to full within-team diversity (1) is associated with
63.1% less patenting. We find that the statistical significance of our main indepen-
dent variables with respect to their influence on innovation impact (as measured by
forward citations) is higher than it is with respect to general innovation output (as
measured by patent count).
——————–Insert Table 3.3——————–
3.4.2 Inventor-Year Level Analysis
We turn to the inventor-year level analyses in Table 3.4 and Table 3.5. Table 3.4
provides summary statistics and variable definitions, while Table 3.5 presents the
results of the inventor-year difference-in-differences analysis.7 We find a positive co-
efficient on the “treatment” of across-team diversity for the outcome variable inventor
current existing collaborators (5-1) but not for inventor current new collaborators (5-
2), with p-values of less than 0.1% and of 6.7% respectively. The entry of an inventor
7We also run models with an interaction effect of the two different “treatments,” but find thatthe interaction term coefficient is not significant.
139

into a regime of high across-team diversity is associated with 0.19 more collabora-
tions with inventors with whom she worked previously. These results suggest some
dimension of team stability (a correlate of coordination costs): in a high across-team
regime, inventors are likely to keep working with inventors they worked with in the
past, but not with new inventors they have not worked with before. We find a rela-
tively small positive effect size on the treatment of within-team diversity for inventor
current existing collaborators (5-1), with a p-value of 1.3%, but a relatively large
negative coefficient for inventor current new collaborators (5-2) with a p-value of less
than 0.1%. The entry of an inventor into a regime of high within-team diversity is
associated with .08 more collaborations with inventors with whom she worked pre-
viously but 0.14 fewer collaborations with inventors with whom she never worked
with before: combining the two results, a high within-team diversity regime is thus
associated with less net collaboration. A Wald test on the difference between the
coefficients for the main independent variables for entry into either the high across-
or high within-team regime is statistically significant with p-values of 3.4% and 1.4%
in specifications (5-1) and (5-2) respectively. These distinct findings suggest that
across-team and within-team diversity do have distinct effects at the inventor-level,
which may drive the firm-level findings discussed earlier.
We find negative coefficients on both “treatments” with regard to firm self-
citations (5-3) and originality (5-4) and of their patents. In specification (5-3), entry
into a high across-team or high within-team regime is associated with 0.10 or 0.12
fewer self-citations back to the focal firm respectively; a Wald test shows that the dif-
ference between these two coefficients is statistically insignificant (with a p-value of
82.7%). In both dimensions of diversity, inventors draw less from knowledge within
the firm and more from knowledge external to it, suggesting that either diversity
regime reduces exploratory behavior with respect to knowledge outside firm bound-
140

aries. This negative effect may not necessarily have a negative performance impact on
firm-level innovation, and may be indicative of a lower need for individual inventors
to gather knowledge from outside the firm. The originality coefficients presented in
(5-4) imply that in diverse regimes on either dimension, inventors draw from a less
diverse base of knowledge to form their inventions, with 0.046 and 0.073 lower levels
of originality for across-team and within-team diverse regimes, which is equivalent to
0.12 and 0.20 standard deviations of the originality values.8 A Wald test shows that
the difference between coefficients for the main independent variables for entry into
either a high across- or a high within-team regime is statistically significant with a
p-value of 0.1%. Given the consistent results across distinct dependent variables of
originality and firm self-citations, which are proxies for knowledge recombination or
exploratory behavior, we can infer that the two diversity regimes do not have a sub-
stantially distinct effect, and are ambiguous with regard to the effect on knowledge
recombination.
——————–Insert Table 3.4——————–
——————–Insert Table 3.5——————–
3.5 Discussion
In this study we examine the link between the organization of inventive human cap-
ital within a firm and the firm’s innovation output. We introduce the notion of across-
team diversity, exploring the idea that alternate ways of organizing a firm’s inventors’
prior technical experience influences innovation via the mechanisms of knowledge re-
combination and coordination costs. Using the empirical context of biotechnology
8We ran the same analysis for other dependent variables which are proxies for breadth of knowl-edge base used: complexity (Fleming, 2001; Fleming and Sorenson, 2001) and backward citationclass span. The results are robust to the choice of dependent variable.
141

start-ups, we find that at the firm-level, across-team technical experience diversity
results in greater benefits to firm-level innovation output as compared to within-team
technical experience diversity. We examine how these two alternate regimes shape the
productive output of a firm’s human capital, finding that the main lever distinguish-
ing the impact of alternate technical experience diversity regimes is team stability, a
proxy for coordination costs.
Before turning to the implications of our results for theory and future research, we
briefly touch on several limitations of the present study. First, our use of patent data
as a measure of innovation raises the issue of generalizability. The use of patenting
varies significantly across industries; while in biotechnology, medical instruments,
and pharmaceuticals, patents have been effective at protecting intellectual property
arising from R&D (Arora et al., 2008b), this holds to a lesser degree in other industries
such as software (Bessen and Maskin, 2009). Relatedly, patent data only capture
“patentable” innovations disclosed by the firm, and not innovations retained as trade
secrets, or otherwise unpatented. Future work might thus examine the degree to
which our findings hold in other industries where patents are less salient as a measure
of innovation. Second, our empirical strategy is to infer team composition from the
list of inventors on a patent; we might be concerned, however, about other features
of team composition that might be salient. As an example, it is not obvious from
the data whether teams are co-located or not. Finally, although we have focused on
the association between team organization and innovative performance, how team
structure itself is set is an area for further exploration. We partially address this via
our inventor-level analysis in which we explore the collaboration patterns of inventors,
but future work might seek to address this issue directly.
Our work has implications for several research streams within the strategy field,
including work in the domains of organization design, strategic human capital, and
142

teams. With respect to the literature on organization design, the technical experi-
ence diversity constructs we develop in this paper have implications for how we might
conceptualize several of the core issues in that body of work. As noted previously,
organization design involves a set of fundamental choices that include task division,
task allocation, provision of awards, and provision of information (Puranam et al.,
2014). To the degree that across-team diversity has a beneficial influence on innova-
tion as a result of enabling greater team stability, future work might then address the
various organization design contingencies that can influence this effect. For example,
in a within-team diversity setting, can factors such as the provision of information and
awards be structured so as to achieve the benefits of team stability? More generally,
our finding that across-team diversity is influential with respect to a firm’s innovation
output suggests that the particular role it plays should be taken into account when a
firm manager considers employing levers such as inter-team governance and employee
incentive systems.
Future research in the domain of organization design might examine issues such
as the determinants of heterogeneity in across- and within-team diversity (i.e., the
drivers of alternate firm-level technical experience diversity regimes in the first place);
the nature of interdependencies across-teams; and the micro-foundations of interde-
pendencies in an across-team setting, with a particular view on how these interde-
pendencies differ from those which exist within a particular team. There is a growing
literature on coordination mechanisms, which are necessary to address interdepen-
dencies, which can take the form of ongoing communication, modularity, and tacit
coordination mechanisms (Srikanth and Puranam, 2014). On the within-team coor-
dination dimension, ongoing communication and tacit coordination mechanisms are
likely to be present. While the across-team dimension represents a modularity choice
by the firm, there may be ongoing communication and tacit coordination across-teams
143
as well. Further work should explore the use of coordination mechanisms both within-
and across-teams.
A second domain of work relevant to our study is the literature on strategic hu-
man capital. This literature views firm-specific human capital as a source of com-
petitive advantage (e.g. Campbell et al., 2012), and tends to stress employee inter-
organizational mobility. Our study points to an important additional dimension
through which firms can create value from their human capital assets: via the re-
organization of internal labor resources, as alternate regimes of technical experience
diversity can influence the effectiveness with which a firm’s labor is utilized.
Future research in strategic human capital incorporating the findings presented
here may explore a variety of directions. A first such avenue relates to how the alter-
nate dimensions of team organization influence the balance between firms’ use of the
internal versus external labor markets. Internal labor markets are a major source of
human capital (especially) when there are frictions to hiring externally. We find that
organization regimes affect team stability and the ability to retain labor within teams,
and this same mechanism could affect the ability of firms to retain labor within firm
boundaries (though that we leave for future investigation). Second, while we study
one particular human capital attribute (inventive ability), the notion of across-team
diversity may be conceptualized across a host of other relevant human capital at-
tributes. Future work might thus aim to understand not only the implications of the
organization of each such attribute in isolation, but also with respect to the interac-
tions of these attributes with one another. Third, as the literature suggests, managers
are imperfect in their measurement of human capital in the sense that they under-
value general human capital and overvalue firm-specific human capital (Campbell
et al., 2012). Does this bias influence the ability of managers to effectively allocate
human capital across teams? And how does this bias relate to our construct of team
144

stability? What implications do imperfections in workers’ own assessments of their
attributes have for team composition (and the resulting innovation and performance
implications associated with team organization)?
Finally, with respect to the strategy literature more generally, while there has been
a large body of work examining top management teams (TMTs), work on production
teams has been relatively scarce. We hope that this study might ignite interest
among scholars in addressing this unit of analysis, with a particular focus on the
notion of across-team diversity as a construct of interest. For example, given that
firms contain multiple production teams, how do the findings regarding factors such
as age and tenure (Ndofor et al., 2011), functional experience (Eesley et al., 2014;
Qian et al., 2013), and nationality (Nielsen and Nielsen, 2013) operate in an across-
team framework? For founding teams in an entrepreneurial context, who themselves
may be situated within a broader setting (e.g., an accelerator or ecosystem), we might
conceptualize these teams as being a part of a community of teams; do across-team
effects apply when there is also a firm boundary around the team?
In conclusion, by focusing on the impact of the organization of inventive human
capital within a firm, this study opens a number of avenues for future work in the
domain of strategy related to organization design, strategic human capital, and teams.
145

Figure 3.1: Across-Team and Within-Team Diversity. This figure depicts twoalternate firm-level approaches to organizing inventors on teams within a firm. FirmA is a firm with high within-team diversity and low across-team diversity, and Firm Bis a firm low within-team diversity and high across-team diversity. The dashed linesrepresent team boundaries, and solid lines represent firm boundaries. The shapesrepresent particular types of inventors on a team.
146

1
Count of Patents in Each Class
Team 1
Team 2
Team 3
Class John Paul George Ringo Total
Total
Total
1 3 3 0 3 9
4
0
2 4 4 0 0 8
3
6
3 0 0 5 4 9
0
2
W ithin-Team Diversity of Team 1 Across-Team Diversity of Firm
Pairings Dyadic Diversity Pairings Dyadic Diversity
1 −𝐴 ∙ 𝐵
‖𝐴‖ ∗ ‖𝐵‖ 1 −
𝐴 ∙ 𝐵
‖𝐴‖ ∗ ‖𝐵‖
John & Paul 0 Team 1 & Team 2 1 −
12
√226
John & George 1
John & Ringo 16/25 Team 2 & Team 3 1 −
9
5√10
Paul & George 1
Paul & Ringo 16/25 Team 3 & Team 1 1 −
33
2√565
George & Ringo 1/5
Within-Team
Diversity 0.58
Across-Team
Diversity 0.31
Figure 3.2: Calculation of Diversity Measures. This figure demonstrates theprocess for calculating the across-team diversity and within-team diversity measuresused in the empirical analysis for a hypothetical firm. The table at the top shows thestock count of patents in each primary patent class for the members of Team 1, andthe total amounts for Team 2 and Team 3. The lower left table shows the calculationfor the within-team diversity of Team 1, where the dyadic diversity, which is 1 minusthe cosine similarity of each dyad, is calculated for each dyad of inventors, and thenaveraged across all dyads. The lower right table shows the calculation of across-teamdiversity for the firm, where dyadic diversity is calculated for each dyad of teams andthen averaged across all dyads.
147

Table 3.1: Summary Statistics for Firm-Year Analysis. This table presentsthe summary statistics and variable definitions for the firm-year level of analysis inTable 3.3. Correlation coefficients are presented in Table 3.2.
Variable Definition Mean S.D.
Dependent Variable
Forward Citations (4Y) Total forward citations within a four-year window to
granted patents filed in firm-year
5.14 21.46
Main Independent Variables
(1) Across-Team Diversity Average angular distance in technology class experience
between patent teams
0.12 0.23
(2) Within-Team Diversity Average angular distance in technology class experience
between inventors on a patent team, averaged over teams
0.20 0.18
Inventor Team Controls
(3) Team Patenting Experience Average patenting experience of teams in a firm 9.81 10.72
(4) Team Fwd. Citation Experience Average forward citations within a four-year window to
patents by teams in a firm
29.18 70.28
(5) Team Class Experience Average class experience of teams in a firm 4.70 3.30
Firm Patenting Controls
(6) Patent Count Number of patents in a firm-year 2.24 7.93
(7) Inventor Count Number of inventors in a firm-year 4.46 12.61
(8) Class Span Number of classes in a firm-year 0.80 1.47
Corporate Controls
(9) Age Years since firm founding 8.42 6.09
(10) VC Inflows Stock Cumulative venture capital investment into the firm 16.39 27.88
(11) Strategic Alliance Stock Stock count of strategic alliances 10.39 17.91
(12) Active Product (All Stages) Indicator for an active product under FDA review 0.65 0.48
(13) Post-IPO Indicator for IPO in firm history 0.32 0.47
(14) Post-M&A Indicator for M&A in firm history 0.15 0.35
148

Table 3.2: Correlation Matrix for Firm-Year Analysis. This table presents thepairwise correlation matrix of independent variables for the firm-year level of analysis.The labels across the top and on the left on side correspond with Table 3.1.
(1) (2) (3) (4) (5) (6) (7) (8) (9) (10) (11) (12) (13) (14)
(1) 1
(2) 0.05 1
(3) -0.03 0.07 1
(4) -0.05 0.03 0.57 1
(5) 0.04 0.37 0.53 0.25 1
(6) 0.20 -0.04 0.36 0.14 0.10 1
(7) 0.30 -0.02 0.19 0.04 0.16 0.77 1
(8) 0.45 0.03 0.25 0.11 0.19 0.71 0.79 1
(9) 0.02 -0.10 0.11 -0.02 0.10 0.08 0.15 0.09 1
(10) 0.07 0.03 0.16 0.00 0.23 0.09 0.14 0.20 0.11 1
(11) 0.21 -0.05 0.15 -0.01 0.11 0.31 0.46 0.40 0.43 0.15 1
(12) 0.05 -0.11 -0.11 -0.11 -0.14 0.04 0.07 0.06 0.34 -0.14 0.14 1
(13) 0.15 -0.04 0.09 -0.05 0.10 0.19 0.24 0.30 0.39 0.21 0.45 0.27 1
(14) -0.03 -0.03 0.03 0.00 -0.03 -0.06 -0.06 -0.09 0.30 0.06 0.07 -0.09 0.15 1
149

Table 3.3: Average Effects for Firm-Year Analysis. This table presents theaverage effects of across-team and within-team diversity at the firm-year level ofanalysis. Specifications (3-1), (3-2), and (3-3) use firm forward citations over a fouryear window as the dependent variable, and specification (3-4) uses firm patent countas the dependent variable. All specifications are estimated using conditional firmfixed effects Poisson estimation with robust standard errors. Reported coefficientsare incidence rate ratios, and p-values are reported in parentheses. Following theguidance of Bettis et al. (2015), we report coefficients as well as actual p-values(calculated based on robust standard errors) in parentheses. Values for the robuststandard errors are available upon request.
Forward Citations (4Y) Patent Count
(3-1) (3-2) (3-3) (3-4)
Across-Team Diversity 2.033 1.907 1.706 1.203
(0.000) (0.000) (0.001) (0.165)
Within-Team Diversity 0.515 0.475 0.527 0.369
(0.060) (0.007) (0.035) (0.000)
Team Patenting Experience 1.007 0.992 1.013
(0.192) (0.265) (0.000)
Team Fwd. Citation Experience 1.000 1.002 0.999
(0.729) (0.156) (0.313)
Team Class Experience 1.055 1.049 1.003
(0.002) (0.009) (0.741)
Patent Count 1.007
(0.000)
Inventor Count 0.998 1.003
(0.539) (0.003)
Class Span 1.089 1.116
(0.026) (0.017)
Age 1.469 1.156
(0.323) (0.384)
VC Inflows Stock 1.001 1.001
(0.824) (0.679)
Strategic Alliance Stock 1.010 1.000
(0.004) (0.936)
Active Product (All Stages) 1.087 1.062
(0.582) (0.599)
Post-IPO 0.994 1.187
(0.964) (0.073)
Post-M&A 0.679 0.702
(0.019) (0.004)
Firm FE Yes Yes Yes Yes
Year FE Yes Yes Yes Yes
Log Pseudo-likelihood -19855.1 -14824.3 -12004.1 -4428.7
Observations 4386 2546 2283 2314
150

Table 3.4: Summary Statistics for Inventor-Year Level of Analysis. This tablepresents the summary statistics and variable definitions for the inventor-year level ofanalysis in Table 3.5.
Variable Definition Mean S.D.
Dependent Variables
Inventor Existing Collaborators Number of co-inventors with whom the inventor
patented previously
0.86 2.47
Inventor New Collaborators Number of new co-inventors 0.97 2.75
Inventor Originality Originality of inventor's patents 0.23 0.36
Inventor Firm Self Citations Backward citations to the inventor's employer 0.36 2.27
Independent Variables
High Across-Team Div.
* Post Across-Team Entry
Indicator when inventor enters a firm-level regime of
high across-team diversity
0.50 0.50
High Within-Team Div.
* Post Within-Team Entry
Indicator when inventor enters a firm-level regime of
high within-team diversity
0.51 0.50
High Across-Team Div. Indicator if the inventor ever enters a firm-level
regime of high across-team diversity
0.70 0.46
High Within-Team Div. Indicator if the inventor ever enters a firm-level
regime of high within-team diversity
0.76 0.43
Inventor Controls
Inventor Patent Count Cumulative patents by the inventor 4.47 9.13
Inventor Fwd. Cit. (4Y) Forward citations within a four year window of
cumulative patents by the inventor
6.90 23.40
Inventor Class Experience Number of classes spanned by cumulative patents
by the inventor
1.77 1.91
Inventor Career Length Years between the inventor's first patent and the
focal year
4.81 5.56
151

Table 3.5: Average Effects for Inventor-Year Level of Analysis. This tablepresents the average effects of across-team and within-team diversity in a differences-in-differences specification at the inventor-year level. All specifications are estimatedusing ordinary least squares (OLS) with firm fixed effects and robust standard errors.Reported coefficients are directly from OLS, and p-values are reported in parentheses.Following the guidance of Bettis et al. (2015), we report coefficients as well as actualp-values (calculated based on robust standard errors) in parentheses. Values for therobust standard errors are available upon request.
Inventor Existing
Collaborators
Inventor New
Collaborators
Inventor Firm
Self Citations
Inventor
Originality
(5-1) (5-2) (5-3) (5-4)
High Across-Team Div. 0.186 0.017 -0.104 -0.046
* Post Across-Team Entry (0.000) (0.668) (0.003) (0.000)
High Across-Team Div. 0.033 0.091 0.094 0.039
(0.218) (0.006) (0.000) (0.000)
High Within-Team Div. 0.079 -0.139 -0.117 -0.073
* Post Within-Team Entry (0.013) (0.000) (0.001) (0.000)
High Within-Team Div. 0.035 0.181 0.151 0.063
(0.222) (0.000) (0.000) (0.000)
Inventor Patent Count -0.007 -0.002 0.001 0.003
(0.000) (0.274) (0.528) (0.000)
Inventor Fwd. Cit. (4Y) 0.001 -0.001 0.006 0.001
(0.001) (0.001) (0.000) (0.000)
Inventor Class Experience 0.063 -0.005 -0.003 0.004
(0.000) (0.465) (0.632) (0.003)
Inventor Career Length -0.008 -0.030 -0.007 -0.006
(0.000) (0.000) (0.000) (0.000)
Firm Dummies Yes Yes Yes Yes
Year FE Yes Yes Yes Yes
Adjusted R-Squared 0.0282 0.0161 0.123 0.0838
Observations 75757 75757 75757 75757
152

Bibliography
Agarwal, Rajshree, Raj Echambadi, April M. Franco, Mitrabarun B. Sarkar. 2004.Knowledge transfer through inheritance: Spin-out generation, development, andsurvival. Academy of Management Journal 47(4) 501–522.
Aggarwal, Vikas A., David H. Hsu. 2014. Entrepreneurial exits and innovation. Man-agement Science 60(4) 867–887.
Ahearne, Alan G., William L. Griever, Francis E. Warnock. 2004. Information costsand home bias: An analysis of US holdings of foreign equities. Journal of Interna-tional Economics 62(2) 313–336.
Aldrich, Howard E., C. Marlene Fiol. 1994. Fools rush in? The institutional contextof industry creation. The Academy of Management Review 19(4) 645–670.
Allison, Paul D., Richard P. Waterman. 2002. Fixed-effects negative binomial regres-sion models. Sociological Methodology 32(1) 247–265.
Ancona, Deborah Gladstein, David F. Caldwell. 1992. Demography and design: Pre-dictors of new product team performance. Organization Science 3(3, Focused Issue:Management of Technology) 321–341.
Angrist, Joshua D., Susan M. Dynarski, Thomas J. Kane, Parag A. Pathak, Christo-pher R. Walters. 2012. Who benefits from KIPP? Journal of Policy Analysis andManagement 31(4) 837–860.
Anton, James J., Dennis A. Yao. 1995. Start-ups, spin-offs, and internal projects.Journal of Law, Economics, & Organization 11(2) 362–378.
Arasu, Arvind, Surajit Chaudhuri, Zhimin Chen, Kris Ganjam, Raghav Kaushik,Vivek Narasayya. 2011. Towards a domain independent platform for data cleaning.Bulletin of the Technical Committee on Data Engineering 34(3) 43–50. IEEEComputer Society.
Arora, Ashish, Marco Ceccagnoli, Wesley M. Cohen. 2008a. R&D and the patentpremium. International Journal of Industrial Organization 26(5) 1153–1179.
153

Arora, Ashish, Marco Ceccagnoli, Wesley M. Cohen. 2008b. R&D and the patentpremium. International Journal of Industrial Organization 26(5) 1153–1179.
Austen-Smith, David, Jeffrey S. Banks. 1996. Information aggregation, rationality,and the Condorcet jury theorem. American Political Science Review 90(01) 34–45.
Baldwin, Carliss Y., Kim B. Clark. 1994. Capital-budgeting systems and capabilitiesinvestments in US companies after the Second World War. Business History Review68(01) 73–109.
Ballmer, Steven A., Michael R. Bloomberg, Julian Castro, Phil Gordon, Robert Iger,William Marriott, James McNerney, Rupert Murdoch, Michael Nutter, AntonioVillaraigosa. 2011. The “New American” Fortune 500. Tech. rep., Partnership fora New American Economy.
Banerjee, Payal. 2008. Flexible hiring, immigration, and indian it workers’ experiencesof contract work in the united states. Marjorie L. DeVault, ed., People at Work:Life, Power, and Social Inclusion in the New Economy , 1st ed., chap. 5. New YorkUniversity Press, New York, 97–111.
Bantel, Karen A., Susan E. Jackson. 1989. Top management and innovations inbanking: Does the composition of the top team make a difference? StrategicManagement Journal 10(S1) 107–124.
Bernstein, Shai, Arthur G. Korteweg, Kevin Laws. 2016. Attracting early stageinvestors: Evidence from a randomized field experiment. Journal of Finance .
Bessen, James, Robert M. Hunt. 2007. An empirical look at software patents. Journalof Economics & Management Strategy 16(1) 157–189.
Bessen, James, Eric Maskin. 2009. Sequential innovation, patents, and imitation.RAND Journal of Economics 40(4) 611–635.
Bettis, Richard A., Sendil Ethiraj, Alfonso Gambardella, Constance Helfat, WillMitchell. 2015. Creating repeatable cumulative knowledge in strategic manage-ment. Strategic Management Journal .
Black, Dan A., Jeffrey A. Smith, Mark C. Berger, Brett J. Noel. 2003. Is the threatof reemployment services more effective than the services themselves? Evidencefrom random assignment in the UI system. American Economic Review 93(4)1313–1327.
Block, Joern, Philipp Sandner. 2009. What is the effect of the financial crisis onventure capital financing? Empirical evidence from US Internet start-ups. VentureCapital 11(4) 295–309.
Bock, Laszlo. 2013. Google supports high-skilled immigration reform.
154

Bound, John, Sarah Turner, Patrick Walsh. 2009. Internationalization of U.S. doctor-ate education. Richard B. Freeman, Daniel Goroff, eds., Science and EngineeringCareers in the United States: An Analysis of Markets and Employment , chap. 2.University of Chicago Press, Chicago, IL, 59–97.
Bower, Joseph L. 1986. Managing the Resource Allocation Process: A Study of Cor-porate Planning and Investment , vol. 3. Harvard Business Press, Boston, MA.
Bygrave, William D. 1988. The structure of the investment networks of venturecapital firms. Journal of Business Venturing 3(2) 137–157.
Bygrave, William D., Jeffry A. Timmons. 1992. Venture Capital at the Crossroads .Harvard Business Press, Boston, MA.
Campbell, Benjamin A., Russell Coff, David Kryscynski. 2012. Rethinking sustainedcompetitive advantage from human capital. Academy of Management Review 37(3)376–395.
Chellaraj, Gnanaraj, Keith E. Maskus, Aaditya Mattoo. 2008. The contribution of in-ternational graduate students to us innovation. Review of International Economics16(3) 444–462.
Christensen, Clayton M. 1993. The rigid disk drive industry: A history of commercialand technological turbulence. Business History Review 67(04) 531–588.
Clark, Kim B., Steven C. Wheelwright. 1992. Organizing and leading “heavyweight”development teams. Revolutionizing Product Development: Quantum Leaps inSpeed, Efficiency, and Quality . Free Press, New York, NY, 188.
Cleveland, William S. 1979. Robust locally weighted regression and smoothing scat-terplots. Journal of the American Statistical Association 74(368) 829–836.
Coff, Russell W. 1997. Human assets and management dilemmas: coping with hazardson the road to resource-based theory. Academy of Management Review 22(2) 374–402.
Cohen, Wesley M., Daniel A. Levinthal. 1990. Absorptive capacity: A new perspectiveon learning and innovation. Administrative Science Quarterly 35(1, Special Issue:Technology, Organizations, and Innovation) 128–152.
Csaszar, Felipe A. 2012. Organizational structure as a determinant of performance:Evidence from mutual funds. Strategic Management Journal 33(6) 611–632.
Csaszar, Felipe A., J. P. Eggers. 2013. Organizational decision making: An informa-tion aggregation view. Management Science 59(10) 2257–2277.
155

Cyert, Richard M., James G. March. 1963. A Behavioral Theory of the Firm, vol. 2.Wiley-Blackwell, Englewood Cliffs, NJ.
de Condorcet, Nicolas. 1785. Essai sur l’Application de l’Analyse a la Probabilite desDecisions Rendues a la Pluralite des Voix . Imprimerie Royale, Paris, France.
Dessein, Wouter. 2005. Information and control in ventures and alliances. The Journalof Finance 60(5) 2513–2549.
Doran, Kirk, Alexander Gelber, Adam Isen. 2015. The effects of high-skilled immi-gration policy on firms: Evidence from H-1B visa lotteries. NBER Working Paperw(20668).
Eesley, Charles E., David H. Hsu, Edward B. Roberts. 2014. The contingent effectsof top management teams on venture performance: Aligning founding team com-position with innovation strategy and commercialization environment. StrategicManagement Journal 35(12) 1798–1817.
Ewens, Michael, Matthew Rhodes-Kropf. 2015. Is a VC partnership greater than thesum of its partners? Journal of Finance 70(3) 1081–1113.
Fleming, Lee. 2001. Recombinant uncertainty in technological search. ManagementScience 47(1, Design and Development) 117–132.
Fleming, Lee, Olav Sorenson. 2001. Technology as a complex adaptive system: Evi-dence from patent data. Research Policy 30(7) 1019–1039.
Gavetti, Giovanni, Daniel Levinthal, William Ocasio. 2007. Perspective–neo-Carnegie: The Carnegie school’s past, present, and reconstructing for the future.Organization Science 18(3) 523–536.
Gerling, Kerstin, Hans Peter Grner, Alexandra Kiel, Elisabeth Schulte. 2005. Infor-mation acquisition and decision making in committees: A survey. European Journalof Political Economy 21(3) 563–597.
Goldfarb, Brent D., Gerard Hoberg, David Kirsch, Alexander J. Triantis. 2013. Areangels different? An analysis of early venture financing. Robert H. Smith SchoolResearch Paper 06–072.
Goldfine, Dayna, Dan Geller. 2011. Something ventured.
Gompers, Paul A., Anna Kovner, Josh Lerner, David Scharfstein. 2008. Venturecapital investment cycles: The impact of public markets. Journal of FinancialEconomics 87(1) 1–23.
Gompers, Paul A., Joshua Lerner. 2004. The venture capital cycle. MIT Press,Cambridge, MA.
156

Grant, Robert M. 1996. Toward a knowledge-based theory of the firm. StrategicManagement Journal 17(S2) 109–122.
Hall, Bronwyn H., Rosemarie Ham Ziedonis. 2001. The patent paradox revisited:An empirical study of patenting in the U.S. semiconductor industry, 1979–1995.RAND Journal of Economics 32(1) 101–128.
Hargadon, Andrew, Robert I. Sutton. 1997. Technology brokering and innovation ina product development firm. Administrative Science Quarterly 42(4) 716–749.
Hatch, Nile W., Jeffrey H. Dyer. 2004. Human capital and learning as a source ofsustainable competitive advantage. Strategic Management Journal 25(12) 1155–1178.
Hausman, Jerry, Bronwyn H. Hall, Zvi Griliches. 1984. Econometric models for countdata with an application to the patents-R&D relationship. Econometrica 52(4)909–938.
Hellmann, Thomas, Veikko Thiele. 2014. Friends or foes? The interrelationshipbetween angel and venture capital markets. Journal of Financial Economics 115(3)639–653.
Hoyt, David, Theresia Gouw Ranzetta, Ilya Strebulaev. 2012. Venture capital dealsourcing and screening. Stanford Graduate School of Business E(447).
Hsu, David H. 2004. What do entrepreneurs pay for venture capital affiliation? Jour-nal of Finance 59(4) 1805–1844.
Huang, Laura, Andrew P. Knight. 2015. Resources and relationships in entrepreneur-ship: An exchange theory of the development and effects of the entrepreneur-investor relationship. Academy of Management Review .
Huang, Laura, Jone L. Pearce. 2015. Managing the unknowable: The effectiveness ofearly-stage investor gut feel in entrepreneurial investment decisions. AdministrativeScience Quarterly 60(4) 634–670.
Hunt, Jennifer. 2011. Which immigrants are most innovative and entrepreneurial?Distinctions by entry visa. Journal of Labor Economics 29(3) 417–457.
Hunt, Jennifer, Marjolaine Gauthier-Loiselle. 2010. How much does immigrationboost innovation? American Economic Journal: Macroeconomics 2(2) 31–56.
Isaacson, Walter. 2014. The Innovators: How a Group of Inventors, Hackers, Ge-niuses, and Geeks Created the Digital Revolution. Simon and Schuster, New York,NY.
157

Jaffe, Adam B. 1986. Technological opportunity and spillovers of R&D: Evidencefrom firms’ patents, profits, and market value. American Economic Review 76(5)984–1001. ID: 223.
Jaffe, Adam B., Manuel Trajtenberg. 2002. Patents, Citations, and Innovations: AWindow on the Knowledge Economy . MIT Press, Cambridge, MA.
Jensen, Michael C., William H. Meckling. 1976. Theory of the firm: Managerialbehavior, agency costs and ownership structure. Journal of Financial Economics3(4) 305–360.
Jones, Benjamin F. 2009. The burden of knowledge and the “death of the renaissanceman”: Is innovation getting harder? Review of Economic Studies 76(1) 283–317.
Jones, Benjamin F. 2010. Age and great invention. Review of Economics and Statistics92(1) 1–14.
Kahneman, Daniel, Amos Tversky. 1979. Prospect theory: An analysis of decisionunder risk. Econometrica 47(2) 263–291.
Karim, Samina, Aseem Kaul. 2015. Structural recombination and innovation: Unlock-ing intraorganizational knowledge synergy through structural change. OrganizationScience 26(2) 439–455.
Katila, Riitta, Gautam Ahuja. 2002. Something old, something new: A longitudinalstudy of search behavior and new product introduction. Academy of ManagementJournal 45(6) 1183–1194.
Kerr, Sari Pekkala, William R. Kerr, William F. Lincoln. 2015. Skilled immigrationand the employment structures of US firms. Journal of Labor Economics 33 S147–S186.
Kerr, William R., Josh Lerner, Antoinette Schoar. 2014. The consequences of en-trepreneurial finance: Evidence from angel financings. Review of Financial Studies27(1) 20–55.
Kerr, William R, William F Lincoln. 2010. The supply side of innovation: H-1B visareforms and U.S. ethnic invention. Journal of Labor Economics 28(3) 473–508.
Kirsch, David, Brent Goldfarb, Azi Gera. 2009. Form or substance: the role ofbusiness plans in venture capital decision making. Strategic Management Journal30(5) 487–515.
Klepper, Steven. 2001. Employee startups in high-tech industries. Industrial andCorporate Change 10(3) 639–674.
158

Kogut, Bruce, Udo Zander. 1992. Knowledge of the firm, combinative capabilities,and the replication of technology. Organization Science 3(3) 383–397.
Kotha, Reddi, Gerard George, Kannan Srikanth. 2013. Bridging the mutual knowl-edge gap: Coordination and the commercialization of university science. Academyof Management Journal 56(2) 498–524.
Kotha, Reddi, Jared Nai, Jayanth Narayanan, Phanish Puranam, Jeremy Tan YongZhi. 2015. Decentralization in organizational resource allocation: An experimentalstudy. Working Paper .
Kretschmer, Tobias, Phanish Puranam. 2008. Integration through incentives withindifferentiated organizations. Organization Science 19(6) 860–875.
Lam, Alice. 2000. Tacit knowledge, organizational learning and societal institutions:An integrated framework. Organization Studies 21(3) 487–513.
Lawrence, Paul R., Jay W. Lorsch. 1967. Differentiation and integration in complexorganizations. Administrative Science Quarterly 12(1) 1–47.
Lemley, Mark A., Bhaven Sampat. 2012. Examiner characteristics and patent officeoutcomes. Review of Economics and Statistics 94(3) 817–827.
Leonard-Barton, Dorothy. 1992. Core capabilities and core rigidities: A paradox inmanaging new product development. Strategic Management Journal 13(S1) 111–125.
Lerner, Joshua. 1998. “Angel” financing and public policy: An overview. Journal ofBanking & Finance 22(6) 773–783.
Levin, Richard C., Alvin K. Klevorick, Richard R. Nelson, Sidney G. Winter, RichardGilbert, Zvi Griliches. 1987. Appropriating the returns from industrial researchand development. Brookings Papers on Economic Activity 1987(3, Special IssueOn Microeconomics) 783–831.
Levitt, Barbara, James G. March. 1988. Organizational learning. Annual Review ofSociology 14 319–340.
Li, Guan-Cheng, Ronald Lai, Alexander D’Amour, David M. Doolin, Ye Sun, Vetle I.Torvik, Amy Z. Yu, Lee Fleming. 2014. Disambiguation and co-authorship networksof the U.S. patent inventor database (1975–2010). Research Policy 43(6) 941–955.
MacMillan, Ian C., Robin Siegel, PN Subba Narasimha. 1986. Criteria used by venturecapitalists to evaluate new venture proposals. Journal of Business venturing 1(1)119–128.
159

Maxwell, Andrew L., Scott A. Jeffrey, Moren Levesque. 2011. Business angel earlystage decision making. Journal of Business Venturing 26(2) 212–225.
Milliken, Frances J., Luis L. Martins. 1996. Searching for common threads: Un-derstanding the multiple effects of diversity in organizational groups. Academy ofManagement Review 21(2) 402–433.
Ndofor, Hermann Achidi, David G. Sirmon, Xiaoming He. 2011. Firm resources,competitive actions and performance: Investigating a mediated model with evi-dence from the in-vitro diagnostics industry. Strategic Management Journal 32(6)640–657.
Nielsen, Bo Bernhard, Sabina Nielsen. 2013. Top management team nationality di-versity and firm performance: A multilevel study. Strategic Management Journal34(3) 373–382.
Ochel, Wolfgang. 2000. Recruitment of highly skilled labour abroad: The practice ofselected OECD countries. CESifo Forum 1(2) 48–52.
Persico, Nicola. 2004. Committee design with endogenous information. Review ofEconomic Studies 71(1) 165–191.
Petersen, Mitchell A. 2004. Information: Hard and soft. Working Paper .
Polanyi, Michael. 1966. The Tacit Dimension. Doubleday Broadway, Garden City,NY.
Popp, David, Ted Juhl, Daniel KN Johnson. 2004. Time in purgatory: Examiningthe grant lag for US patent applications. Topics in Economic Analysis & Policy4(1).
Puranam, Phanish, Oliver Alexy, Markus Reitzig. 2014. What’s “new” about newforms of organizing? Academy of Management Review 39(2) 162–180.
Puranam, Phanish, Marlo Raveendran, Thorbjrn Knudsen. 2012. Organization de-sign: The epistemic interdependence perspective. Academy of Management Review37(3) 419–440.
Qian, Cuili, Qing Cao, Riki Takeuchi. 2013. Top management team functional diver-sity and organizational innovation in China: The moderating effects of environment.Strategic Management Journal 34(1) 110–120.
Reagans, Ray, Ezra W. Zuckerman. 2001. Networks, diversity, and productivity: Thesocial capital of corporate R&D teams. Organization Science 12(4) 502–517.
Rosenberg, David. 2002. Venture captial limited partnerships: A study in freedom ofcontract. Columbia Business Law Review 2002 363–398.
160

Rosenkopf, Lori, Atul Nerkar. 2001. Beyond local search: Boundary-spanning, ex-ploration, and impact in the optical disk industry. Strategic Management Journal22(4) 287–306.
Sah, Raaj K., Joseph E. Stiglitz. 1991. The quality of managers in centralized versusdecentralized organizations. Quarterly Journal of Economics 106(1) 289–295.
Sahlman, William A. 1990. The structure and governance of venture-capital organi-zations. Journal of Financial Economics 27(2) 473–521.
Samuelson, Paul A. 1964. Theoretical notes on trade problems. Review of Economicsand Statistics 145–154.
Schelling, Thomas C. 1980. The Strategy of Conflict . Harvard University Press,Cambridge, MA.
Shane, Scott, Daniel Cable. 2002. Network ties, reputation, and the financing of newventures. Management Science 48(3) 364–381.
Singh, Jasjit, Lee Fleming. 2010. Lone inventors as sources of breakthroughs: Mythor reality? Management Science 56(1) 41–56.
Solow, Robert M. 1956. A contribution to the theory of economic growth. QuarterlyJournal of Economics 70(1) 65–94.
Sørensen, Morten. 2007. How smart is smart money? A two-sided matching modelof venture capital. Journal of Finance 62(6) 2725–2762.
Sorenson, Olav, Toby E. Stuart. 2001. Syndication networks and the spatial dis-tribution of venture capital investments. American Journal of Sociology 106(6)1546–1588.
Srikanth, Kannan, Phanish Puranam. 2014. The firm as a coordination system:Evidence from software services offshoring. Organization Science 25(4) 1253–1271.
Stuart, Toby E., Joel M. Podolny. 1996. Local search and the evolution of technolog-ical capabilities. Strategic Management Journal 17(S1) 21–38.
Swan, Trevor W. 1956. Economic growth and capital accumulation. Economic Record32(2) 334–361.
Thompson, James D. 1967. Organizations in Action: Social Science Bases of Admin-istrative Theory. Classics in Organization and Management Series . TransactionPublishers, Piscataway, NJ. ID: 212.
Trajtenberg, Manuel. 1990. A penny for your quotes: Patent citations and the valueof innovations. RAND Journal of Economics 21(1) 172–187.
161

Trajtenberg, Manuel, Rebecca Henderson, Adam Jaffe. 1997. University versus cor-porate patents: A window on the basicness of invention. Economics of Innovationand New Technology 5(1) 19–50.
Trumka, Richard. 2013. AFL-CIO: American high-tech workers not in shortage.
Vincenty, Thaddeus. 1975. Direct and inverse solutions of geodesics on the ellipsoidwith application of nested equations. Survey Review 23(176) 88–93.
Wiggins, Steven N. 1995. Entrepreneurial enterprises, endogenous ownership, and thelimits to firm size. Economic Inquiry 33(1) 54–69.
Williams, Katherine Y., Charles A. O’Reilly. 1998. Demography and diversity in or-ganizations: A review of 40 years of research. Research in Organizational Behavior20 77–140.
Wuchty, Stefan, Benjamin F. Jones, Brian Uzzi. 2007. The increasing dominance ofteams in production of knowledge. Science 316(5827) 1036–1039.
Zott, Christoph, Quy Nguyen Huy. 2007. How entrepreneurs use symbolic manage-ment to acquire resources. Administrative Science Quarterly 52(1) 70–105.
162