Community Health Needs Assessment: Unity Medical Center, Grafton, ND
102
_____________________________________________________________________________________________ _____________________________________________________________________________________________ Community Health Needs Assessment 1
-
Upload
academyadmissions -
Category
Documents
-
view
0 -
download
0
Transcript of Community Health Needs Assessment: Unity Medical Center, Grafton, ND
_____________________________________________________________________________________________
_____________________________________________________________________________________________ Community Health Needs Assessment 1
_____________________________________________________________________________________________
_____________________________________________________________________________________________ Community Health Needs Assessment 2
Table of Contents
Introduction .....................................................................................................................................2
Unity Medical Center .....................................................................................................................3
Assessment Methodology ..............................................................................................................6
Demographic Information .............................................................................................................11
Health Indicators and Outcomes ..................................................................................................12
Survey Results .................................................................................................................................21
Findings of Key Informant Interviews and Focus Group .........................................................54
Priority of Health Needs ................................................................................................................60
Summary ..........................................................................................................................................62
Appendix A – Survey Instruments ...............................................................................................64
Appendix B – Community Group Members and Key Informants Participating in
Interviews .........................................................................................................................................80
Appendix C – County Health Rankings Model .........................................................................81
Appendix D – Definitions of Health Variables ...........................................................................82
Appendix E – Walsh County Community Health Profile.........................................................83
Appendix F – County Analysis by North Dakota Health Care Review, Inc. .........................92
Appendix G – Prioritization of Community’s Health Needs ...................................................100
_____________________________________________________________________________________________
_____________________________________________________________________________________________ Community Health Needs Assessment 3
Introduction
To help inform future decisions and strategic planning, Unity Medical Center (UMC) in
Grafton, N.D., conducted a community health needs assessment. Through a joint effort,
UMC and the Center for Rural Health at the University of North Dakota School of
Medicine and Health Sciences analyzed community health-related data and solicited
input from community members and area health care professionals. The Center for
Rural Health’s involvement was funded through its Medicare Rural Hospital Flexibility
(Flex) Program. The Flex Program is federally funded by the Office of Rural Health
Policy and as such associated costs of the assessment were covered by a federal grant.
To gather feedback from the community, residents of the health care service area and
local health care professionals were given the chance to participate in a survey.
Additional information was collected through a Community Group comprised of
community leaders as well as through key informant interviews.
The purpose of conducting a community health needs assessment is to describe the
health of local people, identify use of local health care services, identify and prioritize
community needs, and identify action needed to address the future delivery of health
care in the defined area. A health needs assessment benefits the community by: 1)
collecting timely input from the local community, providers, and staff; 2) providing an
analysis of secondary data related to health conditions, risks, and outcomes; 3)
compiling and organizing information to guide decision making, education, and
marketing efforts, and to facilitate the development of a strategic plan; 4) engaging
community members about the future of health care delivery; and 5) allowing the
charitable hospital to meet federal regulation requirements of the Affordable Care Act,
which requires not-for-profit hospitals to complete a community health needs
assessment at least every three years.

_____________________________________________________________________________________________
_____________________________________________________________________________________________ Community Health Needs Assessment 4
Unity Medical Center
Unity Medical Center brings health and healing to all people living in Grafton and
throughout the region. According to its mission statement, UMC is committed to
“serving Grafton and its surrounding area with a dedicated and caring staff, promoting
health care for the community, and serving its needs through all stages of life.”
Unity Medical Center is a 17-bed critical access hospital. It is a state-designated Level IV
trauma hospital and family care clinic. The facility offers 24-hour acute care, swing bed,
emergency care, and respite services and is staffed by a team of licensed and certified
professional staff, including physicians, nurses, technicians, therapists, and a nurse
practitioner.
For more than 110 years, Unity Medical Center and its predecessors Grafton
Deaconess Hospital, St. Joseph’s Hospital, and Grafton Family Clinic have
existed to bring health care to people in northeast North Dakota. In 2001 it was
designated as a critical access hospital. It is a not-for-profit corporation and
employs more than 100 people with annual salaries totaling $3,189,000 in the
Grafton area. UMC has benefitted from a recent remodel, completed in 2011,
which was supported and approved by a community sales tax increase.
Included in the physical remodeling of the facility was a technological
advancement in equipment.
UMC offers a number of specialty clinics that bring in medical professionals from
around the region to Grafton. Some of the medical specialties include: audio
care, cardiology, diabetes education, Ear, Nose and Throat (ENT), oncology,
orthopedics, podiatry, psychiatry and psychology. Additionally, UMC has a
Convenience Clinic which is staffed after hours, from 5:00-7:00pm on week days
and from 10:00-12:00pm on Saturdays.
Another critical access hospital is located in Walsh County. First Care Health Center,
(FCHC) located in Park River, is just 16 miles west from Grafton. Opened in 1950, this
hospital is a 14-bed Level IV Trauma Center. Many physicians and services are shared
between UMC and FCHC and the relationship between these two facilities is marked
with friendly collaboration.

_____________________________________________________________________________________________
_____________________________________________________________________________________________ Community Health Needs Assessment 5
Health Care Facilities and Other Resources Other health care clinics in Grafton include a Veterans Administration Clinic and a
migrant health clinic. Migrant Health Services, Inc. (MHSI), located in Grafton, is the
only year-round migrant health location in North Dakota. A nurse practitioner sees
patients from around the region, including patients from northwestern Minnesota.
MHSI offers programs to target two groups: pregnant women and individuals with
chronic diseases like diabetes, high blood pressure and depression. MHSI offers free
health assessments, health and nutrition education, bilingual health education materials
and interpreters to all patients.
The North Dakota Developmental Center is located in Grafton and is a state-operated,
comprehensive support agency for people with intellectual and developmental
disabilities as well as medical and health issues. Some of the services provided include
medical, mental health and substance abuse, child protection, refugee services, adult and
aging services and child support enforcement. The Development Center currently
provides specialized services and acts as a safety net for 130 people whose needs exceed
community resources.
Grafton is also home to Lutheran Sunset Home, a nursing home. Additional health care
resources servicing Grafton include two chiropractors, two dentists and an eye doctor.
Services offered locally by Unity Medical Center include:
General and Acute Services
• 24- hour emergency room
• Anesthesia
• Cardiology (visiting
specialist)
• Clinic
• Home health care
• Family Medicine
• General Surgery
• Hospice
• Hospital (acute care)
Oncology (visiting
specialist)
Ophthalmology (visiting
specialist)
Podiatry (visiting
specialist)
Social services
Specialty Clinics
Swing Bed and respite
care
Telemedicine via
eEmergency
_____________________________________________________________________________________________
_____________________________________________________________________________________________ Community Health Needs Assessment 6
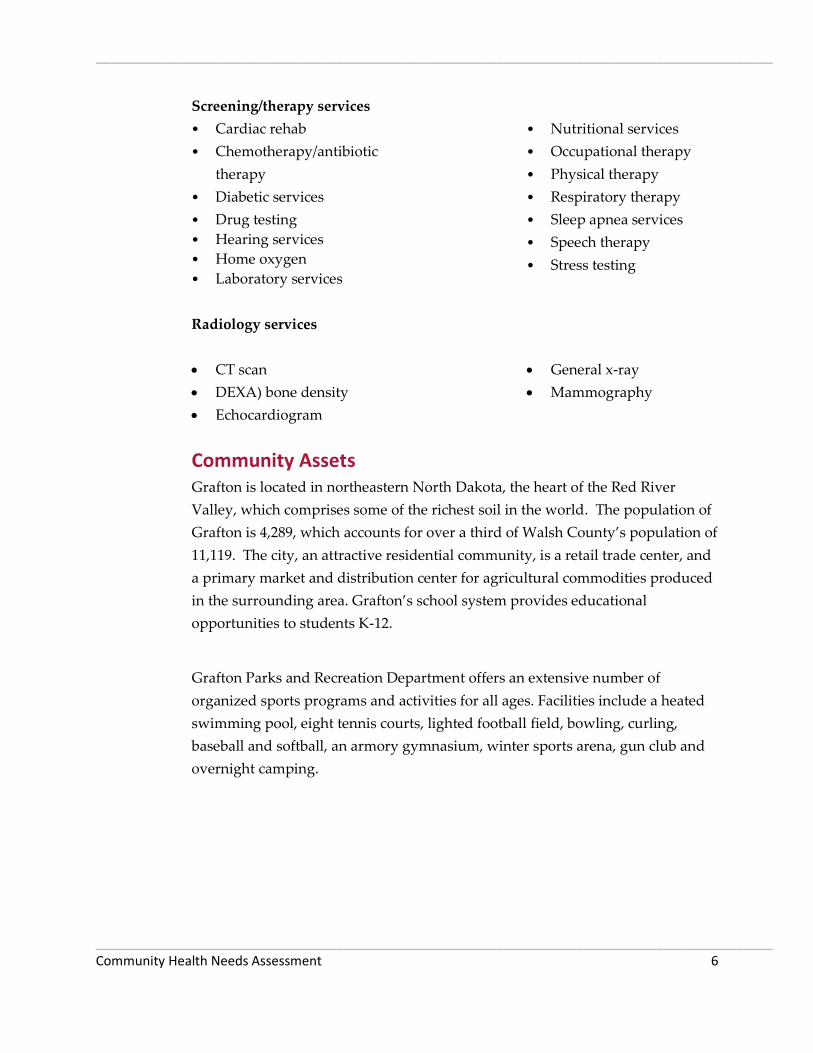
Screening/therapy services
• Cardiac rehab
• Chemotherapy/antibiotic
therapy
• Diabetic services
• Drug testing
• Hearing services
• Home oxygen
• Laboratory services
• Nutritional services
• Occupational therapy
• Physical therapy
• Respiratory therapy
• Sleep apnea services
• Speech therapy
• Stress testing
Radiology services
CT scan
DEXA) bone density
Echocardiogram
General x-ray
Mammography
Community Assets
Grafton is located in northeastern North Dakota, the heart of the Red River
Valley, which comprises some of the richest soil in the world. The population of
Grafton is 4,289, which accounts for over a third of Walsh County’s population of
11,119. The city, an attractive residential community, is a retail trade center, and
a primary market and distribution center for agricultural commodities produced
in the surrounding area. Grafton’s school system provides educational
opportunities to students K-12.
Grafton Parks and Recreation Department offers an extensive number of
organized sports programs and activities for all ages. Facilities include a heated
swimming pool, eight tennis courts, lighted football field, bowling, curling,
baseball and softball, an armory gymnasium, winter sports arena, gun club and
overnight camping.
_____________________________________________________________________________________________
__________________________________________________________________________________________ Community Health Needs Assessment 7
Assessment Methodology
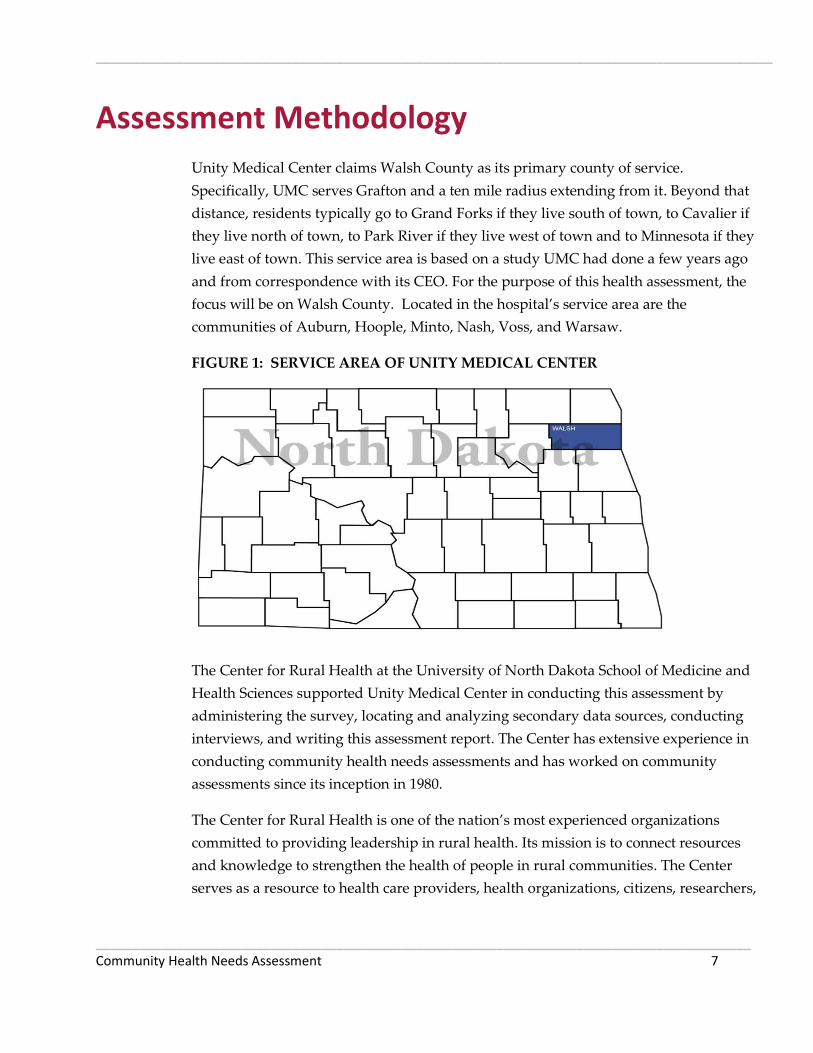
Unity Medical Center claims Walsh County as its primary county of service.
Specifically, UMC serves Grafton and a ten mile radius extending from it. Beyond that
distance, residents typically go to Grand Forks if they live south of town, to Cavalier if
they live north of town, to Park River if they live west of town and to Minnesota if they
live east of town. This service area is based on a study UMC had done a few years ago
and from correspondence with its CEO. For the purpose of this health assessment, the
focus will be on Walsh County. Located in the hospital’s service area are the
communities of Auburn, Hoople, Minto, Nash, Voss, and Warsaw.
FIGURE 1: SERVICE AREA OF UNITY MEDICAL CENTER
The Center for Rural Health at the University of North Dakota School of Medicine and
Health Sciences supported Unity Medical Center in conducting this assessment by
administering the survey, locating and analyzing secondary data sources, conducting
interviews, and writing this assessment report. The Center has extensive experience in
conducting community health needs assessments and has worked on community
assessments since its inception in 1980.
The Center for Rural Health is one of the nation’s most experienced organizations
committed to providing leadership in rural health. Its mission is to connect resources
and knowledge to strengthen the health of people in rural communities. The Center
serves as a resource to health care providers, health organizations, citizens, researchers,

_____________________________________________________________________________________________
__________________________________________________________________________________________ Community Health Needs Assessment 8
educators, and policymakers across the state of North Dakota and the nation. Activities
are targeted toward identifying and researching rural health issues, analyzing health
policy, strengthening local capabilities, developing community-based alternatives, and
advocating for rural concerns.
As the federally designated State Office of Rural Health (SORH) for the state and the
home to the North Dakota Medicare Rural Hospital Flexibility (Flex) program, the
Center connects the School of Medicine and Health Sciences and the University to rural
communities and their health institutions to facilitate developing and maintaining rural
health delivery systems. In this capacity the Center works both at a national level and at
state and community levels.
In addition to its work in the state, the Center also runs five national programs: (1)
Rural Assistance Center (www.raconline.org), an information portal that received more
than 900,000 web visits in the most recent year; (2) the Health Workforce Information
Center (HWIC), which provides free access to the most recent resources on the nation’s
health workforce in one easy-to-use online location (www.hwic.org); (3) the Rural
Health Research Gateway program, which extends the reach and impact of important
findings at the national, state, and community level; (4) the National Resource Center on
Native American Aging, the foremost authority on the subject of aging issues for Native
Americans in the country; and (5) the newest program, the National Indigenous Elder
Justice Initiative (NIEJI), which will focus on elder abuse in Indian Country.
Data for this community health needs assessment was collected in a variety of ways: (1)
a survey solicited feedback from area residents; (2) another version of the survey
gathered input from health care professionals who work at Unity Medical Center (3)
community leaders representing the broad interests of the community took part in one-
on-one key informant interviews; (4) a Community Group comprised of community
leaders and area residents was convened to discuss area health needs; and (5) a wide
range of secondary sources of data was examined, providing information on a multitude
of measures including demographics; health conditions, indicators, and outcomes; rates
of preventive measures; rates of disease; and at-risk activities.

_____________________________________________________________________________________________
__________________________________________________________________________________________ Community Health Needs Assessment 9
Survey
A survey was distributed to gather feedback from the community. The survey was not
intended to be a scientific or statistically valid sampling of the population. Rather, it was
designed to be an additional tool for collecting qualitative data from the community at
large – specifically, information related to community-perceived health needs.
Two versions of a survey tool were distributed to two different audiences: (1)
community members and (2) health care professionals. Copies of both survey
instruments are included in Appendix A.
Community Member Survey
The community member survey was distributed to various residents of the service area
of Unity Medical Center. The survey tool was designed to:
Understand community awareness about services provided by the local health
system and whether consumers are using local services;
Understand the community’s need for services and concerns about the delivery
of health care in the community;
Learn about broad areas of community concerns;
Learn of residents’ perceptions about community assets;
Determine preferences for using local health care versus traveling to other
facilities; and
Solicit suggestions and help identify any gaps in services (now and in the future).
Specifically, the survey covered the following topics: community assets, awareness and
utilization of local health services, barriers to using local services, suggestions for
improving collaboration within the community, local health care delivery concerns,
reasons consumers use local health care providers and reasons they seek care elsewhere,
travel time to the nearest clinic and to the Unity Medical Center hospital in Grafton,
demographics (gender, age, years in community, marital status, employment status,
income, and insurance status), and respondents’ current health conditions or diseases.
Approximately 500 community member surveys were distributed in the service area.
The surveys were distributed through members of the Community Group and at area
churches, community events, UMC facilities, and senior centers. To help ensure
confidentiality and anonymity, included with each survey was a postage-paid return

_____________________________________________________________________________________________
__________________________________________________________________________________________ Community Health Needs Assessment 10
envelope to the Center for Rural Health. The survey took place in June and July, 2012.
Approximately 47 completed community member surveys were returned.
Area residents also were given the option of completing an online version of the survey,
which was publicized in the local newspaper. Twenty-three online surveys were
completed, making a total of 70 surveys completed by community members.
Health Care Professional Survey
Employees of Unity Medical Center were encouraged to complete an online version of
the survey geared to health care professionals. Approximately 59 of these surveys were
completed online. The version of the survey for health care professionals covered the
same topics as the consumer survey, although it sought less demographic information
and didn’t ask whether health care professionals were aware of the services offered by
Unity Medical Center.
Interviews
One-on-one interviews with key informants were conducted in person in Grafton on
June 27, 2012. A representative of the Center for Rural Health conducted the interviews.
Interviews were held with selected members of the Community Group who could
provide insights into the community’s health needs. These interviewees represented the
broad interests of the community served by UMC. They included representatives of the
health community, business community, nonprofit agencies, and public health. Included
among the informants was a public health nurse with special knowledge in public health
acquired through several years of direct care experience in the community, including
working with medically underserved, low income, and minority populations, as well as
with populations with chronic diseases. Those who took part in interviews are listed in
Appendix B.
Topics covered during the interviews included the general health needs of the
community, delivery of health care by local providers, awareness of health services
offered locally, utilization of local services, barriers to using local services, suggestions
for improving collaboration within the community, local health care delivery concerns,
reasons community members use local health care providers, and reasons community
members use other facilities for health care.

_____________________________________________________________________________________________
__________________________________________________________________________________________ Community Health Needs Assessment 11
Community Group
A Community Group consisting of 15 community members was convened and met for
the first time on June 27, 2012. During the first community meeting, group members
were introduced to the needs assessment process, reviewed basic demographic
information about UMC’s service area, and served as a focus group. Covered topics
included the general health needs of the community, delivery of health care by local
providers, awareness of health services offered locally, utilization of local services,
barriers to using local services, suggestions for improving collaboration within the
community, local health care delivery concerns, reasons community members use UMC
and reasons community members use other facilities for health care.
The Community Group met again on August 15, 2012. At this second meeting the
Community Group was presented with survey results, findings from key informant
interviews and the focus group, and a wide range of secondary data relating to the
general health of the population in the UMC service area. The group was then tasked
with identifying and prioritizing the community’s health needs.
Members of the Community Group represented the broad interests of the community
served by UMC. They included representatives of the health community, business
community, schools, nonprofit agencies, and public health. Members of the Community
Group are listed in Appendix B. Not all members of the group were present at both
meetings.
Secondary Research
Secondary data were collected and analyzed to provide a snapshot of the area’s overall
health conditions, risks, and outcomes. Information was collected from a variety of
sources including the U.S. Census Bureau; the North Dakota Department of Health; the
Robert Wood Johnson Foundation’s County Health Rankings (which pulls data from 14
primary data sources); North Dakota Health Care Review, Inc. (NDHCRI); the National
Survey of Children’s Health Data Resource Center; the Centers for Disease Control and
Prevention; the North Dakota Behavioral Risk Factor Surveillance System; and the
National Center for Health Statistics.

_____________________________________________________________________________________________
__________________________________________________________________________________________ Community Health Needs Assessment 12
Demographic Information
The following table summarizes general demographic and geographic data about the
counties served by UMC.
TABLE 1: COUNTY INFORMATION AND DEMOGRAPHICS
(From 2010 Census where available; some figures from earlier Census data)
Walsh County North Dakota
Population 11,119 672,591
Population change, 2000-2010 -10.3% 4.7%
Square miles 1,282 69,001
People per square mile 8.7 9.7
White persons 93.5% 90.0%
High school graduates 81.4% 89.4%
Bachelor’s degree or higher 15.8% 26.3%
Persons below poverty level 9.9% 12.3%
Children in poverty 16% 16%
65 years or older 20.1% 14.5%
Median age 45.9 37.0
Not proficient in English language 1.9% 1%
The data indicate that Walsh County has a greater percentage of individuals over the
age of 65 than the North Dakota average. Walsh County also has a higher median age,
by almost nine years, than the North Dakota median. This may signify an increased
need for medical care due to an aging population. Moreover, Walsh County has almost
double the rate of residents who are not proficient in the English language due to a high
migrant population. Providing health care for this population requires bilingual
services.
Walsh County has lower rates, compared to the state average, in terms of individuals
with a high school diploma and a bachelor’s degree or higher. The rate of county
residents aged 25 and older that are high school graduates trails the state average by
eight percentage points, while the rate of county residents with a bachelor’s degree or
higher trails the state average by more than ten percentage points. The educational
_____________________________________________________________________________________________
__________________________________________________________________________________________ Community Health Needs Assessment 13
backgrounds of area residents can affect a health care facility’s ability to find qualified
staff members.
Fewer adults live below the federal poverty level in Walsh County, compared to the
state average, however the rate of children in poverty matches the state rate. Unity
Medical Center’s service area is fairly rural with an average of 8.7 people per square
mile, compared to the state average of 9.7 people per square mile. The generally rural
area has implications for the delivery of services and residents’ access to care.
Transportation can be an issue for rural residents, as can isolation, which can have many
effects on health status.
Health Conditions, Behaviors and Outcomes As noted above, several sources were reviewed to inform this assessment. This data is
presented below in four categories: (1) County Health Rankings, (2) public health
community profiles, (3) preventive care data, and (4) children’s health. One other source
of information, the Gallup-Healthways Well-Being Index, shows that North Dakota
ranked second nationally in well-being during 2011. The index is an average of six sub-
indexes, which individually examine life evaluation, emotional health, work
environment, physical health, healthy behaviors, and access to basic necessities.
County Health Rankings
The Robert Wood Johnson Foundation, in collaboration with the University of
Wisconsin Population Health Institute, has developed the County Health Rankings to
illustrate community health needs and provide guidance for actions toward improved
health. In this report, counties are compared to national benchmark data and state rates
in various topics ranging from individual health behaviors to the quality of health care.
The data used in the 2012 County Health Rankings is pulled from 14 primary data
sources and then is compiled to create county rankings. Counties in each of the 50 states
are ranked according to summaries of a variety of health measures. Those having high
ranks, e.g. 1 or 2, are considered to be the “healthiest.” Counties are ranked on both
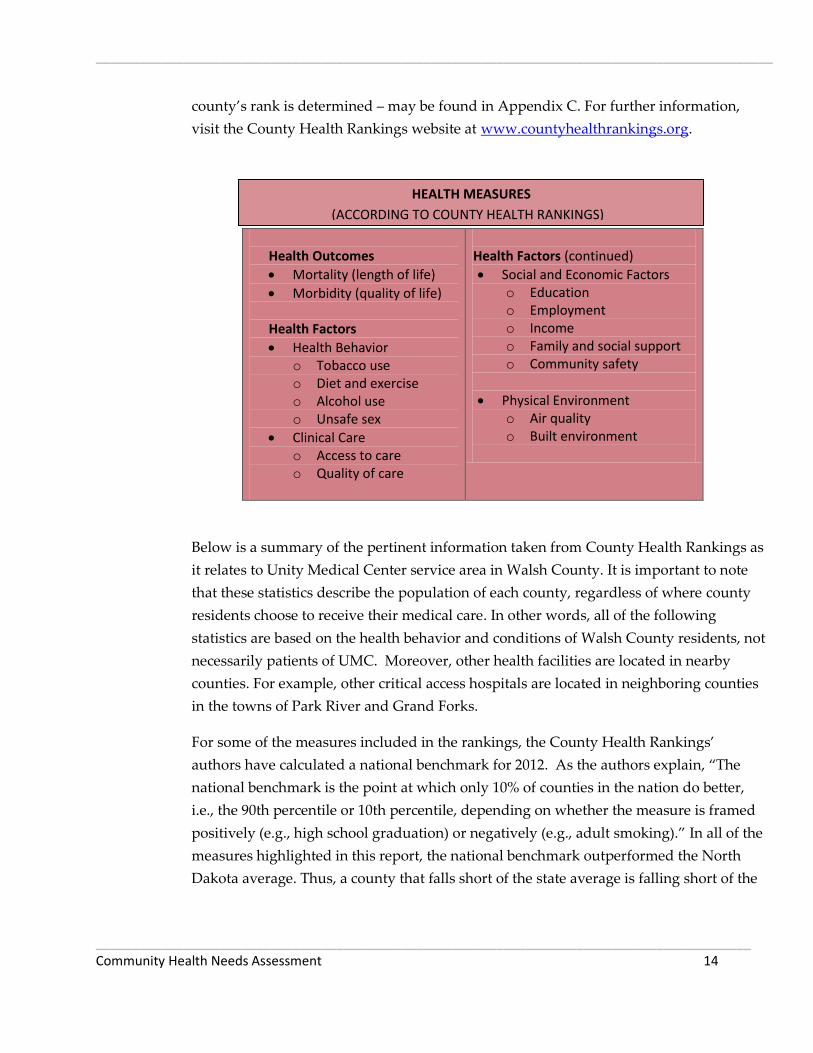
health outcomes and health factors. Below is a breakdown of the variables that influence
a county’s rank. A model of the 2012 County Health Rankings – a flow chart of how a
_____________________________________________________________________________________________
__________________________________________________________________________________________ Community Health Needs Assessment 14
county’s rank is determined – may be found in Appendix C. For further information,
visit the County Health Rankings website at www.countyhealthrankings.org.
Health Outcomes
Mortality (length of life)
Morbidity (quality of life)
Health Factors
Health Behavior o Tobacco use o Diet and exercise o Alcohol use o Unsafe sex
Clinical Care o Access to care o Quality of care
Health Factors (continued)
Social and Economic Factors o Education o Employment o Income o Family and social support o Community safety
Physical Environment o Air quality o Built environment
Below is a summary of the pertinent information taken from County Health Rankings as
it relates to Unity Medical Center service area in Walsh County. It is important to note
that these statistics describe the population of each county, regardless of where county
residents choose to receive their medical care. In other words, all of the following
statistics are based on the health behavior and conditions of Walsh County residents, not
necessarily patients of UMC. Moreover, other health facilities are located in nearby
counties. For example, other critical access hospitals are located in neighboring counties
in the towns of Park River and Grand Forks.
For some of the measures included in the rankings, the County Health Rankings’
authors have calculated a national benchmark for 2012. As the authors explain, “The
national benchmark is the point at which only 10% of counties in the nation do better,
i.e., the 90th percentile or 10th percentile, depending on whether the measure is framed
positively (e.g., high school graduation) or negatively (e.g., adult smoking).” In all of the
measures highlighted in this report, the national benchmark outperformed the North
Dakota average. Thus, a county that falls short of the state average is falling short of the
HEALTH MEASURES
(ACCORDING TO COUNTY HEALTH RANKINGS)_
_____________________________________________________________________________________________
__________________________________________________________________________________________ Community Health Needs Assessment 15
national benchmark as well; conversely, a county meeting or exceeding the national
benchmark will be performing better than the state average on that measure.
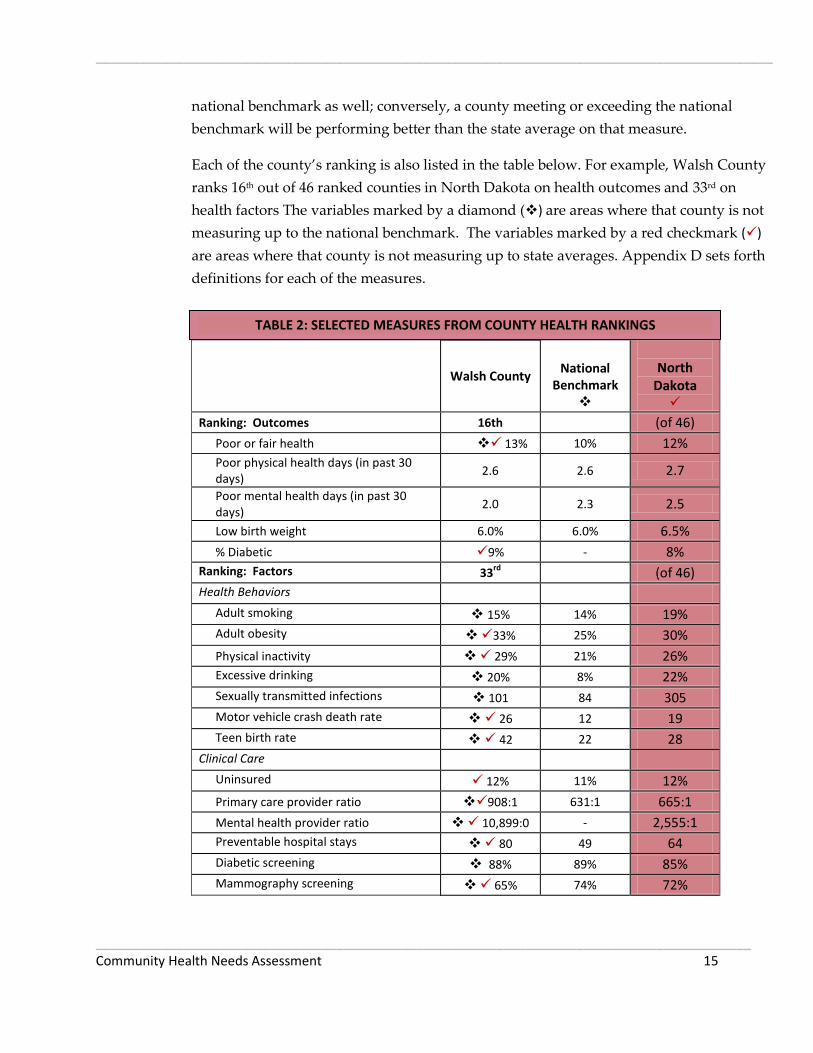
Each of the county’s ranking is also listed in the table below. For example, Walsh County
ranks 16th out of 46 ranked counties in North Dakota on health outcomes and 33rd on
health factors The variables marked by a diamond () are areas where that county is not
measuring up to the national benchmark. The variables marked by a red checkmark ()
are areas where that county is not measuring up to state averages. Appendix D sets forth
definitions for each of the measures.
Walsh County
National
Benchmark
North
Dakota
Ranking: Outcomes 16th (of 46)
Poor or fair health 13% 10% 12%
Poor physical health days (in past 30 days)
2.6 2.6 2.7
Poor mental health days (in past 30 days)
2.0 2.3 2.5
Low birth weight 6.0% 6.0% 6.5%
% Diabetic 9% - 8%
Ranking: Factors 33rd
(of 46)
Health Behaviors
Adult smoking 15% 14% 19%
Adult obesity 33% 25% 30%
Physical inactivity 29% 21% 26%
Excessive drinking 20% 8% 22%
Sexually transmitted infections 101 84 305
Motor vehicle crash death rate 26 12 19
Teen birth rate 42 22 28
Clinical Care
Uninsured 12% 11% 12%
Primary care provider ratio 908:1 631:1 665:1
Mental health provider ratio 10,899:0 - 2,555:1
Preventable hospital stays 80 49 64
Diabetic screening 88% 89% 85%
Mammography screening 65% 74% 72%
TABLE 2: SELECTED MEASURES FROM COUNTY HEALTH RANKINGS
_____________________________________________________________________________________________
__________________________________________________________________________________________ Community Health Needs Assessment 16
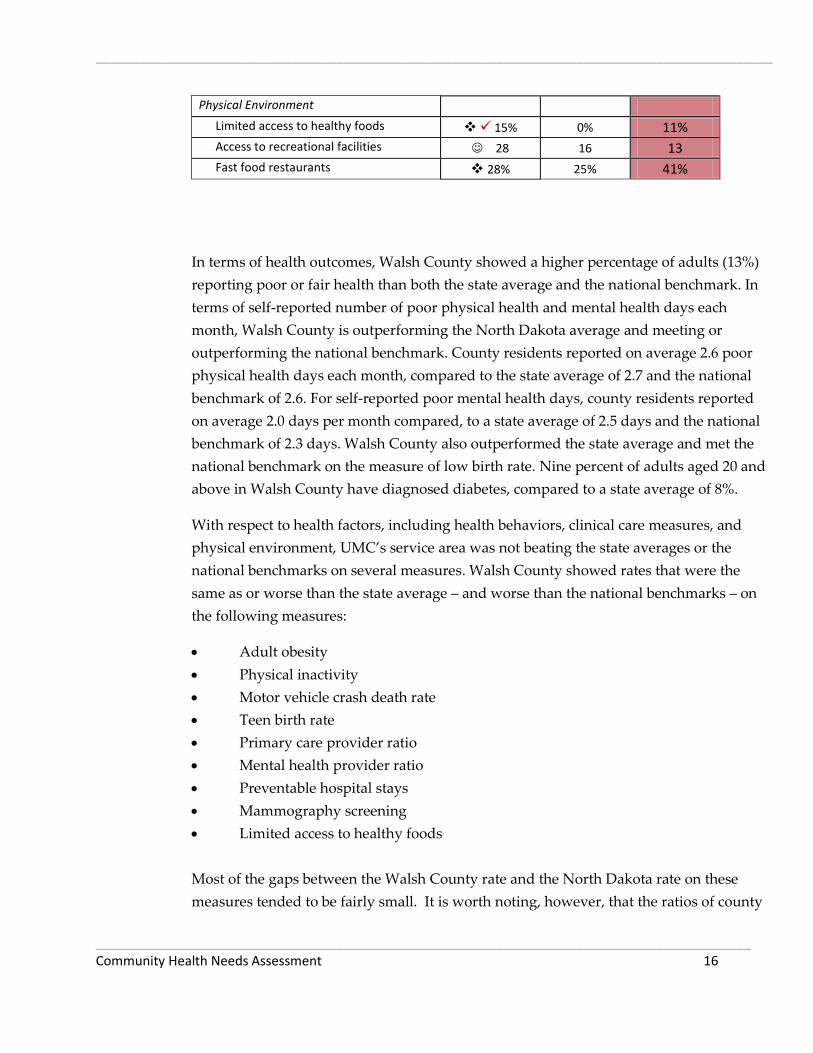
Physical Environment
Limited access to healthy foods 15% 0% 11%
Access to recreational facilities 28 16 13
Fast food restaurants 28% 25% 41%
In terms of health outcomes, Walsh County showed a higher percentage of adults (13%)
reporting poor or fair health than both the state average and the national benchmark. In
terms of self-reported number of poor physical health and mental health days each
month, Walsh County is outperforming the North Dakota average and meeting or
outperforming the national benchmark. County residents reported on average 2.6 poor
physical health days each month, compared to the state average of 2.7 and the national
benchmark of 2.6. For self-reported poor mental health days, county residents reported
on average 2.0 days per month compared, to a state average of 2.5 days and the national
benchmark of 2.3 days. Walsh County also outperformed the state average and met the
national benchmark on the measure of low birth rate. Nine percent of adults aged 20 and
above in Walsh County have diagnosed diabetes, compared to a state average of 8%.
With respect to health factors, including health behaviors, clinical care measures, and
physical environment, UMC’s service area was not beating the state averages or the
national benchmarks on several measures. Walsh County showed rates that were the
same as or worse than the state average – and worse than the national benchmarks – on
the following measures:
Adult obesity
Physical inactivity
Motor vehicle crash death rate
Teen birth rate
Primary care provider ratio
Mental health provider ratio
Preventable hospital stays
Mammography screening
Limited access to healthy foods
Most of the gaps between the Walsh County rate and the North Dakota rate on these
measures tended to be fairly small. It is worth noting, however, that the ratios of county

_____________________________________________________________________________________________
__________________________________________________________________________________________ Community Health Needs Assessment 17
residents to primary care and mental health providers were substantially higher than the
state ratios.
Additionally, the county was not meeting the national benchmarks on the following
measures:
Adult smoking
Excessive drinking
Sexually transmitted infections
Percentage of population under age 65 without health insurance
Diabetic screening
Prevalence of fast food restaurants
The data also show that Walsh County’s rate of excessive drinking (which includes
binge and heavy drinking) was more than two times the national benchmark. The rates in
the county of adult obesity and physical inactivity (which are, for apparent reasons,
interrelated) were eight percentage points higher than the national benchmarks.
Examining these statistics together demonstrates their interrelatedness. The Center for
Disease Control and Prevention (CDC) explains that physical inactivity can lead to
obesity and type 2 diabetes, while physical activity can help control weight, reduce the
risk of heart disease and some cancers, strengthen bones and muscles, and improve
mental health. Limited access to healthy foods can further exacerbate the issue. A
strength of Walsh County is its access to recreational facilities. Encouraging more use of
these resources could help to combat the physical inactivity and obesity problems
discussed above.
Other trends to be aware of are that the county’s motor vehicle crash death rate was
more than twice the national benchmark and the teen birth rate was almost twice the
national benchmark.
According to County Health Rankings, Walsh County has no mental health providers,
which gives it a population-to-mental-health-provider ratio of 10,899:0, as compared to
the state average ratio of 2,555:1. Walsh County’s ratio is the worst in the state, which
has a minimum-maximum range of 10:899:0 to 1,191:1. Under the rankings model,
mental health providers include full-time psychiatrists, clinical psychologists, clinical
social workers, psychiatric nurse specialists, and marriage and family therapists who
meet certain qualifications and certifications. While no qualifying providers reside in
Walsh County, it should be noted that graduate counseling students from the University
_____________________________________________________________________________________________
__________________________________________________________________________________________ Community Health Needs Assessment 18
of North Dakota do provide regular mental health services at UMC. There is a clear need
for mental health providers to practice in rural areas as well as a strong demand for
more general practitioners.
Public Health Community Health Profile
Included as Appendix E is North Dakota Department of Health’s community health
profiles for Walsh County. Some of the demographic information presented in these
community health profiles is based on earlier census data. Data concerning causes of
death is from 2004 to 2008.
For Walsh County, the leading cause of death for people aged 15-44 is unintentional
injury. Other leading causes of death for adults aged 44 and younger include suicide,
cancer and heart disease. Cancer is the leading cause of death for those aged 45-64,
followed by heart disease. The reverse is true for those aged 65 and older as heart
disease is the leading cause of death, followed by cancer. A graph illustrating leading
causes of death in various age groups in the public health unit may be found as part of
Appendix E.
This data on causes of death suggests that in Walsh County, reductions in mortality may
be achieved by focusing on early detection and prevention of cancer and heart disease,
as well as prevention of accidents and suicides.
According to the county’s community health profile, measures of self-reported adult
behavioral risk factors in which there is a statistically significant difference between the
Walsh County rate and the state average (with Walsh County performing below the
state average) include residents who are overweight but not obese, residents who report
not always using a seatbelt, and residents who report not getting the recommended
amount of physical activity. Walsh County was performing better than the state
averages on the following measures: residents reporting they have ever been diagnosed
with asthma, residents reporting they currently have asthma, and residents reporting
they have a personal health care provider.
In assessing the region’s health needs, attention also should be paid to other information
provided in the public health profiles about quality of life issues and conditions such as
_____________________________________________________________________________________________
__________________________________________________________________________________________ Community Health Needs Assessment 19
arthritis, asthma, cardiovascular disease, cholesterol, crime, drinking habits, fruit and
vegetable consumption, health insurance, health screening, high blood pressure, mental
health, obesity, physical activity, smoking, stroke, tooth loss and vaccination.
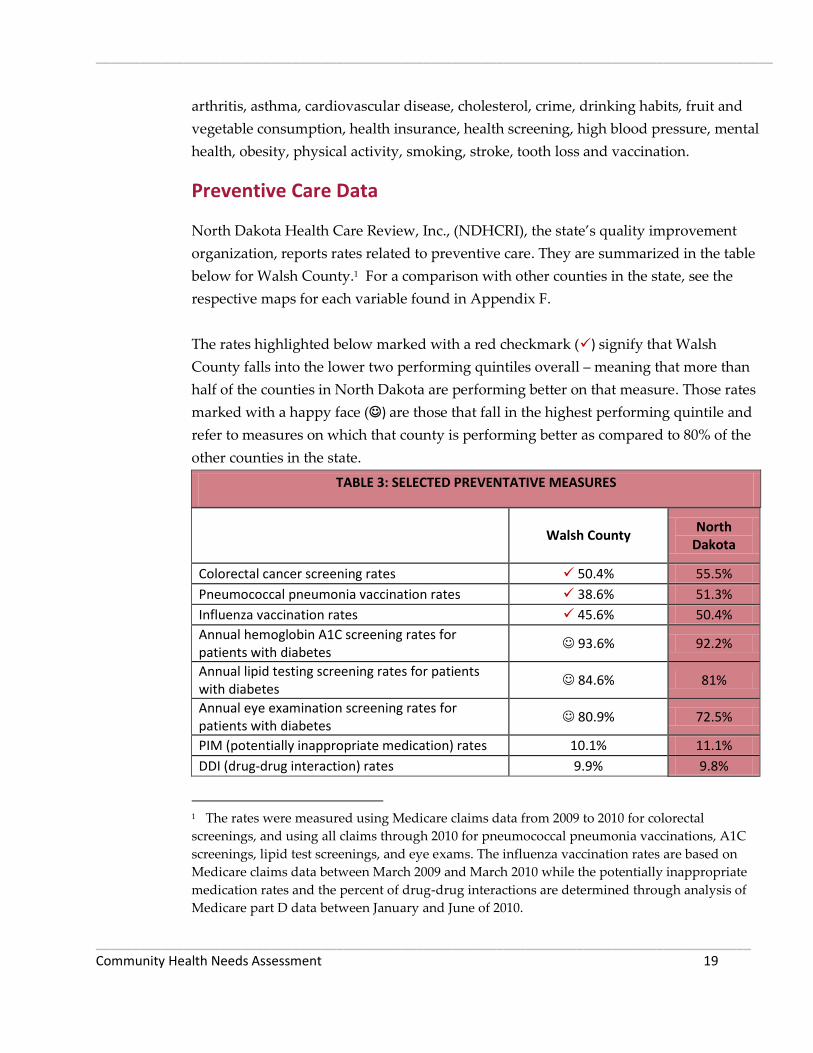
Preventive Care Data
North Dakota Health Care Review, Inc., (NDHCRI), the state’s quality improvement
organization, reports rates related to preventive care. They are summarized in the table
below for Walsh County.1 For a comparison with other counties in the state, see the
respective maps for each variable found in Appendix F.
The rates highlighted below marked with a red checkmark () signify that Walsh
County falls into the lower two performing quintiles overall – meaning that more than
half of the counties in North Dakota are performing better on that measure. Those rates
marked with a happy face () are those that fall in the highest performing quintile and
refer to measures on which that county is performing better as compared to 80% of the
other counties in the state.
TABLE 3: SELECTED PREVENTATIVE MEASURES
Walsh County
North Dakota
Colorectal cancer screening rates 50.4% 55.5%
Pneumococcal pneumonia vaccination rates 38.6% 51.3%
Influenza vaccination rates 45.6% 50.4%
Annual hemoglobin A1C screening rates for patients with diabetes
93.6% 92.2%
Annual lipid testing screening rates for patients with diabetes
84.6% 81%
Annual eye examination screening rates for patients with diabetes
80.9% 72.5%
PIM (potentially inappropriate medication) rates 10.1% 11.1%
DDI (drug-drug interaction) rates 9.9% 9.8%
1 The rates were measured using Medicare claims data from 2009 to 2010 for colorectal
screenings, and using all claims through 2010 for pneumococcal pneumonia vaccinations, A1C
screenings, lipid test screenings, and eye exams. The influenza vaccination rates are based on
Medicare claims data between March 2009 and March 2010 while the potentially inappropriate
medication rates and the percent of drug-drug interactions are determined through analysis of
Medicare part D data between January and June of 2010.
_____________________________________________________________________________________________
__________________________________________________________________________________________ Community Health Needs Assessment 20
The data indicate that Walsh County is doing well in a number of preventive care
measures, with several instances of scoring in the top quintile compared to other North
Dakota counties. There is, however, room for improvement in several measures related
to the delivery of preventive care. For example, Walsh County is below state averages on
annual colorectal cancer screening rates, pneumococcal pneumonia vaccination rates
and influenza vaccination rates
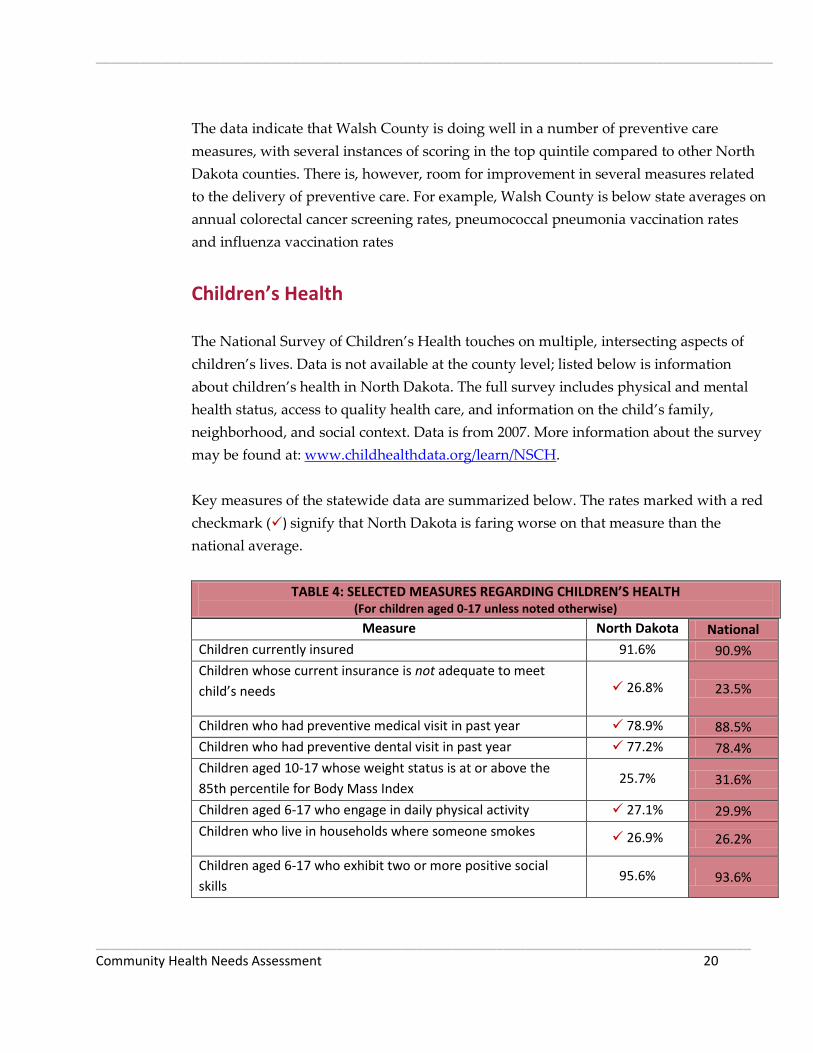
Children’s Health
The National Survey of Children’s Health touches on multiple, intersecting aspects of
children’s lives. Data is not available at the county level; listed below is information
about children’s health in North Dakota. The full survey includes physical and mental
health status, access to quality health care, and information on the child’s family,
neighborhood, and social context. Data is from 2007. More information about the survey
may be found at: www.childhealthdata.org/learn/NSCH.
Key measures of the statewide data are summarized below. The rates marked with a red
checkmark () signify that North Dakota is faring worse on that measure than the
national average.
TABLE 4: SELECTED MEASURES REGARDING CHILDREN’S HEALTH (For children aged 0-17 unless noted otherwise)
Measure North Dakota National
Children currently insured 91.6% 90.9%
Children whose current insurance is not adequate to meet
child’s needs 26.8% 23.5%
Children who had preventive medical visit in past year 78.9% 88.5%
Children who had preventive dental visit in past year 77.2% 78.4%
Children aged 10-17 whose weight status is at or above the
85th percentile for Body Mass Index 25.7% 31.6%
Children aged 6-17 who engage in daily physical activity 27.1% 29.9%
Children who live in households where someone smokes 26.9% 26.2%
Children aged 6-17 who exhibit two or more positive social
skills 95.6% 93.6%

_____________________________________________________________________________________________
__________________________________________________________________________________________ Community Health Needs Assessment 21
Children aged 6-17 who missed 11 or more days of school in the
past year 3.9% 5.8%
Young children (10 mos.-5 yrs.) receiving standardized
screening for developmental or behavioral problems 17.6% 19.5%
Children aged 2-17 years having one or more emotional,
behavioral, or developmental condition 11.4% 11.3%
Children aged 2-17 with problems requiring counseling who
received mental health care 72.4% 60.0%
The data on children’s health and conditions reveals that while Walsh County is doing
better than the national average on several measures, it is not measuring up to the
national average in annual preventive medical and dental visits, with respect to health
insurance that is adequate to meet children’s needs, and in terms of daily physical
activity, households with smokers, developmental screening, and rates of emotional,
behavioral or developmental conditions. Over 20% of the state’s children are not
receiving an annual preventive medical visit or a preventive dental visit. Lack of
preventive care now affects these children’s future health status. Access to behavioral
health is an issue throughout the state, especially in frontier and rural areas. Anecdotal
evidence from the Center for Rural Health indicates that children living in rural areas
may be going without care due to the lack of mental health providers in those areas.
_____________________________________________________________________________________________
__________________________________________________________________________________________ Community Health Needs Assessment 22
Survey Results Survey Demographics
Two versions of the survey were administered: one for community members and one
for health care professionals. With respect to demographics, both versions asked
participants about their gender, age, and education level, and how long they have lived
in the community. In addition, health care professionals were asked to state their
professions and how long they have worked in the community. Community members
were asked about marital status, employment status, household income, and travel time
to the nearest clinic and to the Unity Medical Center in Grafton. Figures 2 through 16
illustrate the demographics of health care professionals and community members.
Throughout this report, numbers (N) instead of percentages (%) are reported because
percentages can be misleading with smaller numbers. Survey respondents were not
required to answer all survey questions; they were free to skip any questions they
wished.
Community Members and Health Care Professionals
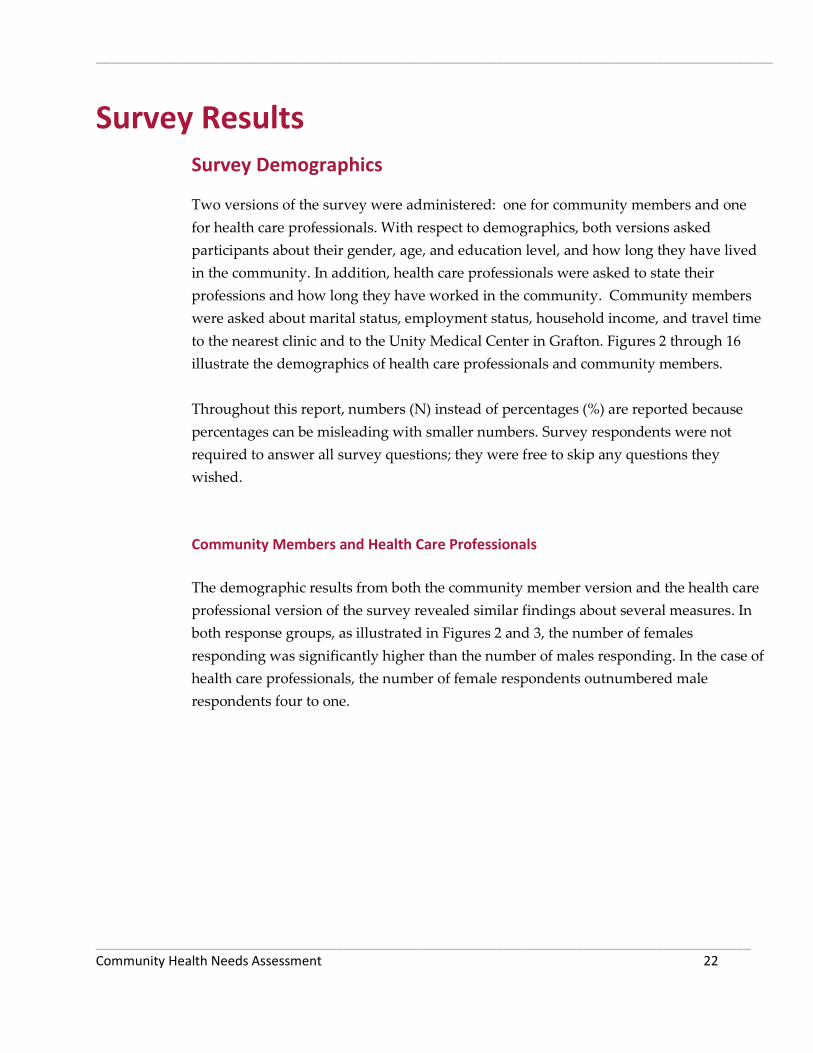
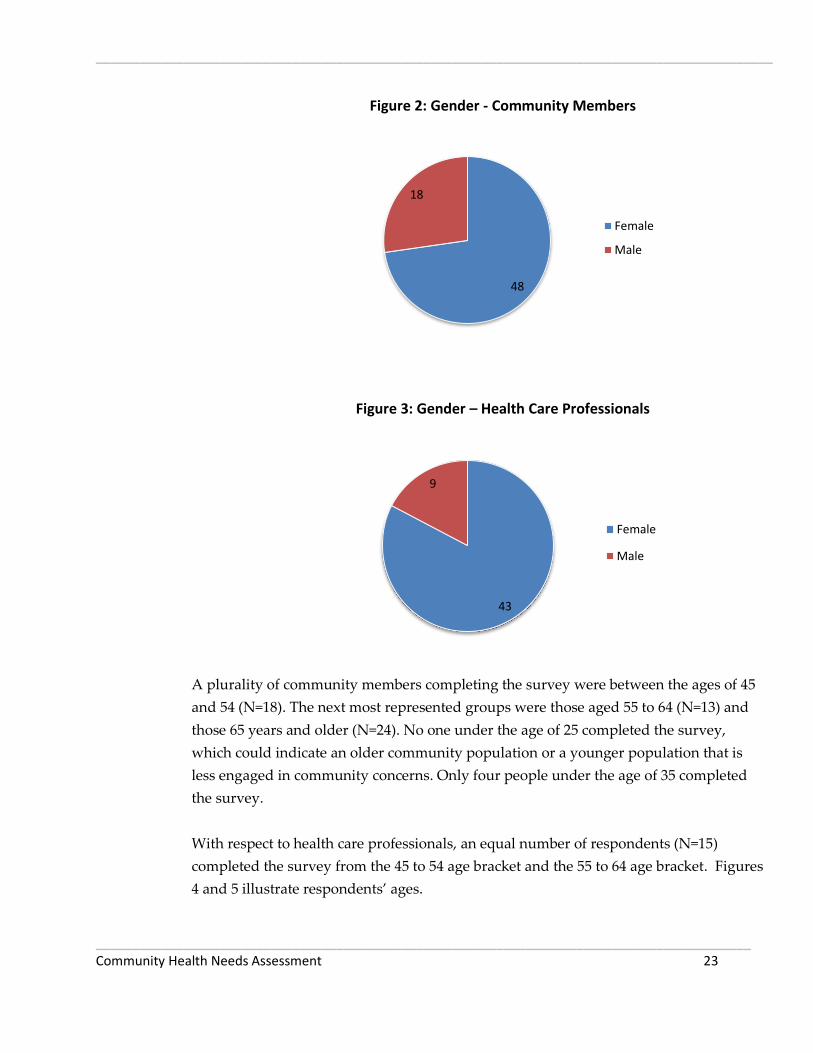
The demographic results from both the community member version and the health care
professional version of the survey revealed similar findings about several measures. In
both response groups, as illustrated in Figures 2 and 3, the number of females
responding was significantly higher than the number of males responding. In the case of
health care professionals, the number of female respondents outnumbered male
respondents four to one.
_____________________________________________________________________________________________
__________________________________________________________________________________________ Community Health Needs Assessment 23
Figure 2: Gender - Community Members
Figure 3: Gender – Health Care Professionals
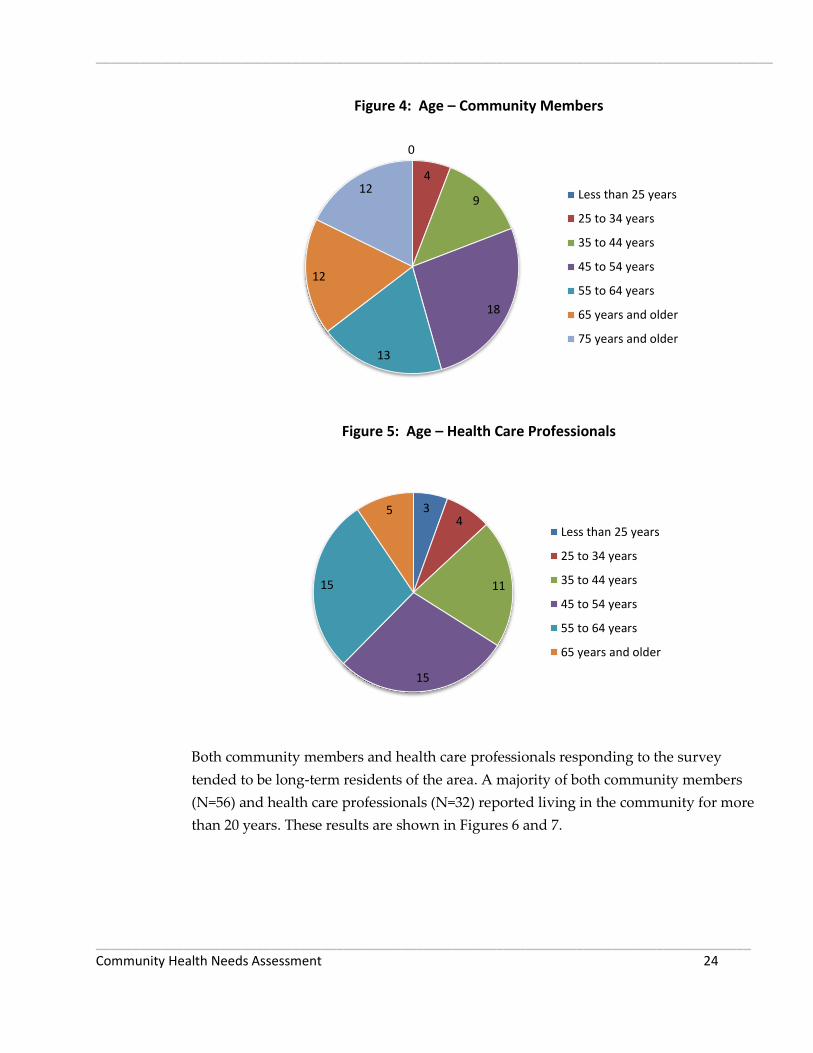
A plurality of community members completing the survey were between the ages of 45
and 54 (N=18). The next most represented groups were those aged 55 to 64 (N=13) and
those 65 years and older (N=24). No one under the age of 25 completed the survey,
which could indicate an older community population or a younger population that is
less engaged in community concerns. Only four people under the age of 35 completed
the survey.
With respect to health care professionals, an equal number of respondents (N=15)
completed the survey from the 45 to 54 age bracket and the 55 to 64 age bracket. Figures
4 and 5 illustrate respondents’ ages.
48
18
Female
Male
43
9
Female
Male
_____________________________________________________________________________________________
__________________________________________________________________________________________ Community Health Needs Assessment 24
Figure 4: Age – Community Members
Figure 5: Age – Health Care Professionals
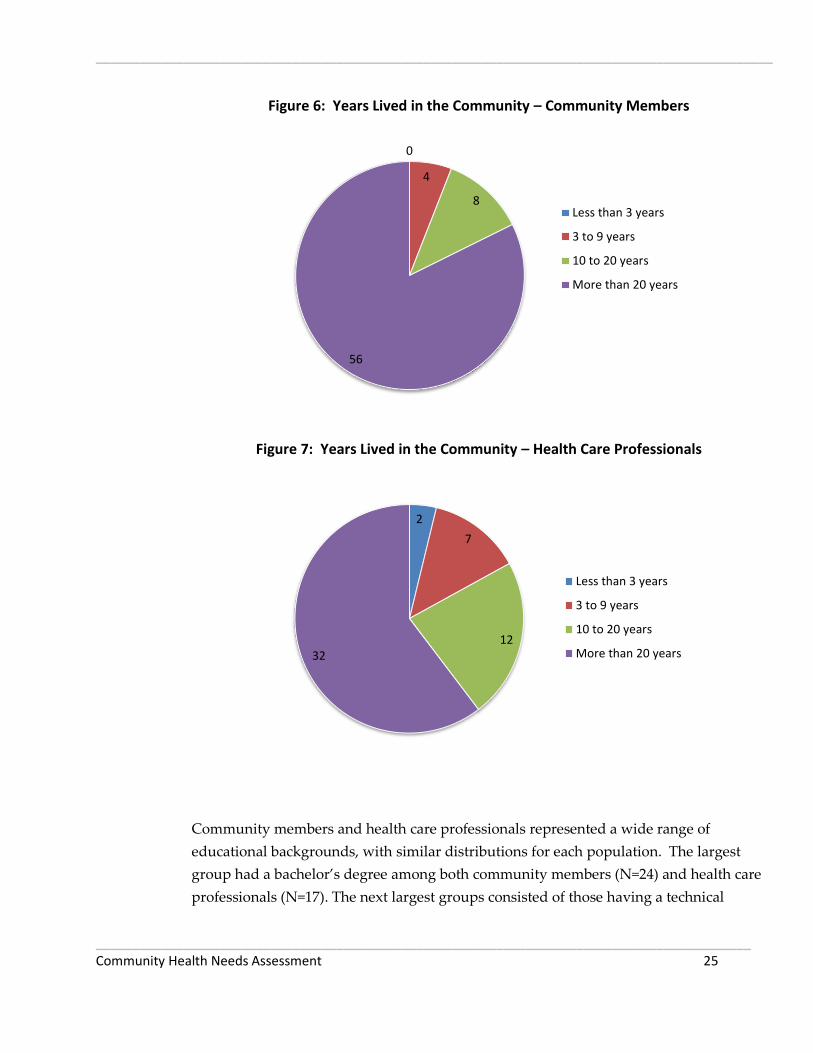
Both community members and health care professionals responding to the survey
tended to be long-term residents of the area. A majority of both community members
(N=56) and health care professionals (N=32) reported living in the community for more
than 20 years. These results are shown in Figures 6 and 7.
0
4
9
18
13
12
12 Less than 25 years
25 to 34 years
35 to 44 years
45 to 54 years
55 to 64 years
65 years and older
75 years and older
3 4
11
15
15
5
Less than 25 years
25 to 34 years
35 to 44 years
45 to 54 years
55 to 64 years
65 years and older
_____________________________________________________________________________________________
__________________________________________________________________________________________ Community Health Needs Assessment 25
Figure 6: Years Lived in the Community – Community Members
Figure 7: Years Lived in the Community – Health Care Professionals
Community members and health care professionals represented a wide range of
educational backgrounds, with similar distributions for each population. The largest
group had a bachelor’s degree among both community members (N=24) and health care
professionals (N=17). The next largest groups consisted of those having a technical
0
4
8
56
Less than 3 years
3 to 9 years
10 to 20 years
More than 20 years
2
7
12 32
Less than 3 years
3 to 9 years
10 to 20 years
More than 20 years
_____________________________________________________________________________________________
__________________________________________________________________________________________ Community Health Needs Assessment 26
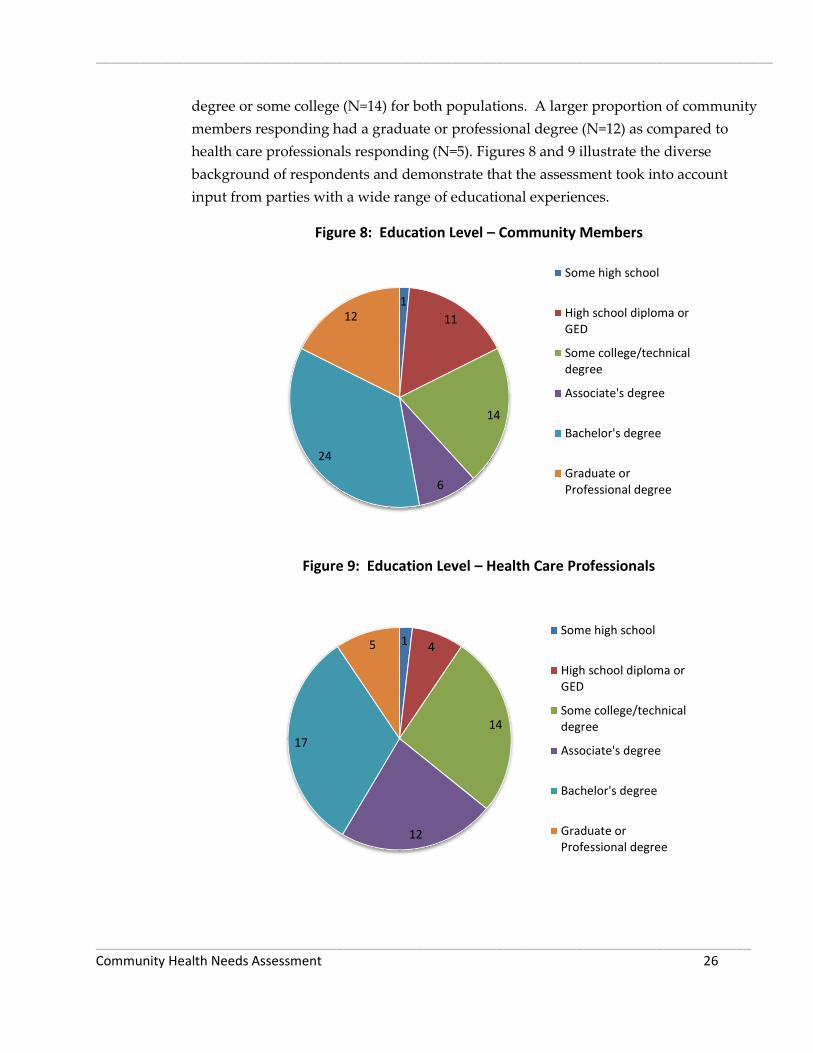
degree or some college (N=14) for both populations. A larger proportion of community
members responding had a graduate or professional degree (N=12) as compared to
health care professionals responding (N=5). Figures 8 and 9 illustrate the diverse
background of respondents and demonstrate that the assessment took into account
input from parties with a wide range of educational experiences.
Figure 8: Education Level – Community Members
Figure 9: Education Level – Health Care Professionals
1
11
14
6
24
12
Some high school
High school diploma orGED
Some college/technicaldegree
Associate's degree
Bachelor's degree
Graduate orProfessional degree
1 4
14
12
17
5 Some high school
High school diploma orGED
Some college/technicaldegree
Associate's degree
Bachelor's degree
Graduate orProfessional degree

_____________________________________________________________________________________________
__________________________________________________________________________________________ Community Health Needs Assessment 27
Health Care Professionals
Health care professionals were asked to identify their specific professions within the
health care industry. As shown in Figure 10, respondents represented a range of job
roles, with the greatest response from clerical staff (N=12) and allied health professionals
(N=11). There were no responses from physician assistants or nurse practitioners.
Figure 10: Jobs – Health Care Professionals
Health care professionals also were asked how long they have been employed or in
practice in the area. As shown in Figure 11, the responses show most employees are
long-term area employees, with 31 respondents reporting employment in the area for
more than ten years. Eight respondents said they were employed in the area less than
five years.
12
4 11
2
5
1
0
1 Clerical
Health care administration
Allied health professional
Environmental services
Nurse
Physician
Physician's Assistant/NursePractitionerCNA/Other assistant

_____________________________________________________________________________________________
__________________________________________________________________________________________ Community Health Needs Assessment 28
Figure 11: Length of Employment or Practice – Health Care Professionals
Community Members
Community members were asked additional demographic information not asked of
health care professionals. This additional information included marital status,
employment status, household income, and their proximity to the nearest clinic and to
Unity Medical Center in Grafton.
The majority of community members (N=52) identified themselves as married, as
exhibited in Figure 12.
Figure 12: Marital Status – Community Members
8
10
31
Less than 5 years
5 to 10 years
More than 10 years
2
52
3
10
Divorced/separated
Married
Single/never married
Widowed
_____________________________________________________________________________________________
__________________________________________________________________________________________ Community Health Needs Assessment 29
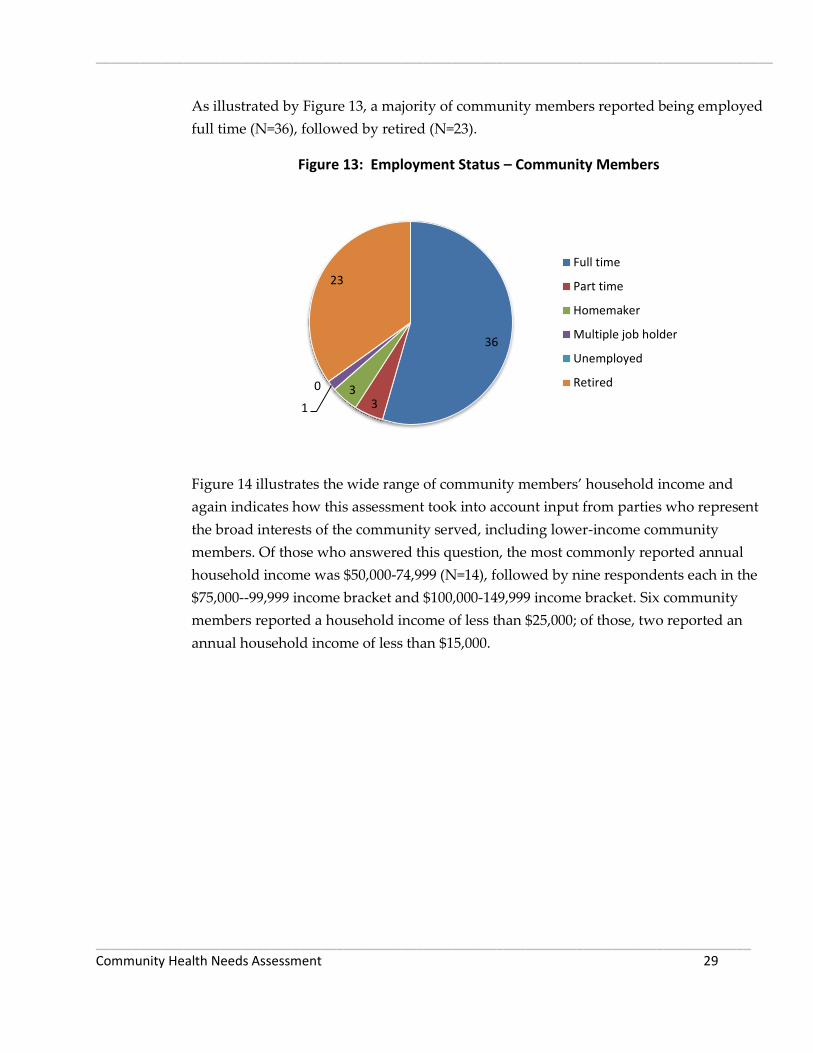
As illustrated by Figure 13, a majority of community members reported being employed
full time (N=36), followed by retired (N=23).
Figure 13: Employment Status – Community Members
Figure 14 illustrates the wide range of community members’ household income and
again indicates how this assessment took into account input from parties who represent
the broad interests of the community served, including lower-income community
members. Of those who answered this question, the most commonly reported annual
household income was $50,000-74,999 (N=14), followed by nine respondents each in the
$75,000--99,999 income bracket and $100,000-149,999 income bracket. Six community
members reported a household income of less than $25,000; of those, two reported an
annual household income of less than $15,000.
36
3 3
1
0
23
Full time
Part time
Homemaker
Multiple job holder
Unemployed
Retired

_____________________________________________________________________________________________
__________________________________________________________________________________________ Community Health Needs Assessment 30
Figure 14: Annual Household Income – Community Members
Community members responding to the survey represented a fairly large geographic
area. As shown in Figure 15, a majority of the community members responding (N=45)
lived less than ten minutes from the nearest clinic, followed by those living 10 to 30
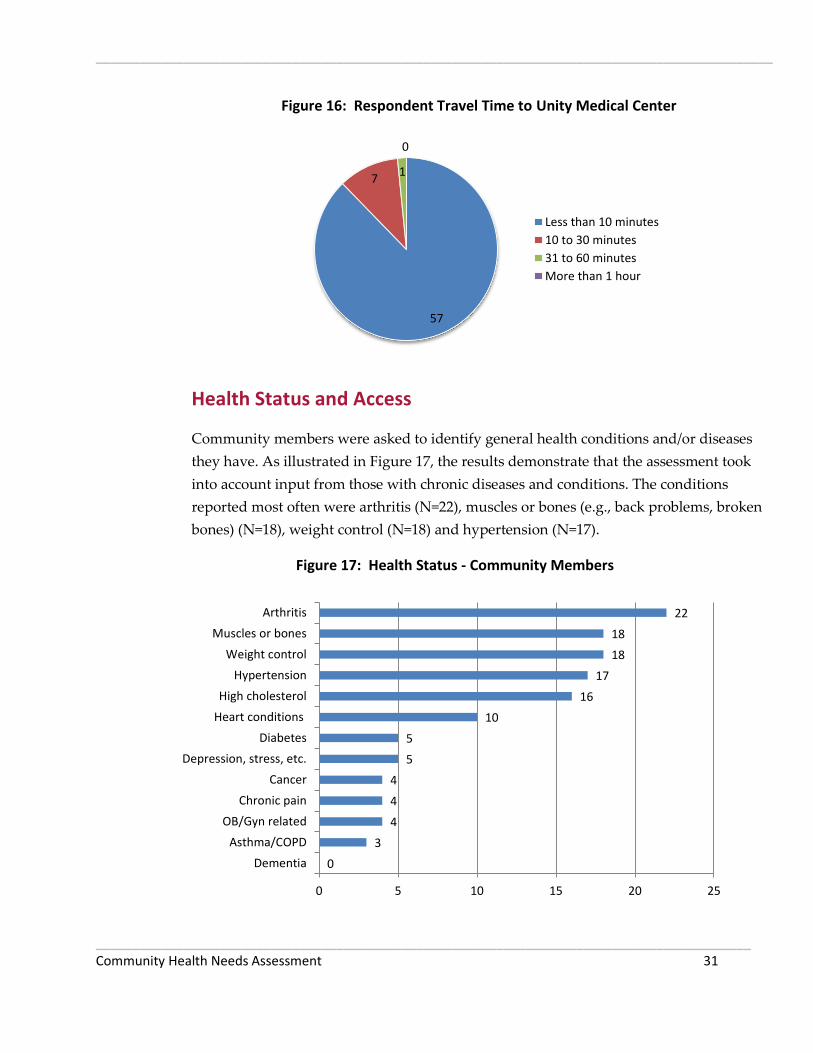
minutes from the nearest clinic (N=13). Survey results about the travel time to Unity
Medical Center in Grafton mirrored the results pertaining to clinic proximity, with a
majority (N=57) living less than ten minutes from the hospital, followed by 10 to 30
minutes (N=7) as illustrated in Figure 16.
Figure 15: Respondent Travel Time to Nearest Clinic
2 4
6
8
14 9
9
4
1 10
$0 to $14,999
$15,000 to $24,999
$25,000 to $34,999
$35,000 to $49,999
$50,000 to $74,999
$75,000 to $99,999
$100,000 to $149,999
$150,000 to $199,999
$200,000 and over
Prefer not to answer
45
13
5 1
Less than 10 minutes
10 to 30 minutes
31 to 60 minutes
More than 1 hour
_____________________________________________________________________________________________
__________________________________________________________________________________________ Community Health Needs Assessment 31
Figure 16: Respondent Travel Time to Unity Medical Center
Health Status and Access
Community members were asked to identify general health conditions and/or diseases
they have. As illustrated in Figure 17, the results demonstrate that the assessment took
into account input from those with chronic diseases and conditions. The conditions
reported most often were arthritis (N=22), muscles or bones (e.g., back problems, broken
bones) (N=18), weight control (N=18) and hypertension (N=17).
Figure 17: Health Status - Community Members
57
7 1
0
Less than 10 minutes
10 to 30 minutes
31 to 60 minutes
More than 1 hour
0
3
4
4
4
5
5
10
16
17
18
18
22
0 5 10 15 20 25
Dementia
Asthma/COPD
OB/Gyn related
Chronic pain
Cancer
Depression, stress, etc.
Diabetes
Heart conditions
High cholesterol
Hypertension
Weight control
Muscles or bones
Arthritis
_____________________________________________________________________________________________
__________________________________________________________________________________________ Community Health Needs Assessment 32
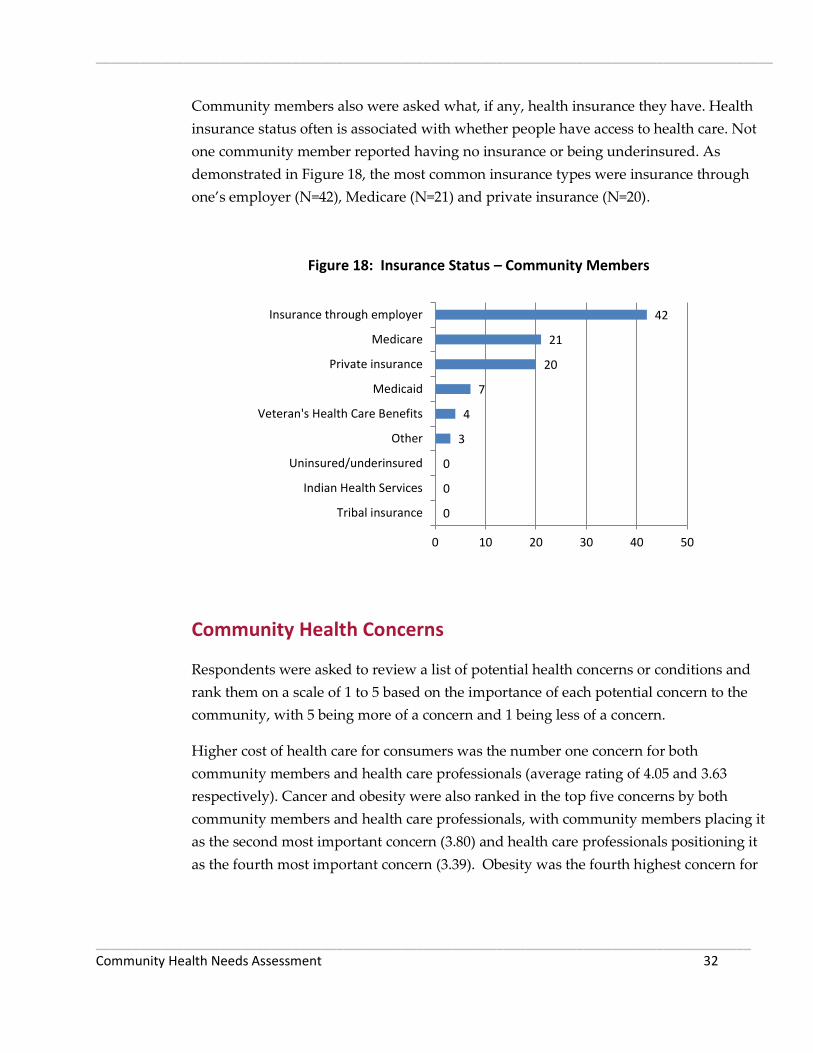
Community members also were asked what, if any, health insurance they have. Health
insurance status often is associated with whether people have access to health care. Not
one community member reported having no insurance or being underinsured. As
demonstrated in Figure 18, the most common insurance types were insurance through
one’s employer (N=42), Medicare (N=21) and private insurance (N=20).
Figure 18: Insurance Status – Community Members
Community Health Concerns
Respondents were asked to review a list of potential health concerns or conditions and
rank them on a scale of 1 to 5 based on the importance of each potential concern to the
community, with 5 being more of a concern and 1 being less of a concern.
Higher cost of health care for consumers was the number one concern for both
community members and health care professionals (average rating of 4.05 and 3.63
respectively). Cancer and obesity were also ranked in the top five concerns by both
community members and health care professionals, with community members placing it
as the second most important concern (3.80) and health care professionals positioning it
as the fourth most important concern (3.39). Obesity was the fourth highest concern for
0
0
0
3
4
7
20
21
42
0 10 20 30 40 50
Tribal insurance
Indian Health Services
Uninsured/underinsured
Other
Veteran's Health Care Benefits
Medicaid
Private insurance
Medicare
Insurance through employer

_____________________________________________________________________________________________
__________________________________________________________________________________________ Community Health Needs Assessment 33
community members (3.65) while it was the second gravest concern for health care
professionals (3.62).
Rounding out the top five concerns held by community members were adequate
number of providers (3.73) and mental health issues (3.64). Health care professionals
ranked addiction/substance abuse as their third highest concern (3.56) and mental health
issues (3.24) was positioned in fifth place.
On the opposite end of the spectrum, family planning and accident and injury
prevention were perceived to be the lowest concerns for community members with
average rankings of 2.55 and 2.83 respectively. For health care professionals, emergency
services (2.04) and emergency preparedness (2. 27) were their least important concerns.
Figures 19 and 20 illustrate these results.
Figure 19: Concerns of Community Members
2.55
2.83
3.17
3.20
3.22
3.22
3.25
3.28
3.40
3.41
3.47
3.57
3.59
3.64
3.65
3.73
3.80
4.05
0.00 0.50 1.00 1.50 2.00 2.50 3.00 3.50 4.00 4.50 5.00
Family planning/reproductive health
Accident/injury prevention
Distance/transportation to health care facility
Emergency preparedness
Emergency services (ambulance & 911) available…
Access to needed technology/equipment
School nursing
Not enough health care staff in general
Suicide prevention
Focus on wellness and prevention of disease
Diabetes
Addiction/substance abuse
Heart disease
Mental health (e.g., depression,…
Obesity
Adequate number of health care providers and…
Cancer
Higher costs of health care for consumers

_____________________________________________________________________________________________
__________________________________________________________________________________________ Community Health Needs Assessment 34
Figure 20: Concerns of Health Care Professionals
Respondents also were asked, in an open-ended question, to identify their most
important concern and explain why it was the most important. Thirty community
members answered this question, as did 25 health care professionals.
A plurality of community members (N=5) chose the need for school nursing as the most
important concern. The concern of aging doctors (N=1) and “not enough good doctors”
(N=2) could be grouped with the concern of not enough health care staff in general
(N=4), making this theme of inadequate number of doctors the most frequently cited
concern (N=7 collectively).
Also cited as most important concerns were the following:
Suicide prevention (N=4)
Higher costs of health care (N=3)
Cancer (N=3)
Bullying (N=2)
Addiction/substance abuse (N=2)
Twenty-five health care professionals responded and their most important concerns
were high costs for health care (N=7) and addiction/substance abuse (N=5).
2.04
2.27
2.37
2.39
2.47
2.63
2.73
2.76
2.82
2.84
2.98
2.98
3.06
3.24
3.39
3.56
3.62
3.63
0.00 0.50 1.00 1.50 2.00 2.50 3.00 3.50 4.00 4.50 5.00
Emergency services (ambulance & 911) available…
Emergency preparedness
Family planning/reproductive health
Distance/transportation to health care facility
Accident/injury prevention
Not enough health care staff in general
Focus on wellness and prevention of disease
Access to needed technology/equipment
School nursing
Adequate number of health care providers and…
Suicide prevention
Heart disease
Diabetes
Mental health (e.g., depression,…
Cancer
Addiction/substance abuse
Obesity
Higher costs of health care for consumers
_____________________________________________________________________________________________
__________________________________________________________________________________________ Community Health Needs Assessment 35
Comments from both community members and health care professionals about what
they view as the most important concerns included:
Community members’ comments relating the need for school nurses
• We have school age children and have witnessed bullying and believe it is not
being adequately dealt with. In fact, it is ignored and tolerated.
• They have a cop in the school, they could have a nurse.
• School Nursing- Intervention of student's depression, etc.
Community members’ comments relating to suicide prevention
No one should ever die from suicide. More public awareness.
If this issue was addressed better it may be able to prevent other issues... disease,
mental health and lower health costs.
Too many suicides lately.
It's usually younger folks, who should have a 'whole' life ahead of them!
Health care professionals’ comments relating to addiction and substance abuse
It seems to me we have an exceptionally high rate of addiction and abuse in
our community.
Working in a health care facility we see it EVERYDAY. People coming in seeking
pills/drugs.
Illicit drug use sales. Very high number of incidents in the area.
Addiction & substance abuse is high & is leading to more violence & higher
health care.
Lots of substance abuse in community, but limited resources for treatment.
_____________________________________________________________________________________________
__________________________________________________________________________________________ Community Health Needs Assessment 36
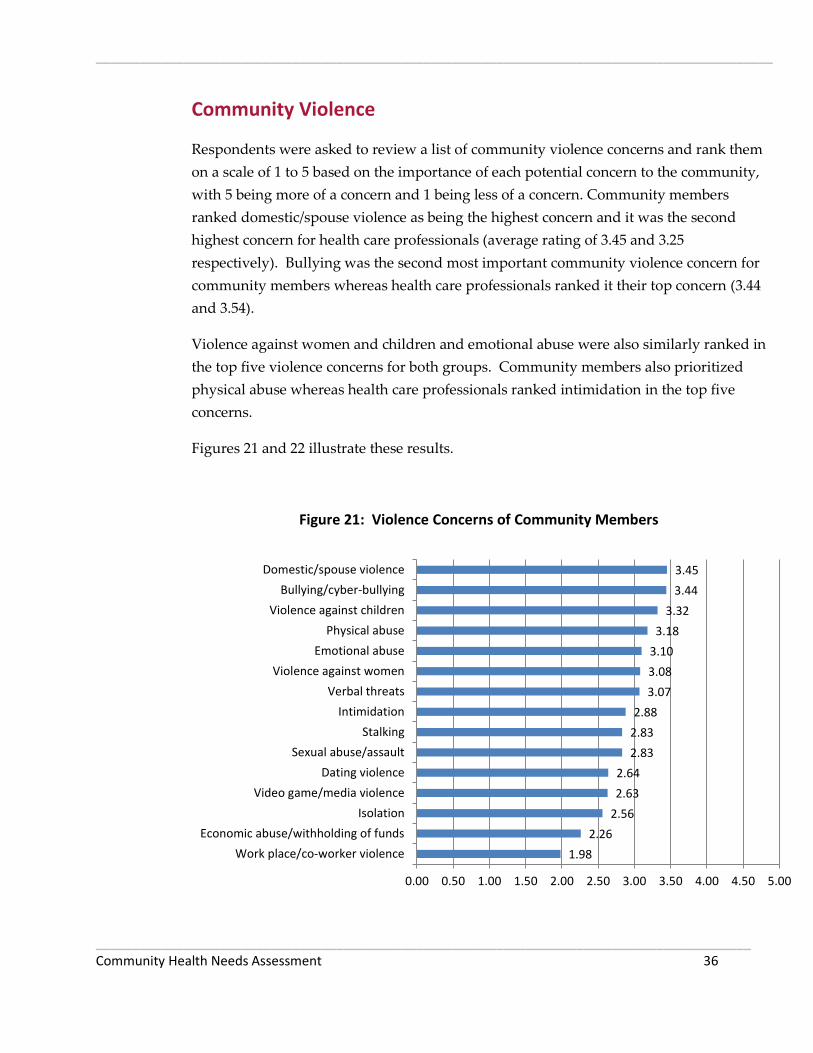
Community Violence
Respondents were asked to review a list of community violence concerns and rank them
on a scale of 1 to 5 based on the importance of each potential concern to the community,
with 5 being more of a concern and 1 being less of a concern. Community members
ranked domestic/spouse violence as being the highest concern and it was the second
highest concern for health care professionals (average rating of 3.45 and 3.25
respectively). Bullying was the second most important community violence concern for
community members whereas health care professionals ranked it their top concern (3.44
and 3.54).
Violence against women and children and emotional abuse were also similarly ranked in
the top five violence concerns for both groups. Community members also prioritized
physical abuse whereas health care professionals ranked intimidation in the top five
concerns.
Figures 21 and 22 illustrate these results.
Figure 21: Violence Concerns of Community Members
1.98
2.26
2.56
2.63
2.64
2.83
2.83
2.88
3.07
3.08
3.10
3.18
3.32
3.44
3.45
0.00 0.50 1.00 1.50 2.00 2.50 3.00 3.50 4.00 4.50 5.00
Work place/co-worker violence
Economic abuse/withholding of funds
Isolation
Video game/media violence
Dating violence
Sexual abuse/assault
Stalking
Intimidation
Verbal threats
Violence against women
Emotional abuse
Physical abuse
Violence against children
Bullying/cyber-bullying
Domestic/spouse violence

_____________________________________________________________________________________________
__________________________________________________________________________________________ Community Health Needs Assessment 37
Figure 22: Violence Concerns of Health Care Professionals
Awareness of Services
The survey asked community members whether they were aware of the services offered
locally by Unity Medical Center. The survey given to health care professionals did not
include this inquiry as it was assumed they were aware of local services due to their
direct work in the health care system.
In the paper version of the survey, respondents were given the option to check a “Yes”
or “No” box for each listed service to indicate whether they were familiar with the
service. Because a large number of respondents checked only the “Yes” boxes, reported
below are the numbers of “Yes” choices for each service offered. The online version
included only a choice for “Yes, aware this service is offered locally.” The limitation with
this reporting method is that it is implied that the gap between how many answered
“Yes” and the total response count reflects those who are not aware. However, it is
unknown if the difference reflects unawareness or respondents skipping that particular
listed service.
1.85
2.10
2.23
2.32
2.48
2.53
2.54
2.63
2.71
2.79
2.81
2.87
2.94
3.25
3.54
0.00 0.50 1.00 1.50 2.00 2.50 3.00 3.50 4.00 4.50 5.00
Work place/co-worker violence
Economic abuse/withholding of funds
Stalking
Video game/media violence
Dating violence
Isolation
Verbal threats
Sexual abuse/assault
Physical abuse
Violence against children
Intimidation
Violence against women
Emotional abuse
Domestic/spouse violence
Bullying/cyber-bullying
_____________________________________________________________________________________________
__________________________________________________________________________________________ Community Health Needs Assessment 38
Overall, community members were cognizant of UMC’s service offerings, indicating
successful advertising strategies by the hospital. Community members were most
aware of:
Emergency room (N=66)
Ambulance (N=64)
Clinic (N=64)
Physical therapy (N=62)
Chiropractic services (N=61)
Hospice (N=61)
Community members were least aware of the following services:
Speech therapy (N=25)
Sleep studies (N=29)
Telemedicine via E-emergency (N=31)
The services with lower levels of awareness may present opportunities for further
marketing, greater utilization, and increased revenue. Figure 23 illustrates community
members’ awareness of services.
Figure 23: Community Members’ Awareness of Locally Available Services

_____________________________________________________________________________________________
__________________________________________________________________________________________ Community Health Needs Assessment 39
25
29
31
37
40
41
43
43
44
45
46
47
48
49
51
52
52
53
54
54
55
55
55
55
57
57
57
58
58
58
59
59
59
59
60
61
61
62
64
64
66
0 10 20 30 40 50 60 70
Speech therapy
Sleep studies
Telemedicine via eEmergency
Mental health services
Home oxygen service
Ophthalmology (eye/vision) (visiting…
Cardiology (visiting specialist)
Laparoscopic surgery
Chemotherapy
Oncology (visiting specialist)
Drug testing
Hearing services
Orthopedic (visiting specialist)
Radiology – echocardiogram
Cardiac Rehab
Podiatry (foot/ankle) (visiting specialist)
Radiology – Dexa scans (bone density)
Respiratory therapy
Diabetic services/ education
Radiology – MRI
Social services
Nutritional services
Radiology – ultrasound
Optometric services
Anesthesia services
Laboratory services
Radiology – CT scan
Occupational therapy
Radiology – mammography
Dental services
Home health care
Hospital (acute care)
Surgical services
Swing bed and respite care services
Radiology – general x-ray
Hospice
Chiropractic services
Physical therapy
Clinic
Ambulance
Emergency room

_____________________________________________________________________________________________
__________________________________________________________________________________________ Community Health Needs Assessment 40
Information about how community members learn of local services emerged during the
focus group session. Participants commented that the hospital’s strategy of listing all of
the available service offerings available while a caller is on hold is very effective. Some
participants said that although the outgoing message was tedious to listen to, it did
work. The level of awareness confirms the usefulness of this practice.
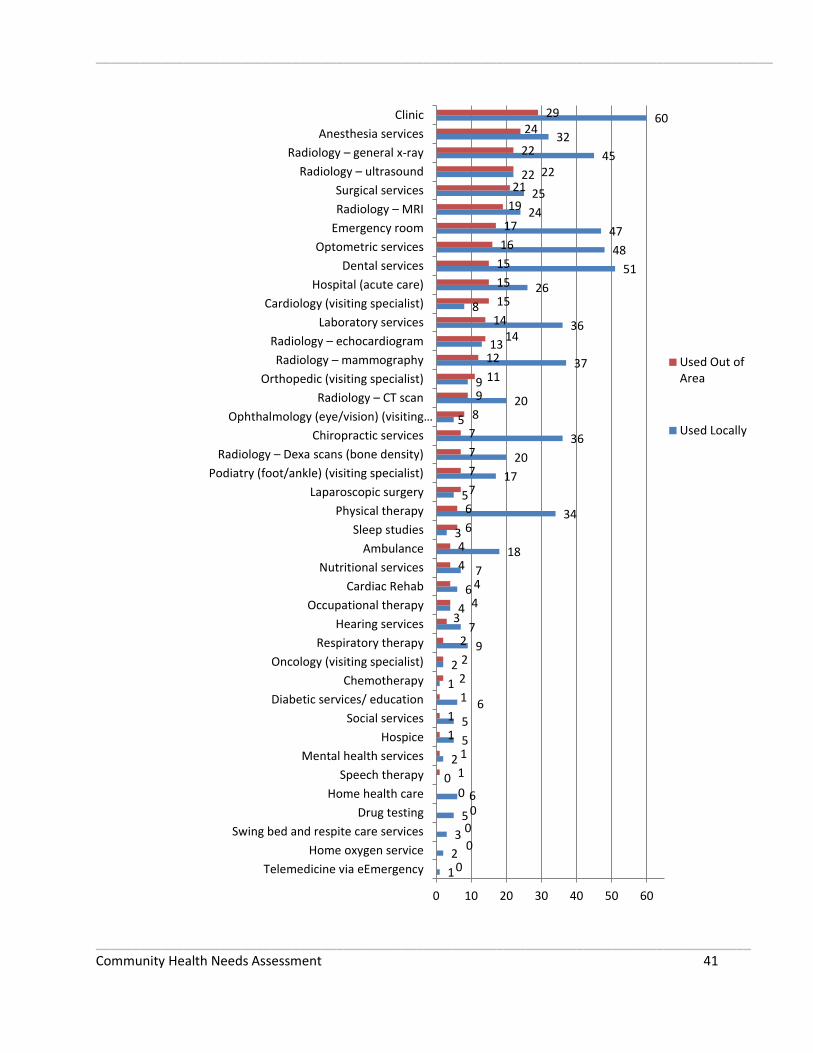
Health Service Use
Community members were asked to review a list of services provided locally by Unity
Medical Center and indicate whether they had used those services locally, out of the
area, or both. Figure 24 illustrates these results.
Respondents identified clinic (N=60), dental services (N=51), optometric services (N=48),
and emergency room (N=47) as the services most commonly used locally. There were a
few services that respondents traveled outside of the area to receive, even though they
are available locally. The services they most commonly sought out of the area were:
Clinic (N=29)
Anesthesia services (N=24)
Radiology-- general X-ray (N=22)
Radiology--ultrasound (N=22)
Surgical services (N=21)
As with low-awareness services, these services – for which community members are
going elsewhere – may provide opportunities for additional education about their
availability from the local health system and potential greater utilization of local
services.
Figure 24: Community Member Use of Locally Available Services
_____________________________________________________________________________________________
__________________________________________________________________________________________ Community Health Needs Assessment 41
1
2
3
5
6
0
2
5
5
6
1
2
9
7
4
6
7
18
3
34
5
17
20
36
5
20
9
37
13
36
8
26
51
48
47
24
25
22
45
32
60
0
0
0
0
0
1
1
1
1
1
2
2
2
3 4
4
4
4
6
6
7
7
7
7
8
9
11
12
14 14
15
15
15
16
17
19
21 22
22
24 29
0 10 20 30 40 50 60
Telemedicine via eEmergency
Home oxygen service
Swing bed and respite care services
Drug testing
Home health care
Speech therapy
Mental health services
Hospice
Social services
Diabetic services/ education
Chemotherapy
Oncology (visiting specialist)
Respiratory therapy
Hearing services
Occupational therapy
Cardiac Rehab
Nutritional services
Ambulance
Sleep studies
Physical therapy
Laparoscopic surgery
Podiatry (foot/ankle) (visiting specialist)
Radiology – Dexa scans (bone density)
Chiropractic services
Ophthalmology (eye/vision) (visiting…
Radiology – CT scan
Orthopedic (visiting specialist)
Radiology – mammography
Radiology – echocardiogram
Laboratory services
Cardiology (visiting specialist)
Hospital (acute care)
Dental services
Optometric services
Emergency room
Radiology – MRI
Surgical services
Radiology – ultrasound
Radiology – general x-ray
Anesthesia services
Clinic
Used Out ofArea
Used Locally

_____________________________________________________________________________________________
__________________________________________________________________________________________ Community Health Needs Assessment 42
Additional Services
In another open-ended question, both community members and health care
professionals were asked to identify services they think Unity Medical Center needs to
add. Fifteen community members provided responses to this question, with two of those
each suggesting adding dermatology and dialysis. Other responses included offering
more hands-on stroke patient care, birthing, pediatrics, increasing customer service and
increasing cooperation with area fitness centers.
Of the twenty-one health care professionals who gave responses, four recommended
adding an Ob/Gyn and two suggested adding a pediatrician. The request for renal care
and dialysis was echoed by health care professionals as was the desire for dermatology.
Other suggestions varied from internal medicine, endocrinologist, mental health
services, orthopedic surgeon, alternative medicine, substance abuse counselor and
oncologist.
Reasons for Using Local Health Care Services and Non-Local Health Care Services
The survey asked community members why they seek health care services at Unity
Medical Center and why they seek services at another health care facility. Health care
professionals were asked why they think patients use services at UMC and why they
think patients use services at another facility. Respondents were allowed to choose
multiple reasons.
Community members and health care professionals were in alignment across the board
concerning why people choose care at UMC. The top four reasons were: convenience to
UMC (N=59 and N=52), proximity (N=47 and N=41), familiarity with providers (N=45
and N=42) and loyalty to local service providers (N=41 and N=40). The similarities
among the results from the two groups indicate a shared set of health care values from
community members and health care professionals. The parallel results could also
indicate an accurate assessment of the hospital’s strengths and weaknesses.
Figures 25 and 26 illustrate these responses.

_____________________________________________________________________________________________
__________________________________________________________________________________________ Community Health Needs Assessment 43
Figure 25: Reasons Community Members Seek Services at Unity Medical Center
Figure 26: Reasons Health Care Professionals Believe Community Members Seek Services at Unity Medical Center
The similarities continued in results from community members and health care
professionals with respect to seeking health care services at other facilities. Both groups
indicated that the primary motivator for seeking care elsewhere was, by a large margin,
2
5
7
10
10
16
18
27
27
34
41
45
47
59
0 10 20 30 40 50 60 70
Other
Disability access
Transportation is readily available
Less costly
They take new patients
Confidentiality
Access to specialist
High quality of care
Open at convenient times
They take my insurance
Loyalty to local service providers
Familiarity with providers
Proximity
Convenience
3
10
15
15
17
19
25
26
26
33
40
41
42
52
0 10 20 30 40 50 60
Other
Less costly
Confidentiality
Transportation readily available
Disability access
Access to specialist
We take new patients
High quality of care
We take their insurance
Open at convenient times
Loyalty to local service providers
Proximity
Familiarity with providers
Convenience
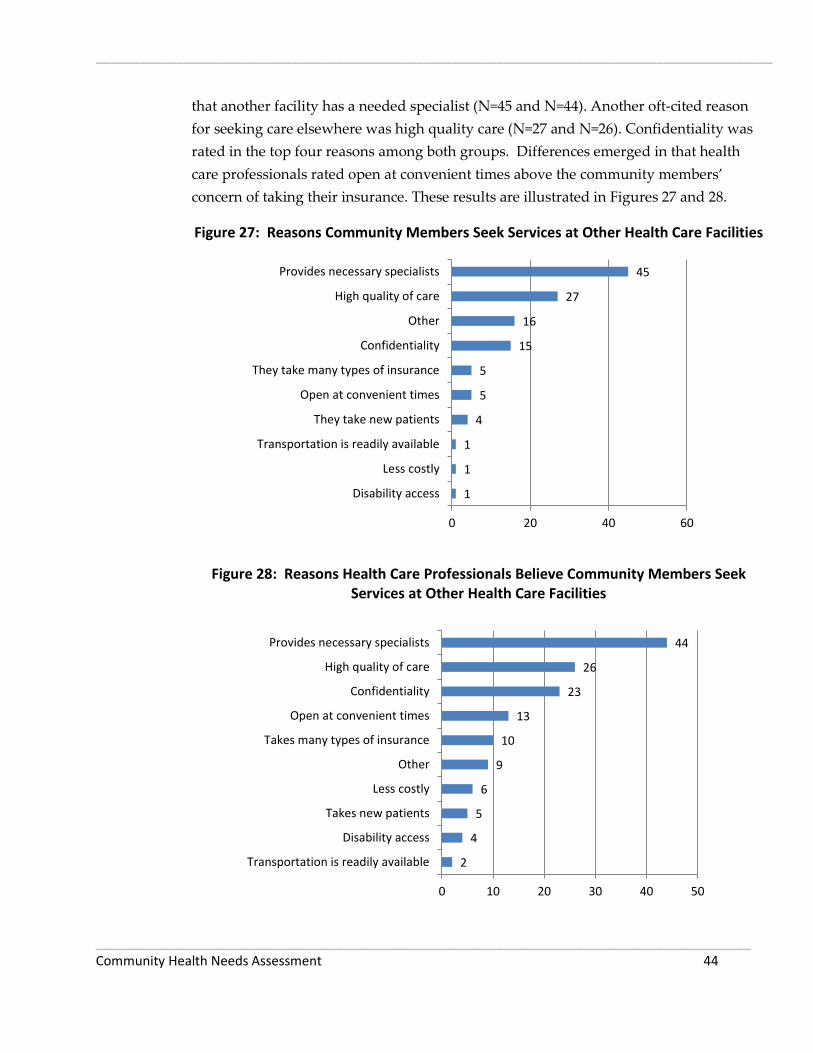
_____________________________________________________________________________________________
__________________________________________________________________________________________ Community Health Needs Assessment 44
that another facility has a needed specialist (N=45 and N=44). Another oft-cited reason
for seeking care elsewhere was high quality care (N=27 and N=26). Confidentiality was
rated in the top four reasons among both groups. Differences emerged in that health
care professionals rated open at convenient times above the community members’
concern of taking their insurance. These results are illustrated in Figures 27 and 28.
Figure 27: Reasons Community Members Seek Services at Other Health Care Facilities
Figure 28: Reasons Health Care Professionals Believe Community Members Seek Services at Other Health Care Facilities
1
1
1
4
5
5
15
16
27
45
0 20 40 60
Disability access
Less costly
Transportation is readily available
They take new patients
Open at convenient times
They take many types of insurance
Confidentiality
Other
High quality of care
Provides necessary specialists
2
4
5
6
9
10
13
23
26
44
0 10 20 30 40 50
Transportation is readily available
Disability access
Takes new patients
Less costly
Other
Takes many types of insurance
Open at convenient times
Confidentiality
High quality of care
Provides necessary specialists

_____________________________________________________________________________________________
__________________________________________________________________________________________ Community Health Needs Assessment 45
The survey provided both community members and health care professionals the
opportunity to suggest “other” reasons patients seek health care services in the local
area as well as other reasons they seek services outside of the area. In terms of using
local services, one community member praised the availability of care, saying “can
always get in and don’t have to miss work.” Three health care professionals typed in
“other” responses, one of which echoed the above comment on easy availability. The
other comments spoke to the high elderly population in the Grafton area. Health care
professionals said the lack of transportation and the ease of convenience make the
elderly choose UMC.
In terms of using other health care facilities, 15 community members chose the open-
ended “other” answer, most often citing access to specialized services or specialists
(N=3), being referred to another provider (N=3), and loyalty to another doctor or clinic
(N=3).
Nine health care professionals offered “other” responses, noting that dissatisfaction and
conflict with local doctors is a motivator to seek care elsewhere (N=4). One commented
specifically on the rude behavior of nurses and doctors, writing that “A lot of doctors
complain at Grafton Family Clinic that they don't want to see new patients, we hear
them say these things while we are sitting in the waiting area. The nurses talk very loud
about patients (complain about why they are coming in) at the clinic front desk, while
we are sitting in the waiting room.” Other comments touched on the perception that
“bigger is better” and “further away is better.”
Barriers to Accessing Health Care
Both community members and health care professionals were asked what would help to
address the reasons why patients do not seek health care services in the Grafton area.
Community members and health care professionals agreed in their top
recommendations that having greater access to specialists (N=33 and N=34) would help
remove barriers to using local care. The next most common responses from community
members were more doctors (N=17) and adequate training of providers and staff (N=14).
Ten of the “other” responses indicated that those respondents were satisfied or happy
with local offerings.

_____________________________________________________________________________________________
__________________________________________________________________________________________ Community Health Needs Assessment 46
Among health care professionals, the next most common responses were flipped from
the community members, with adequate training of staff the second most cited response
(N=22), followed by more doctors (N=21) in third place. See Figures 29 and 30 for
additional items that may help remove barriers to local health care use.
Figure 29: Community Members’ Recommendations to Help Remove Barriers to Using
Local Care
1
1
4
8
8
8
10
14
17
33
0 5 10 15 20 25 30 35
Interpretive services
Transportation services
Evening or weekend hours
Collaboration between competing providers
Confidentiality
Telehealth (patients seen by providers at…
Other
Adequate training of providers/staff
More doctors
More specialists

_____________________________________________________________________________________________
__________________________________________________________________________________________ Community Health Needs Assessment 47
Figure 30: Health Care Professionals’ Recommendations to Help Remove Barriers to
Using Local Care
Concerns and Suggestions for Improvement
Each version of the survey concluded with an open-ended question that asked, “Overall,
please share concerns and suggestions to improve the delivery of local health care.”
Responses were supplied by eight community members and nineteen health care
professionals. Responses varied widely, but an appreciation for and contentment with
the services offered by UMC was often expressed.
Below are some of the specific comments relating to overall concerns and suggestions
from community members. Unless otherwise indicated, each response was expressed
once.
I am very satisfied with the quality of health care. (N=2)
In the ER, you have to wait for doctors to get there. It takes so long sometimes.
6
6
6
6
9
9
19
21
22
34
0 5 10 15 20 25 30 35 40
Other
Transportation services
Evening or weekend hours
Telehealth
Interpretive services
Confidentiality
Collaboration between competing providers
More doctors
Adequate training of staff
More specialists
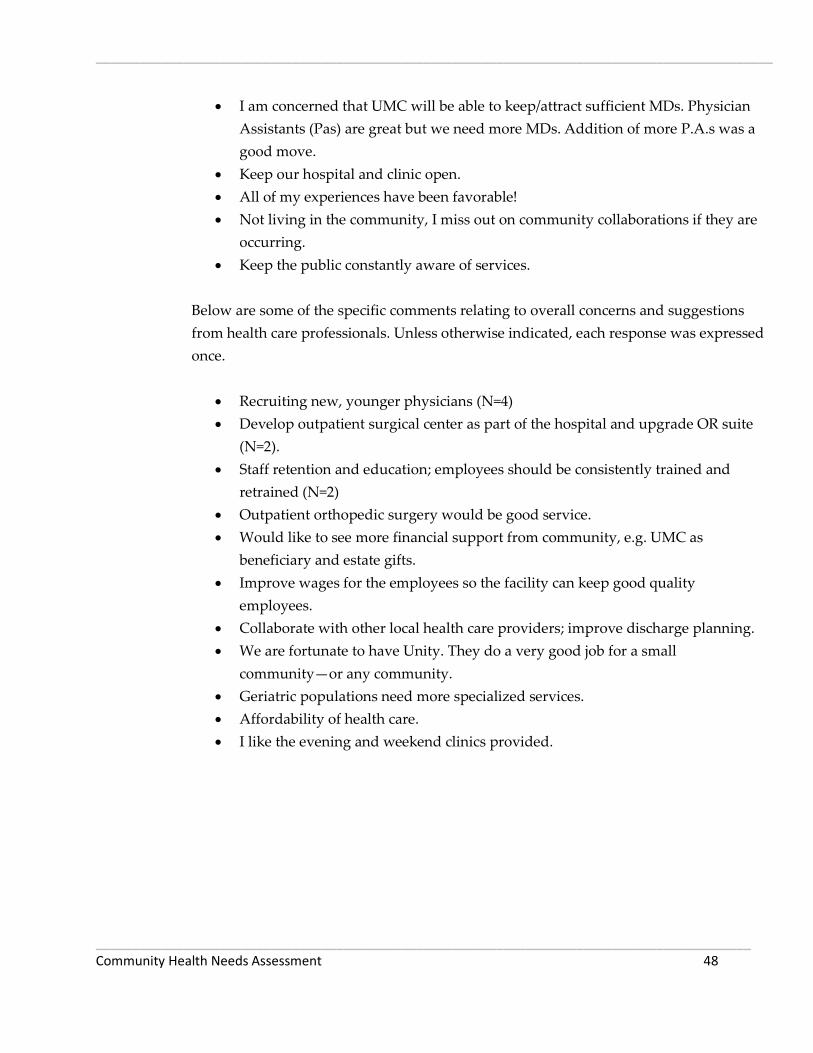
_____________________________________________________________________________________________
__________________________________________________________________________________________ Community Health Needs Assessment 48
I am concerned that UMC will be able to keep/attract sufficient MDs. Physician
Assistants (Pas) are great but we need more MDs. Addition of more P.A.s was a
good move.
Keep our hospital and clinic open.
All of my experiences have been favorable!
Not living in the community, I miss out on community collaborations if they are
occurring.
Keep the public constantly aware of services.
Below are some of the specific comments relating to overall concerns and suggestions
from health care professionals. Unless otherwise indicated, each response was expressed
once.
Recruiting new, younger physicians (N=4)
Develop outpatient surgical center as part of the hospital and upgrade OR suite
(N=2).
Staff retention and education; employees should be consistently trained and
retrained (N=2)
Outpatient orthopedic surgery would be good service.
Would like to see more financial support from community, e.g. UMC as
beneficiary and estate gifts.
Improve wages for the employees so the facility can keep good quality
employees.
Collaborate with other local health care providers; improve discharge planning.
We are fortunate to have Unity. They do a very good job for a small
community—or any community.
Geriatric populations need more specialized services.
Affordability of health care.
I like the evening and weekend clinics provided.

_____________________________________________________________________________________________
__________________________________________________________________________________________ Community Health Needs Assessment 49
Collaboration
Respondents were asked whether Unity Medical Center could improve its levels of
collaboration with other local entities, such as schools, economic development
organizations, local businesses, schools and other providers. Of the three answer choices
(“yes,” “no, it’s fine as is,” “don’t know”) community members and health care
professionals were both most likely to choose “no, it’s fine as is.” However, results show
that both groups would like UMC to improve its collaboration with hospitals in other
cities (N=24 and N=25) and schools (N=22 and N=22).
Health care professionals were mixed in their decision regarding collaboration with
other local health providers. Results show a tie between wanting more collaboration
and saying it is fine as it is (N=23 for each).Figures 31 and 32 illustrate these results.
Figure 31: Community Members – Could Unity Medical Center Improve Collaboration?
7
22
10
14
10
15
24
13
25
21
27
21
33
24
18
26
29
19
25
27
19
22
17
21
0 10 20 30 40 50 60 70
State developmental center
School
Public Health
Other local providers
Nursing home
Local job/economic…
Hospitals in other cities
Business and industry
Yes
No, it's fine as is
Don't know

_____________________________________________________________________________________________
__________________________________________________________________________________________ Community Health Needs Assessment 50
Figure 32: Health Care Professionals – Could Unity Medical Center Improve
Collaboration?
Foundational Awareness and Support
Community members were polled regarding their awareness of UMC’s foundation and
whether or not they had supported it. The majority of community members were aware
of UMC’s foundation (N=60). Of those that support the foundation, cash or stock gifts
are the most common option (N=31), followed by giving a memorial or honorarium
(N=28). Figures 33 and 34 illustrate these results.
Figure 33: Aware of UMC’s Foundation
7
22
16
23
6
15
25
13
31
20
24
23
38
22
22
20
11
11
9
6
6
12
6
17
0 10 20 30 40 50 60 70
State developmental center
School
Public Health
Other local providers
Nursing home
Local job/economic…
Hospitals in other cities
Business and industry
Yes
No, it's fine as is
Don't know
60
3
Yes No

_____________________________________________________________________________________________
__________________________________________________________________________________________ Community Health Needs Assessment 51
Figure 34: Support for UMC’s Foundation
Finally, community members were asked if they were aware of UMC’s Convenience
Clinic, which is open Monday-Friday from 5:00-7:00pm and Saturdays from 10:00 am-
12:00 pm. The majority of respondents indicated they were aware of the Clinic’s new
extended availability. Figure 35 shows these results.
Figure 35: Awareness of UMC’s Convenience Clinic
31
2
28
0 9
Cash or stock gift
Endowment gifts
Memorial/Honorarium
Planned gifts through wills,trusts or life insurancepoliciesOther
56
8
Yes No

_____________________________________________________________________________________________
__________________________________________________________________________________________ Community Health Needs Assessment 52
Community Assets
Both community members and health care professionals were asked what they
perceived as the best things about their community in five categories: people, services
and resources, quality of life, geographic setting, and activities. In each category,
respondents were given a list of choices and asked to pick the top three. Respondents
occasionally chose less than three or more than three choices within each category. The
results indicate that residents view the friendliness and helpfulness of people as the top
community asset.
Other assets include things such as a sense of community; socially and culturally diverse
community. Health care professionals added the sense of community engagement.
Figures 36 to 40 illustrate the results of these questions.
Figure 36: Best Things about the PEOPLE in Your Community
1
12
17
30
35
47
57
5
6
13
24
20
35
39
0 20 40 60 80 100 120
Other
People are tolerant, inclusive, open-minded
Sense that you can make a difference – government is accessible
People who live here are aware of/engaged in social, civic, or political issues
Community is socially and culturallydiverse and/or becoming more diverse
Sense of community/feeling connectedto people who live here
People are friendly, helpful, supportive
CommunityMembers
Health CareProfessionals

_____________________________________________________________________________________________
__________________________________________________________________________________________ Community Health Needs Assessment 53
Figure 37: Best Things about the SERVICES AND RESOURCES in Your Community
Figure 38: Best Things about the QUALITY OF LIFE in Your Community
2
5
10
21
22
24
55
58
4
5
4
15
14
16
41
48
0 20 40 60 80 100 120
Other
Transportation
Availability of child daycare
Academic opportunities and…
Shopping (e.g., close by, good variety,…
Local restaurants and food
Quality school systems and other…
Local access to quality health care
CommunityMembers
Health CareProfessionals
0
26
35
35
44
62
2
23
27
28
32
41
0 20 40 60 80 100 120
Other
Informal, simple, laidback lifestyle
Peaceful, calm, quiet environment
Safety and safe places to live, little/nocrime
Healthy place to live
Family-friendly environment; goodplace to raise kids
CommunityMembers
Health CareProfessionals

_____________________________________________________________________________________________
__________________________________________________________________________________________ Community Health Needs Assessment 54
Figure 39: Best Things about the GEOGRAPHIC SETTING of Your Community
Figure 40: Best Thing about the ACTIVITIES in Your Community
Findings from Key Informant Interviews and Focus Group
0
12
13
26
47
50
55
0
12
13
15
43
37
38
0 20 40 60 80 100
Other
General beauty of environment and/orscenery
Natural setting: outdoors and nature
Climate and seasons
Relatively small size and scale ofcommunity
Cleanliness of area (e.g., fresh air, lackof pollution and litter)
General proximity to work andactivities (e.g., short commute,…
CommunityMembers
Health CareProfessionals
1
2
21
41
50
58
2
4
21
30
33
43
0 20 40 60 80 100 120
Arts and cultural activities and/orcultural richness of community
Other
Hunting and fishing
Activities for families and youth
Community events and festivals
Recreational and sports activities (e.g.,outdoor recreation, parks, bike paths,…
CommunityMembers
Health CareProfessionals

_____________________________________________________________________________________________
__________________________________________________________________________________________ Community Health Needs Assessment 55
The questions posed in the survey also were explored during a focus group session with
the Community Group as well as during key informant interviews with community
leaders and public health professionals. As an initial matter, interviewees and focus
group participants generally were complimentary toward hospital staff and overall
health care services in the community. As one key informant summarized, “Service is
good. Wonderful doctors on staff.” Another commented, “I’ve never known poor care.
Keep up the good work.” Participants also pointed to the availability of services and
how they are “seen immediately.” Community members were very proud of the variety
of health care offerings available in such a small town: three health clinics, two
chiropractors, two dentists, an eye doctor, three fitness centers that offer classes such as
yoga and zumba, and a bike path.
Several themes emerged from these sessions. Many of the same issues which were
prevalent in the survey results emerged during the key informant interviews as well
(and were further explored during the discussions), but additional issues also appeared.
Generally, overarching issues that developed during the interviews can be grouped into
five categories (listed in no particular order):
1. Having adequate number of health care staff
2. Desire for more visiting specialists
3. Financial ability of UMC and patients
4. Need for more mental health providers
5. Technological currency
A more detailed discussion about these noteworthy issues follows:
1. Having adequate availability of health care staff
A pressing immediate concern facing the community is having an adequate number of
health care personnel and keeping the hospital staffed with physicians, nurses and
technicians. It was noted that Grafton has an aging population with aging doctors.
Three or four doctors are over the age of 60 and may be close to retiring. There is a
general concern of where their replacements will be coming from. This is a long-range
concern as community members fret that when these doctors retire, no one else is in line
to replace them. Participants worry about recruiting young doctors to come and stay in
the community. This concern was heightened by “all the other little hospitals” around
_____________________________________________________________________________________________
__________________________________________________________________________________________ Community Health Needs Assessment 56
the area. Further exacerbating the recruitment problem is the perception that salaries
are lower in Grafton and competition is high. To this end, participants suggested
recruitment efforts should focus on the advantages of living here, such as the low-cost of
living and variety of patients seen. Other suggestions to entice young doctors include
having a local organization sponsor a new doctor to help offer incentives or pay for
medical school loans. Also, respondents would like the hospital to be more proactive in
offering internships and training to UND medical students, in hopes of recruiting them.
One participant referred to this recruitment attempt as the “grow your own doctor”
approach.
2. Desire for more visiting specialists
Although participants were generally pleased with the variety of specialists available,
they expressed a strong desire for maternity and pediatric care to be offered locally.
Without having an OB or pediatrician, UMC may be losing an entire family of patients.
An expecting mother may be able to start her care at UMC but at a certain point in her
pregnancy, she will be referred to Grand Forks. The disruption in continuity of care is
troublesome to mothers. Due to the relationship with the doctor that is developed
through frequent visits, many women opt to continue their health care with that doctor,
despite the fact those services could be met locally.
Specific comments include:
I stayed with my pediatrician in Grand Forks for 17 years rather than see a family
doctor here.
I would like to have my babies delivered locally. Some women refuse to go
elsewhere and it is frightening because new nurses here don’t know OB.
Liability for the hospital is great because sometimes ambulances get re-routed
here and they need to be prepared for delivery.
I still get my well-baby check-ups in Grand Forks.
The doctors there [Grand Forks] know my medical history so why would I
change?
Longevity of relationship with that doctor makes me travel outside of the
community to get care.
Other visiting specialists sought at UMC include a gerontologist and a sports medicine
doctor. Respondents articulated that the aging process is similar to the birthing process
where specific services and care are needed. With an aging community a specialized
_____________________________________________________________________________________________
__________________________________________________________________________________________ Community Health Needs Assessment 57
doctor is needed to address the particular concerns of this population. Moreover, this
aging population needs greater medical services. Respondents stated that the elderly
population’s needs are not met locally all the time and travel is hardest on this sector.
Conversely, at the other end of the spectrum, an active population warrants the need for
a sports medicine doctor. One respondent said “we have enough students and they
have a lot of concussions. A sports medicine doctor on a visiting basis would be really
beneficial.” One respondent furthered this recommendation by saying UMC could
model the sports medicine rotation that is currently being implemented in the town of
Cavalier.
The above two concerns were addressed in a couple of question in the survey, where
respondents were asked to rank the potential health concern of “Adequate number of
health care providers and specialists” and “Not enough health care staff in general.”
Community members ranked the adequate number of health care providers as their
third most important concern, while health care professionals perceived it as a less
important concern, ranking it eighth. Not enough health care staff was ranked as the 11th
(out of 19 concerns) for community members and 12th for health care professionals.
3. Financial ability of UMC and patients
Another health concern expressed by the participants was the financial solvency of the
hospital as well as the financial ability of patients. The community as a whole seems
unaware of the financial viability of the hospital and there is a concern that the hospital
may close and along with it, bring down the community as well. The majority said they
had “no sense of financial stability” of the hospital. The viability of the hospital is very
important to the community as it has a strong economic impact. UMC is one of the last
stand-alone hospitals left; it is not affiliated with a larger health care system and that
could make it more vulnerable. Participants were unsure if the hospital should publish
its financial statements in the newspaper but some thought more awareness of the
financial situation would be appreciated.
In terms of patient ability to pay for care, participants noted that a lot of low income
people “fall between the cracks” with no insurance, but they also don’t qualify for the
programs that are out there. If patients don’t qualify for programs, they won’t get seen
because they can’t afford it. One respondent observed that there used to be someone
working as an individual case manager to help get grants and secure financial aid but
that position no longer exists.
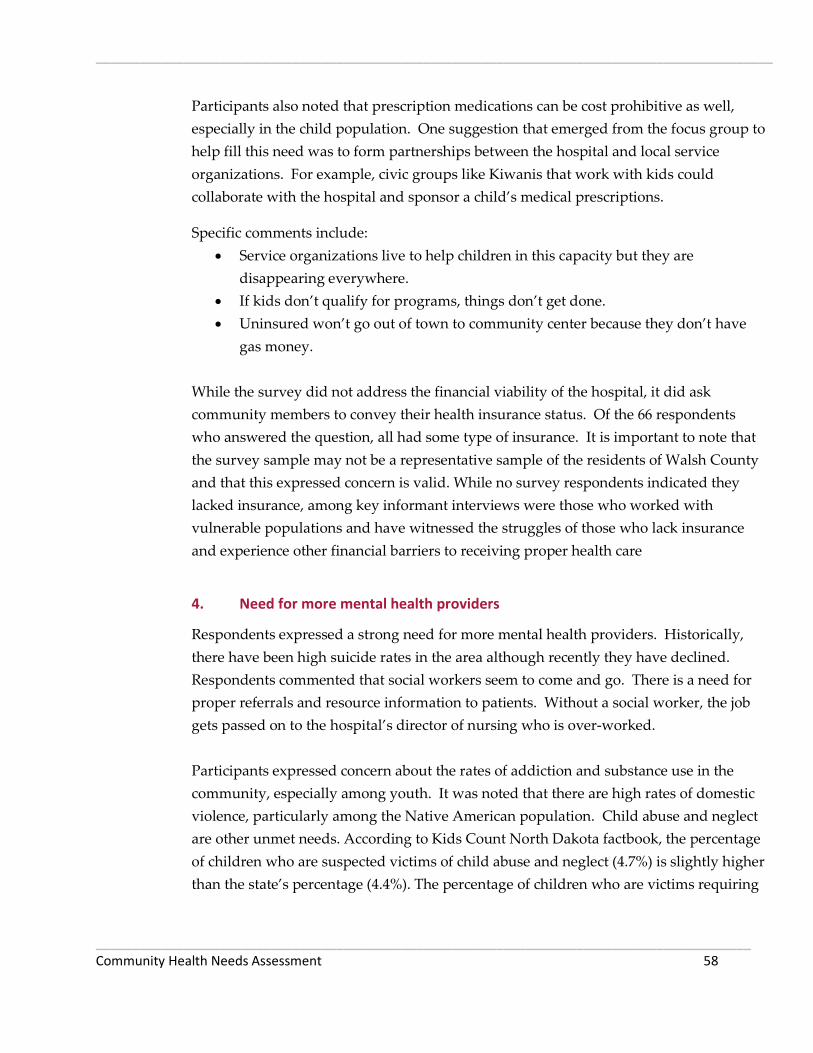
_____________________________________________________________________________________________
__________________________________________________________________________________________ Community Health Needs Assessment 58
Participants also noted that prescription medications can be cost prohibitive as well,
especially in the child population. One suggestion that emerged from the focus group to
help fill this need was to form partnerships between the hospital and local service
organizations. For example, civic groups like Kiwanis that work with kids could
collaborate with the hospital and sponsor a child’s medical prescriptions.
Specific comments include:
Service organizations live to help children in this capacity but they are
disappearing everywhere.
If kids don’t qualify for programs, things don’t get done.
Uninsured won’t go out of town to community center because they don’t have
gas money.
While the survey did not address the financial viability of the hospital, it did ask
community members to convey their health insurance status. Of the 66 respondents
who answered the question, all had some type of insurance. It is important to note that
the survey sample may not be a representative sample of the residents of Walsh County
and that this expressed concern is valid. While no survey respondents indicated they
lacked insurance, among key informant interviews were those who worked with
vulnerable populations and have witnessed the struggles of those who lack insurance
and experience other financial barriers to receiving proper health care
4. Need for more mental health providers
Respondents expressed a strong need for more mental health providers. Historically,
there have been high suicide rates in the area although recently they have declined.
Respondents commented that social workers seem to come and go. There is a need for
proper referrals and resource information to patients. Without a social worker, the job
gets passed on to the hospital’s director of nursing who is over-worked.
Participants expressed concern about the rates of addiction and substance use in the
community, especially among youth. It was noted that there are high rates of domestic
violence, particularly among the Native American population. Child abuse and neglect
are other unmet needs. According to Kids Count North Dakota factbook, the percentage
of children who are suspected victims of child abuse and neglect (4.7%) is slightly higher
than the state’s percentage (4.4%). The percentage of children who are victims requiring
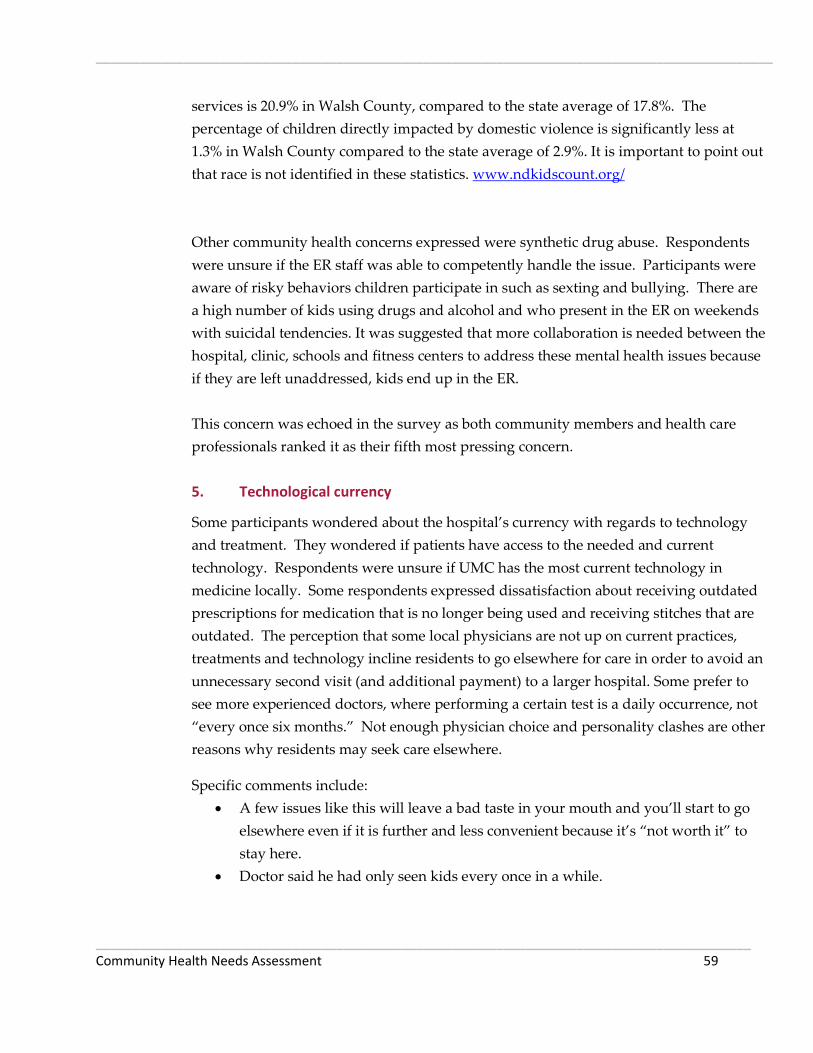
_____________________________________________________________________________________________
__________________________________________________________________________________________ Community Health Needs Assessment 59
services is 20.9% in Walsh County, compared to the state average of 17.8%. The
percentage of children directly impacted by domestic violence is significantly less at
1.3% in Walsh County compared to the state average of 2.9%. It is important to point out
that race is not identified in these statistics. www.ndkidscount.org/
Other community health concerns expressed were synthetic drug abuse. Respondents
were unsure if the ER staff was able to competently handle the issue. Participants were
aware of risky behaviors children participate in such as sexting and bullying. There are
a high number of kids using drugs and alcohol and who present in the ER on weekends
with suicidal tendencies. It was suggested that more collaboration is needed between the
hospital, clinic, schools and fitness centers to address these mental health issues because
if they are left unaddressed, kids end up in the ER.
This concern was echoed in the survey as both community members and health care
professionals ranked it as their fifth most pressing concern.
5. Technological currency
Some participants wondered about the hospital’s currency with regards to technology
and treatment. They wondered if patients have access to the needed and current
technology. Respondents were unsure if UMC has the most current technology in
medicine locally. Some respondents expressed dissatisfaction about receiving outdated
prescriptions for medication that is no longer being used and receiving stitches that are
outdated. The perception that some local physicians are not up on current practices,
treatments and technology incline residents to go elsewhere for care in order to avoid an
unnecessary second visit (and additional payment) to a larger hospital. Some prefer to
see more experienced doctors, where performing a certain test is a daily occurrence, not
“every once six months.” Not enough physician choice and personality clashes are other
reasons why residents may seek care elsewhere.
Specific comments include:
A few issues like this will leave a bad taste in your mouth and you’ll start to go
elsewhere even if it is further and less convenient because it’s “not worth it” to
stay here.
Doctor said he had only seen kids every once in a while.
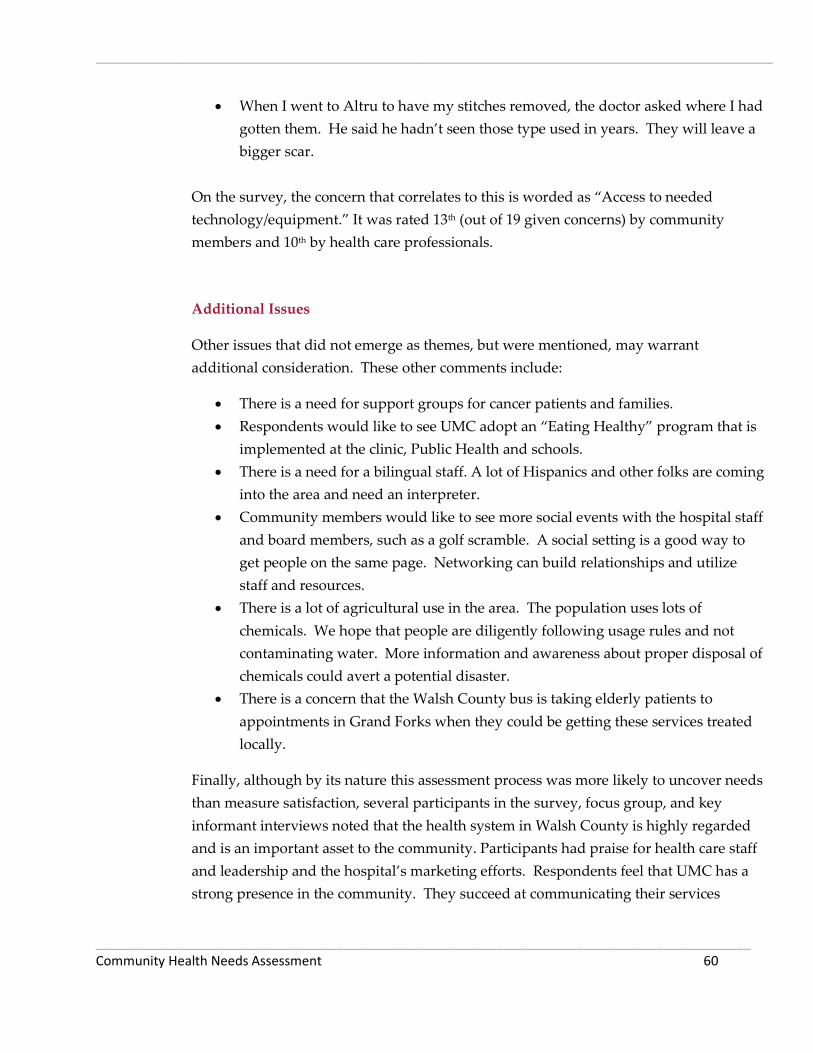
_____________________________________________________________________________________________
__________________________________________________________________________________________ Community Health Needs Assessment 60
When I went to Altru to have my stitches removed, the doctor asked where I had
gotten them. He said he hadn’t seen those type used in years. They will leave a
bigger scar.
On the survey, the concern that correlates to this is worded as “Access to needed
technology/equipment.” It was rated 13th (out of 19 given concerns) by community
members and 10th by health care professionals.
Additional Issues
Other issues that did not emerge as themes, but were mentioned, may warrant
additional consideration. These other comments include:
There is a need for support groups for cancer patients and families.
Respondents would like to see UMC adopt an “Eating Healthy” program that is
implemented at the clinic, Public Health and schools.
There is a need for a bilingual staff. A lot of Hispanics and other folks are coming
into the area and need an interpreter.
Community members would like to see more social events with the hospital staff
and board members, such as a golf scramble. A social setting is a good way to
get people on the same page. Networking can build relationships and utilize
staff and resources.
There is a lot of agricultural use in the area. The population uses lots of
chemicals. We hope that people are diligently following usage rules and not
contaminating water. More information and awareness about proper disposal of
chemicals could avert a potential disaster.
There is a concern that the Walsh County bus is taking elderly patients to
appointments in Grand Forks when they could be getting these services treated
locally.
Finally, although by its nature this assessment process was more likely to uncover needs
than measure satisfaction, several participants in the survey, focus group, and key
informant interviews noted that the health system in Walsh County is highly regarded
and is an important asset to the community. Participants had praise for health care staff
and leadership and the hospital’s marketing efforts. Respondents feel that UMC has a
strong presence in the community. They succeed at communicating their services

_____________________________________________________________________________________________
__________________________________________________________________________________________ Community Health Needs Assessment 61
provided, notably by their weekly newspaper ads, radio spots on the local AM station,
KXBO, and anytime people call and are put on hold, the outgoing message voices the
whole list of services provided. Relaying the services provided through the telephone
seems to be a very effective practice as most participants were aware of all the services
and specialists that UMC has.
This perception is consistent with the survey result that the primary motivator for
residents to seek care at UMC is its high quality of care. A few specific comments
included:
Good job serving the community; we appreciate you.
Doctors readily return phone calls.
Unity has done a great job providing coverage for on-call doctors.
Good collaboration with Altru and Sanford.
Good job at updating facility and equipment. Hospital doesn’t look like an
institution. Nice rooms.
Extended Clinic hours are nice. Great job.
Female staff is very important. Women want that option for their care.
Toot your horn more. This hospital does awesome things. More personal stories
and testimonials need to be shared. General public has no idea of the serious
situations that go on here and are treated well.
Priority of Needs
The Community Group held its second meeting on the evening of August 15, 2012.
Sixteen members of the group attended the meeting. A representative from the Center
for Rural Health presented the group with a summary of this report’s findings,
including background and explanation about the secondary data, highlights from the
results of the survey (including perceived community health concerns, awareness of
local services, why patients seek care at UMC, community collaboration, and barriers to
care), and findings from the focus group and key informant interviews.
Following the presentation of the assessment findings, and after careful consideration of
and discussion about the findings, each member of the group was asked to identify on a
ballot what they perceived as the top five community needs. There was a tie (five votes

_____________________________________________________________________________________________
__________________________________________________________________________________________ Community Health Needs Assessment 62
each) between higher cost of health care for consumers and financial ability of UMC and
patients. Since both of these concerns were financially related issues, the community
group decided to lump them together as their fourth concern. The results were totaled,
and the concerns most often cited were:
Rates of adult obesity (12 votes)
Limited number of health care providers (11 votes)
Adequate number of visiting specialists (6 votes)
Higher cost of health care for consumers & (5 votes)
Financial ability of UMC and patients (5 votes)
Decreased rate of colorectal cancer screening (5 votes)
Based on the Community Group’s feedback about the prioritization of community
health needs, the needs were ranked from one to five based on how many votes each
concern received, with the number one concern receiving the most votes. After ranking
the concerns, the Community Group was asked if they thought the list adequately
reflected the health needs of their community. The Community Group thought the
ranked list did reflect the health needs of the community and would serve as a guiding
template for the hospital’s strategic planning.
Unity Medical Center may use this prioritization for informational purposes – and as
one form of community feedback – as it develops its implementation strategy, which is a
plan for addressing community health needs. These identified needs satisfy the
requirements the community health needs assessment, as mandated by the ACA, and
they can help UMC’s strategic planning and programming implementation. A summary
of this priority of needs may be found in Appendix G.
Limitations
While this community health needs assessment tried to invite community participation
and involve community members who represent various demographics, it is by no
means a representative sample. The survey sampling method utilized convenience and
snowballing strategies, which may produce non-representative information. Having the
hospital staff select key informant interviewees may result in biased responses. The
mixed methods research design, using both qualitative (interviews and focus group) and
quantitative (survey and secondary data) methods, triangulates results and strengthens
overall research design but ultimately, the prioritization of needs is based on the

_____________________________________________________________________________________________
__________________________________________________________________________________________ Community Health Needs Assessment 63
participants who attend the second community meeting. Granting this much influence
on attendees may result in one particular community group having too much power.
Summary
This study took into account input from approximately 129 community members and
health care professionals from several counties as well as a total of 29 community
leaders, including a public health professional. This input represented the broad
interests of the community served by Unity Medical Center. Together with secondary
data gathered from a wide range of sources, the information presents a snapshot of
health needs and concerns in the community.
An analysis of secondary data reveals a large portion of UMC’s service area has a higher
percentage of adults over the age of 65 than the state average and a higher median age
than the state median, indicating an increased need for medical services to attend to an
aging population. Additionally, the data compiled by County Health Rankings shows
that Walsh County is performing below the state average on the measures of adult
obesity, physical inactivity, motor vehicle crash death rate, teen birth rate, preventable
hospital stays, mammography screening, limited access to healthy foods, and the ratio of
population to primary care and mental health care providers.
Walsh County is not meeting the national benchmark with respect to excessive drinking,
with a rate that is 2½ times the national benchmark. Additionally, the county’s motor
vehicle crash death rate was more than twice the national benchmark, while the teen
birth rate was almost twice the national benchmark.
Results from the survey revealed that among community members the top five
community health concerns were: (1) higher costs of health care for consumers, (2)
cancer, (3) adequate number of health care providers and specialists (4) obesity and (5)
mental health issues.
Health care professionals also focused on medical and health conditions, collectively
ranking as the top five concerns (1) higher costs of health care for consumers, (2) obesity,
(3) addiction and substance abuse, (4) cancer and (5) mental health issues. The amount
of overlap between these two survey results indicates strong alignment in the perception
of community health care needs from community members and health care
professionals.

_____________________________________________________________________________________________
__________________________________________________________________________________________ Community Health Needs Assessment 64
There is similar alignment in thought regarding the perception of community violence.
Both community members and health care professionals ranked bullying,
domestic/spouse violence, violence against women and children, and physical and
emotional abuse as their most pressing concerns.
Input from Community Group members and community leaders echoed many of the
concerns raised by survey respondents, and also highlighted concerns about not having
adequate numbers of health care providers, mental health providers and specialists in
the community, the financial solvency of the hospital and its patients, and being
technologically current.
Following careful consideration of the results and findings of this assessment,
Community Group members determined that the top health needs or issues in the
community are elevated rates of obesity, limited number of health care providers and
visiting specialists, financial ability of hospital and patients and low colorectal cancer
screening rates.

_____________________________________________________________________________________________
__________________________________________________________________________________________ Community Health Needs Assessment 65
Appendix A – Community Member Survey Instrument

_____________________________________________________________________________________________
__________________________________________________________________________________________ Community Health Needs Assessment 66

_____________________________________________________________________________________________
__________________________________________________________________________________________ Community Health Needs Assessment 67
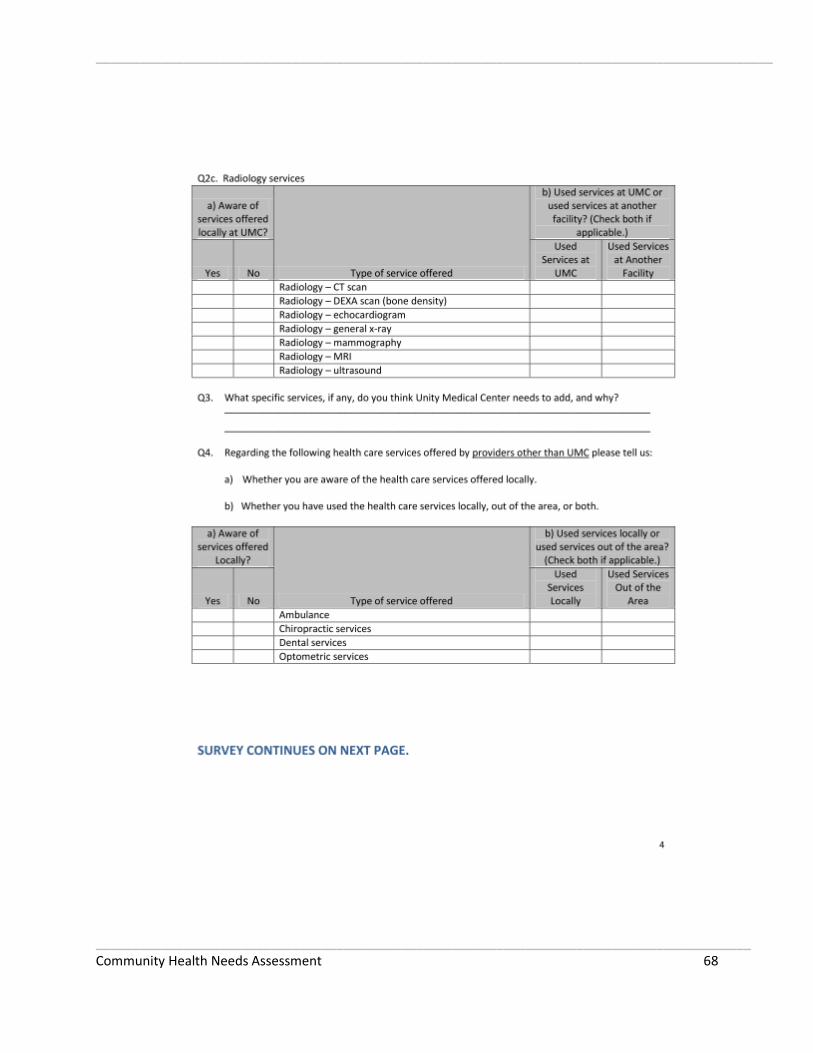
_____________________________________________________________________________________________
__________________________________________________________________________________________ Community Health Needs Assessment 68

_____________________________________________________________________________________________
__________________________________________________________________________________________ Community Health Needs Assessment 69
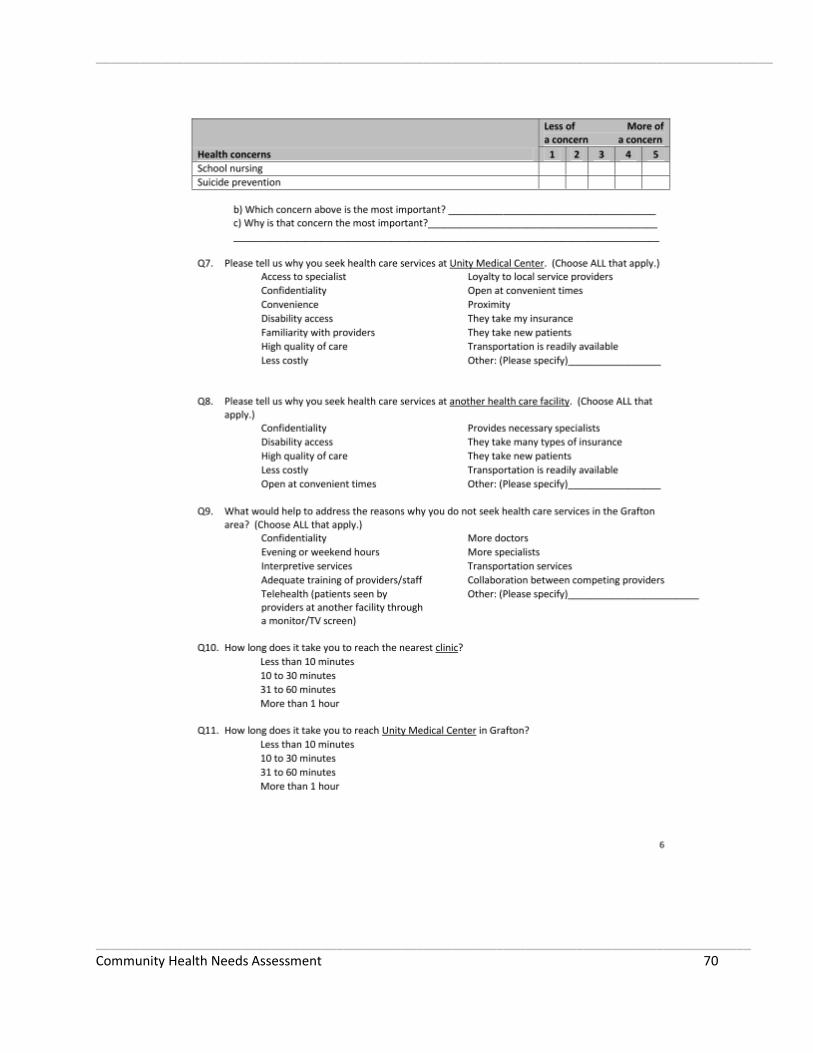
_____________________________________________________________________________________________
__________________________________________________________________________________________ Community Health Needs Assessment 70
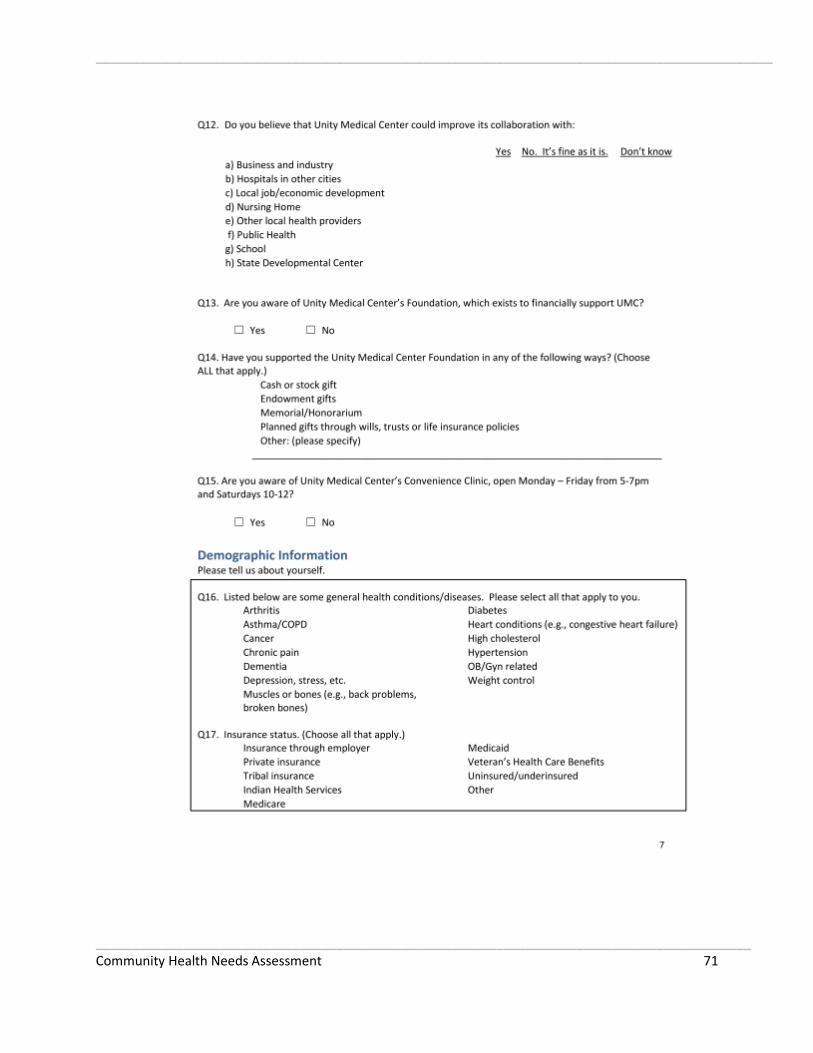
_____________________________________________________________________________________________
__________________________________________________________________________________________ Community Health Needs Assessment 71

_____________________________________________________________________________________________
__________________________________________________________________________________________ Community Health Needs Assessment 72
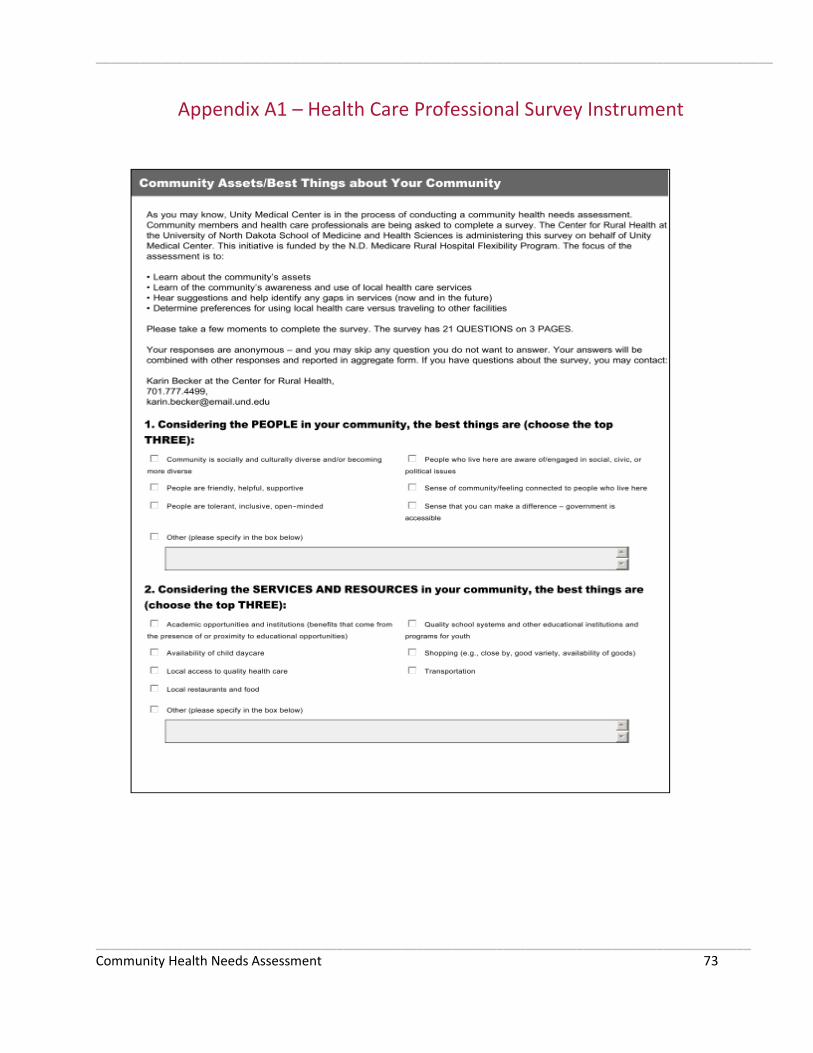
_____________________________________________________________________________________________
__________________________________________________________________________________________ Community Health Needs Assessment 73
Appendix A1 – Health Care Professional Survey Instrument
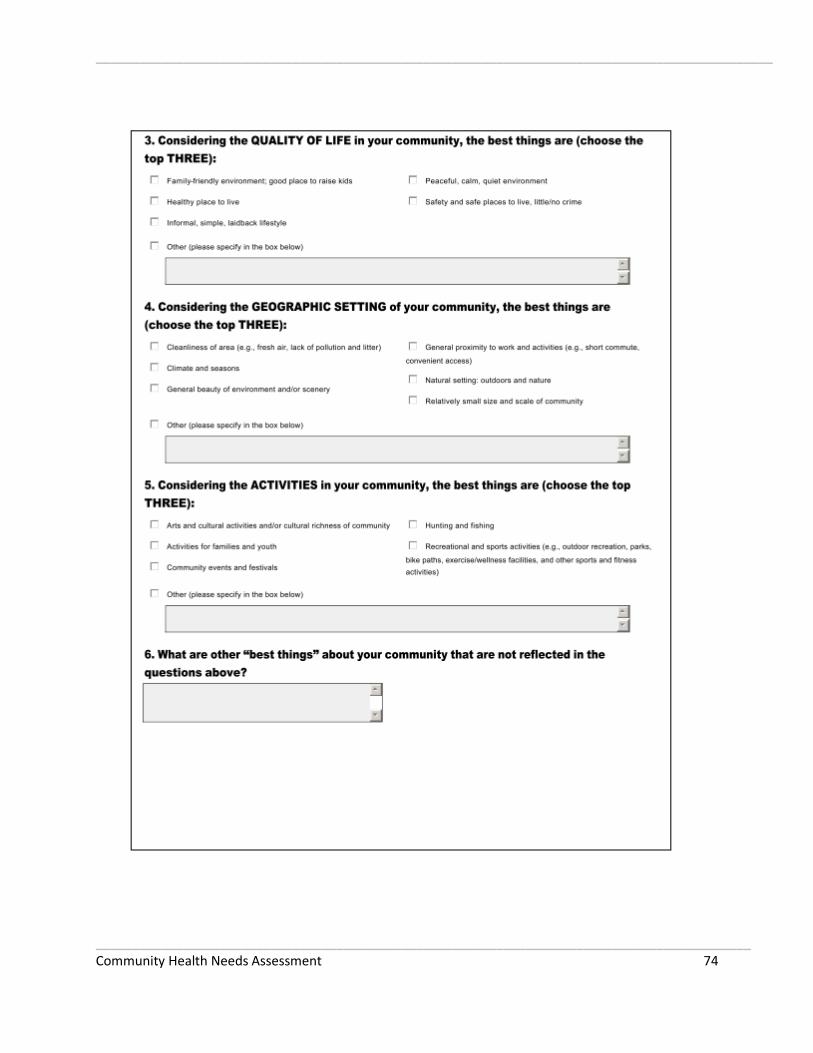
_____________________________________________________________________________________________
__________________________________________________________________________________________ Community Health Needs Assessment 74
_____________________________________________________________________________________________
__________________________________________________________________________________________ Community Health Needs Assessment 75
_____________________________________________________________________________________________
__________________________________________________________________________________________ Community Health Needs Assessment 76

_____________________________________________________________________________________________
__________________________________________________________________________________________ Community Health Needs Assessment 77
_____________________________________________________________________________________________
__________________________________________________________________________________________ Community Health Needs Assessment 78
_____________________________________________________________________________________________
__________________________________________________________________________________________ Community Health Needs Assessment 79

_____________________________________________________________________________________________
__________________________________________________________________________________________ Community Health Needs Assessment 80

_____________________________________________________________________________________________
__________________________________________________________________________________________ Community Health Needs Assessment 81
Appendix B – Community Group Members and Key Informants Participating in Interviews
Name Organization Title
Heather Narloch Homecare Social Worker Social Worker
Christine Bjorneby Homemaker Homemaker
Jean Jiskra Country Realty Owner
Claudia Thompson Valley Special Education Speech Pathologist
James Aasand Farmer Farmer
Jackie Adamen Construction Owner Retired
Rob Gellner Agriculture Agriculture
Jeff Rerick Grafton Public Schools School Principle
Mark Wagner North Valley Career Tech. Center Administrator
Mary Beth Feltman Juvenile Court Administrator
Pat Dusek Grafton Public Schools Retired Educator
Patti Olson Homemaker Homemaker
Karen A. Anderson Homemaker Homemaker
Tim Carlson Pastor Pastor
Norv Elbert Retail Retired
Jane Myers Unity Medical Center
Sandra Lessard Unity Medical Center
Tim Johnson Unity Medical Center
Marilyn Bryan Unity Medical Center
Christie Durand Unity Medical Center
Mark Wagner Unity Medical Center
Jeff Rerick
Susan Geiger Invisima
Everett Butler Unity Medical Center CEO
Mary Beth Feltman North Dakota Judicial System
Kathryn Miskavige Unity Medical Center
Rachel Ray Unity Medical Center
Jacqualyn Adamsen
Linda Whip Unity Medical Center

_____________________________________________________________________________________________
__________________________________________________________________________________________ Community Health Needs Assessment 82
Appendix C – County Health Rankings Model
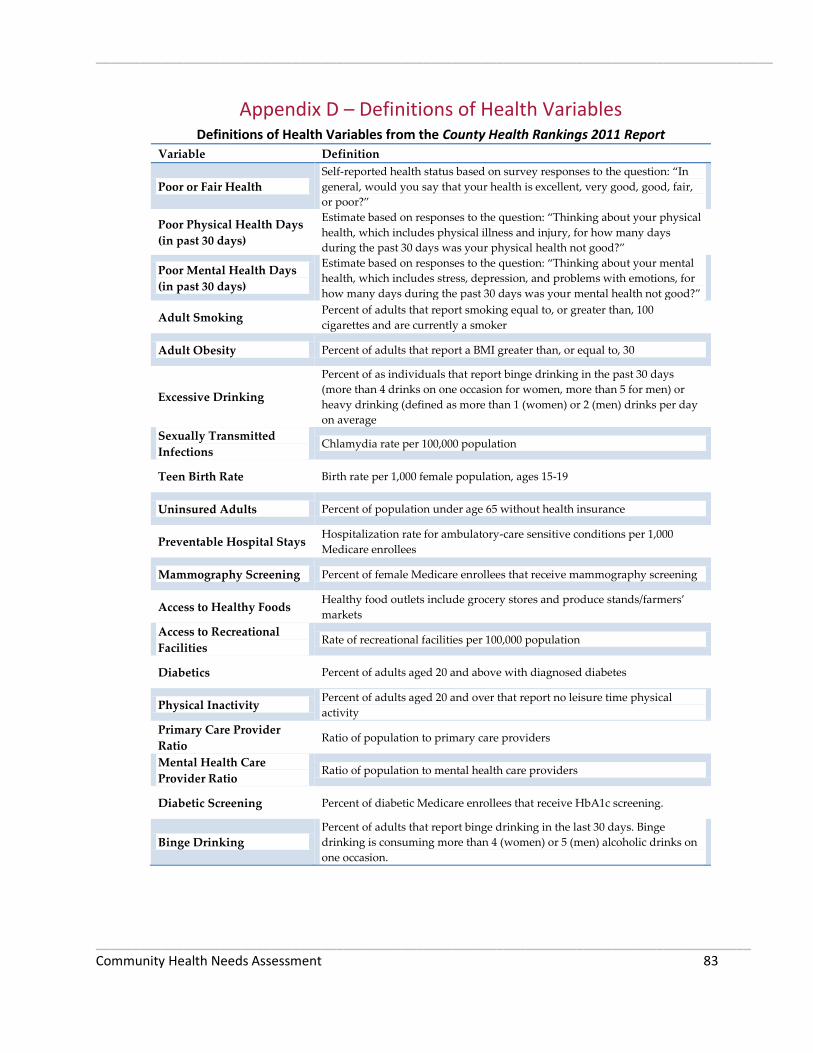
_____________________________________________________________________________________________
__________________________________________________________________________________________ Community Health Needs Assessment 83
Appendix D – Definitions of Health Variables Definitions of Health Variables from the County Health Rankings 2011 Report
Variable Definition
Poor or Fair Health
Self-reported health status based on survey responses to the question: “In
general, would you say that your health is excellent, very good, good, fair,
or poor?”
Poor Physical Health Days
(in past 30 days)
Estimate based on responses to the question: “Thinking about your physical
health, which includes physical illness and injury, for how many days
during the past 30 days was your physical health not good?”
Poor Mental Health Days
(in past 30 days)
Estimate based on responses to the question: “Thinking about your mental
health, which includes stress, depression, and problems with emotions, for
how many days during the past 30 days was your mental health not good?”
Adult Smoking Percent of adults that report smoking equal to, or greater than, 100
cigarettes and are currently a smoker
Adult Obesity Percent of adults that report a BMI greater than, or equal to, 30
Excessive Drinking
Percent of as individuals that report binge drinking in the past 30 days
(more than 4 drinks on one occasion for women, more than 5 for men) or
heavy drinking (defined as more than 1 (women) or 2 (men) drinks per day
on average
Sexually Transmitted
Infections Chlamydia rate per 100,000 population
Teen Birth Rate Birth rate per 1,000 female population, ages 15-19
Uninsured Adults Percent of population under age 65 without health insurance
Preventable Hospital Stays Hospitalization rate for ambulatory-care sensitive conditions per 1,000
Medicare enrollees
Mammography Screening Percent of female Medicare enrollees that receive mammography screening
Access to Healthy Foods Healthy food outlets include grocery stores and produce stands/farmers’
markets
Access to Recreational
Facilities Rate of recreational facilities per 100,000 population
Diabetics Percent of adults aged 20 and above with diagnosed diabetes
Physical Inactivity Percent of adults aged 20 and over that report no leisure time physical
activity
Primary Care Provider
Ratio Ratio of population to primary care providers
Mental Health Care
Provider Ratio Ratio of population to mental health care providers
Diabetic Screening Percent of diabetic Medicare enrollees that receive HbA1c screening.
Binge Drinking
Percent of adults that report binge drinking in the last 30 days. Binge
drinking is consuming more than 4 (women) or 5 (men) alcoholic drinks on
one occasion.

_____________________________________________________________________________________________
__________________________________________________________________________________________ Community Health Needs Assessment 84
Appendix E – Walsh Community Health Profile
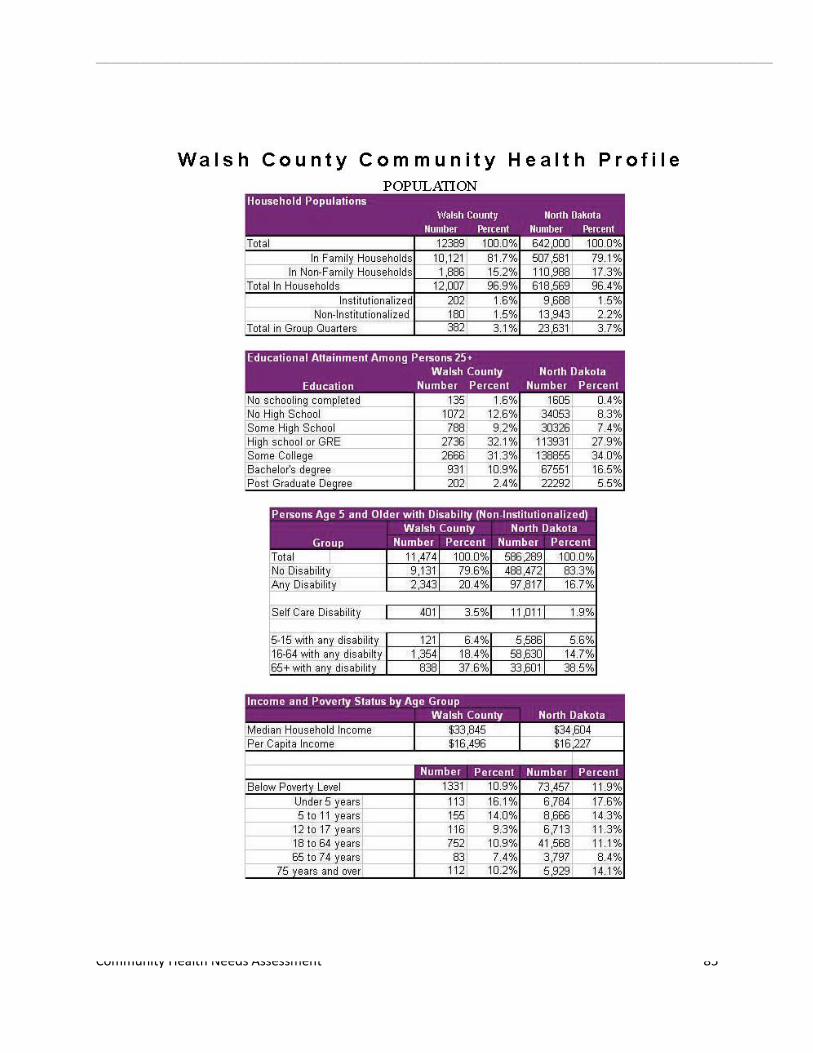
_____________________________________________________________________________________________
__________________________________________________________________________________________ Community Health Needs Assessment 85
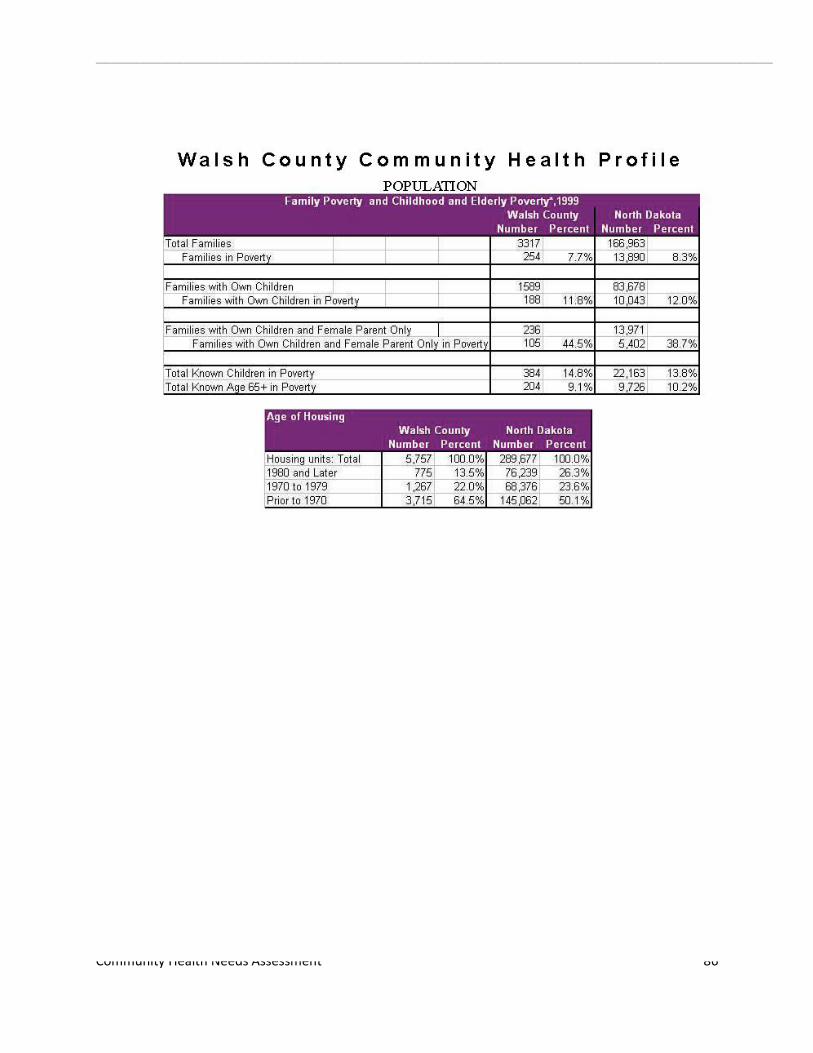
_____________________________________________________________________________________________
__________________________________________________________________________________________ Community Health Needs Assessment 86

_____________________________________________________________________________________________
__________________________________________________________________________________________ Community Health Needs Assessment 87
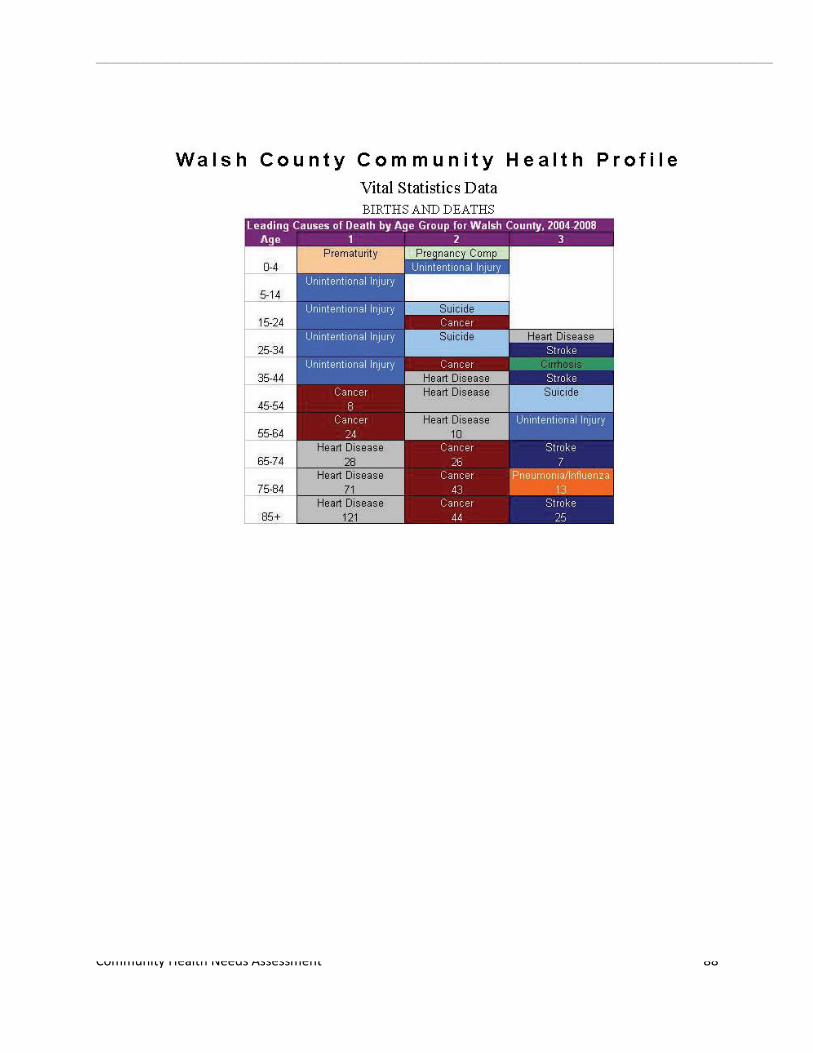
_____________________________________________________________________________________________
__________________________________________________________________________________________ Community Health Needs Assessment 88

_____________________________________________________________________________________________
__________________________________________________________________________________________ Community Health Needs Assessment 89
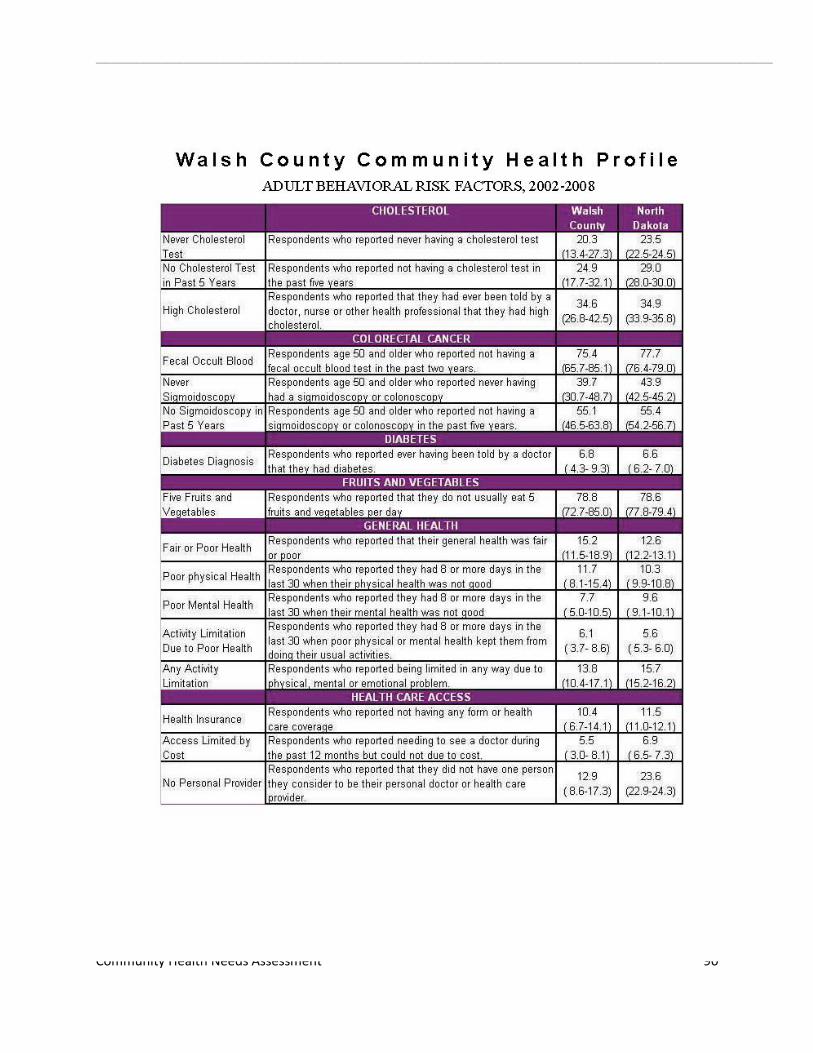
_____________________________________________________________________________________________
__________________________________________________________________________________________ Community Health Needs Assessment 90

_____________________________________________________________________________________________
__________________________________________________________________________________________ Community Health Needs Assessment 91

_____________________________________________________________________________________________
__________________________________________________________________________________________ Community Health Needs Assessment 92
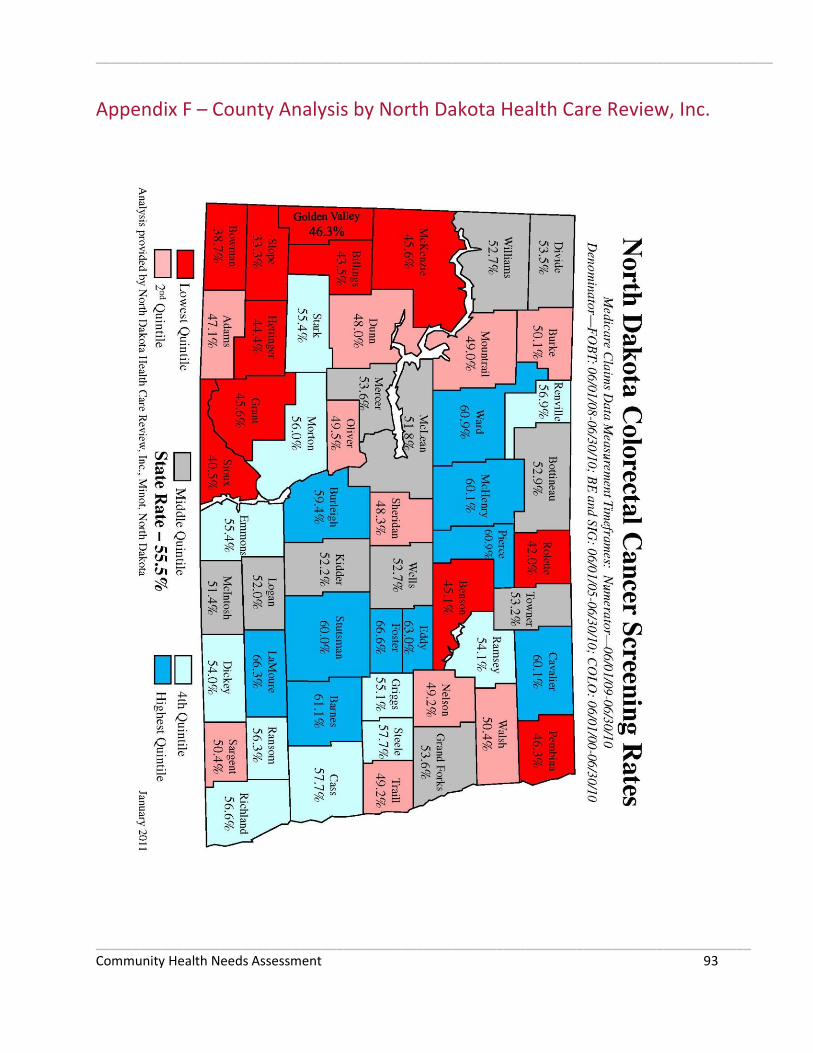
_____________________________________________________________________________________________
__________________________________________________________________________________________ Community Health Needs Assessment 93
Appendix F – County Analysis by North Dakota Health Care Review, Inc.

_____________________________________________________________________________________________
__________________________________________________________________________________________ Community Health Needs Assessment 94
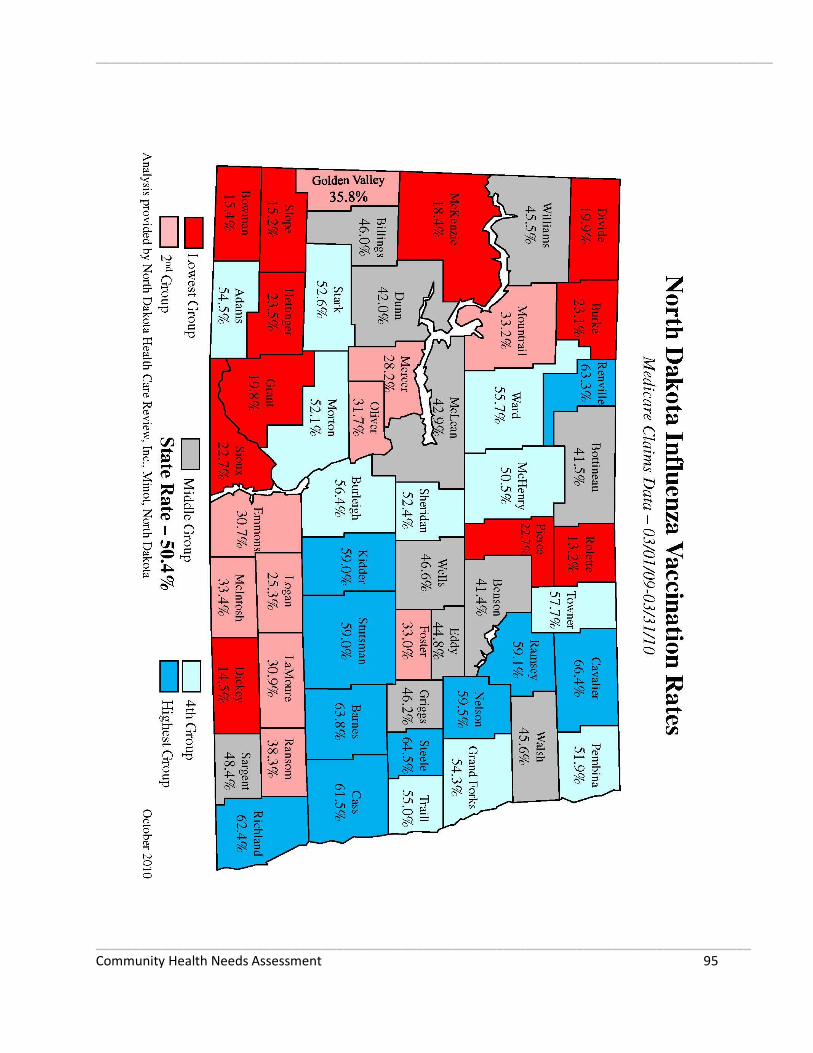
_____________________________________________________________________________________________
__________________________________________________________________________________________ Community Health Needs Assessment 95

_____________________________________________________________________________________________
__________________________________________________________________________________________ Community Health Needs Assessment 96

_____________________________________________________________________________________________
__________________________________________________________________________________________ Community Health Needs Assessment 97

_____________________________________________________________________________________________
__________________________________________________________________________________________ Community Health Needs Assessment 98

_____________________________________________________________________________________________
__________________________________________________________________________________________ Community Health Needs Assessment 99
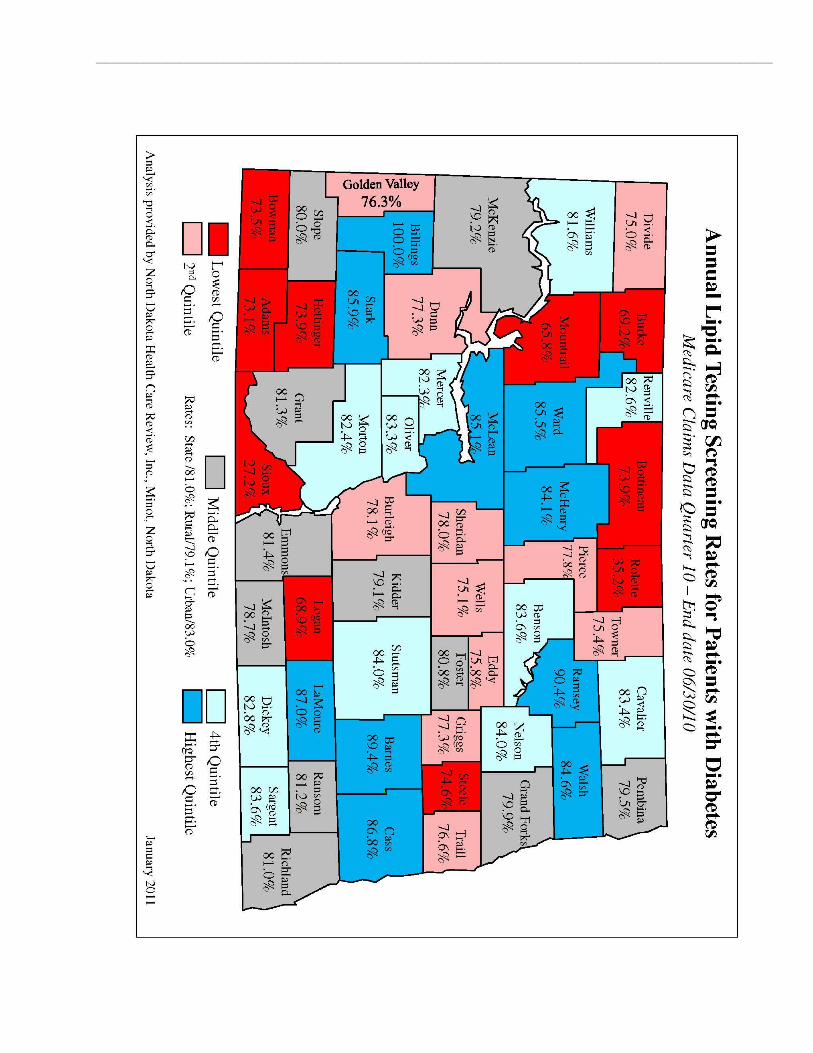
_____________________________________________________________________________________________
__________________________________________________________________________________________ Community Health Needs Assessment 100

_____________________________________________________________________________________________
__________________________________________________________________________________________ Community Health Needs Assessment 101
Appendix G – Prioritization of Community’s Health Needs
POTENTIAL COMMUNITY HEALTH NEEDS – GRAFTON
(Listed in no particular order)
IDENTIFIED NEED VOTE
1. Secondary data: Elevated rate of diabetics 5
2. Secondary data: Elevated rate of adult smoking 2
12 Secondary data & Survey: Elevated rate of adult obesity 12
4. Secondary data: Elevated rate of physical inactivity 5
5. Secondary data: Elevated rate of excessive drinking 11
6. Secondary data: Elevated level of sexually transmitted infections 0
7. Secondary data: Elevated motor vehicle crash death rate 0
8. Secondary data: Elevated teen birth rate 2
9. Secondary data: Elevated rate of uninsured adults 1
10. Secondary data & Survey & Interview/Focus Group: Limited number of health care
providers 11
11. Secondary data & Interviews/Focus Group: Limited number of mental health care
providers 2
12. Secondary data: Elevated level of preventable hospital stays 1
13. Secondary data: Decreased rate of diabetic screening 0
14. Secondary data: Decreased rate of mammography screening 1
15. Secondary data: Limited access to healthy foods 0
16. Secondary data: Decreased rate of colorectal cancer screening 5
17. Secondary data: Decreased rate of pneumococcal pneumonia vaccination 0
18. Survey: Cancer 4
19. Survey: Higher cost of health care for consumers 5
20. Survey: Addiction/substance abuse 3

_____________________________________________________________________________________________
__________________________________________________________________________________________ Community Health Needs Assessment 102
21. Interview/Focus Group: Adequate number of visiting specialists 6
22. Interview/Focus Group: Financial ability of UMC and patients 5
23. Interviews/Focus Group: Technological currency 3
= Not meeting state average
= Not meeting national benchmark