Sunil Nd Bo B GCA94 2012
20
(This is a sample cover image for this issue. The actual cover is not yet available at this time.) This article appeared in a journal published by Elsevier. The attached copy is furnished to the author for internal non-commercial research and education use, including for instruction at the authors institution and sharing with colleagues. Other uses, including reproduction and distribution, or selling or licensing copies, or posting to personal, institutional or third party websites are prohibited. In most cases authors are permitted to post their version of the article (e.g. in Word or Tex form) to their personal website or institutional repository. Authors requiring further information regarding Elsevier’s archiving and manuscript policies are encouraged to visit: http://www.elsevier.com/copyright
Transcript of Sunil Nd Bo B GCA94 2012

(This is a sample cover image for this issue. The actual cover is not yet available at this time.)
This article appeared in a journal published by Elsevier. The attachedcopy is furnished to the author for internal non-commercial researchand education use, including for instruction at the authors institution
and sharing with colleagues.
Other uses, including reproduction and distribution, or selling orlicensing copies, or posting to personal, institutional or third party
websites are prohibited.
In most cases authors are permitted to post their version of thearticle (e.g. in Word or Tex form) to their personal website orinstitutional repository. Authors requiring further information
regarding Elsevier’s archiving and manuscript policies areencouraged to visit:
http://www.elsevier.com/copyright

Author's personal copy
Spatial distribution of dissolved neodymium and eNd in the Bayof Bengal: Role of particulate matter and mixing of water masses
Satinder Pal Singh ⇑, Sunil Kumar Singh, Vineet Goswami, Ravi Bhushan,Vinai Kumar Rai
Physical Research Laboratory, Ahmedabad 380009, India
Received 19 December 2011; accepted in revised form 16 July 2012
Abstract
The concentration and isotope composition of dissolved Nd have been measured in the water column along an 87�E tran-sect (GIO1 section of International GEOTRACES Program) in the Bay of Bengal (BoB) to investigate the effect of water massmixing and Nd release from particulate matter in determining these properties. The concentration of Nd in surface waters ofthe BoB shows a North–South decreasing non-linear trend (�46 to �22 pmol/kg) with salinity, whereas its depth profiles typ-ically show a high value in surface waters, a minimum (�15 to �23 pmol/kg) in the shallow subsurface (�50–200 m), followedby a gradual increase with depth. The Nd concentration of BoB waters is generally higher than that in nearby oceanic basins.On the other hand, the eNd values in the BoB are less radiogenic compared to those reported for other regions of the globaloceans (except Baffin Bay, the North Atlantic Subpolar Gyre and the Niger delta margin), and show a greater variation in theupper water column. Surface waters of the southernmost profile (�6�N) show a more radiogenic eNd value ��8, whichdecreases to �15 in the northernmost profile (�20�N), close to the values for dissolved and particulate phases of theGanga–Brahmaputra (G–B) Rivers. This latitudinal trend is most likely a result of variations in mixing proportion betweenthe more radiogenic Indonesian Throughflow surface waters (IW) and unradiogenic BoB low salinity water; the former’s sig-nature being more clearly discernible in surface waters of the two southernmost profiles (�6�N and �8.5�N).
Attempts to balance the Nd budget in the water column based on an inversion model, suggest that in addition to watermasses other source(s) is required, the strength of which is estimated to vary from 1% to 65% of the measured Nd concen-tration. The calculations also show that the eNd of this additional source(s) has to be in the range of ��16 ± 2, typical ofG–B river sediments. These observations, coupled with the North–South distribution of dissolved Nd and eNd, indicate thatthis additional source is release from particulate phases supplied by the G–B river system. The calculations also bring out thepresence of “hot-spots” of Nd release (excess Nd) near the sediment–water interface along the northern slope of the bay, indi-cating supply of Nd from continental margin sediments. This study underscores the significant role of dissolved/particulateNd from the Ganga–Brahmaputra river system in contributing to the dissolved Nd budget of the global oceans.� 2012 Elsevier Ltd. All rights reserved.
1. INTRODUCTION
The distribution of dissolved Nd in seawater, along withits radiogenic isotope composition, serves as a water masstracer on an ocean-wide scale. The oceanic residence time
of neodymium, though not well established, is known tobe of the order of the ocean mixing time (Broecker andPeng, 1982; Jeandel et al., 1995; Nozaki and Alibo, 2003;Tachikawa et al., 2003; Johannesson and Burdige, 2007).This leads to the dispersal of continental Nd in the globaloceans through water circulation. The eNd data of differentoceanic regions reflect those of its sources, predominantlycontinental supply, and their subsequent modification by
0016-7037/$ - see front matter � 2012 Elsevier Ltd. All rights reserved.
http://dx.doi.org/10.1016/j.gca.2012.07.017
⇑ Corresponding author.E-mail address: [email protected] (S.P. Singh).
www.elsevier.com/locate/gca
Available online at www.sciencedirect.com
Geochimica et Cosmochimica Acta 94 (2012) 38–56

Author's personal copy
water mass mixing and boundary exchange (Frank, 2002;Goldstein and Hemming, 2003 and references therein;Piepgras and Wasserburg, 1987; Jeandel, 1993; Lacan andJeandel, 2005).
There have been a number of studies that have utilizedNd isotopes to investigate water mass mixing in the Arctic,Atlantic and the Pacific Oceans (Piepgras and Wasserburg,1987; Andersson et al., 2008; Amakawa et al., 2009; Porcelliet al., 2009; Rickli et al., 2009, 2010; Carter et al., 2012).Similar studies in the Indian Ocean, however, are sparse(Bertram and Elderfield, 1993; Jeandel et al., 1998; Amak-awa et al., 2000; Tazoe et al., 2011). The limited availableresults show that eNd values of the Indian Ocean are inter-mediate between the less radiogenic Atlantic and the moreradiogenic Pacific Ocean values (Bertram and Elderfield,1993; Jeandel et al., 1998; Frank, 2002). These findingsare based primarily on the equatorial and southern IndianOcean. There have been only a few studies on the northernIndian Ocean, particularly in the Bay of Bengal and theArabian Sea, both of which receive significant input of freshwater and particulate matter from rivers draining theHimalaya. These rivers, the Ganga, Brahmaputra, Irra-waddy and the Indus all drain terrains in the Himalayacharacterized by unradiogenic neodymium (Robinsonet al., 2001; Singh and France-Lanord, 2002; Singh et al.,2008). This study focuses on the measurements of dissolvedNd concentration and its isotope composition in waters ofthe Bay of Bengal, which receives large quantities of freshwater and particulate matter through the Ganga–Brah-maputra (G–B) and the Irrawaddy river systems drainingthe Himalaya.
The Bay of Bengal (BoB) covers an area of2.2 � 106 km2 in the northern Indian Ocean, with an aver-age depth of 3 km. The G–B river system contributes�1000 km3 of freshwater to the bay, corresponding to�25% of the annual input of fresh water to the BoB(Sarin et al., 1989; Sengupta et al., 2006). The annualdelivery of fresh water to the BoB accounts for about0.06% of the total inventory of water in the bay. Thislarge influx of fresh water is also responsible for the strat-ification of the upper water column commonly observedin the bay (Murty et al., 1992; Gopalakrishna et al.,2002). The water mass structure of the bay has been wellcharacterized (Sastry et al., 1985; Dileep Kumar and Li,1996; Rao et al., 1996; You, 1997, 2000) and circulationof the upper water column has been shown to be proneto monsoon-driven seasonal changes (Wyrtki, 1973;Colborn, 1975; Shetye et al., 1996; You, 1997; Shenoiet al., 1999; Schott and Mccreary, 2001; Shankar et al.,2002). In the present study, the concentration as well asisotope composition of dissolved Nd in the BoB watercolumn have been measured to characterize the watermasses, to learn about geochemical cycling of Nd in theregion, particularly to assess the role of particulate Ndin modifying the abundance of dissolved Nd and itsisotope signature in different water masses. The latterobjective becomes significant in the BoB, as it is one ofthe oceanic regions receiving the world’s largest flux ofparticulate matter, �1012 kg/year (Milliman and Mead,1983; Galy and France-Lanord, 2001).
2. MATERIALS AND METHODS
2.1. Sampling
Seawater samples from the surface and various depthsdown to the sea floor were collected during November,2008 the fall inter-monsoon season, onboard FORV SagarSampada, cruise SS259. The sampling was done along the87�E meridian in the Bay of Bengal, from �20�N to�6�N (Fig. 1). All samples were filtered through 0.45 lmMillipore filters onboard, soon after their recovery. TheNd concentration and its isotope composition determinedin these filtered waters are treated as dissolved phase mea-surements. For the determination of Nd-isotope composi-tion, REEs were pre-concentrated onboard from �10 L ofseawater using the Fe co-precipitation protocol (Amakawaet al., 2000) for stations 0807, 0809, 0810, 0812 and 0813 orfrom �5 L of seawater following the C18 cartridge method(Jeandel et al., 1998) for stations 0806, 0808 and 0811. TheREEs extracts from the Fe(OH)3 or the cartridges were ta-ken up in 50 ml 6 N HCl and stored in acid cleaned LDPEbottles until their analysis. In the laboratory, these storedextracts were dried and re-dissolved in 2 N HCl. The re-dis-solved solution was loaded on a cation exchange resin, AG50W-X8 (200–400 mesh) to separate REEs from other ma-jor ions. The REEs were eluted with 6 N HCl after remov-ing the major ions with 2 N HCl. The solution containingREEs was evaporated to dryness, and re-dissolved in0.16 N HCl. The Nd was separated from REEs by loadingthe solution onto a reverse phase chromatographic column(Ln Resin, LN-B50-S in a quartz column). The Nd waseluted using 0.25 N HCl from this resin. The purified Ndwas dried and re-dissolved in 0.4 N HCl to measure its iso-tope composition using MC–ICPMS.
For the determination of dissolved Nd, one liter seawa-ter samples, soon after their recovery, were filtered on deckthrough 0.45 lm Millipore filters. The filtered seawatersamples were acidified to pH �2 with quartz distilled 6 NHCl and stored in acid cleaned LDPE bottles for furtheranalysis. From this filtered and acidified seawater a pre-cisely weighed aliquot (�500 g) was spiked with a knownamount of 150Nd tracer and the REEs were pre-concen-trated and purified using Fe co-precipitation followed bycation exchange separation (Tachikawa et al., 1999; Amak-awa et al., 2000). The Nd concentration in these extractswas measured by the isotope dilution technique using aquadrupole ICPMS.
2.2. Analysis
The Nd isotope composition of the purified Nd extractswas determined by MC–ICPMS (Neptune) using a PFA100nebulizer with an APEX introduction system as Nd+ in sta-tic multi-collection mode by measuring the intensities atmasses 143, 144 and 146 for 40 cycles. Sm correction, ifany, was done by measuring the intensity at mass 147.Amplifiers connected to Faraday cups are rotated afterevery 10 cycles to eliminate amplifier efficiency variations.The signal intensity of Nd at mass 144 in the samples de-pended on their Nd concentration, and typical values were
S.P. Singh et al. / Geochimica et Cosmochimica Acta 94 (2012) 38–56 39

Author's personal copy
in the range 0.2–0.6 V. Instrumental mass bias was cor-rected using an exponential law relative to 146Nd/144Nd ra-tio of 0.7219. To check the accuracy and precision ofmeasurements, an international standard, JMC321 wasrepeatedly run during the period of analysis. The measuredaverage 143Nd/144Nd of JMC321 was 0.511024 ± 0.000016(2r, n = 9) against the reported value of 0.511123 ±0.000012 (Barrat and Nesbitt, 1996). The measured143Nd/144Nd of JMC321 was lower compared to its re-ported value and hence the 143Nd/144Nd in samples wascorrected by normalization to the reported 143Nd/144Ndof JMC321.
The concentration of Nd was determined on a quadru-pole ICPMS (Thermo X-series-II) based on the isotopedilution technique. Samples were analyzed for the intensi-ties of Nd–Sm isotopes and the Nd concentrations werecalculated after Sm correction. The total procedural blankof Nd for concentration determination was 50 ± 2 pg(n = 2) and for Nd isotope determination it was 70 ± 2 pg(n = 2) based on the iron co-precipitation method and�600 ± 50 pg (n = 2) for Nd extraction using C18 cartridgesimilar to earlier reported blank levels (Lacan and Jeandel,2004). The coefficient of variation (CV%) for dissolved Ndconcentration based on repeat measurements of ninedifferent samples was determined to be 2.5%.
The hydrographic data (temperature, pH, salinity anddissolved oxygen) of the profiles are reported elsewhere(Singh et al., 2011). However, for the sake of completeness
the potential temperature and salinity data used for inter-pretation in this study are given in Table 1.
3. RESULTS AND DISCUSSION
The Nd concentration in the water column along the87�E transect of the BoB covers a wide range, from 14.8to 46.4 pmol/kg (Table 1). For convenience of interpreta-tion, the data are sub-grouped into the northern BoB(north of 17�N), central BoB (10�N–17�N) and the south-ern BoB (south of 10�N). The concentration of Nd in sur-face waters of the BoB decreases from north to south,while the subsurface value exhibits a minimum at a waterdepth of around 100 m (c.f. Sections 3.1 and 3.2). Nozakiand Alibo (2003) have reported Nd concentration–depthprofile at a station (PA-9; 8.000�N, 88.995�E) near to sta-tion 0807 measured in this study. The Nd concentration–depth profiles at these stations are similar, but the Nd con-centrations measured in this study are systematically higherby �10% than those reported for PA-9. The cause for thisdifference is unclear; it could be due to spatial variabilityand/or calibration uncertainties. A cursory look at theNd concentration data in the northern and central BoBwaters from the upper water column (�100 m to�2000 m) also show that they are higher (about two fold)than those reported for similar depths from other oceanicbasins (Stordal and Wasserburg, 1986; Bertram and Elder-field, 1993; Jeandel et al., 1998; Nozaki and Alibo, 2003;
Fig. 1. Locations of sampling sites (red circles) in the BoB during the cruise SS259. The pink triangle represents the sampling location of PA-9(Nozaki and Alibo, 2003), and the yellow squares are sediment trap locations (Unger et al., 2003). All the color contours (bathymetry) in thisand subsequent figures are plotted with the help of ODV4 software (Schlitzer, 2010). The bathymetry data for the section contours are takenalong the 87�E transect using GMRT grid (http://www.geomapapp.org; Ryan et al., 2009). (For interpretation of the references to color inthis figure legend, the reader is referred to the web version of this article.)
40 S.P. Singh et al. / Geochimica et Cosmochimica Acta 94 (2012) 38–56

Author's personal copy
Table 1Depth profiles of potential temperature, salinity, dissolved Nd and Nd isotope composition in the Bay of Bengal.
Station Depth (m) Pot. temp. (�C) Salinity Nd (pmol/kg) eNda 2rl
b
0806(5.813�N, 86.997�E;max. depth �3890 m)
5 29.252 33.351 22.1 �8.0 1.260 27.523 35.034 18.6 �8.7 0.7
130 18.541 34.807 16.8 nm nm200 13.818 35.027 18.1 �11.3 0.5290 11.766 35.061 19.7 �12.1 0.2380 11.038 35.082 17.0 nm nm420 10.707 35.066 – �10.8 0.2460 10.376 35.050 21.4 nm nm600 9.454 35.030 21.1 �11.4 0.4800 8.035 34.989 21.2 �11.4 0.4
1000 6.634 34.936 21.5 �10.0 0.31200 5.738 34.903 24.3 nm nm1400 4.893 34.871 25.4 �10.2 0.31700 3.397 34.813 27.7 �10.5 0.22000 2.577 34.777 29.2 �10.2 0.32300 2.082 34.755 30.3 nm nm2600 1.772 34.742 30.9 �10.0 0.12900 1.542 34.734 33.8 nm nm3200 1.385 34.728 36.5 �9.7 0.23500 1.211 34.723 39.8 nm nm3800 1.097 34.719 38.2 �9.1 0.2
0807(8.494�N, 87.007�E;max. depth �3630 m)
5 29.211 33.305 24.2 �10.4 0.670 27.284 34.878 17.8 �12.8 0.9
160 16.446 34.999 18.8 �13.6 0.6300 12.127 35.052 22.7 �13.1 0.6400 10.857 35.050 21.5 �12.8 0.5600 9.053 35.010 22.1 �12.5 0.8800 7.820 34.980 23.3 �19.1 0.1900 7.148 34.958 24.8 �11.2 0.2
1000 6.628 34.938 23.5 �12.5 0.31300 5.190 34.880 27.5 �11.3 0.31500 4.296 34.849 33.2 nm nm1800 3.097 34.800 nm �11.2 0.42100 2.420 34.771 32.6 nm nm2400 1.989 34.752 nm �11.6 0.32700 1.670 34.739 35.2 nm nm3000 1.500 34.732 nm �10.6 0.23300 1.305 34.726 40.5 nm nm3550 1.174 34.721 36.4 �10.6 0.3
0808(11.270�N, 86.990�E;max. depth �3314 m)
5 28.796 33.313 34.5 �13.9 0.470 25.648 34.947 24.8 �13.6 0.5
175 14.793 34.947 22.7 �12.3 0.4280 11.583 35.032 21.1 �11.5 0.4380 10.588 35.032 20.5 �10.5 0.5495 9.563 35.006 29.9 �12.8 0.4600 8.827 34.986 24.2 �11.6 0.4700 8.143 34.963 23.1 �12.1 0.4900 6.903 34.945 26.1 �12.5 0.5
1200 5.394 34.856 29.0 �13.6 0.41700 3.306 34.775 29.9 �11.6 0.42300 2.072 34.755 43.3 �11.7 0.32900 1.549 34.727 38.5 �11.0 0.33200 1.324 34.727 41.2 �11.0 0.2
0809(13.769�N, 87.004�E;max. depth �3028 m)
5 28.671 33.207 35.6 �14.8 0.285 25.232 34.961 14.8 �14.0 0.3
180 14.938 34.966 22.2 �16.3 0.2300 11.604 35.038 21.5 �13.9 0.3400 10.537 35.035 23.1 �13.4 0.2500 9.768 35.027 23.8 �14.5 0.4600 9.012 35.010 23.9 �13.9 0.4700 8.242 34.988 24.5 �14.8 0.2
S.P. Singh et al. / Geochimica et Cosmochimica Acta 94 (2012) 38–56 41
Author's personal copy
Table 1 (continued)
Station Depth (m) Pot. temp. (�C) Salinity Nd (pmol/kg) eNda 2rl
b
800 7.720 34.973 33.1 �14.3 0.4900 7.172 34.954 25.9 nm nm
1000 6.475 34.929 25.6 �10.9 0.31400 4.764 34.864 27.8 �14.2 0.22000 2.617 34.778 34.1 �10.6 0.52600 1.793 34.743 36.8 �10.1 0.22900 1.524 34.733 35.2 �10.5 0.2
0810(16.420�N, 90.498�E;max. depth �2437 m)
5 28.389 32.117 43.1 �13.7 0.240 28.882 33.541 32.9 �13.3 0.3
140 20.670 34.650 21.0 �13.6 0.5200 14.306 34.959 22.6 �13.0 0.3300 11.445 35.031 23.0 �10.3 0.4400 10.549 35.030 23.7 �11.8 0.3500 9.917 35.024 23.3 �12.9 0.3600 9.222 35.012 23.4 �12.5 0.3700 8.511 34.992 24.2 �12.5 0.4800 7.791 34.971 25.8 �11.7 0.4
1000 6.574 34.930 28.5 �16.4 0.41200 5.594 34.894 29.0 �11.0 0.31400 4.783 34.864 30.4 �11.0 0.31700 3.493 34.814 31.4 �11.8 0.32000 2.587 34.777 34.4 �11.6 0.22200 2.246 34.762 34.8 �12.2 0.4
0811(16.759�N, 86.993�E;max. depth �2580 m)
5 28.327 33.856 34.0 �15.0 0.370 23.162 34.747 26.5 �14.5 0.3
110 19.491 34.874 23.1 �14.5 0.3180 14.670 34.960 23.7 �14.8 0.4300 11.475 35.032 23.7 �14.6 0.4400 10.550 35.033 24.7 �14.0 0.4500 9.776 35.024 26.8 �13.4 0.4600 9.049 35.009 26.8 �14.1 0.4700 8.473 34.993 27.4 �13.3 0.5900 7.235 34.954 26.4 �12.1 0.4
1100 6.181 34.917 28.9 nm nm1300 5.328 34.886 30.2 nm nm1500 4.488 34.854 31.9 �11.0 0.31700 3.590 34.818 32.9 nm nm1900 2.920 34.791 34.7 �11.7 0.42100 2.422 34.770 38.5 nm nm2300 2.169 34.759 35.8 �12.0 0.42500 1.859 34.746 37.7 �11.9 0.3
0812(18.759�N, 86.997�E;max. depth �2128 m)
5 27.497 32.049 45.4 �14.5 0.350 25.633 34.311 31.0 �13.9 0.3
110 18.693 34.875 22.5 �13.4 0.3200 13.249 34.991 25.8 �14.0 0.4300 11.472 35.028 26.3 �13.3 0.3400 10.564 35.030 30.0 �14.0 0.4500 9.885 35.024 25.7 �13.2 0.5600 9.232 35.012 28.3 �14.2 0.2800 7.986 34.979 28.0 �11.8 0.3
1000 6.634 34.934 29.4 �13.1 0.31200 5.506 34.892 31.1 �13.0 0.31400 4.552 34.855 32.0 �12.7 0.21700 3.225 34.803 37.2 �12.2 0.22000 2.351 34.766 38.8 �11.7 0.2
(continued on next page)
42 S.P. Singh et al. / Geochimica et Cosmochimica Acta 94 (2012) 38–56

Author's personal copy
Amakawa et al., 2004, 2009; Porcelli et al., 2009; Rickliet al., 2009; Bayon et al., 2011; Carter et al., 2012).
eNd in the Bay of Bengal displays large variability, from�16.4 to �8 (n = 124; Table 1), with one sample fromstation 0807 (depth �800 m) having a highly unradiogenicvalue of �19.1 possibly contributed by rivers drainingpeninsular India. Surface and intermediate waters of thenorthern and central bay have lower eNd compared towaters from similar depths of the southern bay (c.f.Sections 3.1 and 3.2). eNd in the southern BoB comparesfavorably with the available data for a few samples fromthis region (Amakawa et al., 2000). The eNd of the northernand central BoB waters is less radiogenic compared to thosereported from other regions of the Indian Ocean (Bertramand Elderfield, 1993; Jeandel et al., 1998; Amakawa et al.,2000; Tazoe et al., 2011), and also the rest of global oceans;the only exceptions being Baffin Bay, the North AtlanticSubpolar Gyre and the Niger delta margin (Stordal andWasserburg, 1986; Amakawa et al., 2004, 2009; Porcelliet al., 2009; Rickli et al., 2009; Bayon et al., 2011; Carteret al., 2012). It is interesting to note that the eNd values ofbottom waters in the profiles 0806–09 south of 15�N (�9to �11) and in profiles 0810–0813 north of 15�N (�11 to�13) overlap with reported eNd values of Holocene sedi-ments from the region (Colin et al., 1999). The close resem-blance of eNd values of bottom waters and Holocenesediments is indicative of the role that sediments of theBoB play as sources or sinks of dissolved Nd to bottomwaters. More recently, Piotrowski et al. (2009) have utilizedthe Nd isotope composition of sedimentary Fe–Mn oxyhy-droxides to trace deep water circulation in the IndianOcean. The composition of core top eNd values of thoseFe–Mn phases shows good agreement with eNd of bottomwater measured in this study from similar depths atadjacent locations (depth �3800 m at station 0806), whichre-affirms the application of Nd isotope composition ofFe–Mn oxyhydroxides as a proxy of Nd isotope composi-tion of deep waters.
3.1. Surface waters
Samples from depths 65 m are considered as surfacesamples. The salinity of surface waters in the northernBay of Bengal is generally low due to a large influx of freshwater from the Ganga–Brahmaputra river system. Simi-larly the contribution of less saline Indonesian Through-
flow water through an eastward Equatorial Jet (EJ),generally encountered during the fall inter-monsoon (She-noi et al., 1999), decreases the salinity in southern BoB sur-face waters. In the central BoB, the salinity of surfacewaters at station 0811 is marginally higher compared tothose of the northern and southern bay (Fig. 2a). Thiscould be due to eddy pumping of more saline subsurfacewater from 50–100 m depth in the region (Murty et al.,1992). In contrast to salinity, the concentration of dissolvedNd in surface waters of the BoB shows a North–Southdecreasing trend (Fig. 2b), ranging from 46.4 to22.1 pmol/kg, albeit with significant scatter. The plot ofNd concentration in surface waters with salinity (Fig. 3a)shows an overall decreasing trend, although the data pointsdo not fall on the theoretical mixing line. This suggests thatin addition to water mixing, other processes also influencethe dissolved Nd abundance and distribution in these sur-face waters. Similar to dissolved Nd in surface waters ofthe bay, eNd also shows a North–South trend (Fig. 2c), withless radiogenic values (eNd ��15) at station 0813 in thenorthernmost surface waters, compared to that in surfacewaters of the southernmost station 0806 (eNd ��8). Thedissolved Nd in surface waters of the northern and centralBoB has eNd values in range of �14 ± 1 (Fig. 2c). TheNorth–South trend in eNd values can be explained in termsof source functions of Nd to the bay. The major contribu-tors of dissolved Nd to the bay are the dissolved and par-ticulate phases of the G–B and the Irrawaddy Rivers alongwith inputs from the peninsular rivers, the Godavari andthe Krishna. Yet, there is no published data on dissolvedeNd of the G–B Rivers. Chatterjee et al. (personal commu-nication) have measured dissolved eNd values of �16 for theGanga River, similar to or slightly more radiogenic com-pared to that of its particulate load (��16 to �18; Gold-stein et al., 1984; Goldstein and Jacobsen, 1987; Singhet al., 2008). The isotope composition of dissolved Nd ofthe Brahmaputra River is not available, but it supplies sed-iments with eNd � �14 (Galy and France-Lanord, 2001;Singh and France-Lanord, 2002), more radiogenic thanthe Ganga River. The combined flow of the Ganga–Brah-maputra, therefore, is likely to supply dissolved Nd witheNd ��15 ± 1 to the BoB. Another potential source oflow radiogenic Nd to surface waters of the northern BoBis its release from particulate matter supplied by the G–BRivers and/or from the shelf sediments of the bay, whichare also dominated by contributions from the G–B Rivers.
Table 1 (continued)
Station Depth (m) Pot. temp. (�C) Salinity Nd (pmol/kg) eNda 2rl
b
0813(20.047�N, 87.262�E;max. depth �688 m)
5 27.652 32.668 46.4 �15.0 0.370 23.952 34.661 24.4 �13.9 0.3
150 17.110 34.895 22.5 �16.0 0.3250 12.411 35.008 25.3 �13.1 0.2350 11.053 35.029 24.8 �13.3 0.3440 10.350 35.028 27.0 �12.6 0.3550 9.411 35.016 27.3 �13.5 0.3640 8.824 35.003 30.4 �11.7 0.3
nm: Not measured.a
eNd is calculated with respect to 143Nd/144Nd value 0.512638 of CHUR (Jacobsen and Wasserburg, 1980).b
Internal precision.
S.P. Singh et al. / Geochimica et Cosmochimica Acta 94 (2012) 38–56 43

Author's personal copy
Such a release can also support the non-conservativebehavior of dissolved Nd in BoB surface waters. Thus,the supply of Nd to the BoB from the G–B river systemboth as dissolved and particulate phases can account forthe measured eNd in the northern bay. On the other hand,the more radiogenic eNd in surface waters of the southernBoB (Fig. 2c), could be a result of mixing of the IndonesianThroughflow Surface water (IW), having eNd � �4.1 (Jean-del et al., 1998; Amakawa et al., 2000), with surface watersof the central bay (eNd � �14 ± 1), a proposition corrobo-rated by the salinity data. Alternatively, if the peninsular
rivers, the Godavari and the Krishna supply significantamounts of low radiogenic Nd, then its mixing with moreradiogenic eNd water from the Irrawaddy system may alsoexplain the Nd isotope composition of the southern BoBsurface waters. Data on the dissolved Nd concentrationand isotope composition in the peninsular and the Irra-waddy Rivers are unavailable to validate the above alterna-tive. Given the likely similarity in eNd values of particulatesof the G–B and the peninsular rivers (Ahmad et al. 2005,2009), and considering that water and particulate matterdischarge of the peninsular rivers is orders of magnitudelower than that of the G–B river system, it seems unlikelythat the contribution of the peninsular rivers to the budgetof Nd and the eNd of the BoB would be significant. Thisinference however needs to be attested through direct mea-surements of dissolved Nd concentration and its eNd in thepeninsular rivers and their estuaries. Similarly, the domi-nance of the G–B river contribution over that of the Irra-waddy River is also indicated in the eNd value of surfacewaters of station 0810 (Fig. 1). This station in the easternBoB along the track of the Irrawaddy mouth has eNd -� �13.7, significantly less radiogenic than the river value(eNd � �10; Allegre et al., 2010). Further, modeling thesurface water circulation in this region (Shankar et al.,2002) using an Oceanic General Circulation Model(OGCM) has shown that the flow of the Irrawaddy riverwater to the southern BoB during the period of this study(November) is restricted. Thus the available data seem toindicate that the Ganga–Brahmaputra river system domi-nates over the Irrawaddy and the peninsular rivers in terms
Fig. 2. The distribution of (a) salinity, (b) dissolved Nd concen-tration and (c) eNd in surface waters along the 87�E transect.Salinity increases southward, except at station 0811 where it ishigher compared to the rest of BoB surface waters. The Ndconcentration shows a North–South decreasing trend, with morenegative eNd values in the northern BoB compared to that in thesouthern BoB. The high Nd concentration and lower eNd in thenorthern and central BoB reflects dissolved Nd sourced from theG–B river system.
Fig. 3. Scatter plots of (a) salinity versus Nd concentration; (b)1/Nd versus eNd in surface waters of the BoB. The salinity versusNd concentration plot shows a decreasing trend, albeit withsignificant scatter. 1/Nd versus eNd also exhibits an overall lineartrend, with data for the northern and central BoB scatteringaround the mixing line.
44 S.P. Singh et al. / Geochimica et Cosmochimica Acta 94 (2012) 38–56
Author's personal copy
of their contribution to the dissolved Nd budget in the BoBsurface waters along the 87�E transect.
Fig. 3b is a plot of 1/Nd vs eNd in surface waters. Thedata show an overall mixing trend with data points fromthe northern and central BoB scattering around the mixingline. This overall trend, though indicative of two endmem-ber mixing in surface waters of the BoB, also suggests that,analogous to dissolved Nd concentration, the behavior ofeNd in these waters is also not strictly conservative due topossible Nd release from particulate matter. The North–South features of dissolved Nd and its isotope compositionin surface waters bring out the roles of dissolved andparticulate phases of the G–B river system and the Indone-sian Throughflow waters in determining their distribution(Fig. 3a and b).
3.2. Subsurface waters
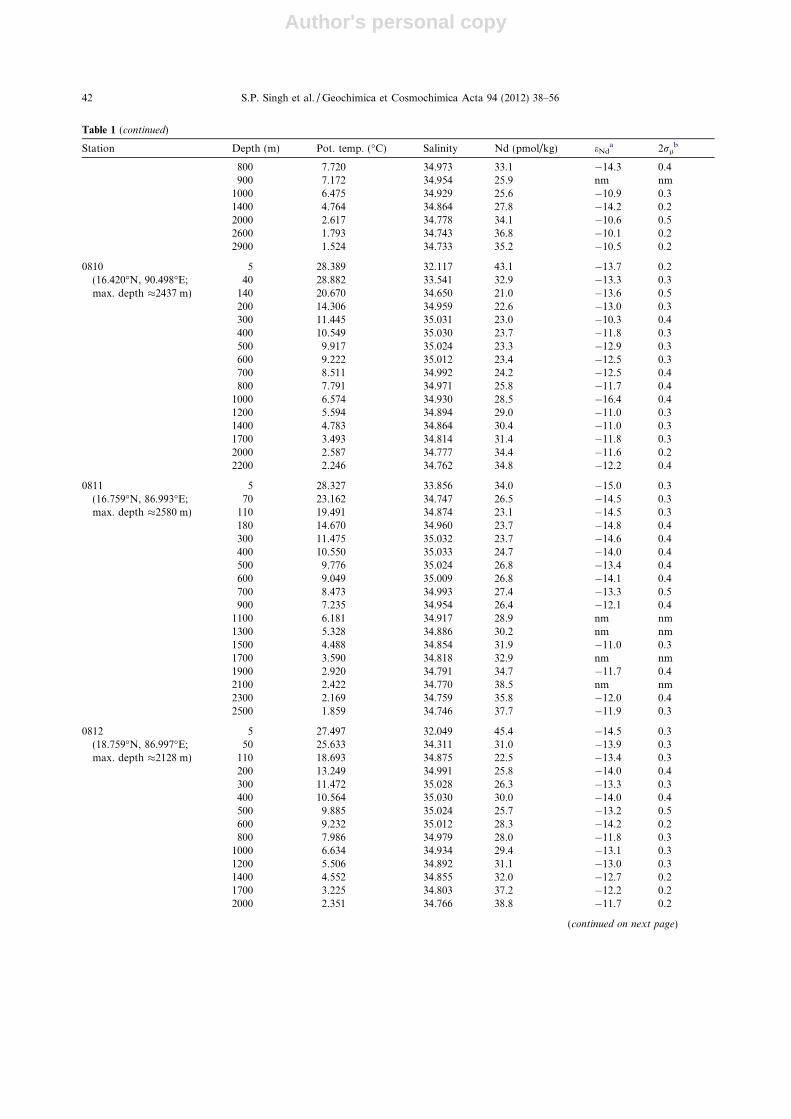
The contours of dissolved Nd concentration in the Bayof Bengal are shown in Fig. 4a. A common feature of theNd concentration–depth profiles (Table 1) is that it de-creases from a high value at or near the sea surface toa minimum at about 100 m, followed by a gradual in-crease with depth (Fig. 5). The high concentration ofNd in surface waters is typical of many other elementsthat include Al, Pb, etc. observed in various oceanic re-gions (Bruland and Lohan, 2003 and references therein;Measures and Vink, 1999, 2000; Obata et al., 2004). Theseenhanced concentrations in surface waters, particularly in
open ocean regions, have been interpreted in terms oftheir release from eolian dust as it interacts with surfacewaters. The high surface concentration of Nd in theBoB, on the other hand, may have multiple sources: dis-solved Nd from the G–B endmember, the Bay of BengalLow Salinity water (GB–BBLS) at station 0812 and its re-lease from particulate matter (Amakawa et al., 2000; La-can and Jeandel, 2005; Jacobson and Holmden, 2006).The source of this particulate matter could be either thatdischarged by the G–B river system or eolian dust orboth. Further, Amakawa et al. (2000) observed thatdissolved Nd distribution in surface waters of the BoBfollows the distribution of 228Ra sourced from the conti-nental shelf. These results highlight the important roleof particulate matter and shelf sediments in supplyingNd to surface waters of the bay.
The additional Nd (NdAdd) in the BoB surface layer(top �100 m) from these source(s) (equal to the differencein the area between the measured Nd concentration–depthprofile and the extrapolated Nd profile from its minimumto the sea surface) is calculated to range from �285 to�1350 nmol/m2 (Table 2). This addition represents thesum of in situ release of Nd from the particulate phasesat the sampling sites and that transported as dissolvedphase by estuarine and low salinity water following its re-lease from G–B River particles. The in situ release couldbe from both eolian dust and river particles. The NdAdd
shows an overall North–South decreasing trend with sig-nificant scatter. This trend is similar to that reported for
Fig. 4. The distribution of dissolved Nd (a) concentration; (b) isotope composition in the water column of the Bay of Bengal along the 87�Etransect.
S.P. Singh et al. / Geochimica et Cosmochimica Acta 94 (2012) 38–56 45
Author's personal copy
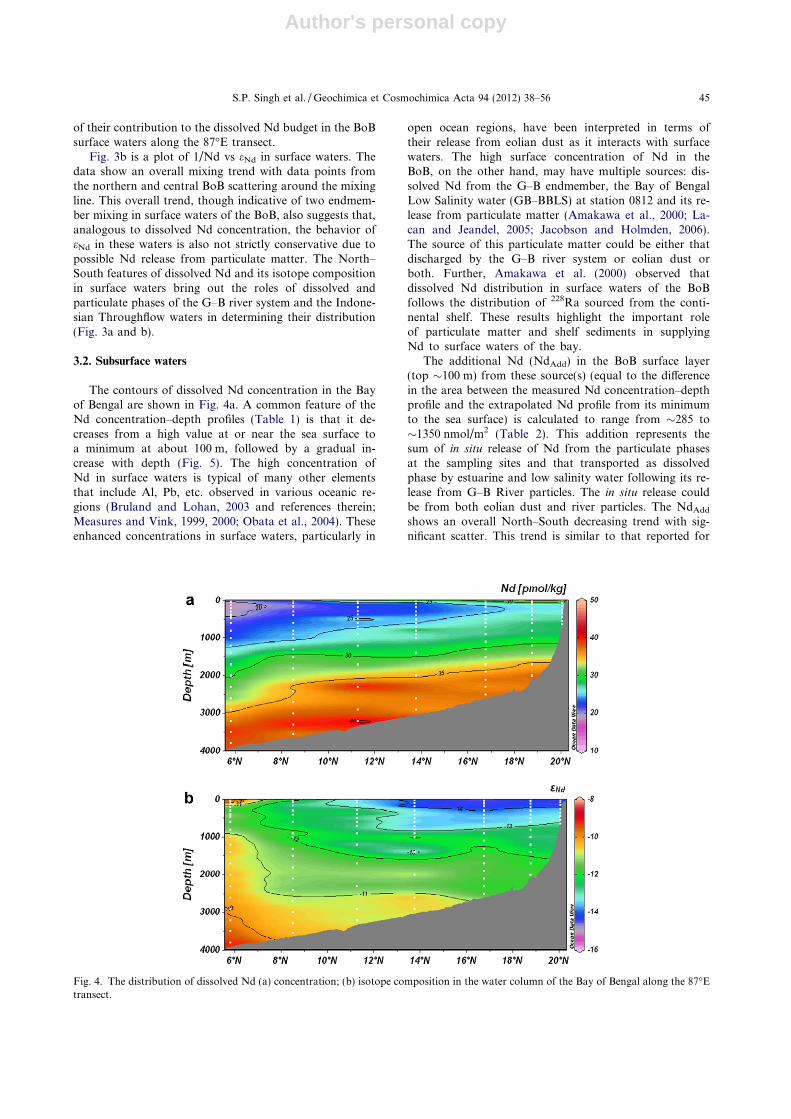
settling lithogenic particle flux (Table 2, Unger et al.,2003), suggestive of their inter–relation. The calculatedNdAdd allows us to constrain the leachable Nd from par-ticulate phases, if data on Nd abundance in particles, theirfluxes and residence time of dissolved Nd are available.The Nd concentration of the G–B particulate phases isassumed to be the same as that measured for Nd in sus-pended and bed sediments in the Ganga and BrahmaputraRiver basins (Singh and France-Lanord, 2002; Singhet al., 2008). These values are similar to the Nd abundancein Upper Continental Crust (UCC) and Holocene sedi-ments of the bay (Colin et al., 1999; McLennan, 2001).The particulate lithogenic flux has been reported for differ-ent locations in the bay (Fig. 1, Unger et al., 2003). Usingthese lithogenic fluxes and assuming a residence time of
2.5 years (Amakawa et al., 2000) for dissolved Nd insurface waters (�100 m), it can be estimated thatthe NdAdd corresponds to a minimum Nd release of�9–23% from sinking G–B particulate matter (Table 2).This is likely to be an upper limit, considering that asignificant part of NdAdd may be released in estuaries(Sholkovitz, 1993; Sholkovitz and Szymczak, 2000 and ref-erences therein) and transported as dissolved Nd to thesampling locations. The dip in Nd concentration in theupper thermocline (�100–200 m, Table 1) is therefore anartifact of the surface addition of Nd, if there is no supplyof Nd from estuaries and/or particulate matter then itsprofile would likely have been similar to those ofnutrients, characterized by surface water removal andsub–surface water regeneration. The steady increase inthe concentration of dissolved Nd with depth (Table 1)can result from its release from sinking particles as theytransit through the water column. Alternatively, supplyof Nd to the bottom waters from sediment pore waters(benthic flux) and its subsequent upward diffusion can alsogenerate profiles similar to those observed. The impor-tance of pore water as a source of dissolved Nd to bottomwaters is debated. The results of Haley et al. (2004) andBayon et al. (2011) from the California margin, off Peruand the Niger delta for the stations away from cold seepssupport the hypothesis, whereas the data of Nozaki andAlibo (2003) for station PA-9 in the BoB and that ofCarter et al. (2012) for two stations in the eastern PacificSector of the Southern Ocean, seem to indicate potentialremoval of Nd in the benthic boundary layer rather thanits release. The relative significance of Nd release from thesinking particles vis-a-vis benthic supply can be assessedonly when data on dissolved Nd concentration in sedimentpore waters become available.
The distribution of eNd in the upper water column(Fig. 4b; Table 1) shows a wide range, between �8 and�15, attributable to multiple sources of dissolved Nd withtheir distinct eNd signatures. In the following section an ef-fort has been made to estimate the particulate Nd releaseand its source signature using an inverse modelingapproach.
Fig. 5. Concentration–depth profiles of dissolved Nd in the watercolumn of the northern, central and southern BoB along the 87�Etransect. Note the increase in water column depth from north tosouth. The data show a North–South decreasing trend (shift in thegrey band representing Nd concentration in the depth interval�100 to �2000 m). Nd concentrations in the bottom waters of thesouthern BoB show a marginal decrease similar to the trendreported for PA-9 (Nozaki and Alibo, 2003).
Table 2The settling lithogenic flux, additional Nd (NdAdd) and fractionalsolubility of Nd in top 100 m.
Station Lithogenica
flux (g/m2/year)NdAdd
(nmol/m2)Fractionalsolubilityb (%)
0806 4.3 285 150807 7.9c 300 90808 11.2 780 160809 10.0c 800 180810 11.6c 1160 230811 11.6c 600 120812 14.5 1180 180813 14.5 1350 21a
From Unger et al., (2003).b
Fractional solubility (%) = (NdAdd/Lithogenic particulateNd) � 40.c
Calculated average flux.
46 S.P. Singh et al. / Geochimica et Cosmochimica Acta 94 (2012) 38–56
Author's personal copy
3.3. Dissolved Nd supply from various water masses and from
particulate phases in the Bay of Bengal
3.3.1. Inverse modeling
The lateral and vertical distributions of dissolved Ndconcentration and its isotope composition in the BoBwaters are the result of a complex mixture of Nd contribu-tions from various water masses, sinking particulate matterand sediment–water interactions with their characteristiceNd values. An inverse modeling (Tarantola, 2005; Tripathyand Singh, 2010) approach has been used to determine thecontributions from these sources, particularly release fromparticulate matter. For an underdetermined system suchas considered in this study, an inverse model provides themost probable estimates of the fraction of various watermasses and the amount of excess dissolved Nd along withtheir uncertainties based on the mass balance equations ofsalinity, temperature, Nd concentration and its radiogenicisotope composition.
The inversion method used in this study relies on the fol-lowing set of mass balance equations for the ‘ith’ watermass and the ‘jth’ water sample.
X9
i¼1
fij ¼ 1 ð1Þ
X9
i¼1
fijxi ¼ xj ð2Þ
X9
i¼1
fijNdi þNdexcessj ¼ Ndj ð3Þ
X9
i¼1
fijNdieNdi þNdexcessj eNdexcess
j¼ NdjeNdj ð4Þ
where, fij is the water mass fraction of the ‘ith’ water massin ‘jth’ sample, xi and xj are either potential temperature orsalinity of the ‘ith’ water mass and ‘jth’ sample, and Ndexcess
j
is the fraction of dissolved Nd in ‘jth’ sample in excess ofthe sum of contributions from different water masses. Theseequations are written in a matrix form i.e., d = g(v), where“d” and “v” form the measured and unknown parametricmatrices associated by a transformation matrix “g”. In thisapproach, it has been assumed that the variables (elementsof matrix “v”) follow the log normal probabilitydistributions for the constraint of positivity and the dataset (elements of matrix “d”) is a linear (quasi-linear)combination of these variables. The quasi-Newton method(Tarantola, 2005) has been used to find the most probableset of variables (v) along with their uncertainties by mini-mizing the misfit between the matrices, “d” and “g(v)”.Considering the underdetermination of the problem andlower sampling frequency at deeper depths, the entire dataset is dealt with collectively to seek the most probablesolution of the problem.
3.3.2. A priori information
The application of inverse modeling requires a priori
knowledge of various water mass endmembers contributingNd to a given sample, their Nd concentration and eNd
values. The prominent water masses present in the surfaceand subsurface layers of the BoB have been discussed pre-viously by several authors (Sastry et al., 1985; Dileep Ku-mar and Li, 1996; Rao et al., 1996; You, 1997, 2000).Among these, nine water masses are assumed to contributedissolved Nd to the region of this study (Table 3). Theseare, (1) G–B dominated Bay of Bengal Low Salinity Water(GB–BBLS); (2) Bay of Bengal Subsurface Water (BBSS);(3) Arabian Sea High Salinity Water (ASHS); (4) NorthIndian Intermediate Water (NIIW); (5) North IndianDeep Water (NIDW) (6) Indonesian Throughflow SurfaceWater (IW); (7) Indonesian Throughflow IntermediateWater (IIW); (8) Modified North Atlantic Deep Water(MNADW); and (9) Antarctic Bottom Water (AABW).The a priori information on potential temperature, salinity,dissolved Nd and eNd for these water masses are given inTable 3. These data for GB–BBLS and BBSS are taken tobe the same as those measured in this study for surfacewaters of station 0812, and for the sample from a waterdepth of 70 m from the central BoB profile at 0811 sinceits occasional shoaling can measurably alter salinity, Ndand eNd in the BoB surface waters. These parameters forASHS, NIIW and NIDW, water masses forming in theArabian Sea (Wyrtki, 1973; Dileep Kumar and Li, 1996)are based on unpublished results from station 0802(14.419�N, 69.418�E; Goswami et al., in preparation) inthe eastern Arabian Sea. The values of these propertiesfor the IW and IIW are those reported from the Indonesianstraits (Jeandel et al., 1998; Amakawa et al., 2000). Thedata for MNADW are taken to be the same as that mea-sured at a depth of 3100 m in the profile CD-1504(27.01�S, 56.97�E) in the Madagascar basin (Bertram andElderfield, 1993). The potential temperature and salinitydata for AABW are assumed to be the same as those re-ported for water from a depth of 4709 m at GEOSECS sta-tion 430 (Dileep Kumar and Li, 1996). The eNd anddissolved Nd data for AABW are taken from Frank(2002), Jeandel (1993) and Zieringer et al. (2011).
3.3.3. A posteriori values
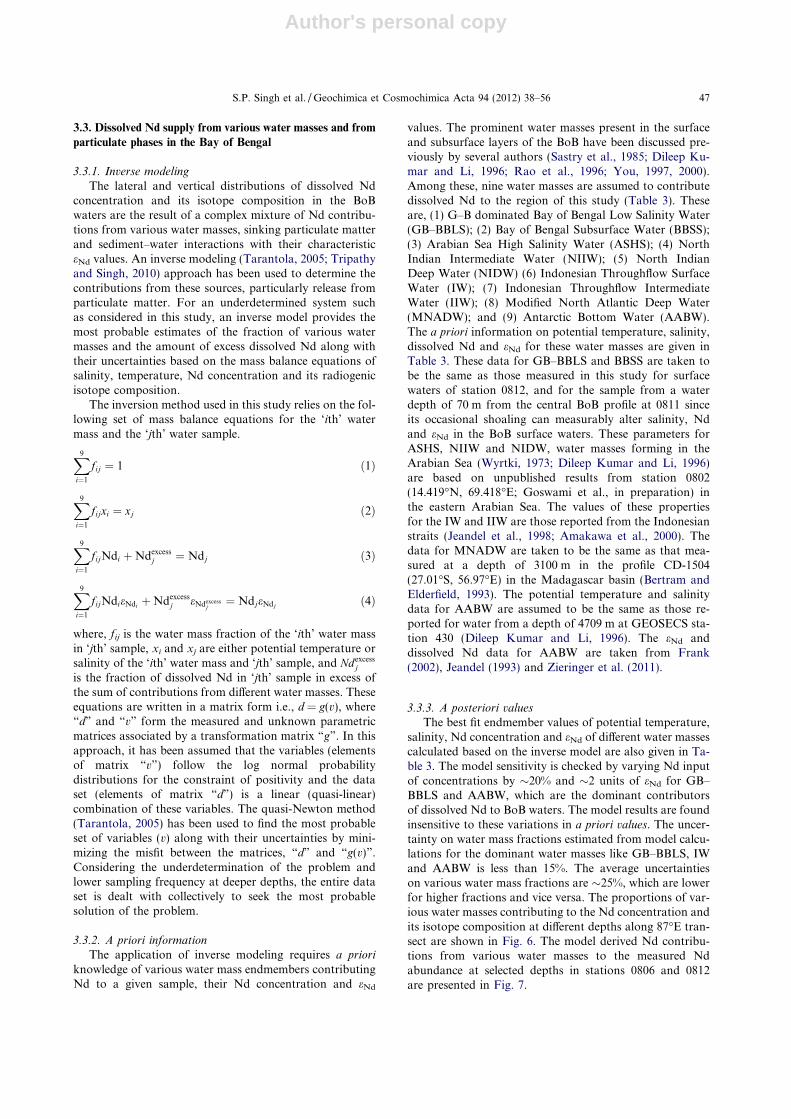
The best fit endmember values of potential temperature,salinity, Nd concentration and eNd of different water massescalculated based on the inverse model are also given in Ta-ble 3. The model sensitivity is checked by varying Nd inputof concentrations by �20% and �2 units of eNd for GB–BBLS and AABW, which are the dominant contributorsof dissolved Nd to BoB waters. The model results are foundinsensitive to these variations in a priori values. The uncer-tainty on water mass fractions estimated from model calcu-lations for the dominant water masses like GB–BBLS, IWand AABW is less than 15%. The average uncertaintieson various water mass fractions are �25%, which are lowerfor higher fractions and vice versa. The proportions of var-ious water masses contributing to the Nd concentration andits isotope composition at different depths along 87�E tran-sect are shown in Fig. 6. The model derived Nd contribu-tions from various water masses to the measured Ndabundance at selected depths in stations 0806 and 0812are presented in Fig. 7.
S.P. Singh et al. / Geochimica et Cosmochimica Acta 94 (2012) 38–56 47

Author's personal copy
3.3.3.1. Nd contribution from different water masses. In sur-face waters, as would be expected, GB–BBLS makessignificant contribution to the water mass budget(f GB–BBLS > 5%) along the entire 87�E transect (Fig. 6a)with its maximum value (f GB–BBLS > 80%) at station 0812in the northern Bay of Bengal. The Nd contributed bythe GB–BBLS decreases generally southward from >95%at the northern station 0812 to �10% at the southernmoststation 0806, and drastically below a depth of �50 m(f GB–BBLS �10% or less; Figs. 6a and 7). On the other hand,the Nd contribution of IW decreases from �30% in surfacewaters at station 0806 to �10% at �50 m depth at station0812 (Fig. 7). The depth of penetration of IW also decreasesnorthward (Fig. 6b); it has Nd contribution of >5% atdepths of �200 m in the southernmost profile (�6�N).These two water masses, GB–BBLS and IW by and largeaccount for almost 100% of salinity but only �40 to�95% of dissolved Nd in BoB surface waters, with lowervalues in the southern region. This suggests that the surfacewater salinity of the BoB in the latitude belt �20�N–6�N isdetermined by the Ganga–Brahmaputra in the north (char-acterized by GB–BBLS) and the Indonesian Throughflowwaters in the south. For dissolved Nd, in addition to thesetwo water masses additional source(s) is required to balance
the budget. This finding is consistent with earlier observa-tions based on Nd–Salinity and eNd–1/Nd relation (c.f.Section 3.1).
Below the surface layer, significant water mass fraction(�30%) of ASHS and BBSS waters are noticed south andnorth of 13�N respectively, without any discernible signa-ture of their upwelling (Fig. 6c and d). The results indicatethat the ASHS water mass enters the southern BoB at adepth interval of �50–100 m and spreads northwardconsistent with the finding of Murty et al. (1992) and Sastryet al. (1985). The Nd contribution of ASHS is at a maxi-mum (�30%) at 60 m depth at station 0806, and decreasesboth northward as well as with depth to values of �5% at�800 m depth (Fig. 7). On the other hand, Nd contributionof BBSS is �15% at 200 m depth at station 0812, decreasingboth above and below this depth.
IW is the dominant source of surface waters of thesouthern and central BoB. In contrast, intermediate waterfrom the Indonesian straits (IIW) is only minor(f IIW � 5%) along the 87�E transect (Fig. 6e). This frac-tion accounts for �5–10% of Nd in the depth range of200–1400 m at station 0806 (Fig. 7). The NIIW, a mixtureof Persian Gulf Water (PGW) and Red Sea Water (RSW)with ASHS water, enters the southern Bay of Bengal
Table 3A priori and a posteriori values of the water mass endmembers.
Water mass Pot. temp. (�C) Salinity Nd (pmol/kg) eNd
A priori values
GB–BBLS 27.497 ± 0.001 32.049 ± 0.001 45.4 ± 1.1 �14.5 ± 0.3BBSS 23.162 ± 0.001 34.747 ± 0.001 26.5 ± 0.7 �14.5 ± 0.3ASHS 26.347 ± 0.001 36.514 ± 0.001 14.0 ± 0.4 �7.1 ± 0.3NIIW 11.677 ± 0.001 35.506 ± 0.001 13.5 ± 0.3 �9.0 ± 0.3NIDW 2.717 ± 0.001 34.813 ± 0.001 17.5 ± 0.4 �10.7 ± 0.3IW 29.700 ± 0.001 33.970 ± 0.001 7.4 ± 0.2 �4.1 ± 0.3IIW 4.470 ± 0.001 34.612 ± 0.001 17.6 ± 0.4 �3.6 ± 0.3MNADW 1.774 ± 0.001 34.738 ± 0.001 24.9 ± 0.6 �8.5 ± 0.3AABW �0.615 ± 0.001 34.659 ± 0.001 34.0 ± 0.9a �8.6 ± 0.3b
A posteriori values
GB–BBLS 27.521 ± 0.001 32.020 ± 0.001 44.7 ± 1.0 �14.8 ± 0.2BBSS 23.162 ± 0.001 34.747 ± 0.001 25.5 ± 0.7 �17.1 ± 0.3ASHS 26.347 ± 0.001 36.514 ± 0.001 12.8 ± 0.4 �8.1 ± 0.3NIIW 11.677 ± 0.001 35.506 ± 0.001 13.0 ± 0.3 �9.8 ± 0.3NIDW 2.717 ± 0.001 34.814 ± 0.001 16.5 ± 0.4 �13.8 ± 0.3IW 29.738 ± 0.001 33.912 ± 0.001 7.1 ± 0.2 �4.5 ± 0.3IIW 4.470 ± 0.001 34.612 ± 0.001 17.2 ± 0.4 �3.9 ± 0.3MNADW 1.774 ± 0.001 34.739 ± 0.001 24.0 ± 0.6 �9.2 ± 0.3AABW �0.615 ± 0.001 34.665 ± 0.001 32.3 ± 0.8 �8.7 ± 0.2
Data source:GB–BBLS; this study; station 0812 (18.76�N, 87.00�E), depth � 5 m.BBSS; this study; station 0811 (16.76�N, 86.99�E), depth � 70 m.ASHS; Goswami et al. (unpubl.); station 0802 (14.42�N, 69.42�E), depth � 65 m.NIIW; Goswami et al. (unpubl.); station 0802 (14.42�N, 69.42�E), depth � 500 m.NIDW; Goswami et al. (unpubl.); station 0802 (14.42�N, 69.42�E), depth � 2100 m.IW; (Amakawa et al., 2000); station PA-7 (9.99�S, 101.98�E), depth � 5 m.IIW; (Jeandel et al., 1998); station 20 (11.50�S, 115.95�E), depth � 1099 m.MNADW; (Bertram and Elderfield, 1993); station 1504 (27.01�S, 56.97�E), depth � 3100 m.AABW; (Dileep Kumar and Li, 1996); station GEOSECS 430 (59.98�S, 60.98�E), depth � 4709 m.a
Zieringer et al. (2011).b
Jeandel (1993) and Frank (2002).
48 S.P. Singh et al. / Geochimica et Cosmochimica Acta 94 (2012) 38–56

Author's personal copy
from the Arabian Sea, contributing a maximum of �25%Nd at �400 m depth at station 0806 (Figs. 6f and 7). TheNd contribution (>10%) of NIIW shows a South–Northgradient in the depth range �200–1400 m. This high salin-ity water mass (NIIW) is present throughout the BoB atan intermediate depth interval of 300–500 m (Wyrtki,1973; Dileep Kumar and Li, 1996), and is responsiblefor the high salinity at these depths along the entire87�E transect in the bay. Below this high saline watermass, NIDW, MNADW and AABW constitute the BoBdeep waters (Fig. 6g, h and i). The average depth (NIDW�900 m and MNADW �1700 m) of appearance of bothNIDW and MNADW (Fig. 6g and h) are shallower com-
pared to their depths of occurrence in the Arabian Sea (atstation 0802) and the Madagascar Basin (at station 1504),respectively (Bertram and Elderfield, 1993). This resulthints at shoaling of the waters sourced from the AtlanticOcean due to mixing during their transport to the BoB.In contrast to NIDW and MNADW, AABW seems tobe the major contributor of Nd in the BoB deeper waterswith its Nd contribution varying from �80% to the bot-tom waters (depth �3800 m at station 0806) to �20%at depths �800 m (Fig. 7). Nd concentration at depthsshallower than �800 m is determined by roughly similarcontributions from the NIIW, NIDW and MNADW(Fig. 7).
Fig. 6. Distribution of the prominent water masses at different depths along the 87�E transect, (a) GB–BBLS (G–B dominated Bay of BengalLow Salinity Water); (b) IW (Indonesian Throughflow Surface Water); (c) ASHS (Arabian Sea High Salinity Water); (d) BBSS (Bay of BengalSubsurface Water); (e) IIW (Indonesian Throughflow Intermediate Water); (f) NIIW (North Indian Intermediate Water); (g) NIDW (NorthIndian Deep Water); (h) MNADW (Modified North Atlantic Deep Water); (i) AABW (Antarctic Bottom Water). The contour lines indicatethe water mass fractions in the water column of the bay.
S.P. Singh et al. / Geochimica et Cosmochimica Acta 94 (2012) 38–56 49
Author's personal copy
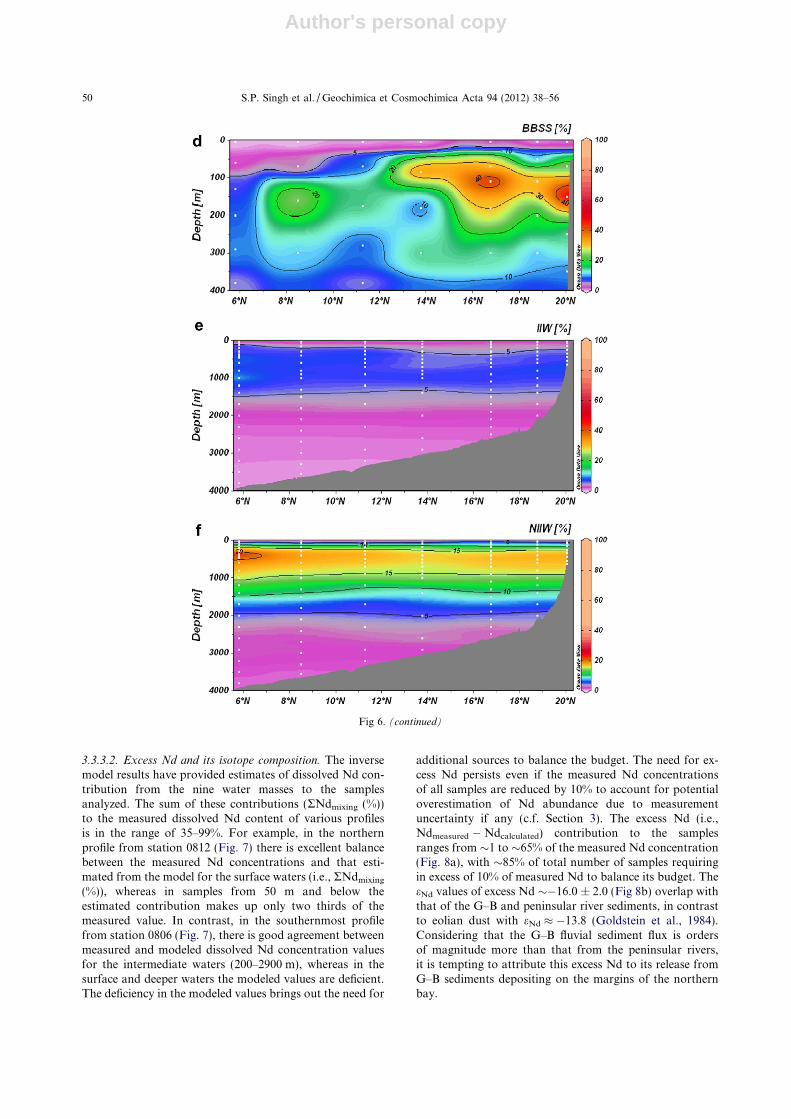
3.3.3.2. Excess Nd and its isotope composition. The inversemodel results have provided estimates of dissolved Nd con-tribution from the nine water masses to the samplesanalyzed. The sum of these contributions (RNdmixing (%))to the measured dissolved Nd content of various profilesis in the range of 35–99%. For example, in the northernprofile from station 0812 (Fig. 7) there is excellent balancebetween the measured Nd concentrations and that esti-mated from the model for the surface waters (i.e., RNdmixing
(%)), whereas in samples from 50 m and below theestimated contribution makes up only two thirds of themeasured value. In contrast, in the southernmost profilefrom station 0806 (Fig. 7), there is good agreement betweenmeasured and modeled dissolved Nd concentration valuesfor the intermediate waters (200–2900 m), whereas in thesurface and deeper waters the modeled values are deficient.The deficiency in the modeled values brings out the need for
additional sources to balance the budget. The need for ex-cess Nd persists even if the measured Nd concentrationsof all samples are reduced by 10% to account for potentialoverestimation of Nd abundance due to measurementuncertainty if any (c.f. Section 3). The excess Nd (i.e.,Ndmeasured � Ndcalculated) contribution to the samplesranges from �1 to �65% of the measured Nd concentration(Fig. 8a), with �85% of total number of samples requiringin excess of 10% of measured Nd to balance its budget. TheeNd values of excess Nd ��16.0 ± 2.0 (Fig 8b) overlap withthat of the G–B and peninsular river sediments, in contrastto eolian dust with eNd � �13.8 (Goldstein et al., 1984).Considering that the G–B fluvial sediment flux is ordersof magnitude more than that from the peninsular rivers,it is tempting to attribute this excess Nd to its release fromG–B sediments depositing on the margins of the northernbay.
Fig 6. (continued)
50 S.P. Singh et al. / Geochimica et Cosmochimica Acta 94 (2012) 38–56

Author's personal copy
The sources of excess Nd in the BoB waters can be itsrelease from in situ riverine particulate matter as well asfrom margin sediments. The distribution of dissolved Ndconcentration with depth also shows a North–Southdecreasing trend, with systematically higher concentrationsthroughout the water column in the northern bay relative tothe southern stations (Fig. 5). The parallel North–Southfeature of both dissolved Nd concentrations and settlinglithogenic fluxes (Fig. 5; Table 2) is an indication of Nd re-lease from settling particles, analogous to the observationof Nozaki and Alibo (2003) in the Bay of Bengal and theAndaman Sea. Assuming a one dimensional verticaladvection–diffusion–scavenging model (Nozaki and Alibo,2003), the total remineralization flux, J (pmol/kg/year)can be estimated from Eq. (5).
Kz@2Cd
@z2
� �þ w
@Cd
@z
� �¼ R ð5Þ
where R is a function of J flux, the concentration of Nd invarious particle classes and their aggregation–disaggrega-tion coefficients, Kz is the eddy diffusion coefficient; w isthe advection velocity; Cd is the Nd concentration in thedissolved phase and z is vertical depth below the sea sur-face. The solution of this equation with various parame-ters drawn from Nozaki and Alibo (2003) predicts alinearly increasing trend of dissolved Nd concentrationwith depth. The slope of this trend is a measure of the J
flux. The J fluxes estimated from the slope of linear fitof Cd (anomalously high Cd at top �100 m are excludedfrom the regression) and depth (z) of profiles and various
Fig 6. (continued)
S.P. Singh et al. / Geochimica et Cosmochimica Acta 94 (2012) 38–56 51
Author's personal copy
parameters used for profile PA-9 (Nozaki and Alibo,2003) yield values of �0.14 pmol/kg/year for the centraland southern BoB (Table 4). The similarity in J fluxesof Nd in the central and southern BoB suggests that thecollective behavior of particles and their properties inthese two regions is similar. This is in contrast to thenorthern BoB where J fluxes a factor of two higher aremost likely due to increased particle density. However, de-spite the similar settling particulate fluxes at the two
stations, 0812 and 0813 in the northern BoB, their J fluxesare significantly different (Table 4). High remineralizationrate (J flux) at the latter shallow station is due to its closeproximity to the continental slope sediment efflux. Thisobservation further corroborates that in-situ particle dis-solution is not the only cause of excess Nd in the BoB.
Furthermore, the observation that there are “hot-spots”
of modeled excess Nd (orange patch, Fig. 8a) near the sed-iment–water interface of the continental margin hints at
Fig. 7. The Nd contribution from different water masses for the southernmost station, 0806 and one northern station, 0812. The sum of Ndcontributed (RNdmixing (%)) by the various water masses at various depths are also given. It seems that RNdmixing (%) do not account for themeasured dissolved Nd concentrations at several depths in the profiles suggesting the need for additional Nd source(s).
52 S.P. Singh et al. / Geochimica et Cosmochimica Acta 94 (2012) 38–56

Author's personal copy
possibility of a sediment source in this region. The release ofNd from margin sediments can be facilitated by solution ofFe–Mn oxyhydroxide coatings on the grains but thisrequires suboxic redox conditions. Concurrent measure-ments of dissolved Fe, Mn, REEs and DO would help intesting this hypothesis. Higher remineralization rates inthe northern BoB could be due to sediment efflux shownby the hot-spots. Thus, the release of Nd from margin sed-iments can be an important process (Boundary Exchange)controlling the dissolved Nd budget of the Bay of Bengalsimilar to earlier studies from other oceanic regions (Jean-del et al., 1998; Lacan and Jeandel, 2005; Arsouze et al.,2009).
The excess Nd from sinking particles and/or from mar-gin sediments contributes significantly to the dissolved Ndbudget of coastal and remote regions of this basinreceiving a large sediment flux. Considering the averageJ flux �0.14 pmol/kg/year, the average excess Nd content(�7.5 pmol/kg) in the water column of the BoB can bebuilt up in �50 years only, in comparison to the residencetime of Nd �200 years in the bay (Nozaki and Alibo,2003). The eNd of the water column resulting from themixing of different water masses is altered due to the addi-tion of this excess Nd and exhibits non–conservativebehavior. Thus, it would be difficult to use eNd of the watercolumn to track water masses in the presence of the excessNd derived from particulates. It is therefore important toknow the geographical extent to which this process couldbe significant in a basin in order to use eNd as a water masstracer. In the case of the BoB, receiving a huge sedimentinflux from the Ganga–Brahmaputra river system, the onlystation that seems to be free from excess Nd is 0806. Forthe entire water column, except at the surface and at thebottom of station 0806, the excess Nd is negligible. Hencebased on the example of BoB, it can be estimated that theimpact of particulate Nd is diminished, and the conserva-tive nature of eNd in the water column could be retrieved,at about 1500 km away from the source of the particulates.However, this will vary from basin to basin and will de-pend on the source strength and flow direction in thebasin.
Fig. 8. The BoB water column distribution of (a) excess Nd concentration and (b) excess eNd as calculated from the inverse model. The “hot-spots” of Nd release in the northern slope region are indicative of a source of this element from margin sediments (see text). The eNd of��16.0 ± 2.0 for the excess Nd overlaps with that of G–B particles, suggesting that the excess Nd is most likely sourced from the G–B Rivers.
Table 4The J flux based on a one dimensional vertical advection–diffusion–scavenging model.
Station Ja flux (pmol/kg/year)
0806 0.130807 0.140808 0.150809 0.140810 0.140811 0.130812 0.170813 0.32a
Based on Nozaki and Alibo (2003).
S.P. Singh et al. / Geochimica et Cosmochimica Acta 94 (2012) 38–56 53

Author's personal copy
4. CONCLUSIONS AND IMPLICATION
The lateral and vertical distribution of dissolved Ndand eNd in the water column of the Bay of Bengal along87�E transect exhibits significant lateral and depthvariations. The results show that GB–BBLS (GangaBrahmaputra–Bay of Bengal Low Salinity Water) andAABW (Antarctic Bottom Water) are the dominantsources of dissolved Nd to the surface and deeper watersof the Bay of Bengal. On the other hand, NIIW (NorthIndian Intermediate Water), NIDW (North Indian DeepWater) and MNADW (Modified North Atlantic DeepWater) make significant Nd contributions to intermediatewaters. However, the budget calculations show that thesums of Nd contributions from all the different watermasses are inadequate to balance the measured Nd abun-dances, underscoring the need for an additional source.The source is inferred to be release of Nd from particulatematter delivered by the G–B river system bearing eNd
��16.0 ± 2.0. Calculations based on an inverse modelbring out the existence of “hot-spots” of “Nd excess”
along the northern margin sediment–water interface. Thisexcess is most likely a result of Nd release from marginsediments, probably through dissolution of Fe–Mn oxyhy-droxide coatings enriched in REEs (Nd) on the nascentsettled particles. Consistent with other modeling studies,this study highlights the importance of particle–waterinteraction in estuaries and sediment–water interaction inmargins in regulating the spatial distribution of dissolvedNd and its eNd.
The dominant role of GB–BBLS and AABW in regu-lating Nd and eNd distribution in the water column sug-gests that variations in their fluxes to the BoB wouldinfluence the Nd and eNd in the bay and global oceansthrough water circulation. Further, significant variationsin the supply of particulate matter from the G–B riversystem and/or sediment water exchange can modify theeNd of surface and bottom waters of the bay. Investiga-tions of these records can provide insight into these pro-cesses and their causative factors. The studies of Burtonand Vance (2000), Gourlan et al. (2010), Piotrowskiet al. (2009) and Stoll et al. (2007) attest to thisapplication.
ACKNOWLEDGEMENTS
We thank the Ministry of Earth Sciences, India for providingfinancial support for the project, “GEOTRACES” and ship timeonboard FORV Sagar Sampada. The help provided by Masterand crew of Sagar Sampada during sampling is thankfullyacknowledged. We also thank S. Krishnaswami for his construc-tive suggestions on an earlier version of this manuscript, J.P.Bhavsar, B. Srinivas and J. Chatterjee for their help in samplecollection and onboard analysis of hydrographic parameters,S.V.S. Murty for providing ICP–MS time in the PLANEX facil-ity and D. Prasad for help with ICP–MS measurements, J. Chat-terjee and V. Goswami for providing unpublished Nd data, andG.R. Tripathy, K. Patel and S. Gautam for help in inverse mod-eling. We thankfully acknowledge Associate Editor Derek Vancefor handling and reviewing the manuscript and three anonymousreviewers for their constructive comments and suggestions thathelped to improve the manuscript.
REFERENCES
Arsouze T., Dutay J. C., Lacan F. and Jeandel C. (2009)Reconstructing the Nd oceanic cycle using a coupled dynam-ical–biogeochemical model. Biogeosciences 6, 2829–2846.
Ahmad S. M., Anil Babu G., Padmakumari V. M., Dayal A. M.,Sukhija B. S. and Nagabhushanam P. (2005) Sr, Nd isotopicevidence of terrigenous flux variations in the Bay of Bengal:Implications of monsoons during the last �34,000 years.Geophys. Res. Lett. 32, L22711.
Ahmad S. M., Padmakumari V. M. and Babu G. A. (2009)Strontium and neodymium isotopic compositions in sedimentsfrom Godavari, Krishna and Pennar Rivers. Curr. Sci. 97,
1766–1769.
Allegre C. J., Louvat P., Gaillardet J., Meynadier L., Rad S. andCapmas F. (2010) The fundamental role of island arc weath-ering in the oceanic Sr isotope budget. Earth Planet. Sci. Lett.
292, 51–56.
Amakawa H., Alibo D. S. and Nozaki Y. (2000) Nd isotopiccomposition and REE pattern in the surface waters of theeastern Indian Ocean and its adjacent seas. Geochim. Cosmo-
chim. Acta 64, 1715–1727.
Amakawa H., Nozaki Y., Alibo D. S., Zhang J., Fukugawa K. andNagai H. (2004) Neodymium isotopic variations in NorthwestPacific waters. Geochim. Cosmochim. Acta 68, 715–727.
Amakawa H., Sasaki K. and Ebihara M. (2009) Nd isotopiccomposition in the central North Pacific. Geochim. Cosmochim.
Acta 73, 4705–4719.
Andersson P. S., Porcelli D., Frank M., Bjork G., Dahlqvist R. andGustafsson O. (2008) Neodymium isotopes in seawater fromthe Barents Sea and Fram Strait Arctic-Atlantic gateways.Geochim. Cosmochim. Acta 72, 2854–2867.
Barrat J. A. and Nesbitt R. W. (1996) Geochemistry of the Tertiaryvolcanism of Northern Ireland. Chem. Geol. 129, 15–38.
Bayon G., Birot D., Ruffine L., Caprais J. C., Ponzevera E.,Bollinger C., Donval J. P., Charlou J. L., Voisset M. andGrimaud S. (2011) Evidence for intense REE scavenging at coldseeps from the Niger Delta margin. Earth Planet. Sci. Lett. 312,
443–452.
Bertram C. J. and Elderfield H. (1993) The geochemical balance ofthe rare earth elements and neodymium isotopes in the oceans.Geochim. Cosmochim. Acta 57, 1957–1986.
Broecker W. S. and Peng T. H. (1982) Tracers in the Sea. EldigoPress, Palisades, New York.
Bruland K. W. and Lohan M. C. (2003) Controls of trace metals inseawater. In Treatise on Geochemistry 6 (eds. H. D. Hollandand K. K. Turekian). Pergamon, Oxford, pp. 23–47.
Burton K. W. and Vance D. (2000) Glacial-interglacial variationsin the neodymium isotope composition of seawater in the Bayof Bengal recorded by planktonic foraminifera. Earth Planet.
Sci. Lett. 176, 425–441.
Carter P., Vance D., Hillenbrand C. D., Smith J. A. and ShoosmithD. R. (2012) The neodymium isotopic composition of watersmasses in the eastern Pacific Sector of the Southern Ocean.Geochim. Cosmochim. Acta 79, 41–59.
Colborn J. G. (1975) The Thermal Structure of the Indian Ocean.Univ. of Hawaii Press, Honolulu.
Colin C., Turpin L., Bertaux J., Desprairies A. and Kissel C. (1999)Erosional history of the Himalayan and Burman ranges duringthe last two glacial-interglacial cycles. Earth Planet. Sci. Lett.
171, 647–660.
Dileep Kumar M. and Li Y.-H. (1996) Spreading of water massesand regeneration of silica and 226Ra in the Indian Ocean. Deep
Sea Res. II 43, 83–110.
Frank M. (2002) Radiogenic isotopes: Tracers of past oceancirculation and erosional input. Rev. Geophys. 40, 1001.
54 S.P. Singh et al. / Geochimica et Cosmochimica Acta 94 (2012) 38–56

Author's personal copy
Galy A. and France-Lanord C. (2001) Higher erosion rates in theHimalaya: Geochemical constraints on riverine fluxes. Geology
29, 23–26.
Goldstein S. J. and Jacobsen S. B. (1987) The Nd and Srisotopic systematics of river-water dissolved material: Impli-cations for the sources of Nd and Sr in seawater. Chem. Geol.
66, 245–272.
Goldstein S. L. and Hemming S. R. (2003) Long-lived isotopictracers in oceanography, paleoceanography, and ice-sheetdynamics. In Treatise on Geochemistry 6 (eds. H. D. Hollandand K. K. Turekian). Pergamon, Oxford, pp. 453–489.
Goldstein S. L., O’Nions R. K. and Hamilton P. J. (1984) A Sm-Nd isotopic study of atmospheric dusts and particulates frommajor river systems. Earth Planet. Sci. Lett. 70, 221–236.
Gopalakrishna V. V., Murty V. S. N., Sengupta D., Shenoy S. andAraligidad N. (2002) Upper ocean stratification and circulationin the northern Bay of Bengal during southwest monsoon of1991. Cont. Shelf Res. 22, 791–802.
Gourlan A. T., Meynadier L., Allegre C. J., Tapponnier P., Birck J.L. and Joron J. L. (2010) Northern Hemisphere climate controlof the Bengali rivers discharge during the past 4 Ma. Quat. Sci.
Rev. 29, 2484–2498.
Haley B. A., Klinkhammer G. P. and McManus J. (2004) Rareearth elements in pore waters of marine sediments. Geochim.
Cosmochim. Acta 68, 1265–1279, http://www.geomapapp.org.
Jacobsen S. B. and Wasserburg G. J. (1980) Sm-Nd isotopicsystematics of chondrites and achondrites. Meteoritics 15, 307–
308.
Jacobson A. D. and Holmden C. (2006) Calcite dust and theatmospheric supply of Nd to the Japan Sea. Earth Planet. Sci.
Lett. 244, 418–430.
Jeandel C. (1993) Concentration and isotopic composition of Nd inthe South Atlantic Ocean. Earth Planet. Sci. Lett. 117, 581–591.
Jeandel C., Bishop J. K. and Zindler A. (1995) Exchange ofneodymium and its isotopes between seawater and small andlarge particles in the Sargasso Sea. Geochim. Cosmochim. Acta
59, 535–547.
Jeandel C., Thouron D. and Fieux M. (1998) Concentrations andisotopic compositions of neodymium in the eastern IndianOcean and Indonesian straits. Geochim. Cosmochim. Acta 62,
2597–2607.
Johannesson K. H. and Burdige D. J. (2007) Balancing the globaloceanic neodymium budget: Evaluating the role of groundwa-ter. Earth Planet. Sci. Lett. 253, 129–142.
Lacan F. and Jeandel C. (2004) Subpolar Mode Water formationtraced by neodymium isotopic composition. Geophys. Res. Lett.
31, L14306.
Lacan F. and Jeandel C. (2005) Neodymium isotopes as a new toolfor quantifying exchange fluxes at the continent-ocean inter-face. Earth Planet. Sci. Lett. 232, 245–257.
McLennan S. M. (2001) Relationships between the trace elementcomposition of sedimentary rocks and upper continental crust.Geochem. Geophys. Geosyst. 2, 1–24.
Measures C. I. and Vink S. (1999) Seasonal variations in thedistribution of Fe and Al in the surface waters of the ArabianSea. Deep Sea Res. II 46, 1597–1622.
Measures C. I. and Vink S. (2000) On the use of dissolvedaluminum in surface waters to estimate dust deposition to theocean. Global Biogeochem. Cycles 14, 317–327.
Milliman J. and Mead R. H. (1983) World-wide delivery of riversediment to the oceans. J. Geol. 21, 1–21.
Murty V. S. N., Sarma Y. V. B., Rao D. P., Murty C. S. J. and ResM. (1992) Water characteristics, mixing and circulation in theBay of Bengal during SW monsoon. J. Mar. Res. 50, 207–228.
Nozaki Y. and Alibo D. S. (2003) Importance of verticalgeochemical processes in controlling the oceanic profiles of
dissolved rare earth elements in the northeastern Indian Ocean.Earth Planet. Sci. Lett. 205, 155–172.
Obata H., Nozaki Y., Alibo D. S. and Yamamoto Y. (2004)Dissolved Al, In, and Ce in the eastern Indian Ocean and theSoutheast Asian Seas in comparison with the radionuclides210Pb and 210Po. Geochim. Cosmochim. Acta 68, 1035–1048.
Piepgras D. J. and Wasserburg G. J. (1987) Rare earth elementtransport in the western North Atlantic inferred from Nd isotopicobservations. Geochim. Cosmochim. Acta 51, 1257–1271.
Piotrowski A. M., Banakar V. K., Scrivner A. E., Elderfield H.,Galy A. and Dennis A. (2009) Indian Ocean circulation andproductivity during the last glacial cycle. Earth Planet. Sci. Lett.
285, 179–189.
Porcelli D., Andersson P. S., Baskaran M., Frank M., Bjork G.and Semiletov I. (2009) The distribution of neodymium isotopesin Arctic Ocean basins. Geochim. Cosmochim. Acta 73, 2645–
2659.
Rao D. P., Sarma V. V., Rao V. S., Sudhakar U. and Gupta G. V.M. (1996) On watermass mixing ratios and regenerated siliconin the Bay of Bengal. Indian J. Mar. Sci. 25, 56–61.
Rickli J., Frank M., Baker A. R., Aciego S., de Souza G., Georg R.B. and Halliday A. N. (2010) Hafnium and neodymiumisotopes in surface waters of the eastern Atlantic Ocean:Implications for sources and inputs of trace metals to the ocean.Geochim. Cosmochim. Acta 74, 540–557.
Rickli J., Frank M. and Halliday A. N. (2009) The hafnium-neodymium isotopic composition of Atlantic seawater. Earth
Planet. Sci. Lett. 280, 118–127.
Robinson D. M., DeCelles P. G., Patchett P. J. and Garzione C. N.(2001) The kinematic evolution of the Nepalese Himalayainterpreted from Nd isotopes. Earth Planet. Sci. Lett. 192, 507–
521.
Ryan W. B. F., Carbotte S. M., Coplan J. O., O’Hara S.,Melkonian A., Arko R., Weissel R. A., Ferrini V., GoodwillieA., Nitsche F., Bonczkowski J. and Zemsky R. (2009) GlobalMulti-Resolution Topography synthesis. Geochem. Geophys.
Geosyst. 10, Q03014.
Sarin M. M., Krishnaswami S., Dilli K., Somayajulu B. L. K. andMoore W. S. (1989) Major ion chemistry of the Ganga-Brahmaputra River system: Weathering processes and fluxes tothe Bay of Bengal. Geochim. Cosmochim. Acta 53, 997–1009.
Sastry J. S., Rao D. P., Murty V. S. N., Sarma Y. V. B.,Suryanarayana A. and Babu M. T. (1985) Water mass structurein the Bay of Bengal. Mahasagar Bull. Nat. Inst. Oceanogr. 18,
153–162.
Schlitzer R. (2010) Ocean Data View. http://odv.awi.de.Schott F. A. and McCreary J. P. (2001) The monsoon circulation
of the Indian Ocean. Prog. Oceanogr. 51, 1–123.
Sengupta D., Bharath Raj G. N. and Shenoi S. S. C. (2006) Surfacefreshwater from Bay of Bengal runoff and Indonesian Through-flow in the tropical Indian Ocean. Geophys. Res. Lett. 33,
L22609.
Shankar D., Vinayachandran P. N. and Unnikrishnan A. S. (2002)The monsoon currents in the north Indian Ocean. Prog.
Oceanogr. 52, 63–120.
Shenoi S. S. C., Saji P. K. and Almeida A. M. (1999) Near-surfacecirculation and kinetic energy in the tropical Indian Oceanderived from Lagrangian drifters. J. Mar. Res. 57, 885–907.
Shetye S. R., Gouveia A. D., Shankar D., Shenoi S. S. C.,Vinayachandran P. N., Sundar D., Michael G. S. and Nampo-othiri G. (1996) Hydrography and circulation in the westernBay of Bengal during the northeast monsoon. J. Geophys. Res.
101, 14011–14025.
Sholkovitz E. R. (1993) The geochemistry of rare earth elements inthe Amazon River estuary. Geochim. Cosmochim. Acta 57,
2181–2190.
S.P. Singh et al. / Geochimica et Cosmochimica Acta 94 (2012) 38–56 55
Author's personal copy
Sholkovitz E. and Szymczak R. (2000) The estuarine chemistry ofrare earth elements: comparison of the Amazon, Fly, Sepik andthe Gulf of Papua systems. Earth Planet. Sci. Lett. 179, 299–
309.
Singh S. K. and France-Lanord C. (2002) Tracing the distributionof erosion in the Brahmaputra watershed from isotopiccompositions of stream sediments. Earth Planet. Sci. Lett.
202, 645–662.
Singh S. K., Rai S. K. and Krishnaswami S. (2008) Sr and Ndisotopes in river sediments from the Ganga Basin: Sedimentprovenance and spatial variability in physical erosion. J.
Geophys. Res. 113, F03006.
Singh S. P., Singh S. K. and Bhushan R. (2011) Behavior ofdissolved redox sensitive elements (U, Mo and Re) in the watercolumn of the Bay of Bengal. Mar. Chem. 126, 76–88.
Stoll H. M., Vance D. and Arevalos A. (2007) Records of the Ndisotope composition of seawater from the Bay of Bengal:Implications for the impact of Northern Hemisphere cooling onITCZ movement. Earth Planet. Sci. Lett. 255, 213–228.
Stordal M. C. and Wasserburg G. J. (1986) Neodymium isotopicstudy of Baffin Bay water: sources of REE from very oldterranes. Earth Planet. Sci. Lett. 77, 259–272.
Tachikawa K., Jeandel C. and Roy-Barman M. (1999) A newapproach to the Nd residence time in the ocean: the role ofatmospheric inputs. Earth Planet. Sci. Lett. 170, 433–446.
Tachikawa K., Athias V. and Jeandel C. (2003) Neodymiumbudget in the modern ocean and paleo-oceanographic implica-tions. J. Geophys. Res. 108, 3254.
Tarantola A. (2005) The least-square criterion. In Inverse Problem
Theory and Methods for Model Parameter Estimation. Society
for Industrial and Applied Mathematics, Philadelphia, Paris.
Tazoe H., Obata H., Nagai H. and Gamo T. (2011) Nd isotopiccompositions in the central Indian Ocean. Mineral. Mag. 75,
1992.
Tripathy G. R. and Singh S. K. (2010) Chemical erosion rates ofriver basins of the Ganga system in the Himalaya: Reanalysisbased on inversion of dissolved major ions, Sr, and 87Sr/86Sr.Geochem. Geophys. Geosyst. 11, 1–20.
Unger D., Ittekkot V., Schafer P., Tiemann J. and Reschke S.(2003) Seasonality and interannual variability of particle fluxesto the deep Bay of Bengal: influence of riverine input andoceanographic processes. Deep Sea Res. II 50, 897–923.
Wyrtki K. (1973) Physical oceanography of the Indian Ocean. InThe Biology of the Indian Ocean (ed. B. Zeitzschel). Springer-Verlag, Berlin, pp. 18–36.
You Y. (1997) Seasonal variations of thermocline circulation andventilation in the Indian Ocean. J. Geophys. Res. 102, 10391–
10422.
You Y. (2000) Implications of the deep circulation and ventilationof the Indian Ocean on the renewal mechanism of NorthAtlantic Deep Water. J. Geophys. Res. 105, 23895–23926.
Zieringer M., Stichel T. and Frank M. (2011) The hafnium andneodymium isotopic composition of seawater in the tropicalAtlantic Ocean. Mineral. Mag. 75, 2286.
Associate editor: Derek Vance
56 S.P. Singh et al. / Geochimica et Cosmochimica Acta 94 (2012) 38–56