Bo truing BO Tai nguyen va Mai tnrOng quy dinh ve Dinh mac ...

Measuring Performance as aDependent Variable ofPatent ManagementMaturity
R. Hilarius
July 15, 2013

Measuring Performance as a Dependent Variable of Patent ManagementMaturity
R. Hilariusa
aUniversiteit Twente, Drienerlolaan 5, 7522 NB, Enschede, Netherlands
Abstract
In this article the effect of the Strategic Patent Management Maturity will be assessed by using the patenth-index. The author will start by discussing the typology for assessing the strategic patent managementmaturity. In detail the attributed function Liability will be discussed regarding the results from the case-study and an alternative implementation is proposed. Next the similarities and differences of inventing andinnovating are discussed because these concepts are often applied incorrectly. While the correct use canbe of importance to make essential differences clear. To asses the Strategic Patent Management Maturityusing patents, different options are discussed regarding the quantity and quality of patents. The patenth-index is chosen as the best indicator representing the inventive impact of an organizations patent portfolio.Because of the strong influence of sectoral differences on the propensity to patent of an organization andthe representation of the patent portfolio as sample of inventive output, the use of propensity to patentas intervening variable is discussed. The operationalization of the used indicators is discussed and thedetermination of the h-index is worked out, using the biopharmaceutical and biotechnological companiesfrom van Reekum’s pilot and case study. We conclude by discussing the found results.
Keywords: Invention, Innovation, Patent Management Maturity, h-index, Patent, Propensity to Patent
1. introduction
In this article I attempt to make a contributionto the Strategic Patent Management typology de-veloped by van Reekum. Following the results fromKern and van Reekum (2012), i will suggest a dif-ferent and more general approach for the liabilityattribute of patents. Using this typology as my start-ing point I will build a conceptual model and useinsights from the field of scientometrics to suggestan independent variable to measure performancedifferences between the four categories as developedby van Reekum.
2. A typology for assessing strategic patentmanagement maturity
Based on Ackoff’s categories of strategic planningattitudes (Ackoff, 1981), Kern and van Reekum de-veloped four attitudes that are applicable in the
Email address: [email protected] (R.Hilarius)
strategic patent management practice. In his bookAckoff develops four categories based on the atti-tudes towards planning. He develops them by look-ing at the distinctive differences of their temporalorientation and planning posture, see table 1 (Ackoff,1981, p. 52-65).
Although Kern and van Reekum do not use a formof temporal orientation, they develop four planningattitudes for patent management based on Ackoff’splanning attitudes. Each representing an increasinglevel of activeness. Van Reekum however, does thisregarding eight patent functions. In analogue toAckoff, van Reekum distinguishes the following fourplanning attitudes for patent management: Inactive,Reactive, Active and Proactive. The eight functionsare divided in two categories; the inherent functionsand the attributed functions. The inherent func-tions are the functions of patents as intended bythe designers of the patent system. The attributedfunctions are the functions, other than the inherentfunctions, assigned to patents by managers for cor-porate purposes. The functions and its attributes
2

Temporal Orientation Types of planning
Reactive Past Tactical
Inactive Present Operational
Preactive Future Strategic
Interactive (Proactive) All Normative
Table 1: Ackoff’s categories of strategic planning attitudes
are summarized in table 2 and will not be discussedin detail here. When looking at the four differentattitudes and their eight functions one has to realizethat their borders are not absolute. What Ackoffsays about his planning orientations can also beregarded in this case: “The four basic planning ori-entations are like the primary colors; they seldomappear in their pure form. Most of the planning wesee, like colors, are mixtures; nevertheless, they areusually dominated by one of the four pure types.”(Ackoff, 1981, p. 53)
From the pilot study performed by Kern and vanReekum the relevance of seven of the eight functionswere confirmed, leaving liability unconfirmed. Intheir article Kern and van Reekum discuss this andnote that the financial meaning of patent liability isnot applicable in the Netherlands because the Dutchtax policy prohibits sale & lease-back constructionswith patents (Hulsink and Schenk, 2002). However,patent liability in the sense of its legal meaning, theconsequence of infringement, is still of importance.With the experience gained from the pilot and casestudy the liability function is going to be developedin an alternative way.
2.1. Liability
In van Reekum’s typology, liability is consideredto be ambiguous, taking into account it’s financialas well as its legal meaning. In the Pilot study con-ducted the financial aspect of this function was notconfirmed. Presumably because the applied defi-nition was not applicable in the Netherlands. Wedepart from van Reekums elaboration and take adifferent approach to this function. The foundationsfor the new approach are the concepts of Freedomto Operate (FtO) and Liability of Newness (LoN).Freedom to Operate is not new in the field of intel-lectual property. It essentially denotes the (legal)freedom one has before risking infringement. Or asSandal and Kumar put it: “FTO is essentially alegal concept, which connotes absence of any third
party valid intellectual property right (IPR) claimsagainst a particular commercial operation” (Sandaland Kumar, 2011, p. 204). To determine the FtO, aprior art search has to be carried out. This may bedone for various reasons; determining the patentabil-ity of an invention, ground of patent invalidationor possibility to proceed with the research, develop-ment and/or commercial production, marketing oruse of a new product or process. (Sandal and Ku-mar, 2011) The results of this FtO analysis shouldmake clear if there is a liability or an opportunity.
The second concept used to elaborate on liabilityis Liability of Newness (LoN). Generally this conceptis used as introduced by Stinchcombe (1965), to de-scribe a greater mortality risk of new organizationscompared to established organizations. Howeverthis concept can be applied to inventions insteadof organizations, essentially describing aspects ofthe liability function. The notion here is that aninvention carries inherent risks. It starts with thequestion if an invention has the potential to becomean innovation and if so, if it can be patented orotherwise protected. Any technology that has beendeveloped to this point already needed a certainamount of effort (time, money, R&D). This initialinvestment constitutes the inherent technologicalrisk of an invention. To further illustrate this, theconcepts of incremental and radical innovation canbe considered. The framework these concepts arepart of consists of two dimensions where innovationcan find place. It also assesses different, not alwayscontrollable, forces that influence the possible suc-cess of the innovation, or to put it differently, therisks there are of an invention becoming an innova-tion.
Not included in the concepts of FtO and LoN isa form of financial liability as used by van Reekum.With this third form of liability he includes the (in-ternational) practice of using patents as collateralto obtain a loan, placing a lien on the patent. Thereason that this liability was not confirmed in the
3

Inherent functions
Incentive This function represents the patent as an input motivator to R&D efforts
Appropriation This function represents the patent as an mechanism providing functional exclusive-ness to an invention
Protection This function represents the patent as the legal ability to exclude others from gainingreturns on investments the proprietor made to create the invention.
Dissemination This is about the patent as a source of information open to rival companies (as aconsequence of being a publication), often inducing circumvention.
Attributed functions
Liability The financial meaning of patent liability is that of securing a loan.
Portfolio component The patent considered as part of a set of more or less related proprietary technologiesthat serve the corporate future.
Asset The patent as a financially valued means of producing gains to the owner.
Performance indicator The patent considered as an informational medium to represent the company’sresearch performance and technology marketing potential.
Table 2: Patent functions. Kern and van Reekum (2012)
pilot study is because it is prohibited by Dutch pol-icy. Internationally however this practice is realityand thus it needs to be included.
Now that the liability function is explained in abroader scope to cover all the aspects, it is necessaryto operationalize this to the four attitudes of thetypology, see table 3.
3. Invention or innovation?
With the adjustments done to the strategic patentmanagement attributes by reevaluating the Liabil-ity function we now have a complete frameworkto use as an independent variable for evaluating afirm’s attitude regarding patent management. Todo more than merely categorize firms, it is necessaryto develop a dependent variable. Although scholarshave written a lot about a firms performance, inmost cases financial performance, there is not muchwritten about the performance of a firms Intellec-tual Property Management (IPM). There is no suchthing as a generally accepted way to measure the ef-fectiveness of a firms IPM. Therefore it is necessaryto develop our own performance variable.
We start by making clear what we mean whentalking about inventions and innovations. When dis-cussing patent management and performance, oftenthe terms invention and innovation are concerned.In practice the difference between inventing and in-novating is often unclear and the words are used as
synonyms. It even went so far that innovation be-came a buzzword, used by managers (and everyoneelse) for everything that was even remotely new (tothem). In our discussion the difference between aninvention and innovation is however very important.
As starting point we use the definition used byTidd et al. (2005). Tidd describes that inventing isonly the beginning in the innovation process, thereare enough good ideas available but only a few ofthem become true innovations. The step from in-vention to innovation is by no means automatic,as already discussed by Maclaurin (1953). For ex-ample: Often researchers are great inventors but,more often than not, poor innovators. Or to usean example from Tidd: “Edison appreciated bet-ter than most that the real challenge in innovationwas not invention –coming up with good ideas –butmaking them work technically and commercially.”(Tidd et al., 2005, p. 65). Regarding innovation,R&D and marketing are two sides of the same coin.In addition it is worth mentioning that the size ofthe invention (the technological leap forward) is notnecessarily proportional to the size of the innova-tion. An incremental improvement of a productmay become a big innovation and a revolutionarynew product may never sell a single unit. Inventingand innovating both can be done in incremental toradical proportions.
Next there is the relationship between inventing,innovating and patenting. Based on the discussion
4

Inactive Reactive Active Pro-active
FtO: When infringement isclaimed the activitiesare stopped and/orthe litigation is re-solved by settlement.
An FtO is conductedafter infringement isclaimed to prevent fu-ture litigation.
A FtO search is done.When (possible) in-fringement is foundthe problem is circum-vented or the projectcanceled.
A FtO search is done.When (possible) in-fringement is found,circumvention is anoption as well as ac-quiring a license orpatent.
LoN: R&D in new prod-ucts is avoided. Theorganizations effortsare aimed at improv-ing and evolving theproven products.
R&D for new prod-ucts is started whentechnological rivalry isassessed on the basisof patent info
Alternatives assessedbefore investing
Initial (R&D) costsare seen as invest-ments, not as costs.The (strategic) devel-opment of new prod-ucts is done accordingthe product life-cycle.
Financial: Does not use a patentas collateral to obtaina loan.
The patent(portfolio)is valuated, but is notused as collateral
On request of a fi-nancier a patent isused to obtain a loan.(exclusively)
The organization usesa patent to obtain aloan. (exclusively)
Table 3: Liability in the typology
Figure 1: A generalized picture of the relationship between patenting, invention and innovation. The sizes of the different partsof the figure are of course arbitrary chosen and may vary across sectors and in time. (Basberg, 1987)
5

of this subject by Maclaurin (1953), Basberg (1987)represents this graphically as can be seen in figure 1.Patented inventions and innovations only make upa small part of all inventions and patented innova-tions an even smaller part. Besides the relationshipbetween inventions, innovations and patents, figure1 tries to make clear that the use of patent statisticsrests on the assumption that they are somehow re-flecting inventive and innovative activity (Basberg,1987).
4. Quantity and Quality
Now we have clarified the distinction between in-ventions and innovations we are going to continuewith patents and performance. For many years schol-ars analyzed patent data in an attempt to makepredictions based on it, or otherwise learn and drawconclusions from it. Patent law and thus patentscame into existence with the purpose to give aninventor an exclusive right to commercialize its in-vention during a limited time. This is of importancebecause it stimulates to invest in the developmentof new ideas. The thought being that if everyonecould simply copy a successful idea, no one wouldwant to invest in development any more. This basicprinciple makes clear why patents are an intermedi-ate product of inventions with potential. Becauseof this it is plausible to assume patents containsinformation from the creative processes going onin firms, organizations or persons. However a re-lationship between patents and a firm’s (financial)performance is not as obvious as one may think. Inhis article, Holger Ernst states the following: “Onthe firm level in particular, the question of whetherthere is a correlation between patents and financialperformance remains unresolved” He adds: “Someempirical studies — recent ones, in particular — es-tablish a positive correlation between a firms patentsituation and its competitive position,” Finally inhis conclusion he states: “From a theoretical pointof view with regard to further empirical patent re-search, we were able to show in addition to thefindings of previous cross-section analyses a pos-itive correlation between patent applications andsubsequent changes in economic performance vari-ables on the firm level” (Holger, 2001). From thiswe can conclude that patents may not be directlycorrelated to a firms financial performance, but theydo seem to be able to comprise some kind of perfor-mance. So for what are patents a suitable indicator?
In essence patents are an intermediate product re-sulting from inventive activities. This makes theminherently more suitable to asses these inventiveactivities than innovation. The process in whichan invention becomes an innovation depends on farmore than a firms IPM, which does govern the con-ditions regarding inventing and patent awareness.
As our starting point we are going to look at thearticle from Hagedoorn and Cloodt (2003). In thisarticle, Hagedoorn and Cloodt discuss several in-dicators used to measure innovative performanceand what the added value is in using more than oneindicator. Interesting for us is that in relation to in-novative performance they also discuss the conceptof inventive performance. In their article they statethe following: “We define inventive performance asthe achievements of companies in terms of ideas,sketches, models of new devices, products, processesand systems. As discussed below, inventive per-formance is frequently measured in the context ofpatents where both raw counts of patents and patentcitations are taken as the actual measures.” (Hage-doorn and Cloodt, 2003, p.1366). Further on theyadditionally state: “Innovative performance in thenarrow sense refers to results for companies in termsof the degree to which they actually introduce inven-tion into the market, i.e. their rate of introductionof new products, new process systems or new de-vices.” (Hagedoorn and Cloodt, 2003, p.1367). Thiscorresponds with the distinction we made abovebetween invention and innovation. Farther in theirarticle Hagedoorn and Cloodt discuss the differencesand overlap between inventive and innovative per-formance and they conclude with the discussion andtesting of single versus multiple indicators regardinginnovative performance.
The use of patent counts as an indicator for inven-tive or innovative performance is still the topic of anextensive discussion. However even critical authorsadmit that patent counts can be an appropriate indi-cator (Hagedoorn and Cloodt, 2003). The problemwith counting individual patents is that, especiallywhen the patent portfolios are larger, tend to con-tain a lot of similar patents protecting the sameinvention in different countries. With this in regard,counting individual patents may still be valid whenconsidering innovative performance or evaluatingthe perceived value of an invention. In essence theproblem is that alone, the quantity of patents is nota great indicator for performance. However, becausethis information is readily available geographical aswell as historical it is being used cautiously for this
6

Figure 2: Schematic curve of number of citations versus paper number, with papers numbered in order of decreasing citations.The intersection of the 45◦ line with the curve gives h. The total number of citations is the area under the curve. Hirsch (2005)
purpose.
One of the problems when using patents to assesperformance is that the quantity of patents is onlyrelevant in regard to their quality. The problem withpoor patents is that they do not offer the intendedprotection, they are easily circumvented or do nothold up in court. Because of this, the patent isworthless and it only costs money. To control forthis, the quality of a patent needs to be included inthe evaluation of a patent portfolio.
Another principle of patents is the idea of Quidpro quo, meaning that you do not get anything fornothing. The idea behind this is that although aninventor gets an exclusive right to commercialize hisinvention, the invention does get published. As aresult, anyone can see the invention, but they areprohibited to exploit it commercially. They canhowever build upon or circumvent it. This resultsin that pivotal patents are used as a starting pointfor other inventions that may lead to a patent. Inthe article of Harhoff et al. (1999) they use citationsas a measuring instrument in an attempt to learnsomething about the value of patented inventions.Depending on national practice, citations are placedin the patent text to show how it is different fromthe prior art. Harhoff et al. (1999) al state: “For one,it is reasonable to suppose that the prior inventionscited in new patents tend to be the relatively impor-tant precursors that best define the state of the art.”
And: “Second, because prior inventions set the stagefor new inventions, citations are used to measure apotentially important economic externality, i.e., theimpact the knowledge embodied in prior inventionshas in stimulation new contributions.” (Harhoffet al., 1999, p. 511). Although Harhoff et al. (1999)continue to research the causality between citationfrequency and the value of patented inventions, itis reasonable to assume that if patents are morefrequently cited the inventions are more important.
The field that analysis publications is called bib-liometrics and when it is specifically concerningscientific literature, it is called scientometrics. Oneof the subjects they are engaged in is the analysis ofscientific publications to asses the productivity, qual-ity and impact of publications and scholars. Theanalysis of patents and citations is quite analogueto this and that is why we looked for some insightsand indicators in this field. One interesting indexthat measures the productivity and impact fromscholars is the Hirsch-index (h-index). The h-indexis proposed by Hirsch (2005) as a particularly simpleand useful way to characterize the scientific outputof a researcher. The h-index is defined as followed:A scientist has index h if h of his or her Np papershave at least h citations each and the other (Np−h)papers have ≤h citations each. This can be graph-ically represented as can be seen in figure 2. Thestrength of he h-index is that it combines a quantity
7

and a quality indicator into a single comparablevalue. Hirsch developed the h-index to character-ize scientific output of researches however it canalso be used to analyze the impact of an organiza-tions patent portfolio as been showed by Guan andGao (2009) in his article; Exploring the h-index atpatent level. In the article Guan applies the h-indexto patents where the patent h-index is defined asfollows: For a general group of patents h is suchthat h patents received at least h citations fromlater patents, while other patents received no morethan h citations. Only patent to patent citationsare counted, non-patent references (NPR) are notregarded. This is because a citation from anotherpatent can be seen as a ”vote” from the referenc-ing patent to the referred patent, as such NPR canbe seen as votes for oneself. Guan compares thepatent h-index to other technological indicators andconcludes the following: “this confirms that on onehand, similar to citation counts, the patent h-indexdoes reflect the importance or impact of patents; onthe other hand, unlike citation counts, the patenth-index balances the quantity (number of patents)and the quality (citations) of patents for an assigneein a reasonable way. In summary, the above findingsshow that the patent h-index is indeed an effectiveindicator for evaluating the technological impact orquality of an entity.”. The patent h-index thus is asuitable performance indicator to asses the inventiveimpact of an organizations patent portfolio.
5. Propensity to Patent
For a performance indicator to have any meaningit is necessary that it is compared to the perfor-mance indicator of other organizations. This waywe can attempt to analyse the characteristics thatlead to the difference in performance. The frame-work created in this article with the patent maturitytypology as independent variable and patent h-indexas dependent variable works in the same way. Ahigher score on the patent h-index is expected formore mature and active organizations (figure 3).When comparing the PMM and patent h-index oforganizations, we hope to explain the differencesin their patent h-index score by the differences intheir PMM. The connecting element between thesevariables are the patents. With a higher PMM scorewe expect the patent output to rise in quantity andquality, leading to a higher patent h-index. In thiscase the patents are regarded as a sample of the in-ventive output of the organization. When doing this
the assumption is made that patents are a represen-tative sample of the inventive output. The questionarises if this assumption can be made and can begeneralized to other organizations. Unfortunately,most likely this is not the case. When we look tothe literature regarding the use of patent statistics,different variables are discussed that could cause abias. These variables will have, direct or indirect,an influence on the Propensity to Patent (P2P) ofan organization. In essence this means that the sizeand composition of the patent portfolio will varybetween organizations. figure 4.
Propensity to patent is not a new concept, Scherer(1965) already used it to describe the limitationsof counting patents for an inventive index. Scherer(1965) measured P2P by looking to the differencesin patent output per unit of engineering input. Amultitude of researchers use different definitions,applications and measurement methods. As mightbe expected it is difficult to compare the inventiveimpact of a mining company and a pharmaceuticalcompany, largely because of the differences in theindustry sector. We are going to use P2P as aconstruct that consists of uncontrollable externalforces that influences the quantity and quality ofthe patents, most notably industry sector and firmsize
The best way to evaluate the PMM s is to usea homogeneous sample; firms in the same industryand of approximately the same size. However this isnot always possible or desirable for the researcher.When a heterogeneous sample cannot be avoided,P2P can be used as a intervening variable to correctfor the differences.
6. Conceptual model
With the introduction of P2P we can now con-struct the complete model. In figure 5 there is anschematic overview of the conceptual model. ThePMM is the independent variable with four modes,ranked ordinal. It has a direct positive effect onthe inventive impact which is measured using thepatent h-index. If necessary the P2P can be used asintervening variable, positively influencing the effectof PMM on the inventive index.
7. Operationalization
With the model now complete we can operational-ize it so the necessary data can be collected. First
8

Figure 3: A possible course of the patent h-index related to the patent management maturity
Inventions
Innovations
Patents
Inventions
in usePatented inventions
in use Inventions
not in use
Patented inventions
not in use
Influence of
Propensity to Patent
on sample size and
distribution
Figure 4: The influence of P2P on the sample
9

Figure 5: Conceptueel model.
the PMM needs to be established. This will be doneby using a questionnaire, as has been done by Kernand van Reekum (2012).
Secondly it needs to be established if we are work-ing with a homogeneous or heterogeneous sample.When it is the latter it will be necessary to establishthe P2P rates of the sample organizations and theirindustry sectors. Because of the sector wide infor-mation needed it is unpractical to do a own surveyfor this, however existing surveys exist that reportsome results regarding the P2P. Good examples arethe research of Arundel and Kabla (1998) using theMERIT/SESSI data and the research of Brouwerand Kleinknecht (1999) using the CIS micro data.
At last the patent h-index needs to be determined.This can be done by using the Derwent InnovationIndex as has been done by Guan and Gao (2009).We will elaborate on the gathering of this data.
7.1. Derwent Innovation Index
The Derwent Innovation Index is accessible as anon-line database through web of knowledge fromThomson Reuters. It covers 40 worldwide patentissuing authorities covering over 14.3 million inven-tions dating back to 1963. Using the Derwent Inno-vation Index and the instructions from Guan andGao (2009) it is simple to determine the patent h-index of an assignee. All the patents of an assigneeduring a given time span can be retrieved up tothe date of accessing the database. These patentscan be sorted according to the number of citationsthey have, making it possible to find the patent h-index of the portfolio. Alternatively this list can beplotted together with a 45◦ line (y = x) in a graph.The intersection between the two marks the patent
h-index score, rounded down to the lowest integer.An example of such a plot can be seen in figure 6.
Using the Derwent Innovation index we deter-mined the h-index of the 19 biotechnological andbiopharmaceutical organizations that where the sub-ject of the pilot and case study of van Reekum (1999).In table 4 the patent h-index is shown accompaniedby the total number of patents and citations.
8. Discussion
Continuing with the information from the Der-went Innovation Index, we put it besides the PatentManagement Maturity scores found in the pilot andcase study of van Reekum (1999). We looked ifthere was any correlation between the h-index andthe PMM, unfortunately no correlation was found.Although this is unfortunate, it was more or lessexpected. The time lag between the determinationof the PMM and patent h-index score is almost 14years and although most literature regarding patentstatistics plead to take account for one Holger (2001),it is safe to say that 14 years is to long. Duringthese 14 years the management practice of theseorganization most like also changed, meaning thatthe current state of their patent portfolio and thuspatent h-index is a reflection of the management ofmore recent years. Another indicator for this is thatmost of the patents are granted in last five years.However, there is something to learn from theseresults. We can consider it as a test case where wehave shown that the patent h-index can be used as aindicator for small-medium enterprises and that it isnot only applicable to large multinationals as Guanand Gao (2009) showed. From the results in table
10
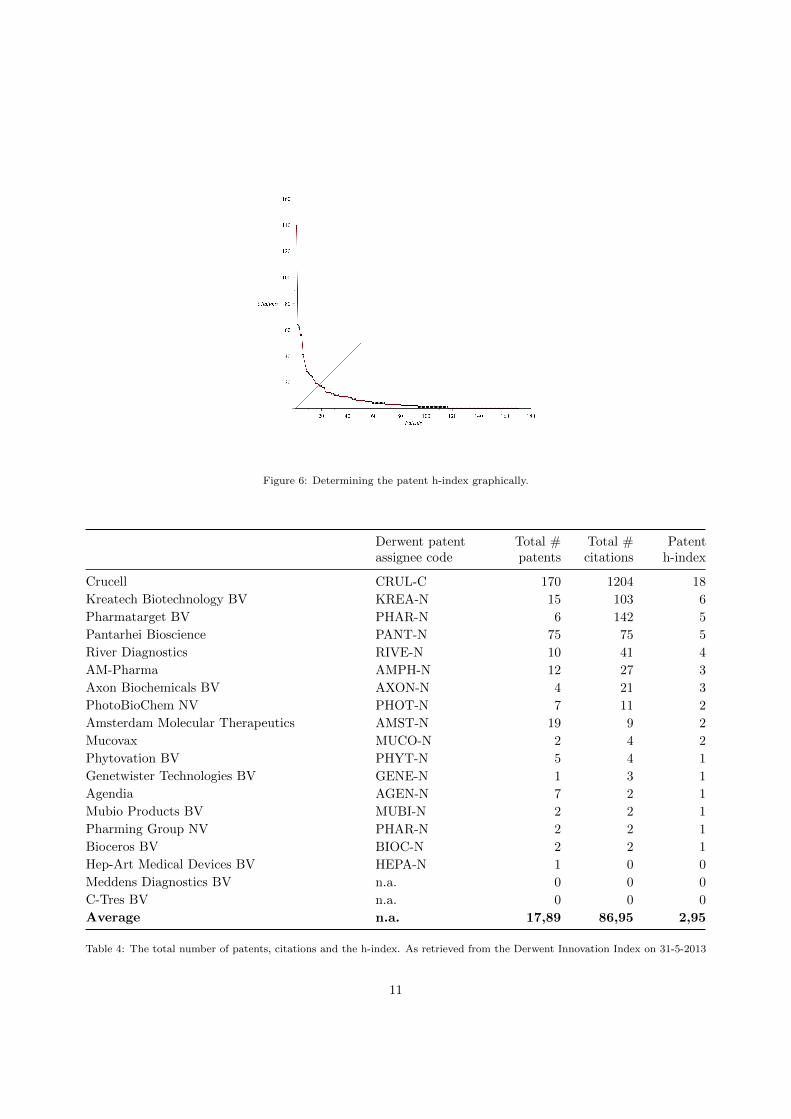
Figure 6: Determining the patent h-index graphically.
Derwent patentassignee code
Total #patents
Total #citations
Patenth-index
Crucell CRUL-C 170 1204 18
Kreatech Biotechnology BV KREA-N 15 103 6
Pharmatarget BV PHAR-N 6 142 5
Pantarhei Bioscience PANT-N 75 75 5
River Diagnostics RIVE-N 10 41 4
AM-Pharma AMPH-N 12 27 3
Axon Biochemicals BV AXON-N 4 21 3
PhotoBioChem NV PHOT-N 7 11 2
Amsterdam Molecular Therapeutics AMST-N 19 9 2
Mucovax MUCO-N 2 4 2
Phytovation BV PHYT-N 5 4 1
Genetwister Technologies BV GENE-N 1 3 1
Agendia AGEN-N 7 2 1
Mubio Products BV MUBI-N 2 2 1
Pharming Group NV PHAR-N 2 2 1
Bioceros BV BIOC-N 2 2 1
Hep-Art Medical Devices BV HEPA-N 1 0 0
Meddens Diagnostics BV n.a. 0 0 0
C-Tres BV n.a. 0 0 0
Average n.a. 17,89 86,95 2,95
Table 4: The total number of patents, citations and the h-index. As retrieved from the Derwent Innovation Index on 31-5-2013
11

4 we can also conclude that the patent h-index hasdistinctive properties compared to counting patentsand/or citations, because as table 4 clearly shows,the most patents and/or citations do not directlytranslate to the highest h-index. Additionally italso accentuates the differences between portfolio’sof approximately the same size.
One of the biggest problems in research wherepatent data is used as measurement, is that theresearcher makes reservations on the use of patentsas data, but still continues using the data as if realreservations had not been made (Basberg, 1987).The use of patents as data has inherent weaknesseswe have to account for, using the patent h-indexmay be a good way to remedy some of this issues.Nevertheless, what Schmookler wrote in 1966 still isvery true: “We have a choice of using patent datacautiously and learning what we can from them, ornot using them and learning nothing about whatthey alone can teach us (Schmookler, 1966, p. 56).”
References
Ackoff, R. L. (1981). Creating the corporate future : plan orbe planned for. Wiley, New York.
Arundel, A. and Kabla, I. (1998). What percentage of inno-vations are patented? empirical estimates for Europeanfirms. Research Policy, 27(2):127–141.
Basberg, B. r. L. (1987). Patents and the measurement oftechnological change: A survey of the literature. ResearchPolicy, 16(24):131–141.
Brouwer, E. and Kleinknecht, A. (1999). Innovative output,and a firm’s propensity to patent. An exploration of CISmicro data. Research Policy, 28(6):615–624.
Guan, J. C. and Gao, X. (2009). Exploring the h-indexat patent level. Journal of the American Society forInformation Science and Technology, 60(1):35–40.
Hagedoorn, J. and Cloodt, M. (2003). Measuring innova-tive performance: is there an advantage in using multipleindicators? Research Policy, 32(8):1365–1379.
Harhoff, D., Narin, F., Scherer, F. M., and Vopel, K. (1999).Citation frequency and the value of patented inventions.Review of Economics and Statistics, 81(3):511–515.
Hirsch, J. E. (2005). An index to quantify an individual’sscientific research output. Proceedings of the NationalAcademy of Sciences of the United States of America,102(46):16569–16572.
Holger, E. (2001). Patent applications and subsequentchanges of performance: evidence from time-series cross-section analyses on the firm level. Research Policy,30(1):143–157.
Hulsink, W. and Schenk, H. (2002). 13 Privatisation andderegulation in the Netherlands. Privatization in theEuropean Union: Theory and Policy Perspectives, page242.
Kern, S. and van Reekum, R. (2012). The Use of Patents inDutch Biopharmaceutical SME: a Typology for AssessingStrategic Patent Management Maturity.
Maclaurin, W. R. (1953). The sequence from invention toinnovation and its relation to economic growth. The Quar-terly Journal of Economics, 67(1):97–111.
Sandal, N. and Kumar, A. (2011). Role of freedom to op-erate in business with proprietary products. Journals ofIntellectual Property Rights, 16(2):204–209.
Scherer, F. M. (1965). Firm Size, Market Structure, Op-portunity, and the Output of Patented Inventions. TheAmerican Economic Review, 55(5):pp. 1097–1125.
Schmookler, J. (1966). Invention and Economic Growth.Camebridge.
Stinchcombe, A. (1965). Social Structure and Organziations.In Handbook of Organizations, chapter 4, pages 142–193.Rand McNally, Chicago.
Tidd, J., Bessant, J. R., and Pavitt, K. (2005). Manag-ing innovation : integrating technological, market andorganizational change. Wiley, Hoboken, 3rd edition.
van Reekum, A. H. (1999). Intellectual property and phar-maceutical innovation : a model for managing the creationof knowledge under proprietary conditions.
12
Copyright © 2022 FDOKUMEN


![M. PA TJI, BO TJRGh]T](https://static.fdokumen.com/doc/165x107/6333b1ff4e43a4bcd80ce297/m-pa-tji-bo-tjrght.jpg)