ND STATE INVESTMENT BOARD MEETING
217
Friday, July 22, 2016, 8:30 a.m. Bismarck State College National Energy Center of Excellence Energy Generation Conference Room #335 1500 Edwards Avenue Bismarck, ND AGENDA I. CALL TO ORDER AND ACCEPTANCE OF AGENDA II. ACCEPTANCE OF MINUTES (May 27, 2016) III. ELECTION OF OFFICERS 2016-17 A. Chair B. Vice Chair C. Parliamentarian (Appointed by Chair) IV. AUDIT COMMITTEE MEMBERSHIP 2016-17 (Board Acceptance) - Mr. Hunter (enclosed) (5 min) V. GOVERNANCE A. Strategic Investment Beliefs - Mr. Hunter (enclosed) (10 minutes) B. Governance Education - Jeanna Cullins, Aon Hewitt (enclosed) (90 minutes) =============================== Suggested Break from 10:15 to 10:30 am ============================ C. Board Education: Open Records - Ms. Janilyn Murtha (enclosed) (45 minutes) D. Code of Conduct Affirmation - Mr. Schmidt (enclosed) (5 min) Informational E. Investment Manager Catalog - Mr. Schmidt (enclosed) (5 min) Informational F. 2016-17 Planning Cycle/Meeting Schedule - Mr. Hunter (enclosed) (5 min) Informational VI. INVESTMENTS (30 minutes) A. PERS & Highway Patrol Investment Policy Statement - Mr. Hunter (enclosed) Board Acceptance B. Legacy Fund Investment Policy Statement - Mr. Hunter (enclosed) Board Acceptance C. Budget Stabilization Investment Policy Statement - Mr. Hunter (enclosed) Board Acceptance D. Private Equity, Fixed Income and Risk Update - Mr. Hunter (enclosed) Informational E. Litigation Update: Status of GM Litigation and VW Litigation - Ms. Janilyn Murtha Executive Session for Attorney Consultation Pursuant to 44-04-19.2 and 44-04-19.1(2) and (5) VII. OTHER Next Meetings: SIB - August 26, 2016, 8:30 am - State Capitol, Peace Garden Room SIB Audit Committee - September 23, 2016, 1:00 pm - State Capitol, Peace Garden Room VIII. ADJOURNMENT Note: The meeting is scheduled to adjourn at approximately 12:00 pm CT. Any individual requiring an auxiliary aid or service, please contact the Retirement and Investment Office (701) 328-9885 at least three (3) days prior to the scheduled meeting. ND STATE INVESTMENT BOARD MEETING
-
Upload
khangminh22 -
Category
Documents
-
view
0 -
download
0
Transcript of ND STATE INVESTMENT BOARD MEETING

Friday, July 22, 2016, 8:30 a.m. Bismarck State College
National Energy Center of Excellence Energy Generation Conference Room #335
1500 Edwards Avenue Bismarck, ND
AGENDA
I. CALL TO ORDER AND ACCEPTANCE OF AGENDA
II. ACCEPTANCE OF MINUTES (May 27, 2016)
III. ELECTION OF OFFICERS 2016-17
A. Chair
B. Vice Chair
C. Parliamentarian (Appointed by Chair)
IV. AUDIT COMMITTEE MEMBERSHIP 2016-17 (Board Acceptance) - Mr. Hunter (enclosed) (5 min)
V. GOVERNANCE
A. Strategic Investment Beliefs - Mr. Hunter (enclosed) (10 minutes)
B. Governance Education - Jeanna Cullins, Aon Hewitt (enclosed) (90 minutes) =============================== Suggested Break from 10:15 to 10:30 am ============================
C. Board Education: Open Records - Ms. Janilyn Murtha (enclosed) (45 minutes)
D. Code of Conduct Affirmation - Mr. Schmidt (enclosed) (5 min) Informational
E. Investment Manager Catalog - Mr. Schmidt (enclosed) (5 min) Informational
F. 2016-17 Planning Cycle/Meeting Schedule - Mr. Hunter (enclosed) (5 min) Informational
VI. INVESTMENTS (30 minutes)
A. PERS & Highway Patrol Investment Policy Statement - Mr. Hunter (enclosed) Board Acceptance
B. Legacy Fund Investment Policy Statement - Mr. Hunter (enclosed) Board Acceptance
C. Budget Stabilization Investment Policy Statement - Mr. Hunter (enclosed) Board Acceptance
D. Private Equity, Fixed Income and Risk Update - Mr. Hunter (enclosed) Informational
E. Litigation Update: Status of GM Litigation and VW Litigation - Ms. Janilyn Murtha
Executive Session for Attorney Consultation Pursuant to 44-04-19.2 and 44-04-19.1(2) and (5)
VII. OTHER
Next Meetings: SIB - August 26, 2016, 8:30 am - State Capitol, Peace Garden Room SIB Audit Committee - September 23, 2016, 1:00 pm - State Capitol, Peace Garden Room
VIII. ADJOURNMENT
Note: The meeting is scheduled to adjourn at approximately 12:00 pm CT.
Any individual requiring an auxiliary aid or service, please contact the Retirement and Investment Office
(701) 328-9885 at least three (3) days prior to the scheduled meeting.
ND STATE INVESTMENT BOARD MEETING

5/27/2016 1
NORTH DAKOTA STATE INVESTMENT BOARD
MINUTES OF THE
MAY 27, 2016, BOARD MEETING
MEMBERS PRESENT: Drew Wrigley, Lt. Governor, Chair
Mike Sandal, Vice Chair
Lance Gaebe, Commissioner of Trust Lands
Mike Gessner, TFFR Board
Adam Hamm, Insurance Commissioner
Rob Lech, TFFR Board
Mel Olson, TFFR Board
Yvonne Smith, PERS Board
Cindy Ternes, WSI designee
MEMBERS ABSENT: Kelly Schmidt, State Treasurer
Tom Trenbeath, PERS Board
STAFF PRESENT: Eric Chin, Investment Analyst
Connie Flanagan, Fiscal & Invt Ops Mgr
Bonnie Heit, Assist to the SIB
David Hunter, ED/CIO
Bradley Kasper, Intern
Fay Kopp, Dep ED/CRA
Terra Miller Bowley, Supvr Audit Services
Cody Schmidt, Compliance Officer
Darren Schulz, Dep CIO
GUESTS PRESENT: Alex Browning, Callan Associates
Jeff Engleson, Dept. of Trust Lands
Paul Erlendson, Callan Associates
Andrew Goldberg, JP Morgan
Eric Hardmeyer, Bank of North Dakota
Jan Murtha, Attorney General’s Office (TLCF)
Tim Porter, Bank of North Dakota
Bryan Reinhardt, PERS
Jim Sakelaris, JP Morgan
CALL TO ORDER:
Lt. Governor Wrigley called the State Investment Board (SIB) meeting to order at
8:30 a.m. on Friday, May 27, 2016, at the State Capitol, Peace Garden Room,
Bismarck, ND.
AGENDA:
IT WAS MOVED BY MS. TERNES AND SECONDED BY MR. GESSNER AND CARRIED ON A VOICE
VOTE TO ACCEPT THE AGENDA FOR THE MAY 27, 2016, MEETING AS DISTRIBUTED.
AYES: MR. GESSNER, COMMISSIONER HAMM, MS. TERNES, COMMISSIONER GAEBE, MS. SMITH,
MR. LECH, MR. SANDAL, MR. OLSON, AND LT. GOVERNOR WRIGLEY
NAYS: NONE
MOTION CARRIED
ABSENT: TREASURER SCHMIDT, MR. TRENBEATH
1518

5/27/2016 2
MINUTES:
IT WAS MOVED BY MR. LECH AND SECONDED BY MR. OLSON AND CARRIED ON A VOICE VOTE TO
ACCEPT THE APRIL 22, 2016, MINUTES AS DISTRIBUTED.
AYES: MS. SMITH, MR. SANDAL, MR. OLSON, MR. GESSNER, MR. LECH, MS. TERNES,
COMMISSIONER HAMM, COMMISSIONER GAEBE, AND LT. GOVERNOR WRIGLEY
NAYS: NONE
MOTION CARRIED
ABSENT: TREASURER SCHMIDT, MR. TRENBEATH
INVESTMENTS:
Asset/Investment Performance Overview – Mr. Hunter reviewed SIB clients assets
under management as of March 31, 2016. Assets under management grew by
approximately 4.9 percent or $513 million in the last year. Assets totaled
$11,078,966,753 based on unaudited valuations as of March 31, 2016. The Pension
Trust posted a net return of -0.41 percent (down $20 million) in the last year.
During the last 5 years, the Pension Trust generated a net annualized return of
6.27% exceeding the performance benchmark of 5.87%. The Insurance Trust generated
a net return of 0.79 percent (up $20 million) in the last year. During the last 5
years, the Insurance Trust generated a net annualized return of 4.8% exceeding
the performance benchmark of 3.9%. The Legacy Fund generated a net investment
loss of -0.33 percent for the year ended March 31, 2016. Since inception, the
Legacy Fund has generated a net annualized return of 2.5% (over the last 4.5
years) exceeding the performance benchmark of 1.8%.
Every Pension Trust client generated positive excess returns for the 5 years
ended March 31, 2016, with PERS and TFFR generating net investment returns of
approximately 6.3% for the 5 years ended 3/31/16.
Every Non-Pension Trust client generated positive excess returns and positive
risk adjusted excess returns for the 5 years ending March 31, 2016, if
applicable, with one exception for the PERS Retiree Health Insurance Credit Fund.
Mr. Hunter also highlighted the investment work plan as of May 20, 2016.
JP Morgan Capital Markets – Mr. Andrew Goldberg presented his perspective on the
current status of capital markets. Mr. Goldberg is a co-developer and oversees
the development of JP Morgan’s quarterly “Markets Insights – Guides to the
Markets” publication.
Callan Associates – Mr. Erlendson and Mr. Browning reviewed the performance of
the Pension Trust, Legacy Fund, and Insurance Trust for the period ending March
31, 2016.
IT WAS MOVED BY MS. TERNES AND SECONDED BY MR. GESSNER AND CARRIED BY A VOICE
VOTE TO ACCEPT CALLAN’S PERFORMANCE REVIEW AND REPORTS FOR THE PERIOD ENDING
MARCH 31, 2016.
AYES: COMMISSIONER GAEBE, MR. SANDAL, COMMISSIONER HAMM, MR. OLSON, MS. TERNES,
MR. GESSNER, MR. LECH, MS. SMITH, AND LT. GOVERNOR WRIGLEY
NAYS: NONE
MOTION CARRIED
ABSENT: TREASURER SCHMIDT, MR. TRENBEATH
The Board recessed at 10:33 a.m. and reconvened at 10:45 a.m.
1519

5/27/2016 3
Commissioner Hamm was absent.
Bank of North Dakota (BND) Match Loan CD Program – Mr. Hunter stated staff is
recommending that the BND CD Program be transferred from the Budget Stabilization
Fund to the Legacy Fund prior to a portion of the Budget Stabilization Fund being
used to offset expected budget shortfalls. Mr. Hunter stated the transfer is
contingent upon BND guaranteeing a minimum 1.75% return noting that current 5-
year Treasury rates, which the CD rates are based, were 1.37% as of May 23, 2016.
The minimum return requirement will be reviewed at least annually if not more to
ensure the Legacy Fund will be able to maintain its’ long-term expected rate of
return of approximately 6.4% per annum. Mr. Hunter stated if the investment is
not transferred to the Legacy Fund, the future of the Program is uncertain from
an SIB perspective.
Discussion followed on the funding protocol for the Bank of ND Match Loan CD
Program. After discussion,
IT WAS MOVED BY MR. OLSON AND SECONDED BY MR. LECH AND CARRIED BY A ROLL CALL
VOTE TO UPHOLD SIB GOVERNANCE POLICY E-12 INVESTMENTS/BANK OF NORTH DAKOTA MATCH
LOAN PROGRAM WHICH STATES THE SOURCE OF FUNDING FOR THE CD’S SHALL BE DETERMINED
BY THE INVESTMENT DIRECTOR; THAT FUNDING TO BE FROM THE MOST APPROPRIATE SOURCE
CONSISTENT WITH LIQUIDITY AND RELATIVE YIELD AND RETURN OBJECTIVES AND
CONSTRAINTS.
AYES: COMMISSIONER GAEBE, MS. SMITH, MR. LECH, MR. OLSON, MR. SANDAL, AND LT.
GOVERNOR WRIGLEY
NAYS: MR. GESSNER, MS. TERNES
MOTION CARRIED
ABSENT: TREASURER SCHMIDT, COMMISSIONER HAMM, MR. TRENBEATH
Mr. Hunter will be reviewing this transaction with the Legacy and Budget
Stabilization Fund Advisory Board at their June 15, 2016, meeting and will report
back to the SIB.
Executive Session VW Litigation – Ms. Murtha requested the SIB enter into
Executive Session for attorney consultation regarding the Volkswagen Securities
Fraud Litigation pursuant to NDCC 44-04-19.2 and 44-04-19.1(2) and (5).
IT WAS MOVED BY COMMISSIONER GAEBE AND SECONDED BY MS. SMITH AND CARRIED BY A
VOICE VOTE TO ENTER INTO EXECUTIVE SESSION FOR ATTORNEY CONSULTATION PURSUANT TO
NDCC 44-04-19.2 AND 44-04-19.1(2) AND (5).
AYES: MR. OLSON, COMMISSIONER GAEBE, MR. GESSNER, MS. SMITH, MR. SANDAL, MS.
TERNES, MR. LECH, AND LT. GOVERNOR WRIGLEY
NAYS: NONE
MOTION CARRIED
ABSENT: MR. TRENBEATH, COMMISSIONER HAMM, TREASURER SCHMIDT
The SIB, RIO staff, Ms. Murtha (TLCF), were present during Executive Session.
Executive Session began at 11:39 am and concluded at 11:57 am.
IT WAS MOVED BY MR. SANDAL AND SECONDED BY MR. OLSON AND CARRIED BY A ROLL CALL
VOTE TO ACCEPT STAFF RECOMMENDATION AND DESIGNATE GRANT & EISENHOFER TO ACT AS
LIAISON COUNSEL WITH REGARDS TO THE VW LITIGATION MATTER AND TO AUTHORIZE RIO’S
EXECUTIVE DIRECTOR TO EXECUTE NECESSARY FUNDING AND PARTICIPATION DOCUMENTS AND
PROCEED WITH THE STEPS REQUIRED UNDER NDCC 54-12-08 AND 54-12-08.1.
1520

5/27/2016 4
AYES: MR. GESSNER, COMMISSIONER GAEBE, MS. SMITH, MR. LECH, MR. OLSON, MR.
SANDAL, MS. TERNES, AND LT. GOVERNOR WRIGLEY
NAYS: NONE
MOTION CARRIED
ABSENT: TREASURER SCHMIDT, COMMISSIONER HAMM, MR. TRENBEATH
ADMINISTRATION:
Audit Committee Report – Ms. Miller Bowley reported on the May 19, 2016, SIB
Audit Committee meeting. Mr. Thomas Rey, CliftonLarsonAllen, reviewed the
financial audit scope and approach for RIO for the period of July 1, 2015 – June
30, 2016. The GASB 68 audit report for the period of July 1, 2014 – June 30,
2015, was also approved as well as the Audit Committee’s work plan for the period
of July 1, 2016 – June 30, 2017. The Audit Committee also received an update on
the internal audit division’s activities for the third quarter. Included in the
SIB packet was a revised charter of the Audit Committee. Ms. Miller Bowley stated
the Audit Committee has updated and revised their charter and will present it to
the SIB for their review and acceptance on an annual basis going forward. SIB
Governance Policy B-6, Governance Process/Standing Committees, references the
Audit Committee and that the Audit Committee shall operate under the terms of a
charter approved by the SIB. Ms. Miller Bowley requested the SIB’s acceptance of
the revised charter as presented.
IT WAS MOVED BY MS. SMITH AND SECONDED BY COMMISSIONER GAEBE AND CARRIED BY A
ROLL CALL VOTE TO ACCEPT THE SIB AUDIT COMMITTEE CHARTER AS PRESENTED.
AYES: MR. OLSON, MR. GESSNER, MR. SANDAL, MS. SMITH, MS. TERNES, COMMISSIONER
GAEBE, MR. LECH, AND LT. GOVERNOR WRIGLEY
NAYS: NONE
MOTION CARRIED
ABSENT: TREASURER SCHMIDT, COMMISSIONER HAMM, MR. TRENBEATH
IT WAS MOVED BY MR. GESSNER AND SECONDED BY MR. OLSON AND CARRIED BY A VOICE VOTE
TO ACCEPT THE AUDIT COMMITTEE REPORT AS PRESENTED.
AYES: MS. TERNES, MR. OLSON, COMMISSIONER GAEBE, MR. LECH, MR. SANDAL, MS. SMITH,
MR. GESSNER, AND LT. GOVERNOR WRIGLEY
NAYS: NONE
MOTION CARRIED
ABSENT: COMMISSIONER HAMM, TREASURER SCHMIDT, MR. TRENBEATH
Executive Review Committee – Mr. Sandal, Chair of the Executive Review Committee,
Mr. Lech, and Lt. Governor Wrigley reviewed their final report on the evaluation
of the ED/CIO of RIO for the period of January 1, 2015 – December 31, 2015. The
Committee felt that the ED/CIO continues to provide the SIB with strong and
trusted leadership and vision. The ED/CIO has proven his ability to evaluate the
needs of the SIB, board clients, and the RIO team, and the ED/CIO strives for
continuous improvement in all areas. The ED/CIO has the respect of his team, SIB,
board clients, and the legislature. As importantly, the ED/CIO continues to
represent the SIB with unquestionable integrity. The Committee felt the SIB is
very fortunate to have Mr. Hunter in the role of Executive Director/CIO. The
Committee also recommended a 3 percent salary increase for the ED/CIO effective
July 1, 2016.
IT WAS MOVED BY MR. SANDAL AND SECONDED BY COMMISSIONER GAEBE AND CARRIED BY A
VOICE VOTE TO ACCEPT THE EXECUTIVE REVIEW COMMITTEE REPORT AND THEIR
RECOMMENDATION OF A 3 PERCENT SALARY INCREASE FOR THE ED/CIO EFFECTIVE JULY 1,
2016.
1521

5/27/2016 5
AYES: MS. TERNES, MR. OLSON, MR. SANDAL, MR. GESSNER, MS. SMITH, COMMISSIONER
GAEBE, MR. LECH, AND LT. GOVERNOR WRIGLEY
NAYS: NONE
MOTION CARRIED
ABSENT: COMMISSIONER HAMM, TREASURER SCHMIDT, MR. TRENBEATH
Employee Benefits Programs Committee – Included in the SIB meeting materials was
the presentation given to the Employee Benefits Programs Committee on April 28,
2016, by Mr. Schulz. The report was for informational purposes only.
RIO Code of Conduct and Ethics Policy – Mr. Hunter reviewed RIO’s current Code of
Conduct and Ethics Policy and Travel Policy. Mr. Hunter also highlighted areas
that had been enhanced to specifically clarify business expenses and fraud
reporting.
OTHER:
The next meeting of the SIB is scheduled for July 22, 2016, at 8:30 a.m. at
Bismarck State College, National Energy Center of Excellence, Energy Generation
Conf Rm #335, 1500 Edwards Avenue, Bismarck, ND.
The next meeting of the SIB Audit Committee is scheduled for September 23, 2016,
at 1:00 p.m. in the Peace Garden Room at the State Capitol.
ADJOURNMENT:
With no further business to come before the SIB, Lt. Governor Wrigley adjourned
the meeting at 12:17 p.m.
___________________________________
Lt. Governor Wrigley, Chair
State Investment Board
___________________________________
Bonnie Heit
Assistant to the Board
1522
AGENDA ITEM III.
TO: State Investment Board (SIB)
FROM: Dave Hunter, Executive Director/CIO
DATE: July 15, 2016
RE: Election of Officers – July 2016 to June 2017
In accordance with the SIB Governance Policy B-7 on “Annual Board Planning Cycle”, the SIB will conduct an “Election of Officers” each July. The relevant By-Laws and Governance Policy of the SIB are highlighted immediately below for reference purposes.
CHAPTER 3 - OFFICERS AND DUTIES
Section 3-1. The officers of the SIB are a Chair and Vice Chair, one of which must be an
appointed or elected member of the TFFR or PERS Board. The officers will be
elected by the SIB to a one-year term at the first regularly scheduled meeting
following July 1 of each year. Vacancies will be filled by the SIB at the first
scheduled meeting following the vacancy.
Section 3-2. Chair. The Chair will preside at all meetings of the SIB.
Section 3-3. Vice Chair. In the absence of the Chair, the Vice Chair will perform the duties of the Chair.
Section 3-4. Executive Director. An Executive Director will be retained by the SIB. The
Executive Director will serve at the SIB's pleasure, be responsible for keeping the
records of the SIB and TFFR Board actions, and perform such duties as the SIB
prescribes. The Executive Director will make out and give out all notices
required to be given by law, procedures, or rules and regulations of the two
boards.
Policy Implemented: June 23, 1995.
The chairperson's primary responsibility is to insure the integrity of the board's process. The
chairperson is the only board member authorized to speak for the board other than in specifically
authorized instances.
1. The duty of the chairperson is to see that the board operates consistent with state
law, administrative rules, and its own policies.
A. The board agenda will be the responsibility and be coordinated by the
chairperson.
B. Meeting discussion content will only be those issues which,
according to board policy, clearly belong to the board and not the
executive director, or in a board member's opinion, may deal with
fiduciary responsibilities.
C. Deliberation will be fair, open, and thorough, but also efficient,
timely, orderly, and brief.
D. The chairperson shall appoint a parliamentarian.

Board Action Requested
TO: STATE INVESTMENT BOARD
FROM: David Hunter, ED/CIO and Terra Miller-Bowley, Supervisor of Audit Services
DATE: July 15, 2016
RE: Audit Committee Appointments
As directed by SIB Policy B-6, Governance Process/Standing Committees, the Audit Committee shall
consist of five members selected by the SIB. Three members of the Audit Committee represent the three
groups on the SIB (TFFR board, PERS board, and the elected and appointed officials). The other two
members will be selected from outside of the SIB and will be auditors with at least a Certified Public
Accountant (CPA) or Certified Internal Auditor (CIA) designation.
The SIB previously approved the following four Board representatives for the past year:
Rebecca Dorwart, CPA, CIA
Cindy Ternes (Workforce Safety & Insurance designee) representing elected and appointed officials
Mike Sandal, representing PERS
Michael Gessner, representing TFFR
Background and Recommendation:
SIB Policy B-6 states the following: “An Audit Committee has been established as a standing committee
of the SIB. The Audit Committee will assist the SIB in carrying out its oversight responsibilities as they
relate to RIO’s internal and external audit programs, including financial and other reporting practices,
internal controls, and compliance with laws, regulations and ethics.” Based on the strong performance of
the Audit Committee during the past year with regards to assisting the SIB in carrying out its
oversight responsibilities, the Executive Director and Supervisor of Audit Services recommend the
re-appointment of the four existing audit committee members. RIO also recommends that one new
member, Mr. Joshua J. Wiens, be appointed as a new member of the Audit Committee to replace the
position previously held by Karol Riedman, who no longer desires to serve on the Committee.
Rebecca Dorwart, CPA, CIA
Ms. Rebecca Dorwart is currently the Human Resources Project Manager for MDU Resources Group,
Inc., reporting to the Vice President of Human Resources. Responsibilities in the role of Human
Resources Project Manager include analysis of executive and board member total compensation, tracking
multi-employer plan status, working with outside consultants on pension and post-retirement valuations,
leading the preparation of compensation related sections of the proxy statement and providing audit
resolution assistance to business units on human resources related control deficiencies.
Prior to her new assignment, Rebecca was the Director of Internal Controls for MDU Resources Group,
Inc. for four years where she was responsible for the risk assessment of company-wide financial processes
and controls and the coordination of the company’s Sarbanes-Oxley compliance program. She reported to
the Vice President/Chief Financial Officer but also communicated with the Audit Committee of MDU
Resources Group’s Board of Directors.
AGENDA ITEM IV.

Ms. Dorwart also served as the Director of Internal Auditing MDU Resources Group, Inc. for nine years
where she managed all internal audit functions of MDU and coordinates the work with the external audit.
She directly supervised eleven internal auditors and reported to the Vice President/Chief Financial Officer,
President and Chief Executive Officer and the Audit Committee of MDU Resources Group’s Board of
Directors.
Rebecca worked for the Montana Office of the Legislative Auditor as a financial compliance auditor for
five years before joining MDU Resources Group, Inc. in 1992. At MDU Resources Group, Inc., Becky
worked in the Internal Auditing Department until 1997 when she was transferred to Portland, Oregon as
General Accounting Manager for International Line Builders, Inc., a MDU acquisition. In 1999, she
transferred to Medford, Oregon as Senior Business Development Analyst for Knife River Corporation,
working on the merger and acquisition of construction materials related businesses. In February of 2003,
she was named Internal Auditing Manager for MDU Resources Group, Inc. She is active in the local
chapter of the IIA.
Joshua J. Wiens, CPA
Mr. Joshua Wiens currently serves as Chief Financial Officer of McDonalds of Bismarck-Mandan. Joshua
manages the finances and accounting for six McDonalds stores in Bismarck and Mandan including all
accounting and payroll related functions. He also manages the insurance and Affordable Care Act
regulations and reporting for employees in addition to submitting monthly and annual financial statements
to McDonalds Corporation. Joshua has served in this role since 2013 to date.
Mr. Wiens concurrently acts as Chief Financial Officer for Shiloh Christian School in Bismarck. Joshua
effectively manages the business side of this private school which includes a $3.6 billion budget and
working with a bank and contractor on construction projects and financing along with handling numerous
vendor relationships for the school.
Prior to serving as CFO for his two current employers, Joshua was a Senior Audit Manager for Eide
Bailly, LLP in Bismarck. Mr. Wiens specialized in non-profit/government, financial institution, small
business and construction contractor audits and consulting. Clients ranged in size from $100,000 to $5
billion in assets and total revenues of up to $100 million. Joshua’s 15 years of professional auditing
experience with Eide Bailly is ideal for serving as a member of the SIB Audit Committee. His resume is
attached for further reference including his career accomplishments and professional education.
Review of Board By-Laws relating to Audit Committee Member Qualifications:
The SIB By-Laws state “The other two members (of the Audit Committee) will be selected from outside
of the SIB and be auditors with at least a CPA or CIA designation.” RIO requests the SIB to confirm its’
interpretation of auditors to be a degreed accounting professional with significant auditing experience in
the public or private sector. This clarification is sought as the current Chair of the Audit Committee,
Rebecca Dorwart, and newly recommended candidate, Joshua Wiens, are not currently employed as
auditors even though both candidates have extensive professional auditing backgrounds, in addition to
holding CPA and/or CIA designations.

JOSHUA J. WIENS, CPA
EMPLOYMENT
Shiloh Christian School
2014-Present Chief Financial Officer
Manage the business side of the school which includes a $3.6 million budget, proposing annual tuition and
teacher’s salaries to the Board, working with families on financial aid, working with a bank and
contractor on construction projects and financing, working with vendors, etc.
McDonalds of Bismarck-Mandan
2013-Present Chief Financial Officer
Manage the finances and accounting for the six stores in Bismarck-Mandan which include all accounting
and payroll related functions.
Manage the insurance and Affordable Care Act for our employees.
Submit monthly and annual financial statements to McDonalds Corporation.
Eide Bailly LLP
1999-2013 Senior Manager
Specialized in non-profit/government, financial institution, small business, and construction contractor
audits and consulting. Clients ranged in size with $100,000 to $5 billion in assets and total revenues of up
to $100 million.
Reported audit plan, engagement status, issues, and results to client management and the Audit
Committee of the Board of Directors.
Managed relationships with current clients and their Board of Directors which includes presenting at their
Board meetings
Developed aptitude for working under strict deadlines and in high-pressure situations.
Successfully monitored the budget and performance of the engagement team to ensure each audit jobs
profitability.
Performed risk assessment procedures, including inquiries with senior management, analytical
procedures, and industry analysis, to effectively develop the audit plan and work program.
CAREER ACCOMPLISHMENTS
Obtained Certified Public Accounting license
Graduate of the Dakota School of Banking
Graduate of Dale Carnegie
Graduate of Eide Bailly’s Leadership Training Program
EDUCATION
1999: B.S. in Accounting, North Dakota State University
COMMUNITY INVOLVEMENT
Graduate of the Chambers’ Leadership Bismarck Mandan program.
Member of Stewardship Board for seven years at a local church; 4 years as the treasurer which involves
preparing and presenting the $1 Million budget
Treasurer of Child Evangelism Fellowship State Association.
Created and ran Wild Game Feeds, Men’s Sporting Clays Event, and other Men’s events at a local church
Started, organized, and periodically teach an adult Sunday School class with 15 to 40 participants;

Fundamental Investment Beliefs RIO’s Mission Statement and Strategic Plan
RIO’s Mission Statement and Strategic Investment Plan are based on the Fundamental Investment Belief that asset allocation decisions are the main drivers of long-term investment returns, but the prudent use of active management is an important contributor to ensuring our clients attain their stated investment objectives.
Dave Hunter, Executive Director / CIO
ND Retirement & Investment Office (RIO)
State Investment Board (SIB)
AGENDA ITEM V. A.

RIO’s Mission Statement
2
RIO’s “Mission” is defined in SIB Governance Policy D-1 on “Ends”.
The Retirement and Investment Office serves the SIB and exists in order that:
1) SIB clients receive investment returns, consistent with their written investment policies and market
variables, in a cost effective investment manner and under the Prudent Investor Rule. D-3
2) Potential SIB clients have access to information regarding SIB’s investment services. D-4
3) TFFR benefit recipients receive their retirement benefits in a cost effective and timely manner. D-5
4) TFFR members have access to information which will allow them to become knowledgeable about
the issues and process of retirement. D-6
5) SIB clients and TFFR benefit recipients receive satisfactory services from the boards and staff. D-7
Mission Accomplishments:
1) Every SIB client generated positive excess returns for the 5-years ended 12/31/15 and 3/31/16, with
one exception (PERS Retiree Health) while adhering to approved investment guidelines and noting
that management fees have declined from 0.65% to 0.47% in the last two fiscal years (2013 to 2015).
2) RIO implemented a transparency enhancement initiative in late-2015 which enhanced public access
to our website by adding new hyperlinks for our governance manual, audit charter and meeting
materials (including our quarterly investment performance reviews).
3) RIO’s internal audit team conducted reviews which provide reasonable assurance that TFFR benefit
recipients receive their retirement benefits in a cost effective and timely manner.
4) TFFR member surveys support management’s belief that members have access to information which
will allow them to become knowledgeable about retirement issues and processes.
5) SIB and TFFR client surveys confirm that the boards and staff provide satisfactory services.
SIB Gov. Policy D-2 RIO clients are those which are statutorily defined and those which have been contracted for services under statutory authority.

NDRIO 2015-17 Strategic Investment Plan
3
Fundamental Investment Beliefs
Asset allocation decisions are the primary driver of investment returns, but the prudent use of active investment management is an important
contributor towards ensuring our clients attain their stated investment objectives. SIB clients generated over $200 million of incremental income
via the prudent use of active investment management over the past five years including approximately $40 million of excess return in 2015.
Strategic Investment Plan
1. Reaffirm the organizational commitment to our current governance structure including a persistent awareness to the importance of continuing
board education.
2. Enhance transparency and understanding of our core goals and beliefs.
a. Remain steadfast in our commitment to the prudent use of active investment management.
b. Expand awareness to downside risk management which is essential to achieving our long term investment goals.
c. Given actual and projected growth of SIB client assets and the heightened public awareness of the Legacy Fund, align our investment
platforms to promote greater clarity and efficiency in reporting and implementing client investment policies.
3. Expand RIO’s influence and ability to create positive and sustainable change by developing relationships with existing clients, organizations
and legislative leaders.
a. Enhance community outreach to build upon public awareness and confidence.
b. Develop concise presentations which highlight our overall risk, return and cost control framework including our progress towards
attaining our long-term goals.
4. Heighten employee engagement by promoting an open and collaborative work environment while encouraging employee participation in staff
meetings, offer more opportunities to impact RIO’s change initiatives and improve overall compensation levels.
a. RIO’s ability to continue to deliver strong results is dependent on the combined efforts of our highly valuable team members.
5. Enhance our existing risk management tools and processes by developing a more robust risk management framework utilizing proven risk
management solutions with a focus on portfolio construction and downside risk management (or “stress test” scenarios).
a. A robust risk management framework provides a foundation to understand downside risks and our ability to withstand market
corrections in varying stress test scenarios.
6. Evaluate and expand the efficient use of technology in our investment program activities including risk management, compliance monitoring,
client satisfaction surveys, website design and communications in order to increase overall efficiency and effectiveness.

Fundamental Investment Beliefs
4
Asset allocation is the # 1 driver of investment returns.
The prudent use of active investment management is an
important contributor towards ensuring our clients attain their
stated investment objectives.
SIB clients generated $200 million of incremental income via the
prudent use of active investment management since 2011.
SIB clients generated over $40 million of excess return via the
prudent use of active investment management in 2015.
SIB Governance Policy D-3 on the “Ends” for Investment Services are based on the following:
1. Comparison of client fund’s rate of return net of fees and expenses, to that of the client’s policy benchmark
over a minimum evaluation period of 5 years.
2. Comparison of the client fund’s risk, measured by standard deviation of net returns, to that of the client’s
policy benchmark over a minimum period of 5 years.
3. Comparison of the risk adjusted performance of the client fund, net of fees and expenses, to that of the client’s
policy benchmark over a minimum period of 5 years.

Reaffirm Commitment to Governance & Board Education
5
Reaffirm organizational commitment to our current governance
structure.
Annual governance training provided by leading industry experts
serve as the focal point of our July board meetings the last two
years. (Keith Ambachtsheer of KPA Advisory Services i 2015 and
Jeanna Cullins of Aon Hewitt in 2016)
Maintain a persistent awareness to the importance of continuing
board education.
Emphasize continuing board education at SIB meetings and promote
the attendance of educationally focused industry conferences.

Enhance Understanding of Core Goals and Beliefs
6
Enhance transparency and understanding of our core
goals and beliefs.
Remain steadfast in our commitment to the prudent use of
active investment management.
Expand awareness to downside risk management which is
essential to achieving our long term investment goals.
Given actual and projected growth of SIB client assets and
the heightened public awareness of the Legacy Fund, align
our investment platforms to promote greater clarity and
efficiency in reporting and implementing client investment
policies.

Expand Influence and Ability to Create Positive Change
7
Expand RIO’s influence and ability to create positive and
sustainable change by developing relationships with existing
clients, organizations and legislative leaders.
Enhance community outreach to build upon public awareness and
confidence.
Develop concise presentations which highlight our overall risk,
return and cost control framework including our progress towards
attaining our long-term goals.

Heighten Employee Engagement and Impact
8
Heighten employee engagement by promoting an open and
collaborative work environment while encouraging employee
participation in staff meetings, offer more opportunities to
impact RIO’s change initiatives and improve overall
compensation levels.
RIO’s ability to continue to deliver strong results is dependent on
the combined efforts of our highly valuable team members.
Enhance Existing Risk Management Framework
9
Enhance our existing risk management tools and processes
by developing a more robust risk management framework
utilizing proven risk management solutions with a focus on
portfolio construction and downside risk management (or
“stress test” scenarios).
A robust risk management framework provides a foundation to
understand downside risks and our ability to withstand market
corrections in varying stress test scenarios.

Evaluate and Expand the Efficient Use of Technology
10
Evaluate and expand the efficient use of technology in our
investment program activities including risk management,
compliance monitoring, client satisfaction surveys, website
design and communications in order to increase overall
efficiency and effectiveness.

State Investment Board – Client Assets Under Management
11
SIB client assets grew by approximately 4.9% (or $513 million) in the last year with the Legacy Fund creating the largest asset growth of $479 million primarily due to tax collections.
The Legacy Fund generated a net investment loss of -0.33% for the year ended March 31, 2016. Since inception, the Legacy Fund has generated a net annualized return of 2.5% (over the last 4.5 years) exceeding the performance benchmark of 1.8%.
The Pension Trust posted a net return of -0.41% (down $20 million) in the last year. During the last 5-years, the Pension Trust generated a net annualized return of 6.27% exceeding the performance benchmark of 5.87%.
The Insurance Trust generated a net return of +0.79% (up $20 million) in the last year. During the last 5-years, the Insurance Trust generated a net annualized return of 4.8% exceeding the performance benchmark of 3.9%.
SIB client assets exceeded $11 billion as of March 31, 2016, based on unaudited valuations.
Market Values Market Values
Fund Name as of 3/31/16 (1) as of 3/31/15 (1)
Pension Trust Fund
Public Employees Retirement System (PERS) 2,421,987,130 2,401,309,136
Teachers' Fund for Retirement (TFFR) 2,057,394,854 2,090,299,471
Job Service of North Dakota Pension 95,573,693 98,026,580
City of Bismarck Employees Pension 81,075,233 81,230,926
City of Grand Forks Employees Pension 54,800,673 56,504,623
City of Bismarck Police Pension 33,434,044 35,631,338
Grand Forks Park District 5,813,061 6,033,693
City of Fargo Employees Pension 1,489
Subtotal Pension Trust Fund 4,750,078,688 4,769,037,256
Insurance Trust Fund
Legacy Fund 3,194,769,809
Workforce Safety & Insurance (WSI) 1,801,047,070 1,770,406,238
Budget Stabilization Fund 579,947,916 595,135,717
ND Tobacco Control and Prevention 44,805,976
PERS Group Insurance Account 38,575,386 41,205,242
City of Fargo FargoDome Permanent Fund 38,079,559 41,752,458
State Fire and Tornado Fund 23,599,019 25,431,804
Petroleum Tank Release Compensation Fund 7,034,692 7,232,124
State Risk Management Fund 6,357,621 6,929,517
State Risk Management Workers Comp Fund 5,853,318 6,290,439
ND Association of Counties (NDACo) Fund 3,967,813 3,562,951
State Bonding Fund 3,238,892 3,339,532
ND Board of Medical Examiners 2,183,569 2,168,964
Insurance Regulatory Trust Fund 1,071,344 658,357
Bismarck Deferred Sick Leave Account 628,166 881,132
Cultural Endowment Fund 378,831 383,865
Subtotal Insurance Trust Fund 2,556,769,172 5,700,148,149
Legacy Trust Fund
Legacy Fund 3,673,717,322
PERS Retiree Insurance Credit Fund 98,401,571 96,499,236
Total Assets Under SIB Management 11,078,966,753 10,565,684,641
(1) 3/31/16 and 3/31/15 market values are unaudited and subject to change.

The Pension Trust was ranked in the 35th percentile for the 5-years ended March 31, 2016, based on Callan’s “Public Fund Sponsor Database”.
12 Note: The above chart is prepared on an standard or unadjusted basis.

Prepared by Aon Hewitt Investment ConsultingRetirement and InvestmentNorth Dakota State Investment Board, July 22, 2016
Board Governance SessionNorth Dakota State Investment BoardFriday, July 22, 2016 Presented by: Jeanna M. Cullins, Partner – Fiduciary Services Practice

Aon Hewitt Investment Consulting | Retirement and Investment
Fiduciary Services Practice | July 22, 2016 2
Agenda
What is Governance
2 Common Board Governance Models
Discussion: Current Governance Model in Light of Other Models3
1

Aon Hewitt Investment Consulting | Retirement and Investment
Fiduciary Services Practice | July 22, 2016 3
What Is Governance?

Aon Hewitt Investment Consulting | Retirement and Investment
Fiduciary Services Practice | July 22, 2016 4
What is Governance?
Governance is the structure, manner, and process -- the framework - by which an organization exercises authority or control -- the process of decision-making and the process by which decisions are implemented (or not implemented)
– Good governance begins with a clear understanding of fiduciary duty
– Unless all involved share the same understanding, governance problems could arise
– Good governance practices institutionalize behavior and facilitate the ability to meet fiduciary standards
– Poor governance practices introduce risk and can leave an organization open to criticism

Aon Hewitt Investment Consulting | Retirement and Investment
Fiduciary Services Practice | July 22, 2016 5
What are Some Essential Elements of “Good” Governance?
Accountability
Transparency
Accurate documentation
Adherence to rules (applicable law(s) and policies)
Effectiveness and efficiency
A participatory process (Inclusiveness)
Consensus oriented
Fairness
Responsiveness (designed to serve best interest of beneficiaries and participants)

Aon Hewitt Investment Consulting | Retirement and Investment
Fiduciary Services Practice | July 22, 2016 6
What are Some Characteristics of “Poor” Governance?
Lack of transparency and accountability
– Inadequate reporting and oversight – Roles are not properly defined and understood
Poor documentation
Inconsistent decision-making
High tolerance for conflicts
Micromanagement
No strategic plan/direction

Aon Hewitt Investment Consulting | Retirement and Investment
Fiduciary Services Practice | July 22, 2016 7
Why is Good Governance Important?
Good governance helps boards to meet their fiduciary responsibilities
Good governance helps to prevent fiduciary breaches and minimize risk
Good governance fosters stakeholder confidence
Good governance adds tangible value*– Studies show that good governance is associated with increased returns
* “Good Governance Adds Value”, a study published by Rotman International Journal of Pension Management, found that better governed pension funds outperformed poorly governed funds by 2.4% per annum during the 4-year period ending 12/2003. A similar study for the period 1993-1996 found a 1% annual good governance performance dividend. Capelle, Ronald, Lunn, Hubert and Ambachtsheer, Keith, “The Pension Governance Deficit: Still with Us” (October, 2008), Rotman International Journal of Pension management, Vol. 1, 2008, at SSRN: http://ssrn.com/abstract=1280907.

Aon Hewitt Investment Consulting | Retirement and Investment
Fiduciary Services Practice | July 22, 2016 8
Why is Good Governance Important?
The Stanford Institutional Investors’ ForumPeter Clapman, Chair, May 31, 2007
“Good governance helps to ensure
better organizational performance,
fewer conflicts of interest, higher
probability that goals and objectives
will be attained, and less opportunity
for misuse of corporate or fund assets.”

Aon Hewitt Investment Consulting | Retirement and Investment
Fiduciary Services Practice | July 22, 2016 9
Common Board Governance Models

Aon Hewitt Investment Consulting | Retirement and Investment
Fiduciary Services Practice | July 22, 2016 10
How is Governance Determined in the Public Fund Environment?
The basic legal tenets of governance are typically defined in a statewide public fund’s governing statutes, including:
- Board size;
- Composition;
- Required qualifications and experience;
- Degree of authority regarding budget, personnel and procurement matters;
- Key responsibilities;
- Accountability;
- Reporting requirements; and
- High level meeting protocols such as open meetings applicability and meeting frequency, among others
The degree of statutory detail varies from state to state; boards typically address gaps through policy and/or regulations
The method by which a board chooses to govern is generally a policy decision

Aon Hewitt Investment Consulting | Retirement and Investment
Fiduciary Services Practice | July 22, 2016 11
Five Common Governance Models
1. The Traditional (Structural) Model
2. Carver (Policy) Model
3. Cortex (Outcomes)
Model4. Consensus
(Process) Model
5. Competency (Skills/Practices)
Model
In practice, many boards adopt a combination of these models, in a mix that is appropriate to the unique culture and features of their organization and board composition.

Aon Hewitt Investment Consulting | Retirement and Investment
Fiduciary Services Practice | July 22, 2016 12
1. The Traditional (Structural) Model
Description‒ Oldest Model‒ Board is legal ownership entity‒ Evolved to limit the liabilities of corporations and directors‒ Often large in size
Primary Features‒ Assists organizations with defining board structure (i.e., decision-making process,
meeting structure, governance structure are put into bylaws or an approved policy)‒ The board only speaks as a board with one voice‒ The board Chair is usually the official “voice” of the board and speaks only as
authorized by the board‒ Defines the delegation of responsibilities from the board to: the Executive Director
and and/or the board Committees

Aon Hewitt Investment Consulting | Retirement and Investment
Fiduciary Services Practice | July 22, 2016 13
1. The Traditional (Structural) Model cont’d
Common Challenges
‒ Silent on the accountability mechanisms and expectations for reporting back when the board delegates powers
‒ Creation of operating committees of management/staff by the Executive Director that interface with board committees with similar sounding responsibility may lead to confused staff and board members crossing the boundary between governance and operational management
‒ Board representing constituents as opposed to abiding by its legal fiduciary duty to avoid conflicts of interest, focus on the whole, and be consensus driven
Where this governance model can be observed in practice‒ Corporations and law firms‒ Charitable organizations and non-profits‒ State-owned enterprises, including a number of large public retirement systems

Aon Hewitt Investment Consulting | Retirement and Investment
Fiduciary Services Practice | July 22, 2016 14
2. The Carver (Policy) Model
Description‒ Board’s main role is to create policy to guide management in its operational work,
and to guide the board in its governance work‒ Board’s focus is on defining the “ends” of the organization
Primary Features
‒ Board’s policies define what the Executive Director is not allowed to do, the “limits” to his/her decision-making, and the parameters within which he/she must operate
‒ As long as the Executive Director does not violate the parameters, he/she has broad discretion
‒ All board members are equally accountable for the decision-making of the board; the board should function as much as possible as a “board of the whole”, and reduce and/or eliminate board committees

Aon Hewitt Investment Consulting | Retirement and Investment
Fiduciary Services Practice | July 22, 2016 15
2. Carver (Policy) Model cont’d
Common Challenges
‒ If a board is overly focused on policy-development and refinement, it can reduce the time available for other board actions and responsibilities
‒ Does not assist the board in establishing clear, strategic/annual expectations or outcomes / measures of success; a board needs to supplement this approach with the development and approval of a strategic plan, annual business plan, and budget process
Where this governance model can be observed in practice‒ Non-profits‒ Some large public retirement system and public fund investment boards, like the
North Dakota State Investment Board

Aon Hewitt Investment Consulting | Retirement and Investment
Fiduciary Services Practice | July 22, 2016 16
3. Cortex (Outcomes) Model
Description‒ Focus of board is on its: stakeholders, the Pension Deal, internal board governance
structure, and periodically engaging in a “reality check”‒ Defines the standards, expectations and performance outcomes to which the
organization aspires
Primary Features‒ Board clarifies and sets the outcomes measures of success‒ Board creates an accountability framework around the outcomes measures, and
identifies who is responsible for leading/taking action in each area (i.e. board, CEO, staff, or even a third party)
‒ Board ensures the capacity of resources exists in each group, and a mechanism for each group to report-back to the board on its progress

Aon Hewitt Investment Consulting | Retirement and Investment
Fiduciary Services Practice | July 22, 2016 17
Primary Feature of the Cortex Model
Prepared by

Aon Hewitt Investment Consulting | Retirement and Investment
Fiduciary Services Practice | July 22, 2016 18
3. Cortex (Outcomes) Model cont’d
Challenges (Common)
‒ Board’s ability to understand the “pension deal” well enough to clearly articulate success measures; must rely on management to do much of the research and develop draft performance statements
‒ Ensuring the governance structure is clearly defined‒ Having current mechanisms or reporting structures in place to measure performance
against the approved outcomes‒ Having the necessary autonomy to carry out its mission
Where this governance model can be observed in practice
‒ Public Funds‒ Useful in establishing a framework for assessing performance of a board/board
committees, CEO and/or staff‒ Beneficial in helping organizations become more transparent and accountable

Aon Hewitt Investment Consulting | Retirement and Investment
Fiduciary Services Practice | July 22, 2016 19
4. Consensus (Process) Model
Description
‒ The model addresses how decision-making is achieved by the board and how issues will be discussed, different experiences and insights contributed; differences of opinion or concerns will be handled; agreement is reached and timeliness and agenda management is handled
‒ It supports contribution from all board members, and expects others to listen, respect, and consider their colleagues’ input
Primary Features
‒ This model is anchored by the understanding that all board members are equal –with an equal vote, equal responsibility, equal liability for decision-making, and equal accountability for the actions of the organization/board
‒ Board members have different areas of expertise, knowledge and wisdom to bring to the table

Aon Hewitt Investment Consulting | Retirement and Investment
Fiduciary Services Practice | July 22, 2016 20
4. Consensus (Process) Model cont’d
Challenges (Common)
‒ Characteristics of model can slow the proceedings of a board
‒ Due to the focus of the model on the way decision-making is made within the board, the board will have to develop policy or by-laws to convey its important processes, and then add attention to strategy, planning, reporting on operational issues, etc. in addition to the decision-making framework
Where this governance model can be observed in practice‒ This model is valuable for the not-for-profit sector, family-owned businesses, as well
as widely held corporations with no majority shareholder

Aon Hewitt Investment Consulting | Retirement and Investment
Fiduciary Services Practice | July 22, 2016 21
5. Competency (Skills/Practices) Model
Description
‒ A developmental model
‒ Defines the style of behavior and frequency/or level of engagement for board members in their work
Primary Features‒ Ensures all members of the board have the appropriate knowledge, skills and attitudes to be a
good board member
‒ Addresses board as a team – communications, trust, relationships etc.
‒ Seeks to continuously improve the performance of the board over time
‒ Prescribes behavior expectations through the implementation of board assessments (either external or self-driven) and ensures they have a common context for their work together
‒ Assist new board members by giving them a picture of the practices they should strive to adopt; and if combined with some mentorship from more experienced board members, can bring new members up to speed fairly quickly to more fully discharge their fiduciary, trusteeship, community interface and other duties

Aon Hewitt Investment Consulting | Retirement and Investment
Fiduciary Services Practice | July 22, 2016 22
5. Competency (Skills/Practices) Model cont’d
Challenges (Common)‒ Model doesn’t drive policy creation, establishment of strategy, or monitoring of
practice per se and doesn’t prescribe them through legal structure
Where you would typically see this model‒ Strong model for recruiting and developing board members

Aon Hewitt Investment Consulting | Retirement and Investment
Fiduciary Services Practice | July 22, 2016 23
Discussion: Current Governance Model in Light of Other Models

Aon Hewitt Investment Consulting | Retirement and Investment
Fiduciary Services Practice | July 22, 2016 24
Open Discussion/Questions for Consideration: Pros and Potential Cons
1) How would the Board best describe its current governance model? Is it pure Carver, or does it reflect a blend of several models?
2) Is the Board still satisfied with its current approach to governance?
a) What aspects are working well?
b) In what areas might there be room for enhancement?
3) Are there elements of the other models that are attractive to the Board, and would be beneficial to explore further?
4) Next steps?

Aon Hewitt Investment Consulting | Retirement and Investment
Fiduciary Services Practice | July 22, 2016 25
Presenter Biography
Works with a wide array of institutional investor clients with a primary focus in the areas of fiduciary and management reviews, policy development, compliance, strategic planning, trustee education, and other board and plan governance matters
Has worked with over 50 public fund boards, corporate pension funds, endowments and foundations to enhance their governance and management processes
Served as the Executive Director and General Counsel for a public retirement board
Over 30 years of industry experience Holds a BA, cum laude, from Brooklyn College, City
University of New York; and a J.D. from Georgetown University Law Center
Licensed to practice law in Washington, D.C. NACD Member
Jeanna Cullins, JDPartner
Fiduciary Services Practice Leader

Aon Hewitt Investment Consulting | Retirement and Investment
Fiduciary Services Practice | July 22, 2016 26
Legal Disclosures and DisclaimersInvestment advice and consulting services provided by Aon Hewitt Investment Consulting, Inc. (“AHIC”). The information contained herein is given as of the date hereof and does not purport to give information as of any other date. The delivery at any time shall not, under any circumstances, create any implication that there has been a change in the information set forth herein since the date hereof or any obligation to update or provide amendments hereto. This document is not intended to provide, and shall not be relied upon for, accounting, legal or tax advice or investment recommendations. Any accounting, legal, or taxation position described in this presentation is a general statement and shall only be used as a guide. It does not constitute accounting, legal, and tax advice and is based on AHIC’s understanding of current laws and interpretation. This document is intended for general information purposes only and should not be construed as advice or opinions on any specific facts or circumstances. The comments in this summary are based upon AHIC’s preliminary analysis of publicly available information. The content of this document is made available on an “as is” basis, without warranty of any kind. AHIC disclaims any legal liability to any person or organization for loss or damage caused by or resulting from any reliance placed on that content. AHIC. reserves all rights to the content of this document. No part of this document may be reproduced, stored, or transmitted by any means without the express written consent of AHIC. Aon Hewitt Investment Consulting, Inc. is a federally registered investment advisor with the U.S. Securities and Exchange Commission. AHIC is also registered with the Commodity Futures Trade Commission as a commodity pool operator, and is a member of the National Futures Association. The AHIC ADV Form Part 2A disclosure statement is available upon written request to:
Aon Hewitt Investment Consulting, Inc.200 E. Randolph StreetSuite 1500Chicago, IL 60601ATTN: AHIC Compliance Officer
© Aon plc 2016. All rights reserved.

2016 North Dakota Open Meetings Law Update
NORTH DAKOTA STATE INVESTMENT BOARD

OPEN MEETINGS LAW UPDATE
DELEGATION OF AUTHORITY
• Records in Possession of Agent – N.D.A.G. 2016-O-3
• Notice of Committee Meetings – N.D.A.G. 2016-O-5
• Series of Smaller Gatherings – N.D.A.G. 2016-O-11
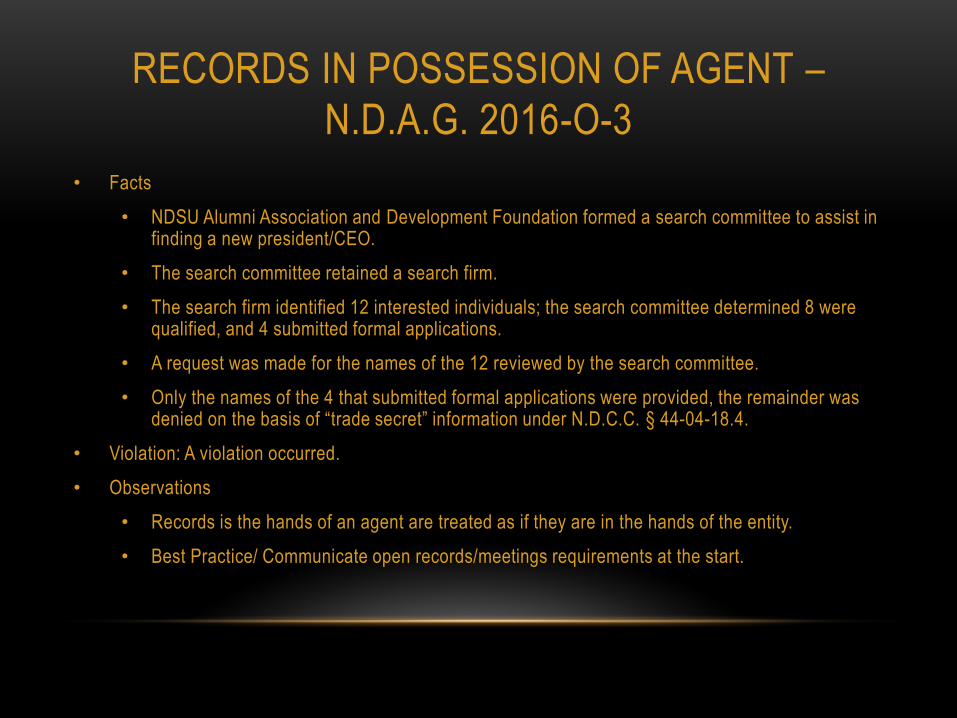
RECORDS IN POSSESSION OF AGENT –
N.D.A.G. 2016-O-3
• Facts
• NDSU Alumni Association and Development Foundation formed a search committee to assist in finding a new president/CEO.
• The search committee retained a search firm.
• The search firm identified 12 interested individuals; the search committee determined 8 were qualified, and 4 submitted formal applications.
• A request was made for the names of the 12 reviewed by the search committee.
• Only the names of the 4 that submitted formal applications were provided, the remainder was denied on the basis of “trade secret” information under N.D.C.C. § 44-04-18.4.
• Violation: A violation occurred.
• Observations
• Records is the hands of an agent are treated as if they are in the hands of the entity.
• Best Practice/ Communicate open records/meetings requirements at the start.

NOTICE OF COMMITTEE MEETINGS –
N.D.A.G. 2016-O-5
• Facts
• Washburn City Commission directed 2 Commissioners to serve on a committee to review bid proposals.
• The committee met 3 times, and the bids were shared with the Commission at a meeting thereafter.
• The first committee meeting was not noticed, the second was posted on the City’s website, the third was posted on the website, emailed to the press, and posted on the door. No agenda was provided.
• Violation: A violation occurred.
• Observations
• Without a regular schedule, all committee meetings were special meetings and subject to special meeting notice requirements.
• Best Practice/ Discuss notice requirements at time of committee formation.

SERIES OF SMALLER GATHERINGS-
N.D.A.G. 2016-O-11
• Facts
• Williston City Commission is comprised of 5 members, including the Mayor.
• Mayor met with members of various industries over at least 4 meetings regarding a similar issue. The Mayor requested 1 Commissioner to attend at least 3 meetings, and when the first Commissioner was unavailable asked a different Commissioner to attend 1 meeting.
• These meetings were not noticed or otherwise open to the public.
• Violation: A violation occurred
• Observations
• No Committee formed.
• Notice was needed at the time the 3 rd Commissioner participated in a meeting.
• Best Practice/ Being mindful of different hats.

ANY QUESTIONS ?

Memorandum To: State Investment Board From: RIO Compliance Officer Date: July 22, 2016 RE: Annual Affirmation of Code of Conduct Policy Governance Process Policy B-8, Board Members’ Code of Conduct, which is attached to this memorandum, details the Code of Ethical Responsibility for the SIB. Item #10 of this policy indicates that each Board Member is required to reaffirm their understanding of this policy annually and disclose any conflicts of interest. Therefore, please read and sign the statement below to comply with this requirement. “I have read and understand SIB Governance Process Policy B-8 Board Members’ Code of Conduct. I have disclosed any conflicts of interest as required by this policy.” Name (printed) ________________________________ Signature_____________________________________ Date_________________________________________ Detail of any conflicts of interest (if any):
AGENDA ITEM V.D.

POLICY TYPE: GOVERNANCE PROCESS
POLICY TITLE: BOARD MEMBERS’ CODE OF CONDUCT
The following will be the Code of Ethical Responsibility for the SIB:
1. SIB members owe a duty to conduct themselves so as to inspire the confidence, respect, and trust of
the SIB members and to strive to avoid not only professional impropriety but also the appearance of
impropriety.
2. SIB members should perform the duties of their offices impartially and diligently. SIB members are
expected to fulfill their responsibilities in accord with the intent of all applicable laws and regulations
and to refrain from any form of dishonest or unethical conduct. Board members should be unswayed
by partisan interest, public sentiment, or fear of criticism.
3. Conflicts of interest and the appearance of impropriety shall be avoided by SIB members. Board
members must not allow their family, social, professional, or other relationships to influence their
judgment in discharging their responsibilities. Board members must refrain from financial and
business dealings that tend to reflect adversely on their duties. If a conflict of interest unavoidably
arises, the board member shall immediately disclose the conflict to the SIB. A board member must
abstain in those situations where the board member is faced with taking some official action regarding
property or a contract in which the board member has a personal interest. Conflicts of interest to be
avoided include, but are not limited to: receiving consideration for advice given to a person
concerning any matter over which the board member has any direct or indirect control, acting as an
agent or attorney for a person in a transaction involving the board, and participation in any transaction
involving for which the board member has acquire information unavailable to the general public,
through participation on the board.
―Conflict of Interest‖ means a situation in which a board member or staff member has a direct and
substantial personal or financial interest in a matter which also involves the member’s fiduciary
responsibility.
4. The board should not unnecessarily retain consultants. The hiring of consultants shall be based on
merit, avoiding nepotism and preference based upon considerations other than merit that may occur
for any reason, including prior working relationships. The compensation of such consultants shall not
exceed the fair value of services rendered.
5. Board members must abide by North Dakota Century code 21-10-09, which reads: ―No member,
officer, agent, or employee of the state investment board shall profit in any manner from transactions
on behalf of the funds. Any person violating any of the provisions of this section shall be guilty of a
Class A misdemeanor.‖
6. Board members shall perform their respective duties in a manner that satisfies their fiduciary
responsibilities.
7. All activities and transactions performed on behalf of the public funds must be for the exclusive
purpose of providing benefits to plan participants and defraying reasonable expenses of administering
the plan.
B-8

POLICY TYPE: GOVERNANCE PROCESS
B-8 (cont’d)
POLICY TITLE: BOARD MEMBERS’ CODE OF CONDUCT
8. Prohibited transactions. Prohibited transactions are those involving self-dealing. Self-dealing refers to
the fiduciary’s use of plan assets or material, non-public information for personal gain; engaging in
transactions on behalf of parties whose interests are adverse to the plan; or receiving personal
consideration in connection with any planned transaction.
9. Violation of these rules may result in an official reprimand from the SIB. No reprimand may be issued
until the board member or employee has had the opportunity to be heard by the board.
10. Board Members are required to affirm their understanding of this policy annually, in writing, and
must disclose any conflicts of interest that may arise (See Exhibit B-I).
Policy Implemented: June 23, 1995.
Amended: January 22, 1999, February 25, 2011, January 27, 2012, February 27, 2015.

Investment Manager Trust Asset Class Opened Description
Adams Street Partners
Miguel Gonzalo
Pension Private Equity various commitments since
1991
The Adams Street Partnership Fund Program (“ASP Fund Program”) invests in private equity partnerships and portfolio companies, creating a portfolio diversified by time, manager and subclass. Investment commitments will typically be made over a three- to four-year period in venture capital, buyout and other partnerships, which include mezzanine/subordinated debt, restructuring/distressed debt and special situations. A portion of a participant’s subscription to the ASP Fund Program may be used to opportunistically invest in secondary interests in private equity partnerships and/or their portfolio companies. All of the Adams Street Partner funds which North Dakota State Investment Board has invested in are based in U.S. dollars.
Atlanta Capital
Emma Hutchinson
Pension Small Cap Equity April-16 The High Quality Small Cap strategy is a fundamental core approach that invests in small cap companies in strong financial condition and whose equities are priced below the team's estimate of fair value. The investment team seeks to own innovative businesses that dominate a niche, maintain high barriers to entry, and have consistent demand over an economic cycle. They conduct bottom-up proprietary research, and meet with the management teams as well as visit the facilities of each of their companies. Stock purchases are analyzed as if they were a potential acquirer of the entire business. Atlanta Capital’s Core Equity team is comprised of three portfolio managers and one investment specialist. Each portfolio manager serves as a generalist and conducts his own analytical research while investment decisions are made on a consensus basis. Chip Reed, CFA, Bill Bell, CFA and Matt Hereford, CFA are responsible for all purchase and sell decisions.
Axiom InternationalClifton
Chris Lively
Pension Emerging Markets Equity
August-14 The Emerging Markets strategy seeks to invest in emerging market securities issued by companies whose key business drivers are both improving and exceeding expectations, as determined by Axiom's stock selection techniques focused on fundamental company analysis. The strategy considers emerging markets securities to include securities of companies either (i) located in countries that are not included in the MSCI Developed Markets Index series or (ii) that derive a majority of their revenues or assets from a country or countries not included in the MSCI Developed Markets Index series, in each case at the time of investment. Although the Manager generally expects the strategy’s investment portfolio to be geographically diverse, there are no prescribed limits on geographic distribution of the strategy’s investments and the strategy has the authority to invest in securities traded in securities markets of any country in the world.
Babson Capital Management Chad Strean
Insurance Short Term Fixed Inc September-11 The investment objective of the Babson Capital's Active Short Duration Strategy is to outperform the total return of the Barclays Capital 1-3 year US Government Index while minimizing fluctuations in capital value and providing sufficient liquidity to fund withdrawals driven by client activity. The portfolio seeks to achieve a high total rate of return primarily from current income while minimizing fluctuations in capital values by investing in a well-diversified portfolio of US Government, mortgage-backed, asset backed securities and corporate bonds.
The investment team uses proprietary research to conduct value-driven sector rotation and intensive credit and structure analysis, while utilizing a dynamic yield curve management process, to construct effective portfolios. In addition to income, primary goals for the Active Short Duration strategy are stability and liquidity. In meeting these goals, risk is measured by perceived or actual changes in credit worthiness, adequate diversification and exposure to potential changes in interest rates. Babson Capital explicitly manages the portfolio to minimize these risks and endeavors to add value through security selection and portfolio duration structure designed to maximize the risk-return characteristics of the yield curve.
North Dakota State Investment Board Managers
1 updated 7/12/2016
AGENDA ITEM V.E. (1)

Investment Manager Trust Asset Class Opened Description
North Dakota State Investment Board Managers
Brandywine Asset Management
Nedra Hadley
Pension Int'l Fixed Income May-03 Brandywine's Global Fixed Income investment style is a disciplined, active, value-driven, strategic approach. Their investment strategy concentrates on top-down analysis of macro-economic conditions in order to determine where the most attractive valuations exist. Specifically, they invest in bonds with the highest real yields globally. They manage currency to protect principal and increase returns, patiently rotate among countries and attempt to control risk by purchasing undervalued securities.
They believe their approach is ideally suited to the asset class, as each country, and sector exhibit unique valuation parameters. They believe that a client’s portfolio should be invested in markets with, what they believe, demonstrate above-average value. Value is defined as a combination of above-average real interest rates and an under-valued currency. They typically concentrate investments where existing economic and market conditions may enable that value to be realized in an intermediate time frame. Their research has identified global fixed income as an opportunity class wherein active strategies have the most potential for reward and passive, index-replicating strategies are fundamentally insufficient and add an unnecessary level of risk to the portfolio management process. Country-by-country return dispersion (and, therefore, opportunity) across developed country bond markets is remarkable, and if capitalized upon as part of an actively managed process, can potentially provide significant excess return (alpha) above the benchmark. They seek to capture those excess returns through strategic investment in countries, currencies, sectors and securities, rather than by maintaining minimum, core commitments, reflective of the benchmark.
Capital Int'l V & VI
Jim McGuigan
Pension Private Equity Aug-07 Capital International Private Equity Fund (CIPEF) has a geographic focus in global emerging markets. CIPEF's investment focus, by stage, primarily includes buy-outs, expansion capital, and replacement capital.
Clifton Group
Ben Lazarus
Pension
Insurance
Legacy Fund
Dom Small Cap EquityDom Lg Cap Equity
Dom Small Cap Equity Dom Lg Cap Equity
Dom Small Cap EquityDom Lg Cap Equity
Nov-09Apr-11
Nov-09Nov-09
March-15May-15
The Clifton Group believes that the U.S. equity universe is highly efficient. As such, we utilize a method of constructing the portfolio that we believe provides us with the greatest likelihood of outperforming the index. Specifically equity futures are used to gain the benchmark exposure. The underlying cash portfolio is then invested in a liquid, high quality short duration fixed income portfolio. Over market cycles excess return generated by the short duration portfolio, when added to the performance of futures is expected to allow the strategy to achieve 0.50% to 1.00% of gross excess annual performance.
Each Enhanced Equity portfolio is carefully constructed and managed within strict quality and diversification guidelines. The Portfolio Management Team oversees all aspects of the construction and management process. Individual Portfolio Managers oversee different parts of the portfolio, but all are required to stay within pre-determined guidelines as provided by NDSIB. The account is monitored daily to verify that performance is maintained within expectation bands. Furthermore, accounts are reconciled monthly and audited semi-annually to confirm compliance with all existing guidelines.
2 updated 7/12/2016

Investment Manager Trust Asset Class Opened Description
North Dakota State Investment Board Managers
Corsair (Fund III, IV & ND Investors)
Michael PoeCliff Brokaw
Pension Private Equity Feb-07 Corsair seeks to earn strong risk-adjusted returns by leveraging the investment team’s knowledge and contacts to identify and execute attractive investments in companies in the financial services industry around the world. Corsair takes control and minority positions, either individually or as a lead member of an investor consortium. Target investments include both privately-held and public companies, generally via private transactions when the target company loses access to, or has difficulty accessing, the public capital markets. In certain circumstances, the Fund may acquire pools of financial assets or securities, or provide financing to a secured pool of assets.
Corsair endeavors to develop a strong relationship and high degree of influence with investee company senior executives and key shareholders. In many instances, Corsair obtains Board representation, observer seats, or other types of management rights. Given the complexities of investing in a regulated industry, Corsair’s ability to receive more traditional generalist buyout governance rights is often limited, and its ability to influence managerial decisions requires a degree of experience which Corsair believes can only be achieved through a long and consistent history of investing in the financial services sector. Corsair expects the Fund to make 10 to 15 investments over its investment period, although there can be no assurances with respect to the number of investments that will be made. Corsair anticipates holding its investments for between three and six years. In those instances where Corsair is part of an investor consortium, Corsair generally endeavors to act as a lead or co-lead investor, as was the case in all Corsair III investments. On select occasions Corsair expects to co-invest with strategic partners that are capable of bringing added value to an investment and where the Fund’s exit considerations can be addressed. Above all, Corsair’s value-driven investment style focuses on those investment opportunities in which the Investment Advisor believes that a positive discrepancy exists between an asset’s price and its intrinsic value.
DFA - Dimensional Fund Advisors
Joe Young
Pension
Insurance
Legacy
Developed Int'l Equity
Int'l Equity
Int'l Equity
Nov-07
Nov-07
Feb-02
The International Small Cap Value Portfolio invests in the stocks of small, non-US developed markets companies that Dimensional believes to be value stocks at the time of purchase. Size is defined as the smallest 8-10% of each country’s market capitalization. Securities are considered value stocks primarily because a company’s shares have a high book value in relation to their market value (BtM). This BtM sort excludes firms with negative or zero book values. In assessing value, additional factors such as price-to-earnings ratios may be considered, as well as economic conditions and developments in the issuer’s industry. The criteria for assessing value are subject to change from time to time. The Portfolio currently invests in companies in Australia, Austria, Belgium, Canada, Denmark, Finland, France, Germany, Greece, Hong Kong, Ireland, Italy, Japan, the Netherlands, New Zealand, Norway, Portugal, Singapore, Spain, Sweden, Switzerland, and the United Kingdom. It does not invest in emerging markets.
DFA - Dimensional Fund Advisors
Joe Young
Pension Emerging Markets Equity Oct-05 The Emerging Markets Small Cap Portfolio invests in small cap emerging markets companies. Presently, this means investment in companies whose market capitalization is less than $2.3 billion at the time of purchase. Dimensional will consider, among other things, information disseminated by the International Finance Corporation in determining and approving emerging market countries. The Portfolio currently invests in companies in Brazil, Chile, China, Hungary, India, Indonesia, Israel, Malaysia, Mexico, the Philippines, Poland, South Africa, South Korea, Taiwan, Thailand, and Turkey. Due to repatriation restrictions, the Portfolio currently holds but does not purchase securities in Argentina.
3 updated 7/12/2016
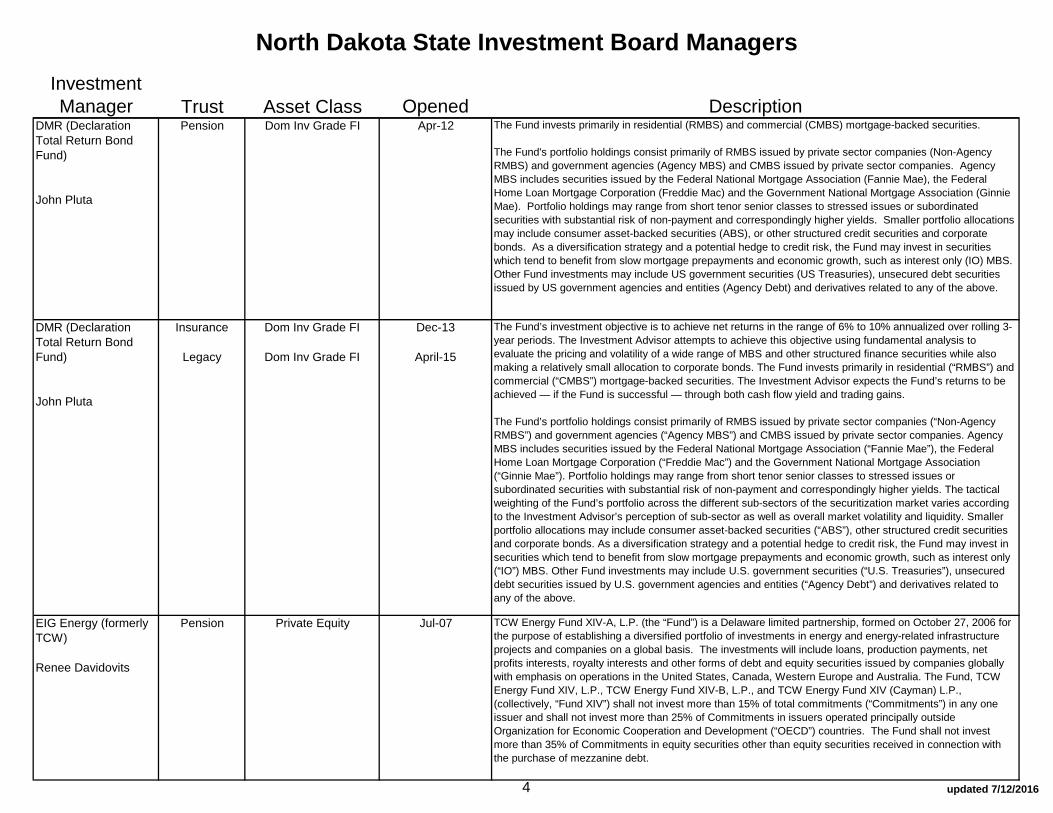
Investment Manager Trust Asset Class Opened Description
North Dakota State Investment Board Managers
DMR (Declaration Total Return Bond Fund)
John Pluta
Pension Dom Inv Grade FI Apr-12 The Fund invests primarily in residential (RMBS) and commercial (CMBS) mortgage-backed securities.
The Fund's portfolio holdings consist primarily of RMBS issued by private sector companies (Non-Agency RMBS) and government agencies (Agency MBS) and CMBS issued by private sector companies. Agency MBS includes securities issued by the Federal National Mortgage Association (Fannie Mae), the Federal Home Loan Mortgage Corporation (Freddie Mac) and the Government National Mortgage Association (Ginnie Mae). Portfolio holdings may range from short tenor senior classes to stressed issues or subordinated securities with substantial risk of non-payment and correspondingly higher yields. Smaller portfolio allocations may include consumer asset-backed securities (ABS), or other structured credit securities and corporate bonds. As a diversification strategy and a potential hedge to credit risk, the Fund may invest in securities which tend to benefit from slow mortgage prepayments and economic growth, such as interest only (IO) MBS. Other Fund investments may include US government securities (US Treasuries), unsecured debt securities issued by US government agencies and entities (Agency Debt) and derivatives related to any of the above.
DMR (Declaration Total Return Bond Fund)
John Pluta
Insurance
Legacy
Dom Inv Grade FI
Dom Inv Grade FI
Dec-13
April-15
The Fund’s investment objective is to achieve net returns in the range of 6% to 10% annualized over rolling 3-year periods. The Investment Advisor attempts to achieve this objective using fundamental analysis to evaluate the pricing and volatility of a wide range of MBS and other structured finance securities while also making a relatively small allocation to corporate bonds. The Fund invests primarily in residential (“RMBS”) and commercial (“CMBS”) mortgage-backed securities. The Investment Advisor expects the Fund’s returns to be achieved — if the Fund is successful — through both cash flow yield and trading gains.
The Fund’s portfolio holdings consist primarily of RMBS issued by private sector companies (“Non-Agency RMBS”) and government agencies (“Agency MBS”) and CMBS issued by private sector companies. Agency MBS includes securities issued by the Federal National Mortgage Association (“Fannie Mae”), the Federal Home Loan Mortgage Corporation (“Freddie Mac”) and the Government National Mortgage Association (“Ginnie Mae”). Portfolio holdings may range from short tenor senior classes to stressed issues or subordinated securities with substantial risk of non-payment and correspondingly higher yields. The tactical weighting of the Fund’s portfolio across the different sub-sectors of the securitization market varies according to the Investment Advisor’s perception of sub-sector as well as overall market volatility and liquidity. Smaller portfolio allocations may include consumer asset-backed securities (“ABS”), other structured credit securities and corporate bonds. As a diversification strategy and a potential hedge to credit risk, the Fund may invest in securities which tend to benefit from slow mortgage prepayments and economic growth, such as interest only (“IO”) MBS. Other Fund investments may include U.S. government securities (“U.S. Treasuries”), unsecured debt securities issued by U.S. government agencies and entities (“Agency Debt”) and derivatives related to any of the above.
EIG Energy (formerly TCW)
Renee Davidovits
Pension Private Equity Jul-07 TCW Energy Fund XIV-A, L.P. (the “Fund”) is a Delaware limited partnership, formed on October 27, 2006 for the purpose of establishing a diversified portfolio of investments in energy and energy-related infrastructure projects and companies on a global basis. The investments will include loans, production payments, net profits interests, royalty interests and other forms of debt and equity securities issued by companies globally with emphasis on operations in the United States, Canada, Western Europe and Australia. The Fund, TCW Energy Fund XIV, L.P., TCW Energy Fund XIV-B, L.P., and TCW Energy Fund XIV (Cayman) L.P., (collectively, “Fund XIV”) shall not invest more than 15% of total commitments (“Commitments”) in any one issuer and shall not invest more than 25% of Commitments in issuers operated principally outside Organization for Economic Cooperation and Development (“OECD”) countries. The Fund shall not invest more than 35% of Commitments in equity securities other than equity securities received in connection with the purchase of mezzanine debt.
4 updated 7/12/2016

Investment Manager Trust Asset Class Opened Description
North Dakota State Investment Board Managers
Epoch Investment Partners
Thomas Pernice
Pension Global Equity July-07Moved from Lg Cap
Jan-12
The Epoch Global Choice strategy seeks to produce superior risk adjusted returns by building portfolios of businesses with outstanding risk/reward profiles.
The concentrated active, global equity portfolio typically consists of approximately 20-35 securities (generally equities) representing the firm's highest conviction names. The expected annual turnover is generally between 90-130%. The equity portion of the portfolio will invest no more than 10% of the portfolio, at the time of purchase, in any one equity security.
Goldman Sachs (2006 Fund, Fund V)
Stephanie Ivy
Pension Below Inv Grade FI Apr-06 The GS Mezzanine Partners family of funds is the largest mezzanine fund family in the world, with over $20 billion invested in 100+ companies since 1996. In 2007, Goldman Sachs established its fifth mezzanine fund, GS Mezzanine Partners V, with $13 billion of leveraged capital.
GS Mezzanine Partners seeks large-sized mezzanine investments comprised generally of fixed income securities and an associated equity component. Our focus is on providing “private high yield” capital for mid- to large-sized leveraged and management buyout transactions, recapitalizations, financings, re-financings, acquisitions and restructurings for private equity firms, private family companies and corporate issuers.
We target high-quality companies with $500 million to $10+ billion of enterprise value; leading market positions; high barriers to entry; well-regarded management teams; and stable, cash generative businesses.
Grosvenor Capital (formerly Credit Suisse)
Andrew JohnsonPaul Burraston
Pension
Insurance
Infrastructure
Real Assets
Dec-11
Dec-11
Established on October 21, 2009, the Customized Infrastructure Strategies LP is a commingled fund focused on providing a comprehensive, diversified solution for investors looking to access the infrastructure asset class. The Fund seeks to generate stable, long-term yield and attractive risk-adjusted returns by investing in a diversified portfolio of primary core and core plus infrastructure funds (30%), co-investments (40%) and opportunistic secondary fund purchases (30%).
Grosvenor Customozed Infastructure II
Andrew JohnsonPaul Burraston
Pension
Legacy
Infrastructure
Real Assets
Mar-15
Mar-15
Following the same strategy as our initial commingled multi-manager infrastructure fund, Customized Infrastructure Strategies, L.P. (“CIS I”), the Fund will seek to generate stable, long-term yield and attractive risk-adjusted returns by investing in a diversified, global portfolio of primarily core and core-plus infrastructure investments. CIS II will target primary fund investments, secondary purchases of investments in funds (“secondaries”), and equity and debt co-investments. Consistent with CIS I’s target returns, CIS II will target a net return to its limited partners in excess of 10%1, with a low single-digit cash yield upon full investment of the Fund.
Hearthstone (MSII, MSIII)
Mark Porath
Pension Private Equity Oct-99 In the Hearthstone-MSII Homebuilding Investors (MS2) and Hearthstone Multi-State Value-Added Fund III (“MS3”) funds, Hearthstone, on behalf of the Fund, is authorized to invest exclusively in residential development projects. Residential development projects include residential land development and single-family homebuilding, including the acquisition and conversion of rental properties into condominiums and other forms of single-family housing. MS3 was authorized to invest in the construction and sale of apartment buildings, but no such investments were made. Land development projects typically involve the acquisition, entitlement and development of anywhere from 100 to 1,000 finished residential lots for sale to merchant builders, but may involve the acquisition, permitting and development of other residential land. Single-family homebuilding projects generally involve the construction and sale of approximately 25 to 500 single-family attached or detached homes.
5 updated 7/12/2016

Investment Manager Trust Asset Class Opened Description
North Dakota State Investment Board Managers
Invesco Asia Fund I
Asia Fund III
Paul Michaels
Pension
Pension
Real Estate Nov-08
Nov-15
This investment strategy will focus on value added investments with an initial focus on China and Japan, with a secondary focus on Singapore and Hong Kong, in residential, industrial, retail and office properties. Where IRE identifies best value, it will execute the following value added strategies for the Fund:-Provide equity for the development of new real estate product that generates high cash returns and demonstrates mid-term growth opportunities.-Reposition assets or change the use of an asset to maximize its value by identifying highest/best use, curing deferred maintenance, improving overall asset quality and developing additional revenue-generating amenities.-Participating in high growth markets-Adopting higher leverage strategies and exploiting market inefficiencies.
Invesco Core USA LLC
Paul Michaels
Pension
Insurance
Legacy
Real Estate Aug-97
Oct-12
April-15
The Fund invests in properties located in the United States, typically requiring an investment of $10 million or greater. The Fund focuses on quality core real estate opportunities and, in addition, the Fund may invest up to 15% of its assets in "value-added" type real estate investment opportunities. The Fund seeks to provide Investors with returns equal to or greater than the NPI on a 3- and 5-year rolling basis.
Invesco IREF II
Invesco IREF III
Value-Add IV
Paul Michaels
Pension
Pension
Pension
Real Estate Nov-07
May-12
April-15
The Fund will invest in value-added real estate opportunities. Investments will be made solely in the United States in four specific product types- multifamily, industrial, retail and office properties. Where IRE identifies best values, it will execute the following strategies for the Fund:• Re-capitalization: Invest in properties or portfolios at a favorable basis by acquiring an equity interest and/or debt.• Lease-up: Acquire properties with vacant space or near-term lease rollover exposure, with the opportunity to reposition rent roll and tenancy.• High Yield Debt: Acquire unrated pieces of CMBS debt• Renovation/Retenanting/Repositioning: Reposition assets (an example would be to upgrade an asset from Class B to Class A) or change the use of an asset to maximize its value by curing deferred maintenance, improving overall asset quality and developing additional revenue-generating amenities.• Development: Provide equity commitments/investments for the development of new real estate products that allows for access to new, state-of-the-art products at wholesale pricing.
6 updated 7/12/2016

Investment Manager Trust Asset Class Opened Description
North Dakota State Investment Board Managers
InvestAmerica Lewis & Clark
L&C II
John CosgriffDavid Schroder
Pension Private Equity Feb-02
Jun-09
The investment strategy for Lewis and Clark Private Equities, LP and L&C Private Equities II, LP (the Funds) is to assemble a portfolio of investments in private growth and later-stage companies that have a strong probability of providing high returns without undue volatility and risk to investors. The Funds target for investment middle market growth and later stage companies throughout the United States with existing sales from $5,000,000 to $100,000,000. Typically, these small to medium sized companies are seeking to raise $1,000,000 to $10,000,000. The Principals of the Funds have demonstrated through the successful investment of previous venture funds, that this market niche has historically delivered high returns with more limited competition for financing. The Funds seek to achieve a minimum of a 25% and in many cases in excess of a 30% internal rate of return on each of its company investments.
The Funds diversify their investments by investing in portfolio companies across many industries and geographic locations. Investments will be made across a range of manufacturing, service, distribution and technology companies. Most investments are expected to be in later stage companies with established sales and profitability. Some investments may be opportunistically made in growth stage companies. The investment team has historically invested throughout the United States with offices strategically located in the Midwest and Northwest.
JP Morgan Short Term Bond Fund
Jim Sakelaris
Insurance Short Term FI Sep-11 The investment objective of the Short Term Bond Fund is to outperform (based on the portfolio's total return, gross of fees) the Barclays Capital 1-3 Year Government/Credit Index (the benchmark) while maintaining total return risk similar to that of the Benchmark as measured over a market cycle.
JP Morgan Alternative Property Fund
Jim Sakelaris
Pension Real Estate Jan-06 The JPMorgan Alternative Property Fund seeks current income and capital appreciation from a portfolio of investments consisting of alternative real estate (senior housing, medical office, hotels, single-family subdivision development, condos, storage, parking and other “non-core” cash-flow-generating property investments) and real estate-related assets in the U.S., as well as traditional and alternative real estate and real estate-related assets in Canada, Mexico and the Caribbean. The Fund pursues a broadly diversified absolute-return strategy targeting a 12-15% total annualized IRR (including a current income return of 5-7% and the balance from capital appreciation) gross of all Fund-level fees and expenses, assuming at least a 5-year holding period.
The Fund is designed to benefit from less competitive flow of capital relative to core property. As an infinite-life structure, the Fund offers potential investors the opportunity for periodic liquidity at net asset values established on a quarterly basis. The Fund will also periodically rebalance sector, product and geographic diversification to dampen volatility and create a stable alternative real estate investment portfolio with a conservative level of leverage (60% on a portfolio basis).
7 updated 7/12/2016

Investment Manager Trust Asset Class Opened Description
North Dakota State Investment Board Managers
JP Morgan Asian Infrastructure & Related Resources Opportunity Fund
Jim Sakelaris
Pension Infrastructure Aug-08 The JPMorgan Asian Infrastructure & Related Resources Opportunity (“AIRRO”) Fund seeks to invest in infrastructure and related resources opportunities across the greater Asia Pacific region. The Fund seeks to invest in a broad range of assets, including (but not exhaustive): core infrastructure such as transportation, power both from conventional and renewable sources, communications, water and waste-water, public works, urban development and other "social" infrastructure assets (i.e. hospitals, schools, government centers) and related resources such as energy, raw materials, natural resources, construction and construction-related materials and real estate (that are part of or associated with any of the installation and operation of infrastructure).
The Fund will seek an internal rate of return in excess of 19% (net of Incentive Allocation and Fund Expenses and any Taxation that is payable by the Fund, but exclusive of any Taxation payable by Investors with respect to distributions), assuming a constant exchange rate during the term of the Fund between the USD and the currencies in the countries where the Fund's Investments are located. The Investment Adviser will have the right, but not the obligation, to hedge currency risk at its discretion, however there currently is no intent to engage in active hedging except as follows: (i) in exceptional cases where we believe the underlying risk is excessive and (ii) where there are known future equity commitments subject to currency risk, including with respect to the acquisition of new assets. The Fund team’s view of infrastructure, in the Asian context, takes a holistic approach, encompassing not only core infrastructure but also the raw material and construction-related stages of infrastructure and those companies needed "to make infrastructure happen". By focusing on both infrastructure and related resources, the Investment Adviser has developed a strategy which seeks to capitalize on the entire opportunity presented by the large forecasted growth and required investment in Asian infrastructure.
The Fund monitors its currency exposure on a regular basis taking account of the outlook for any currencies in which AIRRO is invested. At this time, AIRRO does not anticipate hedging its currency exposure in the near-term. Based on consensus forecasts prepared by Bloomberg, analysts expect Asian currencies to strengthen versus the USD over the medium-term. AIRRO’s entry cost (based on average weighted rates) for its investments are 47.68 INR/USD for SevenHills and 7.76 HKD/USD for Scitus (6.93 RMB/USD for Scitus’ corresponding investments onshore). We anticipate these positions to strengthen in the favor of AIRRO by exit (estimated to be 2013 for each investment). AIRRO will continue to monitor movements in Asian currencies and review its hedging strategy accordingly.
8 updated 7/12/2016

Investment Manager Trust Asset Class Opened Description
North Dakota State Investment Board Managers
JP Morgan Greater China Property Fund
Jim Sakelaris
Pension Real Estate Jan-08 The JPMorgan Greater China Property Fund is a closed-end investment fund which seeks to invest in real estate development projects in Greater China (defined to include China, Hong Kong, Macau and Taiwan). Drawing on over 30 years of real estate investing experience and its position as one of the largest real estate investment managers globally, J.P. Morgan Investment Management Inc. seeks to develop and manage a portfolio of capital-appreciation oriented real estate assets in Greater China. The Fund will generally make its investments across the office, residential, industrial, retail and hospitality sectors by creating project-level joint venture arrangements with multiple operating partners in Greater China. In addition to direct real estate investments, the fund may invest in shorter-term, “structured capital” opportunities in the real estate sector (typically 6-18 months in nature). Such investments may involve publicly listed companies and private companies seeking funding for their operations. The fund will limit the structured capital investments to 20% of the fund’s total allocation.
The Fund seeks to capitalize on the rapid and sustained economic growth, rising income levels, as well as the recent developments in China that will present opportunities for experienced real estate investment firms like J.P. Morgan to partner with local developers for new investments. The investment objective of the Fund is to seek capital appreciation. Since most of the Fund’s investments will be development stage properties, the Fund expects to generate little to no current income. The Fund expects that aggregate secured permanent indebtedness will not exceed, on average over a fiscal year, 75% of the greater of the fair market value or total cost of all of the Fund investments.
Investment returns may be hedged on a case by case basis as some investments may be hedged while others may not. Whether to hedge will depend on a number of factors including the currency outlook, the cost/benefit of the hedge, the requirements of lenders, etc. In addition, in cases where debt borrowings are in local currency, there is effectively a built in hedge as well.
9 updated 7/12/2016

Investment Manager Trust Asset Class Opened Description
North Dakota State Investment Board Managers
JP Morgan Greater Europe Opportunistic Property Fund
Jim Sakelaris
Pension Real Estate Sep-09 The JPMorgan Greater Europe Opportunistic Property Fund is a closed-end opportunity fund that offers investors an opportunity to participate in an actively managed portfolio of property investments throughout Europe both in direct assets and select investments in existing property companies. The Fund has the flexibility to invest in a variety of different types of real estate, including, without limitation, office, retail, industrial/warehouse, multi-family, hotel/leisure, parking and self-storage. The Fund aims to provide Investors with a targeted annualized IRR of at least 15% over the life of the fund net of all fees and expenses. The Fund intends to achieve its Target Return by using JPMorgan Asset Management's expertise and market contacts to successfully make use of the following risks: leasing risk; development risk; restructuring risk; liquidity/transparency risk and leverage.
J.P. Morgan Asset Management - Global Real Assets believes that opportunities exist in the Target Markets for investors to create value through the development, rehabilitation, repositioning and recapitalization of undervalued real estate and real estate-related assets through the purchase of high quality assets or portfolios of assets from distressed sellers. After a period of rapid capital appreciation and falling risk premium for European real estate assets, partially a result of excess liquidity, the dislocation in capital markets experienced since the end of July 2007 has resulted in a substantial re-pricing of risk, particularly at the higher risk end of the spectrum. More uncertain prospects for occupier markets in some, though not all, countries are likely to continue to impact risk and therefore pricing. In Europe, JPMAM-GRA believes this creates two very distinct but compelling opportunities for the foreseeable future. The first is to capitalize on the opportunity to purchase high quality assets in core Western European markets which will be sold at favorable prices due to the lack of liquidity in the market or where the underlying risk is mispriced. Property owners overleveraged with short duration leverage, developers overexposed to construction and leasing risk, and corporate owners whose balance sheets have come under pressure are all expected to be excellent sources of these buying opportunities.
We consider hedging on a deal-by-deal basis when we think it makes sense and is cost-effective. We consult with our foreign exchange desk at J.P. Morgan on a regular basis. At the present time, we believe the British Pound is underpriced relative to the Euro on a long-term historical basis and, therefore, we are currently not hedging the Pound position (at least with respect with the net equity, leverage acts as a natural hedge against 65% of the GAV since the debt on UK transactions is also denominated in Pounds). The Greater Europe Opportunistic Property Fund is Euro-denominated and thus reflects periodic currency movements in addition to property valuation changes.
10 updated 7/12/2016

Investment Manager Trust Asset Class Opened Description
North Dakota State Investment Board Managers
JP Morgan Income & Growth Fund
Jim Sakelaris
Insurance Real Estate Nov-05 J.P. Morgan U.S. Real Estate Income and Growth Fund - The J.P. Morgan U.S. Real Estate Income and Growth Fund seeks to construct and opportunistically manage a portfolio of core direct real estate investments, complemented by other real estate and real estate-related assets. The Fund pursues a broadly diversified absolute-return strategy targeting an 8-10% total annualized IRR (including a current income return of 5-7% per annum and the balance from capital appreciation) net of management fees and expenses, the payment of any Infrastructure Development Fee, if applicable, and the effect of taxes payable by certain of the Fund's Entities.
The Fund pursues all property investments on an opportunistic basis. The majority (>50%) of the Fund’s investments will be in direct core properties in the office, industrial, retail and residential sectors. In addition to direct real estate, the Fund has the ability to invest in other access points - mezzanine debt, CMBS and REITs - when they provide core real estate cash flows at a better price than owning the property. This helps diversify the portfolio and offer a superior risk reward equation. This dynamic investment approach focuses on relative value and is not constrained by fixed allocation targets or benchmark composition allowing the Investment Advisor the ability to change the Fund’s portfolio composition in response to changing market conditions and opportunities.
JP Morgan U.S. Income and Growth
Jim Sakelaris
Insurance
Legacy
Real Estate
Real Estate
Nov-05
April-15
The U.S. Real Estate Core - Plus strategy invests in leveraged core direct real estate (at least 85% direct real estate), complemented by mezzanine investments (up to 15%). The strategy is income-oriented and focuses on stabilized, core U.S. real estate assets. We seek to construct and tactically manage a portfolio of core direct real estate investments, complemented by mezzanine investments. Investments are concentrated in the four primary sectors (office, industrial, retail and apartments), while volatile and/or specialized sectors, such as hotels and self-storage investments, are avoided. Our investment approach is predicated on the following:• Large and significant player in U.S. Real Estate transactions• Has the ability to evaluate and bid for the top institutional core assets in the U.S.• The acquisition team completes due diligence on billions of dollars worth of properties each year.• Over four decades of acquisition and asset management experience• National in scale and diverse in both transaction size and investment structure• Stable senior management team backed by deep industry experience• Team-based investment approach• Ensures all pertinent disciplines have a voice in the investment process• Helps to ensure all pertinent disciplines have a voice in the investment process• Unanimous approval required by the investment committee
11 updated 7/12/2016

Investment Manager Trust Asset Class Opened Description
North Dakota State Investment Board Managers
JP Morgan Infrastructure Investments Fund
Jim Sakelaris
Pension
Insurance
Legacy
Infrastructure
Real Assets
Real Assets
May-07
Nov-08
Feb-15
Infrastructure Investments Fund - Launched October 31, 2006, JPMorgan Infrastructure Investments Fund is the only open-ended private commingled infrastructure fund in the U.S. It invests in stabilized assets in OECD countries with selected value-added opportunities, across infrastructure industry sub-sectors, including toll roads, bridges and tunnels; oil and gas pipelines; electricity transmission and distribution facilities; contracted power generation assets; water distribution; waste-water collection and processing; railway lines and rapid rail links; and, seaports and airports.
Our open-ended strategy supports a long-term investment horizon as we seek to achieve steady returns over time that are largely cash yield with modest capital appreciation. Our open-end format also aids in our acquisition and disposition process as a long-term outlook is attractive to governments, regulators and operating partners.
The Fund seeks to achieve a leveraged portfolio target IRR of 10–12%, net of Fund Expenses. Leverage is targeted at 75% at the fund level. Its diverse client base, includes U.S., European, Asian and Canadian government, union and corporate pension plans, insurance companies, and high net worth individuals.
The interaction of multiple currencies is viewed by many investors as another form of diversification. With respect to the JPMorgan Infrastructure Investments Fund ('IIF' or the 'Fund'), the Investment Adviser has the right, but not the obligation, to hedge currency risk at its discretion. Due to clients' differing perspectives on currency, and the complexities/costs of hedging an illiquid portfolio, there currently is no intent to engage in active hedging except as follows: (i) in exceptional cases where we believe the underlying risk is excessive and (ii) where there are known future equity commitments subject to currency risk, including with respect to the acquisition of new assets; this is a strategy that we have utilized for several investments in the existing portfolio. Generally speaking, we believe clients are more concerned with active management of infrastructure assets and strategies than with currency hedging. We understand that many clients prefer to hedge their currency exposures on an individual total portfolio basis. Further, many clients are interested in actively managing their currency exposure to generate alpha. J.P. Morgan has the capability to provide currency hedging (as a separate service outside of the Fund) for those clients that are interested in hedging currency risk and for clients wishing to generate additional alpha (whether the risk is associated with the Fund’s portfolio or with other client investments).
JP Morgan Mortgage Backed Securities
Jim Sakelaris
Pension Domestic Fixed Income Sep-14 JPM seeks to create portfolios that offer superior stability of cash-flows (over a wide range of interest rate scenarios) versus those of the Barclays Capital Mortgage Securities benchmark. Due to a focus on identifying undervalued securities our selection is not limited to securities within the index, we may also utilize agency and non-agency commercial mortgage obligations. Because the mortgage-backed sector, in particular, has been less efficient relative to other sectors in recent years, security selection skills can add particular value. The JPM investment approach seeks to add value through the following: •We take a longer-term view of investing versus adopting a trading mentality.• Sub-sector allocation decisions are based on broad sector outlook, using expected return and valuation analysis.• Undervalued securities are identified through diligent research.• Relative risk/reward relationships are evaluated along the yield curve.• Strategy emphasizes research and individual security analysis rather than large macro bets.• Duration is managed primarily as a risk control measure.• Portfolios are well diversified and of high credit quality.• Risk management is embedded throughout process and seeks to limit downside risk relative to the benchmark.
12 updated 7/12/2016

Investment Manager Trust Asset Class Opened Description
North Dakota State Investment Board Managers
JP Morgan Strategic and Special Situations Property Funds
Jim Sakelaris
Pension Real Estate Oct-90 Strategic Property Fund is an actively managed diversified, core, open-end commingled pension trust fund. It seeks an income-driven rate of return of 100 basis points over the NCREIF Property Index over a full market cycle (three-to-five-year horizon) through asset, geographic and sector selection and active asset management. The Fund invests in high-quality stabilized assets with dominant competitive characteristics in markets with attractive demographics throughout the United States.
Following a core strategy, Strategic Property Fund focuses primarily on existing high-quality, well-leased assets in the four major property types: office, industrial, multi-family and retail. Strategic Property Fund focuses on the larger primary economic markets.
Each sector is well leased with modest lease expiration exposure of approximately 10% per annum over the next five years. Due to the broad diversification in the Fund’s investments, no individual properties or tenancies have the capacity to materially affect the Fund’s performance.
Special Situation Property Fund is an actively managed, value-added, open-ended commingled trust fund. It seeks an increased total return with a moderate-to-high risk level, as reflected in the potential volatility of both income and property values. Our investment philosophy for Special Situation Property Fund is based on our belief that consistently excellent investment results can be achieved by focusing on value-added investment opportunities while maintaining an optimum leverage ratio. The investment process is designed to continuously add value throughout the acquisition, ownership and disposition of an asset.
Following a value-added strategy, Special Situation Property Fund focuses primarily on value-added real estate opportunities in the following major property types: office, industrial, hotel, retail and multi-family. The Fund does not attempt to match the geographic and property type diversification of the benchmark, but does maintain guidelines in order to limit over-or underweighting in regards to the NCREIF’s property type and geographic guidelines. Our assets are generally located in major markets across the country (i.e., Washington D.C. and surrounding areas, Los Angeles, San Francisco, Atlanta, Chicago, Denver and Northern New Jersey).
The Fund invests in a wide variety of value-added real estate opportunities, including but not limited to, improved properties that have significant appreciation potential through lease up, new development, redevelopment, repositioning and re-merchandising situations. The Fund may also acquire vacant land to be held for future development or appreciation. Development, renovation and property repositioning are important aspects of our value-added strategy.
13 updated 7/12/2016

Investment Manager Trust Asset Class Opened Description
North Dakota State Investment Board Managers
LA Capital Enhanced
Tom Stevens
Pension
Insurance
Legacy
Dom Lg Cap Equity
Dom Lg Cap Equity
Dom Lg Cap Equity
Aug-00
Apr-04
May-15
A large core portfolio benchmarked to the Russell 1000 Index. This we would characterize as more of an enhanced index assignment where the objective is to track the benchmark with lower variability. This mandate is targeting a 1% annual alpha with a risk budget of 3%. The pension portfolio began in July of 2000 and the insurance portfolio was initiated in April of 2004. In October of 2006 we received approval from you to allocate a portion of each of these core accounts into the Large Cap Alpha Fund which we were launching at that time. A small portion of the portfolio has as a result been allocated to that product. The benchmark for this fund is the S&P500 which is very similar to the Russell 1000 Index. The objective here has been to outperform the benchmark by 5% while allowing for a risk budget as high as 7%. The intent here was to add incremental alpha to the assignment given that the information ratio was expected to be higher. The overall objectives have been met since this was initiated.
Investment PhilosophyAll of our applications are driven by our Dynamic Alpha Model which is a quantitative process based upon understanding how specific factors are behaving in the market. We believe that investment results are driven by Investor Preferences which simply put, highlight which factors investors like or dislike at any point in time. We have developed sophisticated attribution tools which allow us to measure how the different factors are performing. While there is a significant amount of persistence, i.e. factors will move in one direction for sometimes an extended period of time, they will change at some point. Investors are not static in the views and one needs to recognize that when preferences shift a different posture related to that factor is warranted.
Consequently we are not static and we are dynamic. In turbulent markets it is important to be able to understand how investor preferences change. In the last year there have been dramatic shifts in investor attitudes about risk factors and we feel our ability to perform during this period has been directly related to our ability to adapt.
LA Capital Structured (Russell 1000 Growth)
Tom Stevens
Pension
Insurance
Legacy
Dom Lg Cap Equity
Dom Lg Cap Equity
Dom Lg Cap Equity
Jun-98
Aug-03
May-15
A large growth portfolio benchmarked to the Russell 1000 Growth Index. It is an active assignment meaning that we are targeting a 2% alpha and constraining our risk budget (tracking error) to 4% relative to the benchmark.
Investment PhilosophyAll of our applications are driven by our Dynamic Alpha Model which is a quantitative process based upon understanding how specific factors are behaving in the market. We believe that investment results are driven by Investor Preferences which simply put, highlight which factors investors like or dislike at any point in time. We have developed sophisticated attribution tools which allow us to measure how the different factors are performing. While there is a significant amount of persistence, i.e. factors will move in one direction for sometimes an extended period of time, they will change at some point. Investors are not static in the views and one needs to recognize that when preferences shift a different posture related to that factor is warranted.
Consequently we are not static and we are dynamic. In turbulent markets it is important to be able to understand how investor preferences change. In the last year there have been dramatic shifts in investor attitudes about risk factors and we feel our ability to perform during this period has been directly related to our ability to adapt.
14 updated 7/12/2016

Investment Manager Trust Asset Class Opened Description
North Dakota State Investment Board Managers
Loomis Sayles
Stephanie Lord
Pension Below Inv Grade FI Apr-04 The High Yield Full Discretion Strategy seeks to exploit the collaborative efforts of our economics group and Sector Teams in conjunction with the fundamental credit analysis from our Fixed Income Research Department. Our economics group and yield curve teams provide a global economic and interest rate framework for identifying sectors that we think are attractive. Our research department, along with the Sector Teams, seeks to identify specific investment opportunities primarily within the global fixed income market. Asset class and sector allocations reflect the macroeconomic view, while security selection based on fundamental and relative value analysis within sectors provides our primary source of excess return. Portfolio guidelines are broad and offer the portfolio management team significant investment flexibility. Experienced portfolio managers collaborate with our in-house credit analysts to identify attractive total rate of return investment opportunities in the global fixed income market. Portfolio managers incorporate the long-term macroeconomic view along with a stringent bottom-up investment evaluation process that drives security selection and resulting sector allocations. Opportunistic investments in non-benchmark sectors including investment grade corporate, emerging market, and non-US dollar debt and convertible bonds help to manage overall portfolio risk and enhance total return potential. The product's portfolio managers are responsible for strategy implementation, portfolio construction, and adherence to guidelines. This rigorous investment process results in portfolios that, we believe, are well diversified and expected to generate superior long-term investment performance when compared to the Barclays Capital High Yield Index.
LSV Int'l Equity
James Owens, Jr.
Insurance
Legacy
Int'l Equity
Int'l Equity
Nov-04
Feb-15
The objective of our International Large Cap Value strategy is to outperform the MSCI EAFE Index (50% Hedged) by at least 250 basis points (gross of fees) per annum over an annualized 3-5 year period with a tracking error of approximately 5-6%. The process used to select stocks is a quantitative approach developed by our founding partners through years of academic research on a variety of investment and investor behavior topics. The process ranks a broad universe of stocks on a combination of value and momentum factors and seeks to invest approximately 150 stocks in the most attractive securities possible within our strict risk parameters to control the portfolio's tracking error relative to the benchmark. The resulting portfolio will be broadly diversified across industry groups and fully invested (cash balances are typically less than 1% of the portfolio). LSV weights countries at a neutral weight relative to the benchmark country weights. Initial positions must be in stocks with a market capitalization above $500 million. 50% of the portfolio is US dollar hedged.
LSV Large Cap
James Owens, Jr.
Insurance
Legacy
Dom Lg Cap Equity
Dom Lg Cap Equity
Jun-98
May-15
The objective of our Large Cap Value Equity (U.S.) strategy is to outperform the Russell 1000 Value by at least 200 basis points (gross of fees) per annum over a 3-5 year period with a tracking error of approximately 4%. The process used to select stocks is a quantitative approach developed by our founding partners through years of academic research on a variety of investment and investor behavior topics. The process ranks a broad universe of stocks on a combination of value and momentum factors and seeks to invest approximately 100 stocks in the most attractive securities possible within our strict risk parameters to control the portfolio's tracking error relative to the benchmark. The resulting portfolio will be broadly diversified across industry groups and fully invested (cash balances are typically less than 1% of the portfolio). Initial positions must be in stocks with a market capitalization above $500 million.
15 updated 7/12/2016

Investment Manager Trust Asset Class Opened Description
North Dakota State Investment Board Managers
LSV Global Equity
James Owens, Jr.
Pension Global Equity Feb-13 The objective of the Global ACWI strategy is to outperform the unhedged total rate of return, net of dividend withholding taxes of the benchmark by at least 200 basis points (gross of fees) per annum. The process used to select stocks is a quantitative approach developed by our founding partners through years of academic research on a variety of investment and investor behavior topics. The process ranks a broad universe of stocks on a combination of value and momentum factors and seeks to invest approximately 125 stocks in the most attractive securities possible within our strict risk parameters to control the portfolio's tracking error relative to the benchmark. The resulting portfolio will be broadly diversified across countries and industry groups. Initial positions must be in stocks with a market capitalization above $400 million.
Matlin Patterson (Fund I, II, III)
Mark Patterson
Pension Private Equity Jul-02 Invest globally in the severely discounted securities and obligations of financially distressed companies with the objective of obtaining corporate control. Through the Investment Adviser’s active management of the Fund’s investments, the Fund is seeking superior risk adjusted returns and is operating globally in a segment of the distressed sector in which it has few significant competitors.Invest globally in the severely discounted securities and obligations of financially distressed companies with the objective of obtaining corporate control. Through the Investment Adviser’s active management of the Fund’s investments, the Fund is seeking superior risk adjusted returns and is operating globally in a segment of the distressed sector in which it has few significant competitors.
NTAM (Northern Trust Asset Management) Enhanced S&P 500
Jason Pasquinelli
Pension Dom Lg Cap Equity Aug-00 The Investment Manager will use an investment approach primarily based on quantitative investment techniques. The principal source of value added is the stock selection process. Relative attractiveness is assessed using a proprietary multiple factor model. Attractive securities are over weighted relative to the Index while unattractive securities are under weighted, or excluded entirely. The account will invest primarily in a broadly diversified portfolio of equity securities. Equity securities include securities convertible into equity securities (including common stock), warrants, rights and units or shares in trusts, exchange traded funds and investment companies. The account may invest and reinvest in long or short positions in any of the instruments.
The Investment Manager may purchase or sell futures and exchange traded and over-the-counter options on the Index or on a similarly broad index. The Investment Manager intends to use futures and options to manage market risk associated with the account’s investments by selling futures on a stock index which correlates in price movement with a portion of the account to hedge against a potential decline in the prices of the securities comprising that portion of the account and, conversely, by purchasing futures on a stock index which correlates in price movement to a group of stocks which the account anticipates purchasing, to hedge against an increase in the value of such stocks. A portion of the cash in the account may be deposited with a broker as margin on futures or options transactions, to be invested on behalf of the account in obligations issued or guaranteed by the US Government or other appropriate short-term investments.
To meet liquidity needs, the Investment Manager may also invest in short term cash investments, including shares of money market portfolios, which may be registered investment companies for which the Investment Manager or an affiliate serves as custodian or investment advisor.
16 updated 7/12/2016

Investment Manager Trust Asset Class Opened Description
North Dakota State Investment Board Managers
NTAM (Northern Trust Asset Management) World Ex-US
Jason Pasquinelli
Pension International Equity Dec-13 The Fund will be maintained by the Trustee with the objective of providing investment results that replicate the overall performance of the MSCI® Emerging Markets Equity Index (the “Index”). The Trustee will attempt to meet the Fund’s investment objective by including the common stocks of one or more companies included in the Index, on the sole basis of computer-generated statistical data, deems representative of the industrydiversification of the entire Index.
The Fund will be invested primarily in equity securities of business enterprises organized and domiciledoutside of the United States (“U.S.”) or for which the principal trading market is outside the U.S. In the Fund, and where applicable with respect to the Fund, the Trustee will employ statistical methods to select securities which comprise or will comprise the Index without necessarily buying all the relevant Index equities. Such securities will be selected, acquired, held and liquidated solely on the basis of such methods and not on the basis of any economic, financial, market timing, or other analysis. Securities purchased for the Fund will generally, but not necessarily, be traded on a foreign securities exchange. The Trustee may, in its discretion, purchase or sell depositary receipts. The Fund will be rebalanced from time to time in order to minimize the expected or predicted deviation between the performance of the Fund and the performance of the relevant Index or to reflect changes in the composition of the Index.
PIMCO Bravo II
Julie MeggersTodd StaleyMichael Chandra
Pension
Insurance
Residential & Commercial Debt
Oct-13
Oct-13
To seek to capitalize on the perceived market opportunity and achieve its Target Return, the Fund will have broad discretion to invest principally in (or otherwise gain exposure to) U.S. and non-U.S.: (i) performing, underperforming or non-performing loans and other assets that have historically been securitized and/or otherwise traditionally held by financial institutions (as well as participations and other interests therein), including commercial and residential mortgage loans (each of which may convert to real estate holdings), consumer loans (such as credit card receivables, automobile loans and student loans) and/or servicing or similar rights relating to such loans and other assets; (ii) structured products, securitizations and other assetbacked securities (“ABS”) backed by assets of any type (whether U.S. or non-U.S. based collateral), including non-agency residential mortgage-backed securities (“RMBS”) and commercial mortgage-backed securities (“CMBS” and, together with RMBS, “MBS”), collateralized debt obligations (“CDOs”), collateralized loan obligations (“CLOs”) and repackaged securities (collectively, “Structured Investments”), including Structured Investments managed by PIMCO or an affiliate thereof; (iii) residential and commercial real estate; and/or (iv) investments in equity securities, equity-linked securities and/or debt instruments (including loans) of operating companies and other entities (whether stressed, distressed or otherwise on an opportunistic basis), including banks and other financial institutions, specialty finance entities, and other opportunities.
PIMCO Distressed Senior Credit Opportunities (DiSCO)
Fund II
Julie MeggersTodd StaleyMichael Chandra
Pension
Insurance
Dom Inv Grade FI
Fixed Income
Oct-11
Oct-11
The PIMCO Distressed Senior Credit Opportunities Fund is an opportunistic private-equity style Fund which seeks to provide investors enhanced returns principally through long-biased investments in undervalued senior and super senior structured credit securities that are expected to produce attractive levels of current income and that may also appreciate in value over the long term. The fund will look to capitalize on forced sales by liquidity constrained investors.
17 updated 7/12/2016

Investment Manager Trust Asset Class Opened Description
North Dakota State Investment Board Managers
PIMCO MBS
Julie MeggersTodd Staley
Pension Dom Inv Grade FI Mar-12 The PIMCO Mortgage-Backed Securities Strategy is an actively managed bond portfolio that invests in high quality, short to intermediate duration mortgage-backed securities. The fund invests primarily in securities that are highly rated, such as US Government guaranteed Ginnie Mae securities and Agency-guaranteed Fannie Mae and Freddie Mac mortgage-backed securities.
PIMCO (formerly Research Affiliates)
Julie MeggersTodd StaleyMichael Chandra
Insurance
Legacy
Dom Small Cap Equity
Dom Small Cap Equity
July-07
March-15
Small company value equity portfolio utilizing the index strategy and philosophy described as the Enhanced RAFI® US Small strategy which in turn is based on our patent pending Fundamental Index® concept. The Enhanced RAFI® US Small strategy relies on portfolio weights derived from firm fundamentals (free cash flow, book equity value, total sales and gross dividend), instead of market capitalization. In addition, the enhanced portfolio strategy uses a quality of earnings screening and a financial distress screening to augment portfolio returns and reduce portfolio volatility.
PIMCO Unconstrained (SMA)
Julie MeggersTodd StaleyMichael Chandra
Pension Dom Inv Grade FI Mar-14 The Fund seeks to achieve its investment objective by investing under normal circumstances at least 80% of its assets in a diversified portfolio of Fixed Income Instruments of varying maturities, which may be represented by forwards or derivatives such as options, futures contracts, or swap agreements. “Fixed Income Instruments” include bonds, debt securities and other similar instruments issued by various U.S. and non-U.S. public- or private-sector entities. The Fund intends to utilize various investment strategies in a broad array of fixed income sectors to achieve its investment objective. The Fund will not be constrained by management against an index. The average portfolio duration of this Fund will normally vary from (negative) 3 years to positive 8 years based on Pacific Investment Management Company LLC’s (“PIMCO”) forecast for interest rates. Duration is a measure used to determine the sensitivity of a security’s price to changes in interest rates. The longer a security’s duration, the more sensitive it will be to changes in interest rates.
The Fund may invest in both investment-grade securities and high yield securities (“junk bonds”) subject to a maximum of 40% of its total assets in securities rated below Baa by Moody’s Investors Service, Inc. (“Moody’s”), or equivalently rated by Standard & Poor’s Ratings Services (“S&P”) or Fitch, Inc. (“Fitch”), or, if unrated, determined by PIMCO to be of comparable quality. The Fund may also invest without limitation in securities denominated in foreign currencies and in U.S. dollar-denominated securities of foreign issuers. In addition, the Fund may invest up to 50% of its total.
Prudential Core Plus
Peter Taggert
Insurance
Legacy
Fixed Income
Fixed Income
Aug-06
April-15
The core plus fixed income account is a multi-sector strategy with alpha objective of +150 basis points versus the Barclays Aggregate Index over a full market cycle. The strategy is diversified across a broad range of fixed income sectors, including Treasuries, agencies, mortgage-backed securities, structured product (asset-backed securities, commercial mortgage-backed securities), investment grade corporate bonds, high yield bonds, bank loans and international debt. The primary sources of excess return are sector allocation and security selection, with duration and yield curve less of a focus.
18 updated 7/12/2016

Investment Manager Trust Asset Class Opened Description
North Dakota State Investment Board Managers
Quantum (Energy Partners, Resources)
Michael Dalton
Pension Private Equity Oct-06 Founded in 1998, Quantum Energy Partners is a leading provider of private equity to the global energy industry. With more than $5.7 billion in assets under management, Quantum targets investment opportunities between $100 and $400 million with proven management teams that possess a clear vision and whose companies have sustainable competitive advantages within well-defined segments of or strategies in the energy industry. Quantum primarily focuses on the oil and gas upstream, midstream and power sectors, but will consider opportunities across the entire energy industry.
Quantum Resources’ investment strategy is to acquire, develop, enhance and exploit mature oil and gas properties in order to provide investors with both a current income vehicle with capital appreciation potential and a hedge to other investments through long-term exposure to changes in commodity prices. The company will acquire cash flow producing oil and gas properties primarily located in North America through asset or corporate purchases. By acquiring properties in a diverse set of mature fields with long operating histories, long-lived production characteristics and additional development potential, the company is emphasizing a focus on capital preservation and the reinvestment of cash flow into property development or add-on acquisitions. Management expects to acquire income streams generated by the production of oil and gas reserves at attractive discount rates of future net cash flows.
SEI Investments
Bob Thomas
PERS Retiree Health
Multiple Jul-09 Fixed Income Strategy - A diversified set of lowly correlated alpha sources increase confidence in consistent excess return -Combination of managers with a broad opportunity sets inclusive of government, credit and structured securities-Derivatives provide an efficient means of strategy implementation-Managers have the ability to utilize derivatives to manage duration, yield curve, sector and security strategies to enhance return or reduce riskEmerging Markets Debt Strategy - Specialist Emerging Market Debt Managers and seasoned investment teams with complementary investment philosophies that invest broad opportunity sets inclusive of tactical allocations to external debt, local debt, local currency, and corporate debt.High Yield Strategy - Diversified group of managers with deep and experienced credit resources whose outperformance will be generated from both Sector/Industry and Selection decisions. The differentiation between managers is not on the alpha source they are seeking to exploit, but rather on the credit philosophy and process. Broad opportunity sets primarily in fixed income securities rated below investment grade, including corporate bonds. May also invest in bank loans, convertible and preferred securities, zero coupon obligations and credit derivatives. Given the illiquidity of the high yield market, managers also have the ability to utilize the credit default swap market for enhancing return or reducing risk.Small Cap Strategy - Utilizing multiple SEI Portfolio sub-advisors, the SEI Portfolio invests in common stocks and other equity securities with the goal of providing capital appreciation.World Equity ex-US Strategy - Utilizing multiple SEI portfolio sub-advisors, the SEI portfolio invests in equity securities of foreign companies, including those in emerging market countries with the goal of capital appreciation. These securities may include common stocks, preferred stocks, warrants, exchange-traded funds based on an international equity index and derivative instruments whose value is based on an underlying equity security or basket of equity securities. The SEI portfolio is diversified as to issuers, market capitalization, industry and country. Certain SEI portfolio sub-advisors use strategies that are designed to correlate with a portfolio of international equity securities, but which are composed of derivative instruments backed by other types of securities.Large Cap Equity Strategy - A Russell 1000 index fund.
19 updated 7/12/2016

Investment Manager Trust Asset Class Opened Description
North Dakota State Investment Board Managers
SEI Investments
Bob Thomas
Job Service Multiple Dec-16 The Fund uses a multi-manager approach to portfolio construction that seeks to generate excess returns (i.e., returns in excess of benchmark) and at the same time provide diversification by avoiding over- concentration in a single investment style, sector or market trend. SEI analysis seeks to identify each manager's competitive advantage and characteristics of that advantage that can be monitored on an ongoing basis. Asset allocation to a given manager is based on the manager's skill set, the current macro economic environment, and the risks inherent in each manager's strategy.
State Street Global Advisors
Joe Cadigan
Pension Dom Inv Grade FI Jun-13 This is a commingled index fund that seeks to replicate the risk and return characteristics of the Barclays Long Treasury Bond Index.
State Street Global Advisors
Joe Cadigan
Insurance
Legacy
Fixed Income
Fixed Income
June-13
April-15
This is a commingled index fund that seeks to replicate the risk and return characteristics of the Barclays Government/Credit Bond Index.
State Street Global Advisors
Joe Cadigan
Tobacco Short Term Fixed Income
Oct-15 The Strategy is managed using a "passive" or "indexing" investment approach, by which SSgA attempts to replicate, before expenses, the performance of the Index. The Strategy will not necessarily own all of the securities included in the Index.
The Strategy may attempt to invest in the securities comprising the Index, in the same proportions as they are represented in the Index. However, due to the diverse composition of securities in the Index and the fact that many of the securities comprising the Index may be unavailable for purchase, it may not be possible for the Strategy to purchase some of the securities comprising the Index. In such a case, SSgA will select securities for the Strategy comprising a portfolio that SSgA expects will provide a return comparable to that of the Index.
SSgA expects that it will typically seek to replicate index returns for the Portfolio through investments in the "cash" markets - actual holdings of debt securities and other instruments - rather than through "notional" or "synthetic" positions achieved through the use of derivatives, such as futures contracts or swap transactions (except in the unusual case where SSgA believes that use of derivatives is necessary to achieve an exposure that is not readily available through the cash markets).
BenchmarkBarclays U.S. 1-3 Year Treasury Bond Index
20 updated 7/12/2016

Investment Manager Trust Asset Class Opened Description
North Dakota State Investment Board Managers
State Street Global Advisors
Joe Cadigan
Tobacco Large Cap Equity Ex-Tobacco
Oct-15 The Strategy is managed using a "passive" or "indexing" investment approach, by which SSgA attempts to match, before expenses, the performance of the Index. SSgA will typically attempt to invest in the equity securities comprising the Index, in approximately the same proportions as they are represented in the Index. Equity securities may include common stocks, preferred stocks, depository receipts, or other securities convertible into common stock. The Strategy may purchase securities in their initial public offerings ("IPOs"). In some cases, it may not be possible or practicable to purchase all of the securities comprising the Index, or to hold them in the same weightings as they represent in the Index. In those circumstances, SSgA may employ a sampling or optimization technique to construct the portfolio in question.
From time to time securities are added to or removed from the Index. SSgA may sell securities that are represented in the Index, or purchase securities that are not yet represented in the Index, prior to or after their removal or addition to the Index.
The Strategy may at times purchase or sell index futures contracts, or options on those futures, or engage in other transactions involving the use of derivatives, in lieu of investment directly in the securities making up the Index or to enhance the Strategy's replication of the Index return. The Strategy's return may not match the return of the Index.
BenchmarkS&P 500® ex Tobacco is comprised of the S&P 500® minus tobacco companies. The S&P 500® is comprised of approximately 500 leading companies in leading industries of the U.S. market with approximately 75% coverage of the U.S. stock market capitalization.
TIR-Timberland Investment Resources
Tom Johnson
Pension Timber Jun-01
Sept-04
Teredo Timber LLC - The investment objective of Teredo is to provide competitive investment returns from increasing saw timber production through the 20 year term of the partnership. TIR’s management strategy is to maximize saw timber volume by applying intensive forest management techniques which accelerate growth through the diameter class distribution (from pulpwood to saw timber). Periodic cash flows are produced from thinning and final harvests of the individual timber stands.
Springbank LLC - The investment objective of Springbank is to maximize long-term investment potential. TIR will implement four key strategies to attain the objective:• Formation of a dedicated land management group;• Intensive timber management to increase timber production;• Coordination of timber harvesting with land management activities;• Direct marketing and selective real estate partnerships.
TIR-Timberland Investment Resources
Tom Johnson
Insurance Real Assets Oct-08 Eastern Timberland Opportunities Fund - The investment objective of the Eastern Timberland Opportunities fund is to provide competitive timberland investment returns from Eastern US timberland investments by pursuing management strategies to increase timber production and land values through the investment term. TIR will maximize timber values within the portfolio with the application of intensive forest management techniques to accelerate the growth in timber volume and movement into higher value product categories. Additional value will be captured by realizing higher and better use opportunities for select timberland properties throughout the portfolio.
21 updated 7/12/2016

Investment Manager Trust Asset Class Opened Description
North Dakota State Investment Board Managers
UBS Global Asset Management
Betsy Sanders
Pension Dev. Int'l Fixed Income Jul-89 The non-US fixed income portfolio’s assets may be invested in emerging markets debt on an opportunistic basis up to the stated maximum allocation of 5%. The account’s non-US fixed income assets will be fully-invested at all times, but such assets may be invested in the UBS US Cash Management Prime Collective Fund for operational and risk management purposes.
Vanguard Group
Bruce Mears
Insurance
Legacy
Int'l Equity
Int'l Equity
June-03
Feb-15
Vanguard International Explorer Fund seeks to provide long-term capital appreciation. The fund invests primarily in the equity securities of small-capitalization companies located outside the United States that the advisor believes offer the potential for capital appreciation. In doing so, the advisor considers, among other things, whether a company is likely to have above-average earnings growth, whether the company's securities are attractively valued, and whether the company has any proprietary advantages.
Wellington Trust Company
Elizabeth O'Hara
Pension Developed Int'l Equity Mar-02 Securities lending is the temporary loan of a security from an institutional investor's portfolio to a broker/dealer or dealer bank to support that firm's trading activities. These trading activities include short selling, selling on margin or the satisfaction of some other type of transaction. Loaned securities are generally collateralized, reducing the lender's credit exposure to the borrower. Except for the right to vote proxies, the lender retains entitlement to all the benefits of owning the original securities, including the receipt of dividends and interest. Additionally, the lender receives a fee for the use of the securities and can reinvest the collateral. The lender, however, bears the market risk of the loaned securities. This is due to the borrower being obligated to ultimately return the securities, not the original market value of the securities, at the time the loan was made. Lendable securities include U.S. government and agency bonds, U.S. and foreign equities, U.S. corporate and Eurobonds, foreign government bonds, asset backed and mortgage backed securities.
The International Small Cap Opportunities investment approach is bottom-up focused, and leverages the global research resources at Wellington Management. In implementing purchase decisions, consideration is given to the size, liquidity, and volatility of these prospects. Sell decisions are based on changing fundamentals or valuations, or on finding better opportunities elsewhere. The assets are not hedged.
Wells Capital Management
Stephen Scharre
Insurance
Legacy
Fixed Income
Fixed Income
Apr-02
April-15
The Medium Quality Credit fixed income strategy is designed to maximize total return from the high-grade corporate bond market while maintaining a strategic allocation to the BBB portion of the high yield market. Credit research is a primary driver of our results; however, our process starts with a "top-down" strategy to guide decision-making. Security selection is determined by in-depth credit research. We believe in-depth knowledge of industries, companies, and their management teams enable us to identify credit trends that can lead to investment opportunities. In conjunction with performing rigorous fundamental research, we also apply a disciplined relative value framework which helps us determine the optimal position to invest within an industry and within an individual issuer's capital structure.
Western Asset
Derek Fan
Pension
Insurance
Legacy
Dom Inv Grade FI
Fixed Income
Fixed Income
Oct-09 to Mar-12Mandate changed
to MBS
Dec-93
April-15
A portfolio using all major fixed-income sectors with a bias towards non-Treasuries, especially corporate, mortgage-backed and asset-backed securities. Value can be added through sector rotation, issue selection, duration and term structure weighting.
22 updated 7/12/2016

Investment Manager Trust Asset Class Opened Description
North Dakota State Investment Board Managers
Western Asset
Derek Fan
Insurance
Legacy
Real Assets
Real Assets
Oct-09
March-15
Western Asset's Global Inflation-Linked composite includes portfolios that employ an active, team-managed investment approach around a long-term, value-oriented investment philosophy. These portfolios use diversified strategies in seeking to add value while minimizing risk.
The approach is to construct a portfolio primarily of inflation-indexed securities. Value can be added through country selection, term structure, issue selection, duration management and currency management.
William Blair
Wally Fikri
Pension
Insurance
Legacy
Developed Int'l Equity
International Equity
International Equity
William Blair invests in a growth-oriented, diversified portfolio that will typically hold between 40-70 securities. The firm's investment philosophy is to focus on companies with above-average growth prospects where growth can be sustained through leading or franchise positions in terms of proprietary products, marketing dominance, or cost/asset base advantage. Portfolio candidates typically have above-average prospective growth, evidence of sustainability of future growth, above-average profitability and reivestment of internal capital, and conservative capital structure relative to sector norms.
The portfolio will be diversified by region and country and may invest up to 2X the MSCI ACWI ex-US IMI Index weighting in Emerging Markets securities. In addition, the portfolio will be diversified by sector with no individual sector representing over 35.0% based upon market value. The maximum allocaton to any one security is 5.0% of the portfolio (at market value) and notwithstanding this limitation, no immediate liquidation of investments shall be required solely due to changed in market value.
23 updated 7/12/2016

Investment Manager Trust Asset Class
Open to Close Date Description
AllianceBernstein/Clifton
Liz Smith
Pension Lg Cap Dom Equity Jun-09 to Oct-10Capital Returned
The AllianceBernstein Term Asset-Backed Securities Loan Facility ("TALF") Opportunities Fund is a bottom-up research driven investment strategy structured to take advantage of the opportunity extended to investors through the TALF. The strategy will primarily draw its research from the AllianceBernstein Special Situations Group, which, among other asset classes, covers secured credit sensitive securities (e.g., ABS), as well as non-credit sensitive prime residential mortgage securities. For credit sensitive securities, credit research is overlaid on structural analyses to develop a complete picture of expected loss content, resiliency of cash flows, risk and return. All holdings are closely followed within our proprietary database which contains a time series of investment credit metrics, repayment rates, cohort, and originator statistics.
The TALF Opportunities Fund will invest in a concentrated leveraged portfolio of structured asset securities that are eligible for non-recourse lending from the NY Fed TALF. The Fund's goal is to generate high risk-adjusted returns created by the dislocations in asset-backed and other securitization markets. The Fund will invest in AAA/Aaa-rated asset-backed securities as well as other TALF-eligible securities defined by the NY Fed. The TALF program limits the investment universe to US dollar-denominated securities whose underlying collateral is primarily based in the United States. Owing to the high credit quality of the underlying investments, we expect the majority of the Fund's return to be generated by the income in excess of the TALF loans' fees and interest.
The Clifton Group is charged with applying the S&P 500 “beta” exposure for the AllianceBernstein “alpha” exposure. The overall goal of the account is to get the return of the S&P 500 index plus an additional alpha amount provided by the TALF fund.
Babson Capital Management Chad Strean
Legacy Short Term Fixed Inc
Sep-11 to Feb-15Change of asset
allocation
Babson was hired to manage the Bank Loans in the former Prudential account. Their direction is to manage and supervise the deliberate liquidation, over time of these holdings. As securities mature or are sold off the proceeds will be transferred to the Active Short Duration Strategy.
Bank of North Dakota
Tim Porter
Pension
Insurance
Dom Inv Grade FI
Fixed Income
Apr-91 to Apr-12Changed mandate to
long treasury
Dec-93 to Apr-13Terminated
The Bank of North Dakota (BND) manages this fixed income portfolio for the State Investment Board with a passive management style designed to replicate the Barclay’s Government/Corporate Bond Index. In order to accomplish this objective, BND utilizes optimization software that allows us to monitor several portfolio and individual security constraints (duration, yield, convexity, credit quality and issue size). The portfolio is rebalanced monthly in order to achieve an annualized time-weighted rateof return that matches the Barclay’s Gov/Corp Bond Index with a tracking error not more than (+ or -) 30 basis points.
Bank of North Dakota
Tim Porter
Pension Dom Inv Grade FI Apr-12 to Apr-13Terminated
The Bank of North Dakota (BND) manages this fixed income portfolio for the State Investment Board with a passive management style designed to replicate the Barclay’s Long Treasury Index. In order to accomplish this objective, BND utilizes optimization software that allows us to monitor several portfolio and individual security constraints (duration, yield, convexity, credit quality and issue size). The portfolio is rebalanced monthly in order to achieve an annualized time-weighted rate of return that matches the Barclay’s Gov/Corp Bond Index with a tracking error not more than (+ or -) 30 basis points.
North Dakota State Investment Board Managers - ClosedAGENDA ITEM V.E. (2)

Investment Manager Trust Asset Class
Open to Close Date Description
North Dakota State Investment Board Managers - Closed
Blackfriars Asset Management (WestAM)
Hugh Hunter
Pension Emerging Markets Equity
Mar-06 to Jun-12Terminated
Blackfriars Asset Management Limited has been appointed by North Dakota State Investment Board to manage a Global Emerging Market Equity portfolio. The fund is invested in the WestAM Group Trust.
Blackfriars strategy is that of a core, active manager with the objective of outperforming the MSCI Emerging Markets index by 2% over rolling three year periods. Our investment approach is team-based and focuses on capturing alpha from our top-down and bottom-up decisions. Our country allocation process is primarily driven by a factor model encompassing fundamental marketand economic factors, whilst stock selection is driven by fundamental research by our internal team of analysts.
Blackfriars Asset Management, at the time of appointment, was called WestLB Asset Management which was owned by WestLB AG, a German bank. Following the creation of a 50:50 joint venture with BNY Mellon in 2006, the company became fully owned by BNY Mellon on 31 December 2008 and changed its name to Blackfriars Asset Management Limited. The investment process and investment personnel involved in the management of the portfolio have not changed as a result of the change in ownership.
Brookfield Investment Management (Hyperion)
Richard Torykian
Insurance Fixed Income Jan-07 to Mar-10Terminated
Acct taken over by Declaration
The Enhanced MBS investment process begins with a macro-economic assessment of the market. Included in the macro-economic assessment is the analysis of: the interest rate environment, the phase of the real estate cycle, consumer credit trends, recently released or pending economic data, supply and demand relationships, housing prices, and the Mortgage Refinancing Index. The analysis and review that occurs at this stage provides the groundwork for establishing the asset allocation for our Enhanced MBS Investment Strategy. We then conduct a detailed review of the MBS sub-sectors. We evaluate developments in each sector; current offerings; recent transactions and market clearing levels; security types and yield spread levels to formulate a relative value outlook. Our research analysts provide fundamental analysis on prepayment speeds, borrower credit exposure, geographic diversification, refinancing trends, and the correlation of returns. We then further analyze the risks of the various MBS sectors—specifically, the outlook for delinquencies, housing affordability, consumer debt, collateral value appreciation, and loss severities. These factors build a larger picture for the appropriate asset allocation for this strategy. The asset mix for our Enhanced MBS Investment Strategy is a ratio that may change over time, as opportunities in the sectors and sub-sectors are identified. Once the initial allocation mix has been determined, the investment process moves to the securityselection phase.
The most important component of our Enhanced MBS Investment Strategy is security selection. In short, while the market for non-Agency MBS may seem generic, the credit performance from one issue to another varies. Our security selection process results from both quantitative and qualitative inputs, as well as the substantial experience of the portfolio managers. Members of the investment team, utilizing Hyperion Brookfield’s proprietary analytics, determine the relative strengths of various securities based on applicable criteria such as issuer, issue, vintage, credit rating, structure, and geographic exposure.
Calamos Investments
Meredith French
Pension Dom Inv Grade FI Oct-06 to Mar-12Terminated
Mandate changed to Global Opportunities
Calamos Advisors LLC manages a convertible mandate for the North Dakota State Investment Board through the Calamos Convertible Plus strategy. The primary objective of the strategy is to achieve high long-term total return through growth and income. The strategy is focused on primarily investing in convertible securities but in addition utilizes both equities and fixed income. This enhanced flexibility allows Calamos to better manage the overall risk/reward profile of a convertible mandate. To take advantage of international opportunities, the portfolio will utilize the Calamos International Convertible Group Trust, a commingled fund in which we purchase units on behalf of the North Dakota State Investment Board. This commingled fund is generally hedged between 70-100% from a currency perspective.

Investment Manager Trust Asset Class
Open to Close Date Description
North Dakota State Investment Board Managers - Closed
Calamos Investments
Meredith French
Pension Global Equity Mar-12 to Dec-13Terminated
The Global Opportunities objective is high long-term total return through capital appreciation and current income. The Trust invests primarily in a global portfolio of equity, convertible and fixed-income securities. In pursuing the Trust's investment objective, the Investment Manager attempts to utilize these different types of securities to strike, in its opinion, the appropriate balance between risk and reward in terms of growth and income.
The Investment Manager attempts to keep a consistent balance between risk and reward over the course of different market cycles, through various combinations of stock, bonds and/or convertible securities, to achieve what the Investment Manager believes to be an appropriate blend for the then-current market. As the market environment changes, portfolio securities may change in an attempt to achieve a relatively consistent risk level over time. At some points in a market cycle, one type of security may make up a substantial portion of the portfolio, while at other times certain securities may have minimal or no representation, depending on market conditions.
Callan Associates
Greg Allen
Pension Small Cap Dom Equity
May-06 to March-16Terminated
The investment strategy for the Diversified Alpha Small Cap Equity Fund (“Fund”) is based on two empirical studies. The first observed that the average portfolio for a comprehensive universe of active institutional small cap products out-performed the Russell 2000 Index in every three-year period since 1984, resulting cumulative out-performance in excess of five percent per year over the 20-year period with a tracking error of five percent annualized. The consistency and magnitude of this out-performance led to Callan’s use of the average institutional small cap portfolio as the target in the Fund’s portfolio construction methodology rather than one of the standard small cap indices. The second study observed that the illiquidity of the small cap market presents significant structural challenges to managers as they grow in assets under management (“AUM”). These challenges resulted in smaller products (in terms of AUM) out-performing their larger counterparts by in excess of three percent per year over the observed 20-year period. The consistency and magnitude of this out-performance provided the basis for favoring smaller, less capacity-constrained products in the Fund's manager selection methodology.
The Fund’s strategy is implemented through the use of a stratified sampling technique, and it begins with the decomposition of Callan’s Total Institutional Small Cap (“TISC”) universe (consisting of over 700 products) into 10 distinct sub-styles, with approximately 70-75 products in each sub-style. After extensive screening, four products from each sub-style are selected which, when held in combination, are expected to closely track the performance of each sub-style as a whole. This process results in a total portfolio made up of 40 equity sub-advisors, equally weighted in the Fund’s portfolio, which very closely tracks the performance of the average actively managed institutional small cap product (historical tracking error since inception of approximately one percent annualized).
Capital Guardian
Michael Bowman
Pension
Insurance
Legacy
Developed Int'l Equity
Int'l Equity
Int'l Equity
Mar-92 to May-16Terminated
Apr-97 to May-16Terminated
Feb-15 to May-16Terminated
The Portfolio will invest primarily in equity or equity type securities of companies in developed countries excluding the U.S. These equity securities will be listed on a stock exchange or traded in another recognized market and include, but are not limited to, common and preferred stocks, securities convertible or exchangeable into common or preferred stock, warrants, rights and depository arrangements. The Portfolio may invest in fixed-income securities (including cash or cash equivalents) when market conditions warrant. The Portfolio's investments may be denominated in U.S. dollars or in non-U.S. currencies. The Portfolio may include securities eligible for resale pursuant to Rule 144A and securities in offerings that are not registered for sale in the U.S. but are listed or quoted in the securities' local markets. Instruments acquired as a result of corporate actions are permitted.
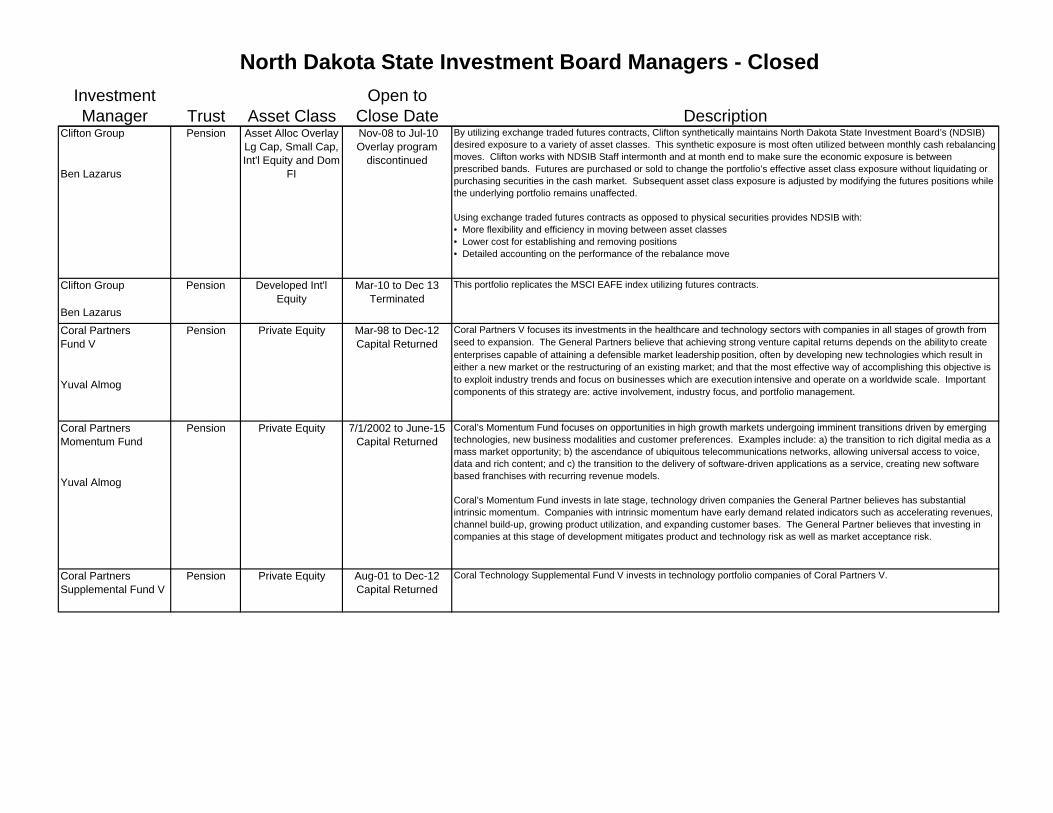
Investment Manager Trust Asset Class
Open to Close Date Description
North Dakota State Investment Board Managers - Closed
Clifton Group
Ben Lazarus
Pension Asset Alloc OverlayLg Cap, Small Cap, Int'l Equity and Dom
FI
Nov-08 to Jul-10Overlay program
discontinued
By utilizing exchange traded futures contracts, Clifton synthetically maintains North Dakota State Investment Board’s (NDSIB) desired exposure to a variety of asset classes. This synthetic exposure is most often utilized between monthly cash rebalancing moves. Clifton works with NDSIB Staff intermonth and at month end to make sure the economic exposure is between prescribed bands. Futures are purchased or sold to change the portfolio’s effective asset class exposure without liquidating or purchasing securities in the cash market. Subsequent asset class exposure is adjusted by modifying the futures positions while the underlying portfolio remains unaffected.
Using exchange traded futures contracts as opposed to physical securities provides NDSIB with:• More flexibility and efficiency in moving between asset classes• Lower cost for establishing and removing positions• Detailed accounting on the performance of the rebalance move
Clifton Group
Ben Lazarus
Pension Developed Int'l Equity
Mar-10 to Dec 13 Terminated
This portfolio replicates the MSCI EAFE index utilizing futures contracts.
Coral PartnersFund V
Yuval Almog
Pension Private Equity Mar-98 to Dec-12Capital Returned
Coral Partners V focuses its investments in the healthcare and technology sectors with companies in all stages of growth from seed to expansion. The General Partners believe that achieving strong venture capital returns depends on the ability to create enterprises capable of attaining a defensible market leadership position, often by developing new technologies which result in either a new market or the restructuring of an existing market; and that the most effective way of accomplishing this objective is to exploit industry trends and focus on businesses which are execution intensive and operate on a worldwide scale. Important components of this strategy are: active involvement, industry focus, and portfolio management.
Coral Partners Momentum Fund
Yuval Almog
Pension Private Equity 7/1/2002 to June-15Capital Returned
Coral’s Momentum Fund focuses on opportunities in high growth markets undergoing imminent transitions driven by emerging technologies, new business modalities and customer preferences. Examples include: a) the transition to rich digital media as a mass market opportunity; b) the ascendance of ubiquitous telecommunications networks, allowing universal access to voice, data and rich content; and c) the transition to the delivery of software-driven applications as a service, creating new software based franchises with recurring revenue models.
Coral’s Momentum Fund invests in late stage, technology driven companies the General Partner believes has substantial intrinsic momentum. Companies with intrinsic momentum have early demand related indicators such as accelerating revenues, channel build-up, growing product utilization, and expanding customer bases. The General Partner believes that investing in companies at this stage of development mitigates product and technology risk as well as market acceptance risk.
Coral Partners Supplemental Fund V
Pension Private Equity Aug-01 to Dec-12Capital Returned
Coral Technology Supplemental Fund V invests in technology portfolio companies of Coral Partners V.

Investment Manager Trust Asset Class
Open to Close Date Description
North Dakota State Investment Board Managers - Closed
DMR (Declaration Mgmt & Research) Mortgage Opportunity Fund
John Pluta
Pension Below Inv Grade FI May-08 to Dec-09Fund matured/capital returned
The Fund’s investment strategy is to acquire stressed and distressed mortgage backed securities, primarily non-Agency Residential Mortgage Backed Securities ("RMBS"). The return objective of the Fund is to achieve a net IRR in the 12%-20% range within a target five year horizon from the acquisition of such securities. The goal is to extract a significant liquidity premium (apart from the compensation available for assuming credit risk) using bottom-up security analysis during a period when legacy holders of mortgage backed securities are in need of liquidity. Once fully invested, the Fund will be a long-biased investment in distressed securities within various sub-sectors of mortgage credit. The focus of the Fund is senior class RMBS backed by prime, Alt-A and subprime collateral. Higher allocations are expected to be in prime and Alt-A transactions. Security-specific risk will be analyzed at the loan level. The risk analysis links borrower attributes (loan-to-value, credit score, documentation status, age of loan, size of loan, etc.) to the borrower’s default and prepayment propensities. Similar borrower attributes are examined toestimate recovery rates post default. Risk management at the security level also involves an examination of issue structure, waterfall priorities and other structural features which trap or divert cash flow, particularly as it relates to our target asset. It is anticipated that the Fund's returns will be earned primarily through cash yield on bonds it acquires at discounted prices and through repayment of principal, or partial principal from recoveries on defaulted mortgages, over the holding period of each asset in the Fund.
DMR (Declaration Mgmt & Research) TALF and ABS Fund/Clifton
John Pluta
Pension Lg Cap Dom Equity Aug-09 to Dec-11Fund matured/capital
returned
The investment objective of the DMR TALF and ABS Fund is to achieve attractive risk-adjusted returns in the low to mid-teens by investing opportunistically in senior classes of Consumer ABS and CMBS. The returns are expected to be achieved primarily through cash flow yield from assets acquired and financed using non recourse TALF leverage. The Fund term is expected to be relatively short with distributions beginning in July 2010 and most bonds naturally amortizing and maturing within 2-4 years from our purchase date.
From a tactical standpoint, we believe the risk/return characteristics of short tenor ABS and CMBS compare favorably to other debt sectors. For TALF eligible assets, the low cost, non-recourse borrowing facility is an attractive feature which corporate credit, levered loans and high yield cannot access.
The Fund’s primary focus by sub-sector is on TALF-eligible legacy AAA senior CMBS. These assets are trading near par and tend to have a solid credit profile. The strategy does not involve stressed or “credit intensive” securities. Rather, we seek to execute risk efficient trades by employing non- recourse TALF leverage on lower volatility “par based” assets with high confidence in the receipt of coupon cash flow and full repayment of principal. TALF leverage is likely to range at 5x-15x capital depending upon the asset. In general, we expect to hold investments to their respective maturity dates, although we have the flexibility to sell holdings if spreads tighten. In acquiring assets, we employ a bottom-up analysis and model the structural characteristics of each transaction. DMR has a value orientation in security selection, seeking a margin of safety or cushion between base case performance expectations and extreme loss outcomes.
The Clifton Group is charged with applying the S&P 500 “beta” exposure for the Declaration “alpha” exposure. The overall goal of the account is to get the return of the S&P 500 index plus an additional alpha amount provided by the TALF fund.
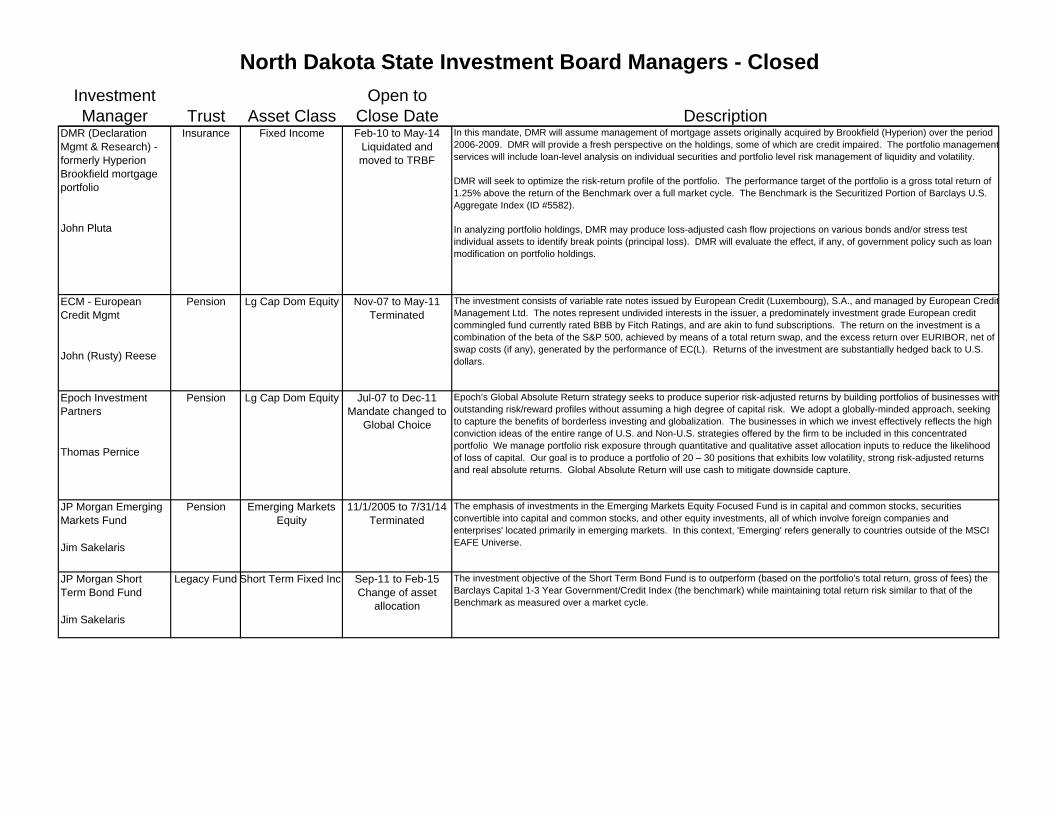
Investment Manager Trust Asset Class
Open to Close Date Description
North Dakota State Investment Board Managers - Closed
DMR (Declaration Mgmt & Research) - formerly Hyperion Brookfield mortgage portfolio
John Pluta
Insurance Fixed Income Feb-10 to May-14Liquidated and moved to TRBF
In this mandate, DMR will assume management of mortgage assets originally acquired by Brookfield (Hyperion) over the period 2006-2009. DMR will provide a fresh perspective on the holdings, some of which are credit impaired. The portfolio managementservices will include loan-level analysis on individual securities and portfolio level risk management of liquidity and volatility.
DMR will seek to optimize the risk-return profile of the portfolio. The performance target of the portfolio is a gross total return of 1.25% above the return of the Benchmark over a full market cycle. The Benchmark is the Securitized Portion of Barclays U.S. Aggregate Index (ID #5582).
In analyzing portfolio holdings, DMR may produce loss-adjusted cash flow projections on various bonds and/or stress test individual assets to identify break points (principal loss). DMR will evaluate the effect, if any, of government policy such as loan modification on portfolio holdings.
ECM - European Credit Mgmt
John (Rusty) Reese
Pension Lg Cap Dom Equity Nov-07 to May-11Terminated
The investment consists of variable rate notes issued by European Credit (Luxembourg), S.A., and managed by European CreditManagement Ltd. The notes represent undivided interests in the issuer, a predominately investment grade European credit commingled fund currently rated BBB by Fitch Ratings, and are akin to fund subscriptions. The return on the investment is a combination of the beta of the S&P 500, achieved by means of a total return swap, and the excess return over EURIBOR, net of swap costs (if any), generated by the performance of EC(L). Returns of the investment are substantially hedged back to U.S. dollars.
Epoch Investment Partners
Thomas Pernice
Pension Lg Cap Dom Equity Jul-07 to Dec-11Mandate changed to
Global Choice
Epoch’s Global Absolute Return strategy seeks to produce superior risk-adjusted returns by building portfolios of businesses withoutstanding risk/reward profiles without assuming a high degree of capital risk. We adopt a globally-minded approach, seeking to capture the benefits of borderless investing and globalization. The businesses in which we invest effectively reflects the high conviction ideas of the entire range of U.S. and Non-U.S. strategies offered by the firm to be included in this concentrated portfolio We manage portfolio risk exposure through quantitative and qualitative asset allocation inputs to reduce the likelihood of loss of capital. Our goal is to produce a portfolio of 20 – 30 positions that exhibits low volatility, strong risk-adjusted returns and real absolute returns. Global Absolute Return will use cash to mitigate downside capture.
JP Morgan Emerging Markets Fund
Jim Sakelaris
Pension Emerging Markets Equity
11/1/2005 to 7/31/14 Terminated
The emphasis of investments in the Emerging Markets Equity Focused Fund is in capital and common stocks, securities convertible into capital and common stocks, and other equity investments, all of which involve foreign companies and enterprises' located primarily in emerging markets. In this context, 'Emerging' refers generally to countries outside of the MSCI EAFE Universe.
JP Morgan Short Term Bond Fund
Jim Sakelaris
Legacy Fund Short Term Fixed Inc Sep-11 to Feb-15Change of asset
allocation
The investment objective of the Short Term Bond Fund is to outperform (based on the portfolio's total return, gross of fees) the Barclays Capital 1-3 Year Government/Credit Index (the benchmark) while maintaining total return risk similar to that of the Benchmark as measured over a market cycle.

Investment Manager Trust Asset Class
Open to Close Date Description
North Dakota State Investment Board Managers - Closed
LSV Int'l Equity
James Owens, Jr.
Pension Developed Int'l Equity
Nov-04 to Jan-13Changed mandate to
Global Equity
The objective of our International Large Cap Value strategy is to outperform the MSCI EAFE Index (50% Hedged) by at least 250basis points (gross of fees) per annum over an annualized 3-5 year period with a tracking error of approximately 5-6%. The process used to select stocks is a quantitative approach developed by our founding partners through years of academic researchon a variety of investment and investor behavior topics. The process ranks a broad universe of stocks on a combination of value and momentum factors and seeks to invest approximately 150 stocks in the most attractive securities possible within our strict risk parameters to control the portfolio's tracking error relative to the benchmark. The resulting portfolio will be broadly diversified across industry groups and fully invested (cash balances are typically less than 1% of the portfolio). LSV weights countries at a neutral weight relative to the benchmark country weights. Initial positions must be in stocks with a market capitalization above $500 million. 50% of the portfolio is US dollar hedged.
LSV Large Cap
James Owens, Jr.
Pension Dom Lg Cap Equity Jun-98 to Jan-13Changed mandate to
Global Equity
The objective of our Large Cap Value Equity (U.S.) strategy is to outperform the Russell 1000 Value by at least 200 basis points (gross of fees) per annum over a 3-5 year period with a tracking error of approximately 4%. The process used to select stocks is a quantitative approach developed by our founding partners through years of academic research on a variety of investment and investor behavior topics. The process ranks a broad universe of stocks on a combination of value and momentum factors and seeks to invest approximately 100 stocks in the most attractive securities possible within our strict risk parameters to control the portfolio's tracking error relative to the benchmark. The resulting portfolio will be broadly diversified across industry groups and fully invested (cash balances are typically less than 1% of the portfolio). Initial positions must be in stocks with a market capitalization above $500 million.
Mellon (Franklin Portfolio Assoc.)
Pension Lg Cap Dom Equity Sep-06 to Aug-09Terminated
To achieve superior long term equity market returns through an investment process consisting of two parts:a) a market neutral equity strategy with approximately equal dollars invested long and short having the objective of neutralizing the overall movements of the market. Furthermore, other systematic sources of risk, including industry/sector and capitalization effects, will be controlled so that the large portion of portfolio returns comes from individual stock selection.b) an equitization strategy using S&P 500 index futures contracts to overlay the performance of the S&P 500 index on the market neutral strategy.
NTGI (Northern Trust Global Investments) Common TIPS Fund
Richard ClarkJim Aitcheson
Insurance Inflation Protected May-07 to July-10Terminated
The Corporate Trustee may invest and reinvest in units of common funds maintained by the Corporate Trustee or any affiliate of the Corporate Trustee, including, but not limited tom the NTGI-QM Common Daily Treasury Inflation Protected Securities (TIPS) Index Fund-Lending. To meet liquidity needs, the Corporate Trustee may also invest in short term cash investments, including shares of money market portfolios, other common funds, or registered investment companies for which the Corporate Trustee or an affiliate serves as trustee, custodian or investment advisor.

Investment Manager Trust Asset Class
Open to Close Date Description
North Dakota State Investment Board Managers - Closed
NTGI (Northern Trust Collective Emerging Markets Index Fund)
Jason Pasquinelli
Pension Emerging Markets Equity
July-12 to July-14 Terminated
The Northern Trust Collective Emerging Markets Index Fund will be invested primarily in equity securities of business enterprisesorganized and domiciled outside the US or for which the principal trading market is outside the US.
In the Fund, and where applicable with respect to the Fund, the Trustee will employ statistical methods to select securities which comprise or will comprise the Index without necessarily buying all the relevant Index equities. Such securities will be selected, acquired, held and liquidated solely on the basis of such methods and not on the basis of any economic, financial, market timing, or other analysis.
Securities purchased for the Fund will generally, but not necessarily be traded on a foreign securities exchange. The Trustee may, in its discretion, purchase or sell depository receipts.
The Fund will be rebalanced from time to time in order to minimize the expected or predicted deviation between the performance of the Fund and the performance of the relevant Index or to reflect changes in the composition of the Index.
PanAgora Asset Mgmt
Lisa Mahoney
Pension Emerging Markets Equity
Feb-06 to Dec-13 Terminated
The Emerging Markets Fund seeks to exceed, in the aggregate, the return of the Morgan Stanley Capital International Emerging Markets Index before fees and expenses. The Emerging Markets fund may be invested in:• International equity securities including common, preferred and instruments convertible into common or preferred stock for those companies which comprise the Benchmark and the Morgan Stanley Capital International Frontier Markets Equity Index.• American Depository Receipts, Global Depository Receipts, European Depository Receipts• Exchange traded funds based on the underlying securities in the Benchmark• Spot and forward currency exchange contracts• US Treasury bills• Daily Liquidity Fund• The maximum investment in companies which comprise the Morgan Stanley Capital International Frontier Markets Equity Index will not exceed 10% measured at time of purchase.
PIMCO Distressed Senior Credit Opportunities (DiSCO)Fund I
Julie MeggersTodd StaleyMichael Chandra
Pension Dom Inv Grade FI Jul-08 to Oct-11 Moved toFund II
The PIMCO Distressed Senior Credit Opportunities Fund is an opportunistic private-equity style Fund which seeks to provide investors enhanced returns principally through long-biased investments in undervalued senior and super senior structured credit securities that are expected to produce attractive levels of current income and that may also appreciate in value over the long term. The fund will look to capitalize on forced sales by liquidity constrained investors.
PIMCO Distressed Mortgage Fund
Julie MeggersTodd StaleyMichael Chandra
Pension Below Inv Grade FI Oct-07 to May-13 Capital Returned
The PIMCO Distressed Mortgage Fund is an opportunistic private-equity-style Fund which seeks to capitalize on the historic dislocation in the US and global mortgage markets. The Fund invests in mortgage-related securities and loans where PIMCO believes the long-term value of the investment is highly attractive relative to current market pricing. Within the universe of mortgage-related assets, the Fund will be otherwise unconstrained. The Fund will essentially look to capitalize on forced liquidations of mortgage risk from mark-to-market and ratings sensitive investors at historic high yields.

Investment Manager Trust Asset Class
Open to Close Date Description
North Dakota State Investment Board Managers - Closed
PIMCO Unconstrained Bond Fund
Julie MeggersTodd Staley
Pension Dom Inv Grade FI Mar-12 to Mar-14 Converted to SMA
The PIMCO Unconstrained Bond Strategy is an absolute return-oriented, investment grade quality fixed income strategy that embodies PIMCO's secular thinking, global themes, and integrated investment process without the constraints of a benchmark orsignificant sector/instrument limitations. The strategy is designed to offer the traditional benefits of a core bond approach - capital preservation, liquidity, and diversification - but with higher alpha potential and the opportunity to mitigate downside risk to a greater degree than what is reasonably possible from traditional active fixed income management approaches.
Prudential PrivestPeter Taggert
Pension Dom Inv Grade FI Jun-05 to Mar-12Terminated
The Prudential Privest fixed income account is invested primarily in unsecured privately placed debt securities.
Prudential PruAlpha
Peter Taggert
Pension
Insurance (currently Budget
Stabilization only)
Dom Lg Cap Equity
Enhanced Cash
Mar-08 to May-12Redeemed
out/Terminated
Jul-07 to May-12Redeemed out/
Terminated
At launch, Pru Alpha was an absolute return strategy investing across multiple sectors of the global fixed income markets. Therewere significant redemptions from Pru Alpha in the wake of the high market volatility in late 2008. Pru Alpha is currently focused on investing in distressed securities in the fixed income markets.
The Pension Trust invested in a feeder fund that allocated a substantial portion of its assets to the Pru Alpha Master Fund and invested substantially all of its remaining assets in a replication strategy based on the S&P 500 Total Return Index. On November 26, 2008, the S&P 500 beta overlay was discontinued. Effective June 1, 2009, the S&P 500 beta overlay was reapplied via a separate account that invests in S&P 500 futures in amounts intended to match the market value of the Pension Trust's Pru Alpha investment.
The budget stabilization account is an “enhanced cash” portfolio to augment the other components of North Dakota’s budget stabilization assets. This account was originally invested across three components: Dryden Core Short-Term Bond Fund (80%),bank loans (10%), and Pru Alpha (absolute return fund, 10%). Core Short-Term Bond Fund is an “enhanced cash” portfolio that seeks to capture incremental yield from various sectors in the short term portion of the market, with virtually no interest rate risk. Holding assets in the structured product and corporate sectors led to significant underperformance through the credit market downturn from 3Q07-1Q09, but the fund has recovered significantly year-to-date 2009. The bank loan component of the portfolio consists of approximately 20-25 individual bank loans managed by PFIM’s high yield/bank loan team. The names held in the account are biased towards the higher quality and more liquid names in the bank loan arena. Pru Alpha is an absolute return strategy and is described with the Pension Trust investment above.
On July 28, 2009, $95mm was added to this account. As a result of discussions with our senior investment team at PFIM and Steve Cochrane, it was decided to invest the new assets in short-term corporate bonds (1-3 years). As of 8/31/09, the account is allocated as follows: Short-term corporates (47%), Dryden Core Short-Term Bond Fund (39%), bank loans (5%), and Pru Alpha (4%) and cash (5).
SEI Investments Pension
Insurance
Dom Small Cap Equity
Dom Small Cap Equity
Jul-01 to Nov-09Terminated
Jul-01 to Nov-09 Terminated
Utilizing multiple SEI Portfolio sub-advisors, the SEI Portfolio invests in common stocks and other equity securities with the goal of providing capital appreciation.
SEI Investments
Bob Thomas
Pension (Job Service only)
Core Plus Fixed Income
Jul-09 to Mar-12Terminated
A diversified set of lowly correlated alpha sources increase confidence in consistent excess return-Combination of managers with a broad opportunity sets inclusive of government, credit and structured securities-Derivatives provide an efficient means of strategy implementation-Managers have the ability to utilize derivatives to manage duration, yield curve, sector and security strategies to enhance return or reduce risk

Investment Manager Trust Asset Class
Open to Close Date Description
North Dakota State Investment Board Managers - Closed
State Street Global Advisors
Kevin Sullivan
Pension Developed Int'l Equity
July-92 to Dec-13 Terminated
SSgA attempts to identify stocks that it believes are undervalued, using detailed investment analysis. The strategy is normally broadly invested among countries and industries. The investable universe is equity securities of companies outside the United States within the market capitalization range of the index.
State Street Global Advisors
Pension
Insurance
Dom Lg Cap Equity
Dom Lg Cap Equity
Jul-92 to Jul-09 Terminated
Oct-96 to July-09Terminated
Originally hired as S&P 500 Index funds and later re-mandated to 130/30 strategies.
State Street Global Advisors
Mar-94 to Jul-09Terminated
Balanced account consisting of index funds in fixed income, large and small cap and int'l equity.
UBS Global Asset Management
Betsy Sanders
Pension Emerging Markets Equity
July 05 to Dec 13 Terminated
Emerging markets equity investments will be confined to the UBS Emerging Markets Equity collective Fund of the UBS Group Trust, which is maintained by UBS Global Asset Management Trust Company. The account’s emerging markets equity assets will be fully-invested at all times, but such assets may be invested in the UBS US Cash Management Prime Collective Fund for operational and risk management purposes.
Wachovia Global Securities Lending
John Menard
PensionInsurance
All asset classes Oct-07 to Jun-11Terminated when acquired by Citi
Securities lending is the temporary loan of a security from an institutional investor's portfolio to a broker/dealer or dealer bank to support that firm's trading activities. These trading activities include short selling, selling on margin or the satisfaction of some other type of transaction. Loaned securities are generally collateralized, reducing the lender's credit exposure to the borrower. Except for the right to vote proxies, the lender retains entitlement to all the benefits of owning the original securities, including thereceipt of dividends and interest. Additionally, the lender receives a fee for the use of the securities and can reinvest the collateral. The lender, however, bears the market risk of the loaned securities. This is due to the borrower being obligated to ultimately return the securities, not the original market value of the securities, at the time the loan was made. Lendable securities include U.S. government and agency bonds, U.S. and foreign equities, U.S. corporate and Eurobonds, foreign government bonds, asset backed and mortgage backed securities
Wells Capital Management
Jeff MellasDoug Beath
Pension Dom Lg Cap Equity Apr-06 to Mar-10Terminated
The State of North Dakota's Alpha Capture Portfolio (ACP) is a quantitatively driven global long/short strategy designed to exploit mispricing of risk between and within asset classes and market sectors. Core models are utilized in conjunction with the management team to identify opportunities between global stock and bond markets. Markets that are designed to focus more directly on specialized markets such as commodities and individual market sectors supplement the core models. ACP is constructed using instruments such as futures contracts and exchange traded funds (ETFs). The ACP strategy does not currently hedge its non-U.S. dollar positions.
Wells/Sutter
Niklas Nordenfelt
Pension Below Inv Grade FI Apr-04 to Mar-10Terminated
The Sutter High Yield strategy applies a bottom-up fundamental based investment strategy focused on identifying the best risk adjusted opportunities in the high yield market. The investment objective is to deliver outperformance with less volatility over a market cycle. Documented rationale supports each initial investment in a credit. The team's philosophy and process is grounded on the principal of "underwriting the credit as though we are making a direct loan to that company" with a focus on U.S. based companies.
PERS Retiree Health

Investment Manager Trust Asset Class
Open to Close Date Description
North Dakota State Investment Board Managers - Closed
Wells Capital Management
Stephen Scharre
Pension Dom Inv Grade FI Nov-98 to Mar-12Terminated
The Medium Quality Credit fixed income strategy is designed to maximize total return from the high-grade corporate bond marketwhile maintaining a strategic allocation to the BBB portion of the high yield market. Credit research is a primary driver of our results; however, our process starts with a "top-down" strategy to guide decision-making. Security selection is determined by in-depth credit research. We believe in-depth knowledge of industries, companies, and their management teams enable us to identify credit trends that can lead to investment opportunities. In conjunction with performing rigorous fundamental research, we also apply a disciplined relative value framework which helps us determine the optimal position to invest within an industry and within an individual issuer's capital structure.
Western Asset
Derek Fan
Pension Dom Inv Grade FI Oct-09 to Mar-12Mandate changed to
MBS
A portfolio using all major fixed-income sectors with a bias towards non-Treasuries, especially corporate, mortgage-backed and asset-backed securities. Value can be added through sector rotation, issue selection, duration and term structure weighting.
Western Asset
Derek Fan
Pension Dom Inv Grade FI Mar-12 to Sep-14 Terminated
The investment objective for the Western Asset Mortgage-Backed Securities portfolio is to outperform the Barclays Capital US Mortgage Backed Securities Index over a three to five year market cycle. The portfolio is designed to hold high quality assets, with at least 90% of the portfolio rated AAA, or the rating of US Treasury or Agency securities, by at least one of the nationally recognized statistical rating organizations.
Western Asset Insurance Inflation Protected May-04 to Oct-09Mandate changed to
Global TIPS
Western Asset’s US TIPS Full Discretion Composite includes portfolios that employ an active, team-managed investment approach around a long-term, value-oriented investment philosophy. These portfolios use diversified strategies in seeking to add value while minimizing risk.
The approach is to construct a well diversified, higher yielding inflation-protected portfolio with a bias towards Treasury Inflation Protected Securities. Exposure to the diversifying sectors (which include credit, global inflation-linked securities and mortgage-backed securities) may be derived through derivative and forward transactions. This strategy allows for opportunistic investments in high yield, emerging markets, non-dollar securities, commodities and bank loans.
Westridge/WG Trading/Clifton
PensionPension
Insurance
Dom Lg Cap EquityDom Inv Grade FI
Dom Lg Cap Equity
Aug-00 to Apr-11Jan-08 to Apr-11Apr-04 to Apr-11
(Settlement proceeds rec'd Apr-11)
S&P 500 Index Arbitrage Portfolio. Pension Domestic Fixed Income beta portfolio was changed to S&P 500 in November 2008. WG Trading was shut down by Federal Regulators in February 2009 and assets are in receivership.An S&P beta exposure was put on the accounts in July, 2009 by Clifton Group to maintain proper exposure to markets while in litigation.
Annual Board Planning Cycle, Meeting Schedule and Board Education Plan
July 15, 2016
Note: The SIB previously approved the attached “Biennial Agenda”
and “Meeting Schedule” on April 24, 2016.
Dave Hunter, Executive Director / CIO
ND Retirement & Investment Office (RIO)
State Investment Board (SIB)
AGENDA ITEM V. F.

Annual Board Planning Cycle – Biennial Agenda Approved by the SIB on April 24, 2016
2
Annual Board Planning Cycle
Biennial Agenda
Fiscal 2015-16 July 2015 August September October November December January 2016 February March April May June
Gov. Offsite Annual Annual Annual Investment No Meeting Investment Review Review Investment No Meeting
- Election of Investment Review of Evaluation Director Scheduled Director Budget "Ends" Director Scheduled
Officers, Performance Gov. Manual of RIO vs. Report on Report on Guidelines Policies, Report on
- Appoint Review (Done) Ends policies Investment Investment for next Biennial Investment
Audit Comm. - Establish - New Board - Annual Work Plan Work Plan Biennium Agenda, Work Plan
- Plan Annual Investment Member Board - Executive Strategic ED/CIO
Agenda Work Plan Orientation Evaluation Limitations Plan and Review
- Plan Board - Add Invest. Complete Review Budget - Investment
Education Education Guidelines Guidelines
Fiscal 2016-17 July 2016 August September October November December January 2017 February March April May June
The SIB Meeting Gov. Offsite Annual Annual Annual Investment No Meeting Investment Confirm Review Investment No Meeting
Agenda has not - Election of Investment Review of Evaluation Director Planned Director Budget Biennial Director Planned
been establised Officers, Performance Gov. Manual of RIO vs. Report on Report on Guidelines Agenda, Report on
for Fiscal 2016-17 - Appoint Review - New Board Ends policies Investment Investment End Policies, Investment
Audit Comm. - Establish Member - Annual Work Plan Work Plan Strategic Work Plan
- Plan Annual Investment Orientation Board - Legislative - Executive - Legislative Investment ED/CIO
Agenda Work Plan Complete Evaluation Update Limitations Update Plan and Review
- Plan Board - Add Invest. Review Budget - Investment
Education Education Guidelines Guidelines
1.) SIB Governance Policy B-7 on Governance Process states that "the Board will follow a biennial agenda which (a) completes a re-exploration of Ends policies annually (April)
(which is also referred to as "RIO's Mission Statement") and (b) continually improves its performance through attention to board education and to enriched input and deliberation."
2.) "In the first three months of the new cycle, the Board will develop its agenda for the ensuing year. Scheduled monitoring will be used to evaluate and adjust the annual
agenda as needed."
3.) "The Board will identify areas of education and input needed to increase the level of wisdom forethought it can give to subsequent choices. A board education plan will be
developed during July and August of each year."
4.) Budget Guidelines: RIO will prepare and submit a biennial budget pursuant to OMB guidelines as established by the Governor which will not reduce the level of service provided by RIO.
Expenditures for budget items will not exceed the appropriation without approval of the State Investment Board. Date: April 14, 2016

Annual SIB Meeting Schedule for 2016-17
3
The SIB approved the above meeting schedule on April 24, 2016.

Reaffirm Commitment to Governance & Board Education
4
Reaffirm organizational commitment to our current governance
structure.
Annual governance training provided by leading industry experts
serve as the focal point of our July board meetings the last two
years. (Keith Ambachtsheer of KPA Advisory Services in 2015 and
Jeanna Cullins of Aon Hewitt in 2016)
Maintain a persistent awareness to the importance of continuing
board education.
Emphasize continuing board education at SIB meetings and promote
the attendance of educationally focused industry conferences.

Recommended Board Education for 2016-17
5
New Member Orientation
1) One on one investment meetings at RIO;
2) Callan Annual Conference; and
3) Callan College (onsite dates to be discussed)
Existing Board Member for up to 3 to 4 years
1) Callan Annual Conference; and
2) Callan College (onsite dates to be discussed)
Existing Board Member for over 3 to 4 years
1) Callan Annual Conference or Callan College
Potential “Callan College Onsite” Dates:
a) October 28, 2016
b) January 27, 2017
c) March 24, 2017
Callan College would occur on an existing SIB Meeting date (from 8:30am to
Noon). Potential educational topics may include Capital Markets Theory, Asset
Allocation, Investment Policy Statements and the Role of the Fiduciary.

Board Education – July 1, 2015 to June 30, 2015
6
SIB members have actively participated in numerous educational opportunities over the last year
including the following sessions which occurred during our regularly scheduled board meetings:
• Governance Education by KPA Advisory (3 hours)
• Reviewing Trust Performance Education by Callan Associates (1 hour)
• Capital Markets Update by PIMCO (1 hour)
• Capital Markets Update by Epoch (1 hour)
• Fiduciary Duty Education by RIO (1 hour)
• Capital Market Updates by Callan (2 hours)
• Capital Markets and Securities Lending Update by Northern Trust (1 hour)
• Litigation Monitoring Education by the Office of the Attorney General (1 hour)
• Capital Markets Update by JPMorgan (1 hour)
Several board members and RIO staff have obtained additional investment education by attending
conferences sponsored by a wide variety of industry experts such as:
• Callan’s Annual Conference and/or Callan College (two to three days)
• CommonFund Forums (two to three days)
• Great Plains (and/or Mountain States) Investor Forum (one to two days)
• National Association of State Retirement Officers (two to three days)
• National Association of State Investment Officers (two to three days)
• National Association of State Investment Professionals (two to three days)
• Various conferences sponsored by “Pensions and Investments” (one to three days)

PERS Investment Policy Statement Approved by the PERS Board on June 16, 2016
July 15, 2016
Board Action:
RIO recommends the SIB approve the revised investment policy statement for PERS, including a revised asset allocation in which Equity and Fixed Income are increased by 1% each and Real Assets and Cash are both reduced by 1%.
Dave Hunter, Executive Director/CIO
Darren Schulz, Deputy Chief Investment Officer
ND Retirement & Investment Office (RIO)
State Investment Board (SIB)
Agenda Item VI. A.

2
Summary of Callan’s Asset Liability Study and
RIO’s Recommended Asset Allocation Targets
PERS engaged Callan to conduct an asset liability study the preliminary results of
which have been previously shared with the PERS Investment Sub-Committee and
Board along with PERS and RIO investment staff.
RIO and Callan are proposing relatively minor revisions to PERS’s existing investment
policy statement noting the vast majority of the changes are conforming in nature:
1. Maintaining the actuarial rate of return on assets of 8.00%; and
2. Adopting the asset class terminology used in Callan’s “Asset Liability Study”.
As example, Global Equity allocations are segmented into Public and Private, while Global
Fixed Income allocations are segmented into Investment Grade and Non-Investment Grade.
Infrastructure and Timber allocations are also referenced as “Other” Real Assets by Callan.
The following pages highlight RIO’s recommendation to the PERS Investment Sub-Committee
based on the expert guidance and assistance of Callan’s asset liability study team including
Julia Moriarty, Alex Browning and Paul Erlendson.
RIO’s primary goal in developing this recommendation was to identify an efficient asset
allocation framework to support PERS’s 8.0% expected return target while minimizing overall
portfolio risk as measured by standard deviation.

3
Comparison of “PERS Current” and “Proposed” Target
Asset Allocations including “TFFR’s Current Target”
Current
Note: PERS asset liability study was based on Callan’s 2016 Capital Market Expectations (CME) while TFFR used Callan’s 2015 CME.
RIO recommended Mix 2B with Equity at 58%, Fixed Income at 23% and Real Assets at 19% which
Callan projects to generate an Expected Return of 7.0% with a Standard Deviation of 14.8%.
Mix 2B represents a modest change and includes a 1% increase to Equity and Fixed Income and a
1% decrease to Real Assets and Cash versus “PERS Current Target”.
Mix 2B is comparable to “TFFR’s Current Target” as both maintain a 58% allocation to Equity,
although Mix 2B has a 1% higher target for Real Assets and 1% lower allocation to Cash.
Asset Class PERS Current Callan RIO Proposed Callan TFFR Current
Target Mix 2A Mix 2B Mix 3 Target
Global Equity 57% 58% 58% 60% 58%
Public 52% 51% 51% 53% 52%
Private 5% 7% 7% 7% 6%
Global Fixed Income 22% 23% 23% 20% 23%
Investment Grade 17% 20% 18% 17% 19%
Non-Investment Grade 5% 3% 5% 3% 4%
Global Real Assets 20% 18% 19% 19% 18%
Real Estate 10% 11% 11% 11% 10%
Infrastructure & Timber 10% 7% 8% 8% 8%
Cash Equivalents 1% 1% 0% 1% 1%
Totals 100% 100% 100% 100% 100%
Expected Return 6.8% 6.9% 7.0% 7.0% 7.1%
Standard Deviation 14.5% 14.5% 14.8% 15.1% 14.7%

4
Current
Callan’s Expected Return is for 10-years and is based on lower
expected inflation without active management in the public markets.
Source: Callan’s Asset Allocation and Liability Study for the North Dakota Public Employees Retirement System dated May 2016.
Note: “PERS Current Target” asset allocation is estimated to generate an expected return of 6.8% with an
expected standard deviation of 14.5%. RIO’s recommended asset allocation (“Mix 2B”) is estimated to generate
a slightly higher expected return (7.0%) with a slightly higher expected standard deviation (14.8%). Both of these
estimates are based on Callan’s 2016 Capital Market Expectations (including inflation) for the next 10-years
while excluding the positive (or negative) impact of active management in the public markets.

5
Current
Callan’s 10-Year Estimated Results Converted to Long-Term
Returns plus a Higher Expected Inflation Rate in North Dakota
Source: Callan’s Asset Allocation and Liability Study for the North Dakota Public Employees Retirement System dated May 2016.
Summary of PERS 8.0% Long-Term Return Expectation:
1. Callan’s Expected Return is 7.0% for the next 10-years as
shown in the table to the left and serves as the starting point.
2. The first adjustment (of 0.5%) is to convert Callan’s 10-year
Capital Market Expectations to Long-Term Returns (of 30+
years) which represents a 50 basis point increase.
3. The second adjustment (of 0.5%) is for PERS higher 3.50%
inflation expectation (for North Dakota) whereas Callan’s
2.25% assumption is based on national expectations.
4. PERS Long-Term Return Expectation is 8.0% as shown below.
1.) PERS Expected Return based on Callan's 2016 Capital Market Expectations 7.0%
2.) Adjustment to convert Callan's 10-Year Returns to Long-Term Expectations 0.5%
3.) Adjustment to incorporate PERS higher inflation assumption 0.5%
4.) PERS Long-Term Return Expectation with a higher inflation assumption 8.0%
Note: PERS returns have benefitted from active management by 50 basis points (or 0.50%)
annualized during the past 5-years which is not incorporated in the above analysis.
Asset Class RIO Proposed
Mix 2B
Global Equity 58% Public 51%
Private 7%
Global Fixed Income 23% Investment Grade 18%
Non-Investment Grade 5%
Global Real Assets 19% Real Estate 11%
Infrastructure & Timber 8%
Cash Equivalents 0% Totals
Expected Return 7.0%
Standard Deviation 14.8%

6
Current

TO: SIB FROM: Dave Hunter, ED/CIO – Retirement and Investment Office (“RIO”) DATE: July 15, 2016 SUBJECT: Investment Policy Statement – PERS Main Plan
The North Dakota Public Employees Retirement System Board approved the attached investment policy statement on June 15, 2016.

STATEMENT OF INVESTMENT GOALS, OBJECTIVES AND POLICIES FOR THE NORTH DAKOTA PUBLIC EMPLOYEES RETIREMENT SYSTEM
1. PLAN CHARACTERISTICS AND FUND CONSTRAINTS The North Dakota Public Employees Retirement System (NDPERS) and the Highway Patrol
Retirement System (HPRS) are pension benefit plans established to provide retirement income to state employees and employees of participating political subdivisions. The plans are administered by a seven member Board of Trustees (the Board). The Chair is appointed by the governor, three members are elected by the active members of the plans, one member is elected by the retired members, one is appointed by the Attorney General and the seventh member is the State Health Officer or their designee.
The NDPERS plan is a multi-employer hybrid benefit public pension plan that provides retirement benefits, disability retirement benefits, and survivor benefits, in accordance with Chapter 54-52 of the North Dakota Century Code (NDCC). Monthly retirement benefits for the Main, National Guard and Law Enforcement Plans are based on the formula: number of Years of Service times 2.0% times the final average salary. For the NDPERS Judges Plan the retirement formula is: for the first ten years of service of the formula is final average salary times 3.5%, for the second ten years of service the formula is final average salary times 2.80% and for all remaining years of service the formula is final average salary times 1.25%. The Highway Patrol plan is a single employer plan that provides retirement benefits, disability benefits, and survivor benefits in accordance with Chapter 39-03.1 of the North Dakota Century Code. Monthly retirement benefits are based upon on the formula: first 25 years of credit service times 3.25% and all remaining years of service times 1.75%.
Funding for the NDPERS plan is provided by monthly employee contributions and employer
contributions with the amount varying based upon which NDPERS plan the member participates in. For the Main NDPERS plan the employee contribution is 4% and the employer contribution is 4.12%, for the Judges Plan the employee contribution is 5% and employer contribution is 14.52%, for the National Guard Plan the employee contribution is 4% and employer contribution is 6.5%, for the Law Enforcement Plan with prior service the employee contribution is 4% and the employer contribution is 8.31% and for the Law Enforcement Plan without prior service the employee contribution rate is 4% and the employer rate is 6.43%.
Funding for the Highway Patrol plan is provided by a monthly employee contribution of 10.3% and
an employer contribution of 16.7% Each year the Board has an actuarial valuation performed. The current actuarial assumed rate of
return on assets for all plans is 8%. 2. RESPONSIBILITIES AND DISCRETION OF THE STATE INVESTMENT BOARD (SIB)
Aggregate plan contributions plus earnings, minus allowable expenses constitute the Fund. The Board is charged by NDCC chapters 54-52, 21-10-01, and 39-03.1 to establish policies for the investment goals and asset allocation of the Fund. The State Investment Board (SIB) is charged with implementing the asset allocation as promptly and prudently as possible in accordance with the Board’s policies by investing the assets of the Fund in the manner provided in the prudent investor rule, which provides: Fund fiduciaries shall exercise the judgment and care, under the circumstances then prevailing, that an institutional investor of ordinary prudence, discretion, and intelligence exercises in the

management of large investments entrusted to it, not in regard to speculation but in regard to the permanent disposition of funds, considering probable safety of capital as well as probable income. The retirement funds belonging to the teachers' fund for retirement and the public employees retirement system must be invested exclusively for the benefit of their members and in accordance with the respective funds' investment goals and objectives. (NDCC 21-10-07)
The SIB may delegate investment responsibility of the Fund or any portion of the Fund to professional money managers. Where a money manager has been retained, the SIB’s role in determining investment strategy is supervisory not advisory.
The SIB may at its discretion, pool the assets of the Fund with another fund or funds having similar investment objectives and time horizons in order to maximize returns and minimize costs. In pooling fund assets the SIB will establish asset class pools it deems necessary to achieve the specific quality, diversification, restrictions, and performance objectives subject to the prudent investor rule and the objectives of the funds participating in the pools. The SIB is responsible for establishing the selection criteria, determining the performance measures, and retaining all fund money managers. SIB is also responsible for the selection and retention of any investment consultants that may be employed in the investment of the Fund assets.
3. DELEGATION OF AUTHORITY Management responsibility for NDPERS funds not assigned to the North Dakota State Investment
Board (SIB) in Chapter 21-10 of the North Dakota Century Code (NDCC) is hereby delegated to the SIB, which must establish written policies and procedures for the operation of the NDPERS funds, consistent with this investment policy.
Such procedures must provide for: 1. The definition and assignment of duties and responsibilities to advisory services and
persons employed by the SIB pursuant to NDCC 21-10-02.1(1) (a). 2. Investment diversification, investment quality, qualification of money managers, and
amounts to be invested by money managers pursuant to NDCC 21-10-02.1(1)(e). In developing these policies it is understood:
a. Futures and options may be used to hedge or replicate underlying index
exposure, but not for speculation. b. The use of derivatives will be monitored to ensure that undue risks are not taken by
the money managers. c. All assets must be held in custody by the SIB's master custodian or such other
custodians as are selected by the SIB. 3. Guidelines for selection and redemption of investments will be in accordance with NDCC
21-10-02.1(1) (d). 4. The criteria for making decisions with respect to hiring, retention, and termination of money
managers will be clearly defined. This also includes selecting performance measurement standards, consultants, report formats, and frequency of meetings with money managers.
All participants in the investment process must seek to act responsibly as custodians of the public
trust.

4. INVESTMENT GOALS The investment goals of the Fund have been established by the NDPERS Board based upon
consideration of the Board's strategic objectives and a comprehensive review of the current and projected financial requirements. These goals are to be viewed over the long term.
Goal # 1 Accumulate sufficient wealth through a diversified portfolio of investments
which will enable the State of North Dakota to pay all current and future retirement benefits and expense obligations of the Fund.
Goal # 2 To obtain an investment return in excess of that needed to allow for
increases in a retiree's annuity to maintain the purchasing power of their retirement benefit.
The Board acknowledges the material impact that funding the pension plan has on the State’s financial performance. To enable the State to continue offering secure pension benefits to plan participants, the Board believes that the Fund should pursue the following secondary goals: 1. Stabilize the employee and employer contributions needed to fund the Plan over the long
term.
2. Avoid both substantial volatility in contributions and sizable fluctuations in the funding status
of the Plan.
These two secondary goals affect the Fund’s investment strategies and often represent conflicting goals. That is, minimizing the long-term funding costs implies a less conservative investment program, whereas dampening the volatility of contributions and avoiding large swings in the funding status implies a more conservative investment program. The Board places greater emphasis on the strategy of stabilizing the employee and employer contribution needed to fund the plan over the long term as it assists our participating employers by having a predictable contribution for budgeting.
5. INVESTMENT PERFORMANCE OBJECTIVE
The Board’s investment objectives are expressed in terms of reward and risk expectations relative to investable, passive benchmarks. The Fund’s policy benchmark is comprised of policy mix weights of appropriate asset class benchmarks as set by the SIB.
1. The fund’s rate of return, net of fees and expenses, should at least match that of the
policy benchmark over a minimum evaluation period of five years.
2. The fund’s risk, measured by the standard deviation of net returns, should not exceed
115% of the policy benchmark over a minimum evaluation period of five years.
3. The risk-adjusted performance of the fund, net of fees and expenses, should at least
match that of the policy benchmark over a minimum evaluation period of five years.

6. ASSET ALLOCATION In recognition of the plan's performance objectives, benefit projections, and capital market
expectations, the NDPERS Board has established the following asset allocation: Asset Class Policy Target (%) Rebalancing Range (%) Global Equity 58 46-66 Public Equity 51 42-57 Private Equity 7 4-9 Global Fixed Income 23 16-30 Investment Grade 18 13-23 Non-Investment Grade 5 3-7 Global Real Assets 19 10-25 Global Real Estate 11 5-15 Other (Infrastructure/Timber) 8 5-10 Inflation Linked Bonds 0-5 Global Alternatives 0-10 Cash 0 0-2 Global Equity 57 46-65 Domestic Equity 31 26-36 International Equity 21 16-26 Developed 16 Emerging 5 Private Equity 5 4-8 Global Fixed Income 22 16-28 Domestic Fixed 17 13-21 Investment Grade 12 10-18 Non-Investment Grade 5 3-7 International Fixed 5 3-7 Developed 5 3-7 Emerging 0-3 Global Real Assets 20 12-28 Global Real Estate 10 5-15 Other 10 0-15 Infrastructure 5 0-10 Timber 5 0-7 Commodities Inflation Linked Bonds Other Inflation Sensitive Strategies Global Alternatives 0-10 Cash 1 0-2

The Board does not endorse tactical asset allocation, therefore, it is anticipated the portfolio be managed as close to the policy target as is prudent and practicable while minimizing re-balancing costs. Any allocation to Global Alternatives shall not increase the expected volatility of the portfolio as measured in Section #5, and all other targets will be adjusted pro-rata. PERS requires that in implementing this asset allocation that the State Investment Board seek to maximize return within the scope of these policies while limiting investment costs.
7. RESTRICTIONS A. Futures and options may be used to hedge or replicate underlying index exposure, but not
for speculation. B. Use of derivatives will be monitored to ensure that undue risks are not taken by the money
managers C. No transaction may be made which threatens the tax exempt status of the Fund. D. No unhedged short sales or speculative margin purchases may be made. Social Investing is defined as "The investment or commitment of public pension fund
money for the purpose of obtaining an effect other than a maximized return to the intended beneficiaries."
E. Social investing is prohibited unless it meets the Exclusive Benefit Rule and it can be
substantiated that the investment must provide an equivalent or superior rate of return for a similar investment with a similar time horizon and similar risk.
Economically targeted investing is defined as an investment designed to produce a
competitive rate of return commensurate with risk involved, as well as to create collateral economic benefits for a targeted geographic area, group of people, or sector of the economy.
F. Economically targeted investing is prohibited unless the investment meets the Exclusive
Benefit Rule. The Exclusive Benefit Rule is met if the following four conditions are satisfied: (1) The cost does not exceed the fair market value at the time of investment. (2) The investment provides the Fund with an equivalent or superior rate of return for a
similar investment with a similar time horizon and similar risk. (3) Sufficient liquidity is maintained in the Fund to permit distributions in accordance
with the terms of the plan. (4) The safeguards and diversity that a prudent investor would adhere to are present. Where investment characteristics, including yield, risk, and liquidity are equivalent, the Board’s policy favors investments which will have a positive impact on the economy of North Dakota.
G. Publicly Traded REITs may not be used in the Real Estate asset allocation.
Where investment characteristics, including yield, risk, and liquidity are equivalent, the Board's policy favors investments which will have a positive impact on the economy of North Dakota.

8. INTERNAL CONTROLS The SIB must have a system of internal controls to prevent losses of public funds arising from fraud
or employee error. The controls deemed most important are the separation of responsibilities for investment purchases from the recording of investment activity, custodial safekeeping, written confirmation of investment transactions, and established criteria for broker relationships. The annual financial audit must include a comprehensive review of the portfolio, accounting procedures for security transactions and compliance with the investment policy.
9. EVALUATION Investment management of the Fund will be evaluated against the Fund's investment objectives
and investment performance standards. An annual performance report must be provided to the Board by the State Investment Officer at a
regularly scheduled NDPERS Board meeting. The annual performance report must include asset returns and allocation data as well as information regarding all significant or material matters and changes pertaining to the investment of the Fund, including:
- Changes in asset class portfolio structures, tactical approaches and market values; - All pertinent legal or legislative proceedings affecting the SIB.
- Compliance with these investment goals, objectives and policies. - A general market overview and market expectations.
- A review of fund progress and its asset allocation strategy.
- A report on investment fees and the SIB’s effort relating to Section 6. To measure
investment cost PERS requires as part of the annual review information from Callan, CEM or other acceptable source showing the value added versus the cost.
- Changes/additions to benchmarks utilized to monitor the funds.
In addition, the State Investment Officer shall review with the Board the procedures and policies established by the SIB relating to this statement of investment goals, objectives, and policies.
_____________________________________________ ____________________________________________
J. Sparb Collins David Hunter
Executive Director Executive Director
North Dakota Public Employees Retirement System North Dakota Retirement and Investment Office
Date: _________________________________________ Date: _______________________________________

Legacy and Budget Stabilization Fund Investment Policy Statement
July 15, 2016
Board Action:
RIO recommends the SIB approve the revised investment policy statements for the Legacy Fund and Budget Stabilization Fund. The revised policies incorporate the previously discussed transfer of the Bank North Dakota Match Loan CD Program to the Legacy Fund from the Budget Stabilization Fund during the next year. The governing bodies of the Legacy Fund and Budget Stabilization Fund approved these recommendations on June 15, 2016.
Dave Hunter, Executive Director/CIO
Darren Schulz, Deputy Chief Investment Officer
ND Retirement & Investment Office (RIO)
State Investment Board (SIB)
Agenda Item VI. B.
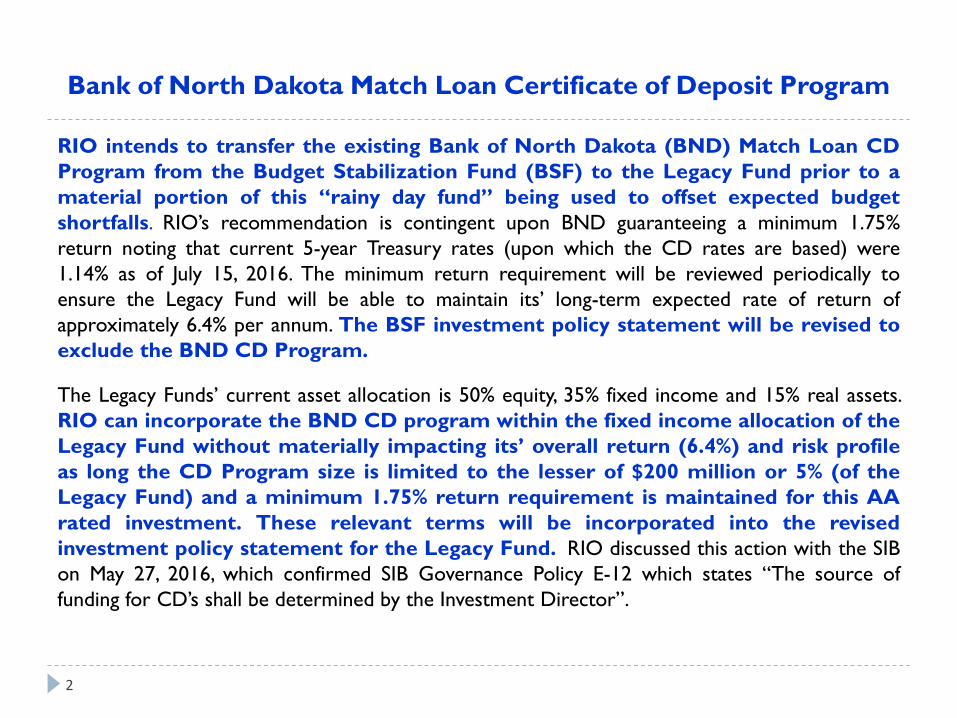
2
Bank of North Dakota Match Loan Certificate of Deposit Program
RIO intends to transfer the existing Bank of North Dakota (BND) Match Loan CD
Program from the Budget Stabilization Fund (BSF) to the Legacy Fund prior to a
material portion of this “rainy day fund” being used to offset expected budget
shortfalls. RIO’s recommendation is contingent upon BND guaranteeing a minimum 1.75%
return noting that current 5-year Treasury rates (upon which the CD rates are based) were
1.14% as of July 15, 2016. The minimum return requirement will be reviewed periodically to
ensure the Legacy Fund will be able to maintain its’ long-term expected rate of return of
approximately 6.4% per annum. The BSF investment policy statement will be revised to
exclude the BND CD Program.
The Legacy Funds’ current asset allocation is 50% equity, 35% fixed income and 15% real assets.
RIO can incorporate the BND CD program within the fixed income allocation of the
Legacy Fund without materially impacting its’ overall return (6.4%) and risk profile
as long the CD Program size is limited to the lesser of $200 million or 5% (of the
Legacy Fund) and a minimum 1.75% return requirement is maintained for this AA
rated investment. These relevant terms will be incorporated into the revised
investment policy statement for the Legacy Fund. RIO discussed this action with the SIB
on May 27, 2016, which confirmed SIB Governance Policy E-12 which states “The source of
funding for CD’s shall be determined by the Investment Director”.

3
BND Match Loan CD Program Background:
BND has a strong desire to maintain the CD Program which provides reduced cost
financing to companies seeking to develop new businesses in North Dakota. RIO
notes this economic development program has been in place for over 20 years although the
funding source has migrated among various funds overseen by the SIB. Given the nature and
size of the $3.7 billion Legacy Fund, RIO views the Legacy Fund as a better funding
alternative given that one can make a case that both programs are intended to
create or preserve intergenerational wealth for North Dakota’s citizens. In contrast,
the BSF serves as a reserve fund with a greater demand for increased liquidity during periods of
economic stress.
BND has issued 25 CD’s over the past 20 years in connection with nearly $1 billion of
“Total Project” developments. Although the rates and terms have varied considerably since
inception, BND has generally issued 5-year fixed rate CD’s post 2008 with the average interest
rate declining materially during this time period. There are $84 million of CD’s outstanding
within the $580 million BSF as of May 20, 2016.
Advisory Board Background:
The Legacy and Budget Stabilization Funds Advisory Board (Advisory Board) is charged by law
under Section 21-10-11 with the responsibility of recommending policies on investment goals and
asset allocation of the legacy and budget stabilization funds. The SIB is charged with implementing
policies and asset allocation and investing the assets of both funds.

1
NORTH DAKOTA LEGACY FUND
INVESTMENT POLICY STATEMENT
1. PLAN CHARACTERISTICS AND FUND CONSTRAINTS
The North Dakota legacy fund was created in 2010 when the voters of North Dakota approved a constitutional amendment--now Article X, Section 26, of the Constitution of North Dakota--to provide that 30 percent of oil and gas gross production and oil extraction taxes on oil and gas produced after June 30, 2011, be transferred to the legacy fund. The principal and earnings of the legacy fund may not be spent until after June 30, 2017, and any expenditure of principal after that date requires a vote of at least two-thirds of the members elected to each house of the Legislative Assembly. Not more than 15 percent of the principal of the legacy fund may be spent during a biennium. The Legislative Assembly may transfer funds from any source to the legacy fund, and such transfers become part of the principal of the fund. The State Investment Board (SIB) is responsible for investment of the principal of the legacy fund. Interest earnings accruing after June 30, 2017, are transferred to the general fund at the end of each biennium. North Dakota Century Code Section 21-10-11 provides that the goal of investment for the legacy fund is principal preservation while maximizing total return.
2. FUND MISSION
The legacy fund was created, in part, due to the recognition that state revenue from the oil and gas industry will be derived over a finite timeframe. The legacy fund defers the recognition of 30 percent of this revenue for the benefit of future generations. The primary mission of the legacy fund is to preserve the real inflation-adjusted purchasing power of the money deposited into the fund while maximizing total return.
3. RESPONSIBILITIES AND DISCRETION OF THE STATE INVESTMENT BOARD
The Legacy and Budget Stabilization Fund Advisory Board (the “Advisory Board”) is charged by law under Section 21-10-11 with the responsibility of recommending policies on investment goals and asset allocation of the legacy fund. The SIB is charged with implementing policies and asset allocation and investing the assets of the legacy fund in the manner provided in Section 21-10-07--the prudent institutional investor rule. The fiduciaries shall exercise the judgment and care, under the circumstances then prevailing, that an institutional investor of ordinary prudence, discretion, and intelligence exercises in the management of large investments entrusted to it, not in regard to speculation but in regard to the permanent disposition of funds, considering probable safety of capital as well as probable income. Management responsibility for the investment program not assigned to the SIB in Chapter 21-10 is hereby delegated to the SIB, which must establish written policies for the operation of the investment program consistent with this investment policy. The SIB may delegate investment responsibility to professional money managers, which are also required to employ investment strategies consistent with the investment policy. Where a money manager has been retained, the SIB's role in determining investment strategy and security selection is supervisory not advisory.

2
At the discretion of the SIB, the fund’s assets may be pooled with other funds. In pooling funds, the SIB may establish whatever asset class pools it deems necessary with specific quality, diversification, restrictions, and performance objectives appropriate to the prudent investor rule and the objectives of the funds participating in the pool. The SIB is responsible for establishing criteria, procedures, and making decisions with respect to hiring, retaining, and terminating money managers. The SIB investment responsibility also includes selecting performance measurement services, consultants, report formats, and frequency of meetings with managers. The SIB shall notify the Advisory Board within 30 days of any substantial or notable changes in money managers; performance measurement services; and consultants, including hiring or terminating a money manager, performance measurement service, or a consultant. The SIB, after consultation with the board, will implement necessary changes to this policy in an efficient and prudent manner.
4. RISK TOLERANCE
The Advisory Board's risk tolerance with respect to the primary aspect of the legacy fund's mission is low. The Advisory Board is unwilling to undertake investment strategies that might jeopardize the ability of the legacy fund to maintain principal value over time. The Advisory Board recognizes that the plan will evolve as the legacy fund matures and economic conditions and opportunities change.
5. INVESTMENT OBJECTIVES
The Advisory Board's investment objectives are expressed in terms of reward and risk expectations relative to investable, passive benchmarks. The legacy fund's policy benchmark is comprised of policy mix weights of appropriate asset class benchmarks as set by the SIB: a. The legacy fund's rate of return, net of fees and expenses, should at least match that of the
policy benchmark over a minimum evaluation period of five years. b. The legacy fund's risk, measured by the standard deviation of net returns, should not exceed
115 percent of the policy benchmark over a minimum evaluation period of five years. c. The risk-adjusted performance of the legacy fund, net of fees and expenses, should at least
match that of the policy benchmark over a minimum evaluation period of five years.
6. POLICY ASSET MIX
After consideration of all the inputs and a discussion of its own collective risk tolerance, the Advisory Board approved the following policy asset mix for the legacy fund as of April 2, 2013:
Asset Class Policy Target Percentage Broad US Equity 30% Broad International Equity 20% Fixed Income 35% Core Real Estate 5% Diversified Real Assets 10%

3
Rebalancing of the fund to this target will be done in accordance with the SIB’s rebalancing policy, but not less than annually. The SIB approved an 18-month implementation strategy which completed in January of 2015. On June 15, 2016, the Advisory Board acknowledged RIO’s stated intent to transfer the Bank of North Dakota Match Loan Certificates of Deposit Program (“BND CD”) to the Legacy Fund on or before July 1, 2017. The BND CD investment will be limited to the lesser of $200 million or 5% of the Legacy Fund (and represent a sector allocation within fixed income). The Advisory Board approved this future change in the Legacy Fund’s asset allocation without exception. BND will be requested to guarantee a minimum 1.75% investment return. The minimum return requirement will be periodically reviewed in connection with the Legacy Fund’s overall asset allocation framework. BND CD’s were rated AA by S&P as of June 15, 2016.
7. RESTRICTIONS
While the SIB is responsible for establishing specific quality, diversification, restrictions, and performance objectives for the investment vehicles in which the legacy fund's assets will be invested, it is understood that:
a. Futures and options may be used to hedge or replicate underlying index exposure, but not for speculation.
b. Derivatives use will be monitored to ensure that undue risks are not taken by the money managers.
c. No transaction may be made that would threaten the tax-exempt status of the legacy fund.
d. All assets will be held in custody by the SIB's master custodian or such other custodians as are acceptable to the SIB.
e. No unhedged short sales or speculative margin purchases may be made.
f. Social investing is prohibited unless it meets the exclusive benefit rule, and it can be substantiated that the investment provides an equivalent or superior rate of return for a similar investment with a similar time horizon and similar risk. For the purpose of this document, social investing is defined as the consideration of socially responsible criteria in the investment or commitment of public fund money for the purpose of obtaining an effect other than a maximized return to the Fund.
g. Economically targeted investing is prohibited unless the investment meets the exclusive benefit rule.
For the purpose of this document, economically targeted investment is defined as an
investment designed to produce a competitive rate of return commensurate with risk involved
as well as to create collateral economic benefits for a targeted geographic area, group of
people, or sector of the economy.
Also, for the purpose of this document, the exclusive benefit rule is met if the following four
conditions are satisfied:
The cost does not exceed the fair market value at the time of investment.
The investment provides the legacy fund with an equivalent or superior rate of return for a similar investment with a similar time horizon and similar risk.
Sufficient liquidity is maintained in the legacy fund to permit distributions in accordance with the terms of the plan.

4
The safeguards and diversity that a prudent investor would adhere to are present.
Where investment characteristics, including yield, risk, and liquidity, are equivalent, the Advisory Board's policy favors investments which will have a positive impact on the economy of North Dakota.
8. INTERNAL CONTROLS
A system of internal controls must be in place by the SIB to prevent losses of public funds arising from fraud or employee error. Such controls deemed most important are the separation of responsibilities for investment purchases from the recording of investment activity, custodial safekeeping, written confirmation of investment transactions, and established criteria for investment manager selection and monitoring. The annual financial audit must include a comprehensive review of the portfolio, accounting procedures for security transactions, and compliance with the investment policy.
9. EVALUATION AND REVIEW
Investment management of the legacy fund will be evaluated against the fund's investment objectives and investment performance standards. Emphasis will be placed on 5-year and 10-year results. Evaluation should include an assessment of the continued feasibility of achieving the investment objectives and the appropriateness of the investment policy statement for achieving those objectives. Performance reports will be provided to the Advisory Board periodically, but not less than quarterly. Such reports will include asset returns and allocation data. Additionally, not less than annually, reports will include information regarding all significant and/or material matters and changes pertaining to the investment of the legacy fund, including: • Changes in asset class portfolio structures, tactical approaches, and market values. • Loss of principal, if any. • Management costs associated with various types of investments. • All material legal or legislative proceedings affecting the SIB. • Compliance with this investment policy statement. • An evaluation of the national economic climate. • A forecast of the expected economic opportunities and dangers. • Management of risk by the SIB.
In addition to the quarterly and annual evaluation and review process, the SIB shall notify the Advisory Board within 30 days of any substantial or notable deviation from the normal management of the legacy fund, including any anomalies, notable losses, gains, or liquidation of assets affecting the fund.

5
Approved by: LEGACY AND BUDGET STABILIZATION STATE INVESTMENT BOARD FUND ADVISORY BOARD _______________________________ __________________________________
Representative Keith Kempenich David Hunter
Chairman Executive Director / CIO
Date: __________________________ Date: ______________________________
Approved by the SIB 1/23/15 Approved by the Advisory Board: 6/15/2016

1
BUDGET STABILIZATION FUND INVESTMENT POLICY STATEMENT
1. FUND CHARACTERISTICS AND CONSTRAINTS.
The Budget Stabilization Fund (Fund) is a special fund created in 1987 under Chapter 54-27.2 of the North Dakota Century Code used to deposit general fund moneys in excess of appropriations. Notwithstanding the provisions of sections 54-27.2-01 and 54-27.2-02, $124,936,548 was required to be transferred by the state treasurer to the budget stabilization fund from the general fund on July 1, 2009 along with $61,414,562 on July 1, 2011 and $181,060,584 on July 1, 2013. These transfers provide over $580 million in the budget stabilization fund as of May 31, 2016. The statutory cap for the 2015-17 biennium is $572,485,454. The state investment board shall supervise investment of the budget stabilization fund in accordance with chapter 21-10. Any interest or other budget stabilization fund earnings must be deposited in the fund. Any amounts provided by law for deposit in the fund and any interest or earnings of the fund which would bring the balance in the fund to an amount greater than five percent of the current biennial state general fund budget, as finally approved by the most recently adjourned special or regular session of the legislative assembly, may not be deposited or retained in the fund but must be deposited instead in the state general fund. If the director of the office of management and budget projects that general fund revenues for the biennium will be at least two and one-half percent less than estimated by the most recently adjourned special or regular session of the legislative assembly, and if the governor orders a transfer, the state treasurer shall transfer the appropriate funds from the budget stabilization fund to the state general fund to offset the decrease in general fund revenues. The amount transferred from the budget stabilization fund upon order of the governor may not exceed the difference between an amount two and one-half percent below the general fund revenue projections for the biennium and the general fund revenue projections for the biennium by the director of the office of management and budget.
2. RESPONSIBILITIES AND DISCRETION OF THE STATE INVESTMENT BOARD (SIB). The Fund is charged by law under NDCC 21-10-02.1 with the responsibility of establishing
policies on investment goals and asset allocation of the Fund. The SIB is charged with implementing these policies and asset allocation and investing the assets of the Fund in a manner consistent with the prudent investor rule as provided in NDCC 21-10-07.
At the discretion of the SIB, the Fund’s assets may be pooled with other funds. In pooling funds, the SIB may establish whatever asset class pools it deems necessary with specific quality, diversification, restrictions, and performance objectives appropriate to the prudent investor rule and objectives of the funds participating in the pools. The SIB may delegate investment responsibility to professional money managers. When a money manager has been retained, the SIB’s role in determining investment strategy and security

2
selection is supervisory, not advisory. In accordance with this Investment Policy Statement, the Fund’s assets may be invested directly or through collective investment vehicles. The SIB is responsible for establishing criteria and procedures and making decisions with respect to hiring, maintaining, and terminating money managers. This responsibility includes selecting performance measurement services, consultants, and report formats and determining the frequency of meetings with managers. The SIB will implement changes to this policy as promptly as is prudent.
3. INVESTMENT OBJECTIVES. The investment objectives of the Fund reflect the relatively unknown life-span and the moderate
risk tolerance of the Fund. Operating and statutory considerations shape the Fund’s policies and priorities as outlined below:
Objective: Sufficient liquidity is to be maintained to meet known or anticipated financial
obligations and preserve the value of the surplus. Cash equivalent investments will be used to achieve this objective.
4. STANDARDS OF INVESTMENT PERFORMANCE.
The Fund's investment objectives are expressed in terms of reward and risk expectations relative to investable, passive benchmarks. The Fund's policy benchmark is comprised of policy mix weights of appropriate asset class benchmarks as set by the SIB: a. The Fund's rate of return, net of fees and expenses, should at least match that of the
policy benchmark over a minimum evaluation period of five years. b. The risk-adjusted performance of the Fund, net of fees and expenses, should at least
match that of the policy benchmark over a minimum evaluation period of five years.

3
5. POLICY AND GUIDELINES.
The asset allocation of the Budget Stabilization Fund is established by the SIB, with input from the Legacy and Budget Stabilization Advisory Board (“Advisory Board”). Asset allocation is based upon the appraisal of projected liquidity and income requirements, and estimates of the investment returns likely to be achieved by the various asset classes over the next five years. In recognition of these factors, the following allocation is deemed appropriate for the fund:
Short-term Fixed Income & BND CDs Bank Loans w/floating yield
Minimum of 90% Maximum of 5%
Absolute Return Strategies Maximum of 5%
Bank of North Dakota Match Loan Certificates of Deposit Program (“BND CD”) limit of 35%. On June 15, 2016, the Advisory Board acknowledged RIO’s stated intent to transfer the BND CD investment to the Legacy Fund on or before July 1, 2017. The latter date was based on preliminary budget guidance provided by OMB, although the transfer may occur in late-2016. Rebalancing of the Fund to this target will be done in accordance with the SIB’s rebalancing policy. While the SIB is responsible for establishing specific quality, diversification, restrictions, and performance objectives for the investment vehicles in which the Fund’s assets will be invested, it is understood that:
a. Futures and options may be used to hedge or replicate underlying index exposure, but not for speculation
b. Derivative use will be monitored to ensure that undue risks are not taken by the
money managers. c. All assets will be held in custody by the State Investment Board’s master
custodian or such other custodians as are acceptable to the State Investment Board. d. No funds shall be borrowed excluding a SIB approved securities lending program. e. No unhedged short sales or speculative margin purchases shall be made. f. Social investing is prohibited unless it meets the Exclusive Benefit Rule and it can be substantiated that the investment must provide an equivalent or superior rate of return for a similar investment with a similar time horizon and similar risk. For the purpose of this document, Social Investing is defined as "The investment or
commitment of public pension fund money for the purpose of obtaining an effect other than a maximized return to the intended beneficiaries."
g. Economically targeted investing is prohibited unless the investment meets the
Exclusive Benefit Rule. For the purpose of this document economically targeted investment is defined as an investment designed to produce a competitive rate of return
4
commensurate with risk involved, as well as to create collateral economic benefits for a targeted geographic area, group of people, or sector of the economy.
Also, for the purpose of this document, the Exclusive Benefit Rule is met if the following
four conditions are satisfied: (1) The cost does not exceed the fair market value at the time of investment. (2) The investment provides the Fund with an equivalent or superior rate of return for
a similar investment with a similar time horizon and similar risk. (3) Sufficient liquidity is maintained in the Fund to permit distributions in accordance
with the terms of the plan. (4) The safeguards and diversity that a prudent investor would adhere to are present.
Where investment characteristics, including yield, risk, and liquidity are equivalent, the Fund's policy favors investments which will have a positive impact on the economy of North Dakota.
6. EVALUATION AND REVIEW. Investment management of the Fund will be evaluated against the Fund’s investment objectives
and investment performance standards. Evaluation will be conducted quarterly by the SIB through its review of funds participating in the Insurance Trust. Money managers will be evaluated by the SIB quarterly. In-state meetings will be held with the money managers at least annually.
Approved by: LEGACY AND BUDGET STABILIZATION NORTH DAKOTA FUND ADVISORY BOARD STATE INVESTMENT BOARD STATE INVESTMENT BOARD ____________________________ _________________________ Representative Keith Kempenich David Hunter Chairman Executive Director/CIO, RIO Date: ______________ Date: ________________
Approved by the NDSIB: 8/28/2015
Approved by the LBSFAB: 6/15/2016

TO: State Investment Board (“SIB”)
FROM: Dave Hunter, Darren Schulz and Eric Chin
DATE: July 15, 2016
SUBJECT: Private Equity Update
Background - Recently Completed Asset Liability Studies:
PERS and TFFR recently completed asset liability studies which included higher allocations to
private equity (“PE”). The TFFR board approved a 6% target allocation to PE on January 21,
2016, which was accepted by the SIB on February 26, 2016. The PERS board approved a 7%
target allocation to PE on June 16, 2016, which is being presented to the SIB for acceptance on
July 22, 2016. Previously, TFFR and PERS had 5% target allocations to this asset class. RIO
notes that PERS has a 1% higher target allocation (than TFFR) as a result of PERS having a
slightly higher return expectation than TFFR (e.g. PERS has an 8.00% long-term return
assumption versus 7.75% for TFFR).
Private Equity - Implementation Update:
RIO will seek to implement the “newly approved” asset allocation policies for PERS and TFFR
by ramping up PE exposure over the next three to five years. RIO deems it prudent to gradually
implement asset allocation changes within PE given the long-term nature of this asset class and
based on consultation with our strategic partners. Adams Street was most recently confirmed as
a strategic PE partner on February 26, 2016, while BlackRock was initially approved as a
complementary strategic PE partner on March 18, 2016. Both of these manager searches were
subject to extensive due diligence examinations conducted by RIO staff and aided by the expert
assistance of Callan Associates. RIO notes that Callan was engaged by TFFR and PERS to
conduct the latest asset liability studies which included the stated target allocations to PE. RIO
intends to split future PE commitments equally between Adams Street and BlackRock. As in the
past, Callan and RIO will continue to provide the SIB with quarterly performance updates for all
SIB clients including a comparison of actual and target asset allocation levels for each asset
class including private equity. The size of PE commitments to Adams Street and BlackRock will
effectively increase up to $100 million per annum as a result of these higher strategic asset
allocations by the PERS and TFFR boards.
AGENDA ITEM VI.D.

Page | 1
Agenda Item VI.D.
INFORMATIONAL MEMO TO: State Investment Board
FROM: Dave Hunter, Darren Schulz and Eric Chin
DATE: July 15, 2016
SUBJECT: Fixed Income Manager Restructuring - Background
Summary:
Amidst a historically low interest rate environment across global developed markets and a regulatory regime that has materially changed following the Global Financial Crisis, the fixed income market climate and breadth of investment options has evolved dramatically over the past several years. In light of these challenges and the opportunities it has created, Staff will be proposing a new fixed income manager framework for the Pension Trust at an upcoming SIB meeting. Additionally, as part of a search for alternative credit managers to diversify and enhance returns within the fixed income allocation, Staff will be bringing forward finalist candidates for consideration as part of the implementation of the new framework.
The Evolution of Fixed Income For Institutional Investors:
Historically, investment in fixed income served to achieve multiple objectives, such as capital preservation, income generation, and diversification. In a bygone age, implementation typically consisted of investing in a basket of publicly traded government and plain vanilla corporate bonds. In the 1980s, with the advent of securitization and the high yield market, not to mention burgeoning derivatives markets, implementation evolved. Today, however, while the core objectives of fixed income remain unchanged, due to a number of long-term secular forces and recent regulatory changes the implementation of fixed income within institutional portfolios has grown increasingly more complex and segmented:
1. A 35-year decline in U.S. interest rates fueled by a dampening of long-term inflation and, more recently, a low rate environment driven by unprecedented monetary stimulus undertaken by central banks across the globe has prompted many institutions to review and restructure their respective fixed income portfolios in response to the low rate environment.
2. In reaction to the worst recession and financial crisis since the Great Recession, regulators have attempted to address areas considered to have caused the last crisis by heavily regulating financial institutions, mortgage lending, structured products, and derivatives. A stricter regulatory environment in the U.S. (Federal Reserve, Volcker Rule, Dodd-Frank, Leveraged Lending Guidelines) and abroad for banks (Basel III, ECB) and problematic balance sheets among European banks has created a financing void as U.K and European banks deleverage and as U.S. banks significantly curtail or eliminate lending activities in areas that require high capital charges. Non-bank investors that are positioned to accept varying degrees of illiquidity have taken note of this sea change, seeing it as a way to harvest diversifying sources of return not available across traditional credit strategies.

Page | 2
3. After the financial crisis, dealers began to move away from a principal model of market making in public fixed income securities, whereby they would facilitate trades using their own inventories and assume some risk, toward an agency model. Pro-crisis regulation has been widely cited as a key factor in this change, the effect of which is upward pressure on bid-ask spreads and trading costs, and a concentration of activity in the most liquid instruments and a move away from less liquid ones. This problem is particularly acute in segments of the U.S. high yield market.
Considerations for Reshaping a Fixed income Allocation in Response The following are key questions to consider across four categories in reshaping a fixed income structure going forward:
Liquidity: How much liquidity is actually needed to fund liabilities? Is there additional potential to harvest illiquidity premiums in less liquid strategies?
Diversification: Are there complementary strategies to diversify a fixed income portfolio that consists of a more traditional allocation to Barclays Aggregate sectors such as Treasuries, government-related, investment grade corporate, and securitized bonds (Agency MBS, CMBS, ABS)?
Interest Rate Risk: Given that rising rates erode the purchasing power of a fixed coupon bond, what strategies can be employed through floating rate structures to deliver returns that are not directly correlated with rates?
Opportunity: Can opportunistic strategies be employed to tactically capitalize upon market dislocations in a timely and efficient manner, two examples being European commercial real estate whole loans and the regulatory-driven disposition of loans by European banks?
Alternatives to Traditional Fixed Income The breadth of fixed income options has expanded considerably since the Great Recession, giving investors greater flexibility to construct fixed income structures tailored to meet expected return targets and risk tolerances. Today, the menu of options has evolved beyond the traditional “plus” sectors of a “core-plus” approach, such as high yield, into a broader group called “alternative credit”, which can be simply defined as all credit which is not traditional investment grade government or corporate debt. Some examples of alternative credit strategies include the following:
Bank loans – Private debt obligations senior in the capital structure (above high yield) issued by companies as part of a leverage buyout, also known as leveraged loans. Loans are typically secured on assets and are floating rate, thus having a higher default recovery rate and lower interest rate risk as compared to high yield bonds. Bank loans are less liquid than high yield and thus command an added illiquidity premium.
Structured credit – Debt securities whose value is determined by an underlying pool of loans producing regular cash flows. By grouping often small illiquid loans into one structure, public securities can be offered to investors with different risk/return profiles. Examples include CLOs (collateralized loan obligations, whose underlying securities are pools of bank loans) or ABS (asset-backed securities, whose underlying securities are pools of other assets, including auto, credit card or student loans).

Page | 3
Direct lending – Includes loans to private companies, privately placed debt of public companies, or loans backed by real assets (real estate, infrastructure). Direct lending is an opportunity for non-bank investors to capitalize on the financing void created by post-crisis regulation. Company-specific terms provide idiosyncratic return drivers and better diversity.
Distressed debt – Debt of public companies at or near bankruptcy, defined as bonds rated CCC or below or those with spreads 10% or more over Treasuries. They can also include distressed real asset loans where collateral value falls below loan value and non-performing consumer, corporate or real asset loan pools (NPLs). Distressed debt is a less liquid strategy, allowing a manager to actively unlock value through a bankruptcy/restructuring process.
In a research article titled “Illiquid Credit – Playing the role of a (good) bank”, Willis Towers Watson summarized the characteristics of various alternative credit strategies in the following table:
Historically, some of these lending strategies fell under the domain of financial institutions, but with regulatory-driven disintermediation they have become increasingly mainstream, more familiar and appealing to non-bank investors, particularly institutions with long investment horizons in a funding position to be adequately compensated for judiciously surrendering liquidity. An important point to make concerning alternative credit strategies is that they are not intended to replace but rather complement a traditional allocation to fixed income. Whereas the more liquid and efficient traditional side of fixed income provides less opportunity for alpha and is more vulnerable to rising rates and inflation, alternative credit strategies tend to focus on less efficient corners of the bond market, are generally floating rate in nature, are structured based on company-specific credit events,

Page | 4
and allow for return enhancement through both manager skill and through the intrinsic illiquidity premium these strategies command. RIO Staff Fixed Income Manager Structure Review and Restructuring Process Over several months, in addition to the ongoing due diligence of existing fixed income manager mandates across all three investment pools, Staff has engaged numerous fixed income solutions teams among our existing roster of fixed income managers to analyze risk and return of current NDSIB fixed income structures. These discussions have yielded frameworks for budgeting liquidity and structuring fixed income with a focus on options to consider for enhancing risk-adjusted returns and diversification. Additionally, in recognition of the merits of alternative credit strategies as a complement to traditional fixed income, Staff has engaged a number of specialist alternative credit managers with the following attributes:
Differentiation in credit origination and sourcing
Time-tested track record
Strong credit underwriting culture across the organization with an understanding of the loans underwritten and the associated risks
Investment process and focus on risk management
Meaningful portfolio management experience
Use of leverage
Technology infrastructure to perform loan administration services Among the firms identified, Staff has conducted due diligence calls and meetings with the following alternative credit firms: Apollo, Ares, Bain/Sankaty, Blackrock, Carlyle, Cerberus, Crescent, Goldman Sachs, Golub, Highbridge, PIMCO, Oaktree, KKR and TPG.
Conclusion At an upcoming SIB meeting, Staff will be proposing a fixed income manager framework that seeks to achieve material improvements in return potential and diversification without increasing plan-level risk. The proposed structure will be a “bar belled” approach, explicitly segmenting the fixed income manager structure based on liquidity, quality and expected return potential: 1) An anchor of low risk, high quality, highly liquid traditional fixed income beta exposures on one end of the credit risk spectrum to fulfill the role of capital preservation and high quality income generation; 2) Complemented by moderate risk, less liquid, higher return potential alternative credit strategies for greater diversification and differentiated sources of return enhancement. Finalist alternative credit managers will be brought forward to the Board for consideration as part of the implementation of the less liquid portion of the manager structure.

TO: State Investment Board (“SIB”)
FROM: Dave Hunter, Darren Schulz, and Eric Chin
DATE: July 15, 2016
SUBJECT: Risk Management Provider: BlackRock Solutions
Risk Management Solution Update:
Over the past year and a half, Staff has been evaluating risk management providers to develop
and implement a comprehensive risk management solution for the NDSIB. Following a rigorous
due diligence process, Staff has determined that BlackRock Solutions (BRS) offers the
combination of sophisticated risk analytics, data management capabilities, and advisory
services that best meets RIO’s technological, intellectual, and operational demands. Over the
next month Staff hopes to finalize contract negotiations with BRS, and subsequently begin
implementation of the risk platform.
BRS Proposal:
BRS’s risk solution for the NDSIB is comprised of two core components Aladdin Risk and
Client Solutions Advisory Services.
1) Aladdin Risk is the analytics engine that produces risk reports and houses BRS’s risk
analytics. It is a hosted solution, which means that BRS is responsible for building and
maintaining the infrastructure required to operate the Aladdin Risk system. BRS models
each security individually, and risk can be calculated at the security level or aggregated
up to the portfolio level.
2) Client Solutions Advisory Services: In addition to implementing and hosting the
Aladdin Risk engine, BRS will assign a team of risk consultants to complement the
Aladdin technology. Leveraging the Aladdin Risk engine, this team will provide RIO with
custom risk and asset allocation analyses, and offer modelling perspectives on different
risk themes. Moreover, this team will serve as a conduit to the resources and thought
leadership of the broader BlackRock organization.
Conclusion:
Staff is excited to bring BlackRock’s sophisticated risk solution onto the RIO platform. The
Aladdin Risk engine is a best in class risk analytics system, and will provide Staff with the
quantitative tools to measure and identify different risks in the NDSIB portfolios at both the
manager level, and the aggregate portfolio level. Moreover, the Client Solutions Advisory Team
will be a valuable resource for developing analyses and reports specifically tailored to the
NDSIB’s needs. Staff believes that the BRS solution is best positioned to identify, measure, and
analyze the different risk factors in the NDSIB portfolios, and will be invaluable for quantifying
the downside risk across a variety of market scenarios.
AGENDA ITEM VI.D.


DETROIT
DRIVING OPPORTUNITY IN DETROITBUILDING A MIDDLE-SKILL WORKFORCE TO STRENGTHEN ECONOMIC RECOVERY AND EXPAND THE MIDDLE CLASS

JPMorgan Chase has been doing business in Detroit for more than 80 years, and we are going to be in Detroit for the long term. Last May, we committed to deploy $100 million over five years to help the city regain its economic strength – doing our part to invest in community development and support nonprofits that are helping the city tackle some of its toughest challenges. One of these challenges is preparing Detroit’s workforce for the job opportunities in the sectors that are expanding as the economy begins to recover. Investing in training will give job seekers of all ages the skills they need to open doors to economic mobility at the same time that it builds the skilled workforce that Detroit will need to thrive.
In February, I visited Detroit to see first hand how the city’s training organizations are working with employers to create career pathways for the city’s residents. Focus: HOPE’s demand-driven training programs are preparing job seekers for opportunities in growing industries, such as advanced manufacturing and technology. While touring its Machinist Training Institute with a local employer, I had a chance to meet with students and hear about the skills they were learning – skills that employers such as Detroit Manufacturing Systems are looking for as they fill jobs.
It is the example of organizations such as Focus: HOPE and countless others across the globe that inspired us to launch New Skills at Work, JPMorgan Chase’s five-year $250 million global workforce readiness and demand-driven training initiative. An important goal of New Skills at Work is to support and showcase models of effective workforce partnerships. A complementary goal is to provide communities with the data they need to understand and respond to the workforce challenges they are facing. This report is one in a series that is examining labor market conditions in metropolitan regions across the United States and Europe, showing both what jobs employers are struggling to fill and what types of training would provide job seekers with the skills needed for success.
As this report details, a critical part of the story of Detroit’s labor market is the importance of middle-skill jobs – jobs that require more education and training than a high school diploma but less than a four-year degree. Occupations such as medical laboratory technician or machine tool operator not only provide a pathway to the middle class, they also are an engine of competitiveness for the Detroit economy.
We are proud to be working with Detroit’s leaders to strengthen the city’s workforce system. We hope the data presented here will support the work underway to expand opportunity by strengthening Detroit’s workforce system and encourage additional efforts to build a pipeline of skilled workers for career-building jobs.
CONTENTS WELCOME
01 ACKNOWLEDGEMENTS
02 EXECUTIVESUMMARY
08 INTRODUCTION
09 RECOVERINGFROMADVERSITY
11 OPPORTUNITIES IN HEALTHCARE
14 OPPORTUNITIES IN MANUFACTURING
17 EXPANDINGOPPORTUNITY
21 RECOMMENDATIONS
23 CONCLUSION
24 APPENDIXA–METHODOLOGY
25 APPENDIXB–CHARTSREFERREDTOINTEXT
WELCOMEFROM JAMIE DIMON, CHAIRMAN AND CHIEF EXECUTIVE OFFICER, JPMORGAN CHASE & CO.
JAMIE DIMON

ACKNOWLEDGEMENTSJPMorgan Chase & Co. is investing $250 million over five years in a global initiative to build demand-driven workforce development systems and to prepare youth and adults for careers in high-demand, middle-skill occupations. To advance this work, we are supporting data analysis in domestic and international markets: Chicago, Columbus, Dallas-Fort Worth, Detroit, Houston, Los Angeles, Miami, New York City, San Francisco, France, Germany, Spain and the United Kingdom.
JPMorgan Chase deeply appreciates the work of partners in producing this report. JobsfortheFuture(www.jff.org), which is a national partner in the New Skills at Work initiative, is serving as the lead intermediary for the U.S. reports. Founded in 1983, Jobs for the Future works to ensure that all underprepared young people and workers have the skills and credentials needed to succeed in our economy, by creating solutions that catalyze change in our education and workforce delivery systems. We are especially thankful for the work of the writers of this report: Thomas J. Hilliard, Hilliard Policy Research Consulting, and Gloria Mwase, as well as data collection and analysis provided by Jeremy Kelley and research assistance by Deborah Kobes and Krista Ford. The report has been strengthened by insightful feedback from Lucretia Murphy, Maria Flynn and Steven Baker and by editing from Carol Gerwin, Sophie Besl and Sara Lamback.
Two national organizations provided the data and analysis for the U.S. reports: EconomicModelingSpecialistsInternational, a CareerBuilder company, turns labor market data into useful information that helps organizations understand the connection between economies, people and work (www.economicmodeling.com). BurningGlassTechnologies develops leading technologies for matching people with jobs through pioneering solutions, and leverages a deep understanding of people and their careers in order to deliver superior workforce and marketplace insight (www.burning-glass.com).
Each report also relies on the insights and feedback of local stakeholders. We would like to express our appreciation to the employers and economic development and workforce development experts in Detroit who informed report findings and reviewed drafts: Pamela Moore, President and CEO, Detroit Employment Solutions Corporation; Gregory Pitoniak, Chief Executive Officer, Southeast Michigan Community Alliance; Lisa Katz, Executive Director, Workforce Intelligence Network; Karen Tyler-Ruiz, Director, Detroit Regional Workforce Fund; James Jacobs, President, Macomb Community College; Carmine Palombo, Deputy Executive Director, Southeast Michigan Council of Governments; Marcia Black-Watson, Industry Talent Director, Michigan Workforce Development Agency; Amy Cell, Senior Vice President, Talent Enhancement, Michigan Economic Development Corporation; and Jeannine LaPrad, President and CEO, and Taryn McFarlane, Vice President, Business and Community Innovation, Corporation for a Skilled Workforce.
In addition, we appreciate the stakeholders who provided valuable insights about the workforce development context, strengths, and challenges in the Detroit region: David Cherry, Program Director, City Connect Detroit; Tammy Coxen, Senior Project Manager, Nicole Sherard-Freeman, Adjunct Consultant, and Jordan Falby, Research Associate, Corporation for a Skilled Workforce; Jeff Bross, Project Manager, Data Driven Detroit; Jose Reyes, Chief Operating Officer, Detroit Employment Solutions Corporation; Malinda Jensen, Director of Business Development and Kenyatta Bridges, Associate Director, Business Development, Detroit Economic Growth Corporation; Christopher Dorle, Lead, City Systems Working Group, Detroit Future City; Marion K. McGhee, Executive Director, Detroit Public Schools, Office of College and Career Readiness; Marsha Cheeks, Program Supervisor and William Aaron, Workforce Readiness Coordinator, Detroit Public Schools, Department of Adult Education; Gregory Eason, Consultant, Detroit Regional Workforce Fund; Rashida Goudeaux, Director of Education and Workforce Development, Focus: HOPE; Scott Jedele, Corp-Industry Program Manager, Corporate Training Office, Henry Ford College; Christopher J. Webb, Counselor at Law, Mediator, Arbitrator, Trainer and Facilitator, Law and ADR Office of Christopher J. Webb, PLC; Domenic Morelli, Vice President and Mike Tenbusch, Community Catalyst, Life Remodeled; Bill Sleight, Director, Livingston County Michigan Works; Linda Chase, Director, Michigan Coalition for Advanced Manufacturing, Macomb Community College; Bernice Kerner, MIS Supervisor, Macomb/St. Clair Workforce Development Board; Leonidas Murembya, Regional Research, Michigan Department of Technology, Management and Budget, Labor Market Information and Strategic Initiatives; Erin Duckett, Industry Talent Specialist, Michigan Workforce Development Agency; Donald C. O’Connell, Executive Director, Operating Engineers Local #324 LMEC; Naheed Huq, Manager, Community and Economic Development, Southeast Michigan Council of Governments; Mary Freeman, Director, Workforce Development, Southwest Solutions; Marlowe Stoudamire, Principal, Vehicles for Change; George Swan III, District Vice Chancellor for External Affairs, Wayne County Community College District; Colby Cesaro, Research Director, Workforce Intelligence Network; Donna Lillian Givens, President, Youth Development Commission; and Melody Barnes, former Director of the White House Policy Council and Co-Chair of the Global Workforce Advisory Council.
01April 2015 www.jpmorganchase.com/skillsatwork JPMORGAN CHASE Driving Opportunity in Detroit
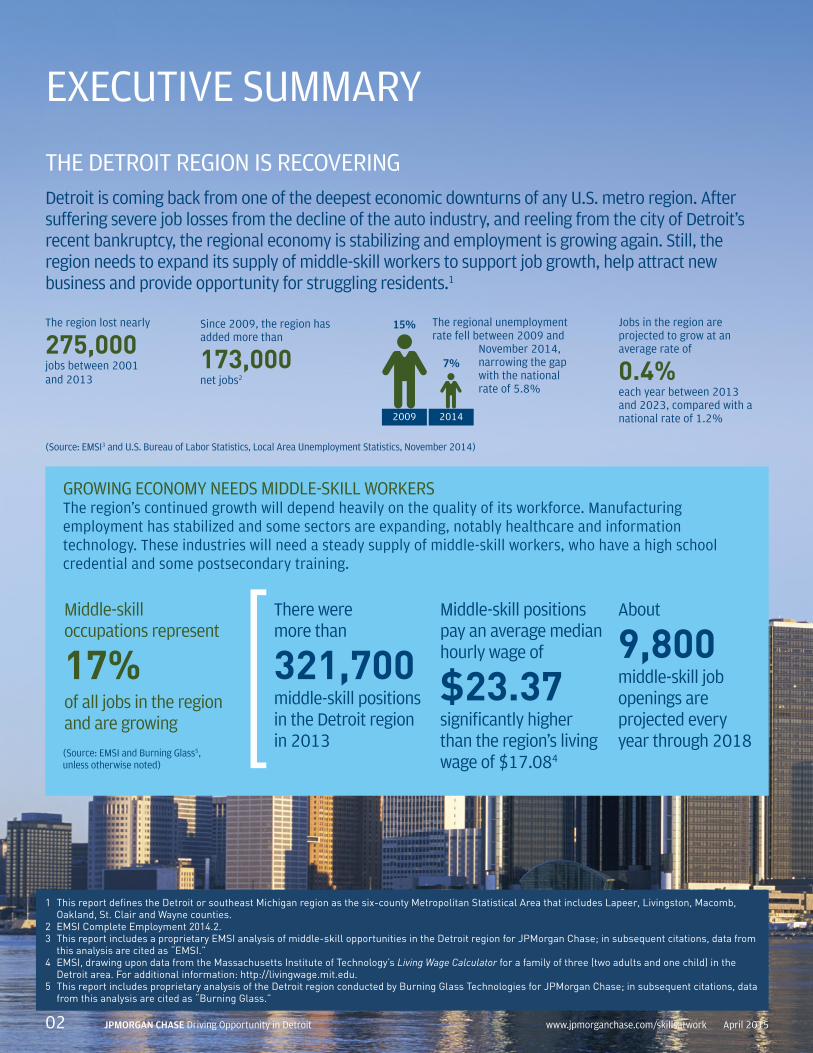
EXECUTIVE SUMMARY
THE DETROIT REGION IS RECOVERING
The region lost nearly
275,000jobs between 2001 and 2013
Detroit is coming back from one of the deepest economic downturns of any U.S. metro region. After suffering severe job losses from the decline of the auto industry, and reeling from the city of Detroit’s recent bankruptcy, the regional economy is stabilizing and employment is growing again. Still, the region needs to expand its supply of middle-skill workers to support job growth, help attract new business and provide opportunity for struggling residents.1
(Source: EMSI3 and U.S. Bureau of Labor Statistics, Local Area Unemployment Statistics, November 2014)
GROWING ECONOMY NEEDS MIDDLE-SKILL WORKERSThe region’s continued growth will depend heavily on the quality of its workforce. Manufacturing employment has stabilized and some sectors are expanding, notably healthcare and information technology. These industries will need a steady supply of middle-skill workers, who have a high school credential and some postsecondary training.
Middle-skill positions pay an average median hourly wage of
$23.37significantly higher than the region’s living wage of $17.084
There were more than
321,700middle-skill positions in the Detroit region in 2013
Middle-skill occupations represent
17%of all jobs in the region and are growing
About
9,800middle-skill job openings are projected every year through 2018
(Source: EMSI and Burning Glass5, unless otherwise noted)
1 This report defines the Detroit or southeast Michigan region as the six-county Metropolitan Statistical Area that includes Lapeer, Livingston, Macomb, Oakland, St. Clair and Wayne counties.
2 EMSI Complete Employment 2014.2.3 This report includes a proprietary EMSI analysis of middle-skill opportunities in the Detroit region for JPMorgan Chase; in subsequent citations, data from
this analysis are cited as “EMSI.” 4 EMSI, drawing upon data from the Massachusetts Institute of Technology’s Living Wage Calculator for a family of three (two adults and one child) in the
Detroit area. For additional information: http://livingwage.mit.edu.5 This report includes proprietary analysis of the Detroit region conducted by Burning Glass Technologies for JPMorgan Chase; in subsequent citations, data
from this analysis are cited as “Burning Glass.”
The regional unemployment rate fell between 2009 and
November 2014, narrowing the gap with the national rate of 5.8%
15%
7%
2009 2014
Jobs in the region are projected to grow at an average rate of
0.4%each year between 2013 and 2023, compared with a national rate of 1.2%
Since 2009, the region has added more than
173,000net jobs2
02 JPMORGAN CHASE Driving Opportunity in Detroit www.jpmorganchase.com/skillsatwork April 2015

6 Poverty levels are for individuals 18–64 years old. American Community Survey data for Detroit MSA are from 2010 to 2012. Data for city of Detroit are from 2011 to 2013.
STARK OPPORTUNITY GAPS CALL FOR RESPONSEWhile people across the Detroit region face real challenges, African-American and Latino residents are faring significantly worse than white residents in employment, income and educational attainment. Detroit city residents also face lower employment, income and education levels than people who live in the suburbs.
• The unemployment rate in the city of Detroit is 13%, double the 6.7% rate in the suburban belt north and west of the city.
• Unemployment affects African-American (13.6%) and Latino (10.3%) workers at roughly twice the rate of white workers (5.9%) across the region. Unemployment is higher among all groups in the city of Detroit, but significantly higher for African-American (15.3%) and Latino (14.0%) residents than for white (8.9%) residents.
• Poverty is an even bigger barrier across the region for African-American (32%) and Latino (22%) individuals. But the rates of white (40%), African-American (38%) and Latino (36%) residents living in poverty in the city of Detroit are particularly discouraging.6
(Source: U.S. Bureau of Labor Statistics, Local Area Unemployment Statistics, 2014 and U.S. Census Bureau, American Community Survey, 2013)
LOW-INCOME ADULTS NEED TRAINING FOR MIDDLE-SKILL WORK, MIDDLE-CLASS PAYHelping to prepare low-income and low-skill individuals – particularly minorities and city residents – for middle-skill occupations must be a regional workforce development priority. While some job seekers require short-term specialized retraining, others lack basic academic, job readiness and technical skills, and will need more extensive education programs before they can begin career pathways.
• About 12% of regional residents (more than 340,000 people) age 25 and above lack a high school diploma or GED.
• Among Detroit city residents, 22% lack a high school diploma or GED.
• The situation is worse for Latino residents: 30% in the region lack a high school diploma or GED, and 55% in the city of Detroit.
• Fewer than one-third of city residents (32%) have earned only a high school diploma.
(Source: U.S. Census Bureau, American Community Survey, 2013)
THEDETROITREGION
Wayne
DETROIT
Livingston
Oakland
Lapeer
Macomb
St. Clair
(Source: EMSI Complete Employment 2014.2)
4.3millionpeople live in the Detroit region
03April 2015 www.jpmorganchase.com/skillsatwork JPMORGAN CHASE Driving Opportunity in Detroit

EXECUTIVE SUMMARY CONT.
DETROIT
HEALTHCARE AND MANUFACTURING LEAD MIDDLE-SKILL DEMAND
In 2013, there were
morethan207,000middle-skill jobs in healthcare
and manufacturing
Demand for middle-skill jobs
MANUFACTURING
33%of all middle-skill
positions advertised online in Detroit
region
(Source: Burning Glass)
HEALTHCARE
23%of all middle-skill
positions advertised online in Detroit
region
Healthcare and manufacturing are the Detroit region’s largest industry sectors, with strong demand for middle-skill workers. Healthcare is an important driver of middle-skill job growth and an increased need for qualified applicants over the next few years creates opportunity for low-skill residents to access training and seek better jobs. Long the foundation of Michigan’s economy, manufacturing continues to provide many middle-skill opportunities, despite its jarring job losses since 2000, and more skilled workers will be needed to replace retirees.
$27.77median hourly
wage
$22.40median hourly
wage
High wages for in-demand middle-skill jobs
From 2013 to 2018
HEALTHCARE
Over2,600projected annual average
openings in middle-skill areas across Detroit region
MANUFACTURING
Over3,100projected average annual
openings in middle-skill areas across Detroit region
(Source: EMSI Complete Employment 2014.2)
HEALTHCARE MANUFACTURING
$17.08regional living
wage
(Source: EMSI)
Source: Burning Glass)
04 JPMORGAN CHASE Driving Opportunity in Detroit www.jpmorganchase.com/skillsatwork April 2015

GROWING NEED FOR WORKFORCE DEVELOPMENT STRAINS SYSTEM CAPACITY
The Detroit region has enormous need for education and training services that can help struggling residents get back on track by preparing them for middle-skill, middle-wage jobs.
• Multiple talent development initiatives, particularly in the manufacturing industry, make it difficult to align across these efforts and expand services.
• Organizations leading these efforts face challenges in securing resources to expand data systems and delivery of services.
• Adult education providers estimate that each year fewer than 10% of adults who need basic literacy or English-language instruction are able to access these crucial services. Moreover, current adult basic education programs struggle to enable a smooth transition to postsecondary education and employment pathways.7
• Some community colleges lack critical resources to expand career pathway programs to meet the demand for technical training.
• Reduced funding for postsecondary occupational training is severely limiting the system’s ability to produce the next generation of skilled workers.8
NEW SKILLS AT WORK
In December 2013, JPMorgan Chase launched its $250 million global New Skills at Work initiative to help communities address workforce readiness challenges. In May 2014, the firm pledged $100 million to support and accelerate Detroit’s economic recovery. These commitments include $12.5 million to help identify growing sectors and create collaborative programs to train residents and develop career pathways in the Detroit region. This report offers a framework for developing a demand-driven career pathways system in Detroit.
INCREASING NEED FOR MIDDLE-SKILL WORKERS, BUT LIMITED TALENT DEVELOPMENT CAPACITY
7 The Detroit Regional Workforce Fund. 2012. Addressing Detroit’s Basic Skills Crisis, pp. 6–7.8 Michigan Workforce Development Agency. 2012. Skilled Trades in Michigan, pp. 10, 12.
HEALTHCARE AND MANUFACTURING LEAD MIDDLE-SKILL DEMAND
Projected retirees
22%
Approximately 22% of all manufacturing employees are age 55 or older
Approximately 22% of all healthcare employees are age 55 or older
INADDITIONTOHEALTHCAREANDMANUFACTURING,THELEADINGECONOMICDRIVERSWITHMIDDLE-SKILLWORKFORCENEEDSARE:
Financial and insurance services
Information technology
Marketing and advertising services
(Source: EMSI)
(Source: U.S. Census Bureau, Longitudinal Employer-Household Dynamics, Quarterly Workforce Indicators, 2014)
05April 2015 www.jpmorganchase.com/skillsatwork JPMORGAN CHASE Driving Opportunity in Detroit

EXECUTIVE SUMMARY CONT.
OPPORTUNITIES TO EARN HIGHER INCOMES WITH MORE EDUCATION AND TRAINING
Occupation
SurgicalTechnologistAssociate’s degree
HealthInformationManagerAssociate’s degree or postsecondary certificate
RegisteredNurseBachelor’s degree or Associate’s degree with five plus years of experience
AuditingandComplianceSpecialistBachelor’s degree
$20.10
$16.79
$32.87
$29.21
MedianHourlyWage(DetroitMSA)
High-Skill
Middle-Skill
MedicalAssistantHigh school diploma with moderate on-the-job training
$13.37
Entry-Level
(Source: Information for career pathways is drawn from Burning Glass Labor/Insight and EMSI Complete Employment 2014.2 and is informed by community college program descriptions from Wayne County and Macomb Community Colleges)
Occupation
ProgrammerAssociate’s degree or Associate of Applied Science degree, apprenticeship experience
EngineerBachelor’s degree
$23.93
$43.80
MedianHourlyWage(DetroitMSA)
OperatorBasic postsecondary certificate
$17.85
HEALTHCAREPATHWAY
MANUFACTURINGPATHWAY
High-Skill
Middle-Skill
Entry-Level
MachinistAdvanced postsecondary certificate, plus apprenticeship or work experience
$19.63
ProductionandOperatingSupervisorBachelor’s degree, or Associate’s degree with five years of experience
$29.75
MedicalBillerHigh school diploma with moderate on-the-job training
WelderHigh school diploma plus moderate on-the-job training
$13.34(entry-level wage)
$17.72
06 JPMORGAN CHASE Driving Opportunity in Detroit www.jpmorganchase.com/skillsatwork April 2015

OUR RECOMMENDATIONS Detroit is on the road to recovery following more than a decade of economic difficulties. Now it is essential to build on the region’s assets and create a comprehensive career pathways system that will help refuel the economy and strengthen the middle class. By targeting healthcare, a high-growth sector, and manufacturing, an industry long linked with Detroit that still offers thousands of middle-skill jobs, the region can beat pessimistic recession-era forecasts to achieve strong and equitable economic growth.
1. Developaregionaltalentdevelopment“masterplan”toalignregionalgoalsandoutcomesforpreparingDetroitresidentsformiddle-skilloccupationsinhigh-demandsectors.
Regional stakeholders should: • Catalogue the local, regional and state-led talent
development initiatives in the manufacturing and healthcare industries and disseminate this information to stakeholders across the region.
• Develop a regional cluster-based industry council that can help to develop and advance an overarching talent development strategy and accountability mechanisms to monitor progress toward goals.
• Identify an individual or an organization with the influence and capacity to champion the regional master plan and engage key regional stakeholders in its implementation.
Recommendation
2. BuildasystemofcareerpathwaysalignedwithindustryclusterdemandtoprepareDetroitresidentseffectivelytoearncredentialsandsecuremiddle-skilloccupationsintheregion.
• Employers can collaborate with providers to expand career exploration strategies, develop employer-endorsed curriculum and strengthen capacity of all regional education and training providers.
• Education and training providers can strengthen pathways by expanding work-based learning and accelerated learning strategies, and by offering flexible course scheduling.
• Community-based organizations and other social service agencies can expand wraparound supports and programs to remove barriers to employment.
Recommendation
3. Alignpublic,privateandphilanthropicinvestmentintalentdevelopmentwithindustry-focusedvisionandgoals.
• Convene public agencies, philanthropies and private employers with common interests in talent development to identify and align resources to address “capacity gaps,” develop an investment strategy to strengthen the capacity of the education and training delivery system, and increase access to middle-skill career pathways for all youth and adults.
• Develop criteria for investment to increase the scale of education and training programs that demonstrate effective results in achieving employer requirements around talent development by identifying best practices and developing strategies for benchmarking and measuring outcomes.
• Regional stakeholders should leverage federal and state funding opportunities to support implementation of industry cluster-based talent development efforts.
Recommendation
CREATEASYSTEMICAPPROACHTOCLUSTER-FOCUSEDWORKFORCEDEVELOPMENTDetroit stakeholders have been strengthening the regional workforce development system by organizing initiatives using a cluster-based approach. The recommendations below will advance stakeholders’ efforts to build on their current successes.
Through the New Skills at Work initiative, JPMorgan Chase will contribute resources and expertise to accelerate this work to help transform lives and help strengthen Detroit’s economy.
07April 2015 www.jpmorganchase.com/skillsatwork JPMORGAN CHASE Driving Opportunity in Detroit

1 DefiningtheDetroitRegion
This report defines the Detroit region as the six-county Metropolitan Statistical Area (MSA) that includes Lapeer, Livingston, Macomb, Oakland, St. Clair and Wayne counties. All references to Detroit relate to this region, unless otherwise stated. This definition differs slightly from several other ways of describing the Detroit region. The Southeast Michigan Council of Governments area includes the counties above plus Washtenaw and Monroe counties and excludes Lapeer County. The nine-county region used by the Workforce Intelligence Network (WIN) in its labor market analyses also excludes Lapeer County and adds Genesee, Shiawassee, Washtenaw and Monroe counties. The Regional Prosperity Initiative defines the Detroit metro region as Wayne, Macomb and Oakland counties.
2 WhatareCareerPathways?
The term “career pathways,” as used in this report, describes education and training programs that offer a well-articulated sequence of courses and work experiences that align with employer skill demands and lead to the completion of industry-valued “stackable credentials.” Stackable credentials offer students multiple clear entry and exit points for education and training as they progress toward an Associate’s degree or the highest industry credential required for a specific occupation. Stackable credentials enable people to find jobs with increasing responsibility, knowing they can access additional short-term training as needed to move ahead. Career pathways can be particularly effective for launching young people and low-skill adults into good jobs because they can be designed to serve a range of populations and skill levels.
A “career pathways system” aligns employers, workforce development agencies, education providers, funders and other partners to identify shared goals and drive changes in programs, institutions and policies to address employer demand through multiple career pathways in the targeted industry sectors.
INTRODUCTIONThe near-collapse of the U.S. auto industry and the impact of the Great Recession dramatically shrank the region’s job base over the past 15 years. Detroit’s bankruptcy for more than a year publicized the city’s economic woes. Proposing to boost the supply of workers qualified for middle-skill positions would have seemed absurd just a few years ago. Yet today, the regional economy has started to recover and employers are hiring again.
As growth resumes in the city of Detroit and the surrounding region 1 , stakeholders will need to expand the skilled workforce in order to help existing businesses thrive and to attract new companies to the city of Detroit and the region. The Detroit area’s economic trajectory will increasingly depend on the quality of its talent supply, and that will depend on the ability of stakeholders to prepare low-skilled residents for the region’s high-demand, middle-skill careers.
This report highlights two industries essential to the emerging recovery – healthcare and manufacturing. Drawing on real-time and traditional labor market information and input from local stakeholders, the report identifies strategies to prepare more residents for middle-skill jobs so they can advance their careers and earnings potential and employers can sustain long-term economic growth. As the data show, and stakeholders often express, Detroit city residents do not consistently have equal access to all of the opportunities in the region. The report concludes with recommendations for developing a demand-driven career pathways system 2 that can propel the Detroit region’s economic resurgence and help more residents achieve financial stability and join the middle class.
08 JPMORGAN CHASE Driving Opportunity in Detroit www.jpmorganchase.com/skillsatwork April 2015
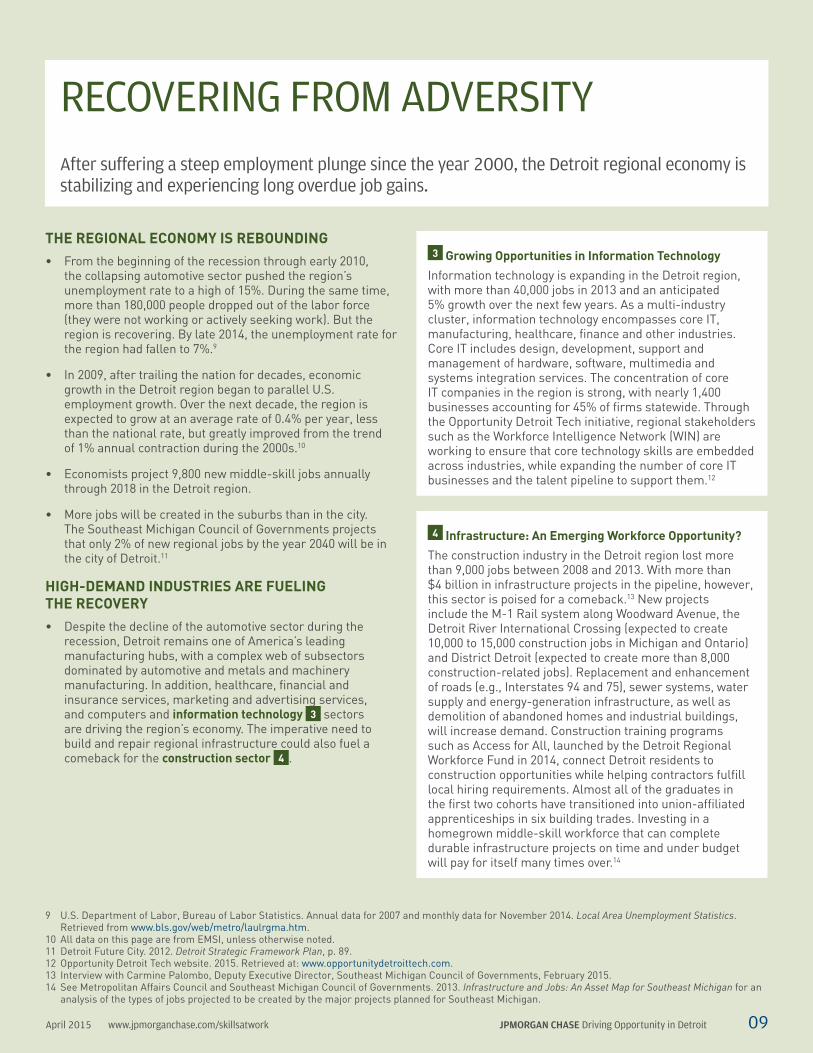
THEREGIONALECONOMYISREBOUNDING• From the beginning of the recession through early 2010,
the collapsing automotive sector pushed the region’s unemployment rate to a high of 15%. During the same time, more than 180,000 people dropped out of the labor force (they were not working or actively seeking work). But the region is recovering. By late 2014, the unemployment rate for the region had fallen to 7%.9
• In 2009, after trailing the nation for decades, economic growth in the Detroit region began to parallel U.S. employment growth. Over the next decade, the region is expected to grow at an average rate of 0.4% per year, less than the national rate, but greatly improved from the trend of 1% annual contraction during the 2000s.10
• Economists project 9,800 new middle-skill jobs annually through 2018 in the Detroit region.
• More jobs will be created in the suburbs than in the city. The Southeast Michigan Council of Governments projects that only 2% of new regional jobs by the year 2040 will be in the city of Detroit.11
HIGH-DEMANDINDUSTRIESAREFUELINGTHERECOVERY• Despite the decline of the automotive sector during the
recession, Detroit remains one of America’s leading manufacturing hubs, with a complex web of subsectors dominated by automotive and metals and machinery manufacturing. In addition, healthcare, financial and insurance services, marketing and advertising services, and computers and informationtechnology 3 sectors are driving the region’s economy. The imperative need to build and repair regional infrastructure could also fuel a comeback for the constructionsector 4 .
RECOVERING FROM ADVERSITYAfter suffering a steep employment plunge since the year 2000, the Detroit regional economy is stabilizing and experiencing long overdue job gains.
3 GrowingOpportunitiesinInformationTechnology
Information technology is expanding in the Detroit region, with more than 40,000 jobs in 2013 and an anticipated 5% growth over the next few years. As a multi-industry cluster, information technology encompasses core IT, manufacturing, healthcare, finance and other industries. Core IT includes design, development, support and management of hardware, software, multimedia and systems integration services. The concentration of core IT companies in the region is strong, with nearly 1,400 businesses accounting for 45% of firms statewide. Through the Opportunity Detroit Tech initiative, regional stakeholders such as the Workforce Intelligence Network (WIN) are working to ensure that core technology skills are embedded across industries, while expanding the number of core IT businesses and the talent pipeline to support them.12
4 Infrastructure:AnEmergingWorkforceOpportunity?
The construction industry in the Detroit region lost more than 9,000 jobs between 2008 and 2013. With more than $4 billion in infrastructure projects in the pipeline, however, this sector is poised for a comeback.13 New projects include the M-1 Rail system along Woodward Avenue, the Detroit River International Crossing (expected to create 10,000 to 15,000 construction jobs in Michigan and Ontario) and District Detroit (expected to create more than 8,000 construction-related jobs). Replacement and enhancement of roads (e.g., Interstates 94 and 75), sewer systems, water supply and energy-generation infrastructure, as well as demolition of abandoned homes and industrial buildings, will increase demand. Construction training programs such as Access for All, launched by the Detroit Regional Workforce Fund in 2014, connect Detroit residents to construction opportunities while helping contractors fulfill local hiring requirements. Almost all of the graduates in the first two cohorts have transitioned into union-affiliated apprenticeships in six building trades. Investing in a homegrown middle-skill workforce that can complete durable infrastructure projects on time and under budget will pay for itself many times over.14
9 U.S. Department of Labor, Bureau of Labor Statistics. Annual data for 2007 and monthly data for November 2014. Local Area Unemployment Statistics. Retrieved from www.bls.gov/web/metro/laulrgma.htm.
10 All data on this page are from EMSI, unless otherwise noted.11 Detroit Future City. 2012. Detroit Strategic Framework Plan, p. 89.12 Opportunity Detroit Tech website. 2015. Retrieved at: www.opportunitydetroittech.com. 13 Interview with Carmine Palombo, Deputy Executive Director, Southeast Michigan Council of Governments, February 2015.14 See Metropolitan Affairs Council and Southeast Michigan Council of Governments. 2013. Infrastructure and Jobs: An Asset Map for Southeast Michigan for an
analysis of the types of jobs projected to be created by the major projects planned for Southeast Michigan.
09April 2015 www.jpmorganchase.com/skillsatwork JPMORGAN CHASE Driving Opportunity in Detroit

15 The priority industry clusters for the city of Detroit are healthcare, manufacturing and information technology. Detroit Employment Solutions Corporation. 2014. Comprehensive Five-Year Local Plan: July 1, 2012–June 30, 2017, p. 7.
16 Michigan Workforce Development Agency. 2014. Skilled Trades Training Fund Frequently Asked Questions (FAQs).
17 EMSI.18 Southeast Michigan Council of Governments. 2013. Creating Success
with Our Transportation Assets: 2040 Regional Transportation Plan for Southeastern Michigan, p. 13.
19 EMSI.
TABLE1.PROPORTIONOFMIDDLE-SKILLJOBSINDETROITMSA,201319
2013 Total Jobs % Middle-Skill Occupations
Healthcare 231,502 16%
Automotive Manufacturing 110,601 77%
Financial and Insurance Services 73,251 46%
Metals and Machinery Manufacturing 64,246 77%
All Other Manufacturing 60,181 60%
Computers and Information Technology 40,440 46%
Marketing and Advertising Services 25,040 36%
• Manufacturing is the region’s largest industry, employing more than 235,000 workers, and provides nearly one-third of the middle-skill jobs across all subsectors.
• Healthcare is the Detroit region’s second-largest sector, employing more than 231,000 workers, and it is projected to be one of its fastest growing. Of the more than 19,000 jobs expected to be created by 2018, about 16% require middle skills.
• Given regional demand and current state investment priorities, a focus on the healthcare and manufacturing sectors can help maximizemiddle-skillopportunities 5 for Detroit city residents.
5 StrengtheningBusinessCompetitivenessthroughIndustryClusters
The Michigan State Legislature has capitalized a $10 million per year Skilled Trades Training Fund to support workforce development.15 Brokered by local Michigan Works! agencies, since 2014 some 59 manufacturing, healthcare and related employers in the Detroit region have received $2.8 million in grants to train 1,291 new hires and 5,158 incumbent workers. The training leads to transferable credentials and employment at regionally competitive wages.16
The number of residents age 65 and over will continue to rise, reaching about
one-quarterof the region’s total population by 204018
The region also has a large and growing share of
“BabyBoomers”many of whom are nearing retirement
The twin imperatives of meeting demand in growing industry sectors and replacing retiring workers drive the need to develop a middle-skill workforce pipeline in the
region’s key industries
MIDDLE-SKILL JOBS ARE VITAL TO ECONOMIC GROWTH
Across the Detroit region
17%of all jobs are middle skill.17 Many growing sectors have
high proportions of middle-skill jobs
(see Table 1)
10 JPMORGAN CHASE Driving Opportunity in Detroit www.jpmorganchase.com/skillsatwork April 2015

• Healthcare accounts for 20% of Michigan’s jobs, and more than half of all healthcare services statewide are offered in the Detroit region.20 A University of Michigan economic analysis projects that the healthcare and private education industry will have the strongest long-term growth at 1.23% per year.21
• Major investments in healthcare facilities in the region are stoking demand for skilled workers, such as the recent $129 million expansion of St. Joseph Mercy Oakland.22
• Employer demand is strong in several healthcare areas, as indicated by projected average annual openings and job postings, notably for nurses, healthcare practitioners and administrative roles.23 (See Appendix B for examples of in-demand middle-skill healthcare occupations.)
TABLE2.EMPLOYERDEMANDINHEALTHCAREPRIMARYSKILLAREASINDETROITMSA,2014
Primary Skill Areas24 Annual Openings 2013–201825 Total Job Postings 201426
Nursing
Sub-BA Practitioner
Healthcare Support
Administrative
Technical, Non-Patient Care
Health Information Management
1,682 7,930
1,680 5,014
2,463 4,006
1,912 2,544
1,651433
273 502
For entry-level positions
59daysfor certified nursing assistant
For middle-level positions
76daysfor medical laboratory technician
For higher-level positions
35daysfor registered nurses
Long average job posting duration indicates a demand for middle-skill workers across the healthcare spectrum
Employers are struggling to hire qualified staff in these occupations
20 Michigan Workforce Development Agency. 2013. Health Care Cluster Workforce Analysis, p. 2. 21 Grimes, Donald A. and Fulton, George A. 2012. Retrenchment and Renewal: The Economic and Demographic Outlook for Southeast Michigan through 2040,
University of Michigan, Institute for Research on Labor, Employment, and the Economy, p. 24.22 Detroit Regional Chamber website. 2015. Retrieved from: www.detroitchamber.com/industry-clusters/healthcare-innovation/.23 Burning Glass.24 Primary skill areas include middle-skill jobs, as well as entry-level occupations that are critical to the vitality of the sector and provide opportunity for
continued career growth. These occupations also include fields that employed large numbers of workers, but may be declining or that pay below the living wage.
25 Annual openings are the combined number of projected job openings due to growth and the need to replace workers who change occupations or leave the labor force. EMSI Complete Employment 2014.2.
26 Job postings data are gathered from employer online job postings by private vendors and organized to provide current information on hiring trends and employer demand. Burning Glass.
OPPORTUNITIESINHEALTHCAREHealthcare delivery is an important driver of middle-skill job growth in the Detroit region, and an anticipated shortage of trained applicants over the next few years is creating a window of opportunity for Detroit area residents who want to enter the industry.
11April 2015 www.jpmorganchase.com/skillsatwork JPMORGAN CHASE Driving Opportunity in Detroit

• The aging of the region’s Baby Boomer population will increase the need for healthcare workers, ranging from physicians to geriatric specialists to home health aides.30 Projected growth in middle-skill occupations ranges from 9% in technical, non-patient care roles to 47% among healthcare support staff.31
• Furthermore, statewide implementation of the national Patient Protection and Affordable Care Act (ACA) is expected to increase the number of residents who regularly access healthcare services and prompt the need to increase staff, especially in ambulatory care. Pending resolution of Supreme Court challenges to portions of the law, employers will also need to train existing employees to implement new models of service delivery, creating opportunities to strengthen career pathways within healthcare subsectors.32
• In addition, national trends are raising skill requirements. While many healthcare employers still hire registered nurses with Associate’s degrees (67% regionally versus 60% nationally), some employers now prefer registered nurses with Bachelor’s degrees, in line with national trends.33
• Similarly, federal legislation is making ICD-10 certification (an international diagnostic and coding standard) an essential credential for both current and future medicalcoders 6 . Detroit employers are scrambling to hire or train workers with these skills by the October 2015 deadline.
6 UpskillingDetroit’sMedicalCoders
As the U.S. healthcare system moves to adopt the new international ICD-10 standard (an international diagnostic and coding standard), WIN has been working with eight healthcare systems and nine community colleges in the region to prepare for the transition. Community college partners are working collaboratively with employers to develop a joint curriculum for training workers in this certification. In addition, several employers in the region have partnered with their local Michigan Works! agency to access Skilled Trade Training Fund dollars to offer ICD-10 training to their workers.
27 U.S. Census Bureau. 2013 Q3–2014 Q2. Longitudinal Employer-Household Dynamics: Quarterly Workforce Indicators. Retrieved from: http://qwiexplorer.ces.census.gov.
28 Michigan Center for Nursing. 2014. Survey of Nurses 2014, p. 4.29 Michigan Center for Nursing. 2014. Survey of Nurses 2014, p. 4.30 Wilson, Randall. 2014. Healthcare Pathways for Opportunity Youth: A Framework for Practitioners and Policymakers, Jobs for the Future, p. 6.31 Burning Glass.32 Wilson, Randall. 2014. Implementing the Patient Protection and Affordable Care Act, Jobs for the Future, p. viii. 33 Burning Glass.
22%of healthcare workers in
the region are 55 years or older and may soon be
retiring27
40%of active registered
nurses statewide are 55 years and older28
46%of active licensed practical nurses
statewide are 55 years and older29
Increasing pressure to expand the talent pipeline
12 JPMORGAN CHASE Driving Opportunity in Detroit www.jpmorganchase.com/skillsatwork April 2015

HEALTHCAREERPATHWAY34
Middle-skill occupations in healthcare provide opportunities for career advancement. Some occupations pay entry-level wages, but allow for workers to attain higher incomes as they acquire additional education and experience. Below are examples of career pathways in healthcare.
CAREER PATHWAYS
34 Information for healthcare career pathway is drawn from Burning Glass Labor/Insight and EMSI Complete Employment 2014.2 and is informed by community college program descriptions from Wayne County and Macomb Community Colleges.
Occupation MedianHourlyWage(DetroitMSA)
EducationLevel Industry-ValuedCertifications
SkillsandCompetencies
High-Skill
Middle-Skill
Entry-Level
AuditingandComplianceSpecialist
Bachelor’s degree$29.21 RHIA Certification, Certified HIPAA Administrator
- Advanced clinical billing- Accounting- Business administration- Auditing- Mentoring- Problem solving
RegisteredNurse Bachelor’s degree or Associate’s degree with five plus years of experience
$32.87 Registered Nurse - Acute and critical patient care
- Treatment planning- Patient evaluation and
monitoring- Case management and
care plans
HealthInformationManager
Associate’s degree or postsecondary certificate
$16.79 RHIT Certification - ICD-10- Electronic health records- Clinical procedure
terminology- CPT- Microsoft Excel- Organizational skills- Research- Writing
SurgicalTechnologist Associate’s degree$20.10 Certified Surgical Technologist
- Surgical equipment and technology
- Operating room experience- Patient preparation- Aseptic technique- Time management- Multitasking
MedicalBiller High school diploma with moderate on-the-job training
$13.34 (entry-level wage)
- Scheduling and appointment setting
- Basic medical terminology- Basic billing systems- Data entry and word
processing- Customer service- Communication skills
MedicalAssistant High school diploma with moderate on-the-job training
$13.37 First Aid CPR AEDMedical Assistant Certification
- Vital signs measurement- Patient preparation- Cleaning- Injections- Communication skills- Basic computer skills
13April 2015 www.jpmorganchase.com/skillsatwork JPMORGAN CHASE Driving Opportunity in Detroit

OPPORTUNITIESINMANUFACTURINGManufacturing has long been the foundation of Michigan’s economy. Even after the sharp workforce declines of recent years, it continues to be a vibrant industry and a major source of middle-skill jobs.
35 Michigan Workforce Development Agency. 2013. Manufacturing Cluster Workforce Analysis, p. 2.36 All data on this page are from Burning Glass unless otherwise noted.37 U.S. Census Bureau. 2013 Q3–2014 Q2. Longitudinal Employer-Household Dynamics: Quarterly Workforce Indicators. Retrieved from: http://qwiexplorer.ces.
census.gov. 38 Primary skill areas include middle-skill jobs, as well as entry-level occupations that are critical to the vitality of the sector and provide opportunity for continued
career growth. These occupations also include fields that employed large numbers of workers, but may be declining or that pay below the living wage.39 EMSI Complete Employment 2014.2.
A projected wave of retirements will open new employment opportunities, as employers seek to replace a large number of skilled workers in a relatively short time. Many employers will seek to upskill and promote their incumbent workers and hire new entry-level workers, creating greater opportunity across the skill continuum
Currently, the manufacturing sector employs more than
halfamillionworkers across the state35
33%of all middle-skill
demand in the Detroit region is in manufacturing36
22%of the region’s
manufacturing workers were over 55
in 201437
Long average posting durations –
morethan40daysfor automotive service technician and procurement clerk openings, for example – suggest that employers struggle to find workers with the right skills
TABLE3.EMPLOYERDEMANDINMANUFACTURINGPRIMARYSKILLAREASINDETROITMSA,2014
Primary Skill Areas38 Annual Openings 2013–201839 Total Job Postings 2014
Installation, Maintenance, and Repair
Machining
Logistics and Transportation
Engineering and Manufacturing Technology
Testing and Inspection
4,986
4,462
407
511
625
993
199
1,037 4,559
1,336
14 JPMORGAN CHASE Driving Opportunity in Detroit www.jpmorganchase.com/skillsatwork April 2015

• Some middle-skill occupations in manufacturing are expected to grow much faster in the Detroit region than in the nation as a whole. For example, employment of machinists is projected to rise 17% by 2020 in the Detroit region while remaining flat nationally.
• A key determinant of future growth will be the competitiveness of the domestic automotive industry, which dominates employment in installation, maintenance and repair occupations, as well as logistics and transportation. Employers also are looking for workers in occupations related to automotive design, such as mechanical drafters. In the Detroit region, automotive occupations account for 19% of advertised manufacturing demand and 9% of all middle-skill jobs.
• The technology skills required in manufacturing also are increasing, as manufacturing processes become more sophisticated. Mechatronics – the combination of mechanical, computer and electrical skills – is in strong demand in parts of the region.40 Employers’ demand for workers with strong technology skills is especially intense in automotive manufacturing, where emerging technologies continue to gain traction – from new powertrains and electrified vehicles to “smart car” connected vehicles that can talk to other vehicles or infrastructure to fully automated, “self-driving” vehicles.41
• Middle-skill occupations in manufacturing pay good wages, although compensation varies sharply based on occupation, experience and credentials. All of the high-demand, middle-skill jobs analyzed for this report pay hourly wages that exceed the Detroit region’s living wage of $17.08 per hour.42 Middle-skill positions such as tool and die makers ($25.05) and industrial machining mechanics ($24.05) earn considerably more than the living wage.43 (See Appendix B for examples of in-demand middle-skill manufacturing occupations.)
• Despite strong current demand and employer reports of growing demand for middle-skill workers, ongoing labor-market analysis and dialogue with employers will be essential to determine long-term demand and develop a regional cluster-wide plan for education and training investments in the long run.
• Efforts are underway to expand the manufacturingsector 7 and grow the number of jobs. Skilled manufacturing workers will also be in high demand in construction-related jobs as infrastructure expansion continues in the region.
Middle-skill positions such as tool and die makers
$25.05Industrial machining mechanics
$24.05
Detroit region’s living wage per hour
$17.08
7 GrowingManufacturingandJobsintheDetroitRegion
Detroit holds important competitive advantages in manufacturing: decades of experience; a sophisticated understanding of manufacturing’s many technologically complex frontiers; and an extensive educational, R&D and marketing infrastructure that other regions would find difficult to replicate. Initiatives are now underway to build on these assets, ranging from place-based strategies such as the DetroitFutureCityEmploymentDistrictMarketingInitiative to supply-chain approaches such as Innostate, to research-based strategies such as the MichiganAcademyforGreenMobilityAlliance(MAGMA) to technology transfer strategies such as LightweightInnovationsforTomorrow(LIFT)Initiative. AdvanceMichigan is pursuing an integrated strategy to grow a skilled manufacturing workforce, expand manufacturing businesses and strengthen production processes in Detroit and key regions across the state. The 13-county region covered by this initiative has received federal Investing in Manufacturing Communities Partnership designation, which increases access to funding to grow manufacturing jobs.44 Finally, the CenterforAutomotiveResearch continues to deepen the knowledge base around transportation systems, evolving technologies and manufacturing engineering systems. These initiatives hold great promise to strengthen the Detroit region’s economic competitiveness and job base. As they develop, regional stakeholders should make more transparent the aggregate talent development goals they are pursuing and which skill levels (entry level, middle skill, or high skill) they are targeting.
40 Mwase, Gloria. Email correspondence with Macomb Community College President James Jacobs, February 15, 2015. 41 Hill, Kim et al. 2015. Contribution of the Automotive Industry to the Economies of All Fifty States and the United States. Center for Automotive Research.42 EMSI, drawing upon data from the Massachusetts Institute of Technology’s Living Wage Calculator for a family of three (two adults and one child) in the
Detroit area. For additional information: http://livingwage.mit.edu.43 Burning Glass.44 The White House. 2014. Obama Administration Designates the First 13 Manufacturing Communities through the Investing in Manufacturing Communities
Partnership to Spur Investment and Create Jobs.
15April 2015 www.jpmorganchase.com/skillsatwork JPMORGAN CHASE Driving Opportunity in Detroit

MANUFACTURINGCAREERPATHWAY45
Manufacturing occupations offer promising opportunities for workers to move up a career pathway as they gain more skills and obtain certifications and degrees. Below are examples of career pathways in manufacturing.
CAREER PATHWAYS
Occupation
Machinist
Welder
Programmer
Operator
Advanced postsecondary certificate, plus apprenticeship or work experience
High school diploma plus moderate on-the-job training
$19.63
$17.72
Associate’s degree or Associate of Applied Science degree, apprenticeship experience
$23.93
Basic postsecondary certificate
$17.85
Welding certification (e.g. AWS Certified Welder)
- Grinding- Drill pressing- Mill cutting- Welding- Inspection- Repair- Data entry- Forklift operation
- Soldering- Metal Inert Gas (MIG) or
Tungsten Inert Gas (TIG) welding
- Schematic diagrams- Wiring
Computer-Aided Design Certification
- G Code (CNC programming language)
- Computer-aided drafting (AutoCAD)
- Computer-aided manufacturing
- SURFCAM- Microsoft Excel- Microsoft Office
CNC Machining - Machine operation- Lathes- Blueprints- Micrometers- Calipers- Hand tools
MedianHourlyWage(DetroitMSA)
EducationLevel Industry-ValuedCertifications
SkillsandCompetencies
High-Skill
Middle-Skill
Entry-Level
45 Information for career pathway is drawn from Burning Glass Labor/Insight and EMSI Complete Employment 2014.2 and is informed by community college program descriptions from Wayne County and Macomb Community Colleges.
ProductionandOperatingSupervisor
Bachelor’s degree, or Associate’s degree with five years of experience
$29.75 Six Sigma Certification
- Production management- Inventory management- Process improvement- Scheduling and logistics- Material flow management- SAP- CATIA- ERP Systems
Engineer Bachelor’s degree$43.80 - ASME (American Society of Mechanical Engineers) Certification
- Capability Model Maturity Integration (CMMI) Certification
- Mechanical engineering and design
- Manufacturing process knowledge
- Product design and concept development
- Advanced mathematics- Mentoring
16 JPMORGAN CHASE Driving Opportunity in Detroit www.jpmorganchase.com/skillsatwork April 2015

ECONOMICDISPARITIESARELEAVINGMANYBEHIND–ESPECIALLYDETROITCITYRESIDENTSANDPEOPLEOFCOLORPost-recession unemployment in the Detroit area has dropped more rapidly than in the nation as a whole. Yet the region’s 7% unemployment rate remains high among U.S. metro areas.
• People who live in the city of Detroit face particularly difficult circumstances. City residents face an unemployment rate of 13%, nearly double the 6.7% rate in the five-county suburban belt.46
• City residents often seek work in the suburbs, only to find that long commutes and inadequate publictransportation 8 make suburban jobs impractical.
• At the same time, the significant outmigration from the city also means that many low-skill adults seeking economic opportunity now reside in the surrounding suburbs.
• Across the region, 14% of African-American residents and 10% of Latino residents are unemployed, compared with 6% of white residents. In the city of Detroit, 15% of African-Americans and 14% of Latinos are unemployed, compared with 9% of white residents.
• In addition, fewer city residents participate in the labor force (people who are working or actively looking for work). In the city, 61% of Latinos are in the labor force, compared with 49% of white and 53% of African-American residents. Across the region, 67% of Latinos are in the labor force, compared with 64% of whites and 58% of African-Americans.
EXPANDING OPPORTUNITYExpanding the middle-skill workforce and rebuilding the middle class are essential to the Detroit region’s future. Low-income residents need better preparation for middle-skill jobs to improve their financial stability and help sustain the region’s economic recovery. Successful efforts will narrow the gaps in employment, education and income between white and minority residents, and between those who live in the city and those who live in the suburbs.
8 GettingTherefromHere:Detroit’sTransportationChallenge
More than half of all working people who live in the city of Detroit leave the city to reach their jobs47 and the number is expected to grow as more jobs are created in the suburbs. Unfortunately, jobs outside the city are often inaccessible, as one in four city residents lacks a car, and the public transit system does not adequately connect city residents to suburban job opportunities.
Yet changes are on the horizon. The Southeast Michigan Council of Governments established a Regional Transit Authority (RTA) with a mandate to develop regional solutions to southeast Michigan’s transportation challenges, and it is preparing a transit plan to go before Michigan voters in November 2016. If voters approve the plan and the revenues to implement it, RTA will have the potential to become a transit powerhouse, with the resources, operations and infrastructure needed to help move Detroit residents much more efficiently to suburban jobs.48
46 The 6.7% regional unemployment rate excludes Wayne County. The unemployment rate for the six-county MSA is 7.0%. All data from Jeremy Kelly analysis of data from U.S. Department of Labor, Bureau of Labor Statistics. November 2014. Local Area Unemployment Statistics. Detroit MSA (by county) and Detroit City. Retrieved from www.bls.gov/web/metro/laulrgma.htm.
47 Southeast Michigan Council of Governments. 2014. Improving Public Transit and Accessibility, p. 3. 48 Lawrence, E., “Detroit Area’s Transit Head Must Sell Voters on Funding,” Detroit Free Press, November 19, 2014. Accessed at http://on.freep.com/1qW0m5Y.
17April 2015 www.jpmorganchase.com/skillsatwork JPMORGAN CHASE Driving Opportunity in Detroit

• Young people living in the city also face greater barriers to work than young people living in the suburbs. Some 42% of city residents age 16–24 were unemployed in 2012, compared with 24% of the same age group across the region.49 Teens face more difficulty finding work than adults in their early 20s. In 2013, Detroit cityyouth 9 age 16–19 had an unemployment rate of 58%; for 20–24 year-olds, the rate was 38%.
• Adultsunemployedforlongperiods 10 find jobs increasingly difficult to obtain.
• Employment gaps lead to income disparities: individuals in the city of Detroit face higher poverty rates than in the region overall, regardless of race: 38% of African-Americans in the city live in poverty, versus 32% of African-Americans regionwide; 36% versus 22% for Latinos; and 40% versus 11% for whites.50
10 FromEconomicDevastationtoEconomicStabilityfortheLong-TermUnemployed
Helping the long-term unemployed get back to work is a national priority. Through our New Skills at Work initiative, JPMorgan Chase is helping to address this challenge through better research and support of best practices to help job seekers become and stay employed.
In 2014, over one-third of the unemployed in Michigan (about 119,000 people) were out of work for 27 weeks or more. Over one-quarter of Michigan’s unemployed were jobless for 52 weeks or more.53 The Community Ventures program, convened by the Michigan Economic Development Corporation in four urban centers (Detroit, Flint, Pontiac and Saginaw), has become a nationally recognized model for helping long-term unemployed adults get back to work. Launched in 2012, the program supports job seekers who have limited education or literacy, have been unemployed for more than six months, or have high barriers to employment, such as a criminal record.
Participants are screened, selected and referred by Michigan Works! agencies. Community Ventures provides employers with a talent match and an on-the-job training grant, in return for which the employer is required to guarantee one-year minimum employment in a market rate, full-time, permanent position.54 Several workforce and community partners provide supportive services (such as transportation, child care and financial literacy) to help participants stay on the job, including Detroit Employment Solutions Corporation, Detroit Centers for Working Families, Focus: HOPE, SER Metro, Jobs for Progress, Goodwill and Southwest Solutions. In Detroit, nearly 1,500 residents have been placed in jobs with 57 employers, and almost three-quarters were still employed a year later, at wages that compared favorably with entry-level wages in similar positions.55 The model will be implemented across the state in 2015.
49 U.S. Census Bureau. 2012 estimates for Detroit MSA. American Community Survey. Retrieved from: http://factfinder.census.gov/faces/nav/jsf/pages/index.xhtml. 50 Unless otherwise noted, all data on this page are from U.S. Census Bureau. 2011–2013 estimates for Detroit MSA and City of Detroit. American Community
Survey. Retrieved from: http://factfinder.census.gov/faces/nav/jsf/pages/index.xhtml.51 See http://gdyt.org/learn-more/.52 See www.bmecommunity.org/bme_detroit.53 Information on the long-term unemployed is from unpublished data from the U.S. Department of Labor, Bureau of Labor Statistics provided by the Michigan
Department of Technology, Management and Budget, Labor Market Information and Strategic Initiatives.54 Michigan Economic Development Corporation. 2013. Community Ventures Fact Sheet.55 Gerald R. Ford School of Public Policy. 2013. Michigan Economic Development Corporation Community Ventures Program Outcomes Report, p. 13.
9 CreatingOpportunityforYouth
Boosting economic opportunities for Detroit’s young adults is an urgent public priority. With funding from JPMorgan Chase and others, City Connect launched the Grow Detroit’s Young Talent initiative, a summer jobs campaign that placed nearly 1,900 Detroit youth in six-week paid summer work experiences and employment-focused workshops during summer and fall 2014.51 Detroit Mayor Mike Duggan is seeking to expand the program in 2015 by linking it with the 40-year, publicly funded summer jobs program led by the Detroit Employment Solutions Corporation and its year-round youth employment efforts.
In addition, BMe Detroit, a network of African-American male community builders, is working with young African-American men through mentorship and other programs to promote retention and completion for high school students, college access and success for high school graduates and employment opportunities for young ex-offenders.52
18 JPMORGAN CHASE Driving Opportunity in Detroit www.jpmorganchase.com/skillsatwork April 2015

11 EmployersSpeakOutaboutTheirSkilledWorkforceChallenges
The Detroit Employment Solutions Corporation, in partnership with other Michigan Works! agencies in the region and the Michigan Economic Development Corporation, collected information on employer skills gap challenges through customer insight surveys administered in early 2015. For the Detroit metro region:
• More than 40% of employers who responded noted that they plan to hire entry-level or mid-level middle-skill positions (requiring more than a high school diploma but less than a Bachelor’s degree) in the next three years.
• Work readiness skills, also known as “soft skills,” are the most influential factor in hiring decisions by local employers, even above technical skills and credentials. Specific skills and attributes identified include teamwork, leadership skills, self-motivation, problem solving, strong basic academic skills, communications and customer service skills.
• Many employers are already involved or interested in regional talent development. More than one-third of the respondents reported their current participation or willingness to be involved in advising career and technical education programs, providing apprenticeships, mentoring high school students and offering summer youth employment opportunities.
MANYPEOPLEAREUNPREPAREDTOTAKEADVANTAGEOFMIDDLE-SKILLJOBOPPORTUNITIES• Postsecondary education or training is essential to
obtaining middle-skill employment. Yet many adults in the region, especially minorities and Detroit city residents, have not even finished high school. About 12% of regional residents 25 years and older (more than 340,000 people) lack a high school diploma or GED, including 21% of Detroit city residents (93,000 people). Another third of city residents (more than 138,000 people) have earned only a high school diploma or GED.
• Behind the overall picture lurk major gaps in educational attainment by race and ethnicity. Regionally, 30% of Latinos age 25 and older lack a high school diploma or GED, as do a daunting 55% in the city of Detroit. Whites have high educational attainment rates regionally but lower rates in the city. (See Figures 1 and 2.)
FIGURE1.EDUCATIONALATTAINMENTBYRACEFORPOPULATION25YEARSANDOLDERINDETROITMSA,2013
FIGURE2.EDUCATIONALATTAINMENTBYRACEFORPOPULATION25YEARSANDOLDERINDETROITCITY,2013
White
African-American
Latino
10%28%
32%
16%31%
36%
30%26%
25%
31%33%
25%
32%36%
25%
23%35%
16%
White
African-American
Latino
23%31%
23%
20%33%
35%
55%25%
16%
31%33%
25%
32%36%
25%
23%35%
16%
(Source: U.S. Census Bureau, American Community Survey)
Less than high school diplomaHigh school graduate (includes equivalency)Some college or Associate’s degree
• In a curious paradox, more than two-thirds of African-Americans in both the Detroit region and the city have middle-skill credentials (a high school credential and some college or an Associate’s degree), more than white and Latino residents. Yet African-Americans have the highest unemployment rate of any race or ethnicity, suggesting that educationalattainmentisnotthesolefactor 11 explaining employment in southeast Michigan.
• Detroit stakeholders have noted other factors affecting employment, including limited access to education advising and career counseling; lack of flexible and accelerated degree programs, tuition, transportation and/or housing assistance, or day-care subsidies; and employment barriers due to criminal records. In 2013, more than 11,000 residents were convicted of criminal offenses in Wayne County.56
56 Heyns, Daniel H. 2014. Michigan Department of Corrections 2013 Statistical Report, p. A-4.
19April 2015 www.jpmorganchase.com/skillsatwork JPMORGAN CHASE Driving Opportunity in Detroit

57 The Detroit Regional Workforce Fund. 2012. Addressing Detroit’s Basic Skills Crisis, pp. 6–7.58 Michigan Workforce Development Agency. 2012. Skilled Trades in Michigan, pp. 10, 12. One innovative resource is the Michigan New Jobs Training Fund,
which allows employers to partner with colleges to train new workers and reimburse them through new employee payroll tax diversions. 59 Global Detroit website. 2015. Retrieved at: www.globaldetroit.com/partner-initiatives/welcome-mat-detroit/.
12 EngagingDetroit’sImmigrantTalent
Immigrants – whether from Latino, Asian, Middle Eastern or other nationalities – are a growing presence in the city of Detroit and in the region. These residents have a strong drive to succeed, often helping to revitalize distressed communities through their entrepreneurial spirit. While English-language proficiency is a barrier for many immigrants, they also bring diverse skills that can be leveraged to support regional competitiveness.
Organized by Global Detroit, ACCESS and the International Institute of Metropolitan Detroit, a network of more than a dozen organizations is collaborating to help connect immigrants to growing economic opportunity through workforce-related services such as employment training, job search assistance and access to employers.59
STAKEHOLDERSHAVEMADEIMPORTANTSTRIDESINTALENTDEVELOPMENT
• Groups of employers within the manufacturing industry cluster have worked to develop goals and plans for segments of this sector.
• The seven workforce boards in the region have developed collaborative goals through the Southeast Michigan Works! Agency Council.
• The region’s nine community colleges are striving to cooperate through the Southeast Michigan Community College Consortium.
• WIN helps to foster collaboration among the seven workforce boards and the nine colleges in the region to build a talent pipeline for employers in key industry sectors.
• The Detroit Jobs Alliance, convened by the Detroit Regional Workforce Fund, has created a forum to foster information sharing, capacity building, and collaboration for all of the city’s stakeholders focused on education and training, supportive services and employment in the city of Detroit.
Yet stakeholders report that significant challenges remain. Community colleges, community-based organizations, adult education programs and other training partners struggle to find overarching alignment at the industry cluster level across multiple talent development initiatives that can identify common employer needs and guide their work with job seekers. The result has been siloed and duplicated services; an inability to leverage shared information, activities, or resources; and challenges in demonstrating systemic results in connecting disadvantaged residents to employment.
OVERWHELMINGNEEDSSTRAINPROVIDERCAPACITY• As collaborative initiatives scale up to meet the growing
needs of the region, particularly the need to connect Detroit residents to opportunities in surrounding communities, the organizations leading these efforts face challenges in expanding the infrastructure necessary for collective action.
• Adult education providers estimate that fewer than 10% of adults who need these services each year are able to access them, especially those with low literacy or English-language 12 proficiency. The content and delivery of these programs often do not align well with the transition to postsecondary education and employment pathways.57
• Community colleges in some parts of the region lack important resources, such as college preparatory programs and clinical sites, preventing them from expanding technical training programs to meet employer and student demand.
• Reduced funding to support the engagement of adults in postsecondary occupational training is constricting the pipeline to produce the next generation of skilled workers.58
20 JPMORGAN CHASE Driving Opportunity in Detroit www.jpmorganchase.com/skillsatwork April 2015

13 AligningBusinessIntelligencetoStrengthentheTalentPipeline
WIN is working with the Southeast Michigan Health System HR Executives Council, a collaboration of eight healthcare systems, to understand their workforce needs better and support short- and long-term planning around talent development.61 The employers are providing information about their current workforce in 12 nursing specialties and 14 other critical healthcare occupations so that each employer can benchmark its own workforce against the aggregate. The database will also provide valuable information to education and training providers on existing skills gaps and anticipated healthcare workforce shortages by occupation and skill level.62
RECOMMENDATIONSDetroit has impressive strengths in healthcare, manufacturing and other vital sectors that offer well-paying jobs with the opportunity for career mobility. Stakeholders can build on these strengths by developing a demand-driven career pathways system.
1.Developaregionaltalentdevelopment“masterplan,”advancedbyaprominentchampion,toalignregionalgoalsandoutcomesforpreparingDetroitresidentstoentermiddle-skilloccupationsinhigh-demandsectors.
Regional stakeholders should:
• Catalogue the local, regional and state-led talent development initiatives in the manufacturing and healthcare industries, including the initiative partners, outcome goals, geographical and population focus, skill-level targets and results to date. Develop or leverage mechanisms to disseminate this information across the region, specifically to education and training providers and community-based organizations serving the targeted populations.
• Create a regional cluster-based industry council that can help to develop and advance an overarching strategic talent development vision and goals, along with data tracking and accountability mechanisms to ensure that employment goals for Detroit residents are met.
• Use labor market information (such as quarterly analysis from WIN) and direct engagement with employers to build on existing efforts60 and align various state and regional initiatives with the cluster-based goals around training and placing residents in middle-skill occupations in Detroit and the region.
• Identify an individual or an organization with the influence and capacity to champion the regional master plan and engage key regional stakeholders in its implementation.
Recommendation
2.BuildasystemofcareerpathwaysalignedwithindustryclusterdemandtoprepareDetroitresidentseffectivelytoearncredentialsandsecuremiddle-skilloccupationsintheregion.
Employers can:
• Collaborate to expand career exploration strategies, develop structured career pathways and increase work experience opportunities (summer youth employment, internships, apprenticeships and on-the-job training).
• Work with education and training providers to develop a portable, employer-endorsed curriculum for employability/work readiness skills.
• Leverage existing employer–provider partnerships to strengthen capacity of all regional education and training providers. This work should include identifying common standards for middle-skill jobs, sharingbusinessintelligence 13 across talent development initiatives and expanding partnership opportunities with new providers in order to scale programs and increase the number of people served.
Recommendation
60 The industry cluster council can build on Governor Rick Snyder’s efforts to establish a new cabinet-level Department of Talent and Economic Development and the Regional Prosperity Initiative to align state resources to promote economic prosperity.
61 The systems are Beaumont Health System, Detroit Medical Center, Henry Ford Health System, McLaren Health, Oakwood Health, St. John Providence Health System, CHE Trinity Health and University of Michigan Health System.
62 Workforce Intelligence Network. Executive Summary: Southeast Michigan Regional Healthcare Workforce Database, p. 6.
21April 2015 www.jpmorganchase.com/skillsatwork JPMORGAN CHASE Driving Opportunity in Detroit

Community colleges, community-based training providers and adult education programs can:
• Strengthen apprenticeships 14 and other work-based learning strategies, with an emphasis on efficient pre-apprenticeship pathways and competency-based education approaches that increase access and reduce the time and expense of completing a program of study.
• Increase integration of acceleratedlearningstrategies 15 that build the skills of underprepared youth and adults more quickly, structure pathways with stackable credentials that offer relevant exit and re-entry points for employment so workers can advance their credentials and careers and offer flexible course scheduling that accommodates students’ work schedules.
• Build seamless career pathways between training programs offered by community-basedorganizationsandcommunitycolleges’ 16 non-credit and credit-bearing programs of study.
• Expand adult education bridge programs (incorporating literacy, numeracy, computer technology and workforce readiness) and integrate occupational content from middle-skill careers to strengthen connections to postsecondary education and employment and improve student retention.
Community-based organizations and other social service agencies can:
• Expand “wraparound” supports, such as child care and streamlined public benefit eligibility, to help residents persist in education and training programs within a career pathway.
• Expand programs and policy initiatives to remove criminal backgrounds as a barrier to employment, including identification and support of employers willing to hire ex-offenders.
All partners can:
• Expand career-matching services and develop a consistent set of career exploration materials that education and training providers and other innovative programs can utilize to educate youth and adults about middle-skill opportunities.
• Work with employers and regional planning agencies to build regional transportation systems that can bring Detroit city residents to jobs outside the city.
14 DetroitRegisteredApprenticeshipProgram
The Detroit Registered Apprenticeship Program (D-RAP) was developed by the Detroit Employment Solutions Corporation (DESC), the local workforce agency, in collaboration with employers and unions. D-RAP places participants in pre-apprenticeship readiness programs that provide occupational training, support services and training supports for employers, and paid full-time unsubsidized work experiences. Participants enter apprenticeships in diverse fields, including healthcare, IT and skilled trades, with ongoing support from DESC to improve employee retention. Since the program’s inception 139 participants have been placed in apprenticeships or jobs. Other programs like D-RAP are being expanded throughout the state through the Michigan Apprenticeship, Internship, and Mentoring Initiative.
15 CollaboratingtoAddressEmployerNeeds:MichiganCoalitionforAdvancedManufacturing
The Michigan Coalition for Advanced Manufacturing (M-CAM), led by Macomb Community College and supported by a $25 million federal grant, is retooling its member colleges’ capacity to provide aspiring professionals with the technology, educational offerings and cutting-edge delivery strategies they need to launch middle-skill careers in advanced manufacturing. M-CAM colleges are adding new courses and purchasing new robotic technology to keep up with what employers actually use on the shop floor. Even more important is the work each college is carrying out to align their courses with career pathways that begin with certificates and lead smoothly to Associate and Bachelor degree programs. In many courses, students move forward as they achieve workplace and vocational competencies.
16 FocusonOpportunity
Focus: HOPE has developed a nationally recognized workforce program that provides GED preparation followed by training in manufacturing or information technology. The program benefits from strong employer demand and clear career pathways. After completing training and earning professional certifications, participants are ready to apply for entry-level positions through the organization’s extensive employer network, including more than a dozen employers who serve on Focus: HOPE’s training advisory committee. Focus: HOPE’s Machinists Training Institute has a 90% job placement rate for the nearly 2,000 students it has trained over the past three decades. Students are also connected to college degree programs in manufacturing and information technology so that they can continue to advance in their professional fields.
22 JPMORGAN CHASE Driving Opportunity in Detroit www.jpmorganchase.com/skillsatwork April 2015
CONCLUSIONThe Detroit region is entering a pivotal phase. With the city of Detroit emerging from bankruptcy and the broader regional labor market climbing out of a brutal multi-year downturn, attention now shifts to the private employers on whom a sustained recovery will depend. These employers are already experiencing difficulty in finding qualified middle-skill workers, and their challenge will intensify as Baby Boomers retire from key industry sectors over the next several years. Simultaneously, many residents of southeast Michigan are watching the economic recovery from the outside because they lack employer-valued skills. Leaders in the city of Detroit and the region have kicked off initiatives to address this dual dilemma. But the challenge will be to coordinate and align these initiatives regionally so that they add up to more than the sum of their parts.
Through our New Skills at Work initiative, JPMorgan Chase proposes to offer guidance on the development of a demand-driven career pathways system that can launch young people and low-skill adults into good jobs with advancement potential. Middle-skill occupations in the healthcare and manufacturing industries represent a powerful opportunity to implement this strategy in the Detroit region, thereby fortifying the regional economy and helping residents gain the opportunity to obtain jobs that will support themselves and their families.
17 UnderstandingtheStrengthsandGapsintheWorkforceSystem
JPMorgan Chase is partnering with the Corporation for a Skilled Workforce to undertake a mapping project to identify the strengths and gaps of the Detroit workforce system. The project will paint a picture of the city of Detroit’s current and potential workforce (including demographics, educational attainment and skills gaps). It will also identify the network of educational institutions, public sector entities and nonprofits that serve this workforce, including existing capacity, service delivery mix and outcomes. The workforce system map that results from this process will inform investment decisions by public, private and philanthropic funders seeking to expand economic opportunity for Detroit city residents.
3.Alignpublic,privateandphilanthropicinvestmentintalentdevelopmentwithindustry-focusedvisionandgoals.
Federal, state and local public and private funders, in collaboration with employers, should:
• Identify and address education and training “capacity gaps” related to target industry sectors to maximize the use of available resources and increase the scale of programs to address employer needs.
• Leverage and align federal funding (e.g., through the Workforce Innovation and Opportunity Act) and state funding (e.g., the Skilled Trades Training Fund and the Regional Prosperity Initiative) to support the implementation of industry cluster-based talent development efforts.
• Develop criteria for investment to increase the scale of education and training programs that demonstrate effective results in achieving employers’ talent development goals by identifying best practices and developing strategies for benchmarking and measuring outcomes.
• Identify gaps in education and training service delivery and develop an investment strategy to strengthenthesystems’capacity 17 . Leverage existing infrastructure such as the Detroit Regional Workforce Fund to convene public agencies, funders and private employers with common interests in talent development.
Recommendation
23April 2015 www.jpmorganchase.com/skillsatwork JPMORGAN CHASE Driving Opportunity in Detroit

APPENDIX A – MethodologyAll data in this report are provided for the Detroit region, defined as the Detroit-Warren-Livonia Metropolitan Statistical Area (and referred to in this report as the Detroit MSA), unless otherwise noted. The Detroit MSA includes Lapeer, Livingston, Macomb, Oakland, St. Clair and Wayne counties.
MethodologytoIdentify“Middle-skill”Occupations
Four criteria were used to identify middle-skill occupations, as follows:
1. Selected occupations must pass a minimum requirement for the percentage of their workforce that possesses a high school diploma and less than a four-year degree.
2. 25% or more of the workforce for each target occupation must surpass the living wage for families with two adults and one child.
3. Each occupation must surpass a minimum growth rate over the past three years.
4. Occupations with limited annual openings are filtered out. The term “middle-skill” typically refers to the level of education required by a job. This study expands the common definition by adding three additional criteria (wage, growth rate and number of annual openings). This expanded approach will make sure selected occupations not only are middle-skill but also provide a living wage and are growing.
To provide a picture of the economy (e.g., a description of employment, unemployment, productivity, workforce and education), the report uses EMSI’s data aggregated from more than 90 federal, state and private sources. EMSI applies proprietary methods to remove suppressions and include data for proprietors to yield a comprehensive representation of the regional workforce.
The report also includes analytical information from Burning Glass Technologies, which provides real-time labor market information (RT LMI) from online job postings. Burning Glass’ patented parsing and data extraction capabilities can extract, derive, and infer more than 70 data elements from any online job posting, providing in-depth insights into employers’ demand for skills and credentials.
Limitations
When assessing a phenomenon as complex as a local economy, gaps in our analysis and understanding remain. While traditional labor market information (LMI) offers the best data available to capture historical industry and occupational trends, it is infrequently updated and does not adequately account for future macro- or micro-economic shifts in supply or demand. Some of the federal and state data sources EMSI uses contain non-disclosed or “suppressed” data points, created by the government organizations that publish the data products in order for them to comply with laws and regulations that are in place to help protect the privacy of the businesses that report to them. In some cases, EMSI utilizes proprietary algorithms to replace suppressions with mathematically educated estimates.
RT LMI complements the traditional LMI with more recent information on employer skills, education and credential demand. However, a common limitation of job postings data is that it can only access information that is indeed posted online. To control for duplicate job listings Burning Glass employs an advanced parsing engine that considers the actual job functions and skills described by the employer rather than just the text. Burning Glass focuses on the content of the posting, not simply the words or basic fields.
Some of the limitations from both traditional and RT LMI will be ameliorated through qualitative interviews with employers, educators, policymakers and workforce intermediaries whose on-the-ground experience can fill in gaps about both future employer skill demand and participant supply. Overall, data can be a useful starting point, but the intricacies of talent shortages and job openings will need to be verified locally.
24 JPMORGAN CHASE Driving Opportunity in Detroit www.jpmorganchase.com/skillsatwork April 2015

APPENDIX B – Selected Middle-Skill Occupations in Healthcare and Manufacturing Sectors in Detroit MSA63
(referredtoinTables2and3intext)
Middle-Skill Occupations by Primary Skill Area
Average Annual Openings(2013–2018)64
Job Postings (2014)
Median Hourly Wage
Nursing
Registered Nurse 1,374 6,462 $32.91
Licensed Practical/Vocational Nurse 408 778 $22.53
Sub-BAPractitioner
Medical Assistant 375 1,146 $13.37
EMT/Paramedic 156 327 $15.24
HealthcareSupport
Nursing Assistant 863 1,824 $10.03
Caregiver/Personal Aide 1,027 1,212 $12.97
Administrative
Registrar/Patient Service Representative N/A 674 $12.61
Medical Secretary 182 609 $15.66
TechnicalNon-PatientCare
Medical Laboratory Technician 141 849 $15.57
Pharmacy Technician 109 556 $13.48
HealthInformationManagement
Medical Coder N/A 336 $16.79
Machining65
First Line Supervisors of Production and Operating Workers 220 1,820 $29.60
Computer-Controlled Machine Tool Operators, Metal and Plastic 157 1,265 $17.85
Installation,MaintenanceandRepair
Automotive Service Technicians and Mechanics 377 1,242 $18.50
First-Line Supervisors of Mechanics, Installers and Repairers 160 928 $29.32
LogisticsandTransportation
Production, Planning and Expediting Clerks 111 984 $22.05
Shipping, Receiving and Traffic Clerks 245 550 $15.10
EngineeringManufacturingTechnology
Mechanical Drafters 38 399 $24.97
TestingandInspection
Quality Control Analysts 39 326 $17.32
63 All data in these tables are from Burning Glass and EMSI, unless otherwise noted. 64 EMSI and EMSI Complete Employment 2014.2. 65 Occupations in the machining category correspond to the skilled trades and technicians manufacturing subsector defined by the Detroit Workforce
Intelligence Network. Occupations in the engineering manufacturing technology category correspond to the engineers and designers manufacturing subsector defined by the Detroit Workforce Intelligence Network.
25April 2015 www.jpmorganchase.com/skillsatwork JPMORGAN CHASE Driving Opportunity in Detroit

“JPMorgan Chase,” “J.P. Morgan,” “Chase,” the octagon symbol and other words or symbols in this report that identify JPMorgan Chase products or services are service marks of JPMorgan Chase & Co. Other words or symbols in this report that identify other parties’ goods and services may be trademarks or service marks of those other parties.
©2015 JPMorgan Chase & Co. All rights reserved.
MOREINFORMATIONFor more information on New Skills at Work, visit www.jpmorganchase.com/skillsatwork
From:Economic GlobalisationOrigins and consequences
Access the complete publication at:http://dx.doi.org/10.1787/9789264111905-en
Does globalisation promote employment?
Please cite this chapter as:
Huwart, Jean-Yves and Loïc Verdier (2013), “Does globalisation promoteemployment?”, in Economic Globalisation: Origins and consequences,OECD Publishing.http://dx.doi.org/10.1787/9789264111905-7-en

This document and any map included herein are without prejudice to the status of orsovereignty over any territory, to the delimitation of international frontiers and boundaries and tothe name of any territory, city or area.

Even though competition from low-wage countries has some negative effects on employment in OECD countries, the link between globalisation and job losses is less obvious than it fi rst appears. In times of economic shock such as the recent recession, globalisation seems to create more jobs overall than it destroys. Likewise, the total increase in wage inequality of the past two decades seems more linked to technology and legislation than globalisation – which does nevertheless undeniably contribute to increased job insecurity in some cases. The challenge is to help the “losers” of globalisation stay in the race and seize the new opportunities offered by openness to international trade.
6

Does globalisation
promote employment?

90 OECD Insights: Economic Globalisation
6. Does globalisation promote employment?
6 By way of introduction……
In January 2008, mobile phone manufacturer Nokia announcesit’s closing its factory in Bochum (Germany), moving production toCluj-Napoca (Romania) and axing 2 300 jobs. One year earlier,Ben-Q/Siemens and Motorola also closed their German productionsites. And yet the mobile telephone market, born only 15 years earlier,is still young. Faced with the emotion triggered by this announcement,the German government demands that Nokia reimburse theEUR 17 million it received in subsidies.
International competition has grown in most sectors. Companieswant to reduce costs. For many years, offshoring has been a means tothis end. The gradual diversification and internationalisation of share-holders has reduced many companies’ local foothold, creating uncer-tainty and worrying workers in developed countries, whose jobsconstantly risk being transferred to the other side of the globe.
This uncertainty has been prevalent for decades, and the 2008 crisis,with its devastating effects on jobs, has increased it. In many countries,the employment situation has got considerably worse. Economies pre-viously characterised by relatively low unemployment rates have seenthem soar. Between December 2007 and March 2010, jobless rates rosefrom about 4.5% to slightly over 8% in the United Kingdom. The risein unemployment has been even more acute in the United States, withrates climbing from 4.5% to close to 10% of the workforce.
This chapter looks at the impact of globalisation on employment inthe past 20 years. This is no easy feat. As we’ve seen, globalisationinvolves different phenomena, from international trade through migra-tion to FDI. Some clues can help us evaluate the impact of globalisationon employment, but they can also mask the less visible underlyingtrends, both in terms of employment volume and job quality.
Globalisation destroys some jobs,
but creates many more
Offshoring, while certainly painful, is only one aspect of globalisa-tion. An analysis of the global effects of the increased economic

6. Does globalisation promote employment?
OECD Insights: Economic Globalisation 91
integration of different world regions reveals a complex reality. Here,we mostly concentrate on employment tendencies in OECD countriesbecause unemployment has been widespread since the late post-warperiod and here more than elsewhere, globalisation has been blamedfor robbing workers of their jobs. Some employment trends in develop-ing and emerging countries appear in parallel as jobs lost in some sectorsin OECD countries often appear as jobs gained in other regions.
Job losses due to competing goods from emerging countries
Imported products competing against domestic products havespawned job losses in OECD countries. The new configuration of inter-national trade discussed in Chapter 4 is characterised by the decreasedcompetitiveness of some goods manufactured in developed countriescompared with those from emerging countries.
It is difficult to establish the total volume of job losses due to interna-tional competition, because the link between the two is often indirectand not clear-cut. Even so, the evolution of employment data in someindustries is telling. Since the 1990s, industrial employment has back-tracked in most OECD countries – a symptom of the de-industrialisa-tion of developed countries. In the 1990s, a flood of clothing made inChina that was sold at unbeatable prices proved fatal to a vast swatheof the textile industry in several OECD countries. Many companieswere forced to downsize or close down. From 1970-2003, the textileworkforce dropped 60% in G7 countries. This carnage caused OECDcompanies to refocus on branches with higher value added, such astextile technology, design, haute couture, etc. Similar trends affectedmass electronics, toys, household objects and other sectors whoseproducts did not require specialised skills and technology.
But some industrial activities – such as agribusiness, chemicals(including pharmaceutical products) and cars – remain a source ofemployment in OECD countries. These sectors maintained a moreor less stable workforce over the past 25 years, at least up until therecent economic crisis. In the case of agribusiness, industrial pro-cessing must often be located close to the distribution market. Thismeans that international competition has less of an impact on theactivity and the way it’s organised, so the industry is relatively safefrom the strong winds of international competition.

92 OECD Insights: Economic Globalisation
6. Does globalisation promote employment?
But competition can also be beneficial to workers in developedcountries. The automotive, pharmaceutical and chemical sectors arelargely dependent on international competition, which has notaffected their employment levels. This is because, unlike the textileor mass electronics sectors, they essentially export and import amongOECD countries which, as it turns out, manufacture more or less thesame type of products. For example, German automobile imports toFrance don’t threaten French automobile production, because Francealso exports its cars to Germany and other OECD counties. In otherwords, it’s mostly competition among some imported goods – lower-value-added goods produced in developing and emerging countries –that causes some job losses in OECD countries.
Not all the OECD countries have evolved in the same way. In Korea,Mexico or Ireland, the number of industrial jobs has risen. Since theindustrial fabric developed late, these countries are catching up ineffect, thanks in part to foreign investment. In the 1990s, US personalcomputer manufacturer Dell established a base and created over4 500 jobs in Ireland. In recent years, most Dell PCs sold in Europewere assembled at Limerick. Thanks to the huge number of comput-ers exported from its Irish base, Dell contributed nearly 5% of theIrish GDP. Yet in 2009, caught up in the global crisis, the companyclosed its Limerick unit and transferred production to Poland.
The North’s de-industrialisation and its negative effects on employ-ment are also due to another form of competition – wage competition,which prompts many OECD companies to outsource production.
Loss of jobs due to offshoring
The impact of offshoring in OECD countries can’t be overstated.Some of the research is quite worrisome. In 2005, one study showedthat 40% of major corporate chief executives outsourced orintended to outsource one or several units to a foreign country.While many jobs first migrated to Asia, they now also move toNorth Africa, central Europe or even the Caucasus. In 2005, Internetprovider Lycos France, a subsidiary of Spanish group Telefonica,transferred a portion of its operations to Erevan, in Armenia.
This trend isn’t limited to industry. In 2004, one in two firms wasconsidering relocating a service activity. Today, one wage earner out offive in OECD countries works in an activity that could be outsourced.
Offshoring is a direct consequence of stepped-up globalisationfrom the 1990s onward. From the moment most obstacles to

6. Does globalisation promote employment?
OECD Insights: Economic Globalisation 93
international trade were lifted, communications became instanta-neous, companies were able to establish themselves abroad easilyand production chains were globalised, companies couldn’t wait toseek out labour in least-cost countries.
The impact of offshoring on employment isn’t straightforward.Many companies only outsource part of their production to emerg-ing countries. The jobs lost in this way are in labour-intensive, low-skill areas such as assembly lines. The savings the company makesin productivity, competitiveness, etc., allow it to make new invest-ments. Its overall sales and turnover grow, allowing it to hire newworkers.
Job losses are not only due to globalisation
While offshoring is a highly visible symptom of the impact of glo-balisation on some job types, it is far from the only cause of job lossesin developed countries. In Europe, fewer than 5% of job losses inindustry and services can be explained by the decision to outsourcean activity to a lower-wage country. In France, offshoring caused13 500 industrial job losses from 1995-2001 – a relatively low num-ber compared with total job losses. A study over the period 2002-04showed that 75% of European job losses were caused by internalrestructuring following technological or process improvements orcorporate strategic re-orientation, and 15% by bankruptcies.
In the United States, the share of job losses due to delocalisation isalso low – even if it has risen in recent years. In 2003, 13 000 job losses– or less than 1% of total job losses – were due to offshoring. During thefirst quarter of 2004 alone, the number of jobs eliminated due to off-shoring had reached 2% of total job losses. As in Europe, most US joblosses resulted from productivity gains stemming from new technolo-gies and from companies’ strategic re-orientation.
Indeed, globalisation does have an impact on these factors. Aswe’ve seen, the increased economic integration of countries pro-moted growth through productivity gains and the spread of newtechnologies, allowing companies to realise considerable produc-tivity gains. Job losses due to increased efficiencies, restructuringand corporate bankruptcies can be viewed as indirect consequencesof globalisation. But these gains in efficacy and productivity alsocreate new jobs. In any event, the opening of borders to trade andinvestment isn’t the sole culprit.

94 OECD Insights: Economic Globalisation
6. Does globalisation promote employment?
Creation of new jobs in high-tech industries and services
The recent economic crisis caused a significant spike in unemploy-ment in most OECD countries. While countries’ growing interdepen-dence made it easier for the shock to spread, the shock itself was causedby the malfunctioning financial sector and some macroeconomic imbal-ances (see Chapter 8). In the decade preceding the crisis, the total num-ber of jobs in the OECD did not fall, quite the contrary – job losses insome sectors were compensated by millions of job creations.
New professions appeared, particularly in the services industry,which in Germany created 3 million jobs from 1995-2003. Business-to-business activities alone (accounting, human resources, call cen-tres, web design, logistics, etc.), hotels and restaurants, health careand services to individuals created over 2.5 million positions. Thesenew service professions often generate greater value-added thanlabour-intensive activities. The wealth thus created could bere-invested in new activities, which in turn create new jobs.
On average, the number of service-related jobs created in this waywas greater than the number of lost industrial jobs in developed coun-tries during the last decade. Between 1995 and 2005, the employmentrate in OECD countries rose 1.1% annually. This progression is higherthan the 1% annual population increase. This means that globalisationand competition from low-cost countries did not stop developed coun-tries from creating more jobs. Better still, the resulting productivitygains led to new job creations in higher-value-added sectors. In 2007,just before the global economic crisis, the average unemployment rateof 5% in OECD countries was at its lowest since 1990.
In developing countries – and particularly emerging countries –globalisation led to job creation, either through new businessesbeing created or companies offshoring from developed countries.While it may be difficult to put a precise figure on this, it can be saidthat globalisation created more jobs overall than it destroyed.
But jobs are just one adjustment variable among others. Countriescan’t ignore globalisation’s “losers”. They must implement adjust-ment and training measures to meet the challenges of globalisation(see the conversation with Paul Swaim at the end of this chapter).And, what’s more, the positive balance we refer to here only con-cerns employment volume. What about employment quality? Thisis where, more often than not, globalisation gets the blame.

6. Does globalisation promote employment?
OECD Insights: Economic Globalisation 95
Source: “Seizing the Benefits of Trade for Employment and Growth”, joint report of the OECD, ILO, World Bank and WTO, available at www.oecd.org/dataoecd/61/57/46353240.pdf.
1 2 http://dx.doi.org/10.1787/888932780190
-20
-15
-10
-5
0
5
10
GDP EmploymentTrade
2007
Q2
2007
Q3
2007
Q4
2008
Q1
2008
Q2
2008
Q3
2008
Q4
2009
Q1
2009
Q2
2009
Q3
2009
Q4
THE CRISIS: A DEEP BUT BRIEF IMPACT ON TRADE, A MORE LASTING IMPACT ON EMPLOYMENTQuarterly percentage change in GDP, trade, and employment in the G20 countries
Note: Employment data exclude India, Indonesia, and Saudi Arabia. GDP is seasonally adjusted; trade and employment data are not.
While increased international trade benefits employment overall, the high integration of international goods and services markets facilitated the propagation of shocks that can negatively impact on employment.
In real life
Albert Lebleu, 62 years old, former engineer at Metaleurop, Courcelles-lès-Lens, France
“The worst, for us, was that decisions were no longer made locally.”
The road that leads to Courcelles-lès-Lens, in France’s Nord-Pas-de-Calais, bears constant reminders of the region’s historical milestones: its glory days, with its textile factories, its wealth, its coal mines. The volcano-like silhouette of the highest slag-heap in Europe (186 metres) brings to life the flat and monotonous terrain of this little corner of the northwest. In 1914, at the beginning of the First World War, the front line was 15 kilometres away. The area was
hit by cannonades. Men from over twelve countries and three continents killed each other in the environs during this time of globalised conflict. A military cemetry at the entrance to the town keeps alive the memory of the events.
Today, low houses emphasise the peaceful nature of this village of a few thousand souls. In a room on the first floor of the small city hall, Albert Lebleu busies himself in the middle of a bric-à-brac of cases, stacked chairs and ageless computers.
At 62 years old, this trained chemical engineer with greying hair is still full of energy. The various associations he heads, including that for former Metaleurop workers,

96 OECD Insights: Economic Globalisation
6. Does globalisation promote employment?
In real life (cont.)
keep him almost as busy as ever, but this time on a volunteer basis. His plant closed suddenly in 2003. After 33 years of loyal service to the Metaleurop Nord foundry, Albert Lebleu agreed to take early retirement. During those years, he witnessed the impact of globalisation on his company. Since joining in 1970, he held various posts. In 1975, his contribution to an internal research programme resulted in the company adopting a then-unique process in the field of germanium production. The patent still bears his name, along with the names of two colleagues who fine-tuned the process with him.
Today, there is pride in his eyes as he recounts his factory’s past. In the 1960s, the Metaleurop foundry was the first to adopt the pyrolysis process for treating metals such as lead and zinc. This process was later implemented elsewhere, in Australia, North America… The booming company then changed its positioning to produce rarer metals. Metaleurop Nord was the largest global exporter of germanium, a metal used to make night-vision goggles. The factory produced a component used in liquid crystal monitors. “As a production unit, we were very technology-oriented”, remembers Lebleu.
But 35 years ago, other countries started occupying the same niche, sometimes with more recent installations and technologies – the first signs of globalisation. “Our competitiveness started to erode”, he relates. “First, Japan entered the competition in the 1970s. Then, China arrived on our markets in the 1980s, followed by India in the 1990s. To maintain our competitive edge, we had to step up equipment automation. In 1986, my team went from 19 to 16 employees.” In three decades, the workforce was halved, from 1 600 to 830 employees. The pace picked up, along with stress. “Before, workers didn’t drag their feet to come to work”, he notes. “They enjoyed chatting over coffee breaks. But the pace just kept speeding up. These relaxing moments became increasingly rare. At the same time, the average age in the company kept rising as no new people were taken on”, he continues. “In the early 2000s, the average age was 50. We had to preserve our market share to keep the factory going.” But globalisation became more present and decisions were being made further and further away. “The factories started changing hands according to the mood of the financial markets.”
In the mid-1990s, a Swiss group bought into Metaleurop’s capital. “The foundry no longer interested the previous shareholder, a German industrial group
that made a 180-degree turn to focus on… tourism. The Swiss group became a major shareholder, with one-third of the capital. Very quickly, it froze investments. We felt we were losing control over our destiny. Financial holdings, with their army of lawyers, became the plant’s real bosses”, he protests. “Faced with these entities – some of them protected in tax havens – we couldn’t do much. The problem is that globalisation happens quickly and that laws, behaviours and codes can’t keep up.”
In the meantime, the rising number of cheaper foundries in emerging countries meant that Metaleurop could no longer break even, and accounts plunged into the red. The company built up losses. “Early in 2003, the parent company turned off the tap”, recounts Lebleu, as Metaleurop’s majority shareholder dropped its subsidiary with no resources and without giving the workers any notice. At the time, there was no transnational legislation to force the parent company to honour the commitments of a subsidiary if it was not a majority shareholder. “From one day to the next, we found ourselves without jobs and without unemployment benefits. Management simply decided to abandon the production unit, hiding behind the fact that the coffers were empty at the branch level.”
Metaleurop Nord was then known as one of Europe’s most polluted sites. Hazardous chemicals were stored in the open and not one euro was spent on cleaning up. “We lived through savage capitalism in all its horror”, judges Lebleu today. “With globalisation, capital came and went across borders. They could run a factory into the ground and leave behind an ecological and social disaster.” Finally, the French authorities financed a portion of the decontamination process. Five years later, new activities have sprung up. Of the 830 employees of Metaleurop Nord, only 60 or so are still unemployed. “The social damages have been mitigated”, concedes Lebleu.
Four years later, the retired engineer has found new occupations, but he now wonders about the future of his 35-year-old daughter, also an engineer. “In the early 1970s, fewer than 10% of people in my age range had earned the baccalaureate (the secondary education diploma). Today, nearly everyone has one. Becoming an engineer in no way guarantees you a good career – you have to prove yourself constantly. On top of that, our purchasing power is not keeping pace. More and more people work for the minimum wage. And globalisation doesn’t help this at all”, he concludes.

6. Does globalisation promote employment?
OECD Insights: Economic Globalisation 97
Globalisation seems to increase disparities
in job quality
Some fear that globalisation will lower employment standards– the “race to the bottom” – as workers in industrialised countriessee their wages and work conditions align with those in low-wagecountries. Is this fear founded?
Lower salaries in low value-added sectors
Wage levels in OECD countries present a mixed picture. Faced withinternational competition, some real wage concessions are takingplace. Here again, offshoring has painful consequences. In 2008, theUnited Auto Workers (UAW) union of US automotive workers agreedto halve the wages of young workers to preserve employment at aFord plant threatened with a transfer to Mexico. On the other side ofthe Rio Grande, Mexican workers’ representatives made even greaterconcessions, with newly hired workers sometimes agreeing to start atUSD 1.50 per hour. At that rate, a Mexican worker is competitive, evencompared with a Chinese worker.
The simple threat of offshoring is sometimes enough to loweremployment quality in developed countries, because it reduces cor-porate union activism. As companies internationalised and out-sourced a number of functions, the links between the top and thebottom of the pyramid grew looser – which caused wages to rise more
“In OECD countries, globalisation is found to have disproportionate impacts on certain types of workers, particularly low-skilled workers who may also be concentrated in certain regions.”
OECD, Staying Competitive in the Global Economy – Compendium of Studieson Global Value Chains, 2008
“One of the arguments for adopting the North America Free Trade Agreement (NAFTA) was that Mexican wages would climb gradually until they were the same as in the United States. Instead of there being upward pressure on Mexican wages, US wages were subjected to downward pressure.”
Ben Davis, director of the Mexico City solidarity bureauof US union AFL-CI

98 OECD Insights: Economic Globalisation
6. Does globalisation promote employment?
slowly (see Albert Leleu’s account above). Between 2001 and 2006,the real weekly wages of average US workers – those in the middle ofthe wage distribution range – decreased by 4%, despite a 15% pro-ductivity gain. In Germany and Japan, real wages stagnated. The over-all result is that since the 1980s, the share of income from labour inOECD countries has declined. In contrast, in 2006 the share of com-pany profits exceeded 15% of the GDP of the seven most industrialisedcountries, compared with 13% in the early 1980s.
Here too, of course, situations differ from one industry to another.The workers whose wages and working conditions are under pres-sure toil in industries competing with low-cost countries. Stan-dardised and repetitive industrial and service jobs are underconstant threat of relocation. Computing, chemicals or finance arenot subjected to the same international pressure as more traditionalsectors such as textiles, cars or electronics. On the contrary, wagesin these sectors grew at the same time as globalisation intensified.
The impact of globalisation on wages in OECD countries is thereforemixed: while job quality has worsened in the now less-competitivesectors, many high-quality jobs have been created in sectors wherethese countries have a major comparative advantage in internationalmarkets. On the demand side, the development of emerging countrieshas offered new outlets for OECD area companies. With regard to theoffer, international competition has made products and services morecompetitive and has resulted in the hiring of a better-trained andmore productive workforce. Today, companies need an ever widen-ing range of specialised skills. In 2006, jobs that demanded a highcapacity for judgment represented over 40% of open corporate jobs inthe United States and nearly 70% of overall jobs created since 1998.These kinds of job are more valued and generally better paid.
The result is the appearance of a two-speed labour market inOECD countries. On the one hand, the wages of unskilled workershave shrunk. On the other, the wages of educated and experiencedworkers in prime niches have soared. Wage inequalities haveincreased over the past decades. In 2006, the richest Americansearned the equivalent of 16% of all the income generated in theUnited States in a year, compared with only 8% in 1980. Theincome gap between the richest 10% of citizens and the poorest10% has widened in developed countries, with some rare excep-tions: in Ireland and Spain, that gap actually shrank between 1994and 2005, their economic catching-up period.

6. Does globalisation promote employment?
OECD Insights: Economic Globalisation 99
But is this growing inequality only due to globalisation? Accordingto the in-depth OECD study Divided We Stand: Why Inequality KeepsRising, the relationship between inequality and globalisation andtheir effect on overall employment isn’t that obvious. The studyshows that the main factors behind wage disparities over the past
Source: OECD (2011), Divided We Stand: Why Inequality Keeps Rising.1 2 http://dx.doi.org/10.1787/888932780209
0.15
0.20
0.25
0.30
0.35
0.40
0.45
0.50
1985 2008 ()
Mex
ico
Unite
d St
ates
Israe
l
Unite
d King
dom
Italy
Austra
lia
New Z
ealan
d
Japan
Cana
da
Germ
any
Netherlands
Luxembour
g
Finlan
d
Swed
en
Czec
h Re
publi
c
Norway
Denmar
k
Rising inequalityLittle
change in inequality
Drop in inequality
Fran
ce
Hung
ary
Belgium
Turk
ey
Gree
ce
RISING INEQUALITY Inequality in selected countries, 1985 – 2008
Note: For the Czech Republic and Hungary, the period under study started in the early 1990s, not in 1985.
NB: Temporary data from the OECD Database on the Distribution of Income and Poverty.
In most OECD countries, inequality grew between the mid-1980s (the average Gini coefficient was then 0.28) and the late 2000s (with an average 0.31 Gini coefficient). For a definition of the Gini coefficient, see the graph on the evolution of inequality in China and India in Chapter 5.

100 OECD Insights: Economic Globalisation
6. Does globalisation promote employment?
decades at the global level have been institutional and politicalchanges (especially labour market rules) and technological advances.
Some job insecurity
Wages aside, many workers and union representatives point tothe increasing lack of job security. Here too, OECD firms’ ability tooffshore to low-wage countries with less rigid social legislationweakens unions’ bargaining power and exerts downward pressureon employment quality.
OECD area companies increasingly resort to part-time work andfixed-term contracts. According to the European Trade Union Con-federation (ETUC), of the 4 million jobs created in the EuropeanUnion in 2006, the share of part-time jobs has grown. In 2008,40 million EU workers held a part-time position, compared with32 million ten years ago. Some 14.5% of European workers have afixed-term contract, compared with 11.5% in 1997. According toETUC, young people all over Europe – and up to 50% of 16-25 yearolds – are subjected to this type of contract. In Sweden, 68% of youngpeople work under a fixed-term contract.
The overall picture therefore reveals a degree of insecurity inunskilled jobs in OECD countries, partly linked to increased compe-tition from low-wage countries – where laws and practices oftengive less protection to employees.
Improvement in job quality in emerging countries
One of the dark sides of globalisation is sweatshops – workshopsrun by the sub-contractors of major brands in which employeeswear themselves down working long hours for subsistence wages.Likewise, child labour and modern slavery are realities in manycountries. Some unscrupulous entrepreneurs settle in countrieswith such dire poverty that workers are willing to make consider-able sacrifices. Sometimes, the global race for the lowest wages andleast restrictive social legislation leads to situations where workerrelations resemble the law of the jungle. Countries do not alwayshave the administrative and legal infrastructure necessary toenforce the most basic employment laws.
Yet globalisation can also lead to improved employment condi-tions in developing and particularly emerging countries. ManyMNEs that have settled there to manufacture and sell products andservices have imported their original quality standards and good

6. Does globalisation promote employment?
OECD Insights: Economic Globalisation 101
practices. Local companies that have entered into partnerships withMNEs have noticed higher levels of productivity than competitorswho do not have this experience. Overall, MNEs pay their employ-ees higher wages than local companies. Likewise, their unionisationrate is slightly higher, except in the Middle East.
That said, these positive repercussions may mostly benefit skilledworkers, as opposed to manual workers performing minor or rou-tine tasks. Recent studies in Brazil and Indonesia show that when aforeign company purchased a local business, wages quickly rose10% to 20% on average. But we do not have accurate enough datato find out how these gains are distributed.
The improvements brought about by MNEs are not always auto-matic or spontaneous. The moral pressure exerted by NGOs, unionsand civil society can produce higher wages and improved workingconditions in MNE subsidiaries or local sub-contractors. In recentyears, major international groups have established in-house corpo-rate social responsibility programmes (CSR) which, while it may begood that they exist, are not always optimally effective on theground – as witness the example of Nike (see the box).
Corporate social responsibility (CSR): A mixed review for Nike, Inc.
Nowadays, the impact of CSR programmes on working conditions seems limited. The main difficulty lies in elevating employment standards in a very tense competitive environment. Nike, the US manufacturer of sports equipment, is a case in point. The brand only has 24 000 direct employees. Almost all of its production is subcontracted to some 800 manufacturers in 51 countries. In the early 1990s, Nike was the target of a very negative media campaign because it was discovered that its subcontractors
used underage workers. In reaction, Nike established a very strict supplier control system. In 2004, the firm employed 80 CSR supervisors and inspectors responsible for ensuring that subcontractors were respecting Nike’s code of conduct on the ground. Despite this army of controllers, 80% of Nike’s external suppliers failed to implement and follow the code prescribed by the US management. Controllers’ visits have until now had a very limited effect.

102 OECD Insights: Economic Globalisation
6. Does globalisation promote employment?
By way of conclusion…
In order to make an objective assessment of the impact of globali-sation on employment, we have to look at the bigger picture, Thissuggests that, overall, globalisation creates more jobs than itdestroys. But this should not be cause for celebration. For the thou-sands of workers who lose their job or purchasing power due tocompany offshoring or loss of competitiveness, it is of no consola-tion whatsoever to know that there are plenty of vacancies and thatwages are rising in other sectors or countries.
Governments cannot ignore globalisation’s “losers” – those whowork in sectors weakened by international competition. The2008 economic crisis caused unemployment rates in the OECD areato soar. By the first quarter of 2010, employment had receded 2.1%over a period of two years and the unemployment rate had risen byslightly over 50% to 8.7% – or 17 million additional jobless.
The crisis led governments to take unprecedented steps to tackleunemployment and help workers weather the storm, compared torecent recessions. Three major types of measure were implementedwhich, while not specifically aimed at job losses linked todecreased international trade, did cover them.
First, governments (including Germany and several centralEuropean countries such as Hungary) sought to prevent job lossesthrough part-time work programmes. These aimed to reduce workinghours for the entire workforce, so long as economic difficulties lasted,in order to maintain jobs at the company. Since this meant lowerwages, governments committed to make up some of the shortfall. Asthe goal of these public financing mechanisms is to preserve jobs thatare viable over the long term, they must be time-limited (say, to oneyear), otherwise governments risk permanently financing jobs that areno longer competitive. The Netherlands went one step further: compa-nies that laid off workers within six months of receiving the last subsi-dies had to refund the authorities half of the monies received.
Secondly, governments (including in Japan) aimed to support theunemployed proactively, by extending the available subsidies toinclude temporary workers who had lost their jobs. While oftendone on an ad hoc basis, this measure was still very useful to themost economically fragile jobless persons.

6. Does globalisation promote employment?
OECD Insights: Economic Globalisation 103
Finally, governments proactively increased their support for pro-grammes to help people return to work. Public budgets were consider-ably expanded, for example to hire more staff in public employmentservices. During periods of economic growth, governments shouldpreferably focus on people’s adaptability in terms of employment. Intimes of crisis, though, this isn’t enough. They need to increase thenumber of training programmes and funding for work experience, etc.
Most of these measures have been temporary, because they weredesigned to respond to an exceptional situation. A number of govern-ments progressively adjusted or terminated them in order to maintainflexibility in the employment market and guarantee competitiveness.
Long-term measures capable of maintaining employment levelsand reducing inequalities while preserving competitiveness arethose included in redistributive social and fiscal policies, as well as– crucially – in dialogue among social partners (see the conversa-tion below with Paul Swaim). More importantly, governments mustinsist on life-long educational and training policies if they are tooffer a better response to the negative effects of globalisation. Thismust be a priority, so that globalisation can promote employment– for both companies and workers.
A conversation
Paul Swaim, OECD Directorate for Employment, Labour and Social Affairs
“To remedy the negative effects of globalisation on employment in some sectors, we must help workers adapt their qualifications or expectations to the most promising employment sectors.”
The financial then economic crisis, which originated in the United States, had a severe and unprecedented impact on most developed economies, which suffered record unemployment. Doesn’t the crisis prove that globalisation destroys jobs?
The link between job losses and globalisation isn’t as obvious as it seems. Of course, the crisis caused heavy job losses in most economies, particularly in some sectors like construction and industry. But job losses
in construction were less linked to international trade, while industry was more affected than expected. This is probably due to the drop in international trade, which was also steeper than expected.
That said, while international trade fell off dramatically in Germany, for example, unemployment rose relatively moderately. This was partly because employers adopted a long-term view and preferred to keep their workforce in order to be more competitive when recovery came.
Globalisation undeniably accelerated the spread of the crisis, first to the financial sector, then to companies, then to employment – with unexpected speed and gravity due to highly integrated production and trade networks in different countries.

104 OECD Insights: Economic Globalisation
6. Does globalisation promote employment?
A conversation (cont.)
We’ve seen recently that recovery in China and other emerging countries has played a major role in the strong recovery of Australia, Germany and Korea, thanks to their dynamic exports. But while globalisation can help spread the mishaps, it also spreads the benefits of periods of economic prosperity. In terms of the volume of employment, it seems to me that globalisation is more of a catalyst than an underlying cause.
But doesn’t globalisation itself impact on the employment rate in certain sectors?
Globalisation goes hand in hand with decreased competitiveness of some industrial sectors like textiles or mass electronics in developed countries and hence, with job losses in these sectors. But it’s hard to evaluate the impact of globalisation on job volume worldwide. Openness to the global market doesn’t automatically lead to job losses. In the years that preceded the crisis, the more open countries – like Scandinavia or Switzerland, where wages are very high – did not experience a weaker employment market.
If we look at OECD countries since the early 1990s, employment levels rose before the crisis even as their economies were becoming increasingly integrated. After a peak in the early 2000s, the unemployment rate dropped. By 2007, at the height of the last economic cycle, the average unemployment rate in OECD countries had dropped to its lowest level since 1980. Trade liberalisation was also a means for a certain number of developing and emerging countries to create pressure to improve the jobs market and increase employment. But here again, this wasn’t automatic. Many developing countries didn’t benefit from globalisation because they didn’t have the necessary preconditions, like an effective and impartial legal system.
Even if the relationship isn’t automatic, it does seem that, overall, trade promotes employment gains and better living standards. It allows countries to develop specialties – hence, jobs – where they are the most competitive. In OECD countries, the term
“creative destruction” is quite appropriate. Certainly, if governments establish adequate national policies to support growth and employment, globalisation should not deter from a consistently high employment level.
What about employment quality? Doesn’t globalisation foster a race to the bottom?
Some pre-crisis concerns seem justified. Two wage indicators are quite worrying. First, the global share of wages and workers’ compensation has been dropping in relation to GDP since the late 1980s. Globalisation is no stranger to this. Experts agree that increased trade with low-wage countries such as China or Central European nations, leads to a compression of wages in industrialised countries. As workers in low-wage countries today have the same competencies as unskilled workers in OECD countries, the unskilled workers’ wages tend to drop.
Likewise, globalisation lowers the wage bargaining power of unions – in case of disagreement, employers can always threaten offshoring. But globalisation also increases many workers’ purchasing power by lowering the prices of a range of consumer goods used in everyday life. Also, not all workers in developed countries lose out in terms of wages. Highly skilled workers in the high-tech sectors have had wage increases.
So employment quality evolves differently depending on the skill level?
This brings us to our second concern: the gap is widening between the top and the bottom of the wage pyramid. This phenomenon can be observed in two-thirds of OECD countries. The gap has been widening for quite a while already in the United States and United Kingdom. In Continental Europe, inequalities were less pronounced – but the wage gap has deepened in the past 20 years or so. Several studies show that the fragmentation of union power plays a major role in this respect.

6. Does globalisation promote employment?
OECD Insights: Economic Globalisation 105
A conversation (cont.)
The fact that the wage inequalities were less pronounced in Europe than in the United States was due mainly to unions having more centralised influence on wage determination. Scandinavian countries used to have a particularly advanced social consultation system. Now they are moving away from this model, decentralising further and giving more margin to sector discussions at lower levels. It’s hard to predict for now how far this process will take them. But with rising international competition, solidarity among different social segments will probably not be as much a given as it was in the 1960s.
Of course, we can’t align all wages, as it would have a negative impact on productivity and competitiveness. But to maintain an acceptable level of inequality, some mechanisms are less harmful to competitiveness – for example income transfers by public authorities, redistributive tax systems, support for education and training…
So it’s been proven that globalisation increases wage inequalities?
Rising inequalities do not stem just from globalisation. In the United States, the consensus 10 years ago was that rising inequality was caused by the reduced power of unions and by globalisation (two related factors), as well as by technological evolution. It’s quite clear that the changing nature of technology has become a major differentiating factor. Twenty years ago, knowing how to use a computer efficiently was not a decisive asset, whereas it most definitely is today. It’s hard to determine which – globalisation or technology – has had more impact on employment. Nevertheless, we believe that technological development still has more influence on rising inequality than global economic integration.
Why is employment flexibility so vital?
With globalisation, some employment flexibility is vital to corporate competitiveness, hence growth, which in turn promotes employment. In countries such as France where layoffs are
a complicated matter and existing jobs are highly protected, it’s a lot harder to make a place for oneself on the job market. Which is why young people are increasingly turning to interim or temp work and internships until interesting jobs become available.
The recent economic crisis showed that this situation forces young workers to bear the lion’s share of the flexibility burden. For example, during the last year of the crisis (from Q4 2008 to Q4 2009), the employment rate dropped 8.4% for workers aged under 25, compared with a 2.2% drop for workers aged 25 to 54 and a 1.7% hike for workers aged 55 and over. The result is very high unemployment among youth in some countries such as Spain, where one working-age youth out of two is unemployed. There is, however, an encouraging sign: some countries where this duality is pronounced are trying to introduce reforms to even out the employment protection offered to some categories of worker.
Is globalisation incompatible with job security?
That seems to be going too far. Some degree of flexibility is vital, but this doesn’t mean that there should be no supportive measures in place – quite the contrary. Some countries have placed textile workers in training programmes. Others have set up training systems for older workers. Their success isn’t always a given, as it’s not easy to undergo training and master computer tools when school is a distant – and often not very positive – memory. It’s all the more difficult as there is no guarantee that an employer will not choose to hire a 23-year-old with equal qualifications. Our research shows that the most effective solution is often to help unemployed workers find a position close to the one they held in their original sector. Of course, from a macroeconomic viewpoint it is better to help people move from declining sectors to developing sectors. But this doesn’t necessary hold true at the microeconomic level.

106 OECD Insights: Economic Globalisation
6. Does globalisation promote employment?
A conversation (cont.)
Effective support measures can also include wage levels. Some countries test wage insurance systems, knowing that the job a person will find after a restructuring will often earn less than the previous one. The United States, France, Germany are testing such systems. In the United States, the company must prove that the restructuring was due to international competition. But here again, we don’t have enough hindsight yet to evaluate the impact of these measures.
The measures that seemed most essential to countering the negative effects of globalisation on employment involve helping workers adapt their qualifications or expectations to the most promising employment sectors. Whatever the case may be, the best solution isn’t to close oneself to international trade, but rather to offer the best possible educational level to young generations and life-long training to workers – in short, to allow people to climb the social ladder rather than tumble down to the lower wages.
Is a good education sufficient to find a job today?
University graduates do not feel as privileged as they used to. They are feeling more insecure. Previously, 10% of the population
went to university. Now, it’s 50% – even 80% in some countries. Yet senior management and executive positions are not more plentiful, and a huge gap has arisen in some countries between supply and demand for them. Over-qualification – where people are considered too skilled to fit a position – is also a cause of unemployment.
International competition is increasing even in sectors that require a high level of qualifications. An Indian physician can now analyse scans taken in Austria. This was unimaginable only 10 years ago, when Western specialists could not even imagine having to compete one day with radiologists in Mumbai! More and more, people want life-long training so that they can adapt to major technological, economic and social evolutions. Clearly, governments must play a role in this respect.
That said, even though the race for university degrees and international competition has risen in the OECD area, there is still a higher likelihood of finding employment if people have a higher-education degree than if they are low-skilled. Moreover, university graduates’ difficulties in finding work quickly are more often related to inadequate employment policies than to globalisation.

6. Does globalisation promote employment?
OECD Insights: Economic Globalisation 107
Find out more
FROM OECD…
On the Internet
The OECD website’s “Trade and Jobs” page summarises the organisation’s analyses on globalisation’s impact on employment and provides varied, clear and useful sources: www.oecd.org/trade/tradeandjobs.htm.
OECD work on employment is available at: www.oecd.org/employment.
International Collaborative Initiative on Trade and Employment (ICITE): A joint initiative of 10 international organisations including the OECD, the World Bank and the World Trade Organization (WTO), the ICITE aims to provide a better understanding of how trade interacts with employment; promote dialogue on these issues; and to develop policy-relevant conclusions: www.oecd.org/trade/ICITE (in English only).
Publications
OECD Employment Outlook 2011: An annual report of the OECD on employment in OECD countries and beyond. The 2011 edition focuses on the impact of the global economic crisis. While most economies are experiencing a surge in production, employment will take longer to recover. Chapter 1 evaluates how the safety
net functioned in OECD countries in the throes of the “Great Recession”. Chapter 2 analyses the effect of social protection systems on the employment market in emerging economies.
Divided We Stand: Why Inequality Keeps Rising (2011): This OECD book examines to what extent economic globalisation, technological advances based on competencies and institutional and regulatory reforms have had an impact on wage distribution.
Globalisation, Employment and Wages (2007): This OECD Policy Brief reviews among others the consequences of increased international competition on employment levels and studies the evolution of real wages in OECD countries in recent years.
… AND OTHER SOURCES
Prospects for Foreign Direct Investment and the Strategies of Transnational Corporations (2005-08): This report of the United Nations Conference on Trade and Development provides insight to understand the strategies of companies undergoing offshoring and their obvious effects on employment in the country they are leaving.

KPA Policy Paper May 25, 2016
Page 1
Dear Andrew, I am a big fan of the ‘At Issue’ panel on the CBC ‘The National’ newscast, and your contributions to it. Well-reasoned common sense has been your trademark. So your column on the CPP Investment Board last week came as a surprise. You told readers that the manager of their collective CPP nest egg had a “conspicuously bloated” organization, and had “plunged into an increasingly esoteric risky range of private investments” for “no appreciable [financial] pay-off”. You also declared the just-released Annual Report “unreadable”. I agree the CPPIB Annual Report needs a short, readable summary, and that is what I am going to provide you here. You declare that investment theory implies “active managers cannot consistently beat the market”. That is true if all participants have access to all information, and interpret and use that information identically. In the real world, these assumptions do not hold. For example, a recent academic study found that a sample 500,000 Canadian retail mutual fund investors consistently underperformed ‘the market’ by an average 3% per year over the course of the last 15 years. Why? Due to excessive use of high fee mutual funds and value-destroying ‘buy high-sell low’ trading activity. And what about their 5,000 advisors? It turned out their own accounts underperformed the market by an even worse aver-age 4% per year for the same reasons. The researchers pronounced the cause of these disastrous investment results as “misguided investment beliefs”.1 What about long-term investors who have systematic (legal) access to a broad range of macro and micro information and, on average, interpret and use it correctly? I showed in a recent paper that investors with these characteristics consistently outperform ‘the market’ by statistically significant margins.2
So what kind of investor is CPPIB? Its Annual Report is clear about that. CPPIB sees itself as a long-term global investor with good macro and micro information sources, and an ability to turn that information into actionable investment decisions, especially in the expert-intensive (and expensive) private debt, equity, real estate, and infrastructure markets. Active investors of this kind (rather than the buy-high/sell-low short-term traders) are a key ingredient of functional capitalism. It is these kind of investors who transform retirement savings into wealth-producing capital.
POLICY PAPER
AN OPEN LETTER TO ANDREW COYNE IN RESPONSE TO HIS MAY 18, 2016 NATIONAL POST COLUMN:
“CPP BOARD CAN’T ESCAPE BLAME FOR FUND’S BLOATED STATE”
Keith Ambachtsheer
May 25, 2016

KPA Policy Paper May 25, 2016
Page 2
So how is CPPIB doing? Has there really been “no appreciable pay-off” from its active, labour-intensive (and hence more costly) strategies to date? Let’s take the last five years as the period during which these ‘active’ strategies have been in full force. Over this period, CPPIB’s net return (i.e., after all expenses) was 10.6% per year versus a 9.1% return for ‘the market’.3 The Annual Report translates this 5-year return outperformance into $16 billion of additional net value-creation for the CPP’s 19 million participants. These results are in line with previous research findings for this kind of active investing.4 Just to make sure you ‘get’ this, let me make the same point differently. If, over the course of the last five years, CPPIB had invested in its ‘reference portfolio’, its estimated value increase from March 31, 2011 to March 31, 2016 would have +$89 billion. Instead, the actual increase was +$105 billion, a net value-added increase of +$16 billion due to CPPIB’s active management strategies. Andrew, do you really believe that this additional $16 billion active management contribution (after all costs) to CPP’s assets over the course of the last five years represents “no appreciable pay-off” due to its chosen strategic stance? Aren’t you being a bit churlish about the significance of this $16 billion value-added pay-off? I said above that well-reasoned (and well-researched) common sense has been your trademark over many years. By that standard, your recent CPP column was an anomaly. I wish you a speedy recovery to your old self. Yours sincerely, Keith Ambachtsheer 5 President, KPA Advisory Services Ltd. Director Emeritus, International Centre for Pension Management Rotman School of Management, University of Toronto Endnotes
1. See Linnainmaa, Melzer, and Previtera (2015), “Costly Investment Advice: Conflicts of Interest or Misguided Investment Beliefs?”
2. See Ambachtsheer (2014), “The Case for Long-Termism”. See also my new book “The Future of Pension Management: Integrating Design, Governance, and Investing”.
3. ‘The market’ in this case is CPPIB’s ‘reference portfolio’, which it defines as a low-cost way to achieve CPP’s long-term return objective. You argue the ‘reference portfolio’ is less risky because it has greater liquidity. This is irrelevant: the CPP doesn’t need liquidity and thus illiquidity is not a CPP risk. As a further point, the CPPIB’s 10.6%/yr. is net of all implemen-tation expenses, while no implementation expenses are deducted from the ‘reference portfolio’ gross return of 9.1%. Thus arguably, the 9.1% overstates the ‘reference portfolio’s’ achievable return.
4. See endnote 2 above. As a specific example, Ontario Teachers’ has outperformed its benchmark portfolio by a net 2.2% per year over the course of the last 25 years, adding $36 billion of value due to its active management strategies.
5. I was involved in the CPP reforms that created the CPPIB. Since its creation, I have occasionally provided strategic advice to the organization through KPA Advisory Services. I am also a co-owner of CEM Benchmarking Inc., which provides ‘value-for-money’ benchmarking services to hundreds of pension organizations around the world, including CPPIB.
The information herein has been obtained from sources which we believe to be reliable, but do not guarantee its accuracy or completeness.
Published by KPA Advisory Services Ltd., Toronto ON Canada 416.925.7525. www.kpa-advisory.com

KPA Policy Paper July 12, 2016 Page 1
Copyright 2016 KPA Advisory Services Ltd. www.kpa-advisory.com
“ Given the importance of the changes being made to the CPP and the wider implications
for Canada’s retirement income system, it’s unfortunate that an expert of Ambachtsheer’s stature has fuelled misunderstanding over the benefits of CPP expansion”.
The Fraser Institute
The last thing in the world I want to do is to fuel misunderstanding over the benefits of CPP expansion. The Fraser Institute (FI) believes I did this in demonstrating that all five of its criticisms of CPP expansion were off the mark ‘Is The New Canada Pension Plan Expansion Based On Myths Or Facts? A Readers’ Guide’ . They said so last Friday in a piece titled ‘Rebuttal—5 Myths About The CPP’, which is the source of the quote above. I rebut their rebuttal in this short (and I promise final!) piece in this exchange. Understanding the Looming Retirement Savings Challenge I reminded FI that the CPP enhancements were not about today’s retirees, but about giving today’s young people “a reasonable shot at retirement security 20, 30, 40 years down the road”. The underly-ing premise was that today’s young people face a radically different set of economic circumstances than their ‘boomer’ parents did when they were young (e.g., later workforce entry, later family formation, higher house prices, fewer workplace pension plans, lower investment returns). FI respond-ed that I “provided no evidence to support his assertion”. There are, in fact, a number of recent studies that have reached that same conclusion. One example is the C.D. Howe study by Moore, Robson, and Laurin titled “Canada’s Looming Retire-ment Challenge: Will Future Retirees be Able to Maintain Their Living Standards upon Retirement?” The authors conclude “while only about 16% of recent retirees are in circumstances that imply a substantial reduction in consumption post-retirement, the persistence of recent trends would raise this number over time to 44% of current 25 to 30-year-olds…..”. FI is of course right to say that this is only a projection which may, or may not be on the mark. The frustrating thing about the future is that it is uncertain.
POLICY PAPER
UNDERSTANDING THE BENEFITS OF CPP EXPANSION:
ONE MORE TRY
Keith Ambachtsheer
July 12, 2016

KPA Policy Paper July 12, 2016 Page 2
Copyright 2016 KPA Advisory Services Ltd. www.kpa-advisory.com
Understanding the Role of Investment Returns FI claims I am mistaken “that future retirees will benefit from strong investment performance of the CPP Investment Board (CPPIB). This simply isn’t true”. This assertion unveils FI’s fundamental misunder-standing of the difference between ‘pay-as-you-go’ and ‘pre-funded’ pension arrangements. As there are no investment reserves in ‘pay-go’ arrangements, investment performance is an irrelevant concept. However, as ‘pre-funded’ pension arrangements do have significant investment reserves, simple logic suggests investment performance matters a lot in the ultimate cost of the pension arrangement. Specifically, the stronger the investment performance, the lower the contribution rate required to pay the promised benefits. The original 1960s version of the CPP was a largely pay-go arrangement, meaning that only sufficient contributions were collected over time to pay the calculated benefits (plus a small reserve). This original version of CPP (call it ‘Old CPP’) was modified in the 1990s to build up a larger reserve fund to stabilize the CPP contribution rate at 9.9% of pay (it is still that today). So today’s CPP is about 20% funded and 80% pay-go. FI is correct to point out that as a result, CPPIB’s investment return will only have a minor impact on the ‘value-for-money’ return CPP participants get on their contributions in the form of ‘Old CPP’ benefits. What FI seems to not have caught up with is that the economics of CPP enhancements (‘New CPP”) are quite different, because the CPP Act requires these enhancements must be fully pre-funded. This means that the investment return CPPIB earns on ‘New CPP’ contributions will matter a great deal. The most recent CPP Actuarial Report is very clear about this. Table 13 on page 33 projects that the sources of ‘Old CPP’ revenues will be 70% contributions and 30% investment returns, and 30% contributions and 70% investment returns for ‘New CPP’ revenues (i.e., for the fully-funded piece). Understanding the Elephant in the Canadian Pension Room The FI rebuttal sings the praises of people saving for their own retirement, ignoring the empirical reality that most of those savings run the gauntlet of Canada’s investment ‘advisor’/high mutual fund fee net-work. My critique of FI’s ‘’Five Myths about the CPP’ article cited a study which found that a sample of 500,000 Canadian mutual fund investors underperformed the market by an average 3%/yr. over the last 15 years. This kind of investment outcome has disastrous consequences for these unsuspecting investors. For example, $100 invested by a young worker today grows to $326 over a 40-year working life if it earns a real return of 3%/yr. If that 3%/yr. goes to other people, the starting $100 is still only $100 40 years later. This amounts to 70% pension ‘haircut’ for our young worker, and constitutes compelling evidence of a ‘market failure’. It is the elephant in the Canadian pension room. How can the market for pension investment services fail its participants so badly? George Akerlof was awarded the 2001 Nobel Prize in economics for the explanation. He demonstrated that fair market outcomes require fully-informed market participants. If a market suffers from ‘asymmetric’ infor-mation, that market will fail and produce unfair outcomes. Akerlof teamed up with another Nobel Prize-winning economist Robert Shiller to demonstrate the implications for retail investors. They show that the kind of investment outcomes cited above are predictable events. I urge FI to read their 2015 book “Phishing for Phools: The Economics of Manipulation and Deception”. Speaking of books, I am sure my FI friends have read “Cost and Choice” by the most conservative, libertarian economist ever to be awarded the Nobel Prize: James Buchanan in 1986. He argued that just because a government is democratically elected doesn’t mean they cannot mess up economic policy

KPA Policy Paper July 12, 2016 Page 3
Copyright 2016 KPA Advisory Services Ltd. www.kpa-advisory.com
decisions….and indeed, often do. However, in the end, even Buchanan recognized the possibility of market failures and the legitimate right and obligation of democratically-elected governments to address them. While Buchanan might have questioned the decision of Canada’s federal and provincial governments to enhance the CPP, my guess is that he would also have seen it as a legitimate response to a clear case of ‘market failure’. That’s it. I’m done. Keith Ambachtsheer
The information herein has been obtained from sources which we believe to be reliable, but do not guarantee its accuracy or completeness.
Published by KPA Advisory Services Ltd., Toronto ON Canada 416.925.7525. www.kpa-advisory.com


Hedge Fund Risks and FeesWhat Trustees Need to Know and How They Can Find Answers
CtW Investment Groupc o m m i s i o n e d b y :
june
2016

Hedge Fund Risks and FeesWhat Trustees Need to Know and How They Can Find Answers
CtW Investment Groupc o m m i s i o n e d b y :
Hedge Fund Risks and Fees What Trustees Need to Know and How They Can Find Answers
1
intr
oduc
tion
VER THE PAST DECADE, many teacher pension funds have begun investing
in hedge funds or funds of funds as part of their allocation to “alterna-tive investments.” Hedge funds have been marketed to pension fund trustees as an ideal solution to the challenges pension funds face: finding investments that earn sufficiently high returns to meet promises to beneficiaries, but without exposing the fund to excessive volatility, especially during down markets. Because they are not con-strained with respect to the type of securities (stocks, bonds, commod-ities, etc.), positions (both short and long), or strategies they employ, hedge funds claim to be able to achieve the best of both worlds: equity-like high returns but with bond-like low volatility. Moreover, media accounts of the vast fortunes hedge fund man-agers have accumulated further encourage trustees to believe that by investing in hedge funds they will enable their pension fund to benefit from extraordinary invest-ment expertise and talent, provid-ing higher returns than available through traditional investment vehicles and strategies. But in recent years, it has become apparent that hedge funds
do not deliver on these promises. Instead, the average hedge fund achieves returns inferior to those of ordinary public market invest-ments, in part because they charge fees several orders of magnitude larger than those pension funds pay for their traditional invest-ments. Worse still, investigative jour-nalists and federal regulators have determined that hedge funds also impose a variety of hidden fees and charges on their limited part-ners, further reducing returns for pension funds and undermining retirement security. Pension fund trustees should insist that any existing hedge fund investments are carefully scrutinized to ensure that they are not being assessed fees or other costs in excess of those to which they contractually agreed, for instance by posing the questions listed in the final section of this report to hedge fund repre-sentatives. Moreover, pension fund trust-ees should actively engage in their fund’s asset allocation and invest-ment manager selection processes, in order to ensure that they are fully informed as to the true costs and benefits of hedge fund invest-ments, and that their fund is not taken advantage of by unscrupu-lous marketers and managers.
O

june 2016
2
Hedge Funds Underperform Conventional Investments
The notion that hedge funds pro-vide returns that are comparable to public equity investments but at levels of risk comparable to fixed income (bonds) investments has been central to the marketing strategies of hedge funds, place-ment agents, and alternative asset consultants for at least two decades. For instance, a 2012 report issued by the accounting firm KPMG and the Alternative Investment Management Associa-tion (AIMA, a hedge fund industry group) claimed that “from 1994 to 2011, our performance analysis shows that hedge funds have significantly outperformed equi-ties, bonds and commodities on a risk adjusted basis.” Journalists and public policy analysts often make similar claims, as for instance Jonathan Rothwell of the Brookings Institution, who recent-ly suggested that the lower level of regulation to which hedge funds are subject (compared to mutual funds) “have allowed hedge funds to consistently outperform stocks and other assets by roughly 2 per-centage points each year.” However, since the financial crisis began in 2007, a growing chorus of critics have suggested
that hedge fund performance no longer lives up to these claims: in particular, Bloomberg Business-week published a cover story in 2013 challenging the notion that hedge funds deliver returns to investors that are superior to those available to them through more conventional and less expensive instruments. Indeed, as long as a decade ago there have been inde-pendent analysts and academics who have pointed out that the returns associated with either broad hedge fund indexes or even specific hedge funds can be very cheaply and accurately emulated with publicly available, low-cost investment products. In order to assess this debate, we should bear in mind a few pre-liminary points. First, “hedge fund” describes more of a legal category than a financial one: a hedge fund is classified as such because it cannot offer its prod-ucts to retail investors in general, but only to (high income and high net worth) accredited investors. Thus, a hedge fund could in princi-ple have a portfolio identical to a retail mutual fund. Nevertheless, hedge funds are able to utilize financial instruments (including commodities and derivatives) and strategies (e.g., shorting, leverage) that law, regulation, and pension f

Hedge Fund Risks and Fees What Trustees Need to Know and How They Can Find Answers
3
fund policy will typically prevent mainstream investment managers from using. So, while we will below compare the performance of typical hedge funds to typical conventional investments, you should be clear that the hedge funds in which your pension fund has or is considering an invest-ment may have significantly different characteristics and historical performance. Second, in comparing these different investment products, we will be using publicly available historical data for indexes com-piled by financial companies and trade groups. For conventional assets, the construction and reporting of these index returns is straightforward. But because indi-vidual hedge funds are both creat-ed and closed down year-to-year, there are a variety of potential biases built into these indexes. For instance, when an existing hedge fund is no longer counted as part of a hedge-fund index (because it has been closed down, for instance), its subtraction from the index may mechanically boost per-formance for that period (since poor performing funds are more likely to shutter). This is called “survivorship bias” and has been
found to inflate hedge fund index returns by 3.7% annually. Additionally, when a new hedge fund is added to an index, the index typically incorporates the new fund’s performance in prior periods, which will typically boost the index for those periods. This is called “instant history” or “backfill bias” and has been estimated to boost reported performance by 3% annually . Moreover, reporting performance data to the databases maintained by the index compilers is voluntary, such that the perfor-mance of the index may not be representative of the full popula-tion of hedge funds. This “self-se-lection bias” has been estimated to boost hedge fund index returns by 1.9% annually. Taking all of these possible biases into account, Pictet Alterna-tive Advisors reports that “cumu-lative studies have estimated the impact of biases on performances to range between 0.7 per cent to 10.7 per cent per annum.” Even at the minimum of this range, the upward bias would significantly distort reported performance: over a thirty year time period a 0.7% annual boost would bias the cumulative return upward by 18%. So, while the hedge fund
‘Survivorship Bias’ \-ˈvī-vər-ˌship bī-əsˈ\
The tendency for investment products and firms to be excluded from perfor-mance reporting, generally due to poor results or low asset accumulation.
This phenomenon results in an overestimation of past returns.

june 2016
4
indexes are the only reasonable way we have to evaluate the rela-tive performance of these invest-ment products, you should be aware that these measures are likely biased upward to a substan-tial degree. Third, the indexes typically require the hedge funds they include to report returns after feeshave been subtracted. In contrast, the indexes for conventional investments do not make any effort to net out investment man-agement fees (because they are indexes of instruments – stocks and bonds -- and not of managers or investment products). However, as we will see short-ly, there are good reasons to believe that at least some of the fees being paid to hedge fund man-agers are not fully netted-out of the reported returns, again sug-gesting an upward bias. In any event, you should bear in mind that your own pension fund’s return from investing in conven-tional instruments may be a bit lower than the returns reported here, because your pension fund will be incurring some investment management and trading costs.
With these preliminaries out of the way, let’s look at the historical per-formance of hedge funds versus conventional pension fund invest-ments in stocks and bonds. For this analysis, we use the Credit Suisse Tremont Hedge Fund Index, the S&P 500 index, and the Barclays Capital US Aggregate Bond Index. We will be looking at the years 1994 to 2015, more or less that same period analyzed in the KPMG/AIMA report noted above, but including the four additional years of data that have since become available. Figure 1 reports the compound annual growth rate for each of these products, as well as a “Pension” return representing an equally-weighted combination of the stock and bond returns (cur-rently pension funds hold roughly equal shares of their assets in public equity and fixed income). We have chosen to break this time period into four segments, the 1990s (including the tech stock bubble), the pre-crisis 2000s (including the housing bubble), the two-years during which the finan-cial crisis was most acute (2008-2009), and the post-crisis recovery from 2010-2015.
Contrary to the assertions made by the hedge fund industry, hedge funds do not typically outperform conventional assets ...

Hedge Fund Risks and Fees What Trustees Need to Know and How They Can Find Answers
5
Contrary to the assertions made by the hedge fund industry, hedge funds do not typically outperform conventional assets, and there would appear to be little reason for pension funds to create hedge fund allocations, based on returns alone. Within these time periods the relative performance of hedge funds was not superior to conven-tional asset classes. During both the 1990s and the post-crisis recov-ery, stocks clearly earned higher returns than hedge funds, while during the crisis itself, bonds earned a superior return. Hedge funds only outperformed during the 2000-2007 period. Note also that, during both the 1990s and 2010s, our model pen-sion fund outperforms the hedge
fund, while trailing its perfor-mance by a small amount during the crisis and by a wider margin during the 2000s. Again, this study utilized the hedge fund industry’s own data that likely has a bias of between 0.7% to 10% per year. These biases may explain the large discrepancy between the return figures pre-sented here and CEM Benchmark-ing’s recent findings that “Average value added net of costs was -1.88 per cent,” as the CEM study was able to utilize actual fund data from over 300 funds. That said, one of the key arguments made in favor hedge fund investing is that hedge funds can generate these returns while incurring much less risk.
representing an equally-weighted combination of the stock and bond returns (currently pension funds hold roughly equal shares of their assets in public equity and �xed income). We have chosen to break this time period into four segments, the 1990s (including the tech stock bubble), the pre-crisis 2000s (includ-ing the housing bubble), the two-years during which the �nancial crisis was most acute (2008-2009), and the post-crisis recovery from 2010-2015.
1994 - 1999
2000 - 2007
2008 - 2009
2010 - 2015
1994 - 2015
-15% -10% -5% 0% 5% 10% 15% 20% 25% 30%
Figure 1: Hedge Fund Returns Don’t Consistently Beat Conventional EstimatesHedge Fund CAGR S&P 500 CAGR Bond CAGR Pension CAGR

june 2016
6
It is conventional in finance to define “risk” as the volatility of returns, and operationally to mea-sure and operationally to measure risk by the standard deviation of those returns. Figure 2 below reports the volatility of annual returns for the indexes represent-ing each asset class as well as our model pension fund. Bear in mind that volatility is costly to investors, so low volatility is generally to be preferred to high volatility. And, in each time period shown, the volatility of the hedge funds is indeed lower than that for public equity. However, hedge fund volatility is clearly a good deal higher than bond volatility, with the consequence that our model pension fund has lower
volatility than the hedge funds in both the 1990s and the financial crisis, with slightly higher volatili-ty in the other two periods. According to CEM Benchmarking’ s recent study, “The reality is most hedge fund portfolios behaved like simple blends of equity and debtwith unattractive returns and no risk-reducing characteristics.” This finding suggests that we need to consider “risk adjusted returns” or a measure of how efficiently different asset classes combine returns with risk. Again the claim made by hedge funds and their proponents is that hedge funds provide a better combination of return and risk than otherwise available to investors.
1994 - 1999
2000 - 2007
2008 - 2009
2010 - 2015
1994 - 2015
0% 5% 10% 15% 20% 25% 30% 35%
Figure 2: Hedge Fund Volatility Higher Than Balanced Pension Fund
Hedge Fund Volatility S&P 500 Volatility Bond Volatility Pension Volatility

Hedge Fund Risks and Fees What Trustees Need to Know and How They Can Find Answers
7
In Figure 3, we have calculated the Sharpe ratio for each asset class (returns above the risk-freerate per unit of volatility). One point to note about Figure 3 is that in none of these time periods are the hedge funds the most efficient investment: they trail stocks in the 1990s, bonds in the early 2000s, and stocks again in the 2010s. As a result, our model pension fund generates higher risk-adjust-ed returns than hedge funds in three of the four time periods. Moreover, our model pension fund with an equally weighted mix of stocks and bonds is the most efficient investment vehicle ana-lyzed here for both the earliest and most recent periods. Contrary to the frequent claims from the
hedge fund industry, but congru-ent with the arguments hedge fund critics have raised, it does not appear that hedge funds consis-tently provide a more attractive combination of risk and return than pension funds have been able to generate through the judicious balancing of conventional assets. Moreover, as we noted above, the hedge fund index we are using likely biases actual performance upwards due to the exit of poor performing funds from the index, the entry of new funds with their performance history (likely supe-rior to the exited funds), and fees paid by hedge fund investors over and above those reported by the hedge fund constituents to the company constructing the index.
Figure 3: Risk Adjusted Returns for Conventional Investments Match Hedge Funds
Hedge Fund Sharpe S&P 500 Sharpe Bond Sharpe Pension Sharpe
-0.50
1994 - 1999
2000 - 2007
2008 - 2009
2010 - 2015
1994 - 2015
0.00 3.00 12.00 14.00

june 2016
8
The
Impa
ct o
f “
Head
line
” He
dge
Fund
Fee
s
8
E WILL CONSIDER THE impact of three differ-ent categories of hedge
fund fees: those that are most explicitly disclosed and easily calculated (e.g., 2%/20%), fees that are disclosed in partnership docu-ments but that may be difficult for outside observers to calculate or track over time, and fees that are a consequence of hedge fund man-agement decisions, such as how often to trade or to update key benchmarks. We will examine headline fees in this section, and the additional and hidden fees in the two subsequent sections, respectively. The easiest component of hedge fund fees to explain and understand are the “headline” fees: a management fee assessed as a percentage of assets under management (typically about 2%) and an incentive fee assessed as a percentage of profits earned by the fund in a given year (typically 20%). Often the incentive fee is calculated in a way that takes account of the past “high water mark” for the fund, so that inves-tors will only pay the fee on profits over and above those required to make up for losses in previous years. Sometimes, hedge funds also have a “hurdle rate” which
the fund must clear before the incentive fee must be paid. Because this fee structure is standard across the alternative assets industry (private equity, venture capital, and private real estate funds calculate fees in an almost identical fashion), these fees have attracted the most atten-tion from pension funds and other investors, and in recent years this attention has resulted in some-what lower fees for investors will-ing and able to drive hard bar-gains. Suffice it to say that these fees are far in excess of those that a pension fund should expect to be paying for conventional asset management. While those fees vary by asset class, strategy, and manager, generally large US pen-sion funds are able to keep total fee payments below 0.25%, and the very largest pension funds have even lower investment manage-ment costs. The justification for these high hedge fund fees has been that hedge funds perform so much better than conventional investment products that the addi-tional fees are more than made up for by additional returns. As we noted above, this does not actually appear to be the case, at least as far as we can tell from comparing
W

Hedge Fund Risks and Fees What Trustees Need to Know and How They Can Find Answers
9
the available index data. Never-theless, it is worth understanding just how large a bite out of poten-tial returns hedge fund managers take just with these headline fees. Figure 4 illustrates the impact of investment management fees on an investment with a constant rate of return over a 30-year period. Using the “no fees” return as a benchmark, we can see that a fee level 0.5%, not unusual for retail stock index funds, would produce a somewhat smaller ending value for the investment, but the hedge fund fees dramatically reduce investment value over time. Table 1 below shows that over the 30
year period considered in this exercise, the hedge fund fees require investors to accept a 66% markdown relative to the no-fee benchmark, in contrast to the much smaller 13% cumulative discount borne by investors paying fees closer to those paid by pension funds. However, as we all know, investment performance is subjectto substantial variation over time.In order to take such variation intoaccount, and to evaluate how it interacts with underlying perfor-mance, we have generated randomreturns for a 30-year period matching the average return and standard deviation of the S&P 500 from 1994-2015. Figure 5 illus-trates the impact of these fees on an investment whose return varies. To calculate the hedge fund fees reflected in Figure 5, we charged the 20% incentive fee only in periods where the assets under
Figure 4: Headline Fees on Constant Returns
0 5 10 15 20 25
No Fees .5% Fee HF Fees$1,600
$1,400
$1,200
$1,000
$800
$600
$400
$200
$0
Table 1: 30-Year Total Return After Fees, Constant Returns
No Fees Public Fees HF Fees
Constant
Discount
$1,345.15 $1,171.91 $462.83
13% 66%

june 2016
management exceed those in any prior time period; i.e., when the model hedge fund starts at or above its all-time high water mark. In practice, as well will discuss below, hedge funds may reset their high water mark more frequently, resulting in higher fees. Nevertheless, the more conser-vative assumptions used here suffice to demonstrate that, as shown in Table 2, the greater the return to the underlying invest-ments held in the hedge fund, the larger the share of investment returns captured by the hedge fund managers fees. So, whereas an investor enduring low returns (in our randomly generated sample these averaged 3%) would take home 48% less than if no fees were charged, an investor in a high return (16%) period would be forgoing 58% of the baseline return earned by the underlying assets.
One additional point to consider is that in what are called hedge-funds-of-funds, in which an investor buys a share of a fund that then invests in a portfolio of hedge funds, these headline fees would double-up: investors bear not only the fees charged by the underlying hedge fund in which they have ultimately made an investment, but will pay nearly equal fees to the manager of the hedge fund of funds, making such products considerably more expensive.
Figure 5: Headline Fees on Variable Returns
0 5 10 15 20 25
No Fees .5% Fee HF Fees$8,000
$7,000
$6,000
$5,000
$4,000
$3,000
$2,000
$1,000
$0
Table 2: 30-Year Total Return After Fees, Varying Returns
No Fees Public Fees HF Fees
Variable (Low)Discount
$166.34 $143.17 $86.5714% 48%
Variable (High)Discount
$6,386.02 $5,592.69 $2,707.2112% 58%
10
Hedge Fund Risks and Fees What Trustees Need to Know and How They Can Find Answers
11
Additional Fees Disclosed in Partnership Documents
The large fees illustrated in Figures 4 and 5 may only be scratching the surface. While much media commentary focuses solely on headline fees, hedge funds may charge investors for a variety of costs as specified in their partnership agreements. Some of these will be trading-relat-ed expenses or costs associated with retaining the services of external professionals, including:
Interest expensesDividend expensesAdministration feesAudit feesLegal feesDirector feesStock loan feesBank, Brokerage, and Custody feesResearch expenses
While many hedge fund investors have accepted the separate expensing of items such as these over and above the roughly 2% of assets under management fee they are already being charged, it is certainly open to argument that these costs should be borne by the manager, not least because by allowing managers to add these charges to their clients bill removes any clear incentive to minimize such charges, and there-
by exacerbates the conflict of interest inherent in a princi-ple-agent relationship. This point applies with greater force to additional charges that may appear in a hedge fund’s report to its investors in a category labeled “other expenses” or some-thing similar. These line items may contain costs including:
Employee salariesTechnologyRegulatory filingsPortfolio and accounting systemsOutsourced office functionsInsuranceTrade ErrorsTravel & Entertainment
Passing on these costs to investors seems even less justifiable than those mentioned previously, because most if not all of these costs would have to be incurred by the hedge fund manager in order to have an operating business at all. Investors should not be simul-taneously bearing a roughly 2% annual charge for management, and then also be charged for tech-nology, software, or employee salaries, all of which would seem to count as basic elements of fund management. Moreover, in order to ensure than any direct charges for which their pension fund is liable, trustees and other pension fund officials should insist that

june 2016
12
hedge funds in which they invest provide a complete and detailed itemization of charges and should reject charges for basic investment management functions, instead insisting that the fund manage-ment company pay for those costs out of its already quite large man-agement fee.
Truly Hidden Fees
Over and above the headline and documented fees charged by hedge fund managers, investors in hedge funds also incur expenses as a consequence of the trading and management decisions made by the manager itself. For instance, if a hedge fund manager is able to pass through to investors charges for trading activity, then the man-ager will have much less incentive either to negotiate the best terms for executing trades, or to diligent-ly monitor broker costs on an ongoing basis. Similarly, hedge fund managers may enter into “soft dollar” arrangements in which the fund agrees to channel transactions through a specific broker in exchange for access to research. Such an agreement both limits the visibility of research charges to investors, but also mini-mizes any incentive that hedge fund managers might have to economize on such expenses. Finally, the hedge fund’s part-
nership documents may allow the manager to reset the “high water mark” for a fund on a frequent basis, enabling the hedge fund manager to reap a higher incen-tive fee without improving perfor-mance. To understand the impact of such hidden fees, specifically of the frequent updating of the fund’s high water mark, we have modi-fied the hedge fund fee model used to create Figure 5 so that, rather than charging the 20% incentive fee only when the fund starts a period with a higher balance than in any prior period, the incentive fee is paid in any period where the fund starts with a higher balance than in the immediately previous period. In the hidden fee scenario con-sidered here, the investors in the hedge fund incur cost sufficient to reduce their ultimate return by 68% compared to the underlying baseline return generated by the assets held by the fund. This rep-resents a significant increase in fees even compared to the already steep discount imposed on inves-tors just by the 2%/20% structure. Clearly, such non-transparent extra expenses generated by the trading, contractual, or other deci-sions made by hedge fund manag-ers can have a significant and neg-ative impact on pension funds and other hedge fund investors.

Hedge Fund Risks and Fees What Trustees Need to Know and How They Can Find Answers
13
Ste
ps y
ou c
anTa
ke T
o Pr
otec
t Yo
ur P
ensi
on F
und N LIGHT OF THESE SIGNI-
ficant hidden costs to hedge fund investment, which we
note again come on top of perfor-mance that may be much less impressive than indicated by available hedge fund indexes, many pension funds have taken steps to reign in hedge fund costs. First, as noted above, pension funds and other investors in alter-native assets have become increas-ingly vocal in demanding that managers lower the fees they charge; the Institutional Limited Partners Association (ILPA) has found that hedge funds in 2015 are charging somewhat lower man-agement and incentive fees in response. But some pension funds have gone much further: in 2014, the California Public Employees Retirement System (CalPERS) to eliminate its $4 billion allocation to hedge funds, and has since been winding down those investments. While not all pension funds may currently view the elimination of hedge funds as a prudent option, there are a variety of questions trustees should be posing to staff or consultants when new hedge fund mandates are brought to the
board for approval, when hedge fund managers are placed on the fund’s watch list, or generally when pension fund staff are reporting on fund performance and their oversight and monitor-ing of fund managers and invest-ments.
When a New Hedge Fund Mandate is Proposed
What headline fees will the pen-sion fund be charged?
Are there any other fees?Can the fund charge limited part-ners for any of the following:
Interest expenses Dividend expensesAdministration feesAudit fees Legal fees Director fees Stock loan fees Bank, Brokerage, and Custody feesResearch expenses
I

june 2016
14
FOLLOW-UP, IF YES:
What are the limitations the fund managers have agreed to on these fees, or are there none?
FOLLOW-UP, IF YES:
How are these additional fees calculated, and will you review those calculations?
ADDITIONAL FOLLOW-UP:
if reasonable safeguards and transparency are not in place:
How can we be assured that the fund managers are restricted from overcharging limited partners?
Will the investment staff be moni-toring all dollars taken by the man-agement firm, even beyond the headline fees, annually?
Are there any other potential means for fund managers to extract assets from limited part-ners beyond those mentioned earlier?
Do fund managers have the authority to spin-off assets to other investors and leave the underlying companies we own in a dire
situation or even facing bankrupt-cy, like what happened to Southern Cross? If so: Doesn’t that open the door to self-dealing?
What is the goal of the asset class? Is it an effort to hedge or increase real returns?
How much leverage is being used by the fund? Is there any limit on how much leverage can be used?
How much are other pension funds or similar limited part-ners paying in headline fees to this manager?
How much are limited partners generally paying managers of hedge funds with similar focus and strategy?
Will the incentive fee be paid on all profits earned by the fund, on those profits above a particular level (a hurdle rate), on profits only once the fund has made up for past losses (high water mark), or some combination?
Does the hedge fund manager have discretion to reset the high water mark or the hurdle rate?
How often or under what circum-stances?

Hedge Fund Risks and Fees What Trustees Need to Know and How They Can Find Answers
15
How much has the pension fund been paying the hedge fund man-ager in fees since its initial investment?
How does this amount compare to the amount returned to the pension fund as a result of investment gains?
Since the pension fund’s initial investment, has the hedge fund manager used its discretion to either raise fees, hurdle rates, or the frequency with which the fund high water mark is updat-ed?
If the pension fund had matched the performance of the hedge fund using a blend of its conven-tional asset managers, how much would it have paid those managers in fees?
When Considering Ongoing Monitoring of the Portfolio and Asset Allocation
When a Hedge Fund is Placed on a Watch List
What expenses are hedge fund managers allowed to charge their investors, and what expenses are they actually charging?
Have managers changed their practices with respect to con-tractually allowed charges?
Is the fund charging limited part-ners for any of the following:
Interest expenses Dividend expensesAdministration feesAudit fees Legal fees Director fees Stock loan fees Bank, Brokerage, and Custody feesResearch expenses
How much is being charged for each and what are the limitations that we have secured?
For instance, is there a limit to how much the fund can charge us for auditing or legal services? Or, do we just trust the fund managers?

june 2016
16
Will you be annually reviewing all charges to the limited partners, including those outside of the headline fees?
Can you tell us how much we are paying compared to other limited partners with similar levels of money invested?
Can you provide us with a summa-ry of all of the charges and expens-es paid to the fund managers in the past 3 years?
If we can’t review these charges and other expenses, how can we feel certain that we are being treated fairly?
How often are managers chang-ing hurdle rates or high water marks, and how much have such changes increased the fees paid by the pension funds?
How easily could the perfor-mance of the pension fund’s hedge fund portfolio be replicat-ed using conventional assets,
and how much would the pen-sion fund save in fees and expenses?
Are placement agents or other intermediaries receiving pay-ments from hedge fund manag-ers in order to facilitate commu-nication with the pension fund?
More generally, pension fund trustees should consider whether a fixed allocation (i.e., as a % of total pension fund assets) to hedge funds is prudent, considering the failure of hedge funds indexes to outperform conventional assets, the various measurement issues that plague the construction of hedge fund performance indexes, and the substantial fees pension funds must bear in order to invest in hedge funds. In discussing this question, trustees may also pru-dently consider the broader conse-quences of hedge fund invest-ments – including their effects on income inequality, corporate per-formance, and public policy.

Hedge Fund Risks and Fees What Trustees Need to Know and How They Can Find Answers
17
8
The
Broa
der
Impa
ct o
f H
edge
Fun
d In
vest
men
t S THE HEDGE FUND INDU-stry has grown over the past few decades, the
broad social and economic conse-quences of hedge fund practices have been felt more acutely and have come under greater scrutiny. While pension fund trustees, in fulfilling their fiduciary duties, must first and foremost consider the comprehensive financial returns from hedge fund invest-ments, they may also consider these broader consequences once they have satisfied themselves that there are non-hedge fund invest-ment options that provide compa-rable returns. Among the issues that trustees may wish to consider are the effects of the growth of hedge funds on income inequality, corporate performance, and public policy. Because hedge funds charge such large fees as a percentage of assets – academic research finds that total hedge fund fees are often 3.4% - 5.15% of assets under man-agement per year – and because hedge funds themselves tend to have relatively few employees or operating costs other than employ-ee salaries, the rapid growth in
hedge fund assets has translated directly into skyrocketing incomes for individual hedge fund portfolio managers and officers. As public concern over economic inequality has increased, it has become clear that financial services, and hedge fund managers in particular, play an outsize role in the top 1% and its large share of national income. Pension fund trustees have good reason to be concerned that increasing inequality may have negative economic consequences, undermining the economic perfor-mance on which pension benefi-ciaries’ retirement security ulti-mately depends. Additionally, the strategies hedge funds pursue, especially what have been called “activist” strategies in which hedge funds seek to pressure public companies to name hedge fund officers to their board of directors, restruc-ture corporations through transac-tions such as spin-offs or mergers, and increase cash returns to shareholders, have been cited as impeding the ability of public com-panies to make long-term invest-ments in their operations. The resulting changes in corporate
A

june 2016
18
decision making, including the vastly expanded volume of share buybacks over the past decade compared to prior periods, appear to have contributed to both the stagnation in productivity growth observed since 2004, as well as the increase in income inequality noted previously. This short-ter-mism may make sense to a time-limited investment vehicle, but may be damaging to long-term investors as much of their assets are affected by long-term econom-ic growth trends. Trustees willing to push back against short-term investment strategies and in favor of a long-term approach should be especially leery of the effect that rising hedge fund investments will likely have on the behavior of public corporations. Finally, some of the hedge fund managers and officers who are the recipients of the lion’s share of fees paid by hedge fund investors devote a significant part of their income to contributions to election campaigns, 527s, Super PACs, and other entities engaged in partisan political activity.
Additionally, many of these hedge fund managers also contribute to public policy-oriented non-profit organizations, including those advocating for educational vouch-ers, deregulation of charter schools, weakening employment protections for school teachers, eliminating defined benefit pen-sion benefits, and restricting the right of public employees to bar-gain collectively. Given both the very direct relationship leading from pension funds paying high fees to hedge funds, to hedge funds paying high salaries to their top managers and officers, to those individuals con-tributing to political organizations that match their partisan and ideo-logical leanings, it is well within the fiduciary responsibility of trustees to consider whether those high investment management fees are justified given the actual per-formance of hedge funds and the ultimate transfer of that fee income to entities whose activities are inimical to the interests of pen-sion fund participants and benefi-ciaries.