Investment Subsidies Resource
13
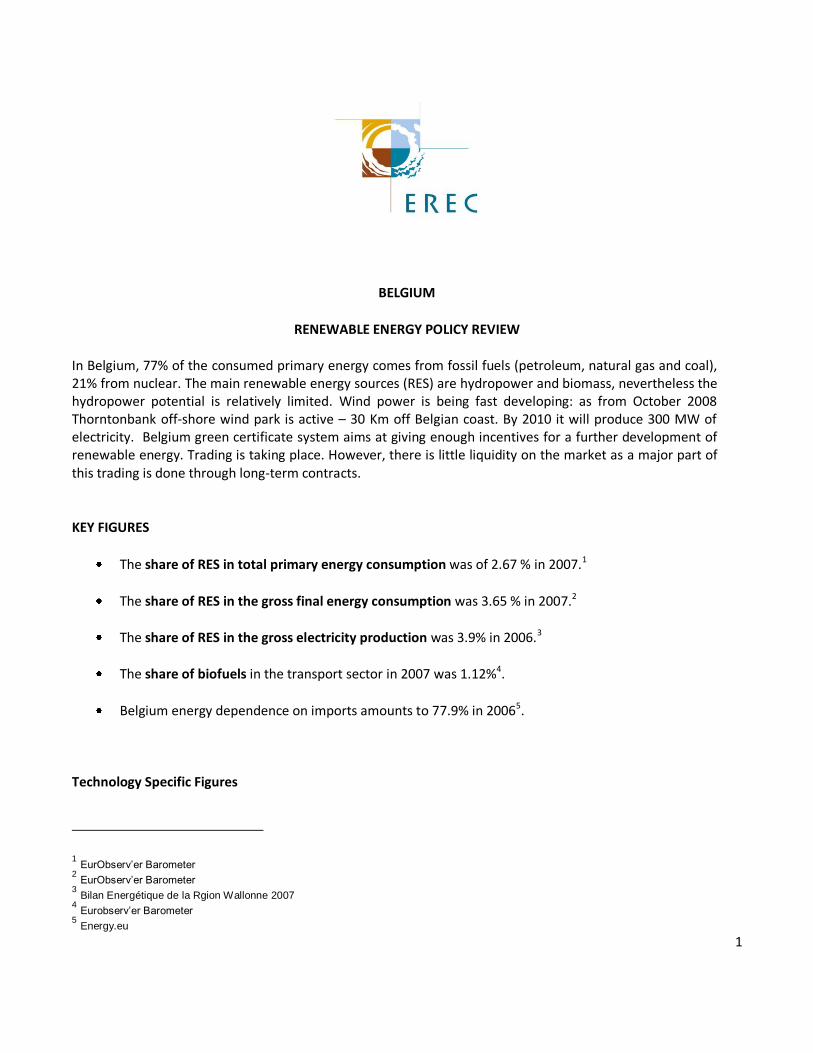
1 BELGIUM RENEWABLE ENERGY POLICY REVIEW In Belgium, 77% of the consumed primary energy comes from fossil fuels (petroleum, natural gas and coal), 21% from nuclear. The main renewable energy sources (RES) are hydropower and biomass, nevertheless the hydropower potential is relatively limited. Wind power is being fast developing: as from October 2008 Thorntonbank off-shore wind park is active – 30 Km off Belgian coast. By 2010 it will produce 300 MW of electricity. Belgium green certificate system aims at giving enough incentives for a further development of renewable energy. Trading is taking place. However, there is little liquidity on the market as a major part of this trading is done through long-term contracts. KEY FIGURES The share of RES in total primary energy consumption was of 2.67 % in 2007. 1 The share of RES in the gross final energy consumption was 3.65 % in 2007. 2 The share of RES in the gross electricity production was 3.9% in 2006. 3 The share of biofuels in the transport sector in 2007 was 1.12% 4 . Belgium energy dependence on imports amounts to 77.9% in 2006 5 . Technology Specific Figures 1 EurObserv’er Barometer 2 EurObserv’er Barometer 3 Bilan Energétique de la Rgion Wallonne 2007 4 Eurobserv’er Barometer 5 Energy.eu
Transcript of Investment Subsidies Resource
1
BELGIUM
RENEWABLE ENERGY POLICY REVIEW
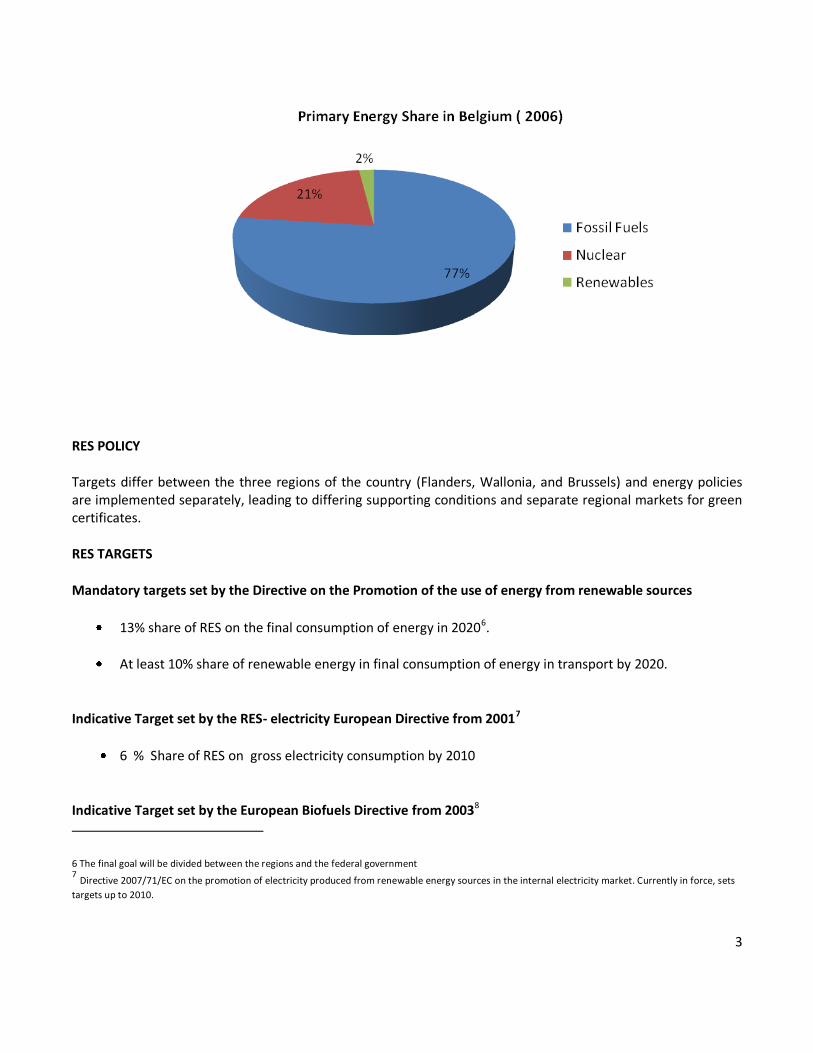
In Belgium, 77% of the consumed primary energy comes from fossil fuels (petroleum, natural gas and coal), 21% from nuclear. The main renewable energy sources (RES) are hydropower and biomass, nevertheless the hydropower potential is relatively limited. Wind power is being fast developing: as from October 2008 Thorntonbank off-shore wind park is active – 30 Km off Belgian coast. By 2010 it will produce 300 MW of electricity. Belgium green certificate system aims at giving enough incentives for a further development of renewable energy. Trading is taking place. However, there is little liquidity on the market as a major part of this trading is done through long-term contracts.
KEY FIGURES
The share of RES in total primary energy consumption was of 2.67 % in 2007.1
The share of RES in the gross final energy consumption was 3.65 % in 2007.2
The share of RES in the gross electricity production was 3.9% in 2006.3
The share of biofuels in the transport sector in 2007 was 1.12%4.
Belgium energy dependence on imports amounts to 77.9% in 20065.
Technology Specific Figures
1 EurObserv’er Barometer
2 EurObserv’er Barometer
3 Bilan Energétique de la Rgion Wallonne 2007
4 Eurobserv’er Barometer
5 Energy.eu
2
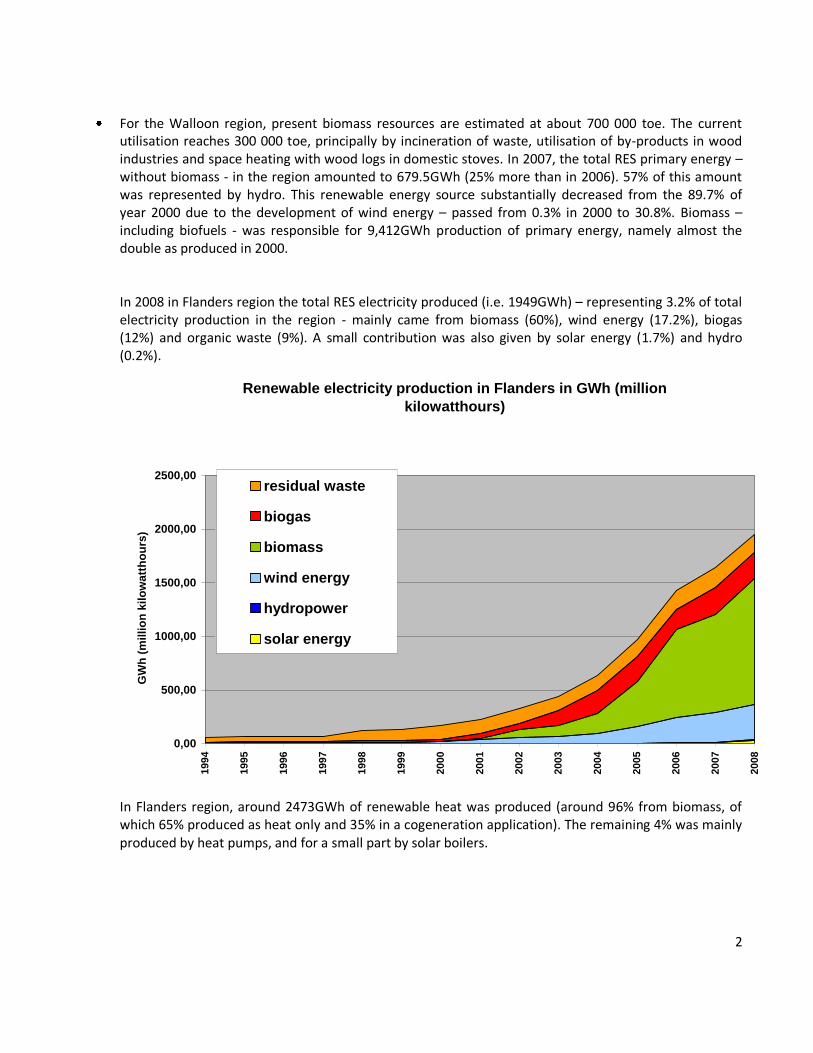
For the Walloon region, present biomass resources are estimated at about 700 000 toe. The current utilisation reaches 300 000 toe, principally by incineration of waste, utilisation of by-products in wood industries and space heating with wood logs in domestic stoves. In 2007, the total RES primary energy – without biomass - in the region amounted to 679.5GWh (25% more than in 2006). 57% of this amount was represented by hydro. This renewable energy source substantially decreased from the 89.7% of year 2000 due to the development of wind energy – passed from 0.3% in 2000 to 30.8%. Biomass – including biofuels - was responsible for 9,412GWh production of primary energy, namely almost the double as produced in 2000. In 2008 in Flanders region the total RES electricity produced (i.e. 1949GWh) – representing 3.2% of total electricity production in the region - mainly came from biomass (60%), wind energy (17.2%), biogas (12%) and organic waste (9%). A small contribution was also given by solar energy (1.7%) and hydro (0.2%).
Renewable electricity production in Flanders in GWh (million
kilowatthours)
0,00
500,00
1000,00
1500,00
2000,00
2500,00
1994
1995
1996
1997
1998
1999
2000
2001
2002
2003
2004
2005
2006
2007
2008
GW
h (
mil
lio
n k
ilo
wa
tth
ou
rs)
residual waste
biogas
biomass
wind energy
hydropower
solar energy
In Flanders region, around 2473GWh of renewable heat was produced (around 96% from biomass, of which 65% produced as heat only and 35% in a cogeneration application). The remaining 4% was mainly produced by heat pumps, and for a small part by solar boilers.
3
RES POLICY
Targets differ between the three regions of the country (Flanders, Wallonia, and Brussels) and energy policies are implemented separately, leading to differing supporting conditions and separate regional markets for green certificates. RES TARGETS
Mandatory targets set by the Directive on the Promotion of the use of energy from renewable sources
13% share of RES on the final consumption of energy in 20206.
At least 10% share of renewable energy in final consumption of energy in transport by 2020.
Indicative Target set by the RES- electricity European Directive from 20017
6 % Share of RES on gross electricity consumption by 2010
Indicative Target set by the European Biofuels Directive from 20038
6 The final goal will be divided between the regions and the federal government 7 Directive 2007/71/EC on the promotion of electricity produced from renewable energy sources in the internal electricity market. Currently in force, sets
targets up to 2010.
4
Biofuels consumption of 5.75% of petrol and diesel use for transport in 2010.
National commitments
The target for renewable electricity is 8% by 20109in the Walloon region, 6% by 2010 (and 13% by 2020) in Flanders10 and 2.5% by 2006 in Brussels. Wallonia and Flanders are on track to meets their targets. Wallonia is expected to overtake its target from 2009/2010.
There is no national target/commitment for heating and cooling.
Technology Roadmap
The Walloon Region aims at reaching a production of 4,100GWh11 heat from wood and vegetal by-products by 2010.
The Walloon region aims at reaching a production of electricity from wind of 370GWh (approximately 150 windmills) by 2010).
Flanders region aims at a production capacity of electricity from wind of about 1,000GWh by 2010. A memorandum of the Flemish government has been published in May 2006 aiming to reach this objective through accelerating measures. PV sector is also growing: from the 553 kW installed in 2005, it passed to 2035 kW in 2006, to 15,658 kW in 2007 and 40,000 kW in 2008.
Progress towards the targets
With an RES-E share of 2.98% in 2006 the national target of 6% is still far away. Wallonia and Flanders are on track to meet their targets set at national level. Wallonia is expected to overtake this target from 2009/2010.
8 Directive 2003/30/EC on the promotion of the use of biofuels or other renewable fuels for transport currently in force, sets targets up to 2010, with
indicative targets by 2005.
9 According to the 2003 “Plan pour la Maîtrise Durable de l’Energie”
10 As stated in the Action Plan for the period 2004-2009 set by the Flemish Government.
11 According to the 2003« Plan pour la Maîtrise Durable de l’Energie”

5
MAIN POLICY INSTRUMENTS
Support to RES Electricity 3 sets of measures are key to the Belgian approach to RES-e: Quota obligations Quotas have been set (obligation for all electricity suppliers to supply a specific proportion of RES-e) and guaranteed minimum prices or ‘fall back prices’ have been foreseen. In all three regions, a separate market for green certificates has been created. In order to guarantee the authenticity of certificates, the certificates are registered in a data bank managed by the respective regulative authorities in charge (for instance Art. 13 arrêté royal du 16. juillet 2002, Art. 21 arrêté du gouvernement wallon du 30 novembre 2006 , besluit van de Vlaamse Regering van 5 maart 2004.) In the Walloon Region, the price of the green certificates depends on the quotas which are going to appear quickly too low to sell the green certificates at a competitive price. The Walloon region should increase its quotas at the time of the future regional government.
Resource Penalty level *€cents/ kWh+ Quota in % (in year) Comments
All RES-E technologies
WALLONIA and BRUSSELS: 100 euro for each missing GC FLANDERS : 125 € for each missing GC
WALLONIA : 3% 2003 - increase of 1 % a year till 2012 BRUSSELS : 2 % in 2004 2,25 % in 2005 2,5 % in 2006, 2007 and 2008 increase of 0,25 % after 2008 FLANDERS : 3.75% in 2007 4.90% in 2008 5.25% in 2009 6% in 2010
WALLONIA : electricity suppliers must pay to Wallonia’s energy authority for each GC missing at the end of each accounting period BRUSSEL : electricity suppliers must pay to Brussels’ energy authority for each GC missing at the end of each accounting period FLANDERS : electricity suppliers must pay to Flanders energy authority for each GC missing at the end of each accounting period
Green certificates Price
In the Flanders Region, around 1 million of certificates were traded for the quota period 1 April 2007 – 31 march 2008, with an average price of 109 euro/MWh. The price is very stable since 2004. The price of quota certificates with or without guarantee of origin does not indicate a significant value for the guarantees of origin. CWaPE (Commission Wallonne pour l’Energie), energy regulator in the Walloon region of Belgium, has recently published the green certificates market prices and volumes for the fourth quarter of 2007 - covering the months from October to December. The volume of green certificates traded was 154,087. The third quarter of 2007 ended with the highest volume traded since 2004, reaching 227,009. The average price for the fourth quarter was 88.16 Euro/MWh. The price of certificates traded in the previous quarter, from July to September, was 91.46 Euro/MWh

6
Resource Support level *€cents/ kWh+ Duration [years that an investor is entitled to support]
Comments
biomass WALLONIA: Market price: 90 €/GC Maximum price: price of penalty = 100 €/GC Minimum price : 65 €/GC during a period calculated on the profitability of the investment (maximum 15 years) OR 20€/MWh in any case BRUSSELS : Market price : ??? (no transaction yet) Maximum price : price of penalty = 100 €/GC Minimum price : 20€/MWh FLANDERS Market price : 108 €/GC Maximum price : price of penalty = 125 €/GC Minimum price : 80 €/GC during a 10-year period
WALLONIA : 15 years BRUSSELS : 10 years FLANDERS: Unlimited for market price, 10 years for minimum price
WALLONIA : 1 GC = 456 kg CO2 avoided - maximum 2 GC / MWh BUT reduction of the amount of green certificates during the last 5 years calculated on the profitability of the investment in order to insure a 12% VAT 65 €/GC = regional minimum price on basis of a convention with the grid operator BRUSSELS : 1 GC = 217 kg CO2 avoided - maximum 2 GC/MWh for installations > 1 MWe (no maximum under) - 5 GC/MWh for biomethanisation FLANDERS : 1 GC = 1 MWh renewable electricity ALL THREE : 20 €/MWh = TSO undertake to buy any green certificate for biomass electricity at this price
Wind onshore
WALLONIA: Market price : 90 €/GC Maximum price : price of penalty = 100 €/GC Minimum price : 65 €/GC during a period calculated on the profitability of the investment (maximum 15 years - usually 10 years) OR 50 €/MWh BRUSSEL : No market price : ??? (no transaction yet) Maximum price : price of penalty = 100 €/GC Minimum price : 50€/MWh FLANDERS Market price : 108 €/GC Maximum price : price of penalty = 125 €/GC Minimum price : 80 €/GC during a 10-year period
WALLONIA : 15 years BRUSSEL : 10 years FLANDERS Unlimited for market price, 10 years for minimum price
WALLONIA : 1 GC / MWh BUT reduction of the amount of green certificates during the last 5 years calculated on the profitability of the investment iun order to insure a 12% VAT 65 €/GC = regional minimum price on basis of a convention with the grid operator - 50 €/MWh = TSO undertake to buy any green certificate for onshore wind electricity at this price BRUSSEL : 1 GC / MWh FLANDERS : 1 GC = 1 MWh renewable electricity ALL THREE : 50 €/MWh = TSO undertake to buy any green certificate for wind electricity at this price
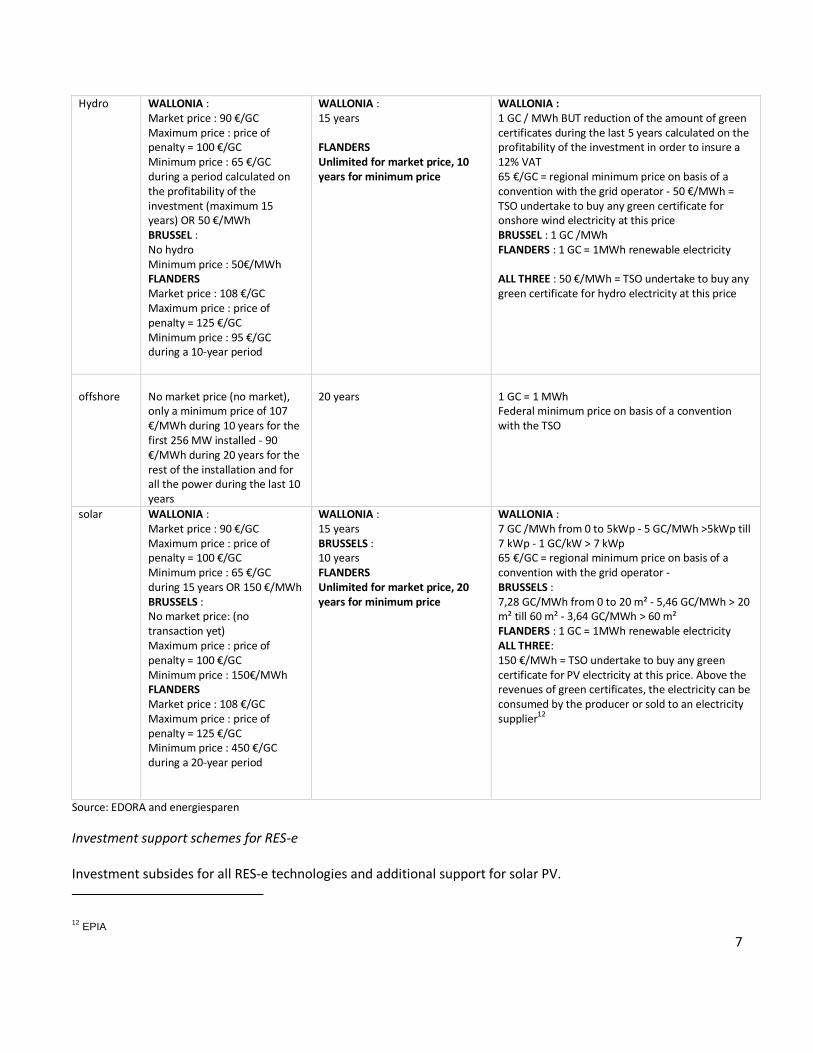
7
Hydro WALLONIA : Market price : 90 €/GC Maximum price : price of penalty = 100 €/GC Minimum price : 65 €/GC during a period calculated on the profitability of the investment (maximum 15 years) OR 50 €/MWh BRUSSEL : No hydro Minimum price : 50€/MWh FLANDERS Market price : 108 €/GC Maximum price : price of penalty = 125 €/GC Minimum price : 95 €/GC during a 10-year period
WALLONIA : 15 years FLANDERS Unlimited for market price, 10 years for minimum price
WALLONIA : 1 GC / MWh BUT reduction of the amount of green certificates during the last 5 years calculated on the profitability of the investment in order to insure a 12% VAT 65 €/GC = regional minimum price on basis of a convention with the grid operator - 50 €/MWh = TSO undertake to buy any green certificate for onshore wind electricity at this price BRUSSEL : 1 GC /MWh FLANDERS : 1 GC = 1MWh renewable electricity ALL THREE : 50 €/MWh = TSO undertake to buy any green certificate for hydro electricity at this price
offshore
No market price (no market), only a minimum price of 107 €/MWh during 10 years for the first 256 MW installed - 90 €/MWh during 20 years for the rest of the installation and for all the power during the last 10 years
20 years
1 GC = 1 MWh Federal minimum price on basis of a convention with the TSO
solar WALLONIA : Market price : 90 €/GC Maximum price : price of penalty = 100 €/GC Minimum price : 65 €/GC during 15 years OR 150 €/MWh BRUSSELS : No market price: (no transaction yet) Maximum price : price of penalty = 100 €/GC Minimum price : 150€/MWh FLANDERS Market price : 108 €/GC Maximum price : price of penalty = 125 €/GC Minimum price : 450 €/GC during a 20-year period
WALLONIA : 15 years BRUSSELS : 10 years FLANDERS Unlimited for market price, 20 years for minimum price
WALLONIA : 7 GC /MWh from 0 to 5kWp - 5 GC/MWh >5kWp till 7 kWp - 1 GC/kW > 7 kWp 65 €/GC = regional minimum price on basis of a convention with the grid operator - BRUSSELS : 7,28 GC/MWh from 0 to 20 m² - 5,46 GC/MWh > 20 m² till 60 m² - 3,64 GC/MWh > 60 m² FLANDERS : 1 GC = 1MWh renewable electricity ALL THREE: 150 €/MWh = TSO undertake to buy any green certificate for PV electricity at this price. Above the revenues of green certificates, the electricity can be consumed by the producer or sold to an electricity supplier
12
Source: EDORA and energiesparen
Investment support schemes for RES-e Investment subsides for all RES-e technologies and additional support for solar PV.
12 EPIA
8
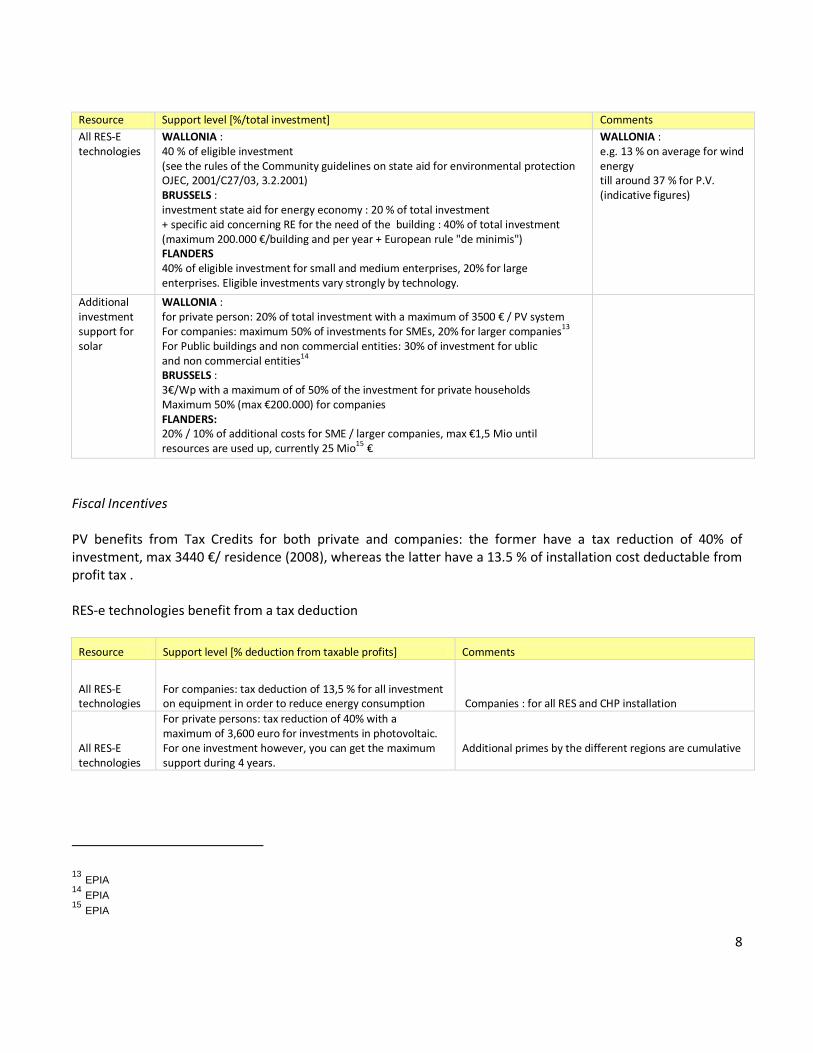
Resource Support level [%/total investment] Comments
All RES-E technologies
WALLONIA : 40 % of eligible investment (see the rules of the Community guidelines on state aid for environmental protection OJEC, 2001/C27/03, 3.2.2001) BRUSSELS : investment state aid for energy economy : 20 % of total investment + specific aid concerning RE for the need of the building : 40% of total investment (maximum 200.000 €/building and per year + European rule "de minimis") FLANDERS 40% of eligible investment for small and medium enterprises, 20% for large enterprises. Eligible investments vary strongly by technology.
WALLONIA : e.g. 13 % on average for wind energy till around 37 % for P.V. (indicative figures)
Additional investment support for solar
WALLONIA : for private person: 20% of total investment with a maximum of 3500 € / PV system For companies: maximum 50% of investments for SMEs, 20% for larger companies13 For Public buildings and non commercial entities: 30% of investment for ublic and non commercial entities14 BRUSSELS : 3€/Wp with a maximum of of 50% of the investment for private households Maximum 50% (max €200.000) for companies FLANDERS: 20% / 10% of additional costs for SME / larger companies, max €1,5 Mio until resources are used up, currently 25 Mio15 €
Fiscal Incentives PV benefits from Tax Credits for both private and companies: the former have a tax reduction of 40% of investment, max 3440 €/ residence (2008), whereas the latter have a 13.5 % of installation cost deductable from profit tax . RES-e technologies benefit from a tax deduction
Resource Support level [% deduction from taxable profits] Comments
All RES-E technologies
For companies: tax deduction of 13,5 % for all investment on equipment in order to reduce energy consumption Companies : for all RES and CHP installation
All RES-E technologies
For private persons: tax reduction of 40% with a maximum of 3,600 euro for investments in photovoltaic. For one investment however, you can get the maximum support during 4 years.
Additional primes by the different regions are cumulative
13 EPIA
14 EPIA
15 EPIA
9
Others
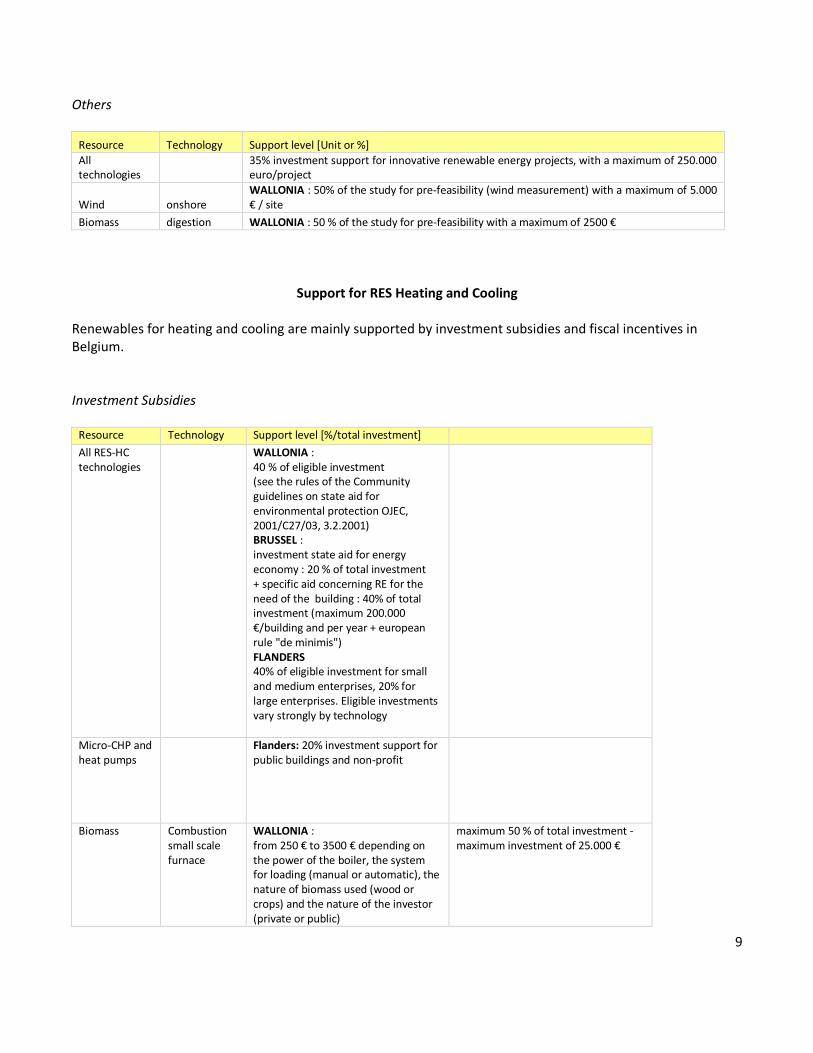
Resource Technology Support level [Unit or %]
All technologies
35% investment support for innovative renewable energy projects, with a maximum of 250.000 euro/project
Wind onshore WALLONIA : 50% of the study for pre-feasibility (wind measurement) with a maximum of 5.000 € / site
Biomass digestion WALLONIA : 50 % of the study for pre-feasibility with a maximum of 2500 €
Support for RES Heating and Cooling
Renewables for heating and cooling are mainly supported by investment subsidies and fiscal incentives in Belgium. Investment Subsidies
Resource Technology Support level [%/total investment]
All RES-HC technologies
WALLONIA : 40 % of eligible investment (see the rules of the Community guidelines on state aid for environmental protection OJEC, 2001/C27/03, 3.2.2001) BRUSSEL : investment state aid for energy economy : 20 % of total investment + specific aid concerning RE for the need of the building : 40% of total investment (maximum 200.000 €/building and per year + european rule "de minimis") FLANDERS 40% of eligible investment for small and medium enterprises, 20% for large enterprises. Eligible investments vary strongly by technology
Micro-CHP and heat pumps
Flanders: 20% investment support for public buildings and non-profit
Biomass Combustion small scale furnace
WALLONIA : from 250 € to 3500 € depending on the power of the boiler, the system for loading (manual or automatic), the nature of biomass used (wood or crops) and the nature of the investor (private or public)
maximum 50 % of total investment - maximum investment of 25.000 €

10
Geothermal Heat pump WALLONIA : 75 % of the invoice BRUSSEL : 50% of the invoice FLANDERS: 210 euro/kW additional for companies and for households
WALLONIA : maximum 1500 € for the heating of a new building and 750 € for water heating of any building BRUSSEL : maximum 5000 € for the heating of a building and 2500 € for water heating
FLANDERS : maximum 1680 euro
Solar Thermal WALLONIA : 1.500 € for all installation from 2 m² to 4 m² + 100 € / m² for additional surface BRUSSEL : 50% of the invoice FLANDERS: 300 euro additional on subsidy for lower energy level
WALLONIA : maximum 6.000 € + possibility t be combined with other incentive if total amount of the aid is maximum 75% of total investment BRUSSEL : maximum 6000 € for the heating of a building and 300 € for water heating
Fiscal Incentives RES H&C technologies benefit from a tax deduction from taxable profits.
Resource Support level [% deduction from taxable profits]
Comments
All RES-HC technologies
Companies: Tax deduction of 13,5 % for all investment on equipment in order to reduce energy consumption
Companies : for all RES and CHP installation
All RES-HC technologies
For private persons: tax reduction of 40% with a maximum of 2770 € for investment in 2009 in heat pumps and biomass heating and 3.600 euro for investments in solar boilers. For one investment however, you can get the maximum support during 4 years.)
Additional primes by the different regions are cumulative
Support for Biofuels
Quota Obligations
For the production of bio ethanol, a yearly quota of 250 million litres has been allocated on October 2006 and until 2013, to 3 companies. For the production of bio diesel, the Belgian Government decided to allocate production quotas with reduced excise duties to three Flemish and one Walloon companies. These four producers must be ready to deliver adequate bio diesel supply to the Belgian market from September 1st, 2007
Resource Quota in % (per year)
Biofuels 2% 2005
11
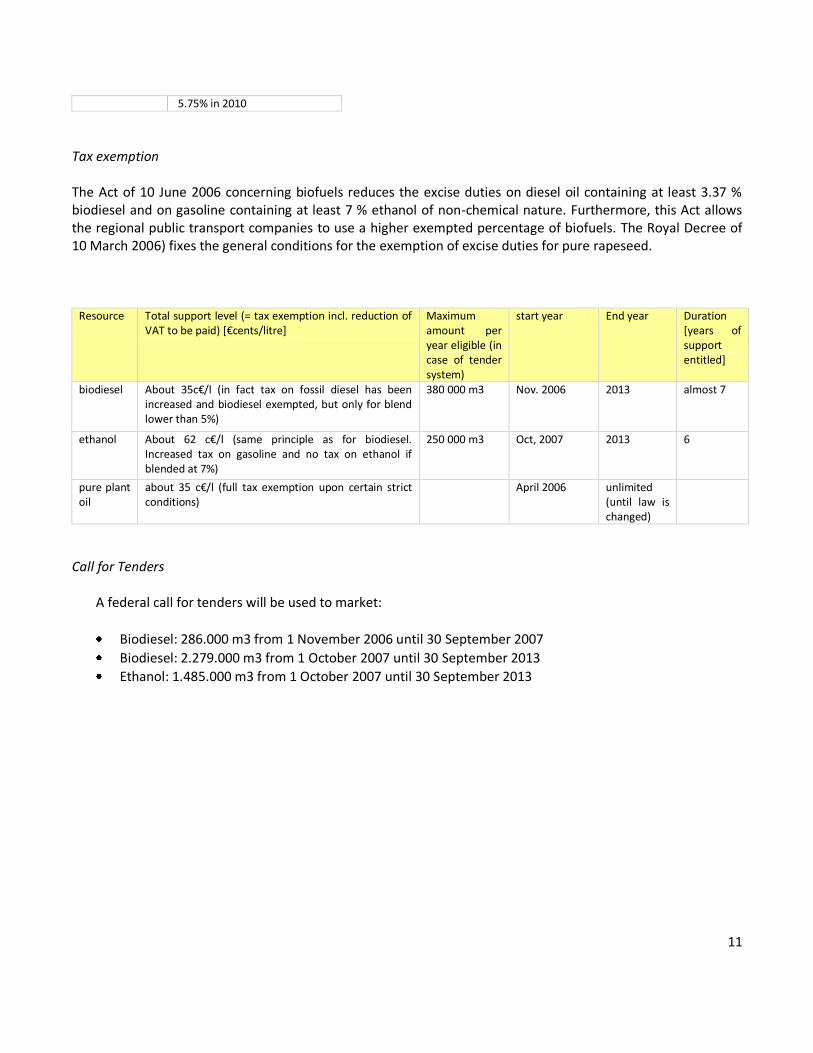
5.75% in 2010
Tax exemption The Act of 10 June 2006 concerning biofuels reduces the excise duties on diesel oil containing at least 3.37 % biodiesel and on gasoline containing at least 7 % ethanol of non-chemical nature. Furthermore, this Act allows the regional public transport companies to use a higher exempted percentage of biofuels. The Royal Decree of 10 March 2006) fixes the general conditions for the exemption of excise duties for pure rapeseed.
Resource Total support level (= tax exemption incl. reduction of VAT to be paid) *€cents/litre]
Maximum amount per year eligible (in case of tender system)
start year End year Duration [years of support entitled]
biodiesel About 35c€/l (in fact tax on fossil diesel has been increased and biodiesel exempted, but only for blend lower than 5%)
380 000 m3 Nov. 2006 2013 almost 7
ethanol About 62 c€/l (same principle as for biodiesel. Increased tax on gasoline and no tax on ethanol if blended at 7%)
250 000 m3 Oct, 2007 2013 6
pure plant oil
about 35 c€/l (full tax exemption upon certain strict conditions)
April 2006 unlimited (until law is changed)
Call for Tenders
A federal call for tenders will be used to market:
Biodiesel: 286.000 m3 from 1 November 2006 until 30 September 2007
Biodiesel: 2.279.000 m3 from 1 October 2007 until 30 September 2013
Ethanol: 1.485.000 m3 from 1 October 2007 until 30 September 2013
12
Sources: European Commission Factsheets by Country
http://ec.europa.eu/energy/energy_policy/facts_en.htm
Member States Reports in the framework of the Directive 2001/77/EC on renewable electricity
http://ec.europa.eu/energy/res/legislation/electricity_member_states_en.htm
Member States Reports in the framework of the Directive 2003/30/EC on biofuels
http://ec.europa.eu/energy/res/legislation/biofuels_members_states_en.htm
EDORA
http://www.edora.be/
ODE Vlaanderen
http://www.ode.be/
Valbiom, Belgium
http://www.valbiom.be/
EurObserv’er Barometer
http://www.energies-renouvelables.org/observ-er/sig/eufores/sig.asp
Flemish Region Action Plan 2004-2009
http://www2.vlaanderen.be/economie/energiesparen/milieuvriendelijke/ActieplanMVRE2008-2009.pdf
Belgium – Renewable Energy Fact Sheet
http://www.energy.eu/renewables/factsheets/2008_res_sheet_belgium_en.pdf
Flemish Energy Agency
www.energiesparen.be
EPIA
EPIA - Overview of European PV support schemes - last update on 16/12/2008
13
In the framework of the EU co –funded project: RES 2020: Monitoring and Evaluation of the RES Directives implementation in EU27 and policy recommendations to 2020
The sole responsibility for the content of this publication lies with the authors. It does not represent the opinion of the Community. The European Commission is not responsible for any use that may be made of the information contained therein.
Drafted in March 2009.