Investment Facility
60
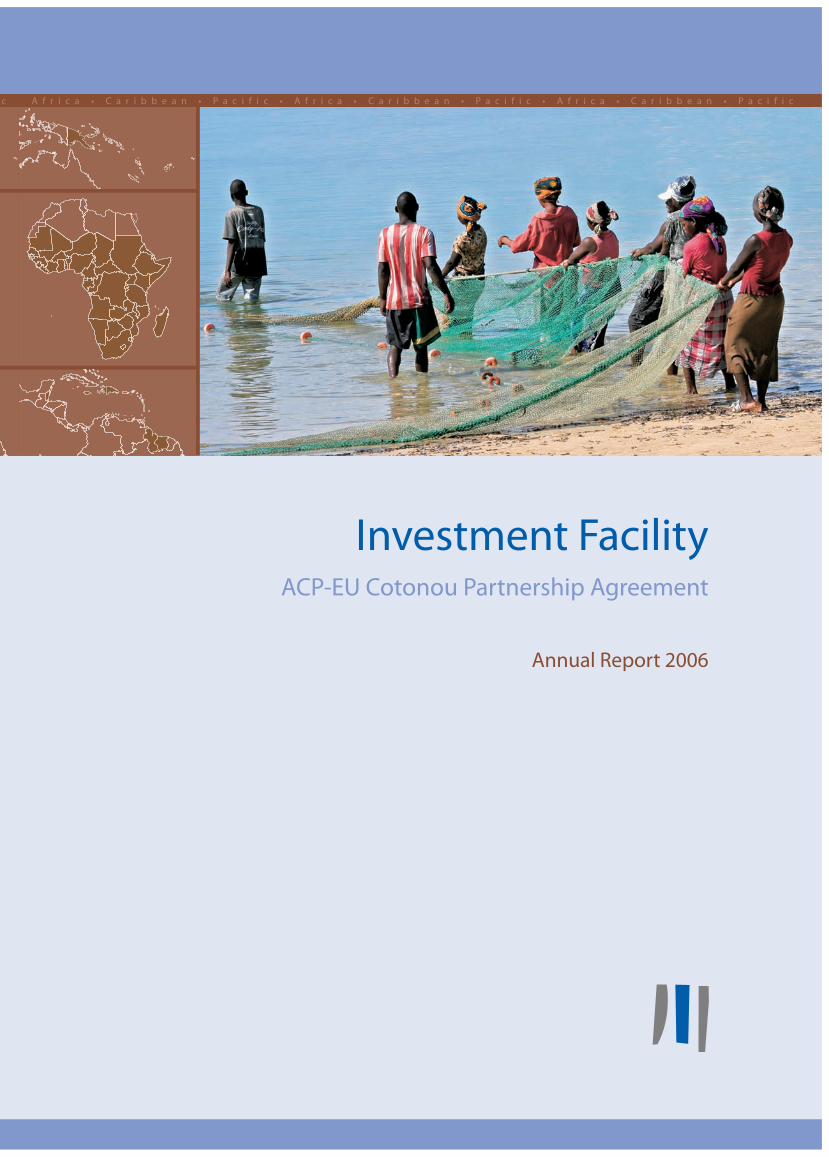
c Africa • Caribbean • Pacific • Africa • Caribbean • Pacific • Africa • Caribbean • Pacific Investment Facility ACP-EU Cotonou Partnership Agreement Annual Report 2006
-
Upload
khangminh22 -
Category
Documents
-
view
0 -
download
0
Transcript of Investment Facility
i b b e a n • P a c i f i c A f r i c a • C a r i b b e a n • P a c i f i c • A f r i c a • C a r i b b e a n • P a c i f i c • A f r i c a • C a r i b b e a n • P a c i f i c
Investment FacilityACP-EU Cotonou Partnership Agreement
Annual Report 2006

A f r i c a • C a r i b b e a n • P a c i f i c • A f r i c a • C a r i b b e a n • P a c i f i c • A f r i c a • C a r i b b e a n • P a c i f i c A f ra c i f i c A f r
Investment FacilityACP-EU Cotonou Partnership Agreement
Annual Report 2006
A f r i c a • C a r i b b e a n • P a c i f i c • A f r i c a • C a r i b b e a n • P a c i f i c • A f r i c a • C a r i b b e a n • P a c i f i c
“The Investment Facility shall operate in all economic sectors and support investments of private and
commercially runpublic sector entities, including revenue-generating economic and technological infra-
structure critical for the private sector. The Facility shall:
¸ bemanaged as a revolving fund and aim at being financially sustainable. Its operations shall be on
market-related terms and conditions and shall avoid creating distortions on local markets and dis-
placing private sources of finance;
¸ support theACP financial sectorandhaveacatalyticeffectbyencouraging themobilisationof long-term
local resources and attracting foreign private investors and lenders to projects in the ACP States;
¸ bear part of the risk of the projects it funds, its financial sustainability being ensured through the
portfolio as awhole and not from individual interventions; and
¸ seek to channel funds throughACP national and regional institutions and programmes that promote
the development of small andmedium-sized enterprises (SMEs).”
Revised Cotonou Partnership Agreement, Annex II, Article 3
Investment Facility – Annual Report 20062
A f r i c a • C a r i b b e a n • P a c i f i c • A f r i c a • C a r i b b e a n • P a c i f i c • A f r i c a • C a r i b b e a n • P a c i f i c AA f r i c a • C a r i b b e a n • P a c i f i c • A f r i c a • C a r i b b e a n • P a c i f i c • A f r i c a • C a r i b b e a n • P a c i f i c A
LOMECOTONOU
S P A I N
BURKINA FASO
GHANA
NIGERIA
N I G E R
GAMBIA
GUINEA-BISSAU
SIERRA LEONE
LIBERIA
CÔTED'IVOIRE
MAURITANIA
SENEGAL
MALI
BENIN
TOGO
GUINEA
BURUNDIRWANDA
CENTRALAFRICAN REPUBLIC
CONGO
CAMEROON
GABONEQUAT. GUINEA DEM. REP. OF CONGO
ANGOLA
SUDANCHAD
ETHIOPIA
KENYA
TANZANIA
MADAGASCAR
MOZAMBIQUEMALAWI
ZAMBIA
UGANDASÃO TOMÉ AND PRINCIPE
ERITREA
S O MAL I A
NAMIB IABOTSWANA
SOUTH AFRICA
SWAZILAND
LESOTHO
ZIMBABWE
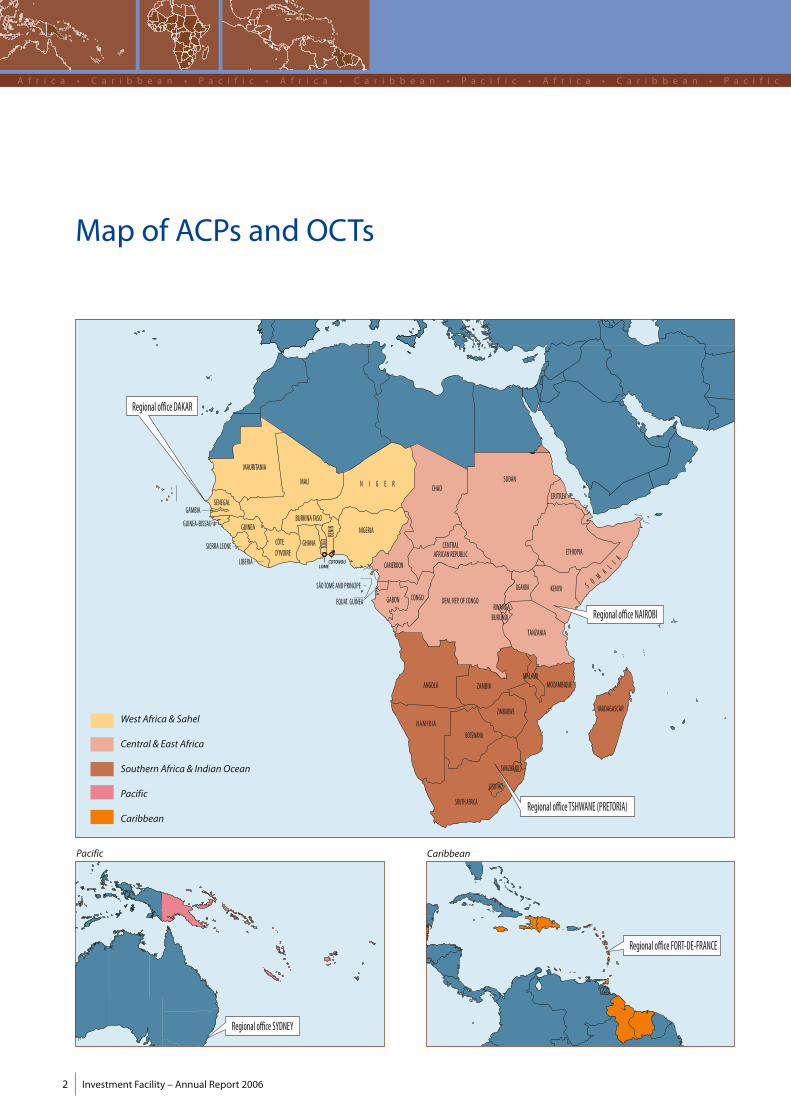
Regional office NAIROBI
Regional office DAKAR
Regional office TSHWANE (PRETORIA)
Map of ACPs and OCTs
West Africa & Sahel
Central & East Africa
Southern Africa & IndianOcean
Pacific
Caribbean
Pacific
Regional office SYDNEY
Caribbean
Regional office FORT-DE-FRANCE

c A f r i c a • C a r i b b e a n • P a c i f i c • A f r i c a • C a r i b b e a n • P a c i f i c • A f r i c a • C a r i b b e a n • P a c i f i c
Annual Report 2006 – Investment Facility 3
c A f r i c a • C a r i b b e a n • P a c i f i c • A f r i c a • C a r i b b e a n • P a c i f i c • A f r i c a • C a r i b b e a n • P a c i f i c
Mission of the Investment Facility
TheEuropean InvestmentBank supports
the European Union’s cooperation and
development policies in the African,
Caribbean and Pacific regions in the
framework of the Cotonou Partner-
ship Agreement between the EU and
the 79 ACP countries. It manages the
Investment Facility, a EUR 2 037m risk-
bearing instrument funded from the
European Development Fund geared
specifically to fostering private sector
investment in a difficult economic and
political context and, thereby, to fill-
ing financing gaps in the market. In so
doing, the Bank must balance respon-
siveness to opportunities with scrutiny
and accountability, together with the
managementofpublic funds,whilepay-
ing due attention to the developmental
merits of the projects it finances. In line
with the aims and objectives that were
expressed by the international commu-
nity in theUNMillenniumDevelopment
Goals, it supports those projects that
promise appreciable social, economic
or environmental benefits.
In parallel, a EUR 20 m OCT Investment
Facility was set up in accordancewith the
Council Decision of 27 November 2001
on the association of Overseas Countries
and Territories (OCTs) with the European
Community with a similar aim for the 20
OCTssituated in theCaribbean, thePacific,
and the north and south Atlantic Oceans
that are eligible for EuropeanCommunity
financial assistance.
Both the ACP and the OCT Investment
Facilities (IF)aresupplementedbyanenve-
lope of up to EUR 1 700m and EUR 20m
respectively fromtheBank’sown resources.
Operations carried out under the Bank’s
own resourcesareultimately coveredbya
guarantee from the EUMember States.
The Cotonou Agreementwas concluded
in June 2000 for a 20-year period, with
separateprotocolsdefining theaggregate
amount of Community aid to the ACP
States foreach successive financialperiod.
The second financial protocol, covering
theperiod2008-2013,was signed in June
2006on theoccasionof theACP-EUCoun-
cil of Ministers in Port Moresby (Papua
New Guinea). It includes an additional
EUR 1.53 bn allocation to be managed
by the EIB and split as follows:
Reducing poverty through a stronger private sectorin the ACPs and the OCTs
¸ EUR1.1bnasa secondcapitalendow-
ment for the ACP Investment Facility;
¸ EUR 30m as a second capital endow-
ment for theOCT Investment Facility;
¸ EUR 400m for interest rate subsidies,
of which up to 10% can be used for
project-related technical assistance.
Thiswill be supplemented by an appro-
priation of up to EUR 2 bn and EUR 30m
for own resources lending in the ACPs
and in the OCTs respectively which, as
in the past, will be covered by a spe-
cific guarantee from the EU Member
States.
The new financial protocol will come
into force upon completion of the rati-
fication process of the revised Cotonou
Agreement.
Investment Facility – Annual Report 20064
A f r i c a • C a r i b b e a n • P a c i f i c • A f r i c a • C a r i b b e a n • P a c i f i c • A f r i c a • C a r i b b e a n • P a c i f i c
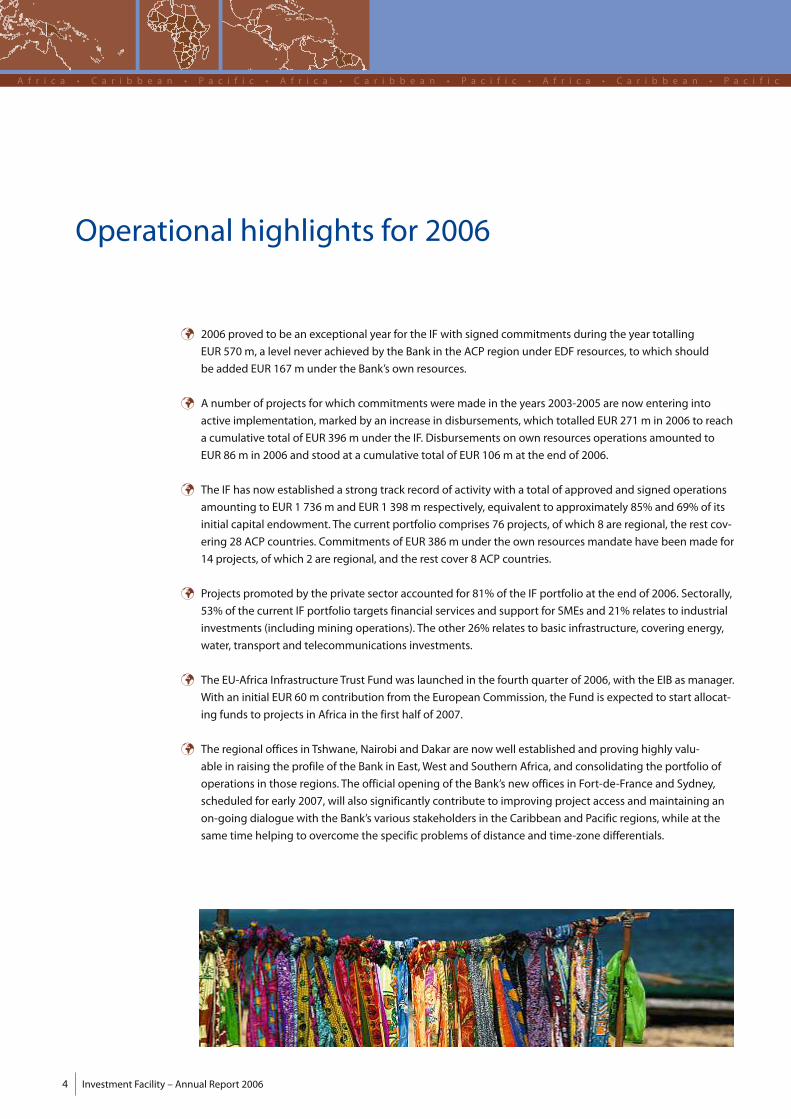
Operational highlights for 2006
¸ 2006 proved to be an exceptional year for the IFwith signed commitments during the year totalling
EUR 570m, a level never achieved by the Bank in the ACP region under EDF resources, towhich should
be added EUR 167m under the Bank’s own resources.
¸ A number of projects forwhich commitmentsweremade in the years 2003-2005 are now entering into
active implementation,marked by an increase in disbursements,which totalled EUR 271 m in 2006 to reach
a cumulative total of EUR 396m under the IF. Disbursements on own resources operations amounted to
EUR 86m in 2006 and stood at a cumulative total of EUR 106m at the end of 2006.
¸ The IF has now established a strong track record of activity with a total of approved and signed operations
amounting to EUR 1 736m and EUR 1 398m respectively, equivalent to approximately 85% and 69% of its
initial capital endowment. The current portfolio comprises 76 projects, ofwhich 8 are regional, the rest cov-
ering 28 ACP countries. Commitments of EUR 386m under the own resourcesmandate have been made for
14 projects, ofwhich 2 are regional, and the rest cover 8 ACP countries.
¸ Projects promoted by the private sector accounted for 81% of the IF portfolio at the end of 2006. Sectorally,
53% of the current IF portfolio targets financial services and support for SMEs and 21% relates to industrial
investments (including mining operations). The other 26% relates to basic infrastructure, covering energy,
water, transport and telecommunications investments.
¸ The EU-Africa Infrastructure Trust Fundwas launched in the fourth quarter of 2006,with the EIB asmanager.
With an initial EUR 60m contribution from the European Commission, the Fund is expected to start allocat-
ing funds to projects in Africa in the first half of 2007.
¸ The regional offices in Tshwane, Nairobi and Dakar are nowwell established and proving highly valu-
able in raising the profile of the Bank in East,West and Southern Africa, and consolidating the portfolio of
operations in those regions. The official opening of the Bank’s new offices in Fort-de-France and Sydney,
scheduled for early 2007,will also significantly contribute to improving project access andmaintaining an
on-going dialoguewith the Bank’s various stakeholders in the Caribbean and Pacific regions,while at the
same time helping to overcome the specific problems of distance and time-zone differentials.
Annual Report 2006 – Investment Facility 5
A f r i c a • C a r i b b e a n • P a c i f i c • A f r i c a • C a r i b b e a n • P a c i f i c • A f r i c a • C a r i b b e a n • P a c i f i c
Contents
Map of ACPs andOCTs 2
Mission of the Investment Facility 3
Operational highlights for 2006 4
Investment conditions in ACP Countries 6
Operations in 2006 10
Outlook for 2007 23
Portfolio overview 24
Partnership 31
Organisation and staffing 34
Financial review 36
Annexes 37
Annex 1 – IF Portfolio of signed operations 2003-2006 38
Annex 2 – Portfolio of signed own resources operations
2003-2006 41
Annex 3 – Organisation Chart 42
Annex 4 – Financial Statements of the Investment Facility
as at 31 December 2006 43
Annex 5 – ACP Countries and OCTs 54
Annex 6 – Glossary of abbreviations 55
Investment Facility – Annual Report 20066
A f r i c a • C a r i b b e a n • P a c i f i c • A f r i c a • C a r i b b e a n • P a c i f i c • A f r i c a • C a r i b b e a n • P a c i f i c
Investment conditions in ACP Countries
C ountries in the developingworld have always been particularly
exposed to the vagaries of volatile capital flows. In recent years,
with the recovery ofworld growth, private capital flows to developing
countries have been rising sharply, recovering from their trough in 2001.
Alongside narrowing interest rate spreads, developing countries
managed to secure gross funding of USD 329 bn in 2005, up from
USD 214 bn in the previous year1.
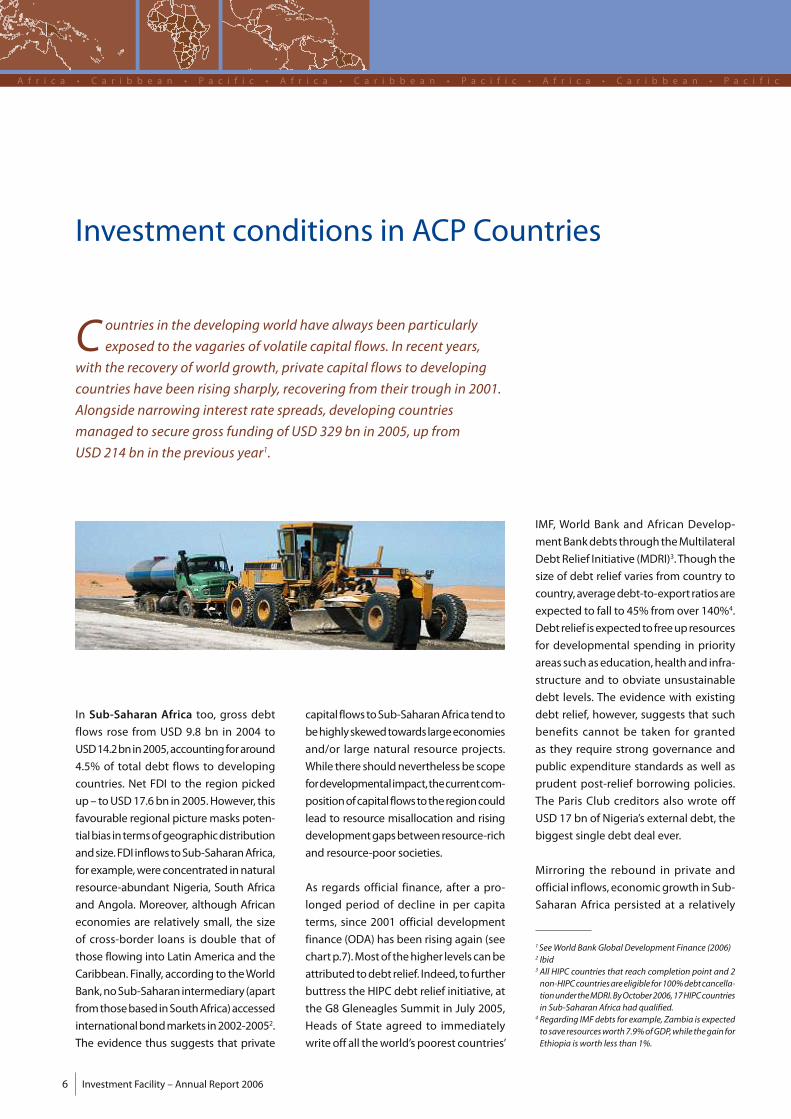
In Sub-Saharan Africa too, gross debt
flows rose from USD 9.8 bn in 2004 to
USD14.2bnin2005,accounting foraround
4.5% of total debt flows to developing
countries. Net FDI to the region picked
up– toUSD17.6bn in2005.However, this
favourable regional picturemasks poten-
tialbias in termsofgeographicdistribution
andsize.FDI inflows toSub-SaharanAfrica,
forexample,wereconcentrated innatural
resource-abundant Nigeria, South Africa
and Angola. Moreover, although African
economies are relatively small, the size
of cross-border loans is double that of
those flowing into Latin America and the
Caribbean. Finally, according to theWorld
Bank,noSub-Saharanintermediary (apart
from thosebased inSouthAfrica)accessed
internationalbondmarkets in2002-20052.
The evidence thus suggests that private
capital flows toSub-SaharanAfrica tend to
behighlyskewed towards largeeconomies
and/or large natural resource projects.
While there shouldneverthelessbe scope
fordevelopmental impact,thecurrentcom-
positionofcapital flowsto the regioncould
lead to resource misallocation and rising
developmentgapsbetween resource-rich
and resource-poor societies.
As regards official finance, after a pro-
longed period of decline in per capita
terms, since 2001 official development
finance (ODA) has been rising again (see
chartp.7).Mostof thehigher levelscanbe
attributed todebt relief. Indeed, to further
buttress the HIPC debt relief initiative, at
the G8 Gleneagles Summit in July 2005,
Heads of State agreed to immediately
writeoff all theworld’s poorest countries’
IMF, World Bank and African Develop-
mentBankdebts through theMultilateral
DebtRelief Initiative (MDRI)3.Though the
size of debt relief varies from country to
country,averagedebt-to-export ratiosare
expected to fall to 45% from over 140%4.
Debt relief isexpected to freeupresources
for developmental spending in priority
areas suchaseducation,healthand infra-
structure and to obviate unsustainable
debt levels. The evidence with existing
debt relief, however, suggests that such
benefits cannot be taken for granted
as they require strong governance and
public expenditure standards as well as
prudent post-relief borrowing policies.
The Paris Club creditors also wrote off
USD 17 bn of Nigeria’s external debt, the
biggest single debt deal ever.
Mirroring the rebound in private and
official inflows, economicgrowth in Sub-
Saharan Africa persisted at a relatively
1SeeWorld BankGlobalDevelopment Finance (2006)2 Ibid3 All HIPC countries that reach completion point and 2non-HIPCcountriesareeligible for100%debtcancella-tionunder theMDRI.ByOctober2006,17HIPCcountriesin Sub-Saharan Africa had qualified.
4 Regarding IMF debts for example, Zambia is expectedto save resourcesworth7.9%ofGDP,while thegain forEthiopia isworth less than 1%.

Annual Report 2006 – Investment Facility 7
A f r i c a • C a r i b b e a n • P a c i f i c • A f r i c a • C a r i b b e a n • P a c i f i c • A f r i c a • C a r i b b e a n • P a c i f i c
high rate in 2005 and 2006, hovering
between 5% and 6% per annum. Condi-
tionshavebeenespecially favourable for
oil,metal and precious stone exporters,
such as Nigeria, Zambia, Namibia or
Angola (seep.8/9).Oilexporters’GDPgrew
by an annual average of around 7% over
the past two years. In contrast, oil price
rises put pressure on current account
deficits and activity in oil-importing
countries.The end of preferential access
to developed markets also affected
many textile-producing countries. Still,
in contrastwithpreviousdecades, better
macroeconomic policies and a smaller
incidenceofpolitical turmoilwere effec-
tive counterweights. In the CFA zone,
for example, economies grew on aver-
age by around 4% per annum in 2005-
2006, while Mozambique and Ethiopia
both recorded growth in excess of 7%
per annum. Growth in South Africa, the
largest economy in the region (1/3 of
the region’s GDP), is expected to fall to
around its potential rate of 4% in 2006.
However, highly liquid financial systems,
notably in the CFA zone, suggest that
thereare risks tomacroeconomic stability
if structural reforms are not accelerated.
ManySub-SaharanAfricancountriescon-
tinue to rank at the bottom of theWorld
Bank“EaseofDoingBusiness”surveys (see
boxp.9).Nevertheless,progresshasbeen
made in the last fewyears: inGhana, pet-
rol price liberalisation advanced; Nigeria
increased capital requirements in the
banking system to encourage consoli-
dation and efficiency; Rwanda improved
land titling and labour laws; and Gabon
published its first EITI report on theman-
agement of oil revenues for 2004.
In the Caribbean, economic growth
bounced back in 2005 and 2006 to the
orderof 5-6%peryear.Affectedespecially
harshly by hurricanes in recent years, the
region is gradually moving away from
some of the traditional industries par-
ticularlyexposed toweather shocks (sugar
cane and bananas) (see p. 8/9). Activity in
the tourismsectorhas,however, remained
robust. In the Dominican Republic, one
of the largest economies in the region,
tourism is the main earner of foreign
exchange,andoneof the largestemploy-
ers.Aneconomicmainstay isalsoworkers’
remittances –mainly from the estimated
1 million Dominicans living in the US –
accounting forabout12%ofGDP in2004.
Theexternalaccountpositionsofmanyof
the countries in the region have recently
suffered from high oil prices (though the
few who are natural gas and oil produc-
ers, such as Trinidad and Tobago have of
course benefited). Public debt levels are
highand rising, reachingover90%ofGDP
in 2005, up from 70% in themid 1990s.A
largeportionofpublic sectordebt isheld
by localbanking systems, raising issuesof
systemicvulnerabilitiesanddiscouraging
effective intermediationof savings to the
private sector.Morepositivehasbeen the
Caribbean Single Market and Economy
agreement (CSME), on which progress
wasmadeduring2006with the launchof
the singlemarketcomponent.This should
boost tradeand investmentandpositively
affect the region’s growth potential.
In the Pacific islands, annual economic
growth in the 2–6% range was recorded
across the region in 2005, reflecting con-
tributions from aid flows, commodity
exports (see p. 8/9), fishing, remittances,
tourism, and trust funds. However, the
geologically challenging environment
and the high cost of developing infra-
structure across widely dispersed small
islands is hampering the efficient exploi-
tation of natural resources and broader
economic activity. Dependence on for-
eign aid,mostly coming fromAustralia, is
likely to remaincrucial tosustainactivity in
themedium term. In some countries (Fiji,
smaller Pacific Islands) the rise in global
oil prices has been weighing on activity,
given the importance of oil products for
airand sea transportationandpowergen-
eration.Moreover, theclothing industry is
struggling since losingguaranteedaccess
tomajormarkets.Sporadiccivilunrestand
political uncertainty has alsobeen a con-
straining factor on private sector activity
and foreign investment in many islands.
The latest coup d’état dates back to only
Foreign aid to Sub-Saharan Africa*
Aid per capita (currentUSD) rhs
Aid (% ofGNI) rhs
Debt forgiveness lhs
*Data for debt forgiveness refers to all developing countries Source:WDI,OECDDAC
01990
1 000
2 000
3 000
4 000
5 000
6 000
7 000
8 000
9 000
1993 1996 1999 20020
5
10
15
20
25
30
35
40
%USDUSDm
Investment Facility – Annual Report 20068
A f r i c a • C a r i b b e a n • P a c i f i c • A f r i c a • C a r i b b e a n • P a c i f i c • A f r i c a • C a r i b b e a n • P a c i f i c
December 2006, when the military took
control of the Fiji islands. Finally, weak
enforcement often counterbalances the
relativelybusiness-friendly rulesand regu-
lations ofmany Pacific Islands.
Commoditymarketsand ACP countries
Commodities represent importantbusi-
ness and income streams in many ACP
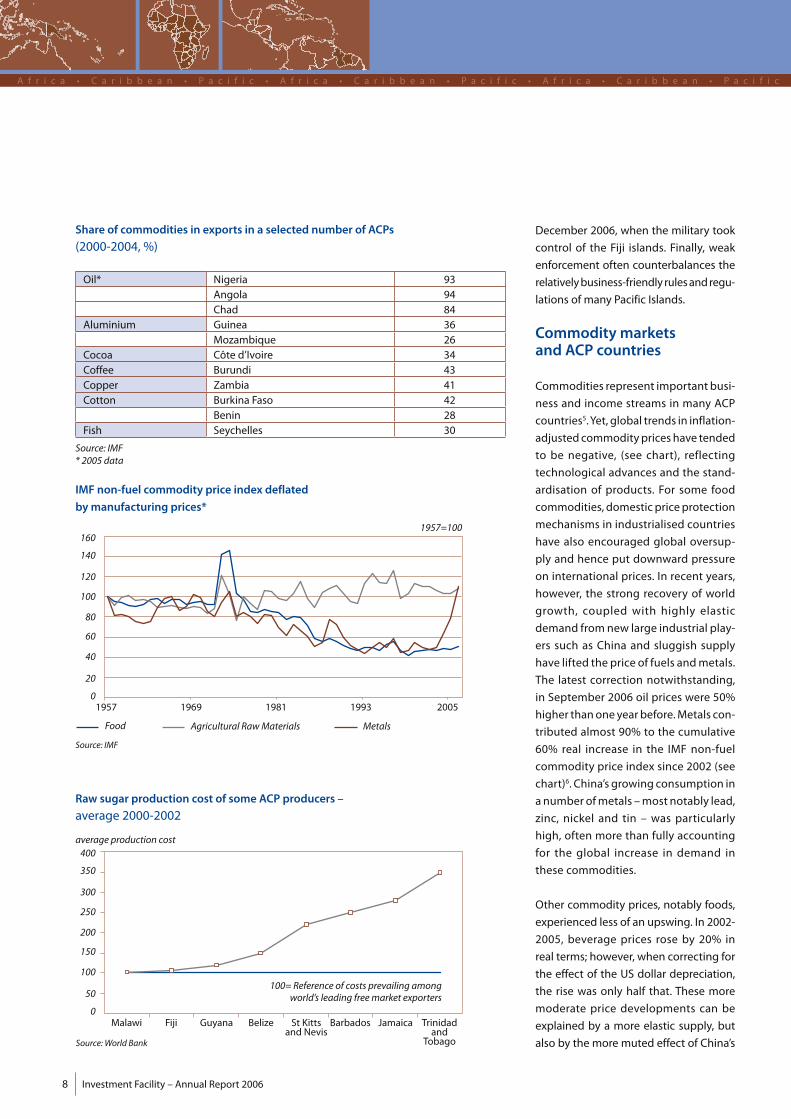
countries5.Yet,global trends in inflation-
adjusted commoditypriceshave tended
to be negative, (see chart), reflecting
technological advances and the stand-
ardisation of products. For some food
commodities, domesticpriceprotection
mechanisms in industrialised countries
have also encouraged global oversup-
ply and hence put downward pressure
on international prices. In recent years,
however, the strong recovery of world
growth, coupled with highly elastic
demand from new large industrial play-
ers such as China and sluggish supply
have lifted the price of fuels andmetals.
The latest correction notwithstanding,
in September 2006 oil prices were 50%
higher thanone yearbefore.Metals con-
tributed almost 90% to the cumulative
60% real increase in the IMF non-fuel
commodity price index since 2002 (see
chart)6.China’sgrowing consumption in
anumber ofmetals –mostnotably lead,
zinc, nickel and tin – was particularly
high, often more than fully accounting
for the global increase in demand in
these commodities.
Other commodity prices, notably foods,
experienced less of an upswing. In 2002-
2005, beverage prices rose by 20% in
real terms; however,when correcting for
the effect of the US dollar depreciation,
the rise was only half that. These more
moderate price developments can be
explained by a more elastic supply, but
also by themoremuted effect of China’s
Raw sugar production cost of some ACP producers –
average 2000-2002
IMF non-fuel commodity price index deflated
bymanufacturing prices*
01969
20
40
60
80
100
120
140
1601957=100
1957 19931981 2005
Agricultural RawMaterialsFood Metals
0
50
100
150
200
250
300
350
400average production cost
100= Reference of costs prevailing amongworld’s leading freemarket exporters
Malawi Fiji Guyana Belize St Kittsand Nevis
Barbados Jamaica Trinidadand
Tobago
Oil* Nigeria 93Angola 94Chad 84
Aluminium Guinea 36Mozambique 26
Cocoa Côte d’Ivoire 34Coffee Burundi 43Copper Zambia 41Cotton Burkina Faso 42
Benin 28Fish Seychelles 30
Share of commodities in exports in a selected number of ACPs
(2000-2004,%)
Source: IMF* 2005 data
Source: IMF
Source:World Bank

Annual Report 2006 – Investment Facility 9
A f r i c a • C a r i b b e a n • P a c i f i c • A f r i c a • C a r i b b e a n • P a c i f i c • A f r i c a • C a r i b b e a n • P a c i f i c
industrialisation on demand for these
commodities.
Developments in commodity markets
have affectedACP countries in a number
of ways. Economic growth was indeed
stronger in oil and mineral producers
than elsewhere and picked up in 2002-
2006 relative to the previous four-year
period. Non-resource-intensive coun-
tries also recorded stronger growth. This
is noteworthy considering the adverse
growth effects of the oil price shock7. In
contrast, activity in food and non-food
agricultureproducingeconomies slowed
down slightly, partly owing to repeated
drought-relatedpoorharvests.Regarding
pricedevelopments,oilandmetalproduc-
ers, despitenotableprogress, experienced
greaterdifficulties incontrolling inflation-
ary pressures. Oil producers recorded
average inflation rates of around 16%
in 2002-2006. In contrast, non-resource-
intensive countries managed to lower
inflationby two thirds to6-7%. Inaddition,
despitemanycountries’attempts tomod-
erate thepracticeof trying to cushion the
effect of higher oil prices on retail prices,
oil price pass-through remains a burden
on fiscal positions and prevents the effi-
cient allocation of resources. In Angola,
for example, fuel subsidies exceeded 3%
of GDP in 2005.
Apart from macroeconomic develop-
ments, changes in trade policies and
liberalisation also impact on commodity
markets. Preferential access to EU and
USmarkets in cotton, sugar and banana
exports is being eroded for many ACP
countries, necessitating adjustments
and the elimination of inefficiencies in
production processes8. Cost structures
in a number of ACP countries, especially
in the Caribbean, are particularly high
when comparedwith those of themajor
sugar-exporting countries such as Brazil
or Australia (see chart p. 8)9.
In reaction, St. Kitts & Nevis has recently
announced plans to close its sugar indus-
try and Trinidad & Tobago began amajor
restructuring programme in 2003. At the
same time, in themedium run, theplanned
removal of agricultural production and
price support measures in industrialised
countries isestimated to raiseglobalprices
by between 0.1% and 35% on average,
dependingoncommodityand thedegree
of liberalisation considered. In sugar, for
example, the range of estimated price
changes lies between 1.1% and 16%10.
Doing business in ACPcountries
TheWorld Bank “Doing Business” sur-
vey ranks 175 countries according
to the business-friendliness of their
rulesand regulations.Thesurveynotes
that the ACP countries were engaged
in many reforms in 2005/2006. As a
group, the ACPs improved their rank-
ing from 116th to 112th place out
of 175, mainly thanks to measures
taken to ease regulations and reduce
the administrative burden in cross-
border trade and taxation. Individ-
ually, Ghana and Tanzania ranked
among the top ten reformers. Some
countries, for example Namibia, the
Solomon Islands and Samoa, record
better business settings than average
relationships between GNI per capita
and the country’s rankwould suggest.
However, many ACPs continue to be
plagued by business-hostile regula-
tions: on an individual basis, a large
numberof countries remainataround
the 150th rank out of 175.
5 Roughly one third of economies can be classified asresource-intensive, i.e. with natural resource rentsaccounting for over 10% ofGDP.
6 See “The boom in non-fuel commodity prices. Can itlast?”, September 2006 IMFWorld EconomicOutlook.
7Model work suggests that the 2002-2005 fuel priceincrease lowered GDP by between 0.2 and 1% acrossnineoil-importingcountries inSSA.See IMFRegionalEco-nomicOutlook - Sub-SaharanAfrica, September 2006.
8 The Multi-Fiber Agreement expired in January 2005,providing for the gradual dismantling of the quotasthat existedunder theMFA. In the contextof theDohatrade liberalisation roundpressure isalsomounting toreduce domestic sugar prices in ACPs and eliminatepreferential access. The EU and US pay two to threetimesworldmarketprices for imports fromquotahold-ers. European Commission proposals (2005) suggestreducing intervention sugar prices by 36%.
9 SeeDonaldMitchell “Sugar in theCaribbean:Adjustingto Eroding Preferences”, World Bank Policy ResearchWorking Paper,December 2005.
10 IMF, op.cit.
Investment Facility – Annual Report 200610
A f r i c a • C a r i b b e a n • P a c i f i c • A f r i c a • C a r i b b e a n • P a c i f i c • A f r i c a • C a r i b b e a n • P a c i f i c
Operations in 2006
2 006 proved to be an exceptional year for the IF,which succeeded in
significantly increasing its lending volume,whilstmaking themost of
its flexibility in terms of risk-taking and of a diversified range of financial
instruments.
Signatures under the IF during the year
totalled EUR 570m, a level never achieved
by the Bank in the ACP region under EDF
funds,towhichshouldbeaddedEUR167m
under theBank’sown resources (adetailed
list of signed operations is presented in
Annexes 1 and 2).Project implementation
alsomade good progresswithmore than
50% of the IF finance contracts signed so
farbeingunderdisbursement.Anumberof
projects signed in the years 2003-2005 are
now entering into active implementation,
marked by an increase in disbursements
from EUR 99.8m and EUR 127.3m in 2004
and 2005 respectively to EUR 271.2 m in
2006 for the IFonly.Disbursementsonown
resources operations totalled EUR 86m in
2006, up from EUR 13.6m in 2005.
The financial sector is a key focus area of
the Cotonou Agreement and the IF con-
tinued implementing its strategy in the
sector, further contributing to the devel-
opmentofACP financialmarkets,notably
by supporting creditworthy institutions
and enabling them to grow in a sustain-
ablemanner,aswellasbydevelopingnew
financial instrumentssuitablefor the local
markets in question.
n The Banque Internationale d’Investis-
sement (BII) is a newly created bank
in Mauritania in which the IF acquired
a 25% share alongside Ballouhey s.a., a
French groupwith a strong presence in
the country. It was founded in 2006 to
provide modern financial services and
bestpractices to thebanking sectorand
economic actors and wasmanaged by
ING under a renewable 2-year contract
for management services and techni-
cal assistance. The IF’s initial expecta-
tion, that its equity investment in a
greenfield bank would send a strong
signal to domestic and international
investors, was validated when Société
Générale of France later offered to buy
a controlling stake in BII. By year-end,
BII’s two shareholders agreed to cede
control of the bank through a partial
saleof their shares.The arrival of a lead-
ing internationalbank,Mauritania’s first
non-domesticbank,givesanewdimen-
sion to the localbanking sector andwill
benefit the economy as awhole.
n Under the Pacific Islands Financing
Facility II, funds have beenmade avail-
able to theDevelopmentBankofPalau,
following on from the successful uti-
lisation of the financing provided to
DevelopmentBankofSamoaandTonga
DevelopmentBankundera similar facil-
ity, signed inOctober 2004. By combin-
ing a series of lines of credit under one
facility, the Bank has been able to gain
significant efficiencies in the process-
ing andmonitoring of individual loans,
and to provide substantially improved
financeaccess forSMEsandmicro-sized
initiatives in the Pacific region.
n The IF has undertaken a second DFCU
Leasing Global Loan (II) in Uganda,
following the successful implemen-
tation of the previous global loan of
EUR 5m granted in 2004. The loan will
be in local currency for the financing of
leasing transactions, a highly suitable
arrangement to support SMEs operat-
ing in theagro-industry, fishing,mining,
manufacturing and tourism sectors,
and services related to these sectors,
or providing healthcare and education
in Uganda.
n Following threeprevious successfulcol-
laborations, the IFhasalsoestablisheda
loanguarantee facility for theCaribbean
DevelopmentBank (CDB) to support its
Moving further towardsinnovative financing
Annual Report 2006 – Investment Facility 11
A f r i c a • C a r i b b e a n • P a c i f i c • A f r i c a • C a r i b b e a n • P a c i f i c • A f r i c a • C a r i b b e a n • P a c i f i c
whichareamongst thebestperforming
banks in the country with awell-devel-
oped branch network. This facility is
expected to have a high development
impact and supports the intermediary
banks’strategicgoal of developing their
SME portfolio, notably by serving seg-
ments of the market which are poorly
provided for.
n TheOldMutualMIDINAFundhasbeen
setup for thepurposeofproviding long-
term debt finance primarily formunici-
pal infrastructuredevelopmentprojects
inNamibia.Eligible investmentprojects
include transport infrastructure, power
supply and distribution projects,water
and wastewater projects, telecommu-
nications infrastructure, agricultural
projects, property investments and
communityprojects inunderdeveloped
areas, lowcosthousingandprivatisation
of Government services. The Fund is
managedbyOldMutualAssetManagers
(Namibia),partof theOldMutual group
and the largest asset manager in the
country. As a new type of debt instru-
ment, the operation contributes to the
diversification of the country’s financial
sector.The IF is providing indirect fund-
ing through a long-term (15 years) ZAR
denominated line of creditmade avail-
able to theMIDINA Fund promoter and
main investor.
n The IF has also provided a loan aimed
at supporting the development of First
BankofNigeria (FBN),oneof the coun-
try’s largestbankswhichhas embarked
on a far-reaching modernisation exer-
cise. Thanks to its unique position and
following its planned merger with
Ecobank, FBN is going to be a lead-
ing actor in financial deepening and
economic integration inWest Africa. It
will leverage its new regional network
to improve services to commercial and
corporate customers. The IF loan is giv-
ingFBNaccess toa sourceof stable long-
term finance to implement its strategies.
Through the provision of tier II capital,
the IF is also contributing as a catalyst
to increasing the flow of private sector
funding to FBN, and hence to a diversi-
fication of its funding base.
n Under the Ghana Financial Sector
Global Loan II, the Bank is providing
loans from both IF and own resources
toEcobankGhanaLtd. (EBG)andSociété
Générale – SSB (SG–SSB), respectively.
Thesecredit lines intend toprovide term
finance for amounts of up to EUR 5 m
to foreign currency-earning corporate
clients in sectors such as manufactur-
lendingoperations in theprivate sector
by establishing a risk sharing facility,
whereby the Bankwould guarantee up
to50%of the riskson loansprincipally to
the private sector originated andman-
agedbyCDB.The facility shouldprovide
CDBwith additional financial flexibility
tomeet itseconomicdevelopmentand
poverty reductionmandate,whilemain-
taining its financial soundness.
n The Rwanda Global Loan II: Private
Sector Support consists of the estab-
lishment of a line of credit aimed at
financing long-term loans in euros and
local currency for investment projects
in Rwanda. Final beneficiaries are SMEs
andmicro enterprises operating in the
productiveand services sectorseligible
under the Cotonou Agreement. The
funds have been made available to
Banque Rwandaise deDéveloppement
and Banque Commerciale du Rwanda,
Investment Facility – Annual Report 200612
A f r i c a • C a r i b b e a n • P a c i f i c • A f r i c a • C a r i b b e a n • P a c i f i c • A f r i c a • C a r i b b e a n • P a c i f i c
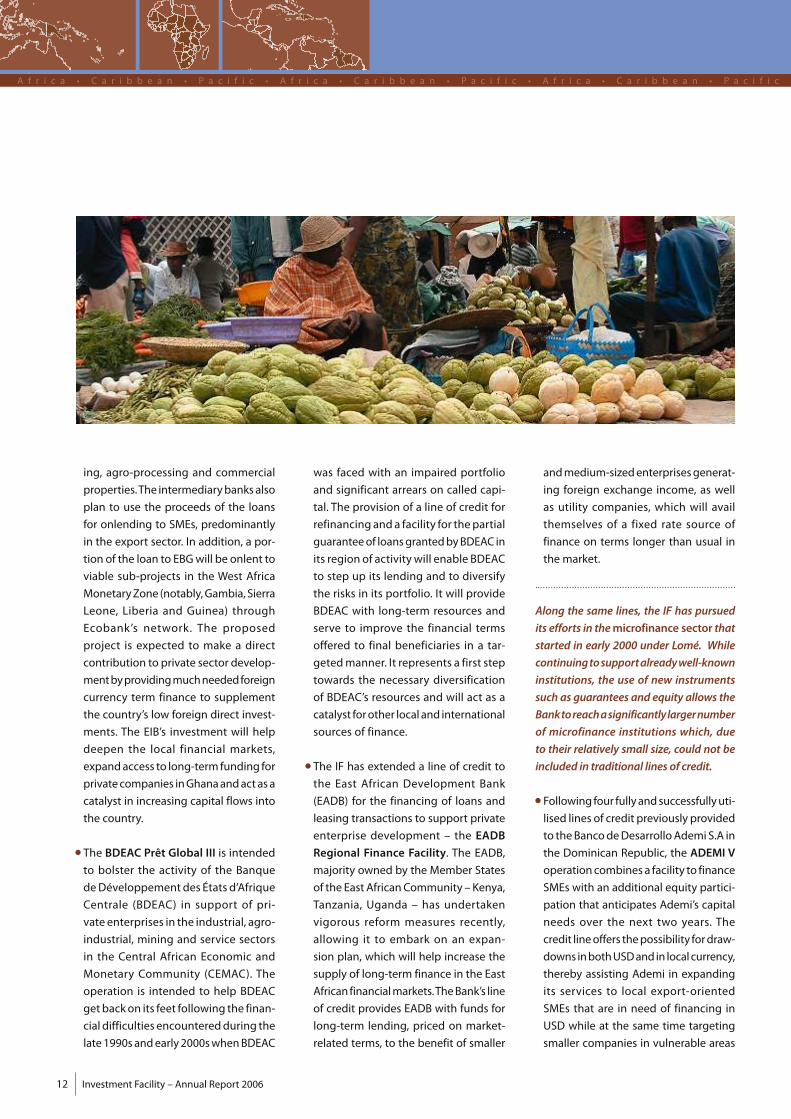
ing, agro-processing and commercial
properties.The intermediarybanksalso
plan to use the proceeds of the loans
for onlending to SMEs, predominantly
in the export sector. In addition, a por-
tion of the loan to EBGwill be onlent to
viable sub-projects in the West Africa
MonetaryZone (notably,Gambia,Sierra
Leone, Liberia and Guinea) through
Ecobank ’s network . The proposed
project is expected to make a direct
contribution to private sector develop-
mentbyprovidingmuchneededforeign
currency term finance to supplement
the country’s low foreign direct invest-
ments. The EIB’s investment will help
deepen the local financial markets,
expandaccess to long-term funding for
privatecompanies inGhanaandactasa
catalyst in increasing capital flows into
the country.
n The BDEAC Prêt Global III is intended
to bolster the activity of the Banque
deDéveloppementdes Étatsd’Afrique
Centrale (BDEAC) in support of pri-
vate enterprises in the industrial, agro-
industrial, mining and service sectors
in the Central African Economic and
Monetary Community (CEMAC). The
operation is intended to help BDEAC
getback on its feet following the finan-
cialdifficulties encounteredduring the
late1990sandearly2000swhenBDEAC
was faced with an impaired portfolio
and significant arrears on called capi-
tal. The provision of a line of credit for
refinancing and a facility for thepartial
guaranteeof loansgrantedbyBDEAC in
its region of activitywill enable BDEAC
to step up its lending and to diversify
the risks in its portfolio. It will provide
BDEAC with long-term resources and
serve to improve the financial terms
offered to final beneficiaries in a tar-
getedmanner. It represents a first step
towards the necessary diversification
of BDEAC’s resources and will act as a
catalyst forother localand international
sources of finance.
n The IF has extended a line of credit to
the East African Development Bank
(EADB) for the financing of loans and
leasing transactions to support private
enterprise development – the EADB
Regional Finance Facility. The EADB,
majority owned by theMember States
of the EastAfricanCommunity –Kenya,
Tanzania, Uganda – has undertaken
vigorous reform measures recently,
allowing it to embark on an expan-
sion plan, which will help increase the
supply of long-term finance in the East
African financialmarkets.TheBank’s line
of credit provides EADB with funds for
long-term lending, priced on market-
related terms, to the benefit of smaller
andmedium-sizedenterprisesgenerat-
ing foreign exchange income, as well
as utility companies, which will avail
themselves of a fixed rate source of
finance on terms longer than usual in
themarket.
Along the same lines, the IF has pursued
its efforts in themicrofinance sector that
started in early 2000 under Lomé. While
continuingtosupportalreadywell-known
institutions, the use of new instruments
such as guarantees and equity allows the
Banktoreachasignificantly largernumber
of microfinance institutions which, due
to their relatively small size, could not be
included in traditional lines of credit.
n Following four fullyand successfullyuti-
lised lines of credit previously provided
to theBancodeDesarrolloAdemiS.A in
the Dominican Republic, the ADEMI V
operation combinesa facility to finance
SMEswith an additional equity partici-
pation that anticipates Ademi’s capital
needs over the next two years. The
credit lineoffers thepossibility fordraw-
downs inbothUSDand in localcurrency,
thereby assisting Ademi in expanding
its services to local export-oriented
SMEs that are in need of financing in
USD while at the same time targeting
smaller companies in vulnerable areas
Annual Report 2006 – Investment Facility 13
A f r i c a • C a r i b b e a n • P a c i f i c • A f r i c a • C a r i b b e a n • P a c i f i c • A f r i c a • C a r i b b e a n • P a c i f i c
and improving thedevelopment impact
of the operation.
n The Small Enterprises Global Loan is
another example of the IF’s support to
the financial sector in the Dominican
Republic. The credit line is comple-
mented by an equity participation in
Banco ADOPEM’s capital, to be final-
ised in the near future. The objec-
tive is to repeat the successful model
used in the same country with Ademi
by supporting the transformation of
an experienced microfinance NGO
into a regulated bank. Through the
equity participation the IF will at an
early stage provide institutional and
capital support,while the lineof credit,
denominated in pesos, will be key
to improving and diversifying Banco
ADOPEM’s sources of finance.
n Access Microfinance Holding AG
(“Access Holding”) is a microfinance
holding company whose key objec-
tive is to develop financial institutions
in low-income countries, including
Mozambique, Madagascar and Tanza-
nia. To this effect, Access Holding aims
to become a leading commercial stra-
tegic investor focusing on greenfield
and early-stage microfinance institu-
tions (MFIs). Alongside the IF equity
participation, the Bank is providing a
grant for technical assistance. The ini-
tial subscription also includes IFC,KfW,
LFS FinancialSystemsGmbH, aGerman
consulting firm dedicated to microfi-
nance and,MicroAssets GbR aswell as
twoprivate investors,GrayGhost Fund
LLC and Omidyar-Tufts Microfinance
Fund, illustrating thisoperation’s strong
demonstration effect.
n Business Partners Ltd of South Africa
(BPSA) has been operating in South
Africa since 1981 and has established
a solid track record. In partnership
AfriCapMicrofinance Fund
“Since its introduction in the 1980s, themicrofinance industry in Africa has grown
exponentially….Thepoorareno longerdeemedunbankable. This sectorhasestab-
lished itselfasan industry in itsown right, successfullymeetingadouble bottom line
using commercial tools toprovideeconomicand socialdividends.”W.Diouf,Manag-
ing Partner of AfriCapMicrofinance Fund.
Through Lomé risk capital funds, the Bank is one of the largest founding investors
in the AfriCapMicrofinance Fund, a USD 14 m private equity investment fund dedi-
cated to microfinance in Africa. Other co-founders of the fund are DFIs, including
IFC, FMO and the Belgian BIO as well asmicrofinance NGOs, including Acción and
Calmeadow.
AfriCap invests in the formof equityandquasi-equity instrumentswhilealsoprovid-
ingmanagementadvice,governanceand technicalassistance. Since its inception in
2001,AfriCaphas rapidlybuilta strongdeal-flow throughoutanumberof countries:
Ghana,Kenya,Madagascar,Mauritius,Mozambique,Nigeria,Senegal,Sierra Leone,
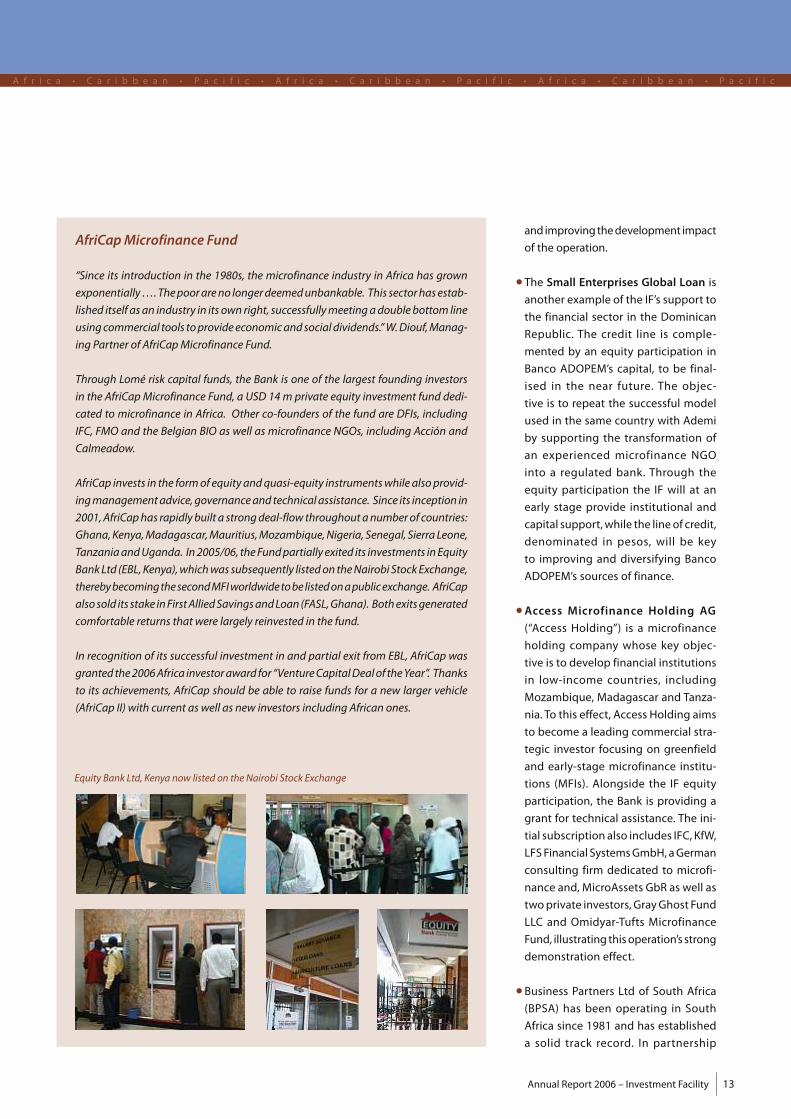
TanzaniaandUganda. In2005/06, theFundpartiallyexited its investments inEquity
Bank Ltd (EBL,Kenya),whichwas subsequently listedon theNairobiStockExchange,
therebybecoming thesecondMFIworldwide tobe listedonapublicexchange. AfriCap
also sold its stake inFirstAlliedSavingsandLoan (FASL,Ghana). Bothexitsgenerated
comfortable returns thatwere largely reinvested in the fund.
In recognition of its successful investment in and partial exit from EBL, AfriCapwas
granted the2006Africa investoraward for “VentureCapitalDeal of theYear”. Thanks
to its achievements, AfriCap should be able to raise funds for a new larger vehicle
(AfriCap II)with current aswell as new investors including African ones.
Equity Bank Ltd, Kenya now listed on theNairobi Stock Exchange

Investment Facility – Annual Report 200614
A f r i c a • C a r i b b e a n • P a c i f i c • A f r i c a • C a r i b b e a n • P a c i f i c • A f r i c a • C a r i b b e a n • P a c i f i c
with IFC, it is seeking to expand its
business internationally via Business
Partners International (BPI), a new,
wholly-owned subsidiary. It is envis-
aged that BPIwill manage a number of
funds inAfrica, including theBPIMada-
gascar SME Fund, aimed at provid-
ing equity and quasi-equity finance to
SMEs inMadagascar and theBPI Kenya
SME fund,making small investments in
young Kenyan SMEs operating across a
rangeof sectors,witha specific focuson
the businesses at the lower end of the
SME spectrum. InMadagascar, the fund-
ing will be complemented by business
servicesprovided,under theoversightof
thepromoter, by localand international
consultantsandmentors. InKenya, itwill
make use of investment instruments
developed by BPSA for the SME sector,
which employs primarily quasi-equity
and debt structures. In both countries,
thecombinationof equity,quasi-equity
and debt instruments provided by the
IF offers amore innovative and flexible
range of risk-bearing instruments to
those companies which often experi-
encea lackofaccess to fundingadapted
to their specific needs.
n The IF isparticipating in the secondclos-
ingof InvestisseuretPartenairepour le
Développement (I&P),a regional hold-
ingcompanyestablishedbywell-known
private equity investors and dedicated
to investing in SMEs and microfinance
institutions. The primary geographical
focus of direct investments is on West
Africa. I&P is aunique investment com-
pany, since it is primarily supported by
private investorsand is targeting smaller
SMEs, which are usually neglected by
traditional private equity funds due to
their relatively small size. The IF invest-
ment, alongside that of PROPARCO, is
critical to support the development
of public-private partnerships in this
area traditionally dominated by public
investors. It will bring the company to
a sustainable level of capitalisation and
help it realise a growing deal-flow.
TheBank remainsakeyplayer insupport-
ing the provision of basic infrastructure,
which is the basis for economic growth
andaprerequisiteforprivate investment.
In2006,a totalofEUR145.5m, equivalent
to25.5%of IF signatures,was committed
for four projects in the energy andwater
andwastewater sectors.
n The Aménagement Hydroélectrique
deFelouproject concernsa60MW run-
of-river (without reservoir)hydropower
plant close to the town of Kayes,Mali,
implemented as part of the energy
strategyof theOrganisationdeMiseen
Valeurdu Fleuve Sénégal –OMVS (Sen-
egal RiverDevelopmentOrganisation)
to supplyMali,Mauritania andSenegal.
The IF’s loanwill supplement contribu-
tions from the World Bank (IDA) and
from the OMVS’s own resources. The
projectcontributes tomeetinggrowing
electricitydemand and to the reliability
of power supply in the three countries
through the use of renewable energy.
It constitutes the least-cost solution
for additional power supply in the
region, and helps defer investment in
thermal power generation capacity.
Once operational, the projectwill also
displace some thermal generation,
thereby allowing for fuel consumption
savings and avoidance of atmospheric
and GHG emissions. This project is the
first potential beneficiary of the Trust
Fund in support of infrastructure in
Africa.
n With the AES-SONEL Electricity Sup-
ply project, the IF is extending a loan
to the privatised integrated national
electricity supply utility of Cameroon,
theformerSociétéNationaled’Electricité
(SONEL), to finance the rehabilitation of
thermalandhydro-generation facilities,
erection andupgradingof transmission
lines and HV stations and upgrading
and extension of distribution facilities
across the country. The financing plan
of AES Sonel’s post-privatisation invest-
ment programme provides for EIB and
IFC (coordinator of the lenders) financ-
ing of EUR 135 m, together the largest
portion of a syndicate also including
the AfDB, the BDEAC, DEG, the Emerg-
ingAfrica Infrastructure Fund, FMO and
Proparco. The project is expected to
Annual Report 2006 – Investment Facility 15
A f r i c a • C a r i b b e a n • P a c i f i c • A f r i c a • C a r i b b e a n • P a c i f i c • A f r i c a • C a r i b b e a n • P a c i f i c
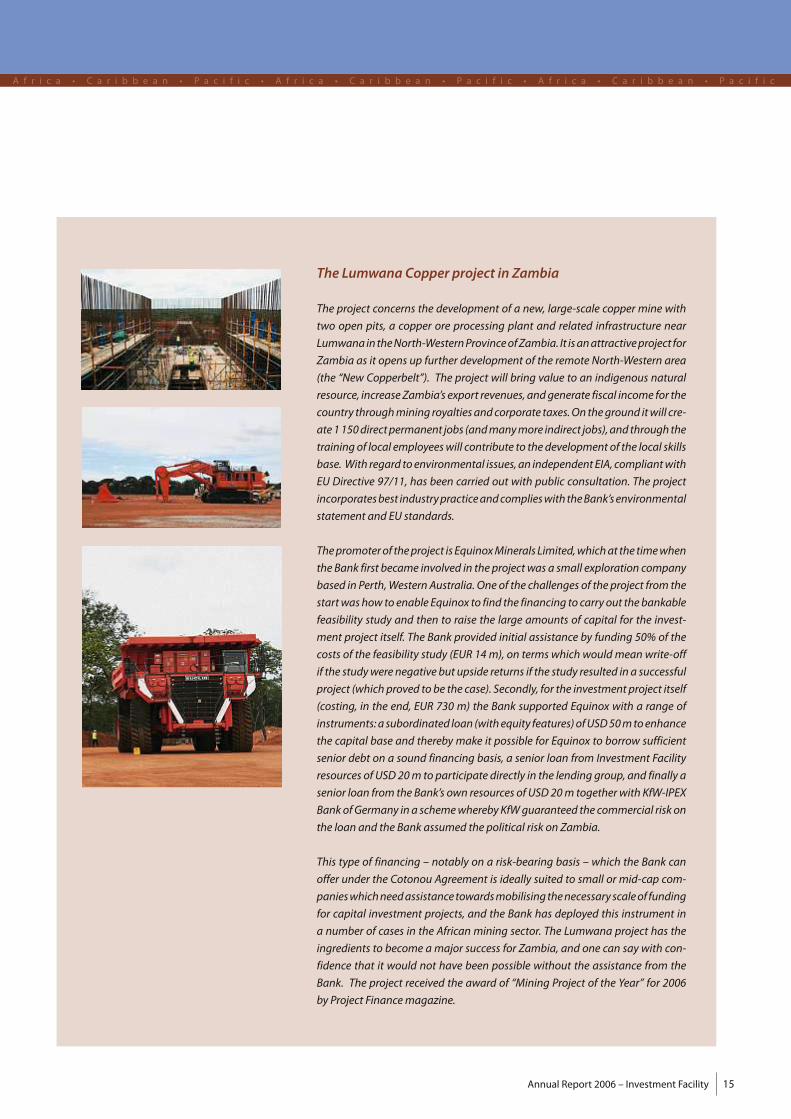
The Lumwana Copper project in Zambia
The project concerns the development of a new, large-scale coppermine with
two open pits, a copper ore processing plant and related infrastructure near
Lumwana in theNorth-WesternProvinceofZambia. It isanattractiveproject for
Zambia as it opens up further development of the remote North-Western area
(the “New Copperbelt”). The project will bring value to an indigenous natural
resource, increaseZambia’s export revenues,andgenerate fiscal income for the
country throughmining royaltiesandcorporate taxes.On theground itwill cre-
ate1150direct permanent jobs (andmanymore indirect jobs),and through the
training of local employeeswill contribute to the development of the local skills
base. With regard to environmental issues,an independentEIA, compliantwith
EU Directive 97/11, has been carried out with public consultation. The project
incorporatesbest industrypracticeandcomplieswith theBank’senvironmental
statement and EU standards.
Thepromoterof theproject isEquinoxMineralsLimited,whichat the timewhen
the Bank first became involved in the projectwas a small exploration company
based in Perth,WesternAustralia.One of the challenges of the project from the
startwashow to enable Equinox to find the financing to carryout the bankable
feasibility study and then to raise the large amounts of capital for the invest-
ment project itself. The Bank provided initial assistance by funding 50% of the
costs of the feasibility study (EUR 14 m), on termswhichwouldmeanwrite-off
if the studywerenegative but upside returns if the study resulted in a successful
project (which proved to be the case). Secondly, for the investment project itself
(costing, in the end, EUR 730 m) the Bank supported Equinox with a range of
instruments:a subordinated loan (withequity features)ofUSD50m toenhance
the capital base and therebymake it possible for Equinox to borrow sufficient
senior debt on a sound financing basis, a senior loan from Investment Facility
resources ofUSD 20m to participate directly in the lending group, and finally a
senior loan from the Bank’s own resources ofUSD 20m togetherwith KfW-IPEX
Bank ofGermany ina schemewherebyKfWguaranteed the commercial risk on
the loan and the Bank assumed the political risk on Zambia.
This type of financing – notably on a risk-bearing basis – which the Bank can
offer under the Cotonou Agreement is ideally suited to small ormid-cap com-
panieswhichneedassistance towardsmobilising thenecessary scaleof funding
for capital investment projects, and the Bank has deployed this instrument in
a number of cases in the African mining sector. The Lumwana project has the
ingredients to become amajor success for Zambia, and one can say with con-
fidence that it would not have been possible without the assistance from the
Bank. The project received the award of “Mining Project of the Year” for 2006
by Project Financemagazine.
Investment Facility – Annual Report 200616
A f r i c a • C a r i b b e a n • P a c i f i c • A f r i c a • C a r i b b e a n • P a c i f i c • A f r i c a • C a r i b b e a n • P a c i f i c
provide increased power supply and to
prevent load shedding, to allow for the
connection of 50 000 new customers
every year and tomeet the incremental
demandfromindustrialandcommercial
customers, enabling them to increase
their production and create employ-
ment.Overall, itwill generate significant
economic benefits, including improved
efficiency, increased system reliability
and quality of supply, increased access
to electricity, reduced risk of potential
accidentsdue tooverloadedequipment
andexposeddistribution lines, reduced
operation and maintenance costs, and
a significant reduction of technical and
commercial losses.
Despite thefocuson financialservicesand
infrastructure, the Bank remains respon-
sive to opportunities in other sectors
whenever these are identified, notably
in the industry,mining and services sec-
tors, which continued to offer a number
of potential investments promoted by
private sector operators. There, the IF
is providing investors with long-term
financial resources either not available
locally at all, or at least not available on
terms suitable to ensure the sustainabil-
ity of their projects, while often having
a strong catalytic effect to attract other
sources of funding.
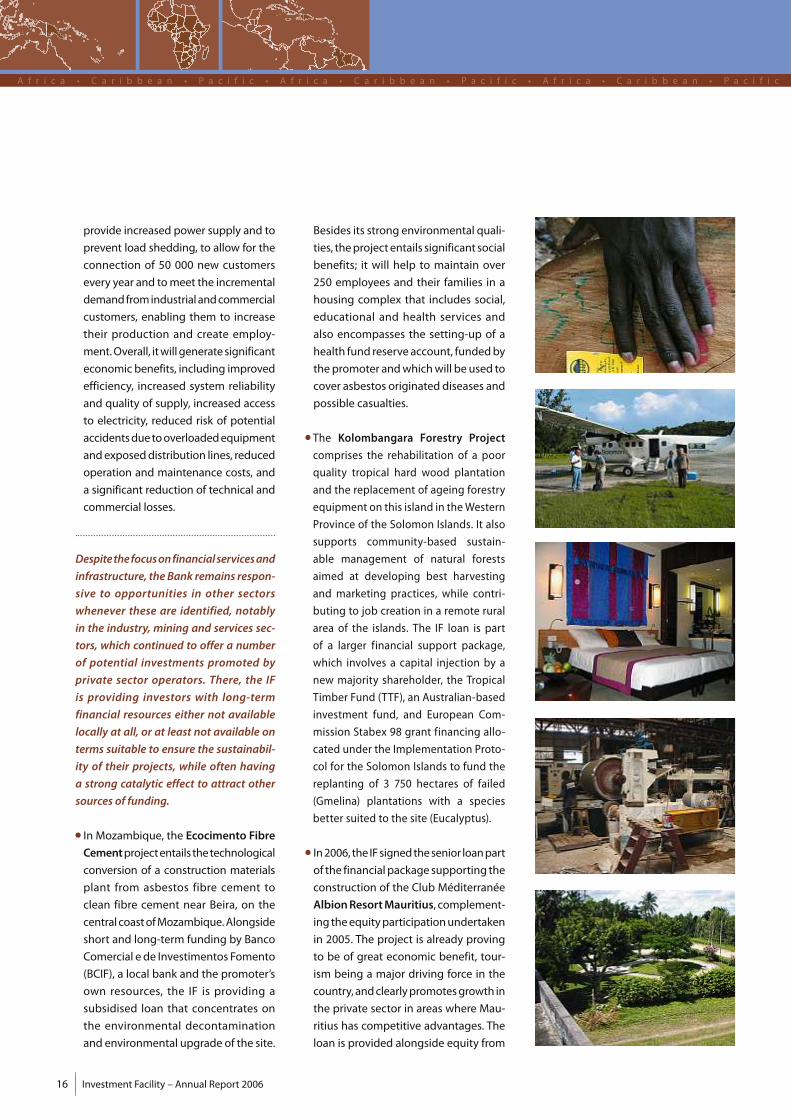
n InMozambique, the Ecocimento Fibre
Cementprojectentailsthe technological
conversion of a construction materials
plant from asbestos fibre cement to
clean fibre cement near Beira, on the
centralcoastofMozambique.Alongside
short and long-term funding by Banco
Comercial e de Investimentos Fomento
(BCIF), a local bank and the promoter’s
own resources, the IF is providing a
subsidised loan that concentrates on
the environmental decontamination
and environmental upgrade of the site.
Besides its strong environmental quali-
ties, theprojectentails significant social
benefits; it will help to maintain over
250 employees and their families in a
housing complex that includes social,
educational and health services and
also encompasses the setting-up of a
health fund reserve account, fundedby
thepromoter andwhichwillbeused to
cover asbestos originated diseases and
possible casualties.
n The Kolombangara Forestry Project
comprises the rehabilitation of a poor
quality tropical hard wood plantation
and the replacement of ageing forestry
equipment on this island in theWestern
Province of the Solomon Islands. It also
supports community-based sustain-
able management of natural forests
aimed at developing best harvesting
and marketing practices, while contri-
buting to job creation in a remote rural
area of the islands. The IF loan is part
of a larger financial support package,
which involves a capital injection by a
new majority shareholder, the Tropical
Timber Fund (TTF), an Australian-based
investment fund, and European Com-
mission Stabex 98 grant financing allo-
cated under the Implementation Proto-
col for the Solomon Islands to fund the
replanting of 3 750 hectares of failed
(Gmelina) plantations with a species
better suited to the site (Eucalyptus).
n In2006, the IFsigned thesenior loanpart
of the financialpackage supporting the
construction of the ClubMéditerranée
AlbionResortMauritius, complement-
ing theequityparticipationundertaken
in 2005. The project is already proving
to be of great economic benefit, tour-
ism being a major driving force in the
country,andclearlypromotesgrowth in
the private sector in areas whereMau-
ritius has competitive advantages. The
loan is provided alongside equity from
Annual Report 2006 – Investment Facility 17
A f r i c a • C a r i b b e a n • P a c i f i c • A f r i c a • C a r i b b e a n • P a c i f i c • A f r i c a • C a r i b b e a n • P a c i f i c
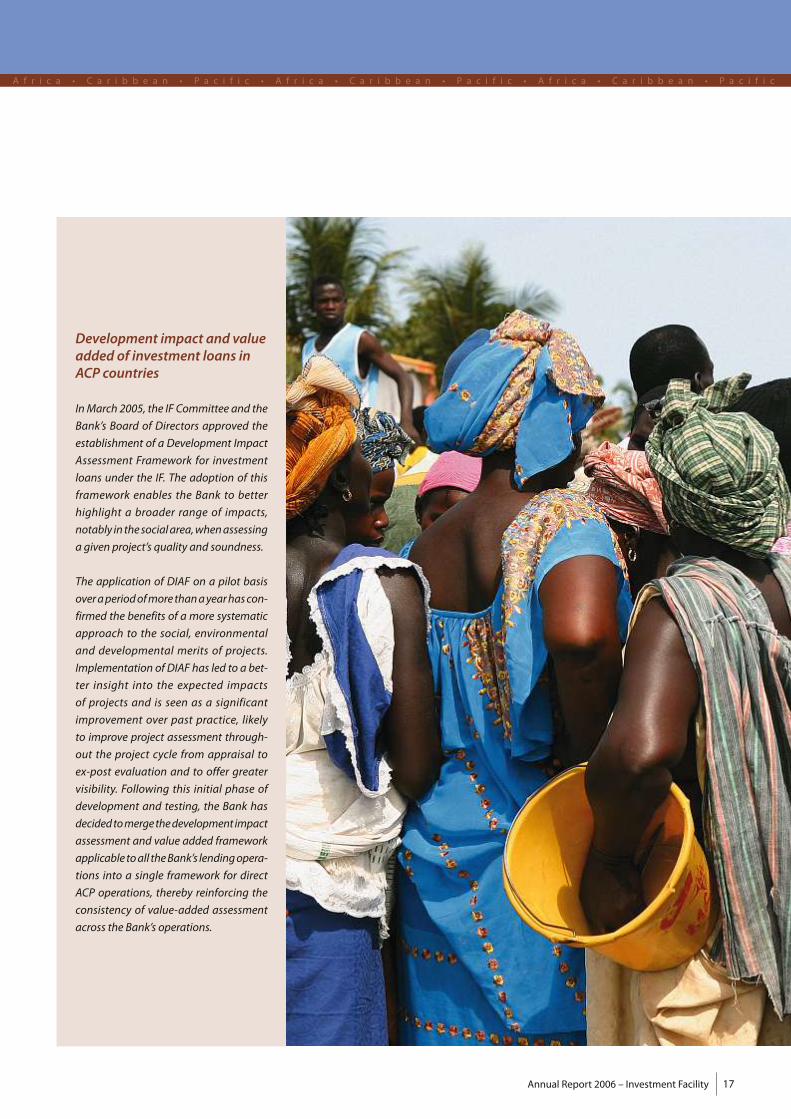
Development impact and valueadded of investment loans inACP countries
InMarch 2005, the IF Committee and the
Bank’s Board of Directors approved the
establishment of a Development Impact
Assessment Framework for investment
loans under the IF. The adoption of this
framework enables the Bank to better
highlight a broader range of impacts,
notably in the socialarea,whenassessing
a given project’s quality and soundness.
The application of DIAF on a pilot basis
overaperiodofmore thanayearhascon-
firmed the benefits of amore systematic
approach to the social, environmental
and developmental merits of projects.
Implementation ofDIAF has led to a bet-
ter insight into the expected impacts
of projects and is seen as a significant
improvement over past practice, likely
to improve project assessment through-
out the project cycle from appraisal to
ex-post evaluation and to offer greater
visibility. Following this initial phase of
development and testing, the Bank has
decided tomerge thedevelopment impact
assessment and value added framework
applicable toall theBank’s lendingopera-
tions into a single framework for direct
ACP operations, thereby reinforcing the
consistency of value-added assessment
across the Bank’s operations.
Investment Facility – Annual Report 200618
A f r i c a • C a r i b b e a n • P a c i f i c • A f r i c a • C a r i b b e a n • P a c i f i c • A f r i c a • C a r i b b e a n • P a c i f i c
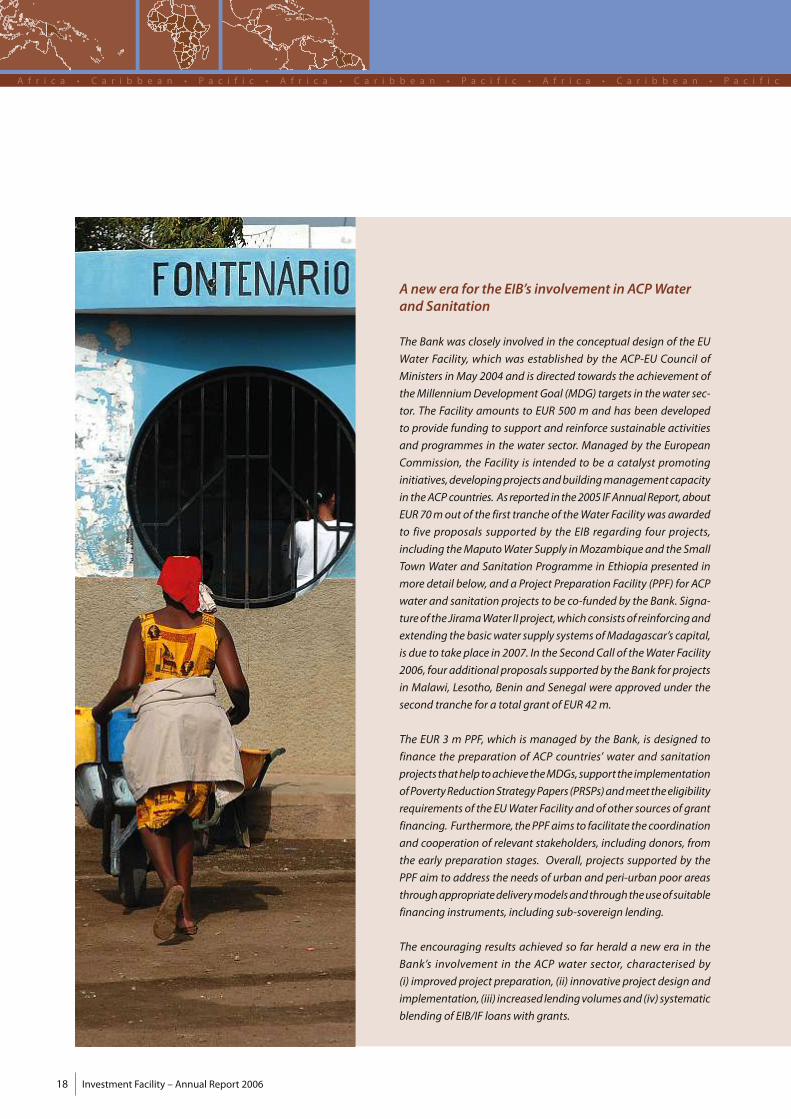
A new era for the EIB’s involvement in ACPWaterand Sanitation
The Bank was closely involved in the conceptual design of the EU
Water Facility, which was established by the ACP-EU Council of
Ministers inMay 2004 and is directed towards the achievement of
theMillenniumDevelopmentGoal (MDG) targets in thewater sec-
tor. The Facility amounts to EUR 500 m and has been developed
to provide funding to support and reinforce sustainable activities
and programmes in the water sector. Managed by the European
Commission, the Facility is intended to be a catalyst promoting
initiatives, developingprojectsandbuildingmanagementcapacity
in theACP countries. As reported in the2005 IFAnnualReport,about
EUR70mout of the first tranche of theWater Facilitywas awarded
to five proposals supported by the EIB regarding four projects,
including theMaputoWater Supply inMozambique and the Small
Town Water and Sanitation Programme in Ethiopia presented in
more detail below, and a Project Preparation Facility (PPF) for ACP
water and sanitation projects to be co-funded by the Bank. Signa-
tureof the JiramaWater IIproject,whichconsistsof reinforcingand
extending the basicwater supply systems ofMadagascar’s capital,
is due to take place in 2007. In the Second Call of theWater Facility
2006, four additional proposals supported by the Bank for projects
in Malawi, Lesotho, Benin and Senegal were approved under the
second tranche for a total grant of EUR 42m.
The EUR 3 m PPF, which is managed by the Bank, is designed to
finance the preparation of ACP countries’ water and sanitation
projects thathelptoachieve theMDGs,support the implementation
ofPovertyReductionStrategyPapers (PRSPs)andmeet theeligibility
requirements of the EUWater Facility and of other sources of grant
financing. Furthermore, thePPFaims to facilitate the coordination
and cooperation of relevant stakeholders, including donors, from
the early preparation stages. Overall, projects supported by the
PPF aim to address the needs of urban and peri-urban poor areas
throughappropriatedeliverymodelsand through theuseofsuitable
financing instruments, including sub-sovereign lending.
The encouraging results achieved so far herald a new era in the
Bank’s involvement in the ACP water sector, characterised by
(i) improved project preparation, (ii) innovative project design and
implementation, (iii) increased lendingvolumesand (iv) systematic
blending of EIB/IF loanswith grants.
Annual Report 2006 – Investment Facility 19
A f r i c a • C a r i b b e a n • P a c i f i c • A f r i c a • C a r i b b e a n • P a c i f i c • A f r i c a • C a r i b b e a n • P a c i f i c
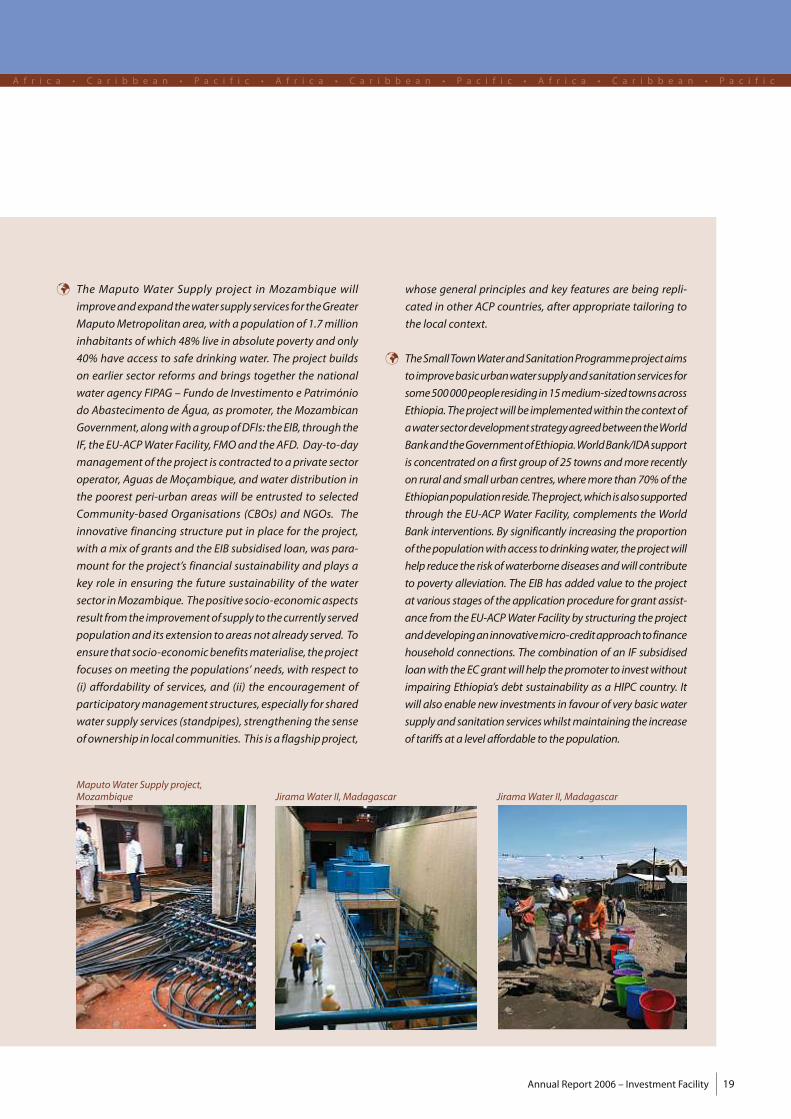
¸ The Maputo Water Supply project in Mozambique will
improveandexpand thewater supply services for theGreater
MaputoMetropolitan area,with a population of 1.7million
inhabitants ofwhich 48% live in absolute poverty and only
40% have access to safe drinking water. The project builds
on earlier sector reforms and brings together the national
water agency FIPAG – Fundo de Investimento e Património
do Abastecimento de Água, as promoter, theMozambican
Government,alongwithagroupofDFIs: theEIB, through the
IF, the EU-ACPWater Facility, FMOand theAFD. Day-to-day
management of the project is contracted to a private sector
operator, Aguas deMoçambique, andwater distribution in
the poorest peri-urban areas will be entrusted to selected
Community-based Organisations (CBOs) and NGOs. The
innovative financing structure put in place for the project,
with amix of grants and the EIB subsidised loan,was para-
mount for the project’s financial sustainability and plays a
key role in ensuring the future sustainability of the water
sector inMozambique. Thepositive socio-economicaspects
result from the improvementof supply to thecurrently served
populationand its extension toareasnotalready served. To
ensure that socio-economicbenefitsmaterialise, theproject
focuses on meeting the populations’ needs,with respect to
(i) affordability of services, and (ii) the encouragement of
participatorymanagement structures, especially for shared
water supply services (standpipes), strengthening the sense
ofownership in local communities. This isa flagshipproject,
whose general principles and key features are being repli-
cated in other ACP countries, after appropriate tailoring to
the local context.
¸ TheSmallTownWaterandSanitationProgrammeprojectaims
toimprovebasicurbanwatersupplyandsanitationservices for
some500000peopleresidingin15medium-sizedtownsacross
Ethiopia.Theprojectwillbe implementedwithin thecontextof
awatersectordevelopmentstrategyagreedbetweentheWorld
BankandtheGovernmentofEthiopia.WorldBank/IDAsupport
is concentratedona firstgroupof 25 townsandmore recently
on ruraland smallurban centres,wheremore than 70%of the
Ethiopianpopulationreside.Theproject,whichisalsosupported
through the EU-ACP Water Facility, complements the World
Bank interventions. By significantly increasing the proportion
of thepopulationwithaccess todrinkingwater, theprojectwill
help reduce the riskofwaterbornediseasesandwill contribute
to poverty alleviation. The EIB has added value to the project
at various stagesof theapplicationprocedure forgrantassist-
ance from the EU-ACPWater Facilityby structuring theproject
anddevelopinganinnovativemicro-creditapproachtofinance
household connections. The combination of an IF subsidised
loanwith theECgrantwill help thepromoter to investwithout
impairing Ethiopia’s debt sustainability as a HIPC country. It
will also enable new investments in favour of very basicwater
supplyand sanitation serviceswhilstmaintaining the increase
of tariffsata levelaffordable to thepopulation.
MaputoWater Supply project,Mozambique JiramaWater II,Madagascar JiramaWater II,Madagascar
Investment Facility – Annual Report 200620
A f r i c a • C a r i b b e a n • P a c i f i c • A f r i c a • C a r i b b e a n • P a c i f i c • A f r i c a • C a r i b b e a n • P a c i f i c
Proparco,usefullycomplementing local
funding,which remains constrained by
limited long-term resources.
n InBelize, the IF is financing theestablish-
ment and operation of Astrum Travel
Helicopter Services, which will con-
tribute to strengthening tourism in this
small country, characterisedbypoverty
and limited transport infrastructurebut
which is just beginning to exploit its
tourism potential. The IF loan provides
appropriate term finance for this start–
up operation in amarketwith a dearth
of suitable financing and accordingly is
expected to facilitate the cautious but
potentially quite rapid growth of this
entrepreneurial venture. Helicopter
flights will reduce travel times to tour-
ist attractions by as much as 75%. Fur-
thermore, the helicopters will improve
Search and Rescue (SAR) infrastructure
andmedical support topeople living in
remote areas.
n The KouilouMagnesium Phase I oper-
ation concerns the execution of the
remaining bankable feasibility studies,
includingdevelopmentworks and Envi-
ronmental and Social Impact Assess-
ments,necessary to reach financialclose
for thedevelopmentof theKouilouMag-
nesiumDeposit and associated produc-
tion plants in the Pointe Noire region of
the Republic of Congo (Brazzaville). The
outcome of the studies should enable
the promoter, MagIndustries Corp, a
Canadian-based resource development
and industrial materials company, to
proceedwith the establishment of new
mining, processing and power supply
facilities designed to produce magne-
siumandpotash forworldwidemarkets.
Thesefacilitieswouldbeoneof themajor
industrial investments in a post-conflict
country that is slowly attracting inflows
of FDI. The IF support for the project,
with very flexible terms and conditions
The Bank’s own resources
In2006, theBank supportedanumberofoperationsunder itsown resourcesman-
datewith commitments for the year totalling EUR 167m. Besides the Lumwana
Copperproject inZambiaand theGhanaFinancialSectorGlobalLoan IIdescribed
above,whichboth featureda combinationofown resourcesand IF funding, three
projects benefited from own resources lending:
¸ The Fiji Power project will increase Fiji’s power generation capacity and
reduce fuel costs by replacing oil-fired power with a new run-of-the-river
hydropower plant. The project comprises a build, own and operate 38 MW
hydropowerplantand ispartofa larger investmentplanco-financedwith the
ADB and theWorldBank (WB), eachof themoffering concessional features in
the formof technical assistance and carbon credit support respectively. The
long maturity and the cost-effective terms of the Bank loan are vital for the
development of new generation capacity while the Bank’s support by way
of an interest rate subsidy attached to the loan, is also viewed as important
to help deliver electricity at sustainable prices to end-consumers.
¸ TheWest African Gas Pipeline (WAGP) project consists of a pipeline system
(678 km long) thatwill transportnatural gas fromNigeria toGhana,Togo and
Benin, primarily for power generation, but eventually for other uses aswell.
Volta River Authority (VRA), the state-owned Electricity Company of Ghana
will initiallybe theprincipalbuyerof thegas.Theprojectwillbring significant
benefits in terms of reduced greenhouse gas emissions inGhana, Benin and
Togo, where natural gas transported by the project will replace liquid fuels.
Its cost is financed through direct equity and loans to theWest African Gas
PipelineCompany (WAPCo),anewly formedcompanywhich is incorporated in
Bermuda, fromits shareholders (ChevronTexaco,NigerianNationalPetroleum
Corporation, Shell Oil Company, Takoradi Power Company, awholly-owned
subsidiary of VRA, Bengaz and Sotogaz). WAPCo secured guarantees from
IDA andMIGA before the start of the pipeline construction andwill operate
theWAGP frommid-2007 onwards. The EIB loan of EUR 75mwill enable the
Government of Ghana to refinance its participation in the WAGP through
Takoradi Power Company Ltd (TAPCo) with sufficient long-term resources.
FMO similarly provided an amount of USD 36m to Bengaz and Sotogaz, the
gas companies enabling Benin and Togo to connect to theWAGP.
¸ Following three previous successful operationswith the Barbados Light and
Power Company Limited (BLPC), themajority privately-owned power utility
of Barbados, the Bank is providing a senior loanwith interest rate subsidy to
BLPC for the financing of the BLPCWind Power project. The project, which
is supported by the Government of Barbados, concerns the construction of
a 9.4 MWe wind farm to be located on the northeast coast of Barbados. By
virtue of substituting fossil fuel power generation and thereby contributing

Annual Report 2006 – Investment Facility 21
A f r i c a • C a r i b b e a n • P a c i f i c • A f r i c a • C a r i b b e a n • P a c i f i c • A f r i c a • C a r i b b e a n • P a c i f i c
EURm 2003 2004 2005 2006 Cumulative
Approvals 43.1 47.3 170 217.2 477.6
Signatures 6.1 62.2 150.9 167.2 386.4
Disbursements - 6.7 13.6 86 106.3
to a reduction in atmospheric emissions, thewind farmproject is eligible under
the Bank’s Climate Change Financing Facility, which provides formore flexible
financial terms and conditions.Wind energy is one of the important potential
renewableenergy resources, andcouldprovideup to10%of the island’senergy
needs. This project will be the first renewable energy project financed by the
Bank not only in Barbadoswhere itmakes an important contribution the Gov-
ernment’s ambitious target of meeting 40% of the island’s energy needs with
renewable sources by 2025, but also in the wider Caribbean region where it is
expected to have a significant catalytic effect.
Yearlyandcumulativeapprovals, signaturesanddisbursementsunderown resources
in the ACPs are presented in the table below:
Investment Facility – Annual Report 200622
A f r i c a • C a r i b b e a n • P a c i f i c • A f r i c a • C a r i b b e a n • P a c i f i c • A f r i c a • C a r i b b e a n • P a c i f i c
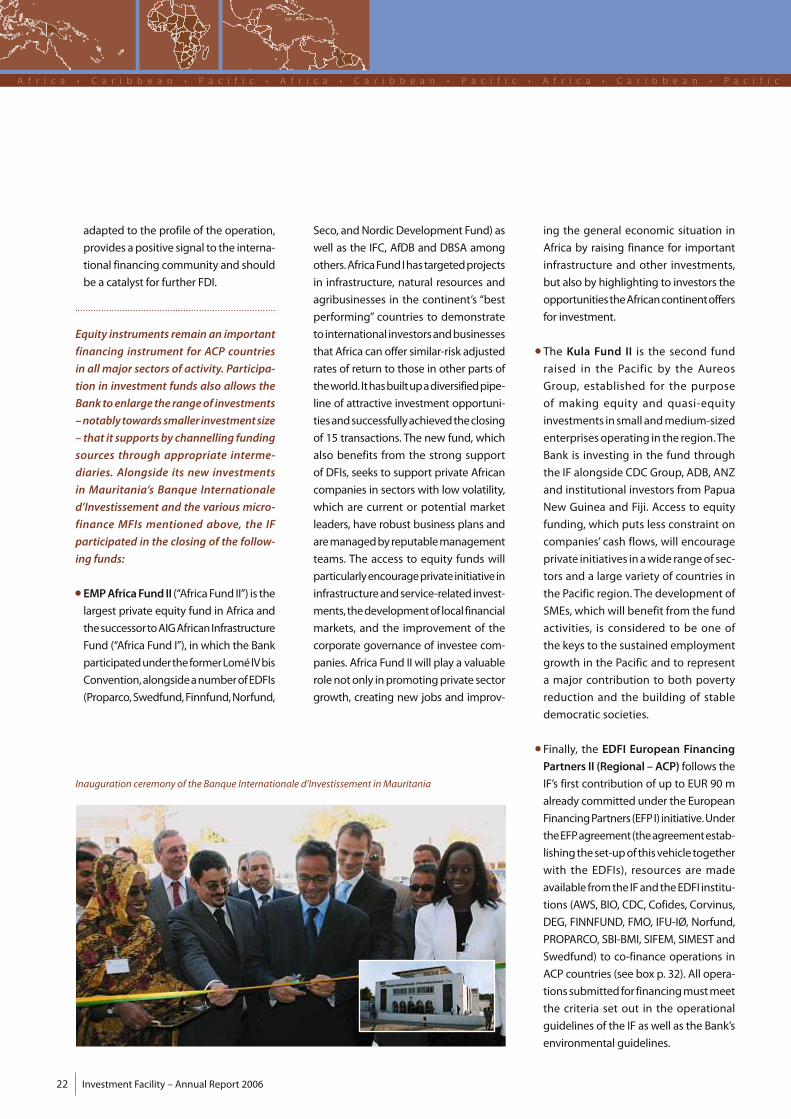
Inauguration ceremony of the Banque Internationale d’Investissement inMauritania
adapted to the profile of the operation,
provides apositive signal to the interna-
tional financing community and should
be a catalyst for further FDI.
Equity instruments remain an important
financing instrument for ACP countries
in all major sectors of activity. Participa-
tion in investment funds also allows the
Bank toenlarge the rangeof investments
–notably towardssmaller investmentsize
– that it supportsby channelling funding
sources through appropriate interme-
diaries. Alongside its new investments
in Mauritania’s Banque Internationale
d’Investissement and the variousmicro-
finance MFIs mentioned above, the IF
participated in the closing of the follow-
ing funds:
n EMPAfricaFund II (“AfricaFund II”) is the
largest private equity fund in Africa and
thesuccessortoAIGAfrican Infrastructure
Fund (“Africa Fund I”), inwhich the Bank
participatedundertheformerLomé IVbis
Convention,alongsideanumberofEDFIs
(Proparco,Swedfund,Finnfund,Norfund,
Seco, andNordicDevelopment Fund) as
well as the IFC, AfDB and DBSA among
others.AfricaFund Ihastargetedprojects
in infrastructure, natural resources and
agribusinesses in the continent’s “best
performing” countries to demonstrate
tointernational investorsandbusinesses
thatAfrica can offer similar-risk adjusted
rates of return to those in other parts of
theworld. Ithasbuiltupadiversifiedpipe-
line of attractive investment opportuni-
tiesandsuccessfullyachieved theclosing
of 15 transactions. The new fund,which
also benefits from the strong support
of DFIs, seeks to support private African
companies in sectorswith low volatility,
which are current or potential market
leaders, have robust business plans and
aremanagedby reputablemanagement
teams. The access to equity funds will
particularlyencourageprivate initiative in
infrastructureand service-related invest-
ments, thedevelopmentof local financial
markets, and the improvement of the
corporate governance of investee com-
panies. Africa Fund IIwill play a valuable
rolenotonly inpromotingprivate sector
growth, creating new jobs and improv-
ing the general economic situation in
Africa by raising finance for important
infrastructure and other investments,
but also by highlighting to investors the
opportunitiestheAfricancontinentoffers
for investment.
n The Kula Fund II is the second fund
raised in the Pacific by the Aureos
Group, established for the purpose
of making equity and quasi-equity
investments in smallandmedium-sized
enterprisesoperating in the region.The
Bank is investing in the fund through
the IF alongside CDC Group, ADB, ANZ
and institutional investors from Papua
New Guinea and Fiji. Access to equity
funding, which puts less constraint on
companies’ cash flows, will encourage
private initiatives inawide rangeof sec-
tors and a large variety of countries in
the Pacific region. The development of
SMEs,whichwill benefit from the fund
activities, is considered to be one of
the keys to the sustained employment
growth in the Pacific and to represent
a major contribution to both poverty
reduction and the building of stable
democratic societies.
n Finally, the EDFI European Financing
Partners II (Regional –ACP) follows the
IF’s first contribution of up to EUR 90m
already committed under the European
FinancingPartners (EFP I) initiative.Under
theEFPagreement(theagreementestab-
lishing theset-upof thisvehicle together
with the EDFIs), resources are made
availablefrom the IFand theEDFI institu-
tions (AWS, BIO, CDC, Cofides, Corvinus,
DEG, FINNFUND, FMO, IFU-IØ, Norfund,
PROPARCO, SBI-BMI, SIFEM, SIMEST and
Swedfund) to co-finance operations in
ACP countries (see box p. 32). All opera-
tions submittedfor financingmustmeet
the criteria set out in the operational
guidelines of the IF aswell as the Bank’s
environmental guidelines.
Annual Report 2006 – Investment Facility 23
A f r i c a • C a r i b b e a n • P a c i f i c • A f r i c a • C a r i b b e a n • P a c i f i c • A f r i c a • C a r i b b e a n • P a c i f i c
Outlook for 2007
The first financialprotocolof theCotonou
Agreement is due to expire at the end of
2007.Provided the ratificationprocess for
the revisedCotonouAgreementhasbeen
completed, the second financialprotocol
will enter into force at the earliest on
1 January2008.Hence,withonly justover
EUR 300 m available for new approvals,
theBankwill notbe inaposition to report
further growth in the IF lending volume
in 2007 as reflowsonoutstanding invest-
ments will not yet have reached a level
that allows significant reinvestments in
new projects. The focuswill therefore be
on improving (i) the ratioof commitments
to approvals so far, and (ii) the disburse-
ment pattern of the portfolio. Effortswill
also be made to promote greater use of
own resources and technical assistance
wherever possible.
With this in mind, regional integration,
environment and good governance will
begivenacertaindegreeofpriority in the
identification of new potential projects.
This will apply to all sectors of activity,
whether infrastructure – notably in the
frameworkof theEU-Africa Infrastructure
Partnership – or industry, or in support
of the financial sector and SMEs. The
Bank will also endeavour to support the
European Commission in its programme
to assist theACP countries in their efforts
to adapt to the planned reform of the
preferential EU/ACP sugar regime, in line
with the June 2006PortMoresbyCouncil
Declaration.

Investment Facility – Annual Report 200624
A f r i c a • C a r i b b e a n • P a c i f i c • A f r i c a • C a r i b b e a n • P a c i f i c • A f r i c a • C a r i b b e a n • P a c i f i c
Portfolio overview
T he IF ismoving into the fifth and final year of the first Financial
Protocol of the Cotonou Agreement and has now established a strong
track record of activity with a total of approved and signed operations
amounting to EUR 1 736m and EUR 1 398m11 respectively, equivalent to
approximately 85% and 69% of the IF’s initial capital endowment and
corresponding to some 76 projects financed.
Yearly and cumulative approvals, signatures and disbursements under the IF are presented in the table below:
At the end of 2006,more than half of the
financecontracts signed so farwereunder
active disbursement or completely dis-
bursed.Cumulativedisbursements stood
atEUR396m, equivalent to19.5%of the IF
capitalendowment and28.3%12of signa-
tures todate (see charts p. 25).Whilst this
percentage representsanaverage for the
whole portfolio, experience shows that
disbursement patterns differ depending
on the type of operation, i.e. individual
loans, lines of credit to financial sector
intermediaries or equity investments
(notably throughequity funds).At theend
of 2006, 40% of commitments signed for
individual / direct loans –mainly for pri-
vate sectorprojects–hadbeendisbursed,
against 32% for equityholdings and 26%
only for lines of credit.
In line with the orientations and objec-
tivesof theCotonouAgreement, the focus
remained on projects promoted by the
private sector, which accounted for 81%
of the IF signed portfolio at the end of
2006 (on a cumulative basis).
Otherwise, 49% of the current IF portfo-
lio targets investments in the financial
sector, and ultimately promotes invest-
ments by SMEs. This can take the form
of lines of credit in favour of local or
regional financial institutions, partici-
pation in investment funds or the EFP
agency agreements. The relative share
of lines of credit (see statistical overview
p. 26) remained stable at around 20% of
the overall portfolio. Despite a marked
improvement in the actual utilisation of
credit lines extended to financial inter-
mediaries in 2004 and 2005, notably in
BurkinaFasoandNigeria, resultsachieved
so far remainbelowexpectations incoun-
tries where excess liquidity remains an
obstacle. Repeat operations in Niger
and Uganda and their rapid utilisation
nevertheless confirm the utility of credit
lines in support of SME development in
those countries.
Investments in the financial sector also
cover microfinance operations, and by
the end of 2006, the IF had committed
EUR 26.4m in debt and equity formicro-
finance in favour of 7MFIs in the ACPs. A
number of these are focusing more spe-
cifically on Africa, which remained until
recently the poor child of the industry.
Infrastructure isthesecond largestsectorof
interventionofthe IF–andby farthe largest
11 Thisamountdoesnot take intoaccountpartialcancel-lation of signed amounts equivalent to EUR 37m or2.8% of signed amounts at the end of 2006.
12 If taking into account partial cancellation of signedcontracts, the percentage increases to 31%.
EURm 2003 2004 2005 2006 Cumulative% of IF capitalendowment
Approvals 368.9 318.2 472.5 576.0 1 735.6 85.2%
Signatures 140.2 337.2 351.2 569.6 1 398.2 68.6%
Disbursements 4.1 93.2 113.8 185.2 396.3 19.5%
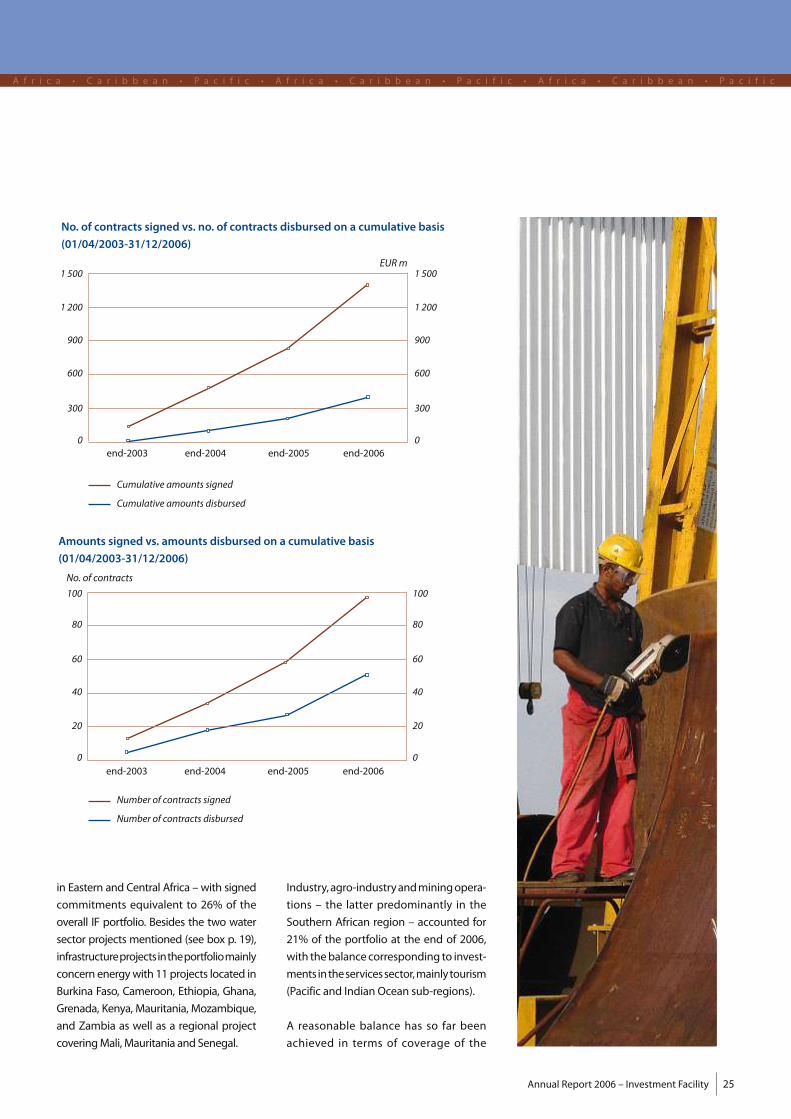
Annual Report 2006 – Investment Facility 25
A f r i c a • C a r i b b e a n • P a c i f i c • A f r i c a • C a r i b b e a n • P a c i f i c • A f r i c a • C a r i b b e a n • P a c i f i c
in Eastern and Central Africa –with signed
commitments equivalent to 26% of the
overall IF portfolio. Besides the two water
sector projectsmentioned (see box p. 19),
infrastructureprojects intheportfoliomainly
concern energywith 11projects located in
Burkina Faso, Cameroon, Ethiopia, Ghana,
Grenada, Kenya,Mauritania,Mozambique,
and Zambia as well as a regional project
coveringMali,Mauritania and Senegal.
Industry,agro-industryandminingopera-
tions – the latter predominantly in the
Southern African region – accounted for
21% of the portfolio at the end of 2006,
with thebalance corresponding to invest-
ments in theservicessector,mainly tourism
(Pacific and IndianOcean sub-regions).
A reasonable balance has so far been
achieved in terms of coverage of the
No. of contracts signed vs. no. of contracts disbursed on a cumulative basis
(01/04/2003-31/12/2006)
Cumulative amounts disbursed
Cumulative amounts signed
0
300
600
900
1 200
1 500
0
300
600
900
1 200
1 500
end-2003 end-2004 end-2005 end-2006
EURm
Amounts signed vs. amounts disbursed on a cumulative basis
(01/04/2003-31/12/2006)
Number of contracts disbursed
Number of contracts signed
end-2003 end-2004 end-2005 end-20060
20
40
60
80
100
0
20
40
60
80
100
No. of contracts
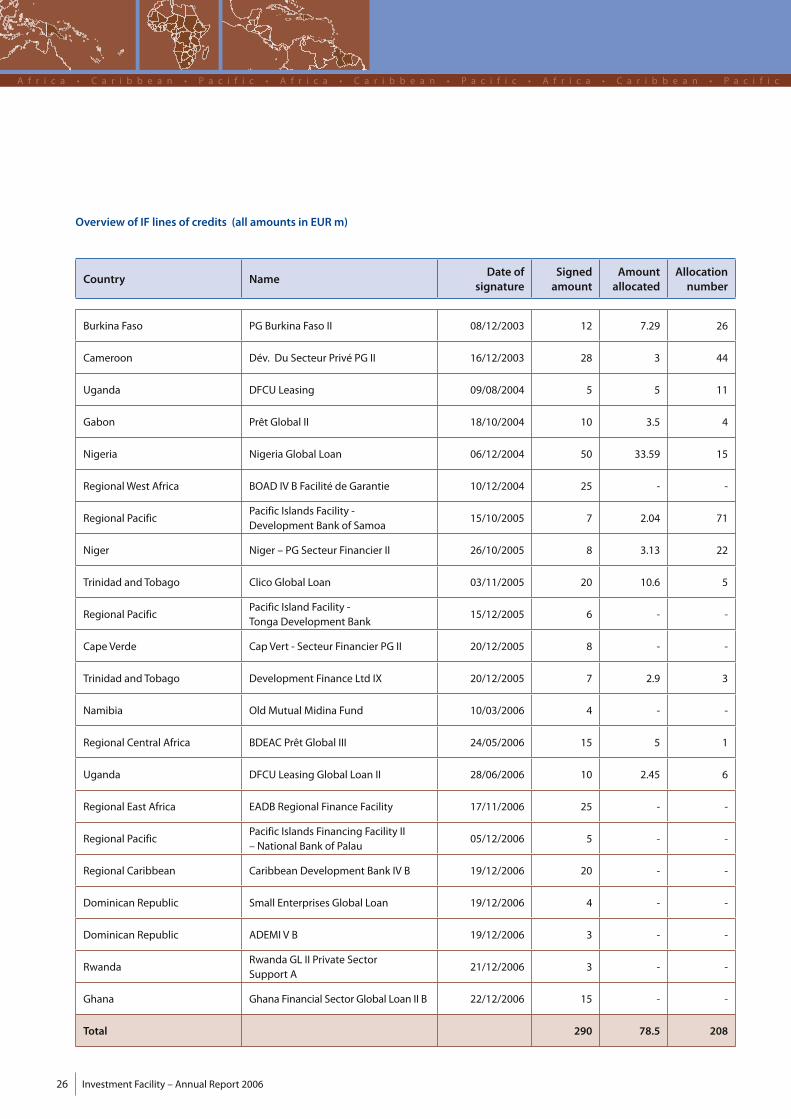
Investment Facility – Annual Report 200626
A f r i c a • C a r i b b e a n • P a c i f i c • A f r i c a • C a r i b b e a n • P a c i f i c • A f r i c a • C a r i b b e a n • P a c i f i c
Country NameDate of
signatureSignedamount
Amountallocated
Allocationnumber
Burkina Faso PG Burkina Faso II 08/12/2003 12 7.29 26
Cameroon Dév. Du Secteur Privé PG II 16/12/2003 28 3 44
Uganda DFCU Leasing 09/08/2004 5 5 11
Gabon Prêt Global II 18/10/2004 10 3.5 4
Nigeria Nigeria Global Loan 06/12/2004 50 33.59 15
RegionalWest Africa BOAD IV B Facilité de Garantie 10/12/2004 25 - -
Regional PacificPacific Islands Facility -Development Bank of Samoa
15/10/2005 7 2.04 71
Niger Niger – PG Secteur Financier II 26/10/2005 8 3.13 22
Trinidad and Tobago Clico Global Loan 03/11/2005 20 10.6 5
Regional PacificPacific Island Facility -Tonga Development Bank
15/12/2005 6 - -
Cape Verde Cap Vert - Secteur Financier PG II 20/12/2005 8 - -
Trinidad and Tobago Development Finance Ltd IX 20/12/2005 7 2.9 3
Namibia OldMutualMidina Fund 10/03/2006 4 - -
Regional Central Africa BDEAC Prêt Global III 24/05/2006 15 5 1
Uganda DFCU Leasing Global Loan II 28/06/2006 10 2.45 6
Regional East Africa EADB Regional Finance Facility 17/11/2006 25 - -
Regional PacificPacific Islands Financing Facility II– National Bank of Palau
05/12/2006 5 - -
Regional Caribbean Caribbean Development Bank IV B 19/12/2006 20 - -
Dominican Republic Small Enterprises Global Loan 19/12/2006 4 - -
Dominican Republic ADEMI V B 19/12/2006 3 - -
RwandaRwanda GL II Private SectorSupport A
21/12/2006 3 - -
Ghana Ghana Financial SectorGlobal Loan II B 22/12/2006 15 - -
Total 290 78.5 208
Overview of IF lines of credits (all amounts in EURm)
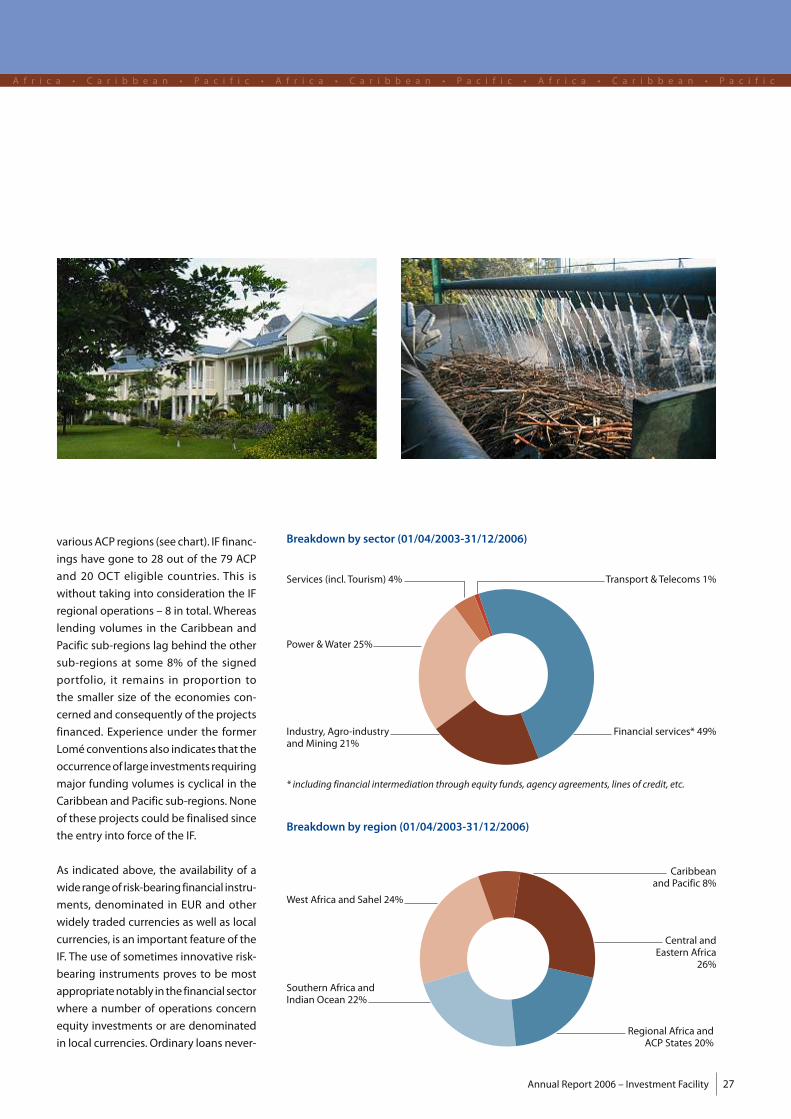
Annual Report 2006 – Investment Facility 27
A f r i c a • C a r i b b e a n • P a c i f i c • A f r i c a • C a r i b b e a n • P a c i f i c • A f r i c a • C a r i b b e a n • P a c i f i c
variousACP regions (see chart). IF financ-
ings have gone to 28 out of the 79 ACP
and 20 OCT eligible countries. This is
without taking into consideration the IF
regional operations – 8 in total.Whereas
lending volumes in the Caribbean and
Pacific sub-regions lag behind the other
sub-regions at some 8% of the signed
portfolio, it remains in proportion to
the smaller size of the economies con-
cerned and consequently of the projects
financed. Experience under the former
Lomé conventions also indicates that the
occurrenceof large investments requiring
major funding volumes is cyclical in the
Caribbean and Pacific sub-regions.None
of these projects could be finalised since
the entry into force of the IF.
As indicated above, the availability of a
wide rangeof risk-bearing financial instru-
ments, denominated in EUR and other
widely traded currencies as well as local
currencies, is an important feature of the
IF. The use of sometimes innovative risk-
bearing instruments proves to be most
appropriatenotably in the financial sector
where a number of operations concern
equity investments or are denominated
in local currencies.Ordinary loans never-
Breakdown by region (01/04/2003-31/12/2006)
West Africa and Sahel 24%
Southern Africa andIndian Ocean 22%
Caribbeanand Pacific 8%
Central andEastern Africa
26%
Regional Africa andACP States 20%
Breakdown by sector (01/04/2003-31/12/2006)
Transport & Telecoms 1%
Financial services* 49%Industry, Agro-industryandMining 21%
Power &Water 25%
Services (incl. Tourism) 4%
* including financial intermediation through equity funds, agency agreements, lines of credit, etc.
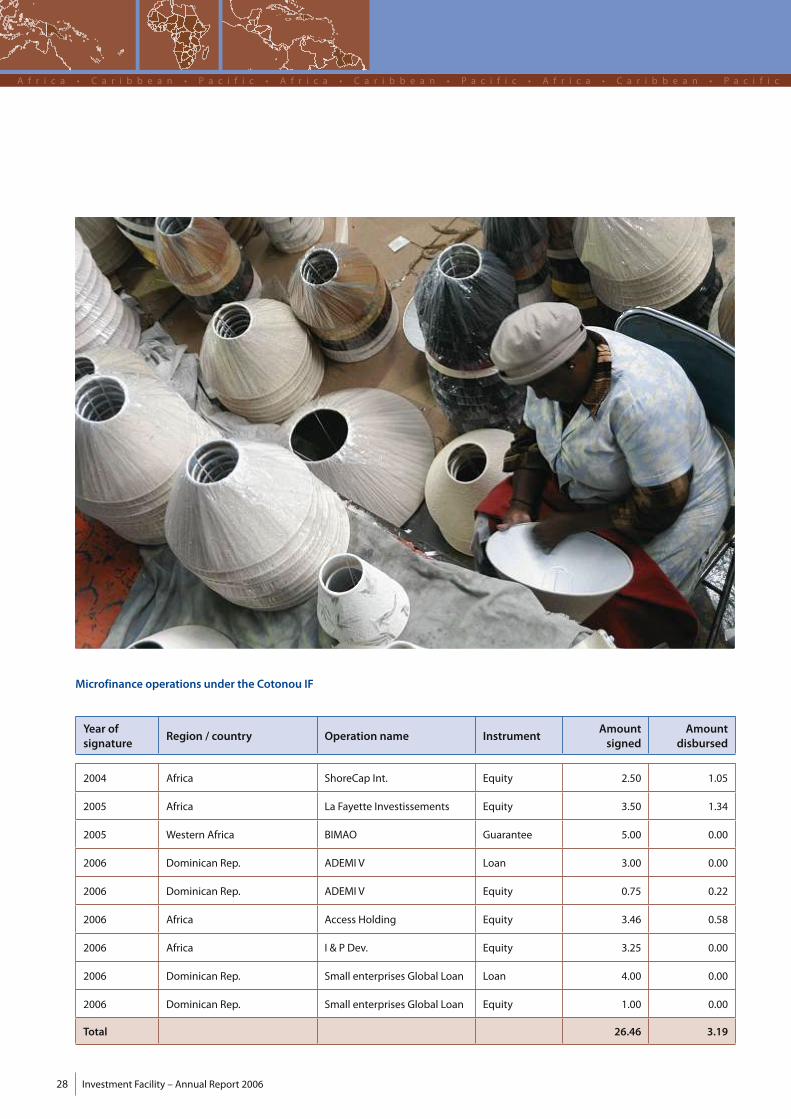
Investment Facility – Annual Report 200628
A f r i c a • C a r i b b e a n • P a c i f i c • A f r i c a • C a r i b b e a n • P a c i f i c • A f r i c a • C a r i b b e a n • P a c i f i c
Year ofsignature
Region / country Operation name InstrumentAmountsigned
Amountdisbursed
2004 Africa ShoreCap Int. Equity 2.50 1.05
2005 Africa La Fayette Investissements Equity 3.50 1.34
2005 Western Africa BIMAO Guarantee 5.00 0.00
2006 Dominican Rep. ADEMI V Loan 3.00 0.00
2006 Dominican Rep. ADEMI V Equity 0.75 0.22
2006 Africa Access Holding Equity 3.46 0.58
2006 Africa I & P Dev. Equity 3.25 0.00
2006 Dominican Rep. Small enterprises Global Loan Loan 4.00 0.00
2006 Dominican Rep. Small enterprises Global Loan Equity 1.00 0.00
Total 26.46 3.19
Microfinance operations under the Cotonou IF

Annual Report 2006 – Investment Facility 29
A f r i c a • C a r i b b e a n • P a c i f i c • A f r i c a • C a r i b b e a n • P a c i f i c • A f r i c a • C a r i b b e a n • P a c i f i c
Breakdownby region and sector (01/04/2003-31/12/2006)
Financial Services
Industry &Mining
Power &Water
Services (incl. Tourism)
Transport & TelecomsCaribbeanand Pacific
Central andEast Africa
RegionalAfrica & ACP
States
SouthernAfrica &
Indian Ocean
West Africa &Sahel
4%
22%
3%
68%
3%
58%
31%
11%
100%
16%
8%
5%
71%
24%
4%
60%
12%
theless remainpredominant in theoverall
portfolio in terms of lending volume, as
theymainly concern large infrastructure
or industrial projects for which lending
volumes aremore significant than those
involving equity or quasi-equity invest-
ments.At theendof2006, thebreakdown
of the IFportfolioby financial instruments
in terms of number of operations was
(i) 25 equity or quasi-equity investments,
(ii) 58 ordinary loans, (iii) 6 guarantees
and (iv) 9 subordinated loans (see chart
below for percentages). Local currency
investments totalled the equivalent of
EUR93m for14operationsandconcerned
the following currencies: Rwanda franc,
CFA franc, Uganda shilling, Fiji dollar,
Dominican Republic pesos and Mauri-
tanian ouguiya. Overall the current risk
profile of the IF portfolio fully reflects its
intrinsic risk-bearing nature, with 60%
of the portfolio rated in the high-risk
category.
Moma TitaniumMinerals - mining and processing of heavymineral sands in northernMozambique
Cumulative signatures
Breakdown by financial instrument (01/04/2003-31/12/2006)
Guarantee 5%
Subordinatedloan 12%
Equity and indirect equity 12%
Ordinary loan 71%

Investment Facility – Annual Report 200630
A f r i c a • C a r i b b e a n • P a c i f i c • A f r i c a • C a r i b b e a n • P a c i f i c • A f r i c a • C a r i b b e a n • P a c i f i c
Greater concessionality through interest rate subsidies
IF operations and own resources (OR) loans can benefit from an interest rate subsidy appropriation of some EUR 187m, the
purpose ofwhich is to increase their concessionality under certain specific conditions:
* “For infrastructure projects in the Least-Developed Countries, in post-conflict countries and post-natural disaster countries…
that are prerequisites for private sector development...;
* For infrastructureprojectsby commercially runpublic entities thatareprerequisites for private sectordevelopment in countries
subject to restrictive borrowing conditions under theHeavily Indebted PoorCountries (HIPC) initiative or another internationally
agreed debt sustainability framework…;
* For projects that involve restructuring operations in the framework of privatisation or for projectswith substantial and clearly
demonstrable social or environmental benefits….”
Revised Cotonou Partnership Agreement, Annex II, Article 2, paragraph 7.
At the end of 2006, a total amount of EUR 90.8 m equivalent to 48.6% of the Cotonou I interest rate subsidy appropria-
tion, had been earmarked for 14 projects both on own resources and under the IF, 11 of which concerned infrastructure
investments.
UnderCotonou’s second financialprotocol, the interest rate subsidy appropriationwillbe increased to EUR 400m,ofwhich
up to 10% can be used for project-related technical assistance.
Contract name CountryLoan amount
in EUREstimated subsidy
amount in EURSector Justification
SONABEL III (IF) Burkina Faso 15 250 000 2 160 000 Energy Social
COMPAGNIE SUCRIERE DUTCHAD (IF) Chad 11 800 000 1 800 000 Agro-industry
Environmental& social
LIAISONMARITIME DAKAR-ZIGUINCHOR(IF) Senegal 10 000 000 2 396 000 Transport HIPC
GILGEL GIBE II HYDROPOWER PLANT (IF) Ethiopia 50 000 000 18 410 000 Energy HIPC
VRA VII (IF) Ghana 10 500 000 2 580 000 Energy HIPC
KPLC GRID DEVELOPMENT (IF) Kenya 43 000 000 10 290 000 Energy HIPC
CARIBBEAN DEVELOPMENT BANK IIIFACILITY
Regional –Caribbean 40 000 000 5 000 000 Financial
Sector Social
MAPUTOWATER SUPPLY (IF) Mozambique 31 000 000 9 152 000 Water HIPC
AMENAGEMENT HYDROELECTRIQUE DEFELOU (IF)
Regional –West Africa 33 000 000 9 137 000 Energy HIPC
ECOCIMENTO FIBRE CEMENT (IF) Mozambique 1 300 000 173 000 Industry Environment
SMALL TOWNWATER & SANITATIONPROGRAMME (IF) Ethiopia 16 500 000 4 608 000 Water HIPC
FIJI POWER (OR) Fiji 24 500 000 4 251 000 Energy Environment
WEST AFRICAN GAS PIPELINE (OR) Regional –West Africa 75 000 000 18 148 000 Energy HIPC
BLPC IVWIND POWER (OR) Barbados 9 750 000 2 750 000 Energy Environment
TOTAL 371 600 000 90 855 000
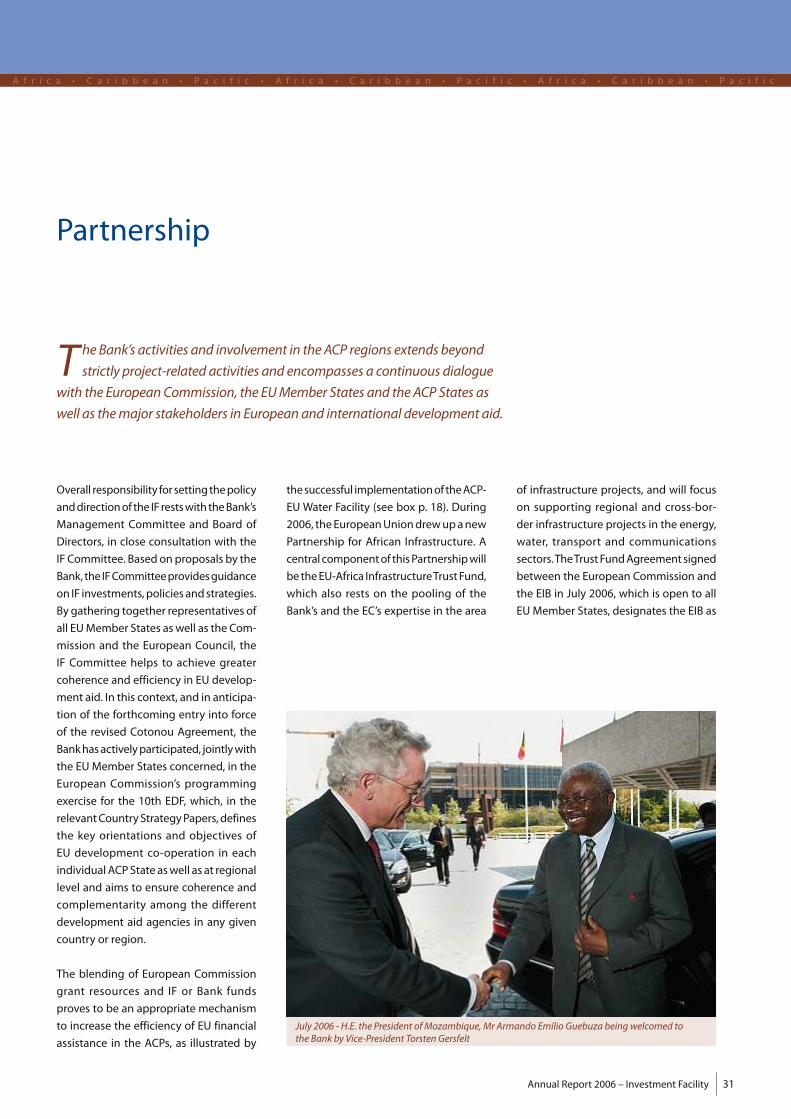
Annual Report 2006 – Investment Facility 31
A f r i c a • C a r i b b e a n • P a c i f i c • A f r i c a • C a r i b b e a n • P a c i f i c • A f r i c a • C a r i b b e a n • P a c i f i c
Partnership
T he Bank’s activities and involvement in theACP regions extends beyond
strictly project-related activities and encompasses a continuous dialogue
with the EuropeanCommission, the EUMember States and theACP States as
well as themajor stakeholders in European and international development aid.
Overall responsibility for setting thepolicy
anddirectionof the IF restswith theBank’s
Management Committee and Board of
Directors, in close consultation with the
IF Committee. Based onproposalsby the
Bank, the IFCommitteeprovidesguidance
on IF investments,policiesand strategies.
By gathering together representatives of
all EUMember States aswell as the Com-
mission and the European Council, the
IF Committee helps to achieve greater
coherence and efficiency in EU develop-
ment aid. In this context, and in anticipa-
tion of the forthcoming entry into force
of the revised Cotonou Agreement, the
Bankhasactivelyparticipated, jointlywith
the EUMember States concerned, in the
European Commission’s programming
exercise for the 10th EDF, which, in the
relevantCountryStrategyPapers, defines
the key orientations and objectives of
EU development co-operation in each
individualACPState aswell as at regional
level and aims to ensure coherence and
complementarity among the different
development aid agencies in any given
country or region.
The blending of European Commission
grant resources and IF or Bank funds
proves to be an appropriatemechanism
to increase the efficiency of EU financial
assistance in the ACPs, as illustrated by
thesuccessful implementationof theACP-
EU Water Facility (see box p. 18). During
2006, theEuropeanUniondrewupanew
Partnership for African Infrastructure. A
centralcomponentof thisPartnershipwill
be theEU-Africa InfrastructureTrustFund,
which also rests on the pooling of the
Bank’s and the EC’s expertise in the area
of infrastructure projects, and will focus
on supporting regional and cross-bor-
der infrastructure projects in the energy,
water, transport and communications
sectors.TheTrustFundAgreement signed
between the European Commission and
the EIB in July 2006, which is open to all
EUMember States, designates the EIB as
July 2006 -H.E. the President ofMozambique,Mr Armando EmílioGuebuza beingwelcomed tothe Bank by Vice-President TorstenGersfelt
Investment Facility – Annual Report 200632
A f r i c a • C a r i b b e a n • P a c i f i c • A f r i c a • C a r i b b e a n • P a c i f i c • A f r i c a • C a r i b b e a n • P a c i f i c
theTrust Fundmanager. In addition to an
initial contribution of EUR 60m from the
European Commission, detailed discus-
sions in late 2006 suggest that several
MemberStateswillcontribute to thisnew
European development initiative during
2007. The Trust Fund is expected to start
allocating funds to projects in Africa in
the first half of 2007.
With regard to the EU’s major bilateral
aid agencies, following the signature in
2005ofaMemorandumofUnderstanding
between the Bank, the AFD and the KfW,
aworking group comprising representa-
tives of the three institutions concluded
its assignment in December 2006. The
group’s findingswill be put into practice
by jointly appraising projects for co-
financing. In the ACPs, opportunities for
co-financinghavebeen identified inbasic
infrastructureprojects (energyandwater)
and in microfinance.
The promotion of a consistent approach
between the Bank and the various mul-
tilateral development banks (MDBs) and
IFIs continued tobe a key feature of insti-
tutional cooperation, notably through
the HIPC initiative, but also through the
recently established EIB-World Bank co-
managed Carbon Fund for Europe of
aboutEUR100m,whichaims topurchase
greenhousegasemission reductions (ERs)
generated through the project-based
mechanisms of the Kyoto Protocol on
behalf of European sovereigns and cor-
porate investors.ThisFund isexpected to
stimulate fixed investment indeveloping
countriesand introduceadditional liquid-
ity into the EU Emission Trading Scheme
through the purchase of ERs.
At another level, microfinance is an area
of intense dialogue with the othermajor
actorsof developmentaid.Despite recent
encouraging developments, amajority of
poorpeoplestillhavenoaccessto financial
European Financing Partners – enhanced financial cooperationbetween EuropeanDevelopment Finance Institutions (EDFIs)
Following the successful implementation and subsequent evaluation of European
Financing Partners (EFP) activities in 2005, the Bank contributed an additional
EUR 100m to bemade available from IF resources (in parallelwith an additional
EUR 50m from the EDFIs), bringing the IF’s total participation in EFP to EUR 190m.
At the end of 2006, EFP had committed EUR 156m, equivalent to just over 50% of
its EUR 315 m funding base in favour of 13 projects in 7 countries in Africa and in
the Caribbean. This includes EUR 7.1 m in equity investments. Among the projects
supported by the IF through EFPwere:
¸ NigeriaZenithBank,oneof the leading commercialbanks inNigeria, a so-called
NewGenerationBank,whichhasbeenvery successful incompetingwith theold
anddominantbanks, by following an aggressivegrowth strategy andproviding
a diversified range of new banking products and services. Its strategic goal is
to become a reputable international financial institution whilemaintaining its
position as a leading bank in Nigeria.
¸ Digicel International Finance Ltd. is the financial holding of Digicel Ltd. (Digi-
cel) group of companies that was founded in March 2000 and is the number
one cellular phone operator in the English-speaking Caribbean countries,with
operations in 20markets and over 2million subscribers. EFP is participating in
the financing of the rollout and the development of the company’s GSM net-
works in St. Lucia and Haiti.
¸ NigeriaGuarantyTrust Bank Plc (GTB)was incorporated in July 1990 as aprivate
limited liability company and commenced operation in February 1991. In April
1996 thebank listed74%of its shareson theNigerianStockExchangeand in2001
it obtained its universalbanking licence.GTB’s strategy is toprovide specialised
financial services to themiddle and top end of themarket. GTB is a successful
full service commercial Nigerian bank.
services.A lot remains tobedone and the
Bankendeavours to contribute inaproac-
tivemannerby remaining at the forefront
of the industry.During2006, theEIBsigned
aMemorandumofUnderstandingwith the
Grand Duchy of Luxembourg that estab-
lished a framework for cooperation on
funding technicalassistanceprogrammes
relating to thepromotionofmicrofinance
activities in theACPs.This frameworkgives
the Bank’s microfinance projects access
to grants that can be used to strengthen
existing or newly created MFIs by meet-
ing their demand for technical assistance
in the particular areas of (i)management
informationsystems, (ii) riskmanagement,

Annual Report 2006 – Investment Facility 33
A f r i c a • C a r i b b e a n • P a c i f i c • A f r i c a • C a r i b b e a n • P a c i f i c • A f r i c a • C a r i b b e a n • P a c i f i c
Climate Change TechnicalAssistance Facility (CCTAF)
The EUR 5 m CCTAF established by
the Bank in 2005 provides advance
conditional funding for activities
associatedwith the development of
project-based carbon assets (cred-
its) under the Clean Development
Mechanism (CDM) and Joint Imple-
mentation (JI) instruments of the
Kyoto Protocol. A number of activi-
ties are needed for a project to be
registered for carbon credits, all of
which involve complicated techni-
cal and methodological issues. In
addition, in order to be entitled to
carbon credits, the project has to
take anumberof steps (e.g. a carbon
feasibility study),which incurconsid-
erable up-front costs. The CCTAF is
designed to facilitate development
ofCDMand JIbyproviding technical
assistance for project promoters to
get them through the main stages
of the CDM/JI project cycle till credit
registration. The necessary studies
andprocessingworkareoutsourced
to private sector consultants. The
CCTAF takes the formof conditional
funding that would be reimbursed
by the promoter if the project were
successfully registered by the rel-
evant CDM/JI authority. Should the
carbon asset development fail, the
Bankwouldassume theCCTAFcosts.
In the ACP, a first commitment was
madeunder theCCTAF foranenergy
project in Namibia. Calls for expres-
sions of interest have beenmade for
a hydro IPP project in Madagascar,
the BLPC IV Wind Power project in
Barbadosanda regional hydropower
investment inWestern Africa.
¸ Zambia Copperbelt Energy Corporation (CEC) is a profitable USD revenue-
generating, independent electricity transmission and distribution company.
The company supplies power to Zambia’s copper and cobalt mining and
processing companies on the Copperbelt, accounting for 60% of Zambia’s
power sales.CECwas created in 1997 as a first step in theprivatisationprocess
of the parastatal Zambia Consolidated CopperMines (ZCCM). A consortium
consisting of Cinergy, National Grid Transco and a team of five individuals
with senior executive experience in the Zambian mining and power indus-
try was the successful bidder for ZCCM’s Power Division which upon its sale
became CEC. Each for their own strategic reasons, Cinergy andNationalGrid
Transco decided in 2003 to sell their joint stake in CEC to Zambia Energy
Corporation (ZamEn). ZamEn is a joint venture formed by: three directors
of CEC, the power project developer Aldwych International, DBSA and FMO.
EFP is providing financing to ZamEn for the acquisition of CEC as well as for
the financing of CEC’s capital expenditure requirements.
¸ Kenya Panda Flowers Ltd. produces and
exports cut flowerswith a greenhouse area
of40ha located in the so-calledFlowerBusi-
ness Park in Naivasha, Kenya and provides
services toindependentcompaniesengaged
in cut flower production as tenants or part
owners of the flower park. The flower park
comprises well-developed infrastructure
(roads, water supply, electricity, etc.) and
150 ha of greenhouses. With the proceeds
of the loan the companywill be investing in
new infrastructure for the flower park, new
greenhouses and the expansion of its exist-
ing cut flower production.
(iii)human resources, (iv)productdevelop-
ment and (v) the creation ofnew financial
instruments targetingMFIs.TheBank also
played a leading role in settingup the EU-
ACPMicrofinanceFrameworkprogramme,
a pilot programme funded by the EC to
provide technical assistance funding for
microfinanceoperations.Thisprogramme
isadministeredby theConsultativeGroup
toAssist the Poor (CGAP), a consortiumof
public andprivatedevelopment agencies
working together to expand access to
financial services for the poor in develop-
ingcountries.Since2005theBankhasbeen
an activemember of CGAP,which held its
2006 annual meeting in Benin.
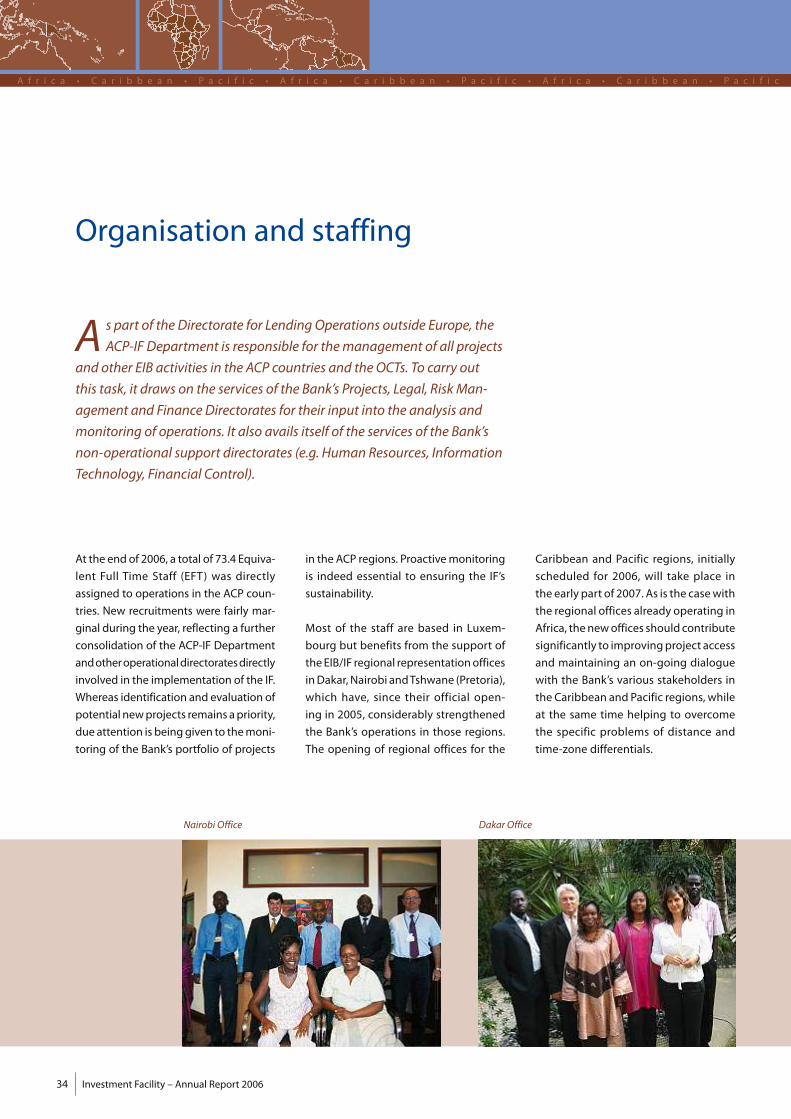
Investment Facility – Annual Report 200634
A f r i c a • C a r i b b e a n • P a c i f i c • A f r i c a • C a r i b b e a n • P a c i f i c • A f r i c a • C a r i b b e a n • P a c i f i c
Organisation and staffing
A s part of theDirectorate for LendingOperations outside Europe, the
ACP-IF Department is responsible for themanagement of all projects
and other EIB activities in the ACP countries and theOCTs. To carry out
this task, it draws on the services of the Bank’s Projects, Legal, RiskMan-
agement and FinanceDirectorates for their input into the analysis and
monitoring of operations. It also avails itself of the services of the Bank’s
non-operational support directorates (e.g.Human Resources, Information
Technology, Financial Control).
At the end of 2006, a total of 73.4 Equiva-
lent Full Time Staff (EFT ) was directly
assigned to operations in the ACP coun-
tries. New recruitments were fairly mar-
ginal during the year, reflecting a further
consolidation of the ACP-IF Department
andotheroperationaldirectoratesdirectly
involved in the implementation of the IF.
Whereas identification and evaluation of
potential newprojects remains apriority,
due attention isbeing given to themoni-
toring of the Bank’s portfolio of projects
in the ACP regions. Proactivemonitoring
is indeed essential to ensuring the IF’s
sustainability.
Most of the staff are based in Luxem-
bourg but benefits from the support of
the EIB/IF regional representationoffices
inDakar,Nairobi andTshwane (Pretoria),
which have, since their official open-
ing in 2005, considerably strengthened
the Bank’s operations in those regions.
The opening of regional offices for the
Caribbean and Pacific regions, initially
scheduled for 2006, will take place in
the earlypart of 2007.As is the casewith
the regional offices already operating in
Africa, thenewoffices should contribute
significantly to improvingproject access
and maintaining an on-going dialogue
with the Bank’s various stakeholders in
the Caribbean and Pacific regions,while
at the same time helping to overcome
the specific problems of distance and
time-zone differentials.
NairobiOffice DakarOffice
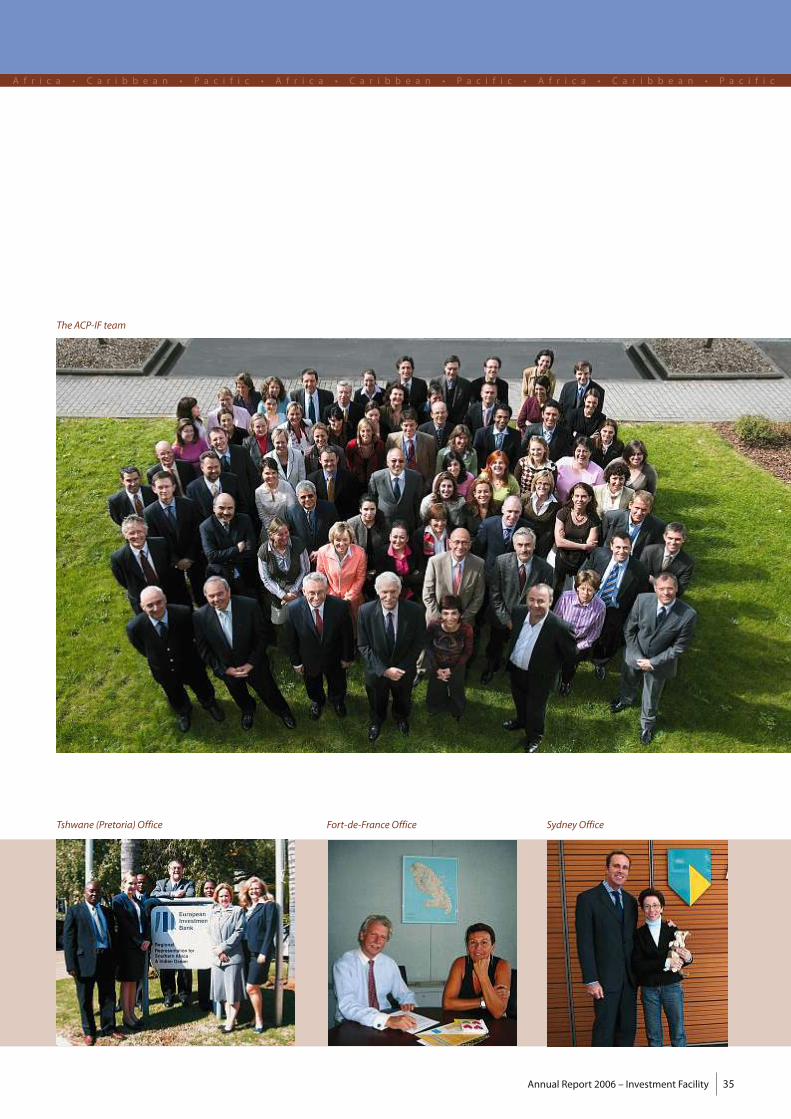
Annual Report 2006 – Investment Facility 35
A f r i c a • C a r i b b e a n • P a c i f i c • A f r i c a • C a r i b b e a n • P a c i f i c • A f r i c a • C a r i b b e a n • P a c i f i c
SydneyOfficeFort-de-FranceOfficeTshwane (Pretoria)Office
The ACP-IF team

Investment Facility – Annual Report 200636
A f r i c a • C a r i b b e a n • P a c i f i c • A f r i c a • C a r i b b e a n • P a c i f i c • A f r i c a • C a r i b b e a n • P a c i f i c
A significant share of the IF portfolio of
investments isdenominated in non-euro
currencies, notably US dollar invest-
ments which accounted for 52% of the
total outstanding at the endof 2006.The
IF minimises its currency risk exposure
on USD lending by entering into cur-
rency swaps. This policy can however
not be applied equally to the whole
portfolio of USD investments, notably
equity or quasi-equity, nor to the ACP
currencies denominated investments.
In accordance with IFRS, unrealised
foreign exchange gains or losses on
equity investments do not impact the
IF profit and loss account directly, but
are included in the fair value reserve in
the balance sheet. The net EUR 153 000
loss on financial operations reported in
2006 therefore relates to the unhedged
portion of the IF’s portfolio of non-EUR
denominated loans.
Impairments are made for loans out-
standing at the end of the financial year,
when presenting objective evidence of
risksofnon-recoveryof all or partof their
amounts according to the original con-
tractual terms or the equivalent value.
At the end of 2006, specific provisions
for impairment totalled EUR 1.8 m, cor-
responding mainly to a specific invest-
ment inMauritania.
Financial review
T he IF financial statements,which are prepared in accordance
with International Financial Reporting Standards (IFRS), are
presented in Annex 4. At the end of its third full year of activity,
the IF reported a net profit of EUR 23.7mon total assets of EUR 710m,
ofwhich EUR 402m corresponds to outstanding loans and equity
investments.
The EUR 24mnet profit for the yeardoes
not take into account the costs incurred
by the Bank for managing the IF, which
are fully covered by theMember States’
remuneration and by appraisal or com-
mitment fees charged by the IF for spe-
cific projects. These costs include the
direct costs incurred by the respective
operational directorates and, on a pro-
rata basis, the costs of non-operational
directorates and other overheads.
Costs and revenues for 2006 are sum-
marised in the table below:
Investment Facility – Costs and Revenue (in EUR ’000) Year: 2006
Total expenses 35 413
ofwhich: operational directorates 23 600
non-operational directorates and overheads 11 813
Revenue 35 413
ofwhich: fees charged to theMember States 33 913
project appraisal fees 1 500
Annual Report 2006 – Investment Facility 37
A f r i c a • C a r i b b e a n • P a c i f i c • A f r i c a • C a r i b b e a n • P a c i f i c • A f r i c a • C a r i b b e a n • P a c i f i c
Ann
exes
Annexes
1 IF Portfolio of signed operations 2003-2006
2 Portfolio of signed own resources operations 2003-2006
3 Organisation Chart
4 Financial statements of the Investment Facility as at 31 December 2006
5 ACP Countries andOCTs
6 Glossary of abbreviations
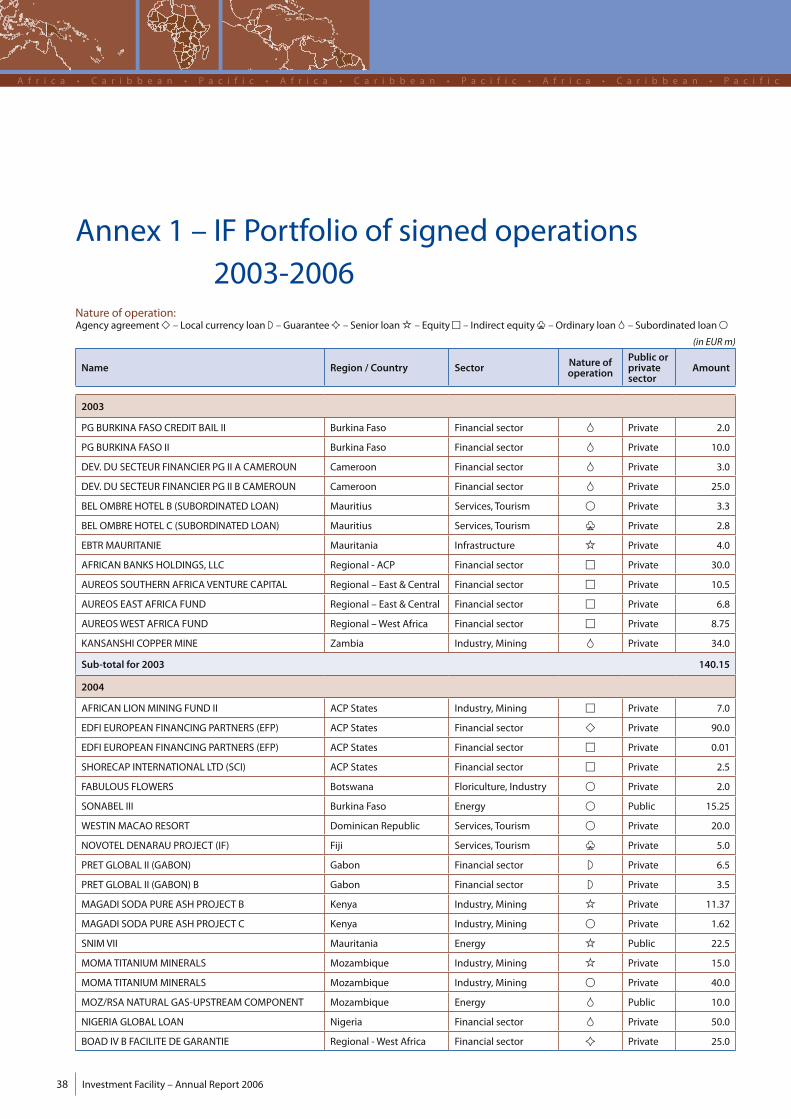
Investment Facility – Annual Report 200638
A f r i c a • C a r i b b e a n • P a c i f i c • A f r i c a • C a r i b b e a n • P a c i f i c • A f r i c a • C a r i b b e a n • P a c i f i c
Annex 1 – IF Portfolio of signed operations2003-2006
Nature of operation:Agency agreement◆ – Local currency loan ◗ – Guarantee✦ – Senior loan´ – Equity■ – Indirect equity♣ –Ordinary loan S – Subordinated loan●
Name Region / Country Sector Nature ofoperation
Public orprivatesector
Amount
2003
PG BURKINA FASO CREDIT BAIL II Burkina Faso Financial sector S Private 2.0
PG BURKINA FASO II Burkina Faso Financial sector S Private 10.0
DEV. DU SECTEUR FINANCIER PG II A CAMEROUN Cameroon Financial sector S Private 3.0
DEV. DU SECTEUR FINANCIER PG II B CAMEROUN Cameroon Financial sector S Private 25.0
BEL OMBRE HOTEL B (SUBORDINATED LOAN) Mauritius Services, Tourism ● Private 3.3
BEL OMBRE HOTEL C (SUBORDINATED LOAN) Mauritius Services, Tourism ♣ Private 2.8
EBTRMAURITANIE Mauritania Infrastructure ´ Private 4.0
AFRICAN BANKS HOLDINGS, LLC Regional - ACP Financial sector ■ Private 30.0
AUREOS SOUTHERN AFRICA VENTURE CAPITAL Regional – East & Central Financial sector ■ Private 10.5
AUREOS EAST AFRICA FUND Regional – East & Central Financial sector ■ Private 6.8
AUREOSWEST AFRICA FUND Regional –West Africa Financial sector ■ Private 8.75
KANSANSHI COPPERMINE Zambia Industry,Mining S Private 34.0
Sub-total for 2003 140.15
2004
AFRICAN LIONMINING FUND II ACP States Industry,Mining ■ Private 7.0
EDFI EUROPEAN FINANCING PARTNERS (EFP) ACP States Financial sector ◆ Private 90.0
EDFI EUROPEAN FINANCING PARTNERS (EFP) ACP States Financial sector ■ Private 0.01
SHORECAP INTERNATIONAL LTD (SCI) ACP States Financial sector ■ Private 2.5
FABULOUS FLOWERS Botswana Floriculture, Industry ● Private 2.0
SONABEL III Burkina Faso Energy ● Public 15.25
WESTIN MACAO RESORT Dominican Republic Services, Tourism ● Private 20.0
NOVOTEL DENARAU PROJECT (IF) Fiji Services, Tourism ♣ Private 5.0
PRET GLOBAL II (GABON) Gabon Financial sector ◗ Private 6.5
PRET GLOBAL II (GABON) B Gabon Financial sector ◗ Private 3.5
MAGADI SODA PURE ASH PROJECT B Kenya Industry,Mining ´ Private 11.37
MAGADI SODA PURE ASH PROJECT C Kenya Industry,Mining ● Private 1.62
SNIM VII Mauritania Energy ´ Public 22.5
MOMA TITANIUMMINERALS Mozambique Industry,Mining ´ Private 15.0
MOMA TITANIUMMINERALS Mozambique Industry,Mining ● Private 40.0
MOZ/RSA NATURAL GAS-UPSTREAM COMPONENT Mozambique Energy S Public 10.0
NIGERIA GLOBAL LOAN Nigeria Financial sector S Private 50.0
BOAD IV B FACILITE DE GARANTIE Regional -West Africa Financial sector ✦ Private 25.0
(in EURm)
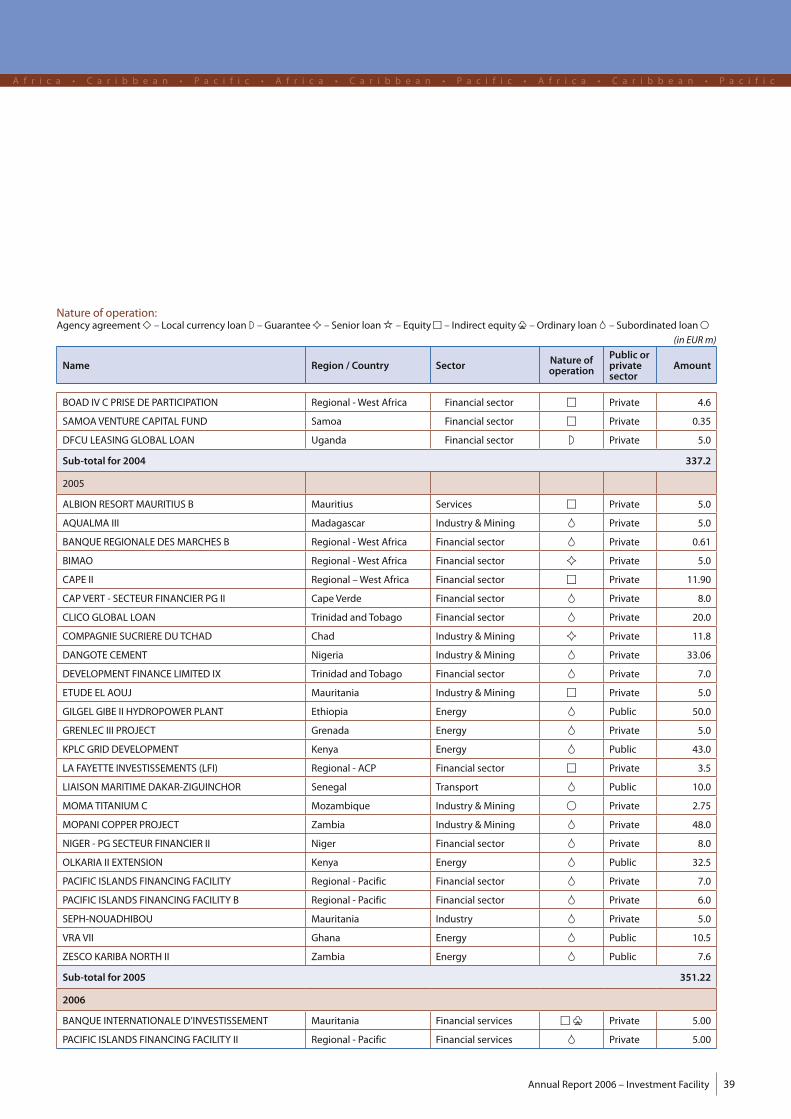
Annual Report 2006 – Investment Facility 39
A f r i c a • C a r i b b e a n • P a c i f i c • A f r i c a • C a r i b b e a n • P a c i f i c • A f r i c a • C a r i b b e a n • P a c i f i c
Nature of operation:Agency agreement◆ – Local currency loan ◗ – Guarantee✦ – Senior loan´ – Equity■ – Indirect equity♣ –Ordinary loan S – Subordinated loan●
Name Region / Country Sector Nature ofoperation
Public orprivatesector
Amount
BOAD IV C PRISE DE PARTICIPATION Regional -West Africa Financial sector ■ Private 4.6
SAMOA VENTURE CAPITAL FUND Samoa Financial sector ■ Private 0.35
DFCU LEASING GLOBAL LOAN Uganda Financial sector ◗ Private 5.0
Sub-total for 2004 337.2
2005
ALBION RESORTMAURITIUS B Mauritius Services ■ Private 5.0
AQUALMA III Madagascar Industry &Mining S Private 5.0
BANQUE REGIONALE DESMARCHES B Regional -West Africa Financial sector S Private 0.61
BIMAO Regional -West Africa Financial sector ✦ Private 5.0
CAPE II Regional –West Africa Financial sector ■ Private 11.90
CAP VERT - SECTEUR FINANCIER PG II Cape Verde Financial sector S Private 8.0
CLICO GLOBAL LOAN Trinidad and Tobago Financial sector S Private 20.0
COMPAGNIE SUCRIERE DUTCHAD Chad Industry &Mining ✦ Private 11.8
DANGOTE CEMENT Nigeria Industry &Mining S Private 33.06
DEVELOPMENT FINANCE LIMITED IX Trinidad and Tobago Financial sector S Private 7.0
ETUDE EL AOUJ Mauritania Industry &Mining ■ Private 5.0
GILGEL GIBE II HYDROPOWER PLANT Ethiopia Energy S Public 50.0
GRENLEC III PROJECT Grenada Energy S Private 5.0
KPLC GRID DEVELOPMENT Kenya Energy S Public 43.0
LA FAYETTE INVESTISSEMENTS (LFI) Regional - ACP Financial sector ■ Private 3.5
LIAISONMARITIME DAKAR-ZIGUINCHOR Senegal Transport S Public 10.0
MOMA TITANIUM C Mozambique Industry &Mining ● Private 2.75
MOPANI COPPER PROJECT Zambia Industry &Mining S Private 48.0
NIGER - PG SECTEUR FINANCIER II Niger Financial sector S Private 8.0
OLKARIA II EXTENSION Kenya Energy S Public 32.5
PACIFIC ISLANDS FINANCING FACILITY Regional - Pacific Financial sector S Private 7.0
PACIFIC ISLANDS FINANCING FACILITY B Regional - Pacific Financial sector S Private 6.0
SEPH-NOUADHIBOU Mauritania Industry S Private 5.0
VRA VII Ghana Energy S Public 10.5
ZESCO KARIBA NORTH II Zambia Energy S Public 7.6
Sub-total for 2005 351.22
2006
BANQUE INTERNATIONALE D’INVESTISSEMENT Mauritania Financial services ■ ♣ Private 5.00
PACIFIC ISLANDS FINANCING FACILITY II Regional - Pacific Financial services S Private 5.00
(in EURm)
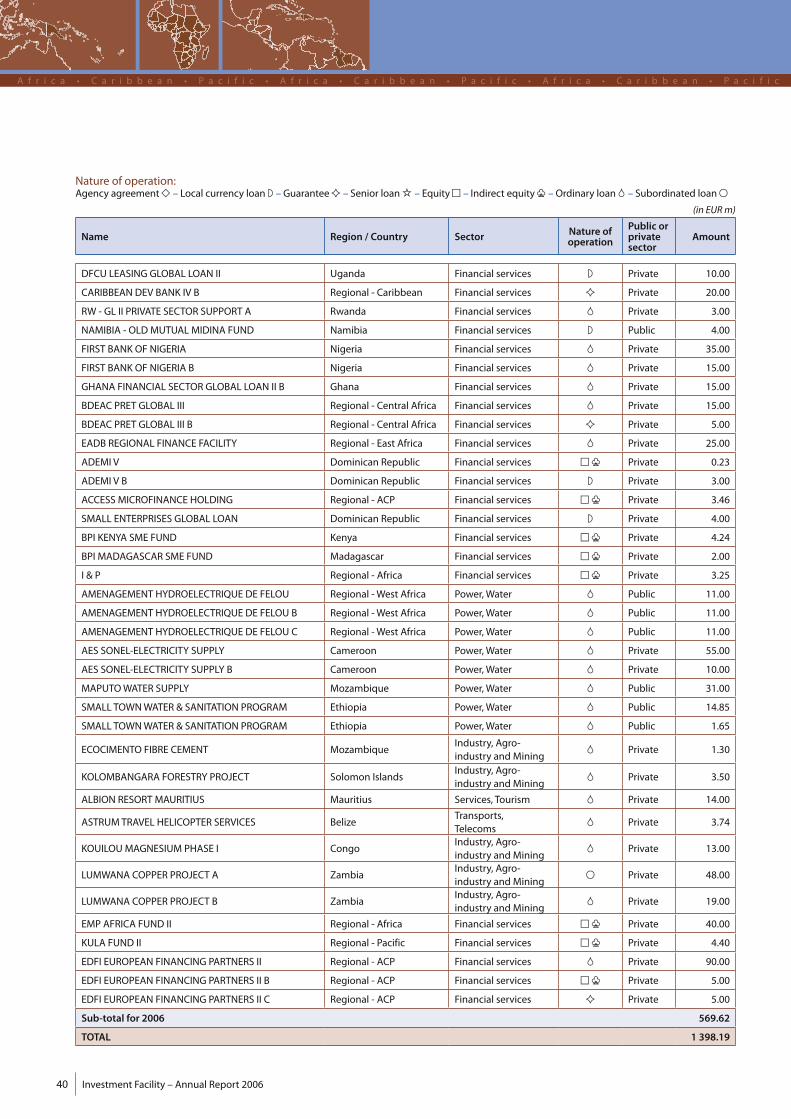
Investment Facility – Annual Report 200640
A f r i c a • C a r i b b e a n • P a c i f i c • A f r i c a • C a r i b b e a n • P a c i f i c • A f r i c a • C a r i b b e a n • P a c i f i c
Name Region / Country Sector Nature ofoperation
Public orprivatesector
Amount
DFCU LEASING GLOBAL LOAN II Uganda Financial services ◗ Private 10.00
CARIBBEAN DEV BANK IV B Regional - Caribbean Financial services ✦ Private 20.00
RW - GL II PRIVATE SECTOR SUPPORT A Rwanda Financial services S Private 3.00
NAMIBIA - OLD MUTUAL MIDINA FUND Namibia Financial services ◗ Public 4.00
FIRST BANK OF NIGERIA Nigeria Financial services S Private 35.00
FIRST BANK OF NIGERIA B Nigeria Financial services S Private 15.00
GHANA FINANCIAL SECTOR GLOBAL LOAN II B Ghana Financial services S Private 15.00
BDEAC PRET GLOBAL III Regional - Central Africa Financial services S Private 15.00
BDEAC PRET GLOBAL III B Regional - Central Africa Financial services ✦ Private 5.00
EADB REGIONAL FINANCE FACILITY Regional - East Africa Financial services S Private 25.00
ADEMI V Dominican Republic Financial services ■ ♣ Private 0.23
ADEMI V B Dominican Republic Financial services ◗ Private 3.00
ACCESSMICROFINANCE HOLDING Regional - ACP Financial services ■ ♣ Private 3.46
SMALL ENTERPRISES GLOBAL LOAN Dominican Republic Financial services ◗ Private 4.00
BPI KENYA SME FUND Kenya Financial services ■ ♣ Private 4.24
BPI MADAGASCAR SME FUND Madagascar Financial services ■ ♣ Private 2.00
I & P Regional - Africa Financial services ■ ♣ Private 3.25
AMENAGEMENT HYDROELECTRIQUE DE FELOU Regional -West Africa Power,Water S Public 11.00
AMENAGEMENT HYDROELECTRIQUE DE FELOU B Regional -West Africa Power,Water S Public 11.00
AMENAGEMENT HYDROELECTRIQUE DE FELOU C Regional -West Africa Power,Water S Public 11.00
AES SONEL-ELECTRICITY SUPPLY Cameroon Power,Water S Private 55.00
AES SONEL-ELECTRICITY SUPPLY B Cameroon Power,Water S Private 10.00
MAPUTOWATER SUPPLY Mozambique Power,Water S Public 31.00
SMALL TOWNWATER & SANITATION PROGRAM Ethiopia Power,Water S Public 14.85
SMALL TOWNWATER & SANITATION PROGRAM Ethiopia Power,Water S Public 1.65
ECOCIMENTO FIBRE CEMENT MozambiqueIndustry, Agro-industry andMining
S Private 1.30
KOLOMBANGARA FORESTRY PROJECT Solomon IslandsIndustry, Agro-industry andMining
S Private 3.50
ALBION RESORTMAURITIUS Mauritius Services, Tourism S Private 14.00
ASTRUM TRAVEL HELICOPTER SERVICES BelizeTransports,Telecoms
S Private 3.74
KOUILOUMAGNESIUM PHASE I CongoIndustry, Agro-industry andMining
S Private 13.00
LUMWANA COPPER PROJECT A ZambiaIndustry, Agro-industry andMining
● Private 48.00
LUMWANA COPPER PROJECT B ZambiaIndustry, Agro-industry andMining
S Private 19.00
EMP AFRICA FUND II Regional - Africa Financial services ■ ♣ Private 40.00
KULA FUND II Regional - Pacific Financial services ■ ♣ Private 4.40
EDFI EUROPEAN FINANCING PARTNERS II Regional - ACP Financial services S Private 90.00
EDFI EUROPEAN FINANCING PARTNERS II B Regional - ACP Financial services ■ ♣ Private 5.00
EDFI EUROPEAN FINANCING PARTNERS II C Regional - ACP Financial services ✦ Private 5.00
Sub-total for 2006 569.62
TOTAL 1 398.19
Nature of operation:Agency agreement◆ – Local currency loan ◗ – Guarantee✦ – Senior loan´ – Equity■ – Indirect equity♣ –Ordinary loan S – Subordinated loan●
(in EURm)
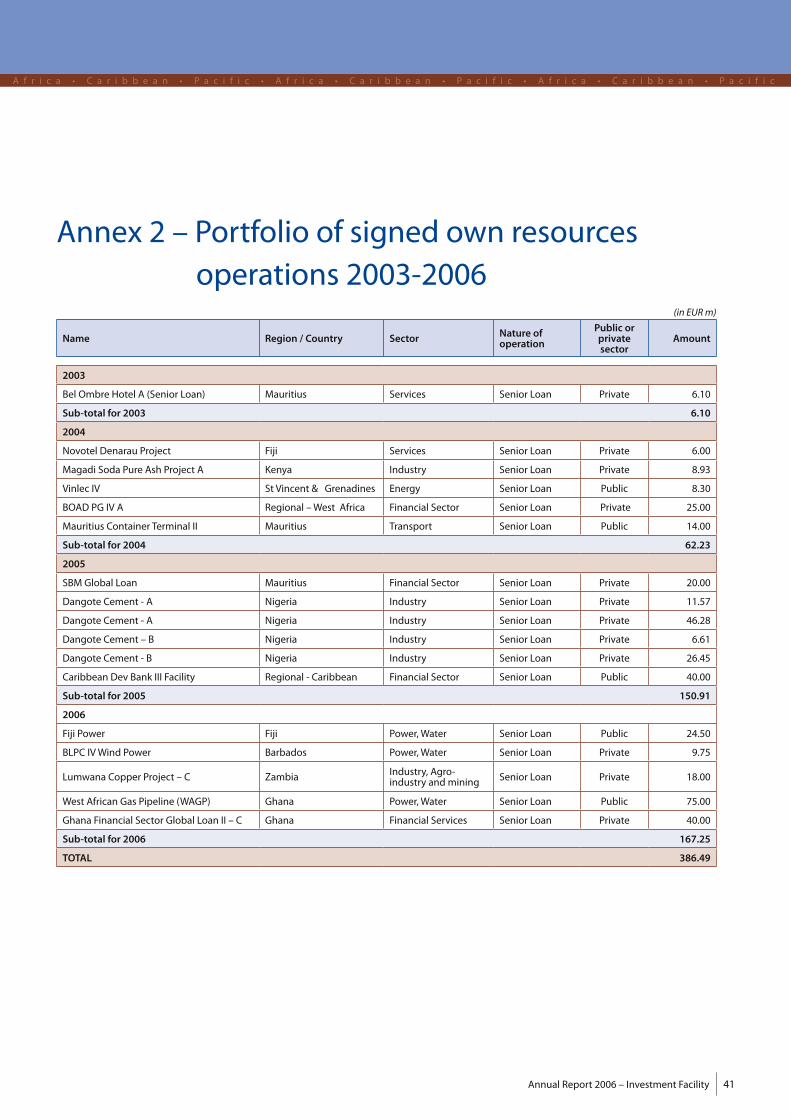
Annual Report 2006 – Investment Facility 41
A f r i c a • C a r i b b e a n • P a c i f i c • A f r i c a • C a r i b b e a n • P a c i f i c • A f r i c a • C a r i b b e a n • P a c i f i c
Annex 2 – Portfolio of signed own resourcesoperations 2003-2006
Name Region / Country Sector Nature ofoperation
Public orprivatesector
Amount
2003
Bel Ombre Hotel A (Senior Loan) Mauritius Services Senior Loan Private 6.10
Sub-total for 2003 6.10
2004
Novotel Denarau Project Fiji Services Senior Loan Private 6.00
Magadi Soda Pure Ash Project A Kenya Industry Senior Loan Private 8.93
Vinlec IV St Vincent & Grenadines Energy Senior Loan Public 8.30
BOAD PG IV A Regional –West Africa Financial Sector Senior Loan Private 25.00
Mauritius Container Terminal II Mauritius Transport Senior Loan Public 14.00
Sub-total for 2004 62.23
2005
SBM Global Loan Mauritius Financial Sector Senior Loan Private 20.00
Dangote Cement - A Nigeria Industry Senior Loan Private 11.57
Dangote Cement - A Nigeria Industry Senior Loan Private 46.28
Dangote Cement – B Nigeria Industry Senior Loan Private 6.61
Dangote Cement - B Nigeria Industry Senior Loan Private 26.45
Caribbean Dev Bank III Facility Regional - Caribbean Financial Sector Senior Loan Public 40.00
Sub-total for 2005 150.91
2006
Fiji Power Fiji Power,Water Senior Loan Public 24.50
BLPC IVWind Power Barbados Power,Water Senior Loan Private 9.75
Lumwana Copper Project – C Zambia Industry, Agro-industry andmining Senior Loan Private 18.00
West African Gas Pipeline (WAGP) Ghana Power,Water Senior Loan Public 75.00
Ghana Financial Sector Global Loan II – C Ghana Financial Services Senior Loan Private 40.00
Sub-total for 2006 167.25
TOTAL 386.49
(in EURm)
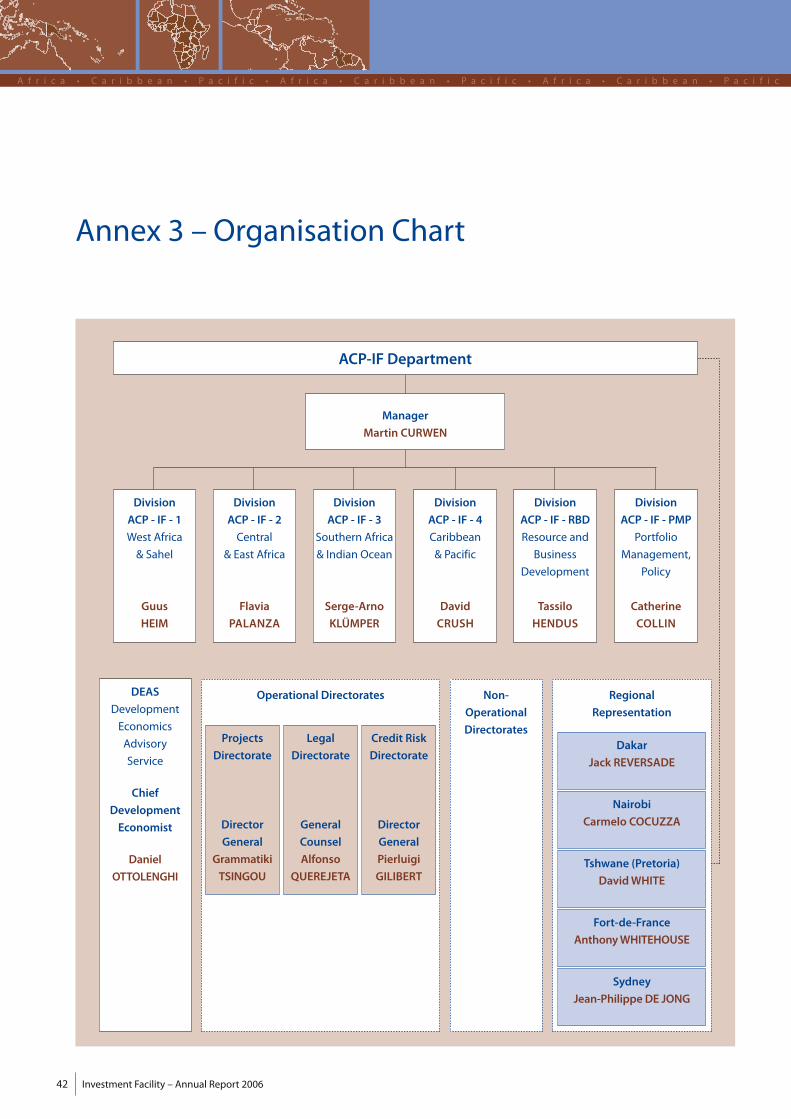
Investment Facility – Annual Report 200642
A f r i c a • C a r i b b e a n • P a c i f i c • A f r i c a • C a r i b b e a n • P a c i f i c • A f r i c a • C a r i b b e a n • P a c i f i c
Annex 3 –Organisation Chart
DEAS
Development
Economics
Advisory
Service
Chief
Development
Economist
Daniel
OTTOLENGHI
Operational Directorates
Projects
Directorate
Director
General
Grammatiki
TSINGOU
Legal
Directorate
General
Counsel
Alfonso
QUEREJETA
Credit Risk
Directorate
Director
General
Pierluigi
GILIBERT
Non-
Operational
Directorates
Regional
Representation
Dakar
Jack REVERSADE
Nairobi
Carmelo COCUZZA
Tshwane (Pretoria)
DavidWHITE
Fort-de-France
AnthonyWHITEHOUSE
Sydney
Jean-PhilippeDE JONG
Division
ACP - IF - 1
West Africa
& Sahel
Guus
HEIM
Division
ACP - IF - 2
Central
& East Africa
Flavia
PALANZA
Division
ACP - IF - 3
Southern Africa
& Indian Ocean
Serge-Arno
KLÜMPER
Division
ACP - IF - 4
Caribbean
& Pacific
David
CRUSH
Division
ACP - IF - RBD
Resource and
Business
Development
Tassilo
HENDUS
Division
ACP - IF - PMP
Portfolio
Management,
Policy
Catherine
COLLIN
Manager
Martin CURWEN
ACP-IF Department
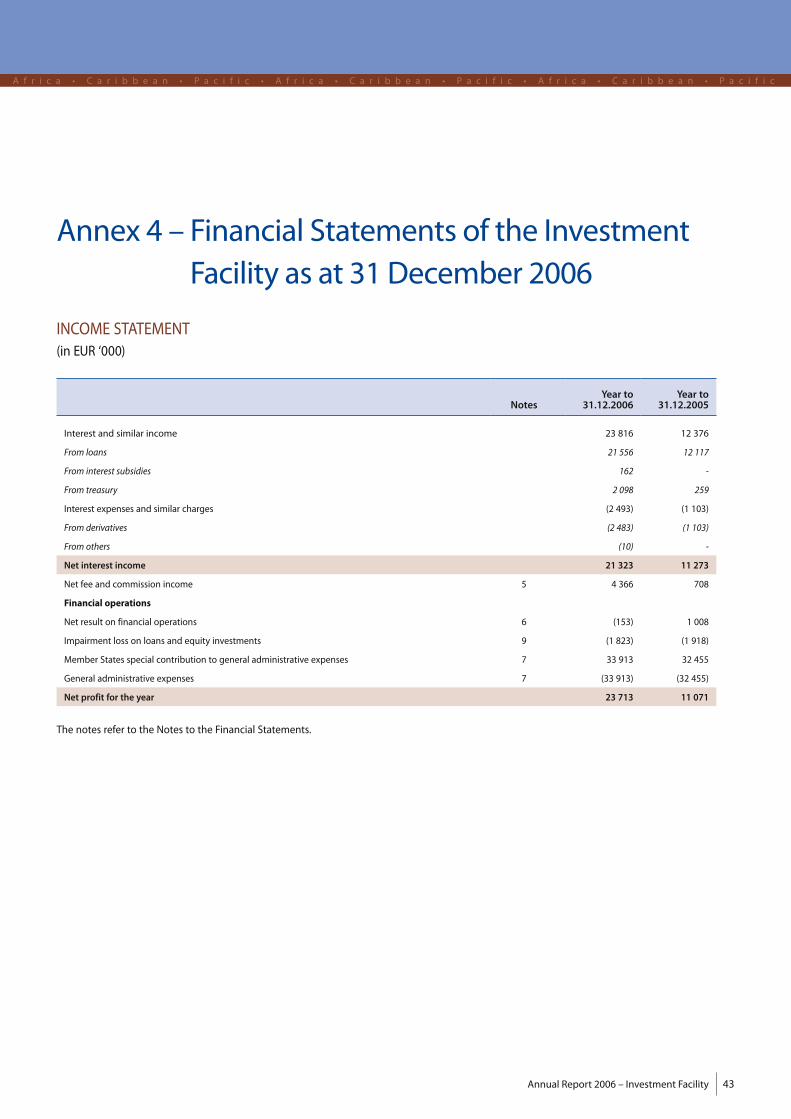
Annual Report 2006 – Investment Facility 43
A f r i c a • C a r i b b e a n • P a c i f i c • A f r i c a • C a r i b b e a n • P a c i f i c • A f r i c a • C a r i b b e a n • P a c i f i c
Annex 4 – Financial Statements of the InvestmentFacility as at 31December 2006
INCOME STATEMENT(in EUR ‘000)
NotesYear to
31.12.2006Year to
31.12.2005
Interest and similar income 23 816 12 376
From loans 21 556 12 117
From interest subsidies 162 -
From treasury 2 098 259
Interest expenses and similar charges (2 493) (1 103)
From derivatives (2 483) (1 103)
From others (10) -
Net interest income 21 323 11 273
Net fee and commission income 5 4 366 708
Financial operations
Net result on financial operations 6 (153) 1 008
Impairment loss on loans and equity investments 9 (1 823) (1 918)
Member States special contribution to general administrative expenses 7 33 913 32 455
General administrative expenses 7 (33 913) (32 455)
Net profit for the year 23 713 11 071
The notes refer to the Notes to the Financial Statements.

Investment Facility – Annual Report 200644
A f r i c a • C a r i b b e a n • P a c i f i c • A f r i c a • C a r i b b e a n • P a c i f i c • A f r i c a • C a r i b b e a n • P a c i f i c
BALANCE SHEET(in EUR ‘000)
Notes 31.12.2006 31.12.2005
ASSETS
Cash and cash equivalents 8 190 780 194 916
Derivative financial instruments 12 8 473 -
Loans and equity investments 9
Loans 338 997 196 731
ofwhich accrued interest 3 784 2 722
Equity investments 66 449 30 886
Amounts receivable from contributors 10 103 913 92 455
Other assets 11 1 365 351
Total assets 709 977 515 339
LIABILITIES
Derivative financial instruments 12 - 5 584
Amounts owed to third parties 13 134 425 115 655
Deferred income 14 7 908 186
Other liabilities 15 1 463 -
Total liabilities 143 796 121 425
EQUITY ATTRIBUTABLE TOMEMBER STATES
FacilityMember States Contribution called 16 515 000 370 000
Retained earnings 41 184 17 471
Fair value reserve 9 997 6 443
Total equity 566 181 393 914
Total liabilities andMember States’ resources 709 977 515 339
The notes refer to the Notes to the Financial Statements.

Annual Report 2006 – Investment Facility 45
A f r i c a • C a r i b b e a n • P a c i f i c • A f r i c a • C a r i b b e a n • P a c i f i c • A f r i c a • C a r i b b e a n • P a c i f i c
CASH FLOW STATEMENT(in EUR ‘000)
Year to31.12.2006
Year to31.12.2005
Cash flows from operating activities
Profit for the financial year 23 713 11 071
Adjustments
Impairment on equity investments 130 1 918
Impairment on loans 1 693 -
Interest capitalised (4 303) (1 978)
Increase in accruals and deferred income 8 038 468
Profit on operating activities 29 271 11 479
Net loan disbursements (157 004) (107 817)
Repayments 3 585 863
Fair valuemovement on derivatives (14 057) 5 441
Increase in prepayments and accrued income on loans (1 062) (2 404)
Increase in equity investments (31 965) (5 854)
Proceeds from equity investments 25 -
Increase in other assets (1 014) (351)
Increase in other liabilities 1 463 -
Net cash from operating activities (170 758) (98 643)
Cash flows from financing activities
Paid in by FacilityMember States 145 000 210 000
(Increase) / decrease in amount receivable from contributors (11 458) (32 455)
Net increase in amount payable from interest subsidies 17 312 78 200
Increase in amount payable to third parties 1 458 32 455
Net cash from financing activities 152 312 288 200
Effects of exchange rate changes on loans and equity investments 14 310 (6 431)
Summary statement of cash flows
Cash and cash equivalents at beginning of financial year 194 916 11 790
Net cash from operating activities (170 758) (98 643)
Net cash from financing activities 152 312 288 200
Effects of exchange rate changes on loans and equity investments 14 310 (6 431)
Cash and cash equivalents at end of financial year 190 780 194 916
STATEMENT OF CHANGES IN EQUITY(in EUR ‘000)
For the year ended 31 December 2006FacilityMember States
contributionRetainedearnings
Fair valuereserve on AFS
investment Total Equity
At 31 December 2004 160 000 6 400 (899) 165 501
FacilityMember States contribution called during the year 230 000 - - 230 000
FacilityMember States contribution cancelled during the year (20 000) - - (20 000)
Net profit of the year - 11 071 - 11 071
Change in fair value during the year - - 7 342 7 342
At 31 December 2005 370 000 17 471 6 443 393 914
FacilityMember States contribution called during the year 145 000 - - 145 000
Net profit of the year - 23 713 - 23 713
Change in fair value during the year - - 3 554 3 554
At 31 December 2006 515 000 41 184 9 997 566 181
Investment Facility – Annual Report 200646
A f r i c a • C a r i b b e a n • P a c i f i c • A f r i c a • C a r i b b e a n • P a c i f i c • A f r i c a • C a r i b b e a n • P a c i f i c
Notes to the Financial Statements
1. General informationThe Investment Facility (the “Facility”) has been established within the frameworkof the Cotonou Agreement (the “Agreement”) on co-operation and developmentassistance negotiated between the African, Caribbean and Pacific Group of States(the “ACP States”) and the European Union and itsMember States on 23 June 2000and revised on 25 June 2005.
The Facility ismanaged by the European Investment Bank (the “EIB” or the “Bank”).Under the terms of theAgreement up to EUR 2,200million forACP and EUR 20millionforOCT (as agreed by the CouncilDecision of 27November 2001 on the associationof the Overseas Countries and Territories with the European Community)may beallocated to finance the Facility. Within the framework of the Agreement, the EIBalsomanages loans granted from its own resources.All other financial resources andinstruments under the Agreement are administered by the European Commission.
2. Significant accounting policies2.1 Basis of preparation
The Facility ’s f inancial statements have been prepared in accordance withInternational Financial Reporting Standards (IFRS) as adopted by the EuropeanUnion.
The accounting policies applied are in conformity with the IFRS andwith the overallprinciples of the Directive 86/635/EEC of the Council of the European Communitiesof 8December 1986 on the annual accounts and consolidated accounts of banks andother financial institutions, as amended by Directive 2001/65/EC of 27 September2001 and by Directive 2003/51/EC of 18 June 2003 on the annual and consolidatedaccounts of certain types of companies, banks and other financial institutions andinsurance undertakings (the “Directives”).
2.2 Significant accounting judgements and estimates
The preparation of financial statements in conformity with IFRS requires the use ofcertain critical accounting estimates. It also requires management to exercise itsjudgment in the process of applying the Facility’s accounting policies. The areasinvolving a higher degree of judgment or complexity, or areas where assumptionsand estimates are significant to the financial statements, are disclosed.
Themost significant use of judgements and estimates are as follows:
Fair value of financial instruments
Where the fair values of financial assets and financial liabilities recorded on thebalance sheet cannot be derived from activemarkets, they are determined usinga variety of valuation techniques that include the use ofmathematical models. Theinput to thesemodels is taken from observablemarketswhere possible, butwherethis is not feasible, a degree of judgement is required in establishing fair values. Thejudgements include considerations of liquidity andmodel inputs such as correlationand volatility for longer dated derivatives.
Impairment losses on loans and advances
The Facility reviews its problem loans and advances at each reporting date to assesswhether an allowance for impairment should be recorded in the income statement.In particular, judgement bymanagement is required in the estimation of the amountand timing of future cash flows when determining the level of allowance required.Such estimates are based on assumptions about a number of factors and actualresultsmay differ, resulting in future changes to the allowance. In addition to specificallowance against individually significant loans and advances, the Facility alsomakesa collective impairment allowance against exposureswhich, althoughnot specificallyidentified as requiring a specific allowance, have a greater risk of default thanwhenoriginally granted. This collective allowance is based on any deterioration in theinternal rating of the loan or investment since it was granted or acquired. Theseinternal ratings take into consideration factors such as any deterioration in countryrisk, industry, and technological obsolescence, as well as identified structuralweaknesses or deterioration in cash flows.
Valuation of unquoted equity investments
Valuation of unquoted equity investments is normally based on one of thefollowing:
- recent arms length market transactions;
- current fair value of another instrument that is substantially the same;
- the expected cash flowsdiscounted at current rates applicable for itemswith similarterms and risk characteristics; or
- other valuation models.
The determination of the cash flows and discount factors for unquoted equityinvestments requires significant estimation. The Facility calibrates the valuationtechniques periodically and tests them for validity using either prices from
observable current market transactions in the same instrument or from otheravailable observablemarket data.
Impairment of equity investments
The Facility treats available-for-sale equity investments as impairedwhen there hasbeen a significant or prolonged decline in the fair value below its cost orwhere otherobjective evidence of impairment exists. The determination ofwhether a decline issignificant or prolonged is based on a judgmental appreciation.
2.3 Change in accounting policies
The accounting policies adopted are consistent with those used in the previousfinancial year except as follows:
The Facility adopted the amendment to IAS 39 Financial Instruments: RecognitionandMeasurement for financial guarantee contracts (issued in August 2005), whichrequires for financial guarantee contracts that are not considered to be insurancecontracts to be recognized initially at fair value and to be remeasured at the higherof the amount determined in accordancewith IAS 37 Provision,Contingent Liabilitiesand Contingent Assets and the amount initially recognized less, when appropriate,cumulative amortization recognized in accordancewith IAS 18 Revenue.
Certain new standards, amendments and interpretations to existing standards havebeen published that aremandatory for the Facility’s accounting periods beginningon or after 1 March 2006 or later periods but which the Facility has not yet earlyadopted, as follows:
- IFRS 7 Financial Instruments:Disclosures (effective for annual periods beginning onor after January 1, 2007): the Standard requires the Facility tomake disclosures thatenable users to evaluate the significance of the Facility’s financial instruments andthe nature and extent of risks arising from those financial instruments.
- Amendment to IAS 1 Presentation of Financial Statements (effective for annualperiods beginning on or after January 1, 2007): this amendment requires the Facilitytomake new disclosures to enable users of the financial statements to evaluate theFacility’s objectives, policies and processes formanaging capital.
- IFRIC 9 (effective for annual periods beginning on or after June 1, 2006): thisinterpretation establishes that the date to assess the existence of an embeddedderivative is the date an entity f irst becomes a party to the contract, withreassessment only if there is a change to the contract that significantlymodifiesthe cash flows. The Facility is still evaluating the effect of this interpretation andexpects that adoption of this interpretation will have no impact on the Facility’sfinancial statementswhen implemented in 2007.
2.4 Summary of significant accounting policies
The balance sheet represents assets and liabilities in decreasing order of liquidityand does not distinguish between current and non-current items.
2.4.1 Foreign currency translation
The Facility uses the Euro (EUR) for presenting its financial statements,which is alsothe functional and presentational currency.
Foreign currency transactions are translated, in accordance with IAS 21, at theexchange rate prevailing on the date of the transaction.
Monetary assets and liabilities denominated in currencies other than in Euro aretranslated into Euro at the exchange rate prevailing at the balance sheet date. Thegain or loss arising from such translation is recorded in the income statement.
Non-monetary items that aremeasured in termsofhistorical cost in a foreign currencyare translated using the exchange rates at the dates of the initial transactions. Non-monetary itemsmeasured at fair value in a foreign currency are translated using theexchange rates at the datewhen the fair valuewas determined.
Exchange differences arising on the settlement of transactions at rates different fromthose at the date of the transaction, and unrealized foreign exchange differenceson unsettled foreign currencymonetary assets and liabilities, are recognized in theincome statement.
The elements of the income statement are translated into Euro on the basis of theexchange rates prevailing at the end of each month.
2.4.2 Cash and cash equivalents
The Facility defines cash equivalents as current accounts or short-term depositswithoriginal maturities of threemonths or less.
2.4.3 Financial assets other than derivatives
Financial assets are accounted for using the settlement date basis.
• Loans
Loans originated by the Facility are recognized in the assets of the Facility whencash is advanced to borrowers. They are initially recorded at cost (net disbursed
Annual Report 2006 – Investment Facility 47
A f r i c a • C a r i b b e a n • P a c i f i c • A f r i c a • C a r i b b e a n • P a c i f i c • A f r i c a • C a r i b b e a n • P a c i f i c
amounts), which is the fair value of the cash given to originate the loan, includingany transaction costs, and are subsequentlymeasured at amortized cost, using theeffective yieldmethod, less any provision for impairment or uncollectability.
• Equity investments
After initial measurement, these direct and indirect equity investments, classified asavailable for sale financial investments, are subsequently carried at fair value.
a. Venture capital funds
The fair value of each venture capital fund will be based on the Net Asset Value(NAV), reported by the fund, if calculated based on international valuation standardrecognized to be compliantwith IFRS. The Facilitymay however decide to adjust theNAV reported by the fund if there are issues thatmay affect the valuation.
If no internationally recognized fair valuation standard is applied, the valuationwillbe conducted on the basis of the underlying portfolio.
b.Direct equity investments
The fair value of the investmentwill be based on the latest set of financial statementsavailable, re-using, if applicable, the samemodel as the one used at the acquisitionof the participation.
Unrealized gains or losses on equity investments are reported in equity until suchinvestment is sold, collected or disposed of, or until such investment is determinedto be impaired. If an available for sale investment is determined to be impaired, thecumulative unrealized gain or loss previously recognized in equity is included inthe income statement.
For non quoted investment, the fair value is determined by applying recognizedvaluation technique. These investments are accounted for at costwhen the fair valuecannot be reliablymeasured.
•Guarantees
Financial guarantees are initially recognized at fair value in the balance sheet underitem “Other liabilities”. Subsequent to initial recognition, the Facility’s liabilities undereach guarantee aremeasured at the higher of the amortized premium and the bestestimate of expenditure required to settle any financial obligation arising as a resultof the guarantee.
Any increase in the liability relating to financial guarantees is taken to the incomestatement under item “Credit loss expense”. The premium received is recognized inthe income statement under item “Net fee and commission income” on a straightline basis over the life of the guarantee.
2.4.4 Impairment of financial assets
The Facility assesses at each balance sheet date whether there is any objectiveevidence that a financial asset is impaired. A financial asset or a group of financialassets is deemed to be impaired if, and only if, there is objective evidence ofimpairment as a result of one or more events that has occurred after the initialrecognition of the asset (an incurred “loss event”) and that loss eventhas an impactonthe estimated future cash flows of the financial asset or the group of financial assetsthat can be reliably estimated. Evidence of impairmentmay include indications thatthe borrower or a group of borrowers is experiencing significant financial difficulty,default or delinquency in interest or principal payments, the probability that theywill enter bankruptcy or other financial reorganization and where observable dataindicate that there is ameasurable decrease in the estimated future cash flows, suchas changes in arrears or economic conditions that correlatewith defaults.
For the loans outstanding at the end of the financial year and carried at amortizedcost, impairments are made when presenting objective evidence of risks of nonrecovery of all or part of their amounts according to the original contractual termsor the equivalent value. If there is objective evidence that an impairment loss hasbeen incurred, the amount of the loss ismeasured as the difference between theasset’s carrying amount and the present value of estimated future cash flows. Thecarrying amount of the asset is reduced through the use of an allowance accountand the amount of the loss is recognized in the income statement. Interest incomecontinues to be accrued on the reduced carrying amount based on the effectiveinterest rate of the asset. Loans togetherwith the associated allowance arewrittenoff when there is no realistic prospect of future recovery. If, in a subsequent year,the amount of the estimated impairment loss increases or decreases because of anevent occurring after the impairment was recognized, the previously recognizedimpairment loss is increased or reduced by adjusting the allowance account.
The Facility conducts credit risk assessments based onwhich there is no need for acollective impairment provision.
For the available for sale equity investments, the Facility assesses at each balancesheet date whether there is objective evidence that an investment is impaired.Objective evidence would include a significant or prolonged decline in the fairvalue of the investment below its costs.Where there is evidence of impairment, the
cumulative loss (measured as the difference between the acquisition cost and thecurrent fair value, less any impairment loss on that investment previously recognizedin the income statement) is removed from equity and recognized in the incomestatement. Impairment losses on equity investments are not reversed through theincome statement; increases in their fair value after impairment are recognizeddirectly in equity.
The European Investment Bank ’s Risk Management reviews financial assets forimpairment at least once a year. Resulting adjustments include the unwinding ofthe discount in the income statement over the life of the asset, and any adjustmentsrequired in respect of a reassessment of the initial impairment.
2.4.5 Derivative financial instruments
Derivatives include cross currency swaps and cross currency interest rate swaps.
In the normal course of its activity, the Facilitymay enter into swap contractswith aview tohedge specific lending operations, denominated in actively traded currenciesother than the Euro, in order to offset any gain or loss caused by foreign exchangerate fluctuations.
However, the Facility has not entered into any hedge accounting transactions underIFRS rules as atDecember 31, 2006 and 2005. Therefore, all derivatives aremeasuredat fair value through the income statement. Fair values are derived primarily fromdiscounted cash-flowmodels, option-pricing models and from third party quotes.
Derivatives are recorded at fair value and carried as assets when their fair value ispositive and as liabilitieswhen their fair value is negative. Changes in the fair value ofderivatives held for trading are included in “Net result on financial operations”.
2.4.6 Contributions
Contributions fromMember States are recognized as receivable in the balance sheeton the date of the Council Decision fixing the financial contribution to be paid bytheMember States to the Facility.
2.4.7 Interest income on loans
Interest on loans originated by the Facility is recorded in the profit and loss account(interest and similar income) and on the balance sheet (loan and advances) on anaccrual basis using the effective interest rate,which is the rate that exactly discountsestimated future cash payments or receipts through the expected life of the loanto the net carrying amount of the loan. Once the recorded value of a loan has beenreduced due to an impairment, interest income continues to be recognized usingthe original effective interest rate applied to the new carrying amount.
2.4.8 Interest subsidies
As part of its activity, the Facilitymanages interest subsidies onbehalf of theMemberStates.
The part of the Member States contributions allocated to the payment of interestsubsidies is not accounted for in the Facility’s equity but is classified as an amountowed to third parties.
2.4.9 Interest income on treasury
Under the terms of the Facility and according to the Financial Regulation applicableto the 9thEuropean Development Fund, the funds received by the EIB on behalf ofthe Facility are recorded in an account in the Commission’s name. Interest on thesedeposits, placed by the Facility with the EIB, is not accounted for by the Facility as itis payable directly to the European Commission.
Reflows, being repayment of principal, interest or commissions stemming fromfinancial operations, and interest calculated on these reflows are accounted forwithin the Facility.
2.4.10 Fees, commissions and dividends
Fees received in respect of services provided over a period of time are recognized asincome as the services are provided. Commitment fees are deferred and recognizedin income using the effective interestmethod over the period from disbursementto repayment of the related loan.
Dividends relating to equity investments are recognizedwhen received.
2.4.11 Taxation
The Protocol on the Privileges and Immunities of the European Communities,appended to the Treaty of 8 April 1965 establishing a Single Council and a SingleCommission of the European Communities, stipulates that the assets, revenues andother property of the Institutions of the Union are exempt from all direct taxes.
2.4.12 Reclassification of prior year figures
Where necessary, certain prior year figures have been reclassified to conform withchanges to the current year’s presentation for comparative purpose.

Investment Facility – Annual Report 200648
A f r i c a • C a r i b b e a n • P a c i f i c • A f r i c a • C a r i b b e a n • P a c i f i c • A f r i c a • C a r i b b e a n • P a c i f i c
3 RiskManagement3.1 Credit risk
This section presents financial information about the investmentsmade by theFacility.
The table hereafter analyses the Facility exposure disbursed by nature of borrower.
Exposure disbursed (in EUR ’000) 2006 2005
Private borrowers 378 428 225 174
Sovereign and Public borrowers 23 234 -
Total 401 662 225 174
The table hereafter analyses the Facility exposure disbursed by type of investmentinstrument used.
Exposure disbursed (in EUR ’000) 2006 2005
Senior Loans (exposure disbursed) 226 392 111 671
ofwhichGlobal Loans 96 841 50 314
Subordinated Loans and Quasi Equity 108 821 82 617
Equity 66 449 30 886
Total 401 662 225 174
The table below analyses the Facility exposure disbursed by sector.
Exposure disbursed (in EUR ’000) 2006 2005
Infrastructure 1 693 3 683
Industry 182 783 140 597
Energy 38 291 -
Services 33 618 11 548
Agriculture 9 349 6 500
Services (financial activities) 39 087 12 532
Global loans 96 841 50 314
Total 401 662 225 174
3.2 Interest rate risk
The table below summarizes the Facility’s exposure to interest rate risk throughits investments.
Exposure disbursed (in EUR ’000) 2006 2005
Fixed rate interest 170 790 92 150
Floating rate interest 164 423 102 138
Non-interest bearing investments 66 449 30 886
Total 401 662 225 174
3.3 Liquidity risk
The table below sets out the Facility’s assets and liabilities by relevantmaturity groupings based on the remaining period to the contractual maturity date.
Liquidity risk (in EUR ’000)Up to 3months
3-12months
1-5years
Over 5years Total
ASSETSCash and cash equivalents 190 780 - - - 190 780
Derivative financial instruments - - 1 558 6 915 8 473
Loans and equity investments
Loans 1 945 1 518 15 714 319 820 338 997
Equity investments - - - 66 449 66 449
Amounts receivable from contributors 103 913 - - - 103 913
Other assets 1 365 - - - 1 365
Total assets 298 003 1 518 17 272 393 184 709 977
LIABILITIESAmounts owed toMember States (134 425) - - - (134 425)
Deferred income - - - (7 908) (7 908)
Other liabilities (1 463) - - - (1 463)
Total liabilities (135 888) - - (7 908) (143 796)
Net liquidity position at 31 December 2006 162 115 1 518 17 272 385 276 566 181
Net liquidity position at 31 December 2005 174 110 397 2 192 217 215 393 914
3.4 Foreign exchange risk
The table below analyses the Facility assets and liabilities by relevant currency groupings.
Foreign exchange risk (in EUR ’000) EUR USD CADACP/OCT
Currencies Total
ASSETSCash and cash equivalents 190 549 231 - - 190 780
Derivative financial Instrument 8 473 - - - 8 473
Loans and equity investments
Loans 141 075 176 214 (*) - 21 708 338 997
Equity investments 18 541 32 427 3 356 12 125 66 449
Amounts receivable from contributors 103 913 - - - 103 913
Other assets - 965 - 400 1 365
Total assets 462 551 209 837 3 356 34 233 709 977
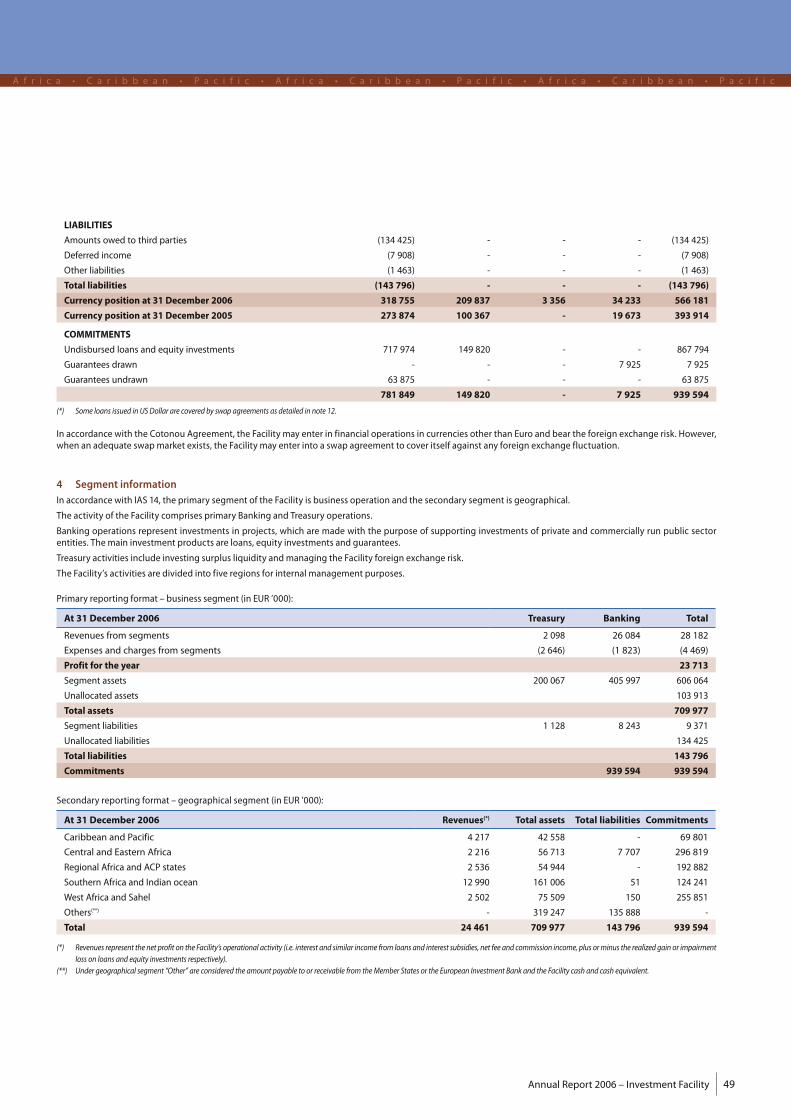
Annual Report 2006 – Investment Facility 49
A f r i c a • C a r i b b e a n • P a c i f i c • A f r i c a • C a r i b b e a n • P a c i f i c • A f r i c a • C a r i b b e a n • P a c i f i c
LIABILITIES
Amounts owed to third parties (134 425) - - - (134 425)
Deferred income (7 908) - - - (7 908)
Other liabilities (1 463) - - - (1 463)
Total liabilities (143 796) - - - (143 796)
Currency position at 31 December 2006 318 755 209 837 3 356 34 233 566 181
Currency position at 31 December 2005 273 874 100 367 - 19 673 393 914
COMMITMENTS
Undisbursed loans and equity investments 717 974 149 820 - - 867 794
Guarantees drawn - - - 7 925 7 925
Guarantees undrawn 63 875 - - - 63 875
781 849 149 820 - 7 925 939 594
(*) Some loans issued inUSDollar are covered by swap agreements as detailed in note 12.
In accordancewith the Cotonou Agreement, the Facilitymay enter in financial operations in currencies other than Euro and bear the foreign exchange risk. However,when an adequate swapmarket exists, the Facilitymay enter into a swap agreement to cover itself against any foreign exchange fluctuation.
4 Segment informationIn accordancewith IAS 14, the primary segment of the Facility is business operation and the secondary segment is geographical.
The activity of the Facility comprises primary Banking and Treasury operations.
Banking operations represent investments in projects, which are made with the purpose of supporting investments of private and commercially run public sectorentities. Themain investment products are loans, equity investments and guarantees.
Treasury activities include investing surplus liquidity andmanaging the Facility foreign exchange risk.
The Facility’s activities are divided into five regions for internal management purposes.
Primary reporting format – business segment (in EUR ’000):
At 31 December 2006 Treasury Banking Total
Revenues from segments 2 098 26 084 28 182
Expenses and charges from segments (2 646) (1 823) (4 469)
Profit for the year 23 713
Segment assets 200 067 405 997 606 064
Unallocated assets 103 913
Total assets 709 977
Segment liabilities 1 128 8 243 9 371
Unallocated liabilities 134 425
Total liabilities 143 796
Commitments 939 594 939 594
Secondary reporting format – geographical segment (in EUR ’000):
At 31 December 2006 Revenues(*) Total assets Total liabilities Commitments
Caribbean and Pacific 4 217 42 558 - 69 801
Central and Eastern Africa 2 216 56 713 7 707 296 819
Regional Africa and ACP states 2 536 54 944 - 192 882
Southern Africa and Indian ocean 12 990 161 006 51 124 241
West Africa and Sahel 2 502 75 509 150 255 851
Others(**) - 319 247 135 888 -
Total 24 461 709 977 143 796 939 594
(*) Revenues represent the net profit on the Facility’s operational activity (i.e. interest and similar income from loans and interest subsidies, net fee and commission income, plus orminus the realized gain or impairmentloss on loans and equity investments respectively).
(**) Under geographical segment “Other” are considered the amount payable to or receivable from theMember States or the European Investment Bank and the Facility cash and cash equivalent.

Investment Facility – Annual Report 200650
A f r i c a • C a r i b b e a n • P a c i f i c • A f r i c a • C a r i b b e a n • P a c i f i c • A f r i c a • C a r i b b e a n • P a c i f i c
5 Net fee and commission income (in EUR ’000)
Themain components of net fee and commission income are as follows:
2006 2005
Fee and commission on loans and equity investments 4 168 684
Guarantee fee 198 24
4 366 708
6 Net result on financial operations (in EUR ’000)The main components of net result on dealing activities and foreign exchangeare as follows:
2006 2005
Net result arising from foreign exchange variations (14 210) 6 449
Fair valuemovement on derivatives 14 057 (5 441)
(153) 1 008
7 General administrative expenses (in EUR ’000)General administrative expenses represent the actual costs incurred by theEuropean Investment Bank (the “Bank”) for managing the Facility less incomegenerated from standard appraisal fees directly charged by the Bank to clientsof the Facility.
9 Loans and equity investments (in EUR ’000)
LoansEquity
investments Total
At 1st January 2006 194 009 30 886 224 895
Movement in fair value revaluation - 3 554 3 554
Impairment (1 693) (130) (1 823)
Change in amortized cost (316) - (316)
Disbursements 157 004 31 965 188 969
Interest capitalised 4 303 - 4 303
Repayments (3 585) (25) (3 610)
Foreign exchangemovement (14 509) 199 (14 310)
At 31st December 2006 335 213 66 449 401 662
At 31 December 2006, two operationswere impaired for a total of EUR 1.8million. One of these operations concerned a loan inMauritania for an impairment amountof EUR 1.7million.
Investments in quoted companies represent EUR 15.2million of the total equity investments.
10 Amounts receivable from contributors (in EUR ’000)Themain components of amounts receivable from contributors are as follows:
2006 2005
Contribution called but not paid 70 000 60 000
Special contribution to generaladministrative expenses 33 913 32 455
103 913 92 455
11 Other assetsThemain components of other assets are as follows:
2006 2005
Interest on loans not yet collected 551 351
Amounts receivable from EIB 814 -
1 365 351
12 Derivative financial instruments (in EUR ’000)
At December 31, 2006
ContractNotionalAmount
PositiveFairValue
Cross currency swaps 114 597 6 046
Cross currency interest rate swaps 86 963 2 427
8 473
At December 31, 2005
ContractNotionalAmount
NegativeFairValue
Cross currency swaps 59 176 3 979
Cross currency interest rate swaps 21 089 1 605
5 584
2006 2005
Actual cost incurred by the European Investment Bank 35 413 33 364
Income from appraisal fees charged to clientsof the Facility (1 500) (909)
Net general administrative expenses 33 913 32 455
Under CouncilDecision of 8 April 2003, theMember states agreed to cover in fullthe expenses incurred by the Bank for themanagement of the Facility for the first5 years of the 9thEuropean Development Fund.
8 Cash and cash equivalents (in EUR ’000)For the purposes of the cash flow statement, cash and cash equivalents comprisethe following balances with less than three months maturity from the date ofacquisition.The cash and cash equivalents can be broken down between the funds receivedfrom theMember States and not yet disbursed and the funds from the Facility’soperational and financial activities.
2006 2005
Member states contributions receivedand not yet disbursed 69 720 155 523
Funds from the Facility’s financial andoperational activities 121 060 39 393
190 780 194 916
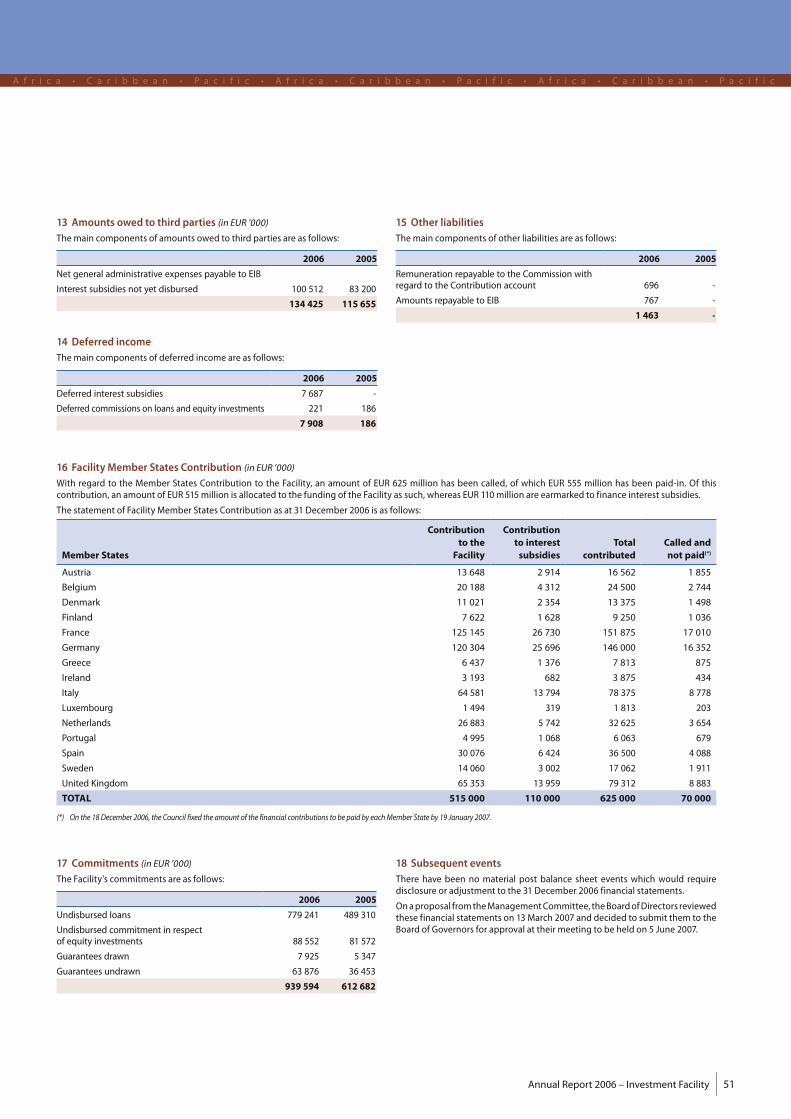
Annual Report 2006 – Investment Facility 51
A f r i c a • C a r i b b e a n • P a c i f i c • A f r i c a • C a r i b b e a n • P a c i f i c • A f r i c a • C a r i b b e a n • P a c i f i c
16 FacilityMember States Contribution (in EUR ’000)
With regard to the Member States Contribution to the Facility, an amount of EUR 625 million has been called, of which EUR 555 million has been paid-in. Of thiscontribution, an amount of EUR 515million is allocated to the funding of the Facility as such,whereas EUR 110million are earmarked to finance interest subsidies.
The statement of FacilityMember States Contribution as at 31 December 2006 is as follows:
Member States
Contributionto the
Facility
Contributionto interestsubsidies
Totalcontributed
Called andnot paid(*)
Austria 13 648 2 914 16 562 1 855
Belgium 20 188 4 312 24 500 2 744
Denmark 11 021 2 354 13 375 1 498
Finland 7 622 1 628 9 250 1 036
France 125 145 26 730 151 875 17 010
Germany 120 304 25 696 146 000 16 352
Greece 6 437 1 376 7 813 875
Ireland 3 193 682 3 875 434
Italy 64 581 13 794 78 375 8 778
Luxembourg 1 494 319 1 813 203
Netherlands 26 883 5 742 32 625 3 654
Portugal 4 995 1 068 6 063 679
Spain 30 076 6 424 36 500 4 088
Sweden 14 060 3 002 17 062 1 911
United Kingdom 65 353 13 959 79 312 8 883
TOTAL 515 000 110 000 625 000 70 000
(*) On the 18December 2006, the Council fixed the amount of the financial contributions to be paid by eachMember State by 19 January 2007.
17 Commitments (in EUR ’000)The Facility’s commitments are as follows:
2006 2005
Undisbursed loans 779 241 489 310
Undisbursed commitment in respectof equity investments 88 552 81 572
Guarantees drawn 7 925 5 347
Guarantees undrawn 63 876 36 453
939 594 612 682
18 Subsequent eventsThere have been no material post balance sheet events which would requiredisclosure or adjustment to the 31 December 2006 financial statements.
Onaproposal from theManagementCommittee, theBoardofDirectors reviewedthese financial statements on 13March 2007 and decided to submit them to theBoard of Governors for approval at theirmeeting to be held on 5 June 2007.
13 Amounts owed to third parties (in EUR ’000)Themain components of amounts owed to third parties are as follows:
2006 2005
Net general administrative expenses payable to EIB
Interest subsidies not yet disbursed 100 512 83 200
134 425 115 655
14 Deferred incomeThemain components of deferred income are as follows:
2006 2005
Deferred interest subsidies 7 687 -
Deferred commissions on loans and equity investments 221 186
7 908 186
15 Other liabilitiesThemain components of other liabilities are as follows:
2006 2005
Remuneration repayable to the Commission withregard to the Contribution account 696 -
Amounts repayable to EIB 767 -
1 463 -
Investment Facility – Annual Report 200652
A f r i c a • C a r i b b e a n • P a c i f i c • A f r i c a • C a r i b b e a n • P a c i f i c • A f r i c a • C a r i b b e a n • P a c i f i c
Independent Auditor’s Report
To the chairman of the Audit Committee ofEUROPEAN INVESTMENT BANKLuxembourg
We have audited the accompanying financial statements of the Investment Facility,which show a profit of EUR 23.713million and atotal balance sheet of EUR 709.977million and which comprise the balance sheet as at December 31, 2006, the income statement,the statement of changes in equity, the cash flow statement for the year then ended, and a summary of significant accountingpolicies and other explanatory notes to the financial statements.
Management Committee’s responsibility for the financial statements
The Management Committee is responsible for the preparation and fair presentation of these financial statements in accordancewith International Financial Reporting Standards and with the general principles of the Directives of the European Union on theannual accounts and consolidated accounts of certain type of companies, banks and other financial institutions and insuranceundertakings. This responsibility includes: designing, implementing and maintaining internal control relevant to the preparationand fair presentation of financial statements that are free frommaterial misstatement, whether due to fraud or error, selecting andapplying appropriate accounting policies, andmaking accounting estimates that are reasonable in the circumstances.
Responsibility of the “Réviseur d’Entreprises”
Our responsibility is to express an opinion on these financial statements based on our audit. We conducted our audit in accordancewith International Standards on Auditing as adopted by the Luxembourg “Institut des Réviseurs d’Entreprises”. Those standardsrequire that we comply with ethical requirements and plan and perform the audit to obtain reasonable assurance whether thefinancial statements are free from material misstatement.
An audit involves performing procedures to obtain audit evidence about the amounts and disclosures in the financial state-ments. The procedures selected depend on the judgement of the “Réviseur d’Entreprises”, including the assessment of therisks of material misstatement of the financial statements, whether due to fraud or error. In making those risk assessments,the “Réviseur d’Entreprises” considers internal control relevant to the entity’s preparation and fair presentation of the finan-cial statements in order to design audit procedures that are appropriate in the circumstances, but not for the purpose ofexpressing an opinion on the effectiveness of the entity’s internal control.
An audit also includes evaluating the appropriateness of accounting policies used and the reasonableness of accountingestimates made by the Management Committee, as well as evaluating the overall presentation of the financial statements.We believe that the audit evidence we have obtained is sufficient and appropriate to provide a basis for our audit opinion.
Opinion
In our opinion, the financial statements give a true and fair view of the financial position of the Investment Facility as ofDecember 31, 2006, of its financial performance, of its changes in equity and of its cash flows for the year then ended inaccordancewith International Financial Reporting Standards andwith the general principles of theDirectives of the EuropeanUnion on the annual accounts and consolidated accounts of certain types of companies, banks and other financial institu-tions and insurance undertakings.
ERNST & YOUNGSociété Anonyme
Réviseur d’Entreprises
March 13, 2007 Bernard LHOEST Alain KINSCH
Annual Report 2006 – Investment Facility 53
A f r i c a • C a r i b b e a n • P a c i f i c • A f r i c a • C a r i b b e a n • P a c i f i c • A f r i c a • C a r i b b e a n • P a c i f i c
The Audit Committee
The Audit Committee reports to the Board of Governors, the following statement being communicated to the Governors prior totheir approval of the Annual Report and the financial statements for the past financial year.
Statement by the Audit Committee on the Investment Facility financial statements1
The Committee, instituted in pursuance of Article 14 of the Statute and Article 25 of the Rules of Procedure of the European Investment Bankfor the purpose of verifying that the operations of the Bank are conducted and its books kept in a propermanner, having
– designated Ernst & Young as external auditors, reviewed their audit planning process, examined and discussed their reports,
– noted that the opinion of Ernst & Young on the financial statements of the Investment Facility for the financial period ending on 31December 2006 is unqualified,
– convened on a regular basiswith theHeads ofDirectorates and relevant services, and studied the documentswhich it deemed necessaryto examine in the discharge of its duties,
– received assurance from the Management Committee concerning the effectiveness of the internal control structure and internaladministration,
and considering
– the financial statements for the financial period ending on 31 December 2006 as drawn up by the Board of Directors at its meeting on13March 2007,
– that the foregoing provides a reasonable basis for its statement and,
– Articles 22, 23 & 24 of the Rules of Procedure,
to the best of its knowledge and judgement:
confirms that the activities of the Investment Facility are conducted in a propermanner, in particular with regard to risk management andmonitoring;
has verified that the operations of the Investment Facility have been conducted and its books kept in a propermanner and that to this end,it has verified that the Investment Facility’s operations have been carried out in compliance with the formalities and procedures laid downby the Statute and Rules of Procedure;
confirms that the financial statements, comprising the balance sheet, the income statement, the statement of changes in equity, the cashflow statement and the notes to the financial statements give a true and fair view of the financial position of the Investment Facility as at 31December 2006 in respect of its assets and liabilities, and of the results of its operations for the year then ended.
Luxembourg, 13March 2007
The Audit Committee
R. POVEDA ANADÓN M. DALLOCCHIO
1 The Financial Regulation applicable to the 9th European Development Fund in Article 112with regard to the operationsmanaged by the European Investment Bank states that these operations shall be subject to theaudit and discharge procedures laid down in the Statute of the Bank for all of its operations.On this basis, the Audit Committee issues the above statement.
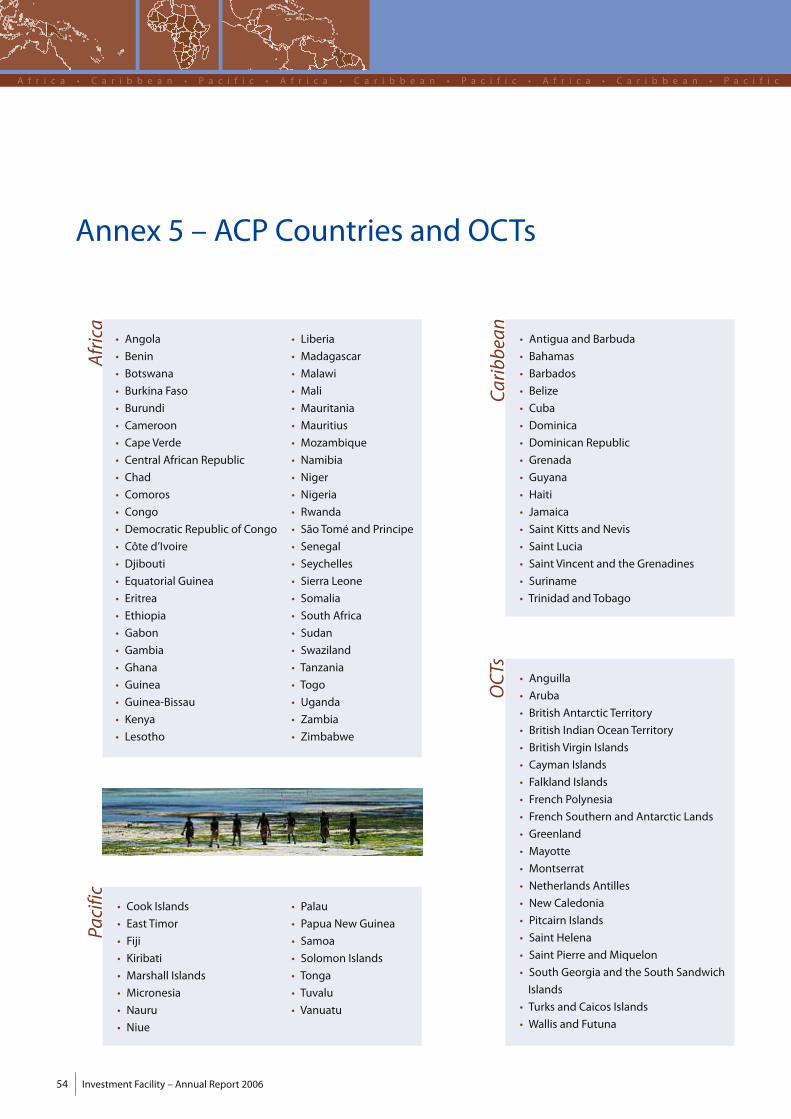
Investment Facility – Annual Report 200654
A f r i c a • C a r i b b e a n • P a c i f i c • A f r i c a • C a r i b b e a n • P a c i f i c • A f r i c a • C a r i b b e a n • P a c i f i c
Annex 5 – ACP Countries and OCTs
• Anguilla
• Aruba
• British Antarctic Territory
• British Indian Ocean Territory
• British Virgin Islands
• Cayman Islands
• Falkland Islands
• French Polynesia
• French Southern and Antarctic Lands
• Greenland
• Mayotte
• Montserrat
• Netherlands Antilles
• New Caledonia
• Pitcairn Islands
• Saint Helena
• Saint Pierre andMiquelon
• South Georgia and the South Sandwich
Islands
• Turks and Caicos Islands
• Wallis and Futuna
OCTs
Africa
• Angola
• Benin
• Botswana
• Burkina Faso
• Burundi
• Cameroon
• Cape Verde
• Central African Republic
• Chad
• Comoros
• Congo
• Democratic Republic of Congo
• Côte d’Ivoire
• Djibouti
• Equatorial Guinea
• Eritrea
• Ethiopia
• Gabon
• Gambia
• Ghana
• Guinea
• Guinea-Bissau
• Kenya
• Lesotho
• Liberia
• Madagascar
• Malawi
• Mali
• Mauritania
• Mauritius
• Mozambique
• Namibia
• Niger
• Nigeria
• Rwanda
• São Tomé and Principe
• Senegal
• Seychelles
• Sierra Leone
• Somalia
• South Africa
• Sudan
• Swaziland
• Tanzania
• Togo
• Uganda
• Zambia
• Zimbabwe
Pacific • Cook Islands
• East Timor
• Fiji
• Kiribati
• Marshall Islands
• Micronesia
• Nauru
• Niue
• Palau
• Papua New Guinea
• Samoa
• Solomon Islands
• Tonga
• Tuvalu
• Vanuatu
Carib
bean • Antigua and Barbuda
• Bahamas
• Barbados
• Belize
• Cuba
• Dominica
• Dominican Republic
• Grenada
• Guyana
• Haiti
• Jamaica
• Saint Kitts and Nevis
• Saint Lucia
• Saint Vincent and the Grenadines
• Suriname
• Trinidad and Tobago
Annual Report 2006 – Investment Facility 55
A f r i c a • C a r i b b e a n • P a c i f i c • A f r i c a • C a r i b b e a n • P a c i f i c • A f r i c a • C a r i b b e a n • P a c i f i c
Annex 6 – Glossary of abbreviations
AACP: Africa, Caribbean and PacificADB: Asian Development BankAFD: Agence Française de DéveloppementAfDB: African Development BankApprovals: Projects approved for financing by the EIB’s decision-making
bodiesAWS: AustriaWirtschaftsserviceBBDEAC: Banque de Développement des Etats de l’Afrique CentraleBIO: Belgium Investment Company for Developing CountriesBOAD: West African Development BankBPI: Business Partners InternationalBPSA: Business Partners Ltd. of South AfricaBII: Banque Internationale d’InvestissementCCBOs: Community-based OrganisationsCDB: Caribbean Development BankCDC: Capital for Development Group PlcCEMAC: Central African Economic andMonetary CommunityCFA: Communauté française d’AfriqueCofides: Compañía Española de Financiación del DesarrolloCommitments: Signed loans, equity, quasi-equity investment, agency and
guarantee agreementsCorvinus: Corvinus International Investment Ltd.CRPGs: Credit Risk Policy GuidelinesDDBSA: Development Bank of South AfricaDEG: Deutsche Investitions- und EntwicklungsgesellschaftmbHDFCU: Development Finance Company of UgandaDFIs: Development Finance InstitutionsDIAF: Development Impact Assessment FrameworkDisbursements:Loans and investments paid outEEADB: East African Development BankECOWAS: Economic Community ofWest African StatesEDF: European Development FundEDFIs: European Development Finance InstitutionsEFP: European Financing PartnerEIA: Environmental Impact AssessmentEIB: European Investment BankEITI: Extractive Industry Transparency InitiativeEU: European UnionFFDI: Foreign Direct InvestmentFINNFUND: Finnish Fund for Industrial Cooperation LtdFMO: Netherlands Development Finance CompanyGGDP: Gross Domestic ProductGNI: Gross National Income
HHIPC: Heavily Indebted Poor CountriesIIDA: International Development AgencyIF: Investment FacilityIFC: International Finance CorporationIFIs: International Financial InstitutionsIFRS: International Financial Reporting StandardsIFU Industrialisation Fund for Developing CountriesIMF: InternationalMonetary FundING: Internationale Nederlanden GroupK:KfW: Kreditanstalt fürWiederaufbauMMDGs: Millennium Development GoalsMDRI: Multilateral Debt Relief InitiativeMFIs: Microfinance InstitutionsMIDINA: Managing Infrastructure Development in NamibiaMIGA: Multilateral Investment Guarantee AgencyMoU: Memorandum of UnderstandingNNGOs: Non-governmental OrganisationsNorfund: Norwegian Investment Fund for Developing CountriesOOCTs: Overseas Countries and TerritoriesODA: Official Development AssistanceOMVS: Organisation pour laMise en Valeur du fleuve SénégalOPEC: Organisation of the Petroleum Exporting CountriesPPPF: Project Preparation FacilityPROPARCO: SociétédePromotionetdeParticipationpour laCoopération
EconomiqueQQuasi-equity: Instruments incorporating both loan and equity features,
designedtoprovidevaryingdegreesofrisk/returntrade-offsthatlie between those of straight loans and equity investments
SSADC: Southern African Development CommunitySBI-BMI: Belgian Corporation for International InvestmentSIFEM: Swiss Investment Fund for EmergingMarketsSIMEST: Società Italiana per le Imprese all’EsteroSMEs: Small andMedium-Sized EnterprisesSPV: Special Purpose VehicleSwedfund: Swedfund International ABUUEMOA: Union Economique etMonétaire Ouest AfricaineUN: United NationsWWAEMU: West African Economic andMonetary Union
A f r i c a • C a r i b b e a n • P a c i f i c • A f r i c a • C a r i b b e a n • P a c i f i c • A f r i c a • C a r i b b e a n • P a c i f i c

i b b e a n • P a c i f i c Ai b b e a n • P a c i f i c A f r i c a • C a r i b b e a n • P a c i f i c • A f r i c a • C a r i b b e a n • P a c i f i c • A f r i c a • C a r i b b e a n • P a c i f i c
European Investment Bank
100, boulevard Konrad Adenauer 3 (+352) 43 79 1
L-2950 Luxembourg 5 (+352) 43 77 04
FindelOffice
4, Rue Lou-Hemmer
L-1748 Findel
www.eib.org/acp –U [email protected]
EIB Addresses
Dakar3, rue du Docteur Roux 3 (+221) 889 43 00
BP 6935 Dakar 5 (+221) 842 97 12
U [email protected], boulevard du Général de Gaulle 3 (+596) 596 74 73 10
F-97200 Fort-de-France 5 (+596) 59 44 88
Nairobi5th Floor, Africa RE Centre 3 (+254) 20 273 52 60
Hospital Road, PO Box 40193 5 (+254) 20 271 19 54
00100 Nairobi U [email protected]
SydneyLevel 31, ABN AMRO Tower 3 (+61-2) 82 11 05 36
88 Phillip Street 5 (+61-2) 82 11 06 88
Sydney NSW 2000 U [email protected]
Tshwane (Pretoria)5, Greenpark Estate 3 (+27-12) 425 04 60
27, George Storrar Drive 5 (+27-12) 425 04 70
Groenkloof 0181, Pretoria U [email protected]
ExternalOffices:
Whilematerial appearing in this reportmay be freely reproduced, the EIB would appreciate an acknowledgement and press clipping.
© Photos: EIB Photo Library.
Layout: EIB GraphicsWorkshop.
Printed in Luxembourg by Imprimerie Centrale s.a. on AcondaVerd Silk paper using vegetable oil-based inks. Certified in accordance with ForestStewardship Council (FSC) rules, the paper consists of 60% virgin fibre (of which at least 30% from well-managed forests), 30% de-inked post-consumer waste and 10%mill broke.
© EIB – 06/2007 – QH-AG-07-001-EN-C
ISSN 1725-924X
A f r i c a • C a r i b b e a n • P a c i f i c • A f r i c a • C a r i b b e a n • P a c i f i c • A f r i c a • C a r i b b e a n • P a c i f i c A f r