A Summer Internship Report - IMI Bhubaneswar
37
1 | Page STUDY OF FACTORS INFLUENCING CONSUMER SHIFT TOWARDS ONLINE MEDIA STREAMING PLATFORM FROM TRADITIONAL MEDIA PLATFORM (TELEVISION) A Summer Internship Report SUBMITTED TO International Management Institute Bhubaneswar IN PARTIAL FULFILMENT FOR THE AWARD OF POST GRADUATE DIPLOMA In MANAGEMENT By BIDISHA MITRA 2020
-
Upload
khangminh22 -
Category
Documents
-
view
4 -
download
0
Transcript of A Summer Internship Report - IMI Bhubaneswar

1 | P a g e
STUDY OF FACTORS INFLUENCING CONSUMER SHIFT
TOWARDS ONLINE MEDIA STREAMING PLATFORM FROM TRADITIONAL MEDIA PLATFORM (TELEVISION)
A Summer Internship Report
SUBMITTED TO
International Management Institute
Bhubaneswar
IN PARTIAL FULFILMENT FOR THE AWARD OF
POST GRADUATE
DIPLOMA
In
MANAGEMENT
By
BIDISHA MITRA
2020

2 | P a g e
ACKNOWLEDGEMENTS
I would take this opportunity to express my heartfelt gratitude to my institute, International
Management Institute, Bhubaneswar for planning such a viable and integrated learning process
through the induction of the Summer Internship Program of two months in our course curriculum. These
two months of learning has enabled me to invigorate my future perspectives. I would also like to express
a sincere gratitude to Zee Entertainment Enterprises, for giving me this opportunity to shape my
learning curve and bolster my knowledge through practical expedition. My sincere gratitude to my
corporate guide, Mr. Arunabha Mukherjee for his constant support and guidance, despite the
horrendous Covid 19 situation.
I also, express a most profound gratitude to my esteemed faculty guide Prof. Bindu Chhabra Ma’am,
for her indispensable and unadulterated counsel. Her constant enlightening and encouragement has
enabled the completion of this study.
I would also take this opportunity to thank my parents, whose constant guidance, support and sacrifice
motivates me by galore to explore and undertake all realms of life.

3 | P a g e
Annexure VII
Student’s Undertaking
I, BIDISHA MITRA bearing Institute Roll No 19PGDM-BHU018, declare that the summer project
titled Study of factors which influence Consumer shift towards Online Media Streaming
Platforms from Traditional Media Platforms (Television) is my original work and complete
under the supervisions of Mr. Arunabha Mukherjee of Zee Entertainment Enterprises and
Prof. Bindu Chhabra of IMI Bhubaneswar. Further, I also declare that the report being
submitted herewith is free of any textual plagiarism.
Signature:
Date: 9/10/2020
Place: IMI Bhubaneswar

4 | P a g e

5 | P a g e
Annexure-IV
APPROVAL OF THE FACULTY GUIDE
Recommended that the Summer Internship Report titled Study of factors influencing Consumer shift towards Online Media Streaming Platforms from Traditional Media Platforms (Television) prepared by Ms Bidisha Mitra under my/ our supervision and guidance
be accepted as fulfilling this part of the requirements for the award of Post Graduate Diploma in Management. To the best of my/ our knowledge, the contents of this report did not form a basis for the award of any previous degree/ diploma to anybody else.
Date: 21/9/2020
Signature:
Name of the Guide: Prof. Bindu Chhabra

6 | P a g e
TABLE OF CONTENTS
Serial No.
TOPIC Page No.
1 INTRODUCTION 7
2 PROBLEM STATEMENT 8
3 PURPOSE/FOCUS OF THE STUDY 8
4 STATEMENT OF OBJECTIVES 8
5 ABOUT THE MEDIA & ENTERTAINMENT INDUSTRY 9
6 METHODOLOGY 16
7 FINDINGS & INTERPRETATIONS 17
8 CONCLUSION & RECOMMENDATIONS 33
9 LIMITATIONS OF STUDY & SCOPE FOR FUTURE IMPROVEMENTS 33
10 REFERENCES 34
11 APPENDICES 35

7 | P a g e
1. INTRODUCTION:
It is truly said that “Necessity is the mother of all inventions”. With the ever-enhancing technological
advancements and dire need of mankind for ease and comfort, the advent of Digitalization has evolved
rapidly. Starting from Digital Education to Online Banking facilities, Digitalization has grasped all
possible spheres and become a part and parcel of our lives. The Media and Entertainment Industry is
no exception from the same. The fast and dynamic lifestyles of consumers have led to the need for
one-screen platforms having a touch of personalization and customization. This has resulted in the
fabrication of Digital Media Platforms such as OTT platforms. An Over-the-top platform, most
commonly known as OTT Platform is a streaming media service that offers services directly to viewers,
bypassing cable, broadcast, and satellite television platforms, the companies that would traditionally
act as controller or distributor of such content. Varied research over the years have shown that there
is a significant shift in Consumer base from Traditional media platforms (Linear Television) to Online
Media Streaming Platforms. As per the Insight Summary Report 2017, by Global Web Index, termed
“Digital vs. Traditional Media Consumption”, Consumers spend an average of 56.8% of their time on
Online Media Streaming platforms, while they spend an average of only 21.6% of their time on Linear
Television.
This study aims at citing and analysing the factors which influence this very shift of Consumer base
from Traditional Media Platforms to Online Media Streaming Platforms. The factors have been
analyzed using various statistical tools and methods. The study includes field research techniques. As
the study requires the understanding of Consumer Behaviour, the data used is real-time data, collected
mainly through Primary Data collection method, namely; Questionnaires. However, for the purpose for
reference, Secondary Data has also been used.

8 | P a g e
2. PROBLEM STATEMENT:
The Media and Entertainment Industry is a rather dynamic one and thus the need for continued Market Research is a rather crucial factor.
Due to the advent of digitalization and technological advancement, Online Media Streaming Platforms have become widely accepted.
It is thereby essential to understand the varied reasons which make Online Media Streaming Platforms so popular.
3. OBJECTIVES OF STUDY:
To enlist and analyze the various factors which drive the increasing digital media consumption.
Identify the challenges of traditional media platform.
Analyze the gap between Zee5 (Zee Entertainment's OTT Platform) and other OTT Platforms such as Netflix, Amazon Prime, Hotstar etc.
4. PURPOSE/FOCUS OF STUDY:
There are various underlying factors which make OTT Platforms more acceptable than Traditional
Media Platforms (Televisions). Some of which are –
Relaxation and Amusement
Social Trends
Financial Benefit
Ease of use and Convenience
The purpose/focus of this study is to identify such factors, define those factors and analyze as to
what extent they contribute to the success of Online Media Streaming Platforms (OTT Platforms)
as well as to undertake a conclusive study, by providing suitable recommendations that can be
adapted by Media & Entertainment industry to enhance these platforms to create increased positive
outcome.

9 | P a g e
5. ABOUT THE MEDIA & ENTERTAINMENT INDUSTRY:
I. Overview:
The Indian Media & Entertainment Industry includes Television, Film, Print, Radio, Music,
Digital Media, Animation, Gaming, Events & Live Media, Out-of-home & other ancillary
media.
Valued at over US $16.2bn (1,02,600 Cr INR) which is 0.9% of the global M&E Industry
(estimated at US $1.8tn).
Its growth (11.7%) is nearly double the growth of the global M&E Industry (at 6.1%).
II. Types of Television Channels:
General Entertainment Channels A general entertainment channel is a television channel whose target audience is not
confined to a particular set of people, but instead aims to offer a wide range of products to
a diverse general public. General Entertainment channels focus on general entertainment
while putting an extra emphasis on News Programming, regarding the provision of news
and information as part of their duty.
A book published in 2010 cited a study stating that General Entertainment channels 41%
of global television market value and accounted for 70% of global television market
volume.
Movie Genre Movie channels are television specialty channels that present film content. The market is becoming heterogeneous and thus, challenging producers, directors, as well as, marketing fraternity for greater acceptance by the viewers. Many in the industry feel a need for more research into the evolving taste and demand of various audiences to better cater to all sections of film viewers.

10 | P a g e
III. About Zee Entertainment Enterprises: Essel Group, most widely known as the Zee Group is an Indian conglomerate holding company and corporate promoter. Zee Entertainment Enterprises is a leading global conglomerate in the Media & Entertainment Industry. It was incorporated in 1926 by Jagannath Goenka and through its constant innovation and evolvment, today it is considered as a one of the major market players in the Media & Entertainment Industry. Having its headquarters in Mumbai, India, Zee Entertainment Enterprises is widely spread in all regions of India and produces content in numerous regional languages. Its major subsidiaries are as follows -
Zee Entertainment Enterprises • Zee Media Corporation • Dish TV • Siti Networks etc.
The company had its claws in industries such as Mass Media, Broadcasting Infrastructure and Packaging. Its primary content categories are as follows –
• General Entertainment Category • Movie Genre
Headed by Chairman, Subhash Chandra, Zee Entertainment has more than 10000 employees all over India. Right after the Production Department, the most crucial functions and responsibilities are shouldered by the Research & Development Department, followed by the Marketing Department. Currently, it is estimated to have a Revenue of ₹6.869 billion with a Net Income of ₹131.7 million.

11 | P a g e
IV. PESTEL Analysis:
Business cycles.
Interest rates.
GNP Trends.
Inflation.
Disposable Income.
Competitor’s Pricing.
Economical
Political
Government stablity and initiatives.
Deregulation
Privatisation
Foreign trade regulation.
Taxation policy
Population Demographics.
Social mobility.
Income distribution.
Lifestyle changes.
Attitudes to work and leisure.
Social
Technological
Spending on research by Government and industry.
Spread of technology transfer.
New materials and processes.
Refinement in equipments.
IT Development.
Health & Safety Law.
Employment regulations.
Tax policies.
New restrictions on trade and product
standards.
Legal
Environmental
Pollution control.
Noise control.
Additional requirements on manufacturing
processes.

12 | P a g e
V. Porter’s Five Force Model:
Barriers to Entry (High)
Consumers can switch channels.
Increase of GLOBALISATION.
Availability of alternative sources of Entertainment
Threat of New Entrants (Low)
High SLUNK COST.
High Capital REQUIREMENTS.
Difficult access to DISTRIBUTION.
Steeper Learning Curve because of Mature Market.
Threat of Competitors (High)
Highy fragemented market.
Bargaining power of suppliers (Low)
Decreasing bargaining power of suppliers.
Increasing number of content writers.
Threat of substitites (High)
Print Media
Social Media

13 | P a g e
VI. SWOT Analysis of Zee Entertainment Enterprises:
• THREATS• OPPORTUNITIES
• WEAKNESSES• STRENGTHS
First private Bengali channel in India.
Brand equity.
Retained No. 1 spot for last two years.
Started legacy of reality shows and historical
operas.
Pioneer of Cookeyshow .
Shows mostly focus on Saas-Bahu drama.
Earlier shows like Disney Hour used to capture attention of
kids.
Similarity of shows in all GECs.
New channels such as Colors proving to be
continuous competition.
Can catch audience by giving genuine humour based programmes.
Can make some good shows for kids.

14 | P a g e
VII. Main Competitors of Zee Bangla (Zee Entertainment Enterprises):
Star Jalsha 2008
A part of the Star Group, having
launched its own HD feeds in 2016, Star Jalsha is the first
Bengali-language HD Channel in India.
Colors Bangla, 2000
Owned by Viacom 18, Colors Bangla was
previously known as ETV Bangla. It
launched Film Fare Awards East in 2017.
Aakash Aath, 1999
Formerly known as Aakash Bangla, Aakash
Aath is owned by Channel Eight Group and is a 24 hour news broadcasting channel.
Sony Aath, 2008
Owned by Sony Networks Pictures, Sony Aath airs soap
operas, events, animated shows
produced or dubbed in Bengali.

15 | P a g e
VIII. Covid 19 and its Aftermath:
Covid 19 having a marked impact on media supply, consumption, and advertising around the world.
Demand for content creation, from live sports to sitcoms to movies, has been largely turned off.
Advertising spend has come under significant pressure with some sectors largely ceasing
advertising and some campaigns now deemed inappropriate at the time of social distancing.
Potential Impact-
Increasing demand for content, but challenges in production and advertising revenue.
Disruptions to and adaptions for in-person events and entertainment.
Increased potential for Media & Advertisements through online streaming platforms.
Major Concerns-
Maintaining positive customer experience despite surge in online demand.
Leveraging digital channels to build engagement.
Adjusting content & advertising to resonate in these changing times.
Reassessing cost structure to off-set revenue decline.
Recommendations-
Assessing the impact on employees and broader network of contractors and external stakeholders.
Identifying approaches that could enable content creation to resume, keeping in mind the wide variation of local and national regulations.
Considering availability of government stimulus incentives targeted at M&E companies.

16 | P a g e
6. METHODOLOGY:
Type of Research – Exploratory Research
The research conducted was exploratory in nature. Exploratory Research primarily involves
investigating a problem which is yet to be clearly defined. It does provide a conclusive result but
definitely helps understand the existing scenario much better. It gives a clarified picture of the
existing problem.
The method that was adopted to carry out the data was “Primary Research method”, which can be
of varied types, such as; Surveys/polls, Interviews, Focus Groups, Observations. However, this
research has followed Survey method of data collection, through Questionnaire method, which is
the main instrument in Survey Research.
Nature of Data – Primary Data (Majorly)
Since the research focuses on understanding Consumer perception and thereby analyse the
factors which make OTT Platforms more preferable than Traditional Media Platforms (Televisions),
the data collected was Primary Data. It consists of real-time primary data collected through
respondents from varying Educational, Economical, and Geographical background.
Method of Data collection – Questionnaire method
A fully integrated questionnaire encompassing questions pertaining to varied factors under study,
such as Financial benefits, Ease of Use and Convenience, Relaxation and Social Trends were
covered. General questions were also implemented to cover factors such as Educational
background, Employment status, Age, Gender
Sources of Data – Real time data collected from Consumers.
The questionnaire was floated through social media platform – LinkedIn, and thereby 238 real-time
data was acquired from people of varied geographical, cultural, educational background.

17 | P a g e
7. FINDINGS & INTERPRETATIONS:
A. Preferred platform of customers for viewing media content:
Interpretation
From the above figure, we can observe that out of a that out of a total of 238 respondents, 97%
claimed that they prefer viewing media content on OTT Media as opposed to only 3% of the sample
size preferring to view content on other platforms such as cable network.
3%
97%
Preferred platform of consumers to view media content
Others
OTT Platform
18 | P a g e
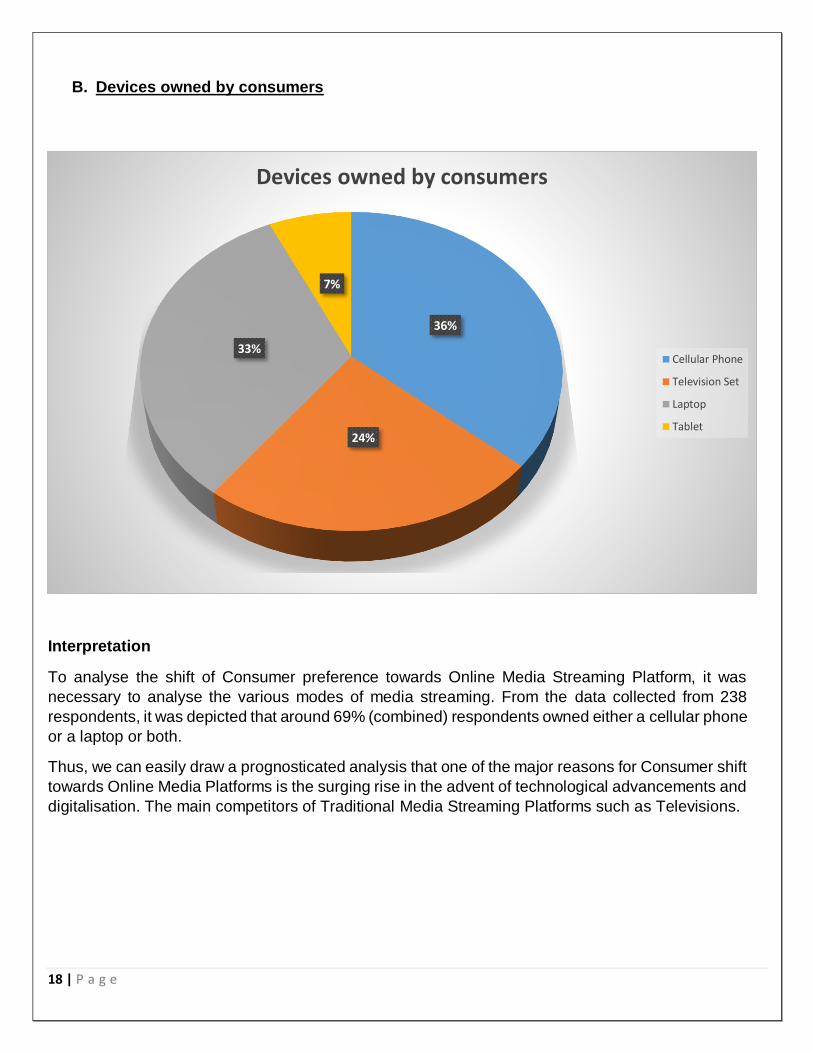
B. Devices owned by consumers
Interpretation
To analyse the shift of Consumer preference towards Online Media Streaming Platform, it was
necessary to analyse the various modes of media streaming. From the data collected from 238
respondents, it was depicted that around 69% (combined) respondents owned either a cellular phone
or a laptop or both.
Thus, we can easily draw a prognosticated analysis that one of the major reasons for Consumer shift
towards Online Media Platforms is the surging rise in the advent of technological advancements and
digitalisation. The main competitors of Traditional Media Streaming Platforms such as Televisions.
36%
24%
33%
7%
Devices owned by consumers
Cellular Phone
Television Set
Laptop
Tablet

19 | P a g e
C. Consumer’s Most Preferred Device
Interpretation
To find the most preferred device of the respondents for viewing content through online media
streaming platforms we can see from the above pie-chart that out of 238 respondents 48% preferred
to stream media through Cellular phone, 38% preferred to stream content through Laptop, 10% of
the respondents streamed online media content through their television set and the rest through
Tablet.
Thus, we can infer that the respondents mostly prefer to view content through their cellular phone
mainly probably because of their busy schedule and convenience as we prefer to use mobile phones
most of the time as everything is readily available. Some portion of the respondents also preferred
to view content through laptop because of the fact that they didn’t want to compromise the viewing
experience.
48%
10%
38%
4%
Consumer's Most Preferred Device
Cellular Phone
Television Set
Laptop
Tablet

20 | P a g e
D. Viewing Time of Consumers
Interpretation
From the above bar graph, we can interpret that out of 238 respondents the majority of the
respondents i.e. 193 respondents preferred to view content in less than 1 hour through cable
network. As the cable network provide fixed time to view content the respondents preferred to stream
content through cable network not more than 1 hour.
Interpretation
From this bar graph it is clear that majority of the respondents preferred to view OTT platform
between 1-3 hours in a day over cable network for the simple reason that they have various content
to choose from which they don’t get in cable network and also the OTT Platform is flexible as
opposed to cable network as they can stream content in OTT Platform as per their convenience.
L E S S T H A N 1 H O U R B E T W E E N 1 - 3 H O U R S M O R E T H A N 3 H O U R S
C A B L E N E T W O R K
193
387
VIEWING TIME OF CONSUMERS
0
20
40
60
80
100
120
140
160
Less than 1 hour Between 1-3 hours More than 3 hours
OTT Platform
VIEWING TIME OF CONSUMERS

21 | P a g e
E. Financial Relaxation of OTT Platform over Television Media
Interpretation
The above pie chart suggests that 60% of the respondents i.e. 143 respondents feel OTT platform
is financially more preferable than television media while 40% prefer traditional television media to
stream content. As there is flexibility of viewing content as per the convenience of the respondent
that is why the OTT Platform is preferred more and the content provided by OTT platform against
the charges is far more than Television media. As respondents can view content through OTT
platform with multiple devices with the cost paid same as viewing content through television media
that is why the majority respondents feel there is financial relaxation of OTT Platform over Television
media.
40%
60%
Financial relaxation of OTT Platform over Television Media
Yes No

22 | P a g e
F. COST PER MONTH OF VIEWING OTT PLATFORMS
Interpretation
From the above bar graph we can interpret that more than 100 customers pay an average amount
of Rs 200- Rs 500 for viewing OTT Platforms, around 65 respondents spend less than Rs 200 to
stream content through OTT Platform and the rest of the respondents spend over Rs 500 to view
OTT Platforms. We can infer that very less number of respondents want to spend over Rs 500 for
viewing OTT Platforms and they don’t want to spend more than Rs 500 as they get sufficient content
and what they are looking for in their current OTT platforms.
0
20
40
60
80
100
120
140
Less than Rs. 200 Between Rs. 200 -Rs. 500 More than Rs. 500
COST PER MONTH OF VIEWING OTT PLATFORMS

23 | P a g e
G. Reasons for choosing OTT Platform over Television
Interpretation
To understand why people were viewing OTT Platforms for longer time as compared to Cable
Networks, these certain set of factors were provided and respondents were asked to choose the viable
factor from there. From the above pie chart it is evident that 31% of respondents said that they choose
OTT Platforms for the facility of Personalised viewing. Another 31% said it was because of the facility
of anytime-anywhere. 22% said it was because of portability and another 16% said it was because of
the facility of anytime-anywhere,
134, 22%
189, 31%
185, 31%
95, 16%
Reasons for choosing OTT Platform over Television
Portability
Personalized viewing
Facility of anytime-anywhere
Facility of downloading content for offlineviewing

24 | P a g e
H. NET PROMOTERS’ SCORE
To understand the satisfaction of customers with respect to Zee5, which is Zee Entertainment
Enterprises’ OTT Platform, the Net Promoters’ Score test or NPS Test was conducted. Here, each
respondent was asked to rate Zee5 on a scale of 0-10 (10 being highest) with respect to how likely they
are to recommend Zee5 to someone.
The rating of 0-6 was grouped and the people who rated 0-6 were termed as Detractors. Detractors are
basically the consumers who are unsatisfied with the service/product and would not recommend Zee5
to someone else.
Next, the rating of 7-8 was grouped and the people who rated 7-8 were termed as Passives. They are
basically the people who are satisfied customers. However, there is no absolute guarantee that they
would recommend Zee5 to others. There is a sheer chance that they might not recommend Zee5 at all.
Next, the rating of 9-10 was grouped and the people who rated 9-10 were termed as Promoters. The
Promoters are basically are delighted customers and would most definitely recommend Zee5 to others.
Rank No. of Respondants Classification Groups
No. of responses Percentage
0 0 Detractors 0-6 26 10.92
1 1 Passives 7-8 132 55.46
2 1 Promoters 9-10 80 33.61
3 0
4 1
5 7 NPS 22.69
6 16
7 43
8 89
9 72
10 8

25 | P a g e
Thereafter, Promoters, Passives and Detractors were calculated percentage wise. The values stood as
follows –
Promoters – 33.61%, Passives – 55.46%, Detractors – 10.92%.
Thereby, making it evident that the percentage of delighted customers were comparatively well.
However, to derive a net score, a simple formula was followed, wherein,
Net Promoter’s Score = Percentage of Promoters – Percentage of Detractors
From the above formula, the Net Promoter’s Score was computed to be 22.69.
Since, any organization having a positive Net Promoter’s Score is considered a widely accepted and
favoured organization. Zee5 can be concluded to be much favoured and accepted by its target market.
Various reasons can be responsible for this, such as;
Comparatively low price of subscription than other OTT Platforms.
Availability of shows which appeal more to middle-aged Indian population who prefer soap operas in regional languages such as Hindi or Bengali.
Availability of reality shows such as Saregamapa, Dadagiri etc which are not available on other OTT Platforms.
However, to understand and analyse some other aspects of consumer perception towards Zee5, some
other statistical tests were conducted.

26 | P a g e
F. STATISTICAL INTERPRETATION
Variables of study: Dependent Variable –
1) Rating of Zee5 – Respondents were asked to rate Zee5, as per their perception towards it, on a scale of 1-10, 10 being highest.
Independent Variables – 1) Popularity 2) Convenience 3) Originality of content 4) Variety of content 5) Financial Benefits
The respondents were asked to rate all the above factors in regards to Zee5, based on their perception
on a scale of 1-10, 10 being highest.
Statistical Tools used: 1) Descriptive Statistics 2) Pearson Correlation (2-tailed) 3) Regression Analysis
The above analysis were run using SPSS on the data derived from the questionnaire circulated
amongst 238 respondents.

27 | P a g e
1) DESCRIPTIVE STATISTICS
To derive the mean value of each factor, a descriptive statistics was run. Wherein, it was observed that as per mean value, the highest value was obtained by Convenience which was 8.75, followed by Variety of content at 8.84 and Originality of content at 8.64. Popularity achieved a mean value of 7.87 and Financial Benefits achieved 7.27. The overall rating of Zee5 achieved a mean value of 7.89. The details of which are depicted in the following table.
Descriptive Statistics
Mean Std. Deviation N
Popularity 7.87 1.631 238
Convenience 8.75 1.388 238
Originality of content 8.64 1.555 238
Variety of content 8.84 1.499 238
Financial Benefits 7.27 2.327 238
Rating of Zee5 7.89 1.253 238
2) CORRELATION ANALYSIS
To understand the linear relationship between the various variables and to understand the statistical
association between the various variables a Correlation test was conducted. If there is a positive
correlation between the variables, it indicates that the variables are directly related to each other, i.e.,
one unit increase in one variable would result in the increase of the other variable by the amount of
correlation between them and vice-versa. Similarly, a negative correlation indicates an indirect
relationship between the variables, i.e., one unit increase/decrease in one variable would lead to the
increase/decrease in the other variable by the amount of correlation between them.
In this particular study, Pearson Correlation test (2-tailed test) was conducted using SPSS Software.
The findings are depicted in the following table.

28 | P a g e
From the above Correlations tables, it can be observed that each independent variable, i.e., Popularity,
Convenience, Originality of content, Variety of content and Financial Benefits have a significance level
of less than 0.05. Thus, indicating that the variables have a statistical significance on the Rating of
Zee5, which is the dependent variable.
Considering the last two rows, there is a positive correlation between Rating of Zee5 and Convenience
of 84.3%, which is the highest amongst all other correlation, which means that with 1 unit increase in
Convenience there will be a 0.843 unit increase in Rating of Zee5. Next there is a positive relationship
between Rating of Zee5 and Variety of content of 78.3%, which means that with 1 unit increase in
Variety of content there will be an increase of 0.783 unit increase in Rating of Zee5, followed by the
positive correlation between Rating of Zee5 and Popularity of 75.7%, which means 1 unit increase in
Popularity will lead to and 0.757 unit increase in Rating of Zee5. There is a positive correlation between
Originality of content and Rating of Zee5 of 68.8%, which means that 1 unit increase in Originality of
content will lead to a 0.688 unit increase in Rating of Zee5. Lastly, there is a positive correlation between
Financial Benefits and Rating of Zee5 of 50.9%, indicating that 1 unit increase in Financial Benefits will
lead to a 0.509 unit increase in Rating of Zee5.
Correlations
Popularit
y
Convenienc
e
Originalit
y of
content
Variety
of
content
Financial
Benefits
Rating
of Zee5
Popularity
Pearson
Correlation 1 .493** .420** .416** .170** .757**
Sig. (2-tailed) .000 .000 .000 .008 .000
Convenience
Pearson
Correlation .493** 1 .628** .742** .359** .843**
Sig. (2-tailed) .000 .000 .000 .000 .000
Originality of
content
Pearson
Correlation .420** .628** 1 .581** .369** .688**
Sig. (2-tailed) .000 .000 .000 .000 .000
Variety of content
Pearson
Correlation .416** .742** .581** 1 .373** .783**
Sig. (2-tailed) .000 .000 .000 .000 .000
Financial Benefits
Pearson
Correlation .170** .359** .369** .373** 1 .509**
Sig. (2-tailed) .008 .000 .000 .000 .000
Rating of Zee5
Pearson
Correlation .757** .843** .688** .783** .509** 1
Sig. (2-tailed) .000 .000 .000 .000 .000
**. Correlation is significant at the 0.01 level (2-tailed).
29 | P a g e
3) REGRESSION ANALYSIS
The Hypothesis formulated for the Regression analysis was as follows –
Null Hypothesis –
H1: There is no significant relation between the factors of choosing an OTT Platform and the ranking
of an OTT Platform.
Alternate Hypothesis -
H2: There is a significant relation between the factors of choosing an OTT Platform and the ranking of
an OTT Platform.
In this study, the factors of choosing an OTT Platform are Popularity, Convenience, Originality of
content, Variety of content & Financial Benefits, whereas, the specific OTT Platform is Zee5.
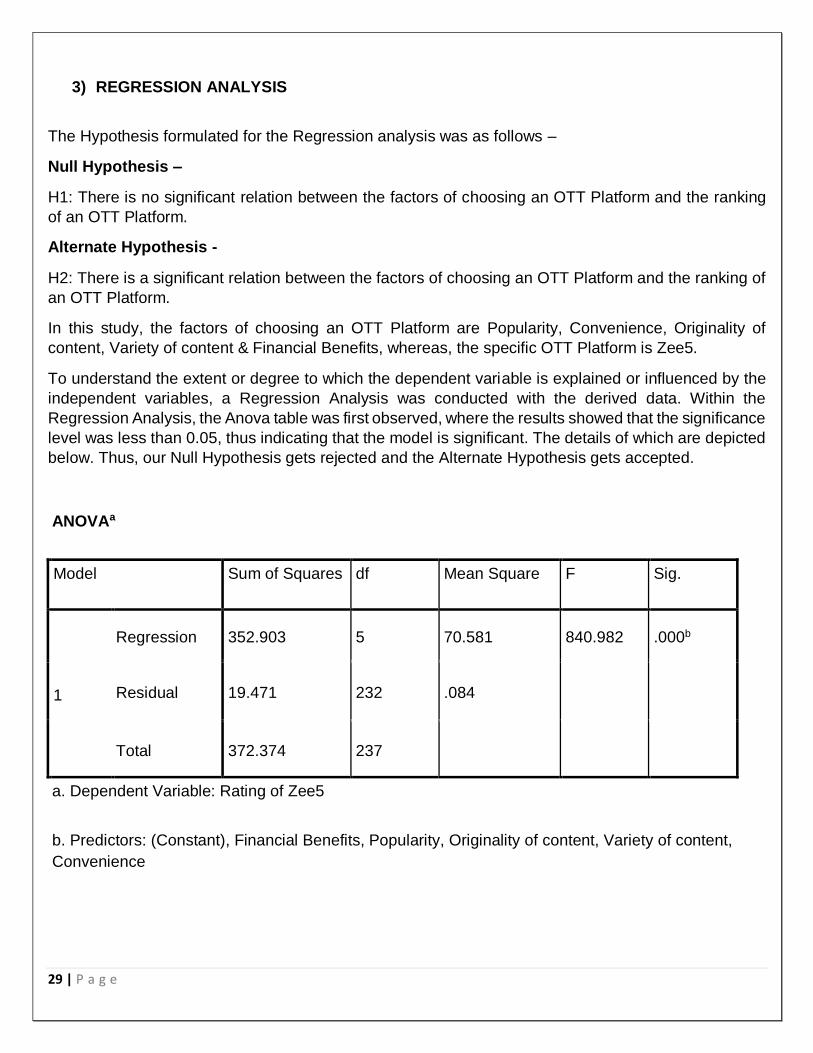
To understand the extent or degree to which the dependent variable is explained or influenced by the
independent variables, a Regression Analysis was conducted with the derived data. Within the
Regression Analysis, the Anova table was first observed, where the results showed that the significance
level was less than 0.05, thus indicating that the model is significant. The details of which are depicted
below. Thus, our Null Hypothesis gets rejected and the Alternate Hypothesis gets accepted.
ANOVAa
Model Sum of Squares df Mean Square F Sig.
1
Regression 352.903 5 70.581 840.982 .000b
Residual 19.471 232 .084
Total 372.374 237
a. Dependent Variable: Rating of Zee5
b. Predictors: (Constant), Financial Benefits, Popularity, Originality of content, Variety of content,
Convenience

30 | P a g e
Next, to validate the viability of the model, we analyse the Model Summary of the Regression analysis, wherein, we observe that the R2 value derived is 94.8%. As per statistical implications, a model having R2 value more than 50% is considered a good value. So, in this case, we can conclude that the model is robust. Moreover, the Adjusted R2 which is derived after deducting all insignificant variables, if any, is 94.7%, which has negligible difference from R2 value which is 94.8%. Thus, we can safely conclude that the model is definitely robust. A R2 value of 94.8% indicates that, 94.8% of the dependent variable, i.e., Rating of Zee5 is defined by the independent variables, which are; Popularity, Convenience, Originality of content, Variety of content & Financial benefits.
Model Summary
Model R R Square Adjusted R Square Std. Error of the
Estimate
1 .974a .948 .947 .290
a. Predictors: (Constant), Financial Benefits, Popularity, Originality of content, Variety of content,
Convenience
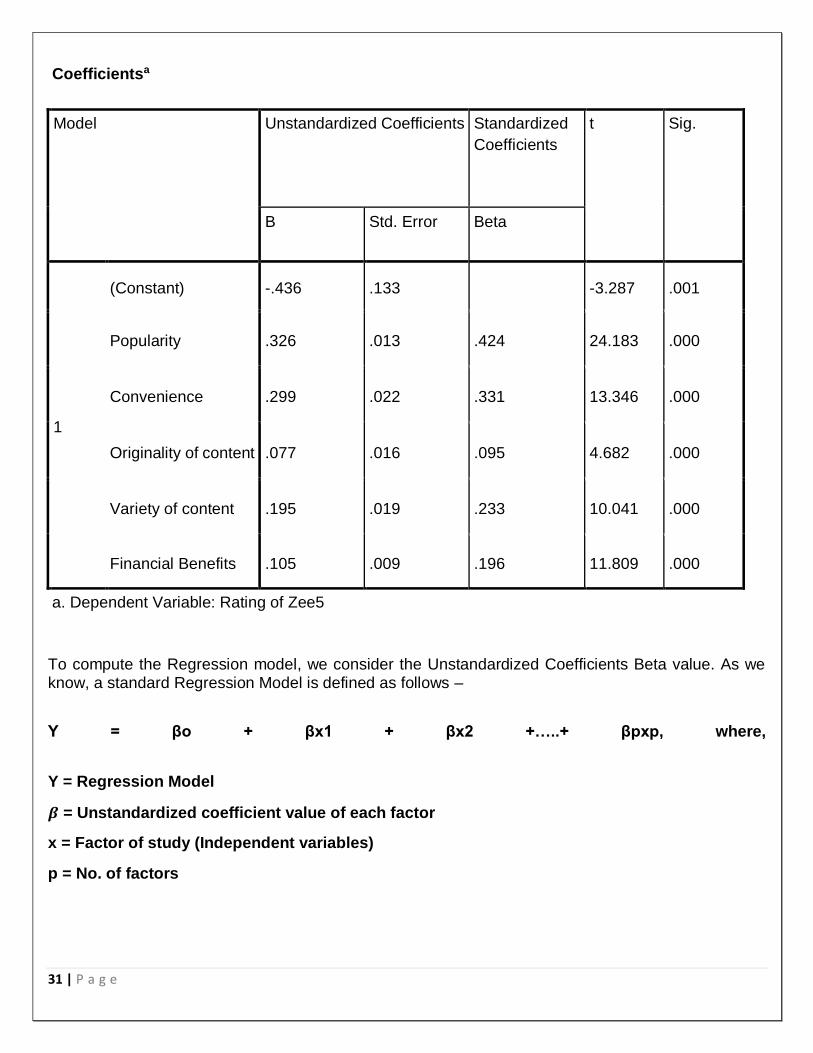
Next to understand the impact of each factor on the Rating of Zee5 we observe the Coefficients table.
First and foremost, we observe the significance level of each factor. As stated earlier only a significance
level equal to or less than 0.05 is considered. Any significance level of more than 0.05 is disregarded,
as it has no statistical implication of the factor under study. However, from the below table, we can
observe that each factor, i.e., Popularity, Convenience, Originality of content, Variety of content and
Financial Benefits have a significance level of less than 0.05. Thus, we can conclude, that all the factors
have a significance of the Rating of Zee5 and are to be considered in drawing up the Regression model.
Next to analyse the extent of impact of each factor and summarise the regression model, we consider
the Unstandardized and Standardized Beta value of each factor from the following table.
31 | P a g e
To compute the Regression model, we consider the Unstandardized Coefficients Beta value. As we know, a standard Regression Model is defined as follows –
Y = βo + βx1 + βx2 +…..+ βpxp, where,
Y = Regression Model
𝜷 = Unstandardized coefficient value of each factor
x = Factor of study (Independent variables)
p = No. of factors
Coefficientsa
Model Unstandardized Coefficients Standardized
Coefficients
t Sig.
B Std. Error Beta
1
(Constant) -.436 .133
-3.287 .001
Popularity .326 .013 .424 24.183 .000
Convenience .299 .022 .331 13.346 .000
Originality of content .077 .016 .095 4.682 .000
Variety of content .195 .019 .233 10.041 .000
Financial Benefits .105 .009 .196 11.809 .000
a. Dependent Variable: Rating of Zee5
32 | P a g e
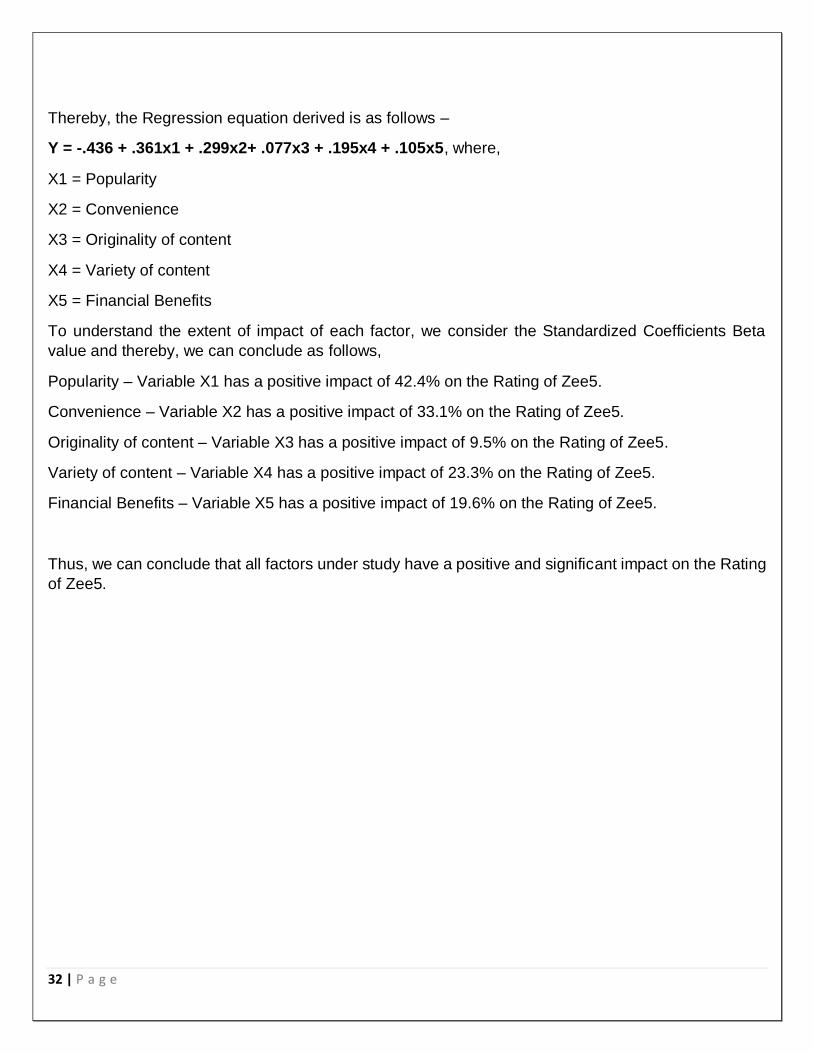
Thereby, the Regression equation derived is as follows –
Y = -.436 + .361x1 + .299x2+ .077x3 + .195x4 + .105x5, where,
X1 = Popularity
X2 = Convenience
X3 = Originality of content
X4 = Variety of content
X5 = Financial Benefits
To understand the extent of impact of each factor, we consider the Standardized Coefficients Beta
value and thereby, we can conclude as follows,
Popularity – Variable X1 has a positive impact of 42.4% on the Rating of Zee5.
Convenience – Variable X2 has a positive impact of 33.1% on the Rating of Zee5.
Originality of content – Variable X3 has a positive impact of 9.5% on the Rating of Zee5.
Variety of content – Variable X4 has a positive impact of 23.3% on the Rating of Zee5.
Financial Benefits – Variable X5 has a positive impact of 19.6% on the Rating of Zee5.
Thus, we can conclude that all factors under study have a positive and significant impact on the Rating
of Zee5.

33 | P a g e
8. CONCLUSION & RECOMMENDATIONS
• Continual growth and evolvement of Digitalization has led to a rapid decline in Traditional
Media Platform preference.
• Due to the advancement in technology and technological devices, which offer increased ease
and convenience, traditional media platforms such as televisions are facing a stifling
competition.
• The main factors which are driving increase in Online Media consumption are – Popularity,
Convenience, Originality and Variety of content. Financial Benefit also has been recognized
as one of the factors, but however, it does not play a much significant role as the others.
• To cope up with this stifling competition, traditional media platforms such as Television
channels should either go for their own online platform, such as Zee5 or should go for tie-ups
with an already established OTT Platform such as Netflix, Amazon Prime, etc.
• In order to maintain their market position, OTT Platforms should maintain the quality of all the
recognized factors such as Originality and Variety of content and should engage in
promotional activities to maintain and achieve Popularity, which is the most highly rated
factor.
9. LIMITATIONS AND SCOPE OF FUTURE STUDY
• Inability to communicate directly (face-to-face) with consumers.
• Inability to communication with cable agents, other distribution agents, Television
manufactures, retailers.
• Sample had majority respondents from same age group, i.e., 18-30 years.
• Further research can be done taking into account the perception of all the third parties, such
as distribution agents, television manufacturers etc.
• Further research can be done taking into account the perception of other age – groups as
well.
34 | P a g e
10. REFERENCES
• Traditional Media versus New Media: A Case Study in the Karnataka Urbun and Rural Areas - D.S.Shivarudrappa
• Television versus the internet: A comparative study of traditional and new video Platforms in substitutability, perceptions and displacement effect- Jiyoung Cha
• Competition between OTT TV Platforms and traditional television in Taiwan – Yi-Ning Katherine Chen
• Global streaming platforms and national paytelevision markets: a case study of Netflix and multi-channel providers in Israel – Michael L. Wayne
• Digital Media: Rise of On-demand Content - http://www.deloitte.com/in
Digital vs. Traditional Media Consumption – http://www.globalwebindex.net//

35 | P a g e
11. APPENDICES Sample of Questionnaire which was used for Survey.
1. General Questions –
Gender
Male
Female
Age
< 18
>18 & <30
>30
Highest Education
X/XII
Graduation
Post-Graduation
Employment
Student
Business
Service
Self-Employed
Income
Not applicable (if student)
< 30000 per month
> 30000 per month
Which of the following devices do you own? (More than one option)
Cellular Phone (Android, Ios)
Laptop
Tablet
Linear TV
Which of the following devices do you prefer most to view Online Media Content? (Any
one option)
Cellular Phone (Android, Ios)
Laptop
Tablet
Linear TV

36 | P a g e
2. Factor specific questions–
Relaxation and Amusement
How many hours of a day are you able to devote to leisure time?
How many hours of the leisure time do you use to view media content on Linear
Television?
How many hours of the leisure time do you use to view media content on OTT
Platforms?
Social Trends
Why did you first start using OTT Platform?
Intrigued by online advertisement
Fascinated by print media advertisement
Recommended by an acquaintance
Hype about a particular show
Completely driven by ease and comfort
Free service offered by telecom network provider (Airtel TV, Jio TV)
Financial Benefit
Does your OTT Platform give you any financial relaxation over Linear Television?
How much does your online media viewing cost you on an average?
< Rs. 200 pm
>Rs. 200 & <Rs. 500 pm
>Rs. 500 pm
Do you use a third party account, free of charge? (Friends’, Family’s)
Ease of Use & Convenience
When do you use OTT Platforms to view content?
Only during leisure time
While travelling to and from work place
Both during leisure time and travelling
Other (please specify)
Does your OTT platform give you any other benefit than just viewing content?
Please specify, if your response is “Yes”
Does your OTT Platform allow you to view content on Television?
Which of the following reasons would you regard for choosing OTT Platform over
Linear Television?
Personalised viewing
Facility of anytime-anywhere
Portability
Facility of downloading content for offline viewing

37 | P a g e
3. Analysis of Zee5 & other OTT Platforms –
Do you use Zee5 online platform?
Are you aware of Zee5 online platform?
Which of the following ways have you come across any information about Zee5?
Online Advertisements on Social Media platforms
Linear Television advertisement
Print media advertisement
Word of mouth
Referral of acquaintance
Which of the following OTT Platforms would you prefer availing?
Zee5
Either of these OTT Platform (Netflix, Amazon Prime, Hotstar, Voot)
Others (please specify)
On a scale of 1-10 (10 being highest) rate the following factors with respect to Zee5. Popularity (1-10)
Variation in content (1-10)
Original shows (1-10)
Wide choice of shows (1-10)
Financial benefit (1-10)
On a scale of 1-10 (10 being highest) rate how satisfied you are with the usage of ZEE Media.
1-10