Internship report-Part-3
115
CHAPTER ONE Introduction 1
Transcript of Internship report-Part-3

CHAPTER ONEIntroduction
1

1.0 Introduction
The organization part fully covers the detailed information of
GlaxoSmithKline and its operations in Bangladesh Market. It
covers the mission, strategy of the company and the
organizational structure or the organ gram as well as the
departments of the company. Moreover I tried to figure out its
market position and the SWOT analysis of the company.
1.1 Background of the study
Each student of MBA program is required to undergo the
internship program and prepare an internship report according to
a format specified by the supervising teacher. I comply with the
concerned rules made by the authority. I was assigned to make an
internship report tilted Analysis of Financial Performance of
GSK Bangladesh Ltd. to expand my practical knowledge.
1.2 Rationale of the study
2
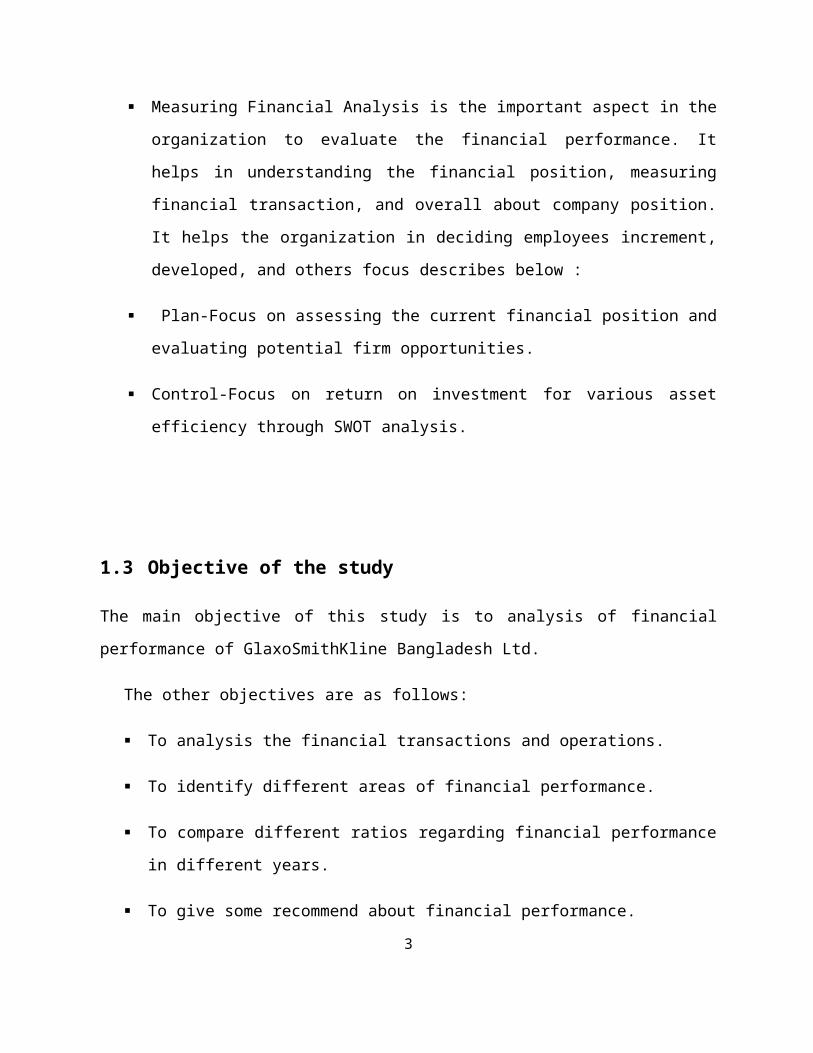
Measuring Financial Analysis is the important aspect in the
organization to evaluate the financial performance. It
helps in understanding the financial position, measuring
financial transaction, and overall about company position.
It helps the organization in deciding employees increment,
developed, and others focus describes below :
Plan-Focus on assessing the current financial position and
evaluating potential firm opportunities.
Control-Focus on return on investment for various asset
efficiency through SWOT analysis.
1.3 Objective of the study
The main objective of this study is to analysis of financial
performance of GlaxoSmithKline Bangladesh Ltd.
The other objectives are as follows:
To analysis the financial transactions and operations.
To identify different areas of financial performance.
To compare different ratios regarding financial performance
in different years.
To give some recommend about financial performance.
3

1.4 Methodology of the study
The report was fully experimental in nature. Data have been
collected from both primary and secondary sources.
Primary sources of data
Conversation with the officers and staffs.
Secondary sources of data
Annual report of GSK Bangladesh Ltd.
Different papers of GSK Bangladesh Ltd.
Unpublished data
Different text books
Different manuals of GSK Bangladesh Ltd.
Different circulars of GSK Bangladesh Ltd
1.5 Scope of the study
Defining the scope of the study is a broad aspect to bedescribed. Still the Secretarial & Finance Department helpedme a lot to prepare the report. On the other hand due to someconfidential resolutions there were difficulties to find outsome information as well.
4
1.6 Duration of the study
After completion of the program period of a student mustsubmit the report on the assigned topic to the supervisor andthe department. Three credit hours for this internship programout of 60 credit hours of the program. The program is of threemonths duration. I worked there from 20th October 2013 to 20thDecember 2013.
1.7 Limitations of the study
The present study was not out of limitations. Some constraints
are as follows:
The main constraints of the study are inadequate access to
information, which has hampered the scope of analysis
required for the study.
Due to time limitations many of the aspects could not be
discussed in the present report.
Every organization has their own secrecy that is not
revealed to others. While collecting data they did not
disclose much information for the sake of organizational
confidentiality.
Since employees were very busy they could provide me very
little time.
5

CHAPTER TWO
Profile of the Organization
6

2.0 GlaxoSmithKline
GlaxoSmithKline (GSK) is a world’s leading research-basedpharmaceutical company with a powerful combination of skillsand resources that provides a platform for delivering stronggrowth in today’s rapidly changing healthcare environment.
GSK has leadership in four major therapeutic areas- antiinvectives, central nervous system (CNS) and respiratory &gastro- intestinal/ metabolic. In addition it is a leader inthe important areas of vaccines and has growing portfolio ofoncology products.
GSK supplies products to 140 global markets and has over100,000 employees worldwide. GSK has 180 manufacturing sitein 41 countries.
2.1 History of GlaxoSmithKline
7
In 1973
The company was oriented as Joseph Nathan & Company in NewZealand with the founding of a small import export company. Itstarted its operation as a processing unit of abundant freshmilk of New Zealand. The only product it was producing wasGlaxo Baby Food.
In 1875
It started to export baby food to UK Alec Nathan, son ofJoseph Nathan, coined the name Glaxo from Glactose.
In 1924
Joseph Nathan & Company entered the pharmaceutical industry withthe manufacture of Ostelin, the first Vitamin D preparation. Theimportance of the pharmaceutical market was soon realized and in1935, Glaxo Laboratories Limited was founded with itsheadquarters at Greenford, Middlesex and London for theproduction and marketing of foods and pharmaceuticals.In 1947After the 2nd world war, Glaxo developed rapidly. GlaxoLaboratories Limited absorbed its parent Joseph Nathan & Company,and became a public company in 1947.
In 1963
Edinburgh Pharmaceutical Industries Limited, which owned Duncan,Flockhart and Company Limited and MAC Farlane Smith Limited,joined Glaxo.
In 1995
Glaxo acquired 100% share, of Wellcomes PLC on may 01, 1995 and
8

formed Glaxo Wellcome PLC.
In 1998
Glaxo Wellcome achieved a number of regulatory milestones forseveral of its key projects, such as ZEFFIX for the treatmentof influenza.In 2000
Glaxo Wellcome and SmithKlineBeechman merged to formGlaxoSmithKline; a worldwide research based pharmaceuticalcompany.GlaxoSmithKline is the only British organization in theworld’s top 20 pharmaceutical companies. Subsidiary companiesare established over 50 countries of the world many with theirown manufacturing facilities and the group have agencyrepresentation in more than 100 offices.
9

2.2 GlaxoSmithKline Bangladesh Limited
GlaxoSmithKline Bangladesh Limited is a subsidiary ofGlaxoSmithKline Plc; world’s leading research basedpharmaceutical company. One of its strong strength is itspowerful combination of skills and resources that provides aplatform to deliver fastest growth In today’s rapidly changinghealthcare environment. The principle activities of thecompany are manufacturing and marketing of pharmaceutical,vaccines and healthcare products.
GlaxoSmithKline conducts the operational activities inBangladesh as a principal with its own set-up ofmanufacturing, marketing and distribution. The company hasstarted business in Bangladesh in 1969 at Chittagong byimporting products from group of company.
In 1969A supporting factory of Glaxo Laboratories (Pakistan) Limited was founded in Chittagong.In 1974Glaxo Bangladesh Ltd. was incorporated as a company in Bangladesh.
10

In 1996It has been incorporated as Glaxo Wellcome Bangladesh Ltd.
In 2002It has been incorporated as GlaxoSmithKline Bangladesh Limited.
The Chittagong factory of GlaxoSmithKline Bangladesh Limitedis considered as the Center of Excellence in Globalmanufacturing & supply network of the group. In Bangladesh GSKheld 6th position in pharmaceutical industry having marketshare of 5.2% (as of September 2002) occupying strong hold inkey therapeutic areas like Respiratory, Dermatology, Anti-infective and Vaccines. Brand names of some major products ofthe company are: Ventolin Inhaler, Ceoprex, Zinnat, Parapyrol,Zantac, Piriton, Dextrose and Engerix –B etc. on the otherhand, in terms of consumer goods GSK is doing business bymanufacturing Horlicks, Boost, Viva, Maltova etc.
2.2.1 Operations in Bangladesh
HeadquarterGlaxoSmithKline Bangladesh LimitedCorporate OfficeHouse # 2A, Road # 138.Gulshan-1.
Registered Office & Factory11

Fouzderhat Industrial AreaNorth Kattali, Chittagong.
District Marketing OfficeGlaxoSmithKline Bangladesh Limited has eleven DistrictMarketing Offices (DMO) throughout the country. These aredivided in five zones by which GSK’s products are sold.
Zone DMODhaka Dhaka, MymensingChittagong Chittagong, MaijdeeComilla Comilla, SylhetBogra Bogra, Rajshahi, RangpurBarisal Barisal, Jessore
Table 1: List of DMOs
2.2.2 GlaxoSmithKline Bangladesh Ltd. (In Market Place)
Total Market Share: Tk. 140 Crore (2012) Market Share: 1.95 % (2012) Ranking: 12 (2012)
2.2.3 Share Information GlaxoSmithKline Bangladesh Ltd.
Share Price Tk. 10 each Total No. of Authorized Share 20,000,000 Authorized Share Capital Tk. 20,000,000
12

Market Capitalization 6920.685 (Million)
2.2.4 Banking Operation of GlaxoSmithKline Bangladesh Ltd.In 2012, GSK transacted its banking operations through:
SCB HSBC Citi Bank NA Agrani Bank Sonali Bank
2.3 GlaxoSmithKline- Mission, Strategic Intent & Spirit
2.3.1 Mission
The mission statement of the business- “ Our global quest is toimprove the quality of human life by enabling people to do more, feel better andlive longer”
2.3.2 Strategic Intent
“Our strategic intent states our business goal” - We want to become theindisputable leader in our industry.
2.3.3 Spirit
“Our company spirit describes how we need to behave if we areto achieve our goal” – We undertake our quest with theenthusiasm of entrepreneurs, excited by the constant searchfor innovation. We value performance achieved with integrity.We will attain success as a world class global leader witheach and every one of our people contributing with passion andunmatched sense of urgency.
13

2.3.4 Corporate Strategies
Quality and Customer acceptance – Achieve business visionthrough quality and customer acceptance by providing safe& effective medicine.
Good manufacturing practice – Strictly maintained GMP(Good Manufacturing Practice)
Customer focus - A respective quality throughout a) The entire organization or each operating unit andcompany b) All processes, systems and services product design anddevelopment, through manufacture, supply and marketing
Compliance – With regulatory requirements, corporatequality requirements, group products and other applicablestandards.
Added value – Through Continuous improvements and error-prevention to benefit customers and company
Dedicated Human resources – Develop a pool, of dedicatedhuman resources through regular training.
2.3.5 Quality Statement
Quality is the heart of everything we do- from the discoveryof the module, through product development, manufacture,
14

supply and sale; and is vital to all the service that supportsour business performance.
Commitment
- The health and safety of global operations. - Stewardship of our products. - Delivering competitive business advantage.
Responsibility
- The health and safety of employees, contractors,visitors.
- The protection of the environment and communities. - Compliance with laws and GSK standards.
GlaxoSmithKline in time- Every second, more than 30 doses of vaccines are
distributed by GSK. - Every minute, more than 1,100 prescriptions are written
for GlaxoSmithKline. - Every hour, GSK spends more than US $ 450,000 to find
new products.
- Every day, more than 200 million people around theworld use a GSK toothbrush or toothpaste.
- Every hour, GSK donates more than US $ 148million in cash and products to communitiesaround the world.
15

2.4 GlaxoSmithKline Bangladesh Limited Organ Gram
ManagingDirector
Finance Commercial Director-HR Sisite DirectorDirecto
r Director
16

Managing Director
FinanceDirector Commercial
Communication Medical Affairs
&Company Director- H RSite DirectorDirector Manager ManagerSecreta
ry
Finance National Sales HRD Manager
Manager Manager
DeputyCompany Marketing Admin
ManagerSecretary
Manager
Management MrketingServiceReport
ing ManagerManager
IT M anager Senior PurchesManager ofVaccine
InternalAuditManage
r
17

2.5 Functional Department of GlaxoSmithKline Bangladesh Ltd.GlaxoSmithKline Bangladesh limited comprises of six major departments. Those are as follows:-
Marketing Human Resources Finance & Accounts Technical and Medical Regulatory Affairs Information Technology
Each department at GSK operates in different aspects but they are inter-related and complement each other. The main functions of these departments are shown bellow:-
2.5.1 MarketingDepartment Head: Mr. Shamim Rabbani (Commercial Director)»Designing and implementing Sales Strategy »Controlling and updating distribution network »Providing marketing information services »Carrying out different awareness programs »Controlling international trades. »Building up public communication network. »Conducting market surveys as required.
2.5.2 Human ResourcesDepartment Head: AKM Firoz Alam (HR Director)»Recruiting and training the best pool of employees needed forthe company.
»Managing smooth work flow in the organization. 18

»Managing demands of the labors in the factory. »Allocating annual holidays. »Arranging the employee motivational programs. »Looking after the wage structure and waivers.
19

2.5.3 Finance & AccountsDepartment Head: Mr. Sarwar Azam Khan (Company Secretary & Finance Director)»Controlling the accounts. »Completing the annual budgets. »Allocating all kinds of payments to the staffs and managers. »Looking after all the revenues and expenses. »Conducting internal audit. »Keeping records through IT. »Facilitating local production cost.
2.5.4 Technical»Producing precise amounts of products as per the year plan. »Ensuring total quality management. »Following good manufacturing practice. »Implementing raw material management. »Procuring and allocating assets efficiently. »Prioritizing best possible observations over the finished goods.
2.5.5 Medical Regulatory Affairs»Liaison with government for legal issues. »Communicate with doctors and handling advertisement.
20

2.6 Industry AnalysisIn Bangladesh, the pharmaceutical sector is one of the fastestgrowing sectors.. In 2008 the total size of the pharma market inBangladesh was estimated to be USD 700 million and is growing ata steady rate. The pharmaceutical sector is the second highestcontributor to the National Ex-Checker and the largest whitecollar labor intensive employment sector of the country. Thereare 245 registered pharmaceutical manufacturing companies inBangladesh. The local pharmaceutical manufacturers cater toabout 97% of the internal demand.
Today, Bangladesh Pharmaceutical Industry is successfullyexporting APIs and a wide range of products covering all majortherapeutic classes and dosage forms to 71 countries. Besideregular forms like; Tablets, Capsules & Syrups, Bangladesh isalso exporting high-tech specialized products like HFA Inhalers,CFC Inhalers, Suppositories, Nasal Sprays etc. are also beingexported from Bangladesh, and have been well accepted by theMedical Practitioners, Chemists, Patients and the RegulatoryBodies of all the importing nations. The packaging and thepresentation of the products of Bangladesh are comparable to anyinternational standard and have been accepted by them.
The Pharma Industry of Bangladesh is now on the verge ofentering highly regulated overseas markets like USA and Europe.In this connection, several pharmaceutical manufacturers havealready made huge investments in their new state of art
21

manufacturing facilities
2.6.1 Dominant Economic Characteristics of the Industry
The dominant economic characteristics are the factors that influence the overall operations of the players in it. The following table is the summary of the factors:-
► Market size ► Product Characteristics► Scope of competitive rivalry► Presence of learning effects► Market growth rate ► Industry profitability► Life cycle stage ► Target & end consumers ► Type of distribution channel used
22

Factors Description
1. Market size Taka 7,186 Crore
2.Scope of competitive rivalry
National. In some case it is regional
3. Market growth rate 5% to 7% annually on an average
4. Life cycle stageMature, continuous research does not let thecurve decline
5.Target customer & end consumers
The doctors are the target customer & the endconsumers are the general people
6.Type of distribution channel used
Wholesaler and retailer. In some cases (likevaccines) it is done through special outlet
7.Product Characteristics
Standardized and no scope of customization
8.Presence of learning effects
Yes, especially in drug research andformulation
9. Industry profitabilityAbove par, ultimately it is affected by the stateof national economy.
Table 2: Summary of the keyfactors
2.6.2 GSK’S Market Share & Position
YearMarketShare Position
2008 3.34% 1223

2009 2.90% 12
2010 2.91% 12
2011 2.24% 12
2012 1.95% 12
Table 3: GSK’s Market Share &Position
24

2.6.3 GSK’S Market Share & Position Comparison
Top 12 Pharmaceutical Company’s Comparison
CompaniesMarketshare
Ranking
SQUARE 19.18% 1
INCEPTA PHARMA 9.05% 2
BEXIMCO 8.62% 3
OPSONIN PHARMA 4.94% 4
ESKAYEF 4.84% 5
RENATA 4.73% 6
ACME 4.44% 7
A.C.I. 4.08% 8
ARISTOPHARMA 3.99% 9
DRUG INTERNATIONAL 3.75% 10
SANOFI AVENTIS 2.57% 11
GLAXOSMITHKLINE 1.95% 1225

Table 4: GSK’s Market Share & Position
26

2.6.2 Porter’s five forces
The five forces analysis is done on the basis of the mostimportant 5 driving forces of the industry. While doing theanalysis, information gathered in the previous table is used.The most important points that will determine the outcome ofthe analysis are:
Slow market growth due to the low purchasing power of the endconsumers.
Exit barrier of the industry is very high due to highinvestment.
Specialization knowledge for the technology and research ismust for a player.
No actual substitutes for pharmaceutical products areavailable.
27

Figure 1: Industry Analysis
28

The players are big and powerful enough to influence inputcost.
Suppliers are chosen on a competition basis. Many brands for the same products are available in the
market. End consumers are not really aware of the quality of the
products. Direct marketing of the products is illegal as per government
rules.
So the summary of the entire analysis refers to the scenario which is as such:
Industry Analysis - At a glanceForces Position
Threat of potential entry Very low
Threat of substitute products Very low
Bargaining power of the suppliers Very low
Bargaining power of the buyers Very high
Rivalry among the competitorsModerate to High
Table 5: Industry Analysis at A Glance29

30

2.7 SWOT AnalysisSWOT is the acronym for Strengths, Weaknesses, Opportunitiesand Threats. It is an analytical framework to help summarize ina quick and concise way the risk and opportunities for anycompany across the value chain. A good SWOT should look intointernal and external factors affecting the issue at hand.
- Factors pertaining to the internal environment of thecompany. These are usually classified as Strengths (S)or Weaknesses (W)
- Factors that pertaining to the external environmentof the company. These are classified asOpportunities (O) or Threats (T).
2.7.1 Strengths
Considerable financial resources to grow the business. A widely recognized company with an attractive customer base. Ability to take advantage of economies of scale. Renowned for better quality products. Follows GMP- Good Manufacturing practices. Product innovation skill. Proprietary technology and important patents. Efficient, capable and honest work force. Goodwill of the company.
2.7.2 Weaknesses
31

Higher overall unit cost relatively to key competitors. Weaker dealer or distribution network than key rivals. Underutilized plant capacity.
32

2.7.3 Opportunities
Target and acquire an untapped market for vaccines.
Expanding geographic coverage and product segment.
Expanding the company’s product line to meet a broaderrange of customer needs.
Alliances- Company manufacturing that expands the firm’smarket coverage and competitive capability.
2.7.4 Threats
Slowdowns in the market growth.
Adverse shifts in foreign exchange rates and tradepolicies of governments.
Increasing threats from local competitors.
Costly new regulatory requirements.
33

34

CHAPTER THREE
Activities within GSK
35

3.0 Activities within GSK
While doing the internship program, so far the activities I didand the activities I learned from asking others from my curiosityreferring from the other departments than that off Secretarial &Legal Department, I tried to put those knowing here at my best.
3.1 Work Related
3.1.1 Tax deduction
Paying authority deduct the Taxes it is rule of government. Whenbuyer, buying something, like raw material, packing material andGSK cuts the TDS, payers should follow the same role wheretransaction must be occur within financial year, July to June.These roles will be accepted for every organization against withtransaction.
1 lac - 2lac = 0% 2 lac -5 lac = 1% 5 lac -15 lac = 2.5% 15 lac -25 lac = 3.5 % 25 lac -3crore = 4 % Above -3crore = 5 %
This rule is applicable for every individual Account payable within financial year.
3.1.2 Verifying the expense claims
Every month, GSK confronts with a numerous numbers of expenseclaims which GSK is supposed to disburse as per company policy.
36

The policy refers theses payments as allowance to the employees.There are two types of expense claims and those are-
- Travelling Expense - Medical Expense
This is what something which is allowed for all the employeesincluding Corporate Office, GMS Factory and DMO or field as well.But in terms of medical policy, GSK’s allowance is available forthe employee’s spouse and children as well up to a certain ageuntil or unless he/ she is not a minor.
37

There are some costs which are known as Remuneration which areallowed for the Managers of the Corporate Office and DMO. Asidefrom these remunerations the Directors are the main receiver ofthe remuneration from the company. The claims are supposed to beverified with priority basis in every month as it is an auditissue.
3.1.3 T &E Forms
The expense claims of the Corporate Office and GMS factory aresupposed to be sent through T&E Forms.This form allows employees to place their claims for furtherapproval from their Bosses and as soon as the Boss gives theapproval, Secretarial Legal Department goes for furtherprocessing.
3.1.4 Final settlements
If any of the employees leave GSK or gets terminated by GSK,Secretarial Department arranges a document known as Final Settlement
Copy, which refers to keep the document as evidence for both theparties acknowledging that GSK don’t have any claim with theperson any more neither do the party.
3.1.5 Payroll activities
Though there is the HR and Accounts departments in GSK but thepayroll is always been made by the Secretarial & Legaldepartment as there are few issues that are required to bechecked.
3.1.6 Employee information database/software38

Secretarial & Legal, Human Resources and Finance & Accounts Department, all these three departments used to work in software named Vista 3P which may be referred as employee database system as well.
3.1.7 Unison reporting
Each and every month GSK need to submit group report andinternal report. Unison is a system where GSK Bangladesh Ltd.needs to submit report and this system control by the parentscompany.
How many item share with group.
Financial position Profit and loss sharing
39

This system contains unique code for every transaction. Beforesubmission all debit item are positive, credit sign are negativemust need to given
3.1.8 Closing stock submission
Value of the closing stock must retain at the value equivalent to Taka. When it comes to the question of submission in Unison system then it needs to convert the value at thousand.
3.2 Organization Wide
3.2.1 Prepare budget
The budget is prepared on an annual basis in GSK and detailed byquarters, and then by months within those quarters. As we know acompany can either follow a continuous budget or a zero basedbudget process. In case of zero based budgeting all costs arerequired to be justified is if die programs involved are beingproposed for the first time. GSK Bangladesh follows a continuousbudget process, which is an ongoing twelve-month budget that iscreated by the addition of a new budget month (twelve months inthe future) as each current month expires; also known as arolling budget.
How much activity done by the management reporting manager related with budget
1. Calculation profit and loss and total turnover of GSKBangladesh Ltd
40

2. Prepare income statement budget which head count how muchwill be profitable
3. Sales budget analysis like actual sales, standard sales,percentage of total, percentage of total growth.
4. Budget for every head count like manufacturing GMS, selling,distribution, marketing, medical, administration, consumerhealth.
5. Capital expenditure budget like plant budget, machinerybudget, IT budget, furniture budget, other appliance budget,transportation budget.
41

6.Summary of departmental expenses for each and every singlemoth also operating expenses.
7. Summary of revenue expenditure like advertising promotion,financial statement, marketing, distribution, medical, adminalso product revenue calculate based on month basis
8. Product profitability statement calculation productprice, standard cost and gross profit.
9. Prepare production cost sheet based on budget volume, unitcost, quality requirement, total cost, percentage of loss,percentage of total production cost.
3.2.2 Price fixation:
Price of the imported material re –fixation, before change the price list reporting manager need to think,
Unit Currency Cost and future price Duty and vat Proposed MRP
After everything completing need to approved by board of directorand then launched new price set for imported product.
3.2.3 Maximum retail price calculation:
Calculation the MRP imported product, need to consider somefactor like transfer price current , currency (USD/GBP), current
42
exchange rate as per before exchange rate , new mark factor,current MRP, revised MRP , changing MRP , change in MRPpercentage, gaining total profit , net gain.
CHAPTER FOUR
Analysis and Findings
43

4.0 GSK’s Financial Performance Trend Analysis
4.1 Activity Analysis(Short term)
Short Term Activity RatiosRatio 2008 2009 2010 2011 2012
Inventory turnover
ratio 0.55 0.65 0.69 0.86 0.92
Average no of daysinventory in stock 667.58 557.84 526.50 423.64 398.87
Receivable Turnover
Ratio 2.33 1.86 1.34 1.82 2.08
Average no. of daysreceivable 156.96 196.75 272.63 200.33 175.33outstanding
Payable turnover
ratio 0.91 0.91 0.83 1.02 0.82
Average no. of dayspayable outstanding 401.54 402.43 440.73 356.52 442.55
Table 6: Short Term Activity Ratio Analysis Calculation is given in appendices
44

45

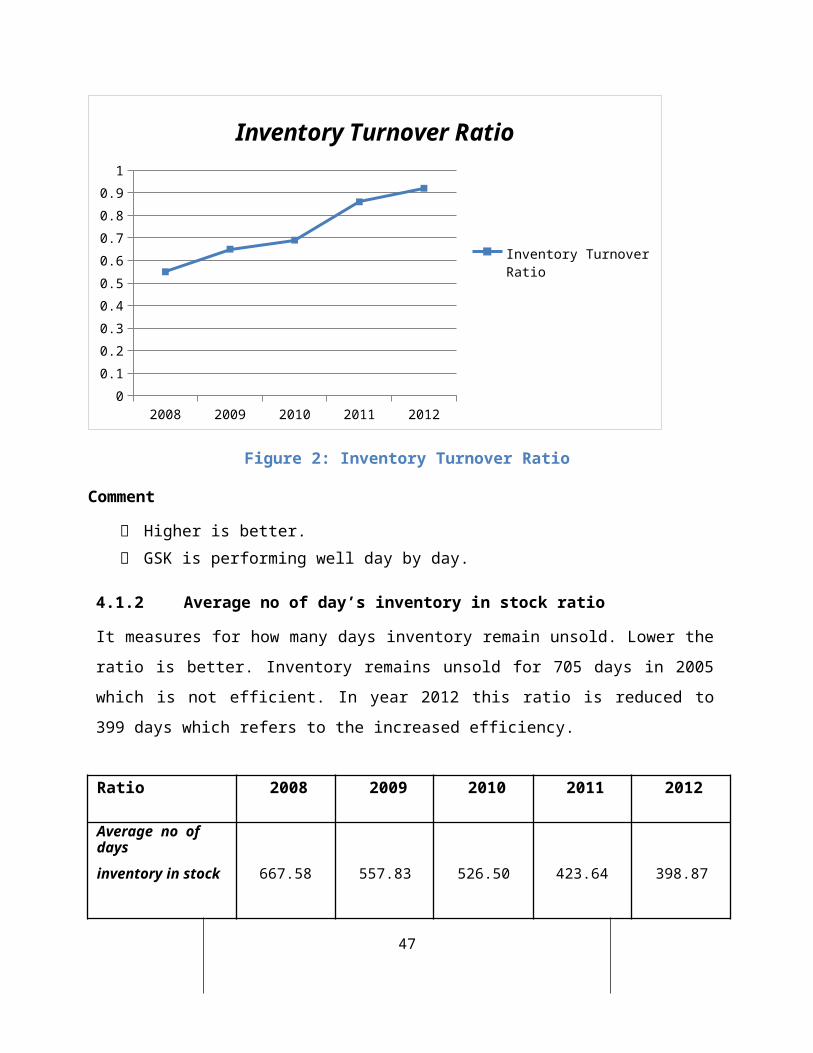
4.1.1 Inventory Turnover Ratio
Inventory turnover ratio measures the efficiency of managinginventory in an organization. Higher ratio indicates betterposition of inventory. It means inventory does not remain inwarehouse. This ratio measures how many times inventory turnedover in a year. The operation of a firm starts with purchasingof raw materials and go through production process andproduction of finished goods. After completion of productionprocess, finished goods are sold. This entire process is calledinventory turnover. This ratio increased in 2012 which is 0.92.It indicates that during that period inventory management of thecompany became efficient. The ratio was lower in 2004-2005 whichwas 0.52 and then gradually it increased over years.
Ratio 2008 2009 2010 2011 2012
Inventoryturnover
ratio 0.55 0.65 0.69 0.86 0.92
% Change over the period of time
2008-2009 2009-2010 2010-2011 2011-201219.67 5.95 24.28 6.20
46
2008 2009 2010 2011 20120
0.10.20.30.40.50.60.70.80.91
Inventory Turnover Ratio
Inventory Turnover Ratio
Figure 2: Inventory Turnover Ratio
Comment
Higher is better. GSK is performing well day by day.
4.1.2 Average no of day’s inventory in stock ratio
It measures for how many days inventory remain unsold. Lower theratio is better. Inventory remains unsold for 705 days in 2005which is not efficient. In year 2012 this ratio is reduced to399 days which refers to the increased efficiency.
Ratio 2008 2009 2010 2011 2012
Average no of daysinventory in stock 667.58 557.83 526.50 423.64 398.87
47

% Change over the period of time2008-2009 2009-2010 2010-2011 2011-2012-16.43 -5.61 -19.53 -5.84
2008 2009 2010 2011 20120
100
200
300
400
500
600
700
800
Average No of Days Inventory in Stock
Average No of Days Inventory in Stock
Figure 3: Average No of Days Inventory in StockComment
Fewer numbers of days indicates the better situation GSK is performing well day after day.
4.1.3 Receivable Turnover Ratio
This ratio shows how many times receivable is turned over in ayear. Receivable turnover starts at the point where inventoryturnover ends. Higher the ratio indicates the efficiency incredit management of a company. Here the receivable turnoverratio has increased over 2005 to 2008. In 2009 and 2010 theratio declined and in 2012 it again increased 2.08 to whichmeans receivable is collected almost 2 times in year 2012.
48

Ratio 2008 2009 2010 2011 2012
Receivable Turnover
2.32 1.85 1.33 1.82 2.08Ratio
% Change over the period of time
2008-2009 2009-20102010-2011 2011-2012
-20.22 -27.83 36.09 14.25
2008 2009 2010 2011 20120
0.5
1
1.5
2
2.5
Receivable Turnover Ratio
Receivable Turnover Ratio
Figure 4: Receivable Turnover Ratio
Comment
Higher turnover is better. Credit policy has been changed by GSK by the year 2011 after
the down fall at 2010. Overall GSK is doing fair.
4.1.4 Average No of Days Receivable Outstanding
This ratio measures the number of days requires for collecting
49

the receivable after selling inventory. Lower the ratio isbetter for the company. The ratio was 159.09 days in the year2005. Then it decreased in 2008 to 157 days. Then in 2009 and2010 it again increased to 197 days and 273 days. In 2012 GSKrequired 175 days to collect the receivable, that means it againdeclined.
Ratio 2008 2009 2010 2011 2012
Average no. of daysreceivable 156.96 196.75 272.63 200.33 175.33outstanding
% Change over the period oftime
2008-2009 2009-20102010-2011
2011-2012
25.35 38.56 -26.51 -12.47
2008 2009 2010 2011 20120
50
100
150
200
250
300
Average No of Days Receivable Outstanding
Average No of Days Receivable Outstanding
Figure 5: Average No of Days Receivable Outstanding
50

Comment
Fewer the days are the best. GSK is performing great day by day though there is an
inverse downfall in 2008.
4.1.5 Payable Turnover
This ratio measures that how many times payable is turned overin a year. It is a process which starts with purchasing of rawmaterials and ends with the payment of this. Lower the ratio isbetter because payables are turned over less frequently. Socompany gets time to pay its debts. The payable turnover ratiowas 0.75 in 2005. In 2008 and 2009 the ration remain constant at0.91. In year 2010 it decreased to 0.83. In 2011 it was 1.02which was higher than rest 4 years.
Ratio 2008 2009 2010 2011 2012
Payableturnover
0.90 0.90 0.82 1.02 0.82ratio
% Change over the period of time
2008-2009 2009-2010 2010-2011 2011-2012-0.22 -8.68 23.61 -19.43
51

2008 2009 2010 2011 20120
0.2
0.4
0.6
0.8
1
1.2
Payable Turnover
Payable Turnover
Figure 6: Payable Turnover
Comment
Lower turnover is the best Consistency is maintained by GSK at a great extent.
4.1.6 Average No. of Day’s Payable Outstanding
This ration measures that, how many days company can defer itspayment. Larger the time period is better for the company ascompany can make its’ payment lately. In 2005, the averagenumber of days’ payable outstanding was 487 days. In 2008 and2009 the ration remain constant at 402 days. In year 2012 itincreased to 442 days which was higher than rest of the previousyears.
Ratio 2008 2009 2010 2011 2012
52

Average no. of dayspayable outstanding 401.53 402.43 440.72 356.52 442.55
% Change over the period of time2008-2009 2009-2010 2010-2011 2011-2012
0.22 9.51 -19.10 24.13
2008 2009 2010 2011 2012050100150200250300350400450500
Average No. of Day’s Payable Outstanding
Average No. of Day’s Payable Outstanding
Figure 7: Average No. of Day’s Payable Outstanding
Comment
Higher is better. GSK is consistently trying to match the best.
4.2 Activity Analysis (Long term)
Long Term Activity Ratios53

Ratios 2008 2009 2010 2011 2012
Fixedasset turnover
ratio 4.29 4.71 5.49 8.23 9.31
TotalAsset Turnover
ratio 1.42 1.48 1.38 1.77 1.64
Table 7: Long Term Activity Ratio Analysis Calculation is given in appendices
4.2.1 Fixed Asset Turnover Ratio
This ratio measures that, how efficiently firm manages its fixedasset. And higher ratio indicates efficiency of firm. The ratiois not stable over the years. The ratio decreased in year 2008from 4.62 to 4.29. It increased in year 2009, 2010, 2011 and 2012to 4.71, 5.49, 8.23, and 9.31. It indicates the efficiency of thefirm in managing its fixed assets.
Ratios 2008 2009 2010 2011 2012
Fixed asset turnover ratio
4.29 4.71 5.49 8.23 9.31
54

% Change over the period of time2008-2009 2009-2010 2010-2011 2011-2012
9.77 16.42 49.96 13.07
2012 9.31
2011 8.23
5.49
Fixed Asset Turnover Ratio
2010
2009 4.7158
2008 4.295
0 2 4 6 8 10
Figure 8: Fixed Asset Turnover RatioComment
Higher is better. GSK’s performance is great in this regard.
4.2.2 Total Asset Turnover Ratio
Total asset turnover ratio measures the efficiency in managingtotal assets. Higher the ratio is better for the company. Heretotal asset turnover ratio has increased subsequently from year2008 to year 2009. In year 2010 the ratio declined to 1.38. In
55

2011 the ratio is higher at 1.77. It means firm is able toincrease the efficiency in managing the total asset.
56

Ratios 2008 2009 2010 2011 2012Total Asset Turnoverratio 1.42 1.48 1.38 1.77 1.64
% Change over the period of time2008-2009 2009-2010 2010-2011 2011-2012
4.46 -6.81 28.22 -7.69
2012 1.64
2011 1.777
1.3859
Toatl Asset Turnover Ratio
2010
2009 1.487
2008 1.42
0 0.5 1 1.5 2
Figure 9: Total Asset Turnover RatioComment
Higher is better. GSK is inconsistent regarding this factor.
57

58
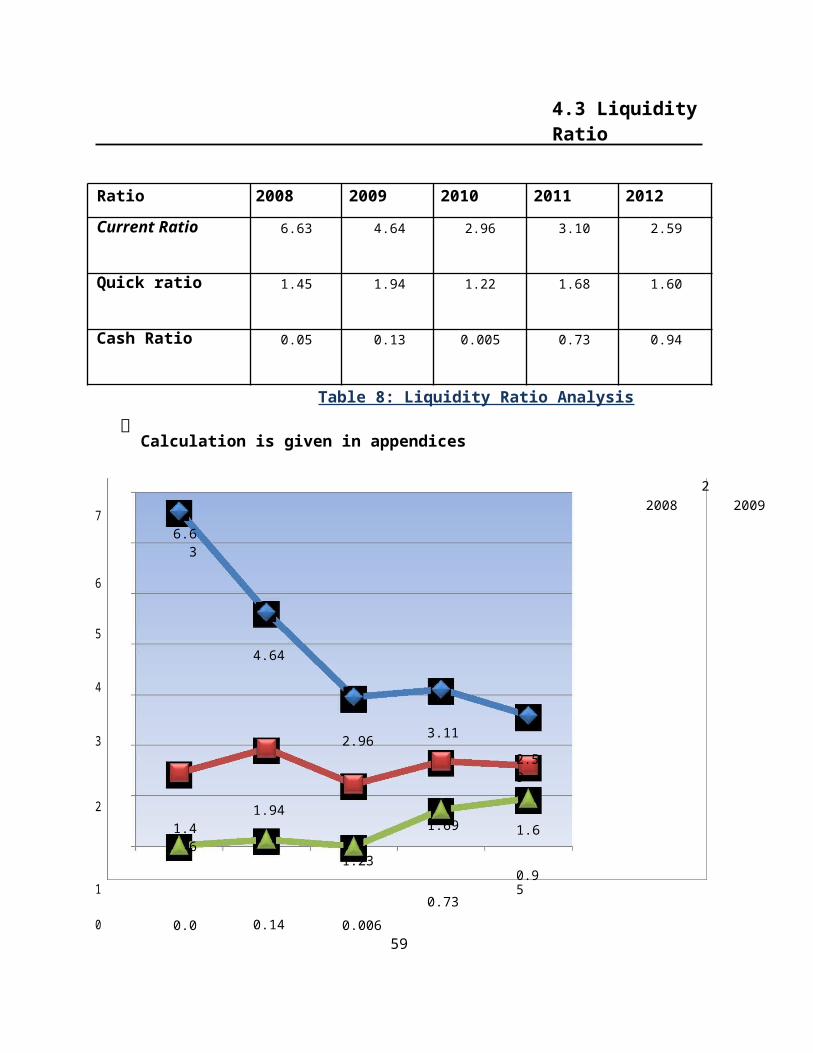
4.3 Liquidity Ratio
Ratio 2008 2009 2010 2011 2012Current Ratio 6.63 4.64 2.96 3.10 2.59
Quick ratio 1.45 1.94 1.22 1.68 1.60
Cash Ratio 0.05 0.13 0.005 0.73 0.94
Table 8: Liquidity Ratio Analysis Calculation is given in appendices
76.63
6
54.64
4
3 2.96 3.112.59
2 1.941.691.4
61.6
1.23
10.73
0.95
0 0.0 0.14 0.006
22008 2009
59

Current Ratio
Quick Ratio
Cash Ratio
Figure 10: Liquidity Ratio
60
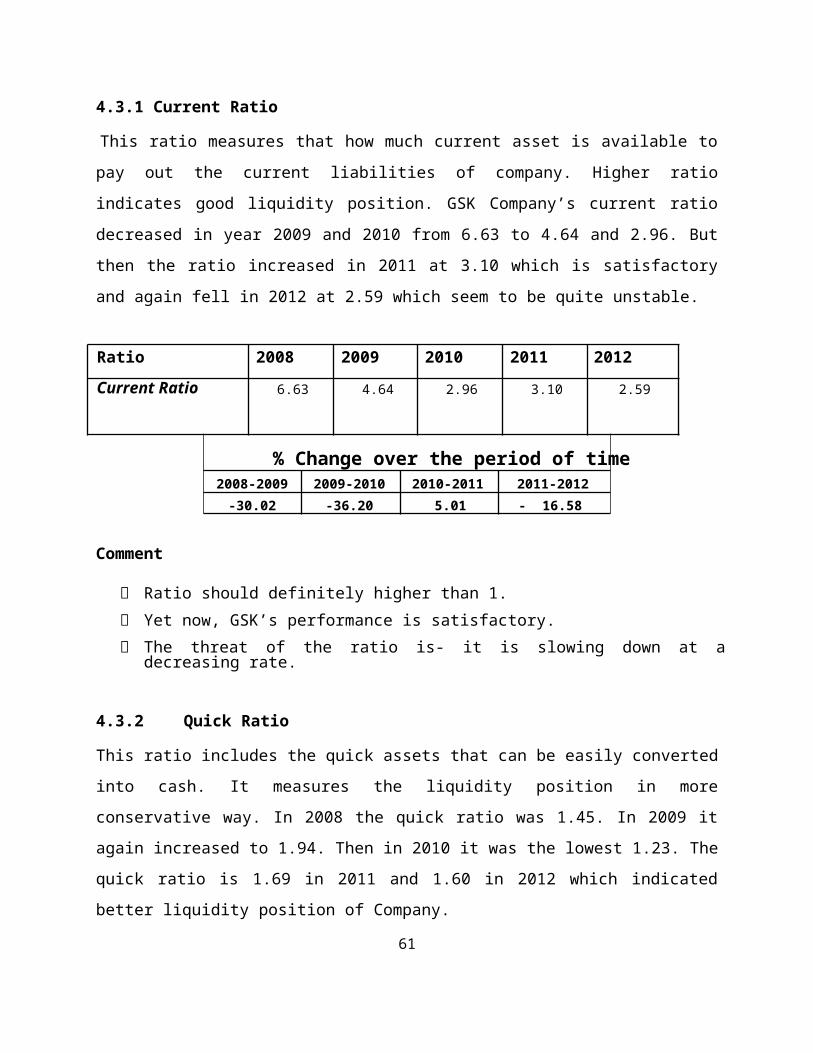
4.3.1 Current Ratio
This ratio measures that how much current asset is available topay out the current liabilities of company. Higher ratioindicates good liquidity position. GSK Company’s current ratiodecreased in year 2009 and 2010 from 6.63 to 4.64 and 2.96. Butthen the ratio increased in 2011 at 3.10 which is satisfactoryand again fell in 2012 at 2.59 which seem to be quite unstable.
Ratio 2008 2009 2010 2011 2012Current Ratio 6.63 4.64 2.96 3.10 2.59
% Change over the period of time2008-2009 2009-2010 2010-2011 2011-2012-30.02 -36.20 5.01 - 16.58
Comment
Ratio should definitely higher than 1. Yet now, GSK’s performance is satisfactory. The threat of the ratio is- it is slowing down at a
decreasing rate.
4.3.2 Quick Ratio
This ratio includes the quick assets that can be easily convertedinto cash. It measures the liquidity position in moreconservative way. In 2008 the quick ratio was 1.45. In 2009 itagain increased to 1.94. Then in 2010 it was the lowest 1.23. Thequick ratio is 1.69 in 2011 and 1.60 in 2012 which indicatedbetter liquidity position of Company.
61

Ratio 2008 2009 2010 2011 2012Quick ratio 1.45 1.94 1.22 1.68 1.60
% Change over the period of time2008-2009 2009-2010 2010-2011 2011-201233.03 -36.79 37.39 -4.83
62

Comment
Ratio> 1 is required to pay its debt without selling itsinventory.
GSK is always capable of paying its debts without anystress.
4.3.3 Cash Ratio
The most conservative measure of liquidity position is cashratio. Here the cash ratios of GSK fluctuate over the first five-year but in year 2012 the ratio is 0.94 which indicate improvedliquidity position without relying in receivables and GSK can payits short term debts in cash.
Ratio 2008 2009 2010 2011 2012Cash Ratio 0.05 0.13 0.005 0.73 0.94
% Change over the period of time2008-2009 2009-2010 2010-2011 2011-2012158.35 -95.82 12906.15 29.29
Comment
Cash ratio should always be less than 1. GSK’s performance is satisfactory.
63

64

4.4 Long Term Debt and Solvency Ratio
Ratio 2008 2009 2010 2011 2012Debt to equity 0.32 0.34 0.49 0.46 0.60
Debt to total capital 0.24 0.25 0.33 0.32 0.37
Time interest earned
2.67 17.25 25.23 519.69 653.16ratio
Fixedcharg
e-1.16 10.43 19.97 216.08 253.49
coverageCFO to Debt 0.06 0.32 0.15 0.84 0.73
Capital ExpenditureRatio 0.25 1.43 1.11 7.60 0.51
Table 9: Long Term Debt Ratio Analysis Calculation is given in appendices
4.4.1 Debt to Equity Ratio
This ratio shows how much debt a company has compared to itsequity. Higher the ratio indicates higher the risk for thecompany. GSK Company had highest debt to equity ratio in year2012. In year 2012, for every Tk. 1 of equity GSK had Tk. 0.60debt. It means the dependency on external financing has increasedand riskiness of the firm as well.
65

Ratio 2008 2009 2010 2011 2012
Debt to equity 0.32 0.34 0.49 0.460.60321717
2
% Change over the period of time2008-2009 2009-2010 2010-2011 2011-2012
5.47 46.59 -6.34 30.53
66

2012 0.6
2011 0.46
Debt To Equity2010 0.49
2009 0.34
2008 0.32
0 0.2 0.4 0.6 0.8
Figure 11: Debt to equity ratio
Comment
Ratio should remain less than 1. GSK is showing a great prospect in this ratio analysis.
4.4.2 Debt to Capital Ratio
It measures the proportion of debt on total capital. This ratioshows that how much a firm is dependent on external financing.But from the balance sheet we came to learn that GSK Company washighly dependent on external financing from year 2010 to 2012which make the company more risky. But in the earlier years thecompany was less reliable on debt which reduces the bankruptcyrisk of GSK.
Ratio 2008 2009 2010 2011 2012
67

Debt to total capital 0.24 0.25 0.33 0.32 0.37
% Change over the period of time2008-2009 2009-2010 2010-2011 2011-20124.09 31.19 -4.34 19.04
68

2012 0.376
2011 0.32
Debt To Total Capital2010 0.33
2009 0.25
2008 0.24
0 0.1 0.2 0.3 0.4
Figure 12: Debt to Total Capital
Comment
Lower the fraction is better. GSK showed a tendency to depend more on debt with respect to
other years.
4.4.3 Time Interest Earned Ratio
It is a direct measure of ability of paying the interest for acompany. This ratio fluctuates over five year period. In year2008, for Tk. 1 interest GSK has Tk. 2.67 EBIT which wassatisfactory. Then in year 2012 it became highest at Tk. 653.16EBIT.
Ratio 2008 2009 2010 2011 2012Time interest earned 2.67 17.25 25.23 519.69 653.16
69

ratio
% Change over the period of time2008-2009 2009-2010 2010-2011 2011-2012545.70 46.29 1959.65 25.68
70

2012653.16
7
2011 519.69
25.23Times Interest Earned Ratio
2010
2009 17.25
2008 2.67
0 200 400 600 800
Figure 13: Times Interest Earned RatioComment
Ratio should always be greater than 1. Higher the fraction shows the strengths. GSK has an extraordinary performance regarding the ratio.
4.4.4 Fixed Charge Coverage Ratio
This ratio measures the ability to pay all fixed charges for a company. Higher the ratio is better. In 2012 this ratio was 253.49 which was higher than rest of the years.
Ratio 2008 2009 2010 2011 2012
Fixedcharge -1.16 10.43 19.97 216.08 253.49
coverage
71

% Change over the period of time2008-2009 2009-2010 2010-2011 2011-2012999.51 91.38 982.002 17.31
72

300
250 253.49
200
216.08
150 Fixed Charge Coverage
100Ratio
5010.4
319.9
7
0-
1.162008 2009 2010 2011 2012
-50
Figure 14: Fixed Charge Coverage RatioComment
Ratio should always be greater than 1. Higher the fraction shows the strengths. GSK has an extraordinary performance regarding the ratio.
4.4.5 CFO to Debt Ratio
This ratio measures the cash flow generated by the firm to paydebt. Higher the ratio is better. CFO to debt ratio was 0.06 in2008. But it increased to 0.73 in year 2012 compare to 2008,which indicates solvency of the company.
Ratio 2008 2009 2010 2011 2012CFO to Debt 0.06 0.32 0.15 0.84 0.73
73

% Change over the period of time2008-2009 2009-2010 2010-2011 2011-2012
0.002 -53.80 474.43 -12.51
74

0.9
0.80.84
0.70.74
0.60.50.4 CFO To Debt
0.3 0.32
0.2
0.10.15
0.060
2008 2009 2010 2011 2012
Figure 15: CFO to DebtComment
Higher the ratio is better. The graph shows the increased solvency of GSK.
4.4.6 Capital Expenditure Ratio
This ratio measures the cash flow generated by the firm to paycapital expenditure. In 2005 it was 0.79. Then it decreased to0.25 in 2008. From 2009 it started to increase and in 2011 it was7.60 which is satisfactory but again it fell in 2012 to 0.51dramatically.
Ratio 2008 2009 2010 2011 2012Capital Expenditure 0.25 1.43 1.11 7.60 0.514Ratio
75

% Change over the period of time2008-2009 2009-2010 2010-2011 2011-2012482.29 -22.72 586.29 -93.23
76

87.6
7
6
5
4Capital Expenditure Ratio
3
21.43
1 1.11
0.250.5
02008 2009 2010 2011 2012
Figure 16: Capital Expenditure RatioComment
Higher the ratio shows the growth of the company. GSK’s performance can be evaluated as satisfactory.
77

78
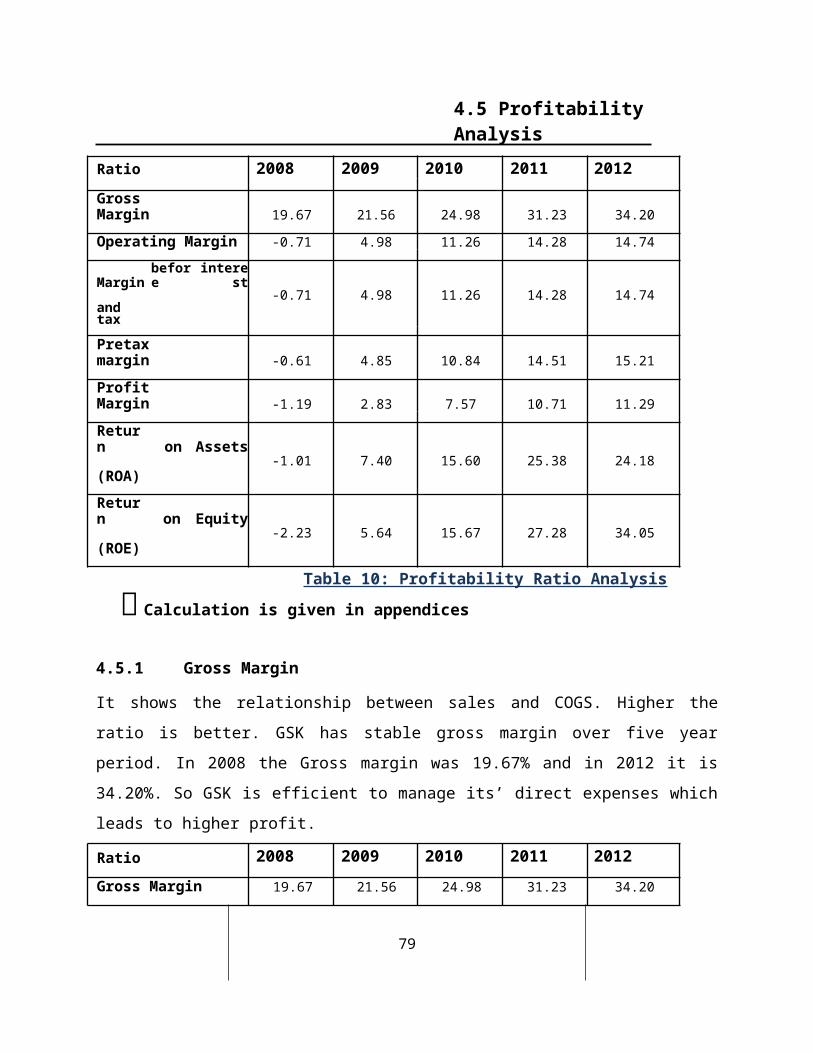
4.5 Profitability Analysis
Ratio 2008 2009 2010 2011 2012Gross Margin 19.67 21.56 24.98 31.23 34.20
Operating Margin -0.71 4.98 11.26 14.28 14.74
Marginbefore
interest
-0.71 4.98 11.26 14.28 14.74and taxPretax margin -0.61 4.85 10.84 14.51 15.21
Profit Margin -1.19 2.83 7.57 10.71 11.29
Return on Assets
-1.01 7.40 15.60 25.38 24.18(ROA)Return on Equity
-2.23 5.64 15.67 27.28 34.05(ROE)
Table 10: Profitability Ratio Analysis Calculation is given in appendices
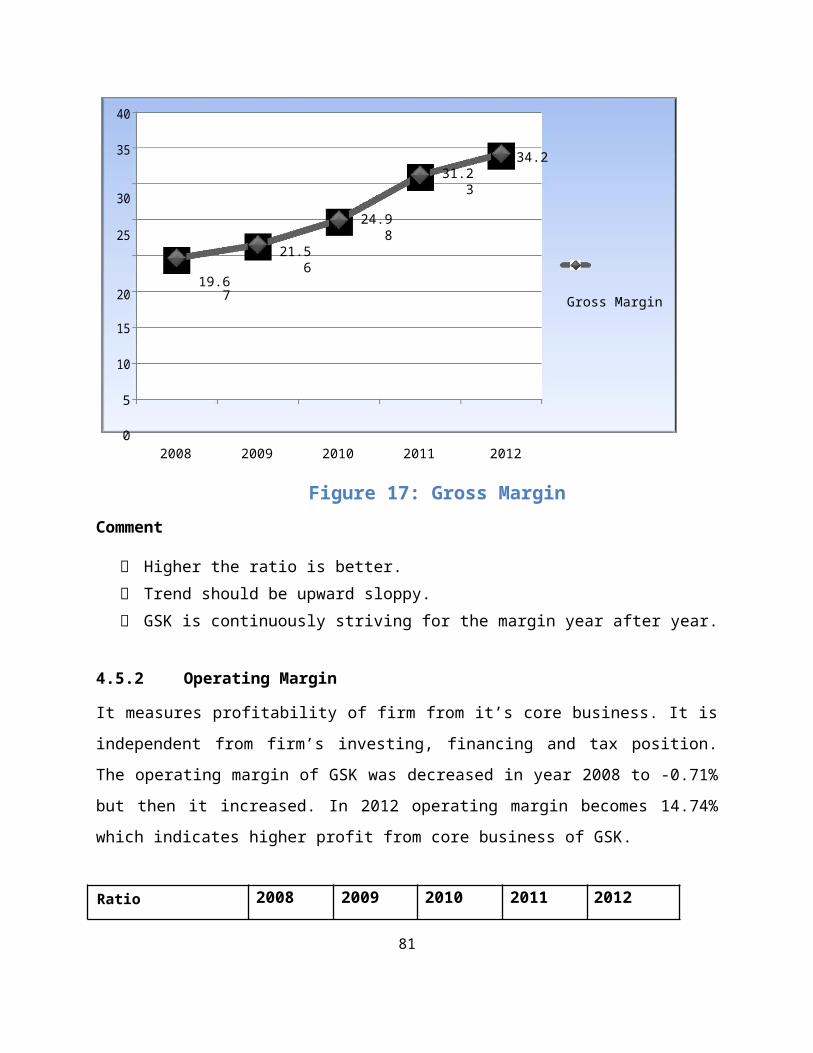
4.5.1 Gross Margin
It shows the relationship between sales and COGS. Higher theratio is better. GSK has stable gross margin over five yearperiod. In 2008 the Gross margin was 19.67% and in 2012 it is34.20%. So GSK is efficient to manage its’ direct expenses whichleads to higher profit.
Ratio 2008 2009 2010 2011 2012Gross Margin 19.67 21.56 24.98 31.23 34.20
79

% Change over the period of time2008-2009 2009-2010 2010-2011 2011-2012
9.58 15.86 25.01 9.52
80
40
35 34.2
3031.2
3
2524.9
8
20
21.56
19.67 Gross Margin
15
10
5
02008 2009 2010 2011 2012
Figure 17: Gross MarginComment
Higher the ratio is better. Trend should be upward sloppy. GSK is continuously striving for the margin year after year.
4.5.2 Operating Margin
It measures profitability of firm from it’s core business. It isindependent from firm’s investing, financing and tax position.The operating margin of GSK was decreased in year 2008 to -0.71%but then it increased. In 2012 operating margin becomes 14.74%which indicates higher profit from core business of GSK.
Ratio 2008 2009 2010 2011 2012
81

Operating Margin -0.71 4.98 11.26 14.28 14.74
% Change over the period of time2008-2009 2009-2010 2010-2011 2011-2012799.81 126.34 26.82 3.24
2008 2009 2010 2011 2012-2
0
2
4
6
8
10
12
14
16
Operating Margin
Operating Margin
Figure 18: Operating Margin
Comment
Higher the ratio is better. The trend should be upward sloppy. The trend is increasing at a decreasing rate.
4.5.3 Pretax Margin
Pretax margin measures the profitability which is independent from the impact of tax. Pretax margin is highest in year 2012 which is 15.22%.
82

Ratio 2008 2009 2010 2011 2012Pretax margin -0.61 4.85 10.84 14.51 15.21
% Change over the period of time2008-2009 2009-2010 2010-2011 2011-2012891.17 123.29 33.92 4.86
2008 2009 2010 2011 2012-2024681012141618
Pretax Margin
Pretax Margin
Figure 19: Pretax Margin
Comment
Higher the ratio is better. Trend should be upward sloppy. GSK is continuously striving for the margin year after year.
4.5.4 Profit Margin
83
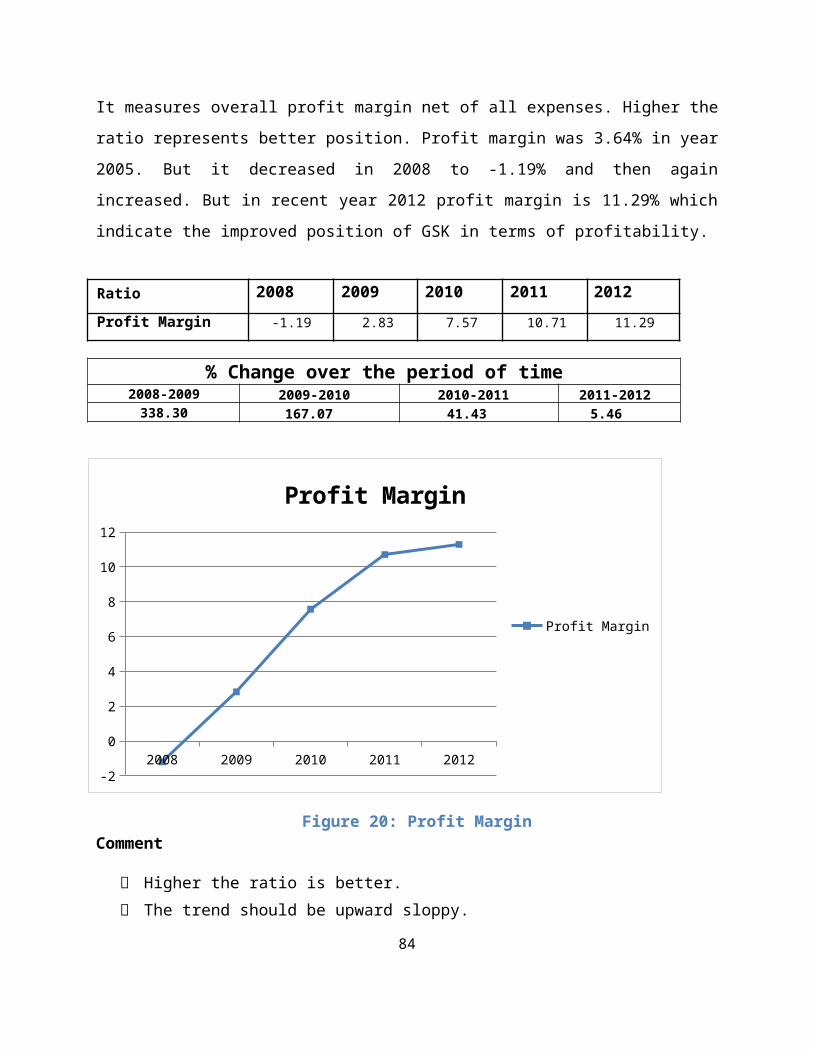
It measures overall profit margin net of all expenses. Higher theratio represents better position. Profit margin was 3.64% in year2005. But it decreased in 2008 to -1.19% and then againincreased. But in recent year 2012 profit margin is 11.29% whichindicate the improved position of GSK in terms of profitability.
Ratio 2008 2009 2010 2011 2012Profit Margin -1.19 2.83 7.57 10.71 11.29
% Change over the period of time2008-2009 2009-2010 2010-2011 2011-2012338.30 167.07 41.43 5.46
2008 2009 2010 2011 2012-2
0
2
4
6
8
10
12
Profit Margin
Profit Margin
Figure 20: Profit MarginComment
Higher the ratio is better. The trend should be upward sloppy.
84

The trend is increasing at a decreasing rate.
4.5.5 ROA
ROA measures the efficiency of firm to utilize its assets togenerate revenue and return available to the capital providers.GSK had low ROA -1.012 in year 2008 which means asset could notutilize properly to generate profit. But gradually ROA of GSK hasincreased to 25.381 at 2011 which indicates better utilization ofasset in recent years. So capital providers also get higherreturn
Ratio 2008 2009 2010 2011 2012Return on Assets -1.01 7.40 15.60 25.38 24.18(ROA)
% Change over the period of time2008-2009 2009-2010 2010-2011 2011-2012831.03 110.92 62.62 - 4.69
85

201224.18
8
2011 25.38
2010
7.4
15.61Return On Assets
2009
-1.0122008
-5 0 510 15 20 25 30
Figure 21: Return on AssetsComment
Higher the ratio is better. The trend should be upward sloppy. The trend shows stable position of GSK.
4.5.6 ROE
Measures the return on total stockholder’s equity and excludesdebt in the dominator and uses either pretax income or netincome. Higher the ratio is the better for the firm. The firm hashigher ROE in 2012 which is 34.05%. ROE is higher in those yearswhen ROA rises. This firm’s shareholders get higher return overthe years.
Ratio 2008 2009 2010 2011 2012
86

Return on Equity -2.23 5.64 15.67 27.28 34.05(ROE)
% Change over the period of time2008-2009 2009-2010 2010-2011 2011-2012352.91 177.83 74.09 24.81
87

2012 34.05
2011 27.28
2010 15.67 Return On Equity
20095.64
-2.23 2008
-10 0 10 20 30 40
Figure 22: Return on EquityComment
Higher the ratio is better. 12-15% is the average. The trend shows the extraordinary performance of GSK.
88

89

4.6 Operating & Financial Leverage
Ratio 2008 2009 2010 2011 2012Operating Leverage -27.67 4.33 2.22 2.19 2.319EffectFinancial Leverage 0.60 1.76 1.49 1.33 1.30EffectTotal Leverage -16.54 7.61 3.30 2.92 3.02Effect
Table 11: Operating & Financial Leverage Ratio Analysis
Calculation is given in appendices
4.6.1 OLE (Operating Leverage Effect)
OLE is a measure of percentage change in income due topercentage change in sales volume. When OLE is greater than 1,operating leverage in present. GSK Company has highest OLE inyear 2009 that is 4.33. It means if sales increase (decrease) by1%, then operating income will increase (decrease) by 4.33%. TheOLE of GSK has reduced then gradually. In 2012 OLE is 2.31 whichmean riskiness has reduced.
Ratio 2008 2009 2010 2011 2012Operating Leverage -27.67 4.33 2.22 2.19 2.31Effect
% Change over the period of time2008-2009 2009-2010 2010-2011 2011-2012
90

115.65 -48.81 -1.43 6.08
91

2012 2.31
2011 2.19
2010 2.22 OLE
2009 4.33
-27.67 2008
-30 -25 -20 -15 -10 -5 0 5
Figure 23: Operating Leverage EffectComment
The ratio should be greater than or equal to 1. GSK stands at the stable position. Extreme higher ratio will lead to destruction.
4.6.2 FLE (Financial Leverage Effect)
FLE measures for a given change in operating income how much netincome will change. GSK has highest fixed cost in year 2009 so asFLE. So in year 2009 risk was higher. If operating income changesby 1% then net income will change by 1.76%. GSK has lowest FLE inyear 2008 that is 0.60.
Ratio 2008 2009 2010 2011 2012Financial Leverage 0.60 1.76 1.49 1.33 1.30Effect
92

% Change over the period of time2008-2009 2009-2010 2010-2011 2011-2012193.65 -15.24 -10.33 -2.09
93

2012 1.31
2011 1.33
2010 1.49 FLE
20091.76
2008 0.60
0 0.2 0.4 0.6 0.8 1 1.2 1.4 1.6 1.8
Figure 24: Financial Leverage Effect
Comment
The ratio should be greater than or equal to 1. GSK stands at the stable position. Extreme higher ratio will lead to destruction.
4.6.3 TLE (Total Leverage Effect) It measures the percentage change in net income due to percentagechange in sales.
GSK has highest total leverage in 2009 that is 7.61. But TLE is 2.92 in year 2011. It means the firm was more risky in previous years but now risk of the firm has reduced.
Ratio 2008 2009 2010 2011 2012Total Leverage -16.54 7.61 3.30 2.92 3.02Effect
94

% Change over the period of time2008-2009 2009-2010 2010-2011 2011-2012145.98 -56.61 -11.61 3.85
95

2012 3.03
2011 2.92
2010 3.30 TLE
2009 7.61
-16.54 2008
-20 -15 -10 -5 0 5 10
Figure 25: Total Leverage EffectComment
The ratio should be greater than or equal to 1. GSK stands at the stable position right now than year 2009. Now GSK is comparatively less risky than that off the other
year’s TLE.
96

97

4.7 Investor’s Analysis
RATIO 2008 2009 2010 2011 2012EPS -1.43 3.74 11.87 28.88 34.05P/E Ratio -95.43 51.60 27.81 25.10 33.17
Table 12: Investor’s Analysis Calculation is given in appendices
4.7.1 Earnings Per Share (EPS)
Earnings per share ratio (EPS Ratio) are a small variation ofreturn on equity capital ratio and are calculated by dividingthe net profit after taxes and preference dividend by the totalnumberof equity shares. EPS indicates the profitability of GSK.
Ratio 2008 2009 2010 2011 2012EPS -1.43 3.74 11.87 28.88 34.05
% Change over the period of time2008-2009 2009-2010 2010-2011 2011-2012363.38 217.37 143.30 17.90
As gross profit ratio start to increasing same way earning per share start to increase from 2009 to 2012 company well performedto improved share holder right. We can see year to GSK earning per share increases. So, the company is well managing its profitability compared to the industry.
98

99

35
30
25
2034.05 EP
S15 28.88
1011.875
3.740 -1.43
-52008 2009 2010 2011 2012
Figure 26: Earnings Per ShareComment
Higher the ratio is better. GSK’s trend is upward sloppy which is a good sign. The trend shows the extraordinary performance of GSK.
4.7.2 Price Earnings Ratio (P/E)
Price earnings ratio is the ratio between market price per equity share and earnings per share. The ratio is calculated to make an estimate of appreciation in the value of a share ofa company and is widely used by investors to decide whether ornot to buy shares in a particular company
Ratio 2008 2009 2010 2011 2012P/E Ratio -95.43 51.60 27.81 25.10 33.17
100

% Change over the period of time2008-2009 2009-2010 2010-2011 2011-2012154.07 -46.10 -9.71 32.13
101

Over all price earnings ratio effect to the buying attitude tothe share holder when P/E ratio is high than buyers discourage toGSK share but company well performed every year increase theirgross profit ratio, profit margin, earning per share ratio viceversa start to decries P/E ratio. Above calculation can recommendGSK start financially stronger more competent than previous yearfrom 2009 to 2012 continuously decries show that well position ofGSK.
60
4051.620
27.81 25.11 33.17
02008 2009 2010 2011 2012
-20P/E Ratio
-40-95.433
-60
-80
-100
Figure 27: P/E RatioComment
Ratio> 20 indicates strong investor confidence & Ratio<12 islikely to grow slowly.
No P/E ratio has a fixed meaning good or bad. There is nocut-off for what is high or low.
102

Comparing to the years- 2008 & 2009; GSK’s position is quitestable in the next three years.
103

CHAPTER FIVE
Conclusion
&
Recommendation
104

5.0 Conclusion
Financial performance analysis and management reporting activityis the process of understanding the budget preparation processand participation of different departments through analysis ofreported financial information, particularly annual and quarterlyreports. It is the selection, evaluation, and interpretation ofbudgeting data, along with other relevant information, to assistin investment and financial decision-making.
Affiliation report helps us to more efficient and more active togather practical knowledge it efficient for practical life.
Financial statement analysis is an evaluative method ofdetermining the past, current and projected performance of acompany. One technique is commonly used as part of financialstatement analysis ‘ratio’ analysis, which calculates statisticalrelationships between data.
Financial statement analysis enables organizations to assesstheir current operating performance, review the state of theeconomy and determine how they will perform in the future.Understanding that an ounce of prevention is worth a pound of
105

cure, corporate management fully supports forecasting activities.
106

5.1 Identified Factors
GSK has no long term debt almost depend on their capital.
GSK has no over capital because their current asset, fixedasset own asset and not over-capitalized as its earnings aresufficient to justify a fair return on the amount of sharecapital that has been invested. The total of owned andborrowed capital does not exceed its fixed and currentassets.
GSK is one of the world recognized pharmaceutical companyevery year increase their sales current ratio increase yearafter year and asset turnover ratio. The current ratio andthe turnover ratios justify that GSK is not under-trading.
GSK is not under-capitalized as well. If the owned capital ofGSK was less than the total borrowed capital, then it wouldhave been a sign of under capitalization. This would indicatethat the owned capital of the company is disproportionate tothe scale of its operation and the business is dependent uponborrowed money and trade creditors.
107

108

5.2 Recommendation
GSK needs to give a check in its Operating expensesspecially, Selling and Distribution expenses.
GSK need to increase market share in pharmaceutical sectorand vaccine because it is one of the second largest researchbased company in the world.
GSK needs to improvise marketing strategy at pharmaceuticalsector because every year they lost market share.
GSK should think over its standard budgeting policy of payingdividends out of Retained earnings because this may lead toan investment crisis in future when GSK might have to borrowto meet the investment needs.
GSK should oversee whether its Debt-to-Equity ratio is infavor of the Company. A rising dependency on debt may createa future liquidity as well as credit-worthiness problem. SoGSK should make a proper budget plan for further investment.
GSK should try to increase their market share.
109

Bibliography
Annual Reports of GlaxoSmithKline, 2008-2012 Donald E. Kieso, Jerry J. Weygandt, Terry D. Warfield
(Intermediate Accounting) Eugene Brigham & Gapenski: Intermediate Financial Management
(5th Ed.) http://medibd.blogspot.com http://www.asiapharma.org/ape/ape_index.html http://www.thefinancialexpress-bd.com Thompson/ Strickland/ Gamble: Crafting & Executive Strategy
(16th Ed.) www.accountingformanagement.com
110

www.ehow.com www.googlefinance.com www.gsk.com www.yahoofinance.com
111

Appendices
112

113

Particulars Formula 2008 2009 2010 2011 2012
(1) Activity Analysis
(i) Short-Term (Operating) Activity RatiosInventory Turnover Cost of Goods Sold / Average Inventory 0.55 0.65 0.69 0.86 0.92
Average No. Days Inventory In Stock 365 / Inventory Turnover 667.58 557.84 526.50 423.64 398.87
Receivables Turnover Sales / Average Trade Receivables 2.33 1.86 1.34 1.82 2.08Average No. Days Receivables
Outstanding 365 / Receivables Turnover 156.96 196.75 272.63 200.33 175.33
Payable Turnover Purchase / Average Accounts Payable 0.91 0.91 0.83 1.02 0.82Average No. Days Payables
Outstanding 365 / Payables Turnover 401.54 402.43 440.73 356.52 442.55
(ii) Long-Term (Investment) Activity Ratios
Fixed Asset Turnover Sales / Fixed Assets 4.30 4.72 5.49 8.23 9.31Total Asset Turnover Sales / Total Assets 1.42 1.49 1.39 1.78 1.64
(2) LiquidityAnalysis
Current Ratio Current Assets / Current Liabilities 6.63 4.64 2.96 3.11 2.59Quick Ratio (Current Assets - Inventories) / Current Liabilities 1.46 1.94 1.23 1.69 1.60Cash Ratio (Cash + Marketable Securities) / Current Liabilities 0.05 0.14 0.01 0.73 0.95
(3) Long term Debt and Solvency Ratio
(i) Debt CovenantsDebt to Total Capital Total Debt / Total Capital 0.24 0.25 0.33 0.32 0.38
Debt to Equity Total Debt / Total Equity 0.32 0.34 0.49 0.46 0.60Time Interest Earned (TIE) EBIT / Interest Expense 2.67 17.25 25.23 519.69 653.17
Fixed Charge Coverage Earning before Fixed Charges & Taxes / Fixed Charges -1.16 10.43 19.97 216.08 253.49
(ii) Capital Expenditure and CFO to DebtRatio
Capital Expenditure Ratio CFO / Capital Expenditure 0.25 1.43 1.11 7.60 0.51CFO to Debt CFO / Total Debt 0.06 0.32 0.15 0.84 0.74
(4) ProfitabilityAnalysis
(i) Return on SalesGross Margin Gross Profit / Sales 19.67 21.56 24.98 31.23 34.20
Operating Margin Operating Profit / Sales -0.71 4.98 11.26 14.28 14.75Margin before Interest and Tax EBIT / Sales -0.71 4.98 11.26 14.28 14.75
Pretax Margin EBT / Sale -0.61 4.85 10.84 14.51 15.22Profit Margin Net Income /Sales -1.19 2.83 7.57 10.71 11.29
(ii) Return on Investment
Return on Assets (ROA)( Net Income + After Tax Interest ) / Avg Total
Asset -1.01 7.40 15.61 25.38 24.19Return on Equity (ROE) Pretax Income / AVG Shareholder’s Equity -2.23 5.64 15.67 27.28 34.05
(5) Operating and Financial Leverage
Operating Leverage Effect (OLE) Gross Profit / EBIT or Operating Income -27.67 4.33 2.22 2.19 2.32Financial Leverage Effect (DLE) Operating Income / Net Income 0.60 1.76 1.49 1.33 1.31Total Leverage Effect (TLE) Gross Profit / Net Income -16.54 7.61 3.30 2.92 3.03
(6) Investor's Analysis
Earning Per Share (EPS)EPS= (EAT − Preference Dividend) / No. of Common
Shares -1.42 3.74 11.87 28.88 34.05Price Earning Ratio (P/E) Market Price Per Share/ EPS -95.42 51.60 27.81 25.11 33.17
114

115