COVER SHEET - Global IMI
181
0 0 0 0 0 9 4 4 1 9 I N T E G R A T E D M I C R O E L E C T R O N I C S , I N C . N O R T H S C I E N C E A V E N U E, L A G U N A T E C H N O P A R K - S E Z, B O. B I Ñ A N, L A G U N A 1 2 3 1 2 0 - I S 0 4 1 5 Dept. Requiring this Doc. Total No. Of Stockholders Remarks = pls. Use black ink for scanning purposes Document I.D. Cashier S T A M P S Domestic Foreign To be accomplished by SEC Personnel concerned File Number LCU Fiscal Year Annual Meeting Secondary License Type, if Applicable Section 3, 6, 7 & 8 Amended Articles Number/Section Total Amount of Borrowings Contact Person DEFINITIVE Company Telephone Number Month Day FORM TYPE Month Day COVER SHEET (Company's Full Name) (Business Address: No. Street City / Town / Province) ATTY. SOLOMON M. HERMOSURA 908-3346
-
Upload
khangminh22 -
Category
Documents
-
view
1 -
download
0
Transcript of COVER SHEET - Global IMI

0 0 0 0 0 9 4 4 1 9
I N T E G R A T E D M I C R O E L E C T R O N I C S ,
I N C .
N O R T H S C I E N C E A V E N U E, L A G U N A
T E C H N O P A R K - S E Z, B O. B I Ñ A N, L A G U N A
1 2 3 1 2 0 - I S 0 4 1 5
Dept. Requiring this Doc.
Total No. Of Stockholders
Remarks = pls. Use black ink for scanning purposes
Document I.D.Cashier
S T A M P S
Domestic Foreign
To be accomplished by SEC Personnel concerned
File Number LCU
Fiscal Year Annual Meeting
Secondary License Type, if Applicable
Section 3, 6, 7 & 8
Amended Articles Number/Section
Total Amount of Borrowings
Contact Person DEFINITIVE Company Telephone Number
Month Day FORM TYPE Month Day
COVER SHEET
(Company's Full Name)
(Business Address: No. Street City / Town / Province)
ATTY. SOLOMON M. HERMOSURA 908-3346

Integrated Micro-Electronics, Inc. North Science Avenue,
Special Export Processing Zone Laguna Technopark Binan Laguna 4024
Philippines
Tel +63 2 7756 6840; +63 2 7756 6940 Tel +63 49 544 0312
www.global-imi.com Reg. No. 34218
NOTICE OF ANNUAL STOCKHOLDERS’ MEETING
NOTICE IS HEREBY GIVEN that the annual meeting of stockholders of INTEGRATED MICRO-ELECTRONICS, INC. will be conducted virtually via http://www.ayalagroupshareholders.com/ on Thursday, April 15, 2021 at 9:00 o’clock in the morning with the following
A G E N D A1 1. Call to Order 2. Certification of Notice and Quorum 3. Approval of Minutes of Previous Meeting 4. Annual Report 5. Ratification of All Acts of the Board of Directors and Officers 6. Election of Directors (including the Independent Directors) 7. Election of External Auditor and Fixing of its Remuneration 8. Consideration of Such Other Business as May Properly Come Before the Meeting
9. Adjournment
Only stockholders of record as of March 1, 2021 are entitled to notice of, and to vote at, this meeting.
Given the current circumstances, stockholders may only attend the meeting by appointing the
Chairman of the meeting as their proxy, by remote communication or by voting in absentia.2 Stockholders intending to participate by remote communication should notify the Company on or before April 5, 2021.
Duly accomplished proxies shall be submitted on or before April 5, 2021 to the Office of the
Corporate Secretary at 4/F Tower One and Exchange Plaza, Ayala Triangle, Ayala Avenue, Makati City or by email to [email protected]. Validation of proxies is set for April 7, 2021 at 9:00 a.m.
Stockholders may vote by remote communication, or in absentia subject to validation
procedures. The procedures for participating in the meeting through remote communication and for casting votes in absentia will be set forth in the Information Statement3.
1 See pages 3 and 4 for the explanation for each agenda item. 2 The Company shall hold a physical meeting if so requested by stockholders holding at least 10% of our outstanding capital stock and provided that the same is allowed by government regulations and issuances. Stockholders have until February 24, 2021 to submit their requests to [email protected]. 3 Stockholders should notify the Company at [email protected] of their preference to receive hard copies of the Information Statement and other ASM materials on or before March 11, 2021.

Stockholders of record as of March 1, 2021 owning at least 5% of the total outstanding capital
stock of the Company may submit proposals on items for inclusion in the agenda on or before April 8, 20214.
All communications should be sent by email to [email protected] on or before
the designated deadlines.
Makati City, February 11, 2021. SOLOMON M. HERMOSURA
Corporate Secretary
4 The inclusion of the proposed agenda item shall be in accordance with SEC Memorandum Circular No. 14, Series of 2020, and the Company’s internal guidelines.

EXPLANATION OF AGENDA ITEMS Call to order The Chairman will formally open the meeting at approximately 9:00 o’clock in the morning. Certification of notice and quorum (and rules of conduct and procedures) The Corporate Secretary will certify that written notice for the meeting was duly sent to stockholders and that a quorum exists for the transaction of business. Pursuant to Sections 57 and 23 of the Revised Corporation Code which allow voting in absentia by the stockholders, the Company has set up a designated online web address which may be accessed by the stockholders to register and vote on the matters at the meeting in absentia.5 A stockholder participating by remote communication or who votes in absentia shall be deemed present for purposes of quorum. The following are the rules of conduct and procedures for the meeting to be conducted in virtual format: (i) Stockholders may attend the meeting remotely through the online web address (URL) provided. Questions and comments
may be sent prior to or during the meeting at [email protected] and shall be limited to the Items in the Agenda.
(ii) In the event that physical attendance will be allowed at the meeting - a. Anyone who wishes to make a remark shall identify himself after being acknowledged by the Chairman and shall limit
his remarks to the item in the Agenda under consideration; b. Stockholders present at the meeting may opt for manual or electronic voting. For manual voting, each stockholder will
be given, upon registration, a ballot where he can write his vote on every item in the agenda or proposed resolution. For electronic voting, there will be computer stations near the registration table where stockholders may cast their votes electronically using a digital version of the ballot.
(iii) Each of the proposed resolutions will be shown on the screen during the livestreaming as the same is taken up at the meeting.
(iv) Stockholders must notify the Company on or before April 5, 2021 of their intention to participate in the Meeting by remote communication to be included in determining the existence of a quorum, together with the stockholders who voted in absentia and by proxy.
(v) Voting shall only be allowed for stockholders registered in the Voting in Absentia and Shareholder (VIASH) System or through authorizing the Chairman of the meeting as proxy.
(vi) Stockholders voting in absentia, who have previously registered in the VIASH System, may cast their votes electronically at any time using the VIASH System prior to or during the meeting.
(vii) All the items in the agenda for the approval by the stockholders will need the affirmative vote of stockholders representing at least a majority of the issued and outstanding voting stock present at the meeting, unless the law requires otherwise.
(viii) Election of directors will be by plurality of votes and every stockholder will be entitled to cumulate his votes. Each outstanding share of stock entitles the registered stockholder to one vote.
(ix) The Proxy Validation Committee will tabulate all votes received and an independent third party will validate the results. The Corporate Secretary shall report the results of voting during the meeting.
(x) The meeting proceedings shall be recorded in audio and video format. Approval of minutes of previous meeting The minutes of the meeting held on April 15, 2020 are available at the Company’s website, www.global-imi.com. Soft copies of the minutes will also be distributed to the stockholders after their registration for the meeting. Annual report The Chairman, Mr. Jaime Augusto Zobel de Ayala, and the President and Chief Executive Officer, Mr. Arthur R. Tan, will report on the performance of the Company in 2020 and the outlook for 2021. The Company’s Annual Report will contain the Message from the Chairman and the Message from the CEO. Copies of the Annual Report will be distributed to the stockholders and posted on the Company’s website, www.global-imi.com. The Audited Financial Statements as of December 31, 2020 (AFS), to be approved by the Board on March 2, 2021 upon the recommendation of the Audit Committee, will be included in the Information Statement to be sent to the stockholders at least 28 days prior to the meeting. Ratification of all acts of the Board of Directors and Officers The actions and resolutions of the Board and its committees were those taken and adopted since the annual stockholders’ meeting on April 15, 2020 until April 15, 2021. They include the approval of operations-related and treasury-related matters and other matters covered by disclosures to the Securities and Exchange Commission and the Philippine Stock Exchange such as the election of a replacement director and his appointment as member of various Board committees, the approval of amendments to the Company’s By-Laws and Charters of the Corporate Governance and Nomination Committee and Personnel and Compensation Committee and agreements, and the appointment of a new Data Protection Officer,. The acts of the officers were those taken to implement the resolutions of the Board or its committees or made in the general conduct of business.
5 The detailed instructions pertaining to the URL and the use thereof will be provided in the Information Statement.

Election of directors (including the independent directors) The eleven (11) nominees for directors, to be evaluated and determined by the Corporate Governance and Nomination Committee of the Board to have all the qualifications and competence necessary for the effective performance of the Board’s roles and responsibilities, and none of the disqualifications to serve as members of the Board, shall be presented for election to the stockholders. The profiles of the nominees to the Board will be provided in the Information Statement. Election of external auditor and fixing of its remuneration The Audit and Risk Committee of the Board will endorse to the stockholders the election of the external auditor for the ensuing fiscal year as well as its proposed remuneration. The profile of the external auditor will be provided in the Information Statement. Consideration of such other business as may properly come before the meeting The Chairman will open the floor for comments and questions by the stockholders, and take up agenda items received from stockholders on or before April 8, 2021 in accordance with existing laws, rules and regulations of the Securities and Exchange Commission and the Company’s internal guidelines6.
6 SEC Memorandum Circular No. 14, series of 2020 or “Shareholders’ Right to Put items on the Agenda for Regular/Special Stockholders’ Meetings”: https://www.sec.gov.ph/mc-2020/mc-no-14-s-2020shareholders-right-to-put-items-on-the-agenda-for-regular-special-stockholders-meetings/.

PROXY
The undersigned stockholder of INTEGRATED MICRO-ELECTRONICS INC. (the “Company”) hereby appoints the Chairman of the meeting, as attorney-in-fact and proxy, to represent and vote all shares registered in his/her/its name at the annual meeting of stockholders of the Company on April 15, 2021 and at any of the adjournments thereof for the purpose of acting on the following matters:
A SCANNED COPY OF THIS PROXY MUST BE SUBMITTED TO THE CORPORATE SECRETARY AT [email protected] ON OR BEFORE APRIL 5, 2021, THE DEADLINE FOR SUBMISSION OF PROXIES. FOR CORPORATE STOCKHOLDERS, PLEASE ATTACH TO THIS PROXY FORM THE SECRETARY’S CERTIFICATE ON THE AUTHORITY OF THE SIGNATORY TO APPOINT THE PROXY AND SIGN THIS FORM.
THIS PROXY, WHEN PROPERLY EXECUTED, WILL BE VOTED IN THE MANNER AS DIRECTED HEREIN BY THE STOCKHOLDER(S). IF NO DIRECTION IS MADE, THIS PROXY WILL BE VOTED FOR THE ELECTION OF ALL NOMINEES AND FOR THE APPROVAL OF THE MATTERS STATED ABOVE AND FOR SUCH OTHER MATTERS AS MAY PROPERLY COME BEFORE THE MEETING IN THE MANNER DESCRIBED IN THE INFORMATION STATEMENT AND/OR AS RECOMMENDED BY MANAGEMENT OR THE BOARD OF DIRECTORS.
A STOCKHOLDER GIVING A PROXY HAS THE POWER TO REVOKE IT AT ANY TIME BEFORE THE RIGHT GRANTED IS EXERCISED. A PROXY IS ALSO CONSIDERED REVOKED IF THE STOCKHOLDER REGISTERS IN THE VOTING IN ABSENTIA & SHAREHOLDER (VIASH) SYSTEM. STOCKHOLDERS PARTICIPATING BY REMOTE COMMUNICATION WILL NOT BE ABLE TO VOTE UNLESS THEY REGISTER IN THE VIASH SYSTEM OR THEY AUTHORIZE THE CHAIRMAN TO VOTE AS PROXY, ON OR BEFORE APRIL 5, 2021.
NOTARIZATION OF THIS PROXY IS NOT REQUIRED.
1. Approval of Minutes of Previous Meeting For Against Abstain 2. Approval of Annual Report For Against Abstain 3. Ratification of the Acts of the Board of Directors and
Officers For Against Abstain 4. Election of Directors
No. of Votes
Jaime Augusto Zobel de Ayala
Arthur R. Tan
Fernando Zobel de Ayala
Jose Ignacio A. Carlos
Alberto M. de Larrazabal
Delfin L. Lazaro
Rafael C. Romualdez
Independent Directors:
Diosdado P. Banatao
Edgar O. Chua
Hiroshi Nishimura
Sherisa P. Nuesa
5. Election of SyCip Gorres Velayo & Co. as the external auditor and fixing of its remuneration. For Against Abstain
6. At his/her discretion, the proxy named above is authorized to vote upon such other matters as may properly come before the meeting. For Against
____________________________________
PRINTED NAME OF STOCKHOLDER ____________________________________
SIGNATURE OF STOCKHOLDER/ AUTHORIZED SIGNATORY
____________________________________ DATE

__________________________________________________________________________ 1
SECURITIES AND EXCHANGE COMMISSION
SEC FORM 20-IS
Information Statement of
INTEGRATED MICRO-ELECTRONICS, INC. (the “Registrant,” “Company”, “Corporation” or “IMI”)
Pursuant to Section 20 of the Securities Regulation Code 1. Check the appropriate box: Preliminary Information Statement Definitive Information Statement 2. Name of Registrant as specified in its charter: INTEGRATED MICRO-ELECTRONICS, INC. 3. Province, country or other jurisdiction of incorporation or organization:
REPUBLIC OF THE PHILIPPINES
4. SEC Identification Number: 94419 5. BIR Tax Identification Code: 000-409-747-000 6. Address of Principal Office: North Science Avenue Laguna Technopark-Special Economic Zone (LT-SEZ) Bo. Biñan, Biñan, Laguna
7. Registered Business Address: North Science Avenue
Laguna Technopark-Special Economic Zone (LT-SEZ) Bo. Biñan, Biñan, Laguna
8. Registrant’s telephone number, including area code: (632) 7756-6840 9. Date, time and place of the meeting of security holders: Date - April 15, 2021 Time - 9:00 A.M. Place - To be conducted virtually through
http://www.ayalagroupshareholders.com/ 10. Approximate date on which the Information Statement is first to be sent or given to security holders:
March 25, 2021
11. Securities registered pursuant to Sections 8 and 12 of the Code or Sections 4 and 8 of the RSA:
a. Shares of Stock
__________________________________________________________________________ 2
Title of Each Class Par Value No. of Shares Amount
Common P1.00 2,217,293,215 P2,217,293,215. 00
b. Debt Securities - None 12. Are any or all of registrant’s securities listed in a Stock Exchange? Yes _____ No
2,115,636,697 common shares are listed with the Philippine Stock Exchange (“PSE”), including 15,892,224 treasury shares.
* * *

__________________________________________________________________________ 3
INFORMATION REQUIRED IN INFORMATION STATEMENT
A. GENERAL INFORMATION
Item 1. Date, time and place of meeting of security holders (hereafter, the “annual stockholders’ meeting” or “meeting”)
a. Date - April 15, 2021, Thursday
Time - 9:00 A.M.
Place - To be conducted virtually through http://www.ayalagroupshareholders.com/
Principal - North Science Avenue Office Laguna Technopark-Special Economic Zone (LT-SEZ) Bo. Biñan, Biñan, Laguna
b. Approximate date when the Information Statement is first to be sent to security holders:
March 25, 2021
WE ARE NOT ASKING YOU FOR A PROXY AND YOU ARE REQUESTED NOT TO SEND US A PROXY
Item 2. Dissenter’s right of appraisal
Under Section 80, Title X of the Revised Corporation Code of the Philippines (“Revised Corporation Code”), a stockholder shall have the right to dissent and demand payment of the fair value of his shares in the following instances:
(a) In case any amendment to the Articles of Incorporation has the effect of changing or restricting the
rights of any stockholder or class of shares, or of authorizing preferences in any respect superior to those of outstanding shares of any class, or of extending or shortening the term of corporate existence;
(b) In case of sale, lease, exchange, transfer, mortgage, pledge or other disposition of all or substantially
all of the corporate property and assets as provided in the Revised Corporation Code; (c) In case of merger or consolidation; and
(d) In case of investment of corporate funds for any purpose other than the primary purpose of the
Corporation. No matters or actions that may give rise to a possible exercise by stockholders of their appraisal rights will be taken up at the meeting.
Item 3. Interest of certain persons in or opposition to matters to be acted upon
None of the Directors or Executive Officers of the Company has any personal involvement or interest, either direct or indirect, in the matters to be acted upon.
No Director has informed the Company of his opposition to any matter to be acted upon.

__________________________________________________________________________ 4
B. CONTROL AND COMPENSATION INFORMATION
Item 4. Voting securities and principal holders thereof
a. Number of shares outstanding as of February 28, 2021: 2,217,293,215 Common shares
Number of votes entitled: one (1) vote per common share
b. All stockholders of record as of March 1, 2021 are entitled to receive notice and to vote at the annual stockholders’ meeting.
c. Manner of voting
Sections 7 and 8 of Article III of the By-laws of the Company (the “By-laws”) provide:
Section 7 - Each share of stock entitles the person in whose name it is registered
in the books of the corporation to one vote, provided the conditions as regards payment subject to which it was issued have been complied with.
Section 8 - The election of Directors shall be by ballot and each stockholder entitled to vote may cast the vote to which the number of shares he owns entitles him, for as many persons as are to be elected as Directors, or he may give to one candidate as many votes as the number of Directors to be elected multiplied by the number of his shares shall equal, or he may distribute them on the same principle among as many candidates he may see fit, provided that the whole number of votes cast by him shall not exceed the number of shares owned by him multiplied by the whole number of Directors to be elected. x x x
On March 8, 2019, the Executive Committee of the Company, in the exercise of its authority under the By-Laws, approved and authorized voting by the stockholders through remote communication or in absentia during meetings of the stockholders of the Company in accordance with Sections 57 and 23 of the Revised Corporation Code. Stockholders may vote on the resolutions for approval at the meeting by appointing the Chairman of the Meeting as their proxy or electronically in absentia using the online web address, http://www.ayalagroupshareholders.com/, subject to validation procedures. A stockholder voting electronically in absentia shall be deemed present for purposes of quorum. The detailed instructions for electronic voting in absentia are set forth in Annex A (I).
d. Security ownership of certain record and beneficial owners and management
(i) Security ownership of certain record and beneficial owners (of more than 5%) as of February 28, 2021.
Title of Class
Name, address of Record Owner and Relationship with Issuer
Name of Beneficial Owner and Relationship with Record Owner
Citizenship No. of Shares Held
Percent of Outstanding Shares
Common AC Industrial Technology Holdings, Inc.1 32nd Floor, Tower One and
AC Industrial Technology Holdings, Inc.2
Filipino 1,153,725,046
52.0330%
1 AC Industrial Technology Holdings, Inc. (AC Industrials) is a stockholder of the Company. 2 The Board of Directors of AC Industrials has the power to decide how AC Industrials’ shares in IMI are to be voted. Mr. Jaime Augusto Zobel de Ayala has been named and appointed to exercise the voting power.

__________________________________________________________________________ 5
Exchange Plaza, Ayala Triangle, Ayala Avenue, Makati City.
Common PCD Nominee Corporation (Non- Filipino)3 29th Floor, BDO Equitable Tower, 8751 Paseo de Roxas, Makati City 1226
PCD participants acting for themselves or for their customers 4
Various Non-Filipino
322,486,924 14.5442%
Common Resins, Inc.5 E. Rodriguez Jr. Avenue, Bagong Ilog, Pasig City.
Resins, Inc.6 Filipino 291,785,034 13.1595%
Common PCD Nominee Corporation (Filipino)3
29th Floor, BDO Equitable Tower, 8751 Paseo de Roxas, Makati City 1226
PCD participants acting for themselves or for their customers4
Filipino 191,712,088 8.6462%
Common PCD Nominee Corporation (Non- Filipino)3 29th Floor, BDO Equitable Tower, 8751 Paseo de Roxas, Makati City 1226
Fremach International7 Belgian 200,000,000 9.0200%
(ii) Security ownership of directors and management as of February 28, 2021.
Title of Class Name of Beneficial Owner Amount and Nature of Beneficial
Ownership Citizenship Percentage
of Ownership
Directors Common Jaime Augusto Zobel de Ayala 100 (direct) Filipino 0.0000% Common Fernando Zobel de Ayala 100 (direct) Filipino 0.0000% Common Delfin L. Lazaro 100 (direct) Filipino 0.0000% Common Jose Teodoro K. Limcaoco 100 (direct) Filipino 0.0000% Common Arthur R. Tan 21,223,552 (direct & indirect) Filipino 0.9572% Common Rafael C. Romualdez 1 (direct) Filipino 0.0000% Common Jose Ignacio A. Carlos 1 (direct) Filipino 0.0000% Common Edgar O. Chua 100 (direct) Filipino 0.0000% Common Hiroshi Nishimura 712,578 (direct & indirect) Japanese 0.0321% Common Sherisa P. Nuesa 853,385 (direct & indirect) Filipino 0.0385% Common Diosdado P. Banatao 115 (direct) Filipino 0.0000% CEO and Most Highly Compensated Officers Common Arthur R. Tan 21,223,552 (direct & indirect) Filipino 0.9572% Common Eric De Candido 0 French 0.0000% Common Laurice S. Dela Cruz 157,221 (indirect) Filipino 0.0071% Common Mary Ann S. Natividad 882,139 (direct & indirect) Filipino 0.0398%
3 PCD Nominee Corporation (PCD) is not related to the Company. 4 Each beneficial owner of shares through a PCD participant is the beneficial owner to the extent of the number of shares in his/her account with the PCD participant. The beneficial owner, with certification of ownership of shares from the PCD Participant, has the power to vote either in person or by proxy. Out of the 514,199,012 common shares registered in the name of PCD, 234,858,328 common shares or 10.5921%of the outstanding common shares are for the account of The Hongkong and Shanghai Banking Corporation (HSBC). As communicated to the Company, neither HSBC nor any of its customers beneficially owns more than 5% of the Company’s common shares. 5 Resins is not related to the Company. 6 The Board of Directors of Resins has the power to decide how Resins’ shares in IMI are to be voted. Mr. Jose Ignacio A. Carlos is usually appointed to exercise the voting power. 7 The Board of Directors of Fremach International has the power to decide how Fremach International’s shares in IMI are to be voted. The Chairman of the meeting is usually appointed to exercise the voting power.

__________________________________________________________________________ 6
Common Jerome S. Tan 2,884,733 (indirect) Singaporean 0.1301% Other Executive Officers Common Rosalyn O. Tesoro 19,505 (indirect) Filipino 0.0009% Common Solomon M. Hermosura 620,015 (indirect) Filipino 0.0203% Common Joanne M. Lim 0 Filipino 0.0000% All Directors and Officers as a group 27,353,745 1.2336%
No director or member of the Company’s management owns 2.0% or more of the outstanding capital stock of the Company.
(iii) Voting trust holders of 5% or more
The Company knows of no person holding more than 5% of common shares under a voting trust or similar agreement.
(iv) Changes in control
No change of control in the Company has occurred since 2017.
e. Foreign owned shares as of February 28, 2021: 534,133,096 shares or 24.0894% of the total
outstanding shares
Item 5. Directors and executive officers
Section 9 of Article III of the By-laws provides:
Section 9 - At the regular general meetings, a Board of eleven (11) Directors shall be elected who shall hold office for a term of one (1) year or until their successors shall have been elected and qualified.
The attendance of the directors at the meetings of the Board of Directors (the “Board”) held in 2020 is as follows:
Directors No. of Meetings Attended/Held8 Percent Present
Jaime Augusto Zobel de Ayala 6/6 100% Fernando Zobel de Ayala 6/6 100% Delfin L. Lazaro 6/6 100% Jose Teodoro K. Limcaoco 6/6 100% Arthur R. Tan 6/6 100% Gilles Bernard9 0/2 - Jose Ignacio A. Carlos 6/6 100% Rafael C. Romualdez 6/6 100% Hiroshi Nishimura10 4/5 80% Edgar O. Chua 6/6 100% Sherisa P. Nuesa 6/6 100% Diosdado P. Banatao11 4/5 80%
8 In 2020 during the incumbency of the director. 9 Resigned on June 17, 2020. 10 His term expired on April 15, 2020 and was replaced as an Independent Director of the Company by Mr. Banatao on the same date. He was re-elected as an Independent Director on June 17, 2020. 11 Elected as Independent Director on April 15, 2020.

__________________________________________________________________________ 7
The Management Committee members and other officers of the Company, unless removed by the Board, shall serve as such until their successors are elected or appointed.
a. Information required of directors and executive officers
i. Directors and executive officers
The nominees for election to the Board at the annual meeting of the shareholders are as follows:
Jaime Augusto Zobel de Ayala Alberto M. de Larrazabal Fernando Zobel de Ayala Diosdado P. Banatao Arthur R. Tan Sherisa P. Nuesa Jose Ignacio A. Carlos Rafael C. Romualdez Edgar O. Chua Hiroshi Nishimura Delfin L. Lazaro
Messrs. Edgar O. Chua, Diosdado P. Banatao, and Hiroshi Nishimura, and Ms. Sherisa P. Nuesa are nominated as independent directors. Mr. Aldrin Lopez, a shareholder of the Company, formally nominated all the eleven (11) candidates. Mr. Lopez is not related to any of the nominees. Please refer to Annex “B” for the summary of the directors’ qualifications. The certifications on the qualifications of the nominees for independent directors are attached herewith as Annex “B-1”.
Each nominee has accepted his or her nomination. The Corporate Governance and Nomination Committee of the Company (with Sherisa P. Nuesa, as Chairman and Hiroshi Nishimura and Edgar O. Chua, as members) evaluated the qualifications of the nominees and prepared the final list of nominees in accordance with SRC Rule 38 (Requirements on Nomination and Election of Independent Directors) and the By-laws of the Company. Messrs. Jaime Augusto Zobel de Ayala, Fernando Zobel de Ayala, Lazaro, Romualdez, Tan, Carlos, and Chua have served as directors of the Company for more than five years; Mr. Limcaoco for five years; Ms. Nuesa for three years; and Mr. Banatao for one year. Mr. Nishimura served as an Independent Director of the Company from April 2010 to April 2020. He was re-elected as an Independent Director on June 17, 2020. The Corporate Governance and Nomination Committee endorsed his nomination as an independent director notwithstanding the fact that if elected once again, his service as such will exceed the recommended nine-year term provided in the SEC Corporate Governance Code for Publicly-Listed Companies after taking into consideration Mr. Nishimura’s commitment and dedication in fulfilling his mandate. The above-named nominees are expected to attend the annual stockholders’ meeting. The Company undertakes to abide by SRC Rule 38 on the required number of independent directors subject to any revision that may be prescribed by the Securities and Exchange Commission (“SEC”). None of the directors and officers of the Company are employed by the Philippine government.

__________________________________________________________________________ 8
ii. Significant employees
The Company attributes its continued success to the collective efforts of its employees, all of whom contribute significantly to the business in various ways.
iii. Family relationships
Jaime Augusto Zobel de Ayala, Chairman of the Board, and Fernando Zobel de Ayala, a director of the Company, are brothers. Jose Ignacio A. Carlos and Rafael C. Romualdez, both incumbent directors, are first cousins. Except for the foregoing, there are no known family relationships between the current members of the Board and the key officers.
iv. Involvement in Certain Legal Proceedings There are no material pending legal proceedings, bankruptcy petition, conviction by final judgment, order, judgment or decree or any violation of a securities or commodities law for the past five years up to the present date to which the Company or any of its subsidiaries or its directors or executive officers is a party or of which any of its material properties are subject in any court or administrative government agency.
The Company filed a civil case on April 11, 2011 against Standard Insurance (“Standard”) seeking to collect Standard’s share in the loss incurred by the Company consisting in damage to production equipment and machineries as a result of the May 24, 2009 fire at the Company’s Cebu facility which the Company claims to be covered by Standard’s “Industrial All Risks Material Damage with Machinery Breakdown and Business Interruption” policy. The share of Standard in the loss is 22% or US $1,117,056.84 after its co-insurers all paid the amount of loss respectively claimed from them. The Company had to resort to court action after Standard denied its claim on the ground that the claim is an excepted peril. Standard filed a motion to dismiss on various grounds, such as lack of cause of action and of prescription. The Regional Trial Court denied the motion to dismiss but Standard filed a Motion for Reconsideration with the Court of Appeals (CA). On April 26, 2013, the CA dismissed the case on the ground that the claim has prescribed. On April 19, 2013, the Company filed a Motion for Reconsideration. On December 10, 2013, the Company received a decision promulgated on December 2, 2013 denying the said Motion for Reconsideration. The Company filed a Petition for Review on Certiorari dated January 23, 2014 with the Supreme Court (SC). On 17 February 2021, IMI received the SC’s Decision dated 27 August 2020 affirming the Decision of the CA. IMI will be filing its Motion for Reconsideration within the reglementary period.
b. Certain relationships and related transactions
The Company and its subsidiaries (the “Group”), in its regular conduct of business, has entered into transactions with subsidiaries, affiliate, and other related parties principally consisting of advances, loans and reimbursement of expenses. Sales and purchases of goods and services as well as other income and expenses to and from related parties are made at normal commercial prices and terms. None of the Company’s directors have entered into self-dealing and related party transactions with or involving the Company in 2020.

__________________________________________________________________________ 9
Terms and Conditions of Transactions with Related Parties The Group has a Related Party Transactions (RPT) Committee that evaluates and governs related party transactions. Prior to finalization of any related party agreement, the management shall report for review and approval to the RPT Committee all new and proposed significant related party transaction above the threshold set by the RPT Committee. Outstanding balances at year-end are unsecured and settlement occurs in cash unless otherwise stated. For the years ended December 31, 2020, 2019 and 2018, the Group has not recorded any impairment on receivables relating to amounts owed by related parties. Impairment assessment is undertaken each financial year through examining the financial position of the related parties and the markets in which the related parties operate. In the ordinary course of business, the Group transacts with its related parties. The transactions and balances of accounts with related parties follow:
• Transactions with Bank of the Philippine Islands (BPI), an affiliate As of December 31, 2020 and 2019, the Group maintains current and savings accounts and short-term investments with BPI amounting to nil and $1.14 million, respectively. Total interest income earned from investments with BPI amounted to $0.01 million, $0.01 million and $0.31 million for the years ended December 31, 2020, 2019 and 2018, respectively.
• Outstanding balances of the Group’s related party transactions with its affiliates follow:
Receivables/Deposits Payables 2020 2019 2020 2019 KTM Asia Motor Manufacturing Inc. (KAMMI) $184,412 $256,167 $– $– Merlin Solar Technologies (Phils.) Inc. (MSTPI) 99,862 135,751 – – AC Industrials Technology Inc. (AC Industrials) 14,979 48,055 – – BPI – – 20,873 – Innove Communication, Inc. (ICI) 6,460 Globe Telecom, Inc. (GTI) – – – 2,024 $299,253 $439,973 $27,333 $2,024
i. Transaction with KAMMI and MSTPI pertains to trade related receivables.
ii. Transaction with AC Industrials pertains to management fee on corporate and support services.
iii. Payable to BPI pertains to employee related transactions.
iv. Payables to ICI pertain to building rental, leased lines, internet connections and ATM connections.
v. Payables to GTI pertain to billings for software and WiFi connections. These are due and demandable.
• Revenue/income and expenses from the Group’s affiliates follow:
Revenue/Income Expenses
2020 2019 2018 2020 2019 2018 KAMMI $1,040,797 $1,361,041 $3,845,192 $– $– $–

__________________________________________________________________________ 10
MSTPI 857,807 668,115 872,118 – – – AC Industrials 42,801 49,370 − – – – BPI 3,851 9,740 223,944 − − − IADI – – 110,900 – – – HCMI – – 66,540 – – – ACEI – – 15,430 – – – TLI – – – 1,407,557 1,094,592 1,032,845 Laguna Water (LAWC) – – – 961,519 608,094 571,938 AC – – – 676,738 1,913,224 1,664,336 AG Legal – – – 172,011 113,111 131,289 ICI – – – 135,011 210,871 132,578 GTI – – – 103,492 147,337 108,812 ACEHI – – – – 463,874 4,633,019 $1,945,256 $2,088,266 $5,134,124 $3,456,328 $4,551,103 $8,274,817
Revenue/income from its affiliates pertains to the following transactions:
i. Revenues from KAMMI and MSTPI pertain to subcontracting services related to registered activities.
ii. Revenues from AC Industrials, IADI, HCMI and ACEI represent recoveries for the provision of
corporate and support services.
iii. Interest income earned from investments with BPI.
Expenses incurred from related party transactions include:
i. Light and power allocation charged by ACEHI to the Parent Company. The contract with ACEHI ended in January 2019.
ii. Administrative services charged by AC related to certain transactions.
iii. Rental expense from the lease contract between the Parent Company and TLI.
iv. Water allocation charged by LAWC.
v. Building rental, leased lines, internet connections and ATM connections with ICI.
vi. Consultations on legal matters and assistance on regulatory and legal requirements from AG
Legal.
vii. Billings for cellphone charges and WiFi connections with GTI.
• Revenue and expenses eliminated at the Group level follow:
i. Intercompany revenues mainly pertain to billings of IMI USA and IMI Japan to IMI Singapore and the Parent Company for recovery costs related to the management salaries of key management personnel under IMI ROHQ.
ii. Expenses incurred from related party transactions include interest expense of PSi, IMI MX, STI
and IMI CZ from loans granted by the Parent Company, IMI Singapore and STSN.
Guarantees and Commitments IMI BG has agreed to provide continuing operational, investment and financial assistance to the facilities of C-Con GmbH (“C-Con”), a related party and an entity under common control of AC

__________________________________________________________________________ 11
Industrials, for C-Con will duly and timely perform all required obligations under contracts to be entered into with a particular customer. In case of C-Con’s failure to perform its contractual obligations under the contract including but not limited to failure to perform due to C-Con’s insolvency (“Breach”), IMI BG will indemnify and hold harmless the customer from any and all costs, liabilities, damages, losses, and reasonable amount of actually-incurred out of pocket expenses (including court costs and legal expenses) of the customer occasioned by or arising from such Breach. As consideration for extending said guarantee, IMI BG will be charging C-Con a guarantee fee equivalent to two (2%) of the revenue for the projects won using or relying upon IMI BG’s guarantee. Additionally, IMI BG’s guarantee to C-Con is backstopped by AC Industrials (Singapore) Pte. Ltd., another related party of IMI BG. Compensation of Key Management Personnel of the Group Compensation of key management personnel by benefit type follows:
2020 2019
Short-term employee benefits $6,482,92
8 $9,513,67
8 Post-employment benefits 73,519 206,487
$6,556,44
7 $9,720,16
5
c. Ownership structure and parent company
The Company’s parent is AC Industrial Technology Holdings, Inc. which owns 52.0330% of the total outstanding capital stock of the Company as of February 28, 2021. Resins, Inc. owns 13.1595% of the total outstanding capital stock of the Company.
d. Resignation of directors
No director has resigned from or declined to stand for re-election to the Board since the date of the 2020 annual meeting of stockholders due to any disagreement with the Company relative to the Company’s operations, policies and practices.
Item 6. Compensation of directors and executive officers a. Executive Compensation
Name and Principal Position Year Salary Other Income
Arthur R. Tan President and Chief Executive Officer
Eric De Candido Chief Operations Officer
Laurice S. Dela Cruz Global Head, Financial Planning and Analysis and Compliance Officer
Mary Ann S. Natividad Chief Commercial Officer
Jerome S. Tan Senior Managing Director, Global Chief Financial Officer and Treasurer
CEO & Other Named Executive Officers
Actual 2019 (Restated)**
P 145.22M P 25.19M
Actual 2020*** 65.05M 24.03M

__________________________________________________________________________ 12
Projected 2021 68.30M 25.23M All officers as a group unnamed* Actual 2019
(Restated)** P 763.97M P 142.09M
Actual 2020*** 565.04M 82.32M Projected 2021 593.29M 86.44M
*All employees with a rank of manager and higher, including all above-named officers.
**Restated amount due to inclusion of a recently acquired subsidiary. ***Reduction of Allocation to IMI The Company has no other arrangement with regard to the remuneration of its existing directors and officers aside from the compensation received as stated above.
b. Compensation of directors
Section 9 of Article IV of the By-laws provides:
Section 9 - Each director shall be entitled to receive from the Corporation, pursuant to a resolution of the Board of Directors, fees and other compensation for his services as director. The Board of Directors shall have the sole authority to determine the amount, form and structure of the fees and other compensation of the directors. In no case shall the total yearly compensation of directors exceed five percent (5%) of the net income before income tax of the Corporation during the preceding year. (As amended on February 23, 2011.)
x x x
The Chairman of the Board shall receive such remuneration as may be fixed by
the Board of Directors each year, in addition to the per diem and compensation that each Director may be entitled to receive. (As amended on February 23, 2011.)
i. Standard arrangement
During the 2008 annual stockholders’ meeting, the stockholders approved a resolution fixing the remuneration of non-executive directors as follows: Board Meeting Fee per meeting attended P 100,000.00 Committee Meeting Fee per meeting attended P 20,000.00 The executives who are members of the Board of the Company do not receive any amount as per diem. Their compensation as executives of the Company is included in the compensation table indicated above.
In 2020, the non-executive directors and independent directors of the Company received remuneration, as follows:
Name Amount Jaime Augusto Zobel de Ayala PhP600,000.00 Fernando Zobel de Ayala 600,000.00 Jose Teodoro K. Limcaoco 800,000.00 Delfin L. Lazaro 700,000.00 Jose Ignacio A. Carlos 640,000.00 Rafael C. Romualdez 840,000.00

__________________________________________________________________________ 13
Edgar O. Chua 800,000.00 Diosdado P. Banatao 400,000.00 Sherisa P. Nuesa 760,000.00 Hiroshi Nishimura 560,000.00
ii. Other arrangements
None of the non-executive directors and independent directors have been engaged and compensated by the Company for services other than those provided as a director. The Company has no other arrangement with regard to the remuneration of its existing directors and officers aside from the compensation received as herein stated.
c. Employment contracts and termination of employment and change-in-control arrangements
The above-named executive officers are covered by letters of appointment and employment agreements stating their respective job functions, among others.
d. Warrants and options outstanding, repricing
The Company has not offered any stock options, warrants or rights to its employees. Item 7. Independent Public Accountants
a. The principal accountant and external auditor of the Company is the accounting firm of SyCip Gorres Velayo & Company (SGV & Co.). The same accounting firm is being recommended for election at the scheduled annual stockholders’ meeting.
b. Representatives of SGV & Co. for the most recently completed fiscal year are expected to be present
at the annual stockholders’ meeting. They will have the opportunity to make a statement if they desire to do so and are expected to be available to respond to appropriate questions. Pursuant to the General Requirements of Revised SRC Rule 68, Par. 3 (Qualifications and Reports of Independent Auditors), the Company has engaged SGV & Co. as external auditor of the Company. Ms. Cyril Jasmin B. Valencia is the audit partner for the years 2020 and 2019, while Mr. Carlo Paolo V. Manalang served as such for the audit years 2018 and 2017.
c. Changes in and disagreements with accountants on accounting and financial disclosure
The Company has engaged the services of SGV & Co. during the two most recent fiscal years. There
are no disagreements with SGV & Co. on accounting and financial disclosures. d. Audit and audit-related fees
The Company paid or accrued the following fees to its external auditors in the past two years:
Audit & Audit-related Fees Tax Fees Other Fees
2020 P 4.17M - P 0.07M 2019 P 16.00M - P 0.07M
Audit and audit-related fees include the audit of annual financial statements and review of interim financial statements and services that are normally provided by the independent auditor in connection

__________________________________________________________________________ 14
with statutory and regulatory filings or engagements for those calendar years. The 2019 audit fees include fees amounting to P11.9M for the review of interim financial statements.
The fees above are exclusive of out-of-pocket expenses incidental to the independent auditors’ work.
e. Tax fees
The Company engaged SGV & Co. to perform tax advisory services in 2018.
f. All other fees The Company engaged the services of SGV & Co. to perform financial and accounting advisory, financial reporting valuation reviews, assessment of compliance with the Data Privacy Act in 2018, and the validation of votes during its 2020 and 2019 annual stockholders’ meetings.
The Company’s Audit and Risk Committee (with Edgar O. Chua, as Chairman and Rafael C. Romualdez and Hiroshi Nishimura, as members) recommended the election of SGV & Co. as its external auditor and the fixing of the audit fees to the Board. Likewise, the other services rendered by SGV & Co. were approved by the Board of Directors upon the recommendation of the Audit and Risk Committee. The foregoing recommendations are now being endorsed for approval by the stockholders.
Item 8. Compensation Plans No matter or action relating to any compensation plan pursuant to which cash or non-cash compensation may be paid or distributed will be taken up during the meeting.
C. ISSUANCE AND EXCHANGE OF SECURITIES
Item 9. Authorization or issuance of securities other than for exchange No matter or action concerning authorization or issuance of securities will be taken up during the meeting.
Item 10. Modification or exchange of securities
The Company will not be presenting any matter or act involving the modification of any class of the Company’s securities or the issuance or authorization for issuance of one class of the Company’s securities in exchange for outstanding securities of another class, during the meeting.
Item 11. Financial and other information
The audited financial statements as of December 31, 2020, Management’s Discussion and Analysis, Market Price of Shares and Dividends and other data related to the Company’s financial information are attached hereto as Annex “C.” The schedules required under Part IV(c) of Revised SRC Rule 68 will be included in the Annual Report (Form 17-A).
Item 12. Mergers, consolidations, acquisitions and similar matters
There is no proposed merger, consolidation, acquisition by, sale or liquidation of the Company that will be presented during the meeting.
Item 13. Acquisition or disposition of property

__________________________________________________________________________ 15
There are no matters or actions to be taken up in the meeting with respect to an acquisition or disposition
of any property by the Company requiring stockholders’ approval under the Revised Corporation Code.
Item 14. Restatement of accounts
The accounting policies adopted in the preparation of the unaudited interim condensed consolidated financial statements are consistent with those of the previous financial years except for the new PFRS, amended PFRS and improvements to PFRS which were adopted beginning January 1, 2020. The Group has not early adopted any other standard, interpretation or amendment that has been issued but is not yet effective.
• Amendments to PFRS 3, Business Combinations, Definition of a Business
The amendments to PFRS 3 clarify that to be considered a business, an integrated set of activities and assets must include, at a minimum, an input and a substantive process that together significantly contribute to the ability to create output. Furthermore, the amendments clarify that a business can exist without including all of the inputs and processes needed to create outputs. These amendments may impact future periods should the Group enter into any business combinations. These amendments had no impact on the consolidated financial statements of the Group as it did not enter to any business combinations during the period.
• Amendments to PFRS 7, Financial Instruments: Disclosures and PFRS 9, Financial Instruments, Interest Rate Benchmark Reform The amendments to PFRS 9 provide a number of reliefs, which apply to all hedging relationships that are directly affected by the interest rate benchmark reform. A hedging relationship is affected if the reform gives rise to uncertainties about the timing and or amount of benchmark-based cash flows of the hedged item or the hedging instrument. These amendments had no impact on the consolidated financial statements of the Group.
• Amendments to PAS 1, Presentation of Financial Statements, and PAS 8, Accounting Policies,
Changes in Accounting Estimates and Errors, Definition of Material The amendments provide a new definition of material that states “information is material if omitting, misstating or obscuring it could reasonably be expected to influence decisions that the primary users of general purpose financial statements make on the basis of those financial statements, which provide financial information about a specific reporting entity.” The amendments clarify that materiality will depend on the nature or magnitude of information, either individually or in combination with other information, in the context of the financial statements. A misstatement of information is material if it could reasonably be expected to influence decisions made by the primary users. The amendments were consistently applied to the disclosures of the Group.
• Conceptual Framework for Financial Reporting issued on March 29, 2018 The Conceptual Framework is not a standard, and none of the concepts contained therein override the concepts or requirements in any standard. The purpose of the Conceptual Framework is to assist the

__________________________________________________________________________ 16
standard-setters in developing standards, to help preparers develop consistent accounting policies where there is no applicable standard in place and to assist all parties to understand and interpret the standards. The revised Conceptual Framework includes new concepts, provides updated definitions and recognition criteria for assets and liabilities and clarifies some important concepts. The amendments were consistently applied to the disclosures of the Group.
• Amendments to PFRS 16, COVID-19-related Rent Concessions The amendments provide relief to lessees from applying the PFRS 16 requirement on lease modifications to rent concessions arising as a direct consequence of the COVID-19 pandemic. A lessee may elect not to assess whether a rent concession from a lessor is a lease modification if it meets all of the following criteria: • The rent concession is a direct consequence of COVID-19; • The change in lease payments results in a revised lease consideration that is substantially the same
as, or less than, the lease consideration immediately preceding the change; • Any reduction in lease payments affects only payments originally due on or before June 30, 2021;
and • There is no substantive change to other terms and conditions of the lease. A lessee that applies this practical expedient will account for any change in lease payments resulting from the COVID-19 related rent concession in the same way it would account for a change that is not a lease modification, i.e., as a variable lease payment. The amendments are effective for annual reporting periods beginning on or after June 1, 2020. Early adoption is permitted. The Group adopted the amendments to PFRS 16 using the practical expedient beginning January 1, 2020.
Pronouncements issued but not yet effective are listed below. Unless otherwise indicated, the Group does not expect that the future adoption of the said pronouncements will have a significant impact on its consolidated financial statements. The Group intends to adopt the following pronouncements when they become effective.
Effective beginning on or after January 1, 2021
• Amendments to PFRS 9, PFRS 7, PFRS 4 and PFRS 16, Interest Rate Benchmark Reform – Phase 2
Effective beginning on or after January 1, 2022 • Amendments to PFRS 3, Reference to the Conceptual Framework • Amendments to PAS 16, Plant and Equipment: Proceeds before Intended Use • Amendments to PAS 37, Onerous Contracts – Costs of Fulfilling a Contract • Annual Improvements to PFRSs 2018-2020 Cycle
Amendments to PFRS 1, First-time Adoption of Philippines Financial Reporting Standards,
Subsidiary as a first-time adopter
__________________________________________________________________________ 17
Amendments to PFRS 9, Financial Instruments, Fees in the ’10 per cent’ test for derecognition of financial liabilities
Amendments to PAS 41, Agriculture, Taxation in fair value measurements
Effective beginning on or after January 1, 2023 • Amendments to PAS 1, Classification of Liabilities as Current or Non-current • PFRS 17, Insurance Contracts
Deferred effectivity • Amendments to PFRS 10, Consolidated Financial Statements, and PAS 28, Sale or Contribution of
Assets between an Investor and its Associate or Joint Venture D. OTHER MATTERS Item 15. Action with respect to reports
a. Approval of the minutes of the 2020 annual stockholders’ meeting held on April 15, 2020 covering the following matters:
(i) Annual report of officers; (ii) Ratification of the acts of Board of Directors and Officers; (iii) Election of Directors, including the Independent Directors, and (iv) Election of external auditor and fixing of its remuneration.
The minutes of the 2020 Annual Stockholders Meeting had been uploaded to the Company’s website
within five (5) days from the date of the meeting and may be viewed through the following link: https://www.global-imi.com/sites/default/files/IMI%20-%202020%20ASM%20Minutes%20.pdf
b. Approval of the annual report of Management for the year ending December 31, 2020.
Item 16. Matters Not Required to be Submitted
There are no matters or actions to be taken up in the meeting that will not require the vote of the stockholders as of the record date.
Item 17. Amendment of charter, by-laws or other documents
On October 8, 2020, Board of Directors ratified and approved the amendments to various sections of the By-Laws, as endorsed by the Corporate Governance and Nomination Committee of the Board. The substantial and significant amendments are summarized in the attached Annex “D”. In addition to the foregoing amendments, there were editorial revisions, updating of references to applicable laws, formatting changes and renumbering of the sections. The amendments are intended primarily to align the Company’s By-Laws with the Revised Corporation Code and with recognized good corporate governance practices, and to digitalize certain governance processes. Given that the Company’s stockholders have delegated to the Board the authority to amend the By-Laws, the amendments will become effective upon approval by the Securities and Exchange Commission. This

__________________________________________________________________________ 18
matter will be presented to the Company’s stockholders at their annual meeting in 2021 as part of the resolutions of the Board for ratification. The Board of Directors also approved the updating of the Charters of the Personnel and Compensation Committee and the Corporate Governance Committee on October 8, 2020.
Item 18. Other proposed actions
a. Ratification of the acts of the Board of Directors and Officers
The acts of the Board of Directors and Officers involve – (i) Constitution of Board Committees and appointment of Chairmen and members; (ii) Election of lead independent director and officers; (iii) Updating of the lists of attorneys-in-fact and bank signatories; (iv) Ratification of the actions of the board committees including the approval of the hedging
plans; (v) Authorization of capital-raising exercises by subsidiaries; (vi) Renewal of credit facilities from various banks and other fund-raising exercises; (vii) Renaming of Compensation Committee as Personnel and Compensation Committee, and the
amendment of its Charter; (viii) Amendment of the Charter of the Corporate Governance and Nomination Committee (ix) Amendment of the Corporation’s By-Laws to align with the Revised Corporation Code and
with recognized good corporate governance practices, as well as to digitalize certain governance processes of the Corporation;
(x) Sale of industrial building and closure of IMI Cavite Plant; (viii) Renewal of lease agreement for the parcel of land being occupied by the Corporation; (ix) Implementation of strategic business initiatives through the execution of relevant agreements; (x) 2021 budget; and (xi) Appointment of new officers
b. Election of the members of the Board, including the independent directors, for the ensuing calendar year; and
c. Election of external auditor and fixing of its remuneration.
Item 19. Voting procedures
a. Vote required
The affirmative vote of at least a majority of the issued and outstanding capital stock entitled to vote and represented at the annual stockholders’ meeting is required for the approval of all matters to be presented to the stockholders for decision. The election of directors is by plurality of votes.
b. Method of Voting In all items for approval, each share of stock entitles its registered owner as of Record Date to one vote. In light of the Regulations (as defined in Item 20), stockholders will only be allowed to vote by appointing the Chairman of the meeting as their proxy or electronically in absentia. In the case of election of directors, each stockholder may vote such number of shares for as many persons as there are directors to be elected or he may cumulate said shares and give one nominee as

__________________________________________________________________________ 19
many votes as the number of directors to be elected multiplied by the number of his shares, or he may distribute them on the same principle among as many nominees as he shall see fit, provided that the whole number of votes cast by him shall not exceed the number of shares owned by him multiplied by the total number of directors to be elected. Proxies shall be in writing, signed and filed, by the stockholders, in the form provided in this DIS, and shall be received by the Corporate Secretary at [email protected] on or before April 5, 2021. A stockholder may vote electronically in absentia using the online web address, http://www.ayalagroupshareholders.com/, subject to validation procedures. A stockholder voting electronically in absentia shall be deemed present for purposes of quorum.
All votes will be counted and tabulated by the Proxy Validation Committee and the results will be validated by an independent third party.
Item 20. Participation of Shareholders by Remote Communication
To comply with applicable regulations prohibiting mass gatherings, and/or requiring social distancing to prevent the spread of COVID-19 (the “Regulations”) and to ensure the safety and welfare of its stockholders, the Company will dispense with the physical attendance of stockholders at the meeting and will allow attendance only by remote communication, as set forth below, and by voting in absentia, as provided in Item 4(c) and Item 19 above, or voting through the Chairman of the meeting as their proxy.
The live webcast of the meeting shall be accessible through the following online web address: http://www.ayalagroupshareholders.com/. To enable the Company to perform validation procedures, identify the shareholders participating by remote communication and record their presence for purposes of quorum, the shareholders shall inform the Company by email to [email protected] on or before April 5, 2021, of their participation in the meeting by remote communication. Further, stockholders may participate by remote communication by clicking on the Meeting livestreaming access button which will be available on the Stockholder’s dashboard in the VIASH System on the date set for the Meeting as indicated in the Company’s Notice of Meeting. Stockholders may email questions or comments prior to or during the meeting at the following email address: [email protected]. The detailed instructions for participation through remote communication are set forth in Annex A (II).
Item 21. Acceptance of Stockholder Proposals on Agenda Item Stockholders of record as of March 1, 2021 owning at least 5% of the total outstanding capital stock of the Company may submit proposals on items for inclusion in the agenda on or before April 8, 202112.
12 The inclusion of the proposed agenda item shall be in accordance with SEC Memorandum Circular No. 14, Series of 2020, and the Company’s internal guidelines.

__________________________________________________________________________ 20
After reasonable inquiry and to the best of my knowledge and belief, I certify that the information set forth in this report is true, complete and correct. This report is signed this March 23, 2021.
INTEGRATED MICRO-ELECTRONICS, INC.
by: SOLOMON M. HERMOSURA Corporate Secretary

__________________________________________________________________________ 21
ANNEX “A”
2021 ANNUAL STOCKHOLDERS’ MEETING
OF INTEGRATED MICRO-ELECTRONICS, INC.
(THE “MEETING”)
REQUIREMENTS AND PROCEDURE FOR ELECTRONIC VOTING IN ABSENTIA
AND PARTICIPATION BY REMOTE COMMUNICATION
Electronic voting in absentia and participation by remote communication shall be allowed only through complete registration and successful validation in the Voting in Absentia & Shareholder (VIASH) System.
I. ELECTRONIC VOTING IN ABSENTIA I. ELECTRONIC VOTING IN ABSENTIA 1. Stockholders as of March 1, 2021 (“Stockholders”) have the option of electronic voting in absentia on the
matters in the Agenda, after complete registration and successful validation in the VIASH System. Stockholders with e-mail addresses on record shall be sent an e-mail with a link to the VIASH System. To register in the VIASH System, Stockholders shall simply follow the instructions sent in the e-mail.
2. Otherwise, Stockholders may access the link http://www.ayalagroupshareholders.com/ to create an account and register in the VIASH System. Stockholders should complete the online registration form and submit for validation together with the requirements provided in Item 4 below.
3. All registered accounts shall be subject to the validation process set forth in this Annex. The deadline for
registration to vote in absentia is April 5, 2021. The VIASH System will be open for registration on March 19, 2021.
4. The following are needed for registration:
4.1 For individual Stockholders –
4.1.1 A recent photo of the Stockholder, with the face fully visible (in JPG or PNG format). The
file size should be no larger than 5MB; 4.1.2 A scanned copy of the Stockholder’s valid government-issued ID showing photo and
personal details, preferably with residential address (in JPG or PDF format). The file size should be no larger than 5MB;
4.1.3 A valid and active e-mail address; 4.1.4 A valid and active contact number;
4.2 For Stockholders with joint accounts –
A scanned copy of an authorization letter signed by all Stockholders, identifying who among them is authorized to cast the vote for the account (in JPG or PDF format). The file size should be no larger than 5MB;

__________________________________________________________________________ 22
4.3 For Stockholders under Broker accounts –
4.3.1 A broker’s certification on the Stockholder’s number of shareholdings (in JPG or PDF
format). The file size should be no larger than 5MB; 4.3.2 A recent photo of the stockholder, with the face fully visible (in JPG or PNG format). The
file size should be no larger than 5MB; 4.3.3 A scanned copy of the Stockholder’s valid government-issued ID showing photo and
personal details, preferably with residential address (in JPG or PDF format). The file size should be no larger than 5MB;
4.3.4 A valid and active e-mail address; 4.3.5 A valid and active contact number;
4.4 For corporate Stockholders –
4.4.1 A secretary’s certificate attesting to the authority of the representative to vote for, and on
behalf of the Corporation (in JPG or PDF format). The file size should be no larger than 5MB;
4.4.2 A recent photo of the Stockholder’s representative, with the face fully visible (in JPG or PNG format). The file size should be no larger than 5MB;
4.4.3 A scanned copy of the valid government-issued ID of the Stockholder’s representative showing photo and personal details, preferably with residential address (in JPG or PDF format). The file size should be no larger than 5MB;
4.4.4 A valid and active e-mail address of the Stockholder’s representative; 4.4.5 A valid and active contact number of the Stockholder’s representative.
Important Notes: • Stockholders who are also stockholders as of record date of the other publicly listed corporations in the Ayala group need only to register one account in the VIASH System. The digital absentee ballot for each corporation shall be separately accessed from the Stockholder’s Dashboard in the VIASH System and votes shall be cast per corporation.
• Considering the prevailing extraordinary circumstances in relation to COVID-19, the Company shall allow electronic signature for the required documents, as applicable. Notarization requirement shall also be dispensed with at this time. However, the Company reserves the right to request additional information, and original signed and notarized copies of these documents at a later time. • Incomplete or inconsistent information may result in an unsuccessful registration. As a result, Stockholders will not be allowed access to vote electronically in absentia, but may still vote through the Chairman of the Meeting as their proxy, by submitting a duly accomplished proxy form, on or before April 5, 2021.
5. The validation process in the VIASH System will be concluded by the Company no later than three (3)
business days from the date of the Stockholder’s complete registration. The Stockholder’s dashboard in the VIASH System will indicate the status of registration.
Once validated, the Stockholder will receive an e-mail confirmation on their successful registration. Registered Stockholders have until the end of the Meeting to cast their votes in absentia.
6. All agenda items indicated in the Notice of the Meeting will be set out in the digital absentee ballot in the
VIASH System and the registered Stockholder may vote as follows:

__________________________________________________________________________ 23
6.1 For items other than the Election of Directors, the registered Stockholder has the option to vote: For,
Against, or Abstain. The vote is considered cast for all the registered Stockholder’s shares. 6.2 For the Election of Directors, the registered Stockholder may either: (1) vote for all nominees, (2)
not vote for any of the nominees, or (3) vote for some nominees only, in such number of shares as preferred by the Stockholder, provided that the total number of votes cast shall not exceed the number of shares owned, multiplied by the number of directors to be elected.
Once voting on the agenda items is finished, the registered Stockholder can proceed to submit the accomplished ballot by clicking the ‘Submit’ button.
The VIASH System will prompt the Stockholder to confirm the submission of the ballot. The votes cast in absentia will have equal effect as votes cast by proxy. After the ballot has been submitted, Stockholders may no longer change their votes except by submitting a duly accomplished proxy form within the set deadline.
7. The Office of the Corporate Secretary will tabulate all votes cast in absentia together with the votes cast by proxy, and a firm selected for this purpose will validate the results.
II. PARTICIPATION BY REMOTE COMMUNICATION
1. Stockholders as of March 1, 2021 (“Stockholders”) are required to register in the VIASH System to
participate in the Meeting on April 15, 2021 by remote communication. A Meeting livestreaming access button will be available on the VIASH System on the date set for the Meeting as indicated in the Company’s Notice of the Meeting.
2. The procedure and requirements for registration in the VIASH System are found in the Electronic Voting in Absentia section in this Annex. The deadline for registration to participate by remote communication is on April 5, 2021.
3. In addition to their registration in the VIASH System, Stockholders are requested to notify the Company by e-mail to [email protected] by April 5, 2021of their intention to participate in the Meeting by remote communication.
4. Only the Stockholders who have notified the Company of their intention to participate in the Meeting by
remote communication, together with the Stockholders who voted in absentia and by proxy, will be included in the determination of quorum at the Meeting.
5. Stockholders participating by remote communication may vote any time until the end of the Meeting using
the digital ballot in the VIASH System.
6. Stockholders may send their questions and/or remarks prior to or during the Meeting by e-mail to [email protected].
7. A link to the recorded webcast of the Meeting will be posted on the Company’s website after the Meeting.
Stockholders shall have two weeks from posting to raise to the Company any issues, clarifications and concerns on the Meeting conducted by e-mail to [email protected].
For any clarifications, please contact our Office of the Corporate Secretary through [email protected].

__________________________________________________________________________ 24
ANNEX “B”
DIRECTORS AND KEY OFFICERS
The write-ups below include positions held by the directors and executive officers currently and during the past five years and their personal circumstances as of December 31, 2020. Board of Directors Jaime Augusto Zobel de Ayala Chairman of the Board of Directors Arthur R. Tan Director, President, and Chief Executive Officer Fernando Zobel de Ayala Director Jose Ignacio A. Carlos Director Delfin L. Lazaro Director Jose Teodoro K. Limcaoco Director Rafael C. Romualdez Director Edgar O. Chua Independent Director Hiroshi Nishimura Independent Director Sherisa P. Nuesa Independent Director Diosdado P. Banatao Independent Director
Jaime Augusto Zobel de Ayala, Filipino, 61, has served as Chairman of the Board of Directors of IMI since January 1995. He holds the following positions in publicly listed companies: Chairman and CEO of Ayala Corporation; Chairman of Globe Telecom, Inc. and Bank of the Philippine Islands; and Vice Chairman of Ayala land, Inc., Manila Water Company, Inc., and AC Energy Corporation (formerly AC Energy Philippines, Inc.). He is also the Chairman of Ayala Retirement Fund Holdings, Inc., AC Industrial Technology Holdings, Inc., AC Ventures Holding Corp., AC Infrastructure Holdings Corporation, AC Energy International, Inc. and Asiacom Philippines, Inc.; Co-Chairman of Ayala Foundation, Inc. and Ayala Group Club, Inc.; Director of Alabang Commercial Corporation, Ayala International Pte. Ltd., AC Energy and Infrastructure Corporation (formerly AC Energy, Inc.), Ayala Healthcare Holdings, Inc., Light Rail Manila Holdings, Inc. and AG Holdings Ltd. Outside the Ayala Group, he is a member of various business and socio- civic organizations in the Philippines and abroad, including the JP Morgan International Council, JP Morgan Asia Pacific Council, and Mitsubishi Corporation International Advisory Council. He sits on the board of the Singapore Management University and on various advisory boards of Harvard University, including the Global Advisory Council, HBS Board of Dean’s Advisors, and HBS Asia-Pacific Advisory Board, which he chairs. He is Chairman Emeritus of the Asia Business Council, a member of the Global Board of Adviser of the Council on Foreign Relations, and Co-Vice Chairman of the Makati Business Club, Chairman of Endeavor Philippines, and a board member of Eisenhower Fellowships. He was awarded the Presidential Medal of Merit in 2009, the Philippine Legion of Honor with rank of Grand Commander in 2010, and the Order of Mabini with rank of Commander in 2015 by the President of the Philippines in recognition of his outstanding public service. In 2017, he was recognized as a United Nations Sustainable Development Goals Pioneer by the UN Global Compact for his work in sustainable business strategy and operations. The first recipient of the award from the Philippines, he was one of 10 individuals recognized for championing sustainability and the pursuit of the 17 SDGs in business. He graduated with B.A. in Economics (Cum Laude) from Harvard College in 1981 and obtained an MBA from the Harvard Graduate School of Business in 1987.
Arthur R. Tan, Filipino, 61, has been a member of the Board of Directors of IMI since July 2001. He has been the Chief Executive Officer of IMI since April 2002 and was re-elected as President effective January 1, 2020. Concurrently, he is a Senior Managing Director of Ayala Corporation and a member of the Ayala Group Management Committee. He is also the Group President and Chief Executive Officer of AC Industrial Technology Holdings, Inc. Concurrently, he is also the Chairman of the Board and Chief Executive Officer of PSi Technologies Inc. and Merlin Solar Technologies (Phils.), Inc.; President and Chief Executive Officer of

__________________________________________________________________________ 25
Speedy-Tech Electronics Ltd.; Chairman of the Board of Surface Technology International (STI), Ltd., Chairman of the Advisory Board of Via Optronics GmbH and MT Technologies GmbH. He was the President of IMI from July 1, 2001 to June 23, 2016. Prior to IMI, he was the Northeast Area Sales Manager and Acting Design Center Manager of American Microsystems Inc. (Massachusetts, USA), from 1994 to 1998, of which he became the Managing Director for Asia Pacific Region/Japan from 1998 to 2001. He graduated with B.S. in Electronics Communications Engineering degree from Mapua Institute of Technology in 1982 and attended post- graduate programs at the University of Idaho, Singapore Institute of Management, IMD and Harvard Business School. Fernando Zobel de Ayala, Filipino, 60, has served as a director of IMI since January 1995. He holds the following positions in publicly listed companies: Director, President and Chief Operating Officer of Ayala Corporation; Chairman of Ayala Land, Inc. and Manila Water Company, Inc., and AC Energy Corporation (formerly AC Energy Philippines, Inc.); Director of Bank of The Philippine Islands and Globe Telecom, Inc.; and Independent Director of Pilipinas Shell Petroleum Corporation. He is the Chairman of AC International Finance Ltd., Liontide Holdings, Inc., AC Energy and Infrastructure Corporation (formerly AC Energy, Inc.), Ayala Healthcare Holdings, Inc., Automobile Central Enterprise, Inc., Alabang Commercial Corporation, Accendo Commercial Corp. and Hero Foundation, Inc.; Co- Chairman of Ayala Foundation, Inc. and Ayala Group Club, Inc.; Vice-Chairman of AC Industrial Technology Holdings, Inc., ALI Eton Property Development Corporation, Ceci Realty Inc., Fort Bonifacio Development Corporation, Bonifacio Land Corporation, Emerging City Holdings, Inc., Columbus Holdings, Inc., Berkshires Holdings, Inc. AKL Properties, Inc., AC Ventures Holdings Corp., and Bonifacio Art Foundation, Inc.; Director of LiveIt Investments, Ltd., AG Holdings Ltd., AC Infrastructure Holdings Corporation, Altaraza Development, Corporation, Asiacom Philippines, Inc., Ayala Retirement Fund Holdings, Inc., Honda Cars Philippines, Inc., Isuzu Philippines Corporation, and Manila Peninsula; Member of the Board of INSEAD Business School and Georgetown University; Member of the International Advisory Board of Tikehau Capital and of the Hispanic Society Museum & Library International Advisory Council; Vice Chairman of the Philippine-Singapore Business Council, member of the World Presidents’ Organization and Chief Executives Organization; Chairman of Habitat for Humanity International’s Asia-Pacific Capital Campaign Steering Committee; and Member of the Board of Trustees of Caritas Manila, Pilipinas Shell Foundation, and the National Museum. He graduated with B.A. Liberal Arts at Harvard College in 1982 and holds a CIM from INSEAD, France. Jose Ignacio A. Carlos, Filipino, 51, has been a Director of IMI since December 2006. Concurrently, he is the President of Polymer Products Philippines, Inc. and AVC Chemical Corporation. He is also a member of the Board of Directors of Resins, Inc., Riverbanks Development Corporation, Mindanao Energy Systems, Inc., Cagayan Electric Power and Light Co., and Philippine Iron Construction and Marine Works, Inc. He is not a director of any publicly listed company in the Philippines other than IMI. He earned a BS Management degree from the Ateneo de Manila University in 1991 and finished Masters of Business Administration at the Johnson Graduate School of Management Cornell University in 1999. Delfin L. Lazaro, Filipino, 73, has served as member of the Board of IMI since May 2000. He holds the following positions in publicly listed companies: Director of Ayala Corporation, Ayala Land, Inc., Manila Water Company, Inc., and Globe Telecom, Inc. His other significant positions include: Chairman of Atlas Fertilizer & Chemicals Inc., Chairman and President of A.C.S.T. Business Holdings, Inc.; Vice Chairman and President of Asiacom Philippines, Inc.; Director of AC Industrial Technology Holdings, Inc., AYC Holdings, Ltd.., AC International Finance, Ltd., Purefoods International Limited and Probe Productions, Inc. He is an Independent Adviser to the Board of Directors of Ayala Land, Inc. He graduated with BS Metallurgical Engineering at the University of the Philippines in 1967 and took his MBA (with Distinction) at Harvard Graduate School of Business in 1971. Jose Teodoro K. Limcaoco, Filipino, 57, has been a director of IMI since April 8, 2016. He also holds the following positions in publicly listed companies: Chief Finance Officer, Chief Risk Officer, Chief Sustainability Officer and Finance Group Head of Ayala Corporation. He is a Director of Globe Telecom, Inc.

__________________________________________________________________________ 26
and Bank of the Philippine Islands, and an Independent Director of SSI Group, Inc., all publicly listed companies. He is the Chairman of AC Energy International, Inc. (formerly Presage Corporation), Darong Agricultural and Development Corporation and Zapfam Inc. He is the President and CEO of AC Ventures Holding Corp., AYC Finance Limited, AC International Finance Limited. He is the Vice Chairman of Lagdigan Land Corporation. He is the President of Liontide Holdings, Inc. and of Philwater Holdings Company, Inc. He is a Director of Ayala Hotels, Inc., AC Energy and Infrastructure Corporation (formerly AC Energy, Inc.), Ayala Healthcare Holdings, Inc., AC Infrastructure Holdings Corporation, Ayala Aviation Corporation, Asiacom Philippines, Inc., Ayala Group Legal, Michigan Holdings, Inc., AC Industrial Technology Holdings, Inc., A.C.S.T Business Holdings, Inc., Bestfull Holdings Limited, Purefoods International Limited, AYC Holdings Limited, AG Holdings Limited, Fine State Group Limited, AG Region Pte. Ltd., Ayala International Holdings Limited, Ayala International Pte. Ltd., Strong Group Limited, Total Jade Group Limited, VIP Infrastructure Holdings Pte. Ltd., AI North America, Inc., LICA Management Inc., and Just For Kids, Inc. He is the Treasurer of Ayala Retirement Fund Holdings, Inc. He joined Ayala Corporation as a Managing Director in 1998. Prior to his appointment as CFO in April 2015, he held various responsibilities including President of BPI Family Savings Bank, President of BPI Capital Corporation, Officer-in-Charge for Ayala Life Assurance, Inc. and Ayala Plans, Inc., Trustee and Treasurer of Ayala Foundation, Inc., President of myAyala.com, and CFO of Azalea Technology Investments, Inc. He served as the President of the Chamber of Thrift Banks from 2013-1015. He was named as the ING-Finex CFO of the Year in 2017. He has held prior positions with JP Morgan & Co. and with BZW Asia. He graduated from Stanford University with a BS Mathematical Sciences (Honors Program) in 1984 and from the Wharton School of the University of Pennsylvania with an MBA (Finance and Investment Management) in 1988. Rafael C. Romualdez, Filipino, 58, has been a Director of IMI since May 1997. He is a Director of Resins Incorporated (RI) and sits in the boards of several of its affiliates: RI Chemical Corporation, Chemserve Incorporated, Claveria Tree Nursery, Incorporated (CTNI), and Bio Renewable Energy Ventures Incorporated (BIOREV); he is also Chairman of Philippine Iron Construction and Marine Works, Incorporated (PICMW), Pacific Resins, Incorporated (PRI), and MC Shipping Corporation, also subsidiaries of RI. He is a Director of Lakpue Drug Incorporated and La Croesus Pharma Incorporated. He earned a Bachelor of Arts degree in Mathematics from Boston College in 1986 and a Masters in Business Administration from George Washington University in 1991. Edgar O. Chua, Filipino, 64, has been an independent director of IMI since April 2014 and its Lead Independent Director since August 16, 2017. He is currently an independent director of Metropolitan Bank and Trust Company, a publicly listed company, Energy Development Corporation, and Philcement. He is also in the advisory boards of Mitsubishi Motors Philippines Corporation and Coca Cola Bottlers Corp. He is the Chairman of the Makati Business Club, College of Saint Benilde, University of St. La Salle Bacolod, and the Philippine Eagle Foundation. He is also President of De La Salle Philippines. He is also a trustee of various civic and business organizations. He was the Country Chairman of the Shell Companies in the Philippines from September 2003 to October 2016. He had corporate responsibility for the various Shell companies in the exploration, manufacturing and marketing sector of the petroleum business. Likewise, he also oversaw the Shared Services operations and various Shell holding companies. Outside the Philippines, he held senior positions as Transport Analyst in Group Planning in the UK and as General Manager of the Shell Company of Cambodia. Mr. Chua earned his Bachelor of Science Degree in Chemical Engineering from De La Salle University in 1978 and attended various international seminar and courses including the senior management course in INSEAD, France. Hiroshi Nishimura, Japanese, 68 has been an independent director of IMI since June 17, 2020. He served as an Independent Director of the Company from April 2010 to April 15, 2020. He is the Chairman and President of Linkwest International Consultancy Services, Inc. He also serves as the Executive Vice President of All Purpose Appliances & Multi-Products, Inc. He served as President of Panasonic Communications Philippines Corporation (PCP), formerly known as Kyushu Matsushita Electronics Philippines (PKME), from 2000-2007.

__________________________________________________________________________ 27
He is not a director of any publicly listed company in the Philippines other than IMI. He finished a degree in Electronics Engineering Course at Kurame University in 1976. Sherisa P. Nuesa, Filipino, 66, has been an independent director of IMI since April 2018. Currently, she is the President and Director of the ALFM Mutual Funds Group and will serve as such March 31, 2021. Also, she is an Independent Director of the following publicly listed companies: Manila Water Company, Inc., AC Energy Corporation (formerly AC Energy Philippines, Inc.), Ayala Land, Inc. and Far Eastern University. She is also an Independent Director of FERN Realty Corporation and East Asia Computer Center Inc. She is a Senior Adviser to the Boards of Metro Retail Stores Group, Inc. and Vicsal Development Corporation. She is a member of the boards of trustees of the Institute of Corporate Directors, the Judicial Reform Initiative, and the Financial Executives (FINEX) Foundation. In addition to her background as a Chief Finance Officer and currently as a Board Director, she also held previous positions in management operations and has been active in speaking and lecturing engagements. She was the Chief Finance Officer and Chief Administration Officer of IMI from January 2009 to July 2010. She was then a Managing Director of Ayala Corporation and served in various capacities in Ayala Corporation, Ayala Land, Inc., and Manila Water Company, Inc. She was awarded the ING-FINEX CFO of the Year for 2008. She received a Master in Business Administration degree from the Ateneo Graduate School of Business in Manila. She also attended post-graduate courses in Harvard Business School and in Stanford University. She graduated summa cum laude with a degree of Bachelor of Science in Commerce from the Far Eastern University in 1974. She is a Certified Public Accountant. Diosdado P. Banatao, Filipino, 74, has served as an Independent Directors of the Company since April 15, 2020. He was a Director of IMI from 1994 to 2014. He served as managing partner of Tallwood Venture Capital and was a venture partner at the Mayfield Fund. He co-founded three technology startups: S3, Chips & Technologies, and Mostron. He held positions in engineering and general management at National Semiconductor, Seeq Technologies, Intersil, and Commodore International. He pioneered the PC chip set and graphics acceleration architecture that continue to be two of the foundation technologies in every PC today. He is honored by Stanford University as one of the leaders in the development of Ethernet and was the developer of the first Ethernet chip at SEEQ & Technologies. Ethernet is the standard for moving data around enterprises and homes and is a key component to today’s Internet. Mr. Banatao is credited with developing several key semiconductor technologies and is regarded as a Silicon Valley visionary. He serves as Chairman of Blaize, Inc and is Emeritus Chairman at INPHI after serving as Chairman for 20 years. He also served as Chairman and led investments in SiRF Technology, acquired by CSR; Marvell Technology Group; Acclaim Communications, acquired by Level One; Newport Communications, acquired by Broadcom; Cyras Systems, acquired by Ciena; Stream Machine, acquired by Cirrus Logic; and Wilocity, acquired by Qualcomm. Mr. Banatao holds a B.S.E.E degree, cum laude, from the Mapua Institute of Technology in the Philippines and an M.S. in Electrical Engineering from Stanford University. Nominees to the Board of Directors for election at the stockholders’ meeting Except for Mr. Jose Teodoro K. Limcaoco, all the incumbent directors of the Company are being nominated to the Board of Directors with the addition of Mr. Alberto M. de Larrazabal. Alberto M. de Larrazabal, Filipino, 65, is Globe’s Chief Commercial Officer (CCO). As CCO, Mr. de Larrazabal oversees the integration and execution of Globe’s strategies across all commercial units, including marketing, sales and channels, and product development for all segments of business. He joined Globe in June 2006 as Head of the Treasury Division. He became the company's Chief Finance Officer in April 2010. He had over two decades of extensive experience as a senior executive in Finance, Business Development, Treasury Operations, Joint Ventures, Mergers and Acquisitions, as well as Investment Banking and Investor Relations. Prior to joining Globe, he held such positions as Vice President and CFO of Marsman Drysdale Corp., Vice President and Head of the Consumer Sector of JP Morgan, Hong Kong, and Senior Vice President and CFO of San Miguel Corporation. He holds a Bachelor of Science degree in Industrial Management Engineering from De La Salle University.

__________________________________________________________________________ 28
Management Committee Members and Key Executive Officers
* Jaime Augusto Zobel de Ayala Chairman of the Board
*/** Arthur R. Tan President and Chief Executive Officer ** Eric De Candido Chief Operations Officer ** Jerome S. Tan Senior Managing Director, Global Chief Financial Officer, and
Treasurer
Mary Ann S. Natividad Chief Commercial Officer Laurice S. Dela Cruz Global Head, Financial Planning and Analysis, and Compliance Officer Rosalyn O. Tesoro Chief Information Officer and Data Protection Officer Solomon M. Hermosura Corporate Secretary Joanne M. Lim Assistant Corporate Secretary
* Members of the Board of Directors ** Members of the Management Committee Eric De Candido, French, 45, has been IMI’s Chief Operations Officer since January 1, 2020. He was IMI’s Regional Head for Europe Operations covering Bulgaria, Czech Republic and Serbia since January 2018. He has more than 11 years of experience as a General Manager handling Bulgarian operations of Fremach International (formerly EPIQ NV) and IMI since 2008. His professional experience includes working for 11 years in different Valeo production plants in Poland, France, Iran and Morocco. Currently, he is managing the biggest and most advanced electronics production plant in Bulgaria – ensuring for its 7 and a half years of sustainable growth in revenues and profitability. He has graduated with Production Engineering in ESIEE / Electronics & Electrotechnic High School in Amiens, France. Jerome S. Tan, Singaporean, 59, is a Senior Managing Director and the Global Chief Financial Officer of IMI and Treasurer since January 2011. He is responsible for providing leadership, direction and management of all Finance functions including Treasury, Financial Planning & Analysis and Controllership. He brings more than 30 years of broad experience and various achievements in finance, strategic planning, business development and acquisition/integration. He has assumed regional leadership roles in multi-national Banking and Finance companies, and Food and Beverage industry located in different countries in the Asia Pacific Region. Prior to joining IMI, he was with General Electric holding various regional and operating roles in Finance and Business Development including CFO for CNBC / NBC Universal Asia Pacific, CFO of GE Money Singapore and GE Money Bank in the Philippines. Before taking on operating CFO positions, he was the Regional FP&A Leader for GE Money Asia; and a Business Development Director for GE Capital responsible for mergers and acquisition. Prior to joining GE, he was also a key member of the management team of San Miguel Brewing International Ltd., managing Treasury and Financial Planning, and Corporate Planning and Business Development. He started his career in banking as an Associate in Robert Fleming, Inc. based in New York and was also an Assistant Director in First Pacific Bank Asia, Ltd. in Hong Kong. He graduated with B.A. in Economics under the Honors Program from De La Salle University in 1982 and obtained an MBA in General Management from the Darden Business School at University of Virginia in 1987. Mary Ann S. Natividad, Filipino, 53, has been the Chief Commercial Officer of IMI since January 1, 2020. She was the Global Head of Sales and Marketing of IMI since 2016. Prior to this assignment, she managed Key Accounts and Management, and Strategic Planning. She is also the former Business Unit Head for Singapore Turnkey Operations. Her track record spans over 20 years in the electronics industry, covering its various aspects. She is a licensed Electronics and Communications Engineer. She has an Electronics and Communications Engineering degree from the Mapua Institute of Technology. Laurice S. Dela Cruz, Filipino, 36, has been the Global Head for Financial Planning and Analysis since 2011 and was appointed as the Compliance Officer in April 2020. She has over 15 years of professional experience

__________________________________________________________________________ 29
in the field of audit, accounting and controllership. Prior to joining IMI, she held the position of Business Unit Controller for the Agro-Industrial Division at Universal Robina Corporation for over two years. She was also a Senior Associate Auditor at Sycip Gorres Velayo (SGV) & Co. for four years. She graduated with a degree of BS in Accountancy from the University of Santo Tomas in 2004 and is a Certified Public Accountant. Rosalyn O. Tesoro, Filipino, 49, has been the Chief Information Officer since 2013 and Data Protection Officer of IMI since August 12, 2020. Prior to joining IMI, she held various roles in semiconductor manufacturing and IT companies. She joined IMI in 2005, initially as IT Infrastructure manager, before being designated as IT head in 2010. She has been an IT practitioner for almost 30 years. She holds a BS Computer Engineering degree from Mapua Institute of Technology. Solomon M. Hermosura, Filipino, 58, has served as Corporate Secretary of IMI since November 2013. He is a Managing Director of Ayala Corporation and a member of its Management Committee since 2009 and the Ayala Group Management Committee. He is also the Group Head of Corporate Governance, and the Chief Legal Officer, Chief Compliance Officer, Corporate Secretary and Data Protection Officer of Ayala Corporation. He is the CEO of Ayala Group Legal. He serves as the Corporate Secretary and Group General Counsel of Ayala Land, Inc., and Corporate Secretary of Globe Telecom, Inc., Manila Water Company, Inc., Integrated Micro-Electronics, Inc., AC Energy Corporation (formerly AC Energy Philippines, Inc.), AREIT, Inc. and Ayala Foundation, Inc. He also serves as a Corporate Secretary and a member of the Board of Directors of a number of companies in the Ayala group. Mr. Hermosura is currently a member of the faculty of the College of Law of San Beda University. He graduated valedictorian with Bachelor of Laws degree from San Beda College in 1986 and placed third in the 1986 Bar Examinations. Joanne M. Lim, Filipino, 38, has served as Assistant Corporate Secretary of IMI since June 23, 2016. She is also the Assistant Corporate Secretary of Ayala Corporation, Ayala Foundation, AC Industrial Technology Holdings, Inc., LiveIt Investments Limited and other companies within the Ayala Group to which she also provides other legal services. She is a Senior Counsel at Ayala Group Legal. Prior to joining Ayala Group Legal in 2015, she was a Project Legal Advisor for CFT Transaction Advisors. She served as Director of the Legal Affairs Office of the Department of Finance from 2011 to 2013 and was an Associate at SyCip, Salazar, Hernandez & Gatmaitan Law Offices from 2007 to 2010. She obtained her Bachelor of Laws degree in 2007 and her Bachelor of Arts degree in Broadcast Communication (magna cum laude) in 2003, both from the University of the Philippines, Diliman. She has a Master of Laws degree in Global Business Law from New York University and a Master of Laws degree in Corporate and Financial Services Law from National University of Singapore. She was admitted to the Philippine Bar in 2008 and to the New York State Bar in 2015.

Annex B-1


CERTIFICATION OF INDEPENDENT DIRECTOR
(, Hiroshi Nishimura, of legal age and a resident of 1503A Cypress Point Ridge, Fort Bonifacio, Taguig City, after having been duly sworn to in accordance with law do hereby declare that:
I. I an1 a nominee for independent director oflntegrated Micro-Electronics, Inc. and have been re-elected as independent director on June 17, 2020.
2. .. ...... --- -the foll . -..... 墨_____...... -------- . 一 —~ ------
COMPANY/ORGANIZATION POSITION/RELATIONSHIP PERIOD OF SERVlCE
Linkwest International Consultancy Chairman and President April 12, 2008 to Services, Inc. present All Purpose Appliance and Multi Executive Vice-President November 23, 2009 Products, Inc. to present
VTS-Touchsensor Co., Ltd (VTA Independent Director March 2020 Japan)
I am not affiliated with any Government-Owned and Controlled Corporation.
3. I possess all the qualification and none of the disqualifications to serve as an Independent Director of Integrated Micro-Electronics, Inc., as provided for in Section 38 of the Securities Regulation Code, its Implementing Rules and Regulations and other SEC issuances.
4. I am not related to the following director/officer/substantial shareholder of Integrated Micro-Electronics, lnc. and its subsidiaries and affiliates other than the relationship provided under Rule 38.2.3 of the Securities Regulation Code.
5. To the best ofmy knowledge, I am not the subject of any pending criminal or administrative investigation or proceeding.
6. I shall faithfully and diligently comply with my duties and responsibilities as independent director under the Securities Regulation Code and its implementing Rules and Regulations, Code of Corporate Governance and other SEC Issuances.
7. I shall infonn the Corporate Secretary of Integrated Micro-Electronics, Inc. of any changes in the abo vementioned mfom皿 ionwithin five d ays from ,ts occurrence.
Done, this day of at

SUBSCRIBED AND SWORN to before me this day of al alliant personally appeared before me and exhibited to me his Passport No. TZ084 I 499 iりsuedat Embas!iy of Japan in the Philippines on July 17, 2013.
Doc. No. Page No. ・ Book No. ,
Series of 2021 .

__________________________________________________________________________ 30
ANNEX “C”
MANAGEMENT REPORT
I. MANAGEMENT’S DISCUSSION AND ANALYSIS (MD&A) OF FINANCIAL CONDITION AND RESULTS OF OPERATION
Results of Operations Revenues, gross profit, net income, and the related computed EBITDA and basic earnings per share, for the years ended 2020, 2019 and 2018 are shown on the following table:
For the years ended December 31
2020 2019 2018 (As Restated)
(in US$ thousands,
except Basic EPS) Revenues from contracts with customers 1,135,841 1,250,366 1,349,400 Cost of goods sold and service (1,039,504) (1,148,138) (1,214,979)
Gross profit 96,337
102,228
134,421
Net income attributable to equity holders of the Parent Company
(3,455) (7,781) 47,187
EBITDA13 58,884 41,381 72,176 Basic Earnings per Share (EPS) (0.002) (0.004) 0.022
2020 vs 2019 Revenues from Sales and Services The Company posted consolidated full year 2020 revenues of US$1.14 billion, 9 percent lower than 2019. The company, however, achieved its highest quarterly performance with a revenue record of US$347 million in the fourth quarter of 2020, an increase of 12% over the same period in 2019. IMI’s wholly owned businesses made US$867 million of revenues, a 14 percent reduction from 2019, as plant shutdowns in various operating regions during the first half of the year significantly affected financial results. Facilities in the Philippines, China, and Mexico all adhered to government mandated lockdowns to contain the spread of COVID-19, while operating sites in Bulgaria and Czech Republic aligned with the demand slowdown
13 EBITDA = EBITDA represents net operating income after adding depreciation and amortization (including amortization of right-of-use assets in accordance with PFRS 16, Leases), interest income and foreign exchange gains/losses. EBITDA and EBITDA Margin are not measures of performance under PFRS and investors should not consider EBITDA, EBITDA Margin or EBIT in isolation or as alternatives to net income as an indicator of our operating performance or to cash flows, or any other measure of performance under PFRS. Because there are various EBITDA calculation methods, our presentation of these measures may not be comparable to similarly titled measures used by other companies.

__________________________________________________________________________ 31
of OEM customers by exercising voluntary reduced work schedules. The global situation led to a 25% year-on-year reduction in top line sales in the first half. Revenues in the second half of the year recouped, 39% better than first half and 7% higher year-on year on the back of strong demand recovery and subsequent normalization of operations. The global demand for security and I-o-T products boosted industrial revenue while mobility-focused European and North American facilities benefitted from the rapid rise of global automotive production. In addition, IMI’s growing foothold in the profitable medical segment also led to increased higher margin sales for its manufacturing plants in Asia. Subsidiaries VIA Optronics and STI Ltd posted combined revenues of US$269 million, an increase of 9 percent from the previous year. Via Optronics continues its shift towards automotive display solutions by partnering with leading manufacturers in both traditional and electric vehicle spaces. Meanwhile, STI Ltd is buoyed by the continued growth of its medical segment and recovery of the aerospace and defense markets. The financial information included herein for the fourth quarter and full year 2020 for Via Optronics and STI Ltd. may change; however, IMI does not expect any such changes to be material, in the aggregate, to IMI. Gross Profit and Gross Profit Margin The full year gross profit of $96.3 million declined 6% versus 2019 due to the effect of revenue decline from the lockdowns but margins improved to 8.5% from last year’s 8.2% driven by improved manufacturing efficiency. To mitigate the effects of the pandemic, IMI successfully collaborated with local government units to secure various forms of employee related subsidies in Bulgaria, China, Czech Republic, France, Mexico, Serbia, and Singapore., thereby reducing the operating costs. Operating Income Operating income is at $3.9 million from a negative ($4M) in 2019 mainly driven by reduced general and administrative expenses driven by cost reduction initiatives (reduced people costs, travel, professional fees, etc.) and reversals of inventory provisions. Net Loss The Company posted a net loss of $3.5 million, lower than last year’s net loss of $7.8 million or an improvement of +$4.3M mainly from improved operating income by +$7.9 million, economic, technological and industrial subsidies plus special Covid incentives (+$6.3M), beneficial FX position (+$3.5M), increase in mark to market gains on put options (+$2.6M), lower interest expense (+$1.8M), higher share of minority on losses (+$2.9M), offset by asset impairments (-$7.3M), reversal of contingent in 2019 (-$3.7M), higher taxes (-$2.9M) and insurance provisions (-$1M). EBITDA EBITDA of $58.9 million, 42% higher than last year. Financial Condition In 2020, IMI spent $18.7 million on capital expenditures, significantly lower than last year’s $38.8 million, still part of the Company’s cost reduction initiatives and cash flow management. IMI’s balance sheet remains robust with a current ratio of 1.54:1 and debt-to-equity ratio of 0.41:1.

__________________________________________________________________________ 32
Key Performance Indicators of the Company The table below sets forth the comparative performance indicators of the Company:
As of end Dec 31, 2020 Dec 31, 2019 Performance indicators Liquidity: Current ratioa 1.54x 1.49x Solvency: Debt-to-equity ratiob 0.41x 0.55x
For the years ended
31 Dec 2020 2019 Operating efficiency: Revenue growthc (9%) (7%) Profitability: Gross profit margind 8.5% 8.2% Net income margine (0.3%) (0.6%) Return on equityf (0.8%) (2.0%) Return on common equityg (0.8%) (2.0%) Return on assetsh (0.3%) (0.7%) 14EBITDA margin 5.2% 3.3%
a Current assets/current liabilities b Bank debts/Total Equity c (Current year less previous year revenue)/Previous year revenue d Gross profit/Revenues
e Net income attributable to equity holders of the Parent Company/Revenues
f Net income attributable to equity holders of the Parent Company/Average equity attributable to Parent g Net income attributable to equity holders of the Parent Company/Average common equity attributable to Parent h Net income attributable to equity holders of the Parent Company/Total Assets In the above: The risk of recurrence of further pandemic related shutdowns after the reporting period may cause uncertainties that may impact the Company’s liquidity. The Company is continuously monitoring its liquidity and solvency position. There are no known trends, events or uncertainties that will result in the Company’s liquidity increasing or decreasing in a material way.
14 EBITDA Margin = EBITDA divided by revenues from sales and services where EBITDA represents net operating income after
adding depreciation and amortization (including amortization of right-of-use assets in accordance with PFRS 16, Leases), interest income and foreign exchange gains/losses. EBITDA and EBITDA Margin are not measures of performance under PFRS and investors should not consider EBITDA, EBITDA Margin or EBIT in isolation or as alternatives to net income as an indicator of our operating performance or to cash flows, or any other measure of performance under PFRS. Because there are various EBITDA calculation methods, our presentation of these measures may not be comparable to similarly titled measures used by other companies.

__________________________________________________________________________ 33
There were no events that will trigger direct or contingent financial obligation that is material to the Company, including any default or acceleration of an obligation. Likewise, there were no material off-balance sheet transactions, arrangements, obligations (including contingent obligations), and other relationships of the Company with unconsolidated entities or other persons created during the reporting period. The effects of potential recurrence of pandemic related shutdowns after the reporting period may pose risks and unfavorable impact to the Company but will not materially affect the Company’s ability to continue as going concern. There are no known trends, events or uncertainties that have had or that are reasonably expected to have a material favorable or unfavorable impact on the Company’s revenues from continuing operations. There were no significant elements of income or loss that did not arise from continuing operations. There are no seasonal aspects that may have a material effect on the financial condition of the Company. Causes for any material changes (Increase or decrease of 5% or more in the financial statements) Income Statement Items (Years ended 31 December 2020 versus 31 December 2019) 9% decrease in Revenues ($1.25B to $1.14B) The decrease was driven mainly by drop in Europe and China’s factory shutdown in the first half of the year. 9% decrease in Cost of goods sold ($1,148.1M to $1,040.3M) Direct costs decreased relevant to the decline in revenues. 13% decrease in Operating expenses ($106.2M to $92.5M) Mainly due to decrease in people costs as a result of freeze hiring, optimization and work reduction programs (+4M), and reduced general and administrative expenses driven by cost reduction initiatives (travel (+3.1M), professional fees (+2.2M), etc.) and reversals of inventory provisions (+4.9M). 26% increase in Non-operating income/(expenses) ($-$7.2M to -$5.3M) Economic, technological and industrial subsidies plus special Covid incentives (+$6.3M), beneficial FX position (+$3.5M), increase in mark to market gains on put options (+$2.6M), lower interest expense (+$1.8M), offset by asset impairments (-$7.3M), reversal of contingent in 2019 (-$3.7M), and insurance provisions (-$1M). 46% increase in Noncontrolling interest (-$5.42M to -$2,92M) Higher share of minority in the net losses of VIA (from 76% to 50.32% beginning Oct 2020) and STI (20%). Balance Sheet items (31 December 2020 versus 31 December 2019) 60% increase in Cash and cash equivalents ($152.7M to $244.4M) Cash provided by operating activities +$78.3M mainly driven by improved operating income and decrease in inventory levels and receivables; cash used in investing -$13.1M mainly from capital expenditure to support line expansion and new programs; cash provided by financing $29.9M mainly due to net proceeds from

__________________________________________________________________________ 34
subsidiary’s public offering (+$106.8M), offset by net repayments of loans (-$31M), redemption of subsidiary’s preferred shares (-$30M) and payment of lease liabilities (-$11.2M) and dividends paid to preference shares (-$6.5M). 5% decrease in Loans and receivables ($290.6M to $275.6M) Decrease in receivables mainly from collections of outstanding trade receivables and shorter AR days. 7% decrease in Inventories ($152.6M to $142.3M) Decrease in inventories mainly from improved inventory turnover as a result of proactive inventory management through level loading. 7% decrease in Contract Assets ($58.9M to $54.5M) Recovery of backlogs reduced work-in process and finished goods inventories. 9% decrease in Other current assets ($19.1M to $17.4M) Decrease in prepayments and tax credits. A portion of the prepayment pertaining to IPO transaction costs was reversed to equity upon IPO of VIA. 8% decrease in Property, plant and equipment ($194.3M to $178M) Decrease from yearly depreciation (-$38M) and impairment losses (-2.6M), offset by additional capex for the year (+$18.1M) and impact of forex appreciation on translation. 5% increase in Goodwill ($140.8M to $147.2M) Increase mainly due to forex rate valuation at year end. 40% decrease in Intangible assets ($28.6M to $17.1M) Decrease was mainly due to impairment losses recognized during the year (-$4.7M) and yearly amortization (-$7.9M). 6% decrease in Financial assets through OCI ($1.2M to $1.1M) Decrease in fair value of quoted club shares. 9% decrease in Other noncurrent assets ($21.9M to $19.9M) Decrease in deferred charges representing tooling items customized based on the specifications of the customers and to be repaid as part of the price of the manufactured items. 5% decrease in Accounts payable and accrued expenses ($267.1M to $253.8M) Mainly from decrease in trade and nontrade payables and government-related payables. 68% decrease in Contract liabilities ($4.7M to $1.5M) Decrease in advance payments received to render manufacturing services. 64% increase in Loans and trust receipts payable ($126.1M to $206.5M) Refinancing of long-term to short term loans. 132% increase in Income tax payable ($1.4M to $3.4M) Increase due to higher taxable income. 92% decrease in Other financial liabilities ($22.4M to $1.7M) Mainly reduction in the value of STI and termination of VIA’s put options.

__________________________________________________________________________ 35
92% decrease in Current portion of long-term debt ($28.0M to $2.1M) Repayment of $28.0 million and subsequently refinanced to short-term loans. 72% decrease in Noncurrent portion of long-term debt ($114.4M to $32.2M) Repayment of $80 million and subsequently refinanced to short-term loans. 15% decrease in Deferred tax liabilities ($1.9M to $1.6M) Decrease DTL from ROU assets, contract assets and fair value adjustments. 7% decrease in Lease liabilities ($29.7M to $27.6M) Decrease due to payments of leases. 45% increase in Other noncurrent liabilities ($3.6M to $5.3M) Increase in long-term provisions. 33% increase in Additional Paid-in Capital ($146.2M to $193.9M) Termination of VIA put reverted to equity ($15M) and dilution of ownership without loss of control recognized in equity ($32M). 152% increase in Cumulative translation adjustments (-$17.7M to $9.1M) Arising from translation of management accounts in Europe denominated in their respective local currencies to the Parent Company’s functional currency. The significant movement is due to appreciation of EUR against USD from 1.11 to 1.22, GBP against USD from 1.30 to 1.35 and RMB against USD from 6.99 to 6.54. 7% decrease in Remeasurement losses on defined benefit plans (-$10.5M to -$9.8M) Actuarial changes in financial assumptions particularly lower discount rate and salary increase. 32% increase in Equity attributable to NCI ($101.2M to $133.2M) Increase in ownership of minority arising from the VIA IPO ($62.5M), offset by redemption of preferred shares of a subsidiary to non-controlling interest.(-$30M). 2019 vs 2018 Revenues from Sales and Services The Company achieved US$1.3 billion of consolidated revenues in 2019, a seven percent decline versus 2018. The marked slowdown in global markets continues to hinder revenue growth across majority of IMI’s operating units. IMI’s wholly owned businesses made US$1 billion of revenues, a 3 percent reduction from 2018. Operating units in Asia dropped a total of 11 percent to US$547.7 million as China’s domestic market, particularly in the automotive, telecommunications and industrial space have underperformed in 2019. On the other hand, operations in Europe and North America, which are largely automotive based, achieved a combined 14 percent growth year-on-year to US$485.2 million amidst widespread industry slowdown and Euro depreciation. Subsidiaries VIA Optronics and STI Ltd posted combined revenues of US$248 million, a decline of 21 percent from the previous year. The drop in VIA was mainly driven by a general slowdown in computing and consumer segments as well as a delay in the release of the new generation Intel Chip. In STI, the Brexit uncertainty continues to plague manufacturing industries prompting delays in program awards.

__________________________________________________________________________ 36
Gross Profit and Gross Profit Margin The full year gross profit of $102.2 million with an 8.2% margin declined versus 2018 margin of 10%. Apart from decline in revenues driven by market slowdown, increasing material prices and labor, and significant investments in capacity and technical capabilities for growth areas also increased company expenditures impacting its gross profit margins. Operating Loss Operating loss is at $4 million, a significant decline from last year’s $37.5 million driven mainly by decline in gross profit margins and higher GAE by 9.6% pertaining to higher people costs and inventory and other provisions. Net Income The Company posted a net loss of $7.78 million vs last year’s net income of $47.2 million. In addition to the $41.5 million decline in operating income, interest expenses increased by $1.2M and forex losses increased by $0.4 million. The reported net income last year includes non-operating items such as net gain on the sale of a China entity (+$19.1 million) and reversal of contingent consideration related to the STI acquisition (+$21.3 million), gain on bargain purchase (+$2.4M), partially offset by impairment of China goodwill (-$6.9 million), mark-to-market losses on put options (-$5.4 million) and other one-off transaction costs. This year’s non-operating income includes reversal of contingent consideration (+$3.7 million) and mark-to-market gains on put options (+$3.4 million). The decline is tempered by lower taxes (+$6.1M) and higher share of non-controlling interest on the subsidiary net losses (+$7M). EBITDA EBITDA of $41.4 million, 43% lower than last year. Financial Condition In 2019, IMI spent $38.8 million on capital expenditures, mainly purchase of additional machineries intended for emerging technologies and new projects and improvements on existing facilities. IMI’s balance sheet remains robust with a current ratio of 1.49:1 and debt-to-equity ratio of 0.55:1 Key Performance Indicators of the Company The table below sets forth the comparative performance indicators of the Company:
As of end Dec 31, 2019 Dec 31, 2018 Performance indicators Liquidity: Current ratioa 1.49x 1.31x Solvency: Debt-to-equity ratiob 0.55x 0.79x

__________________________________________________________________________ 37
For the years ended
31 Dec 2019 2018 Operating efficiency: Revenue growthc (7%) 24% Profitability: Gross profit margind 8.2% 10.0% Net income margine (0.6%) 3.5% Return on equityf (2.0%) 13.9% Return on common equityg (2.0%) 13.9% Return on assetsh (0.7%) 4.4% 15EBITDA margin 3.3% 5.3%
a Current assets/current liabilities b Bank debts/Total Equity c (Current year less previous year revenue)/Previous year revenue d Gross profit/Revenues
e Net income attributable to equity holders of the Parent Company/Revenues
f Net income attributable to equity holders of the Parent Company/Average equity attributable to Parent g Net income attributable to equity holders of the Parent Company/Average common equity attributable to Parent h Net income attributable to equity holders of the Parent Company/Total Assets In the above: There are no known trends, events or uncertainties that will result in the Company’s liquidity increasing or decreasing in a material way. There were no events that will trigger direct or contingent financial obligation that is material to the Company, including any default or acceleration of an obligation. Likewise, there were no material off-balance sheet transactions, arrangements, obligations (including contingent obligations), and other relationships of the Company with unconsolidated entities or other persons created during the reporting period. There are no known trends, events or uncertainties that have had or that are reasonably expected to have a material favorable or unfavorable impact on the Company’s revenues from continuing operations. There were no significant elements of income or loss that did not arise from continuing operations. There are no seasonal aspects that may have a material effect on the financial condition of the Company.
15 EBITDA Margin = EBITDA divided by revenues from sales and services where EBITDA represents net operating income after
adding depreciation and amortization (including amortization of right-of-use assets in accordance with PFRS 16, Leases), interest income and foreign exchange gains/losses . EBITDA and EBITDA Margin are not measures of performance under PFRS and investors should not consider EBITDA, EBITDA Margin or EBIT in isolation or as alternatives to net income as an indicator of our operating performance or to cash flows, or any other measure of performance under PFRS. Because there are various EBITDA calculation methods, our presentation of these measures may not be comparable to similarly titled measures used by other companies.

__________________________________________________________________________ 38
Causes for any material changes (Increase or decrease of 5% or more in the financial statements) Income Statement Items (Years ended 31 December 2019 versus 31 December 2018 - As restated) 7% decrease in Revenues ($1.35B to $1.25B) The decrease was driven mainly by drop in China’s domestic market, VIA’s general slowdown in computing and consumer segments as well as a delay in the release of the new generation Intel Chip and delays in programs for STI caused by Brexit uncertainty. 5% decrease in Cost of goods sold ($1,215.0M to $1,148.1M) Driven by the 7% decrease in revenues offset by high DM% due to material price increase, increasing labor costs and increase in overhead expenditures particularly full year effect of depreciation related to prior year’s significant investments in capacity and technical capabilities in future growth areas. 10% increase in Operating expenses ($96.9M to $106.2M) Mainly due to increase in people costs and inventory and other provisions. 137% decrease in Non-operating income/(expenses) ($19.3M to -$7.2M) The reported net income last year includes non-operating items such as net gain on the sale of a China entity (+$19.1 million) and reversal of contingent consideration related to the STI acquisition (+$21.3 million), gain on bargain purchase (+$2.4M), partially offset by impairment of China goodwill (-$6.9 million), mark-to-market losses on put options (-$5.4 million) and other one-off transaction costs. This year’s non-operating income includes reversal of contingent consideration (+$3.7 million) and mark-to-market gains on put options (+$3.4 million). 439% decrease in Noncontrolling interest ($1.60M to -$5.42M) Share of minority in the net loss of VIA (23.99%), VTS (35%), and STI (20%). Balance Sheet items (31 December 2019 versus 31 December 2018 – As restated) 41% increase in Cash and cash equivalents ($108.5M to $152.7M) Cash provided by operating activities +$71.1M mainly driven by decrease in inventory levels and receivables; cash used in investing -$58.2M mainly from capital expenditure to support line expansion and new programs (-$38.8M) and refund to a third party related to prior year sale transaction (-$11.5M); cash provided by financing $31.4M mainly due to proceeds from issuance of preferred shares (+$100.0M), offset by net repayments of loans (-$55M), payment of lease liabilities (-$7.6M) and dividends (-$4.4M). 5% decrease in Loans and receivables ($304.7M to $290.6M) Decrease mainly due to lower revenues and collections from customers. 21% decrease in Inventories ($192.7M to $152.6M) Decrease in inventories mainly from recoveries of backlogs. 7% decrease in Contract Assets ($63.5M to $58.9M) Decrease in work-in-process and finished goods inventories which were recognized as revenue earned from manufacturing services as receipt of consideration is conditional on successful completion of the services, plus corresponding margins.

__________________________________________________________________________ 39
8% decrease in Other current assets ($20.8M to $19.1M) Decrease in advances to suppliers and tax credits, offset by increase in prepayments. 100% increase in Right-of-use assets (nil to $32.0M) Recognition of ROU asset upon adoption of PFRS 16. 11% increase in Financial assets through OCI ($1.1M to $1.2M) Increase in fair value of quoted club shares 40% increase in Other noncurrent assets ($15.7M to $21.9M) Recognition of deferred charges representing tooling items customized based on the specifications of the customers and to be repaid as part of the price of the manufactured items. 159% increase in Contract liabilities ($1.8M to $4.7M) Increase in advance payments received to render manufacturing services. 8% decrease in Accounts payable and accrued expenses ($291.2M to $267.5M) Mainly from payment of outstanding trade payable -$20.6M, refund of deposit to buyer of Shenzhen (-$11.5M) and lower accruals and taxes payables (-$6M). 8% decrease in Loans and trust receipts payable ($136.3M to $126.1M) Repayment of $20.5 million offset by availment of $11.1M. 25% decrease in Other financial liabilities ($29.8M to $22.4M) Reversal of STI contingent liability ($3.7M) and reduction in the value of put options ($3.4M). 56% decrease in Current portion of long-term debt ($63.4M to $28.0M) Reclass to current portion of long-term debt of Philippines, Czech and VIA ($11.2M) offset by decrease due to payment of $46.5M. 8% decrease in Noncurrent portion of long-term debt ($124.5M to $114.4M) Reclass to current portion of ($11.2M) offset by additional availment of $1M. 71% decrease in Deferred tax liabilities ($6.4M to $1.9M) Reduced by deferred tax asset recognized on unrealized forex gains, contract asset and loss carryover. 117% increase in Pension liability ($4.2M to $9.2M) Remeasurement adjustments due to lower discount rate assumptions. 100% increase in Lease liabilities ($0.1M to $29.7M) Recognition of liabilities on operating leases upon adoption of PFRS 16 31% decrease in Other noncurrent liabilities ($5.3M to $3.6M) Decrease in long-term provisions. 13% decrease in Subscriptions receivable ($3.4M to $3.0M) Collections and forfeitures on subscriptions 34% increase in negative Cumulative translation adjustments (-$13.2M to -$17.7M) Arising from translation of management accounts in Europe denominated in their respective local currencies to the Parent Company’s functional currency. The significant movement is due to depreciation of EUR against USD from 1.15 to 1.11 and RMB against USD from 6.86 to 6.99.

__________________________________________________________________________ 40
68% increase in Remeasurement losses on defined benefit plans (-$6.2M to -$10.5M) Actuarial changes in financial assumptions particularly lower discount rate. 884% increase in Equity attributable to NCI ($7.6M to $101.2M) Increase pertains to the preferred shares issued by IMI Singapore to ACI Singapore ($100M) For the Years ended 31 December 2018 vs. 2017 Revenues, gross profit, net income, and the related computed EBITDA and basic earnings per share, for the years ended 2018, 2017 and 2016 are shown on the following table:
For the years ended December 31
2018 (As Restated) 2017 2016
(in US$ thousands,
except Basic EPS)
Revenues from contracts with customers 1,349,400 1,090,588 842,966 Cost of goods sold and service (1,214,979) (960,990) (741,657)
Gross profit 134,421
129,599
101,309
Net income attributable to equity holders of the Parent Company
47,187
34,002
28,116
EBITDA1 72,176 70,342 64,967 Basic Earnings per Share (EPS) 0.022 0.018 0.015
2018 vs. 2017 Revenues from Sales and Services The Company brought 2018 to a close with consolidated revenues of US$1.35 billion (P=70.81 billion), an increase of 24 percent year-on-year. IMI’s traditional business delivered US$1.04 billion revenues, a growth of 16 percent while recently acquired companies, VIA and STI, accelerated further with a growth of 61 percent year-on-year posting a combined revenue of US$312.4 million. The Company benefited from new programs in the industrial and automotive segments which grew 39 percent (excl. VTS) and 21 percent, respectively, while strong activities firmed up for strategic opportunities in aerospace. IMI’s automotive business now accounts for 40% of total revenues while industrial contributes 25% to total revenues. Europe remains to be our dominant market comprising 50% of global sales.
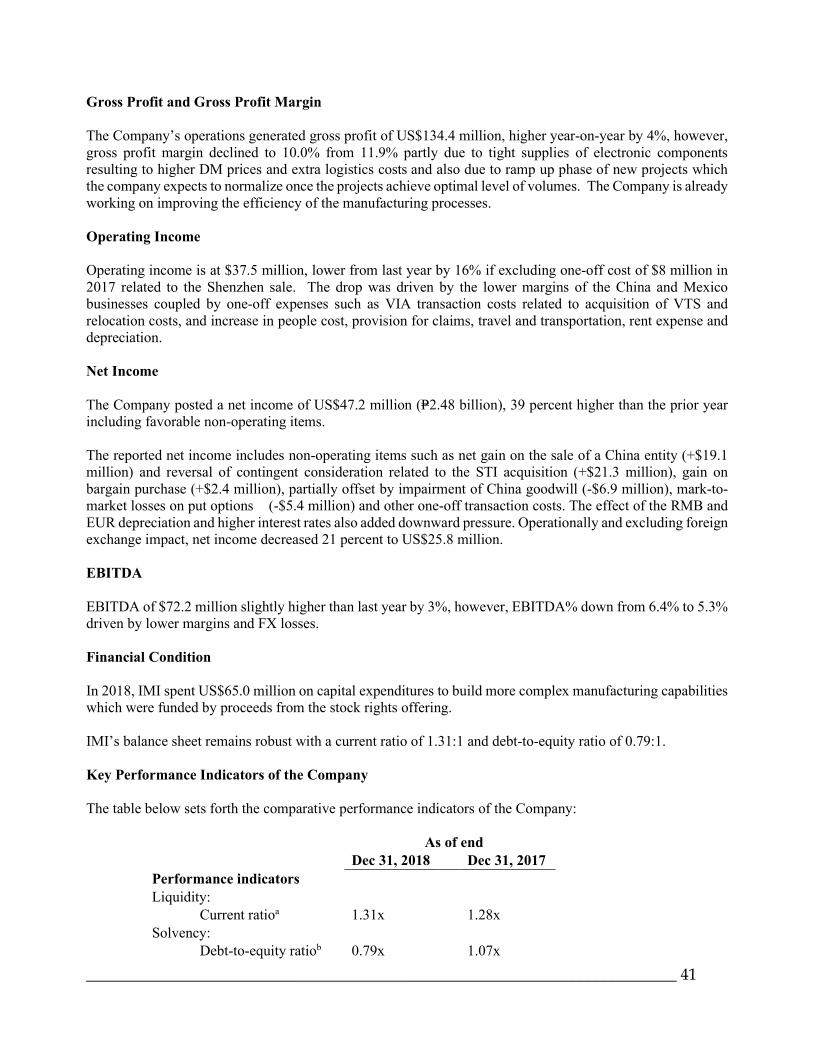
__________________________________________________________________________ 41
Gross Profit and Gross Profit Margin The Company’s operations generated gross profit of US$134.4 million, higher year-on-year by 4%, however, gross profit margin declined to 10.0% from 11.9% partly due to tight supplies of electronic components resulting to higher DM prices and extra logistics costs and also due to ramp up phase of new projects which the company expects to normalize once the projects achieve optimal level of volumes. The Company is already working on improving the efficiency of the manufacturing processes. Operating Income Operating income is at $37.5 million, lower from last year by 16% if excluding one-off cost of $8 million in 2017 related to the Shenzhen sale. The drop was driven by the lower margins of the China and Mexico businesses coupled by one-off expenses such as VIA transaction costs related to acquisition of VTS and relocation costs, and increase in people cost, provision for claims, travel and transportation, rent expense and depreciation. Net Income The Company posted a net income of US$47.2 million (P=2.48 billion), 39 percent higher than the prior year including favorable non-operating items. The reported net income includes non-operating items such as net gain on the sale of a China entity (+$19.1 million) and reversal of contingent consideration related to the STI acquisition (+$21.3 million), gain on bargain purchase (+$2.4 million), partially offset by impairment of China goodwill (-$6.9 million), mark-to-market losses on put options (-$5.4 million) and other one-off transaction costs. The effect of the RMB and EUR depreciation and higher interest rates also added downward pressure. Operationally and excluding foreign exchange impact, net income decreased 21 percent to US$25.8 million. EBITDA EBITDA of $72.2 million slightly higher than last year by 3%, however, EBITDA% down from 6.4% to 5.3% driven by lower margins and FX losses. Financial Condition In 2018, IMI spent US$65.0 million on capital expenditures to build more complex manufacturing capabilities which were funded by proceeds from the stock rights offering. IMI’s balance sheet remains robust with a current ratio of 1.31:1 and debt-to-equity ratio of 0.79:1. Key Performance Indicators of the Company The table below sets forth the comparative performance indicators of the Company:
As of end Dec 31, 2018 Dec 31, 2017 Performance indicators Liquidity: Current ratioa 1.31x 1.28x Solvency: Debt-to-equity ratiob 0.79x 1.07x

__________________________________________________________________________ 42
For the years ended
31 Dec 2018 2017 Operating efficiency: Revenue growthc 24% 29% Profitability: Gross profit margind 10.0% 11.9% Net income margine 3.5% 3.1% Return on equityf 13.9% 13.3% Return on common
equityg 13.9% 13.3%
Return on assetsh 4.4% 3.7% 16EBITDA margin 5.3% 6.4%
a Current assets/current liabilities b Bank debts/Total Equity c (Current year less previous year revenue)/Previous year revenue dGross profit/Revenues
eNet income attributable to equity holders of the Parent Company/Revenues
f Net income attributable to equity holders of the Parent Company/Average equity attributable to Parent g Net income attributable to equity holders of the Parent Company/Average common equity attributable to Parent h Net income attributable to equity holders of the Parent Company/Total Assets In the above: There are no known trends, events or uncertainties that will result in the Company’s liquidity increasing or decreasing in a material way. There were no events that will trigger direct or contingent financial obligation that is material to the Company, including any default or acceleration of an obligation. Likewise, there were no material off-balance sheet transactions, arrangements, obligations (including contingent obligations), and other relationships of the Company with unconsolidated entities or other persons created during the reporting period. There are no known trends, events or uncertainties that have had or that are reasonably expected to have a material favorable or unfavorable impact on the Company’s revenues from continuing operations. There were no significant elements of income or loss that did not arise from continuing operations. There are no seasonal aspects that may have a material effect on the financial condition of the Company.
16 EBITDA Margin = EBITDA divided by revenues from sales and services where EBITDA represents net operating income after
adding depreciation and amortization, cost of share-based payments and foreign exchange gains (losses). EBITDA and EBITDA Margin are not measures of performance under PFRS and investors should not consider EBITDA, EBITDA Margin or EBIT in isolation or as alternatives to net income as an indicator of our operating performance or to cash flows, or any other measure of performance under PFRS. Because there are various EBITDA calculation methods, our presentation of these measures may not be comparable to similarly titled measures used by other companies.

__________________________________________________________________________ 43
Causes for any material changes (Increase or decrease of 5% or more in the financial statements) Income Statement Items (Years ended 31 December 2018 versus 31 December 2017) 24% increase in Revenues ($1.09B to $1.35B) The increase was driven by the surge in revenues of VIA (+$28.3M) plus contribution of the new VTS business ($26.5M), core growth in China ($61.6M), Europe (+$41.3M), Mexico (+$22.5M), Philippines ($14.9M) and full year effect of STI ($63.8M) 26% increase in Cost of goods sold ($961.0MM to $1,215.0M) Driven by the 24% increase in revenues coupled by high DM costs due to more turnkey businesses, change in product mix and higher purchase price due to effect of global component shortage, increase in labor costs and higher overhead due to additional freight costs, depreciation and amortization, rental expenses, repairs and maintenance, utilities and government related expenses. 9% increase in Operating expenses ($89.2M to $96.9M) Excluding $8M SZ relocation costs in 2017, GAE increased by $14.8M mainly from full year impact of STI (+$4.3M), one-off VIA costs related to acquisition transaction costs and relocation costs ($1.9M), operating expenses of the new VTS business ($3.7M). The rest pertains mainly to provision for inventory obsolescence, travel and transportation, professional fees, depreciation and amortization, and insurance. 1218% increase in Non-operating income ($1.5M to $19.3M) Other income pertains to net gain on the sale of a China entity (+$19.1 million) and reversal of contingent consideration related to the STI acquisition (+$21.3 million), gain on bargain purchase (+$2.4M), partially offset by impairment of China goodwill (-$6.9 million), mark-to-market losses on put options (-$5.4 million), higher interest expenses (-$5.1M), and forex impact (-$5.1M) mainly due to RMB and EUR depreciation. 262% increase in Noncontrolling interest ($0.44M to $1.60M) Share of minority in the net income of VIA (23.99%), STI (20%), and recognized non-controlling interest on acquisition of VTS. Balance Sheet items (31 December 2018 versus 31 December 2017) 20% increase in Cash and cash equivalents ($90.6M to $108.5M) Cash used by operating activities -$13.3M from increase in working capital; cash used in investing -$83.2M mainly from capital expenditure to support line expansion and new programs; cash provided by financing $114.6M mainly due proceeds from stock rights offering ($95.9M), $65M million of which have been used for capital expenditure and $30 million for debt repayment. The company also availed $25M net loans and paid dividends of $10.1M for the year. 16% increase in Loans and receivables ($263.1M to $304.7M) Increase mainly due to higher sales and longer credit terms. 100% increase in Contract Assets (nil to $63.5M) Recognition of contract assets upon adoption of PFRS 15. These originated from the work-in-process and finished goods inventories which were recognized as revenue earned from manufacturing services as receipt of consideration is conditional on successful completion of the services, plus corresponding margins. If PFRS 15 was not adopted, total inventories increased by $56.5M.

__________________________________________________________________________ 44
23% decrease in Other current assets ($27.1M to $20.8M) Decrease in advances to suppliers and prepayments 20% increase in Property, plant and equipment ($164.6M to $196.8) Capital expenditures amounting to $63.8M driven by ongoing big projects in Philippines, China, Mexico, and additional SMT lines in Europe and construction of the Serbia facility. 30% increase in Intangible assets ($22.9M to $29.8M) Increase mainly from capitalized costs arising from the development phase of certain projects under qualification (+$5M), IP acquired for the VTS joint venture ($5.3M) and additional software costs ($1M). 29% increase in Financial assets through OCI ($0.8M to $1.1M) Increase in fair value of quoted club shares 775% increase in Other noncurrent assets ($1.8M to $15.7M) Recognition of deferred charges representing tooling items customized based on the specifications of the customers and to be repaid as part of the price of the manufactured items. 100% increase in Contract liabilities (nil to $1.83M) Contract liabilities were recognized upon adoption of PFRS 15 pertaining to short-term advances received to render manufacturing services. 34% increase in Other financial liabilities ($22.3M to $29.8M) Increase due to the reclassification of the remaining balance of contingent liability ($3.7M) of STI to current portion and recognition of additional mark-to-market loss on put options ($5.4M). 823% increase in Current portion of long-term debt ($6.9M to $63.4M) Reclass to current portion of long-term debt of Philippines, Czech and VIA ($63M) offset by decrease due to the final payment of the long-term debt to EPIQ NV ($5.0M) 23% decrease in Noncurrent portion of long-term debt ($158.2M to $124.5M) Reclass to current portion of ($63M) offset by additional availment in PH of $26M and noncurrent portion of VIA of $3.5M 175% increase in Deferred tax liabilities ($2.3M to $6.4M) Deferred tax recognized on unrealized forex gains, contract asset and loss carryover. 18% decrease in Pension liability ($5.1M to $4.2M) Actuarial gains due to higher discount rate 80% decrease in Other noncurrent liabilities ($26.09M to $5.3M) Decrease was due to the reversal of contingent liability of STI ($21.3M) offset by long-term payable related to acquired IP of VTS ($5.3M) 19% increase in Capital stock ($35.7M to $42.6M) Issued shares of 350M from stock rights offer ($6.7M) plus fully paid ESOWN shares $0.2M 152% increase in Additional paid-in capital ($58.1M to $146.5M) Related to stock rights offering (excess over par). This was offset by capitalized transaction costs on SRO ($661K) and ESOWN forfeitures ($190K)

__________________________________________________________________________ 45
36% decrease in Subscriptions receivable ($5.4M to $3.4M) Collections and forfeitures on subscriptions 341% decrease in Other components of equity ($454K to -$1.1M) Cumulative impairment losses previously recognized under PAS 39 for equity instruments measured at FVOCI was transferred from retained earnings to OCI under “Other components of equity” account. 418% increase in negative Cumulative translation adjustments (-$2.5M to -$13.2M) Arising from translation of management accounts in Europe denominated in their respective local currencies to the Parent Company’s functional currency. The significant movement is due to depreciation of EUR against USD from 1.20 to 1.15 and RMB against USD from 6.53 to 6.86. 16% decrease in Remeasurement losses on defined benefit plans (-$7.4M to -$6.2M) Actuarial changes in financial assumptions particularly higher discount rate 146% increase in Equity attributable to NCI ($3.1M to $7.6M) Mainly from increase in share of non-controlling interest in the net income, adoption of PFRS 15 and effect of acquisition, offset by share of NCI in the negative CTA. For the Years Ended 31 December 2017 vs 2016 Revenues, gross profit, net income, and the related computed EBITDA and basic earnings per share, for the years ended 2017, 2016 and 2015 are shown on the following table:
For the years ended December 31
2017 2016 2015 (in US$ thousands,
except Basic EPS) Revenues from sales and services 1,090,588 842,966 814,364 Cost of goods sold and service (960,990) (741,657) (720,333)
Gross profit 129,599
101,309
94,031
Net income attributable to equity holders of the Parent Company
34,002
28,116 28,790
EBITDA17 70,342 64,967 58,763 Basic Earnings per Share (EPS) 0.018 0.015 0.015
17 EBITDA = EBITDA represents net operating income after adding depreciation and amortization and foreign exchange gains/losses.
EBITDA and EBITDA Margin are not measures of performance under PFRS and investors should not consider EBITDA, EBITDA Margin or EBIT in isolation or as alternatives to net income as an indicator of our operating performance or to cash flows, or any other measure of performance under PFRS. Because there are various EBITDA calculation methods, our presentation of these measures may not be comparable to similarly titled measures used by other companies.

__________________________________________________________________________ 46
RATIOS For the Period Ended December 31, 2020 and December 31, 2019
Ratios Formula Dec 31, 2020 Dec 31, 2019
(i) Current ratioCurrent assets / Current
Liabilities 1.54 1.49
(ii) Quick / Acid ratio
Current assets less inventories, contract assets
and other current assets/Current liabilities 1.09 0.98
(iii) Solvency ratioTotal Assets / Total
Liabilities 2.05 1.79 (iv) Debt ratio Total Debt / Total Assets 0.21 0.24
(v) Debt-to-Equity ratio
Bank debts (loans and trust receipts payable and long-term debt) / Total Equity 0.41 0.55
(vi) Assets-to-Equity ratio Total Assets / Total Equity 1.95 2.27
(vii) Interest rate coverage ratioEarnings before interest and
taxes / Interest Expense 0.83 0.08 (viii) Profitability ratios
GP margin Gross Profit / Revenues 8.5% 8.2%
Net profit marginNet Income after Tax /
Revenues -0.30% -0.62%EBITDA margin EBITDA / Revenues 5.2% 3.3%
Return on assetsNet Income after Tax / Total
Asset -0.30% -0.71%
Return on equity
Net Income after Tax / Average equity attributable
to parent -0.83% -1.98%
Dec 31, 2020 Dec 31, 2019
Current Assets 734,174 673,947 Current Liabilities 476,756 453,790 Total Assets 1,133,675 1,096,336 Bank Debts 240,810 268,475 Total Liabilities 552,812 612,557 Total Equity 580,863 483,779 Average equity Attributable to parent 415,122 392,796 Revenues 1,135,841 1,250,366 Gross Profit 96,337 102,228 Net income attributable to equity holders of the parent (3,455) (7,780) Earnings before interest and taxes 8,644 1,076 Interest expense 10,423 13,142 EBITDA 58,884 41,381
(in US$'000)

__________________________________________________________________________ 47
NATURE AND SCOPE OF BUSINESS Integrated Micro-Electronics, Inc. (IMI or the Parent Company), a stock corporation organized and registered under the laws of the Republic of the Philippines on August 8, 1980, has four wholly-owned subsidiaries, namely: IMI International (Singapore) Pte. Ltd. (IMI Singapore), IMI USA, Inc. (IMI USA), IMI Japan, Inc. (IMI Japan) and PSi Technologies, Inc. (PSi) (collectively referred to as the Group). The Parent Company is 52.03% owned by AC Industrial Technology Holdings, Inc. (AC Industrials), a wholly-owned subsidiary of Ayala Corporation (AC), a corporation incorporated in the Republic of the Philippines and listed in the Philippine Stock Exchange (PSE). AC is 47.33% owned by Mermac, Inc. (Ultimate Parent Company) and the rest by the public. The registered office address of the Parent Company is North Science Avenue, Laguna Technopark- Special Economic Zone (LT-SEZ), Bo. Biñan, Biñan, Laguna. The Parent Company was listed by way of introduction in the PSE on January 21, 2010. It has completed its follow-on offering and listing of 215,000,000 common shares on December 5, 2014. On March 2, 2018, the Parent Company completed the stock rights offer and listing of 350,000,000 common shares to all eligible stockholders. The Parent Company is registered with the Philippine Economic Zone Authority (PEZA) as an exporter of printed circuit board assemblies (PCBA), flip chip assemblies, electronic sub-assemblies, box build products and enclosure systems. It also provides the following solutions: product design and development, test and systems development, automation, advanced manufacturing engineering, and power module assembly, among others. It serves diversified markets that include those in the automotive, industrial, medical, storage device, and consumer electronics industries, and non-electronic products (including among others, automobiles, motorcycles, solar panels) or parts, components or materials of non-electronic products, as well as to perform and provide information technology services such as but not limited to data labeling/encoding or image annotation services. IMI Singapore is a strategic management, investment and holding entity that owns operating subsidiaries of the Group and was incorporated and domiciled in Singapore. Its wholly-owned subsidiary, Speedy-Tech Electronics Ltd. (STEL), was incorporated and domiciled also in Singapore. STEL, on its own, has subsidiaries located in Hong Kong and China. STEL and its subsidiaries (collectively referred to as the STEL Group) are principally engaged in the provision of electronic manufacturing services (EMS) and power electronics solutions to original equipment manufacturers (OEMs) in the automotive, consumer electronics, telecommunications, industrial equipment, and medical device sectors, among others. In 2009, IMI Singapore established its Philippine Regional Operating Headquarters (IMI International ROHQ or IMI ROHQ). It serves as an administrative, communications and coordinating center for the affiliates and subsidiaries of the Group. In 2011, the Parent Company, through its indirect subsidiary, Cooperatief IMI Europe U.A. (Cooperatief) acquired Integrated Micro-Electronics Bulgaria EOOD (formerly EPIQ Electronic Assembly EOOD) (IMI BG), Integrated Micro-Electronics Czech Republic s.r.o. (formerly EPIQ CZ s.r.o.) (IMI CZ) and Integrated Micro-Electronics Mexico, S.A.P.I. de C.V. (formerly EPIQ MX, S.A.P.I. de C.V.) (IMI MX) (collectively referred to as the IMI EU/MX Subsidiaries). IMI EU/MX Subsidiaries design and produce PCBA, engage in plastic injection, embedded toolshop, supply assembled and tested systems and sub-systems which include drive and control elements for automotive equipment, household appliances, and industrial equipment, among

__________________________________________________________________________ 48
others. IMI EU/MX Subsidiaries also provide engineering, test and system development and logistics management services. In 2016, Cooperatief acquired a 76.01% ownership interest in VIA Optronics GmbH (VIA), a Germany-based company with operations in Germany and China and sales offices in the USA and Taiwan. VIA is a leading provider of enhanced display solutions for multiple end markets in which superior functionality or durability is a critical differentiating factor. The acquisition allows the Group to strengthen its partnerships with customers by offering complementary automotive camera and display monitor solutions for advanced driver assistance systems. The Group together with VIA enables the scale to introduce patented technology into automotive camera monitor systems for increased safety. In 2018, VIA acquired 65% ownership interest in VTS-Touchsensor Co., Ltd. (VTS), a Japanese entity that develops and manufactures metal mesh touch sensor technologies and electrode base film. In 2019, VIA formed VIA Optronics AG (VIA AG) by way of a contribution in kind against issuance of new shares making VIA AG the sole shareholder of VIA Optronics GmbH. The contribution in kind and resulting re-organization was recognized as a business combination under common control. In the same year, VIA Optronics (Taiwan) Ltd was also founded as a new subsidiary with the purpose of conducting sales activities. In 2020, VIA raised some proceeds through an initial public offering (IPO) and was listed on the New York Stock Exchange under the ticker symbol “VIAO”. As a result of the IPO, IMI’s ownership interest in VIA was diluted from 76.01% to 50.32%. In 2018, the Group opened its 21st manufacturing site in Niš, Republic of Serbia in line with the IMI’s strategy to strengthen its global footprint and support the growing market for automotive components in the European region.
In 2017, IMI, through its indirect subsidiary Integrated Micro-electronics UK Limited (IMI UK), acquired an 80% stake in Surface Technology International Enterprises Limited (STI), an EMS company based in the United Kingdom (UK). STI has factories in the UK and Cebu, Philippines. STI provides electronics design and manufacturing solutions in both PCBA and full box-build manufacturing for high-reliability industries. The acquisition of STI strengthens the Group’s industrial and automotive manufacturing competencies, broaden its customer base, and also provides access to the UK market. Further, the partnership allows the Group’s entry into the aerospace, security and defense sectors. IMI USA acts as direct support to the Group’s customers by providing program management, customer service, engineering development and prototype manufacturing services to customers, especially for processes using direct die attach to various electronics substrates. It specializes in prototyping low to medium PCBA and sub-assembly and is at the forefront of technology with regard to precision assembly capabilities including, but not limited to, surface mount technology (SMT), chip on flex, chip on board and flip chip on flex. IMI USA is also engaged in advanced manufacturing process development, engineering development, prototype manufacturing and small precision assemblies. IMI Japan was registered and is domiciled in Japan to serve as IMI’s front-end design and product development and sales support center. IMI Japan was established to attract more Japanese OEMs to outsource their product development to IMI. PSi is a power semiconductor assembly and test services company serving niche markets in the global power semiconductor market. PSi provides comprehensive package design, assembly and test services for power semiconductors used in various electronic devices.

__________________________________________________________________________ 49
IMI France serves as a support entity which provides manufacturing support services, market research and analysis, sales promotional activity support, strategic planning advisory, and general corporate marketing support.

__________________________________________________________________________ 50
II. MARKET PRICE OF AND DIVIDENDS ON THE REGISTRANT’S COMMON EQUITY
A) Principal market where the registrant’s common equity is traded.
The following table shows the high and low prices (in PhP) of IMI’s shares in the Philippine Stock Exchange in 2021 and 2020.
Philippine Stock Exchange
Prices in PhP/share
High Low Close 2020 2019 2020 2019 2020 2019 First Quarter 8.14 13.70 3.31 10.70 4.53 12.50 Second Quarter 5.65 13.60 4.45 10.00 6.08 10.06 Third Quarter 6.50 10.30 4.60 7.99 5.68 8.00 Fourth Quarter 9.50 8.62 5.45 7.68 9.10 7.89
The market capitalization of the Company’s common shares as of December 31, 2020, based on the closing price of P9.10/share, was approximately P20.18 billion. The price information of IMI’s common shares as of the close of the latest practicable trading date, March 19, 2021, is P10.10 per share.
B) Holders
There are 287 registered common stockholders as of February 28, 2021. The following are the top 20 registered holders of common shares of the Company.
Stockholder Name No. of Common
Shares Percentage of
Common Shares 1. AC Industrial Technology Holdings, Inc. 1,153,725,046 52.0330% 2. PCD Nominee Corporation (Non-Filipino) 522,486,924 23.5641% 3. Resins Incorporated 291,785,034 13.1595% 4. PCD Nominee Corporation (Filipino) 191,712,088 8.6462% 5. 2014 ESOWN Subscription 22,356,871 1.0082% 6. 2007 ESOWN Subscription 9,418,215 0.4247% 7. SIIX Corp. 7,815,267 0.3524%
8. 2015 ESOWN Subscription 4,786,374 0.2158% 9. 2009 ESOWN Subscription 4,464,690 0.2013%
10. Ayala Corporation 1,379,892 0.0622% 11. Helmut Baumgart 1,265,448 0.0570% 12. Meneleo J. Carlos Jr. 805,288 0.0363% 13. Allen B. Paniagua 357,726 0.0161% 14. Transtechnology Pte. Ltd 304,836 0.0137% 15. Alfredo Gramata Jr 258,842 0.0116% 16. Emmanuel V. Barcelon 240,000 0.0108% 17. Philippe Marquet 225,519 0.0101% 18. Conrad J. Eisenman 160,163 0.0072% 19. Joselito Senadoza Bantatua 150,000 0.0067% 20. Sylke Ludewig 137,601 0.0062%

__________________________________________________________________________ 51
A list of the company’s top 100 shareholders as of December 31, 2020 can be found through this link: https://edge.pse.com.ph/openDiscViewer.do?edge_no=bff1a7c5f6a389825d542af6f1e997b9
On June 25, 2015, the Board of Directors of the Company approved the redemption of all of the Company’s outstanding 1,300,000,000 Redeemable Preferred Shares which were issued in 2008. The redemption price of P1.00 per share and all accumulated unpaid cash dividends were paid on August 24, 2015 to the stockholders as of record date July 24, 2015.
C) Dividends
Stock Dividend-Common Shares
PAYMENT DATE PERCENT RECORD DATE
Sept. 24, 2010 15% Aug. 31, 2010 Cash Dividends-Common Shares
PAYMENT DATE RATE RECORD DATE May 4, 2017 USD 0.004529/P0.22739 April 20, 2017 March 21, 2018 USD0.00458/P0.235 March 7, 2018 May 7, 2019 USD0.00201/ P0.10542 April 25, 2019
There was no cash dividend declaration in 2020.
Cash Dividends-Preferred Shares (Redeemed in 2015)
PAYMENT DATE RATE RECORD DATE February 21, 2014 2.90% p.a. February 7, 2014
May 21, 2014 2.90% p.a. May 7, 2014 August 22, 2014 2.90% p.a. August 7, 2014
November 21, 2014 2.90% p.a. November 7, 2014 February 20, 2015 2.90% p.a. February 6, 2015
May 22, 2015 2.90% p.a. May 8, 2015 August 24, 2015 2.90% p.a. August 7, 2015
Dividend policy Dividends declared by the Company on its shares of stocks are payable in cash or in additional shares of stock. The payment of dividends in the future will depend upon the earnings, cash flow and financial condition of the Company and other factors. There are no other restrictions that limit the payment of dividends on common shares. Cash dividends are subject to approval by the Company’s Board of Directors but no stockholder approval is required. Property dividends which may come in the form of additional shares of stock are subject to approval by both the Board of Directors and the stockholders of the Company. In addition, the payment of stock dividends is likewise subject to the approval of the SEC and PSE. The Subsidiaries have not adopted any formal dividend policies. Dividend policies for the Subsidiaries shall be determined by their respective Boards of Directors.

__________________________________________________________________________ 52
Recent Sale of Securities There were 9,773,144 shares subscribed by the Company’s executives as a result of their subscription to the stock ownership (ESOWN) plan in 2015. No share was subscribed under the ESOWN Plan since 2016. On July 20, 2004, the SEC approved the issuance of 150,000,000 ESOWN shares as exempt transactions pursuant to Section 10.2 of the Securities Regulation Code.
D) Corporate Governance
The Company submitted its Revised Manual on Corporate Governance to the SEC on 30 May 2017 in compliance with SEC memorandum Circular No. 13, series of 2016, and made additional revisions to the same in 2018.
(i) The evaluation system which was established to measure or determine the level of compliance of
the Board and top level management with its Revised Manual of Corporate Governance consists of a Board Performance Assessment which is accomplished by the members of the Board indicating the compliance ratings. The above is submitted to the Compliance Officer who issues the required Integrated Annual Corporate Governance Report (“I-ACGR”) yearly.
(ii) To ensure good governance, the Board establishes the vision, strategic objectives, key policies,
and procedures for the management of the Company, as well as the mechanism for monitoring and evaluating management’s performance. The Board also ensures the presence and adequacy of internal control mechanisms for good governance.
(iii) The Company has adopted in the Revised Manual of Corporate Governance the leading practices
and principles of good corporate governance, and full compliance therewith has been made since the adoption of the Manual.
(iv) The Company is taking further steps to enhance adherence to principles and practices of good
corporate governance through the adoption of the Revised Code of Corporate Governance. In line with this, the Board also adopted the Charter of the Board of Directors on 25 January 2015.
(v) Reflecting its dedication to continuous improvement, IMI received the Golden Arrow 2
recognition for the 2019 ASEAN Corporate Governance Scorecard Assessment (one level higher than previous year’s Golden Arrow 1 award) awarded by the Institute of Corporate Directors through a virtual domestic recognition last February 19, 2021.
Upon the written request of the stockholders, the Company undertakes to furnish said stockholder with a copy of SEC Form 17-A free of charge. Any written request for a copy of SEC Form 17-A shall be addressed to the following: Integrated Micro-Electronics, Inc. North Science Avenue
Special Export Processing Zone Laguna Technopark
Bo. Biñan, Biñan, Laguna Attention: Mr. Jerome S. Tan
Global Chief Financial Officer

__________________________________________________________________________ 53
ANNEX “D” INTEGRATED MICRO-ELECTRONICS, INC.
Amendments to the By-Laws
Article and Section Nos. From To
Art. III, Sec. 2 General meetings may be regular or special, and shall be held at the offices of the Corporation or at any place designated by the Board of Directors in Metro Manila. xxx xxx xxx
General meetings may be regular or special, and shall be held at the principal office of the Corporation or at any place in the city where the principal office of the Corporation is located. xxx xxx xxx
Art. III, Sec. 3 Written notice of each stockholders’ meeting stating the date, time and place and, for a special meeting, the purpose(s) for which the meeting is called, shall be given by the Corporation not less than fifteen (15) business days prior to the date of the meeting to each stockholder of record, to the stockholder’s address as it appears on the record of stockholders of the Corporation. The written notice may be in paper, digital or electronic medium. The notice of any meeting of the stockholders shall be deemed to have been given at the time when delivered personally or deposited in the post office, or sent electronically or by e-mail and addressed as herein provided. The Company may provide information or documents to a stockholder by e-mail or by posting the information or documents on the website of the Company or another electronic network; provided that, a separate notice is given to the stockholder of such posting. In case the Company provides information or documents by electronic posting, the information or documents shall be deemed delivered or given upon the later of (i) the posting of the information or documents or (ii) the giving of a separate notice to the stockholder of such specific posting. The Company shall give notice and provide information or documents electronically, as provided above, only to stockholders who have consented to receive notices, information or documents by e-mail or electronic transmission. A stockholder shall be deemed to have consented to receiving notices, information or documents electronically if he has provided an e-mail or electronic address to the Company and he has not notified the Company in writing that he requires notices, information or documents to be given to him in physical paper form.
Regular or special meeting of stockholders shall be called by written notice. The notice shall be served to all stockholders primarily by electronic transmission, or by physical service in case no means of electronic transmission is available. For regular meetings, the notice shall be sent at least twenty-one (21) days prior to the date of the meeting, while for special meetings, at least one (1) week written notice shall be sent to all stockholders. The notice shall be deemed to have been given at the time when it has been electronically transmitted through any of the means mentioned herein, or in the case of physical service, when delivered personally or deposited in the post office. Notice of regular or special meeting shall contain, in addition to the date, hour and place of the meeting, a statement of the matters to be transacted at the meeting, and no business other than that specified in the notice shall be transacted at such meeting. Any stockholder may propose any other matter for inclusion in the agenda at any regular or special stockholders’ meeting, subject to reasonable guidelines issued by the Board which are consistent with applicable laws, rules and regulations of the Securities and Exchange Commission, as may be amended from time to time. The notice of the stockholders’ meeting shall also set the date, time and place of the validation of proxies, which in no case, shall be less than five (5) business days prior to the stockholders’ meeting. The notice shall also contain the procedures to be followed when a stockholder elects to participate and vote through remote communication or in absentia.

__________________________________________________________________________ 54
The Corporation shall also provide information or documents to all stockholders by electronic transmission. The information or documents shall be deemed delivered upon the transfer or posting by electronic means. As used herein, electronic transmission means the delivery or transfer of documents, data or information by electronic mail to the electronic address of the stockholders registered in the books of the Corporation, posting in the Philippine Stock Exchange, posting in the Corporation’s website (in the subsections for stockholders’ meetings or disclosures of the Governance section), or such other recognized means of electronic transfer of data or information. The Corporation shall require all stockholders to provide a valid electronic address for them to receive notices and other information or documents from the Corporation. Stockholders preferring to receive physical copies of the notice, information or documents shall make a written request to the Corporation. Upon receipt of the request, the Corporation shall send the notice, information and documents by personal service. Notice to any meeting may be waived, expressly or impliedly, including through a stockholder’s attendance at a meeting unless the stockholder’s presence is for the express purpose of contending that the meeting is not lawfully convened.
Art. III, Sec. 4 - xxx xxx xxx The Corporation may opt to hold fully virtual stockholders’ meetings, subject to applicable laws, rules and regulations of the Securities and Exchange Commission, as may be amended from time to time. The virtual meetings shall be conducted in such a way that the stockholder experience will be, to every extent possible, similar to a physical meeting. In any such instance, if stockholders holding at least ten percent (10%) of the outstanding capital stock ask for a physical meeting, the Corporation

__________________________________________________________________________ 55
shall conduct a physical meeting unless prevented by existing rules and regulations. The request shall be made within two (2) weeks from the announcement of the holding of a virtual meeting, which shall be made ahead of the sending out of the Notice of Meeting.
Art. III, Sec. 5 - xxx xxx xxx Stockholders casting votes through remote communication or in absentia, electronically or otherwise, shall be deemed present for purposes of determining the existence of a quorum.
Art. III, Sec. 6 Any stockholder entitled to vote may be represented by proxy at any regular or special stockholders’ meetings. Proxies shall be in writing and signed, but no other formality is required.
Any stockholder entitled to vote may vote in person, through remote communication, in absentia, or be represented by proxy at any regular or special stockholders’ meetings, subject to compliance with rules and regulations as may be issued by the Securities and Exchange Commission from time to time. Proxies shall be in writing and signed and in accordance with existing laws, rules and regulations of the Securities and Exchange Commission. Duly accomplished proxies must be submitted to the Office of the Corporate Secretary not later than seven (7) business days prior to the date of the stockholders’ meeting. Validation of proxies shall be conducted at least five (5) business days prior to the date of the stockholders’ meeting.
Art. III, Sec. 8 The election of Directors shall be by ballot and each stockholder entitled to vote may cast the votes to which the number of shares he owns entitles him, for as many persons as are to be elected as Directors, or he may give one candidate as many votes as the number of Directors to be elected multiplied by the number of his shares shall equal, or he may distribute them on the same principle among as many candidates as he may see fit, provided that the whole number of votes cast by him shall not exceed the number of shares owned by him multiplied by the whole number of Directors to be elected.
The election of Directors shall be by ballot and each stockholder entitled to vote may cast the vote in person, by proxy, through remote communication, or in absentia, electronically or otherwise, to which the number of shares he owns entitles him, for as many persons as are to be elected as Directors, or he may give one candidate as many votes as the number of Directors to be elected multiplied by the number of his shares shall equal, or he may distribute them on the same principle among as many candidates as he may see fit, provided that the whole number of votes cast by him shall not exceed the number of shares owned by him multiplied by the whole number of Directors to be elected.
Art. III - Section 12 – The Board of Directors shall fix a record date for the purpose of determining the stockholders entitled to
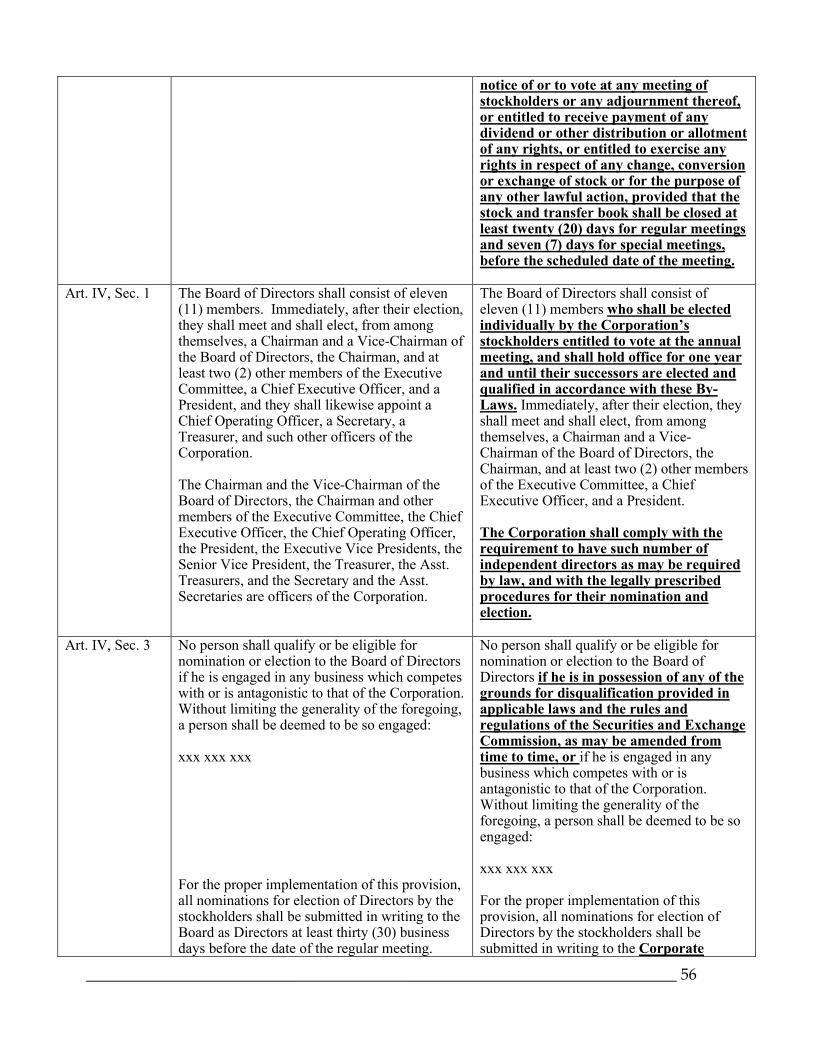
__________________________________________________________________________ 56
notice of or to vote at any meeting of stockholders or any adjournment thereof, or entitled to receive payment of any dividend or other distribution or allotment of any rights, or entitled to exercise any rights in respect of any change, conversion or exchange of stock or for the purpose of any other lawful action, provided that the stock and transfer book shall be closed at least twenty (20) days for regular meetings and seven (7) days for special meetings, before the scheduled date of the meeting.
Art. IV, Sec. 1 The Board of Directors shall consist of eleven (11) members. Immediately, after their election, they shall meet and shall elect, from among themselves, a Chairman and a Vice-Chairman of the Board of Directors, the Chairman, and at least two (2) other members of the Executive Committee, a Chief Executive Officer, and a President, and they shall likewise appoint a Chief Operating Officer, a Secretary, a Treasurer, and such other officers of the Corporation. The Chairman and the Vice-Chairman of the Board of Directors, the Chairman and other members of the Executive Committee, the Chief Executive Officer, the Chief Operating Officer, the President, the Executive Vice Presidents, the Senior Vice President, the Treasurer, the Asst. Treasurers, and the Secretary and the Asst. Secretaries are officers of the Corporation.
The Board of Directors shall consist of eleven (11) members who shall be elected individually by the Corporation’s stockholders entitled to vote at the annual meeting, and shall hold office for one year and until their successors are elected and qualified in accordance with these By-Laws. Immediately, after their election, they shall meet and shall elect, from among themselves, a Chairman and a Vice-Chairman of the Board of Directors, the Chairman, and at least two (2) other members of the Executive Committee, a Chief Executive Officer, and a President. The Corporation shall comply with the requirement to have such number of independent directors as may be required by law, and with the legally prescribed procedures for their nomination and election.
Art. IV, Sec. 3 No person shall qualify or be eligible for nomination or election to the Board of Directors if he is engaged in any business which competes with or is antagonistic to that of the Corporation. Without limiting the generality of the foregoing, a person shall be deemed to be so engaged: xxx xxx xxx For the proper implementation of this provision, all nominations for election of Directors by the stockholders shall be submitted in writing to the Board as Directors at least thirty (30) business days before the date of the regular meeting.
No person shall qualify or be eligible for nomination or election to the Board of Directors if he is in possession of any of the grounds for disqualification provided in applicable laws and the rules and regulations of the Securities and Exchange Commission, as may be amended from time to time, or if he is engaged in any business which competes with or is antagonistic to that of the Corporation. Without limiting the generality of the foregoing, a person shall be deemed to be so engaged: xxx xxx xxx For the proper implementation of this provision, all nominations for election of Directors by the stockholders shall be submitted in writing to the Corporate

__________________________________________________________________________ 57
Governance and Nomination Committee at least thirty (30) business days before the date of the regular meeting of the stockholders.
Art. IV, Sec. 4 In case any vacancy or vacancies should occur in the Board of Directors during the period between two annual meetings due to death, resignation or other causes, the remaining Directors, if still constituting a quorum, may fill said vacancies by election from among the stockholders, and the stockholders so elected shall act as members of said Board until the new Board of Directors is elected.
Any vacancy due to expiration of term shall be filled no later than the day of such expiration at the annual stockholders’ meeting. For any vacancy arising from removal by the stockholders, the election shall be held on the same meeting if so stated in the agenda and notice of meeting. In all other cases, the vacancy may be filled by at least a majority vote of the remaining directors, if still constituting a quorum; otherwise, the vacancy shall be filled in a special stockholders’ meeting called for that purpose, in any instance no later than forty-five (45) days from the time the vacancy occurred. The director so elected shall be referred to as replacement director and act as a member of the said Board only for the unexpired term of his predecessor. However, when the remaining directors cannot constitute a quorum and emergency action is required to prevent grave, substantial or irreparable loss or damage to the Corporation, the vacancy may be temporarily filled from among the officers of the Corporation by the unanimous vote of the remaining directors. The designated director’s actions shall be limited to any necessary emergency action and his term shall cease within a reasonable time from the termination of the emergency or upon election of the replacement director, whichever comes first.
Art. IV, Sec. 5 The Board of Directors shall designate the days when it shall meet in session, but it shall meet at least once each quarter. It may be convened in special session by the Chairman or at the request of two (2) directors.
The Board of Directors shall designate the days when it shall meet in regular session, but it shall meet at least six (6) times a year. It may be convened in special session by the Chairman or at the request of three (3) directors.
Art. IV, Sec. 6 A majority of the Directors shall constitute a quorum for the holding of a meeting, and any resolution by a majority of the quorum duly convened in session shall be valid as a corporate act.
Two-thirds (2/3) of the number of directors as fixed in the articles of incorporation shall constitute a quorum for the transaction of corporate business. Any resolution by a majority of the quorum duly convened in session shall be valid as a corporate act.

__________________________________________________________________________ 58
Participation of directors, including voting, at board meetings can be in person, through remote communication, such as videoconferencing, teleconferencing or other alternative modes of communication allowed by the Securities and Exchange Commission. Participation and voting cannot be done by proxy.
Art. IV, Sec. 9 xxx xxx xxx
The compensation and remuneration committee of the Board of Directors shall have the responsibility for recommending to the Board of Directors the fees and other compensation for directors. In discharging this duty, the committee shall be guided by the objective of ensuring that the level of compensation should fairly pay directors for work required in a company of the Corporation’s size and scope.
xxx xxx xxx The Personnel and Compensation Committee of the Board of Directors shall have the responsibility for recommending to the Board of Directors the fees and other compensation for directors. In discharging this duty, the Committee shall be guided by the objective of ensuring that the level of compensation should fairly pay directors for work required in a company of the Corporation’s size and scope. No director shall be involved in deciding his own remuneration during his incumbent term.
- - Section 10 – The Chairman of the Board shall have the following powers: a. To preside at all stockholders’
meetings and meetings of the Board of Directors;
b. To cast the deciding vote in case of a tie in the stockholders’ meetings or in the Board meetings; and
c. To exercise such other powers which are given him by these By-Laws.
In the absence of the Chairman, the Vice Chairman shall automatically take his place as Acting Chairman of the Board of Directors.
- - Section 11 - Directors with interest, potential or otherwise, in any related party transaction shall timely and fully disclose any and all material facts and abstain from deliberations on and approval of the same without prejudice to compliance with the requirements of the law and the rules and regulations of the Securities and Exchange Commission, as may be amended from time to time. Material related party contracts, as defined in applicable laws, rules and regulations of the Securities and Exchange Commission,

__________________________________________________________________________ 59
shall be approved by at least two-thirds (2/3) of all the directors, including at least a majority of the independent directors.
Art. VI, Sec. 1 The Chairman of the Board shall, when present, preside at all meetings of the Board of Directors and shall render advice and counsel to the President.
The Chief Executive Officer (CEO), the Chief Operating Officer (COO), the President, the Executive Vice Presidents, the Senior Vice President, the Treasurer, the Asst. Treasurers, the Secretary, the Asst. Secretaries and the Compliance Officer are officers of the Corporation, all of whom shall be elected by the Board of Directors. The election of these officers shall require the vote of a majority of all the members of the Board of Directors.
Art. VI, Sec. 8 - The Compliance Officer shall ensure compliance by the Corporation, its directors and officers with applicable laws, rules and regulations, and governance issuances of regulatory agencies, proper onboarding of new directors, identification and appropriate resolution of any compliance issues, and the integrity and accuracy of all documentary submissions to regulators, and perform all other duties which may be assigned to him by the Board of Directors.
Art. VIII, Sec. 1 xxx xxx xxx xxx xxx xxx
Cash dividend payouts shall be done through electronic means such as direct bank transfer, transfer to an electronic wallet account and the like as may be decided by the Board of Directors. The Corporation shall request stockholders to provide the account details where the dividend payout shall be transferred or remitted to. Stockholders who fail to provide account details shall receive their dividend payout by check, which will be available for pick-up at a designated office as announced in the Corporation’s website and in regulatory disclosures.
- - ARTICLE IX
ARBITRATION
Section 1 – Any dispute, controversy or claim between the Corporation and its stockholders arising from, relating to, or

__________________________________________________________________________ 60
in connection with the implementation of the articles of incorporation or by-laws, or from intra-corporate relations, except those involving criminal offenses and interests of third parties, may be referred to and resolved by arbitration in accordance with prevailing Philippine Dispute Resolution Center, Inc. (PDRCI) Arbitration Rules and Securities and Exchange Commission Rules and Regulations. Section 2 – The number of arbitrators shall be three (3) appointed by the Philippine Dispute Resolution Center, Inc. (PDRCI) and the place of arbitration shall be in Metro Manila, Philippines. The language to be used for the arbitral proceedings shall be English. Section 3 – The parties shall be bound by the award rendered by the Arbitral Tribunal and confirmed by the appropriate Regional Trial Court. Arbitration shall not be available for disputes involving claims in excess of One Million Pesos (Php1,000,000.00) or involving the determination of the fair valuation of shares in appraisal proceedings.


*SGVFSM005291*
C O V E R S H E E Tfor
AUDITED FINANCIAL STATEMENTS
SEC Registration Number
9 4 4 1 9
C O M P A N Y N A M E
I N T E G R A T E D M I C R O - E L E C T R O N I C S ,
I N C . a n d S U B S I D I A R I E S
PRINCIPAL OFFICE ( No. / Street / Barangay / City / Town / Province )
N O R T H S C I E N C E A V E N U E , L A G U N A T
E C H N O P A R K - S P E C I A L E C O N O M I C Z O N
E ( L T - S E Z ) , B O . B I Ñ A N , B I Ñ A N ,
L A G U N A
Form Type Department requiring the report Secondary License Type, If Applicable
A A F S S E C N / A
C O M P A N Y I N F O R M A T I O N
Company’s Email Address Company’s Telephone Number Mobile Number
[email protected] (02) 7756-6840 N/A
No. of Stockholders Annual Meeting (Month / Day) Fiscal Year (Month / Day)
288 APRIL 15 12/31
CONTACT PERSON INFORMATION
The designated contact person MUST be an Officer of the Corporation
Name of Contact Person Email Address Telephone Number/s Mobile Number
Mr. Jerome S. Tan [email protected] (02) 7756-6840 N/A
CONTACT PERSON’s ADDRESS
North Science Avenue, Laguna Technopark, Biñan, LagunaNOTE 1 : In case of death, resignation or cessation of office of the officer designated as contact person, such incident shall be reported to the Commissionwithin thirty (30) calendar days from the occurrence thereof with information and complete contact details of the new contact person designated.
2 : All Boxes must be properly and completely filled-up. Failure to do so shall cause the delay in updating the corporation’s records with the Commissionand/or non-receipt of Notice of Deficiencies. Further, non-receipt of Notice of Deficiencies shall not excuse the corporation from liability for its deficiencies

*SGVFSM005291*
INDEPENDENT AUDITOR’S REPORT
The Board of Directors and StockholdersIntegrated Micro-Electronics, Inc.North Science AvenueLaguna TechnoparkBiñan, Laguna
Opinion
We have audited the consolidated financial statements of Integrated Micro-Electronics, Inc. and itssubsidiaries (the Group), which comprise the consolidated balance sheets as at December 31, 2020 and2019, and the consolidated statements of income, consolidated statements of comprehensive income,consolidated statements of changes in equity and consolidated statements of cash flows for each of thethree years in the period ended December 31, 2020, and notes to the consolidated financial statements,including a summary of significant accounting policies.
In our opinion, the accompanying consolidated financial statements present fairly, in all material respects,the consolidated balance sheets of the Group as at December 31, 2020 and 2019, and its consolidatedfinancial performance and its consolidated cash flows for each of the three years in the period endedDecember 31, 2020 in accordance with Philippine Financial Reporting Standards (PFRSs).
Basis for Opinion
We conducted our audits in accordance with Philippine Standards on Auditing (PSAs). Ourresponsibilities under those standards are further described in the Auditor’s Responsibilities for the Auditof the Consolidated Financial Statements section of our report. We are independent of the Group inaccordance with the Code of Ethics for Professional Accountants in the Philippines (Code of Ethics)together with the ethical requirements that are relevant to our audit of the consolidated financialstatements in the Philippines, and we have fulfilled our other ethical responsibilities in accordance withthese requirements and the Code of Ethics. We believe that the audit evidence we have obtained issufficient and appropriate to provide a basis for our opinion.
Key Audit Matters
Key audit matters are those matters that, in our professional judgment, were of most significance in ouraudit of the consolidated financial statements of the current period. These matters were addressed in thecontext of our audit of the consolidated financial statements as a whole, and in forming our opinionthereon, and we do not provide a separate opinion on these matters. For each matter below, ourdescription of how our audit addressed the matter is provided in that context.
We have fulfilled the responsibilities described in the Auditor’s Responsibilities for the Audit of theConsolidated Financial Statements section of our report, including in relation to these matters.Accordingly, our audit included the performance of procedures designed to respond to our assessment ofthe risks of material misstatement of the consolidated financial statements.
SyCip Gorres Velayo & Co.6760 Ayala Avenue1226 Makati CityPhilippines
Tel: (632) 8891 0307Fax: (632) 8819 0872ey.com/ph
BOA/PRC Reg. No. 0001, October 4, 2018, valid until August 24, 2021SEC Accreditation No. 0012-FR-5 (Group A),
November 6, 2018, valid until November 5, 2021
A member firm of Ernst & Young Global Limited

*SGVFSM005291*
- 2 -
The results of our audit procedures, including the procedures performed to address the matters below,provide the basis for our audit opinion on the accompanying consolidated financial statements.
Recoverability of Goodwill
Under PFRS, the Group is required to annually test the amount of goodwill for impairment. As ofDecember 31, 2020, the Group’s goodwill attributable to the following cash-generating units (CGUs):Integrated Micro-Electronics, Inc., Speedy-Tech Electronics, Ltd., IMI Czech Republic s.r.o., VIAOptronics GmbH (VIA), and Surface Technology International Enterprises Limited (STI), amounted to$147.25 million, which is considered significant to the consolidated financial statements. In addition,management’s assessment process requires significant judgment and is based on assumptions which aresubject to higher level of estimation uncertainty due to the current economic conditions which have beenimpacted by the coronavirus pandemic, specifically revenue growth rate, gross margin and discount rate.
The Group’s disclosures about goodwill are included in Note 11 to the consolidated financial statements.
Audit response
We obtained an understanding of the Group’s impairment assessment process and the related controls.We involved our internal specialist in evaluating the methodologies and assumptions used. Theseassumptions include revenue growth rate, gross margin and discount rate. We compared the keyassumptions used such as revenue growth rate against actual historical performance of the CGU andindustry outlook, the gross margins against historical rates, and other relevant external data, taking intoconsideration the impact associated with coronavirus pandemic. We tested the parameters used in thedetermination of the discount rate against market data. We also reviewed the Group’s disclosures aboutthose assumptions to which the outcome of the impairment test is more sensitive; specifically those thathave the most significant effect on the determination of the recoverable amount of goodwill.
Valuation of the put options arising from the acquisition of VIA Optronics GmbH (VIA) and STI
The terms of the acquisition of VIA in 2016 and STI in 2017 included put options that granted thenoncontrolling shareholders the right to sell their shares in the acquiree to the Group. This resulted to arecognition of financial liability which is being revalued at every reporting period. In 2020, theshareholders agreement for VIA was amended which resulted to the cancellation of the put option andreclassification of the put option liability amounting to $15.3 million to additional paid-in capital. As ofDecember 31, 2020, the remaining put options liability for STI amounted to $1.59 million. Weconsidered the valuation of the put options to be a key audit matter because it requires significantjudgment and is based on assumptions which are subject to higher level of estimation uncertainty due tothe current economic conditions which have been impacted by the coronavirus pandemic, specifically,revenue growth rate, EBITDA multiple, discount rate, forecasted interest rate and the probability oftrigger events occurring.
Details of the transactions and the valuation of the put options are disclosed in Notes 18 and 32 to theconsolidated financial statements.
A member firm of Ernst & Young Global Limited

*SGVFSM005291*
- 3 -
Audit response
We involved our internal specialists in testing the fair values of the put options, including the evaluationof the methodologies and key assumptions used. These assumptions include revenue growth rate,EBITDA multiple, discount rate, forecasted interest rate and probability of trigger events occurring. Weevaluated the revenue growth rate against the acquirees’ historical financial performance, the Group’sbusiness plan for the acquirees and industry outlook. We evaluated the EBITDA multiple against marketdata of comparable companies. We tested the parameters used in the derivation of the discount rateagainst market data. We compared the interest rate used in forecasting the future equity value to the risk-free rate in Germany and the United Kingdom, and inquired with management its basis for the probabilityof trigger events occurring. We also examined the agreement supporting the cancellation of the putoption granted to the noncontrolling shareholders.
Recoverability of capitalized product development costs and property, plant and equipment
Under PFRS, the Group is required to test the recoverability of nonfinancial assets when indicators ofimpairment exist. In 2020, the continuing gross loss position since the start of mass production for theproduction line for certain customers in Philippines and Mexico has been assessed as an impairmentindicator requiring an impairment assessment. The management’s impairment assessment processrequires significant judgment and is based on assumptions which are subject to higher level of estimationuncertainty due to the current economic conditions which have been impacted by the coronaviruspandemic, specifically revenue growth rate and inclusion of future price increases in the revenue growth,cost ratios and discount rates. As of December 31, 2020, the carrying amount of the capitalized productdevelopment costs and the property, plant, and equipment specifically used in the projects amounted to$10.99 million, and the impairment loss recognized for the year amounted to $7.22 million. Thesebalances are considered significant to the consolidated financial statements.
The Group’s disclosures about the capitalized product development costs and property, plant andequipment are included in Notes 10 and 12 to the consolidated financial statements.
Audit response
We obtained an understanding of the Group’s impairment assessment process and the related controls.We involved our internal specialist in evaluating the methodologies and assumptions used. Theseassumptions include revenue growth rate, cost ratios and discount rate. We compared the keyassumptions used such as revenue growth rate and cost ratios against actual historical performance of thespecific production line and other relevant external data, taking into consideration the impact associatedwith coronavirus pandemic. We tested the parameters used in the derivation of the discount rate againstmarket data. We also reviewed the Group’s disclosures about those assumptions to which the outcome ofthe impairment test is more sensitive; specifically, those that have the most significant effect on thedetermination of the recoverable amount of the capitalized product development costs and property, plantand equipment.
Other Information
Management is responsible for the other information. The other information comprises the informationincluded in the SEC Form 20-IS (Definitive Information Statement), SEC Form 17-A and Annual Reportfor the year ended December 31, 2020, but does not include the consolidated financial statements and ourauditor’s report thereon. The SEC Form 20-IS (Definitive Information Statement), SEC Form 17-A and
A member firm of Ernst & Young Global Limited

*SGVFSM005291*
- 4 -
Annual Report for the year ended December 31, 2020 are expected to be made available to us after thedate of this auditor’s report.
Our opinion on the consolidated financial statements does not cover the other information and we will notexpress any form of assurance conclusion thereon.
In connection with our audits of the consolidated financial statements, our responsibility is to read theother information identified above when it becomes available and, in doing so, consider whether the otherinformation is materially inconsistent with the consolidated financial statements or our knowledgeobtained in the audits, or otherwise appears to be materially misstated.
Responsibilities of Management and Those Charged with Governance for the ConsolidatedFinancial Statements
Management is responsible for the preparation and fair presentation of the consolidated financialstatements in accordance with PFRSs, and for such internal control as management determines isnecessary to enable the preparation of consolidated financial statements that are free from materialmisstatement, whether due to fraud or error.In preparing the consolidated financial statements, management is responsible for assessing the Group’sability to continue as a going concern, disclosing, as applicable, matters related to going concern andusing the going concern basis of accounting unless management either intends to liquidate the Group or tocease operations, or has no realistic alternative but to do so.
Those charged with governance are responsible for overseeing the Group’s financial reporting process.
Auditor’s Responsibilities for the Audit of the Consolidated Financial Statements
Our objectives are to obtain reasonable assurance about whether the consolidated financial statements as awhole are free from material misstatement, whether due to fraud or error, and to issue an auditor’s reportthat includes our opinion. Reasonable assurance is a high level of assurance, but is not a guarantee that anaudit conducted in accordance with PSAs will always detect a material misstatement when it exists.Misstatements can arise from fraud or error and are considered material if, individually or in theaggregate, they could reasonably be expected to influence the economic decisions of users taken on thebasis of these consolidated financial statements.
As part of an audit in accordance with PSAs, we exercise professional judgment and maintainprofessional skepticism throughout the audit. We also:
Identify and assess the risks of material misstatement of the consolidated financial statements,whether due to fraud or error, design and perform audit procedures responsive to those risks, andobtain audit evidence that is sufficient and appropriate to provide a basis for our opinion. The risk ofnot detecting a material misstatement resulting from fraud is higher than for one resulting from error,as fraud may involve collusion, forgery, intentional omissions, misrepresentations, or the override ofinternal control.
Obtain an understanding of internal control relevant to the audit in order to design audit proceduresthat are appropriate in the circumstances, but not for the purpose of expressing an opinion on theeffectiveness of the Group’s internal control.
A member firm of Ernst & Young Global Limited

*SGVFSM005291*
- 5 -
Evaluate the appropriateness of accounting policies used and the reasonableness of accountingestimates and related disclosures made by management.
Conclude on the appropriateness of management’s use of the going concern basis of accounting and,based on the audit evidence obtained, whether a material uncertainty exists related to events orconditions that may cast significant doubt on the Group’s ability to continue as a going concern. Ifwe conclude that a material uncertainty exists, we are required to draw attention in our auditor’sreport to the related disclosures in the consolidated financial statements or, if such disclosures areinadequate, to modify our opinion. Our conclusions are based on the audit evidence obtained up tothe date of our auditor’s report. However, future events or conditions may cause the Group to ceaseto continue as a going concern.
Evaluate the overall presentation, structure and content of the consolidated financial statements,including the disclosures, and whether the consolidated financial statements represent the underlyingtransactions and events in a manner that achieves fair presentation.
Obtain sufficient appropriate audit evidence regarding the financial information of the entities orbusiness activities within the Group to express an opinion on the consolidated financial statements.We are responsible for the direction, supervision and performance of the audit. We remain solelyresponsible for our audit opinion.
We communicate with those charged with governance regarding, among other matters, the planned scopeand timing of the audit and significant audit findings, including any significant deficiencies in internalcontrol that we identify during our audit.
We also provide those charged with governance with a statement that we have complied with relevantethical requirements regarding independence, and to communicate with them all relationships and othermatters that may reasonably be thought to bear on our independence, and where applicable, relatedsafeguards.
From the matters communicated with those charged with governance, we determine those matters thatwere of most significance in the audit of the consolidated financial statements of the current period andare therefore the key audit matters. We describe these matters in our auditor’s report unless law orregulation precludes public disclosure about the matter or when, in extremely rare circumstances, wedetermine that a matter should not be communicated in our report because the adverse consequences ofdoing so would reasonably be expected to outweigh the public interest benefits of such communication.
A member firm of Ernst & Young Global Limited

*SGVFSM005291*
- 6 -
The engagement partner on the audit resulting in this independent auditor’s report isCyril Jasmin B. Valencia.
SYCIP GORRES VELAYO & CO.
Cyril Jasmin B. ValenciaPartnerCPA Certificate No. 90787SEC Accreditation No. 1737-A (Group A), January 24, 2019, valid until January 23, 2022Tax Identification No. 162-410-623BIR Accreditation No. 08-001998-074-2020, December 3, 2020, valid until December 2, 2023PTR No. 8534376, January 4, 2021, Makati City
March 2, 2021
A member firm of Ernst & Young Global Limited

*SGVFSM005291*
INTEGRATED MICRO-ELECTRONICS, INC. AND SUBSIDIARIESCONSOLIDATED BALANCE SHEETS
December 31
(Forward)
2020 2019
ASSETS
Current AssetsCash and cash equivalents (Note 5) $244,355,425 $152,660,116Receivables (Notes 6 and 31) 275,621,791 290,643,361Contract assets (Note 7) 54,525,401 58,908,123Inventories (Note 8) 142,316,055 152,629,272Other current assets (Notes 9 and 33) 17,355,310 19,106,392 Total Current Assets 734,173,982 673,947,264
Noncurrent AssetsProperty, plant and equipment (Note 10) 177,950,968 194,294,448Goodwill (Note 11) 147,245,094 140,781,251Intangible assets (Note 12) 17,145,629 28,576,837Right-of-use assets (Note 30) 32,660,720 32,027,604Financial assets at FVOCI (Notes 13 and 32) 1,124,461 1,199,763Deferred tax assets - net (Note 25) 3,491,878 3,610,639Other noncurrent assets (Note 14) 19,882,038 21,898,132 Total Noncurrent Assets 399,500,788 422,388,674
$1,133,674,770 $1,096,335,938
LIABILITIES AND EQUITY
Current LiabilitiesAccounts payable and accrued expenses (Note 15) $253,824,928 $267,072,013Contract liabilities (Note 7) 1,515,095 4,742,170Loans payable (Note 16) 206,490,427 126,051,547Other financial liabilities (Notes 18, 32 and 33) 1,680,879 22,370,085Current portion of long-term debt (Note 17) 2,109,394 28,037,902Current portion of lease liabilities (Note 30) 7,785,039 4,074,866Income tax payable 3,350,479 1,441,505 Total Current Liabilities 476,756,241 453,790,088
Noncurrent LiabilitiesNoncurrent portion of: Long-term debt (Notes 17 and 32) 32,210,531 114,385,913 Lease liabilities (Note 30) 27,628,221 29,722,846Net retirement liabilities (Note 27) 9,355,655 9,165,082Deferred tax liabilities - net (Note 25) 1,598,134 1,869,955Other noncurrent liabilities (Note 24) 5,263,259 3,623,257 Total Noncurrent Liabilities 76,055,800 158,767,053 Total Liabilities 552,812,041 612,557,141

*SGVFSM005291*
- 2 -
December 312020 2019
EQUITY
Equity Attributable to Equity Holders of the Parent CompanyCapital stock - common (Note 19) $42,674,930 $42,674,027Subscribed capital stock (Note 19) 744,823 752,560Additional paid-in capital (Notes 18 and 19) 193,869,684 146,208,099Subscriptions receivable (Notes 19 and 28) (2,888,800) (2,955,581)Retained earnings (Note 19) 215,793,690 225,752,846Treasury stock (Note 19) (1,012,588) (1,012,588)Other components of equity (Note 13) (874,804) (735,811)Cumulative translation adjustment 9,137,769 (17,682,926)Remeasurement losses on defined benefit plans (Note 27) (9,750,213) (10,450,763)
447,694,491 382,549,863
Equity Attributable to Non-controlling Interestsin Consolidated Subsidiaries (Note 19) 133,168,238 101,228,934
Total Equity 580,862,729 483,778,797$1,133,674,770 $1,096,335,938
See accompanying Notes to Consolidated Financial Statements.

*SGVFSM005291*
INTEGRATED MICRO-ELECTRONICS, INC. AND SUBSIDIARIESCONSOLIDATED STATEMENTS OF INCOME
Years Ended December 312020 2019 2018
REVENUE FROM CONTRACTS WITH CUSTOMERS(Note 29) $1,135,840,593 $1,250,365,914 $1,349,400,445
COST OF SALES (Notes 20 and 22) 1,039,503,708 1,148,137,698 1,214,979,839
GROSS PROFIT 96,336,885 102,228,216 134,420,606
OPERATING EXPENSES (Notes 21 and 22) (92,460,393) (106,222,063) (96,935,285)
OTHERS – NetInterest expense and bank charges (Note 23) (10,422,633) (13,141,935) (11,992,384)Foreign exchange losses – net (755,744) (4,215,058) (3,845,781)Interest income (Note 5) 330,682 860,775 998,995Miscellaneous income – net (Note 24) 5,522,929 9,285,288 34,178,491
(5,324,766) (7,210,930) 19,339,321
INCOME (LOSS) BEFORE INCOME TAX (1,448,274) (11,204,777) 56,824,642
PROVISION FOR INCOME TAX (Note 25)Current 6,496,089 5,279,215 7,737,422Deferred (1,570,668) (3,288,780) 304,920
4,925,421 1,990,435 8,042,342
NET INCOME (LOSS) ($6,373,695) ($13,195,212) $48,782,300
Net Income (Loss) Attributable to:Equity holders of the Parent Company ($3,455,073) ($7,780,648) $47,187,313Non-controlling interests (2,918,622) (5,414,564) 1,594,987
($6,373,695) ($13,195,212) $48,782,300
Earnings (Loss) Per Share (Note 26)Basic and diluted ($0.002) ($0.004) $0.022
See accompanying Notes to Consolidated Financial Statements.

*SGVFSM005291*
INTEGRATED MICRO-ELECTRONICS, INC. AND SUBSIDIARIESCONSOLIDATED STATEMENTS OF COMPREHENSIVE INCOME
Years Ended December 312020 2019 2018
NET INCOME (LOSS) ($6,373,695) ($13,195,212) $48,782,300
OTHER COMPREHENSIVE INCOME (LOSS)Other comprehensive income (loss) to be reclassified
into profit or loss in subsequent periods:Exchange differences arising from translation
of foreign operations (Note 19) 29,152,586 (5,475,454) (12,021,978)
Other comprehensive income (loss) not to bereclassified into profit or loss in subsequentperiods:
Remeasurement gains (losses) on defined benefitplans (Note 27) 700,550 (4,214,969) 1,201,302
Fair value changes on financial assets at FVOCI - netof tax (138,993) 360,553 202,768
561,557 (3,854,416) 1,404,07029,714,143 (9,329,870) (10,617,908)
TOTAL COMPREHENSIVE INCOME (LOSS) $23,340,448 ($22,525,082) $38,164,392
Total Comprehensive Income (Loss)Attributable to:
Equity holders of the Parent Company $23,927,179 ($16,161,173) $37,972,252Non-controlling interests (586,731) (6,363,909) 192,140
$23,340,448 ($22,525,082) $38,164,392
See accompanying Notes to Consolidated Financial Statements.

*SGVFSM005291*
INTEGRATED MICRO-ELECTRONICS, INC. AND SUBSIDIARIESCONSOLIDATED STATEMENTS OF CHANGES IN EQUITYFOR THE YEARS ENDED DECEMBER 31, 2020, 2019 AND 2018
Attributable to Equity Holders of the Parent CompanyOther Comprehensive Income (Loss)
Capital Stock-Common(Note 19)
SubscribedCapital
Stock(Note 19)
AdditionalPaid-inCapital
(Note 19)
SubscriptionsReceivable
(Notes 19and 28)
RetainedEarnings(Notes 2
and 19)
TreasuryStock
(Note 19)
OtherComponents
of Equity(Note 13)
CumulativeTranslationAdjustment
(Note 19)
Remeasurementlosses on
defined benefitplans (Note 27)
Attributable toEquity Holders
of the ParentCompany
(Note 19)
Attributable toNon-controlling
Interests(Note 19) Total
Balances at January 1, 2020 $42,674,027 $752,560 $146,208,099 ($2,955,581) $225,752,846 ($1,012,588) ($735,811) ($17,682,926) ($10,450,763) $382,549,863 $101,228,934 $483,778,797Issued shares during the year 903 (903) – – – – – – – – – –Redemption of preferred shares – – – – – – – – – – (30,000,000) (30,000,000)Refund on subscriptions – – – (5,023) – – – – – (5,023) – (5,023)Forfeitures during the year – (6,834) (64,970) 71,804 – – – – – – – –Dilution of ownership interest in
a subsidiary – – 32,397,610 – – – – – – 32,397,610 62,526,035 94,923,645Derecognition of put option
financial liability – – 15,328,945 – – – – – – 15,328,945 – 15,328,945Cash dividends – – – – (6,504,083) – – – – (6,504,083) – (6,504,083)
42,674,930 744,823 193,869,684 (2,888,800) 219,248,763 (1,012,588) (735,811) (17,682,926) (10,450,763) 423,767,312 133,754,969 557,522,281Net loss – – – – (3,455,073) – – – – (3,455,073) (2,918,622) (6,373,695)Other comprehensive income
(loss) – – – – – – (138,993) 26,820,695 700,550 27,382,252 2,331,891 29,714,143Total comprehensive income
(loss) – – – – (3,455,073) – (138,993) 26,820,695 700,550 23,927,179 (586,731) 23,340,448Balances at December 31, 2020 $42,674,930 $744,823 $193,869,684 ($2,888,800) $215,793,690 ($1,012,588) ($874,804) $9,137,769 ($9,750,213) $447,694,491 $133,168,238 $580,862,729
See accompanying Notes to Consolidated Financial Statements.

*SGVFSM005291*
- 2 -
Attributable to Equity Holders of the Parent CompanyOther Comprehensive Income (Loss)
.
Capital Stock -Common(Note 19)
SubscribedCapital
Stock(Note 19)
AdditionalPaid-inCapital
(Note 19)
SubscriptionsReceivable
(Notes 19and 28)
RetainedEarnings(Notes 2
and 19)
TreasuryStock
(Note 19)
OtherComponents
of Equity(Note 13)
CumulativeTranslationAdjustment
(Note 19)
Remeasurementlosses on
defined benefitplans (Note 27)
Attributable toEquity Holders
of the ParentCompany(Note 19)
Attributable toNon-controlling
Interests(Note 19) Total
Balances at January 1, 2019 $42,648,042 $815,198 $146,513,264 ($3,402,940) $236,289,815 ($1,012,588) ($1,096,364) ($12,894,291) ($6,235,794) $401,624,342 $4,811,994 $406,436,336Effect of finalization of business
combination (Note 2) – – – – 1,680,386 – – (262,526) – 1,417,860 2,780,849 4,198,709Balances at January 1, 2019,
as restated 42,648,042 815,198 146,513,264 (3,402,940) 237,970,201 (1,012,588) (1,096,364) (13,156,817) (6,235,794) 403,042,202 7,592,843 410,635,045Issued shares during the year 25,985 (25,985) – – – – – – – – – –Issuance of preferred shares
(Note 19) – – – – – – – – – – 100,000,000 100,000,000Collections on subscriptions – – – 105,541 – – – – – 105,541 – 105,541Forfeitures during the year – (36,653) (305,165) 341,818 – – – – – – – –Cash dividends – – – – (4,436,707) – – – – (4,436,707) – (4,436,707)
42,674,027 752,560 146,208,099 (2,955,581) 233,533,494 (1,012,588) (1,096,364) (13,156,817) (6,235,794) 398,711,036 107,592,843 506,303,879Net loss – – – – (7,780,648) – – – – (7,780,648) (5,414,564) (13,195,212)Other comprehensive income
(loss) – – – – – – 360,553 (4,526,109) (4,214,969) (8,380,525) (949,345) (9,329,870)Total comprehensive income
(loss) – – – – (7,780,648) – 360,553 (4,526,109) (4,214,969) (16,161,173) (6,363,909) (22,525,082)Balances at December 31, 2019 $42,674,027 $752,560 $146,208,099 ($2,955,581) $225,752,846 ($1,012,588) ($735,811) ($17,682,926) ($10,450,763) $382,549,863 $101,228,934 $483,778,797
See accompanying Notes to Consolidated Financial Statements.

*SGVFSM005291*
- 3 -
Attributable to Equity Holders of the Parent CompanyOther Comprehensive Income (Loss)
.
Capital Stock -Common(Note 19)
SubscribedCapital
Stock(Note 19)
AdditionalPaid-inCapital
(Note 19)
SubscriptionsReceivable
(Notes 19and 28)
RetainedEarnings(Note 19)
TreasuryStock
(Note 19)
OtherComponents
of Equity(Note 13)
CumulativeTranslationAdjustment
Remeasurementlosses on
defined benefitplans (Note 27)
Attributable toEquity Holders
of the ParentCompany(Note 19)
Attributable toNon-controlling
Interests(Note 2) Total
Balances at January 1, 2018 $35,709,679 $1,058,278 $58,121,266 ($5,351,844) $194,499,540 ($1,012,588) $454,457 ($2,537,686) ($7,437,096) $273,504,006 $3,090,593 $276,594,599Cumulative catch-up adjustment
due to adoption of PFRS 9and 15 – – – – 6,413,470 – (1,753,589) – – 4,659,881 295,522 4,955,403
Balances at January 1, 2018,adjusted 35,709,679 1,058,278 58,121,266 (5,351,844) 200,913,010 (1,012,588) (1,299,132) (2,537,686) (7,437,096) 278,163,887 3,386,115 281,550,002
Issued shares during the year 220,513 (220,513) – – – – – – – – – –Issued shares from stock rights
offer 6,717,850 – 89,213,052 – – – – – – 95,930,902 – 95,930,902Transaction costs on shares
issuance – – (660,853) – – – – – – (660,853) – (660,853)Cost of share-based payments
(Note 28) – – 29,589 – – – – – – 29,589 – 29,589Collections on subscriptions – 1,736,547 – – – – – 1,736,547 – 1,736,547Forfeitures during the year – (22,567) (189,790) 212,357 – – – – – – – –Increase in non-controlling interest
due to acquisition of asubsidiary during the year(Note 2) – – – – – – – – – – 4,065,562 4,065,562
Effect of finalization of businesscombination – – – – – – – – – – (50,974) (50,974)
Cash dividends – – – – (10,130,122) – – – – (10,130,122) – (10,130,122)42,648,042 815,198 146,513,264 (3,402,940) 190,782,888 (1,012,588) (1,299,132) (2,537,686) (7,437,096) 365,069,950 7,400,703 372,470,653
Net income, as previously stated – – – – 45,506,927 – – – – 45,506,927 2,344,129 47,851,056Effect of finalization of business
combination (Note 2) – – – – 1,680,386 – – – – 1,680,386 (749,142) 931,244Net income, as restated – – – – 47,187,313 – – – – 47,187,313 1,594,987 48,782,300Other comprehensive income
(loss), as previously stated – – – – – – 202,768 (10,356,605) 1,201,302 (8,952,535) (1,402,847) (10,355,382)Effect of finalization of businesscombination (Note 2) – – – – – – – (262,526) – (262,526) – (262,526)Other comprehensive income
(loss) – – – – – – 202,768 (10,619,131) 1,201,302 (9,215,061) (1,402,847) (10,617,908)Total comprehensive income
(loss) – – – – 47,187,313 – 202,768 (10,619,131) 1,201,302 37,972,252 192,140 38,164,392Balances at December 31, 2018,
as restated $42,648,042 $815,198 $146,513,264 ($3,402,940) $237,970,201 ($1,012,588) ($1,096,364) ($13,156,817) ($6,235,794) $403,042,202 $7,592,843 $410,635,045
See accompanying Notes to Consolidated Financial Statements.

*SGVFSM005291*
INTEGRATED MICRO-ELECTRONICS, INC. AND SUBSIDIARIESCONSOLIDATED STATEMENTS OF CASH FLOWS
Years Ended December 312020 2019 2018
CASH FLOWS FROM OPERATING ACTIVITIESIncome (loss) before income tax ($1,448,274) ($11,204,777) $56,824,642Adjustments for: Depreciation of property, plant and equipment
(Notes 10, 20, and 21) 38,158,147 35,308,020 31,097,283 Amortization of right-of-use asset (Notes 20, 21
and 30) 9,395,254 6,955,732 –Interest expense on loans (Note 23) 8,411,717 10,262,423 10,566,675
Amortization of intangible assets (Notes 12, 20,and 21) 7,879,168 6,464,921 6,440,284
Impairment loss on product development cost(Note 24) 4,693,985 – –
Unrealized foreign exchange losses - net 3,723,227 1,106,924 4,460,835 Impairment of property, plant and equipment
(Note 24) 2,620,779 – –Interest expense on lease liabilities (Note 23) 1,644,189 1,368,494 –Loss (gain) on derivative transactions (Note 33) 92,122 (15,373) (152,368)
Gain on sale of property, plant and equipment (Notes 10 and 24) (657,101) (99,404) (189,298)Interest income (Note 5) (330,682) (860,775) (998,995)
Mark-to-market loss (gain) on put options(Notes 18 and 24) (6,068,906) (3,445,288) 5,372,114
Reversal of contingent consideration(Notes 18 and 24) – (3,728,985) (21,304,030)
Net gain on disposal of a subsidiary (Note 24) – – (19,062,344)Impairment loss on goodwill (Notes 11 and 24) – – 6,902,838Gain from bargain purchase (Notes 2 and 24) – – (2,411,951)
Cost of share-based payments (Note 28) – – 29,589Operating income before working capital changes 68,113,625 42,111,912 77,575,274Changes in operating assets and liabilities:Decrease (increase) in:
Receivables 21,328,413 13,411,173 (46,398,064)Inventories 13,873,495 38,984,113 (36,441,769)Contract assets 4,382,722 4,576,071 (16,364,351)
Other current assets (5,446,059) 1,719,633 5,871,820Increase (decrease) in:
Accounts payable and accrued expenses (7,405,255) (16,870,412) 30,969,749Contract liabilities (3,227,075) 2,911,110 (3,794,787)Retirement liabilities 487,307 717,179 549,433Advances from customers – – (1,843,501)
Net cash generated from operations 92,107,173 87,560,779 10,123,804Interest paid (9,954,398) (9,915,877) (9,624,264)Income tax paid (4,587,114) (7,368,934) (8,028,054)Interest received 330,682 860,775 998,995Net cash provided by (used in) operating activities 77,896,343 71,136,743 (6,529,519)
(Forward)

*SGVFSM005291*
- 2 -
Years Ended December 312020 2019 2018
CASH FLOWS FROM INVESTING ACTIVITIESAcquisitions of:
Property, plant and equipment (Note 10) ($18,121,100) ($37,398,057) ($63,822,429)Intangible assets (Note 12) (595,188) (1,388,481) (1,139,531)
Proceeds from sale and retirement of property, plantand equipment 1,529,412 862,996 3,136,331
Decrease (increase) in other noncurrent assets 4,130,406 (6,227,538) (13,879,679)Capitalized product development costs, excluding
depreciation (Notes 10 and 12) – (2,520,866) (3,476,821)Acquisition through business combination, net of cash
acquired (Note 2) – – (1,558,227)Increase (decrease) in deposits from a third party – (11,540,911) (9,231,423)Net cash used in investing activities (13,056,470) (58,212,857) (89,971,779)
CASH FLOWS FROM FINANCING ACTIVITIESProceeds from: Net proceeds from subsidiary’s public offering
(Note 19) 106,787,500 – – Availments of loans payable
and long-term debt 82,665,635 12,002,758 66,879,877Stock rights offering (Note 19) – – 95,930,902
Payments of: (Note 35)Loans payable (4,974,751) (20,540,547) (35,152,844)Long-term debt (108,497,471) (46,510,457) (6,710,439)Lease liabilities (Note 30) (10,799,326) (7,603,732) –
Dividends paid to preference shareholders of a subsidiary (Note 19) (6,504,083) – –
Dividends paid to common equity holders of theParent Company (Note 19) – (4,436,707) (10,130,122)
Issuance (redemption) of preferred shares of asubsidiary to non-controlling interest (Note 19) (30,000,000) 100,000,000 –
Increase (decrease) in noncurrent liabilities 1,640,002 (1,626,646) 1,949,887Collections (refund) of subscriptions receivable
(Note 19) (5,023) 105,541 1,736,547Settlement of derivatives (Note 33) (5,321) 13,555 112,675Net cash provided by financing activities 30,307,162 31,403,765 114,616,483
EFFECT OF CHANGES IN FOREIGN EXCHANGERATES ON CASH AND CASH EQUIVALENTS (3,451,726) (201,876) (208,072)
NET INCREASE IN CASH ANDCASH EQUIVALENTS 91,695,309 44,125,775 17,907,113
CASH AND CASH EQUIVALENTS AT BEGINNINGOF YEAR 152,660,116 108,534,341 90,627,228
CASH AND CASH EQUIVALENTS ATEND OF YEAR (Note 5) $244,355,425 $152,660,116 $108,534,341
See accompanying Notes to Consolidated Financial Statements.

*SGVFSM005291*
INTEGRATED MICRO-ELECTRONICS, INC. AND SUBSIDIARIESNOTES TO CONSOLIDATED FINANCIAL STATEMENTS
1. Corporate Information
Integrated Micro-Electronics, Inc. (IMI or the Parent Company), a stock corporation organized andregistered under the laws of the Republic of the Philippines on August 8, 1980, has four wholly-ownedsubsidiaries, namely: IMI International (Singapore) Pte. Ltd. (IMI Singapore), IMI USA, Inc. (IMI USA),IMI Japan, Inc. (IMI Japan) and PSi Technologies, Inc. (PSi) (collectively referred to as the Group).The Parent Company is 52.03% owned by AC Industrial Technology Holdings, Inc. (AC Industrials), awholly-owned subsidiary of Ayala Corporation (AC), a corporation incorporated in the Republic of thePhilippines and listed in the Philippine Stock Exchange (PSE). AC is 47.28% owned by Mermac, Inc.(Ultimate Parent Company) and the rest by the public.
The registered office address of the Parent Company is at North Science Avenue, LagunaTechnopark- Special Economic Zone (LT-SEZ), Bo. Biñan, Biñan, Laguna.
The Parent Company was listed by way of introduction in the PSE on January 21, 2010. It hascompleted its follow-on offering and listing of 215,000,000 common shares on December 5, 2014.On March 2, 2018, the Parent Company completed the stock rights offer and listing of 350,000,000common shares to all eligible stockholders.
The Parent Company is registered with the Philippine Economic Zone Authority (PEZA) as anexporter of printed circuit board assemblies (PCBA), flip chip assemblies, electronic sub-assemblies,box build products and enclosure systems. It also provides the following solutions: product designand development, test and systems development, automation, advanced manufacturing engineering,and power module assembly, among others. It serves diversified markets that include those in theautomotive, industrial, medical, storage device, and consumer electronics industries, and non-electronic products (including among others, automobiles, motorcycles, solar panels) or parts,components or materials of non-electronic products, as well as to perform and provide informationtechnology services such as but not limited to data labeling/encoding or image annotation services.
IMI Singapore is a strategic management, investment and holding entity that owns operatingsubsidiaries of the Group and was incorporated and domiciled in Singapore. Its wholly-ownedsubsidiary, Speedy-Tech Electronics Ltd. (STEL), was incorporated and domiciled also in Singapore.STEL, on its own, has subsidiaries located in Hong Kong and China. STEL and its subsidiaries(collectively referred to as the STEL Group) are principally engaged in the provision of electronicmanufacturing services (EMS) and power electronics solutions to original equipment manufacturers(OEMs) in the automotive, consumer electronics, telecommunications, industrial equipment, andmedical device sectors, among others.
In 2011, the Parent Company, through its indirect subsidiary, Cooperatief IMI Europe U.A.(Cooperatief) acquired Integrated Micro-Electronics Bulgaria EOOD (formerly EPIQ ElectronicAssembly EOOD) (IMI BG), Integrated Micro-Electronics Czech Republic s.r.o. (formerly EPIQ CZs.r.o.) (IMI CZ) and Integrated Micro-Electronics Mexico, S.A.P.I. de C.V. (formerly EPIQ MX, S.A.P.I.de C.V.) (IMI MX) (collectively referred to as the IMI EU/MX Subsidiaries). IMI EU/MX Subsidiariesdesign and produce PCBA, engage in plastic injection, embedded toolshop, supply assembled andtested systems and sub-systems which include drive and control elements for automotive equipment,household appliances, and industrial equipment, among others. IMI EU/MX Subsidiaries also provideengineering, test and system development and logistics management services.
In 2016, Cooperatief acquired a 76.01% ownership interest in VIA Optronics GmbH (VIA), aGermany-based company with operations in Germany and China and sales offices in the USA andTaiwan. VIA is a leading provider of enhanced display solutions for multiple end markets in whichsuperior functionality or durability is a critical differentiating factor. The acquisition allows the Group tostrengthen its partnerships with customers by offering complementary automotive camera and display

- 2 -
*SGVFSM005291*
monitor solutions for advanced driver assistance systems. The Group together with VIA enables thescale to introduce patented technology into automotive camera monitor systems for increased safety.
In 2018, VIA acquired 65% ownership interest in VTS-Touchsensor Co., Ltd. (VTS), a Japaneseentity that develops and manufactures metal mesh touch sensor technologies and electrode basefilm.
In 2019, VIA formed VIA Optronics AG (VIA AG) by way of a contribution in kind against issuance ofnew shares making VIA AG the sole shareholder of VIA Optronics GmbH. The contribution in kindand resulting re-organization was recognized as a business combination under common control. Inthe same year, VIA Optronics (Taiwan) Ltd was also founded as a new subsidiary with the purpose ofconducting sales activities.
In 2020, VIA raised some proceeds through an initial public offering (IPO) and was listed on the NewYork Stock Exchange under the ticker symbol “VIAO”. As a result of the IPO, IMI’s ownership interestin VIA was diluted from 76.01% to 50.32% (see Note 19).
In 2018, the Group opened its 21st manufacturing site in Niš, Republic of Serbia in line with the IMI’sstrategy to strengthen its global footprint and support the growing market for automotive componentsin the European region.
IMI France serves as a support entity which provides manufacturing support services, marketresearch and analysis, sales promotional activity support, strategic planning advisory, and generalcorporate marketing support.
In 2017, IMI, through its indirect subsidiary Integrated Micro-electronics UK Limited (IMI UK), acquiredan 80% stake in Surface Technology International Enterprises Limited (STI), an EMS company basedin the United Kingdom (UK). STI has factories in the UK and Cebu, Philippines. STI provideselectronics design and manufacturing solutions in both PCBA and full box-build manufacturing forhigh-reliability industries. The acquisition of STI strengthens the Group’s industrial and automotivemanufacturing competencies, broaden its customer base, and also provides access to the UK market.Further, the partnership allows the Group’s entry into the aerospace, security and defense sectors.
IMI USA acts as direct support to the Group’s customers by providing program management,customer service, engineering development and prototype manufacturing services to customers,especially for processes using direct die attach to various electronics substrates. It specializes inprototyping low to medium PCBA and sub-assembly and is at the forefront of technology with regardto precision assembly capabilities including, but not limited to, surface mount technology (SMT), chipon flex, chip on board and flip chip on flex. IMI USA is also engaged in advanced manufacturingprocess development, engineering development, prototype manufacturing and small precisionassemblies.
IMI Japan was registered and is domiciled in Japan to serve as IMI’s front-end design and productdevelopment and sales support center. IMI Japan was established to attract more Japanese OEMs tooutsource their product development to IMI.
PSi is a power semiconductor assembly and test services company serving niche markets in theglobal power semiconductor market. PSi provides comprehensive package design, assembly and testservices for power semiconductors used in various electronic devices.
The consolidated financial statements as of December 31, 2020 and 2019 and for each of the threeyears in the period ended December 31, 2020 were endorsed for approval by the Audit Committee onFebruary 22, 2021 and authorized for issue by the Parent Company’s Board of Directors (BOD) onMarch 2, 2021.

- 3 -
*SGVFSM005291*
2. Group Information
Information about SubsidiariesThe consolidated financial statements include the financial statements of the Parent Company andthe following subsidiaries:
Percentage ofOwnership Country of
Subsidiary 2020 2019 Incorporation Functional CurrencyIMI International (Singapore) Pte. Ltd. 100.00% 100.00% Singapore United States Dollar (USD)
IMI International ROHQ 100.00% 100.00% Philippines USDSpeedy-Tech Electronics Ltd. (STEL) Group 100.00% 100.00% Singapore USD
IMI (Chengdu) Ltd. (IMICD) 100.00% 100.00% China Renminbi (RMB)IMI Technology (Shenzhen) Co. Ltd. (IMI SZ) 100.00% 100.00% China USD IMI Smart Technology (Shenzhen) Co. Ltd. a 100.00% 100.00% China RMBSpeedy-Tech Electronics (HK) Limited (STHK) 100.00% 100.00% Hong Kong USDSpeedy-Tech Electronics (Jiaxing)
Co., Ltd. (STJX) 100.00% 100.00% China RMBSpeedy-Tech (Philippines), Inc. (STPH) 100.00% 100.00% Philippines USD
Cooperatief IMI Europe U.A. 100.00% 100.00% Netherlands Euro (EUR)Integrated Micro-Electronics Bulgaria EOOD 100.00% 100.00% Bulgaria EUR
Microenergia EOOD (Microenergia) 100.00% 100.00% Bulgaria Bulgarian Lev (BGN)Integrated Micro-Electronics d.o.o. Niš (IMI Serbia) 100.00% 100.00% Serbia Serbian Dinar (RSD)Integrated Micro-Electronics Czech Republic s.r.o. 100.00% 100.00% Czech Republic EURIntegrated Micro-Electronics Mexico, S.A.P.I. de C.V. 100.00% 100.00% Mexico USDIMI France SAS (IMI France) 100.00% 100.00% France EURVIA Optronics AG (VIA) b/c 50.32% 76.01% Germany EUR
VIA Optronics GmbH (VIA) 100.00% 100.00% Germany EURVIA Optronics Suzhou Co. Ltd. (VIA Suzhou) 100.00% 100.00% China RMBVIA Optronics LLC (VIA LLC) 100.00% 100.00% USA USDVIA Optronics (Taiwan) Ltd b 100.00% 100.00% Taiwan Taiwan DollarVTS-Touchsensor Co., Ltd. (VTS) 65.00% 65.00% Japan Japanese Yen (JPY)
Integrated Micro-Electronics UK Limited (IMI UK) 100.00% 100.00% United Kingdom British Pounds (GBP)Surface Technology International Enterprises Ltd (STI) 80.00% 80.00% United Kingdom GBP
STI Limited 100.00% 100.00% United Kingdom GBPSTI Philippines Inc. (STIPH) 100.00% 100.00% Philippines USDSTI Asia Ltd d 100.00% 100.00% Hong Kong Hong Kong Dollar (HKD)STI Supplychain Ltd d 100.00% 100.00% United Kingdom GBPST Intercept Limited 100.00% 100.00% United Kingdom GBP
IMI USA 100.00% 100.00% USA USDIMI Japan 100.00% 100.00% Japan USDPSi 100.00% 100.00% Philippines USD
PSiTech Realty, Inc. (PSiTech Realty) d 40.00% 40.00% Philippines USDPacsem Realty, Inc. (Pacsem Realty) d 64.00% 64.00% Philippines USD
a New subsidiary under IMI SZ incorporated in 2019 as a spin-off of the Kuichong operations.b New entities of VIA in 2019c IMI’s ownership in VIA was diluted to 50.32% as a result of the initial public offering of VIA in the New York Stock Exchange
(NYSE)d In the process of liquidation
Business CombinationsAcquisition of VTS-Touchsensor Co., Ltd. (VTS)On April 9, 2018, VIA and Toppan Printing Co., Ltd. (Toppan) entered into an agreement to serve themarket for copper-based metal mesh touch sensors. The agreement provides that Toppan transfer65% of its shares in VTS to VIA. VTS is a newly formed spin-off company of Toppan.
VTS develops and manufactures the metal mesh touch sensors in Japan on the existing premises ofToppan. The new setup strengthens VIA’s portfolio of differentiated and value-added sensortechnology for touch panels, touch-display modules, display head assemblies, and interactive displaysystems across multiple markets and segments.
The Group elected to measure the non-controlling interest in VTS at the proportionate share of itsinterest in the acquiree’s identifiable net assets.

- 4 -
*SGVFSM005291*
The net assets recognized in December 31, 2018 financial statements were based on a provisionalassessment of their fair value. The valuation had not been completed by the date the 2018 financialstatements were approved for issue by the Board of Directors.
In March 2019, the purchase price allocation was finalized. The fair value of the property, plant andequipment (PPE) and intangible asset increased by $7.16 million and $2.58 million, respectively(see Notes 10 and 12). The increase in fair value of PPE arose from the assessment and valuationmainly of technical equipment and machinery, buildings and improvements and other equipment,which was determined using current replacement cost method. The increase in intangible asset isdue to the identification and valuation of customer relationship as a separate asset with fair valuedetermined using the Multi Period Excess Earnings Method (MEEM). PPE was depreciated usingvarious useful lives ranging from 3-10 years while the customer relationship is amortized over aperiod of 5 years.
As a result, deferred tax liability on the increase in fair value of the property, plant and equipment andintangible asset was recognized amounting to $3.32 million. There was also correspondingrecognition of gain on a bargain purchase amounting to $2.41 million upon finalization and theprovisional goodwill amounting to $0.97 million was reversed. In addition, additional depreciation andamortization from increase in fair values of property and equipment and intangible assets net of shareof non-controlling interest totaling to $0.73 million was recognized in 2018.
Below are the final fair values and provisional fair values as of December 31, 2019:
Fair ValuesProvisionalFair Values
AssetsReceivables $184,781 $184,781Inventories 1,338,391 1,243,686Property, plant and equipment (Note 10) 7,252,918 97,536Intangible assets (Note 12) 7,835,218 5,258,211
16,611,308 6,784,214LiabilitiesDeferred tax liabilities 3,321,558 –Other noncurrent liabilities 5,254,010 5,254,010
8,575,568 5,254,010Net Assets $8,035,740 $1,530,204Non-controlling interest (35%) (4,065,562) (535,571)Goodwill (Gain on a bargain purchase) (Note 11) (2,411,951) 970,725Cost of acquisition $1,558,227 $1,965,358
The 2018 comparative information was restated to reflect the adjustments to the provisional amounts.The effects of the restatement on the consolidated financial statements as of December 31, 2018 areas follows:
Consolidated Balance Sheet
Increase (decrease) after depreciation andamortization:
Receivables $407,131Inventories (2,204)Property, plant and equipment 5,086,344Goodwill (918,412)Intangible assets 2,031,774Deferred tax liabilities 2,405,924Retained earnings 1,680,386Cumulative translation adjustment (262,526)Non-controlling interests in balance sheet 2,780,849

- 5 -
*SGVFSM005291*
Consolidated Statement of Income
Increase (decrease) in:Cost of sales $1,820,635Operating expenses 416,083Gain from bargain purchase 2,411,951Deferred tax benefit 756,011Non-controlling interest in net income (749,142)
Consolidated Statement of Cash Flow
Increase (decrease) in:Cash flow from operating activities ($407,131)Cash flow from investing activities 407,131
Analysis of cash flows on acquisition:
Initial purchase consideration $1,965,358Purchase price adjustment related to inventory (407,131)Cost of acquisition $1,558,227
From the date of acquisition, VTS contributed $26.46 million of revenue and $0.95 million profit beforetax to the Group in 2018.
Acquisition-related costs, which consist of professional and legal fees, travel and recruitment servicesamounting to $1.47 million were recognized as expense in 2018.
3. Summary of Significant Accounting and Financial Reporting Policies
Basis of PreparationThe accompanying consolidated financial statements of the Group have been prepared on a historicalcost basis, except for financial assets and liabilities at fair value through profit or loss (FVPL) andfinancial assets at fair value through other comprehensive income (FVOCI). The consolidatedfinancial statements are presented in United States Dollar (USD) and all values are rounded to thenearest dollar, unless otherwise indicated.
The consolidated financial statements provide comparative information in respect of the previousperiod.
Statement of ComplianceThe consolidated financial statements of the Group have been prepared in compliance with PFRS.
Basis of ConsolidationThe consolidated financial statements comprise the financial statements of the Group as ofDecember 31, 2020 and 2019 and for each of the three years in the period endedDecember 31, 2020.
Control is achieved when the Group is exposed, or has rights, to variable returns from its involvementwith the investee and has the ability to affect those returns through its power over the investee.Specifically, the Group controls an investee if and only if the Group has:
a. Power over the investee (i.e. existing rights that give it the current ability to direct the relevantactivities of the investee)
b. Exposure, or rights, to variable returns from its involvement with the investee, andc. The ability to use its power over the investee to affect its returns

- 6 -
*SGVFSM005291*
When the Group has less than a majority of the voting or similar rights of an investee, the Groupconsiders all relevant facts and circumstances in assessing whether it has power over an investee,including:
a. The contractual arrangement with the other vote holders of the investeeb. Rights arising from other contractual arrangementsc. The Group’s voting rights and potential voting rights
The Group re-assesses whether it controls an investee if facts and circumstances indicate that thereare changes to one or more of the three elements of control. Consolidation of a subsidiary beginswhen the Group obtains control over the subsidiary and ceases when the Group loses control of thesubsidiary. Assets, liabilities, income and expenses of a subsidiary acquired or disposed of duringthe year are included or excluded in the consolidated financial statements from the date the Groupgains control or until the date the Group ceases to control the subsidiary.
Non-controlling interests pertain to the equity in a subsidiary not attributable, directly or indirectly tothe Parent Company. Any equity instruments issued by a subsidiary that are not owned by the ParentCompany are non-controlling interests including preferred shares and options under share-basedtransactions. The portion of profit or loss and net assets in subsidiaries not wholly-owned arepresented separately in the consolidated statements of income, consolidated statements ofcomprehensive income, consolidated statements of changes in equity and consolidated statements offinancial position, separately from the Parent Company’s equity. Non-controlling interests are net ofany outstanding subscription receivable.
Losses within a subsidiary are attributed to the non-controlling interests even if that results in a deficitbalance.
In accounting for call and put options over non-controlling interests, management determines whetherit has present access to the returns associated with the non-controlling interests. If the options givethe Group access to the returns over the non-controlling interests, the Group consolidates theacquiree as if it acquired a 100% interest.
If the options do not give the Group present access to the returns over the non-controlling interests,the Group takes the view that the non-controlling interests should be accounted for in accordancewith PFRS 10, Consolidated Financial Statements and must be presented within equity separate fromthe equity of the Parent Company, until the option is exercised.
The call option is accounted for under PFRS 9, Financial Instruments, as a derivative instrumentcarried at fair value through profit or loss.
The financial liability for the put option is accounted for under PFRS 9 like any other written put optionon equity instruments. On initial recognition, the corresponding debit is made to a component ofequity attributable to the parent, not to the non-controlling interest. All subsequent changes in thecarrying amount of the financial liability that result from the remeasurement of the present valuepayable on exercise are recognized in profit or loss also attributable to the parent.
If the put option is exercised, the entity accounts for an increase in its ownership interest. At thesame time, the entity derecognizes the financial liability and reverses the component of equity thatwas reduced on initial recognition. If the put option expires unexercised, the financial liability isreclassified to the same component of equity that was reduced on initial recognition.
A change in the ownership interest of a subsidiary, without a loss of control, is accounted for as anequity transaction. Any difference between the amount by which the non-controlling interests areadjusted and the fair value of the consideration paid or received is recognized directly in equity andattributed to the owners of the Parent Company. The difference is included as part of additional paid-in capital.

- 7 -
*SGVFSM005291*
If the Group losses control over a subsidiary, it derecognises the related assets (including goodwill),liabilities, non-controlling interest and other components of equity, while the resulting gain or loss isrecognised in profit or loss. Any investment retained is recognised at fair value.
Changes in Accounting Policies and DisclosuresThe accounting policies adopted in the preparation of the consolidated financial statements areconsistent with those of the previous financial years except for the new PFRS, amended PFRS andimprovements to PFRS which were adopted beginning January 1, 2020. The Group has not earlyadopted any other standard, interpretation or amendment that has been issued but is not yeteffective.
Amendments to PFRS 3, Business Combinations, Definition of a Business
The amendments to PFRS 3 clarifies that to be considered a business, an integrated set ofactivities and assets must include, at a minimum, an input and a substantive process thattogether significantly contribute to the ability to create output. Furthermore, it clarifies that abusiness can exist without including all of the inputs and processes needed to create outputs.These amendments may impact future periods should the Group enter into any businesscombinations.
These amendments had no impact on the consolidated financial statements of the Group as it didnot enter to any business combinations during the period.
Amendments to PFRS 7, Financial Instruments: Disclosures and PFRS 9, Financial Instruments,Interest Rate Benchmark Reform
The amendments to PFRS 9 provide a number of reliefs, which apply to all hedging relationshipsthat are directly affected by the interest rate benchmark reform. A hedging relationship is affectedif the reform gives rise to uncertainties about the timing and or amount of benchmark-based cashflows of the hedged item or the hedging instrument.
These amendments had no impact on the consolidated financial statements of the Group.
Amendments to PAS 1, Presentation of Financial Statements, and PAS 8, Accounting Policies,Changes in Accounting Estimates and Errors, Definition of Material
The amendments provide a new definition of material that states “information is material ifomitting, misstating or obscuring it could reasonably be expected to influence decisions that theprimary users of general purpose financial statements make on the basis of those financialstatements, which provide financial information about a specific reporting entity.”
The amendments clarify that materiality will depend on the nature or magnitude of information,either individually or in combination with other information, in the context of the financialstatements. A misstatement of information is material if it could reasonably be expected toinfluence decisions made by the primary users.
The amendments were consistently applied on the disclosures of the Group.
Conceptual Framework for Financial Reporting issued on March 29, 2018
The Conceptual Framework is not a standard, and none of the concepts contained thereinoverride the concepts or requirements in any standard. The purpose of the ConceptualFramework is to assist the standard-setters in developing standards, to help preparers developconsistent accounting policies where there is no applicable standard in place and to assist allparties to understand and interpret the standards.

- 8 -
*SGVFSM005291*
The revised Conceptual Framework includes new concepts, provides updated definitions andrecognition criteria for assets and liabilities and clarifies some important concepts.The amendments were consistently applied on the disclosures of the Group.
Amendments to PFRS 16, COVID-19-related Rent Concessions
The amendments provide relief to lessees from applying the PFRS 16 requirement on leasemodifications to rent concessions arising as a direct consequence of the COVID-19 pandemic. Alessee may elect not to assess whether a rent concession from a lessor is a lease modification ifit meets all of the following criteria:
The rent concession is a direct consequence of COVID-19; The change in lease payments results in a revised lease consideration that is substantially
the same as, or less than, the lease consideration immediately preceding the change; Any reduction in lease payments affects only payments originally due on or before
June 30, 2021; and There is no substantive change to other terms and conditions of the lease.
A lessee that applies this practical expedient will account for any change in lease paymentsresulting from the COVID-19 related rent concession in the same way it would account for achange that is not a lease modification, i.e., as a variable lease payment.
The amendments are effective for annual reporting periods beginning on or after June 1, 2020.Early adoption is permitted.
The Group adopted the amendments to PFRS 16 using the practical expedient beginningJanuary 1, 2020 and recognized rent concession as variable lease payments amounting to $0.42million as part of cost of sales.
Pronouncements issued but not yet effective are listed below. Unless otherwise indicated, the Groupdoes not expect that the future adoption of the said pronouncements will have a significant impact onits consolidated financial statements. The Group intends to adopt the following pronouncements whenthey become effective.
Effective beginning on or after January 1, 2021
Amendments to PFRS 9, PFRS 7, PFRS 4 and PFRS 16, Interest Rate Benchmark Reform –Phase 2
The amendments provide the following temporary reliefs which address the financial reportingeffects when an interbank offered rate (IBOR) is replaced with an alternative nearly risk-freeinterest rate (RFR): Practical expedient for changes in the basis for determining the contractual cash flows as a
result of IBOR reform Relief from discontinuing hedging relationships Relief from the separately identifiable requirement when an RFR instrument is designated as
a hedge of a risk component
The Group shall also disclose information about: The about the nature and extent of risks to which the entity is exposed arising from financial
instruments subject to IBOR reform, and how the entity manages those risks; and Their progress in completing the transition to alternative benchmark rates, and how the entity
is managing that transition
The amendments are effective for annual reporting periods beginning on or after 1 January 2021and apply retrospectively, however, the Group is not required to restate prior periods.

- 9 -
*SGVFSM005291*
Effective beginning on or after January 1, 2022
Amendments to PFRS 3, Reference to the Conceptual Framework
The amendments are intended to replace a reference to the Framework for the Preparation andPresentation of Financial Statements, issued in 1989, with a reference to the ConceptualFramework for Financial Reporting issued in March 2018 without significantly changing itsrequirements. The amendments added an exception to the recognition principle of PFRS 3,Business Combinations to avoid the issue of potential ‘day 2’gains or losses arising for liabilitiesand contingent liabilities that would be within the scope of PAS 37, Provisions, ContingentLiabilities and Contingent Assets or Philippine-IFRIC 21, Levies, if incurred separately.
At the same time, the amendments add a new paragraph to PFRS 3 to clarify that contingentassets do not qualify for recognition at the acquisition date.
The amendments are effective for annual reporting periods beginning on or after 1 January 2022and apply prospectively.
Amendments to PAS 16, Plant and Equipment: Proceeds before Intended Use
The amendments prohibit entities deducting from the cost of an item of property, plant andequipment, any proceeds from selling items produced while bringing that asset to the locationand condition necessary for it to be capable of operating in the manner intended by management.Instead, an entity recognizes the proceeds from selling such items, and the costs of producingthose items, in profit or loss.
The amendment is effective for annual reporting periods beginning on or after January 1, 2022and must be applied retrospectively to items of property, plant and equipment made available foruse on or after the beginning of the earliest period presented when the entity first applies theamendment.
The amendments are not expected to have a material impact on the Group.
Amendments to PAS 37, Onerous Contracts – Costs of Fulfilling a Contract
The amendments specify which costs an entity needs to include when assessing whether acontract is onerous or loss-making. The amendments apply a “directly related cost approach”.The costs that relate directly to a contract to provide goods or services include both incrementalcosts and an allocation of costs directly related to contract activities. General and administrativecosts do not relate directly to a contract and are excluded unless they are explicitly chargeable tothe counterparty under the contract.
The amendments are effective for annual reporting periods beginning on or after January 1,2022. The Group will apply these amendments to contracts for which it has not yet fulfilled all itsobligations at the beginning of the annual reporting period in which it first applies theamendments.
Annual Improvements to PFRSs 2018-2020 Cycle
Amendments to PFRS 1, First-time Adoption of Philippines Financial Reporting Standards,Subsidiary as a first-time adopter
The amendment permits a subsidiary that elects to apply paragraph D16(a) of PFRS 1 tomeasure cumulative translation differences using the amounts reported by the parent, basedon the parent’s date of transition to PFRS. This amendment is also applied to an associate orjoint venture that elects to apply paragraph D16(a) of PFRS 1.

- 10 -
*SGVFSM005291*
The amendment is effective for annual reporting periods beginning on or after January 1,2022 with earlier adoption permitted. The amendments are not expected to have a materialimpact on the Group.
Amendments to PFRS 9, Financial Instruments, Fees in the ’10 per cent’ test forderecognition of financial liabilities
The amendment clarifies the fees that an entity includes when assessing whether the termsof a new or modified financial liability are substantially different from the terms of the originalfinancial liability. These fees include only those paid or received between the borrower andthe lender, including fees paid or received by either the borrower or lender on the other’sbehalf. An entity applies the amendment to financial liabilities that are modified or exchangedon or after the beginning of the annual reporting period in which the entity first applies theamendment.
The amendment is effective for annual reporting periods beginning on or after January 1,2022 with earlier adoption permitted. The Group will apply the amendments to financialliabilities that are modified or exchanged on or after the beginning of the annual reportingperiod in which the entity first applies the amendment. The amendments are not expected tohave a material impact on the Group.
Amendments to PAS 41, Agriculture, Taxation in fair value measurements
The amendment removes the requirement in paragraph 22 of PAS 41 that entities excludecash flows for taxation when measuring the fair value of assets within the scope of PAS 41.
The amendments are expected to have no impact on the Group.
Effective beginning on or after January 1, 2023
Amendments to PAS 1, Classification of Liabilities as Current or Non-current
The amendments clarify paragraphs 69 to 76 of PAS 1, Presentation of Financial Statements, tospecify the requirements for classifying liabilities as current or non-current. The amendmentsclarify: What is meant by a right to defer settlement That a right to defer must exist at the end of the reporting period That classification is unaffected by the likelihood that an entity will exercise its deferral right That only if an embedded derivative in a convertible liability is itself an equity instrument
would the terms of a liability not impact its classification
The amendments are effective for annual reporting periods beginning on or after January 1,2023 and must be applied retrospectively. The Group is currently assessing the impact theamendments will have on current practice and whether existing loan agreements may requirerenegotiation.
PFRS 17, Insurance Contracts
PFRS 17 is a comprehensive new accounting standard for insurance contracts coveringrecognition and measurement, presentation and disclosure. Once effective, PFRS 17 willreplace PFRS 4, Insurance Contracts. This new standard on insurance contracts applies toall types of insurance contracts (i.e., life, non-life, direct insurance and re-insurance),regardless of the type of entities that issue them, as well as to certain guarantees andfinancial instruments with discretionary participation features. A few scope exceptions willapply.

- 11 -
*SGVFSM005291*
The overall objective of PFRS 17 is to provide an accounting model for insurance contractsthat is more useful and consistent for insurers. In contrast to the requirements in PFRS 4,which are largely based on grandfathering previous local accounting policies, PFRS 17provides a comprehensive model for insurance contracts, covering all relevant accountingaspects. The core of PFRS 17 is the general model, supplemented by: A specific adaptation for contracts with direct participation features (the variable fee
approach) A simplified approach (the premium allocation approach) mainly for short-duration
contracts
PFRS 17 is effective for reporting periods beginning on or after January 1, 2023, withcomparative figures required. Early application is permitted.
The amendments are expected to have no impact on the Group.
Deferred effectivity Amendments to PFRS 10, Consolidated Financial Statements, and PAS 28, Sale or Contribution
of Assets between an Investor and its Associate or Joint Venture
The amendments address the conflict between PFRS 10 and PAS 28 in dealing with the loss ofcontrol of a subsidiary that is sold or contributed to an associate or joint venture. Theamendments clarify that a full gain or loss is recognized when a transfer to an associate or jointventure involves a business as defined in PFRS 3. Any gain or loss resulting from the sale orcontribution of assets that does not constitute a business, however, is recognized only to theextent of unrelated investors’ interests in the associate or joint venture.
On January 13, 2016, the Financial Reporting Standards Council deferred the original effectivedate of January 1, 2016 of the said amendments until the International Accounting StandardsBoard (IASB) completes its broader review of the research project on equity accounting that mayresult in the simplification of accounting for such transactions and of other aspects of accountingfor associates and joint ventures.
The significant accounting policies that have been used in the preparation of the consolidatedfinancial statements are summarized below. These policies have been consistently applied to all theyears presented, unless otherwise stated.
Current versus Noncurrent ClassificationThe Group presents assets and liabilities in the consolidated balance sheet based on current ornoncurrent classification.
An asset is current when it is:
Expected to be realized or intended to be sold or consumed in the normal operating cycle; Held primarily for the purpose of trading; Expected to be realized within twelve months after the balance sheet date; or Cash or cash equivalent, unless restricted from being exchanged or used to settle a liability for at
least twelve months after the balance sheet date.
All other assets are classified as noncurrent.
A liability is current when:
It is expected to be settled in the normal operating cycle; It is held primarily for the purpose of trading; It is due to be settled within twelve months after the balance sheet date; or There is no unconditional right to defer the settlement of the liability for at least twelve months
after the balance sheet date.

- 12 -
*SGVFSM005291*
All other liabilities are classified as noncurrent.
Deferred tax assets and liabilities are classified as noncurrent assets and liabilities, respectively.
Cash and Cash EquivalentsCash includes cash on hand and in banks. Cash equivalents are short-term, highly liquid investmentsthat are readily convertible to known amounts of cash with original maturities of three months or lessand that are subject to an insignificant risk of change in value.
Financial InstrumentsA financial instrument is any contract that gives rise to a financial asset of one entity and a financialliability or equity instrument of another entity.
a) Financial assetsInitial recognition and measurementFinancial assets are classified at fair value, at initial recognition, and subsequently measured atamortized cost, FVOCI, and FVPL.
The classification of financial assets at initial recognition depends on the financial asset’s contractualcash flow characteristics and the Group’s business model for managing them. With the exception oftrade receivables that do not contain a significant financing component or for which the Group hasapplied the practical expedient, the Group initially measures a financial asset at its fair value plus, inthe case of a financial asset not at FVPL, transaction costs. Trade receivables that do not contain asignificant financing component or for which the Group has applied the practical expedient aremeasured at the transaction price determined under PFRS 15.
In order for a financial asset to be classified and measured at amortized cost or FVOCI, it needs togive rise to cash flows that are ‘solely payments of principal and interest (SPPI)’ on the principalamount outstanding. This assessment is referred to as the SPPI test and is performed at aninstrument level.
The Group’s business model for managing financial assets refers to how it manages its financialassets in order to generate cash flows. The business model determines whether cash flows will resultfrom collecting contractual cash flows, selling the financial assets, or both.
Purchases or sales of financial assets that require delivery of assets within a time frame establishedby regulation or convention in the market place (regular way trades) are recognized on the trade date,i.e., the date that the Group commits to purchase or sell the asset.
Subsequent measurementFor purposes of subsequent measurement, financial assets are classified in four categories: Financial assets at amortized cost (debt instruments) Financial assets at FVOCI with recycling of cumulative gains and losses (debt instruments) Financial assets designated at FVOCI with no recycling of cumulative gains and losses upon
derecognition (equity instruments) Financial assets at FVPL
The financial assets of the Group as of December 31, 2020 and 2019 consist of financial assets atamortized cost (debt instruments) and financial assets designated at FVOCI with no recycling ofcumulative gains and losses upon derecognition (equity instruments).
Financial assets at amortized cost (debt instruments)This category is the most relevant to the Group. The Group measures financial assets at amortizedcost if both of the following conditions are met: The financial asset is held within a business model with the objective to hold financial assets in
order to collect contractual cash flows; and

- 13 -
*SGVFSM005291*
The contractual terms of the financial asset give rise on specified dates to cash flows that aresolely payments of principal and interest on the principal amount outstanding.
Financial assets at amortized cost are subsequently measured using the effective interest (EIR)method and are subject to impairment. Gains and losses are recognized in profit or loss when theasset is derecognized, modified or impaired.
The Group’s financial assets at amortized cost includes cash and cash equivalents, receivables andmiscellaneous deposits included under “Other noncurrent assets” account.
Financial assets designated at FVOCI (equity instruments)Upon initial recognition, the Group can elect to classify irrevocably its equity investments as equityinstruments designated at FVOCI when they meet the definition of equity under PAS 32, FinancialInstruments: Presentation, and are not held for trading. The classification is determined on aninstrument-by-instrument basis.
Gains and losses on these financial assets are never recycled to profit or loss. Dividends arerecognized as other income in the consolidated statement of income when the right of payment hasbeen established, except when the Group benefits from such proceeds as a recovery of part of thecost of the financial asset, in which case, such gains are recorded in OCI. Equity instrumentsdesignated at FVOCI are not subject to impairment assessment.
The Group elected to classify irrevocably its investments in club shares and non-listed commonequity shares under this category.
Financial assets at FVPLFinancial assets at FVPL include financial assets held for trading, financial assets designated uponinitial recognition at FVPL, or financial assets mandatorily required to be measured at fair value.Financial assets are classified as held for trading if they are acquired for the purpose of selling orrepurchasing in the near term. Derivatives, including separated embedded derivatives, are alsoclassified as held for trading unless they are designated as effective hedging instruments. Financialassets with cash flows that are not solely payments of principal and interest are classified andmeasured at FVPL, irrespective of the business model. Notwithstanding the criteria for debtinstruments to be classified at amortized cost or at FVOCI, as described above, debt instruments maybe designated at FVPL on initial recognition if doing so eliminates, or significantly reduces, anaccounting mismatch.
Financial assets at FVPL are carried in the consolidated balance sheet at fair value with net changesin fair value recognized in the consolidated statement of income.
This category includes derivative instruments which the Group had not irrevocably elected to classifyat FVOCI.
A derivative embedded in a hybrid contract, with a financial liability or non-financial host, is separatedfrom the host and accounted for as a separate derivative if: the economic characteristics and risks arenot closely related to the host; a separate instrument with the same terms as the embeddedderivative would meet the definition of a derivative; and the hybrid contract is not measured at fairvalue through profit or loss. Embedded derivatives are measured at fair value with changes in fairvalue recognized in profit or loss. Reassessment only occurs if there is either a change in the terms ofthe contract that significantly modifies the cash flows that would otherwise be required or areclassification of a financial asset out of the fair value through profit or loss category.
DerecognitionA financial asset (or, where applicable, a part of a financial asset or part of a group of similar financialassets) is primarily derecognized (i.e., removed from the Group’s consolidated balance sheet) when: The rights to receive cash flows from the asset have expired, or

- 14 -
*SGVFSM005291*
The Group has transferred its rights to receive cash flows from the asset or has assumed anobligation to pay the received cash flows in full without material delay to a third party under a‘pass-through’ arrangement; and either (a) the Group has transferred substantially all the risksand rewards of the asset, or (b) the Group has neither transferred nor retained substantially allthe risks and rewards of the asset, but has transferred control of the asset.
When the Group has transferred its rights to receive cash flows from an asset or has entered into apass-through arrangement, it evaluates if, and to what extent, it has retained the risks and rewards ofownership. When it has neither transferred nor retained substantially all of the risks and rewards ofthe asset, nor transferred control of the asset, the Group continues to recognize the transferred assetto the extent of its continuing involvement. In that case, the Group also recognizes an associatedliability. The transferred asset and the associated liability are measured on a basis that reflects therights and obligations that the Group has retained.
Continuing involvement that takes the form of a guarantee over the transferred asset is measured atthe lower of the original carrying amount of the asset and the maximum amount of consideration thatthe Group could be required to repay.
Impairment of Financial AssetsThe Group recognizes an allowance for expected credit losses (ECLs) for all debt instruments notheld at FVPL. ECLs are based on the difference between the contractual cash flows due inaccordance with the contract and all the cash flows that the Group expects to receive, discounted atan approximation of the original effective interest rate. The expected cash flows will include cashflows from the sale of collateral held or other credit enhancements that are integral to the contractualterms.
For those credit exposures for which there has been a significant increase in credit risk since initialrecognition, a loss allowance is recognized for credit losses expected over the remaining life of theexposure, irrespective of timing of the default (a lifetime ECL).
For trade receivables and contract assets, the Group applies a simplified approach in calculatingECLs. Therefore, the Group does not track changes in credit risk, but instead recognizes a lossallowance based on lifetime ECLs at each reporting date. The Group has established a provisionmatrix that is based on its historical credit loss experience, adjusted for forward-looking factorsspecific to the debtors and the economic environment.
The Group considers a financial asset in default when internal or external information indicates thatthe Group is unlikely to receive the outstanding contractual amounts in full before taking into accountany credit enhancements held by the Group. A financial asset is written off when there is noreasonable expectation of recovering the contractual cash flows.
b) Financial liabilitiesInitial recognition and measurementFinancial liabilities are classified, at initial recognition, as financial liabilities at FVPL, loans andborrowings, payables, or as derivatives designated as hedging instruments in an effective hedge, asappropriate.
All financial liabilities are recognized initially at fair value and, in the case of loans and borrowings andpayables, net of directly attributable transaction costs.
Subsequent measurementThe measurement of financial liabilities depends on their classification, as described below:
Financial liabilities at FVPLFinancial liabilities at FVPL include financial liabilities held for trading and financial liabilitiesdesignated upon initial recognition as at FVPL.

- 15 -
*SGVFSM005291*
Financial liabilities are classified as held for trading if they are incurred for the purpose ofrepurchasing in the near term. This category also includes derivative financial instruments enteredinto by the Group that are not designated as hedging instruments in hedge relationships as defined byPFRS 9. Separated embedded derivatives are also classified as held for trading unless they aredesignated as effective hedging instruments.
Gains or losses on liabilities held for trading are recognized in the consolidated statements of income.
Financial liabilities designated upon initial recognition at FVPL are designated at the initial date ofrecognition, and only if the criteria in PFRS 9 are satisfied.
This category applies to the Group’s derivative liabilities and financial liabilities on put options over thenon-controlling interests.
Other financial liabilitiesThis category pertains to financial liabilities that are not held for trading or not designated as at FVPLupon the inception of the liability. These include liabilities arising from operations and borrowings.
After initial measurement, other financial liabilities are measured at amortized cost using the EIRmethod. Amortized cost is calculated by taking into account any discount or premium on theacquisition and fees or costs that are an integral part of the EIR. Gains and losses are recognized inprofit or loss when other financial liabilities are derecognized, as well as through the EIR amortizationprocess.
This category applies to the Group’s accounts payable and accrued expenses (excluding advancesfrom customers, advances from third party, statutory payables and taxes payables), loans payableand long-term debt.
DerecognitionA financial liability is derecognized when the obligation under the liability is discharged or cancelled orhas expired. When an existing financial liability is replaced by another from the same lender onsubstantially different terms, or the terms of an existing liability are substantially modified, such anexchange or modification is treated as the derecognition of the original liability and the recognition ofa new liability. The difference in the respective carrying amounts is recognized in profit or loss.
c) Offsetting of financial instrumentsFinancial assets and financial liabilities are offset and the net amount is reported in the consolidatedbalance sheets if there is a currently enforceable legal right to offset the recognized amounts andthere is an intention to settle on a net basis, to realize the assets and settle the liabilitiessimultaneously.
Fair Value MeasurementThe Group measures its derivatives, financial assets at FVOCI and financial liabilities at FVPL at fairvalue at each balance sheet date. Also, fair values of financial instruments measured at amortizedcost are disclosed in Note 32.
The fair value is the price that would be received to sell an asset, or paid to transfer a liability in anorderly transaction between market participants at the measurement date. The fair valuemeasurement is based on the presumption that the transaction to sell the asset or transfer the liabilitytakes place either:
In the principal market for the asset or liability; or In the absence of a principal market, in the most advantageous market for the asset or liability.
The principal or the most advantageous market must be accessible to the Group.

- 16 -
*SGVFSM005291*
The fair value of an asset or a liability is measured using the assumptions that market participantswould use when pricing the asset or liability, assuming that market participants act in their economicbest interest.
The Group uses valuation techniques that are appropriate in the circumstances and for whichsufficient data are available to measure the fair value, maximizing the use of relevant observableinputs and minimizing the use of unobservable inputs.
All assets and liabilities for which the fair value is measured or disclosed in the consolidated financialstatements are categorized within the fair value hierarchy, described as follows, based on the lowestlevel input that is significant to the fair value measurement as a whole:
Level 1 - Quoted (unadjusted) market prices in active markets for identical assets and liabilities. Level 2 - Valuation techniques for which the lowest level input that is significant to the fair value
measurement is directly or indirectly observable. Level 3 - Valuation techniques for which the lowest level input that is significant to the fair value
measurement is unobservable.
For assets and liabilities that are recognized in the consolidated financial statements on a recurringbasis, the Group determines whether transfers have occurred between levels in the hierarchy byreassessing categorization (based on the lowest level input that is significant to the fair valuemeasurement as a whole) at balance sheet date.
For purposes of fair value disclosures, the Group has determined classes of assets and liabilities onthe basis of the nature, characteristics and risks of the asset or liability and the level of the fair valuehierarchy as explained above.
InventoriesInventories are valued at the lower of cost and net realizable value (NRV). Cost is determined usingthe moving average method for raw materials and supplies. For finished goods and work-in-process,cost includes direct materials, direct labor, and a proportion of manufacturing overhead costs basedon normal operating capacity determined using the moving average method. NRV is the estimatedselling price in the ordinary course of business, less the estimated costs of completion and costsnecessary to make the sale. In the event that NRV is lower than cost, the decline shall be recognizedas an expense in profit or loss.
Deferred ChargesDeferred charges are recognized when the Group incurred expenses but the benefits are notexpected to be realized on a short-term basis. These are normally chargeable to the customers aspart of the selling price of the manufactured items.
Property, Plant and EquipmentProperty, plant and equipment are stated at cost, net of accumulated depreciation and accumulatedimpairment losses. The initial cost of property, plant and equipment consists of its purchase price andany directly attributable cost of bringing the asset to its working condition and location for its intendeduse. Expenditures incurred after the property, plant and equipment have been put into operation,such as repairs and maintenance and overhaul costs, are normally charged to profit or loss in theperiod in which the costs are incurred. In situations where it can be clearly demonstrated that theexpenditures have resulted in an increase in the future economic benefits expected to be obtainedfrom the use of an item of property, plant and equipment beyond its originally assessed standard ofperformance, the expenditures are capitalized as additional costs of property, plant and equipment.
Construction in progress is stated at cost, less impairment loss, if any. This includes costs ofconstruction and installation of equipment and machinery items, and any other costs directlyattributable to bringing the asset to its intended use. Construction in progress is not depreciated untilsuch time as the relevant assets are completed and put into operational use.

- 17 -
*SGVFSM005291*
Depreciation of property, plant and equipment commences once the property, plant and equipmentare available for use and is calculated on a straight-line basis over the estimated useful lives (EUL) ofthe assets as follows:
YearsBuildings 25 - 30Building improvements 5Machineries and facilities equipment 7Furniture, fixtures and office equipment 3 - 5Transportation equipment 3 - 5Tools and instruments 2 - 5
The EUL and methods of depreciation of property, plant and equipment are reviewed annually andadjusted prospectively, if appropriate. The EUL of property, plant and equipment are based onexpected asset utilization as anchored on business plans and strategies that also consider expectedfuture technological developments and market behavior to ensure that the period of depreciation isconsistent with the expected pattern of economic benefits from items of property, plant andequipment.
An item of property, plant and equipment is derecognized upon disposal or when no future economicbenefits are expected from its use. Any gain or loss arising from the derecognition of the asset(calculated as the difference between the net disposal proceeds and the carrying amount of theasset) is recognized in profit or loss when the asset is derecognized.
Fully depreciated property, plant and equipment are retained in the accounts until these are no longerused and no further depreciation is charged to profit or loss.
Borrowing CostsBorrowing costs directly attributable to the acquisition, construction or production of an asset thatnecessarily takes a substantial period of time to get ready for its intended use or sale are capitalizedas part of the cost of the asset. All other borrowing costs are expensed in the period in which theyoccur. Borrowing costs consist of interest and other costs that the Group incurs in connection with theborrowing of funds.
Business Combinations and GoodwillBusiness combinations are accounted for using the acquisition method. The cost of an acquisition ismeasured as the aggregate of the consideration transferred, measured at acquisition date fair value,and the amount of any non-controlling interest in the acquiree. For each business combination, theGroup elects to measure the non-controlling interest in the acquiree at the proportionate share of theacquiree’s identifiable net assets. Acquisition-related costs are expensed as incurred and included inthe consolidated statements of income under “Operating expenses” account.
When the Group acquires a business, it assesses the financial assets and liabilities assumed forappropriate classification and designation in accordance with the contractual terms, economiccircumstances and pertinent conditions as at the acquisition date. This includes the separation ofembedded derivatives in host contracts by the acquiree.
If the business combination is achieved in stages, any previously held equity interest is remeasuredat its acquisition date fair value and any resulting gain or loss is recognized in profit or loss.Any contingent consideration to be transferred by the acquirer will be recognized at fair value at theacquisition date. Contingent consideration classified as an asset or liability, that is a financialinstrument and within the scope of PFRS 9 is measured at fair value with changes in fair valuerecognized in profit or loss. Other contingent consideration that is not within the scope of PFRS 9 ismeasured at fair value at each reporting date with changes in fair value recognized in profit or loss.

- 18 -
*SGVFSM005291*
Goodwill is initially measured at cost, being the excess of the aggregate of the considerationtransferred and the amount recognized for non-controlling interests over the net identifiable assetsacquired and liabilities assumed. If the fair value of the net assets acquired is in excess of theaggregate consideration transferred, the Group reassesses whether it has correctly identified all ofthe assets acquired and all of the liabilities assumed and reviews the procedures used to measureamounts to be recognized at the acquisition date. If the reassessment still results in an excess of thefair value of net assets acquired over the aggregate consideration transferred, then the gain isrecognized in profit or loss.
After initial recognition, goodwill is measured at cost, less accumulated impairment losses. Forpurposes of impairment testing, goodwill acquired in a business combination is, from the acquisitiondate, allocated to each of the Group’s cash-generating unit (CGU), or group of CGUs, that areexpected to benefit from the synergies of the combination, irrespective of whether other assets orliabilities of the Group are assigned to those units or groups of units.
Each unit or group of units to which the goodwill is allocated should:
Represent the lowest level within the Group at which the goodwill is monitored for internalmanagement purposes; and
Not be larger than an operating segment determined in accordance with PFRS 8, OperatingSegments.
When goodwill has been allocated to a CGU and part of the operation within that unit is disposed of,the goodwill allocated with the disposed operation is included in the carrying amount of the operationwhen determining the gain or loss on disposal. Goodwill disposed in these circumstances ismeasured based on the relative values of the disposed operation.
If the initial accounting for a business combination can be determined only provisionally by the end ofthe period in which the combination is effected because either the fair values to be assigned to theacquiree’s identifiable assets, liabilities or contingent liabilities or the cost of the combination can bedetermined only provisionally, the acquirer shall account for the combination using those provisionalvalues. The acquirer shall recognize any adjustments to those provisional values as a result ofcompleting the initial accounting within twelve months of the acquisition date as follows: (i) thecarrying amount of the identifiable asset, liability or contingent liability that is recognized or adjustedas a result of completing the initial accounting shall be calculated as if its fair value at the acquisitiondate had been recognized from that date; (ii) goodwill or any gain recognized shall be adjusted by anamount equal to the adjustment to the fair value at the acquisition date of the identifiable asset,liability or contingent liability being recognized or adjusted; and (iii) comparative information presentedfor the periods before the initial accounting for the combination is complete shall be presented as ifthe initial accounting has been completed from the acquisition date.
Intangible AssetsIntangible assets acquired separately are measured on initial recognition at cost. The cost ofintangible assets acquired in a business combination is the fair value as of the date of acquisition.
Research and development costsResearch costs are expensed as incurred. Development expenditures on an individual project arerecognized as an intangible asset when the Group can demonstrate:
(a) The technical feasibility of completing the intangible asset so that the asset will be available foruse or sale;
(b) Its intention to complete and ability to use or sell the intangible asset;(c) How the intangible asset will generate probable future economic benefits. Among other things,
the entity can demonstrate the existence of a market for the output of the intangible asset or theintangible asset itself or, if it is to be used internally, the usefulness of the intangible asset;
(d) The availability of adequate technical, financial and other resources to complete the developmentand to use or sell the intangible asset; and

- 19 -
*SGVFSM005291*
(e) Its ability to measure reliably the expenditure attributable to the intangible asset during itsdevelopment.
After initial recognition, intangible assets are carried at cost, less accumulated amortization and anyaccumulated impairment losses. Amortization begins when development is complete and the asset isavailable for use. It is amortized over the period of expected benefit.
The EUL of intangible assets are assessed as either finite or indefinite. Intangible assets with finiteuseful lives are amortized over their EUL and assessed for impairment whenever there is anindication that the intangible asset is impaired. The amortization period and method for intangibleassets with finite useful lives are reviewed at least at the end of each balance sheet date. Changes inthe EUL or the expected pattern of consumption of future economic benefits embodied in the assetare considered to modify the amortization period or method, as appropriate, and are treated aschanges in accounting estimates. The amortization expense on intangible assets with finite usefullives is recognized in profit or loss.
The EUL of intangible assets of finite useful life are as follows:
YearsCustomer relationships 5Unpatented technology 5Licenses 3-5Intellectual properties 5Product development costs 5
Intangible assets with indefinite useful lives and those not yet available for use are not amortized, butare tested for impairment annually, either individually or at the CGU level. The assessment ofindefinite useful life is reviewed annually to determine whether the indefinite useful life continues to besupportable. If not, the change in useful life from indefinite to finite is made on a prospective basis.
Gains or losses arising from the derecognition of an intangible asset are measured as the differencebetween the net disposal proceeds and the carrying amount of the asset and are recognized in profitor loss when the asset is derecognized.
Leases (Upon Adoption of PFRS 16 beginning January 1, 2019)The Group assesses at contract inception whether a contract is, or contains, a lease. That is, if thecontract conveys the right to control the use of an identified asset for a period of time in exchange forconsideration.
Group as LesseeThe Group applies a single recognition and measurement approach for all leases, except for short-term leases and leases of low-value assets. The Group recognizes lease liabilities to make leasepayments and right-of-use assets representing the right to use the underlying assets.
Right-of-use AssetsThe Group recognizes right-of-use assets at the commencement date of the lease (i.e., the date theunderlying asset is available for use). Right-of-use assets are measured at cost, less anyaccumulated depreciation and impairment losses, and adjusted for any remeasurement of leaseliabilities. The cost of right-of-use assets includes the amount of lease liabilities recognized, initialdirect costs incurred, and lease payments made at or before the commencement date less any leaseincentives received. Right-of-use assets are depreciated on a straight-line basis over the shorter ofthe lease term and the estimated useful lives of the assets.
If ownership of the leased asset transfers to the Group at the end of the lease term or the cost reflectsthe exercise of a purchase option, depreciation is calculated using the estimated useful life of theasset.

- 20 -
*SGVFSM005291*
The right-of-use assets are also subject to impairment.
Lease LiabilitiesAt the commencement date of the lease, the Group recognizes lease liabilities measured at thepresent value of lease payments to be made over the lease term. The lease payments include fixedpayments (including in-substance fixed payments) less any lease incentives receivable, variablelease payments that depend on an index or a rate, and amounts expected to be paid under residualvalue guarantees. The lease payments also include the exercise price of a purchase optionreasonably certain to be exercised by the Group and payments of penalties for terminating the lease,if the lease term reflects the Group exercising the option to terminate. Variable lease payments thatdo not depend on an index or a rate are recognized as expenses (unless they are incurred to produceinventories) in the period in which the event or condition that triggers the payment occurs.
In calculating the present value of lease payments, the Group uses its incremental borrowing rate atthe lease commencement date because the interest rate implicit in the lease is not readilydeterminable. After the commencement date, the amount of lease liabilities is increased to reflect theaccretion of interest and reduced for the lease payments made. In addition, the carrying amount oflease liabilities is remeasured if there is a modification, a change in the lease term, a change in thelease payments (e.g., changes to future payments resulting from a change in an index or rate used todetermine such lease payments) or a change in the assessment of an option to purchase theunderlying asset.
Short-term Leases (STL) and Leases of Low-value AssetsThe Group applies the STL recognition exemption to those leases that have a lease term of 12months or less from the commencement date and do not contain a purchase option. The Groupapplies the low-value assets recognition exemption to leases of underlying assets with a value, whennew, of US$5,000 and below. Lease payments on short-term leases and low-value assets arerecognized as expense on a straight-line basis over the lease term.
Leases (Prior to Adoption of PFRS 16 beginning January 1, 2019)The determination of whether an arrangement is, or contains, a lease, is based on the substance ofthe arrangement at the inception date. The arrangement is assessed for whether fulfillment of thearrangement is dependent on the use of a specific asset or assets, or whether the arrangementconveys a right to use the asset or assets, even if that right is not explicitly specified in anarrangement.
Operating and finance lease commitments - Group as lesseeFinance leases that transfer substantially all the risks and benefits incidental to ownership of theleased item to the Group are capitalized at the inception of the lease at the fair value of the leasedproperty or, if lower, at the present value of the minimum lease payments and included in the“Property, plant and equipment” account, with the corresponding liability to the lessor included in the“Accounts payable and accrued expenses” account for the current portion, and “Noncurrent portion ofobligation under finance lease” account for the noncurrent portion in the consolidated balance sheets.Lease payments are apportioned between the finance charges and reduction of the lease liability soas to achieve a constant rate of interest on the remaining balance of the liability. Finance charges arerecognized under “Interest expense and bank charges” account in the consolidated statements ofincome.
Capitalized leased assets are depreciated over the shorter of the EUL of the assets and therespective lease terms.
Leases in which the Group does not transfer substantially all the risks and benefits of ownership ofthe assets are classified as operating leases. Operating lease payments are recognized as expensein profit or loss on a straight-line basis over the respective lease terms.

- 21 -
*SGVFSM005291*
Impairment of Nonfinancial AssetsThe Group assesses, at each balance sheet date, whether there is an indication that a nonfinancialasset (e.g., deferred charges, property, plant and equipment, right-of-use assets and intangibleassets) is impaired. If any indication exists, or when annual impairment testing for an asset isrequired, the Group estimates the asset’s recoverable amount. An asset’s recoverable amount is thehigher of an asset’s or CGU’s fair value less costs to sell and its value-in-use. Recoverable amount isdetermined for an individual asset, unless the asset does not generate cash inflows that are largelyindependent of those from other assets or groups of assets. When the carrying amount of an asset orCGU exceeds its recoverable amount, the asset is considered impaired and is written down to itsrecoverable amount.
In determining fair value less costs to sell, recent market transactions are taken into account. If nosuch transactions can be identified, an appropriate valuation model is used. These calculations arecorroborated by valuation multiples, quoted share prices for publicly traded companies or otheravailable fair value indicators. In assessing value-in-use, the estimated future cash flows arediscounted to their present value using a pre-tax discount rate that reflects current marketassessments of the time value of money and the risks specific to the asset.
The Group bases its impairment calculation on detailed budgets and forecast calculations, which areprepared separately for each of the Group’s CGU to which the individual assets are allocated. Thesebudgets and forecast calculations generally covered a period of five years.
For nonfinancial assets, excluding goodwill, an assessment is made at each balance sheet date todetermine whether there is an indication that previously recognized impairment losses no longer existor have decreased. If such indication exists, the Group estimates the asset’s or CGU’s recoverableamount. A previously recognized impairment loss is reversed only if there has been a change in theassumptions used to determine the asset’s recoverable amount since the last impairment loss wasrecognized. The reversal is limited so that the carrying amount of the asset does not exceed itsrecoverable amount, nor exceed the carrying amount that would have been determined, net ofdepreciation and amortization, had no impairment loss been recognized for the asset in prior years.Such reversal is recognized in profit or loss. After such reversal, the depreciation and amortizationexpense is adjusted in future periods to allocate the asset’s revised carrying amount, less anyresidual value, on a systematic basis over its remaining EUL.
All goodwill of the Group are tested for impairment annually as of December 31 and also tested forimpairment when circumstances indicate that the carrying amount is impaired. Provisional goodwillallocated to a CGU is also tested for impairment even if the fair value exercise is not complete duringthe year.
Impairment is determined for goodwill by assessing the recoverable amount of each CGU (or group ofCGUs) to which the goodwill relates. When the recoverable amount of the CGU is less than itscarrying amount, an impairment loss is recognized. Impairment losses relating to goodwill cannot bereversed in future periods.
ProvisionsProvisions are recognized when the Group has a present obligation (legal or constructive) as a resultof a past event, it is probable that an outflow of resources embodying economic benefits will berequired to settle the obligation and a reliable estimate can be made of the amount of the obligation.
When the Group expects a provision to be reimbursed, the reimbursement is recognized as aseparate asset, but only when the reimbursement is virtually certain.
If the effect of the time value of money is material, provisions are determined by discounting theexpected future cash flows at a pre-tax rate that reflects the current market assessments of the timevalue of money and, when appropriate, the risks specific to the liability. When discounting is used, theincrease in the provision due to the passage of time is recognized as interest expense.
- 22 -
*SGVFSM005291*
Provisions are reviewed at each balance sheet date and adjusted to reflect the current best estimate.
EquityCapital stockCapital stock is measured at par value for all shares issued and outstanding. When the ParentCompany issues more than one class of stock, a separate account is maintained for each class ofstock and the number of shares issued.
Preferred shares may be issued with various rights. In determining whether a preference share isfinancial liability or equity instrument, the issuer is required to assess the particular rights attaching tothe share to determine whether it exhibits the fundamental characteristic of a financial liability.A preference share redeemable only at the holder’s option is an equity instrument because the issuerdoes not have a present or future obligation to transfer financial assets to the shareholder.
Additional paid-in capitalAdditional paid-in capital pertains to the difference of the par value and selling price of issued andoutstanding shares of stock. Direct costs incurred related to equity issuance, such as underwriting,accounting and legal fees, printing costs and taxes are charged to “Additional paid-in capital” account.If additional paid-in capital is not sufficient, the excess is charged against “Retained earnings”account.
The financial liabilities for the put options over the non-controlling interests are recognized at theacquisition date with a debit to additional paid-in capital.
An increase or decrease in a parent’s ownership interest that does not result in a loss of control of asubsidiary is accounted for as an equity transaction, i.e. a transaction with owners in their capacity asowners. A parent’s ownership interest may change without a loss of control, e.g. when a parent buysshares from or sells shares to a non-controlling interest, a subsidiary redeems shares held by anon-controlling interest, or when a subsidiary issues new shares to a non-controlling interest.
The carrying amounts of the controlling and non-controlling interests are adjusted to reflect thechanges in their relative interests in the subsidiary. PFRS 10 states that ‘the entity shall recognizedirectly in equity any difference between the amount by which the non-controlling interests areadjusted and the fair value of the consideration paid or received, and attribute it to the owners of theparent. The Group recognize this difference under “Additional paid-in capital” account.
Subscriptions receivableSubscriptions receivable pertains to the uncollected portion of the subscribed shares.
Retained earnings and dividends on capital stock of the Parent CompanyRetained earnings represent net accumulated earnings of the Group, less dividends declared.Dividends on capital stock are recognized as a liability and deducted from equity when they areapproved by Parent Company’s BOD.
Treasury stockTreasury stock is recorded at cost and is presented as a deduction from equity. When the shares areretired, the “Capital stock” account is reduced by its par value and the excess of cost over par valueupon retirement is debited to “Additional paid-in capital” account to the extent of the specific oraverage additional paid-in capital when the shares were issued and to “Retained earnings” accountfor the remaining balance.

- 23 -
*SGVFSM005291*
Revenue Recognitiona) Revenue from contracts with customers
The Group is in the business of providing electronic manufacturing and other related services tovarious customers. Revenue from contracts with customers is recognized when control of thegoods or services are transferred to the customer at an amount that reflects the consideration towhich the Group expects to be entitled in exchange for those goods or services. The Group hasconcluded that it is the principal in its revenue arrangements because it controls the goods orservices before transferring them to the customer.
Manufacturing of goodsThe Group provides manufacturing services in accordance with the customer’s specifications.The Group promises to provide a combined performance obligation comprised of non-distinctgoods or services, which include issuance of materials to production, assembly, testing andpackaging.
Contracts with customers are generally classified as turnkey or consignment. In a turnkeycontract, the Group procures the materials and provides the assembly services to the customer.In a consignment contract, the Group only provides assembly services to the customer.
For turnkey contracts, revenue is recognized over time since the products created have noalternative use to the Group and the Group has right to payment for performance completed todate including the related profit margin, in case of termination for reasons other than the Group’sfailure to perform as promised.
For goods manufactured not covered by customer purchase orders or firm delivery schedule,revenues are recognized at a point in time, when control of the asset is transferred to thecustomer, generally when goods are shipped or goods are received by the customer, dependingon the corresponding agreement with the customer.
For consignment contracts, revenue is recognized over time as services are rendered since thecustomer simultaneously receives and consumes the benefits as the Group performs.
Revenue from optical bonding technology and metal mesh touch sensors (VIA and VTS)Revenue from contracts with customers is recognized when control of the goods or services aretransferred to the customer at an amount that reflects the consideration to which the Groupexpects to be entitled in exchange for those goods or services. The Group has concluded that itis the principal in its revenue arrangements because it typically controls the goods or servicesbefore transferring them to the customer.
For optical bonding services performed under the consignment model, revenue is recognized at apoint in time based on the fact that the assets created have alternative use to the Group entities.This is when the enhancement process is finalized, the customer removes the enhanced productsfrom the consignment stock and is invoiced, according to contract.
For the sale of products under the full service model, revenue is recognized at a point in timewhen control of the products are transferred to the customers, generally on delivery of theproducts.
Non-recurring engineering servicesNon-recurring engineering charges, tooling and other pre-production revenue stream (NREs) arerecognized at a point in time since the criteria for over time recognition is not met. This is basedon the assessment that while, in general, the Group has no alternative use for these NREs, eitherdue to customization or restrictions by the customer, there is no assurance or relevant experiencethat IMI has enforceable right to payment or can recover the cost, plus reasonable margin, incase of contract termination. Point in time revenue recognition for NREs would mean revenue isrecognized upon customer acceptance of the NREs (transfer of control).

- 24 -
*SGVFSM005291*
The Group considers whether there are other promises in the contract that are separateperformance obligations to which a portion of the transaction price needs to be allocated (e.g.,customer options that provide material rights to customers, warranties). In determining thetransaction price, the Group considers the effects of variable consideration, the existence ofsignificant financing components, noncash consideration and consideration payable to thecustomer, if any.
Variable considerationIf the consideration in a contract includes a variable amount, the Group estimates the amount ofconsideration to which it will be entitled in exchange for transferring the goods to the customer.The variable consideration is estimated at contract inception and constrained until it is highlyprobable that a significant revenue reversal in the amount of cumulative revenue recognized willnot occur when the associated uncertainty with the variable consideration is subsequentlyresolved.
Significant financing componentThe Group’s contracts with its customers are short-term in nature. Using the practical expedientin PFRS 15, the Group does not adjust the promised amount of consideration of the effects of asignificant financing component if it expects, at contract inception, that the period between thetransfer of the promised good or service to the customer and when the customer pays for thatgood or service will be one year or less.
The Group does not have significant separate performance obligations wherein the transactionprice needs to be allocated as of December 31, 2020 and 2019.
b) Contract balances
Contract assetA contract asset is the right to consideration in exchange for goods or services transferred to thecustomer. If the Group performs by transferring goods or services to a customer before thecustomer pays consideration or before payment is due, a contract asset is recognized for theearned consideration that is conditional.
Contract liabilityA contract liability is the obligation to transfer goods or services to a customer for which theGroup has received consideration (or an amount of consideration is due) from the customer. If acustomer pays consideration before the Group transfers goods or services to the customer, acontract liability is recognized when the payment is made or the payment is due (whichever isearlier). A contract liability is recognized as revenue when the Group performs under the contract.
c) Cost to obtain a contract
The Group pays sales commission to its employees for each contract that they obtain. The Grouphas elected to apply the optional practical expedient for costs to obtain a contract which allowsthe Group to immediately expense sales commissions (included under operating expenses)because the amortization period of the asset that the Group otherwise would have used is oneyear or less.
Other IncomeInterest incomeInterest income is recognized as it accrues using the EIR method.
DividendsDividend income is recognized when the right to receive the payment is established.
Miscellaneous incomeMiscellaneous income is recognized as the Group earns the right over it.

- 25 -
*SGVFSM005291*
ExpensesCost of salesThis account includes cost of goods sold and cost of services. These expenses pertain to the directexpenses incurred by the Group in relation to the products and services offered. Cost of sales isrecognized when the related goods are sold and when services are rendered.
Operating expensesThis account pertains to the general and administrative expenses. Operating expenses arerecognized when incurred, except for short term and low value rental expense, which is computed ona straight line-basis over the lease term.
Government GrantsGovernment grants are recognized where there is reasonable assurance that the grant will bereceived and all attached conditions will be complied with. When the grant relates to an expense item,it is initially recognized as a liability in the consolidated balance sheet and recognized as income on asystematic basis over the periods that the related costs, for which it is intended to compensate, areexpensed. When the grant relates to the acquisition or construction of a fixed asset, it is initiallyrecognized as a liability in the consolidated balance sheet and recognized as income in equalamounts over the period of depreciation of the related asset.
Foreign Currency TransactionsFunctional currency is determined for each entity within the Group and items included in the financialstatements of each entity are measured and recorded using that functional currency. Forconsolidation purposes, the foreign subsidiaries’ balances are translated to USD, which is the ParentCompany’s functional and presentation currency.
Transactions in foreign currencies are initially recorded in the functional currency rate ruling at thedate of the transaction. Monetary assets and liabilities denominated in foreign currencies areretranslated at the functional currency rate of exchange ruling at the balance sheet date. Alldifferences are taken to profit or loss. Nonmonetary items that are measured in terms of historicalcost in a foreign currency are translated using the exchange rate as at the date of initial transaction.Nonmonetary items measured at fair value in a foreign currency are translated using the exchangerate at the date when the fair value was determined.
The functional currencies of the Group’s foreign subsidiaries are summarized in Note 2 to theconsolidated financial statements. As at the balance sheet date, the assets and liabilities of thesesubsidiaries are translated into the presentation currency of the Parent Company at the rate ofexchange ruling at the balance sheet date and their profit and loss accounts are translated at theweighted average exchange rates for the year. The exchange differences arising on the translationare recognized in the consolidated statement of comprehensive income and reported as a separatecomponent of equity.
Exchange differences arising from elimination of intragroup balances and intragroup transactions arerecognized in profit or loss. As an exception, if the exchange differences arise from intragroupbalances that, in substance, forms part of an entity’s net investment in a foreign operation, theexchange differences are not to be recognized in profit or loss, but are recognized in OCI andaccumulated in a separate component of equity until the disposal of the foreign operation.
On disposal of a foreign entity, the deferred cumulative amount recognized in the consolidatedstatement of comprehensive income relating to that particular foreign operation shall be recognized inprofit or loss.
Income TaxesCurrent taxCurrent tax assets and current tax liabilities for the current and prior periods are measured at theamount expected to be recovered from or paid to the tax authorities. The tax rates and tax laws used

- 26 -
*SGVFSM005291*
to compute the amount are those that are enacted or substantively enacted as of the balance sheetdate in the countries where the Group operates and generates taxable profit.
Current tax relating to items recognized directly in equity is recognized in equity and not in profit orloss. Management periodically evaluates positions taken in the tax returns with respect to situations inwhich applicable tax regulations are subject to interpretation and establishes provisions, whenappropriate.
Deferred taxDeferred tax is provided using the liability method on all temporary differences between the tax basesof assets and liabilities and their carrying amounts for financial reporting purposes as of the balancesheet date.
Deferred tax assets are recognized for all deductible temporary differences and carryforward benefitsof unused tax losses, to the extent that it is probable that sufficient future taxable profits will beavailable against which the deductible temporary differences and carryforward benefits of unused taxlosses can be utilized, except: When the deferred tax asset relating to the deductible temporary differences arises from the initial
recognition of an asset or liability in a transaction that is not a business combination and, at thetime of the transaction, affects neither the accounting profit nor taxable profit or loss; and
In respect of deductible temporary differences associated with investments in subsidiaries,deferred tax assets are recognized only to the extent that it is probable that the temporarydifferences will reverse in the foreseeable future and sufficient future taxable profits will beavailable against which the temporary differences can be utilized.
The carrying amount of deferred tax assets is reviewed at each balance sheet date and reduced tothe extent that it is no longer probable that sufficient future taxable profits will be available to allow allor part of the deferred tax assets to be utilized.
Deferred tax liabilities are recognized for all taxable temporary differences, except:
When the deferred tax liability arises from the initial recognition of goodwill or an asset or liabilityin a transaction that is not a business combination and, at the time of the transaction, affectsneither the accounting profit nor taxable profit or loss; and
In respect of taxable temporary differences associated with investments in subsidiaries, when thetiming of the reversal of the temporary differences can be controlled and it is probable that thetemporary differences will not reverse in the foreseeable future.
Deferred tax assets and deferred tax liabilities are measured at the tax rates that are expected toapply in the period when the asset is realized or the liability is settled, based on tax rates (and taxlaws) that have been enacted or substantively enacted as of the balance sheet date.
Deferred tax relating to items recognized outside profit or loss is recognized outside profit or loss.Deferred tax items are recognized in correlation to the underlying transaction either in OCI or directlyin equity.
Deferred tax assets and deferred tax liabilities are offset if a legally enforceable right exists to offsetcurrent tax assets against current tax liabilities and the deferred taxes relate to the same taxableentity and the same tax authority.
For periods where an Income Tax Holiday (ITH) is in effect, no deferred taxes are recognized in theconsolidated financial statements as the ITH status of the Group neither results in a deductibletemporary difference or taxable temporary difference. However, for temporary differences that areexpected to reverse beyond the ITH, deferred taxes are recognized.

- 27 -
*SGVFSM005291*
Earnings per Share (EPS) Attributable to Equity Holders of the Parent CompanyBasic EPS is computed by dividing net income attributable to common equity holders by the weightedaverage number of common shares outstanding and adjusted to give retroactive effect to any stockdividends declared during the period. Diluted EPS is computed by dividing net income attributable tocommon equity holders by the weighted average number of common shares outstanding, plus theweighted average number of common shares that would be issued on conversion of all the dilutivepotential common shares. The calculation of diluted EPS does not assume conversion, exercise orother issue of potential common shares that would have an antidilutive effect on EPS.
Retirement and Other Employee BenefitsDefined benefit plansThe Parent Company, PSi, IMI BG and IMI Serbia maintain separate defined benefit plans coveringsubstantially all of their employees. The plans of the Parent Company and PSi are funded andnoncontributory retirement plans administered by their respective Boards of Trustees, while that ofIMI BG and IMI Serbia is unfunded and noncontributory.
The cost of providing benefits under the defined benefit plans is actuarially determined using theprojected unit credit method. This method reflects services rendered by employees up to the date ofvaluation and incorporates assumptions concerning employees’ projected salaries. Actuarialvaluations are conducted with sufficient regularity, with the option to accelerate when significantchanges to underlying assumptions occur.
Service costs which include current service costs, past service costs and gains or losses on non-routine settlements are recognized as expense in profit or loss. Past service costs are recognizedwhen plan amendment or curtailment occurs.
Net interest on net retirement liabilities is the change during the period in net retirement liabilities thatarises from the passage of time which is determined by applying the discount rate based ongovernment bonds to net retirement liabilities. Net interest on retirement liabilities is recognized asexpense or income in profit or loss.
Remeasurements comprising actuarial gains and losses, return on plan assets and any change in theeffect of the asset ceiling (excluding net interest on net retirement liabilities) are recognizedimmediately in OCI in the period in which they arise. Remeasurements are not reclassified to profit orloss in subsequent periods.
Net retirement liabilities are the aggregate of the present value of the defined benefit obligation at theend of the balance sheet date reduced by the fair value of plan assets, adjusted for any effect oflimiting a net retirement asset to the asset ceiling. The asset ceiling is the present value of anyeconomic benefits available in the form of refunds from the plan or reductions in future contributionsto the plan.
Plan assets are assets that are held by a long-term employee benefit fund. Plan assets are notavailable to the creditors of the Group, nor can they be paid directly to the Group. The fair value ofplan assets is based on market price information. When no market price is available, the fair value ofplan assets is estimated by discounting expected future cash flows using a discount rate that reflectsboth the risk associated with the plan assets and the maturity or expected disposal date of thoseassets (or, if they have no maturity, the expected period until the settlement of the relatedobligations).
Defined contribution plansThe Parent Company’s subsidiaries in Singapore, China and Hong Kong, Czech Republic, Mexico,Germany, and UK participate in the respective national retirement schemes defined by the laws of thecountries in which it has operations. These retirement schemes are considered as definedcontribution plans. A defined contribution plan is a plan under which the subsidiary pays fixedcontributions. Each subsidiary has no legal or constructive obligations to pay further contributions ifthe fund does not hold sufficient assets to pay all employees the benefits relating to employee service

- 28 -
*SGVFSM005291*
in the current and prior periods. The required contributions to the national retirement schemes arerecognized as retirement expense as accrued.
SingaporeThe subsidiaries incorporated in Singapore make contributions to the Central Provident Fund (CPF)scheme in Singapore, a defined contribution scheme. Contributions to the CPF scheme arerecognized as an expense in the period in which the related service is performed.
ChinaThe subsidiaries incorporated and operating in China are required to provide certain staff retirementbenefits to their employees under existing China regulations, a defined contribution scheme.Retirement contributions are provided at rates stipulated by China regulations and are contributed toa retirement fund managed by government agencies, which are responsible for administering theseamounts for the subsidiaries’ employees. Contributions to this defined contribution scheme arerecognized as expense in the period in which the related service is performed.
Hong KongThe subsidiary in Hong Kong participates in the defined provident fund. The subsidiary and itsemployees make monthly contributions to the scheme at 5% of the employees’ earnings as definedunder the Mandatory Provident Fund legislation. Contributions to this defined contribution scheme arerecognized as expense in the period in which the related service is performed.
IMI CZIMI CZ, under its collective agreement, is committed to pay contributions to life and retirementinsurance of its loyal employees. This is done on a monthly basis as part of payroll expenses andonly over the employment period. IMI CZ is not obliged to any other payments if employmentterminates.
IMI MXIn accordance with the Mexican Labor Law, IMI MX provides seniority premium benefits to itsemployees under certain circumstances. These benefits consist of a one-time payment equivalent totwelve days of wage for each year of service (at the employee’s most recent salary, but not to exceedtwice the legal minimum wage), payable to all employees with fifteen or more years of service, as wellas to certain employees terminated involuntarily prior to the vesting of their seniority premium benefit.
IMI MX also provides statutorily mandated severance benefits to its employees terminated undercertain circumstances. Such benefits consist of a one-time payment of three months wages plustwenty days wages for each year of service payable upon involuntary termination without just cause.These are recognized when such an event occurs.
VIAVIA only has defined contribution plans relating to statutory pension. Funds paid by the employeesand employers are not saved or invested but are used to pay current pension obligations. Obligationsfor contributions to defined contribution plans are recognized as an expense when incurred.
STIContributions to defined contribution plans are recognized as an expense in the period in which therelated service is provided. Prepaid contributions are recognized as an asset to the extent that theprepayment will lead to a reduction in future payments or a cash refund.
When contributions are not expected to be settled wholly within 12 months of the end of the reportingdate in which the employees render the related service, the liability is measured on a discountedpresent value basis. The unwinding of the discount is recognized as a finance cost in profit or loss inthe period in which it arises.

- 29 -
*SGVFSM005291*
Employee leave entitlementEmployee entitlements to annual leave are recognized as a liability when they accrue to theemployees. The undiscounted liability for leave expected to be settled wholly beforetwelve months after the end of the balance sheet date is recognized for services rendered byemployees up to the end of the balance sheet date.
Share-based Payment TransactionsCertain employees (including directors) of the Group receive remuneration in the form of share-basedpayment transactions, whereby employees render services in exchange for shares or rights overshares (“equity-settled transactions”).
The Group has an employee stock ownership plan (ESOWN) which allows the grantees to purchasethe Parent Company’s shares at a discounted price. The Group recognizes employee benefitexpense over the holding period. The Group treats its ESOWN plan as option payable within a givenperiod. These are accounted for similar to the methods outlined in PFRS 2. Dividends paid on theawards that have vested are deducted from equity while those paid on awards that are unvested arecharged to profit or loss.
Operating SegmentsThe Group is organized and managed separately according to geographical locations of businesses.The geographical segments are segregated as follows: Philippines, China, Europe, Mexico,Germany/UK, and USA/Japan/Singapore/IMI UK. These geographical businesses are the basis uponwhich the Group reports its operating segment information presented in Note 29.
ContingenciesContingent liabilities are not recognized in the consolidated financial statements. These are disclosedin the consolidated financial statements, unless the possibility of an outflow of resources embodyingeconomic benefits is remote. Contingent assets are not recognized in the consolidated financialstatements but are disclosed in the consolidated financial statements when an inflow of economicbenefits is probable.
Events after the Balance Sheet DatePost period events that provide additional information about the Group’s financial position at thebalance sheet date (adjusting events) are reflected in the consolidated financial statements. Postperiod events that are non-adjusting events are disclosed in the consolidated financial statementswhen material.
4. Significant Accounting Judgments, Estimates and Assumptions
The preparation of the consolidated financial statements in conformity with PFRS requiresmanagement to make judgments, estimates and assumptions that affect the amounts reported in theconsolidated financial statements and accompanying notes. Uncertainty about these judgments,assumptions and estimates could result in outcomes that require a material adjustment to the carryingamounts of assets and liabilities affected in future periods.
JudgmentsIn the process of applying the Group’s accounting policies, management has made the followingjudgments, which have the most significant effect on the amounts recognized in the consolidatedfinancial statements:
Determining the lease term of contracts with renewal and termination options - Group as lesseeThe Group determines the lease term as the non-cancellable term of the lease, together with anyperiods covered by an option to extend the lease if it is reasonably certain to be exercised, or anyperiods covered by an option to terminate the lease, if it is reasonably certain not to be exercised.

- 30 -
*SGVFSM005291*
The Group has several lease contracts that include extension and termination options. The Groupapplies judgement in evaluating whether it is reasonably certain to exercise the option to renew orterminate the lease. That is, it considers all relevant factors that create an economic incentive for it toexercise the renewal or termination. After the commencement date, the Group reassesses the leaseterm if there is a significant event or change in circumstances that is within its control and affects itsability to exercise or not to exercise the option to renew or to terminate (e.g., a change in businessstrategy, construction of significant leasehold improvements or significant customization to the leasedasset).
The Group’s leases consist mainly of land, production facilities and warehouses and office buildings(land and buildings). The Group included the renewal period as part of the lease term for leases ofland and buildings due to the significance of these assets to its operations. These leases have alease term of more than one year and there will be a significant negative effect on the business if areplacement is not readily available.
Operating lease commitments - Group as lessee (Prior to adoption of PFRS 16)The Group has entered into contracts with various lease contracts for office spaces and land. TheGroup has determined that all significant risks and rewards of ownership of these properties areretained by the lessor. Further details are disclosed in Note 30.
Revenue from contracts with customers Identifying contracts with customers
Generally, a valid and approved manufacturing service agreement (MSA), scheduling agreement(SA), customer accepted quote, customer forecast, and/or customer purchase order or firmdelivery schedule will be in place before the Group provides services or manufacture goods forthe customers. The Group is not obligated to transfer any goods or provide services until thecustomer submits a purchase order or firm delivery schedule under the MSA or SA, respectively.The purchase order or firm delivery schedule creates the enforceable rights and obligations andis therefore evaluated together with the MSA or SA for revenue recognition in accordance withPFRS 15.
Determining the timing of revenue recognitionThe Group assessed that revenue from manufacturing of goods shall be recognized over time orpoint in time. For turnkey contracts wherein the products created have no alternative use to theGroup and the Group has right to payment for performance completed to date including therelated profit margin, in case of termination for reasons other than the Group’s failure to performas promised, revenue is recognized over time. For goods manufactured not covered by customerpurchase orders or firm delivery schedule, revenues are recognized at a point in time. Forconsignment contracts, revenue is recognized over time as services are rendered since thecustomer simultaneously receives and consumes the benefits as the Group performs.
Determining the method of measure of progress for revenue recognized over timeThe Group measures progress towards complete satisfaction of the performance obligation usingan input method (i.e., costs incurred). Management believes that this method provides a faithfuldepiction of the transfer of goods or services to the customer because the Group providesintegration service to produce a combined output and each item in the combined output may nottransfer an equal amount of value to the customer.
Product development costsExpenditures for the development of new products or production systems are recognized asintangible assets if such expenditures, with a high degree of certainty, will result in future economicbenefits for the Group. The rules require stringent criteria to be met for these developmentexpenditures to be recognized as assets such as determining technical feasibility of completing theintangible asset. Management assessed that it is able to meet the identifiability and separabilitycriteria provided in PAS 38, Intangible Assets, on the premise that the projects involved are inseparate locations from other existing lines and that each project arises from a contractual right

- 31 -
*SGVFSM005291*
between the Group and each customer. Moreover, management is able to demonstrate that theprojects are in the advanced stage of development.
Functional currencyPAS 21, Effects of Changes in Foreign Exchange Rates, requires management to use its judgment todetermine each entity’s functional currency such that it most faithfully represents the economic effectsof the underlying transactions, events and conditions that are relevant to the Group. In making thisjudgment, each entity within the Group considers the currency in which the sales prices for its goodsand services are denominated and settled.
ContingenciesThe Group is currently involved in various legal proceedings. The estimates of the probable costs ofthe resolutions and assessments of these claims have been developed in consultation with outsidecounsels handling the defense in these matters and are based upon analyses of potential results. TheGroup currently does not believe that these proceedings and tax assessments will have a materialeffect on the Group’s financial position. It is possible, however, that future results of operations couldbe materially affected by changes in the estimates or in the effectiveness of the strategies relating tothese proceedings.
Further details are disclosed in Note 34.
Estimates and AssumptionsThe key assumptions concerning the future and other key sources of estimation uncertainty at thebalance sheet date that have a significant risk of causing a material adjustment to the carryingamounts of assets and liabilities within the next financial year are discussed below. The Group basedits estimates and assumptions on parameters available when the consolidated financial statementswere prepared. Existing circumstances and assumptions about future developments, however, maychange due to market changes or circumstances arising beyond the control of the Group. Suchchanges are reflected in the assumptions when they occur.
Lease commitments - Group as lessee
Leases - Estimating the incremental borrowing rateThe Group cannot readily determine the interest rate implicit in the lease, therefore, it uses itsincremental borrowing rate (IBR) to measure lease liabilities. The IBR is the rate of interest that theGroup would have to pay to borrow over a similar term, and with a similar security, the fundsnecessary to obtain an asset of a similar value to the right-of-use asset in a similar economicenvironment. The IBR therefore reflects what the Group ‘would have to pay’, which requiresestimation when no observable rates are available (such as for subsidiaries that do not enter intofinancing transactions) or when they need to be adjusted to reflect the terms and conditions of thelease (for example, when leases are not in the subsidiary’s functional currency).
The Group estimates the IBR using observable inputs (such as market interest rates) when availableand is required to make certain entity-specific estimates (such as the subsidiary’s stand-alone creditrating).
Fair value of the financial liabilities on put optionsThe acquisition of VIA in 2016 and STI in 2017 included call and put options over the non-controllinginterests. These options are considered when determining whether the entity has obtained controlover the acquiree if in substance the entity already has access to the returns associated with thatownership interest. Management assessed that the options do not give the Group present access tothe returns associated with the non-controlling interests in subsidiary and, therefore, accounted forthe non-controlling interests under PFRS 10, while the financial liability was accounted for underPFRS 9 measured at the present value of the redemption amount, with a debit to a component ofequity attributable to the parent.

- 32 -
*SGVFSM005291*
Management assessed that the discounted, probability-weighted cash flow methodology is theappropriate model to derive the present value of the redemption amount. The key estimates andassumptions used in the valuation include impact of coronavirus pandemic, the current equity value ofthe acquiree, forecasted interest rate and probability of trigger events occurring. The equity value ofVIA is determined using the discounted cash flow approach. The future cash flows are projectedusing the projected revenue growth rate of VIA. The discount rate represents the current marketassessment of the risk specific to the acquiree, taking into consideration the time value of money andindividual risks of the underlying assets that have not been incorporated in the cash flowestimates. The discount rate calculation is based on the specific circumstances of the acquiree and isderived from its weighted average cost of capital. For STI, management used the market approach byapproximating the EBITDA multiple taken from comparable companies of STI that are engaged inproviding electronic services solutions to derive its current equity value. Management computedEBITDA as the difference of forecasted gross profit and selling and administrative expenses beforedepreciation and amortization.
Further details on the valuation of the put options are disclosed in Notes 18 and 32.
Provision for expected credit losses of trade receivables and contract assetsThe Group uses a provision matrix to calculate ECLs for trade receivables and contract assets. Theprovision rates are based on days past due for groupings of various customer segments that havesimilar loss patterns (i.e., customer type and rating, and coverage by letters of credit and other formsof credit insurance, etc.).
The provision matrix is initially based on the Group’s historical observed default rates. The Group willcalibrate the matrix to adjust the historical credit loss experience with forward-looking information. Forinstance, if forecast economic conditions (i.e., industry compounded annual growth rate) are expectedto deteriorate over the next year which can lead to an increased number of defaults in themanufacturing sector, the historical default rates are adjusted. At every reporting date, the historicalobserved default rates are updated and changes in the forward-looking estimates are analyzed.
The assessment of the correlation between historical observed default rates, forecast economicconditions and ECLs is a significant estimate. The amount of ECLs is sensitive to changes incircumstances and of forecast economic conditions. The Group’s historical credit loss experience andforecast of economic conditions may also not be representative of customer’s actual default in thefuture.
The Group has considered impact of COVID-19 pandemic and revised its assumptions in determiningthe macroeconomic variables and loss rates in the computation of ECL. The changes in the grosscarrying amount of receivables from the sales of the Group during the year and impact of COVID-19pandemic did not materially affect the allowance for ECLs.
Further details on the expected credit loss are disclosed in Note 6.
Estimating NRV of inventoriesInventories are valued at the lower of cost and NRV. This requires the Group to make an estimate ofthe inventories’ estimated selling price in the ordinary course of business, costs of completion andcosts necessary to make a sale to determine the NRV. In line with the impact of COVID-19, theGroup experienced lower demand and production that resulted to lower sales in 2020. In the eventthat NRV is lower than cost, the decline is recognized as an expense. Further details on inventoriesare disclosed in Note 8.
Depreciation and amortizationThe Group computes depreciation and amortization of property, plant and equipment, right-of-useassets and intangible assets with finite useful life on a straight-line basis over the assets’ EUL. TheEUL and depreciation and amortization method are reviewed annually to ensure that these areconsistent with the expected pattern of the economic benefits from the assets. This requires theGroup to make an estimate of the expected asset utilization from business plans and strategies,

- 33 -
*SGVFSM005291*
future technical developments and market behavior to determine the expected pattern of economicbenefits from the assets. Changes in the EUL or the expected pattern of consumption of futureeconomic benefits embodied in the asset are considered to modify the depreciation and amortizationperiod or method, as appropriate, and are treated as changes in accounting estimates. Thedepreciation and amortization expense on property, plant and equipment and intangible assets withfinite useful lives are recognized in profit or loss, in the expense category, consistent with the functionof the property, plant and equipment and intangible assets.
Further details on property, plant and equipment, right-of-use assets and intangible assets aredisclosed in Notes 10, 30 and 12, respectively.
Evaluation of impairment of nonfinancial assetsThe Group reviews certain property, plant and equipment, right-of-use assets, goodwill, intangibleassets and deferred charges, for impairment of value. Except for the impairment for goodwill which isassessed at least annually, the impairment evaluation for the other nonfinancial assets includesconsidering certain indications of impairment such as significant changes in asset usage, significantdecline in assets’ market value, obsolescence or physical damage of an asset, significantunderperformance relative to expected historical or projected future operating results and significantnegative industry or economic trends. Moreover, lockdown to Group manufacturing sites due to theimpact of COVID-19 pandemic that leads to lower production post impairment indicators requiring theassessment of the recoverable amount for the said assets.
The Group estimates the recoverable amount as the higher of the fair value less costs to sell andvalue-in-use. In determining the present value of estimated future cash flows expected to begenerated from the continued use of the assets, the Group is required to make estimates andassumptions that may affect property, plant and equipment, right-of-use assets, intangible assets anddeferred charges. For goodwill, this requires an estimation of the recoverable amount which is the fairvalue less costs to sell or value-in-use of the CGU to which the goodwill is allocated. Estimating avalue-in-use amount requires management to make an estimate of the expected future cash flows forthe cash generating unit and also to choose a suitable discount rate in order to calculate the presentvalue of cash flows. Further details on property, plant and equipment, right-of-use assets, goodwill,intangible assets and deferred charges are disclosed in Notes 10, 30, 11, 12 and 14, respectively.
Details of the impairment loss recognized are disclosed in Note 24.
TaxesUncertainties exist with respect to the interpretation of complex tax regulations, changes in tax lawsand the amount and timing of future taxable profits. Given the wide range of international businessrelationships and the long-term nature and complexity of existing contractual agreements, differencesarising between the actual results and the assumptions made, or future changes to suchassumptions, could necessitate future adjustments to tax income and expense already recorded. TheGroup establishes provisions, based on reasonable estimates, for possible consequences of auditsby the tax authorities of the respective countries in which it operates. The amount of such provisionsis based on various factors, such as experience on previous tax audits and differing interpretations oftax regulations by the taxable entity and the responsible tax authority. Such differences ininterpretation may arise for a wide variety of issues depending on the conditions prevailing in therespective domicile of the entities within the Group.
Deferred tax assets are recognized for all deductible temporary differences and carryforward benefitsof unused tax losses, to the extent that it is probable that sufficient future taxable profits will beavailable against which the deductible temporary differences and carryforward benefits of unused taxlosses can be utilized. Significant judgment is required to determine the amount of deferred taxassets that can be recognized, based upon the likely timing and the level of future taxable profitstogether with future tax planning strategies.
Further details on taxes are disclosed in Note 25.

- 34 -
*SGVFSM005291*
Retirement and other employee benefitsThe cost of defined benefit plans and other long-term employee benefits as well as the present valueof defined benefit obligation are determined using actuarial valuations. An actuarial valuation involvesmaking various assumptions. These include the determination of the discount rates, turnover rates,mortality rates, salary increase rates, and future retirement increases. Due to the complexity of theactuarial valuation, the underlying assumptions and its long-term nature, a defined benefit obligationis highly sensitive to changes in these assumptions. All assumptions are reviewed at each balancesheet date.
In determining the appropriate discount rate, management considers the interest rates of governmentbonds that are denominated in the currency in which the benefits will be paid, with extrapolatedmaturities corresponding to the expected duration of the defined benefit obligation. The turnover raterepresents the proportion of the current plan members who will resign from service prior to theirretirement date and hence, be entitled to resignation benefits instead of retirement benefits. Themortality rate is based on publicly available mortality tables and is modified accordingly with estimatesof mortality improvements. Salary increase rates and future retirement increases are based onexpected future inflation rates.
The Group also estimates other short-term employee benefit obligations and expenses, including thecost of paid leaves based on historical leave availments of employees, subject to the Group’spolicies. These estimates may vary depending on the future changes in salaries, turn-over rates,mortality rates and actual experiences during the period.
Further details on retirement and other employee benefits are disclosed in Note 27.
5. Cash and Cash Equivalents
This account consists of:
2020 2019Cash on hand $70,169 $81,479Cash in banks 244,285,256 127,288,749Cash equivalents − 25,289,888
$244,355,425 $152,660,116
Cash in banks earns interest at the respective bank deposit rates. Short-term investments are madefor varying periods of up to three months and earn interest at the respective short-term investmentrates.
Interest income earned from cash in banks and short-term investments amounted to $0.33 million in2020, $0.86 million in 2019 and $1.00 million in 2018.
Net proceeds from VIA’s IPO in 2020 amounted to $87.19 million, net of underwriting discounts andcommissions, but before expenses. In addition, proceeds from separate concurrent private placementby Corning Research and Development Corporation on VIA shares amounted to $20 million($19.6 million net of commissions) (see Note 19).

- 35 -
*SGVFSM005291*
6. Receivables
This account consists of:
2020 2019Trade $273,278,729 $284,594,422Nontrade 2,825,231 6,080,113Receivable from insurance 1,095,700 1,086,673Receivable from employees 329,548 642,995Due from related parties (Note 31) 299,253 439,973Others 540,695 94,696
278,369,156 292,938,872Less allowance for ECLs 2,747,365 2,295,511
$275,621,791 $290,643,361
TradeTrade receivables arise from manufacturing and other related services for electronic products andcomponents and have credit terms averaging 70 days from invoice date.
NontradeNontrade receivables represent billings to customers for production and test equipment and all othercharges agreed with the customers in carrying out business operations. These receivables havecredit terms averaging 45 days from invoice date.
Receivable from InsuranceReceivable from insurance pertains to claims for damages to equipment and inventories caused by afire incident in the Parent Company’s plant in Cebu in 2009 amounting to $1.09 million and which wasfully impaired as of December 31, 2020 and 2019.
Receivable from EmployeesReceivable from employees mostly pertain to non-interest bearing short-term loans granted to theGroup’s employees which are collectible through salary deduction.
Allowance for ECLsTrade receivables, nontrade receivables and receivable from insurance with aggregate nominal valueof $2.75 million and $2.30 million as of December 31, 2020 and 2019, respectively, were individuallyassessed to be impaired and fully provided with allowance for doubtful accounts.
Movements in the allowance for ECLs are as follows:
December 31, 2020
Trade NontradeReceivable from
Insurance TotalAt beginning of year $1,051,715 $157,123 $1,086,673 $2,295,511Provisions (Note 22) 574,495 − − 574,495Foreign currency exchange difference (122,641) (9,027) 9,027 (122,641)At end of year $1,503,569 $148,096 $1,095,700 $2,747,365
December 31, 2019
Trade NontradeReceivable from
Insurance TotalAt beginning of year $797,163 $160,516 $1,056,529 $2,014,208Provisions (Note 22) 265,059 31,148 − 296,207Accounts written-off (24,952) (5,349) − (30,301)Foreign currency exchange difference 14,445 (29,192) 30,144 15,397At end of year $1,051,715 $157,123 $1,086,673 $2,295,511
Provisions form part of “Operating expenses” account and are included under “Facilities costs andothers” (see Note 22).

- 36 -
*SGVFSM005291*
7. Contract Balances
This account consists of:
2020 2019Contract assets $54,525,401 $58,908,123Contract liabilities 1,515,095 4,742,170
Contract assets are initially recognized for revenue earned from manufacturing of goods as receipt ofconsideration is conditional on successful completion of the services. When goods are shipped orgoods are received by the customer, depending on the corresponding agreement with thecustomers, the amounts recognized as contract assets are reclassified to trade receivables.Payments are received from customers depending on the credit terms.
For the years ended December 31, 2020 and 2019, the Group did not recognize a provision forexpected credit losses on contract assets.
Contract liabilities includes short-term advances received to render manufacturing services. Thesignificant decrease in contract liabilities was mainly due to lower advance payments received fromnew and existing customers towards the end of the year.
The Group applied the practical expedient in PFRS 15 on the disclosure of information about thetransaction price allocated to remaining performance obligations given the customer contracts haveoriginal expected duration of one year or less.
8. Inventories
This account consists of:
2020 2019Raw materials and supplies $140,573,218 $149,038,976Work-in-process 6,344,858 7,767,003Finished goods 8,644,901 8,989,036
155,562,977 165,795,015Less allowance for: Inventory obsolescence 13,151,796 13,072,876 Decline in value of inventories 95,126 92,867
13,246,922 13,165,743$142,316,055 $152,629,272
The cost of the inventories carried at NRV amounted to $46.67 million and $46.90 million as ofDecember 31, 2020 and 2019, respectively. The amount of inventories recognized as an expenseunder “Cost of sales” account amounted to $796.04 million in 2020, $888.42 million in 2019, and$952.19 million in 2018 (see Note 20).
Balance of work-in-process and finished goods inventories pertain to VIA’s sale of product under thefull service model since VIA typically controls the goods before transferring them to customers andtherefore revenue is recognized at a point in time upon the delivery of products.
Movements in the allowance for inventory obsolescence follows:
2020 2019At beginning of year $13,072,876 $8,473,726Provisions (reversals) (Note 22) (291,526) 4,599,150Foreign currency exchange difference 370,446 −At end of year $13,151,796 $13,072,876

- 37 -
*SGVFSM005291*
Movements in the allowance for decline in value of inventories value follows:
2020 2019At beginning of year $92,867 $172,389Provisions (reversals) (Note 22) 2,259 (79,522)At end of year $95,126 $92,867
The Group recognized gains from sale of materials and scrap amounting to $0.04 million in 2020,$0.03 million in 2019, and $0.82 million in 2018. Gains from sale of materials and scrap are includedunder “Miscellaneous income (loss) - net” account in the consolidated statements of income(see Note 24).
9. Other Current Assets
This account consists of:
2020 2019Prepayments and deferred charges $5,807,226 $11,113,227Advances to suppliers 5,437,643 2,893,138Input taxes 3,709,501 2,538,002Tax credits 2,007,747 2,547,694Derivative assets (Note 33) − 5,321Others 393,193 9,010
$17,355,310 $19,106,392
Prepayments and Deferred ChargesPrepayments include prepayments for rent, life and fire insurance and prepaid insurance for productliability and recall which covers product recall expenses and potential liability to third parties seekingdamage if the Group recalls any of its products. This also includes prepaid intellectual property rightsand financing transaction costs and deferred charges related to capital raising activity. In 2020, theprepayment pertaining to IPO transaction costs was charged to equity upon IPO of VIA.
Advances to SuppliersThis account represents advance payments made to suppliers for purchase of direct materials.
Input TaxesThis account includes input tax expected to be applied against output tax within 12 months from thebalance sheet date. Input tax is recognized when an entity in the Group purchases goods or servicesfrom a supplier or vendor.
Tax CreditsTax credits represent recoverable taxes of IMI MX and BG such as VAT refundable and business taxand amounts withheld from income tax payments of the Parent Company and PSi.

- 38 -
*SGVFSM005291*
10. Property, Plant and Equipment
Movements in this account follows:
2020
Buildings andImprovements
Machineriesand Facilities
Equipment
Furniture,Fixtures
and OfficeEquipment
TransportationEquipment
Tools andInstruments
Constructionin Progress Total
CostAt beginning of year $98,810,242 $214,876,716 $24,812,986 $2,490,664 $10,292,763 $4,433,974 $355,717,345Additions 2,173,444 4,550,405 549,379 405,134 825,140 9,617,598 18,121,100Disposals/retirement (718,140) (8,396,245) (1,698,207) (432,735) (94,342) – (11,339,669)Transfers (Notes 12 and 14) 2,698,514 4,459,496 (1,498,556) 53,450 (1,176,201) (8,245,470) (3,708,767)Foreign currency exchange difference 3,758,216 9,281,484 981,754 144,139 94,018 402,257 14,661,868At end of year 106,722,276 224,771,856 23,147,356 2,660,652 9,941,378 6,208,359 373,451,877
Accumulated depreciationAt beginning of year 38,011,962 98,328,542 18,642,159 1,226,971 3,481,051 – 159,690,685Depreciation 6,597,929 28,789,323 1,882,472 512,201 376,222 – 38,158,147Disposals/retirement (668,833) (7,613,276) (1,693,083) (397,825) (94,342) – (10,467,359)Transfers (Note 12) − − (1,152,456) − − – (1,152,456)Foreign currency exchange difference 557,358 4,017,755 162,325 95,897 85,566 – 4,918,901At end of year 44,498,416 123,522,344 17,841,417 1,437,244 3,848,497 – 191,147,918
Accumulated impairment lossesAt beginning and end of year − 1,732,212 − − − − 1,732,212Impairment loss (Note 24) − 2,620,779 − − − − 2,620,779At end of year − 4,352,991 − − − − 4,352,991
Net book value $62,223,860 $96,896,521 $5,305,939 $1,223,408 $6,092,881 $6,208,359 $177,950,968
2019
Buildings andImprovements
Machineriesand Facilities
Equipment
Furniture,Fixtures
and OfficeEquipment
TransportationEquipment
Tools andInstruments
Construction in Progress Total
CostAt beginning of year, as previously stated $92,595,629 $188,629,382 $25,215,170 $2,457,369 $9,034,650 $13,547,924 $331,480,124Effects of finalization of business combination 17,673 6,692,850 59,246 − − − 6,769,769At beginning of year, as restated 92,613,302 195,322,232 25,274,416 2,457,369 9,034,650 13,547,924 338,249,893Additions 5,028,622 21,801,433 1,354,800 348,897 1,406,714 7,457,591 37,398,057Disposals/retirement (14,457) (13,755,433) (2,223,490) (303,371) (292,879) − (16,589,630)Transfers 1,999,274 13,668,702 535,160 22,211 159,751 (16,385,098) −Foreign currency exchange difference (816,499) (2,160,218) (127,900) (34,442) (15,473) (186,443) (3,340,975)At end of year 98,810,242 214,876,716 24,812,986 2,490,664 10,292,763 4,433,974 355,717,345
Accumulated depreciationAt beginning of year, as previously stated 31,674,062 83,586,109 18,308,498 942,347 3,494,764 − 138,005,780Effects of finalization of business combination 1,325 1,673,213 8,887 − − − 1,683,425At beginning of year, as restated 31,675,387 85,259,322 18,317,385 942,347 3,494,764 − 139,689,205Depreciation 6,188,538 25,581,603 2,691,888 583,575 262,416 – 35,308,020Depreciation capitalized as development cost 295,704 1,225,787 13,203 – 33,204 – 1,567,898Disposals/retirement (2,528) (13,068,055) (2,201,573) (272,443) (281,439) – (15,826,038)Foreign currency exchange difference (145,139) (670,115) (178,744) (26,508) (27,894) – (1,048,400)At end of year 38,011,962 98,328,542 18,642,159 1,226,971 3,481,051 − 159,690,685
Accumulated impairment lossesAt beginning and end of year − 1,732,212 − − − − 1,732,212Net book value $60,798,280 $114,815,962 $6,170,827 $1,263,693 $6,811,712 $4,433,974 $194,294,448
The Group capitalized depreciation related to development phase for certain projects amounting to nilin 2020 and $1.57 million in 2019. The capitalized cost is included as part of product developmentunder “Intangible assets” account.
During the year, the Company transferred property, plant and equipment with a net book value of$2.56 million to “Other noncurrent assets” representing deferred tooling charges, and licenses to“Intangible assets” account amounting to $2.11 million and $0.44 million, respectively (see Note 12).
Due to declining demand brought by the global automotive downturn, the Group recognizedimpairment losses on certain machineries amounting to $2.62 million in 2020 (see Note 24).
Construction in progress pertains to the construction and development of manufacturing productionlines of the Group. Construction in progress transferred to property, plant and equipment amounted to$8.25 million and $16.39 million as of December 31, 2020 and 2019, respectively.

- 39 -
*SGVFSM005291*
The Group recognized gains from disposal and retirement of certain property, plant and equipmentamounting to $0.66 million in 2020, $0.10 million in 2019, and $0.19 million in 2018 (see Note 24).
As of December 31, 2020 and 2019, the cost of fully depreciated property, plant and equipment stillbeing used by the Group amounted to $71.43 million and $75.20 million, respectively.
Depreciation expense included in “Cost of sales” and “Operating expenses” accounts follows:
2020 2019 2018Cost of sales (Note 20) $34,148,037 $30,961,361 $26,080,694Operating expenses (Note 21) 4,010,110 4,346,659 5,016,589
$38,158,147 $35,308,020 $31,097,283
The Group has no restrictions on its property and equipment and none of these have been pledgedas security for its obligations.
11. Goodwill
Goodwill acquired through business combinations had been allocated to the following CGUs:
2020 2019STI $58,637,679 $56,627,517VIA 48,728,404 44,324,971STEL 38,225,186 38,225,186Parent Company 1,097,776 1,097,776IMI CZ 556,049 505,801
$147,245,094 $140,781,251
Movement in goodwill follows:
2020 2019CostAt beginning of year $147,684,089 $147,354,138Foreign currency exchange difference 6,463,843 329,951At end of year 154,147,932 147,684,089
Accumulated impairment lossAt beginning and end of year 6,902,838 6,902,838
$147,245,094 $140,781,251
STI, VIA, STEL and IMI CZThe recoverable amounts of these CGUs have been based on value-in-use calculations using cashflow projections from financial budgets approved by management covering a five (5)-year period. Thepre-tax discount rates applied to cash flow projections follows:
2020 2019STI 10.11% 9.47%VIA 11.45% 12.78%STEL 12.85% 12.36%IMI CZ 10.60% 7.90%
Cash flows beyond the 5-year period are extrapolated using a steady growth rate of 1%, which doesnot exceed the compound annual growth rate (CAGR) for the global electronics manufacturingservices (EMS) industry, specifically on automotive, industrial equipment, consumer electronics andtelecommunications segments.

- 40 -
*SGVFSM005291*
Key assumptions used in the value-in-use calculationsThe calculations of value-in-use for the CGUs are most sensitive to the following assumptions: Revenue - Revenue forecasts are management’s best estimates considering factors such as
industry CAGR, existing customer contracts and projections, historical experiences and othereconomic factors.
Forecasted gross margins - Gross margins are based on the mix of business modelarrangements with the customers.
Overhead and administrative expenses - estimates are based on applicable inflation rates in therespective countries of the cash generating units considering expected future cost efficienciesand production facilities rationalization.
Pre-tax discount rates - Discount rates represent the current market assessment of the risksspecific to each CGU, taking into consideration the time value of money and individual risks of theunderlying assets that have not been incorporated in the cash flow estimates. This is also thebenchmark used by management to assess operating performance. The discount rate calculationis based on the specific circumstances of the Group and its operating segments and is derivedfrom its weighted average cost of capital.
No impairment loss was assessed for STI, VIA and IMI CZ in 2020, 2019 and 2018.
For STEL, the assessment resulted to an impairment loss of $6.90 million in 2018 triggered byslowing growth in the region. The impairment loss is included under “Miscellaneous income (loss) -net” account in the consolidated statements of income (see Note 24). In 2020 and 2019, despite theweak economy and impact of the pandemic, management assessed that no additional impairmentloss should be recognized given the strategies in place to improve the financial performance andlower discount rates.
Sensitivity to changes in assumptionsWith regard to the assessment of value-in-use of STI, VIA and IMI CZ, management believes that noreasonably possible change in any of the above key assumptions would cause the carrying value ofthese CGUs to exceed their recoverable amount.
Parent CompanyThe goodwill of the Parent Company pertains to its acquisition of M. Hansson Consulting, Inc. (MHCI)in 2006 and IMI USA in 2005. MHCI was subsequently merged to the Parent Company as testing anddevelopment department. IMI USA acts as direct support to the Group’s customers by providingprogram management, customer service, engineering development and prototyping manufacturingservices. IMI USA’s expertise in product design and development particularly on the flip chiptechnology is being used across the Group in providing competitive solutions to customers. In 2018,the recoverable amount was based on the market price of the Parent Company’s shares at valuationdate, less estimated costs to sell. The fair value of the Parent Company’s shares represents the valueof the Group. In 2020 and 2019 given the volatile market, the Group assessed the impairment basedon value-in-use calculations using cash flow projections of the Parent Company from financialbudgets approved by management covering a 5-year period.
The comparison of the recoverable amounts and the carrying amounts resulted to no impairment lossin 2020, 2019 and 2018.

- 41 -
*SGVFSM005291*
12. Intangible Assets
Movements in this account are as follows:
December 31, 2020
CustomerRelationships
UnpatentedTechnology Licenses
IntellectualProperties
ProductDevelopment
Costs TotalCostAt beginning of year $22,046,083 $100,000 $13,858,721 $14,521,541 $20,599,131 $71,125,476Additions – – 595,188 – – 595,188Transfers (Note10) – – 442,001 – – 442,001Foreign currency exchange
difference 196,017 – 584,334 (44,291) – 736,060At end of year 22,242,100 100,000 15,480,244 14,477,250 20,599,131 72,898,725Accumulated amortizationAt beginning of year 20,599,134 100,000 9,936,846 6,161,827 5,226,127 42,023,934Amortization 828,554 – 1,084,613 2,372,035 3,593,966 7,879,168Foreign currency exchange
difference 52,271 – 494,552 84,481 – 631,304At end of year 21,479,959 100,000 11,516,011 8,618,343 8,820,093 50,534,406Accumulated impairment lossAt beginning of year – – – – 524,705 524,705Impairment loss (Note 24) – – – – 4,693,985 4,693,985At end of year – – – – 5,218,690 5,218,690Net book value $762,141 $– $3,964,233 $5,858,907 $6,560,348 $17,145,629
December 31, 2019
CustomerRelationships
UnpatentedTechnology Licenses
IntellectualProperties
ProductDevelopment
Costs TotalCostAt beginning of year, as
previously stated $19,666,617 $100,000 $13,439,236 $13,868,690 $16,510,367 $63,584,910Effects of finalization of business
combination 2,438,129 – – – – 2,438,129At beginning of year, as restated 22,104,746 100,000 13,439,236 13,868,690 16,510,367 66,023,039Additions – – 573,704 814,777 – 1,388,481Capitalized development costs – – – – 4,088,764 4,088,764Foreign currency exchange
difference (58,663) – (154,219) (161,926) – (374,808)At end of year 22,046,083 100,000 13,858,721 14,521,541 20,599,131 71,125,476Accumulated amortizationAt beginning of year, as
previously stated 19,666,617 100,000 8,260,262 4,428,684 2,815,074 35,270,637Effects of finalization of business
combination 406,355 – – – – 406,355At beginning of year, as restated 20,072,972 100,000 8,260,262 4,428,684 2,815,074 35,676,992Amortization 530,132 – 1,762,098 1,761,638 2,411,053 6,464,921Foreign currency exchange
difference (3,970) – (85,514) (28,495) – (117,979)At end of year 20,599,134 100,000 9,936,846 6,161,827 5,226,127 42,023,934Accumulated impairment loss – – – – 524,705 524,705Net book value $1,446,949 $– $3,921,875 $8,359,714 $14,848,299 $28,576,837
Customer RelationshipsCustomer relationships pertain to STEL Group, IMI BG and VTS’ contractual agreements with certaincustomers, which lay out the principal terms upon which the parties agree to undertake business.
Customer relationships of STEL Group and IMI BG aggregating to $19.67 million were fully amortizedas of December 31, 2020, 2019 and 2018.
In 2018, the acquisition of VTS gave rise to identification and valuation of customer relationships thatwere not recognized as internally-developed intangible assets. The net book value of the customerrelationships acquired through business combination (VTS) restated as of December 31, 2018amounted to $2.03 million, net of accumulated amortization and foreign currency revaluation.
LicensesThis includes acquisitions of computer software, applications and modules.

- 42 -
*SGVFSM005291*
Intellectual PropertiesThe Group’s intellectual properties relate to the acquisition of VIA and VTS. VIA’s intellectualproperties pertain to display system optically bonded to a display region and enhanced liquid crystaldisplay system and methods. The finalization of the purchase price allocation for the acquisition ofVIA resulted to the measurement of intellectual properties at fair value amounting to $7.85 million.
Acquisition through business combination in connection with the establishment of VTS amounted to¥568.68 million ($5.26 million). Toppan has agreed to transfer to VTS the intellectual property(technology) relevant to run the business.
As of December 31, 2020 and 2019, the carrying value of VIA and VTS’s intellectual propertiesamounted to $4.23 million and $5.15 million, respectively.
Product Development CostsThis includes capitalized costs arising from the development phase of certain projects which are stillundergoing qualification.
Intangible assets not yet available for use are tested for impairment following the value-in-useapproach. The recoverable amounts of these product development costs and related property, plantand equipment have been determined using cash flow projections from financial budgets approved bymanagement covering a 5-year period, which is within the expected life cycle of the projects. The pre-tax discount rates applied to cash flow projections range from 10.28% to 10.68%. Key assumptionsused in the value-in-use calculations are consistent with those disclosed in Note 11.
Significant delay in the ramp up of certain projects and declining demand brought by the globalautomotive downturn resulted to impairment of the related capitalized development cost. Impairmentloss amounting to $4.69 million was recognized under “Miscellaneous income (loss) - net” account in2020 (see Note 24).
Research expenditure recognized as expense amounted to $4.94 million, $0.85 million, and$2.37 million in 2020, 2019 and 2018, respectively.
Amortization expense included in “Cost of sales” and “Operating expenses” accounts follows:
2020 2019 2018Cost of sales (Note 20) $3,810,122 $2,614,302 $3,088,002Operating expenses (Note 21) 4,069,046 3,850,619 3,352,282
$7,879,168 $6,464,921 $6,440,284
13. Financial assets at Fair Value through Other Comprehensive Income (FVOCI)
The fair value of each of the investments in equity instruments designated at fair value through othercomprehensive income at the end of the reporting period is as follows:
2020 2019Club shares - quoted $1,124,461 $1,199,763
The table below shows reconciliation of fair value measurements:
2020 2019Balance at beginning of year $1,199,763 $1,076,455Change in fair value of quoted securities (75,302) 123,308Balance at end of year $1,124,461 $1,199,763

- 43 -
*SGVFSM005291*
14. Other Noncurrent Assets
This account consists of:
2020 2019Deferred charges $18,203,997 $20,080,285Miscellaneous deposits 1,547,045 1,558,138Others 130,996 259,709
$19,882,038 $21,898,132
Deferred charges represent tooling items customized based on the specifications of the customersand to be repaid as part of the price of the manufactured items.
Miscellaneous deposits comprise utilities and rent deposits.
15. Accounts Payable and Accrued Expenses
This account consists of:
2020 2019Trade payables $176,556,142 $188,022,901Accrued expenses 33,117,472 24,687,733Employee-related accruals 22,993,540 21,443,971Nontrade payables 15,625,138 26,994,655Taxes and government-related payables 3,100,732 1,272,642Advances from customers 1,288,622 934,975Accrued interest payable 821,933 2,364,614Customer deposits 230,701 878,202Due to related parties (Note 31) 27,333 2,024Others 63,315 470,296
$253,824,928 $267,072,013
Trade PayablesTrade payables are noninterest-bearing and are normally settled on 30 to 90-day average terms.
Accrued ExpensesAccrued expenses consist mainly of accruals for taxes, supplies, professional fees, utilities,insurance, and freight and brokerage.
Employee-Related AccrualsThis account consists mainly accrued compensation and benefits including accrued salaries, leavecredits and other employee benefits.
Nontrade PayablesThis account consists of obligations related to outsourced manpower, logistics and freight forwarders,professional and service fees and other nontrade related payables. These payables are normallysettled on 30 to 60-day terms.
Taxes and Government-related PayablesTaxes payable pertain to taxes due other than corporate income tax and remittances related togovernment agencies such as social security and insurance, housing fund and health insurance.
Advances from CustomersAdvances from customers include financial liabilities pertaining to commercial agreements withcertain customers of VIA.

- 44 -
*SGVFSM005291*
Customer DepositsCustomer deposits pertain to advance payment from customers as manufacturing bond.
OthersThis account consists of unreleased checks and consignment payables of the Parent Company forthe materials received from its customers.
16. Loans Payable
This account consists of borrowings of the following entities:
2020 2019Parent Company $143,000,000 $72,000,000STEL 35,500,000 25,901,039VIA and STI 27,110,927 28,150,508CZ 879,500 −
$206,490,427 $126,051,547
Parent CompanyAs of December 31, 2020 and 2019, the Parent Company has unsecured short-term loansaggregating to $143.00 million and $72.00 million, respectively, with maturities ranging from 30 to94 days, and fixed annual interest rates ranging from 1.42% to 2.94% in 2020, 2.45% to 2.95% in2019, and 2.50% to 3.12% in 2018.
The Parent Company incurred interest expense on its short-term loans amounting to $3.23 million in2020, $1.67 million in 2019, and $2.68 million in 2018 (see Note 23).
STELAs of December 31, 2020 and 2019, STEL has short-term loans aggregating to $35.50 million and$25.90 million, respectively, are from existing revolving credit facilities with Singapore-based banksand bear annual interest rate from 2.93% to 4.46% in 2020, 3.46% to 4.64% in 2019, and 4.02% to5.32% in 2018, and have maturities of 91 to 92 days from the date of issue.
STEL incurred interest expense on short-term loans amounting to $1.28 million in 2020, $1.51 millionin 2019, and $1.29 million in 2018 (see Note 23).
VIA & STIThe loans of VIA and STI were obtained from China, Germany and UK-based banks with termsranging from 90 to 365 days and interest rates ranging from 1.16% to 4.0% in 2020 and 2.91% to5.0% in 2019. VIA has pledged a portion of its trade accounts receivable, up to amounts drawn underthe respective loans, in support of the obligations. The carrying value of the related trade receivablesfactored amounted to $21.09 million and $17.58 million as of December 31, 2020 and 2019,respectively.
VIA and STI incurred interest expense on the short-term loan amounting to $1.47 million,$1.29 million and $1.39 million in 2020, 2019 and 2018, respectively (see Note 23).
IMI CZThe loans of IMI CZ are clean loans from existing revolving credit facilities with Czech-based bankwhich bear annual interest based on 1-month EURIBOR plus 0.9%.
IMI CZ incurred interest expense on short-term loans amounting to $0.01 million in 2020,$0.01 million in 2019 and $0.02 million in 2018 (see Note 23).

- 45 -
*SGVFSM005291*
17. Long-Term Debt
This account consists of borrowings of the following entities:
2020 2019Parent Company $29,795,564 $135,835,000VTS and IMI CZ 4,524,361 6,588,815
34,319,925 142,423,815Less current portion: Parent Company – 25,830,000 VTS and IMI CZ 2,109,394 2,207,902
2,109,394 28,037,902Noncurrent portion $32,210,531 $114,385,913
Parent CompanyThe long-term debts of the Parent Company aggregating to $30 million ($29.80 million if net ofdiscount) and $135.84 million as of December 31, 2020 and 2019, respectively, were obtained fromSingapore-based and Philippine banks with terms of three to five years, subject to fixed annualinterest rate of 3.798% in 2020 and interest ranging from 2.70% to 3.41% in 2019.
Loan covenants related to the Parent Company’s loans are as follows:
The ratio of net debt to equity shall not exceed 1.75:1 with reference to the borrower’sconsolidated financial statements;
Maintenance of debt service coverage ratio of at least 1.25:1 on the consolidated financialstatements;
Maintenance at all times of a current ratio of at least 1:1 on the parent financial statements;
As of December 31, 2020 and 2019, the Parent Company has complied with all of theabove-mentioned loan covenants.
The Parent Company incurred interest expense on its long-term loans amounting to $2.36 million in2020, $5.70 million in 2019, and $5.00 million in 2018 (see Note 23).
VTS and IMI CZVTS and IMI CZ have unsecured long-term loans with Japanese and Czech-based banks that arepayable in regular monthly installments both with terms of five years. The VTS loan has interest rateranging 1.67% while the CZ loan bears interest based on 1-month EURIBOR plus 0.9% but is not toexceed 15% per annum.
VTS and IMI CZ incurred interest expense on its long-term debt amounting to $0.06 million,$0.08 million and $0.06 million in 2020, 2019 and 2018, respectively (see Note 23).
18. Other Financial Liabilities
The account consists of:
2020 2019Put options over non-controlling interests (Note 32) STI $1,592,518 $5,477,227 VIA – 16,892,858Derivative liabilities (Note 33) 88,361 –
$1,680,879 $22,370,085

- 46 -
*SGVFSM005291*
Put options over non-controlling interestsThe put options of VIA pertain to the right of the non-controlling shareholder to sell to IMI a portion ofits shareholding that is approximately 5% of the issued and outstanding nominal share capital of VIAwithin the first and third anniversary of the agreement (5% put option) and all remaining shares heldby the non-controlling shareholder upon the happening of certain trigger events (exit put options).The 5% put option is exercisable any time between the 1st and 3rd anniversary of the agreement or ifprior to the 3rd anniversary, the share capital of VIA is increased, the 5% put option may be exercisedwithin three months from registration of the capital increase. The exit put options are exercisablewhen there is a termination for a cause of the service agreement or the share capital of VIA isincreased that will dilute the holding of non-controlling interest to below 10%.
In 2020, the put options of VIA was terminated in accordance with the amendment in theshareholders’ agreement. Triggered by VIA’s IPO, the balance of $15.33 million liability before thetermination was closed to equity under “Additional paid-in capital” account (see Note 19).
The put option of STI pertains to the right of the non-controlling shareholder to sell to IMI all non-controlling interests held upon the happening of certain trigger events as specified in the shareholdersagreement. The put option of STI is exercisable during the period commencing upon the earlier of: (1)No Fault Leaver Event (i.e., First Founder of STI ceases to be an employee of a member of the STIGroup) occurring in respect of a Founder, (2) the aggregate relevant proportion of the Foundersfalling to less than 5%, or (3) the fifth anniversary of the service agreement.
The value of put options of STI amounted to $1.59 and $5.48 million as of December 31, 2020 and2019, respectively.
Mark-to-market gains (loss) on put options included under “Miscellaneous income (expense) - net”account amounted to $6.07 million in 2020, $3.45 million in 2019 and ($5.37) million in 2018(see Note 24).
Contingent considerationThe contingent consideration is part of the cost of acquisition of STI and is valued based on the actualnormalized EBITDA performance.
In 2018, the Group reversed $21.30 million contingent liability. The remaining balance of $3.73 millionwas reversed in full in 2019 and was included under “Miscellaneous income (expense) - net” account(see Note 24).
19. Equity
Capital StockThis account consists of:
2020 2019 2018Shares Amount Shares Amount Shares Amount
Authorized - P=1 par valueCommon 2,250,000,000 2,250,000,000 2,250,000,000Preferred 200,000,000 200,000,000 200,000,000Issued - CommonAt beginning of year 2,191,273,522 $42,674,027 2,190,076,503 $42,648,042 1,829,892,224 $35,709,679Issuances from ESOWN 41,765 903 1,197,019 25,985 10,184,279 220,513Issuance from stock rights
offer – – – – 350,000,000 6,717,850At end of year* 2,191,315,287 $42,674,930 2,191,273,522 $42,674,027 2,190,076,503 $42,648,042* Out of the total issued shares, 15,892,224 shares or $1.01 million as of December 31, 2020, 2019 and 2018 pertain to treasury shares.
On January 30, 2018, IMI obtained the approval of the PSE for a stock rights offer of up to350,000,000 new common shares to eligible shareholders. Under the rights offer, each shareholder isentitled to subscribe to one rights share for every 5.3551 existing common shares held as of record

- 47 -
*SGVFSM005291*
date February 14, 2018. The offer price was determined to be at P=14.28 per rights share which wasbased on the 30-day volume-weighted average price of IMI common shares listed at the PSE as ofFebruary 7, 2018 at a discount of 25.3%. On March 2, 2018, the Parent Company completed the offerand the listing of the shares, raising P=5.00 billion ($95.93 million) of proceeds to fund capitalexpenditures and support business expansions and refinance debts. The Parent Company has2,190,076,503 issued and outstanding shares after the offer.
As of December 31, 2020, 2019 and 2018, there were 288, 287 and 295 registered commonstockholders, respectively.
Subscribed Capital StockSubscribed capital pertains to subscriptions relating to the ESOWN of the Group.
Details of this account follow:
2020 2019 2018Shares Amount Shares Amount Shares Amount
At beginning of year 33,308,281 $752,560 36,177,963 $815,198 47,403,889 $1,058,278Issuances during the year -
ESOWN (41,765) (903) (1,197,019) (25,985) (10,184,279) (220,513)Forfeitures during the year -
ESOWN (315,235) (6,834) (1,672,663) (36,653) (1,041,647) (22,567)At end of year 32,951,281 $744,823 33,308,281 $752,560 36,177,963 $815,198
Additional Paid-in CapitalVIA Initial Public OfferingOn September 25, 2020, VIA Optronics, a 76%-owned German subsidiary of IMI, raised someproceeds through an initial public offering (IPO) and was listed on the New York Stock Exchangeunder the ticker symbol “VIAO”. The IPO involves issuance of 6,250,000 American Depositary Shares(ADSs), representing 1,250,000 ordinary shares at a public offering price of $15.00 per ADS, forgross proceeds of $93.75 million (net proceeds of $87.19 million after deducting underwritingdiscounts and commissions). Corning Research & Development Corporation (“Corning”), one of VIA’scommercial partners, has also agreed to purchase additional 1,403,505 ADSs, representing 280,701ordinary shares, at an aggregate purchase price of approximately $20 million (net $19.6 million aftercommissions) in a separate concurrent private placement.
As a result of the IPO, IMI’s ownership interest in VIA was diluted from 76.01% to 50.32%. In relationto the dilution without loss of control, the carrying amount of the non-controlling interest wasincreased by $62.52 million to reflect the changes in the relative interests in VIA (including allocationof goodwill). IMI recognized directly in equity any difference between the amount by which the non-controlling interests are adjusted and the fair value of the consideration received, and attributed it tothe owners of the Parent Company. The amount recognized in equity amounted to $32.40 million andwas recognized as a credit to the “Additional paid-in capital” account.
The additional credit to additional paid up capital of $15.33 million is coming from the reversal of putoption liability as discussed in Note 18.
Subscriptions ReceivableDetails of this account follow:
2020 2019 2018At beginning of year $2,955,581 $3,402,940 $5,351,844Forfeitures during the year (71,804) (341,818) (212,357)Refund/(collections) during the
year 5,023 (105,541) (1,736,547)At end of year (Note 28) $2,888,800 $2,955,581 $3,402,940

- 48 -
*SGVFSM005291*
Dividends2020IMI Singapore paid dividends on the redeemable cumulative preferred stocks (RCPS) to ACIndustrials (Singapore) Pte, Ltd. (ACI Singapore) on the anniversary dates amounting to $3.47 millionand $2.02 million in March 2020 and October 2020, respectively. In November 2020, dividends werepaid to the redeemed portion of the RCPS that have accrued as of redemption date amounting to$1.01 million. No dividend payment was declared to common shareholders.
2019On April 8, 2019, the BOD of the Parent Company approved the declaration of cash dividend of$0.00201 or P=0.10542 per share to all outstanding common shares aggregating to $4.44 million as ofrecord date of April 25, 2019 paid on May 7, 2019.
2018On February 20, 2018, the BOD of the Parent Company approved the declaration of cash dividend of$0.00458 or P=0.235 per share to all outstanding common shares aggregating to $10.13 million as ofrecord date of March 7, 2018 paid on March 21, 2018.
Retained EarningsRetained earnings as of January 1, 2019 was adjusted for the effect of the finalization of purchaseprice allocation of VTS with a net increase of $1.68 million. The net increase is due to the gain on abargain purchase of $2.41 million, net of the increase in depreciation and amortization, deferred taxesand corresponding share of non-controlling interest totaling to $0.73 million.
Upon adoption of PFRS 9, any cumulative impairment losses previously recognized under PAS 39 forequity instruments measured at FVOCI will have to be transferred from retained earnings to OCI. Asa result, a cumulative catch up adjustment was made as of January 1, 2018 resulting to a decrease inOCI and an increase in retained earnings of $1.75 million.
Accumulated net earnings of the subsidiaries amounting to $202.52 million and $201.15 million as ofDecember 31, 2020 and 2019, respectively, are not available for dividend declaration. Thisaccumulated net earnings of subsidiaries becomes available for dividend upon receipt of cashdividends from the investees.
The retained earnings are restricted to dividend declaration to the extent of the cost of treasuryshares amounting to $1.01 million.
In accordance with Securities Regulation Code Rule 68, As Amended (2019), Annex 68-D, the ParentCompany’s retained earnings available for dividend declaration as of December 31, 2020 amountedto $2.58 million.
Treasury SharesIn July 1999, the Company repurchased a total of 8,867,318 Class B common shares issued to aminority stockholder for a price P=75 million.

- 49 -
*SGVFSM005291*
Cumulative Translation AdjustmentsThis account pertains to cumulative translation adjustments of subsidiaries with functional currencyother than the Group’s presentation currency (see Note 2). Exchange differences arising fromtranslation of foreign operations for the period ended December 31, 2020, 2019 and 2018 follows:
2020 2019 2018EU and MX $14,970,268 ($3,977,210) ($7,502,790)VIA and STI 8,330,030 1,927,491 (7,435,746)STEL 3,185,241 (33,983) (113,776)Consolidation and Eliminations 2,667,047 (3,391,752) 3,030,334
$29,152,586 ($5,475,454) ($12,021,978)Attributable to:
Equity holders of the Parent $26,820,695 ($4,526,109) ($10,619,131)Non-controlling interest 2,331,891 (949,345) (1,402,847)
$29,152,586 ($5,475,454) ($12,021,978)
Non-controlling interestIssuance of capital stock - preferred by IMI SingaporeIn 2019, IMI Singapore, a wholly-owned subsidiary of the Parent Company, issued RCPS, which weresubscribed by AC Industrials (Singapore) Pte, Ltd., an entity under common control of AC Industrials.The preferred shares have certain features, rights and privileges, which include redemption at theoption of the issuer and cumulative, non-participating dividend rights at rates to be determined by theBoard of Directors. There is no conversion option to the shareholders to convert the RCPS intoordinary shares of IMI Singapore and the shareholders have no voting rights unless the resolution inquestion varies the rights attached to the RCPS or is for the winding-up of the IMI Singapore. Totalshares issued aggregated to $100 million, $60 million of which was allotted and issued in July 2019and $40 million in November 2019.
In November 2020, the Board approved the partial redemption of the RCPS amounting to$30.0 million and paid the dividends that have accrued as of redemption date amounting to $1.01million. Outstanding balance of the RCPS as of December 31, 2020 amounted to $70.0 million.
Capital ManagementThe primary objective of the Group’s capital management is to ensure that it maintains a strong creditrating and healthy capital ratios in order to support its business and maximize shareholder value.
No changes were made in the objectives, policies and processes for the years endedDecember 31, 2020 and 2019.
The Group monitors capital using a gearing ratio of debt-to-equity and net debt-to-equity. The Groupconsiders bank borrowings in the determination of debt, which consist of loans payable and long-termbank debt. Net debt is equivalent to the total bank borrowings, less cash and cash equivalents.
2020 2019Loans payable $206,490,427 $126,051,547Long-term bank borrowings 34,319,925 142,423,815
Total bank debt 240,810,352 268,475,362Less cash and cash equivalents 244,355,425 152,660,116Net bank debt ($3,545,073) $115,815,246Total Equity $580,862,729 $483,778,797Debt-to-equity ratio 0.41:1 0.55:1Net debt-to-equity ratio (0.01):1 0.24:1
The Group is not subject to externally-imposed capital requirements.

- 50 -
*SGVFSM005291*
20. Cost of Sales
This account consists of:
2020 2019 2018Direct, indirect and other material-
related costs (Note 8) $796,036,703 $888,417,084 $952,186,147Direct labor, salaries, wages and
employee benefits (Note 27) 165,020,873 172,657,671 179,892,752Depreciation and amortization
(Notes 10, 12 and 30) 43,435,464 38,475,325 29,168,696Facilities costs and others
(Note 22) 35,010,668 48,587,618 53,732,244$1,039,503,708 $1,148,137,698 $1,214,979,839
21. Operating Expenses
This account consists of:
2020 2019 2018Salaries, wages and employee
benefits (Note 27) $50,543,361 $54,178,946 $46,727,732Depreciation and amortization
(Notes 10, 12 and 30) 11,997,105 10,253,348 8,368,871Facilities costs and others
(Note 22) 29,919,927 41,789,769 41,838,682$92,460,393 $106,222,063 $96,935,285
22. Facilities Costs and Others - Net
This account consists of:
Cost of Sales Operating Expenses2020 2019 2018 2020 2019 2018
Utilities $16,944,219 $18,561,156 $19,599,504 $1,479,229 $948,015 $1,336,139Outsourced activities 7,968,725 10,332,444 15,828,874 11,184,209 14,143,794 14,377,484Repairs and maintenance 6,203,813 13,052,752 11,508,562 781,950 1,076,059 921,113Government-related 1,795,352 1,316,475 2,226,864 3,028,921 3,497,749 4,505,120Travel and transportation 934,445 1,741,426 1,497,218 2,247,563 5,314,278 5,435,915Technology-related 710,862 1,098,239 361,746 4,224,730 3,912,362 6,229,630Insurance 673,733 1,359,974 1,564,971 2,823,246 2,000,776 1,928,184Postal and communication 301,012 371,828 382,798 431,548 1,459,905 1,171,214Promotional materials, representation
and entertainment 117,674 476,418 242,534 637,995 1,012,922 1,102,576Staff house 15,083 155,727 333,749 272,056 296,117 477,608Membership fees 4,839 57,467 10,237 143,575 143,923 174,346Provision (reversal of provision) for
inventory obsolescence (Note 8) − − − (291,526) 4,599,150 2,344,158Sales commission − − 399,402 1,659,413 1,398,391Provision for ECLs (Note 6) − − − 574,495 296,207 88,238Provision (reversal of provision) for decline
in value of inventories (Note 8) − − − 2,259 (79,522) 93,123Others - net (659,089) 63,712 175,187 1,980,275 1,508,621 255,443
$35,010,668 $48,587,618 $53,732,244 $29,919,927 $41,789,769 $41,838,682
Others include donations, small tools and instruments, spare parts, materials, office supplies, andcopying expenses. In 2020, this also includes Covid-related incentives in the form of social insurancerefunds, electricity cost subsidies and other job support schemes in China, Europe and Singaporerecognized as reduction in cost of sales and operating expenses.

- 51 -
*SGVFSM005291*
23. Interest Expense and Bank Charges
This account consists of:
2020 2019 2018Interest expense on loans (Notes 16 and 17) $8,411,717 $10,262,423 $10,566,675Interest on leases (Note 30) 1,644,189 1,368,494 −Bank charges 320,526 1,505,259 1,398,669Others 46,201 5,759 27,040
$10,422,633 $13,141,935 $11,992,384
Others include interest on employee housing and car loans in 2020, 2019, and 2018.
24. Miscellaneous Income - Net
Miscellaneous income (loss) - net consists of:
2020 2019 2018Financial subsidies $6,288,982 $1,735,855 $1,223,397Mark-to-market gain (loss) on put options
(Note 18) 6,068,906 3,445,288 (5,372,114)Gain on sale of property, plant and equipment
(Note 10) 657,101 99,404 189,298Other income from customers 404,813 456,291 890,489Gain on insurance claims 61,260 12,672 −Sale of materials and scrap (Note 8) 36,332 32,927 820,231Impairment on property, plant and equipment
(Notes 3 and 10) (2,620,779) − −Impairment loss on product development cost
(Notes 3 and 12) (4,693,985) − −Set up of intellectual property related liability − (1,638,206) −Net gain on disposal of a subsidiary − − 19,062,344Gain from bargain purchase (Note 2) − − 2,411,951Impairment loss on goodwill (Notes 3 and 11) − − (6,902,838)Reversal of contingent consideration (Note 18) − 3,728,985 21,304,030Other income (expense) - net (679,701) 1,412,072 551,703
$5,522,929 $9,285,288 $34,178,491
Financial subsidies are comprised of special subsidy funds such as industrial, economic andtechnological development fund subsidies provided by the China government, amortization of thegrant incentives received from the government of Serbia related to the new manufacturing facility andother Covid-related grants in China, Europe and Singapore. The balance of the Serbia grant incentiveincluded under “Other noncurrent liabilities” account amounted to $2.49 million and $1.61 million in2020 and 2019, respectively.
Gain on sale of property, plant and equipment includes gain on the sale of the manufacturing buildinglocated in the Cavite Economic Zone amounting to $0.41 million in 2020.
The liability on contingent consideration was reversed in full to arrive at the fair value of the expectedearn-out based on target normalized EBITDA performance in relation to the acquisition of STI. Theperiod for the prepayment of contingent consideration has lapsed in 2019.
Intellectual property (IP) related liability pertains to provision for potential compensation related to IPrights acquired on the acquisition of VTS.

- 52 -
*SGVFSM005291*
In 2018, the sale of Shenzhen entity was completed for a final purchase price of $85.09 million. Thenet gain recognized from the sale amounted to $19.06 million, net of employee relocation incentive.
Other income and expenses pertain to accruals and reversals for certain non-operating expenses.
25. Income Tax
Current TaxParent CompanyThe Parent Company is registered with PEZA and is entitled to certain incentives, which include ITH.As of December 31, 2020, there are three remaining project activities with ITH. Under its PEZAregistrations, the Parent Company’s projects and activities are subject to certain requirements andare entitled to certain incentives, which include, but are not limited to, ITH and tax and duty freeimportation of inventories and capital equipment. Upon the expiration of the ITH, the Parent Companywill be subject to a 5% tax on gross income earned after certain allowable deductions provided underRepublic Act (R.A.) No. 7916, otherwise known as the “Special Economic Zone Act of 1995”, in lieu ofpayment of national and local taxes. Income from other income-producing activities that are notregistered with PEZA is subject to regular corporate income tax (RCIT) rate of 30%.
IMICD, IMISZ and STJXIn accordance with the “Income Tax Law of the China for Enterprises with Foreign Investment andForeign Enterprises,” the subsidiaries in China are entitled to full exemption from Enterprise IncomeTax (EIT) for the first two years and a 50% reduction in EIT for the next three years, commencingfrom the first profitable year after offsetting all tax losses carried forward from the previous five years.
During the financial year ended December 31, 2020, STJX and IMISZ have been granted taxpreference by the State Taxation Administration of the People’s Republic of China (PRC) for a periodof 3 years as the entities are operating in the high-technology industry. STJX and IMISZ aresubjected to taxation at the statutory tax rate of 15% in 2020 and 25% in 2019 on its taxable incomeas reported in its financial statements, prepared in accordance with the accounting regulations in thePRC.
IMICD is subject to taxation at the statutory rate of 15% on its taxable income as reported in thefinancial statements.
STHKHong Kong profits tax has been provided at the rate of 16.5% on the estimated assessable profit forthe year.
CooperatiefTaxation is calculated on the reported pre-tax result, at the prevailing tax rate of 20% on the first€200,000 and 25% on the taxable amount exceeding €200,000, taking into account any lossescarried forward from previous financial years (if applicable), tax-exempt items and nondeductibleexpenses, and using tax facilities.
IMI BGIncome taxes are calculated in accordance with Bulgarian legislation, and the effect of the current anddeferred taxes is reported. The current tax is calculated based on the taxable income for taxpurposes. The nominal tax rate is 10%.
IMI NISTaxable income is established on the basis of accounting profit. The applicable tax rate is 15%.
IMI CZIncome tax due is calculated by multiplying the tax base by the rate as defined by the income tax lawof Czech Republic. The tax base comprises the book income from operations, which is increased or

- 53 -
*SGVFSM005291*
decreased by permanently or temporarily tax-decreasing costs and tax-deductible revenues (forexample, creation and recording of other provisions and allowances, entertainment expenses,difference between book and tax depreciations). The applicable tax rate is 19%.
IMI MXThe Mexican Income Tax Law (MITL) established a corporate income tax rate of 30% for fiscal years2020, 2019 and 2018. The MITL established requirements and limits regarding certain deductions,including restrictions on the deductibility of payroll-related expenses that are considered tax-exemptfor employees, contributions to create or increase pension fund reserves, and Mexican SocialSecurity Institute dues that are paid by the company but should be paid by the employees. The MITLalso establishes that certain payments made to related parties shall not be deductible if they do notmeet certain requirements.
IMI FranceIncome tax is computed based on the income earned by the entity during the calendar year. Lossesmay be carried forward with no time limit. On certain conditions, losses may be carried back one year.The tax rate applicable is 33% based on net income.
VIA and VTSVIA GmbH is subject to corporate income tax and trade taxes in Germany. For the years endedDecember 31, 2020, 2019 and 2018, the statutory German corporate income tax rate applicable toVIA GmbH is 15,0% plus solidarity surcharge of 5,5% thereon. The municipal trade tax isapproximately 16,0% in 2020 and 16,0% in 2019 and 2018. Overall tax rate for Germany is 31.8% for2020, 2019 and 2018. The change in the municipal trade tax is due to the relocation of a permanentestablishment from Altdorf to Nuremberg, with Nuremberg having higher tax rates.
For VIA’s subsidiaries, VIA LLC (USA) a tax rate of 27.0% in 2020, 2019 and 2018, for VIA Suzhou(China) a tax rate of 25.0% for 2020, 2019 and 2018 and for VTS (Japan) a tax rate of 33.9% isapplicable.
STIThe standard rate of corporation tax in the UK is 19%. STI Philippines is governed by the rules ofR.A. No. 7916, which prescribes a final tax rate of 5% on gross income net of certain deductionsspecifically provided for by the law.
PSiAs a PEZA-registered entity, PSi is subject to a 5% tax on gross income less allowable deductions,as defined in R.A. No. 7916, as amended by R.A. No. 8748, in lieu of all national and local taxes,except real property tax on land being leased by PSi. The 5% tax on gross income shall be paid andremitted as follows: (a) 3% to the National Government; and (b) 2% to the treasurer’s office of themunicipality or city where the enterprise is located. Income from other income-producing activitiesthat are not registered with PEZA is subject to RCIT rate of 30%.
As at December 31, 2020 and 2019, PSi has no PEZA-registered activities with ITH entitlement.
Deferred TaxRecognized deferred taxes of the Group relate to the tax effects of the following:
2020 2019Deferred tax assets:Lease liabilities $7,355,223 $7,254,586Net operating loss carry-over 2,070,468 3,970,284Allowance for inventory obsolescence 580,259 173,612Allowance for doubtful accounts 149,828 21,493Unrealized foreign exchange loss on monetary
assets - net 6,748 −
(Forward)

- 54 -
*SGVFSM005291*
2020 2019Fair value adjustment on property, plant and
equipment arising from business combination $− $78,571Others 947,960 −
$11,110,486 $11,498,546
2020 2019Deferred tax liabilities:Right-of-use asset $6,715,279 $7,230,198Fair value adjustment on property, plant and
equipment arising from business combination 1,804,127 857,370Contract assets 340,363 856,766Fair value adjustments on Intangible Assets from
business combination 263,810 615,557Unrealized foreign exchange gain on monetary
assets - net 93,163 34,956Others − 163,015
$9,216,742 $9,757,862
Deferred tax assets and deferred tax liabilities are offset on per entity level and the net amount isreported in consolidated balance sheets as follows:
December 31, 2020
Deferred TaxAssets
Deferred TaxLiabilities
TotalDeferred TaxAssets - net
Total DeferredTax Liabilities -
netParent Company $– ($106,169) $– ($106,169)PSI 396,315 (389,247) 7,068 –IMI BG 683,776 (1,054,562) – (370,786)IMI CZ 286,934 (55,404) 231,530 –IMI MX 1,005,534 (853,560) 151,974 –VIA and STI 5,527,574 (3,490,362) 2,037,212 –STEL 3,111,258 (2,073,750) 1,037,508 –Serbia 26,231 – 26,231 –Consolidation 72,864 (1,193,688) 355 (1,121,179)
$11,110,486 ($9,216,742) $3,491,878 ($1,598,134)
December 31, 2019
Deferred TaxAssets
Deferred TaxLiabilities
TotalDeferred TaxAssets - net
Total DeferredTax Liabilities -
netParent Company $– ($45,751) $– ($45,751)PSI 172,261 (116,244) 56,017 –IMI BG – (289,848) – (289,848)IMI CZ 286,905 (82,596) 204,309 –IMI MX 1,037,754 (984,357) 53,397 –VIA and STI 5,814,691 (4,577,227) 1,237,464 –STEL 4,169,299 (2,109,847) 2,059,452 –Consolidation 17,636 (1,551,992) – (1,534,356)
$11,498,546 ($9,757,862) $3,610,639 ($1,869,955)
Others pertain to the deferred tax liabilities resulting from the acquisition of IMI EU/MX Subsidiaries.
The movement in deferred taxes are impacted by the translation of the deferred taxes of thesubsidiaries with functional currency other than the presentation currency of the Parent Company.The deferred taxes are translated using the closing rate as at balance sheet date and the exchangedifferences are recognized as part of the other comprehensive income and reported as separatecomponent of equity.

- 55 -
*SGVFSM005291*
As of December 31, 2020 and 2019, the temporary differences for which no deferred tax assets havebeen recognized are as follows:
2020 2019Net operating loss carry-over $36,274,754 $20,896,912Accumulated impairment losses on property, plant
and equipment 4,352,991 1,732,212Excess of cost over NRV of inventories 625,966 644,030Provisions 462,938 786,727Allowance for doubtful accounts 61,805 58,730
$41,778,454 $24,118,611
Deferred tax assets are recognized only to the extent that sufficient future taxable profits will beavailable against which the deferred tax assets can be used.
As of December 31, 2020 and 2019, deferred tax liabilities have not been recognized on theundistributed earnings of subsidiaries (see Note 19) and the related cumulative translationadjustments since the timing of the reversal of the temporary difference can be controlled by theGroup and management does not expect the reversal of the temporary differences in the foreseeablefuture.
On September 30, 2020, the Philippine Bureau of Internal Revenue (BIR) issued RevenueRegulations No. 25-2020 implementing Section 4(bbbb) of “Bayanihan to Recover As One Act” whichstates that the NOLCO incurred for taxable years 2020 and 2021 can be carried over and claimed asa deduction from gross income for the next five (5) consecutive taxable years immediately followingthe year of such loss.
As of December 31, 2020, the entities operating in the Philippines has incurred NOLCO beforetaxable year 2020 which can be claimed as deduction from the regular taxable income for the nextthree (3) consecutive taxable years, as follows:
Year Incurred Availment Period Amount Applied/Expired Unapplied2017 2018 to 2020 $182,397 $182,397 $–2018 2019 to 2021 12,295,900 – 12,295,9002019 2020 to 2022 15,757,987 – 15,757,987
$28,236,284 $182,397 $28,053,887
As of December 31, 2020, the entities operating in the Philippines has incurred NOLCO in taxableyear 2020 which can be claimed as deduction from the regular taxable income for the next five (5)consecutive taxable years pursuant to the Bayanihan to Recover As One Act, as follows:
Year Incurred Availment Period Amount Applied/Expired Unapplied2020 2020 to 2025 $8,619,419 $– $8,619,419
For the carry-over losses of certain entities within the Group, this expires between three to ten yearsfrom the date incurred depending on the jurisdiction the entity is operating.
Year Incurred Amount Applied/Expired Unapplied2020 $30,661,230 $− $30,661,2302019 36,629,041 5,244,205 31,384,8362018 20,750,755 1,297,954 19,452,801
2017 and prior 17,357,130 226,014 17,131,116$105,398,156 $6,768,173 $98,629,983
The tax on income from foreign subsidiaries was derived by aggregating the effective income tax foreach national jurisdiction.

- 56 -
*SGVFSM005291*
The reconciliation of the statutory income tax rate to the effective income tax rate of the Groupfollows:
2020 2019 2018Statutory income tax (30.00%) (30.00%) 30.00%Tax effects of:Nondeductible expenses and
movement in unrecognizeddeferred taxes (277.93%) (13.30%) 16.36%
Income subject to minimum corporateincome tax 7.48% 0.66% (0.31%)
Income subject to gross income tax 100.57% 17.45% (18.36%)Difference in tax jurisdiction (140.61%) 7.24% (13.40%)Interest income subjected to final tax 0.40% 0.19% (0.14%)Provision for income tax (340.09%) (17.76%) 14.15%
26. Earnings per Share
The following table presents information necessary to calculate EPS on net income attributable toequity holders of the Parent Company:
2020 2019 2018Net income (loss) attributable to equity
holders of Parent Company ($3,455,073) ($7,780,648) $47,187,313
Weighted average number of commonshares outstanding 2,208,592,993 2,208,966,029 2,152,356,856
Basic and diluted EPS ($0.002) ($0.004) $0.022
As of December 31, 2020, 2019 and 2018, the Group has no dilutive potential common shares.
27. Personnel Costs
Details of salaries, wages, and employee benefits follow:
2020 2019 2018Salaries, wages and benefits $193,371,691 $203,260,943 $202,411,802Government related contributions 9,509,438 8,699,424 7,692,058Retirement expense under defined
contribution plans 7,239,590 8,877,809 9,104,762Net retirement expense under
defined benefit plans 2,093,381 1,552,705 1,574,569Employee spin-off (Note 21) − 131,270 −Others 3,350,134 4,314,466 5,837,293
$215,564,234 $226,836,617 $226,620,484
Others include expenses such as employee social and recreation, employee awards and recognition,trainings and seminars, labor union expenses, and uniforms.

- 57 -
*SGVFSM005291*
Salaries, wages, and employee benefits are allocated as follows:
2020 2019 2018Cost of sales (Note 20) $165,020,873 $172,657,671 $179,892,752Operating expenses (Note 21) 50,543,361 54,178,946 46,727,732
$215,564,234 $226,836,617 $226,620,484
Defined Benefit PlansThe Parent Company, IMI BG and PSi have defined benefit plans covering substantially all of theiremployees. The latest actuarial valuations were made on December 31, 2020.
The plan is administered by local banks as trustees. The Board of Trustees is responsible for theinvestment direction of the assets. It defines the investment strategy as often as necessary, at leastannually, especially in the case of significant market developments or changes to the structure of theplan participants. When defining the investment strategy, it takes into account the plan’s objectives,benefit obligations and risk capacity. The investment strategy is defined in the form of a long-termtarget structure (investment policy). The Board of Trustees delegates the implementation of theinvestment policy in accordance with the investment strategy, as well as various principles andobjectives to an Investment Committee, which also consists of members of the Board of Trustees,and the Treasurer. The Treasurer oversees the entire investment process.
The defined benefit plans of the Parent Company and PSi meet the minimum retirement benefitspecified under R.A. No. 7641, Retirement Pay Law, while IMI BG is in accordance with the Bulgarianlabour legislation and the Collective Labour Contract.
The Group has net retirement liabilities attributable to the following:
2020 2019Parent Company $7,253,561 $7,549,797IMI BG 1,751,670 1,314,853PSi 343,258 300,432Serbia 7,166 −
$9,355,655 $9,165,082

- 58 -
*SGVFSM005291*
Parent Company, IMI BG and PSiChanges in net retirement liabilities of the Parent Company, IMI BG and PSi’s defined benefit plans are as follows:
2020Net Retirement Expense Remeasurements
January 1Current
Service Cost Net Interest
Loss onCurtailments
andSettlements Subtotal
Separation and
BenefitsPaid
Return onPlan Assets
(ExcludingAmount
Included inNet Interest)
ActuarialChanges
Due toExperience
Adjustments
ActuarialChanges
Due toDemographicAssumptions
ActuarialChanges
Arising fromChanges in
FinancialAssumptions Subtotal
ActualContribution
ForeignCurrency
ExchangeDifference December 31
Present value of definedbenefit obligation $22,193,986 $1,786,540 $986,717 $– $2,773,257 ($1,182,460) $– ($856,746) $– $247,298 ($609,448) $– $1,307,463 $24,482,798
Fair value of plan assets (13,028,904) – (679,876) – (679,876) (585,093) (77,031) (14,071) – – (91,102) – (742,168) (15,127,143)Net retirement liabilities $9,165,082 $1,786,540 $306,841 $– $2,093,381 ($1,767,553) ($77,031) ($870,817) $– $247,298 ($700,550) $– $565,295 $9,355,655
2019Net Retirement Expense Remeasurements
January 1Current
Service Cost Net Interest
Loss onCurtailments
andSettlements Subtotal
Separation and
BenefitsPaid
Return onPlan Assets
(ExcludingAmount
Included inNet Interest)
ActuarialChanges
Due toExperience
Adjustments
ActuarialChanges
Due toDemographicAssumptions
ActuarialChanges
Arising fromChanges in
FinancialAssumptions Subtotal
ActualContribution
ForeignCurrency
ExchangeDifference December 31
Present value of definedbenefit obligation $16,224,860 $1,403,966 $1,081,100 $19,299 $2,504,365 ($1,557,084) $– $1,044,080 ($327,171) $3,681,397 $4,398,306 $– $623,539 $22,193,986
Fair value of plan assets (11,991,926) – (951,660) – (951,660) 562,269 (174,752) (8,585) – – (183,337) – (464,250) (13,028,904)Net retirement liabilities $4,232,934 $1,403,966 $129,440 $19,299 $1,552,705 ($994,815) ($174,752) $1,035,495 ($327,171) $3,681,397 $4,214,969 $– $159,289 $9,165,082
The maximum economic benefit available is a contribution of expected refunds from the plans and reductions in future contributions.

- 59 -
*SGVFSM005291*
The distribution of the plan assets as of December 31, 2020 and 2019 follows:
2020 2019Government securities $10,799,098 $9,623,334Equities 1,596,656 1,207,358Corporate bonds 1,164,006 1,100,609Trust funds 1,057,038 645,374Investment properties 486,472 461,378Cash and cash equivalents 50 76Others 23,823 (9,205)
$15,127,143 $13,028,924
The plan assets include corporate bonds and deposit instruments of related parties, primarily AC,Ayala Land, Inc. (ALI) and Bank of the Philippine Islands (BPI). As of December 31, 2020 and 2019,the fair value of these plan assets amounted to $1.51 million and $1.02 million, respectively.
The plan assets pertain to diverse investments and do not have any concentration risk.
The overall investment policy and strategy of the Group’s defined benefit plans are guided by theobjective of achieving an investment return which, together with contributions, ensures that there willbe sufficient assets to pay retirement benefits as they fall due while also mitigating the various risk ofthe plans.
The Group expects to contribute $2.26 million to the defined benefit plans for 2021.
The actual return (loss) of plan assets amounted to ($0.08) million, ($0.17) million and $0.83 million in2020, 2019 and 2018, respectively.
The average duration of net retirement liabilities at the end of the balance sheet date is 13.2 to 20.03years as of December 31, 2020 and 14.26 to 21.31 years as of December 31, 2019.
Shown below is the maturity analysis of the undiscounted benefit payments as of December 31, 2020and 2019:
2020 2019Less than one year $1,877,723 $1,843,180More than one year to five years 8,798,373 8,497,569More than five years to ten years 12,181,108 11,889,588More than ten years to fifteen years 13,120,139 13,784,395More than fifteen years 46,901,027 52,490,273
$82,878,370 $88,505,005
Principal actuarial assumptionsThe principal actuarial assumptions used to determine retirement benefits are shown below:
2020 2019 2018Discount rate 0.34% - 3.89% 0.40% - 4.99% 0.90% - 7.38%Salary increase rate 3.00% - 5.00% 4.00% - 5.00% 4.00% - 5.00%

- 60 -
*SGVFSM005291*
The sensitivity analysis per entity below has been determined based on reasonably possible changesof each significant assumption on the net retirement liabilities as of the end of the balance sheet date,assuming all other assumptions were held constant:
Increase/Decrease in Actuarial
AssumptionEffect on Net Retirement Liability
Actuarial Assumption 2020 2019Discount rate +1% ($1,833,819) ($1,647,358)
-1% 2,102,930 1,951,455Salary increase rate +1% 2,230,776 2,068,298
-1% (1,981,362) (1,873,459)
The mortality rate in 2020 and 2019 is based on the 2017 Philippine Intercompany Mortality Table forthe Parent Company and PSi. Meanwhile, IMI BG used the table for mortality and average lifecontinuance population in the period 2017-2019 from National Statistical Institute (of Bulgaria) for2020 and 2019. IMI Serbia used the 2012 table of mortality published by the Statistical Office of theRepublic of Serbia for 2020.
The net retirement expense of the Parent Company, IMI BG and PSi under the defined benefit plansis allocated as follows:
2020 2019 2018Cost of sales $1,481,625 $1,058,798 $1,133,974Operating expenses 611,756 493,907 440,595
$2,093,381 $1,552,705 $1,574,569
Defined Contribution PlansThe Parent Company’s subsidiaries, excluding PSi, IMI BG and IMI Serbia, participate in theirrespective national retirement schemes which are considered as defined contribution plans. Theretirement expense of these subsidiaries is allocated as follows:
2020 2019 2018Cost of sales $6,024,351 $7,696,667 $7,726,248Operating expenses 1,215,239 1,181,142 1,378,514
$7,239,590 $8,877,809 $9,104,762
28. Employee Stock Ownership Plan (ESOWN)
The Group has an ESOWN, which is a privilege extended to the Group’s eligible managers and staffwhereby the Group allocates up to 10% of its authorized capital stock for subscription by saidpersonnel under certain terms and conditions stipulated in the ESOWN.
The key features of the plan are as follows:
The subscription price per share shall be based on the average closing price at the PSE for 20consecutive trading days with a discount to be determined by the Parent Company’sCompensation Committee.
Term of payment is eight years reckoned from the date of subscription:
Initial payment 2.5%1st Anniversary 5.0%2nd Anniversary 7.5%3rd Anniversary 10.0%Over the remaining years 75.0% balance

- 61 -
*SGVFSM005291*
Holding period:40% after one (1) year from subscription date30% after two (2) years from subscription date30% after three (3) years from subscription date
Movements in the number of shares outstanding under ESOWN in 2019, 2018 and 2017 follow:
2020 2019 2018
Number ofShares
WeightedAverageExercise
PriceNumber of
Shares
WeightedAverageExercise
PriceNumber of
Shares
WeightedAverageExercise
PriceAt beginning of year 137,692,186 P=6.62 139,364,849 P=6.65 140,406,496 P=6.67Forfeitures (315,235) 10.49 (1,672,663) 9.39 (1,041,647) 9.40At end of year 137,376,951 P=6.61 137,692,186 P=6.62 139,364,849 P=6.65
The balance of the subscriptions receivable amounted to $2.89 million, $2.96 million and$3.40 million as of December 31, 2020, 2019 and 2018, respectively (see Note 19).
The share option expense amounted to nil in 2020 and 2019, and $0.03 million in 2018.
29. Segment Information
Management monitors operating results per geographical area for the purpose of making decisionsabout resource allocation and performance assessment. It evaluates the segment performance basedon gross revenue, interest income and expense and net income before and after tax of its majormanufacturing sites. The Parent Company and PSi are combined under Philippine segment, STELGroup is categorized under China segment, IMI BG, IMI CZ and IMI Serbia are combined underEurope based on the industry segment and customers served, IMI Mexico is presented under Mexicosegment, VIA and STI are combined under Germany/UK segment representing non-wholly ownedsubsidiaries, IMI USA, IMI Japan, IMI UK and IMI Singapore/ROHQ are combined being the holdingand support facilities for strategic management, research and development, engineering developmentand sales and marketing.
Prior period information is consistent with the current year basis of segmentation.
The Parent Company and its subsidiaries generally account for inter-segment revenue and transfersas if the revenue and transfers were to third parties at current market prices. These transactions areaccounted for in accordance with PFRS.
Intersegment revenues, cost of sales, and operating expenses are eliminated on consolidation.
The amount of segment assets and liabilities are based on measurement principles that are similarwith those used in measuring assets and liabilities in the consolidated statement of financial positionwhich is in accordance with PFRS.

- 62 -
*SGVFSM005291*
The following tables present revenue and profit information regarding the Group’s geographical segments per legal entity’s location for the years endedDecember 31, 2020, 2019 and 2018:
December 31, 2020 Philippines China Europe Mexico Germany/UKUSA/ Japan
/Singapore / IMI UK
Consolidationand
Eliminations TotalParent Company PSi
Revenue from contracts with customers: Third party $199,431,778 $13,841,873 $225,121,982 $264,650,680 $125,021,387 $268,973,935 $38,798,958 $− $1,135,840,593 Intersegment 39,560,353 − 27,381,619 4,176,480 730,411 − 5,839,775 (77,688,638) –Total revenue from contracts with customers $238,992,131 $13,841,873 $252,503,601 $268,827,160 $125,751,798 $268,973,935 $44,638,733 ($77,688,638) $1,135,840,593
Segment interest income $1,172,755 $1,723 $1,385,590 $455,145 $− $5,001 $5,791,518 ($8,481,050) $330,682
Segment interest expense $6,031,447 $773,566 $2,995,988 $904,448 $2,907,522 $3,629,390 $345,271 ($7,164,999) $10,422,633
Segment profit (loss) before income tax ($8,821,652) ($2,275,826) $9,913,597 $19,712,613 ($12,695,167) ($8,197,912) $20,301,542 ($19,385,469) ($1,448,274)Segment provision for income tax (1,625,830) (55,074) (1,083,409) (1,741,563) 98,577 (925,219) (175,593) 582,690 ($4,925,421)Segment profit (loss) after income tax ($10,447,482) ($2,330,900) $8,830,188 $17,971,050 ($12,596,590) ($9,123,131) $20,125,949 ($18,802,779) ($6,373,695)
Net income (loss) attributable to the equity holders ofthe Parent Company ($10,447,482) ($2,330,900) $8,830,188 $17,971,050 ($12,596,590) ($6,574,888) $20,125,949 ($18,432,400) ($3,455,073)
December 31, 2019 Philippines China Europe Mexico Germany/UKUSA/ Japan
/Singapore / IMI UK
Consolidationand
Eliminations TotalParent Company PSi
Revenue from contracts with customers: Third party $227,466,226 $18,381,775 $258,300,064 $325,097,663 $159,560,558 $247,597,090 $13,962,538 $− $1,250,365,914 Intersegment 24,023,512 − 19,542,444 3,925,576 612,541 − 6,738,431 (54,842,504) –Total revenue from contracts with customers $251,489,738 $18,381,775 $277,842,508 $329,023,239 $160,173,099 $247,597,090 $20,700,969 ($54,842,504) $1,250,365,914
Segment interest income $2,846,963 $2,835 $796,795 $345,781 $− $− $4,408,597 ($7,540,196) $860,775
Segment interest expense $7,543,137 $1,051,845 $2,397,163 $1,185,177 $3,302,459 $3,557,069 $217,924 ($6,112,839) $13,141,935
Segment profit (loss) before income tax $2,906,087 ($3,325,773) ($5,308,769) $19,232,806 ($10,218,427) ($15,776,081) ($1,814,996) $3,100,376 ($11,204,777)Segment provision for income tax (2,362,461) 25,119 2,119,691 (2,035,036) (259,504) 18,518 311,927 191,311 ($1,990,435)Segment profit (loss) after income tax $543,626 ($3,300,654) ($3,189,078) $17,197,770 ($10,477,931) ($15,757,563) ($1,503,069) $3,291,687 ($13,195,212)
Net income (loss) attributable to the equity holders ofthe Parent Company $543,626 ($3,300,654) ($3,189,078) $17,197,770 ($10,477,931) ($10,635,161) ($1,503,069) $3,583,849 ($7,780,648)

- 63 -
*SGVFSM005291*
December 31, 2018 Philippines China Europe Mexico Germany/UKUSA/ Japan
/Singapore /IMI UK
Consolidationand
Eliminations TotalParent Company PSi
Revenue: Third party $242,582,741 $36,044,400 $332,755,846 $319,126,425 $105,477,420 $312,401,704 $1,011,909 $− $1,349,400,445 Intersegment 1,992,122 − 85,555 918,396 1,575,391 − 7,178,118 (11,749,582) –Total revenue $244,574,863 $36,044,400 $332,841,401 $320,044,821 $107,052,811 $312,401,704 $8,190,027 ($11,749,582) $1,349,400,445
Segment interest income $3,175,737 $1,705 $1,039,448 $− $− $− $2,342,669 ($5,560,564) $998,995
Segment interest expense $8,056,665 $666,421 $1,748,361 $553,883 $2,319,178 $2,855,175 $6,014 ($4,213,313) $11,992,384
Segment profit (loss) before income tax $14,487,977 $400,983 $15,152,053 $30,129,968 ($15,701,909) $15,320,704 ($1,425,367) ($1,715,001) $56,649,408Segment provision for income tax (2,442,028) (171,797) 1,066,461 (3,030,726) (950,036) (3,158,054) (453,742) 341,569 ($8,798,353)Segment profit (loss) after income tax $12,045,949 $229,186 $16,218,514 $27,099,242 ($16,651,945) $12,162,650 ($1,879,109) ($1,373,432) $47,851,055
Net income (loss) attributable to the equity holders ofthe Parent Company $12,045,949 $229,186 $16,218,514 $27,099,242 ($16,651,945) $9,526,359 ($1,879,109) ($1,081,269) $45,506,927

- 64 -
*SGVFSM005291*
The following table presents segment assets of the Group’s geographical segments as ofDecember 31, 2020 and 2019:
Philippines China Europe Mexico Germany /UKUSA/ Japan/
Singapore
Consoli-dation and
Eliminations TotalParent
Company PSi2020 $467,734,712 $10,370,946 $238,505,190 $304,254,610 $91,015,689 $315,906,870 $415,927,432 ($710,040,679) $1,133,674,770
2019 $515,512,985 $11,743,464 $272,001,788 $289,406,640 $123,660,935 $219,970,705 $418,136,948 ($754,097,527) $1,096,335,938
Investments in subsidiaries and intersegment receivables amounting to $392.90 million and$350.52 million as of December 31, 2020, respectively, and $395.47 million and $386.13 million as ofDecember 31, 2019, respectively are eliminated in consolidation.
Goodwill arising from the acquisitions as disclosed in Note 11, are recognized at consolidated levelfor both years ended December 31, 2020 and 2019.
Revenue from Contracts with CustomersRevenues from contracts with customers are further disaggregated by type, customer’s nationality,market segment and timing of revenue recognition, as management believes it best depicts how thenature, amount, timing and uncertainty of revenue and cash flows are affected by economic factors.
The following table presents revenue by type:
2020 2019Manufacturing of goods $1,129,576,030 $1,244,997,918Non-recurring engineering services 6,264,563 5,367,996Revenue from contracts with customers $1,135,840,593 $1,250,365,914
The following table presents revenue from contracts with customer per timing of revenue recognitionfor each reportable segments:
2020Revenue
recognizedover time
Revenuerecognized atpoint in time Total
Philippines Parent Company $199,431,778 $– $199,431,778 PSi 13,841,873 – 13,841,873China 225,121,982 – 225,121,982Europe 263,304,840 1,345,840 264,650,680Mexico 121,994,587 3,026,800 125,021,387Germany/UK 93,140,200 175,833,735 268,973,935USA/Japan/Singapore 37,429,668 1,369,290 38,798,958Revenue from contracts with customers $954,264,928 $181,575,665 $1,135,840,593

- 65 -
*SGVFSM005291*
2019Revenue
recognizedover time
Revenuerecognized at
point in time TotalPhilippines Parent Company $227,466,226 $– $227,466,226 PSi 18,381,775 – 18,381,775China 258,300,064 – 258,300,064Europe 322,701,152 1,986,185 324,687,337Mexico 157,852,371 1,708,187 159,560,558Germany/UK 93,569,019 154,028,071 247,597,090USA/Japan/Singapore – 14,372,864 14,372,864Revenue from contracts with customers $1,078,270,607 $172,095,307 $1,250,365,914
The following table presents revenues from external customers based on customer’s nationality:
2020 2019 2018Europe $675,265,274 $777,467,488 $797,205,895America 164,835,520 197,209,628 238,841,358Japan 73,620,703 71,563,832 51,634,368Rest of Asia/Others 222,119,096 204,124,966 261,718,824
$1,135,840,593 $1,250,365,914 $1,349,400,445
Revenues are attributed to countries on the basis of the customer’s location. The current topcustomer accounts for 8.34%, 8.51% and 5.88% of the Group’s total revenue in 2020, 2019 and2018, respectively.
The following table presents revenues per market segment:
2020 2019 2018Automotive $521,070,692 $601,996,871 $571,123,693Industrial 355,463,462 380,061,711 379,753,654Consumer 85,591,512 95,446,491 172,044,981Telecommunication 64,928,610 80,762,597 89,004,663Aerospace/defense 47,317,163 53,181,362 56,827,484Medical 38,013,836 17,592,584 14,273,519Multiple market/others 23,455,318 21,324,298 66,372,451
$1,135,840,593 $1,250,365,914 $1,349,400,445
The following table presents noncurrent assets based on their physical location:
2020 2019Europe* $217,770,002 $211,101,116America** 36,579,308 45,076,036Rest of Asia/Others 120,653,101 139,502,988
$375,002,411 $395,680,140*Pertains to Europe, Germany and UK**Pertains to Mexico and USA
Noncurrent assets include property, plant and equipment, goodwill, intangible assets and right of useassets.

- 66 -
*SGVFSM005291*
The following table presents the depreciation and amortization expense based on their physicallocation:
2020 2019 2018Europe* $21,591,738 $21,958,792 $14,147,465America** 6,417,245 4,575,137 4,054,506Rest of Asia/Others 27,423,586 22,194,744 19,335,596
$55,432,569 $48,728,673 $37,537,567*Pertains to Europe, Germany and UK**Pertains to Mexico and USA
30. Lease Commitments
Set out below are the carrying amounts of the Group’s right-of-use assets presented under non-current assets, and the movements during the period:
2020 2019As at January 1, 2020 $32,027,604 $39,099,942Additions 8,450,830 –Amortization expense (9,818,095) (6,955,732)Cumulative translation adjustment 2,000,381 (116,606)As at December 31, 2020 $32,660,720 $32,027,604
Set out below are the carrying amounts of the Group’s lease liabilities and the movements during theperiod:
2020 2019As at January 1, 2020 $33,797,712 $39,099,942Additions 10,050,921 –Interest expense on lease liabilities 1,644,189 1,368,494Rental payments (10,799,326) (7,603,732)Waived rentals (422,841) –Cumulative translation adjustment 1,142,605 933,008As at December 31, 2020 $35,413,260 $33,797,712Current $7,785,039 $4,074,866Noncurrent $27,628,221 $29,722,846
The following are the amounts recognized in consolidated statements of income:
2020 2019Amortization expense of right-of-use assets
(Notes 20 and 21) $9,395,254 $6,955,732Interest expense on lease liabilities (Note 23) 1,644,189 1,368,494Expense related to short-term leases and low-value
assets (included in cost of sales) 1,300,718 2,552,296Expense related to short-term leases and low-value
assets (included in operating expenses) 394,971 409,527$12,735,132 $11,286,049
Amortization expense of right-of-use assets recorded in the consolidated statements of income is netof the recognized effect of waived rentals for COVID-19-related rent concessions amounting to$0.42 million (see Note 3).
The Group’s lease agreements have terms of fixed payments and there are no variable paymentprovisions.

- 67 -
*SGVFSM005291*
The Group has several lease contracts that include extension and termination options. These optionsare negotiated by management to provide flexibility in managing the leased-asset portfolio and alignwith Group’s business needs. Management exercises significant judgment in determining whetherthese extension and termination options are reasonably certain to be exercised (see Note 4).
Shown below is the maturity analysis of the undiscounted lease payments as of December 31, 2020and 2019 follow:
2020 2019Within one year $11,615,891 $8,451,525After one year but not more than five years 26,108,092 27,268,012More than five years 10,098,182 10,694,962
$47,822,165 $46,414,499
Lease CommitmentsParent CompanyIn 2018, the Parent Company entered into a lease agreement related to warehouse building locatedin Laguna. The non-cancellable lease is for a period of five years from September 1, 2018 toAugust 31, 2023 without renewal and termination option.
The Parent Company entered into an amended lease contract with Technopark Land, Inc. (TLI), anaffiliate, for the lease of parcels of land situated at the Special Export Processing Zone, LagunaTechnopark, Biñan, Laguna. The previous lease contract which will expire on December 31, 2022was extended by another five years up to 2027 subject to new lease rates beginning 2023 based onmarket with annual escalation thereafter until the end of the term.
On March 7, 2014, the Parent Company executed a Lease Agreement with PEZA for the use of landlocated at the Blk 16 Phase 4 PEZA, Rosario, Cavite to be used exclusively for IMI Cavite’sregistered activities. The lease is for a period of 50 years renewable once at the option of the lesseefor a period of not more than 25 years. In 2020, the lease agreement was cancelled in line with thesale of the building to a third party.
The Parent Company also entered into an agreement involving the lease of residential houses andlots located in Sta. Rosa, Laguna covering a period of five years from January 1, 2016 toDecember 31, 2020.
IMI Singapore and STEL GroupSTEL Group have various operating lease agreements on office premises, plant and equipment,leasehold building and improvement, and motor vehicles. These non-cancellable lease contractshave lease terms of between two to eight years. There are no lease commitments for IMI Singapore.
In 2017, the new entity, IMI SZ, entered into a lease agreement on its manufacturing facility coveringa period of six years from May 2017 to May 2023. The lease premise is a five floor building with29,340 square meters located in an industrial park in Pingshan district of Shenzhen. In 2020, IMI SZexecuted a renewal of lease agreement for its 30,430 square meters plant in Kuichong. The coverageof the lease is from November 2019 to November 2022.
In January 2020, IMI CD entered a five year lease agreement, from January 2021 to January 2026,for its electronic production, office and staff accommodation. The lease premises is a three floorbuilding and a dormitory located at Xindu district, Chengdu City.
IMI BGIMI BG have lease agreements related to office and warehouse building rent lease terms of fiveyears. These leases have renewal options.

- 68 -
*SGVFSM005291*
IMI CZIMI CZ have various operating lease agreements in respect of its company cars with lease terms offour to five years.
IMI MXIMI MX have various lease agreements related to building and automobiles used in operation withlease terms of three to five years
PSiPSi leases its plant facilities, office spaces and other facilities in Calamba, Laguna from CentereachResources, Inc. (CRI), an unrelated entity with a term of four years. The operating lease agreementswill expire in 2022.
VIA and VTSVIA and VTS lease production buildings with terms ranging from 10 to 20 years. Other agreementsinvolve lease of vehicles and other equipment for periods ranging from one to eight years.
STISTI have various lease agreements in respect of manufacturing facilities, office premises andvehicles both in the UK and Philippines. These non-cancellable lease contracts have remaining non-cancellable lease terms of between three to fifty years. There are no restrictions placed upon thelessee by entering into these leases.
IMI JapanIMI Japan entered into a six-year lease for the lease of office premises which matured in 2018. Thelease contract provides for the automatic renewal of the lease contract, unless prior notice oftermination is given to the lessor.
IMI USAOn June 5, 2020, IMI USA entered into a fourth amendment to a standard industrial commercialsingle tenant lease contract for an extended term of five years commencing from November 1, 2020to October 31, 2025 for the lease of office premises. The lease contract contains provisions including,but not limited to, an escalation rate of 3% per year and early termination penalties.
31. Related Party Transactions
Parties are considered to be related if one party has the ability, directly or indirectly, to control theother party or exercise significant influence over the other party in making financial and operatingdecisions. Parties are also considered to be related if they are subject to common control or commonsignificant influence which include affiliates. Related parties may be individuals or corporate entities.
The Group, in its regular conduct of business, has entered into transactions with subsidiaries, affiliate,and other related parties principally consisting of advances, loans and reimbursement of expenses.Sales and purchases of goods and services as well as other income and expenses to and fromrelated parties are made at normal commercial prices and terms.
Terms and Conditions of Transactions with Related PartiesThe Group has a Related Party Transactions (RPT) Committee that evaluates and governs relatedparty transactions. Prior to finalization of any related party agreement, the management shall reportfor review and approval to the RPT Committee all new and proposed significant related partytransaction above the threshold set by the RPT Committee.
Outstanding balances at year-end are unsecured and settlement occurs in cash unless otherwisestated. For the years ended December 31, 2020, 2019 and 2018, the Group has not recorded anyimpairment on receivables relating to amounts owed by related parties. Impairment assessment is

- 69 -
*SGVFSM005291*
undertaken each financial year through examining the financial position of the related parties and themarkets in which the related parties operate.
In the ordinary course of business, the Group transacts with its related parties. The transactions andbalances of accounts with related parties follow:
Transactions with BPI, an affiliate
As of December 31, 2020 and 2019, the Group maintains current and savings accounts andshort-term investments with BPI amounting to nil and $1.14 million, respectively.
Total interest income earned from investments with BPI amounted to $0.01 million, $0.01 millionand $0.31 million for the years ended December 31, 2020, 2019 and 2018, respectively.
Outstanding balances of the Group’s related party transactions with its affiliates follow:
Receivables/Deposits Payables2020 2019 2020 2019
KTM Asia Motor Manufacturing Inc.(KAMMI) $184,412 $256,167 $– $–
Merlin Solar Technologies (Phils.) Inc.(MSTPI) 99,862 135,751 – –
AC Industrials Technology Inc.(AC Industrials) 14,979 48,055 – –
BPI – – 20,873 –Innove Communication, Inc. (ICI) 6,460Globe Telecom, Inc. (GTI) – – – 2,024
$299,253 $439,973 $27,333 $2,024
i. Transaction with KAMMI and MSTPI pertains to trade related receivables.
ii. Transaction with AC Industrials pertains to management fee on corporate and supportservices.
iii. Payable to BPI pertains to employee related transactions.
iv. Payables to ICI pertain to building rental, leased lines, internet connections and ATMconnections.
v. Payables to GTI pertain to billings for software and WiFi connections. These are due anddemandable.
Revenue/income and expenses from the Group’s affiliates follow:
Revenue/Income Expenses2020 2019 2018 2020 2019 2018
KAMMI $1,040,797 $1,361,041 $3,845,192 $– $– $–MSTPI 857,807 668,115 872,118 – – –AC Industrials 42,801 49,370 − – – –BPI 3,851 9,740 223,944 − − −IADI – – 110,900 – – –HCMI – – 66,540 – – –ACEI – – 15,430 – – –TLI – – – 1,407,557 1,094,592 1,032,845Laguna Water (LAWC) – – – 961,519 608,094 571,938AC – – – 676,738 1,913,224 1,664,336AG Legal – – – 172,011 113,111 131,289ICI – – – 135,011 210,871 132,578GTI – – – 103,492 147,337 108,812ACEHI – – – – 463,874 4,633,019
$1,945,256 $2,088,266 $5,134,124 $3,456,328 $4,551,103 $8,274,817

- 70 -
*SGVFSM005291*
Revenue/income from its affiliates pertains to the following transactions:
i. Revenues from KAMMI and MSTPI pertain to subcontracting services related to registeredactivities.
ii. Revenues from AC Industrials, IADI, HCMI and ACEI represent recoveries for the provisionof corporate and support services.
iii. Interest income earned from investments with BPI.
Expenses incurred from related party transactions include:
i. Light and power allocation charged by ACEHI to the Parent Company. The contract withACEHI ended in January 2019.
ii. Administrative services charged by AC related to certain transactions.
iii. Rental expense from the lease contract between the Parent Company and TLI.
iv. Water allocation charged by LAWC.
v. Building rental, leased lines, internet connections and ATM connections with ICI.
vi. Consultations on legal matters and assistance on regulatory and legal requirements from AGLegal.
vii. Billings for cellphone charges and WiFi connections with GTI.
Revenue and expenses eliminated at the Group level follow:
i. Intercompany revenues mainly pertain to billings of IMI USA and IMI Japan to IMI Singaporeand the Parent Company for recovery costs related to the management salaries of keymanagement personnel under IMI ROHQ.
ii. Expenses incurred from related party transactions include interest expense of PSi, IMI MX,STI and IMI CZ from loans granted by the Parent Company, IMI Singapore and STSN.
Guarantees and CommitmentsIMI BG has agreed to provide continuing operational, investment and financial assistance to thefacilities of C-Con GmbH (“C-Con”), a related party and an entity under common control of ACIndustrials, for C-Con will duly and timely perform all required obligations under contracts to beentered into with a particular customer. In case of C-Con’s failure to perform its contractualobligations under the contract including but not limited to failure to perform due to C-Con’s insolvency(“Breach”), IMI BG will indemnify and hold harmless the customer from any and all costs, liabilities,damages, losses, and reasonable amount of actually-incurred out of pocket expenses (including courtcosts and legal expenses) of the customer occasioned by or arising from such Breach. Asconsideration for extending said guarantee, IMI BG will be charging C-Con a guarantee feeequivalent to two (2%) of the revenue for the projects won using or relying upon IMI BG’s guarantee.Additionally, IMI BG’s guarantee to C-Con is backstopped by AC Industrials (Singapore) Pte. Ltd.,another related party of IMI BG.

- 71 -
*SGVFSM005291*
Compensation of Key Management Personnel of the GroupCompensation of key management personnel by benefit type follows:
2020 2019Short-term employee benefits $6,482,928 $9,513,678Post-employment benefits 73,519 206,487
$6,556,447 $9,720,165
32. Fair Values of Financial Instruments
Fair Values of Financial Assets and Financial Liabilities where the Carrying Amounts ApproximateFair ValuesFinancial assets and financial liabilities that are liquid or are short-term in nature which consist ofcash and cash equivalents, receivables, accounts payables and accrued expenses, loans payableand current portion of long-term debt, are assumed to have carrying amounts approximating their fairvalues.
Below are the fair values of financial assets and financial liabilities that are either carried at fair valueor where the carrying amounts do not approximate fair values as of December 31, 2020 and 2019:
Carrying Amounts Fair Values2020 2019 2020 2019
Financial assets:Financial assets at FVOCI $1,124,461 $1,199,763 $1,124,461 $1,199,763
Financial liabilities:Noncurrent portion of long-term debt $32,210,531 $114,385,913 $33,678,393 $109,757,132Financial liabilities on put options 1,592,518 22,370,085 1,592,518 22,370,085
$33,803,049 $136,755,998 $35,270,911 $132,127,217
The following methods and assumptions were used to estimate the fair value of each class offinancial instruments for which it is practicable to estimate such value:
Financial assets at FVOCI pertain to investments in club shares. Fair value is based on the mostrecent selling price of the club shares.
Derivatives - These pertain to currency forwards hedged by the Group for risks associated withforeign currency fluctuations. The fair value of the currency forwards is calculated by reference tocurrent forward exchange rates for contracts with similar maturities as advised by the counterparty tothe currency forwards contracts.
Financial liabilities on put options - These pertain to the liabilities of Cooperatief and IMI UK arisingfrom the written put options over the non-controlling interest of VIA and STI. The fair value of thefinancial liabilities is estimated using the discounted, probability-weighted cash flow method. Thefuture cash flows were projected using the equity forward pricing formula with reference to the currentequity value of the acquiree and the forecasted interest rate which is the risk-free rate in Germanyand UK. The risk-free rate used is (0.72%) and 0.17% for VIA and (1.27%) and 0.74% for STI for2020 and 2019, respectively. Management applied weights on the estimated future cash flows, basedon management’s judgment on the chance that the trigger events for the put options will occur.
The current equity value of VIA prior to derecognition is determined using the discounted cash flowapproach. The future cash flows are projected using the projected revenue growth rate of VIA. Thediscount rate represents the current market assessment of the risk specific to the acquiree, taking intoconsideration the time value of money and individual risks of the underlying assets that have not beenincorporated in the cash flow estimates. The discount rate calculation is based on the specificcircumstances of the acquiree and is derived from its weighted average cost of capital.

- 72 -
*SGVFSM005291*
For STI, management used the market approach by approximating the EBITDA multiple taken fromcomparable companies of STI that are engaged in providing electronics services solutions to deriveits current equity value. Management computed EBITDA as the difference of forecasted gross profitand selling and administrative expenses before depreciation and amortization. Another significantassumption is the probability of trigger event occurring within the put option period.
Contingent consideration - This pertains to the contingent consideration related to the acquisition ofSTI determined by discounting the probability weighted payout as estimated by management. Thepayout is estimated using the projected revenue growth rate of STI. The discount rate is based on thespecific circumstances of the acquiree and is derived from its weighted average cost of capital. Thecontingent liability was fully reversed in 2019.
Noncurrent portion of long-term debt - The fair value of long-term debt is estimated by using thediscounted cash flow method using the current incremental borrowing rates for similar borrowings,with maturities consistent with those remaining for the liability being valued. The discount rates usedfor 2020 and 2019 ranged from 1.67% to 2.33% and from 1.67% to 3.76%, respectively.
Fair Value HierarchyThe following tables provide the fair value hierarchy of the Group’s assets and liabilities:
December 31, 2020Fair Value Measurement Using
Quoted Pricesin ActiveMarkets(Level 1)
SignificantObservable
Inputs(Level 2)
SignificantUnobservable
Inputs(Level 3) Total
Assets measured at fair value:Financial assets at FVOCI $– $1,124,461 $– $1,124,461Liabilities measured at fair
value:Financial liabilities on put options $– $– $1,592,518 $1,592,518Liabilities for which fair values
are disclosed:Long-term debt $– $– $32,210,531 $32,210,531
December 31, 2019Fair Value Measurement Using
Quoted Pricesin ActiveMarkets(Level 1)
SignificantObservable
Inputs(Level 2)
SignificantUnobservable
Inputs(Level 3) Total
Assets measured at fair value:Financial assets at FVOCI $– $1,199,763 $– $1,199,763Liabilities measured at fair value:Financial liabilities on put options $– $– $22,370,085 $22,370,085Liabilities for which fair values aredisclosed:Long-term debt $– $– $114,385,913 $114,385,913

- 73 -
*SGVFSM005291*
The table below shows reconciliation of recurring fair value measurements categorized within Level 3of the fair value hierarchy:
Dec 31, 2019Mark-to-market
gain-netAdjustment
to APIC
CurrencyTranslationAdjustment Dec 31, 2020
Financial liabilities on put options $22,370,085 ($6,068,906) ($15,328,945) $620,284 $1,592,518
The Group’s policy is to recognize transfers into and transfers out of fair value hierarchy levels as ofthe date of the event or change in circumstances that caused the transfer.
There were no transfers between Level 1 and Level 2 fair value measurements, and no transfers intoand out of Level 3 fair value measurements.
The following table presents the valuation techniques and unobservable key inputs used to value theGroup’s financial liabilities categorized as Level 3:
December 31, 2020
ValuationTechnique
Unobservableinputs
Range ofunobservable
inputs Sensitivity of the input to the fair valueFinancial liabilitieson put options
Discounted,probability-weighted cash flowmethod
Probability oftrigger events
occurring
1%-10% (5%) Increase in the probability to 10% would result inan increase in fair value by $0.01 million.
Decrease in the probability to 1% would result in adecrease in fair value by $0.01 million.
December 31, 2019
ValuationTechnique
Unobservableinputs
Range ofunobservable
inputs Sensitivity of the input to the fair valueFinancial liabilitieson put options
Discounted,probability-weighted cash flowmethod
Growth rate 0%-2% (1%) 1% increase in growth rate would result in anincrease in fair value by $1.59 million. Decreasein growth rate by 1% would result in a fair value
decrease of $1.25 million.Discount rate 8%-10% (9%) 1% increase in discount rate would result in a
decrease in fair value by $1.83 million. Decreasein discount rate by 1% would result in a fair value
increase of $2.31 million.Probability oftrigger events
occurring
1%-10% (5%) Increase in the probability to 10% would result inan increase in fair value by $0.77 million.
Decrease in the probability to 1% would result in adecrease in fair value by $1.17 million.
33. Financial Risk Management Objectives and Policies
The Group’s principal financial instruments, composed of loans payable, long-term debt and otherfinancial liabilities, were issued primarily to raise financing for the Group’s operations. The Group hasvarious financial instruments such as cash and cash equivalents, receivables and accounts payableand accrued expenses which arise directly from its operations.
The main purpose of the Group’s financial instruments is to fund its operational and capitalexpenditures. The main risks arising from the Group’s financial instruments are interest rate risk,liquidity risk, credit risk and foreign currency risk. The Group also enters into currency forwards tomanage the currency risk arising from its operations and financial instruments.

- 74 -
*SGVFSM005291*
The Group’s risk management policies are summarized below:
Interest Rate RiskThe Group’s exposure to market risk for changes in interest rates relates primarily to its long-termdebt obligations with floating interest rates. The Group’s policy is to manage its interest cost using amix of fixed and variable rate debt.
The following table demonstrates the sensitivity to a reasonably possible change in interest rates,with all other variables held constant, of the Group’s income before income tax (through the impact onfloating rate borrowings) for the years ended December 31, 2020 and 2019. There is no other impacton the Group’s equity other than those already affecting income.
Effect on Net Loss before TaxIncrease/Decrease in Basis Points 2020 2019
+100 ($734,980) ($1,114,874)-100 734,980 1,114,874
The following table shows the information about the Group’s debt as of December 31, 2020 and 2019that are exposed to interest rate risk presented by maturity profile:
2020 2019Within one year $40,879,500 $78,369,092One to five years 32,618,457 33,118,322
$73,497,957 $111,487,414
Liquidity RiskLiquidity risk is the risk that the Group will encounter difficulty in raising funds to meet commitmentsassociated with financial instruments. The Group’s exposure to liquidity risk relates primarily to itsshort-term and long-term obligations. The Group seeks to manage its liquidity profile to be able tofinance its capital expenditures and operations. The Group maintains a level of cash and cashequivalents deemed sufficient to finance its operations. As part of its liquidity risk management, theGroup regularly evaluates its projected and actual cash flows. To cover financing requirements, theGroup intends to use internally-generated funds and loan facilities with local and foreign banks.Surplus funds are placed with reputable banks.
The table below summarizes the maturity profile of the Group’s financial liabilities based oncontractual undiscounted payments:
2020
On DemandLess than3 Months
3 to12 Months 1 to 5 Years Total
Accounts payable and accrued expenses:Trade payables $− $176,556,142 $− $− $176,556,142Employee-related accruals and contributions − 22,993,540 − − 22,993,540Accrued expenses* − 26,815,538 − − 26,815,538Nontrade payables − 15,625,138 − − 15,625,138Accrued interest payable − 821,933 − − 821,933Due to related parties − 27,333 − − 27,333Others − 63,315 − − 63,315
Contract liabilities − 1,515,095 − − 1,515,095Other financial liabilities 1,680,879 − − − 1,680,879Loans payable − 193,247,087 13,243,340 − 206,490,427Current portion of long-term debt − − 2,109,394 − 2,109,394Noncurrent portion of long-term debt** − − − 33,678,393 33,678,393
$1,680,879 $437,665,121 $15,352,734 $33,678,393 $488,377,127* Excluding statutory payables.** Including future interest payments.

- 75 -
*SGVFSM005291*
2019
On DemandLess than3 Months
3 to12 Months 1 to 5 Years Total
Accounts payable and accrued expenses:Trade payables $− $188,022,901 $− $− $188,022,901Accrued compensation and benefits − 20,768,163 − − 20,768,163Accrued expenses* − 14,887,159 − − 14,887,159Nontrade payables − 30,288,964 − − 30,288,964Accrued interest payable − 2,364,614 − − 2,364,614Due to related parties − 2,024 − − 2,024Others − 470,296 − − 470,296
Contract liabilities − 4,742,170 − − 4,742,170Financial liabilities on put options 22,370,085 − − − 22,370,085Loans payable − 109,861,945 16,189,602 − 126,051,547Current portion of long-term debt − − 28,037,902 − 28,037,902Noncurrent portion of long-term debt** − − − 117,999,395 117,999,395
$22,370,085 $371,408,236 $44,227,504 $117,999,395 $556,005,220* Excluding statutory payables.** Including future interest payments.
The financial liabilities in the above tables are gross undiscounted cash flows and these amounts areto be settled through cash and cash equivalents. Furthermore, liquid assets such as cash and cashequivalents and trade receivables, and available credit lines are used by the Group to manageliquidity.
Credit linesThe Group has credit lines with different financing institutions as of December 31, 2020 and 2019, asfollows:
2020 2019
Financial Institution / Currency Credit LimitAvailable
Credit Line Credit LimitAvailable
Credit LineLocal:
USD 112,000,000 9,000,000 68,000,000 26,000,000PHP 300,000,000 300,000,000 300,000,000 300,000,000
Foreign: USD 106,500,000 25,403,436 110,500,000 40,120,045
JPY 600,000,000 258,900,000 600,000,000 102,940,000Singapore Dollar (SGD) 32,000,000 11,075,000 32,000,000 27,679,595EUR 18,769,597 14,650,130 27,430,000 17,585,654GBP 5,000,000 2,721,751 5,000,000 3,648,121
Credit RiskCredit risk is the risk that the Group’s counterparties to its financial assets will fail to discharge theircontractual obligations. The Group’s major credit risk exposure relates primarily to its holdings of cashand cash equivalents and receivables from customers and other third parties. Credit riskmanagement involves dealing with institutions for which credit limits have been established. Thetreasury policy sets credit limits for each counterparty. The Group trades only with recognized,creditworthy third parties. The Group has a well-defined credit policy and established creditprocedures. The Group extends credit to its customers consistent with sound credit practices andindustry standards. The Group deals only with reputable, competent and reliable customers who passthe Group’s credit standards. The credit evaluation reflects the customer’s overall credit strengthbased on key financial and credit characteristics such as financial stability, operations, focus marketand trade references. All customers who wish to trade on credit terms are subject to credit verificationprocedures. In addition, receivable balances are monitored on an ongoing basis with the result thatthe Group’s exposure to bad debts is not significant.
The Group defines a financial asset as in default when internal or external information indicates thatthe Group is unlikely to receive the outstanding contractual amounts in full. Such internal or externalinformation includes discontinuance of orders, financial difficulty or insolvency, probable bankruptcyor other financial reorganization. Actual historical experience shows low defaulted accounts whichwere also substantially recovered subsequently resulting to insignificant write-offs.

- 76 -
*SGVFSM005291*
The Group’s maximum exposure to credit risk as of December 31, 2020 and 2019 is the carryingamounts of the financial assets. The Group’s maximum exposure for cash and cash equivalentsexcludes the carrying amount of cash on hand.
The Group has 20% and 25% of trade receivables relating to three major customers as ofDecember 31, 2020 and 2019, respectively.
As of December 31, 2020 and 2019, the aging analysis of receivables, contract assets andmiscellaneous deposits follows:
December 31, 2020Neither
Past Duenor Past Due but not Impaired Specifically
Total Impaired <30 Days 30-60 Days 60-90 Days 90-120 Days >120 Days ImpairedReceivables:
Trade $273,278,729 $225,019,629 $26,442,860 $10,695,524 $3,153,478 $1,009,684 $5,453,985 $1,503,569Nontrade 2,825,231 2,469,447 65,695 66,214 18,250 2,219 55,310 148,096Receivable from insurance 1,095,700 − − − − − − 1,095,700Receivable from employees 329,548 329,548 − − − − − −Due from related parties 299,253 299,253 − − − − − −Others 540,695 540,695 − − − − − −
Contract assets 54,525,401 54,525,401 − − − − − −Miscellaneous deposits 1,547,045 1,547,045 − − − − − −
$334,441,602 $284,731,018 $26,508,555 $10,761,738 $3,171,728 $1,011,903 $5,509,295 $2,747,365
December 31, 2019Neither
Past Duenor Past Due but not Impaired Specifically
Total Impaired <30 Days 30-60 Days 60-90 Days 90-120 Days >120 Days ImpairedReceivables:
Trade $284,594,422 $243,321,981 $20,071,061 $6,174,046 $4,368,587 $449,142 $9,157,890 $1,051,715Nontrade 6,080,113 5,765,890 26,151 46,769 43,508 3,284 37,388 157,123Receivable from insurance 1,086,673 − − − − − − 1,086,673Receivable from employees 642,995 642,995 − − − − − −Due from related parties 439,973 439,973 − − − − − −Others 94,696 94,696 − − − − − −
Contract assets 58,908,123 58,908,123 − − − − − −Miscellaneous deposits 1,558,138 1,558,138 − − − − − −
$353,405,133 $310,731,796 $20,097,212 $6,220,815 $4,412,095 $452,426 $9,195,278 $2,295,511
The following table summarizes the credit quality of the Group’s financial assets as of December 31,2020 and 2019:
December 31, 2020Neither Past Due nor Impaired Past Due or
MinimalRisk
AverageRisk
FairlyHigh Risk High Risk
IndividuallyImpaired Total
Cash and cash equivalents $244,355,425 $− $− $− $− $244,355,425Receivables: Trade 6,730,485 218,297,025 − − 48,251,219 273,278,729 Nontrade 2,469,473 − − − 355,758 2,825,231 Receivable from insurance − − − − 1,095,700 1,095,700 Receivable from employees 329,548 − − − − 329,548 Due from related parties 299,253 − − − − 299,253 Others 540,695 − − − − 540,695Financial assets at FVOCI 1,124,461 − − − 1,753,589 2,878,050Miscellaneous deposits 1,547,045 − − − − 1,547,045
$257,396,385 $218,297,025 $– $– $51,456,266 $527,149,676
December 31, 2019Neither Past Due nor Impaired Past Due or
MinimalRisk
AverageRisk
FairlyHigh Risk High Risk
IndividuallyImpaired Total
Cash and cash equivalents $152,660,116 $− $− $− $− $152,660,116Receivables: Trade 7,639,505 235,682,476 − − 41,272,441 284,594,422 Nontrade 5,765,890 − − − 314,223 6,080,113 Receivable from insurance − − − − 1,086,673 1,086,673 Receivable from employees 642,995 − − − − 642,995 Due from related parties 439,973 − − − − 439,973 Others 94,696 − − − − 94,696Financial assets at FVOCI 1,199,763 − − − 1,753,589 2,953,352Miscellaneous deposits 1,558,138 − − − − 1,558,138
$170,001,076 $235,682,476 $– $– $44,426,926 $450,110,478

- 77 -
*SGVFSM005291*
The Group classifies credit quality as follows:
Minimal Risk - Credit can proceed with favorable credit terms; can offer term of 15 to maximum of 45days.
Average Risk - Credit can proceed normally; can extend term of 15 to maximum of 30 days.
Fairly High Risk - Credit could be extended under a confirmed and irrevocable LC and subject tosemi-annual review for possible upgrade.
High Risk - Transaction should be under advance payment or confirmed and irrevocable Stand-ByLC; subject to quarterly review for possible upgrade after one year.
Foreign Currency RiskThe Group’s foreign exchange risk results primarily from movements of the functional currency ofeach legal entity against other currencies. As a result of significant transactions denominated in RMB,PHP and EUR the consolidated statements of income can be affected significantly by movements inthe USD versus these currencies. In 2020 and 2019, the Group entered into currency forwardcontracts to hedge its risks associated with foreign currency fluctuations.
The Group also has transactional currency exposures. Such exposure arises from sales or purchasesdenominated in other than the Group’s functional currency. Approximately 62% and 61% of theGroup’s sales for the years ended December 31, 2020 and 2019, respectively, and 58% and 48% ofcosts for the years ended December 31, 2020 and 2019, respectively, are denominated in currenciesother than USD.
The Group manages its foreign exchange exposure risk by matching, as far as possible, receipts andpayments in each individual currency. Foreign currency is converted into the relevant domesticcurrency as and when the management deems necessary. The unhedged exposure is reviewed andmonitored closely on an ongoing basis and management will consider hedging any material exposurewhere appropriate.
Information on the Group’s foreign currency-denominated monetary assets and liabilities and theirUSD equivalent follows:
Renminbi (RMB)2020 2019
In USD In RMB In USD In RMBCash and cash equivalents $2,351,896 RMB15,345,793 $12,454,756 RMB87,035,335Receivables 20,873,053 136,193,743 57,840,044 404,193,179Accounts payable and accrued
expenses (26,081,420) (170,177,605) (44,575,728) (311,500,545)Net foreign currency-denominated assets
(liabilities) ($2,856,471) (RMB18,638,069) $25,719,072 RMB179,727,969
Philippine Peso (P=)2020 2019
In USD In PHP In USD In PHPCash and cash equivalents $1,096,126 P=52,639,248 $1,006,890 P=50,983,899Receivables 2,015,909 96,809,988 903,770 45,762,395Miscellaneous deposits 718,605 34,509,570 681,536 34,509,570Accounts payable and accrued expenses (18,288,415) (878,264,558) (12,508,462) (633,365,998)Net retirement liabilities (8,989,957) (431,724,693) (7,549,797) (382,283,970)Net foreign currency-denominated
liabilities ($23,447,732) (P=1,126,030,445) ($17,466,063) (P=884,394,104)

- 78 -
*SGVFSM005291*
Euro (€)2020 2019
In USD In EUR In USD In EURCash and cash equivalents $2,990,044 €2,443,046 $2,919,381 €2,622,277Receivables 10,264,297 8,386,549 10,341,564 9,289,108Accounts payable and accrued expenses (16,388,400) (13,390,309) (9,088,738) (8,163,782)Net foreign currency-denominated assets
(liabilities) ($3,134,059) (€2,560,714) $4,172,207 €3,747,603
Information on the Group’s USD-denominated monetary assets and liabilities of the ParentCompany’s subsidiaries with functional currencies other than USD and which is also affected bymovements of USD compared with their respective functional currencies as at December 31, 2020and 2019 follows:
2020In USD In EUR In RMB In GBP
Cash and cash equivalents $100,824,850 €80,925,059 RMB1,936,150 £1,098,723Receivables 16,739,927 5,511,729 24,914,721 4,572,554Accounts payable and accrued
expenses (48,618,830) (15,520,948) (158,942,289) (3,896,969)Net foreign currency-denominated assets
(liabilities) $68,945,947 €70,915,840 (RMB132,091,418) £1,774,308*The USD-denominated monetary assets and liabilities are translated using EUR0.81706 for $1, RMB6.5249 for $1 andGBP0.74041 for $1.
2019In USD In EUR In RMB In GBP
Cash and cash equivalents $2,592,288 €1,043,813 RMB1,064 £1,096,419Receivables 13,763,749 3,194,786 359,633 7,786,193Accounts payable and accrued
expenses (27,643,450) (12,978,500) (31,648,618) (6,643,847)Net foreign currency-denominated assets
(liabilities) ($11,287,413) (€8,739,901) (RMB31,287,921) £2,238,765*The USD-denominated monetary assets and liabilities are translated using EUR0.8982 for $1, RMB6.9881 for $1 andGBP0.7667 for $1.
Sensitivity AnalysisThe following tables demonstrate sensitivity to a reasonably possible change in the USD exchangerate, with all other variables held constant, of the Group’s income before income tax (due to changesin the fair value of monetary assets and liabilities) as of December 31, 2020 and 2019. Thereasonably possible change was computed based on one year average historical movement ofexchange rates between the USD and other currencies.
There is no other impact on the Group’s equity other than those already affecting income. Theincrease in USD rate as against other currencies demonstrates weaker functional currency while thedecrease represents stronger USD value.
CurrencyIncrease/Decrease
in USD RateEffect on Net Income before Tax
2020 2019RMB +1% $31,134 ($284,898)
-1% (31,134) 284,898PHP +1% 246,365 167,699
-1% (246,365) (167,699)EUR +1% 49,052 (42,366)
-1% (49,052) 42,366USD* +1% 1,123,204 (138,146)
-1% (1,160,951) 141,162* The USD-denominated monetary assets and liabilities are translated using EUR0.81706 for $1, RMB6.5249 for $1 andGBP0.74041 for $1.

- 79 -
*SGVFSM005291*
DerivativesAs of December 31, 2020, and 2019, the outstanding forward contracts have a net fair value of$88,361 (liability) and $5,321 (asset), respectively. The changes in fair value of currency forwardsrecognized in 2020 and 2019 amounted to $0.1 million loss and $0.02 million gain, respectively. Thechanges in fair value of currency forwards are recognized in the consolidated statements of incomeunder “Foreign exchange gains (losses) - net” account.
Fair Value Changes on DerivativesThe net movements in the fair value of the Group’s derivative instruments as of December 31, 2020and 2019 follow:
2020 2019Financial assets:At beginning of year $5,321 $3,521Fair value of currency forwards − 15,373Fair value of settled instruments (5,321) (13,555)Foreign currency exchange difference − (18)At end of year $− $5,321Financial liabilities:At beginning of year $− $−Fair value of currency forwards 92,122 −Fair value of settled currency forwards − −Foreign currency exchange difference (3,761) −At end of year $88,361 $−
34. Contingencies
The Group has various contingent liabilities arising in the ordinary conduct of business which areeither pending decision by the courts or being contested. The outcome of these cases is not presentlydeterminable.
The Group’s expanding global activities, while continuing to present a myriad of growth opportunities,also tend to increase its exposure to potential disputes with customers and suppliers. Such exposurecould, in turn, directly or indirectly, affect the Group’s ability to realize its short and long-term targetrevenues and operating margins from its services as well as adversely impact its net assets, financialposition and results of operations. In this connection, the Group is currently involved in an ongoingarbitration proceeding arising from a contractual dispute with its customer.
In the opinion of management and its legal counsel, the eventual liability under these lawsuits orclaims, if any, will not have a material or adverse effect on the Group’s financial position and resultsof operations. The information usually required by PAS 37, Provisions, Contingent Liabilities andContingent Assets, is not disclosed on the ground that it can be expected to prejudice the outcome ofthese lawsuits, claims and assessments.
35. Notes to Consolidated Statements of Cash Flows
The Group’s noncash investing activities include capitalization by the Group of depreciation related tothe development phase of certain projects amounting to nil and $1.57 million for 2020 and 2019,respectively. During the year, the Group transferred property, plant and equipment with a net bookvalue of $2.56 million to other noncurrent assets, and licenses to intangible assets amounting to$2.11 million.

- 80 -
*SGVFSM005291*
The following table shows the reconciliation of liabilities arising from financing activities:
Cash Flows Non-cash Changes
2019 AvailmentSettlement/
Payment Reclass Addition Declaration
Accretionof interest
expenseWaivedrentals
Foreigncurrency
translation 2020Dividends payable $– $– ($6,504,083) $– $– $6,504,083 $– $– $– $–Loans payable 126,051,547 82,665,635 (4,974,751) − − – – – 2,747,996 206,490,427Current portion of
long-term debt 28,037,902 − (28,288,035) 2,062,455 – – – – 297,072 2,109,394Long-term debt 114,385,913 − (80,209,436) (2,062,455) – – – – 96,509 32,210,531Lease liabilities 33,797,712 − (10,799,326) – 10,050,921 – 1,644,189 (422,841) 1,142,605 35,413,260Other noncurrent
liabilities 3,623,257 1,640,002 − – – – − − − 5,263,259$305,896,331 $84,305,637 ($130,775,631) $– $10,050,921 $6,504,083 $1,644,189 ($422,841) $4,284,182 $281,486,871
Cash Flows Non-cash Changes
2018 AvailmentSettlement/
Payment Reclass Addition Declaration
Accretion ofinterestexpense
Foreigncurrency
translation 2019Dividends payable $– $– ($4,436,707) $– $– $4,436,707 $– $– $–Loans payable 136,338,960 11,099,338 (20,540,547) − − – – (846,204) 126,051,547Current portion of long-term debt 63,431,844 − (46,510,457) 11,167,522 – – – (51,007) 28,037,902Long-term debt 124,543,174 903,420 − (11,167,522) – – – 106,841 114,385,913Lease liabilities 39,099,942 − (7,603,732) – 1,174,346 – 1,368,494 (241,338) 33,797,712Other noncurrent
liabilities 5,249,903 − (1,626,646) – − – − − 3,623,257$368,663,823 $12,002,758 ($80,718,089) $– $1,174,346 $4,436,707 $1,368,494 ($1,031,708) $305,896,331
Most of the loans are from existing revolving credit lines.
36. Other Matters
Corporate Recovery and Tax Incentives for Enterprises Act” or “CREATE”On February 3, 2021, the Bicameral Conference Committee, under the 18th Congress of thePhilippines, ratified the reconciled version of the House Bill No. 4157 and Senate Bill No.1357(the CREATE). Some of the key features of the CREATE bill are the following:
Reduction in current income tax rate from 30% to 25% or 20%, whichever is applicable, effectiveJuly 1, 2020;
Reduction of non-deductible interest expense Effective July 1, 2020 until June 30,2023, the MCIT rate shall be one percent 1%; Exemption to tax on foreign-sourced dividends received subject to certain conditions; Imposition of improperly accumulated earnings tax is hereby repealed; Rationalization of fiscal incentives
As at February 24, 2021, the harmonized copy of the CREATE bill has been transmitted to the Officeof the President for signing or approval into law.
COVID-19 PandemicThe manufacturing operations of IMI was highly affected by various government mandated lockdownsin China, Philippines and Mexico and voluntary shutdowns in the Europe factories to align with thedemand slowdown during the first half of the year. Revenues in the second half of the year recouped,39% better than first half and 7% higher year-on year on the back of strong demand recovery andsubsequent normalization of operations. The global demand for security and I-o-T products boostedindustrial revenue while mobility-focused European and North American facilities benefitted from therapid rise of global automotive production. In addition, IMI’s growing foothold in the profitable medicalsegment also led to increased higher margin sales for its manufacturing plants in Asia.
To mitigate the impact of the lockdowns, various sites affected obtained approvals to run essentialbusinesses, optimized manpower resources and implemented various cost cutting initiatives. TheGroup also collaborated with local government units to secure various forms of employee relatedsubsidies as a result of the shutdowns in Bulgaria, China, Czech Republic, France, Mexico, Serbia,

- 81 -
*SGVFSM005291*
and Singapore. These, along with improved manufacturing efficiency drove improved margins andlower losses compared to last year.
The effects of potential recurrence of pandemic related shutdowns after the reporting period maypose risks and unfavorable impact to the Company but will not materially affect the Company’s abilityto continue as going concern.

*SGVFSM005291*
INDEPENDENT AUDITOR’S REPORTON SUPPLEMENTARY SCHEDULES
The Stockholders and the Board of DirectorsIntegrated Micro-Electronics, Inc.North Science AvenueLaguna TechnoparkBiñan, Laguna
We have audited in accordance with Philippine Standards on Auditing, the consolidated financialstatements Integrated Micro-Electronics, Inc. and its subsidiaries (the Group) as at December 31, 2020and 2019, and for each of the three years in the period ended December 31, 2020, included in thisForm 17-A and have issued our report thereon dated March 2, 2021. Our audits were made for thepurpose of forming an opinion on the basic consolidated financial statements taken as a whole. Theschedules listed in the Index to the Consolidated Financial Statements and Supplementary Schedules arethe responsibility of the Group’s management. These schedules are presented for purposes of complyingwith the Revised Securities Regulation Code Rule 68, and are not part of the basic consolidated financialstatements. These schedules have been subjected to the auditing procedures applied in the audit of thebasic consolidated financial statements and, in our opinion, fairly state, in all material respects, thefinancial information required to be set forth therein in relation to the basic consolidated financialstatements taken as a whole.
SYCIP GORRES VELAYO & CO.
Cyril Jasmin B. ValenciaPartnerCPA Certificate No. 90787SEC Accreditation No. 1737-A (Group A), January 24, 2019, valid until January 23, 2022Tax Identification No. 162-410-623BIR Accreditation No. 08-001998-074-2020, December 3, 2020, valid until December 2, 2023PTR No. 8534376, January 4, 2021, Makati City
March 2, 2021
SyCip Gorres Velayo & Co.6760 Ayala Avenue1226 Makati CityPhilippines
Tel: (632) 8891 0307Fax: (632) 8819 0872ey.com/ph
BOA/PRC Reg. No. 0001, October 4, 2018, valid until August 24, 2021SEC Accreditation No. 0012-FR-5 (Group A),
November 6, 2018, valid until November 5, 2021
A member firm of Ernst & Young Global Limited

*SGVFSM005291*
INDEPENDENT AUDITOR’S REPORT ONCOMPONENTS OF FINANCIAL SOUNDNESS INDICATORS
The Stockholders and the Board of DirectorsIntegrated Micro-Electronics, Inc.North Science AvenueLaguna TechnoparkBiñan, Laguna
We have audited in accordance with Philippine Standards on Auditing, the consolidated financialstatements of Integrated Micro-Electronics, Inc. and its subsidiaries (the Group) as at December 31, 2020and 2019 and for each of the three years in the period ended December 31, 2020, and have issued ourreport thereon dated March 2, 2021. Our audits were made for the purpose of forming an opinion on thebasic consolidated financial statements taken as a whole. The Supplementary Schedule on FinancialSoundness Indicators, including their definitions, formulas, calculation, and their appropriateness orusefulness to the intended users, are the responsibility of the Company’s management. These financialsoundness indicators are not measures of operating performance defined by Philippine FinancialReporting Standards (PFRS) and may not be comparable to similarly titled measures presented by othercompanies. This schedule is presented for the purpose of complying with the Revised SecuritiesRegulation Code Rule 68 issued by the Securities and Exchange Commission, and is not a required partof the basic consolidated financial statements prepared in accordance with PFRS. The components ofthese financial soundness indicators have been traced to the Group’s consolidated financial statements asat December 31, 2020 and 2019 and for each of the three years in the period ended December 31, 2020and no material exceptions were noted.
SYCIP GORRES VELAYO & CO.
Cyril Jasmin B. ValenciaPartnerCPA Certificate No. 90787SEC Accreditation No. 1737-A (Group A), January 24, 2019, valid until January 23, 2022Tax Identification No. 162-410-623BIR Accreditation No. 08-001998-074-2020, December 3, 2020, valid until December 2, 2023PTR No. 8534376, January 4, 2021, Makati City
March 2, 2021
SyCip Gorres Velayo & Co.6760 Ayala Avenue1226 Makati CityPhilippines
Tel: (632) 8891 0307Fax: (632) 8819 0872ey.com/ph
BOA/PRC Reg. No. 0001, October 4, 2018, valid until August 24, 2021SEC Accreditation No. 0012-FR-5 (Group A),
November 6, 2018, valid until November 5, 2021
A member firm of Ernst & Young Global Limited

* In the process of liquidation.
** Dormant
Integrated Micro-Electronics, Inc.as of December 2020
100%
100%
100%
50.32%
100%
100%
100%
100%
100%
100%
100%
80%
100%
100%
100%100%100%100%
100%
Integrated Micro-Electronics, Inc.
IMI International (Singapore) Pte. Ltd.
IMI USA IMI Japan PSI Technologies, Inc.
PSiTech Realty, Inc. 40%*
IMI International Regional Operating Headquarter
(“IMI ROHQ”)
Speedy-Tech Electronics (HK) Limited (“STHK”)
IMI France SAS
IMI Microenergia
EOOD
Pacsem Realty, Inc. 64%*
60%Speedy-Tech ElectronicsCooperatief IMI Europe
U.A.
IMI Bulgaria EOOD
(IMI BG)
IMI Czech Republic s.r.o (IMI
CZ)
IMI MX, S.A.P.I. de C.V.
(IMI MX)
100%
100%
100%
100%
100%
100% 100%
100%
100%
Speedy-Tech (Philippines), Inc.
(“STPHIL”) **
100%
Speedy-Tech Electronics (Jiaxing) Co. Ltd. (“STJX”)
IMI (Chengdu) Ltd. (IMI CD)
40%
40%
OthersAC Industrials
52.03% 47.97%
VIA Optronics AGVIA Optronics
GmbH50.32%
VIA Optronics (Suzhuo) Co. Ltd.
50.32%
IMI Niš(Serbia)
100%
IMI UK
STI Enterprises Ltd.
STI Limited 80%
STI Philippines Inc. 80%
STI Asia Ltd.*80%
STI Supplychain Ltd. * 80%
IMI Technology (SZ) Co. Ltd.
VIA Optronics LLC 50.32%
ST Intercept80%
Ayala Corporation
100%
MERMAC, Inc.
47.3%
100% VIA Optronics (Taiwan) Ltd.
50.32%
65% VTS Touchsensor Co. Ltd. 32.70%
IMI Smart Technology (Shenzhen) Co., Ltd.

INTEGRATED MICRO-ELECTRONICS, INC RECONCILIATION OF RETAINED EARNINGS AVAILABLE FOR DIVIDEND DECLARATION DECEMBER 31, 2020 (in U.S. Dollars) Unappropriated retained earnings, beginning $24,600,400 Previous years’ reconciliation adjustments
Treasury shares (1,012,588) Unrealized foreign exchange gain - net (except those
attributable to cash and cash equivalents)
(2,505,098)
Redemption of preferred shares (1,627,019) Other unrealized gains or adjustments to the retained earnings
as a result of certain transactions accounted for under the PFRS
(6,426,763)
(11,571,468)
Unappropriated retained earnings, as adjusted for dividend distribution, beginning
13,028,932
Add: Net loss actually earned/realized during the year (10,447,482) Net income during the year closed to Retained Earnings
Less: Non-actual/unrealized income, net of tax
Equity in net income of associate/joint venture Unrealized foreign exchange gain - net (except those
attributable to cash and cash equivalents)
-
Fair value adjustment (M2M gains) - Fair value adjustment of Investment Property resulting to gain - Adjustment due to deviation from PFRS/GAAP-gain - Other unrealized gains or adjustments to the retained earnings
as a result of certain transactions accounted for under the PFRS -
Subtotal (10,447,482) (10,447,482) Add: Non-actual losses
Depreciation on revaluation increment (after tax) - Adjustment due to deviation from PFRS/GAAP – loss - Loss on fair value adjustment of investment property (after tax) - Subtotal -
Net income actually earned during the year
2,581,450
Add (less):
Dividend declarations during the year - Appropriations of Retained Earnings during the period - Reversals of appropriations - Effects of prior period adjustments - Treasury shares -
TOTAL RETAINED EARNINGS AVAILABLE FOR DIVIDEND DECLARATION, END
$2,581,450

Integrated Microelectronics, Inc. and SubsidiariesSchedule C. Amounts Receivable from Related Parties which are Eliminated during the Consolidation of Financial StatementsDecember 31, 2020(in U.S. Dollars)
Name and designation of debtor
Balance at beginning of
period Additions Amounts collected
Amounts written off Current
Balance at end of period
Accounts receivable -tradeIMI Cooperatief Subsidiaries 2,029,088 2,707,345 3,443,300 1,293,133 1,293,133 STI 203,977 1,081,317 1,069,678 215,615 215,615 IMI International (Singapore) Pte Ltd. 3,658,059 53,603,573 43,412,011 13,849,621 13,849,621 STEL Group 776,866 25,894,995 24,674,840 1,997,021 1,997,021 PSi Technologies Inc. 217,470 729,403 35,107 911,766 911,766 IMI USA 20 - 20 - - IMI Japan 29,957 - 29,957 29,957
Accounts receivable -nontrade - - - IMI Cooperatief Subsidiaries 5,281,629 35,444,481 33,453,001 7,273,109 7,273,109 STEL Group 451,316 2,579,660 1,969,223 1,061,753 1,061,753 PSi Technologies Inc. 27,896,077 1,986,271 26,672,573 3,209,776 3,209,776 STI - 31,667 9,856 21,812 21,812 IMI International (Singapore) Pte Ltd. 11,179,817 6,487,516 13,938,635 3,728,697 3,728,697 IMI International ROHQ 1,184,690 51,190 243,047 992,833 992,833 IMI USA 28,224 23,678 - 51,902 51,902 IMI Japan 986,108 12,551 - 998,660 998,660
Due From - - - IMI Cooperatief Subsidiaries 31,560,480 443,511 30,551,519 1,452,473 1,452,473 IMI International (Singapore) Pte Ltd. 73,322,806 34,004,317 17,739,833 89,587,290 89,587,290 STEL Group 1,007,904 - 1,007,904 - - IMI USA 250,000 284 - 250,284 250,284 STI 682 1,300 0 1,982 1,982
Total 160,065,170 165,083,060 198,220,547 - 126,927,683 126,927,683

Integrated Micro-Electronics, Inc. and SubsidiariesSchedule F. Indebtedness to Related Parties December 31, 2020(in U.S. Dollars)
Indebtedness to Related Parties (Long-term Loans from Related Companies)
Name of Related PartyBalance at Beginning of
PeriodBalance at End of
PeriodNOT APPLICABLE
Related party payables eliminated during consolidation:
Name of Related PartyBalance at Beginning of
PeriodBalance at End of
Period
Accounts Payable - TradeSpeedy-Tech Electronics Ltd. 6,708,948 5,511,728 PSi Technologies Inc. - 4,701 IMI Cooperatief Subsidiaries 275,323 -
Accounts Payable - NontradeSpeedy-Tech Electronics Ltd. 4,316 700 IMI USA 39 44,051 IMI Japan 81,615 - IMI Cooperatief Subsidiaries 275,323 51,601
Due ToSpeedy-Tech Electronics Ltd. 1,376,135 3,663,780 IMI International ROHQ 29,387 1,236 PSi Technologies Inc. 104,140 102,785 IMI Japan 425,529 435,615 IMI USA 840,989 68,859 IMI Cooperatief Subsidiaries 1,389,136 1,301,728
Total 11,510,881 11,186,784
Note 1. These related party liabilities are payable on demand.

INTEGRATED MICRO-ELECTRONICS INC. AND SUBSIDIARIESFINANCIAL RATIOSDecember 31, 2020
Ratios Formula Dec 31, 2020 Dec 31, 2019
(i) Current ratioCurrent assets / Current
Liabilities 1.54 1.49
(ii) Quick / Acid ratio
Current assets less inventories, contract assets
and other current assets/Current liabilities 1.09 0.98
(iii) Solvency ratio Total Assets / Total Liabilities 2.05 1.79 (iv) Debt ratio Total Debt / Total Assets 0.21 0.24
(v) Debt-to-Equity ratio
Bank debts (loans and trust receipts payable and long-term debt) / Total Equity 0.41 0.55
(vi) Assets-to-Equity ratio Total Assets / Total Equity 1.95 2.27
(vii) Interest rate coverage ratioEarnings before interest and
taxes / Interest Expense 0.83 0.08 (viii) Profitability ratios
GP margin Gross Profit / Revenues 8.5% 8.2%
Net profit marginNet Income after Tax /
Revenues -0.30% -0.62%EBITDA margin EBITDA / Revenues 5.2% 3.3%
Return on assetsNet Income after Tax / Total
Asset -0.30% -0.71%
Return on equity
Net Income after Tax / Average equity attributable to
parent -0.83% -1.98%
Dec 31, 2020 Dec 31, 2019
Current Assets 734,174 673,947 Current Liabilities 476,756 453,790 Total Assets 1,133,675 1,096,336 Bank Debts 240,810 268,475 Total Liabilities 552,812 612,557 Total Equity 580,863 483,779 Average equity Attributable to parent 415,122 392,796 Revenues 1,135,841 1,250,366 Gross Profit 96,337 102,228 Net income attributable to equity holders of the parent (3,455) (7,780) Earnings before interest and taxes 8,644 1,076 Interest expense 10,423 13,142 EBITDA 58,884 41,381
(in US$'000)