RMIS View/Print Document Cover Sheet - International ...
291
*** RMIS View/Print Document Cover Sheet *** This document was retrieved from the Documentation and Records Manaqement (DRM) ISEARCH System. It is intended for Information only and may not be the most recent or updated version. Contact a Document Service Center (see Hanford Info for locations) if you need additional retrieval information. Accession #: D196030799 Document #: SD-WM-VI-031 Title/Desc: VECTRA GSI INC LLW MELTER TESTING PHASE 1 TEST REPORT Pages: 291
-
Upload
khangminh22 -
Category
Documents
-
view
3 -
download
0
Transcript of RMIS View/Print Document Cover Sheet - International ...
*** RMIS View/Print Document Cover Sheet ***
This document was retrieved from the Documentation and RecordsManaqement (DRM) ISEARCH System. It is intended for Informationonly and may not be the most recent or updated version. Contact aDocument Service Center (see Hanford Info for locations) if you needadditional retrieval information.
Accession #: D196030799
Document #: SD-WM-VI-031
Title/Desc:VECTRA GSI INC LLW MELTER TESTING PHASE 1 TESTREPORT
Pages: 291

FEB 21 ENGINEERING DATA TRANSMITTALPage \ of
N2 611890
2. To: (Receiving Organization)
Distribution3. From: (Originating Organization)
Waste Product Technology4. Related EDT No.:
N/A5. Proj./Prog./Dept./Div.:
TWRS LLW Program6. Cog. Engr.:
G. E, Stegen (509) 376-55487. Purchase Order No.:
MMI-SVV-3842118. Originator Remarks:
VECTRA GSI, Inc. LLW melter testing Phase 1 test report forissuance.
9. Equip./Component No.:
N/A10. System/Bldg./Facility:
N/A11. Receiver Remarks:
N/A12. Major Assm. Dug. No.:
N/A13. Permit/Permit Application No.
N/A14. Required Response Date:
N/A
15. DATA TRANSMITTED (F ) (G) (H) ( I )IA)
ItemNo.
(B) Document/Drawing No.
(C)Sheet
No.
(D)Rav.No.
IE) Title or Description of DataTransmitted
ApprovalDesig-nator
Reasonfor
Trans-mittal
Origi-nator
Dispo-sition
Receiv-er
Dispo-sition
WHC-SD-WM-VI-031 VECTRA GSI, Inc. Low-Level Waste MelterTesting Phase 1 TestReport
1,2
16. KEY
Approval Designator (F) Reason for Transmittal (G) Disposition (H) & ID
E, S, Q, D or N/A{see WHC-CM-3-5,Sec.12.7)
1. Approval 4. Review2. Release 5. Post-Review3. Information 6. Dist. (Receipt A cknow. Required)
1. Approved2. Approved w/comment3. Disapproved w/comment
4. Reviewed no/comment5. Reviewed w/comment6. Receipt acknowledged
(G) (H) 17. SIGNATURE/DISTRIBUTION(See Approval Designator for required signatures)
(G) IH)
Rea-son
Disp. (J) Name (K) Signature (L) Date (M) MSIN (J) Name (K) Signature (L) Date (M) MSIN Rea-son
Disp.
Cog,Eng. G.E. Stegen H5-27 K.C. Burgard
Cog. Mgr. Q & g C.N. Wilson H 5 " 2 7
OA: D.W.
Safety
Env.
Signature Wf EDT / DOriginat-^ '
19.
Authorized Representative Datefor Receiving Organization
20.
Cognizant Manager Da
21, DOE APPROVAL (if required)Ctrl. No.
[] Approved[] Approved w/comments[] Disapproved w/comments
BD-7400-172-2 (04/94) GEF097
BD-74OO-172-1

WHC-SD-WM-VI-031, Rev. 0
Vectra GSI, Inc. Low-Level Waste Melter TestingPhase 1 Test Report
G. E. Stegen, C. N. WilsonWestinghouse Hanford Company, Richland, WA 99352U.S. Department of Energy Contract DE-AC06-87RL10930
EDT/ECN: 611890 UC: 2020Org Code: 73510 Charge Code: D4NC0B&R Code: EW3130010 Total Pages: 287
Key Words: Low-level waste, vitrification, melter, Hanford Site tankwaste, fluid bed calcination, rotary dryer, slurry feed
Abstract: A multiphase program was initiated in 1994 to testcommercially available melter technologies for the vitrification of thelow-level waste (LLW) stream from defense wastes stored in undergroundtanks at the Hanford Site in southeastern Washington State. VectraGSI, Inc. was one of seven vendors selected for Phase 1 of the melterdemonstration tests using simulated LLW that were completed duringfiscal year 1995. The attached report prepared by Vectra GSI, Inc.describes results of melter testing using slurry feed and dried feeds.Results of feed drying and prereaction tests using a fluid bed calcinerand rotary dryer also are described.
TRADEMARK DISCLAIMER. Reference herein to any specific commercial product, process, or service bytrade name, trademark, manufacturer, or otherwise, does not necessarily constitute or imply itsendorsement, recommendation, or favoring by the United States Government or any agency thereof orits contractors or subcontractors.
Printed in the United States of America. To obtain copies of this document, contact: UHC/BCSDocument Control Services, P.O. Box 1970, Mailstop H6-08, Rich Iand WA 99352. Phone (509) 372-2420;Fax (509) 376-4989.
FEB 21199DATE:
Release Approval Date Release Stamp
Approved for Public Release
A-6400-073 (10/95) GEF321

WHC-SD-WM-VI-031Revision 0
PART 1 - FLUID BED CALCINERTEST REPORT
l - i

WHC-SD-WM-VI-031Revision 0
FLUID BED CALCINERTEST REPORT - FINAL
For
WHC Contract No. MMI-SVV-384211
EVALUATION OF MELTER SYSTEM TECHNOLOGIES FORVITRIFICATION OF HIGH SODIUM CONTENT LLRW
VECTRA GSI Report No. WHC-VIT-03
August 1995
by
VECTRA Government Services, Inc.2939 Richardson RoadRichland, WA 99352
Prepared by: Approved by:
John J. Koehr < ? A ^ ) ^ ^ ^ Brad Mason1
Brent Spurgeon

WHC-SD-WM-VI-031Revision 0
CONTENTS
1.0 INTRODUCTION 1-1
2.0 PURPOSE 1-1
3.0 CHRONOLOGY OF EVENTS 1-2
4.0 EQUIPMENT OPERATING BEHAVIOR 1-24.1 CALIBRATION 1-2
4.1.1 Waste Feed Pump 1-24.1.2 Pressure Indicator (PI) Calibration 1-24.1.3 Temperature Indicator (TI) Calibration 1-24.1.4 CEMS Calibration 1-6
4.2 FLOW DIAGRAM 1-64.3 CHEMICAL MIXING AND BATCHING 1-7
4.3.1 Bench and Pilot Simulant Feed System 1-74.3.2 Bench and Pilot Calciner Filter Blowback Gas 1-74.3.3 Bench Scale Calciner Start-up and Shutdown Sequence . . 1-84.3.4 Sampling 1-84.3.5 Bench Scale Scrubber Solution 1-94.3.6 Bench Scale Dry Glass Former Feed System 1-9
5.0 BENCH SCALE TESTS AND OBSERVATIONS 1-95.1 GLASS FORMER FLUIDIZATION TESTS 1-95.2 FBC-SO: GLASS FORMERS W/ WATER/SIMULANT, NO REDUCTANTS . . . 1-105.3 FBC-S1: GLASS FORMERS AND SIMULANT W/ 600% SUCROSE AT
700 °C 1-125.4 FBC-S2: GLASS FORMERS AND SIMULANT W/ 200% AMMONIA AT
700 °C 1-135.5 FBC-S3: GLASS FORMERS AND SIMULANT W/ 100% SUCROSE AT
700 °C 1-145.6 FBC-S4: GLASS FORMERS AND SIMULANT W/ 125% SUCROSE AT
500 °C 1-155.7 FBC-S5: GLASS FORMERS AND SIMULANT W/ 100% SUCROSE AT
500 °C 1-155.8 FBC-S6: GLASS FORMERS AND SIMULANT W/ 200% AMMONIA AT
500 °C 1-155.9 FBC-S7: GLASS FORMERS AND SIMULANT W/ 200% HYDROGEN AT
300 °C 1-165.10 FBC-S8: GLASS FORMERS AND SIMULANT W/ 200% METHANE AT
500 °C 1-165.11 FBC-S9: GLASS FORMERS AND SIMULANT W/ 75% SUCROSE AT
500 °C 1-165.12 FBC-S10: GLASS FORMERS W/ 100% BORIC ACID FEED AT 500 °C . . 1-175.13 FBC-S11: GLASS FORMERS (INCLUDING 9% BORIC ACID) AND
16% BORIC ACID FEED AT 500 °C 1-175.14 FBC-S12: GLASS FORMERS W/ BORIC OXIDE FEED AND SIMULANT
W/ 100% SUCROSE AT 400 °C 1-185.15 FBC-S13: GLASS FORMERS W/ BORIC OXIDE FEED AND SIMULANT
W/ 100% SUCROSE AT 425 °C 1-195.16 BENCH SCALE TEST EVALUATION SUMMARY 1-19

WHC-SD-WM-VI-031Revision 0
CONTENTS (cont)
6.0 PILOT SCALE TESTS AND OBSERVATIONS 1-216.1 FBC-PO: GLASS FORMERS WITH WATER 1-216.2 PRODUCTION RUN: GLASS FORMERS AND SIMULANT WITH
100% SUCROSE 1-22
7.0 CONCLUSIONS 1-23
8.0 RECOMMENDATIONS FOR FUTURE TESTING 1-24
APPENDIXES
1A LAB ANALYSES 1-25
IB MASS BALANCE CALCULATIONS 1-71
1C DATA SHEETS 1-91
LIST OF TABLES
1-1 Fluid Bed Calciner Test Log Summary 1-3
1-2 Fluid Bed Composition, Glass Former Mix A 1-11
1-3 Fluid Bed Composition, Glass Former Mix B 1-12
1-4 Fluid Bed Composition, Glass Former Mix C 1-14
1-5 Fluid Bed Composition, Glass Former Mix D 1-18
1-6 Fluid Bed Composition, Glass Former Mix E 1-19
1-7 Bench Scale Fluid Bed Calciner Test Run Summary 1-20
1-8 Pilot Scale Glass Former Mix C 1-21
1 - i i v

WHC-SD-WM-VI-031Revision 0
ACRONYMS
GSI VECTRA Government Services, Inc.LLRW low-level radioactive wasteMCW melter cooling waterRBEA Roger B. Ek AssociatesRVR radwaste volume reductionTPD tons per dayWHC Westinghouse Hanford Company
1-v
WHC-SD-WM-VI-031Revision 0
This page intentionally left blank,
1-vi

WHC-SD-WM-VI-031Revision 0
PART 1 - FLUID BED CALCINER TEST REPORT
1.0 INTRODUCTION
The Westinghouse Hanford Company (WHC) is conducting an evaluation ofglass melter system technologies for vitrification of liquid low-levelradioactive waste (LLRU) streams consisting mostly of sodium nitrate andnitrite salts in alkaline liquid slurry form. As part of this technoloqyevaluation, VECTRA will demonstrate the performance of the EnviroGlassTrVitrification System feed and VE-SKULL™ melter subsystems. The Fluid BedCalciner system is part of the melter feed system and is intended to dry andreact the liquid waste simulant and mix the simulant with glass formers priorto vitrification.
2.0 PURPOSE
This test report documents accomplishment of the Fluid Bed Calciner testobjectives. Test objectives included the following:
2.1 Demonstrate that a fluidized bed can be operated successfully toproduce a dry, prereacted material that is suitable as a melter feedusing at least one reductant.
2.2 Demonstrate ability of fluid bed calciner to do the following:- Evaporate water- Volatize C03, NO,, and N02- Reduce N03 and No2 with good yield of N2 gas- Calcine inorganics (Na, K, Al, Ca, etc.)- Pyrolyze/Oxidize organics.
2.3 Determine throughput of calciner when operating within parametersfor achieving objectives 2.1 and 2.2.
2.4 Determine efficiency of N03/N02 reductions to N2 using the followingadditives: methane (CH4) gas, hydrogen (H2) gas, solid sucrose(ci2H22°ii)» and ammonia (NH,) gas. Investigate affects of reductantto nitrate ratio over a wide temperature range.
TMVE-SKULL and EnviroGlass are trademarks of VECTRA Technologies, Inc
1-1

WHC-SD-WM-VI-031Revision 0
3.0 CHRONOLOGY OF EVENTS
A detailed chronology of fluid bed calciner bench scale testing has beenrecorded in the Test Log. A brief summary is provided in Table 1-1. Numbersshown in parentheses following the VECTRA GSI test number are correspondingProcedyne test numbers.
4.0 EQUIPMENT OPERATING BEHAVIOR
4.1 CALIBRATION
Generally, equipment calibration was performed and documented as requiredby the Test Procedure. Any deviations from the test procedure or otherwisenoteworthy equipment calibration related events are summarized below.
4.1.1 Waste Feed Pump
1. Initial Waste feed pump (pump no. 1) was a laboratory, positivedisplacement, piston type, simplex pump. Pump calibration wasperformed at various piston stroke settings (0-10 range) to developa curve of pump setting vs. flowrate. Pump no.l flowrates becameinconsistent during FBC-SO (1-2) testing and the pump was unable toovercome vessel pressure, indicating pump failure.
2. A back-up feed pump (pump no. 2) was calibrated and installed. Pumpno. 2 was a 20 GPD peristaltic tubing pump with variable speed and adischarge pressure rating of 25 psig. The pump was calibrated usingwater and various pump speeds. A curve of pump speed (rpm) vs. flowrate (ml/min)was generated over the range of the pump. Calibratedsettings were verified at multiple discharge pressure settings andwith simulant and sucrose mixtures. Calibration data are includedin Reference 3.2. Pump no. 2 tubing kit was replaced on 2/15/95prior to FBC-S3 (1-7) testing. A single point calibration check wasperformed and found to be consistent with the original calibration.
4.1.2 Pressure Indicator (PI) Calibration
Original pressure gauge PI-FG, for the fluidizing gas supply pressure tothe vessel, had a low ra-nge (0-100" water). Over the course of testing, thisgauge was replace with a 0-10 psig gauge. Gauges were calibrated.
4.1.3 Temperature Indicator (TI) Calibration
Thermocouples Tl through T6 were calibrated using a manufacturer'scalibrated thermocouple (TC) with 2-point temperature check.
1-2

WHC-SD-WM-VI-031Revision 0
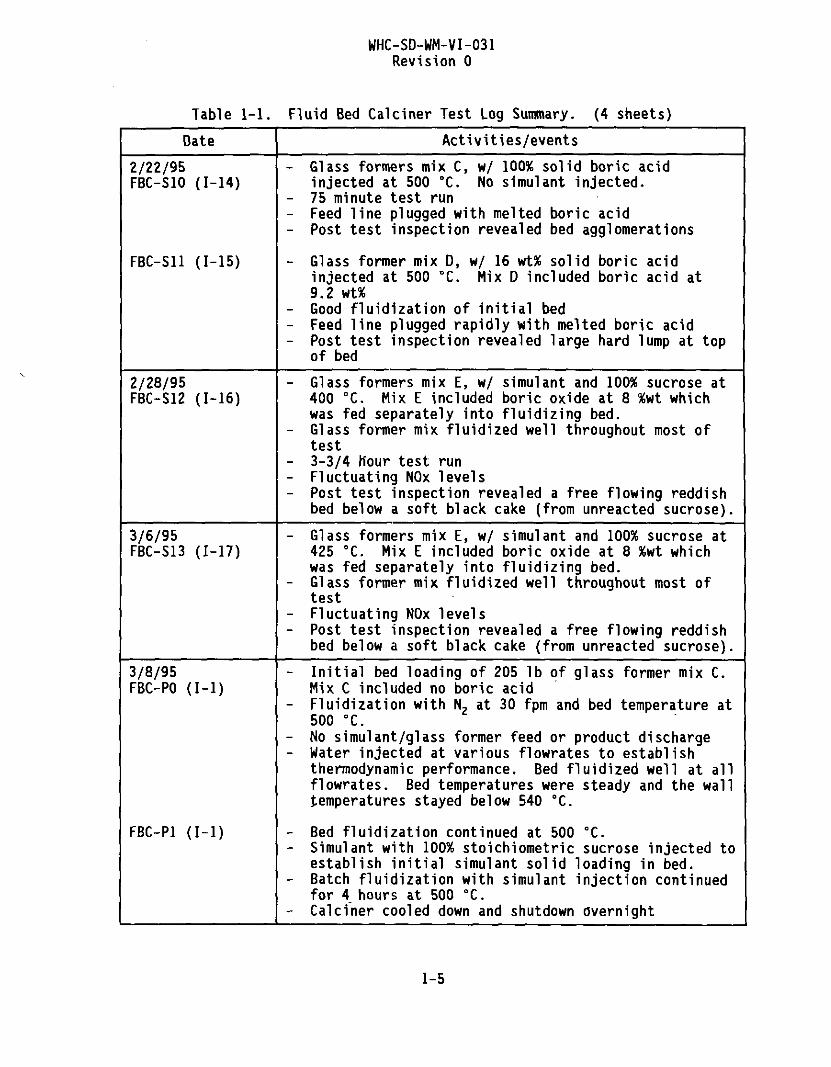
Table 1-1. Fluid Bed Calciner Test Log Summary. (4 sheets)
Date
2/8/95FBC-SO (1-1)
2/9/95FBC-SO (1-2)
2/10/95FBC-SO (1-3)
2/13/95FBC-Sl (1-4)
FBC-Sl (1-5)
2/14/95FBC-S2 (1-6)
Activities/events
- Glass formers mix A, water injection only, noreductants, at 750 °C. Mix A included boric acid atapproximately 9.2 %wt
- Good dry bed fluidization- Obtained/confirmed fluid bed heat transfer data
(20 ml/min max feed flow)- Feed pump no. 1 calibration point verification
failed/ recalibrated pump
- Glass formers mix A with simulant, no reductants, at750 °C
- Feed pump no. 1 failed, test terminated early
- Glass formers mix A with simulant only, noreductants, at 700 °C.
- Feed pump no.2 calibrated and installed- High NOx, rapid bed caking
- Glass formers mix B, at 700 °C. Mix B included boricacid at 16.2%wt
- Modified glass former bed proportions based onrevised calculations.
- Lost fluidization prior to simulant injection due tomelting Boric Acid at higher relative weight percent.
- Glass former mix C, w/simulant and 600% sucrose, at700 °C. Mix C had no boric acid.
- Good initial fluidization, no NOx- Lost fluidization at 3 hours, continued for full run
(4 hours).- Vessel completely caked with carbon
- Glass former mix C, w/ simulant and 200% NH3injection, at 700 °C.
- Feed injection nozzle plugged from previous sucrosetest, repaired
- Low NOx- Lost fluidization rapidly, but continued full run
(4 hours)- Severe caking in bed
1-3

WHC-SD-WM-VI-031Revision 0
Table 1-1. Fluid Bed Calciner Test Log Summary. (4 sheets)
Date
2/15/95FBC-S3 (1-7)
FBC-S4 (1-8)
2/16/95FBC-S5 (1-9)
FBC-S6 (1-10)
2/17/95FBC-S7 (I-ll)
FBC-S8 (1-12)
FBC-S9 (1-13)
Activities/events
- Glass formers mix C, w/ simulant and 100% sucrose, at700 °C.
- Shifted to open testing with modified sucrosepercentages
- Replaced pump no. 2 hose. Performed single pointcalibration check with simulant.
- Added water flush funnel to feed suction line.- Lost fluidization quickly. Terminated test early- Bed inspection revealed caking
- Glass formers mix C, w/ simulant and 125% sucrose, at500 °C
- Full 4-hour run- Low NOx- Post test bed inspection revealed successful run with
minimal caking
- Glass formers mix C, w/ simulant and 100% sucrose, at500 °C
- Full 4-hour run- Low NOx- Inspection revealed successful run
- Glass formers mix C, w/ simulant and 200% NH3addition, at 500 °C
- Rapid loss of fluidization- Low NOx- Terminated test early- Inspection revealed bed caking
- Glass formers mix C, w/ simulant and 200% H2addition, at 300 °C
- Rapid loss of fluidization- Low NOx- Inspection showed bed caking
- Glass formers mix C, w/ simulant and 200% CH6, at500 °C
- Rapid loss of fluidization- High NOx- Terminated test early- Inspection showed caking
- Glass formers mix C, w/ simulant and 75% sucrose at500 °C
- Full 4-hour test run- Low NOx- Post test inspection revealed successful test with
minimal caking
1-4
WHC-SD-WM-VI-031Revision 0
Table 1-1. Fluid Bed Calciner Test Log Summary. (4 sheets)
Date
2/22/95FBC-SIO (1-14)
FBC-Sll (1-15)
2/28/95FBC-S12 (1-16)
3/6/95FBC-S13 (1-17)
3/8/95FBC-PO (I-l)
FBC-Pl (I-l)
Activities/events
- Glass formers mix C, w/ 100% solid boric acidinjected at 500 °C. No simulant injected.
- 75 minute test run- Feed line plugged with melted boric acid- Post test inspection revealed bed agglomerations
- Glass former mix D, w/ 16 wt% solid boric acidinjected at 500 °C. Mix D included boric acid at9.2 wt%
- Good fluidization of initial bed- Feed line plugged rapidly with melted boric acid- Post test inspection revealed large hard lump at top
of bed
- Glass formers mix E, w/ simulant and 100% sucrose at400 °C. Mix E included boric oxide at 8 %wt whichwas fed separately into fluidizing bed.
- Glass former mix fluidized well throughout most oftest
- 3-3/4 Kour test run- Fluctuating NOx levels- Post test inspection revealed a free flowing reddish
bed below a soft black cake (from unreacted sucrose).
- Glass formers mix E, w/ simulant and 100% sucrose at425 °C. Mix E included boric oxide at 8 %wt whichwas fed separately into fluidizing bed.
- Glass former mix fluidized well throughout most oftest
- Fluctuating NOx levels- Post test inspection revealed a free flowing reddish
bed below a soft black cake (from unreacted sucrose).
- Initial bed loading of 205 lb of glass former mix C.Mix C included no boric acid
- Fluidization with N2 at 30 fpm and bed temperature at500 °C.
- No simulant/glass former feed or product discharge- Water injected at various flowrates to establish
thermodynamic performance. Bed fluidized well at allflowrates. Bed temperatures were steady and the walltemperatures stayed below 540 °C.
- Bed fluidization continued at 500 °C.- Simulant with 100% stoichiometric sucrose injected to
establish initial simulant solid loading in bed.- Batch fluidization with simulant injection continued
for 4 hours at 500 °C.- Calciner cooled down and shutdown Overnight
1-5

WHC-SD-WM-VI-031Revision 0
Table 1-1. Fluid Bed Calciner Test Log Summary. (4 sheets)
Date
3/9/95FBC-Pl (I-l)
3/9/95FBC-Pl
Activities/events
- Batch fluidization resumed at 500 °C- Simulant w/ 100% stoichiometric sucrose injected to
achieve initial dry simulant bed loading.- Balanced simulant injection, dry glass former feed,
and product discharge initiated.- Steady state production continued for 7 hours- 181 Kg (400 lb) dry product processed- Calciner cooled: down and shutdown overnight
- Bed fluidization resumed at 500 °C.- Balanced simulant/100% sucrose injection, dry glass
formers, and product discharge resumed.- Feed pump leak forced shutdown and cool down.
Reinitiation of feed at 464 °C resulted in bed cakes,loss of fluidization, and product discharge plugging.
- Steady state fluidization at 500 °C with balancedfeed and discharge was reinitiated after repairs.
- 4 hour mass balance performed- Production complete after 5 hours continuous
operation, 272 Kg (600 1b) product generated fortotal of 454Kg (1,000 1b).
- Calciner cooled down and shutdown.- Inspection revealed free flowing product, some caking
on simulant injection line, and light freeboardcaking.
4.1.4 CENS Calibration
A continuous emissions monitoring system (CEMS) combustion gas andpollution gas monitor was installed and calibrated by an EPA qualified vendorfor NO, N02, and NOx only.
4.2 FLOW DIAGRAM
The following changes to the Bench Scale Calciner Flow Diagram wereincorporated during testing.
• Pressure gauge (PI-FEED) was added downstream of the feed pump.Although positive displacement peristaltic pump flowrates areindependent of discharge pressure within the rating of the pump,PI-FEED was necessary to quickly give an indication of feed systemproblems (such as plugged injection line).
• A branch line with a funnel and isolation valve was added at thefeed pump suction to allow water flush following tests. Theinjection line was found to plug rapidly on tests immediatelyfollowing sucrose injection.
1-6

WHC-SD-WM-VI-031Revision 0
• PI-OUT was not part of the existing equipment, was consideredunnecessary for operations or testing, and was deleted from thedrawing. Filter differential pressure (DP-FF) taps into thecalciner top freeboard and the off-gas line, downstream of thefilters. In many cases during testing, a high vessel pressure(>3 psig) required isolation of DP-FF to prevent over-ranging.
• TI-WALL, inside wall temperature, was deleted since installation wasnot practical. This temperature indication was not critical to benchscale fluid bed calciner operation or test results. A walltemperature indication was available on the pilot scale test bed.
• TI-Annulus (T6), external electric heater temperature, was added andrecorded. Although not critical for testing results, thistemperature readout is useful in verifying proper fluid bed calcineroperation.
4.3 CHEMICAL NIXING AND BATCHING
4.3.1 Bench and Pilot Simulant Feed System
Two (2) DOT 17H 55-gallon drums were provided with DSSF simulant forFluid Bed Calciner testing. These drums were lined with plastic bags prior tosimulant fill and shipment to Procedyne. To avoid damaging the plastic bagswhich could result in plastic contamination of feed, these drums were allowedto settle. Liquid simulant was pumped from the simulant shipping drum to anintermediate 55-gallon poly mix drum. Residual solids within the plasticshipping bags were manually transferred into the intermediate mix drum.
The intermediate mix drum was equipped with an electric mixer, drum pump,and splash lid. DSSF simulant was thoroughly mixed within the intermediatemix drums and transferred via the installed drum pump into a portablecontainer for manual filling of the 26 L (7 gal) stainless steel waste hold-uptank (feed tank). Sucrose (C^H^O^) was manually added to the waste hold-uptank in a batch quantity necessary for the original sugar test (FBC-S1). Opensucrose testing (FBC-S3/4/5/9) utilized the original concentrated 600%stoichiometric simulant/sugar solution remaining from FBC-S1 which was mixedwith new simulant in the waste hold-up tank in the proportions necessary toachieve the proper stoichiometric ratios and test volumes.
The waste hold-up tank mixer was continuously operated during simulantfeeding into the fluid bed calciner. The feed suction flush funnel allowedwater flush through the feed line into the fluid bed prior to cooldown for alltest after FBC-S3.
4.3.2 Bench and Pilot Calciner Filter Blowback Gas
Separate N2 bottles were not utilized for filter blowback gas. Filterblowback operated continuously with a 5 second blowback every 40 secondsduring bed fluidization. Although filter blowback operation introduced N2 gasinto the bed and ultimately in the off-gas, N2 mass balance accountability was
1-7

WHC-SD-WM-VI-031Revision 0
not required for bench scale testing. Additionally, only NO, N02, and N03were monitored in the off-gas. Filter blowback N2 bottles were weightedduring Pilot scale mass balance run (FBC-P1).
4.3.3 Bench Scale Caiciner Start-up and Shutdown Sequence
The bench scale calciner start-up procedure varied slightly from thatoutlined in the Test Procedure (Reference 3.2). The fluidized alumina bathexternal heating furnace was preheated to expected operating temperature priorto each test.
Before insertion into the alumina bath furnace, the bench scale testvessel was loaded with a 5.5 kg (12 lb) premixed glass former bed. The testvessel was then mounted to the top assembly (freeboard) suspended fromoverhead rigging equipment. Fluidizing gas, N2 filter blowback, and off-gashoses were attached. Fluidizing N2 gas flow and the N2 blowback auto sequencewere then initiated. While continuously monitoring temperatures, the benchscale fluid bed test vessel was then lowered into the preheated fluidizedexternal heating furnace bath to commence test bed heat-up. The feed line wasthen connected.
Once steady state temperatures were established in the test fluid bed,gaseous reductant flow was initiated for applicable tests. Feed injection wasthen initiated to start the test. Instead of varying feed flow up to the heattransfer limits of the bed, a nominal 20 ml/min flowrate was maintainedthroughout all testing, based on the conservative heat transfer results withwater injection.
The feed metering quantity was calculated using calibrated pump flowratesand resulting time to achieve the quantity of simulant necessary for properglass ratios. Feed injection was stopped after the appropriate amount ofsimulant had been injected. For FBC-S3 and later tests, a water flush funnelwas available at the feed pump suction. Potable water was added to thefunnel, the waste hold-up tank was isolated, and water was injected to clearthe feed line of any residual simulant. This was particularly important fortests with sucrose.
Following test completion, the feedline was isolated and disconnectedfrom the test vessel. External cooling water flow and fluidizing gas flowwere then initiated to the alumina cooldown bath, located next to the heatingfurnace. The test vessel was then lifted from the furnace and inserted in thealumina cooldown bath using overhead rigging equipment. Test bed fluidizationcontinued until the bed was cooled down to a point where it could be safelyhandled.
4.3.4 Sampling
During testing, small test fluid bed samples were drawn from the lowerbed region using N2 motive gas and a sample line venturi eductor. In manycases, the inability to draw a large volume sample with the eductor indicatedthat the bed had lost fluidization.
1-8

WHC-SD-WM-VI-031Revision 0
4.3.5 Bench Scale Scrubber Solution
Soda ash (Na2C03) was added to the scrubber solution to maintain pH.Scrubber solution replacement was required when temperature reached 120 °F dueto PVC components in the solution piping.
4.3.6 Bench Scale Dry Glass Former Feed System
For bench scale test FBC-S10 (1-14) through FBC-S13 (1-17), dry glassformers were fed into the fluidizing bed during testing in order to graduallyadd boric acid and boric oxide. The feed line utilized an existing un-used3/4" penetration with a "feedlock" spool attached. The feedlock spoolconsisted of two ball valves with a pipe spool between equipped with aconnection for N2 pressurization. One end of the spool was connected to thetop of the calciner freeboard. The other end was open for addition of dryfeed material.
During dry feeding the bottom ball valve was closed and the top valveopen to load the feed material. After loading, the top valve was closed andthe feedlock spool between the valves was pressurized with N2 to approximately80 Kpag (12 psig). With the fluid bed operating at approximately 20 Kpag(3 psig), the bottom ball valve was opened and the feedlock contents wereinjected into the fluid bed.
5.0 BENCH SCALE TESTS AND OBSERVATIONS
5.1 GLASS FORMER FLUIDIZATION TESTS
Although not specifically required by the Test Procedure, fluidizationtests were performed with bulk glass former materials and the premixed glassformer bed in order to qualitatively evaluate the adequate fluidization of theglass formers and determine the optimum fluidization gas velocity forsubsequent testing.
Fluidization tests were performed in transparent fluid bed test tubes 14and 7.6 cm (5.5" and 3" diameter). Compressed air was used as the fluidiza-tion gas. An initial 15 cm (6") bed height was loaded. Fluidization gas flowwas slowly initiated. The "incipient" velocity was recorded when the bedstarted to fluidize. The "operating" velocity was recorded when the bedstabilized at approximately 1.5 times the initial bed height. The "maximum"fluidizing velocity was noted when the fluidizing action became unstable andexcessive dusting started to occur.
A nominal glass former bed flowrate was determined to be 6 m/min (20 fpm)for glass former mix A and 12 m/min (40 fpm) for mix B. Mixed glass formerfluid bed performance was determined to be acceptable. Fluidization velocitywas maintained fairly high (12 m/min) for most tests to minimize the potentialloss of fluidization due to liquid feed injection.
1-9

WHC-SD-WM-VI-031Revision 0
The original Alumina tested was hydrated and exhibited poor fluidizingperformance during bulk testing. A larger particle size, calcined alumina wasalso tested and exhibited superior fluidizing characteristics. The largerparticle size alumina was used in bench and pilot scale testing.
The bulk magnesium carbonate exhibited adequate fluidization character-istics but excessive dusting, which can cause elutriated fines in the off-gas.Since some of the magnesium carbonate required for the glass formulation wasto be derived from the dolomite, the weight of bulk magnesium carbonatenecessary in the fluid bed was relatively small. However, since magnesiumcarbonate has a small bulk density compared to other glass formers (SeeTable 6.1-1) the volume percent of magnesium carbonate was relatively large(approx. 30%) for glass former mix A. The mixed bed dusting was attributed tothe bulk magnesium carbonate. It is anticipated that a bulk magnesiumcarbonate with less water content will fluidize more efficiently.
Glass former mix B was generated based on revised calculations whichaccounted for impurities in various bulk glass formers. Mix B had consider-able lower weight percentage of magnesium carbonate which resulted in a largerweight percentage of boric acid. Mix B was tested in the fluidization testtube and found to be a superior fluidizing mixture. This is largelyattributed to the lower magnesium carbonate percentage.
Glass former mix C differed from mix B only by the removal of boric acid.Glass former mix C was not tested in the fluidizing test tube since theremoval of boric acid was not expected to significantly affect fluidizationcharacteristics. Actual testing showed that mix C fluidized easily at 6-12m/min (20-40 fpm).
Glass former Mix D differed from Mix C due to the addition of 9%wt H2B03.Glass former mix E differed from Mix C due to the addition of 9%wt BoricOxide. Neither Mix D nor Mix E was tested for fluidization but both performedwell in the bench scale calciner at 9 m/min (30 fpm) fluidization velocity.
5.2 FBC-SO: GLASS FORMERS W/ WATER/SIMULANT, NO REDUCTANTS
The purpose of this test was to determine the fluidization performance ofthe mixed glass former bed, determine limiting feed flowrate based on heattransfer relationships with water, prove that a high temperature fluid bedcould volatize NOx, and to verify that feed line caking would not result dueto simulant melting. Portions of this test were performed between 2/8/95 and2/10/95. Test data corresponds to Procedyne test numbers 1-1 through1-3.
The glass former fluid bed composition used for this test is given inTable 1-2.
1-10

WHC-SD-WM-VI-031Revision 0
Table 1-2. Fluid Bed Composition, Glass Former Mix A.
Glass former
Silica sand
Boric acid
Dolomite
Alumina
Iron oxide
Magnesium carbonate
Total
Weightpercent
60.0
9.2
10.9
11.4
1.0
7.5
100.0
Weight, kg (1b) [rounded tonearest .05 lb]
2.45 (5.40)
0.39 (0.85)
0.45 (1.00)
0.48 (1.05)
0.05 (0.10)
0.29 (0.65)
4.10 (9.05)
Initial concerns with bed fluidization at 700 °C included possibilitythat boric acid would decompose to boric oxide and melt (450 °C) causing thebed to agglomerate and lose fluidization. Results of Procedyne test 1-1through 1-3 revealed that in the above concentrations (mix A), the mixed glassformer bed could be successfully fluidized at temperatures up to 750 °Cwithout agglomeration.
An initial concern with injection of liquid slurry into the fluidizingbed was that excess liquid/moisture would result in bed caking causing a lossof fluidization. For conservatism, water was injected into the fluid bed toestablish a maximum feed rate. Since the DSSF Simulant is approximately 60%by weight water, the heat transfer performance of the fluid bed is bounded bymaximum feed rates of 100% water. Procedyne test 1-1 demonstrated that a feedflowrate of up to 20 ml/min of water could be processed effectively within theheat transfer capacity of the bench scale fluid bed without loss offluidization.
Initial concerns with the injection of DSSF Simulant without reductantswas that non-reacted salts would melt and/or decompose, resulting in bedcaking, agglomeration, and loss of fluidization. Additionally, processing thesimulant without reductants in the fluid bed was expected to release largevolumes of NOx off-gas which is an atmospheric pollutant and should beminimized.
Procedyne test no. 1-2 attempted the injection of simulant into afluidizing bed of glass formers (mix A) at 750 °C. Mechanical failure of feedpump no. 1 forced termination of test 1-2. Feed pump no. 2, a peristaltictubing pump, was installed and utilized for injecting simulant at 20 ml/minduring Procedyne test no. 1-3 and later tests. As expected, simulantinjection without reductants resulted in rapidly diverging upper and lowerfluid bed temperatures, indicating a loss of fluidization caused from caking.Additionally, NOx levels in the off-gas increased rapidly to over 12,000 ppm,indicating that the fluid bed was effectively volatizing NOx.
1-11

WHC-SD-WM-VI-031Revision 0
Although loss of fluidization was evident within 15 minutes of startingthe test, the test was continued for a total of 1 hour to evaluate bed andfeed line conditions. Inspection of the bed following testing revealed a veryhard cake; however, the simulant feed line inside was not obstructed.Additionally, liberation of water from the bulk glass formers caused bedshrinkage. In order to guarantee that both the upper and lower thermocoupleswere covered during fluidization, 5.5 kg (12 lb) of glass former mixture wasused on subsequent testing instead of 4.1 kg (9 1b) for FBC-SO.
5.3 FBC-S1: GLASS FORMERS AND SIMULANT W/ 600% SUCROSE AT 700 °C
Glass former mix B was generated based on slightly revised calculationswhich accounted for impurities in various bulk glass formers. Mix B hadconsiderably lower weight percentage of magnesium carbonate which resulted ina larger weight percentage of boric acid. Glass former mix B composition isgiven in Table 1-3 and was used for FBC-S1 (1-4) conducted on 2/13/95.
The bulk sucrose reductant was added directly to the feed tank.Calculation of the initial weight of sucrose additive was based on the 100%stoichiometric reaction with NaNO, in the simulant. This same concentrationof sucrose was utilized for both Procedyne tests 1-4 and 1-5.
As the fluidizing bed was heating up to 700 °C prior to injection of thesimulant/sucrose feed for test FBC-S1 (1-4), the upper and lower bedtemperatures diverged rapidly, indicating loss of fluidization and caking.The test was terminated prior to feed injection. Inspection of the bed showedsevere caking. This caking was attributed to the larger weight percent (16%)of boric acid which melts at 169 "C and decomposes to B203 which melts at450 °C. Note that in test FBC-SO glass former mix A boric acid weight percentwas 9% and bed fluidization was acceptable.
Table 1-3.
Glass former
Silica sand
Boric acid
Dolomite
Alumina
Iron oxide
Magnesium carbonate
Total
Fluici Bed Composition,
Weightpercent
59.69
16.19
10.89
11.48
1.04
0.71
100.0
Glass Former Mix B.
Weight, kg (lb) [rounded tonearest .05 lb]
3.24 (7.15)
0.88 (1.95)
0.59 (1.30)
0.63 (1.40)
0.05 (0.10)
0.05 (0.10)
5.44 (12.00)
1-12

WHC-SD-WM-VI-031Revision 0
The glass former mixture was reformulated to remove the boric acid andreadjust remaining constituent weight percentages. The resulting mixture wasglass former mix C, which was used for test FBC-S1 (1-5) also conducted on2/13/94. Glass former mix C composition is given in Table 1-4.
Test FBC-S1 (1-5) was reinitiated with glass former mix C. Adequatefluidization was observed during bed heat-up to 700 °C indicating that theboric acid had indeed been the cause of previous caking in glass former mix B.
Simulant with sucrose additive was injected at 20 ml/min. Goodfluidization characteristics were observed for the first 3 hours of the test.NOx levels in the off-gas were negligible, indicating a successful reactionbetween the sucrose and the simulant. NOx levels peaked at approximately30 ppm and dropped to 0 ppm after the first half hour.
Fluid bed upper and lower temperatures began to diverge after 3 hoursindicating bed agglomeration or caking. Efforts to bring the temperaturesback together by adjusting fluidizing gas flowrate were unsuccessful.Additionally, NOx levels were detectable after the bed lost fluidization. Thetest was terminated approximately 45 minutes early.
Inspection of the fluid bed test vessel revealed a significant excess ofcarbon material and severe bed caking. The entire bed and freeboard regionwere packed with carbon material which resembled a soft black powder in theupper freeboard, a soft black cake in the lower freeboard, and a hard blackcake in the bed region. Results of the inspection indicated that greater than100% stoichiometric sucrose proportions had been added to the simulant in thefeed tank.
Sucrose calculational assumptions were revised to account for actualconcentrations of sodium nitrate (NaN03), and sodium nitrite (NaN02) and EDTAin the simulant. The results of the revised calculations requirecfsignificantly less sucrose to achieve 100% stoichiometric concentrations.These results indicated that test FBC-S1 (1-5) had been performed withapproximately 600% stoichiometric sucrose. This number seemed reasonablecompared to observations of bed caking.
5.4 FBC-S2: GLASS FORMERS AND SIMULANT W/ 200% AMMONIA AT 700 °C
Test FBC-S2 (1-6) was conducted on 2/14/95. Glass former mix C wasloaded into the bench scale fluid bed calciner and preheated to 500 °C.Ammonia (NH3) reductant gas was added to the fluidization gas (N2) andsimulant was injected at 20 ml/min. Ammonia addition was calculated based on200% stoichiometric necessary to convert sodium nitrites/nitrates(NaN02/NaN03) to sodium oxide (Na2O).
Initial testing was delayed due to feed injection tube plugging, believedto be caused by the previous sucrose testing. The feed line was cleared andtesting resumed.
1-13

WHC-SD-WM-VI-031Revision 0
Table 1-4. Fluid Bed Composition, Glass Former Mix C.
Glass former
Silica sand
Boric acid
Dolomite
Alumina
Iron oxide
Magnesium carbonate
Total
Weightpercent
71.3
0.0
13.0
13.6
1.3
0.8
100.0
Weight, kg (lb) [rounded tonearest .05 lb]
3.88 (8.55)
0.00
0.70 (1.55)
0.75 (1.65)
0.07 (0.15)
0.05 (0.10)
5.44 (12.00)
Fluid bed upper and lower temperatures began to diverge rapidly withinthe first 15 minutes of the test indicating loss of fluidization, caking, oragglomeration. NOx levels were negligible for the first hour of testing, butthen increased to approximately 350 ppm. Although loss of fluidization wasevident by the divergent temperatures, the test was continued for the fullduration since NOx levels were low, indicating that the desired reaction wascontinuing.
Inspection of the bed following test completion showed severe hard cakingwhich was difficult to clean from the inside surfaces of the fluid bed vessel.
5.5 FBC-S3: GLASS FORMERS AND SIMULANT W/ 100% SUCROSE AT 700 °C
Test FBC-S3 (1-7) was performed on 2/15/95. Although the Test Procedure(Reference 3.2) called for scoping tests with methane (CH,) and hydrogen (H2)first, previous successful sucrose results and limited schedule called foropen testing of sucrose as a priority over continuing with the scoping testswith other reductants.
A 100% stoichiometric sucrose and simulant solution was mixed in the feedtank. The fluid bed vessel was preheated to 700 °C and injection began. NOxlevels in the off-gas rose rapidly and stabilized at approximately 600 ppm.After approximately 20 minutes, fluid bed upper and lower temperatures beganto diverge indicating loss of fluidization. After 30 minutes, NOx levelsbegan to increase to approximately 1800 ppm. On line sampling yielded onlysmall amounts of product from the bed. Since loss of fluidization wasobvious, the test was terminated early after 50 minutes total run time.
Bed inspection revealed a soft cake with agglomerated chunks. Itappeared that the reaction at 700 °C resulted in some melting salts.
1-14
WHC-SD-WM-VI-031Revision 0
5.6 FBC-S4: GLASS FORMERS AND SIMULANT W/ 125% SUCROSE AT 500 *C
Based on the results of test FBC-S3, sucrose concentration in thesimulant feed was increased to 125% stoichiometric and fluid bed temperaturewas lowered to 500 °C. Test FBC-S4 was conducted on 2/15/95.
The feed line became blocked upon initiation of feed. Following on-lineremoval, the lower 15 cm (6") of the feed line was discovered to be blockedwith carbon cake and required cutting off that section of tubing. Followingrepairs, simulant and 125% sucrose were injected at 20 ml/min. The fluid bed(mix C) exhibited good fluidization characteristics. NOx levels initiallyrose to approximately 1200 ppm and then gradually lowered to approximately200 ppm after 2 hours where levels remained reasonably stable for the durationof the test. The test was continued to completion with a total duration of4 hours.
Post test inspection of the bed revealed a free flowing dry product witha thin, soft cake on the filters and vessels walls. This product could easilybe handled for melter feed. Final bed weight of 7.6 Kg (16.75 lb) resultedfrom the addition of simulant. Solids from simulant made up 28% of final bedweight.
5.7 FBC-S5: GLASS FORMERS AND SIMULANT W/ 100% SUCROSE AT 500 "C
Following the success and experience of test FBC-S4, 100% stoichiometricsucrose was again attempted, but FBC-S4 (1-9) was conducted with the fluid bedat 500 °C, on 2/16/95.
The 100% stoichiometric sucrose and simulant was injected at 20 ml/miri.NOx levels in the off-gas rose rapidly to over 2500 ppm and gradually loweredover the 4-hour test period to approximately 1500 ppm. The bed exhibitedexcellent fluidizing characteristics. The test was continued untilcompletion.
Post test inspection of the fluid bed revealed a dry free flowing productwith minor lumps/agglomeration. This product could also be easily handled formelter feed. Final bed weight of 7.0 Kg (15.5 1b) resulted from the additionof simulant. Solids from simulant accounted for 23% of final bed weight.
5.8 FBC-S6: GLASS FORMERS AND SIMULANT W/ 200% AMMONIA AT 500 °C
Based on success with sucrose at a lower temperature and previous successconverting nitrites/nitrates with NH3 addition, open testing with ammonia asthe reductant at 500 °C was performed during test FBC-S6 (1-10) on 2/16/95.
The glass former bed (mix C) was preheated with nitrogen fluidization to500 °C. Ammonia was added to the fluidizing gas flow based on 200%stoichiometric necessary to convert sodium nitrites/nitrates (NaN02/NaN03) tosodium oxide (Na2O). NOx levels in the off-gas rose initially to over5,600 ppm but dropped rapidly over a 2 hour period to approximately 300 ppmindicating that nitrite/nitrate conversion was taking place.
1-15

WHC-SD-WM-VI-031Revision 0
The bed upper and lower temperatures began to diverge after approximately30 minutes indicating loss of fluidization. The test was continued for atotal of 2 hours and 15 minutes.
Bed inspection revealed caking and channeling with some free flowing dryproduct within.
5.9 FBC-S7: GLASS FORMERS AND SIMULANT W/ 200% HYDROGEN AT 300 'C
Scoping tests were resumed to evaluate the affect of hydrogen as areductant. The calculation for hydrogen addition was based on 200%stoichiometric hydrogen necessary for conversion of sodium nitrite (NaN02) andnitrate (NaN03) to sodium oxide (Na2O). Test FBC-S7 (I-ll) was performed2/17/95. Since ammonia was unsuccessful at 500 "C and the hydrogen reactionwas expected to be similar, a lower temperature (300 °C) was investigated.
The glass former bed (mix C) was preheated to 300 °C. Hydrogen reactantgas was added to the fluidizing gas flow to achieve expected 200%stoichiometry. Simulant was then injected at 20 ml/min. NOx levels in theoff-gas stream remained less than approximately 300 ppm throughout the test.After approximately 20 minutes, upper and lower fluid bed temperatures beganto diverge. The test was terminated early after 30 minutes due to loss offluidization.
Post test inspection of the fluid bed revealed bed caking.
5.10 FBC-S8: GLASS FORMERS AND SIMULANT W/ 200% METHANE AT 500 °C
Scoping tests continued with investigation of the affects of methane(CH,) as a reductant. The calculation for methane addition was based on 200%stoichiometric methane necessary for conversion of sodium nitrite (NaN02) andnitrate (NaNO,) to sodium carbonate (Na2C03). Test FBC-S8 (1-12) wasperformed 2/17/95.
The glass former bed (mix C) was preheated to 500 °C. Methane reductantgas was added to the fluidizing gas flow to achieve expected 200%stoichiometry. Simulant was then injected at 20 ml/min. NOx levels in theoff-gas stream rose rapidly to over 6,000 ppm and then lowered to less than1200 ppm over a 30 minute period. After approximately 15 minutes, upper andlower fluid bed temperatures began to diverge. The test was terminated early(after 45 minutes) due to loss of fluidization.
Post test inspection of the fluid bed revealed hard caking on top of thebed with lumps in the lower bed region.
5.11 FBC-S9: GLASS FORMERS AND SIMULANT W/ 75% SUCROSE AT 500 °C
Since testing has already proven that a fluid bed without reductantswould agglomerate and lose fluidization, and that a bed with 100%stoichiometric sucrose could process simulant at 500 °C and maintain
1-16
WHC-SD-WM-VI-031Revision 0
fluidization, the affects of a smaller stoichiometric sucrose concentration(75%) were investigated. Test FBC-S9 was performed on 2/17/95.
The glass former bed (mix C) was preheated to 500 °C. 75% stoichiometricsucrose and simulant were added to the fluid bed at 20 ml/min. NOx levels inthe off-gas rapidly stabilized at approximately 7,000 ppm and remainedrelatively stable for the duration of the run. Excellent fluidizationcharacteristics were exhibited for the full duration of the test, 4 hours.
Post test inspection revealed a reddish colored free-flowing bed withsome agglomerates. Freeboard region was coated with fines. Final bed productweight of 6.8 Kg (15 lb) resulted from addition of simulant. Solids added tobed from simulant accounted for 20% of final weight.
5.12 FBC-S1O: GLASS FORMERS W/ 100% BORIC ACID FEED AT 500 °C
Since the presence of boric acid (oxide) in the final product bed isdesirable and premixed boric acid attempts at 700 °C had failed, thepossibility of slowly added boric acid to a fluidizing bed was investigated.
The bench scale calciner was modified to allow addition of a second feedstream through the feed lock in the freeboard region. Solid 100% boric acidwas selected as the second feed stream. Test FBC-S10 was performed on2/22/95.
Glass former Mix C was preheated to 500 °C. Once stable at temperature,solid 100% boric acid feed was slowly initiated through the feedlock. Feedrate was limited to very small amounts. No simulant or reductants wereinjected. After 75 minutes approximately 0.45 pounds of boric acid had beenfed into the fluid bed. The bed still exhibited excellent fluidizationcharacteristics; however, the test was terminated due to feed line plugging.
Post test inspection revealed that the boric acid had melted in the feedpipe which was completely plugged at the 45 ° elbow closest to the freeboard.The product bed was free-flowing with some hard agglomerates mixed throughout.The bed agglomerates were believed to be melted boric acid.
5.13 FBC-S11: GLASS FORMERS (INCLUDING 9% BORIC ACID)AND 16% BORIC ACID FEED AT 500 °C
Since test FBC-S10 proved that 100% boric acid would melt in and plug thefeed line, it was decided to test the use of a 16 wt% boric acid/glass formermix as a feed material.
Additionally, since test FBC-SO (1-1,2,3) demonstrated that a boric acidhydrate weight percent of 9% would fluidize well at 700 °C, a new bed ofpremixed glass formers was prepared with 9 % wt boric acid and loaded into thereactor. The 16% wt boric acid/glass former mix was to be fed into the 9% bedwhile some of the bed material would be extracted through the eductor. Thiswould slowly raise the boric acid level in the reactor to the desired 16% wt.The initial glass former mixture (Mix D) is shown in Table 1-5.
1-17
WHC-SD-WM-VI-031Revision 0
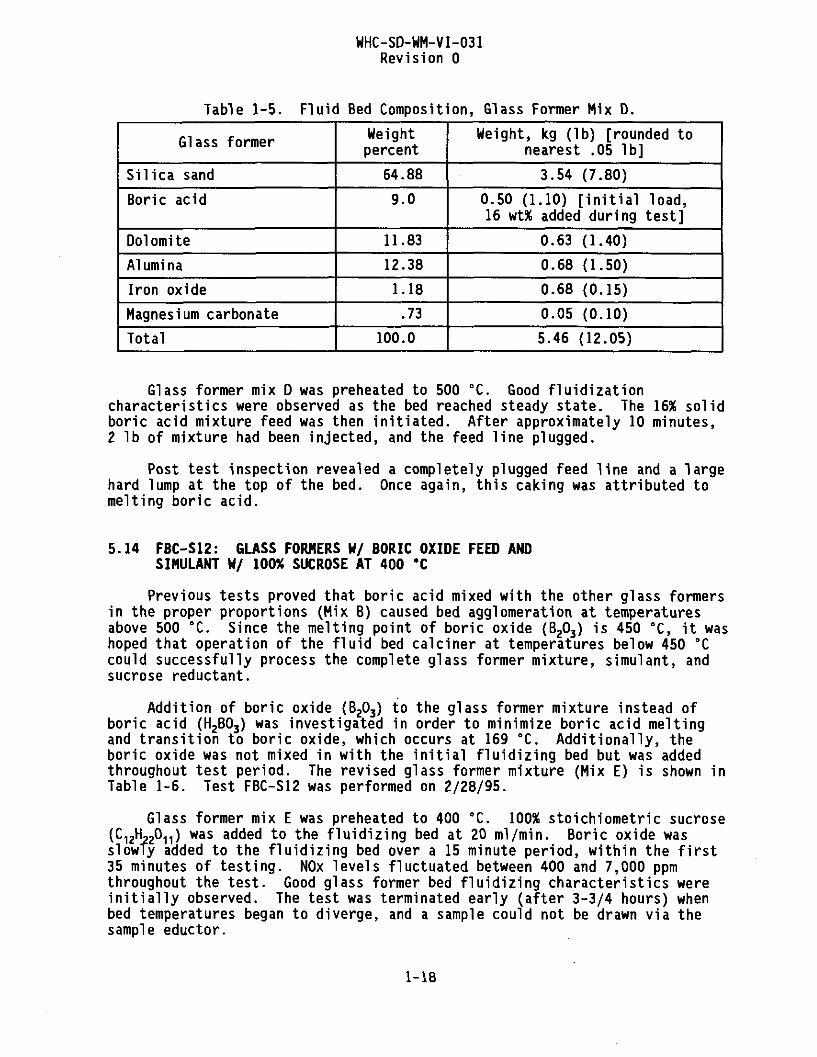
Table 1-5. Fluid Bed Composition, Glass Former Mix D.
Glass former
Silica sand
Boric acid
Dolomite
Alumina
Iron oxide
Magnesium carbonate
Total
Weightpercent
64.88
9.0
11.83
12.38
1.18
.73
100.0
Weight, kg (lb) [rounded tonearest .05 lb]
3.54 (7.80)
0.50 (1.10) [initial load,16 wt% added during test]
0.63 (1.40)
0.68 (1.50)
0.68 (0.15)
0.05 (0.10)
5.46 (12.05)
Glass former mix D was preheated to 500 "C. Good fluidizationcharacteristics were observed as the bed reached steady state. The 16% solidboric acid mixture feed was then initiated. After approximately 10 minutes,2 1b of mixture had been injected, and the feed line plugged.
Post test inspection revealed a completely plugged feed line and a largehard lump at the top of the bed. Once again, this caking was attributed tomelting boric acid.
5.14 FBC-S12: GLASS FORMERS W/ BORIC OXIDE FEED ANDSIMULANT W/ 100% SUCROSE AT 400 #C
Previous tests proved that boric acid mixed with the other glass formersin the proper proportions (Mix B) caused bed agglomeration at temperaturesabove 500 DC. Since the melting point of boric oxide (B203) is 450 °C, it washoped that operation of the fluid bed calciner at temperatures below 450 °Ccould successfully process the complete glass former mixture, simulant, andsucrose reductant.
Addition of boric oxide (B203) to the glass former mixture instead ofboric acid (H2B03) was investigated in order to minimize boric acid meltingand transition to boric oxide, which occurs at 169 °C. Additionally, theboric oxide was not mixed in with the initial fluidizing bed but was addedthroughout test period. The revised glass former mixture (Mix E) is shown inTable 1-6. Test FBC-S12 was performed on 2/28/95.
Glass former mix E was preheated to 400 "C. 100% stoichiometric sucrose(^i2H22°n) was added to the fluidizing bed at 20 ml/min. Boric oxide wasslowly added to the fluidizing bed over a 15 minute period, within the first35 minutes of testing. NOx levels fluctuated between 400 and 7,000 ppmthroughout the test. Good glass former bed fluidizing characteristics wereinitially observed. The test was terminated early (after 3-3/4 hours) whenbed temperatures began to diverge, and a sample could not be drawn via thesample eductor.
1-18

WHC-SD-WM-VI-031Revision 0
Table 1-6. Fluid Bed Composition, Glass Former Mix E.
Glass former
Silica sand
Boric oxide
Dolomite
Alumina
Iron oxide
Magnesium carbonate
Total
Weightpercent
64.8
9.1
11.8
12.4
1.2
0.7
100.0
Weight, kg (lb) [rounded tonearest 0.05 lb]
3.54 (7.80)
0.50 (1.10) [added during test]
0.63 (1.40)
0.68 (1.50)
0.07 (0.15)
0.05 (0.10)
5.46 (12.05)
Post test inspection revealed a reddish colored, free-flowing bed ofglass formers. A soft, black, airy cake filled the freeboard region above theglass former bed. Final bed product weight of 6.01 Kg (13.25 1b) resultedfrom addition of simulant. Solids added to bed from simulant accounted for 9%of final weight.
5.15 FBC-S13: GLASS FORMERS W/ BORIC OXIDE FEEDAND SIMULANT W/ 100% SUCROSE AT 425 *C
Results of previous testing indicated that sucrose would completely reactwith the simulant above 500 °C (FBC-S3,4,9) but not at temperatures below400 °C (FBC-S12). Since the melting point of boric oxide (B203) is 450 °C, atemperature of 425 °C was selected in order to determine the minimumtemperature for the sucrose/simulant reaction, and prevent bed agglomerationresulting from boric oxide melting. FBC-S12 (1-16) was repeated with thetemperature at 425 °C. Test FBC-S13 was performed on 3/6/95.
Glass former mix E was preheated to 425 °C. 100% stoichiometric sucrose(C^H^O^) was added to the fluidizing bed at 20 ml/min. Boric oxide wasslowly added to the fluidizing bed over a 15 minute period. As observed intest FBC-S12, NOx levels fluctuated throughout the test. Good initial glassformer bed fluidizing characteristics were observed. The test was terminatedearly when bed temperatures began to diverge, and a sample could not be drawnvia the sample eductor.
Post test inspection revealed a reddish colored free-flowing bed of glassformers. A soft, black, airy cake filled the freeboard region above the glassformer bed.
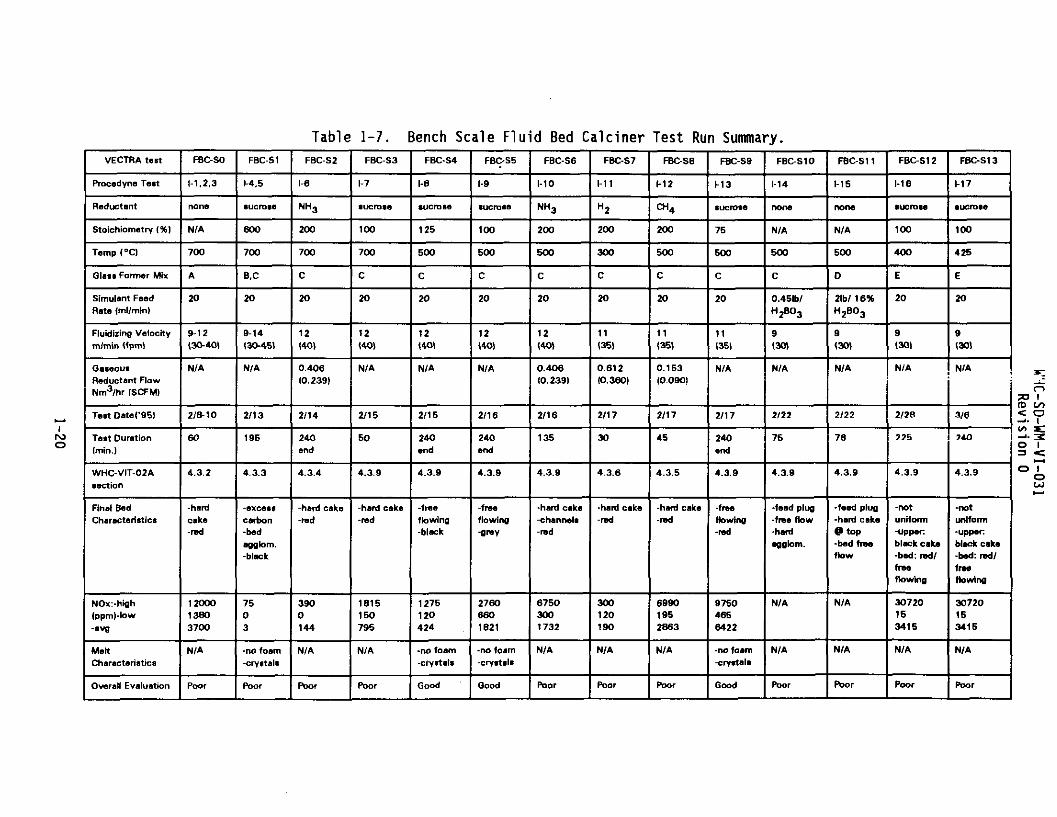
5.16 BENCH SCALE TEST EVALUATION SUMMARY
A summary of test data and conditions for the bench scale fluid bedcalciner test runs is given in Table 1-7.
1-19
r\io
VECTRA test
Procodyne Test
Reductant
Stoichiometry (%)
Temp (°C)
Glass Former Mix
Simulant FaedRata (ml/mln)
Fluidizing Velocitym/min (fpm)
GaseousReductant FlowNm3/hr (SCFM)
Test Date{'95|
Test Duration(min.)
WHC-VIT-02A•action
Final BedCharacteristics
NOx:-Ngh(ppm)-low-avfl
MeltCharacteristics
Overall Evaluation
FBC-SO
1-1,2,3
none
N/A
700
A
20
9-12(30-40)
N/A
2/8-10
60
4.32
•hardcake-rod
1200013803700
N/A
Poor
FBC-S1
1-4,5
sucrose
600
700
B,C
20
9-14(30-45)
N/A
2/13
195
4.3.3
-excesacarbon-bedago lorn,-black
7503
-no foam-crystals
Poor
TableFBC-S2
1-6
NH 3
200
700
C
20
12(40)
0.406(0.239)
2/14
240end
4.3.4
-hard cake-red
3900144
N/A
Poor
1-7. Bench Scale Fluid Bed CalcinerFBC-S3
1-7
sucrose
100
700
C
20
12(40)
N/A
2/15
50
4.3.9
-hard cake-red
1815150795
N/A
Poor
FBC-S4
I-6
sucrose
125
500
C
20
12(40)
N/A
2/15
240end
4.3.9
•freeflowing-black
1275120424
-no foam-cryrtalt
Good
FBC-S5
1-9
sucrose
100
500
C
20
12(40)
N/A
2/16
240end
4.3.9
-freeflowing•grey
27606601821
-no foam-crystals
Good
FBC-S6
1-10
NH 3
200
500
C
20
12(40)
0.406(0.239)
2/16
135
4.3.9
-hard cake-channels-red
67503001732
N/A
Poor
FBC-S7
1-11
H 2
200
300
C
20
11(35)
0.612(0.360)
2/17
30
4.3.6
-hard cake-rod
300120190
N/A
Poor
Test Run Summary.FBC-SB
f-12
CH4
200
500
C
20
11(35)
0.153(0.090)
2/17
45
4.3.5
-hard cake-red
69901952863
N/A
Poor
FBC-S9
1-13
sucrose
75
500
C
20
11(351
N/A
2/17
240end
4.3.9
-freeflowing-red
97504656422
-no foam-crystals
Good
FBC-S10
1-14
none
N/A
500
C
0.451b/H2BO3
9(30)
N/A
2/22
75
4.3.9
-feed plug•free flow-hardagglom.
N/A
N/A
Poor
FBC-S11
1-15
none
N/A
500
D
21b/16%H2BO3
9(30)
N/A
2/22
78
4.3.9
•feed plug-hard cake0 top-bed freeflow
N/A
N/A
Poor
FBC-S12
1-16
sucrose
100
400
E
20
9(30)
N/A
2/28
225
4.3.9
-notuniform-upperblack cake-bed:red/freeflowing
30720153415
N/A
Poor
FBC-S13
1-17
sucrose
100
425
E
20
9(30)
N/A
3/6
7AQ
4.3.9
-notuniform-upperblack cake-bed: red/fnwflowing
30720153415
N/A
Poor

WHC-SD-WM-VI-031Revision 0
6.0 PILOT SCALE TESTS AND OBSERVATIONS
Based on the results of the bench scale testing, the optimum process wasdetermined to be 100% stoichiometric sucrose at 500 °C with initial Mix C bedcomposition. The glass former mix C fluid bed composition used for the pilotscale production run is given in Table 1-8.
Nitrogen was utilized as the fluidizing gas. No other gasses were added
Based on observations of the bench scale tests, the following processparameters were initially selected for pilot scale testing:
Reductant:Reductant to N03/N02 Ratio:Waste Feed Injection Rate:Glass Former Charge:Fluidizing Gas Velocity:Gas Preheat Temperature:Calciner Bed Operating Temperature:Freeboard Temperature:
Sucrose, Powdered100% stoichiometric100 ml/min93 kg (205 lb) (Mix C)9.1 m/min (30 feet/min)240 °C500 °C500 °C
6.1 FBC-PO: GLASS FORMERS WITH WATER
The initial bed was charge with 92.97kg (205 1b) of mix C glass formers.On the morning of March 8, 1995, bed fluidization was initiated with N? onlyand the bed was preheated to 500 °C. Fluidizing gas was initially preheatedto 240 °C and the calciner freeboard was preheated to 520 °C. The off-gasscrubber was started up with pH of 12.
Table 1-8. Pilot Scale Glass Former Mix C.
Glass former
Silica sand
Boric acid
Dolomite
Alumina
Iron oxide
Magnesium carbonate
Total
Weightpercent
74.66
0.00
13.62
9.54
1.30
0.88
100.0
Weight, kg (1b) [rounded tonearest 0.05 1b)
69.42 (153.05)
0.00
12.66 (27.90)
8.87 (19.55)
1.21 (2.65)
0.82 (1.80)
92.98 (205,00)
1-21

WHC-SD-WM-VI-031Revision 0
Once the bed was fluidizing at steady state, potable water feed injectionwas initiated at 100 ml/min in order to establish thermodynamic performancecharacteristics. The pilot scale calciner was operated for approximately4 hours at steady state in the batch mode with water injection into thefluidizing bed of glass formers. The pump speed was gradually increasedthroughout the batch test in order to evaluate thermodynamic performance.Pump speed was adjusted between 100ml/min and 400 ml/min. Good bedfluidization characteristics were observed for all feed rates. The criticaldata point was the inside wall temperature of the calciner. If temperatureswere too high, caking could start on the walls. A feed rate of about350 ml/min showed good performance.
6.2 PRODUCTION RUN: GLASS FORMERS AND SIMULANT WITH 100% SUCROSE
The bed remained fluidizing at 500 °C while simulant with 100% sucrosereductant was mixed in the feed tank. Simulant injection began at 225 ml/min.Fluidization gas preheated temperature was 250 °C and freeboard temperaturewas 550 "C. After approximately 50 minutes with simulant injection at225 ml/min and stable fluidization, feed rate was raised to 275 ml/min. Afteranother 50 minutes of stable fluidization, feed pump speed was raised to350 ml/min. High off-gas flow was observed 1-1/2 hours into the test.Injection of simulant and batch fluidization at 500 CC were continued for atotal duration of 4 hours. The pilot scale calciner was then cooled down andshutdown on the evening of March 8, 1995. The initial simulant loading(20 wt% Na?0 equivalent) had not yet been reached so the fluid bed was notchanged out.
On the morning of March 9, 1995, the pilot scale calciner fluidizationwas reinitiated at 9.1 M/min (30 fpm) and the bed was preheated to 500 °C withthe fluidization gas and freeboard at 270 °C and 570 °C, respectively. Afterthe fluid bed stabilized, simulant injection with 100% stoichiometric sucrosewas initiated at 110 ml/min. Feed injection was gradually increased from110 ml/min to 350 ml/min over a 10 minute period to maintain good fluidizationand minimize wall temperature transients. Batch operation was continued for1 hour until the calculated bed simulant loading had been achieved.Fluidization gas preheated temperature was stabilized at approximately 337 °C,and freeboard temperature was stabilized at approximately 550 °C. Continuousglass former feed was initiated at 20.4 Kg/hr (45 lb/hr), and continuousproduct discharge was initiated at 25.4 Kg (56 lb/hr). Simulant feed wascontinued at 350 ml/min. Continuous processing with balanced feed anddischarge rates was continued for over 7 hours. The pilot scale calciner wascooled down and shutdown on the evening of March 9, 1995. Up to this point acumulative product total weight of 181 Kg (400 lb) had been generated. Theobserved throughputs exceeded expected levels by a factor of 3.
On the morning of March 10, 1995, pilot scale fluidization was againinitiated and stabilized at 9.1 m/min fluidization gas velocity, 500 °C bedtemperature, 300 °C fluidization gas preheat temperature, and 500 °C freeboardtemperature. After the fluid bed was preheated and stable, simulant feed with100% stoichiometric sucrose was initiated. Additionally, continuous dry glassformer feed and product discharge were initiated to balance feed anddischarge.
1-22

WHC-SD-WM-VI-031Revision 0
A feed pump leak developed early in the test run and required securingall feed and discharge. Additionally, calciner heaters were turned off duringfeed pump repair. When repairs were complete, the fluidizing bed temperaturehad cooled to 464 °C. Heaters were turned on to begin heat-up to 500 °C.Balanced simulant injection, dry glass former feed, and product discharge wereall reinitiated while the bed was heating up from 464 °C. Initial feed pumpsetting was 350 ml/min. Within 45 minutes, fluid bed temperatures were above480 °C and began to diverge. Additionally, product discharge flow wasrestricted and ultimately became plugged with small chunks. All feed anddischarges were secured and the discharge line was cleared. Some bed materialwas removed during discharge line corrective maintenance.
After repairs were complete, the fluid bed was allowed to preheat andstabilize at 500 °C. Balanced simulant injection, dry glass former feed, andproduct discharge were initiated and gradually increased to match a feed rateof 350 ml/min. Good bed fluidization characteristics were observed. Steadystate operations were continued for over 5 hours. The correspondingcalculations are presented in Appendix IB. A 4 hour mass balance wasperformed during this period. In the afternoon of March 10, 1995 the requiredquantity of dry product had been produced, feed and discharge were secured,the pilot scale calciner was cooled down, the bed was unloaded through thescrew cooler discharge line, and then the calciner was opened and inspected.A total of 454 Kg (1,000 lb) of dry product was generated by pilot scaletesting.
Post test inspection revealed free flowing product, minor caking in thefreeboard region, and a large lump at the product exit nozzle. Loss offluidization at 464 °C was attributed to incomplete reaction of sucrose andmelting of unreacted salts. This is believed to also be the source of lumpsin the bed.
7.0 CONCLUSIONS
• Mixed glass formers fluidized well at ambient temperature in theproportions of mix A, B, C, D and E.
• Operation of bed at less than 460 °C or greater than 700 °C resultsin bed caking and agglomeration.
• Sucrose (C^H^O,,) proved to be the optimal reductant by efficientlyconverting nitrates and nitrites while maintaining stable bedoperating conditions.
• Addition of less than 100% stoichiometric sucrose in the simulantresulted in lower conversion of nitrites/nitrates to N2 and resultedin higher NOx off-gas levels. Higher levels of sucrose (up to 125%)resulted in lower NOx levels.
• Operation of fluidized bed with addition of simulant and hydrogen,methane or ammonia reductants was unsuccessful, even at operating
1-23

WHC-SD-WM-VI-031Revision 0
temperatures as low as 300 °C as bed caking and loss of fluidizationresulted.
Operation of bed at 480-525 °C produced well fluidized, uniform bedwith reasonable conversion efficiencies when sucrose is used asreductant.
Boric acid addition of greater than 9 wt% in glass former mix causesearly bed agglomeration and loss of fluidization, even attemperatures as low as 500 °C.
Boric oxide in the glass former bed fluidizes well at temperaturesbelow 425 °C.
Sucrose does not completely react with simulant in the fluid bed attemperatures below 480 °C. Incomplete reaction results in cakingand loss of bed fluidization.
Feed addition of glass formers with boric acid (at greater than16 wt%) into a fluidizing bed at 500 °C causes feed line pluggingand bed agglomeration.
8.0 RECONNENDATIONS FOR FUTURE TESTING
Additional testing is recommended to bound fluidized bed calcineroperating temperature range. Suggested test range would be 480 °C to 650 °C,with 6096 stoichiometric sucrose addition.
Testing is also recommended to investigate glass former constituents thatcan be used to incorporate boron into initial bed mix by use of high meltingpoint minerals, such as use of calcium borate, in lieu of boric acid.
1-24

WHC-SD-WM-VI-031Revision 0
APPENDIX 1A
LAB ANALYSES
1-25

I
ALUMINA BATHEXTERNAL HEATING FURNACE
SAMPLE POINT
(TT> CALClNER BED SAMPLE OFF-LINE
( j T ) ON-LINE SAWPLC. FROM VENTURI EDUCTOR
(S) FROM DRY SOLID BULK CONTAINER
{^) OFF-CA5. ON-LINE CEUS TOTAL HOi (NO +
VECiKA Technologies Inc.
WHC-WTRIFICATION DtMONSTRATlON
BENCH SCALE CALClNERSAMPLE LOCATION
oCD CO
< o
O I3 <
h—«O Io
CO
APPENDIX 10 1

I
/STUCK
SAMPLE POINTS( 7 A CALCINER BED SAMPLE. ON-LINEw OUTLET OF 5CREW COOLER(£\ SCRUBBER SOLUTION SAMPLEw OFF-LINE, OM DRAWDOWN
(n) SCRUBBER SOLUTION SAMPLE^ ^ ON-LINE (PH)
(21) OFF-CAS. SAMPLE
(si) FROM BULK CONTAINER
<oc> OFF-GAS. ON-LINE CEUS
(s r ) SIMULANT FEED
IE v|iO>iOW
VECTRA Technologies Inc.
WHC-VITRIflCATON DEMONSTRATION
PILOT SCALE CALCINERSAMPLE LOCATION
APPENWK 10.1
zaCD
w'ion
0
1to
1
1
1-03

SAMPLE LOG
CO
SAMPLE NUMBER
V1FS0/FSB-001
VI FSO/112-002
V1FS0/I12-O03
: V 1 FSO /111 -004
V 1 FSO /112 -005
V1FSO/I12-OO6
V1FS0/I12-007
VI FSO/111-008
\ V 1 FSO /1 11 -009
V1FS0/I11-010
V 1 FSO/I 11-011
1 V 1 FSO/I 11 -012
V IFS1/I 12-013
V 1 FS1/I 11 -014
1 V1FS1/I11-015H
V1FS1/II1-016H
I V1FS1/I11-017H
I V1FS1/I11-018H
i V1FS1/I11-019H
DATE
8/2
8/2
8/2
8/2
8/2
9/2
10/2
13/2
13/2
13/2
13/2
13/2
13/2
14/2 •
14/2
14/2
14/2
14/2
14/2
TIME
1155
1210
1315
1630
1203
1330
1725
SAMPLE TYPE
Initial Bedmix (F)
Bed sample during (I)
Bed sample during (I)
Clump sample (I)
Bed sample (I)
Bed sample (I)
Bed sample (I)
900 I Bed sample
900
900
900
900
1630
0840
0840
0845
0845
0845
0845
Bed sample
Bed sample
Clump sample
Bed sample
Bed sample (I)
Upper freeboard
Lower freeboard
Bed
Bed
Bed
Bed
DESTINATION LAB SHIPMENT DATE j LAB SAMPLE #
73ro
V)ion
o
o1
1
xz1
1-03
SAMPLE LOG

Iroto
SAMPLE NUMBER [ DATE
V1FS1/I11-020H
; V1FS1/I11-021H
VIFS2/I 12-022
V 1 FS2 /111 -023 H
I V 1 FS2 / 111 -024 H
V1FS2/I11-O25H
V1FS2/I11-O26H
i V1FS2/I11-027H
j V 1 FS3 /111 -028 H
V 1 FS3 /1 11 -029 H
V 1 FS3 /1 11 -030 H
V1FS3/I 11 -031
| V 1 FS3 / I I I -032
V1FS4/I 11-033
V 1 FS4 /1 11 -034
V1FS4/I 11 -035
V 1 FS4 /111 -036
V 1 FS4 / 111 -037
V1FS4/I11-038
V1FS5/I 12-039
V 1 FS5 / I 11 -040
V1FS5/I 11-041
14/2
14/2
14/2
15/2
15\2
15/2
15/2
15/2
15/2
15/2
15/2
15/2
15/2
16/2
16/2
16/2
16/2
16/2
16/2
16/2
16/2
16/2
TIME | SAMPLE TYPE
0845
0845
1305
0800
0800
OSOO
0800
0800
1400
1400
1400
1400
1400
1030
1030
1030
1030
1030
1030
1200
1800
1800
Bed Cake
Bed
Bed
Bed Cake
Bed
Bed
Bed
Bed
Bed Cake
Bed
Bed
Bed
Bed
Bed
Bed
Bed
Bed
Freeboard
Crust/Cake
Bed
Bed
Bed
DESTINATION LAB
Melt Test
WHC Archive
PED
WHC Archive
SHIPMENT DATE
3/1/95
2/24/95
3/1/95
~LAB SAMPLE #
oTO ICD l/J< O-•- I
O I
O IoCO
SAMPLE LOG

I
o
SAMPLE NUMBER | DATE
V1FS5/I11-042 | 16/2
VIFS5/I11-O43 j 16/2
V1FS6/I11-044 | 17/2
V1FS6/I11-045 i 17/2
V1FS6/I11-046 j 17/2
V1FS7/ I1I -047 • | 17/2
V1FS7/I11-048
V1FS7/I11-049
17/2
17/2
V1FS8/I11-O50 j 17/2
V1FS8/I11-O51 | 17/2
V1FS8/I11-O52
V1FS9/I12-O53
V 1 FS9 /111 -054 V
V1FP1/W23-O01 1
' VI FP1/W 23-002 I
V1FP1/121-OO3 1
V 1 FP1 / S SF -004 1
V 1 FP1 / W 23 -005 2
V 1 FPt / W 23-006 2
V1FP1/I21-0072
V1FP1/W23-008 1-2
\ V1FPI/W23-O09 1-2
17/2
17/2
24/2
10/3
10/3
10/3
10/3
10/3
10/3
10/3
10/3
10/3
TIME j SAMPLE TYPE
1800 | Bed
1800
0810
0810
Bed
Cake
Bed
0810 j Bed
1400
1400
1400 i
1405 |
1405
1405
1545
1340
1200
1200
1200
1400
1600
1600
1600
1200-1600
1200-1600
Bed
Scrubber
Scrubber
Bed
Simulant & Sugar
Scrubber
Scrubber
Product
Scrubber
Scrubber
DESTINATION LAB
PED
PED
SHIPMENT DATE j LAB SAMPLE #
2/24/951
2/24/95
t
3D(D
tft
Ozso
o1
00I
1
1o
SAMPLE LOG

ICO
SAMPLE NUMBER
V1FPWFSB-010-
VI FP1/I21 -Oil VI
V1FP1/I21-012V2
V1FP1/FSB-013V
V1FP1/I21-O14P2
V1FP1/I21-O15U2
V1FP1/I21-O16U1
V1FP1/I21-O17P1
V1FPWW23-O18P1-2
V1FP1/W23-O19P2
V1FP1/W 23-020 PI
V1FP1/FSB-021V
V1FP1/I21-O22 VI
V1FP1/I21-O23V2
DATE
10/3
30/3
30/3
30/3
31/3
31/3
31/3
31/3
31/3
31/3
31/3
10/3
10/3
10/3
TIME
1700
1545
1545
1545
1200
1200
1200
1200
1300
SAMPLE TYPE
Feed Sample
Taken from 003
Taken from 007
TakenfromOlO
Taken from 007
Taken from 007
Taken from 003
Taken from 003
Taken from 008
1300 j Taken from 006
1300 | Taken from 001T
1700 ; TakenfromOlO
1200 | Taken from 003
1600 1 Taken from 007
DESTINATION LAB
PED
PED
PED
PNL
USGS
USGS
PNL
PNL
PNL
PNL
Lockheed
Lockheed
Lockheed
SHIPMENT DATE | LAB SAMPLE #i n inmnti i in n
3/30/95
3/30/95
3/30/95
3/31/95
3/31/95
3/31/95
3/31/95
3/31/95
3/31/95
3/3/95
5/5/95
5/5/95
5/5/95
1317,95-05284
D -583636 & D - 583637
D-583638&D-583639
1318,95-05285
1319,95-4-256
1320, 954-257
1321,954-258
VIFP1/FSSB-021V
V1FP1/1Z1-O22V1
V1FP1/1Z1-O23V2
TOCD<
v>ion
o
o1CO
o1£
1<1
oCO
SAMPLE LOG

WHC-SD-WM-VI-031Revision 0
Lockheed Analytical Services
c
METALS RESULTS
L 1-32

WHC-SD-WM-VI-031Revision 0
METALS RESULTS
Client Sample ID: V1FP1/FS8-O21V
LAL Batch ID(s): 509 vc
Date Collected: 03-10-95
Date Received: 05-09-95
Matrix: solid waste
Constituents
Aluminum
Boron
Calcium
Chromium
Cesium
Iron
Magnesium
Manganese
Molybdenum
Nickel
Potassium
Silicon
Sodium
Strontium
Zinc
Method
6010
6010
6010
6010
3500
6010
6010
6010
6010
6010
6010
6010
6010
6010
6010
Concentration(mg/kg)
3000
2000
31,000
4.2
<800
6,400
20,000
36
40
<8
<1000
85,000
<1000
<20
6.9
ReportingDetection Limit
(mg/kg)
40
40
1000
2
800
20
1000
3
40
8
1000
400
1000
20
4
DataQualifierlsJ
-
C
C
D(1:5)
DateAnalyzed
05-26-95
05-26-95
05-26-95
05-26-95
05-18-95
05-26-95
05-26-95
05-26-95
05-26-95
05-26-95
05-26-95
05-17-95
05-26-95
05-26-95
05-26-95
LALSample ID
L4472-1
L4472-1
L4472-1
L4472-1
L4472-1
L4472-1
L4472-1
L4472-1
L4472-1
L4472-1
L4472-1
L4472-1
L4472-1
L4472-1
L4472-1
Comments:
c 1-33

WHC-SD-WM-VI-031Revision 0
c METALS RESULTS
Client Sample ID: V1FP1/IZ1-O22V1
LAL Batch ID(s): 509 vc
Date Collected: 03-10-95
Date Received: 05-09-95
Matrix: solid waste
Constituents
Aluminum
Boron
Calcium
Chromium
Cesium
Iron
Magnesium
Manganese
Molybdenum
Nickel
Potassium
Silicon
Sodium
Strontium
Zinc
Method
6010
6010
6010
6010
3500
6010
6010
6010
6010
6010
6010
6010
6010
6010
6010
Concentration(mg/kg)
12000
960
21,000
180
<800
400
13,000
35
610
15
7,500
69,000
91,000
570
16
ReportingDetection Limit
(mtj/kg)
40
4 0
1000
2
800
20
1000
3
4 0
8
1000
4 0 0
1000
20
4
DataQualifiers)
-
C
C
D(1:5)
DateAnalyzed
05-26-95
05-26*95
05-26-95
05-26-95
05-18-95
05-26-95
05-26-95
05-26-95
05-26-95
05-26-95
05-26-95
05-17-95
05-26-95
05-26-95
05-26-95
LALSample ID
14472-2
L4472-2
L4472-2
14472-2
L4472-2
L4472-2
L4472-2
L4472-2
L4472-2
L4472-2
L4472-2
L4472-2
- L4472-2
L4472-2
L4472-2
Comments:
1-34

WHC-SD-WM-VI-031Revision 0
c METALS RESULTS
c
Client Sample ID: V1FP1/IZ1-O23V2
LAL Batch ID(s): 509 vc
Date Collected: 03-10-95
Date Received: 05-09-95
Matrix: solid waste
Constituents
Aluminum
Boron
Calcium
Chromium
Cesium
Iron
Magnesium
Manganese
Molybdenum
Nickel
Potassium
Silicon
Sodium
Strontium
Zinc
Method
6010
6010
6010
6010
3500
6010
6010
6010
6010
6010
6010
6010
6010
6010
6010
Concentration(mg/kg)
12,000
970
24,000
190
' <800
4100
1 5,000
38
580
<8
7,000
67,000
92,000
570
15
ReportingDetection Limit
(mg/kgV
40
40
1000
2
800
20
1000
3
40
8
1000
400
1000
20
4
DataQualifier(s)
C
C
D(1:5)
DateAnalyzed
05-26-95
05-26-95
05-26-95
05-26-95
05-18-95
05-26-95
05-26-95
05-26-95
05-26-95
05-26-95
05-26-95
05-26-95
05-26-95
05-26-95
05-26-95
LALSample ID
L4472-3
L4472-3
L4472-3
L4472-3
L4472-3
L4472-3
L4472-3
L4472-3
L4472-3
L4472-3
L4472-3
L4472-3
L4472-3
L4472-3
L4472-3
Comments:
1-35

c
WHC-SD-WM-VI-031Revision 0
METALS QC DATA SUMMARY
LAL Batch lD{s): 509 vc
c
Constituent
Aluminum
Boron
Calcium
Chromium
Cesium
Iron
Magnesium
Manganese
Molybdenum
Nickel
Potassium
Silicon
Sodium
Strontium
Zinc
ClientSample
ID
V1FP1/FSB-021V
V1FP1/FSB-021V
V1FP1/FSB-021V
V1FP1/FSB-021V
V1FP1/FSB-021V
V1FP1/FSB-021V
V1FP1/FSB-021V
V1FP1/FSB-021V
V1FP1/FSB-021V
V1FP1/FSB-021V
V1FP1/FSB-021V
V1FP1/FSB-021V
V1FP1/FSB-021V
V1FP1/FSB-021V
V1FP1/FSB-021V
LALSample
ID
L4472-1
L4472-1
L4472-1
L4472-1
L4472-1
L4472-1
L4472-1
L4472-1
L4472-1
L4472-1
L4472-1
L4472-1
L4472-1
L4472-1
L4472-1
DateAnalyzed
05-26-95
05-26-95
05-26-95
05-26-95
05-18-95
05-26-95
05-26-95
05-26-95
05-26-95
05-26-95
05-26-95
05-17-95
05-26-95
05-26-95
05-26-95
QC Sample Analyses
ReagentBlank
(mg/kg)
< 4 0
< 4 0
<1000
8
<800
< 2 0
<1000
<3
< 4 0
< 8
2100
<400
<1000
< 2 0
< 4
DuplicatePrecision(% RPD)
1.8
0.1
0.3
2.9
b
0.4
0.6
0.7
b
b
b
0.1
3.7
1.0
14
MatrixSpike
Recovery(%)
a
a
102
104
78
a
100
99
101
102
99
a
100
103
105
Comments:
The RPD cannot be computed, because the sample or the duplicate concentration was belowthe Reporting Detection Limit.
1-36

I •
^ 5 K ^ . j Lockheed Analytical Service;;
c
V-:-S>»M-VI-031R<3wi 5 ion 0
cNON-METALS RESULTS
1-37

c
R> s H i s i on 0
LOCKHEED AlHiLYriCAil SERVICES
COMMON IONS AN!) ADDITIONAL ANALYTES
::!ampl.€i Results
C l i e n t Sample I D : V1FP1/FSB-021V
M a t r i x : Sol idWaste
Constituent
Chloride
Nitrate-N
Mitrite-N
Sulfate
Fluoride
Total Phosphorus
Total Inorganic Carbon
Total Organic Carbon
Iodine
Units
mg/kg
mg/kg
mg/kg
mg/kg
mg/kg
mg/kg
mg/kg
mg/kg
mg/kg
Method
300.0
300.0
300.0
300.0
340.2
365.2
415.2
415.2
I CO IN
Date
Date
Result
14.
0.28
< 0.1
700
19.
0.58
46000
< 1000
< 30
C o l l e c t e d : 10-MAR-95
Rece ived : 09-MAY-95
ReportingOet Limit
0.2
0.2
0.1
1
4.1665
0.3
1000
1000
30
Datadual i f i e r ( s )
H
K
H
H •
HD<1:8.333)
H
H
H
H
DateAnalyzed
11-HAY-95
11-HAY-95
11-MAY-95
11-HAY-95
11-MAY-95
13-MAY-95
17-HAY-95
17-HAY-95
13-MAY-95
LASBatchjID
22723
22724
22725
22726
22727
22799
22728
22729
22730
LASSample)ID
L4472-1
L4472-1
L4472-1
L4472-1
L4472-1
L4472-1
L4472-1
L4472-1
L4472-1
c
c1-38
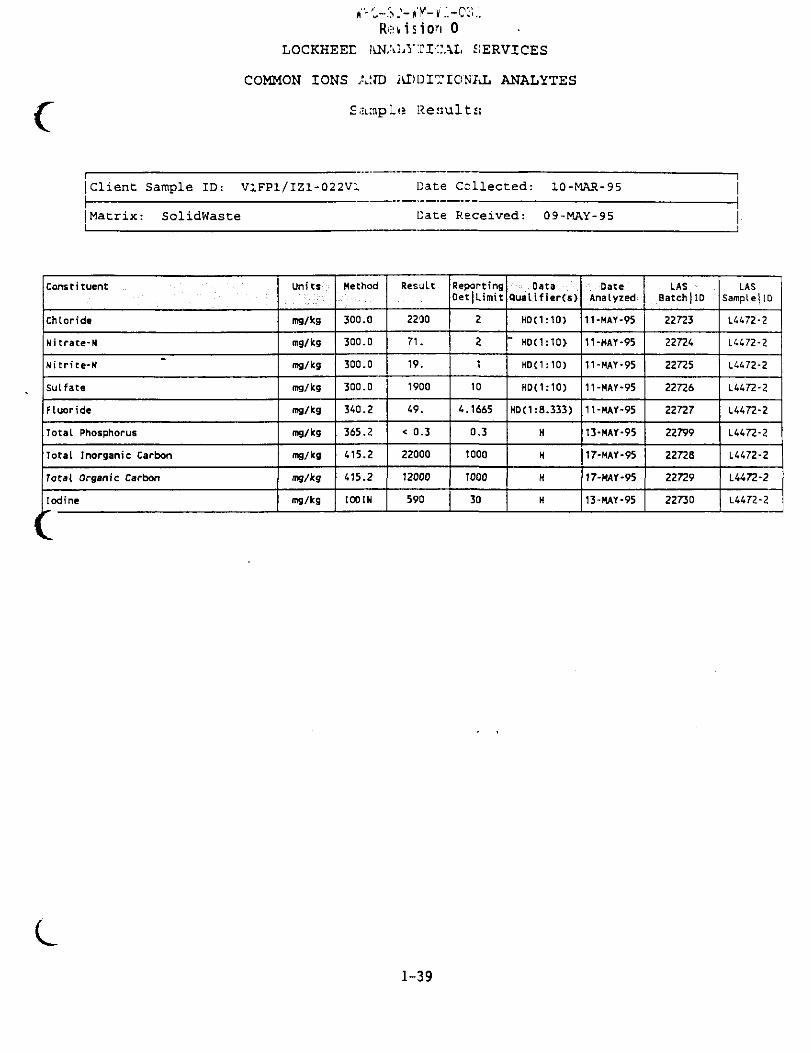
c
Revision 0
LOCKHEEE kNALYXICAI. SiERVICES
COMMON IONS AIJD ADDITIONAL ANALYTES
Sa:aple Results;
Client Sample ID: V1FP1/IZ1-022V;. Date Collected: 10-MAR-95
Matrix: SolidWaste Date Received: 09-MAY-95
Constituent
Chloride
Nitrate-N
Nitrite-N
Sulfate
Fluoride
Total Phosphorus
Total Inorganic Carbon
Total Organic Carbon
Iodine
r 1
Units
mg/kg
mg/kg
mg/kg
mg/kg
mg/kg
mg/kg
mg/kg
mg/kg
mg/kg
Method
300.0
300.0
300.0
300.0
340.2
365.2
415.2
415.2
IODIN
Result
2230
71.
19.
1900
49.
< 0.3
22000
12000
590
ReportingOetjUmit
2
2
1
10
4.1665
0.3
1000
1000
30
DataQualifiers)
HD(1:10)
~ HD(1:10>
HDC1:10)
HD(1:10)
HD<1:S.333)
H
H
H
H
DateAnalyzed
11-HAY-95
11-HAY-95
11-HAY-95
11-HAY-95
11-HAY-95
13-MAY-95
17-MAY-95
17-MAY-95
13-MAY-95
LASBatch | ID
22723
22724
22725
22726
22727
22799
22728
22729
22730
LASSample) ID
L4472-2
L4472-2
L4472-2
L4472-2
L4472-2
L4472-2
L4472-2
L4472-2
L4472-2
1-39

R<: v i s i on 0LOCKHEE::J AMALTCICAIJ SERVICES
COMMON IONS ANT ADDITIONAL ANALYTES
Sample Results
Client Sample ID: V1FP1/IZ1-023V2
Matrix: SolidWaste
Constituent
Chloride
Nitrate-N
Nitrite-N
Sulfate
Fluoride
Total Phosphorus
Total Inorganic Carbon
Total Organic Carbon
Iodine
Units
mg/kg
mg/kg
mg/kg
mg/kg
mg/kg
mg/kg
mg/kg
mg/kg
mg/kg
Method
300.0
300.0
300.0
300.0
340.2
365.2
415.2
415.2
1001M
Date
Date
ResuLt
1600
< 2
20.
1700
400
< 0.3
32000
11000
710
C o l l e c t e d : 10-MAR-95
Received: 09-MAY-95
ReportingDet|Limit
2
2
1
10
2.5
0.3
1000
1000
30
DataQua l i f i e r ( s )
HD(1:10)
HD<1:10)
HD(1:10)
HD(1:10)
HD(1:S)
H
H
H
H
DateAnalyzed
11-HAY-95
11-HAY-95
11-MAY-95
11-MAY-95
11-MAY-95
13-HAY-95
17-HAY-95
17-HAY-95
13-HAY-95
LAS .: Batch{ID
22723
22724
22725
22726
22727
22799
22728
22729
22730
LASSample|ID
L4472-3
L4472-3
L4472-3
L4472-3
L4472-3
L4472-3
U472-3
L4472-3
L4472-3
c
1-40

WHC-SD-WM-VI-031Revision 0
USGS Results
1-41
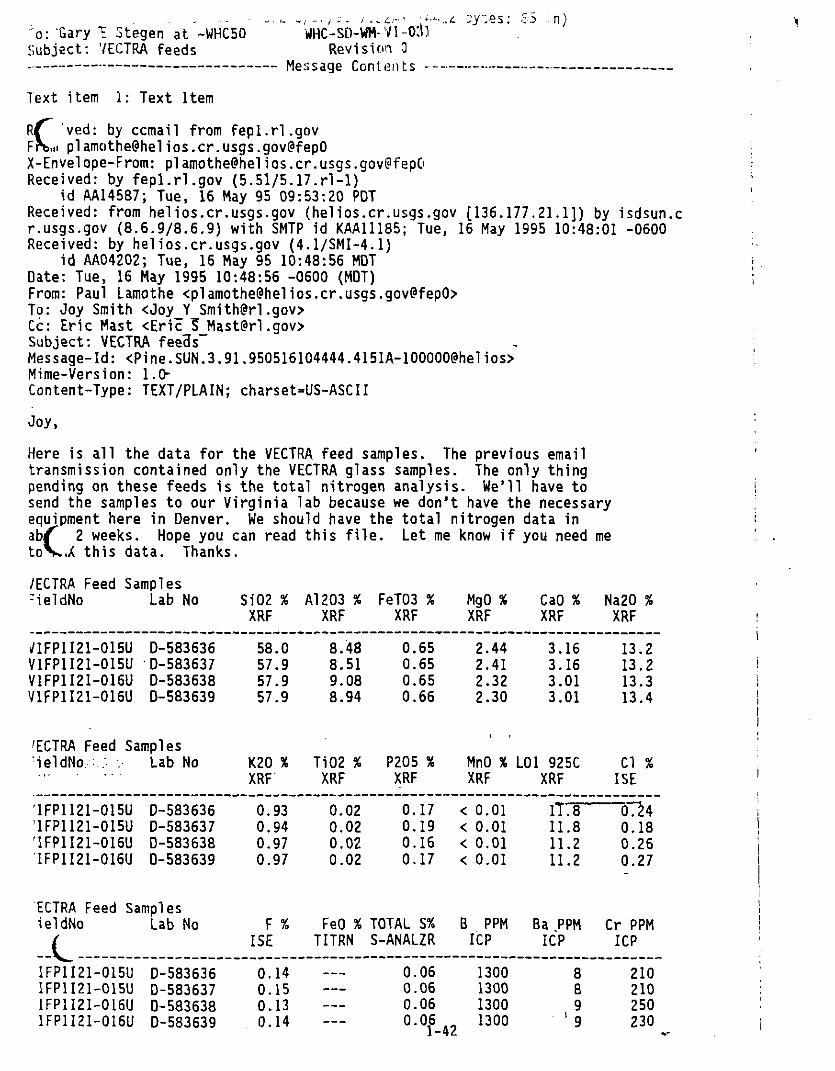
'o: "Gary T Stegen at -WHC50Subject: VECTRA feeds
Text item 1: Text Item
WHC-SD-WM"VNO:tlRevision 3
— Message Contents -
:y:es; £5 n)
ved: by ccmail from [email protected]@fepO
X-Envelope-From: [email protected]@fepOReceived: by fepl.rl.gov (5.51/5.17.rl-1)
id AA14587; Tue, 16 May 95 09:53:20 PDTReceived: from helios.cr.usgs.gov (helios.cr.usgs.gov [136.177.21.1]) by isdsun.cr.usgs.gov (8.6.9/8.6.9) with SMTP id KAA11185; Tue, 16 May 1995 10:48:01 -0600Received: by helios.cr.usgs.gov (4.1/SMI-4.1)
id AA04202; Tue, 16 May 95 10:48:56 MDTDate: Tue, 16 May 1995 10:48:56 -0600 (MDT)From: Paul Lamothe <[email protected]@fepO>To: Joy Smith <Joy_Y [email protected]>Cc: Eric Mast <Eric 5 [email protected]>Subject: VECTRA feeds"Message-Id: <Pine.SUN.3.91.950516104444.4151A-100000(?helios>Mime-Version: 1.0-Content-Type: TEXT/PLAIN; charset=US-ASCII
Joy,
Here is all the data for the VECTRA feed samples. The previous emailtransmission contained only the VECTRA glass samples. The only thingpending on these feeds is the total nitrogen analysis. We'll have tosend the samples to our Virginia lab because we don't have the necessaryequipment here in Denver. We should have the total nitrogen data inibf 2 weeks. Hope you can read this file. Let me know if you need metoV.X this data. Thanks.
/ECTRA Feed Samples-ieldNo
I/1FP1I21-015UV1FP1I21-O15UV1FP1I21-016UV1FP1I21-O16U
Lab No
D-583636•D-583637D-583638D-583639
'ECTRA Feed SamplesieldNo ^ ; . Lab No
'1FP1I21-O15U'1FP1I21-O15U'1FP1I21-016U1FP1I21-016U
D-583636D-583637D-583638D-583639
ECTRA Feed SamplesieldNo Lab No
-L -1FP1I21-015U1FP1I21-O15U1FP1I21-O16U1FP1I21-016U
D-583636D-583637D-583638D-583639
SiO2 %XRF
58.057.957.957.9
K20 %XRF
0.930.940.970.97
F %ISE
0.140.150.130.14
A1203 %XRF
8.488.519.088.94
TiO2 %XRF
0.020,020.020.02
FeO %TITRN
—
FeTO3 %XRF
0.650.650.650.66
P205 %XRF
0.170.190.160.17
TOTAL S%S-ANALZR
0.060.060.06
°-°f-42
MgO %XRF
2.442.412.322.30
MnO %XRF
< 0.01< 0.01< 0.01< 0.01
B PPMICP
1300130013001300
CaOXRF
3.3.3.3.
%
16160101
LOI 925CXRF
IT111111
.8
.8
.2
.2
Ba PPMICP
8899
Na20 %XRF !
j13.213.213.3 !13.4
I
Cl %ISE
0.180.260.27
Cr PPMICP
210210250230

- ~ e c *< o :.a.b Cs PPMINAA
Mo PPV
ICPNi PPMECP
Sr PPMICP
Zr PPMICP
VTOTAL UC-ANALZ^
ReiisionY
cV1FP1I21-015UV1FP1I21-015UV1FP1I21-016U'IFP1I21-016U
D-583636[)-13836370-583638D-583639
750763806806
66]670700700
15< 84429
620630620620
160210220190
3.1:3.0 32.932.9.5
VECTRA Feed SamplesFieldNo Lab No ORGNC C% CRBNT CS
Calc C03-analI ppm Nitrite %Nitrate %Total N %INAA Ion Chromlon ChromCHN-Analz
V1FP1I21-O15UV1FP1I21-015UV1FP1I21-016UV1FP1I21-016U
D-583636 . 0.02 3.08 797 < 0.001 < 0.001D-583637 0.07 3.02 < 0.001 < 0.001D-583638 < 0.01 2.94 866 < 0.001 < 0.001D-583639 0.03 2.92 — < 0.001 < 0.001
Paul J. LamotheU.S. Geologica-1 [email protected](303) 236-1923
c
1-43

WHC-SD-WM-VI-031Revision 0
PNL Results
1-44

r.n CHAIN 01- CUSTODY / SAMPLE ANALYSIS 1UIQUHST
!SAJ:NUMlU:U:9rMQH
of
'i'ijCLi: Mellrr .Syilcui Technology|-vnlimhciii: I'liiNC I
Company Conlacl: C.»ry Sltgen
Telephone No. (509) 376-55-lH Protocol:
Data Tumnround
Priority Normal
Simple Point: Sample Type: i . "' '' Shipped To: Dmc Required:
I'ouihlc l l i /*nl i : PNI.
SAMPLE IDIINTIFICATION
I
o p _ n * .jai l i |>lc I o ini Diit
Conliincr
Weigh i
MotCoitiaincrs
SimpleAnalysis
Ti.
'Usiic
100 grams
b
it
^1
o O
15 UP
&. .5
Plastic
Ul
.a
s";
O I
ioI K
.SI'P.ClAl. INSTRUCTIONS/HI-MARKS: A 1 * J J? rtf v ~ f.Wv,*, SAMPLE TYPES= SiniuUnl G= GA= AJdilives ()=
^ l \V=
/ 7 . / O
Received lly Diic/Timc Rcliii(|uislicd lly Dtic/Pime Itcccivtil lly Daic/fiinc
•7 7 -
Kclini]uiilicJ U Ilclinquislicd lly Dale/Time Received By Dale/Time
My n*ic/Tiine Received lly Dale/Tinic Ity Dale/Time Received IIy Dale/Time
Hcli i i [ [ i i i i l ic i l l l y Dale/Time
nnnKcccived lly Dale/rime lly Date/Time Received lly Dale/Time

WHC-SD-WM-VI-031Revision 0
1II,:.
/(
=:£..z :1^v>-
u
-
h-
C B
vLY
SI
Z<
-j
2^^CO
> -OO
JST
oO
IVI
s
7-
3
ca3
a
•:_..": ?
"*$*
y?$
w.-.is"• ".-• . • • -
. < ^ . <
|S. • : • • • . . :
§
esx
£5
•
u
III
aUec
>n
U
VV
,
-Vr- r
-
X/ N
c
"3
S"—
-
ar—
t o
uc
t -
o
= —
-
—
y
oc .
cA
x j
c
u
-
a
c
- ya >.
ca
g
••a-
_
uu
ncr
" a
O S
,C3usinsuo5wnpc^
Z 11 *JS' IS
n**i"-•>**—»*|^( ltJ!J1~<-f
crsx
xas-WHS
*pn.°s F'r^^s]U3Q^SJ 3Uin[0A^
OLL
0 0 1
TCd 'EOS *Z0N TrOS TO 'd :«0!tfV
f*i Ti *ra 'c *rv
zo
AT
I
1.1
z
1-46
.:•:•-:'
" . ? • : • ; ;
'-:$%
• •••:•• v i
• ^ • ^
• • ; - • . . . . .
• ^ - " ^ s i
• •• :• ;• : . :<;>
• • • : • . ' r ! £ ?
v;L^ ? : >;
C
—
cHI
u
G
r
ccc
t o
1U
V / :
/ \
XXi
O •;'
I .:•* ™ ••••>
• J — ::
' - j •:••
^ ] •'.
o . • • ' •
Ml
•^x1
— C
•:• £ 11 "
:; > cc
V it ti
• ; ; .
. . »
v-
'. .
•
:• O ^': **
•: V ' O*
^ ^
. ^ . >
— N
Jj ^
5 ^
—
c **
< 'vl
o
11
Ar k
s
w
1
I J
..^
Vo
X L
~
r
/
• -
u
lly
u
U
—*
3111
< j
• (
« v_
I )C *Jxt\
~ > \
IZ ,m"y~ -j
i $ c
r
= 4"
(=UUw
1 —
u
u
G
.Illy
c-
,
i"xS o
"g'xX^,
\ v *&
O
V.
i)x^
oc
u
C
c=
S
o
a
uc
u
G
c=
lie
c
u
3111
tG
>v —
u
o
C
c
u
Q
1
e
VC
l
C i
u
u
aG
.Illy
•e*c
u
3111
1—
u
" i : '. j£am J i
a*. "•(/> ii"fc
* — !
itd
n

WHC-SD-WM-VI-031Revision 0

c
-
1_• • <
III
o
73
s.3
—1
P
c
£.
PI
imc
70oft
L=3
b
r»-n3ri
r\
3-E>
C
-
—
—
2civ
=
a
in
n
n
5'"e
L=3
_
n
"*>
3'o _
—
R
S.
b
n
3
—
- \ ^ _-' N . " —
*~\ R
\X ^
r <*
V ^\ NV
I \ ^ yVV *
AM ^
p>
3£.
L
ale
t^'imc
VC
tl
a
imc
CK if;' . -E
—
• - ^ ^- » ^
;
•?.
r o '-••'
- - " * — _
r. -'-' H.
"V ~. T J>
o
S ^ ^ —'r \ **\ i
-B °*
n
|
olly
n
ovci
_
- - .imc
O
i
c
o
^3
—
73
^ "
^
"T\~^^*^*
>
1
"*—-~O .
11 ii ' II II
= - | i 1 >~ " n — £
^- .T:
tf O -1 •<
•*• O 5 "
;—T^
• -
>
>
n
: ^ /
• V
y
•"
^ ;
to
Pi
-3&
r;
c
• •
L
II
( ! •
'?•-:• :?>:
• • . " ? • : * !
:?£| V;':!:
££!;.•
• , ; • : • : • • •
2- i
("1AT
I
Oz
> JB 3
I*
UniihcredMeals: A l B, Ca,Cs. Ci. Fe, K. Mg.^n. Mo^a, Ni. Si.Sr.Zr
6010
I. NO2. N03. POi
Lab Specific
N O ! NO3
~ab Specific
TOC
~ab Specific
ncLab Specific
pH
>ab Specific
Visual Color
.ab Specific
'oial Phosphorvj
-ab Spccifc
De;lSi^
Lit Spcc-j'ic
•
<
oc
-
=-
§— •
_
—
•5
^ ~0
=
t
V
IO
3
?T
> -
?
Liiip
1H
-3Z
f]n
ircd:
—
r
— ^
i —
§ •?
n r
- 3
^-«
_
oXrr
ittly
r.
w
-
- * -
os
3
n0
•
9
• < :
• ^ • "
§;;•
\ • • . -
.;•:••- 3
O*T
urniroufi
c
—
O ->
otl
ncH
oV-<CO
>
3"
• >
mOcm
o
—1
: !z7*.
-
--<
0 "-io 15

WHC-SD-WM-VI-031Revision 0
sXa1V
• • • *
|
"21— ;^ .
c
*"-^-
L>
t '•'V O
LY.S
1
<
2.<t o~ -
Co
u.s
(J
o
—
•
•a
° 'Z- | •§
« x* \
• '•••. ':•':•
\-m
''M
'. >: •
"• •>:
• •£"
•'•' 2
' • > -
j..lacl
1§
j
• /
c
=
* G
loc
o
oo^T
*?
n
o
o
occ
"c."u
— «
5 "
•= "Z-- . *«; —
- '
uS I
^ — : $ : • • • *
i
;
I" ^
" ^
H"
c
rr
r
S
—
"c .
_
i i
^r-
•>
1
lit
—
1
i -
s SLO H
i
u£o
>
-u
1— ~
C C
stjnsodj qr"
araodj q f•
in^OUCSOlM TT1O'
stjisadj qv
^ .
sad-IT: S 1*1
COK tos'
3gpodS q n
rOc 'SOS tON 'I70S 10 'a isyoi^V
0109
1 ' ' S
="5
21O
oLi.
~~
?
1-49
: i!vi
: ; ^ .
If
^:?:---
u
_u
-
C
ini
J3
oc.III
-?c
u
t o
K
K
\
X/ \ •
>
i>
o •;•;
• — » • • ;
' >~ i
r^ :r - •••
1 • ;
* ~ ~ • • ;
c " , ••
<•. v, ••
7- '
.':. ... oO^-'•• ~ ir "
-» ^ " ^ * *^* **^- • • ; E -
;-;: J 11• •
^ . :
\ \ :
. ^ .
's "-a
_ i
l i -
to
5u:c:t o
C
3
IVI
• ~ :
oUII
I—
i.>uu
OU
ilJ
«
J~*
M
c
lly
u>
y
"im
c
C
c=*3
ibii||
u
*
| ' \""S •—-o75 . ^
r
\ j
£ ^ ^• i 5"
% \'_c '_• •
i—. <^~ p'-C
^ 'i ,
Q - J'
|v^xi
s
\ y>
lly
"5 v
0 \
H" »•*. r~,
* • -
\ . \
— ,
-J .— ^ ' • \
uc
0M
•3>
0
.S
u
c
•3
ibllll
u
0
u
G
c=
\ ~
a
u1 :
- 3
. ^
uUII
V
tr/ - I
e
a
0
I—u1
"5
1
U
_E
u
>u
iJ
uc
—
1111

r
DENSITY ANALYSESANALYTICAL AND PROCESS SUPPORT LABORATORY
SUPERNATANT SLURRY
I—•
1t n
1.0
2.0
3.0
4.0
5.0
Lnhorntory Numher(s)
Customer
Customer's S it in pi o Idcntification(s)
Sample Prcparnlion
Sample, i Centriluoe Tube Weight
Ccnlrilufjc Tube Weight
Sample Weight
Sample Volume
Density Cnlculniion
1317
C.Freeman
P 2 O 1 4
129.5363 U(n,»
92.1049 Qrm
37.4314 gram
26.00 mL
1310
IM 017
122.2125 0,nm
92.1049 a.am
30.1076 groin
21.0 mL
fimrn
gram
0.0000 o"m
mL
G M I I I per Millililcr ol Sample 1.44 Q/mL 1.43 Q/mL //DIV/OI n/mL //DIV/0! q/mL
0.0000
proin
grnm
MIL
73 IfD Or
-•• I
O !3 <O I
o
CO Datiinco Used
7.0 Analyst's Sirjnnturo mid Date
8.0 Approved by ond Dnto
3640601-
jv\.
9.0 Comments

WHC-SD-WM-VI-031Revision 0
c ICP ANALYSIS ON FUSED SAMPLESAnalytical and Process Support Laboratory
ICP *™m«T>>a IOIUI IOM from If>a fuaad iimplal warn analyza* on in* ICP al 31* Building
i.o Lie NO
3.0 Cuilamar4,0 Cuilem.'*. IDS.O D . I . Fila 10
8.0 Fuoan Mainod
7.0 Samola Wi
8.0 O.lulwn
C
91.1
MM
Ao
* l
B
5a
a.8-
c.Cd
C .
Co
Cf
Cu
Ov
Eu
e.X
L i
Li
Mg
U n
M a
N .
«d
K i
P
Pb
S
s>So
S'
T .
Tl
V
V
In
Zf
Wl *
iwwi
-0.005%1.359%0.162%-0.003%-0.003%•o.ose%2.734%-0.006%-O.038%•0.009%0.030%-0.006%•0.006%-0.004%0.547%
-0.009%-0.005% :1.658%0.005%0.091% •13.905%
-0.019%
0.290%-0.075%0.161%5.826%-0.075%0.083%-0.056%0.006%-0.009%-0.003%0.106%-0.009%
I EUw—l
' -0.005%3.758%0.16S%-0.003%-0.003%-0.056%2.825%-0.006%•0.037%-0.009%0.028%-0.006%-0.006%-0.004%0.553%0.418%-0.009%-0.005%1.612%0.005%0.087%
0.023%-0.019%0.216%-0.075%0.126%
20.501%-0.075%0.090%•0.056%0.005%-0.009%•0.003%0.184%
SuD-ioia'-
K -
N.-
00
.418%000% • z>-
30.(0%
13.905%0.000%
23.06% 44.50%11.0 I
110 Nqic lisa ROM lui»n 1a a*r4aimad in • ««EaTM»7ii crudbliv.lu*< abla.nad ' w n itia K*3O1 / If fuxon. Th* Ni
c-uoBla. Thu. th. Z' and Na '.(Jon.d a'* v . lu . . oE
•? 0 COFTWT7.AU At lew cancanl'll":" el Ca. lha \ . 7 0 J fir.
O.JBSB
Qxid*
A02OAI2O36203B«0BeO
B.203C«0CdOC«O2
Co 20 3O 20 3CuO
0v203Eu2O3Fe2O3K20
U2O3LF20MgO
MnO
MoO3N»20
Nd2O3NiO
P20SPbOS03s>02SnO2SrO
TeO2no 2V02
V2O3ZnOZrO2
Wl %Omrt*
-0.005%3.701%0.522%•0.003%•0.008%-0.063%3.826%-0.006%•0.046%•0.013%0.044%•0.007%-0.006%-0.004%0.782%
•0.011%-0.010%2.750%0.008%0.136%1S.7*4%
•0.022%
0.664%•0.081%0.402%12.452%-0.096%0.09S%-0.071%0.010%-0.015%•0.004%0.231%-0.013%
/ w , % \
i ^J.005% \1 7.101% \I 0.536%
- I -0.003%; -0.008%1 -0.063%/ 3.952%1 -0.006%1 -0.046%/ -0.013%f 0.040%f -0-007% 1i -0.006% 1! -0.004% 1
0.791%0.503% ,-0.011%-0.010% '2.674% \0.008% 10.131% \
1 0.027%/ -0.024%/ 0.495%/ -0.081%/ 0.315%/ 43.854%1 -0.095%1 0.107%/ -0.070%1 0.008%! -0.015%' -0.004%* 0.229%
A n n g iWt %Oxida
-0.01%S.4O%0.53%0.00%-0.01%-0.06%3.83%•0.01%•0.05%-0.01%0.04%-0.01%-0.01%0.00%0.79%0.50%-0.01%-0.01%2.71%0.01%0.13%18.74%
0.00%\ -0.02%\ 0.58%\ -0.08%1 0.36%1 28.16%i -0.10%t 0.10%f -0.07%I 0.01%\ -0.02%
0.00%0.23%
1 -0.01%
ParcanlD«vn!»n
Olid*
0%•63%
— 3 %0%0%0%
0%0 %
0%9%0%0%0 %
- 1 %
0 %
0 %
3 %
3 %
4 %
-1952%
29%0%
24%• 1 1 1 %
0 %
-8%0 %
2 1 %
0 %
0 %
1 %
SuB-ioTa! •
K ! 0 -
Tatai -
44 .302* '
00
503% N« :O-
000% I-OJ.
44.9%
«0 773%
18.744%0.000%
79.5%1/
/I
62.2%. Thu* eeiaiaium and n«Kal •aoainad aia \201 tv«*«i •< aa'fAffVHad »n lifco*iwf* mau.lainad 'rom IK. HOM^M. lua-an.
tlud.i <
.J
1-51

WHC-SD-WM-VI-031Revision 0
c ICP ANALYSIS ON FUSED SAMPLESAnalytical and Process Support Laboratory
.0 ICP Analy»<«
Tha (Okttiona tram iha (u*ad ••mpi«( wai» aiulyx'd an tn« ICP at 374 Building
2.0 L«0 Ne3.0 Cuiumn4.0 Cu*lam*r'i 105.0 Oala Pila ID
9 . 0
c
8.0 fuaien Malhod KOH/W NaJOJ/Zr7,0 Samoia Wt O.Jfl47 p O.27J4B.O Dilution rsoo 2S0O
Al
aa*6* *
a>c.Cd
c.Co
Cf
Cu
Or
Eu
F,
K
L.
I.
M g
Mn '
M e
N a
N d
N i
P
Pb
S
si
Sn
S i
T.
T,
V
Y
I f .
Z'
n~« /-0.005% /3.083% /0.21S% /-0.003% 10.007% /-0.057% ,'4.197% 10.009% 1-0.038% 1-0.009% 10.058% 1•0.006% 1-0.006% 1-0.004% 10.546% !
1-0.009% !0.012% i2.421% 10.009% 10.099% |19.108% \
I-0.019% t
10.325% 1-0.076% i0.195% |10.994% 1-0.076% 1
. 0.116% t-0.057% i0.005% !•0.009% !0.008% I0.162% ;0.019% /
-0.005%3.565%0.24O%0.003%-0.003%-0.055%4.374%-0.006%-0.037%-0.009%0.040%-0.006%-0.006%-0.004%0.603%0.6S9% --0.009%0.005%2.439%0.008%0.101%
0.045%-0.018%0.519%•0.073%0.193%11.742%-0.073%0.127%•0.055%0.006%•0.009%-0.003%0.263%
0.0
1.0
Sue
r
lOial-
K-
N i -
ottl -
41,51% /
0.659% , ' * , .0.000% 1 Zr-
42.25% \
24 93%
19.108%0.019%
44 06%
vaiuaa gbitint* l . s m tn. NalO! /Zf lufan. Th* Ncucibla. Thu4 iha It ind Na npanta . ' • ¥alu«> o
.n i : * i low ct>*t—.i.,t,<,r. cl C«. Ih. N.TOJ l«t
Oiiai
A Q 2 0
AI2O3B2O38 . 08eO
Bi2O3
c«oCdO
CeOZCo 203Cr2O3
CuO
Dv2O3Eu2O3Fe2O3K20
L.2O3Li20MoOMnO
Mo03N«20
Nd203NiO
P20SPbOSO3SiO2SrtO2SrO
T«O2no aVOJY2O3ZrtO
2'02
Wt %Oarda
-0.005%5.826%0.692%•0.003%0.020%-0.063%5.872%0.010%-0.046%•0.013%0.085%•0.007%-0.007%-0.004%0.780%
-0.011%0.025%4.016%0.015%0.148% |25.758%
-0.022%j
0.745% /•0.081% I0.4SS% /
23.518% /-0.096% /0.138% /-0.071% f0.009% I•0.015% I0.010% i0.202% ' ;0.025% :
/ Wi%/ Ouda
/ -0.005%I 6.737%1 0.773%1 0.003%/ -0.008%I -0.061%
6.119%•0.006%•0.045%-0.013%0.059%-0.007%-0.006%-0.004%0.363%0.793%-0.011%0.010%4.045%0.013%0.152%
0.052%-0.023%1.189%-0.079%0.481%25.117%•0.093%0.150%-0.069%0.010%-0.015%•0.003%0.328%
Avafaga
\ Quid*
- 0 . 0 1 %• 6.28%1 0.73%; 0.00%i 0 .01%i -0.06%•• S.87%1 0-00%: -0.05%i -o.oi%t 0.07%! -0 .01%i - 0 .01%j 0.00%! 0.82%1 0.79%I -0 .01%I 0.02%I 4.03%\ 0 .01%1 0.15%I 25.76%
0.02%1-0.02%1 0.97%I -0.08%/ 0.48%/ 24.32%/ -0.09%/ 0.14%; -0.07%I 0.01%/ -0.02%1 0.00%'• 0.26%I 0.03%
PaitantDaviatnn
Oaida
3%-15%
—11%-12221%
438%3 %
929%3 %
3 %
37%3 %
3%3 %
-10%
3 %
3 5 %
• 1 %
1 2 %
• 3 %
-492%
-46%3 %
1 %
-7%3%- 3 %
3%
•a%3 %
432%•43%
Sub-tolal •
K I O -
N.O •
Tatai •
68 379%
0.793% .* . IO0.000% VZ-O2
69.2% \
1*C 896%
- 25.758% /- 0.025% /
72.7%/ 70.9%
. Thua pcMiiwn and nickal rapsrtad • ' •202 (ua>an it 0*iiaim<d in liican.um mataiia<na« Irwn Iha K0H/Ni luidn.
on -a «•! mcludad in Iha »<ng« vaiua.
1 5.0 Asoraoad 0y and data
y • 5 ,•;, _ ' .
-K <\S
1-52

WHC-SD-WM-VI-031Revision 0
c!CP ANALYSIS ON ACIDIFIED SAMPLES
Element Concentration in the Sample
1.0 The ICP/AES analysis are performed by the Analytical Proceii and Support Laboratory (APSL) uiing the method APSL-14.The instrument u n d it a Thermo Jarrell-Aih Model 61 E Spectrometer located in room 146 in 324 Building.
0414 File No 2692.0 Customer C.Freeman
3.0 Laboratory Log No. 1319
•1.0 Customer's Sample ID W23-VIFP1 01 80
1320 1321
S.O Acid u»ud6.0 Dilution Factor
HN0310
V1FP1-W23O19P2
fs'H0310
UFP1-W23020P1
NH0310 0
7.0 lCPAnaly«i«Sine* the ICP have detection limit value* which are different for each element, concentration* below trie estimated detection limit* aretabulated a i negative values. Sample dilution's performed by thu laboratory have been corrected irt the tabulated "ElementConcentration in the Sample**.
Ag
Ai "
B
Ba
Be
Bi
Ca
Cd
Ce
Co
Cr
Cu
0y
Eu
Fe
K
La
Li
Mg
Mn
Mo
Na
Nd
Ni
P
Pb
S
Si
Sn
Sr
Te
T7
V
Y
Zn
Zr
0.01
0.03
0.01
0.000.00
0.06
0.Q1
0.01
0.04
0.01
0.02
0.010.01
0.00
0.010.30
0.010.010.060.0O
0.010.05
0.02
0.02
0.06
0.08
0.08
0 01
0.080.00
C.06
0.00
0.01
0.00
0 010.01
Cone •» Sam**
- 0
• 0
23
-0•0
-0
1-0
-0-0-0
1-0
-0
.05
.30
. 1 9
.03
. 0 3
.60
.03
0 6
.40
10
2 0
0 9
06
0 4
2.24-3
-0
•0
1
00
2077-0
00
10
OS68
17
2314
20
2.1910
-0
18
1
2-0.
-0
-0.
- 0 .
- 0 .
4 0 .
49
SO
00
26
33
03
60
03
10
03
49-0.10
Cone •> it
-0
-0
23
-0
-0-0
1
-0-0
-0' 0
0
-0
-0
2
-3
-0
-0
1
0
0
2635-0
210
• 0
19
1
2- 0 .
-0
- 0 .
- 0 .
- 0 .
50.- 0 .
.05
.30
.77
. 03
.03
60
.94
0 6
4 0
10
2 0
8 8
0 6
04
0 3
00
10OS
8814
22
25
2014
2980
63
12
57
03
60
0 3
10
03
6 2
10
2131.62 2757.48
Clamant
Cant: n Sanola
-0
•0
38
-0
-0
-01
-0
-0-0
-00
-0
-0
1
-3
i -°I -020
0
3575-0
2
11
-0
23
1
2
-0
- 0 .
- 0 .
- 0 .
. 05
.30
18
03
03
60
07
06
40
10
2 0
36
0 6
0 4
75
00
10
05
35
13
22
61
20
2 3
9 4
8 0
07
36
5 1
03
60
03
10
•0.03
29. 60
-0.10
3G90.94
Oamani
Cone « Sam* *
usnx.
0.000
0
0
000
0
0
0
.00
.00
.00
.00
. 00
. 0 0
0 0
0 0
0 0
0.000
0
0
0
0
0
0
00
0
0
0
0
01 0
0
00
0
0
0
0
0
0.0.
. 00
0 0
0 0
0 0
0 0
0 0
0 0
0 0
00
00
0 0
0 0
0 0
0 0
0 0
0 0
0 0
0 0
0 0
0 0
0 0
0 0
0 0
0 0
0 0
0.000.000.000.000.000.000.000.000.000.000.000.000.000.000.000.000.000.000.000.000.000.000.000.000.000.000.000.000.000.000.000.000.000.000.000.00
0.000.000.000.000.000.000.000.000.000.000.000.000.00o.oo0.000.000.000.000.000.000.000.000.000.000.000.000.000.000.000.000.000.000.000.000.000.00
0.00 0.00 0.00
3 3 Ci.cuUied Ov
i : C A;srovt« by
/ • - . - •
f7t /"* '•'J
1-53

rheell
1—•1
Customer C.FREEMAN
Caiibilion curve used
SELECT IVE FLORIDE ION ELECTRODE DATA ENTRY SHEET
loyiO(conc) = B - A * (mV)
Analytical and Process Support Laboratory
Low nnd high slandaid used lo verify calibration curve
Lab No13171318131913201321
standard blank0.5ppm25ppm
Customer Sample IDP1-017P2-0HV1FP1-018V1FP1-019V1FP1-020
Dclecliun limit - 0.1 ppm F
Data entered by and dale
I
15687-6
mV758487
. 9093
y
mVr»vTlV
Raw Con (ug/nil)1.020.720.630.56
0.5
. U(/T\ ty V1 a
Correlation
Dilution545.5541.6
101010
Slope (A)ntercepl (B)
coefficient
Cone, (ppm)Cone, (ppm)
Cone, (ppm)
6.35.6
5
i
0.01721.299750.9993
0.6325.29
Cone, (mg/g)0.5530.392
I
nya i< o
© I
O Io
Page 1

.tlR: lie 1 LING COHGOl: UORU: .|---25^9GL-iMiHR NUMBER: l-;10209 PROJECT: ^20193Or 1-t'lTEniriL: SOLUTIONS
ftSR*
-ES fiSSOCliiTGD UITII TIIIG Sril'iPLE SET:
•!-IPT10H OF XRFft TECHMIQUtS USED
;inr:nnL PROCEDURE FOR SOLUTION snt-PLES,•.•00 I . I W D A ON SPOT.
I
en
oSO ICD in< o->• iO I
ilif'.LVST RON SflllDERS37B-3377
REV1EU:

c3
13
X
i
CNj
I\4-
; .CM
• in— cn
f-J
CO
V
in
cn
V
rvj v
inin
• 6
•v
1-0in
c]T
V
ci* •
D X Q ( J O Z ~ C 3 U Ifl G C W(v (v D_ T - U — ' / i t D S - — U C 3 - 1 U
in P1* + cn(Ti —
— t inm — • _— ~ \ ? LT N D S3 N CO m
c—-, CD - * U3 l£i U> U) CD C) — C3 CO fO C4 T
3 I Q L 5 0 - Z O W Ul C C U iat oz c_ <r u — m (Si H — u ca _i u
^- c- 'j- &_ c c =_
WHC-SD-WM-VI-031Revision 0
in i • n cn . . . CDS) \ U3 • • O in 7 KiCJ + w & ^? TT to rj —i
IT • T in • - • o1- v O - ' - O N ' - . - Q i a i f l W<x m r * - * T — . • r j [ * ) r * - T i n L n < ^ f m
inr^ - — — cncn — — — C J O T — PJ
^^ • • v \y \ ^ «• \ /
i r a u Jo: o. c u - tnwi— — u a - t u
I + VJ3 —
L3
tn cna m in m is. - T I-Tcn rj T i'. in N CJ3 cDcncncTiCDcn — — — CJto —
u a z r c n i u c / i ^ i uc. c u - uii/ji— — u a -1 u
£ 1-56
\ -

cK
t —
^ CO M (Ti Q L"> i "iIO I-"J "7 i£f tO ~ T-J I1- Q
CD CD Q Q O M — — l*"> CJ
v •„' v •».' ••.' •«.' v •«.'
— C U U l U l r - U D J U
CD L I MUi t-- Ci
O CZi
o r^ CM — :•:• \n•^ M in io w o; ( i
^ — -
CS3 CD CD CD If J " —
U3 Ci z a m LTi—eLi:C U LT i/. r - U G J 'J
WHC-SD-WM-VI-031Revision 0
— IT)
— — c-.j r j to m
(S >3 Q Q Q Q
V V S.' • ^ V •v'
C CM
LD Ci — CD U '.1
r.i
— — O r»"j • <7:
• • " • • ci ~J- '^ • ~ ' •
S.- V N/ V S.' \ - '•-'
IJ ii : c u '/• c c irC U '/i 'J-i I - — f_; t l _ ; 'w
1-57
c
WHC-SD-WM-VI-031Revision 0
c
\+
O
CO
IS
1 )
O
CD
> IIS
m
Q
ca
r-
mI -
o—
CO
N
f 1
<£t o TT
— ;<) m
1\+
orj
Q
v
in
oV
'.0
CD - —
LI
V \/ V
L3 CJ S C3 UJ '.'I C C L JI U W W I- - U G J U
2 i
^k- W Q II O fll C\t ^X- ' ' ' •*> *r i-1"' WJ f""> C'.; n
o o o <D o o 1 — — ri —
O ~ C U ' / ' <Z du <J"J '/J f- — (_r c: _•
1-58

c
j r
>
Name:
Work Package
Report Date: _
WHC-SD-WM-VI-031Revision 0
ADVANCED INORGANIC ANALYSIS GROUPATOMIC AND MOLECULAR CHEMISTRY SECTION. CHEMICAL SCIENCES DEPARTMENT
BATTELLE. PACIFIC NORTHWEST LABORATORIES. RlCHLAND. WA
pH, Conductivity, Titration. Ion Chromatograph, and Carbon AnalyzerRESULTS
Reviewed By:
Analysis Performed By: ICA_-
Sampl* Log-In X
Sample ID
pH
Conductivityturn hot/em)
P* («Ucvo4«)
NH3 («l*«/od*)
F* (IC)
HCO," (IC)
ci- (icj
NO,* (IC)
MO,' pet
PO, - 1 (:C)
SO 4 ' J (IC)
(IC)
|IC)
(IC1
COj"2 (Titrition)
HCO,' rnu-atian)
OH" fniratlon)
Oj (Tiuation)
ToUl Carbon
Total Organic C*rt>on
Inorganic Carbon
?OlS
4500
Concentration in 7C-
?Ol<*\
45OO
1 \0O
P0 2-O
*-\ \oo
or as specified
•
Dateof
Analysis
:
Reference :
i
p-IS
Equipment: D pH Meter, Orion Model 501 (S/N 51137)D Conductivity Bridge, Yellow Spring, inc. Model 32 (S/N 24C4)O Ion Chromatograph (IC), Dionex Ser.es 4000i (W337427)
uioiitratar, V.ertlftr (V;A27£9S. WA27998)Scn Ar.al^er. /er.ex-Dohimann Model DC-50 f.VA72-iO2. l.'.'A72iS2}
Q Ealancs, Me"ler elftctrGnic f«VA276S7}, csiibralion expires
c PNL-ALO-2'2 Rev. 1 (iC): Z =N'L-ALC-3£2.l Rev. 0 (TOC); Q PNL-ALO-501 Rev. 0 (D.H); C tnc:ruc;:5n f.'.a.TJs! (c=nauctn/ir;
on zpccl'.c ciec::c = e]: C •" M-AL0-225 Rev 0 U-jH^ by oiectfocc-j; C r.'.1L-ALC-22S ;£li:a!.-;:y t y ti'.rsticn)0 U-j

WHC-SD-WM-VI-031Revision 0
c
c
ION CHROMATOGRAPHYAnalytical and Process Support Laboratory
Lab No
Customer
Custom ers's
Water Leach
Sample DF
Analysis
ID
DF
IC values
fug/ml)
Fluoride
Chloride
Nitrite
Nitrate
Phosphate
Sulfate
IND
9.347
2.435
8.663
Oxllata
Lab No
Customer
Customers'* 10
Water Lsach dilution
Second dilution
Analysis
IC values
{ug/mU
Fluoride
Chloride
Nitrite
Nitrate
Phosphate
Sulfate
Oxalaia
Formal*
INO
1.568
10.056
1317-95
Freeman
I21-017P1109.09
SlurryReported
values
LVALUE!
2039.33-218.18-218.18531.27
1890.09-218.18-109.09
1320-95Freeman
W23-O19P21
SupernatantReported
values
ug/mL
LVALUE!-2.50-5.00-5.007.84
50.28-5.00-2.50
F
Cl
NO 2
NO3
PO4
SO4
(COOH)2
(HCOO)
F
Cl
NO2
NO3
P04
S04
ICOOH12
(HCOO.
IC values
IC values
(ug/mLJ
Dionex Model 300DX M&TE Nunber WDOO284
Analyst Signature and Date _**r 'J ' ^
Reviewed by and Date
Comments
1318-95Freemen
I21-014P2108.33
SlurryReported
values
ug/mL)IND
9.771
2.151
10.844
ug/g#VALUE!2116.98-216.66-216.66466.04
2349.46-216.66-108.33
1321-95Freeman
W23-020P11
SupernatantReported
values
ug/mL
IND
2.101
11.247
LVALUE!. -2.50
-5.00-5.0010.5156.24-5.00-2.50
.-/?-
F
Cl
N02
NO3
PO4
SO4
(COOH12
(HCOO)
F
Cl
NO2
NO3
P04
S04
(C00HJ2
IHCOO)
JZ •'- • / " £J < 1-60
IC values
(ug/mU
IND
9.169
C values
(ug/mU
1319-95Freeman
W23-018P-1-21
5
SupernatantReported
values
ug/mL
#VALU£!-2.50-5.00-5.00-5.00
45.85-5.00-2.50
SlurryReported
values
ug/mL
0.000.000.000.000.000.000.000.00
Estimated detectionFluoride
Chloride
Form.ite
Nil rile =
Nuran* =
TJecative
= 0.
= 0.
= 0.
1.0
1.0
val
5 ug/mL
.5 uo/mL
5 ug/mt.
ug/mL
ua/mi.
ues are
limit of the anions analvsedPhosphate =•
Sulfate >
O^alate
:ne es'.imsted
1.0ug/mL
« 1.0 ug/mL
= 1.0 ug/mL
1 detec'ion limit
in The
of the
diluted
anions
solution.
m the sample.
WHC-SD-WM-VI-031Revision 0
Off Gas Results
1-61
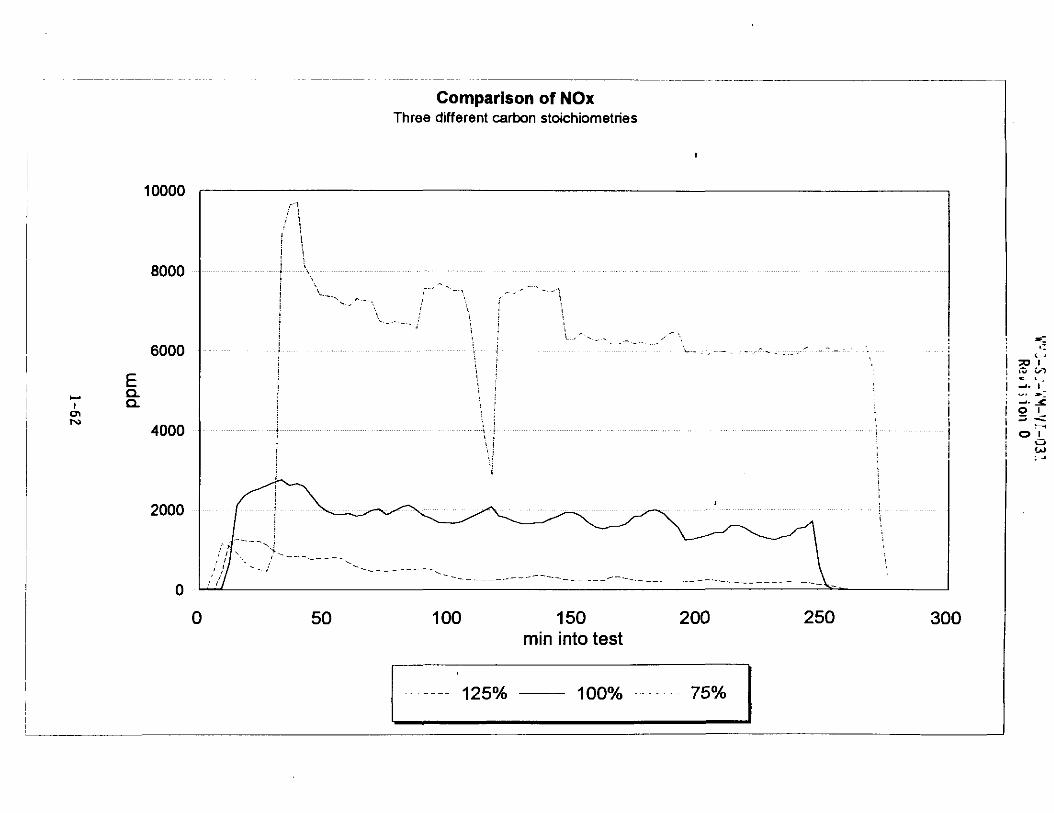
10000
8000
6000
EQ.Q.
O l
4000
2000
0
0
n/ \
Comparison of NOxThree different carbon stoichiometries
50 100 150min into test
200 250 300
o ' f

04/10/95 10:09 FAI 201 616 1930
WHC-SD-WM-VI-031Revision 0
C AA T L A N T I CA N A L Y T I C A LL A B O H A T O R Y
Gas Analysis Report
First Environment90 Riverdale RoadRiverdale, NT 07457201-616-9700 (Fax 201-616-1930)_Atm_; Mr-.Larry.Brunt_ .' • _
Sample ID I: Chemical Process GasSample ID 2: Project # VEG001, ProcedyneComiaents: 5, 15L Tedlar bags containing brownish gas.
AAL Number: 4607Received On: 03/10/95Report Date: 03/14/95PO Number: VEG001
Sampled On: 3/8-3/10/95Sample Point: see COC
Date Identification
3/8/95, 1500h,Bag#l( 3/9/95, U35h, Bag #2V 3/9/95, 1600h, Bag #3
3/10/95, 1305h, Bag #43/10/95, 1600h,Bagi?5
Nitrogen1
% v/v
94.693.892.296.195.5
Nitrous Oxide2
DDm v/v
8907501,6801,9802,170
Note 1: Nitrogon (N^ Detection, limit =• 0.001 %Note 2: Nitrous Oxide (N2O) Detection limit - 5 ppm v/v
nd — indicates the concentration is less than ths report d«Uction limit. — *• test not pexfonoed. % = parts per hundred(percent), ppm >".partB per.milJiQnji-W/* •• T**id;f anjjytit/weight sample format. WT « yplumesample format (equivalent to mole fraction for normalized, ideal gas fixtures).
Comments: . ,
>
Revie
Joa Pachuta, Ph,D.
Actachmencs:-Chain of Custody
Addendum:-Cbromatograms on-file-Notebook data on-file
f»O
1-63ATIAMTIC AMAUT1CAL LABOflAltlUr, INC.
PHONE MW-534-SBOO

WHC-SD-WM-VI-031Revision 0
F£ n G1P 9 0 Rwerdale Road
C jSf* O f Rtverdale, New Jersey 07457
ENVIRONMENT (2O1> 61^7°° • Mx <2O1> ei&May 8, 1995
Mr. Jim CareVectra Government Services, Inc.2939 Richardson RoadRichland, Washington 99352
Ho: Emission Tests - Paniculate Sampling ResultsPrbcedyne Facility
Dear Jim,
The paniculate analyses have been completed for the samples collected at the Procedyne facility.The results are summarized below:
Paniculate Concentration, mg/1
0.1460.1410.1430.1250.113
These results should be the final data required from the emission testing completed at theProcedyne facility. Please check your records to ensure that you have received all the necessarydata.
If you have any questions, please do not hesitate to call* .
Very truly yours,
FIRST ENVIRONMENT, INC.
Run No.
2345
Samme I.D.
' P-2P-3P-4P-5
Lawrence G. Brunt, P.E.Manager - Riverdale Office
cc: R. Biasca
f V F < 3 8 7 QRr/erdale.'New jersey • Tampa, Florida • Kennesaw, Georgia • Chicago, Illinois • Jackson, Mississippi • San Juan, Puerto Rico

APR 24'95 1S:36 FR ZENON WHC-SD-WM-VI-031Revision 0
TO 1201S1G1930 P. 0 1 / 0 5
ZENON 5555 Noilh Sttrvicc *oaa Tel 905 332 9733
Environmental BurlinQton Ontario Fax 905 332 9163
Laboratories Canada L?L SH7
Certificate of Analysis
CLIENT INFORMATION
Attention:
Client Name:
Project
Project Desc:
L.Brunl
First Environment Tnc.
VEG001
Vectni Govcnuncnt Corp.
A ddrcss: 90 Ri verdale Road
Rivcrdalc, New Jersey
NJ 07457
Fax Number: 201-616-1930
Phone Number: 201-616-9700
LABORATORY INFORMATION
Contact:
Project:
Date Received:
Date Reported:
Submission No.
Sample No.:
Yvonne Bond/Ron McLeodAN950ZS7
95A)3/I595AW/24
5C0317
008169-008174
Laboraionos:
Bniisn
Oniano
NOTES: :*u mot analysed '<•- less than Mtthod Detection Limit (MDL)'ftA'- no dataavailabletOQ can be deurmbudfor off anaiytts by mu&pfyiitg th* appropriate HOL X -TJ.IAU organic data is blank eorneUd txctptfor PCDD/F, fti-Rsx MS and CLP volatile analysesSolids data U bostd an dry weight txttptfor biota analyses.Organic analysts art not eomettdfor extraction rtcovtry standards txewptfor isotopedilution methods, (i.t. CARS 429 PAH, all PCDDtF and OBD/DBP analysts)
Methods used by Zcnon arc based upon those found in 'Standard Methods for the Examination of Water andWiisiewaier*, Seventeenth Edition. Ottier methods are based on the principles of MISA or EPA methodologies.
AU wwk recorded herein hux been dune in iiccordance with normal professional standard* using accepted testingmethodologies, quality assurance and quality control procedures except where otherwise agreed to by ihe cli<=mand testing company in writing. Any and ail use of these test results shall be limited to the actual cost of thepertinent analysis done. There is no oihcr warranty expressed or implied. Your samples will be retained mZenon for a period of three weeks from receipt of data or as per coniracL
COMMENTS:
Certified by1-65

N
95/04/24 Zenon Environmental Laboratories - Certificate of Analysis Paec 02
(3nCD
ID
ID
Q
o
oUl
a.
n
Component
[mpinger volume measured
Ammonia (as N)
Fluoride
Chloride
orlho-Phosphate (as P)
Boron
Client ID:Zenon ID:
Dak Sampled:MDL
0
3.0
3.0
0.0050.010
Units
ml
"g
' «e
mg«
MethodBlank
95/03/09
-
<
<
<<
MatrixSpike
95A33/O9
-
-
94
0.190.51
1.0
Cont#2 P5 H2Ot Recovery Matrix Spk. % Recovery lmp.H2O P3 Recovery
Duplicate 00817095 0081719595/03/09 95/03/09 95/03/09 95/03/09 95/03/10
94
97100
94
0.190.51
94
95100
940
3900
1.9<0.094
1400
980
4400000 5700000
4100
2.0<O.O98
680
o3<
o
O Io
inen
CMClient: First Environment Inc. Project: V E G 0 0 I
u.

in
N
n
OL
oen
ID
ID
G>
(\J
o
-67
95/04/24 Zenon Environmental Laboratories - Certificate of Analysis
Component
lmpinger volume measured
Ammonia (as N)
Fluoride
Chloride
ortho-Phosphate (as P)
Boron
Page O3
Client ID:Zenon ID:
Dale Sampled:
MDL
0
3.0
3.0
0.0050.010
1.0
Units
ml
"g
' «g
mg
P5H2ORecovery
00817195
95/03/10Duplicate
-
5700000
-
-
P5H2ORecovery
0081719595AJ3/I0
M. Spike
-
11000000
-
-
-
P5H2ORecovery
008171 95
95/03/10% Recovery
-
82
-
_
-
-
P4 H2ORecovery
008172 95
95/03/10
990
6300000
4900
2.0<0.099
860
PI Cont«bnp.H2O
008173 95
95/03/08
490
1800000
540
0.19<0.049
5600
P2 Conl#2lmp.H2O
008174 95
95/03/09
870
5700000
4800
0.69<0.087
4100
31O
TO 1(O CO
< oV) XZ
O 13 <O 1
oCO
oz:UJ
nID
in
Clieiu: First Environment Inc. Project: VEO00I
Q.
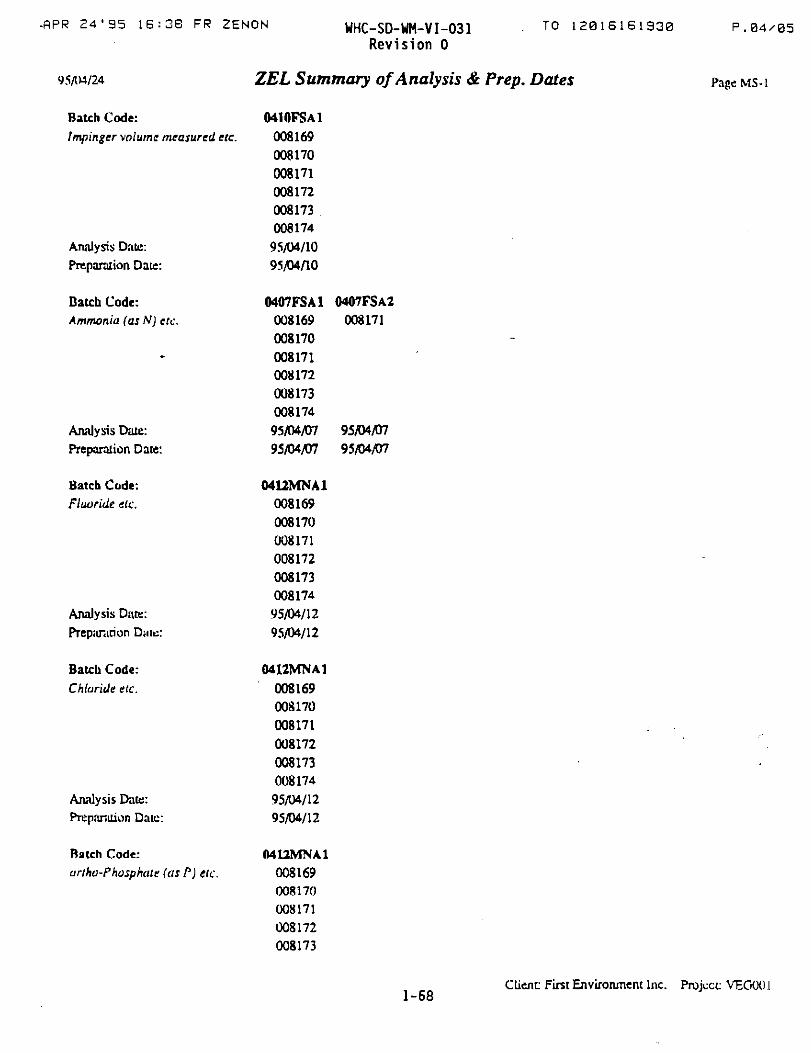
-APR 2 4 ' 9 5 1 6 : 3 8 FR ZENON
95AW/24
WHC-SD-WM-VI-031Revision 0
TO 12016161930
ZEL Summary of Analysis & Prep. Dates
P.04/05
Page MS-1
Batch Code:fmpingcr volume measured etc.
Analysis Date:
Preparation Dace:
Batch Codf:Ammonia (as N) etc.
-
Analysis Date:Preparation Daw:
Batch Code:
Fluoride etc.
Analysis Date:
Preparation Dale:
Batch Code:
Chloride etc.
Analysis Date:Preparation Daie:
Batch Code:
ortha-Phosphate (as fJ) etc.
0410FSA1008169
008170008171008172
008173008174
95AM/10
9S/D4A0
0407FSA1 0407FSA2008169 008171
008170
008171008172
008173008174
95AW/07 95/04JD7
95/04/07 95/04/07
0412MNA1008169
008170008171
008172
008173008174
95/04/12
95/04/12
0412MNA1
008169008170
008171
008172
008173008174
95AW1295/04/12
0412MNA1
008169008170008171
008172008173
1-68Client: First Environment Inc. Project: VEGOOJ

APR £4'95 16:36 FR ZENON TO 12016161930 P. 05 /05_
i/04/24
Analysis Dare:
Preparation Date:
Batch Code:Boron etc.
Analysis Date:Preparation Date:
WHC-SD-WM-VI-031Revision 0
ZEL Summary of Analysis &
008174
95/04/1295/04/12
0421BMB1008169
008170
008171008172
008173008174
95/04/21
95/04/21
Page MS-2
1-69 Client: First Environment Inc. Project; VEGOOl

WHC-SD-WM-VI-031Revision 0
This page intentionally left blank.
1-70

WHC-SD-WM-VI-031Revision 0
APPENDIX IB
MASS BALANCE CALCULATIONS
1-71

flWHCoK
Comport*
MCaCrFaKUg
MONaSrCaPCX4)
CO(3IaFSCX4)NO(3)N«2)OHTOG
M 10MNa•otoaA.
1.016670.001060.006670.000770.500000.001030.000420.01667
10.000000.016670.016670043330.016670.266670.160000.290000043333.166671.666676.666670.13500
ft • „ - .
WWC Hit •P.»
w1s i o n 0f SoJIuwlXft Waste.
1WI1A!
Wa^ht
Dwtwntal26.9840.0B32.00MAS39.102431349399.0423.0087.62
132.919497
174.9060.0135.451900960862.0146011700
416.20
Wlg/l OiM«27.42987 A<I)O(:i)0.0420iC*O0.430631 Of 2)0(3)0.0428} F«2)O(3)
19.55000 KJ2C0.02312 MgO0.O226S MnO(2)1.59900 UoO(31
230.00000< Na(2P1.46033 SO221309 CH21O4.11343 R2)O(9)2.91500 1
16.00267 —9.67200 —475000 —4.16259 SO(3)
196.36500 —7668333 —
113.33333 —56.18700 —
Simulant'—- ™—
w wOxM*
101.9656.06
15100190.60943040.3186.03
143.9462.00
103.62261.81141.96126.91
0.000.000.00
60.070.000.000.000.00
—
Dryad ProductffA51.82067
0.0686*0.050830.06122
23.550000.041660.03822239900
310.000001.727002346433.075602119060.000009.672004.750003.400460.000000.000000.000000.00000
ToM 763 02 411.79 ffL
WHC Olast Fonnuta and Waste LoadingRVRUnM
(Mdo310 ojlifcnJant 90(2}
B(2)O(3)Total awtght of Glaaa Na(2)Oi960 g la lm*M CaO
MgOWaata Loading A1(2)O(3)
26.6%Otwr
528%60%
200%20%21%
100%10%32%
•16.40124.00
0.0044.8932-91
103.1719.440.00
ToW 100.00% 1960.00 1136.41
gwmtatflalmulantg<mlMlaMalmii4anf goUwr'lalnMilaMSacs Sand 611.95 0.00 0.00 0^84eencAdd 2»JS 0625 0.00 O000
DoksnM 14A.13 0.00 0.00 -0.000M m 151.09 54.54 0.00 0.783
Iran O)do* 14i.11 0.00 0.X 0.282MaonattunCttM* ft58 V B 3.53 0.132
Total 1362.12
WHC OlaM Formula and Waste LocdlngCaklnar HuM Bad
Na(2)Otromalniulant310 oJMnUant
Total watgM of Olcaa1560 glalniant
Waat* Loading26.6%
OxMo WSKK2)
Na(2)OCaOMgO
Fa(2)O(3)
vr*
MgMPareaM526%8.0%
20.0%2.9%2 1 %
10.0%1.0%3.2%
816.40124.00310.00
44.953295
155.0015.0049.60
laaitfaMM818.40124.00
0.0044.893251
103.1715.440.00
100.00% 155O00 1136.41
Bone AddMonMaAklWM
iranOMdaMagnttMwCWda
g/latmulaM gwrtariIatawlant gwoHHIa/1abtwlam gothorMalmulaM811.96 0.00 0.00 0284124.25 0.00 0.00 0.248'148.13 0.00 0.00 -0.000103.80 0.00 0.00 1.036
14.12 000 0.00 02829 58 1 M ^53 0.132
Total 1211.43 1 » 3.53 1.99
RVR Glass Formers
Product SKX2) Bf2)O(3) Na(21O CaOComposition (wt%)
CaCOO) MoCOO) MOO AH2XX3) FM2VX3 Wafr VoUH O t wMomna 9.000% 54.000% 40.000% 1.000% -0.00%SUca Sand 99.660% 0.007% 0.010% 0.003% 0.050% 0.015% 0.03%Mflrtn 0.001% 65000% 0.004% 34.900% 0.50%Bone Add 56.300% 43.700% 0.00%Iran Odd* 96.000% 200%Magnaaun C M * 0.130% 0.190% 42.200% 0.030% 0.010% 19.300% 36-600% 1.38%
Calcinw Glass Formers
Composition (wt%)30(2) B(2)O(3) W2X3 CaO CaCO(3) MoCOO) MoO AK2O31 F«<2)O(3) W a w VoWH O f w
DokvnttSHcaSmdAlunnaBone AddIronOMdeMagnemoiOMd
5.000%99.880%
99 800%
0130%
0007% 0010%
0 150%
54000% 40.000%0.003%
1 _ 7 9 42.200%
0.060%99000%
0.030%
1.000%0.015%
96.000%0.010% 19.300% 36.800%
-0.00%0.03%100%0.20%2.00%1.38%

,iRe v i s i o n 0
08/17 PROCMASS.WB2
Mass Balance, Procedyne Pilot Scale
Prepared by: Brent Spurgeon
^ checker A
Calcmer Mass Balance'
Date: 08/17/95
page 1 of 17
Checked by: John Koehr Date: 08/17/95
7
Total Simulant Injection
Total InchesHigh12.62517.12517.37517.00018.50016.500
Low5.2506.1255.0005.7505.5007.000
Difference7.375
11.00012.37511.25013.0009.500
64.500
Density of Simulant 1.49 kg/liter
Assume 0.61 (cmA3/g Sugar) volume increase
15.1 Ib Sugar = 6849.244 g Sugar
180 Ib Simulant =
m—urad during test
Sugar concentration
125 g sugar /1 simulant *
81.64662 kg Simulant54.79639 liters of Simulant
125 g sugar /1 simulant
1 I simulant =1.08 sugar simulant
116.14 g sugarI sim w/ sugar
@100%StoichC64.5 in. x 1.25 liter/in. - 80.625 liters with sugar p«Proc«yn.caire.
80.625 liters w/sugar x 116.14 g sugar xI w/sugar
0.61 ml = 5712 ml sugar
80.625 liters w/sugar - 5.712 liter sugar =
Total Glass Formers In: 170.00 1b = 77.11kg
Glass Former Composition:
g sugar
74.91 liter simulant
Silica SandDolomiteAluminaIron OxideMagnesium Carbonate
74.66%13.62%9.54%1.30%0.88%
1-73

VHC-SD-WM-VI-031^ Revision 0
08/17 PROCMASS.WB2 P r e p a r e r J ; ^ Checker _ 3 ^ page 2 of 17Calciner Mass Balance/
Total Product Out:
223.85 Ib = 101.54 kg
Off-Gas:
Average Reading = 2.6 in H(2)OFlowRate 15.57 CFM(V1)
Assume Gas Temp: 40 °C
313.15 K(T1)
V2 = T2/T1 *V1
Standard Flow (V2) @ 298.15 K (T2):14.82 SCFM
or 25.19 N m3Air
Scrubber:
Start Volume: 22.00 gal = 83.30 literEnd Volume: 36.02 gal = 136.37 liter
1-74

V-':-SpJ-VK-Y.T.-031i Rev is ion 0
08/17 PROCMASS.WB2 Preparer^£_ Checker Jr£- page 3 of 17Calci 2r Mass BalanceCalci BI Mass Bala
Water Balance
Water in:
Total Simulant In: 74.91 liters
Water In Simulant:
Density of Simulant: 1490.00 g/lOther chemicals in simulant: 763.02 g/l f»m OWHC«.Weight of Water in simulant: 726.98 g/l
This equals: 0.727 I water /1 simulant
Total water in: 54.46 liters
Water Out:117 Ib = 53.0703 liters of water plus contaminant
1-75

08/17 PROCMASS.WB2
• -.-.>>Yv-v;.u j . Rewi-ion,
Preparer j}"2_._ ~he::ker fjCalcine Mass EiHancE
page 4 of 17
Nitrogen Balance
NITROGEN IN:
NO(3) 196.37 gyiiter of simulant74.91 liter of simulant14710 g NO(3)
%N= 14.01 g N62.01 g NO(3)
22.59% N
N in NO(3) = 3323.52 g N
NO(2) 76.68 g/liter of simulant74.91 liter of simulant5745 g NO(2)
%N= 14.01 g N = 30.45% N46.01 g NO(2)
pwWHCoxwbi
N in NO(2) -
EDTA:
1749.22 g N
concentration:Simulant Used:
EDTA:x 416.20 g/mol =
28 g N =416.2 gNa(4)EDTA
0.135 mot EDTA/liter Simulant74.91 liter
10.11 mo! EDTA4209 g EDTA
6.73%
N in Na(4)EDTA =
Fluidizing Gas:%flow of flow meter 30.00%Actual Fiow= 12.00 SCFM N(2)
or 20.39 N m3/hr
283.17 g N
n=PV/RT
101.0 kPa 20.39 N m3/hr = 0.831 kmol/hr8.314 kP.-m3ftn.oTK 298.15 k
Total Time = 4.0 hrTotal kmol = 3.32 kmdmwofN(2) 28.01 kg/kmol
Nitrogen from fluidizing gas: 93.07 kg N
Filter Blowback Nitrogen:1-76

Revis ion 0__ Cr
Calciner Mei:>s
I
08/17 PROCMASS.WB2 Preparer^J^__ CrK>;ker_<f*^ page 5 of 17
flowrate= 14.7 Ib = 8.4 Ib/hr1.75 hr
test time: 4 hrTotal N(2): 33.6 Ib = 15.24 kg N
Total Nitrogen In: 113.67 kg N
1-77

A R«;* i s i on 008/17 PROCMASS.WB2 Preparer'-jO_, Ch-sckisr.,^^. page 6 of 17
Calciner Mass; Bauincs
NITROGEN OUT:
Product: Total Product = 101.54 k(j
Nitrogen in Product is Negligible
Off-Gas:
Flow Rate: 25.19 N m3/hr
Elemental Nitrogen:
Average N(2) level in off-gas: 95.80% pwmwsNitrogen flow: 24.13 N m3/hr
n=PV/RT
101.0 kPa * 24.13 N m3/hr= 0.983 kmol/hr8.314 kP.-m^morK 298 .15 K
27.54 kg/hr
Test Time: 4.00 hr total 110.15 kg N
N(2)O:
Average N(2)O Reading: 2075 ppm p ^ ^ .
N(2)O flow: 0.0523 N m3/hr
n=PV/RT
101.0 kPa * 0.0523 Nm3/hr = 0.00213 kmol/hr8.314 wmykimrK 298.15 K
total kmol for 4 hr 0.008518 kmot
28.01 kg Wkmd N(2)O 0.636 kg N/kg N(2)O44.01 kg N(2)O/tanol N(2)O
Total N(2)O: 0.375 kg
Total Nitrogen from N(2)O: 0.239 kg
1-78

e n s i on 0
08/17 PROCMASS.WB2 P r e p a r e . ^ Checker ~ £ _ page 7 of 17Cal:;iner Mass BaiancJ
NO:
Average NO Reading: 3C62 ppm PW.IH.QHM
NO flow: 0.0771 N m3/hr
n=PV/RT
101.0 kPa * 0.0771 Nm3/hr = 0.00314 kmoJ/hr8.314 kP-'martworK 298 .15 K
total kmol for 4 hr: 0.012569 kmol
14.00 kgN/kmolNO 0.467 kg N/kg NO30.00 kg NO/kmol NO
Total NO: 0.377 kg
Total Nitrogen from NO: 0.176 kg
NO(2):
Average NO(2) Reading: 133.5 ppm p#r°fr-g«a.t»
NO(2) flow 3.36E-03 N m3/hr
n=PV/RT
101.0 kPa * 3.36E-03 Nm3/hr= 1.37E-04 kmol/hr8.314 uP.-^y^rK 298.15 K
total kmol for 4 hr 0.000548 kmol
14.00 kg N/kmol N(2)O 0.304 kg N/kg N(2)O46.00 Kg N(2)O/kmol N(2)O
Total NO(2): 0.025 kg
Total Nitrogen from NO(2): 7.67E-03 kg N
1-79

Re*i ion 0
08/17 PR0CMASS.WB2 Preparer ^ [ ^ L - Checker * y * page 8 of 17
Calciner Mass Balanae
NH(3):
Average NH(3) Reading: 6.00 g/hr parZanenAiwiyd.uwM.nd*
total kmol for 4 hr: 24.00 g
14.00 kg N 0.824 kg N/kg NH(3)17.00 kgNH(3)
Total Nitrogen from NH(3): 19.765 g N
Total Nitrogen Out: ERR kg N
Total Nitrogen In: 113.67 kg N
Difference ERR kg% Missing ERR
1-80
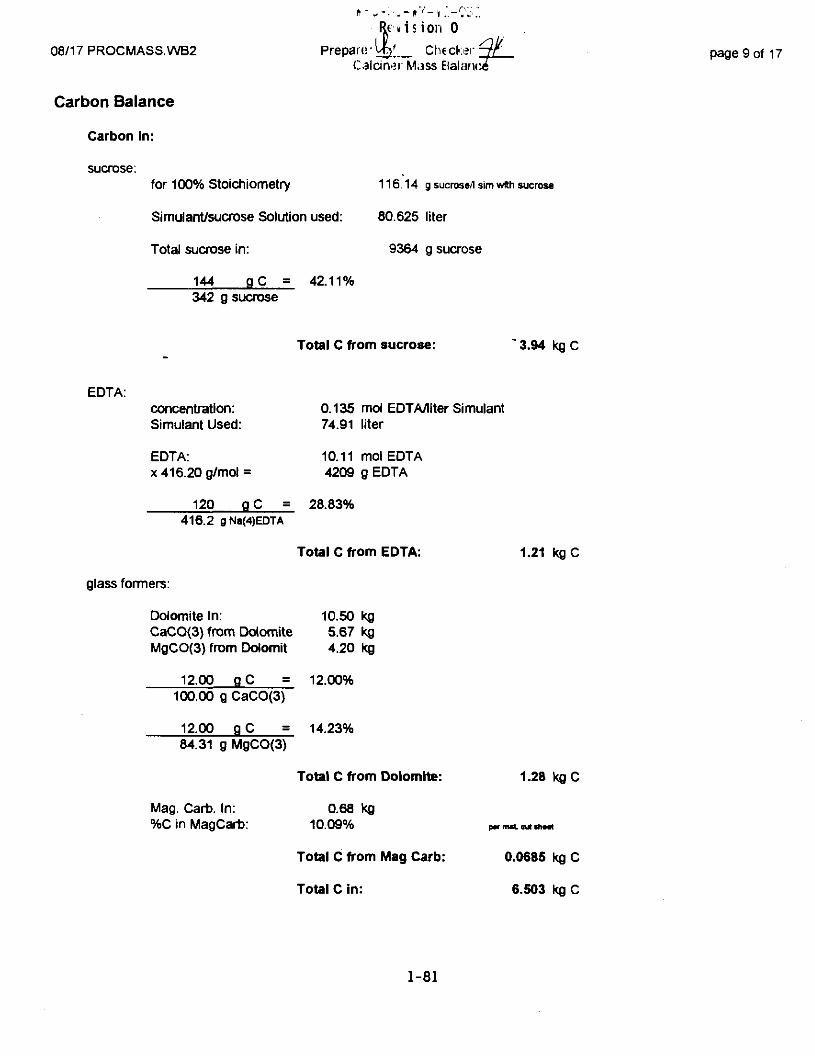
ft - . . - . . - . , - * " < " - 1 . ' - ? ^ . . - .
te y i s i on 0
08/17 PROCMASS.WB2
Carbon Balance
Carbon In:
Prepare • \Q[ CheckerCalciner Mass Etalant
page 9 of 17
sucrose:for 100% Stoichiometry
Simulant/sucrose Solution used:
Total sucrose in:
144 gC = 42.11 %342 g sucrose
116.14 g sucrose/I sim with sucrose
80.625 liter
9364 g sucrose
Total C from sucrose: 3.94 kgC
EDTA:concentration:Simulant Used:
EDTA:x 416.20 g/mol =
0.135 md EDTA/liter Simulant74.91 liter
10.11 molEDTA4209 g EDTA
120 gC = 28.83%416.2 gNa(4)EDTA
Total C from EDTA:
glass formers:
Dolomite In: 10.50 kgCaCO{3) from [Dolomite 5.67 kgMgCO(3) from Dolomit
12.00 gC
4.20 kg
12.00%100.00 g CaCO(3)
12.00 g C 14.23%84.31 g MgCO(3)
Mag. Carb. In:%C in MagCarb:
Total C from Dolomite:
0.68 kg
10.09%
Total C from Mag Carb:
Total C in:
1.21 kgC
1.28 kgC
par mat cut tiiMt
0.0685 kg C
6.503 kg C
1-81

Re 4 i s i ori 008/17 PROCMASS.WB2 Preparer^j^ Ciec<eO[T_ page 10 of 17
MSSJ Balance
Carbon Out:
Product: Total Product Out: 101.54 kg
Average TIC in Product:
Average TOC in Product:
Off-Gas:Flow Rate:
Total Volume out:
CO:Avg Reading:Volume of CO:
n-PV/RT
101.0 kPa *8 . 3 1 4 kPa'm3/kmorK
CO(2):Avg Reading:Volume of CO(2):
n=PV/RT
101.0 kPa *8 . 3 1 4 kPa*m3*mqTK
Total C in
25.19
100.75
34850.351
0.35298.15
2.78%2.82 kg
0.18%0.18 kg
i Product:
N m3/hr
mA3
ppmmA3
Nm3 =k
Total C from CO:
3.31%3.33
3.33298.15
mA3
Nm3 =k
Total C from CO{2):
avg. of
3.01 kg
-
0.014 kmol
0.172 kg C
0.136 kmol
1.63 kgC
TOC: AMUMCHMAvg Reading: 8.87 ppmVolume of TOC: 0.000894 mA3
n=PV/RT
101.0 kPa * 8.94E-04 N m3 = 3.64E-05 kmol8.314 kPa*m3/kmol*K 298 .15 k
Total C from TOC: 4.37E-04 kg C
1-82

WKC-S3-WM-VI-031tension 0
08/17 PROCMASS.WB2 Preps rei J v _ . Checker - ^ page 11 of 17
Ilctlicindr Mass; Balance
Scrubber Solution:
Start C concentration: 4100 mg/LTotal C at Start: 0 342 kgEnd C concentration: 4500 mg/LTotal Cat End: 0.614 kg
carbon accumulation: 0.272 kg C
Total Carbon Out: 5.080 kg C
Total Carbon In: 6.503 kg C
percent missing: 2T.88%
1-83

08/17 PROCMASS.WB2
Sodium Balance
Preparer
n s i on 0
Omcker ^ftfr Mass
mcker ^fts. E3a ance
page 12 of 17
Na(2)O In Simulant:
Silica Sand contains:
Total Na(2)O in :
Na(2)O in product:
Na in Scrubber @ start:
Na in Scrubber @ end:
Na accumulation:corresponding Na(2)O weight:
Total Na(2)O out:
% missing:
310.00 g/liter23.22 kg
0.0040 kg
23.227 kg
16.27%16.52 kg
3576 mg/liter0.298 kg2356 mg/liter
0.321 kg
0.023 kg0.031 kg
16.547 kg
28.76%
1-84

08/17 PROCMASS.WB2
Re *1i i on 0Prepi
Salem er MCreckor ^
ass Balancepage 13 of 17
Hafide Balances
Total Simulant In:Total Off-Gas out:Total Product Out:
Fluoride Balance:
F in Simulant:Total F in:
Avg F in Product:Total F in product:
Avg F in Off-Gas:Total F in Off-Gas:
Fluoride in scrubber @ Start:Total F at Start:Fluoride in scrubber @ End:Total F at End:Accumulation of F:
Total F out:% missing:
74 91 liter100.75 N m3/hr101.54 kg
4.75 g/liter0.356 kg
0.473 g/kg48.03 g
0.0045 g/hr0.018 g
5.00 mg/Iiter0.416 g6.00 mg/Iiter
0.818 g0.402 g
0.0484 kg86.39%
p«WHCo)t.wb1
parPNL
parZENON
pwPNL
Chloride Balance:
Cl in Simulant:Total Cl in:
Avg Cl in Product:Total Cl in product:
Avg Cl in Off-Gas:Total Cl in Off-Gas:
Chloride in scrubber
Total Cl out:% missing:
Iodide Balance:
I in Simulant:Total I in:
Avg I in product:Total I out:
% missing
5.672 g/liter0.425 kg
0.24%0.24 kg
2.00 mg/hr8.00E-O6 kg
0.244 kg42.65%
parWHCox-Wbi
pwUSGS
pwZENON
p*rPNL
2.12 g/liter0.158 kg
832 ppm0.084 kg
46.68%
par WHCoK.wb1
pwUSGS
1-85
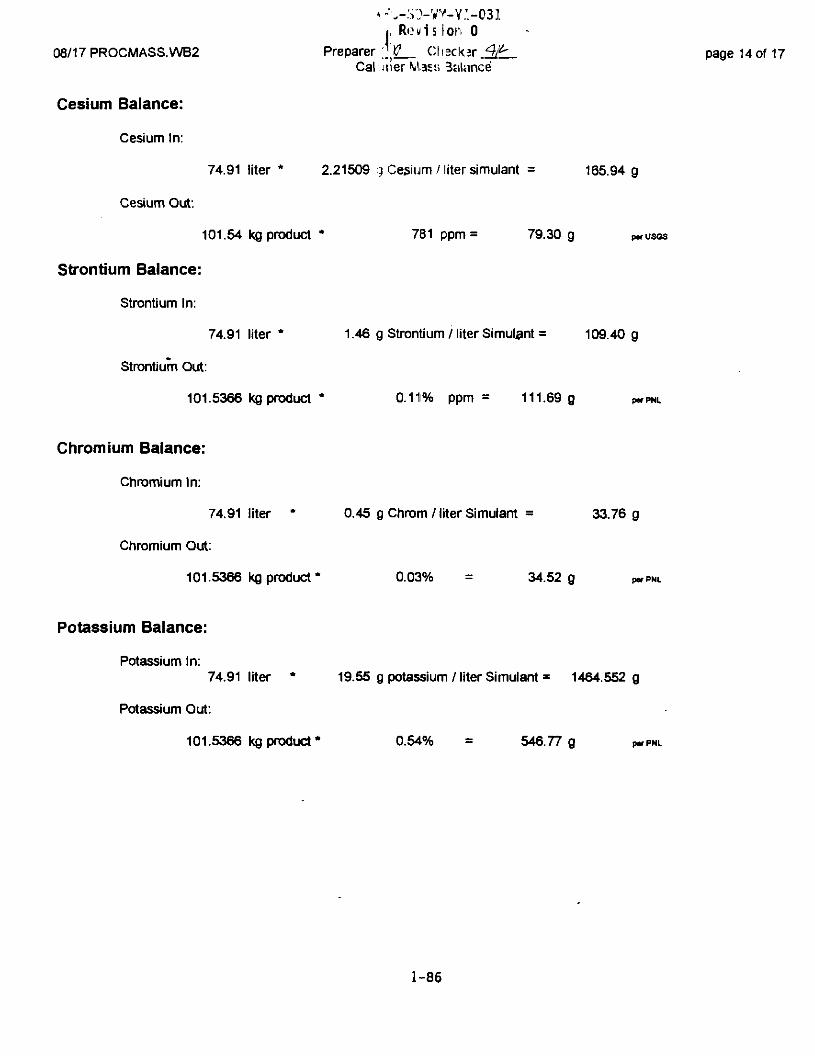
|, Rowi s ion 0
08/17 PROCMASS.WB2 Preparer ;j'g__ C h s c k j r ^ L - page 14 of 17Cal Jtier Mas:; 3aUince
Cesium Balance:
Cesium In:
74.91 liter * 2.21509 g Cesium/litersimulant = 165.94 g
Cesium Out:
101.54 kg product * 781 ppm = 79.30 g P*USGS
Strontium Balance:
Strontium In:
74.91 liter * 1.46 g Strontium / liter Simulant = 109.40 g
Strontium Out:
101.5366 kg product * 0.11% ppm = 111.69 g
Chromium Balance:
Chromium In:
74.91 liter * 0.45 g Chrom / liter Simulant = 33.76 g
Chromium Out:
101.5366 kg product* 0.03% = 34.52 g
Potassium Balance:
Potassium In:
74.91 liter * 19.55 g potassium /liter Simulant * 1464.552 g
Potassium Out:
101.5366 kg product* 0.54% = 546.77 g
1-86

08/17 PROCMASS.WB2
Manganese Balance:
Manganese In:
V'-C-.VJ-WM-V 1-031Re *1 si or 0
Prepari!}% Checker ffiC Ji! cineF Mass 3alance
74.91 liter *
Manganese Out:
101.5366 kg product*
Mn in Scrubber @ Start:
Mn in Scrubber @ End:
Mn Accumulation:
Total Manganese Out:
Molybdenum Balance:
Moly In:
0.02289 g Manganese / liter simulant = 1.71 g
0.01 %
0.130 mg/liter0.011 g0.155 mg/liter0.021 g0.010 g
6.61
6.60 g parPNL
parPNL
pwPNL
Moly Out:
74.91 liter *
101.5366 kg product*
Mo in Scrubber @ Start:
Mo in Scrubber @ End:
Mo Accumulation:
Total Moly Out:
1.599 g moly / liter simulant =
0.09%
0.220 mg/liter0.018 g0.225 mg/liter0.031 g0.012 g
95.46
119.79 g
95.44 g parPNL
parPNL
parPNL
Phosphorous Balance:
Phosphorous in:
74.91 liter * 1.343333 g Phosphorus / liter simulant = 100.63 g
Phosphorous out:
101.5366 kg product* 0.37% = 373.15 gP in Scrubber @ Start:
Pin Scrubber® End:
P Accumulation:
Total Phosphorous Out:
0.37%
11.940 mg/liter0.995 g
10.390 mg/liter1.417 g0.422 g
373.57
parPNL
parPNL
parPNL
page 15 of 17
1-87

08/17 PROCMASS.WB2
Glass Former Balances
VvC-.>D-frfM-VI-031-Revision 0
Prepare^ ^ . . _ CheckerCarrier Mass Balance1
page 16 of 17
Total Glass Formers In: 170 lib
Glass Former Composition:
SiO(2):
CaO:
Silica SandDolomiteAluminaIron OxideMagnesium Carbonate
Silica SandDolomiteAluminaIron OxideMagnesium CarbonateSiO(2) from G.F.:
Silica in product:
74.66%13.62%9.54%1.30%0.88%
57.500.530.000.000.00
58.03
55.00%55.85
kgkgkgkgkgkg
ka
% Missing: 3.76%
77.11069 kg
Avg USGS&PNL
Silica SandDolomiteAluminaIron OxideMagnesium CarbonateCaO from G.F.
CaO in Simulant:
Total CaO in:
CaO in Product:
0.006 kg2.949 kg0.000 kg0.000 kg0.001 kg2.956 kg
0.059 g/liter0.004 kg
2.960 kg
3.09%3.13 kg
Avg USGS&PNL
% Missing: -5.81%
1-88
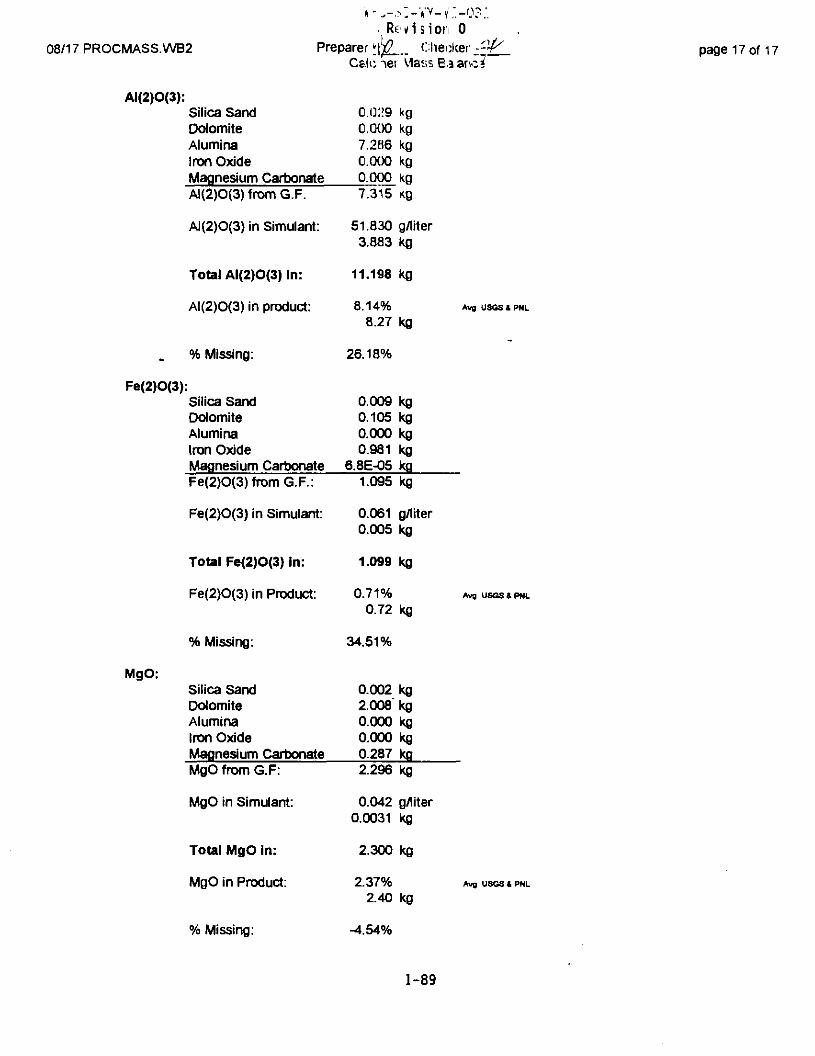
08/17 PROCMASS.WB2 Preparer ^ . _ _ Chenkei ^-Cslo iei V1a;;s B.aanc?
page 17 of 17
AI(2)O(3):Silica SandDolomiteAluminaIron OxideMagnesium CarbonateAI{2)O(3)fromG.F.
AI(2)O(3) in Simulant:
Total AI(2)O(3) In:
AI(2)O(3) in product:
c.o;?90.0007.2H60.000O.OOO7.315
51.8303.883
11.198
8.14%8.27
KgKgKgKgKg
g/literkg
kg
kgAvg USGS & PNL
% Missing: 26.18%
Fe(2)O<3):
MgO:
Silica SandDolomiteAluminaIron OxideMagnesium CarbonateFe(2)O(3)fromG.F.:
Fe(2)O(3) in Simulant:
Total Fe(2)O(3) in:
Fe(2)O(3) in Product:
0.0090.1050.0000.981
6.8E-051.095
0.0610.005
1.099
0.71%0.72
kgkgkgkgkgkg
g/literkg
kg
kgAvg USGS * PNL
% Missing: 34.51%
Silica SandDolomiteAluminaIron OxideMagnesium CarbonateMgO from G.F:
MgO in Simulant:
Total MgO in:
MgO in Product:
0.002 kg2.008 kg0.000 kg0.000 kg0.287 kg2.296 kg
0.042 g/liter0.0031 kg
2.300 kg
2.37%2.40 kg
Avfl USGS* PNL
% Missing:
1-89

WHC-SD-WM-VI-031Revision 0
This page intent ional ly l e f t blank.
1-90

WHC-SD-WM-VI-031Revision 0
APPENDIX 1C
DATA SHEETS
1-91

WHC-SD-WM-VI-031Revision 0
Pilot-Scale Test - DatasheetPg 2. of 2
Test No. FBC-S
Parameter
TI-Heated Bath
TI-Fluidizing Gas
TI-Lower Bed
Tl-Upper Bed
TI-Freeboard
TI— tPyr-*) A~S
T I -
PI-Blowback Gas
PI-Fluidizing Gas
Pl-Calciner Freeboard
Pl-Off-gas l ine (&P)
Pi-Fines Filter £f
P I
Simulant Injection Rate
Total Simulant Injected
Scrubber Level
Blowback Gas
Off-Gas V VV,D
Initials
Units
°C
°c
°c
°c°c
°c
°c
kPag
kPag
kPag
kPag
kPag
kPag
ml/min
cm
kPag
ADDITIVE /^%<5m_^oJ^ Sht^_ofJ^
Readings
0
SO. SL
0^00
lOl
1°L3 b7
i3?17
0<8
s
zt.qi
S&4
X uj
^?/Ci
l-Z-
7.A. I 4
&>Z-So2^
tb%
/r
cW
^±
/Ooo
SoZ.S/3
^ 7
/r
)<7
11 >?
i^5-
1-92

WHC-SD-WM-VI-031Revision 0
Pilot-Scale Test - DatasheetPg 2 of 2
Test No. FBC-S
Parameter
TI-Heated Bath
TI-Fluidizing Gas
TI-Lower Bed
Tl-Upper Bed
TI-Freeboard
TI- C?(v^A5T I -
PI-Blowback Gas
PI-Fluidizing Gas
Pl-Calciner Freeboard
; Pl-Off-gas line (Ar\
Pi-Fines Filter f&P)
PI
Simulant Injection Rate
Total Simulant Injected
Scrubber Level
Blowback Gas
Off-Gas * w c _
Initials
Units
°C
°C
°C
°C
°C
°C
°c
kPag
kPag
kPag
kPag
kPag
kPag
ml/min
cm
kPag
ADDITIVE Ay)%S*r/&X. Sht ' -ofj^
Readings
'Sot
h (^/OS
/ ^
0.Z5
no0
I. 0'
Ki 5 1
lOSo
$(%
101
IT
1,5
l/oo
25 c/
5"2Z-I/O
( ^>Y1 {?
fj —7
i . °\W.'SZ
2-50
5O2.
5Z.2-(Its
db
/O
111)
So ,
5"Z(^/ ^ '
/7
2-7-5"
2 . 2_
WO
5oZ5oz.
c 7
/ 3
/9
10. 1 9
tl'-iS
1-93

WHC-SD-WM-VI-031Revision 0
Pilot-Scale Test - DatasheetPg 2 of
Test No. FBC-S
Parameter
TI-Heated Bath
TI-Fluidizing Gas
TI-Lower Bed
TI-Upper Bed
TI-Freeboard
TI- dft^Mi
TI-
PI-Blowback Gas
PI-Fluidizing Gas
Pl-Calciner Freeboard
Pl-Off-gas line (\\x\
Pi-Fines Filter 7A Y)
P I
Simulant Injection Rate
Total Simulant Injected
Scrubber Level
Blowback Gas
Off-Gas *wc^
j
Initials
Units
°c
°c
°c°c
°c
°c
°c
JcPag
kPag
kPag
3cPag
kPag
kPag
ml/min
Xcm
kPag
ADDITIVE l0o°A-5btf/7& Sht 3 of />
Readings
25%
H^W\537
( 3 */^
/^^5,0
O
ZO.1 M
1300
\.TA
0
5". I
i i y/7
25h5OZ-
(1
2 1 !>
5.7
5 o ^SO?-
!?>%
n
IMZ.3,1
5.?
;voo
5o.5
n
S7
11.d
5 . ' f
1-94

WHC-SO-WM-VI-031Revision 0
Pilot-Scale Test - Datasheet1 of
Test No- FBC-S
Parameter
TI-Heated Bath
TI-Fluidizing Gas
TI-Lower Bed
Tl-Upper Bed
TI-Freeboard
T I -
T I -
Pl-Blowback Gas
PI-Fluidizing Gas
Pl-Calciner Freeboard
Fl-Off-gas line ( Af)
Pi-Fines Filter ( AP
P I
Simulant Injection Rate
Total Simulant Injected
Scrubber Level
Blowback Gas
off-Gas "we-
Initials
Units
•c°c°c
°c
°c°c°c
kPag
kPag
kPag
kPag
kPag
kPag
ml/min
cm
kPag
ADDITIVE /00 %)^o/^K Sht "Vof |>
Readings
IS\Sol.
53?
—
$<5
LI'S
5". 0ZOt \(\
—
A3*?
5. 6
Z5Ifb35"o2.&4O
/?
u Z-
zo. n
/soo
502:5H0
2.O7
mo •
J93O
2-Y75o 35o2
•o ^"l ^
ZO, \q
1-95

WHC-SD-WM-VI-031Revision 0
Pilot-Scale Test - DatasheetPg 2 of 2
Test No. FBC-S
Parameter
TI-Heated Bath
TI-Fluidizing Gas
TI-Lower Bed
TI-Upper Bed
TI-Freeboard
T I -
T I -
PI-Blowback Gas
Pl-Fluidizing Gas
Pl-Calciner Freeboard
Pl-Off-gas line A f
PI-Fines Filter A-\
P I
Simulant Injection Rate
Total Simulant Injected
| Scrubber Level
Blowback Gas
Off-Gas UWC-
! J
Initials
Units
°c
°c
°c
°c
°c
°c°c
kPag
kPag
kPag
kPag
kPag
kPag
ml/min
cm
kPag
ffl^/hr
ADDITIVE /6O% SUt/dS* Sht^~of \\
Readings
z<47
[y%
Z<945-7
}^<tSJO, 7 .
Z-0. \^
\G>QO
So'L
•
z o , /<?
5oz-
&(
34 P
CJ 6
20. i<|
5(93
5O3^H5
2.27
I<o50
Z5o
5^5
r^§
"Swo
ZO. /'/
t~?OQ
2-5-/
50 2.5OZ5"w 7
•2.O
66.^6
1-96

WHC-SD-WM-VI-031Revision 0
Pilot-Scale Test - DatasheetPg 2 of 2
Test No. FBC-S
Parameter
TI-Heated Bath
TI-Fluidizing Gas
TI-Lower Bed
Tl-Upper Bed
TI-Freeboard
T I -
T I -
PI-Blowback Gas
PI-Fluidizing Gas
Pl-Calciner Freeboard
Pl-Off-gas line / /
Pi-Fines Filter Jl P
P I
Simulant Injection Rate
Total Simulant Injected
i Scrubber Level
Blowback Gas
Off-Gas ^ c -
Initials
Units
°C
°C
°C
°C
°c
°c
°c
kPag
kPag
kPag
kPag
kPag
kPag
ml/min
cm
kPag
ADDITIVE fcSO^i SLt£/»K. Sh t v 7 of \~V
Readings
5o\
ID
zny
q Q
zc$5bZ,
SbTL
5io
i "bS/?
—
Z.O
ZO. ( 1
y 'of no
Go?-
11
•
—
5b Z5b-2L
(3>5
0.S7
&. Z.
2-.3ZO. i l
50/
501
HZ—
—
—
( 3%
Or 575:0
Zo l (rY
1-97
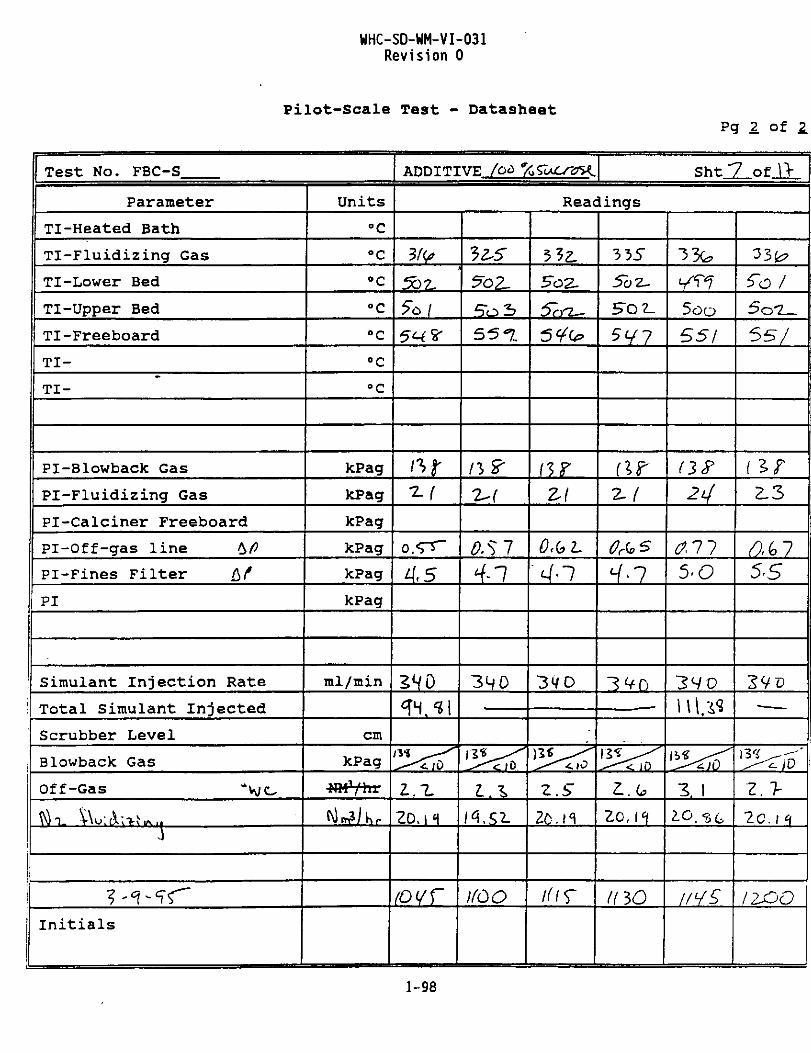
WHC-SD-WM-VI-031Revision 0
Pilot-Scale Test - DatasheetPg 2 of
Tes t No. FBC-S
Parameter
TI-Heated Bath
TI-Fluidizing Gas
TI-Lower Bed
Tl-Upper Bed
TI-Freeboard
T I -
T I -
Pl-Blowback Gas
PI-Fluidizing Gas
Pl-Calciner Freeboard
Pl-Off-gas line *>fl
Pi-Fines Filter bf
PI
Simulant Injection Rate
Total Simulant Injected
! Scrubber Level
\ Blowback Gas
Off-Gas *Vv/o
\
Initials
Units
°C
°c
°c
°c
°c°c°c
kPag
lePag
kPag
kPag
kPag
kPag
ml/min
cm
kPag
•NMYfcr
tiller
ADDITIVE foa %<?uCr<7>{ Sht 7 of\>
Readings
nr
o.<rr-
45
ii Z^
20,11
(Oi/f
55*7.
L.I
1 (00
) * « ^ *
Z . S
20. H
3 35
5c/7
f i f
fasHn
.
2o, \<\
(HO
55!
(IF
5>O
3H0
1. 1
//¥£
5o1L_
5S/
[ ^ < T
a^i5-5
-—
Z . >
2 C . f ^
I2JOO
1-98

WHC-SD-WM-VI-031Revision 0
Pilot-Scale Test - DatasheetPg 2 of 2
Test No. FBC-S
Parameter
TI-Heated Bath
TI-Fluidizing Gas
TI-Lower Bed
Tl-Upper Bed
TI-Freeboard
TI-
TI-
PI-Blowback Gas
PI-Fluidizing Gas
Pl-Calcxner Freeboard
Pl-Off-gas line /)/>
Pi-Fines Filter £/
PI
Simulant Injection Rate
Total- Simulant Injected
Scrubber Level
Blowback Gas
Off-Gas *wc—
Initials
Units
°C
°C
°C
°C
°c°c°c
KPag
kPag
kPag
kPag
kPag
kPag
ml/min
)cm
kPag
ADDITIVE ASO % %£.rov^ Sht^ of. 1.1
Readings
5oZ-
5o7-55 Z-
ISO
ZL.Z
at r
337
tir
QMS-
3H0_^_
12. SO
Sol
5.7
" • • — •
o.t
502.
5o2l
Z 3
55
—
5 o /
ZHQ
—
2,0.1 H
3 3J-5b?5a5
mZJ5
—ZO, St.
1-99

WHC-SD-WM-VI-031Revision 0
Pilot-Scale Test - DatasheetPg 2 of 2.
Test No. FBC-S
Parameter
TI-Heated Bath
TI-Fluidizing Gas
TI-Lower Bed
Tl-upper Bed
TI-Freeboard
T I -
T I -
PI-Blowback Gas
PI-Fluidizing Gas
Pl-Calciner Freeboard
Pl-Off-gas line &P
Pi-Fines Fil ter OP
P I
Simulant Injection Rate
Total Simulant Injected
Scrubber Level
Blowback Gas
Off-Gas *V)O
i
Initials
Units
°c
°c°c
°c
°c
°c
°c
kPag
kPag
kPag
kPag
kPag
kPag
ml/min
Icm
kPag
•HM?/hr
ADDITIVE /66 °A SAtfKt S h t 9 of IT-
Readings
5o2.5b2-
^ 3
—
Id. ^
5"O2_
5b3
—20.«t
/yoo
Sot
SoZ-
(\f23
5.5
* — •
3 355o2_Sol.
1**0
•
^0 , -SG
NX)
3375oo
(3?-Z3
MM
33 7So3
55O
GO
• —
. —
1O. Hi*
(Too
1-100

WHC-SD-WIM-VI-031Revision 0
Pilot-Scale Test - DatasheetPg 2 of 2
Tes t No. FBC-S
Parameter
TI-Heated Bath
TI-Fluidizing Gas
Tl-Lower Bed
Tl-Upper Bed
TI-Freeboard
T I -
T I -
Pl-Blowback Gas
PI-Fluidizing Gas
Pl-Calciner Freeboard
Pl-Off-gas line
Pi-Fines Filter
PI
Simulant Injection Rate
Total Simulant Injected
Scrubber Level
Blowback Gas
Off-Gas * w ^
Initials
Units
°C
°c
°c
°c
°c°c°c
kPag
kPag
kPag
kPag
kPag
kPag
inl/min
.5cm
kPag
t?M3/nr
ADDITIVE /CO % W/totf ShVCP of J i
Readings
^> O *2—
(s-Z
—
Z315o2-
- - — - — • —
56Z-5c f
/•??
O.z.
34 0^
^t> Z-
5"v(^
2.3
I(OOO
32,5
5o2-5b/
5^/7
10. Vie
33?So 2-
t38*Zj>
—
7-Z^
—
/G3O
1-101
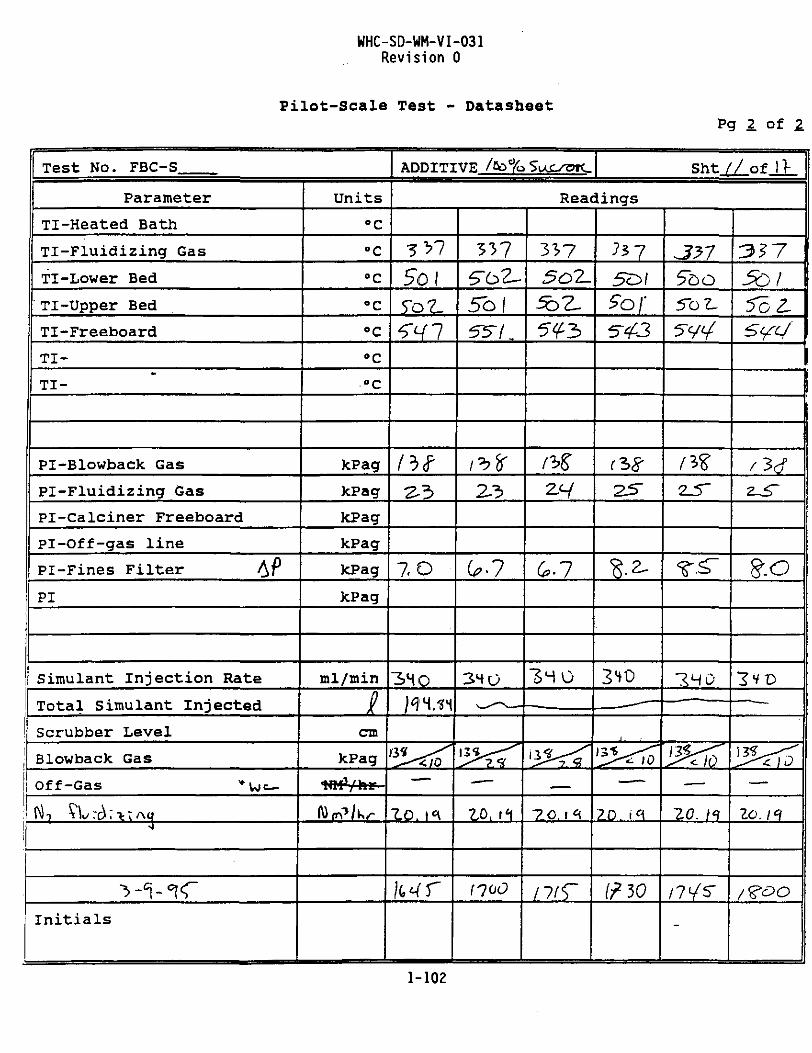
WHC-SD-WM-VI-031Revision 0
Pilot-Scale Test - Datasheet
Test No. FBC-S
Parameter
TI-Heated Bath
TI-Fluidizing Gas
TI-Lower Bed
"Tl-Upper Bed
TI-Freeboard
T I -
T I -
PI-Blowback Gas
PI-Fluidizing Gas
Pl-Calciner Freeboard
Pl-Off-gas line
Pi-Fines Filter A>P
P I
Simulant Injection Rate
Total Simulant Injected
Scrubber Level
Blowback Gas
Off-Gas *Wc-
Initials
Units
°C
°C
°C
°C
°C
°C
°c
kPag
kPag
kPag
kPag
kPag
kPag
ml/min
Icm
kPag
-MM) / h v
ADDITIVE / t o % Si cz-OTC Sht /./_of i i .
Readings
5>7
Sol
/ ^
7.O
3M0
—
Mr
5b 155"/.
ZO, if
5f3
7.0.1^
(*>$-
———
1
ZO. \e\
I? 10
5b o
/ ^
/7«/S"
-
337
5b 1ScZ.Sift/
§•-0
.
10. /<?
1-102

WHC-SD-WM-VI-031Revision 0
Pilot-Scale Test - DatasheetPg 2 of 2
Test No. FBC-S
Parameter
TI-Heated Bath
TI-Fluidizing Gas
TI-Lower Bed
Tl-Upper Bed
TI-Freeboard
T I -
T I -
PI-Blowback Gas
FI-Fluidizing Gas
Pl-calciner Freeboard
Pl-Off-gas line ^
Pi-Fines Fil ter d»f
P I
Simulant Injection Rate
Total Simulant Injected
Scrubber Level
Blowback Gas
j UII uaS VVJU
J
3-lo-C| r r ;^Initials
Units
°C
°C
°C
°c
°c°c
kPag
kPag
kPag
kPag
kPag
kPag
ml/min
Icm
kPag
MM1 , ' h r
ADDITIVE/Oi0/ $A(S6U Sht(2LofJ>
Readings
75?
Sol
•L.O
0,15
2,
olHS
2%lSo4So 4
S(Z-
n
2 .M
^o5-O2-
(!>S"/I
9,?r3-5
'ha-f
5b 3"5^7
(iff
0,0,1
I. >
2£\1
<!<*¥
5((
^^
- " - — •
IS. l>
-
Z-3
0.82.SO
ISO
3.J
offr
1-103

WHC-SD-WM-VI-031Revision 0
Pilot-Scale Test - DatasheetPg 2 of 2
Test NO. FBC-S
Parameter
TI-Heated Bath
TI-Fluidizing Gas
TI-Lower Bed
Tl-Upper Bed
TI-FreeboardX I -
T I -
PI-Blowback Gas
PI-Fluidizing Gas
Pl-Calciner Freeboard
Pl-Off-gas line &P
Pi-Fines Filter A^
P I
Simulant Injection Rate
Total Simulant Injected
Scrubber Level
Blowback Gas
Off-Gas x*Wo
s
1-\O~c\£Initials
Units
°C
°c
°c
•c°c
°c
°c
kPag
kPag
kPag
kPag
kPag
kPag
ml/min
Icm
kPag
TIM1/ 111-
ADDITIVE ,/6o% %£/&*# sht £3 of t>
Readings
5 (is
lbs23
zso—
47 7
•3 1
tf.37
1.5"
hf<r
S/0SO!5~3S
lo.O
fOlO
3/7^a
—
D.37
Ho
/. i"
5btf5o3^za
1 7Z~
23
o.zs
150
ZA
3V?T
So A5o/
SZO
172,
24
0.107^
10, S<\
1-104

WHC-SD-WM-VI-031Revision 0
Pilot-Scale Test - Datasheet2 of 2
Test NO. FBC-S
Parameter
TI-Heated Bath
TI-Fluidizing Gas
TI-Lower Bed
Tl-Upper Bed
TI-Freeboard
T I -
T I -
PI-Blowback Gas
Pl-Fluidizing Gas
Pl-Calciner Freeboard
Pl-Off-gas line f\fl
Pi-Fines Filter /^ P
P I
Simulant Injection Rate
Total Simulant injected
Scrubber Level
Blowback Gas
Off-Gas *WC-
j
Initials
Units
°C
°c
°c
°c
°c
°c
°c
kPag
kPag
kPag
kPag
kPag
kPag
ml/min
Icm
kPag
ADDITIVE /60e/h SZcr<fr^ Sht/^of )>
Readings
56 5
\1L1$
/ao
13fe.o6
2.0. ^
{^3O
50/
5U
(72.
foi
f?Z
Zo. M
5"OZ-
^ /
f72.
0.1O
*• s _ _
10,[t\
So<45o[
I7Z.
•2-3
20. \t\
1330
-
502-
5o/SI(
/, /
1-105

WHC-SD-WM-VI-031Revision 0
Pilot-Scale Test - DatasheetZ of 2.
Test No. FBC-S
i Parameter
TI-Heated Bath
Tl -F lu id iz ing Gas
TI-Lower Bed
Tl-Upper Bed
TI-Freeboard
T I -
T I -
PI-Blowback Gas
PI-F lu id iz ing Gas
Pl-Calciner Freeboard
Pl-Off-gas line (\?
Pi-Fines Filter ()?
P I
Simulant Injection Rate
Total Simulant Injected
Scrubber Level
Blowback Gas
off-Gas v^c-
No. VWa, %\r\ u
Initials
Units
°C
°c°c°c°c
°c
°c
kPag
kPag
kPag
kPag
KPag
kPag
ml/min
itcm
kPag
1%1'L f l i t
ADDITIVE/6o% %(/7>u Sht /^~of R
Readings
5b35oi
oMl(D-Z.
150
2-0-1*4
55356 2-5"oi
2-3
(9-708.0
Zo. 11
S~03
5"Z7
10. IH
5 0 35b 35Z-7
HZ2-Z
0.1O
5b/
^3
<9.57
35o
/TOO
-
0.0? CD
^7
^ - "*'
"Zfl.Kf
1-106

WHC-SD-WM-VI-031Revision 0
Pilot-Scale Test - DatasheetPg 2 of
Test No. FBC-S
ParameterTI-Heated Bath
TI-Fluidizing Gas
TI-Lower Bed'TI-Upper Bed
TI-Freeboard
T I -
i T I -
PI-Blowback Gas
PI-Fluidizing Gas
Pl-Calciner Freeboard
Pl-Off-gas l ine /\/
Pi-Fines Filter £fPI
Simulant Injection Rate
Total Simulant Injected
Scrubber Level
Blowback Gas
off-Gas «w«-
\
Initials
Units
°C
°C
°c
°c
°C
°C
°c
kPag
kPag
kPag
kPag
kPag
kPag
ml/min
Acm
kPag
NtrAr
ADDITIVE ICQ%5~«jSSK Sht /fe of 1>
Readings
33O5*0 2-
SVL.
ITL-
2.SO
-i-—M
Id. ]<K
IS3O
3515b 3Sol
a-u23
O.fco
c—^
5O35"o/52-f
I1Z-
O.bS7-5"
ihoO
¥ ^
(71.
- —- ti
Z . T
2 .0 .1*1
So~2-
nz
O.bO
Z . M
/(o3Q
-
5~0 2-
(72-
O.G-O
8-7
Z . H
1-107

WHC-SD-WM-VI-031Revision 0
Pilot-Scale Test - DatasheetPg 2 of 2
Test No. FBC-S
Parameter
TI-Heated Bath
TI-Fluidizing Gas
TI-Lower Bed
Tl-Upper Bed
TI-Freeboard
T I -
T I -
PI-Blowback Gas
PI-Fluidizing Gas
Pl-Calciner Freeboard
Pl-Off-gas line Ai/>
Pi-Fines Filter
PI
Simulant Injection Rate
Total Simulant Injected
Scrubber Level
Blowback Gas
Off-Gas vwc.
>fo-«tfInitials
Units
°C
°C
°c°c
°c
°c
°c
kPag
kPag
kPag
kPag
kPag
kPag
ml/min
cm
kPag
I'M / h j
ADDITIVE/«O% 3Sr^vf sht/7of n-
Readings
5-535oZ5o/
172,
057
•bZO
7-2- '
1 . 1 )
20. ii
f?0O
1-108

WHC-SD-WM-VI-031Revision 0
PART 2 - RVR DRYER/CALCINERTEST REPORT
2-i
WHC-SD-WM-VI-031Revision 0
RVR DRYER/CALCINER - TEST REPORT - FINAL
FOR
EVALUATION OF MELTER SYSTEM TECHNOLOGIES FORVITRIFICATION OF HIGH SODIUM CONTENT LLRW
VECTRA GSI Report No. WHC-VIT-04
August 1995
for
WHC Contract No. MMI-SVV-384211
by
VECTRA Government Services, Inc.2939 Richardson RoadRichland,WA 99352
(509) 375-3535
Prepared by:
John J. KoehrBrent Spurgeon
Approved by
Brad Mason
2-ii

WHC-SD-WM-VI-031Revision 0
CONTENTS
1.0 INTRODUCTION 2-1
2.0 PURPOSE 2-1
3.0 CHRONOLOGY OF EVENTS 2-1
4.0 EQUIPMENT OPERATING BEHAVIOR 2-54.1 CHEMICAL AND GLASS FORMER MIXING, BATCHING, AND FEEDING .... 2-5
4.1.1 Simulant Feed System 2-54.1.2 Glass Former Feed System 2-6
4.2 OFF-GAS SYSTEM 2-64.3 HEAT TRANSFER SYSTEM 2-74.4 RVR DRYER MECHANICAL 2-7
5.0 SCOPING TESTS AND OBSERVATIONS 2-85.1 TESTING WITH GLASS FORMERS AND WASTE FEED 2-85.2 INITIAL RVR TESTING WITH LLRW SIMULANT AND GLASS FORMERS . . . 2-10
5.2.1 RVR-S1: Glass Former Mix C, Liquid Simulant,100% Stoichiometric Sucrose Reductant 2-10
5.2.2 Glass Former Mix C, Liquid Simulant, 60%Stoichiometric Sucrose 2-11
5.2.3 RVR-S3: Glass Former Mix C, Liquid Simulant,No Additives 2-12
5.3 RVR LABORATORY SCALE OVEN TESTS W/ SUCROSE AND FORMIC ACIDREDUCTANTS 2-125.3.1 Oven Reaction Tests: Dried Glass Formers and
Simulant with 60% and 100% Dry Sucrose Reductant .... 2-135.3.2 Oven Reaction Tests: Glass Formers and Liquid
Simulant with 60% sucrose and 100% Formic AcidReductants 2-13
5.4 RVR SIMULANT VACUUM DRYING PCP TESTS 2-145.5 RVR TWO STAGE DRYING/REACTING 2-15
5.5.1 RVR-S4: Pre-Dried Glass Formers and SimulantW/ 60% Stoichiometric Sucrose 2-16
5.5.2 RVR-S5: Pre-Dried Glass Formers and SimulantW/ 80% Stoichiometric Sucrose 2-17
5.5.3 RVR-S6: Pre-Dried Glass Formers and SimulantW/ 100% Stoichiometric Sucrose 2-17
5.5.4 RVR-S7: Pre-Dried Glass Formers and SimulantW/ 125% Stoichiometric Sucrose 2-18
5.6 SCOPING TEST EVALUATION SUMMAiRY 2-19
6.0 CONCLUSIONS 2-19
7.0 RECOMMENDATION FOR FUTURE TESTS 2-19
2-iii

WHC-SD-WM-VI-031Revision 0
CONTENTS (cont)
APPENDIXES
2A DATA SHEETS 2-21
2B RVR TESTING SAMPLE LOG 2-51
LIST OF TABLES
2-1 RVR Dryer Testing Chronology Summary 2-2
2-2 Glass Former Mix B 2-8
2-3 Glass Former Mix C 2-9
2-4 Oven Reaction Tests with Sugar and Formic Acid Reductants 2-13
2-5 Product Generated During Two Stage RVR Drying Tests 2-15
2-6 Average Steady State Bed Temperature Profiles Observed DuringSecond Stage RVR Drying Tests 2-16
2-7 RVR Test Evaluation Summary 2-20
2-iv
WHC-SD-WM-VI-031Revision 0
PART 2 - REV DRYER/CALCINER TEST REPORT
1.0 INTRODUCTION
The Uestinghouse Hanford Company (WHC) is conducting an evaluation ofglass melter system technologies for vitrification of liquid low-levelradioactive waste (LLRW) streams consisting mostly of sodium nitrate andnitrite salts in alkaline liquid slurry form. As part of this technologyevaluation, VECTRA will demonstrate the performance of the EnviroGlass™Vitrification System feed and VE-SKULL™ melter subsystems. The RVR DryerSystem is a potential EnviroGlass™ feed subsystem and is intended to dry,mix, and react the liquid waste simulant together with glass formers andreductant additives prior to vitrification.
2.0 PURPOSE
This test report documents accomplishment of the RVR Dryer/Calciner testobjectives. Test objectives include the following:
2.1 Generate dry LLRW simulant for use in VE-SKULL™ melter testing.
2.2 Demonstrate the ability of the VECTRA RVR Dryer to do the following
• Evaporate water to produce a dry, free flowing solid• Volatize NO, and NC^• Convert NaN03 and NaNO, salts to Na2C03 salts• Reduce NO^ and N02 to N, gas• Mix dry simulant with glass formers and reductant additive
2.3 Determine throughput of RVR Dryer/Calciner when operating withinparameters for achieving objectives number one and two.
2.4 Determine efficiency of H02/HQ, reductions using the followingadditives to dryer: sucrose fC^H^O,,), formic acid (HC02H).
3.0 CHRONOLOGY OF EVENTS
A detailed chronology of RVR dryer scoping testing has been recorded inthe Test Log and data sheets. A brief summary is provided in Table 2-1.
2-1

WHC-SD-WM-VI-031Revision 0
Table 2-1. RVR Dryer Testing Chronology Summary, (4 sheets)
Dates
3/14/95(Water Feed)
3/16/95(Water Feed)
3/20/95(Water Feed)
3/21/95(RVR-Sl)
3/24/95(60% sucrose)
Activities/events
- Dry glass formers w/ boric acid (Mix B)- Water feed, no simulant, no reductants- Hot oil temp 570 °F.- Slurry leaks at rotor shaft packing seals- Bed caking developed after approx. 1 hour- Following cooldown, bed solidified due to presence of
H2B03 in bed
- Discharge weir removed to lower bed level for futuretests.
- Dry glass formers w/o boric acid (Mix C)- Water feed, no simulant, no reductants- Initial hot oil temp 570 °F. Hot oil temp could not
be maintained above 483 °F.- Hard crust developed on wetted heat transfer surfaces- Bed free-flowing, no solidification on cooldown.
- RVR dryer barrel external jacket insulated- Dry glass formers w/o boric acid (Mix C)- Water feed, no simulant, no reductants- Hot oil temp maintained near 570 °F- Minor caking observed, bed free flowing
- Dry glass formers w/o boric acid (Mix C)- Liquid LLW simulant injection w/ 100% sucrose
reductant- Hot oil temp 570 °F- Test duration approx. 6 hours- Average NOx 1353 ppm, average CO 446 ppm- Off-gas carryover and leaks noted- Periodic exothermic reactions raised bed
temperatures, hot oil system tripped on hightemperature.
- Peak NOx and CO observed during exothermic reactionperiods
- 161.9 kg (357 lbs) black product generated
- Off-gas system modified- More insulation and jacketing added to RVR dryer and
hot oil system piping-dry glass formers w/o boric acid (Mix C)
- Liquid LLW simulant injection- 60% sucrose reductant- Hot oil temp 570 °F- Bag filter in new off-gas drum became plugged- Bed developed cake, required clean-out- No usable product generated
2-2

WHC-SD-WM-VI-031Revision 0
Table 2-1. RVR Dryer Testing Chronology Summary. (4 sheets)
Dates
3/25/95(60% sucrose)
3/26/95-3/27/95(RVR-S3)
3/27/95(Oven ReactionTesting)
3/29/95(Oven Drying/Reaction Testing)
Activities/events
- Dry glass formers w/o boric acid (Mix C) Repeat oftest from 3/24/95.
- Liquid LLW simulant injection- 60% sucrose reductant- Hot oil temp 570 °F- Bed developed hard cake which required clean-out.- No usable product generated- Unable to duplicate results of RVR-S1.
- Dry glass formers w/o boric acid (Mix C)- Liquid LLW simulant injection only, no reductants- Hot oil temperature 225-325 °F- Slow drying, wet zone migrated toward discharge end.- Operated in drying mode for approx. 5 hours- Severe bed caking resulted >240 °F- 81 kg (179 lbs) dry glass formers and simulant
product generated
- Oven test: 200g dry glass formers and simulant (RVR-Sl product)
- Dry 100% stoich. sucrose reductant- Oven temp 530 °F- Dark black free-flowing product generated
- Oven test: 200g dry glass formers and simulant(RVR-S1 product)
- Dry 60% stoich. sucrose reductant- Oven temperature 530 °F- Lighter black free-flowing product generated
- Oven test: dry glass formers- Liquid LLRW simulant w/ 60% stoich. sucrose reductant- Oven temperature 530 °F- Dark black, hard cake formed- Oven test: dry glass formers- Liquid LLRW simulant- Dry 100% stoich. formic acid reductant- Formic reacted w/ NaN02 at room temperature, volatized
some NOx- Oven temperature 530 °F- Formic volatized prior to reacting with NaN03- Hard red cake formed upon cooling indicating no
reaction and resulting melted salts
2-3

WHC-SD-WM-VI-031Revision 0
Table 2-1. RVR Dryer Testing Chronology Summary. (4 sheets)
Dates
3/29/95-3/31/95(RVR Vacuum DryerPCP)
3/29/95-4/2/95(RVR Drying)
4/5/95(RVR-S4)
(RVR-S5)
Activities/events
- RVR Process Control Program (PCP): liquid simulantand glass formers
- 300 ml simulant- Vacuum 22" Hg, temp 120 °F- After 4 hours 0.29 kg (0.63 lbs) glass formers added- Yellowish waxy, oily product, significant particulate
carryover indicated- Hydrated salts present- Not suitable for RVR batch vacuum drying
- RVR PCP: liquid simulant only- Vacuum 25-27" Hg, temp 120 °F- Yellowish hard crystalline cake- Not suitable for RVR batch vacuum drying
- RVR PCP: liquid simulant bubbled w/ CO,- 150 ml simulant bubbles w/ C02 at 1 SCFH and 80 °F for
over 1 hour- Yellowish/white foam, precipitation, no pH change- Vacuum dried at 28"Hg- Yellowish, waxy, oily agglomeration- Not suitable for RVR batch vacuum drying
- RVR stage 1 drying: dry glass formers (Mix C), liquidsimulant, no reductants
- Hot oil 230 °F- 195 kg (430 lbs) additional dry reddish product
generated for uise in stage 2 RVR reactions (RVR-S4through S7). Total of 276 kg (609 lbs) dry RVRproduct available.
- RVR stage 2 reaction test: dry glass formers andsimulant (RVR 1st stage product)
- 60% stoich, sucrose- Hot oil 570 °F- Exothermic reactions (574 °F peak)- Average NOx 45.8 ppm, average CO 18.4 ppm.- Minor caking- Free flowing black product generated
- RVR stage 2 reaction test: dry glass formers and-simulant (RVR 1st stage product)
- 80% stoich. sucrose- Hot oil 570 °F- Exothermic reactions (653 °F peak)- Average NOx 68.2 ppm, average CO 36.1 ppm- Free flowing black product generated
2-4

WHC-SD-WM-VI-031Revision 0
Table 2-1. RVR Dryer Testing Chronology Summary. (4 sheets)
Dates
4/11/95RVR-S6
RVR-S7
Activities/events
- RVR stage 2 reaction test: dry glass formers andsimulant (RVR 1st stage product)
- 100% stoich. sucrose- Hot oil 570 °F- Exothermic reactions (573 °F peak)- Average NOx 185.4 ppm, average CO 52.0 ppm- Free flowing black product generated
- RVR stage 2 reaction test: dry glass formers andsimulant (RVR 1st stage product)
- 125% stoich. sucrose- Hot oil 570 °F- Exothermic reactions (587 °F peak)- Average NOx 220.0 ppm, average CO 60.5 ppm- Free flowing black product generated
4.0 EQUIPMENT OPERATING BEHAVIOR
4.1 CHEMICAL AND GLASS FORMER MIXING, BATCHING, AND FEEDING
4.1.1 Simulant Feed System
DSSF simulant was provided in DOT 17H 55-gailon drums. Drums were stagedadjacent to the RVR feed tank (Waste Hold-up Tank). The drum was opened andfitted with an electric mixer, drum pump, and splash lid. DSSF simulant wasthoroughly mixed within the drum and transferred via the installed drum pumpand hose directly into the RVR feed tank.
A 378 liter (100 gal) stainless steel RVR feed tank was equipped with atop mounted electric tank mixer. The tank was calibrated for liquid level bymeans of visual level indication in the sight glass. As needed, calculatedsimulant quantities were pumped from the simulant drums until the desired RVRfeed tank level was achieved. For testing requiring addition of sucrose(C!2H22°ii) reductant, dry sucrose was manually added to the RVR feed tank inweighed quantities necessary to achieve desired stoichiometric concentration.The RVR feed tank mixer was continuously operated during batching andsubsequent simulant feeding to assure a homogeneous slurry.
Liquid slurry was pumped from the IRVR mix tank into the RVR dryer via astainless steel tubing feed line using a variable speed, positive displace-ment, peristaltic tubing pump. The simulant feed pump stainless steel suctiontubing was provided with a connection for water. This connection was utilizedfor water injection testing and to flush the feed line following simulantinjection. A separate stainless steel tubing feed line was also installed forliquid formic acid injection but never used.
2-5

WHC-SD-WM-VI-031Revision 0
4.1.2 Glass Former Feed System
A variable speed dry product feeder/mixer was utilized for dry glassformer feed. The feeder hopper could hold over 45 kg (100 lbs) of drymaterial. During RVR dryer operation, the feeder was kept full above the topof the discharge pipe in order to prevent dryer off-gas from escaping throughthe dry feed line.
Dry glass formers were premixed by the supplier and shipped in 34 kg(75 lb) bags to VECTRA's Richland, Washington facility. Prior to each test,calculated dry glass former quantities were weighed and added to the dryfeeder hopper. During stage two reaction scoping tests (RVR-S4, S5, S6, andS7) dry sucrose reductant was calculated for desired stoichiometric ratio,weighed, premixed with glass formers, and added to the feeder hopper.
In order to achieve proper weight percentages of constituents in the RVRdischarge, the dry glass former feed rate and liquid slurry feed rate werecarefully balanced based on calculated ratios.
4.2 OFF-GAS SYSTEM
The off-gas system for RVR Dryer testing up to and including RVR-S1(3/21/95) consisted of a spray scrubber/condenser (T-SCB), a scrubberdischarge vent blower (P-VS), a vent separator tank (T-VS), site vent stackand dilution ventilation blower (P-SB). Accumulated condensate and liquidcarryover in the spray scrubber was pumped to a drain tank using an air drivendiaphragm drain pump. Scrubber spray flow was provided by a centrifugal pumpwhich took a suction on the drain tank and discharged into the scrubber sprayheader. The drain pump and spray pump were operated continuously torecirculate the scrubber. The small scrubber discharge blower took a suctionon the scrubber and discharged off-gas into the vent separator tank. Thespray scrubber and scrubber discharge blower were physically located withinthe test building, in close proximity to the RVR dryer. A short run of hose(less than 10') ran directly from the top of the RVR dryer to the sprayscrubber.
During test RVR-S1 (100% sucrose) significant carryover was observed inthe off-gas system as evidenced by the accumulation of glass former materialin the scrubber tank. Additionally, off-gas fumes were observed leaking outof the ductwork at the scrubber discharge blower into the test areaatmosphere.
Following RVR-S1 testing, the off-gas system was modified. The scrubberand small vent fan were retired in place. Vent flow was directed from the RVRdryer lid into a modified 55 gallon drum which served as a dry product/liquidcarryover collection reservoir. The drum outlet was fitted with a bag filter.Off-gas flow traveled through the filter, off-gas hoses, and off-gasinstrumentation to the suction side of a vent blower (located outside the testbuilding) which discharged into the vent separator. The vent separatorinterfaced with centrifugal pumps for continuous vent separator draindown to alarge poly tank and continuous vent separator return spray flow from the polytank. The vent separator was vented into the stack and joined dilution airflow at the discharge of a large vent blower.
2-6

WHC-SD-WM-VI-031Revision 0
During subsequent testing, the off-gas system was further modified byremoval of the bag filter mounted within the 55-gallon collection reservoir.
4.3 HEAT TRANSFER SYSTEM
During initial testing with dry glass former feed and water injection(3/16/95), hot oil inlet temperature setpoint could not be maintained byheater H-HO (40 kw). In order to avoid limiting liquid feed rates to belowacceptable levels, additional thermal insulation was added to the RVR dryerbarrel. The addition of insulation significantly reduced thermal losses toambient and a more stable hot oil inlet temperature was maintained duringsubsequent testing with water injection.
Additional insulation and jacketing was added to the RVR barrel, top, andhot oil system piping following test RVR-S1 (3/21/95). No further difficultywas experienced in maintaining hot oil inlet temperature.
4.4 RVR DRYER MECHANICAL
During initial testing with dry glass former and water feed, liquidslurry was observed leaking from the RVR paddle shaft packing seals when bedlevel was raised above the paddles. In order to minimize leakage of slurryfrom the paddle shaft seals, the RVR bed discharge weir was removed to allowearlier discharge of dry product and limit the bed height. This effectivelylimited the total bed quantity to approximately 23 kg (50 lbs) of material,which is approximately half the maximum bed capacity.
Hot oil leaks were observed at the rotary joints connecting hot oilsystem hoses to the counter-rotating RVR dryer shafts. Repair required partsfor rebuilding the rotary joint seals. Parts were not available, and themaintenance was not performed. Since leakage was minor, testing continued.
During the initial testing with glass formers (boric acid) and waterinjection (3/14/95), severe bed hardening restricted movement of the rotarypaddles and caused the RVR dryer drive motor to trip on over-torque (over-current). No equipment damage was observed.
During test RVR-S3 (3/27/95), the RVR drive motor chain had become looseand required tightening. No subsequent problems were experienced with thedrive unit.
During many RVR dryer tests, hard caking developed within the dryer bed,on barrel wall surfaces, and on the paddles. Due to the configuration of theequipment and the composition of the dried material, this hard, water solublecake was difficult to remove.
2-7
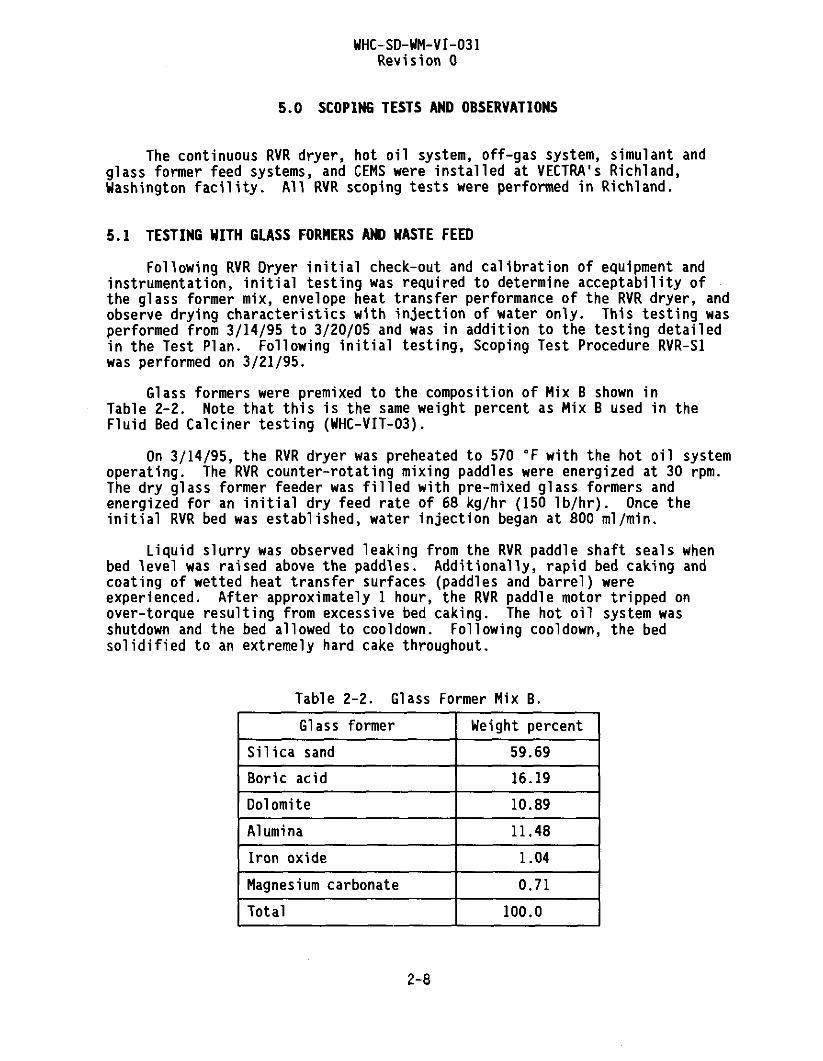
WHC-SD-WM-VI-031Revision 0
5.0 SCOPING TESTS AND OBSERVATIONS
The continuous RVR dryer, hot oil system, off-gas system, simulant andglass former feed systems, and CEMS were installed at VECTRA's Richland,Washington facility. All RVR scoping tests were performed in Richland.
5.1 TESTING WITH GLASS FORMERS AND WASTE FEED
Following RVR Dryer initial check-out and calibration of equipment andinstrumentation, initial testing was required to determine acceptability ofthe glass former mix, envelope heat transfer performance of the RVR dryer, andobserve drying characteristics with injection of water only. This testing wasperformed from 3/14/95 to 3/20/05 and was in addition to the testing detailedin the Test Plan. Following initial testing, Scoping Test Procedure RVR-S1was performed on 3/21/95.
Glass formers were premixed to the composition of Mix B shown inTable 2-2. Note that this is the same weight percent as Mix B used in theFluid Bed Calciner testing (WHC-VIT-03).
On 3/14/95, the RVR dryer was preheated to 570 °F with the hot oil systemoperating. The RVR counter-rotating mixing paddles were energized at 30 rpm.The dry glass former feeder was filled with pre-mixed glass formers andenergized for an initial dry feed rate of 68 kg/hr (150 lb/hr). Once theinitial RVR bed was established, water injection began at 800 ml/min.
Liquid slurry was observed leaking from the RVR paddle shaft seals whenbed level was raised above the paddles. Additionally, rapid bed caking andcoating of wetted heat transfer surfaces (paddles and barrel) wereexperienced. After approximately 1 hour, the RVR paddle motor tripped onover-torque resulting from excessive bed caking. The hot oil system wasshutdown and the bed allowed to cooldown. Following cooldown, the bedsolidified to an extremely hard cake throughout.
Table 2-2. Glass Former Mix B.
Glass former
Silica sand
Boric acid
Dolomite
Alumina
Iron oxide
Magnesium carbonate
Total
Weight percent
59.69
16.19
10.89
11.48
1.04
0.71
100.0
2-8

WHC-SD-WM-VI-031Revision 0
It is believed that the initial caking developed due to melting boricacid which solidified upon cooling, forming an extremely hard cake.
Adjustments were made to minimize problems observed during the initialtest run. The glass former mixture was reformulated to remove boric acid.The resulting RVR dryer test glass former Mix C is shown in Table 2-3. Inorder to minimize leakage of slurry from the paddle shaft seals, the RVR beddischarge weir was removed to allow earlier discharge of dry product and limitthe bed height. The RVR bed and heat transfer surfaces were cleaned out. Thehard dry cake was discovered to be water soluble.
On 3/16/95 the RVR dryer was preheated to 570 °F with the hot oil system.After heat-up, the paddles were energized and dry glass formers were fed intothe bed. The dry glass former feeder was filled above the feed nozzle inorder to seal off the potential vent path. The scrubber water spray flow wasinitiated and the vent fan was energized. Water injection was initiated at500 ml/min. After about 1 hour, hot oil system inlet temperature dropped to483 °F with outlet at 477 °F (6 °F differential temperature). The steadystate bed temperature profile started with boiling (212 °F) in the first 25%of the bed, heat-up in the second 25% of the bed (300 °F), bed temperaturepeak in the bed center (453 °F), and gradual cooldown toward the discharge endof the bed (416 °F). Dry product was produced. Minor caking developed onwetted heat transfer surfaces, but the bed was free-flowing. No additionalcaking or hardening was observed following bed cooldown, confirming thepreviously observed results attributed to-boric acid.
The heat transfer capability of the hot oil system appeared to belimiting feed rates and temperatures. It was hoped that subsequent tests withsimulant (lower percentage of water) would allow higher feed rates.Additionally, insulation was added to the RVR dryer barrel to reduce heatlosses to ambient.
Table 2-3. Glass Former Mix C.
Glass former
Silica sand
Boric acid
Dolomite
Alumina
Iron oxide
Magnesium carbonate
Total
Weight percent
71.3
0.0
13.0
13.6
1.3
0.8
100.0
2-9

WHC-SD-WM-VI-031Revision 0
On 3/20/95, the RVR dryer was again tested with glass former mix C andwater injection to evaluate the effectiveness of the added insulation. Hotoil temperature dropped slowly to 566 °IF with a 9 °F differential temperature.Similar to previous testing, the resulting steady state bed temperatureprofile started with boiling (210 °F) in the first 25% of the bed, heat-up inthe second 25% of the bed (423 °F), temperature peak in the bed center(533 °F), and gradual cooldown toward the discharge end of the bed (514 °F).Dry product was produced. Similar to previous test results, minor caking wasobserved on wetted heat transfer surfaces, but the bed was free-flowing.A dry product generation rate of 1001b/hr was projected.
5.2 INITIAL RVR TESTING WITH LLRW SIMULANT AND GLASS FORMERS
Initial RVR drying runs were made feeding liquid LLRW simulant withdifferent reductant additives and dry glass former mix C. A planned test(RVR-S2) using formic acid reductant was deleted based on oven reactioncrucible test results.
5.2.1 RVR-S1: Glass Former Mix C, Liquid Simulant,100% Stoichiometric Sucrose Reductant
On 3/21/95 the RVR dryer was preheated to 570 °F in preparation for testRVR-S1. Sucrose and liquid simulant were mixed in the feed tank to achieve100% stoichiometric sucrose concentration (110 grams sucrose/liter simulant).Dry glass former feed and liquid simulant/sugar feed were initiated into theRVR. Dry feed and liquid simulant/sugar feed were balanced to achieve atarget 20% Na20 concentration in the final glass form.
The RVR dryer was operated continuously for over 5 hours. During thistime period, simulant injection rate was maintained at 425 ml/min and balanceddry glass former feed rate was maintained at 45.4 kg/hr (100 Ib/hr). Pluggingin the liquid simulant feed line temporarily forced feed shutdown andreplacement of a feed line valve.
Throughout testing, hot oil system supply temperature averaged 566 °Fwith a 5.5 °F differential temperature. "Steady state" was achieved afterapproximately 1 hour of operation. Average temperature profile was nearboiling (222 °F) in the first 25% of the bed, heating up (385 °F) in thesecond 25% of the bed, peak temperature (558 °F) in the center of the bed, andgradual cooldown (507 °F) through the last half of the bed. Average NOx andCO levels of 1353 ppm and 446 ppm, respectively, were observed in the off-gas.
Sucrose reaction with the simulant was noted on several occasions due toexothermic reaction, as evidenced by NOx and CO spikes in the off-gas, andblack colored product. The reaction initially began in the center of the bed.Temperatures in excess of 600 °F were observed. As the reaction progressed,the temperature peak moved toward the bed inlet until slurry was encounteredand temperature dropped. The temperature peak would then move back toward thecenter of the bed. The cycle repeated several times. At one point theexotherm was so extreme that the hot oil outlet temperature increased abovethe inlet temperature to the high temperature trip setpoint. NOx and COspikes in the off-gas were observed simultaneously.
2-10

WHC-SD-WM-VI-031Revision 0
A total of 161.9 kg (357 lbs) of dried product was produced. Sampleswere drawn. Significant carryover was observed in the off-gas system asevident by the accumulation of glass former material in the scrubber tank.Additionally, off-gas fumes were observed leaking out of the ductwork at thevent fan connection into the test area atmosphere. Modification to the off-gas system was necessary.
5.2.2 Glass Former Mix C, Liquid Simulant, 60% Stoichiometric Sucrose
Following the results of the RVR-S1 testing, the off-gas system wasmodified. The scrubber and small vent fan were retired in place. Vent flowwas directed from the RVR dryer lid into a modified 55 gallon drum whichserved as a dry product/liquid carryover collection reservoir. The drumoutlet was fitted with a bag filter. Off-gas flow traveled through thefilter, off-gas hoses, and off-gas instrumentation to the suction side of avent fan (located outside the test building) which discharged into the ventseparator. The vent separator flow loop contained centrifugal pumps forcontinuous vent separator draindown to a large poly tank and continuous ventseparator return spray flow from the poly tank. The vent separator was ventedinto the stack and joined dilution air flow at the discharge of a large ventblower.
In addition to the off-gas system modification, additional insulation andjacketing material was added to the RVR dryer barrel and hot oil systempiping.
On 3/24/95, the impact of reducing the sucrose stoichiometric ratio to60% was investigated. The RVR dryer was once again pre-heated to 570 °F. 60%stoichiometric sucrose was mixed in with the liquid LLRW simulant in the feedtank to achieve 51 grams sucrose per liter of simulant. Balanced dry glassformer (mix C) feed and simulant/sucrose feed were initiated at 120 lb/hr and825 ml/min, respectively.
Excessive glass former carryover was again observed and resulted in rapidplugging of the off-gas system bag filter. Additionally, the RVR beddeveloped severe caking on wetted heat transfer surfaces. Testing wasterminated early to clean-out the bed and remove the off-gas system bagfilter. No usable dry product was generated.
On 3/25/95, following bed clean-out and removal of the off-gas filter,the 60% stoichiometric sucrose testing continued. The RVR dryer was onceagain heated to 570 °F. Balanced dry glass former feed and liquid simulantfeed were initiated at 60 lb/hr and 400 ml/min respectively.
Rapid bed caking resulted and required shutdown after less than 1 houroperation. A hard cake had developed on wetted heat transfer surfacesrequiring dryer clean-out. No usable product was generated. The reasonablysteady state operating conditions and periodic sucrose reactions experienceduring the RVR-S1 testing could not be duplicated.
2-11

WHC-SD-WM-VI-031Revision 0
5.2.3 RVR-S3: Glass Former Mix C, Liquid Simulant, No Additives
Due to the limited success with 100% stoichiometric sucrose and nosuccess with 60% stoichiometric sucrose, investigation of the impact of dryingsimulant with no reductants was necessary. Since high temperatures werecausing bed caking, dryer performance was investigated at lower temperatures.
On 3/26/95 the RVR dryer was heated up to 225 °F. Balanced dry glassformer (mix C) feed and liquid simulant feed were initiated at 60 lb/hr and400 ml/min, respectively. A reasonable flat temperature profile was observedacross the bed with gradual heat-up averaging from 140 °F at the beginning ofthe bed to 188 °F at the discharge end of the bed. Extremely slow dryingrates were observed. The bed became wet throughout with moist productdischarging. Dry and liquid feeds were secured to allow the bed to dry out.When paddle caking began to develop, testing was secured. The bed requiredclean-out prior to resumption of testing.
On the morning of 3/27/95 the RVR dryer was preheated to 235 °F. Dryglass former feed was initiated at 60 lb/hr. After 1-1/2 hours continuousoperation with dry feed only a dry product discharge rate of 54 Ib/hr wasobserved. Balanced liquid simulant/sucrose injection was initiated at300 ml/min. As drying continued, the wet portion of the bed was observedsteadily extending toward the discharge end of the bed. Hot oil inlettemperature was gradually increased to 340 °F over a 1 hour period before thewet zone was observed to travel back toward the front half of the bed.
Bed caking was observed after hot oil temperature was raised above240 °F. Reasonably flat temperature profiles were observed across the bedwith gradual heating throughout with an average heat-up of 53 °F across thebed. After about 3-1/2 hours of continuous operation at 340 °F a hard cakedeveloped on the wetted heat transfer surfaces and the RVR dryer was secured.A total of 81 kg (179 lb) of dry product was produced.
In order to generate dry product for subsequent RVR scoping tests RVR-S4through S7 (described later), additional RVR drying with glass formers (mixC), liquid simulant, and no reductants was performed from 3/29/95 to 4/2/95.Hot oil temperature was limited to 230 °F. A total of 195 kg (430 lb) ofadditional dried glass former/simulant (no additives) was produced.
5.3 RVR LABORATORY SCALE OVEN TESTS W/ SUCROSEAND FORNIC ACID REDUCTANTS
Based on the limited success with drying and reacting glass formers andsimulant with one pass through the continuous RVR dryer, and the resultingexcessive dryer clean-up requirements, laboratory scale tests were initiatedto investigate drying and reacting options.
2-12

5.3.1
WHC-SD-WM-VI-031Revision 0
Oven Reaction Tests: Dried Glass Formers and Simulantwith 60% and 100% Dry Sucrose Reductant
Oven reaction tests were performed to determine if a dried RVR product ofglass formers and simulant (no reductants) would react at high temperatures inthe presence of dry sucrose reductant at 60% and 100% stoichiometric ratios.
On 3/27/95, two separate crucibles were prepared with approximately 200 gof dry glass formers and simulant (no reductants) produced with the RVR dryerduring test RVR-S3 (3/27/95). This material was reddish in color. Drysucrose was added to the two crucibles one with 100% and the other with 60%stoichiometric ratio. The dry sucrose was white in color.
Both crucibles were placed in a laboratory oven and slowly heated to530 °F. After approximately 1 hour, both crucibles were observed to havereacted. The product in the 100% crucible was a homogeneous, dark black, freeflowing, dry powder. The 60% crucible was similar in appearance, but alighter color.
5.3.2 Oven Reaction Tests: Glass Formers and Liquid Simulantwith 60% sucrose and 100% Formic Acid Reductants
Oven reaction tests were performed to determine if dry glass formers,liquid simulant, and liquid formic acid reductant could be successfully driedand reacted to produce a desired product in a single step. Additionally,ability to process dry glass formers and liquid simulant with 60% sucrosereductant was also investigated in an effort to compare laboratory resultswith previous (poor) RVR dryer test results. On 3/29/95, two crucibles wereprepared as described in Table 2-4.
Brownish fumes (NOx) were observed when the formic acid was added tocrucible 1.
Both crucibles were placed in a laboratory oven, slowly heated to 330 °Fand held for 90 minutes. The crucibles were then heated to 530 °F and held for1 hour.
Table 2-4. Oven Reaction Tests with Sugar and Formic Acid Reductants
Constituent
Dry glass formers, mix C (grams)
Liquid simulant (ml)
Liquid simulant with 60% sucrose (ml)
Liquid formic acid (ml)
Crucible 1
153.2
134
60
Crucible 2
98
88
2-13

WHC-SD-WM-VI-031Revision 0
Bubbles were observed in crucible 1 (formic). The reddish productappeared slightly molten and not completely dried. A film formed in crucible2 (sucrose). The crucible 2 product was black, not completely dry, andslightly molten with evidence of foaming. The product in both cruciblessolidified to a hard material following removal from the oven and cooldown.
The fumes observed after initial addition of formic acid to crucible 1were believed to be from volatilization of N02 from formic acid reaction withthe NaNO2 in the simulant at room temperature. It was believed that residualformic acid then volatized at higher temperatures prior to reacting with theNaNO3 in the simulant and the resulting hard product in crucible 1 was due tomelting of salts in the simulant. Based on the results of the formic acidlaboratory scale testing, test RVR-S2 (100% stoichiometric formic acid) wasnot performed.
5.4 RVR SIMULANT VACUUM DRYING PCP TESTS
As discovered in test RVR-S3, a hard cake develops on the RVR dryer heattransfer surfaces when dry glass formers and liquid simulant are mixed withhot oil temperature greater than 240 °F. High temperatures (>570 °F) arerequired to produce the desired reaction between sucrose and simulant. Basedon results of previous oven tests, pre-dried glass formers and simulant willreact with dry sucrose reductant at high temperatures. In order to producedry product at a low temperature and react at a high temperature,investigation of a two stage drying/reacting alternative was necessary.
Drying of simulant using the atmospheric RVR continuous dryer wasobserved to be extremely slow with hot oil temperatures limited to 240 °F.Since liquid saturation temperatures are lower and evaporation rates arehigher within a vacuum, VECTRA RVR vacuum dryer Process Control Program (PCP)tests were performed to determine if liquid simulant could be successfullydried by the batch in VECTRA's RVR Vacuum Dryer.
On 3/29/95, a PCP test was performed to dry liquid simulant and glassformers. Liquid simulant (300 ml) and a magnetic stirring bar were added to aflask. The flask was placed on a magnetic stirring/hot plate and connected tothe PCP vacuum and condensate system. A vacuum of 22" Hg was drawn on theflask, stirring was initiated, and heat-up to 120 °F commenced. Significantparticulate carryover was noted. After 4 hours of boiling, 0.29 kg (0.63 lbs)of dry glass former mix (mix C) was added to the flask. The final driedproduct was a yellowish, oily, waxy agglomeration. The dried product waswater soluble.
On 3/30/95, a PCP was performed to dry liquid simulant at lowertemperatures (higher vacuum). Liquid simulant (150 ml) were added to a flaskand 27" Hg vacuum was drawn in the flask. Stirring and heat-up wereinitiated. After 30 minutes, the flask was boiling at 93 °F. Forty minuteslater, the flask was boiling at 97 °F and a vacuum of 25" Hg. Solutioninternal temperature was measured at 119.2 °F. The final dried product was ahard crystalline substance caked to the bottom of the flask with a soft, oilymaterial around the flask bottom radius. The dried product was water soluble.This product was determined to be unsuitable for RVR vacuum dryer processing.
2-14

WHC-SD-WM-VI-031Revision 0
Inability to vacuum dry liquid simulant was in part attributed to thepresence of hydrated salts, which held on to unliberated water at lowtemperatures. Conversion of hydrated salts within the simulant to carbonatesby exposure to C02 was investigated.
On 3/31/95 150 ml of liquid simulant was added to a flask. Initial pHwas measured at greater than 10.6. C02 was bubbled through the solution inthe flask at 1 SCFH while the flask was stirred and heated to 80 °F. After30 minutes of C02 exposure, a yellowish/white film formed on the top of thesolution and precipitates began to form in the bottom of the flask. The pHwas still greater than 10.6. After over 1 hour of C02 exposure, the C02bubbling was stopped.
The flask with simulant was connected to the laboratory vacuum andcondensate systems, 28" Hg vacuum was drawn and stirring and heat-upinitiated. After 2-1/2 hours, vacuum drying was complete. The final driedproduct formed a waxy agglomeration on the bottom of the flask. This productwas determined to be unsuitable for RVR vacuum dryer processing.
5.5 RVR TWO STAGE DRYING/REACTING
Since laboratory scale oven tests had shown that dry glass formers andsimulant (RVR product) and dry sucrose would react at high temperatures(530 °F), this process was performed using the RVR continuous dryer. Firststage RVR drying had produced 276 kg (609 lb) of dried glass formers andsimulant (no reductants). This first stage dried product was combined withvarious stoichiometric ratios of sucrose reductant for the high temperaturesecond stage reaction tests, RVR-S4 through RVR-S7. The quantities of productgenerated in these second stage RVR tests are given in Table 2-5. The RVRtemperature profiles measured during these tests are given in Table 2-6.
Table 2-5. Product Generated During Two StageRVR Drying Tests.
Date
03/27/95
03/29/95
03/31/95
04/02/95 .
Total
Test
RVR-S4
RVR-S5
RVR-S6
RVR-S7
Product generated,kg (1b)
81.2 (179)
70.3 (155)
51.2 (113)
73.5 (162)
276.2 (609)
2-15

Table 2-6.
WHC-SD-WM-VI-031Revision 0
Average Steady State Bed Temperature Profiles Observed DuringSecond Stage RVR Drying Tests.
Test
RVR-S460% sucrose
RVR-S580% sucrose
RVR-S610096 sucrose
RVR-S7125% sucrose
Temperature, °C (°F)
Inlet
183.7(362.6)
197.6(387.7)
173.9(345.0)
166.0(330.8)
25% point
284.9(544.8)
274.2(525.6)
265.1(509.2)
266.4(511.5)
50% point
272.6(522.6)
272.2(521.9)
272.2(522.0)
291.0(555.8)
75% point
275.4(527.8)
277.7(531.9)
284.6(544.2)
286.0(546.8)
Discharge
201.8(395.2)
200.1(392.1)
255.8(492.4)
248.8(479.8)
5.5.1 RVR-S4: Pre-Dried Glass Formers and SimulantW/ 60% Stoichiometric Sucrose
On 4/5/95, the impact of combining dried glass formers and simulant with60% stoichiometric sucrose in the RVR dryer at high temperature (570 °F) wasinvestigated. 56.7 kg (125 lbs) of dried glass formers/simulant was premixedwith 1.57 kg (3.46 lbs) of dry sucrose reductant to achieve 60% stoichiometricratio. The RVR dryer was preheated with a hot oil supply temperature of566 °F. The off-gas system was started up. RVR dryer rotors were energizedand set at 34 rpm. Dry feed was initiated at 54 kg (120 lb/hr).
After approximately 15 minutes a reasonable steady bed temperatureprofile was observed. Lower temperatures were observed at the inlet anddischarge ends of the bed. Peak temperatures were observed in the first halfof the bed. The average temperature profile for run RVR-S4 is given inTable 2-6.
Reaction between the sucrose and dried simulant was observed. AverageNOx and CO levels throughout the test were 45.8 ppm and 27.3 ppm,respectively. A dry black product was generated. Additionally, exothermicreactions within the bed occasionally resulted in local bed temperaturesslightly higher than hot oil supply temperature. Exothermic temperature peaks[301 "C (574 °F)] did not necessarily correspond to NOx peaks (130 ppm) in theoff-gas. CO peaks (43 ppm) did not occur with NOx peaks, as was observed intest RVR-S1. Average hot oil differential temperature was only 4 °F.
When all the premixed dry material had been fed into the RVR dryer, sandwas added to the glass former feeder to help clear out the bed for the nexttest. Representative samples were drawn at the RVR discharge during themiddle of each scoping test. The dry product was a black, free flowinggranular powder. Minor caking was observed on the dryer heat transfersurfaces.
2-16

WHC-SD-WM-VI-031Revision 0
5.5.2 RVR-S5: Pre-Dried Glass Formers and SimulantW/ 80% Stoichiometric Sucrose
RVR scoping tests continued on 4/5/95 by investigating the impact ofcombining dried glass formers and simulant with 8056 stoichiometric sucrose inthe RVR dryer at high temperature (570 °F). 56.7 kg (125 lbs) of dried glassformers/simulant was premixed with 2.49 kg (5.50 lbs) of dry sucrose reductantto achieve 80% stoichiometric ratio. The RVR dryer was preheated with a hotoil supply temperature of 565 °F. The off-gas system was started up. RVRdryer rotors were energized and set at 34 rpm. Dry feed was initiated at54 kg (120 lb/hr).
As in the 60% sucrose run (RVR-S4) a reasonable steady bed temperatureprofile was observed. Lower temperatures were again observed at the inlet anddischarge ends of the bed. Peak temperatures were observed in the first halfof the bed. The average temperature profile is given in Table 2-6.
Reaction between the sucrose and dried simulant was observed. AverageNOx and CO levels throughout the test were 180 ppm and 60 ppm, respectively.The average NOx and CO off-gas levels were higher than the 60% sucrose run.Dry black product was generated. Additionally, exothermic reactions withinthe bed resulted in local bed temperatures slightly higher than hot oil supplytemperature. Exothermic temperature peaks appeared to correspond with NOx andCO peaks in the off-gas. Exothermic temperature peaks [345 °C (653 °F)] andNOx peaks (215 ppm) were higher than the 60% run. Average hot oildifferential temperature was only 2.3 °F.
When all the premixed dry material had been fed into the RVR dryer, sandwas added to the glass former feeder to help clear out the bed for the nexttest. Representative samples were drawn at the RVR discharge during themiddle of the scoping test. The dry product was a black, free flowinggranular powder slightly lighter than the RVR-S4 (60%) product.
5.5.3 RVR-S6: Pre-Dried Glass Formers and SimulantW/ 100% Stoichiometric Sucrose
RVR scoping tests continued on 4/11/95 by investigating the impact ofcombining dried glass formers and simulant with 100% stoichiometric sucrose inthe RVR dryer at high temperature (570 DF). 56.7 kg (125 lbs) of dried glassformers/simulant was premixed with 3.39 kg (7.47 lbs) of dry sucrose reductantto achieve 100% stoichiometric ratio. The RVR dryer was preheated with a hotoil supply temperature of 571 °F. The off-gas system was started up. RVRdryer rotors were energized and set at 34 rpm. Dry feed was initiated at24 kg/hr (60 Ib/hr) but later increased to approximately 40.8 kg/hr(90 lb/hr).
Similar to the previous two second stage scoping runs (RVR-S4, S5) areasonable steady bed temperature profile was observed. Lower temperatureswere observed at the inlet ends of the bed. Peak temperatures were observedtoward the second half of the bed. The average temperature profile is givenin Table 2-6.
2-17

WHC-SD-WM-VI-031Revision 0
Reaction between the sucrose and dried simulant was observed. AverageNOx and CO levels throughout the test were 220 ppm and 70 ppm, respectively.The average NOx and CO off-gas levels were higher than the 80% sucrose run.Dry black product was generated. Additionally, exothermic reactions withinthe bed resulted in local bed temperatures slightly higher than hot oil supplytemperature. Exothermic temperature peaks [301 °C (573 °F)] and NOx peaks(280 ppm) were higher than the 80% run. Average hot oil differentialtemperature was only 3.6 °F.
When all the premixed dry material had been fed into the RVR dryer, sandwas added to the glass former feeder to help clear out the bed for the nexttest. Representative samples were drawn at the RVR discharge during themiddle of scoping test. The dry product was a dark gray, free flowinggranular powder slightly lighter in color than the RVR-S5 (80%) product.
The results of RVR-S1 (liquid simulant w/ 100% sucrose) can be comparedto the results of RVR-S6 (dry simulant w/ 100% sucrose). A much more stableand even temperature profile was observed during RVR-S6. Additionally, RVR-S6reactions appeared less violent and more controlled. Bed caking wasexperienced during RVR-S1 and not during RVR-S6. Average NOx and CO levels inthe RVR-S1 off-gas were nearly an order of magnitude higher, at 1352.8 and445.6 ppm respectively. However, this may be attributable to exhaust gas flowrates that are such lower in the SI testing.
5.5.4 RVR-S7: Pre-Dried Glass Formers and SimulantW/ 125% Stoichiometric Sucrose
RVR scoping tests continued on 4/11/95 by investigating the impact ofcombining dried glass formers and simulant with 125% stoichiometric sucrose inthe RVR dryer at high temperature (570 °F). 56.7 kg (125 lbs) of dried glassformers/simulant was premixed with 4.56 kg (10.05 lbs) of dry sucrosereductant to achieve 100% stoichiometric ratio. The RVR dryer was preheatedwith a hot oil supply temperature of 568 °F. The off-gas system was startedup. RVR dryer rotors were energized and set at 34 rpm. Dry feed wasinitiated at approximately 40.8 kg/hr (90 lb/hr).
Similar to the previous scoping run (RVR-S6) a reasonable steady bedtemperature profile was observed. Lower temperatures were observed at theinlet ends of the bed. Peak temperatures were observed in the center of thebed. The average temperature profile is given in Table 2-6.
Reaction between the sucrose and dried simulant was observed. AverageNOx and CO levels throughout the test were 220 ppm and 85 ppm, respectively.The average NOx and CO off-gas levels, were about the same as the 100% run.Dry black product was generated. Additionally, exothermic reactions withinthe bed resulted in local bed temperatures slightly higher than hot oil supplytemperature. Exothermic temperature peaks [308 °C (587 °F)] and NOx peaks(335 ppm) were higher than all previous second state scoping runs. NOx and COpeaks in the off-gas were observed to correspond with exothermic temperaturepeaks. Average hot oil differential temperature was only 1.8 °F.
2-18
WHC-SD-WM-VI-031Revision 0
When all the premixed dry material had been fed into the RVR dryer,representative samples were drawn at the RVR discharge. The dry product was adark gray, free flowing granular powder very similar to the RVR-S6 (100%)product.
5.6 SCOPING TEST EVALUATION SUMMARY
A summary of the RVR drying/reacting tests is given in Table 2-7.
6.0 CONCLUSIONS
The following conclusions are drawn from the results of the RVR dryingtests.
• Boric acid in the glass former mixture melts in the RVR dryer at570 °F hot oil inlet temperatures causing hard caking.
• Bed caking results when glass formers and liquid simulant are driedby the RVR continuous dryer. Principal caking occurs in thetransition zone where the final free water is evaporated and theproduct bed temperature begins to exceed the boiling point of water.Liquid simulant drying at <115 °C (<240 °F) and reacting at 300 °C(570 °F) cannot be performed consistently with a single pass throughthe RVR dryer.
• Laboratory scale vacuum drying of liquid simulant results in a waxyproduct which is undesirable for RVR rotary vacuum dryer processing.
• Under laboratory conditions, Formic Acid volatizes before it cancompletely react with liquid simulant at 530 °F and is therefore,not suitable as a reductant for RVR dryer processing.
• Glass formers and predried simulant will react with Sucrose(ci2H22°ii) at stoichiometric ratios of 60%, 80%, 100%, and 125% inthe RvR dryer with 570 °F hot oil inlet temperature. The reaction isexothermic and non-uniform. NOx and CO off-gas concentrationsincrease as stoichiometric sucrose ratio increases. Two stage RVRdrying/reacting can be successfully performed with the continuousRVR dryer. The first stage drying could be a pulse or spray dryerwith the second stage high temperature reacting process performed inan RVR dryer.
7.0 RECOMMENDATION FOR FUTURE TESTS
VECTRA does not recommend any additional testing be considered for anyrotary dryer process. VECTRA recommends that future tests target non-mechanical dryers such as pulse or spray dryers.
2-19

Table 2-7. RVR Test Evaluation Summary.
roi
roo
Parameter
Stoichiometric Reductant Ratio
Off-gas- N0 x Range (PPM)- N0 x Ave (PPM)- CO Range (PPM)- CO Ave (PPM)
Appearance- Free Flowing- Color
Melt Characteristics
Evaluation
Test Run
RVR-S1
Sucrose 100%
472-26001352.8
160-660445.6
-free flowing-black-hand cakeformation
N/A
Not acceptableSporadicdegassing. Cannotmaintain steadyState
RVR-S2'
Formic Acid100%
N/A
Lab:-molten saftt-hard red cukeformation
N/A
Not acceptable(caking)
RVR-S3
None
N/A
•free flowing-red•moderate caking
N/A
Not acceptable(caking)
RVR-S4
Sucrose - 60%
0-13045.80-4318.4
-free flowing-black•minor caking
No foaming GooddegassingNeeds somerefining agarrts
Good as 2nd stageN0 2 / N03 Reactor
RVR-S5
Sucrose - 80%
0-21668.20-7236.1
-free flowing-black/ brown
No foaming GooddegassingNeeds somerefining agents
Good as 2nd stageNOj/ N03 Reactor
RVR-S6
Sucrose- 100%
0-280185.40-8262.0
-free flowing-dark gray
N/A
Good as 2nd stageN0 2 / NO3 Reactor
RVR-S7
Sucrose - 125%
0-335222.00-8660.6
-free flowing-black- dark gray
N/A
Good as 2nd stageN0 2 / N0 3 Reactor
o•ya tro en< o-<• i
O I
O Ioto
'Information from crucible drying test with formic acid raductant. Based on these results, the actual RVH-S2 test was not conducted.

WHC-SD-WM-VI-031Revision 0
APPENDIX 2A
DATA SHEETS
2-21

WHC-SD-WM-VI-031Revision 0
Scoping Test - DatasheetPage 1 of
| Test No. RVR-
| " Parameter
Dace: o /£ ' Hf
Time:
Hoc Oil Svstem
|| Pump In l e t pressure PI-IN
Pump Outlet pressure PI-OUT
Hot Oil Supplv, temperature
Hot Oil Return, temperature
Expansion Tank level '
RVR Drver Bed Temoeratures
TI-1
TI-2
TI-3
TI-4
TI-5
|| Rotor Speed Se t t ing
Class Former Feed Rate
11 Total g lass formers fed (chis period)
1 Total d r i ed product t h i s period
Total dr ied mixture output (accumulated)
1 Tank level reading
Simulant/Additive Inject ion Rate
Total Simulant/Additive Input
Off-Gas Svstem
Off-gas flow annemometer
NO Reading
NOi Reading
Total NO, Reading
CO Reading
Recirc Line Temp - TI-SC9
Scrubber Level - LG-SCB
Off-gas Pressure - PI-OFG
Vent Separator Level - LG-VSNT
Vent Separator Temp - TI-VENT
Additive: ^i/<:'/£*?#/= (^ &•/£ )
Unit
kPag
kPag
°C
°ccm
°C
°C
«C
°C
°C
RPM
/tg/hrDial *
kg
kg
kg
L
y>L/min
L
" A .MmVhE-
ppm
ppm
ppm
ppm
°c
cm
kPag
cm
°c
Sht ' of ?
Readings
o17.4-
7~e>4
-2.4-3
?*
o
a
O
0-4-*00o0
n0
l?-0£
%W
i4-<r
Z&0
U
4zs~
0)
(D
10
o
<n
rz4
Z*
*ri
iff
3c?
+r/<*4-T
/3
ft 4-
171*
47-2-16 0/?
o
;zfZ1&
Z't7•2.0
/^3
162-*^ J 4 tfr
30
iy'to
/#04-zr
/'I
0
otz4z?$
2.0
usZsz
-2-10
-Mrzr3
%
6<3
<?$42.^
y00
700
o
1
NOT 1-11
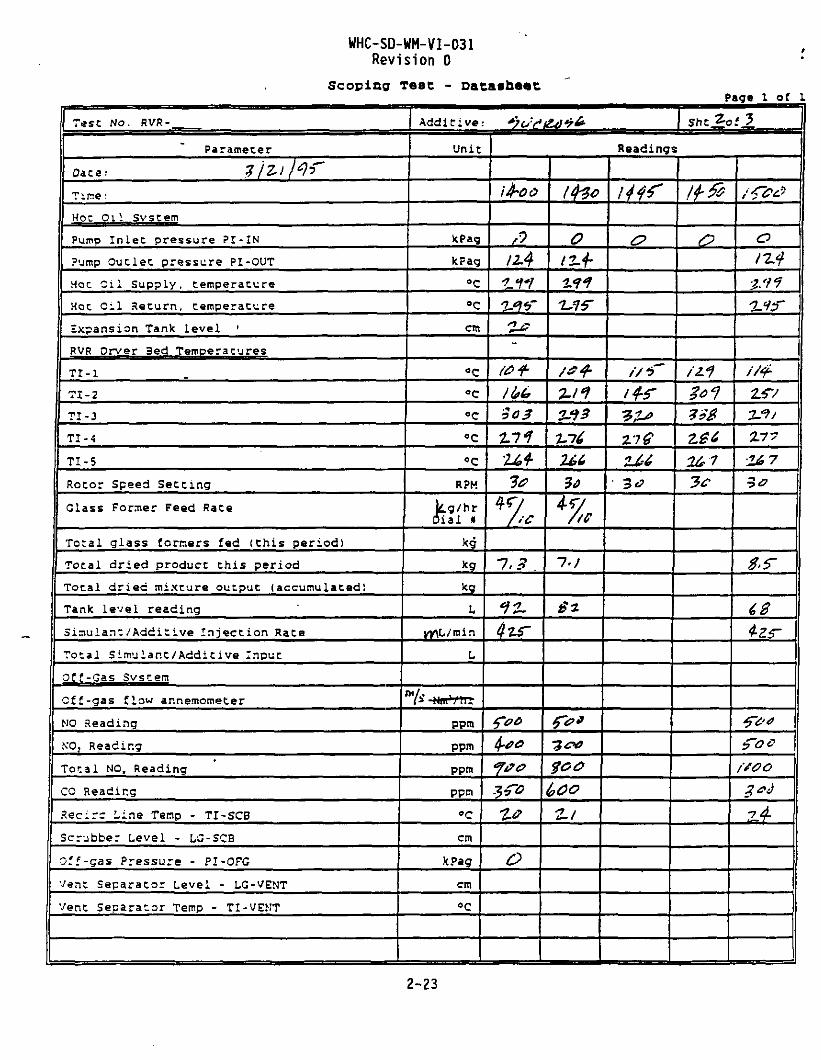
WHC-SD-WM-VI-031Revision 0
Scoping Test - DatasheetPage 1 of 1
Test NO. RVR-
Parameter
Dace: Z/Zl/q-T
Tine:
Hoc Oil Svstem
PumD Inlet pressure ?I-IN
Pump Outlet pressure PI-OUT
Hoc Oil Supply, temperature
Hot Oil Return, temperature
Expansion Tank level '
RVR Drver 3ed Temoeratures
TI-l
TI-2
TI-3
TI-4
TI-5
Rotor Speed Setting
Glass Former Feed Rate
Total glass formers fed (this period)
Total dried product this period
Total dried mixture output (accumulated!
Tank level reading
Simulant/Additive Injection Rate
Total Simulant/Additive Input
Off-Gas Svstem
Cff-gas Clow annemometer
MO Reading
NO, Reading
Total NO. Reading
CO Reading
Secirc Line Tenp - TI-SCB
Scrubber Level - LG-SCB
Off-gas Pressure - PI-OFG
vent Separator Level - LG-VENT
Vent Separator Temp - TI-VENT
Additive: *} v (*(&&$&•
Unit
kPag
kFag
°C
°C
cm
°c°c°co C
°C
R?M
kg/hrDial %
kg
kg
kg
U
yy\L/min
L
ppm
ppm
ppm
ppn
°C
cm
kPag
cm
°C
Sht 2-of 5
Readings
iJhoo
,0
yt<r
-
/&£503
Z7fZ6f
1%4zr
%#
(Ho
o/2-f
/to
I'l
f&*
$00
O
/zf^f?*BZ§626 7
a114
£/?/
2.77
•2&7
la
$,$-
f&0foe/too
7.4
2-23

WHC-SD-WM-VI-031Revision 0
Scoping Teat - DatasheetPage 1 oC I
Test No. RVR-
Parameter
Date: Z/2-t !c?5~
Tine:
Hot Oil Svsterr
Puno Inlet pressure PI-IN
Pump Outlet pressure PI-C'JT
Hot Oil Supoly, terroerature
Hot Oil Return, temperature
I Expansion Tank level '
RVR Drver 3ed Terroeratures
TI-1
TI-2
TI-3
TI-4
TI-S
I Rotor Speed Setting
Glass Former Feed Rate
Total glass formers fed (this period)
|| Total dried product this, period
Total dried mixture output (accumulated:
Tank level reading
Simulant/Additive Injection Rate
Total Simulant/Additive Input
f Off-Gas Svstem
| Cf£-cas flow annemometer
1 NO Reading
! N'O, Reading
Total MO, Reading
| CO Reading
! Recirc Line Temp - TI-SCB
Scrubber Level - LG-3CS
Of*-gas Pressure - PI-OFG
Vent Separator Level - LG-VENT
Vent Separatcr Temp - TI-VENT
Additive: 5t*C
Unit
kPag
k?ag
°C
•ccm
°c
°c
«c
°c
°c
RPM
Dial '#
kg
kg
kg
L
0* L / m i n
T
ppm
ppm
ppm
ppm
°C
cm
k?ag
cm
°C
sht^o;J I
Readinas
o}Z4
2,9$
2.*?6
-
2.*}/
2.7A
'&
&
Too^6
O
Ciz4-
/ۥ/
zieZ63
4-r
%i.o
Or
n&
%.7
Z-93
2-9 ~
/00H6
2.7^
i^i.i
4-2.
ttcct
2.6 oo
£50
t76o
t zf-Z9*Z<t2
Z/2.
3if
ZSl.
it.0
i7tofoe
Z<?
t -i
<r
/?$Z?& i
z/^ I
K--2- i
Z2^
z/r/ 92
•li?
1
I2-24

WHC-SD-WM-VI-031Revision 0
Scoping Teat - Datasheet:Page l of 1
Test No- RVR-
Pa-ameter
Sate: ?/z4/"/rTine:
Hoc oil svst-m
?uno Inlet Dressure PI-IN
Pump Outlet pressure PI-O'JT
Hot Oil Supply, temperature
Hot Oil Return, temperature
Expansion Tank level
RVR Drver 9ed Temperatures
TI-1
TI-2
71-3
TI-4
TI-5
Rotor Speed Setting
Class Former Feed Rate
Total glass formers fed [this period)
Total dried product this period
Total dried mixture output (accumulated!
Tank level reading
Simulant/Additive Injection Rate
Total Simulant/Additive Input
off-Gas Svscam
Off-gas flow anr.err.ometer
NO Reading
NO3 Reading
Total NO, Reading
CO Reading
Recirc Line Temp - TI-SCB
Scrubber Level - 1G-SC3
Off-gas Pressure - PI-OFG
Vep.t Separator Level - L.G-VENT
Vent Separator Temp - TI-VENT
Additive:
Unit
kPag
kPag
°C
°c
oC
°C
«c°c°c
RPM
r.ii 9
leg
kg
kg
L
onL/min
L
ppm
ppni
ppm
ppm
•cen
kPag
cm
°C
...
She lotj.
Readings
7
/Z4-
z$t
/z/
JL77in
fff
oit,
(000
000£>
\
2-25

WHC-SD-WM-VI-031Revision 0
Scoping Test - Datasheet
Test No. RVR-
Parameter
Date: Z/zTJq'TTine:
Mot Oil Svstem
Pump Inlec pressure PI-IN
Pump Outlet pressure PI-OUT
Hoc Oil Supplv, temperature
Hoc Oil Return, temperature
Sxoansion Tank level '
RVR Drver Bed Temoeratures
TI-1
TI-2
TI-3
TI-4
TI-5
Racer Speed Setting
Glass Former Feed Race
Total glass formers fed [this period)
Tocal dried produce this period
Total dried mixture output (accumulated!
Tank l^vel reading
Sixuiant/Additive Injection Rate
Tocal Simulant/Additive Input
Off-Gas Svstem
Off-gas flow annemometer
NO Reading
NO, Reading
Total NO, Reading
Cc Reading
Secirc Line Temp - TI-SCB
Scrubber Level - LC-SCB
Cff-gas Pressure - PI-OFG
v-nt Separacor Level - IC-VENT
Vent Separator T*mp - TI-VEMT
| Addicive:
Unit
kPac
kpag
°C
°C
cm
°C
«c
°c
°C
RPM
l^/hrDial »
kg
kg
'<g
L
n\L/min
r
^ ^ - M m ' / h r
pp.-n
ppra
ppm
ppm
°c
en
kPag
cm
°C
Page 1 of '.
ShzJ_otJ_
Readir.as
Z^7
-
14 +243
%77-
26.3
-
0
tie*
no&D
O
/?/nr-2-62
•z-zj-
U22.7
0
o00
1
Ii
ji!
1i
2-26
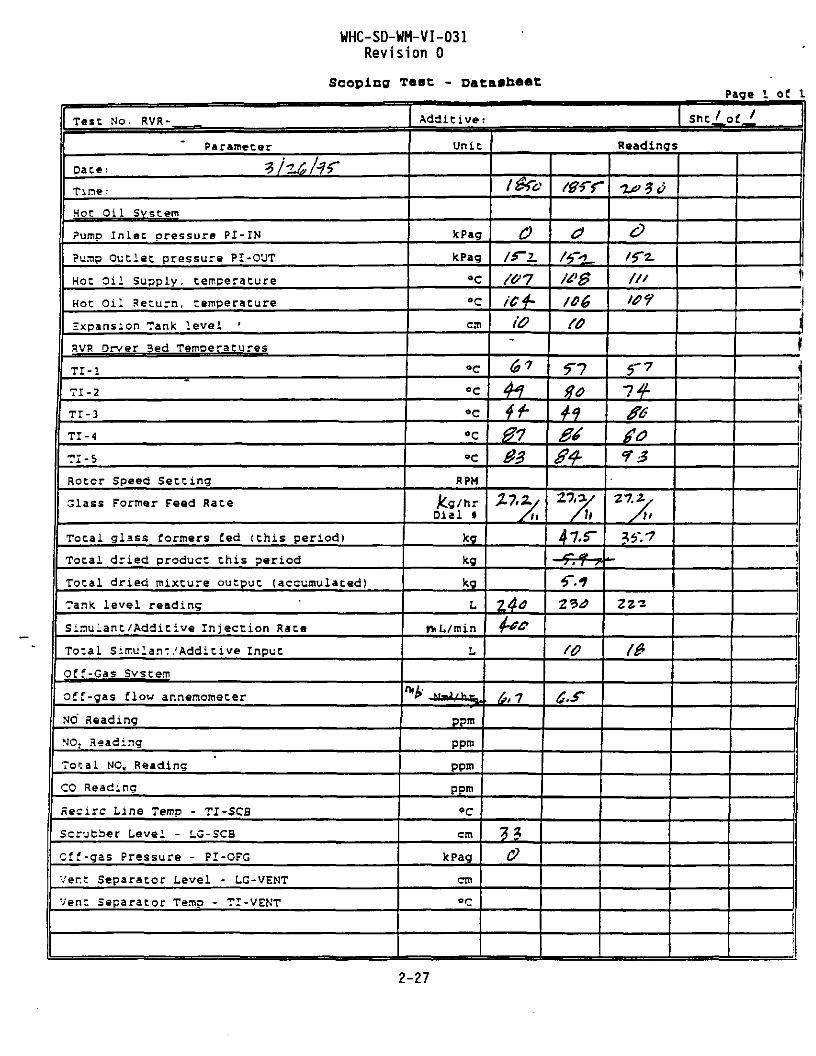
WHC-SD-WM-VI-031Revision 0
Scoping Test - DatasheetPage 1 of 1
Test No. RVR-
| " Parameter
Date: ?> IIJ0MfTine;
Hot Oil System
?umD Iniec oressure PI-IN
Pump Outlet pressure PI-OUT
Hoc Oil Supply, temperature
Hot Oil Return, temperature
Expansion Tank level '
RVR Drver 3ed TemDeracures
TI-1
| TI-2
TI-3
TI-4
TI-5
Rotcr Speed Setting
1 Glass Former Feed Race
Total glass formers fed (this period)
Total dried produce this period
Total dried mixture output (accumulated)
Tank level reading
Sinulant/Additive Injection Race
To;al Simulan-.'Additive Input
Off-Gas Svstem
|| off-gas flow ar.nemometer
|| NO Reading
|| NO, Reading
Total NO, Reading
CO Reading
Recirc Line Temp - TI-SCB
Scrubber Level - LG-SCB
Cff-gas Pressure - PI-OFG
Vent Separator Level - LG-VENT
Vent Separator Temp - TI-VENT
Additive:
Unit
kPag
kPag
°C
°ccat
°c°c*c°c
RPM
Dial »
kg
kg
kg
L
*L/min
L
ppm
ppm
ppm
ppm
o C
cm
kPag
cm
°C
She f of t
Readings
0/rz./Of
-
0703
Z4P
{*,!
0
WB
to
?1Ho413404-
A*
/o
///
1 4
gof 3
7.-7.2.,
ZZ-z
It
r11
2-27

WHC-SD-WM-VI-031Revision 0
Scoping Test - DatasheetPage 1 of I
| Test No. RVR-
|| " Parameter
I Dace; ?/%7 fay"Time:
Mot Oil Svstem
If Pump In le t pressure PI-IN
1 PUITID Outlet pressure PI-OUT
j| Hot Oil Supply, temperature
Hot Oil Return, temperature
Expansion Tank level •
jf RVR Drver Bed Tenoeratures
TI-l
TI-2
TI-3
TI-4
TI-5
II Rotor Speed Setting
Glass Former Feed Rate
Total glass formers fed (this period)
Total dried product this period
11 Total dried mixture output (accumulated)
jj Tank level reading
simulant/Additive Injection Race
| Tocal Sir.ulant/Addit ive Input
Off-Gas Svstsn
Cff-gas flow annerr.ometer
NO Reading
NO, Reading
Total N'O, Reading
CC Reading
Recirc ^ine Temp - TI-SCB
Scrubber -eve i - LG-SCB
Cff-gas Pressure - ?I-OFG
Vent Separator Level - LG-VENT
Vent Separator Temp - TI-VEHT
Additive: /l/e*/&.
Unit
kPag
kPag
°C
°C
CT
°C
°c°c
RPM
fig/hrDial K
kg
kg
kg
j^L/mir.
L
pp i
ppm
oom
pcm
°C
cm
k?ag
cm
°C
She 'of 2*
Readings
09?G
/V2-
f/C
to-
l>%
7 7
qn
?4
?}&#
0
d
o
ni
&*!
oi99
-?fZ7.2-
f.7%7
Z16
to
00O
d
??
o
;6*&7
i0
9-3CS//ff/S9
&?J7< 2.
!(,.$
n—oa
otB<}3
O
&%•
/£//c
/.v7 i
t/i
7-7,2
f.tr7-4.$/*?2.
£>/O000
0
/tir \/£/ I
/£
/'£- I
n$ I//£ I
27,3.
t£4-%&<?
36
ooc<0
/r
€>
i
Ij
2-28

WHC-SD-WM-VI-031Revision 0
Scoping Teac - DatasheetPage 1 of 1
Tesc No. RVR-
Parameter
Date: 3f*2-lH->~
Tine:
Hoc Oil Svstem
Pumo Inlet oressure PI-IN
Pump Outlet pressure PI-OUT
Hot Oil Supply, temperature
Hot Oil Return, temperature
Expansion Tank Level '
RVR Drver Bed Temoeracures
TI-1
TI-2
71-3
TI-4
TI-5
Roccr Speed Setting
Glass Former Feed Race
Total glass formers fed (this period)
Tocal dried product this period
Total dried mixture output (accumulated)
Tank level reading
Sirnulant/Additive Injection Rate
: Total Sir.ulant/Additive Input
Off-Gas Svscem
Cff-gas flow annemometer
NO Reading
N'O, heading
Total NO, Reading
CC Reading
Recirc line Temp - TI-SC3
Scrubber Level - LG-SCB
Ofi-gas Pressure - PI-OFG
Vent Separator Level - LG-VENT
Vent Separator Temp - TI-VENT
Additive:
Unit
kPag
kPag
°C
°ccm
°c«c°co C
°C
RPM
^S/hrOial t
kg
kg
kg
L
r*L/roin
ppm
ppm
ppm
ppm
°C
cm
kPag
cm
°C
Sht^-of "u
Readings
Otfui&i-
/£>/
-
uv),y
//, 7
44->Z74-
H
f.?00oait?
0
C63o
C3
ttr~7
/£%to
n/
27,-a/A
/1.6
fy'7
OO001632£P
07c o
oi4<T
it?fo
/X7
/39/5V
- 34-
*&£>
0$0n
<r
//*t'C
7*90/#£
3027.2/
&£
4.30o0D/9
a
1
2-29

WHC-SD-WM-VI-031Revision 0
Scoping Teat - Data«h««t
Test No. RVR-
Parameter
Date: 3-2^-^5"*Time:
Hot Oil System
Pump Inlec pressure PI-IN
Pump Outlet pressure PI-OUT
Hot Oil Supply, temperature
Hot Oil Return, temperature
Expansion Tank level
RVR Dryer Bed Temneratures
TI-1
TI-2
TI-3
TI-4
TI-5
Rotor Speed Setting
Glass Former Feed Rate
Total glass formers fed (this period)
Total dried product this period
Total dried mixture output {accumulated}
Tank level reading
Simulant/Additive Injection Rats
Total Simulant/Additive Input
Off-Gas System
off-gas flow annemoraeter
NO Reading
NO; Reading
Total NO, Reading
CO Reading
Recirc Line Temp - TI-SCB
Scrubber Level - LG-SCB
Off-gas Pressure - PI-OFG
Vent Separator Level - LG-VENT
Vent Seoarator TeniD - TI-VENT
Additive: N &y\€—
Unit
JcPaa
kPag
•c
"C
cm
•c
"C
'c
•c
*cRPM
kjj/hrDial #
kg
kg
kg
L
n/\L/rain
L
ppra
ppm
ppm
ppm
•c
cm
kPag
cm/in•c
Page 1 of -Sht/ of 4-
Readings
O«rI/O
- to
si
7%52,53Jo
sxzsk
6.3
3
/OOO
O
nz.
/"D
&z
12.3 O
——
33
fold
O
/O<7
/O
so
<*?^3
.
«/0fO
/ • ? 3
/ (*
!/oo
O
fo
W
3V
/3U
/7
D
/ / ;
/O
7 /^3rV
9o7 c /
• p .
/3^/_ —^
G-/Z
i?
i
i
2-30

WHC-SD-WM-VI-031Revision 0
Scoping Test: -Page 1 of
i TeaC No. RVR-
Parameter
Date: H ^ ^ fTime:
Hot Oil system
Pump Inlet pressure PI-IN
Pump Outlet pressure PI-OUT
Hot Oil Supply, temperature
Hot Oil Return, temperature
Expansion Tank level
RVR Dryer Bed Temperatures
TI-1
TI-2
TI-3
TI-4
TI-5
Rotor Speed Setting
Glass Former Feed Rate
Total glass formers fed (this period)
Total dried product this period
total dried mixture output (accumulated)
Tank level reading
Simulant/Additive Injection Rate
Total Simulant/Additive Input
Off-Gas System
off-gas flow annemometer
MO Reading
NO, Reading
Total N0K Reading
CO Reading
Recirc Line Temp - TI-SCB
Scrubber Level - LG-SCB
Off-gas Pressure - PI-OFG
Vent Separator Level - LG-VENT
vent Separator Temp - TI-VENT
Additive: A/tA/£
Unit
JcPag
JcFag
•c"ccm
•c•c
*C
•c•c
RPM
&/hrDial #
kg
leg
kg
L
*\ .L/min
L
(4 HUT / In
ppm
ppm
ppm
ppm
•ccm
kPag
cm/in
•c
ShtZof t
Readings
0
t(p r//2.
- to
87*37<f?*/
3 4ziM .
—
<(0O
n
O
tfZ-io"l/o
9<r?79/Jrl102-
—
%*$-&
1*1
n
O
)4
5 1^ ° \
m
1-7U
/&("
n
n
o
/O?/ D
11??
6?/ 073V
?s,/r
in
-&-
n
/</oo
O
IfO
/o
*?/
*& ]
Z.70
t?rp
^5
•2,0
•
I
2-31

WHC-SD-WM-VI-031Revision 0
Scoping Ttst - DatasheetPage 1 of
1 Test No. RVR-
Parameter
Date: V 2 ^ " °lfTime:
Hot Oil Svstem
Pump In le t pressure PI-IN
pump Outlet pressure PI-OUT
Hot Oil Supply, temperature
Hot Oil Return, temperature
Expansion Tank level
RVR Dryer Sed TemDeratures
TI-1
TI-2
TI-3
TI-4
TI-5
Rotor Speed Sett ing
Glass Former Feed Rate
Total glass formers fed ( this period)
Total dr ied product th is period
Total dr ied mixture output (accumulated)
Tank level reading
Sirnulant/Additive Injection Rate
Total Simulant/Additive Input
Off-Gas System
Off-gas flow annemometer
NO Reading
NO, Reading
Total NO, Reading
CO Reading
Recirc Line Temp - TI-SCB
Scrubber Level - LG-SCB
Off-gas Pressure - Pl-OFG
Vent Separator Level - LG-VENT
Vent Separator Temp - TI-VENT
| Additive: fiJOvQ,
Unit
kPag
JcPag
•c
•ccm
•c•c•c•c•c
RPM
kg/hrDial #
kg
kg
kg
L
M^L/min
L
ppm
ppm
ppm
ppm
•c
cm
kPag
cm/in
•c
Sht3of 7
Readings
a/0TKO}0°[
- /0
£ *
If?3
/0 7?<•/
21-TJ
—
6.G>7
171
>>(
H^
2-\
cP
ZZ-
o
I/O(CX
7 7
<&<ht7^/Oh3W
1 1 - ^ f
/3.5*73r-<70
1(*
o33-
o/fcr*/o*?10 fla
b o
lOL?
3<JZ.1.V
W9r
5, *&-
3 3
ikCO
o
1(1
uoto
14bi
$(*>
IVzJz\
°il$W7,7?52-, S3/(cO
SToS'
o33
/63C
O
HZ.112-
/O
9/72 .TO
//o2.71/
3.0/
^p
o3 3
I
2-32

WHC-SD-WM-VI-031Revision 0
Scoping Teat -Page 1 of
Teat No. RVR-
Parameter
Dace: 'b-l^'CffTime:
Hoc Oil Svstem
Pump Inlet pressure PI-IN
PU-TID outlet pressure PI-OUT
Hoc Oil Supply, temperature
Hot Oil Return, temperature
Expansion Tank level
RVR Dryer Bed Temperatures
TI-1
TI-2
TI-3
TI-4
TI-S
Rotor Speed Setting
Glass Former Feed Rate
Total glass formers fed {this period)
Total dried product this period
Total dried mixture output (accumulated)
Tank level reading
Simulant/Additive Infection Rate
Total Simulant/Additive Input
Off-Gas System
Off-gas flow annerooroeter
NO Reading
NO, Reading
Total NO, Reading
CO Reading
Recirc Line Temp - TI-SCB
Scrubber Level - LG-SCB
Off-gas Pressure - PI-OFG
Vent Seoarator Level - LG-VENT
Vent Separator Temn - TI-VENT
Additive: A/6*V£,
Unit
kPag
kPag
•c•ccm
•c
•c
•c
*c•c
RPM
fcg/hrDial #
kg
kg
kg
L
w\ L/min
L
ppm
ppm
ppm
ppm
•ccm
kPag
cm/in
'C
sht^/of 4*
Readings
noo
o
110
/*[
%
?V
3-iy
try
3./0
f^oo
^^
f/9S93
10.fo^10. iff
^h
—S/D
2-33

WHC-SD-WH-VI-031Revision 0
Scoping Test - Datasha«tPage 1 of
Test No. RVR-
Parameter
Date: 3^0-^T
Time:
Hot Oil system
Pump Inlet pressure PI-IN
Pump Outlet pressure PI-OUT
Hot Oil Supply, temperature
Hot Oil Return, temperature
Expansion Tank, level
RVR Dryer Bed TemDeratures
TI-1
TI-2
TI-3
TI-4
TI-5
Rotor Speed Setting
Glass Former Feed Rate
Total glass formers fed (this period)
Total dried product this period
Total dried mixture output (accumulated)
Tank level reading
Simulant/Additive Injection Rate
Total simulant/Additive Input
Off-Gas system
off-gas flow annemometer
NO Reading
N07 Reading
Total NO. Reading
CO Reading
Recirc Line Temp - TI-SCB
Scrubber Level - LG-SCB
Oft-gas Pressure - PI-orG
Vent Separator Level - LG-VENT
vent Separator Temp - TI-VENT
Additive: A/#/v£
Unit
kPag
kPaa
*C
•c
cm
*c
•c
•c
•c
*cRPM
fc^/hrDial #
leg
kg
kg
L
"HL/min
L
MU Hi /iii
ppra
ppm
ppra
ppm
•c
cm
kEag
cm/in
*C
sht / of
Readings
OIto'CHZ.
' fO
<K
7*
_—
1/00
0
fO
77
—
i(3o
O/hT109\( (
to
5-77.T93
—
12.
33//3
IZJCO
O
/O°7
(09to
77
• ».
—
2,0/
/9Z-
0
Kl/0<?/0
so
/Ob
—
ftffJ/ ^
7-0
/7/ 7
2-34

WHC-SD-WM-VI-031Revision 0
Scoping Teat - DatasheetPage 1 of
T e a t NO. RVR-
Parameter
Date: V3O-<iS*"Time:
Hot Oil System
Pujr.p Inlet pressure PI-IN
pump Outlet pressure PI-OUT
Hot Oil Supply, temperature
Hoc Oil Return, temperature
Expansion Tank level
RVR Dryer 3ed Temoeratures
TI-1
TI-2
TI-3
TI-4
TI-5
Rotor Speed Setting
Glass Former Feed Rate
Total glass formers fed (this period)
Total dried product this period
Total dried mixture output (accumulated)
Tank level reading
simulant/Additive Injection Rate
Total Simulant/Additive Input
Off-Gas System
Off-gas flow annemometer
NO Reading
NO, Reading
Total NO. Reading
CO Reading
Recirc Line Temp - TI-SCB
Scrubber Level - LG-SCB
Off-gas Pressure - PI-OFG
Vent Separator Level - LG-VENT
Vent Separator Temp - TI-VENT
Addit ive:
Unit
kPag
kPag
•c•ccm
•c'C
•c•c•c
RFM
Dia; #
kg
kg
kg
L
•VsL/min
L
Ppm
Ppm
ppm
ppm
•ccm
kPag
cm>±*.
•c
o
(0*1rOf
-to
°fz-7Z"9b>$*-(
34/
/IN
2*2-
z
too
oihrto*}to*)\O
€3
(,*)
*—{Mb
rt(
zs
a. [
shtZ-of *
Readings
yybo
o
10%( O
? v%<=\
+. I,—
0.1^(l'Z511*1
3<e%X
i
'h'bln
/6f"fO°l
\o
(Too
or<*r-
i(f
tO
* 7 ^7
<%§•
Si/
s* 1
A If!<$,%
3'S"72^5*3
3K
t
2-21°}
2-35

WHC-SD-WM-VI-031Revision 0
Scoping Test - DatasheetPage I of
Test No. RVR-
Parameter
Date: VW-'K"Time:
Hoc Oil System
Pump Inlec pressure PI-IN
Pump Outlet pressure PI-OUT
Hot Oil Supply, temperature
Hot Oil Return, temperature
Expansion Tank level
RVR Drver Bed Terroeratures
TI-1
TI-2
TI-3
TI-4
TI-5
Rotor Speed Setting
Glass Former Feed Rate
Total glass formers fed (this period)
Total dried product this period
Total dried mixture output (accumulated)
Tank level reading
simulant/Additive Injection Rate
Total Simulant/Additive Input
Off-Gas System
Off-gas flow annemometer
NO Reading
NO, Reading
Total NO, Reading
co Reading
Recirc Line Temp - TI-SCB
Scrubber Level - LG-SCB
Off-gas Pressure - PI-OFG
Vent Separator Level - LG-VENT
Vent SeDarator Temp - TI-VENT
Additive: UCA/&
Unit
kPag
fcFag
•c*ccm
•c•c"c•c•c
RPM
DiaJ. #
kg
kg
kg
L
^L/inin
L
Mk muVhi:
ppm
ppm
ppm
ppm
•c
cm
JcPag
cm/in
•c
-
sht3of 5
Readings
/S3O
0
• /o
*VVI7
i
o/erffz
ro
75"foO
ri
2*f-tZ
3<7U
zz.
Z*Jo(rs
t<7,37
2-36

WHC-SD-WM-VI-031Revision 0
Scoping T«st - Dat*«h««tPag* 1 of
Teat No. RVR-
|| Parameter
Date: V5\-<7J?If Time:
Hot Oil System
Pump Inlet pressure PI-IN
|| Pump Outlet pressure PI-OUT
|| Hoc Oil Supply, temperature
Hot Oil Return, temperature
|| Expansion Tank level
RVR Dryer Bed Temperatures
TI-1
TI-2
TI-3
TI-4
TI-5
II Rotor Speed Setting
Glass Former Feed Rate
|| Total glass formers fed (this period)
Total dried product this period
Total dried mixture output (accumulated)
1 Tank level reading
Simulant/Additive Injection. Rate
II Total simulant/Additive Input
II Off-Gas System
|| Off-gas flow annemometer
I NO R*ading
|| NO- Reading
|| Total NO, Reading
|| CO Reading
|| Recirc Line Temp - TI-SC8
Scrubber Level - LG-SCB
Off-gas Pressure - PI-OFG
1 Vent Separator Level - LG-VENT
Vent Separator Temp - TI-VENT
1
Additive: AJCA/&.
Unit
kPag
kPag
•c•ccm
•c
*C
•c
•c"c
RPM
iVhrDia^L #
kg
kg
kg
L
cnL/min
L
iA\* . . - . ' /i--
ppm
ppm
ppm
ppm
•c
cm
kPag
cm/in
*C
Sht / of j"
Readings
Ofoo
O
(^7M/QCf
- 1 0
-?c*577Z-117U?•/
Z7. M°\
&l
0^30
oIto5}(O
toqr o
8-37 ^
3
0*500
CD
U (I/O
rO
U>4&(7(*73
5
O
/c-5ffO/C9fo
77^1(S-57S1
y^
Hosbio
15 f
l(
//_L_t
/ O
f 7^ i^37??-?
t
2-37

WHC-SD-WM-VI-031Revision 0
Scoping Test - Datasheet
Test No. RVR-
1 Parameter
Data: "3 "?> f-^ $~
\ Time:
Hot Oil system
II pump Inlet pressure PI-IN
Pump Outlet pressure PI-OUT
Hot Oil Supply, temperature
|| Hot Oil Return, temperature
U Expansion Tank level
1 RVR Dryer Bed Temperatures
TI-1
TI-2
TI-3
TI-4
TI-5
H Rotor Speed Setting
1 Glass Former Feed Rate
j| Total glass formers fed (this period)
Total dried product this period
|| Total dried mixture output (accumulated)
Tank level reading
|| simulant/Additive Injection Rate
(| Total Simulant/Additive Input
tl Off-Gas System
|| Off-gas flow annemometer
|| NO Reading
NO, Reading
|| Total NO, Reading
CO Reading
Recirc Line Temp - TI-SCB
Scrubber Level - LG-SCB
Off-gas Pressure - PI-OFG
| Vent Separator Level - LG-VENT
| Vent Separator Temp - TI-VENT
1
Additive:
UniC
fcPag
kPag
•c
•c
em
•c
•c
•c
•c
•c
REM
Dial #
kg
kg
kg
L
^ L/min
L
ppm
ppm
ppm
ppm
*c
cm
kPag
cm/in
"c
A/
/OlO
O
ftz.noVo
77(a$IB%b7Z.3c/
,ST
/?
33
woo
o/fc5(ft\(t(O
nxi¥
5
i • —
hit*
io
2J*
Reading
! ( JO
O
U2-
\(ftQ
fob
^i
.——
5:75*
/vo
33
Page 1 of
Shttot 4-
1
0
/<o5{[£_
III/o
-7/(o792.687k
fT,/O
273 3
!
0 l!
/C
(•35
ISO
3Z.
31 1
2-38

WHC-SD-WM-VI-031Revision 0
Scoping ?«st - DatasheetPage L of
Test No. RVR-
1 Parameter
Date: 3 ^ ( - ^!' Time:Hot Oil System
Pump Inlet pressure PI-IN
pump Outlet pressure PI-OUT
Hot Oil Supply, temperature
Hoc Oil Return, temperature
Expansion Tank level
RVR Dryer Bed Temperatures
TI-1
TI-2
TI-3
TI-4
TI-5
j( Rotor Speed Setting
Glass Former Feed Rate
Total glass formers fed (this period)
II Total dried product this period
Total dried mixture output (accumulated)
Tank l eve l reading (Jia SIAuJwa" -reun. fto/&2.
[| simulant/Additive Injection Rats
Total Simulant/Additive Input
Off-Gas System
11 Off-gas flow annemoraeter
II NO Reading
|| N0t Reading
|| Total NO, Reading
|| CO Reading
j| Recirc Line Temp - TI-SCB
|| scrubber Level - LG-SCB
Off-gaa Pressure - PI-OFG
|] Vent Separator Level - LG-VENT
[ Vent Separator Temp - TI-VENT
1
Additive: /C<7/v£
Unit
fcPag
kPag
•c
*ccm
•c
•c•c•c
•cRPM
kg/hrDial #
kg
kg
kg
I/L- 2r=n\L/min
L
ppm
ppm
_ppm
ppm
•c
cm
kPag
cm/in
"C
Sht3of %
Readings
O
l(O(fa
- /o
3SM78
3 ^
^O5
/3«p3> ^ / /
O
/or*/COno
ra
81(*G93°!TfC8
></
-2..I"?
TO "ho
33
a
if (
/o
—
U3
V-732Q,r<?3
205?
35
l^3 3
o' /fcrkoft
r o
?3
3^
^U
O
/ O
7 °f——
/CC(7
3 533
^ /
3133
2-39

WHC-SD-WM-VI-031Revision 0
Scoping Teat -Page 1 of
Test Mo. RVR-
|| Parameter
Dat«: ?- 3 \ —°!o
|| Time:
Hot Oil System
Pump Inlet pressure PI-IN
j| pump Outlet pressure PI-OUT
|| Hot Oil Supply, temperature
j| Hot Oil Return, temperature
fl Expansion Tank level
|| RVR Dryer Bed Temperatures
TI-1
| TI-2
TI-3
TI-4
TI-5
Rotor Speed Setting
H Glass Former Feed Rate
II Total glass formers fed (this period)
|| Total dried product this period
|| Total dried mixture output (accumulated)
|| Tank level reading
Simulant/Additive Injection Rate
| Total Simulant/Additive Input
[ Off-Gas System
Off-gas flow annemonieter
1 NO Reading
|| NO; Reading
Total NO, Reading
|| CO Reading
|| Recirc Line Temp - TI-SCB
Scrubber Level - LG-SCB
|| Off-gas Pressure - PI-OFG
|| Vent Separator Level - LG-VENT
| Vent Separator Temp - TI-VENT
1
Additive: A/CA/£
Unit
kPag
kPag
*C
•c
cm
*C
•c
•c
•c
•c
RPM
b/hrOiaJ. #
kg
kg
kg
L
rhL/rein
L
ppm
ppm
ppm
ppm
•c
cm
kPag
cm/in
•c
Sht Tof 4*
Readings
O
/(of
M{1(2.
- /o
7r
*!?«/OS
Zoo
CD
HO/o
nr
838^cf 7
^1
o
/O
~7S%(#%<#<gl3<f
^^
<-f (
——fok<M:\
;1
2-40

WHC-SD-WM-VI-031Revision 0
scoping T««t - Data»h««tPage 1 of 1
Teat No. RVR-
Parameter
Date: 4 "~Z--C7^""Time:
Hot Oil System
Pump Inlet pressure PI-IN
Pump Outlet pressure PI-OUT
Hot Oil Supply, temperature
Hot Oil Return, temperature
Expansion Tank level
RVR Dryer Bed Temperatures
TI-1
TI-2
TI-3
TI-4
TI-5
Rotor Speed Setting
Glass Former Feed Rate
Total glass formers fed (this period)
Total dried product this period
Total dried mixture output (accumulated)
Tank level reading
Simulant/Additive Injection Rate
Total Simulant/Additive Inputoff-Gas System
Off-gas flow annemometer
NO Reading
NO, Reading
Total N0B Reading
CO Reading
Recirc Line Temp - TI-SCB
Scrubber Level - LG-SCB
Off-gas Pressure - PI-OFG
Vent Separator Level - LG-VENT
Vent Separator Temp - TI-VENT
Additive: AJO**&
Unit
kPag
kPag
•c•cem
•c•C
•c•c•c
RPM
Dial #
kg
kg
L
/v\ L/min
L
"fen***ppm
ppm
ppra
ppm
•c
cm
kPag
cm/in
•c
Sht/ off
Readings
a
- L°
6-0
-
7-1
O1/aSt((\Uro
7G77
$092..
'
5.07
b
O((aSKZHO(O
7?~l(o
VI3c/
°t
o/6S"t(f1 if^ o
?H731T3
^
O
i/Of ('/. O
7j-
7n75?3*/
|—
rz.
33
^ 5*« 7*/i
2-41

WHC-SD-WM-VI-031-Revision 0
Scoping Test - DatasheetPage 1 of
R Test No. RVR-
|| Parameter
| Dace: Cf-2-~ ^ 5 ~11 Time:
II Hoc Oil System
II Pump Inlet pressure PI-IN
|| Pump Outlet pressure PI-OUT
Hot Oil Supply, temperature
Hot Oil Return, temperature
Expansion Tank level
I RVR Dryer Bed TemDeratures
TI-1
TI-2
TI-3
TI-4
TX-5
II Rotor Speed Setting
II Glass Former Feed Rate
1 Total glass formers fed {this period)
1 Total dried product this period
Total dried mixture output {accumulated)
Tank level reading
Simulant/Additive Injection Rate
Total Simulant/Additive Input
Off-Gas Svstera
Off-gas flow annemometer
NO Reading
NO, Reading
Total NO* Reading
CO Reading
Recirc Line Temp - TI-SCB
Scrubber Level - LG-SCB
Off-gas Pressure - PI-OFG
Vent Separator Level - LG-VENT
Vent Separator Temp - TI-VENT
Additive:
Unit
kPag
kpag
*c•ccm
•c•c•c•c•c
REM
(£g/hrDial #
kg
kg
kg
L
rn L/rain
L
^-WmVttr
ppm
ppm
ppm
ppm
•ccm
kPag
cm/in
*C
AJ
a
i a
- fo
77
S/IS§k
n.oz.
(?>
n
Reading.
tloo
a
HZ.
IO
3V
r "JtJ
M 3O
O
KZ.HIfo
73Hu
87
CZ. 1
177-
Z.Z.
>
1 zoo
0
/o°ti ((
i4?7
93
55,33fb%
lit
<o
iff/€<=?/O
-73"
$1TZ*SI3s/
-?7-3 //<b 7
-27
ii
25
2-42
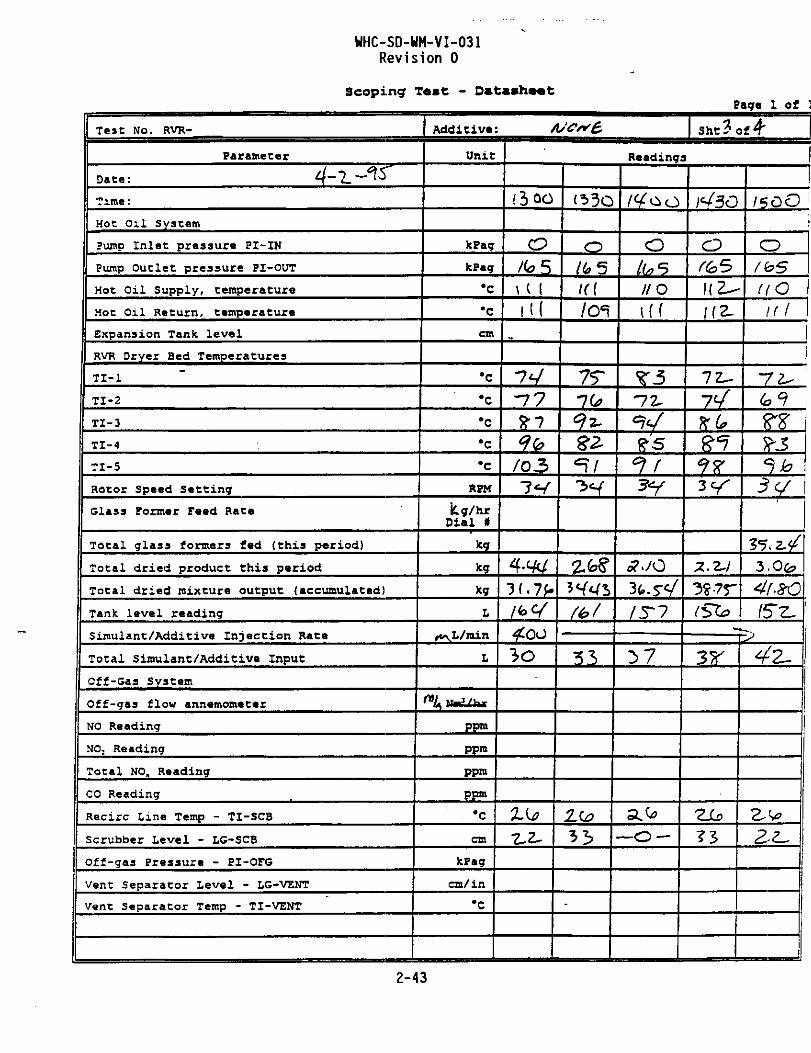
WHC-SD-WM-VI-031Revision 0
Scoping Test -
Test No. RVR-
Parameter
Date: ^~'L~~'^
Time:
Hot Oil System
Pump Inlet pressure PI-IN
Pump Outlet pressure PI-OUT
Hot Oil Supply, temperature
Hot Oil Return, temperature
Expansion Tank level
RVR Dryer Bed Temperatures
TI-1
TI-2
TI-3
TI-4
TI-5
Additive: AJCs*£,
Unit
JcPag
tcPag
•c•ccm
•c
•c
•c•c•c
Rotor Speed Setting j RPM
Glass Former Feed Rate
Total glass formers fed (this period)
Total dried product this period
Total dried mixture output (accumulated)
Tank level reading
Simulant/Additive Injection Rate
Total Simulant/Additive Input
Off-Gas System
Off-gas flow annemometer
NO Reading
NO, Reading
Total NO* Reading
CO Reading
Recirc Line Temp - TI-SCB
Scrubber Level - LG-SCB
Off-gas Pressure - PI-OFG
Vent Separator Level - LG-VENT
Vent Separator Temp - TI-VENT
Dial #
kg
kg
Jcg
L
^ L / m i n
L
% nf /hr
ppm
ppra
ppm
ppm
•c
cm
JcFag
cm/in
•c
Page 1 of
Sht?of 4"
Readings
o
i l l
-77£7
fo37*/
3(.7f-
%{*
o((a 5K(/O*l
7Tlit
(*f
-
o
noIff
-72.
*?</
^ /"3y
37
a^—o —
O"651(2—1(2.
7Z^7*/
g"7?{?3V
"5^7r
/5OO
O
(tOIff
-72^
*
<o9
*? jfe3 c/
35.2./
3.0c?
4{.2O
? $
4z~
2-43

WHC-SD-WM-VI-031Revision 0
Scoping1 Test - Datasheet
Test No. RVR-
Parameter
| Date: ^ Z - - * 7 £ " ~ *II Time:|| Hoc Oil System
|| Pump Inlet pressure PI-IN
Pump Outlet pressure PI-OUT
Hot Oil Supply, temperature
|| Hot Oil Return, temperature
|| Expansion Tank level
I RVR Dryer Bed Temperatures
| TI-1
TI-2
| TI-3
Tl-4
| TI-5
I) Rotor Speed Setting
Glass Former Feed Rate
Total glass formers fed (this period)
Total dried product this period
Total dried mixture output (accumulated)
Tank level reading
Simulant/Additive Injection Rate
Total Simulant/Additive Input
Off-Gas System
J| off-gas flow annemometer
NO Reading
|[ NO, Reading
Total NO, Reading
CO Reading
Recirc Line Temp - TI-SCS
Scrubber Level - LG-SCB
Off-gas Pressure - PI-OFG
Vent Separator Level - LG-VENT
Vent Separator Temp - TI-VENT
Additive: &/CW&
Unit
kPag
kPag
*c
•ccm
•c
•c•c*c•c
RPM
(Lg/hrDial #
kg
leg
kg
L
tS L/min
L
Hh it,!VI-.-.-
ppm
ppra
ppra
ppra
•c
cm
kPag
cm/in
•c
Page 1 of
Sht4of4
Readings
lS"3o
o
It IK(- lO
70
?</
9-
/too
olloS
idCO
"77T^
04*1
ts-l
/•fa3o
O
III112-/O
sz-11£)(,
)os
«/7.37is-o
i?oo
O/6SKZ^1(1/O
t2*>/Ql97^/Q/HZ-J</
53.53
fa
73
73. SG
2-44

WHC-SD-WM-VI-031Revision 0
Scoping Test - D*ta«h««tPage 1 of
T e s t No. RVR- *~
ParameterDate: ^ - T-^S"Time:
Hot Oil System
Pump Inlet pressure PI-IN
pump Outlet pressure PI-OUT
Hot Oil Supply, temperature
Hot Oil Return, temperature
Expansion Tank level
RVR Dryer Bed Temperatures
TI-1
TI-2
TI-3
TI-4
TI-5
Rotor Speed Setting
Glass Former Feed Rate
Additive: 1?c'£&'&£: C&& /# )
Unit
kPag
kFag
•c•ccm
•c•c•c•c•c
RPM
fCa/hrpia l #
Total glass formers fed (this period) r frHTT7 SwuT^kg
Total dried product this period
Total dried mixture output (accumulated)
Tank leve l reading
Simulant/Additive Injection Rate
Total Simulant/Additive Input
Off-Gas System
off-gas flow annemometerNO Reading
NO; Reading
Total NO, Reading
CO Reading
Recirc Line Temp - TI-SCB
Scrubber Level - LG-SCB
Off-gas Pressure - PI-OFG
Vent Separator Level - LG-VENT
Vent Separator Temp - TI-VENT
kg
kg
L
tr\L/min
L
ppm
ppm
ppm
ppra
•c
em
kPag
era/in
•c
Sht /of £
Readings
—
(?<?
1-7JOooo/f3 >
257Z^c/"2^
2.7?^As \&
\M>n\°iso
So
/?oO
o\2J4
**^(&
iir
2^7
/ 3 0-2.O/9
/33O
O(Z.UZ^7
ml
!>Of
gsiUS'
€rS(O2^tz.¥3/9
S3
o
-Z-O
/SZ
2Sf7
'2,8 725,17-
h (fa-s'
7i°lz.0S3
2-45
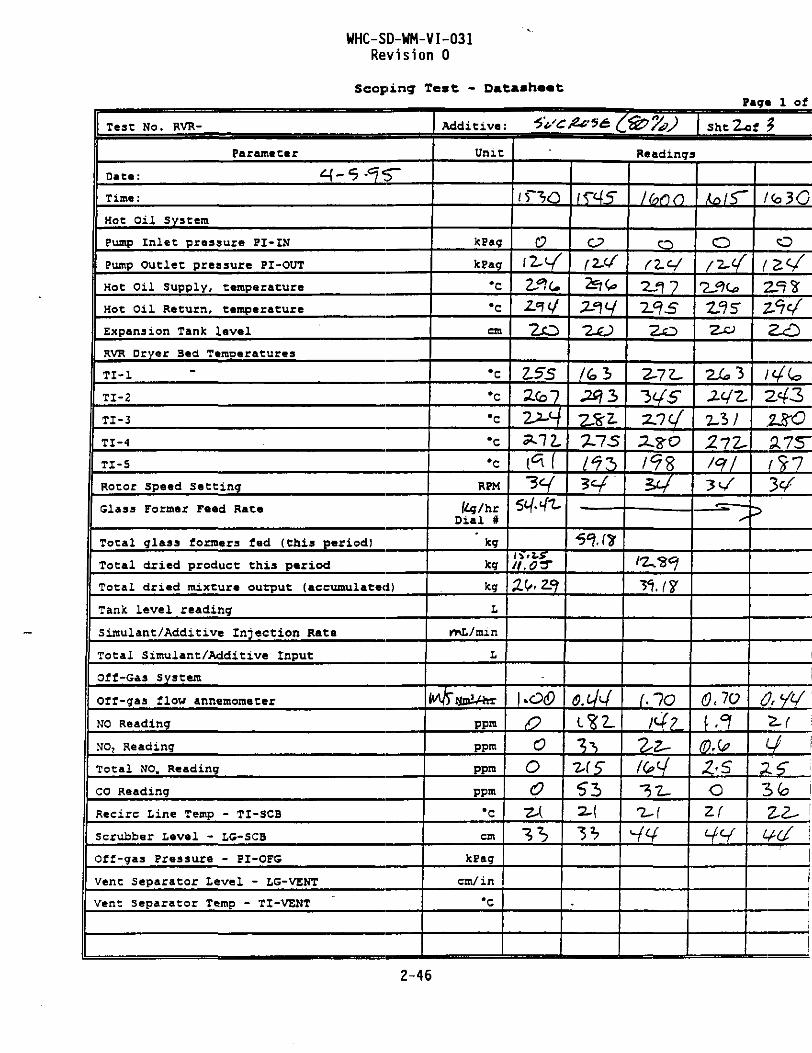
WHC-SD-WM-VI-031Revision 0
Scoping Test - D*t*«he«tPage 1 of
Test No. RVR-
Parameter
Date: q ^ - ^ S "
Time:
Hot Oil System
Pump Inlet pressure PI-IN
Pump Outlet pressure PI-OUT
Hot Oil Supply, temperature
Hot Oil Return, temperature
Expansion Tank level
RVR Dryer 3ed Teraoeratures
TI-1
TI-2
TI-3
TI-4
TI-S
Rotor Speed Setting
Glass Former Feed Rate
Total glass formers fed (this period)
Total dried product this period
Total dried mixture output (accumulated)
Tank level reading
Simulant/Additive Injection Rate
Total Simulant/Additive Input
Off-Gas System
Off-gas flow annemometer
NO Reading
NO, Reading
Total NO, Reading
CO Reading
Recirc Line Temp - TI-SCB
Scrubber Level - LG-SCB
Off-gas Pressure - PI-OFG
Vent Separator Level - LG-VENT
Vent Separator Temp - TI-VENT
Additive: 4*<CAr1& (&>7*J
Unit
JcPag
kPag
•c•ccm
•c
•c•c
•c•c
RPM
fcg/hrDial #
' fcg
leg
kg
L
mL/min
L
M^flmVfer
ppm
ppra
ppm
ppm
•c
cm
kPag
cm/in
•c
shtZof 9
Readings
oiWZflu2J>(tf
2O
ZS5TXol
2MJ
"3V
-
oo
o€
Ko-h
2J5-2.%1S
If 5
oM
-us
o
2 O
Z.7C/
?i.l7
(.10
/W
O
/*-<(
23 S
z<so
Z(
I<o30
o
}</(*>
ISOa 75*
Lf 1
¥(/
i
2-46

WHC-SD-WM-VI-031Revision 0
Scoping Tmmt. - Datash««tPag* 1 of
1 Test No. RVR-
Farameter
Date: «4-?-cf 5
|| Time:
Hot Oil System
|| Pump Inlet pressure PI-IN
|| Pump Outlet pressure PI-OUT
|| Hot oil Supply, temperature
Hot Oil Return, temperature
Expansion Tank level
RVR Dryer Bed TemDeratures
TI-1
TI-2
TI-3
TI-4
TI-5
Rotor Speed Setting
Glass Former Feed Rate
|| Total glass formers fed (this period)
II Total dried product this period
Total dried mixture output (accumulated)
Tank level reading
simulant/Additive Injection Rate
Total Simulant/Additive Input
Off-Gas System
Off-gas flow annemometer
NO Reading
NO; Reading
Total NO, Reading
CO Reading
Recirc Line Temp - TI-SCB
Scrubber Level - LG-SCB
Off-gas Pressure - PI-OFG
Vent Separator Level - LG-VENT
Vent Separator Temp - TI-VENT
| Additive:
Unit
JcPag
kPag
•c•C
cm
•c•c•c
•c'c
RPM
ka/hrDial *
' kg
kg
kg
L
vwL/rain
L
Mfs JteVhrppm
ppm
ppm
ppm
•c
cm
kPag
cm/in
•c
noo
r>
2-Tl
ZO
/MVZiol
i^3
l*S
G^
\ Sht 3 of 3
Readings
Orv4
to
ill2Z1
~*$
ft
731"7 2LZL-
-
2-47

WHC-SD-WM-VI-031Revision 0
Scoping Test - Dat*sh*«tPage 1 of
| Test No. RVR- 5(a
| Parameter
Date: V ( ( "*?*5*"| Time:
Hot Oil System
Pump I n l e t pressure PI-IN
Pump Outlet pressure PI-OUT
Hot Oil Supply, temperature
It Hot Oil Return, temperature
|| Expansion Tank l e v e l
|f RVR Dryer Bed Temperatures
I TI~1
1 TI~2TI-3
TI-4
| TI-5
1 Rotor Speed Setting
1 Glass Former Teed Rate
|| Total glass formers fed (this period)
H Total dried product this period
Total dried mixture output (accumulated)
Tank level reading
simulant/Additive Injection Rate
1 Total Simulant/Additive Input
Off-Gas System
Off-gas flow anneraosieter
NO Reading
NOj Reading
|| Total NO, Reading
|| CO Reading
Recirc Line Temp - TI-SCB
|| Scrubber Level - LG-SCB
If Off-gas Pressure - PI-OFG
|| Vent Separator Level - LG-VENT
\ Vent Separator Temp - TI-VENT
|
Addit ive:
Unit
kPag
fcPag
•c
'ccm
•c*c
•c
*c•c
RPM
Dial *
' *g
kg
kg
L
^L/min
L
ppm
ppm
ppm
ppm
•C
cm
kPag
cm/in
*C
fZoO
O
~&\°\2s? T
1 0
253£5?
•2XL
JH-HZ)
ooO
on
1 7
K - / O O -
O
?£%Zfll/0
/5"C?
2.7*/
^ - ~ • • • •
I-Th
5?
%Vn
& Stan Sht /of /
Readings
o
257*}-232( O
1XS
/-70NO
2.?/fc>7
H^/%S3
o
2.9?
2P}icA&7
—
3*722-L1Z-1733
o
rO 1
30/28*7
3c /
.—/0.934Cf<b3
HO[TSZ
*!%
bl
2-48

WHC-SD-WH-VI-031Revision 0
Scoping T«st - D*t»*h«*tPage 1 of
Te3C No. RVR- 7
|| Parameter
I! Date: U~{( — °l %~ *Time:
Hot Oil System
I! Pump Inlet pressure PI-IN
II Pump Outlet pressure PI-OUT
|| Hot Oil Supply, temperature
II Hot o i l Return, temperature
1 Expansion Tank l eve l
RVR Dryer Bed Temperatures
TI-1
11 TI-2TI-3
TI-4
| TI-S
|| Rotor Speed Setting
I Glass Former Feed Hate
Total glass formers fed (this period)
Total dried product this period
Total dried mixture output (accumulated)
Tank leve l reading
|| simulant/Additive Injection Rate
II Total Simulant/Additive Input
| off-Gas System
Off-gas flow annemometer
NO Reading
NO, Reading
Total NO, Reading
CO Reading
j Recirc Line Temp - TI-SCB
i Scrubber Level - LG-SCB
Off-gaa Pressure - PI-OFG
Vent Separator Level - LG-VENT
Vent Separator Temp - TI-VENT
Additive ?*"*** W % *5Tto (C_
Unit
kPag
kPag
•c•ccm
•c•c•c•c•c
RPM
(tg/hrDial *
' K g
kg
MrL
*viL/min
L
ppa
ppm
ppm
ppm
•ccm
kPag
cm/in"C
Sht (ot f
Readings
O
US']IO
f^V2M\
2XH
—
CDon
33
O
7m(o
I9OIS*)1& (
Z5(*
(to7 0%50
10
lob
I<POS
O
( 0
Wl
50/
23S
t toI(T
D
23$(O
/c/32J8-S?Q?ZZlW<*
53.27
9*12-33
2-49

WHC-SD-WM-VI-031Revision 0
This page intentionally left blank.
2-50

WHC-SD-WM-VI-031Revision 0
APPENDIX 2B
RVR TESTIN6 SAMPLE LOG
2-51

SAMPLE LOG
rot
tnro
SAMPLE NUMBER
VI RSI/121-001
| V1RS1/I21-002
| V1RS3/I21-O03
VI RSI/121-004
VIRS4/I21-OO5
V1RS5/I21-O06
• V1RS6/I21-OO7
| V1RS1-7/W22-O08
DATE
21/3
21/3
5/4
5/4
5/4
11/4
11/4
11/5
TIME
1625
1745
1245
1345
1740
1350
1525
0910
SAMPLE TYPE
Product
Product
DiySIM
Reacted Product
Reacted Product
Reacted Product
Reacted Product
Scrubber Solution Final
DESTINATION LAB SHIPMENT DATE LAB SAMPLE #
!
. . . » ' . » • . . • >...Ml
o
< C3- " . l_
O i
O
SAMPLE LOG

WHC--SD-WM-VI-031Revision 0
PART 3 - VE-SKULL MELTER PHASE 1FINAL TEST REPORT
3-i

WHC-SD-WM-VI-031Revision 0
VE-SKULL™ MELTER PHASE 1 FINAL TEST REPORT
For
WHC Contract No. MMI-SVV-384211
EVALUATION OF MELTER SYSTEM TECHNOLOGIES FORVITRIFICATION OF HIGH SODIUM CONTENT LLRW
VECTRA GSI Report No. WHC-VIT-05
August 1995
by
VECTRA Government Services, Inc.2939 Richardson RoadRichland, WA 99352
Prepared by: Approved by:
John J. Koehr "^^Vv^/Cor1 L>^~ Brad MasonBrent Spurgeoi
3-ii

WHC-SD-WM-VI-031Revision 0
CONTENTS
1.0 INTRODUCTION 3-1
2.0 PURPOSE 3-1
3.0 CHRONOLOGY OF EVENTS 3-1
4.0 EQUIPMENT OPERATING BEHAVIOR 3-44.1 START-UP 3-44.2 BOTTOM DRAIN ASSEMBLY 3-54.3 GLASS FRIT SYSTEM 3-64.4 SLURRY FEED SYSTEM 3-64.5 ELECTRODES 3-74.6 MELTER OPERATING BEHAVIOR 3-84.7 MELTER SAMPLING 3-84.8 OFF-GAS SYSTEM 3-94.9 REFRACTORY 3-94.10 SERVICE LOADS 3-10
5.0 MELTER TESTS AND OBSERVATIONS 3-105.1 MT-1: MELTER TEST PREPARATIONS 3-10
5.1.1 Melter Start-up 3-105.1.2 VECTRA Glass Dry Feed Operations 3-125.1.3 LLRW Slurry Feed Operations 3-14
5.2 MT-2: REACT/VITRIFY GLASS FORMER, LLRW SIMULANT, ANDREDUCTANT SLURRY FEED 3-15
5.3 MT-3: VITRIFY SIMULATED DRY CALCINED PRODUCT 3-175.4 MT-4: VITRIFY DRY CALCINED PRODUCT 3-175.5 V-SIM HIGH THROUGHPUT TEST 3-195.6 SLURRY HIGH THROUGHPUT TEST 3-195.7 HIGH SODIUM TESTING 3-195.8 MELTER DRAINDOWN, SHUTDOWN, AND INSPECTION 3-215.9 MELTER THROUGHPUT 3-225.10 MELTER MASS BALANCE 3-225.11 MELTER SCALE-UP 3-36
6.0 CONCLUSIONS . 3-36
APPENDIXES
3A LAB ANALYSES 3-39
3B THROUGHPUT LOG 3-55
3C MASS BALANCE CALCULATIONS 3-75
3-iii

WHC-SD-WM-VI-031Revision 0
LIST OF FIGURES
3-1 MT-1 VECTRA Glass Throughput 3-24
3-2 MT-1 VECTRA Glass Peak Throughput 3-25
3-3 VECTRA Glass Idle Throughput 3-26
3-4 MT-1 Slurry Throughput 3-27
3-5 MT-1 Slurry Peak Throughput 3-28
3-6 MT-2 Slurry Throughput 3-29
3-7 MT-3 V-SIM Throughput 3-30
3-8 MT-4 Calcined Throughput . 3-31
3-9 V-SIM High Throughput (HT) Run 3-32
3-10 V-SIM High Throughput (HT) Run Peak Throughput 3-33
3-11 Slurry High Throughput (HT) Run 3-34
3-12 High Sodium (Na) Run Throughput 3-35
3-iv

WHC-SD-WM-VI-031Revision 0
LIST OF TABLES
3-1 VE-SKULL Melter Testing Chronology Summary 3-2
3-2 Electrode Weight Losses 3-7
3-3 Melter System Phase 1 Testing Service Loads 3-11
3-4 VECTRA Glass Feed Composition 3-13
3-5 RVR Glass Formers (Mix B) Composition 3-14
3-6 Slurry Feed Batch Recipes 3-15
3-7 Target Glass Composition 3-16
3-8 MT-2 Slurry Feed Composition 3-16
3-9 V-SIM Feed Composition 3-18
3-10 Boric Acid Addition to Dry Calcined Feed Product 3-19
3-11 V-SIM High Throughput Summary 3-20
3-12 LLRW Slurry Feed High Throughput Summary 3-20
3-13 High Sodium Run Batch Makeup 3-20
3-14 High Sodium Run Throughput Summary 3-21
3-15 Phase 1 Throughput Summary 3-23
3-16 VE-SKULL™ Melter Sizing Specifications 3-37
3-v

WHC-SD-WM-VI-031Revision 0
This page intentionally left blank,
3-vi

WHC-SD-WM-VI-031Revision 0
PART 3 - VE-SKULL MELTER PHASE 1FINAL TEST REPORT
1.0 INTRODUCTION
The Westinghouse Hanford Company (WHC) is conducting an evaluation ofglass melter system technologies for vitrification of liquid low-levelradioactive waste (LLRW) streams consisting mostly of sodium nitrate andnitrite salts in alkaline liquid slurry form. As part of this technologyevaluation, VECTRA has demonstrated performance of the EnviroGlass™Vitrification System feed and VE-SKULL™ melter subsystems. The VE-SKULL711melter is the heart of the EnviroGlass™ Vitrification System. Performancetesting for EnviroGlass™ feed system components has been completed anddocumented in Part 1 (Fluid Bed Calciner Test) and Part 2 (RVR Dryer/CalcinerTest) of this report.
2.0 PURPOSE
This final test report (Part 3) documents accomplishment of the VE-SKULLTmelter test objectives. Test objectives include the following:
2.1 Demonstrate ability of VE-SKULL™ melter to melt dry/calcined LLRW(from fluid bed Calciner and RVR dryer tests), simulated calcinedLLRW, and simulant slurry feed combined with glass formers andreductants to create a product glass formulation which exceedsperformance criteria including PCT tests.
2.2 Verify operating parameters while processing with high-sodium LLRWfor test basis glass compositions, 7.e., power supply voltage andamperage, throughput capability, cold-cap (batch blanket) depth,degree of phase separation, glass foaming, melt characteristics ofdry/calcined feed materials, glass pour nozzle operation, and off-gas rates and compositions.
2.3 Investigate throughput capability of melter.
3.0 CHRONOLOGY OF EVENTS
A detailed chronology of VE-SKULL™ melter Phase 1 testing has beenrecorded in the Test Log. Detailed times for specific tests are recorded inthe Throughput Log (Appendix 3C). A brief test chronology summary is providedin Table 3-1.
3-1

WHC-SD-WM-VI-031Revision 0
Table 3-1. VE-SKULL Melter Testing Chronology Summary. (3 sheets)
Date
3/28/95(MT-1, start-up,boring bar)
3/30/95-4/1/95(MT-1, start-up,gas burner)
4/2/95-4/6/95(MT-1, transitionbatch)
4/7/95-4/17/95(MT-1, VECTRAbatch)
4/17/95-4/21/95(MT-1, slurryfeed)
4/21/95-4/22/95(MT-2, slurryfeed massbalance)
Activities/events
- 976 kg (2,152 lb) glass cullet in melter- Attempted start-up with boring bars- Poor success due to boring bar high iron/low
magnesium content- 11 boring bars consumed, unable to establish molten
glass pool between electrodes- Boring Bar start-up terminated due to melter head MCW
jacket erosion
- Melter head MCW jacket repaired- Performed start-up with gas burners- Melter in auto temperature control- 408 kg (900 lb) cullet added as make-up.
- 179 kg (395 lb) of various transition batchesperiodically added to melter
- Establish joule heat through drain ring and pin tomelt bottom glass
- On-line replacement of drain ring
- VECTRA batch- Performed initial drain of 233 kg (513 lb) glass- 5401 kg (11,909 lb) VECTRA glass dry batch added- >3886 kg (8569 lb) VECTRA glass drained- Idled melter over Easter Weekend (4/14-4/16); 135 kg
(297 lb) dry VECTRA glass batch feed; 136 kg (300 lb)glass drained
- Average feed throughput 30.2 kg/hr (66.6 lb/hr)- Peak feed throughput 88.5 kg/hr (195.2 lb/hr),
156 kg/hr-m2 (32,0 lb/hr-ft2)
- Initial slurry feed system arrangement resulted inline plugging
- Additional slurry feed tank, mixer, and recirc hosesadded on melter test stand. Injection pump moved totest stand.
- Commenced slurry feeding- 3563 kg (7857 1b) slurry feed added- >1437 kg (3169 lb) glass drained- Average feed throughput: 36.2 kg/hr (79.8 lb/hr)- Peak feed throughput: 77.3 kg/hr (170.5 lb/hr),
136.4 kg/hr-m2 (28.0 lb/hr-ft2)
- Started slurry feed mass balance at 2300 on 4/21/95.- CEMS monitoring- 14 hour steady state mass balance run ended at 1300
on 4/22/95.- 865 kg (1907 lb) slurry feed added- >406 kg (896 lb) glass drained- Average feed throughput: 59.9 kg/hr (132.0 Ib/hr),
105.6 kg/hr-m2 (21.6 lb/hr-ft2)
3-2

WHC-SD-WM-VI-031Revision 0
Table 3 - 1 . VE-SKULL Melter Testing Chronology Summary. (3 sheets)
Date
4/22/95(MT-3, simulateddry calcinedfeed)
4/23/95(MT-4, drycalcined feed)
4/24/95-4/26/95(V-SIM highthroughput)
4/26/95(Slurry highthroughput)
4/26/95-4/27/95(High Na highthroughput)4/27/95(draindown)
Activities/events
- Prebatched dry "V-SIM" feed to simulate dry calcinedfluid bed product. Started a mass balance at 1900 on4/22/95.
- CEMS monitoring- 3 hour steady state mass balance run ended at 2200 on
4/22/95.- 100 kg (220 Ib) V-SIM added- >69 kg (151 lb) glass drained- Average feed throughput: 43.2 kg/hr (95.2 lb/hr),
76.2 kg/hr-m2 (15.6 lb/hr-ft2)
- Started calcined feed mass balance at 1000 on4/23/95. Steady state mass balance run ended at 1400on 4/23/95.
- 4 hour test duration- 162 kg (357 lb) dry/calcined feed (Procedyne product)
added- >136 kg (300 lb) glass drained- Average feed throughput: 25.7 kg/hr (56.6 lb/hr),
45.3 kg/hr-m2 (9.3 lb/hr-ft2)
- Performed high throughput run with simulateddry/calcined feed (V-SIM)
- 2809 kg (6193 lb) V-SIM feed added- >2101 kg (4632 Ib) glass drained- Average feed throughput: 47.4 kg/hr (104.6 lb/hr)- Peak feed throughput: 71.0 kg/hr (156.5 Ib/hr),
125.2 kg/hr-m2 (25.7 lb/hr-ft*)- Average Power: 119.4 kw
- Performed high throughput run with liquid LLWsimulant, dry glass formers, and dry reductant slurryfeed
- 375 kg (826 Ib) slurry feed added- >310 kg (684 lb) glass drained- Average feed throughput: 67.5 kg/hr (148.9 Ib/hr),
119.1 kg/hr-in2 (24.4 lb/hr-ft2)- Average Power: 121.3 kw
- Performed batch transition to high Na content dryfeed (>26% Na20 in feed on oxide basis).
- 408 kg (900 lb) high Na feed added- >239 kg (528 lb) glass drained- Average feed throughput: 40.0 kg/hr (88.2 lb/hr),
70.6 kg/hr-m' (14.5 lb/hr-ft2)- Average Power: 106.4 kw
- VE-SKULL™ Melter shutdown, complete draindown, andcool down
- 917 kg (2022 Ib) glass drained into two (2) 55-gallondrums
3-3

WHC-SD-WM-VI-031Revision 0
Table 3-1. VE-SKULL Melter Testing Chronology Summary. (3 sheets)
Date
4/28/95(inspection)
Activities/events
- Performed VE-SKULL™ melter post test inspection
4.0 EQUIPMENT OPERATING BEHAVIOR
The Phase 1 Melter test equipment was installed within VECTRA'smaintenance building in Richland, Washington. The Melter and dry feeder weremounted on a large structural steel test stand which contained space for theSCADA control system, CCTV, and melter watch standers. The Melter CoolingWater (MCW) tank, pump, heat exchanger, and ion exchanger were staged underthe Melter Test Stand.
The slurry feed system was mounted on a test stand staged at ground levelacross from the melter test stand and consisted of a mix tank, glass formerfeeder, and two diaphram recirculation pumps. Slurry feed recirculation hosesran from the diaphram recirculation pumps to the melter test stand batch drumand peristaltic feed pump. The glass quench trough and tank were staged atground level between the slurry feed and melter stands.
The off-gas skid was mounted outside the maintenance building andcontained the scrubber, vent fans and stack. The scrubber drain tank, drainpump, and spray pump were staged outside with hoses run to the scrubber. Thequench water recirculation tanks, quench water supply pump, quench waterreturn pump were staged outside the maintenance building with hoses run to thequench trough and tank inside the building. The cooling tower was stagedoutside the maintenance building with hoses run to the MCW heat exchangerunder the melter test stand.
Other equipment stage outside included the diesel generator, service aircompressor, nitrogen tanks, and propane tanks.
4.1 START-UP
Initial start-up was attempted using magnesium boring bars. Temperedglass cullet was loaded into the melter. A boring bar was attached to anoxygen supply hose, ignited, and manually inserted into the melter through anopen 6" port between electrodes. The operator attempted to melt glass culletbetween electrodes so that molten glass continuity could allow melterelectrode operation for continued heat-up. Reddish smoke and a significantquantity of "slag" generated by the boring bars indicated a high iron content.A total of eleven (11) boring bars were expended attempting to start themelter. A flaw in the side of bar number 11 resulted in the erosion of themelter head MCW jacket. An MCW leak was created which required terminatingboring bar start-up, isolating MCW, weld repair to the melter head jacketwithin the 6" nozzle, hydrostatic test to 45 psig, and inspection by an ASMEcertified inspector.
3-4

WHC--SD-WM-VI-031Revision 0
Following unsuccessful boring bar start-up, gas burners were positionedin two of the melter head 6" nozzles between electrode phases. The burnerswere ignited and glass cullet start-up was successfully accomplished.
4.2 BOTTOM DRAIN ASSEMBLY
The bottom drain assembly consisted of a drain ring inserted insidemelter refractory liner. The ring provided a small diameter orifice tocontrol glass drain rate. The drain ring was held in place with four (4) lugsattached to a water cooled bottom support ring which was mounted to the melterbottom plate. The ring support lugs were electrically isolated from the ringby insulated pads. High drain ring temperatures melted the original isolationpads which required replacement with a material rated for higher temperature.
Sparge lines penetrated the bottom support ring through refractory intothe melter to allow glass pool sparging with nitrogen. Nitrogen sparging wasperformed throughout Phase 1 testing.
An air cylinder operated, water cooled, stopper plug was utilized to plugthe drain ring orifice when glass draining was not desired. The stopper plugperformed very well as long as glass buildup broke away from the plug. Airand water tubes were directed at the bottom of the ring and could be utilizedas a back-up method to cool the ring and help reduce ring temperature. Aircooling was periodically utilized to stop any leakage around ring perimeterfollowing glass drain operations.
In order to allow glass draining following melter start-up, the glass onthe bottom of the melter above the drain ring had to be fully melted. Heatgenerated by the three main electrodes was insufficient to melt the glass atthe bottom of the melter. For the Test Program, the electrodes could not befully extended due to fixed electrode holder design. A moveable electrodedesign will correct this limitation. A welding machine provided a singlephase joule heating loop between one electrode phase (A) and the drain ring.Initially, a pin was inserted through the drain ring into the hot glass pool.The joule heating loop was established through this pin which was slowlywithdrawn out the drain ring orifice as heat-up progressed. When the pin wasfully withdrawn, the bottom joule heating loop was shifted back to the drainring. Throughout the test program, drain ring temperature was maintained bythe welding machine. Glass draining was initiated by opening the drainstopper plug and raising the drain ring to >871°C (1600°F). Drain ringtemperature was maintained below 1093°C (2000°F).
No drain ring damage or erosion was observed throughout phase 1 meltertesting except minor damage resulting from metal deposits restricting orificeon the final day of testing.
The metal deposits originated from the boring bars used during the firstattempted start up and also the erosion of the electrodes and the electrodeholders. To remove this metal and restore the drain ring to an acceptableoperating condition, the ring would have to be remachined to open the orificeback to its original diameter.
3-5

WHC-SD-WM-VI-031Revision 0
4.3 GLASS FRIT SYSTEM
The glass frit system functioned to cool the molten glass draining fromthe melter, and allow the glass to cool and shatter into granular pieces undercontrolled conditions. The glass product was collected in the glass frittank. Quench water recirculated from two (2) 10,000 L poly tanks with acentrifugal supply pump, through the glass frit chute and into the glass frittank. Molten glass was dumped from the melter into the quench water streamwithin the glass frit chute. Quench water was pumped from the frit tank by avariable speed centrifugal pump back into the poly tanks. The quench waterwas cooled by tank ambient losses.
The glass frit system produced a fine to medium granular product atmoderate glass drain rates [>4.5 kg/min (10 lb/min)]. At drain rates lessthan approximately 2.3 kg/min (5 lb/min), or with excessive chute water flow,spaghetti-like glass strands were produced.
4.4 SLURRY FEED SYSTEM
The original slurry feed system consisted of a slurry mix tank withinternal mixer, diaphragm recirculation pump, 25 ft dry feeder, LLRW simulantdrum mixer, and LLRW simulant drum transfer pump. The slurry mix tank wasmounted on a scale which provided constant readout of mix tank weight. LLRWSimulant bulk drums were continuously mixed with installed drum mixers. LLRWsimulant was transferred in calculated quantities from the drums to the slurrymix tank with a drum transfer pump. Calculated quantities of dry glassformers and sucrose were added to the slurry mix tank directly or with the dryfeeder. The slurry mix tank was continuously agitated with the tank mixer andrecirculated with the diaphragm pump. The melter feed line ran from thediaphragm pump discharge to the melter off-gas/feed plenum. The slurry mixtank weight was monitored to observe quantities of feed transferred from therecirculating slurry tank into the melter. During initial slurry feedoperations feed line plugging resulted, and steady feed flow could not bemaintained.
The slurry feed system was modified. A batch drum with mixer was placedon the melter test stand near the top of the Melter to serve as a slurry feedday tank. Larger diaphragm pumps were installed as recirculation pumps, andrecirculation lines were run up to the melter stand. Intermediate quantitiesof slurry feed were transferred from the recirculation line to the batch drumas necessary. A positive displacement peristaltic tubing pump took a suctionon the batch drum and injected slurry through tubing into the melter via the16" off-gas/feed plenum. The feed tube extended down to about 15 cm. (6 in)above the glass pool. The batch drum was calibrated for level which wasperiodically monitored. Weight of simulant transferred from the slurry mixtank to the salvage drum was monitored on the slurry mix tank scale. Thismodified slurry feed system was utilized for melter test preparation slurryoperations (MT-1), the slurry feed mass balance testing (MT-2), and the slurryfeed high throughput testing.
3-6

WHC-SD-WM-VI-031Revision 0
4.5 ELECTRODES
The Phase 1 VE-SKULL™ melter utilized three (3) 2-1/2" diameter verticalmolybdenum electrodes. The electrodes were powered from a diesel generatorthrough a 120V transformer and SCR. Electrode power levels ranged from 0-145 kw. Idle power level was approximately 85 kw.
The electrodes penetrated the melter head and were held in position bystainless steel holders and water cooled stainless steel castings andstainless steel pipe sleeves. The castings were designed for water cooling tocontrol electrode temperature and form a cold glass seal at the holder/electrode interface, thus preventing corrosion from the molten glass. Thecooling water was not initiated to the electrode holders throughout the testprogram due to presence of casting defects that caused minor water leakageinto melter. The electrode thermocouples and electrode holder cooling watertubes failed as a result of no cooling water. Severe erosion of the stainlesssteel holders occurred below the upper glass melt line levels.
The electrodes were adjustable in height only during this test. Theelectrodes required very little adjustment during testing other than to extendtwo electrodes as they eroded. During testing, electrode phase B developed aphase imbalance due to electrode erosion. Electrode B was lowered furtherinto the melter and the phase imbalance was corrected. Just prior to finalmelter drain down, electrode A was also extended.
Inspection of the electrodes following final melter drain down indicatedsevere erosion of all three electrodes. Electrodes A and B actually eroded tosuch an extent that a "bubble" erosion pocket in each electrode developed anda 12"-16" section of each electrode separated from the main electrode after28 days of high temperature operation.
Erosion of electrodes was most severe in glass/gas interface zone asindicated by "necking down" of electrode just below electrode holder area.Pre- and post-testing electrode weight given in Table 3-2 indicate the extentof electrode wear.
Table 3-2. Electrode Weight Losses.
Electrode
A*
B*C
Weight
Before
195.47 kg
195.47 kg
195.47 kg
After
150.22 kg
109.07 kg
186.90 kg
Loss
45.25 kg
86.4 kg
8.57 kg
*Loss includes pieces that physically separated andfell to the melter floor.
3-7

WHC-SD-WM-VI-031Revision 0
The electrodes were operated under high power operation for 28 days withglass melt temperature >1400°C (2600°F). It is estimated that the melter wasoperated for at least 14 days at extreme high glass temperatures >1480°C(2700°F) with operation at >1540°C (2800°F) for more than 7 days. The glasscomposition was at approximately 20 wt9£ Na,0 for 26 of the 28 days ofoperation. Electrode erosion is attributed primarily to lack of coolingwater, glass pool level excursions below holder, and lack of sufficient inertgas purge during draindown.
4.6 MELTER OPERATING BEHAVIOR
The goal during dry feeding was to maintain glass pool level above theelectrode holders, provide make-up for melter losses through volatization ordraining, and maintain a stable "batch blanket" on top of the molten glasspool. Optimization of batch blanket thickness allowed control of off-gasparticulate carry-over, minimized melter plenum temperature, and allowedoperator observation of melter pool refinement via the CCTV system.
Glass pool "freeboard" level and batch blanket thickness wereperiodically checked by the operators by removing a 6" insulated plug from themelter head and inserting a calibrated dip stick into the molten glass pool.Glass draining was periodically performed throughout all phases of testing tocontrol glass pool level. When operator inspection revealed sufficient glasspool level, glass draining was initiated by opening the remote drain stopperplug. Melter weight was transmitted from load cells and monitored by theoperator at the control system. Drain rate was dependent upon glass and drainring temperature. Draining was stopped by closing the drain plug when thedesired weight of glass had been removed or when the desired freeboard levelwas achieved.
The melter electrodes were operated in automatic power control afterstart-up throughout all phases of testing. Glass temperature and refiningrate were controlled by limiting electrode power level. One electrode phasesupplied power to a welding machine connected to the drain ring lug. Power tothe welding machine was manually adjusted to maintain drain ring temperatureless than 1093°C (2000°F) and to keep the melter bottom glass molten.Following start-up, melter internal thermocouples failed and glass pooltemperature indication was not available. Glass pool temperature wascontrolled by operator observation via the CCTV system, removal of insulatedplugs for direct inspection through 6" melter head nozzles, and operatorexperience. Periodic dip thermocouple readings indicated glass temperature tobe 1093-1560°C (2000-2850°F) following start-up throughout all phases oftesting.
The nitrogen sparge system was operated continuously to facilitate moltenglass pool mixing and refinement. Nitrogen sparge was maintained at a lowlevel (5-20 scfh) throughout all testing.
4.7 NELTER SAMPLING
Product glass sampling was performed by inserting circular graphite formsinto the molten glass drain stream. Alternatively, stainless steel ladles
3-8

WHC-SD-WM-VI-031Revision 0
were filled with molten glass and poured into forms. Resultant glass diskswould shatter upon cooling unless annealed in an oven. Glass frit sampleswere withdrawn directly from the glass frit tank.
Product glass was originally green with glass cullet, transition batch,and VECTRA Glass feed. When LLRW simulant slurry feed testing was initiatedthe glass gradually turned darker with each pour. Final glass product wasblack.
4.8 OFF-GAS SYSTEM
The melter off gas was drawn out through the 16" combined off-gas/ feedplenum. Off-gas piping, metal hoses, and off-gas instrumentation wereinstalled between the melter plenum and the suction side of a vent blower(located outside the test building) which discharged into the vent separator.The vent separator interfaced with centrifugal pumps for continuous ventseparator draindown to a large poly tank and continuous vent separator returnspray flow from the poly tank. The vent separator was vented into the stackand joined dilution air flow into stack at the discharge of a large ventblower.
The scrubber solution was not treated to control pH. Original scrubbersolution remained from previous RVR Dryer testing and contained noticeableamounts of particulates and glass formers from carryover. The vent separatortank and drain levels were monitored, during melter testing.
4.9 REFRACTORY
The melter is provided with a thin refractory liner inside the innervessel shell. Following 26 days of high temperature operation with high(20 wt%) Na20 glass the refractory appeared to be in original condition withno visible erosion except for:
• Several minor (<1 cm) concave indentations in refractory block inthe glass/gas interface area. It is unknown if the concaveindentations were initially present in refractory blocks.
• Mortar between blocks was partially eroded at interior surfaceleaving minor gaps 0-4 mm (0-0.16 inches) wide by 0-25 mm(0-1 inches deep) between blocks.
Refractory life is estimated to match 10 year design life of melter, ifrefractory seams-gaps are reduced to <1 mm during initial refractoryinstallations.
Mass balance calculations indicated an excess amount of chromium in theproduct glass. This excess chromium may be the result of minor refractoryerosion. Approximately 1 kg of excess Cr2O, resulted from MT-2 testing, andapproximately 180 g of excess Cr203 resulted from MT-3 testing. These valuesare consistent with observed refractory erosion.
3-9
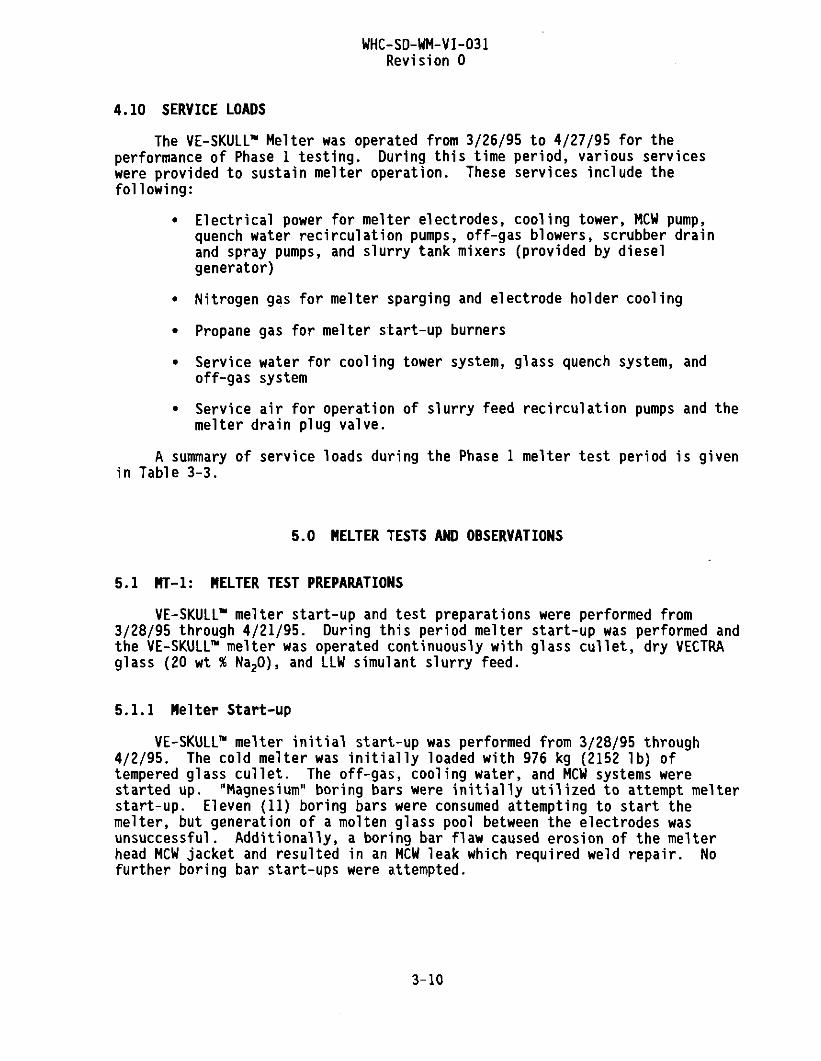
WHC-SD-WM-VI-031Revision 0
4.10 SERVICE LOADS
The VE-SKULL™ Melter was operated from 3/26/95 to 4/27/95 for theperformance of Phase 1 testing. During this time period, various serviceswere provided to sustain melter operation. These services include thefollowing:
• Electrical power for melter electrodes, cooling tower, MCW pump,quench water recirculation pumps, off-gas blowers, scrubber drainand spray pumps, and slurry tank mixers (provided by dieselgenerator)
• Nitrogen gas for melter sparging and electrode holder cooling
• Propane gas for melter start-up burners
• Service water for cooling tower system, glass quench system, andoff-gas system
• Service air for operation of slurry feed recirculation pumps and themelter drain plug valve.
A summary of service loads during the Phase 1 melter test period is givenin Table 3-3.
5.0 NELTER TESTS AND OBSERVATIONS
5.1 MT-1: MELTER TEST PREPARATIONS
VE-SKULL™ melter start-up and test preparations were performed from3/28/95 through 4/21/95. During this period melter start-up was performed andthe VE-SKULL™ melter was operated continuously with glass cullet, dry VECTRAglass (20 wt % Na20), and LLW simulant slurry feed.
5.1.1 Me Her Start-up
VE-SKULL™ melter initial start-up was performed from 3/28/95 through4/2/95. The cold melter was initially loaded with 976 kg (2152 1b) oftempered glass cullet. The off-gas, cooling water, and MCW systems werestarted up. "Magnesium" boring bars were initially utilized to attempt melterstart-up. Eleven (11) boring bars were consumed attempting to start themelter, but generation of a molten glass pool between the electrodes wasunsuccessful. Additionally, a boring bar flaw caused erosion of the melterhead MCW jacket and resulted in an MCW leak which required weld repair. Nofurther boring bar start-ups were attempted.
3-10

WHC-SD-WM-VI-031Revision 0
Table 3-3. Melter System Phase 1 Testing Service Loads.
Service
Electrical Power (ElectrodesOnly)
Average Electrode Power Level
Diesel Fuel (for generator)
Cumulative Diesel Run Hours
Average Diesel FuelConsumption
Nitrogen
Propane
Service Water (initial fill:cooling water, glass quench,scrubber)
Service Water (cooling towermake-up)
Service Air (during feedrecirc pump operations only)
Consumable MolybdenumElectrodes
TOTAL DAILY OPERATING COST
Quantity
55,736 KW-HR
96.9 KW
26,047 liters (6,881 USGallons); $.819/gallon
647.79 hours
40.2 liters/hr (10.62gallons/hr)
5148 kg (11,352 1b); 43bottles, 120 kg (264 lb)N2/bottle, $117/bottle
1022 liters (270gallons); $1.25/gallon
approx. 26,500 liters(7000 US Gallons)
approx. 3785 liters (1000US Gallons)
approx. 120 SCFM
121.3 cm (47.75 inches);6.35 cm (2.5 in) 0D,0.323 kg/cm (1.81 lb/in),$25/lb
Average dailyoperating cost(over 32-daytest period)
$ 176.08
$ 164.00
$ 67.53
$ 408.53
Following weld repair to the melter head MCW jacket, melter start-upstrategy was shifted to gas burners instead of the boring bars which hadproven ineffective. Melter start-up with burners was performed from 3/30/95through 4/1/95. Gas burners were ignited and manually inserted into themelter through the two 6" openings in the top. The glass cullet was slowlymelted to establish a conductive molten glass pool between the electrodes.Glass cullet temperature was monitored by thermocouples inserted into themelter through the head. Electrodes were periodically energized to monitormelt progress. After over 20 hours of slow burner heat-up, the glass culletwas molten between electrodes with glass pool temperature -760-982°C (1400-1800°F). The melter electrodes were shifted to automatic current control, andthe burners were turned off. Glass pool heat-up to approximately 1540° C
3-11

WHC-SD-WM-VI-031Revision 0
(2800°F) with the electrodes continued for approximately 2 days. During thisperiod a total of 408 kg (900 1b) additional glass cullet were added to themelter.
In order to gradually adjust the melter glass pool chemistry toward thetest chemistry expected for LLRW testing, transition batch high sodium feedwas added to the melter. Transition batch consisted of various mixtures ofsoda ash, boric acid, and alumina. A total of 179 kg (395 lb) of transitionbatch feed was added to the melter over a 4-1/2 day period (4/2/95 - 4/6/95).
During the transition batch period, operation of the melter electrodesalone would not melt the glass at the bottom of the melter above the bottomdrain assembly due to the fixed electrode angle. Heating of the bottom glasswas initiated by establishment of an additional single phase joule heatingloop through the drain ring orifice and one electrode phase. A metal pin wasinserted through the drain ring into the glass pool. The joule heating loopwas established through this pin, the glass, and one electrode phase. Asheat-up progressed, the pin was slowly withdrawn. At one point the pin couldnot be withdrawn due to deformation caused by excessive temperatures. Thisrequired on-line replacement of the drain ring and insertion of a new pin.When the pin was fully withdrawn, the bottom joule heating loop was shiftedback to the drain ring.
To initiate glass draining, cooling water to the bottom drain assemblywas stopped, and joule heating was again initiated to the drain ring. On4/6/95, the first VE-SKULL™ melter glass drain was performed when >233 kg(513 lb) of glass was drained from the melter. The glass product was greenupon cooling.
5.1.2 VECTRA Glass Dry Feed Operations
From 4/7/95 through 4/17/95, the VE-SKULL™ phase 1 melter was operatedcontinuously with VECTRA Glass dry feed. The VECTRA Glass feed composition ispresented in Table 3-4.
With the melter in steady state operation following start-up with thecullet and transition batch, the VECTRA Glass feed was initiated. Pre-mixedVECTRA Glass feed was supplied in pre-weighed bulk bags [approximately 36 kg(80 1b) each]. The premixed bags were loaded into the 0.425 m (15 ft3)melter dry feeder hopper which was mounted on the melter test stand andconnected directly to the 16" off-gas/feed plenum. Since the feeder wasconstant speed only, the motor was periodically operated for discrete timeperiods (usually 20 seconds) to establish an average feed rate. The goalduring dry feeding was to maintain glass pool level above the electrodeholders, provide make-up for melter losses through volatization or draining,and maintain a stable "batch blanket" on top of the molten glass pool.Optimization of batch blanket thickness provided reduced particulate carry-over off-gas, reduced melter plenum temperature, and allowed operatorobservation of melter pool refinement via the CCTV system.
3-12

WHC-SD-WM-VI-031Revision 0
Table 3-4. VECTRA Glass Feed Composition.
Component
Silica
Boric Acid
Dolomite
Magnesium Carbonate
Alumina
Iron Oxide
Soda Ash
TOTAL
Glass weight %
As batched
41.17
11.17
7.52
0.49
12.10
0.72
26.87
100.0
Oxide basis
54.40
8.32
4.91
0.27
10.40
0.92
20.78
100.00
Glass pool "freeboard" level and batch blanket thickness wereperiodically checked by the operators by removing a 6" insulated plug from themelter head and inserting a calibrated dip stick into the molten glass pool.During VECTRA Glass feed operation, draining was periodically performed tocontrol glass pool level. When operator inspection revealed sufficient glasspool refinement and adequate freeboard level, glass draining was initiated byopening the remote drain stopper plug. Melter weight was transmitted fromload cells and monitored by the operator at the control system. Drain ratewas dependent upon glass and drain ring temperature. Draining was stopped byclosing the drain stopper plug when the desired weight of glass had beenremoved or when the desired freeboard level was achieved.
The melter electrodes were operated in automatic power control. Glasstemperature and refining rate were controlled by limiting electrode powerlevel. One electrode phase supplied power to a welding machine connected tothe drain ring lug. Power to the welding machine was manually adjusted tomaintain drain ring temperature less than 1093°C (2000°F) and keep the melterbottom glass molten.
During a three day period over the Easter Holiday Weekend (4/14/95through 4/16/95) the melter was operated at idle operations with an averagepower level of approximately 85 kw. During this time period 135 kg (297 lb)of VECTRA Glass batch feed was added to the melter, and >136 kg (300 lb) ofglass product were drained.
Over the eleven (11) day period of VECTRA Glass feed operations, 5401 kg(11,909 1b) of VECTRA Glass dry feed was added to the melter. A total of>3886 kg (8569 lb) of glass product was drained from the melter. This glasswas green upon cooling. The average feed throughput was 30.2 kg/hr(66.6 lb/hr) with a peak throughput of 88.5 kg/hr (195.2 lb/hr). Since thePhase 1 VE-SKULL™ Melter has a 0.56 m2 (6.1 ft2) active glass surface^area,the peak feed throughput corresponds to 156.2 kg/hr-m2 (32.0 lb/hr-ft2). Theactive glass surface area is defined as the glass pool cross sectional area
3-13

WHC-SD-WM-VI-031Revision 0
(8.1 ft3) adjusted for a 2.5" radial cold zone along the melter wall. Sincethe VECTRA batch feed was approximately 25% water and other volatiles(75% glass by weight), the calculated glass throughput is 117.1 kg/hr-m(24.0 lb/hr-ft2). Up to this point, a cumulative total of 7059 kg (15,565 lb)of feed had been added to the VE-SKULL melter and >3886 kg (8,569 1b) of glassproduct had been drained.
5.1.3 LLRW Slurry Feed Operations
Operation of the VE-SKULL™ melter with LLRW simulant slurry feed wasperformed from 4/18/95 through 4/21/95. Liquid LLRW simulant, dry glassformers, and dry sucrose reductant were premixed and injected into the meiteras a slurry. The dry glass formers were identical to the glass former Mix Butilized for initial RVR dryer testing and are shown in Table 3-5.
Sucrose was added to the LLRW simulant and RVR glass formers (Mix B) forreaction with NaN02 and NaN03 to form Na2C03 and nitrogen in the off-gas. Thevarious slurry compositions utilized during slurry testing are given inTable 3-6.
The original slurry feed system consisted of a slurry mix tank withinternal mixer, diaphragm recirculation pump, 0.71 m (25 ft ) dry feeder,LLRW simulant drum mixer, and LLRW simulant drum transfer pump. Duringinitial slurry feed operations on 4/18/95, the feed line plugged, and steadyfeed flow could not be maintained.
The slurry feed system was modified to add a 341 liter (90 gal) batchdrum (slurry feed day tank), larger diaphragm recirculation pumps,recirculation lines to the melter stand, and a positive displacementperistaltic tubing pump. The peristaltic pump took a suction on the batchdrum and injected slurry through tubing into the melter via the 16" off-gas/feed plenum. The slurry batch drum was calibrated for level which wasperiodically monitored. Weight of simulant transferred from the slurry mixtank to the batch drum was monitored on the slurry mix tank scale.
Table 3-5. RVR Glass Formers (Mix B) Composition.
Glass former
Silica Sand
Boric Acid
Dolomite
Magnesium Carbonate
Alumina
Iron Oxide
Total
Weight percent
As batched
59.61
16.17
10.87
0.70
11.61
1.04
100.00
Weight oxide
62.40
14.67
8.65
0.48
12.16
1.64
100.00
3-14

WHC-SD-WM-VI-031Revision 0
Table 3-6. Slurry Feed Batch Recipes.
Slurry batch
Batches 1,2
Batches 3,4,5,6
Weight %
LLRW simulant
48.04
47.06
RVR glassformers
49.96
48.94
Sucrosereductant
2.00
4.00
Total
100.0
100.0
An average feed throughput of 36.2 kg/hr (79.8 lb/hr) and peak feedthroughput of 77.3 kg/hr (170.5 lb/hr) slurry feed were processed by themelter. This translates to a peak throughput of 136.4 kg/hr-m (28.0 lbfeed/hr-ft ) of active glass surface area. Note that evaporation of wateradds an additional heat load to the melter electrodes. Since the slurry feedwas approximately 57% glass by weight, an equivalent calculated peak glassthroughput of 77.8 kg/hr-m (15.9 lb glass/hr-ft ) was observed.
There were a few variations of the slurry batch. These variations didnot change the formulation and the oxide composition of the slurry by morethan ± 2% by weight.
During slurry feed operations, a total of 3563 kg (7857 1b) of LLRWsimulant slurry was added, and a total of >1437 kg (3169 1b) of glass wasdrained. This glass product became a darker green with each pour. At thispoint a cumulative total of 10,622 kg (23,422 lb) of feed had been added tothe melter and a total of >5323 kg (11,738 lb) of glass product had beendrained.
With the completion of Melter Test Preparations (MT-1) the VE-SKULL™melter had processed dry and slurry feed. Homogeneous glass had beenproduced. All melter systems had been tested and were operational.Additionally, the melter chemistry had been adjusted to approximate levelsexpected for the remaining tests. Since a LLRW melter glass volume isapproximately 1224 kg (2700 lb), over one melter glass volume had beenprocessed with slurry feed prior to commencement of the remaining tests (MT-2through MT-4).
5.2 MT-2: REACT/VITRIFY GLASS FORMER, LLRW SIMULANT,AND REDUCTANT SLURRY FEED
For Melter tests MT-2 (Slurry Feed), MT-3 (V-SIM), and MT-4 (Calcinedfeed), the target glass composition was the same and is given in Table 3-7.
Once the melter was operating at nearly steady state with slurry feed,melter test sequence MT-2 was initiated. Testing with LLRW simulant, glassformers, and sucrose reductant slurry was performed from 4/21/95 to 4/22/95.Three (3) separate batches were mixed during test MT-2. The batch slurry feedmakeup fractions are shown in Table 3-8.
3-15

WHC-SD-WM-VI-031Revision 0
Table 3-7. Target Glass Composition.
Component
SiO2
B203
Na20
CaO
MgO
CsCl
A12O3
F e 2 0 3
Other
To ta l
Target composi t ion
52.80
8.00
20.00
2.90
2.10
0.14
10.00
1.00
23.95
100.00
Table 3-8. MT-2 Slurry Feed Composition.
Slurry batch
Batch la
Batches 2a, 3a
Weight %
LLRW simulant
49.72
46.38
RVR glassformers
46.38
49.72
Sucrosereductant
3.90
3.90
Total
100.0
100.0
The slurry feed system was operated identical to slurry feed operationsin MT-1. A total of 141 kg (310 lb) of batch 1 and 724 kg (1596 lb) ofbatches 2a and 3a was added during MT-2. A fourteen (14) hour steady statemass balance run was performed. Mass balance data including off-gas sampleswere taken at the beginning and end of the run. Mass balance off-gas, glass,feed, and liquid sample results are given in Appendix 3C.
During the MT-2 mass balance run, an electrode phase imbalance wasobserved indicating possible erosion on the Phase B electrode. The Phase Belectrode was lowered into the melter and the three electrode phases wereagain balanced. Post run inspection indicated that a piece of the electrodebroke off due to corrosion at the glass/gas interface.
The slurry feed had favorable melting characteristics. Its melt rate wasthe fastest of the three different feeds. The batch blanket was well formedon top of the glass pool and the tendency to foam was minimal.
During the MT-2 mass balance run, a total of 865 kg (1907 1b) of slurryfeed was added to the melter. A total of >406 kg (896 lb) of glass product
3-16
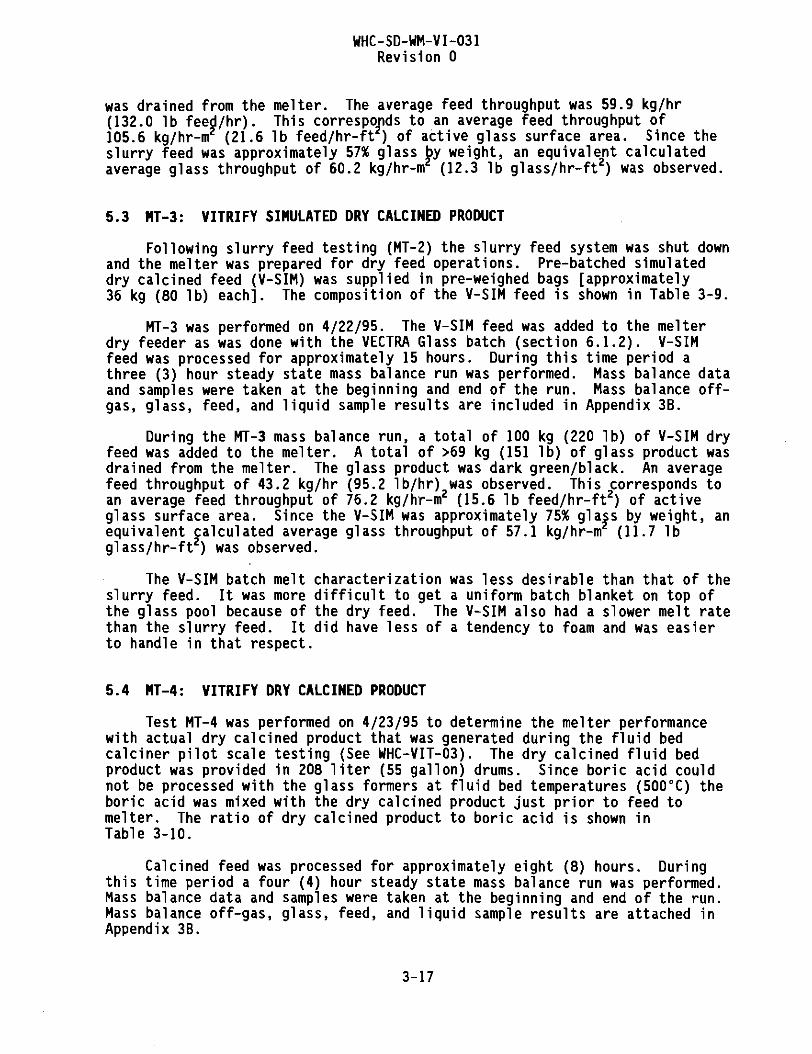
WHC-SD-WM-VI-031Revision 0
was drained from the melter. The average feed throughput was 59.9 kg/hr(132.0 1b feed/hr). This corresponds to an average feed throughput of105.6 kg/hr-m (21.6 1b feed/hr-ft2) of active glass surface area. Since theslurry feed was approximately 57% glass by weight, an equivalent calculatedaverage glass throughput of 60.2 kg/hr-m (12.3 1b glass/hr-ftz) was observed.
5.3 MT-3: VITRIFY SIMULATED DRY CALCINED PRODUCT
Following slurry feed testing (MT-2) the slurry feed system was shut downand the melter was prepared for dry feed operations. Pre-batched simulateddry calcined feed (V-SIM) was supplied in pre-weighed bags [approximately36 kg (80 lb) each]. The composition of the V-SIM feed is shown in Table 3-9.
MT-3 was performed on 4/22/95. The V-SIM feed was added to the melterdry feeder as was done with the VECTRA Glass batch (section 6.1.2). V-SIMfeed was processed for approximately 15 hours. During this time period athree (3) hour steady state mass balance run was performed. Mass balance dataand samples were taken at the beginning and end of the run. Mass balance off-gas, glass, feed, and liquid sample results are included in Appendix 3B.
During the MT-3 mass balance run, a total of 100 kg (220 lb) of V-SIM dryfeed was added to the melter. A total of >69 kg (151 lb) of glass product wasdrained from the melter. The glass product was dark green/black. An averagefeed throughput of 43.2 kg/hr (95.2 Ib/hr) was observed. This corresponds toan average feed throughput of 76.2 kg/hr-m (15.6 1b feed/hr-ft2) of activeglass surface area. Since the V-SIM was approximately 75% glass by weight, anequivalent calculated average glass throughput of 57.1 kg/hr-m (11.7 lbglass/hr-ft2) was observed.
The V-SIM batch melt characterization was less desirable than that of theslurry feed. It was more difficult to get a uniform batch blanket on top ofthe glass pool because of the dry feed. The V-SIM also had a slower melt ratethan the slurry feed. It did have less of a tendency to foam and was easierto handle in that respect.
5.4 MT-4: VITRIFY DRY CALCINED PRODUCT
Test MT-4 was performed on 4/23/95 to determine the melter performancewith actual dry calcined product that was generated during the fluid bedcalciner pilot scale testing (See WHC-VIT-03). The dry calcined fluid bedproduct was provided in 208 liter (55 gallon) drums. Since boric acid couldnot be processed with the glass formers at fluid bed temperatures (500°C) theboric acid was mixed with the dry calcined product just prior to feed tomelter. The ratio of dry calcined product to boric acid is shown inTable 3-10.
Calcined feed was processed for approximately eight (8) hours. Duringthis time period a four (4) hour steady state mass balance run was performed.Mass balance data and samples were taken at the beginning and end of the run.Mass balance off-gas, glass, feed, and liquid sample results are attached inAppendix 3B.
3-17

WHC-SD-WM-VI-031Revision 0
Table 3-9. V-SIM Feed Composition.
Target Oxide Composition
Component
SiO(2)
B(2)0(3)
CaO
MgO
Na(2)O
Al(2)0(3)
Fe(2)0(3)
MoO(3)
Cr(2)0(3)
K(2)0
MnO(2)
SrO
Cs(2)0
P(2)0(5)
I
Cl
SOx
Target WtX
52.80
8.00
2.90
2.10
20.00
10.00
1.00
0.15
0.04
1.52
0.0023
0.11
0.15
0.20
0.07
0.29
0.28
0.22
Actual V-SIM Batch
Component
Silica
Boric Acid
Dolomite
Magnesium Carbonate
Na2CO3
Alumina
I ron Oxide
NaMo04
K2Cr207
K2C03
KMnO4
SrC03
CsCl
T r i -Sod ium Phosphate
NaI03
NaCl
NaF
Na2S04
KOH
NaN03
NaNO2
Carbon
Total
As Batched(wt%)
39.18
10.52
7.27
0.04
23.95
11.53
0.68
0.01
0.03
0.83
0.00
0.12
0.14
0.79
0.09
0.29
0.46
0.21
0.67
0.68
0.28
2.23
100.0
3-18

WHC-SD-WM-VI-031Revision 0
Table 3-10. Boric Acid Addition to DryCalcined Feed Product.
Component
Dry Calcined Product
Boric Acid
Total
Weight %
86.36
13.64
100.0
During the MT-4 mass balance run, a total of 162 kg (357 1b) of drycalcined feed was added to the meiter. A total of >136 kg (300 lb) of glassproduct was drained from the melter on two separate drain operations. Theglass product was dark black. Only a short run was performed due to thelimited quantity of calcine product available.
An average throughput of 25.7 kg/hr (56.6 lb feed/hr) was observed. Thiscorresponds to an average feed throughput of 45.3 kg/hr-m (9.3 1b feed/hr-ft ) of active glass surface area. Since the Calcined feed was approximately95% glass by weight, an equivalent calculated average glass throughput of43.0 kg/hr-m2 (8.8 lb glass/hr-ft2) was observed.
The dry calcined feed was significantly more difficult to melt due to lowN03/N02 levels in the calcined product; however, NOx levels in the off-gaswere negligible. The batch blanket that formed with this product was thickand cold with respect to the other two feed streams. Because of this batchblanket, foaming was non-existent.
5.5 V-SIM HIGH THROUGHPUT TEST
A high throughput run was performed using the V-SIM feed from 4/24/95through 4/26/95. Off-gas data was not obtained during this test. The testresults are summarized in Table 3-11.
5.6 SLURRY HIGH THROUGHPUT TEST
As with the V-SIM, a high throughput run was also performed using slurryfeed mixed to the composition of batch la (Table 3-8). The testing wasperformed on 4/26/95. Off-gas data was not obtained. A summary of testresults is presented in Table 3-12.
5.7 HIGH SODIUM TESTING
In order to investigate the impact of higher Na20 feed levels on melterperformance, a run was performed with a separate transition feed batchprepared to the composition summarized in Table 3-13.
3-19

WHC-SD-WM-VI-031Revision 0
Table 3-11. V-SIM High Throughput Summary.
Parameter
Average Electrode Power (kw)
Average Electrode Power during PeakThroughput period (kw)
Total feed, kg (lb)
Total glass poured, kg (lb)
Duration of high throughput run (hrs)
Average throughput, kg/hr (lb/hr)
Peak throughput, kg/hr (Ib/hr)
Peak throughput, kg/hr-m2 (lb/hr-ft2)
Calculated Peak Glass throughput,kg/hr-m2 (lb/hr-ft2), 75% glass
Value
119.4
129.2
2809 (6193)
2101 (4632)
58.5
47.4 (104.6)
71.0 (156.5)
125.2 (25.7)
93.9 (19.2)
Table 3-12. LLRW Slurry Feed High Throughput Summary.
Parameter
Average Electrode Power (kw)
Total feed, kg.(lb)
Total glass poured, kg (lb)
Duration of high throughput run (hrs)
Average throughput, kg/hr (Ib/hr)
Average throughput, kg/hr-m2 (lb/hr-ft2)
Calculated Average Glass throughput,kg/hr-m2 (lb/hr-ft2), 57% glass
Value
121.3
375 (826)
310 (684)
5.8
67.5 (148.9)
119.1 (24.4)
67.9 (13.9)
Table 3-13. High Sodium Run Batch Makeup
Component
V-SIM Pre-batched Dry Feed
Soda Ash (Na2C03)
Total
Weight %
60.00
40.00
100.0
3-20

WHC-SD-WM-VI-031Revision 0
The goal of the High Sodium Test was to achieve 26-28 wt% Na20 in glass.Lab analyses of the high sodium glass is attached in Appendix 3A. A summaryof high sodium test results is presented in Table 3-14.
5.8 MELTER DRAINDOWN, SHUTDOWN, AND INSPECTION
The VE-SKULL™ Melter was completely drained into two stainless steel208 liter (55 gallon) drums on 4/27/95. The 208 liter (55 gallon) drums wereplaced within 341 liter (90 gal) carbon steel salvage drums. The annulusbetween the outside of the stainless steel drum and the inside of the salvagedrum was filled with silica sand. Molten glass was drained directly into thestainless steel drum via a short graphite trough which ran from the melterbottom drain assembly to the stainless steel 208 liter (55-gallon) drum.A total of approximately 917 kg (2022 1b) of glass product was drained intothe two drums. It took approximately 5 hours to drain the entire melter.
When draindown was complete, electrode power was shut off and the melterallowed to cooldown.
On 4/28/95, following melter cooldown, the melter was disassembled andinspected. The following was observed:
• All three electrode holders were severely eroded.
• All three electrodes were severely eroded. Short sections ofelectrodes A and B had separated and fallen to the bottom of melter.
• Refractory appeared undamaged.
• Glass film on refractory was very thin (<l/8n).
Table 3-14. High Sodium Run ThroughputParameter
Average Electrode Power (kw)
Total feed, kg (1b)
Total glass poured, kg (lb)
Duration of high throughput run (hrs)
Average throughput, kg/hr (lb/hr)
Average throughput, kg/hr-m2 (lb/hr-ft2)
Calculated Average Glass throughput,kg/hr-m2 (lb/hr-ft2), 75% glass
Summary.Value
106.4
408 (900)
239 (528)
8.2
40.0 (88.2)
70.6 (14.5)
52.9 (10.8)
3-21

WHC-SD-WM-VI-031Revision 0
The two drums of glass, together with outer salvage drum and sand, wereallowed to air cool. The partially full [approximately 408 kg (900 lb)] drumwas allowed to air cool to ambient and the full drum [approximately 500 kg(1100 lb)] was wrapped in 2.5 cm (1") of kaowool insulation and allowed to aircool to ambient. The uninsulated drum took approximately 36 hrs to cool toless than 71°C (160°F) and the insulated drum took approximately 168 hrs tocool to less than 71°C (160°F) on outer surface of salvage drum. The glass inthe center and top surface of the insulated drum was sampled and analyzed.Lab results are attached in Appendix 3A.
5.9 MELTER THROUGHPUT
VECTRA's VE-SKULL™ Melter was operated continuously following start-upfrom 4/7/95 to 4/27/95. During this time period, a variety of different feedmaterial was processed to accomplish melter test objectives. Generally,emphasis was placed on testing melter performance rather than maximizingmelter throughput. Cumulative feed (kg) vs. Time (hrs) was plotted for eachPhase 1 test period, and a linear fit of the resulting data scatter wasperformed. The slope of the resulting trend line is the average feedthroughput (kg/hr). For some short duration tests (MT-2 slurry, MT-3 V-SIM,and MT-4 Calcined), data from periods before and after the test were utilizedin order to generate representative throughput results. For tests withsufficient recorded data (MT-1 VECTRA glass, MT-1 slurry, and V-SIM highthroughput), extended high throughput periods (>6 hours) were identified andexpanded to reveal the peak steady state feed throughput. Graphs of thePhase 1 feed throughput data are included in Figures 3-1 through 3-12.
The feed throughput results [kg/hr Hb/hr)] were divided by the VE-SKULL™Melter active glass surface area [0.57 m (6.1 ft2)] to reveal standard unitsof kg/hr-m2 (lb/hr-ft2). The active glass surface area is defined as theglass pool cross sectional area (8.1 ft ) adjusted for a 2.5" radial cold zonealong the melter wall. Since each Phase 1 feed material contained water andother volatiles, the melter glass throughput was calculated by adjusting thegraphical feed throughput results by the corresponding glass weight percentfor each type of feed.
A detailed accounting of quantities of melter feed processed and glassproduced over the entire Phase 1 melter test period is presented inAppendix 3B, Throughput Log. A throughput summary is presented in Table 3-15.
5.10 MELTER MASS BALANCE
Mass balance calculations were performed on melt tests MT-2 and MT-3.A mass balance calculation was not performed on test MT-4 due to the smallamount of feed that was used during this test. The amount of material wouldnot have allowed any amount of change in glass chemistry that could bedetected above the normal laboratory error present in the chemical analyses.
The mass balance calculations are presented in Appendix 3C.
3-22

Iro
Test Phase
-
Start-upMT-1:Vectra-GlassMT-1 :ldleMT-1 SlurryMT-2:SlurryMT-3V-SIMMT-4 CalcinedH»gh Throughput: V-SIMHigh Throughput: SlurryHigh Sodium (Na)Final Drain DownTOTAL PHASE 1 (1)
Notes:
TestDuration
(hrs)
217.22532
73.0102.214.0
3 04 0
58.55 882
768.7
Total Feed
(kg)
1658 05400.9
13473563.18646
99.8161.7
28086374 4408.2
16434 1
(Ib)
3656.011909.0
297.07856.71906 5220.0356.6
6193.0825 6900.0
36237.3
Total GlassProduct
(ka)
0.038862
13611437 2406.368.5
136.12100.7
310.2239.5917.0
10173.7
(t) Totals include feed and drain during transition periods between tests.
(Ib)
0 08569.0
300.03169 0
896.0151.0300.0
4632.0684.0528.0
2022022433.0
Graphical Avg.Fe*d Throughput
ikB/hr)
30.222
36259.943.225 747.467.540.0
(Ib/hr)
66.64.8
798132.095.2566
104.6148.988.2
(2) Active Area - Gross Glass Pool area (8.1 ft3) minus assumed 2.5' radial cold zone along wall • 6 1 ft3
Graphical PeakFeed Throughput
(kg/hr)
68.522
773
59.943225?71.067.540.0
(Ib/hr)
195.24.8
170-5132.095.256.6
156.5148 988.2
Peak Feed Throughput[Based on Active Area
(note 2)1
fko/hr-m1!
156.23 9
136.4105.6
76.245.3
125.2119170 6
flb/hr-ft1!
32.00-8
28.021.615.69-3
25.724.414.5
i
wt%Glas* InF»«t
%
75.075057.057.075.095.075057.0750
Calculated Peak GlassThroughput
fko/hr-m'l
117.12 9
77860.257.143 093.967.952 9
(Ib/hr-ft2!
24.00.6
15 912.311.78.8
19.213.910.8
AveragePower
|kw)
82.391.0827
114.0138.6115.684.4
119.4121.3106 4
96.9
at
o-
nVtft)
*~*
—\3 --so£
t o
• o
r+t o
a><;
o3
O
00o1
1^£t—1
1oCO
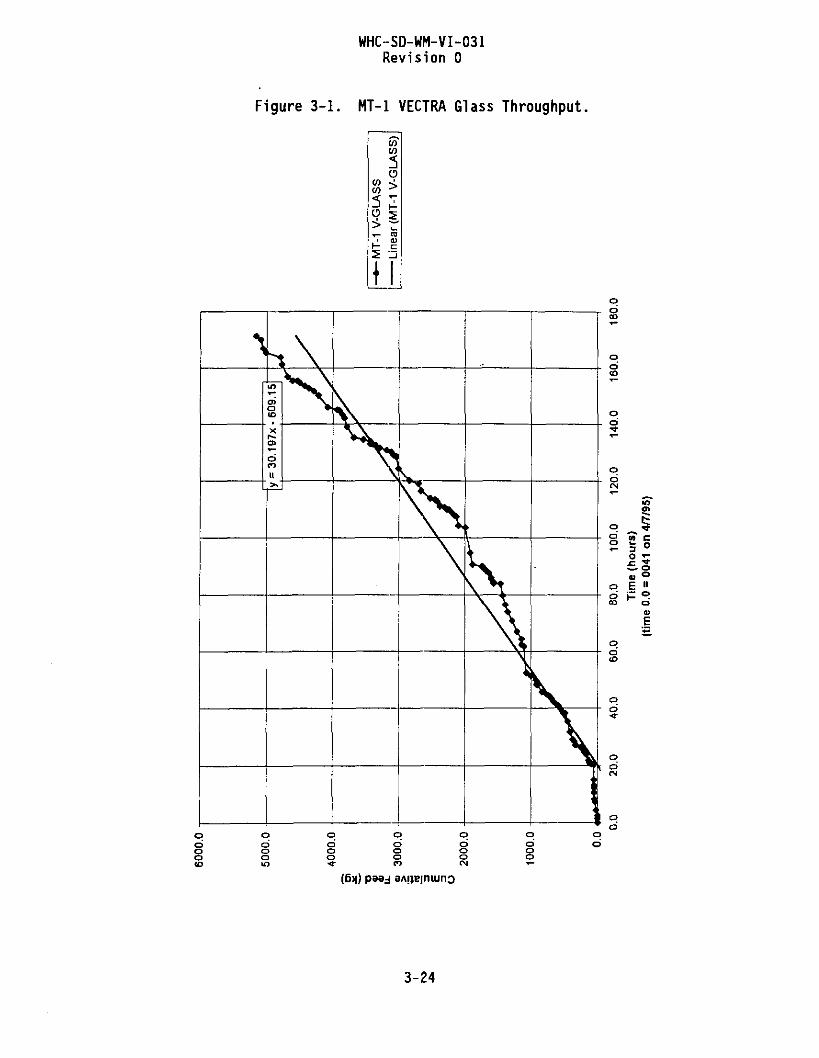
WHC-SD-WM-VI-031Revision 0
Figure 3-1. MT-1 VECTRA Glass Throughput
LAS
O
*>1
\ -
2
\
v>W
5o-»-*i
01c:
_ J
|
* <
y =
30.1
97x-
609.
15
•
%
\ 1
60.0
qd
to c5 °° z:•w O0) °E •r- ©
ooo 5000
odoo
qdooCO
ooo
qdoo
od
3-24

WHC-SD-WM-VI-031Revision 0
Figure 3-2. MT-1 VECTRA Glass Peak Throughput.
(0
w
•GLA
>i
1-
I
tnw5oi• " ^
MT-
1ar
(
Vc
y =
88.
546x
- 8
353.
9 s•
\
\
qdo03
qooCDto
OdoCO
odoCO
odooPI
odoeo
odoto
odoCN
OdoCNCN
odooCN
(6)f) paaj
3-25

WHC-SD-WM-VI-031Revision 0
Figure 3-3. VECTRA Glass Idle Throughput
ild
le
vi
m
9
ig
CO
9CD
.ine
\
\
•
\
\
ca•<tt
6aO1
\
1
;3
s>i
V\
\
\ \
\
od
pd
od
od
£ cs o
o o od £g
E ii
dv
o E
odto
od
odCM
ooodto
o•«*•
odCM
d
(6M)
3-26

WHC-SD-WH-VI-031Revision 0
Figure 3-4. MT-1 Slurry Throughput
lurr
}
CO
•I -
•1 S
lurr
y) I
CO<U
_c1
- 28
4.64
36.2
13x
>
-
\•
i *
oo
oooo
d T-
2 =3 O
<=> 2 • *
SflE ii
q oO <D
odo
dooCM
paaj
3-27

OJI
roCO
V
2700.0
2600.0
2500.0
2400.0
2300.0
22000
2100.0
2000.0
1900.0 -— —
.y=77.346x-3215.2
__—
•
•MT-1 Slurry•Linear (MT-1 Slurry)
toc-I(D
OJ\
^ Peak
Throi
t o
T3
evis
ion
o
o1
1<1
oOJI—*
67.0 68.0 69.0 70.0 71.0 72.0 73.0 74.0 75.0 76.0Time (hours)
(time 67.0 = 1147 on 4/20/95)

1200.0
iro
End Mass Balance (18.0) t o
1(0
- • - MT-2 SlurryLinear (MT-2 Slurry)
toI
3—1
roSlu
—ihro
i
T3
73fD<—'•>ion
o
x:
di
i<i—ii
oOJ
0.0 2.0 4.0 6.0 8.0 10.0 12.0 14.0 16.0 18.0 20.0Time (hours)
(time 0.0 = 1900 on 4/21/95)

too
600.0
500.0
400.0en
•a
u-* 300.0
23Eo
200.0
100.0
0.0
/
\
' \
y = 43.18x +32.34 y
{End Mass Balance (6.92)
[Start Mass Balance (3.92) |
0.00
•MT-3 V-SIM• Linear (MT-3 V-SIM)
CD
I
CO
i
I—I
2
-soszua3"•oC
O
_ J . j
O I
O IoCO
2.00 4.00 6.00Time (hours)
(time 0.00 - 1505 on 4/22/95)
8.00 10.00 12.00

COI
to
300.0
250.0
200.0
aoU.g 150.0
100.0 -.
50.0
0.00
•MT-4-Calcined•Linear (MT-4 Calcined)
1,00 2.00 3.00 4.00 5.00Time (hours)
(time 0.00 - 0955 on 4/23/95)
6.00 7.00 8.00
toc- s(D
COI
CO
o> -•-—i or> 3
o(D CO
< o
(DQ-
o
<n
O Io

WHC-SD-WM-VI-031Revision 0
Figure 3-9. V-SIM High Throughput (HT) Run
X
Pi^;w-A)
i_moc
3-32

WHC-SD-WM-VI-031Revision 0
Figure 3-10. V-SIM High Throughput (HT) Run Peak Throughput
X5CO
pX5CO
tCO
——
Line
\
ec
. T-
>
encI'-ll>
i\x•
\
\
-
oooo
OOO
qdo
OOO
odooCM
ooOCi
odo
odo
oo
qdm
q
in c
D °— CO
V *"E "i= O
(6)()
3-33
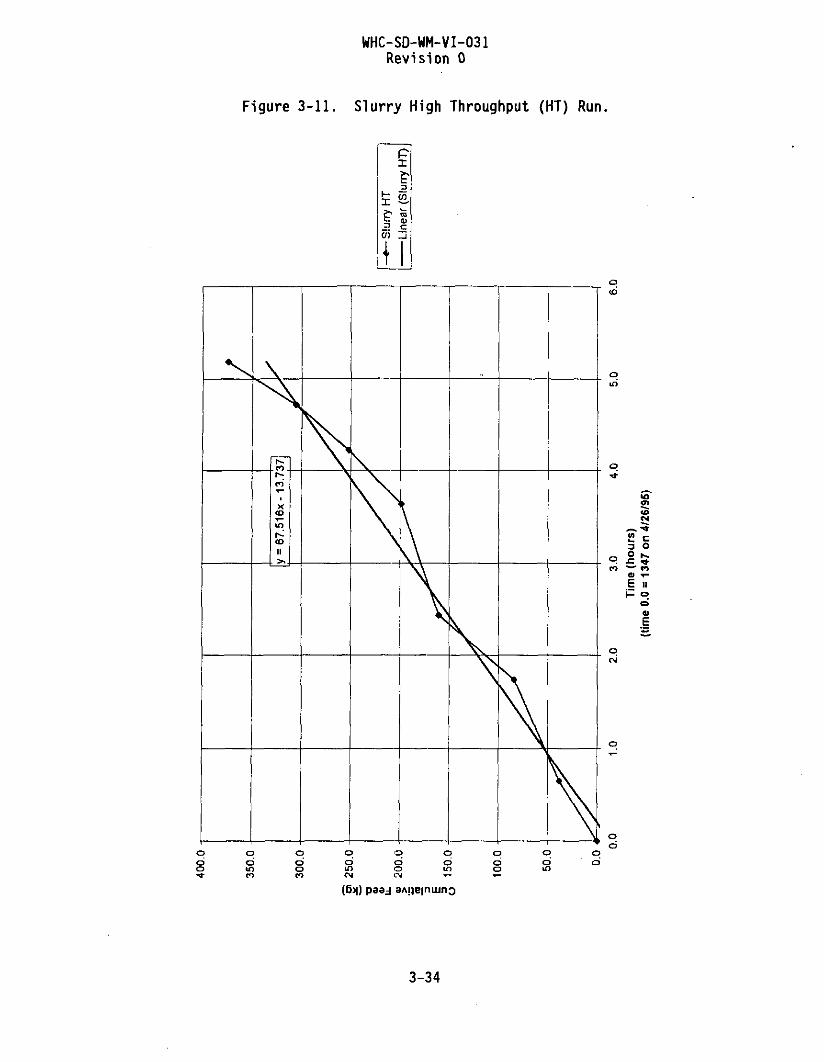
WHC-SD-WM-VI-031Revision 0
Figure 3-11. Slurry High Throughput (HT) Run
h-
r£T
«>
PX
(Slu
n
TO
c
\
3-34

WHC-SD-WM-VI-031Revision 0
Figure 3-12. High Sodium (Na) Run Throughput
<\IT]
C
>CooII>
\\ I\1\\\\\
\ •
\
\
\
\
\
V ~———:=—i>
q<£>
toCM
O „
0) T-E "
qdo
qdo
qo"m
qd
qd
3-35

WHC-SD-WM-VI-031Revision 0
5.11 MELTER SCALE-UP
Phase 1 testing provided throughput basis for various types of melterfeed. With corresponding increases in number and size of electrodes,electrode power supplies, glass surface area, glass pool depth, and feedcomponents, the melter glass throughput (kg/hr) per active glass cross-sectional area (m) is expected to remain relatively constant as the melter isscaled up. Since improved throughput is expected due to increased glassmixing in larger melters, the Phase 1 throughput basis has been adjusted by ascale-up factor. Melter scale-up will be further verified during Phase 2testing.
For basis of scale-up, the active glass area equals melter refractoryinside diameter cross section area (8.1 ft ) less a 2.5" radial cool zonearound inside perimeter of melter. For the Phase 1 melter, the active glassarea was 0.57 m2 (6.1 ft2).
Estimated VE-SKULL™ Melter sizing specifications are presented inTable 3-16.
6.0 CONCLUSIONS
The following conclusions are drawn from the Phase 1 VE-SKULL™ meltertesting.
• Single point dry or slurry feed into VE-SKULL™ melter results in auniform batch blanket covering the molten glass pool with nomechanical spreading required. However, it is expected thatmultiple point or feed spreading will allow use of thicker, moreefficient batch blanket with resultant increased throughput.
• VE-SKULL™ Melter start-up with high iron content "magnesium" boringbars is not recommended. Start-up with gas burners can be performedin a controlled manner.
• The joule heated bottom pour assembly, air operated drain plug, andwater cooled bottom support ring functioned properly to controlglass draining. Occasional minor glass flow around drain ring blocknecessitates future addition of water cooled seal under drain ring.
• Simulated , dry batched calcine feed throughputs were significantlyhigher than actual dry calcined product throughputs. The presenceof very low nitrate levels in calcined product hinders melting rate.Moderate nitrate levels increase melting rates.
• Feed with blended slurry made up of liquid LLRW simulant, dry glassformers, and dry sucrose reductant results in a uniform batchblanket, excellent glass refinement, and significantly higher feedthroughputs than dry calcined feed. Slurry feed is recommended feedmethod.
3-36

WHC-SD-WM-VI-031Revision 0
Table 3-16. VE-SKULL™ Melter Sizing Specifications.
Item
Outside Diameter (ft)
Nat Inside Diameter (ft)
Matter Overall Height (ft)
Melter Croat Sectional Area
Phase 1 DryFeed
4.3
3.2
5.6
8.1
Phase 1 SlurryFeed
4 . 3
3.2
5.5
B.I
10TPD DryFeed
7.5
6.5
8.5
33.2
50TPD DryFeed
14.5
13.4
10.0
140
60TPDSlurry Feed
17.0
15.8
10.0
195
100 TPDDry Feed
19.5
18.3
11.0
265
Throughput Basis:
- Dry Fead |lb/hr-ft2)
- Matter Size Factor [3]
- Design Basis Glass
- Active Glass Surface
Total Design Throughput
Scale-Up Factor
Power Rating, KW [41
No. Electrodes
Electrode Diameter (in)
Electrode Material
Glass Depth (in)
Glass Volume (ft3)
Electrode Current Density
Waste Feed Ports
- Number
• Size, ID (in)
Off-Gas Ports
- Number
- Size, ID (in)
Weight 12]
- Empty lib)
• Operating (Ib)
Glass Drain
- Glass Drain Type
- Materials of Construction
3 0
1.0
3 0
6.1
2
Basis
140
3
2.5
moly
20-30
20
9.1
one
16 [5]
one
16 [5]
18,300
21,500
one
joule heated
proprietary
22
1.0
22
6.1
2
Basis
160
3
2.5
moly
20-30
20
9.1
one
16 15]
one
16 15]
18,300
21,500
one
joule heated
proprietary
3 0
1.1
33
28
1 0
5 .0
3 5 0
3
4 . 0
moly
42-48
150
5.3
one
6 [6]
one
18 [6]
55.OOO
80,000
one
Induction
proprietary
3 0
1.15
35
1 3 0
5 0
5 .0
1050
6
4 . 0
moly
48-6O
6 0 0
B.O
three
6
one
20
155,000
250.000
one
Induction
proprietary
22
1.15
25
185
6 0
5 .0
1200
6
4 . 0
moly
48-60
B80
9.1
three
6
one
20
195,000
335,000
one
Induction
proprietary
3 0
1.2
3 6
255
1OO
10.0
1600
12
4 . 0
moly
48-60
1200
6 .0
four
6
one
24
285,000
480,000
one
Induction
proprietary
3-37

WHC-SD-WM-VI-031Revision 0
The VECTRA Glass composition is a suitable feed mixture for idlemelter operations. Short term idle melter operation can continuewith a minimum amount of feeding or glass draining.
Lower melter NOx and off-gas emissions resulted with dry, reacted,calcined feed than with VECTRA Glass, simulated calcined feed, orLLRW simulant slurry feed.
Severe corrosion and failure of stainless steel electrode holderswas experienced. New electrode holder design is required to allowangle and height adjustment on electrodes while in service. Holdersmust be water cooled to eliminate electrode corrosion at glass/gasinterface. Glass pool level should be maintained above the holder/electrode interface.
Drain ring extension should be placed into melter to allow simplemelting of startup cullet in bottom zone of melter to drain ring.
Partial dissolution of mortar between refractory blocks indicatesthat refractory blocks seams should be minimized and gaps eliminatedto the maximum extent possible.
The nitrogen purge system should be improved to prevent molybdenumoxidation when draining glass from melter.
3-38

WHC-SD-WM-VI-031Revision 0
APPENDIX 3A
LAB ANALYSES
3-39

KHJ10 WASTE SIMULANTWITH GLASS fORMERS
LIOUIOWASTE TANK
T-LW
WASTE FEEDBULK TANK
T-WF
< »*S'E FEED )DRY/CALCINED WASTE SIMULANT
WITH GLASS FORMERS
V-CFC2p-crc v \ / ' G L A S S FRIT TANK
OUENCM ^ - ^ U L J J - - -WATER PUMP
1-CF f ILE VIT5-B1 DWG
SAMPLE POINTS
< SCRUBBER SOLUTION )DRMN / SAMPLE
TO
oSCRUBBER SOLUTION SAMPLE
CMOLTEN GLASS SAMPLE.OFF-LINE, ON DRAWDOWN
1ino
i
oCO
OFF-GAS. SAMPLE
QUENCH TROUGH
SLURRY FEED TANK
VECTRA Technologies Inc.
WhC-VllRIFICATION DEMONSTRATION
VE-SKULL1" MELTER TESTSAMPLE LOCATIONS
APPENDIX 8.1

SAMPLE LOG
SAMPLE NUMBER
V1M2/F35-001
V1M2/W31-OO21
j V1M2/W31-OO3U1
V1M2/W31-004P1
! V1M2/W31 -005A1
I V 1 M2 / W 34 -006 1
1 V 1 M2 / W 34 -007 U 1
j V1M2/W34-OO8A1
| V1M2/W34-OO9P1
| VI M2/F35-OIO
| V1M2/G32-O11P1
V1M2/G32-O12U1
I VIM2/G32-O13C1
| V1M2/G32-014A1
| V1M2/G32-0I5P
I VIM2/G34-016U
| VIM2/G34-017C
1 V1M2/G 34-018 A
1 V 1M2/G32-019P
DATE
21/4
21/4
21/4
21/4
21/4
21/4
21/4
21/4
21/4
21/4
21/4
21/4
21/4
21/4
22/4
22/4
22/4
22/4
22/4
TIME
1700
2000
2000
2000
2000
2000
2000
2000
2000
2300
2230
2230
2230
2230
0500
0500
0500
0500
0545
SAMPLE TYPE
Slurry Feed 1A
Scrubber Solution
Scrubber Solution
Scrubber Solution
Scrubber Solution
Quench Trough
Quench Trough
Quench Trough
Quench Trough
Slurry Feed 2
Glass (Pour 1)
Glass (Pour 1)
Glass (Pour 1)
Glass (1)
Glass Frit (2)
Glass Frit (2)
Glass Frit (2)
Glass Frit (2)
Glass (Pour 2)
DESTINATION LAB
Slurry Mixed Sample
USGS
PNL
Geotechnical
USGS
Geotechnical
PNL
PNL
USGS
Corning
PNL
USGS
Corning
Archive
PNL
SHIPMENT DATE
4/24/95 •
4/24/95
4/24/95
4/24/95
4/24/95
5/9/95
4/24/95
4/24/95
LAB SAMPLE*
1489-95 |
i
„_-_ j
1500-95 I
1501 |
D-583957&D- 583958 j
1,2 !
1507 |
D - 583959 & D - 583960 j
o(D t/J< O-<• I(/> C
O I
O Io
SAMPLE LOG

| SAMPLE NUMBER
V 1 M2 / G 32 -020 U
V1M2/G32-021C
V 1 M2 / G 32 -022 A
j V1M2/F35-023
• V1M2/G32-024P
I V 1 M2 / G 32 -025 U
| V 1 M2 / G 32 -026 C
\ V 1 M2 / G 32 -027 A
| V 1 M2 / W 34 -028 P 2
I V 1 M2 / W 34 -029 U 2
j V1M2/W34-030A2
| V1M2/W34-0312
| V1M2/W31-032P2
| V1M2/W31-O33U2
| V1M2/W31-034A2
| V1M2/W31-0352
j V1M2/G32-036P
1 V1M2/G32-037C
| V1M2/G32-038U
I V1M2/G32-039A
II V 1 M2 / G 32 -040 P 2
1 VIM2/G32-O41C2
DATE
22/4 :
22/4
22/4
22/4
22/4
22/4
22/4
22/4
22/4
22/4
22/4
22/4
22/4
; 22/4
22/4
22/4
i 22/4
! 22/4
i 22/4
22/4
: 22/4
22/4
TIME
0545
0545
0545
0550
0800
0800
0800
0800
1100
1100
1100
1100
1145
1145
1145
1145
1100
1100
1100
1100
1400
1400
SAMPLE TYPE
Glass (2)
Glass (2)
Glass (2)
SlunyFeed
Glass(3)
Glass(3)
Glass(3)
Glass(3)
Quench Trough
Quench Trough
Quench Trough
Quench Trough
Scrubber Solution
Scrubber Solution
Scrubber Solution
Scrubber Solution
Glass (4)
Glass (4)
Glass(4)
Glass(4)
Glass(5)
Glass(5)
DESTINATION LAB
USGS
Coming
Archive
PNL
USGS
Coming
Archive
PNL
USGS
Geotechnical
PNL
USGS
Geotechnical
PNL
Corning
USGS
Geotechnical
PNL
Coming
SHIPMENT DATE
4/26/95
4/24/95
4/24/95
4/26/95
4/24/95
4/24/95
LAB SAMPLES j
1
i
i
D - 583977 & D - 583978
1495-95 !
1490-95
D - 583975 & D - 583976
1502
3,4 |
reo3O I<T> CO< O->• I
O !
O Io
SAMPLE LOG

to1
CO
SAMPLE NUMBER
V 1 M2 / G 32-042 U 2
V 1 M2 / G 32-043 A 2
V 1 M3 / W 34 -044 P 1
V 1 M3 / W 34 -045 U 1
VIM3/W34-O46A1
V 1 M3 / W 34 -047 1
I V1M3/W31-O48P1
V1M3/W31-O49U1
V ! M3 / W 31 -050 A 1[
VI M3/W31-O51 1
V 1 M3 / F SB -052
j V 1 M3 / F SB -053
| V 1 M3 / F SB -054
| VI M3/FSB-O55
I VI Mi/FSB-056i
| V 1 M3 / F SB -057
| V1M3/FSB-058
j V 1 M3 / G 32 -059 P 1
V 1 M3 / G 32 -060 U 1
1 V 1 M3/G32-O6I C 1
\ V1M3/G32-O62 Al
\ V ! M3 / W 34 -063 P 2
DATE
22/4
22/4
22/4
22/4
22/4
22/4
22/4
22/4
22/4
22/4
22/4
22/4
22/4
22/4
22/4
22/4
22/4
! 22/4
22/4
^ 22/4
| 22/4
1 22/4
TIME
1400
1400
1935
1935
1935
1935
1940
1940
1940
1940
1833
1833
1856
1950
1950
1950
2045
2035
2035
: 2035
! 2035
2150
SAMPLE TYPE
Glass (5)
Glass (5)
Quench Trough
Quench Trough
Quench Trough
Quench Trough
Scrubber Solution
Scrubber Solution
Scrubber Solution
Scrubber Solution
V-SIM BAG 1
V-SIM (2) Feed
V-SIM Feed (3)
V-SIM Feed (4)
V-SIM Feed (5)
V-SIM Feed (6)
RVR Feed (7)
Glass (6)
Glass (6)
Glass (6)
Glass (6)
Quench Trough
DESTINATION LAB
USGS
Geotechnical
PNL
USGS
Geotechnical
PNL
USGS
Geotechiuca!
! PNL
USGS
; Coming
i Geotechnical
1 P N L
-*" .............vSHIPMENT DATE4/24/95
5/9/95
4/24/95
4/24/95
i
: 4/24/95
4/24/95
4/24/95
4/24/95
LAB SAMPLE #
D - 583961 &D-583962 j
•
1496-95
1491-95 |
1503 j
D-58397I&D-583972 j
5,6
: 1497-95 j
oSO I
< o
oCO
SAMPLE LOG

j SAMPLE NUMBER
V I M3 / W 34 -064 U 2
V 1 M3 / W 34 -065 A 2
V 1 M3 / W 34 -066 2
V 1 M3 / W 31-067 P 2
V1M3/W31-O68U2
V1M3/W31-O69A2
V1M3/W 31-070 2
V1M3/G34-O71P
VIM3/G34-O72U
| V 1 M3 / G 34 -073 C
| V1M3/G34-O74A
V 1 M3 / G 32 -075 P 2
V 1 M3 / G 32 -076 U 2
V 1 M3 / G 32-077 C 2
V 1 M3 / G 32-078 A 2
V1M4/FSB-079
V1M3/G32-O80P
I V1M3/G32-O81U
V1M3/G32-082C
1 V 1 M3 / G 32 -083 A
| V1M4/W31-O84P1
| V1M4/W31 -085U1
DATE
22/4
22/4
22/4
22/4
22/4
22/4
22/4
22/4
22/4
22/4
22/4
22/4
22/4
22/4
23/4
23/4
23/4
23/4
23/4
23/4
23/4
TIME
2150
2150
2150
2155
2155
2155
2155
2200
2200
2200
2200
2240
2240
2240
2240
0312
0530
0530
0530
0530
' 1045
1045
SAMPLE TYPE
Quench Trough
Quench Trough
Quench Trough
Scrubber Solution
Scrubber Solution
Scrubber Solution
Scrubber Solution
Glass Frit (6)
Glass Frit (6)
Glass Frit (6)
Glass Frit (6)
Glass (7)
Glass (7)
Glass (7)
Glass (7)
Mixed Calcined Feed
Glass (8)
Glass (8)
Glass (8)
Glass (8)
Scrubber
Scrubber
DESTINATION LAB
USGS
Geotechnical
PNL
USGS
Geotechnical
PNL
USGS
Coming
Geotechnical
PNL
USGS
Corning
Geotechnical
PNL
USGS
Coming
Geotechnical
PNL
USGS
SHIPMENT DATE
4/24/95
4/24/95
4/24/95
4/24/95
4/24/95
4/24/95
4/24/95
LAB SAMPLE # |
1492-95 |
1508 |
D - 583963 & D - 583964 !
1504
D - 583965 & D - 583966 j
7,8 |
1493-95 ]
o
< o—• i
o i3 <O 1
o
SAMPLE LOG

| SAMPLE NUMBER
| V1M4/W31-O86A 1
V1M4/W31-087 1
V 1 M4 / G 32 -088 P 1
[ V 1 M4 / G 32 -089 C 1•1j V 1 M4 / G 32 -090 U 1
| VI M4/G32-091 Al
V 1 M4 / W 34-092 P 1
| V1M4/W34-093U1
| V ! M4 / W 34 -094 A !
| V 1 M4 / W 34 -095 1
! V t M4 / G 32 -096 P 2
! V1M4/G32-097C2
\ V1M4/G32-098U2
\ V 1 M4 / G 32 -099 A 2
j V1M4/W34-100P2
| V1M4/W34-101U2
1 VIM4/W34-102A2
|| V1M4/W34-1032
|| V1M4/W31-104P2
!i VI M4/W31-1O5U2
!| V 1 M4/W31-1O6A2
| V 1 M4/W3I -107 2
DATE
23/4
23/4
23/4
23/4
23/4
23/4
23/4
23/4
23/4
23/4
23/4
23/4
23/4
23/4
23/4
23/4
23/4
23/4
23/4
23/4
! 23/4
i 23/4
TIME j SAMPLE TYPE
1045
1045
1015
1015
1015
1015
1300
1300
1300
1300
1315
1315
1315
1315
1600
1600
1600
1600
1600
1600
1600
1600
Scrubber
Scrubber
Glass(9)
Glass (9)
Glass (9)
Glass (9)
Quench Trough
Quench Trough
Quench Trough
Quench Trough
Glass (10)
Glass (10)
Glass (10)
Glass (10)
Quench Trough
Quench Trough
Quench Trough
Quench Trough
Scrubber
Scrubber
Scrubber
Scrubber
DESTINATION LAB
Geotechnical
PNL
Corning
USGS
Geotechnical
PNL
USGS
Geotechnicai
PNL
Corning
USGS
PNL
PNL
SHIPMENT DATE
4/24/95
4/24/95
4/24/95
4/24/95
4/24/95
4/24/95
4/24/95
i i
1 4/24/95
4/24/95
LAB SAMPLE U
1
1505 I
9, 10 !
D - 583967 & D - 583968
1498-95
1506 |
11,12
1 D - 583969 & D - 583970 j
1499-95 |
1494-95 |
o3D I<D 1st< O
O I
O Ioto
SAMPLE LOG

<JJ
O1
| SAMPLE NUMBER
j V 1 M2/F35-I08P
I V 1 M2/F35-109U
| V1M2/F35-11O
I V 1 M2/F 35 -111 A
| V1M5/F35-112
j V1M5/O33-113;|:|
] V1M5/O33-114
ij
1 V 1 M5/O33-115
! V IM5/GIB-116C
! VIM5/GOB-117C
j V 1 M5/G 32 -118 C
DATE
22/4
22/4
22/4
22/4
26/4
28/4
28/4
28/4
18/5
18/5
26/4
TIME
0550
0550
0550
0550
1300
1400
1400
1400
1430
1430
1035
SAMPLE TYPE
Slurry
Slurry
Slurry
Sluny
Slurry
Pipe Scale Build Up(Horizontal Pipe)
Pipe Scale Build Up
(Plenum Cross)
Pipe Scale Build Up
(Lower Elbow)
Inside Barrel
Outside Barrel
Glass from V-Sim
DESTINATION LAB
PNL
Geotech
Coming
Coming
Corning
* • • • • • • • • " " • • • •
SHIPMENT DATE
5/1/95
5/18/95
5/18/95
5/18/95,
LAB SAMPLED 1
1
Sample 1 !
Sample 2 |
Sample 3 i
3Dor
COoI
o
Oo
SAMPLE LOG

WHC-SD-WM-VI-031Revision 0
SUPPLEMENTARY GLASS ANALYSES
Three glass samples were directly submitted to Corning by Vectra andanalyzed under a separate subcontract. Sample description and results ofanalyses are as follows.
Sample Description
Sample VIM5/GIB-116C was taken from a drum of glass poured during finalmelter draining. This drum was wrapped with an insulating fiber mat duringcooldown and the sample was taken near the center of the drum. This glasssample therefore was cooled at a relatively slow rate.
Sample VIM5/GOB-117C was taken from the same drum but from near theoutside. This glass therefore was cooled at a significantly faster rate thanthe first sample.
Sample VIM5/G32-118C was taken during a normal glass pour at the end ofthe V-Sim high-throughput test (see Section 5.5).
Quantitative Chemical Analysis Results
CELS Client No.: 15334-001Lab I.D. No.: 12120-95
Resul ts (wt%)
Sample
K20
Na20
A12O3
B203
CaO
Cr203
Fe203
MgO
MnO2
P205
SiO2
TiO 2
ZrO2
C
VIM5/GIB-116C
1.15
26.8
8.94
7.45
2.52
0.27
0.87
1.83
0.010
0.18
48.0
0.012
0.094 -
0.01
VIM5/G0B-117C
1.15
27.0
8.87
7.46
2.50
0.27
0.87
1.81
0.010
0.15
47.6
0.012
0.085
0.02
VIM5/G32-118C
1.24
20.3
9.91
8.08
2.73
0.29
0.92
1.97
0.013
0.17
52.5
0.012
0.077 .
0.01
Test method
FES
FES
PLS
PLS
PLS
PLS
PLS
PLS
PLS
PLS
PLS
PLS
PLS
LECO
3-47

WHC-SD-WM-VI-031Revision 0
Results (wt%)
Sample
so3o2F"
FeO
cr
VIM5/GIB-116C
0.11
39.6
0.20
0.69
0.14
VIM5/G0B-117C
0.12
39.1
0,20
0.67
0.14
VIM5/G32-118C
0.12
41.3
0.22
0.65
0.17
Test method
LECO
LECO
PRYO
COLOR
TITR
FES = Flame Emission SpectroscopyPLS = Plasma/Emission SpectroscopyLECO = LECO InstrumentationCOLOR = ColorimetryTITR = Titrimetry
Product Consistency Test (PCT) Results
Lab I.D. No.: 12040-95
Sample I.D.
VIH5/GIB-116CDissolution 1Dissolution 2
VIM5/GIB-116CDissolution 1Dissolution 2
VIM5/GOB-117CDissolution 1Dissolution 2
VIM5/GOB-117CDissolution 1Dissolution 2
VIM5/G32-118CDissolution 1Dissolution 2
VIM5/G32-118CDissolution 1Dissolution 2
Results (ppm)
Cs
0.550.55
0.560.56
0.530.53
0.570.57
0.130.13
0.130.13
Na
217217
219220
21521:2
208211
5150
5051
Al
3131
3131
3131
3030
1212
1212
Si
168168
169168
165164
161161
7171
7172
Sr
0.0210.023
0.0210.023
0.0250.027
0.0260.025
0.0120.011
0.0120.013
3-48

WHC-SO-WM-VI-031Revision 0
Sample I.D. Results
PH
VIM5/GIB-116CDissolution 1Dissolution 2
VIM5/GOB-117CDissolution 1Dissolution 2
VIM5/G32-118CDissolution 1Dissolution 2
Test methods:Plasma/Emission
1212
12.112.2
11.311.3
Cs by Flame Emission Spectroscopy. Na, Al, Si, Sr bySpectroscopy.
3-49

WHC-SD-WM-VI-031Revision 0
oLUIu
<CDCM
co"
0CN
u.
O
Os
CaO
Na(
2)O
B(2
)O(3
)
CM"OCO
5
US
GS
|
Com
ing
US
GS
Com
ing
US
GS
Cor
ning
sosn
Cor
ning
sosn
Cor
ning
sosn
Cor
ning
sosn
[Cor
ning
inq
9.55
a>
2.21
CMCM
2.89
COO)CN
15.5
0
oCMto
6.80
tofM
58.9
0
oatin
1.02
|
89
55
en
2.22
8CM
SCN
5)CN
OS
'SL
oCMto
6.96
COr-
58.8
0
oenCO
1.021
.00
9.63
O)
enO)
2.31
CNCM
2.97
r*-COCN
14.9
0
oCMCO
7.35
toCM
58
70
©
CO
m
1.041
.00
9.62
O)
2.28
oCMCM
2.99
egCM
15.0
0
oCNCO
7.28
o>fM
58.7
0
oCNCOin
O>CMCN
COO)CM
oin
o>inf-
oCO
m
o
enin
a>
enCMCM
atatCM
om
CD(0
OCO
58
5a>
CDCMCN
OJOJCM
O
m
CMtor-
o
58.9
9mmen
tntnCM
tnOJ
or
oin
eo
r-
oCO
57
1.01
9.53
2.26
2.93
15.6
1__
____
_7,3
458
.65
| AV
ER
AG
ES
0(3)
|
to"
OOl•cro
SrO
Cs<
2)0
-
u.
O
US
GS
|
Com
ing
sosn
Cor
ning
US
GS
Cor
ning
Cor
ning
sosn
Cor
ning
sosn
Cor
ning
US
GS
Cor
ning
aZ
0900
o
0.31
o>CMO
0.05
104
9
o
0 0
3603
4
o
85.0
00.
11
CM
d
90*0
0.05
0080
o
0.31
enCMo
0.05
104
9
o
0.03
603
4
o
118.
000.1
3
rM
d
od
0.05
0070
o
0.31
enCMo
0.05
904
8
o
0.04
003
4
o
d
CO
d
zoozoo
0060
o
0.31
enCMo
0.05
904
8o
0.04
603
4
o
0,13
CO
d
zoozoo
0280
o
00CN
o
057
o04
1
o
md
0280
o
COCM
o
ZSOo
041
o
in
o
0240
o
COCN
o
057
o
042
o
d
0300
o
COCM
o
056
o
042
o
d
0.01
710.
290.
053
0.03
810
1.50
0.13
0.06
AV
ER
AG
E
In"OCM,
a.Mn
O
oc
K(2
)O
sosn
Cor
ning
US
GS
Cor
ning
US
GS
Cor
ning
US
GS
Cor
ning
0.15
1000
o0.
010.
0093
0.57
69
0
0.15
0930
o
0.01
0.00
900.5
7
OJ
in
d
0.16
0840
o
0.01
0.00
990.
680.
590.
1608
00
o
0.01
06000
0.67
0,59
0920
o
0.00
940.
6709
60
o
06000
0.68
1200
o
0.01
000.
6809
20
o
06000
CO
tod
0.11
480.
0100
0.00
930.
63A
VE
RA
GE
5Q.CM
yCM
CO
oLUIom53-50

WHC-SD-WM-VI-031Revision 0
uLUIu2<CDCO
oCN• c
u
prn
ft(0
o
ora
5
mrn3
FnO
CO
CO
O)
f-oo
US
GS
Foo
(•>CO3
oO
CO
CO3
nin
i
oo
COOto
" roO
(!)CO
3
D)Ccou
CM
o
CNO
oO
o
i n
8o
o
3
Srn
i n
o
CO
o
od
O)
o
oCO
i n
orNCD
CDCN
o
Ko
o
oo
IP
so
062
o
so
ooCMOCM
O
CO
o
o©
COon
oCO
i n
oCNCD
inCN
o
mtNo
n
oo
t n
8©
o
CO
m
mO
16
o
d
o>o
oCDm
oCNCD
CM
o
i nCM
o
or-oo
i n
8o
059
o
m
CD
o
16
o
d
COo
oi n
otoCD
CM
o
8o
8
16
o
CM
d
oCD
rpCMO
8o
in*
(D
©
CM
©
O
CD
CM©
en8o
inm
16
©
oroCO
COCM
o
<n8o
8
16
©
oroCD
I O
d
.50
d
110
oCD
LU
oorUJP-
CO
OlitLi.
U
oo
oCO
to
O
Al(2
)2)
0(3
CD
O(5
(2)
a.
tnCOCO3
cEoo
UiHCO3
boo
CO
f>CO3
cFoo
WCO3
JO
u
CO
CO3
nine
oo
COW3
* roO
oCO3
D)CcoL>
•r-
meoo
CMCM
i -CM
fN
2.96
5>CM
O
i n
oom
_CD
62
o>
CO
COCO
rn
o
>
o
en00
o
CMrN
COCN
CM
S6
2
toenCM
o00
m
o
m
CM
CO
56
CO
CD
CO
O
fM
o
00CD
o
i nCMCM
CM
rM
2.96
COCN
gm
omm
eoCOO)
62
CO
CO
COCO
00
o
o
"
00CO
o
CMCM
rNCM
rM
2.97
CMCO
CM
O
oCOm
oCM
lO
Ot»-CO
55
CO
CN
cn
o
o
o
r*.CO
o
CM
CM
OCO
CM
o00CDi n
CM
mCO
roCD
CO
o
cn©
CNCN
n
CMCO
CN
O
m
inCD
r-
cn
COCO
o
i nCMCM
COCM
oCO
i n
CO
mCO
CD
O
COo
CN
OCO
CM
©
i n
00
CO
m
CO
o
CM
5u>
oo>
r.60
in
o
inOori n
<
o
oV
no
CN
Oe:
O
riCO3
ccoO
t'JCO3
JO
o
CO
CO3
ninj
oo
CO(')CO3
o(J
nCO
3
O)rcoO
©to
o
CO
a
o
o
i nCD
d
oCO
©
rnoo
©O
oCOoo
CO
o
o
o
mCD
d
oCO
o
CO
o©
o©
otooo
CO
o
or -
O
i nCD
d
oCD
O
CDO
o
o©
oCOoo
Ol
o
o
o
mCO
d
oCD
O
rn©
o
o©
oCOoo
o
o
omo
«
o
oCOoo
o
o
oCO
o
COoo
otooo
nCO
o
omo
COoo
oinoo
oto
o
oCO
o
COoo
f >
0.0
I O
gd
.009
o
d
MlO
fr-i l l
a.fM
fM
s
CO
oUJXo£0
3-51

t - - • • . . . , - ft ' - ( . . -
Re K1s ion 0
CMay 16, 1995
Mike HillVectra Technologies, Inc.One Harbison Way, Suite 209Columbia, South Carolina 29212-3408
Dear Mr. Hill:
This letter serves to transmit OMNI Environmental Services, Inc. (OMNI) data report for testingservices conducted on the vitrification process "melter" at the Vectra Technologies, Inc. Richland,Washington facilities during the period from April 21 to April 23, 1995. OMNI conducted isokineticsampling and gaseous emissions analysis procedures on the exhaust stack which vents the processmelter. The sampled exhaust gases consisted of a mixture of fumes generated by the heating offeedstock materials in the melter and ambient air which is drawn through the melter vent system tocarry melter fumes to the emissions control/treatment system before being discharged to theatmosphere. OMNI sampled all emissions at a point in the exhaust-duct system which is more than8 diameters downstream and 2 diameters upstream from disturbances and located between the melterand the emission control/treatment equipment.
Mr. Mike Hill was the project manager and technical liaison for Vectra Technologies and Mr. PaulTiegs was the on-site project manager for OMNI.
Six one-hour test runs were performed on the following schedule:
Run Number 1 from 2305, April 21, 1995 to 0005, April 22, 1995Run Number 2 from 1156, April 22, 1995 to 1256, April 22, 1995Run Number 3 from 1910, April 22, 1995 to 2010, April 22, 1995Run Number 4 from 2105, April 22, 1995 to 2205, April 22, 1995Run Number 5 from 1041, April 23, 1995 to 1141, April 23, 1995Run Number 6 from 1202, April 23, 1995 to 1302, April 23, 1995
Two runs were conducted for each of three different melter feedstock materials:
Run Numbers 1 and 2 were conducted while slurry #1 was used. Run Numbers 3 and 4 wereconducted while slurry #2 was used, and Run Numbers 5 and 6 were conducted while a drycalcined feedstock was used.
Isokinetically (U.S. EPA Method 5 Type) sampled paniculate material was analyzed for total massand for the elemental and cation/anion constituents presented in Table 1. Except for methane andnitrous oxide (N2O), the exhaust-gas gaseous constituents were measured on-site with
OMNI Environmental Services, Inc.Consulting • Engineering • Testing
Mailing- Post Office Box 743 • Seaverion. Oregon 97075 USA Phone (503) 643-3738Street: 5465 SW Western Avenue • Suite M • fleavenon. Oregon 97005 USA 3 - 5 2 Fax. (503) 643-3799

Veclra Technologies, tncRichtand, Washington
Table 2 (Page 1 of 2): RESULTS of Melter Exhaust-Gas Sampling and Analysis (Standard International Reporting Units)Testing Conducted April 21,22, and M,1195)
I
Measured ParametersExhaust Gas:
Flow RateTemperatureMoisture (H2O)Carbon Dioxide (CO2)Carbon Monoxide (CO)Oxygen (02)Nitrogen (N2)
Particular Constituents:TirterfTronihair Catch: Total
Nitrite (NO2)Nitrate (N03)Sutfate (SO4)
Ammonium (NH4)Carbonate (as CaC03)Fluoride (F)Chloride (Cl)Iodide (1)pH(from 1:100 drstiledH2O extract)Elemental Analyses
Silicon (Si)Aluminum (At)Cadmium (Co)Magnesium (Mg)Manganese (Mn)tron (Fe)Molybdenum (Mo)Chromium (Cr)Strontium (Sr)Cesium (Cs)Phosphorus (P)Potasium(K)Sodium (Na)Boron (B)
"Bachhair Catch: TotalAmmonium (NH4)Fluoride (F)Chloride (Cf)Phosporus (P)Boron (B)
0 a s eous Parameter s:Total Nitrogen Oxides (NOx)Nitric Oxide (NO)Nitrogen Dioxide (NO2)Nitrous Oxtde (N2O)Sulfur Dioxide (SO2)Carbon Monoxide (CO)Methane (CH4)Total Hydrocarbon (as propane, C3H8)
Notes:
^Reporting Units
(dscm/m)(Degrees Celcius)(% of exhaust gas)(% of exhaust gas)(% ol exhaust gas)(% of exhaust gas)(% of exhaust gas)
(mg/dscm)(% of total parttculate)(% oflolal parttcutele)(% of total partteutale)(% of total partlculate)(% of total partfcutote)(% of total parHcufete)(% of total partlculate)(% of total particulate)
(-log of H* concentration)
(% of total particuMe)(% of total particulale)(% of total partlculate)(% of total particulate)(% of total particulate)(% of total parMcubte)(% of total particulate)(% of total parttcutate)(% of total particiilate)(% of total partjculste)(% of total partlculale)(% of total particulete)(% of total particuWe)(% of total particulate)
(mgydscm)(ppm)(ppm)(ppm)(ppm)(ppm)
(ppm)(ppm)(ppm)(ppm)(ppm)(ppm)(ppm)(ppm)
Run Number 1
29515012601.10
0.04019 679.1
56660.7000.0125350000125.541.50047601.705894
0.8900.8540.002
ND(00005)0.0130.5300.4070 0780006
ND(0.0002)0.0284109
22.0008.000ND(5)
ND(10)ND(5)NO(5)
ND(i00)NO(IO)
360349I t
ND(1.0)0 8397
ND(10)18 3
Run Number 2
2.B113824.0068000220279.1
42360.7180.0275 2100.00123.151.8506.24013308.99
0.1800.298
HCH00005)ND(0.0005)
00050.278940000420.002
ND<0 0002)00813.765
209006.620N0(5)
NDpO)ND(5)NEHS)
ND(100)N0(10)
2352241)
NO(V0)ND(t.O)
23ND(1.0)
207
ND - Not Detected al the level indicated in parentheses.NAp ' Not ApplicableSTP =21 1 degrees Celcius and 1 00 atmosphere barometric pressureOne gram-mole » 24 1 liters gaseousAl gaseous constituents are reported as dry basis.
Run Number 3
711734.0
0.490.16020.3791
57700420.04625800.00426.63O.BBO92001.3509.46
0.8901.011
ND(0.0005)ND(OOOOS)
0.0261 3620.3950.0490.031
ND(0O002)0.0503,54618.80012000ND(S)
ND(10)NO(5)NO(S)
ND(100)ND<10)
1051032
ND(1 0)ND(10>
1600ND(1.0)
30
~Ri i iTr^rT*er 4
11.38604.4
0.630.11020.279.1
29400030.1072.6700.0032*880.7918.93022569.16
09511047
ND(00005)ND(0.0005)
00060.49607490.0240.021
NDfO.0002)NO(00005}
3.3291990011.7D0NO(5)ND(10)ND(5)ND(5)
ND(100)ND(10)
8080
ND(10)ND<1.0)N0(10)
1100N0(1 0)
0.9
Run Number 5
14.85502.3
0.33N 0(0.005)
20.679.1
81N D(0 001)
0.02226.900
ND(0.0002)15600.43414 6000053918
NDfO.0005)ND(0 0005>ND(0.0005)ND(0.0005)NO(0.0005)
0 01304550.77100010.129
ND<0 0005)3.66632.2009.170ND(5)ND(10)ND(5>N0(5)
ND(100)NO(10)
NO(10)ND(10)ND(10)ND(10)
10.1ND(5O)ND(V0)N0(10)
Run Numbers
9.14471.7
0.32NDfOOOS)
20679.1
145NDfOOOl)
0 0156120
ND(00002)14.60061214 60004429 f «
NDiO.0005)NOW) 00051NCXOOOOS)ND(0.0005)ND(0.0005)
00010.2160.152
NO(0O005)0.141
NDfO.0005)3.114215006.820ND<5)ND(10)ND(5)ND(5)
NO(tOO)ND(10)
ND(1.0)ND(1.0)ND<1.0)ND(fO)
124ND(5.0)ND<1 0)ND(1.0)
yL. JWtoTTEj~—out ^yj/rf^
TO(D
in
O
O
oCO
T11-03

Vecira Technologies, rncRtchbnd. Washington
Table 2 (Page 2 of 2): RESULTS of Melter Exhaust-Gas Sampling and Analysis (Standard International Reportinq Units)Testing Conducted April 2 1 , « . and 21,1995)
( J i
Measured Parameters
Flow RaleTemperatureMoisture (H2OJCatbon Dioxide (CO2)Carbon Monoxide (CO)Oxygen (02)Nitrogen (N2)
Particuiate Constituents:THter/Fronlhair Catch: Total
NilMe (NO2)NBrale (N03)Sulfate (S04)Ammonium (NH4)Carbonate (as CaC03)Fluoride (F)Chkxide (Cl>Iodide (1)pH(from 1:100 distilled H2O extract)Elemental Analyses
Silicon (Si)Aluminum (Al)Cadmium (CdJMagnesum (Mg)Manganese (Mn)Iron (Fe)Molybdenum (Mo)Chromium (C[)Sttontium (Sr)Cesium (Cs)Phosphorus (P)Potasium (K)Sodium (Na)Boron (B)
"Bachhar Catch: TotalAmmonium (NH4)Fluoride (F)Chloride (Cl)phospoms (P)Boron (8)
Gaseous Parameters:Total Nitrogen Oxides (NOx)Nitric Oxide (NO)Nitrogen Dioxide (NO2)Nitrous Oxide (N2O)Sulfur Dioxide (SO2)Carbon Monoxide (CO)Methane (CH4)Total Hydrocarbon {as propane, C3H8)
Noles:
^eportlnp UnHs
(Vgftwur)(Degrees Kelvin)
(kgftwur)(kgmour)fayhour)(kgmour)(kg/hour)
(kgmour)(kgmour)(kg/hour)(kg/hour)(kgmour)(kgmour)(kgmour)(kgmofir)(kg/hour)
NAp
(kg/hour)(kg/hour)(kgmour)(kg/hour)(kgmour)(fcg*ouf)(kgmour)(kg/hour)(dgmour)(kg/hour)(kg/hour)(kg/hour)(kgmour)(kg/hour)(kg/hour)(kgmour){kg/hour)(kgmour)(kgmour)(kg/hour)
(kg/hour)(kgmour)(kgmour)(kgrnour)(kg/hour)(kgmour)(kgmour)(kgmour)
Run Number 1
212742337.036
0061746.5162.7
1000.007020000120053680.000010.256230.015050047760.01711
NAp
0.006920.006570,00002
ND<0.0005>0 000130.005310004080.000780000062ND(0.0002)
0.000280 041230220730.08026
ND(5)ND(tO)ND(5)ND<5)
ND(100)ND(10)
0.121660.071790.00356ND(I.O)0.000360.08167ND(I.O)0.00753
Run Number 2
202.641130.221
0.00444521550
0.710.005130.000190.037210.000010.165320.013210.044570.00950
NAp
0.00129000213
N0(00005)ND(0.00O5)0.000040.001990067140.000300.000011
ND(0.0002)0.000580.026890.149280.04728
ND(5)ND(10>ND(5)ND(5)
NO(IOO)ND(10)
0.07562004388000339ND(1.0)NO(t.O)000441ND(V0)0 00811
#ND = Not Delected at (he level indicated In parenthesesNAp = Not ApplicableSTP = 21 1 degrees CelckK and 1 00 atmosphere barometric pressureOne gram-mole at STP = 24.1 Hers gaseousAH gaseous consifluents are reported as dry basH
Run Number 3
512.934612.738
07935115.1392.5
0.250.000100.000110.006350 000010.065560.002170.022650.00332
NAp
0.DO2190.00249
NO(OOOOSJND(0.0005)
0000000.00340000097000012
0.000077ND(0.0002)
0000120006730046280.02954
ND<5)ND(10)ND(5)NO(S)
ND(100)ND(1O)
0085550.05108000156ND(1.0)ND(I 0)
079354ND(10)000298
Run Number 4
820.33332227.9
0.672516316275
0.200.000010000210.005350000010049840.001590.01790000452
NAp
0001910.00210
ND(0.0005)ND(0.00u5)
0000010.000990.001500.00005
0.000042NQ(0.ODO2)ND(0.0005)
0.00*670.039890.02345
NO(5)ND(10)MD<5)ND(5)
ND(100)ND(10)
0.10425006345NO(10)ND(10)NDftO)087250NfJ(t.O)000146
Run Number f
1070.832315.35.4
0.0000243.8818.8
0.07Nb<0.001>0000020.01933
ND(0.0002)0011350000310.01049000004
NAp
ND<0.OOO5)NDtOOOOS)ND(000O5)NDJO.0005)ND(0.0005)
0.000010.000330.00055
0000001000009
ND(0.0005)0.002630023140.00659
NOi.5)N0(10)N0(5>NO(5)
ND(100)ND{10)
NtHIO)ND(10>NO(10)NDP-0)
0.02390ND(50)ND(10)ND(10)
658.93206.832
00000150.0503.9
008ND(0001)0.000010.00645
ND(p0002)0011590000490011590 00035
NAp
NCK0 0005)ND(0.0005)NO(0.0005)ND(0.000S)N 0(00005)
0000000000170.00012
ND(0 0005)000011
NDtO.0005)0.002470.01707000700
ND(S)ND(10)ND(5)ND(5)
ND(100)ND(10)
ND(I.O)ND(1.0)ND<1.0)ND(1 0)
001806NO(50)ND(10)ND(1 0)
ait ^_
(-1
< a
o i
o iow

WHC-SD-WM-VI-031Revision 0
APPENDIX 3B
THROUGHPUT LOG
3-55
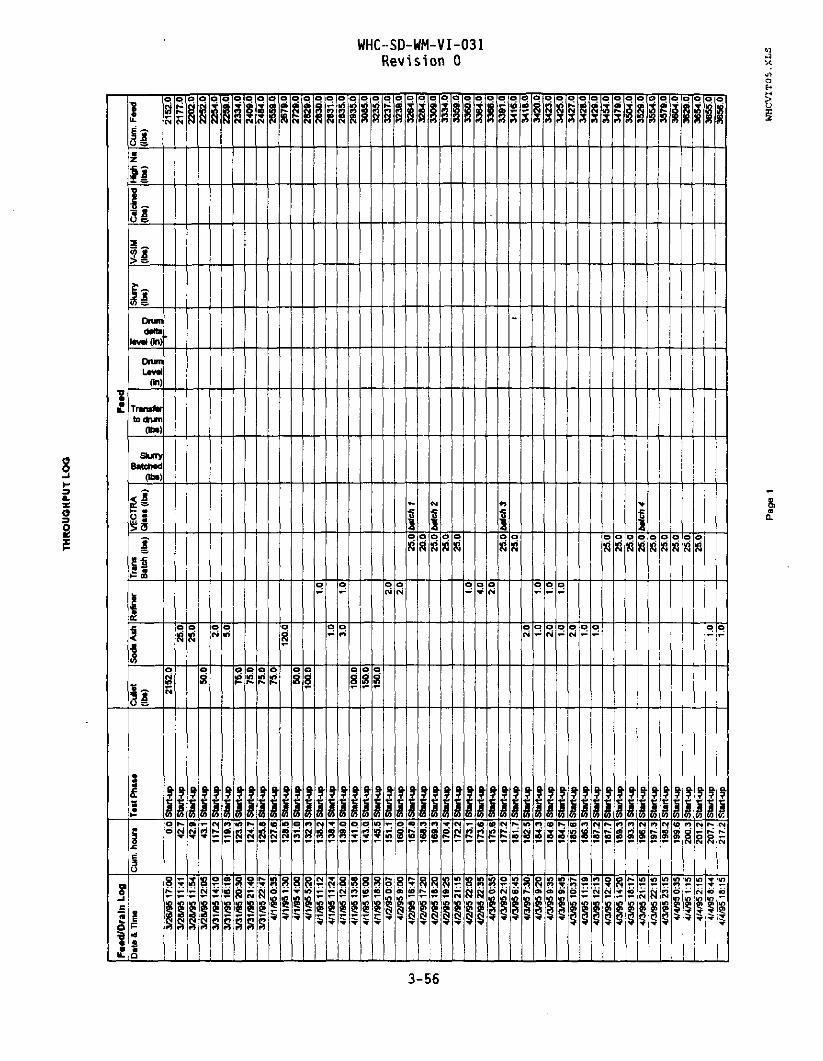
WHC-SD-WM-VI-031Revision 0
8
II
Drumdtfti
lev* (In)
DrumLtvtf
(in)
to drum
SlurrydMdOta)
3 1
3-56

THROUGHPUT LOO
en
F«*d/Draln LogDate & Tim*
4/7/95 0:414/7/95 2:074/7/95 2:134/7/95 3:104/7/95 5:084/7/95 8:004/7/96 9:00
4/7/9511:084/7/95 12:494/7/95 13:474/7/9515:424/7/95 21:044/7/95 21:154/7/95 21:404/7/95 22:304/8/95 0:304/8/951:304/8/952:154*95 3:004/8/95 3:504/8/95 5:004/8/95 5:454*95 6:15
4/8/9512:004/8/95 14:524/8/9514:564/8/9515:044/8/9516204/8/9517:304/8/9518:004/8/95 18:474/8/95 20:004/8/95 21:004/8/95 21 344/8/95 22274/9/951:004/9/951:104/9/95 2:404/9/95 4:104/9/95 5:10
4/9/9514204*9514224/9/95 15:074/9/95 17:004/9/95 19:404/9/95 23:304/10/95 2:354/10/95 5:104/10/95 8:21
Cum. hours
271.7273.1273.2274.2276.1279.0280.0282.1283.8284.8286.7292.1292.2292.7283.5295.5296.5297.2298.0298.8300.0300.8303.2307.0309.9309.9310.1311.3312.5313.0313.8315.0316.0316.6317.4320.0320.2321.7323.2324.2333.3333.4334.1336.0338.7342.5345.6348.2351.3
Te*t Phase
MT-1,V-gtau STARTMT-1, V-gtauMT-1.V-gtas«MT-1, V-glmMT-1. V-tfauMT-1. V-glauMT-1. V 0 WMT-1, V-gla*sMT-1, V-fltKSMT-I.VtfauMT-1.V-tfa*«MT-1.V-gtanMT-1.V-0MSMT-1.V0U*MT-1.V-0auMT-1. V-0IMMT-1. V-tfawMT-1, V-glassMT<1.V-0usMT-1. V-tfassUT-1,V-tf.MMT-1. V-gtaMMT-1.V-gtM»MT-1. V-0a»>MT-1. V-glassMT-1. V-gtattMT-1,V-gtawMT-1,V-flta«*MT-1.V-gb»sMT-1,V-gtaMMT-1,V-g1aMMT-1, V 4 » MMT-1, V-tf«MMT-1,V-gtaMMT-1. V-0IMMT-1. V-giauUM.V- r f iMMT-1. V - ( * M »
MT-1, V -J^ .K
MT-1,V-tf««UT-1. V-tfawMT-1. V-gl«itUT-1.V-o)«MUT-1,V-gtauUT-1. V-glassUT-I.V^glaMMT-1, V-0a«*UT-1. V-glassWT-1.V-tfa«
F u dCullet(Ib.)
Soda Ash
2.0
2.0
2.02.02.04.0
2.0
Reiner TransBatch (lbs)
i
VECTRAGlass 0t»)
70.0
50.025.025.0
80.077.025.077.078.025.080.0
178.040.060.080.075.075.0
75.080.077.077.080.077.076.078.0
156.0158.030.030.0
157.0156.0
70.078.0
158.0155.0155.075.081.0
ill si i
1
Slurry(lbs)
V-SIM(lbs)
Caldned(lbs)
HighNa(lbs)
Cum. Feed(lbs)
3726.03728.03728.03730.03780.03005.03830.03832.03834.03836.03840.03840.03920.03997.04022.04099.04177.04202.04282.04460.04500.04560.04640.04715.04790.04790.04865.04945.05022.05099.05179.05256.05332.05410.05566.05724.05754.05784.05941.06097.06097.06167.06245.06247.06405.06560.06715.06790.06871.0
CD l/>< O- » . Iin 3C
O* I
O IOto
Pago 2 WHCVITO5.XLS

T H R O U O H P U T LOO
COI
tn00
F««dSDraln LogData& Time
4/10/95 12:314/10/95 12:394/10/95 12:424/10/95 13:044/10/9514:194/10/95 14:404/10/95 16244/10/95 17:024/10/95 17:544/10/9518:504/10/95 19264/10/95 23:304/11/99 8:134/11/95 8:524/11/95 8:54
4/11/95 11:004/11/95 12:084/11/9512:394/11/9513:404/11/9514:304/11/95 14:434/11/9515204/11/9515:474/11/9616:004/11/9517264/11/9518:044/11/9518274/11/9518:334/11/95 21:104/11/95 23:35
4/12/95 0:554/12/95 5:004/12/95 8:034/12/95 9:044/12/95 9214/1295 9:36
4/12/95 10:354/12/95 10:394/12/9511:194/12/95 12.-064/12/9513:114/12/95 13:304/12/95 13:324/12/95 14:304/12/95 15:084/12/95 15:554/12/95 18:254/12/95 19:474/12/95 22:47
Cum. hours
355.S3556355.7356.1357.3357.7359.4360.0360.9361.6362.4366.5375.237S.9375.9378.0379.1379.6380.7381.5381.7382.3382.8383.0384.5385.1385.5385.5388.2390.6391.9396.0399.0400.1400.3400.6401.6401.6402.3403.1404.2404.5404.5405.5406.1406.9409.4410.8413.8
T»«t Phasa
MT-I.V-glMsMT-1,V-0kttMT-1, V-^atsMM, V 4 mMT-1,V-4uaMT-1, V-glawMT-1,V-4«uMT-1, V 4 M I
MT-1,V-4usMT-1, V-^utMT-1, V^assMT-1. V - 4 « M
MT-1, V-O^M
MT-1,V-pJaa»MT-1, V ^ M >MT-1, V-tfiMMT-1, V-tMwMT-1, VtfassMT-1. V-On*MT-1. V-tfassMT-1. V-0assMT-1, V-t fuiMT-I.V-tfassMT-1. V-0as*MT-1. V- (M"MT-1. V-0assMT-1. V-tfiMMT-1.V-tfas«MT-1, V -0U*MT-1, V-frfassMT-1,V-fltassMT-1, V ^ M tMT-1, V-giassMT-1.V-gltwMT-1. V - J M «MT-1, V-tf*uMT-1.V-JM"M T - 1 , V - ^ « M
MT-1, V-^W*MT-1, V-gUiwMT-1,V-tfSMMT-1, V-gl«««MT-1, V-tfastMT-1.V-0aMMT-1, V-tf. i*MT-1.V-glauMT-1, V-gltstMT-1, V-glauMT-1,V-g(»»«
CiJat(Ib.)
Soda Ash
1.01.01.0
1.0
Raflner
1.0
2.0
1.0
TramBatcti (lbs)
VECTRAd a w (lb«)
81.0223.0
78.0
77.078.080.078.0
314.077.0
155.0
229.0
79.080.061.077.083.079.0
155 0
82.080.0
159.0317.079.0
313.0348.0
76.0
88.0
77.0156.0231.0155.077.078.0
239.0311.0
233.081.0
ill ill 1,11
I
Slurry(It*)
V-SIMOta)
Calcined(It*)
HltftNa(Ib.)
Cum. FaedOb.)
6871.06952.07175.07176.07255.07256.07333.07411.07491.07569.07883.0796006115.06115.08344.08344.08423.08503.0658408661.38744.08823.0897808980.09062.09142 09142.09301.09618.09697.0
10010.010358.010358010434.010436.010524.010524.010601010757.010988.011143.011220.011298.011299.011538.011849.011649.012082.012163.0
Page 3 WHCVZ T 0 5.X L£

THROUGHPUT LOO
Itn
Faad/Draln LogDate ATI mo
4/13/95 0:154/13/951:304/13/95 1:454/13/95 2:404/13/95 6:554/13/95 8264/13/95 9:094/13/959:30
4/13/95 10:194/13/95 11294/13/95 12:104/13/95 12:124/13/95 13:404/13/95 18:004/13/95 19:384/13/95 20:304/13/95 22:104/13/95 23:304/14/95 2:404/14/95 4:004/14/95 7:004/15/95 9:18
4/16/95 14224/16/95 14274/16/95 15:354/17/95 8:004/17/95 8:45
4/17/9511:064/17/9511:104/17/95 13:524/17/95 16:444/17/9518:174/18/95 0:004/18/95 3214/18/95 7:464/18/95 8:454/18/95 920
4/18/9513:114/18/9523.55
4/19/95 2:354/19/95 2:504/19/95 4274/19/95 7:514/19/95 920
4/19/9510:304/19/95 12:404/19/95 15:454/19/95 16:04
Cum. hours
415.2416.5416.7417.7421.9423.4424.1424.5425.3426.5427.2427.2428.7433.0434.6435.5437.2438.5441.7443.0446.0472.3501.4501.4502.6519.0519.8522.1522.2524.9527.7529.3535.0538.3542.8543.8544.3548.2558.9561.6561.8563.4566.8568.3569.5571.7574.7575.1
Tast Phasa
MT-1, V-glauMT-1, V-daasMT-1, V-dassMT-1. V-dassMT-1, V-dat*MT-1, V-dassMT-1. V 4 a MMM.V-tfaasMT-1. V-dasaMT-1, V-dassMT-1, V4asaMT-1, V-dasaMT-1,V-das*MT-1, V-dawMT-1, V-dassMT-1,V4assMT-1, V-dasaMT-1, V-daasM M , V-daasMT-1, V-dassIdaIdaIdaIdaIdaIdaMT-1,V-da»sMT-1, V-^assMT-1, VtfassMT-1. V-dass STOPMT-1 :slurry STARTMT-1:slurryMT-1:tJurryMT-1:slurryMT-1 slurryMT-1:«lurryMT-1:slurryMT-1.slurryMT-1:slurryMT-1:slurryMT-1:slurryMT-1:slurryMT-1 :slunyMT-1:slurryMT-1:tlurryMT-1:«K*ryMT-1:slurryMT-1:slurry
PaadCuUat(lbs)
Sods Ash Rainar
2.0
2.0
2.0
TransBatch (lbs)
VECTRAGlass (lbs)
79.076.077.0
317.0316.0150 0
159.0158.0160.078.0
161.0159.0200.0
50.0484.0
80.077.0
160.0
62.0
233.0
81.079.0
78.0
40.0
153.0
ill
1255.0
1145.0
6470
iff
bitch 1
btch2116.0
batch 3360.0340.0
Drum
Laval(In)
Drum
lsval(in
)
i
Slurry(lbs)
238.0
1017.0
428.8
20.0
643.2
700.6
V-SIM(lbs)
apprar
apprax
appraur
apprat
Csldned(Ibt)
HtdiNa(lbs)
*
Cum. Faad(lbs)
12242.012318.012395.012712.013028.013178.013176.013337.013495.013655.013735.013896.014055.014257.014257.014307.014791.014871.014948.015106.015108.015170.015170.015403.015405.015405.015405.015405.015486.015565015803.015803.015881.015881.016898.016898.016898016898.017326.817366 617386.817386 618030.018183.018183.018183.016183.018883.0
Page 4 WHCV1TO5.XLS

THROUOHPUT LOO
I
o
Faad/Draln LogData & Him
4/19/95 17:304/19/95 21:104/20/951:404/20/95 2:004/20/95 3:454/20/95 3:454/20/95 5:064/20*5 5:304/20/95 5:494/20/95 6:104/20/95 8:004/20/95 9:154/20/95 9:30
4/20/9510:004/20/95 10:314/20/9511:054/20/9511:304/20/9511:474720/9511:534/20/9512:024/20/9512:304/20/9513:004/20/8513:474/20/95 13:574/209514:104/20/95 14:304/20/95 15:104/20/9515.154/20/9515:304/20/9516264/20/9516:304/20/9517.004009517:304/20/95 17:394/20/9518:004/20/9518:30400/9519:384/20/95 20:0040095 20:224/20/95 20:4440095 20:564/20/95 21:1840095 21:38400/95 21:574/20/95 23:15401/951:264/21/95 4:104/21/95 6:55
4/21/95 10:35
Cum. hours
576.5580.2584.7505.0586.7586.7588.1568.5588.8589.2591.0592.2592.5593.0593.5594.1594.5594.8594.95950595.5596.05968597.0597.2597.5596 2598.2598.5599.45995600.0600.5600.7601.0601.5602 6603 0603.4603.7603.9604.3604.6604.9606.2608.4611.2613.9617.6
TMt Phasa
MT-1:alurryMT-1:slurryMT-1 .slurryMT-1:slurryMT-1 starryUT-1:slurryMT<1:slurryMT-1:skiryMT-1:slurryMT-1 :slurryMT-1:slurryMT-1:slurryMT-1:slurryMT-1:«JurryM T 1 slurryMT-1:slurryMT-1:sknyMT-1 :slurryMT-1:slurryMT-1:slunvMT-1:sturryMT-1:sknyMT-1 slurryMT-1:slurryMT-1 .slurryMT- IHuryMT-1:sJurryMT-1:slurryMT-1 .slurryMT-1:slurryMT-1 slurryMT-1:slurryMT-1:skjrryMT-1:sMryMT-1:slurryMT-1 slurryMT-1:slurryMT-1:sk*ryMT-1:skjnyMT-1:tkjrryMT-1:slurryMT-1:tlurryMT-1:slurryMT-1:slurryMT-1 slurryMT-1:slurryMT-1:slurryMT-1 :slurryMT-1:slurry
F H dCuftst(lbs)
Soda Ash Reflnar TransBatch (Iba)
VECTRAGlass (lbs)
166.0
80.0
315.0
Ill
1064.0
1064.0
849.0
M E * 4
465 0
batch 5
372.0
440.0UtchB
354.0
444.0
364.3
26 0
17.032.023.0
35.029.024.523.021.517.513.011.0
26.525.324 022.516.529.027.3
21.018.515.031.029.026.021.019.018.017.529.327.527.026.0
18.56.0
lii
9.0
9.0
6.04.5
1.51.54.04.52.0
1.31.31.54.0
1.8
6.32.53.5
2.03.05.02.01.00.5
1.80.51.0
7.512.5
Slurry(Iba)
279.0
279.0
186.0139.546.546.5
1240139.562.042.2
38.838.846.5
124.0
54.3
193.877.5
108.5
62.093.0
155.062.031.015.5
54.315.531.0
232.5387.5
V-SIM(lbs)
VpfOK
Caldnad(lb»)
HJghNa(lbs)
Cum. Faed(Ibc)
19049.019049.019049.019049 019328.019328.019607 019607.019607 019607.019793.019932.519979.020025.520149.520289.020351.020393.220473220473220473.220473220473.220511.920550.720597.220721.220721.220775.420775.420969.221046.721155.221155.221217.221310.221465.221527.221558.221S73.721573.721627.921643.421674.421674.421906 922294.422609.422609.4
Rev:
v>o3o
HC-SD--WM
-V]
r—i
IO
PageS WHCVIT05.XLS

THROUGHPUT LOO
COI
Fa«d7Draln LogDate & Time
4/21/9511:174/21/9511:454/21/95 12:154/21/95 12:544/21/95 16204/21/95 16294/21/95 17:004/21/95 17:284/21/9518:304/21/9519:004/21/95 19234/21/9519:374/21/9519:504/21/9520:124/21/95 20:294/21/95 20294/21/95 20:454/21/9521:034/21/95 21274/21/95 21:374/21/9522:084/21/95 22264/21/9522:464/21/9522:554/21/95 23:004/21/95 23:404/21/95 23:454/22/951:544/22/95 3:074/22/95 3:074/22/95 3:454/22/95 4:054/22/95 4:134/22/95 7:104/22/95 7:104/22/95 7:18
4/22/9510:454/22/9511:484/22/9511:484/22/9513:004/22/95 13:574/22/95 14:M4/22/9515:054/22/95 16:584/22/95 17:364/22/95 18:054/22/9518:104/22/95 18:204/22/95 18:33
Cum. hours
618.361S.8619.2619.9623.3623.5624.0624.5629.5626.0626.4626.6626.0627.2627.5627.5627.0629.0626.3620.6629.1628.4629^0629.9630.0630.7630.6632.9634.1634.1634.7635.1635.2638.2630.3630.3641.7642.86428644.0645.0646.0646.1648.0648.6649.1649.2649.3649.5
Test Phase
MT-1:slurryMT-1:slurryMT-1:slurTyMT-1:*lunyMT-1:slurryMT-1:sbrtyMT-1:HurryMT-1:shnyMT-1:sknyMT-1 slurryUT-ItiuryMT-1:tk*ryMT-1:sh*ryMT-1 HurryMT-1:tlurTYMT-iafcnyMT-1:slunyMT-1:*k*TYMT-1:slunyMT-IsturyMT-iahnyMT-1:sk*ryMT-1 :UurryMT-1 :skMry STOPMT-2:sluny MB STARTMT-2:«iurryMT-2:HuryMT-2:*lu*yUT-2:»hJTy
MT-2:«turryMT-2:*lurTyMT-2:*hny
MT-2:«h«7yMT-2:slunyMT-2:»lurTyMT-2:slurryMT-2:sknyMT-2:slurryMT-2:sturryMT-2:slurry MB STOP
F««dCUM(IU)
SodeAsh Reiner
4.01.0
TransBatch (It*)
VECTRAGlaw (Ib*)
I I I
1078.0
1078.0
1070.0
ffg1
batch 1a628.0
429.7batch 2m
643.3
500.0
batch 3m
751.8
372.0
29.028.026.025.0
23.020.516.517.516.515.314.012.025.524.523.2
21.5• 9 8
19.317.0
16.0
12.032.8
21.530.029.0
10.835.0
9021.0
1.01.31.02.02.52.01.01.01.31.31.3
1.01.3
1.7i.80.523
0.34.0
11.3
1.0
18.3
26.0
SJUTTy
(Ib.)
31.038.054 362.077.562.031.031.030.830.838.6
31.039.1
53.954.315.569.8
7.0147.3
340.8
31.0
565.8
806.0
V-SIM(lbs)
40.0
238.078.0
155.078.078.0
155.0
Calcined(lbs)
HltfiNa(lbs)
Cum. Feed(lbs)
22613.422614.422614.422614.422645.422664.222738.422800.422877 922939.922970.923001.923040723079.423116.223110.223149.223168223220.223282.223336 423351.923421.723421.723429.423576.723576.723576.723929.423925.423956.423956.423956.423956.424522224522.224522.22532622S32S.225328.225320.225326225566.225644225644.225799.225877225955226110.2
Page 6 WHCVIT05.XLS
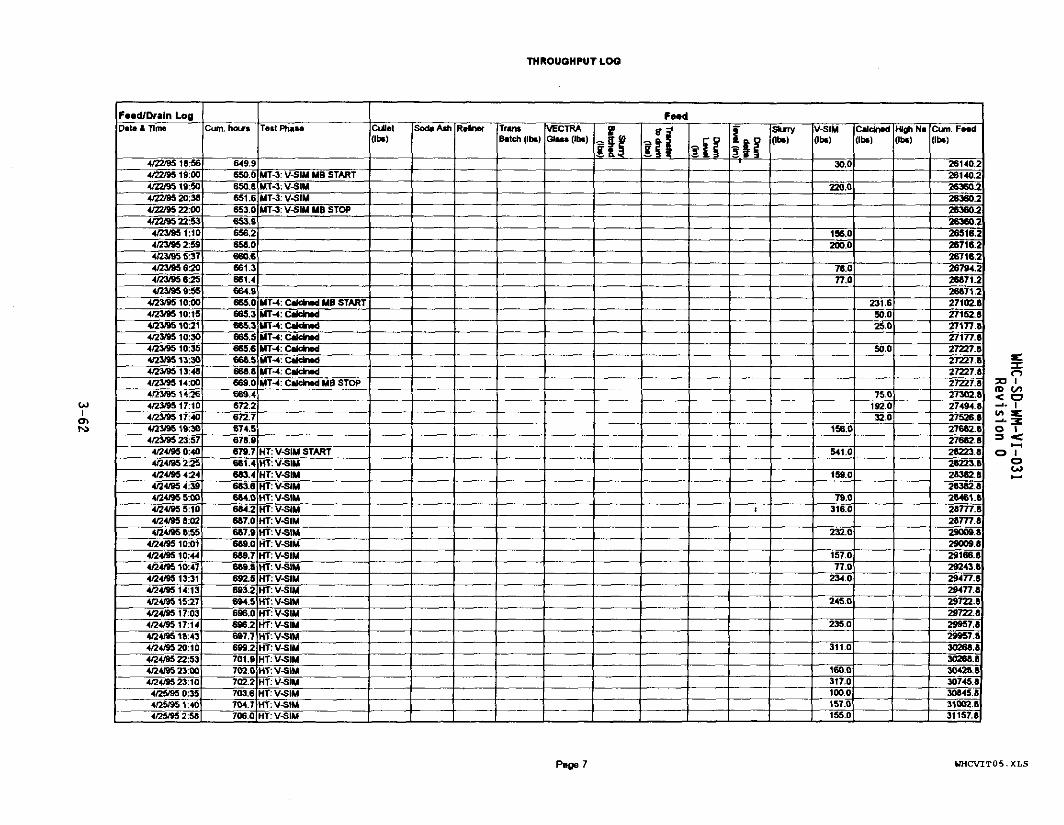
THROUGHPUT LOO
I
F««d/Draln LogData & Tlma
4/22/9S 18:564/229519:004229519:50422/95 20:384/22/95 22:00422/9522:53
4/23/951:104/23/95 2:594/23/95 5:374/23/95 6:2042395 6254/23/95 9:55
4239510:0042395 10:1542395 102142395 10:3042395 10:354239513:3042379513:4842395 14:004/23795 14:2642395 17:1042395 17:404/239519:304/239523:574/24/950:4042495 2254/2495 42442495 4:3942495 5:004/2495 5:1042495 8:0242495 8:55
42495 10:0142495 10:4442495 10:47424/95 13:314/2495 14:1342495 15:2742495 17:034249517:1442495 18:4342495 20:1042495 22:5342495 23:0042495 23:104/2595 0:35425951:4042595 2:58
Cum. hours
649.9650.0650.8651.6653.0653.9656.2658.0660.6661.3661.4664.9665.0665.3665.3665.5665.6668.5668.8669.0669.4672.2672.7674.5678.9679.7681.4683.4683.6684.0684.2687.0687.9689.0689.7689.8692.5693.2694.5698.0696.2697.7699.2701.9702.0702.2703.6704.7706.0
Test Phase
MT-3: V-SIM MB STARTMT-3: V-SIMMT-3: V-SIMMT-3: V-SIM MB STOP
MT-4: Caldnad MB STARTMT-4: CaWnadMT-4: CalcimdMT-4: CaldnadMT-4:CatdmdMT-4: CaldnadMT-4: CaldnadMT-4: Caldnad MB STOP
HT: V-SIM STARTHT: V-SIMHT: V-SIMHT: V-SIMHT: V-SIMHT: V-SIMHT: V-SIMHT: V-SIMHT: V-SIMHT: V-SIMHT: V-SIMHT: V-SIMHT: V-SIMHT: V-SIMHT: V-SIMHT: V-SIMHT: V-SIMHT: V-SIMHT: V-SIMHT: V-SIMHT: V-SIMHT: V-SIMHT: V-SIMHT: V-SIM
Fe«dCuUet(lbs)
Soda Ash Reftnar TransBatch (lfc»)
VECTRAGlass (lbs) iff 111 tU
Drum
data
(aval (In)
i
Slurry V-SIM(lbs)
30.0
220.0
156.0200.0
78.077.0
156.0
541.0
159.0
79.0316.0
232.0
157.077.0
2340
245.0
235.0
311.0
160.0317.0100.0157.0155.0
Calcfnad(lbs)
231.650.025.0
50.0
75.0192.0320
HlghNa(lbs)
Cum. Fa«d(lbs)
26140.226140.226360.226360.226360.226360.226516.226716 226716.226794.226871.226871.227102.827152.827177827177.827227.827227.827227.827227.827302.827494.827526.827682.827682 828223828223.828382.826382.828461.828777.828777.829009.829009.829166.829243829477.829477.829722.829722.829957.829957.830268.830268 830428.830745.830845.831002.831157.8
oCD CO< o-"- I
O I
O IoCO
Page 7 WHCVIT05.XLS

THROUGHPUT LOO
O i
P**d/Or«ln LogData & Time
4/25/95 3:354/25/95 3:494/25/95 5204/25/95 5:554/25/95 0:53
4/25/9511:514/25/95 12:004/25/9513:304/25/9514234/25/95 15:364/25/95 17:314/25/95 19:514/25/95 20:434/25/95 21204/25/9521:354/26/950:004/26/95 0:064/26/951:034/26/952:134/26/95 2:184/26/95 2:424/26/95 3:124/26/95 3:484/26/95 4:304/26/95 4:444/26/95 6:074/26/95 6:094/26/95 0:12
4/26/95 10:454/26/9511:134/26/9513:354/26/9513:474/26/9514:264/26/9515:314/26/95 16:064/26/9516:134/26/95 17:114/26/9517254/26/9510:004/26/95 10:304/26/9510:504/26/95 19:354/26/95 20:004/26/95 23284/27/95 0:094/27/95 3:064/27/95 3:464/27/95 7:404/27/95 9:47
Cum. hours
706.6706.0700.3700.9711.9714.0715.0716.5717.4710.6720.5722.0723.7724.3724.6727.0727.1720.0729.2729.3729.7730.2730.0731.6731.7733.1733.1735.2737.7730.2740.6740.0741.4742.5743.1743.2744.2744.4745.0745.5746.0746.6747.0750.5751.1754.1754.0750.7760.0
Test Phase
HT: V-SIMHT: V-SIMHT: V-SIMHT: V-SIMHT. V-SIMHT:V-StMHT: V-SIMHT: V-SIMHT: V-SIMHT:V-SIMHT: V-SIMHT: V-SIMHT: V-SIMHT: V-SIMHT: V-SIMHT: V-SIMHT: V-SIMHT: V-SIMHT: V-SIMHT: V-SIMHT: V-SIMHT: V-SIMHT: V-SIMHT: V-SIMHT: V-SIMHT: V-SIMHT: V-SIMHT: V-SIMHT: V-SIMHT: V-SIM STOP
HT: Slurry STARTHT:ShnyHT: SlurryHT: SlurryHT: SlurryHT: SlurryHT: SlurryHT: SlurryHT: SlurryHT: Slurry STOPHigh Na STARTHltfiN.HWNaHltfiNsHfghNaHfQh Na STOP
F M dCuMflbs)
Soda Ash R«fnar TransBatch (lbs)
VECTRAGlass (lbs) iff
1070.0 bttchu
665.0
295.0
lit
31.030 520.02S.0
20.030.027.524.020.516.0
ilL
0.52.530
5.0
2.53.53.54.5
Sktry(lbs)
16.904.3
101.1
160.5
04.3110.0110.0151.7
V-SIM(lbs)
154.0146.0146.0
232.0
234.0
232.077.077.0
233.0157.0156.0159.000.0
157.0156 070 0
150.079.0
156.0234.0
150.0
Calcined(It*)
v-stmtoFDR
78.0
45.035 0
70
HtghNa(lbs>
371.0371.0
off-gas saml
Cum. Faad(lbs)
31157.031311.031457.031603.031603.031603.831035.031035.032069.032069.832301.832370.832455.832455.832688.832845.833001.833160.833240.833240.833397.833553.033631.833631033789.833068 834024.834250.834258.034416.034416.834433.634517.934619.034619.034787.534787.534871.734989.735107.635259.335259.335708.336079.336079.336124.336159.336159.336237.3
PageS WHCVTTOS.xr.S

THROUOHPUT LOO
COi
Fa*d/Draln LogDtte & Time
4/27/95 17:43
TOTALS
Cum. hours
768 7
7M.7
Test Phau sr3032.0
Soda Ash
213.0 310
TransBatch (lbs)
393.0
VECTRAO a t s (lbs)
12711.0
ill10330.0 7339.9
ill I =
*
Slurry(tbs)
972S.7
V-SIM
8709.0
Calcined(lbs)
B33.fi
HlghNa(lbs)
742.0
Cum Feed(lbs)
36237.3
30237.3
o35 rn> LO< a
o i
o io
Page 9 WHCVIT05.XLS

THROUGHPUT LOG
COI
en
Faad/Drain LogData & Time
3/26/95 17:003/2545 11:413/28/9511:543/28/95 12:053/31/95 14:103/31/95 16:193/31/95 20:303/31/95 21:40M l / 9 5 22:47
4/1/95 0:354/1/951:304/1/95 4:004/1/95 520
4/1/9511:124/1/9511244/1/95 12:004/1/95 13:584/1/95 16:004/1/95 18:304/245 0:074/2/95 3:00
4/2/95 16:474/2/95 17204/2/9518204/2/9519254/2/95 21:154/2/9522:054/2/95 22:354/3/95 0:354/3/95 2:104/3456:454/3/95 7:304/3/95 9:204/345 9:354/345 9:45
4/3/95 10:374/34511:194/3/9512:134/345 12:404/345 14204/34518:174/3/95 21:154/345 22:154/345 23:154/4/95 0:354/4/951:154/4/95 2:154/4/95 8:44
4/445 18:15
Cum. hours
0.042.742.943.1
117.2119.3123.5124 7125.8127.6128.5131.0132.3138.2138.4139.0141.0143.0145.5151.1160.0167.8160.3169.3170.4172.2173.1173.6175.6177.2181.7182.5184.3104.6184.7185.6106.3107.2107.7169.3193.3196.2197.3198.2199.6200.3201.2207.7217.2
T « t Phast
St*rt-upStart-upStart-upStart-up
Start-upStart-upStvt-upStart-upStart-up
Start-up
Start-upStart-upStart-upStart-upStart-upStart-up
Start-upStart-upStart-upStart-upStart-upStart-upStart-up
Start-upStart-upStart-upStart-upStart-upStart-upStart-upStart-up
Start-upStart-upStart-upStart-upStart-upStart-upStart-up
Start-upStart-upStart-upStart-upStart-upStart-upStart-up
Start-upStart-upStart-upStart-up
Graphicj I DataTest CumHours
T«st CumFfd (kg)
DrainDrain* Drain (lbs) AVGOrak)
RatePta/itfe)
Cum. Drain(lbs)
0.0
0.00.00.00.00.00.00.00.00.00.00.00.00.00.00.00.00.00 00.00.00.00.00.00.00.00.00.00.00.00.00.00.0
000.00.00.00.00.00.00.00.00.00.00.00.00.00.00.0
ThroughputFeedTW*Parted (lUhr)
0.6115.4272.7
002.3
17.964.367.241.7
130.920.075.00.25.06.7
50.673.060.0
0.40.232
36.425.023.113.61.28.01.0
15.85.52.71.1
12.012.02 31.41.1
55.615.06 36.4
25.025.018.837 525.0020.1
Oats ThisParlod (lb/hr)
i
evis
ion
o
COo1
3C1
1-03
Page 10 WHCVIT05.XLS

THROUGHPUT LOG
I
F««d/Orain LogDate & Time
4/7/95 0:414/7/95 2:074/7/95 2:134/7/95 3:104/7/95 5:084/7/95 8:004/7/95 9:00
4/7/9511:084/7/95 12:494/7/95 13:474/7/95 13:424/7/95 21:044/7/05 21:154/7/05 21:404/7/95 22.304/8/95 0:304*951:304/6/95 2:154/8/95 3:004W95 3:5O4/8/95 5:004/0/95 5:454 * 9 5 8:15
4/B/95 12:004/8/95 14:524/8/95 14:564*9515:044/8/95 16:204 * 9 5 17:304*9518:004 * 9 5 18:474/8/95 20:004 * 9 5 21:004 * 9 5 21:344/8/95 22:274/9/951:004/9/951:104 * 9 5 2:404/9/95 4:104/9/95 5:10
4/9/9514:204/9/95 14224/9/95 15:074/9/95 17:004/9/95 19:404 * 9 5 23:304/10/95 2:354/10/95 5:104/10/95 8:21
Cum. hours
271.7273.1273.2274.2276.1279.0200.02821283.0284.8286.7292.1292.2292.7293.5295.5296.5297.2298.0298.8300.0300.8303.2307.0309.9309.9310.1311.3312.5313.0313.8315.0316.0316.6317.4320.0320.2321.7323.2324.2333.3333.4334.1336.0330.7342.5345.6348.2351.3
Tftst Phttft
MT-1, V-giM» STARTMT-1.V-flf«uMT-1. V-tfmMT-1, V-otaMMT-1. V-tfw.MT-1. V-0«uMT-I.V-tfauMM.V-fltaMMT-1. V-0IMMT-1. V~gtaMMT-1. V-tfaMMT-I.V-otaMMT-1, V-tfawMT-I.V-tfawMT-1, V-gtawMT-1. V-gtawMT-1. V-gfeMMT-1. V-fitasaMT-1. V-tfanMT-1. V-(M«MT-1, V-j*awMT-1. V-Ql-MMT-1, V-tf««MT-1, V-gliMMT-1,V-g1aMMT-1. V ^ a uMT-1,V-fltaMMT-1, V-gtauMT-1.V-g1«MMT-1.V-01MMT-1. V-tfauMT-1, V-rf«.MT-1, V-tfaa*MT-1, V - ^ H S jMT-1, V-fllawMT-1. V-glawMT-I.V-ptaw ^MT-1. V-tfassMT-1. V ^ u tMT-1, V-gtats jMT-1, VfflatiMT-1, V-gtaisMT-1, V-gteuMT-1. V-giwsMT-1. V-tfat.MT-1,V-g(aHMT-1, V-gtaMMT-I.V-giMaMT-1, V-glaM
Graphical DataTMlCumHows
0.01.4
2.54.57.30.3
10.512.113.115.020.420.621.021.823.824.825.626.327.128 329.131.635330.2
38.439.740.841.342143.3,44.344.945.848.348.550.051.552.5
61.762.464.367.070.073.976.579.7
Test CumFwd(ko)
0.00.9
1824.535.047.248.149.049.951.751.708.0
122.9134.2169.2204.5215.9252.2332.9351.0j370.2414.5440.5402.5
516.6552.0567.0622.7659.06939728.3763 7834.5906.19197,933.3
1004.51075.3
1107.01142.41143.31215.01285.31355.61389.61426.3
DrainDrain #
1
2
3
4
Drain <lbs)
513.0
827.0
803.0
407.0
AVG DrainRate(fbs/mln)
2.6
4.3
17.5
5.3
Cum. Drain(lbs)
000.0
513.0513.0513.0513.0513.0513.0513.05130513.0
1340.01340.01340.01340 01340.01340.01340.01340.01340.01340.01340.01340.01340.01340.02143.02143.02143.02143.02143.02143.02143.0214302143.02143.02143.02143.02143.02143.02143.02550.02550.02550.02550.0255002550.02550.02550.0255O.0
ThroughputFMdThltParted (Ihftr)
1.31.4
1.925.4
8.725.0
0.91.22.121
14.4184.830.038.578 033.3
106.7213.6
34.380.032.020.026.2
375.063.266.0
154.0102.163.376.0
137.6176.662.0
180.020.0
104.7156.0
7.6104.0
1.159.340.450.329.025.4
GJauThltPeriod flWhr)
1.9
43.9
44.9
j
17.4
on> co< o
o i
oUJ
Page 11 WHCVIT05.XLS

THROUGHPUT LOO
CT>
FaadVDrain LogDate & Time
4/1 0/95 12:314/1CV95 12:394/10/95 12:424/10/95 13:044/10/95 14:194/10/95 14:404/10/95 16244/10/95 17:024/10/95 17:544/1095 18:504/10/95 19264/10/95 23:30
4/11/958:134/11/95 8:524/11/95 8:54
4/11/9511:004/11/95 12*84/11/9512:394/11/9513:404/11/9514:304/11/9514:434/11/9515204/11/9515:474/11/95 16:004/11/9517284/11/95 18:044/11/9518274/11/9518:334/11/95 21:104/11/95 23:354/12/950:554/12/95 5:004/1295 8:034/12/95 9:044/1295 9214/12/95 9:36
4/12/95 10:354/12/95 10:394/12/95 11:194/12/95 12:064/12/9513:114/12/95 13:304/1295 13:324/129514:304/1295 15:084/1295 15:554/12/95 18:254/12/9519:474/1295 22:47
Cum. hours
35S.5355.6355.73561357.3357.7359.4360 0360.9361.8362.4366.5375.2375.937S.9378.0379.1379.6380.7381.5381,7382.3382.8383.0384.5385.1385.5385.5388.2390.6391.9396.0399.0400.1400.3400.6401.6401.6402.3403.14042404.5404.5405.5406.1406.9409 44108413.8
T M I Phato
MT-1.V-4MSMT-1, V-0MSMT-1,V-t*«iMT-1, V-0«MMT-1,V-tfMiMT-1. V-0-MUT-1.V-0M*HT-I.V-rfiMMT-1.V-01UMM.V-d-MMT-1. V-filawMT-1. V-0RUMT-1. V 4 » tMT-1, V 4 u *MT-1,V-tfaMMT-1,V4awMT-1, V-glas*MT-1. V-0u»MT-1, Vi^tiMT-I.VfltauMT-1. V-tfawMT-1.V-fltaMMT-1. V-tf«uMT-1.V-4««MT-1. V-tfassMT-1, V-tfassMT-1, V-glassMT-1, V-glassMT-1,V-fltai»MT-1. V-glMiMT-1, V-0a*sMT-1, V-fllauMM. V-^niM M , V-f*assMT-1, V-0M*MT-1, V^ittMT-1. V-tfu*MT-1.V-gla«« _jMT-1. V-frfassMT-1.V-flt«MMT-1, V-oiatsMT-1, V-fltastMT-1. V^assMT-1, V-^assMT-1.V^itiMT-1. V-tfassMT-1, V-tfassMT-1, V-glas«MT-1, V->ass
Oraphieal DataTastCumHour*
84.084.084485.686.087.788.489.290.190.894.8
103 5
104.2
107.S108.0109.0109.8110.0110.7111.1111.3112.8113.4
113.9116.5118.9120.2124.3
128.4128.7128.9
130 0130.6131.4132.5132.8132.8133.8134.51352
139.1142.1
Ta*t CumFeed (kg)
1463.01564.21564.61600.51600.91635.81671.21707.51742.91885.31920.21990.5
2094.3
2130.22166.42203.22238.12275.72311.62301.92382.82420.02456.2
2528.32672.12707.92849.93007.7
304223043.13083.0
3117.93188.73293.43363.7339863434.03434.53542.93683.9
3789.638263
DrainDrain*
5
6
7
8
9
10
11
Drain (ibt)
564.0
1 30T0
810.0
554.0
593.0
759.0
626.0
AVG DrainRate(Ibs/nUn)
5.2
7.1
19.2
34.0
23.0
33.0
35.0
Cum. Drain
3114.03114.0311403114.03114.03114.03114.03114.03114.0311403114.03114.03114.03421.03421.04231.04231.0423104231.04231.04231.04231.04231.04231.04231.04231.04785,04785.04785.04785.04785.04785.05378.05378.05378.05378.06137.06137.06137.06137.06137 06137.06137.06137.06137.06137.06763.06763.06763.0
Throughput -FaedTNsPeriod (IMv)
69.92.7
6322.9
44.4123.292.383.6
523.318.917.8
335.1
24 4154.879.792.4
383.1128.1344.4
9.2
55.9133.3
329.0121.132.7
234885.2
18.77.1
352.0
73.3234.0294.9143.1
442.91.0
377.4397.0
60.327.0
d a w ThisPeriod (IWhf)
1 25.4
15.1
379.7
74.4
i
43.6
299.6
79.9
TO
<— i .
%n
O3
O
o1
1£
1
1Oto
Page 12 WHCVIT05.XLS

THROUGHPUT LOO
COIa*
Faad/Draln LogData & Time
4/13/95 0:154/13/95 1:304/13/951:454/13/95 2:404/13/95 6:554/13/95 8364/13/95 9.t»4/13/93 9:30
4/13/8510:194/13/95 11294/13/95 12:104/13/95 12:124/13/9513:404/13/9516:004/13/9519:384/13/95 20:304/13/95 22:104/13/95 23:304/14/95 2:404/14/95 4:004/14/95 7:004/15/95 9:18
4/16/95 14224/1&95 14274/16/95 15:354/17/95 8:004/17/95 8:45
4/17/95 11:064/17/9511:104/17/95 13:524/17/9516:444/17/95 18:174/18/95 0:004/18/95 3214/18/95 7:464/1 ft/95 8:454/18/95 920
4/18/9513:114/18/95 23:554/19/95 2:354/19/95 2:504/19/95 4274/19/95 7:514/19/95 9:20
4/19/95 10:304/19/95 12:404/19/9515:454/19/95 16:04
Cum. hours
415.2416.5416.74177421.9423.4424.1424.5425.3426.5427.2427.2428.7433.0434.6435.5437.2438.5441.7443.0446.0472.3501.4501.4502.6519.0519.8522.1522.2524.9527.7529.3535.0538.3542.8543.8544.3548.2558.9561.6561.8563.4566.8568.3569.5571.7574.7575.1
Test Phase
MT-1, V-glassMT-I, V -0M.MT-I.V-glaMMT-1, V-tfM*MT-1, V-dtMMT-1, V-gtauMT-1. V-tf»MMT-1. V-gi.MMT-1, V-glastMT-1, V-fllawMT-1,V4astMT-1,V-dauUT-1,V-tfs.«MT-1, V 4 « M
MT-1.V-4MBMT-1.V-0M*MT-1, V-dassMT-1, V-glassMT-1. V-gl«iMT-1, V-OIHS
Idle(dekleklekleIdaMT-1, V-dassMT-1,V-tf«ttMT-1, V-da«iMT-1, V-das« STOPMT-1 :slurry STARTMT-1:sJurryMT-1:«lunyMT-1:slurryMT-1:slurryMT-1:sMiyMT-1:slunyMT-1:slunryMT-1 .slurryMT-1:sUryMT-I.sktryMT-1:«knvMT-1:sk*ryMT-1:*lurryMT-1 :slurryMT-1:«lurryMT-1 :slurTyMT-1:sk*ry
Graphical DataTest CumHours
143.6144.8145.1146.0150.2151.8
15Z8153.6154.8155.5155.5157.0161.3
163.8165.5166.8170.0171.3
0.0
263
55.556.673.0
0.01.57.3
15.0
31.233.834.1
39140.6
47.3
Test CumFew! (kg)
3862.13896.63931.54075.34216.64286.6
4358.74430.44502.945392461224664.44776.0
4798.65018.15054.45069.35161.9
0.028.1
133.8134.7134.7
0.00.0
35.4
496.6
691.1709.2716.3
1010.01079.4
1396.8
DrainDrain*
12
13
14
15
16
17
18
19
2021
Drain (Ibe)
856.0
548.0
3000
102.0
90.0
504.0
104.0
295.0
197.0156.0
AVG DrainRate(Ibt/nan)
16.8
10.0
1.4
36
22,0
5.4
3.7
8.0
8.08.2
Cum. Drain(lbs)
6763.06763.06763.0676306763.06763.07619.07619.07619.07619.07619.07619.07619.07619.08167.08167.08167.08167.06167.08167.08167.06167.06467.08467.08467.08467.06467.08569.06569.08569.08569.08659.08659.09163.09163.09163.09163.09267.09267.09562.09562.09759.09915.09915.09915.09915.09915.09915.0
ThroughputFeed ThisPeriod (ltVhr)
53.960.8
306.0345.8
74 498.9
149.1193.5137.1
336.3108.446.6
20.0290.4
60.024.3
120.0
2.1
8.01.8
4.129.383.0
10.7
130.9
26.615 080.0
128.2103.1
104.0
Glass ThisPeriod (Ibftr)
58.1
52.3
4.5
4.9
i
12.5
55.6
10.6
22.0
105.545 9
TO(0<
O
O
niCO
o1
<
1
oCO
WHCVIT05.XLS
Page 13

THROUGHPUT LOO
CO
I
Faad/Oratn LogData & Time
4/19/95 17:304/19/9521:104/20/95 1:404/20/95 2:004/20/95 3:454/20/95 3:454/2095 5:064/20/95 5:304/20/95 5:494/20/95 6:104/20/95 8:004/20/95 9:154/20/95 9:30
4/20/9510:004/20/95 10:314/20/9511:054/20/9511:304/20/95 11:474/20/9511:534/20/9512:02•4/20/9512:304/20/9513:004/20/95 13:474/20/95 13:574/20/95 14:104/20/95 14:304/20/95 15:104/20/9515:154/20/9515:304/20/9516264/20/95 16:304/20/95 17:004/20/95 17:304/2095 17:394/20795 18:004/209518:304/2095 19:384/2095 20:004/2095 20:224/2095 20:444/20/95 20:564/20/95 21:184/20/95 21:384/2095 21:574/20/95 23:15
4/21/95 1:264/21/95 4:104/2195 6:55
4/21/95 10:35
Cum. hours
576.5580.2584.7585.0556.7S86.7588.1588.5548.8589.2591.0592.2592.5593.0593.5594.15S4.5594.8594.9595.0595.5596.0596.8597.0587.2597.5598.2598.2598.5599.4599.5600.0600.5600.7601.0601.5602.6603.0603.4603.7603.9604.3604.6604.9606.2608.4611.2613.9617.6
Test Phasa
MT-1:slurryMT-1:«kiryMT-1:iJunyMT-1:*lurryMT-1:tlunyMT-1:tlurtyMT-1:tiunyMT-1:sh*ryMT-1:slunyMT-1:shfryMT-1:sk*ryMT-1:«JUTTYMT-1:tlurryMT-i:skiryMT-1:HunyMT-1:iJunyMT-1:tktryMT-1:U«ryMT-1:slurryMT-1:ifc*ryMT-1:slurryMT-1:slurryMT-1:tlurTVMT-1:slurryMT-L-sknyMT-1:«lurryMT-1 flurryMT-1 :slurryMT-1:«knyMT-1:*jrryMT-1:*lunyMT-1:*lurryMT-1:tiunyMT-1:«luTyMT-1:«lurryMT-1 :»JurryMT-1:riurryMT-1 :»JuTyMT-1:shnyMT-1:flurTyMT-1:»kxTyMT-1:»k*ryMT-1:«lurryMT-1:«turryMT-1:»li*ryMT-1 :thiryMT-1:sfuryMT-1 .slurryMT-1 :sturry
Oraphlcal DataTastCumHours
48.8
59.0
60 4
63.364.564865.365866.366.867.0671
69.269.469.870.4
70.8
71.872.37Z.8
73.373.874.975.375.676.0
78.676.977.2
80.783.486.2
Tast CumFaad(kg)
i _ 1 4 7 2 ^
1598 6
1725.2
1809.51872.81893.91915.01971.22034.52062.62081.72118.0
2135.62153.12174.22230.5
2255.1
2342.92378.124273
2455.42497.62567.92596.02610.02617.1
2641,72648.72662.8
2768.22944.03086.8
DrainDrain*
22
23
24
25
26
27
Drain ( » N )
264.0
502.0
51.0
239.0
231.0
383.0
AVG DrainRate(Ibs/min)
17.0
22.0
11.3
10.9
5.8
5.5
Cum. Drain(IM)
9915.010179.010179 010179.010179.010179.010179 010179.010681.010681.010681.010681.010681.010681.010681.010681.010681.010681.010681.010762.010762.010762.010762.010762.010762.010762.010762.010762.010762.011001.011001.011001.011001.011001.011001.011001.011001.011001.011001.011001.011001,011001 011001.011001.011232.011232.011232.011232.011615.0
ThroughputFecdThkParted (IMir)
115.8
27.2
206.7
64.1111.6186.093.0
240.0246.2148.8148.8800.0
18.7178.8139.5186.0
162.7
193.8155.0217.0
124.0186.0136.8169.184.542 3
95.746.597.9
66.7141.8114.5
a«*Thl«Period (IMir)
19.8
55.6
13.8
54.3i
33.9
33.8
< CT-•- I
O I
O Io
WHCVIT05.XLS
Page 14

THROUGHPUT LOO
F«*d/Draln LogData S Time
4/21/9511:174/21/9511:454/21/95 12:154/21/95 12:544/21/95 16204/21/95 16294/21/95 17:004/21/95 17284/21/95 18:304/21/95 19:004/21/95 1923421/95 19:374/21/95 19:504/21/95 20:124/21/9520294/21/95 20294/21/95 20:45421/95 21:03421/95 2127421/95 21:37421/95 22:00421/95 2226421/95 22 46421/9522:55421/95 23:00421/9523:40421/95 23:45422/951:54422/95 3:07422/95 3:07422/95 3:454/22/95 4:05422/95 4:13422/95 7:10422/95 7:18422/95 7:18
422/95 10:454/22/95 11:484/22/9511:48422/9513:00422/95 13:574/22/95 14:58422/9515:05422/95 16:58422/9517:36422/95 18:054/22/95 18:10422/95 18:20422/95 18:33
Cum. hours
618.3618.86192619.9623.3623.5624.0624.5625.S626.0626.4626.6626.8627.2627.5627.5627.8628.0628.56286629.1629.4629.8629.9630.0630.7630.8632.9634.1634.1634.7635.1635.2638.2638.3638.3641.7642.8642.8644.0645.0646.0646.1648.0648.6649.1649.2649.3649.5
Test Phase
MT-1 :slunyMT-1:sturryMT-1:alurryMT-1:thrryMT-1 slurryMT-1:tfunyMT-1:skiryMT-1:sKnyMT-1:»lurryUT-1:*bnyMT-1:sJurryMT-1:alurryMT-1:aJunyMT-1:ik*TyUT-1:sknyMT-1:sfcjrryMT-1:slunvMT-1:tlurryMT-1 slurryMT-1:sJurryMT-1:alurryMT-1:elurryMT-1:aJurryMT-1 :skary STOPMT-2:slurry MB STARTMT-2:slurryMT-2:slunyMT-2:slunyMT-2:sknyMT-2:slurryMT-2:slunyMT-2:i»unvMT-2:slurryMT-2:tiutryMT-2:slurryMT-2:tlurryMT-2:HurryMT-2:*lurryMT-2:sJuryMT-2:aJurry MB STOP
Graphical DataTest CumHours
90.591.0
95.695.796.396.797.80.00.40.60.81.21.5
1.82.12-5263.13.43.8
404.7
8.1
8.8
12.3
16,8
19.0
0.001.88
3.003.083.253.47
Test CumFeed (kg)
3088.63089.1
3103.13120.7314S.33173.43208.6
0014.128.14S.763 380.8
94-91126130.8155.2179.8186.8218.3
2220288.8
446.9
461.0
717.6
1083.1
1083.1
0.035.4
105.7141.0176.4246.7
DrainDrain*
28
29
3031
I 32"
3334
35
Drain (lbs)
123.0
197.0
193.0189.0
317.0
74.0150.0
204.0
AVG DrainRate(Ita/irin)
6.2
4.9
6.45.4
5.3
7.417.0
20.4
Cum. Drain(Iba)
11615.011615.011615.011615.011615.011615.011615.011615.011615.011615.011615.011615.011615.011615.011615.011615.011615.011615.011615.011615.011615.011615.011615.011738.011738.011738.011738.011935.011935.011935.011935.011935.012128012317.012317.012317.012634.012634.012634.012634.012708.012856.012858.012858.013062.013062013062.013062,013062.0
ThroughputFeed ThisPsrtod (Ib/hr)
0.92.1
6.8258.3105.0132.975.0
124.080.9
132.9178.6105.7136.8
116.3130.2100.0323.6105.051.7
209.2
33.2220.9
101.1
46.9
159.4
179.1
72.541.4
194.2468.0715 4
Glass ThisPeriod (Ib/hr)
10.0
66.0
j
83.364.1
88.5
23.1147.5
77.5
(/>ion
o
00o
11
i
[-03
WHCVIT05.XLS
Pace 15

THROUOHPUT LOO
OJ
F««d/Draln LogOats- & Time
4/22/95 18:564/22/95 19:00
• 4/22/95 19:504/22/9520:384/22/95 22:00422/95 22:53
473/95 1:104/23/95 2:594/23/95 5:374/23/956204/23/956254/23/95 9:55
4/23/9510:004/23/95 10:154/23/9510214/23/9510:304/23/95 10:354/23/95 13:304/23/95 13:484/23/95 14:004/23/9514264/23/95 17:104/23/85 17:40423/95 19:304/23/95 23:574/24/95 0:40424/95 2254/24/93 4244/24/95 4:394/24/95 5:00424/95 5:104/24/95 8:02424/95 8:55
424/95 10:014/24/05 10:44424795 10:474/24/9513:31424/95 14:134/24/95 1527424/95 17:03424/95 17:144/24/95 18:434/24/95 20:104/24/95 22:53424/95 23:004/24/95 23:10425/95 0:35425/95 1:404/25/95 2:58
Cum. hours
649.9650.0650.0651.6653 0653.9656.2658.0660.6661.3661.4664.9665.0665.3665.3665.5665.6668.5668.8669.0669.4672.2672.76745678.9679.7681.4683.4683.6684.0684.2687.0687.96890689.7689.8692.5693.2694.5696.0696.2697.7699.2701.9702.0702.2703.6704.7706.0
Tast Phase
MT-3: V-SIM MB STARTMT-3: V-SIMMT-3: V-SIMMT-3: V-SIM MB STOP
MT-4: CakaiBd MB STARTMT-4: CalctodMRCDchtdMT-4: Cafcfcwd
UT-4 CMdnriMT-4: CafcfcwdMT-4: CaJdnadMT-4: Calcfciad MB STOP
HT: V-SIM STARTHT: V-SIMHT: V-SIMHT: V-SIMHT: V-SIMHT: V-SIMHT: V-SIMHT. V-SIMHT: V-SIMHT: V-SIMHT: V-SIMHT: V-SIMHT: V-SIMHT: V-SIMHT: V-SIMHT: V-SIMHT: V-SIMHT: V-SIMHT: V-SIMHT: V-SIMHT: V-SIMHT: V-SIMHT: V-SIMHT: V-SIM
Graph icat DataTest CumHours
3.85
4.75
10.0011.90
0.000.080.330.43
0.67
4.527.257.75
0.0
3.7
434.5
6.3
10.110.112.8
14.8
16.6
19.5
22.322.523.925.026.3
T«st CumFead (kg)
260.3
360.1
430.8521.5
0.0105.0127.7139.0
161.7
195.7262.8297.3
0.0
72.1
107.9251.2
356.5
427.7462.6568.7
679.8
786.4
927.4
1000.01143.81189.11260.31330.6
DrainDrain*
36
37
38
39
40
41
42
43
44
45
46
47
48
49
Drain (lbs)
151.0
162.0
308.0
184.0
300.0
220.0
197.0
344.0
168.0
254.0
234.0
312.0
79.0
254.0
AVG DrainRate(Ibt/mln)
21.6
5.2
11.4
6.6
7.9
13.8
7.8
24.5
19.0
18.0
18.0
24.0
13.0
5.6
Cum. Drain(lbs)
13062.013062.013062.013213.013213013375.013375.013375.013683.013683.013683.013867.013867.013667.013867.013867.013667.013867.014167.014167.014167014167.014167.014167.014387.014387.014584.014504.014928,014928.014928.015096.015096 015350.015350.015350 015350.015584.015584.015696.015898.015975.015975.016229.016229.016229.016229.016229.016229.0
ThroughputFeed ThisParted (lUhr)
78.3
244.4
29.3110.1
45.1
64.6200.0250.0
214.3
19.570264.085.1
104.7
42.6
515.2
61.9
125.485.6
126.7
131.8
106.0
159.070.6
144.9119.2
Glass ThisParted (IMtf)
49.8
72.0
45.7
42.6
77.3
21.7
79.9
154.0
i
49.7
128.1
55.7
110.1
47.4
61.0
TO V< O
O3O I
o
WHCVIT05.XLS
Page 16

THROUOHPUT LOO
COI
--J
Faad/Draln LogDate* Time
4/25/95 3:354/25/95 3:494/25/95 5:204/25/99 5:554/25/95 8:53
4/25/9511:514/25/9512:004/25/9513:304/25/9514:234/25/9515:384/25/95 17:314/25/95 19:514/25/9520:434/25/95 21204/25/9521:354/26/95 0:004/26/95 0:064/26/95 1:034/26/95 2:134/26/952:184/26/952:424/26/95 3:124/26/95 3:484/26/95 4:384/26/95 4:444/26/95 6:074/26/93 6:094/26/95 8:12
4/26/95 10:454/26/9511:134/2679513:354/26/95 13:474/26/95 14264/26/9515:314/26/95 16:064/26/9516:134/26/9517:114/26/9517254/26/9518:004/26/9518:304/26/9518:584/26/95 19:354/26/95 20:004/26/95 23:284/27/95 0:094/27/95 3:064/27/95 3:464/27/95 7:404/27/95 9:47
Cum. how
706.6706.8708.3708.8711.9714.8715.0716.5717.4718.6720.5722.8723.7724.3724.6727.0727.1728.0729.2729.3729.7730.2730.6731.6731.7733.1733.1735.2737.7738.2740.6740.8741.4742.5743.1743.2744.2744.4745.0745.5746.0746.6747.0750.5751.1754.1754.8758.7760.8
Test Phase
HT: V-SIMHT: V-SIMHT: V-SIMHT: V-SIMKT: V-SIMHT: V-SIMHT:V-SEMHT: V-SIMHT: V-SIMHT: V-SIMHT: V-SIMHT: V-SIMHT: V-SIMHT: V-SIMHTV-S1MHT: V-SIMHT: V-SIMHT: V-SIMHT: V-SIMHT: V-SIM __jHT: V-SIMHT: V-SIMHT: V-SIMHT: V-SIMHT: V-SIMHT: V-SIMHT: V-SIMHT: V-SIMHT: V-SIMHT: V-SIM STOP
HT: Slurry STARTHT: SlurryHT: SlurryHT: SlurryHT: SlurryHT: SlurryHT: SlurryHT: SlurryHT: SlurryHT: Slurry STOPHigh H* STARTHlghNaHlgrtNaHlgtiNaHgtiNiHlgti N« STOP
Oraphlcal DataTettCumHours
27.128.729 3
35.3
37.7
40.043.244.0
44.947.347.448.449.5
50.050.551.1
52153.453.555.5
58.5
0.00.71.7
2.4
3.64.24.75.20.00.43.94.67.58.2
Test CumFeed (ko)
1400.51466.71532.9
1638.1
1744.2
1849.41884.41919.3
2024.92096.12166.92239.02275.3
2346.5241722452.6
2524.32560.12630.82737.0
2809.6
0.038.284.1
160.5
198.7252.2305.7374.4
0.0203.6371.9371.9392.3408.2
DrainDrain*
50
5152
53
54
55
56
57
58
59
60
61
Drain (lbs)
489.0
176.0190.0
204.0
538.0
455.0
501.0
237.0
483.0
201.0
327.0
381.0
AVG DrainRita(Ibs/mln)
5.3
7.05.6
7.0
17.3
21.7
11.1
4.5
5.0
5.7
2.3
8.7
Cum. Drain(lbs)
16718.016718016718.016718.016894.017084 017084.017084 017084.017288.017288.017268.017288.017826.017826.017826.017826.017826.017826.010281 018281.018281.018281.016762.018782.018782.018782.018782.019019.019019.019019.019019.019019.019019.019502.019502.019502.019502.019502 019502.019502.019703.019703.019703.020030.020030.020030.020411.020411.0
ThroughputFeed ThisPeriod (Ib/hr)
181296.3
250.3
38.1
98.2
74.033.086.8
268.8
124.4167.468.6
324.8312.0130.0
169.3
165.9114.1
52.4
6.6129.693.3
240.7
70.2202.2235.9325.0
434.5107.0
12.452.5
Glut ThisPeriod (lb*r)
1 104.0
33.264.0
54.4
93.6
91.6
2147
38.7
i
90.3
57.7
71.6
50.7
m co< o
o i
o ioCO
WHCVIT05.XLS
Paoo17

THROUGHPUT UOO
I
F««<VDraln LogDate & Time
4/27/95 17:43
TOTALS
Cum houri
768.7
768.7
Test PhaseGraphical Data
TMtCumHours
Test CumFeed (kg)
DrainDre(n#
62
82.0
Drain (It*)
2022.0
22433.0
AVGDrabiRate(Ibs/mln)
66
11.7
Cum Drain(Ite)
22433.0
22433.0
ThroughputFeedTWsPeriod (Ib/hr)
1M.4
Glass TWtPeriod (lUhr)
' 2012
60.8
TO I
< o
o i
O IoCO
Page 18 WHCVIT05.XLS

WHC-SD-WM-VI-031Revision 0
This page intentionally left blank.
3-74

WHC-SD-WM-VI-031Revision 0
APPENDIX 3C
MASS BALANCE CALCULATIONS
3-75
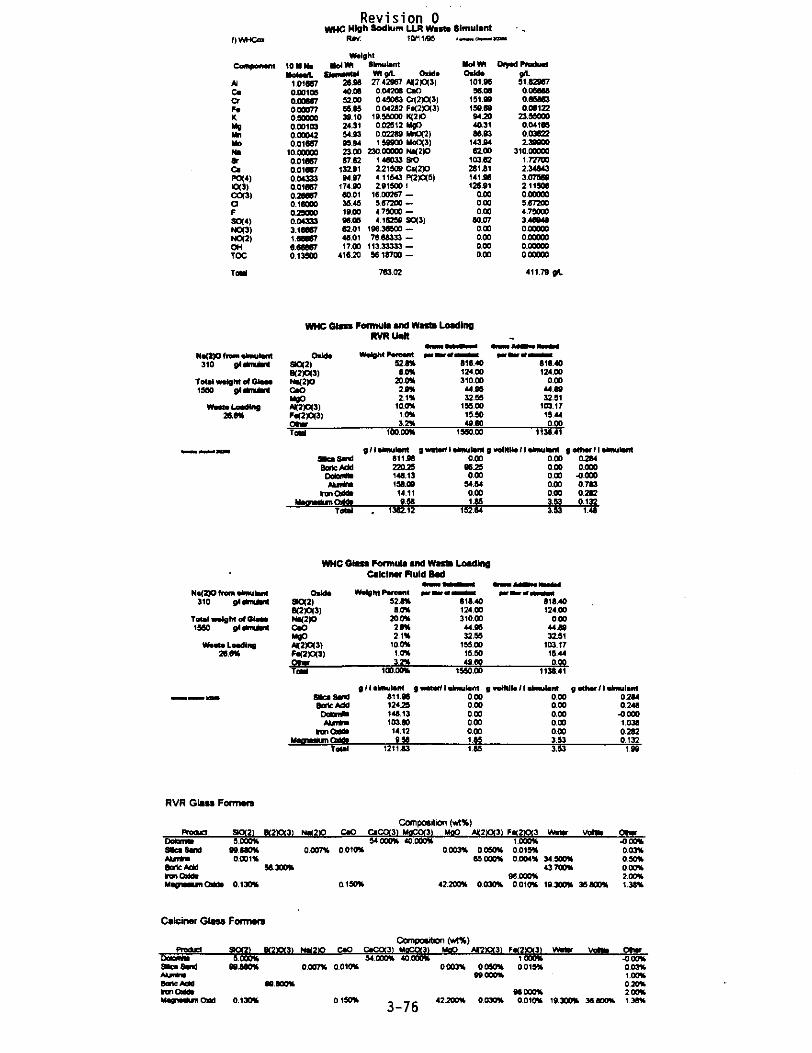
f)WHCox
Cmwponanl
AlCacrF«KMgMnMoNaSrCaPO(4)KX3)CO(3)aFSO(4)NO(3)NO(2)OHTOC
10HNaHolaa/L
1.016870.001050.006070.000770.900000.001030.000420.01067
10.000000.010070.018870.043330.018070.288070.100000.290000.043333.106071.060670.000070.13500
Revision 0WHC High Sodium LLR Waita Simulant
10/11/95
WaightMoJWI
ClomMital20.9640.0852.0059.8538.1024.3154.9399.9423.0087.62
132.9194.97
174.9060.0135.4919.0096.0662.0146.0117.00
416.20
SimulantWlg/L Oxide27 42967 A|J)O(3)0.04208 CaO045003 Crf2)O(3)004282 F«2)O(3)
19.99000 K(2|O0.02912 MgO0 02289 MnO(2)159900 MoO(3)
23000000 H»(Z)O140033 SOZ215O9 Ct(2)O4 11943 P(2)O(9)291500 1
1600267 —567200 —4 75000 —4 10258 SO(3)
196.36500 —76 08333 —
113.33333 —56 18700 —
HolWIOilde
101.9690.08
191.99159.0994.2040.3180.93
143.9462.00
103.02281.81141.90120.91
0.000.000.00
80.070.000.000.000.00
asm
Dryad Product9A-51.829070.060080.058030.00122
23.590000.041660.036222.39900
310.000001.727002.348433.075092.115080.000005.072004.790003408400.000000.000000.000000.00000
ToM 703.02 411.79
WHC Guvs Formula and Waila LoadingRVRUnH
Na(2)O(roma<mulant310 gdaknuMrt
Total weight of Olaee1550 g««mjant
Waete Loading28.0%
Orid*
B(2|OO|N*2)OCaOMgO
F«(2)O(3)Otm
52.8%8.0%
20.0%2.9%2.1%
10.0%1.0%3.2%
818.40124.00310.0044.9032.95
199.0015.904960
818.40124.00
0.00444932.51
103.171544000
100.00% 1560.00 1138.41
g/lalmulant g wai*rflaimulanigwolKH«(laanulaM g other (I «anutantSNca Sand 811J5 0.00 0.00 0.284Bate Add 22025 X2t 0.00 0.000DatonM 148.13 000 0.00 -0.000AUrtn 158.09 54.S4 0.00 0.783
tnn O)M> 14.11 0.00 0.W 0.282Mam«aHiwO>Wa 9J8 VIS 3.93 0.132
Tdtd 1362.12 192.04 3.93 1.48
WHC Glass Formula and Waste LoadingCalclnar fluid Bad
Na(2)Ofromalmulant310
Total wvtght of Q I O M1590 glakmawt
Waato Loading20.0%
OxMe»Of2)B(2)O(3)
CaOMgOA(2)O(3)r^(2)O(3)Otwr
92.0%8.0%
200%29%2 1 %
100%10%3.2%
818.40124.00
0.0044.8832.51
103.1719.440.00
100.00% 1550.00 1136.41
9 m SandBoric AddDoUnMAUrim
mnCMdiMamaaUnCMdt
gflalmulant gwMwfI•Imulant gvoWlto/1alnwlant gothar/laimularri01196 0.00 0.00 0.204124.29 0.00 0.00 0.240148.13 0.00 0.00 -0000103.00 000 0.X 1.03814.12 0.00 0.00 0.2829M 1.65 J93 0132
Total 1211.83 1.05 3.93 199
RVR Glass FomMrs
SO121 Bt2KX3) NX21OComposition (wt%)
CaO CiCOOl MoCOO) MgO Al(2)O(3l F12XX3 WaWr VoWH Otwr5.000% 54.000% 40000% 1000% -000%
99880% 0007% 0010% 0.003% 0050% 0015% 003%0.001% 09000% 0.004% 34.900% 050%
50.300% 43700% 000%90000% 2.00%
SUcaSandAunmaBorKAddtwiOrtJtMagnMKinOttda 0.130% 0190% 42.200% 0030% 0.010% 19.300% 30000% 1.38%
Calciner Glass Formsfs
Predua aOC2) BT2)Ot31Compositon (wt%)
CaO CaCO(3) MQCCT3) MaO AI2O3) Ft2X3(3) VOW* OtwrDotontfliSacaSand
9.000%99.880%
54.000% 40000%0.007% 0.010%
Bane AddiranOMdiMagnaaUnOMd
80800%
0190%3-76
0060%9000%
0030%
1.000%0019%
96000%0010%
-000%0.03%1.00%020%200%
18.300% 3«.80O% 138%

06/17 WHC-SD-WM-VI-031Revision 0
pagei of 2
Expected Na(2)0 Levels and Glass Production for Slurry Feed Glass
Prepared by: Brent Spurgeon ^ f ^ A / f ^ ^ D a t e : 08/17/95/
""" " ' 'n/U-^^~ Date:Checked by: John Koehr 08/17/95
Assume: Density of simulant = 1.49 g/mlMolarity of Simulant = 10 Molar
Feed Ratio, Ib of RVR mix/lb Simulant = 1.07
Na(2)O level1 7 . 7 1 % pwandofcalc
For Batch 2A & 3A
Total Batch Weight
Simulant =RVR Mix =
1036 Ib
500536
-
IbIb
469.92
Per FeedPer Feed
kg
LogLog
-
Total Oxides from RVR Mix:
3 Ib or 1362 g of RVR Mix Yields...
RVR mix IbAbove yields for
SiO(2)B(2)O(3)Na(2)OCaOMgOAI(2)O(3)Fe(2)O(3)OtherTotal
5363
818.40 g124.00 g
0.00 g44.89 g32.51 g
103.17 g15.44 g1.48 a
1138.41 g J
178.6667
perf)WHCox.wb1
Total Oxides From RVR Mix
SiO(2)B(2)O(3)Na(2)OCaOMgOAI(2)O(3)Fe(2)O(3)Other
146.2222.150.008.025.81
18.432.760.26
k9kgkgkgkgkgkgkq
Total 203.66 kg
3-77

06/17
Oxides from Simulant
Density of Simulant =
Total liters of simulant
WHC-SD-WM-VI-031Revision 0
page 2 of 2
1.49 g/ml =
152.21 I simulant
3.28 Ib/I
Oxides from Simulant
OxideAI(2)O(3)CaOFe(2)O(3)MgONa(2)O
g/l simulant51.830.060.060.04
310.00Total
NOTE: aft •fmtiant from WHCox.wt>1
kg total7.890.010.010.01
47.19361.99 55.10
Others
OxideCr(2)O(3)K(2)OMnO(2)MoO(3)SrOCs(2)OP(2)O(5)IClFSO(3)
g/l simulant0.65863
23.550000.036222.399001.727002.34843
- 3.075692.115085.672004.750003.46948
kg total0.103.580.010.370.260.360.470.320.860.720.53
Total 49.80 7.58
Total OxidesOxide
SiO(2)B(2)O(3)Na(2)OCaOMgOA«2)O(3)Fe(2)O(3)Other
kQ146.2222.1547.19
8.03. 5.85
26.322.777.85
54.89%8.32%
17.71%3.01%2.20%9.88%1.04%2.95%
Glass to Slurry Ratio:
56.69%
Total 266.38 100.00%
3-78
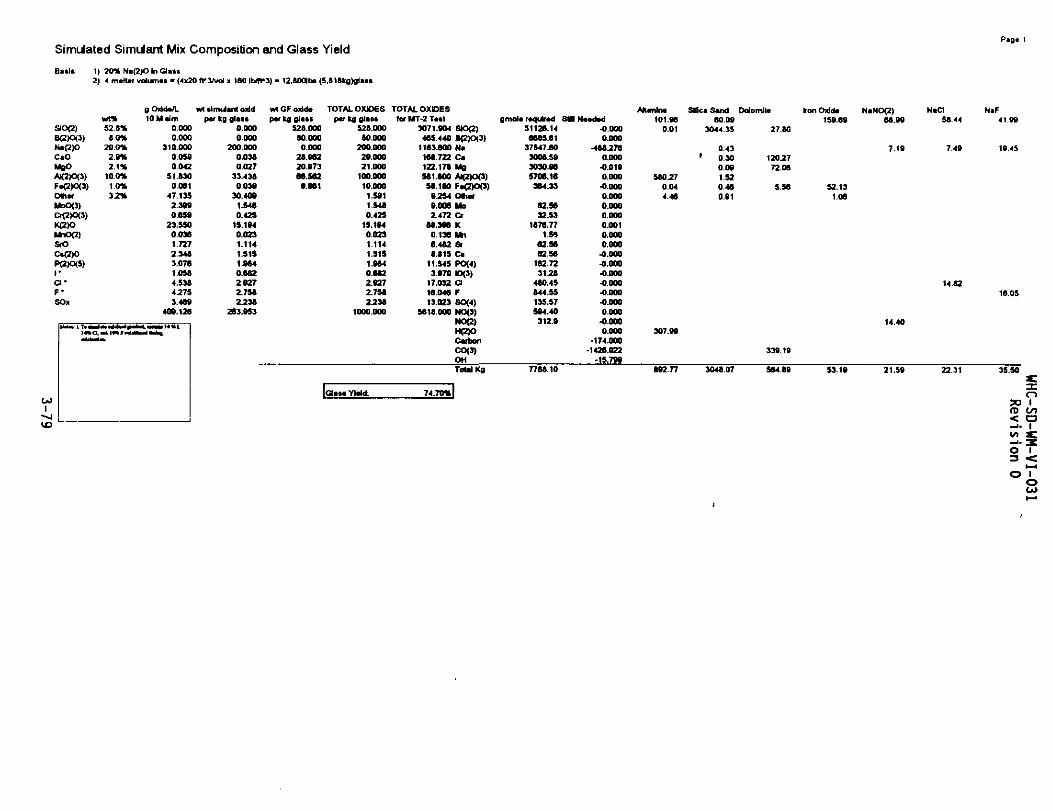
Simulated Simulant Mix Composition and Glass Yield
Bittr 1) 2 0 * Ni(2)O in Glact2) 4 miHu volum** - (4x20 ft*3A/oJ x 160 lbfft*3) - 12,800lb> (5,&18kg)(flaM
P»0«
SIO(2)B(2)CH3)Na{2)0CaOMgOAK2>O(3)F»(2>0<3)OttarMoO<3>Cr<2>0<3>K(2)OMnO(2)SrOC<2)0P(2)O(5)I*a*F*SOx
wt*52 8 *8.0*
20 0 *2.9*2.1*
10.0*1 0 *3 2 *
gOdoMLlOMdm
0.0000.000
310.0000.0590.042
51.6300.061
47.1352.3990.659
23.5500.0361.7272.3463.0761.0564.53842753.469
409.126
wt clnuiant oxtdp*t kg glait
0.0000.000
200.0000.0380.027
33.4360039
30.4091.5480.425
15.1940.0231.1141.5151.9640.6622.9272.7582238
263.953
wIGFoxIdap«( kg glati
528.00080.0000.000
28.98220.97386.582
9.961
TOTAL OXIDESp«r kg glacs
528.00080.000
200.00029.00021.000
100.00010.000
1.5911.S480.425
15.1940.0231.1141.5151.9640.6822.9272.7582238
1000.000
TOTAL OXIDESfor MT-2 TMt
3071.904 SK><2)485.440 B£)O(3}
1163.800 Na186.722 Cm122.176 Mg581.800 AK2)OO)
58.160 Fa£)O(3)9254 Ottw9.005 M B2.472 Cr
88.396 K0.136 Mn6.462 Sf8.815 Ca
11.545 PO<4)3.970 KH3)
17.032 Ct18.048 f13.023 SO<4)
5818.000 NO{3)MO<2)H(2)OCarbonCO(3)OH
gmola r*o>ir«d51128.148665.81
37547.803006.593030.965708.18364.33
62.5632.53
1676.771.54
82.5862.56
162.723128
460.45844.55135.57594.40
312.9
S W N M I M
-0.0000.000
-4882780.000
-0.0190.000
-0.0000.0000.0000.0000.0010.0000.000
-0.000-0.000-0.000-0.000-0.000-0.0000.000
-0.0000.000
-174.000-1428.022
-15.799
Aluminatoi.se
0.01
580270.044.48
307.99
Silica Sand60.09
3044.35
0.43' 0.30
0.091.520.460.91
Dolomite
27.60
1202772.08
5.56
339.19
bonOidda159.69
52.131.06
NaNO(2)68.99
7.19
14.40
NaCI58.44
7.49
14.8216.05
Total Kg 7768.10 692.77 3048.07 584.69 53.19 21.59 22.31 35.50
[Otatt YWd: 74.70%l Oya iID on< a-j. i
O I
O I
oCO
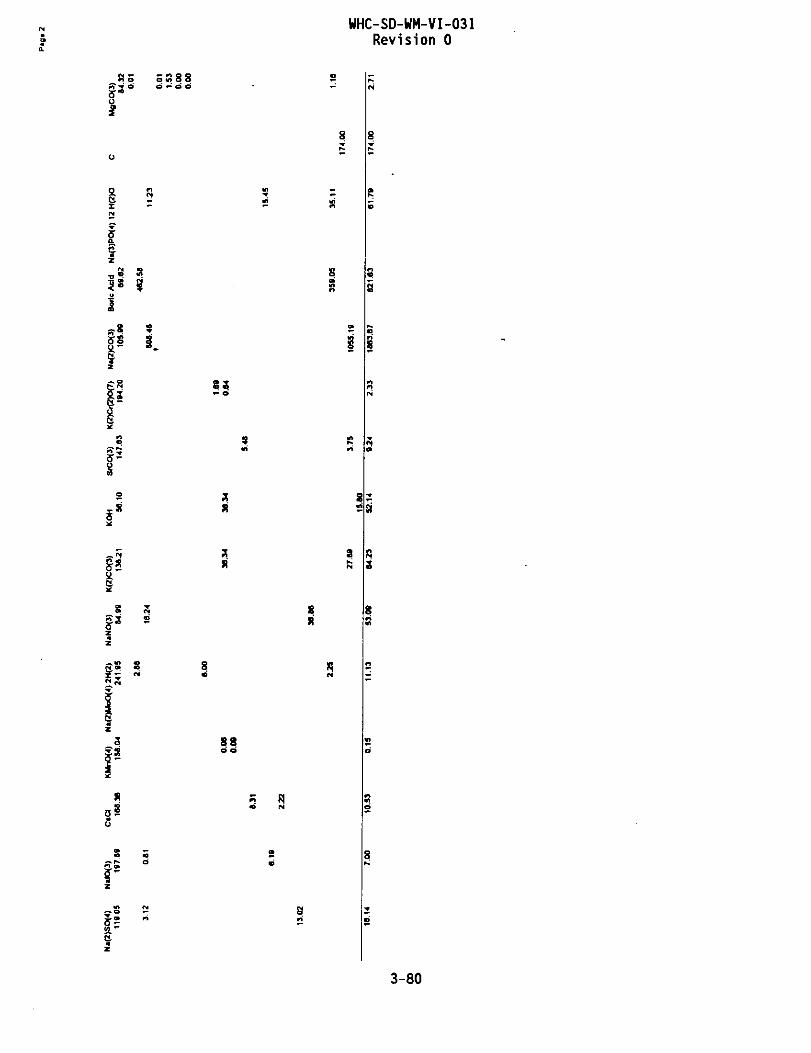
WHC-SD-WM-VI-031Revision 0
S3
n
3
I?
a •- o o
•a ao
o» f>
88
3-80

08/17/9S MT2BAUN.WB2VectraeGSI
PrefMTM*.
Mass Balance for MT-2, slurry feed
Prepared by: Brent Spurgeon
Checked by: John Koehr
J
RUu Balaam MT-2 >
Revi 5 ion 01 «T 13
Date: 08/17/95
Date: 08/17/95
General Information
Test Duration: 14.0 hr
Total Slurry Feed: 864.60 kg
Batch Ratio: wt. of RVR mix / wt. Simulant 1.07
wt. of Sugar / wt. simulant 0.084
Density of Simulant: 1.49 kg/liter
Molarity of Simulant: 10.00 M
Total Simulant: 401.39 kg
269.39 liters
Total RVR Mix: 429.49 kg
Total Sugar: 33.72 kg
v*cvttO5.xJ* • Throughput Summary
par whcvftoSjdi
par WHC inform
par <Mhcox.wti1
Total Glass Product:
Average Off-Gas flow rate:Total Off-Gas:
Average Particulate in Off-Gas:Total Particulate in Off-Gas:
Glass Composition:
ComponentSiO(2)B(2)O(3)Na(2)OCaOMgOAI(2)O(3)Fe(2)O(3)OtherTotal
406.42 kg =
204.70 kg/hr2865.80 kg
0.855 kg/hr =11.97 kg
896.0 Ib
Target Composition Actual Average Composition52.8%8.0%
20.0%2.9%2.1%
10.0%1.0%3.2%
100.00%
58.65%7.34%
15.61%2.93%2.26%9.53%1.01%2.67%
100.00%
4951 par Omri report
11.08%8.25%21.95%1.15%7.62%4.70%1.00%
16.56%
highlowlowhighhighlowhighlow
3-81

OS/17/95 WT2BALAN.WB2 ******Z!2- Checfcw 4^ Jv&VK a 1 OH 0 page 2 •! 13Vedra-tiSI M w Balance MT-2
RVR Mix Composition:
Silica SandBoric AcidDolomiteAluminaIron OxideMag. Carb.
59.61%16.17%10.87%11.61%
1.04%0.70%
3-82
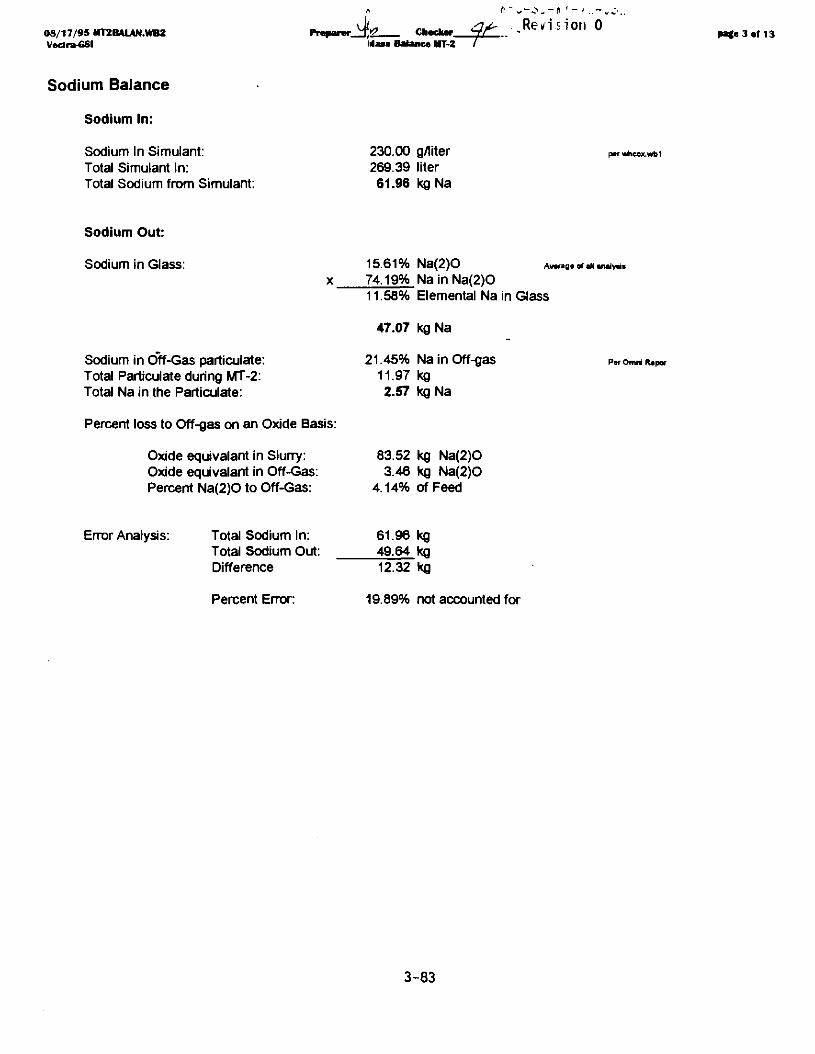
08/17/95 MT2BALAN.WB2Vectra-GSI
Preaarer. Checker. Ren si on 014MS Balance HT-Z
13
Sodium Balance
Sodium In:
Sodium In Simulant:Total Simulant In:Total Sodium from Simulant:
230.00 g/liter269.39 liter61.96 kgNa
p*r wticox.wbi
Sodium Out:
Sodium in Glass:
Sodium in Off-Gas particulate:Total Particulate during MT-2:Total Na in the Particulate:
Percent loss to Off-gas on an Oxide Basis:
Oxide equivalant in Slurry:Oxide equivalant in Off-Gas:Percent Na(2)O to Off-Gas:
15.61% Na(2)O74.19% NainNa(2)O11.58% Elemental Na in Glass
47.07 kg Na
21.45% Na in Off-gas11.97 kg2.57 kg Na
83.52 kg Na(2)O3.46 kg Na(2)O
4.14% of Feed
Avwag* of all analysis
Per Omni Rapor
Error Analysis: Total Sodium In:Total Sodium Out:Difference
Percent Error:
61.96 kg49.64 kg12.32 kg
19.89% not accounted for
3-83

08/17/95 MT28ALIN.WB2V«ctra-GSI
_y2 Checker.l l au Balanca MT-Z••2 r
Re w i s i on 0 4 •I1 13
Chloride Balance
Chloride In:
Chloride in Simulant: 5.672 g/1Total Simulant In: 269.39 literTotal Chloride from Simulant 1.53 kg
pet WHCoK.wbi
Chloride Out:
% Cl in Off-Gas Particulate:Total Particulate Out:Total Chloride Out in Off-Gas:
Percent Chloride lost to Off-Ga
' Chloride in Glass:Total Glass Out:Total Chloride in glass:
% Cl not accounted for:
Fluoride Balance
Fluoride In:
Fluoride in Simulant:Total Simulant In:
5.50%11.97 kg0.66 kg
43.09%
0.06%406.42 kg0.248 kg
Total Cl Out:
40.69%
4.75 g/l269.39 liter
Total Fluoride from Simulant:
0.906 kg
pwWHCox.wb1
1.28 kg
Fluoride Out:
% Fl in Off-Gas Particulate: 1.68%Total Particulate Out: 11.97 kgTotal Fluoride Out in Off-Gas: 0.20 kg
Percent Fluoride lost to Off-Ga 15.67%
Floride in Glass:Total Glass Out:Total Floride in glass:
% F not accounted for
0.13%406.42 kg0.539 kg
Total F Out:
42.25%
0.739 kg
3-84

08/17/95 UT2BUAN.WB2 PrmpamA^Z. Checker ^f¥" ReVJ S i Oil 0 pa^. 5 •IH3Vectra-GSt * » * • Balance KT-2 /
Iodide Balance
Iodide In:
Iodide in Simulant: 2.115 g/lTotal Simulant In: 269.39 liter
Total Iodide from Simulant: 0.57 kg
Iodide Out:
% Iodide in Off-Gas Particulate 1.52%Total Particulate Out: 11.97 kgTotal Iodide Out in Off-Gas: 0.18 kg
Percent Iodide lost to Off-Gas: 31.88%
Iodide in Glass: 203.00 ppmTotal Glass Out: 406.42 kgTotal Iodide in glass: 0.083 kg
Total I Out: 0.264 kg
% I not accounted for: 53.64%
3-85

08/17/95 MT2BAIAN.WB2Vectra-GSI Mass Balance HT-2
Revision 013
Cesium Balance
Cesium In:
Cesium in Simulant:Total Simulant In:
Cesium Out:
Cesium in Off-Gas:
Cesium in Glass:Total Glass Out:Total Cesium in glass:
% Cs not accounted for:
Strontium Balance
Strontium In:
Strontium in Simulant:Total Simulant In:Total Strontium In:
2.22 g/l269.39 liter
Total Cesium from Simulant:
Non Detectable
366.00 ppm406.42 kg0.149 kg
Total Cs Out:
75.07%
1.46 g/liter269.39 liter393.40 g
p*r WHCox.wbi
0.60 kg
0.149 kg
parWHCocwbi
Strontium Out:
Strontium in Off-Gas:Total Paniculate Out:Total Strontium in Off-Gas:
Percent Strontium lost to Off-Gas:
Strontium in Glass:Total Glass Out:Strontium out in glass:
Total Strontium Out:
% Strontium not accounted for
0.0040%11.97 kg
0.4788 g
0.12%
505.00 ppm406.42 kg205.24 g
205.72 g
47.71%
3-86

08/17/95 MT2BAIAN.WB2Vectr*GSI
y r c s vCfcadwr. Hf' ._Rg J j
Ma» Balance MT-2 /
j ni'i 0 pa*« 7 »f 13
Chromium Balance
Chromium in:
Cr(2)O(3) in Simulant:Total Simulant in:total Cr(2)O(3):
0.659 g/liter269.39 liter
0.177 kg
Chromium out:
Cr(2)O(3) in glass:Total Glass out:Cr(2)O(3) out in glass:
Cr out with particulate:total Particulate Out:Total Cr Out:% Cr in Cr(2)O(3):Cr(2)O(3) equivalent:
Total Cr(2)O(3) out:
% Excess:
Potassium Balance
Potassium in:
K(2)O in Simulant:Total Simulant In:Total K(2)O from Simulant:
Potassium Out:
K(2)O in glass:Total Glass Out:Total K(2)O in Glass:
Potassium in Particulate:Total Particulate Out:Total Potassium in Particulate:% K in K(2)O:K(2)O equivalent:
total K(2)O out:
% K(2)O not accounted for
2060.00406.42
0.84
0.06%11.97
0.007268.42%0.0105
0.85
477.78%
PPmkgkg
kgkg
kg
kg
23.55 g/liter269.39 liter
6.34 kg
0.63%406.42 kg
2.56 kg
3.94%11.97 kg0.471 kg
83.02%0.568 kg
3.13 kg
50.69%
3-87

08/17 /95 HT2BALAN.WB2Veetra-GSI
•__2 Ch«cker_Mat* BaUnce HT-2
..., Re H S 1 Oil 0 • ' 13
Manganese Balance
Manganese In:
MnO(2) in Simulant:Simulant In:Total MnO(2) in from Simulant:
Manganese Out:
MnO(2) in Glass:Total Glass Out:Total MnO(2) in Glass:
Mn in Particulate:total Particulate Out:Total Mn in Particulate:%MnirTMnO(2):MnO(2) equivilent:
total MnO(2) out:
% excess MnO(2):
Phosphorus Balance
Phosphorus in:
0.0362269.390.0098
0.0096%406.420.0388
0.0090%11.97
0.001163.22%0.0017
0.0405
415.23%
g/literliterkg
kgkg
kgkg
kg
kg
P(2)O(5) equivilant in Simulant:Total amount of Simulant in:Total P(2)O(5) equivilant in:
3.08 g/liter269.39 liter
0.829 kg
Phosphorus Out:
Phosphorus in Off-Gas Particulate:Total Particulate Out:Total Phosphorus out:
P(2)O(5) equivilant out:percent P(2)O(5) in Off-Gas:
P(2)O(5) in Glass:
Total P(2)O(5) Out:
% P(2}O(5> not accounted for:
0.055%11.97 kg
0.006524 kg
0.014949 kg1.80%
0.11%0.466 kg
0.481 kg
41.91%
3-88

08/17/95 HT2R4LAN.WB2Vectra-«SI
Preaarw ' VHC-SD-WM-VI-031
Checker i r Revision 0i la» Balance HT-2
pat* 9 •( 13
Silicon Balance
Silicon In:
%Silica Sand in RVR MIX:SiO(2) in Silica Sand:
total SiO{2) in RVR mix:
59 61%99 88%
255.71 kg
Silicon Out:
SiO(2) in product:Total Product Out:SiO(2) out:
% SiO(2) no? accounted for:
58.65%406.42238.36 kg
6.78%
Boron Balance
Boron In:
Boric Acid in RVR Mix:Total RVR Mix:Total Boric Acid In:
Boric Acid ->
Total Boron on Oxide Basis:
Boron Out:
16.17%429.49 kg
69.45 kg
56.30% B(2)O(3)
39.10 kgB(2)O(3)
Boron in Off-Gas Particulate:Total Particulate:Total Boron in Particulate:
B in B(2)O(3):
Total Boron on Oxide Basis:
Percent Lost to Off-Gas:
B(2)O(3) in glass:
Total B(2)O(5) out:
% not accounted for
7.31%11.97 kg0.88 kg
31.03%
2.82 kg B(2)O(3)
7.21%
7.45%30.28 kg
33.10 kg
15.35%
parWHCoiwbi
p«rWHCax.wb1
par Omni R*port
3-89

08/17/95 HT2BAUN.WB2 Pr**arer_[>(2 Check«r_^J/;;_._Re:« 1 S i Oil 0 pa<e10«f13V«rtra-GSI Mass Balance M T - 2 T
Calcium Balance
CaCO(3) in RVR Mix:
Silica SandBoric AcidDolomiteAluminaIron OxideMagnesium Carbonate
CaO in Simulant:
Total CaO In:
CaO in Glass:
% Missing:
Magnesium Balance
MgO in RVR Mix:
Silica SandBoric AcidDolomiteAluminaIron OxideMagnesium Carbonate
MgO in Simulant:
Total MgO In:
MgO in Glass:
% Missing:
0.03 kg0.00 kg
14.12 kg0.00 kg0.00 kg
0.005 kg
0.016 kg
14.16 kg
2.93%11.92 kg
15.83%
0.008 kg0.000 kg8.929 kg0.000 kg0.000 kg1.269 kg
0.011 kg
10.216 kg
2.26%9.19 kg
10.09%
3-90
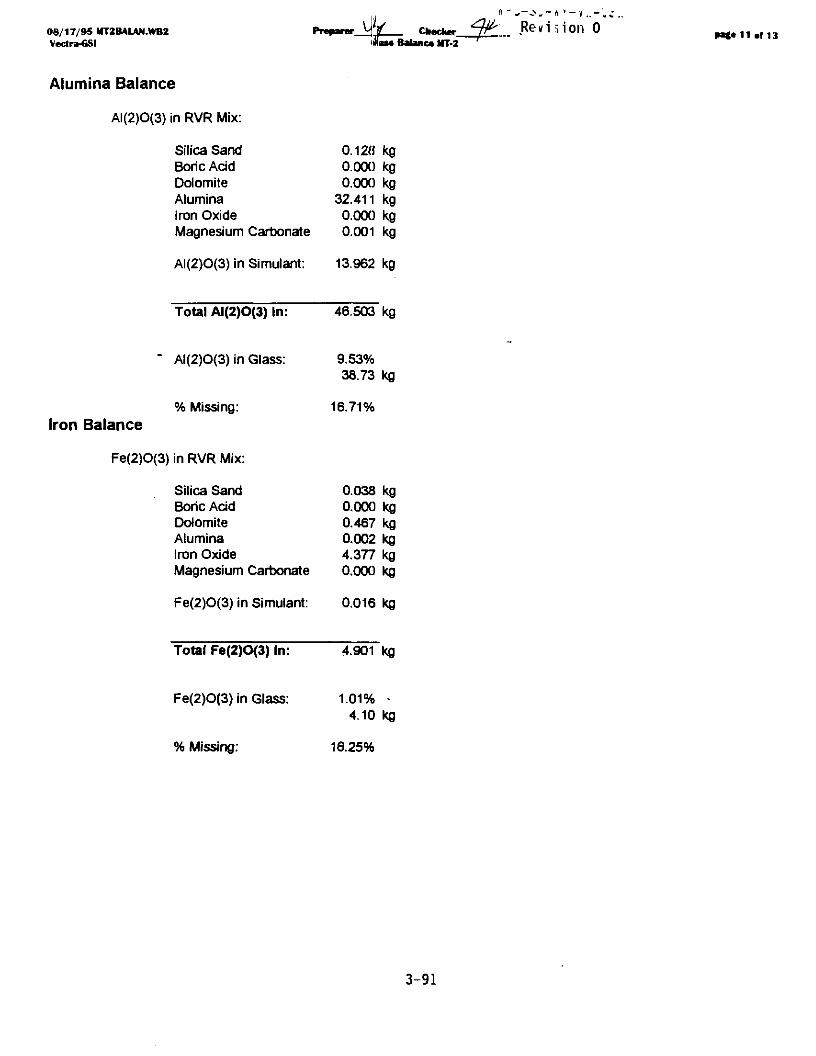
08/17/95 MT2R4LAN.WB2 Pr**ar«r_y / Checker *T7^*' R e v i s i o n 0 p a * e 1 1 . l 1 lV«ctr»6SI Watt Balance MT.2 'Vectr»«SI iMiau Balance HT-2
Alumina Balance
AI(2)O(3) in RVR Mix:
Silica SandBoric AcidDolomiteAluminaIron OxideMagnesium Carbonate
0.12H kg0.000 kg0.000 kg
32.411 kg0.000 kg0.001 kg
AI(2)O(3) in Simulant: 13.962 kg
Total AI(2)O(3) In: 46.503 kg
• AI(2)O(3) in Glass: 9.53%38.73 kg
% Missing: 16.71%Iron Balance
Fe(2)O(3) in RVR Mix:
Silica SandBoric AcidDolomiteAluminaIron OxideMagnesium Carbonate
0.038 kg0.000 kg0.467 kg0.002 kg4.377 kg0.000 kg
Fe(2)O(3) in Simulant: 0.016 kg
Total Fe(2)O(3) In:
Fe(2)O(3) in Glass:
% Missing:
4.901
1.01%4.10
16.25%
kg
kg
3-91

08/17 /95 WT2BAUN.WB2Vectra-GSI
Nitrogen Balance
Nitrogen In Simulant:
Mass Balance MT-2 'page 12 af 13
NO(3) in Simulant:Total NO(3):%N in NO(3):N from NO(3):
NO(2) in Simulant:Total NO(2):% N in NO(2):N from NO(2):
Na(4)EDTA in Simulant:Total Na(4)EDTA:% N in Na(4)EDTA:N from Na(4)EDTA:
196.365 g/liter52.90 xg
22.58%11.94 kg
76.683 g/liter20.66 kg
30.44%6.29 kg
56.187 g/liter15.14 kg
6.73%1.02 kg
par WHCox.Mrb1
par WHCox.wb1
Total Nitrogen from Simulant: 19.25 kg
Nitrogen compound out ofmelter:
Total Particulate Out: 11.97 kg
NO(3) in particulate: 0.020%0.0023 kg
N from NO(3): 0.0005 kg
par OMNI
par OMNI
NO(2) in particulate:
N from NO(2):
NH(3) in Particulate:
N in NH(3):N from NH(3):
NOx in Off-Gas:Total NOx in Off-Gas:N in NOx:Total N from NOx:
0.709%0.0849 kg0.0258 kg
0.001%0.00012 kg82.35%9.9E-05 kg
0.09864 kg/hr1.38096 kg30.44%
0.420295 kg
par OMNI
par OMNI
par OMNI
% NO(2)/NO(3) lost of particulate: 0 . 12%
NO(2)/NO(3) conversion to N: 97.55%
3-92

t>V &11 Revision 008/17/95 MT2RALAN.WB2 *npmr_Z./_ Checker fT • p^e 1 3 . , 1 3
Vedra-GSI Haas Balance MT-2 '
Sulfur Balance
Sulfur in:
SO(4) in Simulant:Total Simulant In:Total SO(4) in:%S in SO(4):
Total S in:
Sulfur out:
SO(3) in Glass:Total Glass Out:Total SO{3) out:% S in SO(3):Total S Tn Glass:
SO(2) in Off-Gas:
SO(4) in Off-Gas Particulate:Total SO{4) out:% S in SO(4):Total S in Particulate:
Total S out:
% missing:
4.16 g/liter269.39 iter
1.12 kg33.33%
0.37 kg
0.017%406.42 kg0.070 kg
40.00%0.028 kg
ND
5.28%0.632 kg
33.33%0.211 kg
0.239
36.19%
3-93

08/17/95 HT3B4LAN.W8ZVectra-GSI
Mass Balance for MT-3, V-SIM
Prepared by: Brent Spurgeon
Pmswwr'*- yp Revision 0• M S
Checked by: John Koehr
Mass Balance WT-3
Date: 08/17/95
Date: 08/17/95
General Information
V-SIM composition:
wticvH05.jd« • Throughput Summary
ComponentAluminaSilica SandDolomiteIron OxideNaNO{2)NaCI
NaFNa(2)SO(4)NalO(3)CsCIKMnO(4)NaMoO(4)NaNO(3)K(2)CO(3)KOHSrCO(3)K(2)Cr(2)O(7)Na(2)CO(3)Boric AcidNa(3)PO(4)*12H(2)OCarbonMag Cart.
Wt%11.500%39.100%
7.250%0.683%0.277%0.286%
0.456%0.207%0.090%0.135%0.002%0.014%0.681%0.825%0.669%0.119%0.030%
23.900%10.500%0.793%2.230%0.035%
100%
Test Duration:
Total Feed Durring Test:
220.0 Ib =
Average Off-Gas flow rate:Total Off-Gas:
Average Particulate in Off-Gas:Total Particulate in Off-Gas:
Total Glass Out:
151.0 Ib =
3 hr
99.79 kg
657.05 kg/hr £ « • " " -1971.15 kg
0.225 kg/hr0.675 kg
parwhcuttoSjds
68.49 kg
3-94

06/17/95 UT3BAUN.WB2Vectra-GSI
Preparer Checker.Mass Balance MT-3
Revision 02 «f 1 fi
Sodium Balance
Sodium In:
Sodium in V-Sim
Components with Sodium
ComponentNaNO(2)NaCINaFNa(2)SO(4)NalO(3)NaMoO(4)NaNO(3)Na(2)CO(3)Na(3)PO(4)*
wt% in
k12H(2)O
V-Sim0.277%0.286%0.456%0.207%0.090%
0.01%0.68%
23.90%0.79%
wt% Nain Component
33.33%39.35%54.76%32.39%11.62%12.57%27.06%43.40%18.16%
wt%Nain V-SIM
0.09%0.11%0.25%0.07%0.01%0.00%0.18%
10.37%0.14%
Total percentage of Na in V-SIM 11.23%
Total V-Sim Feed:Total Sodium Feed:
Equivalent Na(2)O:
Sodium Out:
99.79 kg11.21 kg
15.11 kg
Sodium in Off-Gas Particulate:Total Particulate in Off-Gas:Total Sodium Out:Na(2)O equivalent:
Percent Na lost to Off-Gas:
Na(2)O in Glass:Total glass Out:Total Na(2)O out of glass:
Total Na(2)O Out:
% not accounted for
19.35%0.675 kg0.131 kg0.176 kg
1.17%
16.10%68.49 kg11.03 kg
11.20
25.85%
3-95

0 8 / 1 7 / 9 5 MT3BALAN.WB2Vect ra-GSI
Prcparer.
- - 1 - * ' Y _ , _
Checkeritfau Balance NT-3
ft v
' Revi siort 0I S
Chloride Balance
Chloride In:
Chloride in V-Sim:
ComponentNaCICsCI
wt%In V-SIM in
0.286%0.135%
Total Cl percentage in V-SIM
Total V-Sim Feed:Total Chloride Feed:
Wt% ClComponent
60.68%21.08%
99.790.20
wt% Clin V-SIM
0.17%0.03%0.20%
kgkg
Chloride Out:
Chloride in Particulate: 9.07%Total Particulate in Off-Gas: 0.675 kgTotal Chloride in Particulate: 0.06 kg
Percent loss to Off-Gas: 30.35%
Chloride in Glass: 0.10%Total Glass Out: 68.49 kgTotal Chloride in Glass: 0.068 kg
% not accounted for: 66.02%
3-96

08/17/95 HT3BUAN.WB2Vec*ra-GSI
j o n
H.us Balance MT-3
Fluoride Balance
Fluoride In:
Fluoride in V-Sim:
ComponentNaF
Total V-Sim Feed:Total Fluoride Feed:
Fluoride Out:
Fluoride in Particulate:Total Particulate in Off-Gas:Total Fluoride in Particulate:
Percent loss to Off-Gas:
wt% wt% F wt%In V-SIM in Component in V-SIM
0.00456 45.24% 0.21%
99.79 kg0.21 kg
0.84%0.675 kg0.01 kg
2.74%
Fluoride in Glass:Total Glass Out:Total F in Glass:
Total F out:
% not accounted for:
0.16%68.49 kg0.109 kg
0.115 kg
44.30%
3-97

08/17/95 HT3BALAN.WB2Vectr»6SI
•*repareOt£ Checker.Hau Balance WT-3
• !*"-'C-SD-WM-VJ-031Revis ion 0 page 5 •!' IS
Iodide Balance
Iodide In:
Iodide in V-Sim:
ComponentNalO(3)
Total V-Sim Feed:Total Iodide Feed:
wt% wt% I wt% IIn V-SIM in Component in V-SIM0.090% 64.14% 0.06%
99.79 kg0.06 kg
Iodide Out:
Iodide in Particulate: 1.80%Total Particulate in Off-Gas: 0.675 kgTotal Iodide 1n Particulate: 0.01 kg
Percent loss to Off-Gas: 21.13%
I in Glass:Total glass Out:total I in Glass:
Total I out:
% not accounted for:
199.5 PPM68.49 kg0.014 kg
0.026 kg
55.15%
3-98

08/17/95 KT3BA1AN.WB2Veetr^GSI
Jte * 1 5 i On 0Mau Balance MT-3
Cesium Balance
Cesium In:
Iodide in V-Sim:
ComponentCsCI
Total V-Sim Feed:Total Cesium in Feed:
Cesium Out:
Cesium in Off-Gas:
Cs(2)0 in GlassTotal Glass Out:Total Cs(2)O in Glass:Total Cs in glass:
% not accounted for
wt% wt% Cs wt% CsIn V-SIM in Component in V-SIM
0.135% 78.93% 0.11%
99.79 kg0.11 kg
Non Detectable
0.057%68.49 kg0.039 kg0.037 kg
65.38%
3-99
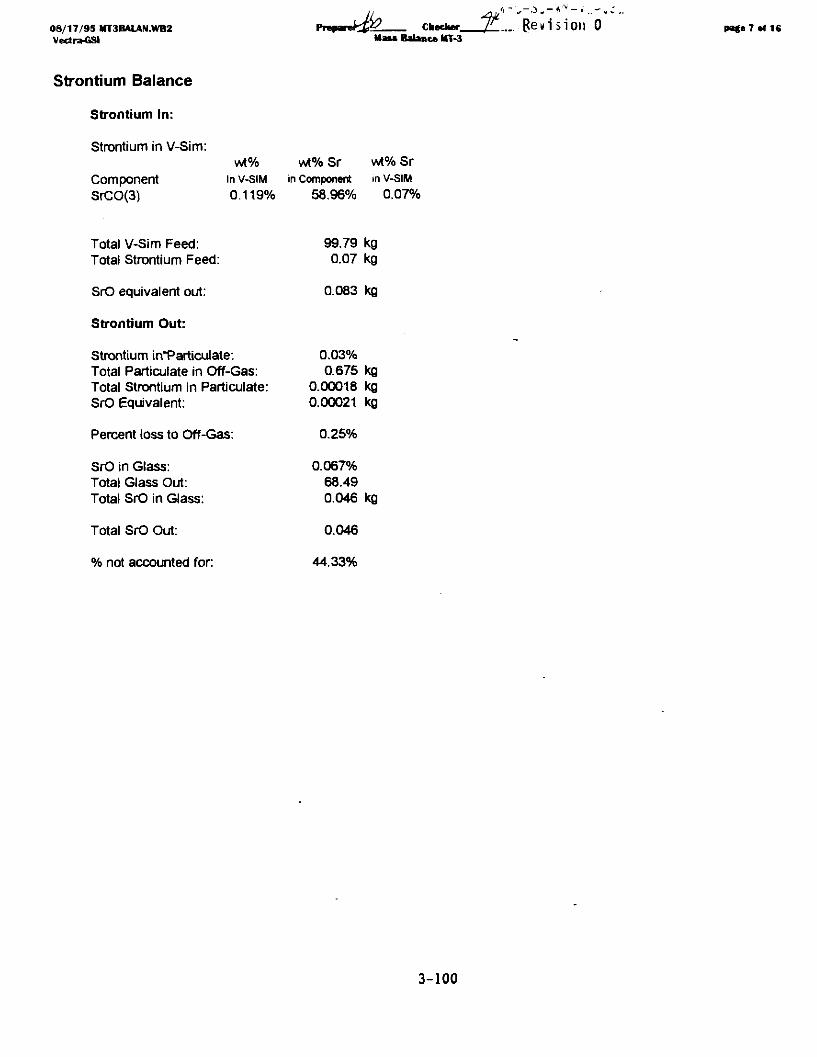
08/17/9S MT3BALAN.WB2Vectra-GSI
Checker.Mat* Balance MT-3
.... (tevision 0 page 7 • ( 16
Strontium Balance
Strontium In:
Strontium in V-Sim:
ComponentSrCO(3)
wt% wt% Sr wt% SrIn V-SIM in Component in V-SIM
0.119% 58.96% 0.07%
Total V-Sim Feed:Total Strontium Feed:
SrO equivalent out:
Strontium Out:
Strontium inTarticulate:Total Particulate in Off-Gas:Total Strontium in Particulate:SrO Equivalent:
Percent loss to Off-Gas:
SrO in Glass:Total Glass Out:Total SrO in Glass:
Total SrO Out:
% not accounted for:
99.79 kg0.07 kg
0.083 kg
0.03%0.675 kg
0.00018 kg0.00021 kg
0.25%
0.067%68.490.046 kg
0.046
44.33%
3-100

08/17/95 MT3BALAN.WB2VectratiSI
Preparei Checker.tlat* Balance HT-3
-VPC-SO-WM-VI-031Revision 0 16
Phosphorus Balance
Phosphorus In :
Phosphorus in V-Sim:
wt% wt% P wt% PComponent In V-SIM in Component in V-SIMNa(3)PO(4) * 12H(2)O 0.793% 8.16% 0.06%
Total V-Sim Feed:Total Phosphorus Feed:
P<2)0(5) equivalent:
Phosphorus Out:
Phosphorus "Tn Particulate:Total Particulate in Off-Gas:Total Phosphorus in Particulate:P(2)O(5) equivalent:
Percent loss to Off-Gas:
P(2)O(5) in Glass:Total Glass Out:
Total P(2)O(5) in Glass:
Total P(2)O(5) Out:
% not accounted for:
99.79 kg0.06 kg
0.148 kg
0.03%0.675
0.00020.0004
0.26%
0.15%68.490.103
kgkgkg
kgkg
0.103
30.25%
3-101

08/17 /95 MT3BALAN.WB2Vect ra-GSI
Boron Balance
Boron In:
Boron in V-Sim:
ComponentBoric Acid
Pnpanr,lilau Balance MT-3
*I16
wt% wt% B wt% BIn V-SIM in Component in V-SIM
10.500% 17.47% 1.83%
Total V-Sim Feed:Total Boron Feed:
99.79 kg1.83 kg
B(2)O(3) equivalent:
Boron Out:
Boron in Particulate:Total Particulate in Off-Gas:Total Boron in Particulate:B(2)O(3) equivalent:
Percent loss to Off-Gas:
B(2)O(3) in Glass:Total Glass Out:Total B(2)O(3) in glass:
Total B(2)O(5) OUT:
% not accounted for:
5.90 kg
11.85%0.675 kg0.080 kg0.258 kg
4.37%
7.60%68.49 kg5.21 kg
5.46 kg
7.94%
3-102

08 /17 /95 MT3BALAN.WB2Vectra-GSl
CheckerMass Balance MT-3
.Revision 0 nafe 10.116
Alumina Balance
Alumina In:
ComponentWt%
in V-SimWt% AI(2)O(3)
in Alumina
Wt% AI(2)O(3)
TotalAlumina
Total V-Sim Feed:Total AI{2)O{3) in:
Alumina Out:
Al in Particulate out:Total Particulate Out:Total Al Out:AI(2)O(3) equivalent:
A|(2)O(3) in Glass:Total Glass Out:Total AI(2)O(3):
Total AI(2)O(3) out:
% not accounted for
11.500% 65.00%
99.79 kg7.46 kg
1.029%0.675
0.0069 kg0.0131 kg
9.60%68.49 kg
6.58 kg
6.59
11.68%
7.48%
Silica Balance
Silica In:
ComponentSilica SandDolomite
Total V-Sim Feed:Total SiO(2) in:
Silica Out:
Si in Particulate:Total Particulate:Total Si in ParticulateSiO(2) equivalent:
SiO(2) in Glass:Total Glass Out:Total SiO(2) in Glass:
Total SiO(2) Out:
% excess:
Wt%in V-Sim39.100%
7.250%
Wt% SiO(2)
in Component
99.80%5.00%
99.7939.30
0.92%0.675
0.00620.0133
57.44%68.4939.34
39.36
0.14%
Wt% SiO(2)
Total39.02%0.36%
39.38%
kgkg
kgkgkg
kgkg
kg
3-103

08/17/95 MT3BALAN.WB2V«ctn»-tiSI
Prepare*. Checker 7 r ... J^e W i S 1 OH 0Balance MT-3
page 11 t i n ;
Calcium Balance
Calcium In:
ComponentWt% Wl% CaO Wt% CaO
in V-Sim in Component TotalDolomite
Total V-Sim Feed:Total CaO in:
Calcium Out:
CaO in Glass:Total Glass Out:Total CaO in Glass:
% not accounted for:
7.250% 30.24% 2.19%
99.79 kg2.19 kg
2.94%68.49 kg
2.01 kg
8.09%
Magnesium Balance
MgO In:
ComponentDolomiteMag Cart).
Total V-Sim Feed:Total MgO:
MgO Out:
MgO in Glass:Total Glass Out:Total MgO in Glass:
% excess:
Wt%in V-Sim
7.250%0.035%
Wt%MgO
in Component19.13%42.20%
99.791.40
2.23%68.49
1.53
9.22%
Wt%MgOTotal
1.39%0.01%1.40%
kgkg
kgkg
3-104

sto, WHC-SD-WM-VI-03.1.08/17/95 MT3&UAN.WB2 Vnpanr^lg. Ctiacfcw ^IK . Dpuicinn 0 P^« 12 «f ISVectr»*SI M«» Balanc* HT-3 ' I\tt\l5-IUM U
Iron Balance
Iron In:
ComponentIron Oxide
Total V-Sim Feed:Total Fe(2)O(3) in:
Iron Out:
Fe(2)O{3) in GlassTotal Glass Out:Total Fe(2)O(3) in
Wt%in V-Sim
0.683%
Glass:
Wt%Fe(2)C(3)
in Component
98.00%
99.790.67
0.99%68.490.68
Wt% Fe{2)0
Total0.67%
kgkg
kgkg
% excess: 1.86%
Chromium Balance
Chromium In:Wt%
Component in V-SimK(2)Cr(2)O(7) 0.030%
Total V-Sim Feed:Total Cr(2)O(3) in:
Chromium Out:
Chromium in Particulate:Total Particulate Out:Total Chromium in Particulate:Cr(2)O(3) equivalent:
Cr(2)O(3) in Glass:Total Glass Out:Total Cr(2)O(3) in Glass:
Total Cr(2)O(3) Out:
% excess:
Wt% Cr(2)O{3) Wt% Cr(2)0
in Component Tota l
51.70% 0.02%
99.79 kg0.0155 kg
0.037%0.675 kg
0.00025 kg0.00036 kg
0.26%68.49 kg
0.1781 kg
0.1784 kg
1052.89%
3-105

08/17/95 MT3R4UN.WB2Vectra-GSI
Preparer_EZHaas Balance MT-3 '
... JRewision 0 page 13 •( 16
Manganese Balance
Manganese In:
ComponentKMnO{4)
Total V-Sim Feed:Total MnO(2) in:
Manganese Out:
Wt%in V-Sim
0.002%
MnO(2) in Glass:Total Glass Out:Total MnO(2) in Glass:
% Excess:
Wt% MnO(2)
in Component
55.03%
99.790.0011
0.009%68.490.006
479.99%
Wt% MnO(2
Total0.0011%
kgkg
kgkg
Molybdenum Balance
Molybdenum In:Wt%
Component in V-SimNaMoO(4) 0.014%
Total V-Sim Feed:Total MoO(3) in:
Molybdenum Out:
MoO(3) in Glass:Total Glass Out:Total MoO(3) in Glass:
Wl%MoO(3)in Component
78.63%
99.790.0110
0.16%68.49
0.11
Wt%MoO(3
Total0.0110%
kgkg
kgkg
% Excess: 885.13%
3-106

08/17 /95 HT3BAIAN.WBZV«ctra-GSI
•i &# awctar__4/!:_._Rennon 0Mas* Balance MT-3 /
pa<« 14 »t US
Potassium Balance
Potassium In:
ComponentWt%
in V-SimWt%K(2)O
in Component
Wt%K(2)O
TotalKMnO(4) 0.002% 59.46%K(2)CO(3) 0.825% 68.12%KOH 0.669% 167.86%K{2)Cr(2)O(7) 0.030% 31.97%
0.0012%0.5620%1.1230%0.0096%
1.70%
Total V-Sim In: 99.79 kg
Total K(2)O in V-Sim: 1.69 kg
Potassium Out:
Potassium in Particulate: 3.44%Total Paniculate out: 0.675 kgTotal Potassium in Particulate: 0.023 kgK(2)O equivalent: 0.028 kgK(2)O in Glass: 0.82%Total Glass Out: 68.49 kgTotal K(2)O in Glass: 0.558 kg
Total K(2)O Out: 0.586 kg
% not accounted for: 65.36%
3-107

08/17/95 MT3BAUN.WB2Vcctra-GSI
Carbon Balance
Carbon In:
ComponentDolomiteK(2)CO(3)SrC0(3)Na(2)CO(3)CarbonMag Cart.
Total V-Sim In:total C in V-Sim:
// Checker,Mau Balance HT-3
Revis ion 0 15 ef 16
wt%in V-Sim
7.250%0.825%0.119%
23.900%2.230%0.035%
wt%cin Component
12.17%8.68%8.13%
11.32%100.00%10.09%
99.795.89
wt%cTotal
0.8825%0.0716%0.0097%2.7057%2.2300%0.0035%5.9031%
kgkg
Carbon Out:
C in Off-Gass:
Carbon Dioxide Out:
Carbon Equivalent:
Carbon Monoxide Out:
Carbon equivalent:
Total C in Off-Gas:
C in Glass:
5.75 kg/hr17.25 kg4.71 kg
0.82 kg/hr2.46 kg1.06 kg
5.76 kg
Total
%not
Total Carbon in GlassTotal Glass Out:Total C in Glass:
COut:
accounted for
0.0033%68.49
0.0023
5.77
2.10%
kgkg
kg
3-108
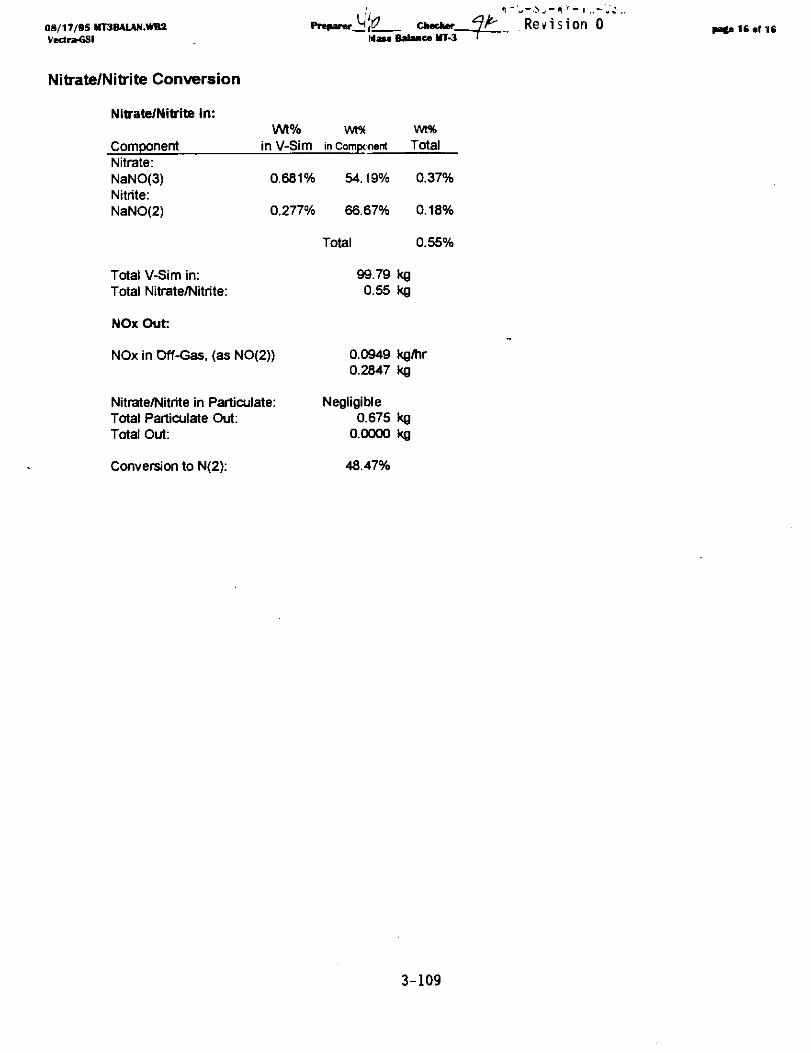
08/17/95 KT3BAUN.WB2Vectr»fiSI
Nitrate/Nitrite Conversion
Nitrate/Nitrite in:
Pnmanr_2 _ Checker.lilass Balance MT-3
ComponentNitrate:NaNO(3)Nitrite:NaNO(2)
Wt%in V-Sim
0.681%
0.277%
Total V-Sim in:Total Nitrate/Nitrite:
NOx Out:
NOx in Off-Gas,
Nitrate/Nitrite inTotal ParticulateTotal Out:
(as NO(2))
Particulate:Out:
wwtin Compc nent
54.19%
66.67%
Total
99.790.55
0.09490.2847
Negligible0.675
0.0000
wt%Total
0.37%
0.18%
0.55%
kgkg
kg/hrkg
kgkg
Revision 0
Conversion to N(2): 48.47%
3-109

WHC-SD-WM-VI-031Revision 0
This page intent ional ly l e f t blank,
3-110

To
Distribution
Project Title/Work
VECTRA GSI, Inc.Report
Order
Low-Level
Name
DISTRIBUTION SHEETFrom
Waste Product Technology
Waste Melter Testing Phase 1 Test
MSINText
With AllAttach.
Text
Page 1 of 2
Date 02/7/96
EDTNo. 611890[WHC-SD-WM-VI-031,Rev. 0]
ECN No.
Only Attach./Appendix
Only
EDT/ECNOnly
QFFSITE
VECTRA GSI. Inc.500 Exectutive Parkway, Suite 500San Ramon, CA 94583
G. Klein (2)
VECTRA Technologies2939 Richardson RoadRichland, WA 99352
M. Hall (2)B. Spurgeon (2)
VECTRA Technologies107 Carpenter Drive, Suite 110Sterling, VA 20164
K. Allen (2)
VECTRA Waste ServicesOne Harbison Way, Suite 209Columbia, SC 29212-3408
P. Denault (2)
Roger B. EK & Associates, Inc2711 226th Ave SEIssaquah, WA 98027
R. B. Ek
Washington State Departmentof Ecology
Nuclear Waste ProgramP.O. Box 47600Olympia, WA 98504-7600
J. Granthum (2)
A-6000-135 (01/93) WEF067

To
Distribution
Project Title/Work
VECTRA GSI, IncReport
Order
Low-Level
Name
DISTRIBUTION SHEETFrom
Waste Product Technology
Waste Melter Testing Phase 1 Test
MSINText
With AllAttach.
Text
Page 2 of 2
Date 02/7/96
EDTNo. 611890[WHC-SD-WH-VI-031,Rev. 0]
ECN No.
Only Attach./Appendix
Only
EDT/ECNOnly
ONSITE
U.S. Department of Energy.Richiand Operations Office
N. R. BrownL. A. HuffmanJ. C. PeschongG. H. SandersC. L. Sohn
Pacific Northwest National Laboratory
C. J. FreemanD. VelaJ. H. WestsikG. A. Whyatt
Westinahouse Hanford Company
M. J. BowmanK. C. BurgardR. P. ColburnD. W. DuncanW. C. EatonP. FeiiseJ. S. GarfieldR. L. GibbyD. W. HendricksonB. A. HigleyS. L. LambertE. S. MastR. J. MurkowskiS. R. NelsonR. M. OrmeC. A. PetersenE. H. RandklevJ. W. ShadeG. E. StegenD. J. WashenfelderC. N. Wilson (5)Central Files (orig. +1)
K6-51K6-51K6-51S7-53K6-51
P7-41K6-51K9-80P7-19
Gl-25H5-03H5-27B4-55H5-27B4-55H5-49H5-27L5-31H5-27H5-27S3-90H5-03B4-55H5-27H5-27H5-27H5-27H5-27H5-61H5-27A3-88
XX
XX
XX
X
XXX
XXX
XX
XX
XXXXXX
A-600Q-135 (01/93) WEF067