EEI National Key Accounts Workshop - Edison Electric Institute
Upload
khangminh22Category
view
0download
0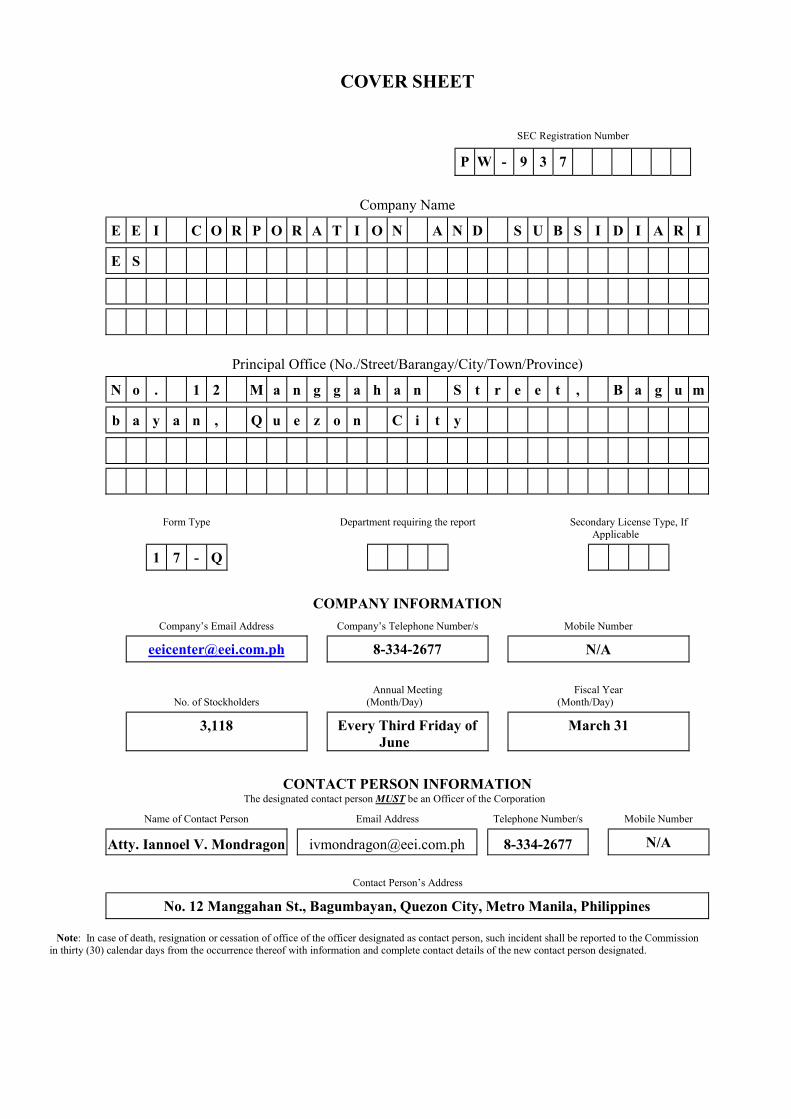
COVER SHEET
SEC Registration Number
P W - 9 3 7
Company Name
E E I C O R P O R A T I O N A N D S U B S I D I A R I
E S
Principal Office (No./Street/Barangay/City/Town/Province)
N o . 1 2 M a n g g a h a n S t r e e t , B a g u m
b a y a n , Q u e z o n C i t y
Form Type Department requiring the report Secondary License Type, If
Applicable
1 7 - Q
COMPANY INFORMATION
Company’s Email Address Company’s Telephone Number/s Mobile Number
[email protected] 8-334-2677 N/A
No. of Stockholders Annual Meeting
(Month/Day) Fiscal Year
(Month/Day)
3,118 Every Third Friday of June
March 31
CONTACT PERSON INFORMATION The designated contact person MUST be an Officer of the Corporation
Name of Contact Person Email Address Telephone Number/s Mobile Number
Atty. Iannoel V. Mondragon [email protected] 8-334-2677 N/A
Contact Person’s Address
No. 12 Manggahan St., Bagumbayan, Quezon City, Metro Manila, Philippines Note: In case of death, resignation or cessation of office of the officer designated as contact person, such incident shall be reported to the Commission
within thirty (30) calendar days from the occurrence thereof with information and complete contact details of the new contact person designated.

SEC FORM 17-Q
QUARTERLY REPORT PURSUANT TO SECTION 17 OF THE SECURITIES
REGULATION CODE AND SRC RULE 17 (2)(b) THEREUNDER 1. For the quarterly period ended March 31, 2022 2. Commission identification number 937 3. BIR tax identification number 000-391-438-000 4. Exact name of issuer as specified in its charter - EEI Corporation 5. Province, country or other jurisdiction of incorporation or organization Quezon City, Philippines 6. Industry Classification Code (SEC use only) 7. Address of issuer's principal office/Postal code No. 12 Manggahan St., Bagumbayan, Quezon City 1110 8. Issuer’s telephone number, including area code (02) 8334-26-77 9. Former name, former address and former fiscal year, if changed since last report Not Applicable 10. Securities Registered pursuant to Sections 4 and 8 of the RSA
Title of each class Number of shares outstanding Common Shares-P=1.00 par value
No. of Shares
Amount
Authorized 2,000,000,000 2,000,000,000 Issued and Outstanding 1,036,281,485 1,036,281,485
Preferred Shares -P=0.50 par value Authorized 240,000,000 120,000,000 Issued and Outstanding
Series A 15,000,000 7,500,000 Series B 45,000,000 22,500,000
11. Are any or all of the securities listed on a Stock Exchange? Yes [x] No [ ] If yes, state the name of such Stock Exchange and the class/es of securities listed therein: Philippine Stock Exchange, Inc. Common Shares 12. Indicate by check mark whether the registrant:
(a) has filed all the reports required to be filed by Section 17 of the Code and SRC Rule 17 thereunder or Sections 11 of the RSA and RSA Rule 11(a)-1 thereunder, and Sections 26 and 141 of the Corporation Code of the Philippines, during the preceding twelve (12) months (or for such shorter period the registrant was required to file such reports)
Yes [x] No [ ] (b) has been subject to such filing requirements for the past ninety (90) days. Yes [x] No [ ]
PART I - FINANCIAL INFORMATION Item 1. Financial Statements The Interim Condensed Consolidated Financial Statements of EEI Corporation and Subsidiaries as of March 31, 2022 with comparative figures for the period ended December 31, 2021 and March 31, 2022, Supplementary Information and Disclosures Required under Revised SRC Rule No. 68 and Schedule of Aging of Accounts Receivable are incorporated by reference as Exhibit 1.
Item 2. Management's Discussion and Analysis of Financial Condition and Results of Operations A. Results of Operations
EEI Corporation (the Parent Company) had a productive first quarter as it continued to obtain new contracts and work on its existing pipeline of projects. The COVID-19 Omicron variant in January 2022 threatened to disrupt the ongoing construction operations, but the existing health protocols in place and extensive vaccine rollout within the Company prevented work stoppages from happening. This as the Parent Company continues to monitor its employees’ health, as well as implement strict health protocols at its job sites to minimize possible COVID-19 transmissions and infections.
For the first quarter of 2022, EEI Corporation and subsidiaries’ (collectively, the Group) consolidated revenues reached ₱3.2 billion. Revenues from domestic construction decreased by 17% to ₱2.8 billion caused by the delays in the Parent Company’s infrastructure projects, while merchandise sales also decreased by 45% to ₱51.2 million. These were partially offset by the 72% increase to ₱334.8 million in revenues from services.
EEI’s costs and expenses decreased by 14% to ₱2.7 billion, primarily due to the decrease in construction contracts by 17% to ₱2.4 billion, and costs from merchandise sales by 45% to ₱45.8 million. Cost of services, on the other hand, increased by 55% to ₱253.3 million.
Equity earnings in associates and joint ventures increased by 26% to ₱224.4 million. The earnings of Al-Rushaid Construction Company Limited (ARCC), the EEI’s joint venture in Saudi Arabia, increased by 9% to ₱141.3 million. The combined earnings from investments in Petro Wind Energy, Inc. and Petro Solar Corporation likewise increased by 59% to ₱77.3 million. EEI’s joint ventures with Shimizu-Fujita-Takenaka, Acciona, and Saiga-Showa collectively earned ₱5.7 million.
The Group’s selling and administrative expenses decreased by 5% to ₱353.2 million, as savings were achieved from personnel related expenses and depreciation. This was slightly offset by increases in training expenses and transport and travel, particularly due to easing COVID-19 restrictions. Interest expense and finance charges decreased by 10% to ₱105.6 million due to lower borrowing rates that decreased to 2.5%-3.25% in 2022, from 3.00%-3.25% in 2021 while interest income increased by ₱19.4 million as a result of the earnings from short term money market placements.
For the period ended March 31, 2022, the Group’s net income increased by 53% to ₱209 million. The Group’s earnings per share for the first quarter of 2022 was at ₱0.13.
B. Financial Position
EEI’s consolidated assets slightly decreased by 2% to ₱31.5 billion, compared to ₱32.2 billion by the end of 2021. Cash and cash equivalents deceased by 13% to ₱6.2 billion mainly due to loan repayments and dividend payment to preferred shares, while receivables increased by 21% to ₱2.9 billion as a result of increased billings to various construction clients during the period. Contract assets decreased by 6% to ₱8.2 billion as the Group was able to convert the unbilled production into trade receivables. Inventories went up

by 5% to ₱1.3 billion as the Parent Company increased the procurement of construction materials for newly awarded and on-going projects. Other current assets saw an increase of 6% due to higher advances to suppliers and subcontractors and prepaid expenses. Investments in associates and joint ventures increased by 8% to ₱3.5 billion as ARCC, Petrosolar, and Petrowind Energy continue to exhibit growth.
Consolidated liabilities decreased by 4% to ₱18.0 billion during the first quarter of 2022. Bank loans decreased by 6% to ₱3.1 billion while total long term debt decreased by 11% to ₱7.4 billion due to loan repayments. On the other hand, the current and non current portions of contract liabilities increased by 32% and 21%, respectively, as a result of advance payments collected for construction contracts. Retirement liabilities increased by 70% to ₱63.3 million as the Group recognized retirement expense accrued for the period while other non-current liabilities decreased by 5% as a result of the settlement of retention payables.
The Group ended the first quarter of 2022 with a total consolidated equity of ₱13.5 billion and book value per share of ₱7.27.
C. Operating Highlights Newly Awarded Buildings
- Megaworld’s Arcovia Palazzo (Residential) Infrastructure
- NLEX - Strenghtening Of Thirteen(13) Link Slab Of The Candaba Viaduct North Bound - NLEX - Construction Of SFEX Capacity Expansion Project - MMSP - CP 101 Supply and Fabrication of Thrust Frame and Cradle - MCRP - CP-5 Site Development and Retaining Wall (Posco Of Korea)
Electromechanical - Capitol Steel Corporation’s Rolling Mill 1 CSA Works
ARCC - SABIC - Furnace 5 Partial Retubing at JUPC - 21 VCM Furnace TH-1301 A/B Repair Jobs at Petrokemya South
Completed Projects Buildings
- Torre Lorenzo Development Corporation’s Torre Lorenzo Malate in Malate, Manila Infrastructure
- The Metro Manila Skyway Stage 2, Sucat - Alabang Viaduct Improvement under San Miguel Corporation
- NLEX – Meycauayan and Bigaa bridge Strengthening Project - Metro Manila Subway Project - North Avenue Station Site Preparation Works
Electromechanical - D&L - Fabrication of 2 Units Reactors and 2 Units Drop T - Temporary Works for the Atimonan Power Plant Project - Integrated Synergy Const. - Site Preparation Work (Zones 3 & 4) at Atimonan Powerplant Project - Analog B3 South Project
ARCC - Saudi Aramco - Abqaiq Plant Restoration (Manpower Supply)
Ongoing Projects Buildings
- Federal Land’s Four Seasons Riviera – Podium and Tower 3 - Federal Land’s Seasons Residences 4-Towers (formerly known as Sunshine Fort) - Federal Land’s Big Apple – Park Avenue Building, all in Bonifacio Global City, Taguig - Federal Land’s Grand Hyatt Manila Gold Residences 2 - Superstructure - Federal Land’s IMET BPO Towers 2, 3, and 4 - Federal Land’s Grand Midori Ortigas

- SMDC’s Air Residences in Makati City - SMDC’s Glam Residences in Quezon City - SMDC’s Light Residences Phase 1 and 2 in Mandaluyong - SMDC’s Ice Tower - SMDC’s Sands Residences - Torre Lorenzo Development Corporation’s 3 Torre Lorenzo in Malate, Manila - Torre Lorenzo Development Corporation’s Torre Lorenzo Loyola in Quezon City - Cyberzone Properties’ Cebu Cyberzone Tower 3 and 4 - Filinvest Land’s Clark Mimosa Lifestyle Mall in Angeles, Pampanga - Cebu Landmasters’ The Masters Tower Project - The Yuchengco Centre Phase 1-Demolition & Excavation
Infrastructure - Metro Manila Subway Project – Phase 1 - Metro Manila Subway Project – Demolition Works for North Avenue Station, Quirino Highway
Tandang Sora and Depot Building Compound - Metro Manila Subway Project CP-101 Construction of Light Repair Shop (Civil, Structural,
Architectural Package) - Metro Manila Subway Project - Temporary Yard Development & Piling Work for Depot - Malolos Clark Railway Project CPN 04 (JV Portion with ACCIONA) - Malolos-Clark Railway Project (MCPR) CP N-05 (Site Clearing and Earthworks Package #1) - Malolos-Clark Railway Project (MCRP) CPN-04 Subcon Package - RC Works Under Ground and
Viaduct Structures - Malolos-Clark Railway Project (MCRP) CPN-04 Structural BR 107 Steel Through Girder - Design and construction of the MRT 7 Civil Works Package for Universal LRT Corporation (with
ongoing talks for the descoping of the stations and depot). - Erection and Construction of the relocation works for the affected transmission and construction of the
MMSS3 Project Sections 3 and 4 (NGCP Skyway) - The Metro Manila Skyway Stage 3, Section 3 and 4 of San Miguel Corp/Citra Central Expressway
Partnership; - The Metro Manila Skyway Stage 3, Section 4 – C3-A. Bonifacio Interchange - The Metro Manila Skyway Stage 3, Section 5 – Balintawak Flyover - Freyfil Corp. - Mindanao Bridge - Supply, Fabrication, and Delivery of Structural Steel Box Girder for NLEX-SLEX Connector Road
Section 1 Electromechanical
- Petron Corporation’s Petron Bataan Refinery - RSFFB PHASE-3 OSBL-3 Electrical Connection and Installation of Spare LPG Pump for Tank Truck Loading Project
- SMNCI Line A Expansion Project - Southern Star Project – SSP Industrial CP-01 General Construction Works - Compostela Inc. Foundation Works - Project Lucy 2.0 Supply of pre-fabricated Pipe Spooling
ARCC - Fire Protection for Sulfur Storage Facilities for Saudi Aramco - Debottleneck Onshore Plant for ENPPI - Dewatering System & Oily Water Sump Pits Project for Saudi Aramco - Acciona Agua S.A. - Sea Water Reverse Osmosis (SWRO) at Al Shuqaiq 3 Project (Civil Work
Package) - Refinery Lagoon FWS Pipes Replacement Project - Hawiyah Unayzah Gas Reservoir Storage Project (Structural, Mechanical, Piping, Insulation &
Painting Works "Package 2") - Installation of New Seal Leg at DR Module C at Hadeed Plant - NEOM Primary Healthcare Facility for ARPIC

- SSEM - Manpower Supply for Reverse Osmosis & Sewage Treatment Plant for Saudi Aramco - MAADEN – Construction of Dust Suppression Pond-3 (DSP-3) in Residue Storage Area (Civil
Works) - DAELIM - Manpower Supply for Maaden Ammonia III Project - TR - Manpower Supply for Ras Tanura Refinery Clean Fuels Project - SAUDI ARAMCO - Riyadh Refinery Restoration - Manpower Supply for Wastewater Disposal System Refurbishment SMR - ARPIC - Supply and Installation of Equipment Shade at Silasil Farm - Manpower & Equipment Supply (Safaniyah - SMR#185) - Heater Mechanical Repair EBS-II T/A 2021 (Petrokemya North) - YANPET Shutdown Works for Line 6 & 7 (SABIC Man Supply) - Remaining Work Activities for Upgrade Onshore Flare Systems at Safaniyah - Shuaiba Desalination Plant Technology and Expired Assets Replacement Project - Furnace Maintenance Services for Saudi Kayan Plant Furnace 7 - Furnace Maintenance Services for Yansab Olefins Plant Furnace 8 - SAUDI APOC PDH / UTOS Project
D. Outlook
The reopening of the Philippine Economy is in a full swing as mobility across the country continues to increase, already exceeding pre-pandemic levels while still under the lowest alert level 1 pandemic restriction. The Construction industry will be one of the main growth drivers of the economy, primarily due to the government’s strong push for infrastructure development and the suppressed demand caused by the delayed projects during the lockdowns, which continue to be worked-on today. Likewise, in the Kingdom of Saudi Arabia, the Saudi Vision 2030 of the Crown Prince Mohammed Bin Salman is aggressively launching new developments and opening the business to international investors. EEI is in a prime position to grow and take advantage of these opportunities, considering the following factors: First, the Group’s unworked portion of existing contracts by the end of the first quarter of 2022 stood at ₱52.9 billion. This amount is at a healthy level and is expected to keep the Group and its employees busy for the next three years. EEI is also well-positioned to win more contracts as it continues to bid for industrial and building projects, as well as mega infrastructure projects through the government’s Build, Build, Build Program. The Parent Company is also prepared to obtain subcontracting works for other infra projects. The EEI Parent Company foresees productive years ahead with these backlog and prospects. Second, EEI’s investments and joint ventures are expected to provide positive and steady streams of income for the Group. Al Rushaid Construction Company, Ltd. (ARCC), EEI’s joint venture in the Kingdom of Saudi Arabia, continues to perform well in its industrial projects, gaining the trust of more foreign clients and winning more contracts. In addition, EEI’s investments in PetroSolar and Petrowind Energy will continue to deliver positive earnings as renewable energy sources continue to become more profitable. The Group also positions itself to expand its portfolio to include other renewable energy sources. Finally, EEI’s successful preferred share offering last December 2021 will pave the way for more growth and expansion. The Parent Company was able to raise ₱6B from this issuance and these will be used to finance its current and future mega-infrastructure projects, manage EEI’s liabilities, fund Capital Expenditures, and invest in new businesses and emerging technologies. EEI continues to explore other business opportunities, both within and outside of the construction sector. Moreover, the Parent Company has also been working on expanding its existing subsidiaries. With this outlook, EEI looks forward to a productive year ahead, while remaining cautious of the still ongoing pandemic.

E. Key Performance Indicators The most significant key indicators of future performance of the Group are the following: 1. Construction contracts and orders – denote the value of construction projects won by the Group. Work to be done on these projects determines its revenue potential. In our domestic market, contracts and orders increase during an expansionary period when private business is on an investment mode, with significant capital expenditures allotted for new capacity and expansion and upgrading, and when government is spending for physical infrastructure. In our overseas markets, orders tend to rise when investors (quasi private/government entities) and corporations invest on new upstream and downstream petroleum facilities and new power and mining facilities. This usually happens during a period of prolonged high price of oil or basic metals/minerals which encourages capacity expansion projects and spurs new infrastructure projects in the host countries. The regime of high petroleum and metal prices in the past has spurred increased construction activities in the Middle East, East Asia and Africa. But when the price of oil and precious metals go down, projects for expansion are sometimes put on hold. 2. Production – represents the value of construction work accomplished by the Group during the period in review. It is synonymous to sales revenue since these are recognized at the value corresponding to the percentage of completion of the projects and orders. Production is determined through the Group’s efforts or inputs towards satisfying the performance obligation relative to the total expected efforts or inputs to complete the performance obligation. Wherein, total inputs correspond to costs incurred as of to date. These translate to better financial performance. 3. Orders backlog – corresponds to the value of unfinished portions of projects; thus providing a measure of the near-term future source of production and revenues of the Group. Backlog has a tendency to increase during times when private companies (both local and foreign) are on an expansionary cycle, as they undertake capital expansion and/or modernization of their respective factories and plants. It also occurs when national and local government is on a pump priming mode of investing on infrastructure. Bigger backlog means a probability of higher profit in the future. 4. Liquidity – refers to existing cash and cash resources and the capability of the Group to quickly draw financial resources (such as working capital and other credit lines) to fund operations and construction activities. This ability to deploy financial resources is critical in fulfilling its contract obligations and ensuring the operational and financial viability of the Group. F. Commitments and Contingencies
Surety Arrangement and Guarantees
The Group is contingently liable for guarantees arising in the ordinary course of business, including performance, surety and warranty bonds for various construction projects amounting to ₱7.3 billion and ₱10.0 billion as at March 31, 2022 and December 31, 2021, respectively.
Standby Letters of Credit
The Group has outstanding irrevocable domestic standby letters of credit amounting to ₱2.9 billion and ₱3.3 billion as at March 31, 2022 and December 31, 2021, respectively, from local banks which are used for bidding and guarantees for down payments received, performance, retention and warranty from its ongoing construction projects. The Group also has outstanding irrevocable foreign standby letters of credit amounting to USD 10.6 million, JPY676.6 million, SGD2.04 million, EU0.3 million and USD 10.0 million, JPY 383.4 million, SGD 2.0 million EU 0.3 million as at March 31, 2022 and December 31, 2021.
Contingencies
There are pending legal cases against the Group that are being contested by the Group and its legal counsels. The information required by PAS 37, Provisions, Contingent Liabilities and Contingent Assets, is not

disclosed until final settlement, on the ground that it might prejudice the Group’s position. Management and its legal counsels believe that the final resolutions of these cases will not have a material effect on the consolidated financial position and operating results of the Group.

PART II – OTHER INFORMATION
None
SIGNATURES
Pursuant to the requirements of Section 17 of the SRC, the registrant has duly caused this report to be signed on its behalf by the undersigned, thereunto duly authorized. Registrant – EEI CORPORATION CRIS NOEL E. TORRES SVP and Chief Financial Officer, Managing Director for EEI Subsidiaries ROSELYN M. MASA AVP Project Control/EEI Controller Date: May 12, 2022
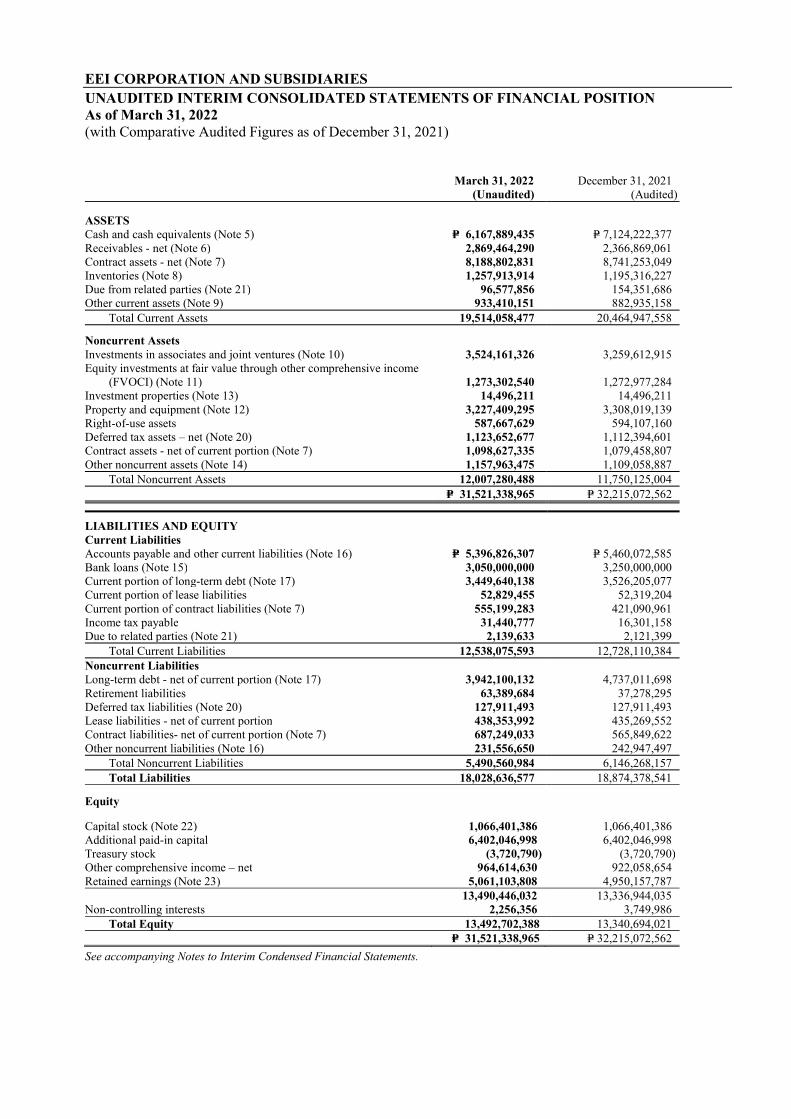
EEI CORPORATION AND SUBSIDIARIES UNAUDITED INTERIM CONSOLIDATED STATEMENTS OF FINANCIAL POSITION As of March 31, 2022 (with Comparative Audited Figures as of December 31, 2021) March 31, 2022 December 31, 2021 (Unaudited) (Audited)
ASSETS Cash and cash equivalents (Note 5) P= 6,167,889,435 P= 7,124,222,377 Receivables - net (Note 6) 2,869,464,290 2,366,869,061 Contract assets - net (Note 7) 8,188,802,831 8,741,253,049 Inventories (Note 8) 1,257,913,914 1,195,316,227 Due from related parties (Note 21) 96,577,856 154,351,686 Other current assets (Note 9) 933,410,151 882,935,158 Total Current Assets 19,514,058,477 20,464,947,558
Noncurrent Assets Investments in associates and joint ventures (Note 10) 3,524,161,326 3,259,612,915 Equity investments at fair value through other comprehensive income
(FVOCI) (Note 11) 1,273,302,540 1,272,977,284 Investment properties (Note 13) 14,496,211 14,496,211 Property and equipment (Note 12) 3,227,409,295 3,308,019,139 Right-of-use assets 587,667,629 594,107,160 Deferred tax assets – net (Note 20) 1,123,652,677 1,112,394,601 Contract assets - net of current portion (Note 7) 1,098,627,335 1,079,458,807 Other noncurrent assets (Note 14) 1,157,963,475 1,109,058,887 Total Noncurrent Assets 12,007,280,488 11,750,125,004 P= 31,521,338,965 P= 32,215,072,562
LIABILITIES AND EQUITY Current Liabilities Accounts payable and other current liabilities (Note 16) P= 5,396,826,307 P= 5,460,072,585 Bank loans (Note 15) 3,050,000,000 3,250,000,000 Current portion of long-term debt (Note 17) 3,449,640,138 3,526,205,077 Current portion of lease liabilities 52,829,455 52,319,204 Current portion of contract liabilities (Note 7) 555,199,283 421,090,961 Income tax payable 31,440,777 16,301,158 Due to related parties (Note 21) 2,139,633 2,121,399 Total Current Liabilities 12,538,075,593 12,728,110,384 Noncurrent Liabilities Long-term debt - net of current portion (Note 17) 3,942,100,132 4,737,011,698 Retirement liabilities 63,389,684 37,278,295 Deferred tax liabilities (Note 20) 127,911,493 127,911,493 Lease liabilities - net of current portion 438,353,992 435,269,552 Contract liabilities- net of current portion (Note 7) 687,249,033 565,849,622 Other noncurrent liabilities (Note 16) 231,556,650 242,947,497 Total Noncurrent Liabilities 5,490,560,984 6,146,268,157 Total Liabilities 18,028,636,577 18,874,378,541
Equity
Capital stock (Note 22) 1,066,401,386 1,066,401,386 Additional paid-in capital 6,402,046,998 6,402,046,998 Treasury stock (3,720,790) (3,720,790) Other comprehensive income – net 964,614,630 922,058,654 Retained earnings (Note 23) 5,061,103,808 4,950,157,787 13,490,446,032 13,336,944,035 Non-controlling interests 2,256,356 3,749,986 Total Equity 13,492,702,388 13,340,694,021 P= 31,521,338,965 P= 32,215,072,562
See accompanying Notes to Interim Condensed Financial Statements.

EEI CORPORATION AND SUBSIDIARIES UNAUDITED INTERIM CONSOLIDATED STATEMENTS OF INCOME For the three months ended March 31, 2022 and 2021 2022 2021
REVENUES Construction contracts P= 2,772,867,277 P= 3,358,699,032 Services 334,814,868 194,959,334 Merchandise sales 51,178,860 93,760,708 Real estate sales - 3,093,022 3,158,861,005 3,650,512,096
COSTS (Note 18) Construction contracts 2,427,826,602 2,940,119,214 Services 253,289,873 163,438,602 Merchandise sales 45,827,788 83,006,241 Real estate sales - 1,628,468 2,726,944,263 3,188,192,524
GROSS PROFIT 431,916,742 462,319,572 EQUITY IN NET EARNINGS OF ASSOCIATES AND JOINT
VENTURE (Note 10) 224,359,909 178,574,101 SELLING AND ADMINISTRATIVE EXPENSES (Note 19) (353,195,733) (373,180,767) FINANCE COST AND OTHER EXPENSES – Net Interest expense (Notes 15 and 17) (111,631,621) (135,710,227) Foreign exchange gains – net 6,064,695 19,021,940
(105,566,926) (116,688,288) INTEREST INCOME 21,273,264 1,840,017 OTHER INCOME – Net 760,071 5,384,448 INCOME BEFORE INCOME TAX 219,547,327 158,249,083
PROVISION FOR (BENEFIT FROM) INCOME TAX (Note 20) Current 21,669,388 - Deferred (11,258,076) 21,685,813
10,411,312 21,685,813
NET INCOME P= 209,136,015 P= 136,563,270 Net income (loss) attributable to: Equity holders of the Parent Company P= 210,629,645 P= 135,790,511 Noncontrolling interests (1,493,630) 772,759 P= 209,136,015 P= 136,563,270
Earnings Per Share – Basic and Diluted (Note 25)
P=0.1311
P=0.1310
See accompanying Notes to Interim Condensed Financial Statements.

EEI CORPORATION AND SUBSIDIARIES UNAUDITED INTERIM CONSOLIDATED STATEMENTS OF COMPREHENSIVE INCOME For the three months ended March 31, 2022 and 2021 (In Thousand Pesos)
2022 2021
CONSOLIDATED NET INCOME P= 209,136,015 P= 136,563,269 OTHER COMPREHENSIVE INCOME (LOSS)
Items not to be reclassified to profit or loss in subsequent periods: Fair value change on equity investments at FVOCI (Note 11) 325,256 (1,048,828)
Item to be reclassified to profit or loss in subsequent periods: Cumulative translation adjustments 42,230,720 9,415,495
TOTAL COMPREHENSIVE INCOME P= 251,691,991 P= 144,929,936
Total comprehensive income (loss) attributable to: Equity holders of the Parent Company P= 253,185,621 P= 144,157,177 Non-controlling interests (1,493,630) 772,759
P= 251,691,991 P= 144,929,936 See accompanying Notes to Interim Condensed Financial Statements.

EEI CORPORATION AND SUBSIDIARIES UNAUDITED INTERIM CONSOLIDATED STATEMENTS OF CHANGES IN EQUITY For the three months ended March 31, 2022 and 2021
Attributable to Equity Holders of the Parent Company Other Comprehensive Income - Net of Deferred Tax Effect
Capital Stock Additional
Paid-In Treasury
Remeasurement Losses on
Retirement Liability
Cumulative Translation
Adjustments
Net Unrealized Gain on
Available for Sale
Financial Assets
Fair Value Reserve of
Equity Investments
at FVOCI Retained Earnings (Note 23) Non-controlling (Note 22) Capital Stock (Note 10) (Note 11) Subtotal Unappropriated Appropriated Subtotal Interests Total
Balances at January 1, 2022 P= 1,066,401,386 P= 6,402,046,998 (P=3,720,790) (P=165,161,422) P= 363,417,852 P=‒ P= 723,802,224 P= 922,058,654 P= 4,950,157,787 P=‒ P= 13,336,944,035 P= 3,749,986 P= 13,340,694,021 Net income (loss) ‒ ‒ ‒ ‒ ‒ ‒ ‒ 210,629,646 ‒ 210,629,646 (1,493,630) 209,136,016 Other comprehensive income ‒ ‒ ‒ ‒ 42,230,720 ‒ 325,256 42,555,976 ‒ ‒ 42,555,976 ‒ 42,555,976 Total comprehensive income (loss) ‒ ‒ ‒ ‒ 42,230,720 ‒ 325,256 42,555,976 210,629,646 ‒ 253,185,622 (1,493,630) 251,691,992 Dividend paid ‒ ‒ ‒ ‒ ‒ ‒ ‒ ‒ (99,683,625) (99,683,625) (99,683,625)
Balances at March 31, 2022 P= 1,066,401,386 P= 6,402,046,998 (P=3,720,790) (P=165,161,422) P= 405,648,572 P=‒ P= 724,127,480 P= 964,614,630 P= 5,061,103,808 P=‒ P 13,490,446,032 P= 2,256,356 P= 13,492,702,388
Attributable to Equity Holders of the Parent Company Other Comprehensive Income - Net of Deferred Tax Effect
Capital Stock Additional
Paid-In Treasury
Remeasurement Losses on
Retirement Liability
Cumulative Translation
Adjustments
Net Unrealized Gain on
Available for Sale
Financial Assets
Fair Value Reserve of
Equity Investments
at FVOCI Retained Earnings (Note 23) Non-controlling (Note 22) Capital Stock (Note 10) (Note 11) Subtotal Unappropriated Appropriated Subtotal Interests Total
Balances at January 1, 2021 1,036,401,386 477,037,443 (3,720,790) (382,168,923) 279,859,518 P=‒ 525,034,702 422,725,297 4,460,457,935 ‒ 6,392,901,270 14,553,340 6,407,454,610 Net income ‒ ‒ ‒ ‒ ‒ ‒ ‒ 135,789,511 ‒ 135,789,511 773,759 136,563,269 Other comprehensive income (loss) ‒ ‒ ‒ ‒ 9,415,495 ‒ (1,048,828) 8,366,667 ‒ ‒ 8,366,667 ‒ 8,366,667 Total comprehensive income (loss) ‒ ‒ ‒ ‒ 9,415,495 ‒ (1,048,828) 8,366,667 135,790,511 ‒ 144,156,178 773,759 144,929,936
Balances at March 31, 2021 P=1,036,401,386 P=477,037,443 (P=3,720,790) (P=382,168,923) P= 289,275,013 P=‒ P= 523,985,874 P= 431,091,964 P= 4,596,248,446 P=‒ P= 6,537,057,448 P= 15,327,098 P= 6,552,384,546

EEI CORPORATION AND SUBSIDIARIES UNAUDITED INTERIM CONSOLIDATED STATEMENTS OF CASH FLOWS For the three months ended March 31, 2022 and 2021 March 31, 2022 March 31, 2021
CASH FLOWS FROM OPERATING ACTIVITIES Income before income tax P=219,547,328 P=158,249,082 Adjustments for: Interest expense 111,631,621 135,710,227 Depreciation and amortization 136,841,502 168,945,426
Movement in retirement assets and liabilities 28,153,607 16,783,904 Gain on sale of property and equipment 50,119 - Interest income (21,273,264) (1,840,017)
Unrealized foreign exchange gains - net (5,116,554) (3,559,262) Dividend income (Note 11) - (1,188,000)
Equity in net earnings of associates (224,359,909) (178,574,101) Operating income before changes in working capital 245,474,450 294,527,260 Decrease (increase) in: Receivables (570,050,329) 781,974,316 Contract assets 533,281,690 (231,964,026)
Due from related parties 57,773,830 (99,435,161) Inventories (62,597,687) (148,989,523) Other current assets (50,474,999) 184,381,574
Other noncurrent assets (55,434,358) 22,615,375 Increase (decrease) in:
Due to related parties 18,236 516,971 Accounts payable and other current liabilities (68,022,335) (950,598,601)
Contract liabilities 255,507,733 (310,893,237) Net cash generated from (used in) operations 285,476,231 (457,865,052) Interest received 21,731,643 1,840,017 Interest paid (109,606,363) (138,249,387) Income tax paid - - Net cash flows provided by (used in) operating activities 197,601,511 (594,274,422)
CASH FLOWS FROM INVESTING ACTIVITIES Proceeds from disposals of: Property and equipment (Note 12) 12,613,845 7,516,344 Acquisition of property and equipment (Note 12) (39,144,155) (45,928,688) Proceeds from return of investment (Note 10) 66,996,720 190,453,883 Dividends received (Note 11) - 1,188,000 Net cash flows provided by investing activities 40,466,410 153,229,539 CASH FLOWS FROM FINANCING ACTIVITIES Availment of: Bank loans (Note 15) 1,900,000,000 2,500,000,000 Long-term debt, net of transaction cost (Note 17) - 1,555,070,935 Payments of: Bank loans (Note 15) (2,100,000,000) (2,771,750,000) Long-term debt (Note 17) (875,000,000) (1,058,209,028)
Principal portion of lease liabilities (19,717,238) - Cash dividends paid (99,683,625) - Net cash flows provided by (used in) financing activities (1,194,400,863) 225,111,907 NET DECREASE IN CASH AND CASH EQUIVALENTS (956,332,942) (215,932,976)
CASH AND CASH EQUIVALENTS AT BEGINNING OF PERIOD 7,124,222,377 1,332,363,040 CASH AND CASH EQUIVALENTS AT END OF PERIOD P= 6,167,889,435 P= 1,116,430,064

EEI CORPORATION AND SUBSIDIARIES NOTES TO INTERIM CONDENSED CONSOLIDATED FINANCIAL STATEMENTS 1. Corporate Information and Authorization for Issuance of Consolidated Financial Statements
EEI Corporation (the Parent Company) is a stock corporation incorporated on April 17, 1931 under the laws of the Philippines. On July 15, 1980, the Parent Company’s corporate life was extended for another fifty years starting April 17, 1981. Its registered office address is No. 12 Manggahan Street, Bagumbayan, Quezon City. The Parent Company’s shares of stock are publicly traded at the Philippine Stock Exchange (PSE). It is a subsidiary of House of Investments, Inc., which is also incorporated in the Philippines. The ultimate parent company of EEI Corporation is Pan Malayan Management and Investment Corporation (PMMIC).
The Parent Company is engaged in general contracting and construction equipment rental. The Parent Company’s subsidiaries, associates and joint ventures are mainly involved in the provision of manpower services, construction, trading of construction equipment and parts, power generation, steel fabrication, scaffoldings rental, and real estate. The unaudited interim condensed consolidated financial statements were approved and authorized for issue on May 5, 2022.
2. Basis of Preparation and Statement of Compliance
The interim condensed consolidated financial statements have been prepared on a historical cost basis, except for equity investments at FVOCI which have been measured at fair value. The accompanying interim condensed consolidated financial statements are presented in Philippine Peso (P=), which is also the Parent Company’s functional currency. Except as indicated, all amounts are rounded off to the nearest Peso.
Statement of Compliance The interim condensed consolidated financial statements have been prepared in compliance with Philippine Accounting Standards (PAS 34), Interim Financial Reporting. The interim condensed consolidated financial statements do not include all the information and disclosures required in the annual consolidated financial statements and should be read in conjunction with the Group’s audited consolidated financial statements as at December 31, 2021. The interim condensed consolidated financial statements of the Group have been prepared for filing with the SEC.

- 2 -
Basis of Consolidation The interim condensed consolidated financial statements as of March 31, 2022 and December 31, 2021 include the Parent Company and the following companies (collectively the Group) that it controls:
Percentage of Ownership
Place of Incorporation Nature of Business Functional Currency
March 2022 December 2021 Direct Indirect Direct Indirect
EEI Limited (formerly EEI BVI Ltd.) British Virgin Islands Holding company US Dollar 100 ‒ 100 ‒ Clear Jewel Investments, Ltd. (CJIL) British Virgin Islands Holding company US Dollar ‒ 100 ‒ 100 Nimaridge Investments, Limited British Virgin Isla ds Holding company US Dollar ‒ 100 ‒ 100 EEI (PNG), Ltd Papua New Guinea Holding company US Dollar − 100 − 100 EEI Corporation (Guam), Inc. United States of America Construction US Dollar 100 ‒ 100 ‒ EEI Construction and Marine, Inc. Philippines Construction Philippine Peso 100 ‒ 100 ‒ EEI Realty Corporation (EEI Realty) Philippines Real estate Philippine Peso 100 ‒ 100 ‒ EEI Subic Corporation Philippines Construction Philippine Peso 100 ‒ 100 ‒ Equipment Engineers, Inc.(EE) Philippines Trading Philippine Peso 100 ‒ 100 ‒ JP Systems Asia Inc. (JPSAI) Philippines Rental of scaffolding
and formworks Philippine Peso ‒ 60 ‒ 60
BiotechJP Corp. Philippines Manufacturing food and therapeutic food
Philippine Peso 60 - 60 -
Shinbayanihan Heavy Equipment Corp. Philippines Rental of construction equipment
Philippine Peso 40 - 40 -
Learn JP Corp. Philippines Service for improvement in language proficiency
Philippine Peso - 60 - 60
EEI Power Corporation (EPC) Philippines Power generation Philippine Peso 89 11 89 11 Gulf Asia International Corporation (GAIC) Philippines Manpower services Philippine Peso 100 ‒ 100 ‒ GAIC Professional Services Inc. (GAPSI) Philippines Manpower services Philippine Peso ‒ 100 ‒ 100 GAIC Manpower Services, Inc. (GAMSI) Philippines Manpower services Philippine Peso ‒ 100 ‒ 100 Bagumbayan Equipment & Industrial
Products, Inc. Philippines Consultancy
services Philippine Peso 100 ‒ 100 ‒
Philmark, Inc Philippines Construction Philippine Peso 100 ‒ 100 ‒ Philrock Construction and Services, Inc. Philippines Manpower services Philippine Peso 100 ‒ 100 ‒ EEI Energy Solutions Corporaton (ESSC) Philippines Power generation Philippine Peso - 100 - 100
EEI Carga Digital Logistic Corporation* Philippines Operate digital logistic platform
Philippine Peso - 100 - -
*On May 14, 2021, EEI Carga Digital Logistics Corporation was incorporated as a wholly owned subsidiary of EEI. EEI Carga’s primary purpose is to own and operate a digital logistics platform that enables shippers to deliver their products through various transportation options available in the platform. EEI Carga’s financial year end is December 31.
The Group operation is not affected by seasonality and cyclicality.
3. Changes in Accounting Policies
The accounting policies adopted are consistent with those of the previous financial year, except that the Group has adopted the following new accounting pronouncements starting January 1, 2022. Adoption of these pronouncements did not have any significant impact on the Group’s financial statements unless otherwise indicated. The Group did not early adopt any other standard, interpretation or amendment that has been issued but is not yet effective. The adoption of these pronouncements does not have a significant impact on the Group’s consolidated financial statements unless otherwise indicated.
Effective beginning on or after January 1, 2022 Amendments to PFRS 3, Reference to the Conceptual Framework
The amendments are intended to replace a reference to the Framework for the Preparation and Presentation of Financial Statements, issued in 1989, with a reference to the Conceptual Framework for Financial Reporting issued in March 2018 without significantly changing its requirements. The amendments added an exception to the recognition principle of PFRS 3, Business Combinations to avoid the issue of potential ‘day 2’gains or losses arising for liabilities and contingent liabilities that would be within the scope of PAS 37, Provisions, Contingent Liabilities and Contingent Assets or Philippine-IFRIC 21, Levies, if incurred separately.

- 3 -
At the same time, the amendments add a new paragraph to PFRS 3 to clarify that contingent assets do not qualify for recognition at the acquisition date. The amendments are effective for annual reporting periods beginning on or after 1 January 2022 and apply prospectively.
Amendments to PAS 16, Plant and Equipment: Proceeds before Intended Use
The amendments prohibit entities deducting from the cost of an item of property, plant and equipment, any proceeds from selling items produced while bringing that asset to the location and condition necessary for it to be capable of operating in the manner intended by management. Instead, an entity recognizes the proceeds from selling such items, and the costs of producing those items, in profit or loss. The amendment is effective for annual reporting periods beginning on or after January 1, 2022 and must be applied retrospectively to items of property, plant and equipment made available for use on or after the beginning of the earliest period presented when the entity first applies the amendment. The amendments are not expected to have a material impact on the consolidated financial statements.
Amendments to PAS 37, Onerous Contracts – Costs of Fulfilling a Contract
The amendments specify which costs an entity needs to include when assessing whether a contract is onerous or loss-making. The amendments apply a “directly related cost approach”. The costs that relate directly to a contract to provide goods or services include both incremental costs and an allocation of costs directly related to contract activities. General and administrative costs do not relate directly to a contract and are excluded unless they are explicitly chargeable to the counterparty under the contract. The amendments are effective for annual reporting periods beginning on or after January 1, 2022. The Group will apply these amendments to contracts for which it has not yet fulfilled all its obligations at the beginning of the annual reporting period in which it first applies the amendments.
Annual Improvements to PFRSs 2018-2020 Cycle o Amendments to PFRS 1, First-time Adoption of Philippines Financial Reporting Standards,
Subsidiary as a first-time adopter The amendment permits a subsidiary that elects to apply paragraph D16(a) of PFRS 1 to measure cumulative translation differences using the amounts reported by the parent, based on the parent’s date of transition to PFRS. This amendment is also applied to an associate or joint venture that elects to apply paragraph D16(a) of PFRS 1. The amendment is effective for annual reporting periods beginning on or after January 1, 2022 with earlier adoption permitted. The amendments are not expected to have a material impact on the consolidated financial statements.
o Amendments to PFRS 9, Financial Instruments, Fees in the ’10 per cent’ test for derecognition of financial liabilities The amendment clarifies the fees that an entity includes when assessing whether the terms of a new or modified financial liability are substantially different from the terms of the original financial liability. These fees include only those paid or received between the borrower and

- 4 -
the lender, including fees paid or received by either the borrower or lender on the other’s behalf. An entity applies the amendment to financial liabilities that are modified or exchanged on or after the beginning of the annual reporting period in which the entity first applies the amendment.
The amendment is effective for annual reporting periods beginning on or after January 1, 2022 with earlier adoption permitted. The Group will apply the amendments to financial liabilities that are modified or exchanged on or after the beginning of the annual reporting period in which the entity first applies the amendment. The amendments are not expected to have a material impact on the consolidated financial statements.
4. Significant Accounting Judgments and Estimates
The preparation of the Group’s consolidated financial statements requires management to make judgments, estimates and assumptions that affect the reported amounts of revenue, expenses, assets and liabilities, and the accompanying disclosures. Except as otherwise stated, the significant accounting policies, judgments, estimates and assumptions used in the preparation of the interim condensed consolidated financial statements are consistent with those used in the annual consolidated financial statements as at and for the year ended December 31, 2021. Judgments Provisions and contingencies The Group is involved in various claims in the ordinary course of business. Management and its legal counsels believe that the Group has substantial legal and factual bases for its position. The Group’s management believes that the outcome of these claims will not have a material adverse effect on the Group’s financial position or operating results. It is possible, however, that future results of operations could be materially affected by changes in estimates or in the effectiveness of the strategies relating to these claims.
Estimates and Assumptions The key assumptions concerning the future and other key sources of estimation uncertainty at the reporting date, that have a significant risk of causing a material adjustment to the carrying amounts of assets and liabilities within the next financial year, are described below. The Group based its assumptions and estimates on parameters available when the financial statements were prepared. Existing circumstances and assumptions about future developments, however, may change due to market changes or circumstances arising that are beyond the control of the Group. Such changes are reflected in the assumptions when they occur. Estimating variable considerations arising from change orders and claims The Group frequently agrees to change orders that modify the scope of its work previously agreed with customers and regularly submits claims to customers when unanticipated additional costs are incurred because of delays or changes in scope caused by the customers. PFRS 15 requires the Group to recognize, as part of its revenue from construction contracts, the estimated amounts the Group expects to be entitled to and to be received from customers due to these change orders and claims (otherwise known as variable considerations), provided that it is highly probable that a significant reversal of the revenue recognized in connection with these variable considerations will not occur in the future. For these unpriced change orders and claims, the Group uses the “most likely amount” method to predict the amount to which it will be entitled and expected to be received from

- 5 -
the customers. The Group also updates its estimate of the transaction price to reflect any changes in circumstances that would result to changes in amount of variable considerations and corresponding increase or decrease in the contract assets.
The aggregate carrying values of receivables and contract assets arising from construction contracts amounted to P=12.2 billion as of March 31, 2022 and December 31, 2021, respectively (Notes 6 and 7). Fair value measurement of unquoted equity investments at FVOCI The Group uses valuation techniques such as discounted cash flow approach and adjusted net asset method to estimate the fair value of investment in Petro Green Energy Corporation (PGEC) and Hermosa Ecozone Development Corporation (HEDC), respectively. These valuation techniques require significant unobservable inputs to calculate the fair value of the Group’s unquoted equity investments at FVOCI. These inputs include forecast cash flows assumptions, discount rates, appraised value of real properties, among others. Changes in assumptions relating to these factors could affect the reported fair value of these unquoted equity financial instruments. For the investment in PGEC, the effects of COVID-19 were reflected in the discount rate used in the discounted cash flow and were not accounted for separately. For the investment in HEDC, the valuation made by the appraisers was based on sales comparison approach. The effects of COVID-19 were reflected in the selling price of comparable listings of real estate properties and were not accounted for separately.
The fair value of unquoted equity investments amounted to P=1.2 billion as of March 31, 2022 and December 31, 2021, respectively. (Note 11). Realizability of deferred tax assets The Group reviews the carrying amounts of deferred taxes of each entity in the Group at each reporting date and reduces deferred tax assets to the extent that it is no longer probable that sufficient taxable profit will be available to allow all or part of the deferred tax assets to be utilized.
Classification of creditable withholding tax The Group classifies its creditable withholding tax (CWT) as current when it is expected to be realized (e.g., will be used as tax credit against income taxes due) within twelve months after the reporting period. The portion of CWT that is expected to be realized more than twelve months after the reporting period is classified as noncurrent. In 2021, the Group classified CWT as non-current as management assessed that it will not be used as tax credits within the next twelve months. CWT recognized by the Group is disclosed in Note 14 to the interim consolidated financial statements.
5. Cash and Cash Equivalents
This account consists of:
March 31, 2022
(Unaudited)December 31,2021
(Audited) Cash on hand P= 9,498,447 P=9,642,680 Cash in banks 2,470,761,365 2,281,602,470 Cash equivalents 3,687,629,623 4,832,977,227 P= 6,167,889,435 P=7,124,222,377

- 6 -
Cash in banks earns interest at the respective bank deposit rates. Cash equivalents are made for varying periods of up to three (3) months depending on the immediate cash requirements of the Group and earn annual interest at the respective short-term investment rates.
6. Receivables - net
This account consists of:
March 31, 2022
(Unaudited) December 31, 2021
(Audited) Trade receivable Non-interest bearing Billed receivables P= 2,798,376,041 P=2,312,725,740 Unbilled receivables 79,754,010 60,082,926 Interest-bearing 11,673,145 16,061,796 Receivable from sale of investment properties 16,937,262 17,285,545 Receivable from EEI RFI ‒ - Other receivables 49,691,687 48,080,909 2,956,432,145 2,454,236,916 Less: Allowance for expected credit losses 86,967,855 87,367,855 P= 2,869,464,290 P=2,366,869,061
Movements in the allowance for expected credit losses follow:
March 31, 2022
(Unaudited)
Non-interest bearing
trade receivables Interest-bearing trade receivables
Other receivables Total
Balances at beginning of period P=76,241,674 P=200,000 P=10,926,181 P=87,367,855 Recovery (Note 19) (400,000) ‒ (400,000) Balances at end of period P= 75,841,674 P=200,000 P= 10,926,181 P= 86,967,855
December 31, 2021
(Audited)
Non-interest bearing
trade receivables Interest-bearing trade receivables
Other receivables Total
Balances at beginning of period P=44,578,717 P=200,000 P=37,508,915 P=82,287,632 Provision 31,662,957 ‒ ‒ 31,662,957 Recovery ‒ ‒ (26,582,734) (26,582,734) Balances at end of period P=76,241,674 P=200,000 P=10,926,181 P=87,367,855
Trade receivables mainly pertain to amounts arising from construction contracts and are generally on a 30-day credit term.
7. Contract Assets and Liabilities
Contract Assets The Group presents contract receivable and retentions withheld by customer as contract assets as the Group’s right for consideration is conditioned on the lapse of the defect and liability period and the receipt of customer certification that there are no defects on the constructed asset. These are reclassified as receivables upon the lapse of the defect and liability period and final customer

- 7 -
acceptance. The Group’s contract assets amounted to P=9.3 billion and P=9.8 billion as of March 31, 2022 and December 31, 2021, respectively. Details of the Group’s contract assets as of March 31, 2022 and December 31, 2021 are shown below:
March 31, 2022
(Unaudited) Current Noncurrent Total Contract asset P= 8,225,213,135 P= 1,108,071,147 P= 9,333,284,282 Less: Allowance for expected credit losses 36,410,304 9,443,812 45,854,116 P= 8,188,802,831 P= 1,098,627,335 P= 9,287,430,166
December 31, 2021
(Audited) Current Noncurrent Total Contract asset P=8,788,954,323 P=1,088,902,619 P=9,877,856,941 Less: Allowance for expected credit losses 47,701,274 9,443,812 57,145,086 P=8,741,253,049 P=1,079,458,807 P=9,820,711,855
Movement in the allowance for expected credit losses as of March 31, 2022 and December 31, 2021 follows:
March 31, 2022
(Unaudited) Current Noncurrent Total Balances as at January 1 P=47,701,274 P=9,443,812 P=57,145,086 Reversal (Note 19) (11,290,970) ‒ (11,290,970) Balances as at March 31 P= 36,410,304 P= 9,443,812 P= 45,854,116
December 31, 2021
(Audited) Current Noncurrent Total Balances as at January 1 P=36,785,303 P=15,154,047 P=51,939,350 Provision 10,915,971 - 10,915,971 Reversals - (5,710,235) (5,710,235) Balances as at December 31 P=47,701,274 P=9,443,812 P=57,145,086
Contract Liabilities Contract liabilities mainly consist of down payments received in relation to construction contracts that will be recognized as revenue in the future as the Group satisfies its performance obligations. The Group’s contract liabilities amounted to P=1.2 billion and P=1.0 billion as of March 31, 2022 and December 31, 2021, respectively, after offsetting with contract asset.
March 31, 2022
(Unaudited) December 31, 2021
(Audited) Total contract liabilities P= 1,242,448,316 P=986,940,853 Less current portion 555,199,283 421,090,961 P= 687,249,033 P=565,849,622

- 8 -
8. Inventories
This account consists of:
March 31, 2022
(Unaudited)
December 31, 2021
(Audited) Construction materials P= 877,986,729 P=828,563,511 Real estate: Land and land development 152,685,109 151,320,246 Subdivision lots and condominium units for sale 40,661,404 39,546,586 Raw land 45,098,913 45,073,466 Merchandise 102,246,939 94,026,848 Spare parts and supplies 79,698,091 77,248,841 1,298,377,185 1,235,779,498 Less: Allowance for inventory obsolescence Construction materials 21,874,203 21,874,203 Merchandise 18,589,068 18,589,068 40,463,271 40,463,271 P= 1,257,913,914 P=1,195,316,227
9. Other Current Assets This account consists of:
March 31,2022
(Unaudited) December 31, 2021
(Audited)Advances to suppliers and subcontractors P= 601,535,790 P=581,912,690 Miscellaneous deposits 125,878,551 128,667,271 Bid bonds 59,822,400 59,822,400 Prepaid expenses 66,134,093 55,052,743 Advances to officers and employees 54,787,656 50,822,589 Others 41,710,329 23,116,133 949,868,819 899,393,826 Less: Allowance for impairment 16,458,668 16,458,668 P= 933,410,151 P=882,935,158
Miscellaneous deposits mainly represent the Group’s refundable rental, utilities and guarantee deposits on various machinery and equipment items.
There is no provision for ECL in 2022.

- 9 -
10. Investments in Associates and Joint Ventures
The investments relate to the following investee companies:
Place of
incorporation Nature of business
Percentage of ownership March 31,
2022(Unaudited)
December 31,2021
(Audited)Associates Al-Rushaid Construction Company Limited (ARCC)
Kingdom of Saudi Arabia Construction 49 49
PetroSolar Corporation (PSOC) Philippines Renewable energy 44 44 Joint ventures PetroWind Energy, Inc. (PWEI) Philippines Renewable energy 20 20
Shinbayanihan Heavy Equipment Corporation (SHEC) Philippines Equipment rental 40 40
BEO Distribution and Marketing Corporation (BEO DMC) Philippines
Distribution and Marketing 30 30
Shimizu-Fujita-Takenaka-EEI Joint Venture (SFTE) Philippines Construction 5 5
Acciona-EEI Joint Venture (AE) Philippines Construction 30 30

- 10 -
Details of the Group’s material investments in associates and joint ventures follow: March 31, 2022 (Unaudited) ARCC PSOC PWEI SHEC BEO DMC SFTE ACCIONA Total
Acquisition cost: Balances as at January 1 P= 595,948,045 P=690,553,362 P=257,020,000 P=20,800,000
450,000
‒
‒ P= 1,564,771,407
Return of investment ‒ ‒ ‒ ‒ ‒ ‒ ‒ ‒ Balances as at March 31 595,948,045 690,553,362 257,020,000 20,800,000 450,000 ‒ ‒ 1,564,771,407 Accumulated equity in net earnings (losses): Balances as at January 1 928,700,211 428,695,847 214,834,375 (1,456,318) (344,169) 7,053,091 20,798,985 1,598,282,022 Equity in net earnings (losses) 141,342,969 48,741,181 28,578,468 (12,414) (11,250) 591,898 5,129,057 224,359,909 Balances as at March 31 1,070,043,180 477,437,028 243,412,843 (1,468,732) (355,419) 7,644,989 25,928,042 1,822,641,931 Accumulated share in other comprehensive
income (loss)
Balances as at January 1 (57,048,497) (181,079) 107,379 − ‒ ‒ ‒ (57,122,197)
Additions − − − − − − − − Balances as at March 31 (57,048,497) (181,079) 107,379 − − − − (57,122,197)
Equity in cumulative translation adjustments 193,870,185 − − − − − − 193,870,185 P= 1,802,812,913 P= 1,167,809,311 P= 500,540,222 P= 19,331,268 P= 94,581 P= 7,644,989 P= 25,928,042 P= 3,524,161,326
December 31, 2021 (Audited) ARCC PSOC PWEI SHEC BEO DMC SFTE ACCIONA Total
Acquisition cost: Balances as at January 1 1,050,087,261 690,553,362 257,020,000 20,800,000
450,000
‒
‒ 2,018,910,623
Additions ‒ ‒ ‒ ‒ ‒ ‒ ‒ ‒ Return of investment (454,139,216) ‒ ‒ ‒ ‒ ‒ ‒ (454,139,216)
Balances as at December 31 595,948,045 690,553,362 257,020,000 20,800,000 450,000 ‒ ‒ 1,564,771,407 Accumulated equity in net earnings (losses): Balances as at January 1 268,810,851 393,898,925 165,438,344 (2,048,155) (285,799) 4,198,492 ‒ 830,012,658 Equity in net earnings (losses) 659,889,360 191,790,922 49,396,031 591,837 (58,370) 2,854,599 20,798,985 925,173,364 Dividends ‒ (156,904,000) ‒ ‒ ‒ ‒ ‒ (156,904,000) Balances as at December 31 928,700,211 428,695,847 214,834,375 (1,456,318) (344,169) 7,053,091 20,798,985 1,598,282,022 Accumulated share in other comprehensive
income (loss)
Balances as at January 1 (21,943,225) (181,079) 107,379 − ‒ ‒ (22,016,925) Additions (35,105,272) − ‒ − ‒ ‒ (35,105,272) Balances as at December 31 (57,048,497) (181,079) 107,379 − − − − (57,122,197) Equity in cumulative translation adjustments 153,681,683 − − − ‒ ‒ − 153,681,683 P=1,621,281,442 P=1,119,068,130 P=471,961,754 P=19,343,682 P=105,831 P=7,053,091 P=20,798,985 P=3,259,612,915
- 11 -
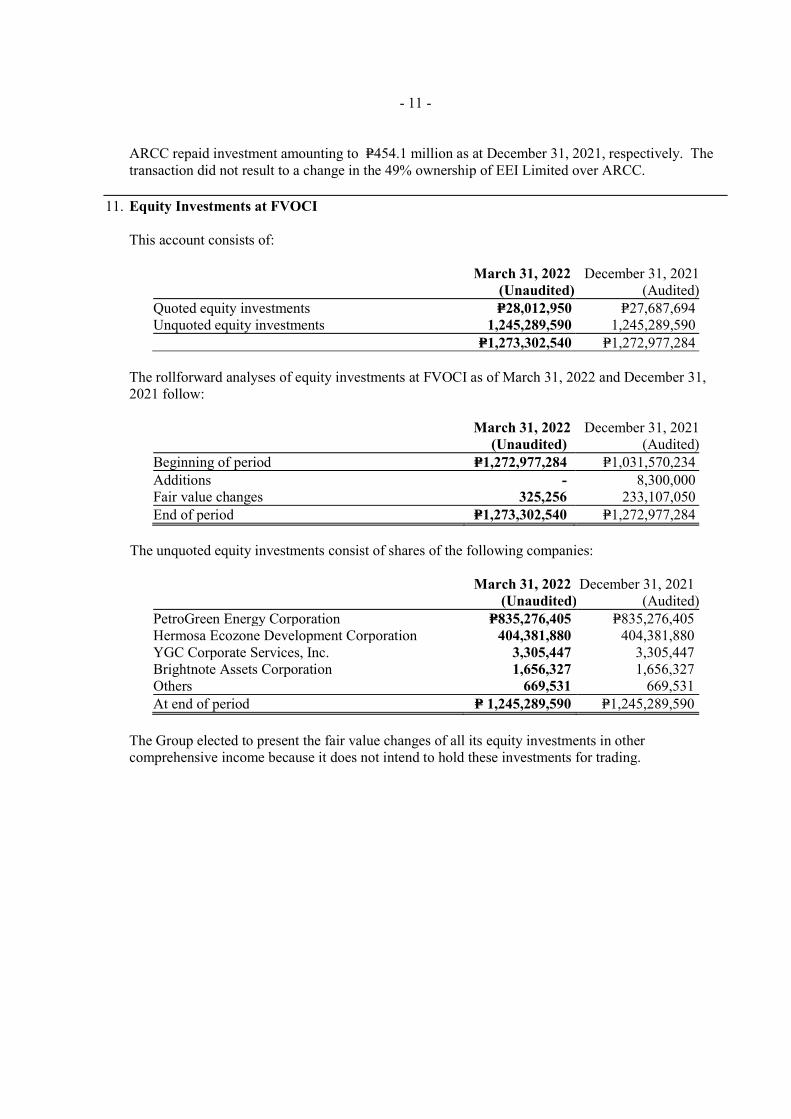
ARCC repaid investment amounting to P=454.1 million as at December 31, 2021, respectively. The transaction did not result to a change in the 49% ownership of EEI Limited over ARCC.
11. Equity Investments at FVOCI
This account consists of:
March 31, 2022
(Unaudited)December 31, 2021
(Audited)Quoted equity investments P=28,012,950 P=27,687,694 Unquoted equity investments 1,245,289,590 1,245,289,590 P=1,273,302,540 P=1,272,977,284
The rollforward analyses of equity investments at FVOCI as of March 31, 2022 and December 31, 2021 follow:
March 31, 2022
(Unaudited) December 31, 2021
(Audited)Beginning of period P=1,272,977,284 P=1,031,570,234 Additions - 8,300,000 Fair value changes 325,256 233,107,050 End of period P=1,273,302,540 P=1,272,977,284
The unquoted equity investments consist of shares of the following companies:
March 31, 2022
(Unaudited)December 31, 2021
(Audited)PetroGreen Energy Corporation P=835,276,405 P=835,276,405 Hermosa Ecozone Development Corporation 404,381,880 404,381,880 YGC Corporate Services, Inc. 3,305,447 3,305,447 Brightnote Assets Corporation 1,656,327 1,656,327 Others 669,531 669,531 At end of period P= 1,245,289,590 P=1,245,289,590
The Group elected to present the fair value changes of all its equity investments in other comprehensive income because it does not intend to hold these investments for trading.
- 12 -
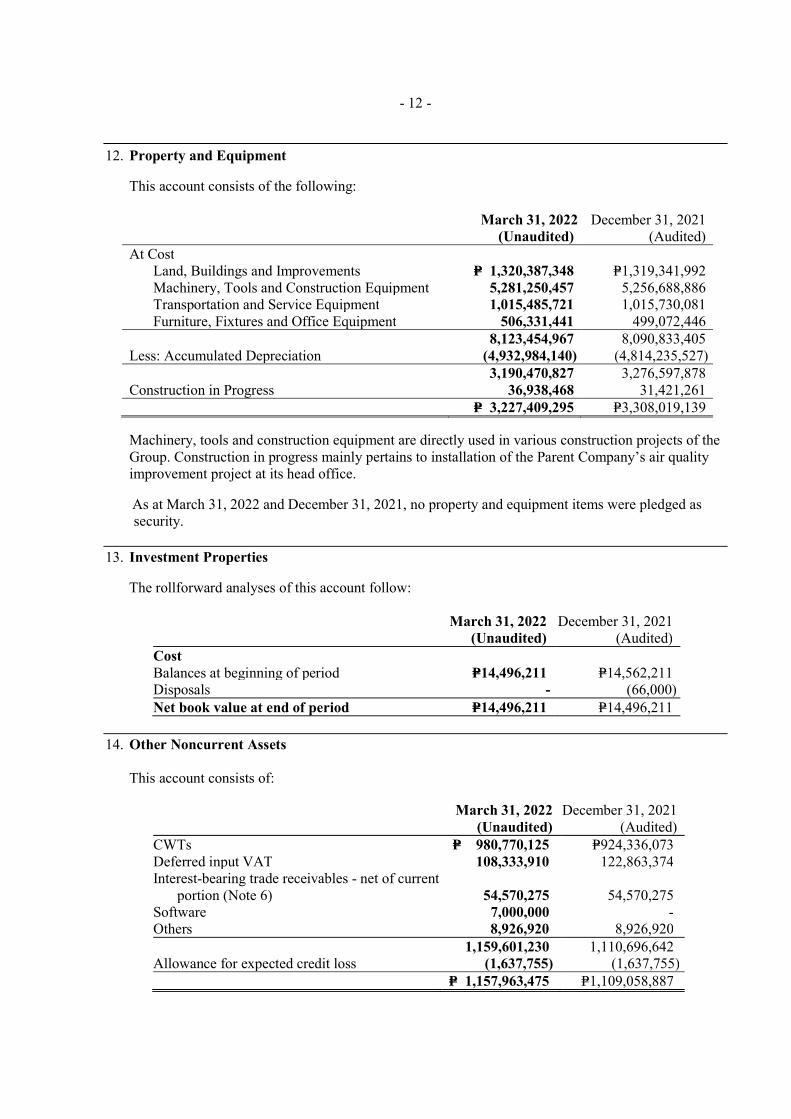
12. Property and Equipment
This account consists of the following:
March 31, 2022 (Unaudited)
December 31, 2021 (Audited)
At Cost Land, Buildings and Improvements P= 1,320,387,348 P=1,319,341,992 Machinery, Tools and Construction Equipment 5,281,250,457 5,256,688,886 Transportation and Service Equipment 1,015,485,721 1,015,730,081 Furniture, Fixtures and Office Equipment 506,331,441 499,072,446
8,123,454,967 8,090,833,405 Less: Accumulated Depreciation (4,932,984,140) (4,814,235,527) 3,190,470,827 3,276,597,878 Construction in Progress 36,938,468 31,421,261 P= 3,227,409,295 P=3,308,019,139
Machinery, tools and construction equipment are directly used in various construction projects of the Group. Construction in progress mainly pertains to installation of the Parent Company’s air quality improvement project at its head office.
As at March 31, 2022 and December 31, 2021, no property and equipment items were pledged as security.
13. Investment Properties
The rollforward analyses of this account follow:
March 31, 2022
(Unaudited) December 31, 2021
(Audited) Cost Balances at beginning of period P=14,496,211 P=14,562,211 Disposals - (66,000) Net book value at end of period P=14,496,211 P=14,496,211
14. Other Noncurrent Assets
This account consists of:
March 31, 2022
(Unaudited) December 31, 2021
(Audited) CWTs P= 980,770,125 P=924,336,073 Deferred input VAT 108,333,910 122,863,374 Interest-bearing trade receivables - net of current
portion (Note 6) 54,570,275 54,570,275 Software 7,000,000 - Others 8,926,920 8,926,920 1,159,601,230 1,110,696,642 Allowance for expected credit loss (1,637,755) (1,637,755) P= 1,157,963,475 P=1,109,058,887
- 13 -
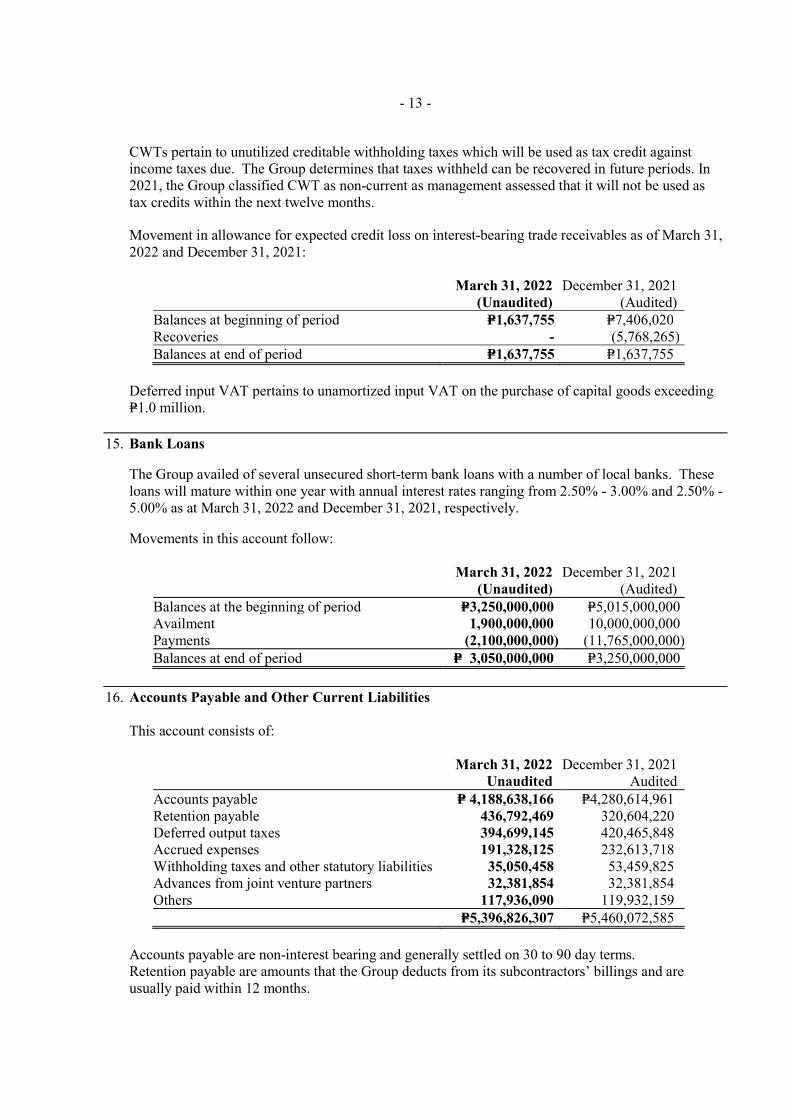
CWTs pertain to unutilized creditable withholding taxes which will be used as tax credit against income taxes due. The Group determines that taxes withheld can be recovered in future periods. In 2021, the Group classified CWT as non-current as management assessed that it will not be used as tax credits within the next twelve months.
Movement in allowance for expected credit loss on interest-bearing trade receivables as of March 31, 2022 and December 31, 2021:
March 31, 2022
(Unaudited) December 31, 2021
(Audited) Balances at beginning of period P=1,637,755 P=7,406,020 Recoveries - (5,768,265) Balances at end of period P=1,637,755 P=1,637,755
Deferred input VAT pertains to unamortized input VAT on the purchase of capital goods exceeding P=1.0 million.
15. Bank Loans
The Group availed of several unsecured short-term bank loans with a number of local banks. These loans will mature within one year with annual interest rates ranging from 2.50% - 3.00% and 2.50% - 5.00% as at March 31, 2022 and December 31, 2021, respectively.
Movements in this account follow:
March 31, 2022
(Unaudited) December 31, 2021
(Audited) Balances at the beginning of period P=3,250,000,000 P=5,015,000,000 Availment 1,900,000,000 10,000,000,000 Payments (2,100,000,000) (11,765,000,000)Balances at end of period P= 3,050,000,000 P=3,250,000,000
16. Accounts Payable and Other Current Liabilities
This account consists of:
March 31, 2022
Unaudited December 31, 2021
Audited Accounts payable P= 4,188,638,166 P=4,280,614,961 Retention payable 436,792,469 320,604,220 Deferred output taxes 394,699,145 420,465,848 Accrued expenses 191,328,125 232,613,718 Withholding taxes and other statutory liabilities 35,050,458 53,459,825 Advances from joint venture partners 32,381,854 32,381,854 Others 117,936,090 119,932,159 P=5,396,826,307 P=5,460,072,585
Accounts payable are non-interest bearing and generally settled on 30 to 90 day terms. Retention payable are amounts that the Group deducts from its subcontractors’ billings and are usually paid within 12 months.

- 14 -
Deferred output taxes pertain to sale of services on credit. Once collected, the amount will be transferred to output VAT payable. Accrued expenses mainly consist of accrual for salaries and wages, interest, provisions, accrual for professional fees, outside services, utilities and other expenses that are expected to be settled within one year. Provisions were provided for claims by third parties in the ordinary course of business. As allowed by PAS 37, Provisions, Contingent Liabilities and Contingent Assets, only a general description is provided as the disclosure of additional details beyond the present disclosures may prejudice the Group’s position and negotiation strategies with respect to these matters. Other noncurrent liabilities pertain to noncurrent portion of retention payables that are expected to be settled beyond one year from the end of reporting period. As of March 31, 2022, and December 31, 2021, other noncurrent liabilities amounted to P=231.6 million and P=243.0 million, respectively.
17. Long-term Debt
This account consists of:
March 31, 2022
(Unaudited)
December 31, 2021
(Audited) Fixed-rate corporate promissory notes P= 7,212,061,376 P=8,078,421,328 Fixed-rate term loan 179,678,894 184,795,447 7,391,740,270 8,263,216,775 Less current portion 3,449,640,138 3,526,205,077 P= 3,942,100,132 P=4,737,011,698
18. Costs of Sales and Services
This account consists of the following balances for the three month periods ended March 31:
2022
(Unaudited)2021
(Unaudited)Cost of services P= 2,681,116,475 P= 3,103,557,816 Cost of sales 45,827,788 84,634,709 P= 2,726,944,263 P= 3,188,192,525
Cost of Services
2022
(Unaudited)2021
(Unaudited)Personnel expenses P= 1,373,534,254 P= 1,088,463,968 Materials 629,269,457 1,067,680,718 Equipment costs and others 579,322,552 824,759,616 Depreciation and amortization 94,750,238 119,509,563 Others 4,239,974 3,143,951 P= 2,681,116,475 P= 3,103,557,816

- 15 -
Cost of Sales
2022
(Unaudited)2021
(Unaudited)Merchandise sales Inventories P= 42,632,117 P= 79,545,090 Personnel expenses 2,058,487 2,232,945 Others 1,137,184 1,228,206 Real estate sales (Note 8) - 1,628,468 P= 45,827,788 P= 84,634,709
19. Selling and Administrative Expenses
This account consists of the following balances for the three month periods ending March 31:
2022
(Unaudited)2021
(Unaudited)Personnel expenses P=189,408,995 P= 191,750,307 Depreciation and amortization 42,091,263 46,135,027 Repairs and maintenance 18,395,031 17,613,338 Travel and transportation 16,649,213 12,159,761 Training 14,353,828 2,873,770 Professional fees 13,275,187 8,484,944 Utilities 10,463,012 9,924,883 Outside services 9,662,432 9,609,474 Taxes and licenses 6,450,557 5,961,419 Rent 2,621,510 4,227,472 Insurance 2,252,999 2,712,604 Advertising 1,414,125 590,860 Supplies 909,610 1,626,601 Food, meals and others 717,349 932,037 Donations 477,536 -Provision (recovery) of allowance for expected
credit loss – net (Notes 6, 7 and 14) (11,690,971) (1,200,000)Others 35,744,057 59,778,270 P= 353,195,733 P= 373,180,767
Others pertain to the various administrative expenses that the Group incurs in support of its day-to-day operations including subscriptions, stock listing fees, postage and other charges. The distribution of the depreciation and amortization expense for the three month periods ending March 31 follows:
2022
(Unaudited)2021
(Unaudited)Property and equipment (Note 12) P= 23,418,734 P= 30,947,765 Right-of-use asset 18,672,529 15,187,262 P= 42,091,263 P= 46,135,027

- 16 -
20. Income Taxes
The components of tax expense as reported in profit or loss and other comprehensive income in the consolidated statements of income and consolidated statements of comprehensive income for the three month periods ending March 31 are as follows:
2022
(Unaudited) 2021
(Unaudited) Current P= 21,669,388 P= (1,403,038) Deferred (11,258,076) 23,088,851 P= 10,411,312 P=21,685,813
Republic Act No. 11534 otherwise known as the Corporate Recovery and Tax Incentives for Enterprises Act or CREATE President Rodrigo Duterte signed into law on March 26, 2021 the Corporate Recovery and Tax Incentives for Enterprises (CREATE) Act to attract more investments and maintain fiscal prudence and stability in the Philippines. Republic Act (RA) 11534 or the CREATE Act introduces reforms to the corporate income tax and incentives systems. It takes effect 15 days after its complete publication in the Official Gazette or in a newspaper of general circulation or April 11, 2021.
The following are the key changes to the Philippine tax law pursuant to the CREATE Act which have an impact on the Group • Effective July 1, 2020, regular corporate income tax (RCIT) rate is reduced from 30% to 25% for
domestic and resident foreign corporations. For domestic corporations with net taxable income not exceeding Php5 million and with total assets not exceeding Php100 million (excluding land on which the business entity’s office, plant and equipment are situated) during the taxable year, the RCIT rate is reduced to 20%.
• Minimum corporate income tax (MCIT) rate reduced from 2% to 1% of gross income effective
July 1, 2020 to June 30, 2023.
• Imposition of improperly accumulated earnings tax (IAET) is repealed. As clarified by the Philippine Financial Reporting Standards Council in its Philippine Interpretations Committee Q&A No. 2020-07, the CREATE Act was not considered substantively enacted as of December 31, 2020 even though some of the provisions have retroactive effect to July 1, 2020. The passage of the CREATE Act into law on March 26, 2011 is considered as a non-adjusting subsequent event. Accordingly, current and deferred taxes as of and for the year ended December 31, 2020 continued to be computed and measured using the applicable income tax rates as of December 31, 2020 (i.e., 30% RCIT / 2% MCIT) for financial reporting purposes. Applying the provisions of the CREATE Act, the Group would have been subjected to lower regular corporate income tax rate of 25% effective July 1, 2020. This resulted in lower provision for current income tax for the year ended December 31, 2020 and lower income tax payable as of December 31, 2020, which was reflected in the Group’s 2020 annual income tax return but was only recognized for financial reporting purposes in the Group’s 2021 interim consolidated financial statements. The adoption of CREATE also resulted in lower deferred tax assets and liabilities as of December 31, 2020 and provision for deferred tax for the year then ended which was recognized in the interim condensed consolidated financial statements.

- 17 -
Deferred tax assets – net amounted to P=1.12 billion and P=1.11 billion as at March 31, 2022 and December 31, 2021, respectively. The Group also recognized deferred tax liability of P=127.9 million, pertaining to the accumulated fair value gain on equity investments at FVOCI as of March 31, 2022 and December 31, 2021, respectively.
21. Related Party Transactions The outstanding balances and transactions with related parties as of March 31, 2022 and December 31, 2021 consist of the following:
(In Thousands of Philippine Peso) March 31, 2022
(Unaudited)
Related party Transaction Amount /
Volume
Outstanding Receivable/
(Payable) Terms Conditions Parent company
Rendering of janitorial services P=4,021 P=6,452 Non-interest bearing
Unsecured, no impairment Purchase of management services (1,071) (3,600)
Associate Rendering of services ‒ 39,476 Non-interest bearing
Unsecured
Extension of advances − (676) Non-interest bearing
Unsecured
Availment of advances (1,169) Non-interest bearing
Unsecured
Entities under the common control
Bank deposits 1,508 2,400,511 Interest bearing; 0.125%
-0.5625% per annum
Unsecured, no impairment
Revenue from construction services
20,199 63,822 Non-interest bearing
Unsecured
Revenue from service contract - 5,053 Non-interest bearing
Unsecured, no impairment
Rendering of janitorial services 133,327 49,147 Non-interest bearing
Unsecured, no impairment
Sale of supplies 1 -
Other related parties
Lease of property (19,547) − Non-interest bearing
Unsecured
Extension of advances − (17,637)
‒ ‒
Extension of advances − 2,179 ‒ ‒ Due from related parties P=96,578
Due to related parties (P=18,806)
(In Thousands of Philippine Peso) December 31, 2021
(Audited)
Related party Transaction Amount /
Volume
Outstanding Receivable/
(Payable) Terms Conditions Parent company Rendering of janitorial services P=16,167 P=9,709 Non-interest
bearing Unsecured,
no impairment Purchase of management services (4,286) (2,400) Non-interest
bearing Unsecured,
Associate Rendering of services ‒ 30,070 Non-interest
bearing Unsecured
Extension advances - 66,345 Non-interest
bearing Unsecured
Extension advances - (1,151) Non-interest
bearing Unsecured
Entities under the common control
Bank deposits 4,280 1,922,895 Interest bearing; 0.20%
-0.25% per annum
Unsecured, no impairment
- 18 -
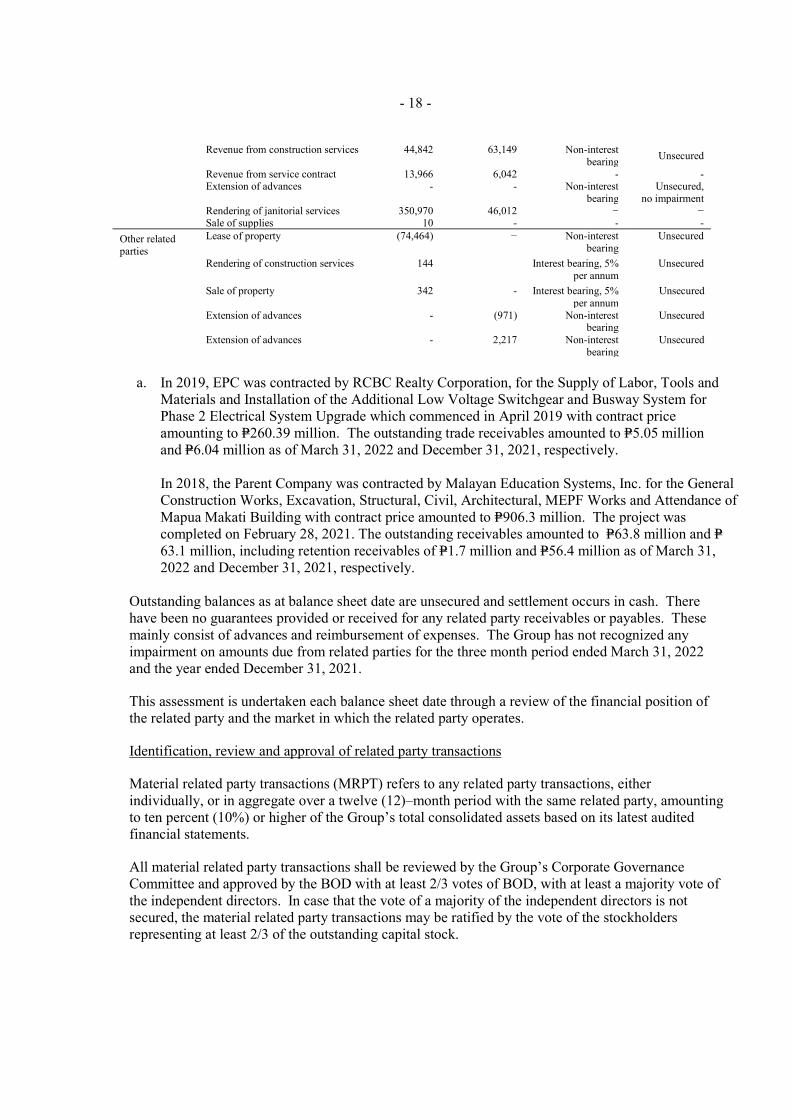
Revenue from construction services 44,842 63,149 Non-interest bearing
Unsecured
Revenue from service contract 13,966 6,042 - - Extension of advances - - Non-interest
bearing Unsecured,
no impairment Rendering of janitorial services 350,970 46,012 − − Sale of supplies 10 - - -
Other related parties
Lease of property (74,464) − Non-interest bearing
Unsecured
Rendering of construction services 144 Interest bearing, 5% per annum
Unsecured
Sale of property 342 - Interest bearing, 5%
per annum Unsecured
Extension of advances - (971) Non-interest
bearing Unsecured
Extension of advances - 2,217 Non-interest
bearing Unsecured
a. In 2019, EPC was contracted by RCBC Realty Corporation, for the Supply of Labor, Tools and Materials and Installation of the Additional Low Voltage Switchgear and Busway System for Phase 2 Electrical System Upgrade which commenced in April 2019 with contract price amounting to P=260.39 million. The outstanding trade receivables amounted to P=5.05 million and P=6.04 million as of March 31, 2022 and December 31, 2021, respectively. In 2018, the Parent Company was contracted by Malayan Education Systems, Inc. for the General Construction Works, Excavation, Structural, Civil, Architectural, MEPF Works and Attendance of Mapua Makati Building with contract price amounted to P=906.3 million. The project was completed on February 28, 2021. The outstanding receivables amounted to P=63.8 million and P=63.1 million, including retention receivables of P=1.7 million and P=56.4 million as of March 31, 2022 and December 31, 2021, respectively.
Outstanding balances as at balance sheet date are unsecured and settlement occurs in cash. There have been no guarantees provided or received for any related party receivables or payables. These mainly consist of advances and reimbursement of expenses. The Group has not recognized any impairment on amounts due from related parties for the three month period ended March 31, 2022 and the year ended December 31, 2021.
This assessment is undertaken each balance sheet date through a review of the financial position of the related party and the market in which the related party operates.
Identification, review and approval of related party transactions
Material related party transactions (MRPT) refers to any related party transactions, either individually, or in aggregate over a twelve (12)–month period with the same related party, amounting to ten percent (10%) or higher of the Group’s total consolidated assets based on its latest audited financial statements.
All material related party transactions shall be reviewed by the Group’s Corporate Governance Committee and approved by the BOD with at least 2/3 votes of BOD, with at least a majority vote of the independent directors. In case that the vote of a majority of the independent directors is not secured, the material related party transactions may be ratified by the vote of the stockholders representing at least 2/3 of the outstanding capital stock.

- 19 -
22. Capital Stock
The Group’s capital stock as at March 31 is consist of the following:
2022 Preferred Common Series A Series B Par value P=1 P=0.5 P=0.5Authorized 2,000,000,000 240,000,000 Issued 1,036,401,386 15,000,000 45,000,000
Common Shares The Group’s common shares were registered with the Securities and Exchange Commission (SEC) on August 28, 1997. The total number of shares registered with SEC at that time was 2 billion with original issue price amounting to P=1.0 per share. As of March 31, 2022, and December 31, 2021, the Group had 3,118 and 3,120 shareholders on record, respectively. Preferred shares On July 15, 2021, the BOD of the Parent Company approved the following: a) Offer of up to four billion pesos of preferred shares of EEI, with over-subscription option of up to
two billion pesos preferred shares, at an offer price of up to Php100 per share. b) Amendment in 2nd paragraph of Article 7 of the Articles of Incorporation to reflect that all
stockholders shall have no pre-emptive rights with respect to any shares of any other class or series of the present capital or on future or subsequent increases in capital.
c) Amendment in 4th paragraph of Article 7 of the Articles of Incorporation changing the characteristic of preferred shares of the Company from non-cumulative to cumulative.
d) Amendment in Article 6 of the Articles of Incorporation increasing the number of board of directors to eleven (11).
The above were approved by the shareholders through written assent on August 26, 2021. On December 23, 2021, the Group issued and listed in PSE the non-convertible preferred shares generating net proceeds of P=5.96 billion. Cumulative dividends in arrears on preferred shares as at March 31, 2022 and December 31, 2021 amounted to P=8.7 million.
Capital Management The primary objective of the Group’s capital management is to ensure that it maintains healthy capital ratios in order to support its business and maximize shareholder value.
The Group manages its capital structure and makes adjustments to it, in light of changes in economic conditions. To maintain or adjust the capital structure, the Group may adjust the dividend payment to shareholders or issue new shares. No changes were made in the objectives, policies or processes as of March 31, 2022 and December 31, 2021.
The Group considers total equity as its capital.
The Group monitors capital using a debt-to-equity ratio, which is total liabilities divided by total

- 20 -
equity attributable to equity holders of Parent Company. The Group’s policy is to maintain a debt-to-equity ratio lower than 4:1 as at March 31, 2022 and December 31, 2021.
March 31, 2022
(Unaudited)
December 31, 2021
(Audited) Current liabilities 12,538,075,593 12,728,110,384 Noncurrent liabilities 5,490,560,984 6,146,268,157 Total liabilities (a) 18,028,636,577 18,874,378,541 Equity attributable to equity holders of Parent
Company (b) 13,490,446,032 13,336,944,035 Debt to Equity Ratio (a/b) 1.34:1 1.42:1
23. Retained Earnings
Under the Tax Code of the Philippines, publicly listed companies are allowed to accumulate retained earnings in excess of capital stock and are exempt from improperly accumulated earnings tax (IAET). With the enactment of CREATE law, IAET had been repealed starting taxable year 2021.
The accumulated earnings of subsidiaries, associates and joint venture which are included in the Group’s retained earnings amounted to P=3.5 billion and P=2.9 billion as of March 31, 2022 and December 31, 2021, respectively, are not available for dividend declaration. Retained earnings are further restricted for payment of dividends to the extent of cost of treasury shares and deferred tax assets amounting to P=1,127.4 million and P=1,149.7 million as of March 31, 2022 and December 31, 2021, respectively. Retained earnings available for dividend declaration amounted to P=0.6 billion as of March 31, 2022 and December 31, 2021, respectively.
The Group takes into consideration the financing requirements of its construction projects when deciding the amount to be declared as dividends.
24. Segment Information
For management purposes, the Group is organized into business units based on geographical location, which comprises of two main groupings as follows: 1. Domestic - all transactions and contracts entered in the Philippines 2. Foreign - all transactions and contracts entered outside the Philippines
EEI Limited - incorporated in British Virgin Islands Clear Jewel Investments, Ltd. - incorporated in British Virgin Islands Nimaridge Investments, Limited - incorporated in British Virgin Islands EEI Corporation (Guam) - incorporated in the United States of America Al Rushaid Construction Company Limited - incorporated in the Kingdom of Saudi Arabia
Management monitors construction revenue and segment net income for the purpose of making decision about resources allocation.
Segment reporting is consistent in all periods presented as there are no changes in the structure of the Group’s internal organization that will cause the composition of its reportable segment to change.

- 21 -
In Thousands of Philippine Peso) As of March 31, 2022
(Unaudited) Domestic Foreign Combined Elimination Consolidated
Assets Current assets 20,208,195 9,267,427 29,475,622 (9,961,563) 19,514,059 Noncurrent assets 13,682,740 3,080,466 16,763,206 (4,755,926) 12,007,280
Total Assets 33,890,935 12,347,893 46,238,828 (14,717,489) 31,521,339
Liabilities
Current liabilities 13,303,910 5,544,898 18,848,808 (6,310,732) 12,538,076 Noncurrent liabilities 5,604,718 1,458,458 7,063,176 (1,572,615) 5,490,561
Total Liabilities 18,908,628 7,003,356 25,911,984 (7,883,347) 18,028,637
Revenue 3,209,942 3,649,426 6,859,368 (3,700,507) 3,158,861 Direct cost (2,781,165) (3,215,766) (5,996,931) 3,269,987 (2,726,944) Selling and administrative expense (364,746) (86,542) (451,288) 98,092 (353,196) Interest expense (108,279) (3,249) (111,528) (104) (111,632) Foreign exchange gain (loss) 6,065 ‒ 6,065 ‒ 6,065 Share in equity in net earnings (losses)
of associates and joint ventures 83,017 ‒ 83,017 141,343 224,360 Interest and other income – net 36,509 14,506 51,015 (28,981) 22,033
Income before tax 81,343 358,375 439,718 (220,171) 219,547 Provision for income tax (10,411) (72,114) (82,525) 72,114 (10,411)
Net income (loss) 70,932 286,261 357,193 (148,057) 209,136
Other disclosures:
Depreciation and amortization P= 136,842 P=‒ P= 136,842 P=‒ P= 136,842 Capital expenditure 51,769 ‒ 51,769 ‒ 51,769 Interest income 25,693 ‒ 25,693 (4,420) 21,273 Investments in associates and
joint ventures 1,721,348 1,802,813 3,524,161 ‒ 3,524,161
December 31, 2021
(Audited) Domestic Foreign Combined Elimination Consolidated
Assets Current assets P=21,012,276 P=7,829,630 P=28,841,906 (P=8,376,958) P=20,464,948 Noncurrent assets 12,697,973 3,179,593 15,877,566 (4,127,441) 11,750,125
Total Assets P=33,710,259 P=11,009,223 P=44,719,472 (12,504,399) P=32,215,073
Liabilities Current liabilities P=13,471,662 P=4,552,028 P=18,023,690 (P=5,295,580) P=12,728,110 Noncurrent liabilities 6,251,128 1,407,798 7,658,926 (1,512,658) 6,146,268
Total Liabilities P=19,722,780 P=5,959,826 P=25,682,616 (6,808,238) P=18,874,378
Revenue P=16,380,153 P=12,867,243 P=29,247,396 (P=13,097,691) P=16,149,705 Direct cost (14,596,707) (10,839,624) (25,436,331) 11,042,043 (14,394,288) Selling and administrative expense (1,590,838) (311,699) (1,902,537) 381,970 (1,520,567) Interest expense (444,455) (63,892) (508,347) 38,865 (469,482) Foreign exchange gain 7,069 - 7,069 ‒ 7,069 Share in equity in net earnings (losses) of associates and joint ventures 265,284 - 265,284 659,889 925,173
Interest and other income – net 129,365 75,328 204,693 (118,643) 86,050
Income before tax 149,871 1,727,356 1,877,227 (1,093,567) 783,660 Provision for income tax (291,121) (389,323) (680,444) 375,681 (304,763)
Net income (loss) (P=141,250) P=1,338,033 P=1,196,783 (717,886) P=478,897
Other disclosures: Depreciation and amortization P=598,298 P=‒ P=598,298 P=‒ P=598,298 Capital expenditure 170,057 ‒ 170,057 ‒ 170,057 Interest income 25,481 1 25,482 (17,760) 7,722 Investments in associates and
joint ventures 1,636,834 1,622,779 3,259,613 ‒ 3,259,613
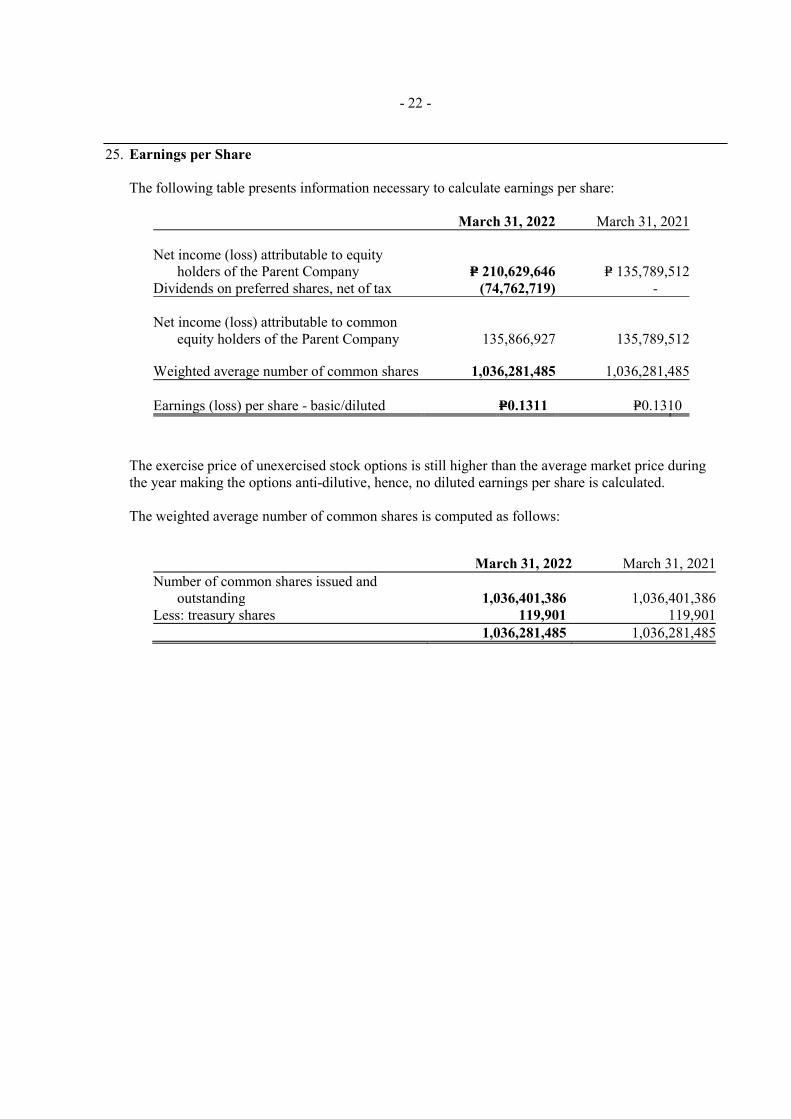
- 22 -
25. Earnings per Share
The following table presents information necessary to calculate earnings per share:
March 31, 2022 March 31, 2021
Net income (loss) attributable to equity holders of the Parent Company P= 210,629,646 P= 135,789,512
Dividends on preferred shares, net of tax (74,762,719) -
Net income (loss) attributable to common equity holders of the Parent Company 135,866,927 135,789,512
Weighted average number of common shares 1,036,281,485 1,036,281,485
Earnings (loss) per share - basic/diluted P=0.1311 P=0.1310
The exercise price of unexercised stock options is still higher than the average market price during the year making the options anti-dilutive, hence, no diluted earnings per share is calculated.
The weighted average number of common shares is computed as follows:
March 31, 2022 March 31, 2021Number of common shares issued and
outstanding 1,036,401,386 1,036,401,386Less: treasury shares 119,901 119,901 1,036,281,485 1,036,281,485

EEI CORPORATION AND SUBSIDIARIES EXHIBIT 1: SUPPLEMENTARY INFORMATION AND DISCLOSURES REQUIRED ON REVISED SRC RULE NO. 68 MARCH 31, 2022 Philippine Securities and Exchange Commission (SEC) issued the Revised Securities Regulation Code Rule No. 68 (Revised SRC Rule No. 68) which consolidates the two separate rules and labeled in the amendment as “Part I” and “Part II”, respectively. It also prescribed the additional information and schedule requirements for issuers of securities to the public. Below are the additional information and schedules required by Revised SRC Rule No. 68, that are relevant to the Group. This information is presented for purposes of filing with the SEC and is not required part of the basic financial statements. Schedule A. Financial Assets The following is the detailed schedule of equity in investments at FVOCI as at March 31, 2022:
Number of Shares
Amount Shown in the Statement of Financial
Position Movement Valuation
Name of Issuing Entities Quoted: Sta. Elena Golf Club Inc. 2 P= 13,000,000 Philippine Long Distance Telephone Co. 37,942 8,902,616 175,256 Manila Southwood Golf & Country Club 2 3,000,000 -
Valle Verde Country Club 2 700,000 -
The Orchard Golf and Country Club 1 850,000 150,000
Canyon Woods 1 70,000 -
Royale Tagaytay Country Club 1 60,000 - Related Parties: The Orchard Golf 1 500,000 -
Sherwoods Hills Golf Club 1 250,000 -
Fairways & Blue Water Resort Golf 1 250,000 -
Club Filipino 1 180,000 -
Forest Hill golf share 1 180,000 -
Royale NorthWoods 1 121,856 -
Eagle Ridge Golf & Country Club 1 60,000 -
PLDT 925 10,333 - Unquoted:
Hermosa Ecozone Development Corp (HEDC) 1,000,000
404,381,881 -
Brightnote Assets Corporation 1,100,000 1,656,327 -
YGC Corporate Services, Inc. 12,000 2,509,932 -
YGC Corporate Services, Inc. 1,389 795,515 -
Tower Club (Philam Properties Corp.) 1 500,000 -
Architectural Center Club, Inc. (ACCI) 1 32,000 -
Philippine Contractors Association 10,000 10,000 -
Philippine Exporters Trading Corp. 5,000 5,000 -
Pilipino Telephone Company 150 675 - Related Party: Petro Green Energy Corporation 205,376,000 835,276,405 -
Total 207,543,424 P= 1,273,302,540 P= 325,256
No dividend income was earned and accrued from the financial assets as of March 2022.

- 2 -
Schedule B. Amounts Receivable from Directors, Officers, Employees, Related Parties and Principal Stockholders (Other than Related Parties) Below is the schedule of advances to employees of the Group with balances above P=1,000,000 as at March 31, 2022:
Name and designation Balance at
beginning of year Additions Collections/ Liquidations
Balance at end of year
Manalad, Janine Ann Bernadette Capistrano* 2,514,163 - 52,465 2,461,698
2,514,163 - - 2,461,698*Salary deduction
Schedule C. Amounts Receivable from Related Parties which are Eliminated during the Consolidation of Financial Statements The following is the schedule of receivables from related parties, which are eliminated in the consolidated financial statements as at March 31, 2022:
Name and Designation of Debtor
Balance at beginning
of year Additions Amounts Collected Balance at end of
March 31, 2022 EEI Realty Corp P 216,318 P 611,967 P (510,563) P 317,722 EEI Power Corp. 428,951 871,725 (845,201) 455,475 Gulf Asia International Corp. - 406,952 (341,620) 65,332 GAIC Manpower Services Inc. - 619,304 (550,892) 68,412 Philrock Construction & Services, Inc. 41,864,355 - - 41,864,355 Philmark, Inc. 33,704,595 - - 33,704,595 Equipment Engineers, Inc. 15,652,768 72,988,195 (2,008,286) 86,632,677 EEI Construction & Marine, Inc. 978 1,147,784 (874,825) 273,937 Learn JP 379,666 210,318 - 589,984 JPSAI 58,580,285 923,137 (906,070) 58,597,352 Biotech 14,971,857 104,372 - 15,076,229 EEI Energy 46,361 14,299 - 60,660 EEI Carga 193,579 77,280 - 270,859 EEI Limited - 1,038,241 - 1,038,241
P= 166,039,713 P= 79,013,574 P= (6,037,457) P= 239,015,830
There were no amounts written off during the year. The following is the schedule of payable to related parties, which are eliminated in the interim condensed consolidated financial statements as at March 31, 2022:
Name and Designation of Creditor
Balance at beginning
of year Additions Amounts
Paid
Balance at end of March 31,
2022 EEI Construction & Marine, Inc. P=58,038,201 - P= (47,237,285) P=10,800,916 Equipment Engineers, Inc. 9,986,226 25,030,834 (26,607,909) 8,409,151 EEI Subic Corporation 89,079,662 - - 89,079,662 Gulf Asia International Corp. - 7,043,232 (7,043,232) - GAIC Manpower Services Inc. 10,205,747 1,227,016 (2,649,728) 8,783,035 Bagumbayan Equipment Industrial Products, Inc. 1,643,054 - - 1,643,054 JP Asia 1,650,377 6,358,221 (4,577,901) 3,430,697 EEI Realty Corp. 42,540,073 3,769,684 (2,728,725) 43,581,032 Biotech JP 57,156,641 69,229,489 - 126,386,130 EEI Power Corp 95,594,248 - (95,594,248) -
P=365,894,229 P= 112,658,476 P=(186,439,028) P=292,113,677
There were no amounts written off during the year.
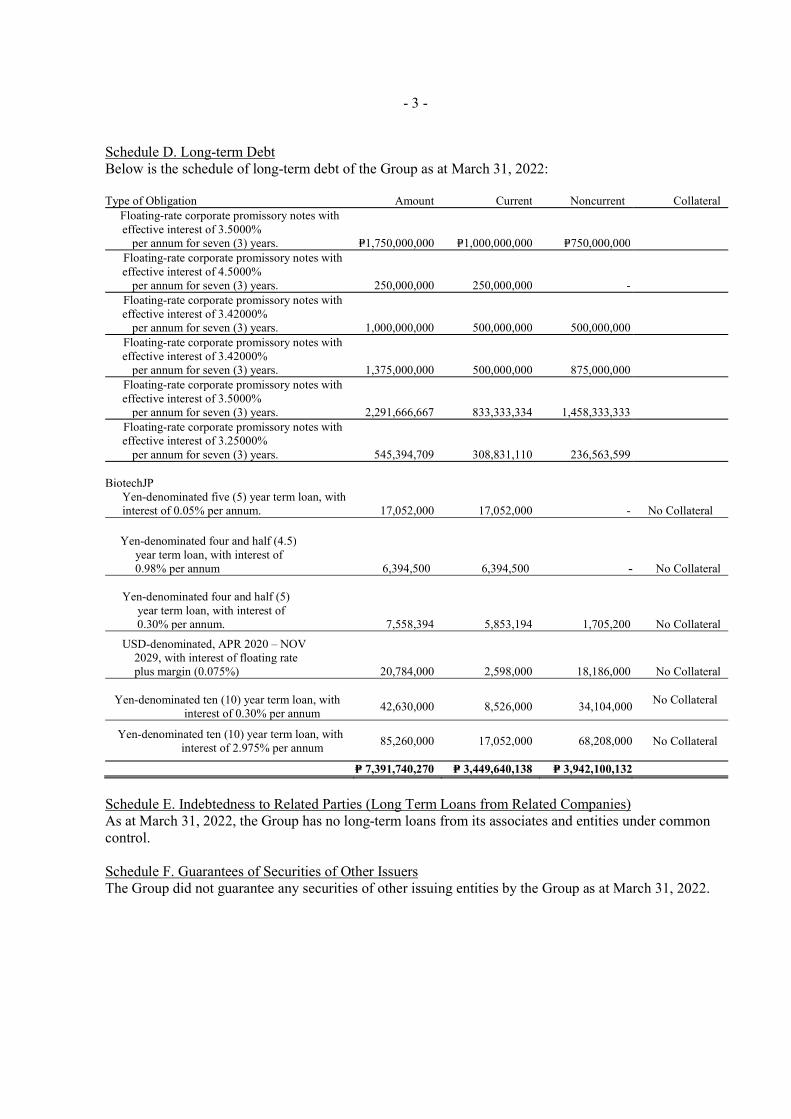
- 3 -
Schedule D. Long-term Debt Below is the schedule of long-term debt of the Group as at March 31, 2022: Type of Obligation Amount Current Noncurrent Collateral Floating-rate corporate promissory notes with
effective interest of 3.5000% per annum for seven (3) years. P=1,750,000,000 P=1,000,000,000 P=750,000,000 Floating-rate corporate promissory notes with
effective interest of 4.5000% per annum for seven (3) years. 250,000,000 250,000,000 - Floating-rate corporate promissory notes with
effective interest of 3.42000% per annum for seven (3) years. 1,000,000,000 500,000,000 500,000,000 Floating-rate corporate promissory notes with
effective interest of 3.42000% per annum for seven (3) years. 1,375,000,000 500,000,000 875,000,000 Floating-rate corporate promissory notes with
effective interest of 3.5000% per annum for seven (3) years. 2,291,666,667 833,333,334 1,458,333,333 Floating-rate corporate promissory notes with
effective interest of 3.25000% per annum for seven (3) years. 545,394,709 308,831,110 236,563,599
BiotechJP
Yen-denominated five (5) year term loan, with interest of 0.05% per annum. 17,052,000 17,052,000 - No Collateral
Yen-denominated four and half (4.5) year term loan, with interest of 0.98% per annum 6,394,500 6,394,500 - No Collateral
Yen-denominated four and half (5) year term loan, with interest of 0.30% per annum. 7,558,394 5,853,194
1,705,200 No Collateral
USD-denominated, APR 2020 – NOV 2029, with interest of floating rate plus margin (0.075%)
20,784,000 2,598,000
18,186,000 No Collateral
Yen-denominated ten (10) year term loan, with
interest of 0.30% per annum
42,630,000
8,526,000 34,104,000
No Collateral
Yen-denominated ten (10) year term loan, with interest of 2.975% per annum
85,260,000 17,052,000 68,208,000 No Collateral
P= 7,391,740,270 P= 3,449,640,138 P= 3,942,100,132
Schedule E. Indebtedness to Related Parties (Long Term Loans from Related Companies) As at March 31, 2022, the Group has no long-term loans from its associates and entities under common control. Schedule F. Guarantees of Securities of Other Issuers The Group did not guarantee any securities of other issuing entities by the Group as at March 31, 2022.

- 4 -
Schedule G. Capital Stock
Title of issue Number of
shares authorized
Number of shares issued
and outstanding as shown under related balance
sheet caption
Number of shares
reserved for options,
warrants, conversion
and other rights
Number of shares held by related parties
Directors, Officers and
Employees Others Common Shares 2,000,000,000 1,036,281,485 35,000,000 573,463,646 3,319,385 459,498,454Preferred Shares 240,000,000 60,000,000 – – – –

EEI CORPORATION RECONCILIATION OF RETAINED EARNINGS AVAILABLE FOR DIVIDEND DECLARATION As of March 31, 2022
Unappropriated retained earnings, January 1, 2022, as adjusted P=641,410,182
Add: Net income actually earned/realized during the period Add: Net income during the period closed to Retained Earnings
Equity share in net loss of joint venture - net of tax Non-actual losses ‒ Depreciation on revaluation increment (after tax) ‒ Adjustment due to deviation from PFRS/GAAP - loss ‒ Loss on fair value adjustment of investment property (after
tax) ‒ Less: Net loss during the period closed to Retained Earnings (50,329,303)
Equity share in net earnings of joint venture - net of tax (5,708,541) Non-actual/ unrealized income net of tax ‒ Unrealized foreign exchange loss - net 2,377,913 Unrealized actuarial gain – net ‒
Fair value adjustment ‒
Adjustment due to deviation from PFRS/GAAP gain ‒ Other unrealized gain or adjustments to the retained earnings
as a result of certain transactions accounted under the PFRS
‒
Movement in deferred tax asset (465,933) Net loss actually earned during the period (54,125,864) Add (Less):
Dividend declarations during the period ‒ Appropriations of retained earnings during the year ‒ Reversals of appropriations ‒ Effects of prior period adjustments ‒ ‒
Unappropriated retained earnings available for dividend distribution, March 31, 2022 P= 587,284,318

EEI CORPORATION AND SUBSIDIARIES MAP OF RELATIONSHIPS OF THE COMPANIES WITHIN THE GROUP Group Structure Below is a map showing the relationship between and among the Group and its ultimate parent company, subsidiaries, and associates as at March 31, 2022:

EEI CORPORATION AND SUBSIDIARIES SCHEDULE OF FINANCIAL SOUNDNESS INDICATORS As at March 31, 2022 and December 31, 2021 Financial Soundness Indicator Below are the financial ratios that are relevant to the Group as at March 31, 2022 and December 31, 2021 and for the periods then ended. Ratios Formula 2022 2021 Current ratio Current assets 1.56:1 1.61:1 Current liabilities Solvency ratio Net income plus depreciation 0.02:1 0.06:1 Total liabilities Debt - equity ratio Total liabilities 1.34:1 1.42:1 Total equity Asset-to-equity ratio Total assets 2.34:1 2.42:1 Total equity Interest rate coverage ratio EBIT* 2.97 2.67:1 Interest expense Return on assets Net income 1% 2% Average total assets Return on equity Net income 2% 5% Average total equity

EEI CORPORATION AND SUBSIDIARIES AGING OF TRADE RECEIVABLES As at March 31, 2022 (In Thousand Pesos)
Current 30 Days 60 Days 90 Days
120 Days/Over
Total
EEI Corporation
1,259,735
367,317
229,119
69,285
395,435
2,320,891
Gulf Asia International Corporation
21,753
6,561
4,968
18,051
22,704
74,037
EEI Construction and Marine, Inc.
58,856
12,600
1,700
46,375
119,531
Equipment Engineers, Inc.
19,062
31,742
13,863
410
27,308
92,385
EEI Power Corporation
10,103
4,699
57
4,757
128,511
148,127
EEI Realty Corporation
10,304
42
41
93
2,075
12,555
Others
1,465
18,239
961
115
10,070
30,850
Total
1,381,278
441,200
249,009
94,411
632,478
2,798,376
Copyright © 2022 FDOKUMEN