ete eei - ERIC
435
ez- ete eei AUTHOR TITLE INSTITUTION SPONS AGENCY PUB DATE CONTRACT NOTE EDRS PRICE DESCRIPTORS ,. Dtconnt ansoma 06 042 Froomkin, Joseph; And Others The Demand for Facilities in the PostSecondary Sector, 1975 to 1990. Froomkin (Joseph) Inc., Washington, D.C. Office of Education (DHEW), Washington, D.C. 15 Aug 74 OEC-0-72-5023 436p. HF-B0.75 HC-321.00 PLUS POSTAGE *Campus Planning; College Planning; *Educational Facilities; *Educational Finance; Educational Needs; Enrollment Trends; Facility Utilization Research; *Higher Education; Post Secondary Education; Proprietary Schools; *Space Utilization ABSTRACT This report addresses a central issue in postsecondary education: how much space is likely to be needed to accommodate the enrollments between 1975 and 1990 in both the nonprofit and proprietary educational sectors. Emphasis is placed on projections of postsecondary enrollments, size distribution of institutions and campuses, current perception of space requirement needs, comparison of space-to space standards, statistical determination of space standards, an estimate of stocks 1970-1990, proprietary postsecondary schools, cost of construction, new technologies and attendance patterns, and how much space is really needed. Statistical data are presented within the report as well as within the attached appendixes. (WJM)
-
Upload
khangminh22 -
Category
Documents
-
view
1 -
download
0
Transcript of ete eei - ERIC
ez- ete eeiAUTHORTITLE
INSTITUTIONSPONS AGENCYPUB DATECONTRACTNOTE
EDRS PRICEDESCRIPTORS
,.Dtconnt ansoma
06 042Froomkin, Joseph; And OthersThe Demand for Facilities in the PostSecondarySector, 1975 to 1990.Froomkin (Joseph) Inc., Washington, D.C.Office of Education (DHEW), Washington, D.C.15 Aug 74OEC-0-72-5023436p.
HF-B0.75 HC-321.00 PLUS POSTAGE*Campus Planning; College Planning; *EducationalFacilities; *Educational Finance; Educational Needs;Enrollment Trends; Facility Utilization Research;*Higher Education; Post Secondary Education;Proprietary Schools; *Space Utilization
ABSTRACTThis report addresses a central issue in
postsecondary education: how much space is likely to be needed toaccommodate the enrollments between 1975 and 1990 in both thenonprofit and proprietary educational sectors. Emphasis is placed onprojections of postsecondary enrollments, size distribution ofinstitutions and campuses, current perception of space requirementneeds, comparison of space-to space standards, statisticaldetermination of space standards, an estimate of stocks 1970-1990,proprietary postsecondary schools, cost of construction, newtechnologies and attendance patterns, and how much space is reallyneeded. Statistical data are presented within the report as well aswithin the attached appendixes. (WJM)
JOSEPH FROOMKIN INC
L.LJ 1015 Eighteenth Street, N. W.Washington, D. C. 20036
rs1
0
THE DEMAND FOR FACILITIESIN THE POST-SECONDARY .
SECTOR, 1975 TO 1990
Contract OEC -O -72 -5023
by
Joseph FroomkinJ. R. Endriss
With the Assistance of
Robert StumpKaren Tammatiy
August 15, 1974
213
U S DEPARTMENT OF HEALTH.EDUCATION A WELFARENATIONAL INSTITUTE OF
EDUCATIONOCKuVE NT NA'. BEEN REPRO
"It, f L, E xACTly AS RECEIVED FROM.+1 PE W ON fh 0,01.ANIZATION ORIGIN
,T LAWN? VIEW OR OPINIONSLin NOT NF 'YAWL Y NEPRE
NI 01 I. if 'AL NATIONAL IN'ITIPJTE OF1)14 PO N OW POL IL V

ACKNOWLEDGEMENTS
We are much indebted to numerous space experts who shared their
wisdom with us and made this report possible. We are especially grateful
to Prince Wilson, Executive Director, Atlanta University Center Corpor-
ation, Atlanta, Georgia; William S. Fuller, New York State Education
Department, Albany, New York; Warren G. Hill, Chancellor, Connecticut
Commission for Higher Education, Hartford, Connecticut; Martin Phillips,
Director of Facilities Research, State University of New York, Albany,
New York; Captain John G. Roenigk, New York State Education Department,
Albany, New York; Dr. Earle Clifford, President, Association of Indepen-
dent Colleges and Universities of New Jersey, Cranford, New Jersey;
Harlan Bareither, Director, Office of Special Studies, University of
Illinois, Urbana, Illinois; Ken Boutwell, Vice Chancellor for Administration,
State University System, Tallahassee, Florida; Dr. Harry Harmon, Vice
Chancellor, Physical Planning and Development, California State Colleges,
Los Angeles, California; Bernard Sisco, Vice Chancellor for Administra-
tion, University of California, La Jolla, California; Donovan Smith,
University of California, Berkeley, California; James F. Blakesley, Co-
ordinator, Schedules and Space, Purdue University, Lafayette, Indiana.
This is also a suitable place to acknowledge the cooperation of the
National Center for Educational Statistics, and especially Dr. D. Pollen,
who facilitated access to FIEGIS tapes.
ii4

Our monitors at OPPE as well as the anonymous referees contributed
to the improvement of the manuscript and have more than earned our
earnest thanks.
The views expressed in this study are those of the authors, and do
not necessarily correspond to those of the Department of Health, Educa-
tion and Welfare, U. S. Office of Education.
- 5
I
1
I1
IIIII1
II1
IIIII

TABLE OF CONTENTS
SUMMARY AND CONCLUSIONS
LIST OF TABLES
CHAPTER 1. SCOPE OF REPORT 1
Trends in Student Enrollments 2Campu:3 or Institution? 6Current Standards for Space 7Current Availability of Space 8Determinants of Space Requirements 8Future Space Availability 9Proprietary Post-Secondary Education 9An Analysis of Costs of Space 10Some Comments on New Technology and
New Patterns of Post-Secondary Education 10How Much Space Will Be Needed? 10
CHAPTER 2. PROJECTIONS OF POST-SECONDARYENROLLMENTS 11
CHAPTER 3. SIZE DISTRIBUTION OF INSTITUTIONSAND CAMPUSES 35
Available Historical Data 37Using the Past to Understand the Future 39Some Further Refinements in the Classification
of Data by Campus 41Size Distribution of Schools 42
CHAPTER 4. SPACE REQUIREMENTS - CURRENTPERCEPTION OF NEED . 50
Information about Space Standards 51Classification of Space 51Class room Sp ace 53Laboratories 57Study Space 60
biV

I-
TABLE OF CONTENTS (Coned)
Office SpaceSpecial Use SpaceGeneral Use SpaceMedical SpaceSupport SpaceTotal Non-Residential Space
1
62 16466
16768
1
1
1
1
1
1
1
CHAPTER 5. A COMPARISON OF SPACE TOSPACE STANDARDS 91
Classification of Schools 93A Comparison of Inventories of Facilities
with Planners' Standards 94Aggregate Comparisons of Space and Inventories 95
Classroom Space 95Laboratory Space 96Classroom and Laboratory Space 96Office Space 97Study Space 98Special Use Space 98General Use Space 99Support Space 99
Analysis of Available Space Based on Rankingsby Total Non-Residential Space 99
Range of Space Available by Quartileof Institution 101
Range of Space by Size of Institution 102
Analysis by Type, Control, and Size of SchoolRanked on Space Availability 104
Total Space 104Classroom Space 105Laboratory Space 106Laboratory and Classroom Space Combined 106Office Space 106Study Space 107Special Use, General Use, and Support Space 107

TABLE OF CONTENTS (Coned)
Incremental Increases of Space by Type,Control, and Size of College
Residential Space108110
CHAPTER 6. STATISTICAL DETERMINATION OFSPACE STANDARDS 157
Description of Data 157Summary of Results 158Analysis of Results 159Conclusions 163
CHAPTER 7. AN ESTIMATE OF STOCKS 1970 - 1990 166
New Evidence on Retirement Rates 167Total Stock of Buildings, 1973 - 1974 170Distribution between Resident ial and
Non-Residential Space 172Other Withdrawals of Space 173Rented Space 174Attitude Toward Space and Future
Construction Plans 178
CHAPTER 8. PROPRIETARY POST-SECONDARY SCHOOLS 189
Advantages of Proprietary Schools 190Character of Proprietary Schools 192Requirements for Space by Type of School 193Availability of Space for Proprietary Schools 194Can Space Standards Be Established for
Proprietary Schools? 196Issues for Federal Policy 197

TABLE OF CONTENTS (Cont'd)
CHAPTER 9. COST OF CONSTRUCTION 203
Difficulties of Forecasting FutureConstruction Costs 203
Probable Levels of Construction Costs 206Costs of Rehabilitation and Refurbishing 207Conclusion 210
CHAPTER 10. NEW TECHNOLOGIES AND NEWATTENDANCE PATTERNS 217
The Computer 220
A Device for Computing or Record-Keeping 220Computer-Assisted Instruction 221Manager of the Learning Process 222
Audio Devices 223Audio - Visual Devices 223General Comments 224
CHAPTER 11. HOW MUCH SPACE IS REALLY NEEDED? 230
Introduction 230Methodologies 235Sufficient Space to Meet Average Standards 236Providing Space for Additional Students 237Eliminating Shortages and Building New Schools 237Increasing Average Space Proportionately 239Economies of Scale 240Available Space and Needed Future Commitments 241Games Planners Can Play 244And the Concerns of Space Experts 246
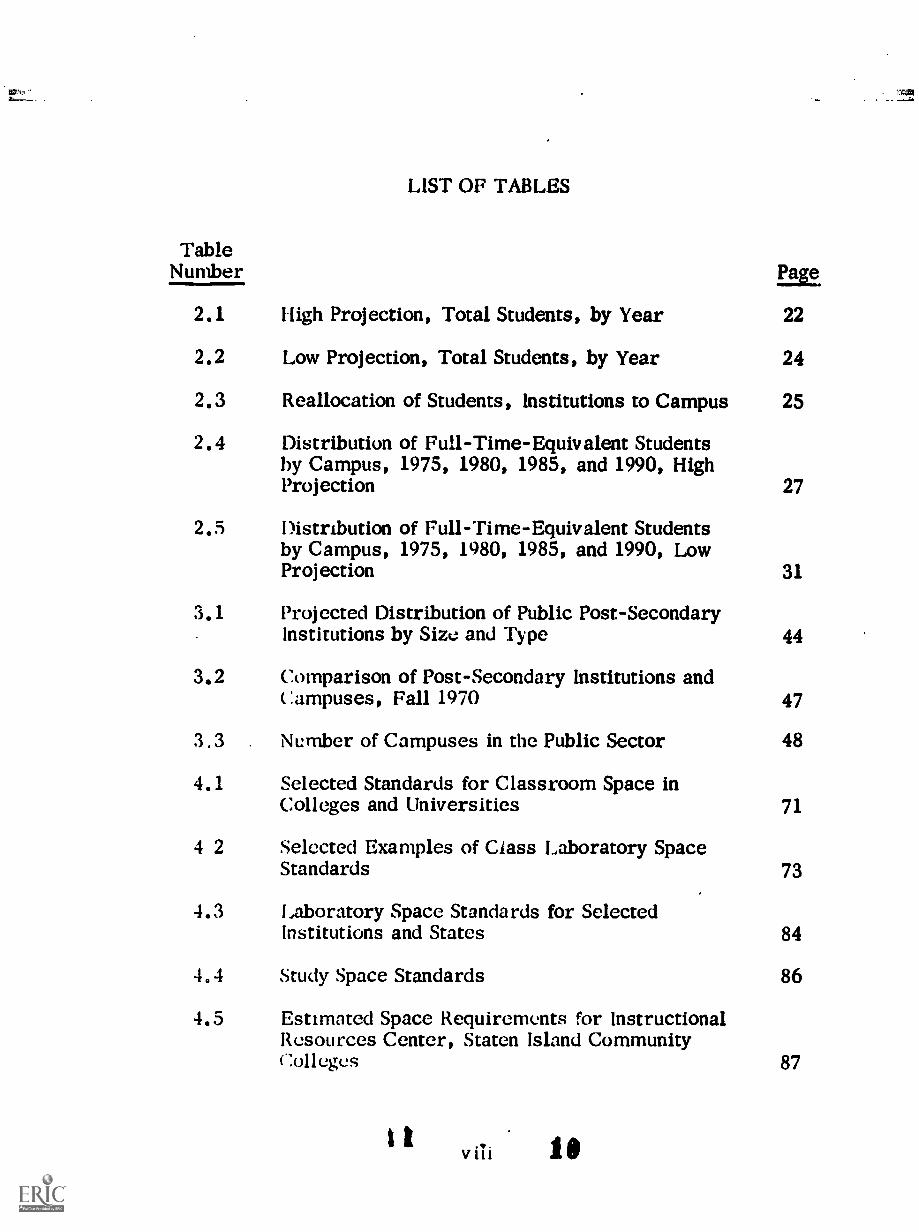
LIST OF TABLES
TableNumber Page
2.1 High Projection, Total Students, by Year 22
2.2 Low Projection, Total Students, by Year 24
2.3 Reallocation of Students, Institutions to Campus 25
2.4 Distribution of Full-Time-Equivalent Studentsby Campus, 1975, 1980, 1985, and 1990, HighProjection
2.5 I)istribution of Full-Time-Equivalent Studentsby Campus, 1975, 1980, 1985, and 1990, LowProjection
27
31
3.1 Projected Distribution of Public Post-SecondaryInstitutions by Size and Type 44
3.2 Comparison of Post-Secondary Institutions andCampuses, Fall 1970 47
3 . 3 Number of Campuses in the Public Sector 48
4.1 Selected Standards for Classroom Space inColleges and Universities 71
4 2 Selected Examples of Class Laboratory SpaceStandards 73
4.3 Laboratory Space Standards for SelectedInstitutions and States
4 . 4 Study Space Standards
4.5 Estimated Space Requirements for InstructionalResources Center, Staten Island Community(:olleges
$1
84
86
87
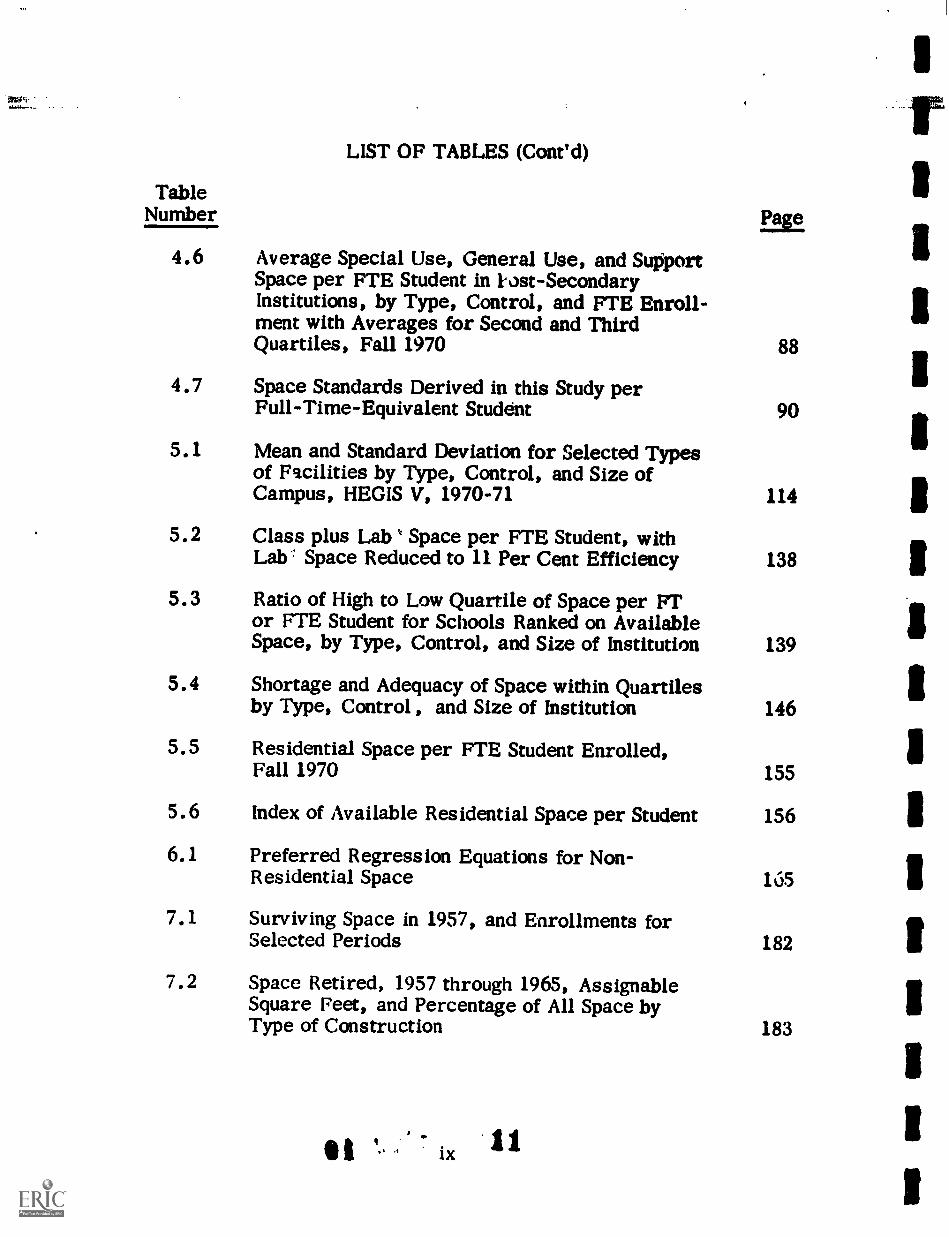
LIST OF TABLES (Cont'd)
TableNumber
4.6 Average Special Use, General Use, and SupportSpace per FTE Student in rust- SecondaryInstitutions, by Type, Control, and FTE Enroll-ment with Averages for Second and ThirdQuartiles, Fall 1970 88
4.7 Space Standards Derived in this Study perFull-Time-Equivalent Student 90
5.1 Mean and Standard Deviation for Selected Typesof Facilities by Type, Control, and Size ofCampus, HEGIS V, 1970-71 114
5.2 Class plus Lab 4 Space per FTE Student, withLab Space Reduced to 11 Per Cent Efficiency 138
5.3 Ratio of High to Low Quartile of Space per FTor FTE Student for Schools Ranked on AvailableSpace, by Type, Control, and Size of Institution 139
5.4 Shortage and Adequacy of Space within Quartilesby Type, Control , and Size of Institution 146
5.5 Residential Space per FTE Student Enrolled,Fall 1970 155
5.6 Index of Available Residential Space per Student 156
6.1 Preferred Regression Equations for Non-Residential Space 165
7.1 Surviving Space in 1957, and Enrollments forSelected Periods 182
7.2 Space Retired, 1957 through 1965, AssignableSquare Peet, and Percentage of All Space byType of Construction 183

LIST OF TABLES (Cont'd)
TableNumber Ems
7.3 Estimated Stock of Total Space in Existenceby 1970 and Survived to 1990 184
7.4 Additions to Non-Residential Stock of Post-Secondary Buildings by Years 186
7.5 Estimated Space Built and Survived by 1975 187
7.6 Estimated Space Built by 1975 and Survivedto 1990 188
8.1 Proprietary Schools, New York, Full-Time-Equivalent Enrollment and Space per Full-Time-Equivalent Student
8.2 Summary of Current Enrollment and OperatingCapacity for Proprietary Schools byOccupational Area and City
199
201
9.1 Indexes of Construction Costs and Cost ofLiving Index 212
9.2 Index of Facilities Costs by Type 213
9.3 Cost per Square Foot of College Construction,by Region 215
10.1 Structure of Educational Technology 228
11.1 Average Space in Schools in Public SectorCampuses with and without Special Programs 251
11.2 Required Non-Residential Space, Based onAverage Space Standards 253
11.3 Space Required to Accommodate AdditionalPublic Sector Students by 1975, 1980, 1985,and 1990 254

TableNumber
11.4
11.5
11.6
LIST OF TABLES (Coded)
Space Required to Eliminate Shortages andProvide for Growing Campuses, Public Sector
Projected Maximum Space in the Public Sectorto Keep the "Pecking Order"
Per Cent of Enrollments in Public SectorSchools with Fewer than 5,000 FTE Students,and Estimated Effect on Space Requirements,1980
255
256
257
11.7 Summary of Required Space underVaryingAssumptions and Available Space, PublicSector, 1975 to 1990 258
11.8 Non-Residential Space Added between Fall1968 and Fall 1971 260
AppendixTable
5.1 Average Square Feet for Schools Ranked byQuartile on Selected Categories of Space perFull-Time-Equivalent Student, by Type,Control, and Size of School
5.2 Schools Ranked by Quartile on Total Non-Residential Space per Full-Time-EquivalentStudent, by Type, Control, and Size ofSchool, Detail of Space by Function
5.3 SchuAs Ranked by Quartile on Total Non-Residential Space per Full-Time Student,by Type, Control, and Size of School,Detail of Space by Function
A-11
A-20
A-34

LIST OF TABLES (Cont'd)
AppendixTable
5.4 Standard Deviations of Type of Space by Type,Control, and Size of School, Ranked onIndividual Space per Full-Time-EquivalentStudent, Total Space per Full-Time Student,and Total Space per Full-Time-EquivalentStudent
5.5 Differences in Space Available betweenQuartiles of Schools, with Schools Ranked byQuartile on Total Non-Residential Space perFull-Time-Equivalent Student, by Type,Control, and Size of School
Page
A-52
A-61
5.6 Incremental Space per Full-Time Student byType, Control, and Size of School A-69
6.1 Number of Institutions in Combined Data Baseby Type, Control, and Size of Institution A-110
6.2 Institutional Variables Included in CombinedData Base A-111
6.3 Groupings of FIEGIS Fields of Study by FiveMajor Fields and Levels of Degrees Granted A-114
6.4 Preliminary Regression Results: Coefficientsof FTE Enrollment, FTE Staff, andInstructional Expenditures in Equations forNon-Residential Space A-117
6.5 Regression Results: Equations for Non-Residential Space for Public Universities withLess than 10,000 FTE Enrollment
6.6 Regression Results: Equations for Non-Residential Space for Public Universities with10,000 to 20,000 FTE Enrollment
xii
A-119
A-121

LIST OF TABLES (Coned)
AppendixTable
6.7 Regression Results: Equations for Non-Residential Space for Public Universitieswith Greater than 20,000 FTE Enrollment
6.8 Regression Results: Equations for Non-Residential Space for Public Universitieswith Greater than 10,000 FTE Enrollment
P.
A-122
A-123
6.9 Regression Results: Equations for Non-Residential Space for All Public Universities A-124
6.10 Regression Results: Equations for Non-Residential Space for Private Universitieswith Less than 10,000 FTE Enrollment A-125
6.11 Regression Results: Equations for Non-Residential Space for Private Universitieswith Less than 20,000 FTE Enrollment
6.12 Regression Results: Equations for Non-Residential Space for Private Universitieswith Greater than 500 FTE Enrollment
6.13 Regression Results: Equations for Non-Residential Space for Public Other Four-Year Schools with Less than 2,500 FTEEnrollment
6.14 Regression Results: Equations for Non-Residential Space for Public Other Four-Year Schools with 2,500 to 5,000 FTEEnrollment
6.15 Regression Results: Equations for Non-Residential Space for Public Other Four-Year Schools with 5,000 to 10,000 FTEEnrollment
A-127
A-129
A-131
A-132
A-133

LIST OF TABLES (Cont'd)
AppendixTable
6.16 Regression Results: Equations for Non-Residential Space for Public Other Four-Year Schools with Less than 5,000 FTEEnrollment
6.17 Regression Results: Equations for Non-Residential Space for Public Other Four-Year Schools with Greater than 5,000 FTEEnrollment
6.18 Regression Results: Equations for Non-Residential Space for Private Other Four-Year Schools with Less than 1,000 FTEEnrollment
6.19 Regression Results: Equations for Non-Residential Space for Private Other Four-Year Schools with 1,000 to 2,500 FTEEnrollment
6.20 Regression Results: Equations for Non-Residential Space for Private Other Four-Year Schools with Greater than 2,500 FTEEnrollment
6.21 Regression Results: Equations for Non-Residential Space for Private Other Four-Year Schools with Less than 2,500 FTEEnrollment
6.22 Regression Results: Equations for Non-Residential Space for Private Other Four-Year Schools with Less than 2,500 FTEEnrollment
6.23 Regression Results: Equations for Non-Residential Space for Public Two-YearSchools with Greater than 2,500 FTEEnrollment

LIST OF TABLES (Cont'd)
AppendixTable
6.24 Regression Results: Equations for Non-Residential Space for Private Two-YearSchools with Less than 1,000 .FTEEnrollment
6.25 Regression Results: Equations for Non-Residential Space for All Private Two-Year Schools
Par.
A-143
A-144

SUMMARY AND CONCLUSIONS
This study of the facilities needs of the post-secondary schools
was conducted at an interesting time. The long period of increasing
undergraduate degree-credit enrollments had come to an abrupt end.
Graduate and professional enrollments were still growing apace, but
it was not at all clear how long this could continue. The only segment
of post-secondary education which exhibited sustained growth, and is
currently the fastest-growing of all, is the vocationally oriented one
catering to non-degree-credit students.
There is a growing consensus that enrollments will not grow
as fast in the post-secondary sector as had been projected in the
past. Hence, a revised set of projections was developed for this
study. Table A presents a comparison of these estimates with some
previous efforts to forecast the workload of the post-secondary
sector. If the low, and pessimistic, projection describes future
enrollments, it is quite likely that degree-credit students may fall
short of most forecasts by as much as 1.0 to 1.5 million.
In our field visits, we found that this message apparently had
not reached campus planners. Extensive construction plans for many
public institutions are still being justified on the basis of fairly high
enrollment targets prepared a number of years ago. In the few

TABLE A
ENROLLMENT PROJECTIONS FOR 1975 AND 1980BY VARIOUS ORGANIZATIONS
(Thousands of FTE Students)
NCES (1968)
1975 1980Degree-Credit
Only All
Degree-Credit
Only
7,283 7,283 n.a. n.a.NCES (1972) 7,472 8,166 8,567 9,431
Norris Committee 8,003 n.a. n.a. n.a.Carnegie Commission 8,052 8,801 9,293 10,156
This Study: !Ugh 7,625 8,334 8,343 9,1189, 11 Low 6,509 7,114 6,969 7,616
Source: Department of Health, Education, and Welfare, Office ofEducation, National Center for Educational Statistics,Projections of Educational Statistics to 1977-78, 1968edition, Table 16, p. 24; ibid, 1972 edition, Table 12,p. 33; DREW, Office of Education, Chalmers G. Norris,Study Group Chairman, Federal Support for Hi her EducationConstruction: Current Pro rams and Future Needs, Reportof the Higher Education Construction Programs Study Group,Table F-10, p. 145; Gus W. Haggstrom, "The Growth ofHigher Education in the United States," Project on Statisticsof Higher Education of the Carnegie Commission on HigherEducation, (mimeographed), Table 1, p. 3.
4

instances where central planning authorities were trying to delay or
v...cluce the level of construction, their attempts were frustrated by
a tug-of-war with individual campus administrators, who, relying on
their political connections, were pushing ahead campus construction
plans based on overly optimistic enrollment projections.
The private sector has not yet perceived the possibility that
the publicly subsidized schools will have more spaces than their
traditional "market share." Private school administrators have not
faced up to the likelihood that enrolments will decline in private
four-year schools as they have in private two-year schools in the
recent past.
In summary, it is quite likely that the next few years will be
times to try campus planners' souls. In this study, we present a
new set of planning factory and techniques to assist them in meeting
this new challenge.
At the very outset of the study, we projected new, likely
distributions of students between the private and public sectors. The
major assumption underlying these projections is that public schools
will fill their quotas irrespective of the level of enrollments. Thus,
the bulk of the shortfall of enrollments will be borne by the private
sector. A comparison of student workloads in the public and private
sectors with the latest NCES projections is shown in Table B. Our

TA
BL
E B
PUB
LIC
AN
D P
RIV
AT
E S
EC
TO
R E
NR
OL
LM
EN
TS
(Tho
usan
ds o
f FT
E S
tude
nts)
MD
"'at
e
1975
1980
1985
1990
Publ
icPr
ivat
ePu
blic
Priv
ate
Publ
icPr
ivat
ePu
blic
Priv
ate
_N
CE
S6,
332
1,83
47,
584
1,84
7n.
a.
n. a
.n.
a,
r. a
Thi
s St
udy:
Ilig
h6,
513
1.82
17,
420
1,69
87,
576
1.65
77,
495
1,54
8O
fO
f
Low
5,56
01,
554
6,20
01,
416
6,10
61,
332
5,73
01,
182
n.a.
: Not
ava
ilabl
e.
Sour
ce: T
able
s 2.
4 an
d 2.
5.
SID
Sill
IMO
SO
IMO
OIP
SN
PS
IMI
NIP
MIS
Sill
1111
111
Al I
S

high projection differs only marginally from that of NCES. However,
if the low enrollment estimates prove to be accurate, the private
sector enrollments will be twenty to twenty-five per cent below
forecasts based on past trends.
We expect that, even under pessimistic enrollment projections,
enrollments in the public sector will grow, at least between now and
1980. Hence, a number of new institutions are likely to be established,
and some present campuses will be expanded to accommodate these
students. A projection of campuses by size appears in Table C.
In order to determine the future space requirements, we
derived a series of space standards, six in all, one for each of the
three types of schools in both the public and private sector--univer-
sities, four-year schools, and two-year schools. These standards,
which include no provision for technical programs, are shown in
Table D. They are most useful for calculating incremental space
requirements. In addition, Table D sh9ws somewhat higher space
standards which could be used if additional space allowances for
small schools and s'whnical programs were included. Finally,
these standards are compared to those developed by the Higher
Education Construction Program Study Group in the late 1960's.
Under any conceivable standards, the overall shortages of
assignable space did not exist by Fall 1971 in either the public or
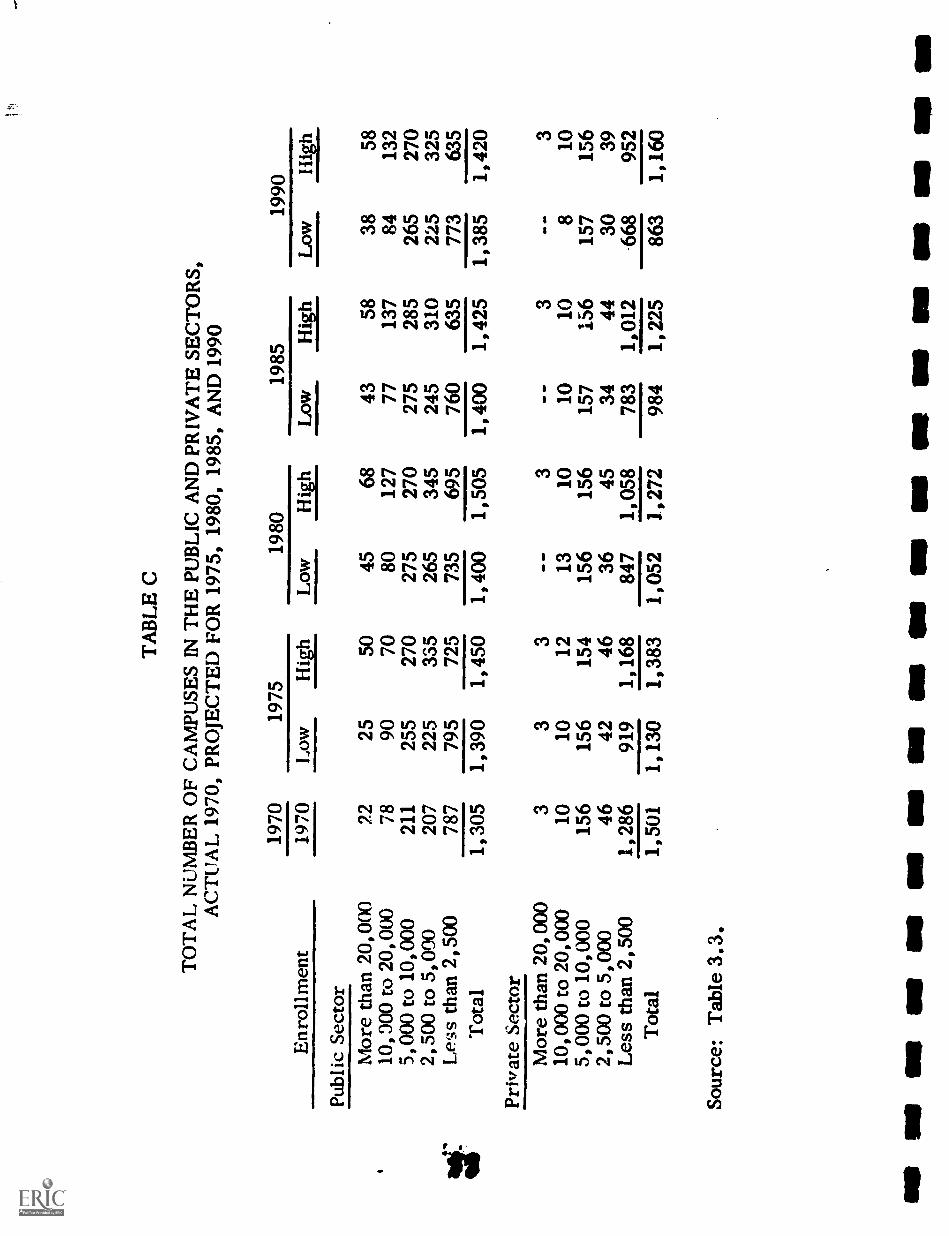
TA
BL
E C
TO
TA
L N
UM
BE
R O
F C
AM
PUSE
S IN
TH
E P
UB
LIC
AN
D P
RIV
AT
ESE
CT
OR
S,A
CT
UA
L 1
970,
PR
OJE
CT
ED
FO
R 1
975,
198
0, 1
985,
AN
D 1
990
Enr
ollm
ent
1970
1975
1970
Low
Hig
h
Publ
ic S
ecto
rM
ore
than
20,
000
2225
5010
,300
to 2
0,00
078
9070
5,00
0 to
10,
000
211
255
270
2,50
0 to
5,0
0020
722
533
5L
ess
than
2,5
0078
779
572
5T
otal
1,30
51,
390
1,45
0Pr
ivat
e Se
ctor
Mor
e th
an 2
0,00
03
33
10,0
00 to
20,
000
1010
125,
000
to 1
0,00
015
615
615
42,
500
to 5
,000
4642
46L
ess
than
2,5
001,
286
919
1,16
8T
otal
1,50
11,
130
1,38
3
Sour
ce: T
able
3.3
.
1980
Low
Hig
h
4568
8012
727
527
026
534
573
569
51,
400
1,50
5
- -
313
1015
615
636
4584
71,
058
1,05
21,
272
1985
1990
Low
Hig
hL
owH
igh
4358
3858
7713
784
132
275
285
265
270
245
310
225
325
760
635
773
635
1,40
01,
425
1,38
51,
420
__3
- -
310
108
1015
715
615
715
634
4430
3978
31,
012
.668
952
984
1,22
586
31,
160
IND
MI S
ill O
N IM
OIle
all
SIN
OW
11 l
IMO
NO
MI
1111
11III
IIIS
IM U
M U
M

TA
BL
E D
SUM
MA
RY
OF
AL
TE
RN
AT
IVE
SPA
CE
ST
AN
DA
RD
S
(Ass
igna
ble
Squa
re F
eet p
er. F
TE
Stu
dent
)
Publ
ic I
nstit
utio
ns
(1)
(2)
(3)
"Nor
ris
Stan
dard
s"T
his
Stud
y's
Stan
dard
s
(1)
plus
Tec
hnic
alPr
ogra
ms
(2)
plus
Size
Allo
wan
ce
Uni
vers
ities
89.8
97.0
97.0
132.
0O
ther
Fou
r-Y
ear
Scho
ols
71.7
75.3
79.8
93.0
Tw
o-Y
ear
Scho
ols
51.7
57.9
72.4
70.0
-sob
Priv
ate
Inst
itutio
ns
72.0
117.
9
77.7
127.
3
83.8
127.
3
100.
8
150.
0ef
t ivU
nive
rsiti
esO
ther
Fou
r-Y
ear
Scho
ols
119.
812
5.8
133.
310
3.0
Tw
o-Y
ear
Scho
ols
118.
413
2.6
132.
675
.011
9.0
126.
813
1.0
116.
'J
Not
e: (
1) N
orri
s st
anda
rds
incl
ude
a pr
ovis
ion
for
non-
clas
s la
bora
tori
es,
appr
oxim
atel
y 17
.2 a
nd 2
1.6
sq.
ft. p
er F
TE
stu
dent
in p
ublic
and
pri
vate
uni
vers
ities
,re
spec
tivel
y, a
nd 2
.3 a
nd 7
.2 s
q. f
t. pe
rFT
E s
tude
nt in
pub
lic a
nd p
riva
te o
ther
fou
r-ye
ar s
choo
ls, r
espe
ctiv
ely.
Non
-cla
ss la
bs o
ccup
ied
7.2
sq. f
t. pe
r FT
E s
tude
nt in
the
publ
icse
ctor
and
8.9
sq.
ft.
per
FTE
stu
dent
in th
e pr
ivat
e se
ctor
.(2
) Sc
hool
s in
eac
h ca
tego
ryar
e no
t str
ictly
com
para
ble
(see
Tab
le 2
.3).
Sour
ce: T
able
s 4.
7, 1
1.7,
and
Nor
ris,
loc.
cit.
,p.
7.

private sectors (see Table E). Table E does not show that the
averages were masking severe shortages in certain types of space:
class laboratories, which were preventing some schools from offering
well-rounded programs; study space, which resulted in less than
adequate library collections and facilities; and office space, which
forced many faculty members to use substandard facilities. This
study documents in great detail the inequality of facilities between
schools, and, if widely disseminated, should draw the attention of
planners to this topic.
Unfortunately, no precise statistical explanation of required
space, or current practices about space usage, could be derived
from an elaborate set of statistical regression analyses. These
analyses contributed to an understanding of some of the factors which
affect space demands: (1) the number of FTE students, (2) the
number of UTE staff, (3) expenditure patterns, and (4) in the case of
schools offering doctorate programs, their course mix. In the case
of private universities, nearly one-fifth of the available space was
explained in regression equations by heavier-than-average doctorates
in natural, physical, and biological sciences.
In order to forecast availability of space, future retirement
rates must be considered. Since over 40 per cent of the non-residential
space in the public sector and 30 per cent in the private sector has been
1
1
1

TA
BL
E E
AV
AIL
AB
LE
NO
N-R
ESI
DE
NT
IAL
SPA
CE
, FA
LL
197
1, A
ND
RE
QU
IRE
D S
PAC
E F
OR
TW
O S
TA
ND
AR
DS
(Mill
ions
of
Ass
igna
ble
Squa
re F
eet)
Act
ual T
otal
Act
ual N
on-
Thi
s St
udy,
Non
-Res
iden
tial
Nor
ris
Res
iden
tial S
pace
Aug
men
ted
Spac
eSt
anda
rds
Les
s N
on-C
lass
Lab
sSt
anda
rds
Publ
ic f
rist
imac
is53
154
349
345
1A
ilgb
Uni
vers
ities
266
268
232
191
Oth
er F
our-
Yea
r Sc
hool
s16
516
216
113
7x x
Tw
o-Y
ear
Scho
ols
100
113
100
123
g"..
4..1 !Pri
vate
Ins
titut
ions
291
212
274
239
Uni
vers
ities
9286
8085
Oth
er p
our-
Yea
r Sc
hool
s18
411
817
913
9T
wo-
Yea
r Sc
hool
s15
815
15
Not
e: S
ee n
otes
to T
able
D.
Sour
ce: S
ee T
able
A; u
npub
lishe
d O
peni
ng F
all E
nrol
lmen
ts, F
all 1
971,
cour
tesy
NC
ES.

built since 1968, special retirement estimates were necessary. We
estimate that, with present commitments through 1975, the stock of
non-residential space will amount to 1,028 million assignable square
feet. Retirements in the next 15 years will claim 68 million
assignable square feet.
flow adequate this stock might be will depend not only on the
number of students, but on the character of programs in the post-
secondary sector. A survey of innovative programs, technological
developments, etc., did not encourage us to modify our projections
of future requirements. We believe that, at best, the changes in the
post-secondary system will be cosmetic; at worst, the system will
not change in this decade or the next.
We could not see any effective way of helping proprietary
schools catering to proprietary students th-ough facilities programs.
Most of these schools are small, and many go in and out of business
in a few years. Their principal worry today is that proprietary
enrollments are declining in the face of stiffening competition from
public junior colleges. A federal policy to subsidize facilities of
schools in this sector v.)uld be difficult to administer and would not
address the fundamental problem of these schools.
Our survey of construction costs has convinced us that, under
ordinary circumstances, they will continue to escalate one per cent
27lilt
xxv

faster than the cost of living. We are also convinced that the cost
per assignable square foot was higher than required by mere concerns
of providing minimum adequate space. Post-secondary schools are
built with aesthetic values in mind.
In the last chapter of this study, we have tried to assess
future space availability in the public sector, determine where space
shortages could conceivably develop, and compare probable levels of
demand for this space. Eight sets of projections of required space
were prepared, using three approaches:
(1) Using standards for space developed by this study:
(a) using these standards without any adjustment,
(b) using these standards and adjusting for spacerequired for technical programs,
(c) augmenting estimates derived in (b) by anallowance for space in schools with campusesbelow 5,000 FTE students.
(2) I !sing the three estimates of space derived above toestimate the space required to accommodate the growthin enrollment between 1970 and 1975, 1980, 1985, and1990.
(3) Estimating the amount of space needed
(a) to eliminate shortages of space in schools inthe public sector with space less than thestandards developed by this study,
(b) to provide adequate facilities for campuses whichwere projected to grow as increased enrollmentsin the public sector increase,
28 xxvi
kr

We prefer the third projection as being the most realistic.
The first projection would result in sufficient space only if all schools
had precisely the space they required. Surpluses in one school
would cause shortages in another. The second projection is some-
what more realistic. It assumes that, since there was enough space
on the average, space to accommodate new students is all that is
needed. The third projection simulates reasonable campus planners'
behavior, and is hence the best of the three.
Under any conceivable assumption, sufficient space will be
available by 1975. If enrollments stabilize, hardly any building will
be required from there on. If they do grow in line with the trends
during the 1960's, modest additions to assignable space, at roughly
two-thirds to one-half the rate of commitments during the past two
years (when no general aid to construction was available), will be
sufficient to meet the projected needs (see Table F).
In conclusion, we see no crisis in post-secondary facilities in
the near future. We do see a challenge to minimizing the expendi-
tures of this nation's resources. If it were possible to integrate
excess space in the private sector into the public sector, the freed
resources could be better applied elsewhere.
2
xxvii

TA
BL
E F
SUM
MA
RY
OF
RE
QU
IRE
D S
PAC
E U
ND
ER
VA
RY
ING
ASS
UM
PTIO
NS
AN
DA
VA
ILA
BL
E S
PAC
E, P
UB
LIC
SE
CT
OR
, 197
5 T
O 1
990
1B
ased
on
Stud
y St
anda
rds
(1)
Stud
y st
anda
rds
(2)
(1),
with
add
ition
al s
pace
for
tech
nica
l pro
gram
s
(3)
(2),
and
add
ition
al s
pace
for
smal
l sch
ools
II P
rese
nt S
pace
Plu
s Sp
ace
for
New
Enr
ollm
ents
(4)
Spac
e fo
r ne
w e
nrol
lmen
ts
(5)
(4),
pre
:,ent
spa
ce, b
pace
for
new
enr
ollm
ents
and
tech
nica
lpr
ogra
ms
(Mill
ions
of
Ass
igna
ble
Squa
re F
eet)
1975
Low
Hig
h
404.
949
4.5
437.
251
2.3
469.
155
0.6
45.7
121.
3
549.
762
5.3
(6)
(5),
incl
udin
g ad
ditio
nal s
pace
553.
963
4.1
for
smal
l sch
ools
1980
1985
Low
-Enr
ollm
ent
Hig
hL
owH
igh
Ass
umpt
ions
452.
454
1.6
448.
855
7.2
488.
658
4.9
484.
060
0.9
542.
062
6.3
517.
264
2.0
97.4
194.
993
.121
1.4
601.
469
8.9
597.
171
5.4
610.
471
1.7
601.
872
6.5
1990
Low
Hig
h
421.
755
1.5
454.
959
5.0
486.
063
5.7
63.7
113.
7
567.
761
7.7
570.
472
0.3

fob
1116
(7)
x'(8
)>
1-
a CIP
TA
BL
E F
(C
oned
.)
SUM
MA
RY
OF
RE
QU
IRE
D S
PAC
E U
ND
ER
VA
RY
LN
G A
SSU
MPT
ION
S A
ND
AV
AIL
AB
LE
SPA
CE
, PU
BL
IC S
EC
TO
R, 1
975
TO
199
0
(Mill
ions
of
Ass
igna
ble
Squa
re F
eet)
111
Spac
e R
equi
rem
ents
Bas
edon
Pre
sent
Spa
ce, S
pace
Nee
ded
to E
limin
ate
Shor
tage
s,an
d Pr
ovid
e fo
r T
echn
ical
Prog
ram
s
Elim
inat
e sh
orta
ges,
bui
ldne
w c
ampu
ses,
plu
s te
chni
cal
prog
ram
s
(7),
plu
s si
ze a
llow
ance
Ava
ilabl
e Sp
ace
n.a.
: Not
app
licab
le.
Sour
ce: S
ee C
hapt
er 1
1,p.
230
.
1975
1980
Low
Hig
hL
ow
543.
3
551.
5
571.
0
590.
3
593.
1
608.
2
697.
2
720.
7
IleIII
IIIO
N E
llS
IMS
IB
639
627
1985
1990
Low
Hig
hL
owH
igh,
Ass
umpt
ions
n.a.
n.a.
n.a.
n.a.
614
n.a.
n.a.
n.a.
n.a.
587
SO a
llG
NI
ON
ale
OM
B M
I WO
INS

CHAPTER 1
SCOPE OF REPORT
The report addresses a central issue in post-secondary
education: how much space is likely to be needed to accommodate
the enrollments between now and 1990 in both the non-profit and
proprietary educational sectors. On the surface, this is a simple
question, since a considerable volume of literature is available on
the subject of desirable standards for facilities in the non-profit
sector, and facilities in the proprietary sector constitute only a
small portion of all the space required for instruction of post-
secondary students.
A closer examination of the topic, though, reveals that
projections of required space are not as simple as they seem. In the
first place, there is considerable uncertainty about the levels of
enrollments, both in the immediate future, say the next three to five
years, as well as during the next two decades. Second, the require-
ments for space do not depend solely on the levels of enrollments, they
are affected by the number of i istitutions and campuses which are
operated. Possible economies of scale could make it possible to
accommodate more students in a given amount of space on fewer
campuses, as contrasted to fewer students with the same amount of

2
space on more campuses. Third, the availability of a given amount
of space does not guarantee that sufficient space will be available for
all students--some institutions may have more space than requires:,
and others may be short of space.
The problems of determining adequate space standards on a
national scale is further complicated by different space requirements
for different types of students, i.e., students in the sciences gener-
ally require more space than students in some other disciplines, and
graduate students are believed to require more space than under-
graduates. Even more importantly, the offerings of a post-secondary
institution are likely to be affected by the type and amount of space
available. It is quite likely that some institutions do not offer certain
programs, or offer inadequate programs, because of total or
specialized space shortages; thus, is some cases, present space
standards may be irrelevant.
There are a large number of additional problems which affect
the determination of adequate space utilization. This introductory
chapter will attempt to give an overview of these problems, and
indicate how they are likely to be handled in the body of the study.
Trends in Student Enrollments
Many observers of post-secondary education, as well as
university planners and administrators, have lived all their adult
13

3
lives during a period when post-secondary enrollments were growing
apace. In the very recent past (some five years ago), it took real
courage to forecast a slowdown in this rate of increase, and during
the past year or so, increasing numbers of researchers have
broached the possibility that enrollments may stabilize in the near
future, and are likely to dip slightly during the 1980's.
Lower forecasts of future enrollments are based upon the
observed decline of the birth rate, which will reduce the number of
persons in the age group most likely to enroll in college. Further-
more, since both academic and financial barriers to college
attendance were lowered during the past decade, a number of
investigators have felt that the peak in the propensity to attend
college is likely to be (or may even have been) reached. Whether
this is the case or not remains a moot point.
It is true, though, that undergraduate enrollments during the
past few years have not increased very fast, and that the degree of
uncertainty about future enrollments has increased exponentially. As
forecasts based on past trends were too high, doubts have been raised
about the future prospects. These doubts are not shared by everybody
in the post-si?condary sector. Persons more optimistic about the
future of higher education enrollments, mostly college administrators,
argue that (1) the demand for post-secondary education will continue
to grow as the affluence of the American population keeps increasing,
it 34

and (2) that new recruits will be found for college admission, i.e.,
persons who may wish to return to college to expand their knowledge,
update skills, or even retired persons desirous of acquiring new
interests.
Current evidence does not support these optimistic proposals.
It is not at all clear to what extent college education has been chosen
by the majority of Americans as a way to enrich their lives, and to
what extent it has been bought as an investment, either to improve
earnings or marital prospects. If projections about the demand for
college graduates are correct, the slight surplus of both college
graduates and college-trained personnel over and above the number
of jobs believed to be suitable for persons with college education will
undoubtedly depress wages, and make college attendance less
attractive. Also, the types of courses offered at both the under-
graduate and graduate levels are not likely to appeal to retired
persons, who are probably interested in less rigor and structure
than is likely to be offered by most institutions.1
The types of institutions which students will decide to attend
will also affect future space needs drastically. it has been generally
1Also, given the cost of attending most institutions, the drain onolder persons' finances of commuting, fees, books, etc., is likelyto be quite considerable in relation to their budgets. Hence, thismarket is more likely to be served by low-cost institutions, if atall. Strangely enough, some high-cost schools, e.g., Columbia,have announced continuing education programs in the humanities,oriented to this market.
C 35t.
4

5
believed that students in private institutions are provided with more
space than students at public institutions; hence, at first blush, one
would be led to believe that the shift from private to public institu-
tions could result in less space requirements than would be manifested
if more students attended private institutions. This may or may not
be the case if enrollments in the private sector remain stable or
decline and enrollments in the public sector grow. There may be
excess space in one sector and shortages in another. As will be
pointed out in the section on institutions, much depends also on the
number of campuses to be operated.
!fere, we shall merely note that not only the control of the
school but also the type will play a role in determining space require-
ments. Thus, it appears that schools specializing in a narrower
range of &ucation, say, junior and community colleges, manage to
be satisfied with less space requirements than four-year schools. In
_turn, universities require mare space per student compared to either
junior or community colleges or four-year schools. Parenthetically,
it may be noted here that technical and engineering schools, as well
as medical schools, have very different space requirements from
other post-secondary inst: ' tions.
There is very little information about the extent of space
requirements in the proprietary sector. Fragmentary information
from select^d schools indicates that both secretarial, data-processing,
7C
36

6
and other non-crafts schools manage with some 40 square feet per
student. Craft schools, e.g., auto-mechanic, boiler-repair, or
medical technician, require some 60 square feet per student. By
contrast, television repair schools, which are generally small,
make do with 15 to 20 square feet per student. In most cases, the
schools provide little more than classroom/lab space, very limited
faculty offices, and some administration space. With very few
exceptions, the amenities of post-secondary institutions are
dispensed with.
The above considerations have prompted us to prepare
enrollment projections (1) for different levels of possible enroll-
ments, (2) by control of institution, (3) by type of campus, and
(4) by size of campus within type. Each one of these dimensions dis-
cussed below is relevant to the determination of space requirements.
Cempus or Institution?
The plan to prepare projections in a disaggregated manner
was adopted despite the fact that it causes a large number of data
problems. For instance, ;here is no published series of enrollment
by campus, and the series of enrollments by type of institution (an
institution may consist of a large number of campuses) does not
extend very far back either. The earliest data available from the
Office of Education goes back only to 1963, and it does not distinguish
37be

7
between enrollments in public and private institutions. There is
very little information either on a campus or institution basis that
traces enrollments by size of institution for 10- to 20-year periods
of time.
Under these circumstances, other ways of allocating students
to schools had to be found. The one selected for this study assumes
that the same proportion of students will attend campuses by size in
future years as they do now, with the distribution within type of
campus adjusted by the propensity to enroll in different types of
institutions. Other methods, e.g., one which takes into account
plans for establishing new campuses or institutions as reported by
states, and trends past developments in the distribution of students
by types of institutions/campuses, could have been used, and are
discussed in the report.
Current Standards for Space
Perceived needs about the space for accommodating students
undoubtedly influence existing space standards. What is believed to
be right is used as a target to reach, given certain enrollment goals.
We collected a variety of standards, studied the way they are derived,
and interviewed administrators and planners of campuses to under-
stand how they NA ere applied in practice. A separate chapter in this
report summarizes some o: the more commonly used planning
#1

8
standards and discusses their adequacy and their usefulness for
mapping national goals and projections.
Current Availability of Space
National inventories of space, when published, generally
present averages by institution, by type and control, and sometimes
by size of institution. This study goes much further: not only have
we compiled data by size of campus, by type, by size, and by control,
we have also calculated the distribution of space in each segment of
the institution by quartile, with institutions ranked by the amount of
space available. For each category of institution, we have further
evaluated means and standard deviations for all space, and for space
by type. This type of,analysis gave us an opportunity to re-analyze
the space availability for various types of campuses, and to pinpoint
differences in space availability between campuses.
The analysis has focused upon the various types of space
available- -classroom, laboratory, general use, and special use
space, as well as dormitory space. The hypotheses for the
differences in available armunts of space are discussed in this
chapter.
Determinants of Space Requirements
A number of hypotheses advanced in the previous chapter were
later tested. The effect of various rates of space utilization were also

9
discussed. Among the hypotheses tested statistically were the
following: that space requirements (1) depend upon the mix of students
(a) by level (graduate, undergraduate), and (b) by orientation of the
institution (degrees granted in selected groups of disciplines);
(2) are related to the number of faculty members per student; and
(3) arc affected by the level of expenditures per student for
instructional purposes.
Some generalizations were drawn about future space
requirements, given the results of these correlations.
Future Space Availability
Not all the space available today will be usable 20 years from
now. Some of the space will become obsolete and have to be retired,
and more will become so dilapidated that it will not be worth refur-
bishing. The experience with space retirement in the late 1950's and
early 1960's was used to project the retirement rates for the next
20 years.
Proprietary Post-Secondary Education
An evaluation of the extent and the future of proprietary
post-secondary education is presented. Some observations about
space procurement are then made on the basis of (1) field visits, and
(2) discussions with operators of proprietary schools. The flexibility
of space acquisition by this sector is contrasted to the non-profit
sector.

10
An Analysis of Costs of Space
Based upon information collected from selected state
departments of education and a file from College Management
magazine, estimates of costs per square foot of construction incurred
in the past few years are presented. Future levels of construction
costs, given the mix of facilities likely to be built, are discussed.
Some Comments on New Technology and New Patterns ofPost - Secondary Education
Past trends are only relevant if the organization of the post-
secondary sector is such that no change takes place. The possibility
of new departures in post-secondary education, such as computer-
assisted instruction, independent study, degrees by examination,
etc. , are discussed, and their impact on space assessed.
low Much Space Will Be Needed?
Alternative projections of space requirements are presented.
The space requirement projections will vary, depending upon assump-
tions made about space utilization, enrollment growth, etc. Four
various alternatives of required space are projected for the period
1975 to 1990.

11
CHAPTER 2
PROJECTIONS OF POST- SECONDARY ENROLLMENTS
How much space will be required for post-secondary institu-
tions will depend on the number of students who will choose to enroll
in these schools during the next two decades. Hence, an estimate
of future enrollrrients is crucial to all forecasts of facilities require-
ments. A few years ago, it appeared that such an estimate would
not require much courage to prepare. All one needed was patience
and skill to analyze the past trends of enrollments by socio-economic
class, by ability grouping, etc. , and apply them to the prospective
size of the high school graduating class. This procedure would
forecast enrollments reasonably well. Even projections based on
fitting least-square trends such as the ones prepared by the U.S.O.E.'s
National Center for Educational Statistics appeared to perform fairly
well in the short run during the late 1960's and early 1970's.
In both 1972 and 1973, though, the complacency of forecasters
has been shattered. Actual fall enrollments for 1972 were below
most projections, especially for degree credit undergraduates. An
analysis of first- :le enrollments for that year, based on the Current
Population Survey (CPS), indicates a serious reversal in the propensity
to enroll in college. While the proportion of high school seniors who
. 42tt

. 12
attended post-secondary institutions in the year after graduation was
increasing every year in the 1960's, first-year enrollments of seniors
in 1972 were some 49 per cent of the graduating class, as contrasted
to 54 per cent in 1969.1
A number of developments may have contributed to this decline,
and the following questions need to be answered:
(1) Did the end of the draft and the Vietnam war affectthe propensity to enroll?
(2) Was the decline in enrollments due to the dryingup of certain kinds of student aid?
(3) Or, perhaps, were enrollment decisions affectedby the unfavorable publicity about job prospectsfor college graduates?
Currently, there is no information about the influence of any
of these or other developments on decisions to enroll. We do know,
though, that the proportion of seniors enrolling in degree programs
is down from most forecasts, the number of graduate and first-
professional students is still increasing apace, and attendance in
non-degree programs is booming. In the fall of 1972, the number
of non-degree students was 13 per cent of pre-baccalaureate degree
students in the United States. In the course of the past three years,
their numbers were growing roughly 50 per cent faster than that of
other undergraduates.
1"The High School Class of 1972," by Ann M. Young, Monthly LaborReview, June 1973, Vol. 96, Slp. 6, p. 29.
- 43

13
An analysis of what has happened is further complicated by
some drastic changes in the timing of enrollments which have
occurred since 1965. A comparison of patterns from the 1960 Talent
study with CPS enrollment analyses for the period 1965 to 1970 lead
one to the conclusion that a larger proportion of students from poor
families enrolled in college right after graduation in the late 1960's
and the 1970's than in the 1950's and the early 1960's. Some modeling
by this writer leads him to believe that in the early 1970's as many
as 80 to 90 per cent of all full-time students from lower socio-economic
groups enrolled in college in the year after high school graduation.
Thus, the patterns of full-time attendance between the rich and the
poor was significantly narrowed during the 1960's.
These changes in the attendance patterns and in propensities
to enroll make past extrapolations and models inoperative. Models
forecasting the future enrollments in post-secondary education have
to be built from the ground up, and require more resources than have
been made available to this project. Under these circumstances,
we have decided to use two estimates of future enrollments. The
high estimate assumes that the propensity to enroll will continue to
go up between now and 1980, and will then level off with roughly 68
per cent of all high school seniors choosing to enroll in a degree
credit post-secondary program at some time during their
14
lifetime.1
Our best judgment is that this is the maximum enrollment
which could be expected during the next twenty years. This compares
to some 62 per cent of all high school seniors who would be expected
to enroll in college at 1969 enrollment rates, and the 56 per cent one
would expect to enroll if past trends hold, given the levels of first-
time enrollments in 1972.2
The high projection of enrollments also assumes that higher
proportions of those receiving bachelor degrees will continue their
education and attend professional and graduate programs. Based on
recent developments, there is no reason to doubt that trend.
Especially if the job prospects for B.A. recipients are unfavorable,
the incentive to improve one's qualifications by participating in
professional or graduate training may prove to be quite strong.
At the same time, there is reason to believe that the
proportion of non-degree students to pre-baccalaureate degree
students will continue to increase. Skill training, as part of career
education models, is being increasingly promoted by federal and
local authorities.
1 Jos -ph Froomkin, Aspirations, Enrollments, and Resources, TheChallenge to I figher Education in the SeverlresnSCJ.S. overnmentPrinting Office, Washington, 1970, Table B-VII, p. 122.
2 Cf. 'Table B-IX, Ibid.
15
To reflect the increasing popularity of skill, non-degree
training, an estimate was prepared by fitting a logistic curve to the
ratio of non-degree to pre-baccalaureate students. The relationship
of non-degree to pre-baccalaureate students was estimated at 17.6
per cent for 1990 and 12.4 per cent of all degree credit students.
Between 1972 and 1990, the proportion of non-degree to pre-bacca-
laureate students was set to increase linearly at 1.7 per cent a year
compounded. The aggregate levels of enrollments in terms of total
students are shown in Table 2.1. This estimate of total students was
based on the projection of enrollments in the post-secondary system,
outlined in The Financial Prospects of the Post-Secondary Sector,
1975 to 1990.1
If past trends provide one a maximum estimate of enrollments,
how is the lower estimate to be derived? It will be remembered that
roughly 50 per cent of all high-school graduates between 1890 and
1950 participated in some post-secondary education. 2 It may be
possible to set this as the trigger to estimate the lower level of future
enrollments, We believe that this procedure would result in esti-
mates which are much too low. As a result, we have estimated
Prepared under Contract I IEW-08-72-162, November 1972 byJoseph Froomkin, Inc.
2 Aspirations, etc., op. cit., Chapter 2, esp. pp. 15ff.

16
a level of undergraduate enrollments based on Fall 1972 enrollment
trends, i.e., enrollments of some 50 per cent of all high-school
graduates in the year after graduation, and a life-time participation
rate in post-secondary education of some 56 to 58 per cent for high-
school graduates. We also assumed that the propensity to enroll in
graduate school would stay at roughly 1972 levels. In other words,
the proportion of graduate students to the eligibles aged 23 to 29
would remain fairly constant. The proportion of non-degree
students to pre-baccalaureate students was kept the same in both
projections. The resulting estimates of total enrollments appear
in Table 2.2.
While the higher projection of enrollments between now and
1985 indicates the growth in the workload of post-secondary insti-
tutions to be close to 26 per cent with a leveling of enrollments
after that date, the low projection indicates that enrollments will be
flat between now and 1975, will grow seven per cent between 1975
and 1981, the peak year, and will then decline ten per cent in the
decade ending in 1990.
The two projections have widely differing implications for
facilities construction. While the high projection implies that
roughly 25 per cent more students will be enrolled in the peak period,
namely 1981-82, the low projection forecasts a more modest topping
out at some seven per cent in that year. In the short run, the high
bi7

17
projection would call for much construction, the low one for very
little.
The implications for the long run are also quite different. If
the high projection proves correct, some replacement of obsolete
facilities and buildings to offset retirements will be required between
1980 and 1990. By contrast, the low projection implies that very
modest refurbishing and remodeling will suffice to meet the needs
of post-secondary institutions during the later time period.
The aggregate projections may not accurately reflect facilities
needs of post-secondary institutions. It is quite possible that one
sector can either remain stable or decline, while another will grow
quite rapidly. Separate projections appear below, showing our best
estimates of enrollments by type of campus for four selected years:
1975, 1980, 1985, and 1990.
The distribution of enrollments by campus is adapted from the
previously cited study (The Financial Prospects of the Post-Secondary
Sector, 1975 to 1990). The projected enrollments in Financial
Prospects were by college or university system, extrapolated from
existing NCES data bases. In other words, a state network of post-
secondary institutions, where one campus was classified as having
strong doctoral orientation, but also included other four-year campuses
and possibly two-year satellite locations, would be reported as a
university. Another institution which is considered by the National

18
Center to have a less strong doctoral commitment, but which
nevertheless grants a Ph.D., is classified as an "other-four-year-
institution." Only independent community and junior colleges are
classified as two-year institutions by the Center.
Since most of th succeeding analysis is based on an analysis
campus by campus, rather than by institutional networks, the
projections below have been adjusted in two ways:
(1) Campuses have been classified by their predominantorientation as of 1970-71, and
(2) All institutions granting a Ph.D., irrespective of theextent of their commitment to a doctoral program,have been classified as universities.
As a result of these changes, the majority of graduate students
are now to be found in the category labeled "universities." The same
observation can be made about first professional students. Roughly
five per cent of university enrollments in the public sector were
shifted to the two-year community college sector. A matrix showing
these shifts appears in Table 2.3. It was assumed that the extent of
these shifts would not change in the future.
The distribution of enrollments by type of institution for the
high projection offers no surprises in the case of the private sector
(Table 2.4). It was assumed that the total enrollments in that sector
would remain stable throughout most of the period, i.e., to 1985,
and would decline between 1985 and 1990, as the absolute number of

19
enrollments in the public sector was assumed to remain stable, and
the declines in enrollment were to be boi,:se by the private Sector.
Towards the end of the time period, by 1990, institutions which offer
graduate programs would probably suffer a smaller loss in enroll-
ments, compared to those which offer only undergraduate instruction.
If the high projection turns out to predict enrollments,
significant growth is likely to occur in the public sector. Two growth
areas in this sector are: universities offering graduate degrees,
which will experience considerable growth between now and 1980, and
will stabilize thereafter; and two-year colleges, where the projected
growth of some 40 to 50 per cent in full-time-equivalent students is
projected between 1970 and 1980.
Recent experience gives no clues as to how either stable or
declining enrollments are likely to affect distribution of students by
institution. The experience of the depression of the 1930's and the
falling post-secondary enrollments during World War II are hardly
relevant in forecasting the distribution of students in the event that
the propensity to enroll in college either moderates or declines.
Causes of declining enrollments are probably different today.
If one of the important factors affecting decisions to enroll in college
is the cost of attendance, it is quite likely that the lack of interest in
a college education would affect the private sector more drastically
than the public one. If, on the other hand, the decline in enrollments
- g. se

20
is due to the reluctance of low-achieving middle- and lower-class
children to finance their P::ucation through debt, it is quite possible
that the publ'c sector could be affected more drastically than the
private one.
Since considerable doubt surrounds the causes of current
shifts in propensity to attend post-secondary institutions, we decided
to allocate the lower enrollments in precisely the same proportion
ass. the higher ones. In other wc rds, it was assumed that all types
of institutions would lose the same proportion of students by type.
Care was taken to allocate the same proportion of pre-baccalaureate,
non-degree, first-professional, and graduate students to each type of
institution in both the high had low projections (see Table 2.5).
If the low enrollment patterns are to materialize, roughly
25 per cent more full-time-equivalent students will be registered in
all public institutions in 1980, as compared to the early 1970's. By
1990, the enrollments will be some 15 per cent above those at the
beginning of this decade.
In the private sectok, we can expect drastic declines in
enrollments, on the order of 15 per cent, between tio% and 1975, and
a co ntinuing. decline of between 6 and 12 per cent for every succeeding
five years. The declines will be less pronounced between now and
1985 in the university sector, rtnd more drastic among the four-year
collews. The two-year junior college segment is relatively unimportant

21
in total enrollments or as a share of enrollments in the private
sector, and we would not be surprised if our projections underestimate
the decline there.

TABLE 2.1
HIGH PROJECTION, TOTAL STUDENTS, BY YEAR
(Students in Thousands)
DegreeCredit
1970 (Actual) 7,868
1975 9,826
1976 10,090
1977 10,350
1978 10,542
1979 10,678
1980 10,739
1981 10,674
1982 10,577
1983 10,480
1984 10,394
1985 10,301
1986 10,350
1987 10,381
1988 10,412
1989 10,443
199() 10,474
tvb
53
22
Non-Degree TotalCredit Enrollment
653 8,521
914 10,740
959 11,049
1,004 11,354
1,033 11,575
1,068 11,746
1,095 11,834
1,110 11,784
1,121 11,698
1,121 11,601
1,143 11,537
1,164 11,465
1,190 11,640
1,215 11,596
1,239 11,651
1,274 11,717
1,299 11,773
1
1

23
TABLE 2.1 (Cont'd)
PROJECTION, TOTAL STUDENTS, BY YEAR
Source: Adapted from: J. Froomkin, Aspirations, Enrollments, andResources, U. S. Department of Health, Education, andWe fare, Office of Education, U. S. Government PrintingOffice, Washington, 1970.

24
TABLE 2.2
LOW PROJECTION, TOTAL STUDENTS, BY YEAR
(Students in Thousands)
DegreeCredit
1970 (Actual) 7,868
1975 8,217
1976 8,378
1977 8,528
1978 8,660
1979 8,752
1980 8,814
1981 8,824
1982 8,777
1983 8,711
1984 8,653
1985 8,560
1986 8,430
1987 8,304
1988 8,179
1989 8,051
1990 7,929
Non-Degree TotalCredit Enrollment
653 8,521
943 9,160
971 9,349
1,004 9,532
1,029 9,689
1,049 9,801
1,071 9,885
1,079 9,903
1,086 9,863
1,092 9,803
1,089 9,742
1,090 9,650
1,089 9,519
1,081 9,385
1,079 9,258
1,077 9,128
1,074 9,003
Source: See Table 2.1, and pi
55

25
TABLE 2.3
REALLOCATION OF STUDENTS, INSTITUTIONS TO CAMPUS
Public Institutions
Universities
+ .50 first professionals of public other four-year schools+ .50 graduates of public other four-year schools
- .05 pre-baccalaureates and non-degrees of public universities
Other Four-Year Schools
- .50 first professionals of public other four-year schools
- .50 graduates of public other four-year schools
Two-Year Schools
+ .05 pre-baccalaureates and non-degrees of public universities
Private Institutions
Universities
+ .20 first professionals of private other four-year schools+ .33 graduates of private other four-year schools
+ .05 pre-baccalaureates and non-degrees of private otherfour-year schoJis
Other Four-Year Schoc!c
- .20 first professionals of private other four-year schools
.33 graduates of private other four-year schools
- .05 pre-baccalaureates and non-degrees of private otherfour-year schools
Two-Year Schools
Unchanged

26
TABLE 2.3 (Cont'd)
REALLOCATION OF STUDENTS, INSTITUTIONS TO CAMPUS
Source: Comparison of REGIS V analysis by campus with FallEnrollment, 1970.

TA
BL
E 2
.4
DIS
TR
IBU
TIO
N O
F FU
LL
- T
IME
EQ
UIV
AL
EN
TST
UD
EN
TS
BY
CA
MPU
S, 1
975,
198
0, 1
985,
AN
D19
90,
HIG
H P
RO
JEC
TIO
N
(Stu
dent
s in
Tho
usan
ds)
1975
Pre-
Bac
cala
urea
tean
d N
on-D
egre
eFi
rst
Prof
essi
onal
Gra
duat
eT
otal
All
Inst
itutio
ns7,263
266
805
8,334
Uni
vers
ities
2,461
196
641
3,298
Oth
er F
our-
Yea
r Sc
hool
s2,
755
70
164
2,989
Tw
o-Y
ear
Scho
ols
2,047
MO
.MP
MI.
2,04
7
Publ
ic I
nstit
utio
ns5,
811
127
575
6,51
3U
nive
rsiti
es2,
004
119
465
2,58
8O
ther
Fou
r-Y
ear
Scho
ols
1,84
38
110
1,96
1T
wo-
Yea
r Sc
hool
s1,964
--M
D...
1,96
4
Priv
ate
Inst
itutio
ns1,
452
139
230
1,821
Uni
vers
ities
457
77
176
710
Oth
er F
our-
Yea
r Sc
hool
s91
262
541,
028
Tw
o-Y
ear
Scho
ols
83-M
DM
b O
IP83
Not
e: F
ull-
time-
equi
vale
nt s
tude
nts
are
com
pute
d by
equ
atin
g th
ree
part
-tim
e st
uden
tsto
one
ful
l-tim
est
uden
t and
add
ing
it to
ful
l-tim
e en
rollm
ent.
Thi
s is
con
sist
ent w
ith N
CE
S pr
actic
e.
Sour
ce: B
ased
on
HE
GIS
V

TA
BL
E 2
.4 (
Con
t'd)
Drs
TR
IBI
TT
ION
OF
FUL
L-T
IME
-EQ
UIV
AL
EN
T S
TU
DE
NT
S B
Y C
AM
PUS,
197
5, 1
980,
198
5,A
ND
199
0,1-
11G
II P
RO
JEC
TIO
N
(Stu
dent
s in
Tho
usan
ds)
1980
Pre-
Bac
cala
urea
tean
d N
on-D
egre
eFi
rst
Prof
essi
onal
Gra
duat
eT
otal
All
Inst
itutio
ns7,
783
385
950
9,11
8U
nive
rsiti
es2,
690
262
730
3,68
2O
ther
Fou
r-Y
ear
Scho
ols
2,77
212
322
03,
115
eel
Tw
o- Y
ear
Scho
ols
2,32
1--
=I
=,
2;32
1
Publ
ic I
nstit
utio
ns6,
515
185
720
7,42
0V
Tel
4U
nive
rsiti
esO
ther
Fou
r-Y
ear
Scho
ols
2,27
91,
992
170 15
560
160
3,00
92,
167
Tw
o-Y
ear
Scho
ols
2,24
4--
__2,
244
Priv
ate
Inst
itutio
ns1,
268
200
230
1,69
8U
nive
rsiti
es41
192
170
673
Oth
er F
our-
Yea
r Sc
hool
s78
010
860
948
Tw
o-Y
ear
Scho
ols
77...
.--
77
00
MIN
I11
111
IIII
III
OS
INS
III
INO
rr11
110
IN IB
SIle
IN N
I Oil
lin

TA
BL
E 2
.4 (
Con
ed)
DIS
TR
IBU
TIO
N O
F Ft
IL
L-T
IME
-EQ
UIV
AL
EN
T S
TU
DE
NT
S B
Y C
AM
PUS,
197
5, 1
980,
198
5, A
ND
199
0,H
IGH
PR
OJE
CT
ION
(Stu
dent
s in
Tho
usan
ds)
1985
Pre-
Bac
cala
urea
tean
d N
on-D
egre
eFi
rst
Prof
essi
onal
Gra
duat
eT
otal
All
Inst
itutio
ns7,663
500
1,07
09,233
Uni
vers
ities
2,63
4320
801
3,755
Oth
er F
our-
Yea
r Sc
hool
s2,
862
180
269
3,311
Tw
o-Y
ear
Scho
ols
2,167
CO
MO
2,167
Public
Inst
itutio
ns6,
506
230
840
7,57
6L
'niv
ersi
ties
2,239
210
635
3,084
Oth
er F
our-
Yea
r Sc
hool
s2,
175
2020
52,
400
Tw
o- Y
ear
Scho
ols
2,092
0000
2,092
Priv
ate
Inst
itutio
ns1,
157
270
230
1,657
Uni
vers
ities
395
110
166
671
Oth
er F
our-
Yea
r Sc
hool
s68
716
064
911
Tw
o- Y
ear
Scho
ols
75C
OM
OC
OM
O75

TA
BL
E 2
.4 (
Con
t'd)
Dis
-num
TT
ION
OF
FUL
L-T
IME
-EQ
UIV
AL
EN
T S
TU
DE
NT
S B
YC
AM
PUS,
197
5, 1
980,
198
5, A
ND
199
0,/1
1G11
PR
OJE
CT
ION
(Stu
dent
s in
Tho
usan
ds)
0A
ll In
stitu
tions
I 'n
iver
sitie
s
1990
Pre-
Bac
cala
urea
tean
d N
on-D
egre
eFi
rst
Prof
essi
onal
Gra
duat
eT
otal
7,40
92,
582
580
370
1,05
576
89,
044
3,72
0lb
Oth
er F
our-
Yea
r Sc
hool
s2,
659
210
287
3,15
640
Tw
o-Y
ear
Scho
ols
2,16
8._
._--
2,16
8Si
*O
. .--
...Pu
blic
Ins
titut
ions
6,35
028
586
07,
495
Uni
vers
ities
2,20
625
563
03,
091
Oth
er F
our-
Yea
r Sc
hool
s2,
053
3023
02,
313
Tw
o-Y
ear
Scho
ols
2,09
14M
A 4
MA
4MA
4M
A
2,09
1
Priv
ate
Inst
itutio
ns1,
059
295
195
1,54
9U
nive
rsiti
es37
611
513
862
9O
ther
Fou
r-Y
ear
Scho
ols
606
180
5784
3T
wo-
Yea
r Sc
hool
s77
- -
477
Sour
ce: B
ased
on:
J. F
room
kin,
The
Fin
anci
alPr
ospe
cts
of th
e Po
st-S
econ
dary
Sec
tor,
197
5 to
199
0,pr
epar
ed u
nder
Con
trac
t HE
W-O
S-72
-162
, Nov
embe
r 19
72.
O
r En
reN
Oas
onus
Er
M ::
us s
e si
rr
r so
l M W
m

TABLE 2.5
DISTRIBUTION OF RM.-TIME-EQUIVALENT STUDENTS
BY CAMPUS, 1975, 1980, 1985, AND 1990,
LOW PROJECTION
(Stu
dent
s in
Tho
usan
ds)
Pre-
Bac
cala
urea
tean
d N
on-D
egre
e
All
Inst
itutio
ns6,
215
t 'ni
vers
ities
2,106
Oth
er F
our-
Yea
r Sc
hool
s2,
357
Tw
o-Y
ear
Scho
ols
1,752
Public
Inst
itutio
ns4,972
Uni
vers
ities
1,71
5O
ther
Fou
r-Y
ear
Scho
ols
1,57
6T
wo-
Yea
r Sc
hool
s1,681
Priv
ate
Inst
itutio
ns1,
243
Uni
vers
ities
391
Oth
er F
our-
Yea
r Sc
hool
s78
1T
wo-
Yea
r Sc
hool
s71
1975
Firs
tPr
ofes
sion
al
225
165
60
Gra
duat
eT
otal
674
7,11
4537
2,808
137
2,554
1,75
2M
b M
b
107
481
100
389
792
118
65
53
5,56
02,204
1, 675
1,681
193
1,55
414
860
445
879 71

a
TA
BL
E 2
.5 (
Con
ed)
I)IS
TR
IBL
'TIO
N O
F11
11-I
.-T
IME
-EQ
UIV
AL
EN
T S
TU
DE
NT
S B
Y C
AM
PUS,
197
5, 1
980,
198
5, A
ND
199
0,L
OW
PR
OJE
CT
ION
(Stu
dent
s in
Tho
usan
ds)
1980
Pre-
Bac
cala
urea
tean
d N
on-D
egre
eFi
rst
Prof
essi
onal
Gra
duat
eT
otal
All
Inst
itutio
ns6,
521
317
778
7,61
6U
nive
rsiti
es2,
254
216
598
3,06
8O
ther
Fou
r-Y
ear
Scho
ols
2,32
410
118
02,
605
Tw
o-Y
ear
Scho
ols
1,94
31M
MI
1M 1
M1,
943
Publ
ic I
nstit
utio
ns5,
458
152
590
6,20
0U
nive
rsiti
es1,
910
140
459
2,50
9O
ther
Fou
r-Y
ear
Scho
ols
1,67
012
131
1,81
3T
wo-
Yea
r Sc
hool
s1,
878
1M 1
M
1,87
8
Priv
ate
Inst
itutio
ns1,
063
165
188
1,41
6U
nive
rsiti
es34
476
139
559
Oth
er F
our
- Y
ear
Scho
ols
654
8949
792
Tw
o-Y
ear
Scho
ols
65al
bt5
es a
s O
n N
O M
e S
alN
MI M
O IM
O M
I IM
OIP
SIB
MIII
IIS
NP
SO
IMO
WM

TA
BL
E 2
.5 (
Con
ed)
DIS
TR
IBU
TIO
N O
F FI
T _
J.-T
IME
-EQ
UIV
AL
EN
T S
TU
DE
NT
S B
Y C
AM
PUS,
197
5, 1
980,
198
5, A
ND
199
0,L
OW
PR
OJE
CT
ION
(Stu
dent
s in
Tho
usan
ds)
Pre-
Bac
cala
urea
tean
d N
on-D
egre
e
All
Inst
itutio
ns6,
195
'niv
ersi
tics
2,12
8O
ther
Fou
r-Y
ear
Scho
ols
2,31
2T
wo-
Yea
r Sc
hool
s1,
755
Publ
ic I
nstit
utio
ns5,
260
Uni
vers
ities
1,80
9O
ther
Fou
r-Y
ear
Scho
ols
1,75
7T
wo-
Yea
r Sc
hool
s1,
694
Priv
ate
Inst
itutio
ns93
5U
nive
rsiti
es31
9O
ther
Fou
r-Y
ear
Scho
ols
555
Tw
o-Y
ear
Scho
ols
61
1985
Firs
tPr
ofes
sion
alG
radu
ate
Tot
al
398
845
255
632
143
213
IM 183
167 16
1=1.
7,43
83,
015
2,66
81,
755
663
6,10
650
12,
477
162
1,93
51,
694
40. I
N.
AM
AM
215
182
8813
112
751
QM
. 411
1111
1,33
253
873
3 61

TA
BL
E 2
.5 (
Con
t'd)
DIS
TR
IBU
TIO
N O
F FU
LL
-TIM
E-E
QU
IVA
LE
NT
ST
UD
EN
TS
BY
CA
MPU
S, 1
975,
198
0, 1
985,
AN
D 1
990,
LO
W P
RO
JEC
TIO
N
(Stu
dent
s in
Tho
usan
ds)
All
inst
itutio
nsU
nive
rsiti
esO
ther
Fou
r-Y
ear
Scho
ols
"Tw
o-Y
ear
Scho
ols
1990
Pre-
Bac
cala
urea
tean
d N
on-D
egre
eFi
rst
Prof
essi
onal
Gra
duat
eT
otal
5,66
81,
978
2,03
31,
657
437
279
158 --
807
587
220 --
6,91
22,
844
2,41
11,
657
Ob
fit
Publ
ic I
nstit
utio
ns4,
857
215
658
5,73
0U
nive
rsiti
es1,
690
192
482
2,36
4O
ther
Fou
r-Y
ear
Scho
ols
1,56
923
176
1,76
8T
wo-
Yea
r Sc
hool
s1,
598
--1=
1 1=
11,
598
Priv
ate
Inst
itutio
ns81
122
214
91,
182
Uni
vers
ities
288
8710
548
0O
ther
Fcu
r-Y
ear
Scho
ols
464
135
4464
3T
wo-
Yea
r Sc
hool
s59
oM O
Po=
b om
o59
Sour
ce: S
ee T
able
2.4
.
ell M
I MO
NIP
WS
INIn
IMO
INN
Sr
IMP
MI M
g r
IIIIII
IM
I Ili
SIN
OM

35
CHAPTER 3
SIZE DISTRIBUTION OF INSTITUTIONS AND CAMPUSES
The considerable uncertainty about the level of future
enrollments outlined in the previous chapter makes it imperative to
project the distribution of students by size of campus. Enroll-
ments in some segments of the post-secondary sector may increase
while they decrease in others, and changes in the distribution of
students by type and size of campus can produce space shortages
or surpluses. Hence, in order to estimate future space requirements,
it is important to project likely distributions of students not only by
type and control of institution, but also by size of institution or
campus.
Since the objectives of this project were (1) to estimate
desirable levels of space in different types of higher education
institutions, (2) to evaluate the impact of past financing patterns upon
attainment of these standards, and (3) to suggest a method for
estimnring future requirements to accommodate expected levels of
enrollments, the first step in our research was to identify a system
for classifyirg different types of institutions which would have similar
space requirements, and to project likely enrollments by type and size
of institution.

36
Much of the analysis below is based upon facilities information
reported in HEGIS V (1970-71). The information has been checked
for consistency with data reported in HEGIS IV, and a small number
of records which appear to be inconsistent from one reporting to
another were eliminated. More than 98 per cent of the records
were retained.
The traditional way in which data is reported classifies higher
education institutions into clusters catering to different levels of
students. Thus, all junior colleges are grouped together, so are all
four-year institutions; universities comprise another grouping.
Generally, a distinction is made as to the control of an institution,
in which all institutions financed by state and local governments are
reported as public and those financed by private or religious sources
are considered private.
The simplicity of this classification is more seductive than
useful. It isn't at all clear what the relevant unit for analysis should
be. Is it better to examine space availability campus by campus, or
analyze aggregated data for several campuses forming one
institution, e.g., a state system which may include a university,
satellite liberal arts colleges, and a few junior codeges? Although
the I I .S .0 chooses the latter system for most of its reports, an
analysis of data from IIEGIS V leads us to the conclusion that it is
probably more logical to deal with the data on a campus-by-campus

37
basis. One major reason is that there is no uniformity among the
states on how they classify the several campuses. Some states group
a large number of campuses under the aegis of one institution, others
favor independent arrangements, either for single campuses or for a
network of similar campuses.
Available Historical Data
Past history on enrollments by size and/or type of institution
collected by the U.S.O.E. is extremely spotty. The earliest data are
for 1960 and 1963. Enrollment by size was published for all schools
in 1960, and in 1963 for the then-current scheme of eight different
types of institutions. The tables do not provide total enrollments in
category, and lump all schools of more than 10,000 students
int.) one size group. The data tapes or source data underlying
these tables are, of course, not readily available. The acquisition
and processing of them, if they still exist, was judged too costly,
both in time and money.
More detailed tables were published for Fall 1968 to Fall 1970.
These tables arc based Oil the Opening Fall Enrollment Survey and
show the number of institutions and the degree-credit enrollment for
nine size breaks of institutions, ranging from under 200 to over
30,000 students. In addition to size, the data are reported by control
and type of institution.
es

38
All tables of enrollment by type, control, and size of
institution have to be used with caution because of the following
four caveats:
(1) Only degree-credit enrollment is reported. Thus,enrollment in two-year institutions is somewhatunderstated.
(2) Reported enrollments are total head counts, and donot distinguish between full-time and part-timestudents.
(3) The classification by size is on an institutionalbasis rather than campus by campus. Forinstance, the University of Maine is reported asone institution. In fact, it consists of eightcampuses. One offers a doctorate, one a master'sdegree, four a baccalaureate degree, and two arejunior colleges.
(4) In order to qualify for the designation of auniversity, the institution concerned has to havea major commitment to a doctoral program, andat least two professional schools: Thus, a largenumber of institutions which offer doctorateprograms are not included in that category.
In summary, there are little meaningful data to trace the past
growth of institutions. Hence, projections of the size distributions
of institutions in the future have to be of necessity, of an
impressionistic and imprecise nature.
1 The Financial Pros ects of the Post-Secondar Sector 1975 to1990, prepared for the Office of ASPE, DHEW (Contract HEW-OS-72-162), November 1972.
S.

39
Using the Past to Understand the Future
Just because the data collected to date aren't in the form which
we would find desirable doesn't mean that they cannot give us certain
insights into the way in which institutions have grown. We have tried
to use it as imaginatively as we know how to try to understand and
estimate future growth patterns.
When faced with a great deal of uncertainty about the relevance
of the data, it is useful to compare more sophisticated projections
against a naive model which assumes either (a) that things will
remain the same in the future, or (b) they will change at the same
rate that they have in the past. First, we have used enrollment
projections prepared in connection with a study performed for the
Assistant Secretary for Planning and Evaluation, Department of
Health, Education, and Welfare.' We allocated these enrollments
and an estimated number of institutions projected for 1980 by state
commissions for higher education2 according to the 1970 distribution
by size. No institutions were added beyond 1980 because of the
levelling off of enrollments after that date.
1 Also Financial Prospects, op. cit.2
Richard A. Holden, An Estimate of Construction Needs of HigherEducation by 1980, 07T Departmentepartment o eat education, andWelfare, Office of Education, Bureau of Higher Education,Washington, D. C., August 1971.
it 7

40
This method suffers from a number of weaknesses. It doesn't
permit institutions to be re-allocated from one size group to another.
Consequently, if the number of institutions is not increased in
some cases, then the average enrollments in a cell exceed the limits
for the enrollment size category. Nevertheless, it can be used to
show the effects of a trend projection of the distribution of students
by size of institution.
A second way of constructing a naive model is to assume that
a certain number of institutions will shift from one cell size to
another as enrollment grows. Using the data from 1968 to 1970, the
probability of an institution moving from a smaller to a larger size
group was calculated in relation to the growth of enrollment. These
propensities for change were then used to forecast both the number
and the size distribution of institutions in future years. This
method, of course, is subject to a very valid criticism. Projections
for twenty years ahead are made on the basis of three years'
experience. A thin reed, indeed, to make projections.
!fence, we tried a third, and more sophisticated, method to
project enrollment patterns. The cumulative per cent of enrollments
and institutions in each size group were charted for the per id 1960
to 1970, for all those years with data on size distribution of institutions.
For 1968 to 1970, curves could be drawn by type of control of
institution. In earlier years, less detail was available. There was
47 71

41
some change in the shape of the curve from 1960 to 1970, but
amazing stability in the shape of the curves in the face of a 12 per
cent growth in enrollment between 1968 and 1970. The size groups
accounted for relatively the same cumulative per cent of institutions
and enrollments in both 1968 and 1970 for all type and control groups.
Over the long haul, 1960 to 1970, the middle-sized institutions
appeared to grow faster than either the very small or very large
ones.
Of course, some judgments must be made as to what type of
relation will hold true in the face of future increases or decreases
in enrollments. The relative stability of the general shape of the
curve in the face of a 60 per cent increase in enrollments between
1963 and 1970 would prompt us to assume that the relative size
distribution of institutions will remain fairly stable. As an illustration,
the resulting distribution of students by size and type of public
institution, using each one of the three methods, is shown in Table 3.1.
Some Further Refinements in the Classification of Data by Campus
As has been stated earlier, one objective of our project is to
estimate 'space requirements in homogeneous institutions. Hence,
the campus-by-campus reports of AEGIS V can profitably be
classified finer than they have been to date.

I42
IAs stated earlier, the U.S .0.E. reports often classify
several related campuses as one institution of the type and control Iof the main campus. Our first adjustment was to designate each
campus on the basis of the highest degree offered. Thus, those
granting doctorates were considered universities, those with less
than a four-year program becanw two-year schools, and the111
remaining campuses became other-fouryear schools.
These adjustments produced some shifts in the distribution
by size and type from what U.S .0 .E. reported by institution. The
differences are detailed in Table 3.2.
Further adjustments were made when our early investigation
of the data showed that a large number of doctorate-granting
institutions are small divinity schools. These were separately
coded, segregated, and ignored in the analysis below. Another
group of schools eliminated were U. S. Service Academies.
Size Distribution of Schools
At the very outset of our research, we attempted to enforce
a similar size distribution of schools or universities, four-year
schools, and junior colleges. We soon found that this classification
was unsuitable. In order to have a reasonable number of schools in
each single cell, it was necessary to adopt another more reasonable
size classification for each type of school. For instance, in the case
73
tt

43
of universities, we chose three size groups, based on FTE
enrollment: under 10,000 students, 10,000 to 20,000 students, and
over 20,000 students. In the case of public four-year campuses,
our size breaks are: under 2,500; 2,500 to 5,000; 5,000 to 10,000;
and over 10,000 FTE enrollment. For private four-year schools
and all junior colleges, the size breaks are different again, since
very few have enrollments of 5,000 or more. The size classifications
the number of campuses, and total FTE enrollment in each cell are
shown in Table 3.3.
4. .
74

TA
BL
E 3
.1
PRO
JEC
TE
D D
IST
RIB
UT
ION
OF
PUB
LIC
POST
-SE
CO
ND
AR
Y I
NST
ITU
TIO
NS
BY
SIZ
EA
ND
TY
PE
A. B
ased
on
Fall
1970
Dis
trib
utio
n
Size
Gro
upN
umbe
r of
Ins
titut
ions
Ave
rage
Deg
r( a
-Cre
dit E
nrol
lmen
t19
7019
8019
9019
7019
8019
90tin
iver
sitie
sL
ess
than
10,
000
1922
228,
042
10,6
0010
,527
10,0
00 to
20,
000
3135
3516
,300
21,2
8321
,137
20,0
00 to
30,
000
1922
2224
,737
31,4
8631
,268
14...
..G
reat
er th
an 3
0,00
025
2828
48,8
0064
,646
64,2
004.
1-.
Tot
al94
107
107
25,0
0132
,533
32,3
0843
Oth
er F
our-
Yea
r Sc
hool
sea
tL
ess
than
1,0
0036
3939
633
872
985
1,00
0 to
2,5
0072
7676
1,82
92,
574
2,90
42,
500
to 5
,000
7883
833,
714
5,18
45,
849
5,00
0 to
10,
000
9510
110
17,
081
9,89
1,
11,1
5910
,000
to 2
0,00
049
5252
12,8
1617
,938
20,2
40G
reat
er th
an 2
0,00
011
1111
25,4
1837
,745
42,5
91T
otal
341
362
362
5,93
78,
306
9,37
2T
wo-
Yea
r Sc
hool
sL
ess
than
1,0
0019
123
423
459
976
170
81,
000
to 2
,500
221
271
271
1,59
52,
025
1,88
42,
500
to 5
,000
123
151
151
3,53
74,
479
4,16
65,
000
to 1
0,00
073
9090
6,82
38,
603
8,00
2G
reat
er th
an 1
0,00
046
5757
15,2
6119
,144
17,8
07T
otal
654
803
803
3,21
44,
076
3,79
1
MO
OM
MI-
MS
SO
ell
IPS
1111
11M
I el
lM
I OM
SIP
ell
MI I
NS
III

TA
BL
E 3
.1 (
Con
ed)
PRO
JEC
TE
D D
IST
RIB
t IT
ION
OF
Pt T
BL
IC P
OST
-SE
CO
ND
AR
Y I
NST
ITU
TIO
NS
BY
SIZ
E A
ND
TY
PE
B. B
ased
on
Cha
nges
, 196
8 to
197
0
Size
Gro
upN
umbe
r of
Ins
titut
ions
Ave
rage
Deg
ree-
Cre
dit E
nrol
lmen
t19
7019
8019
9019
7019
8019
90U
nivL
-rsi
ties
Les
s th
an 1
0,00
019
1919
8,04
29,
653
9,58
910
,000
to 2
0,00
031
1414
16,3
0019
,564
19,4
2920
,000
to 3
0,00
019
1919
24,7
3729
,690
29,4
84G
reat
er th
an 3
0,00
025
4242
48,8
0058
,567
58,1
57-
Tot
al94
9494
25,0
0137
;034
36,7
77...
,:t4*
Oth
er P
our-
Yea
r Sc
hool
sa.
Les
s th
an 1
,000
3653
5963
361
562
01,
000
to 2
,500
7251
451,
829
1,96
92,
036
2,50
0 to
5,0
0078
6661
3,71
44,
003
4,14
35,
000
to 1
0,00
095
112
118
7,08
17,
621
7,88
610
,000
to 2
0,00
049
9110
412
,816
13,7
9614
,275
Gre
ater
than
20,
000
1119
2225
,418
26,4
5727
,200
Tot
al-.
441
392
409
5,93
77,
676
8,29
9T
wo-
Yea
r Sc
hool
sL
ess
than
1,0
0019
114
615
459
980
375
81,
000
to 2
,500
221
270
262
1,59
51,
819
1,77
22,
500
to 5
,000
123
174
168
3,53
74,
029
3.92
45,
000
to 1
0,00
073
101
976,
823
7,78
17,
578
Gre
ater
than
10,
000
4670
6615
,261
16,6
4916
,106
Tot
al65
476
174
73,
214
4,28
54,
067
:

TA
BL
E 3
.1 (
Con
ed)
PRO
JEC
TE
Dni
sTit
ail T
-rio
NO
F PU
BL
IC P
OST
-SE
CO
ND
AR
Y I
NST
ITU
TIO
NS
BY
SIZ
E A
ND
TY
PE
C. B
ased
on
Cum
ulat
ive
Dis
trib
utio
ns o
fIn
stitu
tions
Num
ber
of I
nstit
utio
nsA
vera
ge D
egre
e-C
redi
t Enr
ollm
ent
Size
Gro
up19
7019
80 15 24 35 33
l'niv
ersi
ties
19 31 19 25
Les
s th
an 1
0,0(
X)
10,0
00 to
20,
000
20,0
00 to
30,
0(X
)G
ieat
er th
an 3
0,0(
X)
Tot
alcv
,JO
-O
ther
Fou
r-Y
ear
Scho
ols
94 36
107 35
.IL
ess
than
1,0
001,
000
to 2
,500
7253
2,50
0 to
5,0
0078
715,
000
to 1
0,00
095
102
10,0
00 to
20,
000
4984
Gre
ater
than
20,
000
1117
Tot
al34
136
2T
wo-
Yea
r Sc
hool
sL
ess
than
1,0
0019
120
51,
000
to 2
,500
221
288
2,50
0 to
5,0
0012
314
55,
000
to 1
0,00
073
112
Gre
ater
than
10,
000
4652
Tot
al65
480
2
1990 15 24 36 32 107 32 38 69 104
96 23 362
215
358 77 108 44 802
1970
1980
8,04
27,
653
16,3
0018
,425
24,7
3725
,957
48,8
0061
,076
25,0
0132
,533
633
860
1,82
92,
272
3,71
43,
814
0881
7,08
181
127
1216
14,6
8725
,418
30,9
765,
937
8,31
2
599
669
1,59
51,
940
3,53
74,
101
6,82
38,
605
15,2
6119
,477
3,21
44,
074
1990
7,60
718
,292
25,4
4762
,119
32,3
08
2,93
0636
3,69
1
15,1
717,
866
32,4
749,
379
650
2,07
14,
934
8,55
419
,409
3,78
9
OS
SIB
en11
111
1111
911
.11
INS
1119
GM
MI U
S 1
1111
1111
1111
111
1111
111
1111
1

TABLE 3.2
COMPARISON OF POST-SECONDARY INSTITUTIONSAND CAMPUSES, FALL 1970
Institutions(U .S .0.E .)
Universities 159
Public 94
Private 65
Other Four-Year Schools 1,506
Public 341
Private 1,165
Two-Year Schools 891
Public 654
Private 237
47
Campuses(This Study)*
326
164
162
1,438
045
1,093
1,042
796
246
In this study, all campuses granting doctorate degrees areincluded under the heading of universities. Only those institutionswith major doctoral commitments are classified as universitiesby ( .S .0.E .
Source: See Table 2.3, p. 25

TA
BL
E 3
.3
NU
MB
ER
OF
CA
MPU
SES
l ini
vers
ities
1970
(197
0 A
ctua
l,19
75 to
199
0 Pr
ojec
ted)
A. P
ublic
Sec
tor
1985
19t)
()19
7519
80L
owH
igh
Low
Hig
hL
owH
igh
Low
1110
Les
s th
an 1
0,00
085
9090
9050
9060
9060
v10
,000
to 2
0,00
058
6540
4572
4772
5272
ea w
lM
ore
than
20,
000
2225
5045
6843
5838
58C
DT
otal
165
180
180
180
190
180
190
180
190
Oth
er F
our-
Yea
r Sc
hool
s1,
000
to 2
,500
159
135
110
110
9010
080
103
802,
500
to 5
,000
9410
012
010
011
012
010
011
011
55,
000
to 1
0,00
072
100
110
115
120
120
140
115
125
Mor
e th
an 1
0,00
020
2530
3555
3065
3260
Tot
al34
536
037
036
037
537
038
536
038
0T
wo-
Yea
r Sc
hool
sL
ess
than
1,0
0035
430
022
023
025
530
022
532
022
51,
000
to 2
,500
274
360
395
395
350
360
330
350
330
2,50
0 to
5,0
0011
312
521
516
523
512
521
011
521
0M
ore
than
5,0
0055
6570
7010
065
8560
85T
otal
796
850
900
860
940
850
850
845
850
CO
IMP
SIN
SID
IIIIII
I11
18In
IIIIII
MI M
t SIB
MI M
I11
1111
1111
111

TA
BL
E 3
.3 (
Con
t'd)
NU
MB
ER
OF
CA
MPU
SES
(197
0 A
ctua
l, 19
75 to
199
0 Pr
ojec
ted)
B. P
riva
te S
ecto
r
Uni
vers
ities
1970
1975
1980
1985
1990
Low
Hig
hL
owH
igh
Low
.H
igh
Low
Hig
h
Les
s th
an 1
0,00
014
914
914
714
914
915
214
915
414
910
,000
to 2
0,00
010
1012
1310
1010
810
Mor
e th
an 2
0,00
03
33
03
03
03
Tot
al16
216
216
216
216
216
216
216
216
2O
ther
Fou
r-Y
ear
Scho
ols
Les
s th
an 1
,000
758
597
677
457
610
388
580
288
540
1,00
0 to
2,5
0028
225
028
223
027
024
026
023
024
02,
500
to 5
,000
4642
4636
4534
4430
39M
ore
than
5,0
007
77
77
57
37
Tot
al1,
093
896
1,01
273
093
266
739
155
182
6T
wo-
Yea
r Sc
hool
s *
Les
s th
an 1
,000
229
157
194
145
157
140
157
135
157
Mor
e th
an 1
,000
1715
1515
1515
1515
15T
otal
246
172
209
160
172
155
172
150
172
* B
ased
on p
roje
cted
rat
e of
clo
sing
.
Sour
ce: S
eep.
43

50
CHAPTER 4
SPACE REQUIREMENTS - CURRENT PERCEPTION OF NEED
Space requirements for post-secondary students are expressed
in terms of square feet per student, either for total space, or for
each type of space provided in post-secondary institutions. Gen-
erally, this ratio has as its denominator full-time-equivalent students.
On o...asion, full-time, or full-time day students are considered
appropriate.
Underlying each space requirement estimate are a number of
assumptions about (1) the size of the student station, or the space
required to accommodate an activity, a faculty member, etc., and
(2) the utilization rates for the space, e.g., the per cent of stations
in a room, or study spaces in a library. For assembly areas,
theaters and gymnasiums, student unions, and similar space, there
exists an undocumented consensus of what is necessary to sustain
the ambiance of a given type of college campus. For leading
universities, space requirements are complicated by the necessity
to set aside space for specialized laboratories often used for
organized research, and, if additional senior staff is hired to man
research projects, for additional office space.

51
Information about Space Standards
The space standards developed in this study were based on a
study of existing space standards, either advocated by different
authorities, or published by state planning agencies.' A great help
in reconciling and arriving at new subjective state standards
presented here were interviews with a large number of space planners.
We owe a special debt to Mr. William S. Fuller, of the New York
State Education Department, Mr. Harlan Bareither, of the University
of Illinois, and Mr. Donovan Smith, of the University of California at
Berkeley. In addition, a large number of both university-based and
state-based officials concerned with space spent a considerable
time explaining the needs of colleges and universities. Although we
arc grateful to all of them, the responsibility for space standards
derived in this chapter is solely ours, and does not necessarily reflect
their opinions.
Classification of Space
Although different space planning authorities advocate minor
variations in the manner post-secondary space ought to be reported,
the space classification scheme published in the [MEW, USOE, Higher
Education Facilities Classification and Inventory Procedures Manual
is generally accepted. This classification is the result of a cooperative
For space utilized, see footnotes in Tables 4.1 and 4.3.
111
52
effort of many experts, including campus architects, planning
consultants, and state officials charged with planning campus develop-
ment.
The manual uses these principal classifications in
characterizing non-residential facilities in post-secondary institutions:
classrooms, laboratories, offices, general use, special use, and
support space. While each of these categories is further subdivided
into sub-categories, for purposes of this study we have decided not
to break down the space classifications into finer detail, except in
one instance. Space used for organized research, i.e., non-class
laboratories and their ancillary facilities, are treated separately in
this study.
The major categories are reported in this study as they have
been recorded by the HEGIS space survey. The decision not to alter
this scheme was made after perusing the literature on space planning,
and talking to a number of space planners. We also decided that
further sub-classification of space would serve little purpose
because many respondents to the HEGIS must resort to an educated
guess in order to assign space to a particular sub-category when
filling out the questionnaires. We also found out that in many instances
major categories of space had multiple uses, and their classification
was moot. I7or instance, in a number of smaller schools,
gymnasiums are used as assembly space, thus blurring the

53
distinction between special use and general use space. In some
state schools, assembly halls and theater.. are used as classrooms
for large sections of introductory courses. Since the distinctions
among certain major categories of space are often more apparent
. than real, no useful analytical purpose would be served by gilding
the lily and analyzing space by finer breaks,
Classroom Space
Although classroom space accounts for less than 10 per cent
of the total non-residential space in most schools, it has received
more than its share of attention in the discussion of space needs.
One could be charitable and ascribe this emphasis to the concern
placed on academic features of campus life, or cynical and ascribe
the attention to the ease with which standards can be formulated.
There is fair agreement that a classroom student station is
between 14 and 16 square feet. The average between these two
figures, 15 square feet, has been used by many space planners.
Generally, smaller institutions have reported larger student stations,
probably because they build average-size rooms, have smaller
classes, and provide for fewer students per room. Also some
institutions with large graduate enrollments allow 20 to 24 square
feet per station in seminar rooms. Even if no seminar rooms are
provided, graduate students are bel.-ved to require more space per
.S4
54
student. This is sometimes ascribed to the need for a table in a
seminar room, and at other times because rooms are of an average
size and graduate sections are small. Some space planners told us
that, as tilt. proportion of graduate students to total students increases
in the future, it is likely that the size of graduate sections will increase,
and graduate students will not require more space than undergraduates.
Most master or aggregated plans for classrooms do not
distinguish between classroom space requirements of graduates and
undergraduates because these space differences are dwarfed by dif-
fering practices in planning for space utilization. The amount of
space needed depends upon (a) the number of hours classrooms are
utilized, and (b) the per cent of stations in utilized classrooms which
are occupied. As a general rule, target hours for classrooms are
set at 30 - 36 hours. The occupancy is usually set at 55 to 65 per
cent of available seats in the classrooms being utilized.
Recently the California legislature has set higher standards,
66 hours a week, for classroom utilization. The station occupancy
rate was set very much lower than usual, though, at 34 per cent.
According to some authorities, this could be considered as the upper
limit for utilization of classrooms.
The ground rules for classroom space based upon hours of
utilization and station occupancy fall short of describing a viable
national standard for a number of reasons. The most obvious is that
it 85

55
one would expect basic differences in space utilization among
different types of institutions. Thus, campuses with significant
numbers of part-time students who attend courses after 5:00 PM have
a significant opportunity to extend the usage of classrooms above the
set standards. Institutions which cater predominantly to full-time
students apparently cannot schedule classes at late hours or weekends
without experiencing lower enrollments per class section compared to
classes scheduled during the daylight hours, Monday through Friday.
Our field trips have convinced us that no institution had
classroom shortages in the evenings. Thus, it seems more reason-
able to plan classroom availability for daytime students. A general
rule of thumb, providing space for all full-time students, most of whom
are day students, may be a better measure than planning classroom
availability on a full-time-equivalent basis.
Another factor which vitiates the usefulness of the class
planning standards is the size of the campus. Generally, smaller
campuses have more trouble scheduling large rooms than do campuses
with larger enrollments. Some authorities have suggested excluding
classrooms with more than 100 seats in calculating space standards
for small campuses, others have suggested an allowance for smaller
campuses. There is no standard for this reduction, but in practice
smaller campuses do have more space per student than larger campuses.

I56
IThirdly, plans for classrooms are generally made on the
assumption that either all student contact hours, or student contact
hours other than those in laboratories, are held in classrooms. This
is not the case. A number of studies have documented that between
10 and 20 per cent of all student contact hours are held outside of 111
either classrooms or laboratories. Auditoriums or chapels and
gymnasiums have a large proportion of these classes. In campuses
111with significant agricultural programs, some classes are held out-
doors. Schools with graduate programs conduct some classes in
faculty offices and studios, and provide opportunities for self study.
Lastly, the credit hours earned in laboratories have to be
subtracted from the credit or contact hours in classrooms. An
analysis of usage rates of laboratories and classrooms in the Ohio
and Indiana state systems prompted us to adopt an estimate of
1.2 credit hours per FTE student taken in laboratories.
Thus, the classroom space required per full-time student, on
the realistic assumption that the full-time credit load is 15 credit hours,
of which 12.3 hours are taken in classrooms, is (12.3 x 15 ft /sta)
185 square feet. At 30 hours and 60 per cent occupancy, it is
10.3 square feet. Using the California standard, the classroom
space to be provided is 8.2 square feet. The ratio of FTE to full-time
students is roughly .85. Hence, a 'lwer figure is consistent with a
efiri
57
standard based on an FTE load. Some 10.0 square feet per full-time
student, and somewhat less per FTE student, appears to be a reason-
able, if not generous, standard (see Table 4.1).
Laboratorias
Estimating classroom requirements is fairly straightforward,
compared to the approximations which have to be made to come up
with national estimates of required laboratory space. In the first
place, different disciplines have different requirements for space
per student station for laboratory space. Second, assignment
practices of laboratory space vary discipline by discipline for
students at different levels, and school by school.
Surprisingly, there is no generally accepted grouping of
disciplines to establish planning factors for the square feet requires
for laboratories. In some cases, sub-disciplines are lumped
together; in others, consi..ierable detail is available. Three typical
:istings, showing the amount of detail, are shown in Table 4.2.
The variations of laboratory space by discipline cannot fail to
convince one that space requirements for a given school ca. got be
forecast accurately without considerable detailed knowledge of
course offerings. in most supporting materials accompanying master
plans for new or expanded colleges, such projections are usually
included. The accuracy of these forecasts, unfortunately, is open to
88

58
question because they are based on both the current demand for
courses and majors and the ability of the faculty to meet this demand.
During our interviews, space planners confirmed the suspicion
that changes in job prospects for college students are affecting space
utilization of laboratories. Space set aside for engineering and physics
majors is under-utilized in some schools, and there are shortages of
space in biology and computer laboratories. The difficulty of planning
space demand for a given course was graphically illustrated during
our visit to the Berkeley campus of the University of California.
Demand for the elementary economics course jumped from 400 to
1,000 from one quarter to the next. Only 600 were accommodated.
On the same campus, shortages of biology lab space have resulted
in waiting lists for the elementary biology course.
The inability to increase the usage of laboratories is difficult
for a casual observer to understand. Generally, laboratories are
scheduled for 20 to 24 hours a week with 75 to 80 per cent projected
occupancy. The low hourly utilization rates are a result of a variety
of practices which result in limiting the usage of laboratories. Gen-
erally the number of clock-hours is highest in laboratories used by
undergraduates. There, such practices as providing storage space
for each user at each station sometimes limit the utilization. The
practice of providing an individual station to each student limits the
utilization rate even mere. Special arrangem of this sort are
fro
59
much more common as the students progress through school. Hence,
the utilization declines for laboratories set aside for upper-level
undergraduates and graduate students (see Table 4.3).
In the case of graduate students, class clock-hours are not an
adequate measure of laboratory usage because in a number of schools
space is set aside for graduate students' research. At least one
school, the University of California at La Jolla, affords this luxury
to undergraduates.
The variation of usage rates, mix of disciplines, etc., makes
it extremely difficult to estimate needs. Table 4.3 shows the wide
range of estimated requirements which were collected from various
sources. These ranges can be compared to those derived from the
following calculation:
Average credit hours earned inlaboratories 1.2
Average clock hours to earn1.2 credits 2.4
Assumed average station size 60 sq. ft.
Utilization for 24 hours at80 percent, requirement perstu' lent 7.5 sq. ft,
This estimac rackets fairly well the low and high estimates
provided by some states (see Table 4.3). It should be noted, though,
that the efficiency of lab space in producing credit hours is much lower
te

than that of classroom space. For instance, 0.7 square feet of
classroom space produces one credit hour. By contrast, 6.2 square
feet of lab space are required to produce the same credit hour in
laboratories. Thus, laboratory space is only 0.11 times as
"efficient" a producer of credit hours as classroom space. This is
another way of validating the fact that schools with heavy science
programs require much more space than the average.
Study Space
Study space, according to HEG1S definitions, contains space
for the storage of books, the processing of library acquisitions, as
well as student carrels, reading rooms, etc. The standards for
book storage and processing are fairly straightforward. Most space
planners suggest 0.085 to 0.100 net available square foot per volume
in the collection. These figures, we believe, alsc allow for additions
to the collection for the next five years.
There is less agreement on how much reading room and space
should be provided. Some authorities would provide simultaneous
seating for a fifth of the student body, others for one-third. The
standards also vary by level of student, with more space reserved
for upper-level undergraduates, and still more for graduate students.
The average seems to be roughly 5.0 net available square feet per
student, allowing seats in the library for 25 per cent of all students.
- 91

61
It is usual to allow an additional 20 to 25 per cent of both
stack and reading room space for processing acquisitions and for
administration.
Since a considerable fraction of the space requirements in
this category depends upon the size of the collection, standards for
space are best determined by taking the size of the collection into
account. This has been done in Column 4 of Table 4.4, where
estimates of volumes per FTE were adapted from yet-unpublished
U.S .0.E . statistics on library holdings. U.S.O.E. statistics
provided information on average library holdings in the 25th, 50th,
and 75th percentile of instituti,ins, thus making it possible to estimate
the ranges in space needed for the collections. In addition, provisions
were made for study space to accommodate simultaneously 25 per
cent of FTE studentE- and for administrative space taken as 25 per
cent of the two categories above. Table 4.4 summarizes the
standards calculated for various types of schools. The ranges for
institutions in the 25th and 75th percentiles are shown in the range
column.
The above space requirements should be increased for a
number of schools which locate newer methods of information
retrieval in the library. The space requirements for microfilm
machines or microfiche readers, estimated by space planners at
50 to 60 square feet per station (inc hiding storage), do not add
ie 92

62
considerably to space requirements. Generally, one machine per
500 students is provided. By contrast, the space requirements for
the audio collection, especially if both playback equipment and
language-laboratory stations are located in the library, and for the
imaginative plans in some schools of centralizing computer-assisted
instruction in the library complex could add considerably more space
to the standards. In at least one college plan, production facilities
for audio and video tapes were also included in library planning.
The transformation of the study center into a teaching-information-
video center could conceivably increase space requirements by nearly
10 per cent. The justification for this estimate is shown in Table 4.5.
Office Space
The standards for calculating office space per faculty member
are fairly straightforward. Each faculty member is provided with a
120-square- foot office. Generally, one secretary is provided per
five full-time faculty members. Space for a secretary and the
reception area ccounts for 150 square feet, i.e., some 30 additional
square feet per faculty member. Give or take 10 per cent, these
figures are universally accepted as standards. Here the agreement
stops; some planners add some 10 square feet per professor fcr
storage space; others also provide for 20 - 25 square feet of conference
room space. As a general rt le, though, between 160 and 200 net
.t:e 93

63
available square feet [HI- full-time instructional staff member appears
to bracket requirements quite adequately.
The requirements for additional space for part-time faculty
and graduate students, some of them serving as part-time instructors,
are less clearly articulated. Some authorities believe that 60 square
feet of space per part-time instructor should be provided. Since
generally a part-time instructor is one-third of a full-time member,
the full-time equivalent of faculty multiplied by full-time faculty space
requirements will probably result in a good estimate of needed office
facilities.
In the case of graduate students, two approaches are used:
(1) allowing for more study space in the library, say 10 square feet,
i.e. , part of a carrel, or (2) providing for shared offices, some 30
or 40 net available square feet per doctoral student. The practice of
authorities varies by the orientation of t'icir school, with schools with
a major commitment to the doctorate degree, which de-emphasize
intermediate degrees, providing more space.
Even more complicated is the estimation of space requirements
for administrators. There is a consensus that every president or
chancellor of an institution (irrespective of the institution's size)
deserves 2, (MO square feet of space. Space allocations to professional
administrators arc similar to those made to full-time faculty.
Generally, though, they are supported by larger numbers of clerical

I64
and secretarial personnel, who can be accommodated in 60 square
feet of space each.
As a general rule, since professionals in the administration
are either a minority or, at most, half of the staff, some 90 net
available square feet per administrative staff person appears to be
adequate. It comes out to roughly 180 square feet per adminis-
trative professional. This is the median figure for teaching staff
as well. Hence, 180 square feet, give or take 10 per cent, appears
a reasonable standard of office space per FTE professional.
Special Use Space
Special use space, as defined in the U.S .0.E. manual, 1includes armories, athletic facilities, stadiums, audio-visual
production facilities, on-site schools used for practice teaching,
greenhouses, and patient testing and examination rooms, generally
those limited to psychologists.
There is very little possibility of establishing standards for
so diverse a collection of space. Even in some of the more clear-cut
uses of space, e.g., gymnasiums, standards may vary between 5 and
10 net available square feet, depending upon the commitment of the
college to the sports program (Space Guide, Office of Campus Planning
and Development, The City University of New York, January 29, 1973).

65
In schools where football is important, even more space may be
available.
It !s in this type of space that the rule, referred to by some
space planners as the "one of each" rule, applies. Every school
would like to have at least one gymnasium with an Olympic pool,
etc., etc. Reality often conspires to make do with less. Thus many
schools, even those with the ROTC programs, combine the gymnasium
and armory. Others manage to find unused space in dormitories to
set up a radio- or small TV-transmission studio. What is considered
adequate dep..;nds upon what is customary in other schools. which are
considered to fall within the "peer" group. Thus, for instance, New
York City College guidelines for space are strongly influenced by
standards set for New York state colleges, even though the city
university is set in the midst of the largest metropolitan area in the
country, and many state colleges are in non-metropolitan settings.
Special use facilities in private colleges, if our impression is correct,
are haphazardly planned. Much depends upon the whims of donors.
There can be no hard and fast rules about how much space is
required. In Table 4.6, we have shown, for different types and sizes
of institutions, the average net available square feet per full-time-
equivalent student and for those institutions where over-40 campuses
were reported, the mean space, and the space in the second and third
quartile.
re 91

66
General Use Space
Assembly facilities, theaters, exhibition halls, museums, 111
restaurants, cafeterias, student unions, and bookstores are all
included in general use space. Here again, the "one of each" syn-
drome determines the space to be provided. Some schools make do
with theaters (or chapels) for assembly areas, while the presence or
absence of a museum or exhibition area depends upon the character
111of the school.
Currently, small schools aspire to at least one theater, and
large ones try to build two of them. Space requirements for these
facilities are flexible, and depend, again, on the presence or absence
of a performing arts program.
Food catering facilities also depend on the character of the
school. Residential schools, with food catering part of the 6ormi-,
tories, may wis;: to provide for a larger proportion of the student
body to be seated simultaneously, as compared to commuter schools.
Generally, about 12 square feet are allowed per eating station in a
cafeteria, and at least as much for food preparation and storage. A
modest standard of, say, 20 - 25 per cent of all students, faculty,
and staff to be provided with simultaneous seating could add 6 square
feet per FTE to space requirements. The demand for institutional
space facilities depends, of course, upon the availability of competing1
Iite. 97
67
food facilities in the neighborhood. These vary from location to
location, and no general rules can be specified.
In Table 4.6, we have shown available general use facilities
in the "average" school, as well as the "average" in the quartile
above and below the median. Either one of these standards could be
used nationally.
Medical Space
Medical space, other than the one used for training medical
or nursing students, is generally trivial. Consideration of medical
space is not included here. A short discussion dealing with medical
schools is included in the next chapter.
Support Space
Various shops and services, as well as heating and electric
plant, are included under this category. Parking is also included in
this category, and so is data processing.
Most importantly, a number of schools, in reporting this
space, have left this entry blank, so that standards derived from
statistical averages for this category are not very relevant.
Data processing and parking deserve special comment. Data
processing facilities depend upon both the administrative and the
research activities in a school. In some instances, specialized
equipment is included in research space.
III
98

I
68
The role of parking areas in space planning should not be
underestimated, especially on commuter campuses. If parking is
provided for 20 per cent of the students and faculty, the space required
may amount to half as much as is provided for classrooms. Depending
on location and climate, either covered or open-air parking may be
provided. It is unclear if open-air parking facilities are even
recorded in HEGIS. Some schools do not provide any parking, forcing
students to park on the street.
Some space planners, when faced with our query about
reasonable allowance for support space, have opted for an allowance
of 10 per cent of the total space.
Total Non-Residential Space
A number of authorities and individuals have estimated total
non-residential space requirements for different types of institutions.
The most often cited, and generally referred to as the Norris Standards,
were derived by the Higher Education Construction Programs Study
Group, led by Chalmers G. Norris. This group came up with the
following targets per FTE:
99

NASF
Public universities 132
Public other four-year schools 93
Public two-year schools 70
Private universities 150
Private other four-yer.: schools 103
Private two-year schools 75
These standards are considerably above the ones adopted by a
number of state planning agencies. For instance, the State of Ohio
sets a standard of 75 net assignable square feet for all schools, except
Ohio State University, where the target is set at 90 net assignable square
feet per full-time-equivalent student. New Jersey space planning
standards fall within the same range, except that over 100 square feet
per UTE are provided in engineering schools. In New York, the
master plan provides for 94.6 net available square feet for community
colleges, or roughly 80 square feet per full-time-equivalent student.
As can be seen from the above, there is considerable variation about
what may be considered adequate or desirable.
The standards derived by this study from the opinions of state
facility planners, summarized in Table 4.7, fall within these ranges.
They arc generally lower than the Norris standards, and somewhat
higher than th6 standards set by the states. Since we have tried to
DO

70
reflect the consensus rather than extremes of opinion, these results
are not surprising. The ranges of 90 - 120 net assignable square
feet per FTE student for public and private universities are not
strictly comparable to the Norris standards, since they (1) exclude
the organized research space, which could add roughly 5.0 per cent
to the total space requirements, and (2) ignore special requirements
of medical, technological, and engineering schools, which are treated
separately in our study. On the other hand, the estimates for four-
year schools are roughly comparable to the Norris standards, and
do not differ from them 'y; more than five per cent.
The standards derived in this study can perhaps best be used
to estimate the incremental needs for space in the future. The
average space required to house existing technical, medical, and
other programs, as well as to provide for facilities for additional
students, may possibly be somewhat more than the one indicated y
the standards in Table 4.7. In some cases, as in private junior
colleges, the reliance on current practice probably overestimates
needed space. Many of these schools have been losing students and
are space rich.

Florida2
71
TABLE 4.1
SELECTEE) STANDARDS FOR CLASSROOM SPACEIN COLLEGES AND UNIVERSITIES
Per CentNo. of Hours Occupars4 Square FegtUtilization When in Use Per FTEI
State UniversitySystem2 35
Community CollegesLess than 2,500 FTE 362,500 or more 1;TE :36
California3
1966 34Recent 66
CUNY4
Senior Colleges 30CJM munity Colleges 30
University Spice Planning5 30
Arkansas6 30
Colorado 30
Kentucky 31
Nebraska 30
Texas 39
60 8.5
55 9.370 7.3
66 8.234 8.2
89 6.967 9.2
60 10.3
60 10.3
67 9.2
66 9.0
65 9.5
55 11.2
lSquare feet per FTE is based on an example of 12.8 credit hoursin the classroom per FTE and 15 square feet per FTE. The

72
TABLE 4.1 (Cont'd)
number of hours in the classroom may vary, and a new standardre-calculated according to the following formula:
Weekly contact hours in classroom per FTESquare feet x square feet per station
per FTE Hours per week x per cent occupancy per hour of use
2Reported by State Board of Education, Tallahassee.These standards are used to estimate demand for space and capitalbudget outlays. They are not necessarily strictly applied to allconstruction projects once the funds are appropriated.
31966 Standards: Franklin G. Mats ler, Space Utilization Standards,California Public Higher Education. A report to the CoordinatingCouncil for Higher Education, STEramento, 1966. Recentlegislative action reported by State Legislative Committee onFacilities.
4Space Guides, Office of Campus Planning and Development, Departmentof Space Planning and Management, City University of New York, 1973.
5Harlan D. Bareither and Jerry L. Schillinger, University SpacePlanning, Urbana: University of Illinois Press, 1968.
6State standards reported in Planning Standards, Inventory andUtilization Data for Higher Education Fa ilitiesM-WerWSeven'gates, :ureau o i ig er ucation, Faci ales ompre ensiveWinning, State Education Department, Albany, New York, 1970.
..c.:01103

TA
BL
E 4
.2
SEL
EC
TE
D E
XA
MPL
ES
OF
CL
ASS
LA
BO
RA
TO
RY
SPA
CE
ST
AN
DA
RD
S
Part
A. C
alif
orni
a St
ate
Col
lege
s an
d ln
iver
sitie
s
Upp
er D
ivis
ion
Agr
icul
ture
Bio
logi
cal S
cien
ces
Phys
ical
Sci
ence
sM
athe
mat
ics
Eng
inee
ring
Psyc
holo
gyO
ther
Soc
ial S
cien
ces
Art
Oth
er I
lum
aniti
esB
usin
ess
Adm
inis
trat
ion
Edu
catio
nH
ome
Eco
nom
ics
Jour
nalis
mH
ealth
Sci
ence
s
Ass
igna
ble
Sq.
Ft. /
Stat
ions
60 55 60 30 90 40 30 65 40 30 60 60
u =
und
er s
tudy
, stil
l und
eter
min
ed
Ass
igna
ble
Sq.F
t./W
eekl
y St
uden
tC
onta
ct H
our
ININ
INI
2.6
2.8
1.4
4.25
1.9
1.4
3.0
1.9
1.4
2.8
2.8
Low
er D
ivis
ion
Ass
igna
ble
Sq.
Ft. /
Stat
ions
IMM
M,.
60 70 30 110 60 30 65 40 30 40 60 60 50
Ass
igna
ble
Sq.F
t./W
eekl
y St
uden
tC
onta
ct H
our
3.75
3.75
4.4
1.9
6.9
3.75
1.9
4.0
2.5
1.9
2.5
:3.7
53.
753.
2
11

TA
BL
E 4
.2 (
Con
ed)
SEL
EC
TE
D E
XA
MPL
ES
OF
CL
ASS
LA
BO
RA
TO
RY
SPA
CE
ST
AN
DA
RD
S
Part
B. C
ity U
nive
rsity
of
New
Yor
k
Dep
artm
ent
NA
SF/W
SCH
NA
SF/W
SCH
.L
ab/S
tudi
oN
ASF
/Stn
Lab
.Sv
c.T
otal
Anc
illar
y
Lif
e Sc
ienc
es:
Bio
logy
Ele
men
tary
502.
60.9
43.
541.
57A
dvan
ced
502.
60.9
43.
541.
57N
ursi
ngG
ener
al40
2.08
uu
u41
1bso
w anM
.C.P
.E. S
cien
ces:
Ast
rono
my
Gen
eral
502.
60.5
33.
13.7
0C
hem
istr
yG
erer
al50
2.60
.94
3.54
1.24
Org
anic
502.
60.9
43.
541.
24A
d ,a
nced
602.
13.6
23.
751.
24C
ompu
ter
Gen
eral
321.
66.4
22.
08u
Eng
inee
ring
Gen
eral
100
uu
5.20
uE
lect
rica
l65
uu
3.39
uC
ivil
112
uu
5.83
uM
echa
nica
l16
0u
u8.
33u
Indu
stri
al16
0u
u8.
33u
Mat
hG
ener
al40
2,08
62.
080
Stat
istic
s40
2.08
02.
080
Phys
ics
Ele
men
tary
502.
60.9
43.
54.7
1A
dvan
ced
502.
60.9
43.
54.7
1
al
OM
MG
ON
SO
IMO
MO
Ile
III M
O O
N O
M W
M a
l OM
OM
Ili M
O S
t

TA
BL
E 4
.2 (
Con
t'd)
SEL
EC
TE
D E
XA
MPL
ES
OF
CL
ASS
LA
BO
RA
TO
RY
SPA
CE
ST
AN
DA
RD
S
Part
B. C
ity U
nive
rsity
of
New
Yor
k (C
ont'd
)
Dep
artm
ent
Geo
logy
NA
SF/W
SCH
NA
SF/W
SCII
Lab
/Stu
dio
NA
SF/S
tn1-
_-,Z
;Sv
c.T
otal
Anc
illar
y
Ele
men
tary
Adv
ance
d
.r.-
"B
ehav
iora
l Sci
ence
s:41
1* e
aA
nthr
opol
ogy
Phys
. Ant
hr.
ea s
rA
rcha
eolo
gyE
cono
mic
sG
ener
a!G
eogr
aphy
Gen
eral
His
tory
Gen
eral
Psyc
holo
gyE
lem
enta
ryA
dvan
ced
Soci
olog
yG
ener
al
Hum
aniti
es:
Art
Des
ign
Dra
ftin
gPa
intin
gSc
ulpt
ure
502.
60.9
43.
541.
2450
2.60
.94
3.54
1.24
301.
56.5
22.
08.4
730
1.56
.52
2.08
.47
321.
66.4
22.
080
502.
60.9
43.
540
251.
30.3
61.
660
301.
56.7
82.
34.5
350
2.60
.94
3.54
.81
321.
66.4
22.
08.4
7
603.
13.5
93.
72.7
440
2.08
1.56
3.64
.72
402.
08.5
22.
60.5
250
2.60
.94
3.54
.71

TA
BL
E 4
.2 (
Con
t'd)
SEL
EC
TE
D E
XA
MPL
ES
OF
CL
ASS
LA
BO
RA
TO
RY
SPA
CE
ST
AN
DA
RD
S
Dep
artm
ent
Part
B.
City
Uni
vers
ity o
f N
ew Y
ork
(Con
t'd)
NA
SF/W
SCH
1.ab
/Stu
dio
NA
SF,'S
tnN
ASF
/WSC
HL
ab.
Svc.
Tot
alA
ncill
ary
Perf
orm
ing
Art
sD
ram
a32
1.66
01.
66u
Dan
ce10
05.20
05.20
uT
heat
erl0
05.20
05.20
uSp
eech
Gen
eral
402.
080
2.08
uL
angu
age
Spec
ial
25
1.30
01.30
0L
ingu
istic
sG
ener
al60
3.13
03.
130
Mus
icG
ener
al48
2.50
02.
50u
Ens
embl
e30
1.56
01.56
uPi
ano
301.
560
1.56
uC
hora
l20
1.04
01.
04u
Prof
essi
ons:
Acc
ount
ing
Gen
eral
321.66
01.66
.17
Adm
inis
trat
ion
Gen
eral
402.08
02.08
.17
Arc
hite
ctur
eG
ener
al65
3.39
2.08
5.47
uD
raft
ing
402.08
1.56
3.64
uE
duca
tion
Gen
eral
301.
561.
563.
13.6
2A
rt35
1.82
1.04
2.86
.57
Eng
lish
201.
04.6
61.70
.34
Mat
h20
1.04
.52
1.56
.31

TA
BL
E 4
.2 (
Con
t'd)
SEL
EC
TE
D E
XA
MPL
ES
OF
CL
ASS
LA
BO
RA
TO
RY
SPA
CE
ST
AN
DA
RD
S
Dep
artm
ent
Part
B.
City
Uni
vers
ity o
f N
ew Y
ork
(Con
t'd)
NA
SF
/WS
CII
Lab
/Stu
dio
NA
SF/S
tnN
ASF
/WSC
HL
ab.
Svc.
Tot
alA
ncill
ary
Edu
catio
n (c
oned
))M
usic
-L)a
nce
502.
601.
564.
16.8
3R
eadi
ng70
3.65
3.13
6.78
1.35
Scie
nce
402.
08.5
22.
60.5
2So
cial
Stu
dies
201.
04.6
61.
70.3
4D
enta
l Hyg
iene
Gen
eral
603.
131.
564.
69H
ome
Eco
nom
ics
Gen
eral
703.
651.
565.
202.
60M
anag
emen
tT
ime
& M
otio
n40
2.08
02.
08.4
1M
arke
ting
Gen
eral
502.
600
2.60
.52
Lib
rary
Sci
ence
Gen
eral
402.
080
2.08
Tec
hnic
al-
Voc
atio
nal:
Fash
ion
Gen
eral
804.
161.
045.
20Se
cret
aria
lG
ener
al40
2.08
02.
08T
echn
olog
yA
eros
pace
804.
161.
045.
20C
onst
ruct
ion
804.
161.
045.
20E
ngin
eeri
ng80
4.16
1.04
5.20
Des
ign
804.
161.
045.
20D
ata
Proc
essi
ng32
1.66
.42
2.08
.73
Hea
lth70
3.64
1.56
5.20
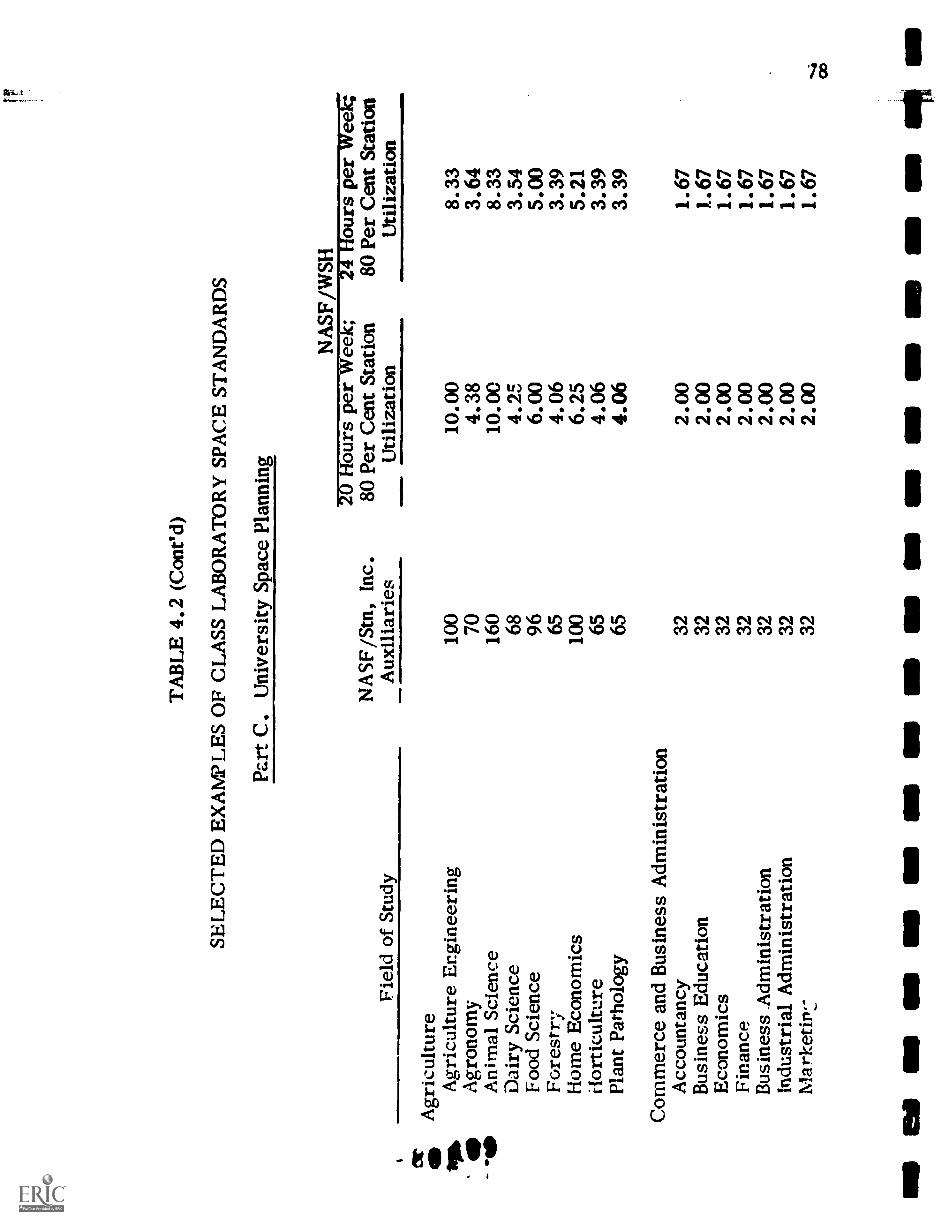
TA
BL
E 4
.2 (
Con
ed)
SEL
EC
TE
D E
XA
MPL
ES
OF
CL
ASS
LA
BO
RA
TO
RY
SPA
CE
ST
AN
DA
RD
S
Part
C. U
nive
rsity
Spa
ce P
lann
ing
aeft
.
Fiel
d of
Stu
dyN
ASF
/Stn
, Inc
.A
uxili
arie
s
NA
SF/W
SH20
Hou
rs p
er W
eek;
80 P
er C
ent S
tatio
nU
tiliz
atio
n
24 H
ours
per
Wee
k;80
Per
Cen
t Sta
tion
Util
izat
ion
Agr
icul
ture
igb
Agr
icul
ture
Eng
inee
ring
100
10.0
08.
33A
gron
omy
704.
383.
64-V
PA
nim
al S
cien
ce16
010
.00
8.33
Dai
ry S
cien
ce68
4.25
3.54
Food
Sci
ence
966.
005.
00Fo
rest
ry65
4.06
3.39
Hom
e E
cono
mic
s10
06.
255.
21H
ortic
ultu
re65
4.06
3.39
Plan
t Pat
holo
gy65
4.06
3.39
Com
mer
ce a
nd B
usin
ess
Adm
inis
trat
ion
Acc
ount
ancy
322.
001.
67B
usin
ess
Edu
catio
n32
2.00
1.67
Eco
nom
ics
322.
001.
67Fi
nanc
e32
2.00
1.67
Bus
ines
s A
dmin
istr
atio
n32
2.00
1.67
Indu
stri
al A
dmin
istr
atio
n32
2.00
1.67
Mar
keth
vz32
2.00
1.67
1111
1 E
a O
Mas
as
so u
s es
as
No
so a
s ow
as
so a
s eg
g

TA
BL
E 4
.2 (
Con
t'd)
SEL
EC
TE
D E
XA
MPL
ES
OF
CL
ASS
LA
BO
RA
TO
RY
SPA
CE
ST
AN
DA
RD
S
Part
C. U
nive
rsity
Spa
ce P
lann
ing
(Con
t'd)
Fiel
d of
Stu
dyN
ASI
7 .S
tn, I
nc.
Aux
iliar
ies
NA
SF/W
SH20
Hou
rs p
er W
eek;
80 P
er C
ent S
tatio
nU
tiliz
atio
n
24 H
ours
per
Wee
k;80
Per
Cen
t Sta
tion
Util
izat
ion
i011
1
Edu
catio
nE
duca
tion
Adm
inis
trat
ion
and
Supe
rvis
ion
322.
001.
67E
duca
tiona
l Psy
chol
ogy
654.
063.
39E
lem
enta
ry E
duca
tion
322.
001.
67I
Iist
ory
and
Philo
soph
y of
Edu
catio
n32
2.00
1.67
Seco
ndar
y an
d C
ontin
uing
Edu
catio
n32
2.00
1.67
Voc
atio
nal a
nd T
echn
ical
Edu
catio
n65
4.06
3.39
Eng
inee
ring
Aer
onau
tical
and
Ast
rona
utic
alE
ngin
eeri
ng16
010
.00
8.33
Cer
amic
Eng
inee
ring
112
7.00
5.83
Civ
il E
ngin
eeri
ng11
27.
005.
83E
lect
rica
l Eng
inee
ring
654.
063.
39G
ener
al E
ngin
eeri
ng32
2.00
1.67
Mec
hani
cal E
ngin
eeri
ng16
010
.00
8.33
Indu
stri
al E
ngin
eeri
ng16
010
.00
8.33
Min
ing
Eng
inee
ring
160
10.0
08.
33

Pr.t
TA
BL
E 4
.2 (
Con
t'd)
SEL
EC
TE
D E
XA
MPL
ES
OF
CL
ASS
LA
BO
RA
TO
RY
SPA
CE
ST
AN
DA
RD
S
Part
C. U
nive
rsity
Spa
ce P
lann
ing
(Con
t'd)
Fiel
d of
Stu
dy
Met
allu
rgy
Eng
inee
ring
Petr
oleu
m E
ngin
eeri
ngN
ucle
ar E
ngin
eeri
ngPh
ysic
sT
heor
etic
al a
nd A
pplie
d M
echa
nics
Fine
and
App
lied
Art
sA
rchi
tect
ure
Art
l-B
and
Lan
dsca
pe A
rchi
tect
ure
Mus
ic L
abor
ator
ies
The
ater
Urb
an P
lann
ing
Jour
nalis
mA
dver
tisin
gJo
urna
lism
Rad
io a
nd T
V
NA
SF/S
tn, I
nc.
Aux
iliar
ies
160
160
160
65 160
65 60 48 65 48 100
65 48 48 96
INS
Net
Ass
igna
ble
Sq. F
t. /W
eekl
y St
uden
tH
ours
20 H
ours
per
Wee
k;24
Hou
rspe
r W
eek;
80Pe
r C
ent S
tatio
n80
Per
Cen
t Sta
tion
Util
izat
ion
Util
izat
ion
10.0
010
.00
10.0
04.
0610
.00
4.06
3.75
3.00
4.06
3.00
6.25
4.00
3.00
3.00
6.00
8.33
8.33
8.33
3.39
8.33
3.39
3.13
2.50
3.39
2.50
5.21
3.39
2.50
2.50
5.00

TA
BL
E 4
.2 (
Con
t'd)
SEL
EC
TE
D E
XA
MPL
ES
OF
CL
ASS
LA
BO
RA
TO
RY
SPA
CE
ST
AN
DA
RD
S
Part
C. U
nive
rsity
Spa
ce P
lann
ing
(Con
t'd)
Fiel
d of
Stu
dyN
ASF
/Stn
, Inc
.A
uxili
arie
s
NA
SF/W
SH20
Hou
rspe
r W
eek;
80 P
er C
ent S
tatio
nU
tiliz
atio
n
24 H
ours
per
Wee
k;80
Per
Cen
t Sta
tion
Util
izat
ion
Lib
eral
Art
s an
d Sc
ienc
esA
nthr
opol
ogy
503.
132.
60A
stro
nom
y50
3.13
2.60
Bot
any
503.
132.
60C
hem
istr
y68
4.25
3.54
Ent
omol
ogy
503.
132.
60G
eogr
aphy
684.
253.
54G
eolo
gy68
4.25
3.54
Mic
robi
olog
y68
4.25
3.54
Phys
ics
654.
063.
39Ph
ysio
logy
684.
253.
54Ps
ycho
logy
503,
113
2.60
Soci
olog
y30
1.88
1.56
Spee
ch32
2.00
1.67
Zoo
logy
503.
132.
60
Lib
rary
Sci
ence
483.
002.
50

TA
BL
E 4
.2 (
Con
t'd)
SEL
EC
TE
D E
XA
MPL
ES
OF
CL
ASS
LA
BO
RA
TO
RY
SPA
CE
ST
AN
DA
RD
S
Part
C. U
nive
rsity
Spa
ce P
lann
ing
(Con
t'd)
Fiel
d of
Stu
dy
APh
ysic
al E
duca
tion
_..
Phys
ical
Edu
catio
n fo
r M
enPh
ysic
al E
duca
tion
for
Wom
enR
ecre
atio
nH
ealth
and
Saf
ety
Dan
ce
Arm
ed F
orce
s3A
ir F
orce
Sci
ence
Mili
tary
Sci
ence
Nav
al S
cien
ce
NA
SF/S
tn, I
nc.
Aux
iliar
ies
NA
SF/W
SH20
Hou
rs p
er W
eek;
80 P
er C
ent S
tatio
nU
tiliz
atio
n
24 H
ours
per
Wee
r;80
Per
Cen
t Sta
tion
Util
izat
ion
250
11.0
029.
1625
011
.002
9.16
322.
001.
6764
4.00
3.33
250
11.0
029.
16
322.
001.
6732
2.00
1.67
322.
001.
67
'Stu
dios
cal
cula
ted
with
res
earc
h sp
ace
requ
irem
ents
.2U
sage
bas
edon
fac
ilitie
s be
ing
sche
dule
d as
wel
l as
clas
sroo
ms
from
7:0
0 A
M to
4:0
0 PM
and
80
per
cent
sta
tion
utili
zatio
n.3D
rill
Hal
lno
t inc
lude
d.
TA
BL
E 4
.2 (
Con
t'd)
SEL
EC
TE
D E
XA
MPL
ES
OF
CL
ASS
LA
BO
RA
TO
RY
SPA
CE
ST
AN
DA
RD
S
Sour
ce:
Fran
klin
G. M
ats
ler,
Spa
ce U
tiliz
atio
n St
anda
rds,
Cal
ifor
nia
Publ
ic H
ighe
r E
duca
tion,
A R
epor
tto
the
Coo
rdin
atin
g C
ounc
ior
I ii
g er
ucat
ion,
acra
men
to,
ecen
t egi
s at
ive
actio
nre
port
ed b
y St
ate
Leg
isla
tive
Com
mitt
ee o
n Fa
cilit
ies.
et;
Mob
Spac
e G
uide
s, O
ffic
e of
Cam
pus
Plan
ning
and
Dev
elop
men
t, D
epar
tmen
t of
Spac
e Pl
anni
ng a
ndM
anag
emen
t, C
ity U
nive
rsity
of
New
Yor
k, 1
973.
Har
lan
D. B
arei
ther
and
Jer
ry L
. Sch
illin
ger,
Uni
vers
ity S
pace
Pla
nnin
g, U
rban
a: U
nive
rsity
of
Illin
ois
Pres
s, 1
968.

84
TABLE 4.3
LABORATORY SPACE STANDARDS FORSELECTED INSTITUTIONS AND STATES
Square Feetper FTE
Staten Island Community College' 22.88
Nev York State University Centers2 17.80
Florida Community Colleges3Non-Occupational, less than 2,500 13.10Non-Occupational, more than 2,500 11.46Occupational/Technical 34.07
Square Feet per FTEHigh4 Low4
Arkansas5 7.51 M.011
California 22.56 3.36Colorado 14.02 7.06Delaware 10.80 7.20Illinois 26.40 3.74Kentucky 7.70 4.94Montana 27.65 5.26Oklahoma 18.00 6.00South Carolina 24.00 4.80Texas 11.52 5.76
'Staten Island Community College Master Plan, 1975, Appendix tothe Master Plan Report, City University of New York, 1971.
211cported by State.
3Reported by State Board of Education, Tallahassee. These standardsare used to estimate demand for space and capital budget outlays.They are not necessarily strictly applied to all constructionprojects once the funds are appropriated.

85
TABLE 4.3 (Cont'd)
4Square feet per I7TE is based on a case of 2.4 clock hours in the labper FTE. The number of hours in the lab may vary and a newstandard be re-calculated according to the following formula:
Weekly contact hours is lab per FTESquare feet x square feet per stationper FTE Hours per week x per cent occupancy per hour of use
5State standards reported in Planning Standards, Inventory andUtilization Data for Higher Education Facilities intates, urcau o ig er ucation, aci ales ompre enswe
Ida ng, State Education Department, Albany, New York, 1970.

TA
BL
E 4
.4
STU
DY
SPA
CE
ST
AN
DA
RD
S
Stud
y Sp
ace
Adm
inis
trat
ive
&(2
5 Pe
r. C
ent
Stac
k Sp
ace
Mis
cella
neou
sT
otal
Ran
ge D
ue to
FTE
Sea
ting
(.08
3 Sq
. Ft.
Spac
e (2
5 Pe
r C
ent
Spac
eV
aryi
ng S
ize
Cap
acity
)pe
r V
olum
e)of
Stu
dy &
Sta
ck)
per
FTE
of C
olle
ctio
n(0
00 S
q. F
t.)(0
00 S
q. F
t.)(0
00 S
q. F
t.)(S
q. F
t.)(S
q. F
t.)
Publ
ic I
nstit
utio
nsC
nive
rsiti
es12
,150
8,923
5,263
13.55
±2.0
Four
-Yea
r10
,225
4,42
73,
663
11.2
1±
1.0
Tw
o- Y
ear
n3ri
vate
Ins
titut
ions
8,82
51,
326
2,538
8.99
±0.5
Uni
vers
ities
3,60
06,
068
2,41
721
.05
±4.
0Fo
ur-Y
ear
7,00
07,543
3,636
16.25
±3.0
Two-
Yea
r67
534
925
611
.74
±1.
0
Sour
ce: S
ee p
. 61
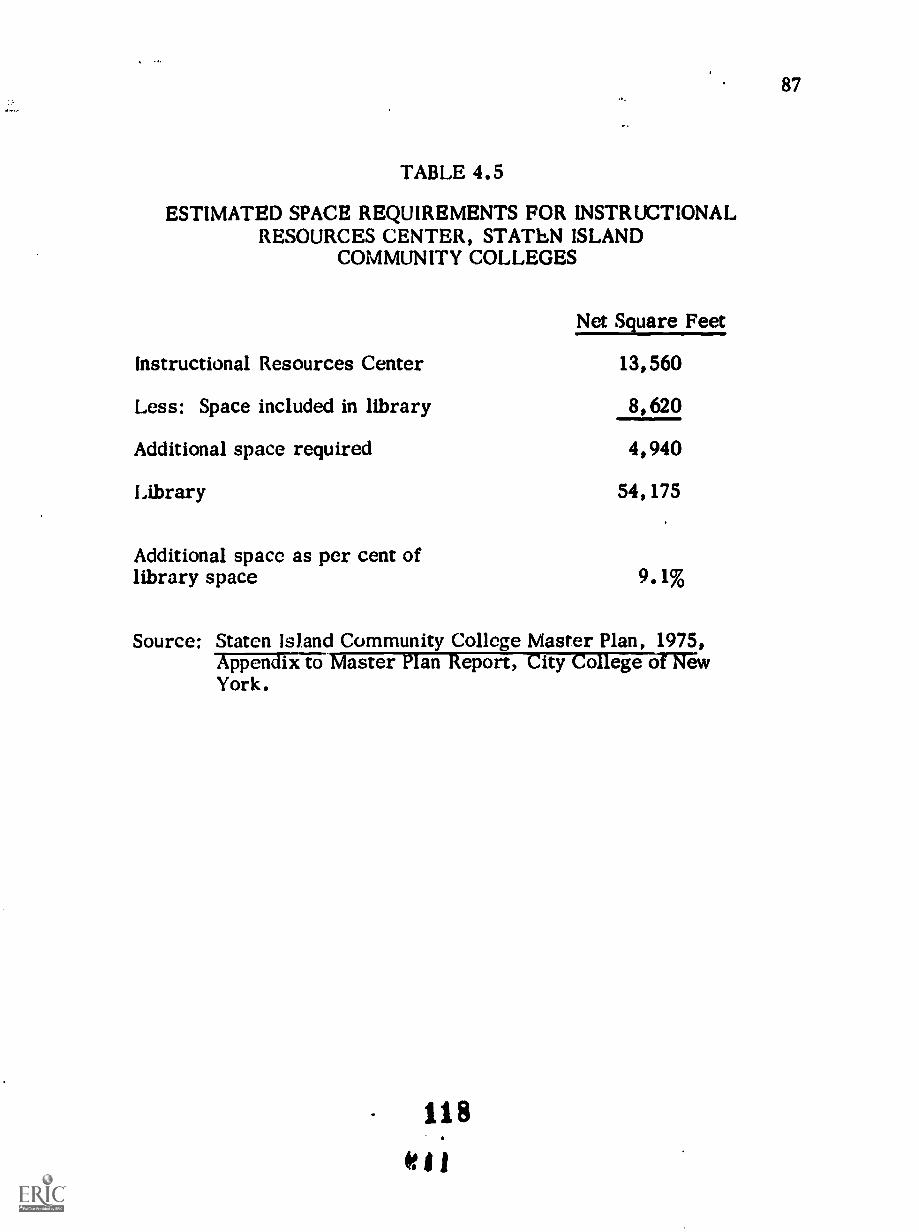
87
TABLE 4.5
ESTIMATED SPACE REQUIREMENTS FOR INSTRUCTIONALRESOURCES CENTER, STATEN ISLAND
COMMUNITY COLLEGES
Net Square Feet
Instructional Resources Center 13,560
Less: Space included in library 8,620
Additional space required 4,940
Library 54,175
Additional space as per cent oflibrary space 9.1%
Source: Staten Island Community College Master Plan, 1975,Appendix to Master Plan Report, City College orgewYork.
118
4:11

TA
BL
E 4
.6
AV
ER
AG
E S
PEC
IAL
USE
, GE
NE
RA
L U
SE, A
ND
SU
PPO
RT
SPA
CE
PE
R F
TE
ST
UD
EN
T I
NPO
ST-S
EC
ON
DA
RY
IN
STIT
UT
ION
S, B
Y T
YPE
, CO
NT
RO
L, A
ND
FT
E E
NR
OL
LM
EN
TW
ITH
AV
ER
AG
ES
FOR
SE
CO
ND
AN
D T
HIR
D Q
UA
RT
ILE
S, F
AL
L 1
970
(NA
SF p
er F
TE
)
Publ
ic U
nive
rsiti
es
Spec
ial U
se S
pace
Gen
eral
Use
Spa
ceSu
ppor
t Spa
ce
Mea
nSe
cond
Qua
rtile
Thi
rdQ
uart
ileM
ean
Seco
ndQ
uart
ileT
hird
Qua
rtile
Mea
nSe
cond
Qua
rtile
Thi
rdQ
tlart
-ii
Les
s th
an 1
0,00
018
.87
10.5
119
.83
19.7
615
.64
22.0
911
.01
8.68
11.0
4:0
,000
to 2
0,00
014
.87
10.0
114
.46
14.2
411
.42
14.1
712
.18
7.14
12.0
3
Nab Pi)
20,0
00 o
r m
ore
gliiv
ate
Uni
vers
ities
Les
s th
an 1
0,00
010
,0e/
0 to
20,
000
13.7
5
19.8
311
.59
10.6
517
.98
*
13.2
2
32.3
019
.73
*
18.2
5
*
31.0
5*
13.3
6
17.3
916
.96
*
8.32 *
*
14.0
2*
20,0
00 o
r m
ore
8.13
8.11
**
*
Publ
ic O
ther
Fou
r-Y
ear
Inst
itutio
nsL
ess
than
2,5
0017
.80
10.0
918
.04
22.9
014
.25
23.9
08.
634.
748.
892,
500
::o 5
,000
14.5
28.
9114
.68
17.7
613
.20
20.1
07.
084.
407.
505,
000
to 1
0,00
010
,000
to 2
0,00
013
.98
7.03
9.87 *
14.7
414
.08
6.45
11.9
516
.58
5.68
5.55
3.66 *
6.10 *
Priv
ate
Oth
er F
our-
Yea
r In
stitu
tions
Les
s th
an 1
,000
24.6
711
.44
22.9
048
.84
36.5
552
.69
16.6
76.
7314
.77
1,00
0 to
2,5
0021
.76
14.6
123
.03
37.6
729
.40
40.3
914
.03
7.02
13.4
12,
500
to 5
,000
13.6
58.
3613
.91
23.3
415
.99
23.4
57.
433.
896.
885,
000
to 1
0,00
06.
28*
*13
.13
**
**
00 00
IN O
M O
N11
1111
111/
1es
soli
amIN
SIII
NM
In M
e M
s 11
11

TA
BL
E 4
.6 (
Con
ed)
Spec
...I
Use
Spa
ceG
ener
al U
se S
pace
Supp
ort S
pace
Seco
ndT
hird
Seco
ndT
hird
Seco
ndT
hird
Mea
nQ
uart
ileQ
uart
ileM
ean
Qua
rtile
Qua
rtile
Mea
n Q
uart
ileQ
uart
ilePu
blic
Tw
o-Y
ear
Inst
itutio
nsL
ess
than
1,0
0017
.49
1.81
15.2
912
.55
6.63
11.8
84.
770.
662.
521,
000
to 2
,500
9.73
2.79
9.76
9.08
4.49
9.63
4.69
1.16
3.01
2,50
0 to
5,0
006.
975.
368.
286.
974.
927.
672.
621.
362.
575,
000
or m
ore
5.78
5.15
6.69
5.61
4.74
6.14
3.00
1.94
3.10
Priv
ate
Tw
o-Y
ear
inst
itutio
ns' L
ess
than
1,0
0032
.04
5.02
24.8
843
.06
27.4
348
.66
16.1
63.
4311
.71
"M'1 00
0 to
2,5
00IN
OPe
r
CID
2,50
0 or
mor
e11
.77
9.63
* *
* *
18.6
614
.17
* *
* *
9.03 *
* *
* *
Sour
ce: H
EG
IS V
.
Not
e:*
Few
er th
an 1
0 ca
ses.
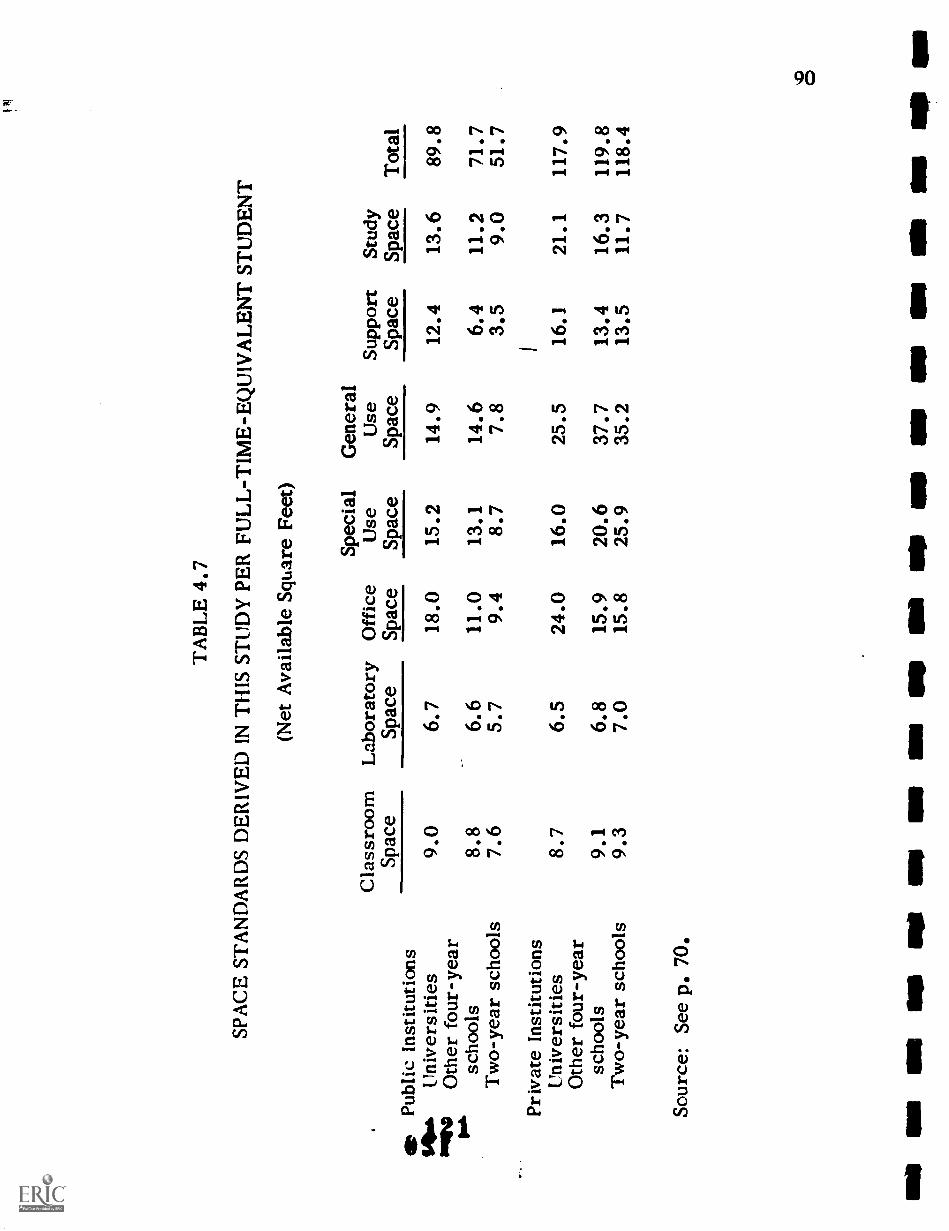
TA
BL
E 4
.7
SPA
CE
ST
AN
DA
RD
S D
ER
IVE
D I
N T
HIS
ST
UD
Y P
ER
FUL
L-T
IME
-EQ
UIV
AL
EN
T S
TU
DE
NT
Publ
ic I
nstit
utio
ns
Cla
ssro
omSp
ace
(Net
Ava
ilabl
e Sq
uare
Fee
t)
Spec
ial
Lab
orat
ory
Off
ice
Use
Spac
eSp
ace
Spac
e
Gen
eral
Use
Spac
e
14U
nive
rsiti
es9.
06.
718
.015
.214
.9M
N)
Oth
er f
our-
year
06.
scho
ols
8.8
6.6
11.0
13.1
14.6
Tw
o-ye
ar s
choo
ls7.
65.
79.
48.
77.
8
Priv
ate
Inst
itutio
nsU
nive
rsiti
es8.
76.
524
.016
.025
.5O
ther
fou
r-ye
arsc
hool
s9.
16.
815
.920
.637
.7T
wo-
year
sch
ools
9.3
7.0
15.8
25.9
35.2
Sour
ce: S
eep.
70.
Supp
ort
Spac
e
12.4 6.4
3.5
16.1
13.4
13.5
Stud
ySp
ace
Tot
al
13.6
89.8
11.2
71.7
9.0
51.7
21.1
117.
9
16.3
119.
811
.711
8.4
I1
0
1111
1O
MM
IMI N
WIII
IIIM
O11
1111
111
1111
IMP
1111
111
NIP
On
IN M
I IM
P M
EI

91
CHAPTER 5
A COMPARISON OF SPACE TO SPACE STANDARDS
The conventional use of space standards derived by consensus
is to compare them to the amount of space actually available in
different types of institutions, and to conclude from the comparison
whether space shortages or surpluses do exist. This chapter, at
the very outset, describes such a conventional comparison, with the
additional refinement of comparing average available space not only
by type and control of institution, as was done in previous studies,
but also by grouping institutions by size for a given type and control.
As will be explained below, to add precision to this study, additional
types of institutions, those with special programs, have been isolated
to make the analysis more- meaningful.
This analysis is followed by a more detailed examination of
space available to schools within a given type, control, and size
category, when schools were grouped into quartiles after being ranked
on total non-residential space. These data help pinpoint possible
shortages of space in categories where the average space available
appears adequate because some institutions or campuses have much
more space than the standards, and others nave much less. We

92
believe that this breakdown of institutional space gives better
insights into the adequacy of space than the conventional analysis.
L istly, we report on an attempt to trace the incremental
differences among different types of space, as total non-residential
space in different institutions, classified by type, control, and size,
in institutions with different amounts of space. The purpose of this
analysis was to find consistent patterns of space acquisition by insti-
tutions, as the total availability of space increases for a given type
of institution.
The conclusions of this chapter are only moderately helpful
to the policy planners. For instance, there did not appear to be a
general shortage of space, if the fairly modest space standards estab-
lished in Chapter 4 are compared to space availability. By contrast,
some 15 to 25 per cent of institutions did have shortages of space in
some category for which firm standards could be established.
The acquisition of additional space, by type, did not follow a
clearly consistent pattern. Two hypotheses may be advanced to
explain this variation: (1) the needs of different institutions are so
different that no generalization is possible, and (2) institutions which
are space-poor and those which are space-rich expand their instruc-
tional space for different reasons, the former to accommodate
students, the latter to expand programs. The ones which are neither
too space-poor nor too space-rich, on the other hand, put a much higher

93
priority upon expansion of non-instructional space. generally to
round off the amenities on their campuses.
Despite the fact that this chapter does not present unassailable
findings about how much space is required or available, it does con-
tribute to the understanding of how space is distributed. The analysis
of distribution of space by quartile, and the high standard deviations
which are associated with it, indicates that a variety of arrangements
are possible to deliver post-secondary education to different mixes of
students.
Classification of Schools
The analysis below is based upon schools which reported
facilities in the IIEGIS V (1970-71). The information contained in
that survey is on a campus-by-campus basis. Thus, a given univer-
sity system, either of a given state or locality, may report more than
one campus in this survey. For instance, the University of Maine
operates a campus where graduate studies are offered, as well as a
series of four-year and two-year campuses. Each one of these
campuses is treated separately in the analysis below.
Campuses have been subdivided into the following categories:
(1) Junior colleges
(2) Four-year schools
(3) Universities and schools offering doctoral degrees
I
124

94
(4) Medical, dental, pharmaceutical, or osteopathicschools
(5) Universities with medical schools on the same campus
(6) Special technical schools
(7) Agricultural
(8) Arts, and arts and crafts schools
Excluded from the analysis were schools of divinity, U. S.
government service schools, and a few schools (mostly those with
small enrollments) with questionable data.
Each of these categories of schools was further subdivided by
control and, whenever the number of institutions was large enough to
warrant it, by size group.
A Comparison of Inventories of Facilities with Planners' Standards
It is possible to visualize a number of alternative ways of
comparing inventories of space available as of 1970-71 with the
planners' standards. The most straightforward is to compare each
type of space to the available standards for a given group of institutions,
either subdivided by size group or for all institutions of a given type.
This procedure has been followed traditionally to estimate possible
space shortages or excesses.
This method has a large number of shortcomings, not the least
of which is to mask shortages in certain institutions, because campuses
with little space are aggregated with campuses which may have space

95
over and above the standards believed to be adequate. This chapter,
after comparing averages by type of campus (and size), further breaks
down availability of space by quartile within each type of campus, with
campuses being ranked from low to high by the availability of a given
type of space. This analysis makes it possible to highlight the
campuses with shortages or surpluses of space.
Aggregate Comparisons of Space and Inventories
The aggregate comparisons of space standards with the space
available show few shortages by type or size of institution, especially
for those categories of space where very specific space standards have
been established, i.e., classrooms, laboratories, and office space.
In the aggregate, there appear to be some shortages of space in
libraries. If special usc, general use, and support space are aggre-
gated, the rule of thumb suggested by a number of space planners- -
that this type of space should amount to some 35 - 40 per cent of the
total non-residential space--indicates that few shortages, in the
aggregate, exist in these categories either. It should be noted that
standards in Chapter 4 do not obey this rule and are somewhat more
generous (see Table 5.1).
Classroom Space. Once the classroom space is adjusted by
the relationship of part-time to full-time students, the space standard
which was expressed as 10.0 square feet per full-time student now

96
varies between 7.6 square feet in junior colleges, with a high
proportion of part-time students, to 9.1 square feet in private four-
year schools, where 90 per cent of the students are full-time. On
the average, there are no shortages of classroom space in any of the
institutions, with only large public four-year schools close to the
lower limit.
Laboratory Space. In the case of laboratory space, where
adjusted standards per FTE vary from to 13.6 square feet of
space, there appear to be some shortages in private junior colleges
and the three largest universities. In this latter case, the shortages
may be more apparent than real, because two out of three schools
have large part-time programs which are not reflected in the standards
which assume the same proportion of part-time students in all schools
in a given category, and which may overstate the need in these three
universities.
Classroom and Laboratory Space. Since the demand for
classroom and laboratory space is a joint demand, and depends upon
programs which are offered in a given school, it may even be more
reasonable to compare the total space available for both purposes in
relation to the standards. Since we have estimated that laboratory
space is only 0.11 times as efficient as classroom space in producing a
standard credit hour, it would be sensible to adjust these two to a
common standard. This has been done in Table 5.2.
127;Is; I

97
Again, on the average, when these two types of space are
aggregated, there appear to be no shortages of space.
Office Space. The situation is more complex with respect to
standards based upon full-time-equivalent students. In the case of
office space, some schools fall below the standard. The shortages
appear most pronounced in junior colleges. This was to be expected,
since traditionally less space was allocated to both junior college
administrators and teachers. Many of them had lower expectations
with respect to office facilities, having previously taught in high
schools, where faculty offices are minimal. Our site visits have
indicated that expectations for office space are escalating, and that
faculties in junior colleges are demanding, and getting, more
generous office space allocations.
In other categories, the findings about space are more
equivocal. In this section, the estimates of space are based on
average staff/student ratios, and one would expect less space in some
larger schools. Nevertheless, it is safe to conclude that public
colleges have less space than is warranted by t ie standards. The
case for shortages of office space is less convincing, even with
these rough figures for other schools. Further analysis, based on
more precise data below, will adduce more convincing evidence.
eJ"

98
Study Space. While there appeared to be no critical shortages
in any of the preceding categories, even aggregate statistics indicate
shortages of study space in most institutions, except the very
smallest ones. Percentage-wise, the largest shortfalls of space
required to accommodate the average collection of books and provide
the necessary space for students occurs in jun;3r colleges. Only
very small junior colleges appear to have sufficient or excess space.
Less serious, but equally sharp shortages, when compared to the
standard, are evident in public four-year institutions and public
universities. Since the standards were derived on the basis of the
average number of volumes in the callections of various types of
institutions, even if one were to ignore variations in the number of
volumes per full-time-equivalent student, it is obvious that study
space for students in libraries is less than most experts consider
adequate.
Special Use Space. The conclusions about special use space
are less easy to draw. Table 5.1 shows that there is less special use
space per full-time-equivalent student in larger schools, as compared
to smaller schools. These amenities are least generously provided
in two-year schools, as compared to other schools. Generally,
public universities, probably because of their commitment to football,
are most generously endowed with this space. So are smaller
private universities.
15:

99
General Use Space. Most smaller schools have their full quota
of general use space. Larger schools have less. It is not possible to
determine from aggregative figures whether we are seeing an example
of economies of scale or just different building patterns.
Support Space. A perusal of forms, institution by institution,
reveals that this space is reported most inaccurately. Many institu-
tions report this space together with other space. Given the standards
derived from schools which have supplied the reports, and space
available in schools which have provided statistics on support space,
one can conclude either that economies of scale operate, or that
large schools are somewhat shorter of support space than smaller
ones.
Analysis of Available Space Based on Rankings b1Total Non - Residential Space
A refrain which should have accompanied the analysis of
space, category by category, is that the conclusions are tentative,
since much space is interchangeable, and the demand for space in a
given institution is affected by the character of its program. We will
defer measures of the character of the program on the demand for
space until the next chapter. In the section below, we shall analyze
the distribution of space within types of institutions, with institutions
grouped into four categories after they were ranked by availability of
total non-residential space.
1.1/213.

100
After prolonged conversations with both state and individual
campus planners, we became aware of a dichotomy between theory
and practice in campus planning. It is not at all clear whether space
should be planned per full-time or full-time-equivalent student; or
ideally on the basis of full-time-equivalent day students, a statistic
not collected nationally. Peak demands for campus facilities occur
during the day, and a fairly accurate way of arriving at an estimate
of full-time-equivalent daytime students is to use thz figure of total
full-time students. Hence, it appeared reasonable to present an
analysis of available space in terms of full-time students as an
approximation of one way of computing space. We became increasingly
aware that, in some states, planning factors for public institutions
were based on full-time-equivalent students, and that much of the
available space was provided to accommodate FTE attendance figures.
An attempt to determine what actually happens in campus
planning through statistical analysis did not turn out to be enlightening.
compared the standard deviations of different types of space on
campuses ranked by total non-residential space by size of school
within type, with space averages computed on the basis of full-time
or full-time-equivalent students. The standard deviations of both
total non-residential space and different categories of space did not
differ significantly from each other in the case when the available
space was calculated per full-time student, or if it was computed per
1
I

101
full-time-equivalent student. In most cases, the standard
deviations for individual types of space within a quartile
were half the size of the mean, thus indicating a wide vari-
ety of space arrangements in different schools. (See Appen-
dix:; Table 5.4)
A comparison of each individual type of space in
institutions which have the same amount of space per student
shows the wide range of space preferences among these in-
stitutions. For instance, one institution will have two or
three times as much classroom space as another institution
with the same amount of total space per student. These
variations could be due to historical accident, differences
in program emphasis or donor whims. It is also posaible
that these differences are more apparent than real since
different types of space may be interchangeable. We do
not take a position on this issue and analyze space under
either assumption.
Range of Space Available by Qurtile of Institution.
Ranges of space between the least-well-endowed quartile of
a given type, control, and size of inst:zution and the one
most richly endowed wits, space vary between 20 and 200
4.1:1132

102
per cent for classroom space between the average institutions,
and more widely for institutions with specialized purposes. In
the case of laboratory space, the variations are even wider, with
some of the average institutions having 3.5 times as much space as
others. Some specialty schools had even wider ranges. These ranges
arc documented in Table 5.3.
If this table proves anything, it is that institutions can
get along with a wide range of space availability.
Raw of Space by Size of Institution. It has been seen that, on
tho average, the larger the size of the institution, the less available
space there is per full-time or full-time-equivalent student. We
believed this proposition as firmly as the majority of authorities in
the field of space planning when we started this study.
This belief that larger institutions need less space than
smaller ones is considerably weakened by our analysis. Two facts
contributed to this conclusion: (1) the space available in institutions
in both the first and second quartiles did not differ significantly or
systernaically from one size group to another (see Appendix Tables
5.1 to 5.3); and (2) within the fairly wide size ranges encompassc!d
within each quartile of institutions, grouped by type and control,
there was little variation between the average enrollment of space-
poor and space-rich institutions.
. 133St t

103
These findings contradiu observations by space planners.
For instance, one authority believes that large classrooms and
auditoriums, necessary to accommodate introductory courses, are
more difficult to schedule efficiently in schools with low enrollments,
as contrasted to schools with more students. Also, in the space plan-
ning guide of the City University of New York, some allowance was
made for additional non-academic facilities above average standards
for small schools. This allowance makes sense, if these schools
are to be provided with "one of each facility." For instance, a single
swimming pool is sufficient for a wide range of student enrollments.
Other athletic facilities also do not come in easily divisible quantities.
On the other hand, it can be argued that schools with
small enrollments do not require the full range of non-academic
facilities, and that multiple uses of space, especially for athletic
facilities, can be attained with better planning and more adventurous
use of modern technology. Some educators have argued that the
advantages of small schools over large ones can offset the relative
dearth of facilities. To this argument can be added the voice of
economists, wao have observed that the amount of fixed capital per
unit of production should be equalized in an efficient society.
For the time being, in the following discussion we have
ignored differences in size, as they affect space utilization. They
will be re-introduced at a later time, when future space requirements
will be discussed.

104
Analysis by Type, Control, and Size of School Rankedon Space Availability
The analysis which follows is more policy-relevant compared
to the one based on average space by school. While average data
provides an over-all impression of the adequacy of the space
available, it fails to highlight shortages of space on certain campuses
by averaging available space in space-poor with space-rich campuses.
A somewhat better idea of the shortages and surpluses of space can
be derived by looking at sub-groups of campuses, when the space-
poor campuses are grouped together, and those with a lot of space
are also grouped together. In effect, each size group for each type
of school (two-year, four-year, and those offering doctorates), by
control, was divided into four groups after the schools were ranked
in ascending order of total space. For each group with at least
40 schools (10 per quartile), various statistics were computed, and
are described below.
Total Space. While the modest space standards developed in
Chapter 4 failed to highlight space shortages in most classes of
schools, with the exception of larger public four-year schools and
junior colleges, the distribution of schools ranked by quartile on
total space shows that a considerable number of schools are not up
to Chapter 4's standards. Thus, all schools in the lower quartile of
their distribution make do with less space than the standards would
105
postulate. In the larger public junior colleges, the facilities shortages
extend to the second and sometimes the third quartile of the larger
schools.
The discussion of space below will give an inkling about
the way schools adjust to shortages of space. Thus, for instance,
while practically every school in the lower quartile was short of
space when total non-residential space standards were considered,
most of them had sufficient space for classroom instruction, and
skimped on other space.
Classroom Space. We shall start our discussion with an
analysis of classroom space. For instance, in the smaller public
junior colleges, those with less than 1,000 students, schools in the
lowest quartile have roughly half the space as those in the top quartile.
In other size groups, the ratio of space between schools in the low
and high quartiles are between three and four to one. Thus,
while aggregated data indicated no shortages of classroom space in
junior colleges, the disaggregated data below would indicate that all
junior colleges with enrollments over 2.5 thousand in the two lowest
quartiles were somewhat short of classroom space. Surprisingly, it
is quite likely that private universities with 10 to 20 thousand enroll-
ment in the lowest quartile were also tight on classroom space,
although not as tight as some junior colleges. Other schools appeared
to be fairly well provided with classrooms.
106
Laboratory Space. In the case of laboratory space, less than
the standard space required for the average program was either
causing overcrowding or limiting the scope of the program. Private
junior colleges generally have fewer science-oriented programs, and
most of them have fewer labs than would be required in an "average"
program. Public and private four-year colleges in the lowest quartile
of space available also appear to be short of laboratory space.
Strangely enough, so are the lowest quartile of public and private
universities. Thus it could be concluded that shortages of space
precluded heavy science-oriented programs.
Laboratory and Classroom Space Combined. It is, of course,
quite possible that schools with less classroom space have more
laboratory space, to compensate for a larger proportion of classes
given in laboratories or vice versa. A combination of laboratory and
classroom space; based on averages per FTE by quartile, indicate
that some such compensation did occur. A more precise assessment
of space, calculated on the basis of full-time students, indicates that
shortages defined as fewer than 20 net square feet of assignable class-
room and laboratory space per full-time student exist only in large
public and private two-year schools.
Office Space. The situation with respect to office space
highlights that roughly half of the schools have sufficient space, and
half do not. While office space, on the average, is sufficient, it is
certainly not distributed evenly between schools.

107
Study Space. Shortages of study space are considerably more
pronounced. No large public two-year college appears to have
sufficient study space, and neither do three-fourths of the smaller
ones. Conditions similar to those in smaller junior colleges prevail in
public and private four-year schools and public universities. About
half of the plant in public universities is sufficient to provide for
average facilities. Given that the standards have been derived on
the basis of an average collection, it would appear that roughly
25 per cent of all schools with below-average collections have less
than adequate space.
Special Use, General Use, and Support Space. Since so much
of the special use and general use space is interchangeable, a
separate analysis will not be attempted here. Those interested in the
details of the distribution of this type of space are referred to the Appendix.
A perusal of the Appendix tables will indicate that the variety of availa-
bility of space is great. So much depends on the amenities which the
school wishes to provide that generalizations are difficult. The
great variety in the practices explains why space planners have been
reluctant to set standards for this type of space.
Table 5.4 details the findings with respect to classroom,
laboratory, office, study, and total non-residential space. Shortages
or the absence of shortages were defined as follows: (1) if the quartile
mean less one standard deviation was still equal to the space standard,
Sal 138

108
no shortage was noted in the table; (2) if the quartile mean less one
standard deviation was less than the space standard, the entry reads,
"some shortage;" (3) if the standard is greater than the mean and at
least half of the schools were below the standard the entry reads,
"shortage:" and (4) if the quartile mean plus three standard deviations
is still below the standard, a "severe shortage" was diagnosed.
A comparison of the different entries in the table
indicates that shortages were most pronounced in office and study
space. Most schools were in much less dire straits with respect to
classroom and laboratory space than their general condition with
respect to total space would lead one to believe.
Incremental Increases of Space by Type,Control, and Size of College
The large variations of space by type which were highlighted in
the analysis of different types of space, as well as in the analysis of
the distribution of space in the exercise when schools were ranked by
total non-residential space available, raised grave doubts about
either the rationality of construction policies of different schools or
the possibility of comparing space allocation, even between similar
types of schools. Another attempt to uncover a pattern on decision-
making in the acquisition of additional space was tried. The ratio of
a given type of non-residential space to the total increment of non-
residential space was calculated, comparing quartile 1 to quartile 2,

109
quartile 2 to quartile 3, and quartile 3 to quartile 4 for a given type,
control, and size of school. For instance, private universities in
the second quartile had 51 square feet more non-residential space per
full-time student than those in the first quartile. Roughly 23 per
cent of that space was accounted for by class and lab space, 27 per
cent by office space, 1C per cent by study space, and 40 per cent by
other space. The patterns are shown irk Appendix Table 5.6.
Regretfully, no clear-cut pattern can be found through those
tables. Institutions add space in a different manner. Strangely
enough, in most institutions, the patterns of space addition from the
first to second and third to fourth quartiles are fairly similar, and
those from the second to the third quartile are somewhat different
from the other two. Hence, it is not possible to calculate the
marginal propensity to add space under most conceivable circumstances.
Two complementary hypotheses may be advanced: (1) Schools
add space over and above the minimum either to round off their
campuses or to build facilities which did not exist before. The
priorities by type of space are by no means clear-cut. These
priorities are different for different kinds of schools. Schools with
more space may decide that their program already meets the demands
of their constituency, and that the first priority lies in the building of
assembly halls, theaters, and libraries. (2) Once minimum needs are
met, an over-all expansion of facilities across the board is undertaken.
111
140

110
These hypotheses have important implications for a national
construction policy. If the needs for individual schools cannot be
evaluated, the federal authorities may wish to take the position to
insure that space available meets certain minimum standards and that
specialized needs be financed either by non-federal authority or by
agencies trying to encourage certain specific activities by institutions
in certain chosen locations.
Residential Space
Residential space plays an important role in the stock of
space owned by post-secondary institutions. In the Fall of 1971, for
instance, residential space accounted for roughly 30 per cent of
assignable space of all institutions. Unfortunately, the analysis of
this type of space need cannot be too detailed. Space standards of
adequate space for single and married students have been documented
by various authorities, and they do not need to be repeated here.
These space standards do not give any guidance as to how much space
is required or desirable, either for any given sets of institutions, or
for an institution itself. institutions have varying policies with
.gard to dormitory and other residential space, with public two-
year schools providing the least space per student, and private two-
and four-year schools providing the most. There are also important
variations in space provided per enrolled student, depending upon the

111
location of the campus. Central city campuses are least well
provided with residential space, campuses in other metropolitan
locations arc somewhat better served, and those in non-metropolitan
areas have the most space per student enrolled (see Table 5.5)
While these figures illustrate the distribution of residential
space during the recent past, they are not extremely helpful in
to/yelling how much space will be required in the future. In 1957,
for instance, there were some 78 million assignable square feet of
residential space. In other words, there were 25 square feet of
residential space per student. By 1968, there were 282 million net
assignable square feet per total students, or 37.5 square feet per
student. By L'71, the total was 368 million square feet, or 41 square
feet for every student enrolled.
During the intervening period, enrollment patterns had
changed considerably. A larger proportion of students was enrolled
in two-year schools and public institutions. Since we are extremely
badly served by data on past patterns of enrollments, only the
crudest comparison can be made of the effect of these shifts (sec
Table 5.6). This table shows the index of space available per
enrolled student, using Fall 1971 as 100 in the first column. Another
index of space availability has been calculated by taking into account
the space per enrolled student in 1971 and enrollments in 1957 and
1968. The ratio of the expected space available in those years was
112
then divided by the actual space to produce another index which
reflects shifts in enrollment.
The new weighted index, which does not take into account the
lessened propensity of graduate students, low-income students, and
other groups recently attracted to our universities to live in institu-
tional settings, shows that residential space is much more generously
provided now than, say, fifteen or even four years ago.
There are strong indications that a general overall
equilibrium has been reached in the supply of residential space.
While vacancies were few in the middle 1960's, the occupancy rate
in the late 1960's and early 1970's dropped to some 95 per cent. As
of 1972, there were indications that occupancy rates (at least in
larger institutions in the Northeast) had picked up, and "no vacancy"
signs were up again. In the Western and some Southwestern states,
there will still reports of underutilization of dormitories.
The changing mores of students have been blamed for the
plateauing of demand for dormitory spaces. Despite relaxation of
parietal rules in the late 1960's, the stampede for dormitory rooms
did not occur, and the explanation must be sought elsewhere.
Despite the fact that at least 90 per cent of all dormitories
has been built in the past 30 years, and 75 per cent in the past
15 year alone, many residential facility buildings offer Spartan
space in unattractive surroundings. Builders failed to take into
143

113
account the increase in the general standard of living in the United
States and the concomitant improvement in non-institutional housing
standards. Dark corridors, shared bathrooms, and box-like rooms
did nothing to endear institutional residential housing to students.
The crisis in residential occupancy was also precipitated by
the unfavorable relationship of prices for residential accommodations
compared to average rental prices in the United States. During the
mid-1960's, prices charged by institutions rose faster than average
prices for rental units. Hence, it became harder and harder to fill
dormitories.
In the recent past, as the rate of new, expensive dormitories
coming on line slowed down, price increases by schools moderated
as well, and there are indications that dorms are filling up again.
If institutions price their dormitories at levels which are competitive
with other alternatives, there is little reason to believe that another
15 to 25 per cent increase in enrollment cannot be accommodated
with present dormitory facilities.
There may, perhaps, be regional or campus-by-campus
shortages. Also, schools may wish to build subsidized housing to
attract students from other schools of equal quality. On the whole,
though, dormitory shortages are not likely to put a crimp on
enrollment growth, if such growth does materialize.
144

114
TABLE 5.1
MEAN AND STANDARD DEVIATION FOR SELECTED TYPES OFFACILITIES BY TYPE, CONTROL, AND SIZE OF CAMPUS,
HEGIS V, 1970-71
Class Space, Square Feet per FTE
FTE EnrollmentCategory
Number ofInstitutions
Mean(StandardDeviation)
Public Universities Over 20,000 22 9.40(Standard: 9.0) (1.97)
10,000 to 20,000 58 10.55(2.58)
Less than 10,000 49 13.55(5.24)
Private t Tniversities Over 20,000 3 8.94(Standard: 8.7) (3.50)
10,000 to 20,000 10 14.65(3.14)
Less than 10,000 68 9.62(1.17)
Public Four-Year Schools Over 10,000 20 8.62(Standard: 8.8) (2.81)
5,000 to 10,000 72 11.19(3.97)
2,500 to 5,000 94 14.26(6.78)
Less than 2,500 122 20.16(12.81)
- 145It'
115
TABLE 5.1 (Cont'd)
MEAN AND STANDARD DEVIATION FOR SELECTED TYPES OFFACILITIES BY TYPE, CONTROL, AND SIZE OF CAMPUS,
REGIS V, 1970-71
Class Space, Square Feet per FTE (Cont'd)
MeanFTE Enrollment Number of (Standard
Category Institutions Deviation)
Private Pour-Year Schools Over 5,000 7 12.73(Standard: 9.1) (3.76)
2,500 to 5,000 46 14.62(4.58)
LOCO to 2,500 282 21.16(9.30)
Less than 1,000 515 30.82(22.6-z)
Public Two-Year Schools Over 5,000 55 8.67(Standard: 7.6) (5.98)
2,500 to 5,000 113 9.71(4.34)
1,000 to 2,500 218 13.42(7.43)
Less than 1,000 304 28.91(68.85)
Private Two- Year Schools 1,000 to 2,500 12 14.65(Standard: 9.3) (5.20)
Less than 1,000 194 38.36(37.63)
146 vi

116
TABLE 5.1 (Cone.i)
MEAN AND STANDARD DP.VIATION FOR SELECTED TYPES OFFACILITIES BY TYPE, CONTROL, AND SIZE OF CAMPUS,
HEGIS V, 1970-71
Lab* Space, Square Feet per FTE
MeanFTE Enrollment Number of (Standard
Category Institutions Deviation)
Public Universities Over 20,000 22 14.40(Standard: 6,7) (4.73)
10,000 to 20,000 58 16.11(6.06)
Less than 10,000 49 19.64(5.24)
Private Universities Ovel 20,000 3 9.59(Standard: 6.5) (4.11)
10,000 to 20,000 10 13.39(5.27)
Less than 10,000 66 17.41(10.52)
Public Four-Yea, Schools Over 10,000 20 12.30(Standard: 6.6) (3.83)
5,000 to 10,000 72 13.31(5.70)
2,500 to 5,000 94 14.78(6.85)
Less than 2,500 116 19.91(14.30)
* Excluding tabs used for research only.
117 hill
117
TABLE 5.1 (Cont'd)
MEAN AND STANDARD DEVIATION FOR SELECTED TYPES Or'FACILITIES BY TYPE, CONTROL, AND SIZE OF CAMPUS,
REGIS V, 1970-71
Lab* Space, Square Feet per FTE (Cont'd)
FTE EnrollmentCategory
Number ofInstitutions
Mean(StandardD Niation)
Private Four-Year Schools Over 5,000 7 8.67(Standard: 6.8) (3.94)
2,500 to 5,000 45 14.01(8.38)
1,000 to 2,500 280 20.11(11.14)
Less than 1,000 480 24.72(17.50)
Public Two-Year Schools Over 5,000 55 13.90(Standard: 5.7) (7.15)
2,500 to 5,000 113 14.82(8.97)
1,000 to 2,500 217 18.42(12.40)
Less than 1,000 298 27.92(28.81)
1.'rivate Two-Year Schools 1,000 to 2,500 12 8.63(Standard: 7.0) (5.26)
Less than 1,000 194 38.36(37.63)
4. Excluding labs used for research only.
fill148

TABLE 5.1 (Cont'd)
MEAN AND STANDARD DEVIATION FOR SELECTED TYPES OFFACILITIES BY TYPE, CONTROL, AND SIZE OF CAMPUS,
HEGIS V, 1970-71
Class and Lab* Space, Square Feet per FTE
Public Universities(Standard: 15.7)
Private Universities(Standard: 15.2)
118
MeanFTE Enrollment Number of (Standard
Category Institutions Deviation)
Over 20,000 22 23.80(5.59)
10,000 to 20,000 58 26.66(7.19)
Less than 10,000 49 33.18(12.89)
Over 20,00() 3 18.53(6.74)
10,000 to 20,000 10 28.04(7.29)
Less than 10,000 68 36.22(14.68)
Public Four-Year Schools Over 10,000 20 20.92
(Standard: 15.4) (4.64)
5,000 to 10,000 72 24.50(8.02)
2,500 to 5,000 94 29.04(10.90)
Less than 2,500 122 39.10(2.:, . 62)
* Excluding labs used for research only.149
1

119
TABLE 5.1 (Cont'd)
MEAN AND STANDARD DEVIATION FOR SELECTED TYPES OFFACILITIES BY TYPE, CONTROL, AND SIZE OF CAMPUS,
HEGIS V, 1970-71
Class and Lab* Space, Square Feet per FTE (Cont'd)
FTE EnrollmentCategory
Number ofInstitutions
Mean(StandardDeviation)
Private Four-Year Schools Over 5,000 7 21.40(Standard: 15.9) (6.28)
2,500 to 5,000 46 28.32(11.87)
1,000 to 2,500 282 41.13(17.33)
Less than 1,000 516 53.76(31.17)
Public Two-Year Schools Over 5,000 55 22.58(Standard: 13.3) (10.61)
2,500 to 5,000 113 24.53(11.59)
1,000 to 2,500 218 31.75(16.35)
Less than 1,000 304 56.28(88.98)
Private Two- Year Schools 1,000 to 2,500 12 23.28(Standard: 16.3) (9.39)
Less than 1,000 194 59.36(51.39)
* Excluding labs used for research only.
Ose

120
TABLE 5,1 (Cemed)
MEAN AND STANDARD DEVIATION FOR SELECTED TYPES OFFACILITIES BY TYPE, CONTROL, AND SIZE OF CAMPUS,
HEGIS V, 1970-71
Office Space, Square Feet per FTE
FTE EnrollmentCategory
Number ofInstitutions
Mean(StandardDeviation)
Public Universities Over 20,000 22 28.74(Standard: 18.0) (10.37)
10.000 to 20,000 58 24.03(7.99)
Less than 10,000 49 26.37(14.47)
Private Universities Over 20,000 3 17.76(Standard: 24.0) (5.68)
10,000 to 20,000 10 36.21(18.44)
Less than 10,000 69 36.13(26.84)
Public Four-Year Schools Over 10,000 20 12.12(Standard: 11.0) (3.29)
5,000 to 10,000 72 13.29(4.40)
2,500 to 5,000 94 14.44(5.03)
Less than 2,500 122 20.74(26.28)
121
TABLE 5.1 (Cont'd)
MEAN AND STANDARD DEVIATION FOR SELECTED TYPES OFFACILITIES BY TYPE, CONTROL, AND SIZE OF CAMPUS,
HEGIS V, 1970-71
Office Space, Square Feet per FTE (Cont'd)
MeanFTE Enrollment Number of (Standard
Category Institutions Deviation)
Private Four-Year Schools Over 5,000 7 13.29(Standard: 15.9) (3.93)
2,500 to 5,000 46 16.39(6.89)
1,000 to 2,500 282 21.58(8.79)
Less than 1,000 516 24.97(14.05)
Public Two-Year Schools Over 5,000 55 6.65(Standard: 9.4) (2.65)
2,500 to 5,000 113 7.43(2.86)
1,000 to 2,500 218 9.24(3.93)
Less than 1,000 302 12.24(7.26)
Private Two-Year Schools 1,000 to 2,500 12 9.76(Standard: 15.8) (5.14)
Less than 1,000 193 25.14(26.75)
Lei
152

122
TABLE 5.1 (Cont'd)
MEAN AND STANDARD DEVIATION FOR SELECTED TYPES OFFACILITIES BY TYPE, CONTROL, AND SIZE OF CAMPUS,
HEGIS V, 1970-71
Study Space, Square Feet per FTE
MeanFTE Enrollment Number of (Standard
Category Institutions Deviation)
Public Universities Over 20,000 22 10.45(Standard: 13.6) (4.50)
10,000 to 20,000 58 9.92(3.7/)
Less than 10,000 48 11.71(5.76)
Private Universities Over 20,000 3 6.57(Standard: 21.1) (3.78)
10,000 to 20,000 10 23.39(11.76)
Less than 10,000 69 21.94(17.38)
Public Four- Year Schools Over 10,000 20 6.31(Standard: 11.2) (3.03)
5,000 to 10,000 72 7.44(3.39)
2,500 to 5,000 94 9.41(4.35)
Less than 2,500 119 13.92(12.70)
. 153
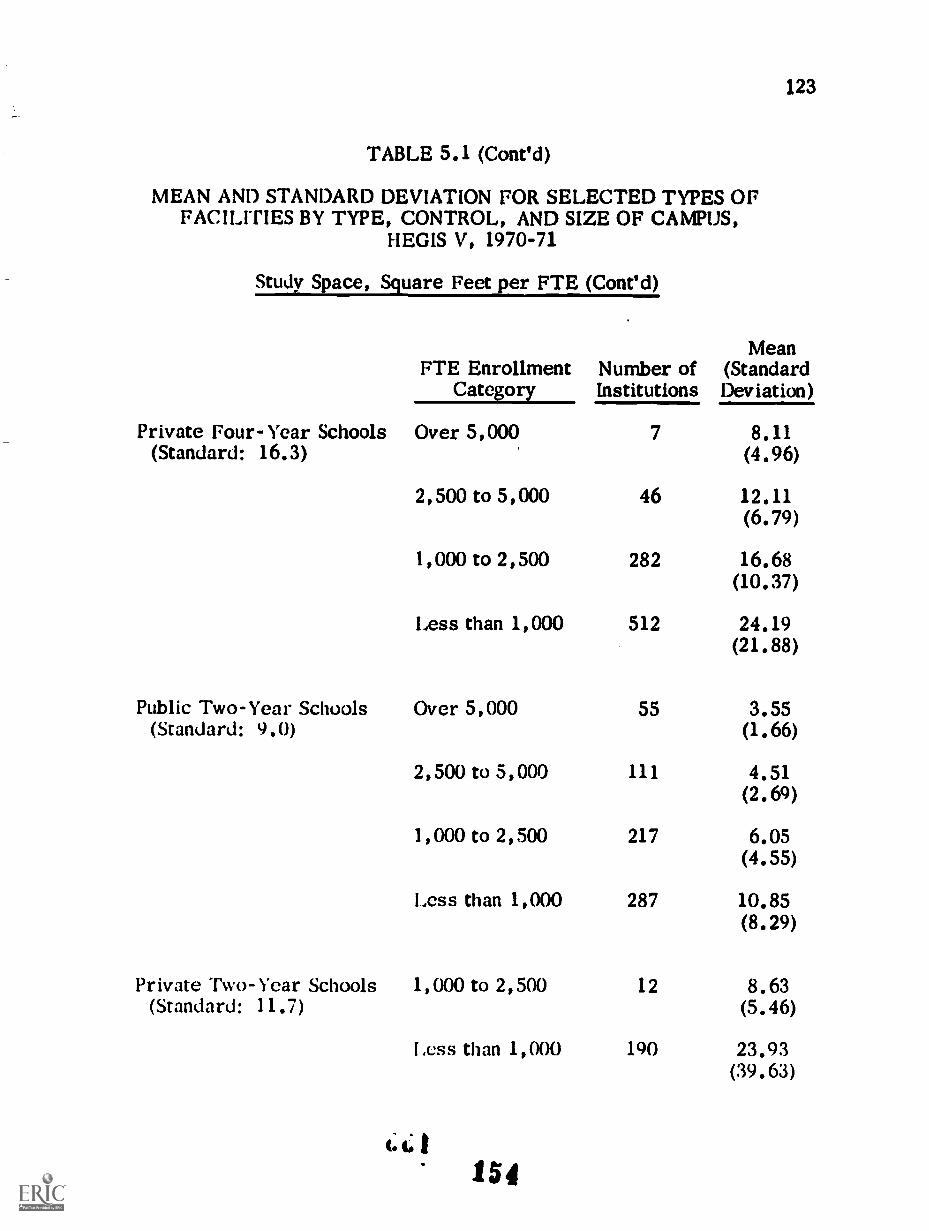
123
TABLE 5.1 (Cont'd)
MEAN AND STANDARD DEVIATION FOR SELECTED TYPES OFFACILITIES BY TYPE, CONTROL, AND SIZE OF CAMPUS,
REGIS V, 1970-71
Study Space, Square Feet per FTE (Cont'd)
FTE EnrollmentCategory
Number ofInstitutions
Mean(StandardDeviation)
Private Four-Year Schools Over 5,000 7 8.11(Standard: 16.3) (4.96)
2,500 to 5,000 46 12.11(6.79)
1,000 to 2,500 282 16.68(10.37)
Less than 1,000 512 24.19(21.88)
Public Two-Year Schools Over 5,000 55 3.55(Standard: 9.0) (1.66)
2,500 to 5,000 111 4.51(2.69)
1,000 to 2,500 217 6.05(4.55)
Less than 1,000 287 10.85(8.29)
Private Two-Year Schools 1,000 to 2,500 12 8.63(Standard: 11.7) (5.46)
Less than 1,000 190 23.93(39.63)

TABLE 5.1 (Cont'd)
MEAN AND STANDARD DEVIATION FOR SELECTED TYPES OFFACILITIES BY TYPE, CONTROL, AND SIZE OF CAMPUS,
HEGIS V, 1970-71
General Use Space, Square Feet per FTE
Public Universities(Standard: 14.9)
Private Universities(Standard: 25.5)
124
MeanFTE Enrollment Number of (Standard
Category Institutions Deviation)
Over 20,000 22 13.22(7.00)
10,000 to 20,000 58 14.24(6.23)
Less than 10,000 48 19.76(10.39)
Over 20,000 3 8.11(3.95)
10,000 to 20,000 10 19.73(10.10)
Less than 10,000 68 32.30(26.94)
Public Four-Year Schools Over 10,000 20 6.45(Standard: 14.6) (5.14) I
5,000 to 10,000 72 14.08(6.03) I
2,500 to 5,000 93 17.76(8.94) 111
Less than 2,500 116 26.35(25.29)
15,5;1

125
TABLE 5.1 (Cont'd)
MEAN AND STANDARD DEVIATION FOR SELECTED TYPES OFFACILITIES BY TYPE, CONTROL, AND SIZE OF CAMPUS,
HEGIS V, 1970-71
General Use Space, Square Feet per FTE (Cont'd)
FTE EnrollmentCategory
Number ofInstitutions
Mean(StandardDeviation)
Private Four-Year Schools Over 5,000 7 13.13(Standard: 37.7) (7.47)
2,500 to 5,000 46 23.34(14.62)
1,000 to 2,500 281 37.67(21.31)
Less than 1,000 512 57.10(60.97)
Public Two-Year Schools Over 5,000 55 5.61(Standard: 7.8) (2.70)
2,500 to 5,000 113 6.97(4.43)
1,000 to 2,500 217 9.08(7.66)
Less than 1,000 282 13.78(12.35)
Private Two - Year Schools 1,000 to 2,500 12 18.66(Standard: 35.2) (15.87)
Less than 1,000 191 62.59(81.07)

TABLE 5.1 (Coned)
MEAN AND STANDARD DEVIATION FOR SELECTED TYPES OFFACILITIES BY TYPE, CONTROL, AND SIZE OF CAMPUS,
REGIS V, 1970-71
Special Use Space, Square Feet per FTE
Public Universities(Standard: 15.2)
Private Universities(Standard: 16.0)
126
MeanFTE Enrollment Number of (Standard
Category Institutions Deviation)
Over 20,000 22 13.75(8.38)
10,000 to 20,000 58 14.89(10.31)
Less than 10,000 47 18.87(13.96)
Over 20,000 3 8.13(7.99)
10,000 to 20, doo 10 11.59(5.57)
Less than 10,000 65 19.83(15.92)
Public Four-Year Schools Over 10,000 20 7.03(Standard: 13.1) (4.54)
5,000 to 10,000 72 13.98(8.59)
2,500 to 5,000 91 14.52(10.06)
Less than 2,500 109 21.03(22.84)
:sr

127
TABLE 5.1 (Cont'd)
MEAN AND STANDARD DEVIATION FOR SELECTED TYPES OFFACILITIES BY TYPE, CONTROL, AND SIZE OF CAMPUS,
IIEGIS V, 1970-71
Special Use Space, Square Feet per FTE (Cont'd)
MeanFTE Enrollment Number of (Standard
Category Institutions Deviation)
Private Four-Year Schools Over 5,000 7 6.28(Standard: 20.6) (2.89)
2,500 to 5,000 46 13.65(10.64)
1,000 to 2,500 277 21.76(15.69)
Less than 1,000 449 27,55(30.56)
Public Two-Year Schools Over 5,000 55 5.78(Standard: 8.7) (2.67)
2,500 to 5,000 110 6.97(4.23)
1,000 to 2,500 190 9.73(8.83)
Less than 1,000 213 20.21(21.78)
Private Two Schools 1,000 to 2,500 9 11.77(Standard: 25.9) (7.18)
Less than 1,000 154 55.65(89.80)
(.1158

121
TABLE 5.1 (Cont'd)
MEAN AND STANDARD DEVIATION FOR SELECTED TYPES OFFACILITIES BY TYPE, CONTROL, AND SIZE OF CAMPUS,
HEMS V, 1970-71
Support Space, Square Feet per FTE
FTE EnrollmentCategory
Number ofInstitutions
Mean(StandardDeviation)
Public Universities Over 20,000 22 13.36(Standard: 12.4) (9.77)
10,000 to 20,000 58 12.18(8.46)
Less than 10,000 47 11.01(5.49)
Private Universities Over 20,000 3 8.61(Standard: 16.1) (5.22)
10,000 to 20,000 10 16.96(14.20)
Less than 10,000 65 19.83(15.92)
Public Four-Year Schools Over 10,000 20 5.55(Standard: 6.4) (3.66)
5,000 to 10,000 72 5.68(4.06)
2,500 to 5,000 94 7.08(5.06)
Less than 2,500 117 10.81(15.57)
15$it41
1
1

129
TABLE 5.1 (Cont'd)
MEAN AND STANDARD DEVIATION FOR SELECTED TYPES OFFACILITIES BY TYPE, CONTROL, AND SIZE OF CAMPUS,
IIEGIS V, 1970-71
Support Space, Square Feet per FTE (Cont'd)
FTE EnrollmentCategory
Number ofInstitutions
Mean(StandardDeviation)
Private Four-Year Schools Over 5,000 7 5.74(Standard: 13.4) (2.41)
2,500 to 5,000 46 7.43(7.11)
1,000 to 2,500 279 14.03(13.76)
Less than 1,000 475 19.53(24.06)
Public Two-Year Schools Over 5,000 55 3.00(Standard: 3.5) (3.E3)
2,500 to 5,000 108 2.62(2.18)
1,000 to 2,500 196 4.69(7.47)
Less than 1,003 217 5.86(9.32)
Private Two-Year Schools 1,000 to 2,500 11 9.03(Standard: 13.5) (6.87)
Less than 1,000 156 30.33(64.53)
tin

130
TABLE 5.1 (Coned)
MEAN AND STANDARD DEVIATION FOR SELECTED TYPES OFFACILITIES BY TYPE, CONTROL, AND SIZE OF CAMPUS,
HEGIS V, 1970-71
Total Non-Residential Space, Square Feet per FTE
FTE EnrollmentCategory
Number ofInstitutions
Mean(StandardDeviation)
Public Universities Over 20,000 22 124.48(Standard: 89.8) (45.87)
10,000 to 20,000 58 114.21(39.15)
Less than 10,000 49 131. '..)5(46.59)
Private Universities Over 20,000 3 73.12(Standard: 117.9) (23.62)
10,000 to 20,000 10 161.40(69.23)
Less than 10,000 69 181.13(129.34)
Public Four-Year &tows 0?cr 10,000 20 59.51(Standard: 71.7) (15.24)
5,000 to 10,000 72 80.03(24.88)
2,500 to 5,000 94 92.56(31.98)
Less th,,a 2,500 122 129.82(104.89)
1
111
III
I1
1
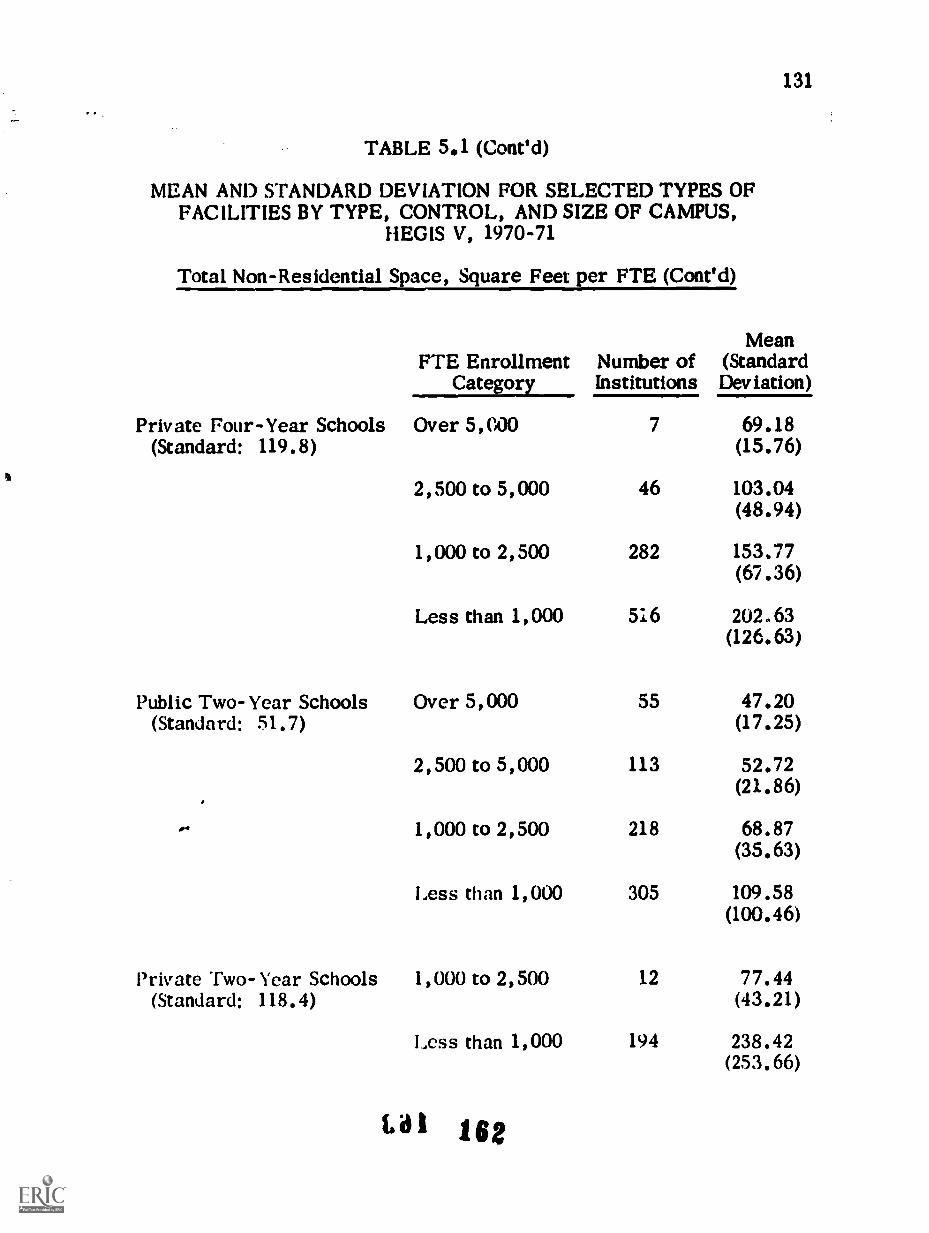
131
TABLE 5.1 (Cont'd)
MEAN AND STANDARD DEVIATION FOR SELECTED TYPES OFFACILITIES BY TYPE, CONTROL, AND SIZE OF CAMPUS,
REGIS V, 1970-71
Total Non-Residential Space, Square Feet per FTE (Cont'd)
MeanFTE Enrollment Number of (Standard
Category Institutions Deviation)
Private Four-Year Schools Over 5,000 7 69.18(Standard: 119.8) (15.76)
2,500 to 5,000 46 103.04(48.94)
1,000 to 2,500 282 153.77(67.36)
Less than 1,000 516 202.63(126.63)
Public Two- Year Schools Over 5,000 55 47.20(Standard: 51.7) (17.25)
2,500 to 5,000 113 52.72(21.86)
1,000 to 2,500 218 68.87(35.63)
Less than 1,000 305 109.58(100.46)
Private Two- Year Schools 1,000 to 2,500 12 77.44(Standard: 118.4) (43.21)
Less than 1,000 194 238.42(253.66)
Lai 112
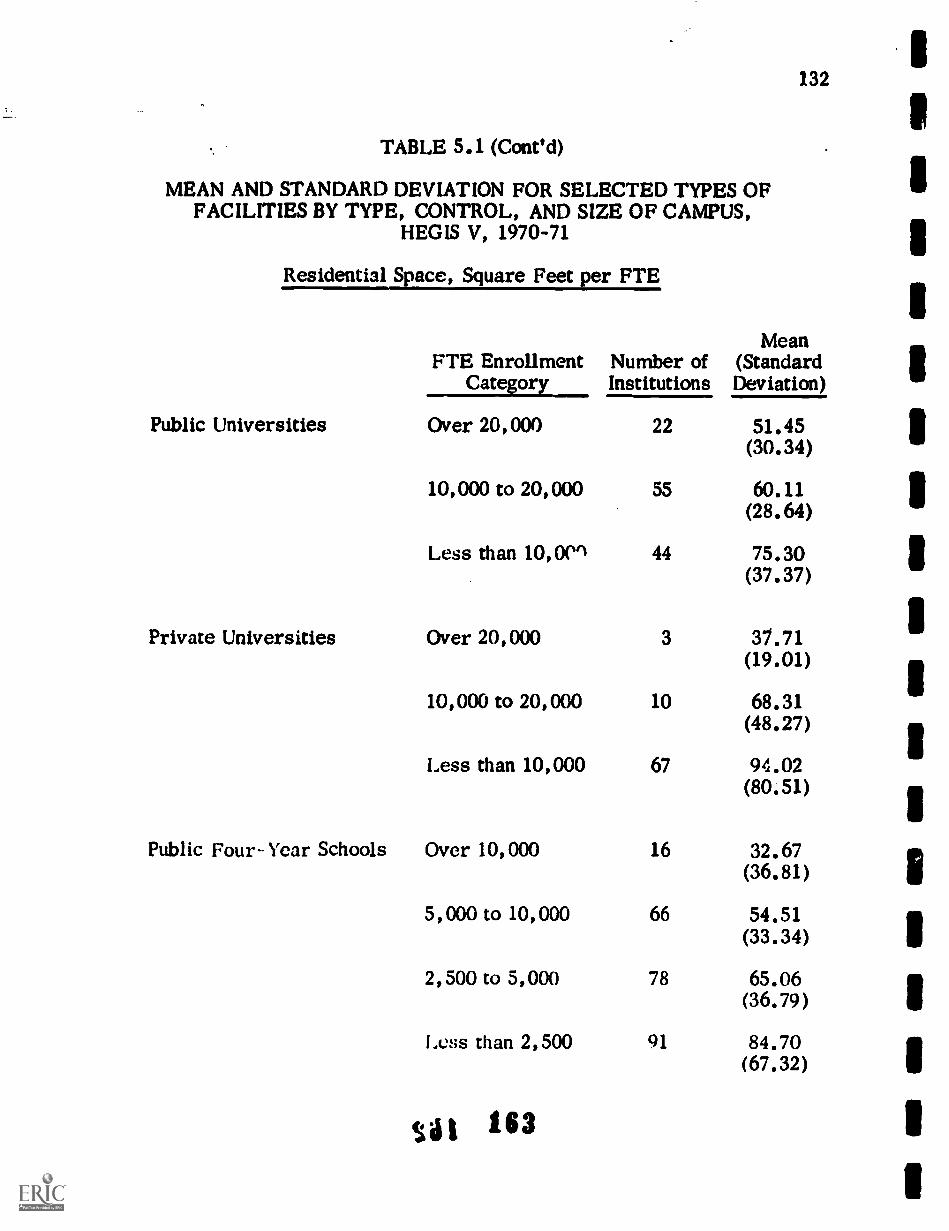
TABLE 5.1 (Coned)
MEAN AND STANDARD DEVIATION FOR SELECTED TYPES OFFACILITIES BY TYPE, CONTROL, AND SIZE OF CAMPUS,
HEMS V, 1970-71
Residential Space, Square Feet per FTE
Public Universities
Private Universities
132
MeanFTE Enrollment Number of (Standard
Category Institutions Deviation)
Over 20,000 22 51.45(30.34)
10,000 to 20,000 55 60.11(28.64)
Less than 10,0en 44 75.30(37.37)
Over 20,000 3 37.71(19.01)
10,000 to 20,000 10 68.31(48.27)
Less than 10,000 67 94.02(80.51)
1
Public Four- Year Schools Over 10,000 16 32.67(36.81) I
5,000 to 10,000 66 54.51(33.34) I
2,500 to 5,000 78 65.06(36.79) I
f.ess than 2,500 91 84.70(67.32) 1
Sit 163 1

133
TABLE 5.1 (Cont'd)
MEAN AND STANDARD DEVIATION FOR SELECTED TYPES OFFACILITIES BY TYPE, CONTROL, AND SIZE OF CAMPUS,
HEGIS V, 1970-71
Residential Space, Square Feet per FTE
FTE EnrollmentCategory
Number ofInstitutions
Mean(StandardDeviation)
Private Four-Year Schools Over 5,000 7 43.82(17.19)
2,500 to 5,000 43 67.20(47.75)
1,000 to 2,500 271 108.43(60.92)
Less than 1,000 465 140.32(92.35)
Public Two-Year Schools Over 5,000 4 1:32(0.95)
2,500 to 5,000 12 14.93(20.91)
1,000 to 2,500 64 27.91(32.28)
Less than 1,000 78 61.79(88.89)
Private Two-Year Schools 1,000 to 2,500 10 81.77(76.75)
Less than 1,000 162 168.99(147.74)

134
TABLE 5.1 (Cont'd)
MEAN AND STANDARD DEVIATION FOR SELECTED TYPES OFFACILITIES BY TYPE, CONTROL, AND SIZE OF CAMPUS,
HEGIS V, 1970-71
Medical Care Space, Square Feet per FTE
FTE EnrollmentCategory
Number ofInstitutions
Mean(StandardDeviation)
Public Universities Over 20,000 12 3.88(3.89)
10,000 to 20,000 20 1.12(1.59)
Less than 10,000 12 1.38(2.08)
Private Universities 10,000 to 20,000 7 2.15(1.21)
Less than 10,000 10 1.78(1.98)
Public Four-Year Schools 5,000 to 10,000 9 0.10(0.10)
2,500 to 5,000 11 0.47(0.37)
Less than 2,500 8 1.48
(2.78)
OM
II1
IIIIIIIIIIIIIIII

135
TABLE 5.1 (Cont'd)
MEAN AND STANDARD DEVIATION FOR SELECTED TYPES OFFACILITIES BY TYPE, CONTROL, AND SIZE OF CAMPUS,
IIEGIS V, 1970-71
Medical Care Space, Square Feet per FTE ( Cont'd)
MeanFTE Enrollment Number of (Standard
Category Institutions Deviation)
Private Four- \ ear Schools Over 5,000 3 1.64(2.07)
2,500 to 5,000 4 0.58(0.50)
1,000 to 2,500 25 1.58(1.84)
Less than 1,000 42 1.66(1.42)
Public Two- Year Schools 2,500 to 5,000 6 0.47(0.32)
1,000 to 2,500 5 0.31(0.17)
Less than 1,000 7 1.86(1.43)
Private Two - Year Schools Less than 1,000 7 2.81(1.67)

136
TABLE 5.1 (Cont'd)
MEAN AND STANDARD DEVIATION FOR SELECTED TYPES OFFACILITIES BY TYPE, CONTROL, AND SIZE OF CAMPUS
HEGIS V, 1970-71
Laboratory Research Space, Square Feet per FTE
FTE EnrollmentCategory
Number ofInstitutions
Mean(StandardDeviation)
Public Universities Over 20,000 22 19.05(12.51)
10,000 to 20,000 58 11.90(11.06)
Less than 10,000 48 12.53(12.35)
Private Universities Over 20,000 3 5.41(0.48)
10,000 to 20,000 10 23.98(16.77)
Less than 10,000 62 21.38(63.66)
Public Four-Year Schools Over 10,000 20 1.13(0.79)
5,000 to 10,000 63 1.21(1.29)
2,500 to 5,000 74 1.41(0.16)
Less than 2,500 69 3.71(17.47)
1
k

137
TABLE 5.1 (Cont'd)
MEAN AND STANDARD DEVIATION FOR SELECTED TYPES OFFACILITIES BY TYPE, CONTROL, AND SIZE OF CAMPUS,
FIEGIS V, 1970-71
Laboratory Research Space, Square Feet per FTE (Cont'd)
FTE EnrollmentCategory
Number ofInstitiIions
Mean(StandardDeviation)
Private Four-Year Schools Over 5,000 7 0.53(0.30)
2,500 to 5,000 37 2.18(2.14)
1,000 to 2,500 191 2.12(2.93)
Less than 1,000 182 3.01(9.49)
Public Two- Year Schools Over 5,000 9 0.14(0.13)
2,500 to 5,000 29 0.16(0.20)
1,000 to 2,500 37 0.64(1.13)
Less than 1,000 27 1.47(1.73)
Private Two-Year Schools Less than 1,000 18 3.40(6.13)
Source: Special tabulations from IIEG!S V.

TABLE 5.2
CLASS PLUS LAB* SPACE PER FTE STUDENT, WITH LAB* SPACEREDUCED TO 11 PER CENT EFFICIENCY
(Square Feet per FTE Student)
MeanPublic Universities
Less than 10,000 15.7110,000 to 2G, 000 12.32Over 20,000 10.98
Private UniversitiesLess than 10,00010,000 to 20,000
21.2416.16
Public Other Four-Year SchoolsLess than 2,500 19.742,500 to 5,000 15.895,000 to 10,000 12.65Over 10,000 9.97
Private Other Four-Year SchoolsLess than 1,000 30.071,000 to 2,500 23.372,500 to 1,000 16.16Over 5,000 13.68
Public Two-Year SchoolsLess than 1,0001,000 to 2,5002,500 to 5,000Over 5,000
Private Two-Year SchoolsLess than 1,0001,000 to 2,500
''Excluding labs used for research only.
Source: See text, p. 96.
23.0515.4511.3410.20
31.0815.60
138

TABLE 5.3
RATIO OF HIGH TO LOW QUARTILE OF SPACE PER FT OR FTESTUDENT FOR SCHOOLS RANKED ON AVAILABLE SPACE,
BY TYPE, CONTROL, AND SIZE OF INSTITUTION
A. Class Space per FT Student
Ratio Type of Institution
Less than 2 Public Universities
Enrollment
Less than 10,00010,000 to 20,000Over 20,000
Private Universities 10,000 to 20,000
Public Four-Year Schools
ft It
Private Four-Year Schools
It
Public Two-Year SchoolsIt
Private Two-Year Schools
Public Technical Schools
Private Technical Schools
Public Institutions withMedical Facilities
Private Institutions withMedical Facilities
Public Medical Schools
Private Medical Schools
Vain
2,500 to 5,0005,000 to 10,00010,000 to 20,000
Less than 1,0001,000 to 2,5002,500 to 5,000
2,500 to 5,000Over 5,000
1,000 to 2,500
1,000 to 2,500
2,500 to 5,000
Over 5.000
Over 5,000
Less than 1,000
Less than 1,000
139
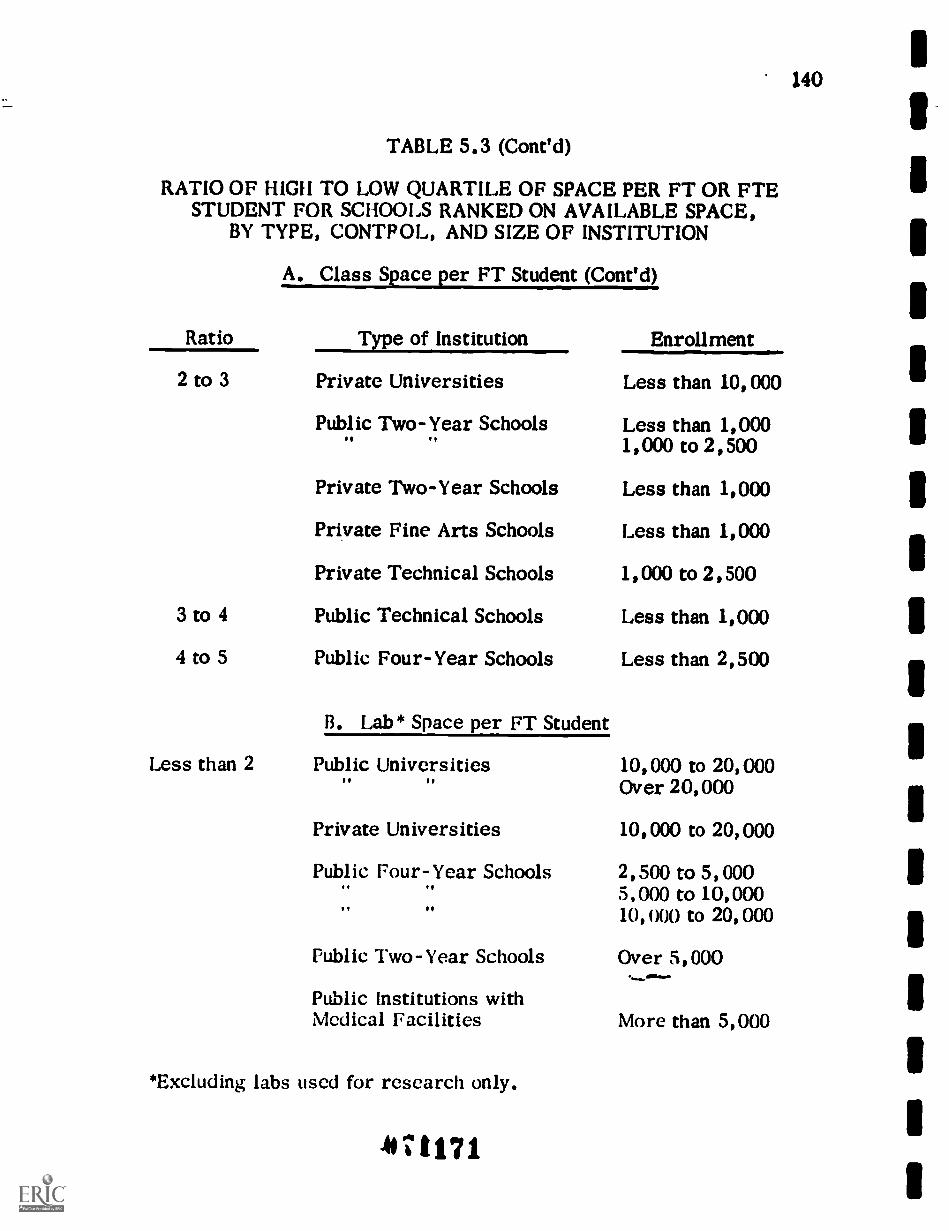
TABLE 5.3 (Cont'd)
RATIO OF HIGH TO LOW QUARTILE OF SPACE PER FT OR FTESTUDENT FOR SCHOOLS RANKED ON AVAILABLE SPACE,
BY TYPE, CONTROL, AND SIZE OF INSTITUTION
Ratio
2 to 3
3 to 4
4 to 5
Less than 2
A. Class Space per FT Student (Cont'd)
Type of Institution
Private Universities
Public Two-Year Schools
Private Two-Year Schools
Private Fine Arts Schools
Private Technical Schools
Public Technical Schools
Public Four-Year Schools
B. Lab* Space per FT Student
Public Universities
Private Universities
Public Four-Year Schools
Public Two-Year Schools
Public Institutions withMedical Facilities
*Excluding labs used for research only.
4171171
Enrollment
Less than 10,000
Less than 1,0001,000 to 2,500
Less than 1,000
Less than 1,000
1,000 to 2,500
Less than 1,000
Less than 2,500
10,000 to 20,000Over 20,000
10,000 to 20,000
2,500 to 5,0005,000 to 10,00010,0(X) to 20,000
Over 5,000
More than 5,000
140

TABLE 5.3 (Cont'd)
RATIO OF HIGH TO LOW QUARTILE OF SPACE PER FT OR FTESTUDENT FOR SCHOOLS RANKED ON AVAILABLE SPACE,
BY TYPE, CONTROL, AND SIZE OF INSTI'T'UTION
Ratio
2 to 3
3 to 4
4 to 5
More than 5
B. Lab * Space per FT Student (Cont'd)
Type of Institution
Public Universities
Private Universities
Public Four- Year Schools
Private Four-Year Schools
Private Two-Year Schools
Private Technical Schools
Private Medical Schools
Private Four-Year Schools
Public Two-Year Schools
Private Two- Year Schools
Private Technical Schools
Public Medical Schools
Public Two - Year Schools
Private Fine Arts Schools
Public Technical Schools
Private Technical Schools
*Excluding labs used for research only.vt
172
Enrollment
Less than 10,000
Less than 10,000
Less than 2,500
1,000 to 2,500
1,000 to 2,500
2,500 to 5,000
Less than 1,000
Less than 1,0002,500 to 5,900
Less than 1,0002,500 to 5,000
Less than 1,000
1,000 to 2,500
Less than 1,000
1,000 to 2,500
Less than 1,000
Less than 1,0001,000 to 2,500
Less than 1,000
141

TABLE 5.3 (Coned)
RATIO OP HIGII TO LOW QUARTILE OF SPACE PER FT OR FTESTUDENT FOR SCHOOLS RANKED ON AVAILABLE SPACE,
BY TYPE, CONTROL, AND SIZE OF INSTITUTION
Ratio
Less than 2
2 to 3
3 to 4
C. Study Space per FTE Student
Type of Institution
Public Universitiesf1 If
Public Four- Year Schools
Public Two-Year Schools
Public Technical Schools
Public Universities
Public Four-Year Schools
f1
Private Four -Year Schools
f1
Public Two-Year Schools
Public institutions withMedical Facilities
Private Universities
Public Two - Year. Schools
Private Two-Year Schools
Private Firic Arts Schools
. 173Lit
Enrollment
Less than 10,00010,000 to 20,000
5,000 to 10,000
Over 5,000
2,500 to 5,000
Over 20,000
Less than 2,5002,500 to 5,00010,000 to 20,000
Less than 1,0001,000 to 2,5002,500 to 5,000
Less than 1,0002,500 to 5,000
More than 5,000
10,000 to 20,000
1,000 to 2, 500
Less than 1,0001,000 to 2 , 500
I .es s than 1,000
142

TABLE 5.3 ( Cont'd)
RATIO OF H IGI I TO LOW QUARTILE OF SPACE PER FT OR FTESTUDENT FOR SCHOOLS RANKED ON AVAILABLE SPACE,
BY TYPE, CONTROL, AND SIZE OF INSTITUTION
Ratio
3 to 4
4 to 5
More than 5
C. Study Space per FTE Student (Cont'd)
Type of Institution
Public Technical Schools
Private Technical Schools
Private Universities
Public Technical Schools
Private Medical Schools
Private Technical Schools
Private Institutions withMedical Facilities
Public Medical Schools
D. Total Non-Residential Space
Enrollment
1,000 to 2,500
2,500 to 5,000
Less than 10,000
Less than 1,000
Less than 1,000
Less than 1,0001,000 to 2,500
More than 5,000
Less than 1,000
er FTE Student
Less than 2 Public Universities11
11
Private Universities
Public Four-Year Schools
ov
11
Less than 10,00010,000 to 20,000Over 20,000
Less than 10,00010,000 to 20,000
Less than 2,5002,500 to 5,0005,000 to 10,00010,000 to 20,000
143

TABLE 5.3 ( Cont'd)
RATIO OF HIGH TO LOW QUARTILE OF SPACE PER FT OR FTESTUDENT FOR SCHOOLS RANKED ON AVAILABLE SPACE,
BY TYPE, CONTROL, AND SIZE OF INSTITUTION
D. Total Non-Residential Space per FTE Student (Cont'd)
Ratio Type of Institution
Less than 2 Private Four-Year Schools
2 to 3
Enrollment
Less than 1,0001,000 to 2,5002,500 to 5,000
Public Two-Year Schools 2,500 to 5,000
Public Two-Year Schools
Private Two -Year Schools19
Public Institutions withMedical Facilities
Public Technical Schools
3 to 4 Public Technical Schools
4 to 5 Private Technical Schools
More than 5
Private Institutions withMedical Facilities
Private Fine Arts Schools
Public Technical Schools
Private Technical Schools
Public Medical Schools
Private Medical Schools
Over 5,000
Less than 1,0001,000 to 2,500
Less than 1,0001,000 to 2,500
More than 5,000
2,500 to 5,000
1,000 to 2,500
2,500 to 5,000
More than 5,000
Less than 1,000
Less than 1,000
Less than 1,0001,000 to 2,500
I,css than 1,000
Less than 1,000
144

TABLE 5.3 (Cont'd)
RATIO OF I UGH TO LOW QUARTILE OF SPACE PER FT OR FTESTUDENT FOR SCHOOLS RANKED ON AVAILABLE SPACE,
BY TYPE, CONTROL, AND SIZE OF INSTITUTION
E. Office Space per Professional FTE
Ratio
Less than 2
2 to 3
3 to 4
4 to 5
Source: IIEGIS V
Type of Institution
Public Four- Year Schools
Public Universities
Public Four- Year Schools
Private Four- Year Schools
Public Two-Year Schools
Private Universities
Public Four-Year Schools
Private Four- Year Schools
Public Two- Year Schools
Private Universities
Public Two-Year Schools
Private Two-Year Schools$.
Enrollment
10,000 to 20,000
Less than 10,00010,000 to 20,000Over 20,000
2,500 to 5,0005,000 to 10,000
1,000 to 2,500
2,500 to 5,000Over 5,000
10,000 to 20,000
Less than 2,500
Less than 1,0002,500 to 5,000
Less than 1,000
Less than 10,000
1,000 to 2,500
Less than 1,0001,000 to 2,500
145

b's
TA
BL
E 5
.4
SHO
RT
AG
E A
ND
AD
EQ
UA
CY
OF
SPA
CE
WIT
HIN
QU
AR
TIL
ES
BY
TY
PE, C
ON
TR
OL
, AN
D S
IZE
OF
INST
ITU
TIO
N
Publ
ic U
nive
rsiti
es
Firs
tSe
cond
Thi
rdFo
urth
Enr
ollm
ent
Spac
eQ
uart
ileQ
uart
ileQ
uart
ileQ
uart
ileL
ess
than
10,
000
Cla
ssSo
me
Shor
tage
Som
e Sh
orta
geN
o Sh
orta
geN
o Sh
orta
geL
ab*
Som
e Sh
orta
geN
o Sh
orta
geN
o Sh
orta
geN
o Sh
orta
geO
ffic
eSo
me
Shor
tage
No
Shor
tage
No
Shor
tage
No
Shor
tage
Stud
ySh
orta
geSh
orta
geSh
orta
geSo
me
Shor
tage
sei
Tot
al N
on-R
esid
entia
lSh
orta
geN
o Sh
orta
geN
o Sh
orta
geN
o Sh
orta
geA 10
,000
to 2
0,00
0C
lass
Som
e Sh
orta
geSo
me
Shor
tage
Som
e Sh
orta
geN
o Sh
orta
geL
ab*
No
Shor
tage
No
Shor
tage
No
Shor
tage
No
Shor
tage
Off
ice
Som
e Sh
orta
geN
o Sh
orta
geSo
me
Shor
tage
No
Shor
tage
Stud
ySh
orta
geSh
orta
geSh
orta
geSh
orta
geT
otal
Non
-Res
iden
tial
Shor
tage
Shor
tage
Shor
tage
Shor
tage
Ove
r 20
,000
Cla
ssSh
orta
geSo
me
Shor
tage
Som
e Sh
orta
geSo
me
Shor
tage
Lab
*N
o Sh
orta
geN
o Sh
orta
geN
o Sh
orta
geN
o Sh
orta
geO
ffic
eSo
me
Shor
tage
No
Shor
tage
No
Shor
tage
No
Shor
tage
Stud
y*
***
* *
* *
Tot
al N
on-R
esid
entia
l*
**
**
**
*
* E
xclu
ding
labs
use
d fo
r re
sear
ch o
nly.
** I
nsuf
fici
ent n
umbe
r of
sch
ools
in q
uart
ile.

TA
BL
E 5
.4 (
Con
ed)
SHO
RT
AG
E A
ND
AD
EQ
UA
CY
OF
SPA
CE
WIT
HIN
QU
AR
TIL
ES
BY
TY
PE, C
ON
TR
OL
, AN
D S
IZE
OF
INST
ITU
TIO
N
Priv
ate
Uni
vers
ities
Firs
tSe
cond
Thi
rdFo
urth
Enr
ollm
ent
Spac
eQ
uart
ileQ
uart
ileQ
uart
ileQ
uart
ile
Les
s th
an 1
0,00
0C
lass
No
Shor
tage
No
Shor
tage
No
Shor
tage
Som
e Sh
orta
geL
ab*
Som
e Sh
orta
geN
o Sh
orta
geN
o Sh
orta
geN
o Sh
orta
geO
ffic
eSo
me
Shor
tage
Som
e Sh
orta
geSo
me
Shor
tage
No
Shor
tage
Stud
ySh
orta
geSh
orta
geSo
me
Shor
tage
Som
e Sh
orta
geT
otal
Non
-Res
iden
tial
Shor
tage
Som
e Sh
orta
geN
o Sh
orta
geN
o Sh
orta
ge
10,0
00 to
20,
000
Cla
ssSo
iae
Shor
tage
No
Shor
tage
No
Shor
tage
No
Shor
tage
Lab
'"So
me
Shor
tage
No
Shor
tage
No
Shor
tage
No
Shor
tage
Off
ice
Shor
tage
Som
e Sh
orta
geN
o Sh
orta
geSo
me
Shor
tage
Stud
ySe
vere
Sho
rtag
eSe
vere
Sho
rtag
eSo
me
Shor
tage
Som
e Sh
orta
geT
otal
Non
- R
esid
entia
lSe
vere
Sho
rtag
eSo
me
Shor
tage
No
Shor
tage
No
Shor
tage
* E
xclu
ding
labs
use
d fo
r re
sear
ch o
nly.

TA
BL
E 5
.4 (
Con
ed)
SHO
RT
AG
E A
ND
AD
EQ
UA
CY
OF
SPA
CE
WIT
HIN
QU
AR
TIL
ES
BY
TY
PE, C
ON
TR
OL
, AN
D S
IZE
OF
INST
ITU
TIO
N
Publ
ic F
our-
Yea
r Sc
hool
s
Enr
ollm
ent
Spac
eFi
rst
Qua
rtile
Seco
ndQ
uart
ileT
hird
Qua
rtile
Four
thQ
uart
ile
Som
e Sh
orta
geN
o Sh
orta
geL
ess
than
2,5
00C
lass
Lab
*So
me
Shor
tage
Som
e Sh
orat
reN
o Sh
orta
geN
o Sh
orta
geN
o Sh
orta
geN
o Sh
orta
geO
ffic
eSh
orta
geSo
me
Shor
tage
Som
e Sh
orta
geN
o Sh
orta
geSt
udy
Shor
tage
Som
e Sh
orta
geSo
me
Shor
tage
Som
e Sh
orta
geT
otal
Non
-Res
iden
tial
Shor
tage
No
Shor
tage
No
Shor
tage
No
Shor
tage
2,50
0 to
5,0
00C
lass
Lab
*So
me
Shor
tage
Som
e Sh
orta
geSo
me
Shor
tage
No
Shor
tage
No
Shor
tage
No
Shor
tage
No
Shor
tage
No
Shor
tage
Off
ice
Shor
tage
Som
e Sh
orta
geN
o Sh
orta
geN
o Sh
orta
geSt
udy
Shor
tage
Shor
tage
Shor
tage
Som
e Sh
orta
geT
otal
Non
-Res
iden
tial
Shor
tage
No
Shor
tage
No
Shor
tage
No
Shor
tage
5,00
0 to
10,
000
Cla
ssL
ab*
Shor
tage
Som
e Sh
orta
geSo
me
Shor
tage
No
Shor
tage
Som
e Sh
orta
geN
o Sh
orta
geN
o Sh
orta
geN
o Sh
orta
geO
ffic
eSh
orta
geSo
me
Shor
tage
No
Shor
tage
No
Shor
tage
Stud
ySh
orta
geSh
orta
geSh
orta
geSh
orta
geT
otal
Non
-Res
iden
tial
Shor
tage
Som
e Sh
orta
geN
o Sh
orta
geN
o Sh
orta
ge

Enr
ollm
ent
TA
BL
E 5
.4 (
Con
t'd)
SHO
RT
AG
E A
ND
AD
EQ
UA
CY
OF
SPA
CE
WIT
HIN
QU
AR
TIL
ES
BY
TY
PE, C
ON
TR
OL
, AN
D S
IZE
OF
INST
ITU
TIO
N
Publ
ic F
our-
Yea
r Sc
hool
s (C
ont'd
)
Spac
e
10,0
00 to
20,
000
Cla
ssL
ab*
Off
ice
Stud
yT
otal
Non
-Res
iden
tial
gap
1116
OD
41)
** I
nsuf
fici
ent
num
ber
of s
choo
ls in
qua
rtile
.*
Exc
ludi
ng la
bs u
sed
for
rese
arch
onl
y.
Firs
tQ
uart
ile
Seve
re S
hort
age
No
Shor
tage
Shor
tage
** ;:*
Seco
ndQ
uart
ile
Shor
tage
Som
e Sh
orta
geSo
me
Shor
tage
** **
Thi
rdQ
uart
ile
Som
e Sh
orta
geN
o Sh
orta
geSo
me
Shor
tage
** **
Four
thQ
uart
ile
Som
e Sh
orta
geN
o Sh
orta
geN
o Sh
orta
ge**
No
Shor
tage

TA
BL
E 5
.4 (
Con
ed)
SIIO
RT
AG
E A
ND
AD
EQ
UA
CY
OF
SPA
CE
WIT
HIN
QU
AR
TIL
ES
BY
TY
PE, C
ON
TR
OL
, AN
D S
IZE
OF
INST
ITU
TIO
N
Priv
ate
Four
-Yea
r Sc
hool
s
Enr
ollm
ent
Spac
eFi
rst
Qua
rtile
Seco
ndQ
uart
ileT
hird
Qua
rtile
Four
thQ
uart
ileL
ess
than
1,0
00C
lass
Som
e Sh
orta
geN
o Sh
orta
geN
o Sh
orta
geN
. Sho
rtag
eL
ab*
Som
e Sh
orta
geN
o Sh
orta
geN
o Sh
orta
geN
o Sh
orta
geO
ffic
eSh
orta
geSo
me
Shor
tage
Som
e Sh
orta
geN
o Sh
orta
geSt
udy
Shor
tage
Som
e Sh
orta
geSo
me
Shor
tage
Som
e Sh
orta
geT
otal
Non
-Res
iden
tial
Shor
tage
No
Shor
tage
No
Shor
tage
No
Shor
tage
1,00
0 to
2,5
00C
lass
No
Shor
tage
No
Shor
tage
No
Shor
tage
No
Shor
tage
Lab
*So
me
Shor
tage
No
Shor
tage
No
Shor
tage
No
Shor
tage
Off
ice
Som
e Sh
orta
geSo
me
Shor
tage
No
Shor
tage
No
Shor
tage
Stud
ySh
orta
geSh
orta
geSo
me
Shor
tage
Som
e Sh
orta
geT
otal
Non
-Res
iden
tial
Shor
tage
No
Shor
tage
No
Shor
tage
No
Shor
tage
2,5C
0 to
5,0
00C
lass
Som
e Sh
orta
geN
o Sh
orta
geN
o Sh
orta
geN
o Sh
orta
geL
ab*
Som
e Sh
orta
geSo
me
Shor
tage
No
Shor
tage
No
Shor
tage
Off
ice
Shor
tage
Som
e Sh
orta
geSo
me
Shor
tage
No
Shor
tage
Stud
ySe
vere
Sho
rtag
eSh
orta
geSh
orta
geSo
me
Shor
tage
Tot
al N
on-R
esid
entia
lSe
vere
Sho
rtag
eSe
vere
Sho
rtag
eSh
orta
geN
o Sh
orta
ge
* E
xclu
ding
labs
use
d fo
r re
sear
ch o
nly.

0 ig
TA
BL
E 5
.4 (
Con
ed)
SHO
RT
AG
E A
ND
AD
EQ
UA
CY
OF
SPA
CE
WIT
HIN
QU
AR
TIL
ES
BY
TY
PE, C
ON
TR
OL
, AN
D S
IZE
OF
INST
ITU
TIO
N
Publ
ic T
wo-
Yea
r Sc
hool
s
Enr
ollm
ent
Spac
eFi
rst
Qua
rtile
Seco
ndQ
uart
ileT
hird
Qua
rtile
Four
thQ
uart
ile
Les
s th
an 1
,000
Cla
ssSo
me
Shor
tage
No
Shor
tage
No
Shor
tage
Som
e Sh
orta
geL
ab*
Som
e Sh
orta
geN
o Sh
orta
geN
o Sh
orta
geN
o Sh
orta
geO
ffic
eSh
orta
geSh
orta
geSo
me
Shor
tage
Som
e Sh
orta
geSt
udy
Shor
tage
Shor
tage
Som
e Sh
orta
geSo
me
Shor
tage
Tot
al N
on R
esid
entia
lSh
orta
geN
o Sh
orta
geN
o Sh
orta
geN
o Sh
orta
ge
1,00
0 to
2,5
00C
lass
Shor
tage
Som
e Sh
orta
geSo
me
Shor
tage
Som
e Sh
orta
geL
ab*
Som
e Sh
orta
geN
o Sh
orta
geN
o Sh
orta
geN
o Sh
orta
geO
ffic
eSh
orta
geSh
orta
geSh
orta
geSo
me
Shor
tage
Stud
ySe
vere
Sho
rtag
eSh
orta
geSh
orta
geSo
me
Shor
tage
Tot
al N
on-R
esid
entia
lSe
vere
Sho
rtag
eSo
me
Shor
tage
No
Shor
tage
No
Shor
tage
2,50
0 to
5,0
00C
lass
Shor
tage
Som
e Sh
orta
geSo
me
Shor
tage
No
Shor
tage
.'L
ab*
Som
e Sh
orta
geN
o Sh
orta
geN
o Sh
orta
geN
o Sh
orta
geO
ffic
eSh
orta
geSh
orta
geSh
orta
geSh
orta
geSt
udy
Seve
re S
hort
age
Shor
tage
Shor
tage
Shor
tage
Tot
al N
on-R
esid
entia
lSe
vere
Sho
rtag
eSh
orta
geN
o Sh
orta
geN
o Sh
orta
ge
CA
se"

Enr
ollm
ent
Ove
r 5,
000
TA
BL
E 5
.4 (
Con
t'd)
SHO
RT
AG
E A
ND
AD
EQ
UA
CY
OF
SPA
CE
WIT
HIN
QU
AR
TIL
ES
BY
TY
PE, C
ON
TR
OL
, AN
D S
IZE
OF
INST
ITU
TIO
N
Publ
ic T
wo-
Yea
r Sc
hool
s (C
ont'd
)
Spac
e
Cla
ssL
ab*
Off
ice
Stud
yT
otal
Non
-Res
iden
tial
* E
xclu
ding
labs
use
d fo
r re
sear
ch o
nly.
1111
111
Firs
tSe
cond
Thi
rdFo
urth
Qua
rtile
Qua
rtile
Qua
rtile
Qua
rtile
'
Som
e Sh
orta
geSh
orta
geSh
orta
geN
o Sh
orta
geN
o Sh
orta
geN
o Sh
orta
geN
o Sh
orta
geN
o Sh
orta
geSh
orta
geSh
orta
geSh
orta
geSo
me
Shor
tage
Seve
re S
hort
age
Seve
re S
hort
age
Seve
re S
hort
age
Shor
tage
Seve
re S
hort
age
Seve
re S
hort
age
Shor
tage
Som
e Sh
orta
ge
1111
i r11
1111
1111
11M
B In
In O
r O
M

Enr
ollm
ent
TA
BL
E 5
,4 (
Con
ed)
SHO
RT
AG
E A
ND
AD
EQ
UA
CY
OF
SPA
CE
WIT
HIN
QU
AR
TIL
ES
BY
TY
PE, C
ON
TR
OL
, AN
D S
IZE
OF
INST
ITU
TIO
N
Spac
e
Les
s th
an 1
,000
Cla
ss!J
ab*
Off
ice
Stud
yT
otal
Non
- R
esid
entia
l
1, 0
00 to
2,5
00C
lass
Lab
*O
ffic
eSt
udy
Tot
al N
on-R
esid
entia
l
*E
xclu
ding
labs
use
d fo
r re
sear
ch o
nly.
Priv
ate
Tw
o- Y
ear
Scho
ols
Firs
tQ
uart
ile
No
Shor
tage
Som
e Sh
orta
geSh
orta
geSh
orta
geSh
orta
ge
Som
e Sh
orta
geSh
orta
geSh
orta
geSe
vere
Sho
rtag
eSe
vere
Sho
rtag
e
Seco
ndQ
uart
ile
No
Shor
tage
Som
e Sh
orta
geSo
me
Shor
tage
Som
e Sh
orta
geSo
me
Shor
tage
No
Shor
tage
Shor
tage
Seve
re S
hort
age
Seve
re S
hort
age
Seve
re S
hort
age
Thi
rdQ
uart
ile
No
Shor
tage
No
Shor
tage
Som
e Sh
orta
geSo
me
Shor
tage
No
Shor
tage
Som
e Sh
orta
geSo
me
Shor
tage
Shor
tage
No
Shor
tage
Shor
tage
Four
thQ
uart
ile
No
Shor
tage
No
Shor
tage
Som
e Sh
orta
geSo
me
Shor
tage
No
Shor
tage
I
No
Shor
tage
No
Shor
tage
No
Shor
tage
Som
e Sh
orta
geSo
me
Shor
tage

TA
BL
E 5
.4 (
Con
ed)
SI I
OR
TA
GE
S A
ND
AD
EQ
UA
CIE
S O
F SP
AC
E W
ITH
IN Q
UA
RT
ILE
SB
Y T
YPE
, CO
NT
RO
L, A
ND
SIZ
E O
F IN
STIT
UT
ION
If th
e qu
artil
e m
ean
less
onc
.. st
anda
rd d
evia
tion
is g
reat
er th
an th
e st
anda
rd:
No
shor
tage
.
If th
e qu
artil
e m
ean
less
one
sta
ndar
d de
viat
ion
is le
ss th
an th
e st
anda
rd:
Som
e sh
orta
ge.
If th
e qu
artil
e m
ean
is le
ss th
an th
e st
anda
rd, b
ut th
e qu
artil
em
ean
Shor
tage
(at
leas
t one
-hal
fpl
us th
ree
stan
dard
dev
iatio
ns is
gre
ater
than
the
stan
dard
:of
sch
ools
bel
ow m
ean)
If th
e qu
artil
e m
ean
plus
thre
e st
anda
rd d
evia
tions
is le
ss th
an th
e st
anda
rd:
Seve
re s
hort
age
(ail
scho
ols
belo
w m
ean)
fte 00N
ote:
The
sta
ndar
ds a
re r
epro
duce
d in
Tab
le 5
.1.
tJt
to CP
rs
MI
OS
1111
1so
or
NE
we
sr a
m m
ilN
M S
A O
M S
S 1
1111
WA
N

TA
BL
E 5
.5
RE
SID
EN
TIA
L S
PAC
E P
ER
FT
E S
TU
DE
NT
EN
RO
LL
ED
, FA
LL
197
0
*07
Sib
GO
Cen
tral
City
Oth
er M
etro
polit
on A
rea
Non
-Met
ropo
litqr
. Are
a
Tot
al
Ilni
vers
ities
Oth
er F
our-
Yea
rSc
hool
sT
wo-
Yea
r Sc
hool
sPu
blic
Priv
ate
Publ
icPr
ivat
ePu
blic
Priv
ate
59 63 78 59
77 109
161 83
29 55 77 55
89 127
134
114
5 0 4 46 16
96 180
203
160
Sour
ce: R
EG
IS V
, Spe
cial
Ana
lysi
s.
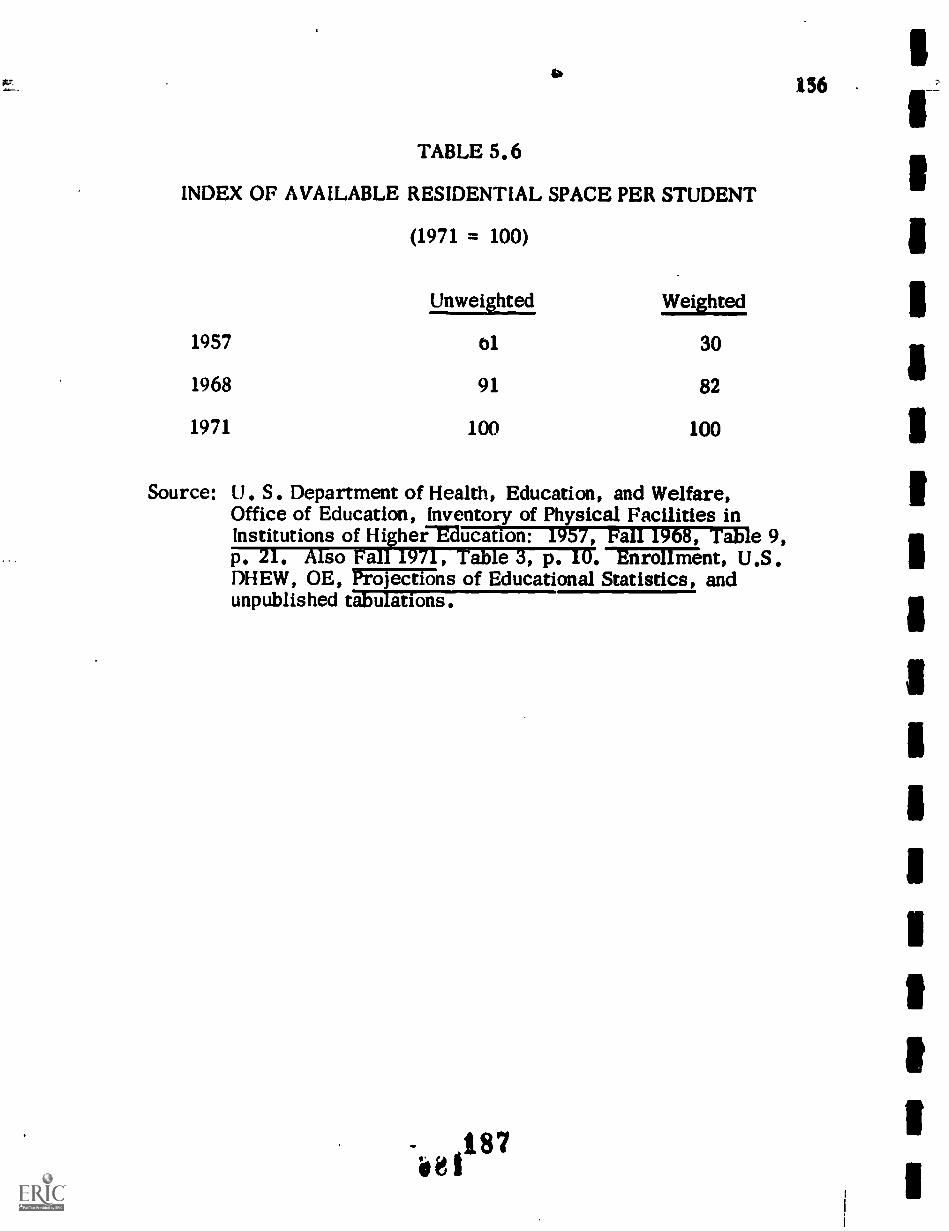
156156
TABLE 5.6
INDEX OF AVAILABLE RESIDENTIAL SPACE PER STUDENT
(1971 = 100)
Unweittal
1957 01
1968 91
1971 100
Weighted
30
82
100
Source: U. S. Department of Health, Education, and Welfare,Office of Education, Inventory of Physical Facilities inInstitutions of HigherMucation: 1957, Fall 1968, Table 9,p. 21. Also Fall 1971, Table 3, p. 10. ErTilo rricent, U.S.DHEW, OE, Projections of Educational Statistics, andunpublished tabulations.
elf
157
CHAPTER SIX
S ATISTICAL DETERMINATION OF SPACE STANDARDS
Available space per full-time-equivalent student varies from
campus to campus. There are also wide differences between the actual
space available and the level recommended by space planning experts.
If the space planning authorities were not influential in determining
available space inventories, could it be possible that there was an un-
stated consensus among post-secondary education administrators which
had not been enunciated up to now?
We attempted to find out whether such consensus existed by con-
ducting an elaborate analysis of the availability of non-residential space.
A series of regression equations werc constructed to explain the stock
of non-residential space as a function of enrollments, expenditures,
staffing patterns and the orientation of the school measured by the number,
level and types of degree granted. We hoped that the results of these
regression equations would contribute to objective standards which
explained how space was utilized.
Description of Data
The data base for these regressions consisted of various data
elements from the REGIS surveys for the school year 1970/1971. The
various surveys collected information on facilities, by type, enrollments
by level, and full-time or part-time status, staff, by type, and level,

158
finances, and degrees granted by level and field of study. The institutions
which reported all items of data accounted for an estimated 92.5 per cent
of the full-time equivalent enrollment for that year, and can be considered
as representative of the total number of institutions. In order to maxi-
m:ze the coverage, a number of responses had to be consolidated because
a number of institutions with multiple campuses did not, or could not,
provide the data for individual campuses, but aggregated certain types
of data on a system-wide basis. In some instances, notably the State
University of New York, data was reported both on a campus &.d system-
wide basis requiring great care in editing the data from the various surveys.
The detail of the data elements, the types and size of institutions
and the results of a large number of regression analysis appear in
Appendix 6. This appendix also contains a detailed explanation of the
methodology used, and the programs used. A summary of the results
of the statistical analysis is given below.
Summary of Results
The analysis of statistical determinants of total non-residential
space confirmed the impression gained through the less sophisticated
analysis of data that there is a great deal of variability in available
space in post-secondary education. For a number of institutional types,
the objective criteria which are generally usrd to plan for space did
1

159
not explain a large enough share of the variability to satisfy us. Apparently,
other factors of a mare subjective manner were responsible for the
amount of space available. To some extent, the analysis was complicated
by the presence of co-linearity of factors used to forecast space, e.g. ,
those schools with high faculty/student ratios were also big spenders.
Other circumstances, such as the recent or anticipated growth of en-
-ollmcnts, as in the case of public two-year schools, had resulted in the
co-existence of schools with too little space or too many students, many
of them in the process of building additional facilities, and others, with
too much space and too few students, at the threshold of enrollment
drives.
The "best" predictive equations, and their respective R2, are
reproduced in Table 6.1. Two comments are appropriate in this con-
nectioa, In those cases where equations have only a few explanatory
variables for the total non-residential space, as general rule the co-
linearity between variables was quite high, and it can be concluded that
the factor proportions of these types of institutions were fairly alike.
Also, whenever the R2 are low, it can be concluded that the variability
in space per student was quite high, despite the apparent homogeneity
of the other factors. Space availability is apparently determined by
different considerations thr.n the allocation of current resources.
Analysis of Results
A set of limited conclusions can be drawn from the statistical
190

160
analysis.
1. As a general rule, the amount of available space is deter-
mined not only by the number of students who attend the institution, but
also by the number of persons employed on the staff, and the resources
expended on instruction by the institution. With the exception of uni-
versities, defined in this study as institutions which grant doctorate
degrees, the course mix did not seem to affect drastically the demand
for space.
2. In universities, emphasis on doctoral programs in the physical
sciences appeared to increase space demands considerably. Evaluated
at the mean values , for small public universities, the enrollment term
accounts for roughly 50 per catt of the space, the staff close to 25 per
cent, anti 23 per cent is derived from additional space demand represented
by the program mix, in this case, represented by degrees granted. The
constant term is nat very important. For all private universities, the
FTE enrollment, FTE staff, and instructional expenditure variables
each contriblite between 20 and 25 per cent of the total, and the degree
variables contribute 22 per cent. The constant is responsible for the
remaining eight per cent. In this last case, though, the demand for
space due to course mix is difficult tc interpret because two out of the
six degree variables have a negative sign, and one is forced to conclude
that mire space than is indicated by the coefficients of other degrees
is needed to houic et...rtain protArams.
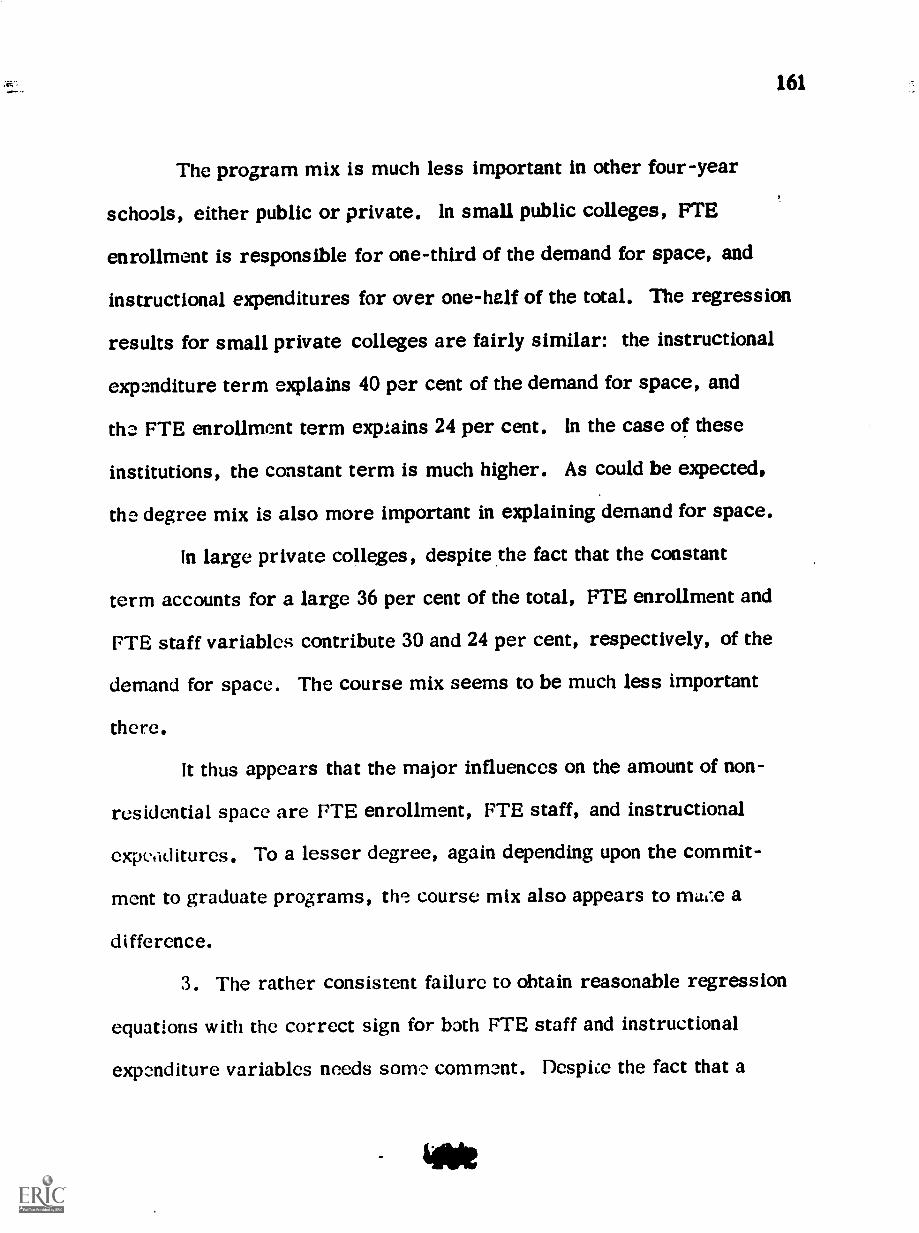
161
The program mix is much less important in other four-year
schools, either public or private. In small public colleges, FTE
enrollment is responsible for one-third of the demand for space, and
instructional expenditures for over one-half of the total. The regression
results for small private colleges are fairly similar: the instructional
expenditure term explains 40 per cent of the demand for space, and
the FTE enrollment term explains 24 per cent. In the case of these
institutions, the constant term is much higher. As could be expected,
the degree mix is also more important in explaining demand for space.
In large private colleges, despite the fact that the constant
term accounts for a large 36 per cent of the total, FTE enrollment and
FTE staff variables contribute 30 and 24 per cent, respectively, of the
demand for space. The course mix seems to be much less important
there.
It thus appears that the major influences on the amount of non-
residential space are FTE enrollment, FTE staff, and instructional
expenditures. To a lesser degree, again depending upon the commit-
ment to graduate programs, the: course mix also appears to a
difference.
3. The rather consistent failure to obtain reasonable regression
equations with the correct sign for both FTE staff and instructional
expenditure variables needs some comment. Despite the fact that a

162,
large number of schools with above-average space had both high staff
ratios and high instructional expenditures par student, the co-linearity
in staff and expenditures makes it difficult to capture this result in the
regression equation. The fact that a negative sign sometimes appeared
in front of the instructional expenditures variable can be plausibly
explained. Institutions with more staff per student, and consequently
lower work loads, as well as possibly more prestige, underpay their
staff compared to institutions with high work loads and less prestige.
4. We have been highly selective in the presentation of results.
Only a fraction of the regressions which were run are presented in this
chapter or the appendix. We do believe that the results presented in
this chapter and appendix are intuitively reasonable. For instance,
the regression coefficient associated with FTE enrollment should exceed
the mean classroom plus -Jib space in a given category, since additional
space other than class and lab space is used by students. In most cases,
and especially for the better regression equations, this was the case.
Similarly, the regression coefficient for FTE staff should exceed the
mean values of office space per FTE staff, since the staff requires some
other types of space as well. This is corroborated by the regression
equations.
5. Finally, an attempt was made to predict space requirements
by using several of the better regression equations across the board--

163
i.e., for all institutional groups by type, control, and size. When these
estimates were compared with the actual group means or reasonable
space standards, the discrepancies were large and varied. The cou-
clusion to be drawn from this is that the differences among the variws
groups of institutions are substantial enough that a regression equation
for one institutional group cannot be expected to produce reliable estimates
for other institutional groups.
Conclusions
The results which were obtained through the statistical analysis
were not powerful enough to propose a new set of standards, but they
can be used to model and validate standards derived in this study and
presented in Table 4.7, and to model the response of institutions to chang-
ing conditions.
For instance, the staff to student ratio in small public univer-
sities if' .274, and for small public colleges, it is .155. If all other
things were equal, and public universities could make do with the same
staff as four-year colleges, their space requirements could be reduced
by 12 per cent.
In the case of private universities with a staff-to-student ratio
of .346, a reduction in the staff -student ratio to .180, typical of private
four-year schools, would result in a reduction of space requirements
of 11 per cent. By comparison, if private universities were to have the

164
same staff - student ratios as the small public oaes (i.e .274), one
could expect a reduction in space requirements of roughly five per cent.
The reduction of space in public universities by 12 per cent, or
roughly 10 square feet, will explain one-half of the difference of the
standards set for these two types of institutions in Chapter 4. The re-
duction of five per cent in the space of private universities will amount
to roughly one-quarter of the difference in the standards between the
public and private institutions and bring to parity to the office space per
FTE student in each one of these institutional types.
The absence of strong relationships between objective variables
and space appears to mask the interesting conclusion that incremental
differences between types of institutions is closely related to space
standards established by this study, standards which are based on a re-
analysis of expert opinion.
te$95

21W
Uni
vers
ities
,M
OE
Enr
ollm
ent
less
than
10,
000
Publ
ic U
nive
rsiti
es,
FTE
Enr
o!Im
ent
mor
e th
an 1
0.00
0
Priv
ate
Uni
vers
ities
,FT
E E
nrol
lmen
tle
ss th
an 2
0.00
0
Stan
dard
R2
Err
or
TA
BL
E 6
.1
PRE
FER
RE
D R
EG
RE
SSIO
N E
QU
AT
ION
S. F
OR
NO
N-R
ESI
DE
NT
IAL
SPA
CE
Reg
ress
ion
Equ
atio
n
. 81
210
NR
-SPA
CE
= -
29.9
+ .0
828
FTE
-EN
R +
.159
FT
E-S
TF
+ 2
8.4
D-A
G-D
+ 1
0.4
D-A
R-D
+ 2
.75
D-1
.F-D
+12
. D -
OS
-D(.
0097
9)(.
0374
)(7
.30)
(4.0
2)(.
4401
(5.0
5!
.92
675
NR
-SPA
CE
= 5
62 +
.382
FT
E-S
TF
(.01
26)
.92
227
Publ
ic O
ther
Fou
r-Y
ear
.82
107
Scho
ols,
FT
E E
nrol
lmen
tle
ss th
an 5
,000
Priv
ate
Oth
er F
our-
Yea
rSc
hool
s. F
TE
Enr
ollm
ent
less
than
2,5
00
Priv
ate
Oth
er F
our-
Yea
rSc
hool
s, F
TE
Enr
ollm
ent
mor
e th
an 2
,500
NR
-SPA
CE
= 5
1.0
+ .0
385
FTE
-EN
R +
.113
FT
E-S
TF
+ 5
52 D
-AG
-B -
2.18
D-L
F-M
+ 2
.90
D -
OS
-B +
8.6
4 D
-OS-
D 4
.(.
0141
)(.
0251
)(1
76)
(.89
4)(.
841)
(1.7
2)
- .2
98 D
-OT
-M +
2.5
7 D
-OT
-D +
.013
9 E
XP
(.14
1)(.
808)
(.00
492)
NR
-SPA
CE
= 3
0.4
+ .0
382
FTE
-EN
R +
2.1
6 D
-AG
-A +
.032
5 E
XP
(.00
660)
(.64
7)(.
0013
7)
. 75
SON
R-S
PAC
E =
26.
7 +
.014
2 FT
-E
NR
+ .2
71 F
T-S
TF
- .8
94 D
-AR
-M +
1.47
D-O
S-B
+ .0
325
EX
P(.
0064
9)(.
0259
)(.
251)
(.25
9)(.
0029
7)
. 93
119
NR
-SPA
CE
= 1
57 +
.267
FT
E-E
NR
+ .1
16 F
TE
-ST
F +
12.
8 D
-AG
-B +
2.79
0 D
-LF-
M(.
0061
7)(.
0136
)(2
.40)
(.65
0)

166
CHAPTER 7
AN ESTIMATE OF STOCKS 1970 - 1990
The U. S. Department of Health, Education, and Welfare,
Office of Education, Report of the Higher Education Construction
Programs Study Group' noted that "current accurate data on replace-
ment needs for colleges and universities is not available" (p. 133).
Arbitrarily, the study group assumed that one per cent of the space
would be retired every year, and noted that this replacement estimate
could be low, if the current backlog of unsatisfactory space (estimated
at four per cent of the 1969 stock) were to be added to the replacement
needs. It also noted that, by the end of the 1960's, a relatively high
proportion of post-secondary space was fairly young, and that a
rate of retirement lower than one per cent could be justified. On
balance, the study group decided to adopt a one per cent rate.
The difficulty which the study group had in setting estimates
of retirement is understandable. At the time the report was written,
the group had at its disposal a snapshot of the age of instructional
facilities in 1957. And this snapshot presented a confusing picture
(see Table 7.1). For instance, nine per cent of all space still in use
1 Federal Support forifigher Education Construction: CurrentPrograms and Future Needs, (mimeo, N.D.)
197
e I! I

1
167
in 1957 was occupied before DUO, and some 42 per cent was occupied
before 1930. It is astonishing that the relation of degree credit
enrollments in 1900 and 1930 was 8 and 38 per cent of those in 1956.
Thus, if 1957 space standards were in effect throughout the 20th
Century, it would imply that there was hardly any retirement of
buildings during 60 years.
Actually, two related hypotheses can be more r easonably
advanced: (1) space per student has been declining throughout the
20th Century, and (2) in all probability, retirements and abandon-
ments occurred at a fairly modest rate throughout the period. This
second hypothesis certainly supports the assumption of an average
life of 100 years adopted by the study group.
New Evidence on Retirement Rates
We were dissatisfied with the method adopted by the study
group to estimate the retirement rates of buildings. An attempt was
made to establish better data bases and use more sophisticated
retirement as'umptions. In this, we were only partially successful.
Estimates of retirements were derived from an
examination of actual retirements between 1957 and 1965. The
reports submitted to the 1965 survey of facilities (still unpublished)
were examined, and the type of construction, condition, principal
use of buildings, and type of insti :ution were noted for all buildings

168
which were reported as being no longer in use. In effect, the
voluminous file of responses for the 1965 survey was examined,
and every building (with the exception of wooden buildings, for which
a 20 per cent sample was taken) retired was noted. This file was
later key-punched and sorted along the lines shown in Table 7.2.
Ratios were calculated of occupied space to retired space and are
shown in that table.
Two conclusions can be drawn from Table 7.2: (1) the
age of a building does not correlate very highly with its retirement
rate, and (2) the small number of retirements may cause wide
fluctuations in the retirement rates of any single type of building.
The total number of buildings retired for the entire eight-year period
was 4,223, or less than 10 per cent of the total buildings and 6 per
cent of the total space. This was not enough to make estimates for
63 cells, i.e., nine types of construction and seven time periods.
For certain types of buildings, thk; retirement rate was calculated on
the basis of one observation. Hence, the only reasonable way of
estimating retirements appeared to be (1) to use all the observations
for the eight years together, (2) estimate the average age of buildings
in 1957, and (3) using the observed average retirement rate of
buildings and their averages, estimate the life of buildings by reading
off from a table (frequently used to estimate retirement rates for
buildings) showing expectancy life- factors for group properties (the
th

169
so-called R-2 retirement curve),' Since observed retirement rates
were 0.8 per cent a year, and the average age of buildings was
25 years, it would appear that the expected average life of buildings
is 75 years.
Using this retirement curve, we have estimated that a
group of buildings comparable to the ones in stock in 1957 would have
an average life of roughly 75 years. This does not mean (as the study
group had assumed) that 1/75 of the stock would be retired every year.
In reality, retirements are much slower in the early life of a building,
and much faster as the building gets older. For instance, using the
curve adopted, we have estimated that some 16 per cent of the
buildings built before 1957 would be retired by 1990. The same curve
applied to buildings built between 1957 and 1968 led us to an estimate
of retirement of some five per cent of the stock of these buildings by
1990. The estimated stock of buildings in existence by 1970, and
those surviving by 1990, are shown in Table 7.3. If our estimates are
correct, even by assuming a shorter life for buildings, it is likely
that retirement rates are going to be less than half of those projected
by the study group.
1 A. Marston. R. Winfrey, J. C. Hempstead, Engineering Valuatieaand Depreciation, McGraw-Hill Book Company, Inc., New York,1953, p. 462.
201.113
170
Total Stock of Buildings, 1973 - 1974
The total stock of buildings as of Fall 1973 is very
difficult to estimate. The last usable ; HEGIS tape in our possession
gives the stock of buildings in Fall 1970. At that time, the total
stock of buildings was equal to 1,138 million net assignable square
feet, of which 777 million square feet were non-residential buildings,
and 361 million square feet were residential.
We attempted to estimate net additions to stock for the
periods 1957 - 1968, and also academic years 1968 and 1969. These
are shown in Table 7.4. A column of this table compares our estimates
of gross additions to the space with those of the Norris report. We
are fairly close in our estimates for the two yeays taken together,
but our estimate is higher than the Norris estimate for 1968 and
lower for 1969. We are not too concerned about these differences,
because the Norris estimates are on a fiscal year basis, and ours are
on an academic year basis.
The gross additions for academic years 1971, 1972,
and 1.973 are impossible to estimate accurately. The only estimates
extant of expenditures for construction are from a survey published each
year in June /July 1970 through 1974 in College and University Manage-
ment magazine. These estimates are:
1969 $3,900 thousand1970 3,572 "1971 2,6131972 2,8291973 3,033
291

171
In constant prices, deflated by the index of construction
costs, the estimated outlays (in 1957 - 1959 dollars) appear as follows:
1969 $2,799 thousand1970 2,386 "1971 1,6411972 1,684 1t
1973 1,715 11
In other words, after peaking sometime in the late 1960's,
construction outlays have declined to roughly the $3.0 billion level in
constant prices, or $1.7 billion in 1957-59 prices.
These outlays to higher education construction cannot
be directly translated into the number of net assignable square feet
built. Some of these outlays result in projects put in place a number
of years later. The same source estimates that 46.1 million assign-
able square feet were put in place in calendar 1972, and some
60 million will be put in place in 1973.
We thus know that (1) some 120 million square feet were
put in place in the academic years 1968 and 1969, and (2) we can
estimate that 53 million square feet came on line in academic year
1972. Given the trends in appropriations for space, it would not be
too out of line to assume that another 120 million square feet were
put in place in 1970 and 1971, and that for the next few years, i.e.,
until 1975, ode could expect some 40 million square feet to be put
in place in each succeeding year.
LOS21.2

172
The total space inventory for academic years 1975-76
and intervening years appears in Table 7.5. One could well expect
an increase of 20 per cent in space between Fall 1970 and Fall 1976.
Distribution between Residential and Non-Residential Space
If past trends were followed, roughly one-third of the
total space constructed would be residential space. In actual
fact, this estimate is much too high. Already, between academic
1957 and academic 1968, about 30 per cent of the additions to space
was residential space. By 1969, only 15 per cent of the space
put in place was residential space. Since that time, there are no
firm statistics of dormitory construction, but all indications are
that dormitories are claiming a smaller and smaller proportion of
the total space being built. If the decline in the proportion of space
built between 1957 and 1965 (using 1962 as the midpoint) and 1969
were to be projected into the future, it is not unrealistic to assume
that no more than 10 per cent of the space to be put in place from
1970 on will be residential. It is possible that the proportion may
even be less.
The projections of residential and non-residential stocks
appear in Table 7.6.
292

173
Other Withdrawals of Space
Between Fall 1970 and Fall 1971, roughly 1.7 million
net assignable square feet were retired because 34 small schools
closed down. The majority of these schools had lost enrollment,
and had an average of 280 non-residential square feet per student in
the private sector, and nearly 300 square feet among public schools.
There are roughly another 91 schools with very large
inventories of space per student which are probable candidates for
early closing. These schools have 23 million net assignable square
feet, and are likely to be closed during the next four years. It is
also possible that an additional 100 or so two-year and four-year
schools in the private sector, with over 200-odd feet of non-residential
space per student, may also find themselves in difficulty. These
schools have an additional 30.5 million net assignable square feet in
non-residential space. Of course, not all these schools will close,
but it is not unreasonable to expect that perhaps half of them may
go out of operation. Thus, some 40 million net assignable square
feet, or 2.0 million a year, may be withdrawn through school
closings. About one-third of that space is assumed to be dormitories,
the rest is non-residential. It is not possible to forecast how these
closings will be phased, and we arbitrarily subtracted an equal
amount each year. For instance, in the Fall of 1974, Parsons College,

174
with roughly half a million square feet of non-residential space, will
be withdrawn from the inventory.
Rented Space
Rented space was estimated at 32 million square feet
in 1969-70 and 29.5 million square feet in 1970-71. These figures,
which account for less than three per cent of the total space and
four per cent of the non-residential space (most of the reported
rented space is rin- residential space), should be treated with great
caution. In a number of instances, the inclusion of rented space
produced extremely high space available per student. Discreet
inquiries for the reasons vo..y such large amounts of space were
rented produced varying responses: (1) in some cases, the total
space rented from a high school to offer night courses for a few
hours an evening was reported, (2) in other cases, the reported
space was used mostly to locate a research group, and a few
ancillary courses were given at the location, and (3) in at least one
instance, the rented space was being converted and only a minute
part was ready for occupancy. On balance, we could only conclude
that the role of the relatively small proportion of rented space is
highly overestimated.
Given the stories about crises in the availability of
space in some instituticns, we were quite surprised about the

175
insignificant role which rented space has played in filling peak
demand before permanent facilities became available. In thi., con-
nection, we investigated in depth the experience of the CUNY system,
one of the post-secondary systems with the least facilities per
student, the lowest office footage per staff member, and with
generally unsatisfactory auxiliary facilities. The system is lOcated
in the largest metropolitan area in the country, which has been experi-
encing above-average vacancies in office space. Hence, on the sur-
face, it appeared reasonable that it could fill its requirements in
existing facilities.
Actually, there were a number of factors which prevented
the system from expanding its space requirements as fast as it wanted
to through rentals. In the first place, much of the expansion was not
in Manhattan, but in outlying boroughs where community colleges were
set up to cater to disadvantaged populations. There was little space
for rent there, and the system had to wait until space became
available in churches, synagogues, or community centers. For
instance, Medgar Evers Community College is housed in a former
Masonic Temple, a Presbyterian church, and assorted other office
buildings. Other community colleges were housed in Jewish Centers
or closed parochial high schools. Another four-year school holds
gym classes in a YWCA.
WI

176
Often a factory was the only available building in the
community considered suitable for the college, and modification
costs were high enough to prompt the purchase and remodeling of the
facility as contrasted to renting it.
In a number of existing schools outside the borough of
Manhattan, trailers were wheeled it for use as offices and class-
rooms. In other instances, a whole campus, such as St. John's in
Brooklyn, was taken over.
In Manhattan itself, CUNY found itself a less-than-
welcome tenant in high-rise buildings. The rush of students from
classroom to classroom at set periods tended to disrupt elevator
service for other tenants. Also, in the case of existing schools,
such as Bernard Baruch and Hunter, the choice of space was limited
by the desire to keep some propinquity between students and faculty.
At Baruch, freshmen and sophomores were located in a nearby
building, and faculty offices were sited in a nearby hotel.
The problem of locating a portion of a campus in rented
space has not been solved satisfactorily, either by CUNY or other
fast-growing campuses. It is difficult and uneconomic to site part
of a school in one location and part in another, especially if the
institution wishes to provide some library and study facilities.
The economics of refurbishing and renting space are
also moot. CLJNY, for instance, paid between $5.00 and $8.00 a net

177
assignable square foot for space in downtown Manhattan. The higher
figure, it is true, included maintenance and cleaning fees estimated
at $1.50 a square foot. In other locations, uptown, space was rented
at $3.00 to $4.00 per square foot. The average cost of trailers was
roughly $5.00 per square foot, on a declining payment scale from
$12.00 to $3.50 a net available square foot over a five-year period.
The cost of trailers is somewhat exaggerated, since CUNY could
purchase them for a nominal amount at the end os: five years, and the
useful life of trailers was estimated to be, at least, double the rental
term.
Another fast-growing system, the state colleges in
California, has also experimented with rentals, again with indifferent
success. As some privately built dormitories were underutilized,
some of the residential space was rented and converted into faculty
offices. According to administrators of programs, this was not a
satisfactory solution either, as commuter students found the location
of offices inconvenient. Lately, surplus classrooms in the system
were converted into faculty offices, as a preferable alternative.
Complaints that these offices are makeshift are still heard, but they
are considered more satisfactory than more gracious facilities in
inconvenient locations.
The only successful rental experience we have heard
about is that of a proprietary school in New York. It leased its
MPS

178
campus to CUNY and rented long-term office space. The principals
of the school managed to reduce their space requirements by one-
half, from some 40 to 20 square feet per full-time-equivalent student.
They claim that this reduction in space could be accomplished in
other schools through better space planning. It should be mentioned,
though, that the school provides few, if any, of the conventional
amenities of college campuses: its library is limited, there are no
food or athletic facilities, etc. We were told that a separate bank
of elevators services for the school reduces complaints from com-
mercial tenants.
Attitude Toward Space and Future Construction Plans
To many college and university administrators, especially
in private schools and universities, the campus is an important
entity which has practically a life of its own. An illustration of the
aspirations of a major university center, which has roughly twice
the "standard space" per student is reproduced in Exhibit I.
There is no end to what can be improved, and standards
set by one institution are generally copied by others. For instance,
the layout of campuses planned by CUNY does not take into account
that Ct 'NY is part of the metropolitan area. A theater built at Staten
Island Community College was reviewed by a professional publication
as rivaling in facilities those of Broadway.

BEST COPY AVAILABLE
179Exhibit I - A Private University President's Point of View
Revitalizing the Divisional Structure
Physical facilities, of course, are only justified ifthey importantly further important activities. Thestructures which I have mentioned have been putto this test. But it hardly needs saying that themaximization of the University's strength involvesdifferent problems as well. Two years ago DeanJacobson appointed a faculty committee to re-view the organization of the Basic BiologicalSciences. That committee reported in February1972. "A central conclusion and main theme ofthe committee," the report states, "is that a con-siderable degree of unity, cohesiveness, and flex-ibility in the Basic Biological Sciences are ab-solutely essential both now and in the futureand this requires both administrative steps andexplicit policies that go beyond simple exhorta-tions of collegiality. There would seem to be littledoubt that biology is becoming in many ways asingle discipline or at least a multi-dimensionalcontinuum of overlapping disciplines." "At ourown institution," the report goes on the say, "de-partments overlap in their (legitimate) interests;much of our divisional strength presently liesacross departmental lines; Ave find ourselvesunable to keep teaching responsibility confinedwithin departments; and there is an increasingneed for kinds of laboratories and of expensivespecialized facilities that are not unique to in-dividual departments. If our divisional enterprisein the basic biological sciences is to he strongand balanced, there is the need, especially in theface of current restraints. to consider the impactof departmental appointments on overall pro-grams and responsibilities in the basic sciences,and one can on!y suspect that our future abilitiesto recruit outstanding students and faculty in newfrontier areas of biology will depend on ourattractiveness on a divisional basis." Among therecommendations of the committee was "thatthere be fewer an larger basic science depart-ments." The committee r,:cognized the need forthe "o itinu;ng use of interest groups formedfor scholarly purposes or: a nondepartmentalbasis." At the present time the Division is con-sidering- recommendations for two consolidationsin the tiyht of the direction of this general report.Biophysics. Theoretical Biology, and part of
he brought tol,ether in one de-partii,,:nt. Pharmacology and the rest of Physiol-ogy, it is proposed, will form another.
I he report of the faculty committee on the
Organization of the Basic Biological Sciencessuggests questions which are appropriate for allthe Divisions. Questions of this type are now be-fore the Social Sciences Division with the recom-mendation of its faculty committee that in viewof the presence of something like 65 psychol-ogists and closely related behavioral scientists invarious parts of the University, including theBusiness School, the Department of Psychiatry,the Department of Biology, the Department ofEducation, and the Committee ottHuman De-velopment, as well as the Department of Psy-chology, there be a serious effort at regrouping.But the number and overlapping of departmentsare not the only issues which the basic biologyreport may be taken to raise. Inherent in thereport are questions as to the reality of the pos-sible collective leadership role of the Divisionsthemselves. This role, no doubt, is a changingone, depending on many external and internalfactors and other supporting arrangements. Theearly organization of the Social Sciences Divisionsurely reflected a belief in the possibility ofinten.hange and divisional leadership. The SocialSci nces Research Building, the first of its kind,was intended as a divisional laboratory, givenadded meaning through the use of multi-depart-ment seminars, interdisciplinary committees, andthe integrative force of the Social Sciences Re-search Divisional Grants Committee. This maywell be a time when, as the report seems to sug-gest, it may be necessary to give new vitality tothe divisional structures. I am, myself, convincedthat the institution of the Cbllegiate Divisions atthe undergraduate level has increased our abilityto solve educational problems. The main reasonfor this is because of the facilitating efforts ofthe Masters themselves. One wonders whethersimilar efforts at the divisional level might notprove to be useful.
Source: Edward H. Levi, "State ofthe University," The University ofChicago Record, Vol. VII, No. 3,March 21, 1973, p. 42, the Univer-sity of Chicago.

180
We do not believe that many systems will him space
shortages because: (1) the space standards they have adopted are
generous, and (2) state and local funds are still allocated on the
assumption that enrollments will increase in line with past trends.
In effect, a number of administrators believe that there is a 10 to
20 per cent leeway in capacities on campuses, especially those cam-
puses which deal with "non-elite" clienteles, and where the faculty
has less say about class size. Also, the plans of such states as New
York have not been revised downward in the light of recently reduced
propensities to enroll. While the latest published census figures show
that only half of high school graduates attend colleges, New York State
plans to provide facilities for seventy per cent. The master plans of
most other states are also somewhat high in the light of most
reasonable projections of enrollments.
In some states, the central administration is becoming
increasingly aware of the optimism of earlier projections of enroll-
ments. Administrators of both the university and college system in
California are attempting to put the brakes on additional construction.
Their message is not read loud and clear at individual university and
college sites. In a number of schools we visited, the administration
was still committed to meet the construction schedule of a master
plan which was based on much higher enrollment projections.

181
Without looking into the array of political forces in each
individual state, it is impossible to forecast who will win the tug-of-
war between the local and central administrations. If the forecast
of College and University Management for calendar 1973 is to be
trusted, the political power is in the hands of the local administrators.
As the economy moved into high gear in 1972, the appropriations for
construction increased some 15 per cent!
112tis

TA
BL
E 7
.1
SUR
VIV
ING
SPA
CE
IN
195
7, A
ND
EN
RO
LL
ME
NT
S FO
RSE
LE
CT
ED
PE
RIO
DS
Gro
ss s
pace
(th
ousa
nds
of s
quar
e fe
et),
cum
u-la
tive
by d
ate
ofoc
cupa
ncy
ree
cred
it en
roll-
"' m
ent (
thou
sand
s)tr
Inde
x of
sur
vivi
ng s
pace
(195
7 =
100
)
Inde
x of
enr
ollm
ents
Thr
ough
1899
1909
56,0
8510
2,61
3
238
355
8.8
16.0
7.9
11.8
1919
162,
240
606
25.4
20.1
a in
clud
es b
uild
ings
not r
epor
ted
by in
itial
occ
upan
cy.
b19
56.
1929
1939
1949
1957
Tot
ala
269,
173
358,
878
468,
829
636,
087
639,
878
1,15
71,
644
2,90
23,
014b
42.1
56.1
73.3
99.4
100.
0
38.4
54.5
96.3
100.
0
Sour
ce: S
pace
: Col
lege
and
Uni
vers
ities
Fac
ilitie
s Su
rvey
:19
52, D
epar
tmen
t of
Hea
lth,
Wel
fare
, Off
ice
of E
duca
tion,
U. S
. Gov
ernm
ent P
rint
ing
Off
ice,
Was
hing
ton,
D.
Enr
ollm
ents
: His
tori
cal S
tatis
tics
of th
e U
nite
d St
ates
:C
olon
ial T
imes
to 1
952,
Cen
sus,
Dep
artm
ent o
f C
omm
erce
,p.
216
.
Edu
catio
n, a
ndC
1965
,pp.
223
-226
.B
urea
u of
the
INN
MP
GO
SIP
III11
111
MN
MI G
O Il
eS
IB O
N N
MI M
I IN
N O
N O
M Il
i

1AB
I,E
7.2
SPA
CE
HE
1957
111
1011
G11
196
5, A
SSIG
NA
BL
E S
QU
AR
E F
EE
T.
AN
D P
ER
CE
NrA
Ge
up*
AI,
I, ti
; AC
E B
Y T
YPE
ON
CO
NS
Mt k:
rioN
(Square Vert in
Hun
dred
s)
..ri I
N.P
4D
ate
Bui
ltT
otal
Per
Cen
t of
Exi
stin
gSp
ace
Ret
ired
1,40
0- 1
,409
1411
-14
1419
20-1
924
1930
-193
919
40-1
949
1950
-195
7
i I a
1,52
61,
1141
2,03
21,
751
20,7
142,
572
29,9
54.0
625
tu.
th3,
222
6.06
S1,
1,16
42,
924
1,51
017
,047
.091
1.
Asu b
11.1
11.,
.111
15,4
799,
/464
9, S
O5
6,431
3,376
4,989
5,004
54,948
.0708
1.217
1,833
4.656
3,242
11,007
5.224
10,767
38,010
.0428
111.
1
N!.
. i-
c :L
bin
2,64
1,976
8,237
2,893
4,665
1,741
5.204
27,420
.0386
A, 3
-..-
1ty
..:
afT
I 1
1,rv
n:A
)Ect
.-(1
f.
634
28
2,640
3,302
.055
2
1,12
114,
/404
16,591
14.256
10.163
27.722
74,697
.0662
mr.
)rar
ysi
ct1
59
47
26
6,275
725
7,140
.1497
..t!A
cr1/
:41.
175
1.403
3.247
5.795
9.255
22.258
.1757
22,62g
31.0
9434,437
34.133
57,853
65,399
274,776
Sour
ce: C
as...
.1A
n 2u
-.1
.sr
s:ai
nple
of
retir
ed w
oode
n bu
ildin
gs, a
nd1(
X)
per
cent
enu
mer
atio
n of
oth
erbuildings, from U.S.O.E.
Lr.
,,L1)
:she
tl re
cor.
;c: C
111.
..ze
and
rniv
erci
ty F
acili
ties
Surv
ey: 1
957,
Dep
artm
ent o
f H
ealth
,Education, and
Wel
fare
, Off
ice
ofU
. S. C
;iver
nmen
t Pru
ning
Off
ice,
Was
hing
ton,
D.C
., 19
65.

TABLE 7.3
ESTIMATED STOCK OF TOTAL SPACE IN EXISTENCE BY 1970AND SURVIVED TO 1990
(Net Assignable Square Felt in Millions)
Survived toBuilt
by 1957
1968 413.3
1969 410.6
1970 407.7
1971 404.0
1972 401.2
1973 397.5
1974 394.1
1975 391.0
1976 387.1
1977 383.5
1978 380.2
1979 376.1
1980 372.2
1981 368.7
1982 364.4
1983 360.0
184
BuiltBetween Built Built
1957 - 1968 in 1968 in 1969 Total Stock
613.7
612.7
611.8
610.6
609.3
608.1
606.9
605.6
604.4
603.2
601.9
600.1
598.8
597,0
595.1
593.9
i 5
1,027.0
72.6 1,095.9
72.5 46.9 1,138.9
72.4 46.9 1,133.9
72.3 46.8 1,129.6
72.2 46.7 1,124.5
72.1 46.7 1,119.8
71.9 46.6 1,115.1
71.9 46.5 1,109.9
71.7 46.4 1,104.8
71.6 46.3 1,100,0
71.4 46.2 1,093,8
71.3 46.1 1,088.4
71.1 46.1 1,082.9
71.0 46.0 1,076.5
70.9 45.9 1,070.7

185
TABLE 7.3 (Cont'd)
ESTIMATED STOCK OF TOTAL SPACE IN EXISTENCE BY 1970AND SURVIVED TO 1990
(Net Assignable Square Feet in Millions)
Survived toBuilt
by 1957
BuiltBetween
1957 - 1968Built
in 1968Built
in 1969 Total Stock
1984 356.6 592.0 70.7 45.8 1,065.1
1985 352.5 590.2 70.5 45.7 1,058.9
1986 347.7 588.3 70.3 45.5 1,051.8
1987 343.8 585.9 70.1 45.4 1,045.2
1988 339.1 584.0 69.9 45.3 1,038.3
1989 334.5 582.2 69.8 45.2 1,031.7
1990 330.4 579.7 69.6 45.1 1,024.8
Source: See text, p, 169,
21$TIT

TABLE 7.4
ADDITIONS TO NON-RESIDENTIAL STOCK OFPOST-SECONDARY BUILDINGS BY YEARS
(Mill
ions
of
Net
Ass
igna
ble
Squa
re F
eet)
Tot
alSt
ock
Bui
lt
Fall
1968
1,02
7.0
1957
- 19
68
Fall
1969
1,09
5.0
1968
-1969
1111-
a' F
all 1
970
1,138.9
1969
-1970
Surv
ived
Squa
rePr
e-19
5719
57 -
196
8Fe
etSt
ock
Add
ition
s
618.
041
3.3
613.
7
72.6
410.6
612.7
46.9
407.7
611.8
1968
1969
--
__
72.6
II =
o
72.5
46.9
Sour
ce: 1
968,
196
9:Fe
dera
l Sup
port
for
Hig
her
Edu
catio
nC
onst
ruct
ion:
Cur
rent
Pro
gram
s an
d Fu
ture
Nee
ds, U
. S. D
epar
tmen
t of
Hea
lth, E
duca
tion,
and
Wel
fare
, Off
ice
of E
duca
tion,
Rep
ort o
fth
eH
ighe
r E
duca
tion
Con
stru
ctio
n Pr
ogra
ms
Stud
yG
roup
, Cha
lmer
s G
. Nor
ris,
Cha
irm
an.
1970
: See
text
,p.
170
.
MIS
noIl
e SO
MO
OW
111
1111
1IN
NO
M Il
e O
M O
M M
ID IM
O M
B e
llSI
D S
IM O
D

TABLE 7.5
ESTIMATED SPACE BUILT AND SURVIVED BY 1975
(Net Assignable Square Feet in Millions)
A. Total Space
BuiltBefore Built in Total
Built 1970 1970-71 1972 1973 1974 Stock
1970 1,138.9 1,138.91971 1,133.9 ) n.a.1972 1,129.6 ) 120'0 1,240.61973 1,124.5 119.8 53.0 1,297.31974 1,119.8 119.6 52.9 40.0 1,332.31975 1,1.15.1 119.4 52.8 40.0 40.0 1,367.3
B. Residential Space
1970 361.5 361.519711972
359.9358.5
) 12 0.)
n.a.370.5
1973 356.9 12.0 5.3 374.21974 355.4 12.0 5.3 4.0 376.71975 353.9 11.9 5.3 4.0 4.0 379.1
C. Non-Residential Space
1970 777.4 777.41971 774.0 ) n. a.
1972 771.1 108.0 879.1
1973 767.6 107.8 47.7 923.1
1974 764.4 107.6 47:6 36.0 955.61975 761.2 107.5 47.5 36.0 36.0 988.2
Source: Sec text, p. 172.
187

TABLE 7.6
ESTIMATED SPACE BUILT BY 1975 AND SURVIVED TO 1990
(Net Assignable Square Feet in Millions)
A. Total Space
BuiltBefore Built in Total
Built 1970 1970-71 1972 1973 1974 Stock
1975 1,115.1 119.4 52.8 40.0 40.0 1,367.3
1980 1,088.4 118.3 52.5 39.6 39.7 1,338.5
1985 1,058.9 117.0 51.9 39.3 39.4 1,306.5
1990 1,024.8 115.4 51.4 38.8 39.0 1,269.4
B. Residential Space
1975 353.9 11.9 5.3 4.0 4.0 379.1
1980 345.5 11.8 5.2 4.0 4.0 370.5
1985 336.1 11.7 5.2 3.9 3.9 360.8
1990 325.3 11.5 5.1 3.9 3.9 349.7
C. Non-Residential Space
1975 761.2 107.5 47.5 36.0 36.0 988.2
1980 742.9 106.5 47.3 35.6 35.7 968.0
1985 722.8 105.3 46.7 35.4 35.5 945.7
1990 699.5 103.9 46.3 34.9 35.1. 919.7
Source: See text, p. 172.
9
188

189
CHAPTER 8
PROPRIETARY POST-SECONDARY SCHOOLS
The number of students enrolled in vocational, non-degree,
programs in predominantly non-profit institutions enumerated in
HEGIS has increased apace in each of the past three years. Concur-
rently, enrollments in for-profit schools, most of which are not
included in the survey, have either remained stable or declined.
Preliminary results of a special study commissioned by NCES, which
used a Curreui Population Survey sample to estimate enrollments of
adults past compulsory school age in private, proprietary trade and
vocational schools, indicates a decline in total enrollment of some
seven per cent between 1969 and 1971. Even if one were to allow for
the imprecision of the sample survey, there is very little evidence
that the demand fnr vocational training has spilled over into the profit
sector. On the contrary, it appears that the proliferation of publicly
subsidized programs has arrested the growth of the proprietary schools.
The recent financial difficulties of some correspondence schools with
a national following arc witness to this trend. As best as can be
determined from the above-mentioned survey, 1.4 million students
were enrolled in proprietary schools as of 1971. Roughly a third
were taking courses by correspondence and did not require formal
92,
190
instruction space. It is difficult to estimate the full-time-equivalent
load for the remainder of the students, since many participated in
more than one program. Our best informed estimate is some 600 to
800 thousand FATE students, based on the median number of class
hours.
Advantages of Proprietary Schools
Proprietary school owners whom we interviewed are quite
upset about the unfair competition of tax-subsidized vocational
programs, which offer substantially the same training as proprietary
schools. The recent trend in the post-secondary sector to encourage
"open admission" programs for all high school graduates has further
shrunk the market for proprietary schools which have catered to
students of sub-post secondary ability.
The advantages of proprietary schools are still maintained in
a few cases: (1) where specific technical training is required,
(2) wnere students opt for short training courses and try to avoid
being burdened by general educational requirements, and (3) where
the placement function is extremely important.
in such fields as data-processing and electronics, a number
of schools- -some affiliated with major industrial companies, others
free-standinghmge carved themselves a niche in the post-secondary
sector by offering up-to-date, practical training. In many cases,

191
especially in the ease of data-processing schools, their appeal to
students is based both on their technical competence and promises
of job placement. Following an investigation of the Federal Trade
Commission, the promises of jobs have been de-emphasized in the
publicity of some schools, and hence the power of their advertising
appeal Ins been reduced.
More narrowly focused schools, teaching a given cluster of
skills and little else, have also been prominent in the proprietary
sector. Besides auto-mechanic schools, schools for welders, etc.,
such schools as the ones for medical assistants and beauticians have
had fairly narrow-gauge curricula which appeal to strictly vocationally
oriented students.
There is considerable controversy surrounding the quality of
schools which train medical and laboratory assistants. The associa-
tion of non-profit, university- or hospital-affiliated schools has
claimed that the recruitment or proprietary medical technical schools
is haphazard (the public relations representative of the non-profit
association promoted a story on the front page of the Washington Post
by enrolling tier clog in one of these schools), that the courses are
substandard, and arc taught by a part-time faculty. Operators of
proprietary schools, in reply, have mustered data about successful
career stories of graduates. Whether the criticism of these schools
is relevant or not, it has certainly limited the popularity of this type
of school.
EIS222

192
Finally, secretarial and commercial schools are probably the
epitome of the third type of school, where placement services are
most important. As placement services of junior colleges improve,
it is quite likely that these schools, too, will be threatened.
Character of Proprietary Schools
The proprietary school sector, with a few exceptions of
nationally franchised or large-company schools, is truly competitive,
marginally profitable, and characterized by a high rate of entry and
exit. For instance, there were 5,019 proprietary schools in 1971.1
A survey of a sample of these schools in 1973, conducted by the
National Commission on the Financing of Post-Secondary Education,
failed to contact roughly 30 per ;..ent of these schools, leading to the
strong presumption that they were out of business.
As of 1971, proprietary schools were distributed as follows.
423 were technical/vocational, 161 were technical institutes, 940 were
business and commercial, 1,475 were schools of cosmetology,
1,332 were flight schools, 112 were correspondence schools, 47 were
1 Adapted from Table 3, p. xix, Directory of Post-Secondary Schoolswith Occupational Programs, 1971, U. S. Office of Education/National Center for Educational Statistics (Washington, D. C.:Government Printing Office, 1973), as cited in Financing Post-Secondary Education in the Last Quarter of the Twentieth Century,the report of The National Commission on the Financing of Post-Secondary Education.
223

193
hospital schools, and 509 were trades schools. An additional 20 were
classed as "other."
Of the 1.4 million adults enrolled in these schools, some
400 thousand were enrolled in part-time correspondence courses,
and studied at home. Nearly half of the remaining students,
475 thousand, attended classes in a building; dedicated to instruction;
some 320 thousand were housed in commercial buildings; with the
remaining 20 per cent receiving instruction in a wide variety of
locations, most of them not specified.
Most proprietary schools are small. With the exception of
technical/vocational and technical institutes, where the average
enrollment is somewhat above 400 students, the majority of other
schools have FTE enrollments of around 200 students, e.g.,
secretarial and trade schools, or 100 or less, as is the case with
cosmetology and hospital schools. Hence, the amount of space
required per school is not very large.
Requirements for Spacf, by Type of School
In the case of the technical/vocational schools, two appear in
the IIEGIS survey: the RCA Institute and the New York Institute of
Technology. These are fairly large institutions with between 30 to
50 square feet per FTE student. Recently Bell & Howell constructed
two model technical training facilities with capacity for roughly
2,000 students each. Fotty square feet per student were provided.
224

194
New York State has collected statistics on 23 proprietary
schools which have been approved by the State. Most of the schools
are either business/secretarial or teach data-processing. The
average number of square feet per student there is roughly forty,
as well (see Table 8.1).
Other state departments of education, although they license
and inspect proprietary schools, do not keep records of facilities.
Hence, the estimates of space for cosmetology and hospital and
medical technicians is not readily available. Telephone inquiries
to the offices of larger schools listed in telephone directories of
three large cities did not elicit very specific estimates. As nearly
as we could determine, cosmetology schools run two shifts, and, if
enrollments were up to capacity, could accnrrrnodate students in
30 square feet per student. Medical technician schools, according
to the statement of a franchiser and the operators of another school,
require some 45 square feet of space per student. In all cases, we
were told that roughly two-thirds of the area was for instructional
space, and the rest for administrative space.
Availability of Space for Proprietary Schools
One of the principal difficulties of determining how much space
is either required or available for proprietary school students is the
great reticence of school operators to give information to a study
225II

financed by any level of government. Our conversations left the
definite impression that junior college vocational programs were
seriously undercutting the market for these schools. This situation
was well recognized by the operators, who implied that they had
more capacity than students.
Similar conclusions can be drawn from a four-city study of
current enrollments and operating capacity of four types of
proprietary schools conducted in 1971.1 In the case of office,
computer, and technical schools, the capacity was, on the average,
some forty per cent above enrollments. In health schools, the
capacity was nearly three times the enrollment (see Table 8.2).
Table 8.2 shows mean and median enrollments, as well as
mean and median capacities. As a general rule, the median school
has fewer students than the average school, and the median capacity
is higher than the mean capacity. This statistic leads one to deduce
that there is more underutilized capacity in the smaller schools than
in the larger ones. This conclusion is buttressed by the observation
that the schools with the smallest average enrollment, the health
schools, have the greatest unused capacity. It would seem that the
195
1 Jean M. Wolman, Vincent N. Campbell, Steven M. Jung, James M.Richards, A Comparative Study of Proprietary and Non-ProprietaryVocational Training Programs, Volume I, American Institutes forResearch, Palo Alto, California, Final Report under ContractNo. OEC -O -70 -5018.
s 1:12 I

196
unfavorable competitive situation of proprietary schools has affected
small schools more severely than the larger ones.
Can Space Standards Be Established for Proprietary Schools?
The above-mentioned study of vocational training programs
compared programs in proprietary and non-proprietary schools. The
findings of this study are that the two sectors have different approaches
to their missions. The non-proprietary sector stressed remedial
instruction in basic skills, while the proprietary schools emphasized
hands-on, laboratory experience. As a general rule, classes in
proprietary schools were smaller, and the proportion of time spent
in laboratories was greater than in non-proprietary schools. The
most striking deficiency of facilities in proprietary schools was in
the library sector. Little library or study space was provided in
proprietary schools.
It appears that the instructional facilities of proprietary
vocational schools arc adequate for their programs. It is not at all
clear that library and study space are really needed by students,
given the hands-on character of the programs offered. The evidence
on this score is equivocal. A survey of hours of homework by
students in propric:tary schools indicates that a vast majority did
have homework. Whether they would have benefited from study and
library facilities is moot.
4'
197
To summarize, the facilities of proprietary schools appear
Spartan compared to those of the rest of the post-secondary sector.
The 40 square feet per student, though, seem adequate for the
missions chosen by these schools. There is little evidence about
shortages of facilities; on the contrary, with stiff competition from
publicly subsidized programs, the evidence points to an excess of
capacity. This excess capacity may be further accentuated as
enrollments decline, because roughly one ouc of five students finances
proprietary school tuition with public funds, i.e., mostly Veterans'
benefits. As the number of veterans declines, the enrollments in
proprietary schools are likely to be affected even more adversely.
Issues for Federal Policy
The stock of buildings needed for proprietary instruction is
not very big compared to the stock of buildings in the non-profit
sector. Of the 600 to 800 thousand FIT proprietary school students
receiving face-to-face instruction, at least 10 per cent (those in
flight training) require no specialized buildings. Hence, no more
than 2.5 - 2.8 million net availato.: square feet are required to
accommodate proprietary students. It appears that more space than
is required by present enrollments is already in place. Also, if the
same standards with respect to subsidy were in force for proprietary
programs as are currently in force with respect to scholarships, and

198
all programs of less than six months were ruled ineligible, at least
80 per cent of proprietary programs would be outside the scope of
any program.
Small subsidies for acquisition or rental space will not remove
the substantial competitive disadvantage which these schools have in
relation to the subsiaped public junior college sector. Higher tuition
fees in the public sector would have to be introduced to remove this
disadvantage.
229

TA
BL
E 8
.1
PRO
PRIE
TA
RY
SC
HO
OL
S, N
EW
YO
RK
, FU
LL
-TIM
E-E
QU
IVA
LE
NT
EN
RO
LL
ME
NT
AN
D S
PAC
E P
ER
FU
LL
-TIM
E-E
QU
IVA
LE
NT
ST
UD
EN
T
FTE
Enr
oll-
Squa
re F
eet p
er E
TE
Nam
e of
Ins
titut
ion
:ren
t.C
lass
Ber
kele
y C
lare
mon
t20
614
.08
(iiic
ksvi
lle)
Ber
kele
y C
lare
mon
t28
86.
08(N
ew Y
ork
City
)
Ber
kele
y Sc
hool
600
11.6
7(W
hite
Pla
ins)
low
The
Woo
d Sc
hool
240
14.9
6et tie
Alb
any
Bus
ines
s C
olle
ge30
037
.85
ftC
olle
giat
e in
stitu
te27
530
.89
SOIn
terb
oro
Inst
itute
300
9.47
Jam
esto
wn
Bus
ines
s C
olle
ge22
510
.09
Ole
an B
usin
ess
Inst
itute
133
16.6
9Po
wel
son
Bus
ines
s In
stitu
te33
86.
10B
ryan
t/Str
atto
n B
usin
ess
1,80
07.
91In
stitu
teT
obe-
Cob
urn
Scho
ol o
f16
510
.92
Fash
ion
Car
eers
Lab
Cla
ss +
Lab
Oth
erT
otal
16.8
230
.90
26.4
657
.36
19.5
325
.61
14.2
739
.88
9.56
21.2
315
.32
36.5
5
9.44
24.4
012
.48
36.8
814
.43
52.2
869
.57
121.
856.
6037
.49
12.0
849
.57
7.17
16.6
48.
8925
.53
9.60
19.6
917
.38
37.0
711
.77
28.4
617
.22
45.6
814
.65
20.7
515
.32
36.0
78.
7216
.63
16.6
333
.26
--10
.92
22.6
933
.61

TA
BL
E 8
.1 (
Con
t'd)
PRO
PRIE
TA
RY
SC
HO
OL
S, N
EW
YO
RK
, FU
LL
-TIM
E-E
QU
IVA
LE
NT
EN
RO
LL
ME
NT
AN
D S
PAC
E P
ER
FU
LL
-TIM
E-E
QU
IVA
LE
NT
ST
UD
EN
T
Nam
e of
Ins
titut
ion
FTE
Enr
oll-
men
tSq
uare
Fee
t per
FT
EC
lass
Lab
Cla
ss +
Lab
Tay
lor
Bus
ines
s In
stitu
teK
athe
rine
Gib
bs S
choo
l51
1
95C
12.68
10.03
11.93
6.24
24.61
16.27
ire
tAtt
tso
Utic
a Sc
hool
of
Com
mer
ceL
abor
ator
y In
stitu
te o
fM
erch
andi
sing
200
20G
21.6
517.45
8.76 IM
30.41
17.45
WC
entr
al C
ity B
usin
ess
380
23.13
20.45
43.58
INII
Inst
itute
RC
A I
nstit
utes
2,24
06.97
11.73
18.70
Am
eric
an A
cade
my
of31
35.
5829
.47
35.0
5D
ram
a &
Art
s
All
Inst
itutio
ns9,
664
11.4
311
.49
22.4
9
Sour
ce: N
ew Y
ork
Stat
e D
epar
tmen
t of
Edu
catio
n, u
npub
lishe
d re
cord
s.
Oth
erT
otal
8.28
32.89
12.40
28.67
10.19
40.60
17.64
35.09
104.55
148.13
15.72
34.42
36.50
71.55
20.61
43.10
MU
IMP
Ile S
IMM
EI
MO
SIB
MO
all
ell
NM
I OM
1111
11O
M O
M IN
D

TA
BL
E 8
.2
SUM
MA
RY
OF
CU
RR
EN
T E
NR
OL
LM
EN
T A
ND
OPE
RA
TIN
G C
APA
CIT
Y F
OR
PRO
PRIE
TA
RY
SC
HO
OL
S B
Y O
CC
UPA
TIO
NA
L A
RE
A A
ND
CIT
Y'
Off
ice
N
Ave
rage
Cur
rent
Enr
ollm
ent
Tot
alE
nrol
lmen
t
Ave
rage
Est
imat
edC
apac
ityT
otal
Cap
acity
Rat
io:
Cap
acity
/E
nrol
lmen
tM
ean
Med
ian
Mea
nM
edia
n
Atla
s :a
611
717
229
150
Chi
cago
496
5716
613
7R
oche
ster
651
1219
310
2Sa
n Fr
anci
sco
896
271,
392
225
551,
800
1.29
Com
pute
rA
tlant
a5
8057
126
122
Chi
cago
625
621
436
232
5R
oche
ster
150
5022
622
6Sa
n Fr
anci
sco
leal
th
610
370
2,60
423
318
03,
796
1.46
Atla
nta
663
5118
516
2C
hica
go5
4431
121
100
Roc
hest
er2
2828
127
127
San
Fran
cisc
o6
5054
954
126
153
2,72
52.
86

te r:.
Atla
nta
317
025
323
100
qt.
Chi
cago
399
521
01,
223
400
Roc
hest
er1
4942
6060
'tot%,
San
Fran
cisc
o2
188
188
3,91
331
231
25,
322
1.36
Tec
hnic
al
TA
BL
E 8
.2 (
Con
t'd)
SUM
MA
RY
OF
CU
RR
EN
T E
NR
OL
LM
EN
T A
ND
OPE
RA
TIN
G C
APA
CIT
Y F
OR
PRO
PRIE
TA
RN
SC
HO
OL
S B
Y O
CC
UPA
TIO
NA
L A
RE
A A
ND
CIT
Y'
Ave
rage
Ave
rage
Cur
rent
Est
imat
edR
atio
:E
nrol
lmen
tT
otal
Cap
acity
Tot
alC
apac
ity/
NM
ean
_M
edia
nE
nrol
lmen
tM
ean
Med
ian
Cap
acity
Enr
ollm
ent
1N
= n
umbe
r of
sch
ools
repo
rtin
g cu
rren
t enr
ollm
ent.
Est
imat
ed c
apac
ity w
as f
requ
ently
bas
ed o
n an
Nso
mew
hat s
mal
ler
sinc
e no
t all
repo
rtin
g sc
hool
spr
ovid
ed c
apac
ity f
igur
es a
lso.
Whe
re N
= 1
, the
scho
ol's
act
ual e
nrol
lmen
t and
capa
city
fig
ures
are
pro
vide
d in
the
mea
n an
d m
edia
n co
lum
ns.
Sour
ce: J
ean
M. W
olm
an, V
ince
nt N
.C
ampb
ell,
Stev
en M
. Jun
g, J
ames
M. R
icha
rds,
A C
ompa
rativ
e St
udy
of P
ropr
ieta
ry a
ndN
on-P
ropr
ieta
ry V
ocat
iona
l "'ra
inin
g Pr
ogra
ms,
Vol
ume
I, A
mer
ican
Ins
titut
esfo
r R
esea
rch,
Pal
o A
lto, C
alif
orni
a, F
inal
Rep
ort u
nder
Con
trac
t No.
OE
C -
O -
70 -
5018
.
OM
MID
MO
P N
W W
M O
M O
S E
liIM
P in
SO
! SO
203
CIIAPTER 9
COST OF CONSTRUCTION
Increases in costs cf construction have been abundantly
documented in a number of publications. Undoubtedly, the cost of
building, which has increased apace during the past decade, will
continue to grow. The College Management building index (repro-
duced in Table 9.1) shows that the cost of erecting a standard college
facility has risen by 75 per cent in the course of the past ten years.
This index behaves roughly in the same manner as the Department of
Commerce composite construction index. Both indexes have grown
faster than the cost of living by about one per cent a year.
Difficulties of Forecasting Future Construction Costs
The future costs of building depend not only upon the behavior
of the general price index in future years, but also on practices in
the construction industry, and on the health of the construction
industry itself. In the ourse of the past two years, the Productivity
Council has actively negotiated with craft unions to permit stream-
lining of practices at building sites. Also, high interest rates and
shortages of mortgage funds have depressed the volume of new
,iousing starts. Both of these developments tended to arrest the
growth of construction costs. Building costs increased somewhat
234

204
slower in 1972 and 1973 in relation to the cost of living as compared
to the previous period. Whether recent price increases of lumber
and other construction costs will reverse this trend is not known.
The influence of the type of building erected on the cost of
construction may result in variations of costs per square foot even
more drastic than those which result from variations of the price
levels. Different types of buildings cost differing amounts to build.
Cheapest among post-secondary buildings are garages, next are
dot anitories; instructional buildings in 1972 cost slightly more than
the average, while laboratories and, especially, medical facilities
were most expensive of all (see Table 9.2). During a given year, the
varying mix of buildings completed or contracted for can affect prices
paid per square foot quite drastically.
In addition to variations in cost by type of building, variations
in the type of construction can affect the cost of new space, whether
the construction is that of a brand-new building, or an addition to an
existing building. A priori, the cost of additions should be a fifth
less per square foot. In fact, a considerable number of additions of
minimal space cost two or three times as much per square foot as
new buildings. Follow-up of these anomalies revealed that in those
cases considerable rehabilitation of existing facilities was included
in the price of the project.
235bES
205
An analysis of the College Management tape revealed that
variations of cost per square foot by projects state by state, or
within urban areas of a group of states, vary quite drastically. A
detailed analysis of costs could not be undertaken because differences
between average costs were not statistically significant.
On the other hand, there is no doubt that regional price
differences exist. It appears that the highest costs are incurred in the
Northeast and in West Coast states, while the lowest cost experience
is in the South. Costs in Midwestern and some Mountain states fall
in between these ranges (sea Table 9.3).
Nevertheless, even when results for groups of states are
aggregated, the year-to-year variations, as shown in Table 9.3, are
quite random. They may be due to a variety of causes: differences
in the types of buildings, variations in specifications, tightness of
the local labor market, etc.
The large variations in costs of similar buildings, say
classrooms, is staggering. In 1970-72, some classrooms were
completed at a cost of $17 - $22 per square foot, while the average
cost per assignable square foot of classrooms exceeded $40 - $45.
Equally wide variations were recorded in costs of dormitories.
The pioneering work of the Educational Facilities Laboratory
(EFL), which has documented the savings made possible with pre-
fabricated, modular buildings, is not widely accepted. The desire to
"las
harmonize the architecture of new buildings with the old, the desire
of college presidents and donors to erect unusual and interesting
buildings, the increasing trend to involve faculty, students, and even
community agencies or individuals in the planning of campuses have
conspired to limit the acceptance of "fast-track" modular buildings.
EFI., personnel argue that, by the time a new facility is ready, a
significant part of the faculty which planned it will no longer be
employed by the institution. The turnover of students and the change
in the composition of community leaders' priorities between the
planning period and occupancy is likely to be even more drastic.
EFL claims that custom-planned buildings are built for phantoms,
since the cycle of planning, consultation, and subsequent custom
building takes some three years to complete from inception to
occupancy.
Probable Levels of Construction Costs
The average cost of a square foot of assignable space exceeded $52
in 1973. With inflation at a high level in 1973-74, it is probable that
space contracted for in 1974 will cost some $57 a square foot.
The current consensus among economists is that inflation will
continue at five per cent or so a year, and it is quite likely that
shortages of cement, steel, and lumber will push prices of building
up faster than the inflation level, with average costs rising at six or
seven per cent a year.
-41.137
207
As more and more construction is concentrated upon library
and laboratory buildings, the actual costs to colleges may be five or
ten per cent higher than the actual trend indicates. The considerable
jump in average costs per square foot between buildings completed
in 1972 and 1973 and those planned in 1973 partially reflects this
shift. It will be remembered that the majority of buildings completed
during these years were contracted for three years earlier.
Costs of Rehabilitation and Refurbishing
If our pessimism about the future levels of enrollments
proves correct, the major effort of most campus planners will no
longer be centered upon expanding or building new campuses, but
will be mostly concerned with rehabilitation and refurbishing.
The Norris Committee estimated that roughly 10 per cent of
the plant as of 1968 needed rehabilitation. We interviewed four state
space planners, several officials charged with a given public
institution's facilities, and half a dozen private school planners, and
came away with a slightly different impression. We concluded that
no more than five per cent of the public sector plant was substandard.
I lowever, proportions varied considerably from campus to campus.
Thus, the New York City public and private plant was in much worse
shape than facilities elsewhere.
Part of the substandard plant in the public sector consisted of
older dormitories and, often, of smaller buildings, mostly wood or

208
stucco, which were taken over by the college as the campus expanded.
Many of the older dormitories were being razed, and some of the
smaller buildings. which were used to house small research groups
were also being abandoned, as support for research programs was
drying up. We were surprised to find that a number of temporary
buildings had been refurbished for special purposes--a laboratory on
some campuses, an art studio on others- -and were considered by
their occupants as superior to alternative accommodations in more
recently erected structures.
The extent of non-maintenance in major state systems is
negligible. Roofs, safety railings, etc. , were kept in good repair.
The skimping, or stretch-out, between replacements was mostly on
marginal items such as painting, hardware (especially windows and
blackboards), and to some extent ground maintenance and cleaning.
Some progress was being made in mechanizing these last two functions,
and a considerable cost savings realized.
The problems most often cited by campus planners which
related to desirable rehabilitation of buildings were more fundamental:
(1) some buildings built as late as the 1940's do not meet current
standards for wiring and fire resistance, and (2) a number of science
laboratories need modernization. In some disciplines where research
techniques were fast-moving, laboratory layouts had become obsolete.
The need to modernize them is quite urgent.
209
After consolidating our notes of field visits, and applying the
factors to facilities in all the public sector, we arrived at the con-
clusion that probably two per cent of the space in the public sector
would require drastic refurbishing. Probably another two per cent
will become obsolete by the end of the 1980's.
Our consultants estimated the cost of refurbishing buildings
at $25 to $30 a square foot, or between 50 and 75 per cent of the
cost of new construction. If these figures are accepted, some $800
million at current prices could be needed for major refurbishing.
Some of this refurbishing may never take place, however, because
older buildings may be demolished rather than refurbished.
In the private sector, the need for rehabilitation is less
clear-cut. The average age of buildings is much higher than in the
public sector. Also, a number of financially hard-pressed schools
have greatly neglected maintenance. In some schools, roofs have
been undermaintained, resulting in damage to the structures. Stories
of bad plumbing and overage boilers in the heating plant are also
commonplace. Painting, minor maintenance, and cleaning are
generally at a lower standard than in the public sector.
Private sector space planners believe that some ten per cent
of the value of the plant should be spent to bring it up to snuft, and
liS210
210
that roughly one per cent a year from there on should be spent on
renovations. We were rather surprised by the consistency of these
estimates coming from space planners in what appeared to be both
well- and under-maintained campuses. In fact, while the cited
backlogs are of the same magnitude, the objectives for refurbishing
differed. The space planner from the under-maintained campus
cited as his priorities heating, roofing, and prating. The priorities
on the well-maintained campus were mostly in tae area of remodeling.
In the opinion of the administration and faculty, classroom buildings
needed remodeling to provide additional office, research, and
specialized library apace. By our modest standards, there were no
shortages of any kind of space on that campus, and considerable
money would be saved in the long run by calling in the bulldozer
rather than the architect.
Conclusion
During our field work, we saw little evidence that the drying
up of federal funds affected construction decisions, except in the case
of one medical school. Nor was there any evidence that shortages of
funds affected the architectural plans of different schools. In certain
instances, space planners complained about the slowness and
inflexibility of state agencies in approving expenditures of funds. By
contrast, fedcral facilities personnel received high marks for their
understanding ncl cooperation in the past.
241fit!:

211
Despite the high regard for federal personnel in local planning
circles, their influence on determining space standards was minimal.
Also, the lip service given to planning educational facilities in a given
area did not bring cooperative ventures into being, either in
construction or operation of facilities, by different entities of public
systems or between public and private schools.

212
TABLE 9.1
INDEXES OF CONSTRUCTION COSTS ANDCOST OF LIVING INDEX
(1957-59 = 100)
CollegeManagement
College BuildingIndex
Department ofCommerce
Composite Index
BLSCost of Living
Index
1963 109.9 109 106.7
1964 112.6 112 108.1
1965 115.7 115 109.9
1966 119.6 119 113.1
1967 124.0 125 116.3
1968 130.( 131 121.2
1969 139.7 142 127.6
1970 149.7 152 135.2
1971 159.2 153 141.1
1972 168.8 164 145.7
1977 177.0* 177** 154.3**
* Estimated** July
Source: College Management, June/July 1972; Department ofCommerce and Bureau of Labor Statistics Cost of livingIndices: adapted from Statistical Abstract of the UnitedSt.lies, 1972, and Survey of Current Business, !dm.
tit kt 3
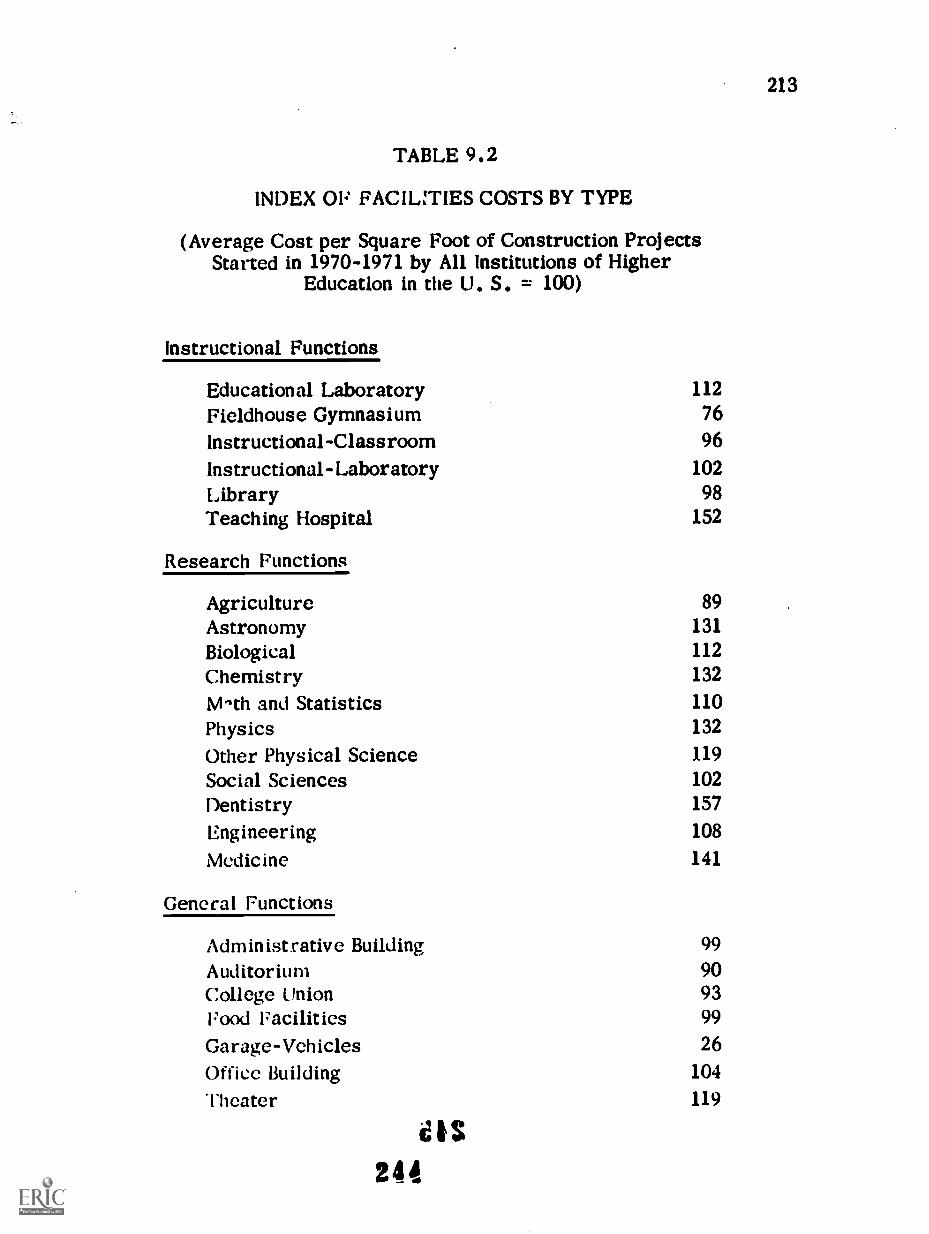
213
TABLE 9.2
INDEX 01: FACILITIES COSTS BY TYPE
(Average Cost per Square Foot of Construction ProjectsStarted in 1970-1971 by All Institutions of Higher
Education in the U. S. = 100)
Instructional Functions
Educational Laboratory 112Fieldhouse Gymnasium 76
Instructional-Classroom 96
Instructional-Laboratory 102Library 98Teaching Hospital 152
Research Functions
Agriculture 89Astronomy 131
Biological 112
Chemistry 132
M,th and Statistics 110Physics 132
Other Physical Science 119
Social Sciences 102Dentistry 157
Engineering 108
Medic ine 141
General Functions
Administrative Building 99
Auditorium 90College Union 93Food Facilities 99
Garage- Vehicles 26
Office Building 104
Theater 119
EIS244

TABLE 9.2 (Coned)
INDEX OF FACILITIES COSTS BY TYPE
(Average Cost per Square Foot of Construction ProjectsStarted in 1970-1971 by All Institutions of Higher
Education in the U. S. = 100)
Residential Functions
Married Student Apartments 75Men's Residence Hall 77Women's Residence Hall 68Coed Residence Hall 83
Source: "1971 Index: Campus. Construction Costs Continueto Rise," College Management, June 1971, p. 9.
,..
245tit'
214

215
TABLE 9.3
COST PER SQUARE FOOT OF COLLEGE CONSTRUCTION,BY REGION
1972 1973 TotalCompleted Completed 1973 Starts 1972-1973
Cost Per Cost Per Cost Per Cost PerRuin* Square Foot Square Foot Square Foot Square Foot
62.21 55.34
76.09 57.45
1 40.67 59.06
2 45.05 53.51
3 37.77 45.81
4 37.72 32.14
5 32.55 33.39
6 29.98 30.19
7 28.65 39.84
8 28.89 35.83
9 55.36 42.62
39.03 43.36
*Regions are as follows:
50.43 44.87
30.95 34.14
47.15 37.47
33.79 31.66
51.13 42.64
36.64 33.90
51.13 49.80
52.22 45.26
Region 1 Region 2 Region 3
Connecticut New Jersey IllinoisMaine New York IndianaMassachusetts Pennsylvania MichiganNew I lampshire OhioRhode Island WisconsinVermont
it%

216
TABLE 9.3 (Cont'd)
COST PER SQUARE FOOT OF COLLEGE CONSTRUCTION,BY REGION
Region 4 Region 5 Region 6Iowa Delaware AlabamaKansas District of Columbia KentuckyMinnesota Florida MississippiMissouri Georgia TennesseeNebraska MarylandNorth Dakota North CarolinaSouth Dakota South Carolina
VirginiaWest Virginia
Region 7 Region 8 Region 9Arkansas Arizona AlaskaLouisiana Colorado CaliforniaOklahoma Idaho HawaiiTexas Montana Oregon
Nevada WashingtonNew MexicoUtahWyoming
Source: 1973 Cost of Building Statistics, College Management,June/July, 1973
ii?
217
CHAPTER 10
NEW TECHNOLOGIES AND NEW ATTENDANCE PATTERNS
Projections of space requirements made on the basis of present
instructional technologies or current attendance patterns can be
criticized as being insufficiently imaginative, since they do not take
into account the startling technological changes which have taken
place since the middle of the twentieth century. Many educators
have argued that the impact of television, learning machines, and
computers is likely to revolutionize higher education, and that the
universities of the twenty-first century will be unrecognizable to
today's students and administrators. The most radical advocates of
change have repeatedly questioned the necessity of bringing together
large numbers of young people on campus, and have advocated
decentralized, home-based learning centers, which will do away
with the need for college campuses altogether.
After perusing a significant volume of literature on the subject
of new technologies and new attendance patterns, we came away with
a feeling of deja vu about a large number of tcpics. The literature
in the past 20 or 30 years is replete with announcements of brave new
experiments which will revolutionize the post-secondary sector. The
institutions in which these experiments were started ten or fifteen years
eis 248

218
ago are indistinguishable today from the stick-in-the-mud institutions
which continued in their conventional way. Time and again, when
the failure of an experiment is reviewed, the optimism for its success
is not dampened, and hopes for one more technological breakthrough
which will allow the technique to become operational are voiced.
Experiments to change drastically the form or content of
post-secondary instruction, in our opinion, have floundered for two
different reasons: (1) their applicability was limited, and (2) their
costs were high. Most technological innovations were pioneered in
rich institutions, with either foundation or government moneys. The
attempts were directed to improving the course content and teaching
techniques, rather than to reducing the cost of material. Thus, the
institutions which had to watch their budgets did not participate in the
development of new technologies and could not use them, while those
which did had little regard for financial constraints.
In addition tc these institutional rigidities, as long as
development costs remain high for course materials using advanced
technologies, such as computers, a number of other stumbling blocks
are in the way of the acceptance of drastically different instructional
technologies:
(1) There is no set national curriculum for post-secondarysubjects. Different schools adapt course content toboth their students and the whims of the instructor.
eit. 249

219
(2) The caliber of students between one school and the nextis drastically different. Individualization of instructionmay be successfully programmed for M .I .T. students,but will not satisfy students at N.Y .U. with S.A.T.scores 200 points lower than those at M .I.T.
(3) The priority for the presentation of material maychange in disciplines subject to a knowledge explosion,or to fads in a discipline where fashions rather thanthe scope of knowledge determine the scope of thecourse work, and destroy the considerable investmentwhich was required to prepare the course materialfor presentation with new technology.
Finally, most discussions of new technology ignore the
function of post-secondary institutions as either socializing, or
"aging-vats," or milieus for learning. Most technologists assume
that it is sufficient to merely present the information covered in post-
secondary courses in order to have it absorbed by the student. The
reinforcement effect of living or communicating with other students
is generally discounted.
It has been claimed that the lecture method, once popular in
Greece, was reinvented during the Renaissance, when dissemination
of knowledge on a larger scale became popular once again. In the
absence of cheap materials, conversational instruction was an
economic necessity. It is amazing that the invention of printing, and
the distribution of cheap printed materials did nothing to reduce the
popularity of the lecture method. Are new technologies, such as the
computer, television, and the tape or video cassette so much more
1 ZS 25

220
powerful than printed matter in breaking the educational system out
of its traditional mold?
The Computer
The computer is a versatile tool with awe-inspiring potential.
It has a number of uses in post-secondary education, some of them
more likely than others. At the very outset, one ought to distinguish
the role of the computer as (1) a device for computing or record-
keeping, (2) a tool in the complex called "computer-assisted-
instruction," and (3) as a manager of the learning process.
A Device for Computing or Record-Keeping. Besides the
administrative functions performed by a computer for the non-
academic function of the university, computers are used in both
research and instruction. A large number of post-secondary
institutions teach their students to use the computer in solving
problems given as part of their course work. Generally, the
laboratory space provided for both science and arts students includes
a provision for a remote terminal, usually placed in the corner of
a laboratory.
The computer at the other end of the terminal may be
located in the given institution or at some remote location. With
considerable economies of scale, the remote computer serving a
number of camptp;es is likely to become the exception rather than
piit251

221
the rule. If one were to assume 15 minutes of computer terminal
usage per student per week (a rather generous estimate based upon
the experience of a pioneering engineering school), with 50 hours a
week availability, a terminal location of 50 square feet is needed for
each 200 students. This is not enough space to worry about.
Computer-Assisted Instruction. Space for being taught by
computer is another matter completely. It is conceivable that as
many as four or five hours a week could be spent at a computer
terminal by students participating in a heavily computerized program.
Thus, as much as five square feet per FTE student could be required
for that purpose.
Unfortunately, the prospects for CAI do not appear to be
very promising. Wits have remarked that anything can be done with
CAI at ten times the conventional cost. More serious analysts have
had the following reservations:'
"Computer-assisted learning: very poor, to date,as a replacement for .textbooks or paper-programmedinstruction for original learning of most material ona cost-benefit basis. Highly worthwhile, if theprograms arc well-developed, in allowing studentsto test their understanding of material or explorethe effects of certain choices in a simulated worldrepresented by a computer model."
1 John F. Rockart. "A Method for the Integrated Use of LearningResource:; in Education," The journal of higher Education,Vol. NI,IV, No. 4 (April 1973).
352

222
A promising development at the University of lllinois,
called PLATO (programmed logic for automated teaching operations),
which uses a sophisticated display and late model equipment, is said
to deliver course material at the cost of $0.60 to $0.80 an hour, as
nearly as we can deduce net of development costs. The effectiveness
of this material versus conventional material on a per-hour basis is
now being tested. Because of high fixed costs, the power of the
computer, etc., the system will only be a success if it is adopted
widely. If it is, to remain competitive, it will require higher
utilization of computer stations, and will not require any more space
than conventional instruction.
Currently, there is a great division of opinion about the
future of computer-assisted instruction in institutional settings. All
cost-conscious ^ciministrators are even less optimistic about the use
of cable television for transmitting course material than they are
about the use of CAI on the premises of post-secondary institutions.
The cost of sophisticated terminals in the home is likely to remain
prohibitive for at least the next decade, and possibly the next two
decades. The slow inroads of cable television are unlikely to speed
up development of such a terminal either.
Manager of the Learning Process, The computer has also
been used as a device to schedule and retrieve audio-visual materials

223
for use in other technology-supported learning situations. It has been
used to locate the right tape or audio-visual cassette for the student.
Sometimes a small process-control type computer has been used for
that purpose, at other times this additional task has been performed
by a powerful administrative or research computer. In neither case
has the space for that purpose been significant. A time-shared,
interactive, computer-controlled television system (TICCIT) is
currently under development.
Audio Devices
Language laboratories and tape-recorded lectures have been
around for a long time, and probably have reached the peak of their
acceptance. Audio centers are found in four out of five campuses.
They are usually small, and employ no more than five full-time-
equivalent staff members.' Space requirements for them have been
provided above. Schools with courses on cassettes, e.g., Michigan
State University, where 3,000 cassette stations average 100 hours a
week, still require the same amount of space.
Audio- Visual Devices
The use of audio-visual devices, be they television programs
or audio-visual cassettes, appears to be much more widely discussed,
"Audiovisual: 1970-71," College Management, October 1970,pp. 12-13.

224
especially since easily accessible video cassettes became
technologically feasible a few years ago. The National Science
Foundation is sponsoring a study of their utilization, and subsidizing
part of the production cost of materials. It is too early to pre-judge
the results of this experiment.
Up to now, though, instructional television has failed to catch
on in post-secondary institutions. A lecture on film is deadly dull.
Some of the best teachers are "cut down to size" by the television
tube. The possibility of instant replay on a cassette may be less of
an advantage than most persons believe, as the continuity of the
exposition is destroyed. Unless special programming is developed,
and the lecture process is adapted to the requirements of television,
little progress is likely in that field.
The experience of pre-school educators, who expended over
$2 million for "Sesame Street," has not been internalized by post-
secondary institutions, who still put substance over presentation,
and are hence out of step with the requirements of the new video
technologies.
General Comments
The pre-conditions for automation in the industrial world
are (1) uniformity of the quality of raw materials, and (2) long
production runs. In a general way, the same pre-conditions must
225
be met by educational institutions before they adapt new technologies
for their use. As long as the level of ability of students is not
differentiated and specified by developers of programs, replication
of successes with programs developed in one institution will not
occur in other locations. Second, in order to iustify the high
development costs of most programs using advanced technology, a
general consensus must be reached about course content and the
usefulness of a technology. Third, as institutions of higher education
pride themselves on their differences, it will be much more difficult
to arrive at a consensus on either of these two topics. This consensus
will certainly not be established until both the costs and the effective-
ness of the new technologies are indisputable. Much in the present
climate of academic penury conspire.; against a revolution in teaching
techniques. The easy supply of faculty, the increasir,j, concerns of
tenured faculty about the security of their jobs, and probable
slower growth in total enrollments are likely to retard the acceptance
of even proven techniques. The groves of academe are unlikely to
shed their leaves and sprout antennas and radar towers for computer
data transmission in the near future, at least not in the next 10 tc
15 years.
The exposition in this chapter that few drastic innovations are
on the horizon reflect the current consensus. A Delphi study by the
25lies

226
National Center for Higher Education, Management Systems at
WICHE, did not expect any major changes to occur before the end
of the decade. The findings of the panel are reproduced in Table 10.1.
Nor can considerable succor for the advocates of change be
obtained from recent surveys of the Carnegie Commission on Higher
Education. In a curious, loosely structured compilation by Roger E.
Levien, The Emerging Technology: Instructional Uses of the Computer
in Higher Education,' the compiler regards CAI as an emerging tech-
nology, which will not gain wide acceptance until the end of the decade,
since program development is still in its incipient stage. The cost
benefit of the computer-aided instruction is certainly attractive,
according to Levien, if (1) the projected costs decline as much as
Levien forecasts, and (2) if program development costs are not
excessive.
After completing Lhis review, we became aware of a technical
report, also sponsored by the Carnegie Commission on Higher
Education.2 r.lis report, substantially used the same materials as
we did, and can be used to document some of our findings. For
instance, our survey of innovative institutions did not uncover striking
1 McGraw-I fill Book Company, New York: 1972.
2 Ann !fess, An Inventory of Academic Innovation and Reform,Carnegie Commission on I ligher Education, Berkeley, California:1973.

227
differences in space. Space usage is not even mentioned in the above
cited discussion of innovative institutions. Findings about shortening
the B.A. period, outside credit by examination and work experience,
etc., document the slight impact of these innovations on the
2,500 post-secondary institutions.
In summary, the general consensus of observers, both
sympathetic and unsympathetic, is that innovation is unlikely to
change the character of demand for space in the post-secondary
sector. On the contrary, attempts to innovate will probably decline
in the future as excess space becomes available. Some of the modest
attempts to provide more flexibility to dispense post-secondary ser-
vices through weaning the student from the campus are likely to be
discontinued. Probably by 1990 the post-secondary sector will be no
different than it is today.
258

TA
BL
E 1
0.1
STR
UC
TU
RE
OF
ED
UC
AT
ION
AL
TE
CH
NO
LO
GY
Cha
nge
Stat
emen
t
Exp
ecte
dM
ost
Mos
tD
ate
of%
Res
pond
ing
Prom
oted
Hin
dere
dL
ikel
ihoo
dIm
pact
Cha
nge
Shou
ld O
ccur
By
By
tise
of in
divi
dual
ized
inst
ruct
ion
Mod
erat
eV
ery
Hig
h19
7996
Stud
ent
Facu
ltyw
ill in
crea
se
The
use
of
TV
, Com
pute
rs, a
ndV
ery
Hig
hH
igh
1979
97In
dust
ryFa
culty
new
tech
nolo
gies
in p
ost-
seco
ndar
y in
stru
ctio
n w
illT
hcre
ase
tVar
iatio
ns in
aca
dem
ic c
alen
-M
oder
ate
Low
1978
79St
uden
tFa
culty
dars
will
incr
ease
IvT
he e
mph
asis
in p
osts
econ
dary
Ver
y L
owM
oder
ate
1982
69St
uden
tFa
culty
ptC
Oed
ucat
ion
will
be
on te
chni
ques
and
proc
esse
s fo
r le
arni
ngra
ther
than
sub
ject
mat
ter
Futu
re p
hysi
cal f
aciP
ties
will
Hig
hM
oder
ate
1980
97St
ate
Facu
ltybe
mor
e fl
exib
le a
nd v
ersa
tile
Few
er f
acul
ty m
embe
rs p
erL
owM
oder
ate
1981
64St
ate
Facu
ltyst
uden
t will
be
requ
ired
for
inst
ruct
iona
l act
iviti
es (
due
tosu
ch f
acto
rs a
s ch
angi
ngte
chno
logy
)
00
OM
Oa
OM
NM
IIN
N11
1111
1S
IMI
SIP
SIM
IE
MI
Ole
1111
111
OM
OM
MI =
I MID
INS
MIN
I

TA
BL
E 1
0.1
(Con
t'd)
STR
UC
TU
RE
OF
ED
UC
AT
ION
AL
TE
CH
NO
LO
GY
Exp
ecte
dM
ost
Mos
tD
ate
of%
Res
pond
ing
Prom
oted
Hin
dere
dC
hang
e St
atem
ent
Lik
elih
ood
Impa
ctC
hang
eSh
ould
Occ
urB
yB
y
Post
seco
ndar
y ed
ucat
ion
Ver
y H
igh
Mod
erat
e19
7798
Stat
eFa
culty
faci
litie
s w
ill b
e us
ed m
ore
hour
s in
the
day
and
mor
e da
ysin
the
year
Dim
inis
hing
am
cunt
s w
ill b
eH
igh
Ver
y L
ow19
7780
Stat
ePu
blic
spen
t for
cap
ital c
onst
ruct
ion
Inst
.in
larg
er p
osts
econ
dary
OPP ga
p ed
ucat
ion
inst
itutio
ns1.
IV dbSo
urce
: Vau
ghn
E. I
luck
feld
t, A
For
ecas
t of
Cha
nges
in P
osts
econ
dary
Edu
catio
n, W
este
rn I
nter
stat
eC
omm
issi
on f
or P
osts
econ
dary
Edu
catio
n, 1
972.

230
CHAPTER 11
110W MUCH SPACE IS REALLY NEEDED?
Introduction
There is no generally accepted method of determining the
amount of space required to accommodate a stated number of full-
time-equivalent students. The most obvious uncertainties surrounding
estimates of required space were described in Chapter 4. Assump-
tions had to be made about the type of program to be offered, the
type of supporting facilities, etc. These assumptions may change
drastically as the character of students changes, and more students
attend vocationally oriented programs. Chapter 4 also stressed that
the amount of space depends not only on the mix between graduate
and undergraduate students, but that institutions enrolling a higher-
than-average proportion of full-time students will probably need
more space than institutions with more part-time students. In
Chapter 6, it was also pointed out that, at least in universities, the
available non-residential space varies considerably from institution
to institution, depending upon the emphasis on physical and biological
sciences.
The extent of support facilities per PTE student also varies a
great deal between institutions. We documented large variations in
4-Hit. 214

231
assignable space per full-time or full-time-equivalent student in
library, office, and other non-residential space categories. To some
extent, these variations were caused by the character of the institu-
tion. Schools with important research commitments accumulate
large book collections. These collections take a great deal of space
to house, and consequently the storage and study space in these schools
has to be above average.
Variations in the amount of office space are less closely tied
to the characteristics of the school. Again, research-oriented
schools provide reasonably elaborate facilities for their faculty. By
contrast, most junior colleges up to now have placed a low priority
on facilities for the use of faculty. Some junior college administrators
still believe that two-year college instructors do not require more
space than high school teachers. These administrators are now in
the minority. As more emphasis is placed on counsAing, and the
general drive to "professionalize" two-year college faculties gains
strength, more elaborate facilities for junior college faculty are
planned. We do not wish to pass judgment en the cost/effectiveness
of this trend, but just note, in passing, that the research activity in
most schools is trivial, yet office facilities, at their optimum, are
fairly similar in research and non-research schools.
The variation in ancillary facilities is most pronounced, and
the standards of what is adequate even more of a gray area. Some

232
institutions, mostly private schools and large state universities, are
practically self-contained enclaves offering, besides instruction,
culture, shopping, food, and housing. Others, especially newly
established state four- and two-year colleges, are no more than
embryos of schools, with classrooms, laboratories, and inadequate
office and library facilities, with ancillary buildings still in the
planning stage. It is possible to argue that these schools should
remain underdeveloped, from a facilities point of view, and be
re-oriented to cater to the fast-growing numbers of episodic, non-
degree, vocationally oriented students.
The estimates of probable demand for space in this study
are not based upon any radical thoughts about the restructuring of
college campuses. Our survey of innovative activity has convinced
us that no drastic change is anticipated by either campus planners
or administrators. Instead, we have tried to apply imaginatively the
modest standards developed in this study to develop a series of
alternative targets. These standards, it will be remembered, are
based upon existing practices. Implicitly, they also assume some
upgrading in junior college facilities, and provide for facilities equal
to those of similarly situated students in four-year schools. The
standards reflect the consensus about what modest but adequate
facilities ought to be.
24110k.;

233
As a general rule, the standards provide for less space than
the average available in most institutions today. This discrepancy
may be due to two causes: (1) the standards do not make any allow-
ances for specialized facilities in medical schools and certain
technological, agricultural, or scientific programs, and (2) actual
availability of space reflects the recent overbuilding of some
campuses, which were planned for higher enrollments than those
which actually materialized. Since campus building is not divisible,
campuses arc built for the potential estimated enrollment, rather
than the enrollment which is recorded the year new construction is
completed.
Factors derived from data in the Appendix to Chapter 5 leads
us to believe that space required for technological programs may add
some nine per cent of the overall inventory. This figure is used in
projections in Table 11.1.
It is also our conviction that very little, if any at all, additional
space is required for the private sector. Undoubtedly, new buildings
will be erected there. In some instances, administrators feel corn-
mited to a new building, e.g., a student union at Syracuse. In other
instances, private schools receive large donations which allow them
to improve their facilities, e.g., the grant from the Fairchild
Corporation to build a science tower at Columbia University to
imitate the Cummings tower at the University of Chicago. In other
CaS2S4
234
words, we believe that construction will continue in the private
sector because most private institutions will build as much as they
can afford.
A much more interesting question, from the point of view of
policy, is the extent to which some of the excess space in the private
sector can be transferred to the public sector. Some of these
transfers are already happening, as the uptown New York University
campus and tile Brooklyn facilities of Long Island University have been
sold to the City system. Other schools, especially private junior
colleges, have large excesses of space by most standards, and it is
quite possible that some of the space could be acquired by the public
institutions, either by absorbing private schools, just as the University
of Buffalo or the Upstate Medical Center in New York were absorbed
by the State system, or through purchase of excess space from
institutions. Estimates of future space requirements for the public
sector, to which the rest of this chapter is devoted, will not take into
account these transfers, since there is no way to forecast this trend
objectively.
We shall now turn to a discussion of possible methodologies
which could be used to estimate space needs in the public sector.
i265
235
Methodologies
The most common methodology (and the most unsatisfactory
one) is to multiply the space standards by the number of full-time-
equivalent students. It assumes that if enough space is available to
meet standards, available space is adequate, and variations of
assignable square feet per student are due to program differences.
Space standards multiplied by I7TE students would provide a reasonable
estimate of space only on condition that no excess space existed in any
institution. With excess space in any one institution, shortages must
exist somewhere else. Because the methodology is widely used, it is
discussed below.
A somewhat more reasonable way of reckoning future space
needs is to estimate the amount of space required to accommodate
additional students who will be attending public institutions. This
method assumes that existing space in 1970/71 was, on the average,
adequate (which it was), and that additional construction will be
channeled to eliminate shortages, and schools with surplus space
will recruit students to fill the available spaces. Despite the fact
that these c ;sumptions are somewhat optimistic, they are not
unwarranted, and an estimate reflecting them is also shown below.
By far the most reasonable estimate requires more complex
calculations. To provide adequate space for all students, it is incum-
bent first to eliminate shortages in schools which are currently short
2sa

236
of space; and second, to provide space for increased enrollments.
Some of the space for additional students is likely to be provided in
schools with mt space than the average, where presumably
facilities in place were planned for larger enrollments. An estimate
of required space using these postulates is presented below.
Finally, it can be argued, albeit not very convincingly, that
space shortages will be eliminated only if the relative advantage of
space-rich schools is allowed to continue in the future. Thus, in
order to bring space-poor schools up to the standard, available space
in all schools has to be increased.
A discussion of each one of these methodologies follows.
Sufficient Space to Meet Average Standards
By Fall 1971, the public sector already had 529 million
assignable square feet in place. (There were roughly 504 million
square feet in the Fall of 1970.) If a contingency of ten per cent of
the overall inventory were placed on our standards, roughly
650 million square feet would be required at peak enrollments in
1980 if our high estimate of enrollment is accepted, and 540 million
square feet if the low estimate is accepted. With construction
continuing to contribute some 40 million square feet in the course
of the next few years, it is likely that these targets will be easily met.
if tl:i projection is used to determine demand for space, and
construction contracted for since Fall 1971 (some 140 million
261

237
assignable square feet, of which 95 to 105 million square feet will
go to the public sector) is added to the surviving stock, a shortage
of space is impossible under the low projection, and is unlikely with
the high projection of students, on condition that a modest number of
building contracts continue to be let (see Table 11.2).
Providing Space for Additional Students
This is a very straightforward estimate. The increase in the
number of. FTE students in both the high and low enrollment projections
are multiplied by the space standards. This exercise produces addi-
tional space requirements of between 90 and 195 million square feet
by 1980/85. Again, given present construction rates, it does not
seem that shortages in space will develop (see Table 11.3).
Eliminating Shortages and Building New Schools
The estimate to eliminate shortages was calculated as
follows: all campuses in quartiles with space less than the standard
were assumed to add space equal to the standard. For instance, if
a group of public universities had less than 89.8 square feet per
FTE student, the difference between the average space and 89.8 was
multiplied by the number of I,TE students to derive the space
shortage. We estimated that the space shortage was 20 million
ass4mable sciodre feet (see Table 11.4), with the lion's share of it in
288
238
other four-year schools. This amounts to less than four per cent
of the available space.
In addition, with this methodology, space must be provided
for universities, other four-year schools, and two-year schools to
increase their size to accommodate new enrollments. Also,
provision is made for a small number of new campuses to be
established, in accordance with the assumptions stated in Chapter 3.
A table was constructed to calculate the additional space
required for a school where enrollments would grow. It was assumed
that, on the average, allowing for technical programs, eight per cent
more space than in our standards ought to be made available in
universities, five per cent in other four-year schools, and twelve per
cent in two-year schools. Thus, a university with less than
10,000 PTE students likely to enroll between 10,000 and 20,000 FTE
students by 1080 was assumed to require additional space to house the
average number of FTE students enrolled in the larger category of
school. The number of assignable square feet already available in
the most space- rich schools was subtracted from the estimated space
required. This method provided estimated requirements of between
89 to 193 million additional assignable square feet to accommodate
irrE students by 1980 (see Table 11.4).
269
d 4,

239
Increasing Average Space Proportionately
Although it may sound both unreasonable and wasteful, the
possibility that average space should be increased proportionately
for all schools in such a way that schools in the lowest quartile attain
the minimum standard of space makes a great deal of sense in
practice. Just as we have been unable to change drastically the
income distribution of the population, and the reduction of the number
of persons at the poverty level has been achieved only by raising
everybody's income, it may also be impossible to allow schools with
inadequate space to catch up to the admittedly modest standards
without allowing the space-rich schools to increase their facilities
as well. In other words, the estimates below give an indication of
the extent of affluence needed to eliminate poverty in space.
These new "standards" have been derived by multiplying
current averages of space by type of school by the ratio of the
standard derived in this study by the actual space in the lowest
quartile falling below the standard. The space in other quartiles was
increased accordingly. For instance, if the space standard was
5t square feet, and the space in the lowest quartile was 25 square
feet, it is presumed that adequate space standards in all space-poor
schools would not be ,ichieved until the space in all schools would

240
The space requirements using the above assumption are
shown in Table 11.5.
Economies of Scale
We have been unable to find in the literature any consistent
justification of larger amounts of space per full-time or full-time-
equivalent student for smaller campuses. Perhaps small campuses
are not planned, they just happen. Hence, there is little literature
on their needs. Nevertheless, institutions catering to commuter
populations in the public sector, as well as a number of smaller
schools in the private sector, have existed for a very long time, and
do perform reasonable, specialized functions to selected segments
of students. In some cases, it appears reasonable to allow more
space per pupil in a small institution because of the tradition of the
school or the services it provides to a local community.
In the case of universities, once small divinity schools are
eliminated, and research institutes such as the Rockefeller University
or M.I.T. ignored, variations of available space per FTE student are
not significant either in the public or private sectors. Among other
four-year schools, both public and private, the differences in available
space are quite striking. For instance, other four-year schools in the
public sector with less than 2,500 enrollment have half again as much
space as those in the 5,000 to 10,000 range. In the private sector,
even wider discrepancies are registered.
271
241
Chart 11.1 shows the average square feet per FTE student
for both other four-year schools and two-year schools. (We would
suggest that the experience of small private junior colleges be ignored,
since the space available there is not representatle. Many of these
schools are operating larger campuses than they want to, becatwe
their enrollments are declining.) If the slope of the two curves is
averaged out, we would come to the conclusion that schools with
less than 1,000 FTE students need roughly twice as much space,
those betwecm 1,000 and 2,500 FTE students about 50 per cent more
space, and those between 2,500 and 5,000 FTE students some ten
per cent more space.
The adjustment to space standards developed by this study for
public institutions in 1980 appears in Table 11.6. The adjustment
would vary slightly from year to year, because we have assumed a
different distribution of institutions over the next 20 years. Because
1980 is the peak year for enrollment projections, it is reasonable to
assume that, with present management techniques, some five to
seven per cent more space than is provided by standards will be
required in other tour -year schools, and some 25 per cent more in
two-year schools.
Available Space and Needed Future Commitments
The nu of total non-residential space which will be
available in the period 1975 to 1490 was estimated in Chapter 7.272
tat

242
Below, we break down these estimates into space likely to be in use
in the public and private sectors.
The starting point for the allocation was the inventory as of
Fall 1971. At that time, 64.6 per cent of the non-residential space
was accounted for by the public sector, and 35.4 per cent by the
private sector. In the four years 1968 through 1971, the increment
in -he stock of non-residential facilities was 72 per cent to the public
sector and 28 per cent to the private sector. We believe that this is
a conservative estimate of the future increment of stock by sector.
The proportion is more likely to be 85 per cent for the public sector
and 15 per cent for the private sector, if the impressions gained
from our field visits are to be trusted. Yet, in the interest of
conservatism, we have adopted the 1968/71 experience. If we were
to assume that an additional 36 million square feet of non-residential
space would come onstream in 1975, to be added to the figures
reproduced in Table 7.5 (a conservative estimate in the light of
1972/73 building starts), the total projected committed stock in the
public sector, after providing generously for retirement, is likely to
amount to the following:
1975 678 million assignable square feet
1980 664 01 It
1985 649 09
1990 62201 11
- 4
273

243
These figures include non-class laboratories, approximately
39 million assignable square feet.
Thus, the available non-residential space dealt with by this
study, with no further starts, would be equal to 639 million square
feet in 1975, declining to 627 million in 1980, 614 million in 1985,
and 587 million in 1990.
If this study's standards, adjusted for technical programs and
size of school were to be adopted, the required space requirements
for the high projection would be met with current commitments
through 1980, and would require only six million square feet of
construction for the period 1980-1985. With no further construction,
the system would have sufficient space through 1990.
Only under the assumption that present surpluses are allowed
to persist, and space is provided for additional students with extra
space allowances for technical standards and additional space for
smaller schools, will the inventory be in balance in 1975 with the
high enrollment projection. After that date, modest additional
construction amounting to nine million square feet a year in 1975-80
would be sufficient to make up the future stock. Construction needs
after that date would be equally modest.
If we were to use our preferred method of projection, that of
eliminating shortages, as well as providing adequate space for new
institutions, space already committed in the public sector would be

244
sufficient to accommodate the low projection and leave 77 million
square feet over, even after an allowance for an effective utilization
for small schools. Additional availability of 14 million square feet
per year during 1975-1980, about one-third the present rate, would
be required during that period. The results of the various projections
are summarized in Table 11.7.
Games Planners Can Play
Our survey of facility planning and existing facilities has
convinced us that there are few hard and fast rules about necessary
space for post-secondary students. We believe that certain minimum
adequate standards can be derived, and we have done so in Chapter 4.
After applying these standards to existing space in 1970, we came to
the conclusion that shortages of space existed mostly in laboratory,
office, and study space in some institutions.
Apparently these perceptions were shared by campus planners.
The share of space added in these categories between 1968 and 1971
was far in excess of the store of space each type of use claimed
during the earlier time period. Space in short supply was added to
faster than space in other categories. This finding ought to give
heart to those who believe in the rule of reason (see Table 11.8).
By contrast, the earlier conclusions of the Norris Committee,
also supporteLI by our study, that private four-year institutions already
1.15

245
had a plethora of space, was not taken to heart. Non-residential
space in every category of private schools was added to between
1958 and 1971.
One game which planners can play is to calculate how much
space for public students can be made available by taking surplus
space off the hands of the private sector. For instance, in 1970 the
average private junior college student had 280 assignable square feet
at his disposal. Generous standards would put the requirements at
not much over half this figure. Given the space standards derived
by our study, if half the private junior college space were reallocated
or rented to public junior colleges, some 200 thousand additional
FTE students could be accommodated.
Similar calculations about the amount of "stock" which could
be transferred from the private to the public system could be made
to estimate the extent to which the system could be challenged to
absorb additional students in case enrollment projections turned out
to be too low. As a matter of fact, since it will be difficult for
schools tc add to their staff if there is a sudden surge in enrollment,
and the number of students accommodated depends on the ratio of
staff to students, an even larger number of students could probably
find places than simple averages would indicate.
To summarize, under most conceivable circumstances, the
total space available for post-secondary students is, in the aggregate,
4S
276
adequate. To minimize future construction, transfers of space from
the private zo the public sector should be encouraged. Perhaps
arrangements for joint use of space by public and private institutions
could be encouraged and institutionalized.
246
ftaisok.
The building boom, which reached its crest in real terms in
the late 1960's, is already on the wane. The decline in construction
levels is not likely to jeopardize admission opportunities for most
students. If the low projections of enrollment describe future trends,
it is most likely that after 1975 most institutions will only spend
construction money to refurbish and modernize their plant.
And the Concerns of Space Experts
The. large fluctuations of actual space available either per full-
time or full-time-equivalent student in the U. S. post-secondary system
makes it difficult to draw any conclusions about the possible redistribu:
tion of space from schools which have much too much space by all
objective standards to other schools which have very little space. Most
schools with excess space would not dream of sharing it with another
institution. The comingling of classrooms, library and other facilities
of a small liberal arts college with that of an open - enrollment junior
college is abhorrent to most college presidents. We spoke about this
possibility to three highly placed Administrators in institutions with
declining enrollments, and met with little enthusiasm for our sugges-
tion about sharing facilities.
277iliS

247
The spinning off of part of a campus, especially if the campus
is not too closely connected to the part of the space which is reduced,
appears to be much more acceptable to private sector administrators.
By contrast, public sector administrators are less happy to inherit
"second-hand" facilities. The CUNY takeover of the New York Univer-
sity Uptown Campus was greatly resented by both the administration
and faculty of the institution which was to be housed there. Not only
had they been deprived of planning a new campus, but they also claimed
that the classrooms in the N.Y.C., complex were too small to accommo-
date the large classes scheduled by the public institution. In that par-
ticular case, considerable pressure from the State Department of
Education, concerned with N.Y .U.'s financial survival, was needed to
have the City of New York agree to the takeover.
Without these pressures, it is quite likely that a number of
campuses of failing schools, like Parsons College, will remain empty
and will be razed. Our estimates of withdrawals space generally
assume that for every college abandoned, one will be taken over. Thus,
for instance, Nova College in Florida is very likely to become part of the
state system, and some other school become the site of a housing develop-
ment.
The real concerns of space planners are directed to three other
topics: (1) to what extent can they accommodate unanticipated peak
demand through renting, (2) how la ge will their exposure be to the
needs of remodeling and refurbishing, and (3) how will space planning*
248
be affected by a surplus of space rather than a shortage.
There are no hard and fast answers to any of these questions.
We already mentioned that renting is not likely to be a possible alter-
native for any but urban schools. The costs of renting, it was implied,
were generally higher than those of building, and the facilities less
satisfactory. Renting a vacant school, factory or office building is not
likely to play an important role in providing available space.
The exposure to the needs for refurbishing and remodeling are
a different matter indeed. To some extent they are related to the
possibility that too much space will be available, and competition be-
tween schools for students will escalate. Buildings which have not
acquired the patina of age which make them charming, and which have
been indifferently maintained by slapping innumerable coats of cheap
paint, are not likely to become beloved by students*. Judging by the
age of buildings, a fifth of the public sector inventory, and probably
two-fifths of the private school inventory could benefit from cosmetic
refurbishing. In addition to cosmetic refurbishing, the pressure to
improve laboratory amenities may be quite high as schools compete
for students. While the amount of space involved may not be large,
the costs of this I efurbishing estimated by heads of three large state
systems at S40 a square foot, including equipment, may loom quite
high.
What is really uncertain is how much of the space needs the
-8Vs270

249
ministering of the architect, and how much would be better off if it
were bulldozed. in the absence of a national policy for training needs,
no estimates can be made of what the refurbishing requirements might
be:. It should be pointed out, though, that the penury of the post-
secondary sector, especially of private institutions, could only be
marginally eased by subsidies or loans made on easy terms to renovate
buildings.
By contrast, the possibility of a "space bank," with buildings
to be purchased by the federal government and held till the need for
them arises, would probably appeal to a large number of institutions.
Unfortunately, since shortages are not on the horizon, this policy is
unlikely to be implemented. Nor are alternative uses obvious for these
buildings. in some cases, the classroom and laboratories could be
used to house a regional high school, say one specializing in art, music
or mathematics and science. Unfortunately, the idea of educational
parks, with the concomitant divorce of students from their neighbor-
hoods, has not caught on, and such uses are unlikely to be p'pular
locally. Perhaps, a federal push to encourage them may be rimely, if
the idea of a space bank catches on.
Fin-Illy, a word may be appropriate about the impact of a pleth-
ora of space on the behaviour of institutions. Physical amenities may
play a role in attracting students from one institution to another. tinder
these circtunstances, the refurbishing of private institutions' plants

250
to keep them competitive appears to make sense, if one wishes to main-
tain the diversity of the post-secondary system. Unfortunately, since
the greatest disadvantage of the private sector is the high tuition which
most of the schools must charge in the absence of state subsidies,
small relief from capital refurbishing outlays will not erase their corn-
petitive disadvantage. It is difficult to envisage a federal policy,
limited to facilities, which will redress the competitive balance between
private and public schools. The federal role in the post-secondary
sector must now concentrate on other issues, not bricks and mortar.
It has been successful in the construction area in providing this country
with a post-secondary plant second to none. As times change, so do
concerns.

BEST COPY 111140.311
CHART 11.1
lARE FEET OF NON-RESIDENTIAL SPACE PERFTE STUDENT BY ENROLLMENT SIZE
40
20;
1,000
%ft
to.611111 Oft
41/01114.
5,000Enrollment Size
s.1
2.1 Public Other Four-Year Schools2.2 Private Other Four-Ye ai Schools
3.1 Public Two-Year Schools3.2 Private Two - Year Schools
251
: I .I -I
7-7 :. .
- .
"lb ON tim, L. .
10,000

TA
BL
E 1
1.1
AV
ER
AG
E S
ilAC
E I
N S
CH
OO
LS
IN P
UB
LIC
SE
CT
OR
CA
MPU
SES
WI-
H A
ND
wri
nfou
T S
PEC
IAL
PR
OG
RA
MS
(Ass
igna
ble
Squa
re F
eet p
er F
TE
Stu
dent
)
All
Scho
ols,
Inc
ludi
ngT
hose
With
Spec
ial P
rogr
ams
Scho
ols
With
out
Spec
ial P
rogr
ams
Spac
e in
Sch
ools
With
Spec
ial P
rogr
ams
asPe
r C
ent o
f T
hose
With
out
All
104
9511
0
Uni
vers
ities
148
137
108
Oth
er F
our-
Yea
r Sc
hool
s82
7810
5
Tw
o-Y
ear
Scho
ols
6760
112
Sour
ce: H
EG
IS V
.
14 CA
MS
NM
MI
INIM
Oi i
i M
I O
M O
le S
O a
llM
I U
M

TA
BL
E 1
1.2
RE
QU
IRE
D N
ON
-RE
SID
EN
TIA
L S
PAC
E, B
ASE
D O
N A
VE
RA
GE
SPA
CE
ST
AN
DA
RD
S
(Tho
usan
ds o
f A
ssig
nabl
e Sq
uare
Fee
t)
1975
1980
1985
1990
Publ
ic I
nstit
utio
nsL
owIl
igh
Low
Hig
hL
owIl
igh
Low
Tot
al40
4,92
347
4,54
345
2,39
254
1,59
744
8,75
255
7,17
942
1,67
0un
iver
sitie
s19
7,91
923
2,4J
222
5,_9
827
0,20
822
2,43
427
6,94
321
2,28
7O
ther
Fou
r-Y
ear
Scho
ols
120,
097
140,
603
129,
992
155,
374
138,
739
172,
080
126,
766
Tw
o-Y
ear
Scho
ols
86,9
07101,538
97,0
9211
6,01
587
,579
108,
156
82,6
17
Priv
ate
Inst
itutio
nsT
otal
184,921
216,
690
168,
484
202,
032
158,
465
197,
128
140,
609
Uni
vers
ities
71,211
83,7
0965
,906
79,3
4663
,430
79,1
1156
,592
Oth
er F
our-
Yea
rSc
hool
s10
5,30
4123,154
94,8
8211
3,57
087
,813
109,
137
77,0
31T
wo-
Yea
r Sc
hool
s8,
406
9,827
7,69
69,
116
7,22
28,
880
6,98
6
Publ
ic a
nd P
riva
teT
otal
589,
844
691,
233
620,
876
743,
629
607,
217
754,
307
562,
279
Sour
ce: S
ee te
xt,
p.23
7.
Hig
h
551,
518
277,
572
165,
842
108,
104
184,
267
74,1
59
100,
991
9,11
7
735,
785

TA
BL
E 1
1.3
SPA
CE
RE
QU
IRE
D T
O A
CC
OM
MO
DA
TE
AD
DIT
ION
AL
PU
BL
IC S
EC
TO
RST
UD
EN
TS
BY
197
5, 1
980,
198
5, A
ND
199
0
(Mill
ions
of
Ass
igna
ble
Squa
re F
eet o
ver
Fall
1970
Inv
ento
ry)
1975
1980
1985
1990
Low
Hig
hL
owH
igh
Low
Hig
hL
owH
igh
Uni
vers
ities
11.5
46.0
38.8
83.8
36.0
90.5
25.8
91.1
Oth
er F
c-
Yea
r Sc
hool
s20
.240
.730
.155
.538
.872
.226
.866
.0
Tw
o-Y
ear
Scho
ols
10.7
'25.
120
.739
.611
.231
.76.
231
.7
Tot
al42
.411
1.8
89.6
178.
986
.019
4.4
58.8
188.
8
Sour
ce: S
ee te
xt, p
. 237
.
1111
111
OM
B O
N M
I M
I11
1111
1ID
S U
M E
llSI
MG
NI
IN il
l Olt

TABLE 11.4
SPACE REQUIRED TO ELIMINATE SIIORTAGES ANDPROVIDE FOR GROWING CAMPUSES,
PUBLIC SECTOR
1975 1980Low High
Universities
Shortages 4.9 4.9
New Campuses 8.6 26.3
Subtotal 13.5 31.2
Other Four-Year Schools
Shortages 10.4 10.4
New Campuses 5.6 10.0
Subtotal 16.0 20.4
Two-Year Schools
Shortages .3.6 5.6
New Campuses 4.2 9. 8
Subtotal 9.8 1;i.4
Total Space Required 39.3 67.0
Source: Sec text, p. 237.
Low High
4.9 4.9
55.0 141.0
59.9 145.9
10.4 10.4
11.0 20.2
21.4 30.6
5.6 5.6
6.2 11.1
11.8 16.7
93.1 193.2
255

TA
BL
E 1
1.5
PRO
JEC
TE
D M
AX
IMU
M S
PAC
E I
N T
HE
PU
BL
IC S
EC
TO
R T
O K
EE
P T
HE
"PE
CK
ING
OR
DE
R"
(Mill
ions
of
Ass
igna
ble
Squa
re F
eet)
1975
1980
1985
1990
I.ow
tligh
Low
Hig
hI.
.ow
Ilig
hL
owI
ligh
Uni
vers
ities
335
393
381
457
377
468
359
470
Oth
er p
our-
Yea
r Sc
hool
s21
925
723
728
425
331
423
130
3
Tw
o-Y
ear
Scho
ols
201
236
225
269
203
251
192
251
Tot
al75
588
684
31,
010
833
1,03
378
21,
024
Sour
ce: S
ee te
xt,
p. 2
40.
CR
NM
I A A
A A
A A
MI
IMP
MI I
ND
,

TABLE 11.6
PER CENT OF ENROLLMENTS IN PUBLIC SECTOR SCHOOLS WITHFEWER TI IAN 5,000 1?TE STUDENTS, AND ESTIMATED
EFFECT ON SPACE REQUIREMENTS, 1980
Other Four-Year Schools
Per Cent of FTEEnrollment
Extra Space asPer Cent ofTotal Space
Low High Low High
Less than 2,000 10 7 5 4
2,500 to 5,000 20 7 2 1......
7 5
Two-Year Schools
Less than 1,000 7 6 7 6
1,000 to 2,500 34 25 17 13
7,500 to 5, 000 25 37 3 4
27 23
Source: IIEGIS V.
288
257

TA
BL
E 1
1.7
SUM
MA
RY
OF
RE
QU
IRE
D S
PAC
E U
ND
ER
VA
RY
ING
ASS
UM
PTIO
NS
AN
DA
VA
ILA
BL
E S
PAC
E, P
UB
LIC
SE
CT
OR
, 197
5 T
O 1
990
(Mill
ions
of
Ass
igna
ble
Squa
re F
eet)
1975
1980
1985
-19
90I
Bas
ed o
n St
udy
Stan
dard
sL
owH
igh
Low
1-lig
hL
owH
igh
Low
Hig
h
(1)
Stud
y st
anda
rds
(2)
(1),
with
add
ition
al s
pace
for
tech
nica
l pro
gram
sel
tM
P) (
2), a
nd a
dditi
onal
spa
ce f
orsm
all s
choo
ls
II P
rese
nt S
pace
Plu
s Sp
ace
for
New
Enr
ollm
ents
(4)
Spac
e fo
r ne
w e
nrol
lmen
ts
(5)
(4),
pre
sent
spa
ce, s
pace
for
new
enr
ollm
ents
and
tech
nica
lpr
ogra
ms
(6)
(5),
incl
udin
g ad
ditio
nal s
pace
.fo
r sm
all s
choo
lsA
404.9
494.
5
437.
251
2.3
469.
155
0.6
45.7
121.
3
549.
762
5.3
553.
964
.1
Enr
olliT
iFE
Ass
umpt
ions
452.
4
468.
6
542.
0
97.4
601.4
616.
4
541.6
448.8
557.2
421.7
551.5
584.
948
4.0
600.
945
4.9
595.
0
626.
351
7.2
642.
048
6.0
635.
7
194.
993
.121
1.4
63.7
113.
7
698.9
597.1
715.4
567.7
617.7
711.7
601.8
726.5
570.4
720.3
CA 00

TA
BL
E 1
1.7
(Con
ed.)
SUM
MA
RY
OF
RE
QU
IRE
D S
PAC
E U
ND
ER
VA
RY
ING
ASS
UM
PTIO
NS
AN
DA
VA
ILA
BL
E S
PAC
E, P
UB
LIC
SE
CT
OR
,19
75 T
O 1
990
(Mill
ions
of
Ass
igna
ble
Squa
reFe
et)
III
Spac
e R
equi
rem
ents
Bas
edon
Pre
sent
Spa
ce, S
pace
Nee
ded
to E
limin
ate
Shor
tage
s,an
d Pr
ovid
e fo
r T
echn
ical
Prog
ram
s
(7)
Elim
inat
e: s
hort
ages
, bui
ldne
w c
ampu
ses,
plu
s te
chni
cal
prog
ram
s
(7),
plu
s si
ze a
llow
ance
Ava
ilabl
e Sp
ace
n.a.
: Not
app
licab
le.
Sour
ce: S
ee C
hapt
er 1
1, p
. 231
.
1975
1980
Low
---R
FL
owH
igh
Enr
ollm
ent
543.
357
1.0
593.
169
7.2
551.
559
0.3
608.
272
0.7
639
627
1985
1990
Low
Hig
hL
owH
igh
Ass
umpt
ions
n.a.
n.a.
n.a.
n.a.
n.a.
n.a.
614
n.a.
n.a.
587

TABLE 11.8
NON-RESIDENTIAL SPACE ADDED BETWEEN FALL 1968AND FALL 1971
Public SectorPrivate Sector
ClassroomLaboratoryStudyOffice
Total Sp icePublic SectorPrivate Sector
Classrooms:If
Laboratories:11
Office:11
Study:11
Public SectorPrivate Sector
Public SectorPrivate Sector
Public SectorPrivate Sector
Public SectorPrivate Sector
Per Cent
7228
10261122
Additional Space asPer Cent of 1968 Space
576841
5432
8158
9364
7764
260
Source: U. S. Department of Health, Education, and Welfare, Officeof Education, National Center for Educational Statistics,Inventory of Physical Facilities, Institutions of Higher Education.Fall 1968, Government Printing Office, Washington, D.C., 1970,also, Fall 1971, Government Printing Office, Washington, D. C.,1973.
!91

JOSEPH FROOMKIN INC.10115 EIGHTCCNTH STMT. N. W.. WASHINGTON. 0. C. 100345
THE DEMAND FOR FACILITIESIN THE POST-SECONDARY
SECTOR, 1975 TO 1990
APPENDIX
Contract OEC-0-72-5023
by
Joseph FroomkinJ. R. Endriss
With the Assistance of
Robert StumpKaren Tammany
August 15, 1974

A-1
APPENDIX TO CHAPTER 5
ANALYSIS OF AVAILABLE SPACE BY TYPE OF SCHOOL
While the general analysis of space throws some light on how wellinstitutions are endowed with different facilities, a better under-standing of how the space is distributed may be garnered by discussingspace availability institution by institution.
Public Universities
It will be remembered that public universities were dividedinto three size groups. The first size group contained all universitieswith less than 10,000 enrollment. In the case of full-time enrollment,this group covered 54 public university campuses. When full-time-equivalent enrollment cut-offs of 10,000 were set, the number ofuniversities covered was 49. The second size group, with enroll-ments between 10,000 and 20,000 full-time or full-time-equivalentstudents, contained 58 universitiL s when the full-time-equivalentstudents were used to estimate. tie cut-offs, and 43 when full-timestudents were used to calculate the group. The largest group, that ofuniversities with over 20,000 enrolment, contained 22 universitieswith more than 20,000 FTE's, or 1:3 universities with more than20,000 full-time students. Because part-time students do not play avery large role in those institutions, the available space calculatedby either method did not vary too much. For instance, in the caseof the smallest group, the total non-residential space for full-timestudents was 142 square feet. Similarly, in the smallest size group,it was 132 square feet for full-time-equivalent student. In the secondgroup, the total non-residential space amounted to 126 square feetper full-time student, and 114 square feet per full-time-equivalentstudent. In the larger size group, the differences were equally small.Per full-time student, they were 154 square feet, and per full-time-equivalent student, 124 square feet.
The differences were much more pronounced when universitieswere grouped by quartile in ascending order of space. In the univer-sities most poorly provided with space (with enrollments of less thanI0,000), 82 square feet per full-time student were available. Thisfigure declined to 74 square feet on an FTE basis. By contrast, thoseuniversities in the same size group most generously endowed with
#93

A2
space (in the upper quartile of the distribution) had as much as213 square feet per full-time student, and 132 square feet per FTE.The divergences were practically as large in the next size group(10,000 to 20,000 students). The space available was 84 square feetper full-time student, and 73 square feet when the group was arrangedper FTE for Institutions in the lowest quartile. The universities inthe fourth quartile, by contrast, had 185 square feet per full-timestudent, and 164 square feet per FTE. The number of campuses inthe larger-size group is too small to be broken down by quartiles,but even there the relationship between the universities with lots ofspice and those with little was equally wide.
In the case of class and laboratory space, the differencesbetween space-rich and space-poor campuses was very much lesspronounced. In the smaller university campuses, the difference inthe availability of classroom space per full-time student betweenthe lowest and the top quartile was on the order of 50 per cent.--Thegreater disparities were in the available space in laboratories.There, practically three times more space was available in thebetter-provided institution as compared to those in the lowestquartile.
Variations in classroom space availability between the lowand top was even less among the second-largest group. Roughly11 square feet were available in the lowest quartile of the institutions,and some 14 square feet in the highest quartile. The lab space in theinstitutions with more space was not quite twice as much as it was ininstitutions with the least amount of space. On the basis of spacestandards, it appeared that the shortages in classrooms wereprobably felt in one-half of the institutions in the lowest quartile.When it came to lab space, given the rather generous standardsadopted it Chapter 4, all the institutions in the lowest quartile weresomewhat short of labs. The conclusions stated above are not changedat all by looking ac. full-time-equivalent enrollment statistics forthese twc kinds of space.
In the case of office space, the figures calculated on a per-student basis showed very wide variations within each size group.In the case of the smallest universities, v hen office space was cal-culated on a full-time-student basis, the variations were more thanthree to one between the best-endowed and the least-well-endowedcollege. In the second group, the ratio of office space per studentin the top quartile was twice that in the bottom quartile. Quitesignificant variations in office space per full-time-equivalent studentcan also be inferred from the appropriate tables.
A-3
As we had occasion to point out, the measure of office spaceper (Amer full-time or full-time-equivalent student is truly anapproximate one and does not reflect the true needs of the institution.A better measure is the office space per total professional employedon a given campus. This figure appears at the bottom of AppendixTables5.1 to 5.3. The variations in space available measured this way aremuch narrower. The uailable office space per professional variesbetween 200 and 286 square feet in the smallest institutions, andbetween 200 and 276 square feet in the second group. It averages290 square feet in the largest universities. Apparent shortagesdisappear because the available office space appea.,:s to be directlyrelated to the staffing pattern of a given institution. From now on,only this measure will be mentioned in discussions of space inother institutions.
When it comes to study space, which includes stack space forthe collections, reading rooms, and library administrative space, wecan expect variations of some five or six square feet per FTE,because of the varying sizes of collections in different institutions.The actual variations, either on a full-time-equivalent or full-timebasis, are just ,sightly larger than this amount in the smaller uni-versities, and approximately six feet in the second size group.Under most conceivable circumstances, it seems likely that at least
quarter of the institutions du have shortages of study space. Eithertheir collection is not housed as well as it ought to be, or, what ismuch more likely, if our field trips are at all representative, mostinstitutions are short of seating space for students in libraries.
The largest variations were, of course, in the space for whichthere is no set of established standards. Thus, availability of special-use space per student varies in ratios of four to one among smalleruniversities. The variation is equally great whether one uses full-time or full -tine- equivalent students to derive available space perstudent. As we have pointed out previously, the amount of space inthat category depends a great deal on the commitment of the schoolto football. A lot of special use space is used in stadiums andathletic facilities. Under the circumstances, we feel again thatprobably there are shortages of space in the bottom auartile ofsmall institutions, and possibly a less-pronounced shortage ininstitutions which are in the second size group. A small number ofinstitutions in the larger size group also havo very little special usespace, less than cen square feet per full-time-equivalent student.Thlse arc probably also candidates for additional facilitie'; if it isbelieved important to improve their amenities.
1'1" 295

A4
In the case of general use space, the variations are wide, butnot as wide - they are roughly two to one. Probably, again, only aquarter of the universities do not have sufficient general-use spaceto mount an impressive program of cultural activities.
We are less sanguine about commenting on the differences insupport space. Some schools did not report any support space atall. Yet, the variations from the schools which did report it arestill roughly two and a half or three to one, depending on how wellthe school is endowed with space.
A special note should be added here on the non-class labspace, namely that space which is put, aside for special laboratories,most of them utilized in research. The variations from campus tocampus in this type of space are truly astonishing. Generally,schools under 20,000 enrollment have, on the average, some13 square feet per full-time student in this type of space. Yet, thevariation between types of schools is startling. In the small sizegroup, the schools in the lowest quartile have less than four squarefeet of research space, and those in the upper quartile have asmuch as 27 square feet. In the top size group, the variations arebetween less than six to more than 25. The largest schools, withover 20,000 enrollment, have an average of 26 square feet of labspace per full-time student. Roughly one-quarter of small univer-sity campuses have as strong a research commitment per studentas do large state public university campuses.
Private Universities
There were 71 universities with 10,000 full-time students.When the 10,01)0 cut-off was applied to full-time-equivalentstudents, 69 of them still were in the same category. Ten univer-sities reported information on both full-time and full-time-equivalentstudents, and are bladed in the next largest group. Only threeuniversities had enrollments of over 20,000 students. All three,Brigham Young, Northeastern, and Boston, were probably betterclassified as liberal arts schools with graduate departments thanuniversities. It is interesting to note that, while the total amountof non-residential space in private universities, on the average,exceeds considerably the same space in private schools, the lowestquartile in each size group is strikingly similar in both the publicand private sectors. Thus, for universities with less than10,000 enrollment in the lowest quartile. of the space distribution,th;: klifferenec between public and private campuses is less than
29

A-5
seven square feet per full-time student, and less than four squarefeet per full-time-equivalent student. Private universities whichhave between 10,000 and 20,000 students enrolled and are in thelowest quartile of space availability only have six square feetmore per full-time student than do the public universities. Coinci-dentally, these schools also appear to enroll a large number ofpart-time students.
The profile of space distribution between both public andprivate universities in the lowest quartile is strikingly similar.The total amount of class and lab space is within two square feet,either on a full-time or a full-time-equivalent basis. Generally,the private universities appear to offer even more restricted tab-oriented classes than Jo the public universities.
In the office space category, private schools do have somewhatmore space per full-time-equivalent student or per full-time studentthan do the public schools. On the other hand, when the comparisonis made for office space per full-time-equivalent professional, theprivate universities appear to have five per cent less space than dothe public schools.
Quite striking similarities are also to be found in study space,special use space, and, to a lesser degree, general use space. Onlyin this last category, the private universities seem to be slightlybetter off than the publics. By contrast, they do appear to requiresomewhat less support space than the public institutions.
If we were to judge the research orientation of privatecampuses by the space pool of non-class lab space, one could con-clude from them that they were not too different from those in thepublic sector. For r rivate universities with little space in the 10,000to 20,0(X) enrollment categories, there is similarity in the totalavailable lab space between them and the public schools.
On the average, these schools also have the same amo'.int ofoffice space per full-time-equivalent professional as do the publicschools. In the upper ranges of the space distribution, privateuniversitkis with less than 20,000 enrollment had roughly twice asmuch non-class lab space as did the publics. Universities whichwere rich in other space also had as much as two to four timesmore space dedicated to reseatch as the publics.
297

A-6
Public Four- Year Schools
The striking fact about public four-year campuses is thatthey are very much smaller than university campuses. In oursample, roughly 131 schools which reported space had enrollmentsof less than 2,500 students. Another 94 schools had enrollments offewer than 5,000 students, but more than 2,500. Sixty-three schoolswere in the category of 5,000 to 10,000 students. Only 12 schoolshad enrollments of between 10,000 and 20,000 students.
Public four-year schools with enrollments of fewer than2,500 students full-time generally devote about 40 per cent of theirspace to class and labs. On the average, schools in the lowestquartile of available space have low levels of availability of labspace, but compensate by having more classrooms to offer otherprograms. By contrast, schools in the second and third quartilesof the space distribution allocated 30 per cent of their space forclassrooms. Strange results were recorded in the upper quartileof space. There, schools again allocated roughly 40 per cent oftheir total space to both class and labs. The average space inspace-rich schools was four times as great on a full-time studentbasis as in a space-poor school. Actually, the situation was some-what different if one looks at space availability on a full-time-equivalent basis. The schools in the upper quartile of space perstudent enrolled a large number of part-time students, and roughlyhalf of their total enrollment was accounted for by part-timers, ascontrasted to roughly 20 pm- cent in so-called space-poor schools.As a result, the difference of available class and lab space betweenthe space-rich and the space-poor schools is much narrower; butspace-rich schools still have two-and-a-half times as much spaceas the space-poor ones.
Office space in space-poor schools fared even worse thanthe space-poor public universities, though, on the average, the totalspace per full-time professional in all the small schools was wilyten per cent less than it was in the universities. It will be notedthat the second quartile of schools had as much space per full-timeprofessional as the lowest quartile of the universities. The upperquartile had roughly the same amount of sdace as the upper quartileof the universities.
The greateEt differences in space available between space-richand space-poor liberal arts colleges occurred in study, special use,general use, and support spice. In the case of study space, the
V
298

A-7
lowest quartile schools had certainly inadequate facilities for study.They also had practically no special and general use space. In theupper quartile of space distribution, the public four-year schoolshad considerably more space than comparable public universities.As a matter of fact, they rivaled in the amount of space with thesmaller private universities.
Public four-year schools with enrollments between 2,500 and5,000 students had strikingly similar characteristics to the oneswhich were somewhat smaller. In general, the average amount ofspace in the lowest quartile for class and labs was about the same.Office space availability was again the same. The laboratory condi-tions were even worse in those schools than in the small schools,but the special use and general use space were somewhat moregenerously provided. The relationship of available class and labspace per full-time-equivalent student between the space-rich andthe space-poor schools was one and a half to one, as contrasted totwo and a half to one in the smaller schools, which leads us to thebelief or conclusion that the smaller schools were not yet fullybuilt up and did not reach their desired enrollments. Office spaceavailabilities were in excess of 200 square feet per total professionalin all categories except the first quartile.
When one looks at public four-year schools with 5,000 to10,000 full-time enrollment, one is struck by the fact that they, too,are somewhat short of lab space. They are also as short of officesas the rest of the schools, and their other facilities are well belowaverage, as well. The very large four-year schools are by far thepoorest of the lot in terms of space. The lowest quartile barelymeets the average standards for classrooms and labs on a full-timebasis, although it is notable that the availability of labs seems to bemore generous that in smaller schools. Office space in schools inthe lowest quartiles is no different than in other four-year colleges.On the other hand, library facilities are the poorest yet, roughlyone-half of the standard suggested in Chapter 4. Special use,general use, and support space are practically non-existent. Theyare much below the levels of even the lowest quartile of the publicuniversities. For instance, in the universities, special use, generaluse, and support space amount to 24 square feet, even among space-poor schools. In public other four-year colleges, they amount toapproximately 12 square feet.
tot 299

A-8
Private Pour-Year Schools
The majority of private four-year schools are extremelysmall. Some two-thirds of them have fewer than 1,000 full-timestudents enrolled. The proportion does not change much if oneclassifies the schools on the basis of full-time-equivalent students,either. As a general rule, the small schools, those with less than1,000 enrollment, appear to have sufficient space in all categories,with the possible exception of office space, where they provide only180 square feet per full-time professional. This is ten per centmore than what is available in the lowest quartile of public schools;however, it still may be somewhat inadequate.
More should be said about schools with between 1,000 and2,500 full-time enrollment. These schools are roughly comparablein size to public schools with less than 2,500 enrollment. Here,the possible space shortages may occur either in labs or study space.The square feet available per total professional staff member,189 square feet, is fairly close to the standard, and is within thelevel of tolerance of the error in our standards.
Private four-year schools between 2,"..00 and 5,000 full-time-equivalent students have roughly the enrollment of schools in thatcategory in the public sector. They are deficient in lab space.However, they have sufficient classroom space to compensate forthis deficiency in lab space, provided one is satisfied with thepresent structure of their programs.
The two private schools with enrollments over 5,000 alsoappear to be weak in terms of their lab space. There do not seemto be any other shortages which are apparent in those schools.
Public Two-Year Schools
Public two -year schools have been divided into four sizecategories: those enrolling under 1, (00 students, those enrollingbetween 1,000 and 2,500 students, those enrolling between 2,500and 5,000 students, and those enrolling over 5,000 students.
Only schools with between 1,000 and 2,500 enrollment areshort of direct instructional space, i.e., classrooms and labs.Other schools seem to be fairly generously endowed with that space.Since so many of the junior colleges have been established recently,the square footage available for students in the third and fourth
StEt' 300

A-9
quartile must probably be taken with a grain of salt. This is not theplanned space per student, and the high figures recorded are due tothe fact that the colleges are still quite new, and have not yet reachedtheir programmed levels of enrollment. In this context, by comparingthe space available in smaller and larger institutions, one gets theimpression that, while study, special use, and general use spaceseem to be fairly adequate in at least three quarters of the publicjunior colleges with enrollments under 1,000 full-time students andin half of the junior colleges with enrollments under 2,500 students,study space appears to be in short supply in all schools over 2,500full-time enrollment, as is all non-instructional type of space.
With the exception of faculty members in the fourth quartileof schools with less than 1,000 enrollment, all the faculty and theprofessional staff in junior colleges seem to be meagerly providedwith office space. In no case does office space exceed 210 squarefeet, with the exception of the upper quartile of the small schools.In the lowest quartile of all schools with enrollments under 5,000 full-time-students, the professional staff has under 185 square feet,sometimes as little as 100 square feet per full-time professional.These facilities are similar to th le in high schools, rather than tothose in the rest of the colleges.
Private Two - Year Schools
Private two-year colleges, with the exception of two whichhave over 2,500 full-time-equivalent enrollment, are extremelysmall. Thus, only 11 of them have over 1,000 students, and themajor proportion, some 170 campuses which reported this space toI IEGIS, have less than 1,000 full-time-equivalent enrollment. Withthe exception of a few schools in the 1,000 to 2,500 category, itappears there is a sufficient amount of space for most activities inthose schools, with the possible exception of office space for faculty,which is poorly provided in the lowest quartile of the small schools.
It is truly remarkable that roughly half of the small privatecolleges have more space per full-time or full-time-equivalentstudent than universities. Probably it was not planned this way, butthose are the schools which are suffering from large declines inenrollment as a result of the competition of the public two-yearinstitutions. Hence, the space in these schoolE which is consideredexcess cannot be considered useful spa:o unless many of thoseinstitutions are taken over by public authorities.

A-10
There are two fairly large private two-year schools. Theyappear to offer very few facilities for technical courses, and cer-tainly skimp a great deal on all other amenities, be they office,library, or any other type of space. Most of the non-instructionalspace is in the general use category, apparently used for a varietyof purposes, including classrooms, since otherwise it is ratherunlikely that they could do with as little space as they have.
BAs

AP
PE
NIM
X T
AB
LE 5
.1
AV
ER
AG
E s
Qi A
RE
FE
ET
PE
R F
IE F
OR
SC
IRE
LS R
AN
KE
DB
Y Q
UA
RT
ILE
ON
SE
LEC
TE
D C
AT
EG
OR
IES
OF
SP
AC
E P
ER
FU
1.1.
-nm
E-E
otliv
AL
Esr
s n
;DE
NT
, RI T
IPZ
, CO
NT
RO
L, A
ND
SIZ
E O
F S
CH
OO
L
1.c
,s th
an 1
0,1;
i al E
nrolA
.U
nive
rsiti
es
10,0
00 -
20,
0(10
Enr
ollm
ent
Ove
r 20
,000
Enr
ollm
ent
liwat
1ir
tSonid
QuarhIe
Thin!
Quartile
Fourth
(luartdc
Mea
nF
irst
Qua
rtile
Sec
ond
Qua
rtile
Thi
rdQ
uart
ileF
ourt
hQ
uart
ileM
ean
Mea
n4;
FF
.6,
135
7,12
76,462
6,590
14,180
15,378
15,702
14,647
14,966
28,293
Sc,
.11
.29
15.11
2.17
13.5
57.
629.
4610
.85
13.8
210
.55
9.40
F1F
.6.
6iU
6,390
6,u93
6,27
66,
570
15.2
2515
.219
15,4
1714
,127
14,9
6628
,293
Sr.
:. F
t.m
.r,s
15.9
920.72
32.2
019
.64
9.76
13.0
316
.80
23.7
616
.11
14.4
0r Labs:
6,01
06,
510
7,449
5,755
6,570
14,572
15,927
14,868
14,553
14,966
28.291
Sq.
li.
17.0
625
.60
35.8
049
.33
33.18
18.28
23.40
28.40
35.34
26.66
23.80
FfE
7, $6
5,722
7,20
75,
592
6,57
013
,700
15,0
2415
,274
15.7
5214
,966
28,2
93Sq.
,r.
140.
020
.77
26.2
243
.02
26.3
715
.00
20.0
025
.74
33.9
624
.03
28.7
4F
IE7,192
6,749
7,406
5,609
6,706
15,393
14,303
14,811
15,30E
14,966
28.203
lt.5.69
9.96
11.97
18.17
11.71
5.45
7.92
10.90
14.70
9.92
10.45
1:T
E7,
127
5,51
67,
416
6,51
66,
706
15,0
2814
,544
15,1
7215
,098
14,966
28,293
Sq.
l'c.
7.37
15.64
22.09
31.89
19.76
7.73
11.42
14.17
22.48
14.2
413
.22
'se:
FT
E6,
696
6,47
36,977
7,067
8,814
14,255
15,539
16,239
13,972
14,966
28,2
93Sq. F:.
4.2,
10.51
19.5
336
.97
18.8
75.73
10.01
14.46
17.54
14.89
13.75
-ra
7,146
6.813
6,59
36,
65?
6,84
714
,675
15,7
5813
,876
15,4
7914
,966
28,2
93S
q. F
t.4.
56a.
6811
.04
19.0
911
.01
4.33
7.14
12.03
23.60
12.18
1336
Tot
al N
on-
Rt..
:i,:c
;.( ia
l Spa
ce:
FT
E7,
421
6,662
5,960
6,267
6.570
14,482
15,244
14,985
15.128
14,966
28,293
Sq.
Ft.
73.0
112.53
146.73
188.91
131.65
73.07
95.41
117.77
163.55
114.21
124.48
Res
iden
tidl S
pace
:F
TE
6,673
7,356
6.739
6,819
6,921
15,007
15,348
15,020
14,826
15,044
28,293
Sq.
Ft.
14.32
57.17
86.16
114.84
75.30
16.13
46.50
72.95
91.02
60.11
51.45
Exc
ludi
ng la
ps u
sed
for
rese
arch
onl
y.

APP
EN
DIX
TA
BL
E 5
.1 (
C.o
nt'd
)
AV
ER
AG
E S
QU
AR
E F
EE
T P
ER
FT
E F
OR
SC
I100
1..S
RA
NK
ED
BY
QU
AR
TIL
E O
N S
EL
EC
TE
DC
AT
EG
OR
IES
OF
SPA
CE
PE
R F
UI.
L-T
IME
-EQ
UIV
AL
EN
1'SW
DE
NT
, BY
TY
PE, C
ON
TR
OL
, AN
D S
IZE
OF
SCH
OO
L
d. P
riva
te I
hiiv
ersi
ties
10,0
00 -
20,
000
Enr
ollm
ent
Ove
r 20
,000
Enr
ollm
ent
Les
s th
an 1
0,00
0 E
nrol
lmen
tFi
rst
La.
ariil
e
Sccoad
Qua
rtile
Thi
rdQ
uart
ileFo
urth
Qua
rtile
Mea
nM
ean
Mea
nClass:
FTE
5,48
25,
616
3,80
52,
680
4,35
413
,778
22,8
92Sq
. Ft.
10.9
914
.74
20.0
630
.36
19.3
214
.65
8.94
Lat
e:FT
E5,
179
5,21
84,
304
3,41
34,
487
13,7
7822
,892
Sq. F
t.5.
9111
.20
18.3
631
.32
17.4
113
.39
9.59
Class + Lake:
FTE
6,13
94.
542
3,96
92,
954
4,35
413
,778
22,8
92C
ras.6
vow
Sq. F
t.19
.74
28.5
938
.32
56.10
36.22
28.04
18.53
V:
Office:
FTE
Sq.
Ft.
6,07
315.05
3,92
423.49
4,51
333.16
2,74
870.79
4,29
236.13
13,7
7836.21
22,8
9217.76
Oa
Study:
FTE
5.465
5,016
4,305
2,486
4,292
13,778
22,892
CD
Sq. Ft.
6.23
13.14
23.16
43.94
21.94
23.39
6.57
alb
Gen
eral
Use
:FTE
6,258
4.441
4,093
2,827
4,354
13,778
22.872
Sq. Ft.
9.69
18.25
31.05
66.86
32.30
19.73
8.11
Spec
ial U
se:
FTE
5.517
4.468
4.329
3,956
4,500
13.778
22,892
Sq. Ft.
5.43
10.65
17.98
40.64
19.83
11.59
8.13
svpom
PIM
4,916
4, 8
134,704
2,820
4,292
13.778
Sq. Ft.
3.31
8.?1
14.62
42.41
17.39
-
16.96
Total
Nc.
n-R
esid
entia
l Spa
ce:
FTE
6,171
4,154
3,640
3,261
4,292
13,778
22,892
Sq. Ft.
77.14
126.13
168.54
343.16
181.13
161.40
73.12
Res
iden
tial S
pace
:FTE
6,038
4,926
4,187
2,781
4.411
13.778
Sq. Ft.
20.79
60.84
94.51
185.94
94.02
68.31
Exc
ludi
ng la
bs u
sed
for
rese
arch
only.
1111
11W
INM
S II
IS
IP.IN
N M
I MI a
llel
l MI M
I MI
APP
EN
DIX
TA
BL
E 5
.1 (
(:or
it'il
AV
ER
AG
E,)
J !A
RE
FE
E1-
PER
FIE
FO
R S
t.110
01S
RA
NK
ED
BY
QU
AR
TIL
E O
NsE
LEcr
ED
CA
TE
GO
RIE
S O
FSP
AC
E P
ER
Fl
FIN
IE-E
QI
VA
I .E
NSn
1>E
Nr.
BY
TY
PE,
CO
NT
RO
L, A
ND
SIZ
E O
F SC
HO
OL
C. P
ublic
Oth
er F
our-
Yea
r Sc
hool
s
Leg
s th
an 2
.51)
11 E
nrol
lmen
t2,
500
- 5,
000
Enr
ollm
ent
Fir-
aQ
uart
ileSe
cond
Qua
rtile
Thi
rdQ
uart
ileFo
urth
Qua
rtile
Mea
nFi
rst
Qua
rtile
Svcu
ndQ
uart
ileT
hird
Qua
rtile
Four
thQ
uart
ileM
ean
CI
.5s:
I71:
1,63
41.662
1,391
1,2M3
1,489
3,467
3,786
3,964
3,502
3,676
S. 1't.
..27
14.43
19.15
27.43
17.74
8.24
11.88
14.53
21.75
14.26
Lill'
.FII:
1,515
1,428
1,641
1,6(18
1,551
3,515
3,532
3,943
3,711
3,676
S. Ft.
5.95
12.b7
1b.76
3!.48
18.16
7.14
11.69
15.80
23.70
14.78
t 'la
.;+
Lab'
:Fly
1,411
1,514
1,629
1,385
1,489
3,490
3,728
3,849
3.639
3.676
Sq. Ft.
17.80
2835
38.13
54.11
34.04
16.68
25.06
30.93
42.34
29.04
Off
ice:
FT
E1,195
1,683
1.571
1,117
1,489
3,393
3,585
3,748
3,954
3,676
Sq. Ft.
b.35
13.33
16.98
26.46
16.46
8.41
12.27
15.68
20.54
14.44
St:.
dy:
::TE
1,672
1,573
1,540
1,304
1,515
3,607
3,727
3,769
3.607
3,676
Sq.
Ft.
4.59
8.59
12.89
23.61
12.83
4.09
7.43
10.54
15.08
9.41
(kne
ral
Flli
1,502
1,653
1,642
1,340
1,532
3,514
3,776
3,674
3,768
3,687
Sq. Ft.
5.48
14.25
23.90
43.39
22.90
7.10
13.20
20.10
29.19
17.76
Spec
!;e
:FTE
1,505
1,623
1,645
1,464
1,564
3,452
3,661
3,677
39147
Sq. Ft.
0.46
10.09
18.04
34.04
17.80
4.00
8.91
14.68
Lf1.51°;
S.
37...
ri:
I1'E
1,611
1,314
1,612
1,567
1,535
3,550
3,680
3,687
3,779
3,676
Sq. R.
1.68
4.74
8.89
17.34
8.63
2.13
4.40
7.50
13.70
7.08
Tot
alN
on-
R i.
; ide
ra i
al S
pace
:FT
E1,
474
1.52
21,630
1,339
1,489
3,459
3,800
3.589
3,842
3,676
Sq. Ft.
50.84
90.72
129.10
168.78
110.89
53.02
81.21
99.93
132.59
92.56
Residential
Spic
e:irr
E1,603
1,610
1,471
1,558
3,535
3,903
3,659
3,732
3,743
Sq. Ft.
25.26
66.26
126.43
75.06
11.55
34.44
67.07
106.36
65.06
Exc
ludi
ng la
bs u
sed
for
rese
arch
onl
y.

APP
EN
DIX
TA
BL
E 5
AV
ER
AG
E S
QU
AR
E F
EE
T P
ER
FT
E F
OR
SPA
CE
PE
R F
UL
L-T
IME
-EQ
l'IV
AL
.1 (
Con
t'd)
SCI1
001.
S R
AN
KE
DE
NT
ST
UD
EN
T, B
YB
Y (
AJA
R T
ILE
ON
SE
LE
CT
ED
CA
TE
GO
RIE
S O
FT
YPE
. (:O
NT
RO
L, A
ND
SIZ
E O
FSC
HO
OL
C. P
ublic
Oth
er r
nur-
Yea
r Sc
hool
s(C
ont'd
)
Ove
r 10
,000
Enr
ollm
ent
5,00
0-
10,0
00 E
nrol
lmen
tFi
rAQ
uart
ileSe
cond
Qua
rtile
Thi
rdul
Liti
leFo
urth
Qua
rtile
Mea
nM
ean
Cla
ss:
FTE
7,11
36,
764
7,11
17,
214
7,05
113
,787
Sq. F
t.6.
849.
3311
.78
16.8
311
.19
8.62
Lab
:FT
E7,
228
7,19
77,
255
6,52
37,
051
13,7
87Sq
. Ft.
6.54
11.5
714
.39
20.7
413
.31
12.3
0C
lass
+ L
ab:
FTE
7,18
17,
317
6,80
96,
896
7,05
113
,787
Sq. F
t.14
.56
21.4
427
.19
34.8
224
.50
20.9
24%
Off
ice:
FTE
6,79
97,
123
7.08
47,
197
7,05
113
.787
Sq. F
t.8.
2611
.26
14.1
219
.51
13.2
912
.12
OMM
Cr)
Stud
y:FT
E7,
040
7,00
57.
226
6,93
27,
051
13.7
87Sq
. Ft.
3.85
5.81
7.75
12.3
37.
446.
31G
ener
al U
se:
.FT
E6,
691
7,69
56,
989
6,82
77,
051
13,7
87C
ern
Sq. r
t.6.
2511
.95
16.5
821
.51
14.0
86.
45Sp
ecia
l use
:FT
E7,
038
7.65
16,
781
6.73
27,
051
13.7
87Sq
. Ft.
5.02
9.87
14.7
426
.29
13.9
87.
03Su
ppor
tFT
E7,
365
6,74
37,
585
6,50
97.
051
13.787
Sq. FL
1.58
3.66
6.10
11.3
9'5
.68
5.55
Tot
al N
on-R
esid
entia
l Spa
ce:
FTE
7,12
97,
433
6,85
76,
734
7.05
113
.787
Sq.
Ft.
48. a
t)72
.09
88.0
611
1.88
80.0
359
.51
Res
iden
tial S
pace
:FT
E7,
221
6,95
46.
964
71.9
57.
071
Sq. F
t.8.
8135
.81
62.8
095
.38
54.5
1
Exc
ludi
ng la
bs u
sed
for
rese
arch
onl
y
op o
n se
as
se a
n ow
as
ay a
s IN
me
um o
n E
N s
e as
in m
e

AP
PE
ND
IX T
AM
E 5
.1 (
Con
ed)
AV
E:A
t;E si t*
E.
'AR
E F
EE
T E
'ER
l'lt
TIM
E E
lFE
1t o
ltilt
k11.
S R
AN
KE
D B
Y Q
t 'A
lt;t
'WA
!S
ft '1
)EN
T, B
Y T
YP
E. C
ON
I).
(till
er F
our-
Yea
r S
choo
ls
ON
SE
LEC
TE
D C
AT
EG
OR
IES
OF
I110
1., A
ND
SIZ
E (
)I: S
CI M
OE
1,00
0 -
2,50
0 E
nrol
lmen
tthan 1, (1(xl
Enr
ollm
ent
ir,t
NcomJ
lain!
Qi,:
irtile
Fou
rth
Qua
rtile
Wan
Firs
tQ
uart
ileS
econ
dQ
uart
ileT
hird
Qua
rtile
Fou
rth
Qua
rtile
Mea
n
FF.
c 27
(Fri
r.it
505
595
1,54
51,
571
1,47
31.
419
1,50
214
.17
22.2
q24
.1i
44,(
1827.55
11.9
217
.41
21.7
733
.20
21.1
6
:51
.462
1)62
o63
26(
N1,
547
1.52
21,
452
1,48
01,
500
Sr,. I:.
5.56
14.6
521
.m42
.11
22.8
97.
7315
.63
21.5
834
.73
20.1
1
, F.
566
5.+
70o
655
9594
1,58
61.
507
1,45
61,
458
1,50
2Sq. It.
23,21)
39.81
53.70
77.6
048
.76
22.2
034
.62
43.6
163
.45
41.1
3
cy-:,...
msc;
641
6;1
5t9
594
1,559
1,51
61,
470
1,46
31,
502
Sq.
Ft.
10.3
519
.36
25.6
436
.57
21.3
812
.16
18.3
622
.75
32.7
221
.58
si,..
1y:
i' ili
615
598
606
568
576
1,52
51,
507
1,56
71,
409
1,50
2C
US
1. It
.7.
5314
.71
21.6
640
.42
21.3
26.
8412
.2')
17.3
929
.84
16.6
8
Ct t
:Lr.
11 t
'Ne:
1. 1
E57
163
560
457
759
71,
635
1,49
01,
517
1,37
61,
503
Sl,
Fr.
14.91
36.55
52.64
b9.65
48.84
14.7
029
4.40
-19
65.0
737
.67
8S
pec:
alrse:
FT
E56
764
664
263
963
21,
549
1,52
11,
502
1,44
71,
503
.(54. Ft.
2.1,
011
.44
22.9
049
.70
24.6
75.
8914
.62
23.0
341
.83
21.7
6IN
s,.;,;orz:
1, r
F.
5tt3
652
butt
582
608
1,53
91,
455
1,48
71,
528
1,50
2; :
T.)
::11
N-o
n-
Sq.
t.
1.71
6.73
14.77
38.2
616
.02.
307.
0i13
.41
32.3
814
.03
taIte
,.dnr
i..1
Spa
ce:
I. T
E543
623
6.52
653
594
1,60
91,
4b0
1,46
21,
456
1,50
2S
q. It
.83
.96
150.
5619
6.11
283.
6517
9.23
79.3
913
0.48
164.
7523
8.04
153.
77
Res
i,ten
cial
Spa
ce;
FT
1:61
663
263
855
861
01,
619
1.51
91,
451
1.44
11,
503
Sq.
Ft.
42.5
292
.82
132.
3722
5.57
132.
8245
.54
86.5
311
2.62
177.
1910
8.43
Exc
li.kl
ing
labs
use
d fo
r re
sear
ch o
nly.

AP
PE
ND
IX T
AB
LE 5
.1 (
Con
ed)
AV
ER
AG
E S
QU
AR
E F
EE
T P
ER
FM
FO
R S
CH
OO
LS R
AN
KE
D B
Y Q
IIAR
TIL
E O
N S
EI.E
CT
ED
CA
TE
GO
RIE
SOF
SP
AC
E P
ER
FU
LL-T
IME
-EQ
I IV
ALE
NT
ST
UD
EN
T, B
Y T
YP
E. C
ON
TR
OL,
AN
D S
IZE
OF
SC
HO
OL
.11P
.IM
P
wry
(lass:
I ..d
r:
Cla
ss +
Lab
:
Office:
FIT
ES
q. F
t.
I.TE
Sq.
It.
FT
ES
q. F
t.
FTE
Sq.
Ft.
D. P
rivat
e O
ther
Fou
r-Y
ear
Sch
ools
(C
oned
)
Ove
r 5,
000
Enr
ollm
ent
2,50
0-
5,00
0 E
nrol
lmen
tF
ir-4
Qua
rtile
Sec
ond
Qua
rtile
Thi
rdQ
uart
ileF
ourt
hQ
uart
ileM
ean
Mea
n
3,47
59.
09
3,35
53.
H2
3,42
214
.39
3.355
9.43
3.00
912
.51
3,49
89.
32
3,39
521
.87
3,510
13.6
1
3.76
015
.29
3.15
815
.42
3.26
830
.46
3.097
16.1
7
2,83
220
.51
3.05
424
.61
2,96
643
.75
3.070
24.8
3
3.24
914
.62
3.25
514
.01
3.249
28.3
2
3,249
16.3
9
6.06
512
.73
6,06
58.
67
6,065
21.40
5.065
13.29
Study:
FT
E3.
472
3.53
93.
298
2.77
63.
249
6,06
5S
q. F
'.5.
118.
4212
.07
21.1
712
.11
8.11
Gen
eral
Use
:.F
TE
3,31
93,
506
3.45
62,
801
3.24
96,
065
CD
Sq.
Ft.
8.35
15.9
923
.45
42.1
623
.34
13.1
3
Spe
cial
Use
:F
TE
3,64
03.
216
3.46
93,
764
3,24
96.065
Sq.
Ft.
2.94
8.36
13.9
136
.95
13.6
56.
28
Sup
port
:F
TE
3,11
83,
553
3,59
93.
809
3,24
9S
q. F
t.1.
423.
896.
8816
.00
7.43
Tot
al N
on-R
esid
entia
l Spa
ce:
FT
C3,
480
3,41
93,
393
2.79
13,
249
6,06
5S
q. F
t.49
.66
80.98
105.06
165.17
103.
0469.18
Res
iden
tial S
pace
:r;
E.
3,71
93.
178
3,13
43,
078
3,23
7S
q. F
t.18.39
43.51
63.56
120.36
67.20
Exc
ludi
ng la
bs u
sed
for
rese
arch
onl
y.
3 .%1
MI
r 81
111
IND
ON
MB
1111
1IM
P11
111
1111
11S
IMI -
SN
IPIII
IIN
M IF
MB
IOW

Ai'V
EN
1)1X
l'A
lli.E
5.1
(co
ned)
AV
ER
AG
E ti
.;;FE
L I
' rig
rE F
t R S
l'1IO
Ot .
S R
AN
KE
D B
Y Q
VA
RT
ILE
SEL
EC
TE
D C
AT
EG
OR
IES
OF
FrIr
'WA
LE
>:
S111
1)E
NT
, BY
TY
PE, C
ON
TR
OL
, AN
D S
IZI:
SCII
001.
E. P
ublic
Tw
o-N
ear
Scho
ols
I (.
., eu
n 1,
(4,0
Eiir
ollin
cnt
1.00
0-
2.5(
10 E
nrol
lmen
ti i
r-4
t)t :
.itill
cN(c.n.hi
Dua
rtdc
Pork
,Q
.:Arr
ileFo
urth
Qua
rtile
Ara
nFi
rst
Qua
rtile
Seco
ndQ
uart
ile.
Thi
rdQ
uart
ileFo
urth
Qua
rtile
NIL
an
I.':
....::
E1
i:65
S
......
..
624
542
441
500
1,83
41,
582
1,53
51,
542
1,62
2Sr
;.r
r.u.
2,14
.4;
20.h
U36
.57
20.4
86.
2410
.06
13.8
923
.12
13.4
2
1..ii
:le
i E5s
561
1547
56
548
1,74
51,
680
1,61
31,
470
1,62
5Sq
.1
i.6.
715
.67
25.;0
42.2
923
.22
5.46
11.8
719
.63
35.6
418
.42
("ir
is1.
ab:
FIE
6;2
586
546
528
590
1,80
71,
(41,
595
1,44
91,
622
Sr,.
It.
14.4
134
.62
46.5
47(
1.28
43.2
113
.76
23.8
934
.83
53.7
131
.75
( ,:c
..:I:
IT
:54
'164
s61
156
05Q
21,
767
1,67
61,
572
1,47
'1,
622
5,. I
I.5.
358.
9112
.t?18
.96
11.4
94.
887.
329.
9314
.62
9.24
S;,:4
71.
-..i:
6.59
622
606
538
602
1,78
61,
720
1,54
61,
455
1,62
5S1
. II.
3.27
6.53
9.96
18.8
810
.16
1.82
3.88
6.06
12.1
66.
C,5
Gcn
e..d
U.e
:11
F.62
862
158
M57
860
21,
755
1,60
81,
572
1,49
41,
623
S :.
ut.
2.58
6.63
11.8
826
.36
12.5
2.02
4.49
9.63
19.6
79.
08
sr...
,:ial
%;e
:I'T
F57
868
057
961
41,
784
1,68
61,
661
1,44
01.
620
Sq. 1
:t.1.
8115
.29
32.2
817
.49
0.20
2.79
9.76
20.8
29.
73
sr.p
e,,r
yFT
I:
677
625
641
647
1,65
81,
733
1,55
91.
519
1,61
2So
,. i't
.0.
662.
5210
.42
4.77
0.31
1.16
3.01
12.2
24.
69
T.,.
. 0 N
..1-
Itcs
isic
ra ia
l Spa
ce:
FTE
613
591
596
558
589
1.81
31,
684
568
1,43
21.
622
Sc. F
t.41
.26
72.6
899
.91
151.
6392
.01
28.7
051
.97
75.4
911
7.52
68.8
7
Res
i&n:
ial S
pace
:FT
E6(
1560
51.
671
1.45
61.
563
Sc. F
t.49
.56
49.5
60,
7831
.78
27.9
1
Exc
l.-lin
g la
bs u
sed
for
rese
arch
onl
y.

AP
PE
ND
IX T
AB
LE 5
.1 (
Con
t'd)
AV
ER
AG
E S
QI '
AR
E F
EE
T P
ER
FT
EFOR se11001.S
RA
NK
ED
BY
Ql /
AR
TIL
E O
N S
ELE
CT
ED
CA
TE
GO
RIE
SO
FSPAt:E
PE
R 1
.1'1
Eiz
t 11V
ALI
:N I
It 'D
EN
I, 1
11 T
YP
E, C
ON
TR
OL.
AN
D S
IZF
OF
SC
HO
OL
E. P
ublic
Avo
-Yea
r S
zlio
ols
(Con
t'd)
2.5o
o -
Soo
n E
nrol
lmen
tO
ver
5.00
0 E
nrol
lmen
tF
irst
Qua
rtile
Sco
xid
Qua
rtile
Tlii
i J
QuA
ri I
leF
ourt
hQ
uart
ileM
ean
Firs
tQ
uart
ileS
econ
dQ
uart
ileT
hird
Qua
rtile
Fou
rth
Qua
rtile
Mea
n(71a,;,:
FIT.
3,568
3,649
3,643
3,521
3,607
7,794
8.368
7,89
06,
630
7.68
95:
. I.'.
5.65
7.73
9.74
15.51
9.71
5.37
6.67
8.32
14.77
8.67
1.4r:
CUE
3,435
3,531
3,968
3,498
3,607
8,481
8.306
7,178
6.723
7.689
Sq. 1- t.
5.41
11.22
15.82
26.43
14.82
7.51
11.74
15.04
21.90
13.90
ll.vis + Lab:
191:
3,5U
3,570
3,116
3,36
3.607
9,013
7,686
7.002
7.006
7,689
Si?. FL
13.25
19.74
24.65
39.94
24.53
14.76
19.28
22.81
34.29
22.58
.41;
Office:
FTE
Sq.
II.
3,462
4.39
3,460
6.07
3,906
7.75
3,657
11.38
3,60
77.43
8,557
4.27
6,702
5.59
7,391
6.61
8.138
10.40
7,689
6.65
snidy7
1-11:
3,509
3,654
3,751
3,579
3,625
8.549
7.258
7.271
7,679
7,689
Sq. Ft.
1.52
3.18
4.84
8.14
4.51
1.65
2.80
4.02
5 91
3.55
M CD
Gen
era1
:'se
:FTE
Sq. It.
3.528
2.47
3.668
4.92
3,626
7.67
3,66
412.f..2
3.60
76.97
8,330
2.65
7,602
4.74
7,610
6.14
7.179
9.17
7,689
5.61
62 rv% IA ..4
Spe-cia1 Use:
FIT
3,595
3,753
3,672
3,484
3,625
6,209
9,447
7.954
7.107
7.689
5.14
Sq. Fr.
1.25
5.36
8.28
12.20
6.97
2.29
S.15
6.69
9.24
5.78
514,20m
FTE
3,606
3,572
3,906
3,449
3,633
7.542
8.698
7.104
7.393
7.689
Sq. FE.
0.58
i,?6
2.57
5.49
2.62
0.60
1.94
3.10
6.63
3.00
411:
1110
N,II
Rc5W.emi...1Space:
11'E
3,442
3,836
3,637
3,517
3,607
8.89
17.
329
7.66
76.
808
7,689
Sq. Ft.
28.01
44.22
55.74
81.86
52.72
32.37
41.2
148
.50
68.2
447
.20
Res
iden
t ia:
Spa
ce:
r."T
E3,
389
3.389
8.43
78.
437
Sq.
Ft.
14.9
314
.93
1.32
1.32
Exc
ludi
ng la
bs u
sed
for
rese
arch
onl
y.
00
1.11
OW
elle
A IM
OIM
O A
IMP
MO
SW
WO
in S
IP P
M-
SS
IBS

AP
PE
ND
IX T
AB
I5.
1 (C
oned
)
A1'E11.1::F. SQ1.ARE FEET PER FTE FOR titla N n
.S R
AN
KE
DBY Qi
!MIT
RE
ON
SE
LEC
TE
D C
AT
EG
OR
IES
OF
5P.i
:'ER 11 1.1.-TIME-E(1111'AI.ENT
5111
)1:N
1, B
Y T
YP
E, C
ON
TR
OL,
Priv
ate
Tw
o-Y
ear
Sch
ools
AN
D S
IZE
OF
SC
HO
OL
1.W
)2,
500
Enrollment
1.ess than
1.04
Enr
ollm
ent
Fir.t
Quariile
Set ond
Quartile
Third
quar
tile
Fourth
Qua
rtile
Mean
Mea
n
Cl, .::-
rrE
43s
453
350
263
375
322
Sq. Ft.
13.51
21.51
29.20
51.16
29.11
14.65
1..i5':
1:.11:
417
384
360
351
375
1.385
Sq. U.
4.36
10.17
17.95
34.41
17.89
8.63
(la, 4 1:11).:
Err
414
465
348
272
375
1.385
Sq. 1't.
21.63
36.13
46.84
76.86
45.73
23.28
Office:
ri1 :
346
452
365
290
375
1,385
Sq. Ft.
6.40
15.61
21.77
34.68
19.79
9.76
Stuay:
ir
482
425
351
268
379
1.385
Sq. 1t.
4.55
11.18
17.75
37.68
18.27
8.63
Cenerall',:e:
.rm.
4n6
433
372
278
377
1.385
Sq. Ff.
6.55
27.43
48.66
84.98
43.0
618.66
Special l'e:
ET
E315
416
475
283
388
1.335
Sq. Ft.
0.18
5.02
24.88
66.11
32.04
11.77
ti,:i32
,wt.
rim
323
404
467
315
391
1.371
Sq. Ft.
0.60
3.43
11.71
35.39
16.16
9.03
Total Non-at:shit:raj:a Space:
FM
435
426
355
269
375
1,385
Sq. Ft.
59.20
127.46
176.26
285.93
163.67
77.44
Res
iden
tial S
pace
:F
TE
482
451
346
358
394
1.334
Sq. Ft.
15.11
71.74
134.96
235.51
136.46
90.60
Exc
ludi
ng la
bs u
sed
for
rese
arch
onl
y.

APP
EN
DIX
TA
BL
E 5
.2SC
IIO
OL
S R
AN
KE
D R
YQ
UA
RT
ILE
ON
TO
TA
L N
ON
-RE
SID
EN
TIA
L S
PAC
EPE
R F
UL
L-T
IME
-EQ
UIV
AL
EN
TST
( 'D
EN
T, B
Y T
YPE
,C
ON
TR
OL
, AN
D S
IZE
OF
SCH
OO
L, D
ET
AIL
OF
SPA
CE
BY
FU
NC
TIO
N
(Squ
are
Feet
per
Ful
l-T
ime-
Equ
ival
ent S
tude
nt)
A. P
ublic
Uni
vers
ities
Les
s th
an 1
0,00
0 E
nrol
lmen
tFi
rst
Seco
ndT
hird
Four
thQ
uart
ileQ
uart
ileQ
uart
ileQ
uart
ileM
ean
FTE
Enr
ollm
ent
7,42
16,
662
5,96
06,
267
6,57
1--
Cla
ss10
.22
13.4
314
.25
16.0
913
.55
7.1*
. ab*
10.4
715
.59
23.1
828
.56
19.6
4C
lass
+ L
ab*
20.6
929
.02
37.4
344
.65
33.1
8{A
Iod
.O
ffic
e15
.79
23.9
028
.72
36.2
526
.37
ivSt
udy
8.59
10.6
011
.88
15.4
811
.71
Spec
ial U
se7.
0115
.41
22.7
529
.48
18.8
'3G
ener
al U
se10
.16
18.6
825
.25
24.9
419
.76
Supp
ort
6.88
9.10
10.8
917
.14
11.0
1T
otal
Non
-Res
iden
tial
Spac
e73
.63
112.
5314
6.78
188.
9113
1.66
Non
-Cla
ss L
ab4.
427.
0713
.29
23.7
212
.53
Off
ice
Spac
epe
r T
otal
Prof
essi
onal
FT
Sta
ff30
3.41
377.
7345
3.37
460.
2540
5.66
Off
ice
Spac
epe
r T
otal
Prof
essi
onal
FT
E S
taff
257.
1531
6.85
373.
2839
1.92
340.
53*
Exc
ludi
ng la
bs u
sed
for
rese
arch
onl
y.
0
NB
1 1
1111
INN
1111
1IP
SSI
DO
M 1
1111
IN
MS
In M
P M
I IS
all
1111
1111
111

APP
EN
DIX
TA
BL
E 5
.2 (
Con
t'd)
sci 1
001
.S R
AN
KE
D B
Y Q
UA
RT
ILE
ON
TO
TA
L N
ON
-RE
SID
EN
TIA
LSP
AC
E P
ER
FU
LL
-TIM
E-E
QU
IVA
LE
NT
sTuD
EN
T, B
Y 1
-YPT
::, C
ON
TR
OL
, AN
D S
IZE
OF
SCH
OO
L, D
ET
AIL
OF
SPA
CE
BY
FU
NC
TIO
N
(Squ
are
Feet
per
Ful
l-T
ime-
Equ
ival
ent S
tude
nt)
A. P
ublic
Uni
vers
ities
(C
ont'd
)
10,0
00-
20,0
00 E
nrol
lmen
tO
ver
20,0
00E
nrol
lmen
tFi
rst
Qua
rtile
Seco
ndQ
uart
ileT
hird
Qua
rtile
Four
thQ
uart
ileM
ean
Mea
niv
.O
wFT
E E
nrol
lmen
t14
,482
15,2
4414
,985
15,1
2814
,966
28,2
94vs
Cla
ss8.
8610
.46
10.4
312
.22
10.5
59.
40to
yL
abs'
11.9
215
.43
14.6
721
.64
16.1
114
.40
all&
Cla
ss +
Lab
*20
.78
25.8
825
.10
33.8
726
.66
23.8
014
Off
ice
15.4
921
.97
25.3
232
.19
24.0
328
.74
Stud
y6.
589.
2912
.47
11.1
59.
9210
.45
Spec
ial U
se10
.28
8.42
16.0
223
.59
14.8
913
.75
Gen
eral
Use
9.96
11.6
514
.88
19.7
014
.24
13.2
2Su
ppor
t7.
0910
.42
11.4
218
.86
12.1
913
.36
Tot
al N
on-R
esid
entia
l Spa
ce73
.07
95.4
111
7.77
163.
5511
4.21
124.
48N
on-C
lass
Lab
2.88
7.75
12.3
923
.00
11.9
019
.05
Off
ice
Spac
epe
r T
otal
Prof
essi
onal
FT
Sta
ff31
3.46
429.
1048
7.63
508.
9342
9.09
461.
04O
ffic
e Sp
ace
per
Tot
alPr
ofes
sion
al F
TE
Sta
ff25
9.18
336.
8236
2.61
414.
7434
1.18
350.
71
Exc
ludi
ng la
bs u
sed
for
rese
arch
onl
y.

APP
EN
DIX
TA
BL
E 5
.2 (
Con
ed)
SCH
OO
LS
RA
NK
ED
BY
QU
AR
TIL
E O
N T
OT
AL
NO
N-R
ESI
DE
NT
IAL
SPA
CE
PER
FU
LL
- T
IME
-E
QU
IVA
LE
NT
STU
DE
NT
, BY
TY
PE, C
ON
TR
OL
, AN
D S
IZE
OF
SCH
OO
L, D
ET
AIL
OF
SPA
CE
BY
FU
NC
TIO
N
(Squ
are
Feet
per
Ful
l-T
ime-
Equ
ival
ent
Stud
ent)
B. P
riva
te U
nive
rsiti
es
Les
s th
an 1
0,00
0 E
nrol
lmen
t10
,000
- 2
0,00
0E
nrol
lmen
tFi
rst
Qua
rtile
Seco
ndQ
uart
ileT
hird
Qua
rtile
Four
thQ
uart
ileM
ean
Mea
nFT
E E
nrol
lmen
t6,
171
4,15
43,
640
3,26
14,
291
13,7
78C
lass
13.4
415
.97
21.4
826
.39
19.4
214
:65
Lab
*7.
7517
.64
16.0
429
.64
17.4
113
.39
INN
Cla
ss +
Lab
*21
.20
33.6
237
.52
52.5
436
.22
28.0
4db
.O
ffic
e19
.66
24.7
134
.66
63.8
736
.13
36.2
1St
udy
9.04
15.0
321
.51
41.0
821
.94
23.3
9Sp
ecia
l Use
7.76
14.2
521
.32
35.0
319
.83
11.5
9G
ener
al U
se12
.41
23.4
132
.69
60.6
732
.30
19.7
3Su
ppor
t4.
688.
7314
.59
40.1
917
.38
16.9
6T
otal
Non
-Res
iden
tial
Spac
e77
.14
126.
1316
8.54
343.
1618
1.13
161.
40N
on-C
lass
Lab
2.60
8.13
8.32
68.9
621
.38
23.9
8O
ffic
e Sp
ace
per
Tot
alPr
ofes
sion
al F
T S
taff
366.
0540
1.26
443.
8649
2.69
429.
6039
2.03
Off
ice
Spac
epe
r T
otal
Prof
essi
onal
FT
E S
taff
250.
6033
7.38
390.
8742
3.02
355.
6430
4.51
*E
xclu
ding
labs
use
d fo
r re
sear
ch o
nly.
Gill
OS
SIP
SIM
AO
US
MID
MO
VIII
OM
VII
GN
I MN
111
11S
al O
M e
rn
APP
EN
DIX
TA
BL
E 5
.2 (
Con
ed)
SCII
001.
S R
AN
KE
D B
Y Q
UA
RT
ILE
ON
TO
TA
L N
ON
-RE
SID
EN
T:A
LSP
AC
E P
ER
FU
LL
-TIM
E-E
QU
IVA
LE
NT
S IV
DE
NT
, BY
TN
PE
, CO
NT
RO
I., A
ND
SIZ
E O
F SC
HO
OL
,D
ET
AIL
OF
SPA
CE
BY
FU
NC
TIO
N
(Squ
are
Feet
per
Ful
l-T
ime-
Equ
ival
ent
Stud
ent)
C. P
ublic
Oth
er F
our-
Yea
r Sc
hool
s
Les
s th
an 2
,500
Enr
ollm
ent
Firs
tSe
cond
Thi
rdFo
urth
Qua
rtile
Qua
rtilc
.:Q
uart
ileQ
uart
ileM
ean
FTE
Enr
ollm
ent
1,47
41,
522
1,63
01,
339
1,48
9C
lass
12.1
515
.95
18.4
123
.97
17.7
4
Lab
*9.
3514
.53
20.9
926
.49
18.1
6-I
VC
lass
+ L
ab*
20.5
429
.96
38.6
549
.58
34.9
4re
Off
ice
10.7
314
.82
17.2
822
.57
16.4
6
Stud
y6.
9511
.73
16.1
115
.70
12.8
3O
il orSp
ecia
l Use
3.91
13.1
419
.79
30.0
417
.80
CR
Gen
eral
Use
6.97
16.7
325
.49
38.7
722
.90
Supp
ort
4.78
5.63
11.1
812
.22
8.63
Tot
al N
on-R
esid
entia
l Spa
ce50
.84
90.7
212
9.10
168.
7811
0.89
Non
-Cla
ss L
ab0.
821.
192.
421.
221.
44
Off
ice
Spac
e pe
r T
otal
Prof
essi
onal
FT
Sta
ff23
1.27
279.
2030
3.02
378.
0630
0.68
Off
ice
Spac
e pe
r T
otal
Prof
essi
onal
FT
E S
taff
210.
5826
0.92
291.
8135
6.16
282.
83
*E
xclu
ding
labs
use
d fo
r re
sear
ch o
nly.

APP
EN
DIX
TA
BL
E 5
.2 (
Con
t'd)
SCH
OO
LS
RA
NK
ED
BY
QU
AR
TIL
E O
N T
OT
AL
NO
N -
RE
SID
EN
TIA
L S
PAC
E P
ER
FUL
L-T
IME
-EQ
UIV
AL
EN
TST
UD
EN
T, B
Y T
YPE
, CO
NT
RO
L, A
ND
SIZ
E O
FSC
HO
OL
, DE
TA
IL O
F SP
AC
E B
Y F
UN
CT
ION
(Squ
are
Feet
per
Ful
l-T
ime-
Equ
ival
ent S
tude
nt)
C. P
ublic
Oth
er F
our-
Yea
r Sc
hool
s(C
ont'd
)
Firs
tQ
uart
ile
2,50
0 -
Seco
ndQ
uart
ile
5,00
0 E
nrol
lmen
tT
hird
Qua
rtile
FTE
Enr
ollm
ent
3,45
93,
800
3,58
9C
lass
10.3
613
.61
13.7
3L
ab*
9.13
15.4
515
.28
Cla
ss +
Lab
*19
.49
29.0
629
.01
Off
ice
10.0
413
.17
15.0
9St
udy
5.64
9.31
10.5
1Sp
ecia
l Use
6.66
8.69
17.3
3G
ener
al U
se8.
1714
.79
18.8
7Su
ppor
t3.
785.
368.
24T
otal
Non
- R
esid
entia
l Spa
ce53
.02
81.2
199
.93
Non
-Cla
ss L
ab0.
650.
951.
01O
ffic
e Sp
ace
per
Tot
alPr
ofes
sion
al F
T S
taff
205.
5526
2.94
294.
42O
ffic
e Sp
ace
per
Tot
alPr
ofes
sion
al F
TE
Sta
ff19
3.34
249.
3628
1.50
*E
xclu
ding
labs
use
d fo
r re
sear
ch o
nly.
Four
thQ
uart
ileM
ean
3,84
23,
676
18.9
414
.26
18.8
914
.78
37.8
329
.04
19.0
614
.44
11.9
69.
4123
.60
14.5
227
.91
17.7
610
.62
7.08
132.
5992
.56
1.81
1.15
322.
2827
4.45
308.
9126
1.41
ME
ISI
MIM
P M
O N
IPIl
e41
111
IMP
Oa
Ole
IMO
MI M
N N
IPS
OB
Ole
OM
OS
INN

APP
EN
DIX
TA
BL
E 5
.2 (
Con
t'd)
SC11
001.
ti R
AN
KE
D B
Y Q
t 'A
RT
ILE
ON
TO
TA
L. N
ON
-RE
SID
EN
TIA
L S
PAC
E P
ER
FU
LL
-TIM
E-E
QU
IVA
LE
NT
STU
DE
NT
, BY
TY
PE, C
ON
TR
OL
, AN
DSI
ZE
OF
SCH
OO
L, D
ET
AIL
OF
SPA
CE
BY
FU
NC
TIO
N
(Squ
are
Feet
per
Ful
l-T
ime-
Equ
ival
ent S
tude
nt)
C. P
ublic
Oth
er F
our
- Y
ear
Scho
ols
(Con
t'd)
Ove
r 10
,000
Enr
ollm
ent
5,00
0 -
10,0
00 E
nrol
lmen
tFi
rst
Qua
rtile
Seco
ndQ
uart
ileT
hird
Qua
rtile
Four
thQ
uart
ileM
ean
Mea
n
.FT
E E
nrol
lmen
t7,
129
7,43
36,
857
6,78
47,
051
13,7
87
elk
Cla
ss7.
4910
.89
11.3
815
.02
11.1
98.
62im
.41
11>
tr.
Lab
*C
lass
+ L
ab'
7.47
14.9
512
.91
23.8
014
.73
26.1
118
.14
33.1
613
.31
24.5
012
.30
20.9
2...
3O
ffic
e9.
1111
.38
14.6
018
.06
13.2
912
.12
Stud
y5.
496.
418.
559.
297.
446.
31
Spec
ial U
se6.
5211
.42
15..4
122
.58
13.9
87.
03G
ener
al U
se8.
7112
.58
15.0
319
.98
14.0
86.
45Su
ppor
t2.
585.
737.
187.
245.
685.
55T
otal
Non
-Res
iden
tial S
pace
48.1
072
.09
88.0
611
1.88
80.0
359
.51
Non
-Cla
ss L
ab1.
000.
861.
311.
561.
201.
13O
ffic
e Sp
ace
per
Tot
alPr
ofes
sion
al F
T S
taff
191.
4224
5.04
285.
4834
4.63
267.
4324
9.61
Off
ice
Spac
e pe
r T
otal
Prof
essi
onal
FT
E S
taff
171.
9431
6.67
271.
0431
6.72
271.
2222
1.75
*E
xclu
ding
labs
use
d fo
r re
sear
ch o
nly.

APP
EN
DIX
TA
BL
E 5
.2 (
Con
ed)
SC11
001,
S R
AN
KE
D B
Y Q
UA
RT
ILE
ON
TO
TA
LN
ON
-RE
SID
EN
TIA
L S
PAC
E P
ER
FU
LL
-TIM
E-E
QU
IVA
LE
NT
STU
DE
NT
, BY
TY
PE, C
ON
TR
OL
, AN
D S
IZE
OF
SCH
OO
L, D
ET
AIL
OF
SPA
CE
BY
FU
NC
TIO
N
(Squ
are
Feet
per
Ful
l-T
ime-
Equ
ival
ent S
tude
nt)
D. P
riva
te O
ther
Fou
r- Y
ear
Scho
ols
Les
s th
an 1
,000
Enr
ollm
ent
Firs
tQ
uart
ileSe
cond
Qua
rtile
Thi
rdQ
uart
ileFo
urth
Qua
rtile
Mea
nFT
E E
nrol
lmen
t54
562
365
255
859
4C
lass
19.7
824
.72
29.4
036
.03
27.5
5L
ab*
9.93
18.5
825
.56
34.2
722
.89
Cla
ss +
Lab
*27
.29
42.6
754
.53
70.0
248
.76
coO
ffic
e13
.34
21.4
424
.96
32.6
723
.16
Stud
y12
.16
16.5
522
.40
33.6
621
.32
Spec
ial U
se11
.80
17.8
925
.20
38.9
824
.67
Gen
eral
Use
19.5
040
.79
54.1
079
.49
48.8
4Su
ppor
t5.
4412
.79
17.0
628
.64
16.6
7T
otal
Non
-Res
iden
tial S
pace
83.9
615
0.56
196.
1138
2.65
179.
23N
on-C
lass
Lab
0.94
2.41
1.49
3.03
2.25
Off
ice
Spac
epe
r T
otal
Prof
essi
onal
FT
Sta
ff34
9.69
334.
5236
0.03
430.
0736
9.03
Off
ice
Spac
epe
r T
otal
Prof
essi
onal
FT
E S
taff
235.
6829
6.23
317.
5836
2.60
304.
17
*E
xclu
ding
labs
use
d fo
r re
sear
ch o
nly.
IND
IN
D S
O M
I O
NO
On
NI
NM
Oa
NB
IN
D S
O N
NI
IND
1111
1IN
D O
S IN
D11
1111
1
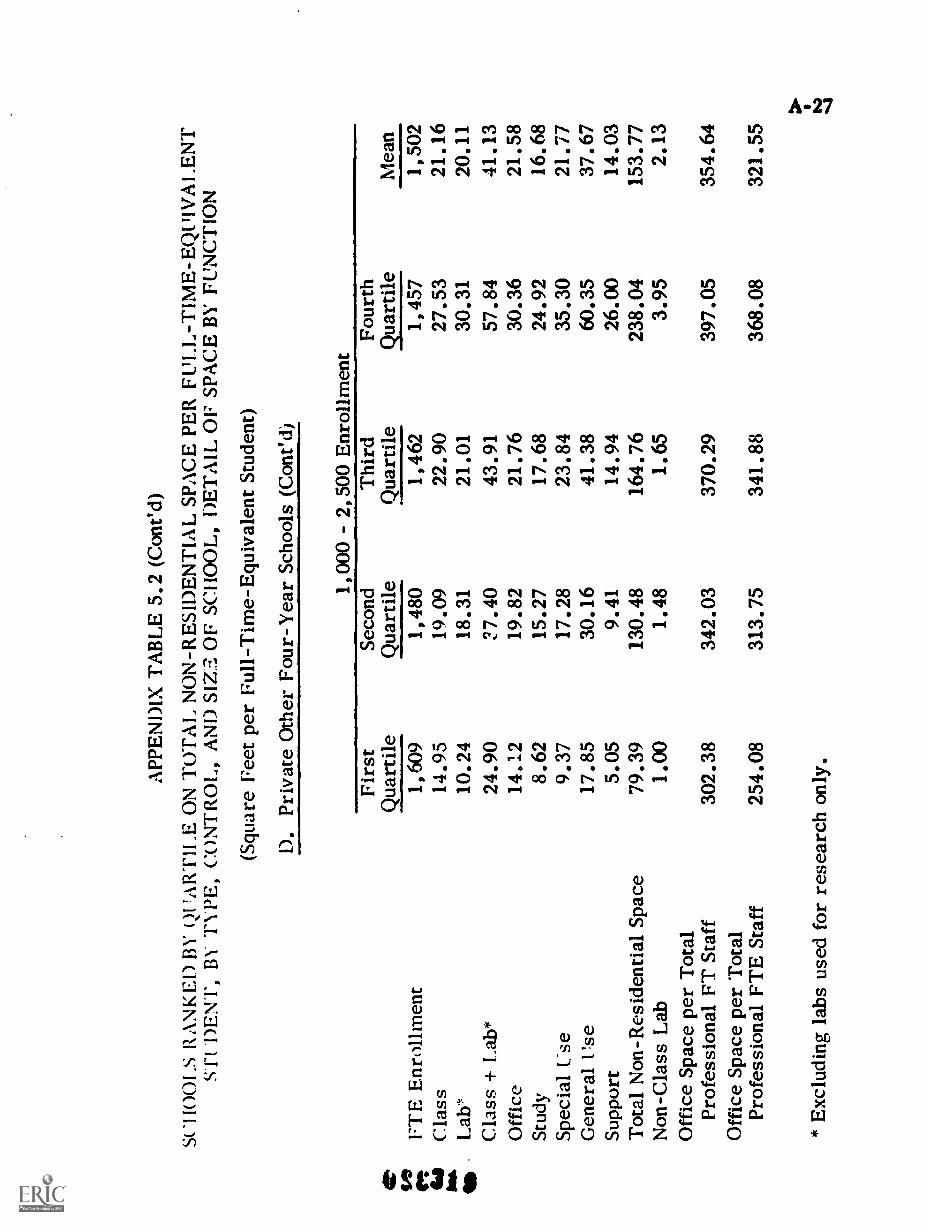
APP
EN
DIX
TA
BL
E 5
.2 (
Con
t'd)
SCH
OO
LS
RA
NK
ED
BY
Ql'A
RT
ILE
ON
TO
TA
L N
ON
-RE
SID
EN
TIA
L S
PAC
E P
ER
FU
LL
-TIM
E-E
QIV
AI.
EN
TS
rt D
EN
T, B
Y T
YPE
, CO
NT
RO
L, A
ND
SIZ
E O
F SC
HO
OL
, DE
TA
IL O
F SP
AC
E B
Y F
UN
CT
ION
(Squ
are
Feet
per
Ful
l-T
ime-
Equ
ival
ent S
tude
nt)
D. P
riva
te O
ther
Fou
r-Y
ear
Scho
ols
(Con
ed)
1,00
0 -
2,50
0 E
nrol
lmen
tFi
rst
Qua
rtile
Seco
ndQ
uart
ileT
hird
Qua
rtile
Four
thQ
uart
ileM
ean
FTE
Enr
ollm
ent
1,60
91,
480
1,46
21,
457
1,50
2C
lass
Lab
'14
.95
10.2
419
.09
18.3
122
.90
21.0
127
.53
30.3
121
.16
201.
11C
lass
+ L
ab*
24.9
027
.40
43.9
157
.84
41.1
3O
ffic
e14
.12
19.8
221
.76
30.3
621
.58
Stud
y8.
6215
.27
17.6
824
.92
16.6
8Sp
ecia
l Use
9.37
17.2
823
.84
35.3
021
.77
Gen
eral
Use
17.8
530
.16
41.3
860
.35
37.6
7Su
ppor
t5.
059.
4114
.94
26.0
014
.03
Tot
al N
on-R
esid
entia
l Spa
ce79
.39
130.
4816
4.76
238.
0415
3.77
Non
-Cla
ss L
ab1.
001.
481.
653.
952.
13O
ffic
e Sp
ace
per
Tot
alPr
ofes
sion
al F
T S
taff
302.
3834
2.03
370.
2939
7.05
354.
64O
ffic
e Sp
ace
per
Tot
alPr
ofes
sion
al F
TE
Sta
ff25
4.08
313.
7534
1.88
368.
0832
1.55
*E
xclu
ding
labs
use
d fo
r re
sear
ch o
nly.

APP
EN
DIX
TA
BL
E 5
.2 (
Con
t'd)
SCH
OO
LS
RA
NK
ED
BY
QU
AR
TIL
EO
N T
OT
AL
NO
N-R
ESI
DE
NT
IAL
SPA
CE
PER
FU
LL
-TIM
E-E
QU
IVA
LE
NT
STU
DE
NT
, BY
TY
PE, C
ON
TR
OL
, AN
DSI
ZE
OF
SCH
OO
L, D
ET
AIL
OF
SPA
CE
BY
FU
NC
TIO
N
(Squ
are
Feet
per
Ful
l-T
ime-
Equ
ival
ent
Stud
ent)
D.
Priv
ate
Oth
er F
our-
Yea
r Sc
hool
s (C
ont'd
)
2,50
0-
5,00
0 E
nrol
lmen
tFi
rst
Qua
rtile
S'co
ndQ
uart
ileT
hird
Qua
rtile
Four
thQ
uart
ileM
ean
i'TE
Enr
ollm
ent
3,48
03,
419
3,39
32,
791
3,24
9C
lass
10.68
13.3
515
.48
18.30
14.6
2i
Lab
*5.
0810
.04
16.3
522
.25
14.0
1...
.C
lass
+ L
ab*
15.2
923
.38
31.83
40.56
28.3
2la ta
Off
ice
11.4
913
.40
16.9
022
.64
16.3
94:
0St
udy
6.56
10.3
411.58
18.74
12.11
Spec
ial U
se3.
9011
.05
10.7
016
.58
13.6
5G
ener
al U
se9.
7016
.89
25.8
138
.26
23.3
4Su
ppor
t2.
325.00
5.88
15.14
7.43
Tot
al N
on-R
esid
entia
l Spa
ce49
.66
80.9
8105.06
165.
1710
3.04
Non
-Cla
ss L
ab0.
711.
122.58
3.16
2.18
Off
ice
Spac
e pe
r T
otal
Prof
essi
onal
FT
Sta
ff306.12
279.
6632
5.47
335.
3331
3.07
Off
ice
Spac
e pe
r T
otal
Prof
essi
onal
FT
E S
taff
215.
7423
4.68
279.
6331
3.29
263.
71
* E
xclu
ding
labs
use
d fo
r re
sear
chon
ly.
IMO
Mil
- M
O S
IBw
SS
ON
WO
OS
SIB
IMO
an
SIP
OM
SID
NB
MID
GIB

APP
EN
DIX
TA
BL
E 5
.2 (
Con
ed)
SCI1
001.
S R
AN
KE
D B
Y Q
uAR
TIL
E O
N T
OT
AL
NO
N-R
ESI
DE
NT
IAL
SPA
CE
PE
R F
UL
L-T
IME
-EQ
UIV
AL
EN
TST
UD
EN
T, B
Y T
YPE
, CO
NT
RO
L, A
NL
) SI
ZE
OF
DE
TA
IL O
F SP
AC
E B
Y F
UN
CT
ION
(Squ
are
Feet
per
Ful
l-T
ime-
Equ
ival
entS
tude
nt)
E.
Firs
tt"
Qua
rtile
hoFT
E E
nrol
lmen
t61
3t
-.gl
ass
13.4
7L
ab*
10.5
2C
lass
+ L
ab*
23.5
2O
ffic
e6.
94St
udy
5.19
Spec
ial U
se3.
43G
ener
al U
se5.
03Su
ppor
t2.
21T
otal
Non
-Res
iden
tial S
pace
41.2
6N
on-C
lass
Lab
--O
ffic
e Sp
ace
per
Tot
alPr
ofes
sion
al F
T S
taff
178.
09O
ffic
e Sp
ace
per
Tot
alPr
ofes
sion
al F
TE
Sta
ff13
4.20
*E
xclu
ding
labs
use
d fo
r re
sear
ch o
nly.
Publ
ic T
wo-
Yea
r Sc
hool
s
Les
s th
an 1
,000
Enr
ollm
ent
Seco
ndQ
uart
ileT
hird
Qua
rtile
Four
thQ
uart
ileM
ean
591
596
558
589
18.3
721
.14
28.5
220
.49
19.2
525
.85
36.1
523
.22
37.3
446
.62
64.1
843
.21
9.95
12.3
816
.49
11.4
98.
2411
.08
15.5
310
.16
10.7
418
.72
27.0
017
.49
8.29
12.2
222
.69
12.5
52.
704.
018.
264.
7772
.68
99.9
115
1.63
92.0
15.
510.
711.
681.
68
202.
7925
3.45
310.
7523
7.81
170.
5221
4.83
272.
4719
9.71

APP
EN
DIX
TA
BL
E 5
.2 (
Con
t'd)
SCI1
001.
S R
AN
KE
D B
Y Q
UA
RT
ILE
ON
TO
TA
L N
ON
-RE
SID
EN
TIA
LSP
AC
E P
ER
FU
LL
-T
IME
- E
QU
IVA
LE
NT
STU
DE
NT
, BY
TY
PE, C
ON
TR
OL
, AN
D S
IZE
OF
SCH
OO
L, D
ET
AIL
OF
SPA
CE
BY
FU
NC
TIO
N
(Squ
are
Feet
per
Ful
l-T
ime-
Equ
ival
ent S
tude
nt)
E. P
ublic
Tw
o- Y
ear
Scho
ols
(Con
t'd)
1,00
0 -
2,50
0 E
nrol
lmen
tFi
rst
Qua
rtile
Seco
ndQ
uart
ileT
hird
Qua
rtile
Four
thQ
uart
ileM
ean
FTE
Enr
ollm
ent
1,81
31,
684
1,56
81,
432
1,62
2C
lass
7.67
12.0
115
.08
18.7
013
.42
Lab
*7.
3613
.19
22.3
230
.18
18.4
2Im
pC
lass
+ L
ab*
14.8
925
.20
37.4
048
.88
31.7
54
Off
ice
5.79
7.86
10.0
513
.11
9.24
Mo.
Stud
y2.
655.
036.
389.
996.
05Sp
ecia
l Use
1.86
7.08
9.59
17.5
59.
73G
ener
al U
se3.
016.
148.
9217
.90
9.09
Supp
ort
1.21
1.70
4.36
10.2
14.
69T
otal
Non
-Res
iden
tial S
pace
28.7
051
.97
75.4
911
7.52
68.8
7N
on-C
lass
Lab
0.26
0.23
1.25
0.68
0.64
Off
ice
Spac
epe
r T
otal
Prof
essi
onal
FT
Sta
ff15
0.37
207.
0823
6.32
276.
1621
7.82
Off
ice
Spac
epe
r T
otal
Prof
essi
onal
FT
E S
taff
117.
8816
7.93
204.
8224
8.07
185.
07
*E
xclu
ding
labs
use
d fo
r re
sear
ch o
nly.
0
=II
NO
OW
Eli
OM
ell
SIM
SIB
Ile
IMS
Ili S
WO
W S
IB O
S W
I
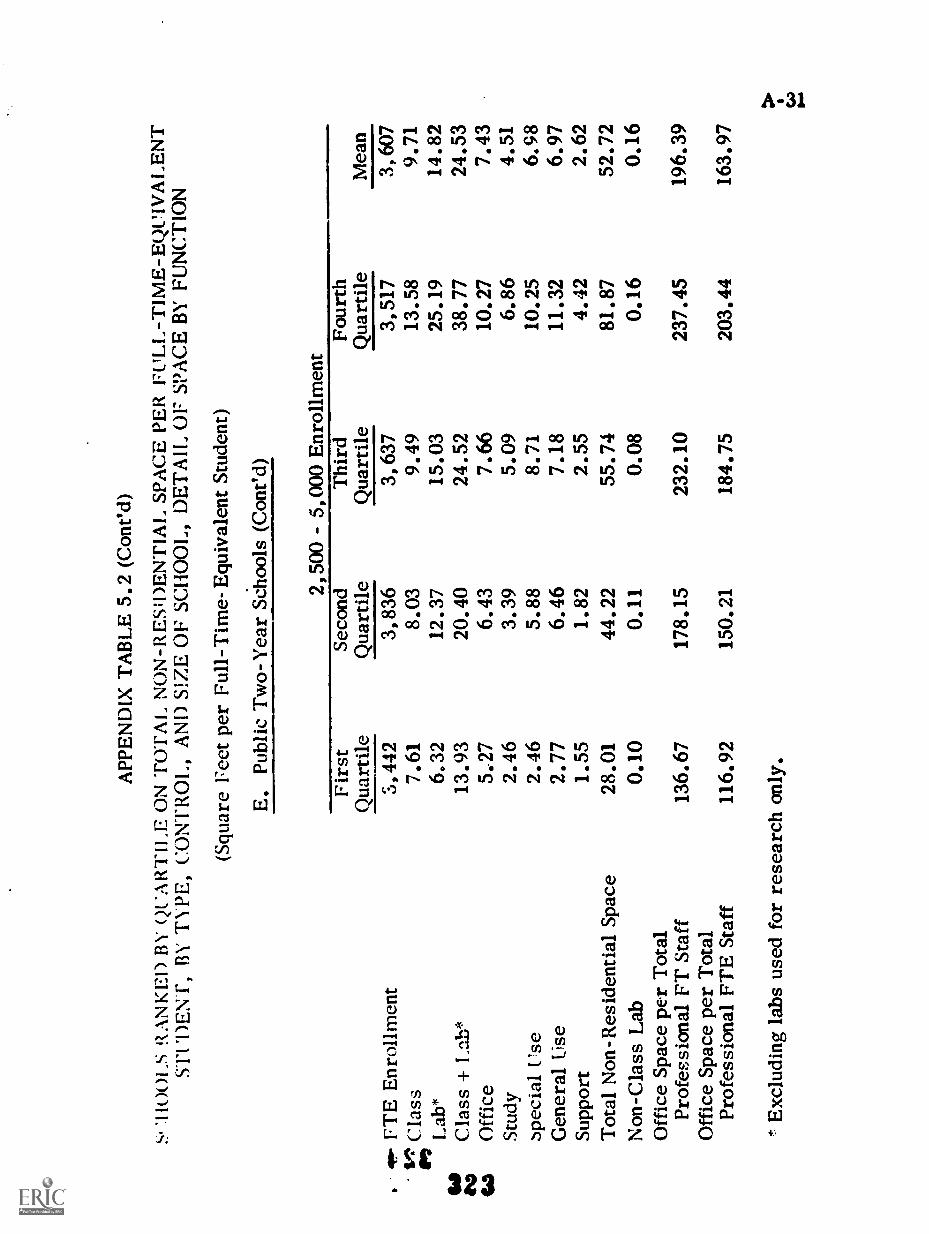
APP
EN
DIX
TA
BL
E 5
.2 (
Con
t'd)
S. '1
10L
S R
AN
KE
D B
Y Q
1'A
RT
ILE
ON
TO
TA
L N
ON
-RE
SID
EN
TIA
L S
PAC
E P
ER
FUL
L-T
IME
-EQ
UIV
AL
EN
TST
I'DE
N r
, BY
TY
PE, C
ON
TR
OL
, AN
D S
IZE
OF
SCH
OO
L, D
ET
AIL
OF
SPA
CE
BY
FU
NC
TIO
N
(Squ
are
Feet
per
Ful
l -T
ime-
Equ
ival
ent S
tude
nt)
E. P
ublic
Tw
o-Y
ear
Scho
ols
( C
ont'd
)
2,50
05,
000
Enr
ollm
ent
Firs
tQ
uart
ileSe
cond
Qua
rtile
Thi
rdQ
uart
ileFo
urth
Qua
rtile
Mea
n
.di
rp-
FTE
Enr
ollm
ent
3,44
23,
836
3,63
73,
517
3,60
7C
lass
Pp7.
618.
039.
4913
.58
9.71
Lab
*6.
3212
.37
15.0
325
.19
14.8
2
ivC
lass
+ I
....,.
.,v,*
13.9
320
.40
24.5
238
.77
24.5
3te
aO
ffic
e5.
276.
437.
6610
.27
7.43
Stud
y2.
463.
395.
096.
864.
51sp
ecia
l I's
e2.
465.
888.
7110
.25
6.98
Gen
eral
Use
2.77
6.46
7.18
11.3
26.
97Su
ppor
t1.
551.
822.
554.
422.
62T
otal
Non
-Res
iden
tial S
pace
28.0
144
.22
55.7
481
.87
52.7
2N
on-C
lass
Lab
0.10
0.11
0.08
0.16
0.16
Off
ice
Spac
e pe
r T
otal
Prof
essi
onal
FT
Sta
ff13
6.67
178.
1523
2.10
237.
4519
6.39
Off
ice
Spac
e pe
r T
otal
Prof
essi
onal
FT
E S
taff
116.
9215
0.21
184.
7520
3.44
163.
97
Exc
ludi
ng la
bs u
sed
for
rese
arch
onl
y.

APP
EN
DIX
TA
BL
E 5
.2 (
Con
t'd)
SCI
KM
! ,S
RA
NK
ED
BQ
t'AR
TIL
E O
N T
OT
AL
NO
N-R
ESI
DE
NT
IAL
SPA
CE
PE
RFU
LL
-TIM
E-E
QU
IVA
LE
NT
STI
DE
NT
, BY
TY
PE, C
ON
FRO
I A
ND
SIZ
E O
F SC
HO
OL
, DE
TA
IL O
FSP
AC
E B
Y F
UN
CT
ION
(Squ
are
Feet
per
Ful
l-T
ime-
Equ
ival
ent
Stud
ent)
cl"
.t- en
FTE
Enr
ollm
ent
Cla
ssI,
ab*
E. P
ublic
Tw
o-Y
ear
Scho
ols
(Con
t'd)
Ove
r 5,
000
Enr
ollm
ent
Firs
tQ
uart
ileSe
cond
Qua
rtile
Thi
rdQ
uart
ile8,
891
5.36
p.55
7,32
97.
2311
.82
7,66
78.
2314
.25
Cla
ss +
Lab
*15
.91
19.0
522
.48
fa ivO
ffic
e4.
825.
766.
60ri
b.St
udy
2.38
3.43
3.89
Spec
ial U
se4.
185.
376.
83G
ener
al U
se3.
834.
855.
99Su
ppor
t1.
242.
702.
67T
otal
Non
-Res
iden
tial
Spac
e32
.37
41.2
148
.50
Non
-Cla
ss L
ab0.
090.
060.
22O
ffic
e Sp
ace
per
Tot
alPr
ofes
sion
al F
T S
taff
153.
1520
0.80
207.
36O
ffic
e Sp
ace
per
Tot
alPr
ofes
sion
al F
TE
Sta
ff12
7.51
370.
3317
8.20
Four
thQ
uart
ileM
ean
6,80
87,
689
13.2
08.
6720
.46
13.9
033
.66
22.5
89.
636.
654.
583.
556.
825.
787.
945.
615.
593.
0068
.24
47.2
00.
160.
14
277.
3521
2.92
203.
1717
2.81
*E
xclu
ding
labs
use
d fo
r re
sear
chon
ly.
9 ck) N
III M
O S
IB it
SIB
UM
GN
IM
I OM
IND
WO
OM
MI N
ISS
IDS
IMI M
I MID
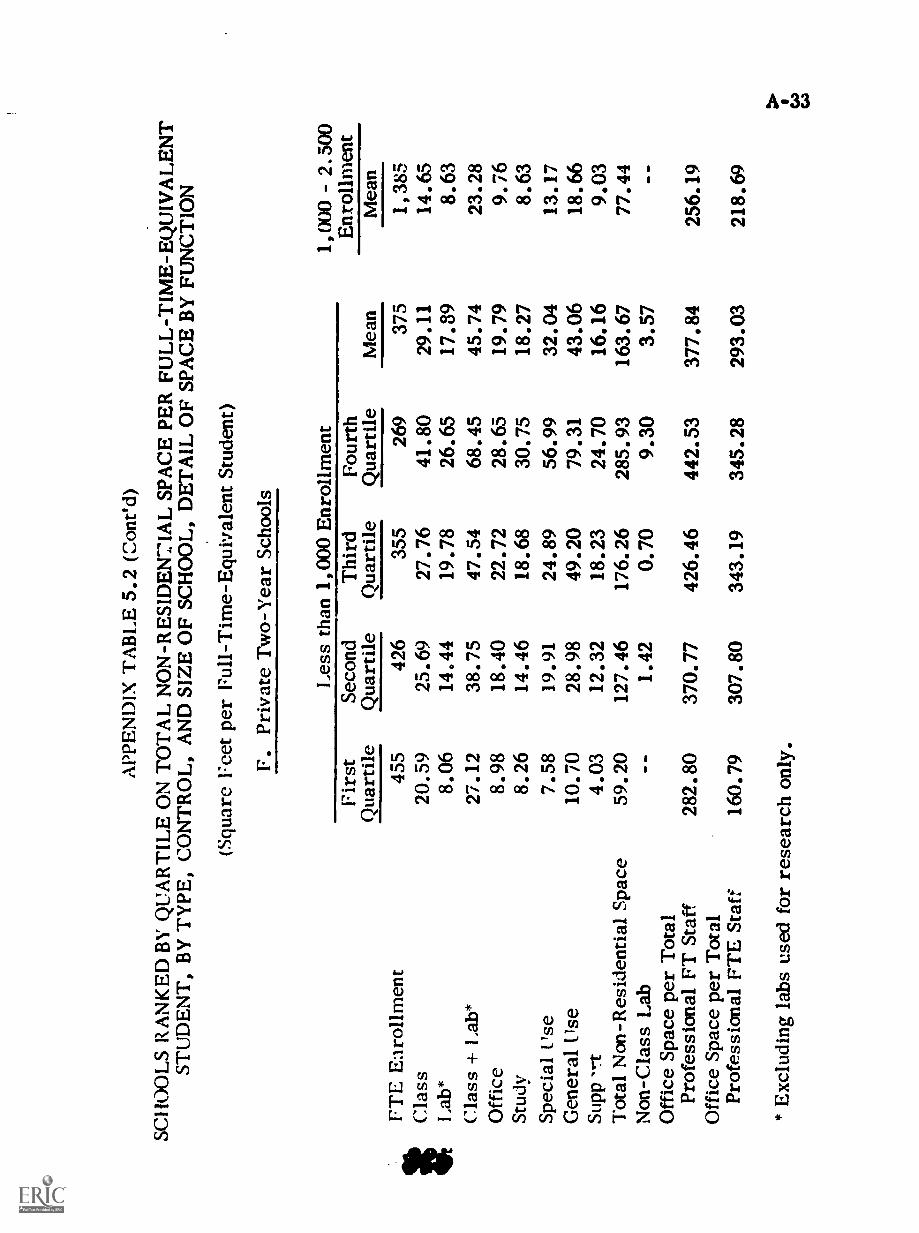
APP
EN
DIX
TA
BL
E 5
.2 (
Con
ed)
SCH
OO
LS
RA
NK
ED
BY
QU
AR
TIL
E O
N T
OT
AL
NO
N-R
ESI
DE
NT
IAL
SPA
CE
PE
RFU
LL
-TIM
E-E
QU
IVA
LE
NT
STU
DE
NT
, BY
TY
PE, C
ON
TR
OL
, AN
D S
IZE
OF
SCH
OO
L, D
ET
AIL
OF
SPA
CE
BY
FU
NC
TIO
N
(Squ
are
Feet
per
Ful
l-T
ime-
Equ
ival
ent S
tude
nt)
F. P
riva
te T
wo-
Yea
r Sc
hool
s
Les
s th
an 1
,000
Enr
ollm
ent
Firs
tSe
cond
Thi
rdFo
urth
Qua
rtile
Qua
rtile
Qua
rtile
Qua
rtile
Mea
n
1,00
0 -
2.50
0E
nrol
lmen
tM
ean
FTE
Enr
ollm
ent
455
426
355
269
375
1,38
5C
lass
20.5
925
.69
27.7
641
.80
29.1
114
.65
Lab
*8.
0614
.44
19.7
826
.65
17.3
98.
63C
lass
+ L
ab*
27.1
238
.75
47.5
468
.45
45.7
423
.28
Off
ice
8.98
18.4
022
.72
28.6
519
.79
9.76
Stud
y8.
2614
.46
18.6
830
.75
18.2
78.
63Sp
ecia
l ['s
e7.
5819
.91
24.8
956
.99
32.0
413
.17
Gen
eral
Use
10.7
028
.98
49.2
079
.31
43.0
618
.66
Supp
-rt
4.03
12.3
218
.23
24.7
016
.16
9.03
Tot
al N
on-R
esid
entia
l Spa
ce59
.20
127.
4617
6.26
285.
9316
3.67
77.4
4N
on-C
lass
Lab
...4E
D
1.42
0.70
9.30
3.57
M. M
.
Off
ice
Spac
epe
r T
otal
Prof
essi
onal
FT
Sta
ff28
2.80
370.
7742
6.46
442.
5337
7.84
256.
19O
ffic
e Sp
ace
per
Tot
alPr
ofes
sion
al F
TE
Sta
ff16
0.79
307.
8034
3.19
345.
2829
3.03
218.
69
*E
xclu
ding
labs
use
d fo
r re
sear
ch o
nly.

APP
EN
DIX
TA
BL
E 5
.3
Scat
TO
OL
S R
AN
KE
D B
Y Q
UA
RT
ILE
ON
TO
TA
L N
ON
-RE
SID
EN
TIA
L S
PAC
EPE
R F
UL
L-T
IME
ST
UD
EN
T,
BY
TY
PE, C
ON
TR
OL
, AN
D S
IZE
OF
SCH
OO
L, D
ET
AIL
OF
SPA
CE
BY
FUN
CT
ION
(Squ
are
Feet
per
Ful
l-T
ime
Stud
ent)
A. P
ublic
Uni
vers
ities
Les
s th
an 1
0,00
0 E
nrol
lmen
tFi
rst
Qua
rtile
Seco
ndQ
uart
ileT
hird
Qua
rtile
Four
thQ
uart
ileFu
ll-T
ime
Enr
ollm
ent
7,56
96,
129
6,27
05,
667
Cla
ss11
.36
13.7
516
.25
17.3
7L
ab*
12.0
617
.60
24.6
132
.03
Cla
ss -
r L
ab*
23.4
231
.35
40.8
649
.40
Off
ice
16.6
926
.61
29.6
442
.20
Stud
y8.
7712
.16
13.9
318
.09
Spec
ial U
se8.
4715
.33
24.3
831
.49
Gen
eral
Use
11.7
017
.93
27.5
727
.12
Supp
ort
8.88
11.5
011
.10
19.6
4T
otal
Non
-Res
iden
tial S
pace
82.0
912
2.82
155.
4321
2.86
Non
-Cla
ss L
ab3.
968.
9310
.91
27.7
2O
ffic
e Sp
ace
per
Tot
alPr
ofes
sion
al F
T S
taff
246.
9427
9.42
320.
1633
4.95
Off
ice
Spac
e pe
r T
otal
Prof
essi
onal
FT
E S
taff
209.
3924
1.12
268.
6228
6.59
Mea
n
6,42
1
14.7
221
.40
36.0
328
.56
13.1
419
.72
20.8
712
.57
142.
1212
.78
296.
89
252.
65
co*
Exc
ludi
ng la
bs u
sed
for
rese
arch
onl
y.4.
OM
OM
ON
IMO
OO
P O
N41
111
MO
OM
OM
r 11
1111
r 1
1111
1O
IO r
r 1
1111
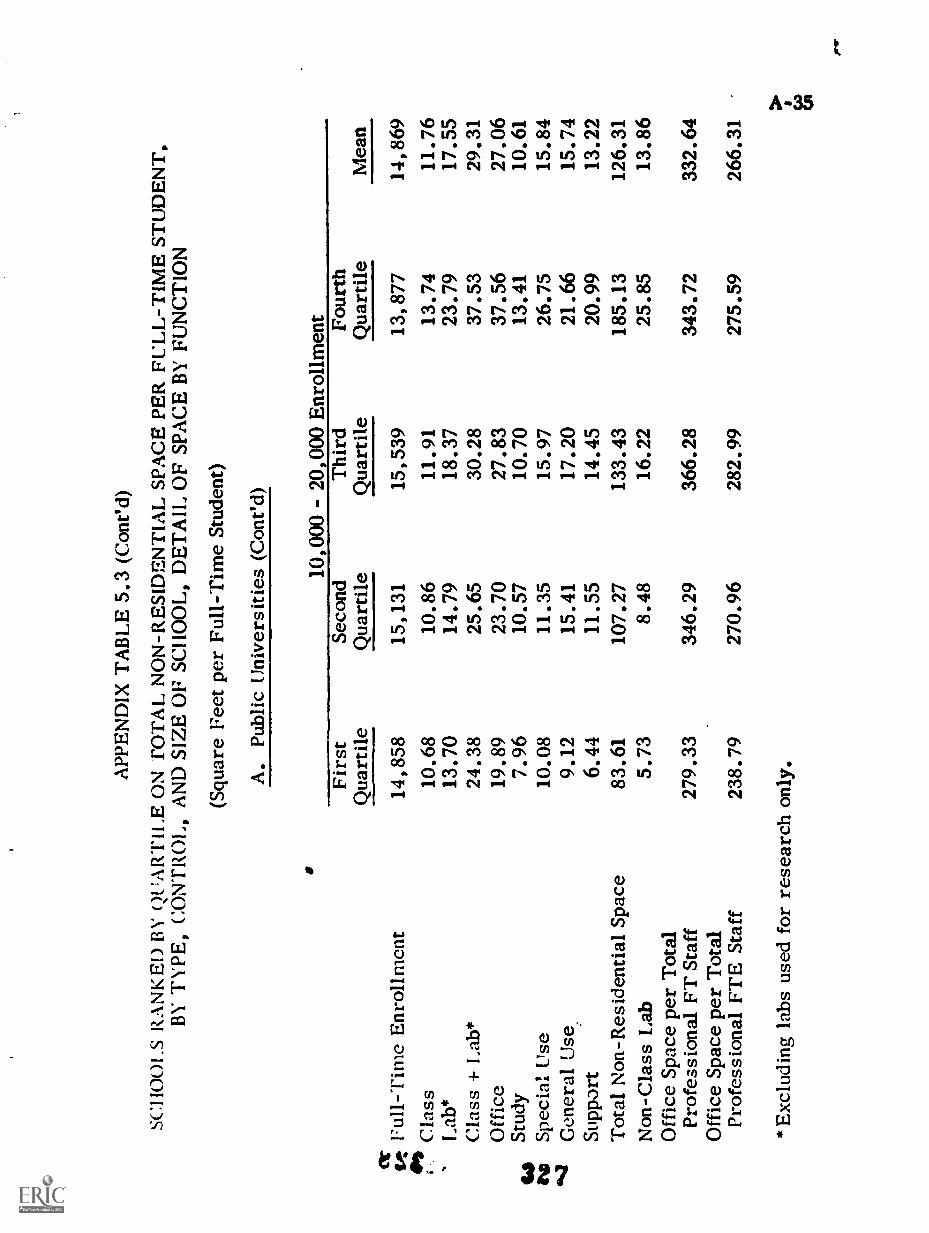
APP
EN
DIX
TA
BL
E 5
.3 (
Con
t'd)
SCI1
001.
S R
AN
KE
D B
Y Q
UA
RT
ILE
ON
TO
TA
L N
ON
-RE
SID
EN
TIA
L S
PAC
E P
ER
FU
LL
-TIM
E S
TU
DE
NT
,B
Y T
YPE
, CO
NT
RO
L, A
ND
SIZ
E O
F SC
1100
L, D
ET
AIL
OF
SPA
CE
BY
FU
NC
TIO
N
(Squ
are
Feet
per
Ful
l-T
ime
Stud
ent)
tt
A. P
ublic
Uni
vers
ities
(C
ont'd
)
10,0
00 -
20,
000
Enr
ollm
ent
Firs
tQ
uart
ileSe
cond
Qua
rtile
Thi
rdQ
uart
ileFo
urth
Qua
rtile
Mea
n
Full-
Tim
e E
nrol
lmen
t14
,858
15,1
3115
,539
13,8
7714
,869
!PI*
Cla
ss10
.68
10.8
611
.91
13.7
411
.76
'L
ab*
13.7
014
.79
18.3
723
.79
17.5
5C
lass
+ L
ab*
24.3
825
.65
30.2
837
.53
29.3
1O
ffic
e19
.89
23.7
027
.83
37.5
627
.06
f02
Stud
y7.
9610
.57
10.7
013
.41
10.6
111
0Sp
ecia
l Use
10.0
811
.35
15.9
726
.75
15.8
4G
ener
al U
se9.
1215
.41
17.2
021
.66
15.7
4Su
ppor
t6.
4411
.55
14.4
520
.99
13.2
2T
otal
Non
-Res
iden
tial S
pace
83.6
110
7.27
133.
4318
5.13
126.
31N
on-C
lass
Lab
5.73
8.48
16.2
225
.85
13.8
6O
ffic
e Sp
ace
per
Tot
alPr
ofes
sion
al F
T S
taff
279.
3334
6.29
366.
2834
3.72
332.
64O
ffic
e Sp
ace
per
Tot
alPr
ofes
sion
al F
TE
Sta
ff23
8.79
270.
9628
2.99
275.
5926
6.31
*E
xclu
ding
labs
use
d fo
r re
sear
chon
ly.

APP
EN
DIX
TA
BL
E 5
.3 (
Con
t'd)
SCH
OO
LS
RA
NK
ED
BY
QU
AR
TIL
E O
NT
OT
AL
NO
N-R
ESI
DE
NT
IAL
SPA
CE
PE
R F
UL
L-T
IME
ST
UD
EN
T,
BY
TY
PE, C
ON
TR
OL
, AN
D S
IZE
OF
SCH
OO
L,
DE
TA
IL O
F SP
AC
E B
Y F
UN
CT
ION
(Squ
are
Feet
per
Ful
l-T
ime
Stud
ent)
A. P
ublic
Uni
vers
ities
(C
ont'd
)
Ove
r 20
,000
Enr
ollm
ent
Firs
tQ
uart
ileSe
cond
Qua
rtile
Thi
rdQ
uart
ileFo
urth
Qua
rtile
Mea
n
Full-
Tim
e E
nrol
lmen
t26
,731
31,5
9430
,083
24,3
6828
,449
Cla
ss8.
7610
.67
10.7
910
.47
10.1
5L
ab*
12.7
213
.31
21.8
518.61
16.49
Class
+ L
ab*
21.4
823
.98
32.6
429
.08
26.6
4O
ffic
e25
.27
35.4
343
.42
40.8
635
.94
Stud
y9.87
15.2
414
.49
13.37
13.23
Spec
ial U
se10
.04
20.1
314
.92
28.73
17.77
Gen
eral
Use
8.89
17.81
14.2
420
.95
15.1
1Su
ppor
t8.
5015
.96
18.8
126.13
16.76
Tot
al N
on-R
esid
entia
l Spa
ce96
.14
154.
8917
4.67
201.
8015
3.88
Non
-Cla
ss L
ab11
.86
22.6
932.77
39.8
525
.92
Off
ice
Spac
e pe
r T
otal
Prof
essi
onal
FT
Sta
ff42
6.09
374.
6334
8.53
387.
38O
ffic
e Sp
ace
per
Tot
alPr
ofes
sion
al F
TE
Sta
ff30
6.00
313.
5424
3.97
289.
65
* E
xclu
ding
labs
use
d fo
r re
sear
chon
ly.

APP
EN
DIX
TA
BL
E 5
.3 (
Con
t'd)
SCII
OO
LS
RA
NK
ED
BY
QU
AR
TIL
E O
N T
OT
AL
NO
N-R
ESI
DE
NT
IAL
SPA
CE
PE
R F
UL
L-T
IME
ST
UD
EN
T,
BY
TY
PE, C
ON
TR
OL
, AN
D S
IZE
OF
SCH
OO
L, D
ET
AIL
OF
SPA
CE
BY
FU
NC
TIO
N
(Squ
are
Feet
per
Full-
Tim
e St
uden
t)
B. P
riva
te U
nive
rsiti
es
Les
sth
an 1
0,00
0 E
nrol
lmen
tFi
rst
Qua
rtile
Seco
ndQ
uart
ileT
hird
Four
thQ
uart
ileQ
uart
ileM
ean
ft.
Full-
Tim
e E
nrol
lmen
t5,
775
3,96
63.
135
2,81
73,
939
etC
lass
14.5
919
.33
23.6
237
.51
23.3
7ir
aL
ab*
10.8
218
.07
17.3
831
.06
18.6
4C
lass
+ L
ab*
25.4
137
.40
41.0
064
.68
41.4
8O
ffic
e18
.74
32.3
835
.79
77.4
140
.57
Stud
y10
.14
15.1
427
.61
46.5
924
.56
Spec
ial U
se11
.15
16.8
224
.68
34.2
421
.33
Gen
eral
Use
15.6
225
.51
37.2
277
.64
37.8
9
Supp
ort
5.65
10.5
114
.17
47.9
3'1
9.17
Tot
al N
on-R
esid
entia
l Spa
ce89
.75
144.
1018
7.80
403.
4620
3.50
Non
-Cla
ss L
ab2.
758.
0610
.56
84.6
722
.79
Off
ice
Spac
e pe
r T
otal
Prof
essi
onal
FT
Sta
ff23
3.82
314.
8730
2.61
352.
8930
0.88
Off
ice
Spac
e pe
r T
otal
Prof
essi
onal
FT
E S
taff
192.
4226
4.52
268.
4230
6.56
258.
20
*E
xclu
ding
labs
use
d fo
r re
sear
ch o
nly.
I

APP
EN
DIX
TA
BL
E 5
.3 (
Con
t'd)
SCII
0OL
S R
AN
KE
D B
YQ
UA
RT
ILE
ON
TO
TA
L N
ON
-RE
SID
EN
TIA
L S
PAC
EPE
R F
UL
L-T
IME
ST
UD
EN
T,
BY
TY
PE, C
ON
TR
OL
, AN
D S
IZE
OF
SCH
OO
L, D
ET
AIL
Or
SPA
CE
BY
FUN
CT
ION
(Squ
are
Feet
per
Ful
l-T
ime
Stud
ent)
4: 41 emit
er3
UP
CD
Full-
Tim
e E
nrol
lmen
tC
lass
Lab
*C
lass
+ L
ab*
Off
ice
Stud
ySp
ecia
l Use
Gen
eral
Use
Supp
ort
Tot
al N
on-R
esid
entia
l Spa
ceN
on-C
lass
Lab
Off
ice
Spac
epe
r T
otal
Prof
essi
onal
FT
Sta
ffO
ffic
e Sp
ace
per
Tot
alPr
ofes
sion
al F
TE
Sta
ff
B. P
riva
te U
nive
rsiti
es (
Con
t'd)
10,0
00 -
20,
000
Enr
ollm
ent
Firs
tQ
uart
ileSe
cond
Qua
rtile
Thi
rdQ
uart
ileFo
urth
Qua
rtile
Mea
n
15,6
5512
.83
12.0
524
.88
26.6
411
.80
5.53
8.85
7.98
98.5
411
.70
384.
56
340.
51
12,7
41
15,0
716
.29
31.3
639
.62
26.8
115
.85
22.8
513
.92
187.
2733
.80
249.
49
197.
28
13,5
2219
.04
-19
.47
38.5
141
.77
25.1
317
.26
25.8
742
.51
213.
7821
.32
335.
36
249.
37
13,4
3320
.43
17.0
837
.53
71.2
444
.74
12.1
633
.06
-
26.6
927
4.05
47.8
6
13,9
1016
.26
15.8
132
.08
42.4
825
.56
12.3
021
.30
20.4
118
3.31
27.4
9
321.
61
264.
01
''*
Exc
ludi
ng la
bs u
sed
for
rese
arch
onl
y.co
.,co

APP
EN
DIX
TA
BL
E 5
.3 (
Con
ed)
SCII
001,
S R
AN
KE
D B
Y Q
UA
RT
ILE
. ON
TO
TA
L N
ON
-RE
SID
EN
TIA
L S
PAC
E P
ER
FU
LL
-TIM
E S
TU
DE
NT
,B
Y T
YPE
, CO
NT
RO
L, A
ND
SIZ
E O
F SC
HO
OL
, DE
TA
IL O
F SP
AC
E B
Y F
UN
CT
ION
:-Fu
ll-T
ime
Enr
ollm
ent
-41.
141
Cla
ssle
sL
ab*
ellla
bib
Cla
ss +
Lab
*O
ffic
eSt
udy
Spec
ial t
;se
Gen
eral
Use
Supp
ort
Tot
al N
on-R
esid
entia
lSp
ace
Non
-Cla
ss L
abO
ffic
e Sp
ace
per
Tot
alPr
ofes
sion
al F
T S
taff
Off
ice
Spac
epe
r T
otal
Prof
essi
onal
FT
E S
taff
(Squ
are
Feet
per
Ful
l-T
ime
Stud
ent)
C. P
ublic
Oth
er F
our-
Yea
r Sc
hool
s
Les
s th
an 2
,500
Enr
ollm
ent
Firs
tQ
uart
ileSe
cond
Qua
rtile
Thi
rdQ
uart
ileFo
urth
Qua
rtile
Mea
n1,
456
1,63
21,
540
1,16
61,
451
16.6
315
.62
20.4
376
.82
32.0
49.
6316
.23
23.0
228
.78
19.4
025
.38
31.8
442
.76
103.
8050
.54
11.7
316
.59
19.3
243
.87
22.7
26.
9012
.58
17.3
326
.62
15.9
84.
8913
.34
21.7
829
.67
17.8
28.
3816
.77
26.6
342
.10
23.7
14.
097.
079.
7819
.25
10.1
758
.49
98.0
913
7.60
262.
1313
8.14
0.92
1.09
2.44
1.44
1.48
174.
3121
9.46
267.
8529
4.84
241.
99
163.
0220
7.28
256.
7928
2.49
230.
26
*E
xclu
ding
labs
use
d fo
r re
sear
ch o
nly.

APP
EN
DIX
TA
BL
E 5
.3 (
Con
t'd)
SCH
OO
LS
RA
NK
ED
BY
QU
AR
TIL
E O
N T
OT
AL
NO
N-R
ESI
DE
NT
IAL
SPA
CE
PE
R F
UL
L-T
IME
ST
UD
EN
T,
BY
TY
PE, C
ON
TR
OL
, AN
D S
IZE
OF
SCH
OO
L, D
ET
AIL
OF
SPA
CE
BY
FU
NC
TIO
N
(Squ
are
Feet
per
Ful
l-T
ime
Stud
ent)
C. P
ublic
Oth
er F
our-
Yea
r Sc
hool
s (C
ont'd
)
2,50
0 -
5,00
0 E
nrol
lmen
tFi
rst
Qua
rtile
Seco
ndQ
uart
ileT
hird
Qua
rtile
Four
thQ
uart
ileM
ean
Full-
Tim
e E
nrol
lmen
t4,
069
3,66
23,
541
3,66
43,
733
Cla
ss12
.25
13.5
314
.33
20.0
115
.14
Lab
*12
.33
14.8
619
.10
20.3
116
.73
Cla
ss +
Lab
*24
.58
28.3
933
.43
40.3
231
.86
Off
ice
12.2
215
.03
15.3
920
.06
15.7
7St
udy
5.93
11.3
910
.26
12.4
310
.05
Spec
ial U
se8.
6311
.96
18.6
024
.94
16.2
2G
ener
al U
se11
.17
16.5
020
.69
28.9
219
.52
Supp
ort
4.28
7.09
9.05
10.6
87.
84T
otal
Non
-Res
iden
tial S
pace
67.0
991
.34
108.
3913
9.17
101.
77N
on-C
lass
Lab
0.83
1.11
1.17
1.86
1.28
Off
ice
Spac
epe
r T
otal
Prof
essi
onal
FT
Sta
ff18
1.59
232.
9123
7.17
269.
5323
1.26
Off
ice
Spac
epe
r T
otal
Prof
essi
onal
FT
E S
taff
175.
3721
9.85
230.
3625
8.09
221.
90
*E
xclu
ding
labs
use
d fo
r re
sear
ch o
nly.
OM
ME
IO
ilS
IB M
I r IM
O M
IIM
O O
M 1
1111
1S
i III
EN

APP
EN
DIX
TA
BL
E 5
.3 (
Con
t'd)
SCI1
0013
RA
NK
ED
BY
QU
AR
TIL
E O
N T
OT
AL
NO
N-R
ESI
DE
NT
IAL
SPA
CE
PE
R F
UL
L -
TIM
E S
TU
DE
NT
,B
Y T
YPE
, CO
NT
RO
L, A
ND
SIZ
E O
F SC
HO
OL
, DE
TA
IL O
F SP
AC
E B
Y F
UN
CT
ION
(Squ
are
Feet
per
Ful
l-T
ime
Stud
ent)
C. P
ublic
Oth
er F
our-
Yea
r Sc
hool
s (C
ont'd
)
5,00
0 -
10,0
00 E
nrol
lmen
t
Full-
Tim
e E
nrol
lmen
tqr el
: Cla
ss11
12L
ab*
60
Firs
tQ
uart
ileSe
cond
Qua
rtile
7,33
24.
3910
.49
7,65
511
.76
12.9
6IA
Cla
ss +
Lab
*19
.89
24.7
2G
OO
ffic
e11
.77
13.6
3St
udy
6.01
9.03
Spec
ial U
se7.
4011
.61
Gen
eral
Use
9.80
13.5
2Su
ppor
t4.
426.
27T
otal
Non
-Res
iden
tial S
pace
60.5
680
.05
Non
-Cla
ss L
ab1.
741.
35O
ffic
e Sp
ace
per
Tot
alPr
ofes
sion
al F
T S
taff
187.
6622
7.07
Off
ice
Spac
e pe
r T
otal
Prof
essi
onal
FT
E S
taff
168.
6030
9.52
* E
xclu
ding
labs
use
d fo
r re
sear
ch o
nly.
Thi
rdFo
urth
Qua
rtile
Qua
rtile
Mea
n
7,02
86,
781
6,45
712
.05
16.6
812
.67
15.8
718
.47
14.6
427
.92
35.1
527
.31
15.8
119
.90
15.5
08.
7310
.39
8.69
16.1
224
.81
15.4
516
.57
20.0
715
.23
7.83
9.11
7.01
94.0
112
1.17
90.4
81.
071.
741.
48
254.
3828
9.66
243.
36
236.
8426
8.68
248.
22

APP
EN
DIX
TA
BL
E 5
.3 (
Con
t'd)
SCH
OO
LS
RA
NK
ED
BY
QU
AR
TIL
EO
N T
OT
AL
NO
N-R
ESI
DE
NT
IAL
SPA
CE
PER
FU
LL
-TIM
E S
TU
DE
NT
,B
Y T
YPE
, CO
NT
RO
L, A
ND
SIZ
E O
PSC
HO
OL
, DE
TA
IL O
F SP
AC
E B
Y F
UN
CT
ION
(Squ
are
Feet
per
Ful
l-T
ime
Stud
ent)
C.
Publ
ic O
ther
Fou
r-Y
ear
Scho
ols
(Con
t'd)
10,0
00 -
20,
000
Enr
ollm
ent
Firs
tQ
uart
ileSe
cond
Qua
rtile
Thi
rdQ
uart
ileFo
urth
Qua
rtile
Mea
nFu
ll-T
ime
Enr
ollm
ent
14,0
1412
,713
13,9
0712
,552
13,2
97C
lass
7.28
9.99
11.6
011
.71
10.1
5L
ab*
12.7
010
.65
16.4
718.66
14.62
Class
+ L
ab*
19.9
820
.64
28.0
730
.37
24.7
7O
ffic
e10
.98
14.2
913
.33
16.9
113.88
Study
4.03
6.14
8.92
9.98
7.27
Spec
ial U
se5.
246.
5811.36
10.39
8.39
Gen
eral
Use
4.05
4.45
6.57
8.24
5.83
Supp
ort
3.33
4.75
4.83
7.55
5.12
Tot
al N
on-R
esid
entia
lSp
ace
48.8
957
.51
73.9
385
.45
66.4
5N
on-C
lass
Lab
1.27
0.66
0.86
2.01
1,20
Off
ice
Spac
epe
r T
otal
Prof
essi
onal
FT
Sta
ff18
5.22
222.
2221
4.98
226.
9221
2.34
Off
ice
Spac
epe
r T
otal
Prof
essi
onal
FT
E S
taff
167.
4920
9.01
193.68
209.57
194.94
*E
xclu
ding
labs
use
d fo
r re
sear
chon
ly.
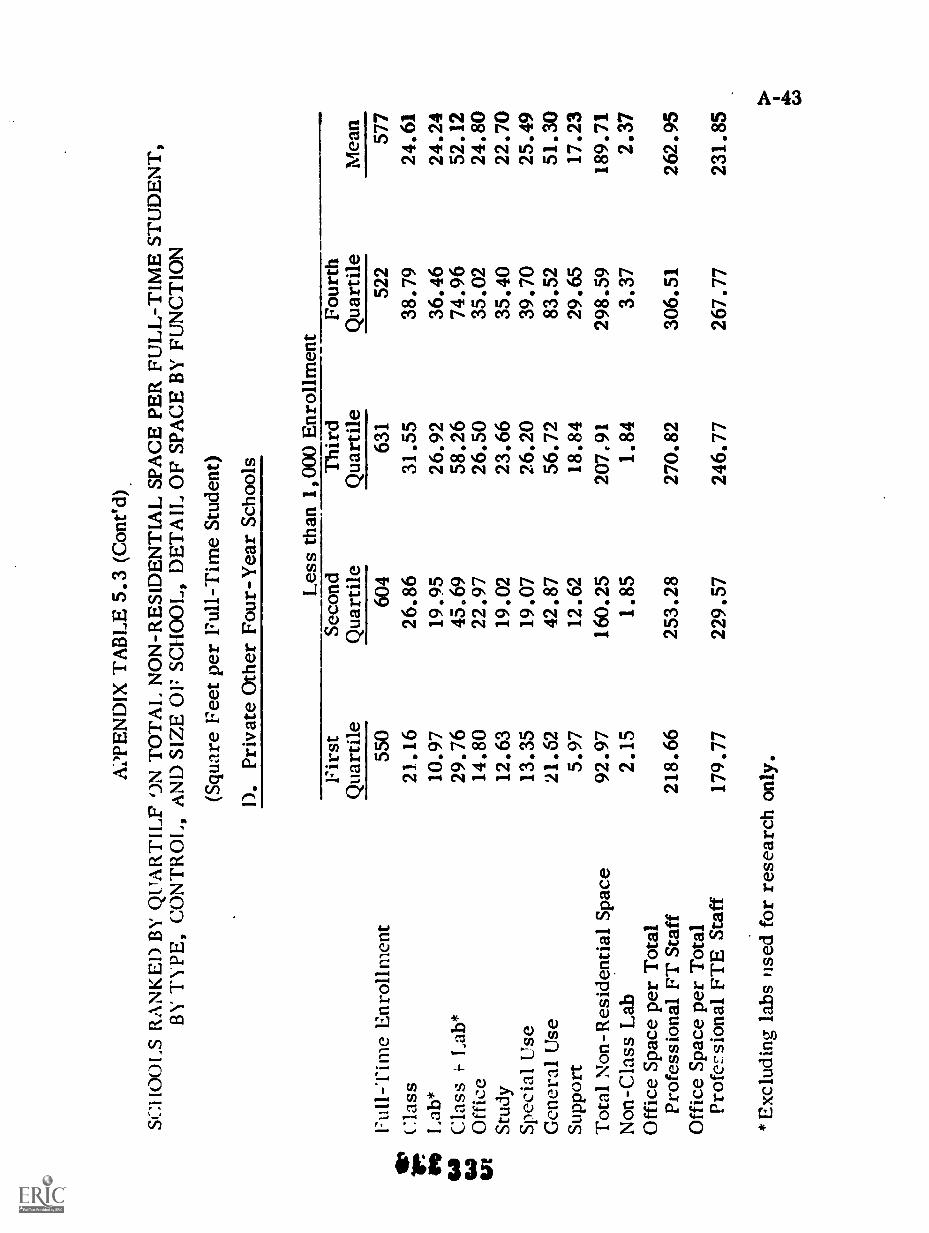
A2P
EN
DIX
TA
BL
E 5
.3 (
Con
ed).
SC:1
1001
,S R
AN
KE
D B
Y Q
tTA
RT
ILF
ON
TO
TA
L N
ON
-RE
SID
EN
TIA
L S
PAC
E P
ER
FU
LL
-T
IME
ST
UD
EN
T,
BY
TY
PE, C
ON
TR
OL
, AN
D S
IZE
OF
SCH
OO
L, D
ET
AIL
OF
SPA
CE
BY
FU
NC
TIO
N
(Squ
are
Feet
per
Ful
l-T
ime
Stud
ent)
I).
Priv
ate
Oth
er F
our-
Yea
r Sc
hool
s
Les
s th
an 1
,000
Enr
ollm
ent
Thi
rdQ
uart
ile63
1
31.5
526
.92
58.2
626
.50
23.6
626
.20
56.7
218
.84
2079
11.
84
270.
82
246.
77
Full-
Tim
e E
nrol
lmen
t
Firs
tQ
uart
ileSe
cond
Qua
rtile
550
604
111/
Ilt
Cla
ss21
.16
26.8
6V
DL
ab*
10.9
719
.95
la la ittC
lass
r L
ab*
Off
ice
29.7
614
.80
45.6
922
.97
.97
Stud
y12
.63
19.0
2Sp
ecia
l Use
13.3
519
.07
Gen
eral
Use
21.6
242
.87
Supp
ort
5.97
12.6
2T
otal
Non
-Res
iden
tial S
pace
92.9
716
0.25
Non
-Cla
ss L
ab2.
151.
85O
ffic
e Sp
ace
per
Tot
alPr
ofes
sion
al F
T S
taff
218.
6625
3.28
Off
ice
Spac
e pe
r T
otal
Prof
essi
onal
FT
E S
taff
179.
7722
9.57
Four
thQ
uart
ileM
ean
522
577
38.7
924
.61
36.4
624
.24
74.9
652
.12
35.0
224
.80
35.4
022
.70
39.7
025
.49
83.5
251
.30
29.6
517
.23
298.
5918
9.71
3.37
2.37
306.
5126
2.95
267.
7723
1.85
* E
xclu
ding
labs
use
d fo
r re
sear
ch o
nly.
so.
GO

APP
EN
DIX
TA
BL
E 5
.3 (
Con
t'd)
SCI
IDO
LS
RA
NK
ED
BY
QU
AR
TIL
E O
N T
OT
AL
NO
N-R
ESI
DE
NT
IAL
SPA
CE
PE
RFU
LL
-TIM
E S
TU
DE
NT
,B
Y T
YPE
, CO
NT
RO
L, A
ND
SIZ
E O
FSC
HO
OL
, DE
TA
IL O
F SP
AC
E B
Y F
UN
CT
ION
(Squ
are
Feet
per
Ful
l-T
ime
Stud
ent)
D. P
riva
te O
ther
Fou
r-Y
ear
Scho
ols
(Con
t'd)
1,00
0 -
2,50
0 E
nrol
lmen
tFi
rst
Qua
rtile
Seco
ndQ
uart
ileT
hird
Qua
rtile
Four
thQ
uart
ileM
ean
Full-
Tim
e E
nrol
lmen
t1,
564
1,50
41,
404
1,44
11,
478
..., .
Cla
ssL
ab*
15.8
611
.64
19.9
119
.34
23.2
021
.15
29.8
331
.85
22.1
721
.02
enC
lass
+ L
ab*
27.1
639
.25
44.3
561
.67
43.0
4O
aO
ffic
e15
.11
21.3
822
.91
32.1
422
.85
14St
udy
9.95
15.5
018
.37
25.5
917
.32
OP
1 .
Spec
ial U
se9.
9419
.17
25.3
636
.44
22.8
2G
ener
al U
se19
.13
32.0
342
.87
63.3
739
.34
Supp
ort
5.43
9.62
16.4
826
.87
14.6
6T
otal
Non
-Res
iden
tial
Spac
e86
.46
138.
2317
1.94
249.
3516
1.18
Non
-Cla
ss L
ab1.
141.
432.
163.
742.
23O
ffic
e Sp
ace
per
Tot
alPr
ofes
sion
al F
T S
taff
213.
8226
0.43
278.
1831
7.03
268.
50O
ffic
e Sp
ace
per
Tot
alPr
ofes
sion
al F
TE
Sta
ff18
8.52
241.
6026
2.43
298.
1924
8.96
*E
xclu
ding
labs
use
d fo
r re
sear
ch o
nly.
Si i
IMO
Ole
OM
NM
IIII
IIIO
M II
IIII
IIi
IND

APP
EN
DIX
TA
BL
E 5
.3 (
Con
t'd)
SCI
1001
.S R
AN
K E
;) B
Y Q
t TA
RT
U":
ON
TO
TA
L. N
ON
- R
ESI
DE
NT
IAL
SPA
CE
PE
R F
UL
L -
TIM
E S
TU
DE
NT
,B
Y T
YPE
, CO
NT
RO
L, A
ND
SIZ
E O
F SC
HO
OL
, DE
TA
IL O
F SP
AC
E B
Y F
UN
CT
ION
(Squ
are
Feet
per
Ful
l-T
ime
Stud
ent)
D. P
riva
te O
ther
Fou
r -
Yea
r Sc
hool
s (C
ont'd
)
2,50
0 -
5,00
0 E
nrol
lmen
tO
ver
5,00
0 E
nrol
lmen
tFi
rst
Qua
rtile
Seco
ndQ
uart
ileT
hird
Qua
rtile
Four
thQ
uart
ileM
ean
Mea
nFu
ll-T
ime
Enr
ollm
ent
3,51
93,
494
3,05
42,
613
3,17
05,
503
Cla
ss13
.79
16.6
818
.22
19.4
117
.03
15.2
9L
ab"
7.69
14.8
916
.01
23.6
615
.56
.25
Cla
ss 4
-l
2148
31.5
734
.23
43.0
632
.59
23.5
515
.16
17.0
719
.51
26.4
619
.55
18.2
1St
udy
8.96
8.92
16.3
620
.33
13.6
412
.02
Spec
ial U
se5.
3010
.88
12.8
729
.70
14.6
95.
75G
ener
al U
se12
.28
22.3
132
.98
38.7
726
.59
17.7
0Su
ppor
t4.
996.
008.
0817
.57
9.16
8.32
Tot
al N
on-R
esid
entia
l Spa
ce69
.65
98.5
612
6.48
179.
9811
8.67
86.5
1N
on-C
lass
Lab
0.94
1.81
3.06
4.'8
2.53
0.59
Off
ice
Spac
e pe
r T
otal
Prof
essi
onal
FT
Sta
ff22
2.25
216.
6627
1.84
309.
3925
4.47
Off
ice
Spac
epe
r T
otal
Prof
essi
onal
FT
E S
taff
181.
5618
8.89
243.
4828
3.78
223.
73
*E
xclu
ding
labs
use
d fo
r re
sear
ch o
nly.

APP
EN
DIX
TA
BL
E 5
.3 (
(:on
ed)
SCH
OO
LS
RA
NK
ED
BY
QU
AR
TIL
E O
N T
OT
AL
NO
N-R
ESI
DE
NT
IAL
SPA
CE
PE
RFU
LL
- T
IME
ST
UD
EN
T,
BY
TY
PE, C
ON
TR
OL
, AN
I )
SIZ
E O
FSC
1100
L, D
ET
AIL
OF
SPA
CE
BY
FU
NC
TIO
N
(Squ
are
Feet
per
Ful
l-T
ime
Stud
ent)
E. P
ublic
Tw
o-Y
ear
Scho
ols
Les
s th
an 1
,000
Enr
ollm
ent
Firs
tQ
uart
ileSe
cond
Qua
rtile
Thi
rdQ
uart
ileFo
urth
Qua
rtile
Mea
nFu
ll-T
ime
Enr
ollm
ent
580
578
579
506
561
Cla
ss14
.51
19.8
924
.66
42.7
325
.43
Lab
*12
.94
23.2
929
.87
44.7
627
.68'
Cla
ss -
4-Lab'`
26.99
43.17
54.1
785.87
52.53
Office
8.76
11.9
614.28
20.90
13.93
Stud
y6.
158.
7612
.36
19.8
211
.74
Spec
ial U
se5.
3113
.01
21.9
629
.25
19.0
8G
ener
al [
'se
6.30
9.86
15.8
424
.46
14.3
7Su
ppor
t2.
303.
155.
2810.72
5.80
Total
Non
-Res
iden
tial s
pace
50.42
85.00
119.94
184.
5610
9.76
Non
-Cla
ss L
ab0.
863.
950.
731.
761.
52O
ffic
e Sp
ace
per
Tot
alPr
ofes
sion
al F
T S
taff
139.
70171.86
210.83
257.42
194.57
Office Space
per
Tot
alPr
ofes
sion
al F
TE
Sta
ffn6
.42
153.
3518
4.39
230.
8817
0.97
Exc
ludi
ng la
bs u
sed
for
rese
arch
only
.
1111
1611
1111
1111
1111
1111
1111
1111
1111
1411
1111
1111
1111
1111
1111
1111
1111
1111
1111
1111
1111
1111
1

APP
EN
DIX
TA
B!,
E 5
.3 (
Con
t'd)
SCI1
0()I
.S R
AN
KE
D B
Y (
)I P
AR
TIL
E O
N T
OT
AL
NO
N-R
ESI
DE
NT
IAL
SPA
CE
PE
R F
UL
L-T
IME
ST
UD
EN
T,
BY
TyP
E, C
ON
TR
OL
, AN
D S
IZE
OF
SCH
OO
L, D
ET
AIL
OF
SPA
CE
BY
FU
NC
TIO
N
(Squ
are
Feet
per
Ful
l-T
ime
Stud
ent)
E.
Publ
ic T
wo-
Yea
r Sc
hool
s (C
ont'd
)
1,00
0 -
2,50
0 E
nrol
lmen
tFi
rst
Qua
rtile
Seco
ndQ
uart
ileFu
ll-T
ime
Enr
ollm
ent
1,65
51:
607
Cla
ss9.
4413
.87
Lab
8.35
15.0
4C
lass
+ I
.ab'
17.7
928
.90
Off
ice
6.89
9.37
Stud
y3.
275.
78Sp
ecia
l Use
2.26
7.33
Gen
eral
Use
3.73
7.41
Supp
ort
1.56
1.79
Tot
al N
on-R
esid
entia
l Spa
ce34
.81
59.0
7N
on-C
lass
Lab
0.35
0.26
Off
ice
Spac
e pe
r T
otal
Prof
essi
onal
FT
Sta
ff11
0.39
160.
24O
ffic
e Sp
ace
per
Tot
alPr
ofes
sion
al F
TE
Sta
ff97
.15
141.
18
* E
xclu
ding
labs
use
d fo
r re
sear
ch o
nly.
Thi
rdFo
urth
Qua
rtile
Qua
rtile
Mea
n1,
599
1,47
81,
584
16.5
424
.53
16.1
725
.76
33.7
62.
0.85
42.3
058
.29
37.0
211
.15
14.3
110
.47
6.81
10.0
16.
5311
:70
18.5
710
.54
9.62
18.6
09.
924.
8210
.51
4.88
85.6
012
9.42
77.7
11.
180.
610.
63
183.
3222
8.52
171.
19
163.
5220
4.76
152.
18

APP
EN
DIX
TA
BL
E 5
.3 (
Con
t'd)
SCI
IoO
LS
RA
NK
ED
BY
QU
AR
TIL
E O
N T
OT
AL
NO
N-R
ESI
DE
NT
IAL
SPA
CE
PE
RFU
LL
-TIM
E S
TU
DE
NT
,B
Y T
YPE
, CO
NT
P 3L
, AN
D S
IZE
OF
SCE
IOO
L, D
ET
AIL
OF
SPA
CE
BY
FU
NC
TIO
N
(Squ
are
Feet
per
Ful
l-T
ime
Stud
ent)
E.
Publ
ic T
wo-
Yea
r Sc
hool
s (
Con
t'd)
2,50
0 -
5,00
0 E
nrol
lmen
tFi
rst
Qua
rtile
Seco
ndQ
uart
ileT
hird
Qua
rtile
Four
thQ
uart
ileM
ean
Full-
Tim
e E
nrol
lmen
t3,
494
3,64
53,
368
3,33
63,
Cla
ss9.
9910.77
12.3
616
.65
12.4
4L
ab*
10.6
518
.46
21.0
733
.55
20.9
3C
lass
+ L
ab4`
20.6
529
.23
33.4
350
.20
33.3
8O
ffic
e7.73
3.32
10.82
13.72
10.15
Stud
y3.
265.
386.
848.
435.
98Sp
ecia
l Use
4.98
7.51
10.9
412.74
9.09
Gen
eral
Use
5.40
7.10
9.58
15.49
9.39
Supp
ort
2.05
3.17
3.46
6.74
3.87
Tot
al N
on-R
esid
entia
lSp
ace
43.8
060
.81
75.09
107.56
71.82
Non
-Cla
ss L
ab0.
070.
180.
080.
390.
23O
ffic
e Sp
ace
per
Tot
alPr
ofes
sion
al F
T S
taff
130.
6816
7.50
195.
9220
2.83
174.41
Off
ice
Spac
epe
r T
otal
Prof
essi
onal
FT
E S
taff
112.
9114
7.20
168.76
176.38
109.73
*E
xclu
ding
labs
use
d fo
r re
sear
ch o
nly.
bp.
00
IIIIII
IIN
SO
N=
I OM
MI

APP
EN
DIX
TA
BL
E 5
.3 (
Con
t'd)
SCI1
001.
S R
AN
KE
D B
Y Q
UA
RT
ILE
ON
TO
TA
L N
ON
-RE
SID
EN
TIA
LSP
AC
E P
ER
FU
LL
-TIM
E S
TU
DE
NT
,-r
) PE
, coN
TR
oi.,
AN
D S
IZE
OF
SCI
MI.
, DE
TA
IL O
FSP
AC
E B
Y F
UN
CT
ION
(Squ
are
Feet
per
Ful
l-Tim
e S
tude
nt)
E.
Pub
lic T
wo-
Yea
r S
choo
ls (
Con
t'd)
Ove
r5,
000
Enr
ollm
ent
Firs
tQ
uart
ileS
econ
dQ
uart
ileT
hird
Qua
rtile
Fou
rth
Qua
rtile
Mea
n
Full-
Tim
e E
nrol
lmen
t8,
553
6,93
56,
049
5,75
36,
824
Cla
ss10
.22
9.62
9.83
13.9
010
.89
Lab
12.4
316
.42
22.3
522
.47
18.4
2
Cla
ss +
Lab
*22
.65
26.0
432
.18
36.3
729
.31
Off
ice
6.79
8.74
8.92
13.3
39.
45
Stud
y3.
683.
944.
376.
574.
64
Spec
ial U
se6.
148.
6311
.26
10.6
49.
17G
ener
al U
se4.
087.
548.
979.
827.
60
Supp
ort
1.48
3.76
6.41
4.07
Tot
al N
on-R
esid
entia
l Spa
ce44
.82
59.5
769
.46
83.1
664
.25
Non
-Cla
ss L
ab0.
14O
ffic
e Sp
ace
per
Tot
alP
rofe
ssio
nal F
TSt
aff
144.
4416
8.73
188.
0123
1.40
189.
67
Off
ice
Spac
e pe
r T
otal
Prof
essi
onal
FT
E S
taff
132.
0814
0.43
167.
1119
4.10
163.
28
*Exc
ludi
ng la
bs u
sed
for
rese
arch
onl
y.

APP
EN
DIX
TA
BL
E 5
.3 (
Con
t'd)
SCH
OO
LS
RA
NK
ED
BY
QU
AR
TIL
E O
N T
OT
AL
, NO
N-R
ESI
DE
NT
IAL
SPA
CE
PE
R F
UL
L-T
IME
ST
UD
EN
T,
BY
TY
PE, C
ON
TR
OL
, AN
D S
IZE
OF
SCH
OO
L, D
ET
AIL
OF
SPA
CE
BY
FU
NC
TIO
N
(Squ
are
Feet
per
Ful
l-T
ime
Stud
ent)
F.Pr
ivat
e T
wo-
Yea
r Sc
hool
s
Les
s th
an 1
,000
Enr
ollm
ent
Firs
tQ
uart
ileSe
cond
Qua
rtile
Thi
rdQ
uart
ileFo
urth
Qua
rtile
Mea
nFu
ll-T
ime
Enr
ollm
ent
427
413
346
257
361
Cla
ss22
.32
26.4
529
.54
45.4
230
.93
Lab
*8.
7114
.81
20.5
728
.84
18.7
9C
lass
+ L
ab*
29.4
139
.89
50.1
274
.26
48.4
2O
ffic
e9.
6719
.76
23.1
334
.19
21.6
9St
udy
8.78
15.0
820
.04
35.0
219
.82
Spec
ial U
se8.
9920
.90
28.7
659
.99
33.9
5G
ener
al U
se11
.53
31.9
249
.84
86.4
145
.52
Supp
ort
5.78
11.0
820
.15
25.9
416
.75
Tot
al N
on-R
esid
entia
l Spa
ce65
.17
134.
3418
4.94
309.
1717
3.41
Non
-Cla
ss L
ab1.
470.
7013
.76
4.90
Off
ice
Spac
epe
r T
otal
Prof
essi
onal
FT
Sta
ff16
0.86
257.
8727
9.46
280.
5424
6.36
Off
ice
Spac
epe
r T
otal
Prof
essi
onal
FT
E S
taff
118.
9022
4.89
235.
8224
5.79
208.
13
*E
xclu
ding
labs
use
d fo
r re
sear
ch o
nly.
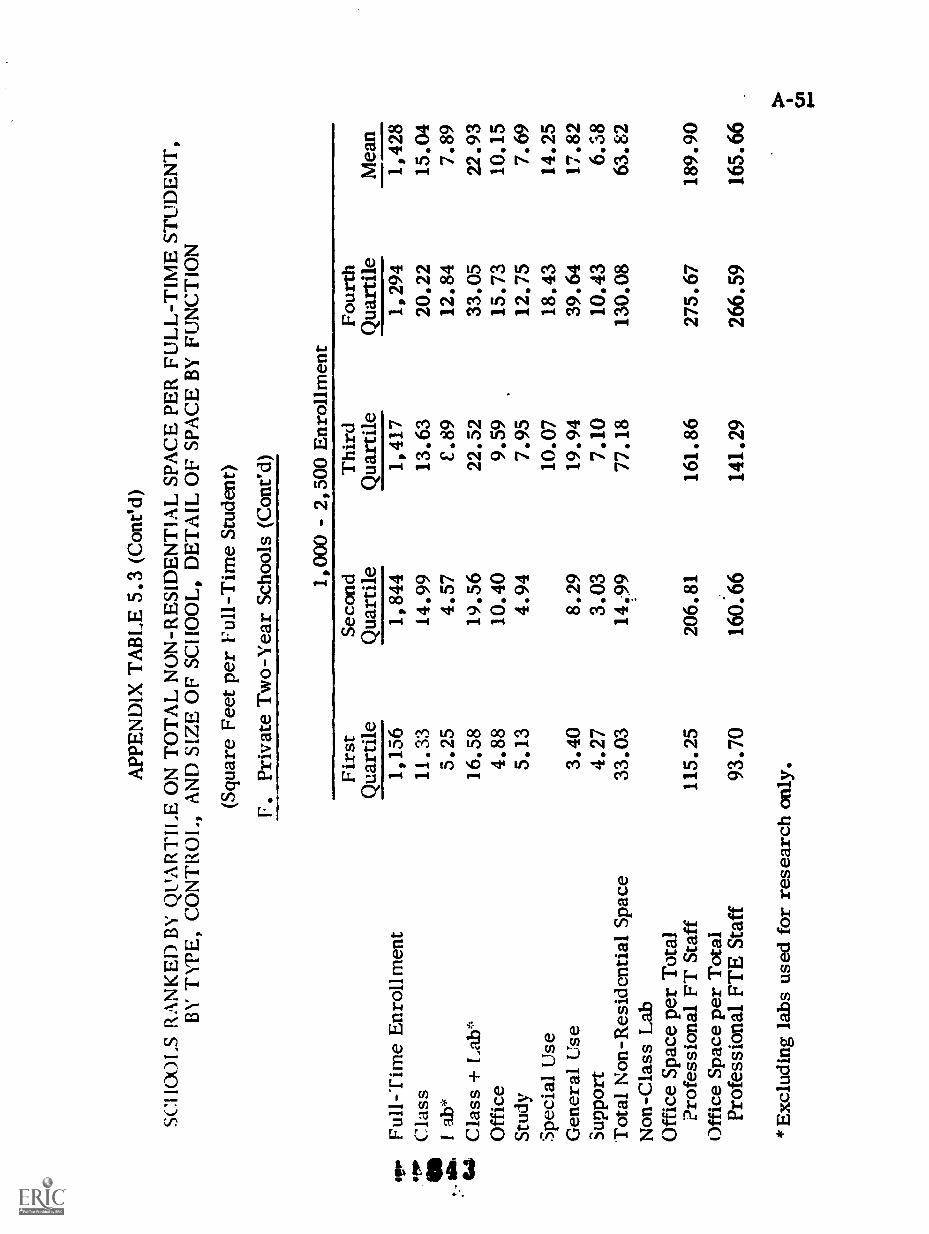
APP
EN
DIX
TA
BI,
E 5
.3 (
Con
t'd)
R))
LS
RA
NK
ED
BY
QU
AR
TIL
E O
N T
OT
AL
NO
N-R
ESI
DE
NT
IAL
SPA
CE
PE
R F
UL
L-T
IME
ST
UD
EN
T,
BY
TY
PE, C
ON
TR
OL
, AN
D S
IZE
OF
SCH
OO
L, D
ET
AIL
OF
SPA
CE
BY
FU
NC
TIO
N
(Squ
are
Feet
per
Ful
l-T
ime
Stud
ent)
F.Pr
ivat
e T
wo-
Yea
r Sc
hool
s (C
ont'd
)
1,00
0 -
2,50
0 E
nrol
lmen
tFi
rst
Qua
rtile
Seco
ndQ
uart
ileT
hird
Qua
rtile
Four
thQ
uart
ileM
ean
VP
Full-
Tim
e E
nrol
lmen
t1,
156
1,84
41,
417
1,29
41,
428
stro
PC
lass
11.3
314
.99
13.6
320
.22
15.0
4S
I ab
hc5.
254.
57C
.89
12.8
47.
8914
Cla
ss +
Lab
*16
.58
19.5
622
.52
33.0
522
.93
Off
ice
4.88
10.4
09.
5915
.73
10.1
5St
udy
5.13
4.94
7.95
12.7
57.
69Sp
ecia
l Use
10.0
718
.43
14.2
5G
ener
al U
se3.
408.
2919
.94
39.6
417
.82
Supp
ort
4.27
3.03
7.10
10.4
36.
58T
otal
Non
-Res
iden
tial S
pace
33.0
314
199
77.1
813
0.08
63.8
2N
on-C
lass
Lab
Off
ice
Spac
e pe
r T
otal
Prof
essi
onal
FT
Sta
ff11
5.25
206.
8116
1.86
275.
6718
9.90
Off
ice
Spac
e pe
r T
otal
Prof
essi
onal
FT
E S
taff
93.7
016
0.66
141.
2926
6.59
165.
66
*E
xclu
ding
labs
use
d fo
r re
sear
ch o
nly.

S,ar
e Fe
et
(las
s:
UL:
Class . Lab:
office:
.A...1%
v OP1
111
0.
Study:
$06
Nab
!....
..cia
,*s
e:
Gen
eral
Use
:
Support:
Total Non-
Residential Space:
APPENDIX TABLE 5.4
STA
ND
AR
D D
EvI
AT
ION
S O
F T
YPE
OF
SPA
CE
BY
TY
PE,
CO
NT
RO
L, A
ND
SIZ
E O
F SC
HO
OL
. RA
Nk:
ED
ON
IN
DIV
IDU
AL
.SP
AC
E P
ER
FU
LL
-TIM
E-E
QU
IVA
LE
NT
sn
DE
NT
,T
OT
AL
. SPA
CE
PE
R F
UL
L-T
IME
ST
UD
EN
T,
AN
D T
UT
AL
. SPA
CE
PE
R R
ILL
-TIM
E-E
QU
IVA
LE
NT
ST
UD
EN
T
A. Public Universities
Les
s th
an 1
0,00
0 E
nrol
lmen
tFi
rst
Qua
rtile
Sec%
ind
Qt,o
/ile
FrE
1.16
231.
4.30
i*r
3.6173
4.2067
FTE
3.77;8
4.04s0
:71-1:
3.1044
1.7412
Fr
4.h176
5.5s20
Fil::
3.8611
4.8108
vrn
3.:4550
2.7816
Fr
6.3357
7.7476
r ri:
5.9981
7.0367
Irril
2.hq35
2.3,1"
Fr
3.8295
12.4614
VII.
4.7286
12.2636
FIT
1..8818
0.8470
irr
4.114';
3.1207
trrc
3.9712
2.4s50
FIT
1.1462
2.2025
Fr
4.1218
8.1710
FIT
4.227
7.4437
FIT
2.5R65
3.3778
FT4.I966
6.6339
FTC
4.3063
6 7105
FIT
1.7314
0.9406
FT9.0 s1
4.2454
FIT
3.8466
2.7446
Fit
19.9028
7.5675
FT19.1804
8.2676
FIT
10.9028
7.5675
Exc
ludi
ng la
bsused foe research only.
10,0(x)
20,000 Enrollment
Over 20,000 Enrollment
Thi
rdFo
urth
Firs
tSe
com
lT
hird
Four
thFi
rst
Seco
ndlld
rdFo
urth
222n
alQ
uart
ileQ
uart
ileQ
uart
ileQ
uart
ileQ
uart
ile22
2E91
,911
-titi
le11
TIE
2EQuartile
1.25
052.
8s25
0.81
220.4682
0.5054
1.9451
0.3624
0.8535
0.4039
0.8719
5.3749
6.s290
1.1218
2.1005
2.6009
3.5768
1.9102
1.1445
2.8726
0.6142
5.6028
5.s525
1.9040
2.4732
1.4071
3.0888
1.6607
1.4383
1.6823
1.7143
1.1)233
9.0289
1.7409
1.4934
1.2264
4.9326
2.1588
0.6090
1.3872
2.2878
8.9561
11.0554
3.4056
3.7956
3.6394
7.4888
5.1323
2.2250
2.2971
4.2646
9.6574
9.0701
3.6720
4.7348
4.0635
6.5251
3.8404
2.7568
2.5128
3.8678
1.4669
9.5358
2.5582
1.5852
1.6255
5.3117
3.3789
1.0194
0.9639
: g:
8.1906
8.7885
16.3566
913.419
4.5408
4.8414
4.5928
5.0775
4.4739
4.7578
6.8863
6.6444
6.0006
6.1498
2.8756
2.1938
2.6120
3.3983
3.7662
1.8042
18.4065
2.3488
1.6612
1.8506
5.7496
5.9538
1.8197
2.7682
3.7206
8..A1c7.
i1.6163
5.5073
5.6413
5.0492
6.9323
4.5414
5.8331
5.9296
0.4124
10.6223
18.5984
2.9971
4.3363
4.6314
7.4320
5.9538
2.4243
3.4327
3.7206
0.7366
6.0381
6.6550
10.7346
1.2794
3.2353
0.9576
3.8113
0.7713
3.1113
1.9010
3.5226
1.4014
2.6581
0.6754
3.4275
0.7000
7.0237
3.4633
3.1927
3.5130
6.5454
2.6526
3.0479
3.6301
3.1531
2.9950
2.3435
3.3048
4.6216
3.7387
11.0467
1.5557
1.2349
1.0291
11.3059
0.7542
1.8726
2.0873
6.4985
8.1362
19.0349
6.4875
4.8317
6.6786
14.7344
6.9557
3.7966
5.5504
9.0476
7.6519
18.6
6)2
5.8479
3.9552
6.0330
13.7221
1.1685
5.7329
2.9874
9.6428
0.4960
9.1394
1.9246
0.8761
0.8527
4.8438
2.1098
0.9855
1.8062
6.0116
13.5280
8.3613
3.5363
7.5447
4.3943
7.1879
1.7128
7.2559
3.0008
6.5222
13.3997
7.3193
4.3593
4.6504
5.4863
5.5250
2.3713
2.7683
8.9478
5.2969
0.8758
4.1498
1.2124
1.1222
1.8135
6.8092
1.8811
1.345S
1.5284
t0.6276
3.7104
7.1465
3.5990
8.5984
6.8057
9.0541
3.7713
4.2412
7.7509
18.9053
3.4271
5.3999
5.9823
8.5398
6.3944
8.1913.
3.4557
6.2113
2.9717
12.8098
11.8730
24.9914
12.6470
6.0007
7.1684
33.0
740
19.7465
9.2117
7.9055
12.6367
13.6126
33.7957
14.8471
8.0743
8.6231
33.3217
15.8339
6.3199
10.6140
7.0554
11.8730
24.9914
12.6470.
6.0007
7.1684
33.0740
19.7465
9.2117
7.9055
17.6367

APPENDIX TABLE 5.4 (Coned)
ST
AN
DA
RD
DE
VIA
TIO
NS
01:
TY
PE
OF
SP
ICE
BY
TY
PE
, CO
NT
RO
L, A
ND
SIZ
E O
F S
CH
OO
L, R
AN
KE
D O
N IN
DIV
IDU
AL
SP
AC
Epiiit 1:1;1.t.-TIME-1..Q111VA LENT s.rt
!DE
NT
, TO
TA
1. S
PA
CE
PE
R R
ILL-
TIM
E S
TU
DE
NT
,A
NDTo
FA
L S
PA
CE
PE
R P
ULL
-TIM
E-E
QU
IVA
LEN
T S
TU
DE
NT
Sqt
.are
1evt
I.es,
; thi
n 10
,006
B. Private Universities
1).000 - 20.000 Enrollment
Over 20.000
Enr
ollm
ent
Loro
llmen
tFir-.t
1:1:J0111e
Souul
Qua
rtile
Fhid
Qua
rtile
Fiuirth
Qua
rtile
First
Qua
rtile
See
' ma
Quartile
Thi
rdQuartile
Fou
rth
Quartile
Mea
n
Class:
1: l'E
1.14
741.
5142
1.74
4911
.940
61.5916
0.3590
1.8671
1.7992
3.5047
r T
2.604i
6.2613
10.0447
46.2707
3.9035
2.6073
0.5717
2.3406
F1 I..
1.6717
4.i2.7.*:
6.4860
11.7743
1.5916
0.3590
0..!185
2.9157
...15':
I' i E
2.1:
261.
6,-"
2.50
787.
6158
0.14
512.
1994
0.21
402.8651
4.1066
:-r
5.7178
8..1:0
7.3118
11.0487
4.9025
0.8476
5.4687
7.9176
Fir.
3.6014
7.5757
6.3984
10.5105
0.1451
0.0249
4.0902
4.15
01S
Cla
ss f
Law
:1:
11:
3.70
282.6796
4.6682
8.57!9
1.7367
0.3S42
0.0835
3.4929
6.7388
OM
1-r
7.1h75
10.0953
10.5061
39.8800
8.7006
2.6176
6.0404
5.5770
411
I, ry.
5.04
788.9285
9.2317
13.4086
1.7367
0.31:2
4.6787
3.2611
mi.:4::
, ".E
2.54
162.
9894
4.3529
31.0615
1.9267
0.4055
4.1697
13.9109
5.6824
IT
3.3567
14.0203
16.0190
38.1909
7.1928
7.4591
3.3325
2.7973
1712
4.2510
8.7795
18.2461
34.5912
1.9267
0.4055
4.7425
14.1501
Stusly
I:FE
2.3718
2.0104
4.0321
18.6'05
3.8148
0.4648
0.5100
9.2038
3.7806
rr
3.'0102
8.1049
9.4234
24.4..72
7.7112
10.5751
1.4315
5.6632
cir2
1ra
4.15H7
8.9384
9.1'187
20.5495
3.8148
0.4648
8.1964
11.2489
lab
So,
-eia
l Use
:F
TC
2.2663
1.2588
3.7310
15.1976
0.6706
0.7450
0.6496
4.4006
7.9896
Cu.
;.r
7.0366
9.4947
14.8260
20.4163
3.2892
6.6987
2.0096
4.08Q2
VA'.
3.1163
7.6707
10.9204
20.202
0.0872
3.8404
2.4508
6.4353
Genera1 Use:
rrr.
3.1894
2.9511
5.4171
29.5150
0.8446
1.0526
2.2928
8.0174
3.9486
1T
6.3187
13.4532
19.3207
89.2117
2.7509
11.8841
0.4551
13.3200
FIT
6.3407
12.3055
17.5014
34.3834
1.6426
15.9585
6.7740
9.4058
Support:
1-rc
1.2601
2.0591
1.4424
39.4728
0.3472
4.2618
0L4767
11.4258
5.2188
irr
3.5530
6.8231
4.5545
46.5652
5.6462
1.7899
14.6251
10.1341
FTE
3.0310
4.6318
4.6512
40.9
436
0.3472
6.5674
24.3864
8.6457
Tota114nn-
Recidenrial
Spa
ceF
TE
15.4750
12.7244
18.2435
156.2962
1.7974
29.8058
9.4730
34.6769
23.6193
UT
17.0266
16.8222
17.6827
223.1669
34.9718
13.6957
0.9743
20.8186
FTE
15.4750
12.7244
18.2435
156.2962
1.7974
29.8058
9.4730
34.6769
Exc
ludi
ng la
bs u
sed
for
rese
arch
onl
y.

APP
EN
DIX
TA
BL
E 5
.4 (
Con
ed)
STA
ND
AR
D D
EV
IAT
ION
S O
F T
YPE
OF
SPA
CE
BY
TY
PE. C
ON
TR
OL
AN
D S
IZE
OF
SC
HO
OL,
RA
NK
ED
ON
IND
IVID
UA
LSP
AC
E P
ER
Fin
.t.-T
ImE
Q(
VA
I1:
:sr
511
:I /E
NT
,T
OT
AL
. SPA
CE
PE
R F
UL
L -
TIM
E S
TU
DE
NT
.A
ND
ro
rA I
. SPA
CE
PE
R F
t.-
TIM
E-
EQ
I.:I
VA
I.E
NT
ST
UD
EN
T
Sm
are
Fee
t
C. P
ublic
Four
-Yea
r Sc
hool
s
2,50
0 -
5.00
0 E
nrol
lmen
tL
ess
than
2,5
00 E
nrol
lmen
tI
Ira
Oil
trt d
eSe
cond
Qu:
irt a
leT
hird
Qua
rtile
Four
thQ
uart
ile
Firs
tIi2
tile
Seco
ndQ
uart
ileT
hird
u.2.
211A
Fou
rth
Qua
rtile
(1.1
.:s:
I, 1
'E2.
1206
1.61
501.
2417
6.9:
671.
6413
0.70
140.
9322
8.70
46I'
r11
.5s2
5.12
676.
6159
288.
1780
3.81
053.
8200
3.80
409.
9207
I' FE
4.61
i7.
5289
6.67
476.
9428
4.02
293.
1107
4.14
9710
.036
6I
.ab'
:FT
E2.
7390
1.59
571.
0973
9.03
302.
5284
1.00
241.
7226
4.84
61FT
5.93
256.
88(5
10.3
265
11.9
315
5.37
873.
9546
8.40
636.2919
I:TE
4.83
914.4869
11.0650
10.2
140
4.76
316.
1353
6.21
086.
5152
et"
Clu
is +
1.ab
:F
rE5.
1574
2.45
983.
1145
08.
7958
3.89
732.
1323
1.79
829.
4701
FT10.8662
9.33
7212
.863
928
3.44
657.
6115
4.03
139.
9522
9.84
341'
TE
6.97
456.
9700
12.7
848
11.4529
7.1509
7.4132
8.1002
11.6057
ortic
,::FT
E2.
1914
1.21
671.
3468
8.33
061.
8377
0.74
111.
2538
3.10
191.
r3.
3048
5.97
706.
7499
103.
4290
3.75
393.
5692
2.96
954.
0357
1-11
14.
2052
6.32
536.
1885
9.51
494.
0561
2.92
653.
4602
4.63
26la
st,:d
y:ri
m1.
6194
1.29
251.
3436
11.2
281
1.19
271.
0778
1.01
642.
1235
IOU
F r
3.7(
466.
1800
12.2
055
50.8
584
2.66
944.
1534
3.80
184.
6810
abFT
E4.
4352
6.27
0912
.041
59.
4135
3.16
943.
2708
3.89
424.
3528
S;le
cial
(.;e
:F
IE0.
5516
3.42
942.
2483
14.4
120
2.41
661.
1011
3.17
747.
3455
FT
6.64
528.
2524
10.4
2%6
18.0
544
4.11
384.
8577
8.92
7711
.40.
50I'1
'E5.
8492
7.87
0'1
9.49
6616
.153
34.
2742
4.18
597.
6445
10.8
705
Gen
era;
I se
-.I,r
E2.
7742
2.44
673.
332
11.6
300
2.91
461.
5709
2.56
325.
0267
FT4.
9558
7.18
549.
6389
16.5
901
4.0109
6.0855
6.5468
6.6533
FTE
3.94
017.
5282
8.41
9816
.238
54.
0994
4.64
075.4448
6.5994
Supp
ort:
1'T
E0.
8263
1.13
461.
2734
9.04
390.9490
0.8168
1.0863
4.5287
Irr
3.55
765.2173
6.0913
28.8663
3.0811
3.4060
5.57
546.
3572
rrE
4.40
243.
8987
10.1
249
7.38
772.
7186
3.06
924.
0050
6.43
76T
otal
Non
-Res
iden
t:al S
pace
:FT
E16
.559
411
.482
18.
7905
22.3
002
15.2
581
6.34
006.
4072
18.2
386
FT15
.453
811
.784
28.
8238
449.
8987
11.0
911
3.30
376.
9220
13.4
234
FTE
16.5
594
11.4
821
8.7905
22.3002
15.2581
6.3400
6.4072
18.2386
.E
xclu
ding
labs
use
d or
res
earc
h on
ly.
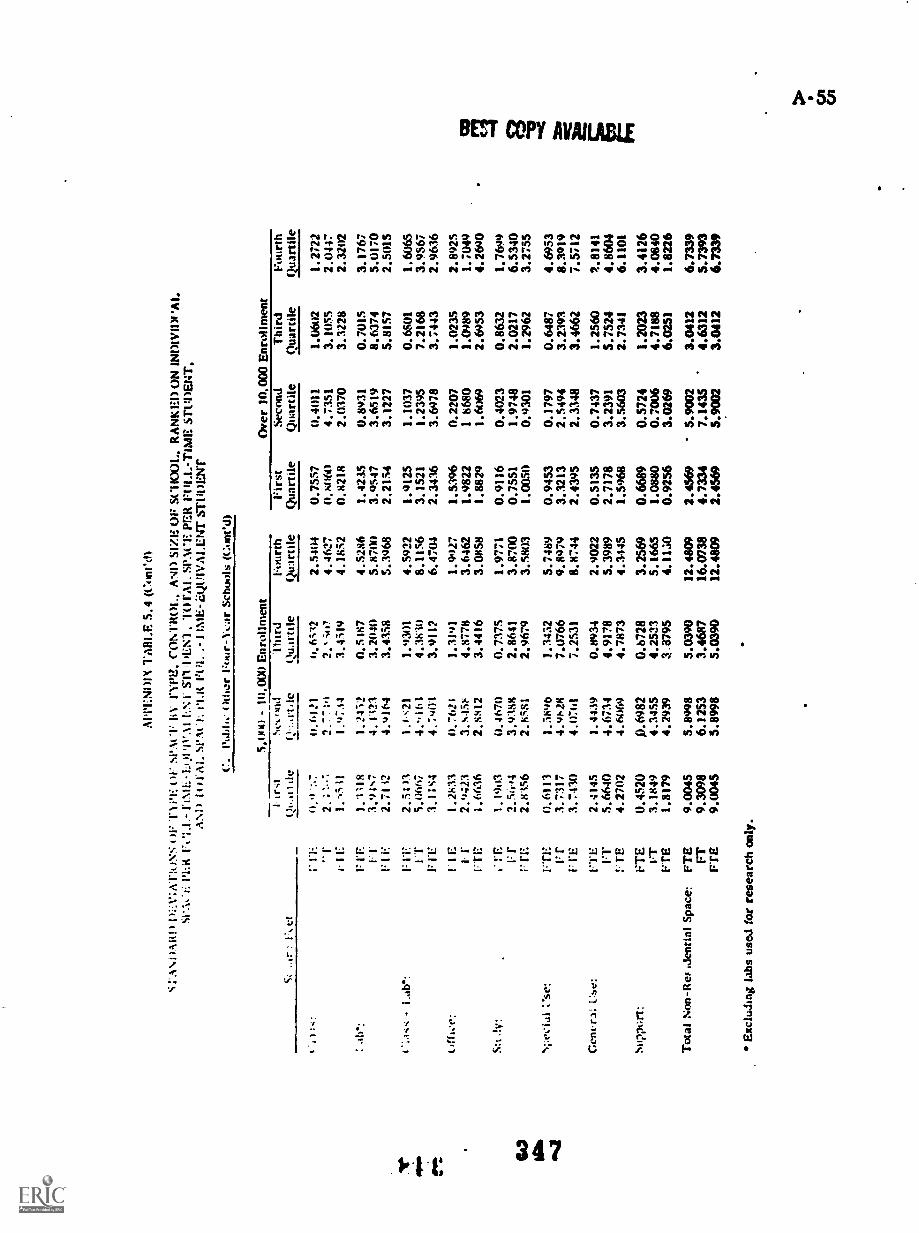
TA111.E 5.4 (Conec0
S:A
NI /
A1(
1) 1
/1..v
;tvnt
,N1:1
)1' S
PA
( "1
:141
l'YPE. ('oNTROL, ANI) sizif.
OF
SC
HO
OL.
RA
NK
EDON IND1V11N'Al.
Ft
.1.- 1 NIL
'i4'.%1
I. S
-11
11/1
iN1
arm sr1("1F.
PE
R F
ULL
-TIM
E S
TU
DE
NT
.A
il))1
A1.
SP
.Nt
01.1
1 F
t U. .
-11N
1E-a
llglIA
LEN
T s
ruyE
NT
C.
l't.1
,11.
()they 1'our-1
ar S
choo
ls (
(one
d)
Si .
.,r :
F. e
t
5.000 - 10,000 Enrollment
Over
10.0
00 E
nrol
lmen
t1
ir,t
Qoa
lt de
NvOtthl
Q:..
t.le
Thi
rdQ
uattl
le
Fou
rth
Quartile
First
Quartile
Second
Quartile
Third
Quartile
Fou
rth
Quartile
cii:..7
r 1-:
0.0 ':.7
0.6121
446;12
2.54(4
0.7557
(1.4011
1.0602
1.2722
''r
2.;-",
2.77;o
2.,;ii,
4.4627
0.1;
o(,1
14.
7351
3.10
552.
0447
r Ili
1. -
,..; 1
11.
47.i4
3.4519
4.1852
0.8218
2.0370
3.3228
2.3202
:ab
*:1'EP
1.1118
1.2412
0.5187
4.5286
1.4235
0.8931
0.7015
3.1767
Fr
3.94
.s,
4.1 113
3.2040
5.87
003.9547
3.6519
8.6374
5.0170
FIE
2.71i2
4.9164
3.4358
5.3968
2.2154
3.1227
5.8157
2.5015
.111'
i';.1-:-; - Lab':
FIT
2.5:
331.
1:21
1.93
014.
5922
1.91
251.
11)3
70.6801
1.6065
aslis
I"t
5.0667
4..,161
4.3830
8.1156
3.1521
1.2395
7.2168
3.9567
a.:
FEE
3.i;s4
4.7401
3.4112
6.4704
2.3436
3.69
783.7443
2.9636
(47,:
FIE
1.2833
11.7
621
1.3191
1.9927
1.5396
0.2207
1.0235
2.8925
1.
1'
2.9423
3.s45:4
4.8778
3.6462
1.4822
1 8680
1.0189
1.7044
UT
E1.6636
2.8812
3.4416
3.01458
1.8829
1.60
692.6453
4.2690
S% .!sr:
l'rE
1.00
0.4670
0.7375
1.9771
0.9116
0.4023
0.8632
1.7699
Fr
2.5,04
3.4188
2.8641
3.8700
0.7551
1.9748
2.0217
6.5340
C4,
FrE
2.8356
2.8581
2.9679
3.5803
1.00.50
0.4)301
1.2962
3.2755
1h.
s;:ec1A :'sr:
FIT
0.6113
1.5890
1.3432
5.7489
0.9453
0.1797
0.6487
4.6953
14F
r3.
7317
4.91-28
7.0766
9.8479
3.3213
2.5494
3.2393
8.3019
FTE
3.7.130
4.0761
7.2531
8.8744
2.4395
2.3348
3.4662
7.5712
Gen
era:
Use
:FTE
2.4145
1.4439
0.8934
2.9022
0.5135
0.7437
1.2560
1.8141
FT
5.6640
4.6734
4.9178
5.3989
2.7178
3.2391
5.7524
4.8604
1; T
E4.2702
4.6069
4.7873
4.3445
1.5968
3.5603
2.7341
6.1101
Suppixt:
FTE
0.45
20p.
6982
0.87
283.2569
0.6689
0.5724
1.2023
3.4126
:rr
3.1849
4.3455
4.2523
5.1665
1.0880
0.7006
4.7188
4.0840
FIE
1.8179
4.2939
3.37
954.
1130
0.92
563.
0269
6.02
511.
8226
Tot
al N
on -
Ref
.ien
tial S
pace
:F
TE
9.0045
5.8998
5.0390
12.4809
2.4569
5.9002
3.0412
6.7339
FT
9.3098
6.1253
3.4687
16.0738
4.7334
7.1435
4.6312
5.7393
FTE
9.0045
5.8998
5.0390
12.4809
2.4569
5.9002
3.0412
6.7339
Excluding labs used
forresearch only.

APP
EN
DIX
TA
BL
E 5
.4 (
Con
ed)
STANDARD IIEV.ATIONS OF TYPEOF SPACE BY TYPE, CONTROL.AND SIZE OF
SCH
OO
L. R
AN
KE
D O
N I
ND
IVID
UA
LSP
AC
E P
ER
FU
LL
- T
IME
-E
QU
IVA
LE
NT
S r
tID
EN
T. T
OT
AL
SPA
CE
PE
RFU
LL
-TIM
E S
TU
DE
NT
.A
NI)
TO
TA
LSPA[ E PER 1:11LI..-TIME-EQUIVALENT
STU
DE
NT
on
11.9
.
ena
..
ge Sib
OD
\
Square Feet
D. P
riva
te O
ther
Fou
r-Y
ear
Scho
ols
1,00
0 -
2,50
0 E
nrol
lmen
tL
ess
than
1,0
00 E
nrol
lmen
tFi
rst
Qua
rtile
Sccnd
/uartile
Third
uart
iieua
rt it
First
Qua
rtile
Seco
ndQ
uart
ileilinFourth
Qua
rtileil
eQ
uart
ile.
9.2617
12.6379
11.4191
9.2072
13.1201
12.9172
15.1
280
19.7
447
19.2
280
8.06
399.
7356
9.65
37
11.1
804
12.7006
12.6
906
15.5
999
20.0
322
19.3598
19.4
367
24.2
380
22.9
676
14.5
709
18.5
181
17.5
797
61.6
362
61.6
376
61.6
362
Class:
Lab:
Cla
ss +
Lab
':
Office:
Sitid
y:
S,Ie
cia1
Use
:
Gcn
eral
tse:
Supp
ort:
Tot
al N
on-R
esid
entia
l Spa
ce:
1-rE
FT
VIE
FTE I'I'
IrrE
I-re Fr
F rE
1: r
E FrFT
E
FTE
FT FM PTE Fr
.:i'E
FTE FT
1 T
E
FTE
FTI,
CE
FM .7T
F 7E
3.2686
11.2891
9.9414
2.7851
8.o('14
7.6210
7.22
9912.8849
11.8
079
3.93
238.
4090
7.8752
2.9316
8.23
788.
9454
1.51
6712
.676
210.6766
8.29
6513
.492
413
.879
5
0.91
806.
0063
5.80
72
29.3
757
29.2
913
29.3
757
2.1128
10.8944
9.3129
2.7273
10.4224
9.5082
4.08
1013.4284
12.4
066
1.77
477.
2658
6.4006
1.9133
10.8
625
8.20
l43.
8243
12.3
637
12.7171
4.28
6716
.970
415
.517
4
2.16
3710
.958
511
.274
7
14.3
334
13.2
581
14.3
334
2.1358
11.8232
12.1
904
3.0708
11.:047
11.2639
4.08
1115.6973
14.9
536
1.69
837.
4874
6.9987
2.35
6610
.702
1
3.78
2918
.085
317.2772
5.60
9219
.158
217
.340
2
2.67
3516
.226
315
.757
4
15.9
800
17.4
560
15.9
800
11.9441
16.1690
13.1893
10.8712
17.5914
16.1613
12.4
901
20.7895
18.4
425
7.48
4112
.791
46.6522
16.7
586
20.9774
19.2
419
20.7
266
26.8
436
26.2568
23.7
007
33.4
869
31.4
774
20.6
183
23.7
670
23.0
489
45.2
066
49.6
741
45.2
064
2.8012
5.70
076.2669
3.2252
6.8296
5.6714
6.37
509.
3000
8.76
44
3.57
945.
5737
5.24
48
2.15
734.7105
3.98
54
3.32
356.
0522
5.9909
6.39
1810
.247
39.
3758
1.36
515.
0286
4.68
43
25.6
992
27.0
470
25.6
992
1.1849
5.72
465.3989
1.9150
6.8840
6.3921
2.61
3910
.345
29.
2125
1.03
515.
0437
5.21
04
1.30
886.3717
6.26
92
2.05
309.
8420
9.4879
3.00
8010
.596
88.
5164
1.46
866.
7189
6.78
93
10.1
364
10.2
803
10.1
364
1.4508
8.12
507.7806
1.9449
6.6401
6.9992
2.74
998.
6314
10.0
407
1.65
215.
2186
4.93
31
1.96
537.3030
8.77
98
2.91
5011
.079
510.7106
4.21
1312
.622
211
.852
7
2.29
9212
.281
811
.290
0
10.6
733
10.8
025
10.6
733
Exc
ludi
ng la
bs u
sed
for
rese
arch
only
.

,t1T
EN
DIY
TA
W L
i 5.4
(C
oned
)
S r
AN
DA
RD
DE
eiA
Tio
Ns
01: T
YP
E 0
1: S
PA
CE
111
TY
PE
, CO
NT
RO
L, A
ND
SIZ
E O
F S
CD
OO
L, R
AN
KE
D O
N IN
DIV
IDU
AL
SP
AC
E P
ER
FIT
I.1.-
TM
IE-
IVA
LE
NT
Sli
DE
NT
. ToT
AI.
SP
AC
E P
ER
IT'L
L -T
IME
ST
IJO
EN
T,
AN
!) T
OT
AL
SP
AC
E P
ER
?W
.I.-T
IME
- E
QU
IVA
LEN
f S
TU
DE
NT
s:lu
ary
D. P
rivat
e O
ther
Fou
r -s
ear
Sch
ools
(C
oned
)
Ove
r 5.
000
Enr
ollm
ent
2.50
0 -
5.00
0 E
nrol
lmen
tl'i
i.- i
Qth
irtile
Se:
tvii.
1T
hird
Qua
rtQ
uart
ileF
ourt
hQ
uart
ileA
kan
(.1.
1,,:
a: r
...1.
7s;2
0.7773
1.2768
2.0324
3.7627
ir
3.x,
174.
5572
3.31
414.
2645
3.51
61I'
rl2.
"4s8
3.')1
444.
1555
3.63
253.
7627
Ile:
FTE
1.4605
1.50
612.
3455
4.34
843.9396
I' 1'
4.4
111
7.51
594.
3358
6.96
351.
2S27
FIE
3.09
,i85.3884
5.0726
6.7022
3.9396
Class
+ L
abF
TE
2.6713
1.9827
3.4857
5.5649
6.2847
vow
Fr
4.5620
8.9628
5.30S0
7.9784
2.2334
-...
FT
E3.
3946
7.01
948.
0886
8.48
836.2847
.....
.-
0:fit-e:
1,1'1,..
2.10
160.5117
1.0118
6.5948
3.9327
Fr
6.62
422.
5518
4.34
778.
1528
4.37
43F
TC
5.61
741.6322
3.2321
8.2068
3.9327
!irk:4:
1:11
::1.
5708
0.92
811.6958
4.6340
4.9591
1:r
3.56
!52.
3590
8.10
227.
2207
10.7965
I'M
2.9293
4.0165
5.9924
6.6026
4.9591
spvcialcs,.:
Fre
1.5546
1.2843
2.0741
9.7346
2.8860
FT
3.5166
5.2446
4.8676
10.1175
0.3033
Fili
2.(417
3.9729
4.8399
10.1587
2.8860
Ckn
eral
Cse
:Fili
3.0463
2.7177
3.0789
!1.8503
7.4654
1: r
2.44,9
4.A
047
15.5598
11.8187
15.2770
FIE
3.6424
6.9989
14.2
506
11.1737
7.4654
Sup
port
:F
TE
0.79
930.
3953
1.1420
7.9603
2.4075
irr
3.3438
3.2749
3.9454
9.6646
0L0582
FT
E1.
5965
2.82
752.
4289
8.95
172.
4075
Tot
alN
on-R
esid
entia
l Spa
ce:
FTE
9.8499
9.8303
9.6684
38.7105
15.7566
FT
15.5430
5.9874
11.8277
28.2339
2.2236
FTE
9.8499
9.8303
9.6684
38.'105
15.7566
Exc
ludi
ng la
bs u
sed
for
rese
arch
onl
y.
4

APP
EN
DIX
TA
BL
E 5
.4 (
Con
ed)
STA
ND
AR
D D
EV
IAT
ION
S O
F T
YPE
OF
SPA
CE
1 V
TY
PE, C
oNT
RO
L, A
ND
SIZ
EO
F SC
HO
OL
. RA
NK
ED
ON
IN
DIV
IDU
AL
SPA
CE
PE
R F
UL
L-T
IME
-EQ
UIV
AI
EN
ESr
unE
N r
. TO
TA
L. S
PAC
E P
ER
FUL
L-T
IME
UD
EN
T,
AN
D T
OT
AL
SPA
I 'L
i PE
R 1
UL
I.-T
IME
-EQ
1.11
VA
LE
NT
ST
UD
EN
T
E. P
ublic
Tw
o-Y
ear
Scho
ols
Les
s th
an 1
,000
Enr
ollm
ent
1.00
0 -
2.50
0 E
nrol
lmen
t
:MI
i....
swr
6
el .41
W1
cin
4IR
Square Feet
First
Quartile
Sconui
Quartile
l'hirJ
Quartile
Fourth
QU
itnile
Firs
tQ
uart
ileSecond
Qua
rtile
t. 1.
1-,S
:
I Ji
b':
Cla
-s +
L4:
C1,:ice:
Stud
y:
Spec
ial I
'se:
Gen
eral
l!se
:
Supp
ort:
Tot
al N
on-R
esid
entia
l Spa
ce:
F11::
FrI,
rE
FTE Fr
FTE
FTE
i: r
FTE
FTE Irr
FTE
FTE Fr
FTE
FTE
FTFT
E
I: I
EFT
FTE
FTE
FTFT
E
TT
E FTFT
E
1.9410
7.86
019.
0755
2.42
447.
7337
6.30
03
5.72
7710
.788
110
.126
9
1.6;987
3.9
/01)
3.4132
1.07
053.
7166
3.31
02
6.95
254.
1299
1.16
743.8628
3.33
55
3.29
993.
3589
12.0
042
14.2
806
12.0
042
1.12"9
9.2072
9.b77.1
2.36
7310
.921
19.
3196
3.97
8913
.314
612
.071
8
0.96
054.
3090
3.4912
0.88
694.
0535
4.10
67
1.63
439.
3301
9.06
71
1.19
105.
0451
5.16
63
0.38
883.
4771
3.60
96
7.85
748.6 50
7.84
74
2.0784
11.9498
9.8201
3.12
4114
.981
812
.713
9
3.92
1515
.253
313
.320
5
1.0875
4.74
744.
4324
1.4315
6.09
535.
4979
4.60
5712
.658
410
.430
3
2.29
169.
0162
7.03
700.
7332
5.38
283.
5511
10.0
526
10.4
128
10.0
526
10.6253
61.2
549
12.6
479
12.7
637
19.2
497
15.5
253
14.5
'46
57.7
066
18.7
402
5.28
208.
8314
6.5)30
5.8039
9.24
337.
5680
9.60
1616
.189
014
.636
9
9.99
9612
.992
212
.813
7
5.64
878.
9399
6.92
27
28.0
844
52.9
109
28.0
844
1.3290
3.56
063.
3268
1.82
484.
5406
4.21
99
3.20
485.
3099
4.76
99
0.97
802.3183
1.88
67
0.6224
2.01
821.
5766
0.11
682.
8027
2.38
91
0.78
822.
0830
1.64
04
0.16
031.
2652
1.08
87
6.22
868.
0428
6.22
86
0.9079
5.67
535.
0231
2.24
015.
7623
5.94
67
2.64
006.
4283
6.42
20
0.6473
3.0013
2.6098
0.7067
2.68
432.
4914
1.90
905.
4171
5.50
46
04.:3
9)12
398
3.73
06
01..6
3776
251
1.48
07
6.47
357.
4408
6.47
35
Exc
ludi
ng la
bs u
sed
for
rese
arch
onl
y.
Third
Fourth
Qua
rtile
Qua
rtile
1.3191
7.4'65
7.21
2418
.718
78.
0961
7.35
852.
7593
8.96
8810
.486
113
.959
29.
8275
12.6
201
3.57
2512
.133
011
.068
924
.183
210
.923
915
.060
)0.781S
2.5825
4.2238
3.3633
3.6120
2.6780
0.78
094.
4608
3.25
905
3.45
325.7623
7562
3
1.86
0S6.
7462
7.83
0810
.849
37.
6672
8.88
99
6.52
581.
8377
9.08
035.
1329
4.93
.!S
8.21
400.
7523
10.6
309
5.68
1911
.841
15.
3619
10.9
922
7.60
1723
.633
67.
4104
29.0
527
7.60
4723
.633
6
IIIIP
IMP
1141
MI a
llIN
NN
M A
l NIP
IIIIII
IIO
N

A1'PEN141\ TAM E 5.4 (Cont'd)
S FAN, ).V111 DEVI Ar I
ONS di!: 7'1 1'1: or SPACE
CONTROL. AND SIZE OF S( :11001 RANKED
ONINDIVIDUAL
NI'AtiL
1.1 I .1.--11\11:.-EQ1
IvA
LFN
rt,D
EN
.roT
A1.
SPACE PER F111.1.-TIME STUDENT.
AND It
) rm
.Sl'At
. Mit
II.r
ixtE
- EQ1 IIVA LENT STUDENT
F.
1.114te Two-Near Schools (Cont'd)
sr!".
IVC
l'o't
2,511,1
5,4100 Puri diluent
Over 5,000 Enrollment
I.0.4
(shf
:rid
eS, ,,,n,1
Qii
IPtle
1 Iiir.1
Quartile
Fourth
(?liarti le
First
Quartile
Sec. is61
Quartile
Thud
Quartile
Fourth
Quartile
(1
:I
oi:
0.7.017
1). 5 . i;
0, k043
4.2965
0.6780
0.3053
0.6913
10.11168
Ir
3..!-
-,:5
2.0(0:7
2.7874
6.11
'83
1.8633
1.4898
-1.8461
2.6374
1.,F.
2.11.2
2,6:.4
3.4611
4,8061
1.7709
2.3646
1.8174
10.8156
t..li*:
. i'F.
2. 'It .66
1.2/11
1.:I522
8.4529
1.6012
1.0070
1.2503
10.03i9
iI.
6.1676
5.4;72
4.4476
13.5517
1.6752
6.6457
3.0122
6.7486
:FF.
3.4676
3.1.022
3.3165
9.8778
3.5896
3.1480
3.4960
10.8853
t 1,:s 1 Lab':
1= i4:
3.1654
1.71:04
1.2822
11.2881
2.5775
1.1693
0.8996
16.2611
1*
6.5151
5.s :69
5.5693
17.6070
3.0524
6.8646
1.7860
6.5873
1'',.li
3, i..141
3.421.0
4.2152
12.4685
3.3710
2.9701
2.7669
16.6439
lif:k7v:
:* i.V.
11."(474
0.:071
0.7959
1.9662
0.8261
0.2873
0.3508
2.7150
:' 1*
2.4 .;13
1, 667.?2
1.7870
4.3613
1.4634
2.6176
1.0243
4.0080
FTE
2.1..i7h
1.5140
2.2265
2.7977
1.4237
1.1941
1.2613
3.4046
51,..
1, IT
0.5111
0.4822
0.6318
1.9492
0.4988
0.3219
0.4909
0.7361
if
2.31162
2.1424
2.2604
4.0792
2.0215
1.8960
1.0223
1.5678
FFE
1.5182
1.41(18
1.5498
3.0543
1.3599
1.7234
1.3274
1.5328
Spvc id 1
1.s
e:1'
71:
1.0456
1.1171
0.6369
2.2474
1.2077
0.6508
0.5411
1.1001
FY
3.71S4
3.7201
3.9714
5.5652
3.2131
3.3590
2.0752
4.0767
;AV.
2.2143S
3.2410
2.711;
3.7475
2.2485
2.3741
1.5249
3.5208
Cc:I-al
I :.s
e":
sT
I::
1.0247
0.5367
0.9302
4.3029
0.6042
0.5475
0.4504
2.5595
FE
3.0614
2.4251
3.6112
6.%116
0.8518
1.8357
1.0603
1.9651
.* i.E
1.3002
2.1512
2.1810
5.5105
2.0088
1.8189
1.2498
3.5554
51P11ort:
ETE
0.2694
0.2555
0.4158
2.0418
0.3254
0.3603
0.3414
5.7836
IT
2.4479
2.3147
1.9500
7.0737
0.7484
3.9358
1.3869
2.4032
Imi
1.5529
1.6570
1.4684
2.6182
0.8465
2.3357
1.2868
6.0424
Total Neu
-Res
iden
tialSpace:
FTE
6.3863
3.8786
3.1340
16.6194
4.8272
1.6259
3.1588
22.7960
IT
8.4760
4.2594
4.1542
27.8521
6.5639
3.9006
1.9891
8.2804
1-11E
6.3863
3.8786
3.1340
16.6194
4.8272
1.6259
3.1588
22.7960
Excluding labs used
for
rese
arch
only.

iND
1111
11M
N
AP
PE
ND
IX T
AB
LE 5
.4 (
Con
ed)
ST
A \O
AR
!) D
EV
IAT
ION
S O
F T
YP
E O
F S
PA
CE
BY
TY
PE
.CONTROL,
AN
D S
IZE
OF
SC
HO
OL.
RA
NK
ED
ON
IND
IVID
UA
LS
PA
CE
PE
R F
ULL
-TIM
E-E
Q(I
IVA
LEN
ST
UD
EN
1.TOTAL
SP
AC
E P
ER
FU
LL -
TIM
E S
TU
DE
NT
,A
ND
'it I
TA
L S
PA
CE
PE
R P
ULL
-TIM
E-E
QU
IVA
LEN
TS
TU
DE
NT
Squi-re
Fee
t
F. P
rivat
e 'A
m-Y
ear
Sch
ools
1,(X
IO -
2,5
00 E
nrol
lmen
tLe
ssthan
1,00
0 E
nrol
lmen
tFirst
Qua
rtile
Stcond
Quartile
Third
Quartile
Fou
rth
Quartile
Firs
tQuartile
Sec
ond
Quartile
Third
Quartile
Fourth
Quartile
GaAs:
tTrE
2.7576
2.3388
2.4174
15.0224
1.9455
1.3727
0.4631
1.6387
1-r
10.9410
16.131K)
13.1344)
19.8
600
2.7281
3.3635
5.1487
3.8756
FIE
10.1018
16.2769
13.0493
16.4453
2.8171
3.8883
2.8626
4.0699
Labe:
FTC.
1.6408
2.-4176
1.8133
11.8276
0.3155
1.8942
1.5173
2.6293
Fr
6.6732
8.20
(8)
9.3700
'7.0000
1.6351
1.7933
5.3613
3.263P
FTE
6.5851
7.9210
9.7626
16.3823
0.9822
3.1435
4.9629
3.3075
Class+ Labs:
FTE
5.2998
3.2436
3.1137
17.6251
2.1512
3.3147
0.919d
2.2182
1:1"
10.8640
15.9900
17.6200
24.0700
1.2147
2.7670
10.1499
5.6477
FTE
10.7411
16.2520
18.1243
20.3593
1.8896
5.7880
3.5443
5.9360
Off,ce:
FTE
3.1196
2.0245
1.8830
9.7635
2.1813
0.3862
2.3854
1.4320
FT
7.1000
7.3504:
8.35(K)
13.3100
2.6071
3.2003
2.5277
2.0897
I:1E
6.9498
7.1534
7.6107
13.4187
2.1813
0.3862
3.6877
2.1418
Study:
FT
E2.4471
1.7214
2.6635
21.7298
0.4521
0.9149
3.1885
1.1188
FT
7.56
008.
66:X
)10.7900
33.0300
2.3918
2.3290
5.4686
4.2329
FT
E7.4270
9.4664
8.4433
24.9541
1.5135
1.3286
0.8444
4.0806
Special ('se:
F113
0.1207
4.3115
5.9253
39.8571
4.6295
0.2317
6.6220
I,r
14.6000
16.6600
17.2700
52.7700
4.4303
7.0649
F13
13.2416
14.6918
'6.0560
47.3390
6.2281
1.6125
6.7391
1General Use:
FTE
4.9988
5.40
977.:454
20.3122
1.07
002.2690
5.3358
13.0500
F1'
10.4100
14.8500
20.7440
34.5500
0.9690
4.1408
8.9572
14.5770
FT
E10.2242
13.7792
18.8640
25.6145
1.0700
4.2081
8.8465
14.8642
Sapport:
FTE
0.2526
1.3704
4.3326
14.9910
1.7919
1.9654
1.5313
6.9458
FT
7.2800
10.8500
20.2400
16.6200
5.4702
3.6912
3.1939
6.3967
FIE
4.4421
11.3050
20.1905
15.5492
4.6077
2.3800
9.0425
6.3769
Tot
alNon-Resid.itial
Spa
ce:
FTE
24.4792
13.8008
18.5434
53.0706
6.9371
5.2424
13.7108
17.7790
FT
25.7400
16.1300
20.4700
81.7100
7.8440
0.2494
24.8777
16.9987
F13
24.4792
13.8008
18.5434
53.0706
6.9371
5.2424
13.7.08
17.7790
Exc
ludi
ng la
bs u
sed
for
rese
arch
onl
y.
MO
IMP
auIN
S N
M
Qt O
SIM
NM
MIN
NIP
rill O
M M
N
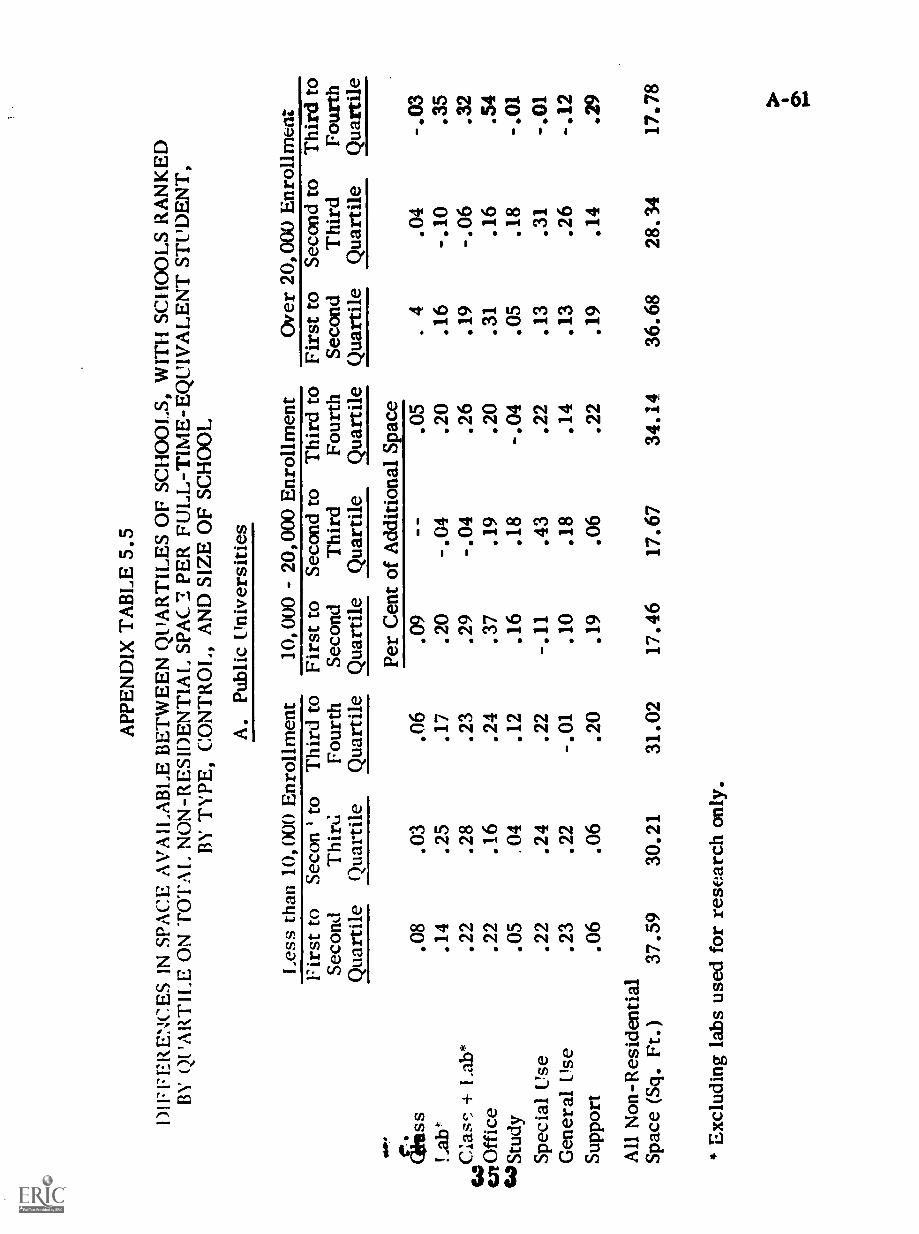
APP
EN
DIX
TA
BL
E 5
.5
DI1
717E
RE
NC
ES
IN S
PAC
E A
VA
ILA
BL
E B
ET
WE
EN
QU
AR
TIL
ES
OF
SCH
OO
LS,
WIT
H S
CH
OO
LS
RA
NK
ED
BY
QU
AR
TIL
E O
N T
OT
AL
NO
N-R
ESI
DE
NT
IAL
SPA
CE
PE
R F
UL
L-T
IME
-EQ
UIV
AL
EN
T S
TU
DE
NT
,B
Y T
YPE
, CO
NT
RO
L, A
ND
SIZ
E O
F SC
HO
OL
A. P
ublic
Uni
vers
ities
1111
1.
Les
s th
an 1
0,00
0 E
nrol
lmen
t10
,000
- 20
,000
Enr
ollm
ent
Ove
r 20
,000
Enr
ollm
ent
Firs
t to
Seco
ndQ
uart
ile
Seco
n ' t
oT
hirt
.;Q
uart
ile
Thi
rd to
Four
thQ
uart
ile
Firs
t to
Seco
ndQ
uart
ile
Seco
nd to
Thi
rdQ
uart
ile
Thi
rd to
Four
thQ
uart
ile
Firs
t to
Seco
ndQ
uart
ile
Seco
nd to
Thi
rdQ
uart
ile
Thi
rd to
Four
thQ
uart
ile
Per
Cen
t of
Add
ition
al S
pace
&SS
.08
.03
.06
.09
.05
.4
.04
-.03
Lab
e*.1
4.2
5.1
7.2
0-.
04.2
0.1
6-.
10.3
5
Cra
+ L
ab*
Ca
Off
ice
.22
.22
.28
.16
.23
.24
.29
.37
-.04 .1
9.2
6.2
0.1
9.3
1-.
06 .16
.32
.54
{4 S
tudy
.05
.04
.12
.16
.18
-.04
.05
.18
-.01
Spec
ial U
se.2
2.2
4.2
2-.
11.4
3.2
2.1
3.3
1-.
01G
ener
al t!
se.2
3.2
2-.
01.1
0.1
8.1
4.1
3.2
6-.
12Su
ppor
t.0
6.0
6.2
0.1
9.0
6.2
2.1
9.1
4.2
9
All
Non
-Res
iden
tial
Spac
e (S
q. F
t.)37
.59
30.2
131
.02
* E
xclu
ding
labs
use
d fo
r re
sear
ch o
nly.
17.4
617
.67
34.1
436
.68
28.3
417
.78
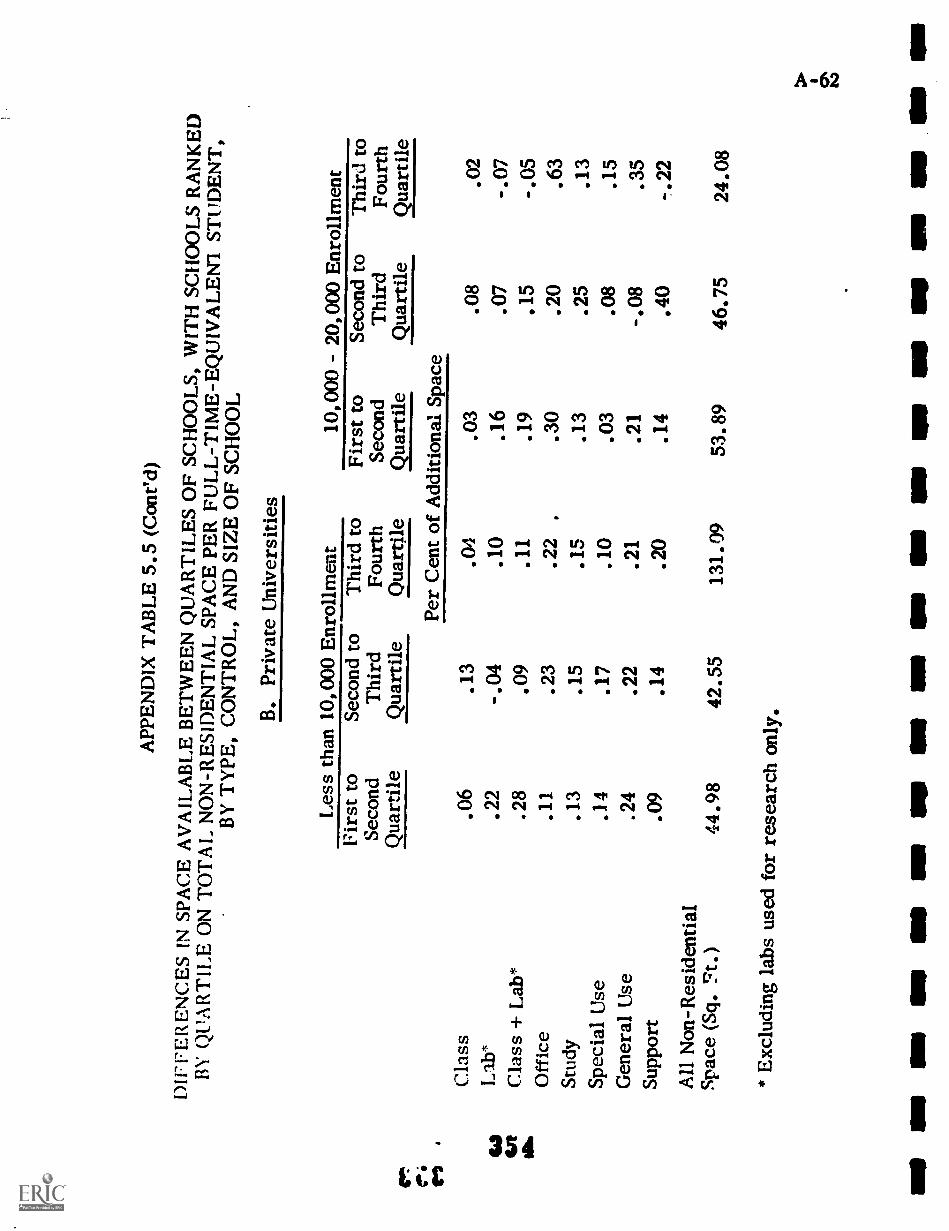
cm:
APP
EN
DIX
TA
BL
E 5
.5 (
Con
ed)
DIF
FER
EN
CE
S IN
SPA
CE
AV
AIL
AB
LE
BE
TW
EE
N Q
UA
RT
ILE
S O
F SC
HO
OL
S,W
ITH
SC
HO
OL
S R
AN
KE
DB
Y Q
UA
RT
ILE
ON
TO
TA
LN
ON
-RE
SID
EN
TIA
L S
PAC
E P
ER
FU
LL
- T
IME
- E
QU
IVA
LE
NT
ST
UD
EN
T,
BY
TY
PE, C
ON
TR
OL
, AN
DSI
ZE
OF
SCH
OO
L
B. P
riva
te U
nive
rsiti
es
Les
s th
an 1
0,00
0 E
nrol
lmen
t10
,000
- 20
,000
Enr
ollm
ent
Firs
t to
Seco
ndQ
uart
ile
Seco
nd to
Thi
rdQ
uart
ile
Thi
rd to
Four
thQ
uart
ile
Firs
t to
Seco
ndQ
uart
ile
Seco
nd to
Thi
rdQ
uart
ile
Thi
rd to
Four
thQ
uart
ilePe
r C
ent o
f A
dditi
onal
Spa
ceC
lass
.06
.13
.04
.03
.08
.02
14L
ib*
.22
-.04
.10
.16
.07
-.07
on O.
Cla
ss +
Lab
*.2
8.0
9.1
1.1
9.1
5-.
05O
ffic
e.1
1.2
3.2
2.
.30
.20
.63
Stud
y.1
3.1
5.1
5.1
3.2
5.1
3Sp
ecia
l Use
.14
.17
.10
.03
.08
.15
Gen
eral
Use
.24
.22
.21
.21
-.08
.35
Supp
ort
.09
.14
.20
.14
.40
-.22
All
Non
-Res
iden
tial
Spac
e (S
q. 7
.7t.)
44.9
842
.55
131.
0953
.89
46.7
524
.08
* E
xclu
ding
labs
use
d fo
rre
sear
ch o
nly.
IMO
IMO
MO
IMP
INS
IMP
IMO
MI I
NN
SIN
111.
Mill
in A
l IP
S O
M S
illIO
N

APP
EN
DIX
TA
BL
E 5
.5 (
Con
ed)
DIF
FER
EN
CE
S IN
SPA
CE
AV
AIL
AB
LE
BE
TW
EE
N Q
UA
RT
ILE
S O
F SC
HO
OL
S, W
ITH
SC
HO
OL
S R
AN
KE
DB
Y Q
ITA
RT
ILE
ON
TC
TA
I. N
ON
-RE
SID
EN
TIA
L S
PAC
E P
ER
FU
LL
-TIN
E -
EQ
UIV
AL
EN
T S
TU
DE
NT
,B
Y T
YPE
, CO
NT
RO
L, A
ND
SIZ
E O
F SC
HO
OL
C. P
ublic
Oth
er F
our-
Yea
r Sc
hool
s
Les
s th
an 2
,500
Enr
ollm
ent
2,50
0 -
5,00
0 E
nrol
lmen
tFi
rst t
oSe
cond
Qua
rtile
Seco
nd to
Thi
rdQ
uart
ile
Thi
rd to
Four
thQ
uart
ile
Firs
t to
Seco
ndQ
uart
ile
Seco
nd to
Thi
rdQ
uart
ile
Thi
rd to
Four
thQ
uart
ile
Per
Cen
t of
Add
ition
al S
pace
Cla
ss.1
0.0
7.1
4.1
2.0
1.1
6.1
3.1
8.1
4.2
4-.
01.1
1C
lass
+ L
ab*
.25
.24
.27
.36
-.00
3.2
8O
ffic
e.1
1.0
7.1
3.1
2.1
0.1
2St
udy
.13
.12
-.01
.14
.06
.05
Spec
ial U
se.2
4.1
8.2
5.0
8.4
6.2
0G
ener
al U
se.2
6.2
4.3
3.2
5.2
2.2
8Su
ppor
t.0
2.1
5.0
3.0
6.1
5.0
7
All
Non
-Res
iden
tial
Spac
e (S
q. F
t.)38
.13
36.4
940
.38
26.6
018
.67
31.9
3
*E
xclu
ding
labs
use
d fo
r re
sear
ch o
nly.

APP
EN
DIX
TA
BL
E 5
.5 (
Con
t'd)
DIF
FER
EN
CE
S IN
SPA
CE
AV
AIL
AB
LE
BE
TW
EE
NQ
UA
RT
ILE
S O
F SC
HO
OL
S, W
ITH
SC
HO
OL
S R
AN
KE
DB
y Q
UA
RT
ILE
ON
TO
TA
L N
ON
- R
ESI
DE
NT
IAL
SPA
CE
PE
RFU
LL
-TIM
E-E
QU
IVA
LE
NT
ST
UD
EN
T,
BY
TY
PE, C
ON
TR
DL
, AN
D S
IZE
OF
SCH
OO
L
C. P
ublic
Oth
er F
our-
Yea
r Sc
hool
s(C
ont'd
)
r i
eb fe...
.C
lass
5,00
0 -
10,0
00 E
nrol
lmen
tO
ver
10,0
00 E
nrol
lmen
tFi
rst t
oSe
cond
Qua
rtile
Seco
nd to
Thi
rdQ
uart
ile
Thi
rd to
Four
thQ
uart
ile
Firs
t to
Seco
ndQ
uart
ile
Seco
nd to
Thi
rdQ
uart
ile
Thi
rd to
Four
thQ
uart
ile
.14
.03
Per
Cen
t of
Add
ition
alSp
ace
.13
.01
.16
.24
Lab
*.2
3.1
2.1
5-.
02.3
0-.
01tJ
tC
lass
+ L
ab*
.37
.15
.30
.22
.43
-.00
211
111
Off
ice
.09
.21
.15
.27
.03
.16
Stud
y.0
4.1
4.0
3.1
3.2
6.0
8Sp
ecia
l Use
.20
.26
.31
.11
.12
.16
Gen
eral
Use
.16
.16
.21
.27
-.08
.56
Supp
ort
.13
.09
.003
.002
.25
.03
All
Non
-Res
iden
tial
Spac
e (S
q. F
t.)23
.95
15.5
623
.43
11.3
612
.76
13.5
6
*E
xclu
ding
labs
use
d fo
r re
sear
ch o
nly.
IMO
SIM
SIN
INS
NM
NM
SIII
IS
S S
IM O
M E
ll11
1111
SIS
IN S
OP
OM
INN

APP
EN
DIX
TA
BL
E 5
.5 (
Con
ed)
D11
717E
lkE
NC
ES
IN S
PAC
E A
VA
ILA
BL
E B
ET
WE
EN
QU
AR
TIL
ES
OF
SCH
OO
LS,
WIT
H S
CH
OO
LS
RA
NK
ED
BY
QU
AR
TIL
E O
N T
OT
AL
. NO
N-R
ESI
DE
NT
IAL
SPA
CE
PE
R F
UL
L-T
IME
-EQ
UIV
AL
EN
T S
TU
DE
NT
,B
Y T
YPE
, CO
NT
RO
L, A
ND
SIZ
E O
F SC
HO
OL
1).
Priv
ate
Oth
er F
our-
Yea
r Sc
hool
s
U.1
1,
4 *.
Ch3
Les
s th
an 1
,000
Enr
ollm
ent
1,00
0-
2,50
0 E
nrol
lmen
t2,
500
5,00
0 E
nrol
lmen
tFi
rst t
oSe
cond
Qua
rtile
Seco
nd to
Thi
rdQ
uart
ile
Thi
rd to
Four
thQ
uart
ile
Firs
t to
Seco
ndQ
uart
ile
Seco
nd to
Thi
rdQ
uart
ile
Thi
rd to
Four
thQ
uart
ile
Firs
t to
Seco
ndQ
uart
ile
Seco
nd to
Thi
rdQ
uart
ile
Thi
rd to
Four
thQ
uart
ile
Per
Cen
t of
Add
ition
al S
pace
Cla
ss.0
8.1
0.0
8.0
8.1
1.0
6.0
9.0
9.0
5L
ab*
.1.4
.15
.10
.16
.08
.13
.16
.29
.10
Cla
ss F
Lab
*.2
5.2
6.1
8.2
5.1
9.2
0.2
6.3
7.1
5O
ffic
e.1
3.0
8.0
9.1
2.0
6.1
2.0
6.1
5.1
0St
udy
.07
.13
.13
.13
.07
.10
.12
.05
.12
Spec
ial U
se.1
0.1
6.1
6.1
6.1
9.1
6.2
3-.
02.2
7G
ener
al U
se.3
4.2
9.3
0.2
5.3
3.2
7.2
3.3
9.2
1
Supp
ort
.12
.09
.14
.09
.16
.16
.09
.04
.16
All
Non
-Res
iden
tial
Spac
e (S
q. F
t.)62
.60
46.1
2
*E
xclu
ding
labs
use
d fo
r re
sear
ch o
nly.
95,2
140
.43
34.1
771
.26
30.8
122
.63
59.2
2

APP
EN
DIX
TA
BL
E 5
.5 (
Con
t'd)
DIF
FER
EN
CE
S IN
SPA
CE
AV
AIL
AB
LE
BE
TW
EE
NQ
UA
RT
ILE
S O
F SC
HO
OL
S, W
ITH
SC
HO
OL
S R
AN
KE
DB
Y Q
UA
RT
ILE
ON
TO
TA
L N
ON
-RE
SID
EN
TIA
LSP
AC
E P
ER
FU
LL
-TIM
E-E
QU
IVA
LE
NT
STU
DE
NT
,B
Y T
YPE
, CO
NT
RO
L, A
ND
SIZ
E O
F SC
HO
OL
E. P
ublic
Tw
o-Y
ear
Scho
ols
Les
s th
an 1
,000
Enr
ollm
ent
1,00
0 -
2,50
0 E
nrol
lmen
tFi
rst t
oSe
cond
Qua
rtile
Seco
nd to
Thi
rdQ
uart
ile
Thi
rd to
Four
thQ
uart
ile
Firs
t to
Seco
ndQ
uart
ile
Seco
nd to
Thi
rdQ
uart
ile
Thi
rd to
Four
thQ
uart
ilePe
r C
ent o
f A
dditi
onal
Spac
eC
lass
.16
.10
.15
.18
.13
.09
Lab
*.2
8.2
4.2
1.2
5.3
9.1
9C
lass
+ L
ab*
.45
.33
.36
.44
.51
.28
Off
ice
.10
.09
.08
.09
.09
.07
Stud
y.1
0.1
0.0
9.1
0.0
6.0
9Sp
ecia
l Use
.24
.29
.17
.22
.11
.19
Gen
eral
Use
.11
.14
.21
.13
.12
.22
Supp
ort
.02
.05
.09
.02
.11
.14
All
Non
-Res
iden
tial
Spac
e (S
q. F
t.)30
.94
27.7
749
.12
23.6
023
.69
40.9
4
*E
xclu
ding
labs
use
d fo
r re
sear
ch o
nly.
SS
=I
SIM
IO
MIll
INN
OM
ON
en
SS
MIS
Ell
1111
881
11

APP
EN
DIX
TA
BL
E 5
.5 (
03ne
ci;
DIF
FER
EN
CE
S IN
SPA
CE
AV
AIL
AB
LE
BE
TW
EE
N Q
UA
RT
ILE
S O
F SC
HO
OL
S, W
ITH
SC
HO
OL
SR
AN
KE
DB
Y Q
UA
RT
ILE
ON
TO
TA
L N
ON
-RE
SID
EN
TIA
L S
PAC
E P
ER
FU
LL
-T1M
E-E
OU
IVA
LE
NT
ST
UD
EN
T,
BY
TY
PE, C
ON
TR
OL
, AN
D S
IZE
OF
SCH
OO
L
E. P
ublic
Tw
o-Y
ear
Scho
ols
(Con
ed)
411:
CrO
2,500
-5,000
Enr
ollm
ent
Ove
r 5,
000
Enr
ollm
ent
Firs
t to
Seco
ndQ
uart
ile
Seco
nd to
Thi
rdQ
uart
ile
Thi
rd to
Four
thQ
uart
ile
Firs
t to
Seco
ndQ
uart
ile
Seco
nd to
Thi
rdQ
uart
ile
Thi
rd to
Four
thQ
uart
ile
Per
Cen
t of
Add
ition
al S
pace
{re
Cla
ss.03
.13
.16
.10
.14
.25
411)
Lab
'.`.38
.23
.39
.26
.33
.31
Cla
ss +
Lab
.41
.36
.54
.36
.47
.57
Off
ice
.07
.11
.10
.11
.12
.15
Stud
y.0
6.1
5.0
7.1
2.0
6.03
Spec
ial U
se.2
1.25
.06
.14
.20
--G
ener
al U
se.23
.06
.16
.12
.16
.10
Supp
ort
.02
.06
.07
.17
.004
.15
All
Non
-Res
iden
tial
Spac
e (S
q. F
t.)15.94
11.33
26.18
8.80
7.30
19.76
*E
xclu
ding
labs
use
d fo
r re
sear
ch o
nly.

APP
EN
DIX
TA
BL
E 5
.5 (
Con
t'd)
DIF
FER
EN
CE
S IN
SPA
CE
AV
AIL
AB
LE
BE
TW
EE
NQ
UA
RT
ILE
S O
F SC
HO
OL
S, W
ITH
SC
HO
OL
S R
AN
KE
DB
Y Q
UA
RT
ILE
ON
TO
TA
L N
ON
-RE
SDE
NT
IAL
SPA
CE
PER
FU
LL
-TIM
E-E
QU
IVA
LE
NT
ST
UD
EN
T,
By
TY
PE, C
ON
TR
OL
, AN
D S
IZE
OF
SCH
OO
L
F. P
riva
te T
wo-
Yea
r Sc
hool
s
Les
s th
an 1
,000
Enr
ollm
ent
1,00
0-
2,50
0 E
nrol
lmen
tFi
rst t
oSe
cond
Qua
rtile
Seco
nd to
Thi
rdQ
uart
ile
Thi
rd to
Four
thQ
uart
ile
Firs
t to
Seco
ndQ
uart
ile
Seco
nd to
Thi
rdQ
uart
ile
Thi
rd to
Four
thQ
uart
ile
Per
Cen
t of
Add
ition
al S
pace
Cla
ss.0
8.0
4.1
3.1
0.1
0.1
2L
ab.1
0.1
1.0
6.0
1.1
7-.
0111
01r. -41$
Cla
ss +
Lab
*.1
8.1
8.1
9.1
1.2
7.1
141
10O
ffic
e.1
4.0
9.0
6.1
2.1
1.1
2St
udy
.09
.09
.11
-.03
.23
-.06
Spec
ial U
se.1
9.1
0.3
0.3
2.0
7.2
5G
ener
al U
se.2
8.4
2.2
8.4
0.1
3.7
5Su
ppor
t.1
3.1
2.0
6.0
8.1
9-.
16A
ll N
on-R
esid
entia
lSp
ace
(Sq.
Ft.)
66.1
548
.44
107.
5925
.26
48.2
126
.87
* E
xclu
ding
labs
use
d fo
r re
sear
ch o
nly.
MO
INS
NS
MI I
MP
GM
NM
111
111
1111
11 In
NM
I11
111
all
1111
11S
PE

APP
EN
DIX
TA
BL
E 5
.6
INC
RE
ME
NT
AL
SPA
CE
PE
R F
UL
L-T
IME
ST
UD
EN
T B
Y T
YPE
, CO
NT
RO
L, A
ND
SIZ
E O
F SC
HO
OL
1.es
s th
an 1
0,(X
)0 E
nrol
lmen
t
A. P
ublic
Uni
vers
ities
Ove
r 20
,000
Enr
ollm
ent
10,0
00-
20,0
00 E
nrol
lmen
tFi
rst t
oSe
cond
toT
hiry
toFi
rst t
oSe
cond
toT
hird
toFi
rst t
oSe
cond
toT
hird
toSe
cond
Thi
rdFo
urth
Seco
ndT
hird
Four
thSe
cond
Thi
rdFo
urth
Qua
rtile
Qua
rtile
Qua
rtile
Qua
rtile
Qua
rtile
Qua
rtile
Qua
rtile
Qua
rtile
Qua
rtile
Per
Cen
t of
Add
ition
al S
pace
t*1.
1 'a s
s.0
6.0
8.0
3.0
1.0
6.0
4.0
4.0
1
IX.a
b*.1
5.2
2.1
8.0
5.2
0.1
3.0
1.8
6C
lass
+ L
ab"
.21
.29
.21
.06
.25
.17
.07
.87
Off
ice
.27
.09
.31
.19
.23
.23
.23
.80
Stud
y.0
9.0
6.1
0.1
3.0
1.0
7.1
2-.
08Sp
ecia
l Use
.19
.28
.18
.06
.25
.26
.23
-.52
Gen
eral
Use
.17
.30
-.01
.31
.10
.11
.20
-.36
Supp
ort
.07
-.01
.21
.25
.16
.16
.17
.29
-.02
-.16
-.17 -.12
-.05 .6
7
.33
.36
All
Non
-Res
iden
tial
Spac
e (S
q. F
t.)36
.95
32.6
040
.46
20.3
618
.20
41.4
744
.50
9.97
20.6
0
* E
xclu
ding
labs
use
d fo
r re
sear
ch o
nly.
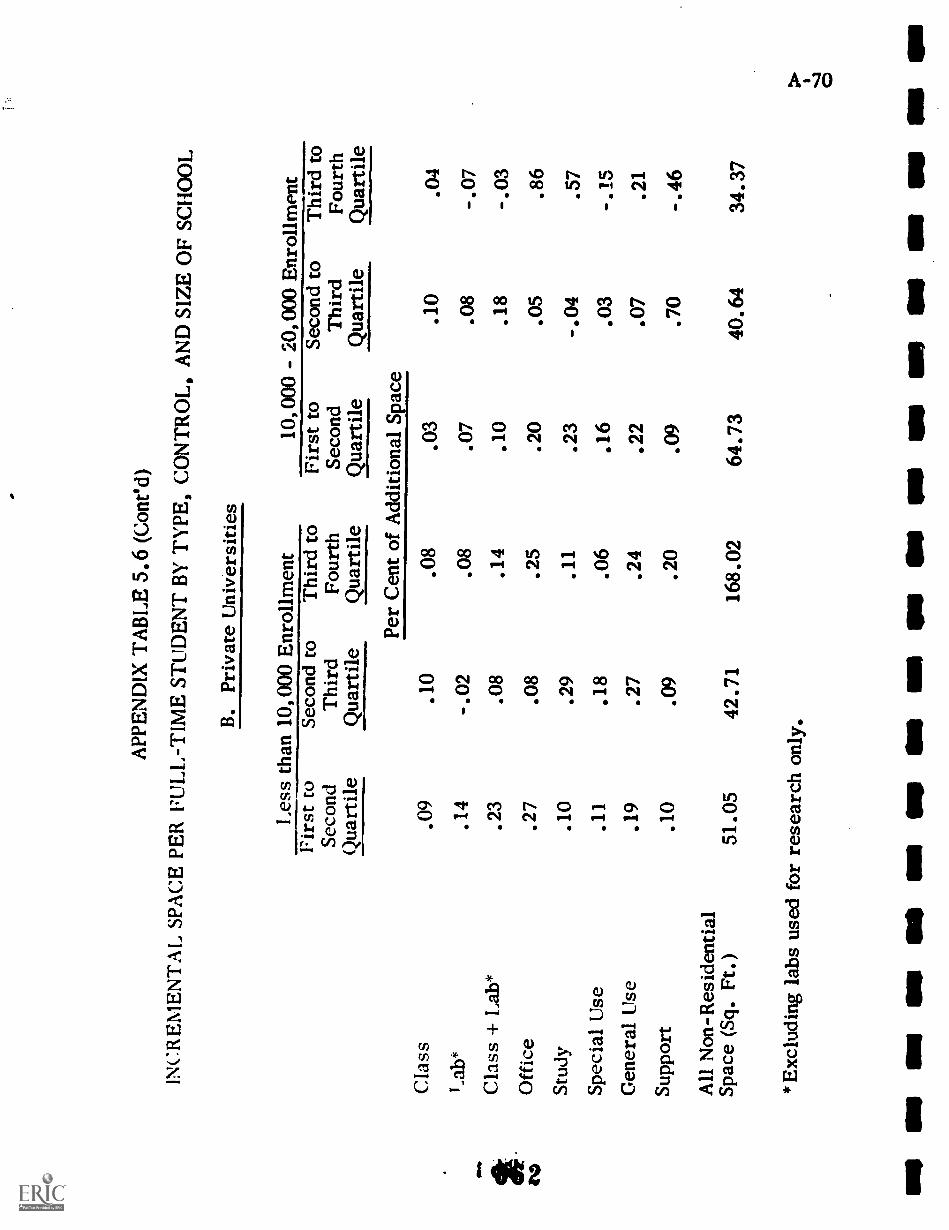
APP
EN
DIX
TA
BL
E 5
.6 (
Con
ed)
INC
RE
ME
NT
AL
SPA
CE
PE
R F
UL
L-T
IME
STU
DE
NT
BY
TY
PE,
CO
NT
RO
L, A
ND
SIZ
E O
F SC
HO
OL
Les
s th
an
B. P
riva
te U
nive
rsiti
es
10,0
00-
20,0
00 E
nrol
lmen
t10
,000
Enr
ollm
ent
Firs
t to
Seco
nd to
Thi
rd to
Firs
t to
Seco
nd to
Thi
rd to
Seco
ndT
hird
Four
thSe
cond
Thi
rdFo
urth
Qua
rtile
Qua
rtile
Qua
rtile
Qua
rtile
Qua
rtile
Qua
rtile
Per
Cen
t of
Add
ition
alSp
ace
.03
.07
.10
.20
.23
.16
.22
.09
64.7
3
Cla
ss.0
9.1
0.0
8I
.,ab,
F.1
4-.
02.0
8C
lass
+ L
ab*
.23
.08
.14
Off
ice
.27
.08
.25
Stud
y.1
0.2
9.1
1Sp
ecia
l Use
.11
.18
.06
Gen
eral
Use
.19
.27
.24
Supp
ort
.10
.09
.20
All
Non
-Res
iden
tial
Spac
e (S
q. F
t.)51
.05
42.7
116
8.02
*E
xclu
ding
labs
use
d fo
r re
sear
ch o
nly.
.10
.04
.08
-.07
.18
-.03
.05
.86
-.04
.57
.03
-.15
.07
.21
.70
-.46
40.6
434
.37
O
MI
SIM
1111
11SI
M S
W S
IMSI
M O
M A
IN
Ole
SIN
GN
Ile
l NI
IMO

APP
EN
DIX
TA
BL
E 5
.6 (
Con
ed)
INC
RE
XIE
NT
AI,
SPA
CE
PE
R I
?ti
STU
DE
NT
BY
TY
PE, C
ON
TR
OL
, AN
D S
IZE
OF
SCH
OO
L
C.
Publ
ic O
ther
Fou
r- Y
ear
Scho
ols
- 5,
000
Enr
ollm
ent
Les
s th
an 2
,500
Enr
ollm
ent
2,50
0Fi
rst t
oSe
cond
toT
hird
toFi
rst t
oSe
cond
toT
hird
toSe
cond
Thi
rdFo
urth
Seco
ndT
hird
Four
thQ
uart
ileQ
uart
ileQ
uart
ileQ
uart
ileQ
uart
ileQ
uart
ile
Per
Cen
t of
Add
ition
al S
pace
Cla
ss-.
03.1
2.4
4.0
5
I .a
b '
.18
.17
.05
.11
Cla
ss +
Lab
'.1
8.2
8.4
8.1
6
Off
ice
.13
.07
.19
.12
Stud
y.1
5.1
2.0
7.2
3
Spec
ial U
se.2
3.2
1.0
6.1
4
Gen
eral
Use
.23
.25
.12
.23
Supp
ort
.08
.07
.07
.12
All
Non
-Res
iden
tial
Spac
e (S
q. F
t.)36
.82
39.4
112
7.71
23.5
5
*E
xclu
ding
labs
use
d fo
r re
sear
ch o
nly.
.05
.19
.25
.04
.30
.23
.02
.16
-.07
.07
.39
.21
.25
.27
.11
.05
17.0
629
.93

APP
EN
DIX
TA
BL
E 5
.6 (
Con
t'd)
INC
RE
NIE
NT
A!.
SPA
CE
PE
R P
UL
L-T
IME
ST
UD
EN
T B
Y T
YPE
,C
ON
TR
OL
, AN
D S
IZE
OF
SCH
OO
L
C. P
ublic
Oth
er F
our-
Yea
r Sc
hool
s (C
ont'd
)
5,00
0 -
10,0
00 E
nrol
lmen
tO
ver
10,0
00 E
nrol
lmen
tFi
rst t
oSe
cond
Qua
rtile
Seco
nd to
Thi
rdQ
uart
ile
Thi
rd to
Four
thQ
uart
ile
Firs
t to
Seco
ndQ
uart
ile
Seco
nd to
Thi
rdQ
uart
ile
Thi
rd to
Four
thQ
uart
ilePe
r C
ent o
f A
dditi
onal
Spa
ceC
lass
.12
.02
.18
.29
.10
.01
Lab
*.1
3.2
0.1
0-.
22.3
6.2
1C
lass
+ L
ab*
.25
.23
.27
.07
.46
.22
Off
ice
.10
.15
.15
.36
-.06
.35
Stud
y.1
5-.
02.0
6.2
3.1
7.1
0Sp
ecia
l Use
.22
.32
.33
.15
.29
-.09
Gen
eral
Use
.19
.21
.13
.04
.13
.16
Supp
ort
.09
.11
.05
.15
.004
.26
All
Non
-Res
iden
tial
Spac
e (S
q. F
t.)19
.49
14.2
026
.45
9.24
16.2
310
.36
* E
xclu
ding
labs
use
d fo
r re
sear
ch o
nly.
SIM
MN
MN
Oil
SO a
llA
IIIII
IS
IM M
IV
III O
M II
Ial
lIP
S M
I11
1111
1

APP
EN
DIX
TA
BL
E 5
.6 (
Con
ed)
INC
RE
ME
NT
AL
. SPA
CE
PE
R F
UL
L-T
IME
ST
UD
EN
TB
Y T
YPE
, CO
NT
RO
L, A
ND
SIZ
E O
F SC
HO
OL
Lab
'
Cla
ss +
Lab
-
Off
ice
Stud
y
Spec
ial I
.'se
Gen
eral
Use
Supp
ort
1).
Priv
ate
Oth
er F
our-
Yea
r Sc
hool
s
I.es
s th
an 1
,0(X
) E
nrol
lmen
t1,
000
- 2,
500
Enr
ollm
ent
2,50
0 -
5,00
0 E
nrol
lmen
tFi
rst t
oSe
cond
Qua
rtile
Seco
nd to
Thi
rdQ
uart
ile
Thi
rd to
Four
thQ
uart
ile
Firs
t to
Seco
ndQ
uart
ile
Seco
nd to
Thi
rdQ
uart
ile
Thi
rd to
Four
thQ
uart
ile
Firs
t to
Seco
ndQ
uart
ile
Seco
nd to
Thi
rdQ
uart
ile
Thi
rd to
Four
thQ
uart
ilePe
r C
ent o
f A
dditi
onal
Spa
ce
.10
.08
.08
.10
.09
.10
.06
.02
.14
.15
.11
,15
.05
.14
.25
.04
.15
.25
.26
.19
.24
.15
.23
.35
.10
.17
.13
.07
.10
.12
.05
.12
.U7
.09
.13
.10
.10
.13
.11
.09
.10
-.00
1.2
7.0
8.0
9.1
5.1
5.1
8.1
9.1
5.2
0.0
7.3
2.3
3.2
9.3
0.2
6.3
2.2
7.3
5.3
9.1
1.1
0.1
3.1
2.0
8.2
1.1
4.0
4.0
8.1
8A
ll N
on-R
esid
entia
lSp
ace
(Sq.
Ft.)
64.1
147
.94
88.0
7
Exc
ludi
ng la
bs u
sed
for
rese
arch
onl
y.
50.2
333
.39
75.7
428
.58
27.2
851
.86
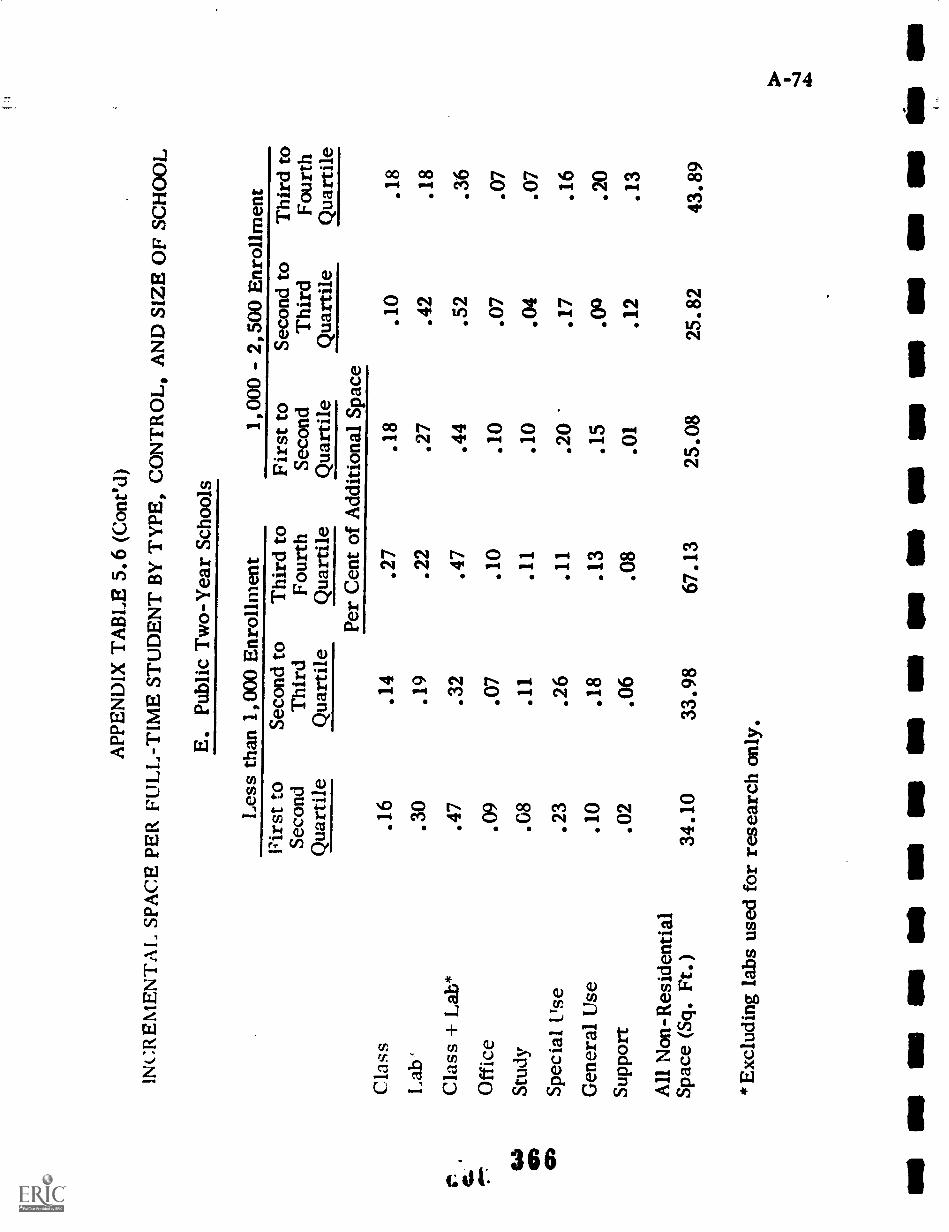
; I
APP
EN
DIX
TA
BL
E 5
.6 (
Con
ed)
INC
RE
ME
NT
AL
SPA
CE
PE
R F
UL
L-T
IME
STU
DE
NT
BY
TY
PE, C
ON
TR
OL
, AN
DSI
ZE
OF
SCH
OO
L
Cla
ss
Lab
'
rC
lass
+ L
ab*
c. 0.O
ffic
e
44St
udy
gra
C)
Spec
ial U
se
Gen
eral
Use
Supp
ort
E. P
ublic
Tw
o-Y
ear
Scho
ols
Les
s th
an 1
,000
Enr
ollm
ent
1,00
0 -
2,50
0 E
nrol
lmen
tFi
rst t
oSe
cond
Qua
rtile
Seco
nd to
Thi
rdQ
uart
ile
Thi
rd to
Four
thQ
uart
ile
Firs
t to
Seco
ndQ
uart
ile
Seco
nd to
Thi
rdQ
uart
ile
Thi
rd to
Four
thQ
uart
ilePe
r C
ent o
f A
dditi
onal
Spa
ce
.16
.14
.27
.18
.10
.18
.30
.19
.22
.27
.42
.18
.47
.32
.47
.44
.52
.36
.09
.07
.10
.10
.07
.07
.G8
.11
.11
.10
.04
.07
.23
.26
.11
.20
.17
.16
.10
.18
.13
.15
.00
.20
.02
.06
.08
.01
.12
.13
All
Non
-Res
iden
tial
Spac
e (S
q. F
t.)34.10
33.98
67.13
25.08
25.82
43.89
* E
xclu
ding
labs
use
d fo
r re
sear
chon
ly.
IMO Ns SO SO
r w
r M
I se
se
as e
s um
On ON SO
if a
s

APP
EN
DIX
TA
BL
E 5
.6 (
Con
t'd)
INC
RE
NIE
NT
AL
SPA
CE
PE
R F
t I.I
.-T
IME
ST
UD
EN
T B
Y T
YPE
, CO
NT
RO
L, A
ND
SIZ
E O
F SC
HO
OL
E. P
ublic
Tw
o-Y
ear
Scho
ols
(Con
t'd)
Cla
ss
1.ab
Cla
ss +
Lab
'
Off
ice
Stud
y
Spec
ial U
seG
ener
al U
se
Supp
ort
All
Non
-Res
iden
tial
Spac
e (S
q. F
t.)
2,50
0 -
5,00
0 E
nrol
lmen
tO
ver
5,00
0 E
nrol
lmen
tFi
rst t
oSe
cond
Qua
rtile
Seco
nd to
Thi
rdQ
uart
ile
Thi
rd to
Four
thQ
uart
ile
Firs
t to
Seco
ndQ
uart
ile
Seco
nd to
Thi
rdQ
uart
ile
Thi
rd to
Four
thQ
uart
ilePe
r C
ent o
f A
dditi
onal
Spa
ce.0
5.1
1.1
3-.
04.0
2.3
0.4
7.1
8.3
9.2
7.6
0.0
1
.52
.29
.52
.23
.62
.31
.04
.17
.09
.13
.02
.32
.13
.10
.05
.02
.04
.16
.15
.24
.06
.17
.26
-.05
.10
.17
.18
.24
.14
.06
.07
.02
.10
.21
-.09
.19
16.6
414
.36
32.2
514
.69
9.95
13.6
8
*E
xclu
ding
labs
use
d fo
r re
sear
ch o
nly.

APP
EN
DIX
TA
BL
E 5
.6 (
Con
ed)
INC
RE
ME
NT
A1,
SPA
CE
PE
R F
UL
L-T
IME
ST
UD
EN
T B
YT
YPE
, CO
NT
RO
L, A
ND
SIZ
E O
F SC
HO
OL
F. P
riva
te T
wo-
Yea
r Sc
hool
s
Les
s th
an 1
,000
Enr
ollm
ent
1,00
0 -
2,50
0 E
nrol
lmen
tFi
rst t
oSe
cond
Qua
rtile
Seco
nd to
Thi
rdQ
uart
ile
Thi
rd to
Four
thQ
uart
ile
Firs
t to
Seco
ndQ
uart
ile
Seco
nd to
Thi
rdQ
uart
ile
Thi
rd to
Four
thQ
uart
ilePe
r C
ent o
f A
dditi
onal
Spac
eC
lass
.06
.06
.13
.31
-.04
.12
Lab
`.0
9.1
1.0
7-.
06.1
4.0
7
fdt
rel*
Cla
ss +
Lab
*
Off
ice
.16
.16
.19
.06
.20
.09
.25
.46
.10
-.03
.20
.12
Cit.
)St
udy
.10
.09
.12
-.02
.10
.09
Spec
ial U
se.1
8.1
5.2
5**
.33
.16
Gen
eral
Use
.32
.34
.30
.41
.38
.37
Supp
ort
.08
.17
.05
-.10
.13
.06
All
Non
-Res
iden
tial
Spac
e (S
q. F
t.)64
.47
53.4
112
3.77
11.9
630
.95
52.8
6
*E
xclu
ding
labs
use
d fo
r re
sear
chon
ly.
* *
Not
repo
rted
for
fir
st a
nd s
econ
d qu
artil
es.
NM
I MI M
I11
1111
1S
IN IN
ell
ON
IMP
MN
MI
IIIIII
IMO
OM
OM
w S
ill IN

A-77
APPENDIX TO CHAPTER 6
A STATISTICAL. ANALYSIS OF SPACE AVAILABILITY
The lack of clearcut results, based on the stratification of
schools by type, control, and size prompted us to attempt a number
of statistica. analyses to explain the availability of the present stock
of non-residential space as a function of enrollments, expenditures,
staffing patterns, and orientation of the school measured by the
number, level, and types of degrees granted. A special data file
was constructed for this purpose.
Description of the Data Base
The data base consisted of data from various HEGIS surveys
for the school year 1970-71. These surveys includea information on
facilities, enrollments, staff, finances, degrees granted, and
institutional characteristics or identifiers. Selected data elements
from each of these surveys were consolidated by individual institution.
In a number of cases, data tram one or more of these surveys were
missing for an individual institution. Only those institutions which
had complete data on each of these surveys were included in our data
base. While roughly four per cent of all campuses failed to repor
space, some additional schools either did not report members of the
faculty or give any financial information, or both. In addition, some

A-78to.
schools did not report the degrees which they granted, and a few
gave no report on their enrollment. As a result, the new data file
which excluded these schools accounted for 6.2 million FTE students
as contrasted to the estimated 6.7 million FTE fall enrollment for 1970-71.
In other words, the reconstituted data file accounted for about
92.5 per cent of the FTE enrollment. Since the objective here is
to develop a data base for statistical analysis, completeness is not
essential. Considered as a sample of the enrollment for 1970-71,
this is a high degree of coverage and should be quite sufficient.
A second (and more difficult) problem associated with the
combination of the various segments of the HEGIS surveys was caused
by the inconsistent bases on which a number of. institutions reported
in the various questionnaires. Whereas each survey requested
information on a campus-by-campus basis, these institutions reported
on an aggregate or all-campus basis. In order to merge the data on
a common basis, it was necessary to aggregate the campus-by-campus
data to the same level (all-campus basis) on which the other data were
reported. Other problems associated with this effort included the
identification of double reporting and the few anomalies encountered
in the use of FICE codes (i.e., neither did the same institutional unit
always use the same FICE code, nor did the same FICE code always
represent the same institutional unit). In a few cases (notably SONY),
data for a particular survey were aggregated for some of the campuses
3:7 04: if
1

A-79
and reported individually for others. There were approximately
50 institutions for which this type of aggregation was necessary,
mostly in the public sector. The number of data points by type,
control, and size are shown in Table 6.1. The extent of the
consolidation can be deduced by comparing that table with Table 3.2.
A list of the data elements included in our data base is shown
in Table 6.2. The number of elements is quite large, even after the
highly selective extraction processes which were applied to the
various I IEGIS surveys. The non-residential space is sub-divided
into classrooms, laboratories, study, general use, special use space,
etc. Enrollments are detailed by level--undergraduate, graduate,
non-degree credit, and first professional students (as well as the
total)--and in each category full-time, part-time, and full-time-
equivalent students arc retained separately. In the case of institutional
employees, several kinds of staff variables were included as potential
explanatory variables. These include the professional staff, the total
staff, including both professional and lion-professional members, the
instructional staff, and the instructional staff along with all other
administrative personnel (this seems intuitively to be a sensible one
in terms of office space). In each category, full-time, part-time,
and full-time-equivalent numbers of staff were carried.
The financial data, besides including a large number of
specific expenses, includes a computed amount equivalent to the
SO;371

A-80
estimated instructional outlays. In effect, all revenues and
expenditures from subsidized research activities were netted out,
as were revenues and outlays from subsidiary enterprises, e.g.,
bookstores, dormitories, etc. Only the outlays directly associated
with the instructional function were aggregated with the net surplus
or deficit from all other activities. Inclusion of this last balancing
item was believed necessary to reflect the character and total activity
of the institution or campus.
The degrees granted are given by level of degree and by groups
of disciplines or fields. The levels of degree include: two-year junior
college degrees, bachelor's degrees, master's degrees, doctor's
degrees, and first professional degrees. The discipline categories are:
(1) agriculture and related sciences, (2) architecture and engineering,
(3) life sciences (including health and medicine), (4) all other scien :es,
and (5) all other fields of study. The various fields included within
each group of disciplines are shown in Table 6.3. These groupings
were constructed to aggregate fields with similar requirements for
laboratory space per student station (see Chapter 2). Since it was
shown that the required space for laboratories differed widely from
discipline to discipline, it was believed that a good way to approximate
space demand without multiplying unduly the nw-aber of space variables
was to perform such a grouping of the degrees granted.
372
1.
I
1

A-81
Methodology
The objective of the statistical analysis was to identify a
meaningful set of institutional variables which could be used to
explain space availability. Various techniques of multiple regression
analysis were employed to discover the relationships among the
institutional space variables and the candidate explanatory variables.
These regressions were performed on data for groups of institutions
by type, control, and size.
First, an attempt was made to explain the various types of
space (e.g., classroom or office space) individually as functions of
student enrollment, total and by level, several measures of staff
size, the types of degrees grantel, total and by level, etc. These
attempts did not produce significant correlations, and a decision was
made to use only the total non-residential space as the dependent
variable in all further analyses.
The simple correlation matrix was computed for each of the
institutional groupings by type, size, and control. An examination of
these matrices indicated that generally the following variables were
most highly correlated with the non-residential space variables which
appeared in the original regression equations: (1) full-time-
equivalent enrollment, (2) full-time-equivalent total staff, and
(3) instructional oxp(nditures. Multiple regressions were run for
each group in an attempt to explain the stock of total non-residential
t 47 3

space with just these three variables. The results appeared most
promising for the universities, and somewhat less than enlightening
for other types of institutions. In these runs, each individual original
institutional grouping was used separately, and in addition, some
combinations of the different size groups were used. For example,
in the case of public universities, the original size groupings used
were: (1) less than 10,000 FTE students, (2) between 10,000 and
20,000 FTE students, and (3) greater than 20,000 FTE students.
Also, all universities with greater than 10,000 FTE enrollment
(groups 2 and 3) and all universities (groups 1, 2, and 3) were used.
The results of these runs are shown in Table 6.4. While the multiple
correlation coefficient (R2) for all public universities exceeds .9,
and was between .8 and .9 for private universities, small public
colleges, and large private colleges, the results for other institutions
showed a much lower R2.1 A detailed examination of the size of
individual coefficients and their associated standard errors indicated
that in some cases, especially instructional expenditures, not only
was the algebraic sign wrong, indicating that richer schools have less
space, but the standard error associated with the coefficient was
1 The multiple correlation coefficient, R2, is the fraction of theoriginal sample varian:e explained by the regression equation.The fraction of the variance remaining about the regressionequation !s 1 R2.

A-83
v
larger than the coefficient itself. See, for example, the results for
the larger private colleges or most of the two-year schools in Table 6.4.
The standard errors are measures of the confidence to be placed on the
individua! coefficients. When the standard error is larger than the
coefficient, this indicates very little confidence in the algebraic sign
of the coefficient, fit alone its numerical value. When one coefficient
in a r-v4res3ion equation is in doubt, the whole equation is in doubt, so
that very little confidence could be placed in many of these regression
equations.
Rather than pursue this course of attempting to find a common
equation form which could be applied to all institutional groups, it
appeared more reasonable to permit the regression equation form to
vary from group to group in an attempt to find better regression
equations to explain the stock of non-residential space. In the interests
of efficiency, recourse was made to a step-wise regression process,
which yields a number of different regression equations with little
marvinal effort. this process chooses one variable, adding it to the
regression equation, producing a new regression equation at each step.
The procedure is directed to insert certain chosen variables (high
priority) in order, after which it will choose certain other variables,
depending on their individual potential contribution to the regression.
By judicious choices of N.. ariables and the priority associated with each
one, this procedure can he made to yield several meaningful
eg Sion .:quatknsifiivach run. -Typically, however.
375
not exclusively,

A-84
in the following runs the staff variable was inserted first, the
enrollment variable next, the instructional expenditures variable,
if used, third, and the degrees granted variables last. These latter
variables were entered on a common priority level so that the
procedure was free to choose the most significant degree variables
in order.
The results are discussed below, and were chosen from the
several hundred runs designed to explain total non-residential space.
Since this analysis produces meaningless as well as meaningful
equations, some discretion must be used in interpreting the results.
The following criteria or constraints were used to distinguish
meaningful from meaningless in this study:
(1) The algebraic signs of the coefficients for the student,staff, and expenditures variables must be non-negative.
(2) The correlation between so-called independent variablesmust be less than .9() (thus, the linear regressionequation relating the twe has a correlation coefficient,Rz, of less than .81).
(3) The standard error associated with each coefficientmust not exceed one-half of the absolute value of thecoefficient (this can also be phrased as an "F" test,where the F associated with that coefficient must begreater than about 4 in the groupings used).
(4) As a practical consideration, no more than ten indepen-dent variables were to be included in any regressionequation.
In the runs described below, the primary variables used were
full-time- eqiiiva lent enrollment, full-time-equivalent staff (total
- 37660.

professional plus non-professional), instructional expenditures, and
degrees by field and level. In addition to these variables, used in
several different priority schemes, the following variations were
evaluated:
(1) Full-time staff was used In place of full-time-equivalent staff.
(2) Full-time enrollment was used in place of full-time-equivalent enrollment.
(3) Full-time undergraduates and full-time graduatesere used in place of full-time enrollment.
(4)
A-85
Instructional expenditures per full-time-equivalentenrollment was used in place of instructional expenditures.
(5) In the case of junior colleges, the full-time under-graduates and full-time non-degree credit studentswere used in place of full-time enrollment.
(6) Degrees by field only (i.e., all degrees regardlessof level) were used in place of degrees granted byfield and level.
(7) In a number of cases, a logarithmic regression wasattempted with a view to fitting a production-typefunction, i.e., the logarithm of non-residentialspace was used as the dependent variable (insteadof non-residential space itself), and the permissibleindependent variables were the logarithm of full-time-equivalent staff; the logarithm of full-time-equivalentenrollment, and the logarithm of instructionalexpenditures.
In some cases, these variations produced significant
improvements, while in others they added nothing the correlations
obtainable with our primary set of variables.
377

A-86
Results
This section presents the better regression equations1 obtained
in our attempts to relate total non-residential space to our explana-
tory variables by type, control, and size of institution. In addition
to those presented below, a large number of pool- or meaningless
regression equations were generated by our procedure.
Universities. As a general rule, the world of institutions
granting doctorates (universities) is the best-ordered of all. Despite
the fact that in most instances the multiple correlation coefficient (R2)
obtained was quite high, the form of the regression equation was not
always enlightening. In this section, the results obtained for public
universities are presented first, followed by the results for private
universities.
1 In Tables 6.5 through 6.25, the variables occurring in the right-hand sides of the regression equations are full-time-equivalentenrollment WTE-ENR), full-time enrollment (FT-ENR), full-time-equivalent total staff (FTE -STF), full-time total staffWT-STF), instructional expenditures (EXP), and degrees byfield and level. Degrees are designated by D-FF-L, where FFdenotes the field (AG = agricultural sciences, AR = architectureand engineering, IX = life sciences, OS = ocher sciences, andOT = other), and L denotes the level of the degrees (B = bachelor's,M = master's, D = ctorates, J = two-year degrees, and Pfirst professional degrees). In a few instances, undergraduateenrollment (UOR), graduate enrollment (GRS), or non-degree-credit enrollment (NCR) appear, prefixed by FT- or PTE- todenote full -time and full-time-equivalent, respectively. In allcases, the standard error associated with each coefficient is givenin parentheses below the coefficient. Space and expenditure variablesare in thousands of square feet and thousands of dollars.
478

A-87
1. Public Universities with Less than 10,000 FTE Enrollment
In the case of the smaller public universities, one of the
more satisfactory predictive equations was obtained. The non-residential
space for these 65 institutions was explained as a function of FTE enroll-
ment, I7TE staff, and a series of advanced degrees (see Table 6.5,
Equation 1). A satisfactory multiple correlation coefficient (R2) of .81
was obtained in this case. The standard error of estimate is 210. The
degrees variables included are doctorates in agriculture, doctorates in
architecture and engineering, first professional degrees in the life and
medical sciences, and doctor's degrees in other sciences. Note that all
the coefficients are positive in this equation. The constant term is
negative, indicating that this equation would produce illogical results
for extremely small universities (i.e., very few students or staff for
degrees granted). This means that the equation is meaningless for
extremely small universities (say, less than 100 students), but it does
represent a reasonable correlation for the larger institutions. This
equation was judged to be the best of those obtained for the small
public universities.
Perhaps some comment on what is meant by "best" is in
order. From the standpoint of multiple regression analysis, an
equation is better if it has a high multiple correlation coefficient, and
a small standard error of estimate. In addition, the standard errors
associated with each of the coefficients in the equation should be
small compared to the coefficients. For purposes of explaining non-
residential space in tering of the explanatory variables, one would
379

A -88
hope for some degree of completeness with respect to the staff and
student variables, i.e., if full-time undergraduates were included
in an equation, then full-time graduate students should be included as
well. Ideally, one would hope to have the expenditure variable
included in the equation. We would prefer to have the staff and
student variables in terms of FTE's, rather than full-time staff or
students, since the latter tends to ignore the influence of part-time
students. Thus, in this case, we tend to prefer Equation 1 in
Table 6.5 to one which is similar but has full-time enrollment and
full-time staff in place of FTE enrollment and FTE staff, and has a
slightly higher R2, .82, and a slightly lower standard error, 203
(see Table 6.5, Equation 2).
An equation such as Equation 1 is a fairly sensible one,
since both space related to students (classroom, laboratory, etc.)
and space related to staff (e.g., office space) represent major
portions of total non-residential space. The numbers of advanced
degrees granted by field represent an attempt to explain the differences
in character among the members of this group of universities. Here
we have four degree variablesdoctorates or first professional degrees
in the case of life sciences--representing four different fields of
study. A comparison between this equation and one which includes
only FTE enrollment and FTE staff shows that, by adding these four
degree variables, the multiple correlation coefficient is increased
;;: 380

A-89
from .62 to .81, and the standard error of estimate is reduced from
288 to 210 (see Fable 6.5, Equations i and 3).
The equation referred to above. (Equation 1) does not
include any measure of the instructional expenditures. However, if
one attempts to introduce instructional expenditures as an additional
variable in the equation above, the resulting equation (see Table 6.5,
Equation 4) has a slightly increased R2 (.82) and a slightly reduced
standard error (209), but the coefficient of instructional expendi-
tures in the equation is negative. This violates our constraint No. 1.
In addition, the standard error of the coefficient of expenditures is
almost as large as the coefficient itself. This resuits in an unsatis-
factory equation because it implies that schools which spend more on
instruction have less space.
The question arises--what would the results be if our
constraints listed above were not so stringent? We pointed out that
relaxation of constraint No. 1 (that the sign of the coefficients be non-
negative for staff, enrollment, and expenditures variables) does not
make any particular sense within the current context. Constraint
No. 3 (that the standard error of the coefficient should be less than
half the magnitude of the coefficient) is sometimes relaxed to include
cases where the standard error is no larger than the coefficient. In
the case of the small public universities, this relaxation on constraint
Nu. 3 permits only the addition of one more degree-type variable,
with a rather insignVnnt increase in R2 (less than .02)
381

A -90
Constraint No. 2 requires that the "independent variables"
be basically independent. In this particular case, since none of the
independent variables are highly correlated with one another, the
exclusion of certain favored variables is not attributable to
co-linearities among the independent or explanatory variables. In
fact, in this case the highest correlation among the independent
variables is less than .6, not a very good correlation at all.
2. Public Universities with FTE Enrollment Between 10,000and 20,0 0
For the somewhat larger 54 public universities, space
was best explained in terms of full-time enrollment, full-time staff,
and bachelor's degrees in non-science fields (with a negative
coefficient). A less impressive R2 of .74 was obtained here (see
Table 6.6, Equation 1). If FTE enrollment and FTE staff are used
here, somewhat worse results arc obtained (see Table 6.6, Equation 2).
In this case, instead of bachelor's degrees in the non-science fields,
the degree variable included was master's degrees in the non-science
fields. By relaxation of constraint No. 3, R2 can be improved by .02
(.76 instead of .74), and the resulting equatioas have no parcicularly
more appealing form, but have slightly reduced standard errors of
estimate. It is not felt that the minor improve; lent is worth the loss
of confidence represented by relaxing constraint No. 3.
7 382

A-91
3. Public Universities with FTE Enrollment Greaterthan 20,000
The largest 26 public universities are homogeneous enough
with respect to their pupil/staff ratios to provide satisfactory predic-
tive equations of space based on either FTE enrollment or FTE staff.
The R2's for the two equations are .89 and .92, respectively, but
the equations themselves are not very informative (see Table 6.7,
Equations 1 and 2). In addition, the non-residential space can be
correlated with the instructional expenditures alone, yielding a
regression equation with an R2 of .93. This is due to the high.
correlations among the FTE enrollment, FTE staff, and instructional
expenditures variables. All of these correlations are greater than .94,
so that only one of these may be included in an equation and still satisfy
our constraint No. 2. In fact, a rather good regression equation
relating staff and enrollment may be found. The equation is
FTE -STF = -5,045 + .426 FTE-ENR
The R2 for this equation is .88, a respectable correlation. For the
sake of completeness, we include the other two regression equations
of instructional expenditures versus FTE enrollment and versus
FTE staff, having R2's of .92 and .89, respectively:
EXP = -33,875 + 3,45 FTE-ENR
EX? = 13,140 + 7.47 FTE-STF
r4
383
R2 = .92
R2 = .89

A-92
In the case of the degrees-granted variables, of the
20 variables applicable to the universities, the correlations of non-
residential space with these variables are greater than .9 in seven
of the 20 cases, the highest being for doctorates in the life and medical
sciences, .981. R2 for the equation relating non-residential space
and this degree variable alone would be .96 (see Table 6.7,
Equation 3).
Thus, in the case of the largest public universities, the
only regression equations obtained are simple linear equations with
quite high correlation coefficients. This is due primarily to the fact
that the explanatory variables arc highly correlated with one another,
and the regression analysis breaks down when more than one of these
are included in the regression equation.
4. Public Universities !Lavin). 17TE Enrollment Greaterthan 10,000
The two largest groups of public universities were
combined in an attempt to remove the co- linearities found among
the variables in the larger group. While this reduced the corre-
lations among the enrollment, staff, and expenditures variables
somewhat, these correlations were still all greater than .93. Thus,
again we obtained simple linear regression equations involving FTE
enrollment, staff, and expenditures variables individually, all with
fairly high multiple correlation coefficients (.86 to .92), but of course
Leg "4

A-93
did not achieve the desired result (see Table 6,8, Equations 1 and 2).
In addition, the correlations between non-residential space and the
numbers of degrees granted by level and field was quite high in
five cases.
5. L',11 Public Universities
All public universities, regardless of size, were grouped
together in a series of regression equations. Again, as before, the
dominance of the largest universities is apparent. The correlations
among the major "independent" variables of interest are quite high,
still greater than .9. The results obtained here were simple linear
regression equations (including only one independent variable) rather
similar to those obtained before. These are characterized by fairly
high correlation coefficients, all around .9 (e.g., see Table 6.9,
Equations 1 and 2).
It would appear that the university public-based sector
is a rather homogeneous group of institutions, where the mix of
prop,-rams is reflected in the number of staff members. It would also
appear that the mix of programs does not vary too much, since non-
residential space is highly correlated with FTE students. Those
in,aitutions which arc somewhat better endowed with staff are, of
nec2ssity, richer, spend more on instruction, and have slightly
more space. It is fairly clear that the influence of the largest
institutions is quite strong in this group of all-public universities.
to385

A44
Apparently, when considered alone, the smaller universities arc of
a more heterogeneous character. leading to more intuitively
attractive regression forms. The regression equations obtained in
the case of the medium-sized public universities are somewhat
intermediate in their intuitive appeal.
In addition to the regressions described above, an attempt
was made to fit the availability of non-residential space in terms of
the linear logarithmic regression. In this case, the logarithm of
non-residential space was taken as the dependent variable, and the
logarithms of 1,TE enrollment, FTE staff, and instructional
expenditures were taken as the independent variables. When an
equation of this sort is converted to antilogs, the equation relates
nun-residential space to a product of 1,TE enrollment, FTE staff,
and instructional expenditures, each raised to some power--a type of
production function. For the combined groups of all public univer-
sities, a regression equation of this type was obtained (see Table 6.9,
Equation 3), having the proper algebraic signs for coefficients of all
of the dependent variables and an R2 of .87 in the logarithmq. if this
It- were put on a common basis with the other R s which have been
quoted heretofore, it could be expected to be substantially lower.
6. Private Tniversities
Our sample of private universities consisted of
124 institutions with an l'TE enrollment of less than 10,000, 10 with
388

A-95
I:TE enrollment between 10,000 and 20,000, and 4 with FTE
enrollment greater than 20,000, The four largest were judged to
be more similar to other four-year colleges than to universities, and
hence were grouped with the largest private colleges. Regressions
were run for both the 124 institutions with less than 10,000 FTE enroll-
ment, and for these 124 institutions plus the 10 with from 10,000 to
to 20,000 (i.e all private universities with FTE enrollment of less
than 20,000). The largest of these ten institutions actually has an
PTE enrollment of 16,299. No separate regression runs were made
on these ten institutions, primarily because the ten points represent
a sample too small to hope for meaningful results. In the case of the
124 private universities with FTE enrollment of less than 10,000,
fairly decent regression equations were obtained (see Table 6.10,
Equations 1, 2, and 3), including as independent variables (1) FTE
staff, instructional expenditures, and three degree variables (with
an R2 of .89); (2) PTE enrollment, FTE staff, and eight degree
variables (R2 = .89); and (3) full-time undergraduate students, full-
time graduate students, FTE staff, and doctor's degrees in other
sciences (R2 = .87). In the case of the third equation, it is
interesting to note that the coefficient for full-time undergraduates
was 3-1/2 times smaller than that for full-time graduate students,
indicating that the marginal space requirements for graduate student.
are 3-1/2 times as great as for undergraduate students.
387

A-96
When the ten intermediate-sized private universities
were included, the regression results were somewhat improved.
here, an R2 of .92 was obtained in an equation which included FTE
enrollment, FTE staff, and instructional expenditures, as well as
six degree variables (see Table 6.11, Equation 1). If full-time
enrollment and staff are used instead of FTE's, the results are
rather similar (see Table 6.11, Equation 2). Very little is lost in
R2 by removing some of the degree variables and the expenditure
variables from the equations, as illustrated by one equation obtained
including FTE enrollment, FTE staff, and three degree variables as
the independent variables - -here the R2 is .90 (see Table 6.11,
Equation 3). (This is one of the few instances where all three of the
major variables are included in a legitimate equation.)
Another series of runs was made on this same group of
private universities, but excluding a number of divinity schools and
very small universities (less than or equal to 500 FTE enrollment),
40 in number. Satisfactory regression equations were obtained using
the data for the 94 remaining universities, with slightly reduced R2's.
For example, an R2 of .88 was obtained using as the independent.
variables 171 E enrollment, FTE staff, and four degree variables
(see Table 6.12, Equation 1). Another equation involving Fl E staff,
instructional expenditures, and five degree variables was obtained,
having an R2 of .89 (see Table 6.12, Equation 21. A third equation
$t 388

A-97
involving full-time undergraduate students, full-time graduate
students, FTE staff, and four degree variables had an R2 of .89 (see
Table 6.12, Equation 3). A fourth equation used full-time enrollment,
full-time staff, instructional expenditures, and three degree variables,
and had an R2 of .88 (see Table 6.12, Equation 4).
In all of the four equations presented above, most of the
correlations are due to our major staff, enrollment, and expenditures
variables, along with the doctorate degrees in other sciences. The
other degree variables which are included in these equations con-
tribute only small increases in R2. For example, removing all
degree variables except doctorates in other sciences from Equation 1
results in reducing R2 by .03 (to .85) in an equation for non-residential
space, whose right-hand side is
76.2 + .0475 FTE-ENR + .197 FTE-STF + 14.3 D-OS-D
Similar simplification of the other equations produces reduction of
.04 in R2 for Equations 2 and 3--both are legitimate regression
equations. For Equation 4, R2 is reduced by only .01, but the
standard error of the expenditure coefficient is large enough to
violate our constraint No. 3, resulting in an unsatisfactory equation.
An attempt to fit a production function in logarithms,
outlined above, for private universities, produced an equation wherein
the logarithm of non-residential space is explained in terms of the
6" 389

A-98
logarithm of staff and the logarithm of expenditures (see Table 6.12,
Equation 5). The R2 in this case was .84 for the logarithms, and
would bP much Jwer if put on a basis consistent with the other quoted
multiple correlation coefficients. In order for this to be considered
satisfactory at all, one must make the assumption that expenditures
are proportionate to enrollments. A simple correlation between
these two variables is .801, and between the logarithms is .286,
neither of which is a particularly good correlation. Hence, this
assumption is not warranted.
Other Four-Year Schools. While it is possible to get some
fairly high correlations of a puzzling nature in the case of univer-
sities, the distribution of non-residential space on other four-year
schools appears to be less well ordered. The only usable correlations
for the four-year colleges were found for the smaller public colleges,
and the larger private colleges. The correlations for the smaller
private colleges were marginal.
1. Public Colleges with FTE Enrollment Less than 2,500
The best regression equation obtained here included as
independeAt variables the full-time enrollment, full-time staff, and
bachelor's degrees in other sciences--R2 was .68 (see Table 6.13,
Equation 1). The low multiple correlation coefficient obtained here
is not indicative of a good regression equation. Deleting the degree
variable here reduces R2 by .03 (see Table 6.13, Equation 2). If

A-99
PTE enrollment and FTE staff are used in place of the full-time
variables used in Equation 1, R2 is reduced to .61 (see Table 6.13,
Equation 3). By relaxing our constraint No. 3 to include those
equations where the standard errors of the coefficients are no larger
than the coefficients themselves, R2 might be increased from .68 to
.71 by including five additional degree variables. This still does not
represent a very good regression equation.
2. Public Colleges with FTE Enrollment between 2,500 and 5,000
For the 89 colleges in this group, there was a high
correlation (.926) betwcen FTE staff and instructional expenditures.
According to our constraint No. 2, then, these two variables may not
appear simultaneou.Ay a regression equation. An R2 of .72 was
obtained in an equation using full-time enrollment and full-time staff
as the independent variables (see Table 6.14, Equation 1). A some-
what higher R2 of .80 was obtained by using FTE enrollment and
instructional expenditures as the independent variables (see Table 6.14,
Equation 2). In this equation, it is interesting to note that the
coefficient for full-time enrollment is less than that for full-time
staff, and is greater than that for the smaller schools. A third
equation (sec Table 6.14, Equation 3) using instructional expenditures
per FTE enrollment and FTE enrollment as the independent variables,
along with two degree variables, had a slightly increased R2 (.82). In
some sense, this variable of expenditures per I?TE enrollment has a
4.
391

A-100
fair appeal in terms of a measure of richness. Although this variable
was tried in most of our groups, universities and two-year colleges,
as well as four-year colleges, this group is one of the few in which
that variable turned up as present in a legitimate equation.
3. Public Colleges with FTE Enrollment between 5,000and 10,000
For this group of 65 four-year colleges, full-time
enrollment and full-time staff account for only 47 per cent of the
variance (see Table 6.15, Equation 1). The highest, that of .53,
ignores graduate students as part of the enrollment, and only
allocates additional space to master's degrees in other sciences
(see Table 6.15, Equation 2). Adding one degree variable to
Equation 1 creases R2 to .51 (see Table 6.15, Equation 3). These
results are more or less useless, unfortunately. In this case, there
are no co-linearities among the proposed independent variables. A
relaxation of our constraint No. 3, dealing with the standard error
of the coefficients, permits no improvement in the equations.
4. Public Colleges with FTE Enrollment Greater than 10,000
This group consists of 21 four-year colleges, a somewhat
small sample for this type of analysis. The equations obtained have
only one variable each, either FTE staff, full-time staff, or FTE
enrollment. In the case of full-time staff, only 50 per cent of the
variation is explained by the equation. Even this, the best of the lot,
is a pretty poor regression.
_ 392Og
A-101
5. Public Colleges with FTE Enrollment of Less than 5,000
In an attempt to find more useful regression equations,
the public colleges were considered as two groups instead of four- -
that is, the two smallest groups were combined and the two largest
groups were combined. The group of 199 schools, a combination of
the two smallest groups, produced a regression equation with an R2
of .82, incluuing as independent variables FTE enrollment,
instructional expenditures, and degrees in agricultural sciences (see
Table 6.16, Equation 1). This latter variable reiresents all degrees
in the agricultural sciences added together. This type of variable was
tried in all other groupings, as vell, but did not emerge in a
respectable regression equation elsewhere. The results here are
better than those obtained for the smaller of the two groups, and about
the same as or a little better than those obtained and discussed previously
for the larger of the two small groups.
The production function approach here produces an R2 of
.62 in the logarithms of non-residential space (see Table 6.16,
Equation 2) . The independent variables, of course, are the log of
FTE enrollment, log of FTE staff, and log of expenditures. In order
for the equation to be meaningful, the R2 in logarithms should be
much higher than .62.
393

A-102
6. Public Cc lieges with FTE Enrollment Greater than 5,000
The consolidation of the two largest groups of public
colleges resulted in this sample of 86 institutions. Fifty-three per
cent of the variance was explained by an equation whose form is
already familiar, namely, one which contained two variablesfull-
time enrollment and full-time staff (see Table 6.17, Equation 1).
This can be improved to an R2 of .57 by including two degree variables
--master's degrees in the life and health sciences and other bachelor's
degrees (see Table 6.17, Equation 2). The equation with the highest
explanatory power (R2 = .59) has a less comfortable form (see
Table 6.17, Equation 3). It includes full-time undergraduates and
full-time staff as independent variables, ignoring graduate enrollment
- - bringing it in only as a function of master's degrees in the life and
health sciences--and has a negative coefficient for bachelor's degrees
in other disciplines. In the case of these larger public colleges, a
slight improvement in both the form of the equations and the R2's
was obtained by this grouping. However, the resulting equations are
still not very good regressions. The relaxation of our constraint No. 3
on the size of the standard error of the coefficients does not produce
anything particularly better.
The production ninction approach in this case essentially
does not work at all, producing an R2 of .45 and a one-variable
(logarithm of staff) equation.
kti: 394

A-103
7. Private Colleges with Full-Time Enrollment Lessthan 1,000
In the private sector, where the average size of school is
considerably smaller, there are 608 schools in this group with less
than 1,000 enrollment. Several regression equations are obtained,
all having R2's around .60. For example, one equation, with an R2
of .62, includes as the independent variables full-time enrollment,
full-time staff, instructional expenditures, and three degree variables
(see Table 6.18, Equation 1). Another, with an R2 of .61, includes
FTE enrollment, FTE staff, instructional expenditures, and two
degree variables (see Table 6.18, Equation 2). A third, having an
R2 of .62, includes FTE staff, instructional expenditures, and five
degree variables (see Table 6.18, Equation 3). While the form of
these equations are intuitively attractive, the quality of the regressions
is not good. Not much improvement may be obtained by relaxing our
constraint No. 3 concerning the size of the standard errors of the
coefficients.
8. Private Colleges with FTE Enrollment Between 1,000and 2,500
In general, the equations obtained for these 278 somewhat
larger private colleges are not even as good as those obtained for the
smaller ones. The best one has an R2 of .59. Two equations have
this same R2; the first includes as independent variables full-time
staff, instructional expenditures, and bachelor's degrees in the other:
(It/ 395

-104
sciences (see Table 6.19, Equation 1). A second, and somewhat
more complete equation, includes FTE enrollment, FTE staff,
expenditures per FTE enrollment, and three degree variables (see
Table 6.19, Equation 2). These regression equations are not
particularly good, and no significant improvement could be realized
by relaxing our constraints.
9. Private Colleges with FTE Enrollment Greater than 2,500
Attempts to run regression equations on the 49 private
colleges with FTE enrollment between 2,500 and 5,000 resulted in
very poor correlations, with a maximum R2 of around .45. To this
group of 49, we added the eight private colleges with FTE enrollment
greater than 5,000 and the four universities with FTE enrollment
greater than 20,000 which appeared to be of a similar nature. This
resulted in a group of 61 institutions and vastly improved regression
equations. For example, 89 per cent of the variance is explained by
using just the two independent variables: FTE enrollment and FTE
staff (see Table 6.20, Equation 1). The use of FTE enrollment and
instructional expenditures alone produces an R2 of .87 (see Table 6.20,
Equation 2). If bachelor's degrees in agricultural sciences and
master's degrees in the life sciences are included along with the
FTE enrollment and FTE staff, R2 is increased to .93 (see Table 6.20,
Equation 3). The highest R2 in this group is .95 for the equation which
uses full-time enrollment, full-time staff, master's degrees in the life
igt 388
1
1
1
A-105
and medical sciences, and bachelor's degrees in the other sciences
(see Table 6.20, Equation 4). An equation using FTE enrollment,
FTE staff, expenditures per FTE enrollment, and two degree
variables had an R2 of .93 (see Table 6.20, Equation 5). In this
group, there was a high correlation (.943) between FTE staff and
instructional expenditures, accounting for the fact that these two
variables do not appear together in any of our regression equations.
The production function approach here yields an R2 of .71
in the logarithmsnowhere near as good as the straight linear
regressions.
10. Priv cite Colleges with FTE Enrollment Less than 2,500
This group is a combination of the two smaller groups of
private colleges previously discussed, and consists of 886 institutions.
It will be recalled that the correlations were around .60 when these
two groups were run independently. By combining the two groups,
somewhat improved regression equations are obtained. FTE enroll-
ment and FTE staff explain .66 of the variance (see Table 6.21,
Equation 1), and the addition of three degree variables increases
R2 to .69 (see Table 6.21, Equation 21. If, instead, we take as
independent variables FTE staff and instructional expenditures, along
with four degree variables, we obtain an R2 of .74 (see Table 6.21,
Equation :3). Perhaps the most satisfying equation is one which uses
full-time enrollment, full-time staff, instructional expenditures, and
397

A-106
two degree variables (see Table 6.21, Equation 4). This results in
an R2 of .75, the highest obtained in this group. This R2 is possibly
not too bad, considering the large size of the sample (886 institutions).
The relaxation of our constraint No. 3 results only to the
admission of the following equation
25.5 + .0111 PrE-ENR + .226 PTE-STF + .0405 EXP
with an R2 of .72. This equation aad been previously excluded
because the standard error of the coefficient of FTE enrollment
(.00588) was larger than half of the coefficient itself.
In an attempt to find improved correlations, 114 divinity
schools were excluded from this group, resulting in a group of
772 institutions. here an R2 of .71 was found for an equation
including the independent variables FTE enrollment, FTE staff, and
instructional expenditures (sec Table 6.22, Equation 1). This would
not appear to be a great improvement. The production function
approach here produces an R2 of .72, not as good as the straight
linear approach (see Table 6.22, Equation 2).
Two- Year Schools. At best, the regression results in the case
of the two-year schools (junior colleges) were poor. The best results
appeared to be for the public junior colleges with enrollments greater
than 2,500, where an R2 as high as .68 was obtained.
398
1, Public junior Colleges with PTE Enrollment Leithan 1,000
:
This group is composed of 262 small institutions,
Maximum R2's for the regression equations were less than .40,
which would indicate practically no correlation at all. No possibility
of improvement was possible without a complete destruction of our
list of constraints.
2. Public Junior Colleges with FTE Enrollment between1,00b and 2,506
This group is composed of 209 institutions. Here, as in
the smaller group, no satisfactory results were obtained, the
maximum R2 was still less than .40, and no improvement could be
found within the framework of this analysis.
3. Public Junior Colleges with FTE Enrollment between2,500 and 5,000
For these 104 institutions, the maximum value of R2
obtained was .42, and no significant improvement could be found by
relaxing our constraints.
4. Public Junior Colleges with 17TE Enrollment Greaterthan 5,000
For the 60 schools in this group, the maximum R2 was
.54. I [owever, the equation had an unsatisfactory form. The .54
could, however, be increased to .59 by relaxing our constraints
somewhat, but, since this is still unsatisfactory, it seems pointless
to pursue.
kill k
399
A107

A-108
5. Public Junior Colleges with FTE Enrollment Greaterthan 2,500
'e his grouping was a combination of the two larger groups
above, and consisted of 164 institutions. The R2's obtained for this
group were somewhat improved, to a maximum of .68. This R2 was
obtained for an equation which included FTE undergraduate students,
FTE non-degree credit students, full-time staff, and two degree
variables, i.e., junior degrees in architecture and engineering, and
in other fields (see Table 6.23, Equation 1). Using FTE staff in this
equation instead of full-time staff yields an equation almost as good,
having an R2 of .65 (see Table 6.23, Equation 2). Replacing the
undergraduate and non-degree-credit variables with the single
variable, FTE enrollment, produces no significant change (see
Table 6.23, Equation 3). Examination of the details suggests that
no substantial improvement could be realized by relaxing our constraint
on the standard error of the coefficients.
6. Private Junior Colleges
The world of private junior colleges consists of
164 institutions with PTE enrollment of less than 1,000, 15 institutions
with FTE enrollment between 1,000 and 2,500, and 3 with FTE enroll-
ment between 2,500 and 5,000. The first series of regression runs
was made using the 164 smallest junior colleges. For these, the
largest it2 obtained was .54 in an equation using as independent
4tet
1
1
1

A-109
variables full-time undergraduates, full-time staff, junior degrees
in architecture and engineering, and other sciences (see Table 6.24,
Equation 1). ilere, full-time non-degree credit students were not
included in the equation, detracting from the appeal of the form.
Dropping out four divinity schools from this group
(resulting in a group of 160 junior colleges) increased the R2 for the
same equation to .57 (see Table 6.24, Equation 2). This is still a
rather low regression coefficient. No improvement could be realized
by relaxing our constraint No. 3 in either this or the previous case.
Another series of regression runs was made, using all
private junior colleges--a group consisting of 182 institutions. For
these, the best R2 obtained was .57 in an equation which included
full-time staff, junior degrees in architecture and engineering, and
other sciences (see Table 6.25, Equation 1). Dropping out the four
divinity schools (resulting in a sample of 178 institutions) increases
the R2 to .59 and permits the addition of full-time undergraduates to
the equation (see Table 6.25, Equation 2). In neither case, of course,
are full-time non-degree credit students used as an independent
variable. At best, these regressions are poor, and no substantial
improvement can be made by relaxing the constraints.

TABLE 6.1
NUMBER OF INSTITUTIONS IN COMBINED DATA BASEBY TYPE, CONTROL, AND SIZE OF INSTITUTION
Type
Universities
A-110
FTE Number ofControl Enrollment Range Institutions
Public Less than 10,000 6510,000 - 10,000 54Greater than 20,000 26
Private Less than 10,000 12410,000 - 20,000 10Greater than 20,000 4
Other Four-Year Public Less than 2,500 110Schools 2,500 - 5,000 89
5,000 - 10,000 65Greater than 10,000 21
Private Less than 1,000 6081,000 - 2,500 2782,500 - 5,000 . 495,000 - 10,000 8
Two-Year Schools Public Less than 1,000 262,000 - 2,500 209
2,500 - 5,000 104Greater than 5,000 60
Private Less than 1,000 1641.000 - 2,500 152,500 - 5,000 3
Source: EIEGIS Surveys 1970-71.
I 01402

TABLE 6.2
INSTITUTIONAL VARIABLES INCLUDED INCOMBINED DATA BASE
Variable Description
A-111
1 Classroom space2 Laboratory space *3 Office space4 Study space5 Special use space6 General use space7 Support space8 Medical care space9 Total non-residential space
10 Total residential space11 Classroom plus laboratory * space12 Non-class 1E.boratory space13 Total degree-credit undergraduates - Full-time14 1? ft ft ff Part-time15 ft ff FTE16 First-professional students - Full-time17 If ft Part-time18 99 ft ft FTE19 Graduate students - Full-time20 Part-time21 FTE22 Non-degree-credit resident students - Full-time23 99 ft If ft Part-time24 " It " If FTE25 Grand total students - Full-time26 Part-time27 FTE28 Professional staff - Full-time29
99 FTE
Excluding- labs used for research only.
ir01
403

A-112
TABLE 6.2 (Cont'd)
INSTITUTIONAL VARIABLES INCLUDED INCOMBINED DATA BASE
Variable Description
30 Professional plus non-professional staff - Full-time31 ,, ,, ,, ,, " FTE32 Instructional staff - Full-time33 " FTE34 "Office staff" - Full-time35 ,, ,, FTE36 Total full-time resident faculty - Academic deans37 ,, tI tI Professors38 tI 91 Associate professors39 tI tI t9 9t Assistant professors40 t9 It tt tt Instructors41 ,, ,, Lecturers42 ,I 91 Undesignated rank43 Degrees granted - Agriculture and related sciences - FP44 ,, ,,
B
45 ,, ,, ,, ,, ,,M
46 ,, D47 ,, ,, ,, ,, ,, JR48 ,, ,, Architecture and engineering - FP49 ,,
B
50 ,,M
51 ,, ,, ,, ,,D
52 ,, ,,JR
53 ,, , e Life and health sciences - FP54 " ,i I I li it
B
55 ,, ,M
56 t, ,, ,, D57 ,, JR
- 404
Lou

TABLE 6.2 (Coned)
INSTITUTIONAL VARIABLES INCLUDED INCOMBINED DATA BASE
Variable Description
A-113
58 Decrees granted - Other sciences - FP59 " It II
B
60II II II If M
61 " " D
62 " II II JR63 II Other fields - FP64 , " II
B
65 " II II II M
66 " " " " D
67 " II II II JR68 Total current funds revenues69 Instructional revenue (tuition, fees, government
appropriations, endowments, gifts)70 Other revenues (total - instructional)71 Expenditures - physical plant maintenance and operation72 Total current funds expenditutles73 Estimate of total spent for physical plant assets74 "Instructional expenditures''75 Other expenditures (total - instructional)76 Instructional profit (revenues - expenditures)77 Other profit (revenues - expenditures)78 Avg. mo. sal'y - Tot. FT res. fac. - Academic deans79 , ,, Professors80 Associate professors81
.. 1. I, *I Assistant professors82
,. ,, " Instructors83 a , I 1, 1, 1, 1, .1 Lecturers84 0, 11 11 11 11 11 Lindesignated rank
Source: I EEG IS !-;uiveys 1070-71 .
A-114
TABLE 6.3
GROUPINGS OF HEMS FIELDS OF STUDY BY FIVE MAJOR FIELDSAND LEVELS OF DEGREES GRANTED
1. Agricultural Sciences
A. Bachelor's Master's, Doctor's Degrees
Agriculture and Natural Resources
B. First Professional Degrees
None
C. Junior Two-Year Degrees
Natural Science Technologies
2. Architecture and Engineering
A. Bachelor's, Master's, Doctor's Degrees
Architecture and Environmental DesignEngineeringFine and Applied Arts
B. First Professional Degrees
None
C. Junior Two-Year Degrees
Mechanical and Engineering Technologies
3. Life Sciences
A. Bachelor's, Master's, Doctor's Degrees
Biological SciencesHealth Professions
B. First Professional Degrees
Medical Sciences
461 406
A-115
TABLE 6.3 (Cont'd)
GROUPINGS OF IIEGIS FIELDS OF STUDY BY FIVE MAJOR FIELDSAND LEVELS OF DEGREES GRANTED
3. Life Sciences (Cont'd)
C. Junior Two-Year Degrees
Health Services and Paramedical Technologies
4. Other. Sciences
A. Bachelor's, Master's, Doctor's Degrees
Computer and Information SciencesHome EconomicsPhysical Sciences
B. First Professional Degrees
None
C. Junior Two-Year Degrees
Data Processing Technologies
5. Other Fields
A. Bachelor's, Master's, Doctor's Degrees
Area StudiesBusiness and ManagementCommunicationsEducationForeign LanguagesLawLettersLibrary ScienceMathematicsMilitary SciencesPsychologyPublic Affairs and ServicesSocial SciencesTheologyInterdisciplinary Studies
6441s 407

TABLE 6.3 (Cont'd)
GROUPINGS OF 11EGIS FIELDS OF STUDY BY FIVE MAJOR FIELDSAND LEVELS OF DEGREES GRANTED
5. Other Fields Cont'd)
B. First Professional Degrees
Lay., Theological Professions and Other - allconsklered as Master's Degrees, no FPD as such
C. Junior Two-Year Degrees
ArtG and Science or General ProgramsBusiness and Commerce TechnologiesPublic Service-Related Technologies
Source: See Appendix 6.
c13 108
A-116

TA
BL
E 6
.4
ei.E
1.1\
itN.lt
RG
RE
SSIO
N P
.Etit
'LT
S: C
OE
FFIC
IEN
TS
OF
FTE
EN
RO
LL
ME
NT
. FT
E. S
TA
FF. A
ND
l'iU
NA
L E
XPE
ND
' IV
rtE
S IN
EQ
UA
TIO
NS
Foit
NO
N-R
ESO
EN
TlA
l. SP
AC
E
Num
ber
oft:w:ts
R-
Stan
dard
Err
orConning
Egl
iEbruEmmt
EWE Staff
Instructional Expenthrares
Stan
dard
Cocffickmt
Error
Stan
dard
Coefficient
Error
Standard
Coefficient
Error
65
.62
240
57.1
.06K8
.0127
.278
.0510
.00260
.011525
I
t..2a,olk
54
.65
476
224.8
.0296
.0270
.324
.0654
.00116
.00934
(.re
at. r
than
2o,
ot)
026
.95
809
314.4
.00616
.0324
.185
.0579
.0239
.00906
Gre
.o. r
tadn
110
08
.94
595
316.7
.0117
.0156
.210
.0366
.0189
.00552
.411
0,145
.94
488
204.4
.0270
.00867
.212
.0271
.0142
.00358
(to
I "s
'. t!
:.(n
10,4
(N)
124
.85
255
13.5
- .0.383
.0149
.0904
.0302
.0605
.00668
All
134
.84
307
70.4
.00371
.0130
.183
.0305
.0270
.00543
r ri
arr
3,00
094
.79
364
124.4
-.00442
.0167
.178
.0064
.0290
.00651
(-Jr-Year Schools
I .es4 toan 2.
i(A
)110
.59
71
31.3
.0613
.0107
.150
.0352
.00940
.00503
CID
2.51
01 u
r i,(
too
89
.50
141
-12.1,
'
.0529
.0221
-.0314
.0922
.0339
.00491
5,01
41 r
165
.35
162
67.7
.0340
.0181
.169
.104
.0114
.00846
1100
41 tt
l21
.41
177
332.7
-.00640
.0222
.286
.161
.00478
.00610
lesg than 5.000
199
.81
109
25.1
.0417
.00665
.0476
.0341
.0294
.00239
Gre
ater
than
%W
O86
.47.
167
268.5
.00488
.0117
.254
.0832
.00378
.00559
Priv
ity O
ther
Fou
r-Y
ear
Scho
ols
Lm
s th
an.1
,000
608
.59
40
16.7
.0444
.00921
.196
.0240
.0354
.00408
IMO
() to
2,500
278
.55
71
62.1
-.0213
.0135
.290
.0564
.0390
.00535
Les
s th
an2,500
886
.72
52
. 25.5
.6.!
11.0
0588
.226
.0249
.0405
.00298
Gre
ater
than
2,500
61
.89
151
99.7
.0505
.00880
.105
.0347
-.00057
.00749

TA
BL
E 6
.4 (
Con
ed)
1".1
1:..1
.1N
1IN
AR
11 E
GR
ESS
ION
RE
St f
IXS:
CO
EFF
ICIE
NT
S O
F FT
EE
NR
OL
LM
EN
T. F
TE
SrA
FP, A
ND
iNST
Ri ;
CT
iON
AL
FX
PEN
ii H
TU
R E
S IN
EQ
I iA
TIO
NS
FOR
NO
N-
RE
SZL
)EN
TIA
LSP
AC
E
11(.
1.:;.
Tw
o- 1
-c..r
Nuo
iht-
rof
tSt
anda
rdR
2E
rror
Con
stan
t
FTE
Enr
ollm
ent
FTE
Sta
ff1m
m:e
au's
' Egi
ceili
ture
sSt
anda
rdSt
anda
rdSt
aaja
rjC
oeff
icie
ntE
rror
Coe
ffic
ient
Err
orC
oeff
icie
ntE
rror
I :4
-: tt
la 1
0114
126
2.2
936
11.2
.031
1.0
132
.744
.103
-.02
45.0
0e25
1.:-
..:2.
nto
2114
.25
5143.8
-.00
352
.010
6.5
31.0
883
-.00
424
.006
28
Z2.
: Ai :
.. .4
,0i A
I10
4.1
781
48.6
.029
7.0148
.270
.0958
- .00913
.00786
410
gill
c :: cl:.r
r.l.i
n c,
Ildi
60.4
412
338
.3.0
238
.00923
.270
.0800
-.00154
.00625
i;r
.17
:r r
tiJa
2, =
hi..
.164
.56
46
36.0
.0309
.00545
.265
.0553
-.00560
.00438
Fr...i:e
: ..,-
"e.e
r S.
::toi
Is
1s
z!la
n 1,
044s
164
.41
2921
.6-.
1115
40.0143
.429
.102
.0206
.0104
1.t,q
ruan
1,0
0016
1).4
328
20.0
.000
55.0
141
.407
.099
3.0
208
Mei
All
382
.47
3220.4
01/030
.00890
.698
.0467
-.00246
178
.48
31
19.d
-.00765
-.00250
.00885
4110
.008
76.6
89.0
953
Stor
kbtr
Stan
dard
It E
rnd
ergr
adita
tcIn
t Non
-Cre
dit
FTE
Sta
ffin
stru
ctio
nal
Esp
endi
tseu
raeL
amSt
anda
rdSt
anda
rdSt
anda
rdof
tR
2E
rror
Om
sran
tC
oeff
icie
ntE
rror
Coe
ffic
ient
Err
orC
oeff
icie
ntE
rror
Coe
ffic
ient
Err
or1
ear
c
G-.
...m
-r tt
...-.
..n 5
, (5X
160
.51
119
86.8
.005
40.0
103
.042
0.0
118
.289
.076
6.0
0166
.006
08I
ess
t'-in
2,5
0047
1.4
343
19.7
.022
8.0
0632
.020
7.0
0843
.560
.063
5-.
0135
.004
66C
rt-a
ter
than
2,5
0016
4.6
295
35.7
.015
6.0
0618
.049
4.0
0704
.275
.053
4-.
0004
6.0
0128
Vith
.sut
schi
xils
So.r
ce: R
EG
IS S
u: a
eys
1970
-71
,
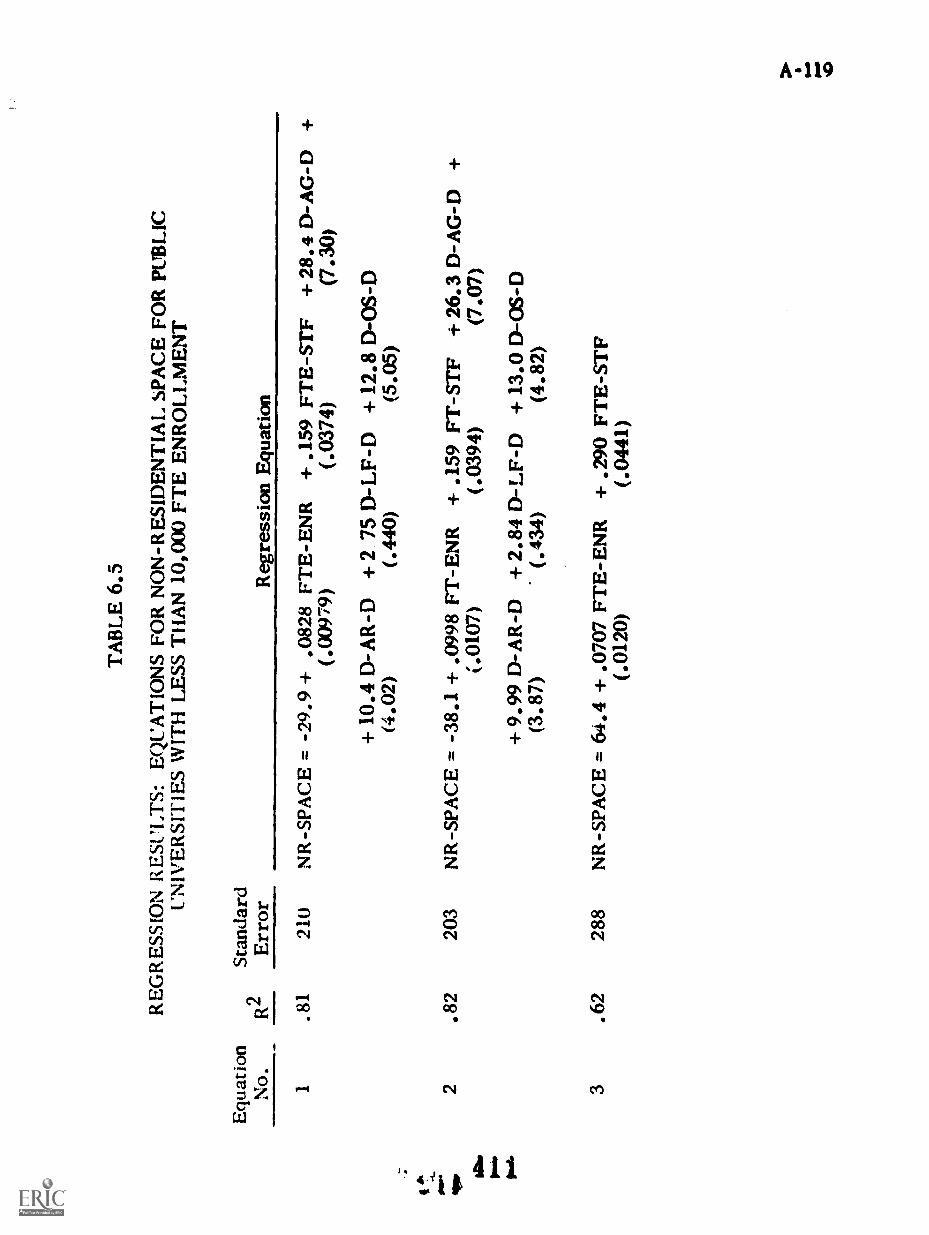
Equ
atio
nN
o. 1
TA
BL
E 6
.5
RE
GR
ESS
ION
RE
SUL
TS:
EQ
UA
TIO
NS
FOR
NO
N-R
ESI
DE
NT
IAL
SPA
CE
FO
R P
UB
LIC
UN
IVE
RSI
TIE
S W
ITH
LE
SS T
HA
N 1
0,00
0 FT
E E
NR
OL
LM
EN
T
R2
Stan
dard
Err
orR
egre
ssio
n E
quat
ion
.81
210
NR
-SPA
CE
= -
29.9
+ .0
828
FTE
-EN
R +
.159
FT
E-S
TF
+ 2
8.4
D-A
G-D
+(.
0097
9)(.
0374
)(7
.30)
+ 1
0.4
D-A
R-D
+ 2
.75
D-L
F-D
+ 1
2.8
D-O
S-D
(4.0
2)(.
440)
(5.0
5)
2.8
220
3N
R-S
PAC
E =
-38
.1 +
.099
8 FT
-EN
R +
.159
FT
-ST
F +
26.
3 D
-AG
-D+
(.01
07)
(.03
94)
(7.0
7)
+ 9
.99
D-A
R-D
+ 2
.84
D-L
F-D
+ 1
3.0
D-O
S-D
(3.8
7)(.
434)
(4.8
2)
3.6
228
8N
R-S
PAC
E =
64.
4 +
.070
7 FT
E-E
NR
+ .2
90 F
TE
-ST
F(.
0120
)(.
0441
)

TA
BL
E 6
.5 (
Con
t'd)
RE
GR
ESS
ION
RE
SUL
TS:
EQ
Z 'A
TIO
NS
FOR
NO
N-R
ESI
DE
NT
IAL
SPA
CE
FO
RPU
BL
ICU
NIV
ER
SIT
IP`;
WIT
H L
ESS
TH
AN
10,0
00 F
TE
Enr
ollm
ent
Equ
atio
nSt
anda
rdN
o.R
2E
rror
Reg
ress
ion
Equ
atio
n4
.82
209
NR
-SPA
CE
= -
23.8
+ .0
876
FTE
-EN
R+
.175
F T
E-S
TF
+ 2
8.4
D -
AG
-L
)+
(.01
05)
(.03
96)
(7.2
7)
+ 1
0.3
D-A
R-D
+ 2
.93
D-L
F-D
+ 1
3.8
D-O
S-D
- .0
0489
EX
Psi
r,(4
.01)
(.46
2)(5
.09)
(.00
401)
'SP
1111
.So
urce
: IIE
G1S
Sur
veys
197
0-71
, and
text
.10

TA
BL
E 6
.6
RE
GR
ESS
ION
RE
SUL
TS:
EQ
UA
TIO
NS
FOR
NO
N-R
ESI
DE
NT
IAL
SPA
CE
FO
R P
UB
LIC
UN
IVE
RSI
TIE
S W
ITH
10,
000
TO
20,
000
FTE
EN
RO
LL
ME
NT
Equ
atio
nSt
anda
rdN
o.R
2E
rror
Reg
ress
ion
Equ
atio
n1
.74
411
NR
-SPA
CE
= -
161
+.1
32 F
T-E
NR
+ .2
89 F
T-S
TF
- .3
80 D
-OT
-B(.
0306
)(.
0468
)(.
123)
2.6
944
5N
R-S
PAC
E =
144
+ .0
555
FTE
-EN
R+
.336
FT
E-S
TF
- .5
01 D
-OT
-M(.
0261
)(.
0420
)(.
188)
1111
0115
-
0006
411.
111
Sour
ce: I
IEG
IS S
urve
ys 1
970-
71, a
ndte
xt.
tea

TA
BL
E 6
.7
RE
GR
ESS
ION
RE
SUL
TS:
EQ
UA
TIO
NS
FOR
NO
N-R
ESI
DE
NT
IAL
SPA
CE
FO
R P
UB
LIC
UN
IVE
RSI
TIE
S W
ITH
GR
EA
TE
R T
HA
N20
,000
FT
E E
NR
OL
LM
EN
T
Equ
atio
nN
o.R
2
1.8
9
2.9
2ow
do.
4.01
+so
b3
.96
Stan
dard
Err
orR
egre
ssio
n E
quat
ion
1,16
7N
R-S
PAC
E =
- 1
,430
+ .1
67 F
TE
-EN
R(.
0117
)
988
NR
-SPA
CE
=71
7 +
.376
FT
E-S
TF
(.02
19)
691
NR
-SPA
CE
= 1
,700
+45
.3 D
-LF-
D(1
.82)
Sour
ce: H
EG
IS V
Surv
eys
1970
-71,
and
text
.

TA
BL
E 6
.8
RE
GR
ESS
ION
RE
SUL
TS:
EQ
UA
TIO
NS
FOR
NO
N-R
ESI
DE
NT
IAL
SPA
CE
FO
R P
UB
LIC
UN
IVE
RSI
TIE
S W
ITH
GR
EA
TE
R T
HA
N 1
0,00
0 FT
E E
NR
OL
LM
EN
T
Equ
atio
nN
o.R
2St
anda
rdE
rror
Reg
ress
ion
Equ
atio
n
1 2
.86
.92
891
675
NR
-SPA
CE
=
NR
-SPA
CE
=
- 60
4 +
.152
i-T
TE
-EN
R(.
0068
4)
562
+ .3
82 F
TE
-ST
F(.
0126
)
ea.
.So
urce
: HE
CIS
V S
urve
ys 1
970-
71, a
nd te
xt.
oft
OA
.47
1

TA
BL
E 6
.9
RE
GR
ESS
ION
RE
SUL
TS:
EQ
UA
TIO
NS
FOR
NO
N-R
ESI
DE
NT
IAL
SPA
CE
FO
R A
LL
PU
BL
ICU
NIV
ER
SIT
IES
Equ
atio
nN
o.R
2St
anda
rdE
rror
Reg
ress
ion
Equ
atio
n1
.86
758
NR
-SPA
CE
= -
88.1
+ .1
36 F
TE
-EN
R(.
0045
9)
2.9
256
7N
R-S
PAC
E =
401
+.3
92 F
TE
-ST
F(.
0095
7)
3.8
7.1
56L
OG
(N
R-S
PAC
E)
= -
.291
+ .3
07 L
OG
(FT
E-E
NR
)+
.399
LO
G (
FTE
-ST
F)+
Sour
ce: H
EG
IS S
urve
ys 1
970-
71.
((.
0474
)(.
0592
)
+ .1
94 L
OG
(M
CP)
(.08
04)

TA
BL
E 6
.10
RE
GR
ESS
ION
RE
SL'L
TS:
EQ
UA
TIO
NS
FOR
NO
N-R
ESI
DE
NT
IAL
SPA
CE
FO
R P
RIV
AT
EIN
IVE
RSI
TIE
S W
ITH
LE
SS T
HA
N 1
0,00
0 FT
E E
NR
OL
LM
EN
T
Equ
atio
nSt
anda
rdN
o.R
2E
rror
Reg
ress
ion
Equ
atio
n
1.8
922
5N
R-S
PAC
E =
23.
1 +
.140
FT
E-S
TF
+ 5
89 D
-AG
-B-
7.96
D-L
F-D
+(.
0335
)(1
67)
(3.8
6)
+ 9
.84
D-O
S-D
+ .0
347
EX
P(1
.65)
(.00
489)
no.
2.8
922
7N
R-S
PAC
E =
65.
9 +
.073
6 FT
E-E
NR
+ .1
50 F
TE
-ST
F+
457
D-A
G-B
+(.
0149
)(.
0258
)(1
78)
- .8
37 D
-AR
-B =
6.7
9 D
-AR
-D-
2.06
D-L
F-M
+(.
321)
(2.3
7)(.
990)
+ 2
.84
D-O
S-B
+ 5
.92
D-O
S-D
- .3
41 D
-OT
-M +
(1.0
6)(2
.85)
+ 3
.02
D-O
T-D
(.97
9)
(.15
5)
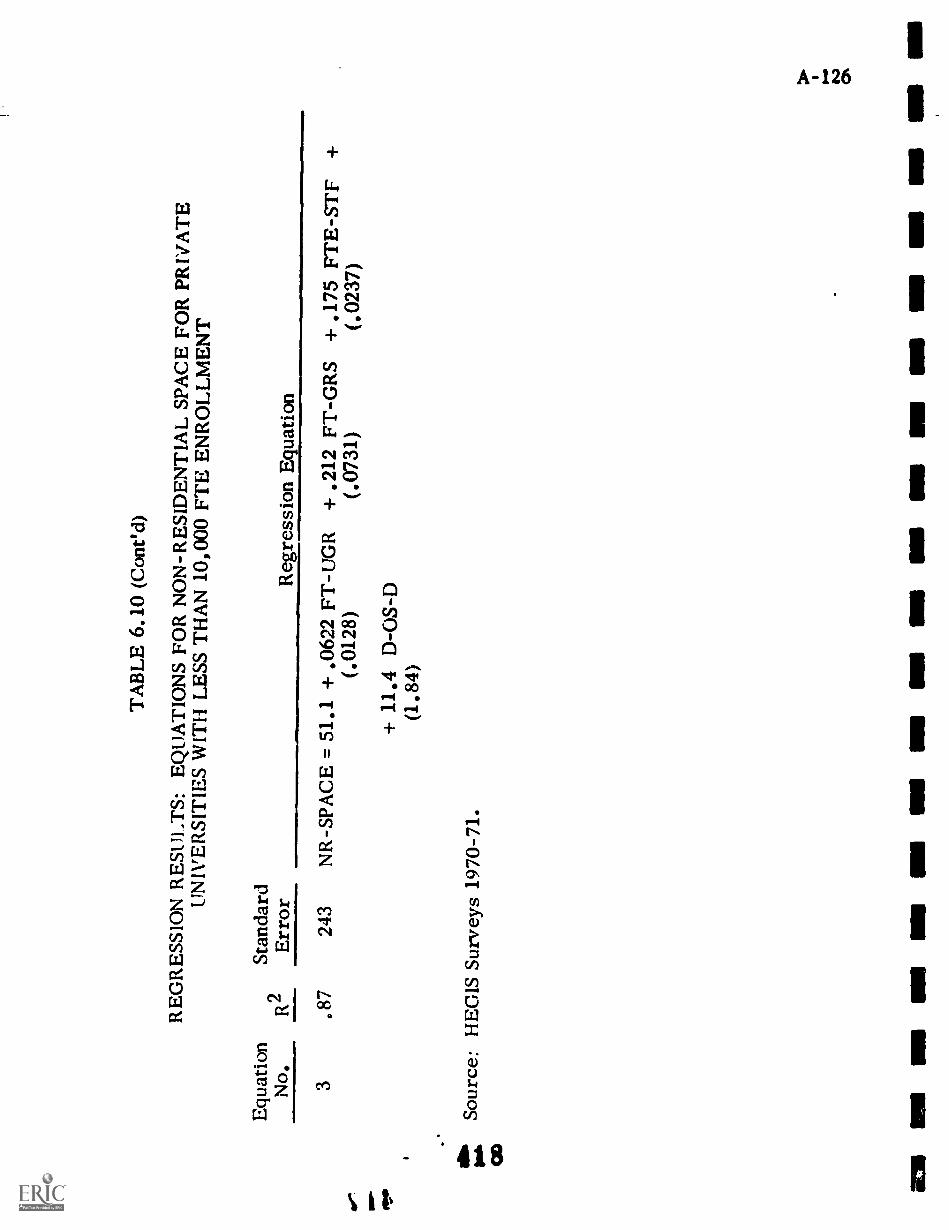
TA
BL
E 6
.10
(Con
ed)
RE
GR
ESS
ION
RE
SUL
TS:
EQ
UA
TIO
NS
FOR
NO
N-R
ESI
DE
NT
IAL
SPA
CE
FO
R P
RIV
AT
EU
NIV
ER
SIT
IES
WIT
H L
ESS
TH
AN
10,
000
FTE
EN
RO
LL
ME
NT
Equ
atio
nSt
anda
rdN
o.R
2E
rror
Reg
ress
ion
Equ
atio
n3
.87
243
NR
-SPA
CE
= 5
1.1
+ .0
622
FT-U
GR
+ .2
12 F
T-G
RS
+ .1
75 F
TE
-ST
F +
(.01
28)
(.07
31)
(.02
37)
111"
Sou
rce:
HE
GIS
Sur
veys
197
0-71
.00
+ 1
1.4
D-O
S-D
(1.8
4) MI
MI
1111
11

TA
BL
E 6
.11
RE
GR
ESS
ION
11E
SIIT
S: E
Q!1
AT
ION
S FO
R N
ON
-RE
SID
EN
TIA
LSP
AC
E F
OR
PR
IVA
TE
UN
IVE
RSI
TIE
S W
ITH
LE
SS T
HA
N 2
0,00
0 FT
E E
NR
OL
LM
EN
T
Equ
atio
nSr
anda
rJN
o.R
2E
rror
Reg
ress
ion
Equ
atio
n
1.9
222
7N
R-S
PAC
E =
51.
0 +
.038
5 FT
E-E
NR
+ .1
13 F
TE
-ST
F+
552
1) -
AG
-B +
(.01
41)
(.02
51)
(176
)
- 2.
18 D
-LF-
M(.
894)
- .2
98 D
-OT
-M(.
141)
+2.
90 D
-OS-
B +
8.6
4 D
-OS-
D +
(.84
1)(1
.72)
+ 2
.57
D-O
T-D
+ .0
139
EX
P(.
808)
(.00
492)
2.9
222
1N
R-S
PAC
E =
43.
0 +
.058
7 FT
-EN
R +
.125
FT
-ST
F+
499
D-A
G-B
+(.
0153
)(.
0267
)(1
73)
- 1.
97 D
-LF-
M +
2.4
1 D
-OS-
B +
8.9
2 D
-OS-
D+
(.86
9)(.
835)
(1.6
8)
- .2
96 D
-OT
-M +
2.57
D-O
T-D
+ .0
112
EX
P(.
125)
(.76
3)(.
0048
8)
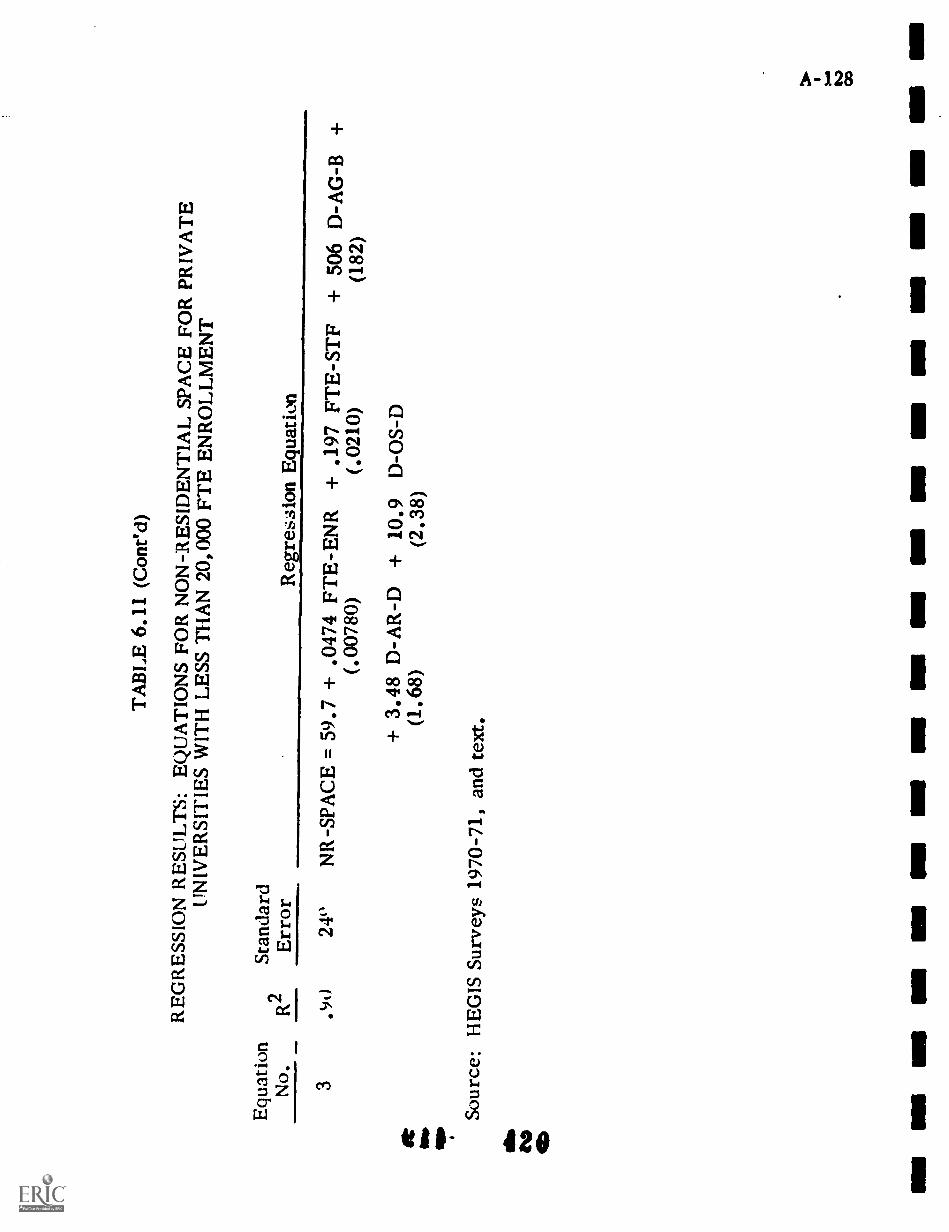
Equ
atio
nN
o. 3
Sour
ce:
TA
BL
E 6
.11
(Con
t'd)
RE
GR
ESS
ION
RE
SUL
TS:
EQ
UA
TIO
NS
FOR
NO
N-R
ESI
DE
NT
IAL
SPA
CE
FO
R P
RIV
AT
EU
NIV
ER
SIT
IES
WIT
H L
ESS
TH
AN
20,
000
FTE
EN
RO
LL
ME
NT
R2
.90
Stan
dard
Err
orR
egre
ssio
n E
quat
ion
24"
NR
-SPA
CE
= 5
9.7
+ .0
474
FTE
-EN
R+
.197
FT
E-S
TF
+ 5
06 D
-AG
-B+
(.00
780)
(.02
10)
(182
)
+ 3
.48
D-A
R-D
+ 1
0.9
D-O
S-D
(1.6
8)(2
.38)
HE
GIS
Sur
veys
197
0-71
, and
text
.

TA
BL
E 6
.12
RE
GR
ESS
ION
RE
SUL
TS:
EQ
IIA
TIO
NS
FOR
NO
N-R
ESI
DE
NT
IAI.
SPA
CE
FOR
PR
IVA
TE
UN
IVE
RSI
TIE
S W
ITH
GR
EA
TE
R T
HA
N 5
00 F
TE
EN
RO
LL
ME
NT
Equ
atio
nN
o.R
2
1.8
8
2.8
9
3.89
Stan
dard
Err
orR
egre
ssio
n E
quat
ion
287
NR
-SPA
CE
= 6
9.0
+ .0
318
FTE
-EN
R +
.153
FT
E-S
TF
+ 4
76 D
-AG
-B+
(.01
12)
(.02
60)
(211
)
+ 3
.19
D-O
S-B
+ 1
1.2
D-O
S-D
+ 1
.84
D-O
T-D
(1.0
6)(2
.00)
(.69
6)
277
NR
-SPA
CE
= 9
1.7
+ .1
19+
617
D-A
G-B
- 2.
21 D
-LF-
M +
(.0288)
(210)
(1.08)
+ 3.46
D-O
S-B
+8.36
D-O
S-D
+ 1
.49
D-O
T-D
+ .0
189
EX
P(.980)
(1.89)
(.715)
(.00484)
274
NR-SPACE = 67.8 + .0486 FT-UGR + .257 FT-GRS
+ .151 FTE-STF +
(.01
53)
(.05
79)
(.02
62)
+ 6
60 D
-AG
-B-
2.14
D-L
F-M
+ 2
.48
D-O
S-B
+(2
08)
(1.0
5)
+ 9
.09
D-O
S-D
(2.1
2)
(1.0
4)
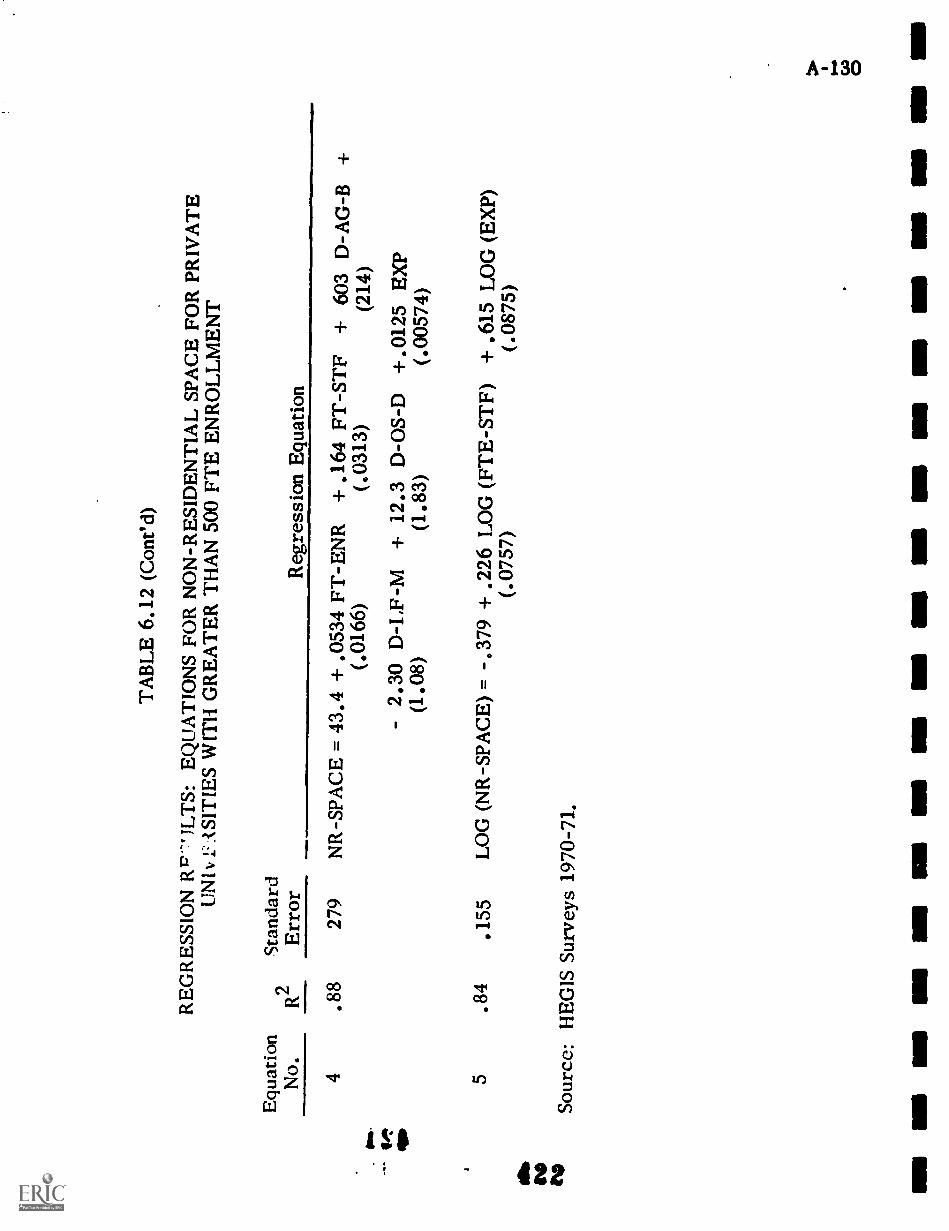
TA
BL
E 6
.12
(Con
ed)
RE
GR
ESS
ION
JLT
S: E
QU
AT
ION
S FO
R N
ON
-RE
SID
EN
TIA
L S
PAC
E F
OR
PRIV
AT
EU
NIV
ISIT
IES
WIT
H G
RE
AT
ER
TH
AN
500
FT
E E
NR
OL
LM
EN
T
Equ
atio
nSt
anda
rdN
o.R
2E
rror
Reg
ress
ion
Equ
atio
n4
.88
279
NR
-SPA
CE
= 4
3.4
+ .0
534
FT-E
NR
+ .1
64 F
T-S
TF
+ 6
03 D
-AG
-B +
(.01
66)
(.03
13)
(214
)
- 2.
30 D
-I,F
-M +
12.
3 D
-OS-
D +
.012
5 E
XP
(1.0
8)(1
.83)
(.00
574)
5.8
4.1
55L
OG
(N
R-S
PAC
E)
= -
.379
+ .2
26 L
OG
(FT
E-S
TF)
+ .6
15 L
OG
(E
XP)
(.07
57)
(.08
75)
Sour
ce: H
EG
IS S
urve
ys 1
970-
71.

TA
BL
E 6
.13
RE
GR
ESS
ION
RE
SUL
TS:
EQ
UA
TIO
NS
FOR
NO
N-R
ESI
DE
NT
IAL
SPA
CE
FO
R P
UB
LIC
OT
HE
R F
OU
R-Y
EA
R S
CH
OO
LS
WIT
H L
ESS
TH
AN
2,5
00 F
TE
EN
RO
LL
ME
NT
Equ
atio
nN
o.R
2
1.6
8
affe
w
tii
2.6
5
*PP
3.6
1
Stan
dard
Err
orR
egre
ssio
n E
quat
ion
63N
R-S
PAC
E =
32.
1 +
.065
2 FT
-EN
R +
.205
FT
-ST
F +
2.5
0 D
-OS-
B(.
0110
)(.
0173
)(.
907)
65N
R-S
PAC
E =
29.
4 +
.078
5 FT
-EN
R +
.206
FT
-ST
F(.
0102
)(.
0178
)
69N
R-S
PAC
E =
48.
6 +
.047
5 FT
E -
EN
R +
.196
FT
E-S
TF
+ 2
.95
D-O
S-B
(.01
15)
(.01
86)
(.99
1)
big
iND
Sour
ce: H
EG
IS S
urve
ys 1
970-
71.
cta

1%0
TA
BL
E 6
.14
RE
GR
ESS
ION
RE
SUL
TS:
EQ
UA
TIO
NS
FOR
NO
N-R
ESI
DE
NT
IAL
SPA
CE
FO
R P
UB
LIC
OT
HE
R F
OU
R-Y
EA
R S
CH
OO
LS
WIT
H2,
500
TO
5,0
00 F
TE
EN
RO
LL
ME
NT
Equ
atio
nN
o.R
2St
anda
rdE
rror
Reg
ress
ion
Equ
atio
n1
.72
168
NR
-SPA
CE
= -
46.3
+ .0
520
FT-E
NR
+ .5
40 F
T-S
TF
(.02
47)
(.04
41)
2.8
014
0N
R-S
PAC
E =
-9.
5 +
.050
6 FT
E-E
NR
+ .0
324
EX
P(.
0209
)(.
0019
1)
3.8
213
5N
R-S
PAC
E =
-18
0.0
+ .0
818
FTE
-EN
R+
2.2
2 D
-AG
-B+
8.3
8D
-LF-
M+
(.02
03)
(.95
5)(3
.58)
Sour
ce: H
EG
IS S
urve
ys 1
970-
71.
+ .1
36 E
XP/
FTE
-EN
R(.
0076
6)

TA
BL
E 6
.15
RE
GR
ESS
ION
RE
SUL
TS:
EQ
UA
TIO
NS
FOR
NO
N-R
ESI
DE
NT
IAL
SPA
CE
FO
RPU
BL
ICO
TH
ER
FO
UR
-YE
AR
SC
HO
OL
S W
ITH
5,0
00 T
O 1
0,00
0 FT
EE
NR
OL
LM
EN
T
Equ
atio
nSt
anda
rdN
o.R
2E
rror
Reg
ress
ion
Equ
atio
n
1.4
714
4N
R-S
PAC
E =
-59
.9 +
.061
2 FT
-EN
R +
.310
FT
-ST
F(.
0158
)(.
104)
2.5
313
8N
R-S
PAC
E =
-65
.9 +
.065
0 FT
-UG
R +
.277
FT
-ST
F+
7.2
4 D
-OS-
M(.
0155
)(.
0979
)(3
.26)
3-3
.51
140
NR
-SPA
CE
= -
45.7
+ .0
589
FT-E
NR
+ .2
78 F
T-S
TF
+ 7
.16
D-O
S-M
(.01
54)
(.10
2)(3
.32)
Sour
ce: H
EG
IS S
urve
ys 1
970-
71.
Cre

TA
BL
E 6
.16
RE
GR
ESS
ION
RE
SUL
TS:
EQ
UA
TIO
NS
FOR
NO
N-R
ESI
DE
NT
IAL
SPA
CE
FO
R P
UB
LIC
OT
HE
R F
OU
R-Y
EA
R S
CH
OO
LS
WIT
H L
ESS
TH
AN
5,0
00 F
TE
EN
RO
LL
ME
NT
Equ
atio
nSt
anda
rdN
o.R
2E
rror
Reg
ress
ion
Equ
atio
n1
.82
107
NR
-SPA
CE
= 3
9.4
+ .0
382
FTE
-EN
R +
2.1
6D
-AG
-A +
.032
5 E
XP
(.00
660)
(.64
7)(.
0013
7)Il
lb NI
2.6
2.P
)0L
OG
(N
P -S
PAC
E)
= -
.396
+ .3
20 L
OG
(FT
E-E
NR
) +
.265
LO
G (
FTE
-ST
F) +
(.05
94)
(.07
26)
+ .2
91 L
OG
(E
XP)
(.07
71)
Sour
ce: H
EG
IS S
urve
ys 1
970-
71, a
ndte
xt.

TA
BL
E 6
.17
RE
GR
ESS
ION
IE
SCII
.TS:
EQ
UA
TIO
NS
FOR
NO
N-R
ESI
DE
NT
IAL
SPA
CE
FOR
PU
BL
ICO
TH
ER
FO
UR
-YE
AR
SC
HO
OL
S W
ITH
GR
EA
TE
R T
HA
N5,
000
FTE
EN
RO
LL
ME
NT
Equ
atio
nN
o.R
2St
anda
rdE
rror
Reg
ress
ion
Equ
atio
n
1.5
315
6N
R-S
PAC
E =
194
.4 +
.022
7 FT
-EN
R+
.273
FT
-ST
F(.
0112
)(.
0842
)
2.5
715
1N
R-S
PAC
E =
204
.8 +
.038
3 FT
-EN
R+
.264
FT
-ST
F+
4.3
5 D
-LF-
M+
(.01
36)
(.08
42)
(2.0
3)
- .1
26 D
-OT
-B(.
0570
)
3.5
914
8N
R-S
PAC
E =
182
.4 +
.044
4 FT
-UG
R+
.269
FT
-ST
F+
4.1
6 D
-LF-
M+
(.01
34)
(.07
87)
(2.0
0)
- .1
33 D
-OT
-B(.
0547
)
Sour
ce: H
EG
IS S
urve
ys 1
910-
71.

TA
BL
E 6
.18
RE
GR
ESS
ION
RE
SUL
TS:
EQ
UA
TIO
NS
FOR
NO
N-R
ESI
DE
NT
IAL
SPA
CE
FOR
PR
IVA
TE
OT
HE
R F
OU
R-Y
EA
R S
CH
OO
LS
WIT
H L
ESS
TH
AN
1,0
00 F
TE
EN
RO
LL
ME
NT
Equ
atio
nSt
anda
rdN
o.R
2E
rror
Reg
ress
ion
Equ
atio
n1
.62
39N
R-S
PAC
E =
18.
7 +
.047
2 FT
-EN
R+
.228
FT
-ST
F +
7.6
9 D
-AG
-B +
(.00
960)
(.02
56)
(3.6
1).0
5vs
.i.-
.613
D-A
R-M
+ 1
.007
D-O
S-B
+ .0
302
EX
PII
IIP
(.22
3)(.
341)
(.00
406)
2.6
140
NR
-SPA
CE
= 1
8.9
+ .0
346
FTE
-EN
R +
.194
FT
E-S
TF
- .8
09 D
-AR
-M +
siti.
(.00
936)
(.02
37)
(.22
5)iN
DC
ID+
1.1
3 D
-OS-
B +
.035
6 E
XP
(.34
8)(.
0040
4)
3.6
239
NR
-SPA
CE
= 2
2.8
+ .2
00FT
E-S
TF
+ 8
.23
D-A
G-B
- .6
13 D
-AR
-M +
(.02
34)
(3.6
4)(.
228)
+1.
01D
-OS-
B +
.140
D-O
T-B
- .1
97 D
-OT
-M +
(.34
6)(.
0310
)(.
0822
)+
.038
5 E
XP
(.00
344)
Sour
ce: H
EG
IS S
urve
ys 1
970-
71.

TA
BL
E 6
.19
RE
GR
ESS
ION
RE
SUL
TS:
EQ
UA
TIO
NS
FOR
NO
N-R
ESI
DE
NT
IAL
SPA
CE
FO
R P
RIV
AT
EO
TII
Ell
FOU
R-Y
EA
R S
CI
IDO
LS
WIT
11 1
,000
TO
2,50
0 FT
E E
NR
OL
LM
EN
T
Equ
atio
nSt
anda
rdN
o.R
2E
rror
Re_
ress
ion
Equ
atio
n
1.5
968
NR
-SPA
CE
= 3
6.1
+ .3
45 F
T-S
TF
+1.
55 D
-OS-
B +
.028
9 E
XP
(.05
60)
(.43
0)(.
0049
5)
2.5
968
NR
-SPA
CE
= -
42.9
+ .0
386
FTE
-EN
R +
.289
FTE
-ST
F-
1.73
D-A
R-M
+(.
0142
)(.
0538
)(.
752)
+ .4
90 D
-LF-
B +
1.7
4 D
-OS-
B +
.051
3E
XP/
FTE
-EN
R(.
223)
(.44
1)(.
0077
5)
Sour
ce: R
EG
IS S
urve
ys 1
970-
71.
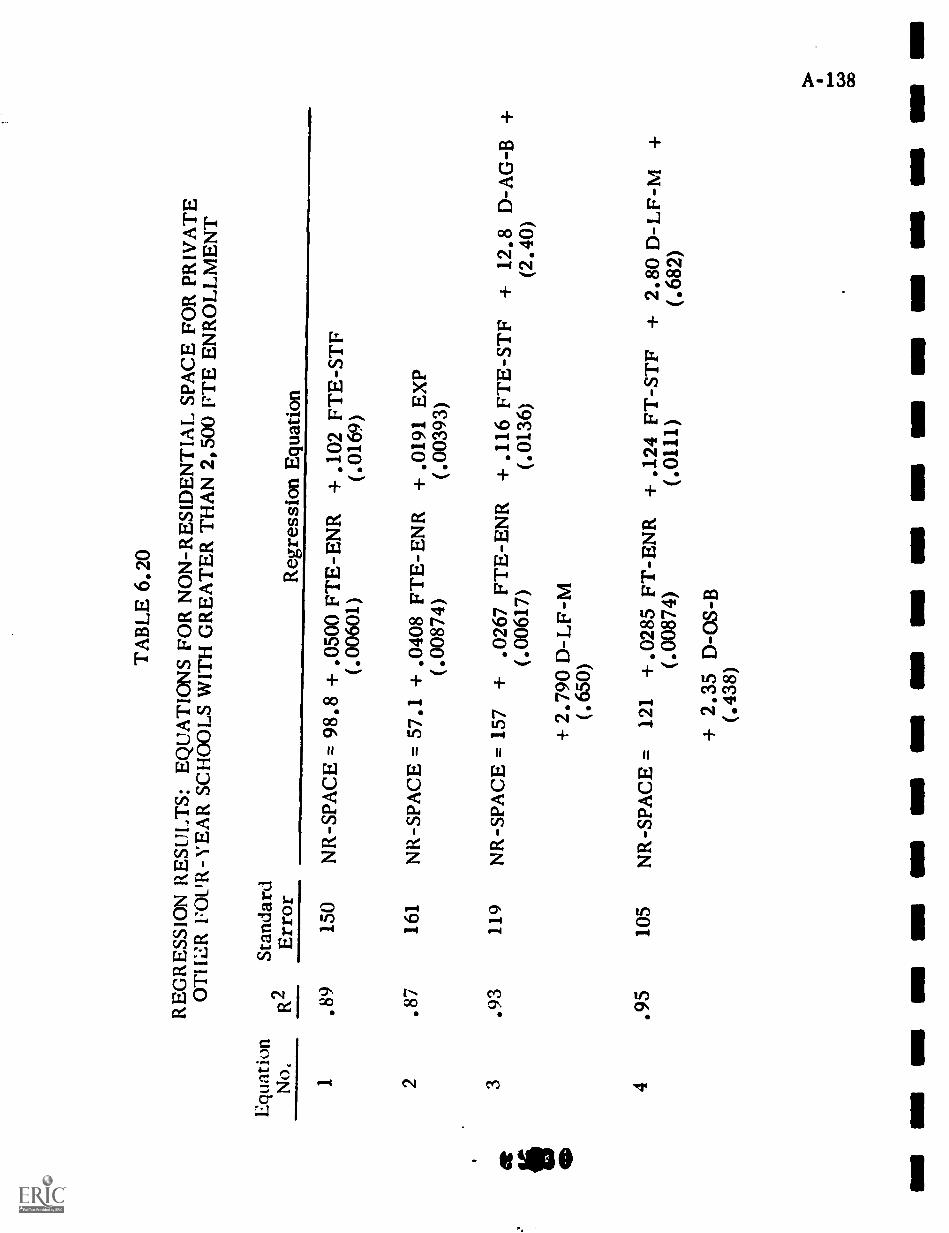
TA
BL
E 6
.20
RE
GR
ESS
ION
RE
SUL
TS:
EQ
UA
TIO
NS
FOR
NO
N-R
ESI
DE
NT
IAL
SPA
CE
FO
RPR
IVA
TE
OT
111:
11 F
OU
R-Y
EA
R S
CH
OO
LS
WIT
H G
RE
AT
ER
TH
AN
2,50
0 FT
E E
NR
OL
LM
EN
T
Equ
atio
nSt
anda
rdN
o,
R2
Err
orR
egre
ssio
n E
quat
ion
1.8
915
0N
R-S
PAC
E =
98.
8 +
.050
0 FT
E-E
NR
+ .1
02 F
TE
-ST
F(.
0060
1)(.
0169
)
2.8
716
1N
R-S
PAC
E =
57.
1 +
.040
8 FT
E-E
NR
+ .0
191
EX
P(.
0087
4)(.
0039
3)
3.9
311
9N
R-S
PAC
E =
157
+ .0
267
FTE
-EN
R+
.116
FT
E-S
TF
+ 1
2.8
D-A
G-B
+(.
0061
7)(.
0136
)(2
.40)
+ 2
.790
D-L
F-M
(.65
0)
4.9
510
5N
R-S
PAC
E =
121
+.0
285
FT-E
NR
+ .1
24 F
T-S
TF
+ 2
.80
D-L
F-M
+(.
0087
4)(.
0111
)(.
682)
+ 2
.35
D-O
S-B
(.43
8)

TA
BL
E 6
.20
(Con
t'd)
RE
GR
ESS
ION
RE
SUL
TS:
EQ
UA
TIO
NS
FOR
NO
N-R
ESI
DE
NT
IAL
SPA
CE
FO
R P
RIV
AT
EO
TH
ER
FO
UR
-YE
AR
SC
HO
OL
S W
ITH
GR
EA
TE
R T
HA
N2,
500
FTE
EN
RO
LL
ME
NT
Equ
atio
nSt
anda
rdN
o.R
2E
rror
Reg
ress
ion
Equ
atio
n
5.9
312
0N
R-S
PAC
E =
-99
.7 +
.056
4 FT
E-E
NR
+ .1
23 F
TE
-ST
F+
6.8
5 D
-AG
-B +
(.00
691)
(.01
80)
(2.6
6)
- 1.
28 D
.-A
R-M
+ .0
920
EX
P/FT
E-E
NR
(.47
6)(.
0270
)
elSo
urce
: HE
GIS
Sur
veys
197
0-71
.C
AD

TA
BL
E 6
.21
RE
GR
ESS
ION
RE
SUL
TS:
EQ
UA
TIO
NS
FOR
NO
N-R
ESI
DE
NT
IAL
SPA
CE
FO
R P
RIV
AT
EO
TH
ER
FO
UR
-YE
AR
SC
HO
OL
S W
ITH
LE
SST
HA
N 2
,500
FT
E E
NR
OL
LM
EN
T
Equ
atio
nSt
anda
rdN
o.R
2E
rror
Reg
ress
ion
Equ
atio
n1
.66
57N
R-S
PAC
E =
24.
2 +
.060
5 FT
E-E
NR
+ .4
18 F
TE
-ST
F(.
0050
8)(.
0226
)
2.6
955
NR
-SPA
CE
= 2
7.8
+ .0
220
FTE
-EN
R+
.391
FT
E-S
TF
+ .5
46 D
-LF-
B +
vs-
(.00
749)
(.02
18)
(.13
0)et M
P+
1.8
2 D
-OS-
B +
.116
D-O
T-B
all
414
(.28
3)(.
0337
)10
3.7
450
NR
-SPA
CE
= 2
6.6
-f .2
18 F
TE
-ST
F-
.854
D-A
R-M
+ .3
82 D
-LF-
B +
(.02
39)
(.25
8)(.
120)
+ 1
.33
D-O
S-B
+ .0
563
D-O
T-B
+ .0
348
EX
P(.
265)
(.02
45)
(.00
267)
4.7
550
NR
-SPA
CE
= 2
6.7
+ .0
142
FT-E
NR
+ .2
71 F
T-S
TF
- .8
94 D
-AR
-M +
(.00
649)
(.02
59)
(.25
1)+
1.4
7 D
-OS-
B +
.032
5 E
XP
(.25
9)(.
0029
7)
Sour
ce: R
EG
IS S
urve
ys 1
970-
71.
1111
1111
INN
EM
Ies
In
ow a
s m
e um
9. I s-e 4. 0
IMO
SIM
I GM
MO

TA
BL
E 6
.22
RE
GR
ESS
ION
RE
S( T
LT
S: E
QU
AT
ION
S FO
R N
ON
-RE
SID
EN
TIA
L S
PAC
E F
OR
PR
IVA
TE
anIE
R F
OU
R-Y
EA
R S
CH
OO
LS
WIT
H L
ESS
TH
AN
2,5
00 F
TE
EN
RO
LL
ME
NT
*
Equ
atio
nSt
anda
rdN
o.It
'E
rror
Reg
ress
ion
Equ
atio
n
1.7
154
NR
-SPA
CE
= 2
2.0
+ .0
155
FTE
-EN
R +
.227
FT
E-S
TF
+ .0
398
EX
P(.
0063
6)(.
0259
)(.
0031
2)
2.7
2.1
87L
OG
(N
R-S
PAC
E)
= -
.387
+ .2
42 L
OG
(FT
E-E
NR
) +
.466
LO
G (
FTE
-ST
F) +
(.04
52)
(.04
73)
* W
ithou
t div
inity
sch
ools
Sour
ce: I
IEG
IS S
urve
ys 1
970-
71.
+ .2
43 L
OG
(E
XP1
(.05
00)

TA
BL
E 6
.23
RE
GR
ESS
ION
RE
SUL
TS:
EQ
UA
TIO
NS
FOR
NO
N-R
ESI
DE
NT
IAL
SPA
CE
FO
RPU
BL
ICT
WO
-YE
AR
SC
HO
OL
S W
ITH
GR
EA
TE
RT
HA
N 2
,500
FT
E E
NR
OL
LM
EN
T
Equ
atio
nSt
anda
rdN
o.R
2E
rror
Reg
ress
ion
Equ
atio
n1
.68
87N
R-S
PAC
E =
22.
7 +
.023
6 FT
E-U
GR
+ .0
534
FTE
-NC
R +
.351
FT
-ST
F+
(.00
604)
(.00
690)
+ .1
32 D
-AR
-J-
.079
6 D
-OT
-J(.
0649
)(.
0236
)
(.05
37)
2.6
591
NR
-SPA
CE
= 2
5.2
+ .0
276
FTE
-UG
Rf
.053
8 FT
E-N
CR
+ .2
42 F
TE
-ST
F(.
0063
0)
+ .1
47 D
-AR
-J(.
0676
)
(.00
727)
(.04
69)
- .0
682
D-O
T-J
(.02
46)
3.6
492
NR
-SPA
CE
= 2
2.1
+ .0
377
FTE
-EN
R+
.201
FT
E-S
TF
+ .2
21D
-AR
-J +
(.00
523)
(.04
57)
(.06
54)
- .0
846
D-O
T-J
(.02
45)
Sour
ce: H
EM
SSu
rvey
s 19
70-7
1, a
nd te
xt.

TA
BL
E 6
.24
RE
GR
ESS
ION
RE
St I
LT
S: E
QU
AT
ION
S FO
R N
ON
-RE
SID
EN
TIA
L S
PAC
E F
OR
PR
IVA
TE
TW
O-Y
EA
R S
CH
OO
LS
WIT
H L
ESS
TI
IAN
1,0
00 F
TE
EN
RO
LL
ME
NT
Equ
atio
nSt
anda
rdN
o.R
`E
rror
Reg
ress
ion
Equ
atio
n
1.5
425
NR
-SPA
CE
= 1
9.4
+ .0
329
FT -
'JG
R +
.519
FT
-ST
F +
1.3
1 D
-AR
-J(.
0134
)(.
0741
)(.
262)
- 1.
0679
I)
-OS
-J(.
324)
' " 2
*.5
724
NR
-SPA
CE
= 1
7.6
+ .0
407
FT-U
GR
+ .4
92 F
T-S
TF
+ 1
.32
D-A
R-J
+r
(.01
29)
(.07
07)
(.24
9)tin
NIP
* W
ithou
tdi
vini
ty s
choo
ls
Sour
ce: H
EG
IS S
urve
ys 1
970-
71.
- 1.
04 D
-OS-
J(.
308)
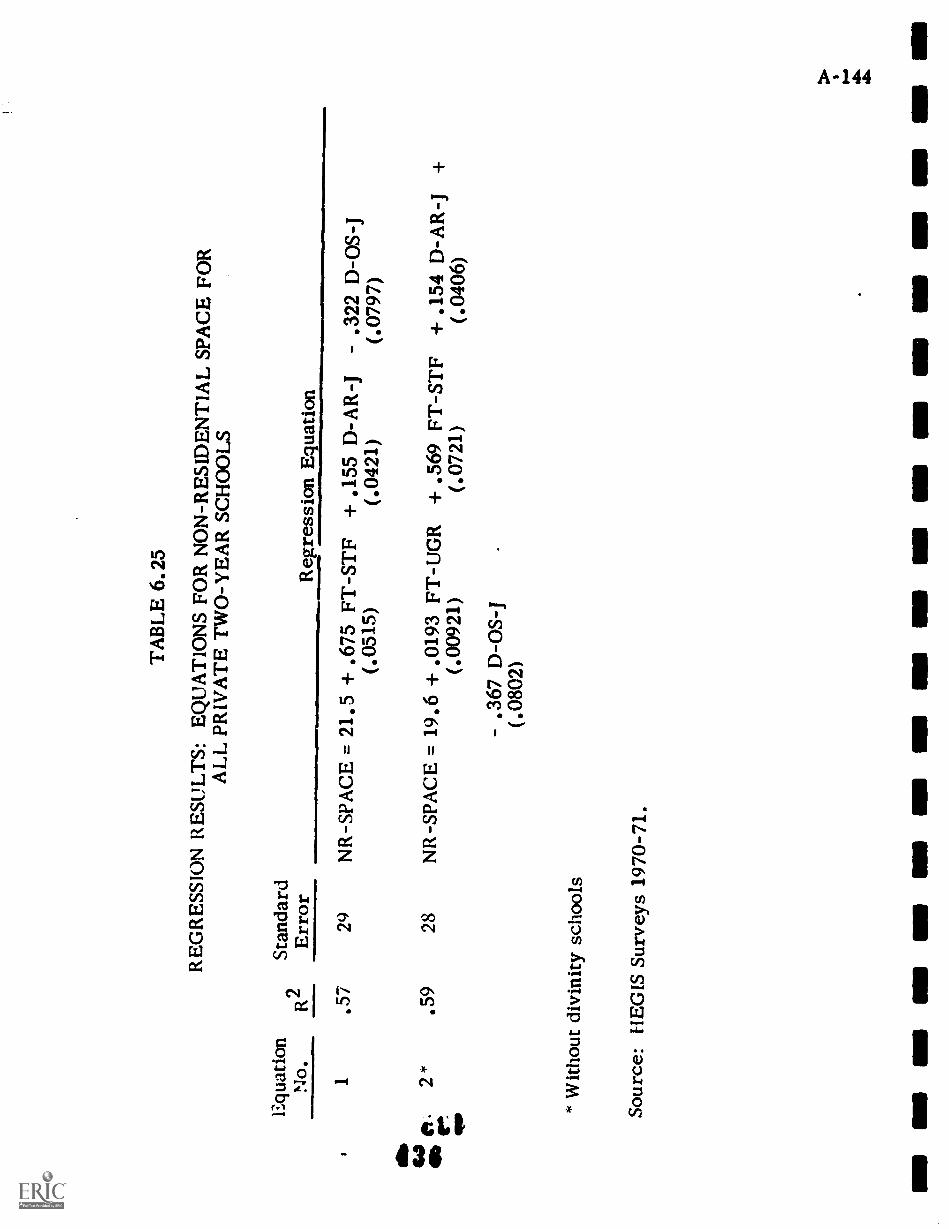
TA
BL
E 6
.25
RE
GR
ESS
ION
RE
SUL
TS:
EQ
UA
TIO
NS
FOR
NO
N-R
ESI
DE
NT
IAL
SPA
CE
FO
RA
LL
PR
IVA
TE
TW
O-Y
EA
R S
CH
OO
LS
1qua
tion
No.
R2
Stan
dard
Err
orR
egre
ssio
n E
quat
ion
db.
46R
ai
1 2*
.57
.59
29 28
NR
-SPA
CE
= 2
1.5
+ .6
75 F
T-S
TF
(.05
15)
NR
-SPA
CE
= 1
9.6
+ .0
193
FT-U
GR
(.00
921)
- .3
67 D
-OS-
J
+ .1
55 D
-AR
-J(.
0421
)
+ .5
69 F
T-S
TF
(.07
21)
- .3
22 D
-OS-
J(.
0797
)
+ .1
54 D
-AR
-J(.
0406
)+
(.08
02)
* W
ithou
tdi
vini
ty s
choo
ls
Sour
ce: F
IEG
IS S
urve
ys 1
970-
71.