COVER SHEET - Del Monte Pacific Limited
261
COVER SHEET S.E.C. Registration Number D E L M O N T E P A C I F I C L I M I T E D (Company's Full Name) c / o J Y C a m p o s C e n t r e 9 t h A v e n u e c o r n e r 3 0 t h S t r e e t B o n i f a c i o G l o b a l C i t y T a g u i g C i t y (Business Address : No. Street Company / Town / Province) Antonio E.S. Ungson +65 2 856 2556 Contact Person Company Telephone Number 1 7 - A Month Day FORM TYPE Month Day Annual Meeting Secondary License Type, If Applicable Dept. Requiring this Doc. Amended Articles Number/Section Total Amount of Borrowings Total No. of Stockholders Domestic Foreign To be accomplished by SEC Personnel concerned File Number LCU Document I.D. Cashier S T A M P S Remarks = pls. use black ink for scanning purposes. SEC Form
-
Upload
khangminh22 -
Category
Documents
-
view
0 -
download
0
Transcript of COVER SHEET - Del Monte Pacific Limited
COVER SHEET
S.E.C. Registration Number
D E L M O N T E P A C I F I C L I M I T E D
(Company's Full Name)
c / o J Y C a m p o s C e n t r e
9 t h A v e n u e c o r n e r 3 0 t h S t r e e t
B o n i f a c i o G l o b a l C i t y
T a g u i g C i t y
(Business Address : No. Street Company / Town / Province)
Antonio E.S. Ungson +65 2 856 2556
Contact Person Company Telephone Number
1 7 - A
Month Day FORM TYPE Month Day
Annual Meeting
Secondary License Type, If Applicable
Dept. Requiring this Doc. Amended Articles Number/Section
Total Amount of Borrowings
Total No. of Stockholders Domestic Foreign
To be accomplished by SEC Personnel concerned
File Number LCU
Document I.D. Cashier
S T A M P S
Remarks = pls. use black ink for scanning purposes.
SEC Form


TABLE OF CONTENTS
Page No.
PART I. BUSINESS AND GENERAL INFORMATION
Item 1 Business 2
Item 2 Properties 13
Item 3 Legal Proceeding 15
Item 4 Submission of Matters to a Vote of Security Holders 15
PART II. OPERATIONAL AND FINANCIAL INFORMATION
Item 5 Market for Registrant’s Common Equity and Related Stockholder Matters 15
Item 6 Management’s Discussion and Analysis or Plan of Operation 20
Item 7 Financial Statements 41
Item 8 Information on Independent Accountant and Other Related Matters 42
PART III. CONTROL AND COMPENSATION INFORMATION
Item 9 Directors and Executive Officers of the Registrant 43
Item 10 Compensation of Directors and Executive Officers 48
Item 11 Security Ownership of Certain Beneficial Owners and Management 49
Item 12 Certain Relationships and Related Transactions 50
PART IV. CORPORATE GOVERNANCE
Item 13 Annual Corporate Governance 51
PART V. ANNEX
Annex A Financial Statements and Supplementary Schedules (Item 7)
Statement of Management’s Responsibility for Financial Statements
Consolidated Financial Statements
Supplementary Schedules
Annex B FY 2020 Annual Report, colored copy (Separate File)

Part I – BUSINESS AND GENERAL INFORMATION
Item 1. Business
Overview
Del Monte Pacific Limited (the “Company” or “DMPL”) was incorporated as an international business company in
the British Virgin Islands on 27 May 1999 under the International Business Companies Act (Cap. 291) of the British
Virgin Islands. It was automatically re-registered as a company on 1 January 2007 when the International Business
Companies Act was repealed and replaced by the Business Companies Act 2004 of the British Virgin Islands. The
registered office of the Company is located at Craigmuir Chambers, Road Town, Tortola, British Virgin Islands.
The principal activity of the Company is that of investment holding. Its operating subsidiaries are principally engaged
in growing, processing and selling canned and fresh pineapples, pineapple juice concentrate, tropical mixed fruit,
canned peaches and pears, canned vegetables, tomato-based products, broth and certain other food and beverage
products mainly under the brand names of “Del Monte”, “S&W”, “Today’s”, “Contadina”, “College Inn” and other
brands. The Company’s subsidiaries also produce and distribute private label food products.
On 2 August 1999, the Company was admitted to the Official List of the Singapore Exchange Securities Trading
Limited (“SGX-ST”). On 10 June 2013, the ordinary shares of the Company were also listed on the Philippine Stock
Exchange, Inc (the “PSE”). On 7 April 2017, the first series of the preference shares of the Company were listed on
the PSE.
Subsidiaries
The details of the Company’s subsidiaries are as follows:
Name of subsidiary Principal activities
Place of in-
corporation
and business
Effective equity
held by the Group
30 April
2020
30 April
2019
% %
Held by the Company
Del Monte Pacific Resources
Limited (“DMPRL”) [7]
Investment holding British Virgin Islands 100.00 100.00
DMPL India Pte Ltd (“DMPLI”) [3] Investment holding Singapore 100.00 100.00
DMPL Management Services Pte
Ltd [3]
Providing administrative
support and liaison services
to the Group
Singapore 100.00 100.00
GTL Limited [4] Trading food products
mainly under the brand
names: “Del Monte” and
buyer’s own label
Federal Territory of
Labuan, Malaysia
100.00 100.00
S&W Fine Foods International
Limited (“S&W”) [7]
Selling processed and fresh
food products under the
“S&W” trademark; Owner
of the “S&W” trademark in
Asia (excluding Australia
and New Zealand), the
Middle East, Western
Europe, Eastern Europe and
Africa
British Virgin Islands 100.00 100.00
DMPL Foods Limited
(“DMPLFL”) [8]
Investment holding British Virgin Islands 89.43 89.43
Held by DMPRL

3
Name of subsidiary Principal activities
Place of in-
corporation
and business
Effective equity
held by the Group
30 April
2020
30 April
2019
% %
Central American Resources, Inc.
(“CARI”)[7]
Investment holding Panama 100.00 100.00
Dewey Limited (“Dewey”) [5] [8] Mainly investment holding Bermuda 100.00 100.00
Held by CARI
Del Monte Philippines, Inc
(“DMPI”) [1] [2]
Growing, processing and
distribution of food
products mainly under the
brand name “Del Monte”
Philippines 88.00 100.00
South Bukidnon Fresh Trading Inc
(“SBFTI”) [1]
Inactive Philippines 100.00 100.00
Held by DMPI
Philippines Packing Management
Services Corporation [1]
Management, logistics and
support services
Philippines 88.00 100.00
Del Monte Txanton Distribution
Inc (“DMTDI”) [a] [1][2]
Inactive Philippines 35.20 40.00
Held by Dewey
Dewey Sdn. Bhd. [4] Owner of various
trademarks
Malaysia 100.00 100.00
Held by DMPLI
DMPL India Limited[10] Investment holding Mauritius 95.13 94.94
Held by S&W
S&W Japan Limited [8] Support and marketing
services for S&W
Japan 100.00 100.00
Held by DMPLFL
Del Monte Foods Holdings Limited
(“DMFHL”) [1]
Investment holding British Virgin Islands 89.43 89.43
Held by DMFHL
Del Monte Foods Holdings II, Inc.
(“DMFHII”) [6]
Investment holding State of Delaware,
U.S.A.
89.43 89.43
Held by DMFHII
Del Monte Foods Holdings Inc.
(“DMFHI”) [6]
Investment holding State of Delaware,
U.S.A.
89.43 89.43
Held by DMFHI
Del Monte Foods, Inc. (“DMFI”) [6] Manufacturing, processing
and distributing food,
beverages and other related
products
State of Delaware,
U.S.A
89.43 89.43
Held by DMFI
Sager Creek Foods, Inc. (formerly
Vegetable Acquisition Corp.) [6]
Manufacturing, processing
and distributing food,
State of Delaware,
U.S.A.
89.43 89.43

4
Name of subsidiary Principal activities
Place of in-
corporation
and business
Effective equity
held by the Group
30 April
2020
30 April
2019
% %
beverages and other related
products
Del Monte Andina C.A. [9] Manufacturing, processing
and distributing food,
beverages and other related
products
Venezuela – –
Del Monte Colombiana S.A. [4] Manufacturing, processing
and distributing food,
beverages and other related
products
Colombia 73.31 73.31
Industrias Citricolas de
Montemorelos, S.A. de C.V.
(ICMOSA) [4]
Manufacturing, processing
and distributing food,
beverages and other related
products
Mexico 89.43 89.43
Del Monte Peru S.A.C. [8] Distribution of food,
beverages and other related
products
Peru 89.43 89.43
Del Monte Ecuador DME C.A. [8] Distribution of food,
beverages and other related
products
Ecuador 89.43 89.43
Hi-Continental Corp. [8] Distributor of non-Del
Monte Products
State of California,
U.S.A.
89.43 89.43
College Inn Foods [8] Distributor of College Inn
brand products
State of California,
U.S.A.
89.43 89.43
Contadina Foods, Inc. [8] Distributor of Contadina
brand products
State of Delaware,
U.S.A.
89.43 89.43
Held by DMFI (cont’d)
S&W Fine Foods, Inc. [8]
Distributor of S&W Fine
Foods, Inc.
State of Delaware,
U.S.A.
89.43 89.43
Del Monte Ventures, LLC (“DM
Ventures”) [b]
Investment holding State of Delaware,
U.S.A.
89.43 89.43
Held by DM Ventures
Del Monte Avo, LLC [b] Development, production,
marketing, sale and
distribution of UHP
avocado products
State of Delaware,
U.S.A.
45.61 45.61
Del Monte Chilled Fruit Snacks,
LLC [b]
Development, production,
marketing, sale and
distribution of processed
refrigerated fruit products
State of Delaware,
U.S.A.
45.61 45.61
Held by Del Monte Andina C.A.
Del Monte Argentina S.A. [9] Inactive Argentina – –

5
(a) DMTDI is consolidated as the Group has de facto control over the entity.
Management believes that the Group has control over DTMTDI since it is exposed, or has rights,
to variable returns and has the ability to affect those returns through its power over DMTDI. In its
special meeting held on 22 April 2019, DMTDI’s board of directors approved the dissolution and
liquidation of DMTDI by shortening its corporate term to 30 April 2019. As at 30 April 2020, the
dissolution and liquidation the application for the dissolution and liquidation is yet to be submitted
with the SEC due to certain regulatory and documentary requirements.
(b) The Group incorporated its subsidiary, Del Monte Ventures, LLC on 21 June 2017 which acquired
interests in four joint venture entities which were all incorporated in the state of Delaware, USA.
These joint ventures will pursue sales of expanded refrigerated offerings across all distribution and
sales channels, and will establish a new retail food and beverage concept. These joint ventures will
initially focus on the U.S. market, with the potential for expansion into other territories. These joint
venture entities are in their pre-operating stages and have no material assets or liabilities as of 30
April 2020 and 2019.
[1] Audited by SyCip Gorres Velayo & Co. (“SGV”)
[2] On 21 May 2020, CARI completed the sale of 12% stake in DMPI to an investor. Conditions of the
sale were already met as of 30 April 2020, as confirmed by both parties.
[3] Audited by Ernst and Young LLP (“EY”) Singapore.
[4] Audited by Ernst & Young member firms in the respective countries.
[5] On 30 April 2019, the Board of Directors of CARI approved the transfer of its outstanding shares
in Dewey, as well as all rights, title and interest attributed thereto, to DMPRL.
[6] Not required to be audited in the country of incorporation. Audited by SGV for the purpose of group
reporting.
[7] Not required to be audited in the country of incorporation. Audited by Ernst and Young LLP,
Singapore for the purpose of group reporting.
[8] Not required to be audited in the country of incorporation.
[9] Not required to be audited in the country of incorporation. The Venezuelan entity was
deconsolidated in 2015. The Venezuelan exchange control regulations have resulted in other-than-
temporary lack of exchangeability between the Venezuelan Bolivar and US Dollar. This has
restricted the Venezuelan entity’s ability to pay dividends and obligations denominated in US
Dollars. The exchange regulations, combined with other recent Venezuelan regulations, have
constrained the Venezuelan entity’s ability to maintain normal production. Due to the Group’s
inability to effectively control the operations of the entity, the Group deconsolidated the subsidiary
with effect from February 2015. The equity interest in this entity is determined to be the cost of
investment of the entity at the date of deconsolidation. The investment is carried at cost less
impairment losses.
[10] In December 2019, DMPLI invested an additional US$1.5 million in DMPL India Limited, thereby
increasing ownership to 95.13%
The Company regularly reassesses whether it controls an investee when facts and circumstances indicate that
there are changes to one or more of the three elements of control listed in Note 4 in the Notes to Financial
Statements (Annex A). The Company determined that it exercised control on all its subsidiaries as it has all
elements of control.

6
Risk Factors relating to the Business
Enterprise-Risk Management Programme
The Del Monte Pacific Group has an established enterprise-wide risk management programme that aims to provide a
structured basis for proactively managing financial, operational, compliance, information technology and
sustainability risks in all levels of the organisation.
Risk management is a regular board agenda item.
Principal risk Specific risk we face Mitigation
COVID-19
Pandemic
The coronavirus pandemic could affect
our business and results of operations.
The Group may experience volatility in
demand for and supply of our products
due to pantry-loading, supply chain
challenges, lockdown restrictions,
closing of businesses and
unemployment, among others.
The pandemic presents a risk to our
employees’ health and well-being and
may reduce employee productivity due
to illness, government restrictions, lack
of reliable internet access and public
transport.
Capitalise on the Group’s offering of health,
wellness and nutrition, and long-shelf life
culinary products suited for home
consumption as consumers stay at home and
prepare more meals and snacks
Leverage improved momentum of new
products catering to health and wellness
Leverage the trust in the Group brands’
reputation for safety and reliability to
sustain demand
For fresh business, develop contingency
plans, customer base and optimise market
mix
Marketing, including digital campaigns,
highlighting the functional health benefits of
the Group’s products
Foodservice to shift from dine-in to take-out
business
Increase sales in e-commerce channel and
direct to customer deliveries
Implement safeguards and protocols to
minimise operational disruption, while
adhering to government regulations on
health and safety:
− Implement the Business Continuity
Plan (BCP)
− Provide work-from-home arrangement
based on mandated quarantine levels
with technology support allowing
employees to have continuous access to
the ERP network, various applications,
emails, files and other necessary
information
− Implement a travel ban and leverage the
use of videoconferencing technology
− Release updates such as health
advisories, status of operations, action
plans to all employees on the status of

7
Principal risk Specific risk we face Mitigation
operations, and plans when employees
can go back to work on site
− Use personal protective equipment such
as face masks, face shields and
sanitisers provided by the company to
employees; conduct temperature
checks, maintain physical distancing,
disinfect facilities, encourage frequent
hand washing and other safety
protocols
− Partner with third party medical
providers in case there is a need to test
if employees are infected
− Implement guidelines of global and
national health agencies, including the
Centre for Disease Control and
Prevention, Department of Health,
Department of Labour and Employment
and Inter-Agency Task Force to protect
our employees
Profitability Del Monte Foods generates more than
70% of the sales of Del Monte Pacific
Group and has yet to generate profits.
Sustain sales momentum amidst the
pandemic anchored on health, nutrition,
plant-based portfolio, shelf-stable and
trusted brand
Optimise transformed supply chain and
production to meet demand
Improve sales mix, increase branded
business, rationalise low-margin and
unprofitable businesses
Sustain innovation and improve
profitability
Grow emerging channels including e-
commerce
Reduce costs by leveraging Asset Light
Strategy and other cost savings initiatives
Increase operating margins
Optimise best results from a strengthened
leadership team
Deliver Annual Operating Plan (AOP)
goals
Product Supply Challenges in planning our operations
during the pandemic. Disruptions may
increase our operating cost and impact
the results of operations.
Adverse weather conditions and
competing crops could limit raw product
supply and increase prices.
Optimise production facilities to meet
demand
Pack early season products and purchase
early season products and prior year packs
to increase inventory cover
Develop alternate raw product sourcing and
implement a global sourcing strategy

8
Principal risk Specific risk we face Mitigation
Improve supply planning capability to
match demand
Financial
Leverage and
Capital
Structure
The Group has a long-term financing in
relation to its acquisition of Del Monte
Foods in 2014, resulting in a leveraged
balance sheet.
Risks would arise if there is a general
economic or industry slowdown that
may impact the Group’s performance,
which subsequently may affect the
Group’s ability to service its interest and
principal obligations.
The Group strengthened its balance sheet
by raising new financing of US$1.3 billion
at Del Monte Foods consisting of a US$500
million five-year bond issue, a new three-
year Asset Based Loan of US$450 million,
and equity of US$380 million from DMPL
Del Monte Pacific completed a private
equity investment in Del Monte Philippines
for US$120 million for a 12% stake.
Proceeds were used for repayment of bank
loans
The Group expects to meet its financial
obligation by generating more cash flows
through the following:
− Improved cash flows in the US, which
accounts for more than 70% of Group
sales, with better sales mix and cost
management
− Expected cost savings from the Asset-
Light Strategy, selling, general and
administrative expense reduction
initiatives, managing working capital,
production levels, productivity
enhancements and operational
efficiencies
− Expected sales and profit growth in
the Asian business with the growth of
the Philippine business, the most
profitable business of the Group,
through its market leadership position,
and expansion of the S&W brand in
Asia and the Middle East, especially
in the fresh business, the second most
profitable business of the Group
Sales The Group has in place an AOP to meet
sales and profit objectives. Our results
depend highly on the performance of our
products in the categories where we
compete.
The Group’s food product categories are
highly competitive. New market trends
emerge and young consumers have
evolving consumption habits. The
younger demographics prefer healthy,
environment friendly and socially
responsible brands. How we delight our
customers and adapt to new and
emerging consumer trends are critical to
Ensure that the Group’s products are well-
positioned to address changing consumer
preferences and does well during recession
Manage and monitor price gaps
Enhance sales processes to improve
forecasting and a new profit mindset to
increase gross margin
Implement brand rationalisation to improve
profitability and increase market share
Adjust price brackets to cover logistics cost

9
Principal risk Specific risk we face Mitigation
deliver our sales and profitability
targets.
A very limited number of customer
accounts for a substantial portion of our
sales. Sales would be adversely affected
if we lose any of our largest customers if
they incur financial difficulties,
bankruptcy, change their purchasing
practices or encounter other disruptions.
In the US, trade promotion activity is still
significant and requires proactive
monitoring and analysis. More than 70%
of the Group’s sales are generated in the
US.
Continuously cultivate and manage
relationship with customers by providing
better service levels and improve product
supply
Establish new capabilities to expand the
Group’s presence in growing channels such
as e-commerce through online retail sites
Enhance relevance of existing portfolio
through consumer communication and
marketing strategy
Implement a quarterly review of the
business with executive management to
address challenges and gaps in attaining the
plan
Carry out international expansion using the
Group’s S&W brand
Supply Chain The Group implemented its Asset-Light
Strategy by reducing its manufacturing
facilities and entered into supply
agreements with third-party co-
manufacturers which are subject to a
number of regulations.
Disruptions may happen if these co-
manufacturers encounter allegations of
compliance failure, quality issues or
financial difficulties.
Manage production and supply of co-
manufacturers to increase speed-to-market
introduction, introduce new capabilities,
ensure consistent product quality and
adhere to production and delivery
schedules
Implement a robust transformation
programme that instills ownership and
accountability across the supply chain and
support function to deliver the plans
Manage relationships with growers and
renegotiate contracts to meet requirements
Working Capital
Management
The Group’s profit performance affects
the ability to manage working capital.
Working capital management impacts
the Group’s ability to manage vendor
payments.
Increases in material and operating cost
such as raw and packaging materials,
labour and fuel will impact the Group’s
profitability.
Aging inventories may be sold at a
lower price or may incur inventory
write-offs.
Execute the Group’s AOP to improve
profitability and cash flow by strengthening
the core business
Implement a rigorous transformation
programme that ensures accountability and
ownership across the supply chain
Embed new processes and procedures to
control supply and costs, produce to sell,
minimise waste and optimise supply chain
Strategically seek cost savings via
procurement
Manage logistics cost and use other modes
of transportation if feasible

10
Principal risk Specific risk we face Mitigation
Assess creative ways to ensure labour
availability during packing operations
Innovation The Group’s branded business in the
US, the Philippines and the Indian
subcontinent through the Del Monte
brand, and in Asia and the Middle East
through the S&W brand, is affected by
evolving consumer preferences and
trends.
Product innovation is one of the Group’s
strategic pillars. The success of new
product launches is a major driver to the
attainment of the Group’s strategic plan.
Develop new products that capitalise on
category trends, especially health and
wellness, and generate growing sales and
profits
Ensure new product launches and platform
criteria are met to improve likelihood of
new product success and breakthrough by
implementing the following measures:
− Shift to branded, value-added and
packaged products by limiting private
label business
− Leverage brand heritage for growth and
position new products that address
consumer needs and preferences
− Fast track innovation projects that have
oversight from the Executive Leadership
Team
− Prioritise effective execution and project
management to improve margins,
profitability and cash flow
Talent
Management
The Group’s capability to acquire and
retain talent has an impact on the
execution of the strategic plan.
New labour regulation in the Philippines
on regular and hired employees, and
occupational health and safety increases
the direct labour cost of manufactured
goods.
In the US, the Group has strengthened its
leadership by hiring new talents in Supply
Chain and Operations, Sales, Finance,
Research and Development, Human
Resources, and Corporate Communication
Long-term incentives and retention plans
are in place for key positions
Good execution of the strategy is ensured to
significantly improve results and the ability
to reward talent
Compliance with new labour legislation is
ascertained and proactive development of
productivity-enhancing and efficiency-
generating work practices and strategies is
established to reduce the impact of these
new regulations
Employee engagement and regular
communication are instituted to create a
positive culture and retain talent

11
Principal risk Specific risk we face Mitigation
Cybersecurity The increasing global incidence of
cyberattacks demonstrates the need to
strengthen and improve security of the
Group’s systems and avoid breach.
Cyberattacks can disrupt operations by
exploiting weaknesses in network
devices and servers, corrupting
information and stealing confidential
data which can lead to financial losses,
among others.
A good number of the Group’s
employees work from home during the
pandemic. This poses a risk due to
unsecured home networks and personal
devices. There is a need to constantly
update the employees’ operating system
and applications. E-mail scams increase
the risk on the employees’ devices to be
infected with a computer virus.
The Group develops and implements the
following measures to counter and
eliminate cyberattacks from outside
sources:
− Adopt industry best practices to
strengthen network security such as
updating security patches to the
system and encrypting workstations
− Continue to monitor progress,
emerging risks and control and
prioritise improvements by the Data
Protection and Privacy Security Task
Force
− Amplify the use of the endpoint
firewalls and design and implement
security policies and control at each
local site
− Implement cybersecurity awareness
and training for all employees
− Deploy effective security governance
to outside sites
The Company made significant progress in
the roll-out of Advanced Persistent Threat
protection for end point systems,
Encryption and Data Loss Protection
systems to key end user devices and pilot
departments, respectively
The Group has engaged a third party to
audit its systems and mitigate such risks
Mitigate cybersecurity risks to address the
vulnerabilities that were identified during
the Vulnerability Assessment and
Penetration Testing of key company
websites
Implement policies that are deployed and
enforced in Data Loss Prevention
Regular management, monitoring and
periodic maintenance are also being carried
out to the other cybersecurity
implementations on network access control,
network segmentation, advanced persistent
threat protection and encryption
Tax The Group may be exposed to additional
losses from write-offs of deferred tax Execute the Group’s strategic and AOP to
meet its projected income in the US

12
Principal risk Specific risk we face Mitigation
credits should the operations in the US
continue to incur losses.
The Group may lose certain tax
incentives should it fail to comply with
the conditions or through new tax
legislation rationalising incentives.
− Work on cost savings from sales,
general and administrative expense
reduction initiatives, management of
working capital, production levels,
productivity enhancements and
operational efficiencies
Implement measures to comply with
conditions related to the tax incentive
Operations
As an integrated producer of packaged,
frozen and fresh fruit products for the
world market, the Group’s earnings are
inevitably subject to certain other risk
factors, which include general
economic, market and business
conditions, especially amidst the
coronavirus pandemic, change in
business strategy or development plans,
international business operations,
production efficiencies, input costs and
availability, disruption of logistics and
transportation facilities, litigious
counterparties, insurgent activities and
changes in government regulations,
including environmental regulations.
Execute a long-term strategic plan and AOP
with clear targets and accountabilities,
supported by a BCP, especially in relation
to the pandemic, risk management and a
corporate sustainability programme
Enhance relevance of existing products
across key brands and segments through
marketing strategy and consumer
communication
Implement price adjustments to cover cost
inflation
Optimise packing operations, procurement,
logistics and transportation cost
Pursue productivity-enhancing and
efficiency-generating work practices and
capital projects
Continue to comply with new legislations
on the environment, taxation and labour that
affect operations and proactively develop
strategies to reduce the impact of these
regulations
Manage security risks in operating units in
the Philippines by strengthening security
measures and improving stakeholder
relations in local communities
Environmental
Risks
Production output is subject to certain
risk factors relating to weather
conditions, catastrophes, crop yields,
crop diseases, contract growers and
service providers’ performance,
leasehold arrangements and changes in
regulations.
There is no assurance that natural
catastrophes or climate change will not
materially disrupt the Group’s business
operations in the future or that the
Group is fully capable to deal with these
situations with respect to all the
The Group develops and executes a long-
term strategic plan and AOP, supported by
risk mitigation measures
The Group also has in place disaster
recovery plans and BCPs and has
implemented programmes and initiatives to
mitigate the effects of climate change
The Group has Good Agricultural Practices
certifications and complies with agricultural
standards
13
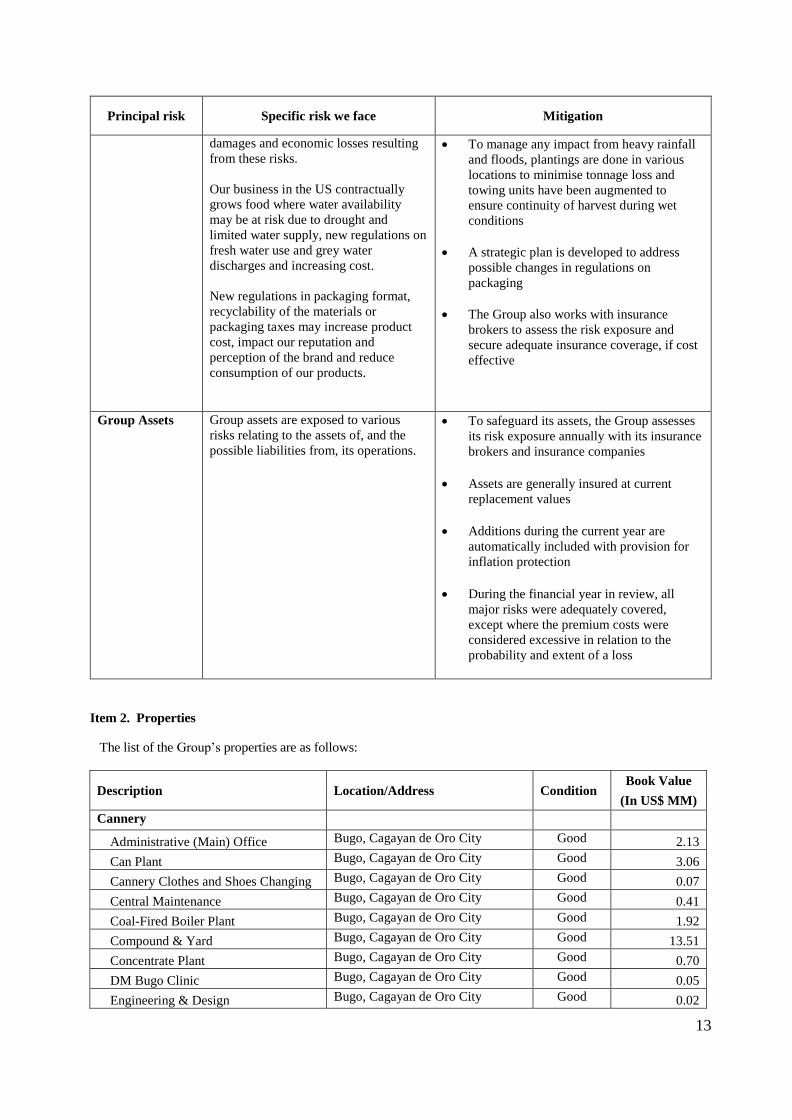
Principal risk Specific risk we face Mitigation
damages and economic losses resulting
from these risks.
Our business in the US contractually
grows food where water availability
may be at risk due to drought and
limited water supply, new regulations on
fresh water use and grey water
discharges and increasing cost.
New regulations in packaging format,
recyclability of the materials or
packaging taxes may increase product
cost, impact our reputation and
perception of the brand and reduce
consumption of our products.
To manage any impact from heavy rainfall
and floods, plantings are done in various
locations to minimise tonnage loss and
towing units have been augmented to
ensure continuity of harvest during wet
conditions
A strategic plan is developed to address
possible changes in regulations on
packaging
The Group also works with insurance
brokers to assess the risk exposure and
secure adequate insurance coverage, if cost
effective
Group Assets
Group assets are exposed to various
risks relating to the assets of, and the
possible liabilities from, its operations.
To safeguard its assets, the Group assesses
its risk exposure annually with its insurance
brokers and insurance companies
Assets are generally insured at current
replacement values
Additions during the current year are
automatically included with provision for
inflation protection
During the financial year in review, all
major risks were adequately covered,
except where the premium costs were
considered excessive in relation to the
probability and extent of a loss
Item 2. Properties
The list of the Group’s properties are as follows:
Description Location/Address Condition Book Value
(In US$ MM)
Cannery
Administrative (Main) Office Bugo, Cagayan de Oro City Good 2.13
Can Plant Bugo, Cagayan de Oro City Good 3.06
Cannery Clothes and Shoes Changing Bugo, Cagayan de Oro City Good 0.07
Central Maintenance Bugo, Cagayan de Oro City Good 0.41
Coal-Fired Boiler Plant Bugo, Cagayan de Oro City Good 1.92
Compound & Yard Bugo, Cagayan de Oro City Good 13.51
Concentrate Plant Bugo, Cagayan de Oro City Good 0.70
DM Bugo Clinic Bugo, Cagayan de Oro City Good 0.05
Engineering & Design Bugo, Cagayan de Oro City Good 0.02

14
Description Location/Address Condition Book Value
(In US$ MM)
Factory Offices Bugo, Cagayan de Oro City Good 0.09
General Products Plant Bugo, Cagayan de Oro City Good 0.00
GPSL/PCL/GL Plant Bugo, Cagayan de Oro City Good 0.18
Labeling & Warehousing Bugo, Cagayan de Oro City Good 3.87
Labeling & Warehousing Bugo, Cagayan de Oro City Good 0.01
Machine Shop Bugo, Cagayan de Oro City Good 0.00
Mixed Fruit Plant Bugo, Cagayan de Oro City Good 1.21
Mixed Fruit Plant Bugo, Cagayan de Oro City Good 0.00
Preparation Plant Bugo, Cagayan de Oro City Good 1.53
Processing Plant Bugo, Cagayan de Oro City Good 4.87
Processing Plant Bugo, Cagayan de Oro City Good 0.22
Quality Control Bugo, Cagayan de Oro City Good 0.15
Steam & Power Plant Bugo, Cagayan de Oro City Good 0.81
Sugar Recovery Plant Bugo, Cagayan de Oro City Good 0.27
Tetra Plant Bugo, Cagayan de Oro City Good 4.30
Waste Water Treatment Plant Bugo, Cagayan de Oro City Good 9.37
Others
Customers Area Bonifacio Global City, Taguig City Good 1.38
Forwarding Warehouses Bonifacio Global City, Taguig City Good 0.32
Kalawaan Office Pasig City Good 0.07
Las Pinas Warehouse Las Pinas City Good 0.04
MDC Good 0.58
NutriAsia Plant Cabuyao, Laguna Good 0.02
PET Plant Cabuyao, Laguna Good 4.62
Taguig Office Taguig City Good 4.21
Taguig Office Taguig City Good 0.00
Toll Packer - Dairy Zest Pasig City Good 0.00
Toll Packer - Innovative Packaging Valenzuela City Good 0.17
Tropical Asset Fruit Corp. (TFAC) Good 0.07
Plantation Operations
Baungon Baungon, Bukidnon Good 0.06
Camp 1 (JMC) Manolo Fortich, Bukidnon Good 6.16
Camp 1 (JMC) Manolo Fortich, Bukidnon Good 0.00
Camp 14 Manolo Fortich, Bukidnon Good 0.24
Camp 14 Manolo Fortich, Bukidnon Good 0.00
Camp 9 Manolo Fortich, Bukidnon Good 0.71
Camp 9 Manolo Fortich, Bukidnon Good 0.00
Camp Fabia Manolo Fortich, Bukidnon Good 0.01
Camp Fabia Manolo Fortich, Bukidnon Good 0.00
Camp Phillips Manolo Fortich, Bukidnon Good 10.68
Camp Phillips Manolo Fortich, Bukidnon Good 0.00
Cawayanon Manolo Fortich, Bukidnon Good 0.19
Claveria Claveria, Misamis Oriental Good 0.09
Dalwangan Malaybalay City, Bukidnon Good 0.12
15
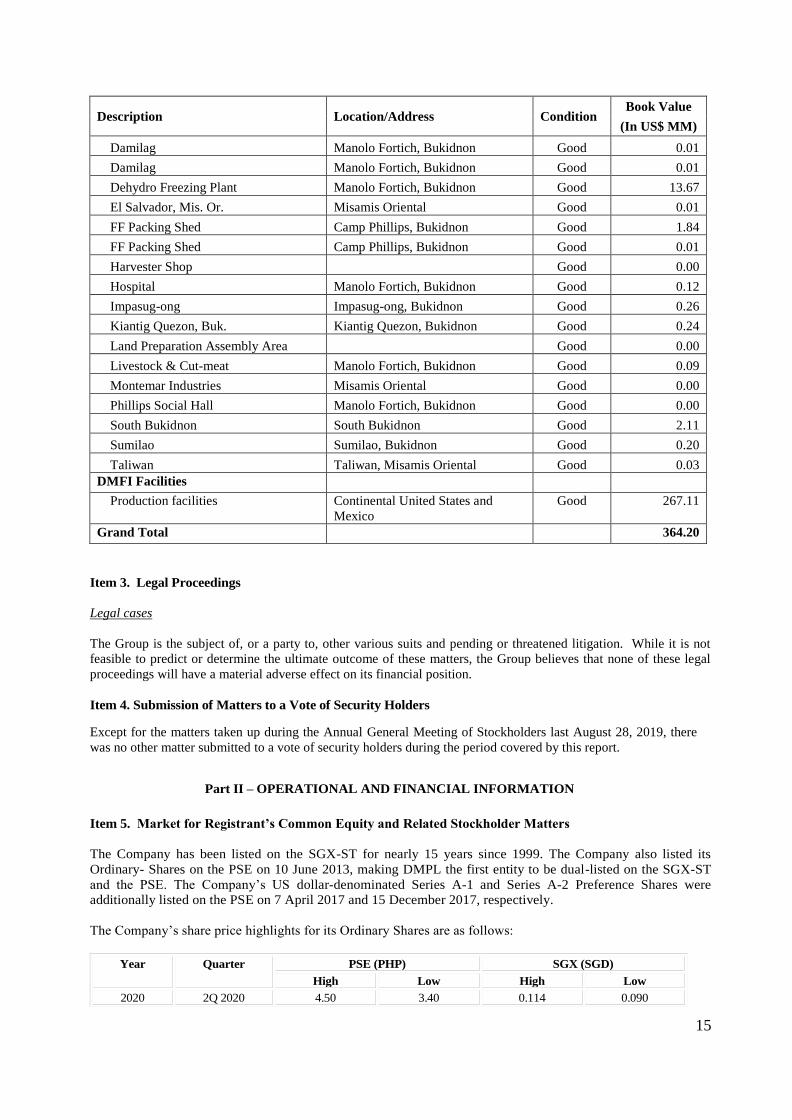
Description Location/Address Condition Book Value
(In US$ MM)
Damilag Manolo Fortich, Bukidnon Good 0.01
Damilag Manolo Fortich, Bukidnon Good 0.01
Dehydro Freezing Plant Manolo Fortich, Bukidnon Good 13.67
El Salvador, Mis. Or. Misamis Oriental Good 0.01
FF Packing Shed Camp Phillips, Bukidnon Good 1.84
FF Packing Shed Camp Phillips, Bukidnon Good 0.01
Harvester Shop Good 0.00
Hospital Manolo Fortich, Bukidnon Good 0.12
Impasug-ong Impasug-ong, Bukidnon Good 0.26
Kiantig Quezon, Buk. Kiantig Quezon, Bukidnon Good 0.24
Land Preparation Assembly Area Good 0.00
Livestock & Cut-meat Manolo Fortich, Bukidnon Good 0.09
Montemar Industries Misamis Oriental Good 0.00
Phillips Social Hall Manolo Fortich, Bukidnon Good 0.00
South Bukidnon South Bukidnon Good 2.11
Sumilao Sumilao, Bukidnon Good 0.20
Taliwan Taliwan, Misamis Oriental Good 0.03
DMFI Facilities
Production facilities Continental United States and
Mexico
Good 267.11
Grand Total 364.20
Item 3. Legal Proceedings
Legal cases
The Group is the subject of, or a party to, other various suits and pending or threatened litigation. While it is not
feasible to predict or determine the ultimate outcome of these matters, the Group believes that none of these legal
proceedings will have a material adverse effect on its financial position.
Item 4. Submission of Matters to a Vote of Security Holders
Except for the matters taken up during the Annual General Meeting of Stockholders last August 28, 2019, there
was no other matter submitted to a vote of security holders during the period covered by this report.
Part II – OPERATIONAL AND FINANCIAL INFORMATION
Item 5. Market for Registrant’s Common Equity and Related Stockholder Matters
The Company has been listed on the SGX-ST for nearly 15 years since 1999. The Company also listed its
Ordinary- Shares on the PSE on 10 June 2013, making DMPL the first entity to be dual-listed on the SGX-ST
and the PSE. The Company’s US dollar-denominated Series A-1 and Series A-2 Preference Shares were
additionally listed on the PSE on 7 April 2017 and 15 December 2017, respectively.
The Company’s share price highlights for its Ordinary Shares are as follows:
Year Quarter PSE (PHP) SGX (SGD)
High Low High Low
2020 2Q 2020 4.50 3.40 0.114 0.090

16
1Q 2020 5.40 2.50 0.148 0.079
2019
4Q 2019 6.05 4.82 0.144 0.121
3Q 2019 6.40 5.40 0.157 0.129
2Q 2019 6.18 5.30 0.15 0.12
1Q 2019 6.85 6.00 0.15 0.12
2018
4Q 2018 7.45 6.32 0.19 0.12
3Q 2018 8.27 6.56 0.20 0.17
2Q 2018 10.48 7.62 0.24 0.16
1Q 2018 11.20 10.00 0.29 0.24
2017
4Q 2017 11.80 10.80 0.31 0.28
3Q 2017 12.00 11.18 0.33 0.29
2Q 2017 12.40 11.20 0.35 0.32
1Q 2017 12.80 11.74 0.36 0.33
2016
4Q 2016 13.18 11.74 0.37 0.33
3Q 2016 13.04 11.46 0.38 0.34
2Q 2016 12.50 10.60 0.37 0.29
1Q 2016 13.40 11.00 0.40 0.30
2015
4Q 2015 13.44 9.49 0.45 0.29
3Q 2015 13.00 9.94 0.42 0.30
2Q 2015 13.98 11.50 0.47 0.34
1Q 2015 15.09 11.28 0.47 0.31
2014
4Q 2014 17.60 13.80 0.55 0.46
3Q 2014 20.75 17.40 0.56 0.51
2Q 2014 23.70 20.50 0.63 0.52
1Q 2014 24.00 21.75 0.65 0.59
2013
4Q 2013 33.45 22.50 0.96 0.58
3Q 2013 29.95 25.00 0.94 0.74
2Q 2013 27.20 23.00 0.95 0.69
1Q 2013 - - 0.96 0.64
On 7 April 2017 and 15 December 2017, the Company listed its Series A-1 and Series A-2 Preference Shares,
respectively on the PSE. The Company’s share price highlights for its Preference Shares are as follows:
Series A-1 Preference Shares:
Year Quarter PSE (USD)
High Low
2020 2Q 2020 10.30 9.60
1Q 2020 10.30 10.00
2019
4Q 2019 10.40 10.00
3Q 2019 10.40 10.10
2Q 2019 10.40 10.00
1Q 2019 10.40 10.00
2018
4Q 2018 10.70 10.00
3Q 2018 10.32 10.00
2Q 2018 10.30 10.00
1Q 2018 10.50 10.10
2017
4Q 2017 11.10 10.00
3Q 2017 11.00 10.50
2Q 2017 10.90 10.00
1Q 2017 - -

17
Series A-2 Preference Shares:
Year Quarter PSE (USD)
High Low
2020 2Q 2020 10.28 9.60
1Q 2020 10.30 9.70
2019
4Q 2019 10.30 9.90
3Q 2019 10.50 10.00
2Q 2019 10.40 10.00
1Q 2019 10.20 10.00
2018
4Q 2018 10.26 9.70
3Q 2018 10.26 9.80
2Q 2018 10.28 10.00
1Q 2018 10.40 10.00
2017 4Q 2017 10.30 10.00
The Company has an authorized capital stock of US $630.0 million consisting of 3,000,000,000 Ordinary Shares,
each with a par value of US $0.01 and 600,000,000 Preference Shares, each with a par value of US $1.00.
Out of the authorized capital stock, the Company has (i) 1,943,960,024 Ordinary Shares, (ii) 30,000,000
Series A-1 Preference Shares; and (iii) Series A-2 Preference Shares outstanding.
The number of Ordinary Shares outstanding excludes 975,802 Ordinary Shares held by the Company as treasury
shares. The Company has a total of 1,944,935,826 issued Ordinary Shares, including treasury shares.
The top 20 shareholders of the Company’s Ordinary Shares, Series A-1 Preference Shares and Series A-2 Preference
Shares as of 30 June 2020 are as follows:
a. Ordinary Shares
Rank Name No. of Shares %
1 Nutriasia Pacific Limited 1,196,539,958 61.55
2 Bluebell Group Holdings Limited 189,736,540 9.76
3 Lee Pineapple Company Pte Ltd 97,040,600 4.99
4 Dbs Nominees Pte Ltd 68,212,244 3.51
5 Bnp Paribas Noms Spore Pl 53,136,290 2.73
6 Raffles Nominees(Pte) Limited 34,984,305 1.80
7 Government Service Insurance System 15,957,937 0.82
8 Wee Poh Chan Phyllis 15,677,700 0.81
9 Citibank Noms Spore Pte Ltd 10,413,279 0.54
10 United Overseas Bank Nominees P L 8,535,280 0.44
11 Joselito Jr Dee Campos 7,621,466 0.39
12 Saw Paik Peng 7,100,000 0.37
13 Hsbc (Singapore) Nominees Pte Ltd 6,663,550 0.34
14 Col Financial Group, Inc. 6,479,676 0.33
15 Pineapples Of Malaya Private Limited 6,432,000 0.33
16 Banco De Oro - Trust Banking Group 6,282,266 0.32
17 Uob Kay Hian Pte Ltd 5,573,720 0.29
18 Ocbc Securities Private Ltd 5,449,985 0.28
19 Maybank Kim Eng Securities Pte.Ltd 4,766,090 0.25
20 Cts Global Equity Group, Inc. 4,652,600 0.24
Subtotal (Top 20 Stockholders) 1,751,255,486 90.09
Others 192,704,538 9.91
Total Outstanding 1,943,960,024 100.00

18
b. Series A-1 Preference Shares
Rank Name No. of Shares %
1 China Banking Corporation - Trust Group 4,359,790 21.80
2 BDO Securities Corporation 4,030,240 20.15
3 Banco De Oro - Trust Banking Group 3,153,560 15.77
4 Citibank N.A. 3,031,290 15.16
5 RCBC Trust & Investment Division - Various Taxable Accts 2,521,660 12.61
6 PNB Trust Banking Group 1,972,990 9.86
7 Sterling Bank Of Asia Trust Group 249,810 1.25
8 RCBC Trust & Investment Division 245,500 1.23
9 China Bank Securities Corp 179,410 0.90
10 Armstrong Securities Inc 50,450 0.25
11 Wealth Securities Inc 47,270 0.24
12 First Metro Securities Brokerage Corp 30,490 0.15
13 Astra Securities Corporation 27,290 0.14
14 Eastwest Banking Corporation - Trust Division 22,830 0.11
15 Bpi Securities Corporation 22,430 0.11
16 Luis. F Alejandro 15,000 0.08
17 Parag Sachdeva 15,000 0.08
18 Philippine Equity Partners Inc 13,600 0.07
19 Ignacio Carmelo Sison 8,000 0.04
20 AP Securities Incorporated 2,890 0.01
Subtotal (Top 20 Stockholders) 19,999,500 100.00
Others 500 0.00
Total Outstanding 20,000,000 100.00
c. Series A-2 Preference Shares
Rank Name No. of Shares %
1 Bdo Securities Corporation 2,514,850 25.15
2 China Banking Corporation - Trust Group 2,151,790 21.52
3 Citibank N.A. 1,449,480 14.49
4 Banco De Oro - Trust Banking Group 1,373,320 13.73
5 Pnb Trust Banking Group 1,275,770 12.76
6 United Coconut Planters Life Assurance Corporation 190,000 1.90
7 Rcbc Trust & Investment Division - Various Taxable Accts 187,400 1.87
8 Philippine Equity Partners Inc 176,260 1.76
9 China Bank Securities Corp 150,540 1.51
10 First Metro Securities Brokerage Corp 148,420 1.48
11 Eastwest Banking Corporation - Trust Division 115,420 1.15
12 Standard Chartered Bank 60,000 0.60
13 Sterling Bank Of Asia Trust Group 59,000 0.59
14 Wealth Securities Inc 56,190 0.56
15 Bpi Securities Corporation 33,510 0.34
16 Astra Securities Corporation 14,900 0.15
17 Mbtc - Trust Banking Group 12,960 0.13
18 United Fund, Inc. 10,000 0.10
19
The Hongkong And Shanghai Banking Corp. Ltd. -Clients'
Acct. 9,700 0.10
20 Sunsecurities, Inc. 5,280 0.05
Subtotal (Top 20 Stockholders) 9,994,790 99.95
Others 5,210 0.05
Total Outstanding 10,000,000 100.00

19
DIVIDENDS
Under the Company’s Articles of Association and the terms of the Company’s Preference Shares, the Company may,
by a resolution of directors, declare and pay dividends on Ordinary Shares provided there are adequate and available
funds for dividends on Preference Shares which have priority over Ordinary Shares.
Dividends shall only be declared and paid out of surplus. No dividends shall be declared and paid, unless the Directors
determine that, immediately after the payment of the dividends: (a) the Company will be able to satisfy its liabilities
as they become due in the ordinary course of its business; and (b) the realizable value of the assets of the Company
will not be less than the sum of its total liabilities, other than its deferred taxes, as shown in its books of accounts, and
its capital. 30 April 2020 30 April 2019 30 April 2018
US$’000 US$’000 US$’000
Declared and paid during the financial year:
Dividends on ordinary shares
2020: US$0.0052 (2019: US$nil; 2018: US$0.0061) 10,112 - 11,882
Dividends on preference shares
A-1 preference shares for 2020, 2019 and 2018: US$0.6625 13,250 13,250 13,250
A-2 preference shares for 2020 and 2019: US$0.6500 2018:
US$0.20403 6,500 6,500 2,040
19,750 19,750 15,290
29,862 19,750 27,172
Proposed but not recognised as a liability as at reporting
date:
Dividends on ordinary shares
2020: US$0.0154 (2019: US$0.0052) 29,937 10,109 -
Dividends on Ordinary Shares
The Company’s dividend payment policy for Ordinary Shares has been to distribute a minimum of 33% of full year
profit. The holders of Ordinary Shares are entitled to receive dividends, as declared from time to time, after dividends
of Preference Shares are paid.
On 24 July 2020, the Company declared a special dividend of US$0.0154 per share to ordinary shareholders on record
as at 12 August 2020. The special dividend will be paid on 19 August 2020.
On 20 June 2019, the Company declared dividends of US$0.0052 per share for ordinary shareholders on record as at
12 July 2019. The final dividend was paid on 19 July 2019.
On 23 August 2017, the Company declared a dividend of US$0.0061 per share to stockholders on record as at 28
August 2017. The final dividend was paid on 8 September 2017.
Dividends on Preference Shares
The holders of Preference Shares are entitled to cash dividends based on the issue price, at the dividend rate per annum
from the issue date, payable every 7 October and 7 April of each year following the issue date, upon declaration by
the Company.
On 11 March 2020, the Company declared dividends to holders of Series A-1 Preference Shares, at the fixed rate of
6.625% per annum, or equivalent to US$0.33125 per Series A-1 Preference Share for the six-month period from 8
October 2019 to 7 April 2020. The Company also declared dividends to holders of Series A-2 Preference Shares at
the fixed rate of 6.5% per annum, or equivalent to US$0.32500 per Series A-2 Preference Share for the six-month
period from 8 October 2019 to 7 April 2020. The final dividends were paid on 7 April 2020.
On 9 September 2019, the Company declared dividends to the holders of the Series A-1 Preference Shares at the

20
fixed rate of 6.625% per annum, or equivalent to US$0.33125 per Series A-1 Preference and Series A-2 Preference
Shares at the fixed rate of 6.5% per annum, or equivalent to US$0.32500 per series A-2 Preference Shares for the six-
month period from 8 April 2019 to 7 October 2019. The final dividends were paid on 7 October 2019.
The Company endeavors to pay dividends to its shareholders in a timely manner within 30 days after being declared.
The dividend policy and terms, including the declaration and payment dates, are provided in the Company’s website.
Item 6. Management’s Discussion and Analysis or Plan of Operation
As of the fiscal year ended 30 April 2020
The financial statements of the Group as of 30 April 2020 are attached and incorporated herein by reference.
MANAGEMENT’S DISCUSSION AND ANALYSIS OF FINANCIAL CONDITION AND RESULTS OF
OPERATION
Review of Operating Performance for FY2020 vs FY2019
Impact of COVID-19
Del Monte Pacific Group’s results had been favourably impacted by the pandemic. As consumers stayed home,
prepared more meals and consumed more snacks, they purchased trusted brand names and consumed healthier, shelf-
stable culinary products. DMPL’s retail business in the USA and Philippines posted higher sales. The Group offers
more health and wellness product options to consumers and supports this with campaigns highlighting the functional
health benefits of its products.
Amidst the pandemic, operations were ongoing and compliant with COVID-19 precautions for employee protection.
Facility safety measures were strictly enforced and flexible work arrangements were adopted across sites. Critically,
performance was achieved through focus, dedication and personal sacrifice especially across Plantation, Production,
Supply Chain and Sales – to execute despite community quarantine challenges.
Sales
DMPL generated sales of US$2.1 billion in FY2020, higher by 9% versus the prior year on higher sales across all
geographies - United States, Philippines, S&W Asia and Europe.
USA
DMPL’s US subsidiary, Del Monte Foods, Inc (DMFI), generated sales of US$1.5 billion or 72% of Group sales,
higher by 8% versus prior year driven by a surge in demand across all categories due to the pandemic. DMFI benefited
in the categories and segments with strong leadership positions, as consumers turned to trusted brand names. All
principal categories experienced strong growth as consumer behaviour shifted to healthy, shelf-stable products in
response to COVID-19 stay-at-home orders. Momentum peaked in mid-March, with volume similar to what was
typically seen during holidays, as consumers stocked their pantries.
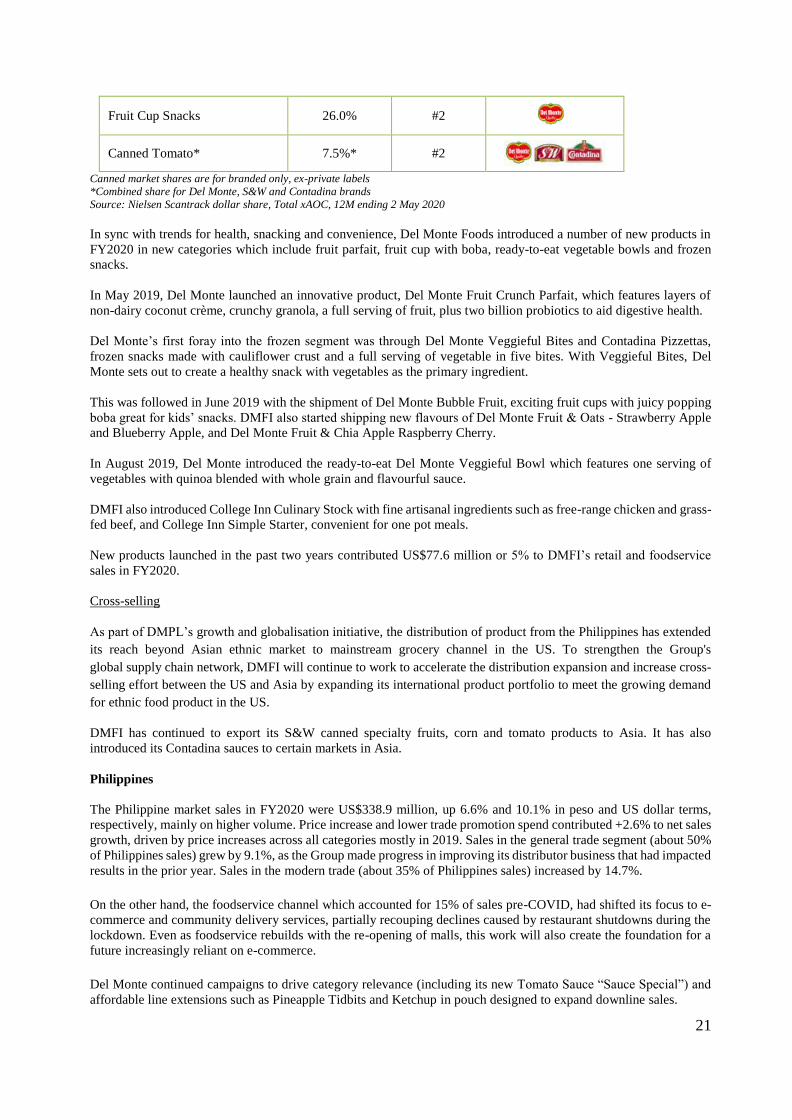
DMFI maintained its leading market share position for the full year in canned vegetable and fruit.
Strong Market Position in Key Categories in the USA
Products Market
Share
Market
Position Brands
Canned Vegetable 29.8% #1
Canned Fruit 25.3% #1
21
Fruit Cup Snacks 26.0% #2
Canned Tomato* 7.5%* #2
Canned market shares are for branded only, ex-private labels
*Combined share for Del Monte, S&W and Contadina brands
Source: Nielsen Scantrack dollar share, Total xAOC, 12M ending 2 May 2020
In sync with trends for health, snacking and convenience, Del Monte Foods introduced a number of new products in
FY2020 in new categories which include fruit parfait, fruit cup with boba, ready-to-eat vegetable bowls and frozen
snacks.
In May 2019, Del Monte launched an innovative product, Del Monte Fruit Crunch Parfait, which features layers of
non-dairy coconut crème, crunchy granola, a full serving of fruit, plus two billion probiotics to aid digestive health.
Del Monte’s first foray into the frozen segment was through Del Monte Veggieful Bites and Contadina Pizzettas,
frozen snacks made with cauliflower crust and a full serving of vegetable in five bites. With Veggieful Bites, Del
Monte sets out to create a healthy snack with vegetables as the primary ingredient.
This was followed in June 2019 with the shipment of Del Monte Bubble Fruit, exciting fruit cups with juicy popping
boba great for kids’ snacks. DMFI also started shipping new flavours of Del Monte Fruit & Oats - Strawberry Apple
and Blueberry Apple, and Del Monte Fruit & Chia Apple Raspberry Cherry.
In August 2019, Del Monte introduced the ready-to-eat Del Monte Veggieful Bowl which features one serving of
vegetables with quinoa blended with whole grain and flavourful sauce.
DMFI also introduced College Inn Culinary Stock with fine artisanal ingredients such as free-range chicken and grass-
fed beef, and College Inn Simple Starter, convenient for one pot meals.
New products launched in the past two years contributed US$77.6 million or 5% to DMFI’s retail and foodservice
sales in FY2020.
Cross-selling
As part of DMPL’s growth and globalisation initiative, the distribution of product from the Philippines has extended
its reach beyond Asian ethnic market to mainstream grocery channel in the US. To strengthen the Group's
global supply chain network, DMFI will continue to work to accelerate the distribution expansion and increase cross-
selling effort between the US and Asia by expanding its international product portfolio to meet the growing demand
for ethnic food product in the US.
DMFI has continued to export its S&W canned specialty fruits, corn and tomato products to Asia. It has also
introduced its Contadina sauces to certain markets in Asia.
Philippines
The Philippine market sales in FY2020 were US$338.9 million, up 6.6% and 10.1% in peso and US dollar terms,
respectively, mainly on higher volume. Price increase and lower trade promotion spend contributed +2.6% to net sales
growth, driven by price increases across all categories mostly in 2019. Sales in the general trade segment (about 50%
of Philippines sales) grew by 9.1%, as the Group made progress in improving its distributor business that had impacted
results in the prior year. Sales in the modern trade (about 35% of Philippines sales) increased by 14.7%.
On the other hand, the foodservice channel which accounted for 15% of sales pre-COVID, had shifted its focus to e-
commerce and community delivery services, partially recouping declines caused by restaurant shutdowns during the
lockdown. Even as foodservice rebuilds with the re-opening of malls, this work will also create the foundation for a
future increasingly reliant on e-commerce.
Del Monte continued campaigns to drive category relevance (including its new Tomato Sauce “Sauce Special”) and
affordable line extensions such as Pineapple Tidbits and Ketchup in pouch designed to expand downline sales.
22
Amidst the pandemic in the fourth quarter ending April, faster growth was seen across all categories, most especially
behind flagship Del Monte brands of 100% Pineapple Juice, Spaghetti Sauce and Tomato Sauce. The relevance and
imagery of these iconic Del Monte brands became magnified in a pandemic environment where consumers became
more concerned with health, and shifted to home cooking. Digital communications highlighted health and immunity
(100% Pineapple Juice ACE), product quality and taste, and meal planning and preparation (Del Monte
Kitchenomics), sustaining growth even as the lockdown eased.
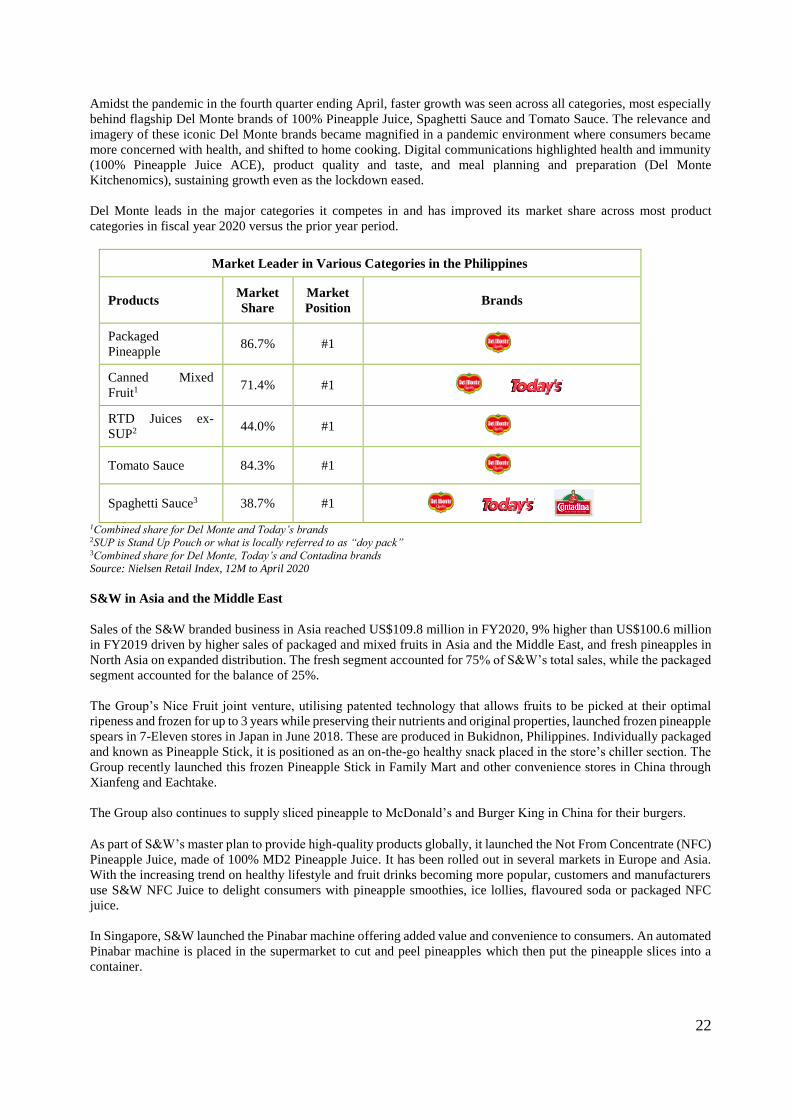
Del Monte leads in the major categories it competes in and has improved its market share across most product
categories in fiscal year 2020 versus the prior year period.
Market Leader in Various Categories in the Philippines
Products Market
Share
Market
Position Brands
Packaged
Pineapple 86.7% #1
Canned Mixed
Fruit1 71.4% #1
RTD Juices ex-
SUP2 44.0% #1
Tomato Sauce 84.3% #1
Spaghetti Sauce3 38.7% #1
1Combined share for Del Monte and Today’s brands 2SUP is Stand Up Pouch or what is locally referred to as “doy pack” 3Combined share for Del Monte, Today’s and Contadina brands
Source: Nielsen Retail Index, 12M to April 2020
S&W in Asia and the Middle East
Sales of the S&W branded business in Asia reached US$109.8 million in FY2020, 9% higher than US$100.6 million
in FY2019 driven by higher sales of packaged and mixed fruits in Asia and the Middle East, and fresh pineapples in
North Asia on expanded distribution. The fresh segment accounted for 75% of S&W’s total sales, while the packaged
segment accounted for the balance of 25%.
The Group’s Nice Fruit joint venture, utilising patented technology that allows fruits to be picked at their optimal
ripeness and frozen for up to 3 years while preserving their nutrients and original properties, launched frozen pineapple
spears in 7-Eleven stores in Japan in June 2018. These are produced in Bukidnon, Philippines. Individually packaged
and known as Pineapple Stick, it is positioned as an on-the-go healthy snack placed in the store’s chiller section. The
Group recently launched this frozen Pineapple Stick in Family Mart and other convenience stores in China through
Xianfeng and Eachtake.
The Group also continues to supply sliced pineapple to McDonald’s and Burger King in China for their burgers.
As part of S&W’s master plan to provide high-quality products globally, it launched the Not From Concentrate (NFC)
Pineapple Juice, made of 100% MD2 Pineapple Juice. It has been rolled out in several markets in Europe and Asia.
With the increasing trend on healthy lifestyle and fruit drinks becoming more popular, customers and manufacturers
use S&W NFC Juice to delight consumers with pineapple smoothies, ice lollies, flavoured soda or packaged NFC
juice.
In Singapore, S&W launched the Pinabar machine offering added value and convenience to consumers. An automated
Pinabar machine is placed in the supermarket to cut and peel pineapples which then put the pineapple slices into a
container.

23
FieldFresh India (equity accounted)
Sales at FieldFresh Foods, our Indian joint venture (JV), which are equity accounted and not consolidated, were
US$76.8 million in FY2020, up 1% in Rupee terms but down 1% in US dollar terms, versus prior year. US$67.0
million came from the Del Monte-branded packaged segment and US$9.8 million from the FieldFresh-branded fresh
segment.
B-to-B accounts for more than 50% of sales of the Group’s JV in India. As a result, the pandemic had an unfavourable
impact on DMPL’s Indian business. DMPL’s share of loss was unfavourable at US$2.0 million from US$0.1 million
in the prior year period due to lower foodservice volume as impacted by the pandemic in the fourth quarter, higher
operating costs mainly from marketing spends for brand advertising and higher raw material cost from tomato paste,
soya oil and dairy products partly offset by improved margins from Olive Oil.
The leadership team will mitigate the risks by increasing the share of retail sales, leveraging e-commerce and reducing
costs.
Gross Profit and Margin
DMPL generated a gross profit of US$452.2 million, higher by 14.5% versus the prior year, while gross margin
increased to 21.2% from 20.2% in the same period last year.
DMFI generated higher gross profit and margin of 17.6% from 16.4% due to higher volume, more favourable sales
mix and better pricing across multiple channels. These improvements were partially offset by the increase in metal
packaging costs and higher delivered costs.
DMPL ex-DMFI delivered higher gross margin of 28.1% from 27.3% mainly from higher sales and improved margins
from the Philippine market and higher sales of fresh pineapples despite some slowdown in the fourth quarter due to
the pandemic.
EBITDA and Net Profit
DMPL generated an EBITDA of US$142.2 million of which US$33.2 million came from DMFI and US$103.3 million
from DMPL ex-DMFI. DMPL’s EBITDA was slightly lower by 1% mainly due to one-off expenses of US$83.5
million from the closure/sale of four plants in the United States.
Excluding the one-off expenses, the Group’s EBITDA would have been US$225.7 million, 45% higher versus the
recurring EBITDA of US$156.1 million in the prior year period. DMFI contributed a recurring EBITDA of US$116.7
million, significantly higher by 80%, while DMPL ex-DMFI generated an EBITDA of US$103.3 million, higher by
18%, both due to better sales contributing to improved operating results. Group EBITDA was also favourably
impacted by the adoption of IFRS 16, Leases. Please refer to Notes no. 3.2 of the Financial Statements for more
details.
As part of the Group’s strategy to improve operational excellence, reduce fixed costs and increase competitiveness,
DMFI closed/sold four of its facilities. Production at rationalised facilities has been transitioned to other DMFI
production facilities in the USA as well as to strategic co-packers. These divestitures are enabling DMFI to
significantly improve capacity utilisation at the remaining plants in its production network. While DMFI’s Asset-
Light Strategy has been a complex undertaking, it has been a critical step in repositioning DMFI for the future.
Execution of this strategy and other cost saving initiatives should improve the Group’s EBITDA by US$50-60 million
over 24 months from November 2019.
In preparation for its capital raising initiatives, DMPL’s Philippine subsidiary, Del Monte Philippines, Inc, declared a
dividend to its parent in the first quarter which was taxed at 15% amounting to US$39.6 million. It also booked a
deferred tax of US$7.5 million in relation to future dividends based on the dividend policy.
In view of this and the one-off expenses incurred by DMFI due to plant closures/sale and retirement of loans, the
Group reported a net loss of US$81.4 million in FY2020, unfavourable compared to the prior year period’s net profit
of US$20.3 million. DMFI reported a net loss of US$100.4 million while DMPL ex-DMFI a net income of US$47.8
million. Last year’s Group net profit had also included a one-off gain, net of transaction costs, of US$16.7 million
pre-tax or US$13.0 million post-tax from the purchase of US$105.6 million of DMFI’s Second Lien Term Loan at a
discount in the secondary market.

24
Without the one-off items, the Group achieved a recurring net profit of US$32.2 million, significantly higher
compared to last year’s recurring net profit of US$15.8 million. DMFI had a recurring net loss of US$37.0 million
versus a loss of US$43.0 million in the prior year. DMPL ex-DMFI had a recurring net income of US$55.4 million,
8% higher than prior year.
Del Monte Philippines, Inc (DMPI), the Group’s most profitable business where it is a dominant market leader,
generated a net income of US$67.7 million in FY2020.
Please refer to the following table for the schedule of one-off items.
Non-Recurring Expense/(Income)
(in US$m)
FY2019 FY2020 Booked under
Closure/sale of plants1 5.1 79.8 G&A and other
income /expense
Severance and others 7.3 3.6 G&A and other
income/ expense
Gain due to loan purchase2 (16.7) (1.5) Interest income
Loan retirement (swap settlement etc) - 11.2 Interest expense
Total expense/(income) (pre-tax basis) (4.3) 93.1
Dividends tax3 - 47.1 Tax Expense
Total (net of tax and non-controlling interest of
10.6%)
(4.5) 113.6
1As part of its multiyear restructuring project to streamline operations and improve profitability, the Group closed/sold four plants in the
US in FY2020
2In FY2019, the Group purchased an additional US$105.6 million Second Lien Term Loans bringing the total purchased loans to US$231.4
million out of US$260 million. These loans were the highest-interest bearing loans for DMFI. The one-off gain of US$16.7 million pre-tax
or US$13.0 million post-tax booked in FY2019 was a result of principal savings given the purchase discount.
3In preparation for its capital raising initiatives, DMPL’s Philippine subsidiary, Del Monte Philippines, Inc, declared a dividend to its
parent in the first quarter of FY2020 which was taxed at 15%
INVENTORIES
DMPL’s inventories decreased to US$482.5 million as at 30 April 2020, from US$664.9 million as at 30 April 2019
mainly due to higher sales in the USA and Philippines.
CAPEX
Capital expenditures were US$130.5 million in FY2020, higher than the US$121.6 million in FY2019. DMFI
accounted for US$20.6 million of Group capex in FY2020, lower than the US$21.7 million in FY2019 due to reduced
projects with plant closures, while DMPL ex-DMFI’s capex accounted for US$109.9 million in FY2020, up from
US$99.9 million in FY2019 due to additions to biological assets.
CASH FLOW AND DEBT
The Group’s cash flow from operations in FY2020 was US$375.7 million, higher versus prior year’s cash flow of
US$180.9 million mainly from higher sales, higher operating profit and increase in trade and other payables.

25
The Group had negative working capital at the end of the fiscal year amounting to US$663.7 million. This was mainly
driven by the First Lien Term Loan of DMFI that became current in the last quarter of FY2020 and current portion of
long-term loans of DMPI and DMPL that were due within FY2021. DMFI has successfully refinanced its loans
through senior secured notes amounting to US$500 million due 2025. DMPL and DMPI are also in the process of
refinancing the current portion of long-term loans due in August 2020.
The Group’s net debt (borrowings less cash and bank balances) amounted to US$1.36 billion as at 30 April 2020,
lower than US$1.46 billion as at 30 April 2019 due to significant improvement in cash flow from operations which
were used to pay off loans.
Out of the total net debt of US$1.36 billion, DMFI accounted for US$706.1 million while DMPL ex-DMFI accounted
for US$656.8 million.
The Group’s net debt to equity ratio decreased to 240.8% from 242.4% in the prior year.
DMFI REFINANCING
On 15 May 2020, the Group completed the refinancing of Del Monte Foods, Inc. DMFI raised new financing of
US$1.3 billion consisting of a US$500 million five-year bond issue, a new three-year Asset-Based Loan of US$450
million, and equity contribution of US$380 million from DMPL, thereby recapitalising DMFI’s balance sheet. DMPL
invested US$150 million in new equity and converted US$228 million of Second Lien Repurchase Loans into
common equity in DMFI. (Please refer to the footnote on Non-Recurring Expenses table above regarding the Second
Lien Repurchase Loans).
Bond investors responded positively to DMFI’s March-April performance, the success of its asset-light cost
management initiatives, and plans for growth and profitability going forward.
PRIVATE EQUITY INVESTMENT IN DEL MONTE PHILIPPINES
On 20 May 2020, the Group completed the private equity investment of a 12% stake in DMPI for US$120 million.
This gives an implied valuation of US$1 billion for DMPI, which attests to its strong franchise and prospects. This is
highly commendable amidst a stressed and declining capital market with the PSE index down around 25% from the
peak of 2019. This resulted in a net gain of US$77 million which under IFRS rules had to be booked in retained
earnings, instead of recognising it as net income. The proceeds from the private equity investment were used for
repayment of DMPL’s bank loans.
This transaction is a testament to Del Monte Philippines’ solid standing and future prospects for growth as a food
company. Del Monte is well-positioned in this environment given its nutritious long shelf-life products which
consumers are using to prepare more meals at home as well as build their immunity.

26
REVIEW OF COST OF GOODS SOLD AND OPERATING EXPENSES
REVIEW OF OTHER MATERIAL CHANGES TO INCOME STATEMENTS
% of Turnover For the year ended 30 April
FY2020 FY2019 Explanatory Notes
Cost of Goods Sold 78.8 79.8Overall impact of increase in sales, than increase in cost of production, resulting to
higher margin rate
Distribution and
Selling Expenses10.0 10.4
Total expense is low er versus prior year due to higher variable selling cost as w ell
as higher promotion spending for new product launches. Low er turnover rate is
due to overall impact of increase in sales.
G&A Expenses 5.6 5.9Total admin expense is higher mainly from higher benefits this year. Low er turnover
rate is due to overall impact of increase in sales.
Other Operating
Expenses (Income)3.2 (0.2) Losses incurred on DMFI plant closures
In US$'000 For the year ended 30 April
FY2020 FY2019 % Explanatory Notes
Depreciation and
amortization (178,503) (138,706) (28.7) Amortisation of right-of-use assets (Adoption of IFRS 16)
Reversal/ (Provision) of
asset impairment (40,746) (1,262) (3,128.7) Impairment relating to closure of plant assets
Reversal/ (Provision) for
inventory obsolescence (9,649) (19,245) 49.9
Reversals mainly from low er inventory as a result of higher demand
this year compared to unmet demand in prior year resulting to provision
for obsolescence
Provision for doubtful
debts 292 (2,646) 111 Higher provision for trade receivables last year
Net gain/(loss) on
disposal of fixed assets (2,502) 6,158 (140.6)
Loss recognised on sale of DMFI plant assets this quarter compared to
net gain recognised last year.
Foreign exchange
gain/(loss)- net (631) 394 (260.2)
Attributed to forex losses from devaluation of Mexican Peso during the
year. Last year's forex gain w as due to valuation of U$ denominated
receivables on depreciating Philippine Peso
Interest income 2,569 18,125 (85.8) Higher recognised gain on second lien buyout last year
Interest expense (114,693) (96,958) (18.3)
While there w as repayment of loans w hich reduced borrow ing year on
year, on the overall, interest w as higher due to higher average loan
balance during the year
Share in net loss of JV (2,887) (983) (193.7) Higher losses of the joint ventures
Taxation Benefit
(Expense) (29,176) 13,524 (315.7) Final taxes paid on intercompany dividends

27
REVIEW OF GROUP ASSETS AND LIABILITIES
Balance Sheet
30
April 2020
(Audited)
30
April 2019
(Audited)
30
April 2018
(Audited)
FY20 vs
FY19
Variance %
Explanatory Notes
In US$'000
ASSETS
Property, plant and equipment - net 507,497 582,033 610,889 (12.8)Attributable to DMFI's disposal of its
machineries and equipment
Right-of-use assets 166,085 - - 0.0 Change in accounting policy (IFRS 16)
Investment in joint ventures 22,855 24,212 25,195 (5.6) Mainly from losses recorded during the year
Intangible assets and goodwill 701,347 707,997 714,651 (0.9) nm
Other noncurrent assets 34,937 41,622 41,223 (16.1)
Change in accounting policy (IFRS 16)
reclassified most deferred rentals to right-of-
use assets
Deferred tax assets - net 144,974 106,321 79,829 36.4 Higher tax loss carry forward from DMFI
Pension assets 6,675 8,240 10,607 (19.0)No actual funding due to over payment of fund
in prior years.
Biological assets 63,278 54,002 43,592 17.2Higher fair value of agricultural growing
produce attributed to price changes
Inventories 482,463 664,922 760,981 (27.4)Due to increase in sales in the US as well all
Philippine markets
Trade and other receivables 323,065 149,054 161,627 116.7Due to increase in sales and timing of
collection of sales revenue
Prepaid expenses and other current
assets 67,712 34,190 30,782 98.0
Driven by DMFI, due to higher prepayments
which were amortized subsequently.
Cash and cash equivalents 33,465 21,636 24,246 54.7
Higher cash inflow from higher operating
results and lower inventories and lower
receivables
Noncurrent assets held for sale - 4,465 5,504 (100.0)Unsold held-for-sale assets repositioned to
property and equipment
EQUITY
Share capital 49,449 49,449 49,449 - nm
Share premium 478,339 478,339 478,323 - nm
Retained earnings 60,763 96,074 95,505 (36.8) Net loss during the year and dividend pay-out
Reserves (77,474) (65,827) (64,082) (17.7) Driven by reserve from sale of shares of DMPI
Non-controlling interest 54,820 43,106 49,065 27.2 Share in the losses during the year
LIABILITIES
Loans and borrowings 1,396,029 1,478,655 1,465,223 (5.6) Due to loan repayments
Lease liabilities 158,525 - - nm Change in accounting policy (IFRS 16)
Other noncurrent liabilities 23,380 30,015 35,195 (22.1)
Attributable to the decrease in derivative
liability of DMFI. Also, lease liabilities are
presented separately due to the adoption of
IFRS 16
Employee benefits 105,345 91,421 114,550 15.2
Higher liability due to changes in financial
assumptions in remeasuring retirement
plans
Environmental remediation
liabilities 9,587 697 144 1,275.5 Higher provisions related to plant closures
Deferred tax liabilities - net 12,447 6,404 7,128 94.4Recognition of deferred final tax on
undistributed profits of DMPI for the year
Trade and other current liabilities 276,893 188,669 276,618 46.8
Mainly on timing of payment of trade payables
and higher accruals driven by DMFI for
refinancing activity
Current tax liabilities 6,250 1,692 2,008 269.4Taxes on Non PEZA activities increased
during the year.

28
Key Performance Indicators
The following sets forth the explanation why certain performance ratios (i.e. current ratio, debt to equity ratio, net
profit margin, return on asset, and return on equity) do not fall within the benchmarks indicated by the Securities and
Exchange Commission of the Philippines (the “SEC”).
A. Current Ratio
30-Apr-20 30-Apr-19 Benchmark
Current Ratio 0.6 1.3 Minimum of 1.2
Mainly due to increase current liabilities from loans which have turned current as at fourth quarter of the fiscal
year. This was subsequently refinanced in May 2020.
B. Debt to Equity
30-Apr-20 30-Apr-19 Benchmark
Debt to Equity 3.5 3.0
Maximum of
2.5
The increase is due to increase in trade and other payables mainly from timing of payment, as well as increase
of lease liability to comply with the new IFRS standard on leases (IFRS 16).
C. Net Profit Margin
30-Apr-20 30-Apr-19 Benchmark
Net Profit/(Loss) Margin attributable to
owners of the company -3.82% 1.04%
Minimum of
3%
The Group generated a net loss margin for the full year of FY2020, largely unfavourable compared to prior
year, due to significant expenses incurred due to plant closure losses.
D. Return on Asset
30-Apr-20 30-Apr-19 Benchmark
Return on Asset -3.67% 0.59% Minimum of 1.21
The DMPL Group generated a negative return on asset for the full year of FY2020, largely unfavourable
compared to prior year, due to significant expenses incurred due to plant closure losses.
E. Return on Equity
30-Apr-20 30-Apr-19 Benchmark
Return on Equity -16.58% 2.36%
Minimum of
8%
The DMPL Group generated a negative return on equity for the full year of FY2020, largely unfavourable
compared to prior year, due to significant expenses incurred due to plant closure losses.
29
Material Changes in Accounts
A. Cash and cash equivalent
Increase is due to higher cash inflow from higher operating results and lower inventories and lower receivables.
B. Inventories
Decrease in inventory is mainly due to increase in sales in the US as well all Philippine markets.
C. Prepaid and other current assets
Increase is due to higher prepayments which were amortized subsequently.
D. Biological assets
Increase is higher fair value of agricultural growing produce attributed to price changes.
F. Deferred tax assets
Due to higher future tax benefits from loss carry-forwards of DMFI.
G. Trade & Other Payables
Increase in trade and other payable is mainly on timing of payment of trade payables and higher accruals driven
by DMFI for refinancing activity.
H. Employee benefits– non-current
Higher liability due to changes in financial assumptions in remeasuring retirement plans.
I. Other noncurrent liabilities
Decrease is attributable to the decrease in derivative liability of DMFI. Also, lease liabilities are presented
separately due to the adoption of IFRS 16.
Review of Operating Performance for FY2019 vs FY2018
Sales
DMPL generated sales of US$2.0 billion in FY2019, lower by 11% versus the prior year as higher sales in S&W in
Asia were offset by lower sales in the United States, Philippines and Europe.
USA
DMPL’s US subsidiary, Del Monte Foods, Inc (DMFI), generated sales of US$1.4 billion or 73% of Group sales,
lower by 14% versus prior year due to the divestiture of the Sager Creek vegetable business in September 2017, and
lower volume of retail branded products due to price increase and reduced promotional spend. There was also a decline
in non-branded products which was in line with DMFI’s strategy, partially offsetting lower retail trade spend.
DMFI maintained its leading market share position for the full year in canned vegetable and fruit. Business
fundamentals remain on solid ground with strong shelving, new innovation and sustained marketing investments.
Strong Market Position in Key Categories in the USA
Products Market Market Brands

30
Share Position
Canned Vegetable 29.4% #1
Canned Fruit 37.8% #1
Fruit Cup Snacks 31.1% #2
Canned Tomato* 8.4%* #2
Canned market shares are for branded only, ex-private labels
*Combined share for Del Monte, S&W and Contadina brands
Source: Nielsen Scantrack dollar share, Total US Grocery + WalMart, 12M ending 27 April 2019
Campaigns
A new, integrated master brand campaign “Growers of Good” was launched in September 2018 promoting Del Monte
as an advocate for doing what is good – Del Monte nurtures Earth’s goodness today to grow a healthier and more
hopeful tomorrow. Bibie Wu, DMFI’s Chief Marketing Officer said, “Growers of Good tells multiple stories about
our product line. It will feel very big because it will have the scale of an effective campaign, but also be able to
highlight different parts of our portfolio”.
DMFI relaunched the Contadina brand with national marketing support. In 2018, Contadina celebrated its 100th
Anniversary. To honour its 100-year-history of being in the kitchen of confident female cooks, Contadina – which is
Italian for "woman in the field" – celebrated 100 years of women in the culinary field. As part of the programme,
Contadina partnered with Cherry Bombe, a bi-annual magazine that champions women and food, for the launch of
The Cherry Bombe 100, its inaugural list of 100 women who are making unique and lasting contributions to the food
industry.
New Products - Retail
Three years ago, to meet the unique snacking needs of on-the-go adults, DMFI introduced Del Monte Fruit Refreshers,
the first-ever adult fruit cup. This won the 2017 Product of the Year Award in the Healthy Snacking category in the
USA. Two years ago, DMFI expanded the adult fruit cup snacking segment with the launch of Del Monte Fruit &
Chia, combining fruit with wholesome chia. Nearly 50% of US food consumption is in snacking, hence, the exciting
potential in the fruit cup segment.
DMFI’s thrust on innovation accelerated in FY2019 with entry into new categories. Following the success of Del
Monte Fruit Refreshers and Del Monte Fruit & Chia, DMFI entered a new segment with the launch of innovative Del
Monte Fruit & Oats in June 2018. It is the first shelf stable ready-to-eat oatmeal item combining healthy fruit and
wholesome oats in a cup, is delicious, filling as well as convenient for breakfast and snack. Del Monte Fruit & Oats
was voted 2019 Product of the Year in the Breakfast category in the USA, backed by votes of 40,000 consumers in a
national representative survey, conducted by research firm Kantar, a global leader in consumer research.
In synch with trends for health, snacking and convenience, and to diversify beyond the declining centre-of-store
canned goods aisle, Del Monte introduced four products in the growing refrigerated produce and frozen categories -
Del Monte Citrus Bowls, Del Monte Fruit Crunch Parfaits, Del Monte Veggieful Bites and Contadina Pizzettas.
DMFI launched Del Monte Citrus Bowls in the refrigerated produce section in February 2019. These are grapefruit
and citrus salad in 100% juice with a longer shelf life than fresh cut fruit, and without any preservatives. Del Monte
entered a new category and introduced, Del Monte Fruit Crunch Parfaits, which feature layers of non-dairy coconut
crème, crunchy granola, a full serving of fruit, plus two billion probiotics to aid digestive health.
Del Monte’s first foray into the frozen segment was through Del Monte Veggieful Bites and Contadina Pizzettas,
frozen snacks made with cauliflower crust, with no artificial flavours or preservatives. Both of these come with a full
serving of vegetable in five bites, making eating vegetables easier and crave-worthy! “With Veggieful Bites, we set
out to create a healthy snack with vegetables as the primary ingredient,” said DMFI’s CEO Gregory Longstreet. “In
fact,” he adds, “we are the only brand in the frozen snack space that can list vegetables as the largest ingredient in the

31
recipe, with veggies in the filling and the dough. This meets consumers’ desire for quick, convenient, delicious snacks
that are wholesome and nutritious.”
New Products - Foodservice
For the foodservice channel, DMFI also entered new product categories with Riced Cauliflower and other vegetables
with broadly positive industry reception. These are pre-cut, recipe ready vegetables which provide easy and tasty
alternative to high carbohydrate-sides. Del Monte is the first national player in this rapidly-growing new category.
Items are now stocked nationally throughout the United States.
One foodservice operator, Clean Eatz (with over 50 locations) offers as an alternative to rice to provide healthy menu
options. Its commissary prepares contracted meals sold through Gold’s Gym as well. Selection was based on Del
Monte’s higher quality and consistency versus the fresh products in the market.
Del Monte Nice Fruit Fresh Frozen Pineapple from the Philippines had also been placed within the College and
University segment in the USA at Stanford University as well as University of California Davis. With the patented
Nice Fruit freezing technology, frozen pineapple retains cellular integrity and when thawed, retains fresh-quality
colour, taste and texture.
DMFI introduced grab-and-go singles for foodservice and vending operators. These are single-serve fruit cups with
‘sporks’ in the lid, for convenient snacking on the go perfect for college students. Aramark is a contract foodservice
management company. Del Monte placed its Adult Fruit Cup singles with Aramark’s college and university division
and initial shipment will put the cups into 500 locations across the USA.
Response was positive from distributors and operators, especially on the Del Monte Fruit Crunch Parfaits, due to the
micro-mart need for diverse offerings and extended shelf life.
DMFI’s foodservice team has also realigned and reinforced its relationship with Vistar, the leading nationwide
distributor for Vending, Concessions and Hospitality. Its partnership with Vistar is expected to increase the availability
of its products to operators across the USA.
DMFI’s foodservice teams are focusing efforts and Broker attention on key channels where it has the strongest
opportunity to succeed: College and University, Healthcare and Lodging channels. Del Monte product benefits
(branded quality, healthy ingredients, labour solutions, grab and go snacking occasions) resonate most with the needs
of these channels, and these operators are drawn to Del Monte’s new innovative products.
Cross-selling
As part of DMPL’s growth and globalisation initiative, the distribution of imported product from the Philippines has
extended its reach beyond Asian ethnic market to mainstream grocery channel in the US. To strengthen the Group's
global supply chain network, DMFI will work to increase the cross-selling effort between the US and Asia
by expanding its international product portfolio to meet the growing demand of ethnic food product in the US.
DMFI has continued to export its S&W canned specialty fruits, corn and tomato products to Asia. It has also
introduced its Contadina sauces and College Inn broth to certain markets in Asia.
Philippines
The Philippine market sales in FY2019 were US$307.8 million, down 4.2% and 8.0% in peso and US terms,
respectively. Decline was mainly in the general trade and mixed fruit categories as a result of operational issues and
distributor transition. Decline in sales was further driven by unfavourable sales mix and higher direct promotion
spending. These were partly offset by price increases implemented across several categories in line with inflation.
Specific to distributor operations, FY2019 was a year of transformation as the Group worked to upgrade operations
and processes. As some of its legacy distributors have lagged in terms of modernisation required, the Group felt it
necessary to transition out of these distributors and replace them with those that could support the level of expansion
that the Group expects, particularly in a fast-changing, highly competitive environment. While the transition impacted
Philippine market sales in FY2019, the Group believes it will help set up a stronger base for future
growth. Improvements are expected to be seen beginning in the first quarter of FY2020.
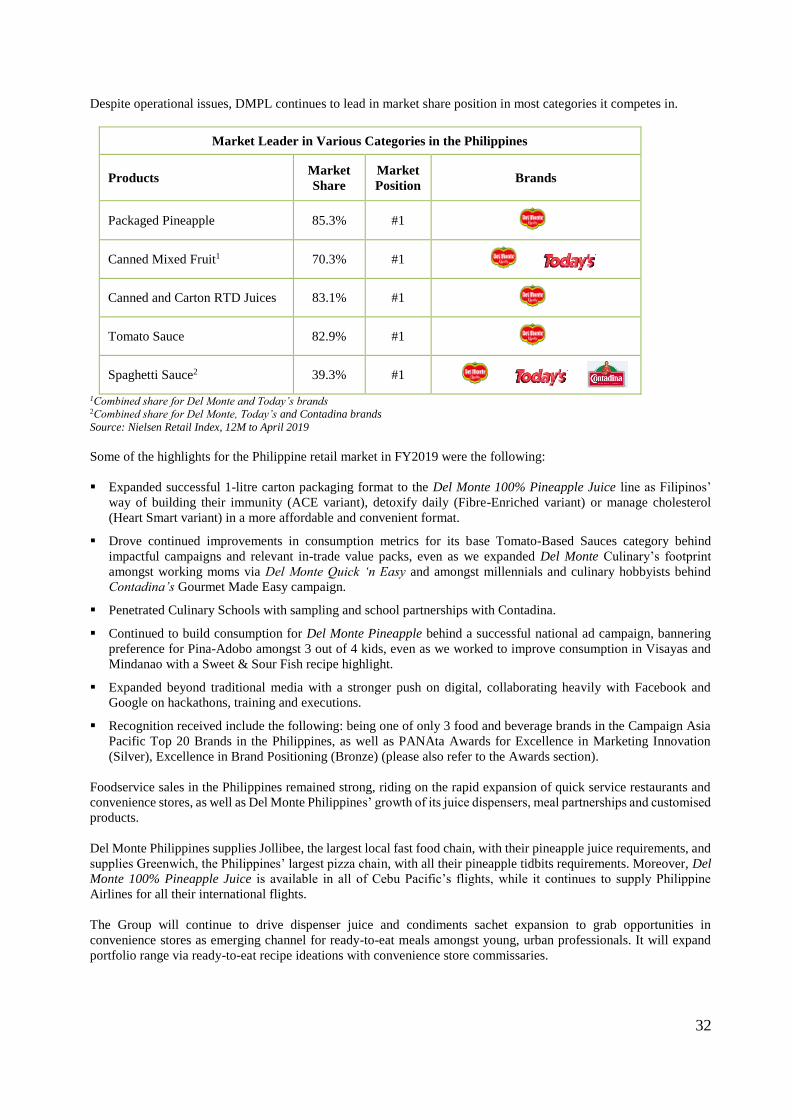
32
Despite operational issues, DMPL continues to lead in market share position in most categories it competes in.
Market Leader in Various Categories in the Philippines
Products Market
Share
Market
Position Brands
Packaged Pineapple 85.3% #1
Canned Mixed Fruit1 70.3% #1
Canned and Carton RTD Juices 83.1% #1
Tomato Sauce 82.9% #1
Spaghetti Sauce2 39.3% #1
1Combined share for Del Monte and Today’s brands 2Combined share for Del Monte, Today’s and Contadina brands
Source: Nielsen Retail Index, 12M to April 2019
Some of the highlights for the Philippine retail market in FY2019 were the following:
Expanded successful 1-litre carton packaging format to the Del Monte 100% Pineapple Juice line as Filipinos’
way of building their immunity (ACE variant), detoxify daily (Fibre-Enriched variant) or manage cholesterol
(Heart Smart variant) in a more affordable and convenient format.
Drove continued improvements in consumption metrics for its base Tomato-Based Sauces category behind
impactful campaigns and relevant in-trade value packs, even as we expanded Del Monte Culinary’s footprint
amongst working moms via Del Monte Quick ‘n Easy and amongst millennials and culinary hobbyists behind
Contadina’s Gourmet Made Easy campaign.
Penetrated Culinary Schools with sampling and school partnerships with Contadina.
Continued to build consumption for Del Monte Pineapple behind a successful national ad campaign, bannering
preference for Pina-Adobo amongst 3 out of 4 kids, even as we worked to improve consumption in Visayas and
Mindanao with a Sweet & Sour Fish recipe highlight.
Expanded beyond traditional media with a stronger push on digital, collaborating heavily with Facebook and
Google on hackathons, training and executions.
Recognition received include the following: being one of only 3 food and beverage brands in the Campaign Asia
Pacific Top 20 Brands in the Philippines, as well as PANAta Awards for Excellence in Marketing Innovation
(Silver), Excellence in Brand Positioning (Bronze) (please also refer to the Awards section).
Foodservice sales in the Philippines remained strong, riding on the rapid expansion of quick service restaurants and
convenience stores, as well as Del Monte Philippines’ growth of its juice dispensers, meal partnerships and customised
products.
Del Monte Philippines supplies Jollibee, the largest local fast food chain, with their pineapple juice requirements, and
supplies Greenwich, the Philippines’ largest pizza chain, with all their pineapple tidbits requirements. Moreover, Del
Monte 100% Pineapple Juice is available in all of Cebu Pacific’s flights, while it continues to supply Philippine
Airlines for all their international flights.
The Group will continue to drive dispenser juice and condiments sachet expansion to grab opportunities in
convenience stores as emerging channel for ready-to-eat meals amongst young, urban professionals. It will expand
portfolio range via ready-to-eat recipe ideations with convenience store commissaries.

33
S&W in Asia
Sales of the S&W business in Asia reached US$115.4 million in FY2019, 9% higher than the US$106.1 million in
FY2018, a record for this brand since the Group acquired it in 2007. The fresh segment accounted for 79% of S&W’s
total sales, while the packaged segment accounted for the balance 21%.
Improved sales were driven by the robust 19% growth of the S&W Sweet 16 fresh pineapple mainly in China on the
back of increased distribution of fresh pineapple in Tier 1-3 cities.
However, the packaged segment’s sales were lower mostly in Turkey, Korea and Indonesia. Turkey was impacted by
currency devaluation and political instability, while North Asia suffered from increased competition from cheaper
canned pineapple products from Thailand and Indonesia, partly offset by new customers.
The Group’s Nice Fruit joint venture, utilising patented technology that allows fruits to be picked at their optimal
ripeness and frozen for up to 3 years, while preserving its nutrients and original properties, successfully launched
frozen pineapple spears in 7-Eleven stores in Japan in June 2018. These are produced in Bukidnon, Philippines.
Individually packaged and known as Pineapple Stick, it is positioned as an on-the-go healthy snack placed in the
store’s chiller section. The joint venture followed this with the launch of frozen pineapple chunks called Golden
Pineapple in the same convenience store chain in November.
FieldFresh India (equity accounted)
Sales at FieldFresh Foods, our Indian joint venture (JV), which are equity accounted and not consolidated, were
US$77.5 million in FY2019, 10% and 2% higher in rupee and US$ terms, respectively, versus prior year.
US$69.3 million came from the Del Monte-branded packaged segment and US$8.2 million from the FieldFresh-
branded fresh segment.
The Del Monte business in India was up 12% in rupee terms on continued product innovation, as well as trade,
marketing and digital campaigns.
Tapping into the growing consumer trend for healthier snacking alternatives amongst young working adults, Del
Monte extended its dried fruit range, adding variants like Dried Cherries, Cherry Berry Mix and Nutty Cruiser Trail
Mix. The latter is a delicious and healthy blend of almonds, cashews, dried cranberries and black raisins. Del Monte
also started working with fitness and running communities to promote this range and an overall healthier lifestyle.
October saw the relaunch of Del Monte gourmet pasta sauces. The range was revamped to include two tomato-based
sauces, Napoletana & Puttanesca, and one vegetarian Alfredo sauce with real cheese (a first for the Indian market).
Also, in line with its desire to move to cleaner products and labels, these sauces contain no added preservatives,
making Del Monte the only brand to offer preservative-free pasta sauces in India.
The year also saw Del Monte introduce a range of low unit priced-SKUs like Mayonnaise 80g and Tomato Ketchup
200g to expand its presence in traditional trade outlets in India. On the back of these introductions, Del Monte managed
to increase its distribution in top metros like Delhi and Mumbai by 20%.
Del Monte joined Aahar, India’s largest B2B food exhibition in New Delhi with 100,000+ footfalls overs 5 days and
with 10,000+ visits to the Del Monte stall.
FieldFresh sustained its positive EBITDA, growing by double-digit, while DMPL’s share of loss in the FieldFresh
joint venture in India was lower at US$0.1 million from US$0.3 million in the prior year on higher sales and margins.
Gross Profit and Margin
DMPL generated a gross profit of US$395.0 million, lower by 9% versus the prior year, while gross margin increased
to 20.2% from 19.7% in the same period last year.
DMFI’s gross margin increased to 16.4% from 15.0% driven by lower trade spend, increase in retail list prices, higher
USDA pricing and favourable sales mix, partially offset by higher costs.

34
DMPL ex-DMFI gross margin was 27.3% from 30.4% due to lower, cyclical pineapple juice concentrate pricing,
unfavourable sales mix and higher product costs. These were partly offset by price increases in the Philippine market
in line with inflation.
EBITDA and Net Profit
DMPL generated an EBITDA of US$143.7 million of which US$52.5 million came from DMFI and US$87.9 million
from DMPL ex-DMFI. DMPL’s EBITDA improved by 40.5% due to a net one-off gain of US$4.5 million in FY2019
versus a net one-off expense of US$48.5 million in the prior year.
As part of the Group’s strategy to improve operational excellence and streamline operations, DMFI divested its
underperforming Sager Creek vegetable business in FY2018. This resulted in incremental one-off expenses for the
year ended. Please refer to the table below for the schedule of one-off items.
Non-Recurring Expense/(Income)
(in US$m)
FY2018 FY2019 Booked under
Closure of plants1 55.1 6.2 CGS, G&A and other
income /expense
Gain due to loan purchase2 (33.6) (16.7) Interest income
Severance and others 7.6 6.2 G&A expense and
other income/ expense
Total expense/(income) (pre-tax basis) 29.1 (4.3)
Write-off of Deferred Tax Asset at DMFI 39.83 - Tax expense
Total (net of tax and non-controlling interest of
10.6%)
48.5 (4.5)
1As part of its multiyear restructuring project to streamline operations and improve profitability, the Group closed two plants in the US in
FY2018-2019.
2Please refer to the “Cash Flow and Debt” section in the next page for the purchase of loan in the USA.
3The Group wrote off US$39.8m of deferred tax assets at DMFI due to the change in Federal income tax rate from 35% to 21%. Other
companies in the US with deferred tax assets have similar write-offs due to the reduction in income tax rates. However, this should be
more than offset by the reduced tax rates in future years which will be substantial.
Excluding one-off expenses, the Group’s EBITDA would have been US$156.1 million, 5% lower versus the recurring
EBITDA of US$165.0 million in the prior year. DMFI contributed an EBITDA of US$64.9 million, higher by 21%
mainly from lower marketing and general and administrative (G&A) expenses while DMPL ex-DMFI generated an
EBITDA of US$87.9 million, lower by 17% due to reduced sales in the Philippines.
The Group reported a net income of US$20.3 million for the full year, favourable compared to the prior year’s net
loss of US$36.5 million. Of the US$20.3 million of Group income, DMFI reported a loss of US$51.5 million while
DMPL ex-DMFI reported a net income of US$41.9 million. This year’s one-off adjustments from DMFI’s continued
restructuring initiatives and sale of Sager Creek were more than offset by the one-off gain worth US$16.7 million pre-
tax or US$13.0 million post-tax from the additional purchase of US$105.5 million of DMFI’s second lien loan at a
discount in the secondary market. Total loans bought back including that of FY2018 amounted to US$231 million out
of the total US$260 million.
Without the one-off items, the Group achieved a recurring net income of US$15.8 million as compared to last year’s
net income of US$12.0 million. DMFI had a recurring net loss of US$43.0 million from a loss of US$57.7 million in
the prior year mainly due to lower sale of branded fruits and vegetables and sale of Sager residual inventory. However,
DMFI’s recurring loss was reduced versus prior year loss due to increased list price, lower trade promotion, marketing
and G&A expenses. DMPL ex-DMFI had no one-off expenses and as such, its reported net income of US$41.9 million
was also its recurring net income.

35
INVENTORIES
DMPL’s inventories decreased to US$664.9 million as at 30 April 2019, from US$761.0 million as at 30 April 2018
mainly due to lower level of inventories in its USA subsidiary, DMFI.
CAPEX
Capital expenditures (capex) were US$121.6 million in FY2019, lower than the US$148.2 million in the prior year.
DMFI accounted for US$21.7 million of Group capex in FY2019, lower than the US$37.3 million in FY2018 due to
timing, while DMPL ex-DMFI’s capex accounted for US$99.9 million, down from US$110.8 million in FY2018 due
to lower spending on capital projects.
CASH FLOW AND DEBT
The Group’s cash flow from operations in FY2019 was US$180.9 million, lower versus prior year’s cash flow of
US$357.0 million mainly driven by lower trade and other payables.
In FY2018, the Group purchased from certain lenders US$125.9 million worth of principal amount of DMFI’s Second
Lien Term Loans at a 30% discount to par value in the secondary market. In FY2019, the Group purchased an
additional US$105.5 million bringing the total purchased loans to US$231.4 million out of US$260 million. The
Second Lien Term Loans are the highest-interest bearing loans for DMFI with an interest rate of LIBOR or 1%, plus
7.25% (10.15% p.a. until 24 June 2019 and 9.47% thereafter) and will mature in August 2021.
While the Second Lien Term Loans that have been acquired currently remain on DMFI’s balance sheet as an
obligation, the intercompany holdings of the loans and related interest expense is eliminated upon consolidation of
the DMPL Group, thereby resulting in a reduction of leverage for the Group.
This loan purchase is in line with the Company’s plan to delever its balance sheet and improve the capital structure
and profitability of the DMPL Group, through a reduction in effective interest expense of over US$10 million per
annum and savings from the purchase price discount for the Second Lien Term Loans. The one-off gain of US$16.7
million pre-tax or US$13.0 million post-tax booked in FY2019, and the US$33.6 million pre-tax or US$25.3 million
post-tax booked in FY2018 was a result of principal savings given the purchase discount.
The Group’s net debt (cash and bank balances less borrowings) amounted to US$1.46 billion as at 30 April 2019,
slightly higher than the US$1.44 billion as at 30 April 2018 due to additional loans obtained during the year. This is
just a timing difference to augment working capital needs.
Out of the total net debt of US$1.46 billion, DMFI accounted for US$823 million while DMPL ex-DMFI accounted
for US$634 million.
The Group’s net debt to equity ratio increased to 242% from 237% in the prior year.
DIVIDENDS
In October 2018 and April 2019, respectively, the Company paid dividends to holders of the Series A-1 Preference
Shares at the fixed rate of 6.625% per annum, or equivalent to US$0.33125 per Series A-1 Preference Share for the
six-month period from 8 April 2018 to 7 October 2018 and US$0.33125 for the six-month period 8 October 2018 to
7 April 2019. The Series A-1 Preference Shares were listed on the Philippine Stock Exchange on 7 April 2017.
In October 2018 and April 2019, respectively, the Company paid dividends to holders of the Series A-2 Preference
Shares at the fixed rate of 6.5% per annum, or equivalent to US$0.325 per Series A-2 Preference Share for the six-
month period from 8 April 2018 to 7 October 2018 and US$0.325 for the six-month period 8 October 2018 to 7 April
2019. The Series A-2 Preference Shares were listed on the Philippine Stock Exchange on 15 December 2017.
Under the Company’s Articles of Association and the terms of the Preference Shares, the Company may declare and
pay dividends on Common Shares provided there are adequate and available funds for dividends on Preference Shares
which have priority over Common Shares. Subject to the foregoing, the Board approved a final dividend of 0.52 US
cents (US$0.0052) or 0.706 Singapore cents (S$0.00706) per share representing 50% of FY2019 net profit.

36
For the fiscal year ended 30 April
2019 2018
Name of dividend Final Ordinary Final Ordinary
Type of dividend Cash Cash
Rate of dividend US$0.0052 per ordinary share Nil
Tax rate Nil Nil
Book closure date 12 July 2019 Nil
Payable date 19 July 2019 Nil
REVIEW OF COST OF GOODS SOLD AND OPERATING EXPENSES
% of Turnover For the full year ended 30 April
FY2019 FY2018 Comments
Cost of Goods Sold 79.8 80.3
Driven by lower sales of DMPL ex-DMFI and
release of inventory reserve for DMFI
Distribution and Selling
Expenses 10.4 10.1
Due to higher distribution and provision for
doubtful accounts
G&A Expenses 5.9 7.4 Lower personnel cost, lower facilities expense
Other Operating Expenses (0.2) 0.8
Lower miscellaneous expense due to assets
written off last year on closed plants
REVIEW OF OTHER MATERIAL CHANGES TO INCOME STATEMENTS
in US$’000 For the full year ended 30 April
FY2019 FY2018 % Comments
Depreciation and amortization (138,706) (147,845) 6.2
Mainly due to lower depreciation from
lower asset base
Reversal/(Provision) of
asset impairment (2,037) (24,534) 91.7
Impairment loss mainly on Sager Creek
assets which was higher in FY2018
Reversal/(Provision) for
inventory obsolescence 19,245 (21,823) 188.2 Due to reversal of provision
Provision for doubtful debts (2,646) (502) (427.1) Provided for doubtful accounts in Q4
Net gain/(loss) on disposal
of fixed assets 6,158 11,317 (45.6)
Mainly on sale of Sager Creek assets
from last year
Foreign exchange gain/(loss)-
net 394 3,379 (88.3)
Lower favourable impact of peso
devaluation for the year
Interest income 18,125 34,763 (47.9)
Due to one-off gain on second lien loan
purchased at a discount in the secondary
market from last year which was higher
at US$33.6 million compared to this
year at US$ 16.7 million.
Interest expense (96,958) (102,323) 5.2 Lower level of borrowings
Share in net loss of JV (983) (1,552) (36.7)
FieldFresh losses was higher last
FY2018 than in FY2019
Taxation 13,524 (14,844) 191.1
Write off of non-cash deferred tax
assets of US$39.8m at DMFI, partially
offset by DMFI’s higher net operating
loss from last year

37
REVIEW OF GROUP ASSETS AND LIABILITIES
Extract of Accounts with
Significant Variances
30 April
2019
30 April 2018
30 April
2017 Comments
in US$’000
Deferred tax assets 106,321 79,829 92,786
Due to higher future tax benefits
from loss carryforwards of DMFI
Other assets 39,096 41,223 27,112
Reclassification of receivable from
sale of Sager Creek vegetable
business to current assets
Biological assets 54,002 43,592 45,767
Favourable fair value adjustment in
biological assets
Inventories 664,922 760,981 916,892 Lower inventory level at DMFI
Prepaid and other current
assets 36,176 30,782 43,046
Due to increase in prepaid input
VAT and downpayments to
contractors in DMPI and higher
prepaid slotting expense for DMFI.
Cash and cash equivalents 21,636 24,246 37,571
Due to repayments of payables,
partially offset by better working
capital management mainly on lower
inventories
Other non-current liabilities 30,015 35,195 44,018 Lower workers compensation
Employee benefits– non-
current 63,781 76,905 87,599
Due to retirement plan amendment
which resulted to lower employee
retirement benefits
Trade and other payables 188,669 263,026 299,545
Due to lower trade and accrued
expenses
Key Performance Indicators
The following sets forth the explanation why certain performance ratios (i.e. current ratio, debt to equity ratio, net
profit margin, return on asset, and return on equity) do not fall within the benchmarks indicated by the Securities and
Exchange Commission of the Philippines (the “SEC”).
A. Current Ratio
30-Apr-19 30-Apr-18 Benchmark
Current Ratio 1.3 1.3 Minimum of 1.2
The decrease in the current ratio is due to reduced inventory driven by plant closure.
B. Debt to Equity
30-Apr-19 30-Apr-18 Benchmark
Debt to Equity 3.0 3.1
Maximum of
2.5
The decrease in the debt to equity is due to lower debt due to payment and higher equity this year due to
issuance of additional preference shares.
C. Net Profit Margin
30-Apr-19 30-Apr-18 Benchmark

38
Net Profit/(Loss) Margin attributable to
owners of the company 1.04% -1.66%
Minimum of
3%
The Group generated a net profit margin of 1.04% for the full year of FY2019, largely favourable compared
to prior year, due to significant expenses incurred due to plant closure losses and deferred tax asset write
off incurred in FY2018.
D. Return on Asset
30-Apr-19 30-Apr-18 Benchmark
Return on Asset 0.59% -2.04% Minimum of 1.21
The DMPL Group generated a return on asset of 0.59% for the full year of FY2019, largely favourable
compared to prior year, due to significant expenses incurred due to plant closure losses and deferred tax
asset write off incurred in FY2018.
E. Return on Equity
30-Apr-19 30-Apr-18 Benchmark
Return on Equity 2.36% -8.40%
Minimum of
8%
The DMPL Group generated a return on equity of 2.36% for the full year of FY2019, largely favourable
compared to prior year, due to significant expenses incurred due to plant closure losses and deferred tax
asset write off incurred in FY2018.
Material Changes in Accounts
A. Cash and cash equivalent
Due to repayments of payables, partially offset by better working capital management mainly on lower
inventories
B. Inventories
Decrease in inventory is mainly due to lower inventory level at DMFI.
C. Prepaid and other current assets
Due to increase in prepaid input VAT and downpayments to contractors in DMPI and higher prepaid slotting
expense for DMFI.
D. Biological assets
Due to favourable fair value adjustment in biological assets.
F. Deferred tax assets
Due to higher future tax benefits from loss carryforwards of DMFI.
G. Trade & Other Payables
Decrease in trade and other payable is mainly due to lower trade and accrued expenses.
H. Employee benefits– non-current

39
Due to plan amendment which lowered the retirement benefits this year.
I. Other noncurrent liabilities
Due to lower workers’ compensation

40
Financial Ratios
Supplementary Schedule of Financial Soundness Indicator
Ratio Formula
30 April
2020
30 April
2019
30 April
2018
(i) Liquidity Analysis Ratios:
Current Ratio or
Working Capital
Ratio Current Assets / Current Liabilities 0.6 1.3 1.3
Quick Ratio
(Current Assets - Inventories -
Prepaid expenses and other current
assets - Biological Assets –
Noncurrent assets held for sale) /
Current Liabilities 0.2 0.2 0.2
(ii) Solvency Ratio Total Assets / Total Liabilities 1.3 1.3 1.3
Financial Leverage
Ratios:
Debt Ratio Total Debt/Total Assets 0.8 0.7 0.7
Debt-to-Equity
Ratio
Total Debt/Total Stockholders'
Equity 3.5
3.0
3.1
(iii) Asset to Equity
Ratio
Total Assets / Total Stockholders'
Equity 4.5 4.0 4.1
(iv) Interest Coverage
Earnings Before Interest and Taxes
(EBIT) / Interest Charges 0.4 0.8 0.3
(v) Debt/EBITDA
Ratios
Total Debt/ Earnings Before Interest,
Taxes, Depreciation and
Amortization (EBITDA) 12.5 18.6
(vi) Profitability Ratios
Gross Profit
Margin Revenue - Cost of Sales / Revenue 21.24% 20.21% 19.68%
Net Profit Margin
attributable to
owners of the
company
Net Profit attributable to owners /
Revenue -3.82% 1.04% (1.66)%
Net Profit Margin Net Profit / Revenue -4.41% 0.73% (2.32)%
Return on Assets Net Profit / Total Assets -3.67% 0.59% (2.04)%
Return on Equity
Net Profit / Total Stockholders'
Equity -16.58% 2.36% (8.40)%

41
BUSINESS OUTLOOK
As the demand for its trusted, healthy shelf-stable products is sustained, the Group will continue to operate its
production facilities while implementing strict safety measures and protecting its people. The strategy is to strengthen
the core business and expand the product portfolio, in line with market trends for health and wellness, and grow its
branded business while reducing non-strategic business segments.
The Group will continue to strengthen its product offerings and enter new categories. It will continue to focus on
business segments which are on-trend, pursue innovation to address growing consumer needs for more convenient,
healthy and flavourful solutions, as well as build its distribution base in emerging channels.
While DMFI’s Asset-Light Strategy has been a complex undertaking, it has been a critical step in repositioning DMFI
for the future. Execution of this strategy and other cost saving initiatives should improve the Group’s EBITDA margin
by an estimated 225–275 basis points (US$50 to 60 million) over the next 24 months starting November 2019. In the
fourth quarter of FY2020, the Group recognised cost savings of US$5 to 6 million which favourably impacted
profitability. DMFI is expected to achieve 95% capacity utilisation for vegetable in the next pack season this year, up
from 50%.
A portion of these improved cost savings will be reinvested in the growth and expansion of DMFI’s iconic brands.
DMFI is capitalising on growing consumer desire for convenient, healthy and tasty plant-based foods. It is expanding
its brands beyond center store grocery into higher growth categories such as frozen, produce and deli.
“The restructuring is a necessary step for us to remain competitive in a rapidly changing marketplace,” said DMPL
Managing Director and Chief Executive Officer Joselito D Campos, Jr. “Our asset-light strategy will lead to more
efficient and lower cost operations,” he added.
The Group will continue to expand its existing branded business in Asia, through the Del Monte brand in the
Philippines, where it is a dominant market leader. S&W, both packaged and fresh, will continue to gain more traction
as it leverages its distribution expansion in Asia and the Middle East.
The Nice Fruit frozen pineapple plant is in operation, with shipments to the USA, Japan, China and South Korea. We
expect to make Nice Fruit frozen pineapple available across more markets.
The Group has been exploring e-commerce opportunities for its range of products across markets.
Barring unforeseen circumstances, the Group is expected to remain profitable in FY2021.
Item 7. Financial Statements (FS) and Other Documents Required to be filed with the FS under SRC Rule
68, as Amended
The FY 2020 Audited Financial Statements of the Company is attached hereto as Annex “A”. The additional
components of the FS are hereto attached as follows:
Index to Supplementary Schedules
Tabular schedule of standards and interpretations as of reporting date, and a Map of the
group of companies showing the relationships between and among the company and its
ultimate parent company, middle parent, subsidiaries or co- subsidiaries, and associates
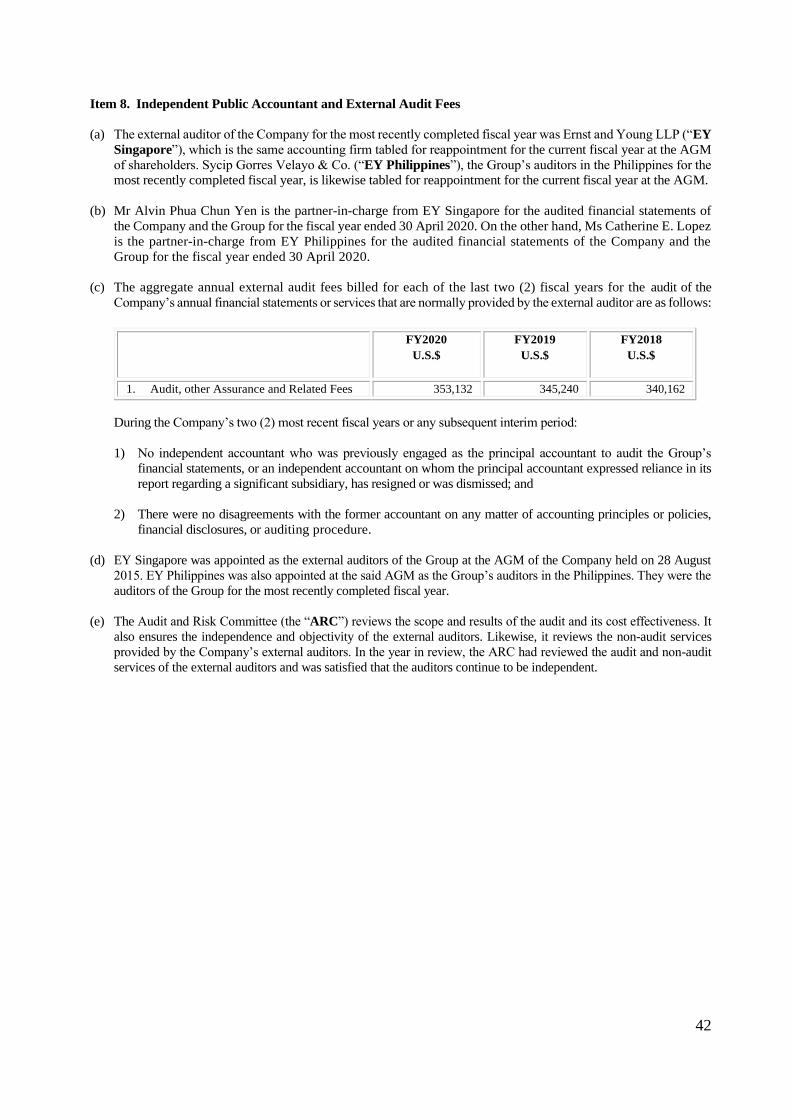
42
Item 8. Independent Public Accountant and External Audit Fees
(a) The external auditor of the Company for the most recently completed fiscal year was Ernst and Young LLP (“EY
Singapore”), which is the same accounting firm tabled for reappointment for the current fiscal year at the AGM
of shareholders. Sycip Gorres Velayo & Co. (“EY Philippines”), the Group’s auditors in the Philippines for the
most recently completed fiscal year, is likewise tabled for reappointment for the current fiscal year at the AGM.
(b) Mr Alvin Phua Chun Yen is the partner-in-charge from EY Singapore for the audited financial statements of
the Company and the Group for the fiscal year ended 30 April 2020. On the other hand, Ms Catherine E. Lopez
is the partner-in-charge from EY Philippines for the audited financial statements of the Company and the
Group for the fiscal year ended 30 April 2020.
(c) The aggregate annual external audit fees billed for each of the last two (2) fiscal years for the audit of the
Company’s annual financial statements or services that are normally provided by the external auditor are as follows:
FY2020
U.S.$
FY2019
U.S.$
FY2018
U.S.$
1. Audit, other Assurance and Related Fees 353,132 345,240 340,162
During the Company’s two (2) most recent fiscal years or any subsequent interim period:
1) No independent accountant who was previously engaged as the principal accountant to audit the Group’s
financial statements, or an independent accountant on whom the principal accountant expressed reliance in its
report regarding a significant subsidiary, has resigned or was dismissed; and
2) There were no disagreements with the former accountant on any matter of accounting principles or policies,
financial disclosures, or auditing procedure.
(d) EY Singapore was appointed as the external auditors of the Group at the AGM of the Company held on 28 August
2015. EY Philippines was also appointed at the said AGM as the Group’s auditors in the Philippines. They were the
auditors of the Group for the most recently completed fiscal year.
(e) The Audit and Risk Committee (the “ARC”) reviews the scope and results of the audit and its cost effectiveness. It
also ensures the independence and objectivity of the external auditors. Likewise, it reviews the non-audit services
provided by the Company’s external auditors. In the year in review, the ARC had reviewed the audit and non-audit
services of the external auditors and was satisfied that the auditors continue to be independent.

43
Part III – CONTROL AND COMPENSATION INFORMATION
Item 9. Directors and Executive Officers of the Registrant
Board of Directors and Senior Management
The following comprises the Company’s Board of Directors:
Name Age Citizenship Position
Rolando C. Gapud 78 Filipino Executive Chairman
Joselito D. Campos, Jr. 69 Filipino Managing Director & Chief Executive Officer
Edgardo M. Cruz, Jr. 65 Filipino Executive Director
Benedict Kwek Gim Song 73 Singaporean Lead Independent Director
Godfrey E. Scotchbrook 74 British Independent Director
Dr. Emil Q. Javier 79 Filipino Independent Director1
Yvonne Goh 67 Singaporean Independent Director
The following comprises the Group’s Senior Management:
Name Age Citizenship Position
Joselito D. Campos, Jr. 69 Filipino Managing Director and CEO
Luis F. Alejandro 66 Filipino Chief Operating Officer
Ignacio C. O. Sison 56 Filipino Chief Corporate Officer
Parag Sachdeva 50 Indian Chief Financial Officer
Antonio E.S. Ungson 48 Filipino Chief Legal Counsel and Chief Compliance Officer, and
Company Secretary
Ruiz G. Salazar 56 Filipino Chief Human Resource Officer
Ma. Bella B. Javier 60 Filipino Chief Scientific Officer
The following is a brief description of the business experience of the Company’s Board of Directors and Senior
Management for the past five (5) years.
Mr Rolando C Gapud
Executive Chairman, 78
Appointed on 20 January 2006 and last re-elected on 30 August 2017
Mr Rolando C Gapud has over 45 years of experience in banking, finance and general management, having worked
as CEO of several Philippine companies, notably Security Bank and Trust Company, Oriental Petroleum and Minerals
Corp and Greenfield Development Corp. He was also the COO of the joint venture operations of Bankers Trust and
American Express in the Philippines. He has served in the Boards of various major Philippine companies, including
the Development Bank of the Philippines, the development finance arm of the Philippine Government. Mr Gapud is
the Chairman of the Board of Del Monte Foods, Inc, DMPL’s US subsidiary, and Executive Chairman of Del Monte
Philippines, Inc, DMPL’s Philippine subsidiary. He is also a Director of FieldFresh Foods Private Ltd, a joint venture
of DMPL with the Bharti Group of India. He holds a Master of Science in Industrial Management degree from the
Massachusetts Institute of Technology. He is a member of the Asian Executive Board of the Sloan School of MIT and
the Board of Governors of the Asia School of Business, a joint venture between the Sloan School of MIT and Bank
Negara, the Central Bank of Malaysia.
1Dr. Emil Q. Javier is an Independent Director, pursuant to Sec. 2.3 of the Monetary Authority of Singapore.

44
Mr Joselito D Campos, Jr
Executive Director, 69
Appointed on 20 January 2006 and last elected on 28 April 2006
Mr Joselito D Campos, Jr is Chairman and CEO of the NutriAsia Group of Companies, a major food conglomerate in
the Philippines. He is also Chairman of Fort Bonifacio Development Corp and Chairman of Ayala-Greenfield
Development Corp, two major Philippines property developers. He is a Director of San Miguel Corporation, one of
the largest and oldest business conglomerates in the Philippines. Mr Campos is the Vice Chairman of Del Monte
Foods, Inc, DMPL’s US subsidiary, and a Director of Del Monte Philippines, Inc, DMPL’s Philippine subsidiary. He
is also a Director of FieldFresh Foods Private Ltd, a joint venture of the Company with the Bharti Group of India. He
was formerly Chairman and CEO of United Laboratories, Inc and its regional subsidiaries and affiliates. Unilab is the
Philippines’ largest pharmaceutical company with substantial operations in the Asian region. Mr Campos is the Consul
General in the Philippines for the Republic of Seychelles. He is also Chairman of the Metropolitan Museum of Manila,
Bonifacio Arts Foundation Inc, The Mind Museum and the Del Monte Foundation, Inc. He is a Trustee and Global
Council Member of the Asia Society in the Philippines; a Trustee of the Philippines-China Business Council and the
Philippines Center for Entrepreneurship; a National Advisory Council Member of the World Wildlife Fund-
Philippines; and a Director of the Philippine Eagle Conservation Program Foundation, Inc. Mr Campos holds an MBA
from Cornell University.
Mr Edgardo M Cruz, Jr
Executive Director, 65
Appointed on 2 May 2006 and last re-elected on 17 August 2018
Mr Edgardo M Cruz, Jr is a member of the Board of the NutriAsia Group of Companies. Mr Cruz is a Director of Del
Monte Foods, Inc, DMPL’s US subsidiary, and an Executive Director of Del Monte Philippines, Inc, DMPL’s
Philippine subsidiary. He is the Chairman of the Board of Bonifacio Gas Corporation, Bonifacio Water Corporation,
Bonifacio Transport Corporation and Crescent West Development Corporation. He is a member of the Board of
Evergreen Holdings Inc, Fort Bonifacio Development Corporation and the BG Group of Companies. He is also a
Board member and Chief Financial Officer of Bonifacio Land Corporation. He sits on the Boards of Ayala Greenfield
Development Corporation and Ayala Greenfield Golf and Leisure Club Inc. He is a member of the Board of Trustees
of Bonifacio Arts Foundation Inc, The Mind Museum and the Del Monte Foundation, Inc. Mr Cruz earned his MBA
degree from the Asian Institute of Management after graduating from De La Salle University. He is a Certified Public
Accountant.
Mr Benedict Kwek Gim Song
Lead Independent Director, 73
Appointed on 30 April 2007 and last re-elected on 30 August 2017
Appointed as Lead Independent Director on 11 September 2013
Mr Benedict Kwek Gim Song is a Director of Del Monte Foods, Inc, DMPL’s US subsidiary. Mr Kwek was Chairman
of previously SGX-listed Pacific Shipping Trust from 2008 to 2012. He was also a Director and Chairman of the
Audit Committee of listed companies including Ascendas REIT. He has over 30 years of banking experience, having
served as the President and CEO of Keppel TatLee Bank. He has held various key positions at Citibank in the
Philippines, Hong Kong, New York and Singapore. He holds a Bachelor of Social Science (Economics) degree from
the then University of Singapore and attended a management development programme at Columbia University in the
United States.
Mr Godfrey E Scotchbrook
Independent Director, 74
Appointed on 28 December 2000 and last re-elected on 17 August 2018
Mr Godfrey E Scotchbrook is an independent practitioner in corporate communications, issues management and
investor relations with more than 40 years of experience in Asia. In 1990, he founded Scotchbrook Communications
and his prior appointments included being an executive director of the then publicly listed Shui On Group. A
proponent of good corporate governance, he is an Independent Director of Boustead Singapore Ltd and a Non-
Executive Director of Hong Kong-listed Convenience Retail Asia. He is a Fellow of the Hong Kong Management
Association and also of the British Chartered Institute of Public Relations. He is also a Director of Del Monte Foods,
Inc, DMPL’s US subsidiary. Mr Scotchbrook earned his DipCam PR having studied Media and Communications at
City University, London.

45
Dr Emil Q Javier
Independent Director, 79
Appointed on 30 April 2007 and last re-elected on 30 August 2016
Dr Emil Q Javier is a Filipino agronomist with a broad understanding of developing country agriculture. He was the
first and only developing country scientist to Chair the Technical Advisory Committee of the prestigious Consultative
Group for International Agricultural Research (CGIAR), a global consortium led by the World Bank and the Food
and Agriculture Organization of the United Nations (FAO). He was Director General of the Asian Vegetable Research
and Development Center (AVRDC) based in Taiwan and has served as Chairman of the Board of
International Rice Research Institute (IRRI), and as Chairman and Acting Director of the Southeast Asian Regional
Center for Graduate Study and Research in Agriculture (SEARCA). In the Philippines at various periods, he had been
President of the University of the Philippines, Minister for Science and Technology and President of the National
Academy of Science and Technology, Philippines (NAST PHL). In May 2019, he was elected by his peers in NAST
as a National Scientist, the highest honour conferred by the President of the Philippines to a Filipino in the field of
science and technology. Dr Javier is an Independent Director of Del Monte Foods, Inc, DMPL’s US subsidiary, and
of Del Monte Philippines, Inc, DMPL’s Philippine subsidiary, and is an Independent Director of Philippine-listed
Centro Escolar University. He holds doctorate and master’s degrees in plant breeding and agronomy from Cornell
University and University of Illinois at Urbana-Champaign, respectively. He completed his bachelor’s degree in
agriculture at the University of the Philippines Los Baños.
Mrs Yvonne Goh
Independent Director, 67
Appointed on 4 September 2015 and last re-elected on 30 August 2016
Mrs Goh is a Director of UNLV Singapore Limited, the Singapore campus of the University of Nevada Las Vegas
(UNLV), USA. Mrs Goh is also a Director of EQUAL-ARK Singapore Ltd, a charity registered under the Charities
Act and an Institution of a Public Character (IPC), assisting at-risk-kids and the elderly through equine-assisted
learning and therapy. She also serves on the Board of Del Monte Foods, Inc, DMPL's US subsidiary. Mrs Goh was
previously Managing Director of the KCS Group in Singapore, a professional services organisation and Managing
Director of Boardroom Limited, a company listed on the SGX. Mrs Goh had served on the Board of WWF Singapore
Limited, the Singapore chapter of WWF International, a leading global NGO. She was a Council Member and Vice
Chairman of the Singapore Institute of Directors as well as Chairman of its Professional Development Committee. Mrs
Goh was also a Director of the Accounting and Corporate Regulatory Authority (ACRA) and a past Chairman of the
Singapore Association of the Institute of Chartered Secretaries and Administrators. Mrs Goh is a Fellow of the
Singapore Institute of Directors and a Fellow of the Institute of Chartered Secretaries and Administrators, UK.
Luis F. Alejandro
Chief Operating Officer
Mr Luis F Alejandro has over 30 years of experience in consumer product operations and management. He started his
career with Procter & Gamble where he spent 15 years in brand management before joining Kraft Foods Philippines
Inc as President and General Manager. Later, he joined Southeast Asia Food Inc and Heinz UFC Philippines, Inc, two
leading consumer packaged condiment companies of the NutriAsia Group, as President and Chief Operating Officer.
He then became President and Chief Operating Officer of ABS-CBN Broadcasting Corporation, a leading media
conglomerate in the Philippines. Mr Alejandro is a Director of Del Monte Foods, Inc, DMPL’s US subsidiary, and
Del Monte Philippines, Inc, DMPL’s Philippine subsidiary. He is also a Director of FieldFresh Foods Private Ltd, a
joint venture of DMPL with the Bharti Group of India. He holds a Bachelor’s degree in Economics from the Ateneo
de Manila University and an MBA from the Asian Institute of Management.
Ignacio C. O. Sison
Chief Corporate Officer
Mr Ignacio C O Sison is DMPL’s Chief Corporate Officer responsible for strategic planning, sustainability, risk
management and investor relations. He has been with DMPL since 1999 and was the group’s Chief Financial Officer
for nine years. Mr Sison has nearly 30 years of experience spanning corporate and strategic planning, financial
planning, treasury, controllership, corporate sustainability, risk management and investor relations. Before joining
Del Monte Pacific, he was CFO of Macondray and Company, Inc, then DMPL’s parent company, for three years.
Amongst others, he also worked for Pepsi-Cola Products Philippines and SGV & Co, the largest audit firm in the
Philippines. Mr Sison holds an MSc degree in Agricultural Economics from Oxford University; an MA, Major in
Economics, from the International University of Japan; a BA in Economics, magna cum laude, from the University

46
of the Philippines; and an International Baccalaureate from the Lester B Pearson United World College of the Pacific
in Canada. In 2010, Mr Sison received the Best CFO award from the Singapore Corporate Awards.
Parag Sachdeva
Chief Financial Officer
Mr Parag Sachdeva has 25 years of management and finance experience spanning planning and controllership,
performance management, mergers and acquisitions, treasury, IT and human resources. Before joining DMPL, he was
with Carlsberg Asia for more than a year and supported efficiency and effectiveness programmes across the Asian
and African regions. Prior to Carlsberg, he was with HJ Heinz for 20 years and held leadership positions in Asia
Pacific regions in finance, IT and human resources. Mr Sachdeva graduated from the Aligarh Muslim University in
India, Major in Accounting and Commerce. He also has an MBA degree, Major in Finance from the same university.
Antonio E. S. Ungson
Chief Legal Counsel, Chief Compliance Officer, and Company Secretary
Mr Antonio E S Ungson is Chief Legal Counsel, Chief Compliance Officer and Company Secretary of the Company.
He is also Head of the Legal Department of Del Monte Philippines, Inc since March 2007. Prior to joining the Group
in 2006, Mr Antonio E S Ungson was a Senior Associate in SyCip Salazar Hernandez & Gatmaitan in Manila, where
he served various clients for eight years in assignments consisting mainly of corporate and transactional work
including mergers and acquisitions, securities and government infrastructure projects. He also performed litigation
work and company secretarial services. Mr Ungson was a lecturer on Obligations and Contracts and Business Law at
the Ateneo de Manila University Loyola School of Management. He obtained his MBA from Kellogg HKUST, his
Bachelor of Laws from the University of the Philippines College of Law and his undergraduate degree in Economics,
cum laude and with a Departmental award at the Ateneo de Manila University.
Ruiz G. Salazar
Chief Human Resource Officer
Mr Ruiz G Salazar is a Human Resources and Organisation Development Leader with over 25 years of professional
career focused on delivering strategic and effective solutions as a value-driven partner to business, most of which was
spent with Johnson & Johnson (J&J). He was Regional Human Resources Director of J&J Asia Pacific, where he was
responsible for talent management, organisation transformation, succession pipelining and capability development
covering mostly J&J’s Consumer Division across the region. Prior to J&J, he was also Group Head – Human
Resources and Organisation Development of NutriAsia Food, Inc. Mr Salazar completed the J&J’s Senior
Management Program at the Asian Institute of Management in 1996, and the J&J’s Advanced Management Program
at the University of California in 1995. He obtained his Bachelor of Arts degree (Major in Economics) from the
University of Santo Tomas.
Ma. Bella B. Javier
Chief Scientific Officer
Ms Ma Bella B Javier has more than 30 years of experience in R&D from leading fast moving consumer goods in the
food industry. She spent 20 years at Kraft Foods, with her last assignment as the Director for Asia Pacific Beverage
Technology and Southeast Asia Development. In her present role, she heads the Consumer Product and Packaging
Development and the Quality Assurance functions for the Group. She is driving the Technology Development
roadmap for the Company, including plantation research programmes that impact consumer product development.
She is a Certified Food Scientist from the Institute of Food Technologists, Chicago, Illinois, USA. Ms Javier is a
Licensed Chemist with a Bachelor’s degree in Chemistry from the University of the Philippines (UP). She sits in the
Board of Trustees of UP’s Chemistry Alumni Foundation. Ms Javier was accorded the 2015 UP Distinguished Alumni
in the field of Science and Technology.
Directorships in Other Listed Companies
The table below sets forth the directorships in other listed companies, both current and in the past three (3) years:
Name Position Company Date
Joselito D Campos, Jr Director San Miguel Corporation 2010 – Present

47
Emil Q Javier Independent Director Centro Escolar University 2002 – Present
Godfrey E Scotchbrook Independent Director Boustead Singapore Ltd. (Singapore) 2000 – Present
Non-Executive Director Convenience Retail Asia (HK) 2002 – Present
None of the Company’s Directors are Chairman in other listed companies.
Significant Employees
The Board and the Senior Management of the Company have been an integral part of its success. Their knowledge,
experience, business relationships and expertise greatly contribute to the Company’s operating efficiency and
financial performance.
The Company maintains that it considers the collective efforts of the Board and all of its employees as instrumental
to its overall success. The business of the Company is not dependent on any individual person. No employee is
indispensable in the organization. The Company has institutionalized, through documentation, its processes and
training to ensure continuity and scalability in the business without relying on any particular employee.
Family Relationships
Other than as provided below, there are no other family relationships known to the Company:
Ms. Jeanette Beatrice Campos Naughton is Vice President, Strategic Planning of the Company’s U.S. subsidiary, Del
Monte Foods, Inc (“DMFI”). She is the daughter of Mr. Joselito D Campos, Jr., the Company’s Managing Director
and CEO, and DMFI’s Vice Chairman and Director.
Involvement in Certain Legal Proceedings
As to the Directors, Executive Officers and Nominees for Election:
Except as set out below, the Company is not aware that any of the incumbent Directors and any nominee for election
as director, executive officer or control person of the Company has been the subject of any: (a) bankruptcy petition;
(b) conviction by final judgment in a criminal proceeding, domestic or foreign; (c) order, judgment, or decree, not
subsequently reversed, suspended or vacated, of any court of competent jurisdiction, domestic or foreign, permanently
or temporarily enjoining, barring, suspending or otherwise limiting his involvement in any type of business, securities,
commodities or banking activities; and (d) judgment of violation of a securities or commodities law or regulation by
a domestic or foreign court of competent jurisdiction, in a civil action, the Philippine SEC or a comparable foreign
body, or a domestic or foreign exchange or other organized trading market or self-regulatory organization, which has
not been reversed, suspended or vacated, for the past five (5) years up to the latest date that is material to the evaluation
of his ability or integrity to hold the relevant position in the Company:
Mr. Luis F. Alejandro, the Group’s Chief Operating Officer, is not involved in any criminal, bankruptcy or
insolvency investigation or any other proceeding against him, except only the libel case pending between GMA
Network, Inc and ABS-CBN Broadcasting Corp where he was impleaded eight years ago as co-accused in his
capacity as then President and Chief Operating Officer of ABS-CBN Broadcasting Corp.

48
Item 10. Compensation of Directors and Executive Officers
The aggregate compensation paid or incurred during the last two fiscal years and estimated to be paid in the ensuing
fiscal year to the CEO and senior executive officers of the Company are as follows:
Name and principal position Year Salary
(in PhP)
Bonus
(in PhP)
A. Chief Executive Officer and most
highly compensated executive
officers*
FY 2020 (Est) 190,510,351 185,796,915
FY 2019 188,109,963 100,182,352
FY 2018 183,301,605 148,565,165
B. All other officers and directors as a
group unnamed
FY 2020 (Est) 169,158,192 44,634,112
FY 2019 154,015,088 43,483,998
FY 2018 158,746,949 52,045,184
*The CEO and executive officers of the Company are as follows: Managing Director & CEO, Mr. Joselito D Campos, Jr. and the executives (in alphabetical order): Luis F. Alejandro, Ma. Bella B. Javier, Parag Sachdeva and Ignacio Carmelo O. Sison.
Standard Arrangement
The Directors receive a fixed remuneration annually based on the following fee structure:
a. Board Chairman: US$79,200 per annum;
b. Directors: US$43,200 per annum;
c. ARC Chairman: US$19,800 per annum;
d. RSOC Chairman: US$9,900 per annum;
e. NGC Chairman: US$9,900 per annum;
f. ARC Members: US$10,800 per annum;
g. RSOC Members: US$5,400 per annum; and
h. NGC Members: US$5,400 per annum.
The Directors do not receive any allowance for attending Board or Board committee meetings.
Other Arrangements
Dr. Emil Q. Javier has a consultancy agreement with the Company to act as a consultant, amongst other things, to
provide guidance and support to the Group on its plantation operations and development of agri-based initiatives.
Except as described above, there are no other arrangements pursuant to which any of the Company’s Directors and
officers are compensated, or are to be compensated, directly or indirectly.
Employment Contracts and Termination of Employment and Change-in-Control Arrangements
There are no arrangements for compensation to be received by any executive officer from the Company in the event
of a resignation, or termination of the executive officer’s employment or a change of control of the Company. The
Company, however, provides retirement benefits to qualified employees, including Key Management Personnel.
Share Options
There are no outstanding share options as of the date of this Information Statement. All unexercised options which
were granted pursuant to the Del Monte Pacific Executive Stock Option Plan 1999 had already lapsed on 6 March
2018.
Share Awards
All share awards granted to Directors had since 20 September 2017 been vested and released to Directors.
Except as disclosed [in the Company’s Annual Report], no Director who held office at the end of the financial year
had interests in shares, debentures, warrants, share options or share-based incentives of the Company or of related
corporations, either at the beginning or at the end of the financial year.

49
Item 11. Security Ownership of Certain Beneficial Owners and Management
i) Security Ownership of Certain Record and Beneficial Owners of More Than 5%
The table below sets forth the security ownership of certain record and beneficial owners of more than 5% of the
Company’s voting securities as of the date of this Information Statement.
Title of
Class
Name and Address of Record
Owner
and Relationship with Issuer
Name of
Beneficial Owner
and Relationship
with Record
Owner
Citizenship
No. of
Common
Shares Held
% of Total
Outstanding
Shares
Ordinary
Shares
NutriAsia Pacific Limited
(“NAPL”)
Trident Chambers Road Town,
Tortola, British Virgin Islands
Shareholder
NAPL is the
beneficial and
record owner of
the shares
indicated.*
British
Virgin
Islands
1,196,539,958
Ordinary
Shares
61.55%
Ordinary
Shares
HSBC (Singapore) Nom’s Pte.
Ltd. (“HSBC”)
21 Collyer Quay #13-01 HSBC
Building Singapore 049320
Shareholder
Bluebell Group
Holdings Limited
(“Bluebell”) is the
beneficial owner of
the shares indicated.*
The shares are held
in nominee by
HSBC.
British
Virgin
Islands
189,736,540
Ordinary
Shares
9.76%
Ordinary
Shares
Lee Pineapple Company Pte.
Ltd. (“Lee”)
65 Chulia St, #44-01 OCBC
Centre Singapore 049513
Shareholder
Lee is the
beneficial and
record owner of
the shares
indicated.**
Singapore 100,422,000
Ordinary
Shares
5.17%
Notes:
* NAPL and Bluebell are beneficially owned by Mr. Joselito D. Campos, Jr. and the Campos family of the Philippines.
** Lee is beneficially owned by the Lee Family of Malaysia.
ii) Security Ownership of Management
The table below sets forth the security ownership of the Company’s directors and executive officers as of the date
of this Information Statement.
Title of Class Name of Beneficial Owner Amount and Nature of
Beneficial Ownership Citizenship
Percent of
Class
Ordinary Joselito D. Campos, Jr. 7,621,466 Direct Filipino 0.39%
Ordinary Rolando C. Gapud 2,651,203 Direct Filipino 0.14%
Ordinary Edgardo M. Cruz, Jr. 2,984,632 Direct Filipino 0.15%
Ordinary Emil Q. Javier 611,828 Direct Filipino 0.03%
Ordinary Benedict Kwek Gim
Song 117,092 Direct Singaporean 0.01%
Ordinary Godfrey E. Scotchbrook 117,092 Direct British 0.01%
Ordinary Luis F. Alejandro
3,381,600 Indirect
Filipino 0.19%
299,400 Direct
Preference 15,000 Direct 0.08%
Ordinary Ignacio C. O. Sison
1,079,736 Direct Filipino
0.06%
Preference 8,000 Direct 0.04%
Preference Parag Sachdeva 15,000 Direct Indian 0.08%
Ordinary Antonio E. S. Ungson 597,864 Direct Filipino 0.03%

50
Ordinary Ma. Bella B. Javier
392,359 Direct Filipino
0.02%
Preference 2,000 Direct 0.02%
a) Voting Trust Holders of 5% or More
There are no persons holding more than 5% of a class of shares of the Company under a voting trust or
similar agreement as of the date of this Information Statement.
b) Changes in Control
There are no arrangements which may result in a change in control of the Company as of the date of this
Information Statement.
Item 12. Certain Relationships and Related Transactions
The Company and its subsidiaries, in the ordinary course of business, engage in transactions with affiliates. The
Company’s policy with respect to related transactions is to ensure that these transactions are entered into on
terms comparable to those available from unrelated third parties.
The Company and its subsidiaries (the “Group”) have the following major transactions with related parties.
For purposes of this section, parties are considered to be related to the Group if the Group has the ability, directly
or indirectly, to control the party or exercise significant influence over the party in making financial and operating
decisions, or vice versa, or where the Group and the party are subject to common control or common significant
influence. Related parties may be individuals or other entities.
Related Party
Transaction Relationship Nature
FY2020
US$’000
FY2019
US$’000
FY2018
US$’000
Del Monte Philippines,
Inc (DMPI Retirement
Fund)
Retirement fund of
the Company’s
subsidiary
Rental to DMPI
Retirement Fund 1,662 1,558 1,858
Security deposit to DMPI
Retirement Fund (21) - -
Management fees from
DMPI Retirement Fund (4) (4) (4)
Del Monte
Philippines, Inc
(DMPI Provident Fund)
Retirement fund of
the Company’s
subsidiary
Rental to DMPI Provident
Fund - - -
NutriAsia Inc (NAI) Affiliate of the
Company
Rental to NAI
Retirement Fund 586 545 543
Security deposit to NAI
Retirement Fund (6) - -
Purchases of Production
Materials 28 34 233
Toll Pack Fees 128 556 572
Utilities / Parking Space
Rental 55 81 160
Recharge of Inventory Count
Shortage - - (33)
Management fee - (92) (15)
Shared IT & Other Services
from NAI (177) (161) (343)
Sale of other raw materials
with NAI - (31) (1)
Sale of tomato sauce with
NAI (5) - (31)
Cash Advances (8,731) (6,000) -
TOTAL (6,485) (3,514) 2,939

51
Part IV – CORPORATE GOVERNANCE
Item 13. Annual Corporate Governance
Please refer to the 2017 Integrated Annual Corporate Governance Report (SEC Form i-ACGR) of DMPL, which
was filed with the SEC and PSE, and posted in the Company’s website www.delmontepacific.com, in compliance
with SEC Memorandum Circular No. 15, Series of 2017.


*SGVFSM004024*
C O V E R S H E E Tfor
AUDITED FINANCIAL STATEMENTS
SEC Registration Number
C O M P A N Y N A M E
D E L M O N T E P A C I F I C L I M I T E D A N D
S U B S I D I A R I E S
PRINCIPAL OFFICE ( No. / Street / Barangay / City / Town / Province )
C R A I G M U I R C H A M B E R S , P O B O X 7 1
R O A D T O W N , T O R T O L A B R I T I S H
V I R G I N I S L A N D S
Form Type Department requiring the reportSecondary License Type, If
Applicable
A A F S C R M D –
C O M P A N Y I N F O R M A T I O N
Company’s Email Address Company’s Telephone Number Mobile Number
www.delmontepacific.com +65 6324 6822 –
No. of Stockholders Annual Meeting (Month / Day) Fiscal Year (Month / Day)
7,548 September 17 April 30
CONTACT PERSON INFORMATION
The designated contact person MUST be an Officer of the Corporation
Name of Contact Person Email Address Telephone Number/s Mobile Number
Antonio E.S. Ungson [email protected]
(02) 8856-2888 –
CONTACT PERSON’s ADDRESS
JY Campos Centre, 9th Avenue corner 30th Street, Bonifacio Global City, Taguig City
NOTE 1 : In case of death, resignation or cessation of office of the officer designated as contact person, such incident shall bereported to the Commission within thirty (30) calendar days from the occurrence thereof with information and complete contact detailsof the new contact person designated.
2 : All Boxes must be properly and completely filled-up. Failure to do so shall cause the delay in updating the corporation’srecords with the Commission and/or non-receipt of Notice of Deficiencies. Further, non-receipt of Notice of Deficiencies shall notexcuse the corporation from liability for its deficiencies.

*SGVFSM004024*
INDEPENDENT AUDITOR’S REPORT
The Board of Directors and StockholdersDel Monte Pacific LimitedCraigmuir ChambersPO Box 71 Road Town, TortolaBritish Virgin Islands
Opinion
We have audited the accompanying consolidated financial statements of Del Monte Pacific Limited and itsSubsidiaries (the Group) and the separate financial statements of Del Monte Pacific Limited (the Company),which comprise the statements of financial position as at 30 April 2020 and 2019, and the incomestatements, statements of comprehensive income, statements of changes in equity and statements of cashflows for each of the three years in the period ended 30 April 2020, and notes to the financial statements,including a summary of significant accounting policies.
In our opinion, the accompanying financial statements of the Group and the Company present fairly, in allmaterial respects, the financial position of the Group and the Company as at 30 April 2020 and 2019, andtheir financial performance and their cash flows for each of the three years in the period ended 30 April2020 in accordance with International Financial Reporting Standards (IFRSs).
Basis for Opinion
We conducted our audits in accordance with Philippine Standards on Auditing (PSAs). Ourresponsibilities under those standards are further described in the Auditor’s Responsibilities for the Auditof the Financial Statements section of our report. We are independent of the Group in accordance withthe Code of Ethics for Professional Accountants in the Philippines (Code of Ethics) together with the ethicalrequirements that are relevant to our audit of the financial statements in the Philippines, and we havefulfilled our other ethical responsibilities in accordance with these requirements and the Code of Ethics.We believe that the audit evidence we have obtained is sufficient and appropriate to provide a basis for ouropinion.
Key Audit Matters
Key audit matters are those matters that, in our professional judgment, were of most significance in ouraudit of the financial statements of the current period. These matters were addressed in the context of ouraudit of the financial statements as a whole, and in forming our opinion thereon, and we do not provide aseparate opinion on these matters. For each matter below, our description of how our audit addressed thematter is provided in that context.
SyCip Gorres Velayo & Co.6760 Ayala Avenue1226 Makati CityPhilippines
Tel: (632) 891 0307Fax: (632) 819 0872ey.com/ph
BOA/PRC Reg. No. 0001, October 4, 2018, valid until August 24, 2021SEC Accreditation No. 0012-FR-5 (Group A), November 6, 2018, valid until November 5, 2021
A member firm of Ernst & Young Global Limited

*SGVFSM004024*
- 2 -
We have fulfilled the responsibilities described in the Auditor’s Responsibilities for the Audit of theFinancial Statements section of our report, including in relation to these matters. Accordingly, our auditincluded the performance of procedures designed to respond to our assessment of the risks of materialmisstatement of the financial statements. The results of our audit procedures, including the proceduresperformed to address the matters below, provide the basis for our audit opinion on the accompanyingfinancial statements.
Applicable to the audit of the consolidated financial statements of the Group
Fair value of biological assets
Why significant How our audit addressed the matter
As at 30 April 2020, the Group’s biologicalassets amounted to US$63.3 million. The gainon changes in the fair value of produce prior toharvest and harvested produce amounted toUS$57.6 million for the year ended30 April 2020.
The valuation of biological assets wassignificant to our audit because the estimationprocess is complex, involves significantmanagement estimate, and is based onassumptions that can be affected by naturalphenomena. The key assumptions for the fairvalue of harvested produce include sellingprices and gross margins. The keyassumptions for the fair value of produce priorto harvest include expected selling prices, grossmargin, estimated tonnage of harvests andfuture growing costs.
The Group’s disclosures relating to biologicalassets and sources of estimation uncertainty areincluded in Note 11 to the financial statements.
We obtained an understanding of management’s fairvalue measurement methodology and their processin fair valuation of the biological assets. Weassessed the appropriateness of the methodologyused in estimating the fair value. We tested the keyassumptions used in the valuation, which includeexpected selling prices and gross margin forharvested produce; and expected selling prices,gross margin, estimated tonnage of harvests andfuture growing costs for produce prior to harvest, bycomparing them to external data such as sellingprices in the principal market and historicalinformation.
We also reviewed the adequacy of the relateddisclosures related to biological assets.
A member firm of Ernst & Young Global Limited

*SGVFSM004024*
- 3 -
Recoverability of goodwill and indefinite life trademarks
Why significant How our audit addressed the matter
As at 30 April 2020, the Group carries goodwillof US$203.4 million and indefinite lifetrademarks of US$408.0 million, representing13% and 26% of the total noncurrent assets,respectively.
a. Goodwill and indefinite life trademarksallocated to Del Monte Foods, Inc. and itssubsidiaries
The Group’s goodwill is allocated to a CashGenerating Unit (CGU), Del Monte Foods, Inc.and its subsidiaries. Included within the CGUare the indefinite life trademarks “Del Monte”and “College Inn” in the United States ofAmerica (USA) amounting toUS$394.0 million. The Group uses the valuein use calculation to estimate the recoverablevalue of the CGU for the purposes of assessingwhether there is any impairment to berecognized.
The annual impairment test is significant to ouraudit because the valuation is complex, involvessignificant management judgement particularlygiven the changes in the market and economicconditions brought by the COVID-19pandemic, and is dependent on certain estimatessuch as expected cash flow covering a five-yearperiod and the long-term growth rate anddiscount rate of the CGU.
The Group’s disclosures relating to the goodwilland indefinite life trademarks allocated to DelMonte Foods, Inc. and its subsidiaries, sourcesof estimation uncertainty and sensitivity of therecoverable amounts are included in Note 8 tothe financial statements.
We obtained an understanding of the Group’simpairment assessment process and the relatedcontrols including management’s consideration ofthe potential impact that COVID-19 pandemic hason the Group’s operations. We tested thereasonableness of the key assumptions, whichinclude revenue growth rate, gross margin, EBITDAmargin, discount rate and long-term growth rate bycomparing them against management plans,historical data and available market information inlight of current market and economic conditions.We also performed independent sensitivity analysison the key assumptions to consider the extent ofreasonable change in these assumptions thatindividually or collectively would result in theimpairment of assets. We involved our internalspecialist in evaluating the assumptions andmethodology used.
We also focused on the adequacy of the Group’sdisclosures in Note 8 to the financial statements,about those assumptions to which the outcome ofthe impairment test was most sensitive, that is, thosethat have the most significant effect on thedetermination of the recoverable amount of theCGU.
A member firm of Ernst & Young Global Limited

*SGVFSM004024*
- 4 -
Why significant How our audit addressed the matterb. Other indefinite life trademarks
As at 30 April 2020, other indefinite lifetrademarks comprising of “Del Monte” in thePhilippines and India, “S&W” in Asia, and“Todays” in the Philippines are carried atUS$14.0 million.
The annual impairment tests are significant toour audit because the valuation process iscomplex, involves significant managementjudgment particularly given the changes inmarket and economic conditions brought by theCOVID-19 pandemic and is dependent oncertain estimates that can be affected as well astrademark and royalty rates in the market.
The Group used the Relief from Royaltymethodology in valuing its Philippines and AsiaS&W trademarks. This approach relies on theforecasted revenue for the related brand ortrademark and applies the royalty rates in themarket. For the India trademark, the Groupused the discounted cash flow of the relatedCGU. This method relies on forecastedfinancial results which uses significantassumptions such as revenue growth rates,EBITDA and long-term margins, terminal valuegrowth rate and discount rate.
The Group’s disclosures relating to its otherindefinite life trademarks, sources of estimationuncertainty and sensitivity of the recoverableamounts are included in Notes 7 and 8 to thefinancial statements.
We assessed the reasonableness of the forecastedrevenue and royalty rates used to derive therecoverable value of the brand and trademarks bycomparing against available market and historicalinformation.
We also evaluated the significant assumptions usedin the financial forecast of the CGU, which includerevenue growth rates, EBITDA and long-termmargins, terminal value growth rate and discountrate, by comparing them against management plansand historical and available market information inlight with the current market and economicconditions. We involved our internal specialist inevaluating the assumptions and methodology used.
We performed independent sensitivity analysis onthe key assumptions to consider the extent of changein assumptions that individually or collectivelywould result in impairment of these assets.
A member firm of Ernst & Young Global Limited

*SGVFSM004024*
- 5 -
Recoverability of deferred tax assets
Why significant How our audit addressed the matter
As at 30 April 2020, the Group has recognizednet deferred tax assets of US$145.0 million, ofwhich US$144.4 million was recognized by DelMonte Foods, Inc., a subsidiary in the USA.
The recoverability of the deferred tax asset wassignificant to our audit because it involvessignificant management judgment and is basedon assumptions that are affected by futuremarket or economic conditions. The keyassumptions in the taxable income forecastinclude revenue growth rates and gross andEBITDA margins.
The Group’s disclosures relating to deferred taxand sources of estimation uncertainty areincluded in Note 9 to the financial statements.
We assessed the recognition of deferred tax assetsby comparing it to the taxable income forecast. Wetested the key assumptions in the taxable incomeforecast such as revenue growth rates and gross andEBITDA margins against available marketinformation, management plans,historical performance and industry/market outlookin light of current market and economic conditions.We compared the consistency of management’staxable income forecasts with those included in thebudget approved by the Board of Directors.
We assessed the robustness of management’sforecasting process by comparing the actual resultsof the subsidiary against the forecast used in prioryear forecast.
We involved our internal tax specialist in reviewingthe deductibility of the temporary differences.
Valuation of defined benefit liability
Why significant How our audit addressed the matter
As at 30 April 2020, the Group has definedbenefit plans in the USA giving rise to definedbenefit liability of US$77.4 million, which aremeasured using projected unit credit valuationmethods.
We considered this to be a key audit matterbecause of the magnitude of the amounts,management's judgement in the use ofassumptions such as future salary increases,discount rates, mortality rates and health caretrends and technical expertise required todetermine these amounts.
The Group’s disclosures relating to its definedbenefit liability and asset, sources of estimationare included in Note 21 to the financialstatements.
Our procedures included, among others, involvingour internal specialist to assist us in reviewing thevaluation methodology and the actuarial anddemographic assumptions used by management tovalue the Group's various pension obligations. Weevaluated the competence, capabilities andobjectivity of management’s specialist.
We evaluated the key actuarial assumptions such asfuture salary increases, discount rates, mortalityrates and health care trends by comparing them tomarket data and historical information.
We tested the employees’ payroll data on a samplebasis, and reviewed the reconciliation of themembership census data used in the actuarialmodels to the payroll data of the Group.
A member firm of Ernst & Young Global Limited

*SGVFSM004024*
- 6 -
Other Information
Management is responsible for the other information. The other information comprises the informationincluded in the SEC Form 20-IS (Definitive Information Statement), SEC Form 17-A and Annual Reportfor the year ended 30 April 2020, but does not include the financial statements and our auditor’s reportthereon. The SEC Form 20-IS (Definitive Information Statement), SEC Form 17-A and Annual Reportfor the year ended 30 April 2020 are expected to be made available to us after the date of this auditor’sreport.
Our opinion on the financial statements does not cover the other information and we do not express anyform of assurance conclusion thereon.
In connection with our audits of the financial statements, our responsibility is to read the other informationidentified above when it becomes available and, in doing so, consider whether the other information ismaterially inconsistent with the financial statements or our knowledge obtained in the audits, or otherwiseappears to be materially misstated.
Responsibilities of Management and Those Charged with Governance for the Financial Statements
Management is responsible for the preparation and fair presentation of the financial statements inaccordance with IFRSs, and for such internal control as management determines is necessary to enable thepreparation of financial statements that are free from material misstatement, whether due to fraud or error.
In preparing the financial statements, management is responsible for assessing the Group’s ability tocontinue as a going concern, disclosing, as applicable, matters related to going concern and using the goingconcern basis of accounting unless management either intends to liquidate the Group or to cease operations,or has no realistic alternative but to do so.
Those charged with governance are responsible for overseeing the Group’s financial reporting process.
Auditor’s Responsibilities for the Audit of the Financial Statements
Our objectives are to obtain reasonable assurance about whether the financial statements as a whole are freefrom material misstatement, whether due to fraud or error, and to issue an auditor’s report that includes ouropinion. Reasonable assurance is a high level of assurance, but is not a guarantee that an audit conductedin accordance with PSAs will always detect a material misstatement when it exists. Misstatements can arisefrom fraud or error and are considered material if, individually or in the aggregate, they could reasonablybe expected to influence the economic decisions of users taken on the basis of these financial statements.
As part of an audit in accordance with PSAs, we exercise professional judgment and maintain professionalskepticism throughout the audit. We also:
Identify and assess the risks of material misstatement of the financial statements, whether due tofraud or error, design and perform audit procedures responsive to those risks, and obtain auditevidence that is sufficient and appropriate to provide a basis for our opinion. The risk of notdetecting a material misstatement resulting from fraud is higher than for one resulting from error, asfraud may involve collusion, forgery, intentional omissions, misrepresentations, or the override ofinternal control.
A member firm of Ernst & Young Global Limited

*SGVFSM004024*
- 7 -
Obtain an understanding of internal control relevant to the audit in order to design audit proceduresthat are appropriate in the circumstances, but not for the purpose of expressing an opinion on theeffectiveness of the Group’s internal control.
Evaluate the appropriateness of accounting policies used and the reasonableness of accountingestimates and related disclosures made by management.
Conclude on the appropriateness of management’s use of the going concern basis of accounting and,based on the audit evidence obtained, whether a material uncertainty exists related to events orconditions that may cast significant doubt on the Group’s ability to continue as a going concern. Ifwe conclude that a material uncertainty exists, we are required to draw attention in our auditor’sreport to the related disclosures in the financial statements or, if such disclosures are inadequate, tomodify our opinion. Our conclusions are based on the audit evidence obtained up to the date of ourauditor’s report. However, future events or conditions may cause the Group to cease to continue asa going concern.
Evaluate the overall presentation, structure and content of the financial statements, including thedisclosures, and whether the financial statements represent the underlying transactions and events ina manner that achieves fair presentation.
Obtain sufficient appropriate audit evidence regarding the financial information of the entities orbusiness activities within the Group to express an opinion on the financial statements. We areresponsible for the direction, supervision and performance of the group audit. We remain solelyresponsible for our audit opinion.
We communicate with those charged with governance regarding, among other matters, the planned scopeand timing of the audit and significant audit findings, including any significant deficiencies in internalcontrol that we identify during our audit.
We also provide those charged with governance with a statement that we have complied with relevantethical requirements regarding independence, and to communicate with them all relationships and othermatters that may reasonably be thought to bear on our independence, and where applicable, relatedsafeguards.
A member firm of Ernst & Young Global Limited

*SGVFSM004024*
- 8 -
From the matters communicated with those charged with governance, we determine those matters that wereof most significance in the audit of the financial statements of the current period and are therefore the keyaudit matters. We describe these matters in our auditor’s report unless law or regulation precludes publicdisclosure about the matter or when, in extremely rare circumstances, we determine that a matter shouldnot be communicated in our report because the adverse consequences of doing so would reasonably beexpected to outweigh the public interest benefits of such communication.
The engagement partner on the audit resulting in this independent auditor’s report is Catherine E. Lopez.
SYCIP GORRES VELAYO & CO.
Catherine E. LopezPartnerCPA Certificate No. 86447SEC Accreditation No. 0468-AR-4 (Group A), February 19, 2019, valid until February 18, 2022Tax Identification No. 102-085-895BIR Accreditation No. 08-001998-65-2018, February 26, 2018, valid until February 25, 2021PTR No. 8125249, January 7, 2020, Makati City
12 August 2020
A member firm of Ernst & Young Global Limited

Del Monte Pacific Limited and its Subsidiaries
*SGVFSM004024*
Statements of financial positionAs at 30 April 2020 and 2019(In US$’000)
<------------------ Group --------------> <-------------- Company -------------->
Note30 April
202030 April
201930 April
202030 April
2019
Noncurrent assetsProperty, plant and equipment – net 5 507,497 582,033 – –Right-of-use assets 24 166,085 – – –Investments in subsidiaries 6 – – 620,027 830,855Investments in joint ventures 7 22,855 24,212 – 766Intangible assets and goodwill 8 701,347 707,997 – –Deferred tax assets - net 9 144,974 106,321 40 27Biological assets 11 2,118 1,682 – –Pension assets 21 6,675 8,240 – –Other noncurrent assets 10 34,937 41,622 – –Due from a related company 38 – – 228,683 202,471
1,586,488 1,472,107 848,750 1,034,119
Current assetsBiological assets 11 61,160 52,320 – –Inventories 12 482,463 664,922 – –Trade and other receivables 13 323,065 149,054 95,131 3,187Prepaid expenses and other current
assets 14 67,712 34,190 180 192Cash and cash equivalents 15 33,465 21,636 766 886
967,865 922,122 96,077 4,265Noncurrent assets held for sale 16 – 4,465 – –
967,865 926,587 96,077 4,265
Total assets 2,554,353 2,398,694 944,827 1,038,384
EquityShare capital 17 49,449 49,449 49,449 49,449Share premium 18 478,339 478,339 478,478 478,478Retained earnings 18 60,763 96,074 60,763 96,074Reserves 18 (77,474) (65,827) (77,474) (65,827)Equity attributable to owners of the
Company 39 511,077 558,035 511,216 558,174Non-controlling interests 39 54,820 43,106 – –Total equity 565,897 601,141 511,216 558,174
Noncurrent liabilitiesLoans and borrowings 19 97,737 985,915 75,000 241,015Lease liabilities 24 127,696 – – –Employee benefits 21 82,398 63,781 221 148
Environmental remediation liabilities 22 9,587 697 – –Deferred tax liabilities - net 9 12,447 6,404 – –Other noncurrent liabilities 20 23,380 30,015 – –
353,245 1,086,812 75,221 241,163
Current liabilitiesLoans and borrowings 19 1,298,292 492,740 291,282 135,070Lease liabilities 24 30,829 – – –Employee benefits 21 22,947 27,640 – –Trade and other current liabilities 23 276,893 188,669 67,108 103,977Current tax liabilities 6,250 1,692 – –
1,635,211 710,741 358,390 239,047
Total liabilities 1,988,456 1,797,553 433,611 480,210
Total equity and liabilities 2,554,353 2,398,694 944,827 1,038,384
The accompanying accounting policies and explanatory notes form an integral part of the financial statements.

Del Monte Pacific Limited and its Subsidiaries
*SGVFSM004024*
Income statementsYears ended 30 April 2020, 2019 and 2018(In US$’000)
<------------------ Group -----------------> <--------------- Company -------------->
Note
Year ended30 April
2020
Year ended30 April
2019
Year ended30 April
2018
Year ended30 April
2020
Year ended30 April
2019
Year ended30 April
2018
Revenue 25, 30 2,128,343 1,954,842 2,197,309 – – –
Cost of sales (1,676,186) (1,559,857) (1,764,835) – – –Gross profit 452,157 394,985 432,474 – – –Distribution and selling
expenses (213,414) (202,839) (221,433) – – –General and administrative
expenses (120,010) (115,540) (163,378) (11,099) (10,685) (8,823)Other (expenses) income
- net (67,745) 3,516 (18,162) 1,524 1,234 839Results from operating
activities 50,988 80,122 29,501 (9,575) (9,451) (7,984)
Finance income 27 7,738 21,985 41,472 22,111 20,231 1,086Finance expense 27 (120,493) (100,424) (105,653) (16,323) (17,518) (16,275)Net finance (expense) income (112,755) (78,439) (64,181) 5,788 2,713 (15,189)Share in net (loss) income of
joint ventures andsubsidiaries 7 (2,887) (983) (1,552) (77,592) 27,060 (13,303)
(Loss) profit before taxation 26 (64,654) 700 (36,232) (81,379) 20,322 (36,476)Tax (expense) credit - net 28 (29,176) 13,524 (14,844) (15) (2) (16)
(Loss) profit for the year (93,830) 14,224 (51,076) (81,394) 20,320 (36,492)
(Loss) profit attributable to:Owners of the Company 29 (81,394) 20,319 (36,492) (81,394) 20,320 (36,492)Non-controlling interests (12,436) (6,095) (14,584) – – –
(93,830) 14,224 (51,076) (81,394) 20,320 (36,492)
(Loss) Earnings per shareBasic (loss) earnings per
share (US cents) 29 (5.20) 0.03 (2.70)Diluted (loss) earnings per
share (US cents) 29 (5.20) 0.03 (2.70)
The accompanying accounting policies and explanatory notes form an integral part of the financialstatements.
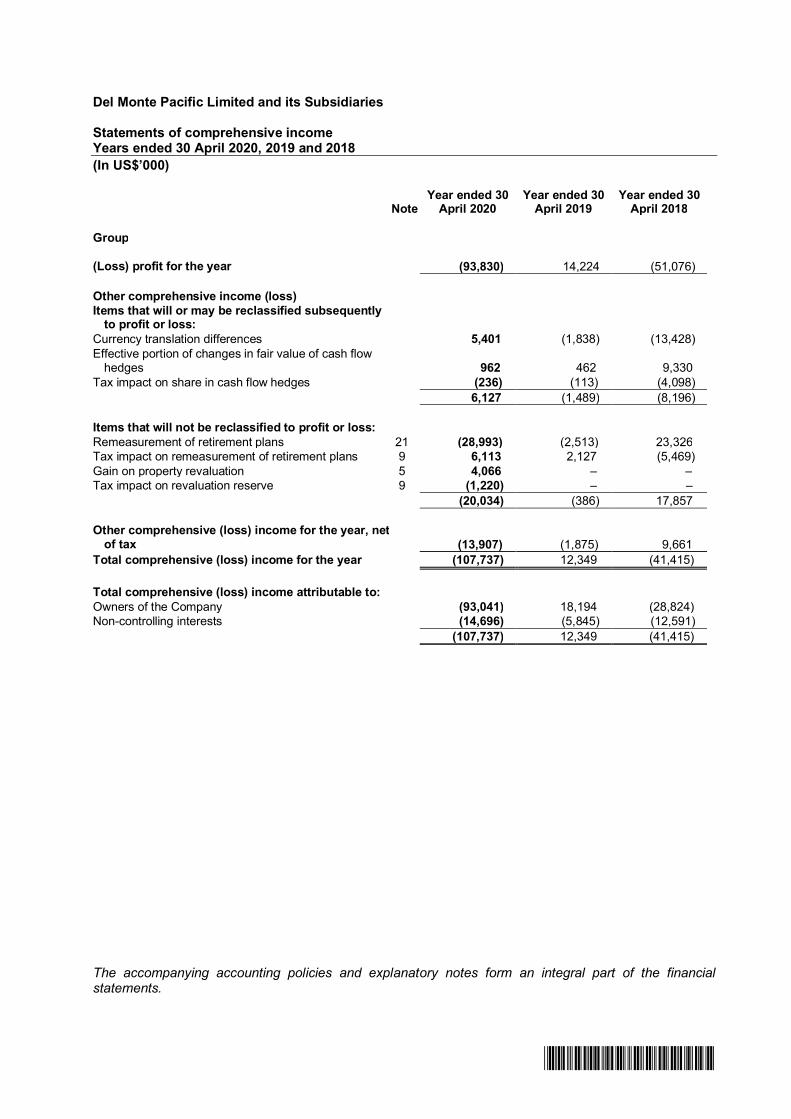
Del Monte Pacific Limited and its Subsidiaries
*SGVFSM004024*
Statements of comprehensive incomeYears ended 30 April 2020, 2019 and 2018(In US$’000)
NoteYear ended 30
April 2020Year ended 30
April 2019Year ended 30
April 2018
Group
(Loss) profit for the year (93,830) 14,224 (51,076)
Other comprehensive income (loss)Items that will or may be reclassified subsequently
to profit or loss:Currency translation differences 5,401 (1,838) (13,428)Effective portion of changes in fair value of cash flow
hedges 962 462 9,330Tax impact on share in cash flow hedges (236) (113) (4,098)
6,127 (1,489) (8,196)
Items that will not be reclassified to profit or loss:Remeasurement of retirement plans 21 (28,993) (2,513) 23,326Tax impact on remeasurement of retirement plans 9 6,113 2,127 (5,469)Gain on property revaluation 5 4,066 – –Tax impact on revaluation reserve 9 (1,220) – –
(20,034) (386) 17,857
Other comprehensive (loss) income for the year, netof tax (13,907) (1,875) 9,661
Total comprehensive (loss) income for the year (107,737) 12,349 (41,415)
Total comprehensive (loss) income attributable to:Owners of the Company (93,041) 18,194 (28,824)Non-controlling interests (14,696) (5,845) (12,591)
(107,737) 12,349 (41,415)
The accompanying accounting policies and explanatory notes form an integral part of the financialstatements.

Del Monte Pacific Limited and its Subsidiaries
*SGVFSM004024*
Statements of comprehensive incomeYears ended 30 April 2020, 2019 and 2018(In US$’000)
Year ended 30April 2020
Year ended 30April 2019
Year ended 30April 2018
Company(Loss) profit for the year (81,394) 20,319 (36,492)
Other comprehensive income (loss)Items that will or may be reclassified subsequently
to profit or loss:Share in currency translation differences of subsidiaries 5,378 (1,860) (13,428)Share in effective portion of changes in fair value of cash flow
hedges of a subsidiary 860 425 8,777Tax impact on share in cash flow hedges (210) (113) (4,098)
6,028 (1,548) (8,749)
Items that will not be reclassified to profit or loss:Share in remeasurement of retirement plans of subsidiaries (26,014) (1,812) 21,448Tax impact on share in remeasurement of retirement plans 5,493 1,235 (5,031)Share in the revaluation reserve of a subsidiary 4,066 – –Tax impact on share in the revaluation reserve of a subsidiary (1,220) – –
(17,675) (577) 16,417
Other comprehensive (loss) income for the year, net of tax (11,647) (2,125) 7,668Total comprehensive (loss) income for the year (93,041) 18,194 (28,824)
The accompanying accounting policies and explanatory notes form an integral part of the financialstatements.

Del Monte Pacific Limited and its Subsidiaries
*SGVFSM004024*
Statements of changes in equityYears ended 30 April 2020, 2019 and 2018(In US$’000)
<---------------------------------------------------- Attributable to owners of the Company ----------------------------------------------------->
NoteSharecapital
Sharepremium
Translationreserve
Revaluationreserve
Remeasure-ment of
retirementplans
Hedgingreserve
Shareoptionreserve
Reservefor ownshares
Retainedearnings Total
Non-controllinginterests
Totalequity
Group2020At 30 April 2019 49,449 478,339 (93,375) 10,885 17,648 (2,452) 1,753 (286) 96,074 558,035 43,106 601,141Effect of adoption of IFRS 16, Leases 3 – – – – – – – – (1,013) (1,013) – (1,013)
49,449 478,339 (93,375) 10,885 17,648 (2,452) 1,753 (286) 95,061 557,022 43,106 600,128Total comprehensive loss for the yearLoss for the year – – – – – – – – (81,394) (81,394) (12,436) (93,830)
Other comprehensive income (loss)Currency translation differences – – 5,378 – – – – – – 5,378 23 5,401Gain on property revaluation, net of tax – – – 2,846 – – – – – 2,846 – 2,846
Remeasurement of retirement plans, net of tax 21 – – – – (20,521) – – – – (20,521) (2,359) (22,880)Effective portion of changes in fair value of
cash flow hedges, net of tax– – – –
– 650– – –
650 76 726Total other comprehensive income (loss) – – 5,378 2,846 (20,521) 650 – – – (11,647) (2,260) (13,907)Total comprehensive income (loss) for the
year – – 5,378 2,846 (20,521) 650 – – (81,394) (93,041) (14,696) (107,737)Transactions with owners of the Company
recognised directly in equityContributions by and distributions
to owners of the CompanySale of shares of a subsidiary 6 – – – – – – – – 76,958 76,958 26,410 103,368Dividends 18 – – – – – – – – (29,862) (29,862) – (29,862)Total contributions by and distributions to
owners – – – – – – – – 47,096 47,096 26,410 73,506At 30 April 2020 17, 18 49,449 478,339 (87,997) 13,731 (2,873) (1,802) 1,753 (286) 60,763 511,077 54,820 565,897

Del Monte Pacific Limited and its Subsidiaries
*SGVFSM004024*
Statements of changes in equity (cont’d)Years ended 30 April 2020, 2019 and 2018(In US$’000)
<---------------------------------------------------- Attributable to owners of the Company ----------------------------------------------------->
NoteSharecapital
Sharepremium
Translationreserve
Revaluationreserve
Remeasure-ment of
retirementplans
Hedgingreserve
Shareoptionreserve
Reservefor ownshares
Retainedearnings Total
Non-controllinginterests
Totalequity
Group2019At 30 April 2018 49,449 478,323 (91,515) 10,885 18,225 (2,764) 1,373 (286) 95,505 559,195 49,065 608,260Total comprehensive income (loss) for the yearProfit for the year – – – – – – – – 20,319 20,319 (6,095) 14,224
Other comprehensive income (loss)Currency translation differences – – (1,860) – – – – – – (1,860) 22 (1,838)Remeasurement of retirement plans, net of tax 21 – – – – (577) – – – – (577) 191 (386)Effective portion of changes in fair value of cash flow
hedges, net of tax – – – – – 312 – – – 312 37 349Total other comprehensive income
(loss) – – (1,860) – (577) 312 – – – (2,125) 250 (1,875)Total comprehensive income (loss) for the year – – (1,860) – (577) 312 – – 20,319 18,194 (5,845) 12,349
Transactions with owners of the Companyrecognised directly in equity
Contributions by and distributionsto owners of the Company
Refund of transaction costs from issue of preferenceshares in FY2018 – 16 – – – – – – – 16 – 16
Value of employee services received for issue of shareoptions 26 – – – – – – 380 – – 380 (114) 266
Dividends 18 – – – – – – – – (19,750) (19,750) – (19,750)Total contributions by and distributions to owners – 16 – – – – 380 – (19,750) (19,354) (114) (19,468)At 30 April 2019 17, 18 49,449 478,339 (93,375) 10,885 17,648 (2,452) 1,753 (286) 96,074 558,035 43,106 601,141

Del Monte Pacific Limited and its Subsidiaries
*SGVFSM004024*
Statements of changes in equity (cont’d)Years ended 30 April 2020, 2019 and 2018(In US$’000)
<----------------------------------------------- Attributable to owners of the Company ----------------------------------------------->
NoteSharecapital
Sharepremium
Translationreserve
Revaluationreserve
Remeasure-ment of
retirementplans
Hedgingreserve
Shareoptionreserve
Reservefor ownshares
Retainedearnings Total
Non-controllinginterests
Totalequity
Group2018At 30 April 2017 39,449 390,320 (78,087) 10,885 1,808 (7,443) 1,779 (802) 159,169 517,078 61,477 578,555Total comprehensive loss
for the yearLoss for the year – – – – – – – – (36,492) (36,492) (14,584) (51,076)
Other comprehensive income (loss)Currency translation differences – – (13,428) – – – – – – (13,428) – (13,428)Remeasurement of retirement plans, net of tax – – – – 16,417 – – – – 16,417 1,440 17,857Effective portion of changes in fair value of cash
flow hedges, net of tax – – – – – 4,679 – – – 4,679 553 5,232
Total other comprehensive income (loss) – – (13,428) – 16,417 4,679 – – – 7,668 1,993 9,661Total comprehensive income (loss) for the year – – (13,428) – 16,417 4,679 – – (36,492) (28,824) (12,591) (41,415)
Transactions with owners of the Companyrecognised directly in equity
Contributions by and distributionsto owners of the Company
Issuance of preference shares 17 10,000 90,000 – – – – – – – 100,000 – 100,000Transaction costs from issue of preference shares – (2,085) – – – – – – – (2,085) – (2,085)Share options expired – 138 – – – – (138) – – – – –Release of share awards 17 – (50) – – – – (466) 516 – – – –Value of employee services received for issue of
share options 26 – – – – – – 198 – – 198 179 377Dividends 18 – – – – – – – – (27,172) (27,172) – (27,172)Total contributions by and distributions to
owners 10,000 88,003 – – – – (406) 516 (27,172) 70,941 179 71,120At 30 April 2018 17, 18 49,449 478,323 (91,515) 10,885 18,225 (2,764) 1,373 (286) 95,505 559,195 49,065 608,260

Del Monte Pacific Limited and its Subsidiaries
*SGVFSM004024*
Statements of changes in equity (cont’d)Years ended 30 April 2020, 2019 and 2018(In US$’000)
NoteSharecapital
Sharepremium
Share intranslationreserve of
subsidiaries
Share inrevaluationreserve of
subsidiaries
Share inremeasure-
ment ofretirementplans of
subsidiaries
Share inhedging
reserve of asubsidiary
Shareoptionreserve
Reservefor ownshares
Retainedearnings
Totalequity
Company
2020At 30 April 2019 49,449 478,478 (93,375) 10,885 17,648 (2,452) 1,753 (286) 96,074 558,174Effect of adoption of IFRS 16, Leases 3 – – – – – – – – (1,013) (1,013)
49,449 478,478 (93,375) 10,885 17,648 (2,452) 1,753 (286) 95,061 557,161
Total comprehensive lossfor the year
Loss for the year – – – – – – – – (81,394) (81,394)
Other comprehensive income (loss)Currency translation differences – – 5,378 – – – – – – 5,378Gain on property revaluation, net of tax 2,846 2,846Remeasurement of retirement plans, net of tax 21 – – – – (20,521) – – – – (20,521)Effective portion of changes in fair value of cash flow
hedges, net of tax – – – – – 650 – – – 650
Total other comprehensive income (loss) – – 5,378 2,846 (20,521) 650 – – – (11,647)Total comprehensive income (loss)
for the year – – 5,378 2,846 (20,521) 650 – – (81,394) (93,041)
Transactions with owners of the Company recogniseddirectly in equity
Contributions by and distributionsto owners of the Company
Sale of shares of a subsidiary 6 – – – – – – – – 76,958 76,958Dividends 18 – – – – – – – – (29,862) (29,862)Total contributions by and distributions to owners – – – – – – – – 47,096 47,096At 30 April 2020 17, 18 49,449 478,478 (87,997) 13,731 (2,873) (1,802) 1,753 (286) 60,763 511,216

Del Monte Pacific Limited and its Subsidiaries
*SGVFSM004024*
Statements of changes in equity (cont’d)Years ended 30 April 2020, 2019 and 2018(In US$’000)
NoteSharecapital
Sharepremium
Share intranslationreserve of
subsidiaries
Share inrevaluationreserve of
subsidiaries
Share inremeasure-
ment ofretirementplans of
subsidiaries
Share inhedging
reserve of asubsidiary
Shareoptionreserve
Reservefor ownshares
Retainedearnings
Totalequity
Company
2019At 30 April 2018 49,449 478,462 (91,515) 10,885 18,225 (2,764) 1,373 (286) 95,505 559,334
Total comprehensive income (loss)for the year
Profit for the year – – – – – – – – 20,319 20,319
Other comprehensive income (loss)Currency translation differences – – (1,860) – – – – – – (1,860)Remeasurement of retirement plans, net of tax 21 – – – – (577) – – – – (577)Effective portion of changes in fair value of cash flow hedges,
net of tax – – – – – 312 – – – 312
Total other comprehensive income (loss) – – (1,860) – (577) 312 – – – (2,125)Total comprehensive income for the year – – (1,860) – (577) 312 – – 20,319 18,194
Transactions with owners of the Company recogniseddirectly in equity
Contributions by and distributionsto owners of the Company
Refund of transaction costs from issue of preference shares inFY2018 – 16 – – – – – – – 16
Value of employee services received for issue of share options 26 – – – – – – 380 – – 380Dividends 18 – – – – – – – – (19,750) (19,750)
Total contributions by and distributions to owners – 16 – – – – 380 – (19,750) (19,354)At 30 April 2019 17, 18 49,449 478,478 (93,375) 10,885 17,648 (2,452) 1,753 (286) 96,074 558,174

Del Monte Pacific Limited and its Subsidiaries
*SGVFSM004024*
Statements of changes in equity (cont’d)Years ended 30 April 2020, 2019 and 2018(In US$’000)
NoteSharecapital
Sharepremium
Share intranslationreserve of
subsidiaries
Share inrevaluationreserve of
subsidiaries
Share inremeasure-
ment ofretirementplans of
subsidiaries
Share inhedging
reserve of asubsidiary
Shareoptionreserve
Reservefor ownshares
Retainedearnings
Totalequity
Company
2018At 30 April 2017 39,449 390,459 (78,087) 10,885 1,808 (7,443) 1,779 (802) 159,169 517,217
Total comprehensive loss for the yearLoss for the year – – – – – – – – (36,492) (36,492)
Other comprehensive income (loss)Currency translation differences – – (13,428) – – – – – – (13,428)Remeasurement of retirement plans, net of tax – – – – 16,417 – – – – 16,417Effective portion of changes in fair value of cash flow hedges,
net of tax – – – – – 4,679 – – – 4,679Total other comprehensive income (loss) – – (13,428) – 16,417 4,679 – – – 7,668Total comprehensive income (loss) for the year – – (13,428) – 16,417 4,679 – – (36,492) (28,824)
Transactions with owners of the Company recogniseddirectly in equity
Contributions by and distributionsto owners of the Company
Issuance of preference shares 17 10,000 90,000 – – – – – – – 100,000Transaction costs from issue of preference shares – (2,085) – – – – – – – (2,085)Value of employee services received for issue of share options 26 – – – – – – 198 – – 198Share options expired – 138 – – – – (138) – – –Release of share awards – (50) – – – – (466) 516 – –Dividends 18 – – – – – – – – (27,172) (27,172)
Total contributions by and distributions to owners 10,000 88,003 – – – – (406) 516 (27,172) 70,941At 30 April 2018 17, 18 49,449 478,462 (91,515) 10,885 18,225 (2,764) 1,373 (286) 95,505 559,334
The accompanying accounting policies and explanatory notes form an integral part of the financial statements.

Del Monte Pacific Limited and its Subsidiaries
*SGVFSM004024*
Statements of cash flowsYears ended 30 April 2020, 2019 and 2018(In US$’000)
<------------------ Group -----------------> <--------------- Company -------------->
Note
Year ended30 April
2020
Year ended30 April
2019
Year ended30 April
2018
Year ended30 April 2020
Year ended30 April 2019
Year ended30 April 2018
Cash flows from operatingactivities
Profit (loss) for the year (93,830) 14,224 (51,076) (81,394) 20,319 (36,492)Adjustments to reconcile profit
(loss) for the year to netcash flows:Amortisation of intangible
assets 8 6,650 6,654 7,784 – – –Depreciation of property,
plant and equipment 5 136,674 132,052 140,061 – – –Amortisation of right-of-use
assets 24 35,179 – – – – –Impairment loss (reversal of
impairment) of property,plant and equipment 5 40,746 1,262 24,534 – – –
Loss (gain) on disposal ofproperty, plant andequipment 26 2,502 (6,158) (11,317) – – –
Equity-settled share-basedpayment transactions – 266 377 – – 30
Share in losses (earnings)of joint ventures andsubsidiaries 7 2,887 983 1,552 77,592 (27,060) 13,303
Finance income (7,738) (18,132) (38,567) (22,111) (20,231) (1,086)Finance expense 119,198 100,363 104,992 16,317 17,518 16,275Unrealised foreign
exchange gain (loss) 1,295 (3,792) (2,244) 6 – –Tax expense - current 28 55,424 11,721 11,701 21 7 25Tax credit - deferred 9, 28 (26,248) (25,245) 3,143 (6) (5) (9)Ineffective portion of cash
flow hedges 941 264 846 – – –Impairment losses on
noncurrent assets held forsale – 775 – – – –
273,680 215,237 191,786 (9,575) (9,452) (7,954)Changes in:
Other assets (28,447) 6,281 (5,169) – – –Inventories 182,344 104,077 147,643 – – –Biological assets (7,505) (10,650) (537) – – –Trade and other receivables (48,956) 12,043 12,716 (29) (24) (1)Prepaid expenses and other
current assets (6,922) (4,083) 10,600 (17) 30 (143)Employee benefits 14,144 3,304 16,298 17 – –Trade and other payables 44,377 (138,454) (11,777) 1,837 (5,481) (6,833)
Operating cash flows 422,715 187,755 361,560 (7,767) (14,927) (14,931)Taxes paid (46,982) (6,830) (4,574) (22) (31) (22)
Net cash flows provided by(used in) operatingactivities 375,733 180,925 356,986 (7,789) (14,958) (14,953)

Del Monte Pacific Limited and its Subsidiaries
*SGVFSM004024*
Statements of cash flows (cont’d)Years ended 30 April 2020, 2019 and 2018(In US$’000)
<------------------ Group -----------------> <--------------- Company -------------->
Note
Year ended30 April
2020
Year ended30 April
2019
Year ended30 April
2018
Year ended30 April
2020
Year ended30 April
2019
Year ended30 April
2018
Cash flows from investingactivities
Interest received 756 715 550 1 – 5Proceeds from disposal of
property, plant andequipment and noncurrentassets held for sale 29,238 16,206 41,241 – – –
Acquisitions of property, plantand equipment (130,864) (123,479) (144,776) – – –
Investments in joint ventures 7 (1,530) – (950) – – (949)Advances to joint ventures – – – (140) (950) (1,570)Repayments from jointventures
–– – – – 6,013
Advances to related company – – – (235,388) (89,232) (97,335)Dividend received – – – 230,474 33,000 57,989Net cash flows used in
investing activities (102,400) (106,558) (103,935) (5,053) (57,182) (35,847)
Cash flows from financingactivities
Interest paid (94,648) (87,494) (94,961) (15,637) (15,927) (12,370)Proceeds from borrowings 40 788,696 886,279 807,822 105,000 227,841 154,570Repayment of borrowings 40 (891,423) (860,631) (1,053,042) (115,000) (187,670) (145,500)Proceeds from issuance of
share capital 17 – – 100,000 – – 100,000Refund (payment) of
transaction costs related toissuance of share capital – 16 (2,085) – 16 (2,085)
Repayments of advances fromrelated companies – – – (46,864) – (281,994)
Advances from relatedcompanies – – – 115,036 65,866 262,025
Payment of debt related costs – (146) (4,515) – – (730)Payments of lease liability 24 (34,427) – – – – –Dividends paid 18 (29,862) (19,750) (27,172) (29,862) (19,750) (27,172)Net cash flows (used in)
provided by financingactivities (261,664) (81,726) (273,953) 12,673 70,376 46,744
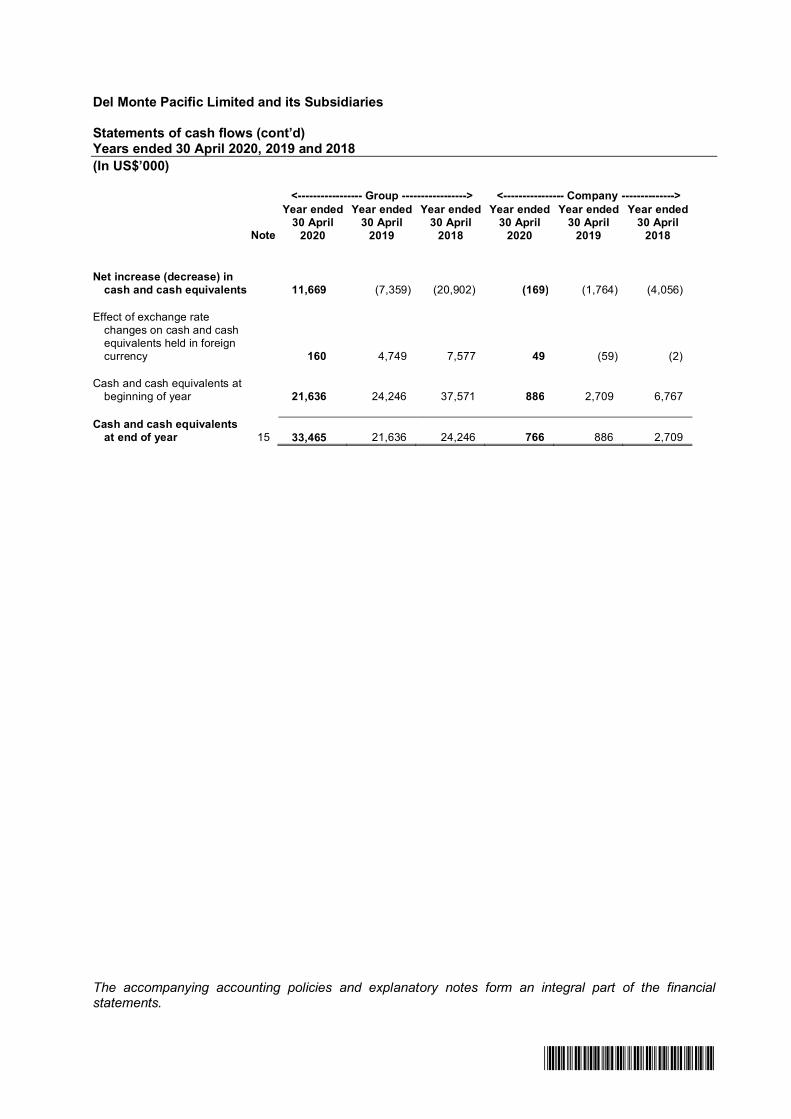
Del Monte Pacific Limited and its Subsidiaries
*SGVFSM004024*
Statements of cash flows (cont’d)Years ended 30 April 2020, 2019 and 2018(In US$’000)
<----------------- Group -----------------> <---------------- Company -------------->
Note
Year ended30 April
2020
Year ended30 April
2019
Year ended30 April
2018
Year ended30 April
2020
Year ended30 April
2019
Year ended30 April
2018
Net increase (decrease) incash and cash equivalents 11,669 (7,359) (20,902) (169) (1,764) (4,056)
Effect of exchange ratechanges on cash and cashequivalents held in foreigncurrency 160 4,749 7,577 49 (59) (2)
Cash and cash equivalents atbeginning of year 21,636 24,246 37,571 886 2,709 6,767
Cash and cash equivalentsat end of year 15 33,465 21,636 24,246 766 886 2,709
The accompanying accounting policies and explanatory notes form an integral part of the financialstatements.

Del Monte Pacific Limited and its Subsidiaries
Notes to the financial statementsFor the financial year ended 30 April 2020
- 1 -
*SGVFSM004024*
These notes form an integral part of the financial statements.
The accompanying financial statements were approved and authorised for issuance by the Board ofDirectors (the “Board” or “BOD”) on 12 August 2020.
1. Domicile and activities
Del Monte Pacific Limited (the “Company”) was incorporated as an international business companyin the British Virgin Islands on 27 May 1999 under the International Business Companies Act (Cap.291) of the British Virgin Islands. It was automatically re-registered as a company on 1 January2007 when the International Business Companies Act was repealed and replaced by the BusinessCompanies Act 2004 of the British Virgin Islands.
The registered office of the Company is located at Craigmuir Chambers, Road Town, Tortola,British Virgin Islands.
The principal activity of the Company is that of investment holding. Its subsidiaries are principallyengaged in growing, processing, and selling packaged fruits, vegetable and tomato, freshpineapples, sauces, condiments, pasta, broth and juices, mainly under the brand names of “DelMonte”, “S&W”, “Today’s”, “Contadina”, “College Inn” and other brands. The Company’ssubsidiaries also produce and distribute private label food products.
The immediate holding company is NutriAsia Pacific Limited (“NAPL”) whose indirect shareholdersare NutriAsia Inc. (“NAI”) and Well Grounded Limited (“WGL”), which at 30 April 2020, 2019and 2018, held 57.8% and 42.2% interests in NAPL, respectively, through their intermediarycompany, NutriAsia Holdings Limited. NAPL, NAI and WGL were incorporated in the British VirginIslands. The ultimate holding company is HSBC International Trustee Limited.
On 2 August 1999, the Company was admitted to the Official List of the Singapore ExchangeSecurities Trading Limited (“SGX-ST”). The Ordinary Shares of the Company were also listed onthe Philippine Stock Exchange Inc. (“PSE”) on 10 June 2013. The first tranche of the Company’sPreference Shares was listed on 7 April 2017 and the second tranche on 15 December 2017.
On 6 August 2010, the Company established DM Pacific Limited-ROHQ (“ROHQ”), the regionaloperating headquarters of the Company in the Philippines. The ROHQ is registered with andlicensed by the Securities and Exchange Commission (“SEC”) to engage in general administrationand planning, business planning and coordination, sourcing and procurement of raw materials andcomponents, corporate financial advisory, marketing control and sales promotion, training andpersonnel management, logistics services, research and product development, technical supportand maintenance, data processing and communication, and business development. The ROHQcommenced its operations in October 2015.
The financial statements of the Group as at and for the year ended 30 April 2020 comprise theCompany and its subsidiaries (together referred to as the “Group”, and individually as “Groupentities”), and the Group’s interests in joint ventures.

Del Monte Pacific Limited and its Subsidiaries
Notes to the financial statementsFor the financial year ended 30 April 2020
- 2 -
*SGVFSM004024*
2. Going concern
As at 30 April 2020, the Group and the Company’s current liabilities exceeded its current assets byUS$667.3 million and US$262.3 million (2019: net current assets of US$215.8 million andUS$234.8 million), respectively. As disclosed in Note 19, the Group’s and the Company’s totalloans and borrowings amounted to US$1,396.0 million and US$366.3 million (2019: US$ 1,478.7million and US$376.1 million), of which US$1,298.3 million and US$291.3 million (2019: US$492.7million and US$135.1 million) were classified as current liabilities. This was mainly driven by theSecured First Lien Term Loan of Del Monte Foods, Inc. (“DMFI”) and current portion of long-termloans of Del Monte Philippines, Inc. (“DMPI”) and the Company that will be due within fiscal year2021.
Management believes that the Group, collectively, will be able to pay its liabilities as and when theyfall due. Accordingly, the use of going concern assumption is appropriate taking into account thefollowing:
DMFI has successfully refinanced the Secured First Lien Term Loan through senior securednotes amounting to US$500.0 million due in 2025.
The Company and DMPI are in the process of refinancing the current portion of long-term loansthat are falling due in August 2020.
The Group has sufficient credit lines available for draw down and as such, managementbelieves that the Group will have sufficient working capital to enable to meet its objectives andfuture financial obligations.
The Group generated net operating cash flows of US$375.7 million (30 April 2019: US$180.9million). Management expects that the operating costs will be further reduced in the succeedingyears as the Group further reviews its manufacturing and distribution footprint in the US as wellas streamline its operations to further improve operational efficiency with the intent ofincreasing future operating cash flows.
3. Basis of preparation
3.1 Statement of compliance
The financial statements have been prepared in accordance with International Financial ReportingStandards (“IFRSs”).
3.2 Basis of measurement
The financial statements have been prepared on historical cost basis except as otherwisedescribed in the succeeding notes below.
3.3 Functional and presentation currency
The financial statements are presented in United States Dollars (US$) which is the Company’sfunctional currency. All financial information presented in US Dollars has been rounded to thenearest thousand, unless otherwise stated.
Del Monte Pacific Limited and its Subsidiaries
Notes to the financial statementsFor the financial year ended 30 April 2020
- 3 -
*SGVFSM004024*
3. Basis of preparation (cont’d)
3.4 Use of estimates and judgements
The preparation of the financial statements in conformity with IFRS requires management to makejudgements, estimates and assumptions that affect the application of accounting policies and thereported amounts of assets, liabilities, income and expenses. Actual results may differ from theseestimates.
Judgements
Information about judgements made in applying accounting policies that have the most significanteffects on the amounts recognised in the financial statements are included in the following notes:
Note 6 – Determination of control over subsidiariesNote 6 – Deconsolidation of Del Monte Andina C.A.Note 6 – Debt versus equity classificationNote 8 – Assessment of intangible assets with indefinite useful lifeNote 16 – Classification of assets held for saleNote 24 – Determination of lease term of contracts with renewal optionsNote 37 – Contingencies
ESTIMATES AND UNDERLYING ASSUMPTIONS
Estimates and underlying assumptions are reviewed on an ongoing basis. Revisions toaccounting estimates are recognised in the period in which the estimates are revised and in anyfuture periods affected.
Information about assumptions and estimation uncertainties that have a significant risk resulting ina material adjustment within the next financial year are included in the following notes:
Note 5 – Useful lives of property, plant and equipment, revaluation of freehold land, estimateof harvest for bearer plant's depreciation
Note 5 – Impairment of property, plant and equipmentNote 6 – Recoverability of investments in subsidiariesNote 6 – Obligation to deliver additional Redeemable and Convertible Preferred Shares
(“RCPS”)Note 6 – Fair valuation of derivative liabilityNote 7 – Recoverability of investments in joint venturesNote 8 – Useful lives of intangible assets and impairment of goodwill and intangible assetsNote 9 – Realisability of deferred tax assetsNote 11 – Future cost of growing crops and fair value of livestock, harvested crops, and
produce prior to harvest and future volume of harvestNote 12 – Allowance for inventory obsolescence and net realisable valueNote 13 – Impairment of trade and nontrade receivablesNote 21 – Measurement of employee benefit obligationsNote 22 – Estimation of environmental remediation liabilitiesNote 23 – Estimation of trade promotion accrualsNote 24 – Determination of incremental borrowing rate for lease liabilitiesNote 28 – Measurement of income taxNote 35 – Determination of fair valuesNote 37 – Contingencies
Del Monte Pacific Limited and its Subsidiaries
Notes to the financial statementsFor the financial year ended 30 April 2020
- 4 -
*SGVFSM004024*
3. Basis of preparation (cont’d)
3.5 Measurement of fair value
Fair value is the estimated price that would be received to sell an asset or paid to transfer a liabilityin an orderly transaction between market participants at the measurement date. The fair value isbased on the presumption that the transaction to sell the asset or transfer the liability takes placeeither in the principal market for the asset or liability or in the most advantageous market for theasset or liability. The principal or most advantageous market must be accessible to the Group.
The fair value of an asset or liability is measured using the assumptions that market participantswould use when pricing the asset or liability, assuming that market participants act in their economicbest interest.
The Group uses valuation techniques that are appropriate in the circumstances and for whichsufficient data are available to measure fair value, maximising the use of relevant observable inputsand minimising the use of unobservable inputs.
All assets and liabilities for which fair value is measured or disclosed in the financial statementsare categorised within the fair value hierarchy, described as follows, based on the lowest level inputthat is significant to the fair value measurement as a whole:
Level 1: quoted prices (unadjusted) in active markets for identical assets or liabilities that theGroup can access at the measurement date.
Level 2: inputs other than quoted prices included within Level 1 that are observable for theasset or liability, either directly or indirectly.
Level 3: unobservable inputs for the asset or liability.
If the inputs used to measure the fair value of an asset or a liability fall into different levels of thefair value hierarchy, then the fair value measurement is categorised in its entirety in the same levelof the fair value hierarchy as the lowest level input that is significant to the entire measurement.
The Group recognises transfers between levels of the fair value hierarchy at the end of the reportingperiod during which the change has occurred.

Del Monte Pacific Limited and its Subsidiaries
Notes to the financial statementsFor the financial year ended 30 April 2020
- 5 -
*SGVFSM004024*
3. Basis of preparation (cont’d)
3.6 Adoption of New or Revised Standards, Amendments to Standards and Interpretations
The Group applied for the first time certain pronouncements, effective 1 May 2019. Adoption ofthese pronouncements did not have a significant impact to the financial statements of the Groupand the Company unless otherwise stated.
IFRS 16, Leases
IFRS 16 supersedes IAS 17, Leases, IFRIC 4 Determining whether an Arrangement containsa Lease, SIC-15 Operating Leases-Incentives and SIC-27 Evaluating the Substance ofTransactions Involving the Legal Form of a Lease. The standard sets out the principles forthe recognition, measurement, presentation and disclosure of leases and requires lesseesto recognise the most leases on the consolidated statement of financial position.
Lessees will be also required to remeasure the lease liability upon the occurrence of certainevents (e.g., a change in the lease term, a change in future lease payments resulting from achange in an index or rate used to determine those payments). The lessee will generallyrecognise the amount of the remeasurement of the lease liability as an adjustment to theright-of-use asset.
Lessor accounting under IFRS 16 is substantially unchanged from today’s accounting underIAS 17. Lessors will continue to classify all leases using the same classification principle asin IAS 17 and distinguish between two types of leases: operating and finance leases.
The Group applied IFRS 16 using the modified retrospective approach, under which thecumulative effect of initial application is recognised in retained earnings as at 1 May 2019.Accordingly, the comparative information presented for fiscal year 2019 has not beenrestated. In relation to those leases under IFRS 16, the Group recognised depreciation andinterest costs, instead of operating lease expense.
As a lessee, the Group previously classified leases as operating or finance leases based onits assessment of whether the lease transferred substantially all of the risk and rewards ofownership. Under IFRS 16, the Group recognises right-of-use assets and lease liabilities formost leases, except for some short-term and low-value assets.
At transition, for leases classified as operating leases under IAS 17, lease liabilities weremeasured at the present value of the remaining lease payments, discounted at the Group’sincremental borrowing rate as at 1 May 2019. The right-of-use assets on lease agreementsof some office buildings and warehouses were recognised based on the carrying amount asif the standard had always been applied, apart from the use of incremental borrowing rate(IBR) at the date of initial application. For other leases, the right-of-use assets wererecognised based on the amount equal to the lease liabilities, adjusted for any relatedprepaid and accrued lease payments outstanding at the date of transition.
For leases classified as finance leases under IAS 17, the carrying amount of the right-of-useasset and the lease liability at 1 May 2019 were determined at the carrying amount of leaseasset and lease liability under IAS 17 immediately before that date. The Group has no financeleases under IAS 17.
Right-of-use assets and lease liabilities are presented separately in the consolidatedstatement of financial position.

Del Monte Pacific Limited and its Subsidiaries
Notes to the financial statementsFor the financial year ended 30 April 2020
- 6 -
*SGVFSM004024*
3. Basis of preparation (cont’d)
3.6 Adoption of New or Revised Standards, Amendments to Standards and Interpretations(cont’d)
IFRS 16, Leases (cont’d)
The impact of adoption of IFRS 16 on the consolidated statement of financial position as at1 May 2019 is as follows:
As at1 May 2019
US$’000AssetsPrepaid expenses and other current assets (9,234)Right-of-use assets - net 209,170Other noncurrent assets (17,972)
181,964
Liabilities and EquityLease liabilities 192,283Other noncurrent liabilities (7,609)Deferred tax liabilities - net (1,697)
182,977Retained earnings (1,013)
181,964
The Group also applied the available practical expedients wherein it:
• Used a single discount rate to a portfolio of leases with reasonably similar characteristics• Relied on its assessment of whether leases are onerous immediately before the date of
initial application• Applied the short-term leases exemptions to leases with lease term that ends within 12
months of the date of initial application• Excluded the initial direct costs from the measurement of the right-of-use asset at the
date of initial application• Used hindsight in determining the lease term where the contract contained options to
extend or terminate the lease
Based on the above, as at 1 May 2019:
• Right-of-use assets of US$209.2 million were recognised and presented separately inthe statement of financial position.
• Lease liabilities of US$192.3 million were recognised.• Other noncurrent assets of US$18.0 million, prepaid assets of US$9.2 million and other
noncurrent liabilities of US$7.6 million related to previous operating leases arising fromstraight-lining under IAS 17 were derecognised.
• Deferred tax liabilities decreased by US$1.7 million because of the deferred tax impactof the changes in assets and liabilities.
• The net effect of these adjustments was adjusted to retained earnings amounting toUS$1.0 million.

Del Monte Pacific Limited and its Subsidiaries
Notes to the financial statementsFor the financial year ended 30 April 2020
- 7 -
*SGVFSM004024*
3. Basis of preparation (cont’d)
3.6 Adoption of New or Revised Standards, Amendments to Standards and Interpretations(cont’d)
IFRS 16, Leases (cont’d)
The lease liabilities as at 1 May 2019 can be reconciled to the operating leasecommitments as at 30 April 2019 as follows:
US$’000
Operating lease commitments as at 30 April 2019 248,188Less: Present value discount using the Group’s IBR (47,985)Discounted operating lease commitments as at 1 May 2019 200,203Less: Commitments relating to short term leases/seasonal leases (12,853)Add: Payments in extension periods and lease contracts not
recognised as at 30 April 2019 4,933
Lease liabilities as at 1 May 2019 192,283
The IBR applied to the lease liabilities on 1 May 2019 ranges between 5.0% to 7.0%depending on the remaining lease term.
Due to the adoption of IFRS 16, the Group’s operating profit in 2020 improved, while itsinterest expense increased. This is due to the change in the accounting for rent expenserelated to leases that were classified as operating leases under IAS 17.
The adoption of IFRS 16 had impact on total equity as at 1 May 2019 since the Groupelected to measure right-of-use assets on certain contracts specifically for leaseagreements on office building and improvement, included as part of right-of-use assetsunder modified retrospective approach wherein right-of-use assets are measured atcarrying amount as if the standard had been applied since the commencement date andlease liabilities were recognised based on the present value of the remaining leasepayments, discounted using the incremental borrowing rate at the date of initial application.The resulting difference between right-of-use assets and lease liabilities was closed toretained earnings.
As a result of the adoption of IFRS 16, the Company recognised adjustment to retainedearnings amounting to US$1.01 million which pertains to the adjustment in investment insubsidiary accounted at equity method in the Company financial statements.

Del Monte Pacific Limited and its Subsidiaries
Notes to the financial statementsFor the financial year ended 30 April 2020
- 8 -
*SGVFSM004024*
3. Basis of preparation (cont’d)
3.6 Adoption of New or Revised Standards, Amendments to Standards and Interpretations(cont’d)
IFRIC 23, Uncertainty over Income Tax Treatment
The interpretation addresses the accounting for income taxes when tax treatments involveuncertainty that affects the application of IAS 12, Income taxes. It does not apply to taxesor levies outside the scope of IAS 12, nor does it specifically include requirements relatingto interest and penalties associated with uncertain tax treatments. The interpretationspecifically addresses the following:
₋ Whether an entity considers uncertain tax treatments separately₋ The assumptions an entity makes about the examination of tax treatments by taxation
authorities₋ How an entity determines taxable profit (tax loss), tax bases, unused tax losses,
unused tax credits and tax rates₋ How an entity considers changes in facts and circumstances
The Group and the Company is required to determine whether to consider each uncertaintax treatment separately or together with one or more other uncertain tax treatments and usethe approach that better predicts the resolution of the uncertainty. The Group and theCompany shall assume that the taxation authority will examine amounts that it has a right toexamine and have full knowledge of all related information when making those examinations.If the Group and the Company concludes that it is not probable that the taxation authority willaccept an uncertain tax treatment, the Group and the Company shall reflect the effect of theuncertainty for each uncertain tax treatment using the method it expects to better predict theresolution of the uncertainty.
Upon adoption of the interpretation, the Group has assessed whether it has uncertain taxposition. The Group applied significant judgement in identifying uncertainties over itsincome tax treatments. The Group determined, based on its assessment, that it is probablethat its income tax treatments will be accepted by the taxation authority. Accordingly, theInterpretation did not have significant impact on the consolidated financial statements of theGroup.
Based on the Company’s assessment, it has no (or no material) uncertain tax treatments,accordingly, the adoption of this Interpretation has no (or no significant) impact on theCompany’s financial statements.
Amendments to IAS 28, Long-term interests in associates and joint ventures
The amendments clarify that an entity applies IFRS 9 to long-term interests in an associateor joint venture to which the equity method is not applied but that, in substance, form part ofthe net investment in the associate or joint venture (long-term interests). This clarification isrelevant because it implies that the expected credit loss model in IFRS 9 applies to suchlong-term interests.
The amendments also clarified that, in applying IFRS 9, an entity does not take account ofany losses of the associate or joint venture, or any impairment losses on the net investment,recognised as adjustments to the net investment in the associate or joint venture that arisefrom applying IAS 28.

Del Monte Pacific Limited and its Subsidiaries
Notes to the financial statementsFor the financial year ended 30 April 2020
- 9 -
*SGVFSM004024*
3. Basis of preparation (cont’d)
3.6 Adoption of New or Revised Standards, Amendments to Standards and Interpretations(cont’d)
Amendments to IAS 28, Long-term interests in associates and joint ventures (cont’d)
These amendments are not applicable to the Group and the Company since interests in jointventures is accounted for using the equity method.
Amendments to IFRS 9, Prepayment Features with Negative Compensation
Under IFRS 9, a debt instrument can be measured at amortised cost or at fair value throughother comprehensive income (“FVOCI”), provided that the contractual cash flows are “solelypayments of principal and interest on the principal amount outstanding” (the “SPPI criterion”)and the instrument is held within the appropriate business model for that classification. Theamendments to IFRS 9 clarify that a financial asset passes the SPPI criterion regardless ofthe event or circumstance that causes the early termination of the contract and irrespectiveof which party pays or receives reasonable compensation for the early termination of thecontract. The basis for conclusions to the amendments clarified that the early terminationcan result from a contractual term or from an event outside the control of the parties to thecontract, such as a change in law or regulation leading to the early termination of the contract.
Amendments to IAS 19, Plan Amendment, Curtailment or Settlement
The amendments to IAS 19 address the accounting when a plan amendment, curtailment orsettlement occurs during a reporting period. The amendments specify that when a planamendment, curtailment or settlement occurs during the annual reporting period, an entity isrequired to:
Determine current service cost for the remainder of the period after the planamendment, curtailment or settlement, using the actuarial assumptions used toremeasure the net defined benefit liability (asset) reflecting the benefits offered underthe plan and the plan assets after that event.
Determine net interest for the remainder of the period after the plan amendment,curtailment or settlement using: the net defined benefit liability (asset) reflecting thebenefits offered under the plan and the plan assets after that event; and the discountrate used to remeasure that net defined benefit liability (asset).
The amendments also clarify that an entity first determines any past service cost, or a gainor loss on settlement, without considering the effect of the asset ceiling. This amount isrecognised in profit or loss. An entity then determines the effect of the asset ceiling after theplan amendment, curtailment or settlement. Any change in that effect, excluding amountsincluded in the net interest, is recognised in other comprehensive income.
As of 30 April 2020, there were amendments to the employee benefit plans and theseamendments to IAS 19 were considered (see Note 21).

Del Monte Pacific Limited and its Subsidiaries
Notes to the financial statementsFor the financial year ended 30 April 2020
- 10 -
*SGVFSM004024*
3. Basis of preparation (cont’d)
3.6 Adoption of New or Revised Standards, Amendments to Standards and Interpretations(cont’d)
Annual Improvements to IFRSs 2015-2017 Cycle
This cycle of improvements contains amendments to the following standards relevant to theGroup and the Company:
Amendments to IFRS 3, Business Combination and IFRS 11, Joint Arrangements,Previously Held Interest in a Joint Operation
The amendments clarify that, when an entity obtains control of a business that is a jointoperation, it applies the requirements for a business combination achieved in stages,including remeasuring previously held interests in the assets and liabilities of the jointoperation at fair value. In doing so, the acquirer remeasures its entire previously heldinterest in the joint operation.
A party that participates in, but does not have joint control of, a joint operation, mightobtain joint control of the joint operation in which the activity of the joint operationconstitutes a business as defined in IFRS 3. The amendments clarify that the previouslyheld interests in that joint operation are not remeasured.
Amendments to IAS 12, Income Tax Consequences of Payments on FinancialInstruments Classified as Equity
The amendments clarify that the income tax consequences of dividends are linked moredirectly to past transactions or events that generated distributable profits than todistributions to owners. Therefore, an entity recognises the income tax consequencesof dividends in profit or loss, other comprehensive income (“OCI”) or equity accordingto where the entity originally recognised those past transactions or events.
In fiscal year 2020, the Group recognised a total tax expense of US$47.2 million, asincome tax consequence of dividends paid by subsidiaries (see Note 28). This amountincludes the US$39.7 million final taxes paid on dividends paid from accumulatedearnings of prior years, as well as the deferred tax expense of US$7.5 million fromundistributed share in subsidiaries’ profits (see Note 9).
Amendments to IAS 23, Borrowing Costs, Borrowing Costs Eligible for Capitalization
The amendments clarify that an entity treats as part of general borrowings anyborrowing originally made to develop a qualifying asset when substantially all of theactivities necessary to prepare that asset for its intended use or sale are complete.

Del Monte Pacific Limited and its Subsidiaries
Notes to the financial statementsFor the financial year ended 30 April 2020
- 11 -
*SGVFSM004024*
4. Significant accounting policies
The accounting policies set out below have been applied consistently to all periods presented inthese financial statements, and have been applied consistently by Group entities, except asexplained in Note 3.6, which addresses the changes in accounting policies.
4.1 Basis of consolidation
(i) Business combination
Business combinations are accounted for using the acquisition method in accordance withIFRS 3, Business Combinations, as at the acquisition date, which is the date on whichcontrol is transferred to the Group.
The Group measures goodwill at the acquisition date as:
the fair value of consideration transferred; plus
the recognised amount of any non-controlling interests in the acquiree; plus
if the business combination is achieved in stages, the fair value of the pre-existingequity interest in the acquiree,
over the net recognised amount (generally fair value) of the identifiable assets acquiredand liabilities assumed. Any goodwill that arises is tested annually for impairment.
When the excess is negative, a bargain purchase gain is recognised immediately in theincome statement.
The consideration transferred does not include amounts related to the settlement of pre-existing relationships. Such amounts are generally recognised in the income statement.
Any contingent consideration payable is recognised at fair value at the acquisition date andincluded in the consideration transferred. If the contingent consideration is classified asequity, it is not remeasured and settlement is accounted for within equity. Otherwise,subsequent changes to the fair value of the contingent consideration are recognised in theincome statement.
Non-controlling interests that are present ownership interests and entitle their holders to aproportionate share of the acquiree’s net assets in the event of liquidation are measuredeither at fair value or at the non-controlling interests’ proportionate share of the recognisedamounts of the acquiree’s identifiable net assets, at the acquisition date. Themeasurement basis taken is elected on a transaction-by-transaction basis. All othercomponents of non-controlling interests are measured at acquisition-date fair value unlessanother measurement is required by another standard.
Costs related to the acquisition, other than those associated with the issue of debt or equitysecurities, that the Group incurs in connection with a business combination are expensedas incurred.

Del Monte Pacific Limited and its Subsidiaries
Notes to the financial statementsFor the financial year ended 30 April 2020
- 12 -
*SGVFSM004024*
4. Significant accounting policies (cont’d)
4.1 Basis of consolidation (cont’d)
(i) Business combination (cont’d)
If the initial accounting for a business combination is incomplete by the end of the reportingperiod it occurs, provisional amounts for the items for which the accounting is incompleteis reported in the financial statements. During the measurement period, which is not morethan one year from acquisition date, the provisional amounts recognised areretrospectively adjusted, and any additional assets or liabilities recognised, to reflect newinformation obtained about facts and circumstances that existed as of the acquisition date.Comparative information for prior periods are revised, as needed.
Changes in the Group’s interest in a subsidiary that do not result in a loss of control areaccounted for as transactions with owners in their capacity as owners and therefore noadjustments are made to goodwill and no gain or loss is recognised in the incomestatement. Adjustments to non-controlling interests arising from transactions that do notinvolve the loss of control are based on a proportionate amount of the net assets of thesubsidiary.
(ii) Investments in subsidiaries
Subsidiaries are entities controlled by the Group. Control is achieved when the Companyis exposed, or has rights, to variable returns from its involvement with the investee and hasthe ability to affect those returns through power over the investee. Specifically, theCompany controls an investee if and only if the Company has:
power over the investee (i.e., existing rights that give the current ability to direct therelevant activities of the investee);
exposure, or rights, to variable returns from its involvement with the investee; and
the ability to use its power over the investee to affect its returns.
When the Company has less than majority of the voting rights or similar rights to aninvestee, the Company considers all relevant facts and circumstances in assessingwhether it has power over an investee, including:
the contractual arrangement with the other vote holders of the investee;
rights arising from other contractual arrangements; and
the Company’s voting rights and potential voting rights.
The Company reassesses whether or not it controls an investee if facts and circumstancesindicate that there are changes to one or more of the three elements of control.Subsidiaries are fully consolidated from the date control is transferred to the Company andcease to be consolidated from the date control is lost. Assets, liabilities, income andexpenses of a subsidiary acquired or disposed of during the year are included in the incomestatement from the date the Company gains control until the date the Company ceases tocontrol the subsidiary.

Del Monte Pacific Limited and its Subsidiaries
Notes to the financial statementsFor the financial year ended 30 April 2020
- 13 -
*SGVFSM004024*
4. Significant accounting policies (cont’d)
4.1 Basis of consolidation (cont’d)
(ii) Investments in subsidiaries (cont’d)
Profit or loss and each component of OCI are attributed to the equity holders of theCompany and to the non-controlling interests, even if this results in the non-controllinginterests having a deficit balance. When necessary, adjustments are made to thefinancial statements of subsidiaries to bring their accounting policies into line with theCompany’s accounting policies.
All intra-group assets and liabilities, equity, income, expenses and cash flows relating totransactions between members of the Company are eliminated in full on consolidation.
(iii) Acquisition under common control
The formation of the Group in 1999 was accounted for as a reorganisation of companiesunder common control using merger accounting. The financial statements thereforereflect the combined financial statements of all companies that form the Group as if theywere a Group for all periods presented. The assets and liabilities of Del Monte PacificResources Limited and its subsidiaries contributed to the Company have been reflected atpredecessor cost in these financial statements.
(iv) Loss of control
When the Group loses control over a subsidiary, it derecognises the assets and liabilitiesof the subsidiary, and any related non-controlling interest and other components of equity.Any resulting gain or loss is recognised in the income statement.
(v) Goodwill
Goodwill that arises upon the acquisition of subsidiaries is included in intangible assets.For the measurement of goodwill on initial recognition, see Note 8.
Subsequent measurement
Goodwill is measured at cost less accumulated impairment losses. In respect of the jointventures, the carrying amount of goodwill is included in the carrying amount of theinvestment, and an impairment loss on such an investment is not allocated to any asset,including goodwill, that forms part of the carrying amount of the joint ventures.
Impairment of goodwill is discussed in Note 4.11.
(vi) Investments in joint ventures
Joint ventures are those entities in which the Group has joint control, whereby the Grouphas rights to the net assets of the arrangement, rather than rights to its assets andobligations for its liabilities. Joint control is the contractually sharing of control of anarrangement, which exists only when decisions about the relevant activities requireunanimous consent of the parties sharing control.

Del Monte Pacific Limited and its Subsidiaries
Notes to the financial statementsFor the financial year ended 30 April 2020
- 14 -
*SGVFSM004024*
4. Significant accounting policies (cont’d)
4.1 Basis of consolidation (cont’d)
(vi) Investments in joint ventures (cont’d)
The considerations made in determining significant influence or joint control are similar tothose necessary to determine control over subsidiaries.
Investments in joint ventures are accounted for using the equity method. They arerecognised initially at cost, which includes transactions costs.
Subsequent to the initial recognition, the financial statements include the Group’s share ofprofit or loss and other comprehensive income of the joint ventures, after adjustments toalign the accounting policies with those of the Group, from the date that significant influenceor joint control commences until the date that significant influence or joint control ceases.
When the Group’s share of losses exceeds its interest in joint ventures, the carryingamount of the investment, together with any long-term interests that form part thereof, isreduced to zero, and the recognition of further losses is discontinued except to the extentthat the Group has an obligation to fund the investee’s operations or has made paymentson behalf of the investee.
Impairment of investments in joint ventures is discussed in Note 4.11.
(vii) Transactions eliminated on consolidation
Intra-group balances and transactions, and any unrealised income or expenses arisingfrom intra-group transactions, are eliminated in preparing the financial statements.Unrealised gains arising from transactions with joint ventures are eliminated against theinvestment to the extent of the Group’s interest in the investee. Unrealised losses areeliminated in the same way as unrealised gains, but only to the extent that there is noevidence of impairment.
(viii) Investments in subsidiaries and joint ventures in the separate financial statements
Interest in subsidiaries and joint ventures are accounted for using the equity method. It isinitially recognised at cost, which includes transactions costs. Subsequent to the initialrecognition, the financial statements include the Company’s share of profit or loss and othercomprehensive income of the equity-accounted investee. Unrealised losses are eliminatedin the same way as unrealised gains, but only to the extent that there is no evidence ofimpairment.
When the Company’s share of losses exceeds its interest in subsidiaries and joint ventures,the carrying amount of the investment, together with any long-term interests that form partthereof, is reduced to zero, and the recognition of further losses is discontinued except tothe extent that the Company has an obligation to fund the investee’s operations or hasmade payments on behalf of the investee.
Del Monte Pacific Limited and its Subsidiaries
Notes to the financial statementsFor the financial year ended 30 April 2020
- 15 -
*SGVFSM004024*
4. Significant accounting policies (cont’d)
4.2 Foreign currency
(i) Foreign currency transactions
Transactions in foreign currencies are translated to the respective functional currencies ofGroup entities at the exchange rate at the dates of the transactions. Monetary assets andliabilities denominated in foreign currencies at the reporting date are retranslated to thefunctional currency at the exchange rate at that date.
Non-monetary assets and liabilities denominated in foreign currencies that are measuredat fair value are retranslated to the functional currency at the exchange rate at the date thatthe fair value was determined. Non-monetary items in a foreign currency that aremeasured in terms of historical cost are translated using the exchange rate at the date ofthe transaction.
Foreign currency differences arising on translation are recognised in the income statement,except for differences which are recognised in OCI arising on the retranslation of qualifyingcash flow hedges to the extent the hedge is effective.
(ii) Foreign operations
The assets and liabilities of foreign operations, including goodwill and fair valueadjustments arising on acquisition, are translated to US Dollars at exchange rates at thereporting date. The income and expenses of foreign operations are translated to USDollars using monthly average exchange rates.
Foreign currency differences are recognised in OCI and presented in the foreign currencytranslation reserve (“translation reserve”) in equity. However, if the operation is a non-wholly-owned subsidiary, then the relevant proportionate share of the translation differenceis allocated to the non-controlling interests. When a foreign operation is disposed of suchthat control, or joint control is lost, the cumulative amount in the translation reserve relatedto that foreign operation is reclassified to profit or loss as part of the gain or loss on disposal.When the Group disposes of only part of its interest in a subsidiary that includes a foreignoperation while retaining control, the relevant proportion of the cumulative amount isreattributed to non-controlling interests. When the Group disposes of only part of itsinvestment in joint venture that includes a foreign operation while retaining significantinfluence or joint control, the relevant proportion of the cumulative amount is reclassified tothe income statement.
When the settlement of a monetary item that is a receivable from or payable to a foreignoperation is neither planned nor likely in the foreseeable future, foreign exchange gainsand losses arising from such a monetary item are considered to form part of a netinvestment in a foreign operation and are recognised in OCI, and presented in thetranslation reserve in equity.

Del Monte Pacific Limited and its Subsidiaries
Notes to the financial statementsFor the financial year ended 30 April 2020
- 16 -
*SGVFSM004024*
4. Significant accounting policies (cont’d)
4.3 Current versus Noncurrent Classification
The Group presents assets and liabilities in the statement of financial position based on currentand noncurrent classification. An asset is current when:
It is expected to be realised or intended to be sold or consumed in the normal operating cycle; It is held primarily for the purpose of trading; It is expected to be realised within 12 months after the reporting period; or It is cash or cash equivalent unless restricted from being exchanged or used to settle a liability
for at least 12 months after the reporting period.
All other assets are classified as noncurrent.
A liability is current when:
It is expected to be settled in the normal operating cycle; It is held primarily for the purpose of trading; It is due to be settled within 12 months after the reporting period; or There is no unconditional right to defer the settlement of the liability for at least 12 months after
the reporting period.
The Group classifies all other liabilities as noncurrent.
Deferred tax assets and deferred tax liabilities are classified as noncurrent assets and liabilities,respectively.
4.4 Intangible assets
(i) Indefinite useful life intangible assets
Intangible assets are measured at cost less accumulated impairment losses.
The Group assess intangible assets as having indefinite useful life if there is no foreseeablelimit to the period over which the assets are expected to generate cash inflows for theentity.
(ii) Research and development
Expenditure on research activities, undertaken with the prospect of gaining new scientificor technical knowledge and understanding, is recognised in the income statement asincurred.
Development activities involve a plan or design for the production of new or substantiallyimproved products and processes. Development expenditure is capitalised only ifdevelopment costs can be measured reliably, the product or process is technically andcommercially feasible, future economic benefits are probable, and the Group intends toand has sufficient resources to complete development and to use or sell the asset. Theexpenditure capitalised includes the cost of materials, direct labour, overhead costs thatare directly attributable to preparing the asset for its intended use, and capitalisedborrowing costs. Other development expenditure is recognised in the income statementas incurred.
Capitalised development expenditure is measured at cost less accumulated amortisationand accumulated impairment losses.

Del Monte Pacific Limited and its Subsidiaries
Notes to the financial statementsFor the financial year ended 30 April 2020
- 17 -
*SGVFSM004024*
4. Significant accounting policies (cont’d)
4.4 Intangible assets (cont’d)
(iii) Other intangible assets
Other intangible assets that are acquired by the Group and have finite useful lives aremeasured at cost less accumulated amortisation and accumulated impairment losses.
(iv) Subsequent expenditure
Subsequent expenditure is capitalised only when it increases the future economic benefitsembodied in the specific asset to which it relates. All other expenditure, includingexpenditure on internally generated goodwill and brands, is recognised in the incomestatement as incurred.
(v) Amortisation
Amortisation is calculated based on the cost of the asset.
Amortisation is recognised in profit or loss on a straight-line basis over the estimated usefullives of intangible assets, other than goodwill and, from the date that they are available foruse. The estimated useful lives for the current period and comparative years are asfollows:
Trademarks - 10 to 20 yearsCustomer relationships - 20 years
Amortisation methods, useful lives and residual values are reviewed at each reporting dateand adjusted if appropriate.
4.5 Financial instruments
A financial instrument is any contract that gives rise to a financial asset of one entity and afinancial liability or equity instrument of another entity.
Initial Recognition and Subsequent Measurement Prior to the Adoption of IFRS 9
The Group classifies non-derivative financial assets into the following categories: financial assetsat fair value through profit or loss (“FVTPL”), held-to-maturity (“HTM”) financial assets, loans andreceivables and available-for-sale (“AFS”) financial assets. The Group classifies non-derivativefinancial liabilities into the following categories: financial liabilities at FVPL and other financialliabilities. The classification depends on the purpose for which the investments were acquired andwhether they are quoted in an active market. Classification is determined at initial recognition and,where allowed and appropriate, re-evaluates such designation at every reporting date. The Grouphas no financial assets and liabilities at FVTPL and HTM financial assets as at 30 April 2018.
(i) Non-derivative financial assets
The Group initially recognises loans and receivables and deposits on the date that theyare originated. All other financial assets are recognised initially on the trade date, whichis the date that the Group becomes a party to the contractual provisions of theinstrument.

Del Monte Pacific Limited and its Subsidiaries
Notes to the financial statementsFor the financial year ended 30 April 2020
- 18 -
*SGVFSM004024*
4. Significant accounting policies (cont’d)
4.5 Financial instruments (cont’d)
(i) Non-derivative financial assets (cont’d)
The Group derecognises a financial asset when the contractual rights to the cash flowsfrom the asset expire, or it transfers the rights to receive the contractual cash flows on thefinancial asset in a transaction in which substantially all the risks and rewards of ownershipof the financial asset are transferred, or it neither transfers nor retains substantially all ofthe risks and rewards of ownership and does not retain control over the transferred asset.Any interest in transferred financial assets that is created or retained by the Group isrecognised as a separate asset or liability.
Financial assets and liabilities are offset and the net amount presented in the statement offinancial position when, and only when, the Group has a legal right to offset the amountsand intends either to settle on a net basis or to realise the asset and settle the liabilitysimultaneously. The Group assesses that it has a currently enforceable right of offset ifthe right is not contingent on a future event, and is legally enforceable in the normal courseof business, event of default, and event of insolvency or bankruptcy of the Group and all ofthe counterparties.
Non-derivative financial assets comprise of loans and receivables.
Loans and receivables
Loans and receivables are financial assets with fixed or determinable payments that arenot quoted in an active market. Such assets are recognised initially at fair value plus anydirectly attributable transaction costs. Subsequent to initial recognition, loans andreceivables are measured at amortised cost using the effective interest method, less anyimpairment losses.
Loans and receivables comprise of due from a related party, note receivable under “Othernoncurrent assets”, trade and other receivables, refundable deposits, and cash and cashequivalents. Cash and cash equivalents comprise of cash on hand, cash in banks andshort-term placements.
(ii) Non-derivative financial liabilities
Financial liabilities are recognised initially on the date that the Group becomes a party tothe contractual provisions of the instrument.
The Group derecognises a financial liability when its contractual obligations aredischarged, are cancelled or expire.
When a financial liability (or part of a liability) is extinguished, the difference between thecarrying amount of the financial liability (or part of a liability) and the consideration paid,including any non-cash assets transferred or liabilities assumed, is recognised in incomestatement. If the Group repurchases only a part of a financial liability, it calculates thecarrying value of the part disposed of by allocating the previous carrying amount of thefinancial liability between the part that continues to be recognised and the part that isderecognised based on the relative fair values of those parts on the date of the repurchase.

Del Monte Pacific Limited and its Subsidiaries
Notes to the financial statementsFor the financial year ended 30 April 2020
- 19 -
*SGVFSM004024*
4. Significant accounting policies (cont’d)
4.5 Financial instruments (cont’d)
(ii) Non-derivative financial liabilities (cont’d)
The Group assesses that it has a currently enforceable right of offset if the right is notcontingent on a future event, and is legally enforceable in the normal course of business,event of default, and event of insolvency or bankruptcy of the Group and all of thecounterparties.
Such financial liabilities are recognised initially at fair value plus any directly attributabletransaction costs. Subsequent to initial recognition, these financial liabilities aremeasured at amortised cost using the effective interest method.
Non-derivative financial liabilities comprise loans and borrowings, and trade and otherpayables.
(iii) Derivative financial instruments, including hedge accounting
The Group uses derivative financial instruments for the purpose of managing risksassociated with interest rates, currencies, and certain commodities. The Group does nottrade or use derivative instruments with the objective of earning financial gains onfluctuations in the derivative instrument alone, nor does it use derivative instruments wherethere are no underlying exposures. All derivative instruments are recorded in thestatement of financial position at fair value. The accounting for changes in the fair value(i.e., gains or losses) of a derivative instrument depends on whether the instrument hasbeen designated and qualifies as part of a hedging relationship and further, on the type ofhedging relationship.
For those derivative instruments that are not designated as hedging instruments, changesin fair value subsequent to initial recognition are recognised in the income statement.
For those derivative instruments that are designated and qualify as hedging instruments,the Group designates the hedging instrument based upon the exposure being hedged, asa fair value hedge, cash flow hedge, or a hedge of a net investment in a foreign operation.
On initial designation of the derivative as the hedging instrument, the Group formallydocuments the relationship between the hedging instrument and the hedged item,including the risk management objectives and strategy in undertaking the hedgetransaction and the hedged risk, together with the methods that will be used to assess theeffectiveness of the hedging relationship. The Group makes an assessment, both at theinception of the hedge relationship as well as on an ongoing basis, of whether the hedginginstruments are expected to be ‘highly effective’ in offsetting the changes in the fair valueor cash flows of the respective hedged items attributable to the hedged risk, and whetherthe actual results of each hedge are within a range of 80 - 125%. For a cash flow hedge ofa forecast transaction, the transaction should be highly probable to occur and shouldpresent an exposure to variations in cash flows that could ultimately affect reported profitor loss.

Del Monte Pacific Limited and its Subsidiaries
Notes to the financial statementsFor the financial year ended 30 April 2020
- 20 -
*SGVFSM004024*
4. Significant accounting policies (cont’d)
4.5 Financial instruments (cont’d)
(iii) Derivative financial instruments, including hedge accounting (cont’d)
Cash flow hedges
When a derivative is designated as a cash flow hedging instrument, the effective portion ofchanges in the fair value of the derivative is recognised in other comprehensive incomeand accumulated in the hedging reserve. Any ineffective portion of changes in the fairvalue of the derivative is recognised immediately in the income statement.
The amount accumulated in equity is retained in other comprehensive income andreclassified to profit or loss in the same period or periods during which the hedged itemaffects profit or loss.
If the hedging instrument no longer meets the criteria for hedge accounting, expires or issold, terminated or exercised, or the designation is revoked, then hedge accounting isdiscontinued prospectively. If the forecast transaction is no longer expected to occur,then the amount accumulated in equity is reclassified to the income statement.
Starting May 1, 2018, the Group has adopted IFRS 9.
(i) Recognition and measurement
Financial instruments are initially recognised when they are originated. All other financialassets and financial liabilities are initially recognised when the Group becomes a party tothe contractual provisions of the instrument.
A financial asset, unless it is a trade receivable without a financing component, or financialliability is initially measured at fair value plus, for an item not at FVTPL, transaction coststhat are directly attributable to its acquisition or issue. A trade receivable without asignificant financing component is initially measured at the transaction price determinedunder IFRS 15, Revenue from Contracts with Customers.
(ii) Classification and subsequent measurement
Financial assets
On initial recognition, the Group classifies its financial assets into the following categories:financial assets at amortised cost, financial assets at FVTPL, and financial assets atFVOCI. The classification depends on the Group’s business model for managing financialinstruments and the contractual cash flow characteristics of the financial instruments.Financial assets are not reclassified subsequent to their initial recognition unless the Groupchanges its business model for managing financial assets, in which case all affectedfinancial assets are reclassified on the first day of the first reporting period following thechange in the business model.
Del Monte Pacific Limited and its Subsidiaries
Notes to the financial statementsFor the financial year ended 30 April 2020
- 21 -
*SGVFSM004024*
4. Significant accounting policies (cont’d)
4.5 Financial instruments (cont’d)
(ii) Classification and subsequent measurement (cont’d)
Financial assets (cont’d)
A financial asset is measured at amortised cost if it meets both of the following conditionsand is not designated at FVTPL: (1) it is held within a business model whose objective isto hold assets to collect contractual cash flows; and (2) its contractual terms give rise onspecified dates to cash flows that are solely payments of principal and interest on theprincipal amount outstanding.
A debt investment is measured at FVOCI if it meets both of the following conditions and isnot designated at FVTPL: (1) it is held within a business model whose objective is achievedby both collecting contractual cash flows and selling financial assets; and (2) its contractualterms give rise on specified dates to cash flows that are solely payments of principal andinterest on the principal amount outstanding.
On initial recognition of an equity investment that is not held for trading, the Group mayirrevocably elect to present subsequent changes in the investment’s fair value in OCI. Thiselection is made on an investment-by-investment basis.
The Group’s financial assets not classified as measured at amortised cost or FVOCI asdescribed above are measured at FVTPL. This includes all derivative financial assets. Oninitial recognition, the Group may irrevocably designate a financial asset that otherwisemeets the requirements to be measured at amortised cost or at FVOCI at FVTPL if doingso eliminates or significantly reduces an accounting mismatch that would otherwise arise.
The Group has insignificant investment in club shares classified and measured at FVOCI.
Financial assets at amortised cost
These assets are subsequently measured at amortised cost using the effective interestmethod. The amortised cost is reduced by impairment losses. Interest income, foreignexchange gains and losses and impairment are recognised in profit or loss. Impairmentlosses on trade receivables are recognised under selling expenses. Any gain or loss onderecognition is recognised in profit or loss.
Financial assets at amortised cost comprise cash in banks and cash equivalents, trade andother receivables, due from related party, refundable deposits and note receivables.

Del Monte Pacific Limited and its Subsidiaries
Notes to the financial statementsFor the financial year ended 30 April 2020
- 22 -
*SGVFSM004024*
4. Significant accounting policies (cont’d)
4.5 Financial instruments (cont’d)
(ii) Classification and subsequent measurement (cont’d)
Business model assessment
The business model refers to how an entity manages its financial assets in order togenerate cash flows. It determines whether cash flows will result from collecting contractualcash flows, selling financial assets or both. The Group makes an assessment of theobjective of the business model in which financial assets held at portfolio level becausethis best reflects the way the business is managed and information is provided tomanagement. The information considered includes:
the policies and objectives in managing the Group’s financial assets for the portfolioand the operation of those policies in practice. These include whether management’sstrategy focuses on earning contractual interest income, maintaining a particularinterest rate profile, matching the duration of the financial assets to the duration ofany related liabilities or expected cash outflows or realizing cash flows through thesale of the assets;
how the performance of the portfolio is evaluated and reported to the Group’smanagement;
the risks that affect the performance of the business model and how those risks aremanaged;
how managers of the business are compensated – e.g. whether compensation isbased on the fair value of the assets managed or the contractual cash flowscollected; and
the frequency, volume and timing of sales of financial assets in prior period, thereasons for such sales and expectations about future sales activity.

Del Monte Pacific Limited and its Subsidiaries
Notes to the financial statementsFor the financial year ended 30 April 2020
- 23 -
*SGVFSM004024*
4. Significant accounting policies (cont’d)
4.5 Financial instruments (cont’d)
(ii) Classification and subsequent measurement (cont’d)
Assessment Whether Contractual Cash Flows are SPPI
For the purposes of this assessment, “principal” is defined as the fair value of the financialasset on initial recognition. “Interest” is defined as consideration for the time value of moneyand for the credit risk associated with the principal amount outstanding during a particularperiod of time and for other basic lending risks and costs (e.g., liquidity risk andadministrative costs), as well as a profit margin.
In assessing whether the contractual cash flows are SPPI, the Group considers thecontractual terms of the instrument. This includes assessing whether the financial assetcontains a contractual term that could change the timing or amount of contractual cashflows such that it would not meet this condition. In making this assessment, the Groupconsiders:
contingent events that would change the amount or timing of cash flows;
terms that may adjust the contractual coupon rate, including variable-rate features;
prepayment and extension features; and
terms that limit the Group’s claim to cash flows from specified assets (e.g., non-recourse features).
A prepayment feature is consistent with the solely payments of principal and interestcriterion if the prepayment amount substantially represents unpaid amounts of principaland interest on the principal amount outstanding, which may include reasonable additionalcompensation for early termination of the contract. Additionally, for a financial assetacquired at a discount or premium to its contractual par amount, a feature that permits orrequires prepayment at an amount that substantially represents the contractual par amountplus accrued (but unpaid) contractual interest (which may also include reasonableadditional compensation for early termination) is treated as consistent with this criterion ifthe fair value of the prepayment feature is insignificant at initial recognition.
Financial liabilities
Financial liabilities are classified as measured at amortised cost or FVTPL. A financialliability is classified as at FVTPL if it is classified as held-for-trading, it is a derivative or itis designated as such on initial recognition. Financial liabilities at FVTPL are measured atfair value and net gains and losses, including interest expense, are recognised in profit orloss. Other financial liabilities are subsequently measured at amortised cost using theeffective interest method. Interest expense and foreign exchange gains and losses arerecognised in profit or loss. Any gain or loss on derecognition is also recognised in profitor loss.

Del Monte Pacific Limited and its Subsidiaries
Notes to the financial statementsFor the financial year ended 30 April 2020
- 24 -
*SGVFSM004024*
4. Significant accounting policies (cont’d)
4.5 Financial instruments (cont’d)
(ii) Classification and subsequent measurement (cont’d)
Financial liabilities (cont’d)
Financial liabilities at amortised cost comprise bank loans, trade and other payables.
Classification of Financial Instruments between Debt and Equity
A financial instrument is classified as debt instrument if it provides for a contractualobligation to:
deliver cash or another financial asset to another entity;
exchange financial assets or financial liabilities with another entity under conditionsthat are potentially unfavorable to the Company; or
satisfy the obligation other than by the exchange of a fixed amount of cash or anotherfinancial asset for a fixed number of own equity shares.
If the Group does not have an unconditional right to avoid delivering cash or anotherfinancial asset to settle its contractual obligation, the obligation meets the definition of afinancial liability. The components of issued financial instruments that contain bothliability and equity elements are accounted for separately, with the equity component beingassigned the residual amount after deducting from the instrument as a whole the amountseparately determined as the fair value of the liability component on the date of issue.
(ii) Derecognition
The Group derecognises a financial asset when the contractual rights to the cash flowsfrom the asset expire, or it transfers the rights to receive the contractual cash flows on thefinancial asset in a transaction in which substantially all the risks and rewards of ownershipof the financial asset are transferred, or it neither transfers nor retains substantially all ofthe risks and rewards of ownership and does not retain control over the transferred asset.Any interest in transferred financial assets that is created or retained by the Group isrecognised as a separate asset or liability.
The Group derecognises a financial liability when its contractual obligations aredischarged, cancelled or expired. Repurchases of a portion of a financial liability result inthe allocation of the original carrying value of the financial liability between the portionthat continues to be recognised and the portion that was repurchased based on therelative fair values on the date of the repurchase.

Del Monte Pacific Limited and its Subsidiaries
Notes to the financial statementsFor the financial year ended 30 April 2020
- 25 -
*SGVFSM004024*
4. Significant accounting policies (cont’d)
4.5 Financial instruments (cont’d)
(iii) Offsetting
Financial assets and financial liabilities are offset and the net amount presented in thestatement of financial position when, and only when, the Group currently has a legallyenforceable right to set off the amounts and it intends either to settle them on a net basisor to realise the asset and settle the liability simultaneously. The Group assesses that ithas a currently enforceable right of offset if the right is not contingent on a future event,and is legally enforceable in the normal course of business, event of default, and event ofinsolvency or bankruptcy of the Group and all of the counterparties.
(iv) Derivative financial instruments, including hedge accounting
The Group uses derivative financial instruments for the purpose of managing risksassociated with interest rates, currencies, and certain commodities. The Group does nottrade or use instruments with the objective of earning financial gains on fluctuations in thederivative instrument alone, nor does it use instruments where there are no underlyingexposures. All derivative instruments are recorded in the statement of financial position atfair value. The accounting for changes in the fair value (i.e., gains or losses) of a derivativeinstrument depends on whether the instrument has been designated and qualifies as partof a hedging relationship and further, on the type of hedging relationship. For thosederivative instruments that are not designated as hedging instruments, changes in fairvalue subsequent to initial recognition are recognised in the income statement. For thosederivative instruments that are designated and qualify as hedging instruments, the Groupdesignates the hedging instrument as a fair value hedge, cash flow hedge, or a hedge ofa net investment in a foreign operation based upon the exposure being hedged.
On initial designation of the derivative as the hedging instrument, the Group formallydocuments the relationship between the hedging instrument and the hedged item,including the risk management objectives and strategy in undertaking the hedgetransaction and the hedged risk, together with the methods that will be used to assess theeffectiveness of the hedging relationship. The Group also documents the economicrelationship between the hedged item and the hedging instrument, including whether thechanges in cash flows of the hedged item and hedging instrument are generally expectedto offset each other. To qualify for hedge accounting, the hedging relationship has to meetthe following hedge effectiveness requirements:
there is an economic relationship between the hedged item and the hedginginstrument;
the effect of credit risk does not dominate the value changes that result from thateconomic relationship;
the hedge ratio of the hedging relationship is the same as that resulting from thequantity of the hedged item that the entity actually hedges and the quantity of thehedging instrument that the entity actually uses to hedge that quantity of hedgeditem; and

Del Monte Pacific Limited and its Subsidiaries
Notes to the financial statementsFor the financial year ended 30 April 2020
- 26 -
*SGVFSM004024*
4. Significant accounting policies (cont’d)
4.5 Financial instruments (cont’d)
(v) Derivative financial instruments, including hedge accounting (cont’d)
the hedged item and the hedging instrument are not intentionally weighted to createhedge ineffectiveness, whether recognised or not, to achieve an accounting outcomethat would be inconsistent with the purpose of hedge accounting.
For a cash flow hedge of a forecast transaction, the transaction should be highly probableto occur and should present an exposure to variations in cash flows that could ultimatelyaffect reported profit or loss.
Cash flow hedges
When a derivative is designated as a cash flow hedging instrument, the effective portion ofchanges in the fair value of the derivative is recognised in OCI and accumulated in thehedging reserve. Any ineffective portion of changes in the fair value of the derivative isrecognised immediately in the income statement.
The amount accumulated in equity is retained in OCI and reclassified to the consolidatedincome statement in the same period or periods during which the hedged item affects theconsolidated income statement, except when a hedged forecast transaction subsequentlyresults in the recognition of a non-financial item such as inventory, in which case theamount retained in OCI is included directly in the initial cost of the non-financial item whenit is recognised.
If the hedging instrument no longer meets the criteria for hedge accounting, expires or issold, terminated or exercised, or the designation is revoked, then hedge accounting isdiscontinued prospectively. When hedge accounting for cash flow hedges is discontinued,the amount that has been accumulated in OCI remains in equity until, for hedge of atransaction resulting in the recognition of a non-financial item, it is included in the non-financial item’s cost on its initial recognition or, for other cash flow hedges, it is reclassifiedto the income statement in the same period or periods as the hedged expected future cashflows affect the income statement. If a hedged forecast transaction is no longer expectedto occur, then the amount accumulated in equity is immediately reclassified to the incomestatement. If a hedged forecast transaction is no longer expected to occur, then theamount accumulated in equity is immediately reclassified to the consolidated incomestatement.
4.6 Property, plant and equipment
(i) Recognition and measurement
Items of property, plant and equipment are measured at cost less accumulateddepreciation and accumulated impairment losses except for freehold land, which are statedat its revalued amounts. The revalued amount is the fair value at the date of revaluationless any subsequent accumulated impairment losses. Revaluation is carried out byindependent professional values regularly such that the carrying amount of these assetsdoes not differ materially from that which would be determined using fair values at thereporting date.
Del Monte Pacific Limited and its Subsidiaries
Notes to the financial statementsFor the financial year ended 30 April 2020
- 27 -
*SGVFSM004024*
4. Significant accounting policies (cont’d)
4.6 Property, plant and equipment (cont’d)
Any increase in the revaluation amount is recognised in OCI and presented in therevaluation reserve in equity unless it offsets a previous decrease in value of the sameasset that was recognised in the income statement. A decrease in value is recognised inthe income statement where it exceeds the increase previously recognised in therevaluation reserve. Upon disposal, any related revaluation reserve is transferred fromother comprehensive income to retained earnings.
A bearer plant is a pineapple and papaya living plant that is used in the production or supplyof agricultural produce, is expected to bear produce for more than one period and has aremote likelihood of being sold as agricultural produce, except for incidental scrap sales.
Costs related to bearer plants are capitalised up to point of maturity of the bearer plants,including costs during the ratoon crop cycle. These costs include land preparation,cultural, spraying and plantation overhead costs.
Cost includes expenditure that is directly attributable to the acquisition of the asset. Thecost of self-constructed assets includes the cost of materials and direct labour, any othercosts directly attributable to bringing the assets to a working condition for their intendeduse, estimated costs of dismantling and removing the items and restoring the site on whichthey are located (when the Group has an obligation to remove the asset or restore the site),and capitalised borrowing costs. Purchased software that is integral to the functionalityof the related equipment is capitalised as part of that equipment.
Construction in-progress represents plant and properties under construction ordevelopment and is stated at cost. This includes cost of construction, plant andequipment, borrowing costs directly attributable to such asset during the constructionperiod and other direct costs. Construction in-progress is not depreciated until such timewhen the relevant assets are substantially completed and available for its intended use.
When parts of an item of property, plant and equipment have different useful lives, they areaccounted for as separate items (major components) of property, plant and equipment.
The gain or loss on disposal of an item of property, plant and equipment is determined bycomparing the proceeds from disposal with the carrying amount of the item, and isrecognised net within other income/other expenses in the income statement.
(ii) Subsequent costs
The cost of replacing a component of an item of property, plant and equipment isrecognised in the carrying amount of the item if it is probable that the future economicbenefits embodied within the component will flow to the Group, and its cost can bemeasured reliably. The carrying amount of the replaced component is derecognised.The costs of the day-to-day servicing of property, plant and equipment are recognised inthe income statement as incurred.

Del Monte Pacific Limited and its Subsidiaries
Notes to the financial statementsFor the financial year ended 30 April 2020
- 28 -
*SGVFSM004024*
4. Significant accounting policies (cont’d)
4.6 Property, plant and equipment (cont’d)
(iii) Depreciation
Depreciation is based on the cost of an asset less its residual value. Significantcomponents of individual assets are assessed and if a component has a useful life that isdifferent from the remainder of that asset, that component is depreciated separately.
Depreciation (except bearer plants) is recognised in the income statement on a straight-line basis over their estimated useful lives of each component of an item of property, plantand equipment, unless it is included in the carrying amount of another asset. Freeholdland is not depreciated.
Depreciation is recognised from the date that the property, plant and equipment areinstalled and are ready for use, or in respect of internally constructed assets, from the datethat the asset is completed and ready for use.
The estimated useful lives for the current period and comparative years are as follows:
Buildings, land improvements and - 3 to 50 years or lease term,leasehold improvements whichever is shorter
Machineries and equipment - 3 to 30 years
For bearer plants, units of production method is used. Depreciation is charged accordingto the cost of fruits harvested at plant crop and ratoon crop harvest months.
Bearer plants are depreciated based on the ratio of actual quantity of harvest over theestimated yield for both plant crop and ratoon crop harvests. Plant crop harvest usuallyoccurs within 16 to 18 months after planting while ratoon crop harvest occurs at the 32nd to34th month after planting. Depreciation is determined on a per field basis.
Depreciation methods, useful lives and residual values are reviewed at each reporting dateand adjusted if appropriate.

Del Monte Pacific Limited and its Subsidiaries
Notes to the financial statementsFor the financial year ended 30 April 2020
- 29 -
*SGVFSM004024*
4. Significant accounting policies (cont’d)
4.7 Biological assets
The Group’s biological assets include: (a) agricultural produce consisting of pineapple and papaya;(b) breeding and dairy herd; (c) growing herd; and (d) cattle for slaughter. Agricultural produceinclude: (a) harvested and unharvested pineapple and papaya fruits from the Group’s bearer plants;and (b) cut meat from the cattle for slaughter.
The Group’s biological assets are accounted for as follows:
Bearer Plants
Bearer plants are measured at cost less accumulated depreciation recognised at point of harvest.Bearer plants are presented as part of property, plant and equipment. Costs to grow includepurchase cost of various chemicals and fertilizers, land preparation expenses and direct expensesduring the cultivation of the primary ratoon crop and, if needed, re-ratoon crops. The accumulatedcosts are deferred and are amortised as raw product costs upon harvest. Raw product cost isrecognised as depreciation based on the actual volume of harvest in a given period (see Note 4.6).
Breeding and Dairy Herd
The breeding and dairy herd are measured at cost. The breeding and dairy herd have useful livesof 3 ½ to 6 years. The cost method was used since fair value cannot be measured reliably. Thebreeding and dairy herd have no active markets and no similar assets are available in the relevantmarkets. In addition, existing sector benchmarks are irrelevant and estimates necessary tocompute for the present value of expected net cash flows comprise a wide range of data which willnot result in a reliable basis for determining the fair value. Breeding and dairy herd are classifiedas noncurrent assets in the statement of financial position of the Group.
Growing Herd
Growing herd is measured at cost. The cost method was used since the fair value cannot bemeasured reliably. Growing herd has no defined active market since it has not yet been identifiedif this will be for breeding or for slaughter. Growing herd is classified as noncurrent assets in thestatement of financial position of the Group.
Cattle for Slaughter
Cattle for slaughter is measured at each reporting date at their fair value less point-of-sale costs.Gains and losses arising from changes in fair values are included in profit or loss for the period inwhich they arise. Cattle for slaughter is classified as noncurrent assets in the statements offinancial position of the Group.
The Group’s agricultural produce are accounted for as follows:
Agricultural Produce
The Group’s growing produce are measured at their fair value from the time of maturity of thebearer plant until harvest. The Group uses the future selling prices and gross margin of finishedgoods, less future growing cost as the basis of fair value and adjusted for margin and associatedcosts related to production. The Group’s harvested produce are measured at fair value at thepoint of harvest based on the estimated selling prices reduced by cost to sell.

Del Monte Pacific Limited and its Subsidiaries
Notes to the financial statementsFor the financial year ended 30 April 2020
- 30 -
*SGVFSM004024*
4. Significant accounting policies (cont’d)
4.7 Biological assets (cont’d)
Cutmeat
Cutmeat is measured at each reporting date at their fair value less point-of-sale costs. Gains andlosses arising from changes in fair values are included in profit or loss for the period in which theyarise.
4.8 Leases
Starting May 1, 2019, the Group has adopted IFRS 16
The determination of whether an arrangement is, or contains, a lease is based on the substanceof the arrangement at inception date. The arrangement is assessed for whether the fulfillment ofthe arrangement is dependent on the use of a specific asset or assets and the arrangementconveys a right to use the asset or assets, even if that right is not explicitly specified in anarrangement.
Group as a lessee
The Group applies a single recognition and measurement approach for all leases, except for short-term leases and leases of low-value assets. The Group recognises lease liability to make leasepayments and right-of-use asset representing the right to use the underlying asset.
Right-of-use Asset
The Group recognises right-of-use asset at the commencement date of the lease (i.e., the date theunderlying asset is available for use). Right-of-use asset is measured at cost, less anyaccumulated depreciation and impairment losses, and adjusted for any remeasurement of leaseliability. The cost of right-of-use asset includes the amount of lease liability recognised, initialdirect costs incurred, and lease payments made at or before the commencement date less anylease incentives received.
Unless the Group is reasonably certain to obtain ownership of the leased asset at the end of thelease term, the recognised right-of-use asset is depreciated on a straight-line basis over the shorterof its estimated useful life and the lease term.
The estimated useful lives are as follows:
Buildings, land improvements and - 2 to 6 yearsleasehold improvements
Land - 2 to 26 yearsMachineries and equipment - 2 to 17 years
The right-of-use asset is presented separately in the statement of financial position.

Del Monte Pacific Limited and its Subsidiaries
Notes to the financial statementsFor the financial year ended 30 April 2020
- 31 -
*SGVFSM004024*
4. Significant accounting policies (cont’d)
4.8 Leases (cont’d)
Lease liabilities
At the commencement date of the lease, the Group recognises lease liabilities measured at thepresent value of lease payments to be made over the lease term. The lease payments includefixed payments (including in substance fixed payments) less any lease incentives receivable,variable lease payments that depend on an index or a rate, and amounts expected to be paid underresidual value guarantees. The lease payments also include the exercise price of a purchaseoption reasonably certain to be exercised by the Group and payments of penalties for terminatinga lease, if the lease term reflects the Group exercising the option to terminate. The variable leasepayments that do not depend on an index or a rate are recognised as expense in the period onwhich the event or condition that triggers the payment occurs.
In calculating the present value of lease payments, the Group uses the incremental borrowing rateat the lease commencement date if the interest rate implicit in the lease is not readily determinable.After the commencement date, the amount of lease liabilities is increased to reflect the accretionof interest and reduced for the lease payments made. In addition, the carrying amount of leaseliabilities is remeasured if there is a modification, a change in the lease term, a change in the in-substance fixed lease payments or a change in the assessment to purchase the underlying asset.
Short-term leases and leases of low-value assets
The Group applies the short-term lease recognition exemption to its short-term leases of machineryand equipment (i.e., those leases that have a lease term of 12 months or less from thecommencement date and do not contain a purchase option). It also applies the leases of low-value assets recognition exemption to leases that are considered of low value (i.e., personalcomputers). Lease payments on short-term leases and leases of low-value assets are recognisedas expense on a straight-line basis over the lease term.
Initial Recognition and Subsequent Measurement Prior to the Adoption of IFRS 16
The determination of whether an arrangement is, or contains, a lease is based on the substanceof the arrangement and requires an assessment of whether the fulfillment of the arrangement isdependent on the use of a specific asset or assets and the arrangement conveys a right to use theasset. A reassessment is made after inception of the lease only if one of the following applies:
(a) There is a change in contractual terms, other than a renewal or extension of the arrangement;(b) A renewal option is exercised or extension granted, unless that term of the renewal or
extension was initially included in the lease term;(c) There is a change in the determination of whether fulfillment is dependent on a specified
asset; or(d) There is a substantial change to the asset.
Where a reassessment is made, lease accounting shall commence or cease from the date whenthe change in circumstances gave rise to the reassessment for scenarios (a), (c) or (d) above, andat the date of renewal or extension period for scenario (b).

Del Monte Pacific Limited and its Subsidiaries
Notes to the financial statementsFor the financial year ended 30 April 2020
- 32 -
*SGVFSM004024*
4. Significant accounting policies (cont’d)
4.8 Leases (cont’d)
A series of transactions that involve the legal form of a lease is linked and is accounted for as onetransaction when the overall economic effect cannot be understood without reference to the seriesof transactions as a whole. This is the case, for example, when the series of transactions are closelyinterrelated, negotiated as a single transaction, and takes place concurrently or in a continuoussequence. This requires an evaluation of the substance of the lease arrangement, including theconveyance of the right to use an asset for an agreed period of time.
Group as Lessee
Leases where the lessor retains substantially all the risks and benefits of ownership of the leasedasset are classified as operating leases. Operating lease payments are recognised as an expensein the income statement on a straight-line basis over the lease term.
Lease Payments
Payments made under operating leases are recognised in the income statement on a straight-linebasis over the term of the lease. Lease incentives received are recognised as an integral part ofthe total lease expenses, over the term of the lease.
Rent expense is being recognised on a straight-line basis over the life of the lease. The differencebetween rent expense recognised and rental payments, as stipulated in the lease, is reflected asdeferred rent in the statements of financial position.
4.9 Inventories
Inventories are measured at the lower of cost and net realisable value.
The cost of raw materials, packaging materials, traded goods, cost of production materials andstoreroom items is based on the FIFO (First-in First-out) method. Cost of processed inventoriescomprises all costs of purchase, costs of conversion and other costs incurred in bringing theinventories to their present location and condition.
The costs of conversion include costs directly related to the units of production, and a systematicallocation of fixed and variable production overheads that are incurred in converting materials intofinished goods.
The allocation of fixed production overheads is based on the normal capacity of the productionfacilities. Normal capacity is the production expected to be achieved on average for the periodsor seasons under normal circumstances, taking into account the seasonal business cycle of theGroup.
Net realisable value is the estimated selling price in the ordinary course of business, less theestimated costs of completion and selling expenses.
The cost of growing crops transferred from biological assets is its fair value less cost to sell at thedate of harvest.
4.10 Cash and cash equivalents
Cash and cash equivalents consist of cash and short-term, highly liquid investments that are readilyconvertible to known amount of cash with original maturities of three months or less that are subjectto insignificant risk of change in value.

Del Monte Pacific Limited and its Subsidiaries
Notes to the financial statementsFor the financial year ended 30 April 2020
- 33 -
*SGVFSM004024*
4. Significant accounting policies (cont’d)
4.11 Impairment (cont’d)
(i) Non-derivative financial assets
Impairment of non-derivative financial assets prior to the adoption of IFRS 9
A financial asset not classified at fair value through profit or loss is assessed at eachreporting date to determine whether there is objective evidence that it is impaired. Afinancial asset is impaired if objective evidence indicates that a loss event(s) have occurredafter the initial recognition of the asset, and that the loss event(s) had a negative effect onthe estimated future cash flows of that asset that can be estimated reliably.
Objective evidence that financial assets are impaired can include default or delinquencyby a debtor, restructuring of an amount due to the Group on terms that the Group wouldnot consider otherwise, indications that a debtor or issuer will enter bankruptcy, adversechanges in the payment status of borrowers or issuers in the Group, or economicconditions that correlate with defaults.
Loans and receivables
The Group considers evidence of impairment for loans and receivables at both a specificasset and collective level. All individually significant loans and receivables are assessedfor specific impairment. All individually significant receivables found not to be specificallyimpaired are then collectively assessed for any impairment that has been incurred but notyet identified.
Loans and receivables that are not individually significant are collectively assessed forimpairment by grouping together loans and receivables with similar risk characteristics.
In assessing collective impairment, the Group uses historical trends of the probability ofdefault, timing of recoveries and the amount of loss incurred, adjusted for management’sjudgement as to whether current economic and credit conditions are such that the actuallosses are likely to be greater or less than suggested by historical trends.
An impairment loss in respect of a financial asset measured at amortised cost is calculatedas the difference between its carrying amount and the present value of the estimated futurecash flows discounted at the asset’s original effective interest rate. Losses arerecognised in the income statement and reflected in an allowance account against loansand receivables. Interest on the impaired asset continues to be recognised.
When the Group considers that there are no realistic prospects of recovery of the asset,the relevant amounts are written off. If the amount of impairment loss subsequentlydecreases and the decrease can be related objectively to an event occurring after theimpairment was recognised, then the previously recognised impairment loss is reversedthrough the income statement.

Del Monte Pacific Limited and its Subsidiaries
Notes to the financial statementsFor the financial year ended 30 April 2020
- 34 -
*SGVFSM004024*
4. Significant accounting policies (cont’d)
4.11 Impairment (cont’d)
(i) Non-derivative financial assets (cont’d)
Impairment of non-derivative financial assets upon adoption of IFRS 9
The Group recognises loss allowances for expected credit losses (“ECLs”) on financialassets measured at amortised cost.
ECLs are probability-weighted estimates of credit losses. Credit losses are measured asthe present value of all cash shortfalls (i.e., the difference between the cash flows due tothe Group in accordance with the contract and the cash flows that the Group expects toreceive), discounted at the effective interest rate of the financial asset, and reflectsreasonable and supportable information that is available without undue cost or effort aboutpast events, current conditions and forecasts of future economic conditions.
Impairment loss allowances are measured on either lifetime ECLs or 12-month ECLs.Lifetime ECLs are the ECLs that result from all possible default events over the expectedlife of a financial instrument. 12-month ECLs are the portion of ECLs that result from defaultevents that are possible within the 12 months after the reporting date, or a shorter periodif the expected life of the instrument is less than 12 months.
The Group measures loss allowances at an amount equal to lifetime ECLs, except for debtsecurities that are determined to have low credit risk at the reporting date and other debtsecurities and bank balances for which credit risk has not increased significantly sinceinitial recognition, which are measured at 12-month ECLs.
Impairment loss allowances for trade receivables without a significant financing componentare measured at an amount equal to lifetime ECL.
When determining whether the credit risk of a financial asset has increased significantlysince initial recognition and when estimating ECLs, the Group considers reasonable andsupportable information that is relevant and available without undue cost or effort. Thisincludes both quantitative and qualitative information and analysis, based on the Group’shistorical experience and informed credit assessment and including forward-lookinginformation.
The Group assumes that the credit risk on a financial asset has increased significantly if itis more than 30 days past due.
The Group considers a financial asset to be in default when the borrower is unlikely to payits credit obligations to the Group in full, without recourse by the Group to actions such asrealising security (if any is held), or when the financial asset is more than 90 days past due.
The Group considers a debt security to have a low credit risk when its credit risk rating isequivalent to the globally understood definition of “investment grade”.

Del Monte Pacific Limited and its Subsidiaries
Notes to the financial statementsFor the financial year ended 30 April 2020
- 35 -
*SGVFSM004024*
4. Significant accounting policies (cont’d)
4.11 Impairment (cont’d)
(i) Non-derivative financial assets (cont’d)
Impairment of non-derivative financial assets upon adoption of IFRS 9
At each reporting date, the Group assesses whether financial assets at amortised cost arecredit-impaired. A financial asset is credit-impaired when one or more events that have adetrimental impact on the estimated future cash flows of the financial asset have occurred.Evidence that a financial asset is credit-impaired may include significant financial difficultyof the debtor, a breach of contract such as a default, the restructuring of an amount due tothe Group on terms that the Group would not consider otherwise, indications that the debtoror issuer will enter bankruptcy or other financial reorganisation, the disappearance of anactive market for that financial asset because of financial difficulties, adverse changes inthe payment status of borrowers or issuers, or economic conditions that correlate withdefaults.
Impairment loss allowances for financial assets measured at amortised cost are deductedfrom the gross carrying amount of the assets in the statement of financial position. Thegross carrying amount of a financial asset is written-off when the Group has no realisticprospects of recovery of the asset.
(ii) Non-financial assets
The carrying amounts of the Group’s non-financial assets, other than biological assets,inventories and deferred tax assets, are reviewed at each reporting date to determinewhether there is any indication of impairment. If any such indication exists, then theasset’s recoverable amount is estimated. For goodwill and intangible assets that haveindefinite useful lives, the recoverable amount is estimated each year at the same time.An impairment loss is recognised if the carrying amount of an asset or its related cash-generating unit (“CGU”) exceeds its estimated recoverable amount.
The recoverable amount of an asset or CGU is the greater of its value-in-use (“VIU”) andits fair value less costs to sell. In assessing VIU, the estimated future cash flows arediscounted to their present value using a pre-tax discount rate that reflects current marketassessments of the time value of money and the risks specific to the asset or CGU. Forthe purpose of impairment testing, assets that cannot be tested individually are groupedtogether into the smallest group of assets that generates cash inflows from continuing usethat are largely independent of the cash inflows of other assets or CGU.
Impairment losses are recognised in the income statement. Impairment lossesrecognised in respect of CGUs are allocated first to reduce the carrying amount of anygoodwill allocated to the CGU (group of CGUs), and then to reduce the carrying amountsof the other assets in the CGU (group of CGUs) on a pro rata basis.
An impairment loss in respect of goodwill is not reversed. In respect of other assets,impairment losses recognised in prior periods are assessed at each reporting date for anyindications that the loss has decreased or no longer exists.

Del Monte Pacific Limited and its Subsidiaries
Notes to the financial statementsFor the financial year ended 30 April 2020
- 36 -
*SGVFSM004024*
4. Significant accounting policies (cont’d)
4.11 Impairment (cont’d)
(ii) Non-financial assets (cont’d)
An impairment loss recognised in prior periods for an asset other than goodwill is reversedif there has been a change in the estimates used to determine the recoverable amount.An impairment loss is reversed only to the extent that the asset’s carrying amount does notexceed the carrying amount that would have been determined, net of depreciation oramortisation, if no impairment loss had been recognised.
Joint ventures and investments in subsidiaries
An impairment loss in respect of joint ventures is measured by comparing the recoverableamount of the investment with its carrying amount. An impairment loss is recognised inthe income statement. An impairment loss is reversed if there has been a favourablechange in the estimates used to determine the recoverable amount.
Goodwill
Goodwill that forms part of the carrying amount of an investment in a joint venture is notrecognised separately, and therefore is not tested for impairment separately. Instead, theentire amount of the investment in a joint venture is tested for impairment as a single assetwhen there is objective evidence that the investment in a joint venture may be impaired.
When conducting the annual impairment test for goodwill, the Group compares theestimated fair value of the CGU containing goodwill to its recoverable amount.
Goodwill is allocated to a CGU or group of CGUs that represents the lowest level withinthe entity at which the goodwill is monitored for internal management purposes. Therecoverable amount is computed using two approaches: the VIU approach, which is thepresent value of expected cash flows, discounted at a risk adjusted weighted average costof capital; and the fair value less cost to sell approach, which is based on the IncomeApproach, which indicates the recoverable amount of an asset based on the value of thecash flows that the asset can be expected to generate in the future.
Subject to an operating segment ceiling test, for the purposes of goodwill impairmenttesting, CGUs to which goodwill has been allocated are aggregated so that the level atwhich impairment testing is performed reflects the lowest level at which goodwill ismonitored for internal reporting purposes. Goodwill acquired in a business combinationis allocated to groups of CGUs that are expected to benefit from the synergies of thecombination.

Del Monte Pacific Limited and its Subsidiaries
Notes to the financial statementsFor the financial year ended 30 April 2020
- 37 -
*SGVFSM004024*
4. Significant accounting policies (cont’d)
4.11 Impairment (cont’d)
(ii) Non-financial assets (cont’d)
Goodwill (cont’d)
An impairment loss in respect of goodwill attributable to acquisition of a subsidiary is notreversed.
Intangible assets with indefinite useful lives, are components of the CGU containinggoodwill and the impairment assessment is as described above.
4.12 Noncurrent assets held for sale
Noncurrent assets held for sale are classified as held-for-sale if it is highly probable thatthey will be recovered primarily through sale rather than through continuing use. Suchassets are measured at the lower of their carrying amount and fair value less cost to sell.Impairment losses on initial classification as held-for-sale and subsequent gains and losseson re-measurement are recognised in the income statement of the Group. Once classifiedas held-for-sale, property, plant and equipment are no longer depreciated. If it is no longerhighly probable that an asset will be recovered primarily through sale, the asset ceases tobe classified as held-for-sale and is measured at the lower of its carrying amount beforethe asset was classified as held-for-sale adjusted for any depreciation that would havebeen recognised had the asset not been reclassified as held-for-sale and its recoverableamount at the date of the subsequent reclassification. The required adjustment to thecarrying amount of an asset that ceases to be classified as held-for-sale is included in theincome statement of the Group.
4.13 Employee benefits
(i) Defined contribution plans
A defined contribution plan is a post-employment benefit plan under which an entity paysfixed contributions into a separate entity and will have no legal or constructive obligation topay further amounts.
Obligations for contributions to defined contribution pension plans are recognised as anemployee benefit expense in the income statement in the periods during which servicesare rendered by employees.
Del Monte Pacific Limited and its Subsidiaries
Notes to the financial statementsFor the financial year ended 30 April 2020
- 38 -
*SGVFSM004024*
4. Significant accounting policies (cont’d)
4.13 Employee benefits (cont’d)
(ii) Defined benefit pension plan
A defined benefit pension plan requires contributions to be made to separatelyadministered funds. The Group’s net obligation in respect of defined benefit plans iscalculated separately for each plan by estimating the amount of future benefit thatemployees have earned in the current and prior periods, discounting that amount anddeducting the fair value of any plan assets. The Group determines the net interestexpense (income) on the net defined benefit liability (asset) for the period by applying thediscount rate used to measure the defined benefit obligation at the beginning of the annualperiod to the net defined benefit liability (asset), taking into account any changes in the netdefined benefit liability (asset) during the period as a result of contributions and benefitpayments.
The calculation of defined benefit obligations is performed annually by a qualified actuaryusing the projected unit credit method. When the calculation results in a benefit to theGroup, the recognised asset is limited to the present value of economic benefits availablein the form of any future refunds from the plan or reductions in future contributions to theplan. To calculate the present value of economic benefits, consideration is given to anyapplicable minimum funding requirements that apply to any plan in the Group. Aneconomic benefit is available to the Group if it is realisable during the life of the plan, or onsettlement of the plan liabilities.
Service costs which include current service costs, past service costs and gains or losseson non-routine settlements are recognised as expense in profit or loss. Past service costsare recognised when plan amendment or curtailment occurs.
Remeasurements of the net defined benefit liability comprise actuarial gains and losses,the return on plan assets (excluding interest) and the effect of the asset ceiling (if any,excluding interest). The Group recognises them immediately in other comprehensiveincome and all expenses related to defined benefit plans in staff cost in profit or loss.When the benefits of a plan are changed or when a plan is curtailed, the resulting changein benefit that relates to past service or the gain or loss on curtailment is recognisedimmediately in the income statement.
When the plan amendment or curtailment occurs, the Group recognises gains and losseson the settlement of a defined benefit plan when the settlement occurs. The gain or losson settlement is the difference between the present value of the defined benefit obligationbeing settled as determined on the date of settlement and the settlement price, includingany plan assets transferred and any payments made directly by the Group in connectionwith the settlement. In fiscal year 2020, there were amendments to the employee benefitplans, eliminating certain benefits in fiscal year 2020 and after fiscal year 2022 (seeNote 21).
Multi-employer plans
The Group participates in several multi-employer pension plans, which provide definedbenefits to certain union employees. The Group accounts for its proportionate share ofthe defined benefit obligation, plan assets and cost associated with the plan in the sameway as other defined benefit plan. For certain union employee related retirement planswhere sufficient information is not available to use defined benefit accounting, the Groupaccounts for these plans as if they were defined contribution plans.

Del Monte Pacific Limited and its Subsidiaries
Notes to the financial statementsFor the financial year ended 30 April 2020
- 39 -
*SGVFSM004024*
4. Significant accounting policies (cont’d)
4.13 Employee benefits (cont’d)
(iii) Other plans
The Group has various other non-qualified retirement plans and supplemental retirementplans for executives, designed to provide benefits in excess of those otherwise permittedunder the Group’s qualified retirement plans. These plans are unfunded and comply withInternal Revenue Service (IRS) rules for non-qualified plans.
(iv) Other long-term employee benefits
The Group’s net obligation in respect of long-term employee benefits other than pensionplans is the amount of future benefit that employees have earned in return for their servicein the current and prior periods. That benefit is discounted to determine its present value,and the fair value of any related assets is deducted. The calculation is performed usingthe projected unit credit method. Any actuarial gains and losses are recognised in theincome statement in the period in which they arise. Other long-term employee benefitsinclude the Group’s long-term executive cash incentive awards (see Note 32).
(v) Termination benefits
Termination benefits are recognised as an expense when the Group is demonstrablycommitted, without realistic possibility of withdrawal, to a formal detailed plan to eitherterminate employment before the normal retirement date, or to provide termination benefitsas a result of an offer made to encourage voluntary redundancy. Termination benefitsarising from involuntary termination are recognised as an expense once the Group hasannounced the plan to affected employees.
(vi) Short-term employee benefits
Short-term employee benefit obligations are measured on an undiscounted basis and areexpensed as the related service is provided. A liability is recognised for the amountexpected to be paid under short-term cash bonus if the Group has a present legal orconstructive obligation to pay this amount as a result of past service provided by theemployee and the obligation can be estimated reliably.
(vii) Share-based payment transactions
The Group grants share awards and share options to employees of the Group. The fairvalue of incentives granted is recognised as an employee benefit expense with acorresponding increase in equity. The fair value is measured at grant date and accountedfor as described below.
Share awards
The fair value, measured at grant date, is recognised over the period during which theemployees become unconditionally entitled to the shares.

Del Monte Pacific Limited and its Subsidiaries
Notes to the financial statementsFor the financial year ended 30 April 2020
- 40 -
*SGVFSM004024*
4. Significant accounting policies (cont’d)
4.13 Employee benefits (cont’d)
(vii) Share-based payment transactions (cont’d)
Share options
The fair value, measured at grant date, is recognised over the vesting period during whichthe employees become unconditionally entitled to the options. At each reporting date, theGroup revises its estimates of the number of options that are expected to becomeexercisable. It recognises the impact of the revision of original estimates in employeebenefit expense and as a corresponding adjustment to equity over the remaining vestingperiod.
4.14 Share Capital and Retained earnings
(i) Share capital
Ordinary shares
Ordinary shares are classified as equity. Holders of these shares are entitled to dividendsas declared from time to time, and to one vote per share at general meetings of theCompany.
Preference shares
Preference shares are classified as equity. Holders of these shares are entitled to cashdividends based on the issue price, at the dividend rate per annum from the issue date,payable every 7 October and 7 April of each year following the issue date, upon declarationby the BOD.
The transaction costs directly attributable to the issue of ordinary and preference sharesare accounted for as deduction from equity to the extent they are incremental costs directlyattributable to the equity transaction that otherwise would have been avoided. The costs ofan equity transaction that is abandoned are recognised as an expense.
Repurchase, disposal and reissue of share capital (treasury shares)
When share capital recognised as equity is repurchased, the amount of the considerationpaid, which includes directly attributable costs, net of any tax effects, is recognised as adeduction from equity. Repurchased shares are classified as treasury shares and arepresented in the reserve for own shares. When treasury shares are sold or reissuedsubsequently, the amount received is recognised as an increase in equity, and the resultingsurplus or deficit on the transaction is presented in share premium.
Share premium
Share premium represents the excess of consideration received over the par value ofordinary and preference shares net of transaction costs from issuance of share capital,share options exercised and released of share awards granted.

Del Monte Pacific Limited and its Subsidiaries
Notes to the financial statementsFor the financial year ended 30 April 2020
- 41 -
*SGVFSM004024*
4. Significant accounting policies (cont’d)
4.14 Share Capital and Retained (cont’d)
(ii) Retained Earnings
Retained earnings include profit attributable to the equity holders of the Group and reducedby dividends declared on share capital.
Retained earnings may also include effect of changes in accounting policy as may berequired by the standard’s transitional provisions.
(iii) Dividends
Dividends are recognised as a liability and deducted from retained earnings when they aredeclared.
4.15 Provisions
A provision is recognised if, as a result of a past event, the Group has a present legal or constructiveobligation that can be estimated reliably, and it is probable that an outflow of economic benefits willbe required to settle the obligation. Provisions are determined by discounting the expected futurecash flows at a pre-tax rate that reflects current market assessments of the time value of moneyand the risks specific to the liability. The unwinding of the discount is recognised as finance cost.
(i) Environment remediation liabilities
In accordance with the Group’s environment policy and applicable legal requirements, aprovision for environmental remediation obligations and the related expense is recognisedwhen such losses are probable and the amounts of such losses can be estimated reliably.Accruals for estimated losses for environmental remediation obligations are recognised nolater than the completion of the remedial feasibility study. These accruals are adjustedas further information develops or circumstances change.
(ii) Retained insurance liabilities
The Group accrues for retained insurance risks associated with the deductible portion ofany potential liabilities that might arise out of claims of employees, customers or other thirdparties for personal injury or property damage occurring in the course of the Group’soperations.
A third-party actuary is engaged to assist the Group in estimating the ultimate cost ofcertain retained insurance risks. Additionally, the Group’s estimate of retained insuranceliabilities is subject to change as new events or circumstances develop which mightmaterially impact the ultimate cost to settle these losses.
Del Monte Pacific Limited and its Subsidiaries
Notes to the financial statementsFor the financial year ended 30 April 2020
- 42 -
*SGVFSM004024*
4. Significant accounting policies (cont’d)
4.16 Revenue recognition
Policy upon adoption of IFRS 15
Revenue from contracts with customers is recognised when control of the goods or services aretransferred to the customer at an amount that reflects the consideration to which the Group expectsto be entitled in exchange for those goods or services, excluding amounts collected on behalf ofthird parties. The Group assesses its revenue arrangements against specific criteria to determineif it is acting as principal or agent. The following specific recognition criteria must also be metbefore revenue is recognised:
(i) Sales of goods
Revenue from the sale of goods is recognised at a point in time when control of the assetis transferred to the customer, generally on delivery and acceptance of the promisedgoods.
Each contract with a customer specifies minimum quantity, fixed prices and effective periodand is not subject to change for the contractual period unless mutually agreed by theparties. Invoices are usually payable within 30 days from delivery.
Certain customers are entitled to, and in most cases avail of, cash discounts whenpayments are made within a defined time frame. For certain contracts, the Group may becharged a penalty for late deliveries. Variable amounts related to these discounts andpenalties are estimated using the most likely amount and included in the transaction priceto the extent it is highly probable that a significant revenue reversal will not subsequentlyoccur.
The Group provides allowances under trade promotions to customers and coupons to endconsumers which are reimbursable by the Group to customers when redeemed.Allowances and coupons are generally considered as reductions of the transaction priceand recognised at the later of when the Group recognises revenue for the transfer of therelated goods and when the Group pays or promises to pay the allowances or coupons.
Variable amounts related to these allowances and coupons are estimated using theexpected value method and included in the transaction price to the extent it is highlyprobable that a significant revenue reversal will not subsequently occur. Accruals for tradepromotions are based on expected levels of performance. Settlement typically occurs insubsequent periods primarily through an off-invoice allowance at the time of sale or throughan authorised process for deductions taken by a customer from amounts otherwise due tothe Group. Evaluation of trade promotions are performed monthly and adjustments aremade where appropriate to reflect changes in the Group’s estimates. The Group accruescoupon redemption costs based on estimates of redemption rates that are developed bymanagement. Management’s estimates are based on recommendations from independentcoupon redemption clearing-houses as well as historical information. Should actualredemption rates vary from amounts estimated, adjustments may be required.

Del Monte Pacific Limited and its Subsidiaries
Notes to the financial statementsFor the financial year ended 30 April 2020
- 43 -
*SGVFSM004024*
4. Significant accounting policies (cont’d)
4.16 Revenue recognition (cont’d)
(ii) Bill-and-hold arrangements
Bill-and-hold arrangements pertain to sales of the Group wherein the customers are billedfor goods that are ready for delivery, but the Group retains physical possession of theproduct until it is transferred to the customer at a future date. The Group assessed whethercontrol has transferred to the customers, even though the customers do not have physicalpossession of the goods. The following criteria must all be met in order for the customersto have obtained control in bill-and-hold arrangements:
the reason for the bill-and-hold arrangement must be substantive; the product must be identified separately as belonging to the customer; the product currently must be ready for physical transfer to the customer; and the entity cannot have the ability to use the product or to direct it to another
customer.
Custodial services provided to the customers are identified as a separate performanceobligation. A portion of the contract price should be allocated to the custodial services andseparately recognised over the period of time the product is being held by the Group, alongwith the related costs of storing the product.
Penalty on the late payment of the invoices affects the estimate of the transaction price.
(iii) Sales returns
The Group uses the expected value method to estimate the goods that will not be returnedbecause this method best predicts the amount of variable consideration to which the Groupwill be entitled. The requirements in IFRS 15 on constraining estimates of variableconsideration are also applied in order to determine the amount of variable considerationthat can be included in the transaction price. The amount of revenue and the receivablerecognised is adjusted for expected returns, which are estimated based on the historicaldata. No right of return asset (and corresponding adjustment to cost of sales) isrecognised for the right to recover products from a customer since Group’s policy is todispose all goods to be returned.
(iv) Contract balances arising from revenue with customer contracts
Contract AssetsA contract asset is the right to consideration in exchange for goods or services transferredto the customer. If the Group performs by transferring goods or services to a customerbefore the customer pays consideration or before payment is due, a contract asset isrecognised for the earned consideration that is conditional.
ReceivablesA receivable represents the Group’s right to an amount of consideration that isunconditional (i.e., only the passage of time is required before payment of the considerationis due).

Del Monte Pacific Limited and its Subsidiaries
Notes to the financial statementsFor the financial year ended 30 April 2020
- 44 -
*SGVFSM004024*
4. Significant accounting policies (cont’d)
4.16 Revenue recognition (cont’d)
(iv) Contract balances arising from revenue with customer contracts (cont’d)
Contract LiabilitiesA contract liability is the obligation to transfer goods or services to a customer for whichthe Group has received consideration (or an amount of consideration is due) from thecustomer. If a customer pays consideration before the Group transfers goods to thecustomer, a contract liability is recognised when the payment is made, or the payment isdue (whichever is earlier). Contract liabilities are recognised as revenue when the Groupperforms under the contract.
Other income:
(i) Finance income
Such income is recognised as the interest accrues taking into account the effective interestyield on the asset.
(ii) Other income
Other income is recognised when earned.
Policy prior to adoption of IFRS 15
Under IAS 18, prior to the adoption of IFRS 15, revenue is recognised to the extent that it isprobable that the economic benefits associated with the transaction will flow to the Group and theamount of revenue can be measured reliably, regardless of when payment is being made. Thefollowing specific recognition criteria must also be met before revenue is recognised:
(i) Sale of Goods
Revenue from the sale of goods in the course of ordinary activities is measured at the fairvalue of the consideration received or receivable, net of returns and allowances, tradediscounts and volume rebates. Revenue is recognised when the significant risks andrewards of ownership of the goods have passed to the customer, recovery of theconsideration is probable, the associated costs and possible return of goods can beestimated reliably, there is no continuing management involvement with the goods, andthe amount of revenue can be measured reliably. If it is probable that discounts will begranted and the amount can be measured reliably, then the discount is recognised as areduction of revenue as the sales are recognised.
The timing of transfers of risks and rewards varies depending on the individual terms of thecontract of sale but usually occurs when the customer receives the product.
(ii) Finance income
Revenue is recognised as the interest accrues, taking into account the effective yield onthe asset.
(iii) Others
Revenue is recognised when earned.
Del Monte Pacific Limited and its Subsidiaries
Notes to the financial statementsFor the financial year ended 30 April 2020
- 45 -
*SGVFSM004024*
4. Significant accounting policies (cont’d)
4.17 Finance income and finance costs
Finance income comprises interest income earned mainly from bank deposits and amounts orbalances due from related parties of the Group. Interest income is recognised as it accrues in theincome statement, using the effective interest method.
Finance expense comprises interest expense on finance leases and borrowings. All finance leaseborrowing costs are recognised using the Group’s incremental borrowing rate. All borrowing costsare recognised in income statement using the effective interest method, except to the extent thatthey are capitalised as being directly attributable to the acquisition, construction or production ofan asset which necessarily takes a substantial period of time to be prepared for its intended use orsale.
Foreign currency gains and losses on financial assets and financial liabilities are reported on a netbasis as either finance income or finance cost depending on whether foreign currency movementsare in a net gain or net loss position.
4.18 Tax
Tax expense comprises current and deferred tax. Current tax and deferred tax are recognised inincome statement except to the extent that it relates to a business combination, or items recogniseddirectly in equity or in OCI.
Current tax is the expected tax payable on the taxable income for the year, using tax rates enactedor substantively enacted at the reporting date, and any adjustment to tax payable in respect ofprevious years.
Deferred tax is recognised in respect of temporary differences between the carrying amounts ofassets and liabilities for financial reporting purposes and the amounts used for taxation purposes.Deferred tax is not recognised for:
temporary differences on the initial recognition of assets or liabilities in a transaction that isnot a business combination and that affects neither accounting nor taxable profit or loss;
temporary differences related to investments in subsidiaries and joint ventures to the extentthat the Group is able to control the timing of the reversal of the temporary difference and itis probable that they will not reverse in the foreseeable future; and
taxable temporary differences arising on the initial recognition of goodwill.
The measurement of deferred taxes reflects the tax consequences that would follow the manner inwhich the Group expects, at the end of the reporting period, to recover or settle the carrying amountof its assets and liabilities. Deferred tax is measured at the tax rates that are expected to be appliedto temporary differences when they reverse, based on the laws that have been enacted orsubstantively enacted by the reporting date.
Deferred tax assets and liabilities are offset if there is a legally enforceable right to offset currenttax liabilities and assets and they relate to income taxes levied by the same tax authority on thesame taxable entity, or on different tax entities, but they intend to settle current tax liabilities andassets on a net basis or their tax assets and liabilities will be realised simultaneously.
A deferred tax asset is recognised for unused tax losses, tax credits and deductible temporarydifferences, to the extent that it is probable that future taxable profits will be available against whichthey can be utilised. Deferred tax assets are reviewed at each reporting date and are reduced tothe extent that it is no longer probable that the related tax benefit will be realised.

Del Monte Pacific Limited and its Subsidiaries
Notes to the financial statementsFor the financial year ended 30 April 2020
- 46 -
*SGVFSM004024*
4. Significant accounting policies (cont’d)
4.18 Tax (cont’d)
In determining the amount of current and deferred tax, the Group takes into account the impact ofuncertain tax positions and whether additional taxes and interest may be due. The Group believesthat its accruals for tax liabilities are adequate for all open tax years based on its assessment ofmany factors, including interpretations of tax law and prior experience. This assessment relies onestimates and assumptions and may involve a series of judgements about future events. Newinformation may become available that causes the Group to change its judgement regarding theadequacy of existing tax liabilities; such changes to tax liabilities will impact tax expense in theperiod that such a determination is made.
4.19 Earnings per share
The Group presents basic and diluted earnings per share data for its ordinary shares. Basicearnings per share is calculated by dividing the profit or loss attributable to ordinary shareholdersof the Company by the weighted average number of ordinary shares outstanding during the year,adjusted for own shares held. Diluted earnings per share is determined in the same manner,adjusted for the effects of any dilutive potential ordinary shares, which comprise the restricted shareplan and share options granted to employees.
4.20 Segment reporting
An operating segment is a component of the Group that engages in business activities from whichit may earn revenues and incur expenses, including revenues and expenses that relate totransactions with any of the Group’s other components. All operating segments’ operating resultsare reviewed regularly by the Group’s Executive Committee to make decisions about resources tobe allocated to the segment and assess its performance, and for which discrete financialinformation is available.
Segment results include items directly attributable to a segment as well as those that can beallocated on a reasonable basis. Unallocated items comprise mainly of non-recurring expenses.
4.21 Contingencies
A contingent liability is:
(a) a possible obligation that arises from past events and whose existence will be confirmedonly by the occurrence or non-occurrence of one or more uncertain future events not whollywithin the control of the Group; or
(b) a present obligation that arises from past events but is not recognised because:(i) It is not probable that an outflow of resources embodying economic benefits will
be required to settle the obligation; or(ii) The amount of the obligation cannot be measured with sufficient reliability.
A contingent asset is a possible asset that arises from past events and whose existence will beconfirmed only by the occurrence or non-occurrence of one or more uncertain future events notwholly within the control of the Group.
Contingent liabilities and assets are not recognised on the statement of financial position of theGroup, except for contingent liabilities assumed in a business combination that are presentobligations and which the fair values can be reliably determined.

Del Monte Pacific Limited and its Subsidiaries
Notes to the financial statementsFor the financial year ended 30 April 2020
- 47 -
*SGVFSM004024*
4. Significant accounting policies (cont’d)
4.22 New standards and interpretations issued but not yet effective
Pronouncements issued but not yet effective are listed below. Unless otherwise indicated, theCompany and the Group does not expect that the future adoption of the said pronouncements willhave a significant impact on its financial statements. The Company and the Group intends to adoptthe following pronouncements when they become effective.
Applicable for the first annual reporting period that begins on or after 1 May 2020
Amendments to References to Conceptual Framework in IFRS Standards sets outamendments to IFRS Standards, their accompanying documents and IFRS practicestatements to reflect the issuance of the revised Conceptual Framework for Financial Reportingin 2018 (2018 Conceptual Framework). The 2018 Conceptual Framework includes:
a new chapter on measurement;
guidance on reporting financial performance;
improved definitions of an asset and a liability, and guidance supporting these definitions;and
clarifications in important areas, such as the roles of stewardship, prudence andmeasurement uncertainty in financial reporting.
Some Standards, their accompanying documents and IFRS practice statements containreferences to, or quotations from, the International Accounting Standards Committee (“IASC”)'sFramework for the Preparation and Presentation of Financial Statements adopted by theInternational Accounting Standards Board (“IASB”) in 2001 or the Conceptual Framework forFinancial Reporting issued in 2010. The amendments update some of those references andquotations so that they refer to the 2018 Conceptual Framework, and makes otheramendments to clarify which version of the Conceptual Framework is referred to in particulardocuments.
These amendments are effective for annual reporting periods beginning on or after 1 May 2020.
Amendments to IFRS 3, Definition of a Business
The amendments to IFRS 3 clarifies the minimum requirements to be a business, remove theassessment of a market participant’s ability to replace missing elements, and narrow thedefinition of outputs. The amendments also add guidance to assess whether an acquiredprocess is substantive and add illustrative examples. An optional fair value concentration testis introduced which permits a simplified assessment of whether an acquired set of activitiesand assets is not a business.
An entity applies those amendments prospectively for annual reporting periods beginning onor after 1 May 2020, with earlier application permitted.
These amendments will apply on future business combinations of the Group.
Del Monte Pacific Limited and its Subsidiaries
Notes to the financial statementsFor the financial year ended 30 April 2020
- 48 -
*SGVFSM004024*
4. Significant accounting policies (cont’d)
4.22 New standards and interpretations issued but not yet effective (cont’d)
Amendments to IAS 1, Presentation of Financial Statements, and IAS 8, Accounting Policies,Changes in Accounting Estimates and Errors, Definition of Material
The amendments refines the definition of material in IAS 1 and align the definitions used acrossIFRSs and other pronouncements. They are intended to improve the understanding of theexisting requirements rather than to significantly impact an entity’s materiality judgements.
An entity applies those amendments prospectively for annual reporting periods beginning onor after 1 May 2020, with earlier application permitted.
Amendments to IFRS 7, Financial Instruments: Disclosures and IFRS 9, FinancialInstruments, Interest Rate Benchmark Reform
The amendments to IFRS 9 provide a number of reliefs, which apply to all hedging relationshipsthat are directly affected by the interest rate benchmark reform. A hedging relationship isaffected if the reform gives rise to uncertainties about the timing and or amount of benchmark-based cash flows of the hedged item or the hedging instrument.
Amendments to IFRS 16, COVID-19-related Rent Concessions
The amendments provides relief to lessees from applying the IFRS 16 requirement on leasemodifications to rent concessions arising as a direct consequence of the COVID-19 pandemic.A lessee may elect not to assess whether a rent concession from a lessor is a leasemodification if it meets all of the following criteria:
• The rent concession is a direct consequence of COVID-19;
• The change in lease payments results in a revised lease consideration that issubstantially the same as, or less than, the lease consideration immediately precedingthe change;
• Any reduction in lease payments affects only payments originally due on or before 30June 2021; and
• There is no substantive change to other terms and conditions of the lease.
A lessee that applies this practical expedient will account for any change in lease paymentsresulting from the COVID-19 related rent concession in the same way it would account for achange that is not a lease modification, i.e., as a variable lease payment.
The amendments are effective for annual reporting periods beginning on or after 1 June 2020.Early adoption is permitted.

Del Monte Pacific Limited and its Subsidiaries
Notes to the financial statementsFor the financial year ended 30 April 2020
- 49 -
*SGVFSM004024*
4. Significant accounting policies (cont’d)
4.22 New standards and interpretations issued but not yet effective (cont’d)
Applicable for the first annual reporting period that begins on or after 1 May 2022
Amendments to IAS 1, Classification of Liabilities as Current or Non-Current
The amendments provides a more general approach to the classification of liabilities under IAS1 based on the contractual arrangements in place at the reporting date. The amendments areeffective for annual reporting periods beginning on or after 1 May 2022.
Amendments to IFRS 3, Updating a Reference to the Conceptual Framework. Theamendments:
updated IFRS 3 by replacing a reference to an old version of the Conceptual Frameworkfor Financial Reporting with a reference to the latest version, which was issued in March2018;
Added an exception to the recognition principle of IFRS 3 to avoid the issue of potential‘day 2’ gains or losses arising for liabilities and contingent liabilities; and
Clarified existing guidance in IFRS 3 for contingent assets that would not be affected byreplacing the reference to the Framework.
The amendments are effective for annual reporting periods beginning on or after1 May 2022.
Amendments to IAS 37, Onerous Contracts - Cost of Fulfilling a Contract. The amendmentsspecify which costs an entity includes in determining the cost of fulfilling a contract for thepurpose of assessing whether the contract is onerous. The cost of fulfilling a contractcomprises the costs that relate directly to the contract which consist of both:
the incremental costs of fulfilling that contract – for example, direct labor and materials;and
an allocation of other costs that relate directly to fulfilling contracts — for example, anallocation of the depreciation charge for an item of property, plant and equipment usedin fulfilling that contract among others.
The amendments are effective for annual reporting periods beginning on or after1 May 2022.
Annual Improvements to IFRS Standards 2018–2020 Cycle. This cycle of improvementscontains amendments to the following standards:
IFRS 1, Subsidiary as a first-time adopter. The amendment permits a subsidiary thatapplies paragraph D16(a) of IFRS 1 to measure cumulative translation differences usingthe amounts reported by its parent, based on the parent’s date of transition to IFRSs.

Del Monte Pacific Limited and its Subsidiaries
Notes to the financial statementsFor the financial year ended 30 April 2020
- 50 -
*SGVFSM004024*
4. Significant accounting policies (cont’d)
4.22 New standards and interpretations issued but not yet effective (cont’d)
Applicable for the first annual reporting period that begins on or after 1 May 2022 (cont’d)
IFRS 9, Fees in the ‘10 per cent’ test for derecognition of financial liabilities. Theamendment clarifies which fees an entity includes when it applies the ‘10 per cent’ test inparagraph B3.3.6 of IFRS 9 in assessing whether to derecognise a financial liability. Anentity includes only fees paid or received between the entity (the borrower) and the lender,including fees paid or received by either the entity or the lender on the other’s behalf.
Annual Improvements to IFRS Standards 2018–2020 Cycle. This cycle of improvementscontains amendments to the following standards (cont’d):
IFRS 16, Lease Incentives. The amendment to Illustrative Example 13 accompanyingIFRS 16 removes from the example the illustration of the reimbursement of leaseholdimprovements by the lessor in order to resolve any potential confusion regarding thetreatment of lease incentives that might arise because of how lease incentives areillustrated in that example.
IAS 41, Taxation in fair value measurements. The amendment removes the requirementin paragraph 22 of IAS 41 for entities to exclude taxation cash flows when measuring thefair value of a biological asset using a present value technique. This will ensureconsistency with the requirements in IFRS 13.
The amendments are effective for annual reporting periods beginning on or after1 May 2022.
Applicable for the first annual reporting period that begins on or after 1 May 2023
IFRS 17, Insurance Contracts
IFRS 17, Insurance Contracts establishes the principles for the recognition, measurement,presentation and disclosure of insurance contracts within the scope of the standard. Theobjective of IFRS 17 is to ensure that an entity provides relevant information that faithfullyrepresents those contracts. This information gives a basis for users of financial statements toassess the effect that insurance contracts have on the entity's financial position, financialperformance and cash flows.
IFRS 17 was issued in May 2017 and applies to annual reporting periods beginning on or after1 May 2023.

Del Monte Pacific Limited and its Subsidiaries
Notes to the financial statementsFor the financial year ended 30 April 2020
- 51 -
*SGVFSM004024*
4. Significant accounting policies (cont’d)
4.22 New standards and interpretations issued but not yet effective (cont’d)
Deferred effectivity
Amendments to IFRS 10, Consolidated Financial Statements, and IAS 28, Sale or Contributionof Assets between an Investor and its Associate or Joint Venture
The amendments addresses the conflict between IFRS 10 and IAS 28 in dealing with the lossof control of a subsidiary that is sold or contributed to an associate or joint venture. Theamendments clarify that a full gain or loss is recognised when a transfer to an associate or jointventure involves a business as defined in IFRS 3. Any gain or loss resulting from the sale orcontribution of assets that does not constitute a business, however, is recognised only to theextent of unrelated investors’ interests in the associate or joint venture.
On January 13, 2016, the Financial Reporting Standards Council deferred the original effectivedate of January 1, 2016 of the said amendments until IASB completes its broader review of theresearch project on equity accounting that may result in the simplification of accounting forsuch transactions and of other aspects of accounting for associates and joint ventures.

Del Monte Pacific Limited and its Subsidiaries
Notes to the financial statementsFor the financial year ended 30 April 2020
- 52 -
*SGVFSM004024*
5. Property, plant and equipment - net
<-----------------------------------------At cost ----------------------------------->At appraised
valueBuildings, landimprovementsand leaseholdimprovements
Machineriesand
equipmentConstruction-in-progress Bearer Plants
Freeholdland Total
US$’000 US$’000 US$’000 US$’000 US$’000 US$’000Cost/Valuation
At 1 May 2019 218,313 596,123 32,483 311,937 61,541 1,220,397Additions 896 4,154 27,340 98,128 – 130,518Disposals (18,114) (72,253) – – (3,571) (93,938)Write off – closed fields – – – (58,290) – (58,290)Revaluation – – – – 4,066 4,066Reclassification from CIP 4,757 26,491 (31,248) – – –Reclassification from assets held
for sale[1] 350 22 – – 870 1,242Currency realignment 1,687 6,855 576 10,207 388 19,713At 30 April 2020 207,889 561,392 29,151 361,982 63,294 1,223,708
At 1 May 2018 217,950 552,084 55,941 260,424 67,109 1,153,508Additions 1,781 4,458 34,906 82,627 – 123,772Disposals (7,809) (5,897) – – (4,018) (17,724)Write off – closed fields – – – (29,234) – (29,234)Reclassification from CIP 11,236 46,805 (58,041) – – –Reclassification to assets held for
sale [2] (4,527) – – – (1,467) (5,994)Currency realignment (318) (1,327) (323) (1,880) (83) (3,931)At 30 April 2019 218,313 596,123 32,483 311,937 61,541 1,220,397

Del Monte Pacific Limited and its Subsidiaries
Notes to the financial statementsFor the financial year ended 30 April 2020
- 53 -
*SGVFSM004024*
5. Property, plant and equipment – net (cont’d)
<----------------------------------At cost ----------------------------------------->At appraised
valueBuildings, landimprovementsand leaseholdimprovements
Machineriesand
equipmentConstruction-in-progress Bearer Plants
Freeholdland Total
US$’000 US$’000 US$’000 US$’000 US$’000 US$’000Accumulated depreciation
and impairment losses
At 1 May 2019 77,408 343,540 – 213,119 4,297 638,364Charge for the year 10,091 48,218 – 78,365 – 136,674Impairment loss 15,672 20,835 – – 4,239 40,746Write off – closed fields – – – (58,290) – (58,290)Disposals (9,200) (46,402) – – – (55,602)Currency realignment 830 5,317 – 8,172 – 14,319At 30 April 2020 94,801 371,508 – 241,366 8,536 716,211
At 1 May 2018 67,563 298,398 – 172,361 4,297 542,619Charge for the year 10,647 50,036 – 71,369 – 132,052Impairment loss 1,262 – – – – 1,262Write off – closed fields – – – (29,234) – (29,234)Disposals (474) (4,036) – – – (4,510)Reclassification to assets held for
sale [2] (1,529) –– – –
(1,529)Currency realignment (61) (858) – (1,377) – (2,296)At 30 April 2019 77,408 343,540 – 213,119 4,297 638,364

Del Monte Pacific Limited and its Subsidiaries
Notes to the financial statementsFor the financial year ended 30 April 2020
- 54 -
*SGVFSM004024*
5. Property, plant and equipment - net (cont’d)
<---------------------------------At cost -------------------------------------->At appraised
valueBuildings, landimprovementsand leaseholdimprovements
Machineriesand
equipmentConstruction-in-progress Bearer Plants
Freeholdland Total
US$’000 US$’000 US$’000 US$’000 US$’000 US$’000Carrying amountsAt 30 April 2020 113,088 189,884 29,151 120,616 54,758 507,497At 30 April 2019 140,905 252,583 32,483 98,818 57,244 582,033
[1] During the financial year, Gilroy assets which was previously classified as assets held for sale has been reclassified as “Property, plant, andequipment” in the consolidated statement of financial position. There are no assets held for sale as of 30 April 2020 (see Note 16).
[2] During the previous financial year, Gilroy and Kenwood assets were classified as assets held for sale (see Note 16).

Del Monte Pacific Limited and its Subsidiaries
Notes to the financial statementsFor the financial year ended 30 April 2020
- 55 -
*SGVFSM004024*
5. Property, plant and equipment - net (cont’d)
A reclassification was made in fiscal year 2019 to present the “Reclassifications from CIP”separately from the “Reclassifications to assets held for sale”.
The Group has amounts in accrued liabilities relating to property, plant and equipment acquisitionsof US$1.2 million as of 30 April 2020 (2019: US$0.6 million). Down payments made by the Groupfor the acquisition of property, plant and equipment amounted to US$1.5 million as of 30 April 2020(2019: to US$2.6 million). The cost of fields closed and written off in 2020 amounted toUS$58.3 million, which have been fully depreciated during the year (2019: US$29.2 million).
Bearer Plants
Bearer plants is stated at cost which comprises actual costs incurred in nurturing the crops reducedby depreciation. Depreciation represents the estimated cost of fruits harvested from the Group’splant crops. An estimated cost is necessary since the growth cycle of the plant crops is beyondtwelve months, hence total growing costs are not yet known as of reporting date. The estimatedcost is developed by allocating estimated growing costs for the estimated growth cycle of two tothree years over the estimated harvests to be made during the life cycle of the plant crops.Estimated growing costs are affected by inflation and foreign exchange rates, volume and labourrequirements. Estimated harvest is affected by natural phenomenon such as weather patterns andvolume of rainfall. Field performance and market demand also affect the level of estimatedharvests. The Group reviews and monitors the estimated cost of harvested fruits regularly.
Leasehold Improvements
As at 30 April 2020 and 2019, the Group has no significant legal or constructive obligation todismantle any of its leasehold improvements as the lease contracts provide, among other things,that the improvements introduced on the leased assets shall become the property of the lessorupon termination of the lease.
Group30 April
202030 April
2019Hectares planted with growing crops: Pineapples 14,733 14,992 Papaya 48 188
Fruits harvested from the growing crops:(in metric tons) Pineapples 675,333 688,596 Papaya 227 223

Del Monte Pacific Limited and its Subsidiaries
Notes to the financial statementsFor the financial year ended 30 April 2020
- 56 -
*SGVFSM004024*
5. Property, plant and equipment - net (cont’d)
Freehold Land
The table below summarises the valuation of freehold land held by the Group as at 30 April 2020in various locations:
30 April2020
30 April2019 Date of
Located in US$’000 US$’000 Latest Valuation
The Philippines 12,104 8,786 2020 (Various)United States of America 32,459 39,399 1 May 2020Singapore 10,195 9,059 18 May 2020
54,758 57,244
The Group engaged independent appraisers to determine the fair values of its freehold land.Revaluations are performed at regular intervals to ensure that the fair value of the freehold landdoes not differ materially from its carrying amount. Management evaluated that the fair values ofits freehold land at the respective valuation dates approximate their fair values as of the reportingdate. The assumptions used in determining the fair value are disclosed in Note 35. In relation tothe revaluation of its freehold land in DMFI, management believes that the cost approximate theirfair values as at 30 April 2020.
In fiscal year 2020, the Group reclassified US$0.6 million of its freehold land as held-for-sale (2019:US$4.6 million) and disposed US$3.6 million (2019: US$0.8 million).
The carrying amount of the Group’s freehold land as at 30 April 2020 would be US$35.6 million(2019: US$41.9 million) had the freehold land been carried at cost less impairment losses.
Construction-in-Progress
Construction-in-progress (“CIP”) includes on-going item expansion projects for the Group’soperations.
Major items in the CIP include construction of can making equipment from Ball Corporation, 2.3Kgtidbits in pouch production line and 202 integration-filling/seaming process, 120T steam peeler,vegetable dip production project and various information technology improvements. Most of theCIP items are expected to be completed within fiscal year 2021.

Del Monte Pacific Limited and its Subsidiaries
Notes to the financial statementsFor the financial year ended 30 April 2020
- 57 -
*SGVFSM004024*
5. Property, plant and equipment - net (cont’d)
Plant closures and divestiture of Sager Creek business
In connection with the plant closures, the Group recognised impairment losses amounting toUS$40.7 million in fiscal year 2020 (2019: US$1.3 million).
Vegetable plants
The Group announced on 20 August 2019 its intention to close its Sleepy Eye plant in Minnesota,its Mendota plant in Illinois, the sale of its Cambria plant in Wisconsin to new ownership, and intendsto sell the production assets from its Crystal City plant in Texas. In connection with the SleepyEye and Mendota plant closures, the Group recognised impairment losses on related property,plant and equipment amounting to US$21.1 million for the year ended 30 April 2020. Inconnection with the Cambria plant sale on 1 November 2019, the Group recognised impairmentlosses on related property, plant and equipment amounting to US$5.1 million for the year ended30 April 2020. In connection with the Crystal City production equipment sale, the Group recognisedimpairment losses on related property, plant and equipment amounting to US$14.6 million for theyear ended 30 April 2020.
Under these plant closures, approximately 910 employees were terminated as of 30 April 2020.During the year, the Group recognised provisions for employee severance benefits amounting toUS$4.5 million, with US$2.3 million outstanding, for the year ended 30 April 2020. The employeeseverance benefits are presented under “Employee benefits” (see Note 21) and are expected tobe paid in fiscal year 2021. Environmental liabilities of US$9.5 million were also recognised as of30 April 2020 (see Note 22). The majority of this liability relates to the obligations to treat andremove the waste-water ponds at Sleepy Eye, Mendota and Crystal City. Related inventory andproperty, plant and equipment write-downs amounting to US$9.2 million were recognised for theyear ended 30 April 2020.
In connection with these announcements, the Group has recorded expenses of US$68.4 million ofexpense in “Other income (expenses) – net” for the year ended 30 April 2020.
As of 30 April 2020, the assets from Crystal City, Sleepy Eye and Mendota, have been sold.
Seed Operation Exit
In fiscal year 2019, the Group entered into production and packaging agreements to meet breedingobjectives with the Group’s intellectual property (research and breeding lines) for its seedoperations. The Group will maintain the variety selection process to select varieties that meet theGroup’s standards. Due to these agreements, the Group closed its Idaho Falls, Idaho and Gilroy,California seed operations in August 2018 and February 2019, respectively. In connection with theIdaho Falls plant closure, the Group recognised a gain on the sale of related property, plant andequipment amounting to US$1.5 million in fiscal year 2019. Additionally, in fiscal year 2019,management committed to a plan to sell certain assets of the Group’s Gilroy plant. In fiscal year2019, assets of US$1.3 million were reclassified as “Assets held for sale” in the consolidatedstatement of financial position. In fiscal year 2020, Gilroy assets have been reclassified as“Property, plant, and equipment” in the consolidated statements of financial position asManagement further evaluates the future use of these assets. There are no assets held for saleas of 30 April 2020.

Del Monte Pacific Limited and its Subsidiaries
Notes to the financial statementsFor the financial year ended 30 April 2020
- 58 -
*SGVFSM004024*
5. Property, plant and equipment - net (cont’d)
Seed Operation Exit (cont’d)
Under these plant closures, 12 employees were affected, all of which were terminated by the endof fiscal year 2019. The Group recognised provisions for employee severance benefits amountingto US$0.3 million, with US$0.1 million outstanding as of 30 April 2019. As of 30 April 2020, there isno employee severance benefits outstanding.
Plymouth Plant
The Group closed its Plymouth, Indiana plant during fiscal year 2018. In connection with the plantclosure, the Group recognised impairment losses on related property, plant and equipmentamounting to US$7.0 million in fiscal year 2018.
Under the termination plan, approximately 100 employees were affected, all of which wereterminated by the end of fiscal year 2018. The Group recognised provisions for employeeseverance benefits amounting to US$2.3 million, with US$0.2 million outstanding as of30 April 2018. Remaining employee severance benefits amounting to US$0.2 million were settledin fiscal year 2019. The employee severance benefits are presented under “Employee benefits”.
As of 30 April 2019, the Plymouth building and land have been sold. As of 30 April 2020 and 2019,a non-current receivable of US$1.0 million has been recorded in “Other Non-current Assets” relatedto this sale (see Note 10). This receivable is due on 2 July 2023.
Sager Creek - Siloam Springs, Arkansas
The Group announced on 20 September 2017 that it will cease operations of its Country productionplant in Siloam Springs, Arkansas.
Under the termination plan, approximately 230 employees were affected, the majority of which wereterminated by the end of fiscal year 2018. The Group recognised provisions for employeeseverance benefits amounting to US$2.3 million, with US$0.4 million outstanding as of 30 April2018. Remaining employee severance benefits amounting to less than US$0.1 million were settledin fiscal year 2019. The employee severance benefits are presented under “Employee benefits”.
Northwest Arkansas Distribution and Warehouse Facilities
The Group announced on 19 January 2018 its intention to close its distribution and warehousefacilities in Northwest Arkansas. These closures occurred during the first half of fiscal year 2019.
Under the termination plan, approximately 125 employees were affected, the majority of which wereterminated by the end of fiscal year 2018. The Group recognised provisions for employeeseverance benefits amounting to US$1.3 million, with US$1.1 million outstanding as of 30 April2018. Employee severance benefits amounting to US$0.5 million were settled in fiscal year 2019,with US$0.1 million outstanding at 30 April 2019. The employee severance benefits are presentedunder “Employee benefits”. As of 30 April 2020, there are no outstanding severance benefits relatedto this closure.

Del Monte Pacific Limited and its Subsidiaries
Notes to the financial statementsFor the financial year ended 30 April 2020
- 59 -
*SGVFSM004024*
5. Property, plant and equipment - net (cont’d)
Source of estimation uncertainty
The Group estimates the useful lives of its buildings, land improvements, leasehold improvementsand machineries and equipment based on the period over which the assets are expected to beavailable for use. The estimated useful lives of property, plant and equipment are reviewedperiodically and are updated if expectations differ from previous estimates due to physical wearand tear, technical or commercial obsolescence and legal or other limits on the use of the assets.
In addition, the estimation of the useful lives of property, plant and equipment is based on collectiveassessment of industry practice, internal technical evaluation and experiences with similar assets.It is possible, however, that future financial performance could be materially affected by changesin estimates brought about by changes in factors mentioned above. The amount and timing ofrecorded expenses for any period would be affected by changes in these factors andcircumstances. A reduction in the estimated useful lives of property, plant and equipment wouldincrease recorded depreciation expense and decrease non-current assets.
The depreciation of bearer plants require estimation of future harvest which is affected by naturalphenomena and weather patterns.
The valuation of freehold land is based on comparable transaction subject to adjustments. Theseadjustments require judgement.
The recoverable amount of the impaired assets was based on fair value less cost to sell, which issubject to estimation.
6. Investments in subsidiaries
30 April2020
30 April2019
US$’000 US$’000
Unquoted equity shares, at cost 640,699 640,699Amounts due from subsidiaries (nontrade) 237,074 205,106
877,773 845,805
Accumulated share in (losses) profit and other comprehensiveincome at the beginning of the year (14,950) (8,298)
Reserve from sale of shares of a subsidiary 76,958 –Share in net profit (losses) of subsidiaries (76,629) 27,931Dividends declared by subsidiaries (230,473) (33,000)Share in other comprehensive losses of subsidiaries, net of
tax (11,639) (1,965)Effect due to adoption of IFRS 16 (1,013) –Others – 382
(257,746) (14,950)Interests in subsidiaries at the end of the year 620,027 830,855
The amounts due from subsidiaries are unsecured and interest-free. Settlement of the balancesare neither planned nor likely to occur in the foreseeable future as they are, in substance, a part ofthe Company’s net investments in the subsidiaries.

Del Monte Pacific Limited and its Subsidiaries
Notes to the financial statementsFor the financial year ended 30 April 2020
- 60 -
*SGVFSM004024*
6. Investments in subsidiaries (cont’d)
In April 2019, the Company converted its advances to wholly owned subsidiaries Del Monte PacificResources Limited (“DMPRL”) and DMPL India, Pte Ltd (“DMPLI”) in the amounts of US$167.6million and US$70.1 million, respectively, into other equity. The conversion was approved by theBOD on 30 April 2019.
Share Purchase Agreement and Shareholders’ Agreement with Sea Diner Holdings (S) Pte. Ltd.(SEA Diner)
On 24 January 2020, the Company, Central American Resources, Inc (“CARI”), DMPI and SEADiner, a company incorporated in Singapore, entered into a Share Purchase Agreement andShareholders’ Agreement whereby CARI will sell 335,678,400 existing common shares equivalentto 12% ownership interest in DMPI to SEA Diner for a consideration of US$120.0 million, subjectto fulfilment of certain conditions precedent. These common shares are convertible to voting,convertible, participating and redeemable preference shares (“RCPS”) of DMPI.
The Board and the stockholders of DMPI approved the conversion of the convertible commonshares to RCPS subject to the completion of the transaction and the Enabling Resolutions whichfurther defined the terms of the RCPS on 3 March 2020. As at 30 April 2020, the Company, CARIand DMPI had fulfilled the conditions precedent under the Share Purchase Agreement. The closingdate of the agreement is on 20 May 2020.
Terms of the RCPS
The terms of the RCPS are as follow:
The RCPS holders participate in the dividends on an as-converted basis, that is, if commonshareholders are entitled to dividends, then the RCPS holders will correspondingly be entitledto dividends on an as-converted basis.
The investor as an RCPS holder will have proportional shareholder voting rights in DMPI on anas-converted basis. There will also be certain reserved matters (for example, matters not in theordinary course of business) which the investor will have the right to approve.
SEA Diner, as long as it holds RCPS, may, at any time, exercise its right to convert the RCPSinto common shares of DMPI at a ratio of one (1) RCPS to one (1) common share of DMPI.The RCPS is automatically converted into common share in the event of initial public offering(IPO) of DMPI.
Upon the occurrence of any of certain agreed “RCPS Default Events”, SEA Diner may requirethe Company, CARI or DMPI to redeem all of the RCPS at the agreed redemption price, whichis the amount of RCPS consideration plus the agreed rate of return (compounded on a perannum basis) calculated from 20 May 2020 up to the date of redemption.
In case of “Other Redemption Events”, redemption shall be subject to the mutual agreement ofthe parties. If DMPI does not consent to the RCPS holder’s written redemption request, theinternal rate of return would be increased annually by 3%, and this increased rate of returnshall apply for each year that the RCPS remain outstanding and shall be compounded on a perannum basis.

Del Monte Pacific Limited and its Subsidiaries
Notes to the financial statementsFor the financial year ended 30 April 2020
- 61 -
*SGVFSM004024*
6. Investments in subsidiaries (cont’d)
Call Option Agreement
On 24 January 2020, the Company, CARI, DMPI and SEA Diner entered into a call optionagreement wherein SEA Diner is entitled to a call option which gives SEA Diner the right to buyfrom CARI additional DMPI shares (“Option Shares”). The exercise price for each Option Share isUS$0.357 (computed based on the DMPI equity valuation of US$1 billion / existing total issuedshare capital of the DMPI shares of 2,797,320,003 as at the date of the Agreement). The calloption is consummated on or before 30 April 2022 and ending on the earliest of 10 years after theclosing date, the date falling 5 years after the date which an IPO of DMPI was consummated andthe date when SEA Diner receives an amount respect of a redemption of its shares.
Impact on the Group
In relation to the above transaction, as at 30 April 2020, the Group recognised the grossconsideration of US$120.0 million under “Trade and other receivables” (see Note 13), transactioncosts of US$14.0 million (US$0.7 million of which was already paid as at 30 April 2020 and theoutstanding balance of US$13.3 million as at 30 April 2020 is recorded as accrued operatingexpenses under “Trade and other current liabilities” (see Note 23)), long-term derivative liability ofUS$2.6 million (see Note 20) for the call option in accordance with the call option agreement, equityreserve under “Retained earnings” of US$77.0 million due to change in ownership interest in DMPIwithout loss of control (see Note 18) and “Non-controlling interests” of US$26.4 million representinginvestor’s proportionate share in the net assets of DMPI (see Note 39).
Impact on the Company
The Company recognised an increase in investment in subsidiary and retained earnings equal tothe net equity reserve amounting to US$77.0 million, accrued transaction costs of US$1.3 million,and receivable from CARI amounting to US$2.1 million.
Significant judgments
1. Recognition as at 30 April 2020
The Share Purchase Agreement is subject to conditions precedent and closing conditions. Theconditions precedent were completed as at 30 April 2020 while the parties agreed the closingdate to be 20 May 2020. Management assessed that the closing conditions are administrativein nature and accounted for the transaction as at 30 April 2020.
Moreover, management assessed that the actual conversion of the common shares to RCPSin records and the issuance of related stock certificates are administrative and procedural innature. The Board and stockholders of DMPI also approved the conversion of the convertiblecommon shares to RCPS in March 2020. Considering this, the Group has accounted for theinstrument as RCPS in substance as at 30 April 2020.

Del Monte Pacific Limited and its Subsidiaries
Notes to the financial statementsFor the financial year ended 30 April 2020
- 62 -
*SGVFSM004024*
6. Investments in subsidiaries (cont’d)
Significant judgments (cont’d)
2. Equity Classification
Management assessed that the RCPS sold to SEA Diner met the equity classification sinceboth conditions below are met:
(a) The Group has no contractual obligation to deliver cash or another financial asset to theinvestor as the “RCPS Default Events”, among the other terms in Share PurchaseAgreement, Shareholders’ Agreement and Call Option Agreement, are assessed to bewithin the control of the Group and the redemption of the RCPS in case of “OtherRedemption Events” is subject to the mutual consent of both parties; and
(b) The RCPS which is convertible to common shares at the ratio of 1:1 does not includecontractual obligation for DMPI to deliver a variable number of its own equity instrumentsupon conversion.
Source of estimation uncertainty
1. Obligation to Deliver Additional RCPS
The Shareholders’ Agreement between the Company, CARI, DMPI and SEA Diner provides aconditional obligation for DMPI to deliver additional RCPS subject to meeting certain level ofnet income and adjusted equity value as defined in the agreement for fiscal year ending30 April 2021. Management assessed that the Group’s derivative liability to deliver additionalRCPS has a carrying value of nil as at 30 April 2020 based on its budgeted net income forfiscal year ending 30 April 2021, and the expected timing and probability of an IPO.Management will remeasure the derivative liability at the end of every reporting period.
2. Obligation to Purchase Excess Shares or Sell Shortfall Shares
The Shareholders’ Agreement provides a conditional obligation for CARI to purchase excessshares or sell shortfall shares to SEA Diner at par value subject to certain conditions (amountof IPO pre-market capitalization) as defined in the Shareholders’ Agreement. Managementassessed that the Group’s derivative asset or liability to purchase excess shares or sell shortfallshares to SEA Diner has a carrying value of nil as at 30 April 2020 as the estimated pre-moneymarket capitalization is lower than the threshold in the Agreement. As a result, the probabilityof the options relating to the excess shares and shortfall shares is nil or minimal.
3. Fair Value of Derivative Liability on the Call Option
The fair value of the derivative liability related to the call option is measured using Cox-Ross-Rubinstein (“CRR”) binomial tree model. The inputs to this model are taken from acombination of observable markets and unobservable market data. Changes in inputs aboutthese factors could affect the reported fair value of the derivative liabilities and impact profit orloss. The carrying value of the derivative liability amounted to US$2.6 millionas at 30 April 2020 (see Note 20).
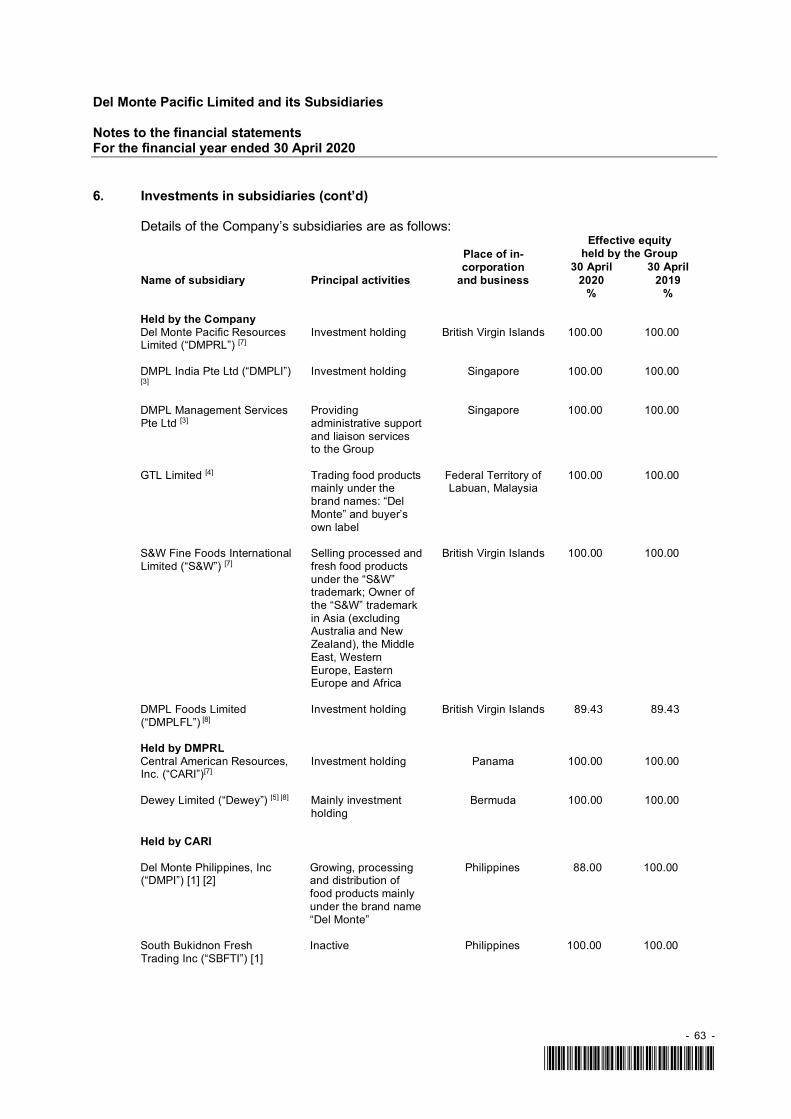
Del Monte Pacific Limited and its Subsidiaries
Notes to the financial statementsFor the financial year ended 30 April 2020
- 63 -
*SGVFSM004024*
6. Investments in subsidiaries (cont’d)
Details of the Company’s subsidiaries are as follows:
Name of subsidiary Principal activities
Place of in-corporation
and business
Effective equityheld by the Group
30 April2020
30 April2019
% %
Held by the CompanyDel Monte Pacific ResourcesLimited (“DMPRL”) [7]
Investment holding British Virgin Islands 100.00 100.00
DMPL India Pte Ltd (“DMPLI”)[3]
Investment holding Singapore 100.00 100.00
DMPL Management ServicesPte Ltd [3]
Providingadministrative supportand liaison servicesto the Group
Singapore 100.00 100.00
GTL Limited [4] Trading food productsmainly under thebrand names: “DelMonte” and buyer’sown label
Federal Territory ofLabuan, Malaysia
100.00 100.00
S&W Fine Foods InternationalLimited (“S&W”) [7]
Selling processed andfresh food productsunder the “S&W”trademark; Owner ofthe “S&W” trademarkin Asia (excludingAustralia and NewZealand), the MiddleEast, WesternEurope, EasternEurope and Africa
British Virgin Islands 100.00 100.00
DMPL Foods Limited(“DMPLFL”) [8]
Investment holding British Virgin Islands 89.43 89.43
Held by DMPRLCentral American Resources,Inc. (“CARI”)[7]
Investment holding Panama 100.00 100.00
Dewey Limited (“Dewey”) [5] [8] Mainly investmentholding
Bermuda 100.00 100.00
Held by CARI
Del Monte Philippines, Inc(“DMPI”) [1] [2]
Growing, processingand distribution offood products mainlyunder the brand name“Del Monte”
Philippines 88.00 100.00
South Bukidnon FreshTrading Inc (“SBFTI”) [1]
Inactive Philippines 100.00 100.00

Del Monte Pacific Limited and its Subsidiaries
Notes to the financial statementsFor the financial year ended 30 April 2020
- 64 -
*SGVFSM004024*
6. Investments in subsidiaries (cont’d)
Name of subsidiary Principal activities
Place of in-corporation
and business
Effective equityheld by the Group
30 April2020
30 April2019
% %
Held by DMPIPhilippines PackingManagement ServicesCorporation [1] [2]
Management,logistics and supportservices
Philippines 88.00 100.00
Del Monte TxantonDistribution Inc(“DMTDI”) [a] [1] [2]
Inactive Philippines 32.00 40.00
Held by DeweyDewey Sdn. Bhd. [4] Owner of various
trademarksMalaysia 100.00 100.00
Held by DMPLIDMPL India Limited [10] Investment holding Mauritius 95.13 94.94
Held by S&WS&W Japan Limited [8] Support and
marketing services forS&W
Japan 100.00 100.00
Held by DMPLFLDel Monte FoodsHoldings Limited(“DMFHL”) [1]
Investment holding British Virgin Islands 89.43 89.43
Held by DMFHLDel Monte FoodsHoldings II, Inc.(“DMFHII”) [6]
Investment holding State of Delaware,U.S.A.
89.43 89.43
Held by DMFHIIDel Monte FoodsHoldings Inc. (“DMFHI”) [6]
Investment holding State of Delaware,U.S.A.
89.43 89.43
Held by DMFHIDel Monte Foods, Inc.(“DMFI”) [6]
Manufacturing,processing anddistributing food,beverages and otherrelated products
State of Delaware,U.S.A
89.43 89.43
Held by DMFISager Creek Foods, Inc.(formerly VegetableAcquisition Corp.) [6]
Real estate holding State of Delaware,U.S.A.
89.43 89.43
Del Monte Andina C.A. [9] Manufacturing,processing anddistributing food,beverages and otherrelated products
Venezuela – –

Del Monte Pacific Limited and its Subsidiaries
Notes to the financial statementsFor the financial year ended 30 April 2020
- 65 -
*SGVFSM004024*
6. Investments in subsidiaries (cont’d)
Name of subsidiary Principal activities
Place of in-corporation
and business
Effective equityheld by the Group
30 April2020
30 April2019
% %
Del Monte ColombianaS.A. [4]
Manufacturing,processing anddistributing food,beverages and otherrelated products
Colombia 73.31 73.31
Industrias Citricolas deMontemorelos, S.A. deC.V. (ICMOSA) [4]
Manufacturing,processing anddistributing food,beverages and otherrelated products
Mexico 89.43 89.43
Del Monte Peru S.A.C. [8] Distribution of food,beverages and otherrelated products
Peru 89.43 89.43
Del Monte Ecuador DMEC.A. [8]
Distribution of food,beverages and otherrelated products
Ecuador 89.43 89.43
Hi-Continental Corp. [8] Distributor of non-DelMonte products
State of California,U.S.A.
89.43 89.43
College Inn Foods [8] Distributor of CollegeInn brand products
State of California,U.S.A.
89.43 89.43
Contadina Foods, Inc. [8] Distributor ofContadina brandproducts
State of Delaware,U.S.A.
89.43 89.43
Held by DMFI (cont’d)S&W Fine Foods, Inc. [8] Distributor of S&W
Fine Foods, Inc,State of Delaware,
U.S.A.89.43 89.43
Del Monte Ventures, LLC(“DM Ventures”) [b]
Holding company State of Delaware,U.S.A.
89.43 89.43
Held by DM VenturesDel Monte Avo, LLC [b] Development,
production, marketing,sale and distributionof UHP avocadoproducts
State of Delaware,U.S.A.
45.61 45.61
Del Monte Chilled FruitSnacks, LLC [b]
Development,production, marketing,sale and distributionof processedrefrigerated fruitproducts
State of Delaware,U.S.A.
45.61 45.61
Held by Del MonteAndina C.A.Del Monte Argentina S.A. [9] Inactive Argentina – –

Del Monte Pacific Limited and its Subsidiaries
Notes to the financial statementsFor the financial year ended 30 April 2020
- 66 -
*SGVFSM004024*
6. Investments in subsidiaries (cont’d)
(a) DMTDI is consolidated as the Group has de facto control over the entity. Even with lessthan the majority voting rights, the Group concluded that DMTDI is a subsidiary and that ithas power to direct the relevant activities of DMTDI due to DMPI having majority seats inthe Board through a shareholders agreement with the other shareholders of DMTDI. Thekey management personnel (i.e., President and Chief Executive Officer, Chief OperatingOfficer, Chief Financial Officer and Treasurer and Corporate Secretary) of DMPI also servein the same positions in DMTDI. In its special meeting held on 22 April 2019, DMTDI’s BODapproved the dissolution and liquidation of DMTDI by shortening its corporate term. As at30 April 2020, the application for the dissolution and liquidation is yet to be submitted withthe SEC due to certain regulatory and documentary requirements.
(b) The Group incorporated its subsidiary, Del Monte Ventures, LLC on 21 June 2017 whichacquired interests in four joint venture entities which were all incorporated in the state ofDelaware, USA. These joint ventures will pursue sales of expanded refrigerated offeringsacross all distribution and sales channels, and will establish a new retail food and beverageconcept. These joint ventures will initially focus on the U.S. market, with the potential forexpansion into other territories. These joint venture entities are in their pre-operating stagesand have no material assets or liabilities as of 30 April 2020 and 2019.
[1] Audited by SyCip Gorres Velayo & Co. (“SGV”) [2] On 21 May 2020, CARI completed the sale of 12% stake in DMPI to Sea Diner. Conditions
of the sale were already met as of 30 April 2020, as confirmed by both parties.[3] Audited by Ernst and Young LLP (“EY”) Singapore.[4] Audited by Ernst & Young member firms in the respective countries.[5] On 30 April 2019, the BOD of CARI approved the transfer of its outstanding shares in
Dewey, as well as all rights, title and interest attributed thereto, to DMPRL.[6] Not required to be audited in the country of incorporation. Audited by SGV for the purpose
of group reporting.[7] Not required to be audited in the country of incorporation. Audited by Ernst and Young LLP,
Singapore for the purpose of group reporting.[8] Not required to be audited in the country of incorporation.[9] Not required to be audited in the country of incorporation. The Venezuelan entity was
deconsolidated in 2015. The Venezuelan exchange control regulations have resulted inan other-than-temporary lack of exchangeability between the Venezuelan Bolivar and USdollar. This has restricted the Venezuelan entity’s ability to pay dividends and obligationsdenominated in US dollars. The exchange regulations, combined with other recentVenezuelan regulations, have constrained the Venezuelan entity’s ability to maintainnormal production. Due to the Group’s inability to effectively control the operations of theVenezuelan entity, the Group deconsolidated its subsidiary effective February 2015. Theequity interest in this entity is determined to be the cost of investment of the entity at thedate of deconsolidation. The investment is carried at cost less impairment losses.
[10] In December 2019, DMPLI invested an additional US$1.5 million in DMPL India Limited,thereby increasing ownership to 95.13%
The Company regularly reassesses whether it controls an investee when facts and circumstancesindicate that there are changes to one or more of the three elements of control listed in Note 4.The Company determined that it exercised control on all its subsidiaries as it has all elements ofcontrol.

Del Monte Pacific Limited and its Subsidiaries
Notes to the financial statementsFor the financial year ended 30 April 2020
- 67 -
*SGVFSM004024*
6. Investments in subsidiaries (cont’d)
Source of estimation uncertainty
When the subsidiary has suffered recurring operating losses, a test is made to assess whether theinterests in subsidiary has suffered any impairment by determining the recoverable amount. Thisdetermination requires significant judgement and estimation. An estimate is made of the futureprofitability, cash flow, financial health and near-term business outlook of the subsidiary, includingfactors such as market demand and performance. The recoverable amount will differ from theseestimates as a result of differences between assumptions used and actual operations.
7. Investments in joint ventures
Name of joint venture Principal activities
Place ofincorporationand business
Effective equityheld by the Group
30 April2020
30 April2019
% %
FieldFresh Foods PrivateLimited (“FFPL”) *[1]
Production and sale offresh and processedfruits and vegetable foodproducts
India 47.56 47.47
Nice Fruit Hong Kong Limited(NFHKL) #
Production and sale offrozen fruits andvegetable food products
Hong Kong 35.00 35.00
* Audited by Deloitte Haskins & Sells, Gurgaon, India.# Audited by Ernst and Young Hong Kong.[1] In December 2019, DMPLI invested an additional US$1.5 million in DMPL India Limited, who invested the same in
FFPL.
The summarised financial information of a material joint venture, FFPL, not adjusted for thepercentage ownership held by the Group, is as follows:
Year ended 30April 2020
Year ended 30April 2019
Year ended 30April 2018
US$’000 US$’000 US$’000
Revenue 74,178 76,597 76,588
Loss from continuing operations a (4,243) (222) (630)Other comprehensive income – – –Total comprehensive loss (4,243) (222) (630)a Includes:- depreciation 65 134 151- interest expense 1,812 1,501 1,522
Noncurrent assets 12,528 13,475 14,657Current assets 23,891 22,309 21,882Noncurrent liabilities (19,978) (17,798) (17,992)Current liabilities (13,908) (13,910) (13,684)Net assets 2,533 4,076 4,863Proportion of the Group’s ownership including non-
controlling interest 50% 50% 50%1,267 2,038 2,432
Goodwill 20,000 20,000 20,000Translation adjustment 1,588 1,408 1,125Carrying amount of investment 22,855 23,446 23,557

Del Monte Pacific Limited and its Subsidiaries
Notes to the financial statementsFor the financial year ended 30 April 2020
- 68 -
*SGVFSM004024*
7. Investments in joint ventures (cont’d)
The summarised financial information of a material joint venture, FFPL, not adjusted for thepercentage ownership held by the Group, is as follows: (cont’d)
Year ended30 April 2020
Year ended30 April 2019
Year ended30 April 2018
US$’000 US$’000 US$’000
Carrying amount of interest in FFPL atbeginning of the year 23,446 23,557 23,872
Capital injection during the year 1,530 – –Group’s share of:- loss from continuing operations (2,121) (111) (315)- other comprehensive income – – –
total comprehensive loss (2,121) (111) (315)Carrying amount of interest
at end of the year 22,855 23,446 23,557
The interest in the net assets of an immaterial joint venture, NFHKL, is as follows:
Year ended30 April 2020
Year ended30 April 2019
Year ended30 April 2018
US$’000 US$’000 US$’000
Carrying amount of interest in NFHKL atbeginning of the year 766 1,638 1,925
Capital injection during the year – – 950Group’s share of:- loss from continuing operations (766) (872) (1,237)- other comprehensive income – – – total comprehensive loss (766) (872) (1,237)Carrying amount of interest
at end of the year – 766 1,638
The summarised interest in joint ventures of the Group, is as follows:
Year ended30 April 2020
Year ended30 April 2019
Year ended30 April 2018
US$’000 US$’000 US$’000Group’s interest in joint venturesFFPL 22,855 23,446 23,557NFHKL – 766 1,638Carrying amount of investments in joint
ventures 22,855 24,212 25,195

Del Monte Pacific Limited and its Subsidiaries
Notes to the financial statementsFor the financial year ended 30 April 2020
- 69 -
*SGVFSM004024*
7. Investments in joint ventures (cont’d)
Determination of joint control and the type of joint arrangement
Joint control is presumed to exist when the investors contractually agreed sharing of control of anarrangement, which exists only when decisions about the relevant activities require the unanimousconsent of the parties sharing control. Management has assessed that it has joint control in alljoint arrangements.
The Group determines the classification of a joint venture depending upon the parties’ rights andobligations arising from the arrangement in the normal course of business. When making anassessment, the Group considers the following:
(a) the structure of the joint arrangement.(b) when the joint arrangement is structured through a separate vehicle:
i. the legal form of the separate vehicle;ii. the terms of the contractual arrangement; andiii. when relevant, other facts and circumstances.
The Group determined that its interests in FFPL and NFHKL are joint ventures as the arrangementsare structured in a separate vehicle and that it has rights to the net assets of the arrangements.The terms of the contractual arrangements do not specify that the parties have rights to the assetsand obligations for the liabilities relating to the arrangements.
Source of estimation uncertainty
When the joint venture has suffered recurring operating losses, a test is made to assess whetherthe investment in joint venture has suffered any impairment by determining the recoverable amount.This determination requires significant judgement and estimation. An estimate is made of thefuture profitability, cash flow, financial health and near-term business outlook of the joint venture,including factors such as market demand and performance. The recoverable amount will differfrom these estimates as a result of differences between assumptions used and actual operations.
Since its acquisition, the Indian sub-continent trademark and the investment in FFPL were allocatedto the Indian sub-continent cash-generating unit (“Indian sub-continent CGU”). The recoverableamount of Indian sub-continent CGU was estimated using the discounted cash flows based on five-year cash flow projections.

Del Monte Pacific Limited and its Subsidiaries
Notes to the financial statementsFor the financial year ended 30 April 2020
- 70 -
*SGVFSM004024*
7. Investments in joint ventures (cont’d)
Key assumptions used in discounted cash flow projection calculations
Key assumptions used in the calculation of recoverable amounts are discount rates, revenuegrowth rates, earnings before interest, taxes, depreciation and amortisation (EBITDA) margin andterminal value growth rate. The values assigned to the key assumptions representedmanagement’s assessment of future trends in the industries and were based on both external andinternal sources.
30 April2020
30 April2019
% %
Pre-tax discount rate 12.7 13.8Revenue growth rate (15.0) – 34.0 19.0 – 21.0EBITDA margin 2.7 – 9.5 4.9 – 13.0Long-term EBITDA margin 9.5 12.8Terminal value growth rate 5.0 5.0
In fiscal year 2020, discount rate is a pre-tax measure estimated based on past experience, andindustry average weighted average cost of capital, which is based on a rate of debt leveraging rateof 47.24% in 2020 (2019: 14.3%), at a market interest rate of 9.3% in 2020 (2019: 9.7%).
Revenue growth rate is expressed as compound annual growth rates in the initial five years of theplan. In the first year of the business plan, revenue growth rate was projected at -15% (2019:32%) based on the near-term business plan and market demand. The annual revenue growthincluded in the cash flow projections for four years was projected at the growth rate based on thehistorical growth in volume and prices and industry growth.
A long-term growth rate into perpetuity has been determined based on management’s estimate ofthe long-term compound annual growth rate in the Indian economy which management believedwas consistent with the assumption that a market participant would make.
EBITDA margin has been a factor of the revenue forecast based on business plan and marketdemand coupled with the cost saving initiatives.
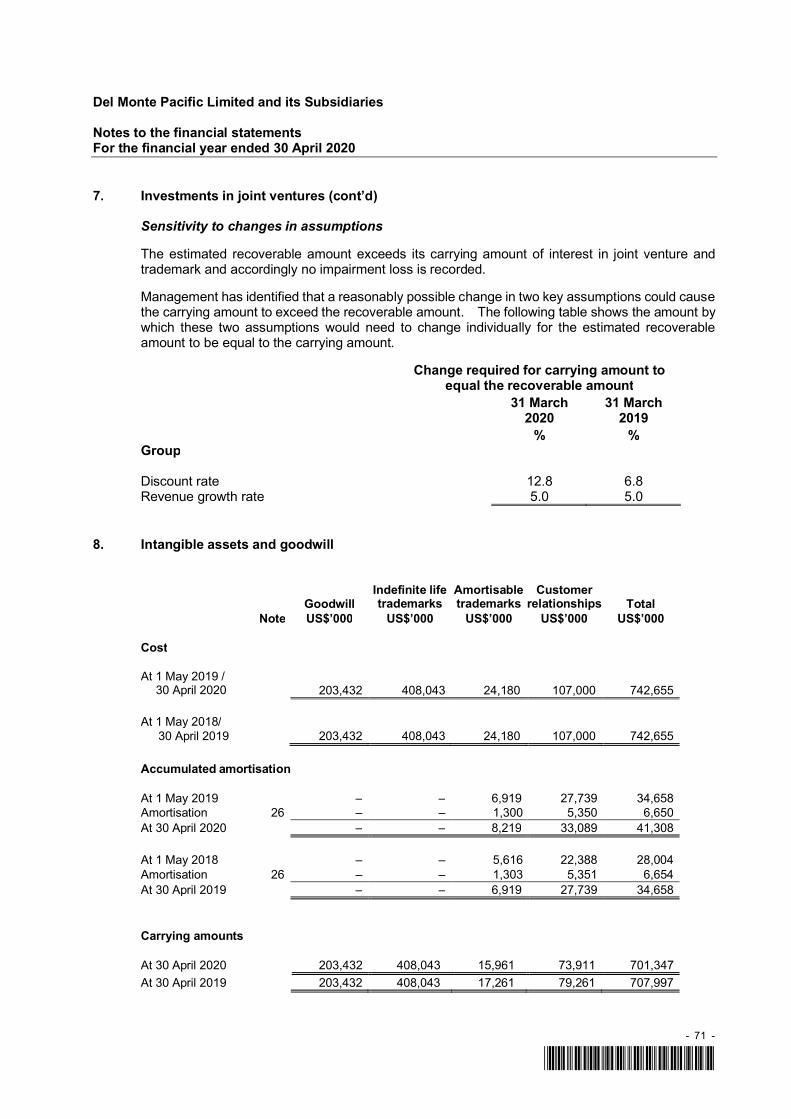
Del Monte Pacific Limited and its Subsidiaries
Notes to the financial statementsFor the financial year ended 30 April 2020
- 71 -
*SGVFSM004024*
7. Investments in joint ventures (cont’d)
Sensitivity to changes in assumptions
The estimated recoverable amount exceeds its carrying amount of interest in joint venture andtrademark and accordingly no impairment loss is recorded.
Management has identified that a reasonably possible change in two key assumptions could causethe carrying amount to exceed the recoverable amount. The following table shows the amount bywhich these two assumptions would need to change individually for the estimated recoverableamount to be equal to the carrying amount.
Change required for carrying amount toequal the recoverable amount
31 March2020
31 March2019
% %Group
Discount rate 12.8 6.8Revenue growth rate 5.0 5.0
8. Intangible assets and goodwill
GoodwillIndefinite lifetrademarks
Amortisabletrademarks
Customerrelationships Total
Note US$’000 US$’000 US$’000 US$’000 US$’000
Cost
At 1 May 2019 /30 April 2020 203,432 408,043 24,180 107,000 742,655
At 1 May 2018/30 April 2019 203,432 408,043 24,180 107,000 742,655
Accumulated amortisation
At 1 May 2019 – – 6,919 27,739 34,658Amortisation 26 – – 1,300 5,350 6,650At 30 April 2020 – – 8,219 33,089 41,308
At 1 May 2018 – – 5,616 22,388 28,004Amortisation 26 – – 1,303 5,351 6,654At 30 April 2019 – – 6,919 27,739 34,658
Carrying amounts
At 30 April 2020 203,432 408,043 15,961 73,911 701,347At 30 April 2019 203,432 408,043 17,261 79,261 707,997
Del Monte Pacific Limited and its Subsidiaries
Notes to the financial statementsFor the financial year ended 30 April 2020
- 72 -
*SGVFSM004024*
8. Intangible assets and goodwill (cont’d)
Goodwill
Goodwill arising from the acquisition of Consumer Food Business was allocated to DMFI and itssubsidiaries, which is considered as one CGU.
Indefinite life trademarks
Management has assessed the following trademarks as having indefinite useful lives as the Grouphas exclusive access to the use of these trademarks. These trademarks are expected to be usedindefinitely by the Group as they relate to continuing businesses that have a proven track recordwith stable cash flows.
America trademarks
The indefinite life trademarks of US$394 million arising from the acquisition of Consumer FoodBusiness relate to those of DMFI for the use of the “Del Monte” trademarks in the United Statesand South America market, and the “College Inn” trademark in the United States, Australia, Canadaand Mexico.
The Philippines trademarks
A subsidiary, Dewey Sdn Bhd, owns the “Del Monte” and “Today’s” trademarks for use inconnection with processed foods in the Philippines (“The Philippines trademarks”) with carryingvalue amounting to US$1.8 million.
Indian sub-continent and Myanmar trademarks
In November 1996, a subsidiary, DMPRL, entered into an agreement with an affiliated company toacquire the exclusive right to use the “Del Monte” trademarks in the Indian sub-continent territoriesand Myanmar in connection with the production, manufacture, sale and distribution of food productsand the right to grant sub-licenses to others (“Indian sub-continent trademark”). In 2007, theCompany acquired shares in FFPL and caused the licensing of trademarks to FFPL to market itsproducts under the “Del Monte” brand in India. These trademarks have a carrying value of US$4.1million.
S&W trademarks
In November 2007, a subsidiary, S&W, entered into an agreement with Del Monte Corporation toacquire the “S&W” trademarks in certain countries in Asia (excluding Australia and New Zealandand including the Middle East), Western Europe and Eastern Europe for a total consideration ofUS$10.0 million. The trademark has a carrying value of US$8.2 million.
Impairment test
Management has performed impairment testing for all indefinite life trademarks and concluded thatno impairment exist at the reporting date.

Del Monte Pacific Limited and its Subsidiaries
Notes to the financial statementsFor the financial year ended 30 April 2020
- 73 -
*SGVFSM004024*
8. Intangible assets and goodwill (cont’d)
Philippines trademarks
In 2020 and 2019, the recoverable amounts of these intangible assets were based on fair valueless cost of disposal using the Relief from Royalty method (RFR). The key assumptions used inthe estimation of the fair value less cost of disposal are set out below. The values assigned to thekey assumptions represent management’s assessment of future trends in the relevant industriesand were based on historical data from both external and internal sources.
2020 2019% %
Royalty rate 3.0 3.0Discount rate 9.6 13.9Revenue growth rate 8.0 5.0
The discount rate was a pre-tax measure estimated based on the historical industry averageweighted-average cost of capital.
The cash flow projections included specific estimates for five years.
Revenue growth was projected taking into account the average growth levels experienced over thepast five years and estimated sales volume and price growth for the next five years. It wasassumed that sales price would increase in line with forecast inflation over the next five years.
Asia S&W trademark
In 2020 and 2019, the recoverable amount was based on fair value less cost of disposal using theRFR method. The key assumptions used in the estimation of the fair value less cost of disposal areset out below.
2020 2019% %
Royalty rate 3.0 3.0Revenue growth rate 4.0 14.0Discount rate 12.4 16.2
Indian sub-continent trademark
The Indian sub-continent trademark and the investment in FFPL were allocated to Indian sub-continent CGU (see Note 7).

Del Monte Pacific Limited and its Subsidiaries
Notes to the financial statementsFor the financial year ended 30 April 2020
- 74 -
*SGVFSM004024*
8. Intangible assets and goodwill (cont’d)
America trademarks and Goodwill
In 2020 and 2019, the recoverable amount of the CGU was based on VIU being greater than thefair value less costs of disposal:
30 April 2020 30 April 2019US$’000 US$’000
Value-in-use 3,250,000 2,650,000Fair value less costs of disposal – income approach 3,190,000 2,600,000Recoverable amount 3,250,000 2,650,000
The Americas trademarks were also included in the CGU used in the goodwill impairment testing.
As of valuation date in January 2020 and 2019, the estimated recoverable amount of the CGUexceeded its carrying amount by approximately US$1,951.2 million and US$1,174.3 million,respectively. Therefore, the CGU is not impaired.
VIUThe VIU is the present value of expected cash flows, discounted at a risk-adjusted weightedaverage cost of capital.
The key assumptions used in the estimation of the recoverable amount using the VIU approachare set out below. The values assigned to the key assumptions represent management’sassessment of future trends in the relevant industries and were based on historical data from bothexternal and internal sources.
2020 2019% %
Pre-tax discount rate 8.0 8.6Terminal value growth rate 2.0 2.0Long-term EBITDA margin 12.6 11.9Revenue growth rate 0.9 – 6.0 (14.3) – 6.2Gross margin 22.1 – 24.1 14.3 – 25.4
The discount rate was a pre-tax measure estimated based on the historical industry averageweighted-average cost of capital, with a possible range of debt leveraging of 60% as at 30 April2020 (2019: 72%) at a risk free interest rate of 3.0% as of 30 April 2020 (2019: 3.5%).
The cash flow projections included specific estimates for five years and a terminal growth ratethereafter. The terminal growth rate was determined based on management’s estimate of thelong-term compound annual EBITDA growth rate consistent with the assumption that a marketparticipant would make.

Del Monte Pacific Limited and its Subsidiaries
Notes to the financial statementsFor the financial year ended 30 April 2020
- 75 -
*SGVFSM004024*
8. Intangible assets and goodwill (cont’d)
America trademarks and Goodwill (cont’d)
Budgeted EBITDA was estimated taking into account past experience adjusted as follows:
Revenue growth was projected taking into account the average growth levels experienced over thepast five years and estimated sales volume and price growth for the next five years. It wasassumed that sales price would increase in line with forecast inflation over the next five years.The amounts are probability-weighted.
Fair value less costs of disposal
Fair value less costs of disposal is determined using the Income Approach, which indicates valuebased on the present value of the cash flows that a business is expected to generate in the future.
The Discounted Cash Flow Method was used in applying the Income Approach. The DiscountedCash Flow Method estimates the value of a business or an asset by combining the projected annualcash flows available to all capital holders in the business (i.e., debt and equity investors) for adiscrete period with the residual value of the cash flows, grown into perpetuity at an estimated long-term growth rate, adjusted for the cost of disposal. Additionally, other adjustments may bewarranted to reflect specific characteristics of the valuation subject. Accuracy of the indicatedresults depends on the reasonableness of the underlying cash flow projections.
The approach involves the use of both observable inputs and unobservable inputs (e.g., projectedrevenue and EBITDA). Accordingly, the fair value measurement is categorised under level 3 of thefair value hierarchy.
Fair value less costs of disposal is also determined using the market approach, which makes useof prices and other relevant information generated by market transactions involving similarcompanies.
The Market Comparable Method was used in applying the Market Approach, making use of marketprice data of companies engaged in the same or similar line of business as that of DMFI and itssubsidiaries. Stocks of these companies are traded in a free and open market or in privatetransactions. The process involves the identification of comparable companies, calculation andapplication of market multiples representing ratios of invested capital or equity to financialmeasures of DMFI and its subsidiaries, application of an appropriate control premium to thecompanies being compared, and adjustment for any non-operating assets or liabilities or workingcapital excess/deficit to arrive at an indication of Business Enterprise Value.
The approach involves the use of both observable inputs and unobservable inputs (e.g., projectedrevenue and EBITDA, and adjusted market multiples). Accordingly, the fair value measurement iscategorised under level 3 of the fair value hierarchy.

Del Monte Pacific Limited and its Subsidiaries
Notes to the financial statementsFor the financial year ended 30 April 2020
- 76 -
*SGVFSM004024*
8. Intangible assets and goodwill (cont’d)
America trademarks and Goodwill (cont’d)
Comparable companies were selected from comprehensive lists and directories of publiccompanies in the packaged foods industry. Potential comparable companies were analysedbased on various factors, including, but not limited to, industry similarity, financial risk, companysize, geographic diversification, profitability, growth characteristics, financial data availability, andactive trading volume. The following comparable companies were selected:
B&G Foods Inc. Campbell Soup Company Conagra Brands, Inc. General Mills, Inc.
Hormel Foods Corporation Seneca Foods Corp. Treehouse Foods, Inc.
Calculation of the market multiples considered Market Value of Invested Capital (MVIC), the sumof the market values of a comparable company’s common stock, interest-bearing debt andpreferred stock, assuming that the book value of the comparable companies’ debt approximatedthe market value of the debt. Adjustments to the market multiples were made to reflect thedifference between the estimated size of DMFI and its subsidiaries and each comparable company,improving comparability based on relative size difference prospects. Relative size adjustmentfactors were calculated based on a regression of a Price / Earnings ratio using size as anindependent variable. The market multiples selected and applied to the DMFI and its subsidiaries’financial results in the analysis were as follows:
2020 2019Selectedmultiple
Assignedweight
Selectedmultiple
Assignedweight
MVIC/Revenue – Last twelve months 2.1x 33% 1.5x 33%MVIC/Revenue – Projected 2.0x 33% 2.0x 33%MVIC/EBITDA – Last twelve months 14.5x 0% 15.2x 0%MVIC/EBITDA – Projected 13.3x 33% 11.8x 33%
Sensitivity analysis
Management has identified that a reasonably possible change in the discount rate or long-termmargin could cause the carrying amount to exceed the recoverable amount. The following tableshows the amount to which these would need to change independently for the estimatedrecoverable amount of the DMFI CGU to be equal to its carrying amount.
Breakeven Multiple2020 2019
MVIC/Revenue – Last twelve months 0.6x 0.8xMVIC/Revenue – Projected 0.5x 0.7xMVIC/EBITDA – Last twelve months 9.0x 14.7xMVIC/EBITDA – Projected 4.5x 7.9x

Del Monte Pacific Limited and its Subsidiaries
Notes to the financial statementsFor the financial year ended 30 April 2020
- 77 -
*SGVFSM004024*
8. Intangible assets and goodwill (cont’d)
America trademarks and Goodwill (cont’d)
The following table shows the amount to which the discount rate, and long-term EBITDA marginwould need to change independently for the estimated recoverable amount of the DMFI CGU to beequal to its carrying amount.
2020 2019% %
Discount rate 15.7 11.8Long-term EBITDA margin 4.4 6.5
Source of estimation uncertainty
Goodwill and the indefinite life trademarks are assessed for impairment annually. The impairmentassessment requires an estimation of the VIU and fair value less costs of disposal of the CGU towhich the goodwill and indefinite life trademarks are allocated.
Estimating the VIU requires the Group to make an estimate of the expected future cash flows fromthe CGU and apply an appropriate discount rate in order to calculate the present value of thosecash flows. Actual cash flows will differ from these estimates as a result of differences betweenassumptions used and actual operations.
Estimating fair value less costs of disposal requires the use of estimates and assumptions. Theestimated fair value would change depending on the assumptions used, such as the discount rateand long-term margin.
Amortisable trademarks and customer relationship
Remainingamortisation
period (years)Net carrying amount30 April
202030 April
2019 2020 2019US$'000 US$'000
Asia S&W trademark – – – –America S&W trademark 762 963 3.8 4.8America Contadina
trademark 15,199 16,298 13.8 14.815,961 17,261
Asia S&W trademark
The amortisable trademark pertains to “Label Development” trademark. As at 30 April 2020 and2019, the trademark has been fully amortised.

Del Monte Pacific Limited and its Subsidiaries
Notes to the financial statementsFor the financial year ended 30 April 2020
- 78 -
*SGVFSM004024*
8. Intangible assets and goodwill (cont’d)
America trademarks
The amortisable trademarks relate to the exclusive right to use of the “S&W” trademark in theUnited States, Canada, Mexico and certain countries in Central and South America and“Contadina” trademark in the United States, Canada, Mexico South Africa and certain countries inAsia Pacific, Central America, Europe, Middle East and South America market.
Management has included these trademarks in the CGU impairment assessment and concludedthat no impairment exists at the reporting date.
Customer relationships
Customer relationships relate to the network of customers where DMFI has establishedrelationships with the customers, particularly in the United States market through contracts. TheSager Creek customer relationships were included in the sale of certain assets of Sager Creek inSeptember 2017.
30 April 2020 30 April 2019US$'000 US$'000
Net carrying amount 73,911 79,261Remaining amortisation period 13.8 14.8
Management has included the customer relationships in the CGU impairment assessment andconcluded no impairment exists at the reporting date.
Source of estimation uncertainty
The Group estimates the useful lives of its amortisable trademarks and customer relationshipsbased on the period over which the assets are expected to be available for use. The estimateduseful lives of the trademarks and customer relationships are reviewed periodically and are updatedif expectations differ from previous estimates due to legal or other limits on the use of the assets.A reduction in the estimated useful lives of amortisable trademarks and customer relationshipswould increase recorded amortisation expense and decrease noncurrent assets.

Del Monte Pacific Limited and its Subsidiaries
Notes to the financial statementsFor the financial year ended 30 April 2020
- 79 -
*SGVFSM004024*
9. Deferred tax
Deferred tax liabilities and assets are offset when there is a legally enforceable right to set-offcurrent tax assets against current tax liabilities and when the deferred taxes relate to the same taxauthority.
Deferred tax assets and liabilities of the Group are attributable to the following:
Assets Liabilities30 April 30 April 30 April 30 April
2020US$’000
2019US$’000
2020US$’000
2019US$’000
GroupProvisions 8,257 4,928 – –Employee benefits 28,816 24,043 – –Property, plant and equipment - net – – (19,813) (24,480)Intangible assets and goodwill – – (69,094) (63,072)Effective portion of changes in fair
value of cash flow hedges 2,162 890 – –Tax loss carry-forwards 160,414 146,586 – –Inventories 876 1,812 – –Biological assets – – (1,841) (1,053)Deferred income – – (5,455) (11,456)Interest 23,139 14,415 – –Undistributed profits from subsidiaries – – (7,514) –Charitable contributions 3,856 3,218 – –Plant closure costs 309 – – –Others 8,415 4,086 – –Deferred tax assets (liabilities) 236,244 199,978 (103,717) (100,061)Set off of tax (91,270) (93,657) 91,270 93,657Deferred Taxes 144,974 106,321 (12,447) (6,404)
Movements in deferred tax assets and deferred tax liabilities of the Group during the year are asfollows:
At 1 May2019
US$’000
Recognisedin profitor loss
US$’000
Recognisedin other
comprehen-sive income
US$’000
Change inaccounting
policy Currencyrealignment
US$’000
At 30 April2020
US$’00030 April 2020Provisions 4,928 2,200 – 1,697 (568) 8,257Employee benefits 24,043 (1,991) 6,113 – 651 28,816Property, plant and equipment - net (24,480) 5,946 (1,220) – (59) (19,813)Intangible assets and goodwill (63,072) (6,022) – – – (69,094)Effective portion of changes in
fair value of cash flow hedges 890 1,508 (236) – – 2,162Tax loss carry-forwards 146,586 13,828 – – – 160,414Inventories 1,812 (1,040) – – 104 876Biological assets (1,053) (609) – – (179) (1,841)Deferred income (11,456) 6,001 – – – (5,455)Interest 14,415 8,724 – – – 23,139Undistributed profits from subsidiaries – (7,514) – – – (7,514)Charitable contributions 3,218 638 – – – 3,856Accrued plant closure costs – 309 – – – 309Others 4,086 4,270 – – 59 8,415
99,917 26,248 4,657 1,697 8 132,527
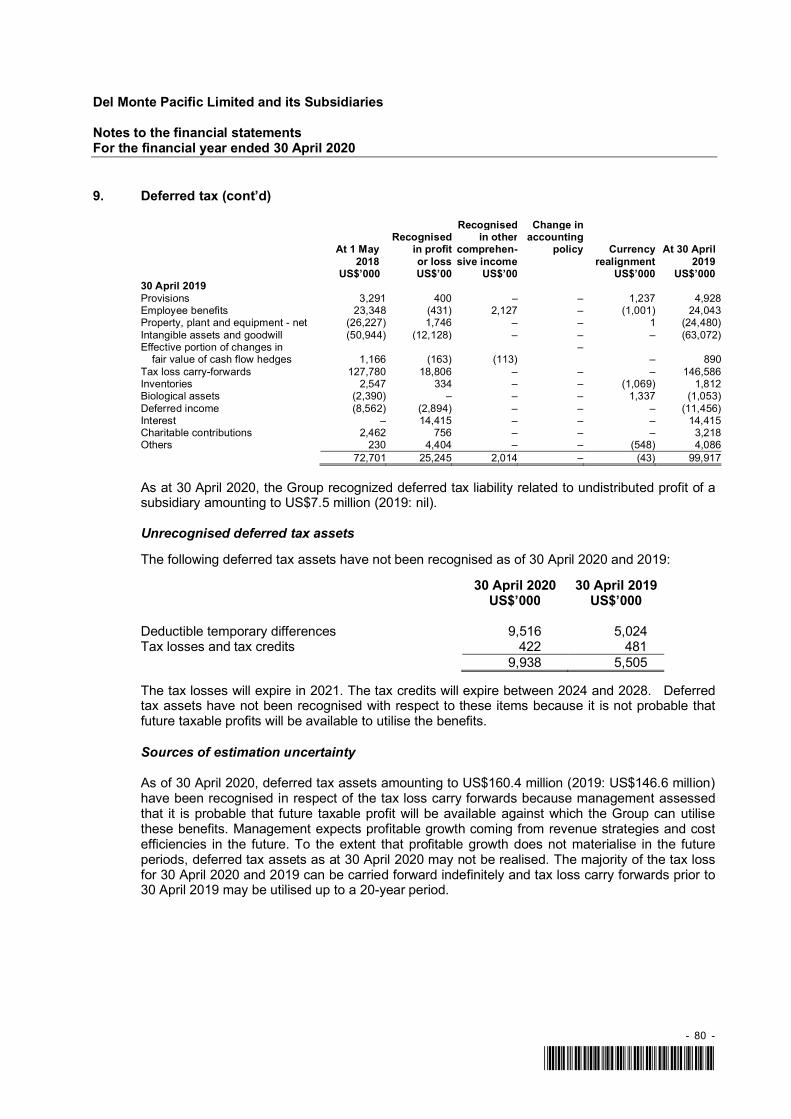
Del Monte Pacific Limited and its Subsidiaries
Notes to the financial statementsFor the financial year ended 30 April 2020
- 80 -
*SGVFSM004024*
9. Deferred tax (cont’d)
At 1 May2018
Recognisedin profitor loss
Recognisedin other
comprehen-sive income
Change inaccounting
policy Currencyrealignment
At 30 April2019
US$’000 US$’000 US$’000 US$’000 US$’00030 April 2019Provisions 3,291 400 – – 1,237 4,928Employee benefits 23,348 (431) 2,127 – (1,001) 24,043Property, plant and equipment - net (26,227) 1,746 – – 1 (24,480)Intangible assets and goodwill (50,944) (12,128) – – – (63,072)Effective portion of changes in
fair value of cash flow hedges 1,166 (163) (113)–
– 890Tax loss carry-forwards 127,780 18,806 – – – 146,586Inventories 2,547 334 – – (1,069) 1,812Biological assets (2,390) – – – 1,337 (1,053)Deferred income (8,562) (2,894) – – – (11,456)Interest – 14,415 – – – 14,415Charitable contributions 2,462 756 – – – 3,218Others 230 4,404 – – (548) 4,086
72,701 25,245 2,014 – (43) 99,917
As at 30 April 2020, the Group recognized deferred tax liability related to undistributed profit of asubsidiary amounting to US$7.5 million (2019: nil).
Unrecognised deferred tax assets
The following deferred tax assets have not been recognised as of 30 April 2020 and 2019:
30 April 2020 30 April 2019US$’000 US$’000
Deductible temporary differences 9,516 5,024Tax losses and tax credits 422 481
9,938 5,505
The tax losses will expire in 2021. The tax credits will expire between 2024 and 2028. Deferredtax assets have not been recognised with respect to these items because it is not probable thatfuture taxable profits will be available to utilise the benefits.
Sources of estimation uncertainty
As of 30 April 2020, deferred tax assets amounting to US$160.4 million (2019: US$146.6 million)have been recognised in respect of the tax loss carry forwards because management assessedthat it is probable that future taxable profit will be available against which the Group can utilisethese benefits. Management expects profitable growth coming from revenue strategies and costefficiencies in the future. To the extent that profitable growth does not materialise in the futureperiods, deferred tax assets as at 30 April 2020 may not be realised. The majority of the tax lossfor 30 April 2020 and 2019 can be carried forward indefinitely and tax loss carry forwards prior to30 April 2019 may be utilised up to a 20-year period.

Del Monte Pacific Limited and its Subsidiaries
Notes to the financial statementsFor the financial year ended 30 April 2020
- 81 -
*SGVFSM004024*
10. Other noncurrent assets
Group
Note30 April
202030 April
2019US$’000 US$’000
Advance rentals and deposits 15,538 7,116Advances to growers 6,081 12,861Excess insurance 5,144 5,514Land expansion (development cost of
acquired lease areas 3,863 8,230Advances to suppliers 1,730 2,526Note receivables 33, 34, 35 1,141 4,038Prepayments 160 631Others 1,280 706
34,937 41,622
Advances to growers and advance rentals and deposits consists a) noninterest-bearing cash andother advances to growers and landowners which are collected against delivery of fruits orminimum guaranteed profits of the growers or against payment of rentals to landowners, and b)security deposits made to Nutri-Asia, Inc. in connection with the Group’s intention to avail of theadditional production capacity under the toll manufacturing agreement. The security deposit will bereturned when tolling agreement for the additional capacity is finalised or in the event that theadditional capacity does not materialize.
Excess insurance relates mainly to reimbursements from insurers to cover certain workers’compensation claims liabilities (see Note 20).
Advances to suppliers represents advance payments made on capital projects. A reclassificationwas made into this account in fiscal year 2019 amounting to US$2.5 million from “Down paymentto suppliers” presented under “Prepaid and other current assets” (see Note 14), due to thenoncurrent nature of the accounts.
Land expansion comprises development costs of newly acquired leased areas including costs suchas creation of access roads, construction of bridges and clearing costs. These costs areamortised on a straight-line basis over the lease periods of 10 years or lease term, whichever isshorter.
As at 30 April 2020 and 2019, note receivables of US$1.0 million relates to the sale of certainassets of Plymouth (see Note 5).
As at 30 April 2019, the note receivables include a receivable relating to the sale of certain assetsof Sager Creek which is payable in three years until December 2020 (see Note 16). The notereceivables are payable in four instalment bearing interest of 3.50% per annum for the firstinstalment and 5.22% from the second instalment up to the final instalment. Remaining notereceivables as at 30 April 2020 amounted to US$2.8 million (2019: US$7.7 million), the currentportion of US$2.8 million as at 30 April 2020 (2019: US$5.4 million), is presented under “Trade andother receivables (see Note 13).

Del Monte Pacific Limited and its Subsidiaries
Notes to the financial statementsFor the financial year ended 30 April 2020
- 82 -
*SGVFSM004024*
11. Biological assets
Group30 April
202030 April
2019US$’000 US$’000
LivestockAt beginning of the year 1,682 1,629Purchases of livestock 1,142 990Sales of livestock (755) (927)Currency realignment 49 (10)At end of the year 2,118 1,682
Group30 April
202030 April
2019US$’000 US$’000
Agricultural produceAt beginning of the year 26,421 23,473Additions 9,915 11,755Harvested (11,068) (8,674)Currency realignment 698 (133)At end of the year 25,966 26,421
Fair value gain on produce prior to harvest 35,194 25,899At end of the year 61,160 52,320
Group30 April
202030 April
2019US$’000 US$’000
Current 61,160 52,320Noncurrent 2,118 1,682Total 63,278 54,002
Group
Note30 April
202030 April
2019US$’000 US$’000
Fair value gain recognised under:Inventories 35 3,657 6,016Cost of sales 26 45,510 39,002Unharvested agricultural produce 8,397 7,409
Fair value gain recognised under revenues 57,564 52,427
The changes in fair values of the Group’s biological assets are recorded as part of revenues(see Note 25).

Del Monte Pacific Limited and its Subsidiaries
Notes to the financial statementsFor the financial year ended 30 April 2020
- 83 -
*SGVFSM004024*
11. Biological assets (cont’d)
Livestock
Livestock comprises growing herd and breeding and dairy herd that are stated at cost and cattlefor slaughter that is stated at fair value less point-of-sale costs. The fair value is determined basedon the actual selling prices approximating those at year end less estimated point-of-sale costs.
Risk Management strategy related to agricultural activities
The Group is exposed to risks arising from changes in cost and volume of fruits harvested from thegrowing crops which is influenced by natural phenomenon such as weather patterns, volume ofrainfall and field performance. The cost of growing crops is also exposed to the change in costand supply of agricultural supplies and labor which are determined by constantly changing marketforces of supply and demand.
The Group is subject to risk relating to its ability to maintain the physical condition of its fruit crops.Plant diseases could adversely impact production and consumer confidence, which impact sales.
The Group secures favorable harvest of pineapples and other agricultural produce from biologicalassets by continuously assessing factors that could affect harvest and responding to them on atimely manner. The Group is equipped with necessary technical manpower, farm inputs, such asfertilizer, chemicals and equipment to respond to any changes brought about by the factors asmentioned above.
The Group is subject to laws and regulations in the Philippines where it operates its agriculturalactivities. The Group has established environmental policies and procedures aimed atcompliance with local environmental and other laws.
Source of estimation uncertainty
The fair values of the harvested pineapple fruits are based on the most reliable estimate of sellingprices, in both local and international markets at the point of harvest, as determined by the Group.For the pineapple variety being sold as fresh fruits, the market price is based on the selling priceof fresh fruits as sold in the local and international markets. For the pineapple variety beingprocessed as cased goods, the market price is derived from average sales price of the processedproduct adjusted for margin related to further processing. Changes in fair values of agriculturalproduce after initial recognition are included in the carrying amount of cased goods at the reportingdate.
The fair values of the growing pineapple crops are based on the most reliable estimate of marketprices, in both local and international markets at the point of harvest, as determined by the Group.Fair value is initially recognised when the pineapple fruit develops when the bearer plant hasreached maturity to bear fruit. The fair value is approximated by the estimated selling price at pointof harvest less future growing costs to be incurred until harvest. Such future growing costsdecreases as the growing crops near the point of harvest.
Bearer plants are stated at cost which comprises actual costs incurred in nurturing the cropsreduced by the equivalent amortisation of fruits harvested which considers the future volume ofharvests. Estimated harvest is affected by natural phenomenon such as weather patterns andvolume of rainfall. Field performance and market demand also affect the level of estimatedharvests. The estimated cost is developed by allocating growing costs for the estimated growthcycle of two to three years over the estimated harvests to be made during the life cycle of the plantcrops. The Group reviews and monitors the estimated future volume of harvests regularly.

Del Monte Pacific Limited and its Subsidiaries
Notes to the financial statementsFor the financial year ended 30 April 2020
- 84 -
*SGVFSM004024*
11. Biological assets (cont’d)
The valuation techniques and significant unobservable inputs used in determining the fair value ofthese biological assets are discussed in Note 35.
12. Inventories
Group30 April
202030 April
2019US$’000 US$’000
Finished goods- at cost 287,838 402,247- at net realisable value 19,909 32,154Semi-finished goods- at cost 62,431 62,337- at net realisable value 11,883 20,656Raw materials and packaging supplies- at cost 98,264 147,528- at net realisable value 2,138 –
482,463 664,922
Inventories recognised as an expense in cost of sales amounted to US$1,201.0 million for the yearended 30 April 2020 (2019: US$1,101.1 million) (see Note 26).
Inventories are stated after allowance for inventory obsolescence. Movements in the allowance forinventory obsolescence during the year are as follows:
Group
Note30 April
202030 April
2019US$’000 US$’000
At beginning of the year 10,527 26,616Allowance for the year 26 9,649 19,245Write-off against allowance (8,152) (35,855)Currency realignment 2,844 521At end of the year 14,868 10,527
Source of estimation uncertainty
The Group recognises allowance on inventory obsolescence when inventory items are identifiedas obsolete. Obsolescence is based on the physical and internal condition of inventory items.Obsolescence is also established when inventory items are no longer marketable. Obsoletegoods when identified are charged to income statement and are written off. In addition to anallowance for specifically identified obsolete inventory, estimation is made on a group basis basedon the age of the inventory items. The Group believes such estimates represent a fair charge ofthe level of inventory obsolescence in a given year. The Group reviews on a monthly basis thecondition of its inventory. The assessment of the condition of the inventory either increases ordecreases the expenses or total inventory.

Del Monte Pacific Limited and its Subsidiaries
Notes to the financial statementsFor the financial year ended 30 April 2020
- 85 -
*SGVFSM004024*
12. Inventories (cont’d)
Source of estimation uncertainty (cont’d)
Estimates of net realisable value are based on the most reliable evidence available at the time theestimates are made of the amount the inventories expected to be realised. These estimates takeinto consideration fluctuations of price or cost directly relating to events occurring after reportingdate to the extent that such events confirm conditions existing at the reporting date.
The Group reviews on a continuous basis the product movement, changes in customer demandsand introductions of new products to identify inventories which are to be written down to the netrealisable values. The write-down of inventories is reviewed periodically to reflect the accuratevaluation in the financial records. An increase in write-down of inventories would increase therecorded cost of sales and operating expenses and decrease current assets.
13. Trade and other receivables
Group Company30 April
202030 April
201930 April
202030 April
2019US$’000 US$’000 US$’000 US$’000
Trade receivables 175,794 132,934 – –Nontrade receivables 156,790 25,893 62 32Amounts due from subsidiaries
(nontrade) 38 – – 92,607 635Amounts due from joint venture
(nontrade) – – 2,462 2,520Allowance for expected credit loss -
trade (4,975) (5,158)–
–Allowance for expected credit loss -
nontrade (4,544) (4,615)–
–Trade and other receivables 323,065 149,054 95,131 3,187
The amounts due from subsidiaries and joint venture are unsecured, interest-free and repayableon demand. There is no allowance for doubtful debts arising from these outstanding balances.
Nontrade receivables consist of vendor rebates, plant receivables, claims from third party serviceproviders, advances to growers, which are claimed upon delivery of fruits, and fuel withdrawalsapplied against truckers’ bills when due.
Nontrade receivables includes of the current portion of the notes receivable from sale of SagerCreek assets amounting to US$2.8 million and US$5.4 million as at 30 April 2020 and 2019,respectively (see Note 10).
Nontrade receivables also includes the consideration for the sale of 12% ownership interest inDMPI amounting to US$120.0 million (see Note 6).

Del Monte Pacific Limited and its Subsidiaries
Notes to the financial statementsFor the financial year ended 30 April 2020
- 86 -
*SGVFSM004024*
13. Trade and other receivables (cont’d)
The aging of trade and nontrade receivables at the reporting date is:
GroupGross ECL allowance
Trade Nontrade Trade NontradeAt 30 April 2020 US$’000 US$’000 US$’000 US$’000
Not past due 126,137 138,412 – –Past due 0 - 60 days 31,097 4,420 – –Past due 61 - 90 days 2,994 492 – –Past due 91 - 120 days 1,764 576 – –More than 120 days 13,802 12,890 (4,975) (4,544)
175,794 156,790 (4,975) (4,544)
GroupGross ECL allowance
Trade Nontrade Trade NontradeAt 30 April 2019 US$’000 US$’000 US$’000 US$’000
Not past due 80,706 16,831 – –Past due 0 - 60 days 26,033 867 – –Past due 61 - 90 days 1,232 523 – –Past due 91 - 120 days 5,935 482 – –More than 120 days 19,028 7,190 (5,158) (4,615)
132,934 25,893 (5,158) (4,615)
The recorded allowance for expected credit loss falls within the Group’s historical experience in thecollection of trade and other receivables. Therefore, management believes that there is nosignificant additional credit risk beyond what has been recorded.
As at 30 April 2020 and 2019, the total receivables of the Company were neither past due norimpaired.
Movements in allowance for expected credit loss during the year are as follows:
GroupTrade Nontrade Total
Note US$’000 US$’000 US$’000
At 1 May 2019 5,158 4,615 9,773Allowance for the year 26 9 – 9Reversal for the year 26 (213) (88) (301)Currency realignment 21 17 38At 30 April 2020 4,975 4,544 9,519
GroupTrade Nontrade Total
Note US$’000 US$’000 US$’000
At 1 May 2018 2,440 4,543 6,983Allowance for the year 26 2,574 72 2,646Currency realignment 144 – 144At 30 April 2019 5,158 4,615 9,773

Del Monte Pacific Limited and its Subsidiaries
Notes to the financial statementsFor the financial year ended 30 April 2020
- 87 -
*SGVFSM004024*
13. Trade and other receivables (cont’d)
Source of estimation uncertainty
The Group maintains an allowance for impairment of accounts receivables at a level consideredadequate to provide for potential uncollectible receivables based on the applicable ECLmethodology. The level of this allowance is evaluated by the Group on the basis of factors thataffect the collectability of the accounts. These factors include, but are not limited to, the length ofthe Group’s relationship with debtors, their payment behaviour and known market factors. TheGroup reviews the age and status of receivables, and identifies accounts that are to be providedwith allowance on a continuous basis. Additionally, allowance is also determined, through aprovision matrix based on the Group’s historical credit loss experience, adjusted for forward-lookingfactors specific to the debtors and the economic environment. The amount and timing of recordedexpenses for any period would differ if the Group made different judgement or utilised differentestimates. An increase in the Group’s allowance for impairment would increase the Group’srecorded operating expenses and decrease current assets.
14. Prepaid expenses and other current assets
Group Company
Note30 April
202030 April
201930 April
202030 April
2019US$’000 US$’000 US$’000 US$’000
Prepaid consultancy fees 31,324 – – –Prepaid expenses 29,586 30,046 132 150Down payment to suppliers 4,136 2,395 – –Derivative asset 20 57 64 – –Others 2,609 1,685 48 42
67,712 34,190 180 192
Prepaid expenses consist of advance payments for insurance, advertising, rent and taxes, amongothers.
Prepaid consultancy fees consist of transaction costs directly attributable to the bond issuance inMay 2020 (see Note 41). These will be subsequently reclassified to debt issuance costs under“Loans and borrowings” upon recognition of the loan.
Down payment to suppliers pertain to advance payments for the purchase of materials and suppliesthat will be used for operations. A reclassification was made from this account to “Advances tosuppliers” under “Other noncurrent assets” (see Note 10) in fiscal year 2019 amounting to US$2.5million due to the noncurrent nature of the accounts.

Del Monte Pacific Limited and its Subsidiaries
Notes to the financial statementsFor the financial year ended 30 April 2020
- 88 -
*SGVFSM004024*
15. Cash and cash equivalents
Group Company30 April
202030 April
201930 April
202030 April
2019US$’000 US$’000 US$’000 US$’000
Cash on hand 61 41 – –Cash in banks 33,087 17,231 766 886Cash equivalents 317 4,364 – –Cash and cash equivalents 33,465 21,636 766 886
Certain cash in bank accounts earn interest at floating rates based on daily bank deposit ratesranging from 0.01% to 0.50% per annum in 2020 (2019: 0.01% to 0.50%). Cash equivalents areshort-term placements which are made for varying periods of up to three months depending on theimmediate cash requirements of the Group and earn interest rate of 0.69% to 4.44% as of 30 April2020 (30 April 2019: 0.18% to 6.50%) per annum.
16. Noncurrent assets held for sale
The Group classifies noncurrent assets as held-for-sale if their carrying amounts will be recoveredprincipally through a sale transaction rather than through continuing use. The criteria are reviewedperiodically if still met, otherwise revert back to property, plant and equipment.
In 2018, management committed to a plan to sell certain assets of the Group’s Plymouth, Indianaplant and an office building in Siloam Springs, Arkansas. The majority of these assets have beensold during fiscal year 2019.
In 2019, management committed to a plan to sell certain assets of the Group’s Gilroy, Californiaand Kenwood, Arkansas plants. Accordingly, these assets were presented as assets held forsale. As of 30 April 2019, these assets comprised the following:
US$’000
Freehold land 1,467Building and machinery 2,998
4,465
As of 30 April 2020, the Kenwood warehouse has been sold, while the Gilroy assets have beenreclassified as “Property, plant, and equipment” in the consolidated statements of financial position.There are no assets held for sale as of 30 April 2020.

Del Monte Pacific Limited and its Subsidiaries
Notes to the financial statementsFor the financial year ended 30 April 2020
- 89 -
*SGVFSM004024*
16. Noncurrent assets held for sale (cont’d)
Sale of business
Sager Creek
On 18 September 2017, the Group entered into an agreement with McCall Farms Inc. (“McCallFarms”) to sell certain assets of its Sager Creek vegetable business (“Sager Creek”) for US$55.0million in total consideration. The Group previously acquired Sager Creek in March 2015. SagerCreek was a producer of specialty vegetables for the foodservice and retail markets headquarteredin Siloam Springs, Arkansas.
The Group received US$30.0 million at closing on 18 September 2017, US$15.0 million on27 February 2018, US$2.5 million on 28 February 2019 and US$5.0 million on February 28, 2020.The remaining US$2.5 million is due along with accrued interest on 1 December 2020. As of 30April 2020, the Group has recorded current receivables of US$2.8 million in “Trade and otherreceivables”. As of 30 April 2019, the Group has recorded current receivables of US$5.4 million in“Trade and other receivables” and noncurrent receivables of US$2.7 million, in “Other noncurrentassets” related to this sale. In 2018, the Group recognised a gain on sale amounting to US$16.4million relating to the sale of certain assets of Sager Creek.
17. Share capital
30 April 2020 30 April 2019No. ofshares(‘000) US$’000
No. ofshares(‘000) US$’000
Authorised:Ordinary shares of
US$0.01 each 3,000,000 30,000 3,000,000 30,000Preference shares of
US$1.00 each 600,000 600,000 600,000 600,000 3,600,000 630,000 3,600,000 630,000
Issued and fully paid:Ordinary shares of
US$0.01 each 1,944,936 19,449 1,944,936 19,449Preference shares of
US$1.00 each 30,000 30,000 30,000 30,0001,974,936 49,449 1,974,936 49,449
Reconciliation of number of outstanding ordinary shares in issue:
Year ended Year ended30 April
202030 April
2019No. of shares
(‘000) (‘000)
At beginning/end of the year 1,943,960 1,943,960
The number of outstanding ordinary shares excludes 975,802 ordinary shares held by theCompany as treasury shares.

Del Monte Pacific Limited and its Subsidiaries
Notes to the financial statementsFor the financial year ended 30 April 2020
- 90 -
*SGVFSM004024*
17. Share capital (cont’d)
Reconciliation of number of outstanding preference shares in issue:
Year ended Year ended30 April
202030 April
2019No. of shares
(‘000) (‘000)
At beginning/end of the year 30,000 30,000
The following summarises the information on the Company’s registration of securities under theRevised Securities Regulation Code of the Philippines (“SRC”):
Ordinary Shares
Date of SEC Approval AuthorisedShares
No. of Shares Issued Issue/OfferPrice
28 May 2013* 2,000,000,000 1,297,500,491 Php29.8015 October 2014** 3,000,000,000 5,500,000 Php17.0014 January 2015*** 3,000,000,000 641,935,335 Php10.60
*The SEC issued an order rendering effective the registration of its issued shares. Company waslisted by way of introduction on The Philippine Stock Exchange, Inc. on 10 June 2013.
**The SEC issued an order rendering effective the registration of additional 5,500,000 ordinaryshares which were offered and sold to the public in the Philippines.
***The rights shares were considered exempt from registration pursuant to Section 10(e) and 10(l)of the SRC. The exemption from registration was confirmed by the SEC in a letter dated 14January 2015.
Preference Shares
Date of SEC Approval AuthorisedShares
No. of Shares Issued Issue/OfferPrice
21 March 2017 600,000,000 20,000,000 Series A-1Preference Shares
US$10.00
21 March 2017* /27 November 2017**
600,000,000 10,000,000 Series A-2Preference Shares
US$10.00
*No Order of Registration was issued for the second tranche offer of preference shares as it waspart of the shelf-registration previously applied by the Company with the SEC.
**Date of issuance of the SEC Permit to Sell.
The total number of ordinary shareholders as at 30 April 2020 and 2019 is 7,504 and 7,646,respectively. Additionally, the total number of Series A-1 preference shareholders as at 30 April2020 and 2019 is 18 and 15, respectively. The total number of Series A-2 preference shareholdersas at 30 April 2020 and 2019 is 26 and 22, respectively.
The holders of ordinary shares are entitled to receive dividends after dividend of preference sharesare paid, as declared from time to time, and are entitled to one vote per share at meetings of theCompany. The preference shares are cumulative, non-voting, redeemable at the option of theissuer, non-participating and non-convertible. The preference share has a par value of US$1.0 pershare and were issued at US$10.0 per share. Ordinary shares rank equally with regard to theCompany’s residual assets after preference shares are paid.

Del Monte Pacific Limited and its Subsidiaries
Notes to the financial statementsFor the financial year ended 30 April 2020
- 91 -
*SGVFSM004024*
17. Share capital (cont’d)
Preference Shares (cont’d)
In April 2014, the Company increased its authorised share capital from US$20.0 million, dividedinto 2,000,000,000 ordinary shares at US$0.01 per share, to US$630.0 million, divided into3,000,000,000 ordinary shares at US$0.01 per share and 600,000,000 preference shares atUS$1.00 per share. The preference shares may be issued in one or more series, each such classof shares will have rights and restrictions as the Board may designate. The terms and conditionsof the authorised preference shares are finalised upon each issuance.
On 30 October 2014, the Company had additional ordinary shares listed and traded on the SGX-ST and the PSE pursuant to a public offering conducted in the Philippines. The Company offeredand sold by way of primary offer 5,500,000 ordinary shares at an offer price of 17.00 Philippinepesos (Php) per share.
In March 2015, additional 641,935,335 ordinary shares were listed on the SGX-ST and the PSE,which were offered and sold to eligible shareholders by way of a stock rights offering at an exerciseprice of S$0.325 or Php10.60 for each share in Singapore and the Philippines, respectively.
In April 2017, the Company completed the offering and listing of 20,000,000 Series A-1 PreferenceShares which were sold at an offer price of US$10.0 per share (US$1.0 par value per share) in thePhilippines, generating US$200 million in proceeds. The said shares were listed on the PSE.
In September 2017, the Company transferred 745,918 of its treasury shares to ordinary shares inconnection with the release of share awards granted to certain Directors pursuant to the Del MontePacific RSP.
In December 2017, the Company completed the offering and listing of 10,000,000 Series A-2Preference Shares in the Philippines generating approximately US$100 million in proceeds (or acombined US$300 million including the US$200 million that was raised in April 2017). TheCompany used the net proceeds to substantially refinance the US$350 million bridging loan thatwas due in February 2019.
The Company also issued share awards under the Del Monte Pacific Restricted Share Plan (“DelMonte Pacific RSP”) (see Note 32) during the fiscal year 2018.
Capital management
The Board’s policy is to maintain a sound capital base so as to maintain investor, creditor andmarket confidence and to sustain future development of the business. The Group’s capitalcomprises its share capital, retained earnings and total reserves as presented in the statements offinancial position. The Board monitors the return on capital, which the Group defines as profit orloss for the year divided by total shareholders’ equity. The Board also monitors the level ofdividends paid to ordinary shareholders.
The bank loans of the Group contain various covenants with respect to capital maintenance andability to incur additional indebtedness. The Board ensures that loan covenants are consideredas part of its capital management through constant monitoring of covenant results through interimand full year results.
There were no changes in the Group’s approach to capital management during the fiscal year.

Del Monte Pacific Limited and its Subsidiaries
Notes to the financial statementsFor the financial year ended 30 April 2020
- 92 -
*SGVFSM004024*
18. Retained Earnings and Reserves
Retained earnings
Dividends
Group Company30 April
202030 April
201930 April
201830 April
202030 April
201930 April
2018US$’000 US$’000 US$’000 US$’000 US$’000 US$’000
Declared and paid during thefinancial year:
Dividends on ordinary shares2020: US$0.0052 (2019: US$nil;2018: US$0.0061) 10,112 - 11,882 10,112 - 11,882
Dividends on preference sharesA-1 preference shares for 2020,
2019 and 2018: US$0.6625 13,250 13,250 13,250 13,250 13,250 13,250A-2 preference shares for 2020
and 2019: US$0.6500 2018:US$0.20403 6,500 6,500 2,040 6,500 6,500 2,040
19,750 19,750 15,290 19,750 19,750 15,290
29,862 19,750 27,172 29,862 19,750 27,172
Proposed but not recognised asa liability as at reporting date:Dividends on ordinary shares2020: US$0.0154 (2019:US$0.0052) 29,937 10,109 - 29,937 10,109 -
Ordinary shares
On 24 July 2020, the Company declared a special dividend of US$0.0154 per share to ordinaryshareholders on record as at 12 August 2020. The special dividend will be paid on 19 August 2020.
On 20 June 2019, the Company declared dividends of US$0.0052 per share for ordinaryshareholders on record as at 12 July 2019. The final dividend was paid on 19 July 2019.
On 23 August 2017, the Company declared a dividend of US$0.0061 per share to stockholderson record as at 28 August 2017. The final dividend was paid on 8 September 2017.

Del Monte Pacific Limited and its Subsidiaries
Notes to the financial statementsFor the financial year ended 30 April 2020
- 93 -
*SGVFSM004024*
18. Retained Earnings and Reserves (cont’d)
Preference shares
On 11 March 2020, the Company declared dividends to holders of Series A-1 Preference Shares,at the fixed rate of 6.625% per annum, or equivalent to US$0.33125 per Series A-1 PreferenceShare for the six-month period from 8 October 2019 to 7 April 2020. The Company also declareddividends to holders of Series A-2 Preference Shares at the fixed rate of 6.5% per annum, orequivalent to US$0.32500 per Series A-2 Preference Share for the six-month period from 8 October2019 to 7 April 2020. The final dividends were paid on 7 April 2020.
On 9 September 2019, the Company declared dividends to the holders of the Series A-1 PreferenceShares at the fixed rate of 6.625% per annum, or equivalent to US$0.33125 per Series A-1Preference and Series A-2 Preference Shares at the fixed rate of 6.5% per annum, or equivalentto US$0.32500 per series A-2 Preference Shares for the six-month period from 8 April 2019 to 7October 2019. The final dividends were paid on 7 October 2019.
On 20 March 2019, the Company declared dividends to holders of Series A-1 Preference Shares,at the fixed rate of 6.625% per annum, or equivalent to US$0.33125 per Series A-1 PreferenceShare for the six-month period from 8 October 2018 to 7 April 2019. The Company also declareddividends to holders of Series A-2 Preference Shares at the fixed rate of 6.5% per annum, orequivalent to US$0.32500 per Series A-2 Preference Share for the six-month period from 8 October2018 to 7 April 2019. The final dividends were paid on 8 April 2019.
On 19 September 2018, the Company declared dividends to holders of Series A-1 PreferenceShares, at the fixed rate of 6.625% per annum, or equivalent to US$0.33125 per Series A-1Preference Share for the six-month period from 7 April 2018 to 7 October 2018. The Company alsodeclared dividends to holders of Series A-2 Preference Shares at the fixed rate of 6.5% per annum,or equivalent to US$0.32500 per Series A-2 Preference Share for the six-month period from 7 April2018 to 7 October 2018. The final dividends were paid on 8 October 2018.
On 3 April 2018, the Company declared dividends to holders of Series A-1 Preference Shares, atthe fixed rate of 6.625% per annum, or equivalent to US$0.33125 per Series A-1 Preference Sharefor the six-month period from 8 October 2017 to 7 April 2018. The Company also declared dividendsto holders of Series A-2 Preference Shares at the fixed rate of 6.5% per annum, or equivalent toUS$0.20403 per Series A-2 Preference Share for the 113-day period from 15 December 2017 to7 April 2018. The final dividends were paid on 10 April 2018.
On 29 September 2017, the Company declared dividends to holders of Series A-1 PreferenceShares, at the fixed rate of 6.625% per annum, or equivalent to US$0.33125 per Series A-1Preference Share for the six-month period from 7 April 2017 to 7 October 2017. The final dividendwas paid on 9 October 2017.
The cumulative undeclared dividends on the preference shares amounted to US$1.3 million as of30 April 2020 and 2019.
The retained earnings is restricted for the payment of dividends representing the accumulatedequity in net earnings of the subsidiaries amounting to US$264.6 million as at 30 April 2020 (2019:US$465.9 million). The accumulated equity in net earnings of the subsidiaries will be available fordividend distribution upon receipt of dividends from the subsidiaries. As of 30 April 2020 and 2019,joint ventures have no undistributed net earnings.

Del Monte Pacific Limited and its Subsidiaries
Notes to the financial statementsFor the financial year ended 30 April 2020
- 94 -
*SGVFSM004024*
18. Retained Earnings and Reserves (cont’d)
Preference shares (cont’d)
On 30 April 2020, the Group recorded in retained earnings, a net equity reserve of US$77.0 million,arising from the sale of DMPI shares (see Note 6).
Share premium
Under the British Virgin Islands law in whose jurisdiction the Company operates, the Company’sshare premium and retained earnings form part of the Company’s surplus that may be available fordividend distribution provided that the solvency test is met by the Company. The Group’s sharepremium is shown net of a merger deficit of US$0.14 million, which arose from the acquisition of asubsidiary, DMPRL, under common control in 1999.
The share premium account includes any premium received on the initial issuing of the sharecapital. Any transaction costs associated with the issuing of shares are deducted from the sharepremium account, net of any related income tax effects.
Reserves
Group Company30 April
202030 April
201930 April
202030 April
2019US$’000 US$’000 US$’000 US$’000
Translation reserve (87,997) (93,375) (87,997) (93,375)Remeasurement of
retirement plan (2,873) 17,648 (2,873) 17,648Revaluation reserve 13,731 10,885 13,731 10,885Hedging reserve (1,802) (2,452) (1,802) (2,452)Share option reserve 1,753 1,753 1,753 1,753Reserve for own shares (286) (286) (286) (286)
(77,474) (65,827) (77,474) (65,827)
The translation reserve comprises foreign exchange differences arising from the translation of thefinancial statements of foreign operations.
The revaluation reserve relates to surplus on the revaluation of freehold land of the Group. Thehedging reserve comprises the effective portion of the cumulative net change in the fair value ofhedging instruments used in cash flow hedges pending subsequent recognition in profit or loss asthe hedged cash flows affect the income statement of the Group (see Note 20).
The share option reserve comprises the cumulative value of employee services received for theissue of share options.
The reserve for the Company’s own shares comprises the cost of the Company’s shares held bythe Group. As at 30 April 2020 and 2019, the Group held 975,802 of the Company’s shares.

Del Monte Pacific Limited and its Subsidiaries
Notes to the financial statementsFor the financial year ended 30 April 2020
- 95 -
*SGVFSM004024*
19. Loans and borrowings
Group Company30 April
202030 April
201930 April
202030 April
2019US$’000 US$’000 US$’000 US$’000
Current liabilitiesUnsecured bank loans 473,152 353,870 216,311 135,070Secured bank loans 825,140 138,870 74,971 –
1,298,292 492,740 291,282 135,070
Noncurrent liabilitiesUnsecured bank loans 75,000 168,825 75,000 111,241Secured bank loans 22,737 817,090 – 129,774
97,737 985,915 75,000 241,0151,396,029 1,478,655 366,282 376,085
Terms and debt repayment schedule
Terms and conditions of outstanding loans and borrowings are as follows:
30 April 2020 30 April 2019
CurrencyNominal
interest rateYear ofmaturity
Facevalue
Carryingamount
Facevalue
Carryingamount
% p. a. US$’000 US$’000 US$’000 US$’000GroupSecured bank
loans PHP 4.50% 2020 59,472 59,472 57,584 57,584Unsecured bank
loans PHP 5.25%-5.50% 2020 150,266 150,266 – –Unsecured bank
loans USD 1.54%-4.50% 2020-2024 397,886 397,886 465,111 465,111Secured
bridging loan USD 4.50% 2020 500 500 53,500 53,500Secured
bridging loan USD 4.50% 2020 74,500 74,471 76,500 76,274Secured bank
loan underABL CreditAgreement USD
Swingline B- 5%Base- 5% 2020 25,072 25,072 136,672 133,851
Secured Firstlien termloan USD
Higher of Liboror 1% + 3.25%
or total of 4.86% 2021 665,625 665,625 674,500 668,697Secured
Second lienterm loan USD
Higher of Liboror 1% + 7.25%
or total of 7.82% 2021 22,737 22,737 28,555 23,6381,396,058 1,396,029 1,492,422 1,478,655

Del Monte Pacific Limited and its Subsidiaries
Notes to the financial statementsFor the financial year ended 30 April 2020
- 96 -
*SGVFSM004024*
19. Loans and borrowings (cont’d)
30 April 2020 30 April 2019
CurrencyNominal
interest rateYear ofmaturity
Facevalue
Carryingamount
Facevalue
Carryingamount
% p.a. US$’000 US$’000 US$’000 US$’000CompanyUnsecured bank
loans USD 2.30%-4.50% 2020-2024 291,311 291,311 246,311 246,311Secured
bridging loans USD 4.50% 2020 75,000 74,971 130,000 129,774366,311 366,282 376,311 376,085
The secured bridging loans of US$0.5 million as at 30 April 2020 (2019: US$53.5 million) representthe remaining balance for the bridging loan that was obtained by the Company to finance theacquisition of Sager Creek and its related costs. In 2017, the Company signed a two-yearextension of the US$350.0 million Banco de Oro Unibank, Inc (BDO) loans from 10 February 2017to 2019. In 2019, the Company settled an additional US$0.5 million and extended the maturitydate from February 2019 to August 2020. In 2020, the Company settled another US$53.0 million.The loans are secured by the following: 1) Share Charge by DMPL on its share in DMPL FoodsLimited; 2) Pledge by DMPRL of its shares in CARI; and 3) Pledge by CARI of its shares in DMPI.
In 2015, the Company obtained loans from BDO amounting to US$130.0 million to refinance itsexisting bridge loans with the same bank and other bridge loans with other lenders and for generalcorporate requirements. The loans are secured by DMPI suretyship. The Company settledUS$53.5 million in 2019 and another US$2.0 million in 2020, bringing the balance to US$74.5million.
The BDO bridging loans above require the Company to continuously maintain a debt to equity ratioof 3:1 applicable to fiscal years 2018 to 2020 and interest coverage of 1.5x. The Company iscompliant with these covenants as at 30 April 2020 and 2019.
The Company has also entered into an agreement with Development Bank of Singapore Limited(DBS) for an omnibus facility comprising of a short-term dollar denominated loan (US$30 million)and import financing facilities. The maximum aggregate utilization for the loans shall not exceedUS$80 million at all times. The Company has drawn US$30 million during fiscal year 2019, andsettled the amount in October 2019. Another US$30 million was drawn during fiscal year 2020,maturing in May 2020 which was subsequently rolled upon maturity.
In fiscal year 2019, the Company obtained loans from Bank of Commerce (BOC) amounting toUS$54.0 million and Development Bank of the Philippines (DBP) amounting to US$57.2 million forvarious financing need. The loans will mature on October 2020 and February 2021, respectively.
In fiscal year 2020, the Company obtained additional long-term loans from DBP amounting to atotal of US$75.0 million maturing in October 2024, to partially finance general corporaterequirements and refinance existing debt.

Del Monte Pacific Limited and its Subsidiaries
Notes to the financial statementsFor the financial year ended 30 April 2020
- 97 -
*SGVFSM004024*
19. Loans and borrowings (cont’d)
Long-term Borrowings
Long-termBorrowings
OriginalPrincipal(In ‘000)
OutstandingBalance(In ‘000)
InterestRate
% p.a.
Year ofMaturity
Payment Terms(e.g., annually,quarterly, etc.)
Interestalready paid
1 May 2019 to30 April 2020
(In ‘000)
Seniorsecuredvariable ratefirst lien termloan
USD 710,000 USD 665,625
Higher ofLibor or 1%+ 3.25% or
total of4.86%
2021
0.25% quarterlyprincipal paymentsfrom 30 April 2014 to31 January 2021;Balance due in fullat its maturity,18 February 2021.
USD 38,160
Seniorsecuredsecond lienvariable rateterm loan
USD 260,000 USD 22,737
Higher ofLibor or 1%+ 7.25% or
total of7.82%
2021Due in full at itsmaturity, 18 August2021.
USD 2,778
BDO Long-term Loan USD 350,000 USD 500 4.50% 2020
Quarterly interestpayment and principalon maturity date.
USD 1,623
BDO Long-term Loan USD 130,000 USD 74,500 4.50% 2020
Quarterly interestpayment and principalon maturity date.
USD 3,424
BOC Long-term Loan USD 54,000 USD 54,000 4.50% 2020
Monthly interestpayment and principalon maturity date.
USD 2,471
DBP Long-term Loan USD 57,241 USD 57,241 2.99% 2021
Quarterly interestpayment and principalon maturity date
USD 2,094
DBP Long-term Loan USD 75,000 USD 75,000 2.72% 2024
Quarterly interestpayment and principalon maturity date
USD 1,206
BDO Long-term Loan PHP 3,000,000 PHP 3,000,000
Higher ofLibor or4.50%
2020Quarterly interestpayment and principalon maturity date
PHP 141,368
Loans and borrowings are stated net of unamortised debt issuance cost. The balance ofunamortised debt issuance cost follows:
Group CompanyYear ended Year ended Year ended Year ended
Note30 April
202030 April
201930 April
202030 April
2019US$’000 US$’000 US$’000 US$’000
Beginning of year 13,767 20,732 226 512Additions – 868 – –Amortisation 27 (13,737) (7,833) (197) (286)End of year 30 13,767 29 226
Del Monte Pacific Limited and its Subsidiaries
Notes to the financial statementsFor the financial year ended 30 April 2020
- 98 -
*SGVFSM004024*
19. Loans and borrowings (cont’d)
DMFI is a party to a First Lien term loan credit agreement and a Second Lien term loan creditagreement (the “Term Loan Credit Agreements”) with the lenders party thereto, Citibank, N.A., asadministrative agent and collateral agent, and the other agents named therein, that provided for aUS$710.0 million First Lien Term Loan and a US$260.0 million Second Lien Term Loan with termsof seven years and seven years plus six months, respectively.
Interest Rates. Loans under the First and Second Lien Term Loans bear interest at a rate equal toan applicable margin, plus a LIBOR rate (with a floor of 1.00%). As of 30 April 2020, the interestrate for First Lien Term Loans is 4.86% (2019: 5.90%) and the interest rate for Second Lien TermLoans is 7.82% (2019: 10.15%).
Principal Payments. The First Lien Term Loan generally requires quarterly scheduled principalpayments of 0.25% of the outstanding principal per quarter from 30 April 2014 to 31 January 2021.The balance is due in full on the maturity date of 18 February 2021. Scheduled principal paymentswith respect to the First Lien Term Loan are subject to reduction following any mandatory orvoluntary prepayments on terms and conditions set forth in the First Lien Term Loan CreditAgreement.
The Second Lien Term Loan is due in full on its maturity date of 18 August 2021.
The Term Loan Credit Agreements also require DMFI to prepay outstanding loans under the FirstLien Term Loan and the Second Lien Term Loan, subject to certain exceptions, with, among otherthings:
50% (which percentage will be reduced to 25% if the leverage ratio is 4.0x or less and to 0%if the leverage ratio is 3.0x or less) of the annual excess cash flow, as defined in the First LienTerm Loan Credit Agreement;
100% of the net cash proceeds of certain casualty events and non-ordinary course asset salesor other dispositions of property for a purchase price above US$2.0 million, in each case,subject to DMFI’s right to reinvest the proceeds; and
100% of the net cash proceeds of any incurrence of debt, other than proceeds from debtpermitted under the First Lien Term Loan Credit Agreement.
On 14 March 2018, the Company, a trust owned by DMFHII and certain seller lenders entered intoa Purchase Agreement wherein the Company, or its designated affiliate, agreed to purchase certainSecond Lien term loans from the seller lenders at an amount equal to 70% of the principal amountof the loans to be sold, plus accrued and unpaid interest thereon. On 27 March 2018, DMFI,DMFHI and the lenders signed the second amendment to the Second Lien term loan allowing theCompany, or its eligible assignee, to purchase any and all loans outstanding under the amendedagreement which were duly submitted by the lenders for purchase at a price equal to 70% of theprincipal amount.

Del Monte Pacific Limited and its Subsidiaries
Notes to the financial statementsFor the financial year ended 30 April 2020
- 99 -
*SGVFSM004024*
19. Loans and borrowings (cont’d)
In March 2018, DMFHII, the affiliate assignee, through a trust, purchased DMFI’s Second Lien termloans with principal amount of US$125.9 million from seller lenders for US$88.2 million.On 5 June 2018, 24 July 2018, 15 April 2019 and 27 November 2019, an additional US$4.0 million,US$95.1 million, US$6.5 million and US$5.8 million, respectively, of the Second Lien Term Loanswere purchased. The pre-tax net gain from the purchase of the loans in 2020 amounting toUS$1.7 million (2019: US$16.9 million), net of no transaction costs (2019: US$2.0 million), wasrecognised in the Group’s consolidated financial statements and is presented under “Financeincome” in the consolidated income statement. The non-controlling interests of DMPLFL agreedto waive its share in any economic benefits arising from the Group’s purchase of the Second Lienterm loans. DMFHII agreed to make an equity contribution to DMFI in the amount equivalent to theinterest received from DMFI.
To finance the purchase of the Second Lien Term Loans, the Company extended a loan to DMFHIIamounting to US$88.2 million in fiscal year 2018 with additional US$87.8 million and US$4.1 millionloans extended in fiscal year 2019 and 2020, respectively. As of 30 April 2020, such loans aresubject to interest of 11.10% (2019: 13.9%), subject to quarterly repricing, and will mature on 18August 2021. The interest income earned by the Company on this loan amounted to US$22.1million in 2020 (2019: US$20.2 million).
Ability to Incur Additional Indebtedness. DMFI has the right to request an additionalUS$100 million plus an additional amount of secured indebtedness under the First Lien Term Loanand the Second Lien Term Loan. Lenders under this facility are under no obligation to provide anysuch additional loans, and any such borrowings will be subject to customary conditions precedent,including satisfaction of a prescribed leverage ratio, subject to the identification of willing lendersand other customary conditions precedent.
ABL Credit Agreement
DMFI is a party to a credit agreement (the “ABL Credit Agreement”) with Citibank, N.A., asadministrative agent, and the other lenders and agents parties thereto, as amended, that providesfor senior secured financing of up to US$442.6 million (with all related loan documents, and asamended from time to time, the ABL Facility) with a term of five years until 18 February 2019, priorto an amendment in 2018.
On 23 April 2018, the Group amended and restated the ABL Credit Agreement. TheUS$442.6 million facility was divided into two tranches: “Tranche A” with an amount up toUS$46.5 million and “Tranche B” with an amount up to US$442.6 million. Any drawdown orrepayment are to be made in proportion to the two tranches and maximum borrowings cannotexceed the Tranche B commitments. Proceeds of US$40.0 million from the amended ABLAgreement were used to pay-off the balance of the previous credit agreement. The Group fullyamortised the deferred financing fees related to the previous credit agreement of US$0.9 millionfrom the amendment. As of 30 April 2020 and 2019, the Group’s commitment could not exceedUS$450.0 million. Tranche A matured on 18 February 2019 and Tranche B matures on 19November 2020.

Del Monte Pacific Limited and its Subsidiaries
Notes to the financial statementsFor the financial year ended 30 April 2020
- 100 -
*SGVFSM004024*
19. Loans and borrowings (cont’d)
ABL Credit Agreement (cont’d)
Interest Rates. Borrowings under the ABL Credit Agreement bear interest at an initial interest rateequal to an applicable margin, plus, at the Group’s option, either (i) a LIBOR rate, or (ii) a base rateequal to the highest of (a) the federal funds rate plus 0.50%, (b) Citibank, N.A.’s “prime commercialrate” and (c) the one month LIBOR rate plus 1.00%. The applicable margin with respect to LIBORborrowings is 2.25% for Tranche B at 30 April 2020 (and may increase to 2.50% or 2.75%depending on average excess availability) (2019: Tranche B: 2.50%) and with respect to base rateborrowings is 1.25% for Tranche B at 30 April 2020 (and may increase to 1.50% or 1.75%depending on average excess availability) (2019: Tranche B: 1.50%).
Commitment Fees. In addition to paying interest on outstanding principal under the ABL CreditAgreement, the Group is required to pay a commitment fee that was initially 0.375% per annum inrespect of the unutilised commitments thereunder. The commitment fee rate on Tranche A fromtime to time is 0.250% or 0.500% depending on the amount of unused commitments under the ABLCredit Agreement for the prior fiscal quarter. The commitment fee rate on Tranche B is 0.500%.The Group must also pay customary letter of credit fees between 1.75% to 2.75% based onaverage excess availability, and fronting fees equal to 0.125% of the face amount for each letter ofcredit issued.
Availability under the ABL Credit Agreement. Availability under the ABL Credit Agreement issubject to a borrowing base. The borrowing base, determined at the time of calculation, is anamount equal to: (a) 85% of eligible accounts receivable and (b) the lesser of (1) 75% of the netbook value of eligible inventory and (2) 85% of the net orderly liquidation value of eligible inventory,of the Group at such time, less customary reserves. The ABL Credit Agreement will terminate, andthe commitments thereunder will mature. On 18 February 2019, Tranche A matured and on 19November 2020 Tranche B will mature. As of 30 April 2020, under Tranche B of the ABL CreditAgreement, there were US$25.1 million (2019: Tranche B: US$136.7 million) of loans outstandingand US$21.9 million of letters of credit issued (2019: Tranche B: US$16.9 million). The Group’s netavailability under the ABL Credit Agreement was US$395.6 million as of 30 April 2020 (2019:US$289.0 million). The weighted average interest rate on the ABL Credit Agreement wasapproximately 4.25% on 30 April 2020 (2019: 4.90%).
The ABL Credit Agreement includes a sub limit for letters of credit and for borrowings on same daynotice, referred to as “swingline loans.”
Ability to Incur Additional Indebtedness. Notwithstanding any increase in the facility size, theGroup’s ability to borrow under the facility will remain limited at all times by the borrowing base (tothe extent the borrowing base is less than the commitments).
Guarantee of Obligations under the Term Loan Credit Agreements and the ABL Credit Agreement.All obligations of DMFI under the Term Loan Credit Agreements and the ABL Credit Agreementare unconditionally guaranteed by the DMFHL and by substantially all existing and future, directand indirect, wholly owned material restricted domestic subsidiaries of DMFI, subject to certainexceptions.

Del Monte Pacific Limited and its Subsidiaries
Notes to the financial statementsFor the financial year ended 30 April 2020
- 101 -
*SGVFSM004024*
19. Loans and borrowings (cont’d)
Security interests
Indebtedness under the First Lien Term Loan is generally secured by (i) a first priority pledge of allof the equity interests of DMFHL, (ii) a second priority lien on all ABL Priority Collateral of DMFHLand (iii) a first priority lien on substantially all other properties and assets of DMFHL. The SecondLien Term Loan is generally secured by (i) a second priority pledge of all of the equity interests ofDMFHL, (ii) a third priority lien on all ABL Priority Collateral of DMFHL and (iii) a second prioritylien on substantially all other properties and assets of DMFHL. The ABL Credit Agreement isgenerally secured by a first priority lien on DMFI’s inventories and accounts receivable and by athird priority lien on substantially all other assets excluding real estate.
All of DMFI’s inventory and trade receivables secure the various borrowings.
Restrictive and Financial Covenants. The Term Loan Credit Agreements and the ABL CreditAgreement contain restrictive covenants that limit DMFI’s ability and the ability of its subsidiaries totake certain actions.
Term Loan Credit Agreement and ABL Credit Agreement Restrictive Covenants. The restrictivecovenants in the Term Loan Credit Agreement and the ABL Credit Agreement include covenantslimiting DMFI’s ability, and the ability of DMFI’s restricted subsidiaries, to incur additionalindebtedness, create liens, engage in mergers or consolidations, sell or transfer assets, paydividends and distributions or repurchase DMFHL’s capital stock, make investments, loans oradvances, prepay certain indebtedness, engage in certain transactions with affiliates, amendagreements governing certain subordinated indebtedness adverse to the lenders, and changeDMFI’s lines of business.
Financial Maintenance Covenants. The Term Loan Credit Agreements and ABL CreditAgreement generally do not require that DMFI comply with financial maintenance covenants.
Minimum Consolidated EBITDA. Beginning on 1 May 2018, the DMFHL Group will be subjectedto an EBITDA financial covenant. Consolidated Trailing Twelve Month EBITDA of the Borrower andthe Guarantors as of the last day of any fiscal quarter shall not be lower than specified amounts inthe Credit Agreement.
Effect of Restrictive and Financial Covenants. The restrictive and financial covenants in the TermLoan Credit Agreements and the ABL Credit Agreement may adversely affect DMFI’s ability tofinance its future operations or capital needs or engage in other business activities that may be inits interest, such as acquisitions.
The Group is compliant with its loan covenants as of 30 April 2020 and 2019.

Del Monte Pacific Limited and its Subsidiaries
Notes to the financial statementsFor the financial year ended 30 April 2020
- 102 -
*SGVFSM004024*
19. Loans and borrowings (cont’d)
Unsecured Bank Loans
Certain unsecured bank loan agreements contain various affirmative and negative covenants thatare typical of these types of facilities such as financial covenants relating to required debt-to-equityratio, interest cover and maximum annual capital expenditure restrictions. These covenantsinclude requirements for delivery of periodic financial information and restrictions and limitations onindebtedness, investments, acquisitions, guarantees, liens, asset sales, disposals, mergers,changes in business, dividends and other transfers.
BankPrincipalIn ‘000
Debt-toequity ratio
Interestcoverage
Unsecured loans BOC USD 54,000 3.0x 2.0xUnsecured loans DBP USD 57,241 3.0x –Unsecured loans DBP USD 75,000 3.0x –
The Company and the Group is compliant with its loan covenants as at 30 April 2020 and 2019.
Ability to Incur Additional Indebtedness.
On 12 December 2017, the Company entered into a Third Amendment Agreement with BDO thatgives the Company the right to reborrow up to an aggregate amount of US$200 million, subject tothe terms of such amendment agreement.
In 2019, the Company also availed of an omnibus facility with DBS totaling US$80 million of whichUS$30 million had been drawn.
20. Other noncurrent liabilitiesGroup
30 April2020
30 April2019
US$’000 US$’000
Workers’ compensation 19,018 19,304Accrued vendors liabilities 623 802Derivative liabilities 2,600 1,759Accrued lease liabilities – 7,610Other payables 1,139 540
23,380 30,015
Workers’ compensation are liabilities for wage replacement and medical benefits to employeesinjured in the course of employment in exchange for mandatory relinquishment of the employee'sright to sue his or her employer for the tort of negligence.

Del Monte Pacific Limited and its Subsidiaries
Notes to the financial statementsFor the financial year ended 30 April 2020
- 103 -
*SGVFSM004024*
20. Other noncurrent liabilities (cont’d)
Derivative liabilities
The Group uses interest rate swaps and commodity swaps to hedge market risks relating topossible adverse changes in interest rates and commodity costs. The Group continually monitorsits positions and the credit rating of the counterparties involved to mitigate the amount of creditexposure to any one party.
As at 30 April 2020 and 2019, the Group designated each of its derivative contracts as a hedge ofa forecasted transaction or of the variability of cash flows to be received or paid related to arecognised asset or liability (“cash flow hedge”). The following cash flow hedges were outstandingfor the Group:
Group
Note30 April
202030 April
2019US$’000 US$’000
Interest rate swap 33, 35 (5,915) (3,960)Commodity contracts 33, 35 (2,909) 64Total (8,824) (3,896)
Included in:Prepaid expenses and other current assets 14, 33 57 64Trade and other current liabilities 23 (8,846) (2,201)Other noncurrent liabilities (35) (1,759)
(8,824) (3,896)
The effect of economic hedges in the consolidated income statements were as follows:
Group30 April
202030 April
2019US$’000 US$’000
Commodity contracts 1,225 (283)
At 30 April 2020 , US$2.9 million (2019: US$2.6 million) are expected to be reclassified from OCIto the consolidated income statement within the next 12 months.

Del Monte Pacific Limited and its Subsidiaries
Notes to the financial statementsFor the financial year ended 30 April 2020
- 104 -
*SGVFSM004024*
20. Other noncurrent liabilities (cont’d)
Derivative liabilities (cont’d)
Interest Rates
The Group adopts a policy of hedging its floating rate exposure in accordance with the current rateenvironment and expected debt balances. This is achieved partly by entering into fixed-rateinstruments and partly by borrowing at a floating rate (based on LIBOR) and using interest rateswaps as hedges of the variability in cash flows attributable to movements in interest rates. TheGroup applies a hedge ratio of 1:1.
The Group determines the existence of an economic relationship between the hedging instrumentand hedged item based on the reference interest rates, tenors, repricing dates and maturities andthe notional quantity or par amounts.
The Group assesses whether the derivative designated in each hedging relationship is expectedto be effective in offsetting changes in cash flows of the hedged item using the hypotheticalderivative method.
In these hedging relationships, the main sources of ineffectiveness are the effect of thecounterparty’s and the Group’s own credit risk on the fair value of the swaps, which is not reflectedin the change in the fair value of the hypothetical derivative used to measure the changes in thefair value of the hedged item attributable to the change in interest rates, and differences in repricingdates between the swaps and the hedged borrowings.
Significant terms of the interest rate swap contracts are as follows:
Contract Date
NotionalamountUS$ ‘000
FixedRate
Effective Date Maturity Date19 March 2014 130,000 2.79% 18 February 2016 18 February 201919 March 2014 284,000 3.30% 18 February 2016 18 February 2021
Commodities
Certain commodities such as diesel fuel and natural gas (collectively, “commodity contracts”) areused in the production and transportation of the Group’s products. Generally, these commoditiesare purchased based upon market prices that are established with the vendors as part of theprocurement process. The Group uses futures, swaps, and swaption or option contracts, asdeemed appropriate, to reduce the effect of price fluctuations on anticipated purchases. Thesecontracts may have a term of up to 24 months. The Group accounts for these commodity derivativesas cash flow hedges. The effective portion of derivative gains and losses is deferred in equity andrecognised as part of cost of products sold in the appropriate period and the ineffective portion isrecognised as cost of products sold.
The notional amounts of the Group’s commodity contracts were as follows as at 30 April 2020(2019: nil):
30 April 2020Natural gas (MMBTU) 332Diesel 7,170

Del Monte Pacific Limited and its Subsidiaries
Notes to the financial statementsFor the financial year ended 30 April 2020
- 105 -
*SGVFSM004024*
20. Other noncurrent liabilities (cont’d)
Derivative liabilities (cont’d)
Amounts Relating to Hedged Items
The amounts at the reporting date relating to items designated as hedged items are as follows:
30 April 2020Change in value
used forcalculating
hedgeeffectiveness
Cashflowhedge reserve
Balances remainingin the cash flow
hedge reserve fromhedging
relationships forwhich hedge
accounting is nolonger applied
US$’000 US$’000 US$’000Interest rate riskVariable rate instruments 4,824 180 –
Commodity price riskInventory purchases 2,909 (2,196) –
30 April 2019Change in value
used forcalculating
hedgeeffectiveness
Cashflow hedgereserve
Balances remaining inthe cash flow hedge
reserve from hedgingrelationships for
which hedgeaccounting is nolonger applied
US$’000 US$’000 US$’000Interest rate riskVariable rate instruments 2,478 (2,472) –
Commodity price riskInventory purchases 46 – –

Del Monte Pacific Limited and its Subsidiaries
Notes to the financial statementsFor the financial year ended 30 April 2020
- 106 -
*SGVFSM004024*
20. Other noncurrent liabilities (cont’d)
Derivative liabilities (cont’d)
Amounts Relating to Hedging Instruments
The amounts relating to items designated as hedging instruments and hedge ineffectiveness are as follows:
30 April 2020 During 2020Notional amount Carrying amount Line item in the
statement of financialposition where the
hedged instrument isincluded
Change in the valueof hedge
instrumentrecognised in OCI
Amount reclassifiedfrom hedging
reserve to profit orloss
Line item in profit orloss affected by the
reclassification
Assets LiabilitiesUS$’000
Interest rate riskVariable rateinstruments
284,000 – (5,915) Derivative Liabilities– CurrentLiabilities
(4,824) 8,695 Net finance expense
– – Derivative liabilities–Non CurrentLiabilities
Commodity priceriskCommoditycontractsNatural gas(MMBTU)
332 57 – Prepaid and OtherCurrent Assets
57 –
Diesel (gallons) 7,170 – (2,931) Derivative Liabilities– CurrentLiabilities
(2,931) –
(35) Derivative Liabilities– Non CurrentLiabilities
(35) –

Del Monte Pacific Limited and its Subsidiaries
Notes to the financial statementsFor the financial year ended 30 April 2020
- 107 -
*SGVFSM004024*
20. Other noncurrent liabilities (cont’d)
Derivative liabilities (cont’d)
Amounts Relating to Hedging Instruments (cont’d)
30 April 2019 During 2019Notional amount Carrying amount Line item in the
statement of financialposition where the
hedged instrument isincluded
Change in the valueof hedge
instrumentrecognised in OCI
Amount reclassifiedfrom hedging
reserve to profit orloss
Line item in profit orloss affected by the
reclassification
Assets LiabilitiesUS$’000
Interest rate riskVariable rateinstruments
284,000 – (2,201) Derivative Liabilities– CurrentLiabilities
(2,478) 2,894 Net finance expense
– (1,759) Derivative liabilities–Non CurrentLiabilities
Commodity priceriskCommoditycontractsNatural gas(MMBTU)
– – – Prepaid and OtherCurrent Assets
46 –
Diesel (gallons) – 64 – Prepaid and OtherCurrent Assets
– –
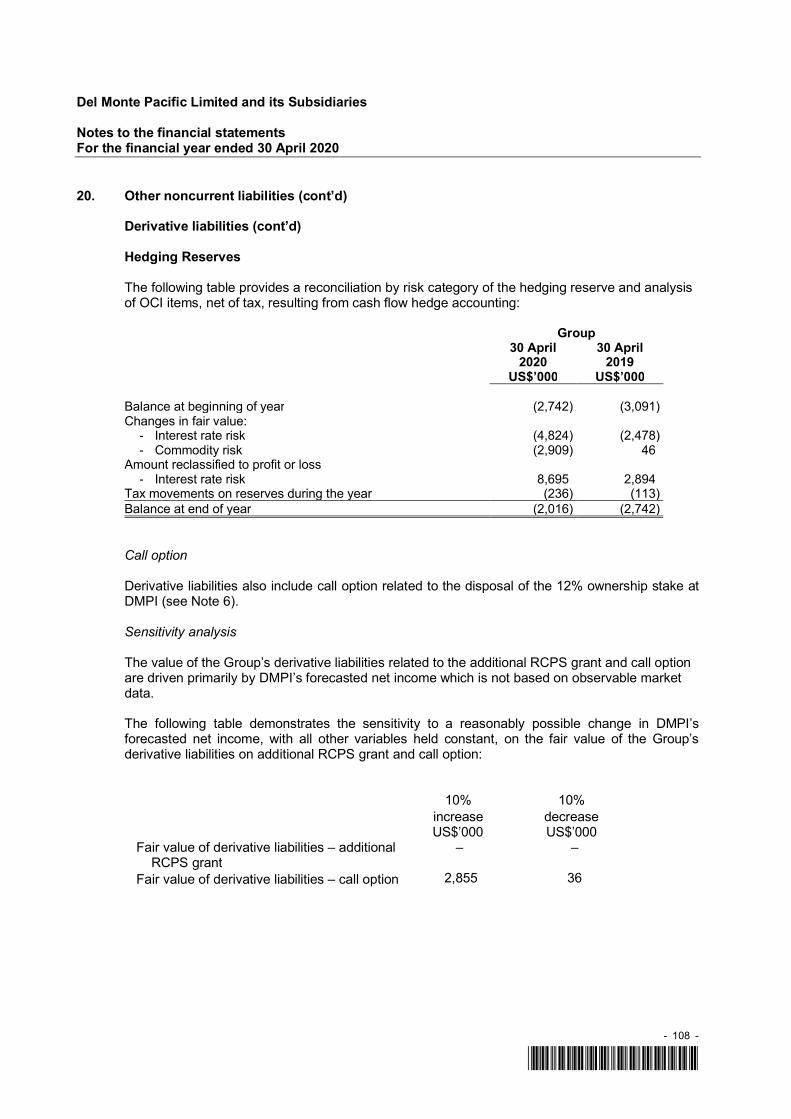
Del Monte Pacific Limited and its Subsidiaries
Notes to the financial statementsFor the financial year ended 30 April 2020
- 108 -
*SGVFSM004024*
20. Other noncurrent liabilities (cont’d)
Derivative liabilities (cont’d)
Hedging Reserves
The following table provides a reconciliation by risk category of the hedging reserve and analysisof OCI items, net of tax, resulting from cash flow hedge accounting:
Group30 April
202030 April
2019US$’000 US$’000
Balance at beginning of year (2,742) (3,091)Changes in fair value:
- Interest rate risk (4,824) (2,478)- Commodity risk (2,909) 46
Amount reclassified to profit or loss- Interest rate risk 8,695 2,894
Tax movements on reserves during the year (236) (113)Balance at end of year (2,016) (2,742)
Call option
Derivative liabilities also include call option related to the disposal of the 12% ownership stake atDMPI (see Note 6).
Sensitivity analysis
The value of the Group’s derivative liabilities related to the additional RCPS grant and call optionare driven primarily by DMPI’s forecasted net income which is not based on observable marketdata.
The following table demonstrates the sensitivity to a reasonably possible change in DMPI’sforecasted net income, with all other variables held constant, on the fair value of the Group’sderivative liabilities on additional RCPS grant and call option:
10% 10%increase decreaseUS$’000 US$’000
Fair value of derivative liabilities – additionalRCPS grant
– –
Fair value of derivative liabilities – call option 2,855 36

Del Monte Pacific Limited and its Subsidiaries
Notes to the financial statementsFor the financial year ended 30 April 2020
- 109 -
*SGVFSM004024*
21. Employee benefitsGroup
30 April2020
30 April2019
US$’000 US$’000
Pension asset 6,675 8,240Total pension asset (noncurrent) 6,675 8,240
Post-retirement benefit obligation 11,599 16,914Executive retirement plan 2,834 3,092Cash incentive award – 6,210Short-term employee benefits 18,385 17,115Other plans 6,523 6,360Net defined benefit liability 66,004 41,730Total employee benefit liability 105,345 91,421
Current 22,947 27,640Noncurrent 82,398 63,781
105,345 91,421
Included in short-term employee benefits is an amount of US$4.5 million (2019: US$0.9 million)relating to provisions for employee severance benefits of employees terminated under plantclosures (see Note 5).
Included in pension asset is an amount of US$6.7 million (2019: US$8.2 million) relating to definedbenefit and defined contribution retirement plan in DMPI.
Included in post-retirement benefit obligation is an amount of US$11.6 million (2019: US$16.9million) relating to post-retirement medical benefits plan in DMFI.
Included in net defined benefit liability is an amount of US$65.7 million and US$0.3 million (2019:US$41.6 million and US$0.1 million) relating to qualified retirement plan in DMFI and ROHQ,respectively.

Del Monte Pacific Limited and its Subsidiaries
Notes to the financial statementsFor the financial year ended 30 April 2020
- 110 -
*SGVFSM004024*
21. Employee benefits (cont’d)
The Group contributes to the following post-employment defined benefit plans:
The DMPI Plan
DMPI has both funded defined benefit and defined contribution retirement plan (the “Plan”) whichcovers all of its regular employees. Contributions and costs are determined in accordance withthe actuarial study made for the Plan. Annual cost is determined using the projected unit creditmethod. DMPI’s latest actuarial valuation date is 30 April 2020. Valuations are obtained on aperiodic basis.
Starting on the date of membership of an employee in the Plan, DMPI shall contribute to theretirement fund 7.00% of the member’s salary as defined every month. In addition, DMPI shallcontribute periodically to the fund the amounts which may be required to meet the guaranteedminimum benefit provision of the plan. Such contributions shall not be allocated nor credited tothe individual accounts of the members, but shall be retained in a separate account to be used incases where the guaranteed minimum benefit applies.
Benefits are based on the total amount of contributions and earnings credited to the personalretirement account of the plan member at the time of separation or the 125% of the final basissalary multiplied by the number of credited years of service under the plan, whichever is higher.The manner of payment is lump sum, payable immediately.
The retirement plan meets the minimum retirement benefit specified under Republic Act (RA) No.7641, The Philippine Retirement Pay Law.
The fund is administered by a trustee bank under the supervision of the Board of Trustees of thePlan.
The Board of Trustees is responsible for investment strategy of the Plan.
DMPI does not expect to make contributions to the plan in fiscal year 2021.
The ROHQ Plan
ROHQ has a funded defined benefit plan wherein starting on the date of membership of anemployee in the ROHQ Plan, ROHQ contributes to the retirement fund 7.00% of the member’ssalary as defined every month. In addition, ROHQ contributes periodically to the fund the amountswhich may be required to meet the guaranteed minimum benefit provision of the plan. Suchcontributions shall not be allocated nor credited to the individual accounts of the members, but shallbe retained in a separate account to be used in cases where guaranteed minimum benefit applies.
Benefits are based on the total amount of contributions and earnings credited to the personalretirement account of the plan member at the time of separation or the 125% of the final basissalary multiplied by the number of credited years of service under the plan, whichever is higher.The manner of payment is lump sum, payable on retirement. ROHQ’s annual contribution to thepension plan consists of payments covering the current service cost for the year plus paymentstowards funding the actuarial accrued liability, if any.
ROHQ does not expect to make contributions to the plan in fiscal year 2021.

Del Monte Pacific Limited and its Subsidiaries
Notes to the financial statementsFor the financial year ended 30 April 2020
- 111 -
*SGVFSM004024*
21. Employee benefits (cont’d)
The DMFI Plan
DMFI sponsors a qualified defined benefit pension plan (the “DMFI Plan”) and several unfundeddefined benefit post-retirement plans providing certain medical, dental, and life insurance benefitsto eligible retired, salaried, non-union hourly and union employees. The DMFI Plan comprises oftwo parts:
The first part is a cash balance plan (“Part B”) which provides benefits for eligible salariedemployees and provides that a participant’s benefit derives from the accumulation of monthlycompensation and interest credits. Compensation credits are calculated based upon theparticipant’s eligible compensation and age each month. Interest credits are calculated eachmonth by applying an interest factor to the previous month’s ending balance. Participants mayelect to receive their benefit in the form of an annuity or a lump sum. Part B of the plan was frozento new participants effective 31 December 2016, which the active participation of certainparticipants was grandfathered subject to meeting participation requirements.
The second part is an arrangement which provides for grandfathered and suspended hourlyparticipants a traditional pension benefit based upon service, final average compensation and ageat termination. This plan was frozen since 31 December 1995, which the active participation ofcertain participants was grandfathered and the active participation of other participants wassuspended.
DMFI currently meets and plans to continue to meet the minimum funding levels required underlocal legislation, which imposes certain consequences on DMFI’s defined benefit plan if it does notmeet the minimum funding levels. DMFI has not made any contributions during the year.
As of 30 April 2020, there were amendments to the DMFI Plan and the post-retirement benefit plan.Under the DMFI Plan amendments, certain benefits were eliminated effective 31 December 2019and 30 April 2022 and the plan obligations associated with these amendments decreased byUS$9.1 million. Under the post-retirement amendments, certain benefits will be eliminated effective30 April 2022 and the plan obligations associated with this amendment decreased by US$5.9million. Both amendments were recognised immediately in “General and administrative expenses”in the consolidated income statement.
As of 30 April 2019, there were amendments to the post-retirement benefit plan. Under anamendment, certain benefits will be eliminated after fiscal year 2022. The net liability impact of thisamendment was a decrease of US$13.4 million, which was recognised immediately in “Generaland administrative expenses” in the consolidated income statement.
DMFI does not expect to make contributions to the plan in fiscal year 2021.
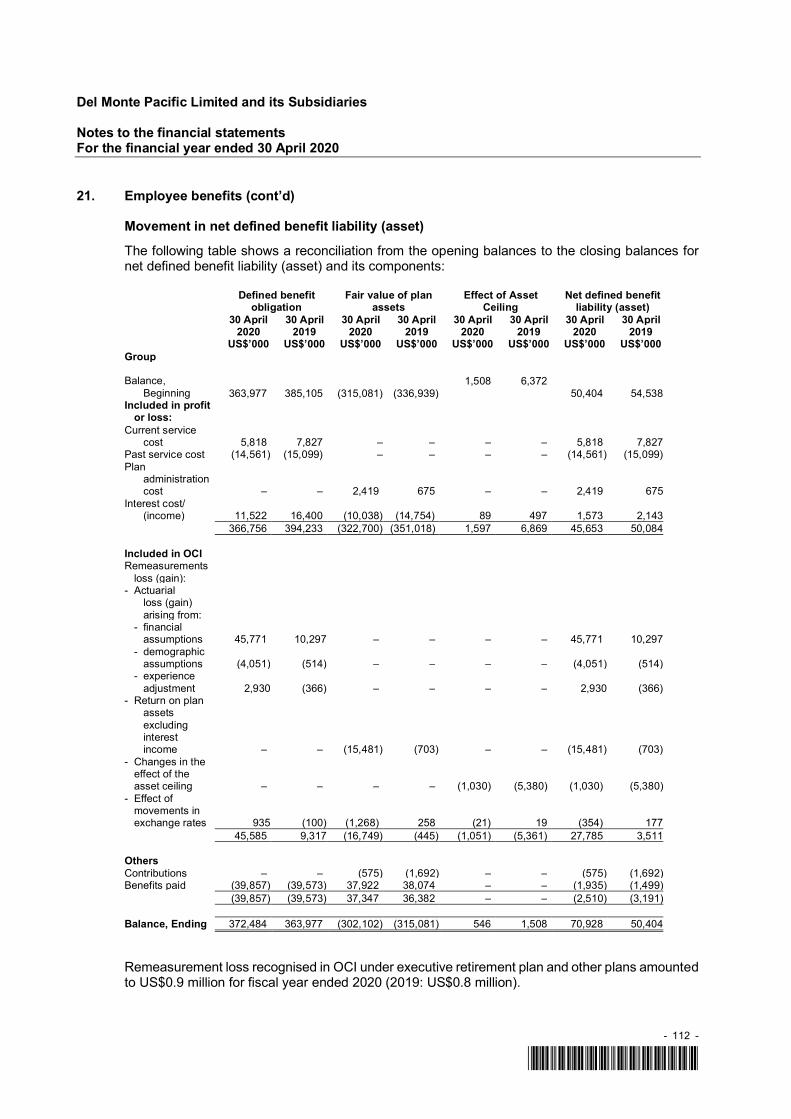
Del Monte Pacific Limited and its Subsidiaries
Notes to the financial statementsFor the financial year ended 30 April 2020
- 112 -
*SGVFSM004024*
21. Employee benefits (cont’d)
Movement in net defined benefit liability (asset)
The following table shows a reconciliation from the opening balances to the closing balances fornet defined benefit liability (asset) and its components:
Defined benefitobligation
Fair value of planassets
Effect of AssetCeiling
Net defined benefitliability (asset)
30 April2020
30 April2019
30 April2020
30 April2019
30 April2020
30 April2019
30 April2020
30 April2019
US$’000 US$’000 US$’000 US$’000 US$’000 US$’000 US$’000 US$’000Group
Balance,Beginning 363,977 385,105 (315,081) (336,939)
1,508 6,37250,404 54,538
Included in profitor loss:
Current servicecost 5,818 7,827 – – – – 5,818 7,827
Past service cost (14,561) (15,099) – – – – (14,561) (15,099)Plan
administrationcost – – 2,419 675 – – 2,419 675
Interest cost/(income) 11,522 16,400 (10,038) (14,754) 89 497 1,573 2,143
366,756 394,233 (322,700) (351,018) 1,597 6,869 45,653 50,084
Included in OCIRemeasurements
loss (gain):- Actuarial
loss (gain)arising from:
- financialassumptions 45,771 10,297 – – – – 45,771 10,297
- demographicassumptions (4,051) (514) – – – – (4,051) (514)
- experienceadjustment 2,930 (366) – – – – 2,930 (366)
- Return on planassetsexcludinginterestincome – – (15,481) (703) – – (15,481) (703)
- Changes in theeffect of theasset ceiling – – – – (1,030) (5,380) (1,030) (5,380)
- Effect ofmovements inexchange rates 935 (100) (1,268) 258 (21) 19 (354) 177
45,585 9,317 (16,749) (445) (1,051) (5,361) 27,785 3,511
OthersContributions – – (575) (1,692) – – (575) (1,692)Benefits paid (39,857) (39,573) 37,922 38,074 – – (1,935) (1,499)
(39,857) (39,573) 37,347 36,382 – – (2,510) (3,191)
Balance, Ending 372,484 363,977 (302,102) (315,081) 546 1,508 70,928 50,404
Remeasurement loss recognised in OCI under executive retirement plan and other plans amountedto US$0.9 million for fiscal year ended 2020 (2019: US$0.8 million).

Del Monte Pacific Limited and its Subsidiaries
Notes to the financial statementsFor the financial year ended 30 April 2020
- 113 -
*SGVFSM004024*
21. Employee benefits (cont’d)
Represented by:
Net defined benefit liability (asset)30 April 2020 30 April 2019
US$’000 US$’000
Net defined benefit asset (6,675) (8,240)Post-retirement benefit obligation 11,599 16,914Net defined benefit liability 66,004 41,730
70,928 50,404
Plan assets
Plan assets comprise:Group
30 April 30 April2020 2019
US$’000 US$’000
Interest-bearing cash/bank deposits 5,703 14,501Real estate (within Philippines) 16,019 15,004Common collective trust funds:
Fixed income 66,340 68,624 Equity fund 93,007 87,474
Mutual funds -Equity fund 12,375 13,840
Debt instruments:Corporate 39,889 41,191Government 43,527 42,590Others 7,223 5,109
Equity securities -Quoted 6,229 12,602
Others 11,790 14,146Fair value of plan assets 302,102 315,081
The BOD of DMFI reviews the level of funding required for the retirement fund. Such a reviewincludes the asset-liability matching (ALM) strategy and investment risk management policy.DMFI’s ALM objective is to match maturities of the plan assets to the retirement benefit obligationas they fall due. The Group monitors how the duration and expected yield of the investmentsmatch the expected cash outflows arising from the retirement benefit obligation.
DMFI’s investment objectives are to ensure that the assets of its qualified defined benefit plan areinvested to provide an optimal rate of investment return on the total investment portfolio, consistentwith the assumption of a reasonable risk level, and to ensure that pension funds are available tomeet the plan’s benefit obligations as they become due.
DMFI believes that a well-diversified investment portfolio, including both equity and fixed incomecomponents, will result in the highest attainable investment return with an acceptable level ofoverall risk. DMFI’s investment policies and procedures are designed to ensure that the plan’sinvestments are in compliance with the Employee Retirement Income Security Act (ERISA).

Del Monte Pacific Limited and its Subsidiaries
Notes to the financial statementsFor the financial year ended 30 April 2020
- 114 -
*SGVFSM004024*
21. Employee benefits (cont’d)
Actuarial valuation
The funded obligations and plan assets are measured and valued with the advice of qualifiedactuary who carries out a full valuation annually. The last valuation of these obligations and planwas performed in April 2020 wherein the results of these valuations form the basis of the fair valueof the funded obligations and plan assets as at 30 April 2020.
The principal actuarial assumptions used for accounting purposes expressed as weighted averagewere:
<------------- DMFI ------------>30 April
202030 April
2019
Discount rate (per annum) 2.14%-3.68% 3.65% – 4.25%Future salary increases (per annum) 3.00% 3.00% – 4.00%Current health care cost trend rate (per annum) 6.40% 6.60%Ultimate health care cost trend rate 4.50% 4.50%
Mortality rate
2012 rates associated withthe Pri-2012 table with
generational projection ofimprovements in mortalityfrom 2012 based on MP-
2019
RP-2014 adjusted backwardto 2006 with
MP-2014 and projectedforward using MP-2018
<------------- DMPI ------------>30 April
202030 April
2019
Discount rate (per annum) 4.43% 6.06%Future salary increases (per annum) 6.00% 6.00%
<------------- ROHQ ------------>30 April
202030 April
2019
Discount rate (per annum) 4.48% 6.21%Future salary increases (per annum) 6.00% 6.00%
Since the defined benefit plans and other benefits liabilities are measured on a discounted basis,the discount rate is a significant assumption. The discount rate for DMFI plan was determinedbased on an analysis of interest rates for high-quality, long-term corporate debt at eachmeasurement date. The discount rate for DMPI and ROHQ Plans were determined based on thetheoretical spot yield curve calculated for the government securities market. In order toappropriately match the bond maturities with expected future cash payments, the Group utiliseddiffering bond portfolios to estimate the discount rates for the defined benefits pension plans andfor the post-retirement benefits.

Del Monte Pacific Limited and its Subsidiaries
Notes to the financial statementsFor the financial year ended 30 April 2020
- 115 -
*SGVFSM004024*
21. Employee benefits (cont’d)
Actuarial valuation (cont’d)
The discount rate used to determine the defined benefit plans and for the post-retirement benefitsprojected benefit obligation as of the reporting date is the rate in effect at the measurement date.The same rate is also used to determine the defined benefit pension plans and post-retirementbenefits for the following fiscal year. The defined benefits pension plans’ investment guidelinesare established based upon an evaluation of market conditions, tolerance for risk and cashrequirements for benefit payments. Assumptions regarding future mortality have been based onpublished statistics and mortality tables.
As at 30 April 2020, the weighted average duration of DMPI’s and ROHQ’s defined benefitretirement obligation is 9.2 years and 7.2 years, respectively (2019: 7.4 years and6.5 years, respectively).
The projected future benefit payments for the DMPI and ROHQ plans as of 30 April 2020 are asfollows:
DMPI ROHQ
Total ExpectedBenefit
PaymentsUS$’000 US$’000 US$’000
2021 1,705 36 1,7412022 4,456 41 4,4972023 2,469 46 2,5152024 4,225 51 4,2762025 3,276 524 3,800
2026 to 2030 16,365 840 17,205
The weighted average duration of DMFI’s defined benefit retirement obligation are as follows:
Duration (years)30 April 2020 30 April 2019
Qualified retirement plan 10.2 9.3Post-retirement benefits plan 8.1 9.5Executive retirement plans 7.5 – 9.0 9.3 – 9.4
The projected future benefit payments for the DMFI plan as of 30 April 2020 are as follows:
NormalRetirement
Other thanNormal
Retirement TotalUS$’000 US$’000 US$’000
Less than one year 25,864 2,077 27,941More than one year to five years 94,143 3,879 98,022More than five years 95,639 2,578 98,217

Del Monte Pacific Limited and its Subsidiaries
Notes to the financial statementsFor the financial year ended 30 April 2020
- 116 -
*SGVFSM004024*
21. Employee benefits (cont’d)
Actuarial valuation (cont’d)
The weighted-average asset allocation of the Group’s pension plan assets and weighted-averagetarget allocation as of the measurement date from date of incorporation is as follows:
Target Allocation30 April 2020 Range
Equity securities 37% 31-51%Debt securities 52% 42-64%Other 11% 2-19%Total 100%
Target Allocation30 April 2019 Range
Equity securities 36% 31-51%Debt securities 50% 42-64%Other 14% 2-19%Total 100%
The plan exposes the Group to market risk.
The BOD of DMFI approves the percentage of asset to be allocated for fixed income instrumentsand equities. The retirement plan has set maximum exposure limits for each type of permissibleinvestments in marketable securities and deposit instruments. The BOD of DMFI may, from timeto time, in the exercise of its reasonable discretion and taking into account existing investmentopportunities, review and revise such allocation and limits.
Source of estimation uncertainty
Pension expense and pension assets/liabilities are determined using certain actuarial estimatesand assumptions relating to the discount rate used in valuing the subsidiary’s defined benefitobligations and future experiences such as future salary increases, retirement date or age, mortalityand turnover rate of covered employees. These estimates and assumptions directly influence theamount of the pension assets/liabilities and expense recognised in the financial statements.

Del Monte Pacific Limited and its Subsidiaries
Notes to the financial statementsFor the financial year ended 30 April 2020
- 117 -
*SGVFSM004024*
21. Employee benefits (cont’d)
Sensitivity analysis
The calculation of the defined benefit obligation is sensitive to the assumptions set out above. Thefollowing table summarises how the impact on the defined benefit obligation at the end of reportingperiod would have increased (decreased) as a result of a change in the respective assumptions bythe respective percentages below.
Defined benefitobligation <-------------------------------DMFI----------------------------->
2020 20190.5% 0.5% 0.5% 0.5%
increase decrease increase decreaseUS$’000 US$’000 US$’000 US$’000
Discount rate(per annum) (14,871) 16,224 (13,692) 14,868
Future salaryincreases(per annum) N/A N/A 1,118 (1,066)
Defined benefitobligation <-------------------------------DMPI----------------------------->
2020 20191.0% 1.0% 1.0% 1.0%
increase decrease increase decreaseUS$’000 US$’000 US$’000 US$’000
Discount rate(per annum) (2,848) 3,332 (2,253) 1,963
Future salaryincreases(per annum) 3,245 (2,834) 2,232 (1,981)
Defined benefitobligation <-------------------------------ROHQ----------------------------->
2020 20191.0% 1.0% 1.0% 1.0%
increase decrease increase decreaseUS$’000 US$’000 US$’000 US$’000
Discount rate(per annum) (53) 60 (38) 35
Future salaryincreases(per annum) 58 (53) 38 (35)
The above sensitivities are based on the average duration of the benefit obligation determined atthe date of the last full actuarial valuation at 30 April 2020 and are applied to adjust the definedbenefit obligation at the end of the report period for the assumptions concerned. Whilst theanalysis does not take account of the full distribution of cash flows expected under the plan, it doesprovide an approximation to the sensitivity of the assumption shown.

Del Monte Pacific Limited and its Subsidiaries
Notes to the financial statementsFor the financial year ended 30 April 2020
- 118 -
*SGVFSM004024*
21. Employee benefits (cont’d)
Sensitivity analysis (cont’d)
Post-retirement benefitobligation
<-------------------------------DMFI----------------------------->2020 2019
1.0% 1.0% 1.0% 1.0%Increase decrease Increase decreaseUS$’000 US$’000 US$’000 US$’000
Health care cost trend rates(per annum) 15 (14) 908 (744)
Accumulated post-retirement benefit obligation
The accumulated post-retirement benefit obligation is computed in accordance with IAS 19Employee Benefits. This quantity is the actuarial present value of all benefits attributed under theprojected unit credit method to service rendered prior to a particular date. Prior to an employee'sfull eligibility date, the accumulated post-retirement benefit obligation as of a particular date for anemployee is the portion of the expected post-retirement benefit obligation attributed to thatemployee's service rendered to that date; on and after the full eligibility date, the accumulated andexpected post-retirement benefit obligations for an employee are the same.
Source of estimation uncertainty
Accumulated post-retirement benefit obligation is determined using certain actuarial estimates andassumptions relating to the annual rate(s) of change in the cost of health care benefits currentlyprovided by the post-retirement benefit plans due to factors other than changes in the compositionof the plan population by age and dependency status, for each year from the measurement dateuntil the end of the period in which benefits are expected to be paid. These estimates andassumptions directly influence the amount of the pension assets/liabilities and expense recognisedin the financial statements.
Multi-employer plans
The Group participates in several multi-employer pension plans, which provide defined benefits tocovered union employees. Contribution rates to the multi-employer plans are provided in thecollective bargaining agreements for the covered union employees. The contribution rates areexpressed in terms of specific amounts to be contributed based on hours worked by covered unionemployees. The Group made contributions of US$6.4 million, US$6.7 million and US$6.1 millionduring fiscal years 2020, 2019 and 2018, respectively.
The risks of participating in the multi-employer pension plans are as follows:
assets contributed to the multi-employer plan by the Group may be used to provide benefits toemployees of other participating employers;
if a participating employer stops contributing to the plan, the unfunded obligations of the planallocable to such withdrawing employer may be partially borne by the Group; and
if the Group stops participating in some of its multi-employer pension plans, the Group may berequired to pay those plans an amount based on its allocable share of the underfunded statusof the plan, referred to as a withdrawal liability.

Del Monte Pacific Limited and its Subsidiaries
Notes to the financial statementsFor the financial year ended 30 April 2020
- 119 -
*SGVFSM004024*
21. Employee benefits (cont’d)
Defined Contribution Plans
The Group participates in two defined contribution plans. Group contributions to these definedcontribution plans are based on employee contributions and compensation. The expenserecognised under these plans for the year ended 30 April 2020 was US$4.4 million (2019: US$4.1million; 2018: US$4.8 million).
Other plans
The Group has various other nonqualified retirement plans and supplemental retirement plans forexecutives, designed to provide benefits in excess of those otherwise permitted under the Group’squalified retirement plans. These plans are unfunded and comply with IRS rules for nonqualifiedplans.
22. Environmental remediation liabilities
Group30 April
202030 April
2019US$’000 US$’000
At beginning of the year 697 144Provision made during the year 9,471 631Provisions used during the year (78) (78)Provisions released during the year (336) -Reclass to current portion (167) -At end of the year 9,587 697
Provision for environmental remediation relates to legal or constructive obligations incurred by theGroup in connection with its operations. The current portion of environmental liabilities is includedin “Trade and other payables” in the consolidated statement of financial position. In connection withthe plant sales of Mendota, Sleepy Eye, and Crystal City, US$6.0 million, US$3.0 million andUS$0.4 million, respectively, of environmental provisions were made in fiscal year 2020.

Del Monte Pacific Limited and its Subsidiaries
Notes to the financial statementsFor the financial year ended 30 April 2020
- 120 -
*SGVFSM004024*
23. Trade and other current liabilities
<----------- Group ---------><-------- Company ------->
Note30 April
202030 April
201930 April
202030 April
2019US$’000 US$’000 US$’000 US$’000
Trade payables 132,597 113,202 24 335Deferred revenue 25 407 530 – –Accrued operating expenses:
Refinancing cost 6, 41 31,324 – – –Taxes and insurance 20,425 6,246 – –Trade promotions 12,657 9,476 – –
Advertising 10,603 11,108 – –Accrued interest 40 9,045 10,481 1,568 2,159Freight and warehousing 7,633 7,121 – –Professional fees 7,364 6,292 1,348 –Utilities 5,861 1,015 –Tinplate and consigned stocks 3,501 3,340 – –
Salaries, bonuses and otheremployee benefits 3,373 2,579
–– –
Plant closure costs 3,125 – – – Miscellaneous 6,894 3,694 659 360Derivative liabilities 20 8,846 2,201 – –Overdrafts 6,280 3,478 – –Accrued payroll expenses 3,806 3,617 3,337 2,661Withheld from employees
(taxes and social security cost) 1,333 2,259 59 28Other payables 1,109 622 – 120Advances from customers 687 304 – –VAT payables 23 1,104 23 120Amounts due to subsidiaries
(non-trade) 38 – – 60,090 98,194276,893 188,669 67,108 103,977
Deferred revenue pertains to contract liabilities relating to advances from customers which aregenerally expected to be recognised as revenue within periods of less than one year. Accordingly,opening contract liabilities are recognised within each reporting period. The Group applies thepractical expedient in paragraph 121 of IFRS 15 and does not disclose the aggregate amount ofthe transaction price of unsatisfied or partially unsatisfied performance obligations as of the end ofthe reporting period because its contracts have original expected durations of one year or less(see Note 25).
The amounts due to subsidiaries are unsecured, interest-free and repayable on demand.
Refinancing cost pertains to unpaid transaction costs directly attributable to the bond issuance inMay 2020 (see Note 41).
Accrued miscellaneous include interest, utilities, customer deposits, freight and warehousing andcustoms and other importation incidental costs.
Sources of estimation uncertainty
The determination of the unbilled trade promotion accrual requires significant estimation of theamount of discount to be redeemed based on volumes sold when the services are performed andbillings are received.

Del Monte Pacific Limited and its Subsidiaries
Notes to the financial statementsFor the financial year ended 30 April 2020
- 121 -
*SGVFSM004024*
24. Leases
Group as a lessee
Set out below are the carrying amount of right-of-use assets recognised and the movements duringthe period:
Buildings, landimprovementsand leaseholdimprovements Land
Machinery andEquipment Total
US$’000 US$’000 US$’000 US$’000Cost/ValuationAt 1 May 2019 – – – –Effect of adoption of IFRS 16 117,070 46,746 45,354 209,170Additions 24 2,998 273 3,295Disposals (1,829) – (7,177) (9,006)Currency realignment 758 1,533 – 2,291At 30 April 2020 116,023 51,277 38,450 205,750
Accumulated amortisationAt 1 May 2019 – – – –Amortisation 21,543 6,828 14,161 42,532Disposals (831) – (2,180) (3,011)Currency realignment 40 104 – 144At 30 April 2020 20,752 6,932 11,981 39,665
Carrying amountsAt 30 April 2020 95,271 44,345 26,469 166,085
The following are the amounts recognised in fiscal year 2020 income statement:
Note US$’000Amortisation expense of right-of-use assets 26 35,179Interest expense on lease liabilities 27 8,567Expenses relating to short-term leases 26 15,365Variable lease payments 793Total amount recognised in statement of income 59,904
Amortisation expense is net of amount capitalised to inventory.
Set out below are the carrying amounts of lease liabilities and the movements during the period:
US$000As at 1 May 2019 192,283Additions 2,469Accretion of interest 10,001Payments of principal (34,427)Payments of interest (7,531)Terminations (5,836)Currency realignment 1,566As at 30 April 2020 158,525
Current 30,829Non-current 127,696

Del Monte Pacific Limited and its Subsidiaries
Notes to the financial statementsFor the financial year ended 30 April 2020
- 122 -
*SGVFSM004024*
25. Revenue
Revenue of the Group comprises fair value gains arising from biological assets, gross invoicedsales of goods, net of discounts and returns, and is recognised when goods are delivered. Allintra-group transactions have been excluded from Group revenue.
Revenue for fiscal year ended 30 April 2020 is net of discounts of US$82.9 million, returns ofUS$19.9 million and direct promotions of US$366.5 million. Revenue for fiscal year ended 30April 2019 is net of discounts of US$75.8 million, returns of US$16.8 million and direct promotionsof US$327.2 million. Revenue for fiscal year ended 30 April 2018 is net of discounts of US$87.1million, returns of US$20.6 million and direct promotions of US$486.5 million.
Disaggregation of revenue is presented in Note 30.
Contract Balances
The following table provides information about trade receivables and contract liabilities fromcontracts with customers.
Group
Note30 April
202030 April
201930 April
2018US$’000 US$’000 US$’000
Receivables, included in Trade and otherreceivables 13 170,819 127,776 142,654
Contract liabilities 23 407 530 13,592
The Group recognised revenue adjustments from performance obligations satisfied or partiallysatisfied in previous periods due to changes in estimates of trade promotions, coupon redemptions,cash discounts and penalties amounting to US$3.3 million and US$3.5 million in fiscal year 2020and 2019, respectively.
The contract liabilities at 30 April 2019 have been recognised as revenue as of 30 April 2020.

Del Monte Pacific Limited and its Subsidiaries
Notes to the financial statementsFor the financial year ended 30 April 2020
- 123 -
*SGVFSM004024*
26. Profit (loss) before taxation
Profit (loss) before taxation is arrived at after charging (crediting):
<------------------ Group ------------------> <---------------- Company ---------------->
Note
Year ended30 April
2020
Year ended30 April
2019
Year ended30 April
2018
Year ended30 April
2020
Year ended30 April
2019
Year ended30 April
2018US$’000 US$’000 US$’000 US$’000 US$’000 US$’000
Inventories recognised ascost of sales 12 1,201,016 1,101,109 1,241,195 – – –
Depreciation of property,plant and equipment 5 136,674 132,052 140,061 – – –
Amortisation of right-of-useassets 24 35,179 – – – – –
Operating lease rentals 36 – 57,971 62,272 – – –Short-term leases 24 15,365 – –Changes in fair value of
agricultural produceharvested and sold 11 45,510 39,002 36,651 – – –
Impairment loss (reversalof impairment) onproperty, plant andequipment 5 40,746 1,262 24,534 – – –
Allowance for inventoryobsolescence 12 9,649 19,245 21,823 – – –
Research and developmentexpenses 11,489 11,526 13,522 – – –
Amortisation of intangibleassets 8 6,650 6,654 7,784 – – –
Impairment (reversal) oftrade and nontradereceivables 13 (292) 2,646 502 – – –
Audit fees- paid to the auditors of
the Company 353 345 340 353 345 340- paid to other auditors 1,150 998 1,064 – – –
Non-audit fees- paid to other auditors 153 144 150 57 3 11
Loss (gain) on disposal ofproperty, plant andequipment 2,502 (6,158) (11,317) – – –
Legal (reversal of legalexpenses) 2,566 2,626 4,956 3 1 (204)
Staff costsWages and salaries 272,006 228,769 353,944 4,761 4,638 3,533Social security costs 16,255 16,133 17,063 6 4 –Pension costs - definedbenefit pension plan* 8,182 7,633 13,390 92 59 –
Pension costs -provident fund 4,817 4,435 5,366 2 1 –
Equity-settled share-based paymenttransactions** 32 – 266 377 – – 30
*Included the effect of post-retirement medical plan amendment and enhanced early retirement program.**Net of non-controlling interests amounting to nil, US$(114) and US$179 for 2020, 2019 and 2018, respectively.
Other expenses not included above are advertising and marketing costs, freight, warehousing costsand others.

Del Monte Pacific Limited and its Subsidiaries
Notes to the financial statementsFor the financial year ended 30 April 2020
- 124 -
*SGVFSM004024*
27. Net finance expense
<---------------- Group ----------------> <------------- Company ------------->
Note
Year ended30 April
2020
Year ended30 April
2019
Year ended30 April
2018
Year ended30 April
2020
Year ended30 April
2019
Year ended30 April
2018US$’000 US$’000 US$’000 US$’000 US$’000 US$’000
Finance incomeInterest income from:
Bank deposits 171 481 269 1 – 5Due from a related party – – – 22,110 20,231 1,079Others 682 744 871 – – –
Gain on purchase of secondlien term loan 19 1,716 16,900 33,623 – – –
Realised foreign exchangegain 5,169 7 3,804 – – –
Unrealised foreign exchange(loss) gain – 3,853 2,905 – – 2
7,738 21,985 41,472 22,111 20,231 1,086Finance expenseInterest expenses on
bank loans (83,694) (89,125) (93,169) (16,117) (17,216) (13,910)Amortisation of debt issue
cost, discount 19 (13,737) (7,833) (9,154) (197) (286) (2,364)Interest rate swap settlement (8,695) – – – – –
Leases 24 (8,567) – – – – –Realised foreign exchange
loss (4,505) (3,405) (2,669) (3) (16) (1)Unrealised foreign exchange
loss (1,295) (61) (661) (6) – –(120,493) (100,424) (105,653) (16,323) (17,518) (16,275)
Net finance expense (112,755) (78,439) (64,181) 5,788 2,713 (15,189)
As discussed in Note 19, the Group recognised a gain of US$1.7 million(2019: US$16.9 million) on purchase of a portion of the Second Lien term loan.
28. Tax expense (credit) - net
GroupYear ended
30 April2020
Year ended30 April
2019
Year ended30 April
2018Note US$’000 US$’000 US$’000
Current tax expense- Current year 55,424 11,721 11,701
Deferred tax credit- Origination and reversal of
temporary differences 9 (26,248) (25,245) 3,14329,176 (13,524) 14,844

Del Monte Pacific Limited and its Subsidiaries
Notes to the financial statementsFor the financial year ended 30 April 2020
- 125 -
*SGVFSM004024*
28. Tax expense (credit) – net (cont’d)
GroupYear ended
30 April2020
Year ended30 April
2019
Year ended30 April
2018US$’000 US$’000 US$’000
Reconciliation of effective tax rate(Loss) profit before taxation (64,654) 700 (36,232)
Taxation on profit at applicable tax rates (25,313) (8,878) (13,687)Dividend subjected to final tax 47,246 – –Non-deductible expenses 2,951 2,225 2,022Non-taxable income (2,013) (2,733) (2,537)Change in unrecognised deferred tax asset 4,433 (4,325) 2,199Others 1,872 187 (90)Change in tax rate – – 26,937
29,176 (13,524) 14,844
CompanyYear ended
30 April2020
Year ended30 April
2019
Year ended30 April
2018US$’000 US$’000 US$’000
Current tax expense- current year 21 7 25
Deferred tax credit- origination and reversal of
temporary differences (6) (5) (9)15 2 16
GroupYear ended
30 April2020
Year ended30 April
2019
Year ended30 April
2018US$’000 US$’000 US$’000
Applicable tax rates
- Philippines (non-PEZA) 30% 30% 30%- Philippines (PEZA)* 5% 5% 5%- India 31% 31% 31%- Singapore 17% 17% 17%- United States of America 25% 25% 25%- Mexico 30% 30% 30%
*based on gross profit for the year
Del Monte Pacific Limited and its Subsidiaries
Notes to the financial statementsFor the financial year ended 30 April 2020
- 126 -
*SGVFSM004024*
28. Tax expense (credit) – net (cont’d)
DMPI’s production operations in Cagayan de Oro City, Philippines are undertaken in the PhilippinePacking Agricultural Export Processing Zone. This zone was established in accordance with theregulations of the Philippine Economic Zone Authority (PEZA). DMPI enjoys several fiscal andnon-fiscal incentives including a 5% (2019 and 2018: 5%) tax on gross profit in lieu of the statutory30% (2019 and 2018: 30%) on profit before tax, duty free importation of capital equipment, rawmaterials and supplies used in pursuit of its Ecozone-registered activities, among other incentives.The incentives may be availed of for as long as DMPI complies with the PEZA’s requirements whichinclude exporting 70% of its production and these incentives are not rationalised by law. Thiscurrent tax incentive expired in fiscal year 2018 and was extended for an additional three yearsending fiscal year 2021.
DMPI received PEZA approval for a second zone, the Bukidnon Agro-Resources Export Zone, foragri-development projects. This current tax incentive expired in fiscal year 2018 and wasextended for an additional three years ending fiscal year 2021.
With respect to DMFI, on 22 December 2017, the United States enacted the Tax Cuts and JobsAct (the “Act”). The Act lowered the U.S. federal statutory income tax rate from 35% to 21% effective1 January 2018.
Company
There is no tax expense for the Company as the income of the Company is exempt from all incometaxes in the British Virgin Islands except for ROHQ in the Philippines which has a preferential taxrate of 10%.
Sources of estimation uncertainty
The Group has exposure to income taxes in several foreign jurisdictions. Significant judgementis involved in determining the group-wide provision for income taxes. There are certaintransactions and computations for which the ultimate tax determination is uncertain during theordinary course of business. The Group recognises liabilities for expected tax issues based onestimates of whether additional taxes will be due. Where the final tax outcome of these mattersis different from the amounts that were initially recognised, such differences will impact the incometax and deferred tax provisions in the period in which such determination is made.

Del Monte Pacific Limited and its Subsidiaries
Notes to the financial statementsFor the financial year ended 30 April 2020
- 127 -
*SGVFSM004024*
29. Earnings (loss) per share
Basic earnings (loss) per share
Basic earnings (loss) per share is calculated by dividing the net profit (loss) attributable toshareholders by the weighted average number of ordinary shares in issue during the year.
Cumulative undeclared preference dividends amounted to US$1.3 million as of 30 April 2020 and2019.
GroupYear ended
30 April2020
Year ended30 April
2019
Year ended30 April
2018
(Loss) profit attributable to owners of theCompany (US$’000) (81,394) 20,319 (36,492)
Cumulative preference share dividends forthe year (US$’000) (19,750) (19,750) (15,958)
(101,144) 569 (52,450)
Weighted average number of ordinaryshares (’000):
Outstanding ordinary shares at 1 May 1,943,960 1,943,960 1,943,214Effect of share awards granted – – 456Weighted average number of ordinary
shares during the year 1,943,960 1,943,960 1,943,670
Basic (loss) earnings per share(in US cents) (5.20) 0.03 (2.70)

Del Monte Pacific Limited and its Subsidiaries
Notes to the financial statementsFor the financial year ended 30 April 2020
- 128 -
*SGVFSM004024*
29. Earnings (loss) per share (cont’d)
Diluted earnings (loss) per share
For the purpose of calculation of the diluted earnings per ordinary share, the weighted averagenumber of ordinary shares in issue is adjusted to take into account the dilutive effect arising fromDel Monte Pacific RSP, with the potential ordinary shares weighted for the period outstanding.
GroupYear ended
30 April2020
Year ended30 April
2019
Year ended30 April
2018
(Loss) profit attributable to owners of theCompany (US$’000) (81,394) 20,319 (36,492)
Cumulative preference share dividends forthe year (US$’000) (19,750) (19,750) (15,958)
(101,144) 569 (52,450)
Diluted weighted average number ofshares (’000):
Weighted average number of ordinaryshares at end of year (basic) 1,943,960 1,943,960 1,943,670
Potential ordinary shares issuable undershare awards – – –
Weighted average number of ordinaryshares issued (diluted) 1,943,960 1,943,960 1,943,670
Diluted (loss) earnings per share(in US cents) (5.20) 0.03 (2.70)
30. Operating segments
The Group has two operating segments: geographical and product. In identifying these operatingsegments, management generally considers geographical as its primary operating segment.
Geographical segments
Americas
Reported under the Americas segment are sales and profit on sales in North and South America,and Canada. Majority of this segment’s sales are principally sold under the Del Monte brand butalso under the Contadina, S&W, College Inn and other brands. This segment also includes salesof private label food products. Sales across various channels include retail markets, as well as tothe United States military, certain export markets, the food service industry and other foodprocessors.
Del Monte Pacific Limited and its Subsidiaries
Notes to the financial statementsFor the financial year ended 30 April 2020
- 129 -
*SGVFSM004024*
30. Operating segments (cont’d)
Asia Pacific
Reported under Asia Pacific are sales and profit on sales in the Philippines, comprising primarily ofDel Monte branded packaged products, including Del Monte traded goods; Today’s; S&W productsin Asia both fresh and packaged; and Del Monte packaged products from the Philippines into Indiansubcontinent as well as unbranded fresh and packaged goods.
Europe
Included in Europe segment are sales of unbranded products in Europe.
Product segments
Packaged fruit and vegetable
The packaged fruit and vegetable segment includes sales and profit of processed fruit andvegetable products under the Del Monte and S&W brands, as well as buyer’s labels, that arepackaged in different formats such as can, plastic cup, pouch and aseptic bag. Key products underthis segment are canned beans, peaches and corn sold in the United States and canned pineappleand tropical mixed fruit in Asia Pacific.
Beverage
Beverage includes sales and profit of 100% pineapple juice in can, juice drinks in various flavoursin can, tetra and PET packaging, and pineapple juice concentrate.
Culinary
Culinary includes sales and profit of packaged tomato-based products such as ketchup, tomatosauce, pasta sauce, recipe sauce, pizza sauce, pasta, broth and condiments under four brandsnamely Del Monte, S&W, College Inn and Contadina.
Fresh fruit and others
Fresh fruit and others include sales and profit of S&W branded fresh pineapples in Asia Pacific andbuyer’s label or non-branded fresh pineapples in Asia, and sales and profit of cattle in thePhilippines. The cattle operation helps in the disposal of pineapple pulp, a residue of pineappleprocessing which is fed to the animals. This would also include non-branded sales to SouthAmerica.
The Group allocated certain overhead and corporate costs to the various product segments basedon sales for each segment relative to the entire Group.
Segment assets
Segment assets consist primarily of property, plant and equipment, intangible assets, trade andother receivables, biological assets, inventories and investments in joint ventures.

Del Monte Pacific Limited and its Subsidiaries
Notes to the financial statementsFor the financial year ended 30 April 2020
- 130 -
*SGVFSM004024*
30. Operating segments (cont’d)
Information about reportable segments
<------------------Americas------------------> <------------------Asia Pacific---------------> <--------------------Europe ------------------> <------------------Total------------------>Year ended
30 April2020
Year ended30 April
2019
Year ended30 April
2018
Year ended30 April
2020
Year ended30 April
2019
Year ended30 April
2018
Year ended30 April
2020
Year ended30 April
2019
Year ended30 April
2018
Year ended30 April
2020
Year ended30 April
2019
Year ended30 April
2018US$’000 US$’000 US$’000 US$’000 US$’000 US$’000 US$’000 US$’000 US$’000 US$’000 US$’000 US$’000
RevenuePackaged/processed
fruit and vegetable 1,259,911 1,150,516 1,349,509 116,846 101,861 123,136 23,513 22,501 24,359 1,400,270 1,274,878 1,497,004Beverage 14,393 14,507 19,522 135,009 122,691 131,412 10,485 9,413 9,133 159,887 146,611 160,067Culinary 262,915 245,695 274,208 129,859 121,299 123,620 76 – – 392,850 366,994 397,828Fresh fruit and others 1,824 4,277 2,217 173,512 162,082 140,193 – – – 175,336 166,359 142,410Total 1,539,043 1,414,995 1,645,456 555,226 507,933 518,361 34,074 31,914 33,492 2,128,343 1,954,842 2,197,309
Gross profitPackaged/processed
fruit and vegetable 233,073 191,191 214,615 30,238 27,939 37,704 1,471 3,515 8,587 264,782 222,645 260,906Beverage 2,118 559 (275) 38,734 27,493 37,014 (550) (4,292) (2,585) 40,302 23,760 34,154Culinary 42,783 49,094 44,226 47,705 44,311 48,582 26 – – 90,514 93,405 92,808Fresh fruit and others (1,314) 1,119 499 57,873 54,056 44,107 – – 56,559 55,175 44,606Total 276,660 241,963 259,065 174,550 153,799 167,407 947 (777) 6,002 452,157 394,985 432,474
Share in net loss ofjoint venturesPackaged/processed
fruit and vegetable – (176) – (1,451) (610) (97) – (111) – (1,451) (897) (97)Beverage – – – (136) (8) (23) – – – (136) (8) (23)Culinary – – – (1,365) (72) (185) – – – (1,365) (72) (185)Fresh fruit and others – – – (132) (6) (1,247) – – – (132) (6) (1,247)Total – (176) – (3,084) (696) (1,552) – (111) – (3,084) (983) (1,552)

Del Monte Pacific Limited and its Subsidiaries
Notes to the financial statementsFor the financial year ended 30 April 2020
- 131 -
*SGVFSM004024*
30. Operating segments (cont’d)
Information about reportable segments
<------------------Americas------------------> <------------------Asia Pacific---------------> <--------------------Europe ------------------> <------------------Total------------------>Year ended
30 April2020
Year ended30 April
2019
Year ended30 April
2018
Year ended30 April
2020
Year ended30 April
2019
Year ended30 April
2018
Year ended30 April
2020
Year ended30 April
2019
Year ended30 April
2018
Year ended30 April
2020
Year ended30 April
2019
Year ended30 April
2018US$’000 US$’000 US$’000 US$’000 US$’000 US$’000 US$’000 US$’000 US$’000 US$’000 US$’000 US$’000
(Loss) profit beforetaxationPackaged/processed
fruit and vegetable (40,430) (49,323) (81,733) 14,316 11,107 20,404 (510) 577 5,618 (26,624) (37,639) (55,711)Beverage (2,256) (4,247) (5,775) 17,174 1,725 9,683 (1,557) (5,513) (3,685) 13,361 (8,035) 223Culinary (14,188) (5,987) (27,904) 25,739 20,706 24,789 (1) – – 11,550 14,719 (3,115)Fresh fruit and others (77,617) (204) (51) 14,676 31,859 22,422 – – (62,941) 31,655 22,371Total (134,491) (59,761) (115,463) 71,905 65,397 77,298 (2,068) (4,936) 1,933 (64,654) 700 (36,232)
Other Material Non-Cash ItemsDepreciation and
amortisation 74,978 51,738 54,677 103,525 86,968 93,168 – – – 178,503 138,706 147,845Capital expenditure 19,495 21,092 30,937 111,369 102,387 113,839 – – – 130,864 123,479 144,776Segment assets 1,798,832 1,843,771 1,972,616 738,672 533,690 521,213 16,849 21,233 15,297 2,554,353 2,398,694 2,509,126Segment liabilities 1,200,459 1,104,990 1,198,647 782,481 649,852 624,249 5,516 42,711 77,970 1,988,456 1,797,553 1,900,866

Del Monte Pacific Limited and its Subsidiaries
Notes to the financial statementsFor the financial year ended 30 April 2020
- 132 -
*SGVFSM004024*
30. Operating segments (cont’d)
Major customer
Revenues from a major customer of the Americas segment for fiscal year 2020 amounted toapproximately US$557.4 million or 26% (2019: US$394.4 million or 20%, 2018: US$631.9 millionor 29%) of the Group’s total revenue. The customer accounted for approximately 17% of tradeand other receivable 30 April 2020 (2019: 12%, 2018: 13%).
31. Seasonality of operations
The Group’s business is subject to seasonal fluctuations as a result of increased demand duringthe end of year festive season. For Americas, products are sold heavily during the Thanksgivingand Christmas seasons. As such, the Group’s sales are usually highest during the five monthsfrom August to December.
The Group operates 11 production facilities (2019 and 2018: 15 production facilities, respectively)in the U.S., Mexico, and Philippines. Fruit plants are located in California and Washington in theUnited States and Philippines. Most of its vegetable plants are located in the U.S. Midwest and itstomato plant are located in California.
The US Consumer Food Business has a seasonal production cycle that generally runs betweenthe months of June and October. This seasonal production primarily relates to the majority ofprocessed fruit, vegetable and tomato products, while some of its processed fruit and tomatoproducts and its College Inn broth products are produced throughout the year. Additionally, theConsumer Food Business has contracts to co-pack certain processed fruit and vegetable productsfor other companies.
32. Share option and incentive plans
The Company adopted the Del Monte Pacific Executive Share Option Plan 2016 (“ESOP 2016”),which was approved by the shareholders at the general meeting held on 30 August 2016. Thepurpose of the ESOP 2016 is to provide an opportunity for Group executives and directors toparticipate in the equity of the Company in order to motivate them to excel in their performance.The ESOP 2016 shall be valid for a period of ten years; however, it has yet to be implemented, andno options had been granted to-date.
The ESOP 2016 is administered by the Remuneration Share Option Committee (RSOC).

Del Monte Pacific Limited and its Subsidiaries
Notes to the financial statementsFor the financial year ended 30 April 2020
- 133 -
*SGVFSM004024*
32. Share option and incentive plans (cont’d)
ESOP
On 30 April 2013, the Company approved the grant of 150,000 stock options, representing a 20%adjustment to the number of unexercised stock options previously granted. The exercise periodtherefore follows that of the options granted on 7 March 2008.
As of 30 April 2020 and 2019, there is no outstanding ESOP options due to the lapse of its exerciseperiod.
Del Monte Pacific RSP
Date of grant ofshare awards Vesting period
Market priceon date of grant
Share awardsgranted
Share awardsoutstanding
S$
22 August 2013 Up to 60%: 22 August 2013- 21 August 201640%: 22 August 2016- 21 August 2017 0.840 688,000 –
1 July 2015 Up to 60%: 22 August 2016- 21 August 201740%: 22 August 2017- 21 August 2018 0.385 57,918 –
745,918 –
Since the commencement of the employee share option plans until the end of the financial year,no option have been granted at a discount.
The fair value of services received in return for share options granted are measured by referenceto the fair value of share options granted. The estimate of the fair value of the services receivedis measured based on the Black-Scholes model. The expected life used in the model has beenadjusted, based on management’s best estimate, for the effects of non-transferability, exerciserestrictions and behavioral considerations.
On 20 September 2017, the Company released all of its outstanding share awards to its Directors.There were no additional share options exercised during the fiscal year ended 30 April 2020 and2019.

Del Monte Pacific Limited and its Subsidiaries
Notes to the financial statementsFor the financial year ended 30 April 2020
- 134 -
*SGVFSM004024*
32. Share option and incentive plans (cont’d)
Fair value of share options/awards and assumptions
Date of grant ofoptions/awards
7 March2008
30 April2013
1 July2015
12 May2009
29 April2011
30 April2013
22 August2013
1 July2015
<----------------ESOP-------------> <--------------- Del Monte Pacific RSP ------------->
Fair value atmeasurementdate US$0.12 US$0.18 US$0.29 US$0.37 US$0.40 US$0.18 US$0.65 US$0.29
Share price(SingaporeDollars)at grant date 0.615 0.810 0.385 0.540 0.485 0.810 0.840 0.385
Exercise price(SingaporeDollars) 0.627 0.627 0.578 – – – – –
Expected volatility 5.00% 2.00% 2.00% – – – – –Time to maturity 2 years 2 years 2 years – – – – –Risk-free interest
rate 3.31% 1.51% 2.51% – – – – –
The expected volatility is based on the historic volatility (calculated based on the weighted averageexpected life of the share options), adjusted for any expected changes to future volatility due topublicly available information.
There are no market conditions associated with the share option grants. Service conditions andnon-market performance conditions are not taken into account in the measurement of the fair valueof the services to be received at the grant date.
Del Monte Foods Holding Equity Compensation Plan
During the second quarter of fiscal year 2016, DMFHI established a new plan, the 2015 ExecutiveLong-Term Incentive Plan (“LTIP”), which intends to provide key executives with the opportunity toreceive grants of stock options, cash-based awards and other stock-based awards. 9,000,000shares of common stock of DMFHI were reserved for grant under the plan. In fiscal year 2016, theCompany granted nonqualified stock options and cash incentive awards under the plan.
In September 2016, the authorised shares reserved for grant under the plan was increased from9,000,000 to 15,000,000. As of 30 April 2020 and 2019, 14,716,500 and 14,372,044 share wereavailable for future grant, respectively.
Del Monte Pacific Limited and its Subsidiaries
Notes to the financial statementsFor the financial year ended 30 April 2020
- 135 -
*SGVFSM004024*
32. Share option and incentive plans (cont’d)
Del Monte Foods Holding Equity Compensation Plan (cont’d)
The fair value for stock options granted was estimated at the date of grant using a Black-Scholesoption pricing model. This model estimates the fair value of the options based on a number ofassumptions, such as expected option life, interest rates, the current fair market value and expectedvolatility of common stock and expected dividends. The expected term of options granted wasbased on the “simplified” method. Expected stock price volatility was determined based on thehistorical volatilities of comparable companies over a historical period that matches the expectedlife of the options. The risk-free interest rate was based on the expected U.S. Treasury rate overthe expected life. The dividend yield was based on the expectation that no dividends will bepaid. The following table presents the weighted-average assumptions for performance-based stockoptions granted for the periods indicated:
3 November 2015
Expected life (in years) 5.5Expected volatility 38.49%Risk-free interest rate 1.64%
Stock option activity and related information during the periods indicated was as follows:
2020 2019
Number ofoptions
Weighted-average
exercise priceNumber of
options
Weighted-average
exercise price
Outstanding at beginning of year 627,956 5.39 1,422,001 5.39Cancelled (79,500) 5.39 (212,163) 5.39Forfeited (264,956) 5.39 (581,882) 5.39Outstanding at end of year 283,500 5.39 627,956 5.39Exercisable at end of year 283,500 – – –
There was no expense recognised in the consolidated income statement for equity-settled sharebased compensation for fiscal year 2020. The expense recognised in profit or loss for equity-settledshare-based payments amounting to US$0.3 million in fiscal year 2019 were included in personnelcost.
Cash incentives
On 3 November 2015, DMFHI granted a total cash incentive of US$13.8 million to key executivesunder cash incentive award agreements. The awards will vest when the employee remainsemployed for a period of approximately four (4) years from the grant date until the defined vestingdate. Of the total grant, US$4.0 million remained outstanding as of 30 April 2019. There is nothingoutstanding as of 30 April 2020 related to this grant (2019: US$4.0 million remained outstanding).
In December 2017, DMFI granted US$4.6 million in cash incentives to key executives under cashincentive award agreements. The awards will vest when the employee remains employed for aperiod of approximately two years from the grant date until the defined vesting date. Additionally,some of the grants require the employee to meet certain performance criteria. There is nothingoutstanding as of 30 April 2020 related to this grant (2019: US$3.5 million remained outstanding).

Del Monte Pacific Limited and its Subsidiaries
Notes to the financial statementsFor the financial year ended 30 April 2020
- 136 -
*SGVFSM004024*
32. Share option and incentive plans (cont’d)
Cash incentives (cont’d)
In March 2018, DMFI granted an additional US$0.3 million in cash incentives to key executivesunder cash incentive award agreements. The awards will vest when the employee remainsemployed for a period of approximately one to two years from the grant date until the definedvesting date. There is nothing outstanding as of 30 April 2020 related to this grant (2019: US$0.3million remained outstanding).
On 16 December 2019, DMFHI granted a total cash incentive of US$2.6 million to key executivesunder cash incentive award agreements. The grants require performance criteria to be achieved.The awards will vest in two equal annual parts over a period of approximately two years when theemployee remains employed on each vesting date.
There is no accrued net obligation at 30 April 2020. The accrued net obligation at 30 April 2019amounted to US$6.2 million. Total expense recognised under “Wages, salaries and other benefits”in the consolidated income statement of the Group amounted to US$1.6 million, US$3.1 million andUS$2.9 million in fiscal years 2020, 2019 and 2018, respectively.
33. Financial risk management
The Group has exposure to the following risks from financial instruments:
credit risk interest rate risk liquidity risk foreign exchange risk commodity price risk
Risk management framework
The Board of the Group has overall responsibility for the establishment and oversight of the Group’srisk management framework. The Audit and Risk Committee (“ARC”) is responsible formonitoring the Group’s risk management policies developed by management.
The Group’s risk management policies are established to identify and analyse the risks faced bythe Group, to set appropriate risk limits and controls, and to monitor risks and adherence to limits.
Risk management policies and systems are reviewed regularly to reflect changes in marketconditions and the Group’s activities. The Group, through its training and management standardsand procedures, aims to develop a disciplined and constructive control environment in which allemployees understand their roles and obligations.
The ARC oversees how management monitors compliance with the Group’s risk managementpolicies and procedures, and reviews the adequacy of the risk management framework in relationto the risks faced by the Group. The ARC is assisted in its oversight role by Internal Audit.Internal Audit undertakes both regular and ad hoc reviews of risk management controls andprocedures, the results of which are reported to the ARC.

Del Monte Pacific Limited and its Subsidiaries
Notes to the financial statementsFor the financial year ended 30 April 2020
- 137 -
*SGVFSM004024*
33. Financial risk management (cont’d)
Financial risk management objectives and policies
Risk management is integral to the whole business of the Group. The Group has a system ofcontrols in place to create an acceptable balance between the cost of risks occurring and the costof managing the risks. The BOD of the Group continually monitors the Group’s risk managementprocess to ensure that an appropriate balance between risk and control is achieved.
Credit risk
Credit risk is the risk of financial loss to the Group if a customer or counterparty to a financialinstrument fails to meet its contractual obligations, and arises principally from the Group’sreceivables from customers. The carrying amounts of financial assets in the statements offinancial position represent the Group and the Company’s maximum exposures to credit risk, beforetaking into account any collateral held. The Group and Company do not hold any collateral inrespect of their financial assets.
The Group’s exposure to credit risk is influenced mainly by the individual characteristics of eachcustomer. However, management also considers the demographics of the Group’s customerbase, including the default risk of the industry and countries in which customers are located, asthese factors may have an influence on credit risk.
The ARC has approved a credit policy under which each new customer is analysed individually forcreditworthiness before the Group’s standard payment and delivery terms and conditions areoffered. The Group’s review includes credit ratings, where available, and in some cases bankreferences. Purchase limits are established for each customer, which represents the maximumopen amount. Customers failing to meet the Group’s benchmark credit worthiness may transactwith the Group only on a prepayment or Letters of Credit basis.
Exposure to credit risk
At the reporting date, the maximum exposure to credit risk for financial assets, excluding cash onhand, by geographic region was:
Group30 April
202030 April
2019US$’000 US$’000
Americas 133,501 85,760Europe 7,375 5,470Asia Pacific 224,895 85,382
365,771 176,612
At 30 April 2020, the Group’s most significant customer accounted for 17% of the trade and otherreceivables carrying amount (2019: 12%).
Del Monte Pacific Limited and its Subsidiaries
Notes to the financial statementsFor the financial year ended 30 April 2020
- 138 -
*SGVFSM004024*
33. Financial risk management (cont’d)
Financial risk management objectives and policies (cont’d)
Credit risk (cont’d)
Impairment losses
The ageing of financial assets excluding cash on hand that were not impaired at the reporting datewas:
30 April2020
30 April2019
Group US$’000 US$’000
Not past due 307,255 125,095Past due 0 - 60 days 35,517 26,900Past due 61 - 90 days 3,486 1,755Past due 91 - 120 days 2,340 6,417More than 120 days 17,173 16,445
365,771 176,612
As at 30 April 2020 and 2019, the Company’s financial assets are all not past due.
The table below shows the credit quality of the Group’s financial assets based on their historicalexperience with the corresponding third parties:
30 April 2020Note Grade A Grade B Total
US$’000 US$’000 US$’000
Cash in banks and cash equivalents 15 33,404 – 33,404Trade and other receivables 13 – 323,065 323,065Note receivables 10 1,141 – 1,141Refundable deposits* 10 – 8,104 8,104Derivative assets 14 – 57 57
34,545 331,226 365,771**included under advance rentals and deposits
30 April 2019Note Grade A Grade B Total
US$’000 US$’000 US$’000
Cash in banks and cash equivalents 15 21,595 – 21,595Trade and other receivables 13 – 149,054 149,054Note receivables 10 4,038 – 4,038Refundable deposits* 10 – 1,861 1,861Derivative assets 14 – 64 64
25,633 150,979 176,612**included under advance rentals and deposits

Del Monte Pacific Limited and its Subsidiaries
Notes to the financial statementsFor the financial year ended 30 April 2020
- 139 -
*SGVFSM004024*
33. Financial risk management (cont’d)
Financial risk management objectives and policies (cont’d)
Credit risk (cont’d)
As at 30 April 2020 and 2019, the Company’s financial assets were all classified under Grade Aand Grade B, respectively.
30 April 2020Note Grade A Grade B Total
US$’000 US$’000 US$’000
Cash in banks and cash equivalents 15 766 – 766Trade and other receivables 13 – 95,131 95,131
766 95,131 95,897
30 April 2019Note Grade A Grade B Total
US$’000 US$’000 US$’000
Cash in banks and cash equivalents 15 886 – 886Trade and other receivables 13 – 3,187 3,187
886 3,187 4,073
Grade A financial assets pertain to those cash that are deposited in reputable banks. Grade Bincludes receivables that are collected on their due dates even without an effort from the Group tofollow them up.
The Group sells its products through major distributors and buyers in various geographical regions.Management has a credit risk policy which includes, among others, the requirement of certainsecurities to ensure prompt observance and performance of the obligations of its distributors andother buyers from time to time. The Group monitors its outstanding trade receivables on an on-going basis. In addition, the Group also engages in sale of its trade receivables without recourseto certain financial institutions.
The Group assessed that all balances under Grade A and Grade B have not experienced significantincrease in credit risk as of 30 April 2020 and 2019.
The Group applies the simplified approach in measuring expected credit losses which uses alifetime expected loss allowance for all trade receivables. The Group uses a provision matrix tomeasure ECLs. Loss rates are based on actual credit loss experience over a period of three years.The Group has assessed that adjusting the loss rates for forward-looking information does not havea material effect considering the significantly low historical loss rates and the absence of economicfactors that are highly correlated with the Group’s credit loss experience on receivables.

Del Monte Pacific Limited and its Subsidiaries
Notes to the financial statementsFor the financial year ended 30 April 2020
- 140 -
*SGVFSM004024*
33. Financial risk management (cont’d)
Financial risk management objectives and policies (cont’d)
Credit risk (cont’d)
Cash in banks and cash equivalents
Cash in banks and cash equivalents are held with banks and financial institutions which areregulated.
The percentages of cash in banks and cash equivalents held in the following regions are:
30 April2020
30 April2019
% %Group
United States of America 22 13Philippines 67 45Hong Kong 11 41Singapore – 1
Company
Philippines 86 55Hong Kong 8 45Singapore 6 –
Apart from the information stated above, the Group and Company have no significant concentrationof credit risk with any single counterparty or group counterparties.
Derivatives
The derivatives are entered into with banks and financial institutions which are regulated.
Interest rate risk
Interest rate risk is the risk that the fair value or future cash flows of a financial instrument willfluctuate because of changes in the market interest rates. The Group’s exposure to the risk ofchanges in market interest rates relates primarily to the Group’s long-term and short-term debtobligations with floating interest rates.
The Group’s cash balances are placed with reputable global banks and financial institutions. TheGroup manages its interest rate risks by placing the cash balances with varying maturities andinterest rate terms. This includes investing the Group’s temporary excess liquidity in short-termlow-risk securities from time to time. The Group also enters into interest rate swaps to managethe volatility. The Group obtains financing through bank borrowings and leasing arrangements.Funding is obtained from bank loan facilities for both short-term and long-term requirement. TheGroup’s policy is to obtain the most favourable interest rate available without increasing its foreigncurrency exposure.
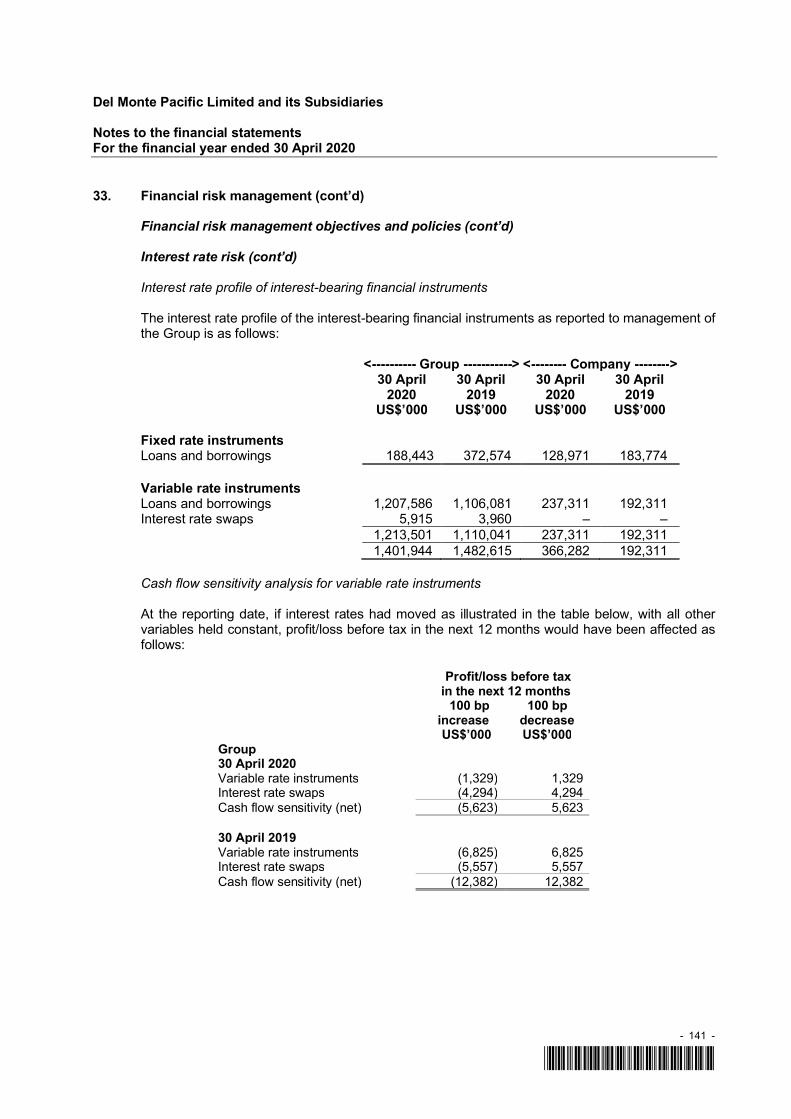
Del Monte Pacific Limited and its Subsidiaries
Notes to the financial statementsFor the financial year ended 30 April 2020
- 141 -
*SGVFSM004024*
33. Financial risk management (cont’d)
Financial risk management objectives and policies (cont’d)
Interest rate risk (cont’d)
Interest rate profile of interest-bearing financial instruments
The interest rate profile of the interest-bearing financial instruments as reported to management ofthe Group is as follows:
<---------- Group -----------> <-------- Company -------->30 April
202030 April
201930 April
202030 April
2019US$’000 US$’000 US$’000 US$’000
Fixed rate instrumentsLoans and borrowings 188,443 372,574 128,971 183,774
Variable rate instrumentsLoans and borrowings 1,207,586 1,106,081 237,311 192,311Interest rate swaps 5,915 3,960 – –
1,213,501 1,110,041 237,311 192,311 1,401,944 1,482,615 366,282 192,311
Cash flow sensitivity analysis for variable rate instruments
At the reporting date, if interest rates had moved as illustrated in the table below, with all othervariables held constant, profit/loss before tax in the next 12 months would have been affected asfollows:
Profit/loss before taxin the next 12 months
100 bpincrease
100 bpdecrease
US$’000 US$’000Group30 April 2020Variable rate instruments (1,329) 1,329Interest rate swaps (4,294) 4,294Cash flow sensitivity (net) (5,623) 5,623
30 April 2019Variable rate instruments (6,825) 6,825Interest rate swaps (5,557) 5,557Cash flow sensitivity (net) (12,382) 12,382

Del Monte Pacific Limited and its Subsidiaries
Notes to the financial statementsFor the financial year ended 30 April 2020
- 142 -
*SGVFSM004024*
33. Financial risk management (cont’d)
Financial risk management objectives and policies (cont’d)
Interest rate risk (cont’d)
The assumed movement in basis points for the interest rate sensitivity analysis is based on thecurrently observable market environment, showing significantly higher volatility than in prior years.
As at 30 April 2020 and 28 April 2019, the Group designated each of its derivative contracts as ahedge of the variability of cash flows to be received or paid related to a recognised asset or liability(“cash flow hedge”).
Liquidity risk
Liquidity risk is the risk that the Group will encounter difficulty in meeting the obligations associatedwith its financial liabilities that are settled by delivering cash or another financial asset. TheGroup’s approach to managing liquidity is to ensure, as far as possible, that it will always havesufficient liquidity to meet its liabilities when due, under both normal and stressed conditions,without incurring unacceptable losses or risking damage to the Group’s reputation.
The Group maintains a balance between continuity of cash inflows and flexibility in the use ofavailable and collateral free credit lines from local and international banks. Currently, the Groupexcluding DMFI is entitled to a total of US$682.6 million (2019: US$655.7 million) in credit lines, ofwhich 13% (2019: 46%) remain available. The lines are mostly for short-term financingrequirements since the long term facilities have been fully drawn. The Group constantly maintainsgood relations with its banks, such that additional facilities, whether for short or long-termrequirements, may be made available.
The Group is able to increase the commitments under the ABL Facility, subject only to the consentof the new or existing lenders providing such increases, such that the aggregate principal amountof commitments does not exceed US$450.0 million. The lenders under this facility are under noobligation to provide any such additional commitments, and any increase in commitments will besubject to customary conditions precedent. Notwithstanding any such increase in the facility size,the Group’s ability to borrow under the facility will remain limited at all times by the borrowing base(to the extent the borrowing base is less than the commitments).
The Group has the right to request an additional US$100.0 million plus an additional amount ofsecured indebtedness under the First Lien Term Loan and the Second Lien Term Loan. Lendersunder this facility are under no obligation to provide any such additional loans, and any suchborrowings will be subject to customary conditions precedent, including satisfaction of a prescribedleverage ratio, subject to the identification of willing lenders and other customary conditionsprecedent.

Del Monte Pacific Limited and its Subsidiaries
Notes to the financial statementsFor the financial year ended 30 April 2020
- 143 -
*SGVFSM004024*
33. Financial risk management (cont’d)
Financial risk management objectives and policies (cont’d)
Liquidity risk (cont’d)
The following are the expected contractual undiscounted cash outflows of financial assetsand liabilities, including interest payments and excluding the impact of netting agreements:
Carryingamount
Contractualcash flows
Less than1 year
1-5years
More than5 years
Group Note US$’000 US$’000 US$’000 US$’000 US$’000
30 April 2020
Derivative financial assetsCommodity contracts 14 57 57 57 − −
Non-derivative financial assetsCash in banks and cash
equivalents 15 33,404 33,404 33,404 − −Trade and other receivables 13 320,217 320,217 320,217 − −Note receivables 10,13 3,989 4,194 2,924 1,270 −Refundable deposits* 10 8,104 8,104 − − 8,104
365,771 365,976 356,602 1,270 8,104*included under advance rentals and deposits
Derivative financial liabilitiesInterest rate swaps used for
hedging, net-settled 20 5,915 6,374 6,374 − −Commodity contracts 20 2,909 10,762 8,122 2,640 −Call option 20 2,565 2,565 2,565 − −
11,389 19,701 17,061 2,640 −
Carryingamount
Contractualcash flows
Less than1 year
1-5years
More than5 years
Note US$’000 US$’000 US$’000 US$’000 US$’000
Non-derivative financial liabilitiesUnsecured bank loans- Current 19 473,152 476,600 476,600 − −- Noncurrent 19 75,000 86,432 2,538 83,894 −Secured bank loans- Current 19 825,140 826,766 826,766 − −- Noncurrent 19 22,737 49,646 20,377 29,269 −Lease liabilities 24 158,525 199,819 39,754 110,546 49,520Trade and other current liabilities* 23 265,597 265,597 265,597 − −
1,820,151 1,904,860 1,631,632 223,709 49,520Net financial liabilities (assets) 1,454,380 1,538,884 1,275,030 222,439 41,416
*excludes derivative liabilities, advances from customers, deferred revenue,withheld from employees (taxes and social security cost) and VAT payables
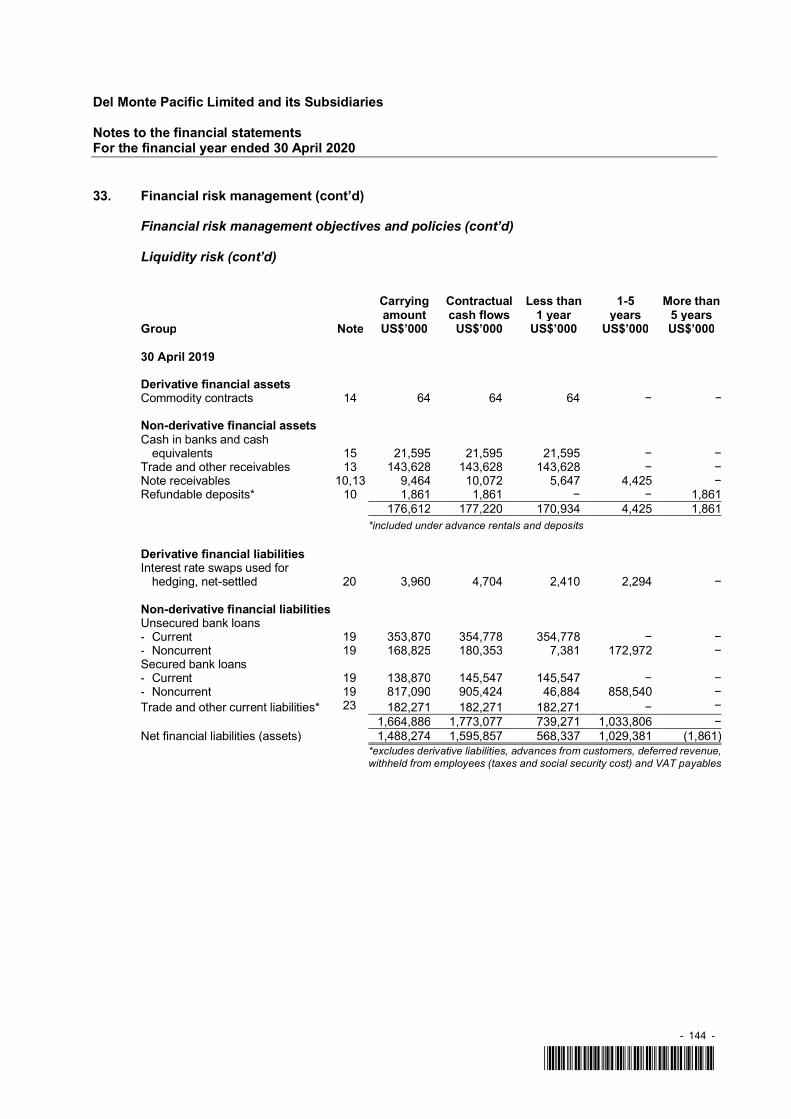
Del Monte Pacific Limited and its Subsidiaries
Notes to the financial statementsFor the financial year ended 30 April 2020
- 144 -
*SGVFSM004024*
33. Financial risk management (cont’d)
Financial risk management objectives and policies (cont’d)
Liquidity risk (cont’d)
Carryingamount
Contractualcash flows
Less than1 year
1-5years
More than5 years
Group Note US$’000 US$’000 US$’000 US$’000 US$’000
30 April 2019
Derivative financial assetsCommodity contracts 14 64 64 64 − −
Non-derivative financial assetsCash in banks and cash
equivalents 15 21,595 21,595 21,595 − −Trade and other receivables 13 143,628 143,628 143,628 − −Note receivables 10,13 9,464 10,072 5,647 4,425 −Refundable deposits* 10 1,861 1,861 − − 1,861
176,612 177,220 170,934 4,425 1,861*included under advance rentals and deposits
Derivative financial liabilitiesInterest rate swaps used for
hedging, net-settled 20 3,960 4,704 2,410 2,294 −
Non-derivative financial liabilitiesUnsecured bank loans- Current 19 353,870 354,778 354,778 − −- Noncurrent 19 168,825 180,353 7,381 172,972 −Secured bank loans- Current 19 138,870 145,547 145,547 − −- Noncurrent 19 817,090 905,424 46,884 858,540 −Trade and other current liabilities* 23 182,271 182,271 182,271 − −
1,664,886 1,773,077 739,271 1,033,806 −Net financial liabilities (assets) 1,488,274 1,595,857 568,337 1,029,381 (1,861)
*excludes derivative liabilities, advances from customers, deferred revenue,withheld from employees (taxes and social security cost) and VAT payables

Del Monte Pacific Limited and its Subsidiaries
Notes to the financial statementsFor the financial year ended 30 April 2020
- 145 -
*SGVFSM004024*
33. Financial risk management (cont’d)
Financial risk management objectives and policies (cont’d)
Liquidity risk (cont’d)
Carryingamount
Contractualcash flows
Less than1 year
1-5years
Morethan
5 yearsCompany US$’000 US$’000 US$’000 US$’000 US$’000
30 April 2020
Non-derivative financial assetsCash in banks and cash
equivalents 15 766 766 766 − −Trade and other receivables 13 95,131 95,131 95,131 − −
95,897 95,897 95,897 − −
Non-derivative financial liabilitiesUnsecured bank loans- Short-term 19 216,311 219,379 219,379 – −- Long-term 19 75,000 86,432 2,538 83,894 −Secured bank loans- Short-term 19 74,971 75,891 75,891 – –Trade and other current liabilities* 23 67,026 67,026 67,026 – –
433,308 448,728 364,834 83,894 –Net financial liabilities (assets) 337,411 352,831 268,937 83,894 –
*excludes withheld from employees (taxes and social security cost) andVAT payables
30 April 2019
Non-derivative financial assetsCash in banks and cash
equivalents 15 886 886 886 − −Trade and other receivables 13 3,187 3,187 3,187 − −
4,073 4,073 4,073 − −Non-derivative financial liabilitiesUnsecured bank loans- Short-term 199 135,070 135,532 135,532 – −- Long-term 19 111,241 119,571 4,783 114,788 −Secured bank loans- Long-term 19 129,774 138,797 5,906 132,891 –Trade and other current liabilities* 23 103,829 103,829 103,829 – –
479,914 497,729 250,050 247,679 –Net financial liabilities (assets) 475,841 493,656 245,977 247,679 –
* excludes withheld from employees (taxes and social security cost) andVAT payables
The Group’s bank loans contain loan covenants, a default of which would require the Group torepay the loans earlier than indicated in the above table. The covenants are constantly monitoredon a regular basis by the treasury department and regularly reported to management to ensurecompliance.
For derivative financial liabilities, the disclosure shows net cash from amounts for derivatives thatare net cash settled.

Del Monte Pacific Limited and its Subsidiaries
Notes to the financial statementsFor the financial year ended 30 April 2020
- 146 -
*SGVFSM004024*
33. Financial risk management (cont’d)
Financial risk management objectives and policies (cont’d)
Liquidity risk (cont’d)
It is not expected that the cash flows included in the maturity analysis could occur significantlyearlier, or at significantly different amounts.
Foreign exchange risk
Foreign currency risk is the risk that the fair value or future cash flows of a financial instrument willfluctuate because of changes in foreign exchange rates. The currency giving rise to this risk isprimarily the Philippine Peso and Mexican Peso.
From time to time, the Group manages its exposure to fluctuations in foreign currency exchangerates by entering into forward contracts to cover a portion of its projected expenditures paid inforeign currency. The Group accounts for these contracts as cash flow hedges.
At the reporting date, the Group’s exposure to foreign currencies is as follows:
PhilippinePeso
MexicanPeso
US$’000 US$’000
30 April 2020
Trade and other receivables 31,821 2,352Cash and cash equivalents 8,165 180Other noncurrent assets 13,126 1,091Loans and borrowings (209,738) −Trade and other payables (89,166) (9,187)
(245,792) (5,564)
30 April 2019
Trade and other receivables 40,259 2,554Cash and cash equivalents 8,434 552Other noncurrent assets 27,654 705Loans and borrowings (57,584) −Trade and other payables (68,766) (8,234)
(50,003) (4,423)
The Company has no significant exposure to foreign currencies as at 30 April 2020 and 2019.

Del Monte Pacific Limited and its Subsidiaries
Notes to the financial statementsFor the financial year ended 30 April 2020
- 147 -
*SGVFSM004024*
33. Financial risk management (cont’d)
Financial risk management objectives and policies (cont’d)
Foreign exchange risk (cont’d)
Sensitivity analysis
A 10% strengthening of the group entities’ foreign currencies against their respective functionalcurrency at the reporting date would have increased (decreased) loss/profit before taxation andequity by the amounts shown below. This analysis assumes that all other variables, in particularinterest rates, remain constant.
A 10% weakening of the group entities’ foreign currencies against their respective functionalcurrency would have the equal but opposite effect on the amounts shown below, on the basis thatall other variables remain constant.
US Dollar Mexican PesoProfit (loss)
beforetaxation Equity
Profit (loss)before
taxation EquityUS$’000 US$’000 US$’000 US$’000
30 April 202010% strengthening (24,579) – (556) –10% weakening 24,579 – 556 –
30 April 201910% strengthening (5,000) – (442) –10% weakening 5,000 – 442 –
Commodity price risk
Certain commodities such as diesel fuel and natural gas (collectively, “commodity contracts”) areused in the production and transportation of the Group’s products. Generally, these commoditiesare purchased based upon market prices that are established with the vendors as part of theprocurement process. The Group uses futures, swaps, and swaption or option contracts, asdeemed appropriate, to reduce the effect of price fluctuations on anticipated purchases. Thesecontracts may have a term of up to 24 months. The Group accounts for these commodity derivativesas cash flow hedges. The effective portion of derivative gains and losses is deferred in equity andrecognised as part of cost of products sold in the appropriate period and the ineffective portion isrecognised as cost of products sold.
The Group determines the existence of an economic relationship between the hedging instrumentand hedged item based on the reference index prices, purchase dates, maturities and the notionalor par amounts.
The Group assesses whether the derivative designated in each hedging relationship is expectedto be effective in offsetting changes in cash flows of the hedged item using the hypotheticalderivative method.
In these hedge relationships, the main sources of ineffectiveness are the effect of the differencesin timing of cash flows of the hedged item and the hedging instrument, difference in indexes linkedto the hedged risk of the hedged item and the hedging instrument, the counterparties’ credit riskdifferently impacting the fair value movements of the hedging instruments and changes to theforecasted amount of cash flows of hedged item and hedging instrument.

Del Monte Pacific Limited and its Subsidiaries
Notes to the financial statementsFor the financial year ended 30 April 2020
- 148 -
*SGVFSM004024*
33. Financial risk management (cont’d)
Financial risk management objectives and policies (cont’d)
Commodity price risk (cont’d)
Sensitivity analysis
A 10% change in commodity prices at the reporting date would have decreased/(increased)profit/loss before tax and increased/(decreased) equity by the amounts shown below.
30 April 2020Profit (loss)
before taxation EquityUS$’000 US$’000
10% increase in commodity price – 1910% decrease in commodity price – (19)
34. Accounting classification and fair values
Fair values versus carrying amounts
The fair values of financial assets and liabilities, together with the carrying amounts shown in thestatement of financial position, are as follows:
Note
Financialassets atamortised
cost Derivatives
Otherfinancialliabilities
Totalcarryingamount Fair value
US$’000 US$’000 US$’000 US$’000 US$’000Group
30 April 2020Cash and cash
equivalents 15 33,465 – – 33,465 33,465Trade and other
receivables 13 317,736– –
317,736 317,736Note receivables 10 6,470 – – 6,470 6,470Refundable deposits** 10 8,104 – – 8,104 8,104Derivative assets 14 – 57 – 57 57
365,775 57 – 365,832 365,832
Loans and borrowings 19 – – 1,396,029 1,396,029 1,327,623
Trade and other payables* 23, 33– –
265,597 265,597 265,597Derivative liabilities 20, 23 – 11,389 – 11,389 11,389
– 11,389 1,661,626 1,673,015 1,604,609*excludes derivative liabilities, advances from customers, deferred revenue, withheld fromemployees (taxes and social security cost) and VAT payables**included under advance rentals and deposits

Del Monte Pacific Limited and its Subsidiaries
Notes to the financial statementsFor the financial year ended 30 April 2020
- 149 -
*SGVFSM004024*
34. Accounting classification and fair values (cont’d)
Fair values versus carrying amounts (cont’d)
Financialassets at
amortisedcost Derivatives
Otherfinancialliabilities
Totalcarrying
amount Fair valueUS$’000 US$’000 US$’000 US$’000 US$’000
Group30 April 2019Cash and cash
equivalents 15 21,636 – – 21,636 21,636Trade and other
receivables 13 143,448 – – 143,448 143,448Note receivables 10 9,644 – – 9,644 9,644Refundable deposits** 10 1,861 – – 1,861 1,861Derivative assets 14 – 64 – 64 64
176,589 64 – 176,653 176,653
Loans and borrowings 19 – – 1,478,655 1,478,655 1,324,846Trade and other payables* 23, 33 – – 182,271 182,271 182,271Derivative liabilities 20, 23 – 3,960 – 3,960 3,960
– 3,960 1,660,926 1,664,886 1,511,077*excludes derivative liabilities, advances from customers, deferred revenue, withheld fromemployees (taxes and social security cost) and VAT payables**included under advance rentals and deposits
Note
Financial assetsat amortised
costOther financial
liabilities
Totalcarryingamount Fair value
US$’000 US$’000 US$’000 US$’000Company
30 April 2020Cash and cash equivalents 15 766 – 766 766Trade and other receivables 13 95,131 – 95,131 95,131Due from a related party 38 228,683 – 228,683 228,683
324,580 – 324,580 324,580
Loans and borrowings 19 – 366,282 366,282 366,367Trade and other payables* 23, 33 – 67,026 67,026 67,026
– 433,308 433,308 433,393*excludes withheld from employees (taxes and social security cost)and VAT payables
30 April 2019Cash and cash equivalents 15 886 – 886 886Trade and other receivables 13 3,187 – 3,187 3,187Due from a related party 38 202,471 – 202,471 136,668
206,544 – 206,544 140,741
Loans and borrowings 19 – 376,085 376,085 367,610Trade and other payables* 23, 33 – 103,829 103,829 103,829
– 479,914 479,914 471,439*excludes withheld from employees (taxes and social securitycost) and VAT payables

Del Monte Pacific Limited and its Subsidiaries
Notes to the financial statementsFor the financial year ended 30 April 2020
- 150 -
*SGVFSM004024*
35. Determination of fair values
Fair value hierarchy
All assets and liabilities for which fair value is measured or disclosed in the financial statementsare categorised within the fair value hierarchy, described as follows, based on the lowest level inputthat is significant to the fair value measurement as a whole:
Level 1: quoted prices (unadjusted) in active markets for identical assets or liabilities that the Groupcan access at the measurement date.
Level 2: inputs other than quoted prices included within Level 1 that are observable for the assetor liability, either directly or indirectly.
Level 3: unobservable inputs for the asset or liability.
For assets and liabilities that are recognised in the financial statements on a recurring basis, theGroup determines whether transfers have occurred between Levels in the hierarchy by reassessingthe categorisation at the end of each reporting period.
For purposes of the fair value disclosure, the Group has determined classes of assets and liabilitieson the basis of the nature, characteristics and risks of the asset or liability and the level of the fairvalue hierarchy, as explained above.
Group 30 April 2020
Note Level 1 Level 2 Level 3 TotalFinancial assetsDerivative assets 14 – 57 – 57Notes receivables 10 – – 1,141 1,141Non-financial assetsFair value of agricultural produce
harvested under inventories 11 – – 3,657 3,657Fair value of growing produce 11 – – 61,160 61,160Freehold land 5 – – 54,758 54,758Financial liabilitiesDerivative liabilities 20, 23 – 8,824 2,565 11,389Lease liabilities 24 – – 176,609 176,609Loans and borrowings – 931,256 396,367 1,327,623

Del Monte Pacific Limited and its Subsidiaries
Notes to the financial statementsFor the financial year ended 30 April 2020
- 151 -
*SGVFSM004024*
35. Determination of fair values
Fair value hierarchy (cont’d)
30 April 2019
Note Level 1 Level 2 Level 3 TotalFinancial assetsDerivative assets 14 – 64 – 64Notes receivables 10 – – 4,038 4,038Non-financial assetsFair value of agricultural produce
harvested under inventories 11 – – 6,016 6,016Fair value of growing produce 11 – – 52,320 52,320Freehold land 5 – – 57,244 57,244Noncurrent assets held for sale 16 – – 4,465 4,465Financial liabilitiesDerivative liabilities 20, 23 – 3,960 – 3,960Loans and borrowings – 918,761 406,085 1,324,846
During the period, there were no transfers between Level 1 and Level 2 fair value measurements,and no transfers into and out of Level 3 fair value measurements.
The Company has no assets and liabilities measured at fair value as of 30 April 2020 and 2019.
A number of the Group’s accounting policies and disclosures require the determination of fair value,for both financial and non-financial assets and liabilities. Fair values have been determined formeasurement and/or disclosure purposes based on the following methods.

Del Monte Pacific Limited and its Subsidiaries
Notes to the financial statementsFor the financial year ended 30 April 2020
- 152 -
*SGVFSM004024*
35. Determination of fair values (cont’d)
Financial instruments measured at fair value
Interest rate swaps Market comparison technique: The fair valuesare calculated using a discounted cash flowanalysis based on terms of the swap contractsand the observable interest rate curve. Fairvalues reflect the risk of the instrument andinclude adjustments to take into account thecredit risk of the Group and counterpartywhen appropriate.
Commodities contracts Market comparison technique. Thecommodities are traded over-the-counter andare valued based on the Chicago Board ofTrade quoted prices for similar instruments inactive markets or corroborated by observablemarket data available from the EnergyInformation Administration. The values ofthese contracts are based on the dailysettlement prices published by the exchangeson which the contracts are traded.
Derivative liabilities The estimated fair value of the additionalRCPS and call option as at 30 April 2020 isbased on the CRR binomial tree model ofvaluing derivatives. The value of thesederivative liabilities is driven primarily byDMPI’s forecasted net income which is notbased on observable market data.
Financial instruments not measured at fair value
Type Valuation techniqueFinancial assets and liabilities The fair value of the secured first lien term
loans, second lien term loans, note receivableand refundable deposits are calculated basedon the present value of future principal andinterest cash flows, discounted at the marketrate of interest at the reporting date (Level 2).
Other financial assets and liabilities The notional amounts of financial assets andliabilities with maturity of less than one year(including trade and other receivables, cashand cash equivalents, and trade and otherpayables) are, because of the short period tomaturity, assumed to approximate their fairvalues.
All financial assets and liabilities with maturityof more than one year are discounted usingrisk free rates, LIBOR and credit spreads todetermine their fair values ranging from 3.5%to 7% (2019: 3.8% to 4.5%) (Level 3).
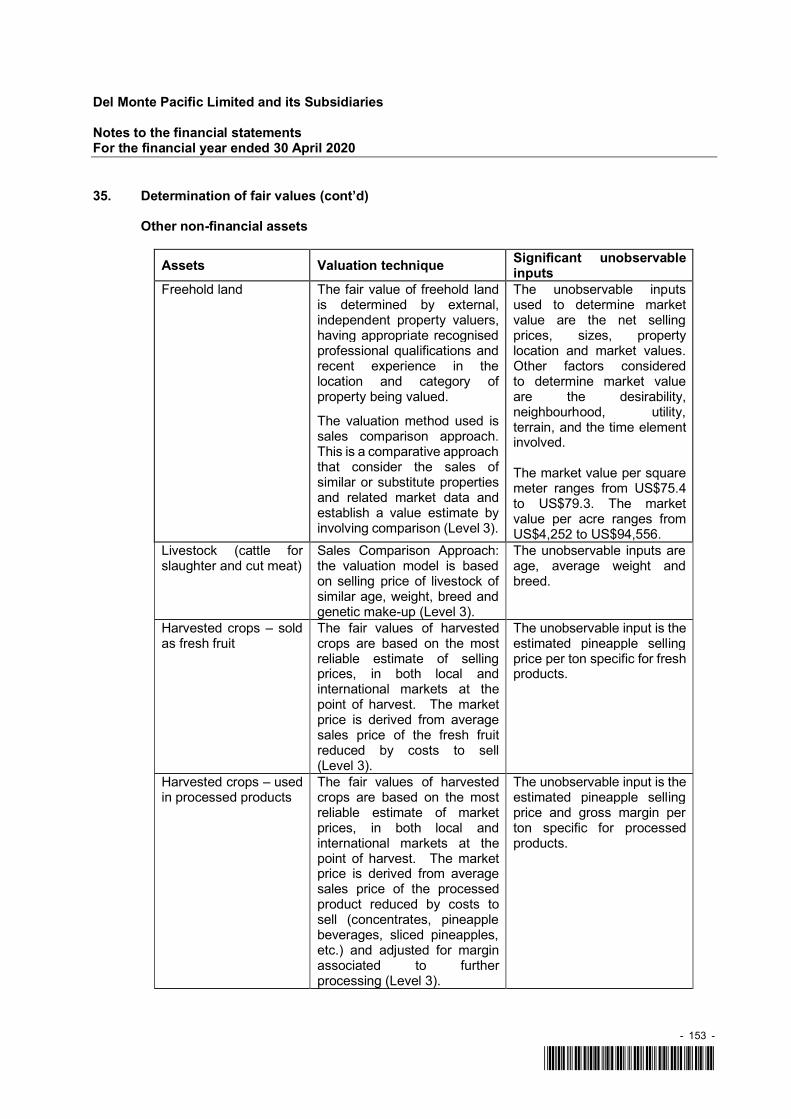
Del Monte Pacific Limited and its Subsidiaries
Notes to the financial statementsFor the financial year ended 30 April 2020
- 153 -
*SGVFSM004024*
35. Determination of fair values (cont’d)
Other non-financial assets
Assets Valuation technique Significant unobservableinputs
Freehold land The fair value of freehold landis determined by external,independent property valuers,having appropriate recognisedprofessional qualifications andrecent experience in thelocation and category ofproperty being valued.
The valuation method used issales comparison approach.This is a comparative approachthat consider the sales ofsimilar or substitute propertiesand related market data andestablish a value estimate byinvolving comparison (Level 3).
The unobservable inputsused to determine marketvalue are the net sellingprices, sizes, propertylocation and market values.Other factors consideredto determine market valueare the desirability,neighbourhood, utility,terrain, and the time elementinvolved.
The market value per squaremeter ranges from US$75.4to US$79.3. The marketvalue per acre ranges fromUS$4,252 to US$94,556.
Livestock (cattle forslaughter and cut meat)
Sales Comparison Approach:the valuation model is basedon selling price of livestock ofsimilar age, weight, breed andgenetic make-up (Level 3).
The unobservable inputs areage, average weight andbreed.
Harvested crops – soldas fresh fruit
The fair values of harvestedcrops are based on the mostreliable estimate of sellingprices, in both local andinternational markets at thepoint of harvest. The marketprice is derived from averagesales price of the fresh fruitreduced by costs to sell(Level 3).
The unobservable input is theestimated pineapple sellingprice per ton specific for freshproducts.
Harvested crops – usedin processed products
The fair values of harvestedcrops are based on the mostreliable estimate of marketprices, in both local andinternational markets at thepoint of harvest. The marketprice is derived from averagesales price of the processedproduct reduced by costs tosell (concentrates, pineapplebeverages, sliced pineapples,etc.) and adjusted for marginassociated to furtherprocessing (Level 3).
The unobservable input is theestimated pineapple sellingprice and gross margin perton specific for processedproducts.

Del Monte Pacific Limited and its Subsidiaries
Notes to the financial statementsFor the financial year ended 30 April 2020
- 154 -
*SGVFSM004024*
35. Determination of fair values (cont’d)
Other non-financial assets (cont’d)
Assets Valuation technique Significant unobservableinputs
Unharvested crops –fruits growing on thebearer plants
The growing produce aremeasured at fair value from thetime of maturity of the bearerplant until harvest.Management used futureselling prices and gross marginof finished goods, adjusted toremove the margin associatedto further processing, lessfuture growing costs applied tothe estimated volume ofharvest as the basis of fairvalue.
The unobservable inputs areestimated pineapple sellingprice and gross margin perton for fresh and processedproducts, estimated volumeof harvest and future growingcosts.
Noncurrent assets heldfor sale
Market comparison techniqueand cost technique: Thevaluation model consideredquoted market prices forsimilar items when available,and depreciated replacementcost as appropriate.
The unobservable inputsused to determine the marketvalue are net selling prices,sizes, and property location.The unobservable inputsused to determinereplacement costs arepurchase price of building,land, and furniture andfixtures reduced by relatedselling costs.
Significant increase (decrease) in the significant unobservable inputs of freehold land, livestock,harvested crops sold as fresh fruit and harvested crop sold used in processed products would resultin higher (lower) fair values. Significant increase (decrease) in the estimated future pineappleselling price, gross margin per ton and estimated volume of harvest would result in higher (lower)fair value of growing produce, while significant increase (decrease) in the future growing costswould result in lower (higher) fair value.

Del Monte Pacific Limited and its Subsidiaries
Notes to the financial statementsFor the financial year ended 30 April 2020
- 155 -
*SGVFSM004024*
36. Commitments
Operating lease commitments
The Group leases certain property, equipment and office and warehouse facilities. At thereporting date, the Group have commitments for future minimum lease payments under non-cancellable operating leases as follows:
Group30 April
2019US$’000
Within one year 46,450Between one to five years 135,678More than five years 66,060
248,188
The leases typically run for an initial period of 2 to 25 years, with an option to renew the lease afterthat date. Some of the leases contain escalation clauses but do not provide for contingent rents.Lease terms do not contain any restrictions on Group activities concerning dividends, additionaldebts or further leasing.
Minimum lease payments, recognised in the Group’s profit or loss as short-term lease expense infiscal year 2020 amounted to US$15.4 million and operating lease expense for the fiscal yearsended 30 April 2019 and 2018 amounted to US$58.0 million and US$62.3 million, respectively.
Operating Lease Commitments – Group as Lessee
The Group has entered into various lease agreements as a lessee. The Group had determinedthat the significant risks and rewards on properties leased from third parties are retained by thelessors.
Purchase commitments
The Group has entered into non-cancellable agreements with growers, co-packers, packagingsuppliers and other service providers with commitments generally ranging from one year to tenyears, to purchase certain quantities of raw products, including fruit, vegetables, tomatoes,packaging services and ingredients.
At the reporting date, the Group have commitments for future minimum payments under non-cancellable agreements as follows:
Group30 April
202030 April
2019US$’000 US$’000
Within one year 225,632 278,910After one year but within five years 294,016 270,448After five years 353,158 406,047
872,806 955,405

Del Monte Pacific Limited and its Subsidiaries
Notes to the financial statementsFor the financial year ended 30 April 2020
- 156 -
*SGVFSM004024*
36. Commitments (cont’d)
Future capital expenditure
Group30 April
202030 April
2019US$’000 US$’000
Capital expenditure not provided for in the financialstatements
- approved by Directors and contracted for 7,184 8,467- approved by Directors but not contracted for 27,032 39,418
34,216 47,885
37. Contingencies
In fiscal year 2019, a contingent liability of a subsidiary, DMPL India Limited, in the form of a letterof undertaking securing 50% of the obligations of FFPL under its Loan Agreement withInfrastructure Development Finance Company Limited, in proportion to its equity interest was fullysettled.
Legal cases
The Group is the subject of, or a party to, various suits and pending or threatened litigation. Whileit is not feasible to predict or determine the ultimate outcome of these matters, the Group believesthat none of these legal proceedings will have a material adverse effect on its financial position.
Source of estimation uncertainty
The Group, in the ordinary course of business, sets up appropriate provisions for its present legalor constructive obligations, if any, in accordance with its policies on provisions. In recognising andmeasuring provisions, management takes risk and uncertainties into account.
No provision for probable losses arising from legal contingencies were recognised in the Group’sfinancial statements as of 30 April 2020 and 2019.
As of 30 April 2020, provision for probable losses arising from environmental remediation amountedto US$9.6 million, US$9.3 million of which is noncurrent (2019: US$1.1 million,US$0.7 million of which is noncurrent) (see Note 22).
As of 30 April 2020, provision for retained liabilities arising from workers’ compensation claimsamounted to US$22.2 million, US$19.0 million of which is noncurrent (2019:US$22.6 million, US$19.3 million of which is noncurrent) (see Note 20).
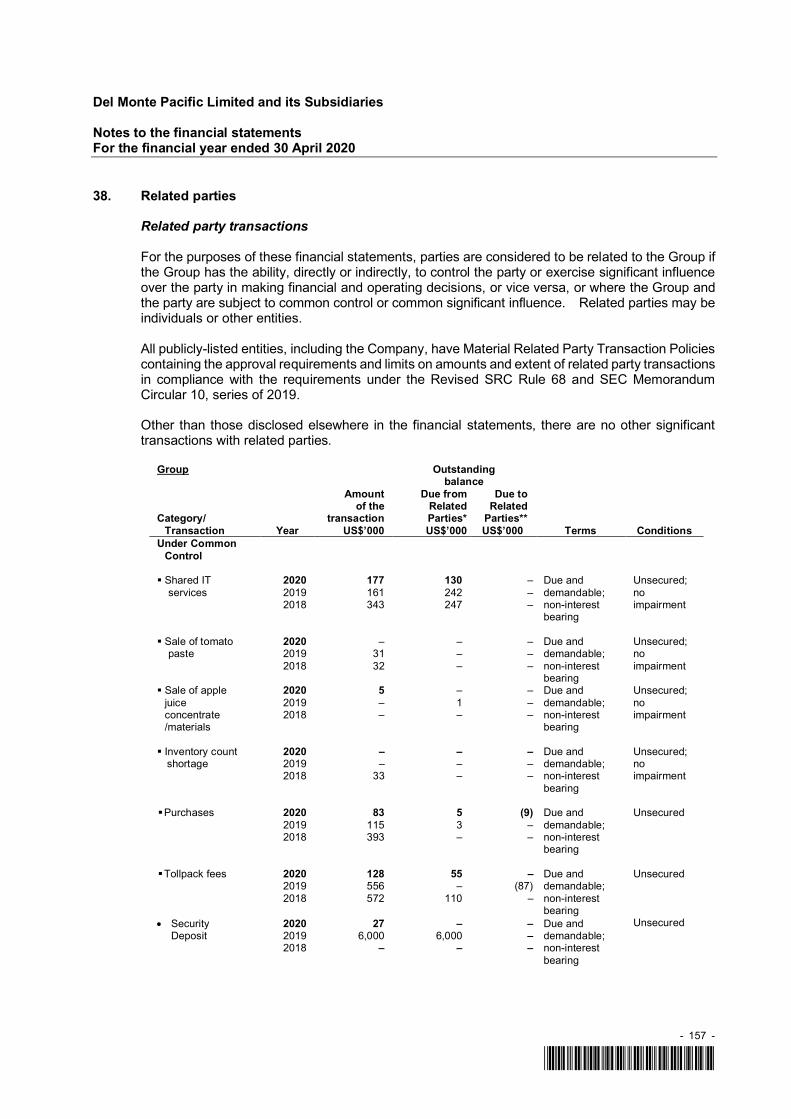
Del Monte Pacific Limited and its Subsidiaries
Notes to the financial statementsFor the financial year ended 30 April 2020
- 157 -
*SGVFSM004024*
38. Related parties
Related party transactions
For the purposes of these financial statements, parties are considered to be related to the Group ifthe Group has the ability, directly or indirectly, to control the party or exercise significant influenceover the party in making financial and operating decisions, or vice versa, or where the Group andthe party are subject to common control or common significant influence. Related parties may beindividuals or other entities.
All publicly-listed entities, including the Company, have Material Related Party Transaction Policiescontaining the approval requirements and limits on amounts and extent of related party transactionsin compliance with the requirements under the Revised SRC Rule 68 and SEC MemorandumCircular 10, series of 2019.
Other than those disclosed elsewhere in the financial statements, there are no other significanttransactions with related parties.
Group Outstandingbalance
Category/Transaction Year
Amountof the
transactionUS$’000
Due fromRelatedParties*US$’000
Due toRelated
Parties**US$’000 Terms Conditions
Under CommonControl
Shared IT 2020 177 130 – Due anddemandable;non-interestbearing
Unsecured;noimpairment
services 2019 161 242 –2018 343 247 –
Sale of tomato 2020 – – – Due anddemandable;non-interestbearing
Unsecured;noimpairment
paste 2019 31 – –2018 32 – –
Sale of apple 2020 5 – – Due anddemandable;non-interestbearing
Unsecured;noimpairment
juice 2019 – 1 –concentrate 2018 – – –/materials
Inventory count 2020 – – – Due anddemandable;non-interestbearing
Unsecured;noimpairment
shortage 2019 – – –2018 33 – –
Purchases 2020 83 5 (9) Due anddemandable;non-interestbearing
Unsecured2019 115 3 –2018 393 – –
Tollpack fees 2020 128 55 – Due anddemandable;non-interestbearing
Unsecured2019 556 – (87)2018 572 110 –
Security 2020 27 – – Due anddemandable;non-interestbearing
UnsecuredDeposit 2019 6,000 6,000 –
2018 – – –

Del Monte Pacific Limited and its Subsidiaries
Notes to the financial statementsFor the financial year ended 30 April 2020
- 158 -
*SGVFSM004024*
38. Related parties (cont’d)
Related party transactions (cont’d)
Group Outstandingbalance
Category/Transaction Year
Amountof the
transactionUS$’000
Due fromRelatedParties*US$’000
Due toRelated
Parties**US$’000 Terms Conditions
Other RelatedParty Managementfeesfrom DMPIretirement fund
2020 4 2 –Due anddemandable;non-interestbearing
Unsecured;noimpairment2019 96 230 –
2018 19 446 –
Rental to DMPI 2020 1,662 – (478) Due anddemandable;non-interestbearing
UnsecuredRetirement 2019 1,558 – (146)
2018 1,858 – –
Other RelatedParty
Rental to NAI 2020 586 – (160) Due anddemandable;non-interestbearing
UnsecuredRetirement 2019 545 – (50)
2018 543 – –
Cash advancesNAI
202020192018
8,731––
14,732––
–––
Short-term;Non interestbearing
Unsecured;noimpairment
2020 11,403 14,924 (647)2019 9,062 6,476 (283)2018 3,793 803 –
*included as part of trade and other receivables excluding long-term loans receivable**included as part of trade and other payables

Del Monte Pacific Limited and its Subsidiaries
Notes to the financial statementsFor the financial year ended 30 April 2020
- 159 -
*SGVFSM004024*
38. Related parties (cont’d)
Related party transactions (cont’d)
Company OutstandingBalance
Category/Transaction Year
Amountof the
TransactionUS$’000
Due fromRelatedParties*US$’000
Due toRelated
Parties**US$’000 Terms Conditions
Subsidiaries
Dividend income 2020 230,473 – – Due anddemandable;non-interestbearing
Unsecured;noimpairment
2019 33,000 – –2018 120,000 62,011 –
Long-term loansreceivable
2020 4,107 228,683 – Due on 2021;Interest-bearing
Unsecured;noimpairment
2019 91,741 202,471 –2018 88,880 88,880 –
Reimbursementof expenses
2020 236,676 92,607 – Due anddemandable;non-interestbearing
Unsecured;noimpairment
2019 (97,981) 635 –2018 136,455 114,938 –
Cash advance 2020 37,380 – 59,645 Due anddemandable;non-interestbearing
Unsecured2019 (20,923) – 98,1042018 29,801 – 77,400
Managementfees payable tosubsidiaries
2020 445 – 445 Due anddemandable;non-interestbearing
Unsecured2019 437 – 90
2018 748 – 1,620Joint Venture
Cash advance 2020 140 2,462 – Due anddemandable;non-interestbearing
Unsecured;noimpairment
2019 99 2,520 –2018 – 2,421
2020 509,221 323,752 60,0902019 6,373 205,626 98,1942018 375,884 268,250 79,020
*included as part of trade and other receivables excluding long-term loans receivable**included as part of trade and other payables
The transactions with related parties are carried out based on terms agreed between the parties.Pricing for the sales of products are market driven, less certain allowances. For purchases, theGroup’s policy is to solicit competitive quotations. Purchases are normally awarded based on thelowest price.
Except for transactions identified in the previous section as interest-bearing, outstanding balancesat financial reporting date are unsecured, interest-free and settlement occurs in cash and arecollectible or payable on demand. For the years ended 30 April 2020 and 2019, the Group has notmade any provision for doubtful accounts relating to amounts owed by related parties.

Del Monte Pacific Limited and its Subsidiaries
Notes to the financial statementsFor the financial year ended 30 April 2020
- 160 -
*SGVFSM004024*
38. Related parties (cont’d)
Related party transactions (cont’d)
As discussed in Note 19, the Company extended a loan to DMFHII that was used to financeDMFHII’s purchase of DMFI’s Second Lien term loans. The loan was converted into ordinaryshares in DMPLFL in May 2020.
Key management personnel compensation
Key management personnel of the Group are those persons having authority and responsibility forplanning, directing and controlling the activities of the Group. The Directors of the Company andkey executive officers (excluding executive directors) are considered as key managementpersonnel of the Group.
The key management personnel compensation is as follows:
<---------------- Group ----------------> <------------- Company ------------->Year ended
30 April2020
Year ended30 April
2019
Year ended30 April
2018
Year ended30 April
2020
Year ended30 April
2019
Year ended30 April
2018US$’000 US$’000 US$’000 US$’000 US$’000 US$’000
Directors -Fees and remuneration 2,942 2,964 2,873 2,542 2,541 2,531
Key executive officers(excluding Directors):
Short-term employee benefits 3,615 3,476 3,317 1,772 1,691 1,486Post-employment benefits 125 170 180 – – –

Del Monte Pacific Limited and its Subsidiaries
Notes to the financial statementsFor the financial year ended 30 April 2020
- 161 -
*SGVFSM004024*
39. Non-controlling interest in subsidiaries
The following table summarises the information relating to the Group’s subsidiaries with materialnon-controlling interests, based on their respective financial statements prepared in accordancewith IFRS, modified for fair value adjustments on acquisition and differences in Group’s accountingpolicies.
30 April2020
30 April2019
30 April2018
US$’000 US$’000 US$’000
DMPLFL
Ownership interests held by non-controllinginterests 10.57% 10.57% 10.57%
Revenue 1,529,840 1,421,317 1,649,060(Loss) profit (116,671) (49,826) (138,130)Other comprehensive (loss) income (21,595) 2,170 18,860Total comprehensive lossAttributable to non-controlling interests:- (Loss) profit (12,329) (5,265) (14,597)- Other comprehensive (loss) income (2,282) 229 1,993
Total comprehensive loss (14,611) (5,036) (12,604)
Noncurrent assets 1,208,461 1,179,843 1,210,583Current assets 577,653 659,036 753,475Noncurrent liabilities (567,731) (982,861) (1,274,477)Current liabilities (896,652) (400,529) (215,884)Net assets 321,731 455,489 473,697Net assets attributable to non-
controlling interests 33,823 48,133 50,057
Cash flows provided by (used in) operatingactivities 212,019 (51,844) 266,304Cash flows provided by (used in) investingactivities 9,511 (4,976) (24,323)Cash flows provided by (used in) financing
activities, before dividends to non-controlling interests (217,072) 57,184 (242,599)
Currency realignment 32 9 3Net increase (decrease) in cash and
cash equivalents 4,490 373 (615)

Del Monte Pacific Limited and its Subsidiaries
Notes to the financial statementsFor the financial year ended 30 April 2020
- 162 -
*SGVFSM004024*
39. Non-controlling interest in subsidiaries (cont’d)
30 April2020
US$’000
DMPI
Ownership interests held by non-controlling interests 12%
Revenue 628,521(Loss) profit 68,405Other comprehensive (loss) income 1,601Total comprehensive lossAttributable to non-controlling interests:- (Loss) profit –- Other comprehensive (loss) income –Total comprehensive loss –
Noncurrent assets 333,925Current assets 330,976Noncurrent liabilities (49,348)Current liabilities (396,519)Net assets 219,034Net assets attributable to non-controlling interests 26,410
Cash flows provided by (used in) operatingActivities 111,286Cash flows provided by (used in) investing activities (116,280)Cash flows provided by (used in) financing activities 17,163Currency realignment (136)Net increase (decrease) in cash and cash equivalents 12,033
In the relation to the sale of 12% stake in DMPI, the Group recognised non-controlling interestamounting to US$26.4 million, representing 12% of the net asset value of DMPI as at 30 April 2020(see Note 6).

Del Monte Pacific Limited and its Subsidiaries
Notes to the financial statementsFor the financial year ended 30 April 2020
- 163 -
*SGVFSM004024*
40. Supplemental Disclosure of Cash Flow Information
The changes in liabilities arising from financing activities of the Group for the year ended 30 April2020, 2019 and 2018 are as follows:
30 April2019
Cashinflows
Cashoutflows
Accruedinterest butnot yet paid
Foreignexchangemovement
Reclassifi-cation and
others30 April
2020Note US$’000 US$’000 US$’000 US$’000 US$’000 US$’000 US$’000
GroupFiscal Year 2020
Current interest-bearing loansand borrowings 19 492,740 713,696 (832,321) – 8,079 916,098 1,298,292
Noncurrent interest-bearingloans and borrowings 19 985,915 75,000 (59,102) – – (904,076) 97,737
Lease liabilities 24 192,283 (41,958) 10,001 1,566 (3,367) 158,525Accrued interest payable 23 10,481 – (84,250) 82,259 13 542 9,045Derivative liabilities 20, 23 3,960 – (2,867) – – 4,822 5,915Total liabilities from financing
activities 1,685,379 788,696 (1,020,498) 92,260 9,658 14,019 1,569,514
30 April2018
Cashinflows
Cashoutflows
Accruedinterest butnot yet paid
Foreignexchangemovement
Reclassifi-cation and
others30 April
2019Note US$’000 US$’000 US$’000 US$’000 US$’000 US$’000 US$’000
GroupFiscal Year 2019
Current interest-bearing loansand borrowings 19 481,620 721,538 (710,798) – (1,508) 1,888 492,740
Noncurrent interest-bearingloans and borrowings 19 983,603 164,741 (149,833) – (406) (12,190) 985,915
Accrued interest payable 23 11,939 – (83,958) 82,623 (3) (120) 10,481Derivative liabilities 20, 23 5,063 – (3,536) – – 2,433 3,960Total liabilities from financing
activities 1,482,225 886,279 (948,125) 82,623 (1,917) (7,989) 1,493,096
30 April2017
Cashinflows
Cashoutflows
Accruedinterest butnot yet paid
Foreignexchangemovement
Reclassifi-cation and
others30 April
2018US$’000 US$’000 US$’000 US$’000 US$’000 US$’000 US$’000
GroupFiscal Year 2018
Current interest-bearing loansand borrowings 449,698 807,822 (822,773) – (6,324) 53,197 481,620
Noncurrent interest-bearingloans and borrowings 1,264,268 – (234,784) – (2,130) (43,751) 983,603
Accrued interest payable 13,186 – (85,274) 84,852 – (785) 11,979Derivative liabilities 17,973 – (9,285) – – (3,625) 5,063Total liabilities from financing
activities 1,745,125 807,822 (1,152,116) 84,852 (8,454) 5,036 1,482,265

Del Monte Pacific Limited and its Subsidiaries
Notes to the financial statementsFor the financial year ended 30 April 2020
- 164 -
*SGVFSM004024*
40. Supplemental Disclosure of Cash Flow Information (cont’d)
30 April2019
Cashinflows
Cashoutflows
Accruedinterest butnot yet paid
Reclassifi-cation and
others30 April
2020Note US$’000 US$’000 US$’000 US$’000 US$’000 US$’000
CompanyFiscal Year 2020
Current interest-bearing loansand borrowings, excludingobligations under financeleases and hire purchasecontracts 19 135,070 30,000 (60,000) – 186,212 291,282
Noncurrent interest-bearingloans and borrowings,excluding obligations underfinance leases and hirepurchase contracts 19 241,015 75,000 (55,000) – (186,015) 75,000
Accrued interest payable 23 2,159 – (15,637) 15,046 – 1,568Total liabilities from financing
activities 378,244 105,000 (130,637) 15,046 197 367,850
30 April2018
Cashinflows
Cashoutflows
Accruedinterest butnot yet paid
Reclassifi-cation and
others30 April
2019Note US$’000 US$’000 US$’000 US$’000 US$’000 US$’000
CompanyFiscal Year 2019
Current interest-bearing loansand borrowings, excludingobligations under financeleases and hire purchasecontracts 19 206,034 63,100 (134,170) – 106 135,070
Noncurrent interest-bearingloans and borrowings,excluding obligations underfinance leases and hirepurchase contracts 19 129,594 164,741 (53,500) – 180 241,015
Accrued interest payable 23 2,345 – (15,927) 15,741 – 2,159Total liabilities from financing
activities 337,973 227,841 (203,597) 15,741 286 378,244
30 April2017
Cashinflows
Cashoutflows
Accruedinterest butnot yet paid
Reclassifi-cation and
others30 April
2018Note US$’000 US$’000 US$’000 US$’000 US$’000 US$’000
CompanyFiscal Year 2018
Current interest-bearing loansand borrowings, excludingobligations under financeleases and hire purchasecontracts 43,070 154,570 (45,500) – 53,894 206,034
Noncurrent interest-bearingloans and borrowings,excluding obligations underfinance leases and hirepurchase contracts 281,854 – (100,000) – (52,260) 129,594
Accrued interest payable 1,826 – (12,370) 12,889 – 2,345Total liabilities from financing
activities 326,750 154,570 (157,870) 12,889 1,634 337,973

Del Monte Pacific Limited and its Subsidiaries
Notes to the financial statementsFor the financial year ended 30 April 2020
- 165 -
*SGVFSM004024*
40. Supplemental Disclosure of Cash Flow Information (cont’d)
Reclassification and others include the effect of reclassification of noncurrent portion of interest-bearing loans and borrowings to current due to the passage of time, deferred financing costs, andfair value adjustments of hedge contracts. This also include additions and terminations of leaseliabilities.
41. Subsequent Events
DMFI Refinancing
On 15 May 2020, DMFI issued US$500.0 million of 11.875% Senior Secured Notes (the “Notes”).The Notes will mature on 15 May 2025 and are redeemable at the option of DMFI. Proceeds ofUS$477.5 million from the issuance of the Notes were used to pay-off the balance of the First LienTerm Loan. As of 30 April 2020, prepaid transaction costs of US$1.6 million, were included in“Prepaid and other current assets” and US$31.3 million of transaction cost accruals were includedin “Trade and other current liabilities” in the consolidated statement of financial position related tothis transaction. The Notes include restrictive covenants limiting the Group’s ability, and the abilityof the Group’s restricted subsidiaries, to incur additional indebtedness, create liens, engage inmergers or consolidations, sell or transfer assets, pay dividends and distributions or repurchasethe Group’s capital stock, make investments, loans or advances, prepay certain indebtedness,engage in certain transactions with affiliates, amend agreements governing certain subordinatedindebtedness adverse to the lenders, and change the Group’s lines of business.
On 15 May 2020, DMFHII issued 64.546 shares of capital stock to DMFHL. On the same date,DMFHL issued 0.64546 shares of capital stock to DMPLFL and DMPLFL issued 645.46 shares ofcapital stock to the Company as full payment of the US$228.4 million loan to finance purchases ofthe Second Lien Term Loans. Upon issuance of the capital stock to the Company, DMFHLunconditionally released of all liabilities for principal and interest through 30 April 2020 relating tothe purchase of the Second Lien Term Loans. On 15 May 2020, DMFHL recorded US$229.5million of additional paid-in capital related to this transaction. In addition, the Company andDMPLFL entered into a supplemental agreement dated 11 August 2020 for the issuance ofadditional 3.23 ordinary shares by DMPLFL to cover the additional accrued interest through 15 May2020 which amounted to $1.14 million.

Del Monte Pacific Limited and its Subsidiaries
Notes to the financial statementsFor the financial year ended 30 April 2020
- 166 -
*SGVFSM004024*
41. Subsequent Events (cont’d)
DMFI Refinancing (cont’d)
On 15 May 2020, DMFHL issued 0.42395 of ordinary shares to DMPLFL and DMPLFL issued432.95 shares of preferred stock to the Company in exchange for US$150.0 million of additionalpaid-in capital. As a result, DMFHL recorded US$150.0 million of additional paid-in capital relatedto this transaction.
On 15 May 2020, DMFHL entered into an agreement to refinance the ABL Credit Agreement withJP Morgan Chase as the administrative agent, and other lenders and agents parties thereto, toprovide for senior secured financing of up to US$450.0 million, subject to availability under theborrowing base, with a term of three years until 15 May 2023. Loans under the ABL CreditAgreement will bear interest based on either the Eurodollar rate of the alternative base rate, plusan applicable margin. Additionally, the Group fully amortised the remaining deferred financing feesrelated to the previous credit agreement of US$1.0 million for the year ended 30 April 2020. TheABL Credit Agreement includes restrictive covenants limiting the Group’s ability, and the ability ofthe Group’s restricted subsidiaries, to incur additional indebtedness, create liens, engage inmergers or consolidations, sell or transfer assets, pay dividends and distributions or repurchasethe Group’s capital stock, make investments, loans or advances, prepay certain indebtedness,engage in certain transactions with affiliates, amend agreements governing certain subordinatedindebtedness adverse to the lenders, and change the Group’s lines of business.
Trademark Assignment
On 1 May 2020, Dewey Sdn. Bhd. assigned various trademarks in the Philippines including the“Del Monte” and “Today’s” trademarks to Philippine Packing Management Service Corporation.

*SGVFSM004024*
INDEPENDENT AUDITOR’S REPORTON SUPPLEMENTARY SCHEDULES
The Board of Directors and StockholdersDel Monte Pacific LimitedCraigmur ChambersPO Box 71 Road Town, TortolaBritish Virgin Islands
We have audited in accordance with Philippine Standards on Auditing, the consolidated financialstatements of Del Monte Pacific Limited and its Subsidiaries (the Group) as at 30 April 2020 and 2019 andfor each of the three years in the period ended 30 April 2020 and have issued our report thereon dated12 August 2020. Our audits were made for the purpose of forming an opinion on the basic financialstatements taken as a whole. The schedules listed in the Index to the Financial Statements andSupplementary Schedules are the responsibility of the Company’s management. These schedules arepresented for purposes of complying with the Revised Securities Regulation Code Rule 68, and are not partof the basic consolidated financial statements. These have been subjected to the auditing proceduresapplied in the audit of the basic consolidated financial statements and, in our opinion, fairly states, in allmaterial respects, the information required to be set forth therein in relation to the basic financial statementstaken as a whole.
SYCIP GORRES VELAYO & CO.
Catherine E. LopezPartnerCPA Certificate No. 86447SEC Accreditation No. 0468-AR-4 (Group A), February 19, 2019, valid until February 18, 2022Tax Identification No. 102-085-895BIR Accreditation No. 08-001998-65-2018, February 26, 2018, valid until February 25, 2021PTR No. 8125249, January 7, 2020, Makati City
12 August 2020
SyCip Gorres Velayo & Co.6760 Ayala Avenue1226 Makati CityPhilippines
Tel: (632) 891 0307Fax: (632) 819 0872ey.com/ph
BOA/PRC Reg. No. 0001, October 4, 2018, valid until August 24, 2021SEC Accreditation No. 0012-FR-5 (Group A),
November 6, 2018, valid until November 5, 2021
A member firm of Ernst & Young Global Limited

*SGVFSM004024*
INDEPENDENT AUDITOR’S REPORTON SUPPLEMENTARY SCHEDULE
The Board of Directors and StockholdersDel Monte Pacific LimitedCraigmur ChambersPO Box 71 Road Town, TortolaBritish Virgin Islands
We have audited in accordance with Philippine Standards on Auditing, the consolidated financialstatements of Del Monte Pacific Limited and its Subsidiaries (the Group) as at 30 April 2020 and 2019 andfor each of the three years in the period ended 30 April 2020 and have issued our report thereon dated12 August 2020. Our audits were made for the purpose of forming an opinion on the basic financialstatements taken as a whole. The Supplementary Schedule on Financial Soundness Indicators, includingtheir definitions, formulas, calculation, and their appropriateness or usefulness to the intended users, are theresponsibility of the Company’s management. These financial soundness indicators are not measures ofoperating performance defined by International Financial Reporting Standards (IFRS) and may not becomparable to similarly titled measures presented by other companies. This schedule is presented for thepurpose of complying with the Revised Securities Regulation Code Rule 68 issued by the Securities andExchange Commission, and is not a required part of the basic financial statements prepared in accordancewith IFRS. The components of these financial soundness indicators have been traced to the Group’sconsolidated financial statements as at 30 April 2020 and 2019 and for each of the three years in the periodended 30 April 2020 and no material exceptions were noted.
SYCIP GORRES VELAYO & CO.
Catherine E. LopezPartnerCPA Certificate No. 86447SEC Accreditation No. 0468-AR-4 (Group A), February 19, 2019, valid until February 18, 2022Tax Identification No. 102-085-895BIR Accreditation No. 08-001998-65-2018, February 26, 2018, valid until February 25, 2021PTR No. 8125249, January 7, 2020, Makati City
12 August 2020
SyCip Gorres Velayo & Co.6760 Ayala Avenue1226 Makati CityPhilippines
Tel: (632) 891 0307Fax: (632) 819 0872ey.com/ph
BOA/PRC Reg. No. 0001, October 4, 2018, valid until August 24, 2021SEC Accreditation No. 0012-FR-5 (Group A),
November 6, 2018, valid until November 5, 2021
A member firm of Ernst & Young Global Limited

Del Monte Pacific Limited and Subsidiaries
Index to the consolidated financial statements and supplementary schedules
As at 30 April 2020
Del Monte Pacific Limited and Subsidiaries
Index to the Consolidated Financial Statements and Supplementary Schedules 30 April 2020
I. Supplementary Schedules required by Annex 68-E
SCHEDULE A
FINANCIAL ASSETS
SCHEDULE B AMOUNTS RECEIVABLE FROM DIRECTORS, OFFICERS,
EMPLOYEES, RELATED PARTIES AND PRINCIPAL
STOCKHOLDERS (OTHER THAN RELATED PARTIES)
SCHEDULE C AMOUNTS RECEIVABLE FROM RELATED PARTIES WHICH
ARE ELIMINATED DURING THE CONSOLIDATION OF
FINANCIAL STATEMENTS
SCHEDULE D INTANGIBLE ASSETS – OTHER ASSETS
SCHEDULE E LONG-TERM DEBT
SCHEDULE F INDEBTEDNESS TO RELATED PARTIES
NOT APPLICABLE
SCHEDULE G GUARANTEES OF SECURITIES OF OTHER ISSUERS
NOT APPLICABLE
SCHEDULE H CAPITAL STOCK
II. Map of Relationships of the Companies within the Group
III. Financial Ratios
IV. Schedule of Reconciliation of Retained Earnings Available for Dividend Declaration

Del Monte Pacific Limited and Subsidiaries
Index to the consolidated financial statements and supplementary schedules
As at 30 April 2020
Schedule A – Financial assets
Description of each issue
Number of shares or principal amount of
bonds and notes
Amount shown in the Statements of Financial Position
Value based on market quotations at
30 April 2020 Income received
and accrued
US$’000 US$’000 US$’000
Cash and cash equivalents ─ 33,465 33,465 171
Trade and other receivables ─ 323,065 323,065 135
Notes receivable, including current portion ─ 1,141 1,141 81
Refundable deposits ─ 8,104 8,104 ─
Derivative assets ─ 57 57 ─
─ 365,832 365,832 987

Del Monte Pacific Limited and Subsidiaries
Index to the consolidated financial statements and supplementary schedules
As at 30 April 2020
Schedule B – Amounts receivable from directors, officers, employees and related parties and principal stockholders (other than related parties)
Name and designation of debtor
Balance at beginning
of period Additions Amounts collected
Amounts written off Current Non-current
Balance at end
of period
US$’000 US$’000 US$’000 US$’000 US$’000 US$’000 US$’000
Advances to officers and employees 624 11,228 (10,839) ─ 1,017 ─ 1,017
624 11,228 (10,839) ─ 1,017 ─ 1,017

Del Monte Pacific Limited and Subsidiaries
Index to the consolidated financial statements and supplementary schedules
As at 30 April 2020
Schedule C – Amounts receivable from related parties which are eliminated during the consolidation of the Financial Statements
Name and designation of debtor
Balance at beginning
of period Additions Amounts collected
Amounts assigned Current Non-current
Balance at end
of period
US$’000 US$’000 US$’000 US$’000 US$’000 US$’000 US$’000
Philippines Packing Management Services Corporation 34 2,768 (2,315) ─ 487 ─ 487
Del Monte Philippines, Inc. 256,069 140,307 (301,851) ─ 94,525 ─ 94,525
Central American Resources, Inc. 7,413 219,743 ─ (220,501) 4,588 2,067 6,655
Dewey Sdn. Bhd. 3,085 4,858 ─ ─ ─ 7,943 7,943
Dewey Limited 2,908 7,977 (4,958) ─ 5,927 ─ 5,927
Del Monte Pacific Resources Limited 62,712 ─ (62,712)
─ ─ ─ ─
GTL Limited 210,767 101,091 (10,939)) (182,520) 118,399 ─ 118,399
S&W Fine Foods International Limited 31,245 62,938 (57,851) (15,599) 20,733
─ 20,733
S&W Japan Limited 26 104 (106) ─ 24 ─ 24
DMPL Management Services Pte Ltd. 1,959 1,547 (604) ─ 2,445 457 2902
DM Pacific Limited-ROHQ 544 2,046 (2,175) ─ 415 ─ 415
Del Monte Pacific Limited 127,673 12,261 (41,444) (6,240) 92,250 ─ 92,250
DMPL India Pte Ltd 65,104 ─ (65,104) ─ ─ ─ ─
Del Monte Foods Incorporated 2,165 387 ─ ─ 2,552 ─ 2,552
South Bukidnon Fresh Trading, Inc. 9 940 (70) ─ 879 ─ 879
Del Monte Foods Holdings II Inc. 202,471 26,212 ─ ─ ─ 228,683 228,683
974,184 583,179 (550,129) (424,860) 343,224 239,150 582,374

Del Monte Pacific Limited and Subsidiaries
Index to the consolidated financial statements and supplementary schedules
As at 30 April 2020
Schedule D – Intangible assets – Other assets
Description Balance at
beginning of period
Additions through
acquisition Additions
Charged to cost and expenses
Additions / (Deductions)
Charged to other accounts
Additions / (Deductions)
Adjustment / Disposal
Currency translation
adjustments Balance at end
of period
US$’000 US$’000 US$’000 US$’000 US$’000 US$’000 US$’000 US$’000
Goodwill 203,432 ─ ─ ─ ─ ─ ─ 203,432
Indefinite life trademarks 408,043 ─ ─ ─ ─ ─ ─ 408,043
Amortisable trademarks 17,261 ─ ─ (1,300) ─ ─ ─ 15,961
Customer relationships 79,261 ─ ─ (5,350) ─ ─ ─ 73,911
Total 707,997 ─ ─ (6,650) ─ ─ ─ 701,347

Del Monte Pacific Limited and Subsidiaries
Index to the consolidated financial statements and supplementary schedules
As at 30 April 2020
Schedule E – Long-term debt
Title of issue and type of obligation
Amount authorised
by indenture Outstanding
balance
Current portion of
long-term debt
Non-current portion of
long-term debt Interest
rates Final
maturity
US$’000 US$’000 US$’000 US$’000
Unsecured bank loans
BOC long-term loan 54,000 54,000 54,000 ─ 4.5% 2020
DBP long-term loan 57,241 57,241 57,241 ─ 2.99% 2021
DBP long-term loan 75,000 75,000 ─ 75,000 2.72% 2024
Secured bank loans
BDO long-term loan
59,472 59,472 59,472 ─ Higher of Libor or 4.50%
2020
BDO long-term loan 350,000 500 500 4.5% 2020
BDO long-term loan 130,000 74,500 74,500 ─ 4.5% 2020
Secured First lien term loan
710,000 665,625
665,625
─ Higher of Libor rate or 1% +
3.25% or 4.86%
2021
Secured Second lien term Loan
260,000 22,737 ─ 22,737 Higher of Libor(2.9%) or 1%+7.25% or
total of 8.87888% or
8.25% or 7.82%
2021
Long-term Debt 1,695,713 1,009,075 911,338 97,737
Less: Unamortized debt issue cost ─ (29) (29) ─
1,695,713 1,009,104 911,367 97,737

Del Monte Pacific Limited and Subsidiaries
Index to the consolidated financial statements and supplementary schedules
As at 30 April 2020
Schedule F – Indebtedness to related parties
Description Name of related party Balance at beginning of period Balance at end of period
Not Applicable

Del Monte Pacific Limited and Subsidiaries
Index to the consolidated financial statements and supplementary schedules
As at 30 April 2020
Schedule G – Guarantees of securities of other issuers
Name of issuing entity of securities guaranteed by the company for which this statement is filed
Title of issue of each class of securities guaranteed
Total amount guaranteed and outstanding
Amount owned by person for which statement is filed
Nature of guarantee
Not Applicable

Del Monte Pacific Limited and Subsidiaries
Index to the consolidated financial statements and supplementary schedules
As at 30 April 2020
Schedule H – Capital stock
Number of shares held
Description
Number of shares
authorised
Number of shares issued
Treasury shares
Number of shares
issued and outstanding
Number of shares
reserved for options
Related party
Directors and officers Others
’000 ’000 ’000 ’000 ’000 ’000 ’000 ’000
Ordinary shares 3,000,000 1,944,936 976 1,943,960 ─ 1,386,276 19,854 537,830 Preference shares 600,000 30,000 ─ 30,000 ─ ─ 40 29,960
3,600,000 1,974,936 976 1,973,960 ─ 1,386,276 19,894 567,790

Del Monte Pacific Limited and Subsidiaries
Index to the consolidated financial statements and supplementary schedules
As at 30 April 2020
II. Map of Relationships of the Companies within the Group
GTL Limited (100%)
S&W Japan Limited (100%)
S & W Fine Foods, Inc (100%)
NutriAsia Inc (57.8%)
NutriAsia Holding Limited (100%) Well Grounded Limited (42.2%)
NutriAsia Pacific Limited (100%)
Del Monte Pacific Limited (59.4%)
South Bukidnon Fresh Trading, Inc.
(100%)
HI Continental Corporation (100%)
DMPL Management Services Pte
Ltd (100%)
Central American Resources, Inc.
(100%)DMPL India, Limited (95.13%)
Del Monte Foods Holdings Limited
(100%)
Del Monte Foods Holdings II Inc.
(100%)
Del Monte Pacific Resources
Limited (100%) DMPL India Pte Ltd (100%) DMPL Foods Limited (89.4%)
Del Monte Foods Inc. (100%)
Pacific Brands Philippines Inc (100%)
S&W Fine Foods International
Limited (100%)
Del Monte Philippines Inc. (88%)
Philippine Packaging Management
Services Corp. (100%)
Del Monte Columbiana S.A.
(81.97%)
Industrias Citricolas de
Montemorelos, S.A. de C.V. (100%)
Del Monte Peru S.A.C. (100%)
Del Monte Txanton Distribution,
Inc. (40%)
Dewey Limited (100%)
Dewey Sdn Bhd (100%) Contadina Foods, Inc. (DE) (100%)
Del Monte Argentina S.A. (100%)
Del Monte Foods Holdings Inc.
(100%)
Del Monte Ventures, LLC
(100%)
Del Monte Avo, LLC (51%)
Del Monte Chilled Fruit Snacks,
LLC (51%)
College Inn Foods (CA) (100%)
Sager Creek Foods, Inc. (CA)
(100%)
Del Monte Ecuador DME
C.A.(100%)
Del Monte Andina C.A. (100%)

Del Monte Pacific Limited and Subsidiaries
Index to the consolidated financial statements and supplementary schedules
As at 30 April 2020
III. Financial Ratios
Ratio Formula 30 April 2020 30 April 2019
Current Ratio or Working Capital Ratio
Current Assets
Current Liabilities 0.6 1.3
Quick Ratio
Current Assets less Inventories less Prepaid expenses and other current
assets, Biological Assets and Noncurrent assets held for sale
0.2
0.2 Current Liabilities
Solvency Ratio
Total Assets
Total Liabilities 1.3 1.3
Debt Ratio
Total Liabilities
Total Assets 0.8 0.7
Debt-to-Equity Ratio
Total Liabilities
Total Stockholders' Equity 3.5 3.0
Asset to Equity Ratio
Total Assets
Total Stockholders' Equity 4.5 4.0
Interest Coverage
Earnings Before Interest and Taxes
Interest Charges 0.4 0.8
Debt/EBITDA Ratios
Total Debt
Earnings Before Interest, Taxes, Depreciation and Amortization1 13.98 12.51
Gross Profit Margin
Revenue - Cost of Sales
Revenue 21.24% 20.21%
Net Profit Margin attributable to owners of the company
Net Profit/(Loss) attributable to owners
Revenue -3.82% 1.04%
Net Profit Margin
Net Profit/(Loss)
Revenue -4.41% 0.73%
Return on Assets
Net Profit/(Loss)
Total Assets -3.67% 0.59%
Return on Equity
Net Profit/(Loss)
Total Stockholders' Equity -16.58% 2.36%
1 EBITDA is exclusive of foreign exchange differences, capitalizable depreciation and depreciation expense attributable to bearer plants

Del Monte Pacific Limited and Subsidiaries
Index to the consolidated financial statements and supplementary schedules
As at 30 April 2020
IV. Schedule of Reconciliation of Retained Earnings Available for Dividend Declaration *
Amount
(In US$’000)
Unappropriated retained earnings, beginning 96,074
Adjustment:
Effect of adoption of IFRS 16 (1,013)
Unappropriated retained earnings, as adjusted,
beginning 95,061
Less: Non-actual/unrealized income net of tax
Equity in net income of associates and joint
ventures 2,524
Treasury shares (286)
Unappropriated retained earnings, as adjusted to
available for dividend distribution, beginning 97,299
Add: Net income actually earned/realized during the
period
Net loss during the period closed to retained
earnings (81,394)
Less: Non-actual/unrealized income net of tax
Equity in net income of associates and joint
ventures 766
Net loss actually earned during the period (80,628)
Add (Less):
Dividends declared during the period (29,862)
Unappropriated retained earnings available for
dividend declaration, end (13,191)
*The Company was incorporated in the British Virgin Islands. Thus, it may be subject
to different rules on dividend declaration.